UNITED STATES
SECURITIES AND EXCHANGE COMMISSION
Washington, D.C. 20549
FORM 8-K
CURRENT REPORT
Pursuant to Section 13 or 15(d) of
the Securities Exchange Act of 1934
Date of Report (Date of earliest event reported): January 26, 2026
Commercial Bancgroup, Inc.
(Exact name of registrant as specified in its charter)
| Tennessee | 001-42889 | 62-1039469 | ||
| (State or other jurisdiction of incorporation) |
(Commission File Number) | (IRS Employer Identification No.) |
6710 Cumberland Gap Parkway
Harrogate, Tennessee 37752
(Address of principal executive offices) (Zip code)
(423) 869-5151
(Registrant’s telephone number, including area code)
(Former name or former address, if changed since last report)
Check the appropriate box below if the Form 8-K filing is intended to simultaneously satisfy the filing obligation of the registrant under any of the following provisions:
| ☐ | Written communications pursuant to Rule 425 under the Securities Act (17 CFR 230.425) |
| ☐ | Soliciting material pursuant to Rule 14a-12 under the Exchange Act (17 CFR 240.14a-12) |
| ☐ | Pre-commencement communications pursuant to Rule 14d-2(b) under the Exchange Act (17-CFR 240.14d-2(b)) |
| ☐ | Pre-commencement communications pursuant to Rule 13e-4(c) under the Exchange Act (17-CFR 240.13e-4(c)) |
Securities registered pursuant to Section 12(b) of the Act:
| Title of each class | Trading Symbol | Name of each exchange on which registered | ||
| Common Stock, $0.01 par value per share | CBK | The Nasdaq Stock Market LLC |
Indicate by check mark whether the registrant is an emerging growth company as defined in Rule 405 of the Securities Act of 1933 (§230.405 of this chapter) or Rule 12b-2 of the Securities Exchange Act of 1934 (§240.12b-2 of this chapter).
Emerging growth company ☒
If an emerging growth company, indicate by check mark if the registrant has elected not to use the extended transition period for complying with any new or revised financial accounting standards provided pursuant to Section 13(a) of the Exchange Act. ☐
Item 2.02 Results of Operations and Financial Condition.
On January 26, 2026, Commercial Bancgroup, Inc., a Tennessee corporation (the “Company”), issued a press release announcing its financial results for the fourth quarter and fiscal year ended December 31, 2025 (the “Earnings Release”). A copy of the Earnings Release is included as Exhibit 99.1 to this Current Report on Form 8-K (this “Report”) and is incorporated herein by reference.
In conjunction with the Earnings Release, the Company also made available an investor presentation of results for the fourth quarter and fiscal year ended December 31, 2025 (the “Presentation”). The Presentation, which is available under the “Investors” section of the Company’s website, located at https://www.cbtn.com/, is included as Exhibit 99.2 to this Report and is incorporated herein by reference. Information on the Company’s website is not, and will not be deemed to be, a part of this Report or incorporated into any other filings the Company may make with the U.S. Securities and Exchange Commission.
The information contained in Item 2.02, including the accompanying exhibits, shall not be deemed “filed” for purposes of Section 18 of the Securities Exchange Act of 1934, as amended (the “Exchange Act”), or otherwise subject to the liabilities under that section, nor shall it be deemed incorporated by reference into any filing of the Company under the Securities Act of 1933, as amended, or the Exchange Act.
Item 9.01 Financial Statements and Exhibits.
(d) Exhibits
| Exhibit | Description | |
| 99.1 | Press release of Commercial Bancgroup, Inc., dated January 26, 2026. | |
| 99.2 | Investor Presentation of Commercial Bancgroup, Inc., dated January 26, 2026. | |
| 104 | Cover Page Interactive Data File (embedded within the Inline XBRL document). |
SIGNATURES
Pursuant to the requirements of the Securities Exchange Act of 1934, the registrant has duly caused this report to be signed on its behalf by the undersigned hereunto duly authorized.
| COMMERCIAL BANCGROUP, INC. | ||
| Date: January 26, 2026 | By: | /s/ Terry L. Lee |
| Terry L. Lee | ||
| President and Chief Executive Officer | ||
Exhibit 99.1

Commercial Bancgroup, Inc. Announces Results for the Fourth Quarter 2025
HARROGATE, TN –January 26, 2026 – Commercial Bancgroup, Inc. (“Commercial” or the “Company”) (Nasdaq: CBK), the parent company of Commercial Bank (the “Bank”), today announced net income less non-controlling interest of $9.9 million, or $0.72 per diluted common share, for the fourth quarter of 2025, compared to net income less non-controlling interest of $5.6 million, or $0.46 per diluted common share, for the fourth quarter of 2024.
On October 1, 2025, the Company priced its initial public offering (the “IPO”) of 7,173,092 shares of its common stock 1,458,343 of which were sold by Commercial and 5,714,758 of which were sold by certain selling shareholders, at a public offering price of $24.00 per share.
Prior to September 18, 2025, Commercial had three classes of common stock outstanding: common stock, Class B common stock, and Class C common stock. On September 18, 2025, Commercial’s charter was amended and restated. The Company’s amended and restated charter provided for, among other things:
| ● | effective upon the filing of the amended and restated charter, the reclassification and conversion of (i) each outstanding share of Class B common stock into 1.15 shares of common stock and (ii) each outstanding share of Class C common stock into 1.05 shares of common stock (collectively, the “Stock Reclassification”); and |
| ● | effective immediately following the Stock Reclassification, a 250-for-1 forward stock split in respect of the outstanding shares of our common stock (the “Stock Split”). |
Our financial statements, including earnings per share and book value per share, reflect the stock Reclassification and Stock Split retroactively. Because the IPO occurred after September 30, 2025, the financial impacts of the IPO are reflected for the fourth quarter of 2025 in the financial statements presented in this press release.
Fourth Quarter 2025 Performance Highlights:
| ● | Net income of $9.9 million or $0.72 per diluted share |
| ● | Return on average assets (“ROAA”) of 1.76% |
| ● | Return on average equity (“ROAE”) of 15.26%; Return on average tangible common equity (“ROATCE”) of 15.99% |
| ● | Net interest margin of 4.01%, a decrease of 1 basis points from the third quarter of 2025 |
| ● | Efficiency ratio of 45.24% |
| ● | Gross loans increased $106.3 million during the quarter, or 24% annualized, from the third quarter |
| ● | Book value per share increased $0.78, or 16% annualized, to $20.81 and tangible book value per increased $0.91, or 19% annualized, to $19.96 at December 31, 2025 from the third quarter of 2025 |
| ● | Net charge-offs to average loans of 0.014% and Nonperforming assets to total assets of 0.28% |
| ● | Redeemed $20.3 million of holding company debt |
2025 highlights:
| ● | Net income less non-controlling interest of $36.9 million or $2.93 per share and $2.92 per diluted share for the twelve months ended December 31, 2025, compared to $31.4 million or $2.58 per share and $2.54 per diluted share for the twelve months ended December 31, 2024. |
| ● | Return on average assets of 1.61% for the twelve months ended December 31, 2025, compared to 1.40% for the twelve months ended December 31, 2024. |
| ● | Return on average shareholders’ equity of 15.60% for the twelve months ended December 31, 2025, compared to 15.30% for the twelve months ended December 31, 2024. |
| ● | Total operating revenue of $90.4 million for the twelve months ended December 31, 2025, compared to $88.5 million for the twelve months ended December 31, 2024. |
| ● | Non-interest expense of $42.5 million for the twelve months ended December 31, 2025, compared to $46.1 million for the twelve months ended December 31, 2024. |
| ● | Tangible book value per share of $19.96 per share as of December 31, 2025, compared to $17.11 per share as of December 31, 2024 (see non-GAAP reconciliation). |
| ● | Efficiency ratio of 47.0% for the twelve months ended December 31, 2025, compared to 48.9% for the twelve months ended December 31, 2024. |
Balance Sheet Trends
Total assets were $2.3 billion as of December 31, 2025, compared to $2.3 billion as of December 31, 2024. This was primarily due to a decrease in the loan portfolio during the first three quarters of the year offset by loan growth during the fourth quarter.
Total net loans were $1.9 billion as of December 31, 2025, an increase of $66.9 million, or 3.7%, from December 31, 2024. While the Bank experienced some large loan payoffs from long-term borrowers selling businesses during the year, the Bank had strong loan growth during the fourth quarter. Total net loans increased by $106.5 million or 6.1% from $1.7 billion as of September 30, 2025.
As of December 31, 2025, the Bank exceeded the minimum requirements to be well-capitalized for bank regulatory purposes, with a total risk-based capital ratio of 14.1%, a Tier 1 risk-based capital ratio of 13.1%, a common equity Tier 1 capital ratio of 13.1%, and a Tier 1 leverage ratio of 10.8%.
Total deposits were $1.8 billion as of December 31, 2025, a decrease of $122.9 million, or 6.3%, from December 31, 2024. This decrease was primarily driven by a $126.9 million reduction in brokered deposits to $48.0 million at December 31, 2025, from $174.9 million at December 31, 2024.
Noninterest bearing demand deposits increased $1.2 million, or 0.3%, to $397.8 million as of December 31, 2025, from $396.6 million as of December 31, 2024.
Non-brokered deposits were $1.8 billion as of December 31, 2025, an increase of $4.1 million, or 0.2%, from December 31, 2024. This increase was primarily driven by normal customer business cycles.
Asset quality decreased slightly with nonperforming assets to total assets of .28% as of December 31, 2025 and compared to .26% as of December 31, 2024. The allowance for credit losses to total loans decreased slightly to 0.95% as of December 31, 2025 from 1.00% as of December 31, 2014.
Net Income Before Income Taxes
Net income before income taxes was $47.7 million for the twelve months ended December 31, 2025, an increase of $7.2 million, or 17.6%, from the twelve months ended December 31, 2024. The increase was primarily the result of an increase in net interest income after provision for credit losses of $4.5 million or 6.0% and a decrease of noninterest expense of $3.6 million or 7.8%.
Non-Interest Income
Non-interest income was $9.9 million for the twelve months ended December 31, 2025, a decrease of $0.9 million, or 8.7%, from the twelve months ended December 31, 2024. This decrease was primarily due to one-time gains on the sale of bank property during 2024 of $0.4 million.
About Commercial Bancgroup, Inc.
Commercial Bancgroup, Inc. is a bank holding company headquartered in Harrogate, Tennessee. Through a wholly owned subsidiary, Commercial Bank, a Tennessee state-chartered bank, the Bank offers a suite of traditional consumer and commercial banking products and services to businesses and individuals in select markets in Kentucky, North Carolina, and Tennessee. More information about Commercial can be found on its website at www.cbtn.com.
Commercial Bancgroup, Inc.
Financial Tables
| Financial Highlights (unaudited) | Table 1A |
| (dollars in | As of and for the Three Months Ended | As of and for the Twelve Months Ended |
||||||||||||||||||||||||||
| thousands except per share amounts) | December 31, 2025 |
September 30, 2025 |
June 30, 2025 |
March 31, 2025 |
December 31, 2024 |
December 31, 2025 |
December 31, 2024 |
|||||||||||||||||||||
| Selected Operating Data: | ||||||||||||||||||||||||||||
| Interest and Dividend Income | $ | 29,958 | $ | 30,021 | $ | 30,859 | $ | 30,766 | $ | 31,334 | $ | 121,604 | $ | 123,213 | ||||||||||||||
| Interest Expense | 9,148 | 9,799 | 10,800 | 11,426 | 11,566 | 41,173 | 45,629 | |||||||||||||||||||||
| Net Interest Income | 20,810 | 20,222 | 20,059 | 19,340 | 19,768 | 80,431 | 77,584 | |||||||||||||||||||||
| Provision for Credit Losses | 150 | - | - | - | 6 | 150 | 1,829 | |||||||||||||||||||||
| Net Interest Income After Provision for Credit Losses | 20,660 | 20,222 | 20,059 | 19,340 | 19,762 | 80,281 | 75,755 | |||||||||||||||||||||
| Noninterest Income | 2,666 | 2,626 | 2,194 | 2,443 | 3,000 | 9,930 | 10,878 | |||||||||||||||||||||
| Noninterest Expense | 10,621 | 10,552 | 10,725 | 10,581 | 13,916 | 42,480 | 46,061 | |||||||||||||||||||||
| Income Before Income Taxes | 12,705 | 12,296 | 11,528 | 11,202 | 8,846 | 47,731 | 40,572 | |||||||||||||||||||||
| Provision for Income Taxes | 2,792 | 2,829 | 2,658 | 2,510 | 3,235 | 10,789 | 8,886 | |||||||||||||||||||||
| Net Income | 9,913 | 9,467 | 8,870 | 8,692 | 5,611 | 36,942 | 31,686 | |||||||||||||||||||||
| Less: Net Income Attributable to Noncontrolling Interest | - | - | - | - | - | - | 276 | |||||||||||||||||||||
| Net Income attributable to Commercial Bancgroup, Inc. | 9,913 | 9,467 | 8,870 | 8,692 | 5,611 | 36,942 | 31,410 | |||||||||||||||||||||
| Share and Per Share Data: | ||||||||||||||||||||||||||||
| Basic earnings per share | $ | 0.72 | $ | 0.77 | $ | 0.72 | $ | 0.71 | $ | 0.46 | $ | 2.93 | $ | 2.58 | ||||||||||||||
| Diluted earnings per share | $ | 0.72 | $ | 0.77 | $ | 0.73 | $ | 0.72 | $ | 0.46 | $ | 2.92 | $ | 2.54 | ||||||||||||||
| Book value per share | $ | 20.81 | $ | 20.03 | $ | 19.22 | $ | 18.48 | $ | 18.18 | $ | 20.81 | $ | 18.18 | ||||||||||||||
| Tangible book value per share (1) | $ | 19.96 | $ | 19.05 | $ | 18.22 | $ | 17.45 | $ | 17.11 | $ | 19.96 | $ | 17.11 | ||||||||||||||
| Shares of common stock outstanding | 13,697,987 | 12,239,644 | 12,239,644 | 12,239,644 | 12,113,114 | 13,697,987 | 12,113,114 | |||||||||||||||||||||
| Weighted average diluted shares outstanding | 13,835,816 | 12,188,624 | 12,137,013 | 12,137,013 | 12,301,998 | 13,835,816 | 12,367,248 | |||||||||||||||||||||
| (1) | Considered non-GAAP financial measure - See “Non-GAAP Financial Measures” and reconciliation of GAAP to non-GAAP financial measures tables 10A - 10I |
Financial Highlights (unaudited)
| As of and for the Three Months Ended | As of and for the Twelve Months Ended |
|||||||||||||||||||||||||||
| (dollars in thousands) | December 31, 2025 |
September 30, 2025 |
June 30, 2025 |
March 31, 2025 |
December 31, 2024 |
December 31, 2025 |
December 31, 2024 |
|||||||||||||||||||||
| Selected Balance Sheet Data: | ||||||||||||||||||||||||||||
| Total assets | $ | 2,291,112 | $ | 2,214,408 | $ | 2,262,511 | $ | 2,266,878 | $ | 2,301,211 | $ | 2,291,112 | $ | 2,301,211 | ||||||||||||||
| Securities available-for-sale at fair value | 43,137 | 29,556 | 30,113 | 48,830 | 47,938 | 43,137 | 47,938 | |||||||||||||||||||||
| Securities held-to-maturity, at carrying value, net of allowance for credit losses | 97,728 | 131,915 | 157,452 | 140,019 | 128,217 | 97,728 | 128,217 | |||||||||||||||||||||
| Gross loans less deferred fees and discounts | 1,873,533 | 1,767,193 | 1,791,516 | 1,795,178 | 1,806,997 | 1,873,533 | 1,806,997 | |||||||||||||||||||||
| Allowance for credit losses | 17,830 | 17,942 | 17,989 | 18,109 | 18,205 | 17,830 | 18,205 | |||||||||||||||||||||
| Goodwill and other intangible assets | 12,767 | 13,149 | 13,546 | 13,938 | 14,339 | 12,767 | 14,339 | |||||||||||||||||||||
| Total deposits | 1,815,734 | 1,780,634 | 1,851,248 | 1,902,207 | 1,938,597 | 1,815,734 | 1,938,597 | |||||||||||||||||||||
| Core deposits (1) | 1,665,470 | 1,631,921 | 1,628,816 | 1,659,301 | 1,669,380 | 1,665,470 | 1,669,380 | |||||||||||||||||||||
| Other borrowings | 166,838 | 162,760 | 148,509 | 109,090 | 109,165 | 166,838 | 109,165 | |||||||||||||||||||||
| Total Shareholders’ equity | 285,090 | 245,153 | 235,268 | 226,180 | 220,256 | 285,090 | 220,256 | |||||||||||||||||||||
| Performance Ratios | ||||||||||||||||||||||||||||
| Pre-tax Pre-provision net revenue (PPNR) (1) | $ | 12,855 | $ | 12,296 | $ | 11,528 | $ | 11,202 | $ | 8,851 | $ | 47,881 | $ | 42,401 | ||||||||||||||
| Return on average assets (ROAA) | 1.76 | 1.69 | 1.57 | 1.52 | 0.99 | 1.61 | 1.40 | |||||||||||||||||||||
| Return on average equity (ROAE) | 15.26 | 15.81 | 15.57 | 15.81 | 10.38 | 15.60 | 15.30 | |||||||||||||||||||||
| Return on average tangible common equity (ROATCE) (1) | 15.99 | 16.65 | 16.43 | 16.75 | 11.03 | 16.44 | 16.49 | |||||||||||||||||||||
| Net interest rate spread | 3.34 | 3.32 | 3.11 | 2.98 | 3.10 | 3.20 | 3.05 | |||||||||||||||||||||
| Net interest margin | 4.01 | 4.02 | 3.84 | 3.63 | 3.77 | 3.87 | 3.75 | |||||||||||||||||||||
| Cost of Funds | 1.88 | 2.07 | 2.18 | 2.25 | 2.31 | 2.10 | 2.31 | |||||||||||||||||||||
| Efficiency ratio | 45.24 | 46.19 | 48.20 | 48.57 | 61.12 | 47.01 | 48.92 | |||||||||||||||||||||
| Noninterest income to average assets | 0.47 | 0.48 | 0.39 | 0.43 | 0.53 | 0.44 | 0.49 | |||||||||||||||||||||
| Noninterest expense to average assets | 1.89 | 1.94 | 1.91 | 1.85 | 2.47 | 1.90 | 2.08 | |||||||||||||||||||||
| Average interest-earning assets to average interst-bearing liabilities | 1.38 | 1.36 | 1.31 | 1.30 | 1.31 | 1.34 | 1.32 | |||||||||||||||||||||
| Average equity to average total assets | 0.12 | 0.11 | 0.10 | 0.10 | 0.09 | 0.11 | 0.09 | |||||||||||||||||||||
| As of and for the Three Months Ended | As of and for the Twelve Months Ended |
|||||||||||||||||||||||||||
| December 31, 2025 |
September 30, 2025 |
June 30, 2025 |
March 31, 2025 |
December 31, 2024 |
December 31, 2025 |
December 31, 2024 |
||||||||||||||||||||||
| Asset Quality Data: | ||||||||||||||||||||||||||||
| Net charge-offs to average loans | 0.01 | % | 0.00 | % | 0.01 | % | 0.01 | % | 0.00 | % | 0.03 | % | 0.01 | % | ||||||||||||||
| Total allowance for credit losses to total loans | 0.95 | 1.02 | 1.00 | 1.01 | 1.01 | 0.95 | 1.01 | |||||||||||||||||||||
| Total allowance for credit losses to nonperforming loans | 286 | % | 333 | % | 307 | % | 375 | % | 360 | % | 286 | % | 360 | % | ||||||||||||||
| Nonperforming loans to gross loans | 0.33 | % | 0.31 | % | 0.33 | % | 0.27 | % | 0.28 | % | 0.33 | % | 0.28 | % | ||||||||||||||
| Nonperforming assets to total assets | 0.28 | % | 0.27 | % | 0.30 | % | 0.24 | % | 0.26 | % | 0.28 | % | 0.26 | % | ||||||||||||||
| Balance Sheet and Capital Ratios (Commercial Bancgroup, Inc.) | ||||||||||||||||||||||||||||
| Loan-to-deposit ratio | 103.18 | % | 99.25 | % | 96.77 | % | 94.37 | % | 93.21 | % | 103.18 | % | 93.21 | % | ||||||||||||||
| Noninterest bearing deposits to total deposits | 21.91 | % | 22.39 | % | 22.53 | % | 22.05 | % | 20.46 | % | 21.91 | % | 20.46 | % | ||||||||||||||
| Total shareholders’equity to total assets | 12.44 | % | 11.07 | % | 10.40 | % | 9.98 | % | 9.57 | % | 12.44 | % | 9.57 | % | ||||||||||||||
| Tangible common equity to tangible assets (1) | 12.00 | % | 10.59 | % | 9.92 | % | 9.48 | % | 9.07 | % | 12.00 | % | 9.07 | % | ||||||||||||||
| Tier 1 leverage ratio | 12.19 | % | 11.03 | % | 10.22 | % | 9.63 | % | 9.51 | % | 12.19 | % | 9.51 | % | ||||||||||||||
| Common equity tier 1 ratio | 14.99 | % | 12.83 | % | 12.26 | % | 11.62 | % | 11.11 | % | 14.99 | % | 11.11 | % | ||||||||||||||
| Total risk-based capital ratio | 15.96 | % | 14.12 | % | 13.55 | % | 12.90 | % | 12.37 | % | 15.96 | % | 12.37 | % | ||||||||||||||
| Other | ||||||||||||||||||||||||||||
| Number of branches | 34 | 34 | 34 | 34 | 34 | 34 | 34 | |||||||||||||||||||||
| Number of full-time equivalent employees | 287 | 287 | 289 | 284 | 279 | 287 | 279 | |||||||||||||||||||||
| (1) | Considered non-GAAP financial measure - See “Non-GAAP Financial Measures” and reconciliation of GAAP to non-GAAP financial measures tables 10 |
| Quarter End Balance Sheets (unaudited) | Table 2 |
| (dollars in thousands) | December 31, 2025 |
September 30, 2025 |
June 30, 2025 |
March 31, 2025 |
December 31, 2024 |
|||||||||||||||
| Assets | ||||||||||||||||||||
| Cash and due from banks | $ | 118,989 | $ | 122,945 | $ | 108,501 | $ | 113,190 | $ | 134,455 | ||||||||||
| Federal funds sold | 25,329 | 31,841 | 42,782 | 37,303 | 43,743 | |||||||||||||||
| Investment securities | 140,865 | 161,471 | 187,565 | 188,849 | 176,155 | |||||||||||||||
| Gross loans less deferred fees and discounts | 1,873,533 | 1,767,193 | 1,791,516 | 1,795,178 | 1,806,997 | |||||||||||||||
| Allowance for credit losses | (17,830 | ) | (17,942 | ) | (17,989 | ) | (18,109 | ) | (18,205 | ) | ||||||||||
| Loans, net of alloawance for credit losses | 1,855,703 | 1,749,251 | 1,773,527 | 1,777,069 | 1,788,792 | |||||||||||||||
| Premises and equipment, net | 49,765 | 50,268 | 50,337 | 50,038 | 50,288 | |||||||||||||||
| Foreclosed assets held for sale, net | 253 | 533 | 861 | 565 | 832 | |||||||||||||||
| Bank owned life insurance | 46,648 | 46,482 | 46,480 | 46,191 | 45,883 | |||||||||||||||
| Goodwill and other intangible assets | 12,767 | 13,149 | 13,546 | 13,938 | 14,339 | |||||||||||||||
| Deferred tax asset | 1,427 | 1,427 | 1,029 | 1,029 | 1,079 | |||||||||||||||
| Other | 39,366 | 37,041 | 37,883 | 38,706 | 45,645 | |||||||||||||||
| Total Assets | $ | 2,291,112 | $ | 2,214,408 | $ | 2,262,511 | $ | 2,266,878 | $ | 2,301,211 | ||||||||||
| Liabilities and Shareholders’ Equity | ||||||||||||||||||||
| Liabilities | ||||||||||||||||||||
| Deposits | ||||||||||||||||||||
| Demand | 913,986 | 928,958 | 926,886 | 960,915 | 976,481 | |||||||||||||||
| Savings, NOW and money market | 414,716 | 382,002 | 382,788 | 390,491 | 385,615 | |||||||||||||||
| Time | 487,032 | 469,674 | 541,574 | 550,800 | 576,501 | |||||||||||||||
| Total deposits | 1,815,734 | 1,780,634 | 1,851,248 | 1,902,206 | 1,938,597 | |||||||||||||||
| Short-term borrowings | 88,251 | 62,663 | 46,300 | 5,900 | 3,392 | |||||||||||||||
| Long-term debt | 78,587 | 100,097 | 102,209 | 103,190 | 105,773 | |||||||||||||||
| Interest Payable | 2,962 | 3,410 | 4,545 | 5,157 | 4,225 | |||||||||||||||
| Other Liabilities | 20,488 | 22,451 | 22,941 | 24,246 | 28,968 | |||||||||||||||
| Total Liabilites | $ | 2,006,022 | $ | 1,969,255 | $ | 2,027,243 | $ | 2,040,699 | $ | 2,080,955 | ||||||||||
| Shareholders’ Equity | ||||||||||||||||||||
| Common stock | 137 | 122 | 122 | 122 | 121 | |||||||||||||||
| Additional paid-in capital | 38,377 | 8,406 | 8,406 | 8,406 | 9,388 | |||||||||||||||
| Retained earnings | 247,251 | 237,366 | 227,900 | 219,000 | 212,312 | |||||||||||||||
| Accumulated other comprehensive loss | (675 | ) | (741 | ) | (1,160 | ) | (1,349 | ) | (1,565 | ) | ||||||||||
| Total Shareholders’equity | 285,090 | 245,153 | 235,268 | 226,179 | 220,256 | |||||||||||||||
| Total liabilities and shareholders’ equity | $ | 2,291,112 | $ | 2,214,408 | $ | 2,262,511 | $ | 2,266,878 | $ | 2,301,211 | ||||||||||
| Statement of Operations (unaudited) | Table 3 |
| As of and for the Three Months Ended | As of and for the Twelve Months Ended |
|||||||||||||||||||||||||||
| (dollars in thousands) | December 31, 2025 |
September 30, 2025 |
June 30, 2025 |
March 31, 2025 |
December 31, 2024 |
December 31, 2025 |
December 31, 2024 |
|||||||||||||||||||||
| Interest and Dividend Income | ||||||||||||||||||||||||||||
| Loans, including fees | $ | 27,866 | $ | 28,074 | $ | 28,432 | $ | 27,930 | $ | 28,422 | $ | 112,301 | $ | 113,391 | ||||||||||||||
| Debt securities-taxable | 739 | 929 | 1,070 | 975 | 764 | 3,714 | 2,679 | |||||||||||||||||||||
| Debt securities-tax-exempt | 114 | 102 | 116 | 110 | 91 | 442 | 368 | |||||||||||||||||||||
| Dividends on restricted stock | 157 | 156 | 148 | 160 | 184 | 621 | 700 | |||||||||||||||||||||
| Interest-bearing deposits | 1,082 | 760 | 1,093 | 1,591 | 1,872 | 4,526 | 6,075 | |||||||||||||||||||||
| Total interest and dividend income | 29,958 | 30,021 | 30,859 | 30,766 | 31,333 | 121,604 | 123,213 | |||||||||||||||||||||
| Interest expense | ||||||||||||||||||||||||||||
| Deposits | 8,441 | 8,654 | 9,717 | 10,294 | 10,377 | 37,107 | 40,352 | |||||||||||||||||||||
| Short-term borrowings | 18 | 55 | 44 | 31 | 40 | 148 | 205 | |||||||||||||||||||||
| Long-term debt | 689 | 1,090 | 1,039 | 1,101 | 1,149 | 3,919 | 5,072 | |||||||||||||||||||||
| Total interest expense | 9,148 | 9,799 | 10,800 | 11,426 | 11,566 | 41,174 | 45,629 | |||||||||||||||||||||
| Net interest income | 20,810 | 20,222 | 20,059 | 19,340 | 19,767 | 80,430 | 77,584 | |||||||||||||||||||||
| Provision for credit losses | 150 | - | - | - | 5 | 150 | 1,829 | |||||||||||||||||||||
| Net interest income after provision for credit losses | 20,660 | 20,222 | 20,059 | 19,340 | 19,762 | 80,280 | 75,755 | |||||||||||||||||||||
| Noninterest Income | ||||||||||||||||||||||||||||
| Customer service fees | 779 | 735 | 674 | 655 | 882 | 2,844 | 3,041 | |||||||||||||||||||||
| Net gains on sales of premises and equipment | 13 | 20 | 2 | (28 | ) | 347 | 38 | 759 | ||||||||||||||||||||
| Net gains on sales of foreclosed assets | 48 | 110 | 1 | 3 | 2 | 161 | 153 | |||||||||||||||||||||
| ATM fees | 877 | 846 | 891 | 799 | 849 | 3,413 | 3,281 | |||||||||||||||||||||
| Increase in BOLI | 342 | 306 | 336 | 308 | 323 | 1,292 | 1,199 | |||||||||||||||||||||
| Other | 607 | 609 | 290 | 706 | 597 | 2,182 | 2,445 | |||||||||||||||||||||
| Total noninterest income | 2,666 | 2,626 | 2,194 | 2,443 | 3,000 | 9,930 | 10,878 | |||||||||||||||||||||
| Statement of Operations (unaudited) | Table 3 |
| As of and for the Three Months Ended | As of and for the Twelve Months Ended |
|||||||||||||||||||||||||||
| (dollars in thousands) | December 31, 2025 |
September 30, 2025 |
June 30, 2025 |
March 31, 2025 |
December 31, 2024 |
December 31, 2025 |
December 31, 2024 |
|||||||||||||||||||||
| Noninterest Expense | ||||||||||||||||||||||||||||
| Salaries and employee benefits | 5,753 | 5,729 | 5,657 | 5,626 | 8,021 | 22,764 | 24,873 | |||||||||||||||||||||
| Occupancy | 734 | 738 | 774 | 875 | 1,135 | 3,264 | 3,786 | |||||||||||||||||||||
| Data processing | 1,068 | 1,103 | 1,151 | 1,207 | 842 | 4,530 | 4,235 | |||||||||||||||||||||
| Deposit insurance premiums | 234 | 267 | 245 | 226 | 254 | 972 | 1,129 | |||||||||||||||||||||
| Professional fees | 229 | 136 | 286 | 195 | 37 | 846 | 1,017 | |||||||||||||||||||||
| Depreciation and amortization | 1,001 | 955 | 803 | 948 | 992 | 3,706 | 4,109 | |||||||||||||||||||||
| Other | 1,602 | 1,624 | 1,809 | 1,504 | 2,635 | 6,397 | 6,912 | |||||||||||||||||||||
| Total noninterest expense | 10,621 | 10,552 | 10,725 | 10,581 | 13,916 | 42,479 | 46,061 | |||||||||||||||||||||
| Income before income taxes | 12,705 | 12,296 | 11,528 | 11,202 | 8,846 | 47,731 | 40,572 | |||||||||||||||||||||
| Provision for income taxes | 2,792 | 2,829 | 2,658 | 2,510 | 3,235 | 10,789 | 8,886 | |||||||||||||||||||||
| Net Income | 9,913 | 9,467 | 8,870 | 8,692 | 5,611 | 36,942 | 31,686 | |||||||||||||||||||||
| Less: Net Income Attributable to Noncontrolling Interest | - | - | - | - | - | - | 276 | |||||||||||||||||||||
| Net Income attributable to Commercial Bancgroup, Inc. | $ | 9,913 | $ | 9,467 | $ | 8,870 | $ | 8,692 | $ | 5,611 | $ | 36,942 | $ | 31,410 | ||||||||||||||
| QTD Average Balances and Yields/Rates (unaudited) | Table 4 |
| Three Months Ended | ||||||||||||||||||||||||
| December 31, 2025 | September 30, 2025 | |||||||||||||||||||||||
| (dollars in thousands) | Average Balance | Interest | Yield/ Rate | Average Balance | Interest | Yield/ Rate | ||||||||||||||||||
| Interest Earning Assets | ||||||||||||||||||||||||
| Gross loans, net of unearned income | $ | 1,807,127 | $ | 27,866 | 6.2 | % | $ | 1,767,379 | $ | 28,074 | 6.4 | % | ||||||||||||
| Investment securities | 152,782 | 1,011 | 2.6 | % | 169,679 | 1,187 | 2.8 | % | ||||||||||||||||
| Other interest-earning assets | 116,517 | 1,081 | 3.7 | % | 76,746 | 760 | 4.0 | % | ||||||||||||||||
| Total interest-earning assets | 2,076,426 | 29,958 | 5.8 | % | 2,013,804 | 30,021 | 6.0 | % | ||||||||||||||||
| Noninterest-earning assets: | ||||||||||||||||||||||||
| Allowance for credit losses | (17,954 | ) | (17,971 | ) | ||||||||||||||||||||
| Noninterest-earning assets | 190,810 | 175,036 | ||||||||||||||||||||||
| Total Assets | 2,249,282 | 2,170,869 | ||||||||||||||||||||||
| Interest-bearing liabilities: | ||||||||||||||||||||||||
| Interest-bearing DDAs | 518,495 | 2,647 | 2.0 | % | 509,726 | 2,806 | 2.2 | % | ||||||||||||||||
| NOW, savings and MMDA deposits | 427,419 | 1,585 | 1.5 | % | 380,421 | 1,396 | 1.5 | % | ||||||||||||||||
| Time Deposits | 475,972 | 4,209 | 3.5 | % | 486,555 | 4,452 | 3.7 | % | ||||||||||||||||
| Federal Home Loan bank advances | 60,781 | 444 | 2.9 | % | 61,827 | 455 | 2.9 | % | ||||||||||||||||
| Other borrowings | 24,953 | 263 | 4.2 | % | 45,934 | 690 | 6.0 | % | ||||||||||||||||
| Total interest-bearing liabilities | 1,507,620 | 9,148 | 2.4 | % | 1,484,463 | 9,799 | 2.6 | % | ||||||||||||||||
| Noninterest bearing liabilites: | ||||||||||||||||||||||||
| Noninterest bearing deposits | 434,578 | 413,376 | ||||||||||||||||||||||
| Other liabilities | 47,299 | 33,557 | ||||||||||||||||||||||
| Total noninterest bearing liabilities | 481,877 | 446,933 | ||||||||||||||||||||||
| Shareholders’ equity | 259,785 | 239,473 | ||||||||||||||||||||||
| Total liabilities and shareholders’s equity | 2,249,282 | 2,170,869 | ||||||||||||||||||||||
| Net interest income | 20,810 | 20,222 | ||||||||||||||||||||||
| Net interest spread | 3.3 | % | 3.3 | % | ||||||||||||||||||||
| Net interest margin | 4.0 | % | 4.0 | % | ||||||||||||||||||||
| YTD Average Balances and Yields/Rates (unaudited) | Table 5 |
| Twelve Months Ended | ||||||||||||||||||||||||
| December 31, 2025 | December 31, 2024 | |||||||||||||||||||||||
| (dollars in thousands) | Average Balance | Interest | Yield/ Rate | Average Balance | Interest | Yield/ Rate | ||||||||||||||||||
| Interest Earning Assets | ||||||||||||||||||||||||
| Gross loans, net of unearned income | 1,791,550 | 112,301 | 6.27 | % | 1,738,433 | 113,391 | 6.52 | % | ||||||||||||||||
| Investment securities | 173,927 | 4,777 | 2.75 | % | 204,554 | 3,747 | 1.83 | % | ||||||||||||||||
| Other interest-earning assets | 112,578 | 4,526 | 4.02 | % | 123,380 | 6,075 | 4.92 | % | ||||||||||||||||
| Total interest-earning assets | 2,078,055 | 121,604 | 5.85 | % | 2,066,367 | 123,213 | 5.96 | % | ||||||||||||||||
| Noninterest-earning assets: | ||||||||||||||||||||||||
| Allowance for credit losses | (18,102 | ) | (17,568 | ) | ||||||||||||||||||||
| Noninterest-earning assets | 179,515 | 168,624 | ||||||||||||||||||||||
| Total Assets | 2,239,468 | 2,217,423 | ||||||||||||||||||||||
| Interest-bearing liabilities: | ||||||||||||||||||||||||
| Interest-bearing DDAs | 533,325 | 11,730 | 2.20 | % | 497,662 | 11,757 | 2.36 | % | ||||||||||||||||
| NOW, savings and MMDA deposits | 396,126 | 5,902 | 1.49 | % | 403,563 | 6,665 | 1.65 | % | ||||||||||||||||
| Time Deposits | 519,390 | 19,475 | 3.75 | % | 546,599 | 21,931 | 4.01 | % | ||||||||||||||||
| Short-term borrowings | ||||||||||||||||||||||||
| Federal Home Loan bank advances | 62,419 | 1,778 | 2.85 | % | 72,540 | 1,983 | 2.73 | % | ||||||||||||||||
| Other borrowings | 40,109 | 2,288 | 5.71 | % | 47,746 | 3,293 | 6.90 | % | ||||||||||||||||
| Total interest-bearing liabilities | 1,551,369 | 41,173 | 2.65 | % | 1,568,110 | 45,629 | 2.91 | % | ||||||||||||||||
| Noninterest bearing liabilites: | ||||||||||||||||||||||||
| Noninterest bearing deposits | 412,956 | 409,405 | ||||||||||||||||||||||
| Other liabilities | 38,373 | 33,286 | ||||||||||||||||||||||
| Total noninterest bearing liabilities | 451,329 | 442,691 | ||||||||||||||||||||||
| Shareholders’ equity | 236,770 | 206,622 | ||||||||||||||||||||||
| Total liabilities and shareholders’s equity | 2,239,468 | 2,217,423 | ||||||||||||||||||||||
| Net interest income | 80,431 | 77,584 | ||||||||||||||||||||||
| Net interest spread | 3.20 | % | 3.05 | % | ||||||||||||||||||||
| Net interest margin | 3.87 | % | 3.75 | % | ||||||||||||||||||||
| Loan Data (unaudited) | Table 6 |
| As of Quarter Ended | ||||||||||||||||||||||||||||||||||||||||
| December 31, 2025 |
September 30, 2025 |
June 30, 2025 |
March 31, 2025 |
December 31, 2024 |
||||||||||||||||||||||||||||||||||||
| (dollars in thousands) | Amount | % of Total | Amount | % of Total | Amount | % of Total | Amount | % of Total | Amount | % of Total | ||||||||||||||||||||||||||||||
| Real Estate Loans | ||||||||||||||||||||||||||||||||||||||||
| Commercial | 1,113,440 | 57 | % | 1,002,192 | 57 | % | 1,016,229 | 57 | % | 1,029,444 | 57 | % | 1,006,207 | 55 | % | |||||||||||||||||||||||||
| Construction and land development | 176,688 | 11 | % | 201,399 | 11 | % | 189,187 | 11 | % | 180,066 | 10 | % | 199,800 | 11 | % | |||||||||||||||||||||||||
| Residential | 377,943 | 21 | % | 376,769 | 21 | % | 376,442 | 21 | % | 372,338 | 21 | % | 369,308 | 20 | % | |||||||||||||||||||||||||
| Other | 14,824 | 1 | % | 14,831 | 1 | % | 15,290 | 1 | % | 16,406 | 1 | % | 16,816 | 1 | % | |||||||||||||||||||||||||
| Commercial | 174,248 | 9 | % | 154,732 | 9 | % | 178,832 | 10 | % | 182,186 | 10 | % | 201,593 | 11 | % | |||||||||||||||||||||||||
| Consumer | 15,417 | 1 | % | 16,009 | 1 | % | 14,636 | 1 | % | 14,908 | 1 | % | 15,214 | 1 | % | |||||||||||||||||||||||||
| Other | 7,450 | 0 | % | 7,642 | 0 | % | 7,772 | 0 | % | 7,505 | 0 | % | 6,744 | 0 | % | |||||||||||||||||||||||||
| Total loans | 1,880,010 | 100 | % | 1,773,574 | 100 | % | 1,798,388 | 100 | % | 1,802,853 | 100 | % | 1,815,682 | 100 | % | |||||||||||||||||||||||||
| Deferred loan fees and discounts | 6,477 | 6,381 | 6,872 | 7,675 | 8,685 | |||||||||||||||||||||||||||||||||||
| Allowance for credit losses | 17,830 | 17,942 | 17,989 | 18,109 | 18,205 | |||||||||||||||||||||||||||||||||||
| Loans, net | 1,855,703 | 1,749,251 | 1,773,527 | 1,777,069 | 1,788,792 | |||||||||||||||||||||||||||||||||||
| As of the Quarter Ended | ||||||||||||||||||||
| (dollars in thousands) | December 31, 2025 |
September 30, 2025 |
June 30, 2025 |
March 31, 2025 |
December 31, 2024 |
|||||||||||||||
| Nonaccrual loans | $ | 6,245 | $ | 5,390 | $ | 5,846 | $ | 4,808 | $ | 5,059 | ||||||||||
| Past due loans 90 days and still accruing | - | - | 6 | 20 | 2 | |||||||||||||||
| Total nonperforming loans | 6,245 | 5,390 | 5,852 | 4,828 | 5,061 | |||||||||||||||
| Other real estate owned | 253 | 533 | 861 | 565 | 832 | |||||||||||||||
| Total nonperforming assets | $ | 6,498 | $ | 5,923 | $ | 6,713 | $ | 5,393 | $ | 5,893 | ||||||||||
| Allowance for credit losses | $ | 17,830 | $ | 17,942 | $ | 17,989 | $ | 18,109 | $ | 18,205 | ||||||||||
| Total loans outstanding at end of period | $ | 1,873,533 | $ | 1,767,193 | $ | 1,791,516 | $ | 1,795,178 | $ | 1,806,997 | ||||||||||
| Nonperforming loans to total loans | 0.33 | % | 0.31 | % | 0.33 | % | 0.27 | % | 0.28 | % | ||||||||||
| Nonperforming assets to total loans and OREO | 0.35 | % | 0.34 | % | 0.37 | % | 0.30 | % | 0.33 | % | ||||||||||
| Allowance for credit losses to nonperforming loans | 286 | % | 333 | % | 307 | % | 375 | % | 360 | % | ||||||||||
| Allowance for credit losses to total loans | 0.95 | % | 1.02 | % | 1.00 | % | 1.01 | % | 1.01 | % | ||||||||||
| Nonaccrual loans to total assets | 0.27 | % | 0.24 | % | 0.26 | % | 0.21 | % | 0.22 | % | ||||||||||
| Nonperforming assets to total assets | 0.28 | % | 0.27 | % | 0.30 | % | 0.24 | % | 0.26 | % | ||||||||||
Allowance for credit losses (unaudited) |
Table 8 |
| As of and for the Three Months Ended | As of and for the Twelve Months Ended |
|||||||||||||||||||||||||||
| (dollars in thousands) | December 31, 2025 |
September 30, 2025 |
June 30, 2025 |
March 31, 2025 |
December 31, 2024 |
December 31, 2025 |
December 31, 2024 |
|||||||||||||||||||||
| Average loans outstanding | $ | 1,807,127 | $ | 1,767,379 | $ | 1,795,846 | $ | 1,794,477 | $ | 1,769,580 | $ | 1,791,550 | $ | 1,738,433 | ||||||||||||||
| Total loans outstanding at end of period | 1,873,533 | 1,767,193 | 1,791,516 | 1,795,178 | 1,806,997 | 1,873,533 | 1,806,997 | |||||||||||||||||||||
| Balance, beginning of period | 17,942 | 17,989 | 18,109 | 18,205 | 18,291 | 18,205 | 16,635 | |||||||||||||||||||||
| Charge-offs: | ||||||||||||||||||||||||||||
| Commercial real estate | (284 | ) | - | (18 | ) | - | - | (301 | ) | (49 | ) | |||||||||||||||||
| Construction and land development | - | - | - | - | ||||||||||||||||||||||||
| Residential real estate | - | - | (121 | ) | - | (105 | ) | (121 | ) | (52 | ) | |||||||||||||||||
| Commercial | (48 | ) | - | - | (314 | ) | (5 | ) | (362 | ) | (177 | ) | ||||||||||||||||
| Consumer and other | (13 | ) | (186 | ) | (34 | ) | (17 | ) | - | (251 | ) | (151 | ) | |||||||||||||||
| Total charge-offs | (345 | ) | (186 | ) | (173 | ) | (331 | ) | (110 | ) | (1,035 | ) | (429 | ) | ||||||||||||||
| Recoveries: | ||||||||||||||||||||||||||||
| Commercial real estate | - | 108 | 33 | 10 | 19 | 151 | 75 | |||||||||||||||||||||
| Construction and land development | - | - | - | 202 | - | 202 | ||||||||||||||||||||||
| Residential real estate | 20 | 26 | 2 | 16 | - | 64 | 9 | |||||||||||||||||||||
| Commercial | 7 | 1 | 3 | - | - | 11 | 54 | |||||||||||||||||||||
| Consumer and other | 56 | 4 | 15 | 7 | 5 | 83 | 32 | |||||||||||||||||||||
| Total recoveries | 83 | 139 | 53 | 235 | 24 | 511 | 170 | |||||||||||||||||||||
| Net (charge-offs) recoveries | (262 | ) | (47 | ) | (120 | ) | (96 | ) | (86 | ) | (524 | ) | (259 | ) | ||||||||||||||
| Provision for credit losses | 150 | - | - | - | - | 150 | 1,829 | |||||||||||||||||||||
| Balance at end of period | $ | 17,830 | $ | 17,942 | $ | 17,989 | $ | 18,109 | $ | 18,205 | $ | 17,831 | $ | 18,205 | ||||||||||||||
| Ratio of allowance to end of period loans | 0.95 | % | 1.02 | % | 1.00 | % | 1.01 | % | 1.01 | % | 0.95 | % | 1.01 | % | ||||||||||||||
| Ratio of net (charge-offs) recoveries to average loans | -0.01 | % | 0.00 | % | -0.01 | % | -0.01 | % | 0.00 | % | -0.03 | % | -0.01 | % | ||||||||||||||
| Loan Risk Ratings (unaudited) | Table 9 |
| As of the Quarter Ended | ||||||||||||||||||||
| (dollars in thousands) | December 31, 2025 |
September 30, 2025 |
June 30, 2025 |
March 31, 2025 |
December 31, 2024 |
|||||||||||||||
| Real Estate Loans | ||||||||||||||||||||
| Commercial | ||||||||||||||||||||
| Pass | $ | 1,104,532 | $ | 999,788 | $ | 1,012,190 | $ | 1,023,884 | $ | 1,002,113 | ||||||||||
| Special mention | 8,814 | 1,776 | 2,515 | 4,182 | 3,605 | |||||||||||||||
| Substandard | 94 | 628 | 1,524 | 1,378 | 489 | |||||||||||||||
| Total Commercial | $ | 1,113,440 | $ | 1,002,192 | $ | 1,016,229 | $ | 1,029,444 | $ | 1,006,207 | ||||||||||
| Construction and land development | ||||||||||||||||||||
| Pass | $ | 176,014 | $ | 201,363 | $ | 189,149 | $ | 180,066 | $ | 199,098 | ||||||||||
| Special mention | 78 | - | - | - | 702 | |||||||||||||||
| Substandard | 596 | 36 | 38 | - | - | |||||||||||||||
| Total Construction and land development | $ | 176,688 | $ | 201,399 | $ | 189,187 | $ | 180,066 | $ | 199,800 | ||||||||||
| Residential | ||||||||||||||||||||
| Pass | $ | 371,583 | $ | 371,226 | $ | 371,353 | $ | 367,216 | $ | 363,952 | ||||||||||
| Special mention | 833 | 838 | 849 | 854 | 865 | |||||||||||||||
| Substandard | 5,527 | 4,705 | 4,240 | 4,268 | 4,491 | |||||||||||||||
| Total Residential | $ | 377,943 | $ | 376,769 | $ | 376,442 | $ | 372,338 | $ | 369,308 | ||||||||||
| Other | ||||||||||||||||||||
| Pass | $ | 14,824 | $ | 14,831 | $ | 15,290 | $ | 16,406 | $ | 16,816 | ||||||||||
| Special mention | - | - | - | - | ||||||||||||||||
| Substandard | - | - | - | - | - | |||||||||||||||
| Total Other | $ | 14,824 | $ | 14,831 | $ | 15,290 | $ | 16,406 | $ | 16,816 | ||||||||||
| Commercial | ||||||||||||||||||||
| Pass | $ | 173,324 | $ | 153,819 | $ | 177,969 | $ | 181,255 | $ | 200,976 | ||||||||||
| Special mention | 793 | 733 | 747 | 808 | 543 | |||||||||||||||
| Substandard | 131 | 180 | 116 | 123 | 74 | |||||||||||||||
| Total Commercial | $ | 174,248 | $ | 154,732 | $ | 178,832 | $ | 182,186 | $ | 201,593 | ||||||||||
| Consumer | ||||||||||||||||||||
| Pass | $ | 15,317 | $ | 15,974 | $ | 14,594 | $ | 14,866 | $ | 15,159 | ||||||||||
| Special mention | 21 | 5 | 6 | 7 | 8 | |||||||||||||||
| Substandard | 79 | 30 | 36 | 35 | 47 | |||||||||||||||
| Total Consumer | $ | 15,417 | $ | 16,009 | $ | 14,636 | $ | 14,908 | $ | 15,214 | ||||||||||
| Other | ||||||||||||||||||||
| Pass | $ | 7,451 | $ | 7,642 | $ | 7,773 | $ | 7,506 | $ | 6,744 | ||||||||||
| Special mention | - | - | - | - | ||||||||||||||||
| Substandard | - | - | - | - | - | |||||||||||||||
| Total Other | $ | 7,451 | $ | 7,642 | $ | 7,773 | $ | 7,506 | $ | 6,744 | ||||||||||
| Total loans | ||||||||||||||||||||
| Pass | $ | 1,863,045 | $ | 1,764,643 | $ | 1,788,318 | $ | 1,791,199 | $ | 1,804,858 | ||||||||||
| Special mention | 10,539 | 3,352 | 4,117 | 5,851 | 5,723 | |||||||||||||||
| Substandard | 6,427 | 5,579 | 5,954 | 5,804 | 5,101 | |||||||||||||||
| Total Gross loans | $ | 1,880,011 | $ | 1,773,574 | $ | 1,798,389 | $ | 1,802,854 | $ | 1,815,682 | ||||||||||
Non-GAAP Financial Measures
This press release contains certain financial measure(s) that are not financial measure(s) recognized under generally accepted accounting principles in the U.S. (“GAAP”) and, therefore, are considered non-GAAP financial measure(s) and should be read along with the accompanying reconciliation of non-GAAP financial measure(s) to GAAP financial measure(s). We use non-GAAP financial measures, certain of which are included in this press release, both to explain our operating results to shareholders and the investment community and to evaluate, analyze, and manage our business. We believe that these non-GAAP financial measures provide a better understanding of ongoing operations, enhance the comparability of results across periods, and enable investors to better understand our performance. However, non-GAAP financial measures should not be considered in isolation and should be considered supplemental in nature and not as a substitute for or superior to the most directly comparable or other financial measures calculated in accordance with GAAP. Additionally, the manner in which the non-GAAP financial measure(s) contained in this press release are calculated may differ from the manner in which measures with similar names are calculated by other companies. You should understand how other companies calculate their financial measures similar to, or with names similar to, the non-GAAP financial measure(s) contained in this press release when comparing such financial measures.
The non-GAAP financial measures in this press release include the following:
| ● | Core deposits. We calculate core deposits by excluding jumbo time deposits (deposits greater than or equal to $250,000) from total deposits. |
| ● | Core net income. We define core net income as net income plus acquisition related expenses, net of the related tax effect of acquisition related expenses. |
| ● | Core diluted earnings per share. We define core diluted earnings per share as core net income divided by diluted weighted average shares outstanding. |
| ● | Core ROAA. We define core ROAA as core net income divided by average assets, with average assets based upon the average daily balance of total assets in each year. |
| ● | Core return on average tangible common equity. We define core return on average tangible common equity as core net income divided by total average shareholders’ equity less average intangible assets (goodwill and core deposit intangibles). |
| ● | Core efficiency ratio. We define core efficiency ratio as operating revenue (net interest income, plus total noninterest income, divided by noninterest expenses (less acquisition related expenses). This ratio is an indicator used by our management to assess operating efficiencies and is intended to demonstrate how efficiently our management is controlling expenses relative to generating revenues on our core activities. |
| ● | Efficiency Ratio. We define efficiency ratio as operating expenses divided by fee income plus tax equivalent net interest income. This metric indicates how effectively the Company manages its expenses relative to its income, providing insights into cost management and profitability. |
| ● | Pre-tax, pre-provision ROAA. We define pre-tax, pre-provision ROAA as pre-tax, pre-provision net income divided by average assets calculated based upon the average daily balance of total assets in each year. |
| ● | Tangible assets. We define tangible assets as total assets less goodwill and other intangible assets. |
| ● | Tangible book value per share. We define tangible book value per share as our tangible common equity, which is shareholders’ equity reduced by goodwill and other intangible assets, divided by diluted weighted average shares outstanding. |
Our management believes that these non-GAAP financial measures and the information they provide are useful to investors since these measures permit investors to view our performance using the same tools that our management uses to evaluate our performance. In addition to the foregoing, our management believes that the “core” metrics described above assist users of the Company’s financial statements with their financial analysis period-over-period as they exclude certain non-recurring items. While we believe that these non-GAAP financial measures are useful in evaluating our performance, these non-GAAP financial measures should not be considered in isolation or as a substitute for the most directly comparable or other financial measures calculated in accordance with GAAP. Moreover, the manner in which we calculate these non-GAAP financial measures may differ from that of other companies reporting measures with similar names.
The following table provides a reconciliation of the above non-GAAP financial measures to their most directly comparable financial measure presented in accordance with GAAP.
| Non-GAAP Reconciliations (unaudited) | Table 10 |
| As of and for the Three Months Ended | As of and for the Twelve Months Ended |
|||||||||||||||||||||||||||
| (dollars in thousands, except per share data) | December 31, 2025 |
September 30, 2025 |
June 30, 2025 |
March 31, 2025 |
December 31, 2024 |
December 31, 2025 |
December 31, 2024 |
|||||||||||||||||||||
| Pre-Tax Pre-Provision Net Income | ||||||||||||||||||||||||||||
| Pre-tax income | $ | 12,705 | $ | 12,296 | $ | 11,528 | $ | 11,202 | $ | 8,846 | $ | 47,731 | $ | 40,572 | ||||||||||||||
| Add: provision for loan and lease losses | 150 | - | - | - | 5 | 150 | 1,829 | |||||||||||||||||||||
| Pre-tax pre-provision net income | $ | 12,855 | $ | 12,296 | $ | 11,528 | $ | 11,202 | $ | 8,851 | $ | 47,881 | $ | 42,401 | ||||||||||||||
| Tangible Common Equity: | ||||||||||||||||||||||||||||
| Shareholders’ equity | $ | 285,090 | $ | 245,153 | $ | 235,268 | $ | 226,179 | $ | 220,256 | 285,090 | 220,256 | ||||||||||||||||
| Less: non controlling interest | - | - | ||||||||||||||||||||||||||
| Less: goodwill | 8,511 | 8,511 | 8,511 | 8,511 | 8,514 | 8,511 | 8,514 | |||||||||||||||||||||
| Less: core deposit intangible (net of tax benefit) | 3,164 | 3,448 | 3,744 | 4,035 | 4,331 | 3,164 | 4,331 | |||||||||||||||||||||
| Tangible common equity | $ | 273,415 | $ | 233,194 | $ | 223,013 | $ | 213,633 | $ | 207,411 | $ | 273,415 | $ | 207,411 | ||||||||||||||
| Pre-Tax Pre-Provision Return on Average Assets: | ||||||||||||||||||||||||||||
| Total average assets | $ | 2,249,282 | $ | 2,170,869 | $ | 2,248,134 | $ | 2,289,582 | $ | 2,255,565 | $ | 2,239,468 | $ | 2,217,423 | ||||||||||||||
| Pre-tax pre-provision net income | 12,855 | 12,296 | 11,528 | 11,202 | 8,851 | 47,881 | 42,401 | |||||||||||||||||||||
| Pre-tax pre-provision return on average assets | 2.29 | % | 2.27 | % | 2.05 | % | 1.96 | % | 1.57 | % | 2.14 | % | 1.91 | % | ||||||||||||||
| Return on Average Tangible Common Equity: | ||||||||||||||||||||||||||||
| Total average shareholders’ equity | $ | 259,784 | $ | 239,473 | $ | 227,883 | $ | 219,940 | $ | 216,140 | $ | 236,770 | $ | 206,622 | ||||||||||||||
| Less: average intangible assets (net of tax benefit) | 11,767 | 11,980 | 11,997 | 12,310 | 12,676 | $ | 12,014 | 13,497 | ||||||||||||||||||||
| Less: average non controlling interest | - | - | - | - | - | - | 2,701 | |||||||||||||||||||||
| Average tangible equity | 248,017 | 227,493 | 215,886 | 207,630 | 203,464 | 224,757 | 190,424 | |||||||||||||||||||||
| Net income to shareholders | 9,913 | 9,467 | 8,870 | 8,692 | 5,611 | 36,942 | 31,410 | |||||||||||||||||||||
| Return on average tangible equity | 15.99 | % | 16.65 | % | 16.43 | % | 16.75 | % | 11.03 | % | 16.44 | % | 16.49 | % | ||||||||||||||
| Tangible Book Value per Common Share, Reported: | ||||||||||||||||||||||||||||
| Tangible common equity | $ | 273,415 | $ | 233,194 | $ | 223,013 | $ | 213,633 | $ | 207,411 | $ | 273,415 | $ | 207,411 | ||||||||||||||
| Shares of common stock outstanding | 13,697,987 | 12,239,644 | 12,239,644 | 12,239,644 | 12,113,114 | 13,697,987 | 12,113,114 | |||||||||||||||||||||
| Tangible book value per share, reported | $ | 19.96 | $ | 19.05 | $ | 18.22 | $ | 17.45 | $ | 17.12 | $ | 19.96 | $ | 17.12 | ||||||||||||||
| Non-GAAP Reconciliations (unaudited) | Table 10 |
| As of and for the Three Months Ended | As of and for the Twelve Months Ended |
|||||||||||||||||||||||||||
| (dollars in thousands, except per share data) | December 31, 2025 |
September 30, 2025 |
June 30, 2025 |
March 31, 2025 |
December 31, 2024 |
December 31, 2025 |
December 31, 2024 |
|||||||||||||||||||||
| Tangible Common Equity to Tangible Assets: | ||||||||||||||||||||||||||||
| Tangible common equity | $ | 273,415 | $ | 233,194 | $ | 223,013 | $ | 213,633 | $ | 207,411 | $ | 273,415 | $ | 207,411 | ||||||||||||||
| Total assets | 2,291,112 | 2,214,408 | 2,262,511 | 2,266,878 | 2,301,211 | 2,291,112 | 2,301,211 | |||||||||||||||||||||
| Less: intangible assets | 12,767 | 13,149 | 13,546 | 13,938 | 14,339 | 12,767 | 14,339 | |||||||||||||||||||||
| Tangible assets | 2,278,345 | 2,201,258 | 2,248,965 | 2,252,940 | 2,286,872 | 2,278,345 | 2,286,872 | |||||||||||||||||||||
| Tangible common equity to tangible assets | 12.00 | % | 10.59 | % | 9.92 | % | 9.48 | % | 9.07 | % | 12.00 | % | 9.07 | % | ||||||||||||||
| Core Deposits: | ||||||||||||||||||||||||||||
| Total Deposits | $ | 1,815,734 | $ | 1,780,634 | $ | 1,851,248 | $ | 1,902,206 | $ | 1,938,597 | $ | 1,815,734 | 1,938,597 | |||||||||||||||
| Less: Time deposits equal to or greater than $250,000 | 102,294 | 100,743 | 97,209 | 97,537 | 94,567 | 102,294 | 94,567 | |||||||||||||||||||||
| Less: Brokered deposits | 47,970 | 47,970 | 125,223 | 145,375 | 174,918 | 47,970 | 174,918 | |||||||||||||||||||||
| Core deposits | $ | 1,665,470 | $ | 1,631,921 | $ | 1,628,816 | $ | 1,659,294 | $ | 1,669,112 | $ | 1,665,470 | $ | 1,669,112 | ||||||||||||||
| Core Net Income: | ||||||||||||||||||||||||||||
| Net income | $ | 9,913 | $ | 9,467 | $ | 8,870 | $ | 8,692 | $ | 5,611 | $ | 36,942 | 31,410 | |||||||||||||||
| Add: merger expenses from AB&T acquisition | - | - | 302 | 7 | 131 | 309 | 2,788 | |||||||||||||||||||||
| Less: tax effect | - | - | (76 | ) | (2 | ) | (33 | ) | (78 | ) | (697 | ) | ||||||||||||||||
| Core net income | $ | 9,913 | $ | 9,467 | $ | 9,096 | $ | 8,697 | $ | 5,709 | $ | 37,173 | 33,501 | |||||||||||||||
| Core Earnings per Share: | ||||||||||||||||||||||||||||
| Core net income | $ | 9,913 | $ | 9,467 | $ | 9,096 | $ | 8,697 | $ | 5,709 | $ | 37,173 | $ | 33,501 | ||||||||||||||
| Average shares outstanding | 13,835,816 | 12,188,624 | 12,137,013 | 12,137,013 | 12,301,998 | 12,574,617 | 12,187,788 | |||||||||||||||||||||
| Core earnings per share | $ | 0.72 | $ | 0.78 | $ | 0.75 | $ | 0.72 | $ | 0.46 | $ | 2.96 | $ | 2.75 | ||||||||||||||
| Core Return on Average Assets: | ||||||||||||||||||||||||||||
| Core net income | $ | 9,913 | $ | 9,467 | $ | 9,096 | $ | 8,697 | $ | 5,709 | $ | 37,173 | $ | 33,501 | ||||||||||||||
| Average assets | 2,249,282 | 2,170,869 | 2,248,134 | 2,289,582 | 2,255,565 | 2,239,468 | 2,217,423 | |||||||||||||||||||||
| Core return on average assets | 1.76 | % | 1.74 | % | 1.62 | % | 1.52 | % | 1.01 | % | 1.66 | % | 1.51 | % | ||||||||||||||
| Core Return on Average Common Tangible Equity: | ||||||||||||||||||||||||||||
| Average tangible common equity | $ | 248,017 | $ | 227,493 | $ | 215,886 | $ | 207,630 | $ | 203,464 | $ | 224,757 | $ | 190,424 | ||||||||||||||
| Core net income | 9,913 | 9,467 | 9,096 | 8,697 | 5,709 | 37,173 | 33,501 | |||||||||||||||||||||
| Core return on average tangible common equity | 15.99 | % | 16.65 | % | 16.85 | % | 16.75 | % | 11.22 | % | 16.54 | % | 17.59 | % | ||||||||||||||
| Non-GAAP Reconciliations (unaudited) | Table 10 |
| As of and for the Three Months Ended | As of and for the Twelve Months Ended |
|||||||||||||||||||||||||||
| (dollars in thousands, except per share data) | December 31, 2025 |
September 30, 2025 |
June 30, 2025 |
March 31, 2025 |
December 31, 2024 |
December 31, 2025 |
December 31, 2024 |
|||||||||||||||||||||
| Core Efficiency Ratio: | ||||||||||||||||||||||||||||
| Add: net interest income | $ | 20,810 | $ | 20,222 | $ | 20,059 | $ | 19,340 | $ | 19,767 | $ | 80,431 | $ | 77,584 | ||||||||||||||
| Add: non interest income | 2,666 | 2,626 | 2,194 | 2,443 | 3,000 | 9,929 | 10,878 | |||||||||||||||||||||
| Operating revenue | $ | 23,476 | $ | 22,848 | $ | 22,253 | $ | 21,783 | $ | 22,767 | $ | 90,360 | 88,462 | |||||||||||||||
| Total noninterest expenses | 10,621 | 10,552 | 10,725 | 10,581 | 13,916 | 42,479 | 46,061 | |||||||||||||||||||||
| Less: merger expenses from AB&T acquisition | - | - | 302 | 7 | 131 | 309 | 2,788 | |||||||||||||||||||||
| Core noninterest expenses | 10,621 | 10,552 | 10,423 | 10,574 | 13,785 | 42,170 | 43,273 | |||||||||||||||||||||
| Core efficiency ratio | 45.24 | % | 46.18 | % | 46.84 | % | 48.54 | % | 60.55 | % | 46.67 | % | 48.92 | % | ||||||||||||||
Contacts
Philip J. Metheny
Sr. Executive Vice President, Chief Financial Officer
Commercial Bancgroup, Inc.
ir@cbtn.com
423-869-5151 Ext. 3307
Roger Mobley Executive Vice President, Chief Financial Officer Commercial Bank ir@cbtn.com 704-648-0185 Ext.
Source
Commercial Bancgroup, Inc.
Forward-Looking Statements
4118 This press release contains statements that constitute “forward-looking statements” within the meaning of the U.S. federal securities laws. The statements in this press release that are not purely historical facts are forward-looking statements. These forward-looking statements are generally identified by the use of forward-looking terminology, including the terms “anticipate,” “believe,” “could,” “estimate,” “expect,” “intend,” “may,” “plan,” “potential,” “predict,” “project,” “should,” “target,” “will,” “would” and, in each case, their negative or other variations or comparable terminology and expressions. You should not place undue reliance on these forward-looking statements as actual future results may differ materially from those expressed or implied by any forward-looking statement. These forward-looking statements are subject to known and unknown risks, uncertainties and other factors that could cause the actual results to differ materially from those expressed in any forward-looking statements, including but not limited to: (1) business and economic conditions nationally, regionally and in our target markets, particularly in Kentucky, North Carolina and Tennessee and the particular geographic areas in which we operate; (2) the level of, or changes in the level of, interest rates and inflation, including the effects thereof on our earnings and financial condition and the market value of our investment securities and loan portfolios; (3) the concentration of our loan portfolio in real estate loans and changes in the prices, values and sales volumes of commercial and residential real estate; (4) the concentration of our business within our geographic areas of operation in Kentucky, North Carolina and Tennessee and neighboring markets; (5) credit and lending risks associated with our commercial real estate, commercial, and construction and land development loan portfolios; (6) risks associated with our focus on lending to small and medium-sized businesses; (7) our ability to maintain important deposit customer relationships, maintain our reputation or otherwise avoid liquidity risks; (8) changes in demand for our products and services; (9) the failure of assumptions and estimates underlying the establishment of allowances for possible credit losses and other asset impairments, losses, valuations of assets and liabilities and other estimates; (10) the sufficiency of our capital, including sources of such capital and the extent to which capital may be used or required; (11) our inability to secure a “satisfactory” rating under the Community Reinvestment Act; (12) the risk that our cost of funding could increase in the event we are unable to continue to attract stable, low-cost deposits and reduce our cost of deposits; (13) our inability to raise necessary capital to fund our growth strategy and operations or to meet increased required minimum regulatory capital levels; (14) our ability to execute and prudently manage our growth and execute our business strategy, including expansionary activities; (15) the composition of and changes in our management team and our ability to attract, incentivize and retain key personnel; (16) the effects of competition from a wide variety of local, regional, national and other providers of financial, investment, trust and other wealth management services and insurance services, including the disruptive effects of financial technology and other competitors who are not subject to the same regulations as the Company and the Bank; (17) the deterioration of our asset quality or the value of collateral securing loans; (18) changes in accounting standards; (19) the effectiveness of our risk management framework, including internal controls; (20) severe weather, natural disasters, pandemics, epidemics, acts of war, terrorism, or other external events, such as the transition risk associated with climate change, and other matters beyond our control; (21) changes in technology or products that may be more difficult, costly, or less effective than anticipated; (22) the risks of acquisitions and other expansionary activities, including without limitation our ability to identify and consummate transactions with potential future acquisition candidates, the time and costs associated with pursuing such transactions, our ability to successfully integrate operations as part of such transactions and our ability, and possible failures, to achieve expected gains, revenue growth, expense savings and/or other synergies from such transactions; (23) our ability to maintain our historical rate of growth; (24) failure to keep pace with technological change or difficulties when implementing new technologies; (25) systems failures or interruptions involving our risk management framework, our information technology and telecommunications systems or fourth-party service providers; (26) our ability to identify and address unauthorized data access, cyber-crime and other threats to data security and customer privacy; (27) our compliance with governmental and regulatory requirements, including the Bank Holding Company Act of 1956, as amended, and other laws relating to banking, consumer protection, securities and tax matters, and our ability to maintain licenses required in connection with mortgage origination, sale and servicing operations; (28) compliance with the Bank Secrecy Act of 1970, Office of Foreign Assets Control rules and anti-money laundering laws and regulations; (29) governmental monetary and fiscal policies; (30) changes in laws, rules, or regulations, or interpretations thereof, or policies relating to financial institutions or accounting, tax, trade, monetary or fiscal matters; (31) our ability to receive dividends from the Bank and satisfy our obligations as they become due; (32) the institution and outcome of litigation and other legal proceedings against us or to which we become subject; (33) the limited experience of our management team in managing and operating a public company; (34) the incremental costs of operating as a public company; (35) our ability to meet our obligations as a public company, including our obligations under Section 404 of the Sarbanes-Oxley Act of 2002; and (36) other risks and factors described under the sections titled “Risk Factors” and “Management’s Discussion and Analysis of Financial Condition and Results of Operations” in our Registration Statement on Form S-1/A (Registration No. 333-289862) filed with the U.S. Securities and Exchange Commission on September 22, 2025. Commercial undertakes no obligation to update these forward-looking statements, as a result of changes in assumptions, new information, or otherwise, after the date of this press release, except as required by law.
Exhibit 99.2

4Q25 Earnings Presentation January 26 , 2026 COMMERCIAL BANCGROUP, INC.

2 Important Notices and Disclaimers Use of Defined Terms As used in this presentation, the terms “Company,” “Commercial,” “we,” “our,” and “us” refer to Commercial Bancgroup, Inc., a Te nnessee corporation. The term “Bank” refers to Commercial Bank, the Company’s wholly owned bank subsidiary. Forward - Looking Statements This presentation contains statements that constitute “forward - looking statements” within the meaning of the U.S. federal securi ties laws. The statements in this presentation that are not purely historical facts, including statements regarding our growth strategy, our strategic focus an d v ision, and the scalability of our business model, are forward - looking statements. These forward - looking statements are generally identified by the use of forward - looking t erminology, including the terms “anticipate,” “believe,” “could,” “estimate,” “expect,” “intend,” “may,” “plan,” “potential,” “predict,” “project,” “should,” “t arget,” “will,” “would” and, in each case, their negative or other variations or comparable terminology and expressions. You should not place undue reliance on these forward - loo king statements as actual future results may differ materially from those expressed or implied by any forward - looking statement. These forward - looking statements are subject to known and unknown risks, uncertainties, and other factors that could cause actual results to differ materially from those expressed in or implied by any forward - looking statements, including but not limited to: (1) business and economic conditions nationally, regionally, and in our target markets , particularly in Kentucky, North Carolina, and Tennessee and the particular geographic areas in which we operate; (2) the level of, or changes in the level of , i nterest rates and inflation, including the effects thereof on our earnings and financial condition and the market value of our investment securities and loan portfo lio s; (3) the concentration of our loan portfolio in real estate loans and changes in the prices, values, and sales volumes of commercial and residential real estate ; ( 4) the concentration of our business within our geographic areas of operation in Kentucky, North Carolina, and Tennessee and neighboring markets; (5) credit and l end ing risks associated with our commercial real estate, commercial, and construction and land development loan portfolios; (6) risks associated with our focu s o n lending to small and medium - sized businesses; (7) our ability to maintain important deposit customer relationships, maintain our reputation, or otherwise av oid liquidity risks; (8) changes in demand for our products and services; (9) the failure of assumptions and estimates underlying the establishment of allowances fo r possible credit losses and other asset impairments, valuations of assets and liabilities, and other estimates; (10) the sufficiency of our capital, including sou rces of such capital and the extent to which capital may be used or required; (11) our inability to secure a “satisfactory” rating under the Community Reinvestment Act ; (12) the risk that our cost of funding could increase in the event we are unable to continue to attract stable, low - cost deposits and reduce our cost of deposits; (13) our inability to raise necessary capital to fund our growth strategy and operations or to meet increased required minimum regulatory capital levels; (14) our ability to execute and prudently manage our growth and execute our business strategy, including expansionary activities; (15) the composition of and changes in our manag eme nt team and our ability to attract, incentivize, and retain key personnel; (16) the effects of competition from a wide variety of local, regional, national, and oth er providers of financial, investment, trust, and other wealth management services and insurance services, including the disruptive effects of financial technology and oth er competitors who are not subject to the same level of supervision and regulation as the Company and the Bank; (17) the deterioration of our asset quality or the val ue of collateral securing loans; (18) changes in accounting standards; (19) the effectiveness of our risk management framework, including internal controls; (20) s eve re weather, natural disasters, pandemics, epidemics, acts of war, terrorism, or other external events, such as the transition risk associated with climate c han ge, and other matters beyond our control; BS0

3 Important Notices and Disclaimers (21) changes in technology or products that may be more difficult or costly or less effective than anticipated; (22) the risk s o f acquisitions and other expansionary activities, including without limitation our ability to identify and consummate transactions with potential future acquisitio n c andidates, the time and costs associated with pursuing such transactions, our ability to successfully integrate operations as part of such transactions, and our abili ty, and possible failures, to achieve expected gains, revenue growth, expense savings, and/or other synergies from such transactions; (23) our ability to maintain our historical rate of growth; (24) failure to keep pace with technological change or difficulties when implementing new technologies; (25) systems failures or interrupt ion s involving our risk management framework, our information technology and telecommunications systems, or third - party service providers; (26) our ability to iden tify and address unauthorized data access, cyber - crime, and other threats to data security and customer privacy; (27) our compliance with governmental and regulato ry requirements, including the Bank Holding Company Act of 1956, as amended, and other laws relating to banking, consumer protection, securities, and tax matte rs, and our ability to maintain licenses required in connection with mortgage origination, sale, and servicing operations; (28) compliance with the Bank Secr ecy Act of 1970, Office of Foreign Assets Control rules, and anti - money laundering laws and regulations; (29) governmental monetary and fiscal policies; (30) chang es in laws, rules, or regulations, or interpretations thereof, or policies relating to financial institutions or accounting, tax, trade, monetary, or fiscal matter s; (31) our ability to receive dividends from the Bank and satisfy our obligations as they become due; (32) the institution and outcome of litigation and other legal proceedin gs against us or to which we become subject; (33) the limited experience of our management team in managing and operating a public company; (34) the incremental cos ts of operating as a public company; and (35) our ability to meet our obligations as a public company, including our obligations under Section 404 of the Sa rbanes - Oxley Act of 2002. Additional factors that could affect forward - looking statements in this presentation can be found in the section titled “Risk Fa ctors” in the final prospectus filed by the Company with the U.S. Securities and Exchange Commission (the “SEC”) pursuant to Rule 424(b)(4) under the Securities Act of 1 933 , as amended, on October 2, 2025 (Registration Nos. 333 - 289862 and 333 - 290681), relating to the Company’s initial public offering, and in other documents th at we file with the SEC from time to time, which are available on the SEC’s website, www.sec.gov. The Company can provide no assurance that that the results contemplated, expressed, or implied by any forward - looking statement will be realized. Our actual future financial results or performance may differ from that currently expected due to additional risks and uncertainties of whi ch we are currently not aware or which we currently do not consider, but in the future may become, material to our business or operating results. Readers are cautioned to not place undue reliance on any of the forward - looking statements contained in this presentation. The f orward - looking statements contained in this presentation speak only as of the date they are made, and the Company undertakes no obligation to review or up date any forward - looking statements, whether as a result of new information, changes in assumptions, or otherwise, except as required by law. Non - GAAP Financial Measures This presentation contains certain financial measures that are not measures recognized under generally accepted accounting pr inc iples in the U.S. (“GAAP”) and, therefore, are considered non - GAAP financial measures. The Appendix to this presentation includes reconciliations of these non - G AAP financial measures to the most directly comparable financial measures calculated in accordance with GAAP. We use non - GAAP financial measures, certain of w hich are included in this presentation, both to explain our operating results to shareholders and the investment community and to evaluate, analyze, an d m anage our business. We believe that these non - GAAP financial measures provide a better understanding of ongoing operations, enhance the comparability of result s across periods, and enable investors to better understand our performance. However, non - GAAP financial measures should not be considered in isolation and s hould be considered supplemental in nature and not as a substitute for or superior to the most directly comparable or other financial measures ca lcu lated in accordance with GAAP. Additionally, the manner in which the non - GAAP financial measures contained in this presentation are calculated may differ from the manner in which measures with similar names are calculated by other companies. You should understand how other companies calculate their financial measures si milar to, or with names similar to, the non - GAAP financial measures contained in this presentation when comparing such non - GAAP financial measures.

4 Important Notices and Disclaimers Industry Information Certain industry and market data and forecasts, and other information, contained in this presentation has been prepared based , i n part, upon data, forecasts, and other information that we obtained from regulatory sources, periodic industry publications, third - party studies and surveys, fil ings of public companies in our industry, internal company surveys, or other independent information publicly available to us. Although we believe such information is rel iable and are not aware of any inaccuracies therein as of the date of this presentation, we have not independently verified this information, and this infor mat ion could prove to be inaccurate or incomplete. Readers are solely responsible for their own assessment of all such information. Stock Reclassification and Stock Split Prior to September 18, 2025, Commercial had three classes of common stock outstanding: common stock, Class B common stock, and C lass C common stock. On September 18, 2025, Commercial’s charter was amended and restated. The Company’s amended and restated charter provided for, a mon g other things, (1) effective upon the filing of the amended and restated charter, the reclassification and conversion of (A) each outstanding share of Class B common stock into 1.15 shares of common stock and (B) each outstanding share of Class C common stock into 1.05 shares of common stock (collectivel y, the “Stock Reclassification”), and (2) effective immediately following the Stock Reclassification, a 250 - for - 1 forward stock split in respe ct of the outstanding shares of our common stock (the “Stock Split”). Unless otherwise indicated, all share and per share data in this presentation has been adju ste d, where applicable, to reflect the Stock Reclassification and the Stock Split as if they had occurred at the beginning of the earliest period presented. The delivery of this presentation will not, under any circumstances, create an implication that there has been no change in t he affairs of the Company since the date of this presentation. The Company is not making any representation or warranty, express or implied, as to the accuracy or com ple teness of the information summarized herein or made available in connection with any further investigation of the Company. The Company disclaims any an d a ll liability based on such information or errors therein or omissions therefrom.
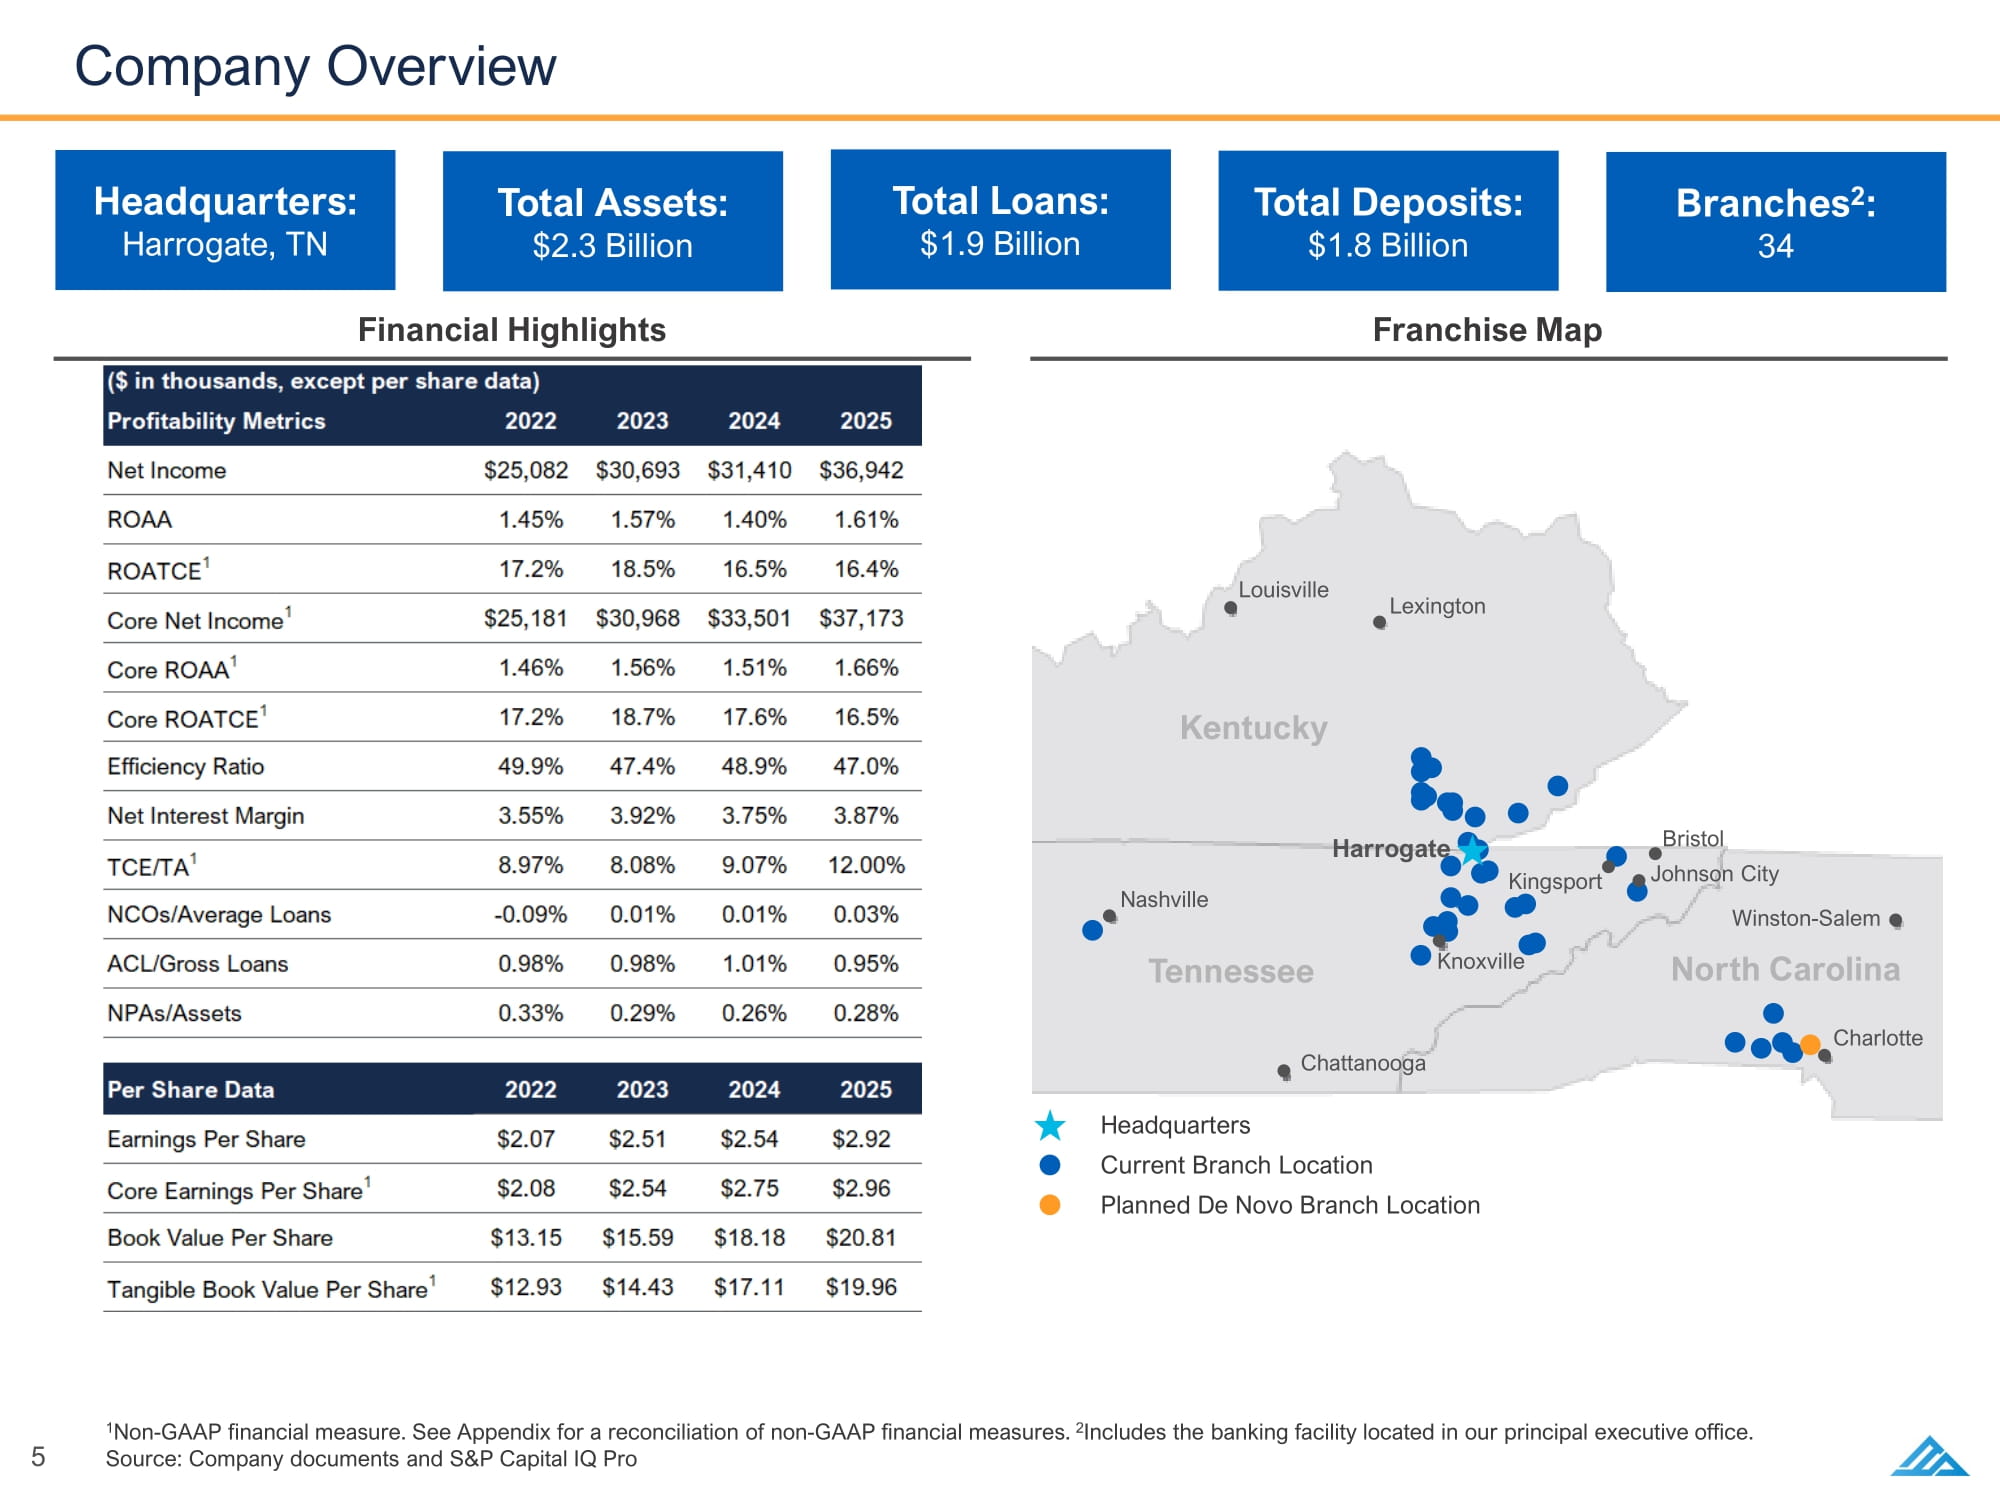
5 Company Overview Headquarters: Harrogate, TN Branches 2 : 34 Total Assets: $2.3 Billion Total Loans: $1.9 Billion Total Deposits: $1.8 Billion 1 Non - GAAP financial measure. See Appendix for a reconciliation of non - GAAP financial measures. 2 Includes the banking facility located in our principal executive office. Source: Company documents and SP Capital IQ Pro Franchise Map Financial Highlights Louisville Lexington Nashville Chattanooga Knoxville Harrogate Kingsport Johnson City Bristol Charlotte Winston - Salem Kentucky Tennessee North Carolina Headquarters Current Branch Location Planned De Novo Branch Location BS0 BS1
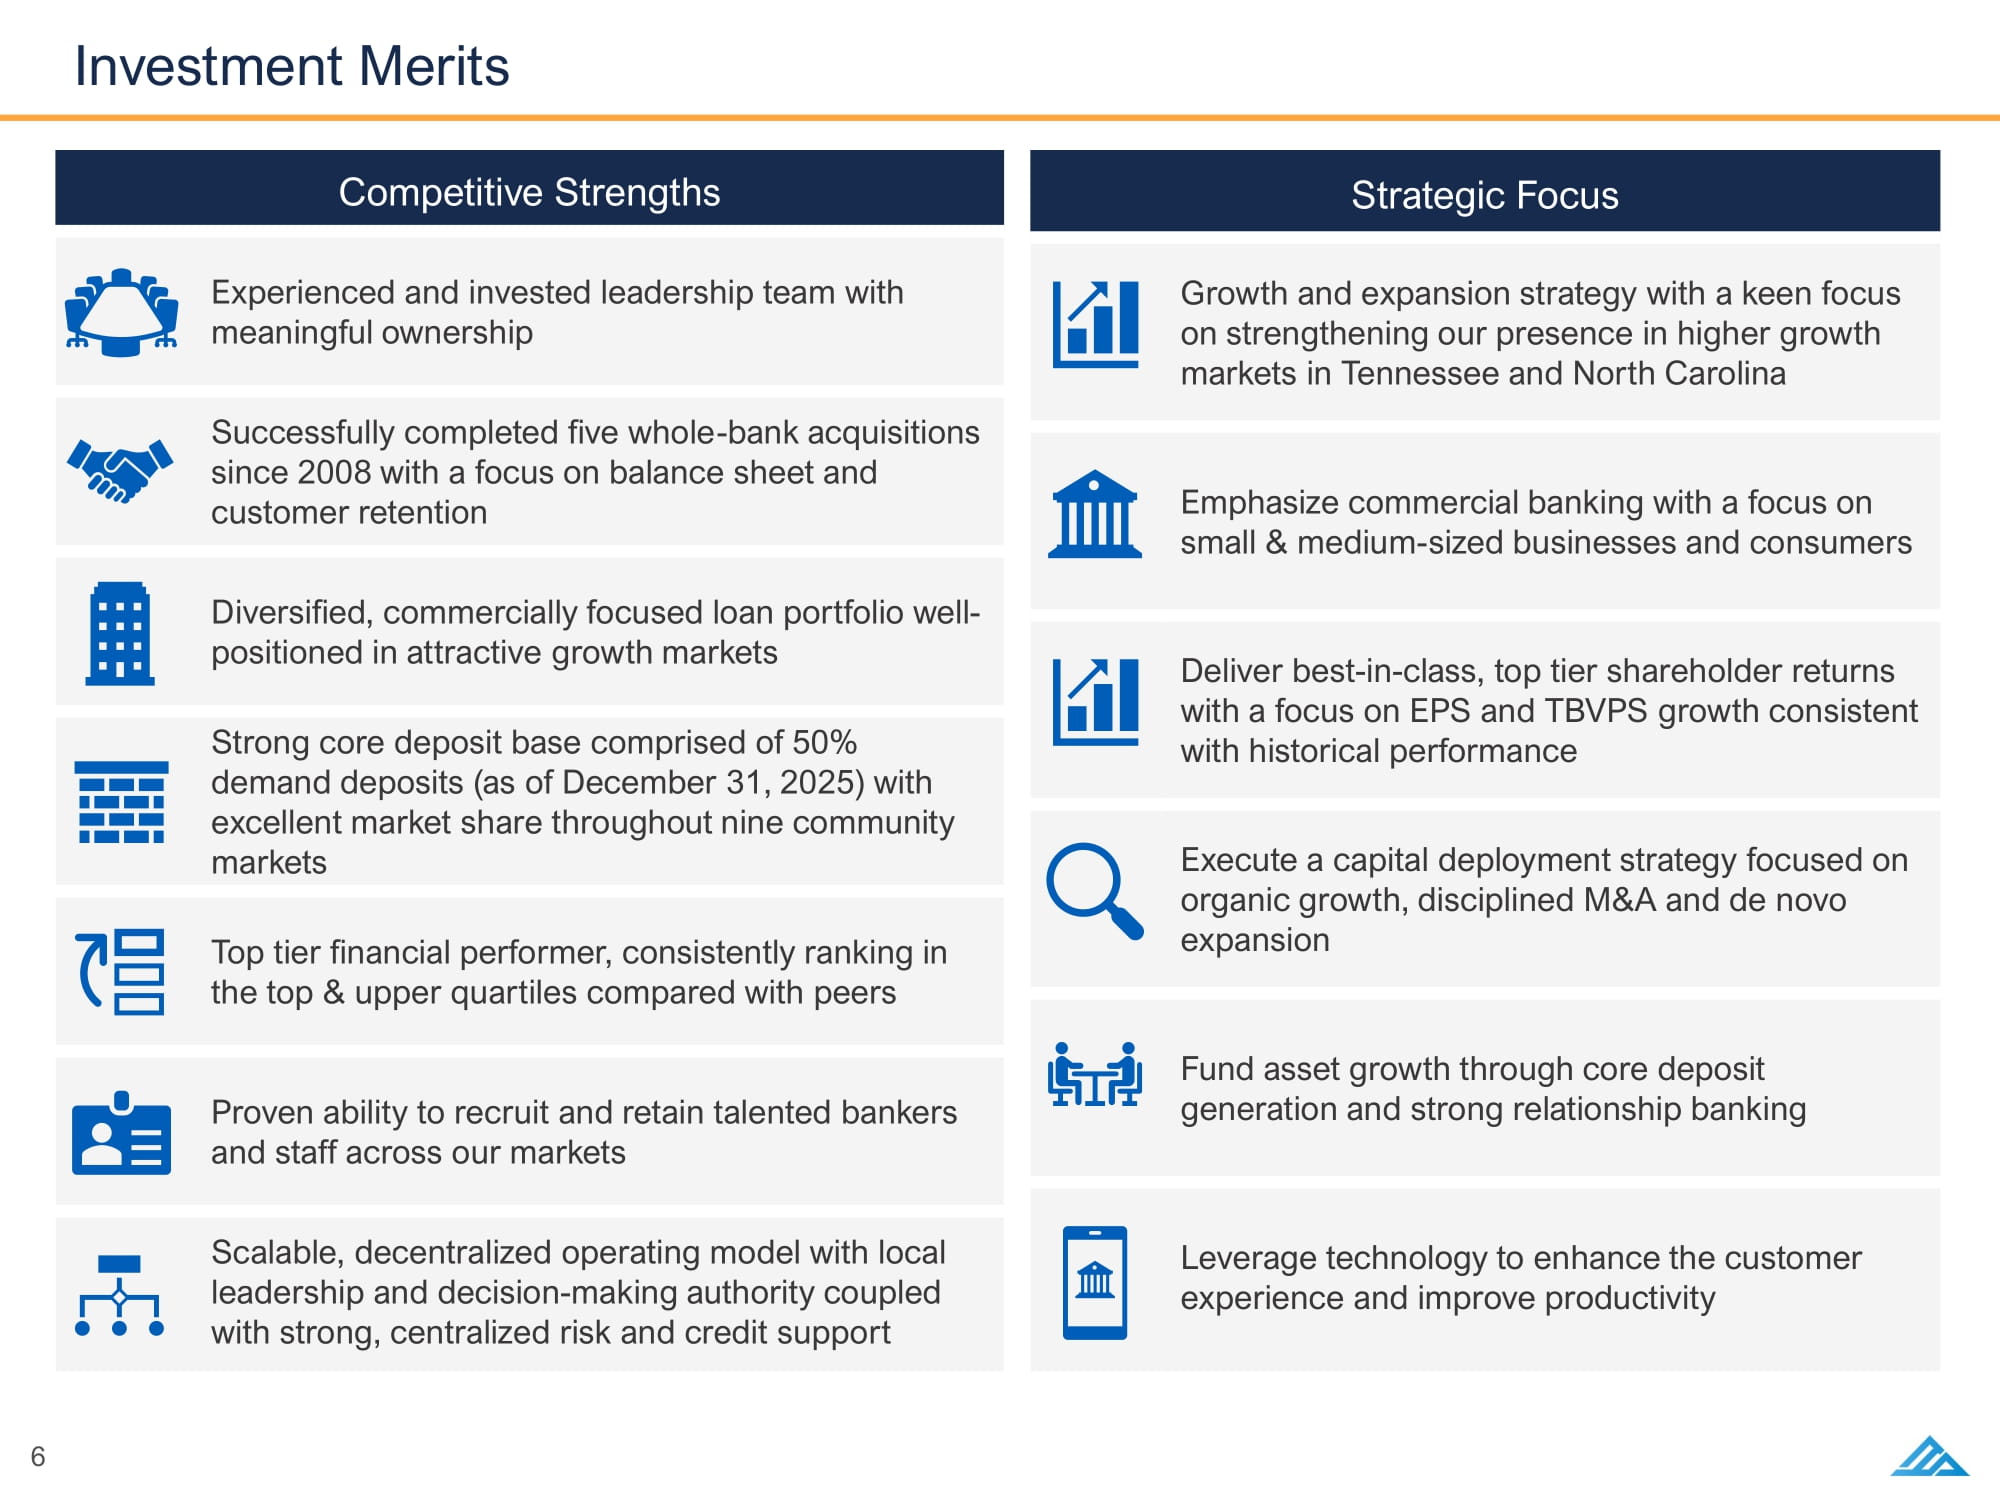
6 Investment Merits Competitive Strengths Experienced and invested leadership team with meaningful ownership Successfully completed five whole - bank acquisitions since 2008 with a focus on balance sheet and customer retention Diversified, commercially focused loan portfolio well - positioned in attractive growth markets Strong core deposit base comprised of 50% demand deposits (as of December 31, 2025) with excellent market share throughout nine community markets Top tier financial performer, consistently ranking in the top upper quartiles compared with peers Proven ability to recruit and retain talented bankers and staff across our markets Scalable, decentralized operating model with local leadership and decision - making authority coupled with strong, centralized risk and credit support Strategic Focus Growth and expansion strategy with a keen focus on strengthening our presence in higher growth markets in Tennessee and North Carolina Emphasize commercial banking with a focus on small medium - sized businesses and consumers Deliver best - in - class, top tier shareholder returns with a focus on EPS and TBVPS growth consistent with historical performance Execute a capital deployment strategy focused on organic growth, disciplined MA and de novo expansion Fund asset growth through core deposit generation and strong relationship banking Leverage technology to enhance the customer experience and improve productivity

7 Executive Management Team ■ Our executive management team has over 100 years of collective experience in the banking industry and has managed through multiple operating cycles Terry L. Lee President, Chief Executive Officer, and Director Terry L. Lee has 36 years of experience in the banking industry, all of which have been with Commercial Bank, the Company’s wholly owned bank subsidiary (the “Bank”). He has served as a member of our executive management team in various capacities since 1995 and has provided steady leadership to the Company and the Bank throughout this time. Philip J. Metheny Executive Vice President, Chief Financial Officer Philip J. Metheny has 44 years of experience in the banking industry and joined the Bank in 2012. He is primarily responsible for overseeing our financial and accounting operations. Richard C. Sprinkle, Jr. Executive Vice President, Chief Credit Officer Richard C. Sprinkle, Jr. has 32 years of experience in the banking industry and joined the Bank in 2008. He is primarily responsible for overseeing the lending activities of the Bank. CBK: 36 Yrs Banking: 36 Yrs CBK: 13 Yrs Banking: 44 Yrs CBK: 18 Yrs Banking: 32 Yrs

8 Business Evolution, Timeline Milestones Source: Company documents Early History History of Deposit - Focused Acquisitions, De Novo Expansion Organic Growth Positioning for Growth The Bank was founded as Commercial Bank of Claiborne County by E. Oscar Robertson on June 9, 1976 1976 1979 The Bank opened its first branch in Speedwell, TN on January 8, 1979 1986 On April 23, 1986, Commercial Bank of Claiborne County purchased Union County Bank from the FDIC and subsequently changed the Bank’s name to Commercial Bank 2001 On November 16, 2001, the Bank acquired Middlesboro Federal Bank adding three branches in KY and one in TN 2008 On September 8, 2008, the Bank acquired The Union National Bank and Trust Company of Barbourville adding five branches 2014 On March 1, 2014, the Bank opened an LPO in Nashville, TN 2016 On April 16, 2016, the Bank acquired National Bank of Tennessee adding two branches 2017 On January 1, 2018, the Bank acquired Citizens Bank adding three branches 2019 On March 1, 2019, the Bank transitioned its LPO in Nashville, TN into a full - service branch in Brentwood, TN (part of the Nashville MSA) 2020 On February 1, 2020, the Bank acquired First National Bank and Trust adding four branches 2023 - 24 On June 1, 2023, the Company acquired a majority stake in ABT Financial Corporation (“ABT”), and, on June 30, 2024, the Company acquired the remaining minority stake in ABT adding four branches and an LPO BS0
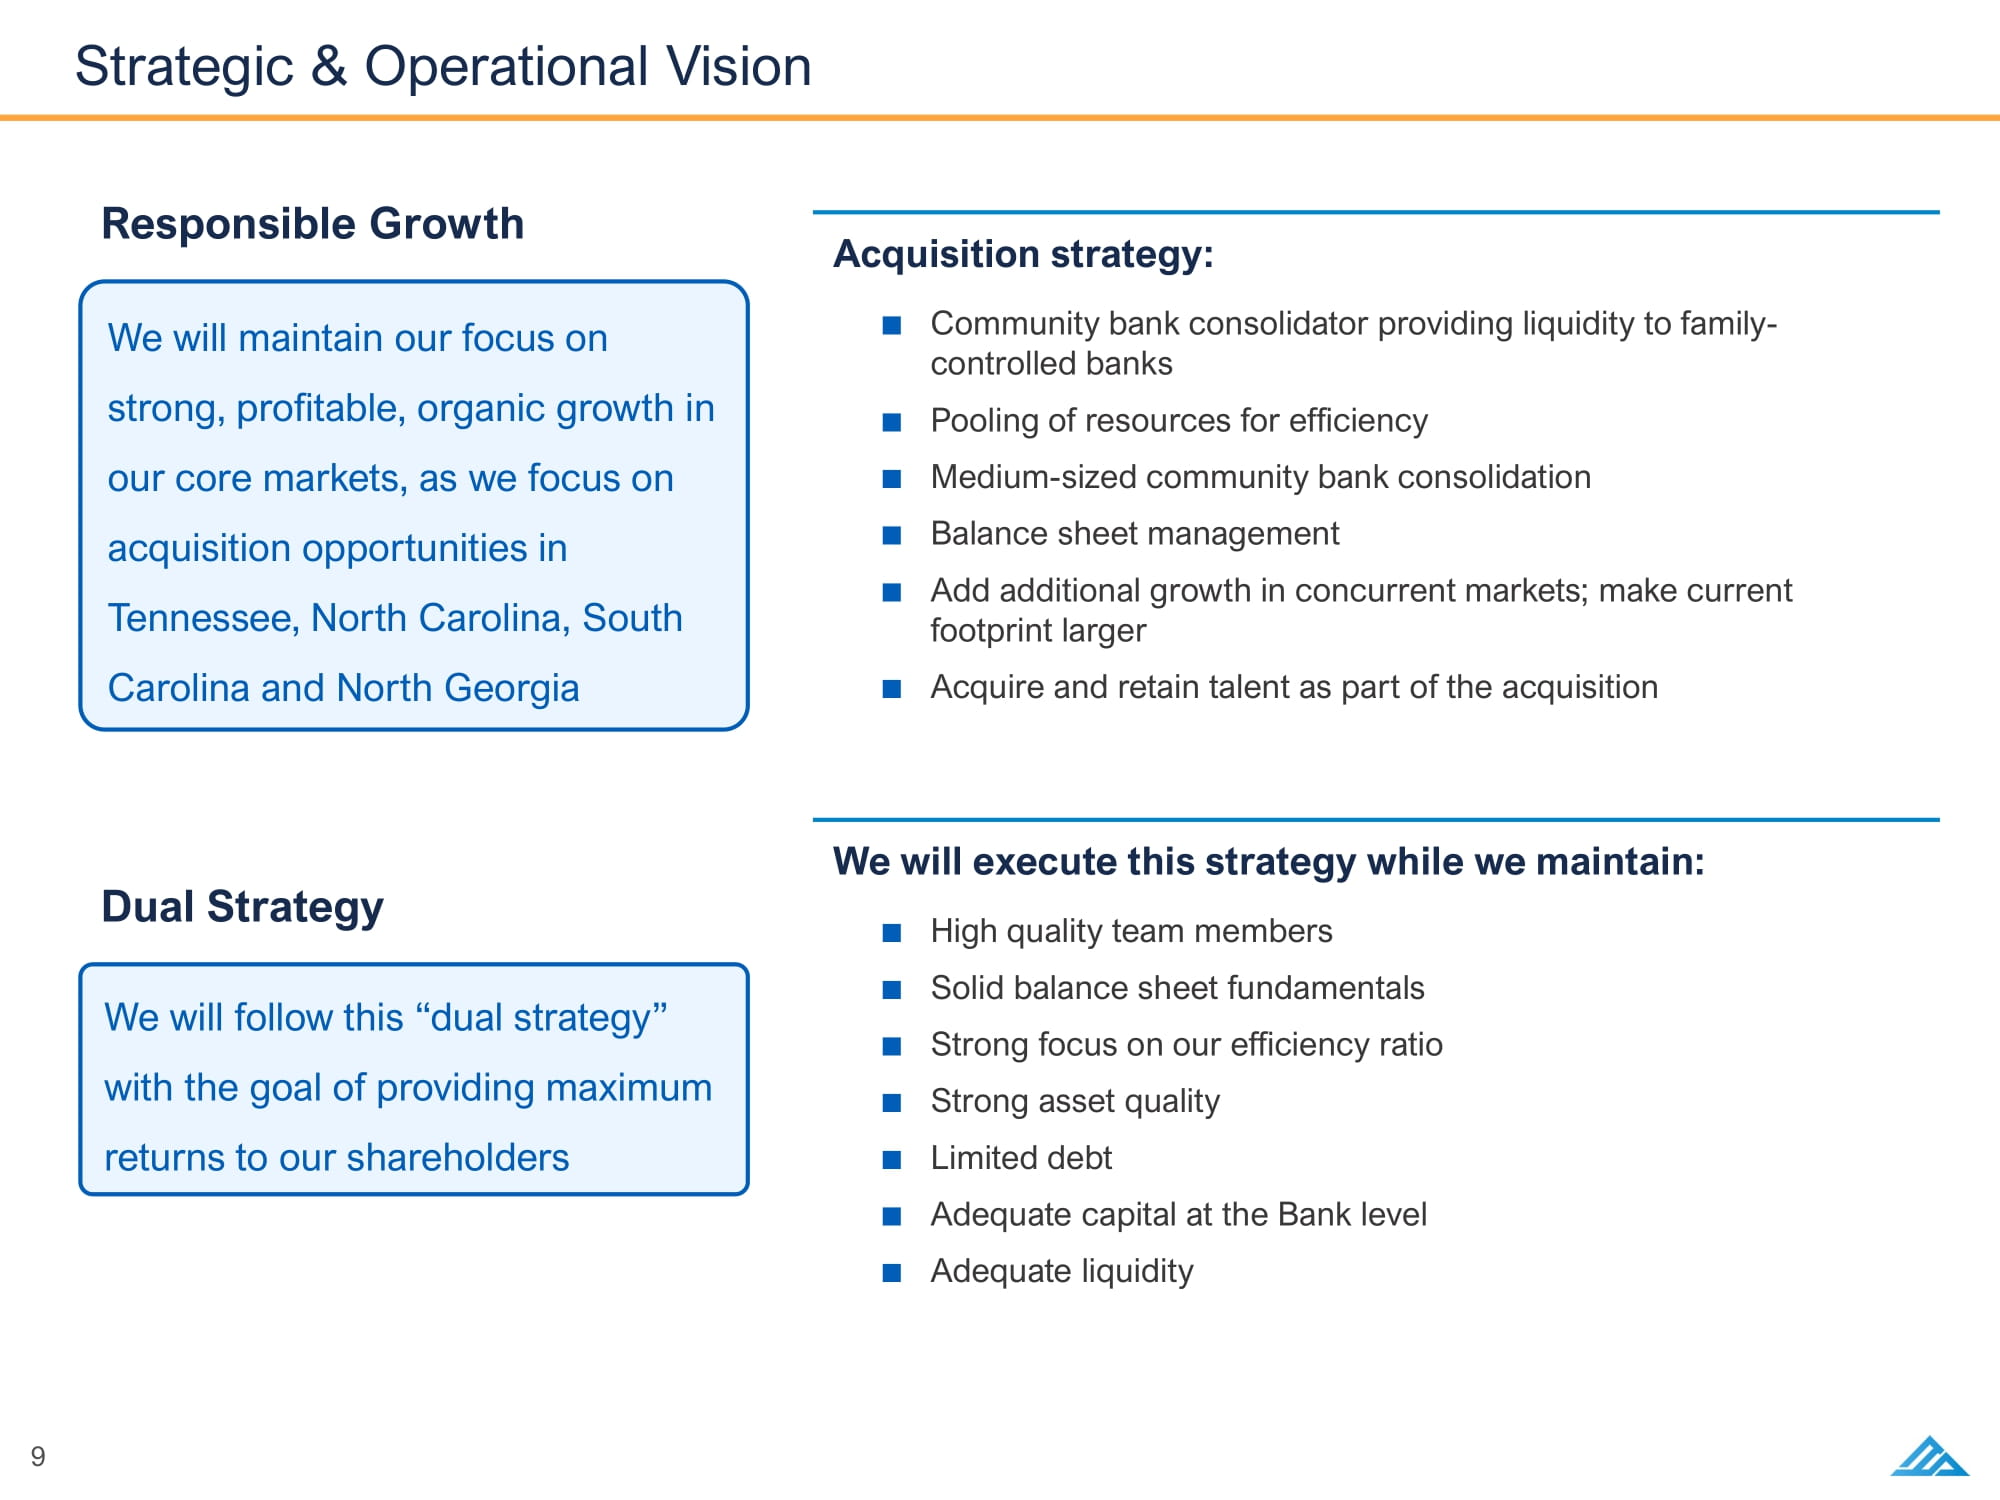
9 Strategic Operational Vision We will maintain our focus on strong, profitable, organic growth in our core markets, as we focus on acquisition opportunities in Tennessee, North Carolina, South Carolina and North Georgia Responsible Growth Acquisition strategy: ■ Community bank consolidator providing liquidity to family - controlled banks ■ Pooling of resources for efficiency ■ Medium - sized community bank consolidation ■ Balance sheet management ■ Add additional growth in concurrent markets; make current footprint larger ■ Acquire and retain talent as part of the acquisition We will execute this strategy while we maintain: ■ High quality team members ■ Solid balance sheet fundamentals ■ Strong focus on our efficiency ratio ■ Strong asset quality ■ Limited debt ■ Adequate capital at the Bank level ■ Adequate liquidity Dual Strategy We will follow this “dual strategy” with the goal of providing maximum returns to our shareholders

$1.08 $1.58 $2.08 $2.54 $2.75 $2.96 2020 2021 2022 2023 2024 2025 10 Driving Shareholder Value is Our Top Priority Tangible Book Value Per Share Core Earnings Per Share Core Efficiency Ratio 1 Core ROATCE 1 Core ROAA 1 Reported PPNI ($M) 1 $19.1 $25.7 $33.1 $43.0 $42.4 $47.9 2020 2021 2022 2023 2024 2025 0.85% 1.14% 1.46% 1.56% 1.51% 1.66% 2020 2021 2022 2023 2024 2025 11.6% 15.1% 17.2% 18.7% 17.6% 16.5% 2020 2021 2022 2023 2024 2025 66% 56% 50% 47% 49% 47% 2020 2021 2022 2023 2024 2025 2 BS0 BS1 BS2 BS3

$89.9 $94.4 $79.2 $63.7 $68.3 $85.7 Charlotte MSA Nashville MSA Knoxville MSA Kingsport- Bristol MSA Johnson City MSA National Average Projected Population Change (2025 – 2030) 1 11 Key Markets Overview/Dynamics ■ A premier financial and economic hub within the Southeastern U.S. with an estimated population of ~2.9 million ■ Home to several major financial institutions and serves as a critical nexus for the energy, healthcare, and logistics sectors ■ Dominance in the financial industry and innovation ecosystem create an unparalleled opportunity for long - term growth Charlotte, NC ■ One of the most rapidly expanding metropolitan regions within the U.S. with an estimated population of ~2.2 million ■ Widely acclaimed for its vibrant cultural scene, dynamic labor market, and relative affordability ■ Nashville serves as home to several Fortune 500 and industry - leading corporations led by the healthcare industry Nashville, TN ■ Dynamic and expanding economic center in East Tennessee with an estimated population of ~1 million ■ The Knoxville MSA hosts key industries, including advanced manufacturing, energy production, and logistics ■ Home to the University of Tennessee and Oak Ridge National Laboratory Knoxville, TN ■ A dynamic and expanding economic hub in Northeast Tennessee and Southwest Virginia with an estimated population of ~0.5 million ■ Diversified economic base, anchored by critical sectors such as healthcare, manufacturing, logistics, and tourism ■ Location at the intersection of major interstate highways enhances its appeal as a logistics and distribution center Tri - Cities, TN ■ Our community markets tend to offer primarily retail and small business customer opportunities and more limited competition ■ This leads to an attractive profitability profile and smaller ticket, more granular loan and deposit portfolios ■ These markets have been deemphasized by national and regional banks which allows for continued growth Community Markets Projected 2030 Median HHI ($000) 1 Tri - Cities includes Kingsport, Bristol, and Johnson City, TN 1 Source: Demographic data provided by SP Capital IQ Pro and sourced from Claritas based on U.S. Census data 6.6% 5.6% 5.9% 2.8% 4.7% 2.4% Charlotte MSA Nashville MSA Knoxville MSA Kingsport- Bristol MSA Johnson City MSA National Average

12 Proven MA Strategy / Seven Historical Acquisitions 1986 2001 2008 2016 2018 2020 2023 2024 Purchased Union County Bank from the FDIC Maynardville, TN Acquired Middlesboro Federal Bank Middlesboro, KY Branches: 3 Assets: $126M Loans: $100M Deposits: $108M Acquired The Union National Bank and Trust Company of Barbourville Barbourville, KY Branches: 5 Assets: $195M Loans: $124M Deposits: $172M Acquired National Bank of Tennessee Newport, TN Branches: 2 Assets: $148M Loans: $52M Deposits: $139M Acquired Citizens Bank New Tazewell, TN Branches: 3 Assets: $197M Loans: $171M Deposits: $172M Acquired First National Bank and Trust London, KY Branches: 4 Assets: $225M Loans: $128M Deposits: $182M Acquired a majority stake in ABT Gastonia, NC Acquired the remaining minority stake in ABT Gastonia, NC Branches: 4 Assets: $245M Loans: $194M Deposits: $223M ■ Completed seven acquisitions since our inception ■ Focus on a mix of both metropolitan growth markets and deposit rich community markets ■ Our most recent acquisition of ABT expanded our franchise into the higher growth Charlotte MSA ■ Emphasis on retaining key customers, employees and growing the acquired institution Future Opportunities MA Strategy ■ Well - positioned to be an acquirer of choice given the abundance of smaller, privately held banking institutions in Tennessee ■ There are 49 banks with assets between $500M and $2B in the state of Tennessee and ~75% of all banks have <$1B in assets ■ The Company is one of only three major exchange - traded banks with total assets between $1.5B and $5.0B headquartered in Tennessee, North Carolina or Kentucky Source: Company documents and SP Capital IQ Pro BS0

; 13 Consistent Balance Sheet Growth Total Net Loans ($M) Total Assets ($M) Total Equity ($M) Total Deposits ($M) Source: Company documents
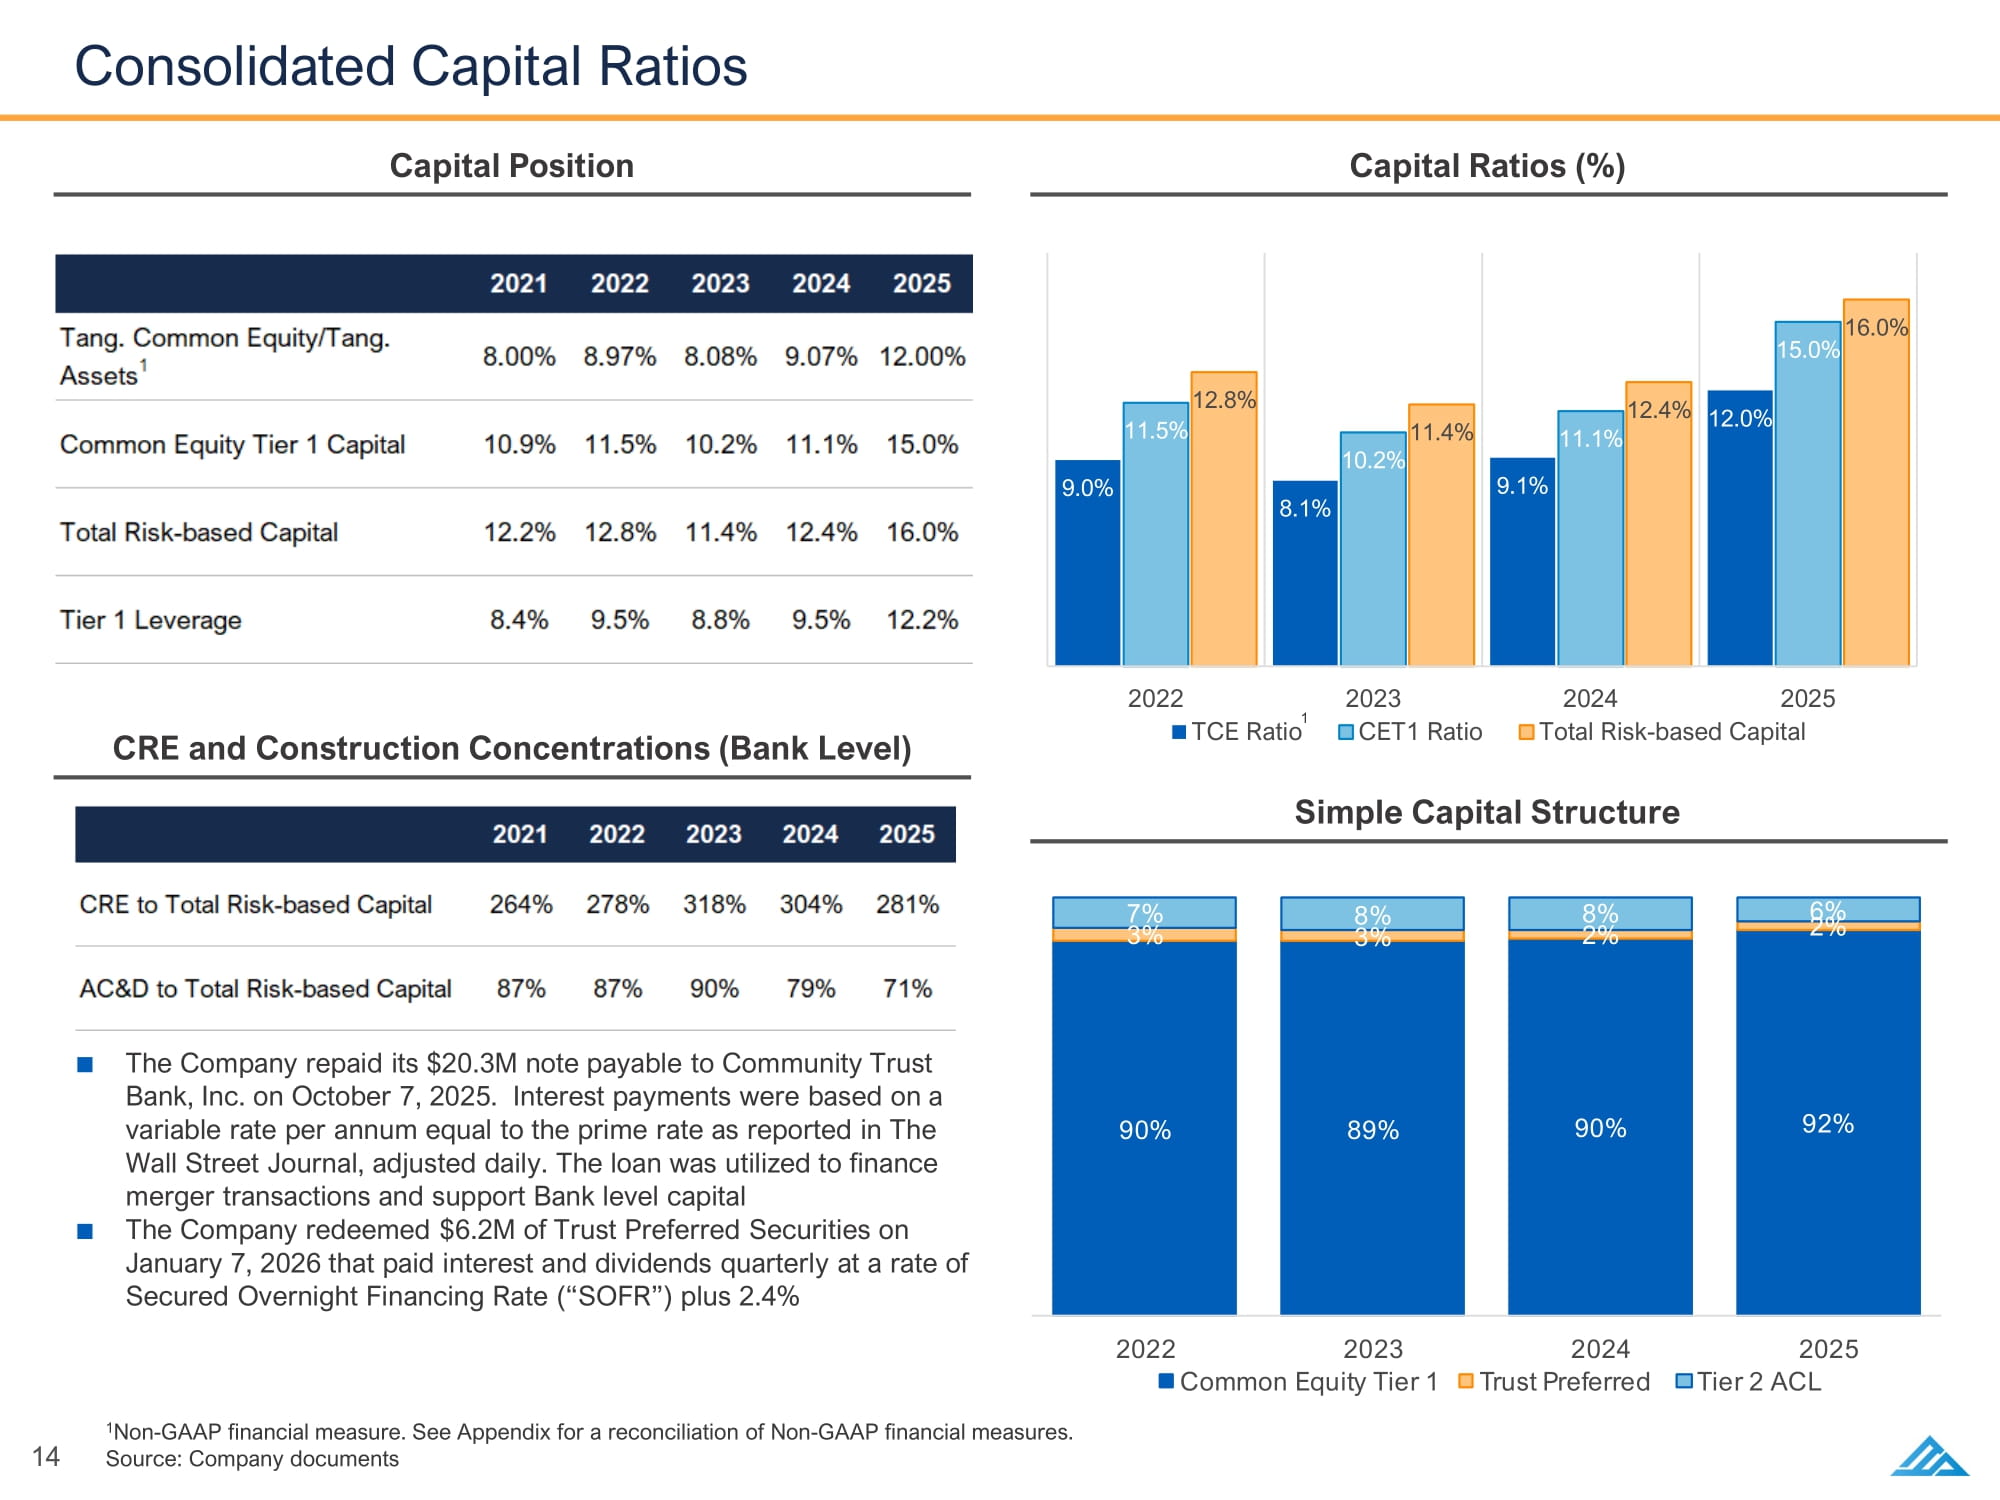
9.0% 8.1% 9.1% 12.0% 11.5% 10.2% 11.1% 15.0% 12.8% 11.4% 12.4% 16.0% 2022 2023 2024 2025 TCE Ratio CET1 Ratio Total Risk-based Capital 14 Consolidated Capital Ratios Capital Ratios (%) Capital Position Simple Capital Structure RPPRQ(TXLW\7LHU 7UXVW3UHIHUUHG 7LHU $/ 1 Non - GAAP financial measure. See Appendix for a reconciliation of Non - GAAP financial measures. Source: Company documents ■ The Company repaid its $20.3M note payable to Community Trust Bank, Inc. on October 7, 2025. Interest payments were based on a variable rate per annum equal to the prime rate as reported in The Wall Street Journal, adjusted daily. The loan was utilized to finance merger transactions and support Bank level capital ■ The Company redeemed $6.2M of Trust Preferred Securities on January 7, 2026 that paid interest and dividends quarterly at a rate of Secured Overnight Financing Rate (“SOFR”) plus 2.4% 1 CRE and Construction Concentrations (Bank Level)

3XEOLF RQVXPHU RPPHUFLDO $626 $725 $758 $922 $976 $914 $491 $509 $488 $659 $693 $751 $1,117 $1,234 $1,245 $1,581 $1,669 $1,665 2020 2021 2022 2023 2024 2025 Other Core Deposits Demand Deposits 46.4% 50.0% 53.3% 50.7% 50.4% 50.3% 1.02% 0.54% 0.47% 1.99% 2.79% 2.56% 2020 2021 2022 2023 2024 2025 Demand Deposits as % of Total Deposits Cost of Interest-bearing Deposits 1RQLQWHUHVW EHDULQJ ,QWHUHVW EHDULQJ 'HPDQG 6DYLQJV 12: 0RQH\ 0DUNHW -XPER7LPH 5HWDLO7LPH 15 Core Deposit Rich Franchise Core Deposit Growth ($M) 1 Deposits by Customer Segment ($M) CAGR Other Core Deposits: 9% Demand Deposits: 8% 50% Checking Accounts Cost of Deposits (%) Deposit Composition as of December 31, 2025 (%) Note: Retail Time Deposits are defined as deposits less than $250,000 and Jumbo Time Deposits are defined as deposits greater th an or equal to $250,000; Deposit composition percentages reflect rounding adjustments. 1 Non - GAAP financial measure. See Appendix for a reconciliation of Non - GAAP financial measures. Source: Company documents

5HWDLO 5HQWDO 2IÞFH :DUHKRXVH ,QGXVWULDO RQVWUXFWLRQDQG /DQG 6HOI6WRUDJH 0RELOH+RPH 3DUN +RVSLWDOLW\ $OO2WKHU5( , 2ZQHU2FFXSLHG5( 1RQ RZQHU2FFXSLHG5( Commercial Real Estate 59% Construction Land Development 10% Residential 20% Other Real Estate 1% Commercial 9% Consumer 1% Other Loans <1% 16 Loan Portfolio Detail Non - owner Occupied CRE as of December 31, 2025 Commercial Loan Growth ($M) Loan Composition as of December 31, 2025 Loan Portfolio Highlights ■ Diversified portfolio with an emphasis on commercial and business clients with sufficient debt service ratios, guarantor liquidity, and multiple forms of collateral ■ Substantial repeat business with very little turnover ■ All lending relationships over $2.5M in exposure get an expansive annual credit review ■ Every commercial loan has a 10% deposit requirement, typically the primary operating account ■ CD portfolio largely domiciled in major metro markets. All transactions greater than $2.5M require multiple site visits. ■ Single family mortgage loans are retained on the balance sheet Source: Company documents ■ Retail portfolio consists of credit tenants capable of covering debt service of entire project ■ No spec loans; pre - leasing required BS0 BS1

'XHLQ2QH <HDURU/HVV 'XHDIWHU2QH<HDU 7KURXJK)LYH<HDUV 'XHDIWHU)LYH <HDUV )L[HG5DWH $GMXVWDEOH 5DWH 17 Loan Portfolio Detail (cont’d) Loans by Geography As of December 31, 2025 CI and Owner - occupied CRE by Industry ($M) As of December 31,2025 Loan Maturity Schedule As of December 31, 2025 Fixed vs. Adjustable - Rate Loans As of December 31, 2025 .QR[YLOOH06$ 1DVKYLOOH06$ KDUORWWH06$ 7UL LWLHV06$ 2WKHU0DUNHWV BS0 BS1 BS2 BS3 BS4
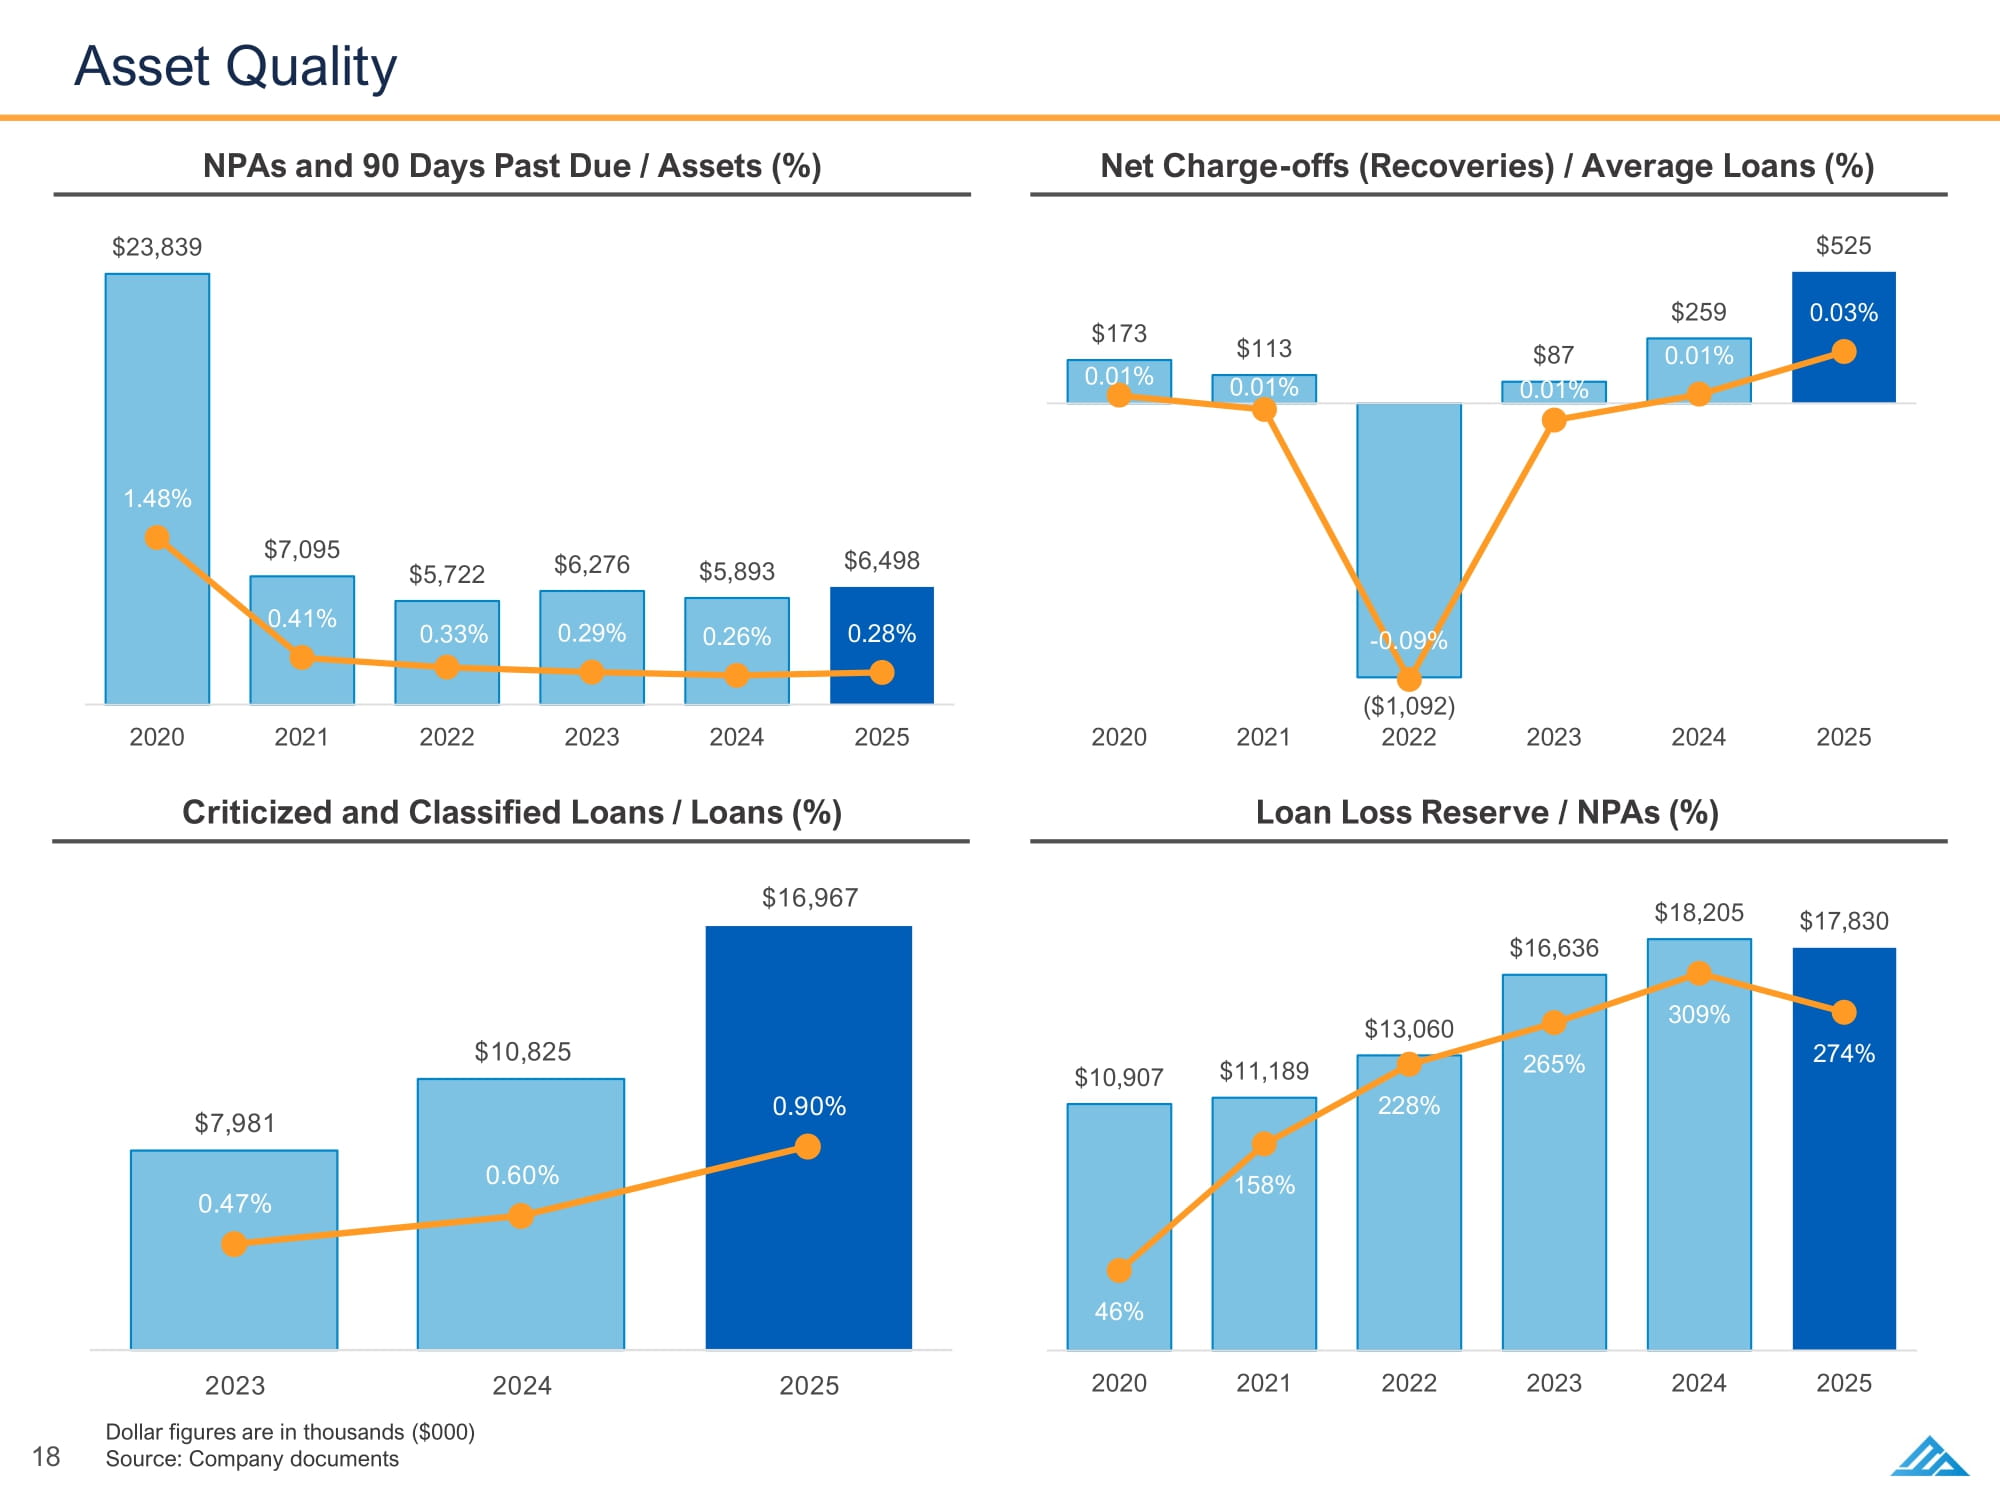
$23,839 $7,095 $5,722 $6,276 $5,893 $6,498 1.48% 0.41% 0.33% 0.29% 0.26% 0.28% 2020 2021 2022 2023 2024 2025 18 Asset Quality Loan Loss Reserve / NPAs (%) Criticized and Classified Loans / Loans (%) Net Charge - offs (Recoveries) / Average Loans (%) NPAs and 90 Days Past Due / Assets (%) $173 $113 ($1,092) $87 $259 $525 0.01% 0.01% - 0.09% 0.01% 0.01% 0.03% 2020 2021 2022 2023 2024 2025 $10,907 $11,189 $13,060 $16,636 $18,205 $17,830 46% 158% 228% 265% 309% 274% 2020 2021 2022 2023 2024 2025 Dollar figures are in thousands ($000) Source: Company documents

Pass 99.1% Special Mention 0.56% Substandard 0.34% Pass 100.0% Pass 99.4% Special Mention 0.14% Substandard 0.51% Pass 99.5% Special Mention 0.46% Substandard 0.08% Pass 100.0% Pass 98.3% Special Mention 0.22% Substandard 1.5% Pass 99.6% Special Mention 0.04% Substandard 0.34% Pass 99.2% Special Mention 0.79% Substandard 0.01% Total Non - Real Estate Secured 19 Loans by Credit Quality Indicators Real Estate Secured Commercial Other Residential Construction Land Dev. $1.1 Billion $14.8 Million $377.9 Million $176.7 Million Commercial Consumer Other $174.2 Million $15.4 Million $7.5 Million $1.9 Billion Total Loans Financial data as of the twelve months ended December 31, 2025 Source: Company documents BS0

Is this what you were thinking? 8QUHDOL]HG*DLQV /RVVHV RQ$)63RUWIROLR RI7RWDO(TXLW\ 'XHLQ2QH <HDURU/HVV f 'XHDIWHU2QH<HDU WKURXJK)LYH<HDUV 'XHDIWHU)LYH<HDUVWKURXJK 7HQ<HDUV f 'XHDIWHU7HQ f 0RUWJDJH %DFNHG 6HFXULWLHV 8 6 *RYW )HGHUDO$JHQF\ 8 6 *RYW 6SRQVRUHG (QWHUSULVHV *6(V 0RUWJDJH %DFNHG *6( 5HVLGHQWLDO 6WDWHDQG3ROLWLFDO 6XEGLYLVLRQV 20 Highly Liquid Investment Portfolio Investment Portfolio Maturities as of December 31, 2025 Unrealized Gains ( Losses ) on AFS Portfolio Yield on Investments (%) / Total Investments ($000) Investment Portfolio as of December 31, 2025 (%) $106,263 $84,888 $35,846 $52,041 $47,938 $43,137 $2,566 $161,472 $180,067 $158,632 $128,217 $97,728 $108,830 $246,361 $215,913 $210,673 $176,155 $140,865 2.04% 1.32% 1.07% 1.28% 1.83% 2.75% 2020 2021 2022 2023 2024 2025 HTM AFS Yield on Securities 1 Expected maturities may differ from contractual maturities of mortgage - backed securities; therefore, these securities are not in cluded in maturity categories Source: Company documents BS0

21 Investment Highlights 1 Investment Highlights History of robust organic growth and proven top tier financial performance Experienced management team with vested ownership Best - in - class shareholder returns with a focus on EPS and TBVPS growth Balanced franchise with a combination of high growth Southeastern metro markets and stable, deposit rich community markets History of successful MA focusing on family run banks, with an emphasis on conservative pricing, effective integration, balance sheet retention and growth Diversified, commercially focused loan portfolio with conservative credit culture and an emphasis on true relationship banking Scalable, decentralized business model supported by centralized underwriting, credit admin and technology

Appendix

23 Non - GAAP Financial Measures Reconciliations Source: Company documents
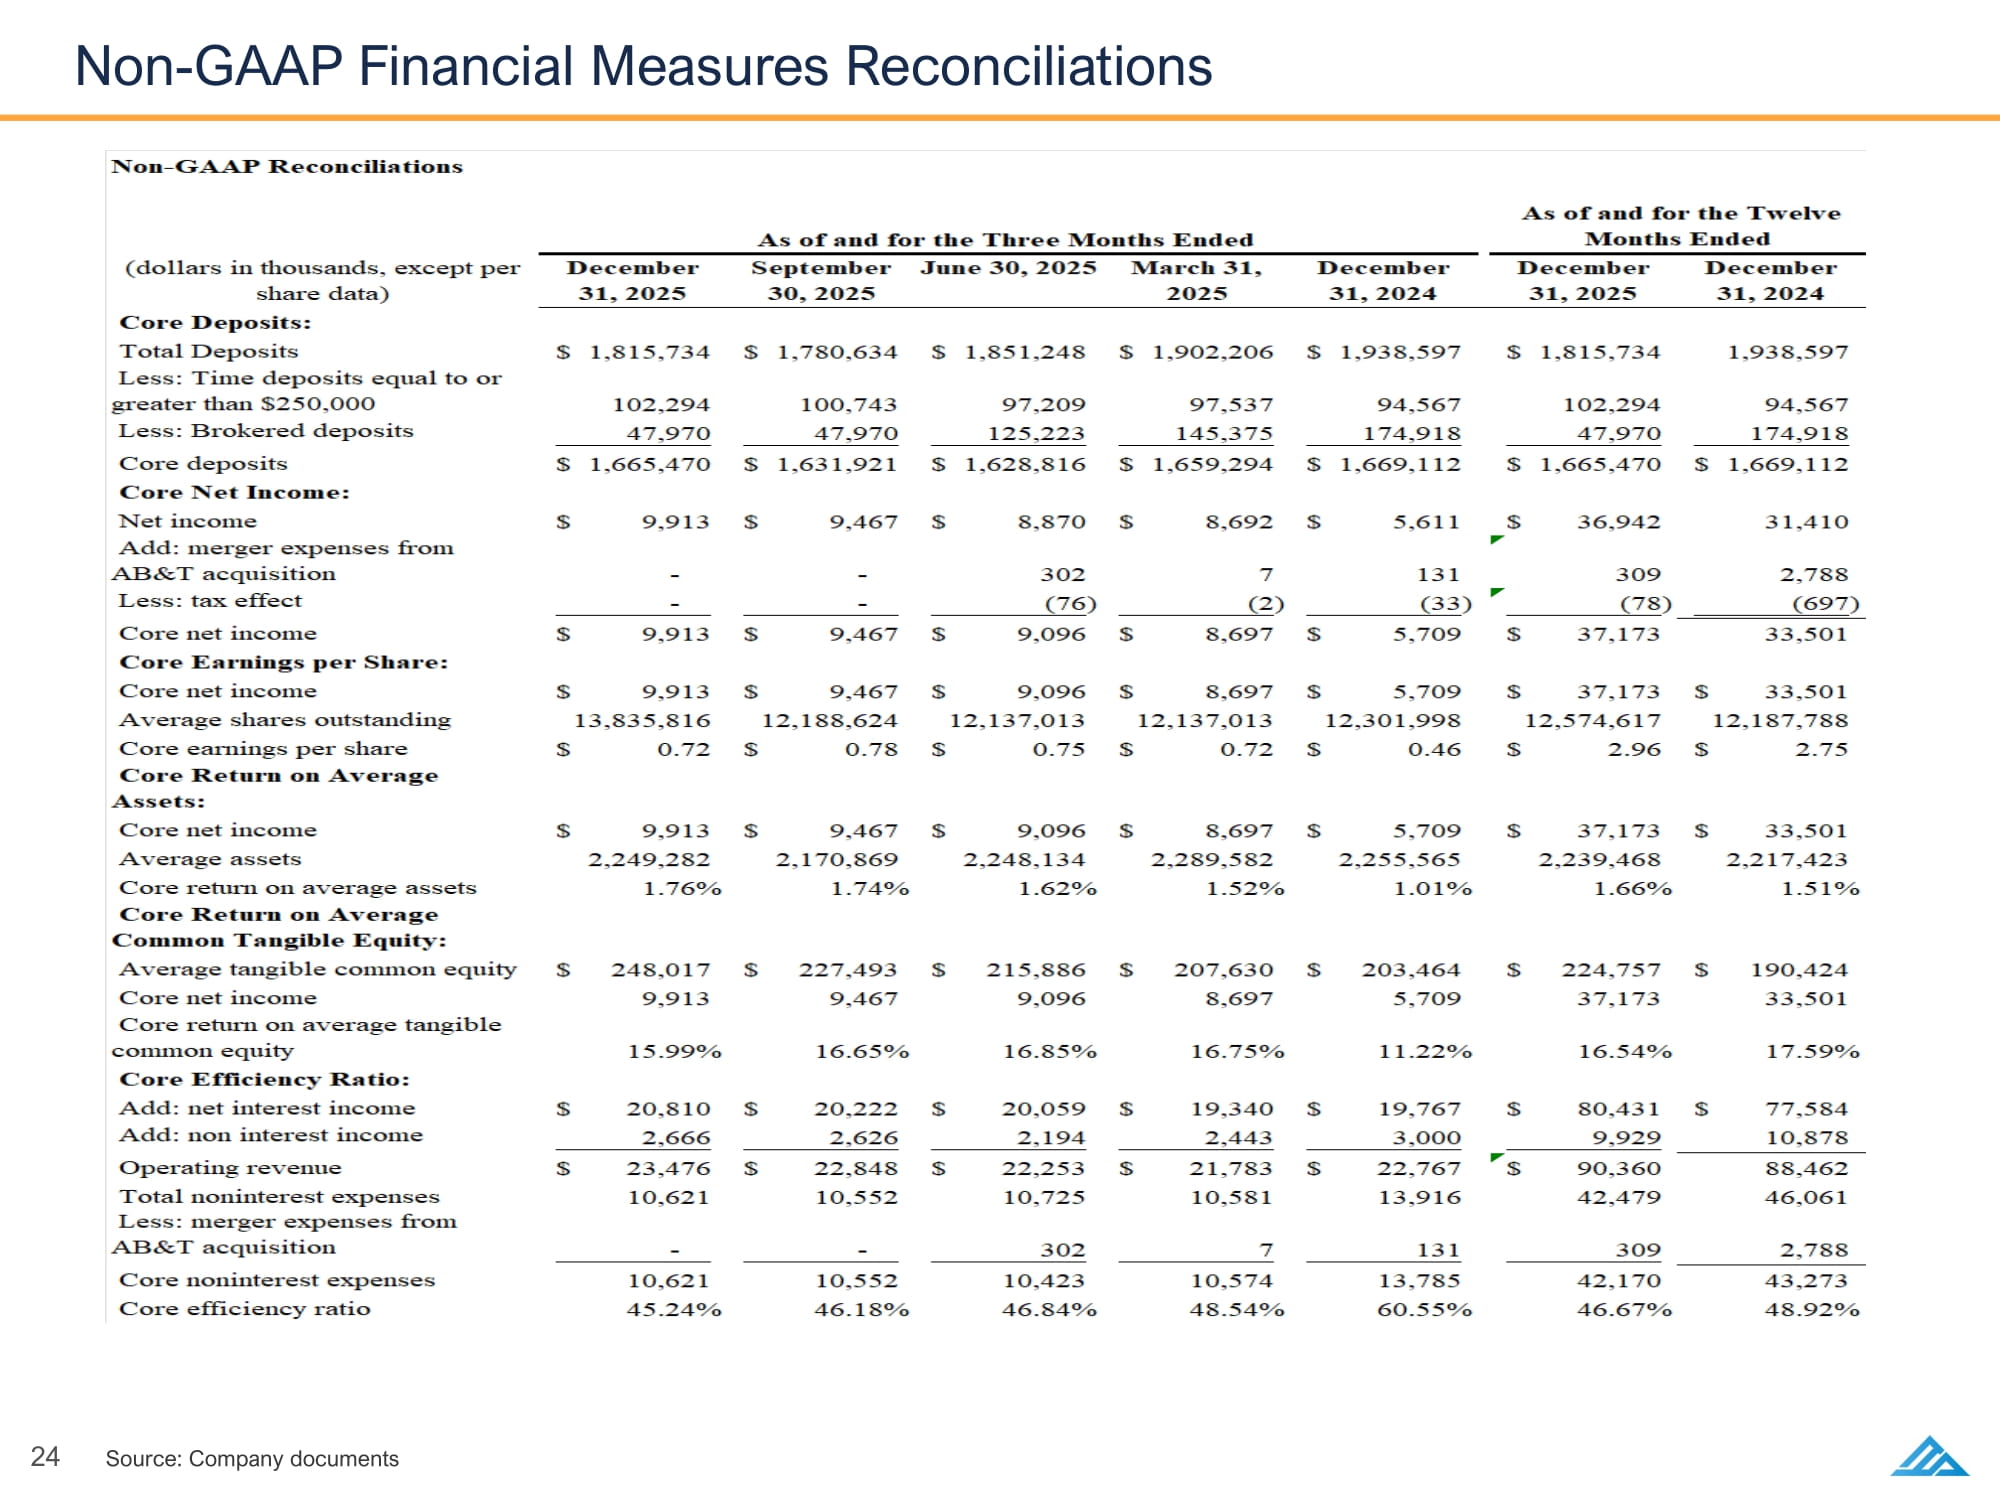
24 Non - GAAP Financial Measures Reconciliations Source: Company documents