UNITED STATES
SECURITIES AND EXCHANGE COMMISSION
Washington, D.C. 20549
FORM 6-K
REPORT OF FOREIGN PRIVATE ISSUER
PURSUANT TO RULE 13a-16 OR 15d-16
UNDER THE SECURITIES EXCHANGE ACT OF 1934
For the month of December 2025
Commission File Number: 001-42568
EPSIUM ENTERPRISE LIMITED
c/o Companhia de Comércio Luz Limitada
Alameda Dr. Carlos D’assumpcao
Edf China Civil Plaza 235-243, 14 Andar P
Macau, SAR China
+853-2857-5252
(Address of principal executive office)
Indicate by check mark whether the registrant files or will file annual reports under cover of Form 20-F or Form 40-F.
Form 20-F ☒ Form 40-F ☐
INFORMATION CONTAINED IN THIS FORM 6-K REPORT
EPSIUM ENTERPRISE LIMITED (the “Company”) is furnishing its unaudited condensed consolidated financial statements and footnotes for the six months ended June 30, 2025, 2024, and 2023. The unaudited condensed consolidated financial statements and notes are attached as Exhibit 99.1 to this report on Form 6-K, and Operating and Financial Review and Prospects for the six months ended June 30, 2025 are attached as Exhibit 99.2 to this report on Form 6-K.
EXHIBIT INDEX
| Exhibit No. | Description | |
| 99.1 | Unaudited condensed consolidated financial statements of EPSIUM ENTERPRISE LIMITED as of June 30, 2025 and for the six months ended June 30, 2025, 2024 and 2023, and the notes related thereto | |
| 99.2 | Operating and financial review and prospects of EPSIUM ENTERPRISE LIMITED for the six months ended June 30, 2025 | |
| 101 | Interactive Data Files (formatted as Inline XBRL) | |
| 104 | Cover Page Interactive Data File (formatted as Inline XBRL and contained in Exhibit 101) |
SIGNATURES
Pursuant to the requirements of the Securities Exchange Act of 1934, the registrant has duly caused this report to be signed on its behalf by the undersigned, thereunto duly authorized.
| EPSIUM ENTERPRISE LIMITED | ||
| Date: December 5, 2025 | By: | /s/ Son I Tam |
| Name: | Son I Tam | |
| Title: | Chief Executive Officer | |
Exhibit 99.1
Epsium Enterprise Limited and Subsidiaries
Consolidated Balance Sheets
(Unaudited)
| June 30, 2025 |
December 31, 2024 |
|||||||
| Assets | ||||||||
| Current assets: | ||||||||
| Cash | $ | 2,430,160 | $ | 148,828 | ||||
| Term deposit | 44,494 | 45,006 | ||||||
| Accounts receivable | 806,478 | 1,170,209 | ||||||
| Prepaid expense | 978,093 | 3,771 | ||||||
| Advances payments for goods | 5,176,667 | 4,361,465 | ||||||
| Other receivables | 33,953 | 19,188 | ||||||
| Inventories | 4,084,466 | 4,642,982 | ||||||
| Total current assets | 13,554,311 | 10,391,449 | ||||||
| Non-current assets: | ||||||||
| Property and equipment, net | 68,424 | 78,115 | ||||||
| Leased right-of-use assets | 171,451 | 158,091 | ||||||
| Total non-current assets | 239,875 | 236,206 | ||||||
| Total assets | $ | 13,794,186 | $ | 10,627,655 | ||||
| Liabilities and Stockholders’ Equity | ||||||||
| Current liabilities: | ||||||||
| Accounts payable | $ | 116,028 | $ | 538,859 | ||||
| Employee benefits payable | 1,838 | 53,667 | ||||||
| Taxes payable | 1,291,995 | 1,299,184 | ||||||
| Lease liability - current | 107,861 | 85,915 | ||||||
| Amount due to related parties | 706 | 363,066 | ||||||
| Total current liabilities | 1,518,428 | 2,340,691 | ||||||
| Non-current liabilities: | ||||||||
| Lease liabilities non-current | 70,684 | 79,784 | ||||||
| Total non-current liabilities | 70,684 | 79,784 | ||||||
| Total liabilities | 1,589,112 | 2,420,475 | ||||||
| Stockholder’s equity: | ||||||||
| Ordinary shares (par value $0.00002 per share, 800,000,000 shares authorized; 13,438,034 and 12,000,534 shares issued and outstanding at June 30, 2025 and December 31, 2024, respectively | 269 | 240 | ||||||
| Preferred shares (par value $0.00002 per share, 200,000,000 shares authorized; no preferred shares issued and outstanding at June 30, 2025 and December 31, 2024 | ||||||||
| Treasury Stock | (300,000 | ) | ||||||
| Paid-in capital | 5,526,795 | 328,241 | ||||||
| Reserve Capital | 1,550 | 1,550 | ||||||
| Accumulated Other Comprehensive Income (Loss) | (61,291 | ) | 44,800 | |||||
| Retained earnings | 7,037,751 | 7,738,123 | ||||||
| Total Epsium stockholder’s equity | 12,205,074 | 8,112,954 | ||||||
| Non-controlling interest | 94,226 | |||||||
| Total stockholder’s equity | 12,205,074 | 8,207,180 | ||||||
| Total liabilities and stockholder’s equity | $ | 13,794,186 | $ | 10,627,655 | ||||
The accompanying notes are an integral part of the unaudited condensed consolidated financial statements
Epsium Enterprise Limited
and Subsidiaries
Consolidated Statements of Operations and Comprehensive Income (Loss)
(Unaudited)
| Six Months ended June 30, 2025 |
Six Months ended June 30, 2024 |
Six Months ended June 30, 2023 |
||||||||||
| Revenue, net | $ | 3,042,988 | $ | 7,114,095 | $ | 18,403,610 | ||||||
| Cost of goods sold | 2,547,678 | 6,182,895 | 13,913,819 | |||||||||
| Gross profit | 495,310 | 931,200 | 4,489,791 | |||||||||
| Operating expenses: | ||||||||||||
| Selling and distribution expenses | 3,816 | 2,136 | 1,229 | |||||||||
| General and administrative expenses | 1,183,240 | 386,770 | 446,187 | |||||||||
| Total operating expenses | 1,187,056 | 388,906 | 447,416 | |||||||||
| Operating (loss) income | (691,746 | ) | 542,294 | 4,042,375 | ||||||||
| Other expenses (income) | ||||||||||||
| Interest expense | 2,900 | |||||||||||
| Other expenses (income), net | (281 | ) | (1,084 | ) | 16,592 | |||||||
| Total other expenses (income), net | (281 | ) | (1,084 | ) | 19,492 | |||||||
| (Loss) Income before provision for taxes | (691,465 | ) | 543,378 | 4,022,883 | ||||||||
| Provision for income taxes | 7,641 | 75,504 | 498,661 | |||||||||
| Net income (loss) | $ | (699,106 | ) | $ | 467,874 | $ | 3,524,222 | |||||
| Less: net income (loss) attributable to non-controlling interest | 1,266 | 6,252 | 37,265 | |||||||||
| Net (loss) income attributable to Epsium Enterprise Limited | $ | (700,372 | ) | $ | 461,622 | $ | 3,486,957 | |||||
| Other comprehensive (loss) income | ||||||||||||
| Foreign currency translation (loss) gain | (106,091 | ) | 9,504 | (15,228 | ) | |||||||
| Comprehensive income (loss) attributable to Epsium Enterprise Limited | $ | (806,463 | ) | $ | 471,126 | $ | 3,471,729 | |||||
| (Loss) Earnings per ordinary share | ||||||||||||
| – Basic and diluted | $ | (0.05 | ) | $ | 0.04 | $ | 0.29 | |||||
| Weighted average number of ordinary shares outstanding | ||||||||||||
| – Basic and diluted | 12,732,689 | 12,000,534 | 12,000,534 | |||||||||
The accompanying notes are an integral part of the unaudited condensed consolidated financial statements
Epsium Enterprise Limited and Subsidiaries
Consolidated Statements of Changes in Stockholders’ Equity
(Unaudited)
| Ordinary shares | Accumulated Other |
Total Epsium | Non- | Total | ||||||||||||||||||||||||||||||||||||
| Number of Shares |
Amount | Treasury Stock |
Paid-in Capital |
Reserve Capital |
Retained Earning |
Comprehensive Income (Loss) |
Stockholder’s Equity |
controlling Interest |
Stockholder’s Equity |
|||||||||||||||||||||||||||||||
| Balance at December 31, 2022 | 12,000,534 | 240 | 323,230 | 1,550 | 3,788,797 | (8,924 | ) | 4,104,893 | 40,584 | 4,145,477 | ||||||||||||||||||||||||||||||
| Imputed interest expense | - | 2,665 | 2,665 | 19 | 2,684 | |||||||||||||||||||||||||||||||||||
| Foreign currency translation gain (loss) | - | (15,228 | ) | (15,228 | ) | (15,228 | ) | |||||||||||||||||||||||||||||||||
| Net income | - | 3,486,957 | 3,486,957 | 37,265 | 3,524,222 | |||||||||||||||||||||||||||||||||||
| Balance at June 30, 2023 | 12,000,534 | 240 | 325,895 | 1,550 | 7,275,754 | (24,152 | ) | 7,579,287 | 77,868 | 7,657,155 | ||||||||||||||||||||||||||||||
| Ordinary shares | Accumulated Other |
Total Epsium | Non- | Total | ||||||||||||||||||||||||||||||||||||
| Number of
Shares |
Amount | Treasury Stock |
Paid-in Capital |
Reserve Capital |
Retained Earning |
Comprehensive Income (Loss) |
Stockholder’s Equity |
controlling Interest |
Stockholder’s Equity |
|||||||||||||||||||||||||||||||
| Balance at December 31, 2023 | 12,000,534 | 240 | 328,241 | 1,550 | 7,463,266 | (6,010 | ) | 7,787,287 | 84,389 | 7,871,676 | ||||||||||||||||||||||||||||||
| Foreign currency translation gain (loss) | - | - | 9,504 | 9,504 | 9,504 | |||||||||||||||||||||||||||||||||||
| Net income | - | - | 461,622 | 461,622 | 6,252 | 467,874 | ||||||||||||||||||||||||||||||||||
| Balance at June 30, 2024 | 12,000,534 | 240 | 328,241 | 1,550 | 7,924,888 | 3,494 | 8,258,413 | 90,641 | 8,349,054 | |||||||||||||||||||||||||||||||
| Number of Shares |
Amount | Treasury Stock |
Paid-in Capital |
Reserve Capital |
Retained Earning |
Accumulated
Other Comprehensive Income (Loss) |
Total
Epsium Stockholder’s Equity |
Non- controlling Interest |
Total
Stockholder’s Equity |
|||||||||||||||||||||||||||||||
| Balance at December 31, 2024 | 12,000,534 | 240 | 328,241 | $ | 1,550 | $ | 7,738,123 | $ | 44,800 | 8,112,954 | 94,226 | 8,207,180 | ||||||||||||||||||||||||||||
| Share issuance for cash | 1,437,500 | 29 | - | 5,103,062 | 5,103,091 | 5,103,091 | ||||||||||||||||||||||||||||||||||
| Share repurchase | - | (300,000 | ) | (300,000 | ) | (300,000 | ) | |||||||||||||||||||||||||||||||||
| Acquisition of non-controlling interest | - | - | 95,492 | 95,492 | (95,492 | ) | ||||||||||||||||||||||||||||||||||
| Foreign currency translation gain (loss) | - | - | (106,091 | ) | (106,091 | ) | (106,091 | ) | ||||||||||||||||||||||||||||||||
| Net loss | - | - | (700,372 | ) | (700,372 | ) | 1,266 | (699,106 | ) | |||||||||||||||||||||||||||||||
| Balance at June 30, 2025 | 13,438,034 | $ | 269 | $ | (300,000 | ) | $ | 5,526,795 | $ | 1,550 | $ | 7,037,751 | $ | (61,291 | ) | 12,205,074 | $ | 12,205,074 |
The accompanying notes are an integral part of the unaudited condensed consolidated financial statements
Epsium Enterprise Limited and Subsidiaries
Consolidated Statements of Cash Flows
(Unaudited)
| Six Months ended June 30, 2025 |
Six Months ended June 30, 2024 |
Six Months ended June 30, 2023 |
||||||||||
| Cash flows from operating activities | ||||||||||||
| Net income (loss) | $ | (699,106 | ) | $ | 467,874 | $ | 3,524,222 | |||||
| Adjustments to reconcile net income (loss) to net cash used in operating activities: | ||||||||||||
| Depreciation | 10,685 | 4,442 | 10,002 | |||||||||
| Imputed interest expense | 2,684 | |||||||||||
| Reduction in the carrying amount of right-of-use assets | 68,059 | 45,934 | 38,049 | |||||||||
| Changes in operating assets and liabilities: | ||||||||||||
| Inventories | 509,494 | 850,447 | 1,365,626 | |||||||||
| Accounts receivable | 353,038 | (285,236 | ) | (556,719 | ) | |||||||
| Prepayments | (1,845,644 | ) | (673,283 | ) | (2,724,749 | ) | ||||||
| Other receivables | (15,095 | ) | 656,826 | 11,242 | ||||||||
| Accounts payable | (196,402 | ) | (1,277,403 | ) | 98,114 | |||||||
| Advances from customers | 11,223 | |||||||||||
| Employee benefits payable | (51,601 | ) | (50,167 | ) | 131 | |||||||
| Taxes and surcharges payable | 7,641 | 75,504 | 498,661 | |||||||||
| Lease liabilities | (68,491 | ) | (53,537 | ) | (46,322 | ) | ||||||
| Other payables | (655,834 | ) | (12,500 | ) | ||||||||
| Net cash flows used in operating activities | (1,927,422 | ) | (894,433 | ) | 2,219,664 | |||||||
| Cash flows from investing activities: | ||||||||||||
| Cash paid for property and equipment | (1,817 | ) | (83,003 | ) | (768 | ) | ||||||
| Net cash flows used in investing activities | (1,817 | ) | (83,003 | ) | (768 | ) | ||||||
| Cash Flow from Financing Activities: | ||||||||||||
| Proceeds from issuance of shares | 5,750,000 | |||||||||||
| Payment for UW discount and fees | (517,500 | ) | ||||||||||
| Payment for offering cost | (354,500 | ) | ||||||||||
| Payments to repurchase of shares | (300,000 | ) | ||||||||||
| Receipts from related parties | 6,226 | 1,480,167 | ||||||||||
| Payments to related parties | (367,137 | ) | (3,736,275 | ) | ||||||||
| Repayments to bank loans | (26,801 | ) | ||||||||||
| Net cash provided by (used in) financing activities | 4,217,089 | (2,282,909 | ) | |||||||||
| Effect of exchange rate change on cash | (6,518 | ) | (2,644 | ) | (4,268 | ) | ||||||
| Net increase (decrease) in cash | 2,281,332 | (980,080 | ) | (68,281 | ) | |||||||
| Cash at the Beginning of the Period | 148,828 | 1,316,158 | 525,561 | |||||||||
| Cash at the End of the Period | $ | 2,430,160 | $ | 336,078 | $ | 457,280 | ||||||
| Supplemental Disclosures of Cash Flow Information: | ||||||||||||
| Cash Paid During the Period for: | ||||||||||||
| Interest | ||||||||||||
| Taxes | $ | $ | $ | |||||||||
| Non-cash Investing and Financing Activities: | ||||||||||||
| Acquisition of non-controlling interest | 95,492 | |||||||||||
| Acquisition of right-of-use assets in exchange for lease liabilities | $ | 83,330 | $ | $ | ||||||||
The accompanying notes are an integral part of the unaudited condensed consolidated financial statements
EPSIUM ENTERPRISE LIMITED AND SUBSIDIARIES
Notes to the Unaudited Consolidated Financial Statements
(All amounts in USD unless otherwise stated)
1. Organization
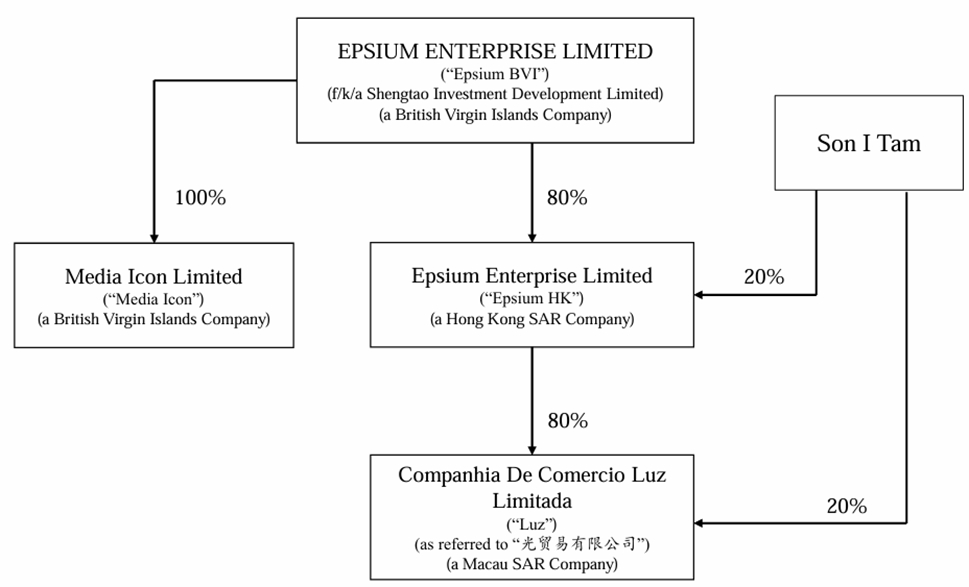
Shengtao Investment Development Limited (“Shengtao”) was established on March 24, 2020 in British Virgin Islands. On April 23, 2021, Shengtao changed its name to Epsium Enterprise Limited (“Epsium BVI” “the Company” “us” “we”).
Epsium Enterprise Limited (“Epsium HK”) was set up on March 12, 2020 in Hong Kong, SAR China. On March 12, 2020, Mr. Chi Long Lou acquired 100% and 10,000 shares of Epsium HK by paying HK$ 10,000. On May 17, 2021, Epsium BVI purchased 8,000 shares of Epsium HK from Mr. Chi Long Lou by paying HK$ 8,000. On May 17, 2021, Mr. Son I Tam who is the CEO of the Company purchased 1,900 shares of Epsium HK from Mr. Chi Long Lou by paying HK$ 1,900. An individual Mr. Lou Chi Long owns 1% of Epsium HK.
Companhia de Comercio Luz Limitada (“Luz”) was established in 2010, is a limited liability Company, with a share capital of MOP 25,000. It is a Macau registered company with an office address in Alameda Dr. Carlos D’assumpcao, Edf China Civil Plaza 235-243, 14 Andar P, Macau.
On May 12, 2021, Epsium HK acquired 80% of all outstanding shares of Luz at no cost. Son I Tam, the CEO of the Company, has the remaining 20% shares of Luz.
The Company’s business focuses on import trading and wholesale of alcoholic beverages. The products available for sale come from countries/regions, including but not limited to, France, Chile, Australia, China, USA, and Scotland. The brands include, but are not limited to, Moutai, Xijiu, Wuliangye, Remy Martin Cognac, Macallan, Cointreau, Piper Heidsieck Champagne, French Fine Wines (Petrus, Lafite, Latour, Mouton, Margaux, Lynch Bages), and Red & White Wines. All products are sold to the customers through formal and legal channels on the premise of original imported basis. The distribution channels of the Company cover most of the areas in Macau, including chain supermarkets, stores, clubs, restaurants, food courts, bars, hotels, and major gaming groups.
On February 8, 2024, pursuant to the written resolutions signed by all the directors of the Company, the Company accepted the surrender of shares by each shareholder of the Company (the “Share Surrender”) and approved the cancellation of the surrendered shares (the “Share Cancellation”) such that following the Share Surrender and Share Cancellation, the total number of issued shares held by each shareholder of the Company will be reduced to 20% (or 1/5) of such shareholder’s shareholding before the Share Surrender. As a result of the Share Surrender and the Share Cancellation, the total number of issued shares of the Company reduced from 60,002,670 ordinary shares to 12,000,534 ordinary shares, with a par value of $0.00002 per share. The maximum number of shares which the Company is authorized to issue and the par value of each share both remain unchanged following the Share Surrender and the Share Cancellation.
On February 8, 2024, 7 shareholders surrendered 48,002,136 shares back to the Company for cancellation for no consideration. (the “Share Surrender and Share Cancellation”). The maximum number of shares which the Company is authorized to issue and the par value of each share both remain unchanged following the Share Surrender and the Share Cancellation. All shares outstanding were retroactively restated for the effect of Share Surrender.
On March 27, 2025, the Company announced the closing of its initial public offering (the “Offering”) of 1,250,000 ordinary shares at a public offering price of US$4.00 per ordinary share. The ordinary shares began trading on the Nasdaq Capital Market on March 26, 2025 under the ticker symbol “EPSM.” The Company received aggregate gross proceeds of US$5,000,000 from the Offering; after deducting underwriting discounts and other related expenses, the company received $4,240,500 in net proceeds from the IPO. In addition, the Company has granted the underwriters a 45-day option to purchase up to an additional 187,500 ordinary shares at the public offering price, less underwriting discounts. On April 16, 2025, the underwriter fully exercised the over-allotment option to purchase an additional 187,500 Ordinary Shares. The Company received $667,500 in net proceeds from the exercise of the over-allotment option, after deducting underwriting discounts and other estimated expenses payable by the Company. The closing of the over-allotment option took place on April 17, 2025.
On April 11, 2025, a subsidiary of the Company entered into an exclusive agent agreement (the “Exclusive Agent Agreement”) with an independent third-party agent incorporated in Hong Kong. This agreement authorizes the agent to exclusively represent the Company in the negotiation and acquisition of biotech-related intellectual property and projects for application in the wine vintage sector.
The Company and its subsidiaries are actively identifying and exploring investment opportunities to broaden their revenue base. The Board believes that the Exclusive Agent Agreement will facilitate the exploration of additional opportunities in biotech-related intellectual property and its applications in wine vintage, thereby diversifying the Group’s existing business portfolio.
The Exclusive Agent Agreement included total consideration of $100,000 for the service fees, with $50,000 paid upon signing of this agreement and $50,000 paid upon completion of the acquisition facilitated; also it required $900,000 refundable deposits to lock up at least a 6-month exclusive period. The Exclusive Agent Agreement is valid for twelve months from the date of the Exclusive Agent Agreement, unless terminated by either party with 30 days’ written notice.
On June 11, 2025, Mr. Son I, Tam who is the CEO of the Company purchased 100 shares of Epsium HK from Mr. Chi Long Lou by paying HK$1. After the purchases, Epsium BVI owns 80% of Epsium HK and Mr. Son I, Tam owns 20% of Epsium HK.
On August 22, 2025, the Company held an Extraordinary General Meeting at which shareholders: 1 approved re-designation and re-classification of the Company’s share capital into 800,000,000 Class A Ordinary Shares, 100,000,000 Class B Ordinary Shares (each carrying 20 votes), and 100,000,000 Preferred Shares. 2 approved amendments to the Company’s Memorandum and Articles of Association to reflect the new share structure and adopted the Second Amended and Restated M&A. 3 authorized the repurchase of 10,800,000 Class A Ordinary Shares from Son I Tam and the simultaneous issuance of 10,800,000 Class B Ordinary Shares to him, resulting in his acquisition of approximately 1% of the Company’s total authorized share capital.
On October 6, 2025, Son I Tam converted 26,000 Class B Ordinary Shares into an equivalent number of Class A Ordinary Shares. Following this conversion, Son I Tam subsequently sold 11,500 Class A Ordinary Shares in the open market. Consequently, Son I Tam is current holding consists of 14,500 Class A Ordinary Shares.
The unaudited consolidated financial statements presented herein consolidate the financial statements of Epsium, with the financial statements of its subsidiaries in the following structure chart:

| Class A Ordinary Shares | Class B Ordinary Shares | Total | ||||||||||||||||||
| Beneficially Owned | Beneficially Owned | Voting | ||||||||||||||||||
| Number | Percent | Number | Percent | Power* | ||||||||||||||||
| Directors and Executive Officers: | ||||||||||||||||||||
| Son I Tam | 14,500 | 0.54 | % | 10,774,000 | 100 | % | 98.79 | % | ||||||||||||
| Ut Ha Lei | ||||||||||||||||||||
| Siu Keung Yeung | ||||||||||||||||||||
| Kewei Joshua Cui | ||||||||||||||||||||
| Ming Yin Gordon Au Yeung | ||||||||||||||||||||
| All directors and executive officers as a group | 14,500 | 0.54 | % | 10,774,000 | 100 | % | 98.79 | % | ||||||||||||
| 5% Principal Shareholders: | ||||||||||||||||||||
| Son I Tam | 14,500 | 0.54 | % | 10,774,000 | 100 | % | 98.79 | % | ||||||||||||
| * | Represents the voting power with respect to all of our Class A Ordinary Shares and Class B Ordinary Shares, voting as a single class. According to our Second Amended Memorandum and Articles of Association, holders of Class A Ordinary Shares are entitled to one vote per share on all matters subject to the vote at general meetings of the Company, and holders of Class B Ordinary Shares are entitled to 20 votes per share on all matters subject to the vote at general meetings of the Company. |
Based on the structure, Mr. Son I Tam, our CEO, Chairman, and principal shareholder, constructively owns 99.23% of Luz. The Company and its subsidiaries are considered under common control.
2. Summary of Significant Accounting Policies
Basis of Presentation and Principles of Consolidation
The accompanying unaudited condensed consolidated financial statements have been prepared in conformity with accounting principles generally accepted in the United States of America (“U.S. GAAP”) and have been consistently applied. In the opinion of management, all adjustments (consisting of normal recurring accruals) considered necessary for a fair presentation have been included.
The unaudited condensed consolidated financial statements of the Company reflect the principal activities of the Company and its subsidiaries, Epsium HK and Luz. All intercompany transactions and balances have been eliminated upon consolidation.
Basis of Presentation and Organization
The unaudited condensed consolidated financial statements of the Company as of June 30, 2025 and December 31, 2024, and for the six months ended June 30, 2025, 2024 and 2023 have been prepared in accordance with U.S. GAAP.
These unaudited consolidated financial statements should be read in conjunction with the Company’s audited consolidated financial statements and the notes thereto included in the Annual Report for the year ended December 31, 2024, which are included in the Form 20-F filed on April 30, 2025. Interim results are not necessarily indicative of results to be expected for the full year in 2025.
Cash
The Company considers cash and all highly liquid debt instruments with a maturity date of three months or less (at date of purchase) to be cash.
Accounts Receivable
Accounts receivable represents amounts due from marketing, sale and distribution of the products and are recorded net of allowance for doubtful accounts.
The Company markets, sells and distributes products, such receivables are recorded as account receivable.
Other than the accounts receivable arising from the marketing, sale and distribution of products, the Company considers many factors in assessing the collectability of its account receivable, such as the age of the amounts due, the payment history, creditworthiness and financial conditions of the customers and industry trend, to determine the allowance percentage for the overdue balances by age. The Company adjusts the allowance percentage periodically when there are significant differences between estimated bad debt and actual bad debts. If there is strong evidence indicating that the accounts receivable is likely to be unrecoverable, the Company also makes specific allowance in the period in which a loss is determined to be probable. Accounts receivable balances are written off after all collection efforts have been exhausted.
Use of Estimates and Assumptions
The preparation of financial statements in conformity with U.S. GAAP requires management to make estimates and assumptions that affect the reported amounts of assets and liabilities and the disclosure of contingent assets and liabilities at the date of the financial statements and the reported amounts of revenues and expenses during the reporting periods. Significant accounting estimates are used for, but not limited to, recoverability of the carrying value of long-lived assets, allowance for expected credit loss, slow-moving and obsolete inventory reserve, depreciable lives of property and equipment and the discount rate for leases, actual results could differ from those estimates. Estimates and assumptions are reviewed periodically, and the effects of revisions are reflected in the financial statements in the period they are determined.
Revenue Recognition
The Company earns revenues through the marketing, sale and distribution of products. The Company adopted ASC 606 and recognizes revenue at the point in time when control of the products is transferred to the customer at the estimated net consideration for which collection is probable, taking into account the customer’s rights to rights to return unsold product. Transfer of control occurs either when products are shipped to or received by the distributor or direct customer, based on the terms of the specific agreement with the customer, if the Company has a present right to payment and transfer of legal title and the risks and rewards of ownership to the customer have occurred. For most of the Company’s product sales, transfer of control occurs upon shipment to the distributor or direct customer. In assessing whether collection of consideration from a customer is probable, the Company considers the customer’s ability and intention to pay that amount of consideration when it is due. Payment of invoices is due as specified in the underlying customer agreement, typically 30 days from the invoice date, which occurs on the date of transfer of control of the products to the customer.
A five-step approach is applied in the recognition of revenue under ASC 606: (1) identify the contract with a customer, (2) identify the performance obligations in the contract, (3) determine the transaction price, (4) allocate the transaction price to the performance obligations in the contract, and (5) recognize revenue when the Company satisfies a performance obligation.
In accordance with ASC 606, the Company evaluates whether it is appropriate to record the gross amount of product sales and related costs or the net amount earned as commissions. When the Company is a principal, that the Company obtains control of the specified goods or services before they are transferred to the customers, the revenues should be recognized in the gross amount of consideration to which it expects to be entitled in exchange for the specified goods or services transferred. When the Company is an agent and its obligation is to facilitate third parties in fulfilling their performance obligation for specified goods or services, the revenues should be recognized in the net amount for the amount of commission which the Company earns in exchange for arranging for the specified goods or services to be provided by other parties.
The Company recognizes the products revenues from retail business on a gross basis as the Company is acting as a principal in these transactions, and is responsible for fulfilling the promise to provide the specified goods.
Leases
The Company adopted lease accounting standard, ASC Topic 842, Leases (“ASC 842”). The Company categorizes leases with contractual terms longer than twelve months as either operating or finance lease. However, the Company has no finance leases for any of the periods presented.
Right-of-use (“ROU”) assets represent the Company’s rights to use underlying assets for the lease term and lease liabilities represent the Company’s obligation to make lease payments arising from the lease. Operating lease ROU assets and liabilities are recognized at commencement date based on the lease at the commencement date. As the implicit rate in lease is not readily determinable for the Company’s operating leases, the Company generally use the incremental borrowing rate based on the estimated rate of interest for collateralized borrowing over a similar term of the lease payments at commencement date. The Company’s lease terms may include options to extend or terminate the lease when it is reasonably certain that the company will exercise that option. Lease expense for lease payments is recognized on a straight-line basis over the lease term.
Comprehensive income
Comprehensive income is defined as changes in equity of the Company during a period from transactions and other events and circumstances excluding transactions resulting from investments from shareholders and distributions to shareholders. Comprehensive income for the periods presented includes net income and foreign currency statement translation gains/(loss).
Fair Value Measurements
The Company applies the provisions of ASC 820-10, “Fair Value Measurements and Disclosures.” ASC 820-10 defines fair value and establishes a three-level valuation hierarchy for disclosures of fair value measurement that enhances disclosure requirements for fair value measures. For certain financial instruments, including cash and cash equivalents, accounts receivable, accounts payable and short-term debt, the carrying amounts approximately fair value due to their relatively short maturities. The carrying amounts of the long-term debt approximate their fair values based on current interest rates for instruments with similar characteristics.
The three levels of valuation hierarchy are defined as follows:
| Level 1: | Valuations consist of unadjusted quoted prices in active markets for identical assets and liabilities and has the highest priority; | |
| Level 2: | rely on quoted prices in markets that are not active or observable inputs over the full term of the asset or liability; | |
| Level 3: | Valuations are based on prices or third party or internal valuation models that require inputs that are significant to the fair value measurement and are less observable and thus have the lowest priority. |
The Company has determined the appropriate level of the hierarchy and applied it to its financial assets and liabilities. Accounts receivable and accounts payable are measured at amortized cost. Some of the Company’s financial instruments are not measured at fair value on a recurring basis but are recorded at amounts that approximately fair value due to their liquid or short-term nature. Such financial assets and financial liabilities include: cash and cash equivalents, accounts receivable, accounts payable, and all current liabilities.
Advertising Expense
Advertising costs are expensed as incurred. For the six months ended June 30, 2025, 2024 and 2023, the Company incurred advertising costs of approximately $3,122, $1,444 and $539, respectively.
Inventories
The Company values its inventories at the lower of cost or net realizable value. Net realizable value is based on estimated selling prices less further costs expected to be incurred for completion and disposal. Inventories are the finished goods or commodities that the Company holds to sell. Inventories include finished goods (commodities) and costs to fulfil contracts etc.
The Company used weighting average method for the inventories. Inventory reserves are provided to cover risks arising from slow-moving items. The estimated obsolescence or unmarketable inventory equal to the difference between the cost of inventory and the estimated market value based on assumptions about future demand and market conditions.
At each balance sheet date, inventories are measured at the lower of cost and net realizable value. When the cost of inventory exceeds its net realizable value, provision for diminution in value of inventories is recognized. The Company usually recognizes provision for diminution in value of inventories on the basis of a single inventory item. For the inventory items of large quantity and low price, the Company recognizes provision for diminution in value of inventories based on inventory categories.
The Company adopts the perpetual inventory system. Low-cost consumables and packaging materials are amortized by the once-off amortization method.
Foreign Currency Translation
The reporting currency of the Company is U.S. dollars. On September 27, 1983, the Macao government announced that the standard of 1.03 MOP to 1 HKD was the fixed linked exchange rate system. The results of operations and cash flows are translated at average exchange rates during the period, and assets and liabilities are translated at the unified exchange rates at the balance sheet dates, and equity is translated at the historical exchange rates. As a result, amounts related to assets and liabilities reported on the statements of cash flows will not necessarily agree with changes in the corresponding accounts on the balance sheets. Translation adjustments resulting from this process are included in accumulated other comprehensive income in the statements of shareholders’ equity.
Luz’s functional currency is MOP. Assets and liabilities were translated at 8.09 MOP and 8.00 MOP to $1.00 USD at June 30, 2025 and December 31, 2024, respectively. The equity accounts were stated at their historical rates. The average translation rates applied to income statements for the six months ended June 30, 2025 and 2024 were 8.03 MOP and 8.05 MOP to $1.00 USD, respectively. Cash flows are also translated at average translation rates for the period; therefore, amounts reported on the statement of cash flows will not necessarily agree with changes in the corresponding balances on the balance sheet.
Epsium HK’s functional currency is HKD. Assets and liabilities were translated at 7.85 HKD and 7.77 HKD to $1.00 USD on June 30, 2025 and December 31, 2024, respectively. The equity accounts were stated at their historical rates. The average translation rates applied to income statements for the six months ended June 30, 2025 and 2024 was 7.79 HKD and 7.82 HKD to $1.00 USD, respectively. Cash flows are also translated at average translation rates for the period; therefore, amounts reported on the statement of cash flows will not necessarily agree with changes in the corresponding balances on the balance sheet.
Translation adjustments for the six months ended June 30, 2025, 2024 and 2023 were $(106,091), $9,504 and $(15,228), respectively. The cumulative translation adjustment and effect of exchange rate changes on cash for the six months ended June 30, 2025, 2024 and 2023 were $(6,518), $(2,644) and $(4,268), respectively. Transaction gains and losses that arise from exchange rate fluctuations on transactions denominated in a currency other than the functional currency are included in the results of operations as incurred.
Non-Controlling Interest
Non-controlling interest represents the portion of equity that is not attributable to the Company. The net income attributable to non-controlling interests are separately presented in the accompanying statements of income and other comprehensive income. Losses attributable to non-controlling interests in a subsidiary may exceed the interest in the subsidiary’s equity. The related non-controlling interest continues to be attributed to its share of losses even if that attribution results in a deficit of the non-controlling interest balance.
Income Taxes
The Company accounts for income taxes in accordance with ASC Topic 740, Income Taxes. ASC 740 requires a company to use the asset and liability method of accounting for income taxes, whereby deferred tax assets are recognized for deductible temporary differences, and deferred tax liabilities are recognized for taxable temporary differences. Temporary differences are the differences between the reported amounts of assets and liabilities and their tax bases. Deferred tax assets are reduced by a valuation allowance when, in the opinion of management, it is more likely than not that some portion, or all of, the deferred tax assets will not be realized. Deferred tax assets and liabilities are adjusted for the effects of changes in tax laws and rates on the date of enactment.
Under ASC 740, a tax position is recognized as a benefit only if it is “more likely than not” that the tax position would be sustained in a tax examination, with a tax examination being presumed to occur. The amount recognized is the largest amount of tax benefit that is greater than 50% likely of being realized on examination. For tax positions not meeting the “more likely than not” test, no tax benefit is recorded. The adoption under ASC 740 affected the tax liabilities from uncertain income tax position on the Company’s financial statements.
Property and Equipment
Property and equipment are stated at cost less accumulated depreciation and impairment. Fixed assets are stated at cost less accumulated depreciation and impairment. Fixed assets are depreciated at rates sufficient to write off their costs less impairment and residual value, if any, over the estimated useful lives on a straight-line basis. The estimated useful lives are as follows:
| Category | Estimated useful lives |
|
| Motor Vehicle | 5 years | |
| Renovation | 5 years | |
| Equipment | 4-5 years | |
| Furniture & Fixture | 4-5 years |
Repairs and maintenance costs are charged to expenses as incurred, whereas the costs of renewals and betterment that extend the useful lives of fixed assets are capitalized as additions to the related assets. Retirements, sales and disposals of assets are recorded by removing the costs, accumulated depreciation and impairment with any resulting gain or loss recognized in the statements of operations and comprehensive income(loss).
Impairment of Long-lived assets
Long-lived assets, which include equipment are evaluated for impairment whenever events or changes in circumstances indicate that an asset may not be recoverable. Long-lived assets evaluated for impairment are grouped with other assets to the lowest level for which identifiable cash flows are largely independent of the cash flows of other groups of assets and liabilities. If the sum of the projected undiscounted cash flows (excluding interest charges) is less than the carrying value of the assets, the assets are written down to the estimated fair value, and such loss is recognized in income from continuing operations in the period in which the determination is made. Management has determined that no impairment of long-lived assets exists for the six months ended June 30, 2025, 2024 and 2023.
Recently Issued Accounting Pronouncements
In June 2016, the Financial Accounting Standards Board (the “FASB”) issued ASU 2016-13, Financial Instruments-Credit Losses (Topic 326) (“ASU 2016-13”), which requires entities to measure all expected credit losses for financial assets held at the reporting date based on historical experience, current conditions, and reasonable and supportable forecasts. This ASU replaces the existing incurred loss model and is applicable to the measurement of credit losses on financial assets measured at amortized cost. ASU 2016-13 was subsequently amended by Accounting Standards Update 2018-19, Codification Improvements to Topic 326, Financial Instruments - Credit Losses, Accounting Standards Update 2019-04 Codification Improvements to Topic 326, Financial Instruments — Credit Losses, Topic 815, Derivatives and Hedging, and Topic 825, Financial Instruments, and Accounting Standards Update 2019-05, Targeted Transition Relief. For public entities, ASU 2016-13 and its amendments are effective for fiscal years, and interim periods within those fiscal years, beginning after December 15, 2019. For all other entities, this guidance and its amendments will be effective for fiscal years beginning after December 15, 2022, including interim periods within those fiscal years. Early application will be permitted for all entities for fiscal years, and interim periods within those fiscal years, beginning after December 15, 2018. As an emerging growth company, the Company adopted this guidance effective on January 1, 2023. The adoption did not have significant impact on the Company’s consolidated financial statements.
In December 2023, the Financial Accounting Standards Board (“FASB”) issued ASU 2023-09, “Income Taxes (Topic 740): Improvements to Income Tax Disclosures” (“ASU 2023-09”). This ASU requires that public business entities must annually “(1) disclose specific categories in the rate reconciliation and (2) provide additional information for reconciling items that meet a quantitative threshold (if the effect of those reconciling items is equal to or greater than 5 percent of the amount computed by multiplying pretax income or loss by the applicable statutory income tax rate).” A public entity should apply the amendments in ASU 2023-09 prospectively to all annual periods beginning after December 15, 2024. The adoption did not have significant impact on the Company’s consolidated financial statements.
In November 2023, the FASB issued ASU 2023-07, Segment Reporting (Topic 280). The amendments in this ASU require disclosures, on an annual and interim basis, of significant segment expenses that are regularly provided to the chief operating decision maker (CODM), as well as the aggregate amount of other segment items included in the reported measure of segment profit or loss. This ASU requires that a public entity disclose the title and position of the CODM and an explanation of how the CODM uses the reported measure(s) of segment profit or loss. Public entities will be required to provide all annual disclosures currently required by Topic 280 in interim periods, and entities with a single reportable segment are required to provide all the disclosures required by the amendments in the update and existing segment disclosures in Topic 280. ASU 2023-07 is effective for fiscal years beginning after December 15, 2023, and interim periods within fiscal years beginning after December 15, 2024, and requires retrospective adoption. Early adoption is permitted. The adoption did not have significant impact on the Company’s consolidated financial statements.
In March 2024, the FASB issued ASU 2024-01, Compensation—Stock Compensation (Topic 718): Scope Application of Profits Interest and Similar Awards. The amended guidance added an illustrative example that includes four fact patterns to demonstrate how an entity should apply the scope guidance in paragraph 718-10-15-3 to determine whether a profits interest award should be accounted for in accordance with Topic 718. The amendments guidance is effective for annual periods beginning after December 15, 2024, and interim periods within those annual periods. The guidance can be applied either prospectively or retrospectively. The adoption did not have significant impact on the Company’s consolidated financial statements.
In November 2024, the FASB issued ASU 2024-03, Income Statement—Reporting Comprehensive Income—Expense Disaggregation Disclosures (Subtopic 220-40): Disaggregation of Income Statement Expenses. The amended guidance improves the disclosures about a public business entity’s expenses and address requests from investors for more detailed information about the types of expenses (including purchases of inventory, employee compensation, depreciation, amortization, and depletion) in commonly presented expense captions (such as cost of sales, SG&A, and research and development). The amended guidance is effective for annual reporting periods beginning after December 15, 2026, and interim reporting periods beginning after December 15, 2027. The requirements will be applied prospectively with the option for retrospective application. The Company is currently evaluating these new disclosure requirements and does not expect the adoption to have a material impact.
In November 2024, the FASB issued ASU 2024-04, Debt—Debt with Conversion and Other Options (Subtopic 470-20): Induced Conversions of Convertible Debt Instruments. This guidance clarifies the assessment of whether a transaction should be accounted for as an induced conversion or extinguishment of convertible debt when changes are made to conversion features as part of an offer to settle the instrument. The amended guidance is effective for all entities for annual reporting periods beginning after December 15, 2025, and interim reporting periods within those annual reporting periods. The guidance can be applied either prospectively or retrospectively. The Company is currently evaluating these new disclosure requirements and does not expect the adoption to have a material impact.
Management does not believe that any other recently issued, but not yet effective, accounting standards could have a material effect on the accompanying financial statements. As new accounting pronouncements are issued, we will adopt those that are applicable under the circumstances.
3. Prepaid expense
Prepaid expense consisted of the following:
| As of June 30, 2025 |
As of December 31, 2024 |
|||||||
| Consulting fee | $ | 900,000 | $ | |||||
| Legal fee | 20,000 | |||||||
| Insurance expenses | 56,023 | 2,599 | ||||||
| Others | 2,070 | 1,172 | ||||||
| Total | $ | 978,093 | $ | 3,771 | ||||
Prepaid expense consist of primarily prepaid consulting fee, legal fee, insurance expenses and office expenses.
Prepaid consulting fee is refundable deposits. On April 11, 2025, a subsidiary of the Company entered into an exclusive agent agreement (the “Exclusive Agent Agreement”) with an independent third-party agent incorporated in Hong Kong. This agreement authorizes the agent to exclusively represent the Company in the negotiation and acquisition of biotech-related intellectual property and projects for application in the wine vintage sector.
The Exclusive Agent Agreement included total consideration of $100,000 for the service fees, with $50,000 paid upon signing of this agreement and $50,000 paid upon completion of the acquisition facilitated. Also it required $900,000 refundable deposits to lock up at least a 6-month exclusive period. The Exclusive Agent Agreement is valid for twelve months from the date of the Exclusive Agent Agreement, unless terminated by either party with 30 days’ written notice.
4. Advances payments for goods
Advances payments for goods consisted of the following:
| As of June 30, 2025 |
As of December 31, 2024 |
|||||||
| Advances payments for goods | $ | 5,176,667 | $ | 4,361,465 | ||||
Advances payments for goods are prepayment is the inventory purchase payment paid to the supplier. Due to frequent purchases with the supplier, a part of the payment is usually required. On February 1, 2024, the Company entered into a material purchase agreement with a supplier for a thirty-five-month period beginning February 1, 2024 and ending December 31, 2026, and purchased goods at the agreed price during the agreement period. In 2023, the company purchased goods from a supplier at preferential prices, as of December 31, 2024, the company prepaid $1,527,576 to this supplier. The Company plan to receive the inventory in 2025. As of June 30, 2025 and December 31, 2024, in order to lock in the purchase price and control the purchase cost, the company prepaid $5,176,667 and $4,361,465 to the supplier, respectively.
5. Term Deposit
As of June 30, 2025 and December 31, 2024, term deposit was $44,494 and $45,006, respectively. This term deposit serves as 120% collateral for a corporate credit card with a limit of $37,505 (MOP 300,000). This term deposit has a maturity of one year from July 30, 2024 to July 30, 2025 and an annual interest rate of 3.2%. After this term deposit expires, it has been renewed for another year. This term deposit has a maturity of one year from July 30, 2025 to July 30, 2026 and an annual interest rate of 1.8%.
6. Other receivables
Other receivables consisted of the following:
| As of June 30, 2025 |
As of December 31, 2024 |
|||||||
| Deposit | $ | 31,864 | $ | 17,787 | ||||
| Others | 2,089 | 1,401 | ||||||
| Total | $ | 33,953 | $ | 19,188 | ||||
Other receivables are mainly rental deposit for office and warehouse.
7. Inventories, Net
Inventories, net consist of the following:
| As of June 30, 2025 |
As of December 31, 2024 |
|||||||
| Finished goods | $ | 4,084,466 | $ | 4,642,982 | ||||
| Total | 4,084,466 | 4,642,982 | ||||||
| Less: valuation allowance | ||||||||
| Inventories, net | $ | 4,084,466 | $ | 4,642,982 | ||||
8. Property and equipment, net
Fixed Assets consist of the following:
| As of June 30, 2025 |
As of December 31, 2024 |
|||||||
| Leasehold improvement | $ | 32,773 | $ | 33,150 | ||||
| Furniture & Fixture | 7,721 | 7,809 | ||||||
| Equipment | 10,419 | 8,715 | ||||||
| Motor Vehicle | 151,559 | 153,302 | ||||||
| Total | 202,472 | 202,976 | ||||||
| Less: accumulated depreciation | 134,048 | 124,861 | ||||||
| Net book value | $ | 68,424 | $ | 78,115 | ||||
Depreciation expenses were $10,685, $4,442 and $10,002 for the six months ended June 30, 2025, 2024 and 2023, respectively.
The new purchased vehicle during the year ended December 31, 2024 was registered with 99% of ownership by the Company, and 1% ownership by the Kam Iat Fu International Company Limited, which is a related party and 95.2% own by Son I Tam, the CEO & Chairman of the Company.
9. Operating Leases
For the period beginning August 2017 and ending August 2022, the Operating Entity occupied office space located at Alameda Dr. Carlos D’assumpcao, Edf China Civil Plaza 235-243, 14 P, Macau based on a lease entered into between Mr. Son I Tam, our CEO, Chairman, and principal shareholder, in Mr. Tam’s individual capacity, and an unaffiliated lessor (the “Office Lease”). The rent for the Office Lease was paid by the Operating Entity for its usage of the office space. The total commitment for the full lease term was approximately USD $155,000. The Office Lease did not provide an option for lease extension. Upon expiration in August 2022, Mr. Tam renewed the Office Lease for a one-year period beginning August 7, 2022, and ending August 6, 2023. As of the date of this annual report, the Operating Entity continues to occupy the space and pay the rents due under the Office Lease. The Company intends to have the Operating Entity take over the Office Lease in August 2023 when the Office Lease expires. The total commitment for the entire term of the Office Lease will amount to approximately USD $43,000. In September 2023, the Operating Entity signed the Office Lease for a two-year period beginning September 7, 2023, and ending August 7, 2025. The total commitment for the entire term of the Office Lease will amount to approximately USD $87,000. The Company has utilized the bank loan interest rate as the discount rate for this transaction.
The Operating Entity has entered into a lease agreement for its warehouse comprising 3,654 square feet, which has a lease period from May 2020 to April 2027. The total commitment for the entire duration of the lease is estimated to be around $396,000. The lease agreement does not include any provisions for lease extension. The Company has utilized the bank loan interest rate as the discount rate for this transaction.
The Operating Entity has entered into a lease agreement for its equipment with a lease period ranging from January 2022 to July 2026. Total commitment for the full term of the lease will be approximately $9,000. The contract does not include an option for extension or renewal. The Company uses the bank loan interest rate as the discount rate.
The Operating Entity has entered into a lease agreement for its parking space with a lease period ranging from November 2022 to October 2024. On October 31, 2024, The Operating Entity renewed its parking space Lease for a two-year period beginning November 1, 2024, and ending October 31, 2026. Total commitment for the full term of the lease will be approximately $7,000. The contract does not include an option for extension or renewal. The Company uses the bank loan interest rate as the discount rate.
The Operating Entity has entered into a lease agreement for its housing allowance for Son I Tam, the CEO & Chairman of the Company with a lease period ranging from January 2025 to December 2026. Total commitment for the full term of the lease will be approximately $87,000. The contract does not include an option for extension or renewal. The Company uses the bank loan interest rate as the discount rate.
| Six Months Ended June 30, 2025 |
Six Months Ended June 30, 2024 |
|||||||
| Lease Cost | ||||||||
| Operating lease cost (included in general and administration in the Company’s consolidated statements of operations) | $ | 73,573 | $ | 51,503 | ||||
| Other Information | ||||||||
| Cash paid for amounts included in the measurement of lease liabilities for the six months ended June 30, 2025 and 2024 | $ | 74,005 | $ | 59,106 | ||||
| Weighted average remaining lease term – operating leases (in years) | 1.63 | 2.42 | ||||||
| Weighted average discount rate – operating leases | 5.30 | % | 5.29 | % | ||||
After the adoption of ASC842, the operating lease right-of-use asset and the operating lease liabilities as of June 30, 2025 and December 31, 2024 are as below:
| As of June 30, 2025 |
As of December 31, 2024 |
|||||||
| Right-of-Use assets | $ | 171,451 | $ | 158,091 | ||||
| Total operating lease assets | $ | 171,451 | $ | 158,091 | ||||
| Short-term operating lease liabilities | $ | 107,861 | $ | 85,915 | ||||
| Long-term operating lease liabilities | 70,684 | 79,784 | ||||||
| Total operating lease liabilities | $ | 178,545 | $ | 165,699 | ||||
Maturities of the Operating Entity’s lease liabilities are as follows:
| Operating Leases |
||||
| Years ending June 30, | ||||
| 2026 | $ | 114,074 | ||
| 2027 | 71,875 | |||
| 2028 | ||||
| 2029 | ||||
| 2030 | ||||
| Total lease payments | 185,949 | |||
| Less: Imputed interest/present value discount | 7,404 | |||
| Present value of lease liabilities | $ | 178,545 | ||
10. Concentration of customers and suppliers
The Company has a concentration of its revenues with specific customers. For the six months ended June 30, 2025, three customers accounted for 36.1%, 13.7% and 11.6% of total revenue, respectively. For the six months ended June 30, 2024, three customers accounted for 18.1%, 17.1% and 10.1% of total revenue, respectively. As of June 30, 2025, one customer’ accounts receivable accounted for 77.0% of the total outstanding accounts receivable balance. As of December 31, 2024, four customers’ accounts receivable accounted for 34.9%, 21.7%, 13.8% and 11.4% of the total outstanding accounts receivable balance, respectively.
For the six months ended June 30, 2025, the Company purchased approximately 48.2% and 25.1% of its inventory from two suppliers, respectively. For the six months ended June 30, 2024, the Company purchased approximately 46.2%, 19.4% and 18.7% of its inventory from three suppliers, respectively. As of June 30, 2025, accounts payable to one major supplier accounted for 96.0% of the total accounts payable outstanding. As of December 31, 2024, accounts payable to three major IPO vendors and one major inventory supplier accounted for 29.6%, 23.0%, 18.7% and 20.6% of the total accounts payable outstanding, respectively.
The loss of either of these customers or suppliers could adversely affect the operating results or cash flows of the Company.
11. Related Party Transactions
As of and for the six months ended June 30, 2025 and 2024, there have been numerous (i) cash advances to Mr. Son I Tam by the Operating Entity, Epsium HK or Epsium BVI or (ii) loans from Mr. Tam, or payment to third parties by Mr. Tam on behalf of, the Operating Entity, Epsium HK or Epsium BVI. These transactions have been conducted without contracts, and they have been interest-free with no repayment terms. The Company is currently in the process of settling all accounts receivable and the outstanding loan to Mr. Tam. In November 2023, all loans extended to Mr. Tam were fully paid off. These transactions are summarized as follows:
During the Six Months Ended June 30, 2025 Transactions
During six months ended June 30, 2025, cash advancements were made to Mr. Tam by the Operating Entity, with amounts ranging between US$6,180 and US$111,235. During the same period, the Company paid off $364,419 owned to Mr. Tam. During the same period, Mr. Tam made loans, or payments to third parties on behalf of, the Operating Entity, Epsium HK or Epsium BVI, with amounts ranging between US$0 and US$6,180 and the total receipts of US$6,180 owed to Mr. Tam. As of June 30, 2025, the net amount owed to Mr. Tam by the Operating Entity, Epsium HK and Epsium BVI is US$706.
During the Six Months Ended June 30, 2024 Transactions
During six months ended June 30, 2024, there have been no cash advancements to, and loans from shareholders. As of June 30, 2024, the net amount owed to Mr. Tam by the Operating Entity, Epsium HK and Epsium BVI is US$8,536.
During the Six Months Ended June 30, 2023 Transactions
During six months ended June 30, 2023, cash advancements were made to Mr. Tam by the Operating Entity, Epsium HK or Epsium BVI with amounts ranging between US$12 and US$247,831 and the total outstanding balance of US$3,737,388 owed by Mr. Tam. During the same period, Mr. Tam made loans, or payments to third parties on behalf of, the Operating Entity, Epsium HK or Epsium BVI, with amounts ranging between US$102 and US$127,819 and the total outstanding balance of US$1,480,603 owed to Mr. Tam. As of June 30, 2023, the net amount owed to Companhia De Comercio Luz Limitada, Epsium HK, and Epsium BVI by Mr. Tam is US1,205,375.
12. Stockholders’ Equity
The Company is authorized to issue 50,000 shares of ordinary shares with $1 par value. In August 2021, the Company increased its authorized shares from 50,000 shares to 1,000,000,000 shares, including 800,000,000 ordinary shares and 200,000,000 preferred shares. The par value is also change from $1.00 to $0.00002 per share.
On March 24, 2020, the Company issued 510 shares of ordinary shares to Ruo Hong, Chen and issued 490 shares to Son I Tam. On April 8, 2021, Son I Tam acquired 510 ordinary shares from Ruo Hong, Chen.
On April 8, 2021, Son I Tam acquired 510 ordinary shares from Ruo Hong, Chen.
On April 23, 2021, the Company changed its name to Epsium Enterprise Limited.
On May 17, 2021, Epsium BVI purchased 8,000 shares of Epsium HK from Mr. Chi Long Lou by paying HK$ 8,000. On May 17, 2021, Mr. Son I, Tam who is the CEO of the Company purchased 1,900 shares of Epsium HK from Mr. Chi Long Lou by paying HK$ 2,000. After the purchases, Epsium BVI owns 80% of Epsium HK, Mr. Son I, Tam owns 19% of Epsium HK, and Mr. Chi Long Lou owns 1% of Epsium HK. The Company and its subsidiaries are considered under common control. The combination the Company and its subsidiaries are considered under common control. The method used to present a common-control transaction that results in a change in the reporting entity is pooling of interests. A pooling of interests was a method of accounting for a merger of the businesses. The assets and liabilities and operations of the businesses were combined at their historical carrying amounts, and all historical periods were adjusted as if the businesses had always been combined. Similarly, in a common-control transaction, the receiving entity retrospectively adjusts its financial statements to include the transferred net assets and any related operations for all periods for which the entities or net assets were under common control.
On August 26, 2021, the previously issued 1,000 ordinary shares were cancelled and the Company re-issued a total of 50,000,000 ordinary shares to founder. On August 26, 2021, the Company issued additional 4,000,000 ordinary shares to Son I Tam, our CEO, Chairman and principal shareholder, for a total of $80, at par value for each share. The transaction was not registered under the Securities Act of 1933, as amended, in reliance on an exemption from registration set forth in Section 4(a)(2) thereof.
From September 8 to September 16, 2021, we entered into subscription agreements and registration rights agreements, pursuant to which we sold through Regulation S offerings a total of 6,002,670 ordinary shares to 75 shareholders, at a price of $0.02 per share, for an aggregate purchase price of $120,053. The transactions were not registered under the Securities Act in reliance on an exemption from registration set forth in Regulation S promulgated hereunder as a transaction by the Company not involving any public offering, because the securities were sold in an offshore transaction by a foreign issuer, to foreign investors, not using any directed selling efforts in the United States. These securities may not be offered or sold in the United States in the absence of an effective registration statement or an exemption from the registration requirements under the Securities Act.
On February 8, 2024, pursuant to the written resolutions signed by all the directors of the Company, the Company accepted the surrender of shares by each shareholder of the Company (the “Share Surrender”) and approved the cancellation of the surrendered shares (the “Share Cancellation”) such that following the Share Surrender and Share Cancellation, the total number of issued shares held by each shareholder of the Company will be reduced to 20% (or 1/5) of such shareholder’s shareholding before the Share Surrender. As a result of the Share Surrender and the Share Cancellation, the total number of issued shares of the Company reduced from 60,002,670 ordinary shares to 12,000,534 ordinary shares, with a par value of $0.00002 per share. The maximum number of shares which the Company is authorized to issue and the par value of each share both remain unchanged following the Share Surrender and the Share Cancellation.
On February 8, 2024, 7 shareholders surrendered 48,002,136 shares back to the Company for cancellation for no consideration. (the “Share Surrender and Share Cancellation”). The maximum number of shares which the Company is authorized to issue and the par value of each share both remain unchanged following the Share Surrender and the Share Cancellation. All shares outstanding were retroactively restated for the effect of Share Surrender.
On March 27, 2025, the Company announced the closing of its initial public offering (the “Offering”) of 1,250,000 ordinary shares at a public offering price of US$4.00 per ordinary share. The ordinary shares began trading on the Nasdaq Capital Market on March 26, 2025 under the ticker symbol “EPSM.” The Company received aggregate gross proceeds of US$5,000,000 from the Offering; after deducting underwriting discounts and other related expenses, the company received $4,240,500 in net proceeds from the IPO. In addition, the Company has granted the underwriters a 45-day option to purchase up to an additional 187,500 ordinary shares at the public offering price, less underwriting discounts. On April 16, 2025, the underwriter fully exercised the over-allotment option to purchase an additional 187,500 Ordinary Shares. The Company received $667,500 in net proceeds from the exercise of the over-allotment option, after deducting underwriting discounts and other estimated expenses payable by the Company. The closing of the over-allotment option took place on April 17, 2025.
| Amount | ||||
| Gross proceed from IPO and OA: | $ | 5,750,000 | ||
| Less: Underwriter discount | (517,500 | ) | ||
| Less: Offering cost paid through fund flow | (324,500 | ) | ||
| Subtotal: Net proceeds from IPO | 4,908,000 | |||
| Add: Payments for proportions of offering cost been expensed and recorded under account payable during prior year | 225,091 | |||
| Less: Paid offering cost and recognized as expenses during prior year | (30,000 | ) | ||
| Total: Shares issuance for cash in SOSE. | $ | 5,103,091 | ||
On June 11, 2025, Mr. Son I, Tam who is the CEO of the Company purchased 100 shares of Epsium HK from Mr. Chi Long Lou by paying HK$1. After the purchases, Epsium BVI owns 80% of Epsium HK and Mr. Son I, Tam owns 20% of Epsium HK.
On June 23, 2025, the Company repurchased 15,000 shares of ordinary shares of par value US$0.00002 from 3 employees for $300,000. The repurchased shares are held as treasury stock.
13,438,034 and 12,000,534 ordinary shares were issued and outstanding as of June 30, 2025 and December 31, 2024, respectively.
No preferred shares were issued and outstanding as of June 30, 2025 and December 31, 2024.
13. Subsequent Events
On August 22, 2025, the Company held an Extraordinary General Meeting at which shareholders: 1 approved re-designation and re-classification of the Company’s share capital into 800,000,000 Class A Ordinary Shares, 100,000,000 Class B Ordinary Shares (each carrying 20 votes), and 100,000,000 Preferred Shares. 2 approved amendments to the Company’s Memorandum and Articles of Association to reflect the new share structure and adopted the Second Amended and Restated M&A. 3 authorized the repurchase of 10,800,000 Class A Ordinary Shares from Son I Tam and the simultaneous issuance of 10,800,000 Class B Ordinary Shares to him, resulting in his acquisition of approximately 1% of the Company’s total authorized share capital.
On October 6, 2025, Son I Tam converted 26,000 Class B Ordinary Shares into an equivalent number of Class A Ordinary Shares. Following this conversion, Son I Tam subsequently sold 11,500 Class A Ordinary Shares in the open market. Consequently, Son I Tam is current holding consists of 14,500 Class A Ordinary Shares.
On October 24, 2025, pursuant to a resolution by the board of directors of the Company, the Company established a wholly-owned subsidiary in the British Virgin Islands, Media Icon Limited.
Exhibit 99.2
MANAGEMENT’S DISCUSSION AND ANALYSIS OF FINANCIAL CONDITION AND RESULTS OF OPERATIONS
The information in this report contains forward-looking statements. The following discussion and analysis of our financial condition and results of operations should be read in conjunction with our condensed consolidated financial statements and the related notes included elsewhere and incorporated by reference in this report. This discussion contains forward-looking statements reflecting our current expectations that involve risks and uncertainties. Actual results and the timing of events could differ materially from those discussed in these anticipated in these forward-looking statements as a result of various factors.
A. Operating results.
Overview
We are a holding company incorporated under the laws of British Virgin Islands on March 24, 2020. As a holding company with no material operation of its own, we conduct substantially all our operations through an indirect Macau subsidiary, Luz. Luz is an 80%-owned subsidiary of Epsium HK. As of the date of this report on Form 6-K, Mr. Son I Tam, our CEO, Chairman, and principal shareholder, and the founder of Epsium and Luz, directly holds (i) 80.369% ownership interest in Epsium, (ii) 20% interest in Epsium HK, and (iii) 20% ownership interest in Luz.
Luz is an import trading and wholesaler of primarily alcoholic beverages in Macau. Through Luz, we import and sell a broad range of premium beverages, primarily alcoholic beverages and, in 2022, a small quantity of tea and fruit juice. The alcoholic beverages we sell include Chinese liquor, French cognac, Scottish whiskey, fine wine, Champagne, and other miscellaneous beverage alcohol. Sales of Chinese liquor are, by far, our most significant operation, and we are a top wholesaler of high-end Chinese liquor in Macau. We operate only in Macau.
Our unaudited consolidated financial statements presented herein consolidate the financial statements of Epsium, with the financial statements of its subsidiaries in the following structure chart:
| Class A Ordinary Shares | Class B Ordinary Shares | Total | ||||||||||||||||||
| Beneficially Owned | Beneficially Owned | Voting | ||||||||||||||||||
| Number | Percent | Number | Percent | Power* | ||||||||||||||||
| Directors and Executive Officers: | ||||||||||||||||||||
| Son I Tam | 14,500 | 0.54 | % | 10,774,000 | 100 | % | 98.79 | % | ||||||||||||
| Ut Ha Lei | - | - | - | - | - | |||||||||||||||
| Siu Keung Yeung | - | - | - | - | - | |||||||||||||||
| Kewei Joshua Cui | - | - | - | - | - | |||||||||||||||
| Ming Yin Gordon Au Yeung | - | - | - | - | - | |||||||||||||||
| All directors and executive officers as a group | 14,500 | 0.54 | % | 10,774,000 | 100 | % | 98.79 | % | ||||||||||||
| 5% Principal Shareholders: | ||||||||||||||||||||
| Son I Tam | 14,500 | 0.54 | % | 10,774,000 | 100 | % | 98.79 | % | ||||||||||||
| * | Represents the voting power with respect to all of our Class A Ordinary Shares and Class B Ordinary Shares, voting as a single class. According to our Second Amended Memorandum and Articles of Association, holders of Class A Ordinary Shares are entitled to one vote per share on all matters subject to the vote at general meetings of the Company, and holders of Class B Ordinary Shares are entitled to 20 votes per share on all matters subject to the vote at general meetings of the Company. |
Based on the structure, Mr. Son I Tam, our CEO, Chairman, and principal shareholder, constructively owns 99.23% of Luz. The Company and its subsidiaries are considered under common control.
The Operating Entity’s business focuses on import trading and wholesale of alcoholic beverages. The products available for sale come from countries/regions, including but not limited to, France, Chile, Australia, China, USA, and Scotland. The brands include, but are not limited to, Moutai, Xijiu, Wuliangye, Remy Martin Cognac, Macallan, Cointreau, Piper Heidsieck Champagne, French Fine Wines (Petrus, Lafite, Latour, Mouton, Margaux, Lynch Bages), and Red & White Wines. All products are sold to the customers through formal and legal channels on an original imported basis. The distribution channels of the Operating Entity cover most of the areas in Macau, including chain supermarkets, stores, clubs, restaurants, food courts, bars, hotels, and major gaming groups.
Following the relaxation of pandemic-related restrictions in January 2023, there was a temporary recovery in tourism and alcohol consumption driven by pent-up demand. This recovery was followed by a noticeable economic downturn, which led to a contraction in both wholesale market and high-end market. Heightened competition in the local market, coupled with consumers’ focus on cost-saving measures, further placed downward pressure on wholesale pricing.
According to Government of Macao Special Administrative Region Statistics and Census Service, although the volume of inbound visitors increased by 15.2% year-on-year in the first five months of 2025, consumption patterns have shifted. Non-gaming spending declined by 13.2% in the first quarter, while retail sales also fell by 15%, reflecting travelers’ cautious spending habits amid global economic uncertainty. On the other hand, compared to the general tourism, those attending MICE events and watching performances/sports events twice the general per capita spending in the first half of the year.
Although the overall market is in a downturn, we were actually aware the market and economic issues could impact our business. As a result, we have been actively seeking solutions and new strategies, exploring new directions and other business partnerships, especially now that the Government of Macao Special Administrative Region is promoting the city as the “Performing Arts Capital”, which Macao will host number of shows and different international conventions. Therefore, we have kept conducting market research to adjust our strategies and development focus, and we discovered a new growth path that may be suitable for us.
As a result, we are seeking corporation opportunities with performance promotion agency to create strong synergies, which can in turn boost beverage sales at the venues, including premium alcoholic products. Meanwhile, we are also actively exploring vertical integration opportunities to diversify and strengthen our revenue streams.
On March 27, 2025, the Company announced the closing of its initial public offering (the “Offering”) of 1,250,000 ordinary shares at a public offering price of US$4.00 per ordinary share. The ordinary shares began trading on the Nasdaq Capital Market on March 26, 2025 under the ticker symbol “EPSM.” The Company received aggregate gross proceeds of US$5.0 million from the IPO; after deducting underwriting discounts and other related expenses payable, the company received $4,240,500 in net proceeds from the IPO. In addition, the Company granted the underwriters a 45-day over-allotment option to purchase up to an additional 187,500 ordinary shares at the IPO price, less underwriting discounts. On April 16, 2025, the underwriter fully exercised the over-allotment option to purchase an additional 187,500 Ordinary Shares. The Company received $667,500 in net proceeds from the exercise of the over-allotment option, after deducting underwriting discounts and other estimated expenses payable by the Company. The closing of the over-allotment option took place on April 17, 2025.
On April 11, 2025, a subsidiary of the Company entered into an exclusive agent agreement (the “Exclusive Agent Agreement”) with an independent third-party agent incorporated in Hong Kong. This agreement authorizes the agent to exclusively represent the Company in the negotiation and acquisition of biotech-related intellectual property and projects for application in the wine vintage sector.
The Company and its subsidiaries are actively identifying and exploring investment opportunities to broaden their revenue base. The Board believes that the Exclusive Agent Agreement will facilitate the exploration of additional opportunities in biotech-related intellectual property and its applications in wine vintage, thereby diversifying the Group’s existing business portfolio.
The Exclusive Agent Agreement included total consideration of $100,000 for the service fees, with $50,000 paid upon signing of this agreement and $50,000 paid upon completion of the acquisition facilitated; also it required $900,000 refundable deposits to lock up at least a 6-month exclusive period. The Exclusive Agent Agreement is valid for twelve months from the date of the Exclusive Agent Agreement, unless terminated by either party with 30 days’ written notice.
On June 11, 2025, Mr. Son I, Tam who is the CEO of the Company purchased 100 shares of Epsium HK from Mr. Chi Long Lou by paying HK$1. After the purchases, Epsium BVI owns 80% of Epsium HK and Mr. Son I, Tam owns 20% of Epsium HK.
On August 22, 2025, the Company held an Extraordinary General Meeting at which shareholders: 1 approved re-designation and re-classification of the Company’s share capital into 800,000,000 Class A Ordinary Shares, 100,000,000 Class B Ordinary Shares (each carrying 20 votes), and 100,000,000 Preferred Shares. 2 approved amendments to the Company’s Memorandum and Articles of Association to reflect the new share structure and adopted the Second Amended and Restated M&A. 3 authorized the repurchase of 10,800,000 Class A Ordinary Shares from Son I Tam and the simultaneous issuance of 10,800,000 Class B Ordinary Shares to him, resulting in his acquisition of approximately 1% of the Company’s total authorized share capital.
For the six months ended June 30, 2025 and 2024, the Company had revenues of $3,042,988 and $7,114,095, and net (loss) incomes of $(699,106) and $467,874, respectively.
Principal Factors Affecting Our Financial Performance
| ● | Our operating results are primarily affected by general factors, including but not limited to China’s overall economic growth, Chinese consumers’ rising disposable income, and Chinese consumers’ increasing emphasis on quality of life. Unfavourable changes in any of these general factors could affect consumers’ demand for the products the Operating Entity sells and could materially and adversely affect our results of operations. |
| ● | Our operating results are also affected by specific facts, including but not limited to the reputation of the brands and the manufacturers of the alcoholic beverage products that the Operating Entity sells, the fluctuating exchange rate and the exchange rate at the time we purchase inventory, our working relationships with our major suppliers and customers and our ability to effectively manage our inventories. |
Results of Operations
The following table sets forth a summary of our consolidated results of operations for the periods presented. This information should be read together with our unaudited consolidated financial statements and related notes included elsewhere in this annual report. The results of operations in any period are not necessarily indicative of our future trends.
SELECTED CONSOLIDATED STATEMENTS OF OPERATIONS
| For the Six Months ended June 30, | ||||||||||||
| 2025 | 2024 | 2023 | ||||||||||
| US$ | US$ | US$ | ||||||||||
| Revenue, net | $ | 3,042,988 | $ | 7,114,095 | $ | 18,403,610 | ||||||
| Cost of goods sold | 2,547,678 | 6,182,895 | 13,913,819 | |||||||||
| Gross profit | 495,310 | 931,200 | 4,489,791 | |||||||||
| Operating expenses | ||||||||||||
| Selling and distribution expenses | 3,816 | 2,136 | 1,229 | |||||||||
| General and administrative expenses | 1,183,240 | 386,770 | 446,187 | |||||||||
| Total operating expenses | 1,187,056 | 388,906 | 447,416 | |||||||||
| Operating (Loss)Income | (691,746 | ) | 542,294 | 4,042,375 | ||||||||
| Other expenses (income) | ||||||||||||
| Interest expense | - | - | 2,900 | |||||||||
| Other expenses (income), net | (281 | ) | (1,084 | ) | 16,592 | |||||||
| Total other expenses(income), net | (281 | ) | (1,084 | ) | 19,492 | |||||||
| (Loss)Income before provision for taxes | (691,465 | ) | 543,378 | 4,022,883 | ||||||||
| Provision for income taxes | 7,641 | 75,504 | 498,661 | |||||||||
| Net (loss)income | $ | (699,106 | ) | $ | 467,874 | $ | 3,524,222 | |||||
For the Six Months Ended June 30, 2025 and 2024
The following tables summarize the results of our operations for the six months ended June 30, 2025 and 2024, respectively, and provides information regarding the dollar and percentage increases (or decreases) during such periods.
| Six Months ended June 30, 2025 |
Six Months ended June 30 2024 |
Amount Increase | Percentage Increase | |||||||||||||||||||||
| Statement of Operations Data: | Amount | As % of Sales | Amount | As % of Sales | (Decrease) | (Decrease) | ||||||||||||||||||
| Revenue, net | $ | 3,042,988 | 100.00 | % | $ | 7,114,095 | 100.00 | % | $ | (4,071,107 | ) | (57.23 | )% | |||||||||||
| Cost of goods sold | 2,547,678 | 83.72 | % | 6,182,895 | 86.91 | % | (3,635,217 | ) | (58.79 | )% | ||||||||||||||
| Gross profit | 495,310 | 16.28 | % | 931,200 | 13.09 | % | (435,890 | ) | (46.81 | )% | ||||||||||||||
| Operating expenses | ||||||||||||||||||||||||
| Selling and distribution expenses | 3,816 | 0.13 | % | 2,136 | 0.03 | % | 1,680 | 78.65 | % | |||||||||||||||
| General and administrative expenses | 1,183,240 | 38.88 | % | 386,770 | 5.44 | % | 796,470 | 205.93 | % | |||||||||||||||
| Total operating expenses | 1,187,056 | 39.01 | % | 388,906 | 5.47 | % | 798,150 | 205.23 | % | |||||||||||||||
| Operating (Loss)Income | (691,746 | ) | (22.73 | )% | 542,294 | 7.62 | % | (1, 234,040) | (227.56 | )% | ||||||||||||||
| Other expenses (income) | ||||||||||||||||||||||||
| Other expenses (income), net | (281 | ) | (0.01 | )% | (1,084 | ) | (0.02 | )% | 803 | (74.08 | )% | |||||||||||||
| Total other expenses(income), net | (281 | ) | (0.01 | )% | (1,084 | ) | (0.02 | )% | 803 | (74.08 | )% | |||||||||||||
| (Loss)Income before provision for taxes | (691,465 | ) | (22.72 | )% | 543,378 | 7.64 | % | (1,234,843 | ) | (227.25 | )% | |||||||||||||
| Provision for income taxes | 7,641 | 0.25 | % | 75,504 | 1.06 | % | (67,863 | ) | (89.88 | )% | ||||||||||||||
| Net (loss)income | $ | (699,106 | ) | (22.97 | )% | $ | 467,874 | 6.58 | % | $ | (1,166,980 | ) | (249.42 | )% | ||||||||||
Sales
During the six months ended June 30, 2025, the Company had sales of $3,042,988 compared to sales of $7,114,095 for the six months ended June 30, 2024, a decrease of $4,071,107, or approximately 57.23%. The three main alcoholic beverages we sell are Chinese liquor, cognac, and whiskey. The combined revenue from our distribution of these products accounted for 84.64% and 97.14% of our total percentage of sales revenue for the six months ended June 30, 2025 and 2024, respectively. As we are a top wholesaler of high-end Chinese liquor, especially sale of Moutai is our most significant operation. For the six months ended June 30, 2025 and 2024, our sales of Moutai were by far the most significant component of our revenues, accounting for 77.72% and 90.97% of our total percentage of sales revenue in these time periods, respectively.
The decreased sales volume was primarily attributable to depression of economic activities in local market. Since January 2023, the loosening of pandemic-related restrictions in Macau and elsewhere resulted in a recovery of tourism and a rebound in the consumption of alcoholic beverages. However, after the period of revenge spending, the overall economic downturn resulted in reduced demand for alcoholic beverages in Macau, causing a serious contraction of both wholesale market and high-end market. In particular since 2024, the competition is fierce in local market and the local customers much intend to save money, which resulted in lower pricing of the wholesale market. According to Government of Macao Special Administrative Region Statistics and Census Service, although the volume of inbound visitors increased by 15.2% year-on-year in the first five months of 2025, consumption patterns have shifted. Non-gaming spending declined by 13.2% in the first quarter, while retail sales also fell by 15%, reflecting travelers’ cautious spending habits amid global economic uncertainty.
Cost of goods sold
Our cost of goods sold consists of the purchase cost. During the six months ended June 30, 2025, our cost of goods sold was $2,547,678, compared to $6,182,895 for the cost of goods sold for the six months ended June 30, 2024, a decrease of $3,635,217, or approximately 58.79%. The decrease in the cost of sales was primarily attributable to a significant decrease in sales. Another factor was the decrease in the amount of inventory the Company purchased during the same period. The Company purchased approximately 61.99% less inventory during the six months ended June 30, 2025, compared to the six months ended June 30, 2024.
The descend in sales costs is mainly due to decreased sales. Macau has been grappling with an economic depression stemming, people tended to cut back on expenses and focused on saving money. As a result, there has been a noticeable decrease in the demand for alcoholic beverages in Macau. Additionally, due to the instability of unit price of the product, the company preordered the main product in a fair price in 2024 and expected to receive the inventory in 2025. Therefore, the company purchased less inventory during 2025.
Gross profit
Our gross profit decreased from $931,200 for the six months ended June 30, 2024, to $495,310 for the six months ended June 30, 2025, representing a decrease of $435,890, or 46.81%. The decrease in the gross profit is mainly attributed to the significant decrease in the sales of local market, which fell from $4,488,470 for the six months ended June 30, 2024 to $1,039,274 for the six months ended June 30, 2025, a decrease of $3,471,638, or approximately 76.85%.
Gross profit Margin
Our gross profit margin increased from 13.09% for the six months ended June 30, 2024, to 16.28% for the six months ended June 30, 2025, mainly due to a huge proportion of low margin local market for the six months ended June 30, 2024. The sales of local market was $4,488,470, which was approximately 62.90% of the total sales, with a profit margin of 3.58% for the six months ended June 30, 2024, and $1,039,274, which was approximately 34.35% of the total sales, with a profit margin of 3.79% for the six months ended June 30, 2025.
Selling expenses
Selling expenses increased from $2,136 for the six months ended June 30, 2024, to $3,816 for the six months ended June 30, 2025, an increase of $1,680, or approximately 78.65%. The increase is mainly attributed to the increase in marketing expenses, comprised primarily of expenses related to our sales system subscription, advertising, and sales promotion.
General and administrative expenses
Our general and administrative expenses consist of salaries, office expenses, utilities, business travel, amortization expenses, and public company expenses (including legal expenses, accounting expenses and investor relations expenses). General and administrative expenses were $1,183,240 for the six months ended June 30, 2025, compared to $386,770 for the six months ended June 30, 2024, an increase of $796,470 or 205.93%. The increase in general and administrative expenses is mainly due to an increase in professional consulting fees in related to seeking potential M&A.
Income from operations
As a result of the factors described above, operating loss was $691,746 for the six months ended June 30, 2025, compared to operating income of $542,294 for the six months ended June 30, 2024, a decrease in income of approximately $1,234,040, or 227.56%.
Other income and expenses
For the six months ended June 30, 2025 six months ended June 30, 2025 and 2024, other income and expenses consist of the following:
| Six Months Ended June 30, 2025 |
Six Months Ended June 30, 2024 |
|||||||
| Other loss | $ | 552 | $ | 1,344 | ||||
| Other income | (833 | ) | (2,428 | ) | ||||
| Total other expenses (income), net | $ | (281 | ) | $ | (1,084 | ) | ||
Other expenses included interest expense and other loss were $552 for the six months ended June 30, 2025, compared to other expenses of $1,344 for the six months ended June 30, 2024, a decrease of $792, or 58.93%. The decrease in other expenses is mainly due to decreased exchange losses, bank charges and interest expenses.
Other income, which includes gain on acquisition of Macau government interest subsidies, interest earnings on savings, other earnings, exchange gains and losses for the six months ended June 30, 2025 and 2024.
Income (Loss) before income taxes
Our income(loss) before income taxes was $(691,465) for the six months ended June 30, 2025, a decrease of $1,234,843 or 227.25% compared with $543,378 for the six months ended June 30, 2024. The decrease was primarily attributable to decreased margin and decreased sales.
Provision for income taxes
Our provision for income taxes was $7,641 for the six months ended June 30, 2025, a decrease of $67,863 or 89.88% from $75,504 for the six months ended June 30, 2024. The decrease was due to the decrease in net income.
Foreign currency translation
The reporting currency of the Company is U.S. dollars. The results of operations and cash flows are translated at average exchange rates during the period, and assets and liabilities are translated at the unified exchange rates at the balance sheet dates, and equity is translated at the historical exchange rates. As a result, amounts related to assets and liabilities reported on the statements of cash flows will not necessarily agree with changes in the corresponding accounts on the balance sheets. Translation adjustments resulting from this process are included in accumulated other comprehensive income in the statements of shareholders’ equity.
Luz’s functional currency is MOP. Assets and liabilities were translated at 8.09 MOP and 8.00 MOP to $1.00 USD at June 30, 2025 and December 31, 2024, respectively. The equity accounts were stated at their historical rates. The average translation rates applied to income statements for the six months ended June 30, 2025 and 2024 were 8.03 MOP and 8.05 MOP to $1.00 USD, respectively. Cash flows are also translated at average translation rates for the period; therefore, amounts reported on the statement of cash flows will not necessarily agree with changes in the corresponding balances on the balance sheet.
Epsium HK’s functional currency is HKD. Assets and liabilities were translated at 7.85 HKD and 7.77 HKD to $1.00 USD on June 30, 2025 and December 31, 2024, respectively. The equity accounts were stated at their historical rates. The average translation rates applied to income statements for the six months ended June 30, 2025 and 2024 was 7.79 HKD and 7.82 HKD to $1.00 USD, respectively. Cash flows are also translated at average translation rates for the period; therefore, amounts reported on the statement of cash flows will not necessarily agree with changes in the corresponding balances on the balance sheet.
Translation adjustments for the six months ended June 30, 2025 and 2024 were $(106,091) and $9,504, respectively. The cumulative translation adjustment and effect of exchange rate changes on cash for the six months ended June 30, 2025 and 2024 were $(6,518) and $(2,644), respectively. Transaction gains and losses that arise from exchange rate fluctuations on transactions denominated in a currency other than the functional currency are included in the results of operations as incurred.
B. Liquidity and Capital Resources
In assessing our liquidity, we analyze our principal sources, our operating and capital expenditure commitments, our short-term loan commitments, and the ability to obtain additional credit facilities such as bank loans and factoring arrangements in the next 12 months from the date of this annual report. Our primary source of liquidity has been available cash and cash equivalents, which we have generated through operating activities, and we believe that our current level of liquidity is adequate for the expected needs of the Company for the next twelve months.
During the six months ended June 30, 2025 and 2024, our cash on hand and net cash flow from operations activities were historically sufficient to meet our working capital and capital expenditure requirements.
As of June 30, 2025 and December 31, 2024, we had cash of approximately $2,430,160 and $148,828, respectively. For the six months ended June 30, 2025 and 2024, our revenue was approximately $3,042,988 and $7,114,095, respectively, and net cash (used in) provided by operating activities was approximately $(1,927,422) and $(894,433), respectively. We have maintained net positive working capital throughout the six months ended June 30, 2025 and 2024, and maintained working capital of approximately $12,035,883 and $8,050,758 as of June 30, 2025 and December 31, 2024, respectively.
As of June 30, 2025 and December 31, 2024, accounts receivable, net of allowance, were $806,478 and $1,170,209, respectively. Accounts receivable are recorded at the invoiced amount and do not bear interest. Our management reviews the adequacy of our allowance for expected credit loss on an ongoing basis, using historical collection trends and the aging of receivables. Management also periodically evaluates individual customers’ financial condition, credit history, and the current economic conditions to make adjustments in the allowance when it is considered necessary.
As of June 30, 2025 and December 31, 2024, inventories were $4,084,466 and $4,642,982, respectively. As of June 30, 2025 and December 31, 2024, the Company has not made provision for slow moving or obsolete inventory. The decrease in inventory over this period is attributable to the Company taking advantage of suppliers’ lowered prices during the COVID-19 pandemic as a result of decreased demand for alcoholic beverages in 2022. The decreased cost is due to inventory is composed of more products with low unit cost.
We believe we will be able generate sufficient profit for the next 12 months from the date of the annual report, as we are able to grow our revenue and are able to provide the products with contribution margins sufficient to cover fixed and variable expenses in daily operations based on the current operating plan. We also expect to maintain positive operating cash flow as we are able to collect the payments within a period of 90 days.
Based on our current operating plan, we believe that our current cash of $2,430,160 as of June 30, 2025 and our anticipated cash flows generated from operations and the Offering, will be sufficient to meet our cash requirements for the next 12 months from the date of the annual report.
On March 27, 2025, the Company announced the closing of its Offering of 1,250,000 ordinary shares at a public offering price of US$4.00 per ordinary share. The ordinary shares began trading on the Nasdaq Capital Market on March 26, 2025 under the ticker symbol “EPSM.” The Company received aggregate gross proceeds of US$5.0 million from the Offering, before deducting underwriting discounts and other related expenses payable by the Company. In addition, the Company granted the underwriters a 45-day option to purchase up to an additional 187,500 ordinary shares at the public offering price, less underwriting discounts.
Net proceeds from the Offering will be used for (i) approximately 10% of the net proceeds for sales and product innovation and brand building, (ii) approximately 60% of the net proceeds for the acquisition of, or investment in, assets, technologies, solutions, or businesses that complement our business, (iii) approximately 20% of the net proceeds for general corporate purposes, and (iv) approximately 10% of the net proceeds for reserve and subject to the discretion of the board of directors.
We may, however, in the future require additional cash resources due to changing business conditions, implementation of our strategy to expand the business, or other investments or acquisitions we may decide to pursue. If our own financial resources are insufficient to satisfy our capital requirements, we may seek to sell additional equity or debt securities or obtain additional credit facilities, such as bank loans and factoring arrangements. The sale of additional equity securities could result in dilution to our shareholders. The incurrence of indebtedness would result in increased debt service obligations and could require us to agree to operating and financial covenants that would restrict our operations. Financing may not be available in amounts or on terms acceptable to us, if at all. Any failure by us to raise additional funds on terms favorable to us, or at all, could limit our ability to expand the business operations and could harm the overall business prospects.
| June 30, 2025 |
December 31, 2024 |
Change | Percentage Change |
|||||||||||||
| Working Capital: | ||||||||||||||||
| Total current assets | 13,554,311 | 10,391,449 | 3,162,862 | 30.44 | % | |||||||||||
| Total current liabilities | 1,518,428 | 2,340,691 | (822,263 | ) | (35.13 | )% | ||||||||||
| Working Capital: | $ | 12,035,883 | $ | 8,050,758 | $ | 3,985,125 | 49.50 | % | ||||||||
| December 31, 2024 |
December 31, 2023 |
Change | Percentage Change |
|||||||||||||
| Working Capital: | ||||||||||||||||
| Total current assets | 10,391,449 | 10,501,230 | (109,781 | ) | (1.05 | )% | ||||||||||
| Total current liabilities | 2,340,691 | 2,724,208 | (383,517 | ) | (14.08 | )% | ||||||||||
| Working Capital: | $ | 8,050,758 | $ | 7,777,022 | $ | 273,736 | 3.52 | % | ||||||||
Cash Flow Summary
For the Six months ended June 30, 2025 and 2024
The following table sets forth summary of our cash flows from operations for the six months indicated:
| Six Months ended June 30, 2025 |
Six Months ended June 30, 2024 |
|||||||
| Net cash used in operating activities | $ | (1,927,422 | ) | $ | (894,433 | ) | ||
| Net cash used in investing activities | (1,817 | ) | (83,003 | ) | ||||
| Net cash provided by financing activities | 4,217,089 | - | ||||||
| Effect of exchange rate changes on cash | (6,518 | ) | (2,644 | ) | ||||
| Net increase (decrease) in cash | 2,281,332 | (980,080 | ) | |||||
| Cash, beginning of period | 148,828 | 1,316,158 | ||||||
| Cash, end of period | $ | 2,430,160 | $ | 336,078 | ||||
Operating Activities
Net cash used in operating activities was $1,927,422 for the six months ended June 30, 2025, an increase of $1,032,989, or 115.49% compared to cash used in operating activities of $894,433 for the six months ended June 30, 2024. The increase in net cash used in operating activities was mainly due to an increase in prepayments, other receivable and inventories, offset by a decrease in net income, account payable, taxes and surcharges payable, other payable for the six months ended June 30, 2025, compared to the same period last year.
Investing Activities
Net cash used in investing activities were $1,817 and $83,003 for the six months ended June 30, 2025 and 2024, respectively, for purchases of term deposit and equipment and intangible assets in connection with our business activities.
Financing Activities
Net cash provided by financing activities was $4,217,089 for the six months ended June 30, 2024, an increase of $4,217,089, or 100.00%, compared to $0 net cash used in financing activities for the six months ended June 30, 2024. The increase in net cash provided by financing activities for the six months ended June 30, 2025 was primarily attributable to an increase in proceeds from issuance of shares, offset by an increase in payments to related parties.
Foreign Currency Translations
The reporting currency of the Company is U.S. dollars. The results of operations and cash flows are translated at average exchange rates during the period, and assets and liabilities are translated at the unified exchange rates at the balance sheet dates, and equity is translated at the historical exchange rates. As a result, amounts related to assets and liabilities reported on the statements of cash flows will not necessarily agree with changes in the corresponding accounts on the balance sheets. Translation adjustments resulting from this process are included in accumulated other comprehensive income in the statements of shareholders’ equity.
Luz’s functional currency is MOP. Assets and liabilities were translated at 8.09 MOP and 8.00 MOP to $1.00 USD at June 30, 2025 and December 31, 2024, respectively. The equity accounts were stated at their historical rates. The average translation rates applied to income statements for the six months ended June 30, 2025 and 2024 were 8.03 MOP and 8.05 MOP to $1.00 USD, respectively. Cash flows are also translated at average translation rates for the period; therefore, amounts reported on the statement of cash flows will not necessarily agree with changes in the corresponding balances on the balance sheet.
Epsium HK’s functional currency is HKD. Assets and liabilities were translated at 7.85 HKD and 7.77 HKD to $1.00 USD on June 30, 2025 and December 31, 2024, respectively. The equity accounts were stated at their historical rates. The average translation rates applied to income statements for the six months ended June 30, 2025 and 2024 was 7.79 HKD and 7.82 HKD to $1.00 USD, respectively. Cash flows are also translated at average translation rates for the period; therefore, amounts reported on the statement of cash flows will not necessarily agree with changes in the corresponding balances on the balance sheet.
Translation adjustments for the six months ended June 30, 2025 and 2024 were $(106,091) and $9,504, respectively. The cumulative translation adjustment and effect of exchange rate changes on cash for the six months ended June 30, 2025 and 2024 were $(6,518) and $(2,644), respectively. Transaction gains and losses that arise from exchange rate fluctuations on transactions denominated in a currency other than the functional currency are included in the results of operations as incurred.
Off-balance Sheet Commitments and Arrangements
There were no off-balance sheet arrangements for the six months ended June 30, 2025 and 2024, that have or that in the opinion of management are likely to have, a current or future material effect on our financial condition or results of operations.
Lease Commitments
For the period beginning August 2017 and ending August 2022, the Operating Entity occupied office space located at Alameda Dr. Carlos D’assumpcao, Edf China Civil Plaza 235-243, 14 P, Macau based on a lease entered into between Mr. Son I Tam, our CEO, Chairman, and principal shareholder, in Mr. Tam’s individual capacity, and an unaffiliated lessor (the “Office Lease”). The rent for the Office Lease was paid by the Operating Entity for its usage of the office space. The total commitment for the full lease term was approximately USD $155,000. The Office Lease did not provide an option for lease extension. Upon expiration in August 2022, Mr. Tam renewed the Office Lease for a one-year period beginning August 7, 2022, and ending August 6, 2023. As of the date of this annual report, the Operating Entity continues to occupy the space and pay the rents due under the Office Lease. The Company intends to have the Operating Entity take over the Office Lease in August 2023 when the Office Lease expires. The total commitment for the entire term of the Office Lease will amount to approximately USD $43,000. In September 2023, the Operating Entity signed the Office Lease for a two-year period beginning September 7, 2023, and ending August 7, 2025. The total commitment for the entire term of the Office Lease will amount to approximately USD $87,000. The Company has utilized the bank loan interest rate as the discount rate for this transaction.
The Operating Entity has entered into a lease agreement for its warehouse comprising 3,654 square feet, which has a lease period from May 2020 to April 2027. The total commitment for the entire duration of the lease is estimated to be around $396,000. The lease agreement does not include any provisions for lease extension. The Company has utilized the bank loan interest rate as the discount rate for this transaction.
The Operating Entity has entered into a lease agreement for its equipment with a lease period ranging from January 2022 to July 2026. Total commitment for the full term of the lease will be approximately $9,000. The contract does not include an option for extension or renewal. The Company uses the bank loan interest rate as the discount rate.
The Operating Entity has entered into a lease agreement for its parking space with a lease period ranging from November 2022 to October 2024. On October 31, 2024, The Operating Entity renewed its parking space Lease for a two-year period beginning November 1, 2024, and ending October 31, 2026. Total commitment for the full term of the lease will be approximately $7,000. The contract does not include an option for extension or renewal. The Company uses the bank loan interest rate as the discount rate.
The Operating Entity has entered into a lease agreement for its housing allowance for Son I Tam, the CEO & Chairman of the Company with a lease period ranging from January 2025 to December 2026. Total commitment for the full term of the lease will be approximately $87,000. The contract does not include an option for extension or renewal. The Company uses the bank loan interest rate as the discount rate.
| Six Months Ended June 30, 2025 |
Six Months Ended June 30, 2024 |
|||||||
| Lease Cost | ||||||||
| Operating lease cost (included in general and administration in the Company’s consolidated statement of operations) | $ | 73,573 | $ | 51,503 | ||||
| Other Information | ||||||||
| Cash paid for amounts included in the measurement of lease liabilities for the six months ended June 30, 2025 and 2024 | $ | 74,005 | $ | 59,106 | ||||
| Weighted average remaining lease term – operating leases (in years) | 1.63 | 2.42 | ||||||
| Weighted average discount rate – operating leases | 5.30 | % | 5.29 | % | ||||
After the adoption of ASC842, the operating lease right-of-use asset and the operating lease liabilities as of June 30, 2025 and December 31, 2024 are as below:
| As of June 30, 2025 |
As of December 31, 2024 |
|||||||
| Right-of-Use assets | $ | 171,451 | $ | 158,091 | ||||
| Total operating lease assets | $ | 171,451 | $ | 158,091 | ||||
| Short-term operating lease liabilities | $ | 107,861 | $ | 85,915 | ||||
| Long-term operating lease liabilities | 70,684 | 79,784 | ||||||
| Total operating lease liabilities | $ | 178,545 | $ | 165,699 | ||||
Maturities of the Operating Entity’s lease liabilities are as follows:
| Operating Leases |
||||
| Years ending June 30, | ||||
| 2026 | $ | 114,074 | ||
| 2027 | 71,875 | |||
| 2028 | - | |||
| 2029 | - | |||
| 2030 | - | |||
| Total lease payments | 185,949 | |||
| Less: Imputed interest/present value discount | 7,404 | |||
| Present value of lease liabilities | $ | 178,545 | ||
Contingencies
The Company is currently not a party to any material legal proceedings, investigation, or claims. However, the Company, from time to time, may be involved in legal matters arising in the ordinary course of its business, and there can be no assurance that matters arising in the ordinary course of business for which the Company could become involved in litigation will not have a material adverse effect on its business, financial condition, or results of operations.
Summary of Critical Accounting Policies
The following discussion relates to critical accounting policies for our company. The preparation of financial statements in conformity with GAAP requires our management to make assumptions, estimates and judgments that affect the amounts reported, including the notes thereto, and related disclosures of commitments and contingencies, if any. We have identified certain accounting policies that are significant to the preparation of our financial statements. These accounting policies are important for an understanding of our financial condition and results of operations. Critical accounting policies are those that are most important to the portrayal of our financial condition and results of operations and require management’s difficult, subjective, or complex judgment, often as a result of the need to make estimates about the effect of matters that are inherently uncertain and may change in subsequent periods. Certain accounting estimates are particularly sensitive because of their significance to financial statements and because of the possibility that future events affecting the estimate may differ significantly from management’s current judgments. We believe the following critical accounting policies involve the most significant estimates and judgments used in the preparation of our financial statements:
Use of Estimates and Assumptions
The preparation of financial statements in conformity with U.S. GAAP requires management to make estimates and assumptions that affect the reported amounts of assets and liabilities and the disclosure of contingent assets and liabilities at the date of the financial statements and the reported amounts of revenues and expenses during the reporting periods. Significant accounting estimates are used for, but not limited to, recoverability of the carrying value of long-lived assets, allowance for expected credit loss, slow-moving and obsolete inventory reserve, depreciable lives of property and equipment and the discount rate for leases. Actual results could differ from those estimates. Estimates and assumptions are reviewed periodically, and the effects of revisions are reflected in the financial statements in the period they are determined.
Revenue Recognition
The Company earns revenues through the marketing, sale, and distribution of alcoholic beverages. The Company adopted ASC 606 and recognizes revenue at the point in time when control of the products is transferred to the customer at the estimated net consideration for which collection is probable, taking into account the customer’s rights to rights to return unsold product. Transfer of control occurs either when products are shipped to or received by the distributor or direct customer, based on the terms of the specific agreement with the customer, if the Company has a present right to payment and transfer of legal title and the risks and rewards of ownership to the customer has occurred. For most of the Company’s product sales, transfer of control occurs upon shipment to the distributor or direct customer. In assessing whether collection of consideration from a customer is probable, the Company considers the customer’s ability and intention to pay that amount of consideration when it is due. Payment of invoices is due as specified in the underlying customer agreement, typically 30 days from the invoice date, which occurs on the date of transfer of control of the products to the customer.
A five-step approach is applied in the recognition of revenue under ASC 606: (1) identify the contract with a customer, (2) identify the performance obligations in the contract, (3) determine the transaction price, (4) allocate the transaction price to the performance obligations in the contract, and (5) recognize revenue when the Company satisfies a performance obligation.
In accordance with ASC 606, the Company evaluates whether it is appropriate to record the gross amount of product sales and related costs, or the net amount earned as commissions. When the Company is a principal, where the Company obtains control of the specified goods or services before they are transferred to the customers, the revenues should be recognized in the gross amount of consideration to which it expects to be entitled in exchange for the specified goods or services transferred. When the Company is an agent, where its obligation is to facilitate third parties in fulfilling their performance obligation for specified goods or services, the revenues should be recognized in the net amount for the amount of commission which the Company earns in exchange for arranging for the specified goods or services to be provided by other parties. Revenues are recorded net of value-added taxes.
The Company recognizes the product revenues from retail business on a gross basis as the Company is acting as the principal in these transactions and is responsible for fulfilling the promise to provide the specified goods.
Leases
The Company adopted lease accounting standard, ASC Topic 842, Leases (“ASC 842”). The Company categorizes leases with contractual terms longer than twelve months as either operating or finance lease. However, the Company has no finance leases for any of the periods presented.
Right-of-use (“ROU”) assets represent the Company’s rights to use underlying assets for the lease term and lease liabilities represent the Company’s obligation to make lease payments arising from the lease. Operating lease ROU assets and liabilities are recognized at commencement date based on the lease at the commencement date. As the implicit rate in lease is not readily determinable for the Company’s operating leases, the Company generally use the incremental borrowing rate based on the estimated rate of interest for collateralized borrowing over a similar term of the lease payments at commencement date. The Company’s lease terms may include options to extend or terminate the lease when it is reasonably certain that the Company will exercise that option. Lease expense for lease payments is recognized on a straight-line basis over the lease term. The Company accounts for lease and non-lease components separately.
Inventories
The Company values inventories at the lower of cost or net realizable value. Net realizable value is based on estimated selling prices less further costs expected to be incurred for completion and disposal. Inventories are the finished goods or commodities that the Company holds to sell. Inventories include finished goods (commodities) and costs to fulfil contracts etc.
The Company uses weighting average method for the inventories. Inventory reserves are provided to cover risks arising from slow-moving items. The estimated obsolescence or unmarketable inventory equals the difference between the cost of inventory and the estimated market value based on assumptions about future demand and market conditions.
At each balance sheet date, inventories are measured at the lower of cost and net realizable value. When the cost of inventory exceeds its net realizable value, provision for diminution in value of inventories is recognized. The Company usually recognizes provision for diminution in value of inventories on the basis of a single inventory item. For the inventory items of large quantity and low price, the Company recognizes provision for diminution in value of inventories based on inventory categories.
The Company adopts the perpetual inventory system. Low-cost consumables and packaging materials are amortized by the once-off amortization method.
Income Taxes
The Company accounts for income taxes in accordance with ASC Topic 740, Income Taxes. ASC 740 requires a company to use the asset and liability method of accounting for income taxes, whereby deferred tax assets are recognized for deductible temporary differences, and deferred tax liabilities are recognized for taxable temporary differences. Temporary differences are the differences between the reported amounts of assets and liabilities and their tax bases. Deferred tax assets are reduced by a valuation allowance when, in the opinion of management, it is more likely than not that some portion, or all of, the deferred tax assets will not be realized. Deferred tax assets and liabilities are adjusted for the effects of changes in tax laws and rates on the date of enactment.
Under ASC 740, a tax position is recognized as a benefit only if it is “more likely than not” that the tax position would be sustained in a tax examination, with a tax examination being presumed to occur. The amount recognized is the largest amount of tax benefit that is greater than 50% likely of being realized on examination. For tax positions not meeting the “more likely than not” test, no tax benefit is recorded. The adoption under ASC 740 effected the tax liabilities from uncertain income tax position on the Company’s financial statements.
Recently Issued Accounting Pronouncements
Management does not believe that any other recently issued, but not yet effective, accounting standards could have a material effect on the accompanying financial statements. As new accounting pronouncements are issued, we will adopt those that are applicable under the circumstances.