UNITED STATES
SECURITIES AND EXCHANGE COMMISSION
Washington, D.C. 20549
FORM 6-K
REPORT OF FOREIGN PRIVATE ISSUER PURSUANT TO RULE 13a-16
OR 15d-16 UNDER THE SECURITIES EXCHANGE ACT OF 1934
For the month of November 2025
Commission File Number 001-42379
Founder Group Limited
No. 17, Jalan Astana 1D, Bandar Bukit Raja,
41050 Klang,
Selangor Darul Ehsan, Malaysia
(Address of principal executive office)
Indicate by check mark whether the registrant files or will file annual reports under cover of Form 20-F or Form 40-F.
Form 20-F ☒ Form 40-F ☐
EXPLANATORY NOTE
Founder Group Limited (the “Company”) is filing this report of foreign private issuer on Form 6-K to report its financial results for the six months ended June 30, 2025 and to discuss its recent corporate developments.
Attached as exhibits to this report of foreign private issuer on Form 6-K are:
| (1) | the unaudited condensed consolidated interim financial statements and related notes as Exhibit 99.1; |
| (2) | the management’s discussion and analysis of financial condition and results of operations as Exhibit 99.2; and |
| (3) | Interactive Data File disclosure as Exhibit 101 in accordance with Rule 405 of Regulation S-T.1 |
SPECIAL NOTE REGARDING FORWARD-LOOKING STATEMENTS
Statements in this report of foreign private issuer with respect to the Company’s current plans, estimates, strategies and beliefs and other statements that are not historical facts are forward-looking statements about the future performance of the Company. Forward-looking statements include, but are not limited to, those statements using words such as “believe,” “expect,” “plans,” “strategy,” “prospects,” “forecast,” “estimate,” “project,” “anticipate,” “aim,” “intend,” “seek,” “may,” “might,” “could” or “should,” and words of similar meaning in connection with a discussion of future operations, financial performance, events or conditions. From time to time, oral or written forward-looking statements may also be included in other materials released to the public. These statements are based on management’s assumptions, judgments and beliefs in light of the information currently available to it. The Company cautions investors that a number of important risks and uncertainties could cause actual results to differ materially from those discussed in the forward-looking statements, including but not limited to, product and service demand and acceptance, changes in technology, economic conditions, the impact of competition and pricing, government regulation, and other risks contained in reports filed by the Company with the U.S. Securities and Exchange Commission. Therefore, investors should not place undue reliance on such forward-looking statements. Actual results may differ significantly from those set forth in the forward-looking statements.
All such forward-looking statements, whether written or oral, and whether made by or on behalf of the Company, are expressly qualified by the cautionary statements and any other cautionary statements which may accompany the forward-looking statements. In addition, the Company disclaims any obligation to update any forward-looking statements to reflect events or circumstances after the date hereof.
EXHIBIT INDEX
| Exhibit No. | Description | |
| 99.1 | Unaudited Condensed Consolidated Financial Statements and Related Notes as of June 30, 2025 and for the Six Months Ended June 30, 2025 and 2024 | |
| 99.2 | Management’s Discussion and Analysis of Financial Condition and Results of Operations | |
| 101.INS | Inline XBRL Instance Document (the instance document does not appear in the Interactive Data File because its XBRL tags are embedded within the Inline XBRL document). | |
| 101.SCH | Inline XBRL Taxonomy Extension Schema Document. | |
| 101.CAL | Inline XBRL Taxonomy Extension Calculation Linkbase Document. | |
| 101.DEF | Inline XBRL Taxonomy Extension Definition Linkbase Document. | |
| 101.LAB | Inline XBRL Taxonomy Extension Labels Linkbase Document. | |
| 101.PRE | Inline XBRL Taxonomy Extension Presentation Linkbase Document. | |
| 104 | Cover Page Interactive Data File (formatted as inline XBRL and contained in Exhibit 101). |
SIGNATURE
Pursuant to the requirements of the Securities Exchange Act of 1934, the registrant has duly caused this report to be signed on its behalf by the undersigned, thereunto duly authorized.
| FOUNDER GROUP LIMITED | ||
| By: | /s/ Lee Seng Chi | |
| Name: | Lee Seng Chi | |
| Title: | Chief Executive Officer, Director, and Chairman of the Board of Directors |
|
Date: November 21, 2025
Exhibit 99.1
FOUNDER GROUP LIMITED
INDEX TO CONDENSED CONSOLIDATED FINANCIAL STATEMENTS
TABLE OF CONTENTS
F-
FOUNDER GROUP LIMITED AND ITS SUBSIDIARIES
UNAUDITED INTERIM CONDENSED CONSOLIDATED STATEMENT OF FINANCIAL POSITION
AS OF DECEMBER 31, 2024 AND JUNE 30, 2025
| As of December 31, 2024 (Audited) |
As
of |
As
of |
|||||||||||||
| Note | RM | RM | USD | ||||||||||||
| ASSETS | |||||||||||||||
| Non-current assets | |||||||||||||||
| Plant and equipment | 6 | 26,582,995 | 25,914,234 | 6,151,747 | |||||||||||
| Right-of-use assets | 7 | 739,244 | 596,165 | 141,523 | |||||||||||
| Trade receivables | 8 | 2,478,739 | 2,195,683 | 521,230 | |||||||||||
| Deferred tax asset | 9 | 74,000 | 609,217 | 144,621 | |||||||||||
| Total non-current assets | 29,874,978 | 29,315,299 | 6,959,121 | ||||||||||||
| Current assets | |||||||||||||||
| Cash and bank balances | 13,901,973 | 23,037,161 | 5,468,763 | ||||||||||||
| Inventories | 10 | 3,049,405 | 1,377,332 | 326,963 | |||||||||||
| Trade receivables | 8 | 18,794,355 | 22,776,475 | 5,406,878 | |||||||||||
| Contract assets | 11 | 32,547,589 | 20,300,766 | 4,819,173 | |||||||||||
| Other receivables and prepayment | 12 | 12,944,794 | 17,963,327 | 4,264,291 | |||||||||||
| Amount due from related parties | 13 | 2,420,493 | 6,380,850 | 1,514,742 | |||||||||||
| Income tax receivable | 9 | 758,543 | 821,322 | 194,973 | |||||||||||
| Total current assets | 84,417,152 | 92,657,233 | 21,995,783 | ||||||||||||
| Total assets | 114,292,130 | 121,972,532 | 28,954,904 | ||||||||||||
| LIABILITIES AND EQUITY | |||||||||||||||
| Current liabilities | |||||||||||||||
| Trade payables | 8 | 27,396,814 | 25,154,330 | 5,971,354 | |||||||||||
| Other payables and accrued liabilities | 12 | 31,816,499 | 12,810,351 | 3,041,033 | |||||||||||
| Convertible securities payable | 14 | 7,656,956 | 1,817,675 | ||||||||||||
| Bank and other borrowings | 15 | 32,940,381 | 37,052,577 | 8,795,864 | |||||||||||
| Lease liabilities | 7 | 276,524 | 284,499 | 67,537 | |||||||||||
| Amount due to related parties | 13 | 2,168,066 | 3,114,186 | 739,273 | |||||||||||
| Income tax payable | 9 | 1,597 | |||||||||||||
| Total current liabilities | 94,599,881 | 86,072,899 | 20,432,736 | ||||||||||||
| Non-current liabilities | |||||||||||||||
| Lease liabilities | 7 | 471,295 | 327,023 | 77,632 | |||||||||||
| Bank and other borrowings | 15 | 2,099,476 | 18,263,817 | 4,335,624 | |||||||||||
| Total non-current labilities | 2,570,771 | 18,590,840 | 4,413,256 | ||||||||||||
| Total liabilities | 97,170,652 | 104,663,739 | 24,845,992 | ||||||||||||
| Capital and reserves | |||||||||||||||
| Share capital | 16 | 7,425,257 | 9,812,347 | 2,329,341 | |||||||||||
| Reserves | 17 | 1,704,989 | 1,704,989 | 404,745 | |||||||||||
| Retained earnings | 7,859,024 | 5,929,426 | 1,407,579 | ||||||||||||
| Other comprehensive income/(loss) | 132,208 | (137,970 | ) | (32,753 | ) | ||||||||||
| Attributable to equity owners of the Company | 17,121,478 | 17,308,792 | 4,108,912 | ||||||||||||
| Non-controlling interests | 1 | ||||||||||||||
| Total equity | 17,121,478 | 17,308,793 | 4,108,912 | ||||||||||||
| Total liabilities and equity | 114,292,130 | 121,972,532 | 28,954,904 | ||||||||||||
The accompanying notes are an integral part of these consolidated financial statements.
F-
FOUNDER GROUP LIMITED AND ITS SUBSIDIARIES
UNAUDITED INTERIM CONDENSED
CONSOLIDATED STATEMENT OF COMPREHENSIVE INCOME
FOR THE SIX MONTHS ENDED JUNE 30, 2024 AND JUNE 30, 2025
| Six months ended June 30, 2024 |
Six months ended June 30, 2025 |
Six months ended June 30, 2025 |
|||||||||||||
| Note | RM | RM | USD | ||||||||||||
| Revenue from contract services | 21,776,845 | 38,289,161 | 9,089,415 | ||||||||||||
| Revenue from sales of goods | 7,595,546 | 2,507,413 | 595,232 | ||||||||||||
| Revenue from contract services – related parties | 1,067,194 | 14,669,420 | 3,482,355 | ||||||||||||
| Total revenue | 18 | 30,439,585 | 55,465,994 | 13,167,002 | |||||||||||
| Cost of sales from contract services | (21,459,409 | ) | (46,953,622 | ) | (11,146,259 | ) | |||||||||
| Cost of sales from sales of goods | (6,750,913 | ) | (2,262,004 | ) | (536,975 | ) | |||||||||
| Cost of sales for contract services – related party | (1,799 | ) | (386,972 | ) | (91,863 | ) | |||||||||
| Total cost of sales | 19 | (28,212,121 | ) | (49,602,598 | ) | (11,775,097 | ) | ||||||||
| Gross profit | 2,227,464 | 5,863,396 | 1,391,905 | ||||||||||||
| Selling and administrative | (3,454,946 | ) | (6,127,228 | ) | (1,454,534 | ) | |||||||||
| Selling and administrative to related party | (56,441 | ) | (216,352 | ) | (51,360 | ) | |||||||||
| Loss from operation before income tax | (1,283,923 | ) | (480,184 | ) | (113,989 | ) | |||||||||
| Other income | 118,707 | 848,670 | 201,465 | ||||||||||||
| Other income from related party | 50,188 | — | — | ||||||||||||
| Finance cost | (703,418 | ) | (2,090,193 | ) | (496,188 | ) | |||||||||
| Finance cost – related parties | (63,514 | ) | (59,223 | ) | (14,059 | ) | |||||||||
| Loss before income tax | (1,881,960 | ) | (1,780,930 | ) | (422,771 | ) | |||||||||
| Income tax benefit/(expense) | 9 | 170,138 | (148,668 | ) | (35,292 | ) | |||||||||
| Net loss for the period | (1,711,822 | ) | (1,929,598 | ) | (458,063 | ) | |||||||||
| Other comprehensive income/(loss): | |||||||||||||||
| Currency translation arising from consolidation | 2,224 | (270,178 | ) | (64,137 | ) | ||||||||||
| Total comprehensive loss for the period | (1,709,598 | ) | (2,199,776 | ) | (522,200 | ) | |||||||||
| Loss attributable to: | |||||||||||||||
| Equity owners of the Company | (1,709,598 | ) | (2,199,776 | ) | (522,200 | ) | |||||||||
| Non-controlling interests | |||||||||||||||
| Total | (1,709,598 | ) | (2,199,776 | ) | (522,200 | ) | |||||||||
| Basic and diluted net loss per share: | |||||||||||||||
| Basic | (0.11 | ) | (0.12 | ) | (0.03 | ) | |||||||||
| Diluted | (0.11 | ) | (0.12 | ) | (0.03 | ) | |||||||||
| Weighted average number of common shares outstanding – Basic and diluted: | |||||||||||||||
| Basic | 15,700,000 | 18,450,460 | 18,450,460 | ||||||||||||
| Diluted | 15,700,000 | 18,450,460 | 18,450,460 | ||||||||||||
The accompanying notes are an integral part of these consolidated financial statements.
F-
FOUNDER GROUP LIMITED AND ITS SUBSIDIARIES
UNAUDITED INTERIM CONDENSED CONSOLIDATED STATEMENT OF CHANGES IN EQUITY
FOR THE SIX MONTHS ENDED JUNE 30, 2024 AND 2025
| Number of outstanding shares |
Share capital |
Reserves | Retained earnings |
Other comprehensive income/(loss) |
Non-controlling interests |
Total shareholders’ equity |
||||||||||||||||||||||
| RM | RM | RM | RM | RM | RM | |||||||||||||||||||||||
| Balance at January 1, 2024 | 15,700,000 | 69,284 | 1,704,989 | 13,009,029 | 6,360 | 14,789,662 | ||||||||||||||||||||||
| Foreign currency translation adjustment | — | 2,224 | 2,224 | |||||||||||||||||||||||||
| Net loss for the period | — | (1,711,822 | ) | (1,711,822 | ) | |||||||||||||||||||||||
| Balance at June 30, 2024 (Unaudited) | 15,700,000 | 69,284 | 1,704,989 | 11,297,207 | 8,584 | 13,080,064 | ||||||||||||||||||||||
| Balance at January 1, 2025 | 17,665,289 | 7,425,257 | 1,704,989 | 7,859,024 | 132,208 | 17,121,478 | ||||||||||||||||||||||
| Transaction costs of share issue | — | (228,590 | ) | (228,590 | ) | |||||||||||||||||||||||
| Convertible securities | 785,171 | 2,615,680 | 2,615,680 | |||||||||||||||||||||||||
| Non-controlling interests arising from a new subsidiary | — | 1 | 1 | |||||||||||||||||||||||||
| Foreign currency translation adjustment | — | (270,178 | ) | (270,178 | ) | |||||||||||||||||||||||
| Net loss for the period | — | (1,929,598 | ) | (1,929,598 | ) | |||||||||||||||||||||||
| Balance at June 30, 2025 (Unaudited) | 18,450,460 | 9,812,347 | 1,704,989 | 5,929,426 | (137,970 | ) | 1 | 17,308,793 | ||||||||||||||||||||
| Share capital |
Reserves | Retained earnings |
Other comprehensive income |
Non-controlling interests |
Total shareholders’ equity |
|||||||||||||||||||
| USD | USD | USD | USD | USD | USD | |||||||||||||||||||
| Balance at June 30, 2024 | 15,700 | 361,265 | 2,393,730 | 798 | 2,771,493 | |||||||||||||||||||
| Balance at June 30, 2025 | 2,234,635 | 404,745 | 1,407,579 | 61,953 | 4,108,912 | |||||||||||||||||||
The accompanying notes are an integral part of these consolidated financial statements.
F-
FOUNDER GROUP LIMITED AND ITS SUBSIDIARIES
UNAUDITED INTERIM CONDENSED CONSOLIDATED STATEMENT OF CASH FLOWS
FOR THE SIX MONTHS ENDED JUNE 30, 2024 AND 2025
| Six months ended June 30, 2024 |
Six months ended June 30, 2025 |
Six months ended June 30, 2025 |
||||||||||
| RM | RM | USD | ||||||||||
| CASH FLOWS FROM OPERATING ACTIVITIES: | ||||||||||||
| Net loss before income tax | (1,881,960 | ) | (1,780,930 | ) | (422,771 | ) | ||||||
| Adjustments for: | ||||||||||||
| Depreciation of plant and equipment | 124,775 | 1,293,080 | 306,963 | |||||||||
| Plant and equipment written off | 32,779 | |||||||||||
| Amortization of right-of-use assets | 71,253 | 143,079 | 33,965 | |||||||||
| Extinguishment of right-of-use asset and lease liabilities | (3,188 | ) | ||||||||||
| Imputed interests of lease liabilities | 5,049 | 19,703 | 4,677 | |||||||||
| Allowance for expected credit losses on trade receivables | 649,075 | 154,083 | ||||||||||
| Reversal of allowance for expected credit losses on trade receivables | (376,000 | ) | (89,258 | ) | ||||||||
| Impairment loss on contract asset | (10,787 | ) | ||||||||||
| Fair value gain on derivative asset | (3,565 | ) | ||||||||||
| Discount on convertible securities | 689,549 | 163,691 | ||||||||||
| Interest income | (34,881 | ) | (58,456 | ) | (13,877 | ) | ||||||
| Finance cost | 766,932 | 1,440,164 | 341,879 | |||||||||
| Unrealized foreign exchange gains | (8,678 | ) | (748,233 | ) | (177,622 | ) | ||||||
| Operating profit before changes in working capital | (942,271 | ) | 1,271,031 | 301,730 | ||||||||
| Changes in operating assets and liabilities: | ||||||||||||
| Contract assets | 18,261,184 | 12,246,823 | 2,907,258 | |||||||||
| Trade receivables | (1,879,608 | ) | (3,972,139 | ) | (942,941 | ) | ||||||
| Inventories | 66,681 | 1,672,073 | 396,931 | |||||||||
| Other receivables and prepayment | (1,654,273 | ) | (5,018,533 | ) | (1,191,343 | ) | ||||||
| Contract liabilities | 2,581,199 | — | ||||||||||
| Trade payables | (15,473,486 | ) | (2,242,484 | ) | (532,340 | ) | ||||||
| Other payables and accrued liabilities | 3,942,595 | (18,804,175 | ) | (4,463,899 | ) | |||||||
| Cash flows generated from/(used in) operations | 4,902,021 | (14,847,404 | ) | (3,524,604 | ) | |||||||
| Income tax paid | (910,677 | ) | (748,261 | ) | (177,629 | ) | ||||||
| Net cash generated from/(used in) operating activities | 3,991,344 | (15,595,665 | ) | (3,702,233 | ) | |||||||
| Investing activities | ||||||||||||
| Interest income | 34,881 | 58,456 | 13,877 | |||||||||
| Purchase of plant and equipment | (3,789,561 | ) | (324,019 | ) | (76,918 | ) | ||||||
| Incorporation of a subsidiary company | 1 | |||||||||||
| Deposit pledged with licensed banks | (1,475,707 | ) | (1,634,469 | ) | (388,005 | ) | ||||||
| Net cash used in investing activities | (5,230,387 | ) | (1,900,031 | ) | (451,046 | ) | ||||||
| Financing activities | ||||||||||||
| Proceeds from issuance of convertible securities | 10,044,046 | 2,384,343 | ||||||||||
| Interest paid | (766,932 | ) | (2,070,490 | ) | (491,511 | ) | ||||||
| Repayment of lease liabilities | (75,000 | ) | (156,000 | ) | (37,033 | ) | ||||||
| Amount due from/(to) related parties | 1,412,732 | (3,073,460 | ) | (729,605 | ) | |||||||
| Proceeds from bank borrowings | 3,616,009 | 19,951,926 | 4,736,362 | |||||||||
| Net cash provided by financing activities | 4,186,809 | 24,696,022 | 5,862,556 | |||||||||
| Net increase in cash and cash equivalents | 2,947,766 | 7,200,326 | 1,709,277 | |||||||||
| Cash and cash equivalents at beginning of period | 1,945,602 | 4,563,108 | 1,083,230 | |||||||||
| Effects of exchange rate changes | 10,902 | 276,082 | 65,539 | |||||||||
| Cash and cash equivalents at end of period | 4,904,270 | 12,039,516 | 2,858,046 | |||||||||
The accompanying notes are an integral part of these consolidated financial statements.
F-
For the purpose of the statement of cash flows, cash and cash equivalents comprise the following as at the end of each reporting period:
| Six months ended June 30, 2024 |
Six months ended June 30, 2025 |
Six months ended June 30, 2025 |
||||||||||
| RM | RM | USD | ||||||||||
| Cash and bank balances | 4,904,270 | 13,529,427 | 3,211,734 | |||||||||
| Deposits with licensed banks | 5,130,252 | 9,507,734 | 2,257,029 | |||||||||
| As per statement of financial position | 10,034,522 | 23,037,161 | 5,468,763 | |||||||||
| Less: | ||||||||||||
| Bank overdraft (Note 15) | (1,489,911 | ) | (353,688 | ) | ||||||||
| Deposit pledged with licensed banks | (5,130,252 | ) | (9,507,734 | ) | (2,257,029 | ) | ||||||
| As per statement of cash flows | 4,904,270 | 12,039,516 | 2,858,046 | |||||||||
Liabilities arising from financing activities
Reconciliation between the opening and closing balances in the statement of financial position for liabilities arising from financing activities of the Company is as follows
| At beginning of year |
Cash flows | Non cash flows |
At end of year |
|||||||||||||
| RM | RM | RM | RM | |||||||||||||
| As of June 30, 2025 | ||||||||||||||||
| Convertible securities payable | 7,362,081 | 294,875 | 7,656,956 | |||||||||||||
| Hire purchase payables | 250,000 | (46,510 | ) | 300,300 | 503,790 | |||||||||||
| Term loan | 2,072,038 | 16,035,373 | 18,107,411 | |||||||||||||
| Trade financing | 31,252,219 | 3,963,063 | 35,215,282 | |||||||||||||
| Lease liabilities | 747,819 | (156,000 | ) | 19,703 | 611,522 | |||||||||||
| 34,322,076 | 27,158,007 | 614,878 | 62,094,961 | |||||||||||||
| At beginning of year |
Cash flows | Non cash flows |
At end of year |
|||||||||||||
| RM | RM | RM | RM | |||||||||||||
| As of December 31, 2024 | ||||||||||||||||
| Hire purchase payables | 250,000 | 250,000 | ||||||||||||||
| Term loan | 942,456 | 1,129,582 | 2,072,038 | |||||||||||||
| Trade financing | 23,766,660 | 7,485,559 | 31,252,219 | |||||||||||||
| Lease liabilities | 215,647 | (205,000 | ) | 737,172 | 747,819 | |||||||||||
| 24,924,763 | 8,410,141 | 987,172 | 34,322,076 | |||||||||||||
F-
FOUNDER GROUP LIMITED AND ITS SUBSIDIARIES
NOTES TO UNAUDITED INTERIM CONDENSED CONSOLIDATED FINANCIAL STATEMENTS
| 1 | ORGANIZATION AND PRINCIPAL ACTIVITIES |
Founder Group Limited (the “Company”) was incorporated in the British Virgin Islands on May 18, 2023 with registered office at Trinity Chambers, P.O Box 4301, Road Town, Tortola, British Virgin Islands while principal place of business of the Company at No. 17, Jalan Astana 1D, Bandar Bukit Raja 41050 Klang, Selangor, Malaysia.
The group structure which represents the operating subsidiaries and dormant companies as of the reporting date is as follow:
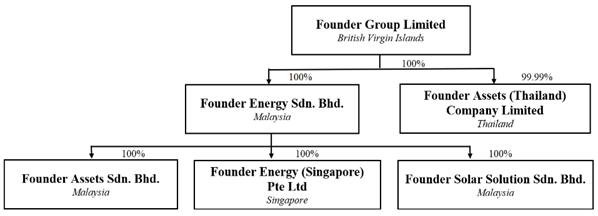
Details of the Company and its subsidiaries (collectively, the “Group”) are shown in the table below:
| Percentage of effective ownership | ||||||||||||||
| June 30, | ||||||||||||||
| Name | Date of incorporation |
2025 | 2024 | Place of incorporation |
Principal activities |
|||||||||
| % | % | |||||||||||||
| Founder Group Limited | May 18, 2023 | British Virgin Islands | Holding company | |||||||||||
| Founder Energy Sdn. Bhd. | April 13, 2021 | 100 | 100 | Malaysia | Business of renewable energy activities and related business and activities of holding companies | |||||||||
| Founder Energy (Singapore) Pte Ltd | May 27, 2022 | 100 | 100 | Singapore | Dormant | |||||||||
| Founder Assets Sdn. Bhd. | September 21, 2022 | 100 | 100 | Malaysia | Business in the investment of renewable energy project | |||||||||
| Founder Assets (Thailand) Company Limited | January 14, 2025 | 99.99 | Thailand | Dormant | ||||||||||
| Founder Solar Solution Sdn. Bhd. | February 10, 2025 | 100 | Malaysia | Business of renewable energy activities | ||||||||||
The Company provides engineering, procurement, construction and commissioning (“EPCC”) services for solar photovoltaic (“PV”) facilities in Malaysia primarily through Founder Energy Sdn. Bhd and Founder Solar Solution Sdn. Bhd.
On April 13, 2021, Mr. Lee Seng Chi incorporate Founder Energy Sdn. Bhd. with 100% equity interest.
On August 25, 2021, Reservoir Energy Link Bhd acquired 51% equity interest in Founder Energy Sdn. Bhd. from Mr. Lee Seng Chi.
F-
FOUNDER GROUP LIMITED AND ITS SUBSIDIARIES
NOTES TO UNAUDITED INTERIM CONDENSED CONSOLIDATED FINANCIAL STATEMENTS
| 1 | ORGANIZATION AND PRINCIPAL ACTIVITIES (cont.) |
Founder Energy (Singapore) Pte Ltd was incorporated and domiciled in Singapore for future business expansion purpose in Singapore.
Founder Assets Sdn. Bhd. and Founder Assets (Thailand) Company Limited were incorporated and domiciled in Malaysia and Thailand respectively to carry out business in the investment of renewable energy project.
| 2 | MATERIAL ACCOUNTING POLICIES INFORMATION |
BASIS OF PREPARATION
The audited consolidated financial statements have been prepared in accordance with the historical cost basis, except as disclosed in the accounting policies below, and are drawn up in accordance with the provisions of the International Financial Reporting Standards (“IFRSs”) as issued by the International Accounting Standards Board (“IASB”).
Historical cost is generally based on the fair value of the consideration given in exchange for goods and services.
ADOPTION OF NEW AND REVISED STANDARDS
At the date of authorization of those financial statements, our Company has not adopted the new and revised IFRS Accounting Standards and amendments to IFRS Accounting Standards that have been issued but are not yet effective to them. We do not anticipate that the adoption of these new and revised IFRS Accounting Standards pronouncements in future periods will have a material impact on our financial statements in the period of their initial adoption.
NEW AND REVISED IFRS IN ISSUE BUT NOT YET EFFECTIVE
The Group has not applied in advance the following accounting standards and/or interpretations (including the consequential amendments, if any) that have been issued by the International Accounting Standards Board (IASB) but are not yet effective for the current financial period:
| IFRSs and/or IC Interpretations (Including The Consequential Amendments) | Effective Date | |
| IFRS 19 Subsidiaries without Public Accountability: Disclosures | 1 January 2027 | |
| IFRS 18 Presentation and Disclosure in Financial Statements | 1 January 2027 | |
| Annual Improvements of IFRS Accounting Standards – Volume 11 | 1 January 2026 | |
| Amendments to IFRS 9 and IFRS 7 Amendments to the Classification and Measurement of Financial Instruments | 1 January 2026 | |
| Amendments to IFRS 9 and IFRS 7 Contracts Referencing Nature-dependent Electricity | 1 January 2026 |
F-
FOUNDER GROUP LIMITED AND ITS SUBSIDIARIES
NOTES TO UNAUDITED INTERIM CONDENSED CONSOLIDATED FINANCIAL STATEMENTS
| 2 | MATERIAL ACCOUNTING POLICIES INFORMATION (cont.) |
RECENTLY ADOPTED IFRS
The Group has adopted the following accounting standards and/or interpretations (including the consequential amendments, if any) that have been issued by the International Accounting Standards Board (IASB) for the current financial period:
| IFRSs and/or IC Interpretations (Including The Consequential Amendments) | Effective Date | |
| Amendment to IAS 21 Lack of Exchangeability | 1 January 2025 | |
| Amendments to the SASB standards to enhance their international applicability | 1 January 2025 |
BASIS OF CONSOLIDATION
The acquisition of entities, businesses or assets under common control are accounted for in accordance with merger accounting.
The combined financial statements incorporate the financial statements of the combined entities or businesses in which the common control combination occurs as if they had been combined from the date when the combining entities or businesses first came under the control of the controlling party.
The combined financial statements have prepared using uniform accounting policies for like transactions and other events in similar circumstances.
All intra-group balances, transactions, income and expenses are eliminated in full on combination and the combined financial statements reflect external transactions only.
The net assets of the combined entities or businesses are combined using the existing carrying amounts from the controlling party’s perspective. No amount is recognized in respect of goodwill or excess of the acquirer’s interest in the net fair value of acquiree’s identifiable assets, liabilities and contingent liabilities over the acquisition cost at the time of common control combination. All differences between the cost of acquisition (fair value of consideration paid) and the amounts at which the assets and liabilities are recorded, arising from common control combination, have been recognized directly in equity as part of the capital reserve.
The combined statements of profit or loss and other comprehensive income include the results of each of the combining entities or businesses from the earliest date presented or since the date when the combined entities or businesses first came under the common control, where this is a shorter period, regardless of the date of the common control combination.
Non-controlling interests comprise the portion of a subsidiary corporation’s net results of operations and its net assets, which is attributable to the interests that are not owned directly or indirectly by the equity holders of the Company. They are shown separately in the unaudited interim condensed consolidated statement of comprehensive income, statement of changes in equity, and statement of financial position. Total comprehensive income is attributed to the non-controlling interests based on the irrespective interests in a subsidiary, even if this results in the non-controlling interests having a deficit balance.
CONVENIENCE TRANSLATION
Translations of amounts in the unaudited interim consolidated statement of financial position, unaudited interim consolidated statement of comprehensive income and unaudited interim consolidated statement of cash flows from RM into USD as of and for the period ended June 30, 2025 are solely for the convenience of the reader. Unless otherwise noted, all translations from RM into USD for the six months ended June 30, 2025 were calculated at the evening middle rate of USD1 = RM4.21250, as published by Bank Negara Malaysia, or an average rate of USD1 = RM4.37809.
F-
FOUNDER GROUP LIMITED AND ITS SUBSIDIARIES
NOTES TO UNAUDITED INTERIM CONDENSED CONSOLIDATED FINANCIAL STATEMENTS
| 2 | MATERIAL ACCOUNTING POLICIES INFORMATION (cont.) |
FINANCIAL ASSETS
Classification and measurement
The Group classifies its financial assets at fair value through other comprehensive income, fair value through profit and loss and amortized cost.
The classification depends on the Group’s business model for managing the financial assets as well as the contractual terms of the cash flows of the financial assets.
| 1. | Financial assets at FVTPL are initially recorded at fair value and transaction costs are expensed in the statement of income and comprehensive income. Realized and unrealized gains and income arising from changes in the fair value of the financial asset held at FVTPL are included in the statement of income and comprehensive income in the period in which they arise. The Company has classified cash as FVTPL. |
| 2. | Financial assets at FVTOCI are initially recognized at fair value plus transaction costs. Subsequently they are measured at fair value, with gains and losses arising from changes in fair value recognized in other comprehensive income. There is no subsequent reclassification of fair value gains and losses to profit or loss following the derecognition of the investment. There are no financial assets classified as FVTOCI. |
| 3. | Financial assets at amortized cost are initially recognized at fair value, net of transaction costs, and subsequently carried at amortized cost less any impairment. They are classified as current assets or non- current assets based on their maturity date. The Company has classified trade receivables, contract assets, other receivables and amounts due from related parties at amortized cost. |
Impairment
The Company assesses at end of each reporting period whether there is objective evidence that a financial asset or group of financial assets is impaired.
The Company recognizes expected credit losses (“ECL”) for accounts receivable based on the simplified approach. The simplified approach to the recognition of expected losses does not require the Company to track the changes in credit risk; rather, the Company recognizes a loss allowance based on lifetime expected credit losses at each reporting date from the date of the account receivable.
The Company measures expected credit loss by considering the risk of default over the contract period and incorporates forward-looking information into its measurement. ECLs are a probability-weighted estimate of credit losses.
ECLs are measured as the difference in the present value of the contractual cash flows that are due to the Company under the contract, and the cash flows that the Company expects to receive. The Company assesses all information available, including past due status, and forward looking macro-economic factors in the measurement of the ECLs associated with its assets carried at amortized cost.
The maximum period considered when estimating ECLs is the maximum contractual period over which the Company is exposed to credit risk.
F-
FOUNDER
GROUP LIMITED AND ITS SUBSIDIARIES
NOTES TO UNAUDITED INTERIM CONDENSED CONSOLIDATED FINANCIAL STATEMENTS
| 2 | MATERIAL ACCOUNTING POLICIES INFORMATION (cont.) |
FINANCIAL LIABILITIES AND EQUITY INSTRUMENTS
Classification as debt or equity
Debt and equity instruments issued by the Group are classified as either financial liabilities or as equity in accordance with the substance of the contractual arrangements and the definitions of a financial liability and an equity instrument.
Equity instruments
An equity instrument is any contract that evidences a residual interest in the assets of an entity after deducting all of its liabilities. Equity instruments issued by the Group are recognised at the proceeds received, net of direct issue costs.
Financial liabilities
Except for derivative financial instruments which are stated at fair value through profit or loss (“FVTPL”), all other financial liabilities are subsequently measured at amortised cost using the effective interest method.
The effective interest method is a method of calculating the amortised cost of a financial liability and of allocating interest expense over the relevant period. The effective interest rate is the rate that exactly discounts estimated future cash payments (including all fees and points paid or received that form an integral part of the effective interest rate, transaction costs and other premiums or discounts) through the expected life of the financial liability, or (where appropriate) a shorter period, to the amortised cost of a financial liability.
Financial liabilities are classified as either financial liabilities at FVTPL or at amortized cost. The Company determines the classification of its financial liabilities at initial recognition.
Financial liabilities are classified as measured at amortized cost, net of transaction costs unless classified as FVTPL. The Company’s trade payables, other payables and accrued liabilities, amounts due to related parties, lease liabilities and bank loans are classified as measured at amortized cost.
The Group derecognises financial liabilities when, and only when, the Group’s obligations are discharged, cancelled or expired. The difference between the carrying amount of the financial liability derecognised and the consideration paid and payable, including any non-cash assets transferred or liabilities assumed, is recognised in profit or loss.
F-
FOUNDER GROUP LIMITED AND ITS SUBSIDIARIES
NOTES TO UNAUDITED INTERIM CONDENSED CONSOLIDATED FINANCIAL STATEMENTS
| 2 | MATERIAL ACCOUNTING POLICIES INFORMATION (cont.) |
PLANT AND EQUIPMENT
Plant and equipment is recognized and subsequently measured at cost less accumulated depreciation and any accumulated impairment losses, if any. When components of property and equipment have different useful lives they are accounted for separately. Depreciation is provided at rates which are calculated to write off the assets over their estimated useful lives as follows:
| Computer and Software | 4 years straight line | |
| Motor Vehicles | 5 years straight line | |
| Office Equipment | 4 years straight line | |
| Equipment and Tools | 5 years straight line | |
| Solar Asset Plant | 10 - 21 years straight line | |
| Office Renovation | 5 years straight line | |
| Plant and Machinery | 5 years straight line | |
| Forklift | 5 years straight line |
Assets under construction are not depreciated as these assets are not available for use.
Plant or equipment is derecognized upon disposal or when no future economic benefits are expected from its use. Any gain or loss arising from derecognition of the asset, being the difference between the net disposal proceeds and the carrying amount, is recognized in profit or loss. The revaluation reserve included in equity is transferred directly to retained profits on retirement or disposal of the asset.
INVENTORIES
Inventories are stated at the lower of cost and net realizable value. Cost is determined based on weighted average method and comprises the purchase price and incidentals incurred in bringing the inventories to their present location and condition.
Net realizable value represents the estimated selling price less the estimated costs of completion and the estimated costs necessary to make the sale.
IMPAIRMENT OF NON-FINANCIAL ASSETS
Impairment of assets are reviewed at the end of each reporting period for impairment when there is an indication that the assets might be impaired. Impairment is measured by comparing the carrying values of the assets with their recoverable amounts. When the carrying amount of an asset exceeds its recoverable amount, the asset is written down to its recoverable amount and an impairment loss shall be recognized. The recoverable amount of an asset is the higher of the asset’s fair value less costs to sell and its value in use, which is measured by reference to discounted future cash flows using a pre-tax discount rate that reflects current market assessments of the time value of money and the risks specific to the asset. An impairment loss is recognized in profit or loss.
When there is a change in the estimates used to determine the recoverable amount, a subsequent increase in the recoverable amount of an asset is treated as a reversal of the previous impairment loss and is recognized to the extent of the carrying amount of the asset that would have been determined (net of amortization and depreciation) had no impairment loss been recognized. The reversal is recognized in profit or loss immediately.
CONTRACT ASSETS AND LIABILITIES
Contract assets includes unbilled amounts resulting from performance obligation satisfied measured under input method. Contract assets are subsequently transferred to trade receivable upon satisfaction of billing milestone base on contract and entitlement to pay becomes unconditional. A contract asset is subject to impairment requirement of IFRS 9.
Contract liabilities include advance payments from customers that performance obligation yet to satisfied. A contract liabilities is stated at cost and represents the obligation of the Group to transfer goods or services to a customer for which consideration has been received (or the amount is due) from the customers.
F-
FOUNDER GROUP LIMITED AND ITS SUBSIDIARIES
NOTES TO UNAUDITED INTERIM CONDENSED CONSOLIDATED FINANCIAL STATEMENTS
| 2 | MATERIAL ACCOUNTING POLICIES INFORMATION (cont.) |
LEASES
The Group assesses whether a contract is or contains a lease, at inception of the contract. The Group recognizes a right-of-use asset and corresponding lease liability with respect to all lease arrangements in which it is the lessee, except for low-value assets and short-term leases with 12 months or less. For these leases, the Group recognizes the lease payments as an operating expense on a straight-line method over the term of the lease unless another systematic basis is more representative of the time pattern in which economic benefits from the leased assets are consumed.
The Group recognizes a right-of-use asset and a lease liability at the lease commencement date. The right-of-use assets and the associated lease liabilities are presented as a separate line item in the statement of financial position.
The right-of-use asset is initially measured at cost. Cost includes the initial amount of the corresponding lease liability adjusted for any lease payments made at or before the commencement date, plus any initial direct costs incurred, less any incentives received.
The right-of-use asset is subsequently measured at cost less accumulated depreciation and any impairment losses, and adjustment for any remeasurement of the lease liability. The depreciation starts from the commencement date of the lease. If the lease transfers ownership of the underlying asset to the Group or the cost of the right-of-use asset reflects that the Group expects to exercise a purchase option, the related right-of-use asset is depreciated over the useful life of the underlying asset. Otherwise, the Group depreciates the right-of-use asset to the earlier of the end of the useful life of the right-of-use asset or the end of the lease term. The estimated useful lives of the right-of-use assets are determined on the same basis as those property, plant and equipment.
The lease liability is initially measured at the present value of the lease payments that are not paid at the commencement date, discounted by using the rate implicit in the lease. If this rate cannot be readily determined, the Group uses its incremental borrowing rate.
The lease liability is subsequently measured at amortised cost using the effective interest method. It is remeasured when there is a change in the future lease payments (other than lease modification that is not accounted for as a separate lease) with the corresponding adjustment is made to the carrying amount of the right-of-use asset, or is recognized in profit or loss if the carrying amount has been reduced to zero.
PROVISIONS
Provisions are recognized when the Group has a present obligation (legal or constructive) as a result of past events, when it is probable that an outflow of resources embodying economic benefits will be required to settle the obligation, and when a reliable estimate of the amount can be made. Provisions are reviewed at the end of each reporting period and adjusted to reflect the current best estimate. Where the effect of the time value of money is material, the provision is the present value of the estimated expenditure required to settle the obligation. The discount rate shall be a pre-tax rate that reflects current market assessments of the time value of money and the risks specific to the liability. The unwinding of the discount is recognized as interest expense in profit or loss.
REVENUE RECOGNITION
The Group accounts for its revenue under IFRS 15 Revenue from Contracts with Customers. (“IFRS 15”) The five-step model defined by IFRS 15 requires the Company to:
| (1) | identify its contracts with customers; |
| (2) | identify its performance obligations under those contracts; |
| (3) | determine the transaction prices of those contracts; |
| (4) | allocate the transaction prices to its performance obligations in those contracts; and |
| (5) | recognise revenue when each performance obligation under those contracts is satisfied. Revenue recognized when promised goods and services are transferred to the client in an amount that reflects the consideration expected in exchange for those services. |
F-
FOUNDER GROUP LIMITED AND ITS SUBSIDIARIES
NOTES TO UNAUDITED INTERIM CONDENSED CONSOLIDATED FINANCIAL STATEMENTS
| 2 | MATERIAL ACCOUNTING POLICIES INFORMATION (cont.) |
REVENUE RECOGNITION (cont.)
Revenues are recognized when persuasive evidence of an arrangement exists, service has occurred, and all performance obligations have been performed pursuant to the terms of the agreement, the sales price is fixed oi determinable and collectability is reasonably assured. Our revenue agreements generally do not include a right of return in relation to the delivered goods or services. Depending on the terms of the agreement and the laws that apply to the agreement, control of the services may be transferred over time or at a point in time. Control of the services is transferred over time if our performance:
| - | provides all of the benefits received and consumed simultaneously by the client; |
| - | creates and enhances an asset that the client controls as the Group performs; or |
| - | does not create an asset with an alternative use to the Group and the Group has an enforceable right to payment for performance complete to date. |
The Group recognises revenue from the following major sources:
| (i) | Large-scale solar projects (“LSS”) |
LSS are utility scale solar PV power plants with installed generating capacity of 1 MWac or more. Large-scale solar projects are ground mounted and floating and are designed to supply power to the power grid. For the majority of our large-scale solar projects, we usually act as the contractor to the project awarder, who is the main contractor for a solar project. As an EPCC provider, we assume most of the responsibility for the entire project lifecycle, from design and engineering to material procurement, construction, installation, integration, and commissioning.
| (ii) | Commercial and industrial (“C&I”) solar projects |
C&I projects are smaller scale solar projects where the solar PV systems are installed on rooftops and are designed to generate electricity for commercial and industrial properties for their own consumption, such as factories, warehouses and commercial stores. For C&I projects, we usually sign a service contract with the project owner and act as the main contractor. As the main contractor, we engage in comprehensive services encompassing project design, engineering, equipment procurement, construction, and commissioning.
Rendering of Services
Revenue from providing product and services related to renewable energy services industry is recognized over time in the year in which the services are rendered using input method, determined based on the proportion of costs incurred for work performed to date over the estimated total costs. Transaction price is computed based on the price specified in the contract and adjusted for any variable consideration such as incentives and penalties.
A receivable is recognized when the services are rendered as this is the point over time that the consideration is unconditional because only the passage of time is required before the payment is due. If the services rendered exceed the payment received, a contract asset is recognized. If the payments exceed the services rendered, a contract liability is recognized.
Billings are made with a credit term of 30 days to 90 days, which is consistent with market practice, therefore, no element of financing is deemed present. The Company become entitled to invoice customers for construction of solar PV power plants and systems based on achieving a series of performance-related milestones.
Defect liability period and performance warranty are usually 24 months from the date of Certificate of Practical Completion as provided in the contracts with customers.
F-
FOUNDER GROUP LIMITED AND ITS SUBSIDIARIES
NOTES TO UNAUDITED INTERIM CONDENSED CONSOLIDATED FINANCIAL STATEMENTS
| 2 | MATERIAL ACCOUNTING POLICIES INFORMATION (cont.) |
REVENUE RECOGNITION (cont.)
Sale of Goods
Revenue is recognized at a point in time when the goods have been delivered to the customer and upon its acceptance, and it is probable that the Group will collect the considerations to which it would be entitled to in exchange for the goods sold. Billings are made with a credit term of 30 days to 90 days, which is consistent with market practice, therefore, no element of financing is deemed present.
The Company generally provides standard warranties to its customers, from date of delivery cost or satisfactory completion of the project. There is no warranty claim historically.
CASH AND CASH EQUIVALENTS
Cash and cash equivalents comprise cash in hand, bank balances, fixed deposits, demand deposits, and short-term, highly liquid investments that are readily convertible to known amounts of cash and which are subject to an insignificant risk of changes in value with original maturity periods of three months or less. For the purpose of the statement of cash flows, cash and cash equivalents are presented net of bank overdrafts.
SHARE CAPITAL
Ordinary shares are classified as equity. Incremental costs directly attributable to the issuance of new ordinary shares are deducted against the share capital account.
INCOME TAX
Current tax assets and liabilities are the expected amount of income tax recoverable or payable to the taxation authorities, measured using tax rates and tax laws that have been enacted or substantively enacted at the end of the reporting period and are recognized in profit or loss except to the extent that the tax relates to items recognized outside profit or loss (either in other comprehensive income or directly in equity).
Deferred taxes are recognized using the liability method for temporary differences other than those that arise from the initial recognition of an asset or liability in a transaction which is not a business combination and at the time of the transaction, affects neither accounting profit nor taxable profit.
Deferred tax assets and liabilities are measured at the tax rates that are expected to apply in the period when the asset is realized or the liability is settled, based on the period.
Deferred tax assets are recognized for all deductible temporary differences, unused tax losses and unused tax credits to the extent that it is probable that future taxable profits will be available against which the deductible temporary differences, unused tax losses and unused tax credits can be utilised. The carrying amounts of deferred tax assets are reviewed at the end of each reporting period and reduced to the extent that it is no longer probable that the related tax benefits will be realized.
Current and deferred tax items are recognized in correlation to the underlying transactions either in profit or loss, other comprehensive income or directly in equity.
Current tax assets and liabilities or deferred tax assets and liabilities are offset when there is a legally enforceable right to set off current tax assets against current tax liabilities and when the deferred taxes relate to the same taxable entity (or on different tax entities but they intend to settle current tax assets and liabilities on a net basis) and the same taxation authority.
F-
FOUNDER GROUP LIMITED AND ITS SUBSIDIARIES
NOTES TO UNAUDITED INTERIM CONDENSED CONSOLIDATED FINANCIAL STATEMENTS
| 2 | MATERIAL ACCOUNTING POLICIES INFORMATION (cont.) |
FOREIGN CURRENCY TRANSACTIONS
The functional currency used by the Company is the Malaysia Ringgit. Consequently, operations in currencies other than the Malaysia Ringgit are considered to be denominated in foreign currency and are recorded at the exchange rates in force on the dates of the operations.
At year-end, monetary assets and liabilities denominated in foreign currency are converted by applying the exchange rate on the balance sheet date. The profits or losses revealed are charged directly to the profit and loss account for the year in which they occur. Non-monetary items in foreign currency measured in terms of historical cost are converted at the exchange rate on the date of the transaction.
The exchange differences of the monetary items that arise both when liquidating them and when converting them at the closing exchange rate, are recognized in the results of the year, except those that are part of the investment of a business abroad, which are recognized directly in equity net of taxes until the time of its disposal.
EARNINGS PER SHARE
Basic income per share is calculated by dividing the income attributable to ordinary shareholders by the weighted average number of ordinary shares outstanding in the period. For all periods presented, the income attributable to ordinary shareholders equals the reported income attributable to owners of the Company.
Diluted income per share is calculated by the treasury stock method. Under the treasury stock method, the weighted average number of ordinary shares outstanding for the calculation of diluted income per share assumes that the proceeds to be received on the exercise of dilutive share options and warrants are used to repurchase ordinary shares at the average market price during the period.
The Company has no potentially dilutive securities, such as options or warrants, currently issued and outstanding, as of June 30, 2025 and 2024.
| 3 | CRITICAL ACCOUNTING JUDGEMENTS AND KEY SOURCES OF ESTIMATION UNCERTAINTY |
Management believes that there are no key assumptions made concerning the future, and other key sources of estimation uncertainty at the reporting date, that have a significant risk of causing a material adjustment to the carrying amounts of the assets and liabilities within the next financial year other than as disclosed below:-
Impairment of Trade Receivables and Contract Assets
The Group uses the simplified approach to estimate a lifetime expected credit loss allowance for all trade receivables and contract assets. The contract assets are grouped with trade receivables for impairment assessment because they have substantially the same risk characteristics as the trade receivables for the same types of contracts. The Group develops the expected loss rates based on the payment profiles of past sales and the corresponding historical credit losses, and adjusts for qualitative and quantitative reasonable and supportable forward-looking information. If the expectation is different from the estimation, such difference will impact the carrying value of trade receivables and contract assets.
Contract Revenue Recognition
Revenue from providing product and services related to renewable energy services industry is recognized over time measure via input method, determined based on the proportion of costs incurred for work performed to date over the estimated total costs. Transaction price is computed based on the price specified in the contract and adjusted for any variable consideration such as incentives and penalties. The Group applied judgement and assumptions significantly affects the determination of the amount and the timing of revenue recognized from contract with customers for commercial& industrial and large scale solar. The Group measures the performance of service work done by comparing the actual costs incurred with the estimated total costs required to complete the services. Significant judgements are required to estimate the total contract costs to complete. In making these estimate, management relied on estimates and also on past experience of completed projects. A change in estimate will directly affect the revenue to be recognized.
F-
FOUNDER GROUP LIMITED AND ITS SUBSIDIARIES
NOTES TO UNAUDITED INTERIM CONDENSED CONSOLIDATED FINANCIAL STATEMENTS
| 4 | ACQUISITION OF FOUNDER ENERGY SDN. BHD. AT DISCOUNT UNDER COMMON CONTROL |
On June 14, 2023, Founder Group Limited acquired 100% equity interests of Founder Energy Sdn. Bhd. from Reservoir Energy Link Berhad and Mr. Lee Seng Chi under common control. The Company accounted the transaction as following:
| RM | Convenience Translation USD |
|||||||
| Obligation assumed by the Company | 4 | 1 | ||||||
| Book value of Share Capital of Founder Energy Sdn. Bhd. | (1,300,000 | ) | (294,583 | ) | ||||
| Bargain purchase accounted as merger reserve in equity | 1,299,996 | 294,582 | ||||||
| 5 | ACQUISITION OF ASSETS AND BUSINESS FROM SOLAR BINA ENGINEERING SDN. BHD. AT DISCOUNT UNDER COMMON CONTROL |
On July 31, 2021, Founder Energy Sdn. Bhd. entered into a Business and Asset Transfer Agreement with Solar Bina Engineering Sdn. Bhd., a common control entity owned and controlled by Mr. Lee Seng Chi, acquiring a variety of fixed assets and inventory at the net asset value as define in aforementioned agreement.
In addition to assets, Founder Energy Sdn. Bhd. acquired renewable energy, mounting structure system, building structural design and installation, solar system installation services and project management business from Solar Bina Engineering Sdn. Bhd.
The net asset value of transferred inventory and other assets by Solar Bina Engineering Sdn Bhd. as of January 1, 2021 amounted to RM 1,375,507, whereas the net asset value of inventory and other assets as of July 31, 2021 amounted to RM 1,020,236, which is also the amount of consideration stipulated in said agreement. As such, the Company accounted for the bargain purchase, as other reserve in equity amounting to RM 355,271.
Business transferred from Solar Bina Engineering Sdn Bhd., resulted in a loss of RM 49,722, which Founder Energy Sdn Bhd. acquired without consideration. As such, the Company accounted for the bargain purchase, as other reserve in equity amounting to RM 49,722.
The consideration, amounting to RM 1,020,236, was made in cash, with payment being completed by Founder Energy Sdn. Bhd. to Solar Bina Engineering Sdn. Bhd. in the year 2021.
The Company account the acquisition of assets and business under common control similarly to business combination under common control, measured at book value of transferring entity tabled as following:
| RM | Convenience Translation USD |
|||||||
| Acquisition of assets from Solar Bina Engineering Sdn. Bhd. | ||||||||
| Computer and Software | 44,171 | 10,009 | ||||||
| Motor Vehicle | 14,746 | 3,342 | ||||||
| Office Equipment | 30,800 | 6,979 | ||||||
| Mould | 8,502 | 1,927 | ||||||
| Plant and Machinery | 691,187 | 156,625 | ||||||
| Forklift | 45,800 | 10,378 | ||||||
| Inventory | 540,301 | 122,434 | ||||||
| Total fixed assets acquired from Solar Bina Engineering Sdn. Bhd. | 1,375,507 | 311,694 | ||||||
| Consideration transferred by Founder Energy Sdn. Bhd. | (1,020,236 | ) | (231,189 | ) | ||||
| Bargain purchase accounted as other reserve in equity | 355,271 | 80,505 | ||||||
| Acquisition of business from Solar Bina Engineering Sdn. Bhd. | ||||||||
| Sales | 20,268 | 4,593 | ||||||
| Staff Costs | (69,990 | ) | (15,860 | ) | ||||
| Net loss absorbed by Solar Bina Engineering Sdn. Bhd. accounted as other reserve in equity | (49,722 | ) | (11,267 | ) | ||||
F-
FOUNDER GROUP LIMITED AND ITS SUBSIDIARIES
NOTES TO UNAUDITED INTERIM CONDENSED CONSOLIDATED FINANCIAL STATEMENTS
| 6 | PLANT AND EQUIPMENT |
| As of December 31, 2024 (Audited) |
Addition | Written off |
As of June 30, 2025 (Unaudited) |
|||||||||||||
| At cost | RM | RM | RM | RM | ||||||||||||
| Computer and Software | 254,214 | 29,521 | 283,735 | |||||||||||||
| Motor Vehicle | 369,547 | 350,000 | 719,547 | |||||||||||||
| Office Equipment | 39,628 | 39,628 | ||||||||||||||
| Equipment and Tools | 59,389 | 40,448 | 99,837 | |||||||||||||
| Office Renovation | 1,082,273 | 1,082,273 | ||||||||||||||
| Solar Asset Under Construction | 470,396 | 470,396 | ||||||||||||||
| Plant and Machinery & Solar Asset Plant | 25,486,353 | 140,000 | 25,626,353 | |||||||||||||
| Forklift | 45,800 | 45,800 | ||||||||||||||
| Capital Work-in-progress | 171,720 | 64,350 | 236,070 | |||||||||||||
| 27,979,320 | 624,319 | 28,603,639 | ||||||||||||||
| As of December 31, 2024 (Audited) |
Depreciation charge during the year |
Written off |
As of June 30, 2025 (Unaudited) |
|||||||||||||
| Accumulated depreciation | RM | RM | RM | RM | ||||||||||||
| Computer and Software | 148,905 | 31,926 | 180,831 | |||||||||||||
| Motor Vehicle | 49,741 | 54,060 | 103,801 | |||||||||||||
| Office Equipment | 30,879 | 3,922 | 34,801 | |||||||||||||
| Equipment and Tools | 22,248 | 9,695 | 31,943 | |||||||||||||
| Office Renovation | 101,419 | 108,227 | 209,646 | |||||||||||||
| Plant and Machinery & Solar Asset Plant | 1,010,144 | 1,081,204 | 2,091,348 | |||||||||||||
| Forklift | 32,989 | 4,046 | 37,035 | |||||||||||||
| 1,396,325 | 1,293,080 | 2,689,405 | ||||||||||||||
| As of December 31, 2023 (Audited) |
Addition | Written off |
As of December 31, 2024 (Audited) |
|||||||||||||
| At cost | RM | RM | RM | RM | ||||||||||||
| Computer and Software | 223,714 | 30,500 | 254,214 | |||||||||||||
| Motor Vehicle | 79,747 | 289,800 | 369,547 | |||||||||||||
| Office Equipment | 39,318 | 4,240 | (3,930 | ) | 39,628 | |||||||||||
| Equipment and Tools | 33,389 | 26,000 | 59,389 | |||||||||||||
| Signboard | 7,180 | (7,180 | ) | |||||||||||||
| Office Renovation | 41,500 | 1,082,273 | (41,500 | ) | 1,082,273 | |||||||||||
| Solar Asset Under Construction | 470,396 | 470,396 | ||||||||||||||
| Plant and Machinery & Solar Asset Plant | 2,025,568 | 23,460,785 | 25,486,353 | |||||||||||||
| Forklift | 45,800 | 45,800 | ||||||||||||||
| Capital Work-in-progress | 171,720 | 171,720 | ||||||||||||||
| 2,496,216 | 25,535,714 | (52,610 | ) | 27,979,320 | ||||||||||||
F-
FOUNDER GROUP LIMITED AND ITS SUBSIDIARIES
NOTES TO UNAUDITED INTERIM CONDENSED CONSOLIDATED FINANCIAL STATEMENTS
| 6 | PLANT AND EQUIPMENT (cont.) |
| As of December 31, 2023 (Audited) |
Depreciation charge during the year |
Written off |
As of December 31, 2024 (Audited) |
|||||||||||||
| Accumulated depreciation | RM | RM | RM | RM | ||||||||||||
| Computer and Software | 83,649 | 65,256 | 148,905 | |||||||||||||
| Motor Vehicle | 30,063 | 19,678 | 49,741 | |||||||||||||
| Office Equipment | 21,329 | 10,402 | (852 | ) | 30,879 | |||||||||||
| Equipment and Tools | 12,204 | 10,044 | 22,248 | |||||||||||||
| Signboard | 3,291 | 898 | (4,189 | ) | ||||||||||||
| Office Renovation | 9,604 | 106,605 | (14,790 | ) | 101,419 | |||||||||||
| Plant and Machinery & Solar Asset Plant | 649,337 | 360,807 | 1,010,144 | |||||||||||||
| Forklift | 25,190 | 7,799 | 32,989 | |||||||||||||
| 834,667 | 581,489 | (19,831 | ) | 1,396,325 | ||||||||||||
| As of December 31, 2024 (Audited) |
As of June 30, 2025 (Unaudited) |
As of June 30, 2025 (Unaudited) |
||||||||||
| Carrying amounts | RM | RM | Convenience Translation USD |
|||||||||
| Computer and Software | 105,309 | 102,904 | 24,428 | |||||||||
| Motor Vehicle | 319,806 | 615,746 | 146,171 | |||||||||
| Office Equipment | 8,749 | 4,827 | 1,146 | |||||||||
| Equipment and Tools | 37,141 | 67,894 | 16,117 | |||||||||
| Signboard | ||||||||||||
| Office Renovation | 980,854 | 872,627 | 207,152 | |||||||||
| Solar Asset Under Construction | 470,396 | 470,396 | 111,667 | |||||||||
| Plant and Machinery & Solar Asset Plant | 24,476,209 | 23,535,005 | 5,586,945 | |||||||||
| Forklift | 12,811 | 8,765 | 2,081 | |||||||||
| Capital Work-in-progress | 171,720 | 236,070 | 56,040 | |||||||||
| 26,582,995 | 25,914,234 | 6,151,747 | ||||||||||
|
As of December 31, 2024 (Audited) |
As of June 30, 2025 (Unaudited) |
As of June 30, 2025 (Unaudited) |
||||||||||
| RM | RM | Convenience Translation USD |
||||||||||
| Depreciation expenses, class under cost of sale | 416,378 | 1,029,431 | 244,375 | |||||||||
| Depreciation expenses, class separately from cost of sale | 165,111 | 263,649 | 62,588 | |||||||||
| Total depreciation expenses | 581,489 | 1,293,080 | 306,963 | |||||||||
F-
FOUNDER GROUP LIMITED AND ITS SUBSIDIARIES
NOTES TO UNAUDITED INTERIM CONDENSED CONSOLIDATED FINANCIAL STATEMENTS
| 6 | PLANT AND EQUIPMENT (cont.) |
During the financial year, the Group made the following cash payments to purchase plant and equipment.
| As of December 31, 2024 (Audited) |
As of June 30, 2025 (Unaudited) |
As of June 30, 2025 (Unaudited) |
||||||||||
| RM | RM | Convenience Translation USD |
||||||||||
| Purchase of plant and equipment | 25,535,714 | 624,319 | 148,206 | |||||||||
| Financed by hire purchase arrangements | (250,000 | ) | (300,300 | ) | (71,288 | ) | ||||||
| Other payables | (24,023,094 | ) | ||||||||||
| Cash payments on purchase of plant and equipment | 1,262,620 | 324,019 | 76,918 | |||||||||
The carrying amount of the plant and equipment of the Group under hire purchase arrangements at the end of the reporting period are as follows:
| As of December 31, 2024 (Audited) |
As of June 30, 2025 (Unaudited) |
As of June 30, 2025 (Unaudited) |
||||||||||
| RM | RM | Convenience Translation USD |
||||||||||
| Motor vehicle | 284,970 | 588,490 | 139,701 | |||||||||
F-
FOUNDER GROUP LIMITED AND ITS SUBSIDIARIES
NOTES TO UNAUDITED INTERIM CONDENSED CONSOLIDATED FINANCIAL STATEMENTS
| 7 | RIGHT-OF-USE ASSETS AND LEASE LIABILITIES |
| As of December 31, 2024 (Audited) |
As of June 30, 2025 (Unaudited) |
As of June 30, 2025 (Unaudited) |
||||||||||
| RM | RM | Convenience Translation USD |
||||||||||
| Right-of-use assets | ||||||||||||
| Balance brought forward | 213,761 | 739,244 | 175,488 | |||||||||
| Less: Amortization | (190,487 | ) | (143,079 | ) | (33,965 | ) | ||||||
| Termination of right-of-use asset | (142,507 | ) | ||||||||||
| Add: New lease recognized | 858,477 | |||||||||||
| Balance carried forward | 739,244 | 596,165 | 141,523 | |||||||||
| Lease liabilities | ||||||||||||
| Balance brought forward | 215,647 | 747,819 | 177,524 | |||||||||
| Add: Imputed interest | 24,391 | 19,703 | 4,677 | |||||||||
| Less: Principal repayment | (205,000 | ) | (156,000 | ) | (37,032 | ) | ||||||
| Termination of lease liability | (145,696 | ) | ||||||||||
| Add: New lease recognized | 858,477 | |||||||||||
| Balance carried forward | 747,819 | 611,522 | 145,169 | |||||||||
| Future minimum lease payments together with the present value of net minimum lease payments are as follows: |
||||||||||||
| Minimum lease payment: | ||||||||||||
| Not later than one (1) year | 312,000 | 312,000 | 74,065 | |||||||||
| Later than one (1) year and not later than five (5) years | 494,000 | 338,000 | 80,238 | |||||||||
| 806,000 | 650,000 | 154,303 | ||||||||||
| Less: Future interest charges | (58,181 | ) | (38,478 | ) | (9,134 | ) | ||||||
| Present value of lease payment | 747,819 | 611,522 | 145,169 | |||||||||
| Repayment as follows: | ||||||||||||
| Lease liabilities current portion | 276,524 | 284,499 | 67,537 | |||||||||
| Lease liabilities non-current portion | 471,295 | 327,023 | 77,632 | |||||||||
| 747,819 | 611,522 | 145,169 | ||||||||||
| The followings are the amounts recognized in profit or loss: | ||||||||||||
| Depreciation charges of right-of-use assets | 190,487 | 143,079 | 33,965 | |||||||||
| Interest expense on lease liabilities | 24,391 | 19,703 | 4,677 | |||||||||
| Extinguishment of right-of-use assets and liabilities | (3,188 | ) | ||||||||||
| Expense relating to short-term leases and leases of low-value assets | 12,499 | 53,943 | 12,805 | |||||||||
| Total | 224,189 | 216,725 | 51,447 | |||||||||
On July 1, 2024, Founder Energy Sdn. Bhd. had entered into a Tenancy Agreement with Mr. Lee Seng Chi pertaining to the rental of our principal office for two years with option to renew for additional year with monthly rental amounted RM 26,000 (December 31, 2024: RM 26,000).
The extension options for lease of office premise has been included in lease liabilities. Subsequent renewal is negotiated with Mr. Lee Seng Chi to align with the Group’s business needs.
F-
FOUNDER GROUP LIMITED AND ITS SUBSIDIARIES
NOTES TO UNAUDITED INTERIM CONDENSED CONSOLIDATED FINANCIAL STATEMENTS
| 8 | TRADE RECEIVABLES AND TRADE PAYABLES |
| As of December 31, 2024 (Audited) |
As of June 30, 2025 (Unaudited) |
As of June 30, 2025 (Unaudited) |
||||||||||
| RM | RM | Convenience Translation USD |
||||||||||
| Trade receivables | ||||||||||||
| Non-current | ||||||||||||
| Project retention receivables | 2,478,739 | 2,195,683 | 521,230 | |||||||||
| Current | ||||||||||||
| Trade receivables | 16,195,071 | 19,435,129 | 4,613,680 | |||||||||
| Project retention receivables | 1,168,425 | 3,363,472 | 798,450 | |||||||||
| Accrued liquidated ascertained damages to sub-contractors | 2,011,284 | 831,374 | 197,359 | |||||||||
| Less: Provision for expected credit loss | (580,425 | ) | (853,500 | ) | (202,611 | ) | ||||||
| Total current trade receivables | 18,794,355 | 22,776,475 | 5,406,878 | |||||||||
| Total trade receivables | 21,273,094 | 24,972,158 | 5,928,108 | |||||||||
| Increase/(Decrease) in provision for expected credit loss | 552,876 | (273,075 | ) | (72,922 | ) | |||||||
| Increase in total trade receivables | 5,371,214 | 3,699,064 | 878,116 | |||||||||
Trade receivables are non-interest bearing and generally have 30 to 90 days (December 31, 2024: 30 to 90 days) payment terms. Other credit terms may be negotiated with customers on a case-by-case basis. Due to their comparatively short maturities, the carrying value of trade receivables approximate their fair value.
F-
FOUNDER GROUP LIMITED
AND ITS SUBSIDIARIES
NOTES TO UNAUDITED INTERIM CONDENSED CONSOLIDATED FINANCIAL STATEMENTS
| 8 | TRADE RECEIVABLES AND TRADE PAYABLES (cont.) |
The aging of the Group’s net trade receivables is as follows:
| Gross | Impaired | Total | ||||||||||||||
| RM | RM | RM | Convenience Translation USD |
|||||||||||||
| As of June 30, 2025 (Unaudited) | ||||||||||||||||
| Current | 4,764,950 | (6,577 | ) | 4,758,373 | 1,129,585 | |||||||||||
| Past due | ||||||||||||||||
| 1 – 30 days | 3,160,798 | (4,058 | ) | 3,156,740 | 749,374 | |||||||||||
| 31 – 60 days | 1,443,752 | (4,373 | ) | 1,439,379 | 341,692 | |||||||||||
| 61 – 90 days | 4,534,038 | (3,522 | ) | 4,530,516 | 1,075,493 | |||||||||||
| More than 90 days | 5,531,591 | (834,970 | ) | 4,696,621 | 1,114,925 | |||||||||||
| 14,670,179 | (846,923 | ) | 13,823,256 | 3,281,484 | ||||||||||||
| 19,435,129 | (853,500 | ) | 18,581,629 | 4,411,069 | ||||||||||||
| Gross | Impaired | Total | ||||||||||||||
| RM | RM | RM | Convenience Translation USD |
|||||||||||||
| As of December 31, 2024 (Audited) | ||||||||||||||||
| Current | 9,400,268 | (6,577 | ) | 9,393,691 | 2,098,915 | |||||||||||
| Past due | ||||||||||||||||
| 1 – 30 days | 2,660,393 | (4,058 | ) | 2,656,335 | 593,528 | |||||||||||
| 31 – 60 days | 1,144,998 | (4,373 | ) | 1,140,625 | 254,860 | |||||||||||
| 61 – 90 days | 958,805 | (3,522 | ) | 955,283 | 213,447 | |||||||||||
| More than 90 days | 2,030,607 | (561,895 | ) | 1,468,712 | 328,167 | |||||||||||
| 6,794,803 | (573,848 | ) | 6,220,955 | 1,390,002 | ||||||||||||
| 16,195,071 | (580,425 | ) | 15,614,646 | 3,488,917 | ||||||||||||
F-
FOUNDER GROUP LIMITED AND ITS SUBSIDIARIES
NOTES TO UNAUDITED INTERIM CONDENSED CONSOLIDATED FINANCIAL STATEMENTS
| 8 | TRADE RECEIVABLES AND TRADE PAYABLES (cont.) |
The movements in the Group’s allowance for expected credit losses are as follows:
| ECL – not credit impaired | ECL – credit impaired | Total | ||||||||||||||
| RM | RM | RM | Convenience Translation USD |
|||||||||||||
| Trade receivables | ||||||||||||||||
| As of December 31, 2023 | 27,549 | 27,549 | 6,156 | |||||||||||||
| Charge for the year | 95,976 | 484,449 | 580,425 | 129,689 | ||||||||||||
| Reversal during the year | (27,549 | ) | (27,549 | ) | (6,156 | ) | ||||||||||
| As of December 31, 2024 | 95,976 | 484,449 | 580,425 | 129,689 | ||||||||||||
| As of January 1, 2025 | 95,976 | 484,449 | 580,425 | 137,786 | ||||||||||||
| Charge for the year | 649,075 | 649,075 | 154,083 | |||||||||||||
| Reversal during the year | (376,000 | ) | (376,000 | ) | (89,258 | ) | ||||||||||
| As of June 30, 2025 | 95,976 | 757,524 | 853,500 | 202,611 |
| As of December 31, 2024 (Audited) |
As of June 30, 2025 (Unaudited) |
As of June 30, 2025 (Unaudited) |
||||||||||
| RM | RM | Convenience Translation USD |
||||||||||
| Trade payables | ||||||||||||
| Trade payables | 25,204,848 | 22,586,074 | 5,361,679 | |||||||||
| Project retention payables | 2,191,966 | 2,568,256 | 609,675 | |||||||||
| Total trade payables | 27,396,814 | 25,154,330 | 5,971,354 | |||||||||
| Decrease in total trade payables | (11,022,059 | ) | (2,242,484 | ) | (532,340 | ) | ||||||
Included in trade payables is related party balance amounting to Nil (December 31, 2024: RM 2,667).
Trade payables are non-interest bearing and generally on cash basis or credit terms of 7 days to 90 days (December 31, 2024: 7 to 90 days). Other credit terms may be negotiated with suppliers on a case-by-case basis.
F-
FOUNDER GROUP LIMITED
AND ITS SUBSIDIARIES
NOTES TO UNAUDITED INTERIM CONDENSED CONSOLIDATED FINANCIAL STATEMENTS
| 9 | DEFERRED TAX ASSET AND INCOME TAX (EXPENSE)/BENEFIT |
| For the six months ended | ||||||||||||
| June 30, 2024 |
June 30, 2025 |
June 30, 2025 |
||||||||||
| RM | RM | Convenience Translation USD |
||||||||||
| Income tax expense/(benefit) | ||||||||||||
| Tax expense/(benefit) recognized in profit or loss | ||||||||||||
| Current income tax | ||||||||||||
| Current financial year | (420,371 | ) | 610,581 | 144,945 | ||||||||
| Prior financial year | 250,233 | 73,304 | 17,402 | |||||||||
| Deferred taxation | ||||||||||||
| Current financial year | (932,747 | ) | (221,424 | ) | ||||||||
| Prior financial year | 397,530 | 94,369 | ||||||||||
| Total income tax expense/(benefit) recognized in profit or loss | (170,138 | ) | 148,668 | 35,292 | ||||||||
British Virgin Islands
The Company is incorporated in the British Virgin Islands and is not subject to tax on income or capital gains under current British Virgin Islands law.
Malaysia
Founder Energy Sdn. Bhd., Founder Assets Sdn. Bhd. and Founder Solar Solution Sdn. Bhd. are subject to Malaysia Corporate Tax on the taxable income as reported in its statutory financial statements adjusted in accordance with relevant Malaysia tax laws. The standard corporate income tax rate in Malaysia is calculated at 24% of the estimated assessable profits for the financial year.
The unutilized tax losses can be carried forward for a maximum period of ten consecutive years to offset future taxable income.
Singapore
Founder Energy (Singapore) Pte Ltd is subject to Singapore Corporate Tax on the taxable income as reported in its statutory financial statements adjusted in accordance with relevant Singapore tax laws. The standard corporate income tax rate in Singapore is 17%.
Thailand
Founder Assets (Thailand) Company Limited is subject to Thailand Corporate Tax on the taxable income as reported in its statutory financial statements adjusted in accordance with relevant Thailand tax laws. The standard corporate income tax rate in Thailand is 20%.
F-
FOUNDER GROUP LIMITED
AND ITS SUBSIDIARIES
NOTES TO UNAUDITED INTERIM CONDENSED CONSOLIDATED FINANCIAL STATEMENTS
| 9 | DEFERRED TAX ASSET AND INCOME TAX (EXPENSE)/BENEFIT (cont.) |
The numerical reconciliations between the tax expense and the product of accounting loss multiplied by the applicable tax rates of the Group are as follows:
| For the six months ended | ||||||||||||
| June 30, 2024 |
June 30, 2025 |
June 30, 2025 |
||||||||||
| RM | RM | Convenience Translation USD |
||||||||||
| Net loss before taxes | (1,881,960 | ) | (1,780,930 | ) | (422,771 | ) | ||||||
| Tax at the Malaysian statutory income tax rate of 24% | (451,670 | ) | (427,423 | ) | (101,465 | ) | ||||||
| Tax effects in respect of: | ||||||||||||
| Different tax rates in other countries | (17,072 | ) | 554,889 | 131,724 | ||||||||
| Deferred tax not recognized on previously unrecognized origination and reversal of temporary differences | (740,027 | ) | (175,674 | ) | ||||||||
| Adjustment in respect of current income tax of prior years | 250,233 | 73,304 | 17,402 | |||||||||
| Adjustment in respect of deferred tax of prior years | 397,530 | 94,369 | ||||||||||
| Non-deductible expenses | 56,742 | 410,137 | 97,361 | |||||||||
| Non-taxable income | (8,371 | ) | (119,742 | ) | (28,425 | ) | ||||||
| Tax benefit | (170,138 | ) | 148,668 | 35,292 | ||||||||
The deferred tax assets are made up of the following:
| As of December 31, 2024 (Audited) |
As of June 30, 2025 (Unaudited) |
As of June 30, 2025 (Unaudited) |
||||||||||
| RM | RM | Convenience Translation USD |
||||||||||
| At beginning of year/period | 74,000 | 74,000 | 17,566 | |||||||||
| Recognised in profit or loss | 535,217 | 127,055 | ||||||||||
| At end of year/period | 74,000 | 609,217 | 144,621 | |||||||||
Presented after appropriate offsetting as follows:
| As of December 31, 2024 (Audited) |
As of June 30, 2025 (Unaudited) |
As of June 30, 2025 (Unaudited) |
||||||||||
| RM | RM | Convenience Translation USD |
||||||||||
| Deferred tax asset | 74,000 | 609,217 | 144,621 | |||||||||
| Deferred tax liability | ||||||||||||
| 74,000 | 609,217 | 144,621 | ||||||||||
F-
FOUNDER
GROUP LIMITED AND ITS SUBSIDIARIES
NOTES TO UNAUDITED INTERIM CONDENSED CONSOLIDATED FINANCIAL STATEMENTS
| 9 | DEFERRED TAX ASSET AND INCOME TAX (EXPENSE)/BENEFIT (cont.) |
The deferred tax asset as at the end of the reporting period are made up of the temporary differences arising from:
| As of December 31, 2024 (Audited) |
As of June 30, 2025 (Unaudited) |
As of June 30, 2025 (Unaudited) |
||||||||||
| RM | RM | Convenience Translation USD |
||||||||||
| Deferred tax asset | ||||||||||||
| Plant and equipment | 181,284 | 43,035 | ||||||||||
| Provisions and others | 707,852 | 2,041,958 | 484,738 | |||||||||
| Other temporary differences | 479,842 | 113,909 | ||||||||||
| Deferred tax liability | ||||||||||||
| Plant and equipment | (295,010 | ) | (164,679 | ) | (39,093 | ) | ||||||
| Other temporary differences | (104,509 | ) | — | |||||||||
| Presented after appropriate offsetting | 308,333 | 2,538,405 | 602,589 | |||||||||
| At 24% | 74,000 | 609,217 | 144,621 | |||||||||
| 10 | INVENTORIES |
| As of December 31, 2024 (Audited) |
As of June 30, 2025 (Unaudited) |
As of June 30, 2025 (Unaudited) |
||||||||||
| RM | RM | Convenience Translation USD |
||||||||||
| Inventories | 3,049,405 | 1,377,332 | 326,963 | |||||||||
The amount of inventories recognized as an expense in cost of sales of the Group was RM 49,602,598 (USD 11,775,097) (June 30, 2024: RM 28,212,121).
F-
FOUNDER
GROUP LIMITED AND ITS SUBSIDIARIES
NOTES TO UNAUDITED INTERIM CONDENSED CONSOLIDATED FINANCIAL STATEMENTS
| 11 | CONTRACT ASSETS AND CONTRACT LIABILITIES |
| As of December 31, 2024 (Audited) |
As of June 30, 2025 (Unaudited) |
As of June 30, 2025 (Unaudited) |
||||||||||
| RM | RM | Convenience Translation USD |
||||||||||
| Contract Assets | ||||||||||||
| Contract cost | 189,071,858 | 232,283,405 | 55,141,461 | |||||||||
| Contract margin | 24,840,605 | 33,377,175 | 7,923,365 | |||||||||
| Contract revenue recognized | 213,912,463 | 265,660,580 | 63,064,826 | |||||||||
| Less: Bill to trade receivables | (180,008,528 | ) | (244,671,600 | ) | (58,082,279 | ) | ||||||
| Contract assets carried forward | 33,903,935 | 20,988,980 | 4,982,547 | |||||||||
| Contract cost assets | ||||||||||||
| Less: Provision for impairment loss | (2,668,908 | ) | (2,668,908 | ) | (633,569 | ) | ||||||
| Add: Accrued revenue | 1,312,562 | 1,980,694 | 470,195 | |||||||||
| Balance carried forward | 32,547,589 | 20,300,766 | 4,819,173 | |||||||||
| Decrease in contract assets | 18,445,458 | 12,246,823 | 2,907,258 | |||||||||
| Increase in provision for impairment loss | (2,372,132 | ) | ||||||||||
Significant decrease in contract assets for the year ended June 30, 2025 primarily due to a decrease in unbilled revenue related to the satisfaction of performance obligation in excess of amounts billed to customers.
| 12 | OTHER RECEIVABLES AND PREPAYMENT AND OTHER PAYABLES AND ACCRUED LIABILITIES |
| As of December 31, 2024 (Audited) |
As of June 30, 2025 (Unaudited) |
As of June 30, 2025 (Unaudited) |
||||||||||
| RM | RM | Convenience Translation USD |
||||||||||
| Other Receivables | ||||||||||||
| Project deposits | 323,067 | 1,162,562 | 275,979 | |||||||||
| Prepayment to suppliers | 10,743,527 | 10,981,418 | 2,606,864 | |||||||||
| Other receivables | 240,666 | 280,382 | 66,560 | |||||||||
| Other deposits | 366,513 | 991,684 | 235,415 | |||||||||
| Other prepayments | 1,271,021 | 1,056,341 | 250,763 | |||||||||
| Other current assets | 3,490,940 | 828,710 | ||||||||||
| 12,944,794 | 17,963,327 | 4,264,291 | ||||||||||
Included in the other current assets of the Group are commitment fee and deferred transaction costs of attributable to the convertible securities payable.
| As of December 31, 2024 (Audited) |
As of June 30, 2025 (Unaudited) |
As of June 30, 2025 (Unaudited) |
||||||||||
| RM | RM | Convenience Translation USD |
||||||||||
| Other Payables | ||||||||||||
| Accrued staff cost | 683,062 | 353,692 | 83,963 | |||||||||
| Other payables and accrued expenses | 30,314,506 | 10,491,985 | 2,490,679 | |||||||||
| Prepayment from customer | 818,931 | 1,964,674 | 466,391 | |||||||||
| 31,816,499 | 12,810,351 | 3,041,033 | ||||||||||
F-
FOUNDER
GROUP LIMITED AND ITS SUBSIDIARIES
NOTES TO UNAUDITED INTERIM CONDENSED CONSOLIDATED FINANCIAL STATEMENTS
| 13 | AMOUNT DUE FROM/(TO) RELATED PARTIES |
| As of December 31, 2024 (Audited) |
As of June 30, 2025 (Unaudited) |
As of June 30, 2025 (Unaudited) |
||||||||||
| RM | RM | Convenience Translation USD |
||||||||||
| Trade | ||||||||||||
| Amount due from Solar Bina Engineering Sdn. Bhd. | 24,727 | 24,727 | 5,870 | |||||||||
| Amount due from RL Sunseap Energy Sdn. Bhd. | 1,387,771 | |||||||||||
| Amount due from Reservoir Link Renewable Sdn. Bhd. | 390,000 | 3,840,451 | 911,680 | |||||||||
| Amount due from RL Sigma Engineering Sdn. Bhd. | 697,677 | 165,620 | ||||||||||
| 1,802,498 | 4,562,855 | 1,083,171 | ||||||||||
| Non-trade | ||||||||||||
| Amount due from Solar Bina Engineering Sdn. Bhd. | 400,000 | 1,600,000 | 379,822 | |||||||||
| Amount due from Reservoir Link Energy Bhd. | 217,995 | 217,995 | 51,750 | |||||||||
| 617,995 | 1,817,995 | 431,572 | ||||||||||
| Amount due from related parties | 2,420,493 | 6,380,850 | 1,514,742 | |||||||||
| Non-trade | ||||||||||||
| Amount due to Reservoir Link Energy Bhd. | 1,514,762 | 1,790,337 | 425,006 | |||||||||
| Amount due to Reservoir Link Sdn. Bhd. | 258,804 | 258,804 | 61,438 | |||||||||
| Amount due to Reservoir Link Holdings Sdn. Bhd. | — | 600,000 | 142,433 | |||||||||
| Amount due to Mr. Lee Seng Chi | 394,500 | 465,045 | 110,396 | |||||||||
| Amount due to related parties | 2,168,066 | 3,114,186 | 739,273 | |||||||||
Both amount due to and from related parties is repayable on demand. Other than amount due to and from related parties that is trade nature, amount due to and from related parties is subject to interest rate of BLR + 1.5% per annum.
Material Transactions with Related Parties
| Name of Related Party | Relationship to Us | |
| Solar Bina Engineering Sdn. Bhd. | An entity where Chief Executive Officer and Director Mr. Lee Seng Chi is a common director. | |
| Reservoir Link Energy Bhd. | Our largest shareholder. | |
| Reservoir Link Holdings Sdn. Bhd. | A corporate shareholder of Reservoir Link Energy Bhd. | |
| Reservoir Link Sdn. Bhd. | An entity controlled by Reservoir Link Energy Bhd. | |
| Reservoir Link Renewable Sdn. Bhd. | An entity controlled by Reservoir Link Energy Bhd. | |
| RL Sigma Engineering Sdn. Bhd. | An entity controlled by Reservoir Link Energy Bhd. | |
| Lee Seng Chi | Our Chief Executive Officer and Director | |
| RL Sunseap Energy Sdn. Bhd. | Related company with Reservoir Link Energy Bhd. |
F-
FOUNDER GROUP LIMITED AND ITS SUBSIDIARIES
NOTES TO UNAUDITED INTERIM CONDENSED CONSOLIDATED FINANCIAL STATEMENTS
| 13 | AMOUNT DUE FROM/(TO) RELATED PARTIES (cont.) |
| For the six months ended | ||||||||||||
| June 30, 2024 |
June 30, 2025 |
June 30, 2025 |
||||||||||
| RM | RM | Convenience Translation USD |
||||||||||
| Revenue from Solar Bina Engineering Sdn. Bhd. | 74,034 | |||||||||||
| Revenue from Reservoir Link Energy Bhd. | 138,170 | |||||||||||
| Revenue from RL Sunseap Energy Sdn. Bhd. | 1,000,483 | 4,360,439 | 1,035,119 | |||||||||
| Revenue from Reservoir Link Renewable Sdn. Bhd. | (145,493 | ) | 7,368,513 | 1,749,202 | ||||||||
| Revenue from RL Sigma Engineering Sdn. Bhd. | 2,940,468 | 698,034 | ||||||||||
| Total revenue from related parties | 1,067,194 | 14,669,420 | 3,482,355 | |||||||||
| Purchases from Reservoir Link Renewable Sdn. Bhd. | 1,799 | 386,972 | 91,863 | |||||||||
| Expenses charged to Reservoir Link Energy Bhd. | 50,188 | |||||||||||
| Expenses charged by Reservoir Link Energy Bhd. | 56,441 | 216,352 | 51,360 | |||||||||
| Rental payment to Mr. Lee Seng Chi | 75,000 | 156,000 | 37,033 | |||||||||
| Finance cost charged by Reservoir Link Energy Bhd. | 90,097 | 59,223 | 14,059 | |||||||||
| Finance cost charged by Reservoir Link Sdn. Bhd. | (26,583 | ) | ||||||||||
| 63,514 | 59,223 | 14,059 | ||||||||||
| Advances to Solar Bina Engineering Sdn. Bhd. | 1,500,000 | 356,083 | ||||||||||
The related party transactions derived from the sales of renewable energy contracting services, project management fees, back charge of expenses, management fees, legal and professional fee, rental expenses, interest expenses on advances, and advances provided.
The revenue from related parties consists of sales of renewable energy and contracting services. The Group was appointed as the contractor to provide engineering, procurement, construction and commissioning works for related parties, primarily for commercial and industrial rooftop solar photovoltaic facilities.
The purchases relate to the consultancy fees for project management services provided by Reservoir Link Renewable Sdn. Bhd. for commercial and industrial rooftop solar photovoltaic facilities.
The expenses charged to Reservoir Link Energy Bhd. include back charge of expenses while the expenses charged by Reservoir Link Energy Bhd. include a one-off legal and professional fee reimbursement related to the Initial Public Offering exercise and management fees.
The Group also incurs rental expenses payable to Mr. Lee Seng Chi amounting to RM26,000 per month for the lease of the Group’s principal office.
The finance cost charged by related parties consists of interest expenses on funds advanced to the Group.
In addition, advances were provided to Solar Bina Engineering Sdn. Bhd. for its short-term working capital needs, which are expected to be settled in due course.
F-
FOUNDER GROUP LIMITED AND ITS SUBSIDIARIES
NOTES TO UNAUDITED INTERIM CONDENSED CONSOLIDATED FINANCIAL STATEMENTS
| 14 | CONVERTIBLE SECURITIES PAYABLE |
The amount of convertible securities payable consists of the followings:
| As of December 31, 2024 (Audited) |
As of June 30, 2025 (Unaudited) |
As of June 30, 2025 (Unaudited) |
||||||||||
| RM | RM | Convenience Translation USD |
||||||||||
| At beginning of year/period | ||||||||||||
| Addition | 9,931,706 | 2,357,675 | ||||||||||
| Interest expenses | 294,875 | 70,000 | ||||||||||
| Conversion | (2,569,625 | ) | (610,000 | ) | ||||||||
| At end of year/period | 7,656,956 | 1,817,675 | ||||||||||
On April 22, 2025, the Company entered into a Securities Purchase Agreement with Avondale Capital, LLC, a Utah limited liability company (“Avondale”), pursuant to which the Company issue and sell to the Avondale an aggregate amount of up to USD10,000,000, representing the Company’s ordinary share.
On April 24, 2025, the Company received net proceeds of USD 1,250,000 from the initial Pre-Paid Purchase with a principal amount of USD 1,357,500, after deduction of USD 87,500 original issue discount and USD 20,000 for Avondale’s transaction costs.
On May 30, 2025, the Company received net proceeds of USD 1,000,000 from the Pre-Paid Purchase #2 and Pre-Paid Purchase #3, with an accrued original issue discount of USD 70,000.
In addition, the Company delivered 1,750,000 shares of ordinary shares as a commitment fee at closing. The Company has the right to repurchase these pre-delivery shares at USD 0.0001 per share. On June 23, 2025, Avondale purchased 785,171 shares of ordinary shares, at par value, in exchange for USD 610,000.
During the six months ended June 30, 2025, the Company charged to interest expense the amounts of USD 157,500 in connection with the discount on this security.
F-
FOUNDER
GROUP LIMITED AND ITS SUBSIDIARIES
NOTES TO UNAUDITED INTERIM CONDENSED CONSOLIDATED FINANCIAL STATEMENTS
| 15 | BORROWINGS |
| Note | As of December 31, 2024 (Audited) |
As of June 30, 2025 (Unaudited) |
As of June 30, 2025 (Unaudited) |
|||||||||||
| RM | RM | Convenience Translation USD |
||||||||||||
| Non-current liabilities | ||||||||||||||
| Hire purchase payables | 171,382 | 326,870 | 77,595 | |||||||||||
| Term loan | 1,928,094 | 17,936,947 | 4,258,029 | |||||||||||
| 2,099,476 | 18,263,817 | 4,335,624 | ||||||||||||
| Current liabilities | ||||||||||||||
| Bank overdraft | 1,465,600 | 1,489,911 | 353,688 | |||||||||||
| Hire purchase payables | 78,618 | 176,920 | 41,998 | |||||||||||
| Term loan | 143,944 | 170,464 | 40,467 | |||||||||||
| Trade financing | 31,252,219 | 35,215,282 | 8,359,711 | |||||||||||
| 32,940,381 | 37,052,577 | 8,795,864 | ||||||||||||
| Total borrowings | ||||||||||||||
| Bank overdraft | (a) | 1,465,600 | 1,489,911 | 353,688 | ||||||||||
| Hire purchase payables | (b) | 250,000 | 503,790 | 119,593 | ||||||||||
| Term loan | (a) | 2,072,038 | 18,107,411 | 4,298,496 | ||||||||||
| Trade financing | (a) | 31,252,219 | 35,215,282 | 8,359,711 | ||||||||||
| 35,039,857 | 55,316,394 | 13,131,488 | ||||||||||||
(a) The following table sets out the carrying amount of the borrowings:
| Capacity | As of December 31, 2024 (Audited) |
As of June 30, 2025 (Unaudited) |
As of June 30, 2025 (Unaudited) |
|||||||||||||
| RM | RM | RM | Convenience Translation USD |
|||||||||||||
| Line of Credit | ||||||||||||||||
| AmBank Islamic Bank – Domestic Recourse Factoring, at Base Financing Rate – 1% | 10,000,000 | 3,692,949 | 4,000,000 | 949,555 | ||||||||||||
| AmBank Islamic Bank – Invoice Financing, at Base Financing Rate | 30,000,000 | 19,502,322 | 19,580,418 | 4,648,170 | ||||||||||||
| AmBank Islamic Bank – Accepted Bills, at Islamic Interbank Discounting Rate + 1.50% | 10,200,000 | 436,269 | 99,926 | 23,721 | ||||||||||||
| CIMB Islamic Bank – Invoice Financing, at Cost of Funds + 1.5% | 14,500,000 | 6,257,673 | 6,984,300 | 1,657,994 | ||||||||||||
| CIMB Islamic Bank – Overdraft, at Base Financing Rate +0.5% | 500,000 | 460,338 | 492,460 | 116,904 | ||||||||||||
| Maybank Islamic Bank – Invoice Financing, at Cost of Funds + 1.5% | 5,000,000 | 1,363,007 | 2,625,323 | 623,222 | ||||||||||||
| Maybank Islamic Bank – Overdraft, at Base Financing Rate +1.0% | 1,000,000 | 1,005,262 | 997,451 | 236,784 | ||||||||||||
| Sunway SCF Sdn Bhd. – Invoice Factoring | 1,925,315 | 457,049 | ||||||||||||||
| AmBank Islamic Bank – Term Financing, at Base Financing Rate – 1% | 1,000,000 | 862,876 | 821,333 | 194,976 | ||||||||||||
| AmBank Islamic Bank – Term Financing, at Base Financing Rate – 1.75% | 9,700,000 | 1,209,161 | 1,195,506 | 283,800 | ||||||||||||
| AmBank Islamic Bank – Term Financing, at Base Financing Rate – 0.75% | 21,500,000 | 16,090,572 | 3,819,720 | |||||||||||||
| 103,400,000 | 34,789,857 | 54,812,604 | 13,011,895 | |||||||||||||
F-
FOUNDER GROUP LIMITED AND ITS SUBSIDIARIES
NOTES TO UNAUDITED INTERIM CONDENSED CONSOLIDATED FINANCIAL STATEMENTS
| 15 | BORROWINGS (cont.) |
The Group entered into banking facilities with AmBank Islamic Bank and is secured by:
| i) | Corporate guarantee from the Group; | |
| ii) | Corporate guarantee from Reservoir Link Energy Bhd; | |
| iii) | Fixed deposits pledged by Founder Energy Sdn. Bhd.; |
| iv) | First legal charge over the escrow account, debt reserve account and sinking fund account; and |
| v) | Insurance policy for the Directors of the Group. |
The Group entered into a banking facility with Maybank Islamic Bank and is secured by:
| i) | Corporate guarantee from the Group; and |
| ii) | Fixed deposits pledged by Founder Energy Sdn. Bhd.. |
The Group entered into a banking facility with CIMB Islamic Bank and is secured by:
| i) | Corporate guarantee from the Group; |
| ii) | Fixed deposits pledged by Founder Energy Sdn. Bhd.; and |
| iii) | Sinking fund account. |
(b) Hire purchase payable
| As of December 31, 2024 (Audited) |
As of June 30, 2025 (Unaudited) |
As of June 30, 2025 (Unaudited) |
||||||||||
| RM | RM | Convenience Translation USD |
||||||||||
| Minimum hire purchase payment | ||||||||||||
| Not later than one (1) year | 90,612 | 197,712 | 46,934 | |||||||||
| Later than one (1) year and not later than five (5) years | 181,213 | 341,173 | 80,990 | |||||||||
| 271,825 | 538,885 | 127,924 | ||||||||||
| Less: Future interest charges | (21,825 | (35,095 | ) | (8,331 | ) | |||||||
| Present value of hire purchase payment | 250,000 | 503,790 | 119,593 | |||||||||
| Repayable as follows: | ||||||||||||
| Non-current liabilities | 171,382 | 326,870 | 77,595 | |||||||||
| Current liabilities | 78,618 | 176,920 | 41,998 | |||||||||
| 250,000 | 503,790 | 119,593 | ||||||||||
The hire purchase payables of the Group bears interest of 3.19% per annum and are secured by the Group’s motor vehicle under hire purchase arrangements.
F-
FOUNDER GROUP LIMITED AND ITS SUBSIDIARIES
NOTES TO UNAUDITED INTERIM CONDENSED CONSOLIDATED FINANCIAL STATEMENTS
| 15 | BORROWINGS (cont.) |
(c) The following table sets out the remaining maturities of the borrowings based on contractual undiscounted repayment obligations:
| As of December 31, 2024 (Audited) |
As of June 30, 2025 (Unaudited) |
As of June 30, 2025 (Unaudited) |
||||||||||
| RM | RM | Convenience Translation USD |
||||||||||
| Maturities | ||||||||||||
| Within 1 year | 32,940,381 | 37,052,578 | 8,795,864 | |||||||||
| 1 - 5 years | 930,524 | 6,457,619 | 1,532,966 | |||||||||
| More than 5 years | 1,168,952 | 11,806,197 | 2,802,658 | |||||||||
| Total | 35,039,857 | 55,316,394 | 13,131,488 | |||||||||
The interest rate profile of the Group’s interest-bearing financial instruments based on their carrying amount as at the end of the reporting period are as follows based on their carrying amount as at the end of the reporting period are as follows:
| As of December 31, 2024 (Audited) |
As of June 30, 2025 (Unaudited) |
As of June 30, 2025 (Unaudited) |
||||||||||
| RM | RM | Convenience Translation USD |
||||||||||
| Fixed rate instrument | ||||||||||||
| Hire purchase payables | 250,000 | 503,790 | 119,593 | |||||||||
| Floating rate instrument | ||||||||||||
| Bank borrowings | 34,789,857 | 54,812,604 | 13,011,895 | |||||||||
| Total | 35,039,857 | 55,316,394 | 13,131,488 | |||||||||
Sensitivity analysis for variable rate instruments
Sensitivity analysis of interest rate for the floating rate instruments at the end of each reporting period, assuming all other variables remain constant, is as follows:
| As of December 31, 2024 (Audited) |
As of June 30, 2025 (Unaudited) |
As of June 30, 2025 (Unaudited) |
||||||||||
| Effects of 50 basis point changes | RM | RM | Convenience Translation USD |
|||||||||
| Floating rate instrument | ||||||||||||
| Bank borrowings | 132,201 | 208,288 | 49,445 | |||||||||
Sensitivity analysis for fixed rate instruments at the end of each reporting period is not presented as fixed rate instruments are not affected by changes in interest rates.
F-
FOUNDER GROUP LIMITED AND ITS SUBSIDIARIES
NOTES TO UNAUDITED INTERIM CONDENSED CONSOLIDATED FINANCIAL STATEMENTS
| 16 | SHARE CAPITAL |
| As of December 31, 2024 (Audited) |
As of June 30, 2025 (Unaudited) |
As of December 31, 2024 (Audited) |
As of June 30, 2025 (Unaudited) |
As of June 30, 2025 (Unaudited) |
||||||||||||||||
| Paid up capital: | Number of ordinary shares | Number of ordinary shares | RM | RM | Convenience Translation USD |
|||||||||||||||
| At beginning of year/period | 15,700,000 | 17,665,289 | 69,284 | 7,425,257 | 1,762,673 | |||||||||||||||
| Issuance of share capital (1) | 1,218,750 | 21,208,687 | ||||||||||||||||||
| Issuance of share capital (2) | 2,813 | 49,301 | ||||||||||||||||||
| Transaction costs of share issue | (18,195,839 | ) | (228,590 | ) | (54,265 | ) | ||||||||||||||
| Issuance of share capital (3) | 743,726 | 4,293,824 | ||||||||||||||||||
| Issuance of share capital (4) | 785,171 | 2,615,680 | 620,933 | |||||||||||||||||
| At end of year/period | 17,665,289 | 18,450,460 | 7,425,257 | 9,812,347 | 2,329,341 | |||||||||||||||
As of December 31, 2023, the Company has authorized 15,700,000 ordinary shares at USD 0.001. The paid up ordinary shares has no par value and carry one vote per share and carry a right to dividends as and when declared by the Company.
| (1) | On October 24, 2024, 1,218,750 ordinary shares were issued in our initial public offering at USD 4.00 per ordinary share, before deduction the discounts and expenses. |
| (2) | On October 31, 2024, 2,813 ordinary shares were issued in our underwriters’ partial exercise of the over-allotment option, at USD 4.00 per ordinary share, before deduction the discounts and expenses. |
| (3) | On December 31, 2024, 743,726 ordinary shares were issued to CNP Equity Limited pursuant to the exercise of warrant as consideration for certain professional consulting service relating to the initial offering rendered to the Company. | |
| (4) | Pursuant to the Securities Purchase Agreement dated April 22, 2025, between Avondale Capital, LLC and the Company, Avondale elected to convert a portion of its convertible securities into redemption conversion shares. On June 23, 2025, 785,171 ordinary shares were issued to Avondale, amount of USD 610,000 at a price of USD 0.7769 per share. |
F-
FOUNDER GROUP LIMITED AND ITS SUBSIDIARIES
NOTES TO UNAUDITED INTERIM CONDENSED CONSOLIDATED FINANCIAL STATEMENTS
| 17 | RESERVES |
| As of December 31, 2024 (Audited) |
As of June 30, 2025 (Unaudited) |
As of June 30, 2025 (Unaudited) |
||||||||||
| RM | RM | Convenience Translation USD |
||||||||||
| Bargain purchases from acquisition of Founder Energy Sdn. Bhd. under common control accounted as merger reserve | 1,299,996 | 1,299,996 | 308,605 | |||||||||
| Bargain purchase from acquisition of plant, equipment and inventory from Solar Bina Engineering Sdn. Bhd. under common control accounted as other reserve | 355,271 | 355,271 | 84,337 | |||||||||
| Bargain purchase from acquisition of business from Solar Bina Engineering Sdn. Bhd. under common control accounted as other reserve | 49,722 | 49,722 | 11,803 | |||||||||
| 1,704,989 | 1,704,989 | 404,745 | ||||||||||
| 18 | REVENUE |
| For the six months ended | ||||||||||||
| June 30, 2024 |
June 30, 2025 |
June 30, 2025 |
||||||||||
| RM | RM | Convenience Translation USD |
||||||||||
| Revenue from contract services | 21,776,845 | 38,289,161 | 9,089,415 | |||||||||
| Revenue from sales of goods | 7,595,546 | 2,507,413 | 595,232 | |||||||||
| Revenue from contract services – related parties | 1,067,194 | 14,669,420 | 3,482,355 | |||||||||
| 30,439,585 | 55,465,994 | 13,167,002 | ||||||||||
| Timing of revenue recognition: | ||||||||||||
| Point in time | 7,595,546 | 1,230,715 | 292,158 | |||||||||
| Over time | 22,844,039 | 54,235,279 | 12,874,844 | |||||||||
| 30,439,585 | 55,465,994 | 13,167,002 | ||||||||||
| Unsatisfied performance obligation | 36,756,234 | 196,695,432 | 46,693,278 | |||||||||
Revenue from contract services primarily involved in project execution, including construction, installation and integration works, testing and commissioning of our solar projects. Revenue from sales of goods involved in supply and selling of solar mounting structure, accessories and electricity.
Unsatisfied performance obligation was duly satisfied and recognized as revenue within 12 months after the reporting year end, respectively. Revenue from contract services primarily involved in project execution, including construction, installation and integration works, testing and commissioning of our solar projects. Revenue from sales of goods involved in supply and selling of parts and accessories.
F-
FOUNDER GROUP LIMITED AND ITS SUBSIDIARIES
NOTES TO UNAUDITED INTERIM CONDENSED CONSOLIDATED FINANCIAL STATEMENTS
| 19 | COST OF SALE |
| For the six months ended | ||||||||||||
| June 30, 2024 |
June 30, 2025 |
June 30, 2025 |
||||||||||
| RM | RM | Convenience Translation USD |
||||||||||
| Material cost | 9,968,658 | 8,774,878 | 2,083,058 | |||||||||
| Construction cost | 14,022,382 | 34,874,969 | 8,278,924 | |||||||||
| Staff cost | 2,166,300 | 2,409,446 | 571,975 | |||||||||
| Logistic cost | 722,336 | 643,081 | 152,660 | |||||||||
| Tools & machinery | 114,303 | 537,700 | 127,644 | |||||||||
| Miscellaneous | 1,185,657 | 1,333,093 | 316,461 | |||||||||
| Depreciation | 32,485 | 1,029,431 | 244,375 | |||||||||
| Total cost of sale | 28,212,121 | 49,602,598 | 11,775,097 | |||||||||
The cost of sale incurred pertaining to revenue derived from related party is amounting to RM 12,804,754 (USD 3,039,704) (June 30, 2024: RM 1,095,340).
Included in Cost of Sale of the Group is liquidated ascertained damages charged to subcontractors amounting to RM Nil (June 30, 2024: RM 959,666).
| 20 | EMPLOYEES SALARY AND RELATED COSTS |
| For the six months ended | ||||||||||||
| June 30, 2024 |
June 30, 2025 |
June 30, 2025 |
||||||||||
| RM | RM | Convenience Translation USD |
||||||||||
| Director fees | 407,080 | 96,636 | ||||||||||
| Director salaries | 246,850 | 390,000 | 92,582 | |||||||||
| Admin salaries | 1,026,827 | 1,485,617 | 352,669 | |||||||||
| Technical staff salaries | 1,418,215 | 1,696,953 | 402,837 | |||||||||
| Total | 2,691,892 | 3,979,650 | 944,724 | |||||||||
| Director related expenses | 137,099 | 327,795 | 77,815 | |||||||||
| Admin related expenses | 653,946 | 584,928 | 138,855 | |||||||||
| Technical staff related expenses | 751,407 | 712,493 | 169,138 | |||||||||
| Total | 1,542,452 | 1,625,216 | 385,808 | |||||||||
F-
FOUNDER GROUP LIMITED AND ITS SUBSIDIARIES
NOTES TO UNAUDITED INTERIM CONDENSED CONSOLIDATED FINANCIAL STATEMENTS
| 21 | FINANCIAL INSTRUMENTS AND RISK MANAGEMENT |
| As of December 31, 2024 (Audited) |
As of June 30, 2025 (Unaudited) |
As of June 30, 2025 (Unaudited) |
||||||||||
| RM | RM | Convenience Translation USD |
||||||||||
| Financial assets at amortized cost | ||||||||||||
| Trade receivables | 21,273,094 | 24,972,158 | 5,928,108 | |||||||||
| Other receivables | 930,246 | 5,925,568 | 1,406,664 | |||||||||
| Amount due from related parties | 2,420,493 | 6,380,850 | 1,514,742 | |||||||||
| Cash and bank balances | 13,901,973 | 23,037,161 | 5,468,763 | |||||||||
| 38,525,806 | 60,315,737 | 14,318,277 | ||||||||||
| Financial liabilities at amortized cost | ||||||||||||
| Trade payables | (27,396,814 | ) | (25,154,330 | ) | (5,971,354 | ) | ||||||
| Other payables and accrued liabilities | (31,816,499 | ) | (12,810,351 | ) | (3,041,033 | ) | ||||||
| Bank and other borrowings | (35,039,857 | ) | (55,316,394 | ) | (13,131,488 | ) | ||||||
| Amount due to related parties | (2,168,066 | ) | (3,114,186 | ) | (739,273 | ) | ||||||
| (96,421,236 | ) | (96,395,261 | ) | (22,883,148 | ) | |||||||
Foreign Currency Risk
We are exposed to foreign currency risk with transactions and balances that are denominated in currencies other than our functional currency. The currencies giving rise to this risk are primarily Chinese Yuan Renminbi (“CNY”) and United States Dollar (“USD”). Foreign currency risk is monitored closely on an on-going basis to ensure that the net exposure is at an acceptable level.
Sensitivity analysis for foreign currency risk
We are exposed to foreign currency risk with transactions and balances that are denominated in currencies other than the respective functional currencies of Group entities. The currencies giving rise to this risk are primarily Chinese Yuan Renminbi (“CNY”) and United States Dollar (“USD”). Foreign currency risk is monitored closely on an on-going basis to ensure that the net exposure is at an acceptable level.
Our exposure to foreign currency risk based on the carrying amounts of the financial instruments at the end of the reporting period is summarized below.
| CNY | USD | |||||||
| As of June 30, 2025 | RM | RM | ||||||
| Financial assets in foreign currencies | ||||||||
| Cash and bank balances | 2,154 | 5,281 | ||||||
| Financial liabilities in foreign currencies | ||||||||
| Trade payables | (2,827,265 | ) | (870,994 | ) | ||||
| Other payables | (47,244 | ) | ||||||
| (2,827,265 | ) | (918,237 | ) | |||||
| CNY | USD | |||||||
| As of December 31, 2024 | RM | RM | ||||||
| Financial assets in foreign currencies | ||||||||
| Cash and bank balances | 2,194 | 1,136,521 | ||||||
| Financial liabilities in foreign currencies | ||||||||
| Trade payables | (7,075,765 | ) | ||||||
F-
FOUNDER GROUP LIMITED AND ITS SUBSIDIARIES
NOTES TO UNAUDITED INTERIM CONDENSED CONSOLIDATED FINANCIAL STATEMENTS
| 21 | FINANCIAL INSTRUMENTS AND RISK MANAGEMENT (cont.) |
The following table details the sensitivity analysis to a 10% change in the foreign currencies at the end of the reporting period, with all other variables held constant.
| As of December 31, 2024 (Audited) |
As of June 30, 2025 (Unaudited) |
|||||||
| RM | RM | |||||||
| United States Dollar | 86,376 | (69,385 | ) | |||||
| Chinese Yuan Renminbi | (537,591 | ) | (214,708 | ) | ||||
Interest Rate Risk
We are exposed to interest rate risk as we have bank loans which are interest bearing. The interest rates and terms of repayment of the loans are disclosed in Note 15 to the financial statements. We currently do not have an interest rate hedging policy.
Liquidity Risk
Liquidity risk arises mainly due to general funding and business activities. We practice prudent risk management by maintaining sufficient cash balances and the availability of funding through certain committed credit facilities.
The table below summarises the maturity profile of the Company’s financial liabilities as at the end of the reporting period and are based on undiscounted contractual payments:
| Carrying amount |
Contractual cash flows |
Within 1 year |
More than 1 year and less than 2 years |
More than 5 years |
||||||||||||||||
| RM | RM | RM | RM | RM | ||||||||||||||||
| As of June 30, 2025 | ||||||||||||||||||||
| Trade payables | 25,154,330 | 25,154,330 | 25,154,330 | |||||||||||||||||
| Other payables and accrued liabilities | 12,810,351 | 12,810,351 | 12,810,351 | |||||||||||||||||
| Bank and other borrowings | 55,316,394 | 61,508,674 | 37,516,252 | 12,137,677 | 11,854,745 | |||||||||||||||
| Lease liabilities | 611,522 | 650,000 | 312,000 | 338,000 | ||||||||||||||||
| Amount due to related parties | 3,114,186 | 3,260,994 | 3,260,994 | |||||||||||||||||
| 97,006,783 | 103,384,349 | 79,053,927 | 12,475,677 | 11,854,745 | ||||||||||||||||
| Carrying amount |
Contractual cash flows |
Within 1 year |
More than 1 year and less than 2 years |
More than 5 years |
||||||||||||||||
| USD | USD | USD | USD | USD | ||||||||||||||||
| As of June 30, 2024 | ||||||||||||||||||||
| Trade payables | 5,971,354 | 5,971,354 | 5,971,354 | |||||||||||||||||
| Other payables and accrued liabilities | 3,041,033 | 3,041,033 | 3,041,033 | |||||||||||||||||
| Bank and other borrowings | 13,131,488 | 14,601,465 | 8,905,935 | 2,881,347 | 2,814,183 | |||||||||||||||
| Lease liabilities | 145,169 | 154,303 | 74,065 | 80,238 | ||||||||||||||||
| Amount due to related parties | 739,273 | 774,123 | 774,123 | |||||||||||||||||
| 23,028,317 | 24,542,278 | 18,766,510 | 2,961,585 | 2,814,183 | ||||||||||||||||
| Carrying amount |
Contractual cash flows |
Within 1 year |
More than 1 year and less than 2 years |
More than 5 years |
||||||||||||||||
| RM | RM | RM | RM | RM | ||||||||||||||||
| As of December 31, 2024 | ||||||||||||||||||||
| Trade payables | 27,396,814 | 27,396,814 | 27,396,814 | |||||||||||||||||
| Other payables and accrued liabilities | 31,816,499 | 31,816,499 | 31,816,499 | |||||||||||||||||
| Bank and other borrowings | 35,039,857 | 35,668,434 | 33,045,385 | 1,289,377 | 1,333,672 | |||||||||||||||
| Lease liabilities | 747,819 | 806,000 | 312,000 | 494,000 | ||||||||||||||||
| Amount due to related parties | 2,168,066 | 2,292,276 | 2,292,276 | |||||||||||||||||
| 97,169,055 | 97,980,023 | 94,862,974 | 1,783,377 | 1,333,672 | ||||||||||||||||
F-
FOUNDER GROUP LIMITED AND ITS SUBSIDIARIES
NOTES TO UNAUDITED INTERIM CONDENSED CONSOLIDATED FINANCIAL STATEMENTS
| 21 | FINANCIAL INSTRUMENTS AND RISK MANAGEMENT (cont.) |
Capital Risk Management
We manage our capital to ensure that entities within our Company will be able to maintain an optimal capital structure so as to support our businesses and maximize shareholders value. To achieve this objective, we may make adjustments to the capital structure in view of changes in economic conditions, such as adjusting the amount of dividend payment, returning of capital to shareholders or issuing new shares.
We manage our capital based on debt-to-equity ratio that complies with debt covenants and regulatory, if any. The debt-to-equity ratio is calculated as net debt divided by total equity. We include within net debt, loans, and borrowings from financial institutions. Capital includes equity attributable to the owners of the parent and non-controlling interest.
| 22 | CONCENTRATION OF RISK |
Customer Concentration
For the six months ended June 30, 2025, the Company generated total revenue of RM 55,465,994, of which three customers accounted for more than 10% of the Company’s total revenue.
For the six months ended June 30, 2024, the Company generated total revenue of RM 30,439,585, of which four customers accounted for more than 10% of the Company’s total revenue.
| For the six months ended | ||||||||||||||||||||
|
June 30, 2024 |
June 30, 2025 |
June 30, 2024 |
June 30, 2025 |
|||||||||||||||||
| Revenues | Percentage of revenues | |||||||||||||||||||
| RM | RM | USD | % | % | ||||||||||||||||
| Customer A | 9,467,487 | N/A* | N/A* | 31.10 | N/A* | |||||||||||||||
| Customer B | 6,570,203 | N/A* | N/A* | 21.58 | N/A* | |||||||||||||||
| Customer C | 5,842,660 | N/A* | N/A* | 19.19 | N/A* | |||||||||||||||
| Customer D | 3,503,863 | N/A* | N/A* | 11.51 | N/A* | |||||||||||||||
| Customer E | N/A* | 13,555,612 | 3,217,949 | N/A* | 24.44 | |||||||||||||||
| Customer F | N/A* | 7,368,513 | 1,749,202 | N/A* | 13.28 | |||||||||||||||
| Customer G | N/A* | 7,163,241 | 1,700,473 | N/A* | 12.91 | |||||||||||||||
| Others | 5,055,372 | 27,378,628 | 6,499,378 | 16.62 | 49.37 | |||||||||||||||
| Total | 30,439,585 | 55,465,994 | 13,167,002 | 100.00 | 100.00 | |||||||||||||||
F-
FOUNDER GROUP LIMITED AND ITS SUBSIDIARIES
NOTES TO UNAUDITED INTERIM CONDENSED CONSOLIDATED FINANCIAL STATEMENTS
| 22 | CONCENTRATION OF RISK (cont.) |
The following table sets forth a summary of customers who represent 10% or more of the Group’s total accounts receivable:
| As of December 31, 2024 (Audited) |
As of June 30, 2025 (Unaudited) |
As of December 31, 2024 (Audited) |
As of June 30, 2025 (Unaudited) |
|||||||||||||||||
| Receivables | Percentage of receivables | |||||||||||||||||||
| RM | RM | USD | % | % | ||||||||||||||||
| Customer A | 7,736,776 | 4,336,087 | 1,029,338 | 36.37 | 17.36 | |||||||||||||||
| Customer B | 5,366,239 | 4,888,821 | 1,160,551 | 25.23 | 19.58 | |||||||||||||||
| Customer E | N/A^ | 3,711,756 | 881,129 | N/A^ | 14.86 | |||||||||||||||
| Customer G | N/A^ | 4,769,930 | 1,132,328 | N/A^ | 19.10 | |||||||||||||||
| Customer H | N/A^ | 2,161,314 | 513,072 | N/A^ | 8.65 | |||||||||||||||
| Others | 8,170,079 | 5,104,250 | 1,211,690 | 38.40 | 20.45 | |||||||||||||||
| Total | 21,273,094 | 25,972,158 | 5,928,108 | 100.00 | 100.00 | |||||||||||||||
| * | Revenue from relevant customer was less than 10% of the Group’s total revenue for the respective year. |
| ^ | Receivables was less than 10% of the Groups total accounts receivables for the respective year. |
Vendor Concentration
For the six months ended June 30, 2025, the Company incurred cost of sale of RM 49,602,598, of which one vendor accounted for more than 10% of the Company’s total cost of sale.
For the six months ended June 30, 2024, the Company incurred cost of sale of RM 28,212,121, of which one vendor accounted for more than 10% of the Company’s total cost of sale.
F-
FOUNDER GROUP LIMITED AND ITS SUBSIDIARIES
NOTES TO UNAUDITED INTERIM CONDENSED CONSOLIDATED FINANCIAL STATEMENTS
| 22 | CONCENTRATION OF RISK (cont.) |
| For the six months ended | ||||||||||||||||||||
|
June 30, 2024 |
June 30, 2025 |
June 30, 2024 |
June 30, 2025 |
|||||||||||||||||
| Cost of sales | Percentage of cost of sales | |||||||||||||||||||
| RM | RM | USD | % | % | ||||||||||||||||
| Vendor A | 7,719,316 | N/A* | N/A* | 27.36 | N/A* | |||||||||||||||
| Vendor B | N/A* | 8,547,239 | 2,029,018 | N/A* | 17.23 | |||||||||||||||
| Others | 20,492,805 | 41,055,359 | 9,746,079 | 72.64 | 82.77 | |||||||||||||||
| Total | 28,212,121 | 49,602,598 | 11,775,097 | 100.00 | 100.00 | |||||||||||||||
The following table sets forth a summary of vendors who represent 10% or more of the Group’s total accounts payable:
| As of December 31, 2024 (Audited) |
As of June 30, 2025 (Unaudited) |
As of December 31, 2024 (Audited) |
As of June 30, 2025 (Unaudited) |
|||||||||||||||||
| Payables | Percentage of payables | |||||||||||||||||||
| RM | RM | USD | % | % | ||||||||||||||||
| Vendor A | 7,011,530 | N/A^ | N/A^ | 25.59 | N/A^ | |||||||||||||||
| Vendor B | N/A^ | N/A^ | N/A^ | N/A^ | N/A^ | |||||||||||||||
| Vendor C | N/A^ | 4,448,954 | 1,056,132 | N/A^ | 17.69 | |||||||||||||||
| Others | 20,385,284 | 20,705,376 | 4,915,222 | 74.41 | 82.31 | |||||||||||||||
| Total | 27,396,814 | 25,154,330 | 5,971,354 | 100.00 | 100.00 | |||||||||||||||
| * | Purchases from relevant vendor was less than 10% of the Group’s total cost of sale for the respective year. |
| ^ | Payables was less than 10% of the Groups total accounts payables for the respective year. |
| 23 | SEGMENT REPORTING |
The group reporting is organized and managed in two major business units. All of our revenue is derived from one segment country which is in Malaysia.
The reportable segments are summarized as follows:
| i) | Large-scale solar — Large-scale solar projects are utility scale solar PV power plants with installed generating capacity of 1 MWac or more. Large-scale solar projects are ground mounted and floating and are designed to supply power to the power grid. For the majority of our large-scale solar projects, we usually act as the contractor to the project awarder, who is the main contractor for a solar project. |
| ii) | Commercial & Industrial — C&I projects are smaller scale solar projects where the solar PV systems are installed on rooftops and are designed to generate electricity for commercial and industrial properties for their own consumption, such as factories, warehouses and commercial stores. For C&I projects, we usually sign a service contract with the project owner and act as the main contractor. |
Revenue from contract services primarily involved project execution, including construction, installation and integration works, testing and commissioning of our solar projects. Revenue from sales of goods involved supply and selling of solar mounting structures and accessories. Consequently, both segments contribute to revenue from contract services and sales of goods, as reflected in our disclosed financial reports.
F-
FOUNDER GROUP LIMITED AND ITS SUBSIDIARIES
NOTES TO UNAUDITED INTERIM CONDENSED CONSOLIDATED FINANCIAL STATEMENTS
| 23 | SEGMENT REPORTING (cont.) |
| For the six months ended | ||||||||||||
|
June 30, 2024 |
June 30, 2025 |
June 30, 2025 |
||||||||||
| By Business Unit | RM | RM | Convenience Translation USD |
|||||||||
| Revenue | ||||||||||||
| Large Scale Solar Contract Services | 18,705,854 | 31,310,177 | 7,432,683 | |||||||||
| Commercial & Industrial Contract Services | 4,075,825 | 21,648,404 | 5,139,087 | |||||||||
| Large Scale Solar Sales of Goods | 5,746,020 | |||||||||||
| Commercial & Industrial Sales of Goods | 1,911,886 | 2,507,413 | 595,232 | |||||||||
| Total revenue | 30,439,585 | 55,465,994 | 13,167,002 | |||||||||
| Cost of Sales | ||||||||||||
| Large Scale Solar Contract Services | (18,266,261 | ) | (28,708,507 | ) | (6,815,076 | ) | ||||||
| Commercial & Industrial Contract Services | (3,140,653 | ) | (18,632,087 | ) | (4,423,047 | ) | ||||||
| Large Scale Solar Sales of Goods | (5,064,522 | ) | ||||||||||
| Commercial & Industrial Sales of Goods | (1,740,685 | ) | (2,262,004 | ) | (536,974 | ) | ||||||
| Total cost of sales | (28,212,121 | ) | (49,602,598 | ) | (11,775,097 | ) | ||||||
| Large Scale Solar gross profit | 1,121,091 | 2,601,670 | 617,607 | |||||||||
| Commercial & Industrial gross profit | 1,106,373 | 3,261,726 | 774,298 | |||||||||
| Total gross profit | 2,227,464 | 5,863,396 | 1,391,905 | |||||||||
| Selling and administrative expenses | (3,454,946 | ) | (6,127,228 | ) | (1,454,534 | ) | ||||||
| Selling and administrative expenses to related parties | (56,441 | ) | (216,352 | ) | (51,360 | ) | ||||||
| Loss from operations before income tax | (1,283,923 | ) | (480,184 | ) | (113,989 | ) | ||||||
| As of December 31, 2024 (Audited) |
As of June 30, 2025 (Unaudited) |
As of June 30, 2025 (Unaudited) |
||||||||||
| Total assets | RM | RM | Convenience Translation USD |
|||||||||
| Large Scale Solar segment | 49,139,582 | 51,498,736 | 12,225,219 | |||||||||
| Commercial & Industrial segment | 33,956,854 | 23,083,016 | 5,479,648 | |||||||||
| Total of reportable segments | 83,096,436 | 74,581,752 | 17,704,867 | |||||||||
| Corporate and other | 31,195,694 | 47,390,780 | 11,250,037 | |||||||||
| Consolidated total assets | 114,292,130 | 121,972,532 | 28,954,904 | |||||||||
| Total liabilities | RM | RM | Convenience Translation USD |
|||||||||
| Large Scale Solar segment | 21,362,655 | 16,445,691 | 3,904,021 | |||||||||
| Commercial & Industrial segment | 29,714,895 | 12,621,562 | 2,996,217 | |||||||||
| Total of reportable segments | 51,077,550 | 29,067,252 | 6,900,238 | |||||||||
| Corporate and other | 46,093,102 | 75,596,487 | 17,945,754 | |||||||||
| Consolidated total liabilities | 97,170,652 | 104,663,739 | 24,845,992 | |||||||||
F-
FOUNDER GROUP LIMITED AND ITS SUBSIDIARIES
NOTES TO UNAUDITED INTERIM CONDENSED CONSOLIDATED FINANCIAL STATEMENTS
| 24 | COMMITMENTS AND CONTINGENCIES |
Operating lease commitments
For the details on future minimum lease payments under the non-cancelable operating leases as of June 30, 2025, please refer to Note 7 to the Consolidated Financial Statements.
Capital commitments
Capital expenditure as at the end of the reporting period is as follows:
|
As of December 31, 2024 (Audited) |
As of June 30, 2025 (Unaudited) |
As of June 30, 2025 (Unaudited) |
||||||||||
| RM | RM | Convenience Translation USD |
||||||||||
| Not later than one year | ||||||||||||
| Capital expenditure: | ||||||||||||
| Plant and equipment | 7,103,190 | 26,230 | 6,227 | |||||||||
| 25 | SUBSEQUENT EVENTS |
The Group evaluated all events and transactions that occurred after June 30, 2025 up through the date of report, which is the date that these consolidated financial statements are available for distribution. Other than the event disclosed below:
| (a) | On July 16, 2025, the Company amended and restated memorandum and articles of association to include a dual class share structure and the creation of two new classes of shares, being A (Class A Shares) and B (Class B Shares), both with no par value which rank pari passu as to distributions (including on a liquidation), and provide for enhanced voting rights at a rate of twenty-to-one in favour of the Class B Shares.
The share designations state that the 2,000,000 Ordinary Shares registered in the name of Mr. Lee Seng Chi and Reservoir Energy Link Bhd shall be redesignated as Class B Shares and the remaining Ordinary Shares in issue shall be redesignated as Class A Shares respectively. |
| (b) | On September 15, 2025, Founder Assets Sdn. Bhd. acquired 49% equity interest in RL Sunseap Energy Sdn. Bhd. for a total purchase consideration of RM1,916,649.80. The investment is classified as associate given the Company has significant influence over the financial and operating policy decisions of RL Sunseap Energy Sdn. Bhd. |
F-
Exhibit 99.2
MANAGEMENT’S
DISCUSSION AND ANALYSIS OF
FINANCIAL CONDITION AND RESULTS OF OPERATIONS
The following discussion and analysis of our financial condition and results of operations should be read in conjunction with our unaudited condensed consolidated financial statements and related notes that appear elsewhere in the report on Form 6-K of which this document is a part. In addition to historical consolidated financial information, the following discussion may contain forward-looking statements that reflect our plans, estimates, and beliefs. Our actual results could differ materially from those discussed in the forward-looking statements.
Overview
We are a pure-play, end-to-end EPCC solutions provider for solar photovoltaic (“PV”) facilities in Malaysia. Our primary focus is on two key segments: large-scale solar projects (“LSS”) and commercial and industrial (“C&I”) solar projects.
Large-scale solar projects are utility scale solar PV power plants with installed generating capacity of 1 MWac or more. Large-scale solar projects are ground mounted and floating and are designed to supply power to the power grid. For the majority of our large-scale solar projects, we usually act as the contractor to the project awarder, who is the main contractor for a solar project. As an EPCC provider, we assume most of the responsibility for the entire project lifecycle, from design and engineering to material procurement, construction, installation, integration, and commissioning.
C&I projects are smaller scale solar projects where the solar PV systems are installed on rooftops and are designed to generate electricity for commercial and industrial properties for their own consumption, such as factories, warehouses and commercial stores. For C&I projects, we usually sign a service contract with the project owner and act as the main contractor. As the main contractor, we engage in comprehensive services encompassing project design, engineering, equipment procurement, construction, and commissioning.
Our revenue for the six months ended June 30, 2025 is mainly derived from execution of construction contract for both LSS and C&I projects.
Key Factors that Affect Our Results of Operations
We believe the following key factors may affect our financial condition and results of operations:
Government Incentives and Regulation
We have not seen any impact of unfavorable government policies upon our business in recent years. However, our business and results of operations can be affected by various factors such as government policies, regulations, subsidies, and incentives. Changes in these factors can lead to market uncertainty and affect the demand for solar PV systems. However, we will seek to adjust as required if and when government policies shift.
Expansion into New Markets
We noticed the significant untapped potential for solar energy in Southeast Asia. Our strategy entails expanding our business presence in the region with a specific focus on countries like Vietnam and the Philippines. Furthermore, we believe that the market for large-scale solar, commercial and industrial, and residential solar services remain substantially untapped in Southeast Asia and in order to capitalize on this potential, we plan to strengthen our existing client relationships while actively searching for new clients to accelerate our growth trajectory.
Geographic Concentration in Malaysia
Despite our intention to expand our business presence in Southeast Asia, our main operations are based in Malaysia and our business and results of operations may be influenced by the changes in political, economic, social environment as well as by the general state of the economy in Malaysia.
Changes in the Macro-Economic Environment and Energy Demand
Our future operating results also depend on the continued demand for utility-scale solar energy. This is dependent on many factors, including the demand for cheaper energy sources driven by regional, national or global macroeconomic trends. If the demand for cheaper energy sources increases, we may face greater competition from conventional and other renewable energy sources, such as coal, natural gas and wind to the extent they are able to offer energy solutions that are less costly. If utility-based customers opt for other sources of energy, the average contract value may be affected if we seek to be more price competitive and as a result, our revenue and operating results could be negatively affected.
Product Costs and Supply Chain Disruptions
Our solar PV installation services involve commodities such as steel and aluminum. Fluctuations in the commodities’ costs that occurred after the signing of fixed lump-sum contracts are critical to our services and may impact our financial performance. In addition, any shortages or other constraints in the supply chain, either solar module component shortages, container shortages, supply chain disruptions which may result in an increase of transportation cost may affect the costs of our services, our margins and our operating results.
Our Ability to Acquire New Customers
Our operating results and growth will depend in part on our ability to continue to attract new customers. While we believe that the underlying market for utility based solar products will continue to grow, it is difficult to predict the growth of potential new customers for our services or whether we will be successful in acquiring these new customers. We plan to continue to invest in our sales and marketing efforts to acquire new customers in order to generate continued revenue growth on a year-over-year basis.
Inflation and Interest Rate
We may be impacted by inflationary pressures. Inflation has continued to accelerate after a series of global events, including the Russia’s invasion of Ukraine, driving up energy prices, freight premiums, and other operating costs. Interest rates, notably mature international market government bond yields, are rising as central banks around the world tighten monetary policy in response to inflationary pressures, while debt remains at high levels in many major markets. The eventual implications of tighter monetary policy, and potentially higher long-term interest rates may drive a higher cost of capital during our forecast period. These inflationary pressures are expected to persist, at least in the near term, and will continue to negatively affect our results of operation. To help mitigate the inflationary pressures on our business, we adjusted our services fee in certain markets and expanded our supplier base.
Key Components of Result of Operations
Revenue
We generate revenues from contract services primarily involved in project execution, including construction, installation and integration works, testing and commissioning of LSS and C&I rooftop solar PV projects for both third-party customers and related parties.
Revenue from sales of goods involved in supply and selling of solar mounting structure and its accessories for LSS and C&I projects. In addition, revenue from sales of goods is derived from the sale of electricity generated under our C&I solar asset ownership portfolio. Our revenue was mainly derived from contract services and is primarily generated from the execution of solar PV projects.
Cost of sales
Our cost of sales comprises material cost, construction cost, staff cost, logistic cost, tools & machinery, miscellaneous project-related expenses and depreciation.
The material cost mainly consists of costs associated with the purchases of solar PV modules, mounting structures, inverters, cables and other accessories required for both sales of goods and contract services.
The construction cost includes the subcontractor and installation costs incurred for contract services activities. Subcontractor costs include payments to external contractors for civil works, mechanical installation, electrical installation, and commissioning services. These costs vary depending on project size, complexity, and site conditions.
The staff cost includes salaries, allowances and related expenses for project engineers, site supervisors, technicians, and other personnel directly involved in project execution.
The logistic cost primarily includes the transportation of materials, loading and unloading activities and warehousing and storage costs.
The tools & machinery costs incurred for equipment rental, tools, and machinery used during construction and installation activities form part of the cost of sales.
The miscellaneous includes project consultancy fees, custom duty, insurance and direct project expenses.
The depreciation relates to the Group’s solar plants and these assets are used directly in the production of electricity.
Selling and Administrative Expenses
Our selling and administrative expenses consist of information and communication technology subscription, legal and professional fees, depreciation of plant and equipment and right-of-use assets, directors’ fee, salaries and other related expenses, employee benefits expenses, net impairment losses on trade receivables and others.
Depreciation under selling and administrative expenses relates to computer and software, motor vehicles, office equipment, office renovation and other assets used in the Group’s day-to-day operations.
Results of Operations
Comparison of the Results for the Six Months Ended June 30, 2025 and June 30, 2024
The results of operations presented below should be reviewed in conjunction with our unaudited interim condensed consolidated financial statements and related notes in Exhibit 99.1 of this Form 6-K. The following table sets forth certain operational data for the six months ended June 30, 2025 and 2024, respectively:
| Note | Six months ended June 30, 2024 |
Six months ended June 30, 2025 |
Six months ended June 30, 2025 |
|||||||||||
| RM | RM | USD | ||||||||||||
| Revenue from contract services | 21,776,845 | 38,289,161 | 9,089,415 | |||||||||||
| Revenue from sales of goods | 7,595,546 | 2,507,413 | 595,232 | |||||||||||
| Revenue from contract services – related parties | 1,067,194 | 14,669,420 | 3,482,355 | |||||||||||
| Total revenue | 18 | 30,439,585 | 55,465,994 | 13,167,002 | ||||||||||
| Cost of sales from contract services | (21,459,409 | ) | (46,953,622 | ) | (11,146,259 | ) | ||||||||
| Cost of sales from sales of goods | (6,750,913 | ) | (2,262,004 | ) | (536,975 | ) | ||||||||
| Cost of sales for contract services – related party | (1,799 | ) | (386,972 | ) | (91,863 | ) | ||||||||
| Total cost of sales | 19 | (28,212,121 | ) | (49,602,598 | ) | (11,775,097 | ) | |||||||
| Gross profit | 2,227,464 | 5,863,396 | 1,391,905 | |||||||||||
| Selling and administrative | (3,454,946 | ) | (6,127,228 | ) | (1,454,534 | ) | ||||||||
| Selling and administrative to related party | (56,441 | ) | (216,352 | ) | (51,360 | ) | ||||||||
| Loss from operation before income tax | (1,283,923 | ) | (480,184 | ) | (113,989 | ) | ||||||||
| Other income | 118,707 | 848,670 | 201,465 | |||||||||||
| Other income from related party | 50,188 | — | — | |||||||||||
| Finance cost | (703,418 | ) | (2,090,193 | ) | (496,188 | ) | ||||||||
| Finance cost – related parties | (63,514 | ) | (59,223 | ) | (14,059 | ) | ||||||||
| Loss before income tax | (1,881,960 | ) | (1,780,930 | ) | (422,771 | ) | ||||||||
| Income tax benefit/(expense) | 9 | 170,138 | (148,668 | ) | (35,292 | ) | ||||||||
| Net loss for the period | (1,711,822 | ) | (1,929,598 | ) | (458,063 | ) | ||||||||
| Other comprehensive income/(loss) | 2,224 | (270,178 | ) | (64,137 | ) | |||||||||
| Total comprehensive loss for the period | (1,709,598 | ) | (2,199,776 | ) | (522,200 | ) | ||||||||
| Loss attributable to: | ||||||||||||||
| Equity owners of the Company | (1,709,598 | ) | (2,199,776 | ) | (522,200 | ) | ||||||||
| Non-controlling interests | — | — | — | |||||||||||
| Total | (1,709,598 | ) | (2,199,776 | ) | (522,200 | ) | ||||||||
| Basic and diluted net loss per share | (0.11 | ) | (0.12 | ) | (0.03 | ) | ||||||||
| Weighted average number of common shares outstanding – Basic and diluted | 15,700,000 | 18,450,460 | 18,450,460 | |||||||||||
Revenue
| As of June 30, 2024 |
As of June 30, 2025 |
As of June 30, 2025 |
Variance | |||||||||||||||||
| RM | RM | USD | RM | % | ||||||||||||||||
| Revenue from contract services | 21,776,845 | 38,289,161 | 9,089,415 | 16,512,316 | 76 | |||||||||||||||
| Revenue from sales of goods | 7,595,546 | 2,507,413 | 595,232 | (5,088,133 | ) | (67 | ) | |||||||||||||
| Revenue from contract services – related parties | 1,067,194 | 14,669,420 | 3,482,355 | 13,602,226 | 1275 | |||||||||||||||
| Total revenue | 30,439,585 | 55,465,994 | 13,167,002 | 25,026,409 | 82 | |||||||||||||||
Revenue for the period ended June 30, 2025 was RM55,465,994 (USD13,167,002) representing an increase of 82% from RM30,439,585 for the period ended June 30, 2024. Revenue from contract services for the period was derived from large-scale solar projects and commercial and industrial projects.
Our revenue generated from contract services for the six months ended June 30, 2025 was RM38,289,161 (USD9,089,415) representing an increase of 76% from RM21,776,845 for the six months ended June 30, 2024. The increase was due to the execution of projects secured in the preceding year, as well as the commencement of few newly awarded contracts during the period.
Our revenue generated from sales of goods for the six months ended June 30, 2025 was RM2,507,413 (USD595,232) representing a decrease of 67% from RM7,595,546 for the six months ended June 30, 2024. The decrease was due to the management’s strategic decision to scale down trading activities during the period.
Our revenue generated from contract services from related parties for the six months ended June 30, 2025 was RM14,669,420 (USD3,482,355) representing an increase of 1275% from RM1,067,194 for the six months ended June 30, 2024. The related parties includes the entities that controlled by or otherwise related to Reservoir Energy Link Bhd., which are primarily involved investing in and operating solar PV assets. The significant growth was primarily attributable to the completion of multiple rooftop solar projects for the related parties and the execution of new rooftop solar contracts with the related parties, following a higher number of contracts secured in the preceding year. As they expand their solar portfolios, they awarded more rooftop commercial and industrial projects to our Group.
Cost of Sales
| As of June 30, 2024 |
As of June 30, 2025 |
As of June 30, 2025 |
Variance | |||||||||||||||||
| RM | RM | USD | RM | % | ||||||||||||||||
| Material Cost | 9,968,658 | 8,774,878 | 2,083,058 | (1,193,780 | ) | (12 | ) | |||||||||||||
| Construction Cost | 14,022,382 | 34,874,969 | 8,278,924 | 20,852,587 | 149 | |||||||||||||||
| Staff Cost | 2,166,300 | 2,409,446 | 571,975 | 243,146 | 11 | |||||||||||||||
| Logistic Cost | 722,336 | 643,081 | 152,660 | (79,255 | ) | (11 | ) | |||||||||||||
| Tools & Machinery | 114,303 | 537,700 | 127,644 | 423,397 | 370 | |||||||||||||||
| Miscellaneous | 1,185,657 | 1,333,093 | 316,461 | 147,436 | 12 | |||||||||||||||
| Depreciation | 32,485 | 1,029,431 | 244,375 | 996,946 | 3069 | |||||||||||||||
| Total cost of sale | 28,212,121 | 49,602,598 | 11,775,097 | 21,390,477 | 76 | |||||||||||||||
Cost of sales represents our cost incurred in constructing projects, purchasing materials, specific staff costs and other project-related costs incurred for identifiable projects.
The increase in cost of sales was consistent with the overall increase in revenue, primarily due to the execution of large-scale solar projects secured in the preceding year and higher number of newly secured and executed commercial and industrial projects. This increase reflects higher project execution activities during the period, resulting in an increase in overall costs. In contrast, the material and logistic costs decreased because revenue from the sale of goods decreased due to the management’s strategic decision to scale down trading activities which in turn reduced the related material and logistic costs.
The material cost for the six months ended June 30, 2025 was RM8,774,878 (USD2,083,058), representing a decrease of 12%, from RM9,968,658 for the period ended June 30, 2024. The decrease was consistent with the decrease in our revenue from sales of goods, following the management’s strategic decision to scale down trading activities during the period.
The construction cost for the six months ended June 30, 2025 was RM34,874,969 (USD8,278,924), representing a significant increase of 149% from RM14,022,382 for the six months ended June 30 2024. The increase is in line with the increase in our revenue from contract services due to the execution of large-scale solar projects and commercial and industrial projects, which resulted in higher subcontractor costs incurred.
The staff costs for the six months ended June 30, 2025 was RM2,409,446 (USD571,975), representing an increase of 11% from RM2,166,300 for the six months ended June 30 2024. The increase was due to an expansion in headcount within the operations team to support a higher number of ongoing large-scale and commercial and industrial projects.
The logistic costs for the six months ended June 30, 2025 was RM643,081 (USD152,660), representing a decrease of 11%, from RM722,336 for six months ended June 30 2024. The decrease was mainly due to lower warehouse storage costs, in line with the reduction in inventory levels resulting from decreased trading activities.
The tools and machinery for six months ended June 30, 2025 was RM537,700 (USD127,644), representing an increase of 370%, from RM114,303 for the six months ended June 30 2024. The increase was due to an increase in rental of machinery and equipment as a result of execution of large-scale solar contracts during the period.
The miscellaneous for six months ended June 30, 2025 was RM1,333,093 (USD316,461), representing an increase of 12%, from RM1,185,657 for the six months ended June 30 2024. The increase was due to an increase in consultancy fees related to project management services provided by related parties for commercial and industrial projects, as well as increased consultancy costs incurred for tender submissions.
The depreciation for six months ended June 30, 2025 was RM1,029,431 (USD244,375), representing a significant increase of 3069%, from RM32,485 for the six months ended June 30 2024. The significant increase was due to the completion of these long-term solar assets in preceding year, which are fully commissioned and used directly in the generation of electricity.
Selling and Administrative Expenses
| As of June 30, 2024 |
As of June 30, 2025 |
As of June 30, 2025 |
Variance | |||||||||||||||||
| RM | RM | USD | RM | % | ||||||||||||||||
| Information and communication technology subscription | 17,736 | 235,511 | 55,908 | 217,775 | 1228 | |||||||||||||||
| Legal and professional fees | 3,571 | 932,286 | 221,314 | 928,715 | 26007 | |||||||||||||||
| Depreciation of plant and equipment and right-of-use assets | 196,028 | 1,436,159 | 340,928 | 1,240,131 | 633 | |||||||||||||||
| Directors’ fee, salaries and other related expenses | 383,949 | 1,124,875 | 267,033 | 740,926 | 193 | |||||||||||||||
| Employee benefits expenses | 1,680,773 | 2,070,545 | 491,524 | 389,772 | 23 | |||||||||||||||
| Impairment losses on trade receivables | — | 649,075 | 154,083 | 649,075 | 100 | |||||||||||||||
| Reversal of impairment losses on trade receivables | — | (376,000 | ) | (89,258 | ) | (376,000 | ) | 100 | ||||||||||||
| Other expenses | 1,229,330 | 271,129 | 64,362 | (958,201 | ) | -78 | ||||||||||||||
| Total selling and administrative expenses | 3,511,387 | 6,343,580 | 1,505,894 | 2,832,193 | 81 | |||||||||||||||
Selling and administrative expenses mainly comprise of directors’ fee, administrative salaries, depreciation of plant and equipment and right-of-use assets, legal and professional fees and other administrative expenses. The selling and administrative expenses increased significantly to RM6,343,580 (USD1,505,894) for six months ended June 30, 2025, representing an increase of 81% from RM3,511,387 for six months ended June 30, 2024. The increase was mainly attributable to the following reasons:
ICT subscription for six months ended June 30, 2025 was RM235,511 (USD55,908), representing an increase of 1228%, from RM17,736 for six months ended June 30, 2024. The increase in ICT subscription was due to the more subscription on accounting and project-related software during the period.
Legal and professional fees paid for six months ended June 30, 2025 was RM932,286 (USD221,314), representing an increase of 26007%, from RM3,571 for six months ended June 30, 2024. The increase was primarily due to the one-off expense reimbursement related to the Initial Public Offering exercise charged by Reservoir Energy Link Bhd. of RM185,519 and one-off legal fees incurred associated with banking facility agreements of RM172,381. In addition, the additional monthly retainer legal fees totaling RM284,344 for the six-month period in connection with post-IPO exercise requirements.
Depreciation of plant and equipment and right-of-use assets incurred for for six months ended June 30, 2025 was RM1,436,159 (USD340,928), representing a significant increase of 633%, from RM196,028 for six months ended June 30, 2024. The increase was primarily attributable to the additional solar assets invested in preceding year.
The directors’ fee for six months ended June 30, 2025 was RM1,124,875 (USD267,033), representing an increase of 193%, from RM383,949 for six months ended June 30, 2024. The significant increase was mainly due to the increase in the number of Directors appointed to ensure compliance with regulatory requirements following the IPO exercise. Furthermore, Directors’ salaries have been revised during the financial year to account for the Directors' increased responsibilities and duties.
Administrative salaries paid for six months ended June 30, 2025 was RM2,070,545 (USD491,524), representing an increase of 23% from RM1,680,773 in six months ended June 30, 2024. The increase was due to the increase in headcount of the selling and administrative team to support company’s business expansion.
Impairment losses of RM649,075 (USD154,083) has been recorded for certain trade receivables, while reversal of impairment losses of RM376,000 (USD89,258) has been recorded upon subsequent collection of amounts previously impaired, for six months ended June 30, 2025. The net movement of RM273,075 (USD64,825) reflects an increase in provision of impairment losses and has been mitigated by the reversal. No impairment loss and reversal of impairment loss that has been recorded in the six months ended June 30, 2024, as the trade receivables were considered recoverable.
Other selling and administrative expenses mainly consist of realized foreign exchange losses, stamp duty, insurance premiums, entertainment expenses and travelling expenses.
Other income
Other income mainly derived from gain from interest income and realized and unrealized gain on foreign exchange.
Other income for the six months ended June 30, 2025 was RM848,670 (USD201,465), representing an increase of 402%, from RM168,895 for six months ended June 30, 2024. This increase was due to i) an increase in interest income on fixed deposits placed with financial institution by RM23,585 and ii) an increase in realized and unrealized gain on foreign exchange for trade and non-trade creditors by RM506,612.
Finance Cost
Finance cost is mainly derived from interest expenses arising from the discount on the convertible securities payable, borrowings from financial institution and interest expenses charged by our related company on advances.
Interest expenses for the six months ended June 30, 2025 were RM2,149,416 (USD510,247), representing an increase of 64%, from RM766,932 in the six months ended June 30, 2024. The increase in interest expenses was due to the interest expense in connection with the discount on the convertible securities payable, pursuant to the Securities Purchase Agreement dated April 22, 2025, between Avondale Capital, LLC and the Company.
In addition, the increase in utilization of term loan and trade financing from financial institutions and advances received from our related company to cater for the increase in working capital requirement as a result of our business expansion also contributed to the increase in interest expenses.
The interest expenses charged by our related company was RM59,223 (USD14,059), representing a decrease of 7%, from RM63,514 in the six months ended June 30, 2024, due to repayment of advances to Reservoir Energy Link Bhd. during the six months ended.
Income Tax
Our current taxation increased from income tax benefit of RM170,138 for the six months ended June 30, 2024 to income tax expense of RM148,668 (USD35,292) for the six months ended June 30, 2025, representing an increase of 187%, due to the decrease in loss before tax during the six months ended June 30, 2025. The increase in income tax expense is in line with the increase in our revenue. However, the increase in revenue did not result in the corresponding increase in net profit due to higher administrative expenses.
For the subsidiaries that are incorporated in Malaysia, they are governed by the income tax laws of Malaysia. The income tax provision in respect of operations in Malaysia is calculated at the applicable tax rates of 24% (June 30, 2024: 24%) on the taxable income for the six months ended June 30, 2025.
Net loss for the period
The Group maintained a gross profit margin for the period, indicating that operations from contract services and sales of goods remain profitable. Despite operational profitability and an increase in revenue to RM55,465,994 (USD13,167,002), representing growth of 82%, the Group recorded a net loss for the six months ended June 30, 2025 were RM1,929,598 (USD458,063) mainly driven by higher administrative expenses, including one-off legal and professional fees incurred in relation to corporate exercises and fund-raising activities, including the Initial Public Offering (“IPO”) exercise of RM185,519 charged by Reservoir Energy Link Bhd., legal fees of RM125,579 associated with banking facility agreements and a discount on the convertible securities payable of RM689,549.
In addition, the net loss was also due to the recurring expenses on compliance post IPO exercise fees, including the directors’ fee, salaries and other related expenses of RM582,193 as the increase in the number of Directors appointed to ensure compliance with regulatory requirements, investor relation and consulting fees of RM126,068 and legal retainer fees of RM284,344.
Segment Reporting
The group reporting is organized and managed in two major business units. All of our revenue is derived from one segment country which is in Malaysia.
The reportable segments are summarized as follows:
| i) | Large-scale solar — Large-scale solar projects are utility scale solar PV power plants with installed generating capacity of 1 MWac or more. Large-scale solar projects are ground mounted and floating and are designed to supply power to the power grid. For the majority of our large-scale solar projects, we usually act as the contractor to the project awarder, who is the main contractor for a solar project. |
| ii) | Commercial & Industrial — C&I projects are smaller scale solar projects where the solar PV systems are installed on rooftops and are designed to generate electricity for commercial and industrial properties for their own consumption, such as factories, warehouses and commercial stores. For C&I projects, we usually sign a service contract with the project owner and act as the main contractor. |
Revenue from contract services primarily involved in project execution, including construction, installation and integration works, testing and commissioning of our solar projects. Revenue from sales of goods involved in supply and selling of solar mounting structure and its accessories. Consequently, both segments contribute to revenue from contract services and sales of goods, as reflected in the financial statements and related notes included elsewhere in this current report.
|
As of (Unaudited) |
As of (Unaudited) |
As of (Unaudited) |
||||||||||
| By Business Unit | RM | RM | Convenience Translation USD |
|||||||||
| Revenue | ||||||||||||
| Large Scale Solar Contract Services | 18,705,854 | 31,310,177 | 7,432,683 | |||||||||
| Commercial & Industrial Contract Services | 4,075,825 | 21,648,404 | 5,139,087 | |||||||||
| Large Scale Solar Sales of Goods | 5,746,020 | — | — | |||||||||
| Commercial & Industrial Sales of Goods | 1,911,886 | 2,507,413 | 595,232 | |||||||||
| Total revenue | 30,439,585 | 55,465,994 | 13,167,002 | |||||||||
| Cost of Sales | ||||||||||||
| Large Scale Solar Contract Services | (18,266,261 | ) | (28,708,507 | ) | (6,815,076 | ) | ||||||
| Commercial & Industrial Contract Services | (3,140,653 | ) | (18,632,087 | ) | (4,423,047 | ) | ||||||
| Large Scale Solar Sales of Goods | (5,064,522 | ) | — | — | ||||||||
| Commercial & Industrial Sales of Goods | (1,740,685 | ) | (2,262,004 | ) | (536,974 | ) | ||||||
| Total cost of sales | (28,212,121 | ) | (49,602,598 | ) | (11,775,097 | ) | ||||||
| Large Scale Solar Gross profit | 1,121,091 | 2,601,670 | 617,607 | |||||||||
| Commercial & Industrial Gross profit | 1,106,373 | 3,261,726 | 774,298 | |||||||||
| Total gross profit | 2,227,464 | 5,863,396 | 1,391,905 | |||||||||
| Selling and administrative expenses | (3,454,946 | ) | (6,127,228 | ) | (1,454,534 | ) | ||||||
| Selling and administrative expenses to related parties | (56,441 | ) | (216,352 | ) | (51,360 | ) | ||||||
| Loss from operations before income tax | (1,283,923 | ) | (480,184 | ) | (113,989 | ) | ||||||
|
As of (Audited) |
As of (Unaudited) |
As of (Unaudited) |
||||||||||
| Total assets | RM | RM | Convenience Translation USD |
|||||||||
| Large Scale Solar segment | 49,139,582 | 51,498,736 | 12,225,219 | |||||||||
| Commercial & Industrial segment | 33,956,854 | 23,083,016 | 5,479,648 | |||||||||
| Total of reportable segments | 83,096,436 | 74,581,752 | 17,704,867 | |||||||||
| Corporate and other | 31,195,694 | 47,390,780 | 11,250,037 | |||||||||
| Consolidated total assets | 114,292,130 | 121,972,532 | 28,954,904 | |||||||||
| Total liabilities | RM | RM | Convenience Translation USD |
|||||||||
| Large Scale Solar segment | 21,362,655 | 16,445,691 | 3,904,021 | |||||||||
| Commercial & Industrial segment | 29,714,895 | 12,621,562 | 2,996,217 | |||||||||
| Total of reportable segments | 51,077,550 | 29,067,252 | 6,900,238 | |||||||||
| Corporate and other | 46,093,102 | 75,596,487 | 17,945,754 | |||||||||
| Consolidated total liabilities | 97,170,652 | 104,663,739 | 24,845,992 | |||||||||
Revenue reported above represents revenue generated from external customers. There were no inter-segment sales in the six months ended June 30, 2025 and 2024. Cost of sales reported above represents direct cost related to each business unit and indirect cost that can’t be segregated into each respective business unit was presented under selling and administrative expenses.
Our gross profit from large scale solar projects increased by RM1,480,579 or approximately 132% from RM1,121,091 for the six months ended June 30, 2024 to RM2,601,670 (USD617,607) for the six months ended June 30, 2025. The increase was due to the execution of projects secured in the preceding year, as well as the commencement of few newly awarded contracts during the period with higher profit margins.
Our gross profit from commercial and industrial projects experienced an increase by RM2,155,353 or approximately 192% from RM1,106,373 for the six months ended June 30, 2024 to RM3,261,726 (USD774,298) for the six months ended June 30, 2025. The increase was due to securing and execution new rooftop solar projects and increase in number of on-going projects throughout the period. The profit margin dropped by 4% compared to the six months ended June 30, 2024 mainly due to an increase in the cost of materials.
The total assets for our large-scale solar segment increased by RM2,359,154 or approximately 5% from RM49,139,582 as of December 31, 2024 to RM51,498,736 (USD12,225,219) as of June 30, 2025. The increase was mainly due to an increase in such segment’s contract assets which is in line with the increase in revenue for our large-scale solar segment.
The total assets for our commercial and industrial segment decreased significantly by RM10,873,838 or approximately 32% from RM33,956,854 as of December 31, 2024 to RM23,083,016 (USD5,479,648) as of June 30, 2025. Despite an increase in revenue for the segment during the period, the decrease in such segment’s contract assets, trade receivables and inventories mainly due to the increase in revenue recognized from contract services that have not yet been billed to customers, which is consistent with the increase in segment’s revenue.
The total assets for our corporate and other segment increased significantly by RM16,195,086 or approximately 52% from RM31,195,694 as of December 31, 2024 to RM47,390,780 (USD11,250,037) as of June 30, 2025. The increase was due to movement of cash and bank balances from the proceeds of convertible securities payable.
The total liabilities for our large-scale solar segment decreased by RM4,916,964 or approximately 23% from RM21,362,655 as of December 31, 2024 to RM16,445,691 (USD3,904,021) as of June 30, 2025. Despite an increase in revenue for the segment during the period, the decrease in such segment’s trade payables mainly due to the decrease in cost of sales from the sale of goods, following the management’s strategic decision to scale down trading activities.
The total liabilities for our commercial and industrial segment decreased by RM17,093,333 or approximately 58% from RM29,714,895 as of December 31, 2024 to RM 12,621,562 (USD2,996,217) as of June 30, 2025. The decrease was due to the decrease in other payables, mainly attributable to the settlement of consideration for the acquisition of rooftop solar assets through bank financing.
The total liabilities for our corporate and other segment increased by RM29,503,385 or approximately 64% from RM46,093,102 as of December 31, 2024 to RM75,596,487 (USD17,945,754) as of June 30, 2025. The increase was mainly due to an increase in bank and other borrowings as a result of utilization of working capital financing from financial institutions. Additionally, there was an increase in proceeds received from convertible securities payable, which have not yet been converted into ordinary shares.
Liquidity and Capital Resources
We expect to satisfy our capital requirements through a combination of cash on hand, cash flow from operations, borrowings under existing and anticipated future financing arrangements, convertible securities payable under the Securities Purchase Agreement with Avondale and the issuance of additional equity securities as appropriate and given market conditions. We expect that these sources of funds will be adequate to provide for our short-term and long-term liquidity and capital needs. However, we are subject to business and operational risks that could adversely affect our cash flow. A material decrease in our cash flows would likely produce a corresponding adverse effect on our borrowing capacity.
Cash and cash equivalents increased from RM4,904,270 as of December 31, 2024 to RM12,039,516 (USD2,858,046) as of June 30, 2025. As of June 30, 2025, our Company had a net cash used in operating activities of RM15,595,665 (USD3,2702,233) mainly due to the settlement of other payables related to solar PV assets of RM16,090,572 (USD3,819,720) by way of drawdowns from term financing. We will seek to improve its liquidity position by potentially improving collection of the outstanding trade and other receivable balances.
As a normal part of our business, depending on market conditions, we will from time to time consider opportunities to repay, redeem, repurchase or refinance our indebtedness. In addition, changes in our operating plans, including lower than anticipated revenues, increased expenses, capital expenditures, acquisitions or other events may cause us to seek additional debt or equity financing in future periods, which may not be available on acceptable terms or at all. Debt financing, if available, could impose additional cash payment obligations, additional covenants and operating restrictions.
Financing Arrangements
As of June 30, 2025, our Company had secured banking facilities with a total credit limit of RM103.4 million from financial institutions including invoice financing, accepted bill, cash line, term loan, bank guarantee and others that can be utilized for short term working capital needs.
| As of December 31, 2024 |
As of June 30, 2025 |
As of June 30, 2025 |
||||||||||
| RM | RM | USD | ||||||||||
| Maturities | ||||||||||||
| Maturity within 1 year | 32,940,381 | 37,052,578 | 8,795,864 | |||||||||
As of June 30, 2025, we utilized a term loan of RM17.1 million, which carries a 11-year and 12-year repayment term, to finance investment of solar assets. Apart from the term loan utilized for utilized for financing of investment of solar assets and term loan acquired for purchasing keyman insurance for two of our directors, which carries a 10- year repayment term, all other financing facilities secured by our Company have a repayment term of less than 1 year.
Cash Flows
| For the six months ended June 30, | ||||||||||||
| 2024 | 2025 | 2025 | ||||||||||
| RM | RM | USD | ||||||||||
| Net cash generated from/(used in) operating activities | 3,991,344 | (15,595,665 | ) | (3,702,233 | ) | |||||||
| Net cash used in investing activities | (5,230,387 | ) | (1,900,031 | ) | (451,046 | ) | ||||||
| Net cash generated from financing activities | 4,186,809 | 24,696,022 | 5,862,556 | |||||||||
| Net increase in cash and cash equivalents | 2,947,766 | 7,200,326 | 1,709,277 | |||||||||
| Cash and bank balances at beginning of period | 1,945,602 | 4,563,108 | 1,083,230 | |||||||||
| Effects of exchange rate changes | 10,902 | 276,082 | 65,539 | |||||||||
| Cash and bank balances at end of period | 4,904,270 | 12,039,516 | 2,858,046 | |||||||||
Operating activities
Net cash generated from/(used in) operating activities consists primarily of net loss adjusted for non-cash items, changes in working capital and income tax expense.
Net cash generated from operating activities in six months ended June 30, 2024 was RM3,991,344, which consists of net loss before income tax for the period of RM1,881,960 and main changes in working capital of RM33,734,670. Adjustments for non-cash primarily included depreciation of plant and equipment and right-of-use assets at RM196,028. The main changes in working capital primarily included decrease in contract assets by RM18,261,184, as amounts previously recognized as revenue but not yet billed were subsequently billed and decrease in trade payables by RM15,473,486 mainly attributable to the settlement of outstanding supplier balances.
Net cash used in operating activities in six months ended June 30, 2025 was RM15,595,665 (USD3,702,233), which consists of net loss before income tax for the period of RM1,780,930 and key changes in working capital of RM11,575,885. Adjustments for non-cash primarily included net impairment loss on trade receivables at RM273,075 and depreciation of plant and equipment at RM1,293,080. The key changes in working capital were due to a decrease in contract assets of RM12,246,823, as amounts previously recognized as revenue but not yet billed were subsequently billed. However, these are mitigated against the increase in other receivables and prepayment of RM5,018,533, mainly comprising commitment fees and deferred transaction costs attributable to the issuance of convertible securities payable, and a decrease in other payables of RM18,804,175, which primarily reflected the settlement of consideration for the acquisition of rooftop solar assets.
Investing activities
Net cash used in investing activities in six months ended June 30, 2024 and 2025 was RM5,230,387 and RM1,900,031 (USD451,046) respectively, which were mainly for the purpose of investment in solar assets, purchase of new motor vehicle and placements of fixed deposits pledged with licensed banks.
Financing activities
Net cash generated from financing activities in six months ended June 30, 2024 was RM4,186,809, which was mainly contributed by drawdown of bank borrowings of RM3,616,009 and repayment of amount due from related parties.
Net cash generated from financing activities in six months ended June 30, 2025 was RM24,696,022 (USD5,862,556), which was mainly contributed by proceeds from convertible securities payable at RM10,044,046 and drawdown of bank borrowings of RM19,951,926 for the purpose of financing our ongoing projects. On April 22, 2025, the Company entered into a Securities Purchase Agreement with Avondale Capital, LLC, pursuant to which the Company issue and sell to Avondale Capital, LLC an aggregate amount of up to USD10,000,000. The Company received net proceeds of RM10,044,046 (USD2,384,343) after accounting for any applicable discounts and transaction costs.
As of June 30, 2025, we had RM23,037,161 (USD5,468,763) in cash and bank balances, out of which RM21,545,962 (USD5,114,768) was held in MYR and the rest was held in USD and SGD. Our cash and bank balances consist of bank balances of RM13,122,471 fixed deposit of RM9,507,734 and cash on hand of RM406,956.
Off-balance Sheet Arrangements
We do not have any off-balance sheet arrangements.
Capital Expenditures, Divestments
As of June 30, 2024, we entered into a Sales and Purchase Agreement and Power Purchase Agreement to develop and purchase 12 solar assets which will cost us approximately RM23,968,681 (USD5,355,531) as part of our strategy to expand our solar assets ownership portfolio, strengthening our recurring income stream. We do not expect to have sufficient amounts of cash on hand to fund the development of all these projects. We will need to finance a portion of these acquisitions by raising equity or incurring debt. We believe that we will have the access to capital to pursue these opportunities. However, we are subject to business, financial, operational and other risks that could adversely affect our cash flows, result of operations, financial condition and ability to raise capital. A material decrease in our cash flows, deterioration in our financial condition or downturn in the financing and capital markets would likely to have an adverse effect on our ability to make such investments.
As of June 30, 2025, we have no material capital expenditures planned for the next 12 months.
Quantitative and Qualitative Disclosures about Market Risk
We are exposed to market risk (including foreign currency risk, interest rate risk, and equity price risk), credit risk, and liquidity risk in the ordinary course of business. Our overall financial risk management policy focuses on the unpredictability of financial markets and seeks to minimize potential adverse effects on our financial performance.
Foreign Currency Risk
We are exposed to foreign currency risk with transactions and balances that are denominated in currencies other than our functional currency. The currencies giving rise to this risk are primarily Chinese Renminbi (“RMB”) and United States Dollar (“USD”). Foreign currency risk is monitored closely on an on-going basis to ensure that the net exposure is at an acceptable level.
Our exposure to foreign currency risk based on the carrying amounts of the financial assets and financial liabilities denominated in RMB and USD at the end of the reporting period is summarized below.
| Assets | Liabilities | |||||||||||||||
| As of December 31, 2024 |
As of June 30, 2025 |
As of December 31, 2024 |
As of June 30, 2025 |
|||||||||||||
| RM | RM | RM | RM | |||||||||||||
| United States Dollar | 1,136,521 | 5,281 | — | 918,237 | ||||||||||||
| Chinese Renminbi | 2,194 | 2,154 | 7,075,765 | 2,827,265 | ||||||||||||
Foreign Currency Risk Sensitivity Analysis
The following table illustrates the potential financial impact arising solely from change in foreign currency exchange rate on our results of operation. Specifically, it assumes a 10% depreciation of the RMB or USD against the RM as of the end of the reporting period and quantifies the corresponding change in profit after tax attributable solely to our net monetary assets and liabilities denominated in those currencies, assuming all other variables remain constant. A depreciation of a foreign currency decreases the RM carrying amount of assets denominated in that currency and correspondingly reduces the RM value of related liabilities, resulting in a gain or loss depending on our net exposure. 10% is the sensitivity rate used when reporting foreign currency risk internally to key management personnel and represents management’s assessment of the reasonably possible change in foreign exchange rates. The sensitivity analysis includes only outstanding foreign currency denominated monetary items and adjusts their translation at the period end for a 10% change in foreign currency rates.
| As of December 31, 2024 |
As of June 30, 2025 |
|||||||
| RM | RM | |||||||
| United States Dollar | 86,376 | (69,385 | ) | |||||
| Chinese Renminbi | (537,591 | ) | (214,708 | ) | ||||
Any significant appreciation or depreciation of RMB and USD may materially and adversely affect our cost of sales, expenses, cash and bank balances and trade and other payables.
Interest Rate Risk
We are exposed to interest rate risk as we have bank borrowings which are interest bearing. The interest rates of the bank borrowings are disclosed in Notes to the financial statements. We currently do not have an interest rate hedging policy.
Interest Rate Sensitivity Analysis
The sensitivity analysis below has been determined based on the exposure to interest rate for non-derivative instruments at the end of the reporting period. A 50 basis point increase or decrease is used when reporting interest rate risk internally to key management personnel and represents management’s assessment of the reasonably possible change in interest rates.
If interest rates on loans had been 50 basis points higher/lower and all other variables were held constant, our profit for six months ended June 30, 2025 would decrease/increase by RM208,288 (USD49,445) (December 31, 2024: RM132,201).
Liquidity Risk
Liquidity risk arises mainly due to general funding and business activities. We practice prudent risk management by maintaining sufficient cash balances and the availability of funding through cash flows from operations, certain committed credit facilities and equity financing.
Based on the above considerations, management is of the opinion that our Company has sufficient funds to meet our working capital requirements and debt obligations as they fall due. Our Company’s liquidity position is supported by the external financing, including the issuance of convertible securities and continued access to funding from capital markets and financial institutions.
Maturity Analysis
The following table sets out the maturity profile of the financial liabilities at the end of the reporting period based on contractual undiscounted cash flows (including interest payments computed using contractual rates or, if floating, based on the rates at the end of the reporting period.)
| The Company | Weighted Average Effective Interest Rate |
Carrying Amount |
Contractual Undiscounted Cash Flows |
Within 1 Year |
1 – 5 Years | Over 5 Years |
||||||||||||||||||
| % | RM | RM | RM | RM | RM | |||||||||||||||||||
| As of June 30, 2025 | ||||||||||||||||||||||||
| Non-derivative Financial Liabilities | ||||||||||||||||||||||||
| Bank borrowings | 4.95% - 5.70 | % | 25,154,330 | 25,154,330 | 25,154,330 | — | — | |||||||||||||||||
| Lease liabilities | 5.70 | % | 12,810,351 | 12,810,351 | 12,810,351 | — | — | |||||||||||||||||
| Trade payables | — | 55,316,394 | 61,508,674 | 37,516,252 | 12,137,677 | 11,854,745 | ||||||||||||||||||
| Other payables and accruals | — | 611,522 | 650,000 | 312,000 | 338,000 | — | ||||||||||||||||||
| Amount due to related parties | 8.20 | % | 3,114,186 | 3,260,994 | 3,260,994 | — | — | |||||||||||||||||
| 97,006,783 | 103,384,349 | 79,053,927 | 12,475,677 | 11,854,745 | ||||||||||||||||||||
| As of December 31, 2024 | ||||||||||||||||||||||||
| Non-derivative Financial Liabilities | ||||||||||||||||||||||||
| Bank borrowings | 4.95% - 5.70 | % | 35,039,857 | 35,668,434 | 33,045,385 | 1,289,377 | 1,333,672 | |||||||||||||||||
| Lease liabilities | 5.70 | % | 747,819 | 806,000 | 312,000 | 494,000 | — | |||||||||||||||||
| Trade payables | — | 27,396,814 | 27,396,814 | 27,396,814 | — | — | ||||||||||||||||||
| Other payables and accruals | — | 31,816,499 | 31,816,499 | 31,816,499 | — | — | ||||||||||||||||||
| Amount due to related parties | 8.20 | % | 2,168,066 | 2,292,276 | 2,292,276 | — | — | |||||||||||||||||
| 97,169,055 | 97,980,023 | 94,862,974 | 1,783,377 | 1,333,672 | ||||||||||||||||||||
Capital Risk Management
We manage our capital to ensure that entities within our Company will be able to maintain an optimal capital structure so as to support our businesses and maximize shareholders’ value. To achieve this objective, we may make adjustments to the capital structure in view of changes in economic conditions, such as adjusting the amount of dividend payment, returning of capital to shareholders or issuing new shares.
We manage our capital based on debt-to-equity ratio that complies with debt covenants and regulatory, if any. The debt-to-equity ratio is calculated as net debt divided by total equity. Net debt includes loans and borrowings from financial institutions, while capital includes equity attributable to the owners of the parent and non-controlling interest. The debt-to-equity ratio of our Company at the end of the reporting period was as follows:
| As at December 31, 2024 |
As at June 30, 2025 |
As at June 30, 2025 |
||||||||||
| RM | RM | USD | ||||||||||
| Total debts | 30,476,479 | 43,276,878 | 10,273,443 | |||||||||
| Total equity | 17,121,478 | 17,308,793 | 4,108,912 | |||||||||
| Debt-to-equity ratio | 1.78 | 2.50 | 2.50 | |||||||||
Our Company’s debt-to-equity ratio increased from 1.78 as of December 31, 2024 to 2.50 as of June 30, 2025, primarily due to additional borrowings to support business expansion. The increase in leverage may expose the Company to higher credit and liquidity risk in the event of adverse market or operating conditions. However, following the conversion of the convertible note payable into ordinary shares, the Company’s equity position is expected to improve, which would in turn reduce the debt-to-equity ratio and strengthen the capital structure.
We complied with the capital requirements and loan covenants imposed by financial institutions for the six months ended June 30, 2025 and December 31, 2024.
Our overall strategy remains unchanged from the previous year.
Critical Accounting Policies and Estimates
Critical accounting, judgments and key sources of estimation uncertainty
Management believes that there are no key assumptions made concerning the future, and other key sources of estimation uncertainty at the reporting date, that have a significant risk of causing a material adjustment to the carrying amounts of the assets and liabilities within the next financial year other than as disclosed below:-
Impairment of Trade Receivables and Contract Assets
We use the simplified approach to estimate a lifetime expected credit loss allowance for all trade receivables and contract assets and there have been no material changes in the underlying assumption. The contract assets are grouped with trade receivables for impairment assessment because they have substantially the same risk characteristics as the trade receivables for the same types of contracts. The Group develops the expected loss rates based on the payment profiles of past sales and the corresponding historical credit losses, and adjusts for qualitative and quantitative reasonable and supportable forward-looking information. If the expectation is different from the estimation, such difference are measured at the present value of all cash shortfalls (i.e., the difference between the cash flows due to us in accordance with the contract and the cashflows that we expect to receive) that will impact the carrying value of trade receivables and contract assets.
Based on the above approach, RM649,075 (USD154,083) of expected credit loss allowance and RM376,000 (USD89,268) of reversal of expected credit loss allowance on trade receivables has been recorded in the six months ended June 30, 2025. There is no expected credit loss allowance that has been recorded in the six months ended June 30, 2024. There are no trade receivables and contract assets written off during the six months ended June 30, 2024 and 2025. Based on the assessment conducted at reporting date, there are no material evidence that the estimate is reasonably likely to change in the foreseeable future.
Contract Revenue Recognition
The Group enters into contracts with customers to provide construction services related to renewable energy sectors. Revenue from providing such services is recognized over time measure via input method, determined based on the proportion of costs incurred for work performed to date over the estimated total costs. The estimated total costs derived based on bill of quantities issued by customer and costing information gathered via request for quotations. Transaction price is computed based on the price specified in the contract and adjusted for any variable consideration such as incentives and penalties.
Based on the above approach, the contract revenue recognized in the six months ended June 30, 2024, and 2025 is RM30,439,585 and RM55,465,994, respectively. Based on assessment conducted at reporting date, there are no material evidence that the estimate is reasonable likely to change in the foreseeable future.
Internal Control over Financial Reporting
Our management may conclude that our internal control over financial reporting is not effective. Moreover, even if our management concludes that our internal control over financial reporting is effective, our independent registered public accounting firm, after conducting its own independent testing, may issue a report that is qualified if it is not satisfied with our internal controls or the level at which our controls are documented, designed, operated, or reviewed, or if it interprets the relevant requirements differently from us. In addition, after we become a public company, our reporting obligations may place a significant strain on our management, operational, and financial resources and systems for the foreseeable future. We may be unable to complete our evaluation testing and any required remediation in a timely manner.
In preparing our unaudited interim condensed consolidated financial statements, we and our independent registered public accounting firm have identified material weaknesses in our internal control over financial reporting, as defined in the standards established by the Public Company Accounting Oversight Board, and other control deficiencies. The material weaknesses identified included a lack of accounting staff and resources with appropriate knowledge of International Financial Reporting Standards and SEC reporting and compliance requirement and deficiency of internal journal entries procedure. Following the identification of the material weaknesses and control deficiencies, we plan to continue to take remedial measures (i) implementing regular and continuous International Financial Reporting Standards accounting and financial reporting training programs for our accounting and financial reporting personnel; and (ii) engaging an external consulting firm to assist us with assessment of Sarbanes-Oxley compliance requirements and improvement of overall internal control. However, the implementation of these measures may not fully address the material weaknesses in our internal control over financial reporting. Our failure to correct the material weaknesses or our failure to discover and address any other material weaknesses or control deficiencies could result in inaccuracies in our financial statements and could also impair our ability to comply with applicable financial reporting requirements and related regulatory filings on a timely basis. As a result, our business, financial condition, results of operations and prospects, and the trading price of our Ordinary Shares, may be materially and adversely affected. Moreover, ineffective internal control over financial reporting significantly hinders our ability to prevent fraud.