UNITED STATES
SECURITIES AND EXCHANGE COMMISSION
Washington, D.C. 20549
Form 6-K
REPORT OF FOREIGN PRIVATE ISSUER PURSUANT TO RULE 13a-16 OR 15d-16
UNDER THE SECURITIES EXCHANGE ACT OF 1934
For the month of November 2025
Commission File Number: 001-42758
CTW Cayman
(Exact Name of Registrant as Specified in Its Charter)
29F, 1 Chome-9-10,
ARK Hills Sengokuyama Mori Tower
Roppongi, Minato City,
Tokyo 106-0032, Japan
(Address of Principal Executive Office)
Indicate by check mark whether the registrant files or will file annual reports under cover of Form 20-F or Form 40-F.
Form 20-F ☒ Form 40-F ☐
Exhibit Index
| Exhibit No. | Description | |
| 99.1 | Press Release—CTW Announces Fiscal Year 2025 Financial Results | |
| 99.2 | CTW Cayman Fiscal 2025 Supplemental Material |
SIGNATURES
Pursuant to the requirements of the Securities Exchange Act of 1934, the registrant has duly caused this report to be signed on its behalf by the undersigned, thereunto duly authorized.
| Date: November 17, 2025 | CTW Cayman | |
| By: | /s/ Patrick Liu | |
| Name: | Patrick Liu | |
| Title: | Chief Financial Officer | |
Exhibit 99.1

CTW Announces Fiscal Year 2025 Financial Results
Management will host an earnings webcast on Tuesday, November 18 at 8:30 a.m. EST
TOKYO, JAPAN, November 17, 2025 – CTW Cayman (Nasdaq: CTW) (“CTW” or “the Company”), a leading game platform company providing global access to web-based games through its flagship HTML5 platform, G123.jp, reports financial results for the six months (“2H25”) and fiscal year ended July 31, 2025 (“FY25”).
Financial and Business Highlights
| ● | Achieved record revenue of $90.4 million in FY25, up 32% YoY, including 41% YoY growth in 2H25 |
| ● | Delivered net income of $3.8 million ($0.06 per share) and Adjusted EBITDA of $8.0 million in FY25, while actively advertising to support robust new game launches and scaling global operations for growth |
| ● | Launched seven new games on G123.jp during FY25, including the popular So I’m a Spider, So What? Ruler of the Labyrinth, bringing total active games to 29, with a robust pipeline slate for FY26 including 24 games in backlog |
| ● | Successfully completed Initial Public Offering in August 2025, raising $12.0 million in gross proceeds |
Comments from Ryuichi Sasaki, Founder, CEO, and Chairman of CTW
“We are proud to have built the world’s leading platform that allows gamers to enjoy playing anime-based games without the need to download special apps or be distracted by in-game ads. Our strong fiscal 2025 results are indicative of our creative vision, strategic direction, and steady execution, all bearing fruit on an increasingly larger scale. Yet, I believe that our journey is just getting started as a public company.”
“Revenue of $90.4 million in fiscal 2025 grew 32%, with accelerated growth of 41% YoY in the second half of the year as compared to the second half of fiscal 2024, reflecting high engagement with our platform and the success of our recently launched games. Encouragingly, revenue increased in all of our major geographic markets in 2025, confirming global interest in anime and in our ability to source and launch games based on compelling IP. This performance is in line with our strategic focus to expand our user base beyond Japan, our historically largest market, and into other regions, especially North America. Users outside of Japan accounted for 30% of revenue in fiscal 2025, up from 19% in the previous year, and we believe we can expand even further into other markets as anime increasingly goes mainstream around the world.”
“In fiscal 2025, we launched seven new games, including hits such as So I’m a Spider, So What? Ruler of the Labyrinth and Arifureta: From Commonplace to World’s Strongest – Rebellion Soul. Together, these seven new games generated $32.3 million in revenue in 2025 and more than offset the maturation of other our existing games, consistent with the gradual tapering of activity for games that follow a natural lifecycle. This dynamic of continuously growing our business through new game launches and user-acquisition marketing is at the very core of our operating model. Our robust pipeline of new launches should continue to drive strong revenue growth in fiscal 2026 and beyond. Notably, the Doraemon Comic Traveler and Crayon Shinchan: My Sugoroku Great Strategy games are close to launch and are each based on rich anime history and represent the most valuable licensed IP in our corporate history. We expect strong global interest from gamers who are familiar with these main characters and healthy in-game purchases from each of those titles.”
“We have invested considerably over the past year to ensure the scalability of our operations. Investments in R&D and personnel in Shanghai and Taipei, especially to strengthen our AI capabilities, have us well positioned for future growth. We have also made initial investments in North America, a large and relatively untapped market for us, and plan to continue this effort in fiscal 2026. While these recent investments may have masked our full potential profitability in 2025, they have also reinforced the foundation to prepare us for future profitable growth, especially when combined with our pipeline of games and our proven ability to secure valuable licensed IP and efficient user acquisition.”
Fiscal 2025 Results
Revenue increased 32% in FY25 to $90.4 million compared to $68.4 million in FY24, with the rate of growth accelerating in the second half of the fiscal year (2H25) to 41% when compared to 2H24. The strong revenue growth was driven by higher in-game purchases, which increased 27% YoY to $107.0 million as compared to $84.5 million in FY24, and lower revenue share percentage paid to developers which decreased to 12.2% of gross in-game purchases in FY25 from 16.1% in FY24. In FY25, CTW launched seven new games that collectively generated $32.3 million in revenue, compared to 15 new games launched in FY24 that generated $12.6 million in revenue.
Segment profits* increased 16% YoY in FY25 to $31.3 million (29.3% of in-game purchases) as compared to $27.0 million in FY24 (32.0% of in-game purchases), as higher revenue was partially offset by increased advertising expense. While advertising expense increased from $52.4 million in FY25 (49.0% of revenue) as compared to $37.3 million in FY24 (44.2% of revenue), ROAS increased to 116.4% in FY25 from 99.3% in FY24.
Net Income was $3.8 million ($0.06 per share) in FY25, as compared with $6.0 million ($0.10 per share) in FY24. In FY25, $3.2 million of net income was recognized in 2H25.
Adjusted EBITDA* was $8.0 million (8.8% of revenue) in FY25, compared to $12.0 million in FY24 (17.5% of revenue). CTW maintained positive Adjusted EBITDA while actively supporting new game launches with increased advertising expenditure and higher spending to scale its global operations for future growth.
| * | Further clarification and explanation of Segment profits can be found in the Segment Reporting section of the release and at ctw.inc/investors. |
| ** | Further clarification and explanation of non-GAAP measures and reconciliation to the most comparable GAAP measure can be found in the “U.S. GAAP Reconciliation of Non-GAAP Adjusted Results” section of the release and at ctw.inc/investors. |
Earnings Conference Call and Webcast
Management will host an earnings webcast at 8:30am EST on Tuesday, November 18, 2025 to review its financial results and provide a general corporate update. Interested investors can register for the webcast here.
The Company has posted a supplemental slide presentation accompanying this release to its investor relations website at ctw.inc/investors. Investors are encouraged to review these materials in conjunction with this release.
About CTW Cayman
CTW is a leading game platform company providing global access to web-based, free-to-play games inspired by popular Japanese animations, including So I’m a Spider, So What? Ruler of the Labyrinth, Arifureta: From Commonplace to World’s Strongest – Rebellion Soul, and Queen’s Blade Limit Break. CTW delivers these games through its globally-accessible flagship HTML5 platform, G123.jp. According to a Frost & Sullivan Report, CTW was the largest anime IP-based H5 game platform in the world in 2023 in terms of gross billings.
For more information, visit www.ctw.inc or G123.jp.
Forward Looking Statements
This announcement contains forward-looking statements within the meaning of Section 21E of the U.S. Securities Exchange Act of 1934, as amended. These forward-looking statements are made under the “safe harbor” provisions of the U.S. Private Securities Litigation Reform Act of 1995. These statements can be identified by terminology such as “will,” “expects,” “anticipates,” “future,” “intends,” “plans,” “believes,” “estimates,” “potential,” “continue,” “ongoing,” “targets,” “guidance” and similar statements. CTW may also make written or oral forward-looking statements in its periodic reports to the U.S. Securities and Exchange Commission (the “SEC”), in its annual report to shareholders, in press releases and other written materials and in oral statements made by its officers, directors or employees to third parties. Any statements that are not historical facts, including statements about CTW’s beliefs and expectations, are forward-looking statements. Forward-looking statements involve inherent risks and uncertainties. A number of factors could cause actual results to differ materially from those contained in any forward-looking statement, including but not limited to the following: CTW’s growth strategies; its future business development, results of operations and financial condition; its ability to distribute successful and engaging games with high “playability” on its platform; its ability to efficiently attract and retain end-users who come to play and make in-game purchases; its ability to achieve positive return on investment on user acquisition efforts; its ability to establish and maintain relationships with game developers; governmental policies and regulations relating to CTW’s industry; and general economic and business conditions globally and in Japan and assumptions underlying or related to any of the foregoing. Further information regarding these and other risks, uncertainties or factors is included in CTW’s filings with the SEC. All information provided in this press release and in the attachments is as of the date of this press release, and CTW undertakes no obligation to update any forward-looking statement, except as required under applicable law.
Contacts
Matt Chesler, CFA
FNK IR
646-809-2183
investor@ctw.inc
CTW Cayman, Inc.
Key Operating Metrics
The following table includes the Company’s key operating metrics for the years ended July 31, 2025, 2024, and 2023.
| For the Years Ended July 31, | ||||||||||||
| 2025 | 2024 | 2023 | ||||||||||
| Gross in-game purchase amount(1) | $ | 106,994,440 | $ | 84,461,982 | $ | 81,388,946 | ||||||
| Paying daily active users (“PDAUs”)(2) | 17,458 | 16,446 | 13,541 | |||||||||
| Daily active users (“DAUs”)(2) | 264,149 | 197,100 | 189,985 | |||||||||
| PDAUs to DAUs ratio | 6.61 | % | 8.34 | % | 7.13 | % | ||||||
| Paying monthly active users (“PMAUs”)(3) | 88,503 | 62,621 | 47,088 | |||||||||
| Monthly active users (“MAUs”)(3) | 3,378,835 | 2,301,929 | 2,170,678 | |||||||||
| PMAUs to MAUs ratio | 2.62 | % | 2.72 | % | 2.17 | % | ||||||
| PDAUs to PMAUs ratio | 19.73 | % | 26.26 | % | 28.76 | % | ||||||
| DAUs to MAUs ratio | 7.82 | % | 8.56 | % | 8.75 | % | ||||||
| ARPPDAU | $ | 16.79 | $ | 14.07 | $ | 16.47 | ||||||
| ARPDAU | $ | 1.11 | $ | 1.17 | $ | 1.17 | ||||||
| ARPPMAU | $ | 100.74 | $ | 112.4 | $ | 144.04 | ||||||
| ARPMAU | $ | 2.64 | $ | 3.06 | $ | 3.12 | ||||||
| Day 1 retention rate for paying users(4) | 59.6 | % | 62.7 | % | 71.7 | % | ||||||
| Day 7 retention rate for paying users(4) | 37.5 | % | 41 | % | 49 | % | ||||||
| Day 30 retention rate for paying users(4) | 17.1 | % | 21.3 | % | 27.9 | % | ||||||
| Day 1 retention rate for active users(5) | 5.9 | % | 6.2 | % | 5.2 | % | ||||||
| Day 7 retention rate for active users(5) | 2.2 | % | 2.4 | % | 2.1 | % | ||||||
| Day 30 retention rate for active users(5) | 0.8 | % | 0.9 | % | 0.9 | % | ||||||
| Return on advertisement spend (“ROAS”) | 116.4 | % | 99.3 | % | 130.3 | % | ||||||
| (1) | “Gross in-game purchase amount” means the total in-purchase amounts, or top-ups, paid by end-users for games on G123.jp platform. |
| (2) | PDAUs and DAUs for each period represents the average number of PDAUs and DAUs across all the days of the respective period. |
| (3) | PMAUs and MAUs for each period represents the average number of PMAUs and MAUs across all the months of the respective period. |
| (4) | Paying user retention rate is calculated by dividing the number of paying users who return to the same game on a specific day (e.g., Day 1, Day 7, or Day 30) and remain active for at least one minute, by the number of users who made their first in-game purchase in that game on Day 0. Pay user retention rate is measured on a per-game basis and reflects whether the same paying user returns to the same game following their initial purchase activity. We track paying user retention rates on a per-game basis and monitor user retention for each subsequent day following a user’s initial in-game purchase. For each day in a given period, we calculate the platform-level paying user retention rate as the average of the paying user retention rates across all games on our platform. The overall platform paying user retention rate for the period is then determined by averaging these daily platform retention rates over all days in the respective period. |
| (5) | Active user retention rate is calculated by dividing the number of users who return to the same game on a specific day (e.g., Day 1, Day 7, or Day 30) and remain active for at least one minute, by the number of users who played that game for the first time on Day 0 and initiated gameplay by creating a character role on that day. Active user retention rate is measured on a per-game basis and only includes new users to that specific game. We track active user retention rates on a per-game basis and monitor user retention for each subsequent day following a user’s initial in-game purchase. For each day in a given period, we calculate the platform-level active user retention rate as the average of the active user retention rates across all games on our platform. The overall platform paying user retention rate for the period is then determined by averaging these daily platform retention rates over all days in the respective period. |
Glossary of Terms for Key Operating Metrics
| ● | “ARPDAU” are to average daily in-game purchase amount per daily active user during a given period, calculated by dividing the total in-game purchase amount in a given period generated on our G123.jp platform by the average number of daily active users, which is averaged over each day within the respective period, by further dividing the number of days in the respective period; |
| ● | “ARPPDAU” are to average daily in-game purchase amount per paying daily active user during a given period, calculated by dividing the total in-game purchase amount in a given period by the average number of paying daily active users, which is averaged over each day within the respective period, by further dividing the number of days in the respective period; |
| ● | “ARPMAU” are to average daily in-game purchase amount per monthly active user during a given period, calculated by dividing the total in-game purchase amount in a given period generated on our G123.jp platform by the average number of monthly active users, which is averaged over each month by further dividing by the number of months in the respective period; |
| ● | “ARPPMAU” are to average daily in-game purchase amount per paying monthly active user during a given period, calculated by dividing the total in-game purchase amount in a given period by the average number of paying monthly active users, which is averaged over each month by further dividing by the number of month in the respective period; |
| ● | “DAUs” are to daily active users, which is a performance indicator that captures the number of Active Users who accessed our G123.jp platform at least once during a 24-hour period. DAUs for a given period is the average DAUs across all days in the respective period, which is calculated by summing the number of DAUs for each day during the given period and dividing the total by the number of days in the respective period; |
| ● | “MAUs” are to monthly active users, which is a performance indicator that captures the number of Active Users who accessed our G123.jp platform at least once during the preceding 30-day period. MAUs for a givern period is the average MAUs across all months in the respective period, which is calculated by summing the number of MAUs for each month during the given period and dividing the total by the number of months in the respective period; |
| ● | “PDAUs” are to paying daily active users, which is a performance indicator that captures the number of users who made at least one in-game purchase, and have spent at least one (1) minute on G123.jp platform during the preceding 24-hour period. PDAUs for a given period is the average PDAUs across all days in the respective period, which is calculated by summing the number of PDAUs for each day during the given period and dividing the total by the number of days in the respective period; |
| ● | “PMAUs” are to paying monthly active users, which is a performance indicator that captures the number of users who made at least one in-game purchase, and have spent at least one (1) minute on G123.jp platform during the preceding 30-day period. PMAUs for a given period is the average PMAUs across all months in the respective period, which is calculated by summing the number of PMAUs for each month during the given period and dividing the total by the number of months in the respective period; |
| ● | “ROAS” are to return on advertisement spending based on created users, calculated by dividing in-game purchase amount generated by created user divided by advertising expenses during the applicable period. Advertising expenses include all expenses recorded under advertising expenses in our financial statements during the applicable period, which consist primarily of paid media costs for online channels and ad placements that are directly attributable to digital marketing efforts aimed at acquiring new users. We exclude from our ROAS calculation the costs not classified as advertising expenses, including (i) compensation for marketing personnel, (ii) travel expenses, event-related costs, and (iii) general overhead, which are not considered advertising expenses under our accounting policies and are separately reported within the broader sales and marketing expenses line item in our financial statements. In-game purchases generated by created users reflect only spending by users acquired during the applicable period and exclude in-game purchases made by existing users. This differs from the gross in-game purchase amounts disclosed elsewhere, which represent total spending by all users on the platform; |
CTW Cayman, Inc.
Consolidated Statements of Comprehensive Income
(Amounts in U.S. dollars, except for number of shares)
| For the Years Ended July 31, | ||||||||||||
| 2025 | 2024 | 2023 | ||||||||||
| Revenue | $ | 90,370,793 | $ | 68,424,577 | $ | 62,944,073 | ||||||
| Cost and expenses: | ||||||||||||
| Cost of revenue | 22,040,054 | 16,211,779 | 17,049,167 | |||||||||
| General & administrative expenses | 8,479,853 | 5,177,570 | 4,473,647 | |||||||||
| Research & development expenses | 5,528,733 | 952,440 | 2,913,436 | |||||||||
| Sales and marketing expenses | 55,387,277 | 39,426,506 | 32,919,491 | |||||||||
| Total cost and expenses | 91,435,917 | 61,768,295 | 57,355,741 | |||||||||
| Income (loss) from operation | (1,065,124 | ) | 6,656,282 | 5,588,332 | ||||||||
| Other income (expense) | ||||||||||||
| Interest income, net | 494,358 | 300,985 | 41,035 | |||||||||
| Foreign currency transaction gain (loss) | (287,946 | ) | 784,674 | (566,100 | ) | |||||||
| Other income | 555,012 | 454,286 | 173,291 | |||||||||
| Contingent gain on recovery of previously impaired assets | 4,709,029 | — | — | |||||||||
| Other income (expense), net | 5,470,453 | 1,539,945 | (351,774 | ) | ||||||||
| Income before income tax expense | 4,405,329 | 8,196,227 | 5,236,558 | |||||||||
| Income tax expense | 576,766 | 2,218,588 | 1,838,174 | |||||||||
| Net income | 3,828,563 | 5,977,639 | 3,398,384 | |||||||||
| Other comprehensive income | ||||||||||||
| Foreign currency translation adjustment | (42,427 | ) | (1,021,512 | ) | (1,151,842 | ) | ||||||
| Comprehensive income | $ | 3,786,136 | $ | 4,956,127 | $ | 2,246,542 | ||||||
| Earnings per share | ||||||||||||
| Basic and Diluted* | $ | 0.06 | $ | 0.10 | $ | 0.06 | ||||||
| Weighted average number of ordinary shares | ||||||||||||
| Basic and Diluted* | 60,000,000 | 60,000,000 | 60,000,000 | |||||||||
| * | Retrospectively restated for effect of share reorganization |
CTW Cayman, Inc.
Consolidated Balance Sheets
(Amounts in U.S. dollars, except for number of shares)
| As of July 31, | ||||||||
| 2025 | 2024 | |||||||
| ASSETS | ||||||||
| Current assets: | ||||||||
| Cash and cash equivalent | $ | 12,208,630 | $ | 14,461,251 | ||||
| Restricted cash | 160,620 | 133,014 | ||||||
| Accounts receivable, net | 1,410,083 | 1,379,288 | ||||||
| Deferred offering cost | 1,429,523 | — | ||||||
| Prepaid expenses and other current assets | 2,866,243 | 2,184,676 | ||||||
| Total current assets | 18,075,099 | 18,158,229 | ||||||
| Non-current assets: | ||||||||
| Property, plant and equipment, net | 1,098,679 | 935,247 | ||||||
| Prepaid royalties, net | 3,499,962 | 3,660,198 | ||||||
| Investments in films and television programs, net | 576,956 | 800,033 | ||||||
| Advance to game developer, net | 14,561,726 | 14,167,091 | ||||||
| Deferred tax assets, net | 49,067 | 5,946 | ||||||
| Rights-of-use assets, net | 6,782,354 | 4,384,300 | ||||||
| Other noncurrent assets | 1,858,413 | 1,831,463 | ||||||
| Total non-current assets | 28,427,157 | 25,784,278 | ||||||
| TOTAL ASSETS | $ | 46,502,256 | $ | 43,942,507 | ||||
| LIABILITIES AND SHAREHOLDERS' EQUITY | ||||||||
| Current liabilities: | ||||||||
| Accounts payable | $ | 2,377,279 | $ | 3,321,614 | ||||
| Accrued advertising expenses | 475,099 | 3,696,323 | ||||||
| Tax payable | 293,482 | 810,716 | ||||||
| Lease liabilities - current | 2,728,326 | 2,121,666 | ||||||
| Accrued expenses and other current liabilities | 2,549,763 | 2,062,560 | ||||||
| Total current liabilities | 8,423,949 | 12,012,879 | ||||||
| Non-current liabilities: | ||||||||
| Lease liabilities - noncurrent | 4,222,089 | 2,425,578 | ||||||
| Deferred tax liabilities, net | 6,208,161 | 5,664,596 | ||||||
| Total non-current liabilities | 10,430,250 | 8,090,174 | ||||||
| Total liabilities | 18,854,199 | 20,103,053 | ||||||
| Shareholders' equity | ||||||||
| Class A ordinary shares, par value $0.0001 per share, 200,000,000 shares authorized, 48,000,000 shares issued and outstanding as of July 31, 2025 and 2024* | 4,800 | 4,800 | ||||||
| Class B ordinary shares, par value $0.0001 per share, 20,000,000 shares authorized, 12,000,000 shares issued and outstanding as of July 31, 2025 and 2024* | 1,200 | 1,200 | ||||||
| Additional paid-in capital | 872,315 | 849,848 | ||||||
| Statutory reserve | 676,416 | 674,156 | ||||||
| Retained earnings | 31,862,339 | 28,036,036 | ||||||
| Accumulated other comprehensive income (loss) | (5,769,013 | ) | (5,726,586 | ) | ||||
| Total Shareholders' equity | 27,648,057 | 23,839,454 | ||||||
| TOTAL LIABILITIES AND SHAREHOLDERS' EQUITY | $ | 46,502,256 | $ | 43,942,507 | ||||
| * | Retrospectively restated for effect of share reorganization; As of July 31, 2025, the Company's authorized share capital consists of 500,000,000 ordinary shares of US$0.0001 par value each, comprising 200,000,000 Class A shares, 20,000,000 Class B shares and 280,000,000 ordinary shares authorized but not designated. The Board of Directors is authorized, prior to issuance, to designate any of the unissued 280,000,000 ordinary shares as either Class A or Class B. |
CTW Cayman, Inc.
Consolidated Statements of Cash Flows
(Amounts in U.S. dollars, except for number of shares)
| For the Years Ended July 31, | ||||||||||||
| 2025 | 2024 | 2023 | ||||||||||
| CASH FLOWS FROM OPERATING ACTIVITIES: | ||||||||||||
| Net income | $ | 3,828,563 | $ | 5,977,639 | $ | 3,398,384 | ||||||
| Adjustments to reconcile net income to net cash provided by operating activities: | ||||||||||||
| Depreciation and amortization | 2,673,255 | 2,067,706 | 779,368 | |||||||||
| Impairment of advance to game developers | 3,147,411 | 401,451 | 2,457,900 | |||||||||
| Impairment of prepaid royalties | 483,149 | — | 831,624 | |||||||||
| Impairment of investments in films and television programs | — | 46,453 | — | |||||||||
| Amortization of right-of-use asset | 2,455,211 | 1,634,833 | 1,369,188 | |||||||||
| Loss from termination of operating lease agreement | 33,055 | — | — | |||||||||
| (Gain)/Losses from disposal of property, equipment and software | 21,332 | (19,931 | ) | — | ||||||||
| Foreign currency exchange (gain) loss | 450,964 | (742,819 | ) | — | ||||||||
| Deferred income tax expenses | 507,034 | 1,734,765 | 1,811,466 | |||||||||
| Changes in operating assets and liabilities: | ||||||||||||
| Accounts receivable, net | (33,896 | ) | 12,495 | 27,836 | ||||||||
| Prepaid expenses and other current asset, net | (630,207 | ) | (1,536,692 | ) | 2,462,046 | |||||||
| Advance to game developers, net | (3,946,469 | ) | (4,559,682 | ) | (7,565,487 | ) | ||||||
| Prepaid royalties, net | (2,024,883 | ) | (2,105,413 | ) | (1,938,905 | ) | ||||||
| Other non-current assets | (80,476 | ) | 374,397 | (280,676 | ) | |||||||
| Accounts payable | (939,611 | ) | (811,959 | ) | 1,130,431 | |||||||
| Accrued advertising expenses | (2,948,326 | ) | 931,036 | 77,822 | ||||||||
| Tax payable | (518,420 | ) | 149,583 | 253,613 | ||||||||
| Accrued expenses and other current liabilities | 87,188 | (13,896 | ) | (1,002,834 | ) | |||||||
| Operating Lease liabilities | (2,501,114 | ) | (1,898,561 | ) | (1,250,884 | ) | ||||||
| Amount to related parties | 47,615 | (53,758 | ) | (1,741 | ) | |||||||
| Net cash provided by operating activities | 111,375 | 1,587,647 | 2,559,151 | |||||||||
| CASH FLOWS FROM INVESTING ACTIVITIES | ||||||||||||
| Purchase of property and equipment | (584,668 | ) | (710,457 | ) | (134,788 | ) | ||||||
| Proceeds from disposal of property and equipment | 28,109 | 106,374 | 231,514 | |||||||||
| Investments in films and television programs | (258,882 | ) | (569,647 | ) | (581,962 | ) | ||||||
| Purchase of intangible asset | (9,947 | ) | — | — | ||||||||
| Advances to third-party loan | (410,000 | ) | — | — | ||||||||
| Proceeds from due from related parties | 55,351 | — | — | |||||||||
| Net cash used in investing activities | (1,180,037 | ) | (1,173,730 | ) | (485,236 | ) | ||||||
| CASH FLOWS FROM FINANCING ACTIVITIES | ||||||||||||
| Proceeds from shareholder's contribution | 22,202 | — | — | |||||||||
| Deferred offering cost | (1,134,538 | ) | — | — | ||||||||
| Net cash used in financing activities | (1,112,336 | ) | — | — | ||||||||
| Effect of exchange rate changes | (44,017 | ) | (812,504 | ) | (998,138 | ) | ||||||
| Net change in cash, cash equivalents and restricted cash | (2,225,015 | ) | (398,587 | ) | 1,075,777 | |||||||
| Cash, cash equivalents and restricted cash, beginning of the year | 14,594,265 | 14,992,852 | 13,917,075 | |||||||||
| Cash, cash equivalents and cash equivalents, end of the year | $ | 12,369,250 | $ | 14,594,265 | $ | 14,992,852 | ||||||
| Cash, cash equivalent and restricted cash, end of the year | $ | 12,369,250 | $ | 14,594,265 | $ | 14,992,852 | ||||||
| Less: restricted cash, end of the year | 160,620 | 133,014 | 140,682 | |||||||||
| Cash and cash equivalent, end of the year | $ | 12,208,630 | $ | 14,461,251 | $ | 14,852,170 | ||||||
| SUPPLEMENTAL DISCLOSURE OF CASH FLOW INFORMATION: | ||||||||||||
| Cash paid for income tax | $ | $ | 6,928 | $ | 1,924 | |||||||
| Cash paid for operating leases | $ | 2,602,143 | $ | 1,969,440 | $ | 1,314,835 | ||||||
| Supplemental disclosures of non-cash activities: | ||||||||||||
| Obtaining right-of-use assets in exchange for operating lease liabilities | $ | 5,129,642 | $ | 1,685,257 | $ | 30,184 | ||||||
| Derecognition of right-of-use assets and lease liabilities related to terminated lease agreement | $ | 516,625 | $ | — | $ | — | ||||||
CTW Cayman, Inc.
U.S. GAAP Reconciliation of Non-GAAP Adjusted Results
(Amounts in U.S. dollars thousands)
(unaudited)
Reconciliation to the most directly comparable U.S. GAAP measure of the on-GAAP measures included in this press release is as follows. The following table reconciles the Company’s net income (loss) to Adjusted EBITDA:
| (in USD ‘000) | Fiscal 2025 | Fiscal 2024 | Fiscal 2023 | |||||||||||||||||||||||||
| H1 2025 | H2 2025 | FY 2025 | H1 2024 | H2 2024 | FY 2024 | FY 2023 | ||||||||||||||||||||||
| Net income | $ | 639 | $ | 3,190 | $ | 3,829 | $ | 3,971 | $ | 2,006 | $ | 5,978 | $ | 3,398 | ||||||||||||||
| Depreciation and amortization | 1,323 | 1,350 | 2,673 | 899 | 1,168 | 2,068 | 779 | |||||||||||||||||||||
| Amortization of right-of-use asset | 1,017 | 1,438 | 2,455 | 755 | 880 | 1,635 | 1,369 | |||||||||||||||||||||
| Interest income, net | (283 | ) | (212 | ) | (494 | ) | (1 | ) | (300 | ) | (301 | ) | (41 | ) | ||||||||||||||
| Income tax expense | (384 | ) | 961 | 577 | 1,999 | 220 | 2,219 | 1,838 | ||||||||||||||||||||
| Extraordinary Income | — | (4,709 | ) | (4,709 | ) | — | — | — | — | |||||||||||||||||||
| Impairment of advance to game developers | 1,114 | 2,034 | 3,147 | 413 | (11 | ) | 401 | 2,458 | ||||||||||||||||||||
| Impairment of prepaid royalties | 279 | 204 | 483 | — | — | — | 832 | |||||||||||||||||||||
| Adjusted EBITDA (non-GAAP) | $ | 3,705 | $ | 4,256 | $ | 7,961 | $ | 8,037 | $ | 3,962 | $ | 11,999 | $ | 10,634 | ||||||||||||||
CTW Cayman has determined to supplement its consolidated financial statements, prepared in accordance with accounting principles generally accepted in the United States of America (“U.S. GAAP”), presented elsewhere within this report, with non-GAAP adjusted EBITDA, “Earnings Before Interest, Taxes, Depreciation, and Amortization.”
This non-GAAP disclosure has limitations as an analytical tool, should not be viewed as a substitute for Net Earnings (Loss) determined in accordance with U.S. GAAP, should not be considered in isolation or as a substitute for analysis of our results as reported under U.S. GAAP, nor is it necessarily comparable to non-GAAP performance measures that may be presented by other companies. CTW Cayman considers this non-GAAP measure in addition to its results prepared under current accounting standards, but it is not a substitute for, nor superior to, U.S. GAAP measures. This non-GAAP measure is provided to enhance readers’ overall understanding of the Company’s current financial performance and to provide further information for comparative purposes. This supplemental presentation should not be construed as an inference that the Company's future results will be unaffected by similar adjustments to Net Earnings (Loss) determined in accordance with U.S. GAAP. Specifically, CTW Cayman believes the non-GAAP measure provides useful information to management and investors by isolating certain expenses, gains, and losses that may not be indicative of the Company’s core operating results and business outlook. In addition, CTW Cayman believes the non-GAAP measure enhances the comparability of results against prior periods.
CTW Cayman, Inc.
Segment Reporting
(Amounts in U.S. dollars)
| For the Years Ended July 31, | ||||||||||||
| 2025 | 2024 | 2023 | ||||||||||
| Consolidated in-game purchases | $ | 106,994,440 | $ | 84,461,982 | $ | 81,388,946 | ||||||
| Less: | ||||||||||||
| Revenue share with game developers and IP holders | 15,898,478 | 14,975,047 | 19,263,857 | |||||||||
| Transaction fee | 5,265,054 | 3,812,118 | 3,659,159 | |||||||||
| Advertisement expense | 52,396,511 | 37,309,197 | 31,080,465 | |||||||||
| Server cost directly related to hosting the games | 2,088,553 | 1,319,704 | 2,396,425 | |||||||||
| Segment profits | $ | 31,345,844 | $ | 27,045,916 | $ | 24,989,040 | ||||||
| Reconciliation from segment profits to income before income tax | ||||||||||||
| Segment profits | $ | 31,345,844 | $ | 27,045,916 | $ | 24,989,040 | ||||||
| Less: other operating expenses: | ||||||||||||
| Payroll and related cost | 13,621,485 | 9,756,710 | 10,165,389 | |||||||||
| Lease expense | 2,661,149 | 1,738,249 | 1,446,048 | |||||||||
| Depreciation and amortization expense (including amortization of prepaid royalties) | 2,702,360 | 2,099,728 | 947,512 | |||||||||
| Impairment expense | 3,632,218 | 447,904 | 3,289,524 | |||||||||
| Recoup of advances made to game developers | 3,583,143 | 2,477,840 | 551,774 | |||||||||
| Other cost of sales(1) | 2,087,031 | 1,563,366 | 809,739 | |||||||||
| Other selling and marketing expenses(2) | 1,713,981 | 1,402,889 | 1,307,165 | |||||||||
| Other general and administrative expenses(3) | 2,409,601 | 902,948 | 883,557 | |||||||||
| Total other operating expense | 32,410,968 | 20,389,634 | 19,400,708 | |||||||||
| Income (loss) from operation | (1,065,124 | ) | 6,656,282 | 5,588,332 | ||||||||
| Interest income, net | 494,358 | 300,985 | 41,035 | |||||||||
| Foreign Currency Transaction gain (loss) | (287,946 | ) | 784,674 | (566,100 | ) | |||||||
| Other income | 555,012 | 454,286 | 173,291 | |||||||||
| Extraordinary income | 4,709,029 | — | — | |||||||||
| Income before income tax expense | $ | 4,405,329 | $ | 8,196,227 | $ | 5,236,558 | ||||||
In November 2023, the FASB issued ASU 2023-07, Segment Reporting (Topic 280): Improvements to Reportable Segment Disclosures. The ASU’s amendments “improve reportable segment disclosure requirements, primarily through enhanced disclosures about significant segment expenses”. In addition, the standard introduces new disclosure requirements specifically for entities with a single reportable segment, and it aims to help investors better understand a company’s performance and assess potential future cash flows. The new guidance applies to all public entities subject to segment reporting under ASC 280. This ASU is effective for fiscal years beginning after December 15, 2023, and interim periods within fiscal years beginning after December 15, 2024. Early adoption is permitted. The Group adopted this ASU for the year ended July 31, 2025. The adoption of ASU does not change how segments are identified, aggregated, or measured, it adds incremental disclosure requirements.
An operating segment is a component of the Group that engages in business activities from which it may earn revenues and incur expenses, and is identified on the basis of the internal financial reports that are provided to and regularly reviewed by the Group’s chief operating decision maker (“CODM”) in order to allocate resources and assess performance of the segment.
The management of the Group concludes that it has only one reporting segment. The Group provides game distribution and related services to game developers. The Group’s services have similar economic characteristics with respect to nature and form of the services provided. The Group’s chief operating decision maker has been identified as the Chief Executive Officer, who reviews Consolidated results when making decisions about allocating resources and assessing performance of the Group, rather than by geographic area; hence the Group has only one reporting segment. CODM reviews operation results on the consolidated in-game purchase amount, recoup of advances to game developers and revenue share with game developers and IP holders, advertising expenses, transaction fees, server cost directly related to the host of games, in-house payroll cost directly related to the art and design support services provided. The following table summarizes the operating results reviewed by CODM and reconciliation to net income as reported in the consolidated statement of comprehensive income.
Exhibit 99.2

CTW Cayman Fiscal 2025 Supplemental Materials November 18, 2025

Disclosures 2 The following materials have been prepared for use in the November 18 , 2025 conference call on CTW Cayman’s results of operations for the fiscal year July 31 , 2025 . The call will be archived on the internet at https : //ctw . inc/investors?lang=en . This presentation contains “forward - looking statements ˮ within the meaning of the “safe harbor ˮ provisions of the Private Securities Litigation Reform Act of 1995 . These forward - looking statements are made as of the date they were first issued and were based on current plans, expectations, estimates, forecasts, and projections as well as the beliefs and assumptions of management . Words such as “expect, ˮ “vision, ˮ “envision, ˮ “evolving, ˮ “drive, ˮ “anticipate, ˮ “intend, ˮ “maintain, ˮ “should, ˮ “believe, ˮ “continue, ˮ “plan, ˮ “goal, ˮ “opportunity, ˮ “estimate, ˮ “predict, ˮ “may, ˮ “will, ˮ “could, ˮ “hope, ˮ “target, ˮ “project, ˮ “potential, ˮ “might, ˮ “shall, ˮ “contemplate, ˮ and “would, ˮ and variations of these terms or the negative of these terms and similar expressions are intended to identify these forward - looking statements . Forward - looking statements are subject to a number of risks and uncertainties, many of which involve factors or circumstances that are beyond our control . Our actual results could differ materially from those stated or implied in forward - looking statements due to a number of factors, including but not limited to risks detailed in our filings with the Securities and Exchange Commission (the “SEC ˮ ), including our annual reports on Form 20 - F, our semi - annual reports on Form [XX], and other filings and reports we make with the SEC from time to time . In particular, the following factors, among others, could cause results to differ materially from those expressed or implied by such forward - looking statements . Additional information regarding these and other risks and uncertainties that could cause actual results to differ materially from our expectations is included in the reports we have filed or will file with the SEC, including our annual report on Form 20 - F . The forward - looking statements included in this presentation represent our views as of the date of this presentation . We anticipate that subsequent events and developments will cause our views to change . However, we undertake no intention or obligation to update or revise any forward - looking statements, whether as a result of new information, future events, or otherwise . These forward - looking statements should not be relied upon as representing our views as of any date subsequent to the date of this presentation . No Offer or Solicitation This presentation does not constitute an offer to sell, or a solicitation of an offer to buy, or a recommendation to purchase, any securities in any jurisdiction, or the solicitation of any vote . consent or approval in any jurisdiction, nor shall there be any sale, issuance or transfer of any securities in any jurisdiction where, or to any person to whom such offer, solicitation or sale may be unlawful under the laws of such jurisdiction . This Presentation does not constitute either advice or a recommendation regarding any securities . No offering of securities shall be made except by means of a prospectus meeting the requirement of the Securities Act of 1933 , as amended, or in reliance on an exemption therefrom . Financial Data The financial information presented in this presentation should be read in conjunction with the audited consolidated financial statements and related notes included in CTW Cayman’s annual report on Form 20 - F filed with the SEC on November 17 , 2025 which provides a more complete discussion of its accounting policies and certain other information . Please review our risk factors on Form 20 - F filed with the SEC .
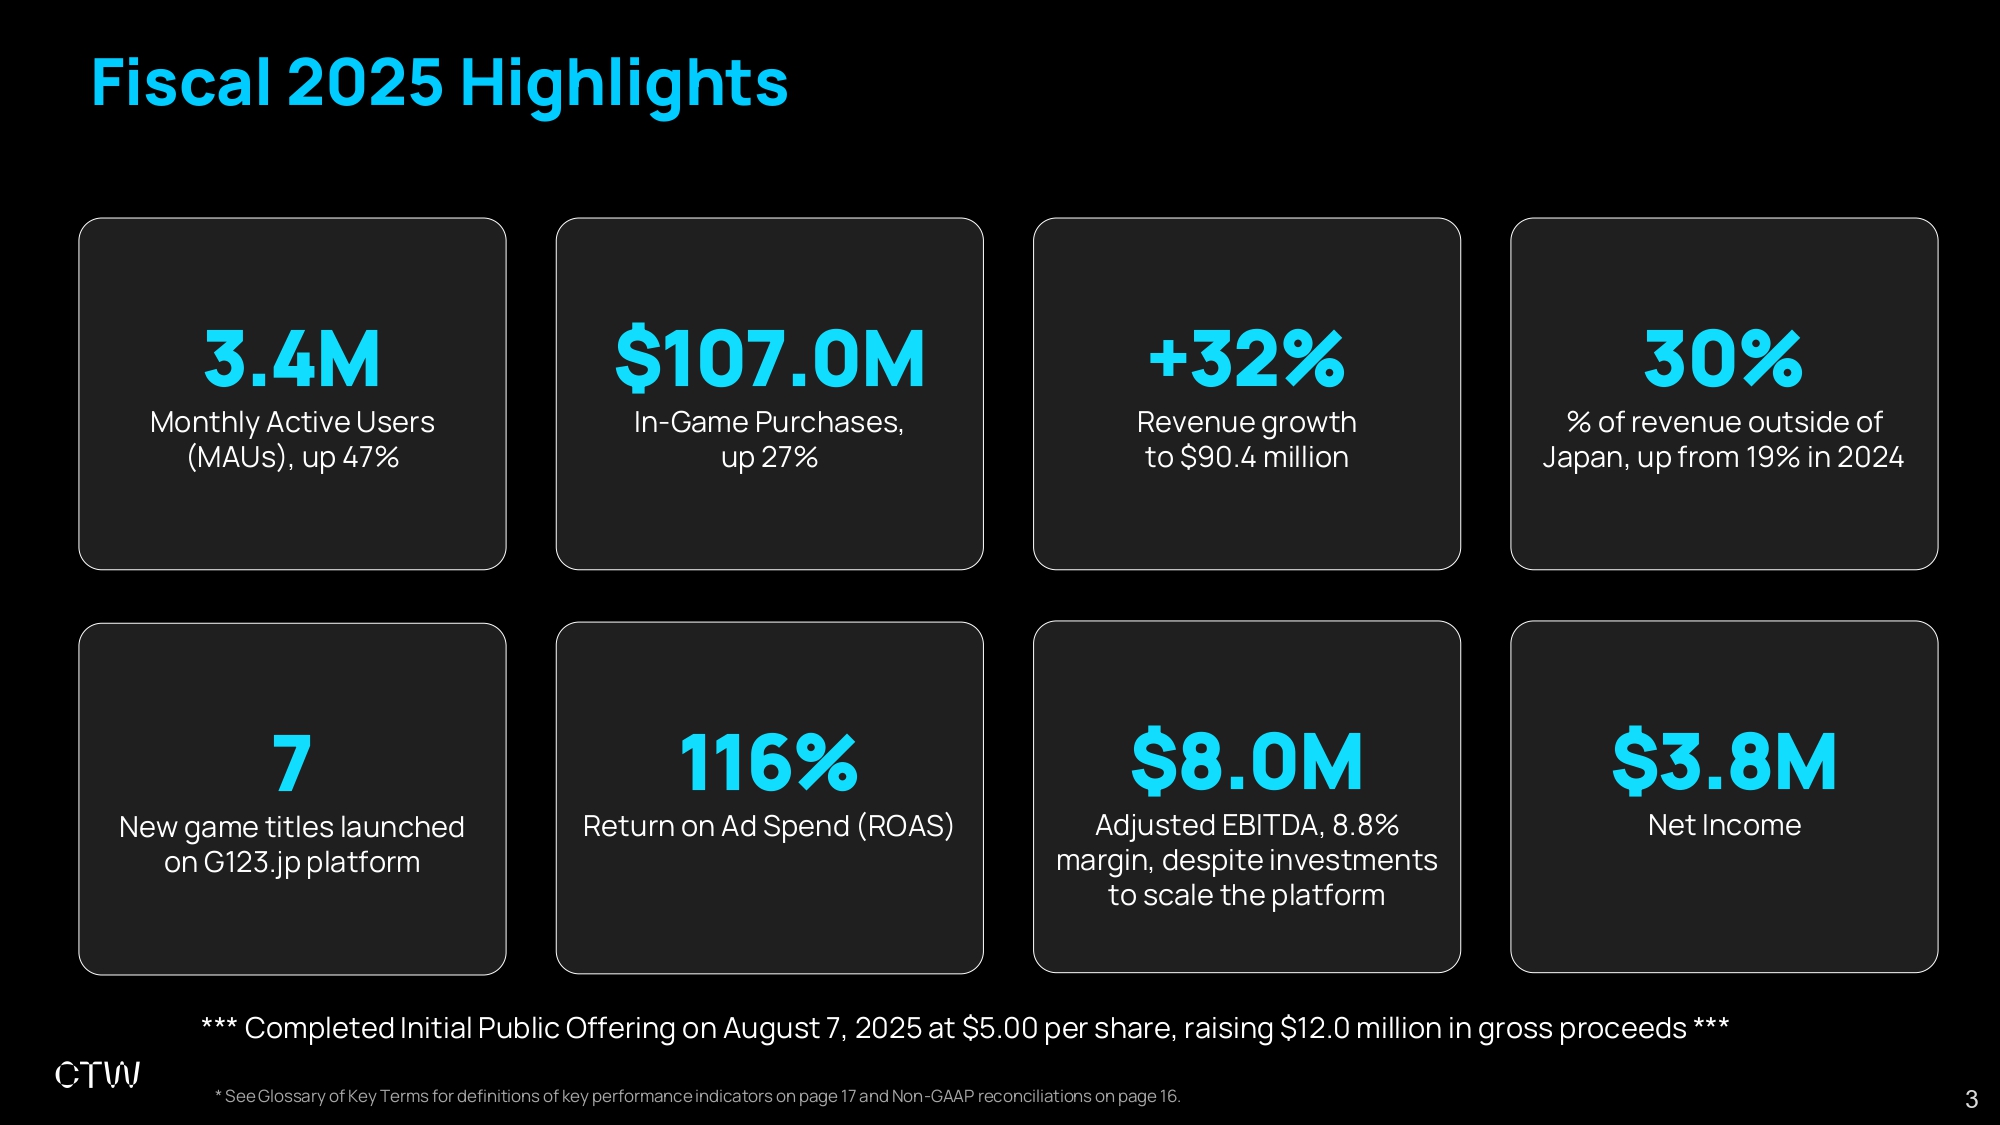
Fiscal 2025 Highlights 3.4M Monthly Active Users (MAUs), up 47% 7 New game titles launched on G123.jp platform $107.0M In - Game Purchases, up 27% 116% Return on Ad Spend (ROAS) +32% Revenue growth to $90.4 million $8.0M Adjusted EBITDA, 8.8% margin, despite investments to scale the platform 30% % of revenue outside of Japan, up from 19% in 2024 $3.8M Net Income * See Glossary of Key Terms for definitions of key performance indicators on page 17 and Non - GAAP reconciliations on page 16. 3 *** Completed Initial Public Offering on August 7, 2025 at $5.00 per share, raising $12.0 million in gross proceeds ***
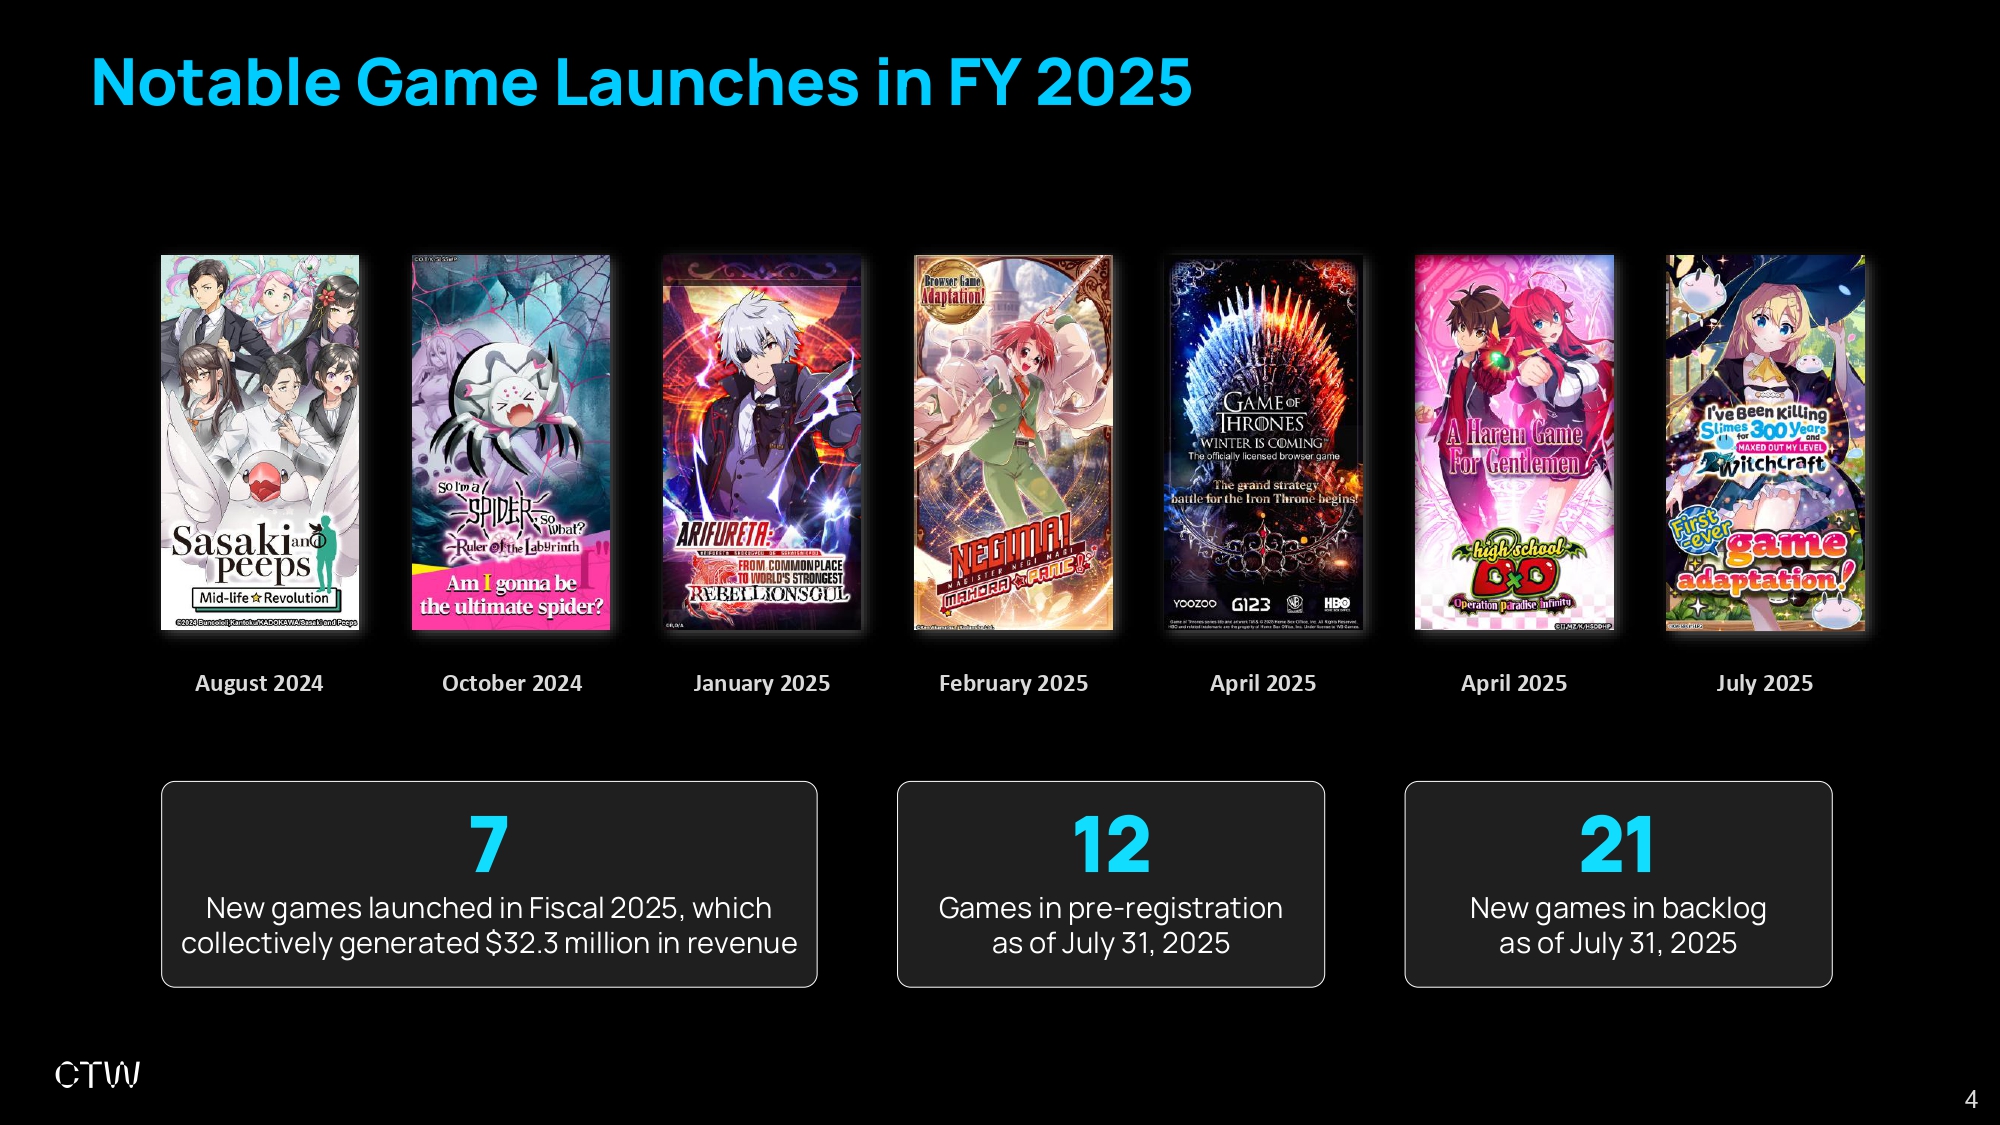
Notable Game Launches in FY 2025 October 2024 January 2025 February 2025 April 2025 July 2025 April 2025 12 Games in pre - registration as of July 31, 2025 21 New games in backlog as of July 31, 2025 7 New games launched in Fiscal 2025, which collectively generated $32.3 million in revenue August 2024 4
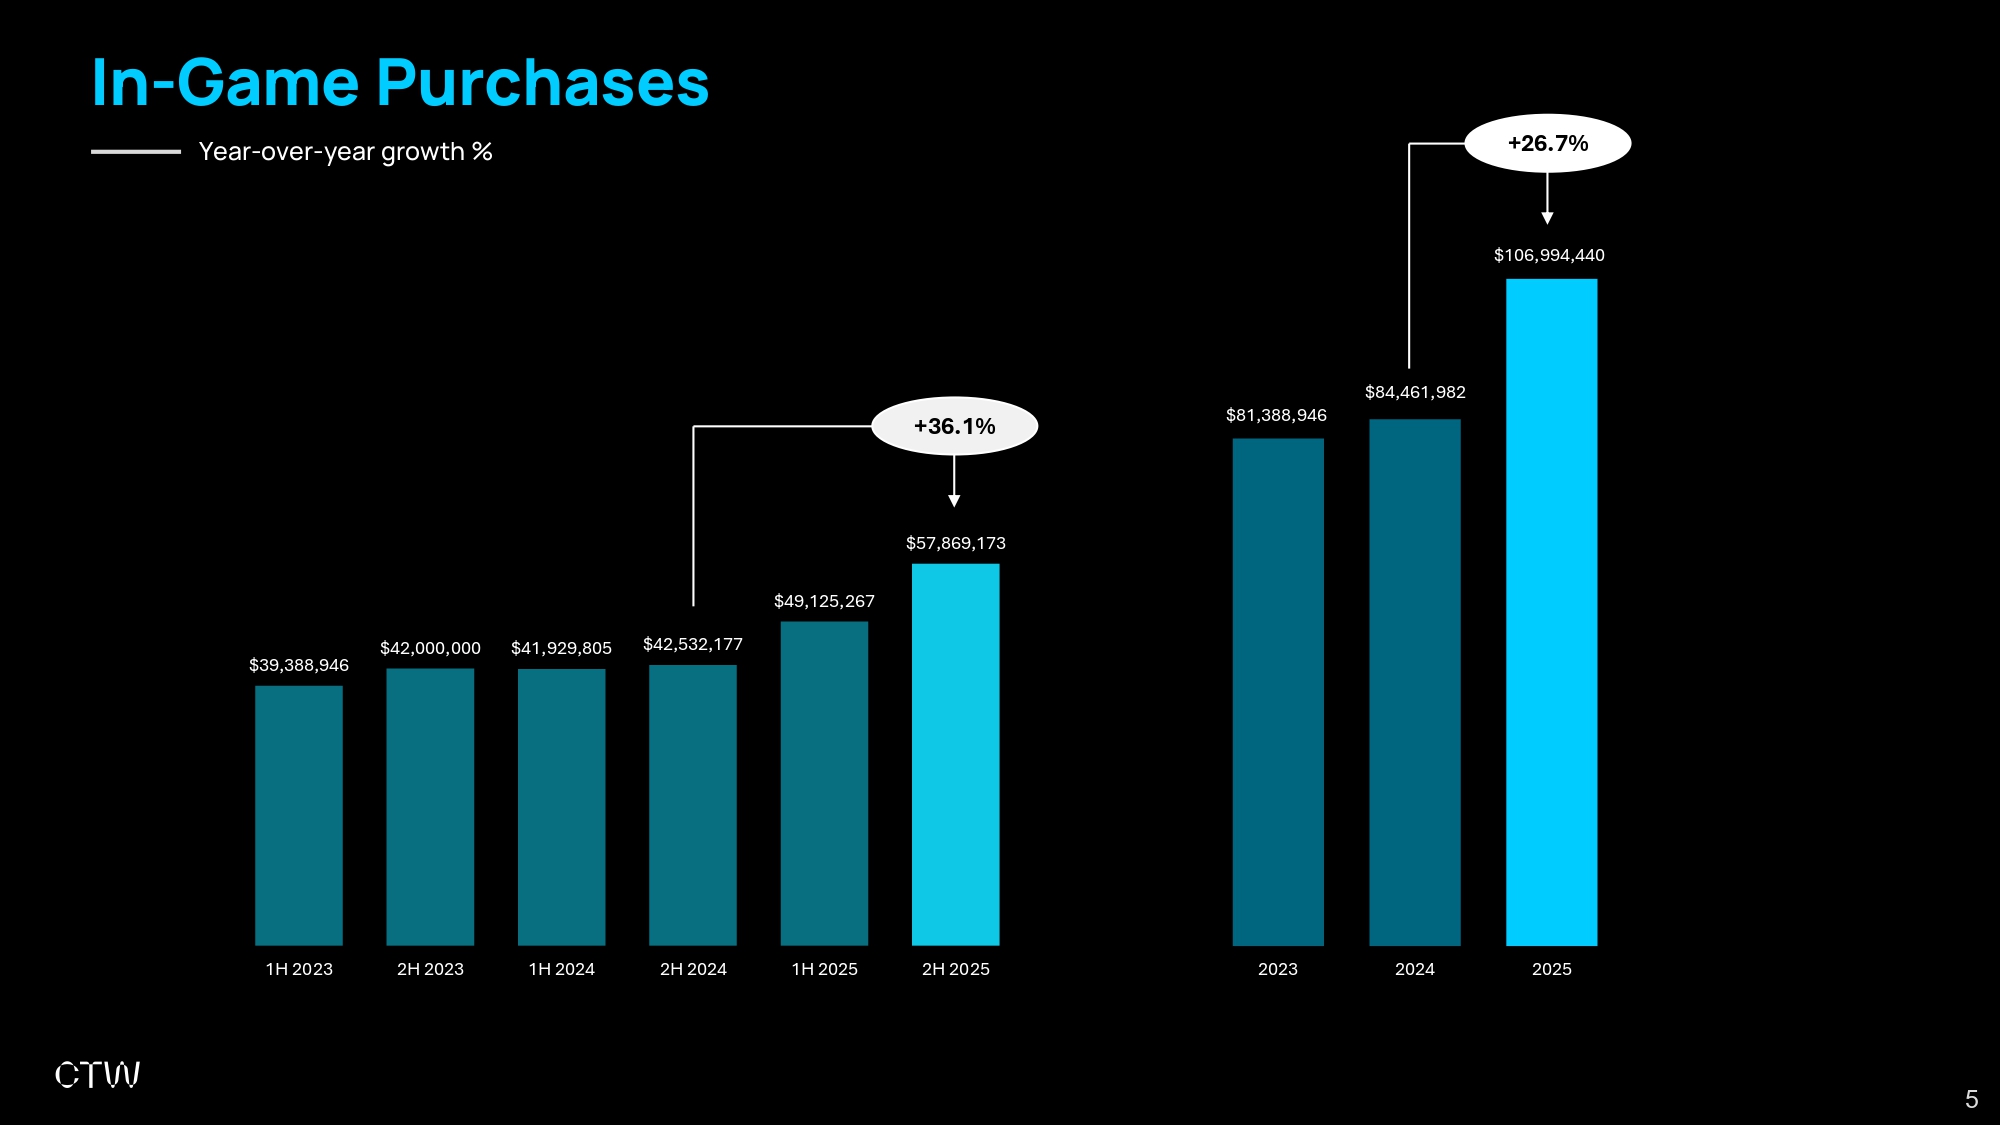
In - Game Purchases Year - over - year growth % $81,388,946 $84,461,982 $106,994,440 2023 2024 2025 $39,388,946 $42,000,000 $41,929,805 $42,532,177 $57,869,173 $49,125,267 1H 2023 2H 2023 1H 2024 2H 2024 1H 2025 2H 2025 +36.1% +26.7% 5
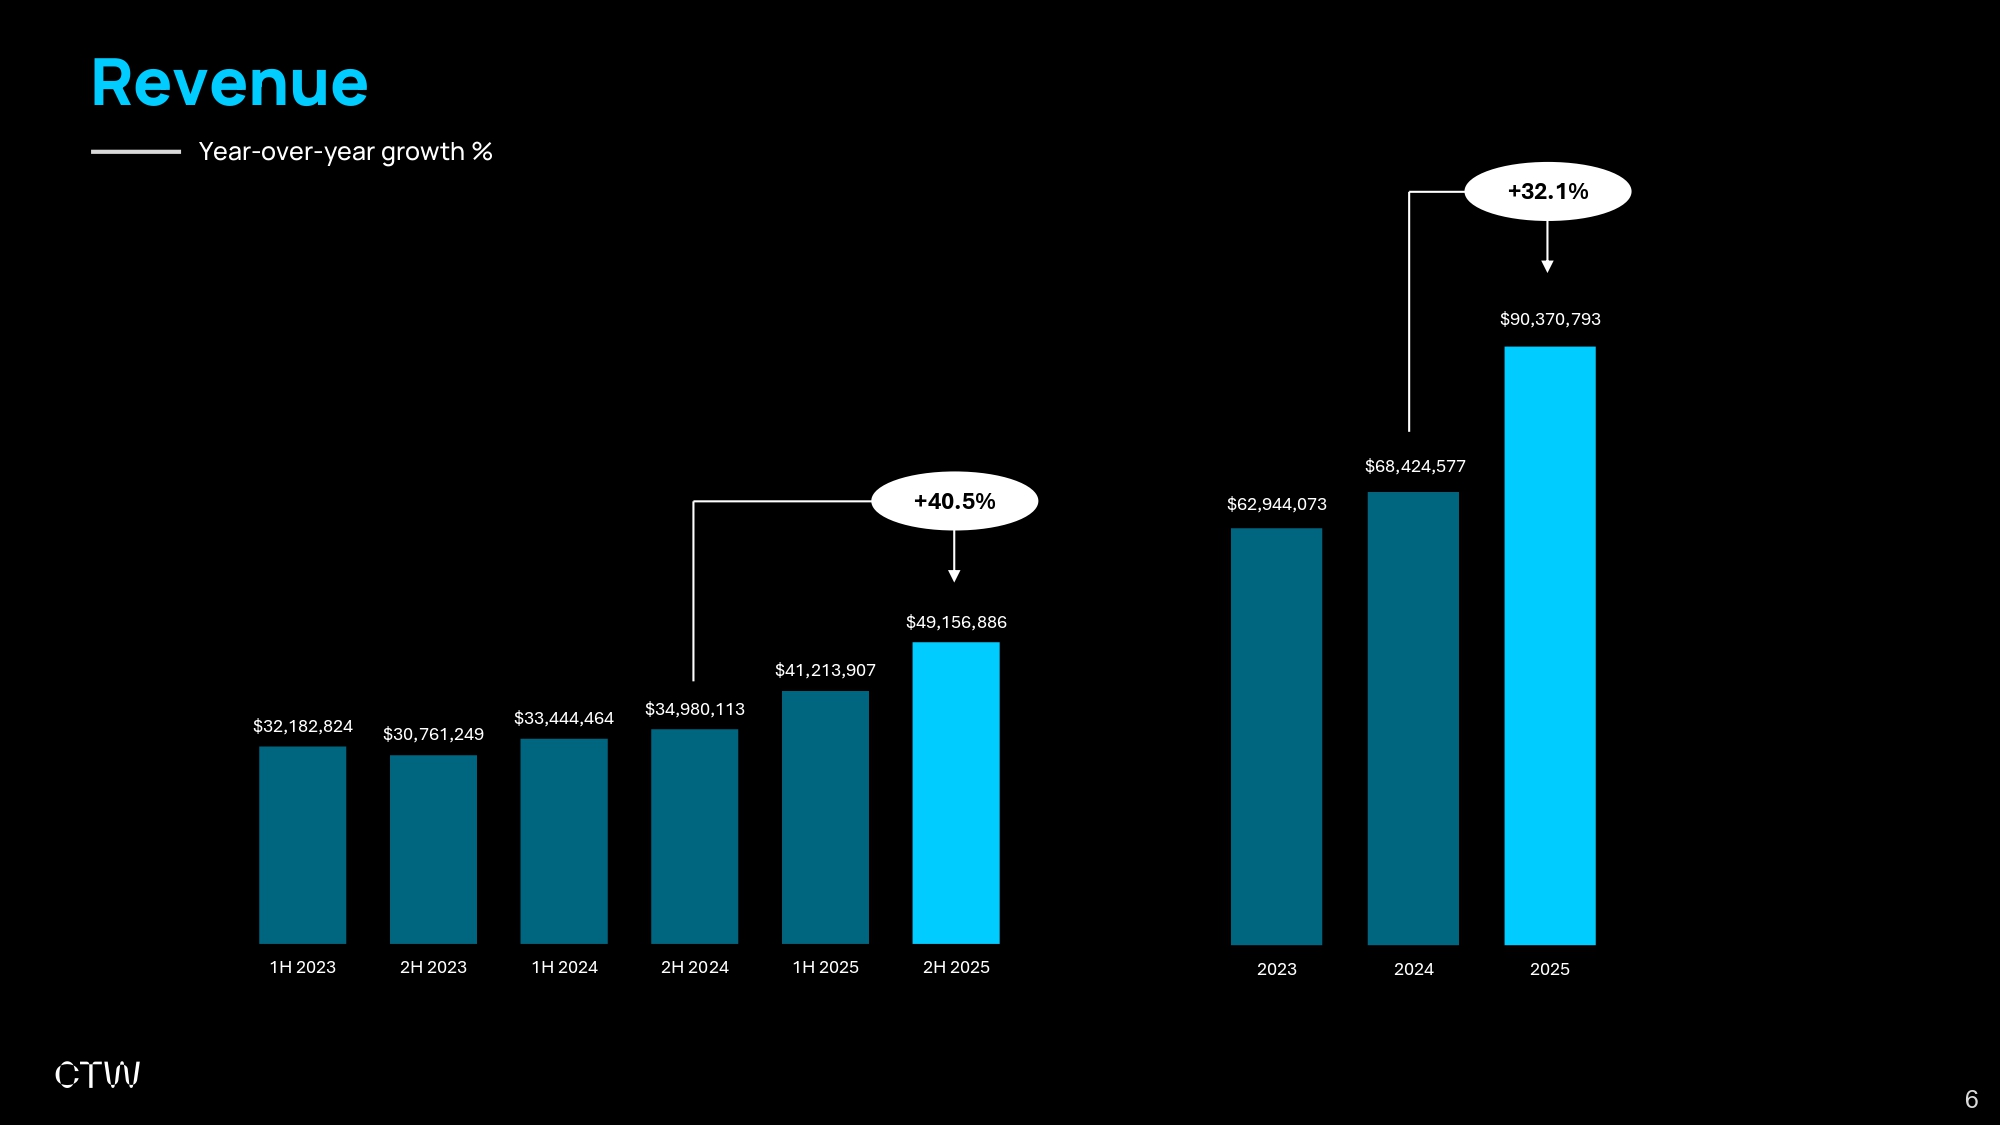
Revenue Year - over - year growth % $32,182,824 $30,761,249 $33,444,464 $34,980,113 $49,156,886 $41,213,907 1H 2023 2H 2023 1H 2024 2H 2024 1H 2025 2H 2025 $62,944,073 $68,424,577 $90,370,793 2023 2024 2025 +40.5% +32.1% 6
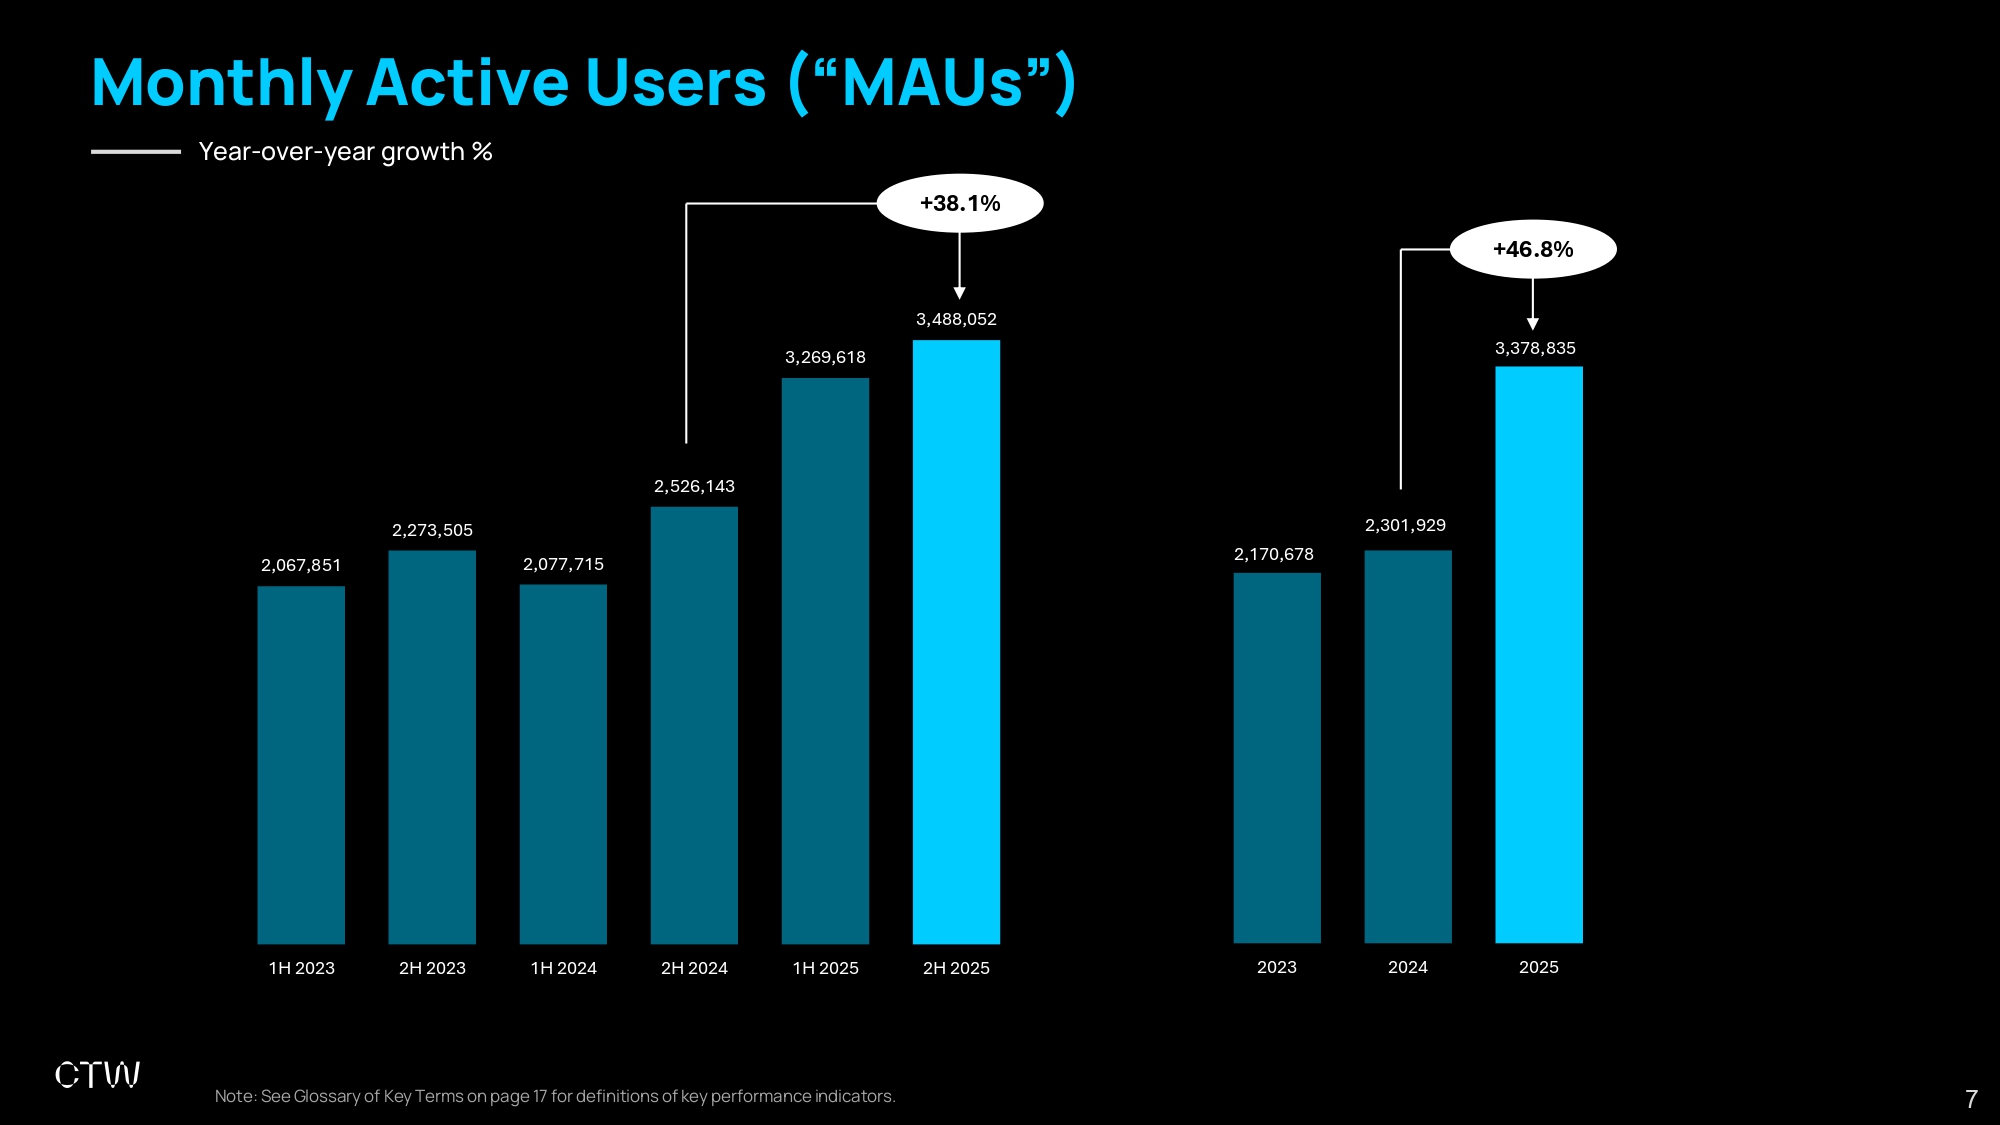
Monthly Active Users (“MAUs”) Year - over - year growth % 2,170,678 2,301,929 3,378,835 2023 2024 2025 +46.8% 2,067,851 2,273,505 2,077,715 2,526,143 3,269,618 3,488,052 1H 2023 2H 2023 1H 2024 2H 2024 1H 2025 2H 2025 +38.1% Note: See Glossary of Key Terms on page 17 for definitions of key performance indicators. 7
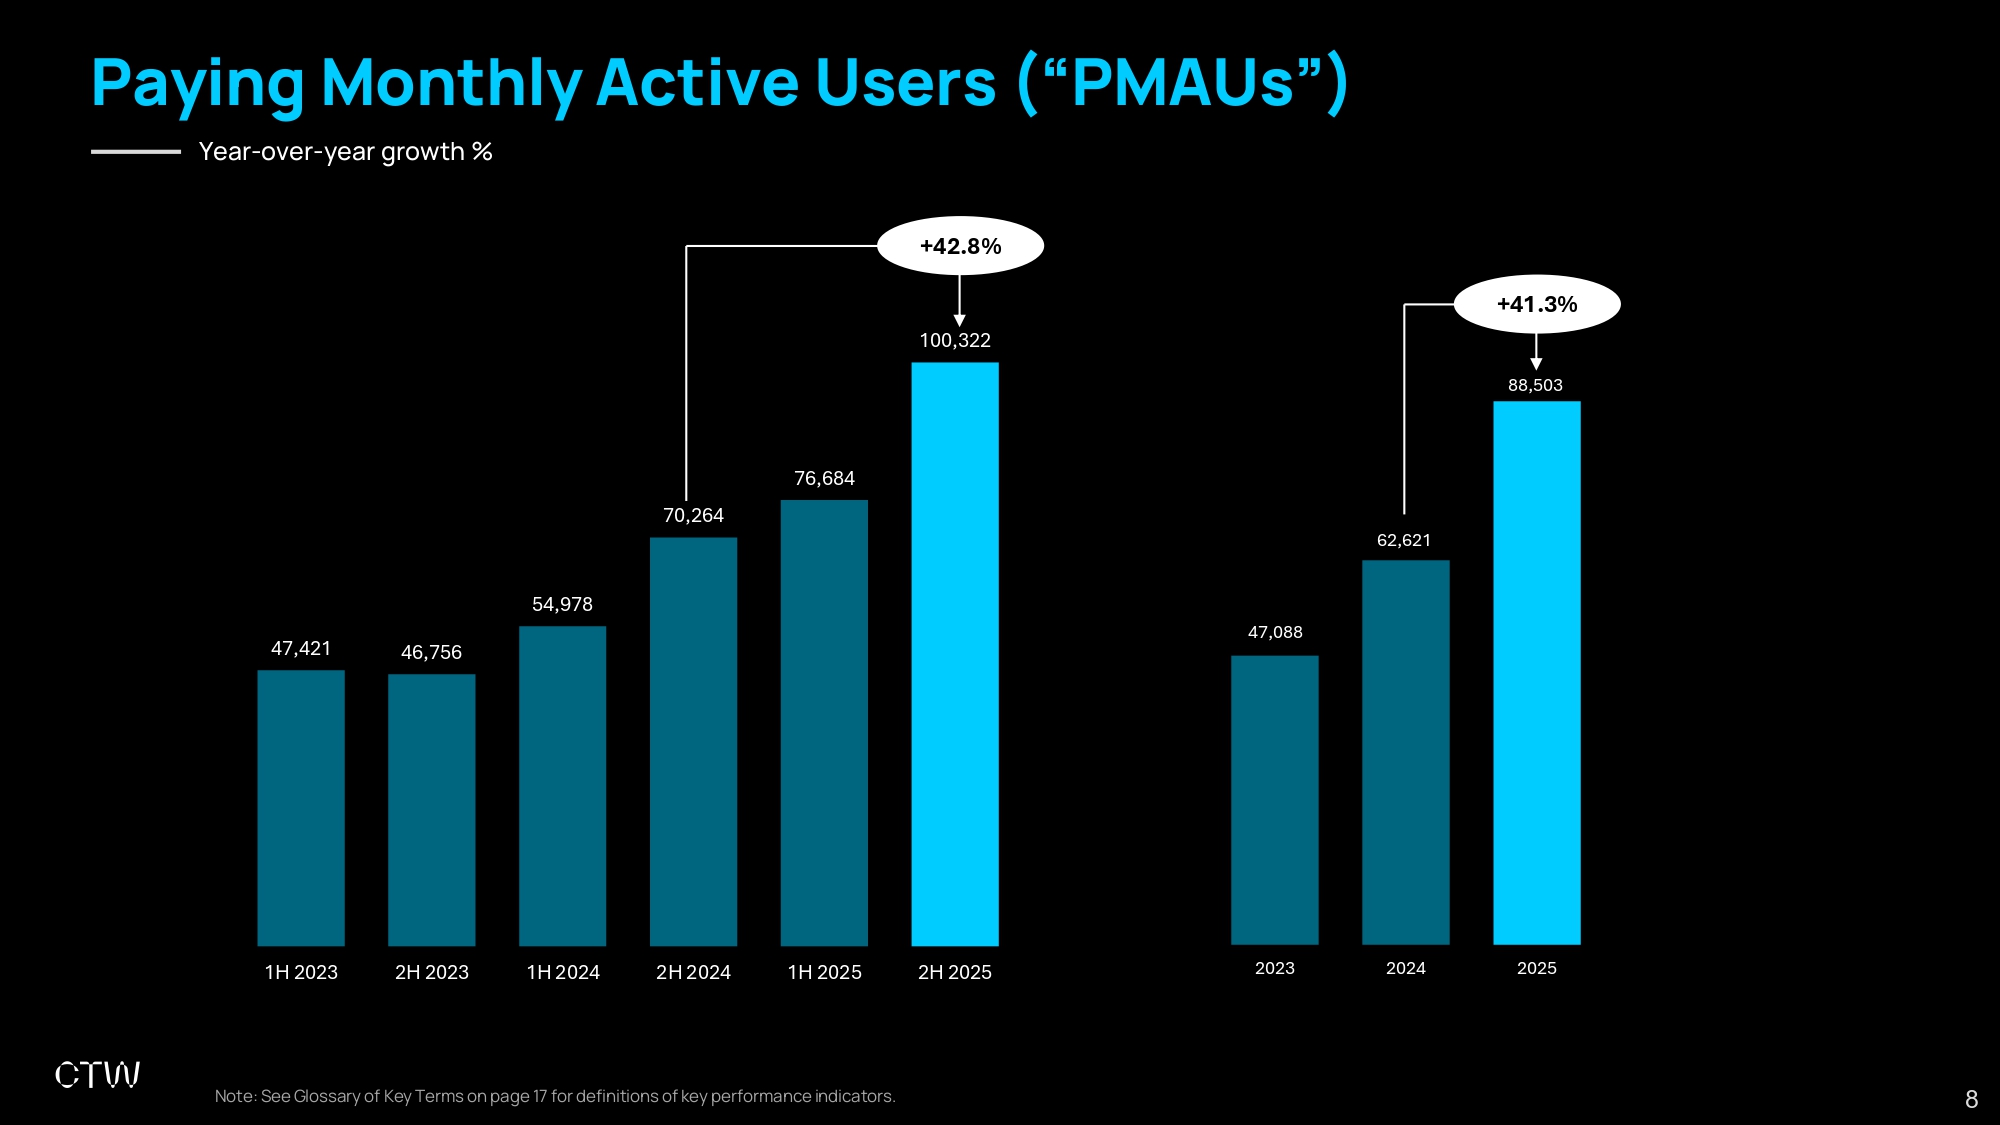
Paying Monthly Active Users (“PMAUs”) Year - over - year growth % +41.3% 47,088 62,621 88,503 2023 2024 2025 47,421 46,756 54,978 76,684 70,264 100,322 1H 2023 2H 2023 1H 2024 2H 2024 1H 2025 2H 2025 +42.8% Note: See Glossary of Key Terms on page 17 for definitions of key performance indicators. 8
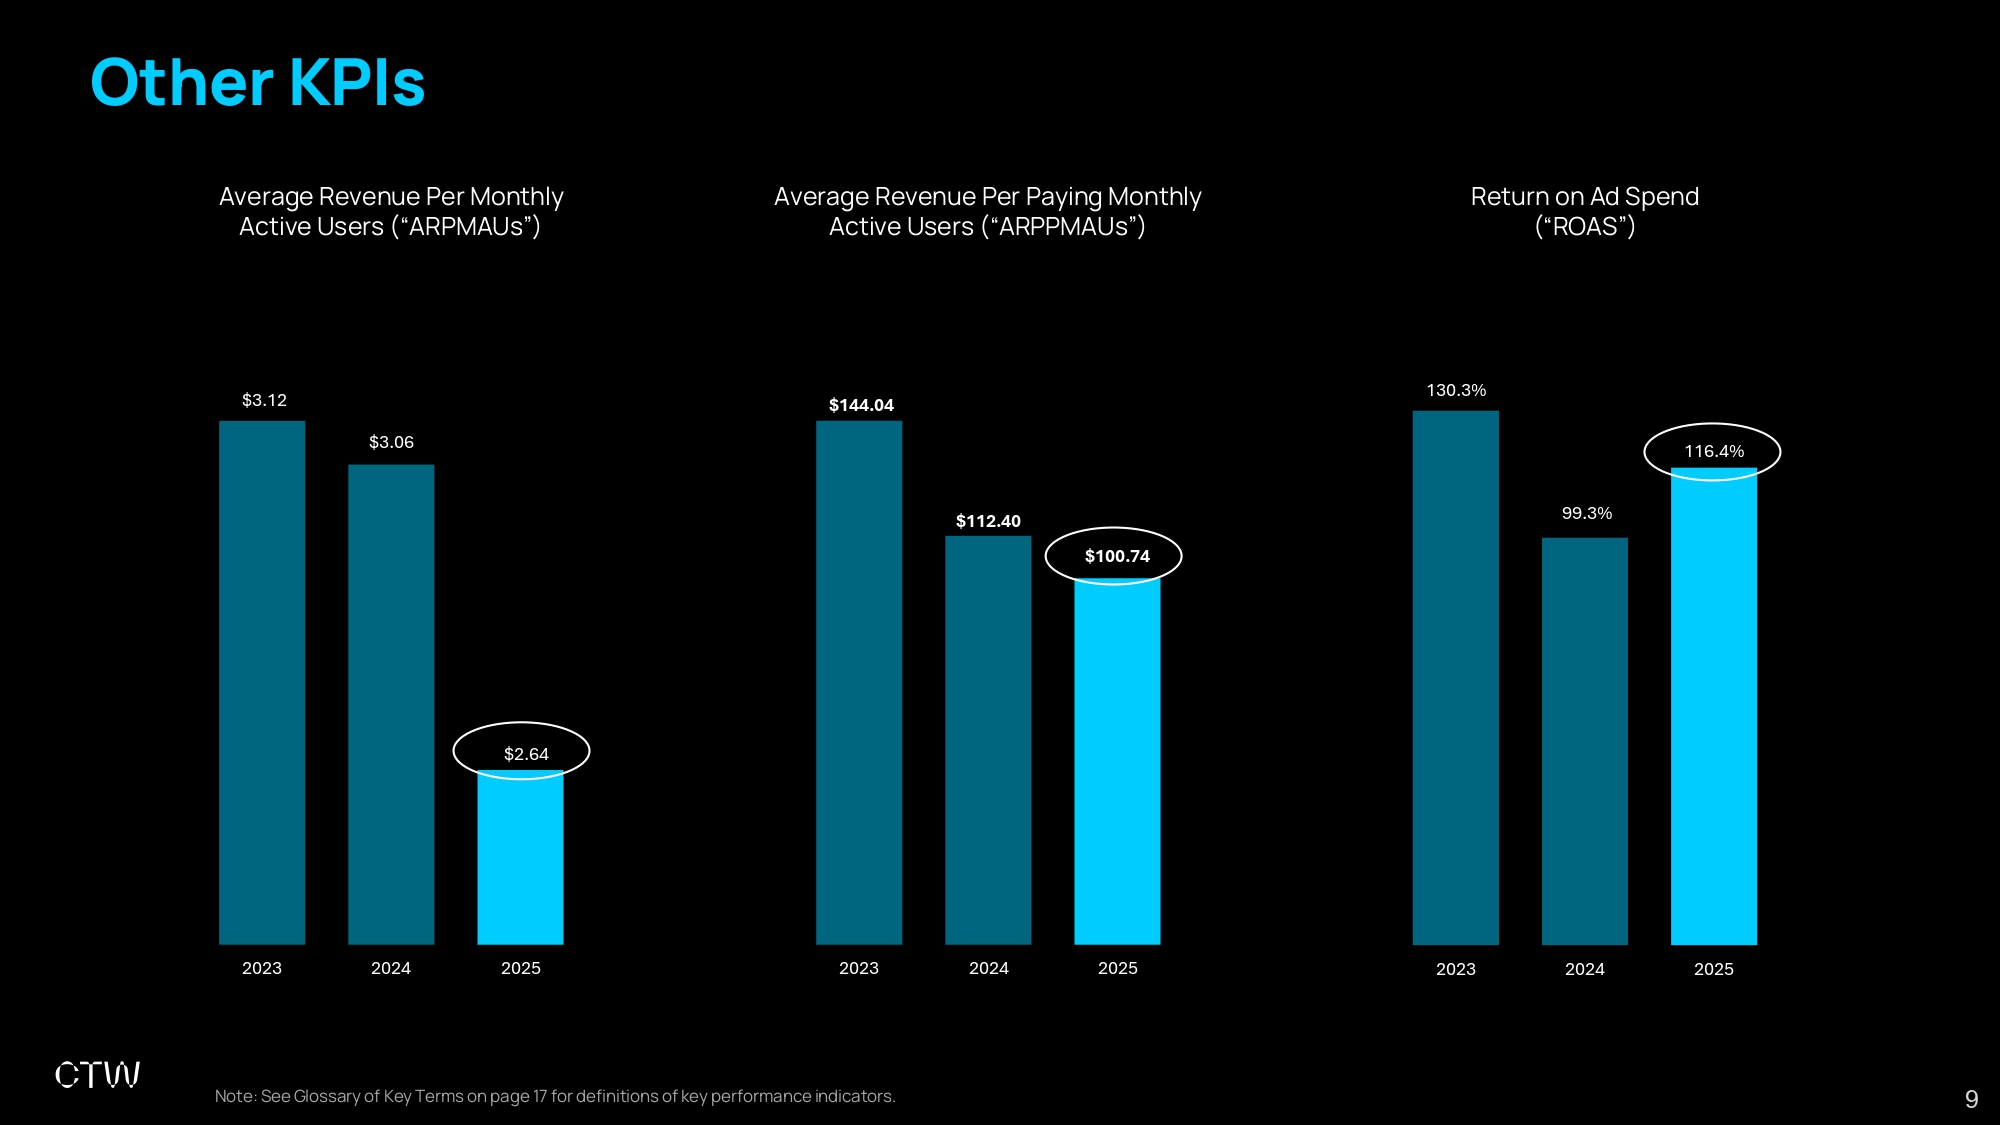
Other KPIs $144.04 $112.40 $100.74 2023 2024 2025 $3.12 $3.06 $2.64 2023 2024 2025 Average Revenue Per Monthly Active Users (“ARPMAUs”) Average Revenue Per Paying Monthly Active Users (“ARPPMAUs”) Return on Ad Spend (“ROAS”) 130.3% 99.3% 116.4% 2023 2024 2025 Note: See Glossary of Key Terms on page 17 for definitions of key performance indicators. 9
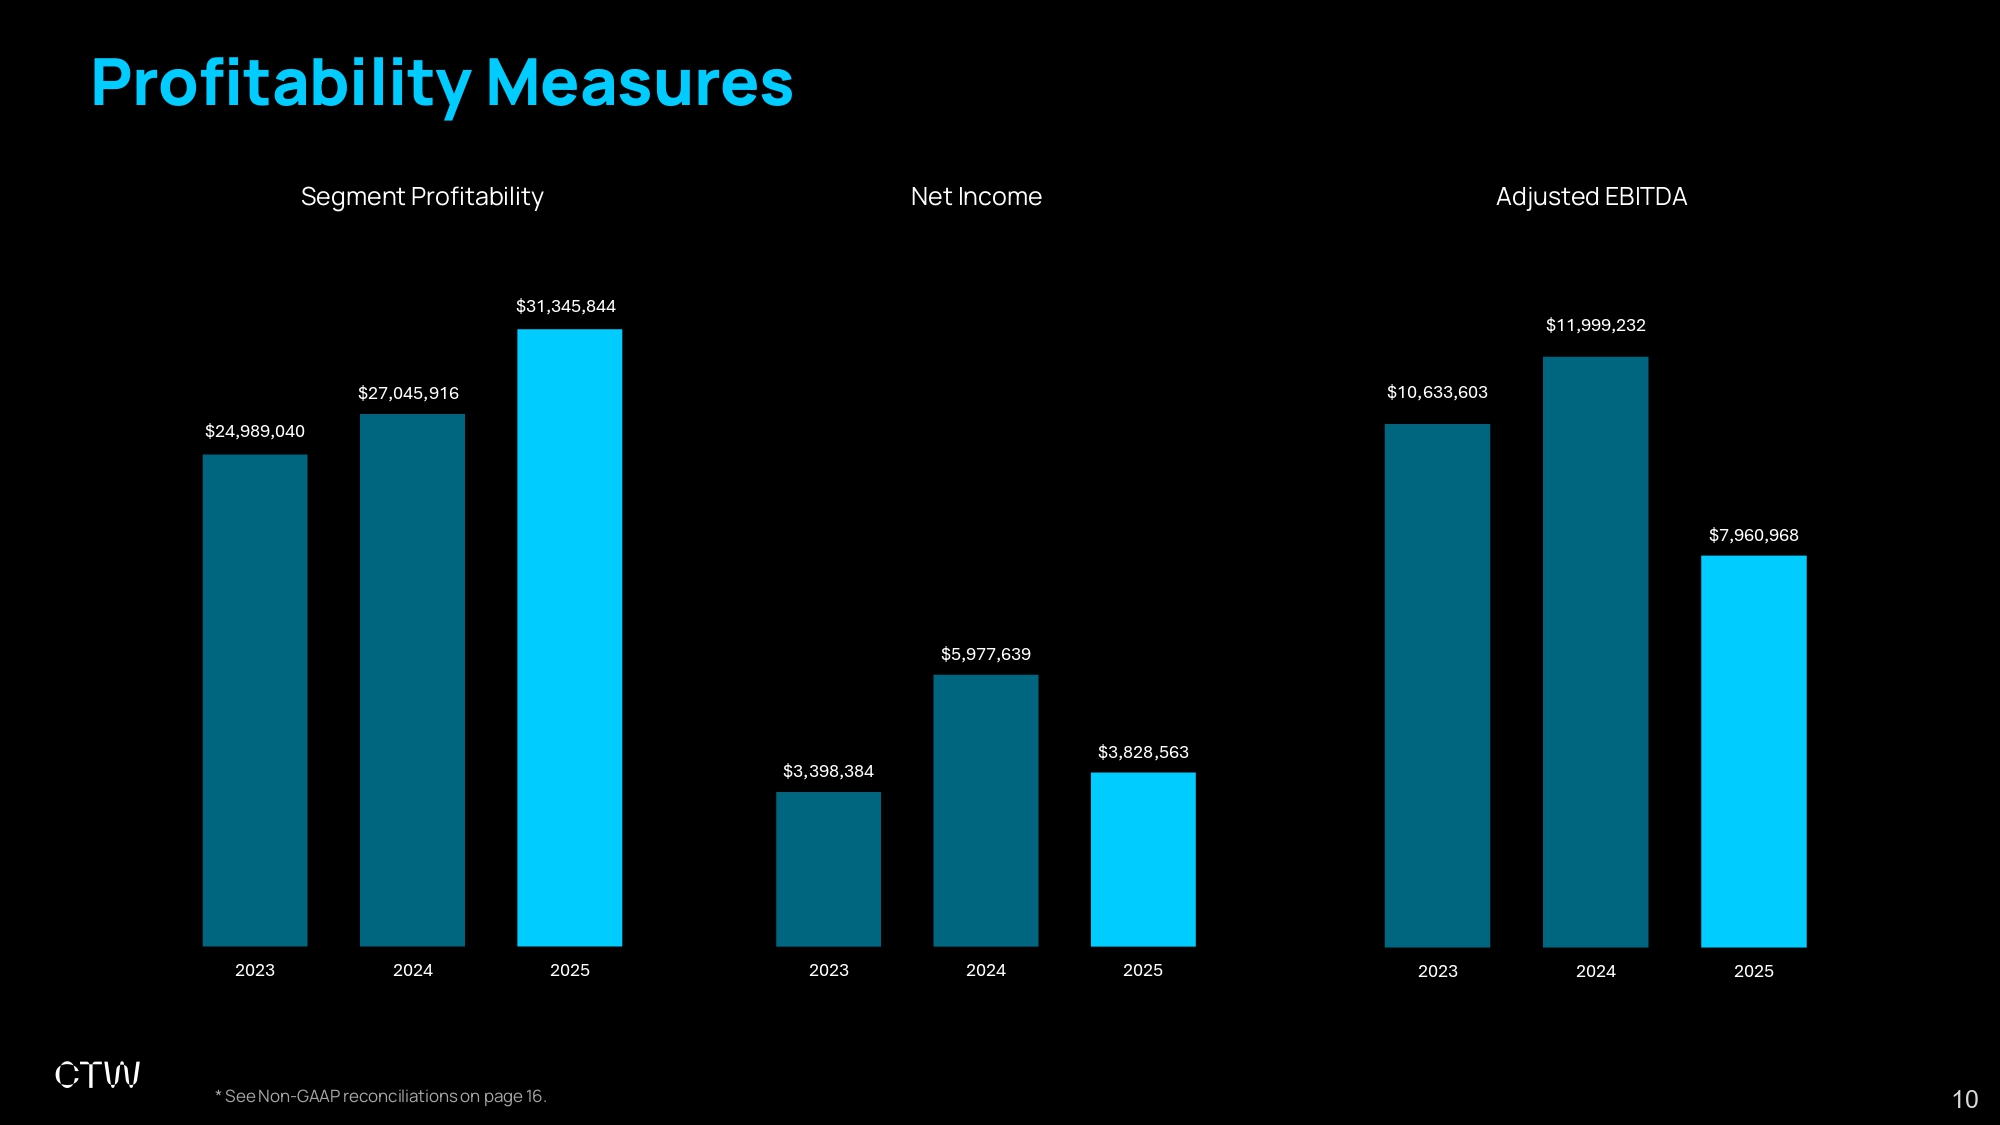
Profitability Measures $24,989,040 $27,045,916 $31,345,844 2023 2024 2025 Segment Profitability Adjusted EBITDA Net Income $3,398,384 $5,977,639 $3,828,563 2023 2024 2025 $10,633,603 * See Non - GAAP reconciliations on page 16. 10 $11,999,232 $7,960,968 2023 2024 2025

Financial Results: Trended Financial Statements and Reconciliations from GAAP to Non - GAAP 11
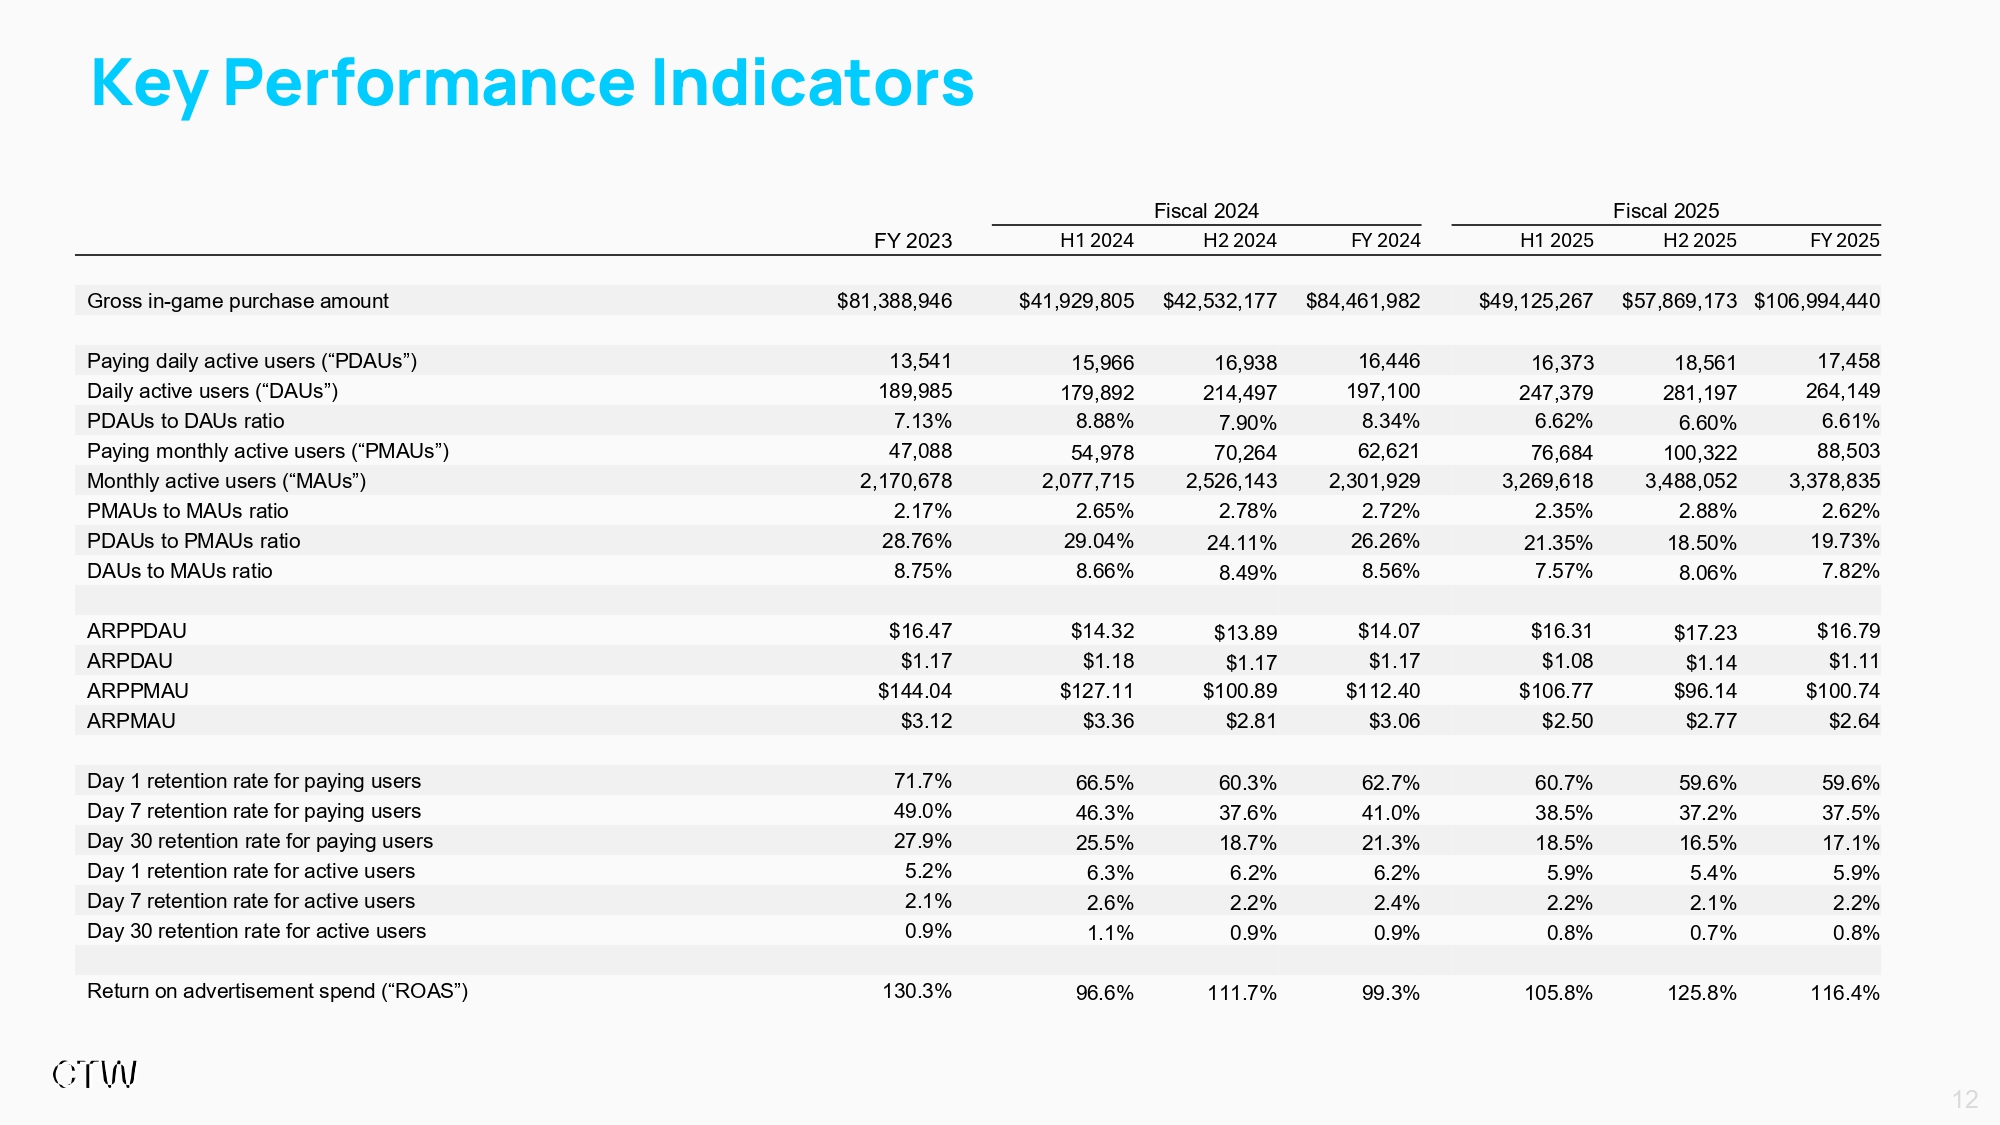
Key Performance Indicators Fiscal 2025 Fiscal 2024 FY 2025 H2 2025 H1 2025 FY 2024 H2 2024 H1 2024 FY 2023 $106,994,440 $57,869,173 $49,125,267 $84,461,982 $42,532,177 $41,929,805 $81,388,946 Gross in - game purchase amount 17,458 18,561 16,373 16,446 16,938 15,966 13,541 Paying daily active users (“PDAUs”) 264,149 281,197 247,379 197,100 214,497 179,892 189,985 Daily active users (“DAUs”) 6.61% 6.60% 6.62% 8.34% 7.90% 8.88% 7.13% PDAUs to DAUs ratio 88,503 100,322 76,684 62,621 70,264 54,978 47,088 Paying monthly active users (“PMAUs”) 3,378,835 3,488,052 3,269,618 2,301,929 2,526,143 2,077,715 2,170,678 Monthly active users (“MAUs”) 2.62% 2.88% 2.35% 2.72% 2.78% 2.65% 2.17% PMAUs to MAUs ratio 19.73% 18.50% 21.35% 26.26% 24.11% 29.04% 28.76% PDAUs to PMAUs ratio 7.82% 8.06% 7.57% 8.56% 8.49% 8.66% 8.75% DAUs to MAUs ratio $16.79 $17.23 $16.31 $14.07 $13.89 $14.32 $16.47 ARPPDAU $1.11 $1.14 $1.08 $1.17 $1.17 $1.18 $1.17 ARPDAU $100.74 $96.14 $106.77 $112.40 $100.89 $127.11 $144.04 ARPPMAU $2.64 $2.77 $2.50 $3.06 $2.81 $3.36 $3.12 ARPMAU 59.6% 59.6% 60.7% 62.7% 60.3% 66.5% 71.7% Day 1 retention rate for paying users 37.5% 37.2% 38.5% 41.0% 37.6% 46.3% 49.0% Day 7 retention rate for paying users 17.1% 16.5% 18.5% 21.3% 18.7% 25.5% 27.9% Day 30 retention rate for paying users 5.9% 5.4% 5.9% 6.2% 6.2% 6.3% 5.2% Day 1 retention rate for active users 2.2% 2.1% 2.2% 2.4% 2.2% 2.6% 2.1% Day 7 retention rate for active users 0.8% 0.7% 0.8% 0.9% 0.9% 1.1% 0.9% Day 30 retention rate for active users 116.4% 125.8% 105.8% 99.3% 111.7% 96.6% 130.3% Return on advertisement spend (“ROAS”) 12
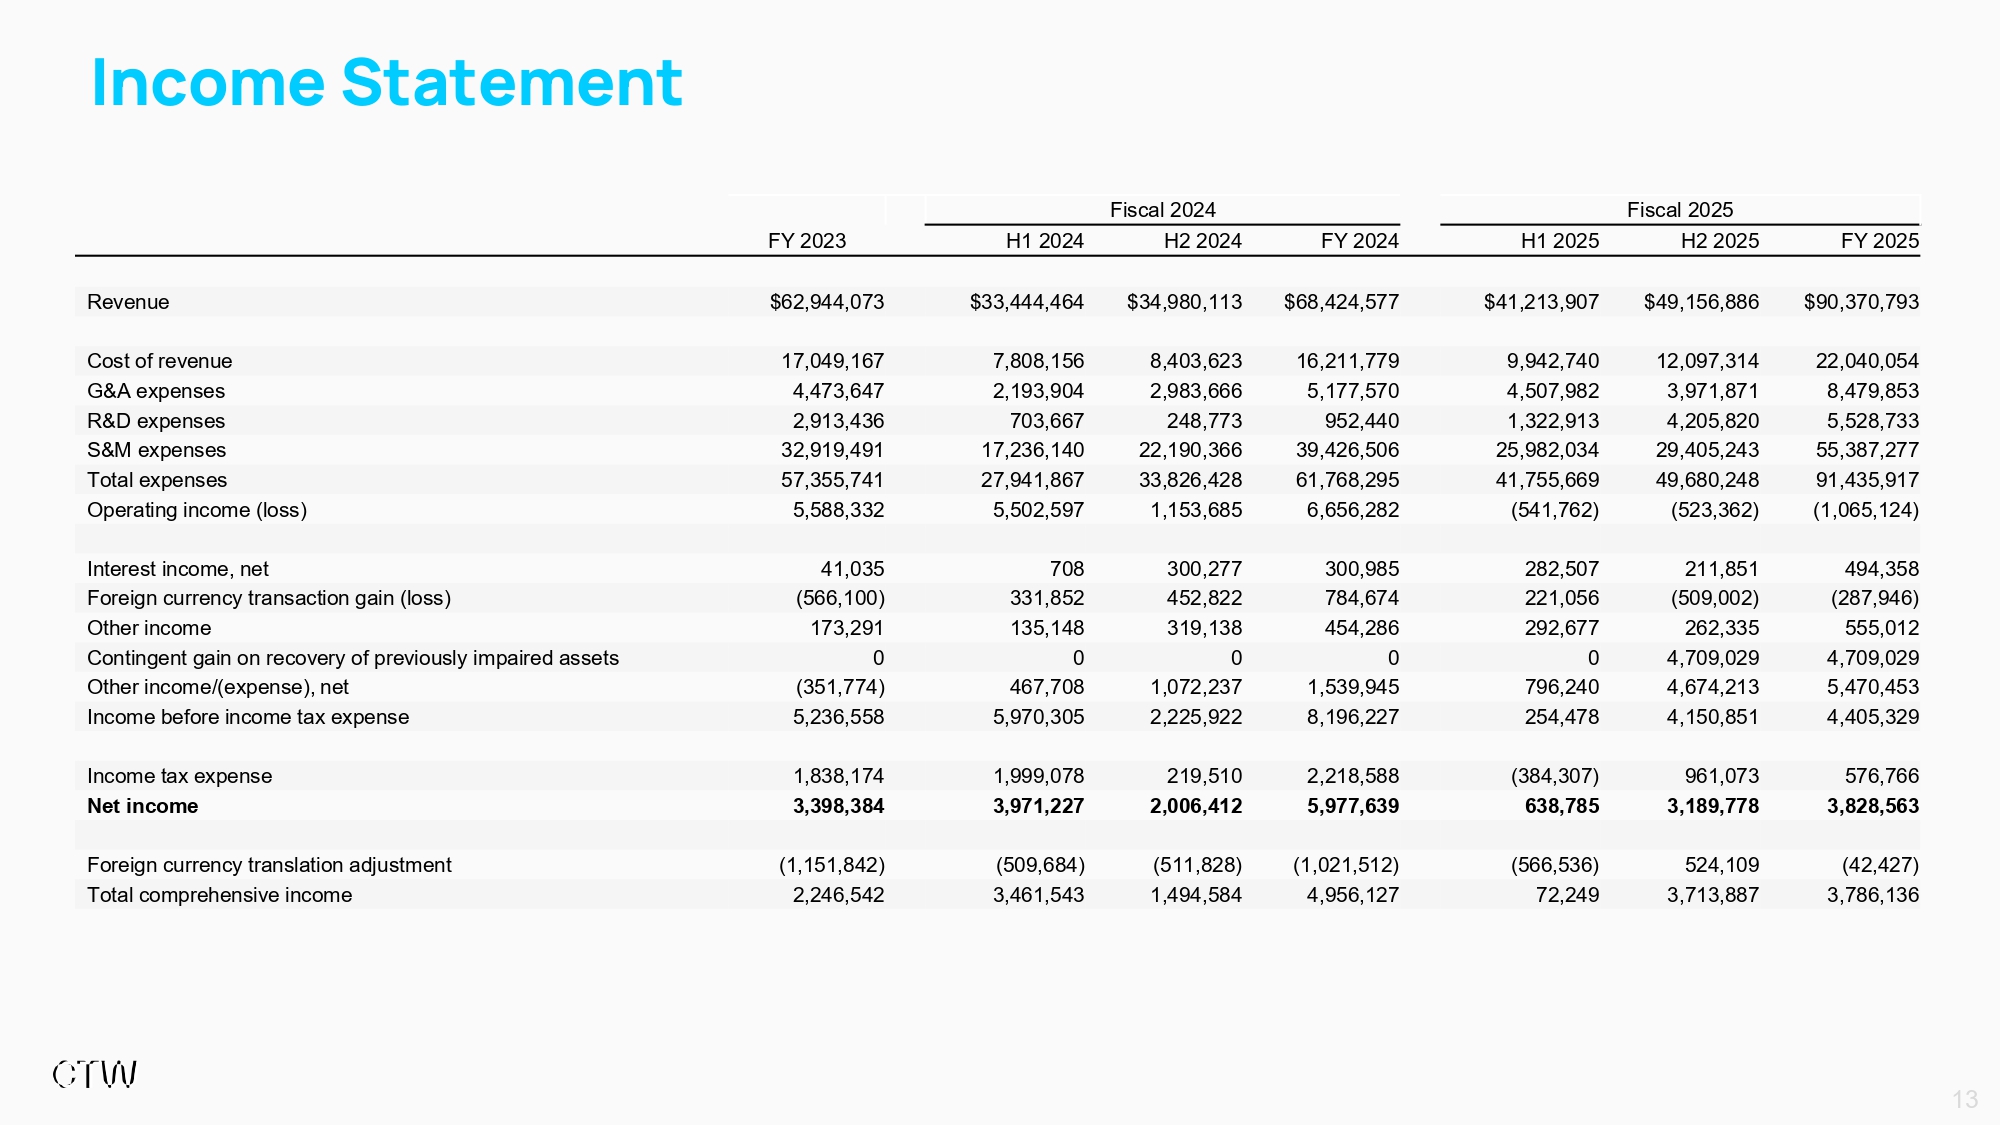
Income Statement Fiscal 2025 Fiscal 2024 FY 2025 H2 2025 H1 2025 FY 2024 H2 2024 H1 2024 FY 2023 $90,370,793 $49,156,886 $41,213,907 $68,424,577 $34,980,113 $33,444,464 $62,944,073 Revenue 22,040,054 12,097,314 9,942,740 16,211,779 8,403,623 7,808,156 17,049,167 Cost of revenue 8,479,853 3,971,871 4,507,982 5,177,570 2,983,666 2,193,904 4,473,647 G&A expenses 5,528,733 4,205,820 1,322,913 952,440 248,773 703,667 2,913,436 R&D expenses 55,387,277 29,405,243 25,982,034 39,426,506 22,190,366 17,236,140 32,919,491 S&M expenses 91,435,917 49,680,248 41,755,669 61,768,295 33,826,428 27,941,867 57,355,741 Total expenses (1,065,124) (523,362) (541,762) 6,656,282 1,153,685 5,502,597 5,588,332 Operating income (loss) 494,358 211,851 282,507 300,985 300,277 708 41,035 Interest income, net (287,946) (509,002) 221,056 784,674 452,822 331,852 (566,100) Foreign currency transaction gain (loss) 555,012 262,335 292,677 454,286 319,138 135,148 173,291 Other income 4,709,029 4,709,029 0 0 0 0 0 Contingent gain on recovery of previously impaired assets 5,470,453 4,674,213 796,240 1,539,945 1,072,237 467,708 (351,774) Other income/(expense), net 4,405,329 4,150,851 254,478 8,196,227 2,225,922 5,970,305 5,236,558 Income before income tax expense 576,766 961,073 (384,307) 2,218,588 219,510 1,999,078 1,838,174 Income tax expense 3,828,563 3,189,778 638,785 5,977,639 2,006,412 3,971,227 3,398,384 Net income (42,427) 524,109 (566,536) (1,021,512) (511,828) (509,684) (1,151,842) Foreign currency translation adjustment 3,786,136 3,713,887 72,249 4,956,127 1,494,584 3,461,543 2,246,542 Total comprehensive income 13
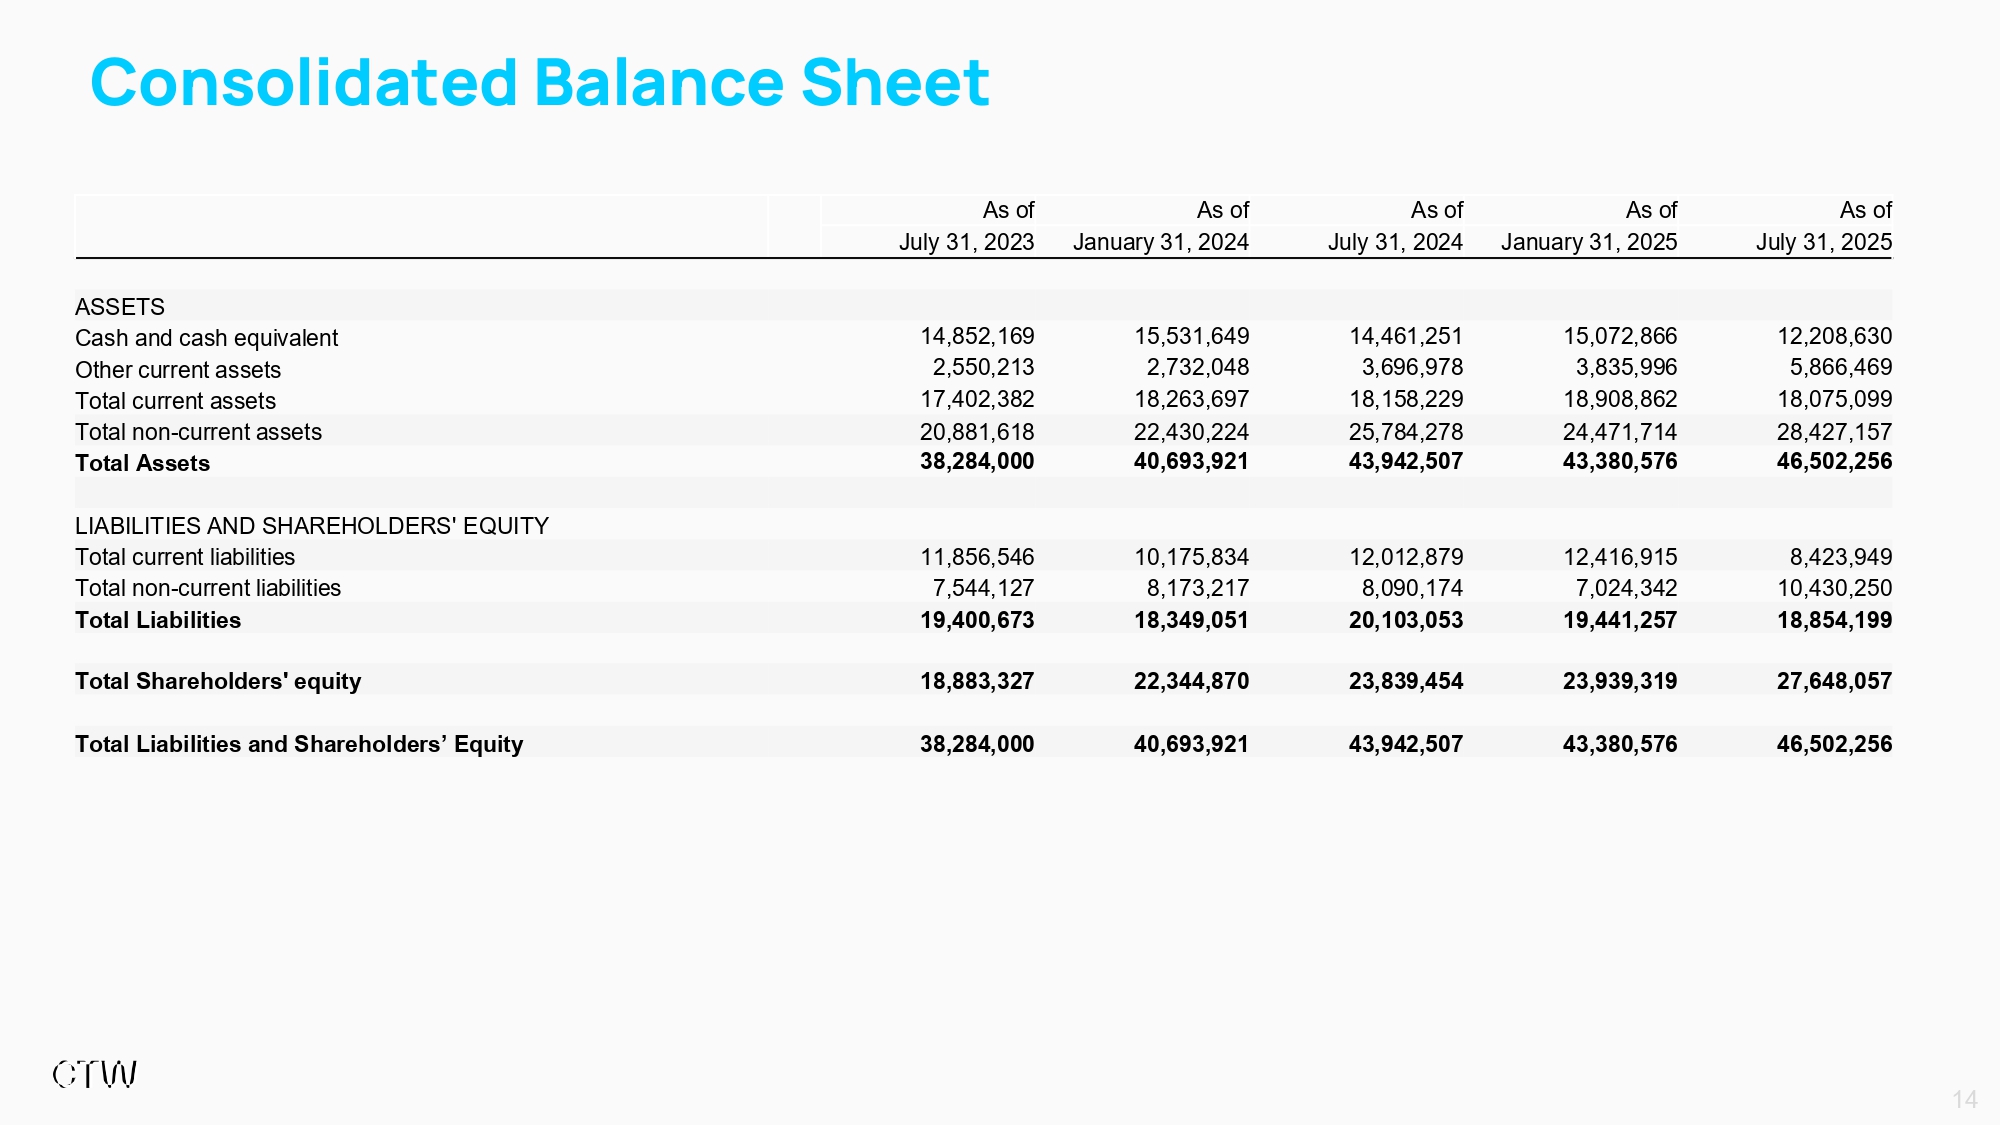
Consolidated Balance Sheet As of As of As of As of As of July 31, 2025 January 31, 2025 July 31, 2024 January 31, 2024 July 31, 2023 ASSETS 12,208,630 15,072,866 14,461,251 15,531,649 14,852,169 Cash and cash equivalent 5,866,469 3,835,996 3,696,978 2,732,048 2,550,213 Other current assets 18,075,099 18,908,862 18,158,229 18,263,697 17,402,382 Total current assets 28,427,157 24,471,714 25,784,278 22,430,224 20,881,618 Total non - current assets 46,502,256 43,380,576 43,942,507 40,693,921 38,284,000 Total Assets LIABILITIES AND SHAREHOLDERS' EQUITY 8,423,949 12,416,915 12,012,879 10,175,834 11,856,546 Total current liabilities 10,430,250 7,024,342 8,090,174 8,173,217 7,544,127 Total non - current liabilities 18,854,199 19,441,257 20,103,053 18,349,051 19,400,673 Total Liabilities 27,648,057 23,939,319 23,839,454 22,344,870 18,883,327 Total Shareholders' equity 46,502,256 43,380,576 43,942,507 40,693,921 38,284,000 Total Liabilities and Shareholders’ Equity 14
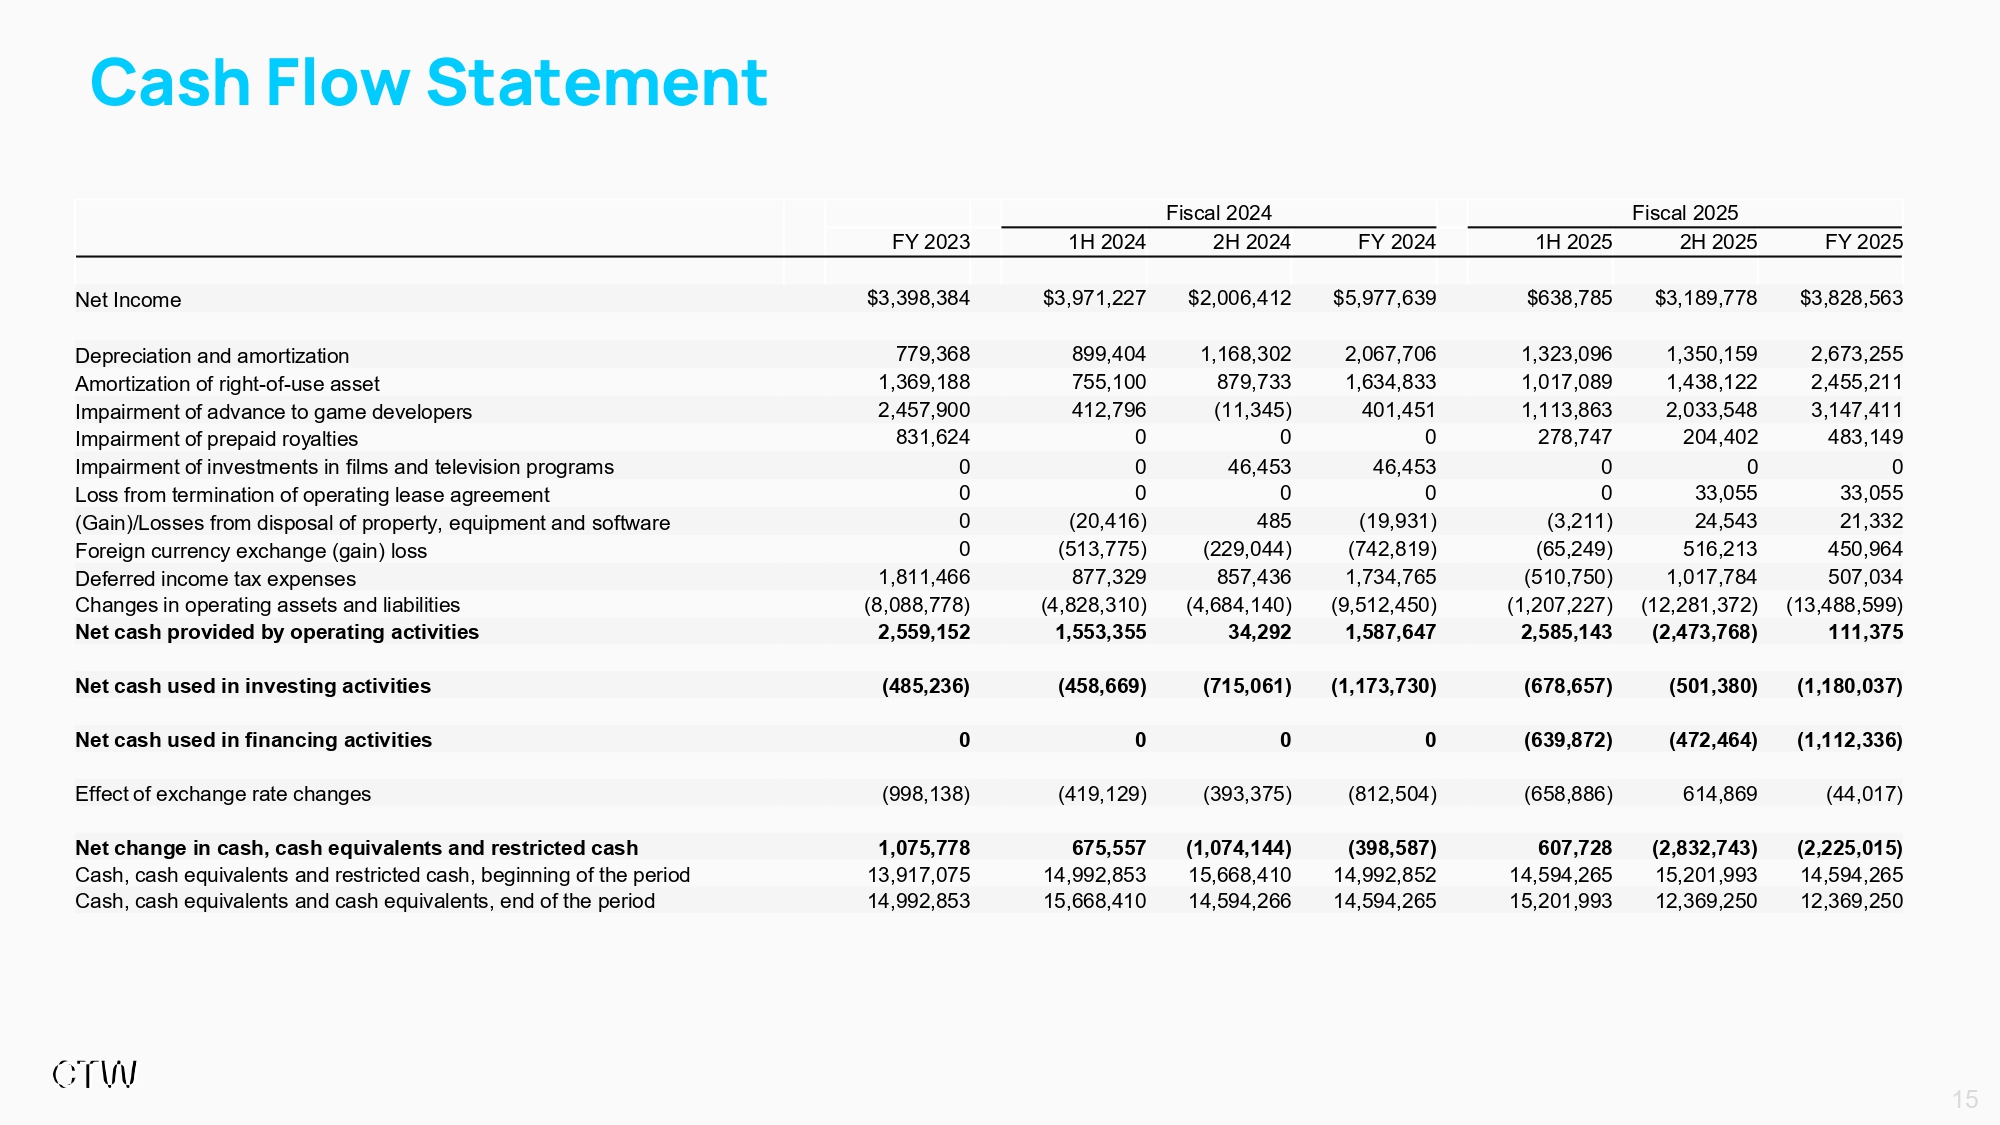
Cash Flow Statement Fiscal 2025 Fiscal 2024 FY 2025 2H 2025 1H 2025 FY 2024 2H 2024 1H 2024 FY 2023 $3,828,563 $3,189,778 $638,785 $5,977,639 $2,006,412 $3,971,227 $3,398,384 Net Income 2,673,255 1,350,159 1,323,096 2,067,706 1,168,302 899,404 779,368 Depreciation and amortization 2,455,211 1,438,122 1,017,089 1,634,833 879,733 755,100 1,369,188 Amortization of right - of - use asset 3,147,411 2,033,548 1,113,863 401,451 (11,345) 412,796 2,457,900 Impairment of advance to game developers 483,149 204,402 278,747 0 0 0 831,624 Impairment of prepaid royalties 0 0 0 46,453 46,453 0 0 Impairment of investments in films and television programs 33,055 33,055 0 0 0 0 0 Loss from termination of operating lease agreement 21,332 24,543 (3,211) (19,931) 485 (20,416) 0 (Gain)/Losses from disposal of property, equipment and software 450,964 516,213 (65,249) (742,819) (229,044) (513,775) 0 Foreign currency exchange (gain) loss 507,034 1,017,784 (510,750) 1,734,765 857,436 877,329 1,811,466 Deferred income tax expenses (13,488,599) (12,281,372) (1,207,227) (9,512,450) (4,684,140) (4,828,310) (8,088,778) Changes in operating assets and liabilities 111,375 (2,473,768) 2,585,143 1,587,647 34,292 1,553,355 2,559,152 Net cash provided by operating activities (1,180,037) (501,380) (678,657) (1,173,730) (715,061) (458,669) (485,236) Net cash used in investing activities (1,112,336) (472,464) (639,872) 0 0 0 0 Net cash used in financing activities (44,017) 614,869 (658,886) (812,504) (393,375) (419,129) (998,138) Effect of exchange rate changes (2,225,015) (2,832,743) 607,728 (398,587) (1,074,144) 675,557 1,075,778 Net change in cash, cash equivalents and restricted cash 14,594,265 15,201,993 14,594,265 14,992,852 15,668,410 14,992,853 13,917,075 Cash, cash equivalents and restricted cash, beginning of the period 12,369,250 12,369,250 15,201,993 14,594,265 14,594,266 15,668,410 14,992,853 Cash, cash equivalents and cash equivalents, end of the period 15
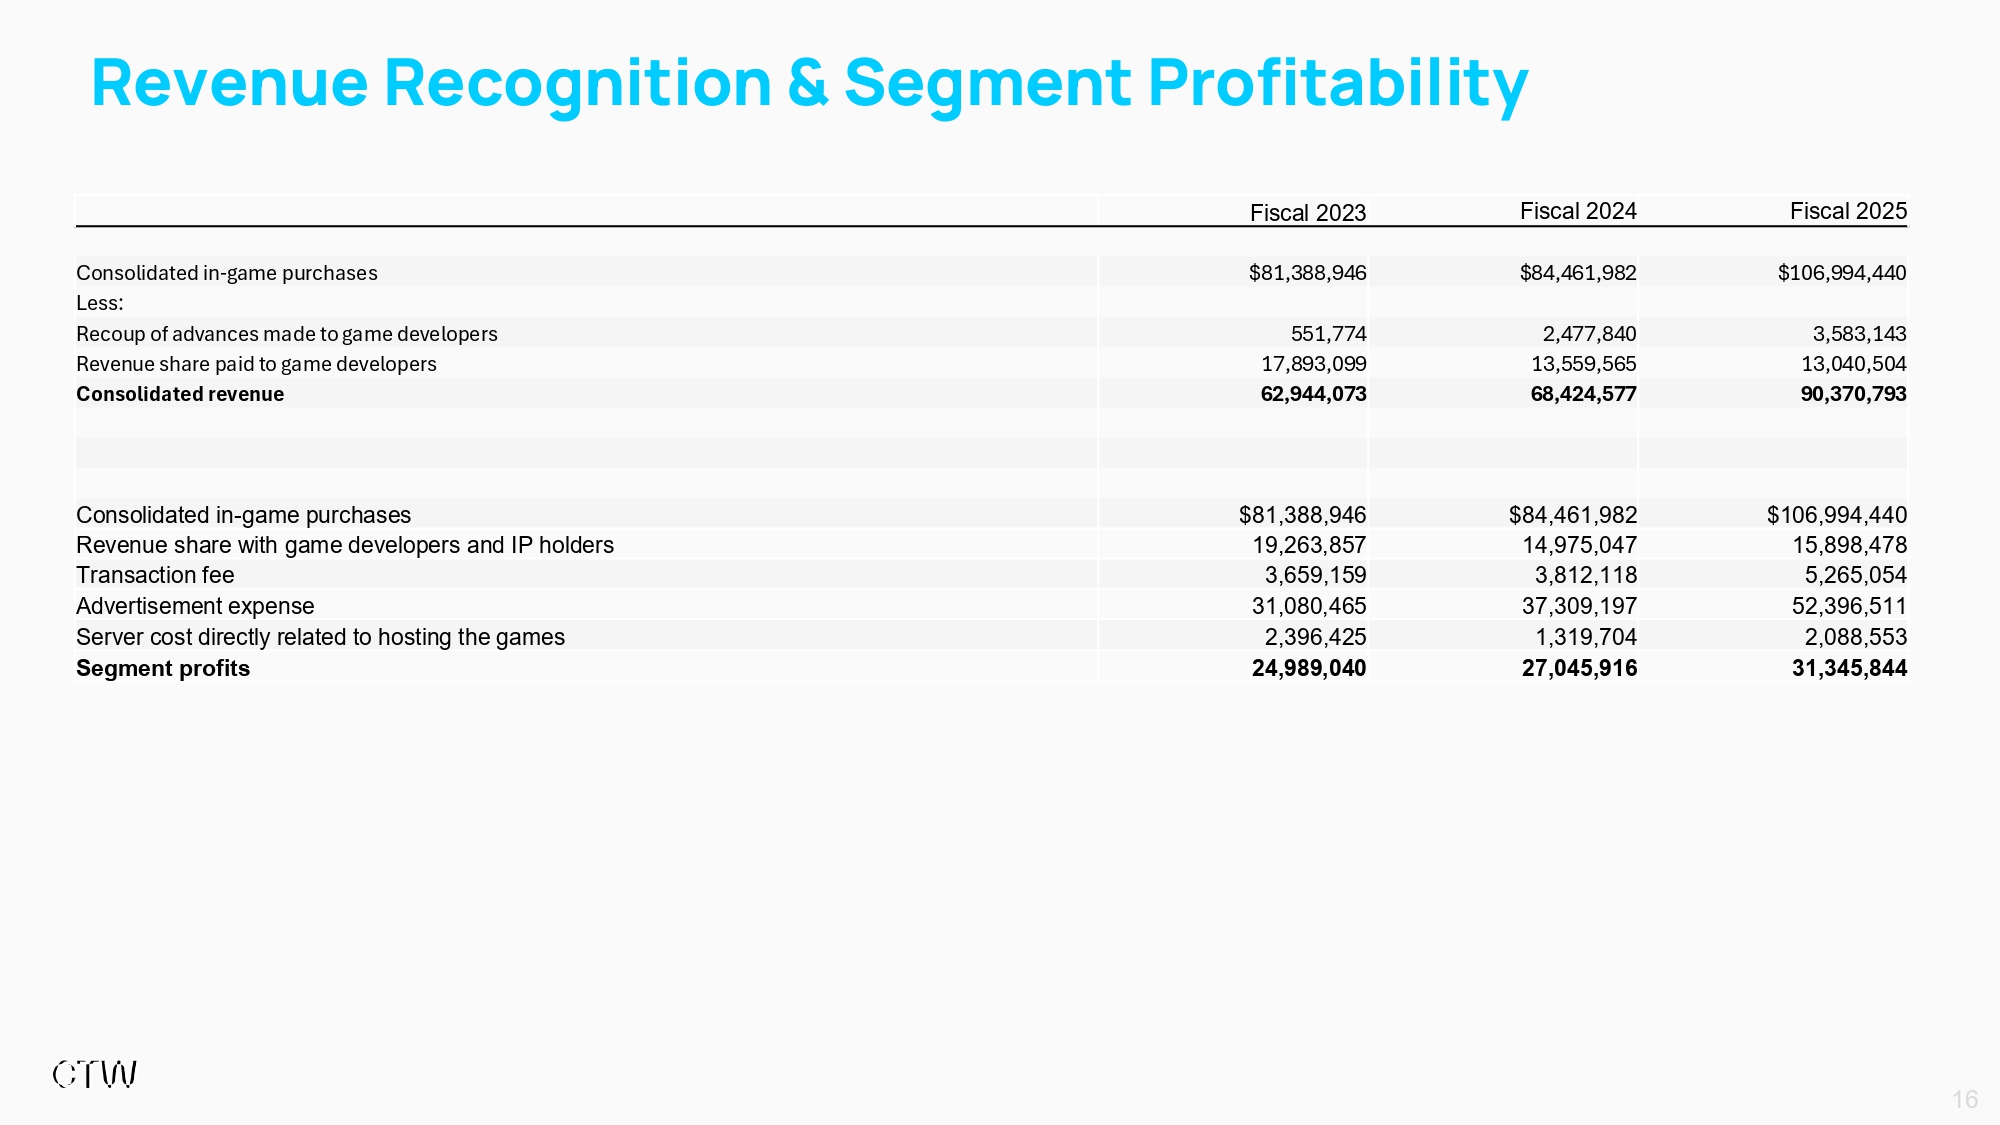
Revenue Recognition & Segment Profitability Fiscal 2025 Fiscal 2024 Fiscal 2023 $106,994,440 $84,461,982 $81,388,946 Consolidated in - game purchases Less: 3,583,143 2,477,840 551,774 Recoup of advances made to game developers 13,040,504 13,559,565 17,893,099 Revenue share paid to game developers G0,370,7G3 68,424,577 62,G44,073 Consolidated revenue $106,994,440 $84,461,982 $81,388,946 Consolidated in - game purchases 15,898,478 14,975,047 19,263,857 Revenue share with game developers and IP holders 5,265,054 3,812,118 3,659,159 Transaction fee 52,396,511 37,309,197 31,080,465 Advertisement expense 2,088,553 1,319,704 2,396,425 Server cost directly related to hosting the games 31,345,844 27,045,916 24,989,040 Segment profits 16
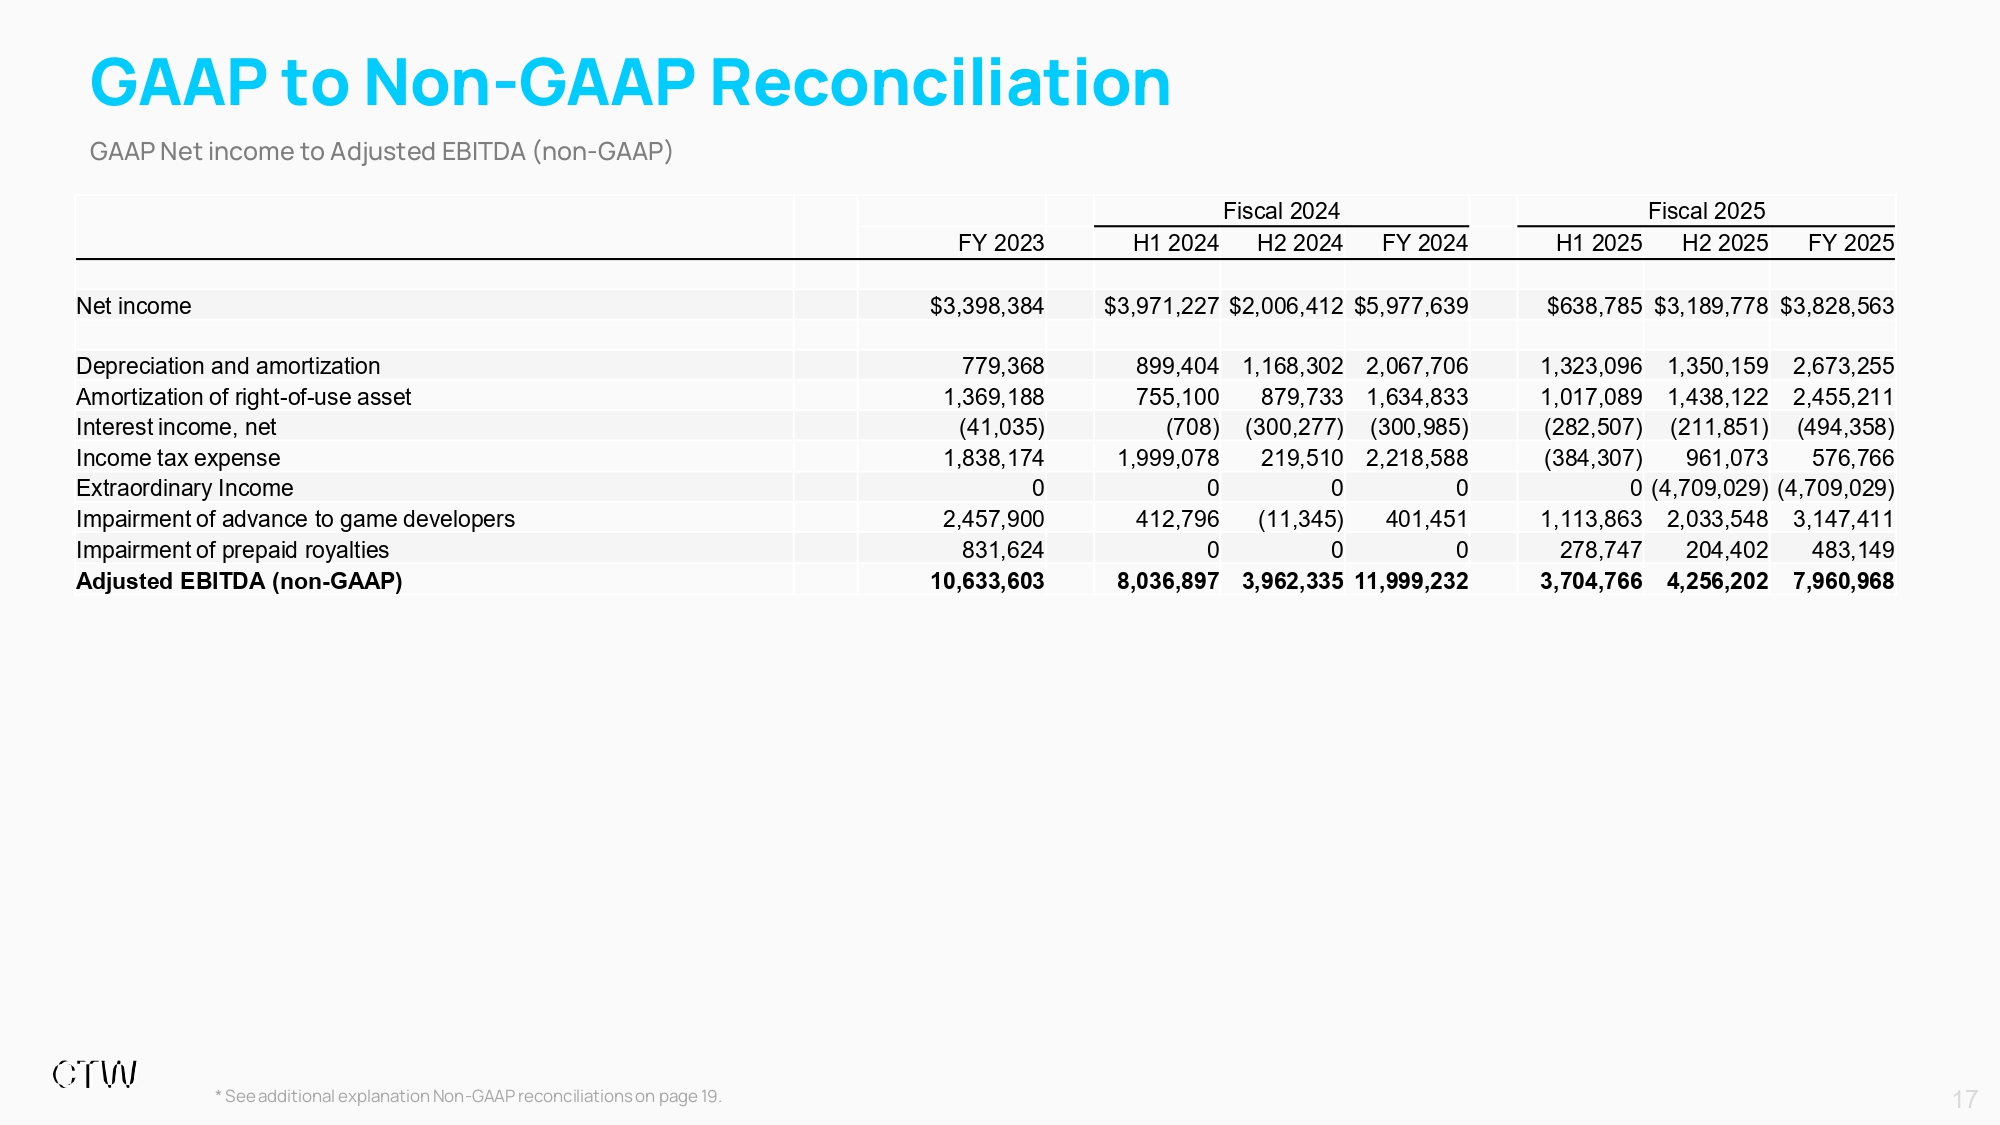
GAAP to Non - GAAP Reconciliation Fiscal 2025 Fiscal 2024 FY 2025 H2 2025 H1 2025 FY 2024 H2 2024 H1 2024 FY 2023 $3,828,563 $3,189,778 $638,785 $5,977,639 $2,006,412 $3,971,227 $3,398,384 Net income 2,673,255 1,350,159 1,323,096 2,067,706 1,168,302 899,404 779,368 Depreciation and amortization 2,455,211 1,438,122 1,017,089 1,634,833 879,733 755,100 1,369,188 Amortization of right - of - use asset (494,358) (211,851) (282,507) (300,985) (300,277) (708) (41,035) Interest income, net 576,766 961,073 (384,307) 2,218,588 219,510 1,999,078 1,838,174 Income tax expense (4,709,029) (4,709,029) 0 0 0 0 0 Extraordinary Income 3,147,411 2,033,548 1,113,863 401,451 (11,345) 412,796 2,457,900 Impairment of advance to game developers 483,149 204,402 278,747 0 0 0 831,624 Impairment of prepaid royalties 7,960,968 4,256,202 3,704,766 11,999,232 3,962,335 8,036,897 10,633,603 Adjusted EBITDA (non - GAAP) * See additional explanation Non - GAAP reconciliations on page 19. 17 GAAP Net income to Adjusted EBITDA (non - GAAP)

Glossary of Key Terms 18 “Active User” are to any user that spend at least one ( 1 ) minute on G 123 . jp platform during the applicable period . Active users are calculated based on cookie - based uniqueness, meaning that a user who accesses the platform on multiple devices or browsers will be counted as a single active user “ARPMAU” are to average in - game purchase amount per monthly active user during a given period, calculated by dividing the total in - game purchase amount in a given period generated on our G123.jp platform by the average number of monthly active users, which is averaged over each month by further dividing by the number of months in the respective period “ARPPMAU” are to average in - game purchase amount per paying monthly active user during a given fiscal year, calculated by dividing the total in - game purchase amount in a given fiscal year by the average number of paying monthly active users, which is averaged over each month by further dividing 12 “MAUs” are to monthly active users, which is a performance indicator that captures the number of Active Users who accessed our G 123 . jp platform at least once during the preceding 30 - day period . MAUs for a given period is the average MAUs across all months in the respective period, which is calculated by summing the number of MAUs for each month during the given period and dividing the total by the number of months in the respective period “ Paying User” are to any user that makes at least one in - game purchase of no less than US$0.01 during the applicable period; “PMAUs” are to paying monthly active users, which is a performance indicator that captures the number of users who made at least one in - game purchase, and have spent at least one ( 1 ) minute on G 123 . jp platform during the preceding 30 - day period . PMAUs for a given period is the average PMAUs across all months in the respective period, which is calculated by summing the number of PMAUs for each month during the given period and dividing the total by the number of months in the respective period ; “ROAS” are to return on advertisement spending based on created users, calculated by dividing average in - game purchase amount per created user divided by average advertising expenses per created user during the applicable period “Gross in - game purchase amount” means the total in - purchase amounts, or top - ups, paid by end - users for games on G123.jp platform. “Retention rate” measures the percentage of users who return to the same game on a specific day (e . g . Day 1 , Day 7 and Day 30 ) after their initial engagement . Platform retention rate is the average of the per - game retention rate of each day during a given period .

Non - GAAP Financial Measures 19 Reconciliation of Non - GAAP Financial Measures In addition to reporting financial results prepared in accordance with U.S. generally accepted accounting principles (“GAAP”), CTW Cayman (“CTW” or the “Company”) presents Adjusted EBITDA (non - GAAP) for the second half and full fiscal years 2025 and 2024. Adjusted EBITDA (non - GAAP) is a non - GAAP financial measure intended to provide management and investors with additional insight into CTW’s underlying operating performance . This measure is unaudited and is not included in CTW’s audited consolidated financial statements or Form 20 - F . Definition of Adjusted EBITDA (non - GAAP) CTW defines Adjusted EBITDA (non - GAAP) as net income (loss) before : interest income and expense, income tax expense (benefit), depreciation and amortization, impairment losses (recoveries), and other items that management considers non - core or not reflective of ongoing operations . Management believes Adjusted EBITDA (non - GAAP) highlights operating results that are more comparable across periods by excluding the effects of non - cash charges, financing decisions, and items that can vary among companies due to capital structure or tax jurisdiction differences . Use and Limitations of Non - GAAP Measures Adjusted EBITDA (non - GAAP) should be considered in addition to, and not as a substitute for, GAAP measures such as income from operations, net income, or cash flows from operating activities . Because companies may define Adjusted EBITDA differently, CTW’s presentation may not be directly comparable to similarly titled measures used by other companies . This measure is presented solely to provide investors with supplemental information and should not be regarded as a measure of liquidity, profitability, or financial condition under GAAP . Management uses Adjusted EBITDA (non - GAAP), together with GAAP income from operations and net income, to evaluate CTW’s operating performance and to assist in financial and strategic decision - making . The Company believes this measure provides investors with a clearer view of CTW’s ability to generate earnings from its core gaming and platform operations .

Segment Profits 20 In November 2023 , the FASB issued ASU 2023 - 07 , Segment Reporting (Topic 280 ) : Improvements to Reportable Segment Disclosures . The ASU’s amendments “improve reportable segment disclosure requirements, primarily through enhanced disclosures about significant segment expenses” . In addition, the standard introduces new disclosure requirements specifically for entities with a single reportable segment, and it aims to help investors better understand a company’s performance and assess potential future cash flows . The new guidance applies to all public entities subject to segment reporting under ASC 280 . This ASU is effective for fiscal years beginning after December 15 , 2023 , and interim periods within fiscal years beginning after December 15 , 2024 . Early adoption is permitted . The Group adopted this ASU for the year ended July 31 , 2025 . The adoption of ASU does not change how segments are identified, aggregated, or measured, it adds incremental disclosure requirements . An operating segment is a component of the Group that engages in business activities from which it may earn revenues and incur expenses, and is identified on the basis of the internal financial reports that are provided to and regularly reviewed by the Group’s chief operating decision maker (“CODM”) in order to allocate resources and assess performance of the segment . The management of the Group concludes that it has only one reporting segment . The Group provides game distribution and related services to game developers . The Group’s services have similar economic characteristics with respect to nature and form of the services provided . The Group’s chief operating decision maker has been identified as the Chief Executive Officer, who reviews Consolidated results when making decisions about allocating resources and assessing performance of the Group, rather than by geographic area ; hence the Group has only one reporting segment . CODM reviews operation results on the consolidated in - game purchase amount, recoup of advances to game developers and revenue share with game developers and IP holders, advertising expenses, transaction fees, server cost directly related to the host of games, in - house payroll cost directly related to the art and design support services provided .