UNITED STATES
SECURITIES AND EXCHANGE COMMISSION
Washington, D.C. 20549
FORM 6-K
REPORT OF FOREIGN PRIVATE ISSUER
PURSUANT TO RULE 13a-16 OR 15d-16 UNDER
THE SECURITIES EXCHANGE ACT OF 1934
For the Month of November 2025
Commission File Number: 001-42804
Kyivstar Group Ltd.
(Translation of registrant’s name into English)
Unit 517, Level 5
Index Tower
Dubai International Financial Centre (DIFC)
United Arab Emirates
(Address of principal executive offices)
Indicate by check mark whether the registrant files or will file annual reports under cover of Form 20-F or Form 40-F.
Form 20-F ☒ Form 40-F ☐
EXPLANATORY NOTE
On November 10, 2025, Kyivstar Group Ltd. (the “Company”) issued a press release announcing its third quarter updates and financial results for the three and nine months ended September 30, 2025, a copy of which is furnished hereto as Exhibit 99.1.
The Company is also making available an earnings release and presentation materials, which are furnished hereto as Exhibit 99.2 and Exhibit 99.3, respectively.
EXHIBIT INDEX
| Exhibit No. | Description of Exhibit | |
| 99.1 | Press Release, dated November 10, 2025 | |
| 99.2 | Earnings Release, dated November 10, 2025 | |
| 99.3 | Presentation Materials, dated November 10, 2025 |
SIGNATURES
Pursuant to the requirements of the Securities Exchange Act of 1934, the registrant has duly caused this report to be signed on its behalf by the undersigned, thereunto duly authorized.
| Date: November 10, 2025 | Kyivstar Group Ltd. | |
| By: | /s/ Boris Dolgushin | |
| Name: | Boris Dolgushin | |
| Title: | Chief Financial Officer | |
Exhibit 99.1

Kyivstar reports 20% top-line and EBITDA growth as digital rises to 12% of revenues
10 November 2025. KYIV, Ukraine
Kyivstar Group Ltd (“Kyivstar”, the “Group”) 3Q25 unaudited results highlights
| ● | Total revenue grew 20.9% YoY to UAH 12.3 bn (+19.8% to USD 297 mn). |
| ● | EBITDA grew 21.5% YoY to UAH 7.1 bn (20.4% to USD 171 mn). |
| ● | Adjusted net profit was USD 73 mn. This metric excludes the non-cash charge of USD 162 mn recognized in 3Q25 related to the Kyivstar listing. Without adjustments, loss for 3Q25 was USD 89 mn. |
| ● | Direct digital revenue grew to 11.9% of total thanks to a 531% surge to UAH 1.5 bn (+526% to USD 35 mn), driven in turn by consolidation of Uklon. |
| ● | Multiplay users expanded 24.8% YoY to 6.6 mn, digital MAUs 49.4% to 13.5 mn. |
| ● | Cash position of USD 472 mn highlights Kyivstar’s fortress balance sheet, supported by LTM equity free cash flow of USD 373 mn. |
10 November 2025. KYIV, Ukraine – Kyivstar Group Ltd (Nasdaq: KYIV), Ukraine’s leading digital operator, today announces selected unaudited financial and operating results for the third quarter ended September 30, 2025.
Kyivstar sustained strong momentum into 3Q25, delivering 20.9% total revenue growth to UAH 12.3 bn (19.8% to USD 297 mn). The performance demonstrates the Group’s disciplined pricing and ability to capture a growing share of consumer spending. Mobile ARPU climbed 14.0% YoY to UAH 153.1 (USD 3.7).
EBITDA rose 21.5% YoY to UAH 7.1 bn (20.4% to USD 171 mn), with the EBITDA margin at 57.6% for the quarter. Continued strong profitability reflects disciplined cost management amid revenue growth and the execution of Kyivstar’s digital strategy.
Direct digital revenue grew 531% to UAH 1,464 mn (526% to USD 35 mn), reaching 11.9% of total revenue and supported by the acquisition of Uklon in April. Kyivstar’s multiplay strategy pushed customer engagement and blended ARPU higher, as users who combine connectivity with at least one digital service rose 24.8% YoY to 6.6 mn, now representing 31.7% of one-month-active mobile customers. Our expanding digital platforms are transforming Kyivstar into a model digital ecosystem ever more embedded in customers’ everyday lives.
The integration of Uklon (consolidated effective April) contributed substantially with USD 24.7 mn in revenue, USD 9.1 mn in EBITDA and USD 6.7 mn in profit for the quarter. The platform recorded strong growth in trip volumes, average fare per ride and digital engagement, strengthening Kyivstar’s foothold in everyday mobility.
The Group steadily advanced on its strategic priorities during the quarter. Kyivstar commenced trading on the NASDAQ on August 15, becoming the first Ukrainian company to list on a US stock exchange. The Group also conducted Ukraine’s first Starlink Direct to Cell network test ahead of service launch in late 4Q25, while progress continues on developing Ukraine’s first national large language model (“LLM”) in partnership with Ukraine’s Ministry of Digital Transformation.
Kyivstar expects revenue growth of 24% to 27% YoY, and EBITDA growth of 23% to 26% YoY, in UAH terms, for the full year. In USD terms, the Group expects revenue growth of 20% to 23% YoY and EBITDA growth of 19% to 22% YoY for 2025, assuming current FX rates. Capex intensity for 2025 is expected in the 30% to 33% range.
Commenting on the results, CEO Oleksandr Komarov said:
“Anchored by Kyivstar’s resilient, market-leading telecom franchise, we are scaling a strong digital ecosystem. Digital services now contribute nearly 12% of revenues, and our ~20% growth in revenue and EBITDA highlights the growing role of our digital portfolio in Ukrainians’ daily lives. This momentum is supported by our robust mobile and fixed-line businesses, where competitive pricing and reliable service sustain our market leadership.
“Looking ahead, we are committed to shaping Ukraine’s digital future, from advancing AI and cloud to expanding how customers connect. Our upcoming nationwide Direct to Cell launch is another key milestone. As the first Ukrainian company to list on a US exchange, we look forward to sharing Kyivstar’s compelling investment opportunity.”
3Q25 results conference call
To register and access the event, please click here or copy and paste this link to the address bar of your browser: https://edge.media-server.com
After registering, you will receive a confirmation email at the address you provided. This email will include a link to access the webcast and the dial-in details for listening to the conference call by phone.
We strongly encourage you to participate in the event through the webcast link, but if you prefer to dial in, please register using this link:
https://register-conf.media-server.com/register/BI16abec37899c48a7b76730d18d0f5357
Once registered, you will receive your unique PIN and dial-in information to join the call. You will also have the option to select your preferred method of participation.
You can dial in directly from your phone using the provided number and PIN, or choose Call Me, enter your phone number, and receive an immediate callback from the system. The call will come from a US-based number.
Q&A
Once Q&A begins, if you have a question, please use the Raise Hand button on your screen. When it is your turn to speak, the moderator will announce your name as well as sending a message to your screen asking you to confirm you want to talk. Once accepted, please unmute your mic and ask your question.
You can also submit your questions prior to the event to Kyivstar Investor Relations at ir@kyivstargroup.com.
About Kyivstar Group Ltd.
Kyivstar Group Ltd. operates Ukraine’s leading digital operator, JSC Kyivstar, serving more than 22.5 million mobile customers and over 1.2 million home internet fixed line customers as of September 30, 2025. Kyivstar Group Ltd. and its subsidiaries provide services across a wide range of mobile and fixed line technologies, including 4G, big data, cloud solutions, cybersecurity, digital TV, ride-hailing, and more. Together with VEON, Kyivstar intends to invest USD 1 billion in Ukraine during 2023-2027, through social investments in infrastructure and technological development, charitable donations and strategic acquisitions. Kyivstar Group Ltd. and its subsidiaries have been operating in Ukraine for more than 27 years. For more information, visit: investors.kyivstar.ua.
PERFORMANCE MEASURES AND NON-GAAP FINANCIAL MEASURES
In presenting our results, Kyivstar has included certain non-GAAP financial measures, including Adjusted EBITDA, CAPEX excl. licenses and ROU and Uklon Adjusted EBITDA, that it believes are useful to consider, in addition to its IFRS results, for a more complete understanding of the financial performance and position of Kyivstar. The key performance measures and non-GAAP financial measures that Kyivstar believes are meaningful in analyzing its performance are summarized in Attachment D in Kyivstar’s earnings release as of the date of this press release and where applicable a reconciliation of non-GAAP financial measures to IFRS financials is set out at the end of this press release. However, any non-GAAP financial measures should not be viewed as a substitute for those determined in accordance with IFRS and Kyivstar’s methodology for calculating these measures may be different from the way its industry peers calculate these measures
DISCLAIMER AND NOTICE TO READER
This document contains “forward-looking statements” within the meaning of the Private Securities Litigation Reform Act of 1995. Such forward-looking statements include, but are not limited to, statements relating to Kyivstar’s future operating results, targets, or financial position. There are numerous risks and uncertainties that could cause actual results and Kyivstar’s plans and objectives to differ materially from those expressed in the forward-looking information, such as those risks discussed in the section entitled “Risk Factors” Kyivstar Group’s final prospectus filed with the SEC on July 22, 2025, as such document may be amended or supplemented from time to time, and other public filings made from time to time by Kyivstar with the SEC. Any forward-looking statements contained in this document speak only as of the date hereof and Kyivstar disclaims any obligation to update or revise any of these forward-looking statements, except as required by law.
See “Disclaimer and Notice to Readers” in our full 3Q25 Earnings Release for a more fulsome description of the above.
Contact information
Kyivstar Group Ltd
Investor Relations
ir@kyivstargroup.com
Exhibit 99.2


| 3Q25 OVERVIEW | 1 |
| 3Q25 GROUP PERFORMANCE | 3 |
| STRATEGIC DEVELOPMENTS | 7 |
| OUTLOOK | 8 |
| PRESENTATION OF UNAUDITED FINANCIAL RESULTS | 9 |
| ATTACHMENTS | 12 |
| DISCLAIMER AND NOTICE TO READERS | 22 |
Kyiv, November 10, 2025 – Kyivstar Group Ltd. (“Kyivstar” or the “Group”), Ukraine’s leading digital operator, today announces selected unaudited financial and operating results for the third quarter ended September 30, 2025.
| Ø | Total revenue increased 19.8% YoY to USD 297 mn (UAH 12.3 bn, +20.9%). This was driven by strong revenue generation across the mobile subscriber base, the Uklon acquisition, and healthy growth across all digital platforms. |
| Ø | Telecom revenue rose 8.0% YoY to USD 262 mn (UAH 10.9 bn, +9.0%). Growth was driven by continued ARPU expansion in sync with higher penetration of digital services. |
| Direct digital revenue increased 525.9% YoY to USD 35 mn (UAH 1.5 bn, +531.3%) on the back of Uklon, our ride-hailing platform (consolidated effective April 2025) and comprised 11.9% of total revenue for 3Q25. Uklon contributed USD 24.7 mn (UAH 1.03 bn) in revenue in 3Q25. |
| Ø | EBITDA rose 20.4% YoY to USD 171 mn (UAH 7.1 bn, +21.5%), with EBITDA margin of 57.6%. Uklon contributed USD 9.1 mn (UAH 378 mn) in EBITDA, and USD 6.7 mn (UAH 277 mn) in profit for 3Q25. |
| Ø | The Group recorded a net loss of USD 89 mn for 3Q25, with loss per share of USD 0.41. However, the headline loss reflects a one-time, non-cash charge of $162 mn recognized in 3Q25 related to the Kyivstar listing. Excluding the impact of this non-cash charge, Adjusted Net Profit for 3Q25 was USD 73 mn, -11.0% YoY (UAH 3.0 bn, -10.1%) and Adjusted EPS for the period was USD 0.33, -16.0% YoY. |
| Ø | Kyivstar served 22.5 mn mobile customers and 1.2 mn fixed internet customers as of September 30, 2025. Mobile ARPU increased +13.0% YoY to USD 3.7 (UAH 153.1, +14.0%). |
| Ø | Multiplay users reached 6.6 mn (+24.8% YoY) and represented 31.7% of one-month-active mobile customers. Uklon recorded 42.2 mn rides and 1.2 mn deliveries in 3Q25, helping lift the Group’s total digital MAUs (Uklon, MyKyivstar, Kyivstar TV and Helsi) to 13.5 mn (+49.4% YoY). |
| Ø | Capital expenditures for 3Q25 totaled USD 89 mn (UAH 3.7 bn), implying LTM capex intensity of 29.1%. |
| Ø | Kyivstar maintains a strong balance sheet with USD 472 mn of cash and cash equivalents as of September 30, 2025. |
| Ø | Advanced the Group’s strategic priorities: (i) historic Nasdaq listing as the first Ukrainian company to trade on a US stock exchange; (ii) launching nationwide Starlink Direct to Cell coverage subsequent to regulatory approvals; and (iii) developing Ukraine’s first national large language model (“LLM”) in partnership with Ukraine’s Ministry of Digital Transformation. |
| Ø | For 2025, Kyivstar expects to deliver revenue growth of 24%-27% and EBITDA growth of 23%-26% YoY in UAH terms. In USD terms, and assuming current FX rates, revenue is expected to grow 20%-23% and EBITDA by 19%-22%. Capex intensity for 2025 is expected within 30%–33% of revenue. |
| Earnings Release 3Q25 |

|
KYIVSTAR: 3Q25 KEY HIGHLIGHTS
| Unit | 3Q25 | 3Q24 | YoY | 9M25 | 9M24 | YoY | ||||||||||||||||||||
| Operating highlights | ||||||||||||||||||||||||||
| Total customer base | ||||||||||||||||||||||||||
| Mobile | mn | 22.5 | 23.3 | -3.6 | % | |||||||||||||||||||||
| Fixed broadband | mn | 1.2 | 1.1 | 2.9 | % | |||||||||||||||||||||
| Multiplay users | mn | 6.6 | 5.3 | 24.8 | % | |||||||||||||||||||||
| Total digital monthly active users | mn | 13.5 | 9.0 | 49.4 | % | |||||||||||||||||||||
| ARPU | UAH | 153.1 | 134.2 | 14.0 | % | |||||||||||||||||||||
| Churn rate annualised | % | 9.9 | % | 16.2 | % | (6.3p.p. | ) | |||||||||||||||||||
| 4G penetration | % | 66.5 | % | 62.6 | % | 3.9p.p. | ||||||||||||||||||||
| Multiplay penetration | % | 31.7 | % | 24.8 | % | 6.9p.p. | ||||||||||||||||||||
| Data usage | GB/user | 13.0 | 10.9 | 18.3 | % | |||||||||||||||||||||
| Total employees | no. | 5,058 | 3,957 | 27.8 | % | |||||||||||||||||||||
| Financials Highlights (UAH) | ||||||||||||||||||||||||||
| Revenue | mn | 12,332 | 10,203 | 20.9 | % | 34,773 | 26,577 | 30.8 | % | |||||||||||||||||
| Digital revenue | mn | 1,464 | 232 | 531.3 | % | 3,056 | 594 | 414.6 | % | |||||||||||||||||
| EBITDA1 | mn | 7,100 | 5,842 | 21.5 | % | 19,840 | 14,858 | 33.5 | % | |||||||||||||||||
| Operating Profit1 | mn | 4,733 | 4,114 | 15.1 | % | 13,393 | 9,852 | 35.9 | % | |||||||||||||||||
| EBIT1 | mn | 4,858 | 4,114 | 18.1 | % | 13,684 | 9,971 | 37.2 | % | |||||||||||||||||
| Net Profit1 | mn | 3,031 | 3,373 | -10.1 | % | 8,140 | 7,548 | 7.8 | % | |||||||||||||||||
| Capex | mn | 3,695 | 2,304 | 60.4 | % | 9,275 | 5,204 | 78.2 | % | |||||||||||||||||
| Capex intensity | % | 30.0 | % | 22.6 | % | 7.4p.p. | 26.7 | % | 19.6 | % | 7.1p.p. | |||||||||||||||
| Equity Free Cash Flow (before Leases & License) | mn | 7,225 | 2,674 | 170.2 | % | 14,017 | 7,269 | 92.8 | % | |||||||||||||||||
| Operating cash flow | mn | 5,977 | 5,102 | 17.2 | % | 16,888 | 12,871 | 31.2 | % | |||||||||||||||||
| Cash & cash equivalents | mn | 19,502 | 21,036 | -7.3 | % | 19,502 | 21,036 | -7.3 | % | |||||||||||||||||
| Shareholder’s equity | mn | 51,069 | - | n.m | 51,069 | - | n.m | |||||||||||||||||||
| Key ratios | ||||||||||||||||||||||||||
| Digital % of Revenue | % | 11.9 | % | 2.3 | % | 9.6p.p. | 8.8 | % | 2.2 | % | 6.6p.p. | |||||||||||||||
| EBITDA margin1 | % | 57.6 | % | 57.3 | % | 0.3p.p. | 57.1 | % | 55.9 | % | 1.2p.p. | |||||||||||||||
| Net profit margin1 | % | 24.6 | % | 33.1 | % | (8.5p.p. | ) | 23.4 | % | 28.4 | % | (5.0p.p. | ) | |||||||||||||
| EPS2 | USD | (0.41 | ) | 0.40 | n.m | 0.16 | 0.92 | -82.5 | % | |||||||||||||||||
| Adjusted EPS1,2 | USD | 0.33 | 0.40 | -16.0 | % | 0.93 | 0.92 | 1.1 | % | |||||||||||||||||
Note:
| 1. | Adjusted figures for 3Q25 exclude the impact of a one-time, non-cash charge of $162 mn (UAH 6.7bn) recognized in 3Q25 results related to the Kyivstar listing, 3Q25 loss for the period was USD 89 mn. |
| 2. | Weighted average common shares outstanding for earnings per share (in millions): 219.3 (3Q25), 206.9 (3Q24) and 211.1 (9M25), 206.9 (9M24). |
Notice: Please see Attachment A for reconciliations to Kyivstar’s non-GAAP measures and Attachment D for a detailed description of such measures.
| Earnings Release 3Q25 |
|
3Q25 GROUP PERFORMANCE
In the third quarter of 2025, Kyivstar delivered revenue growth of 20.9% YoY to UAH 12.3 bn, underscoring the Group’s ability to capture a growing share of consumer spending. Performance was driven by continued improvements in ARPU growth, rising engagement across digital platforms, and the transition to a new value-sharing model of the TV partnership into a platform-rental agreement, enhancing Kyivstar’s customer-facing role.
REVENUE BREAKDOWN
| UAH | USD | |||||||||||||||||||||||||
| Revenue | 3Q25 | 3Q24 | YoY | 3Q25 | 3Q24 | YoY | ||||||||||||||||||||
| Total, of which: | mn | 12,332 | 10,203 | 20.9 | % | 297 | 248 | 19.8 | % | |||||||||||||||||
| Mobile | mn | 10,285 | 9,354 | 10.0 | % | 248 | 227 | 9.0 | % | |||||||||||||||||
| Fixed | mn | 581 | 617 | (5.8 | )% | 14 | 15 | (6.7 | )% | |||||||||||||||||
| Digital | mn | 1,464 | 232 | 531.3 | % | 35 | 6 | 525.9 | % | |||||||||||||||||
Telecom revenue grew 9.0% YoY to reach UAH 10.9 bn in 3Q25, driven by continued ARPU expansion supported by disciplined pricing adjustments, rising mobile data consumption, and continuing migration of users to 4G networks. The Group’s sustained network investments and distinctive digital ecosystem continue to underpin strong subscriber engagement and operational resilience, even amid the ongoing war-related disruptions.
Direct digital revenue soared more than fivefold to reach UAH 1.5 bn in 3Q25, now accounting for 11.9% of total revenue. Growth was driven by the acquisition of Uklon, continued momentum across Helsi’s digital healthcare platform, rising demand for enterprise solutions such as big data services, and an expanding digital subscriber base.
TELECOM REVENUE, ARPU CLIMB ON 4G MIGRATION AND MULTIPLAY
Mobile revenue growth remained strong during the quarter thanks to further deepening of customer engagement and continued positive momentum across key metrics.
| ● | Kyivstar maintains its leadership in the Ukrainian telecom market, with 22.5 mn mobile subscribers as of September 30, 2025. The broadband business continued to gain momentum, adding 32.6 thousand subscribers over the past 12 months. As of the date of this release, the Group has 43,722 buildings (owned and leased) connected to fiber across Ukraine, reflecting its expanding high-speed network footprint and strong execution in fixed connectivity. |
| ● | Ongoing 4G migration: The 4G user base grew 2.4% YoY to 15 mn, 4G penetration rising 3.9 pp to 66.5% of the mobile user base. Transition to 4G dovetails with the ongoing expansion of multiplay users. |
| ● | Mobile ARPU for 3Q25 rose 14.0% to UAH 153.1 (USD 3.7). Our high network reliability, diverse and integrated service offering, and multi-service bundles foster customer loyalty. |
| Earnings Release 3Q25 |
|
KEY SUBSCRIBER AND USAGE DATA
| 3Q25 | 3Q24 | YoY | ||||||||||||
| Mobile customers | mn | 22.5 | 23.3 | (3.6 | )% | |||||||||
| 4G customers | mn | 15.0 | 14.6 | 2.4 | % | |||||||||
| 4G Penetration | % | 66.5 | % | 62.6 | % | 3.9 pp | ||||||||
| Mobile ARPU | USD | 3.7 | 3.3 | 13.0 | % | |||||||||
| Mobile MoU | min | 288 | 300 | (4.3 | )% | |||||||||
| Data usage | GB/user | 13.0 | 10.9 | 18.3 | % | |||||||||
| Fixed Broadband customers | mn | 1.2 | 1.1 | 2.9 | % |
MULTIPLAY SUBSCRIBER EXPANSION
| UAH | USD | |||||||||||||||||||||||||
| Multiplay | 3Q25 | 3Q24 | YoY | 3Q25 | 3Q24 | YoY | ||||||||||||||||||||
| Revenue | mn | 4,317 | 2,988 | 44.5 | % | 104 | 73 | 43.2 | % | |||||||||||||||||
| Users | mn | 6.6 | 5.3 | 24.8 | % | 6.6 | 5.3 | 24.8 | % | |||||||||||||||||
| ARPU | UAH/USD | 220 | 189 | 16.3 | % | 5.3 | 4.6 | 15.2 | % | |||||||||||||||||
Through our multiplay strategy, we aim to consistently increase our multiplay subscriber rate (defined as users that have purchased (i) voice, (ii) 4G data plans, and (iii) at least one digital application, for example Helsi, Kyivstar TV, Uklon or MyKyivstar) by cross-selling our products and services. Our customers can select these digital services, which we call “superpowers,” as add-ons to their paid plans. We have seen a consistent upward trend in ARPU on the back of an increase in multiplay customers who also typically exhibit lower churn rates. Multiplay customers grew 24.8% YoY to 6.6 mn as of September 30, 2025, now representing 31.7% of the total one-month active user base. Multiplay revenue increased 44.5% YoY in UAH terms (43.2% YoY in USD).
DIRECT DIGITAL SERVICES FUEL GROWTH
Kyivstar’s digital platforms continued to scale rapidly in the third quarter. Total digital monthly active users reached 13.5 mn (+49.4% YoY), reflecting both organic adoption and the consolidation of Uklon. The growing user base spans health, mobility and entertainment services, providing the Group with daily, high-frequency touchpoints, in addition to traditional telecom interactions. The breadth of engagement across these platforms is turning Kyivstar into the provider of a digital ecosystem, embedding the Group deeper into its customers’ everyday lives.
DIGITAL MONTHLY ACTIVE USERS
| 3Q25 | 3Q24 | YoY | ||||||||||||
| Digital MAUs, of which: | mn | 13.5 | 9.0 | 49.4 | % | |||||||||
| Uklon | mn | 3.6 | n.a | - | ||||||||||
| Helsi | mn | 2.5 | 2.4 | 5.6 | % | |||||||||
| KyivstarTV | mn | 2.1 | 1.6 | 31.7 | % | |||||||||
| MyKyivstar | mn | 5.2 | 5.1 | 3.7 | % |
Direct digital revenue rose 531.3% YoY to UAH 1.5 bn in 3Q25, increasing its contribution to total revenue from 2.3% in 3Q24 to 11.9% in the third quarter. Growth was driven by the first-time consolidation of Uklon, continued expansion of Helsi’s digital healthcare services and strong uptake of Kyivstar TV.
| Earnings Release 3Q25 |
|
DIRECT DIGITAL REVENUE BY PLATFORM
| UAH | USD | |||||||||||||||||||||||||
| 3Q25 | 3Q24 | YoY | 3Q25 | 3Q24 | YoY | |||||||||||||||||||||
| Direct Digital revenue, of which: | mn | 1,464 | 232 | 531.3 | % | 35.3 | 5.6 | 525.9 | % | |||||||||||||||||
| Uklon | mn | 1,027 | n.a | - | 24.7 | n.a | - | |||||||||||||||||||
| Digital Enterprise | mn | 222 | 123 | 80.6 | % | 5.4 | 3.0 | 78.4 | % | |||||||||||||||||
| KyivstarTV | mn | 140 | 59 | 137.3 | % | 3.4 | 1.4 | 136.4 | % | |||||||||||||||||
| Helsi | mn | 75 | 50 | 50.0 | % | 1.8 | 1.2 | 50.9 | % | |||||||||||||||||
Uklon
The Uklon acquisition, effective April 2, 2025, contributed UAH 1.0 bn in revenue and UAH 378 mn in EBITDA in 3Q25. The platform recorded strong growth in trip volumes, average fare per ride and digital engagement, strengthening Kyivstar’s foothold in everyday mobility and reinforcing its ecosystem of services that extend beyond core telecom services.
UKLON: KEY FINANCIAL AND OPERATING METRICS
| UAH | USD | |||||||||||||||||||||||||
| Uklon | 3Q25 | 3Q24 | YoY | 3Q25 | 3Q24 | YoY | ||||||||||||||||||||
| Uklon financials | ||||||||||||||||||||||||||
| Uklon revenue | mn | 1,027 | n.a | - | 24.7 | n.a | - | |||||||||||||||||||
| Uklon EBITDA | mn | 378 | n.a | - | 9.1 | n.a | - | |||||||||||||||||||
| Uklon operating metrics | ||||||||||||||||||||||||||
| Uklon no. of rides | mn | 42.2 | 36.0 | 17.2 | % | |||||||||||||||||||||
| Uklon no. of deliveries | mn | 1.2 | 0.9 | 33.3 | % | |||||||||||||||||||||
Note: Uklon 3Q24 operating metrics are based on management reports from 2024 (pre acquisition).
Digital Enterprise: Big Data and Cloud Services
For 3Q25, our big data and cloud services generated UAH 222 mn in revenue, up 80.5% YoY (USD 5.4 mn, up 78.4% YoY). The growth was driven by large-scale big data analytics products and solutions, AdTech, cloud productivity and collaboration services, and API-based connectivity and data-exchange services.
We offer a comprehensive B2B hub as well as a big data and an advertising technology (“AdTech”) platform. Our B2B hub offers machine-to-machine (“M2M”) and cloud solutions, real-time kinematic positioning, cybersecurity services, an M2M SIM management platform and a digital marketplace – including 600 different cloud services. The real-time kinematic service alone now has more than 1,400 subscribers. Adwisor, our AdTech self-service platform, plays a central role in the Ukrainian advertising ecosystem with more than 2,500 registered clients. The platform is specifically designed for B2B customers, enabling seamless campaign management, targeted audience engagement and data-driven optimization.
Kyivstar Tech
Kyivstar Tech is a technology company that serves as the key provider of IT and digital services for the other companies in the Group, as well as providing limited IT and digital services to external enterprises. The company now has more than 800 software developers and data scientists.
Kyivstar TV
Kyivstar TV recorded 2.1 mn MAUs (+31.7% YoY), driven by exclusive sports rights, Ukrainian-language content, and the inclusion of new devices (e.g. Xbox, Smart TVs, PCs). Provided both as a mobile OTT internet application and a fixed/IPTV broadband service, Kyivstar TV is the largest media streaming service in Ukraine by number of users. As of September 30, 2025, 34.4% of our broadband customers were also digital TV users. The service’s role in users’ entertainment choices continues to expand, with user sessions rising 30.7% YoY in 3Q25 to 670 mn and the number of minutes watched daily by active OTT users having climbed 21.1% YoY to 244 mn.
Kyivstar does not license or create any content; rather, we sell digital TV services on our branded platform in cooperation with PLUS TV LLC. The TV partnership was revised as of September, enhancing Kyivstar’s role and direct customer engagement in the provision of the “Kyivstar TV” service.
| Earnings Release 3Q25 |
|
Helsi
Helsi is Ukraine’s leading health-tech platform, recording 2.5 mn MAUs (+5.6% YoY) as of 3Q25. Growth was supported by the launch of new family and individual medical care subscription plans, as well as the expansion of enterprise contracts with hospitals and other corporates. Helsi has added new services to its subscription model, such as analysis and telemedical consultations, and launched “Helsi Superpower” for Kyivstar users in September.
Helsi is deeply embedded in Ukraine’s eHealth ecosystem, which powers appointment scheduling, prescriptions, and health records management. This integration creates high switching costs and makes Helsi indispensable for both patients and providers. It also demonstrates Kyivstar’s dedication to ESG matters, as access to high-quality, digital healthcare is a national priority during wartime.
As of September 30, 2025, Kyivstar had approximately 29 mn registered patients who were able to access more than 1,600 public and private clinics and over 38,000 medical professionals.
CAPITAL EXPENDITURE
Capex for 3Q25 was UAH 3.7 bn (USD 89 mn) with an LTM capex intensity of 29.1%. Kyivstar maintained high investment levels while generating strong free cash flow, underscoring the Group’s commitment to investments that fulfill license requirements and sustain network quality and resilience amid the war.
| ● | Capex focus: Continued reinvestment in network resilience, further fiber rollout and energy security. Network modernization, regulatory compliance measures, and power-saving feature installations are key drivers of YoY investment growth, ensuring high quality standards for customers. |
| ● | Energy resilience: Kyivstar’s network sites are now equipped with backup batteries, inverters and solar power, reducing vulnerability to grid instability in line with contemporary legislation requirements. Kyivstar will continue to comply on this matter, inclusive of any new regulatory requirements that may come into force going forward. As of September, the Group had funded the installation of approximately 3,560 generators (stationary diesel generators, mobile diesel generator and third-party stationary diesel generators) and approximately 241,000 additional batteries for backup capacity and improved network resilience. |
LIQUIDITY AND CAPITAL STRUCTURE
| UAH | USD | |||||||||||||||||||||||||
| 30-Sep-25 | 30-Jun-25 | QoQ | 30-Sep-25 | 30-Jun-25 | QoQ | |||||||||||||||||||||
| Cash and cash equivalents | mn | 19,502 | 19,072 | 2.3 | % | 472 | 458 | 3.1 | % | |||||||||||||||||
| Gross debt of which | mn | 18,717 | 16,032 | 16.7 | % | 453 | 385 | 17.7 | % | |||||||||||||||||
| Bonds and loans - principal | mn | 4,132 | 1,915 | 115.7 | % | 100 | 46 | 117.4 | % | |||||||||||||||||
| Lease liabilities - principal | mn | 14,585 | 14,116 | 3.3 | % | 353 | 339 | 4.1 | % | |||||||||||||||||
| Net cash / (debt) | mn | 785 | 3,040 | (74.2 | )% | 19 | 73 | (74.0 | )% | |||||||||||||||||
| Net cash excluding leases | mn | 15,370 | 17,156 | (10.4 | )% | 372 | 412 | (9.7 | )% | |||||||||||||||||
Kyivstar reported UAH 19.5 bn in cash and cash equivalents as of September 2025. Bonds and loans outstanding reflects the debt to VEON and Ukraine Tower Company LLC (“UTC”). Lease liabilities associated with towers transferred to UTC are fully recognized under IFRS 16.
| Earnings Release 3Q25 |
|
STRATEGIC DEVELOPMENTS
On August 14, 2025, VEON Ltd., a global digital operator and then parent company of Ukraine’s leading digital operator JSC Kyivstar, and Cohen Circle Acquisition Corp. (“Cohen Circle”), a special purpose acquisition company, announced the closing of the business combination that resulted in the listing of Kyivstar on Nasdaq Stock Market (“Nasdaq”) following the receipt of approval from Cohen Circle shareholders at the extraordinary general meeting held on August 12, 2025. As a result of the closing of the business combination, Kyivstar began trading its shares and warrants on the Nasdaq on August 15, 2025 under the ticker symbols “KYIV” and “KYIVW”, respectively, thereby becoming the first and only Ukrainian company listed on a US stock exchange. VEON held an 89.6% stake in Kyivstar as of the closing of the business combination.
On August 12, 2025, Kyivstar successfully conducted a test of satellite and terrestrial network integration using Starlink Direct to Cell technology. This is the first field test of Starlink Direct to Cell in eastern Europe. During the pilot in the Zhytomyr region, Kyivstar President and JSC Kyivstar CEO Oleksandr Komarov and Ukraine’s Minister of Digital Transformation, Mykhailo Fedorov, exchanged messages directly via Starlink Direct to Cell satellite service using regular 4G-enabled smartphones. The successful exchange confirmed the technology’s viability for Ukraine. Launch of first commercial services is due in December.
Kyivstar continues to advance its large language model (“LLM”) project in partnership with Ukraine’s Ministry of Digital Transformation and the WINWIN AI Centre of Excellence. In 3Q25, we established the project’s strategy, accelerating hiring, and established a legal framework for transferring datasets. This joint project aims to develop Ukraine’s first LLM trained deliberately on Ukrainian-language data. The cooperation memorandum builds on VEON’s and Kyivstar’s pledge to invest USD 1 bn to rebuild Ukraine’s digital infrastructure over 2023-2027. In addition to capturing the full range of Ukrainian dialects, terminology, history, and cultural context, the project is designed to ensure that sensitive national data is securely stored and processed within Ukraine, a critical requirement for sectors such as government, defense, healthcare, and financial services. The LLM will also serve as the foundation for AI-powered products and services, including legal and regulatory analysis tools, as well as specialized AI applications across both public and private sectors and in fields including education, finance, and health. The model is expected to deliver more accurate, relevant, and actionable insights for Ukrainian users than general-purpose global models. The first version of the Ukrainian LLM is scheduled for release by December 2025.
| Earnings Release 3Q25 |
|
OUTLOOK
For 2025, Kyivstar expects to deliver revenue growth of 24%-27% and EBITDA growth of 23%-26% YoY in UAH terms.
For 2025, in USD terms, and assuming current FX rates, revenues are expected to grow by 20%-23% and EBITDA by 19%-22%.
Capex intensity for 2025 is expected within 30%-33% of revenues.
| FY25 Outlook2 | ||
| Total Revenue, YoY (UAH) | 24% - 27% | |
| Total Revenue, YoY (USD)1 | 20% - 23% | |
| EBITDA, YoY (UAH) | 23% - 26% | |
| EBITDA, YoY (USD)1 | 19% - 22% | |
| LTM Capex Intensity | 30% - 33% |
Note:
| 1. | USD expectations assume no significant fluctuation in UAH/USD exchange rate from current level. |
| 2. | The outlook herein regarding Ukraine is subject to uncertainties due to the ongoing war. Actual outcomes may differ materially from current expectations and current expectations should not be construed as a guarantee of future performance and are provided for informational purposes only. Our guidance includes GAAP and non-GAAP financial measures. |
A reconciliation of IFRS guidance measures to corresponding non-GAAP guidance measures is not available on a forward-looking basis without unreasonable effort due to the uncertainty regarding, and the potential variability of, expenses that may be incurred in the future. This and other factors could be material to Kyivstar’s results computed in accordance with IFRS. Kyivstar has provided a reconciliation of IFRS to non-GAAP financial measures in Attachment A for its historical non-GAAP financial results included in this release. Kyivstar’s fiscal year ends December 31.
| Earnings Release 3Q25 |
|
PRESENTATION OF UNAUDITED FINANCIAL RESULTS
Kyivstar’s results presented in this document are, unless otherwise stated, based on International Financial Reporting Standards (“IFRS”) as issued by the International Accounting Standards Board (“IASB”) and have not been externally audited or reviewed.
Certain amounts and percentages that appear in this document have been subject to rounding adjustments. As a result, certain numerical figures shown as totals, including those in the tables, may not be an exact arithmetic aggregation of the figures that precede or follow them.
The non-IFRS information disclosed in the document, including, among other things, EBITDA, EBITDA margin, Adjusted Net Profit, Adjusted EPS, LTM Equity Free Cash Flow, capex and capex intensity trends, is defined in Attachment D and reconciled to the comparable IFRS information in Attachment A.
UNAUDITED CONDENSED CONSOLIDATED INCOME STATEMENT
| (In millions of U.S. dollars except Earnings per Share) | 3Q25 | 3Q24 | YoY | 9M25 | 9M24 | YoY | ||||||||||||||||||
| Total operating revenues | 297 | 248 | 19.8 | % | 836 | 669 | 25.0 | % | ||||||||||||||||
| Service costs | (30 | ) | (27 | ) | 11.1 | % | (81 | ) | (74 | ) | 9.5 | % | ||||||||||||
| Selling, general and administrative expenses | (96 | ) | (79 | ) | 21.5 | % | (279 | ) | (221 | ) | 26.2 | % | ||||||||||||
| Depreciation | (37 | ) | (30 | ) | 23.3 | % | (102 | ) | (89 | ) | 14.6 | % | ||||||||||||
| Amortization | (17 | ) | (12 | ) | 41.7 | % | (46 | ) | (34 | ) | 35.3 | % | ||||||||||||
| Impairment loss | (3 | ) | 0 | n.m | (6 | ) | (2 | ) | 200.0 | % | ||||||||||||||
| Gain / (Loss) on disposal of non-current assets | - | (1 | ) | n.m | (1 | ) | (1 | ) | n.m | |||||||||||||||
| Listing expense | (162 | ) | - | n.m | (162 | ) | 0 | n.m | ||||||||||||||||
| Other operating income | - | - | - | 1 | - | >100 | % | |||||||||||||||||
| Operating (loss) / profit1 | (48 | ) | 99 | n.m | 160 | 248 | -35.5 | % | ||||||||||||||||
| Net finance costs | (16 | ) | (10 | ) | 60.0 | % | (44 | ) | (36 | ) | 22.2 | % | ||||||||||||
| Other non-operating (loss) / gain, net | (6 | ) | (1 | ) | 500.0 | % | (8 | ) | - | n.m | ||||||||||||||
| Net foreign exchange (loss) / gain | (1 | ) | 14 | n.m | (21 | ) | 24 | n.m | ||||||||||||||||
| (Loss) / Profit before tax1 | (71 | ) | 102 | n.m | 87 | 236 | -63.1 | % | ||||||||||||||||
| Income taxes | (18 | ) | (20 | ) | -10.0 | % | (53 | ) | (46 | ) | 15.2 | % | ||||||||||||
| (Loss) / Profit for the period1 | (89 | ) | 82 | n.m | 34 | 190 | -82.1 | % | ||||||||||||||||
| Earnings per Share2 | ||||||||||||||||||||||||
| Basic | (0.41 | ) | 0.40 | n.m | 0.16 | 0.92 | -82.5 | % | ||||||||||||||||
| Diluted | (0.41 | ) | 0.40 | n.m | 0.16 | 0.92 | -82.5 | % |
| (In millions of U.S. dollars) except Earnings per Share | 3Q25 | 3Q24 | YoY | 9M25 | 9M24 | YoY | ||||||||||||||||||
| Adjusted Net Profit for the period3 | 73 | 82 | -11.0 | % | 196 | 190 | 3.2 | % | ||||||||||||||||
| Adjusted Earnings per Share2,3 | 0.33 | 0.40 | -16.0 | % | 0.93 | 0.92 | 1.14 | % |
| 1. | Reflects a non-cash charge of $162 mn recognized in 3Q25 results related to the Kyivstar listing. |
| 2. | Weighted average common shares outstanding for basic and diluted earnings per share (in millions): 219.3 (3Q25), 206.9 (3Q24) and 211.1 (9M25), 206.9 (9M24). |
| 3. | Excludes a non-cash charge of $162 mn recognized with 3Q25 results related to the Kyivstar listing |
| Earnings Release 3Q25 |
|
Operating (loss) / profit was impacted by non-cash charge of USD 162 mn associated with the Kyivstar listing. This expense represents a one-time, non-cash compensation for a stock exchange listing service equal to the excess of the fair value of the shares transferred compared to the fair value of the net assets received.
Net finance costs amounted to USD 16 mn, an increase primarily due to lower deposit income following the redemption of USD-denominated Ukrainian sovereign bonds.
Other non-operating (loss) / gain, net was USD 6 mn, an increase of USD 5 mn YoY. This increase was mainly driven by the fair value revaluation impact related to outstanding warrants. Under IFRS, these warrants are measured at fair value through profit or loss and revalued at each reporting period end. The valuation is based on the market price of the warrant at the reporting date, which may result in non-cash gains or losses in the income statement from one period to the next. However, these fluctuations have no impact on cash flows or the company’s underlying operating performance.
Net foreign exchange (loss) / gain, was USD 1 million, representing a USD 15 million change from 3Q24. The decline was largely attributable to foreign exchange gains recognized on the revaluation of USD-denominated bonds in 3Q24 which were subsequently redeemed.
Adjusted Net Profit for the period, which adjusts for the $162 mn listing expense, was down 11% YoY due to the factors discussed above as well as higher SG&A expenses, offsetting the $49m increase in revenue, 3Q25 loss for the period was USD 89 mn.
The basic and diluted earnings per share (EPS) are the same because the warrant exercise price exceeded the average market price of the shares during the reporting period, rendering the outstanding warrants out of the money. Accordingly, shares issuable upon warrant exercise are excluded from the diluted share count, resulting in identical basic and diluted shares outstanding and, therefore, identical basic and diluted EPS.
UNAUDITED CONDENSED CONSOLIDATED CASH FLOW STATEMENT
| (In millions of U.S. dollars) | 3Q25 | 3Q24 | 9M25 | 9M24 | ||||||||||||
| Operating activities | ||||||||||||||||
| Net cash flows from operating activities | 144 | 124 | 406 | 324 | ||||||||||||
| Investing activities | ||||||||||||||||
| Net cash flows used in investing activities | (132 | ) | (13 | ) | (4 | ) | (207 | ) | ||||||||
| Financing activities | ||||||||||||||||
| Net cash flows used in financing activities | 11 | (7 | ) | (607 | ) | (21 | ) | |||||||||
| Net increase / (decrease) in cash and cash equivalents | 23 | 104 | (205 | ) | 96 | |||||||||||
| Net foreign exchange difference | (9 | ) | (3 | ) | 3 | (10 | ) | |||||||||
| Cash and cash equivalents at beginning of period | 458 | 410 | 674 | 425 | ||||||||||||
| Cash and cash equivalents at end of period | 472 | 511 | 472 | 511 |
Note: please refer to attachment B for UAH denominated statement
| Earnings Release 3Q25 |
|
UNAUDITED CONDENSED CONSOLIDATED BALANCE SHEET
| (In millions of U.S. dollars) | 30 Sep 2025 |
31 Dec 2024 |
||||||
| Assets | ||||||||
| Non-current assets | ||||||||
| Property and equipment | 803 | 624 | ||||||
| Goodwill | 124 | 14 | ||||||
| Intangible assets | 351 | 283 | ||||||
| Other non-current assets | 67 | 80 | ||||||
| Total non-current assets | 1,345 | 1,001 | ||||||
| Current assets | ||||||||
| Cash and cash equivalents | 472 | 674 | ||||||
| Trade and other receivables | 37 | 40 | ||||||
| Other current assets | 179 | 494 | ||||||
| Total current assets | 688 | 1,208 | ||||||
| Total assets | 2,033 | 2,209 | ||||||
| Equity and liabilities | ||||||||
| Total equity | 1,236 | 1,080 | ||||||
| Non-current liabilities | ||||||||
| Debt and derivatives | 275 | 225 | ||||||
| Other non-current liabilities | 31 | 17 | ||||||
| Total non-current liabilities | 306 | 242 | ||||||
| Current liabilities | ||||||||
| Trade and other payables | 137 | 132 | ||||||
| Debt and derivatives | 227 | 669 | ||||||
| Other current liabilities | 127 | 86 | ||||||
| Total current liabilities | 491 | 887 | ||||||
| Total equity and liabilities | 2,033 | 2,209 | ||||||
Note: please refer to attachment B for UAH denominated statement
Upon listing, the Debt and derivatives started to reflect a current liability associated with the fair value of the outstanding Kyivstar warrants, at USD 31 mn as of September 30, 2025. Under IFRS, these warrants are measured at fair value through profit or loss and are measured at each reporting period end, with the valuation being driven by the market price of the warrant at the end of the quarter.
| Earnings Release 3Q25 |
|

CONTENT OF THE ATTACHMENTS
| Attachment A | Reconciliation tables | 13 |
| Attachment B | Condensed unaudited financial statements (in UAH) | 17 |
| Attachment C | Rates of functional currency to USD | 20 |
| Attachment D | Definitions | 21 |
| Earnings Release 3Q25 |
|
ATTACHMENT A: RECONCILIATION TABLES
| EBITDA to (Loss) / Profit
for the period reconciliation (USD millions) |
3Q25 | 3Q24 | 9M25 | 9M24 | ||||||||||||||
| EBITDA | mn | 171 | 142 | 477 | 374 | |||||||||||||
| Amortization | mn | (17 | ) | (12 | ) | (46 | ) | (34 | ) | |||||||||
| Depreciation | mn | (37 | ) | (30 | ) | (102 | ) | (89 | ) | |||||||||
| EBIT | mn | 117 | 100 | 329 | 251 | |||||||||||||
| Impairment reversal | mn | (3 | ) | - | (6 | ) | (2 | ) | ||||||||||
| (Loss) / Gain on disposal of non-current assets | mn | - | (1 | ) | (1 | ) | (1 | ) | ||||||||||
| Operating Profit | mn | 114 | 99 | 322 | 248 | |||||||||||||
| Net foreign exchange gain | mn | (1 | ) | 14 | (21 | ) | 24 | |||||||||||
| Other non operating (loss) / gain, net | mn | (6 | ) | (1 | ) | (8 | ) | - | ||||||||||
| Finance income | mn | 2 | 10 | 13 | 26 | |||||||||||||
| Finance costs | mn | (18 | ) | (20 | ) | (57 | ) | (62 | ) | |||||||||
| Listing expense | mn | (162 | ) | - | (162 | ) | - | |||||||||||
| (Loss) / Profit before tax | mn | (71 | ) | 102 | 87 | 236 | ||||||||||||
| Income taxes | mn | (18 | ) | (20 | ) | (53 | ) | (46 | ) | |||||||||
| (Loss) / Profit for the period | mn | (89 | ) | 82 | 34 | 190 | ||||||||||||
| Adjusted net profit to (Loss) / Profit for the period reconciliation (USD millions) |
3Q25 | 3Q24 | 9M25 | 9M24 | ||||||||||||||
| Adjusted net profit for the period | mln | 73 | 82 | 196 | 190 | |||||||||||||
| Listing expense | mln | (162 | ) | 0 | (162 | ) | 0 | |||||||||||
| (Loss) / Profit for the period | mln | (89 | ) | 82 | 34 | 190 | ||||||||||||
| Adjusted Earnings per Share1,2 | USD | 0.33 | 0.40 | 0.93 | 0.92 |
| 1. | Reflects adjustment for 3Q25 which excludes a non-cash charge of $162 mn related to the Kyivstar listing. |
| 2. | Weighted average common shares outstanding for Adjusted earnings per share (in millions): 219.3 (3Q25), 206.9 (3Q24) and 211.1 (9M25), 206.9 (9M24). |
| Earnings Release 3Q25 |
|
| Uklon EBITDA to Profit for the period reconciliation (USD millions) |
3Q25 | 3Q24 | ||||||||
| EBITDA | mn | 9.1 | n/a | |||||||
| Amortization | mn | (2.0 | ) | n/a | ||||||
| Depreciation | mn | (0.1 | ) | n/a | ||||||
| EBIT | mn | 7.0 | n/a | |||||||
| Net foreign exchange gain | mn | 0.5 | n/a | |||||||
| Finance income | mn | 0.2 | n/a | |||||||
| Finance costs | mn | - | n/a | |||||||
| Profit before tax | mn | 7.7 | n/a | |||||||
| Income taxes | mn | (1.0 | ) | n/a | ||||||
| Profit for the period | mn | 6.7 | n/a |
| CAPEX reconciliation (USD millions) |
3Q25 | 3Q24 | 9M25 | 9M24 | ||||||||||||||
| Property, plant and equipment | mn | 74 | 42 | 174 | 99 | |||||||||||||
| Intangible assets | mn | 37 | 30 | 130 | 86 | |||||||||||||
| Additions in licenses | mn | (1 | ) | 0 | (1 | ) | 0 | |||||||||||
| Right-of-use assets | mn | (21 | ) | (16 | ) | (80 | ) | (54 | ) | |||||||||
| CAPEX | mn | 89 | 56 | 223 | 131 |
| EFCF reconciliation (USD million) |
3Q25 | 3Q24 | YoY change |
9M25 | 9M24 | YoY change |
||||||||||||||||||||
| EBITDA | mn | 171 | 142 | 29 | 477 | 374 | 103 | |||||||||||||||||||
| Movements in working capital | mn | 9 | 5 | 4 | 31 | 34 | (3 | ) | ||||||||||||||||||
| Movements in provisions | mn | 4 | 1 | 3 | 6 | 4 | 2 | |||||||||||||||||||
| Net tax paid | mn | (19 | ) | (21 | ) | 2 | (53 | ) | (40 | ) | (13 | ) | ||||||||||||||
| Cash capex (excluding license payments) | mn | (101 | ) | (54 | ) | (47 | ) | (203 | ) | (143 | ) | (60 | ) | |||||||||||||
| Proceeds from Share Issuance | mn | 134 | 134 | 134 | 134 | |||||||||||||||||||||
| Unlevered Free Cash Flow | mn | 198 | 73 | 125 | 392 | 229 | 163 | |||||||||||||||||||
| Net interest | mn | (24 | ) | (8 | ) | (16 | ) | (55 | ) | (46 | ) | (9 | ) | |||||||||||||
| Equity Free Cash Flow | mn | 174 | 65 | 109 | 337 | 183 | 154 | |||||||||||||||||||
| Lease liabilities payments - principal | mn | (9 | ) | (7 | ) | (2 | ) | (27 | ) | (21 | ) | (6 | ) | |||||||||||||
| Licenses payments | mn | - | - | - | - | |||||||||||||||||||||
| Equity Free Cash Flow (after leases and licenses) | mn | 165 | 58 | 107 | 310 | 162 | 148 |
| Earnings Release 3Q25 |
|
| EBITDA to (Loss) / Profit for the period reconciliation (UAH millions) |
3Q25 | 3Q24 | 9M25 | 9M24 | ||||||||||||||
| EBITDA | mn | 7,100 | 5,842 | 19,840 | 14,859 | |||||||||||||
| Amortization | mn | (706 | ) | (494 | ) | (1,913 | ) | (1,351 | ) | |||||||||
| Depreciation | mn | (1,536 | ) | (1,234 | ) | (4,243 | ) | (3,536 | ) | |||||||||
| EBIT | mn | 4,858 | 4,114 | 13,684 | 9,971 | |||||||||||||
| Impairment reversal | mn | (125 | ) | - | (250 | ) | (79 | ) | ||||||||||
| (Loss) / Gain on disposal of non-current assets | mn | - | (41 | ) | (42 | ) | (40 | ) | ||||||||||
| Operating Profit | mn | 4,733 | 4,073 | 13,393 | 9,852 | |||||||||||||
| Net foreign exchange gain | mn | (42 | ) | 576 | (885 | ) | 953 | |||||||||||
| Other non operating (loss) / gain, net | mn | (249 | ) | (41 | ) | (333 | ) | - | ||||||||||
| Finance income | mn | 83 | 411 | 541 | 1,033 | |||||||||||||
| Finance costs | mn | (747 | ) | (823 | ) | (2,371 | ) | (2,463 | ) | |||||||||
| Listing expense | mn | (6,726 | ) | - | (6,726 | ) | - | |||||||||||
| (Loss) / Profit before tax | mn | (2,948 | ) | 4,196 | 3,619 | 9,375 | ||||||||||||
| Income taxes | mn | (747 | ) | (823 | ) | (2,204 | ) | (1,827 | ) | |||||||||
| (Loss) / Profit for the period | mn | (3,695 | ) | 3,373 | 1,414 | 7,548 |
| Adjusted net profit to (Loss) / Profit for the period reconciliation (UAH millions) |
3Q25 | 3Q24 | 9M25 | 9M24 | ||||||||||||||
| Adjusted net profit for the period | mln | 3,031 | 3,373 | 8,140 | 7,548 | |||||||||||||
| Listing expense | mln | (6726 | ) | - | (6726 | ) | - | |||||||||||
| (Loss) / Profit for the period | mln | (3,695 | ) | 3,373 | 1,414 | 7,548 | ||||||||||||
| Adjusted Earnings per Share1,2 | UAH | 13.8 | 16.3 | 38.6 | 36.5 |
| 1. | Reflects adjustment for 3Q25 which excludes a non-cash charge of UAH 6.7 bn related to the Kyivstar listing. |
| 2. | Weighted average common shares outstanding for Adjusted earnings per share (in millions): 219.3 (3Q25), 206.9 (3Q24) and 211.1 (9M25), 206.9 (9M24). |
| Earnings Release 3Q25 |
|
| Uklon EBITDA to Profit for the period reconciliation (UAH millions) |
3Q25 | 3Q24 | ||||||||
| EBITDA | mn | 378 | n/a | |||||||
| Amortization | mn | (82 | ) | n/a | ||||||
| Depreciation | mn | (3 | ) | n/a | ||||||
| EBIT | mn | 293 | n/a | |||||||
| Net foreign exchange gain | mn | 21 | n/a | |||||||
| Finance income | mn | 7 | n/a | |||||||
| Finance costs | mn | - | n/a | |||||||
| Profit before tax | mn | 321 | n/a | |||||||
| Income taxes | mn | (44 | ) | n/a | ||||||
| Profit for the period | mn | 277 | n/a |
| CAPEX reconciliation (UAH millions) |
3Q25 | 3Q24 | 9M’25 | 9M24 | ||||||||||||||
| Property, plant and equipement | mn | 3,073 | 1,728 | 7,237 | 3,933 | |||||||||||||
| Intangible assets | mn | 1,536 | 1,234 | 5,407 | 3,416 | |||||||||||||
| Additions in licenses | mn | (42 | ) | - | (42 | ) | - | |||||||||||
| Right-of-use assets | mn | (872 | ) | (658 | ) | (3,328 | ) | (2,145 | ) | |||||||||
| CAPEX excl. licenses and ROU | mn | 3,695 | 2,304 | 9,275 | 5,204 |
| Earnings Release 3Q25 |
|
ATTACHMENT B: CONDENSED UNAUDITED FINANCIAL STATEMENTS IN UAH
UNAUDITED CONDENSED CONSOLIDATED INCOME STATEMENT
| (In millions of UAH) except Earnings per Share | 3Q25 | 3Q24 | YoY | 9M25 | 9M24 | YoY | ||||||||||||||||||
| Total operating revenues | 12,332 | 10,203 | 20.9 | % | 34,773 | 26,577 | 30.8 | % | ||||||||||||||||
| Service costs | (1,246 | ) | (1,111 | ) | 12.2 | % | (3,369 | ) | (2,940 | ) | 14.6 | % | ||||||||||||
| Selling, general and administrative expenses | (3,986 | ) | (3,250 | ) | 22.6 | % | (11,605 | ) | (8,779 | ) | 32.2 | % | ||||||||||||
| Depreciation | (1,536 | ) | (1,234 | ) | 24.5 | % | (4,243 | ) | (3,536 | ) | 20.0 | % | ||||||||||||
| Amortization | (706 | ) | (494 | ) | 42.9 | % | (1,913 | ) | (1,351 | ) | 41.6 | % | ||||||||||||
| Impairment loss | (125 | ) | - | n.m | (250 | ) | (79 | ) | 215.9 | % | ||||||||||||||
| Gain / (Loss) on disposal of non-current assets | - | (41 | ) | n.m | (42 | ) | (40 | ) | 4.0 | % | ||||||||||||||
| Listing expense | (6,726 | ) | - | n.m | (6,726 | ) | - | n.m | ||||||||||||||||
| Other operating income | - | - | 0.0 | % | 42 | - | >100 | % | ||||||||||||||||
| Operating (loss) / profit1 | (1,993 | ) | 4,073 | -148.9 | % | 6,667 | 9,852 | -32.3 | % | |||||||||||||||
| Net finance costs | (664 | ) | (412 | ) | 61.2 | % | (1,830 | ) | (1,430 | ) | 28.0 | % | ||||||||||||
| Other non-operating (loss) / gain, net | (249 | ) | (41 | ) | 507.3 | % | (333 | ) | - | n.m | ||||||||||||||
| Net foreign exchange (loss) / gain | (42 | ) | 576 | n.m | (885 | ) | 953 | n.m | ||||||||||||||||
| (Loss) / Profit before tax1 | (2,948 | ) | 4,196 | n.m | 3,619 | 9,375 | -61.4 | % | ||||||||||||||||
| Income taxes | (747 | ) | (823 | ) | -9.2 | % | (2,204 | ) | (1,827 | ) | 20.6 | % | ||||||||||||
| (Loss) / Profit for the period1 | (3,695 | ) | 3,373 | n.m | 1,414 | 7,548 | -81.3 | % | ||||||||||||||||
| Earnings per Share2 | ||||||||||||||||||||||||
| Basic | (16.8 | ) | 16.3 | n.m | 6.7 | 36.5 | -81.6 | % | ||||||||||||||||
| Diluted | (16.8 | ) | 16.3 | n.m | 6.7 | 36.5 | -81.6 | % | ||||||||||||||||
| (In millions of UAH) except Earnings per Share | 3Q25 | 3Q24 | YoY | 9M25 | 9M24 | YoY | ||||||||||||||||||
| Adjusted Net Profit for the period1 | 3,031 | 3,373 | -10.1 | % | 8,140 | 7,548 | 7.8 | % | ||||||||||||||||
| Adjusted Earnings per Share1,2 | 13.8 | 16.3 | -15.2 | % | 38.6 | 36.5 | 5.7 | % | ||||||||||||||||
| 1. | Reflects a non-cash charge of UAH 6.7 bn recognized in 3Q25 results related to the Kyivstar listing. |
| 2. | Weighted average common shares outstanding for basic and diluted earnings per share (in millions): 219.3 (3Q25), 206.9 (3Q24) and 211.1 (9M25), 206.9 (9M24). |
| Earnings Release 3Q25 |
|
UNAUDITED CONDENSED CONSOLIDATED CASH FLOW STATEMENT
| (In millions of UAH) | 3Q25 | 3Q24 | 9M25 | 9M24 | ||||||||||||
| Operating activities | ||||||||||||||||
| Net cash flows from operating activities | 5,978 | 5,102 | 16,888 | 12,871 | ||||||||||||
| Investing activities | ||||||||||||||||
| Net cash flows used in investing activities | (5,480 | ) | (535 | ) | (167 | ) | (8,222 | ) | ||||||||
| Financing activities | ||||||||||||||||
| Net cash flows used in financing activities | 457 | (288 | ) | (25,248 | ) | (834 | ) | |||||||||
| Net increase / (decrease) in cash and cash equivalents | 955 | 4,279 | (8,527 | ) | 3,815 | |||||||||||
| Net foreign exchange difference | (525 | ) | 137 | (305 | ) | 1,079 | ||||||||||
| Cash and cash equivalents at beginning of period | 19,072 | 16,620 | 28,334 | 16,143 | ||||||||||||
| Cash and cash equivalents at end of period | 19,502 | 21,036 | 19,502 | 21,036 | ||||||||||||
| Earnings Release 3Q25 |
|
UNAUDITED CONDENSED CONSOLIDATED BALANCE SHEET
| (In millions of UAH) | 30 Sep 2025 |
31 Dec 2024 |
||||||
| Assets | ||||||||
| Non-current assets | ||||||||
| Property and equipment | 33,178 | 26,232 | ||||||
| Goodwill | 5,123 | 589 | ||||||
| Intangible assets | 14,502 | 11,897 | ||||||
| Other non-current assets | 2,769 | 3,363 | ||||||
| Total non-current assets | 55,572 | 42,081 | ||||||
| Current assets | ||||||||
| Cash and cash equivalents | 19,502 | 28,334 | ||||||
| Trade and other receivables | 1,529 | 1,682 | ||||||
| Other current assets | 7,397 | 20,767 | ||||||
| Total current assets | 28,428 | 50,783 | ||||||
| Total assets | 84,000 | 92,864 | ||||||
| Equity and liabilities | ||||||||
| Total equity | 51,069 | 45,402 | ||||||
| Non-current liabilities | ||||||||
| Debt and derivatives | 11,362 | 9,459 | ||||||
| Other non-current liabilities | 1,281 | 714 | ||||||
| Total non-current liabilities | 12,643 | 10,173 | ||||||
| Current liabilities | ||||||||
| Trade and other payables | 5,661 | 5,549 | ||||||
| Debt and derivatives | 9,379 | 28,124 | ||||||
| Other current liabilities | 5,248 | 3,616 | ||||||
| Total current liabilities | 20,288 | 37,289 | ||||||
| Total equity and liabilities | 84,000 | 92,864 | ||||||
| Earnings Release 3Q25 |
|
ATTACHMENT C: RATES OF FUNCTIONAL CURRENCIES TO USD
| Average rates | Closing rates | |||||||||||||||||||||||||||
| 3Q25 | 3Q24 | YoY | 30-Sep-25 | 30-Sep-24 | YoY | 31-Dec-24 | ||||||||||||||||||||||
| Ukraine Hryvnia | 41.5 | 41.1 | -0.9 | % | 41.3 | 41.2 | -0.4 | % | 42.0 | |||||||||||||||||||
The unaudited condensed consolidated income statements and the unaudited condensed consolidated cash flow statements have been translated using the average exchange rates prevailing during each reporting period. In the unaudited condensed consolidated balance sheets, all assets and liabilities have been translated using the period-end exchange rates, and all resulting exchange differences have been recognized in net foreign exchange (loss) / gain. UAH translations throughout this release are included solely for the convenience of the reader and were calculated at the exchange rates set forth in the table above under the header “Closing rates”.
| Earnings Release 3Q25 |
|
ATTACHMENT D: DEFINITIONS
4G users are mobile customers who have engaged in revenue-generating activity during the three months prior to the measurement date as a result of activities over fourth-generation (4G or LTE – long term evolution) network technologies.
Adjusted Net Profit is profit / (loss) for the period, excluding the impact of the one-time, non-cash charge of USD 162 mn recognized in 3Q25 related to the Kyivstar listing.
ARPU (average revenue per user) measures the monthly average revenue per mobile user. We generally calculate ARPU by dividing our mobile and digital service revenue during the relevant period (including data revenue, roaming revenue, MFS and interconnect revenue, but excluding revenue from connection fees, sales of handsets and accessories and other non-service revenue, but excluding revenue from fixed IPTV) by the average number of our mobile customers during the period and the number of months in that period.
Capital expenditures (capex) are purchases of property and equipment, new construction, upgrades, software, other long-lived assets and related reasonable costs incurred prior to the intended use of the non-current asset, accounted at the earliest event of advance payment or delivery. Purchases of licenses and capitalized leases are not included in capital expenditures.
Capex intensity is a ratio, which is calculated as last-twelve-month (LTM) capex divided by LTM total revenue.
Direct digital revenues include revenues from Kyivstar Group Ltd.’s proprietary digital platforms and services.
Doubleplay 4G customers are mobile customers who engaged in usage of our voice and data services over 4G (LTE) technology at any time during the one month prior to such measurement date.
EBITDA is a non-IFRS financial measure and is called Adjusted EBITDA. Adjusted EBITDA is a non-IFRS financial measure. Adjusted EBITDA should not be considered in isolation or as a substitute for analyses of the results as reported under IFRS We calculate Adjusted EBITDA as profit/(loss) for the period, before income taxes, depreciation, amortization, loss from disposal of non-current assets and impairment loss, financial expenses and costs, net foreign exchange gain/(loss), share of profit/(loss) of associates and joint ventures, and listing expense, which is also excluded from the calculation.
EBITDA margin is calculated as EBITDA (as defined above) divided by total revenue, expressed as a percentage.
Equity free cash flow is a non-IFRS measure and is defined as free cash flow from operating activities and proceeds from sale of business, less cash flow used in investing activities, excluding license payments, lease payments, cash outflows for business acquisitions, inflow/outflow of deposits, and financial assets, cash inflows from sale of business and proceeds from share issuance.
Gross debt is calculated as the sum of long-term notional debt and short-term notional debt, including capitalized leases.
Mobile customers (also - mobile subscribers) are generally customers in the registered customer base at a given measurement date who engaged in a mobile revenue generating activity at any time during the three months prior to such measurement date. Such activity includes any outgoing calls, customer fee accruals, debits related to service, outgoing SMS and MMS, data transmission and receipt sessions, but does not include incoming calls, SMS and MMS or abandoned calls. Our total number of mobile customers also includes customers using mobile internet service via USB modems and fixed-mobile convergence (“FMC”).
Multiplay customers are Doubleplay 4G customers who also engaged in usage of one or more of our digital products at any time during the one month prior to such measurement date. Effective 1Q25, 4G usage below the 100Mb threshold is included in Multiplay and Double Play 4G user count (excluded prior to 1Q25).
Net debt / (cash) is a non-IFRS financial measure and is calculated as the sum of interest-bearing long-term debt, including capitalized leases (unless specifically excluded) and short-term notional debt minus cash and cash equivalents and deposits, long-term and short-term deposits. We believe that net debt / (cash) provides useful information to investors because it shows the amount of notional debt that would be outstanding if available cash and cash equivalents and deposits and long-term and short-term deposits were applied to repay such indebtedness. Net debt should not be considered in isolation as an alternative to long-term debt and short-term debt, or any other measure of our financial position.
Revenues from telecommunications services (“Telecom revenues”) are revenues generated by Kyivstar Group Ltd from providing telecommunication services. Telecommunication services refer to data, voice, connectivity, television, and similar services, regardless of medium of transmission, including transmission by satellite.
Total digital monthly active users (“MAU”) is a gross total cumulative MAU of all digital platforms, services and applications offered by an entity or by the Group and includes MAU who are active in more than one application.

Kyivstar’s results and other financial information presented in this document are, unless otherwise stated, prepared in accordance with International Financial Reporting Standards (“IFRS”) as issued by the international Accounting Standards Board and have not been externally reviewed and/or audited. As such, you should not place undue reliance on this information. Also, certain amounts and percentages have been subject to rounding adjustments.
This presentation includes certain financial and operating measures, including Adjusted EBITDA, CAPEX excl. licenses and ROU and Uklon Adjusted EBITDA, that are not prepared in accordance with accounting principles generally accepted in the United States (“GAAP”) or IFRS. These non-GAAP/non-IFRS measures, and other measures that are calculated using these non-GAAP/non-IFRS measures, are an addition, and not a substitute for or superior to measures of financial performance prepared in accordance with GAAP or IFRS and should not be considered as an alternative or substitute those determined in accordance with GAAP or IFRS. The Company believes these non-GAAP/non-IFRS financial measures provide valuable insights into key financial and business trends, offering management and potential investors a useful tool for evaluating the Company’s performance and comparing it with peers that report similar metrics. These non-GAAP/non-IFRS measures have limitations, including potential differences in definition from those used by other companies, which may affect comparability.
Our operations in Ukraine continue to be affected by the war. We are doing everything we can to protect the safety of our employees, while continuing to ensure the uninterrupted operation of our communications, financial and digital services. We are closely monitoring events in Ukraine, as well as the possibility of the imposition of further legal and regulatory restrictions, including sanctions and countersanctions, in connection with the ongoing war in Ukraine and any potential impact the war may have on our results, whether directly or indirectly.
This document contains “forward-looking statements”, within the meaning of the Private Securities Litigation Reform Act of 1995 . Such forward-looking statements may be identified by words such as “may,” “will,” “expect,” “plan,” “anticipate,” “potential,” “outlook,” “guidance,” “continue,” and other similar words. Forward-looking statements include, but are not limited to, statements relating to Kyivstar Group’s strategic plans, operating results, targets or financial positions; Kyivstar Group’s intended expansion of its digital experience, including through technologies such as artificial intelligence; and Kyivstar’s assessment of the impact of the war in Ukraine on its current and future operations and financial condition.
While the forward-looking statements included in this document are based on management’s best assessment, there are numerous risks and uncertainties that could cause Kyivstar Group’s actual results, plans and objectives to differ materially from those expressed, such as those risks discussed in the section entitled “Risk Factors” in Kyivstar Group’s final prospectus filed with the SEC on July 22, 2025, as such document may be amended or supplemented from time to time] and other public filings made by Kyivstar Group with the SEC. You are cautioned not to place undue reliance on these forward-looking statements. The forward-looking statements speak only as of the date hereof and we disclaim any obligation to update them, except to the extent required by law.
22
Exhibit 99.3

10 November 2025 | 3Q25 Results Presentation Digital Growth Fuels Revenue & EBITDA Momentum Kyivstar Group Ltd.

Telecom Strong Surging Digital 2 DISCLAIMER AND NOTICE TO READERS Kyivstar’s results and other financial information presented in this document are, unless otherwise stated, prepared in accordance with International Financial Reporting Standards ("IFRS") as issued by the international Accounting Standards Board and have not been externally reviewed and/or audited . As such, you should not place undue reliance on this information . Also, certain amounts and percentages have been subject to rounding adjustments . This presentation includes certain financial and operating measures, including Adjusted EBITDA, CAPEX excl . licenses and ROU and Uklon Adjusted EBITDA, that are not prepared in accordance with accounting principles generally accepted in the United States (“GAAP”) or IFRS . These non - GAAP/non - IFRS measures, and other measures that are calculated using these non - GAAP/non - IFRS measures, are an addition, and not a substitute for or superior to measures of financial performance prepared in accordance with GAAP or IFRS and should not be considered as an alternative or substitute those determined in accordance with GAAP or IFRS . The Company believes these non - GAAP/non - IFRS financial measures provide valuable insights into key financial and business trends, offering management and potential investors a useful tool for evaluating the Company’s performance and comparing it with peers that report similar metrics . These non - GAAP/non - IFRS measures have limitations, including potential differences in definition from those used by other companies, which may affect comparability . Our operations in Ukraine continue to be affected by the war . We are doing everything we can to protect the safety of our employees, while continuing to ensure the uninterrupted operation of our communications, financial and digital services . We are closely monitoring events in Ukraine, as well as the possibility of the imposition of further legal and regulatory restrictions, including sanctions and countersanctions, in connection with the ongoing war in Ukraine and any potential impact the war may have on our results, whether directly or indirectly . This document contains “forward - looking statements”, within the meaning of the Private Securities Litigation Reform Act of 1995 . Such forward - looking statements may be identified by words such as “may,” “will,” “expect,” “plan,” “anticipate,” “potential,” “outlook,” “guidance,” “continue,” and other similar words . Forward - looking statements include, but are not limited to, statements relating to Kyivstar Group’s strategic plans, operating results, targets or financial positions ; Kyivstar Group’s intended expansion of its digital experience, including through technologies such as artificial intelligence ; and Kyivstar’s assessment of the impact of the war in Ukraine on its current and future operations and financial condition . While the forward - looking statements included in this document are based on management’s best assessment, there are numerous risks and uncertainties that could cause Kyivstar Group’s actual results, plans and objectives to differ materially from those expressed, such as those risks discussed in the section entitled “Risk Factors” in Kyivstar Group’s final prospectus filed with the SEC on July 22 , 2025 , as such document may be amended or supplemented from time to time ] and other public filings made by Kyivstar Group with the SEC . You are cautioned not to place undue reliance on these forward - looking statements . The forward - looking statements speak only as of the date hereof and we disclaim any obligation to update them, except to the extent required by law .
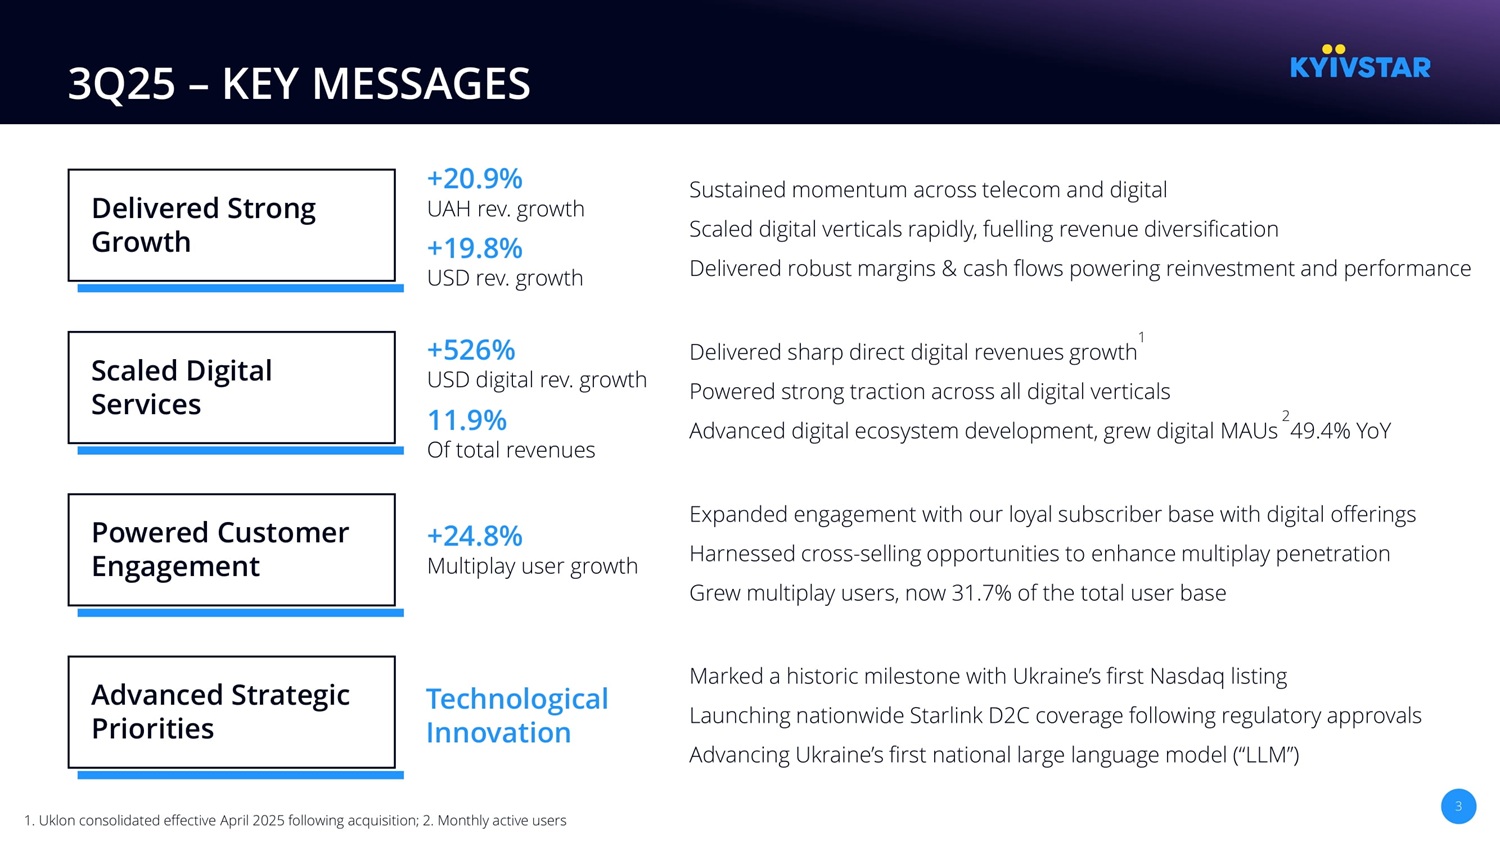
3 3Q25 – KEY MESSAGES Sustained momentum across telecom and digital Scaled digital verticals rapidly, fuelling revenue diversification Delivered robust margins & cash flows powering reinvestment and performance Delivered Strong Growth + 19.8 % USD rev. growth Delivered sharp direct digital revenues growth 1 Powered strong traction across all digital verticals Advanced digital ecosystem development, grew digital MAUs 2 49.4% YoY Scaled Digital Services +526% USD digital rev. growth Expanded engagement with our loyal subscriber base with digital offerings Harnessed cross - selling opportunities to enhance multiplay penetration Grew multiplay users, now 31.7% of the total user base Powered Customer Engagement +24.8% Multiplay user growth Marked a historic milestone with Ukraine’s first Nasdaq listing Launching nationwide Starlink D2C coverage following regulatory approvals Advancing Ukraine’s first national large language model (“LLM”) Advanced Strategic Priorities Technological Innovation 1. Uklon consolidated effective April 2025 following acquisition; 2. Monthly active users +20.9% UAH rev.

growth 11.9% Of total revenues Revenue $297 mn +20.9% in UAH +19.8% in USD Telecom revenue $ 262 mn +9.0% in UAH +8.0% in USD Direct digital revenue $ 35 mn +531% in UAH +526% in USD EBITDA $171 mn +21.5% in UAH +20.4% in USD 3Q25 – KEY FINANCIAL METRICS Adjusted net profit 1 $73 mn (10.1%) in UAH (11.0%) in USD 9M25 2 EPS $0.16 9M25 Adjusted EPS 1,2 : $0.93 Capex $89 mn 3Q capex intensity 30% LTM capex intensity 29% Cash position $472 mn LTM equity FCF 3 $373 mn 4 1. Excludes the impact of a non - cash charge of $162mn recognized in 3Q results related to the Kyivstar listing. 3Q25 loss for the period was USD 89 mn . 2. Weighted average common shares outstanding for earnings per share (in millions): 219.3 (3Q25), 206.9 (3Q24) and 211.1 (9M25), 206.9 (9M24); 3. Equity FCF before accounting for lease and license payments. Notice: See Appendix for additional information on non - IFRS measures and for reconciliations of each to its most directly compar able IFRS measure.
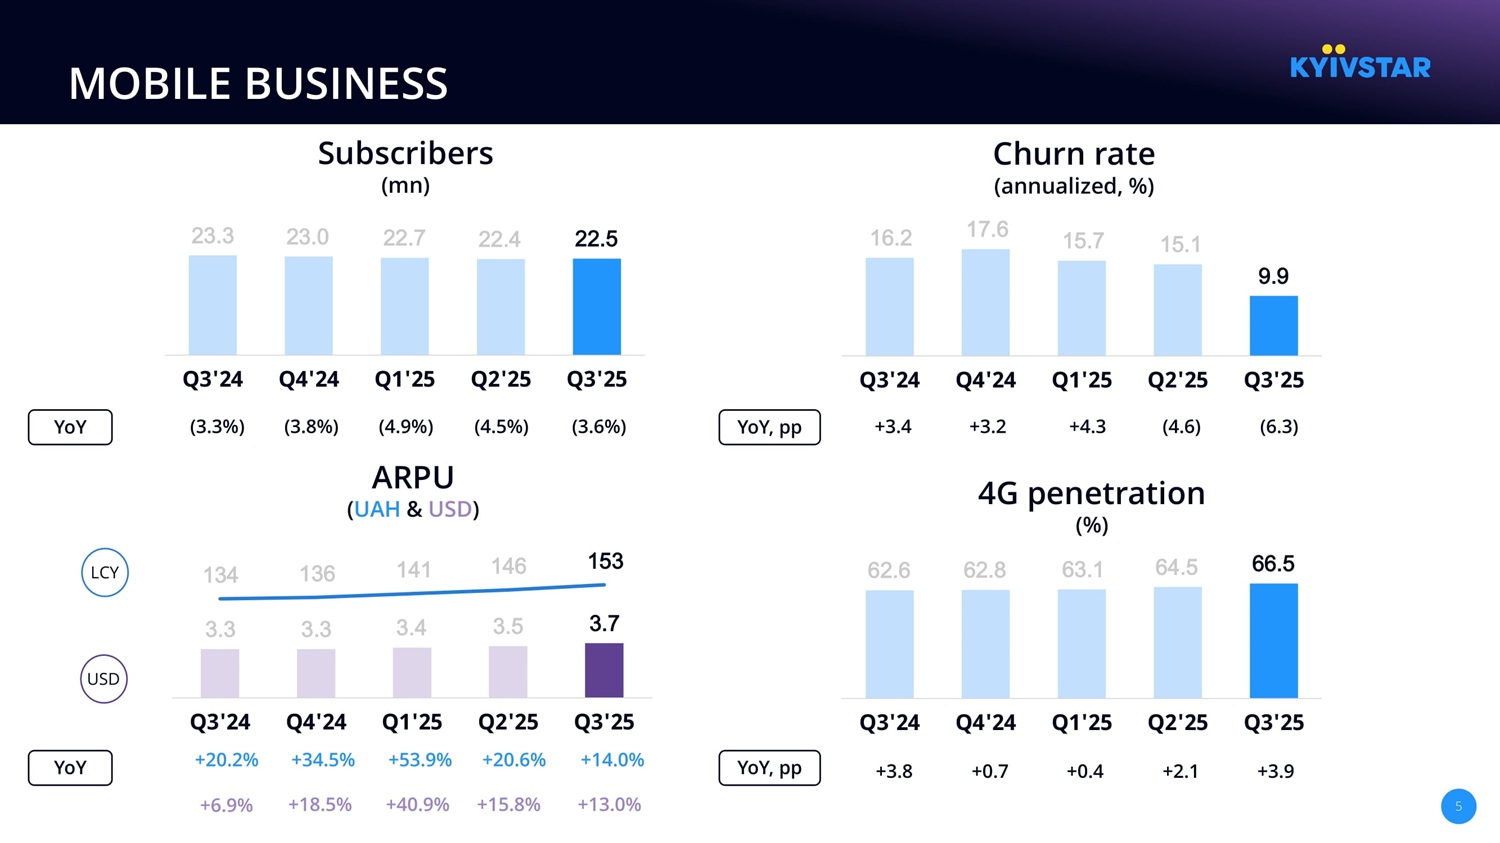
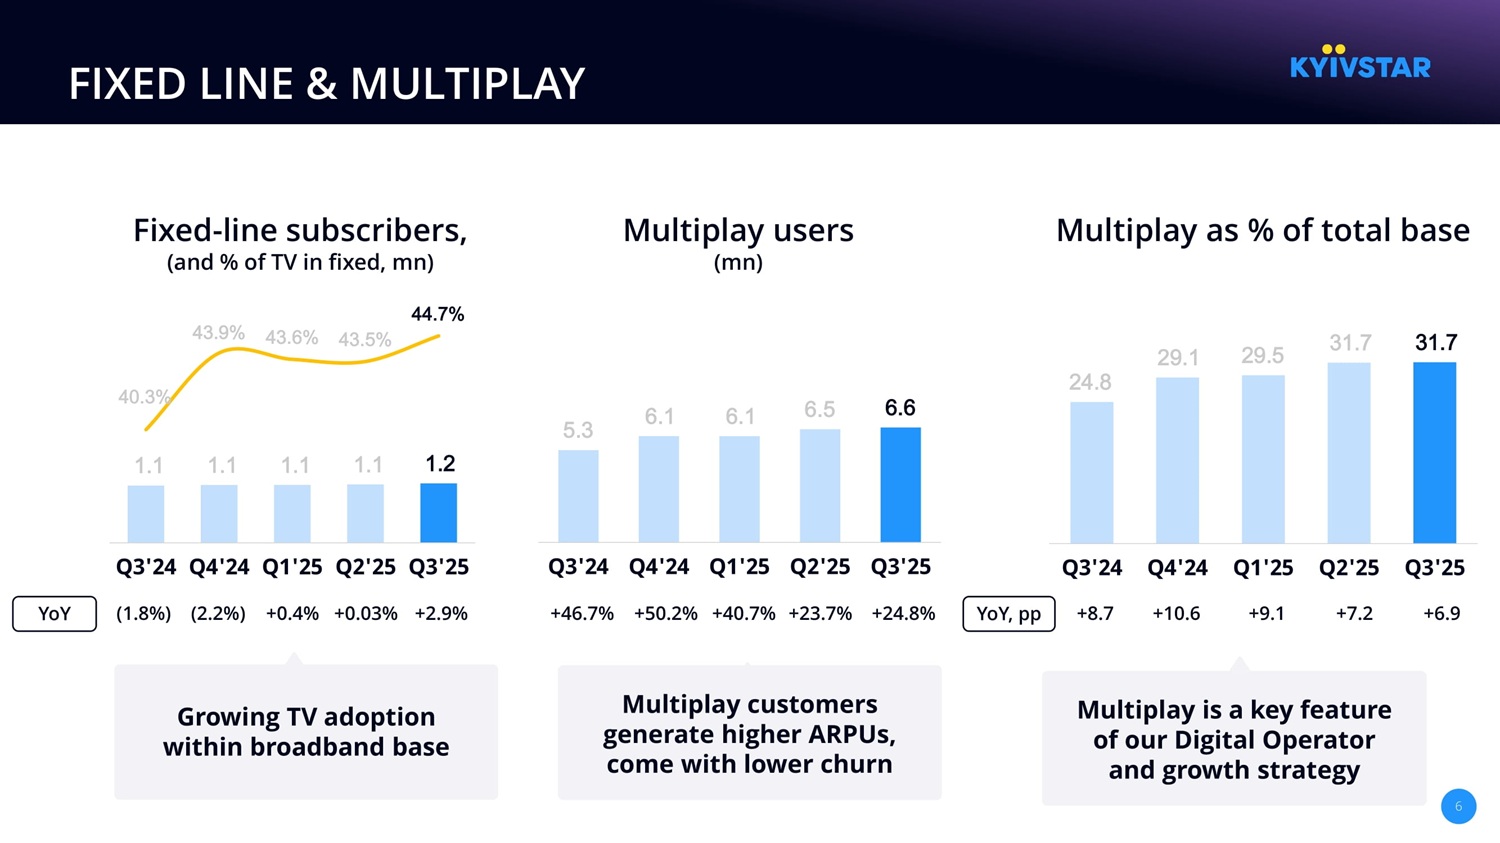
5 MOBILE BUSINESS Subscribers (mn) Churn rate (annualized, %) 4G penetration (%) 23.3 23.0 22.7 22.4 22.5 Q3'24 Q4'24 Q1'25 Q2'25 Q3'25 (3.8%) (4.9%) (4.5%) (3.6%) (3.3%) 62.6 62.8 63.1 64.5 66.5 Q3'24 Q4'24 Q1'25 Q2'25 Q3'25 +0.7 +0.4 +2.1 +3.9 +3.8 YoY ARPU ( UAH & USD ) 16.2 17.6 15.7 15.1 9.9 Q3'24 Q4'24 Q1'25 Q2'25 Q3'25 +3.2 +4.3 (4.6) (6.3) +3.4 3.3 3.3 3.4 3.5 3.7 134 136 141 146 153 Q3'24 Q4'24 Q1'25 Q2'25 Q3'25 +53.9% +20.6% +14.0% +18.5% +40.9% +15.8% +13.0% +6.9% LCY USD +20.2% +34.5% YoY YoY, pp YoY, pp 6 FIXED LINE & MULTIPLAY Fixed - line subscribers, (and % of TV in fixed, mn) 1.1 1.1 1.1 1.1 1.2 40.3% 43.9% 43.6% 43.5% 44.7% Q3'24 Q4'24 Q1'25 Q2'25 Q3'25 (2.2%) +0.4% +0.03% +2.9% (1.8%) YoY Multiplay users (mn) Multiplay as % of total base 24.8 29.1 29.5 31.7 31.7 Q3'24 Q4'24 Q1'25 Q2'25 Q3'25 +10.6 +9.1 +7.2 +6.9 +8.7 5.3 6.1 6.1 6.5 6.6 Q3'24 Q4'24 Q1'25 Q2'25 Q3'25 +50.2% +40.7% +23.7% +24.8% +46.7% Growing TV adoption within broadband base Multiplay customers generate higher ARPUs, come with lower churn Multiplay is a key feature of our Digital Operator and growth strategy YoY, pp
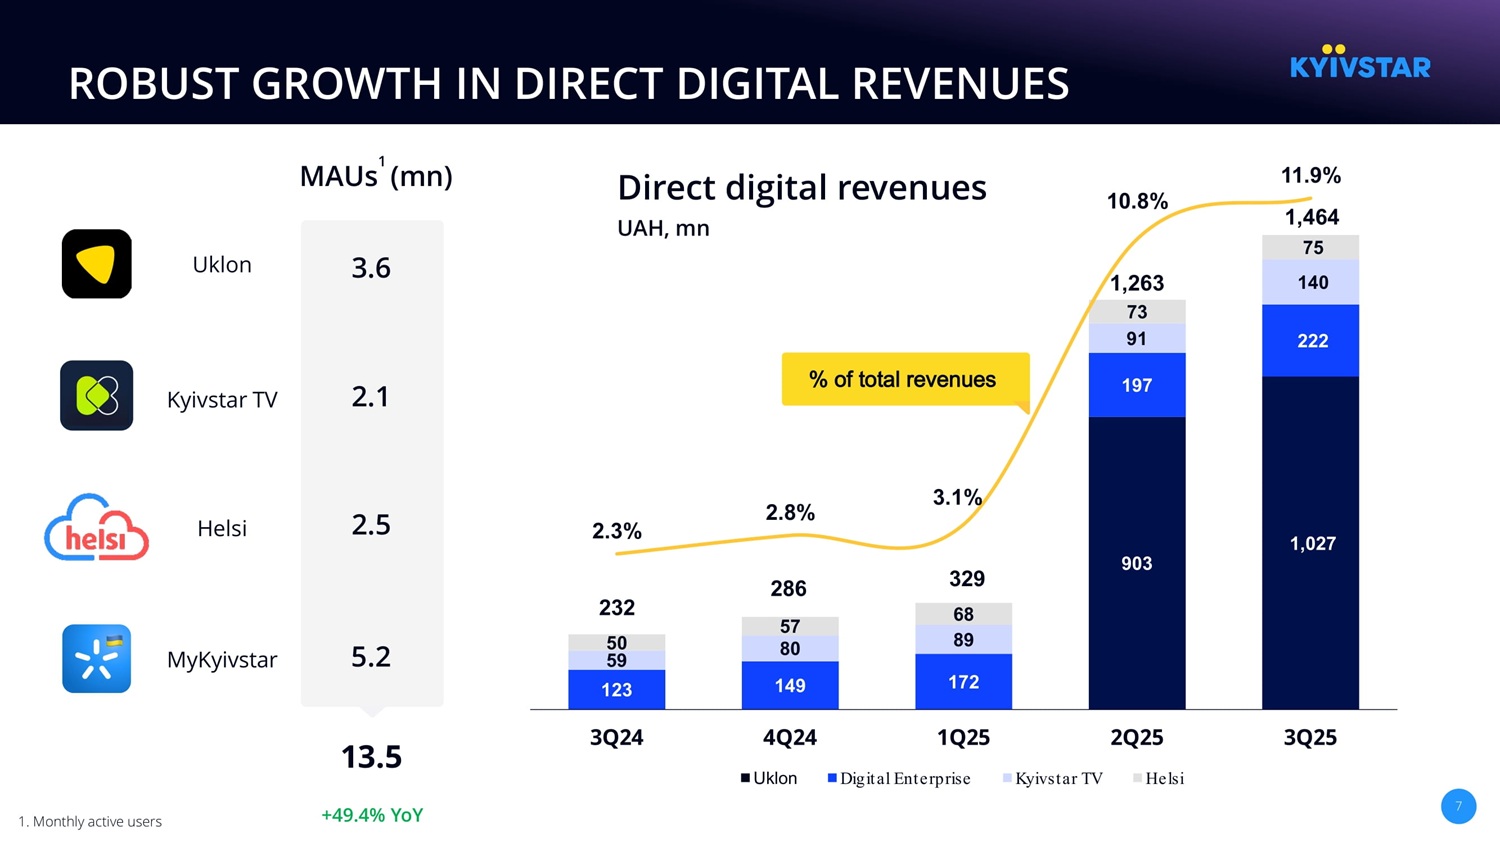
ROBUST GROWTH IN DIRECT DIGITAL REVENUES 7 903 1,027 123 149 172 197 222 59 80 89 91 140 50 57 68 73 75 2.3% 2.8% 3.1% 10.8% 11.9% 3Q24 4Q24 1Q25 2Q25 3Q25 Uklon Digital Enterprise Kyivstar TV Helsi % of total revenues 1,263 1,464 232 286 329 Direct digital revenues UAH, mn 3.6 2. 1 2. 5 5.2 MAUs 1 (mn) 13.5 +49.4% YoY Uklon Kyivstar TV Helsi MyKyivstar 1.

Monthly active users 8 UKLON – RIDE - HAILING & DELIVERY Leading ride - hailing platform in Ukraine Scaling operations and footprint in Uzbekistan 1,027 mn UAH 24.7 mn USD Total revenue 378 mn UAH 9.1 mn USD EBITDA 3 3Q25 3.6 mn MAU 1 42.2 mn Rides booked 2 +17.2% YoY 1.2 mn Deliveries completed 2 +33.3% YoY N/A 1. Refers to users active during Sep 2025; 2. For 3Q25. 3. Uklon EBITDA is a non - IFRS measure. See Appendix for additional infor mation and for reconciliation to its most directly comparable IFRS measure.
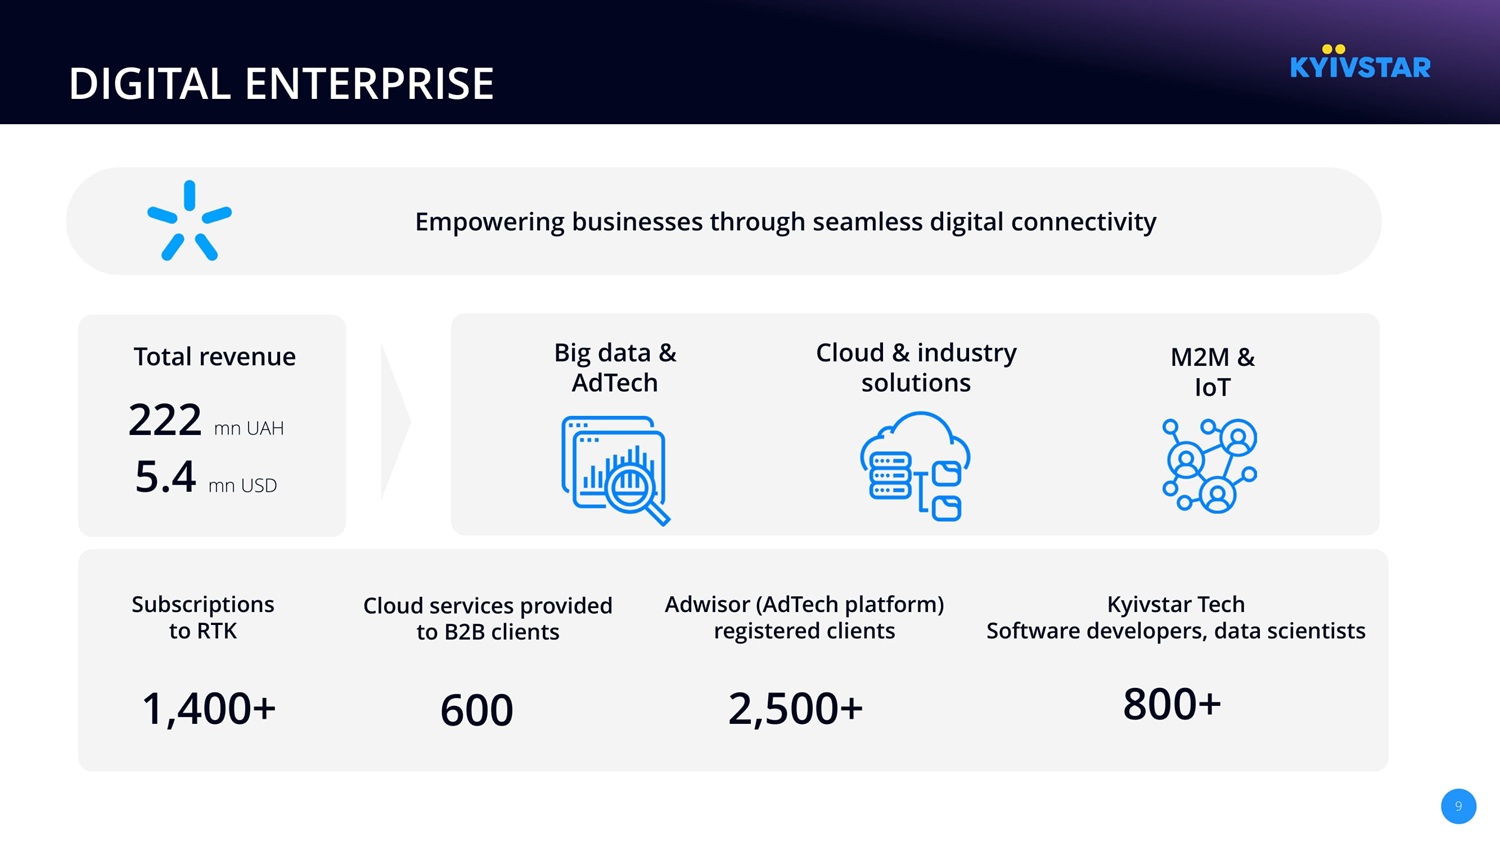
9 DIGITAL ENTERPRISE Empowering businesses through seamless digital connectivity 1,400+ 600 Cloud services provided to B2B clients Subscriptions to RTK 2,500+ Adwisor (AdTech platform) registered clients Cloud & industry solutions Big data & AdTech M2M & IoT 222 mn UAH 5.4 mn USD Total revenue 800+ Kyivstar Tech Software developers, data scientists 10 KYIVSTAR TV – ENTERTAINMENT Largest media streaming service in Ukraine 2.1 mn MAU 1 670 mn Number of sessions 2 +30.7% YoY 244 mn Usage time per user, per active day 2, 3 +21.1% YoY +31.7% YoY 3.4 mn USD 140 mn UAH Total revenue 2 +136% YoY +137% YoY 1.

Refers to users active during Sep 2025; 2. For 3Q25; 3. OTT users only.

11 HELSI – HEALTHCARE The largest digital healthcare platform in Ukraine 38,000+ Active doctors and specialists 2 2.2 mn Appointments made by patients 2 1,600+ Active healthcare institutions 2 (1.1%) YoY +0.5% YoY +0.9% YoY 28+ mn Registered users 2 +8% YoY 2.5 mn MAU 1 +5.6% YoY 1.8 mn USD 75 mn UAH Total revenue 2 +50.9% YoY +50.0% YoY 1. Refers to users active during Sep 2025; 2. For 3Q25.

5.8 5.8 5.8 6.9 7.1 3Q24 4Q24 1Q25 2Q25 3Q25 12 REVENUE AND EBITDA GROWTH Revenue (UAH, bn) 10.2 10.3 10.6 11.8 12.3 3Q24 4Q24 1Q25 2Q25 3Q25 +20.9% CAPEX 3Q25: UAH 3.7 bn / USD 89 mn (capex intensity: 30.0%) LTM: UAH 13.1 bn / USD 316 mn (capex intensity: 29.1%) 297 USD mn EBITDA (UAH, bn) Equity FCF 1 3Q25: UAH 7.2 bn / USD 174 mn LTM: UAH 15.5 bn / USD 373 mn 284 255 250 248 +21.5% 171 165 140 141 142 1 Equity FCF before accounting for lease and license payments. Notice: See Appendix for additional information on non - IFRS measures and for reconciliations of each to its most directly compar able IFRS measure.
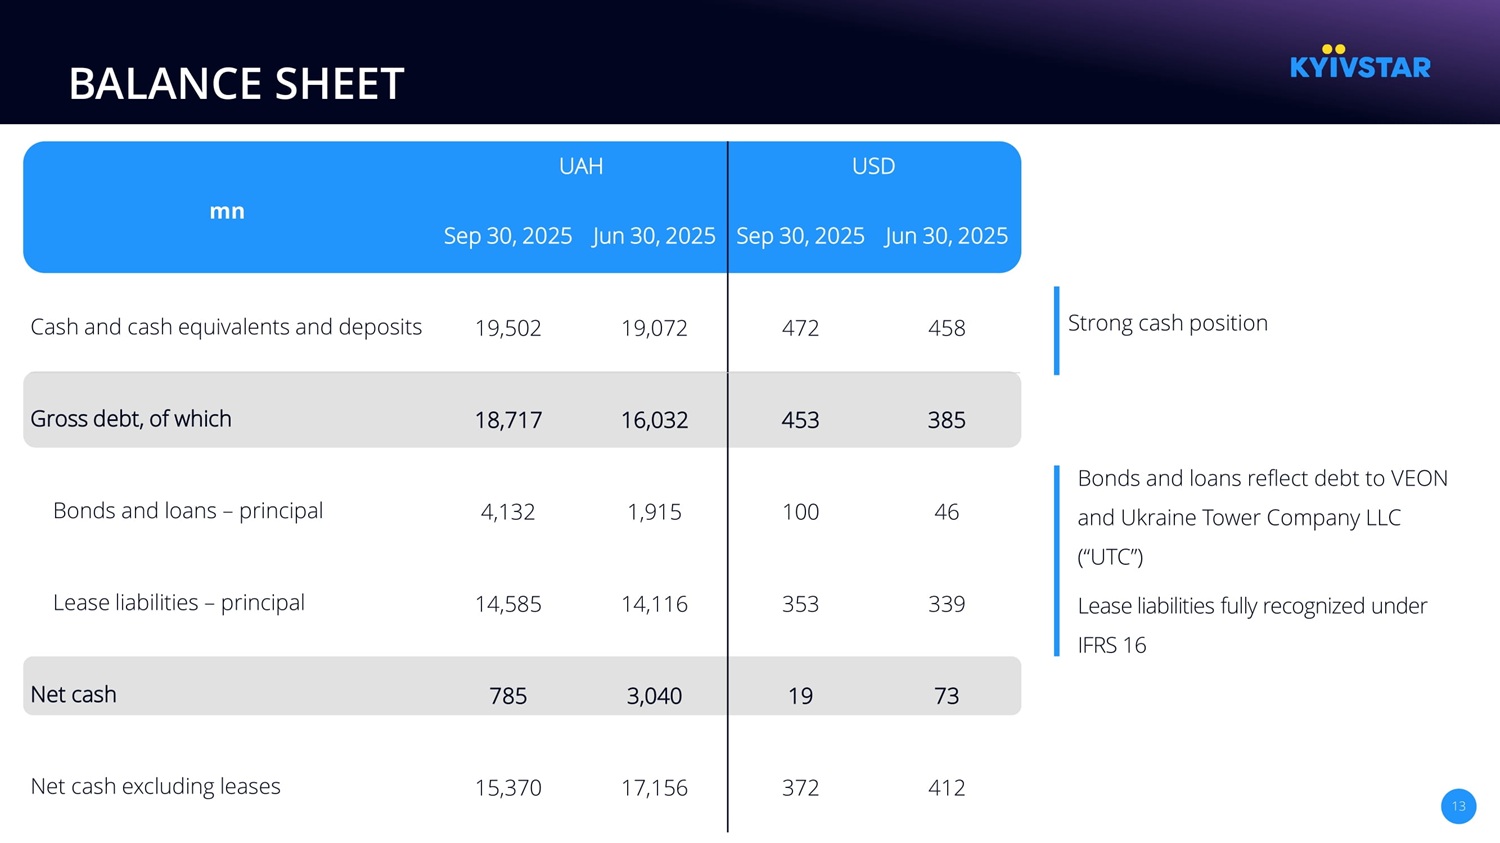
13 BALANCE SHEET Bonds and loans reflect debt to VEON and Ukraine Tower Company LLC (“UTC”) Lease liabilities fully recognized under IFRS 16 USD UAH mn Jun 30, 2025 Sep 30, 2025 Jun 30, 2025 Sep 30, 2025 458 472 19,072 19,502 Cash and cash equivalents and deposits 385 453 16,032 18,717 Gross debt, of which 46 100 1,915 4,132 Bonds and loans – principal 339 353 14,116 14,585 Lease liabilities – principal 73 19 3,040 785 Net cash 412 372 17,156 15,370 Net cash excluding leases Strong cash position Sustain mobile market leadership GROWTH STRATEGY AND PRIORITIES Telecom Business Leverage our loyal customer base to develop and launch new and existing digital products Digital Maintain paying subscriber base and grow share of multiplay users Grow digital offerings organically and through adjacent acquisitions by focusing on increasing multiplay penetration Technology (e.g., Direct to Cell) and value - driven, consistent ARPU growth Target significant organic growth in digital revenues, complemented by acquisitions Fixed broadband market share growth via organic expansion and acquisitions Serve as a key player in restoring and developing Ukraine’s digital ecosystem 14


2025 outlook 9M25 3Q25 Total revenue growth YoY, UAH Total revenue growth YoY, USD 1 EBITDA growth YoY, UAH EBITDA growth YoY, USD 1 Capex intensity OUTLOOK 26 .7% 30.8% 33. 5 % 24% - 27% 23% - 26% 30% - 33% 20% - 23% 19% - 22% 14 1. Assumes no significant fluctuation in exchange rates from current levels. Notice: See Appendix for additional information on non - IFRS measures and for reconciliations of each to its most directly compar able IFRS measure.

30.0 % 20.9 % 21.5 % 16 IN SUMMARY Distinctive Investment Opportunity The only pure play Ukrainian investment opportunity to be publicly listed in the US World Class Team Proven leaders with a track record of resilience through war and robust governance Strong B alance S heet S ignificant financial and strategic flexibility National Champion Leading digital operator, one of the most recognizable national brands Sustained Growth Driven by Multiple Engines Robust margins & cash flows powering reinvestment and performance Kyivstar valuation VALUATION AND OWNERSHIP No te s : 1.
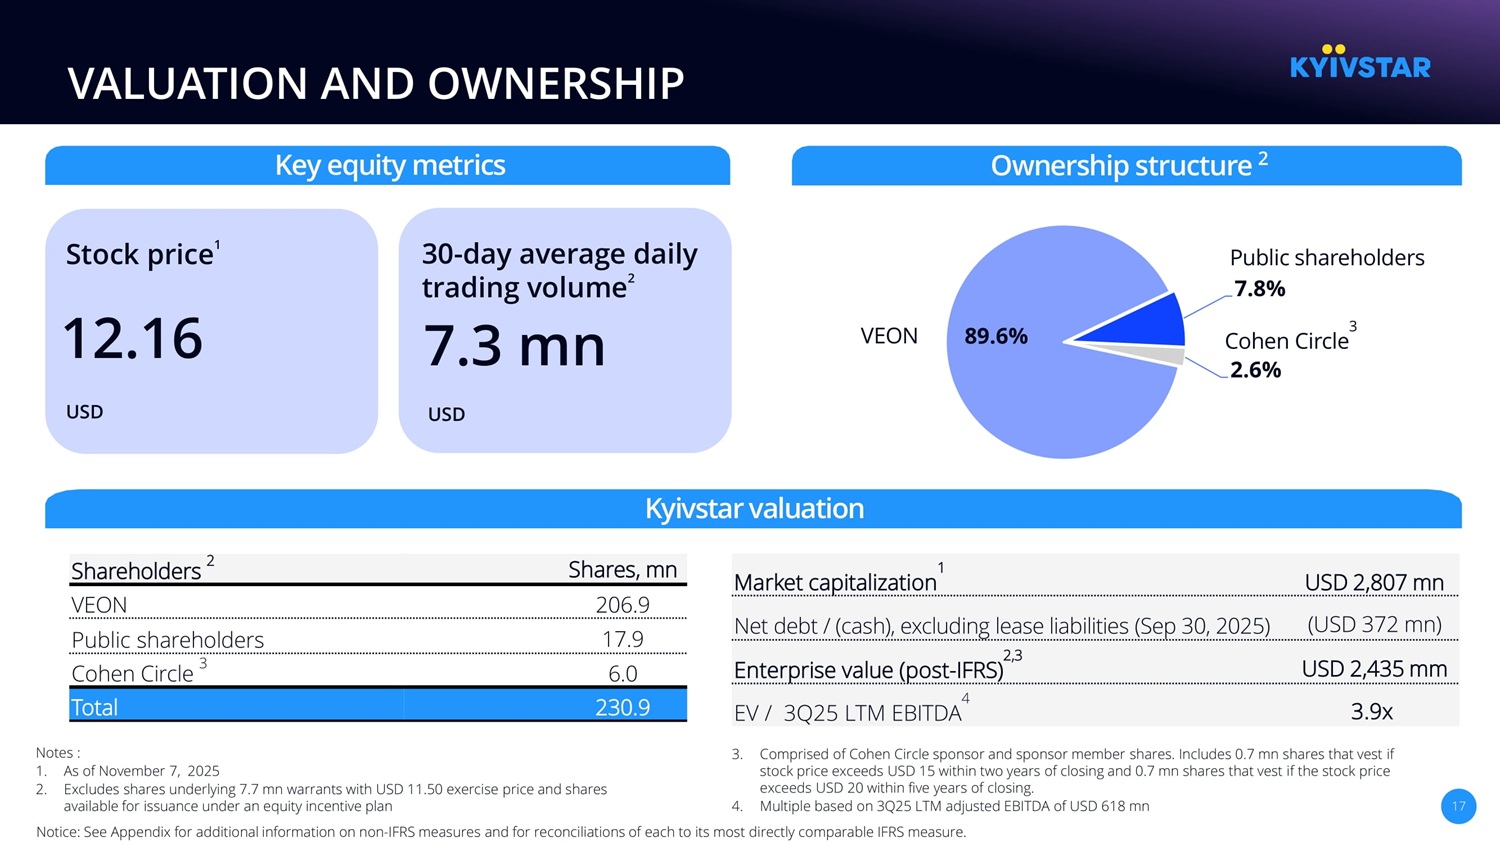
As of November 7, 2025 2. Excludes shares underlying 7.7 mn warrants with USD 11.50 exercise price and shares available for issuance under an equity incentive plan Cohen Circle 3 Public shareholders USD 2,807 mn Market capitalization 1 (USD 372 mn) Net debt / (cash), excluding lease liabilities (Sep 30, 2025) USD 2,435 m m Enterprise value (post - IFRS) 2,3 3.9x EV / 3Q25 LTM EBITDA 4 Key equity metrics Shares , m n Shareholders 2 206.9 VEON 17.9 Public shareholders 6.0 Cohen Circle 3 230. 9 Total Stock price 1 12.16 30 - day average daily trading volume 2 7.3 mn USD 3. Comprised of Cohen Circle sponsor and sponsor member shares. Includes 0.7 mn shares that vest if stock price exceeds USD 15 within two years of closing and 0.7 mn shares that vest if the stock price exceeds USD 20 within five years of closing. 4. Multiple based on 3Q25 LTM adjusted EBITDA of USD 618 mn 17 USD Ownership structure 2 89.6% 7.8% 2.6% VEON Notice: See Appendix for additional information on non - IFRS measures and for reconciliations of each to its most directly compar able IFRS measure.

18 Appendix


RECONCILIATION OF FINANCIAL METRICS (1/3) 19 9M24 9M25 3Q24 3Q25 EBITDA to profit (loss) reconciliation (USD mn) 374 477 142 171 EBITDA (34) (46) (12) (17) Amortization (89) (102) (30) (37) Depreciation 251 329 100 117 EBIT (2) (6) - (3) Impairment reversal (1) (1) (1) - Gain / (loss) on disposal of non - current assets 248 322 99 114 Operating profit 24 (20) 14 (1) Net foreign exchange gain - (8) (1) (6) Other non operating gain / (loss), net 26 13 10 2 Finance income (62) (57) (20) (18) Finance costs - (162) - (162) Listing expense 236 87 102 (71) (Loss) / Profit before tax (46) (53) (20) (18) Income taxes 190 34 82 (89) (Loss) / Profit for the period RECONCILIATION OF FINANCIAL METRICS (2/3) 20 9M24 9M25 3Q24 3Q25 Adjusted profit to (Loss) / Profit for the period reconciliation (USD millions) 190 196 82 73 Adjusted Net profit 0 (162) 0 (162) Listing expense 190 34 82 (89) (Loss) / Profit for the period 0.92 0.93 0.40 0.33 Adjusted Earnings per Share (USD) 1,2 1 . Reflects adjustment for 3 Q 25 which excludes a non - cash charge of $ 162 mn related to the Kyivstar listing . 2 . Weighted average common shares outstanding for Adjusted earnings per share (in millions) : 219 . 3 ( 3 Q 25 ), 206 . 9 ( 3 Q 24 ) and 211 . 1 ( 9 M 25 ), 206 . 9 ( 9 M 24 ) .

3Q24 3Q25 Uklon EBITDA to Profit for the period reconciliation (USD millions) n/a 9.1 EBITDA n/a (2.0) Amortization n/a (0.1) Depreciation n/a 7.0 EBIT n/a 0.5 Net foreign exchange gain n/a 0.2 Finance income n/a - Finance costs n/a 7.7 Profit before tax n/a (1.0) Income taxes n/a 6.7 Profit for the period RECONCILIATION OF FINANCIAL METRICS (3/3) 21 9M24 9M25 3Q24 3Q25 CAPEX reconciliation (USD millions) 99 174 42 74 Property, plant and equipment 86 130 30 37 Intangible assets 0 (1) 0 (1) Additions in licenses (54) (80) (16) (21) Right - of - use assets 131 223 56 89 CAPEX YoY Change 9M24 9M25 YoY Change 3Q24 3Q25 EFCF reconciliation (USD millions) 103 374 477 29 142 171 EBITDA (3) 34 31 4 5 9 Movements in working capital 2 4 6 3 1 4 Movements in provisions (13) (40) (53) 2 (21) (19) Net tax paid (60) (143) (203) (47) (54) (101) Cash capex (excluding license payments) 134 - 134 134 - 134 Proceeds from Share Issuance 163 229 392 125 73 198 Unlevered Free Cash Flow (9) (46) (55) (16) (8) (24) Net interest 154 183 337 109 65 174 Equity Free Cash Flow (6) (21) (27) (2) (7) (9) Lease liabilities payments - principal - - - - - - Licenses payments 148 162 310 107 58 165 Equity Free Cash Flow (after leases and licenses)

DEFINITIONS 4G users are mobile customers who have engaged in revenue - generating activity during the three months prior to the measurement date as a result of activities over fourth - generation (4G or LTE – long term evolution) network technologies. Adjusted Net Profit is profit / (loss) for the period, excluding the impact of the one - time charge of $162 mn recognized in 3Q25 related to the Kyivstar listing. ARPU (average revenue per user) measures the monthly average revenue per mobile user. We generally calculate ARPU by dividing our mobile and digital service revenue during the relevant period (including data revenue, roaming revenue, MFS and interconnect revenue, but excluding revenue from connection fees, sales of handsets and accessories and other non - service revenue, but excluding revenue from fixed IPTV) by the average number of our mobile customers during the period and the number of months in that period. Capital expenditures (capex) are purchases of property and equipment, new construction, upgrades, software, other long - lived assets and related reasonable costs incurred prior to the intended use of the non - current asset, accounted at the earliest event of advance payment or delivery. Purchases of licenses and capitalized leases are not included in capital expenditures. Capex intensity is a ratio, which is calculated as last - twelve - month (LTM) capex divided by LTM total revenue. Direct digital revenues include revenues from Kyivstar Group Ltd.’s proprietary digital platforms and services. Doubleplay 4G customers are mobile customers who engaged in usage of our voice and data services over 4G (LTE) technology at any time during the one month prior to such measurement date. EBITDA is a non - IFRS financial measure and is called Adjusted EBITDA. Adjusted EBITDA is a non - IFRS financial measure. Adjusted EBITDA should not be considered in isolation or as a substitute for analyses of the results as reported under IFRS We calculate Adjusted EBITDA as profit/(loss) for the period, before income taxes, depreciation, amortization, loss from disposal of non - current assets and impairment loss, financial expenses and costs, net foreign exchange gain/(loss), share of profit/(loss) of associates and joint ventures, and listing expense, which is also excluded from the calculation. EBITDA margin is calculated as EBITDA (as defined above) divided by total revenue, expressed as a percentage. Equity free cash flow is a non - IFRS measure and is defined as free cash flow from operating activities and proceeds from sale of business, less cash flow used in investing activities, excluding license payments, lease payments, cash outflows for business acquisitions, inflow/outflow of deposits, and financial assets, cash inflow from sale of business and proceeds from share issuance. Gross debt is calculated as the sum of long - term notional debt and short - term notional debt, including capitalized leases. Mobile customers (also - mobile subscribers) are generally customers in the registered customer base at a given measurement date who engaged in a mobile revenue generating activity at any time during the three months prior to such measurement date. Such activity includes any outgoing calls, customer fee accruals, debits related to service, outgoing SMS and MMS, data transmission and receipt sessions, but does not include incoming calls, SMS and MMS or abandoned calls. Our total number of mobile customers also includes customers using mobile internet service via USB modems and fixed - mobile convergence (“FMC”). Multiplay customers are Doubleplay 4G customers who also engaged in usage of one or more of our digital products at any time during the one month prior to such measurement date. Effective 1Q25, 4G usage below the 100Mb threshold is included in Multiplay and Double Play 4G user count (excluded prior to 1Q25). Net debt / (cash) is a non - IFRS financial measure and is calculated as the sum of interest - bearing long - term debt, including capitalized leases (unless specifically excluded) and short - term notional debt minus cash and cash equivalents and deposits, long - term and short - term deposits. We believe that net debt / (cash) provides useful information to investors because it shows the amount of notional debt that would be outstanding if available cash and cash equivalents and deposits and long - term and short - term deposits were applied to repay such indebtedness. Net debt should not be considered in isolation as an alternative to long - term debt and short - term debt, or any other measure of our financial position. Revenues from telecommunications services (“Telecom revenues”) are revenues generated by Kyivstar Group Ltd from providing telecommunication services. Telecommunication services refer to data, voice, connectivity, television, and similar services, regardless of medium of transmission, including transmission by satellite. Total digital monthly active users (“MAU”) is a gross total cumulative MAU of all digital platforms, services and applications offered by an entity or by the Group and includes MAU who are active in more than one application. 22 23 3Q25 Results Presentation ir@kyivstargroup.com