UNITED STATES
SECURITIES AND EXCHANGE COMMISSION
Washington, D.C. 20549
FORM 6-K
Report of Foreign Private Issuer Pursuant to Rule 13a-16 or
15d-16 of the Securities Exchange Act of 1934
For the month of November 2025
Commission File Number: 001-42757
BRBI BR Partners S.A.
(Exact Name as Specified in its Charter)
N/A
(Translation of registrant’s name into English)
3,732, Floor 28, CEP 04538-132
Avenida Brigadeiro Faria Lima
São Paulo, SP, Brazil
(Address of principal executive offices)
(Indicate by check mark whether the registrant files or will file annual reports under cover of Form 20-F or Form 40-F.)
Form 20-F: ☒ Form 40-F: ☐
EXHIBIT INDEX
| Exhibit Number |
Description of Document | |
| 99.1 | Earnings Release 9M25 |
SIGNATURES
Pursuant to the requirements of the Securities Exchange Act of 1934, the registrant has duly caused this report to be signed on its behalf by the undersigned, thereunto duly authorized.
Date: November 6, 2025
| BRBI BR Partners S.A. | ||
| By: | /s/ Vinicius Carmona Cardoso | |
| Name: | Vinicius Carmona Cardoso | |
| Title: | Investor Relations Officer | |
Exhibit 99.1

1 Copyright © 2025 BR Partners. All rights reserved . ri @brap.com.br Address Av. Brig. Faria Lima, 3.732 – 28º andar Fone + 55 11 3704 - 1000 Website ri.brpartners.com.br E - mail ri@brpartners.com.br brpartnersoficial g ÒŦô ÒŞ \ę Ŧ Űúô 9M25 BR PARTNERS EARNINGS RELEASE
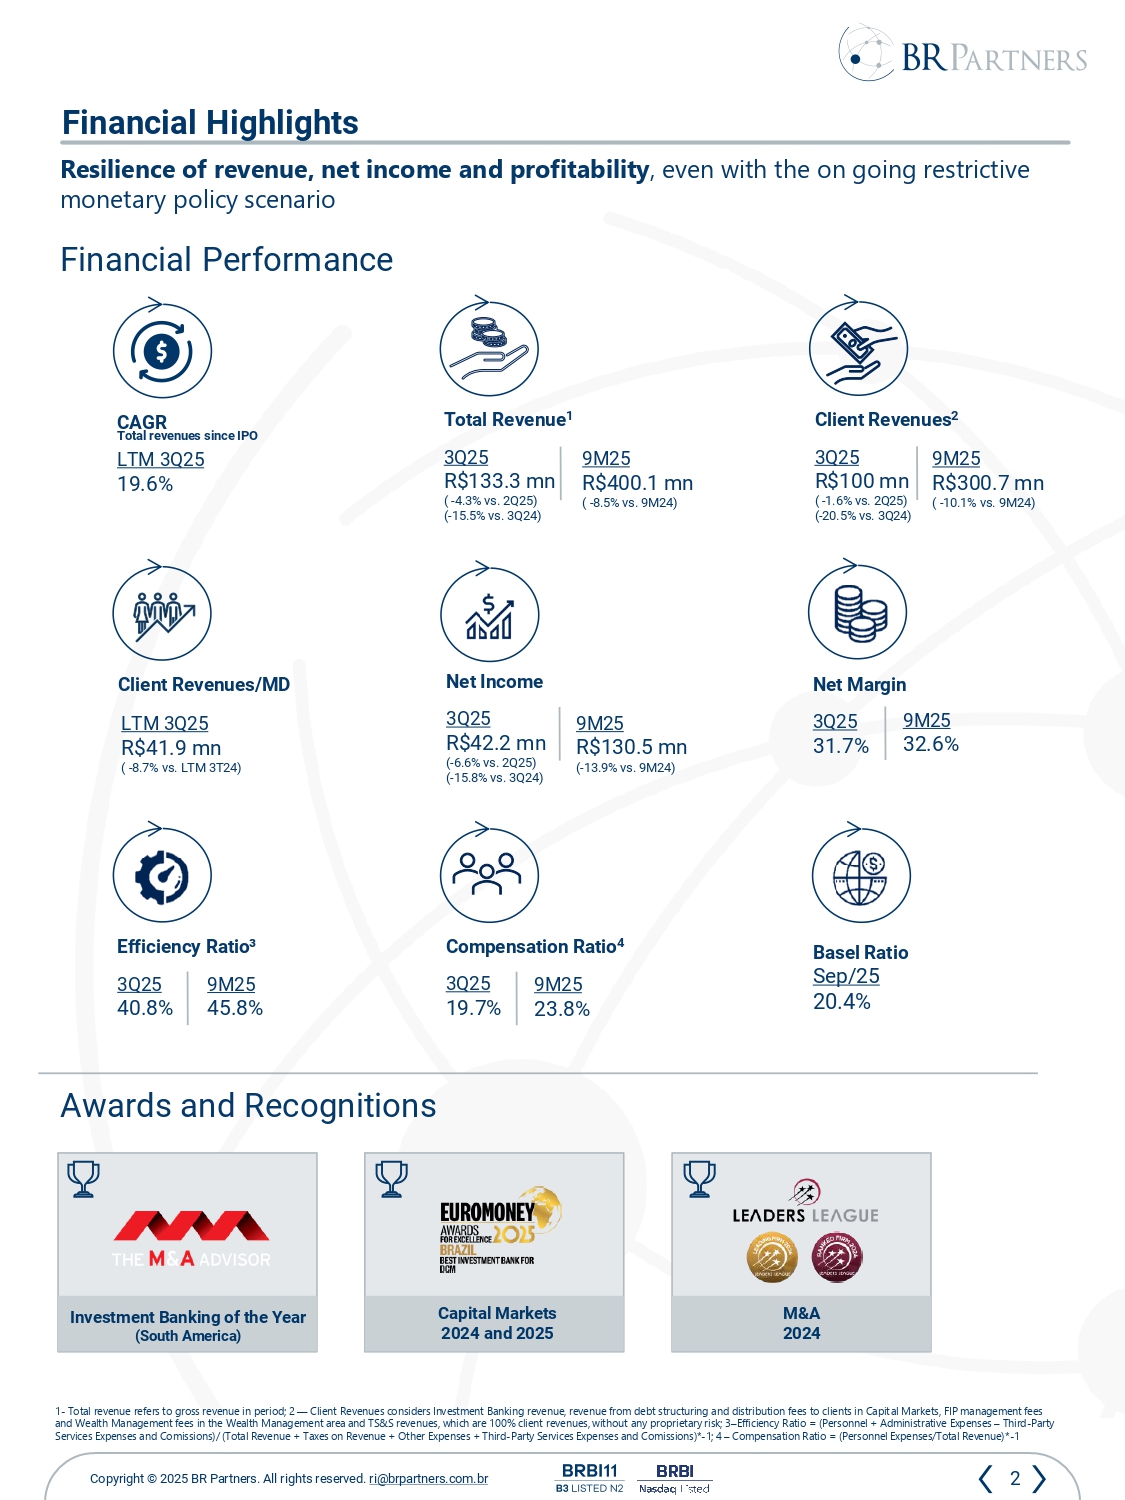
2 Copyright © 2025 BR Partners. All rights reserved . ri @brpartners.com.br Awards and Recognitions Financial Highlights Financial Performance 1 - Total revenue refers to gross revenue in period; 2 –– Client Revenues considers Investment Banking revenue, revenue from debt structuring and distribution fees to clients in Capit al Markets, FIP management fees and Wealth Management fees in the Wealth Management area and TS&S revenues, which are 100% client revenues, without any propr iet ary risk; 3 – Efficiency Ratio = ( Personnel + Administrative Expenses – Third - Party Services Expenses and Comissions )/ (Total Revenue + Taxes on Revenue + Other Expenses + Third - Party Services Expenses and Comissions )* - 1 ; 4 – Compensation Ratio = (Personnel Expenses/Total Revenue)* - 1 Resilience of revenue , net income and profitability , even with the on going restrictive monetary policy scenario Investment Banking of the Year (South America ) Capital Markets 2024 and 2025 M&A 2024 Efficiency Ratio³ 3Q25 40.8% 9M25 45.8% Total Revenue 1 3Q25 R$133.3 mn ( - 4.3% vs. 2Q25) ( - 15.5% vs. 3Q24) 9M25 R$400.1 mn ( - 8.5% vs. 9M24) Net Income 3Q25 R$42.2 mn ( - 6.6% vs. 2Q25) ( - 15.8% vs. 3Q24) 9M25 R$130.5 mn ( - 13.9% vs. 9M24) Client Revenues 2 3Q25 R$100 mn ( - 1.6% vs. 2Q25) ( - 20.5% vs. 3Q24) 9M25 R$300.7 mn ( - 10.1% vs. 9M24) Client Revenues/MD LTM 3Q25 R$41.9 mn ( - 8.7% vs. LTM 3T24) Net Margin 3Q25 31.7% 9M25 32.6% Basel Ratio Sep/25 20.4% Compensation Ratio 4 3Q25 19.7% 9M25 23.8% CAGR Total revenues since IPO LTM 3Q25 19.6%
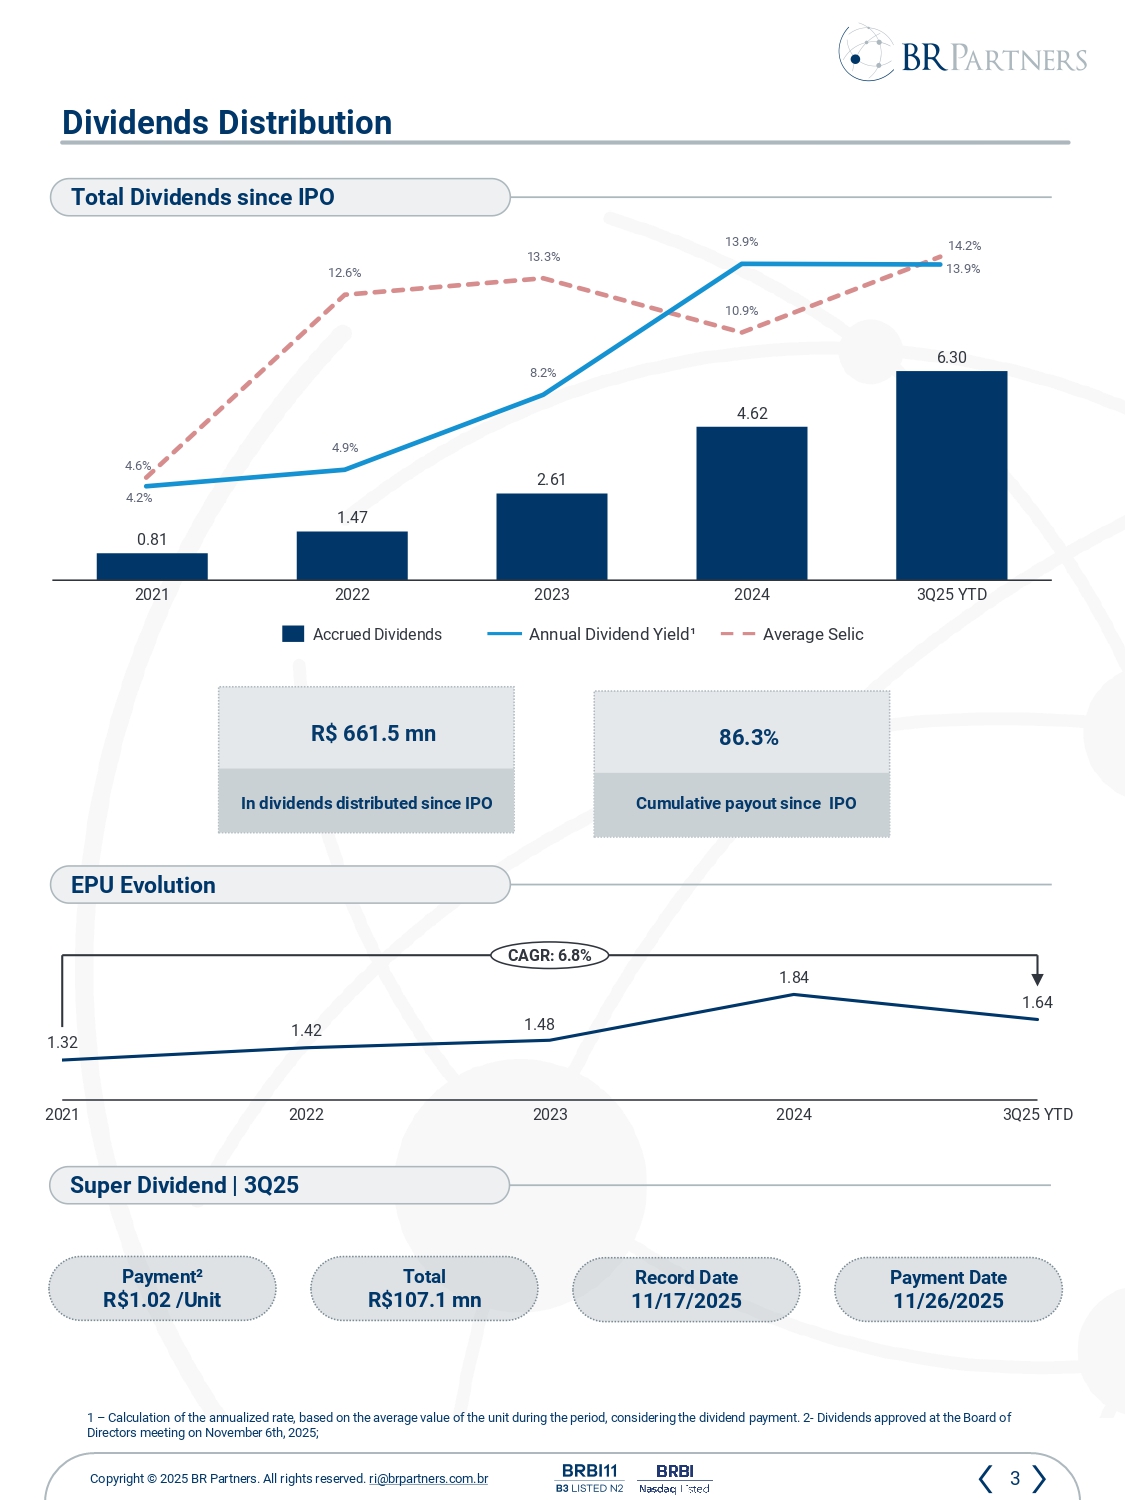
3 Copyright © 2025 BR Partners. All rights reserved . ri @brpartners.com.br Dividends Distribution 1 – Calculation of the annualized rate, based on the average value of the unit during the period , considering the dividend payment . 2 - Dividends approved at the Board of Directors meeting on November 6th, 2025; 2021 2022 2023 2024 3Q25 YTD 0.81 1.47 2.61 4.62 6.30 Annual Dividend Yield¹ Accrued Dividends In dividends distributed since IPO R$ 661.5 mn Cumulative payout since IPO 86.3% EPU Evolution 1.32 2021 1.42 2022 1.48 2023 1.84 2024 1.64 3Q25 YTD CAGR: 6.8% Super Dividend | 3Q25 Payment² R$1.02 /Unit Record Date 11/17/2025 Payment Date 11/26/2025 Total R$107.1 mn Average Selic Total Dividends since IPO 4.6% 12.6% 13.3% 10.9% 14.2% 4.2% 4.9% 8.2% 13.9% 13.9%
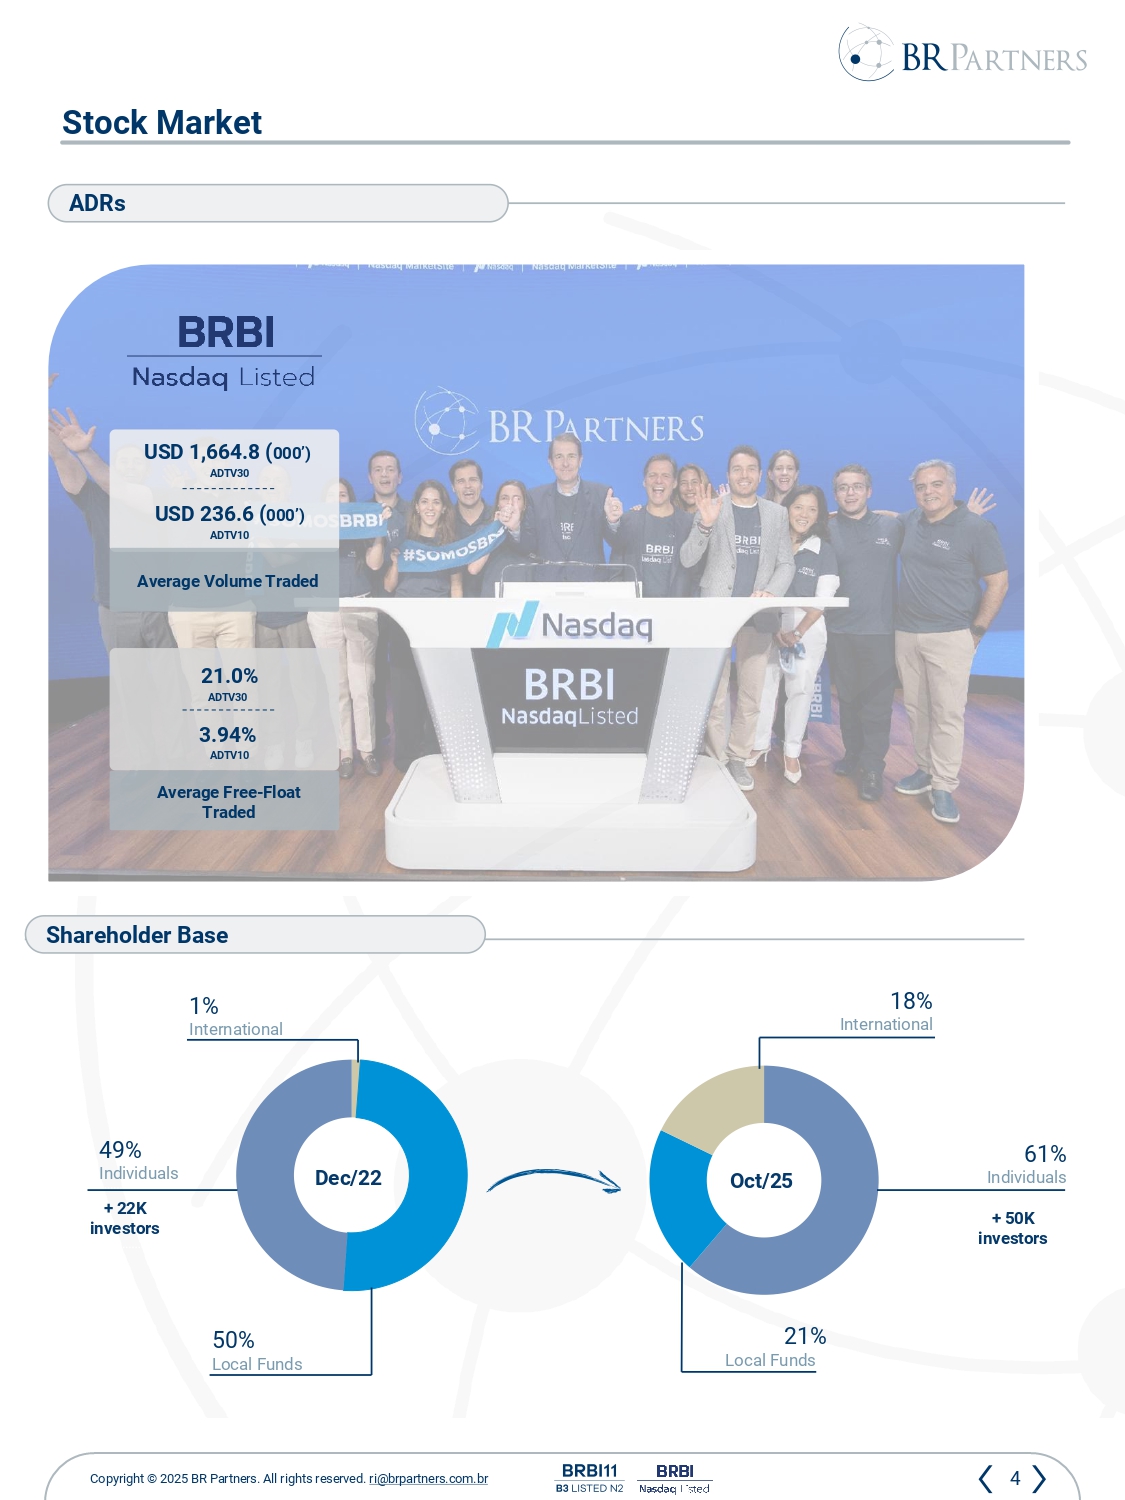
4 Copyright © 2025 BR Partners. All rights reserved . ri @brpartners.com.br Stock Market Dec /22 Oct /25 + 50K investors 21% Local Funds 18% International 61% Individuals 50% Local Funds 49% Individuals 1% International ADRs Shareholder Base USD 1,664.8 ( 000’) ADTV30 USD 236.6 ( 000’) ADTV10 Average Volume Traded 21.0% ADTV30 3.94% ADTV10 Average Free - Float Traded + 22K investors
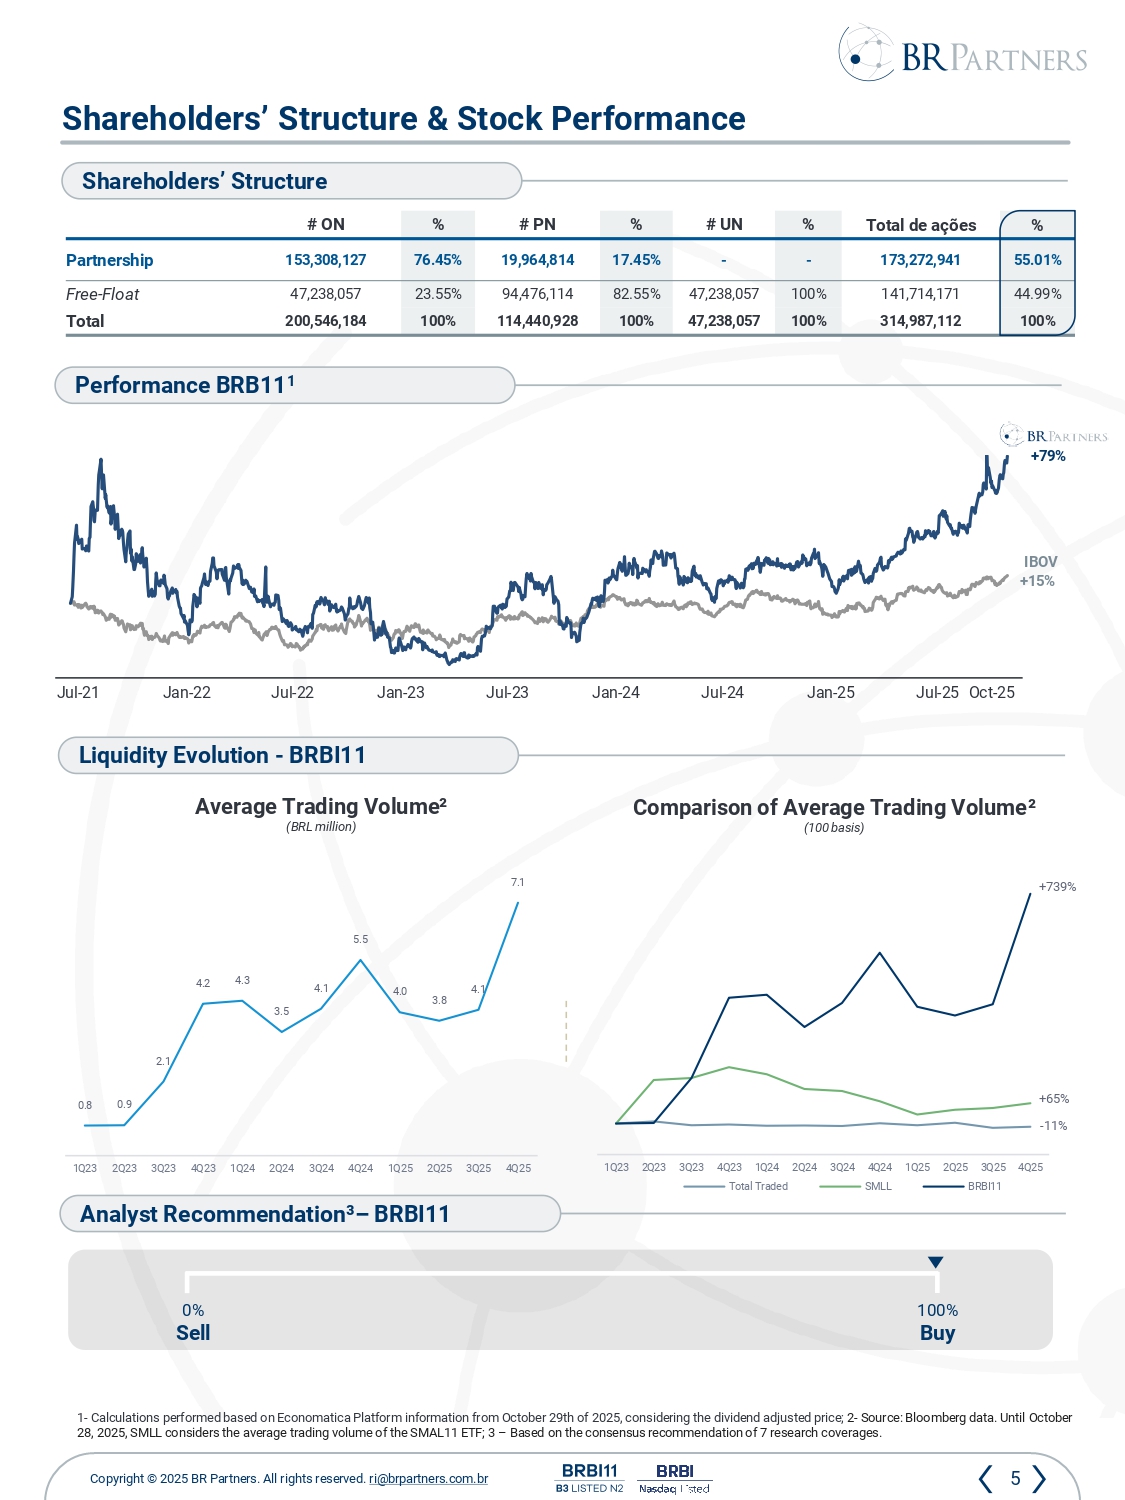
5 Copyright © 2025 BR Partners. All rights reserved . ri @brpartners.com.br % Total de ações % # UN % # PN % # ON 55.01% 173,272,941 - - 17.45% 19,964,814 76.45% 153,308,127 Partnership 44.99% 141,714,171 100% 47,238,057 82.55% 94,476,114 23.55% 47,238,057 Free - Float 100% 314,987,112 100% 47,238,057 100% 114,440,928 100% 200,546,184 Total Shareholders’ Structure & Stock Performance Shareholders ’ Structure Analyst Recommendation³ – BRBI11 100% Buy 0% Sell 1 - Calculations performed based on Economatica Platform information from October 29th of 2025, considering the dividend adjusted price ; 2 - Source: Bloomberg data. Until October 28, 2025, SMLL considers the average trading volume of the SMAL11 ETF; 3 – Based on the consensus recommendation of 7 research c overages. Performance BRB11 1 Liquidity Evolution - BRBI11 Average Trading Volume² (BRL million ) Comparison of Average Trading Volume ² (100 basis ) IBOV +15% Jul - 21 Jan - 22 Jul - 22 Jan - 23 Jul - 23 Jan - 24 Jul - 24 Jan - 25 Jul - 25 Oct - 25 +79% 0.8 0.9 2.1 4.2 4.3 3.5 4.1 5.5 4.0 3.8 4.1 7.1 1Q23 2Q23 3Q23 4Q23 1Q24 2Q24 3Q24 4Q24 1Q25 2Q25 3Q25 4Q25 89 165 839 1Q23 2Q23 3Q23 4Q23 1Q24 2Q24 3Q24 4Q24 1Q25 2Q25 3Q25 4Q25 Total Traded SMLL BRBI11
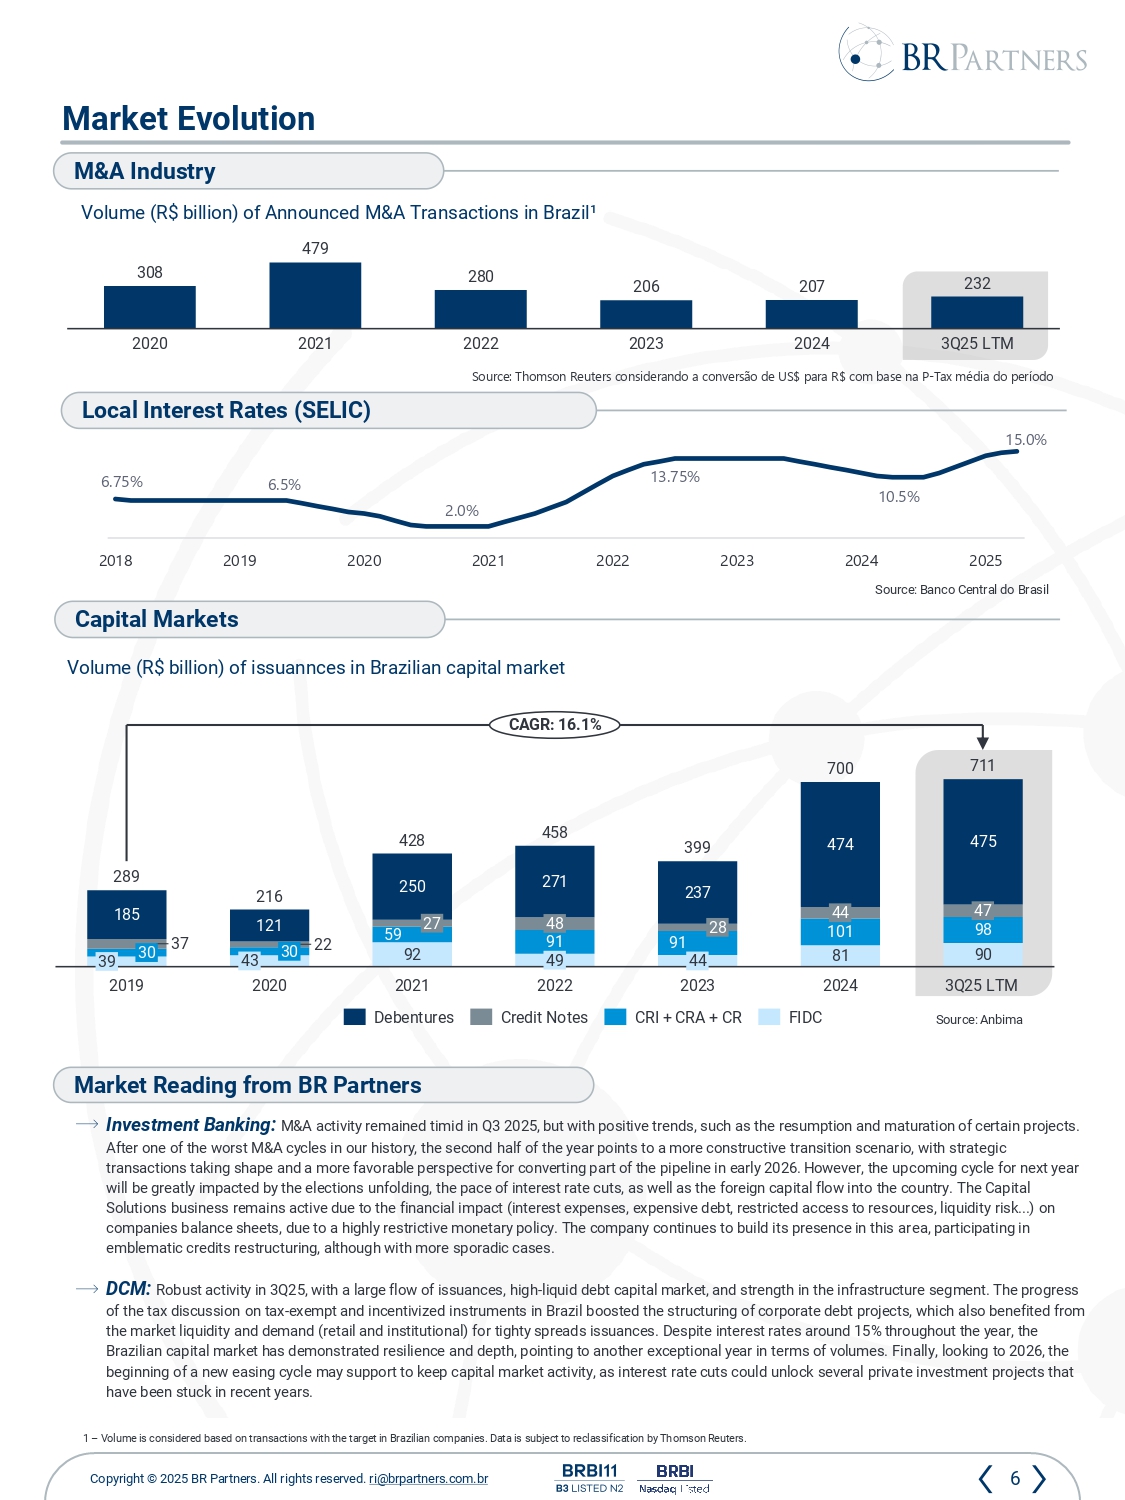
6 Copyright © 2025 BR Partners. All rights reserved . ri @brpartners.com.br Investment Banking: M&A activity remained timid in Q3 2025, but with positive trends, such as the resumption and maturation of certain projects. After one of the worst M&A cycles in our history, the second half of the year points to a more constructive transition scenar io, with strategic transactions taking shape and a more favorable perspective for converting part of the pipeline in early 2026. However, the up com ing cycle for next year will be greatly impacted by the elections unfolding, the pace of interest rate cuts, as well as the foreign capital flow into th e country. The Capital Solutions business remains active due to the financial impact (interest expenses, expensive debt, restricted access to resour ces , liquidity risk...) on companies balance sheets, due to a highly restrictive monetary policy. The company continues to build its presence in this ar ea, participating in emblematic credits restructuring, although with more sporadic cases. DCM: Robust activity in 3Q25, with a large flow of issuances, high - liquid debt capital market, and strength in the infrastructure seg ment. The progress of the tax discussion on tax - exempt and incentivized instruments in Brazil boosted the structuring of corporate debt projects, w hich also benefited from the market liquidity and demand (retail and institutional) for tighty spreads issuances. Despite interest rates around 15% throughout the year, the Brazilian capital market has demonstrated resilience and depth, pointing to another exceptional year in terms of volumes. Fin all y, looking to 2026, the beginning of a new easing cycle may support to keep capital market activity, as interest rate cuts could unlock several priva te investment projects that have been stuck in recent years. Market Reading from BR Partners Market Evolution Volume (R$ billion ) of Announced M&A Transactions in Brazil¹ Source : Thomson Reuters considerando a conversão de US$ para R$ com base na P - Tax média do período Source : Anbima Volume (R$ billion ) of issuannces in Brazilian capital market M&A Industry Capital Markets Local Interest Rates (SELIC) Source : Banco Central do Brasil 92 81 90 59 91 91 101 98 37 22 185 121 250 271 237 474 475 30 39 2019 30 43 2020 27 2021 48 49 2022 28 44 2023 44 2024 47 3Q25 LTM 289 216 428 458 399 700 711 CAGR: 16.1% Debentures Credit Notes CRI + CRA + CR FIDC 6.75% 6.5% 2.0% 13.75% 10.5% 15.0% 2018 2019 2020 2021 2022 2023 2024 2025 1 – Volume is considered based on transactions with the target in Brazilian companies. Data is subject to reclassification by Th omson Reuters . 308 479 280 206 207 232 2020 2021 2022 2023 2024 3Q25 LTM
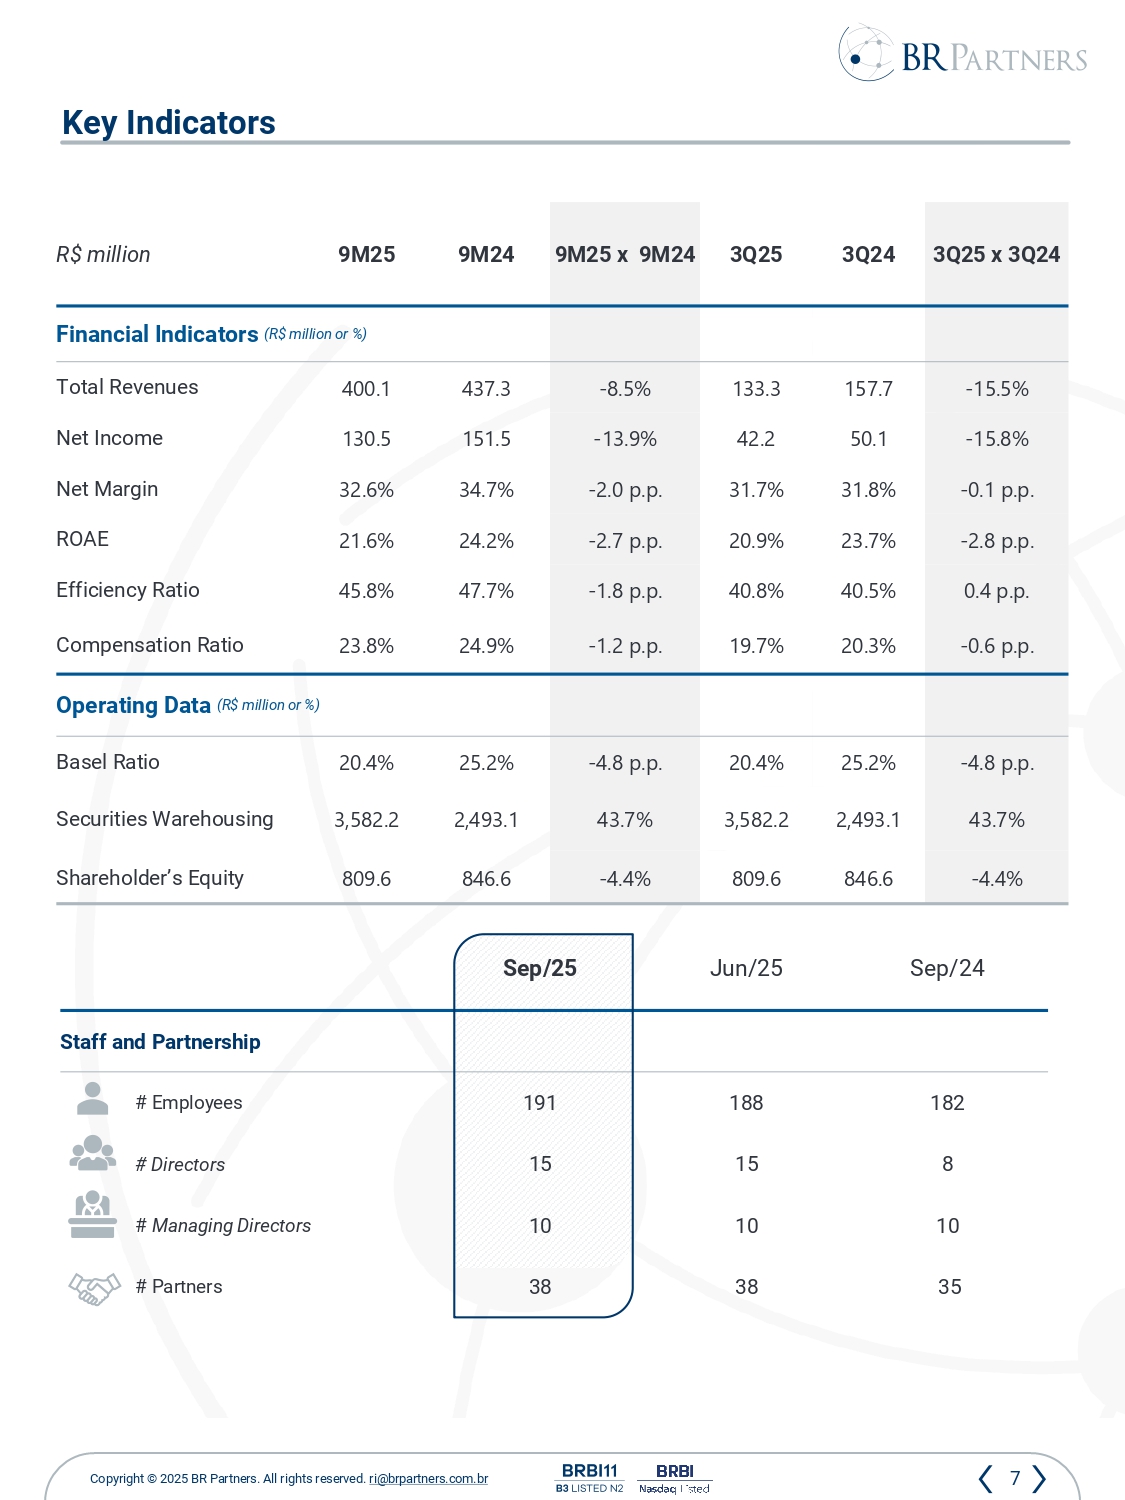
7 Copyright © 2025 BR Partners. All rights reserved . ri @brpartners.com.br Sep /24 Jun /25 Sep /25 Staff and Partnership 182 188 191 # Employees 8 15 15 # Directors 10 10 10 # Managing Directors 35 38 38 # Partners Key Indicators 3Q25 x 3Q24 3Q24 3Q25 9M25 x 9M24 9M24 9M25 R$ million Financial Indicators (R$ million or %) - 15.5% 157.7 133.3 - 8.5% 437.3 400.1 Total Revenues - 15.8% 50.1 42.2 - 13.9% 151.5 130.5 Net Income - 0.1 p.p . 31.8% 31.7% - 2.0 p.p . 34.7% 32.6% Net Margin - 2.8 p.p . 23.7% 20.9% - 2.7 p.p . 24.2% 21.6% ROAE 0.4 p.p . 40.5% 40.8% - 1.8 p.p . 47.7% 45.8% Efficiency Ratio - 0.6 p.p. 20.3% 19.7% - 1.2 p.p. 24.9% 23.8% Compensation Ratio Operating Data (R$ million or %) - 4.8 p.p. 25.2% 20.4% - 4.8 p.p . 25.2% 20.4% Basel Ratio 43.7% 2,493.1 3,582.2 43.7% 2,493.1 3,582.2 Securities Warehousing - 4.4% 846.6 809.6 - 4.4% 846.6 809.6 Shareholder’s Equity
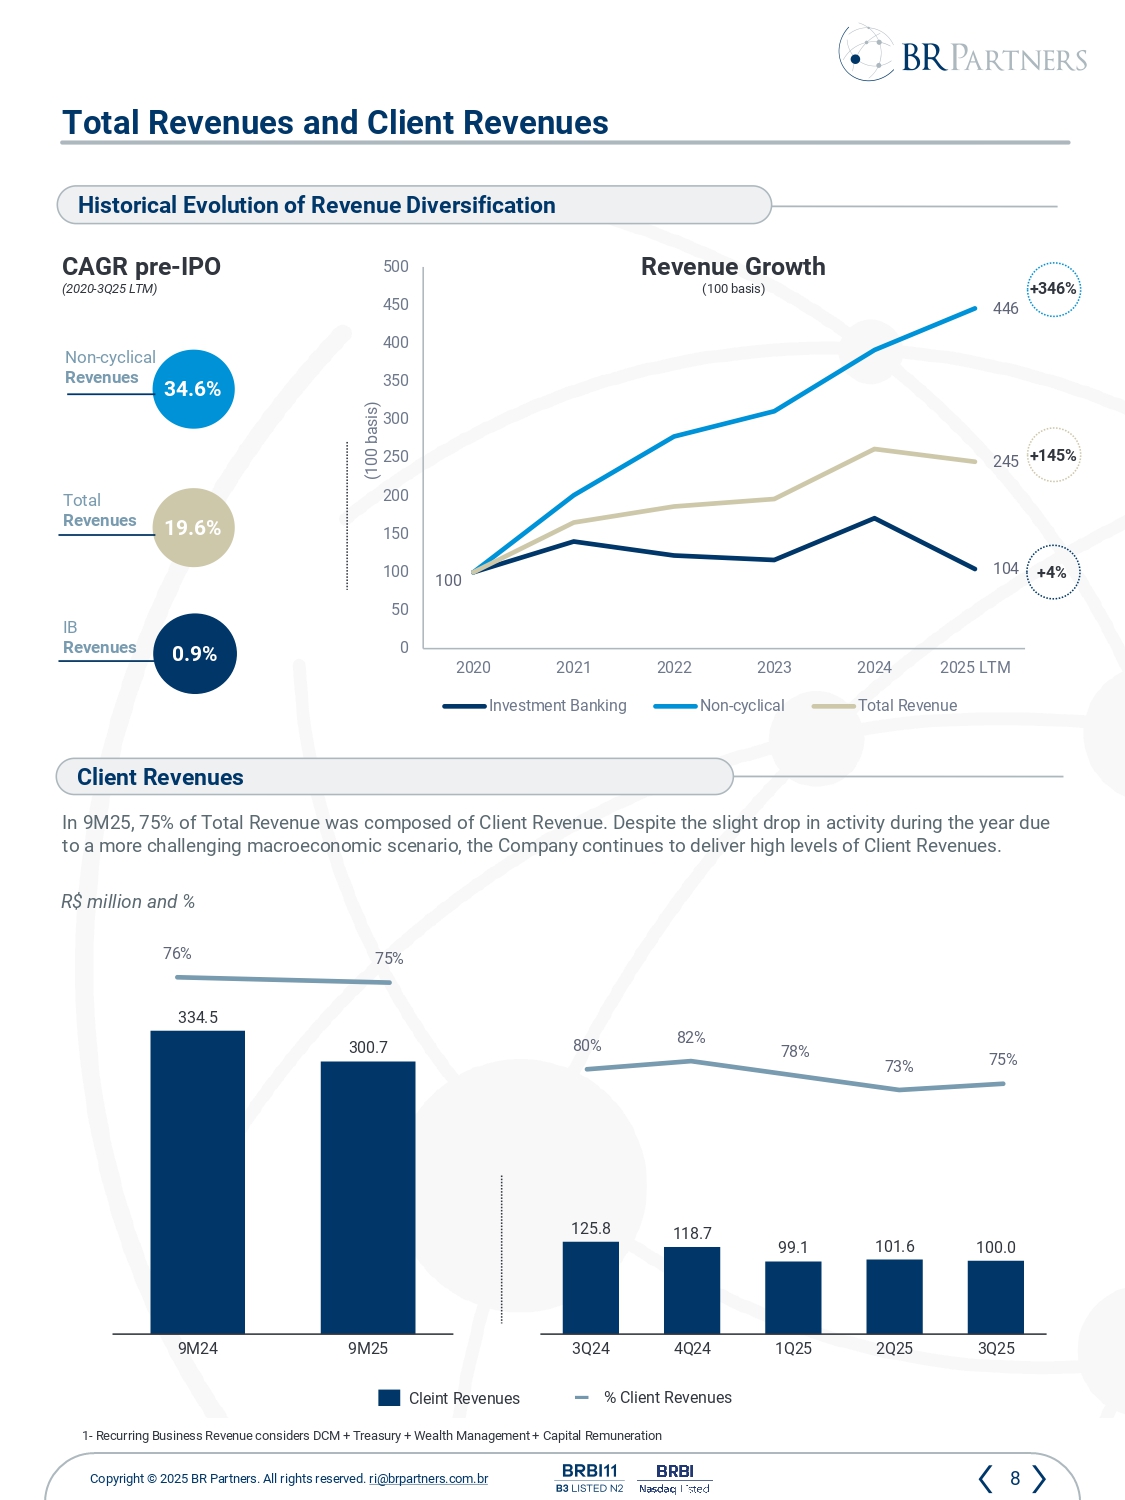
8 Copyright © 2025 BR Partners. All rights reserved . ri @brpartners.com.br 104 446 100 245 0 50 100 150 200 250 300 350 400 450 500 2020 2021 2022 2023 2024 2025 LTM Investment Banking Non-cyclical Total Revenue In 9 M 25 , 75 % of Total Revenue was composed of Client Revenue . Despite the slight drop in activity during the year due to a more challenging macroeconomic scenario, the Company continues to deliver high levels of Client Revenues . Total Revenues and Client Revenues % Client Revenues Client Revenues R $ million and % Cleint Revenues 3Q24 4Q24 1Q25 2Q25 3Q25 125.8 118.7 99.1 101.6 100.0 9M24 9M25 334.5 300.7 76% 75% 80% 82% 78% 73% 75% 1 - Recurring Business Revenue considers DCM + Treasury + Wealth Management + Capital Remuneration Historical Evolution of Revenue Diversification 34.6% 19.6% 0.9% Non - cyclical Revenues Total Revenues IB Revenues CAGR pre - IPO ( 2020 - 3 Q 25 LTM) Revenue Growth (100 basis ) +346% +145% +4% (100 basis )
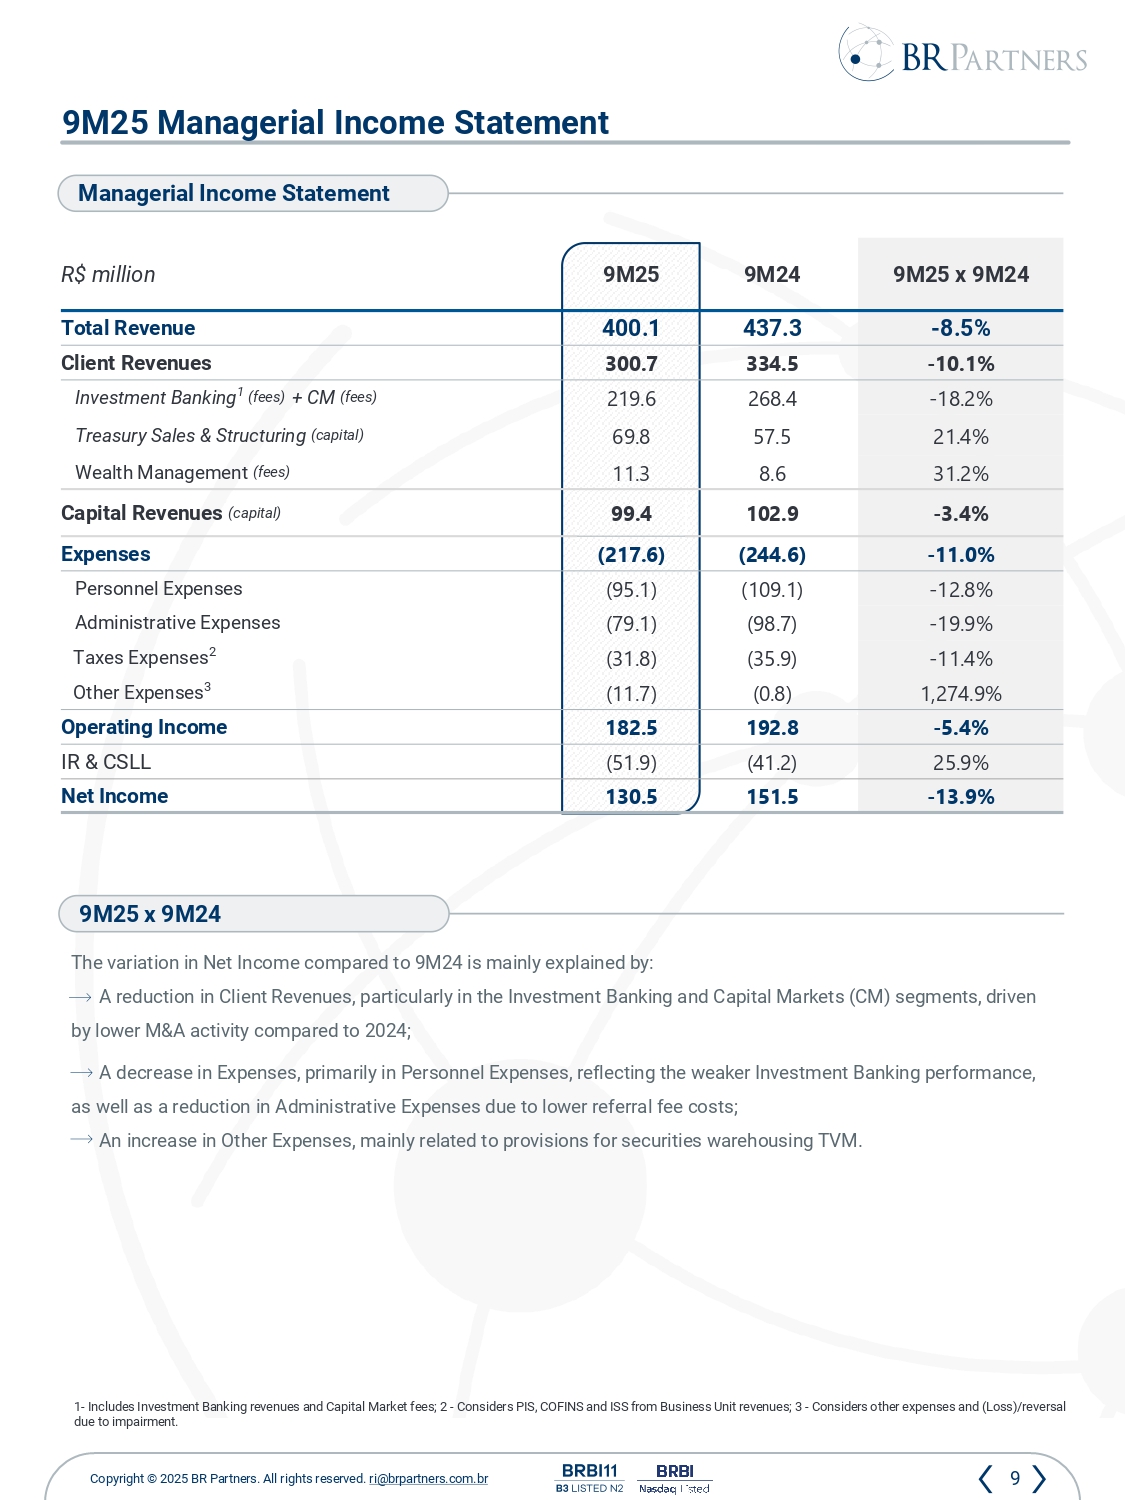
9 Copyright © 2025 BR Partners. All rights reserved . ri @brpartners.com.br 9M25 x 9M24 9M24 9M25 R$ million - 8.5% 437.3 400.1 Total Revenue - 10.1% 334.5 300.7 Client Revenues - 18.2% 268.4 219.6 Investment Banking 1 (fees) + CM (fees) 21.4% 57.5 69.8 Treasury Sales & Structuring (capital) 31.2% 8.6 11.3 Wealth Management (fees) - 3.4% 102.9 99.4 Capital Revenues (capital) - 11.0% (244.6) (217.6) Expenses - 12.8% (109.1) (95.1) Personnel Expenses - 19.9% (98.7) (79.1) Administrative Expenses - 11.4% (35.9) (31.8) Taxes Expenses 2 1,274.9% (0.8) (11.7) Other Expenses 3 - 5.4% 192.8 182.5 Operating Income 25.9% (41.2) (51.9) IR & CSLL - 13.9% 151.5 130.5 Net Income The variation in Net Income compared to 9M24 is mainly explained by: A reduction in Client Revenues, particularly in the Investment Banking and Capital Markets (CM) segments, driven by lower M&A activity compared to 2024; A decrease in Expenses, primarily in Personnel Expenses, reflecting the weaker Investment Banking performance, as well as a reduction in Administrative Expenses due to lower referral fee costs; An increase in Other Expenses, mainly related to provisions for securities warehousing TVM. 9M25 x 9M24 9M25 Managerial Income Statement Managerial Income Statement 1 - Includes Investment Banking revenues and Capital Market fees; 2 - Considers PIS, COFINS and ISS from Business Unit revenues; 3 - Considers other expenses and (Loss)/reversal due to impairment.
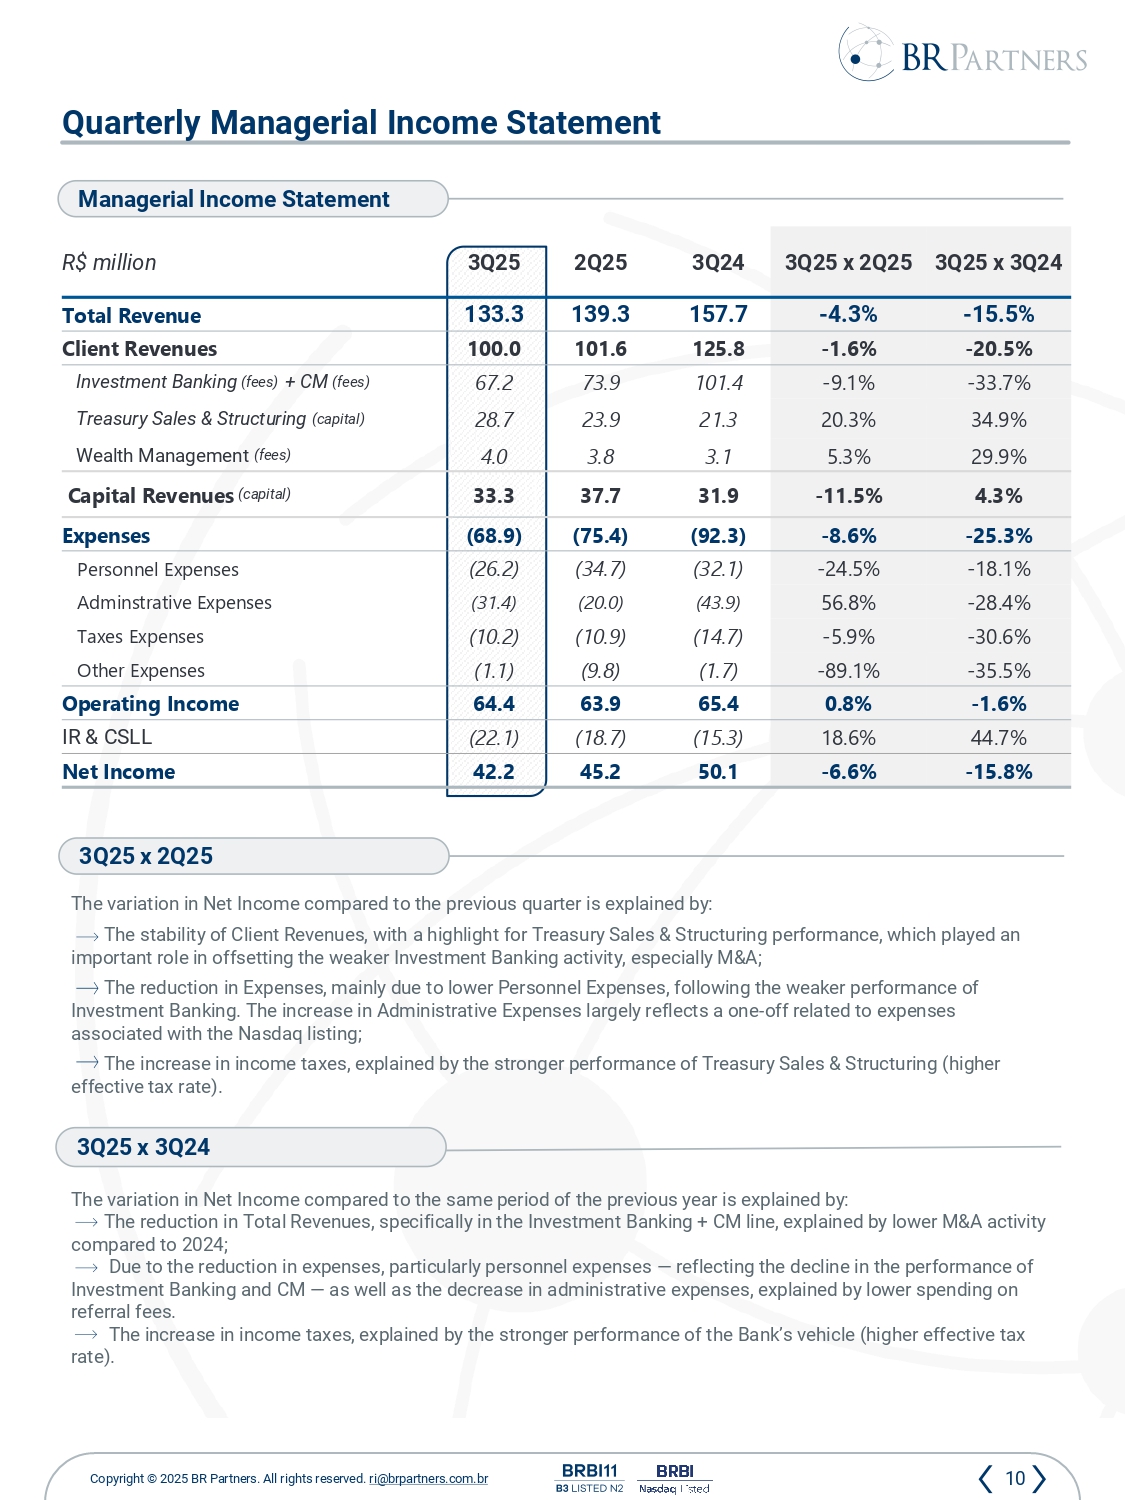
10 Copyright © 2025 BR Partners. All rights reserved . ri @brpartners.com.br Quarterly Managerial Income Statement Managerial Income Statement The variation in Net Income compared to the previous quarter is explained by: The stability of Client Revenues, with a highlight for Treasury Sales & Structuring performance, which played an important role in offsetting the weaker Investment Banking activity, especially M&A; The reduction in Expenses, mainly due to lower Personnel Expenses, following the weaker performance of Investment Banking. The increase in Administrative Expenses largely reflects a one - off related to the full (100%) expenses associated with the Nasdaq listing; The increase in income taxes, explained by the stronger performance of Treasury Sales & Structuring (higher effective tax rate). 3Q25 x 2Q25 3Q25 x 3Q24 3Q25 x 2Q25 3Q24 2Q25 3Q25 R$ million - 15.5% - 4.3% 157.7 139.3 133.3 Total Revenue - 20.5% - 1.6% 125.8 101.6 100.0 Client Revenues - 33.7% - 9.1% 101.4 73.9 67.2 Investment Banking (fees) + CM (fees) 34.9% 20.3% 21.3 23.9 28.7 Treasury Sales & Structuring (capital) 29.9% 5.3% 3.1 3.8 4.0 Wealth Management (fees) 4.3% - 11.5% 31.9 37.7 33.3 Capital Revenues (capital) - 25.3% - 8.6% (92.3) (75.4) (68.9) Expenses - 18.1% - 24.5% (32.1) (34.7) (26.2) Personnel Expenses - 28.4% 56.8% (43.9) (20.0) (31.4) Adminstrative Expenses - 30.6% - 5.9% (14.7) (10.9) (10.2) Taxes Expenses - 35.5% - 89.1% (1.7) (9.8) (1.1) Other Expenses - 1.6% 0.8% 65.4 63.9 64.4 Operating Income 44.7% 18.6% (15.3) (18.7) (22.1) IR & CSLL - 15.8% - 6.6% 50.1 45.2 42.2 Net Income 3Q25 x 3Q24 The variation in Net Income compared to the same period of the previous year is explained by: The reduction in Total Revenues, specifically in the Investment Banking + CM line, explained by lower M&A activity compared to 2024; Due to the reduction in expenses, particularly personnel expenses — reflecting the decline in the performance of Investment Banking and CM — as well as the decrease in administrative expenses, explained by lower spending on referral fees. The increase in income taxes, explained by the stronger performance of the Bank’s vehicle (higher effective tax rate).
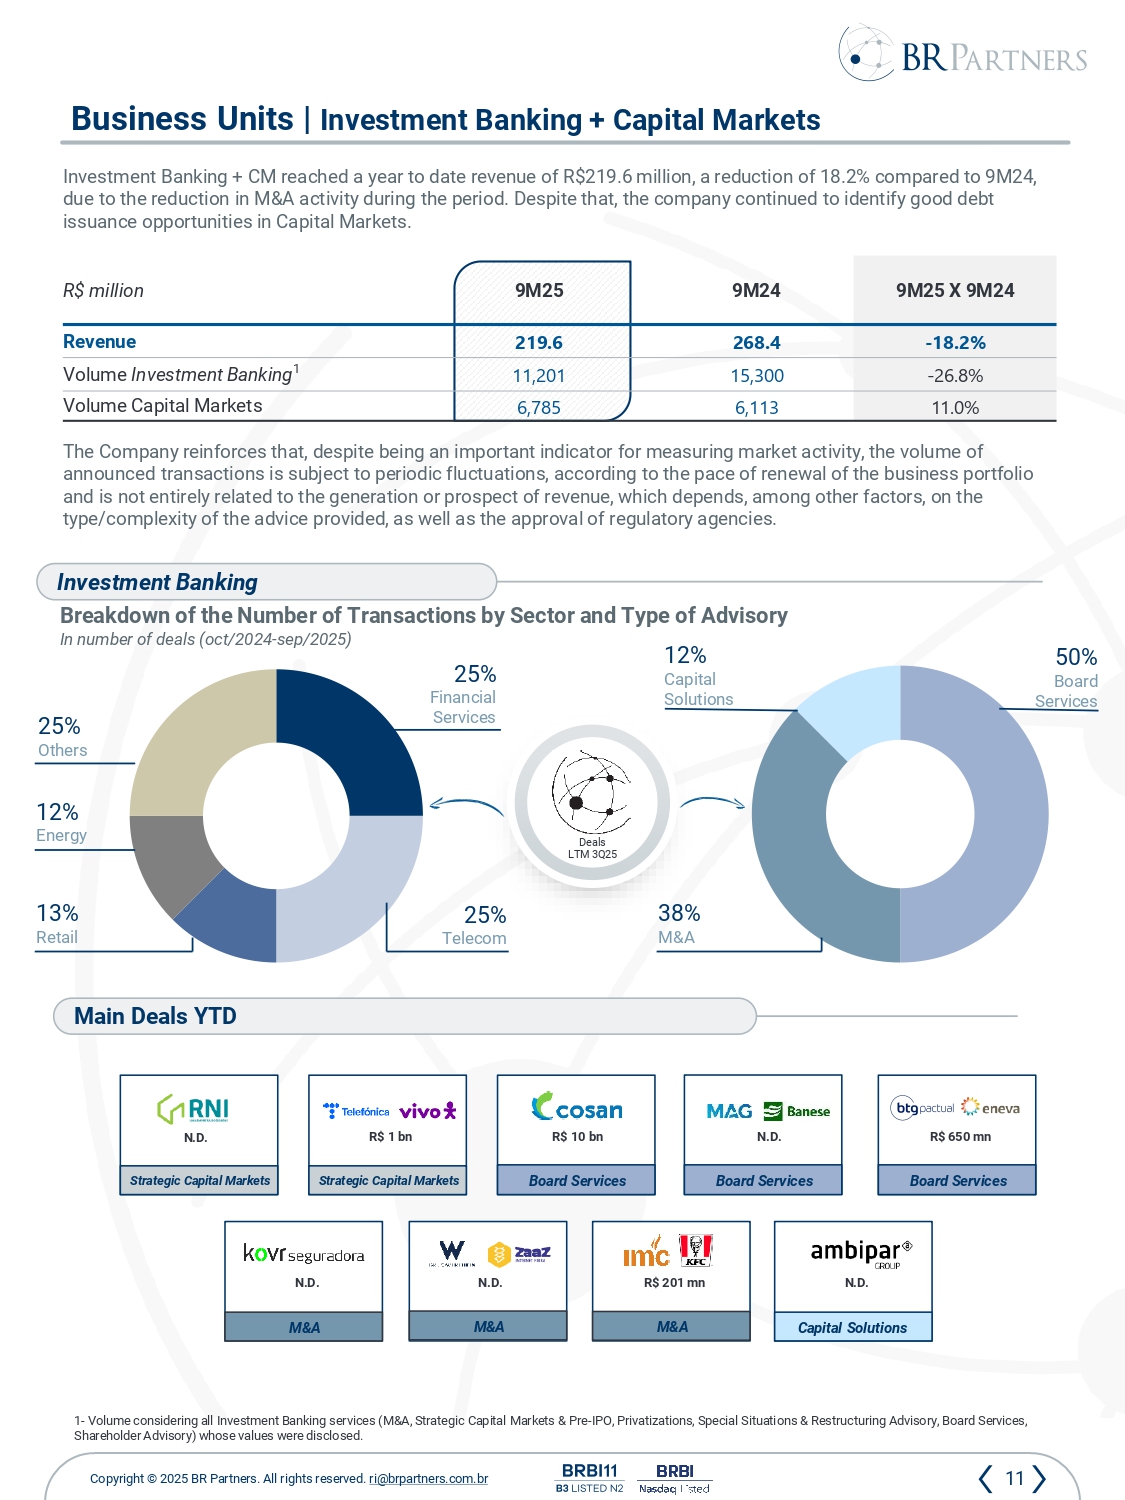
11 Copyright © 2025 BR Partners. All rights reserved . ri @brpartners.com.br Business Units | Investment Banking + Capital Markets Breakdown of the Number of Transactions by Sector and Type of Advisory In number of deals ( oct /2024 - sep/2025) Investment Banking Main Deals YTD Investment Banking + CM reached a year to date revenue of R$219.6 million, a reduction of 18.2% compared to 9M24, due to the reduction in M&A activity during the period. Despite that, the company continued to identify good debt issuance opportunities in Capital Markets. The Company reinforces that, despite being an important indicator for measuring market activity, the volume of announced transactions is subject to periodic fluctuations, according to the pace of renewal of the business portfolio and is not entirely related to the generation or prospect of revenue, which depends, among other factors, on the type/complexity of the advice provided, as well as the approval of regulatory agencies. Deals LTM 3Q25 1 - Volume considering all Investment Banking services (M&A, Strategic Capital Markets & Pre - IPO, Privatizations, Special Situati ons & Restructuring Advisory, Board Services, Shareholder Advisory) whose values were disclosed. 9M25 X 9M24 9M24 9M25 R$ million - 18.2% 268.4 219.6 Revenue - 26.8% 15,300 11,201 Volume Investment Banking 1 11.0% 6,113 6,785 Volume Capital Markets N.D. M&A R$ 10 bn Board Services Strategic Capital Markets N.D. N.D. R$ 1 bn R$ 201 mn R$ 650 mn 13% Retail 12% Energy 25% Financial Services 25% Telecom 50% Board Services 38% M&A 25% Others 12% Capital Solutions N.D. Capital Solutions M&A M&A Board Services Board Services
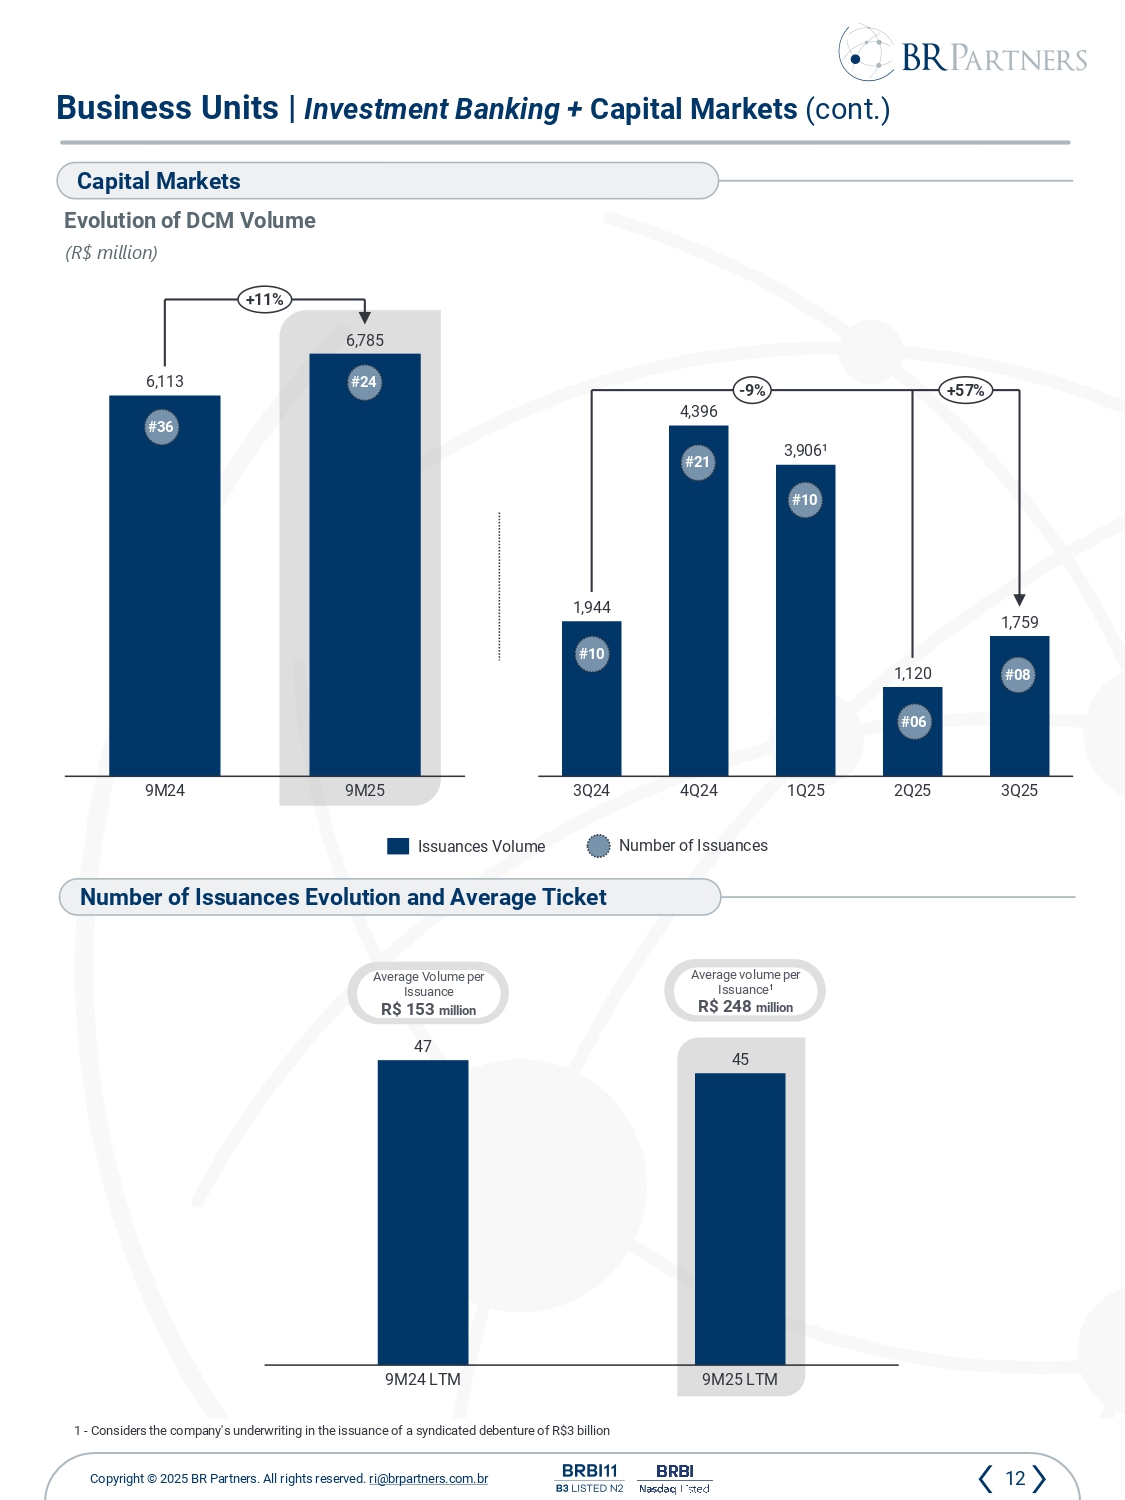
12 Copyright © 2025 BR Partners. All rights reserved . ri @brpartners.com.br Business Units | Investment Banking + Capital Markets (cont.) (R$ million ) Capital Markets Evolution of DCM Volume Number of Issuances Evolution and Average Ticket Number of Issuances Issuances Volume 3Q24 4Q24 1Q25 2Q25 3Q25 1,944 4,396 3,906 ¹ 1,120 1,759 - 9% +57% 9M24 9M25 6,113 6,785 +11% #10 #21 #10 #06 #36 #24 1 - Considers the company's underwriting in the issuance of a syndicated debenture of R$3 billion #08 Average volume per Issuance 1 R$ 248 million Average Volume per Issuance R$ 153 million 47 45 9M24 LTM 9M25 LTM
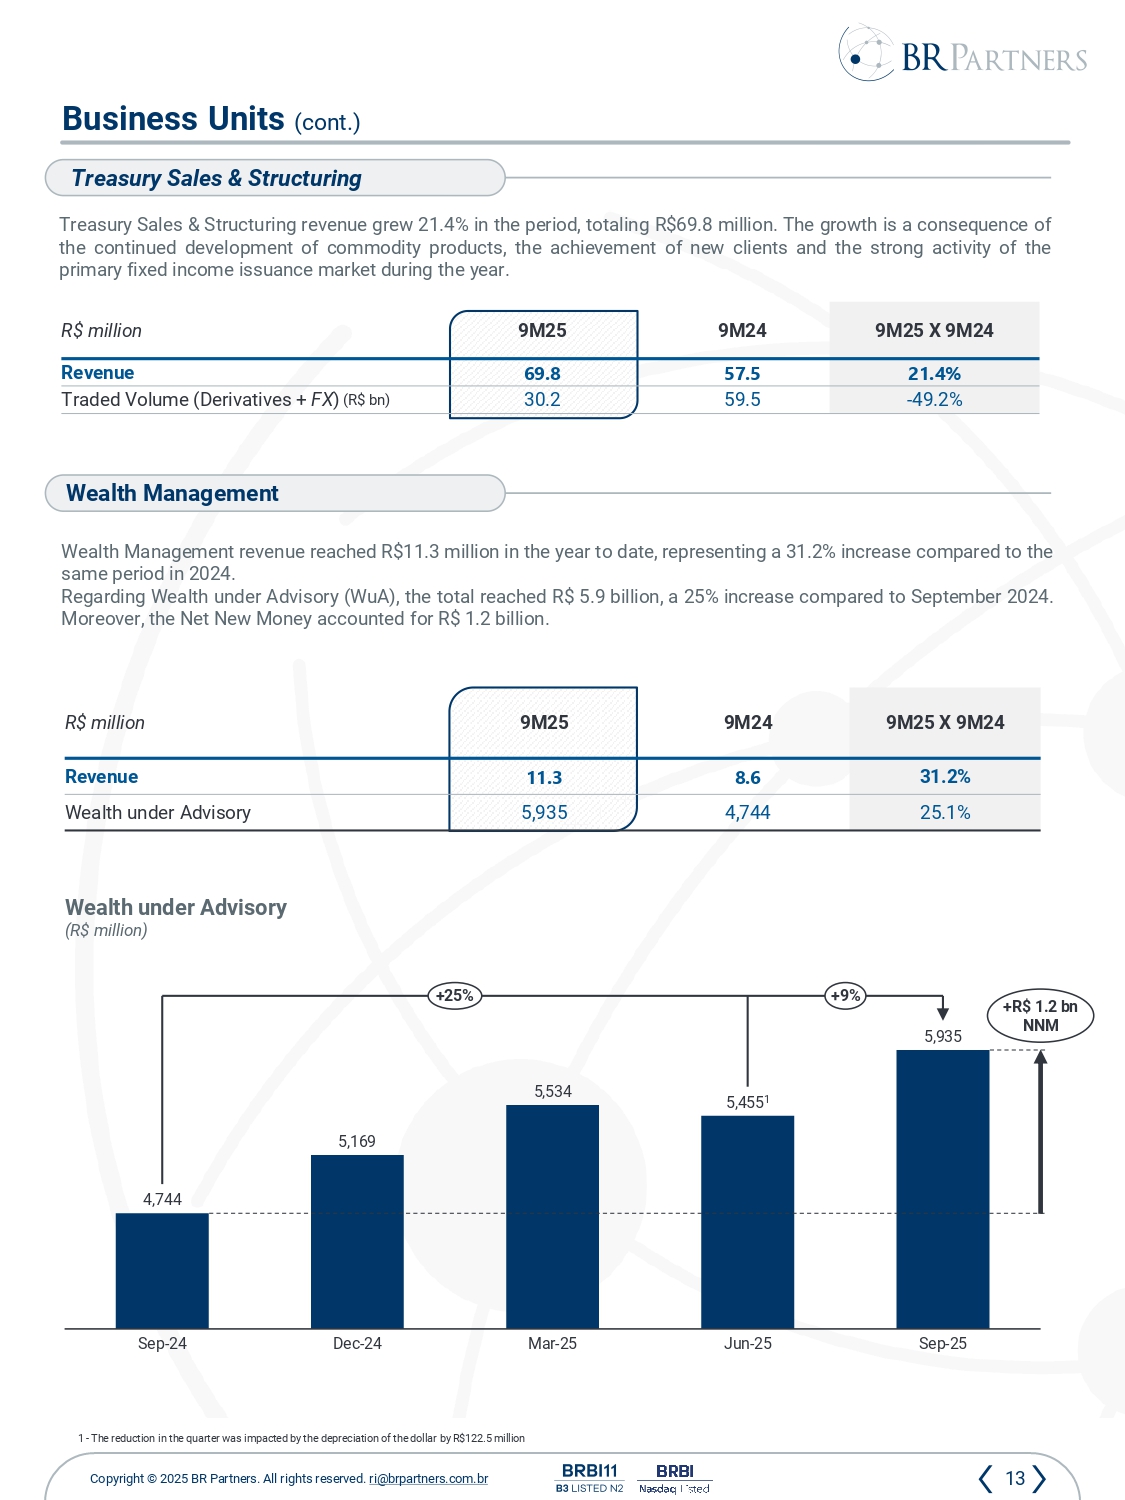
13 Copyright © 2025 BR Partners. All rights reserved . ri @brpartners.com.br Business Units (cont.) Treasury Sales & Structuring revenue grew 21 . 4 % in the period, totaling R $ 69 . 8 million . The growth is a consequence of the continued development of commodity products, the achievement of new clients and the strong activity of the primary fixed income issuance market during the year . Treasury Sales & Structuring Wealth Management revenue reached R $ 11 . 3 million in the year to date, representing a 31 . 2 % increase compared to the same period in 2024 . Regarding Wealth under Advisory ( WuA ), the total reached R $ 5 . 9 billion , a 25 % increase compared to September 2024 . Moreover , the Net New Money accounted for R $ 1 . 2 billion . Wealth Management Wealth under Advisory (R$ million ) 9M25 X 9M24 9M24 9M25 R$ million 21.4% 57.5 69.8 Revenue - 49.2% 59.5 30.2 Traded Volume ( Derivatives + FX ) (R$ bn ) 9M25 X 9M24 9M24 9M25 R$ million 31.2% 8.6 11.3 Revenue 25.1% 4,744 5,935 Wealth under Advisory 1 - The reduction in the quarter was impacted by the depreciation of the dollar by R$122.5 million Sep - 24 Dec - 24 Mar - 25 Jun - 25 Sep - 25 5,455 1 4,744 5,169 5,534 5,935 +R$ 1 . 2 bn NNM +25% +9%
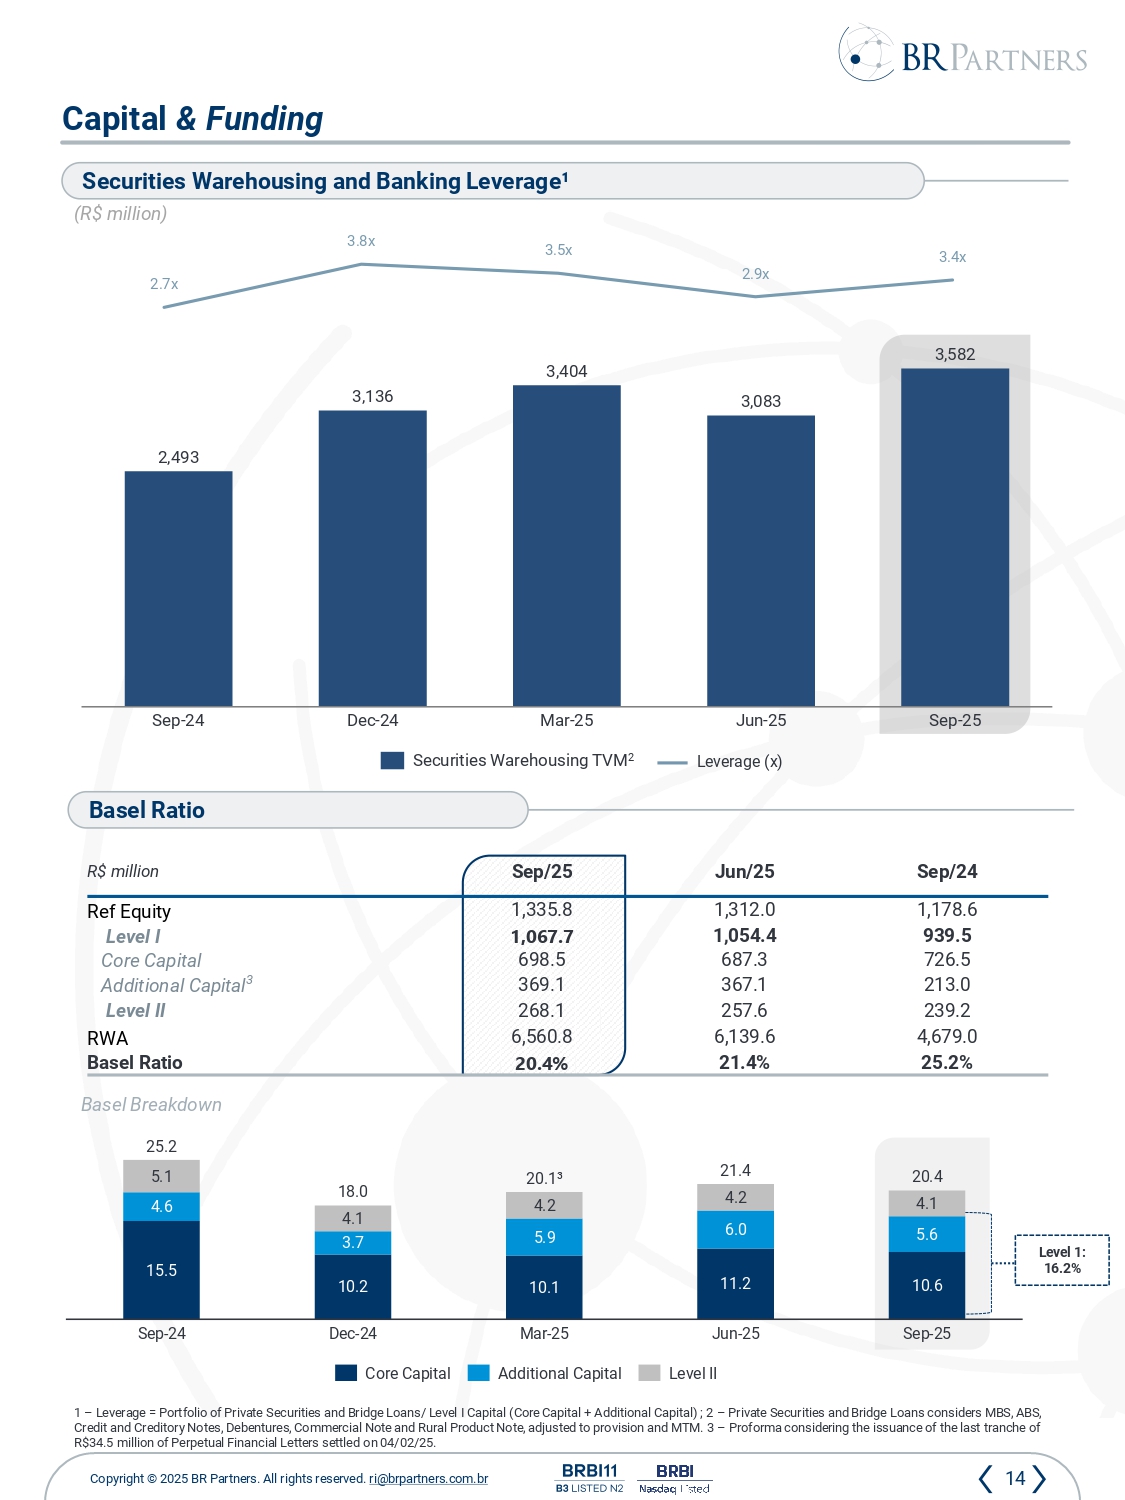
14 Copyright © 2025 BR Partners. All rights reserved . ri @brpartners.com.br Sep /24 Jun /25 Sep /25 R$ million 1,178.6 1,312.0 1,335.8 Ref Equity 939.5 1,054.4 1,067.7 Level I 726.5 687.3 698.5 Core Capital 213.0 367.1 369.1 Additional Capital 3 239.2 257.6 268.1 Level II 4,679.0 6,139.6 6,560.8 RWA 25.2% 21.4% 20.4% Basel Ratio Capital & Funding Basel Ratio Sep - 24 Dec - 24 Mar - 25 Jun - 25 Sep - 25 25.2 18.0 20.1 ³ 21.4 20.4 15.5 4.6 5.1 10.2 3.7 4.1 10.1 5.9 4.2 11.2 6.0 4.2 10.6 5.6 4.1 Basel Breakdown 1 – Leverage = Portfolio of Private Securities and Bridge Loans/ Level I Capital (Core Capital + Additional Capital) ; 2 – Priva te Securities and Bridge Loans considers MBS, ABS, Credit and Creditory Notes, Debentures, Commercial Note and Rural Product Note, adjusted to provision and MTM. 3 – Proforma considering the issuance of the last tranche of R$34.5 million of Perpetual Financial Letters settled on 04/02/25. (R$ million ) Securities Warehousing and Banking Leverage¹ Leverage (x) Sep - 24 Dec - 24 Mar - 25 Jun - 25 Sep - 25 2,493 3,136 3,404 3,083 3,582 Securities Warehousing TVM 2 Core Capital Additional Capital Level II 2.7x 3.8x 3.5x 2.9x 3.4x Level 1: 16.2%
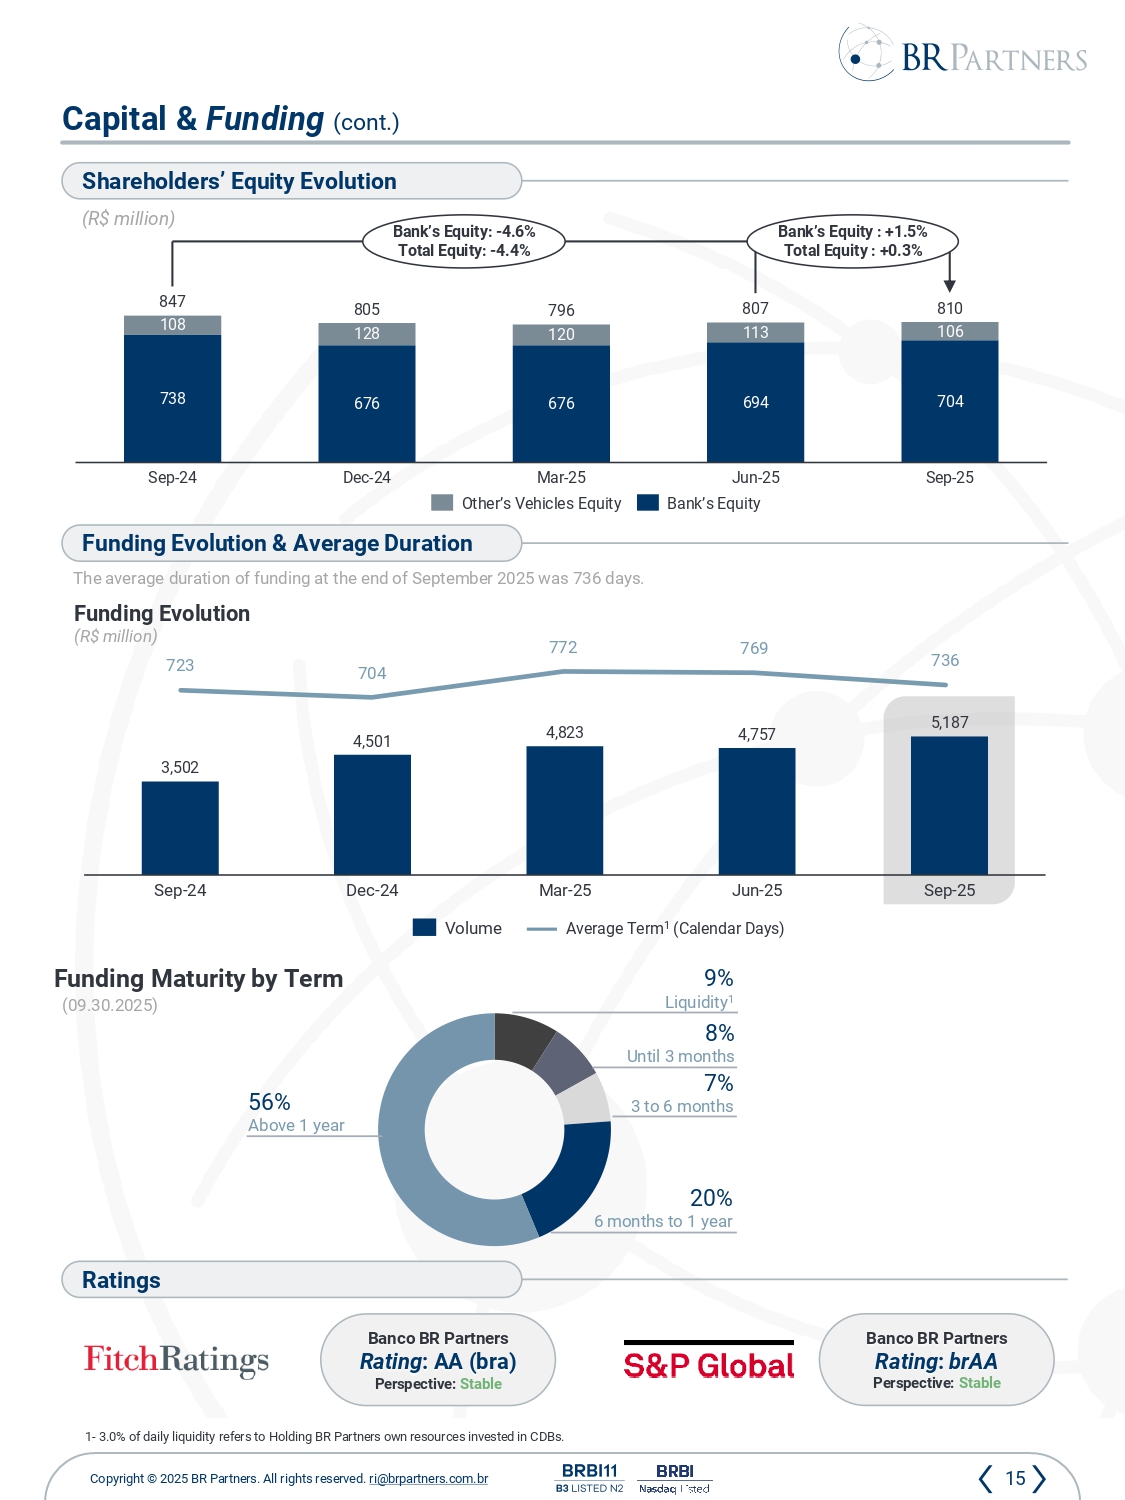
15 Copyright © 2025 BR Partners. All rights reserved . ri @brpartners.com.br Capital & Funding (cont.) ( 09 . 30 . 2025 ) (R$ million ) Shareholders ’ Equity Evolution The average duration of funding at the end of September 2025 was 736 days . Funding Evolution (R $ million ) Funding Evolution & Average Duration Funding Maturity by Term Other’s Vehicles Equity Bank’s Equity 1 - 3.0% of daily liquidity refers to Holding BR Partners own resources invested in CDBs. Ratings Banco BR Partners Rating : AA ( bra ) Perspective: Stable Banco BR Partners Rating : brAA Perspective: Stable 2 738 676 676 694 704 108 128 120 113 106 Sep - 24 Dec - 24 Mar - 25 Jun - 25 Sep - 25 847 805 796 807 810 Bank’s Equity : - 4.6% Total Equity : - 4.4% Bank’s Equity : +1.5% Total Equity : + 0.3 % Sep - 24 Dec - 24 Mar - 25 Jun - 25 Sep - 25 3,502 4,501 4,823 4,757 5,187 Average Term 1 ( Calendar Days ) Volume 56% Above 1 year 9% Liquidity 1 20% 6 months to 1 year 7% 3 to 6 months 8% Until 3 months 723 704 772 769 736
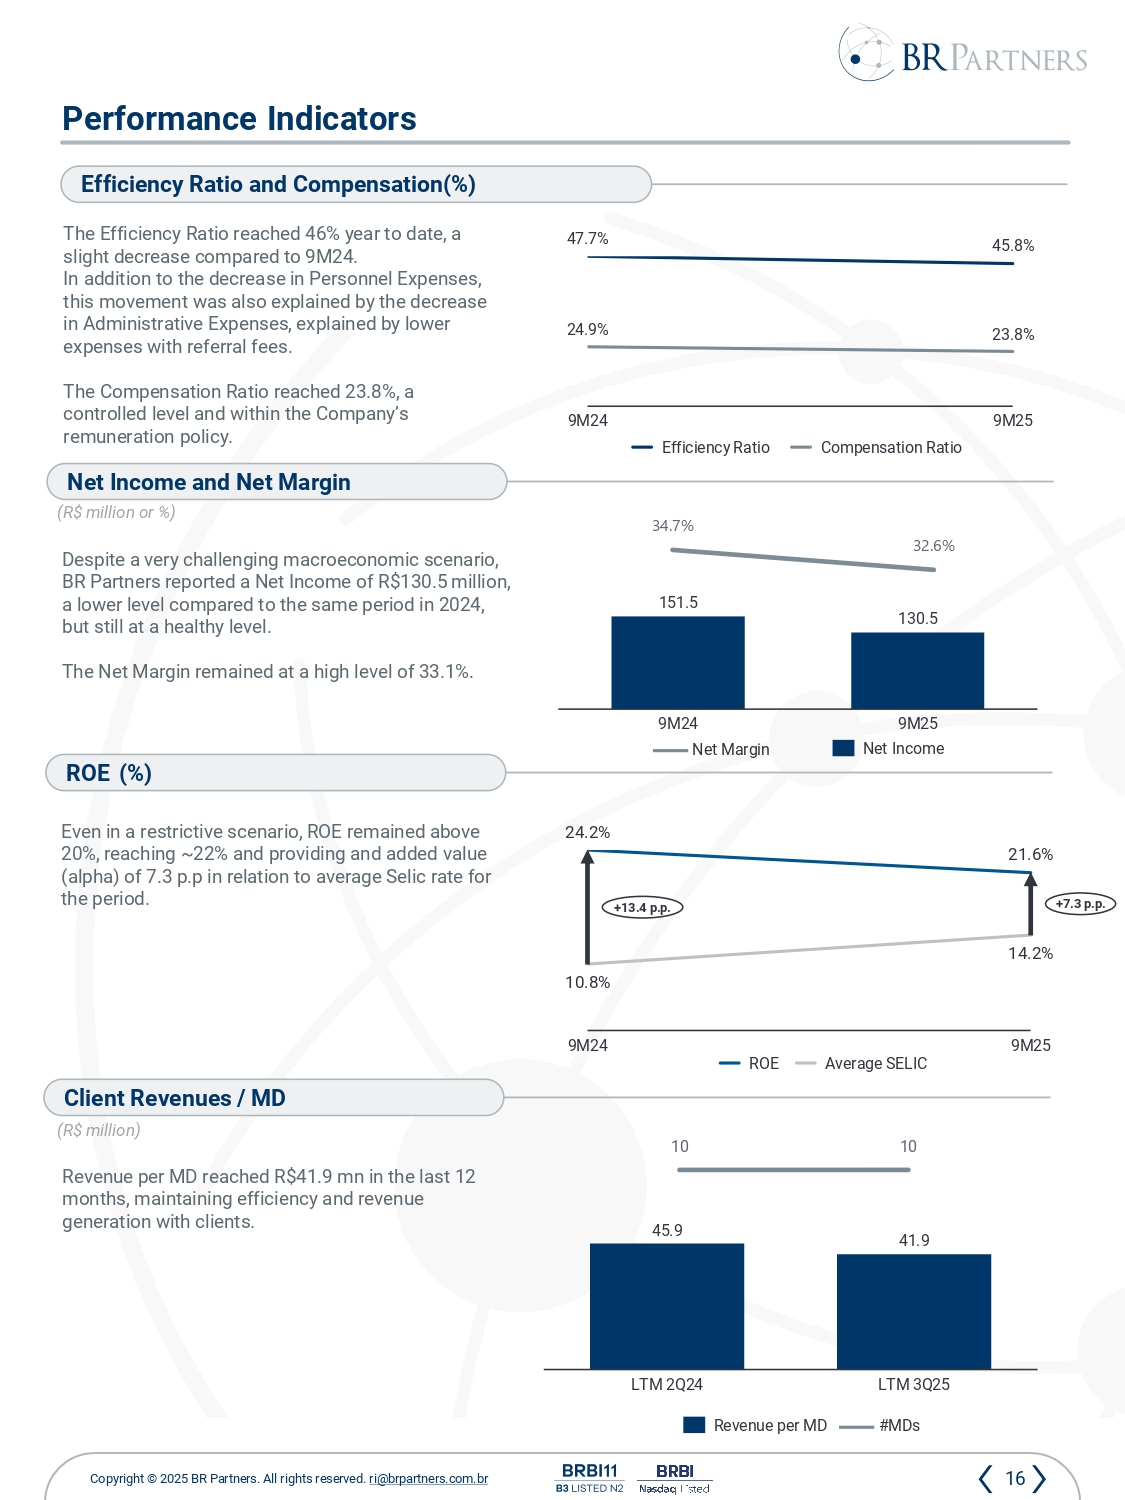
16 Copyright © 2025 BR Partners. All rights reserved . ri @brpartners.com.br Performance Indicators Net Margin Efficiency Ratio and Compensation (%) (R$ million or %) Net Income and Net Margin ROE (%) Despite a very challenging macroeconomic scenario , BR Partners reported a Net Income of R$130.5 million , a lower level compared to the same period in 2024, but still at a healthy level . The Net Margin remained at a high level of 33.1%. Even in a restrictive scenario , ROE remained above 20%, reaching ~22% and providing and added value (alpha) of 7.3 p.p in relation to average Selic rate for the period . The Efficiency Ratio reached 46% year to date, a slight decrease compared to 9M24. In addition to the decrease in Personnel Expenses , this movement was also explained by the decrease in Administrative Expenses , explained by lower expenses with referral fees . The Compensation Ratio reached 23.8%, a controlled level and within the Company’s remuneration policy . Net Income Efficiency Ratio Compensation Ratio Client Revenues / MD Revenue per MD reached R$41.9 mn in the last 12 months , maintaining efficiency and revenue generation with clients . (R$ million ) 47.7% 24.9% 9M24 45.8% 23.8% 9M25 9M24 9M25 151.5 130.5 ROE Average S ELIC 9M24 9M25 24.2% 21.6% 10.8% 14.2% +7.3 p.p. +13.4 p.p. LTM 2Q24 LTM 3Q25 45.9 41.9 Revenu e per MD #MDs 10 10 34.7% 32.6%
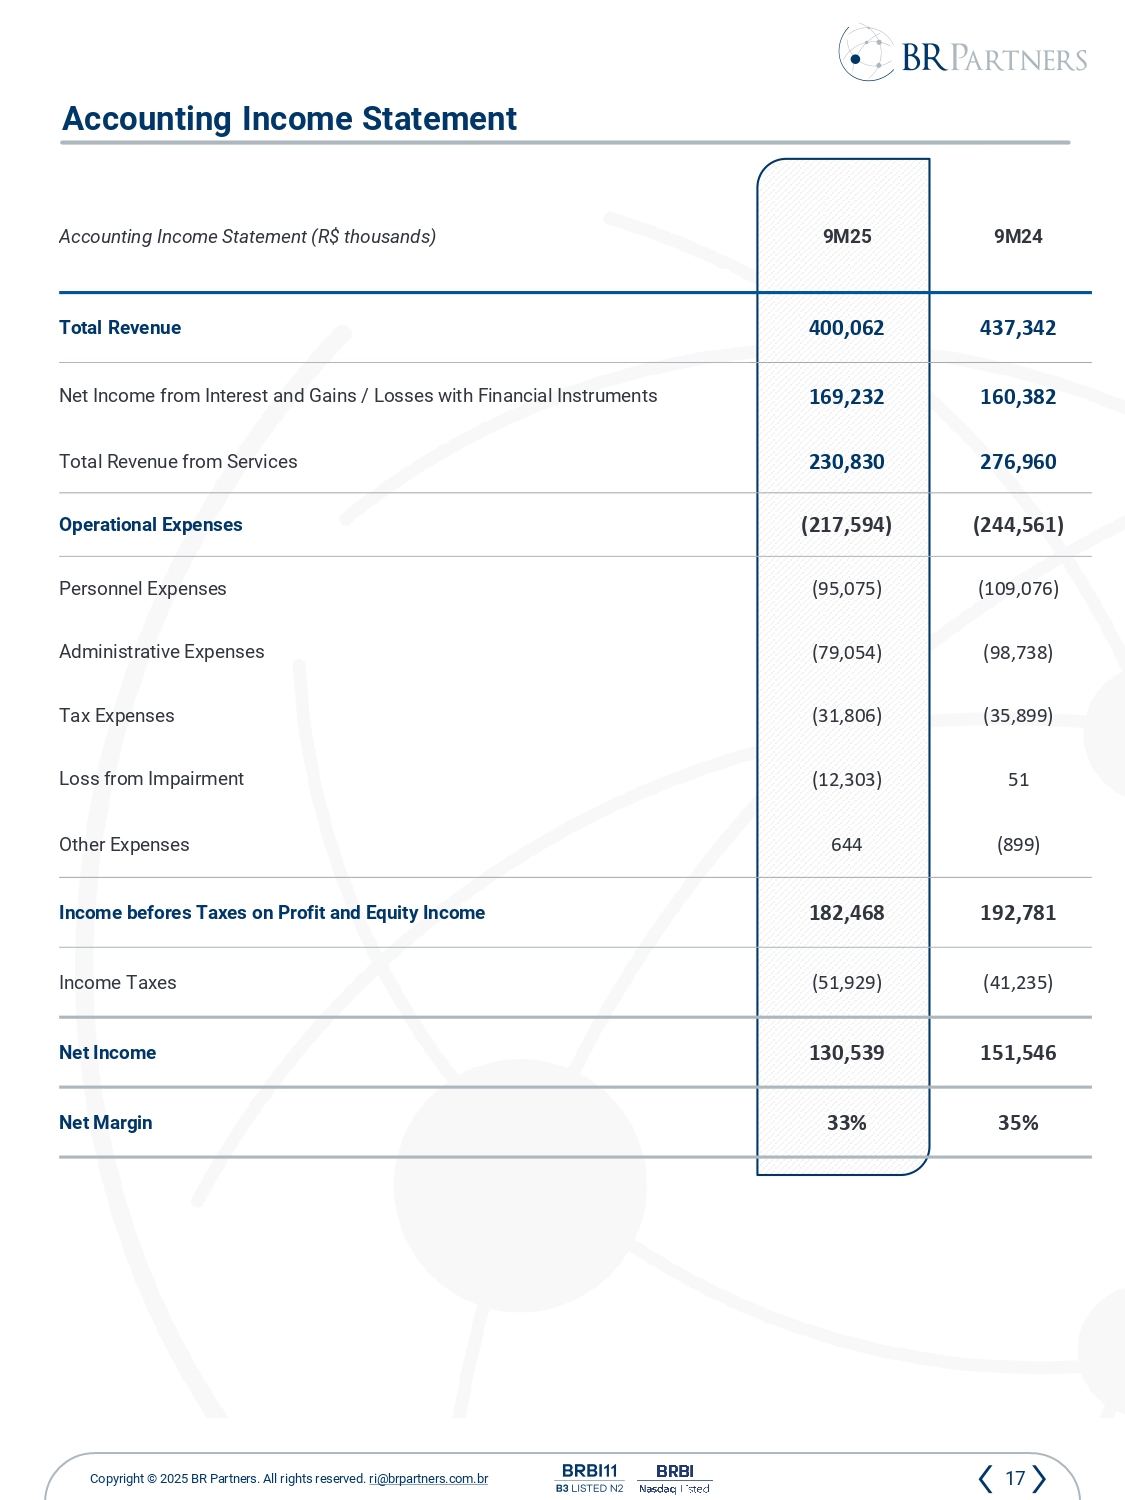
17 Copyright © 2025 BR Partners. All rights reserved . ri @brpartners.com.br Accounting Income Statement 9M24 9M25 Accounting Income Statement (R$ thousands ) 437,342 400,062 Total Revenue 160,382 169,232 Net Income from Interest and Gains / Losses with Financial Instruments 276,960 230,830 Total Revenue from Services (244,561) (217,594) Operational Expenses (109,076) (95,075) Personnel Expenses (98,738) (79,054) Administrative Expenses (35,899) (31,806) Tax Expenses 51 (12,303) Loss from Impairment (899) 644 Other Expenses 192,781 182,468 Income befores Taxes on Profit and Equity Income (41,235) (51,929) Income Taxes 151,546 130,539 Net Income 35% 33% Net Margin
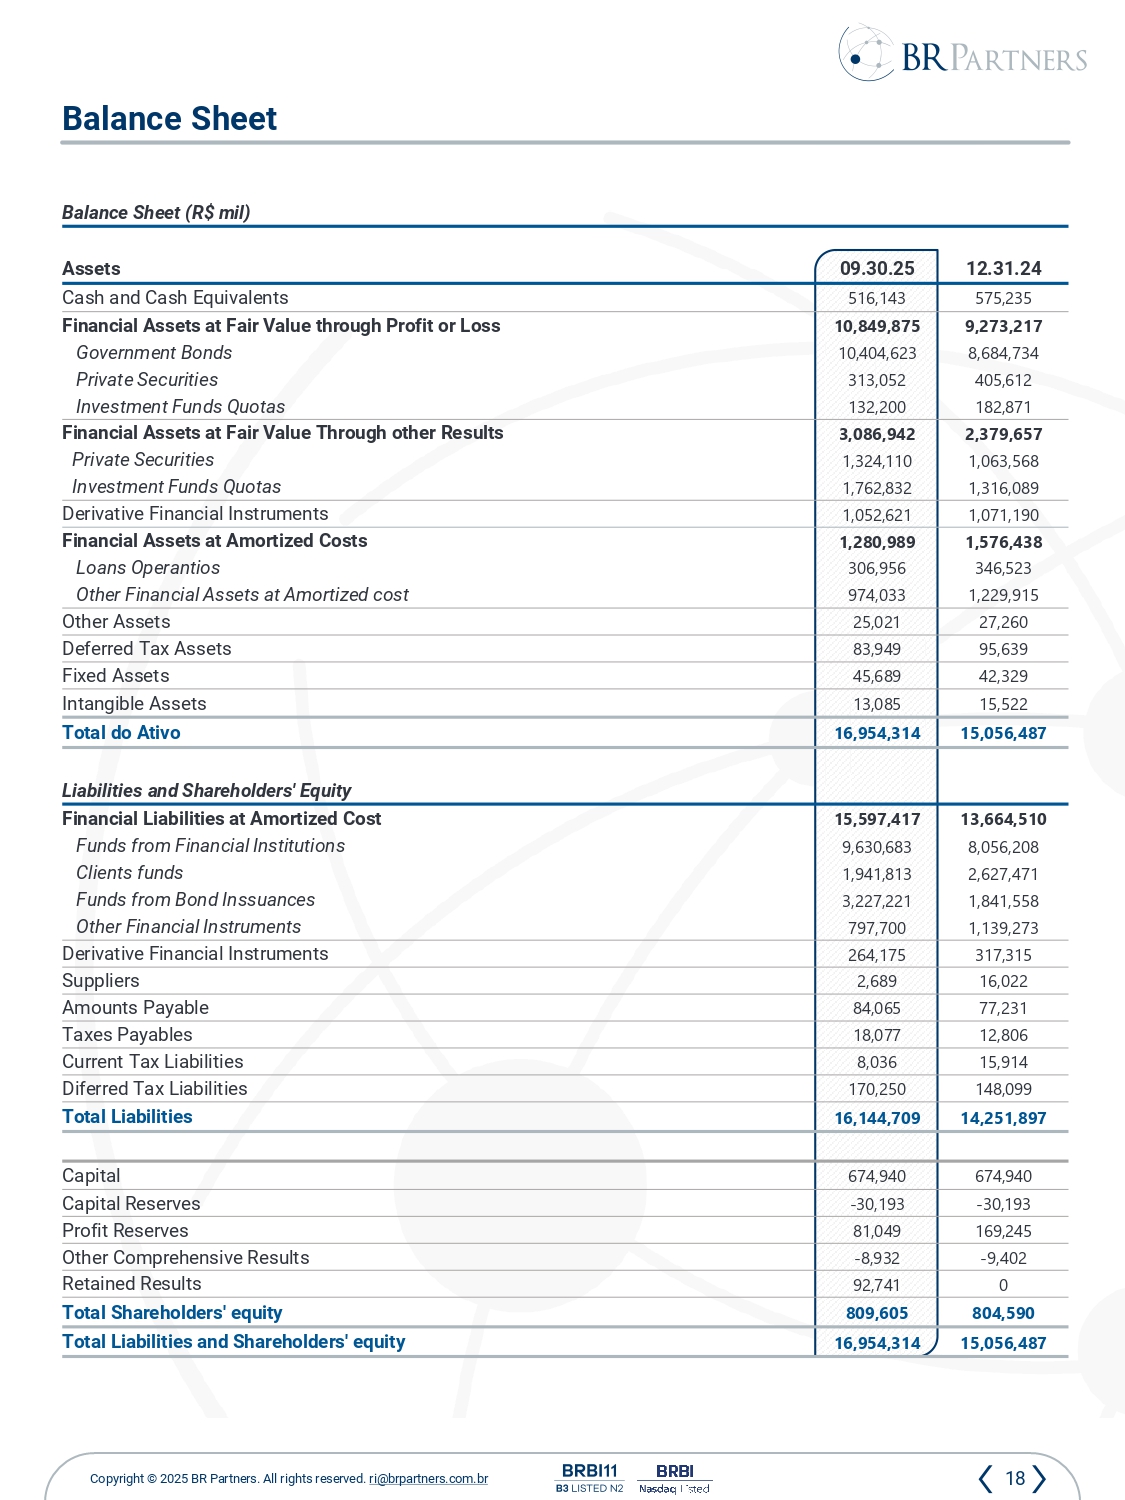
18 Copyright © 2025 BR Partners. All rights reserved . ri @brpartners.com.br Balance Sheet (R$ mil) 12.31.24 09.30.25 Assets 575,235 516,143 Cash and Cash Equivalents 9,273,217 10,849,875 Financial Assets at Fair Value through Profit or Loss 8,684,734 10,404,623 Government Bonds 405,612 313,052 Private Securities 182,871 132,200 Investment Funds Quotas 2,379,657 3,086,942 Financial Assets at Fair Value Through other Results 1,063,568 1,324,110 Private Securities 1,316,089 1,762,832 Investment Funds Quotas 1,071,190 1,052,621 Derivative Financial Instruments 1,576,438 1,280,989 Financial Assets at Amortized Costs 346,523 306,956 Loans Operantios 1,229,915 974,033 Other Financial Assets at Amortized cost 27,260 25,021 Other Assets 95,639 83,949 Deferred Tax Assets 42,329 45,689 Fixed Assets 15,522 13,085 Intangible Assets 15,056,487 16,954,314 Total do Ativo Liabilities and Shareholders' Equity 13,664,510 15,597,417 Financial Liabilities at Amortized Cost 8,056,208 9,630,683 Funds from Financial Institutions 2,627,471 1,941,813 Clients funds 1,841,558 3,227,221 Funds from Bond Inssuances 1,139,273 797,700 Other Financial Instruments 317,315 264,175 Derivative Financial Instruments 16,022 2,689 Suppliers 77,231 84,065 Amounts Payable 12,806 18,077 Taxes Payables 15,914 8,036 Current Tax Liabilities 148,099 170,250 Diferred Tax Liabilities 14,251,897 16,144,709 Total Liabilities 674,940 674,940 Capital - 30,193 - 30,193 Capital Reserves 169,245 81,049 Profit Reserves - 9,402 - 8,932 Other Comprehensive Results 0 92,741 Retained Results 804,590 809,605 Total Shareholders' equity 15,056,487 16,954,314 Total Liabilities and Shareholders' equity Balance Sheet
19 Copyright © 2025 BR Partners. All rights reserved . ri @brpartners.com.br This material was prepared by BR Advisory Partners Participações S . A . (“BRAP”) for exclusive use in its periodic results disclosure . This material should not be considered under any aspect or assessment as a complete document and should be analyzed in conjunction with the financial statements for the period to which it refers . This material was prepared for purely informative purposes only and should not be understood as a request or an offer to buy or sell any securities or financial instruments of BRAP and/or any company in its economic group . The content of this material should not be considered any form of legal, tax, accounting, investment or any other type of advice or recommendation . This material is not intended to be comprehensive, complete or exhaustive about BRAP and/or any other company in its economic group, nor does it contain all the information that shareholders, investors, counterparties of BRAP and/or any company in its economic group, and/or even any third parties may require . No investment, disposal or other financial decisions or actions should be made solely based on the information contained in this material, and each recipient of this material should seek the advice and guidance they deem necessary to make any decision .