FORM 6-K
SECURITIES AND EXCHANGE COMMISSION
Washington, D.C. 20549
Report of Foreign Private Issuer
Pursuant
to Rule 13a-16 or 15d-16
of the Securities Exchange Act of 1934
For the month of April, 2025
Commission File Number 001-15266
BANK OF CHILE
(Translation of registrant’s name into English)
Ahumada 251
Santiago, Chile
(Address of principal executive offices)
Indicate by check mark whether the registrant files or will file annual reports under cover Form 20-F or Form 40-F.
Form 20-F ☒ ☐ Form 40-F
Indicate by check mark whether by furnishing the information contained in this Form, the registrant is also thereby furnishing the information to the Commission pursuant to Rule 12g3-2(b) under the Securities Exchange Act of 1934.
Yes ☐ No ☒
If “Yes” is marked, indicate below the file number assigned to the registrant in connection with Rule 12g3-2(b): 82- ________ BANCO DE CHILE REPORT ON FORM 6-K
Attached is a Press Release issued by Banco de Chile (“the Bank”) on April 29, 2025, regarding its financial results for the First Quarter 2025.
SIGNATURE
Pursuant to the requirements of the Securities Exchange Act of 1934, the registrant has duly caused this report to be signed on its behalf by the undersigned, thereunto duly authorized.
Date: April 29, 2025
| Banco de Chile | ||
| By: | /S/ Eduardo Ebensperger O. | |
| Eduardo Ebensperger O. | ||
| CEO |
2
Exhibit 99.1
| 1 April 2025 131 years contributing to the development of the country and its people.
Financial Management Review 1Q25 | Qu a r t e r l y Report Table of Contents 4 About Banco de Chile I. Our History Financial Snapshot on Banco de Chile 6 Corporate Governance II. Equity Composition and Ownership Structure Board of Directors, Committees and Managerial Structure 9 Business Strategy III. Corporate Statements and Commitments Stakeholders Engagement Competitive Landscape, Business Trends and Regulation Strategy of Banco de Chile At a Glance Business Segments Description Snapshot on Strategic Advances 21 Economic and Business Environment IV. Economic Outlook Banking Industry Performance and Projections Competitive Position 26 Management Discussion & Analysis V. Income Statement Analysis Business Segments Performance Balance Sheet Analysis 46 Risk & Capital Management VI.
Risk Management Approach Funding Concentration and Liquidity Market Risk Operational Risk Capital Adequacy and Credit Ratings | 2 About this Report Basis for Presentation This financial report, which accompanies our quarterly financial statements, has been prepared as requested by the Chilean Financial Market Commission (CMF) in the Compendium of Accounting Standards for Banks while being elaborated in accordance with the IFRS Practice Statement 1 – Management Commentary as issued by the International Accounting Standards Board (IASB) . Figures included in this report “ Financial Management Review ” , for purposes of analysis, are based on both the financial statements and management information systems of Banco de Chile . Forward - Looking Information The information contained herein incorporates by reference statements which constitute “ forward - looking statements ” that include statements regarding the intent, belief or current expectations of our directors and officers with respect to our future operating performance . Such statements include any forecasts, projections and descriptions of anticipated cost savings or other synergies . You should be aware that any such forward - looking statements are not guarantees of future performance and may involve risks and uncertainties, and that actual results may differ from those set forth in the forward - looking statements as a result of various factors (including, without limitations, the actions of competitors, future global economic conditions, market conditions, foreign exchange rates, and operating and financial risks related to managing growth and integrating acquired businesses), many of which are beyond our control . The occurrence of any such factors not currently expected by us would significantly alter the results set forth in these statements . Factors that could cause actual results to differ materially and adversely include, but are not limited to: ⭬ changes in general economic, business or political or other conditions in Chile or changes in general economic or business conditions in Latin America; ⭬ changes in capital markets in general that may affect policies or attitudes toward lending to Chile or Chilean companies; ⭬ unexpected developments in certain existing litigation; ⭬ increased costs; ⭬ unanticipated increases in financing and other costs or the inability to obtain additional debt or equity financing on attractive terms ; ⭬ natural disasters or pandemics ; ⭬ the effect of tax laws or other kind of regulation on our business ; ⭬ other risk factors as reported in our form 20 F filed with the U . S . SEC . Undue reliance should not be placed on such statements, which speak only as of the date that they were made . Our independent public accountants have not examined or compiled the forward - looking statements and, accordingly, do not provide any assurance with respect to such statements . These cautionary statements should be considered in connection with any written or oral forward - looking statements that we may issue in the future . We do not undertake any obligation to release publicly any revisions to such forward - looking statements to reflect later events or circumstances or to reflect the occurrence of unanticipated events .
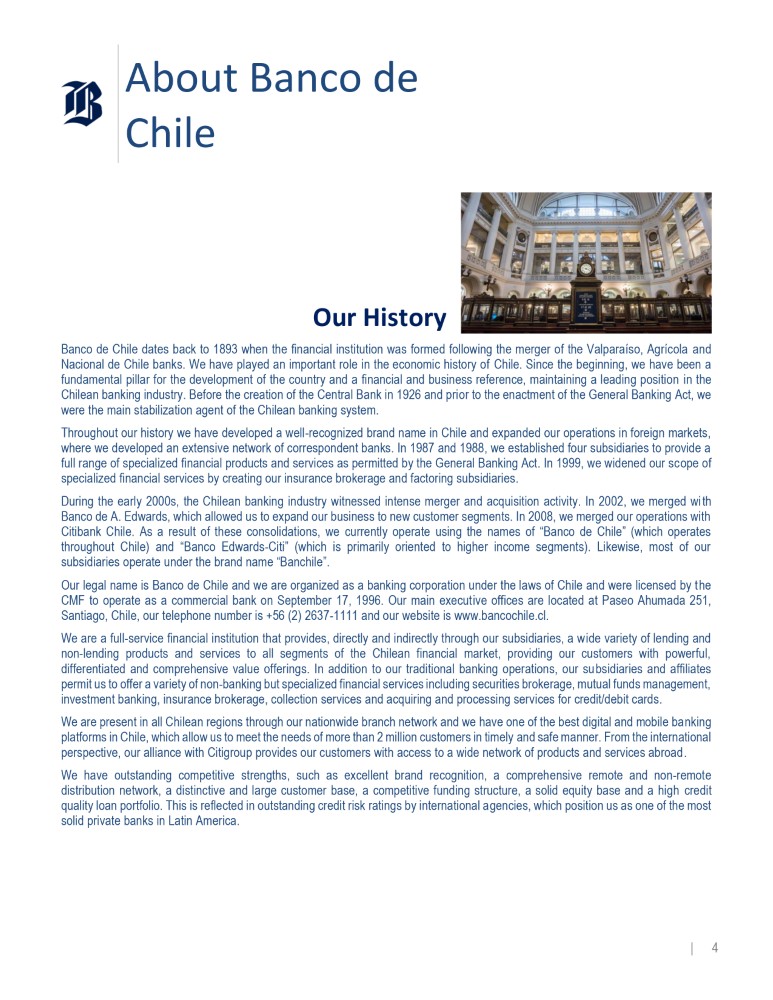
| 3 Contacts Daniel Galarce Head of Financial Control & Capital Management Financial Control & Capital Area | Banco de Chile dgalarce@bancochile.cl Pablo Mejia Head of Investor Relations Investor Relations | Banco de Chile pmejiar@bancochile.cl About Banco de Chile Our History Banco de Chile dates back to 1893 when the financial institution was formed following the merger of the Valparaíso, Agrícola and Nacional de Chile banks . We have played an important role in the economic history of Chile . Since the beginning, we have been a fundamental pillar for the development of the country and a financial and business reference, maintaining a leading position in the Chilean banking industry . Before the creation of the Central Bank in 1926 and prior to the enactment of the General Banking Act, we were the main stabilization agent of the Chilean banking system . Throughout our history we have developed a well - recognized brand name in Chile and expanded our operations in foreign markets, where we developed an extensive network of correspondent banks . In 1987 and 1988 , we established four subsidiaries to provide a full range of specialized financial products and services as permitted by the General Banking Act . In 1999 , we widened our scope of specialized financial services by creating our insurance brokerage and factoring subsidiaries . During the early 2000 s, the Chilean banking industry witnessed intense merger and acquisition activity . In 2002 , we merged wi th Banco de A . Edwards, which allowed us to expand our business to new customer segments . In 2008 , we merged our operations with Citibank Chile . As a result of these consolidations, we currently operate using the names of “Banco de Chile” (which operates throughout Chile) and “Banco Edwards - Citi” (which is primarily oriented to higher income segments) . Likewise, most of our subsidiaries operate under the brand name “Banchile” . Our legal name is Banco de Chile and we are organized as a banking corporation under the laws of Chile and were licensed by t he CMF to operate as a commercial bank on September 17 , 1996 . Our main executive offices are located at Paseo Ahumada 251 , Santiago, Chile, our telephone number is + 56 ( 2 ) 2637 - 1111 and our website is www . bancochile . cl . We are a full - service financial institution that provides, directly and indirectly through our subsidiaries, a wide variety of lending and non - lending products and services to all segments of the Chilean financial market, providing our customers with powerful, differentiated and comprehensive value offerings . In addition to our traditional banking operations, our subsidiaries and affiliates permit us to offer a variety of non - banking but specialized financial services including securities brokerage, mutual funds management, investment banking, insurance brokerage, collection services and acquiring and processing services for credit/debit cards . We are present in all Chilean regions through our nationwide branch network and we have one of the best digital and mobile banking platforms in Chile, which allow us to meet the needs of more than 2 million customers in timely and safe manner . From the international perspective, our alliance with Citigroup provides our customers with access to a wide network of products and services abroad . We have outstanding competitive strengths, such as excellent brand recognition, a comprehensive remote and non - remote distribution network, a distinctive and large customer base, a competitive funding structure, a solid equity base and a high credit quality loan portfolio . This is reflected in outstanding credit risk ratings by international agencies, which position us as one of the most solid private banks in Latin America . | 4 About Banco de Chile Financial Snapshot 1Q25 (In Millions of Ch$) Net Income Annual Var.
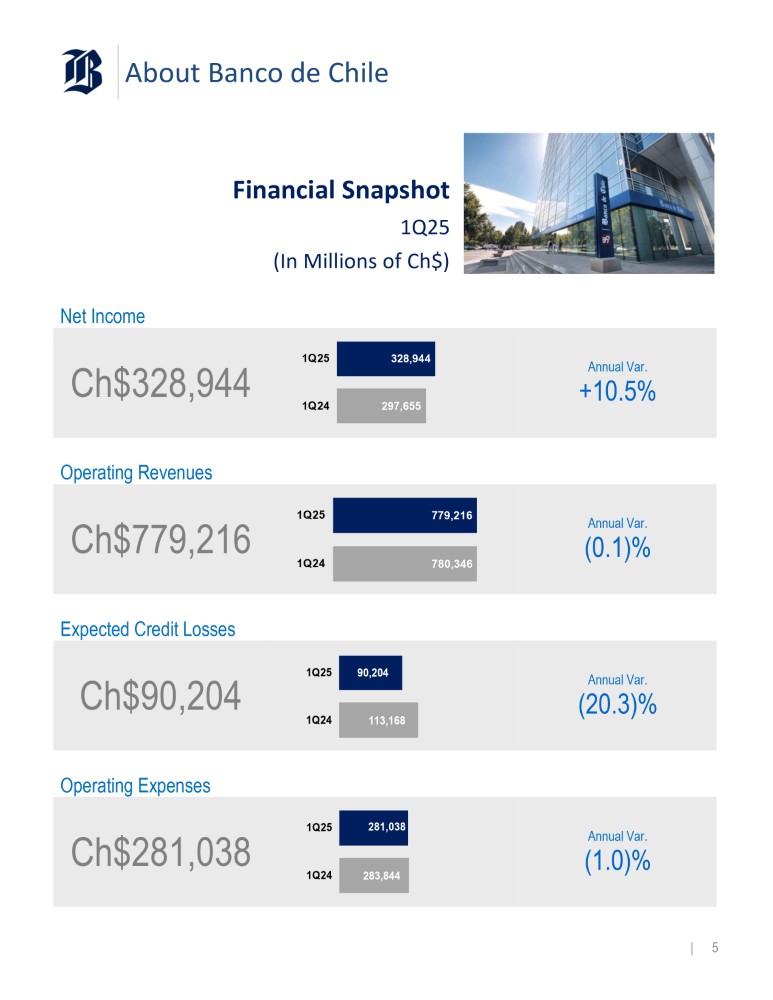
328,944 1Q25 Ch$328,944 +10.5% 297,655 1Q24 Operating Revenues Annual Var. 779,216 1Q25 Ch$779,216 (0.1)% 780,346 1Q24 Expected Credit Losses Annual Var. 90,204 1Q25 Ch$90,204 (20.3)% 113,168 1Q24 Operating Expenses Annual Var.
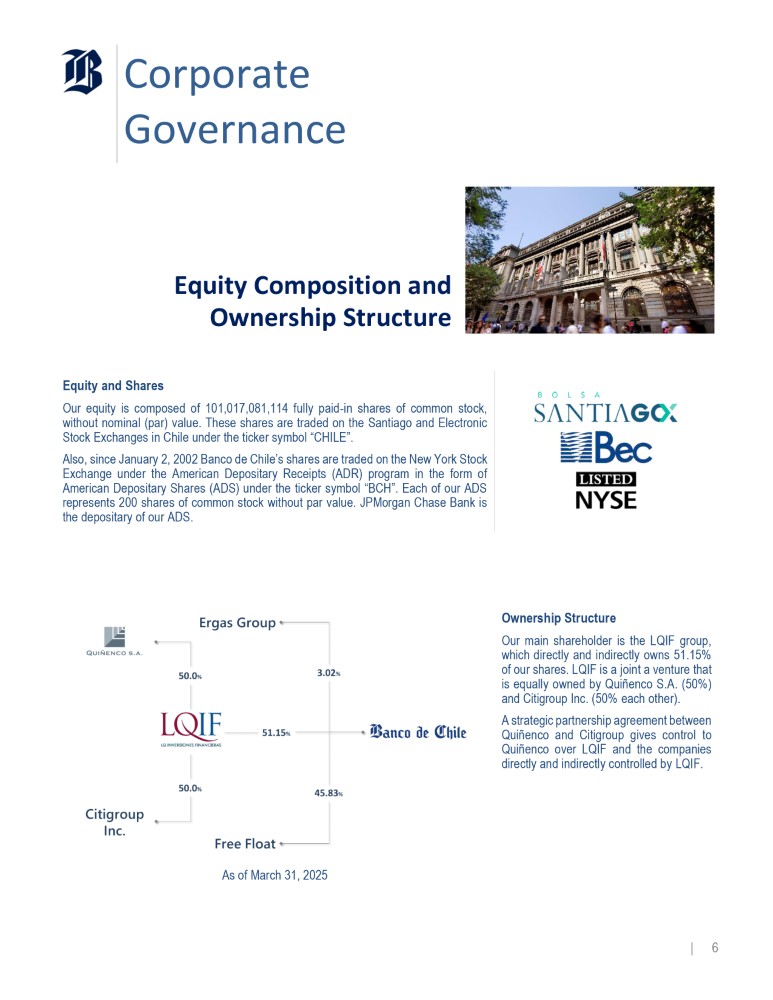
281,038 1Q25 Ch$281,038 (1.0)% 283,844 1Q24 | 5 Corporate Governance Equity Composition and Ownership Structure Equity and Shares Our equity is composed of 101 , 017 , 081 , 114 fully paid - in shares of common stock, without nominal (par) value . These shares are traded on the Santiago and Electronic Stock Exchanges in Chile under the ticker symbol “CHILE” . Also, since January 2 , 2002 Banco de Chile’s shares are traded on the New York Stock Exchange under the American Depositary Receipts (ADR) program in the form of American Depositary Shares (ADS) under the ticker symbol “BCH” . Each of our ADS represents 200 shares of common stock without par value . JPMorgan Chase Bank is the depositary of our ADS . Ownership Structure Our main shareholder is the LQIF group, which directly and indirectly owns 51 . 15 % of our shares . LQIF is a joint a venture that is equally owned by Quiñenco S . A . ( 50 % ) and Citigroup Inc . ( 50 % each other) . A strategic partnership agreement between Quiñenco and Citigroup gives control to Quiñenco over LQIF and the companies directly and indirectly controlled by LQIF .
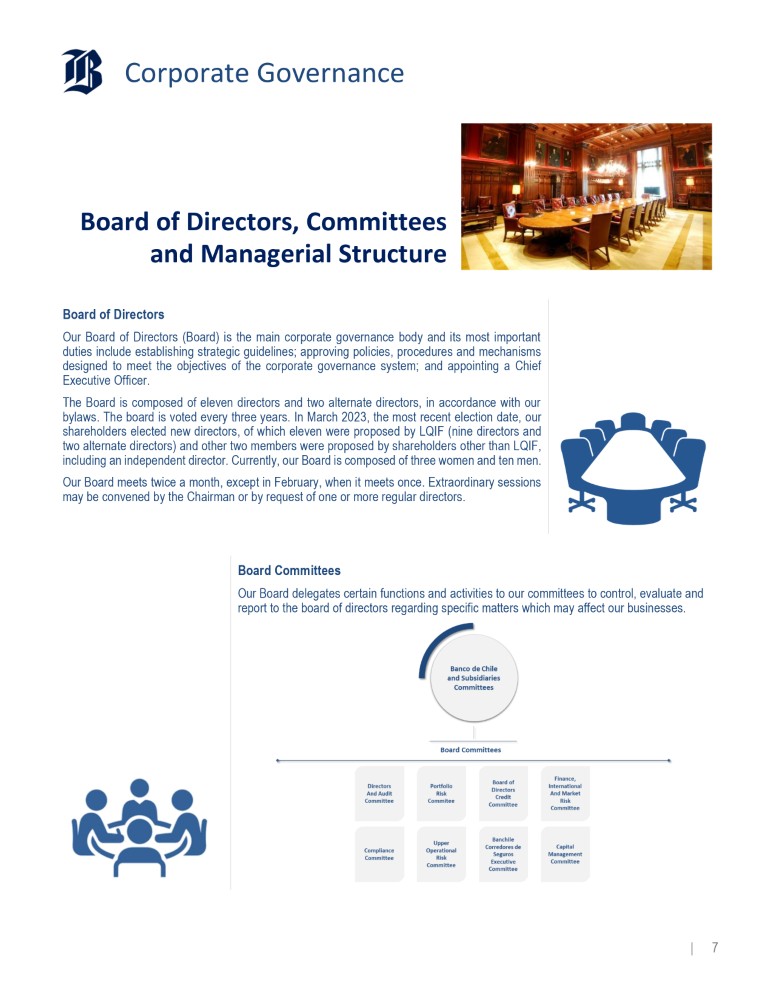
As of March 31, 2025 | 6 Corporate Governance Board of Directors, Committees and Managerial Structure Board of Directors Our Board of Directors (Board) is the main corporate governance body and its most important duties include establishing strategic guidelines ; approving policies, procedures and mechanisms designed to meet the objectives of the corporate governance system ; and appointing a Chief Executive Officer . The Board is composed of eleven directors and two alternate directors, in accordance with our bylaws . The board is voted every three years . In March 2023 , the most recent election date, our shareholders elected new directors, of which eleven were proposed by LQIF (nine directors and two alternate directors) and other two members were proposed by shareholders other than LQIF, including an independent director . Currently, our Board is composed of three women and ten men . Our Board meets twice a month, except in February, when it meets once . Extraordinary sessions may be convened by the Chairman or by request of one or more regular directors . Board Committees Our Board delegates certain functions and activities to our committees to control, evaluate and report to the board of directors regarding specific matters which may affect our businesses.
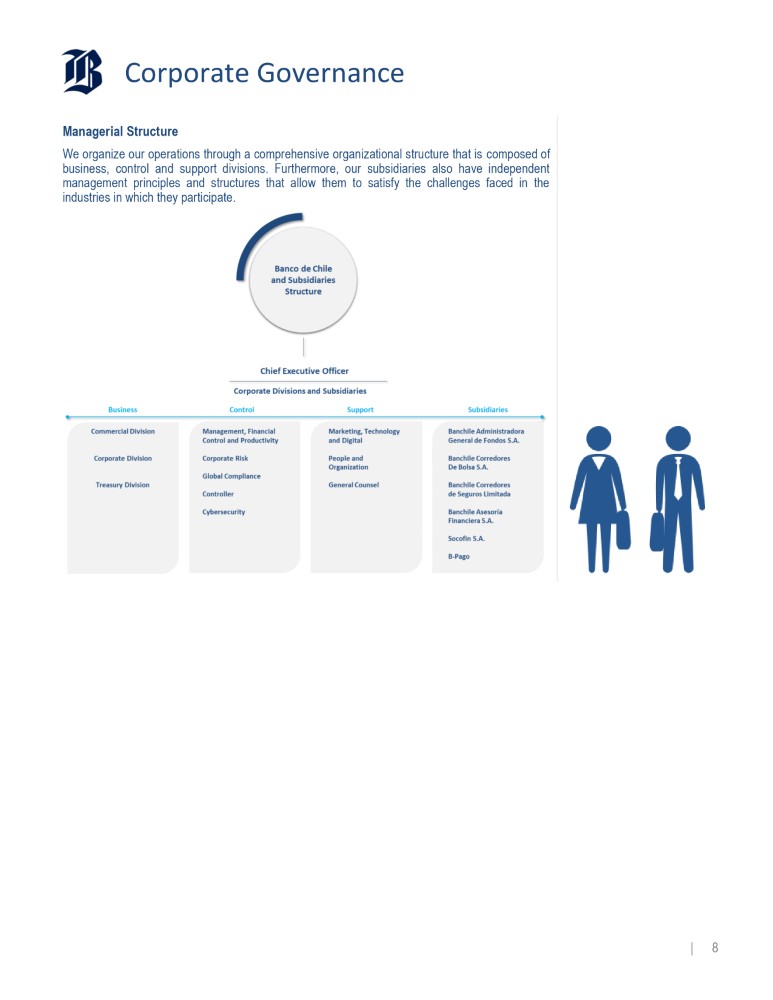
| 7 Corporate Governance Managerial Structure We organize our operations through a comprehensive organizational structure that is composed of business, control and support divisions . Furthermore, our subsidiaries also have independent management principles and structures that allow them to satisfy the challenges faced in the industries in which they participate . | 8 Business Strategy Corporate Statements and Commitments Mission Purpose We are a leading, globally - connected financial corporation with a prestigious business tradition.

We provide financial services of excellence to each customer segment, offering creative, agile and effective solutions and thus ensuring value creation for our shareholders, our employees and the community at large. To contribute to the development of the country, people and companies. Corporate Values Vision In everything we do, we constantly strive to be the best bank for our customers, the best place to work, and the best investment for our shareholders. We do so in a way that demonstrates our commitment to the people in our organization and the community in general.

| 9 Business Strategy Commitments Our Customers We pursue to be the bank with the best service quality, offering innovative, simple and secure products and services designed to meet the needs and aspirations of each segment, with timely, agile and proactive service in order to build trusted and long - term relationships . To achieve this we strive to continuously develop always - available service channels that allow fluid and timely communication, while counting on employees devoted to customer service that also have digital knowledge . Our Staff We are certain that our team is a distinctive asset and a solid competitive advantage in the industry . This is based on their commitment, dedication and excellence . For this reason, we offer development and growth opportunities based on merit, providing competitive compensation and economic and welfare benefits . At the same time, we seek to promote a respectful, friendly and collaborative work environment in a place that has suitable technological tools and infrastructure . We build a homogeneous and distinctive culture, based on corporate commitments and values through the involvement in social activities, in order to become a Corporation distinguished as the best place to work and the best team in Chilean banking industry . Our Shareholders We honor our shareholders' confidence by maximizing the company's value, with responsibility, prudence and a long - term business vision . We deploy our business strategy based on appropriate risk management and a culture of operational excellence that allows us to project the sustainable leadership of the corporation . Our Community We are convinced that our success is linked to the sustainable development of our country and the community . That is why in our daily actions we reflect our commitment to community by supporting diverse initiatives to overcome adversity, through the development of internal policies and being present in emblematic solidarity crusades . We are committed to respecting diversity and inclusion, entrepreneurship, environmental care and equality and governance dimensions .

| 10 Business Strategy Stakeholder Engagement Banco de Chile keeps several communication channels open with our stakeholders in order to gather information to answer questions and manage concerns regarding different issues. We also actively participate in social media and count on specific channels dedicated to managing inquiries and requirements. Frequency Mechanisms and/or Channels of Communication Engagement Objectives Stakeholders Ongoing Monthly Ongoing www.bancochile.c l Branches and ATMs Telephone banking service 600 637 37 37 Mobile applications Newsletter: Sustainability mass email https://cl.linkedin.com/company/banco - de - chile Twitter and Instagram:@bancodechile | @bancoedwards |@ayudaBancoChile Facebook: bancodechile | bancoedwards Offer excellent service characterized by integrity, personalization, agility and proactivity in order to build long - term, trust - based relationships . Use permanently available service channels to keep customers informed in a timely and appropriate manner . Provide differentiated financial solutions featuring quality, innovative products and services for each customer segment . They are the reason for our existence and the center of all our decisions. Customers Annual Quarterly Monthly Ongoing Shareholders’ meeting Annual Report & Form 20 - F Financial reporting Investor Relations: ir@bancochile.c l Webcasts Website Be the best investment option, maintaining a leading position by value of shares traded . Promote operational efficiency and productivity in order to encourage prudent risk management based on integrity and transparency . They share our purpose, trust in our project, and contribute financial resources for our operation. Shareholders Ongoing Intranet / Emails / SOY_DELCHILE Teams Group Competency Assessment Counseling Program (Programa Orienta) My Health Program (Programa Mi Salud) “Más Conectados” Platform Quality of Life Program / Active Chile Program Point Bank / Team meetings Contact: comitedeetica@bancochile.c l apoyolaboral@bancochile.c l centroatencionpersonas@bancochile.c l Offer merit - based development opportunities with competitive compensation and economic benefits . Promote a respectful, polite work environment in a location equipped with the appropriate technology and infrastructure . They represent a distinctive asset for us, whose commitment, dedication, and excellence allow us to honor our purpose every day. Employees Ongoing Contact: sostenibilidad@bancochile.cl www.bancochile.c l prensa@bancochile.cl www.bancochile.cl/saladeprensa https://cl.linkedin.com/company/banco - de - chile Twitter and Instagram:@bancodechile | @bancoedwards @ayudaBancoChile Facebook: bancodechile | bancoedwards Tik Tok: @fanaticosdelchile Promote financial education . Strengthen and enhance inclusion and respect for diversity for a more equitable society with greater opportunities . Manage the business in an environmentally respectful manner . Address press requirements . Support SMEs and entrepreneurs in developing their businesses . We are convinced that our success is linked to the sustainable development of the country and the community. Community Ongoing • proveedores2@bancochile.c l • denunciasley20393@bancochile.cl • ARIBA platform. Build long - term collaborative supplier relationships based on transparency, competition, efficiency, respect and objectivity . Streamline and increase the effectiveness of processes for supplying goods and services . Ensure that services are hired, and goods are acquired under market conditions . They enable us to carry out our operations and are part of our value chain.

Suppliers | 11 Business Strategy Competitive Landscape, Business Trends and Regulation Chilean Financial Industry The financial system in Chile consists of various industries, including Banking, Pension Funds, Insurance and Mutual Funds, with the Banking sector being the most relevant, with total loans representing more than 80 % of the Chilean GDP . The Chilean banking industry, in turn, consists of 17 banks, 16 of which are private sector banks and one is an state - owned bank, namely, Banco Estado . Within the banking industry, we face significant and increasing competition in all market segments in which we operate . As a comprehensive commercial bank that offers a wide range of services to enterprises and individual customers, we deal with a variety of competitors, ranging from large private sector commercial banks to more specialized entities, such as “niche” banks . In addition, we face competition from other types of players, such as non - bank leasing, crowdfunding, factoring and automotive finance companies, fund managers and insurance companies within the savings product market, as well as insurance companies in the mortgage credit market . The Chilean banking industry has experienced increased levels of competition in recent years from domestic as well as foreign banks . It is worth mentioning that the progressive increase in competition has occurred in combination with the consolidation of the industry through diverse mergers and acquisitions, which have resulted in more comprehensive banking players that participate in all market segments . In this context, in recent years other non - traditional providers of financial services have emerged, such as e - commerce, local and foreign fintech companies, Telecom companies, like internet and mobile phone providers, and more recently some marketplaces that offer financing, directly to their customers or providers, which has resulted in the disintermediation of traditional banking service providers that have become increasingly challenged . In the retail market, we compete with other private sector Chilean banks, as well as with Banco del Estado . Among private sector banks, we believe our strongest competitors in this market are Banco Santander — Chile, Scotiabank Chile and BCI, which have developed diversified business strategies focused on both small and medium sized companies and middle - income segments of the Chilean population . In the wholesale market, our strongest competitors are Banco Santander - Chile, BCI, Itaú and Scotiabank Chile . Likewise, our most relevant competitors in the high - income segment are Banco Santander Chile and Banco Bice, which use specialized business models that provide wealth management services and traditional banking services, just like us . Additionally, our subsidiaries compete with companies that offer non - banking specialized financial services in the higher - income individuals segment and the middle market and corporate segment such as Larrain Vial, BTG Pactual, Moneda Patria Investments and Credicorp Capital, whose core businesses are stock brokerage, financial advisory and wealth management services . Other Chilean commercial entities also compete in these markets of specialized financial services, but they are less focused on such businesses . Key Trends in the Banking Business Banco de Chile’s strategy is continuously adapting to the evolution of the business environment . Below are the main elements and trends that currently characterize the business backdrop : Global Environment: Normalization of both inflation and interest rates. Climate change. Armed conflicts and geopolitical reordering. Lower profitability in the banking business. Local Environment: Economic slowdown and subdued private investment. Increased criminality. Political, legal, and institutional uncertainty. Political fragmentation. | 12 Business Strategy Health, pension, and tax reforms in pipeline.
Strengthening of consumer rights (data security). | 13 Banking Industry: New technological capabilities (AI, Cloud, Cyber). Regulatory pressure and increasing capital requirements. Widened competitive perimeter (Open Banking, Fintechs). Sustainability and climate change. Business model modernization, talent management, and IT strategies to adapt to the new environment . More demanding customers. Optimization of the physical service network and consolidation of digital channels as the main way for interaction with customers . Cost base optimization to mitigate increased competition and regulatory requirements . Regulatory Environment Financial Market Commission (CMF): The CMF is responsible for regulating, supervising and sanctioning the operations, stability and development of the Chilean financial market (made up of listed companies, banks and financial institutions, insurance companies, insurance brokers, mutual funds and investment funds), promoting the participation of market agents and ensuring public confidence . To achieve this objective, the CMF must have a global and systemic vision, which allows the interests of investors and insured agents to be safeguarded . Regarding the specific powers of the CMF related to banking regulation, this entity authorizes the creation of new banks and has broad powers to interpret and enforce legal and regulatory requirements applicable to banks and financial institutions . Furthermore, in cases of noncompliance with its legal and regulatory requirements, the CMF has the ability to impose sanctions . In extreme cases, it can appoint, with the prior approval of the board of directors of the Central Bank, a provisional administrator to manage banks . It also has the mandate to approve any amendment to banks’ bylaws . A bank’s financial statements as of December 31 of each year must be audited and submitted to the CMF together with the opinion of its independent auditors . Also, banks are required by the CMF to include in mid - year financial statements (as of June 30 of every fiscal year) an auditor’s limited review statement in accordance with Chilean GAAP . In addition, banks are required to provide extensive information regarding their operations at various periodic intervals to the CMF by means of specialized reports associated with business - related risk, capital, products, debtors, transactions, distribution channels, among others . The Central Bank : The Central Bank is an autonomous legal entity created under the framework of the Chilean Constitution . It is subject to its Ley Orgánica Constitucional (the “Organic Constitutional Law”) and the current Chilean Constitution . The Central Bank is directed and administered by a board of directors composed of five members appointed by the President of Chile, subject to Senate approval . The legal purpose of the Central Bank is to maintain the stability of the Chilean peso, that is, to keep inflation low and stable over time . It must also promote the stability and efficiency of the financial system, ensuring the normal functioning of internal and external payments . The agency regulates the amount of money and credit in circulation, executes international exchange operations and issues monetary, credit, financial and international exchange regulations . Securities and Exchange Commission (SEC) : Since Banco de Chile has been listed on the New York Stock Exchange since January 1 st , 2002 , we are subject to regulation and supervision of the Securities and Exchange Commission . We are required to file with SEC the form 20 F, including audited financial statements, as of December of each year in accordance with IFRS as issued by the International Accounting Standards Board .
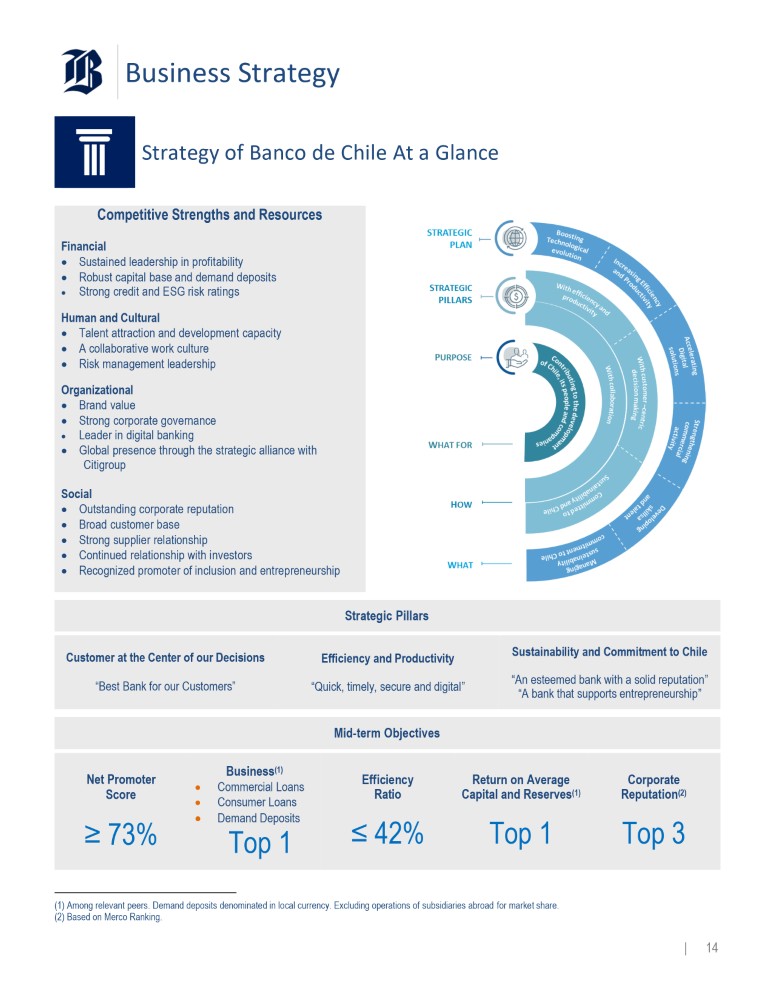
Business Strategy Strategy of Banco de Chile At a Glance Competitive Strengths and Resources Financial Sustained leadership in profitability Robust capital base and demand deposits Strong credit and ESG risk ratings Human and Cultural Talent attraction and development capacity A collaborative work culture Risk management leadership Organizational Brand value Strong corporate governance Leader in digital banking Global presence through the strategic alliance with Citigroup Social Outstanding corporate reputation Broad customer base Strong supplier relationship Continued relationship with investors Recognized promoter of inclusion and entrepreneurship Strategic Pillars Sustainability and Commitment to Chile “An esteemed bank with a solid reputation” “A bank that supports entrepreneurship” Efficiency and Productivity “Quick, timely, secure and digital” Customer at the Center of our Decisions “Best Bank for our Customers” Mid - term Objectives Corporate Reputation (2) Top 3 Return on Average Capital and Reserves (1) Top 1 Efficiency Ratio ≤ 42% Business (1) Commercial Loans Consumer Loans Demand Deposits Top 1 Net Promoter Score ≥ 73% (1) Among relevant peers. Demand deposits denominated in local currency. Excluding operations of subsidiaries abroad for market share. (2) Based on Merco Ranking.

| 14 Business Strategy Business Segments Description In line with our strategic pillar “Customer at the Center of our Decisions”, we pursue to offer the best value proposition in the banking industry by delivering excellent service quality, along with timely and effective solutions.

Given the wide diversity of clients, ranging from individuals to private banking customers and from micro - entrepreneurs to corporations, we organize our operations and value propositions into four business segments : | 15 Business Strategy Retail Banking Segment This business unit provides universal financial solutions to students, employed workers, self – employed workers, retired people, individuals with medium to high incomes, as well as to and micro, small and medium - sized companies with annual sales of up to UF 70 , 000 . The value propositions are characterized by their differentiation, recognizing customers preferences in their way of interacting with the bank, whether on - site or remotely, according to their needs for the simplest to the most sophisticated products and services . The financial products and services offered by this segment include current accounts, debit cards, credit cards, lines of credit, mortgage loans, consumer loans, commercial loans, general purpose mortgage loans, finance leases, factoring services, mutual fund management and stock brokerage, foreign trade, payments and collections, insurance brokerage including life and general insurance, time deposits, savings instruments and foreign currency services, through a network of branches operating under the names of “Banco de Chile” and “Banco Edwards Citi ” . Wholesale Banking Segment The Wholesale Banking unit provides products and services to companies with annual sales that exceed UF 70 , 000 , which include a large proportion of Chilean listed and unlisted companies, subsidiaries of multinational companies and conglomerates operating in Chile, in the financial, commercial, manufacturing, industrial, infrastructure, real estate and construction sectors, as well as projects, concessions, family offices and large companies . This unit provides a wide range of products that include short and long - term commercial loans, working capital loans, lines of credit, corporate credit cards, foreign trade and foreign currency brokerage, factoring services, leases and long - term syndicated loans . Investment banking services are provided by the subsidiary Banchile Asesoría Financiera S . A . , such as transaction structuring services for mergers and acquisitions and assistance with debt restructuring . It provides cash management services, which include paying payroll, suppliers, pensions and dividends, collection services, connections to international funds transfer networks, checking accounts and deposits, fund management, treasury and investment management, derivative contracts, insurance brokerage, and other tailored services .
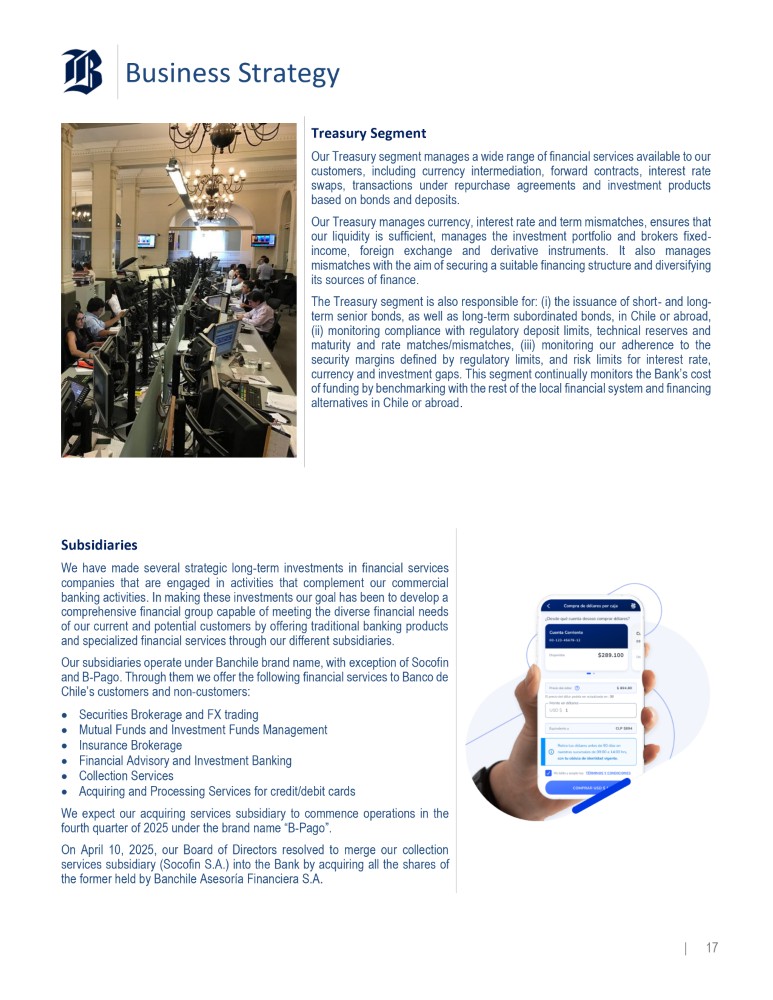
| 16 Business Strategy Treasury Segment Our Treasury segment manages a wide range of financial services available to our customers, including currency intermediation, forward contracts, interest rate swaps, transactions under repurchase agreements and investment products based on bonds and deposits . Our Treasury manages currency, interest rate and term mismatches, ensures that our liquidity is sufficient, manages the investment portfolio and brokers fixed - income, foreign exchange and derivative instruments . It also manages mismatches with the aim of securing a suitable financing structure and diversifying its sources of finance . The Treasury segment is also responsible for : (i) the issuance of short - and long - term senior bonds, as well as long - term subordinated bonds, in Chile or abroad, (ii) monitoring compliance with regulatory deposit limits, technical reserves and maturity and rate matches/mismatches, (iii) monitoring our adherence to the security margins defined by regulatory limits, and risk limits for interest rate, currency and investment gaps . This segment continually monitors the Bank’s cost of funding by benchmarking with the rest of the local financial system and financing alternatives in Chile or abroad . Subsidiaries We have made several strategic long - term investments in financial services companies that are engaged in activities that complement our commercial banking activities . In making these investments our goal has been to develop a comprehensive financial group capable of meeting the diverse financial needs of our current and potential customers by offering traditional banking products and specialized financial services through our different subsidiaries . Our subsidiaries operate under Banchile brand name, with exception of Socofin and B - Pago . Through them we offer the following financial services to Banco de Chile’s customers and non - customers : Securities Brokerage and FX trading Mutual Funds and Investment Funds Management Insurance Brokerage Financial Advisory and Investment Banking Collection Services Acquiring and Processing Services for credit/debit cards We expect our acquiring services subsidiary to commence operations in the fourth quarter of 2025 under the brand name “B - Pago” . On April 10 , 2025 , our Board of Directors resolved to merge our collection services subsidiary (Socofin S . A . ) into the Bank by acquiring all the shares of the former held by Banchile Asesoría Financiera S . A .
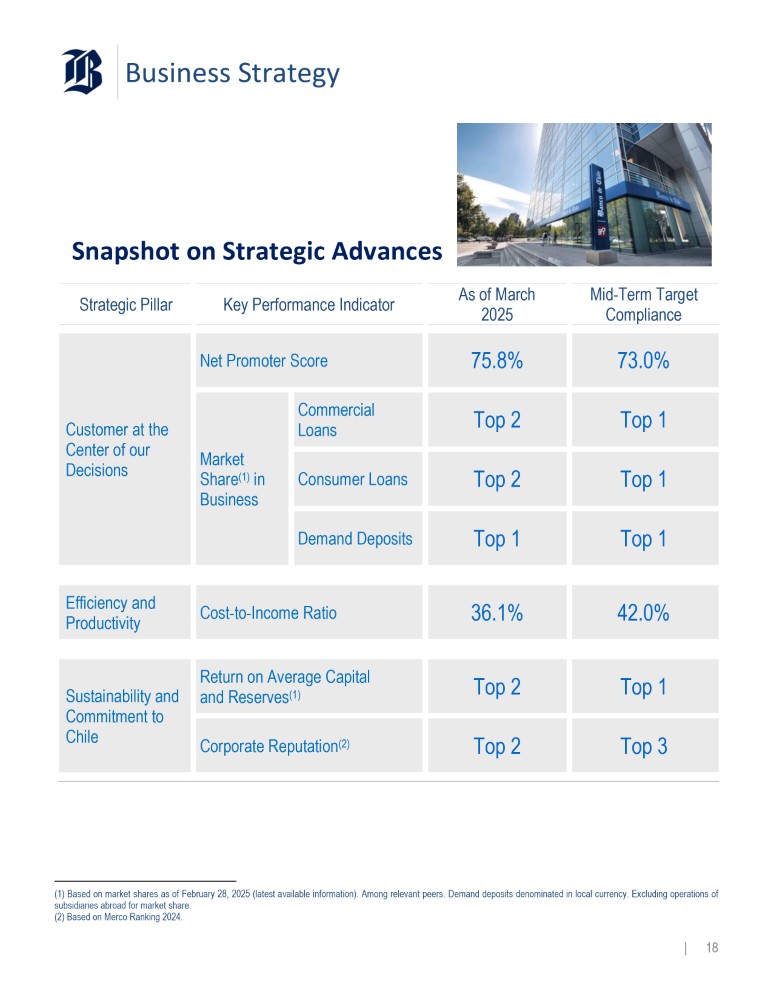
| 17 Business Strategy Snapshot on Strategic Advances Strategic Pillar Key Performance Indicator As of March Mid - Term Target 2025 Compliance 73.0% 75.8% Net Promoter Score Customer at the Center of our Decisions Top 1 Top 2 Commercial Loans Market Share (1) in Business 3 Top 1 Top 2 Consumer Loans Top 1 Top 1 Demand Deposits 42.0% 36.1% Cost - to - Income Ratio Efficiency and Productivity Top 1 Top 2 Return on Average Capital and Reserves (1) Sustainability and Commitment to Chile Top 3 Top 2 Corporate Reputation (2) (1) Based on market shares as of February 28, 2025 (latest available information). Among relevant peers. Demand deposits denominated in local currency. Excluding operations of subsidiaries abroad for market share. (2) Based on Merco Ranking 2024.
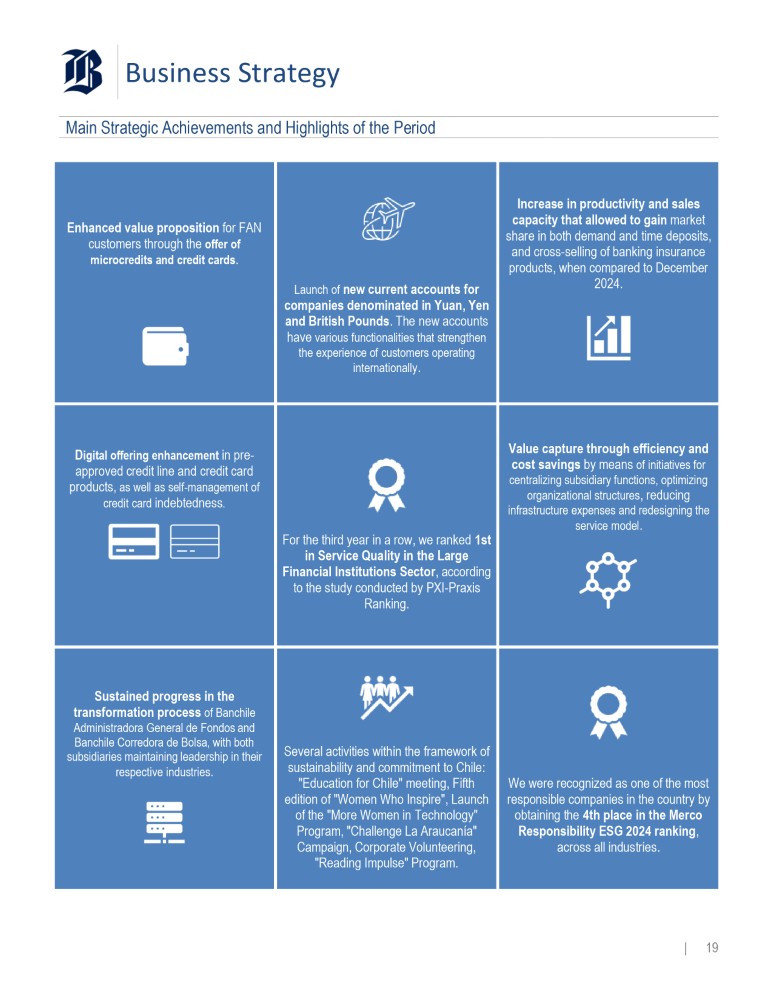
| 18 Business Strategy Main Strategic Achievements and Highlights of the Period Increase in productivity and sales capacity that allowed to gain market share in both demand and time deposits, and cross - selling of banking insurance products, when compared to December 2024. Launch of new current accounts for companies denominated in Yuan, Yen and British Pounds . The new accounts have various functionalities that strengthen the experience of customers operating internationally . Enhanced value proposition for FAN customers through the offer of microcredits and credit cards . Value capture through efficiency and cost savings by means of initiatives for centralizing subsidiary functions, optimizing organizational structures , reducing infrastructure expenses and redesigning the service model . For the third year in a row, we ranked 1st in Service Quality in the Large Financial Institutions Sector , according to the study conducted by PXI - Praxis Ranking. D igital offering enhancement in pre - approved credit line and credit card products, as well as self - management of credit card indebtedness . We were recognized as one of the most responsible companies in the country by obtaining the 4th place in the Merco Responsibility ESG 2024 ranking , across all industries. Several activities within the framework of sustainability and commitment to Chile: "Education for Chile" meeting, Fifth edition of "Women Who Inspire", Launch of the "More Women in Technology" Program, "Challenge La Araucanía" Campaign, Corporate Volunteering, "Reading Impulse" Program. Sustained progress in the transformation process of Banchile Administradora General de Fondos and Banchile Corredora de Bolsa, with both subsidiaries maintaining leadership in their respective industries . | 19 Business Strategy Stakeholders Commitment Advances (1) All staff metrics consider the Banco de Chile’s workforce on an individual basis (excluding subsidiaries).
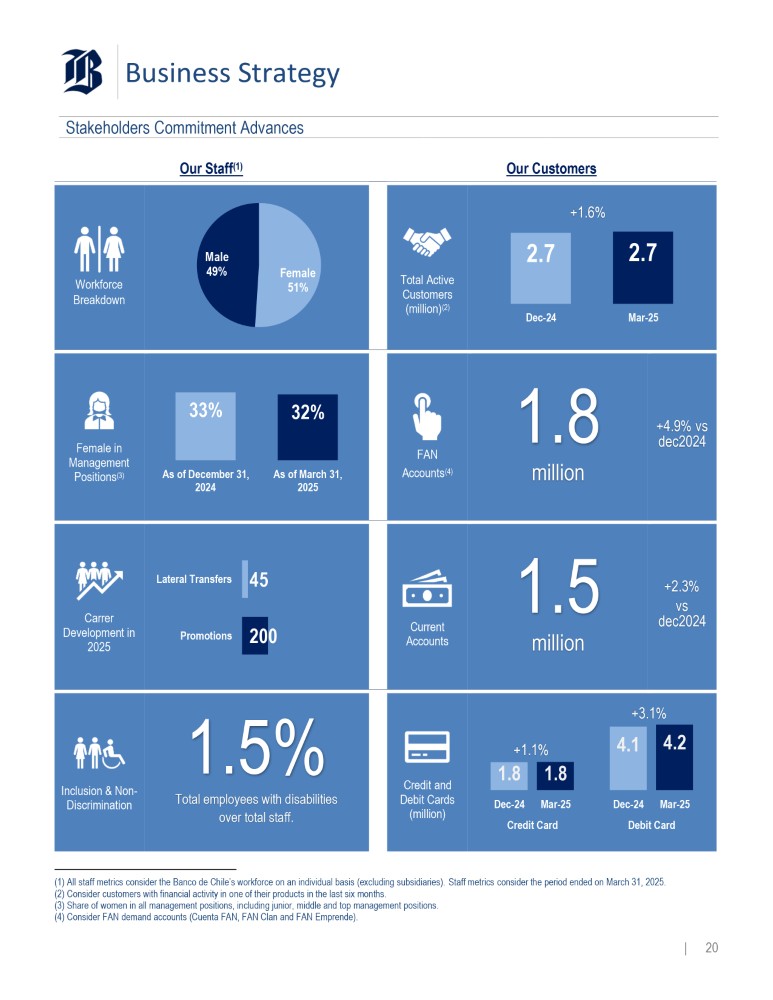
Staff metrics consider the period ended on March 31, 2025. (2) Consider customers with financial activity in one of their products in the last six months. (3) Share of women in all management positions, including junior, middle and top management positions. (4) Consider FAN demand accounts (Cuenta FAN, FAN Clan and FAN Emprende). Our Customers Our Staff (1) +1.6% 2.7 2.7 Dec - 24 Mar - 25 Total Active Customers (million) ( 2 ) Male 49% Female 51% Workforce Breakdown +4.9% vs dec2024 1.8 million FAN Accounts (4) 33% 32% As of December 31, As of March 31, 2024 2025 Female in Management Positions (3) +2.3% vs dec2024 1.5 million Current Accounts Lateral Transfers 45 Promotions 200 Carrer Development in 2025 +3.1% +1.1% 4.1 4.2 1.8 1.8 Dec - 24 Mar - 25 Dec - 24 Mar - 25 Credit Card Debit Card Credit and Debit Cards (million) 1.5% Total employees with disabilities over total staff.
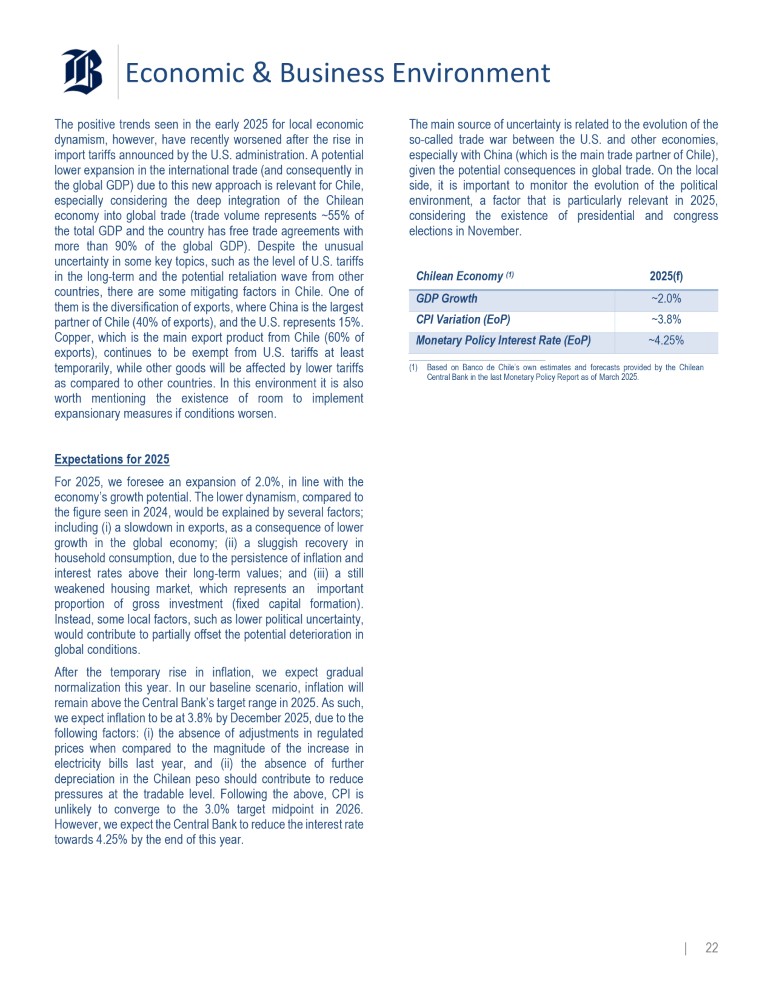
Inclusion & Non - Discrimination | 20 Economic & Business Environment Economic Outlook 1.5 Recent economic data confirm that overall activity improved at a faster - than - expected pace by the end of 2024 . According to the Monthly Economic Activity Index (IMACEC), released by the Central Bank, GDP increased in the 4 Q 24 by 4 . 0 % on an annual basis, after expanding 2 . 0 % in the previous quarter . The breakdown shows that GDP growth was mainly led by the external sector, as exports rose by 9 . 2 % annually, while private consumption grew 2 . 0 % , driven by the 9 . 8 % annual increase in durable goods . By economic sector, mining had a positive influence by growing 7 . 3 % on an annual basis in the 4 Q 24 , whereas the construction sector continued to weaken by decreasing 1 . 1 % on a yearly basis . Consequently, GDP posted higher - than - expected 2 . 6 % expansion in 2024 . GDP Growth (Annual growth, %) 4.0 3.3 2.0 1.2 Mar - 24 Jun - 24 Sep - 24 Dec - 24 Mar - 25(f) Available data from early 2025 suggest a positive performance in domestic demand . In January, the economy grew by 2 . 3 % on an annual basis, driven by commerce and manufacturing activity, which rose by 8 . 7 % and 6 . 4 % , respectively, on an annual basis . In February, however, activity slightly contracted by 0 . 1 % on a yearly basis, which is mainly attributable to temporary factors, including a negative calendar effect (February 2024 was one day longer) and a power outage that affected more than 90 % of the country for one day . Despite this unexpected event, several indicators, such as business confidence and capital goods imports, displayed an improved outlook for private spending . Regarding the labor market, the unemployment rate stood at 8 . 4 % in February, which is 10 bp . below the 8 . 5 % reported in the same period of 2024 . This change had mainly to do with a 0 . 8 % annual growth in the labor force and a 0 . 9 % annual increase in the employed population . 12m CPI Change & 3m Average Unemployment (In Percentage) 3.7 4.2 4.1 4.5 4.9 8.7 8.3 8.7 8.1 8.5 Mar - 24 Jun - 24 Sep - 24 Dec - 24 Mar - 25(f) CPI Unemployment In terms of prices, headline inflation remains above the upper boundary of the Central Bank’s target range . In fact, the annual inflation rate (measured as 12 - month CPI variation) in March 2025 was 4 . 9 % , above the 3 . 7 % observed a year earlier . The persistence of inflation in Chile is attributable to the upward trend in several volatile prices, such as energy (this includes the adjustment of electricity fares) and food, which rose 14 . 2 % and 5 . 4 % on yearly basis, respectively, as of March 2025 . As a response to these trends, the Central Bank decided to maintain the interest rate at 5 . 00 % in March, with a neutral bias . This decision was based on the new baseline scenario released in its Quarterly Monetary Policy Report in March, where the Central Bank board acknowledged the existence of higher inflationary risks .
| 21 Economic & Business Environment The positive trends seen in the early 2025 for local economic dynamism, however, have recently worsened after the rise in import tariffs announced by the U . S . administration . A potential lower expansion in the international trade (and consequently in the global GDP) due to this new approach is relevant for Chile, especially considering the deep integration of the Chilean economy into global trade (trade volume represents ~ 55 % of the total GDP and the country has free trade agreements with more than 90 % of the global GDP) . Despite the unusual uncertainty in some key topics, such as the level of U . S . tariffs in the long - term and the potential retaliation wave from other countries, there are some mitigating factors in Chile . One of them is the diversification of exports, where China is the largest partner of Chile ( 40 % of exports), and the U . S . represents 15 % . Copper, which is the main export product from Chile ( 60 % of exports), continues to be exempt from U . S . tariffs at least temporarily, while other goods will be affected by lower tariffs as compared to other countries . In this environment it is also worth mentioning the existence of room to implement expansionary measures if conditions worsen . Expectations for 2025 For 2025 , we foresee an expansion of 2 . 0 % , in line with the economy’s growth potential . The lower dynamism, compared to the figure seen in 2024 , would be explained by several factors ; including (i) a slowdown in exports, as a consequence of lower growth in the global economy ; (ii) a sluggish recovery in household consumption, due to the persistence of inflation and interest rates above their long - term values ; and (iii) a still weakened housing market, which represents an important proportion of gross investment (fixed capital formation) . Instead, some local factors, such as lower political uncertainty, would contribute to partially offset the potential deterioration in global conditions . After the temporary rise in inflation, we expect gradual normalization this year . In our baseline scenario, inflation will remain above the Central Bank’s target range in 2025 . As such, we expect inflation to be at 3 . 8 % by December 2025 , due to the following factors : (i) the absence of adjustments in regulated prices when compared to the magnitude of the increase in electricity bills last year, and (ii) the absence of further depreciation in the Chilean peso should contribute to reduce pressures at the tradable level . Following the above, CPI is unlikely to converge to the 3 . 0 % target midpoint in 2026 . However, we expect the Central Bank to reduce the interest rate towards 4 . 25 % by the end of this year . | 22 2025(f) Chilean Economy (1) ~2.0% GDP Growth ~3.8% CPI Variation (EoP) ~4.25% Monetary Policy Interest Rate (EoP) The main source of uncertainty is related to the evolution of the so - called trade war between the U . S . and other economies, especially with China (which is the main trade partner of Chile), given the potential consequences in global trade . On the local side, it is important to monitor the evolution of the political environment, a factor that is particularly relevant in 2025 , considering the existence of presidential and congress elections in November . (1) Based on Banco de Chile’s own estimates and forecasts provided by the Chilean Central Bank in the last Monetary Policy Report as of March 2025.
Economic & Business Environment Banking Industry Performance and Projections The loan portfolio of the Chilean banking industry totalled Ch $ 241 , 536 , 304 million as of February 28 , 2025 (latest available data), excluding operations of foreign subsidiaries . When compared to February 2024 , this amount represents a 2 . 7 % nominal growth in total loans and a 2 . 0 % real contraction when adjusting for 12 - month inflation (measured as UF variation) . Total loan growth continues to be mainly driven by commercial loans, which remain in negative 12 - month variation . To a lesser degree, consumer loans stayed mainly flat on an annual basis in real terms while residential mortgage loans have shown a tempered yet steady decline over the last 12 months . Loan Growth (1) (12m % change, in real terms) 2.6% 0.3% - 0.8% - 1.2% - 2.6% - 2.0% - 1.6% - 0.4% - 1.9% - 4.8% 2.4% 1.9% - 0.2% - 1.4% 1.6% - 0.2% - 1.6% 1.7% 0.2% - 5.7% Sep - 24 Feb - 24 Jun - 24 Total Loans Residential Loans Dec - 24 Feb - 25 Commercial Loans Consumer Loans (1) Figures do not include operations of subsidiaries abroad. In fact, commercial loans managed by the industry posted an annual real decrease of 4 . 8 % ( 0 . 2 % nominal decline) in February 2025 , which is nothing but related to sluggish economic activity and private investment in particular that continued to be behind, especially in construction and infrastructure . As demonstrated by the monthly business confidence index (IMCE) published by the Central Bank, after peaking up slightly above 50 % in February 2025 , the business sentiment returned to negative territory in March, which could be influenced by fears about the evolution of both the global and local economy, given the announcements of a revised foreign policy by the U . S . administration . On the whole, commercial loans remain stagnated, which has been prompted by subdued demand from both wholesale and SME banking . Gloomy expectations, looming business risks and still elevated borrowing costs would be conducting investment decisions . Regarding personal banking, consumer loans recorded a 0 . 2 % real annual decline ( 4 . 7 % nominal increase) as of February 28 , 2025 . In line with the drivers mentioned in the previous reports, there are supply and demand conditions conducting the evolution of consumer loans, including : (i) household consumption that remains constrained, (ii) delinquency indicators that have shown an improvement but keep well above the long - term average observed before the pandemic, given the prevailing level of some important market factors, which results in increased cost of risk for banks, and (iii) the unemployment rate that has not returned to pre - pandemic levels . In a similar fashion, even though residential mortgage loans continued to show real positive growth by posting a 1 . 6 % real annual increase ( 6 . 5 % nominal) in February 2025 , it is possible to realize that growth in this lending product has clearly slowed down over the last 12 months . As we have mentioned in the past, demand for housing continues to drive the demand for residential mortgage loans, but there exist other factors, such as the current level of long - term interest rates that determine purchase decisions by borrowers . As for liabilities, Time Deposits (excluding foreign subsidiaries) amounted to Ch $ 111 , 379 , 808 million in February 2025 , which represents a 2 . 2 % nominal growth that results in a 2 . 5 % real contraction when adjusting for 12 - month inflation . As we have pointed out over the last quarters, provided that real profitability earned on Time Deposits has declined significantly as the monetary policy interest rate has remained at a similar level as 12 - month inflation, this kind of liability has become less attractive for customers . In addition, Demand Deposits reached Ch $ 67 , 642 , 604 million in March 2025 , level that was 2 . 0 % above (real contraction of 2 . 7 % ) the amount registered in February 2024 .
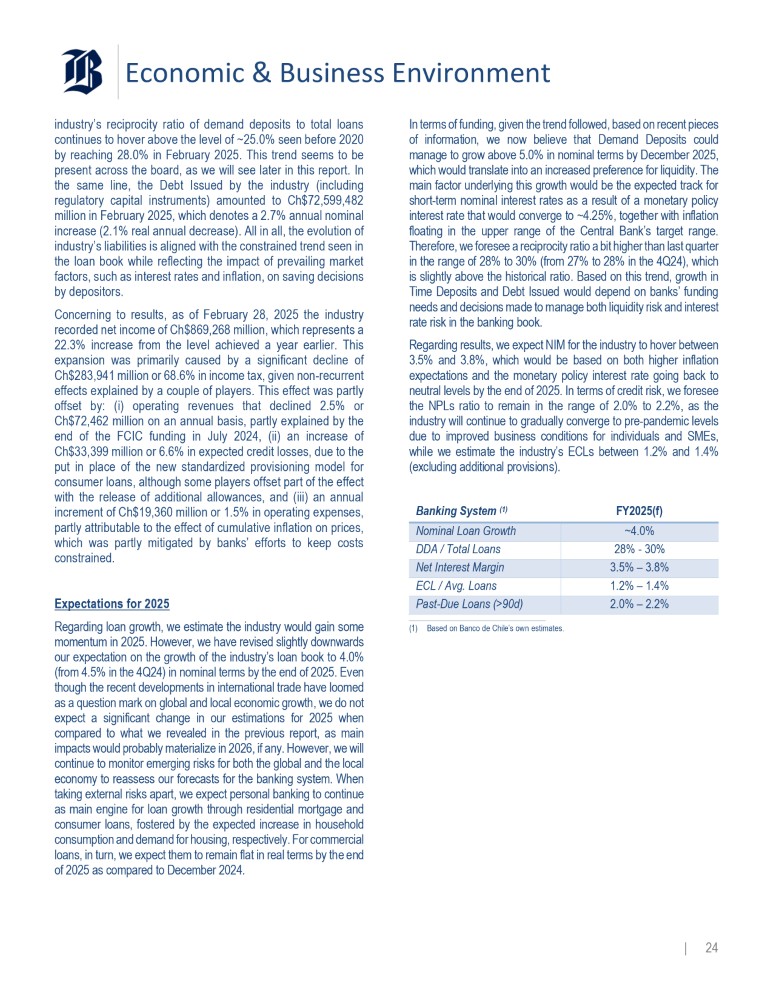
Thus, as we have noticed in past reports, the | 23 Economic & Business Environment industry’s reciprocity ratio of demand deposits to total loans continues to hover above the level of ~ 25 . 0 % seen before 2020 by reaching 28 . 0 % in February 2025 . This trend seems to be present across the board, as we will see later in this report . In the same line, the Debt Issued by the industry (including regulatory capital instruments) amounted to Ch $ 72 , 599 , 482 million in February 2025 , which denotes a 2 . 7 % annual nominal increase ( 2 . 1 % real annual decrease) . All in all, the evolution of industry’s liabilities is aligned with the constrained trend seen in the loan book while reflecting the impact of prevailing market factors, such as interest rates and inflation, on saving decisions by depositors . Concerning to results, as of February 28 , 2025 the industry recorded net income of Ch $ 869 , 268 million, which represents a 22 . 3 % increase from the level achieved a year earlier . This expansion was primarily caused by a significant decline of Ch $ 283 , 941 million or 68 . 6 % in income tax, given non - recurrent effects explained by a couple of players . This effect was partly offset by : (i) operating revenues that declined 2 . 5 % or Ch $ 72 , 462 million on an annual basis, partly explained by the end of the FCIC funding in July 2024 , (ii) an increase of Ch $ 33 , 399 million or 6 . 6 % in expected credit losses, due to the put in place of the new standardized provisioning model for consumer loans, although some players offset part of the effect with the release of additional allowances, and (iii) an annual increment of Ch $ 19 , 360 million or 1 . 5 % in operating expenses, partly attributable to the effect of cumulative inflation on prices, which was partly mitigated by banks’ efforts to keep costs constrained . Expectations for 2025 Regarding loan growth, we estimate the industry would gain some momentum in 2025 . However, we have revised slightly downwards our expectation on the growth of the industry’s loan book to 4 . 0 % (from 4 . 5 % in the 4 Q 24 ) in nominal terms by the end of 2025 . Even though the recent developments in international trade have loomed as a question mark on global and local economic growth, we do not expect a significant change in our estimations for 2025 when compared to what we revealed in the previous report, as main impacts would probably materialize in 2026 , if any . However, we will continue to monitor emerging risks for both the global and the local economy to reassess our forecasts for the banking system . When taking external risks apart, we expect personal banking to continue as main engine for loan growth through residential mortgage and consumer loans, fostered by the expected increase in household consumption and demand for housing, respectively . For commercial loans, in turn, we expect them to remain flat in real terms by the end of 2025 as compared to December 2024 . In terms of funding, given the trend followed, based on recent pieces of information, we now believe that Demand Deposits could manage to grow above 5 . 0 % in nominal terms by December 2025 , which would translate into an increased preference for liquidity . The main factor underlying this growth would be the expected track for short - term nominal interest rates as a result of a monetary policy interest rate that would converge to ~ 4 . 25 % , together with inflation floating in the upper range of the Central Bank’s target range . Therefore, we foresee a reciprocity ratio a bit higher than last quarter in the range of 28 % to 30 % (from 27 % to 28 % in the 4 Q 24 ), which is slightly above the historical ratio . Based on this trend, growth in Time Deposits and Debt Issued would depend on banks’ funding needs and decisions made to manage both liquidity risk and interest rate risk in the banking book . Regarding results, we expect NIM for the industry to hover between 3 . 5 % and 3 . 8 % , which would be based on both higher inflation expectations and the monetary policy interest rate going back to neutral levels by the end of 2025 . In terms of credit risk, we foresee the NPLs ratio to remain in the range of 2 . 0 % to 2 . 2 % , as the industry will continue to gradually converge to pre - pandemic levels due to improved business conditions for individuals and SMEs, while we estimate the industry’s ECLs between 1 . 2 % and 1 . 4 % (excluding additional provisions) . FY2025(f) Banking System (1) ~4.0% Nominal Loan Growth 28% - 30% DDA / Total Loans 3.5% – 3.8% Net Interest Margin 1.2% – 1.4% ECL / Avg. Loans 2.0% – 2.2% Past - Due Loans (>90d) (1) Based on Banco de Chile’s own estimates.
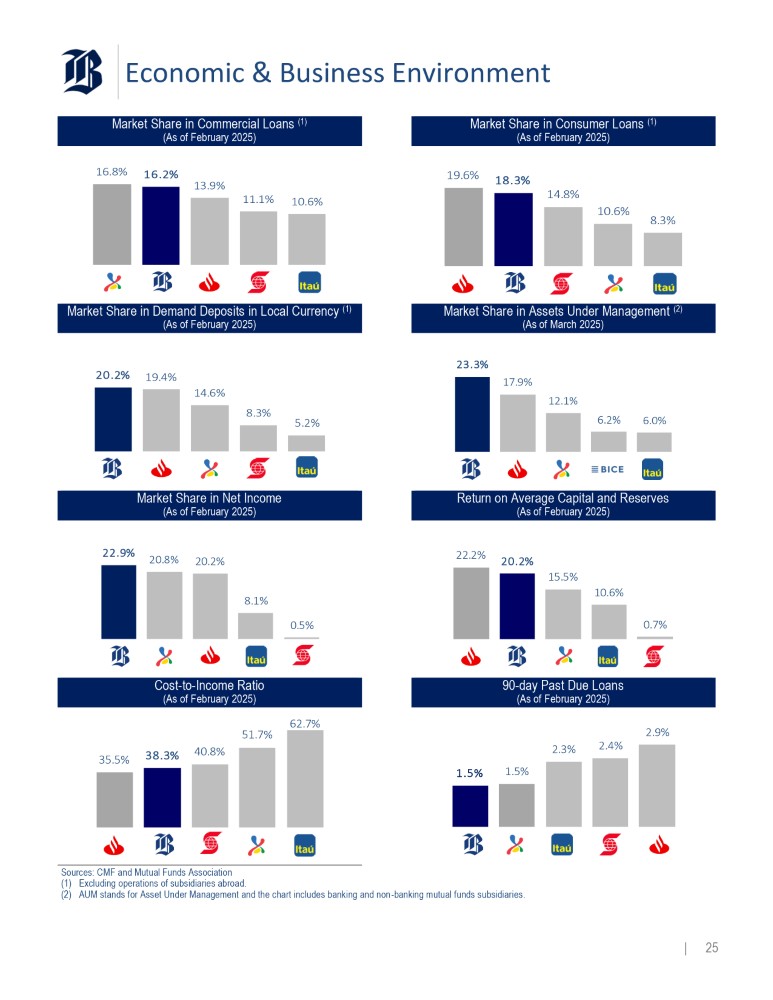
| 24 Economic & Business Environment Market Share in Consumer Loans (1) (As of February 2025) Market Share in Commercial Loans (1) (As of February 2025) 19.6% 18.3% 14.8% 10.6% 8.3% 16.8% 16.2% 13.9% 11.1% 10.6% Market Share in Assets Under Management (2) (As of March 2025) Market Share in Demand Deposits in Local Currency (1) (As of February 2025) 23.3% 17.9% 12.1% 6.2% 6.0% 20.2% 19.4% 14.6% 8.3% 5.2% Return on Average Capital and Reserves (As of February 2025) Market Share in Net Income (As of February 2025) 22.2% 20.2% 15.5% 10.6% 0.7% 22.9% 20.8% 20.2% 8.1% 0.5% 90 - day Past Due Loans (As of February 2025) Cost - to - Income Ratio (As of February 2025) 2.9% 2.3% 2.4% 1.5% 1.5% 62.7% 51.7% 35.5% 38.3% 40.8% Sources: CMF and Mutual Funds Association (1) Excluding operations of subsidiaries abroad. (2) AUM stands for Asset Under Management and the chart includes banking and non - banking mutual funds subsidiaries.
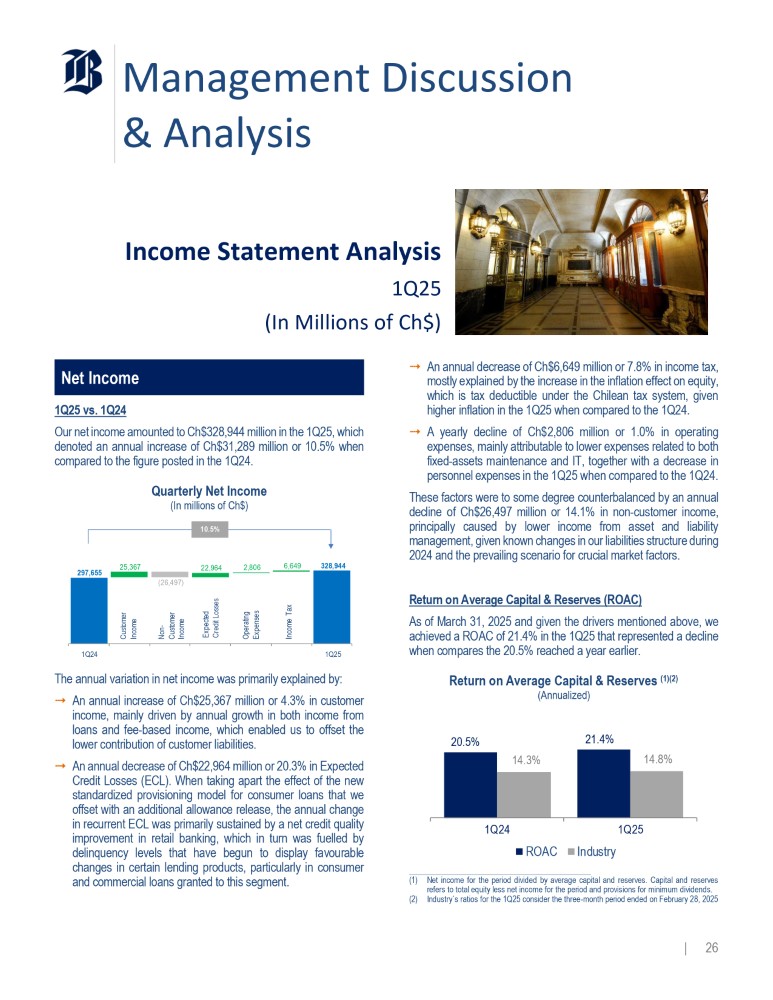
| 25 Management Discussion & Analysis Income Statement Analysis 1Q25 (In Millions of Ch$) Net Income 1 Q 25 vs . 1 Q 24 Our net income amounted to Ch $ 328 , 944 million in the 1 Q 25 , which denoted an annual increase of Ch $ 31 , 289 million or 10 . 5 % when compared to the figure posted in the 1 Q 24 . Quarterly Net Income (In millions of Ch$) Income Tax 297,655 25,367 (26,497) 22,964 2,806 6,649 328,944 1Q24 1Q25 The annual variation in net income was primarily explained by : ⭬ An annual increase of Ch $ 25 , 367 million or 4 . 3 % in customer income, mainly driven by annual growth in both income from loans and fee - based income, which enabled us to offset the lower contribution of customer liabilities . ⭬ An annual decrease of Ch $ 22 , 964 million or 20 . 3 % in Expected Credit Losses (ECL) . When taking apart the effect of the new standardized provisioning model for consumer loans that we offset with an additional allowance release, the annual change in recurrent ECL was primarily sustained by a net credit quality improvement in retail banking, which in turn was fuelled by delinquency levels that have begun to display favourable changes in certain lending products, particularly in consumer and commercial loans granted to this segment . Non - Customer Income Customer Income Expected Credit Losses Operating Expenses 10.5% 20.5% ⭬ An annual decrease of Ch $ 6 , 649 million or 7 . 8 % in income tax, mostly explained by the increase in the inflation effect on equity, which is tax deductible under the Chilean tax system, given higher inflation in the 1 Q 25 when compared to the 1 Q 24 . ⭬ A yearly decline of Ch $ 2 , 806 million or 1 . 0 % in operating expenses, mainly attributable to lower expenses related to both fixed - assets maintenance and IT, together with a decrease in personnel expenses in the 1 Q 25 when compared to the 1 Q 24 . These factors were to some degree counterbalanced by an annual decline of Ch $ 26 , 497 million or 14 . 1 % in non - customer income, principally caused by lower income from asset and liability management, given known changes in our liabilities structure during 2024 and the prevailing scenario for crucial market factors . Return on Average Capital & Reserves (ROAC) As of March 31 , 2025 and given the drivers mentioned above, we achieved a ROAC of 21 . 4 % in the 1 Q 25 that represented a decline when compares the 20 . 5 % reached a year earlier . Return on Average Capital & Reserves (1)(2) (Annualized) 21.4% 14.3% 14.8% 1Q24 1Q25 ROAC Industry (1) Net income for the period divided by average capital and reserves. Capital and reserves refers to total equity less net income for the period and provisions for minimum dividends.
(2) Industry s ratios for the 1Q25 consider the three - month period ended on February 28, 2025 | 26 Management Discussion & Analysis Based on the results we have reached in the 1 Q 25 , we have continued to outpace the industry in terms of profitability by displaying a favourable gap of 661 bp . against the industry average . Also, we continue to outperform our main relevant peers in terms of profitability, which largely relies on our income - generating capacity and the firm cost control and productivity gains we have achieved over the last quarters . Projections For the FY 2025 , we have revised our baseline scenario upwards on the grounds of the positive performance we had in the 1 Q 25 . Even though we recognize the increased uncertainty caused by the U . S . administration’s revised approach to foreign trade, at this point we do not foresee significant impacts on either the local economy or the local banking activity for 2025 . Nevertheless, we acknowledge there are looming risks that could materialize in the future, so we will continue to monitor them in order to revise our main forecast in the coming quarters, if necessary . All in all, we slightly increased our expectation on NIM towards the upper boundary of the range of 4 . 5 % to 4 . 7 % forecasted in the 4 Q 24 , so we expect to achieve ~ 4 . 7 % for the FY 2025 , as a consequence of : (i) an inflation rate that – measured as UF variation – would remain in the upper boundary of the Central Bank’s target range, which should benefit our net asset position indexed to the UF, and (ii) a monetary policy interest rate that would converge to 4 . 25 % by the end of 2025 , in consistency with Central Bank projections, which would translate into a more steepened local yield curve, particularly during the second half of the year . In terms of credit risk, we are also seeing some positive signals in terms of delinquency that make us to be more optimistic than in the previous quarter . Thus, we now expect our ECL ratio to be ~ 1 . 1 % in 2025 , which is the midpoint of the target range shared last quarter ( 1 . 0 % to 1 . 2 % in the 4 Q 24 ) . Regarding NPLs, we expect the past - due ratio to converge around 1 . 3 % by the end of 2025 . Regarding operating expenses, we revised our efficiency ratio downwards to ~ 39 % (from ~ 40 % last quarter) by the end of 2025 . Although we expect revenue growth to normalize, this would be mitigated by strict cost control and productivity gains . Based on the above, in absence of non - recurrent factors, we have revised our ROAC forecast upwards to ~ 20 % for the FY 2025 (from ~ 18 % disclosed in the 4 Q 24 ) . FY2025 Banco de Chile Slightly above industry Loan Growth (Nominal) ~4.7% Net Interest Margin (NIM) ~1.1% Expected Credit Losses / Avg. Loans ~39% Efficiency Ratio ~20% Return on Average Capital (ROAC) (1) (1) Net income for the period divided by average capital and reserves. Capital and reserves refers to total equity less net income for the period and provisions for minimum dividends.
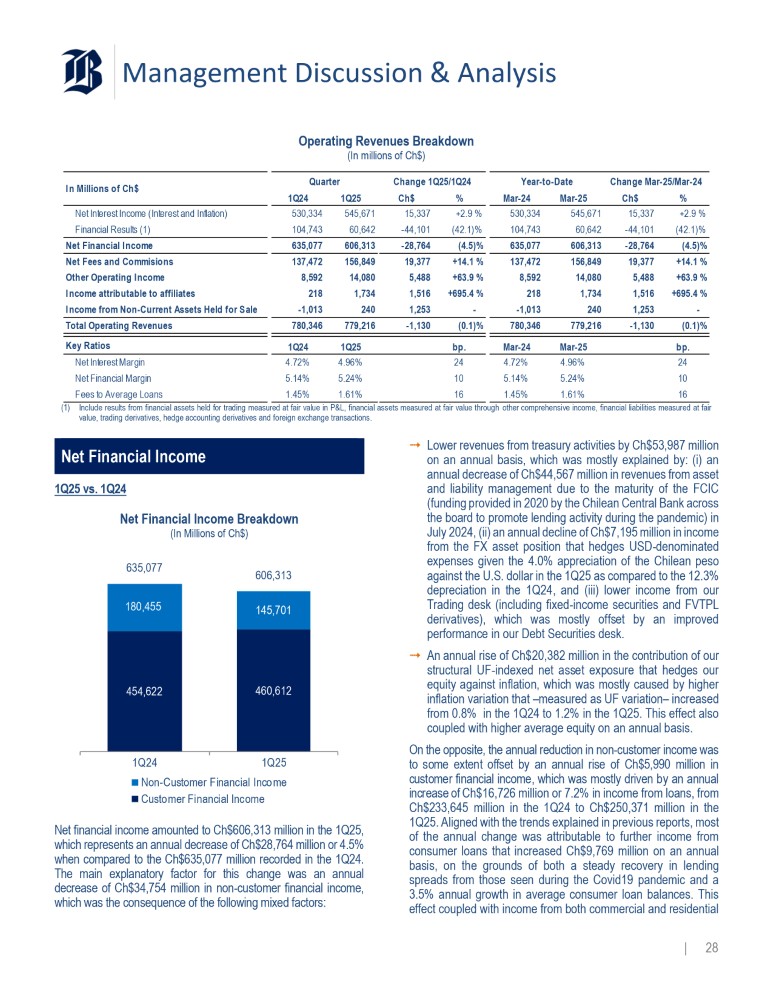
| 27 Management Discussion & Analysis Operating Revenues Breakdown (In millions of Ch$) Quarter Change 1Q25/1Q24 % Ch$ Mar - 25 Mar - 24 % Ch$ 1Q25 1Q24 +2.9 % 15,337 545,671 530,334 +2.9 % 15,337 545,671 530,334 Net Interest Income (Interest and Inflation) (42.1)% - 44,101 60,642 104,743 (42.1)% - 44,101 60,642 104,743 Financial Results (1) (4.5)% - 28,764 606,313 635,077 (4.5)% - 28,764 606,313 635,077 Net Financial Income +14.1 % 19,377 156,849 137,472 +14.1 % 19,377 156,849 137,472 Net Fees and Commisions +63.9 % 5,488 14,080 8,592 +63.9 % 5,488 14,080 8,592 Other Operating Income +695.4 % 1,516 1,734 218 +695.4 % 1,516 1,734 218 Income attributable to affiliates - 1,253 240 - 1,013 - 1,253 240 - 1,013 Income from Non - Current Assets Held for Sale (0.1)% - 1,130 779,216 780,346 (0.1)% - 1,130 779,216 780,346 Total Operating Revenues bp. Mar - 25 Mar - 24 bp. 1Q25 1Q24 Key Ratios 24 4.96% 4.72% 24 4.96% 4.72% Net Interest Margin 10 5.24% 5.14% 10 5.24% 5.14% Net Financial Margin 16 1.61% 1.45% 16 1.61% 1.45% Fees to Average Loans Change Mar - 25/Mar - 24 In Millions of Ch$ Year - to - Date (1) Include results from financial assets held for trading measured at fair value in P&L, financial assets measured at fair value through other comprehensive income, financial liabilities measured at fair value, trading derivatives, hedge accounting derivatives and foreign exchange transactions. Net Financial Income 1Q25 vs. 1Q24 Net Financial Income Breakdown (In Millions of Ch$) 454,622 460,612 180,455 145,701 635,077 606,313 1Q24 1Q25 Non - Customer Financial Income Customer Financial Income | 28 Net financial income amounted to Ch $ 606 , 313 million in the 1 Q 25 , which represents an annual decrease of Ch $ 28 , 764 million or 4 . 5 % when compared to the Ch $ 635 , 077 million recorded in the 1 Q 24 . The main explanatory factor for this change was an annual decrease of Ch $ 34 , 754 million in non - customer financial income, which was the consequence of the following mixed factors : ⭬ Lower revenues from treasury activities by Ch $ 53 , 987 million on an annual basis, which was mostly explained by : (i) an annual decrease of Ch $ 44 , 567 million in revenues from asset and liability management due to the maturity of the FCIC (funding provided in 2020 by the Chilean Central Bank across the board to promote lending activity during the pandemic) in July 2024 , (ii) an annual decline of Ch $ 7 , 195 million in income from the FX asset position that hedges USD - denominated expenses given the 4 . 0 % appreciation of the Chilean peso against the U . S . dollar in the 1 Q 25 as compared to the 12 . 3 % depreciation in the 1 Q 24 , and (iii) lower income from our Trading desk (including fixed - income securities and FVTPL derivatives), which was mostly offset by an improved performance in our Debt Securities desk . ⭬ An annual rise of Ch $ 20 , 382 million in the contribution of our structural UF - indexed net asset exposure that hedges our equity against inflation, which was mostly caused by higher inflation variation that – measured as UF variation – increased from 0 . 8 % in the 1 Q 24 to 1 . 2 % in the 1 Q 25 . This effect also coupled with higher average equity on an annual basis . On the opposite, the annual reduction in non - customer income was to some extent offset by an annual rise of Ch $ 5 , 990 million in customer financial income, which was mostly driven by an annual increase of Ch $ 16 , 726 million or 7 . 2 % in income from loans, from Ch $ 233 , 645 million in the 1 Q 24 to Ch $ 250 , 371 million in the 1 Q 25 . Aligned with the trends explained in previous reports, most of the annual change was attributable to further income from consumer loans that increased Ch $ 9 , 769 million on an annual basis, on the grounds of both a steady recovery in lending spreads from those seen during the Covid 19 pandemic and a 3 . 5 % annual growth in average consumer loan balances .
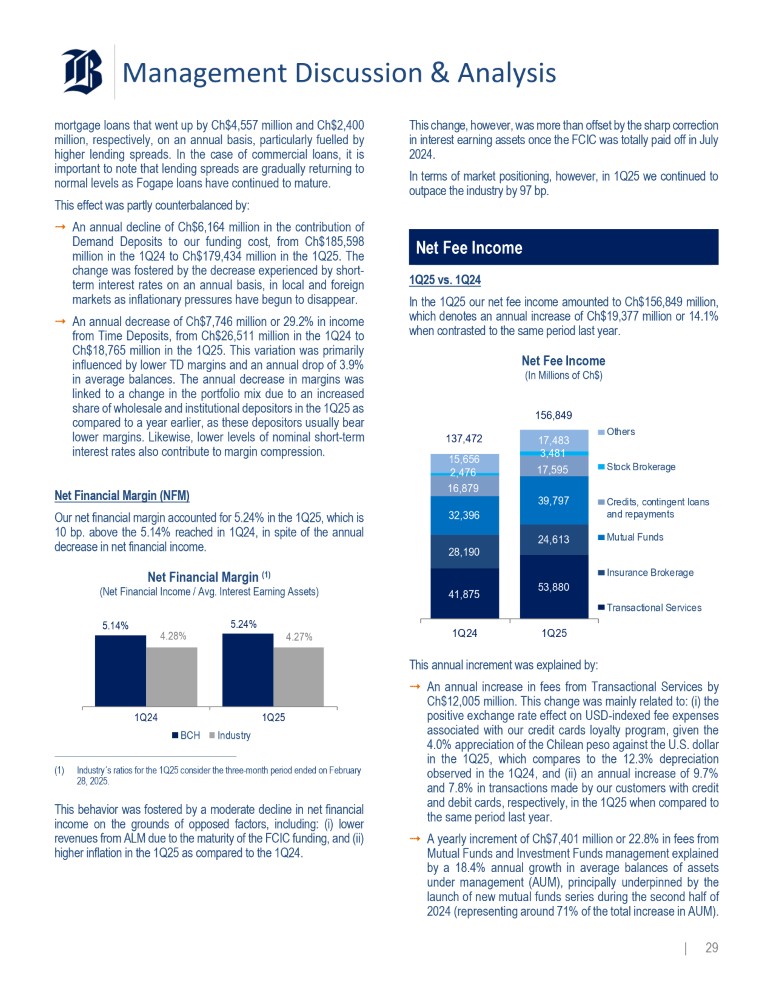
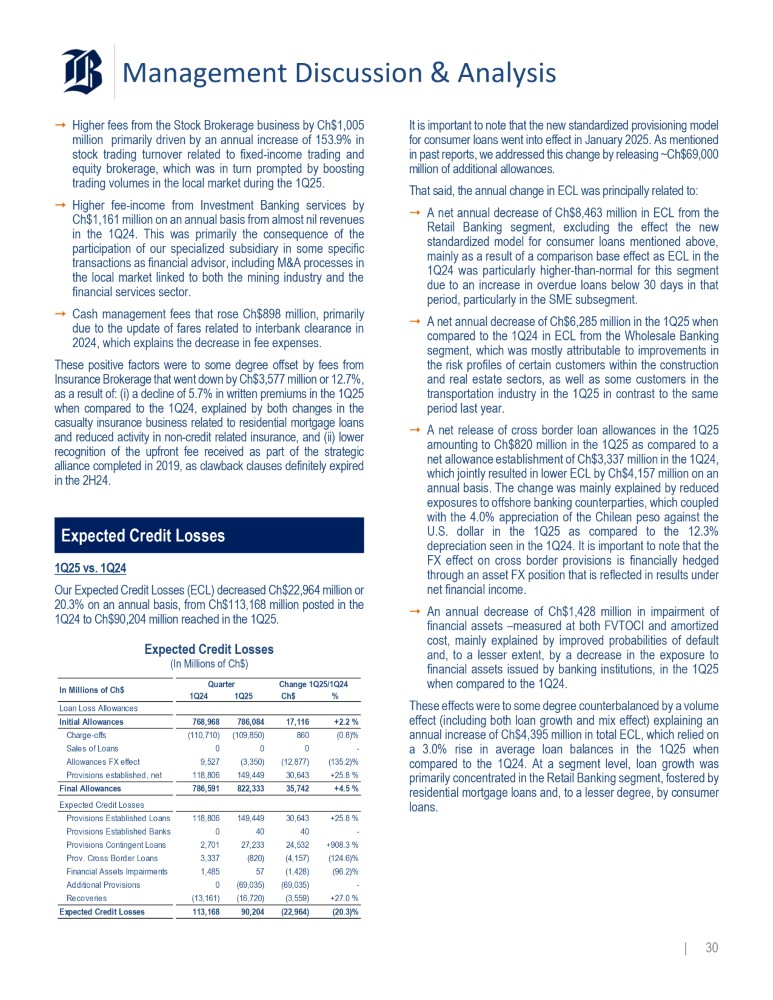
This effect coupled with income from both commercial and residential Management Discussion & Analysis mortgage loans that went up by Ch $ 4 , 557 million and Ch $ 2 , 400 million, respectively, on an annual basis, particularly fuelled by higher lending spreads . In the case of commercial loans, it is important to note that lending spreads are gradually returning to normal levels as Fogape loans have continued to mature . This effect was partly counterbalanced by : ⭬ An annual decline of Ch $ 6 , 164 million in the contribution of Demand Deposits to our funding cost, from Ch $ 185 , 598 million in the 1 Q 24 to Ch $ 179 , 434 million in the 1 Q 25 . The change was fostered by the decrease experienced by short - term interest rates on an annual basis, in local and foreign markets as inflationary pressures have begun to disappear . ⭬ An annual decrease of Ch $ 7 , 746 million or 29 . 2 % in income from Time Deposits, from Ch $ 26 , 511 million in the 1 Q 24 to Ch $ 18 , 765 million in the 1 Q 25 . This variation was primarily influenced by lower TD margins and an annual drop of 3 . 9 % in average balances . The annual decrease in margins was linked to a change in the portfolio mix due to an increased share of wholesale and institutional depositors in the 1 Q 25 as compared to a year earlier, as these depositors usually bear lower margins . Likewise, lower levels of nominal short - term interest rates also contribute to margin compression . Net Financial Margin (NFM) Our net financial margin accounted for 5 . 24 % in the 1 Q 25 , which is 10 bp . above the 5 . 14 % reached in 1 Q 24 , in spite of the annual decrease in net financial income . Net Financial Margin (1) (Net Financial Income / Avg. Interest Earning Assets) 5.14% 5.24% 4.28% 4.27% 1Q25 1Q24 BCH Industry (1) Industry s ratios for the 1Q25 consider the three - month period ended on February 28, 2025. This behavior was fostered by a moderate decline in net financial income on the grounds of opposed factors, including : (i) lower revenues from ALM due to the maturity of the FCIC funding, and (ii) higher inflation in the 1 Q 25 as compared to the 1 Q 24 . This change, however, was more than offset by the sharp correction in interest earning assets once the FCIC was totally paid off in July 2024 . In terms of market positioning, however, in 1 Q 25 we continued to outpace the industry by 97 bp . Net Fee Income 17,483 3,481 137,472 17,595 15,656 2,476 39,797 16,879 32,396 24,613 28,190 53,880 41,875 1 Q 25 vs . 1 Q 24 In the 1 Q 25 our net fee income amounted to Ch $ 156 , 849 million, which denotes an annual increase of Ch $ 19 , 377 million or 14 . 1 % when contrasted to the same period last year . Net Fee Income (In Millions of Ch$) 156,849 Others Stock Brokerage Credits, contingent loans and repayments Mutual Funds Insurance Brokerage Transactional Services 1Q24 1Q25 This annual increment was explained by : ⭬ An annual increase in fees from Transactional Services by Ch $ 12 , 005 million . This change was mainly related to : (i) the positive exchange rate effect on USD - indexed fee expenses associated with our credit cards loyalty program, given the 4 . 0 % appreciation of the Chilean peso against the U . S . dollar in the 1 Q 25 , which compares to the 12 . 3 % depreciation observed in the 1 Q 24 , and (ii) an annual increase of 9 . 7 % and 7 . 8 % in transactions made by our customers with credit and debit cards, respectively, in the 1 Q 25 when compared to the same period last year . ⭬ A yearly increment of Ch $ 7 , 401 million or 22 . 8 % in fees from Mutual Funds and Investment Funds management explained by a 18 . 4 % annual growth in average balances of assets under management (AUM), principally underpinned by the launch of new mutual funds series during the second half of 2024 (representing around 71 % of the total increase in AUM) .
| 29 Management Discussion & Analysis ⭬ Higher fees from the Stock Brokerage business by Ch $ 1 , 005 million primarily driven by an annual increase of 153 . 9 % in stock trading turnover related to fixed - income trading and equity brokerage, which was in turn prompted by boosting trading volumes in the local market during the 1 Q 25 . ⭬ Higher fee - income from Investment Banking services by Ch $ 1 , 161 million on an annual basis from almost nil revenues in the 1 Q 24 . This was primarily the consequence of the participation of our specialized subsidiary in some specific transactions as financial advisor, including M&A processes in the local market linked to both the mining industry and the financial services sector . ⭬ Cash management fees that rose Ch $ 898 million, primarily due to the update of fares related to interbank clearance in 2024 , which explains the decrease in fee expenses . These positive factors were to some degree offset by fees from Insurance Brokerage that went down by Ch $ 3 , 577 million or 12 . 7 % , as a result of : (i) a decline of 5 . 7 % in written premiums in the 1 Q 25 when compared to the 1 Q 24 , explained by both changes in the casualty insurance business related to residential mortgage loans and reduced activity in non - credit related insurance, and (ii) lower recognition of the upfront fee received as part of the strategic alliance completed in 2019 , as clawback clauses definitely expired in the 2 H 24 . Expected Credit Losses 1 Q 25 vs . 1 Q 24 Our Expected Credit Losses (ECL) decreased Ch $ 22 , 964 million or 20 . 3 % on an annual basis, from Ch $ 113 , 168 million posted in the 1 Q 24 to Ch $ 90 , 204 million reached in the 1 Q 25 . Expected Credit Losses (In Millions of Ch$) 1Q24 1Q25 Loan Loss Allowances +2.2 % 17,116 786,084 768,968 Initial Allowances (0.8)% 860 (109,850) (110,710) Charge - offs - 0 0 0 Sales of Loans (135.2)% (12,877) (3,350) 9,527 Allowances FX effect +25.8 % 30,643 149,449 118,806 Provisions established, net +4.5 % 35,742 822,333 786,591 Final Allowances Expected Credit Losses +25.8 % 30,643 149,449 118,806 Provisions Established Loans - 40 40 0 Provisions Established Banks +908.3 % 24,532 27,233 2,701 Provisions Contingent Loans (124.6)% (4,157) (820) 3,337 Prov. Cross Border Loans (96.2)% (1,428) 57 1,485 Financial Assets Impairments - (69,035) (69,035) 0 Additional Provisions +27.0 % (3,559) (16,720) (13,161) Recoveries (20.3)% (22,964) 90,204 113,168 Expected Credit Losses In Millions of Ch$ Quarter Change 1Q25/1Q24 Ch$ % It is important to note that the new standardized provisioning model for consumer loans went into effect in January 2025 . As mentioned in past reports, we addressed this change by releasing ~Ch $ 69 , 000 million of additional allowances . That said, the annual change in ECL was principally related to : ⭬ A net annual decrease of Ch $ 8 , 463 million in ECL from the Retail Banking segment, excluding the effect the new standardized model for consumer loans mentioned above, mainly as a result of a comparison base effect as ECL in the 1 Q 24 was particularly higher - than - normal for this segment due to an increase in overdue loans below 30 days in that period, particularly in the SME subsegment . ⭬ A net annual decrease of Ch $ 6 , 285 million in the 1 Q 25 when compared to the 1 Q 24 in ECL from the Wholesale Banking segment, which was mostly attributable to improvements in the risk profiles of certain customers within the construction and real estate sectors, as well as some customers in the transportation industry in the 1 Q 25 in contrast to the same period last year . ⭬ A net release of cross border loan allowances in the 1 Q 25 amounting to Ch $ 820 million in the 1 Q 25 as compared to a net allowance establishment of Ch $ 3 , 337 million in the 1 Q 24 , which jointly resulted in lower ECL by Ch $ 4 , 157 million on an annual basis . The change was mainly explained by reduced exposures to offshore banking counterparties, which coupled with the 4 . 0 % appreciation of the Chilean peso against the U . S . dollar in the 1 Q 25 as compared to the 12 . 3 % depreciation seen in the 1 Q 24 . It is important to note that the FX effect on cross border provisions is financially hedged through an asset FX position that is reflected in results under net financial income . ⭬ An annual decrease of Ch $ 1 , 428 million in impairment of financial assets – measured at both FVTOCI and amortized cost, mainly explained by improved probabilities of default and, to a lesser extent, by a decrease in the exposure to financial assets issued by banking institutions, in the 1 Q 25 when compared to the 1 Q 24 . These effects were to some degree counterbalanced by a volume effect (including both loan growth and mix effect) explaining an annual increase of Ch $ 4 , 395 million in total ECL, which relied on a 3 . 0 % rise in average loan balances in the 1 Q 25 when compared to the 1 Q 24 . At a segment level, loan growth was primarily concentrated in the Retail Banking segment, fostered by residential mortgage loans and, to a lesser degree, by consumer loans .
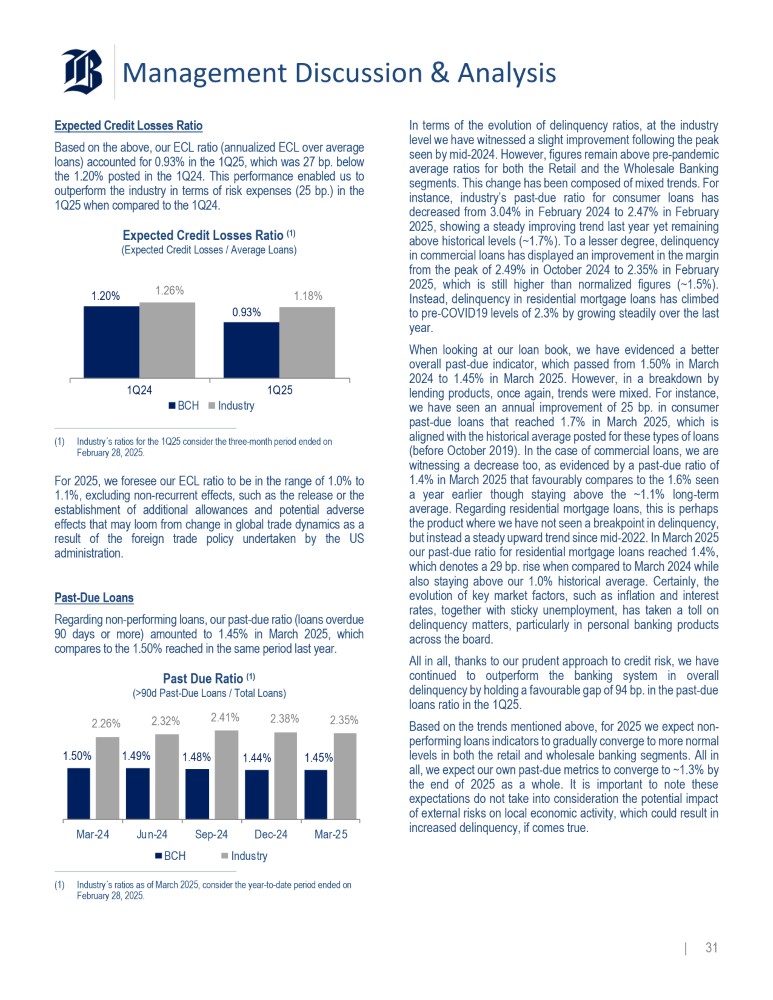
| 30 Management Discussion & Analysis Expected Credit Losses Ratio Based on the above, our ECL ratio (annualized ECL over average loans) accounted for 0 . 93 % in the 1 Q 25 , which was 27 bp . below the 1 . 20 % posted in the 1 Q 24 . This performance enabled us to outperform the industry in terms of risk expenses ( 25 bp . ) in the 1 Q 25 when compared to the 1 Q 24 . Expected Credit Losses Ratio (1) (Expected Credit Losses / Average Loans) 1.20% 0.93% 1.26% 1.18% 1Q25 1Q24 BCH Industry (1) Industry s ratios for the 1Q25 consider the three - month period ended on February 28, 2025. For 2025 , we foresee our ECL ratio to be in the range of 1 . 0 % to 1 . 1 % , excluding non - recurrent effects, such as the release or the establishment of additional allowances and potential adverse effects that may loom from change in global trade dynamics as a result of the foreign trade policy undertaken by the US administration . Past - Due Loans Regarding non - performing loans, our past - due ratio (loans overdue 90 days or more) amounted to 1 . 45 % in March 2025 , which compares to the 1 . 50 % reached in the same period last year . Past Due Ratio (1) (>90d Past - Due Loans / Total Loans) 1.50% 1.49% 1.48% 1.44% 1.45% 2.26% 2.32% 2.41% 2.38% 2.35% Mar - 25 Dec - 24 Jun - 24 Sep - 24 Mar - 24 Industry BCH (1) Industry s ratios as of March 2025, consider the year - to - date period ended on February 28, 2025. | 31 In terms of the evolution of delinquency ratios, at the industry level we have witnessed a slight improvement following the peak seen by mid - 2024 . However, figures remain above pre - pandemic average ratios for both the Retail and the Wholesale Banking segments . This change has been composed of mixed trends . For instance, industry’s past - due ratio for consumer loans has decreased from 3 . 04 % in February 2024 to 2 . 47 % in February 2025 , showing a steady improving trend last year yet remaining above historical levels (~ 1 . 7 % ) . To a lesser degree, delinquency in commercial loans has displayed an improvement in the margin from the peak of 2 . 49 % in October 2024 to 2 . 35 % in February 2025 , which is still higher than normalized figures (~ 1 . 5 % ) . Instead, delinquency in residential mortgage loans has climbed to pre - COVID 19 levels of 2 . 3 % by growing steadily over the last year . When looking at our loan book, we have evidenced a better overall past - due indicator, which passed from 1 . 50 % in March 2024 to 1 . 45 % in March 2025 . However, in a breakdown by lending products, once again, trends were mixed . For instance, we have seen an annual improvement of 25 bp . in consumer past - due loans that reached 1 . 7 % in March 2025 , which is aligned with the historical average posted for these types of loans (before October 2019 ) . In the case of commercial loans, we are witnessing a decrease too, as evidenced by a past - due ratio of 1 . 4 % in March 2025 that favourably compares to the 1 . 6 % seen a year earlier though staying above the ~ 1 . 1 % long - term average . Regarding residential mortgage loans, this is perhaps the product where we have not seen a breakpoint in delinquency, but instead a steady upward trend since mid - 2022 . In March 2025 our past - due ratio for residential mortgage loans reached 1 . 4 % , which denotes a 29 bp . rise when compared to March 2024 while also staying above our 1 . 0 % historical average . Certainly, the evolution of key market factors, such as inflation and interest rates, together with sticky unemployment, has taken a toll on delinquency matters, particularly in personal banking products across the board . All in all, thanks to our prudent approach to credit risk, we have continued to outperform the banking system in overall delinquency by holding a favourable gap of 94 bp . in the past - due loans ratio in the 1 Q 25 . Based on the trends mentioned above, for 2025 we expect non - performing loans indicators to gradually converge to more normal levels in both the retail and wholesale banking segments . All in all, we expect our own past - due metrics to converge to ~ 1 . 3 % by the end of 2025 as a whole . It is important to note these expectations do not take into consideration the potential impact of external risks on local economic activity, which could result in increased delinquency, if comes true .
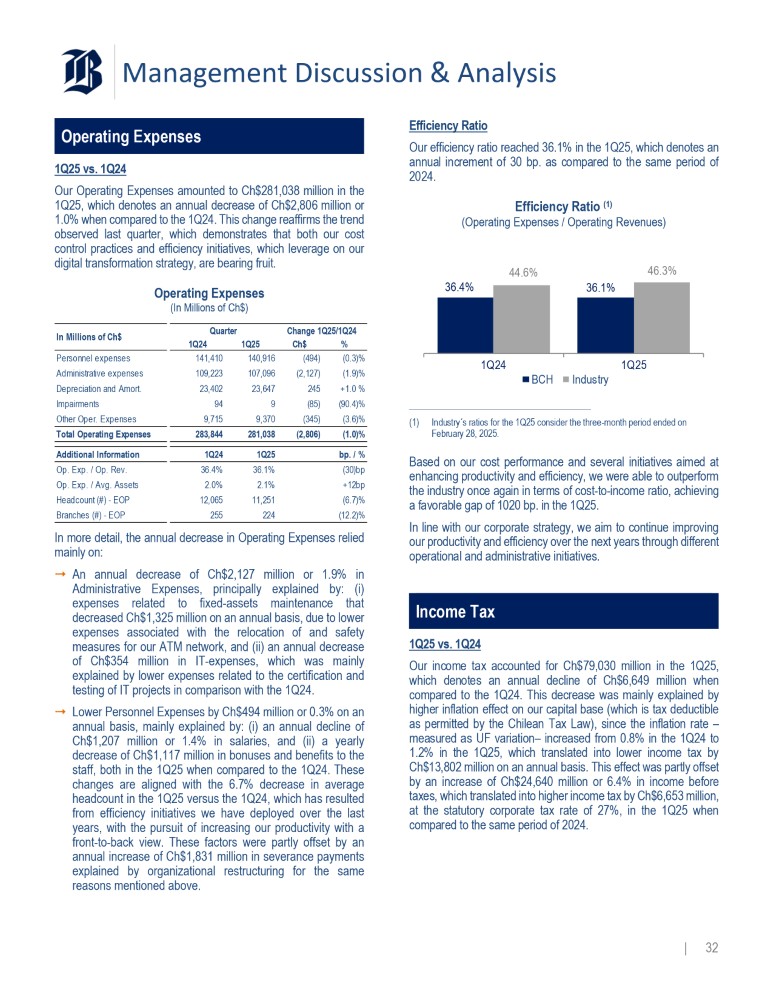
Management Discussion & Analysis Operating Expenses 1 Q 25 vs . 1 Q 24 Our Operating Expenses amounted to Ch $ 281 , 038 million in the 1 Q 25 , which denotes an annual decrease of Ch $ 2 , 806 million or 1 . 0 % when compared to the 1 Q 24 . This change reaffirms the trend observed last quarter, which demonstrates that both our cost control practices and efficiency initiatives, which leverage on our digital transformation strategy, are bearing fruit . Operating Expenses (In Millions of Ch$) 1Q24 1Q25 (0.3)% (494) 140,916 141,410 Personnel expenses (1.9)% (2,127) 107,096 109,223 Administrative expenses +1.0 % 245 23,647 23,402 Depreciation and Amort. (90.4)% (85) 9 94 Impairments (3.6)% (345) 9,370 9,715 Other Oper. Expenses (1.0)% (2,806) 281,038 283,844 Total Operating Expenses bp. / % 1Q25 1Q24 Additional Information (30)bp 36.1% 36.4% Op. Exp. / Op. Rev. +12bp 2.1% 2.0% Op. Exp. / Avg. Assets (6.7)% 11,251 12,065 Headcount (#) - EOP (12.2)% 224 255 Branches (#) - EOP In Millions of Ch$ Quarter Change 1Q25/1Q24 Ch$ % In more detail, the annual decrease in Operating Expenses relied mainly on : ⭬ An annual decrease of Ch $ 2 , 127 million or 1 . 9 % in Administrative Expenses, principally explained by : (i) expenses related to fixed - assets maintenance that decreased Ch $ 1 , 325 million on an annual basis, due to lower expenses associated with the relocation of and safety measures for our ATM network, and (ii) an annual decrease of Ch $ 354 million in IT - expenses, which was mainly explained by lower expenses related to the certification and testing of IT projects in comparison with the 1 Q 24 . ⭬ Lower Personnel Expenses by Ch $ 494 million or 0 . 3 % on an annual basis, mainly explained by : (i) an annual decline of Ch $ 1 , 207 million or 1 . 4 % in salaries, and (ii) a yearly decrease of Ch $ 1 , 117 million in bonuses and benefits to the staff, both in the 1 Q 25 when compared to the 1 Q 24 . These changes are aligned with the 6 . 7 % decrease in average headcount in the 1 Q 25 versus the 1 Q 24 , which has resulted from efficiency initiatives we have deployed over the last years, with the pursuit of increasing our productivity with a front - to - back view . These factors were partly offset by an annual increase of Ch $ 1 , 831 million in severance payments explained by organizational restructuring for the same reasons mentioned above . Efficiency Ratio Our efficiency ratio reached 36 . 1 % in the 1 Q 25 , which denotes an annual increment of 30 bp . as compared to the same period of 2024 . Efficiency Ratio (1) (Operating Expenses / Operating Revenues) 36.4% 36.1% 44.6% 46.3% 1Q24 1Q25 BCH Industry (1) Industry s ratios for the 1Q25 consider the three - month period ended on February 28, 2025. Based on our cost performance and several initiatives aimed at enhancing productivity and efficiency, we were able to outperform the industry once again in terms of cost - to - income ratio, achieving a favorable gap of 1020 bp . in the 1 Q 25 . In line with our corporate strategy, we aim to continue improving our productivity and efficiency over the next years through different operational and administrative initiatives . | 32 Income Tax 1 Q 25 vs . 1 Q 24 Our income tax accounted for Ch $ 79 , 030 million in the 1 Q 25 , which denotes an annual decline of Ch $ 6 , 649 million when compared to the 1 Q 24 . This decrease was mainly explained by higher inflation effect on our capital base (which is tax deductible as permitted by the Chilean Tax Law), since the inflation rate – measured as UF variation – increased from 0 . 8 % in the 1 Q 24 to 1 . 2 % in the 1 Q 25 , which translated into lower income tax by Ch $ 13 , 802 million on an annual basis . This effect was partly offset by an increase of Ch $ 24 , 640 million or 6 . 4 % in income before taxes, which translated into higher income tax by Ch $ 6 , 653 million, at the statutory corporate tax rate of 27 % , in the 1 Q 25 when compared to the same period of 2024 .
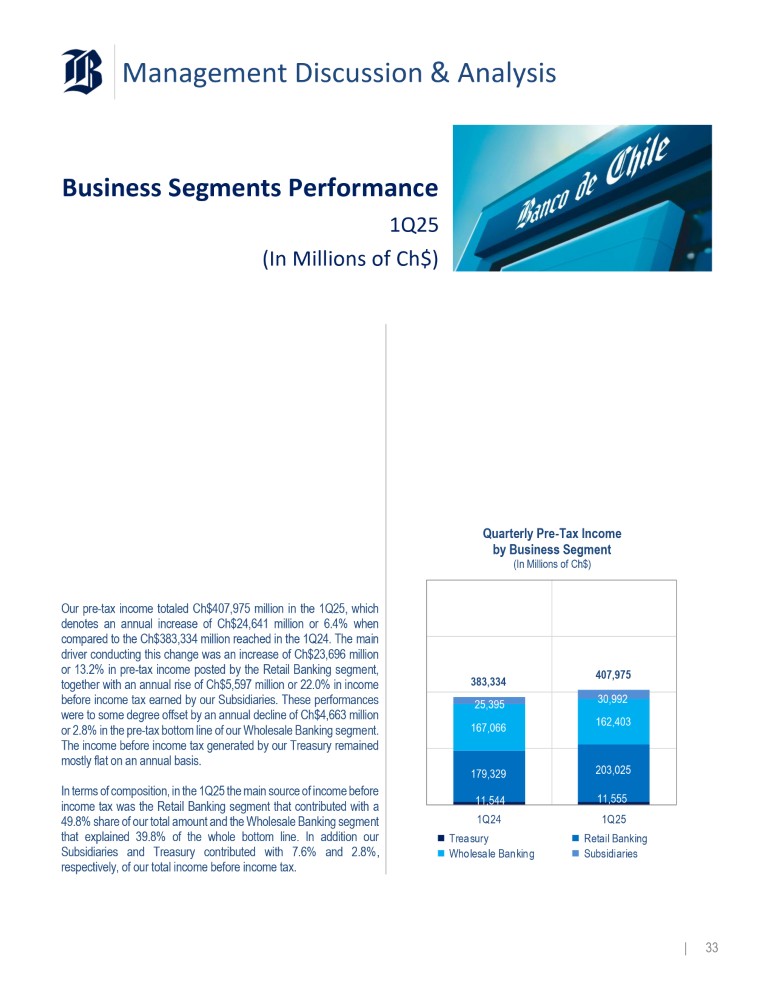
Management Discussion & Analysis Business Segments Performance 1Q25 (In Millions of Ch$) Quarterly Pre - Tax Income by Business Segment (In Millions of Ch$) 383,334 407,975 25,395 30,992 167,066 162,403 179,329 203,025 11,544 11,555 1Q24 1Q25 Treasury Retail Banking Wholesale Banking Subsidiaries Our pre - tax income totaled Ch $ 407 , 975 million in the 1 Q 25 , which denotes an annual increase of Ch $ 24 , 641 million or 6 . 4 % when compared to the Ch $ 383 , 334 million reached in the 1 Q 24 . The main driver conducting this change was an increase of Ch $ 23 , 696 million or 13 . 2 % in pre - tax income posted by the Retail Banking segment, together with an annual rise of Ch $ 5 , 597 million or 22 . 0 % in income before income tax earned by our Subsidiaries . These performances were to some degree offset by an annual decline of Ch $ 4 , 663 million or 2 . 8 % in the pre - tax bottom line of our Wholesale Banking segment . The income before income tax generated by our Treasury remained mostly flat on an annual basis . In terms of composition, in the 1 Q 25 the main source of income before income tax was the Retail Banking segment that contributed with a 49 . 8 % share of our total amount and the Wholesale Banking segment that explained 39 . 8 % of the whole bottom line . In addition our Subsidiaries and Treasury contributed with 7 . 6 % and 2 . 8 % , respectively, of our total income before income tax .
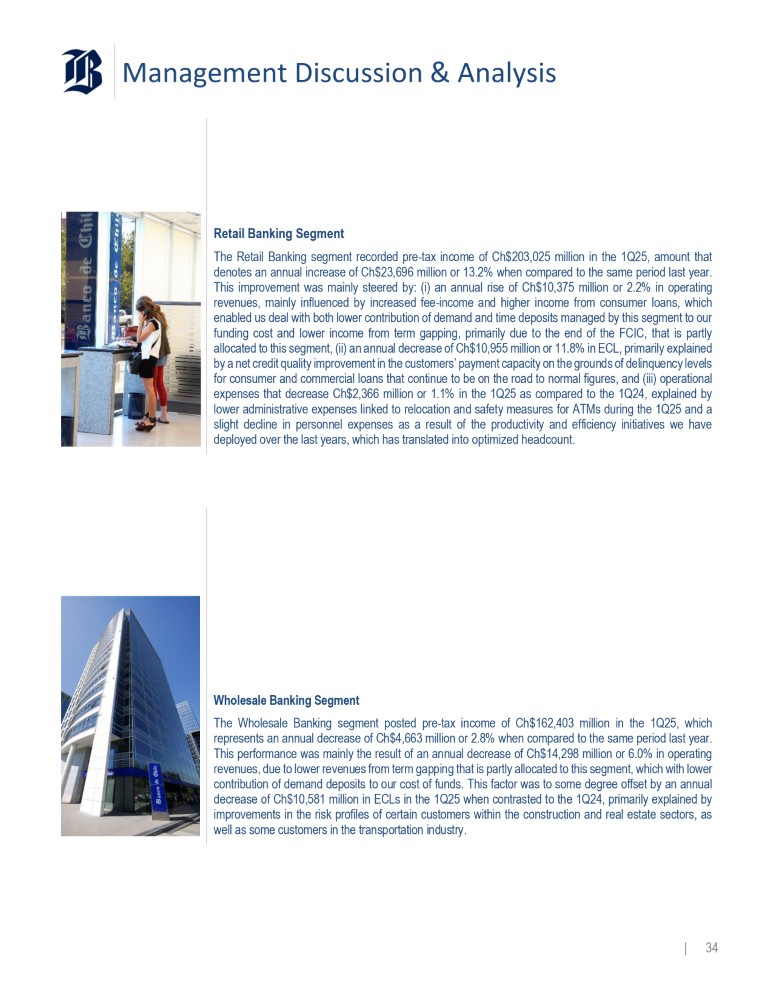
| 33 Management Discussion & Analysis Retail Banking Segment The Retail Banking segment recorded pre - tax income of Ch $ 203 , 025 million in the 1 Q 25 , amount that denotes an annual increase of Ch $ 23 , 696 million or 13 . 2 % when compared to the same period last year . This improvement was mainly steered by : (i) an annual rise of Ch $ 10 , 375 million or 2 . 2 % in operating revenues, mainly influenced by increased fee - income and higher income from consumer loans, which enabled us deal with both lower contribution of demand and time deposits managed by this segment to our funding cost and lower income from term gapping, primarily due to the end of the FCIC, that is partly allocated to this segment, (ii) an annual decrease of Ch $ 10 , 955 million or 11 . 8 % in ECL, primarily explained by a net credit quality improvement in the customers’ payment capacity on the grounds of delinquency levels for consumer and commercial loans that continue to be on the road to normal figures, and (iii) operational expenses that decrease Ch $ 2 , 366 million or 1 . 1 % in the 1 Q 25 as compared to the 1 Q 24 , explained by lower administrative expenses linked to relocation and safety measures for ATMs during the 1 Q 25 and a slight decline in personnel expenses as a result of the productivity and efficiency initiatives we have deployed over the last years, which has translated into optimized headcount . Wholesale Banking Segment The Wholesale Banking segment posted pre - tax income of Ch $ 162 , 403 million in the 1 Q 25 , which represents an annual decrease of Ch $ 4 , 663 million or 2 . 8 % when compared to the same period last year . This performance was mainly the result of an annual decrease of Ch $ 14 , 298 million or 6 . 0 % in operating revenues, due to lower revenues from term gapping that is partly allocated to this segment, which with lower contribution of demand deposits to our cost of funds . This factor was to some degree offset by an annual decrease of Ch $ 10 , 581 million in ECLs in the 1 Q 25 when contrasted to the 1 Q 24 , primarily explained by improvements in the risk profiles of certain customers within the construction and real estate sectors, as well as some customers in the transportation industry .
| 34 Management Discussion & Analysis Treasury Segment The Treasury segment posted a slight annual increase of Ch $ 11 million or 0 . 1 % in income before income tax, from Ch $ 11 , 544 million in the 1 Q 24 to Ch $ 11 , 555 million in the 1 Q 25 . The annual change was fostered by the combination of mixed factors . First of all, we posted an annual decrease of Ch $ 6 , 500 million in income from the management of our Trading desk (fixed - income and derivatives held for trading) explained by a comparison base effect, as favorable shifts in short - term local interest rates allowed us to benefit from positive marking - to - market adjustments in CLP - denominated trading derivatives during the 1 Q 24 . This effect was partly offset by : (i) higher revenues generated by our Debt Securities desk by Ch $ 3 , 723 million, mostly underpinned by favorable changes in market factors, such as increased inflation and lower foreign interest rates, together with lower funding cost on the grounds of the decrease in the monetary policy interest rates in Chile and abroad, all of which resulted in further income from fixed - income securities denominated in CLF and positive fair value adjustments on fixed - income securities denominated in foreign currency, and (ii) lower impairment of financial assets by Ch $ 1 , 428 million on an annual basis, highly influenced by improved probabilities of default of financial counterparties . Subsidiaries Our Subsidiaries reached pre - tax income of Ch $ 30 , 992 million in the 1 Q 25 , amount that was Ch $ 5 , 597 million or 22 . 0 % above the level posted in the same period of 2024 . The annual increase relied mainly on : (i) higher pre - tax income generated by our Mutual Funds subsidiary by Ch $ 4 , 599 million or 45 . 0 % , given higher fee - income related to a 18 . 4 % annual increase in average AUM that in turn was fostered by the launch of new series of mutual funds last year, which coupled with a decline in operating expenses, particularly associated with a decrease in personnel expenses related to organizational optimization, (ii) an annual rise of Ch $ 1 , 010 million in income before income tax from our Investment Banking subsidiary driven by the participation of this subsidiary in merger and acquisition operations in the local market during the 1 Q 25 , and (iii) a yearly increase of Ch $ 758 million in the pre - tax income of our Stock Brokerage subsidiary mainly associated with increased fee - income on the grounds of an increase of 153 . 9 % in stock trading turnover given boosting traded volumes during the 1 Q 25 in the local market and M&A transactions carried out in the local market . These effects were partly compensated by an annual decrease in the pre - tax income of our Insurance Brokerage subsidiary by Ch $ 417 million, which was primarily explained by an increase in operating expenses .
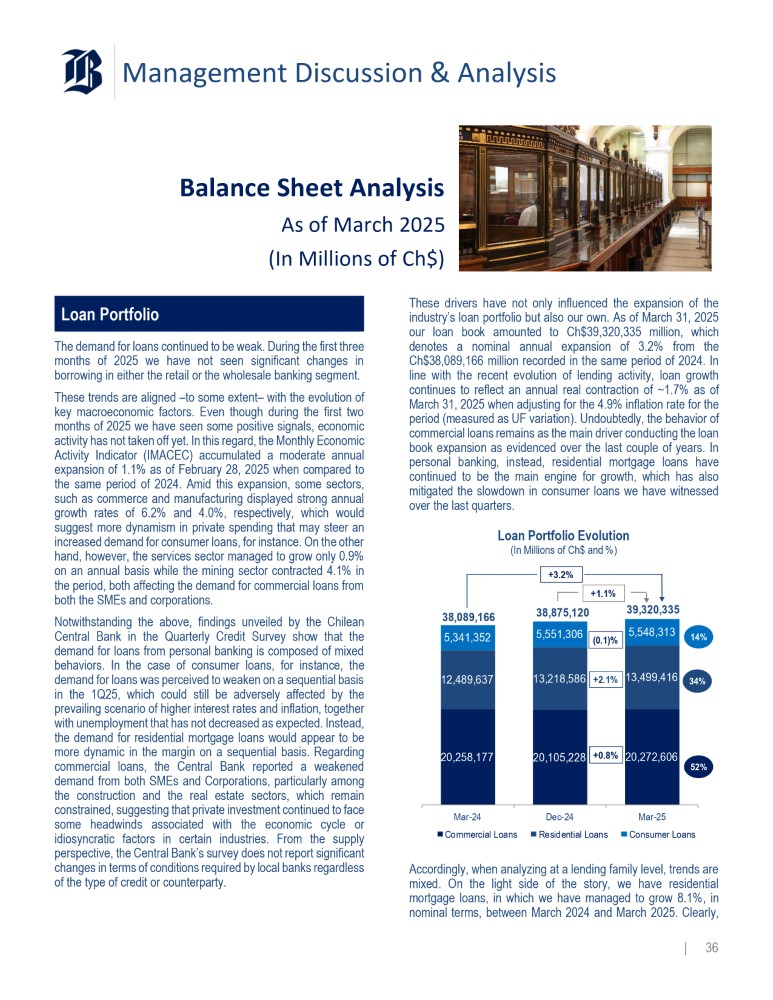
| 35 Management Discussion & Analysis Balance Sheet Analysis As of March 2025 (In Millions of Ch$) Loan Portfolio The demand for loans continued to be weak . During the first three months of 2025 we have not seen significant changes in borrowing in either the retail or the wholesale banking segment . These trends are aligned – to some extent – with the evolution of key macroeconomic factors . Even though during the first two months of 2025 we have seen some positive signals, economic activity has not taken off yet . In this regard, the Monthly Economic Activity Indicator (IMACEC) accumulated a moderate annual expansion of 1 . 1 % as of February 28 , 2025 when compared to the same period of 2024 . Amid this expansion, some sectors, such as commerce and manufacturing displayed strong annual growth rates of 6 . 2 % and 4 . 0 % , respectively, which would suggest more dynamism in private spending that may steer an increased demand for consumer loans, for instance . On the other hand, however, the services sector managed to grow only 0 . 9 % on an annual basis while the mining sector contracted 4 . 1 % in the period, both affecting the demand for commercial loans from both the SMEs and corporations . Notwithstanding the above, findings unveiled by the Chilean Central Bank in the Quarterly Credit Survey show that the demand for loans from personal banking is composed of mixed behaviors . In the case of consumer loans, for instance, the demand for loans was perceived to weaken on a sequential basis in the 1 Q 25 , which could still be adversely affected by the prevailing scenario of higher interest rates and inflation, together with unemployment that has not decreased as expected . Instead, the demand for residential mortgage loans would appear to be more dynamic in the margin on a sequential basis . Regarding commercial loans, the Central Bank reported a weakened demand from both SMEs and Corporations, particularly among the construction and the real estate sectors, which remain constrained, suggesting that private investment continued to face some headwinds associated with the economic cycle or idiosyncratic factors in certain industries . From the supply perspective, the Central Bank’s survey does not report significant changes in terms of conditions required by local banks regardless of the type of credit or counterparty . These drivers have not only influenced the expansion of the industry’s loan portfolio but also our own . As of March 31 , 2025 our loan book amounted to Ch $ 39 , 320 , 335 million, which denotes a nominal annual expansion of 3 . 2 % from the Ch $ 38 , 089 , 166 million recorded in the same period of 2024 . In line with the recent evolution of lending activity, loan growth continues to reflect an annual real contraction of ~ 1 . 7 % as of March 31 , 2025 when adjusting for the 4 . 9 % inflation rate for the period (measured as UF variation) . Undoubtedly, the behavior of commercial loans remains as the main driver conducting the loan book expansion as evidenced over the last couple of years . In personal banking, instead, residential mortgage loans have continued to be the main engine for growth, which has also mitigated the slowdown in consumer loans we have witnessed over the last quarters . Loan Portfolio Evolution (In Millions of Ch$ and %) 20,258,177 12,489,637 5,341,352 5,551,306 5,548,313 38,089,166 38,875,120 39,320,335 Mar - 24 Commercial Loans Dec - 24 Residential Loans Mar - 25 Consumer Loans 13,218,586 +2.1% 13,499,416 +3.2% 20,105,228 +0.8% 20,272,606 52% 34% 14% (0.1)% +1.1% Accordingly, when analyzing at a lending family level, trends are mixed . On the light side of the story, we have residential mortgage loans, in which we have managed to grow 8 . 1 % , in nominal terms, between March 2024 and March 2025 . Clearly, | 36 Management Discussion Analysis | 37 this lending product keeps on growing regardless of the surrounding macroeconomic environment but fueled by demographic changes.
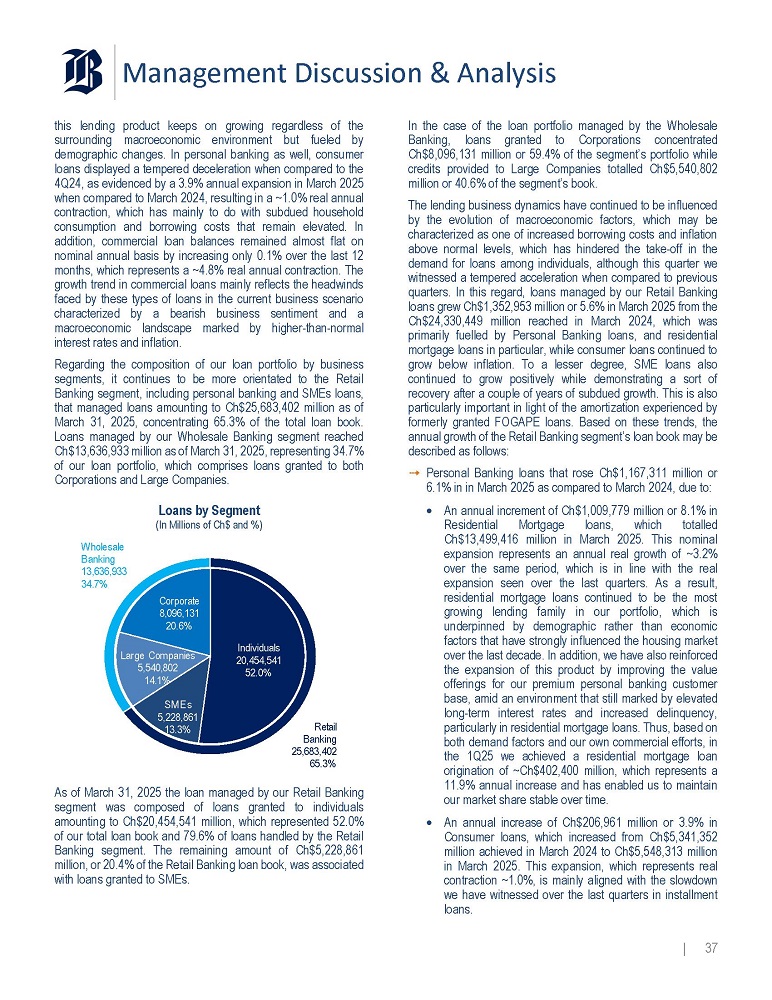
In personal banking as well, consumer loans displayed a tempered deceleration when compared to the 4Q24, as evidenced by a 3.9% annual expansion in March 2025 when compared to March 2024, resulting in a ~1.0% real annual contraction, which has mainly to do with subdued household consumption and borrowing costs that remain elevated. In addition, commercial loan balances remained almost flat on nominal annual basis by increasing only 0.1% over the last 12 months, which represents a ~4.8% real annual contraction. The growth trend in commercial loans mainly reflects the headwinds faced by these types of loans in the current business scenario characterized by a bearish business sentiment and a macroeconomic landscape marked by higher-than-normal interest rates and inflation. Regarding the composition of our loan portfolio by business segments, it continues to be more orientated to the Retail Banking segment, including personal banking and SMEs loans, that managed loans amounting to Ch$25,683,402 million as of March 31, 2025, concentrating 65.3% of the total loan book. Loans managed by our Wholesale Banking segment reached Ch$13,636,933 million as of March 31, 2025, representing 34.7% of our loan portfolio, which comprises loans granted to both Corporations and Large Companies. Loans by Segment (In Millions of Ch$ and %) Retail Banking 25,683,402 65.3% Wholesale Banking 13,636,933 34.7% Individuals 20,454,541 52.0% SMEs 5,228,861 13.3% Large Companies 5,540,802 14.1% Corporate 8,096,131 20.6% As of March 31, 2025 the loan managed by our Retail Banking segment was composed of loans granted to individuals amounting to Ch$20,454,541 million, which represented 52.0% of our total loan book and 79.6% of loans handled by the Retail Banking segment. The remaining amount of Ch$5,228,861 million, or 20.4% of the Retail Banking loan book, was associated with loans granted to SMEs. In the case of the loan portfolio managed by the Wholesale Banking, loans granted to Corporations concentrated Ch$8,096,131 million or 59.4% of the segment's portfolio while credits provided to Large Companies totalled Ch$5,540,802 million or 40.6% of the segment's book. The lending business dynamics have continued to be influenced by the evolution of macroeconomic factors, which may be characterized as one of increased borrowing costs and inflation above normal levels, which has hindered the take-off in the demand for loans among individuals, although this quarter we witnessed a tempered acceleration when compared to previous quarters. In this regard, loans managed by our Retail Banking loans grew Ch$1,352,953 million or 5.6% in March 2025 from the Ch$24,330,449 million reached in March 2024, which was primarily fuelled by Personal Banking loans, and residential mortgage loans in particular, while consumer loans continued to grow below inflation. To a lesser degree, SME loans also continued to grow positively while demonstrating a sort of recovery after a couple of years of subdued growth. This is also particularly important in light of the amortization experienced by formerly granted FOGAPE loans. Based on these trends, the annual growth of the Retail Banking segment's loan book may be described as follows: ? Personal Banking loans that rose Ch$1,167,311 million or 6.1% in in March 2025 as compared to March 2024, due to: o An annual increment of Ch$1,009,779 million or 8.1% in Residential Mortgage loans, which totalled Ch$13,499,416 million in March 2025. This nominal expansion represents an annual real growth of ~3.2% over the same period, which is in line with the real expansion seen over the last quarters. As a result, residential mortgage loans continued to be the most growing lending family in our portfolio, which is underpinned by demographic rather than economic factors that have strongly influenced the housing market over the last decade. In addition, we have also reinforced the expansion of this product by improving the value offerings for our premium personal banking customer base, amid an environment that still marked by elevated long-term interest rates and increased delinquency, particularly in residential mortgage loans. Thus, based on both demand factors and our own commercial efforts, in the 1Q25 we achieved a residential mortgage loan origination of ~Ch$402,400 million, which represents a 11.9% annual increase and has enabled us to maintain our market share stable over time. o An annual increase of Ch$206,961 million or 3.9% in Consumer loans, which increased from Ch$5,341,352 million achieved in March 2024 to Ch$5,548,313 million in March 2025. This expansion, which represents real contraction ~1.0%, is mainly aligned with the slowdown we have witnessed over the last quarters in installment loans.
Management Discussion Analysis | 38 In detail, loans related to credit cards amounted to Ch$2,000,618 million in March 2025, which denotes an annual growth of Ch$148,726 million or 8.0% in nominal terms. This expansion reflects an acceleration when compared to the annual growth rates seen over the last quarters of 2024, which could appear as kind of breakpoint of the slowdown triggered by the tempered evolution of household consumption and regardless of borrowing costs that remain high on the grounds of the current monetary policy interest rate, particularly for revolving products. Growth in credit card loans relies on our outpacing credit risk management policies, which have enabled us to expand this lending product without experiencing a significant change in credit risk expenses. On the other hand, installment loans totalled Ch$3,263,619 million as March 31, 2025, which represents a moderate Ch$40,929 million or 1.3% nominal annual increase when compared to March 2024. Even though we have continued to take diverse steps to targeting financial needs of our premium customer base, origination of installment loans has hardly allowed us to replace the amortization of loans granted formerly. In this regard, it is worth noting that in the 1Q25 we posted installment loans origination of ~Ch$521,700 million, which is roughly the same amount achieved in the same period of 2024. In order to keep on growing in origination of installment loans we have continued to emphasize tailored offerings, including our program of pre-approved consumer loans that leverages on the excellence of our credit risk management policies. ? On a more positive note, loans granted to SMEs reached Ch$5,228,861 million as of March 31, 2025, which represents positive annual growth that resulted in further balances by Ch$185,642 million or 3.7% when compared to March 2024. As we have mentioned in previous reports, growth in SMEs is composed of two opposite effects. First of all, we can mention the recurrent business in the SME subsegment, which has continued to growth steadily. On the other hand, we have witnessed a downsizing driver associated with the scheduled amortization of Fogape loans granted to SMEs until 2023 in order to support these customers in dealing with the financial aftermath of the COVID pandemic. All in all, on an annual basis, the net increase posted in SME loans is explained by: (i) an annual decline in Fogape loan balances by ~Ch$301,000 million in March 2025 when compared to March 2024, and (ii) an annual increment in other-than-Fogape loans amounting to ~Ch$445,500 million, which represents an annual expansion of 8.2% in the same period. In the Wholesale Banking segment, total loans reached Ch$13,636,933 million in March 2025, which denotes a decline of Ch$121,785 million or 0.9% when compared to the Ch$13,758,718 million recorded in March 2024. As we have noted over the last two years, the prevailing economic landscape has adversely affected loan growth in this segment. This has to do with diverse dynamics affecting both private investment and business sentiment, which has certainly translated into lowered demand for loans. Furthermore, the financial strength of some industries has been impacted by specific market conditions and uncertainty about potential changes to the playing field. In addition, in the recent months, the Chilean peso has appreciated against the U.S. dollar. Actually, between March 2024 and March 2025 the Chilean peso appreciated 2.8%, which explains ~Ch$104,000 million of the annual change in Wholesale Banking loans. When diving into the banking units, the change in the loan book handled by the Wholesale Banking segment was mainly due to: ? Loans handled by the Corporate Banking Unit that reached Ch$8,096,131 million in March 2025, which means an annual decrease of Ch$173,684 million or 2.1% when compared to the amount recorded in the same period of 2024. Macroeconomic and financial trends have resulted in negative changes associated with specific products. In this regard, the annual change in the segment's loan book was primarily driven by an annual decline of Ch$122,587 million or 13.9% in Trade Finance loans, which was partly explained by the previously mentioned appreciation of the Chilean peso against the U.S. dollar and, to a lesser extent, lower dynamism in the export sector in comparison with a year earlier that coupled with the boosting effect of revised value offerings last year on this lending product To a lesser degree, this subsegment posted an annual decrease of Ch$23,692 million or 0.4% in commercial credits, which was explained by: (i) a decline in loans granted to clients participating in the concessions, infrastructure and retail sectors, which is in line with the stagnation in private investment, particularly in capital expenditures related to construction, and (ii) in the opposite direction, a strong surge in the family office business on an annual basis due to specific lending operations in the 1Q25 related to MA processes occurring in the local market. ? The loan book managed by the Large Companies Unit amounted to Ch$5,540,802 million in March 2025, which resulted in a Ch$51,899 million or 0.9% annual increase when compared to the balance registered in March 2024. The evolution of this loan book was principally prompted by: (i) by an annual rise of Ch$72,811 million or 6.4% in leasing loans handled by this banking unit, which continued to be aligned with efforts we have devoted over the last couple years that pursue to improve value offerings for this product in the wholesale banking segment, and (ii) a moderate annual increase of Ch$46,982 million or 1.5% in commercial credits, which is particularly important in the context of decreasing Fogape loan balances, which also benefited this subsegment in the past.
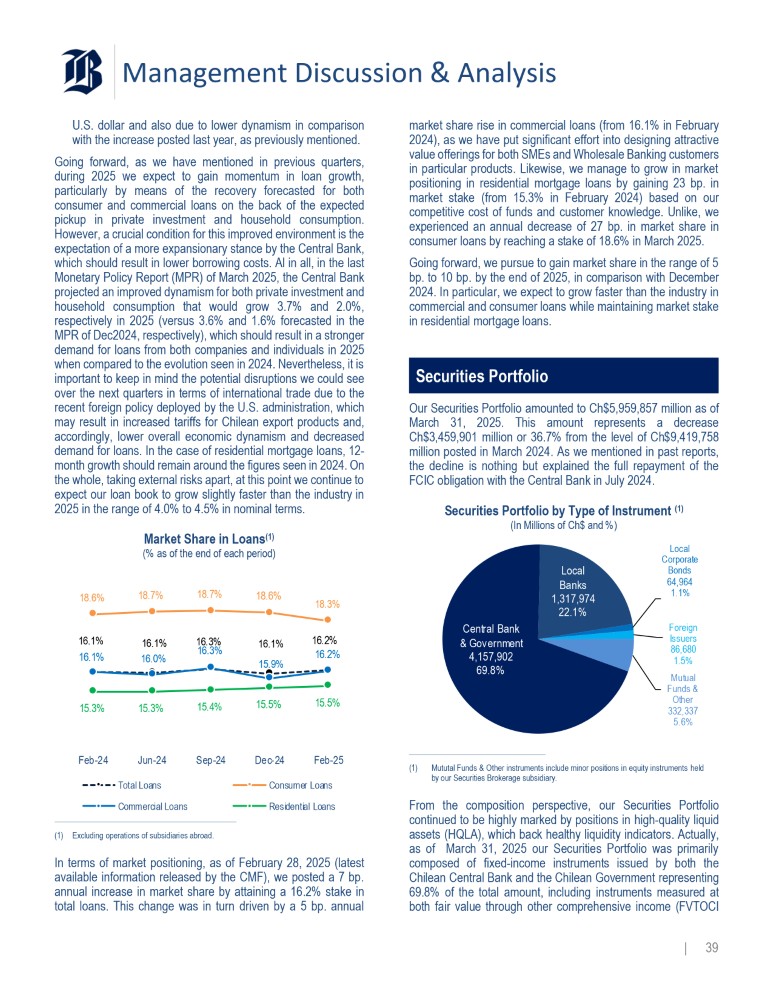
These factors were to some extent offset by an annual decrease of Ch$74,242 million or 7.8% in Trade Finance loans, which was partly influenced by the annual appreciation experienced by the Chilean peso against the Management Discussion & Analysis U.S. dollar and also due to lower dynamism in comparison with the increase posted last year, as previously mentioned. Going forward, as we have mentioned in previous quarters, during 2025 we expect to gain momentum in loan growth, particularly by means of the recovery forecasted for both consumer and commercial loans on the back of the expected pickup in private investment and household consumption . However, a crucial condition for this improved environment is the expectation of a more expansionary stance by the Central Bank, which should result in lower borrowing costs . Al in all, in the last Monetary Policy Report (MPR) of March 2025 , the Central Bank projected an improved dynamism for both private investment and household consumption that would grow 3 . 7 % and 2 . 0 % , respectively in 2025 (versus 3 . 6 % and 1 . 6 % forecasted in the MPR of Dec 2024 , respectively), which should result in a stronger demand for loans from both companies and individuals in 2025 when compared to the evolution seen in 2024 . Nevertheless, it is important to keep in mind the potential disruptions we could see over the next quarters in terms of international trade due to the recent foreign policy deployed by the U . S . administration, which may result in increased tariffs for Chilean export products and, accordingly, lower overall economic dynamism and decreased demand for loans . In the case of residential mortgage loans, 12 - month growth should remain around the figures seen in 2024 . On the whole, taking external risks apart, at this point we continue to expect our loan book to grow slightly faster than the industry in 2025 in the range of 4 . 0 % to 4 . 5 % in nominal terms . Market Share in Loans (1) (% as of the end of each period) 18.6% 18.7% 18.7% 18.6% 16.1% 16.3% 16.1% 16.1% 16.2% 16.2% 18.3% 16.1% 16.0% 16.3% 15.9% 15.3% 15.3% 15.4% 15.5% 15.5% Feb - 24 Jun - 24 Sep - 24 Total Loans Commercial Loans Dec - 24 Feb - 25 Consumer Loans Residential Loans (1) Excluding operations of subsidiaries abroad. In terms of market positioning, as of February 28 , 2025 (latest available information released by the CMF), we posted a 7 bp . annual increase in market share by attaining a 16 . 2 % stake in total loans . This change was in turn driven by a 5 bp . annual market share rise in commercial loans (from 16 . 1 % in February 2024 ), as we have put significant effort into designing attractive value offerings for both SMEs and Wholesale Banking customers in particular products . Likewise, we manage to grow in market positioning in residential mortgage loans by gaining 23 bp . in market stake (from 15 . 3 % in February 2024 ) based on our competitive cost of funds and customer knowledge . Unlike, we experienced an annual decrease of 27 bp . in market share in consumer loans by reaching a stake of 18 . 6 % in March 2025 . Going forward, we pursue to gain market share in the range of 5 bp . to 10 bp . by the end of 2025 , in comparison with December 2024 . In particular, we expect to grow faster than the industry in commercial and consumer loans while maintaining market stake in residential mortgage loans . Securities Portfolio Our Securities Portfolio amounted to Ch $ 5 , 959 , 857 million as of March 31 , 2025 . This amount represents a decrease Ch $ 3 , 459 , 901 million or 36 . 7 % from the level of Ch $ 9 , 419 , 758 million posted in March 2024 . As we mentioned in past reports, the decline is nothing but explained the full repayment of the FCIC obligation with the Central Bank in July 2024 . Central Bank & Government 4,157,902 69.8% Local Banks 1,317,974 22.1% Securities Portfolio by Type of Instrument (1) (In Millions of Ch$ and %) Local Corporate Bonds 64,964 1.1% Foreign Issuers 86 , 680 1.5% Mutual Funds & Other 332,337 5.6% (1) Mututal Funds & Other instruments include minor positions in equity instruments held by our Securities Brokerage subsidiary. | 39 From the composition perspective, our Securities Portfolio continued to be highly marked by positions in high - quality liquid assets (HQLA), which back healthy liquidity indicators . Actually, as of March 31 , 2025 our Securities Portfolio was primarily composed of fixed - income instruments issued by both the Chilean Central Bank and the Chilean Government representing 69 .
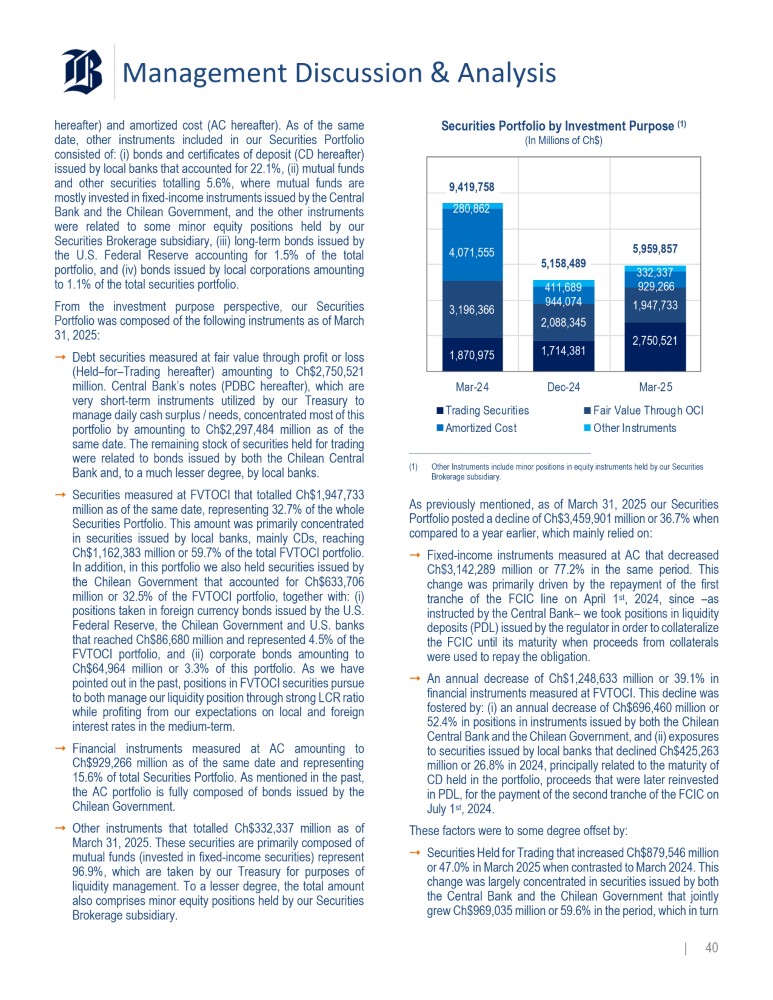
8 % of the total amount, including instruments measured at both fair value through other comprehensive income (FVTOCI Management Discussion & Analysis hereafter) and amortized cost (AC hereafter) . As of the same date, other instruments included in our Securities Portfolio consisted of : (i) bonds and certificates of deposit (CD hereafter) issued by local banks that accounted for 22 . 1 % , (ii) mutual funds and other securities totalling 5 . 6 % , where mutual funds are mostly invested in fixed - income instruments issued by the Central Bank and the Chilean Government, and the other instruments were related to some minor equity positions held by our Securities Brokerage subsidiary, (iii) long - term bonds issued by the U . S . Federal Reserve accounting for 1 . 5 % of the total portfolio, and (iv) bonds issued by local corporations amounting to 1 . 1 % of the total securities portfolio . From the investment purpose perspective, our Securities Portfolio was composed of the following instruments as of March 31 , 2025 : ⭬ Debt securities measured at fair value through profit or loss (Held – for – Trading hereafter) amounting to Ch $ 2 , 750 , 521 million . Central Bank’s notes (PDBC hereafter), which are very short - term instruments utilized by our Treasury to manage daily cash surplus / needs, concentrated most of this portfolio by amounting to Ch $ 2 , 297 , 484 million as of the same date . The remaining stock of securities held for trading were related to bonds issued by both the Chilean Central Bank and, to a much lesser degree, by local banks . ⭬ Securities measured at FVTOCI that totalled Ch $ 1 , 947 , 733 million as of the same date, representing 32 . 7 % of the whole Securities Portfolio . This amount was primarily concentrated in securities issued by local banks, mainly CDs, reaching Ch $ 1 , 162 , 383 million or 59 . 7 % of the total FVTOCI portfolio . In addition, in this portfolio we also held securities issued by the Chilean Government that accounted for Ch $ 633 , 706 million or 32 . 5 % of the FVTOCI portfolio, together with : (i) positions taken in foreign currency bonds issued by the U . S . Federal Reserve, the Chilean Government and U . S . banks that reached Ch $ 86 , 680 million and represented 4 . 5 % of the FVTOCI portfolio, and (ii) corporate bonds amounting to Ch $ 64 , 964 million or 3 . 3 % of this portfolio . As we have pointed out in the past, positions in FVTOCI securities pursue to both manage our liquidity position through strong LCR ratio while profiting from our expectations on local and foreign interest rates in the medium - term . ⭬ Financial instruments measured at AC amounting to Ch $ 929 , 266 million as of the same date and representing 15 . 6 % of total Securities Portfolio . As mentioned in the past, the AC portfolio is fully composed of bonds issued by the Chilean Government . ⭬ Other instruments that totalled Ch $ 332 , 337 million as of March 31 , 2025 . These securities are primarily composed of mutual funds (invested in fixed - income securities) represent 96 . 9 % , which are taken by our Treasury for purposes of liquidity management . To a lesser degree, the total amount also comprises minor equity positions held by our Securities Brokerage subsidiary . Securities Portfolio by Investment Purpose (1) (In Millions of Ch$) 1,870,975 1,714,381 2,750,521 3,196,366 2,088,345 1,947,733 4,071,555 944,074 929,266 411,689 332,337 9,419,758 280,862 5,158,489 5,959,857 Mar - 24 Trading Securities Amortized Cost Dec - 24 Mar - 25 Fair Value Through OCI Other Instruments (1) Other Instruments include minor positions in equity instruments held by our Securities Brokerage subsidiary. | 40 As previously mentioned, as of March 31 , 2025 our Securities Portfolio posted a decline of Ch $ 3 , 459 , 901 million or 36 . 7 % when compared to a year earlier, which mainly relied on : ⭬ Fixed - income instruments measured at AC that decreased Ch $ 3 , 142 , 289 million or 77 . 2 % in the same period . This change was primarily driven by the repayment of the first tranche of the FCIC line on April 1 st , 2024 , since – as instructed by the Central Bank – we took positions in liquidity deposits (PDL) issued by the regulator in order to collateralize the FCIC until its maturity when proceeds from collaterals were used to repay the obligation . ⭬ An annual decrease of Ch $ 1 , 248 , 633 million or 39 . 1 % in financial instruments measured at FVTOCI . This decline was fostered by : (i) an annual decrease of Ch $ 696 , 460 million or 52 . 4 % in positions in instruments issued by both the Chilean Central Bank and the Chilean Government, and (ii) exposures to securities issued by local banks that declined Ch $ 425 , 263 million or 26 . 8 % in 2024 , principally related to the maturity of CD held in the portfolio, proceeds that were later reinvested in PDL, for the payment of the second tranche of the FCIC on July 1 st , 2024 . These factors were to some degree offset by : ⭬ Securities Held for Trading that increased Ch $ 879 , 546 million or 47 . 0 % in March 2025 when contrasted to March 2024 . This change was largely concentrated in securities issued by both the Central Bank and the Chilean Government that jointly grew Ch $ 969 , 035 million or 59 .
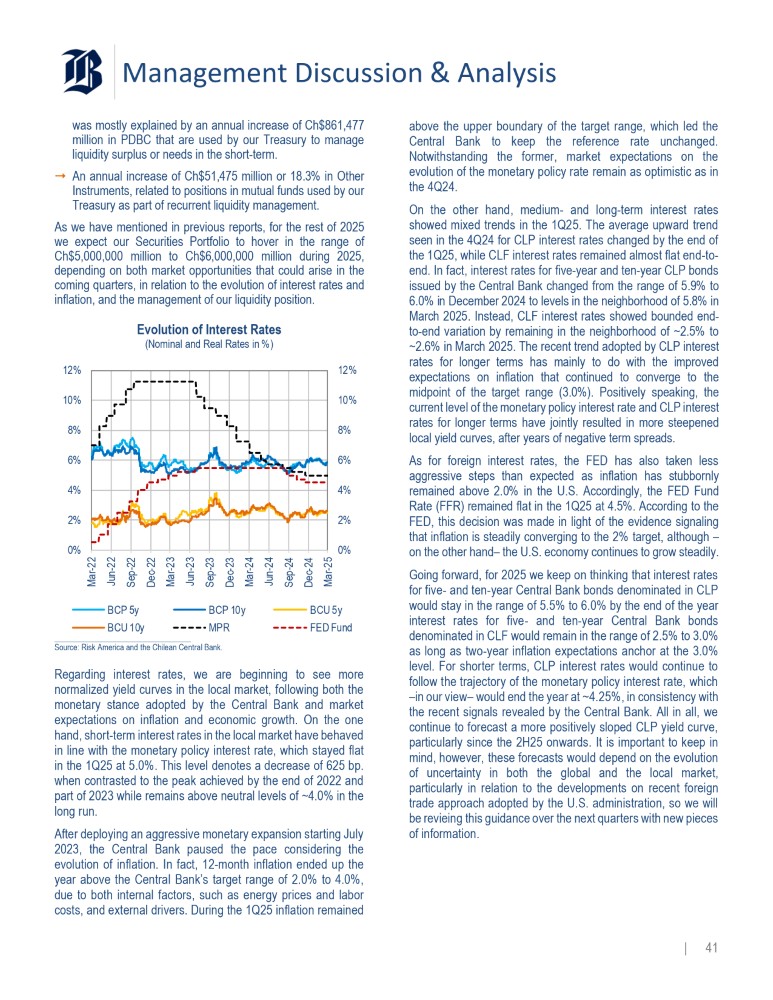
6 % in the period, which in turn Management Discussion & Analysis was mostly explained by an annual increase of Ch $ 861 , 477 million in PDBC that are used by our Treasury to manage liquidity surplus or needs in the short - term . ⭬ An annual increase of Ch $ 51 , 475 million or 18 . 3 % in Other Instruments, related to positions in mutual funds used by our Treasury as part of recurrent liquidity management . As we have mentioned in previous reports, for the rest of 2025 we expect our Securities Portfolio to hover in the range of Ch $ 5 , 000 , 000 million to Ch $ 6 , 000 , 000 million during 2025 , depending on both market opportunities that could arise in the coming quarters, in relation to the evolution of interest rates and inflation, and the management of our liquidity position . Evolution of Interest Rates (Nominal and Real Rates in %) 0% 2% 4% 6% 8% 10% 12% 0% 2% 4% 6% 8% 10% 12% Mar - 22 Jun - 22 Sep - 22 Dec - 22 Mar - 23 Jun - 23 Sep - 23 Dec - 23 Mar - 24 Jun - 24 Sep - 24 Dec - 24 Mar - 25 BCP 5y BCU 10y BCP 10y MPR BCU 5y FED Fund Source: Risk America and the Chilean Central Bank. costs, and external drivers. During the 1Q25 inflation remained | 41 Regarding interest rates, we are beginning to see more normalized yield curves in the local market, following both the monetary stance adopted by the Central Bank and market expectations on inflation and economic growth . On the one hand, short - term interest rates in the local market have behaved in line with the monetary policy interest rate, which stayed flat in the 1 Q 25 at 5 . 0 % . This level denotes a decrease of 625 bp . when contrasted to the peak achieved by the end of 2022 and part of 2023 while remains above neutral levels of ~ 4 . 0 % in the long run . After deploying an aggressive monetary expansion starting July 2023 , the Central Bank paused the pace considering the evolution of inflation . In fact, 12 - month inflation ended up the year above the Central Bank’s target range of 2 . 0 % to 4 . 0 % , due to both internal factors, such as energy prices and labor above the upper boundary of the target range, which led the Central Bank to keep the reference rate unchanged . Notwithstanding the former, market expectations on the evolution of the monetary policy rate remain as optimistic as in the 4 Q 24 . On the other hand, medium - and long - term interest rates showed mixed trends in the 1 Q 25 . The average upward trend seen in the 4 Q 24 for CLP interest rates changed by the end of the 1 Q 25 , while CLF interest rates remained almost flat end - to - end . In fact, interest rates for five - year and ten - year CLP bonds issued by the Central Bank changed from the range of 5 . 9 % to 6 . 0 % in December 2024 to levels in the neighborhood of 5 . 8 % in March 2025 . Instead, CLF interest rates showed bounded end - to - end variation by remaining in the neighborhood of ~ 2 . 5 % to ~ 2 . 6 % in March 2025 . The recent trend adopted by CLP interest rates for longer terms has mainly to do with the improved expectations on inflation that continued to converge to the midpoint of the target range ( 3 . 0 % ) . Positively speaking, the current level of the monetary policy interest rate and CLP interest rates for longer terms have jointly resulted in more steepened local yield curves, after years of negative term spreads . As for foreign interest rates, the FED has also taken less aggressive steps than expected as inflation has stubbornly remained above 2 . 0 % in the U . S . Accordingly, the FED Fund Rate (FFR) remained flat in the 1 Q 25 at 4 . 5 % . According to the FED, this decision was made in light of the evidence signaling that inflation is steadily converging to the 2 % target, although – on the other hand – the U . S . economy continues to grow steadily . Going forward, for 2025 we keep on thinking that interest rates for five - and ten - year Central Bank bonds denominated in CLP would stay in the range of 5 . 5 % to 6 . 0 % by the end of the year interest rates for five - and ten - year Central Bank bonds denominated in CLF would remain in the range of 2 . 5 % to 3 . 0 % as long as two - year inflation expectations anchor at the 3 . 0 % level . For shorter terms, CLP interest rates would continue to follow the trajectory of the monetary policy interest rate, which – in our view – would end the year at ~ 4 . 25 % , in consistency with the recent signals revealed by the Central Bank . All in all, we continue to forecast a more positively sloped CLP yield curve, particularly since the 2 H 25 onwards . It is important to keep in mind, however, these forecasts would depend on the evolution of uncertainty in both the global and the local market, particularly in relation to the developments on recent foreign trade approach adopted by the U . S . administration, so we will be revieing this guidance over the next quarters with new pieces of information .
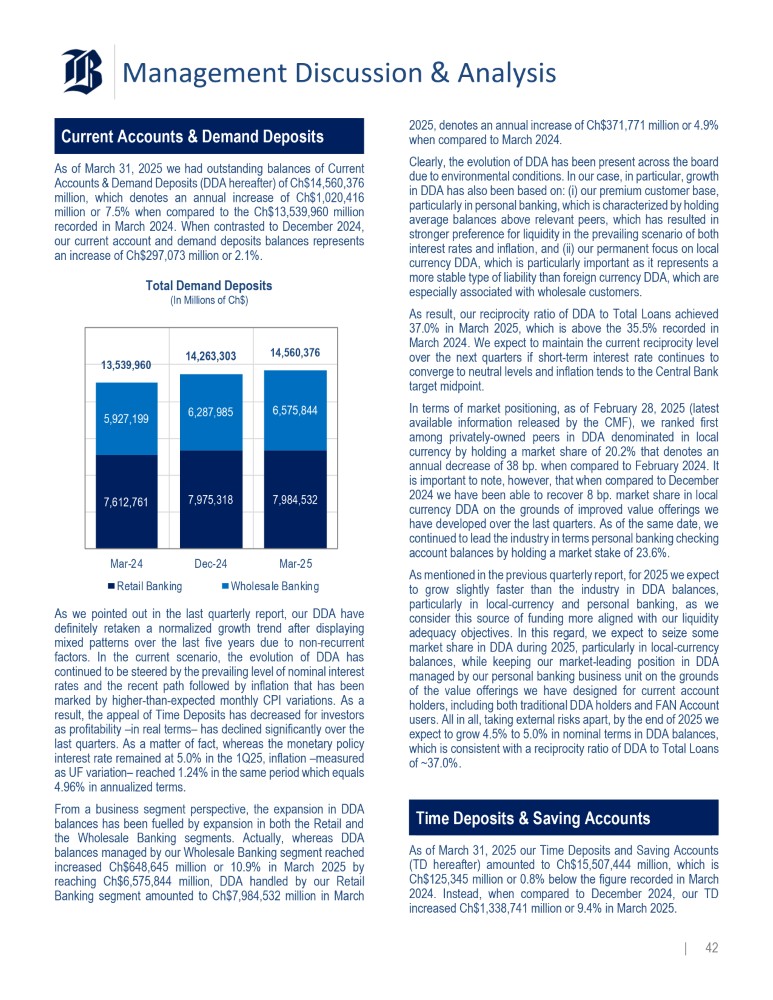
Management Discussion & Analysis Current Accounts & Demand Deposits As of March 31 , 2025 we had outstanding balances of Current Accounts & Demand Deposits (DDA hereafter) of Ch $ 14 , 560 , 376 million, which denotes an annual increase of Ch $ 1 , 020 , 416 million or 7 . 5 % when compared to the Ch $ 13 , 539 , 960 million recorded in March 2024 . When contrasted to December 2024 , our current account and demand deposits balances represents an increase of Ch $ 297 , 073 million or 2 . 1 % . Total Demand Deposits (In Millions of Ch$) 14,560,376 14,263,303 13,539,960 6,575,844 6,287,985 5,927,199 7,984,532 7,975,318 7,612,761 Dec - 24 Mar - 24 Retail Banking Mar - 25 Wholesale Banking As we pointed out in the last quarterly report, our DDA have definitely retaken a normalized growth trend after displaying mixed patterns over the last five years due to non - recurrent factors . In the current scenario, the evolution of DDA has continued to be steered by the prevailing level of nominal interest rates and the recent path followed by inflation that has been marked by higher - than - expected monthly CPI variations . As a result, the appeal of Time Deposits has decreased for investors as profitability – in real terms – has declined significantly over the last quarters . As a matter of fact, whereas the monetary policy interest rate remained at 5 . 0 % in the 1 Q 25 , inflation – measured as UF variation – reached 1 . 24 % in the same period which equals 4 . 96 % in annualized terms . From a business segment perspective, the expansion in DDA balances has been fuelled by expansion in both the Retail and the Wholesale Banking segments . Actually, whereas DDA balances managed by our Wholesale Banking segment reached increased Ch $ 648 , 645 million or 10 . 9 % in March 2025 by reaching Ch $ 6 , 575 , 844 million, DDA handled by our Retail Banking segment amounted to Ch $ 7 , 984 , 532 million in March | 42 2025 , denotes an annual increase of Ch $ 371 , 771 million or 4 . 9 % when compared to March 2024 . Clearly, the evolution of DDA has been present across the board due to environmental conditions . In our case, in particular, growth in DDA has also been based on : (i) our premium customer base, particularly in personal banking, which is characterized by holding average balances above relevant peers, which has resulted in stronger preference for liquidity in the prevailing scenario of both interest rates and inflation, and (ii) our permanent focus on local currency DDA, which is particularly important as it represents a more stable type of liability than foreign currency DDA, which are especially associated with wholesale customers . As result, our reciprocity ratio of DDA to Total Loans achieved 37 . 0 % in March 2025 , which is above the 35 . 5 % recorded in March 2024 . We expect to maintain the current reciprocity level over the next quarters if short - term interest rate continues to converge to neutral levels and inflation tends to the Central Bank target midpoint . In terms of market positioning, as of February 28 , 2025 (latest available information released by the CMF), we ranked first among privately - owned peers in DDA denominated in local currency by holding a market share of 20 . 2 % that denotes an annual decrease of 38 bp . when compared to February 2024 . It is important to note, however, that when compared to December 2024 we have been able to recover 8 bp . market share in local currency DDA on the grounds of improved value offerings we have developed over the last quarters . As of the same date, we continued to lead the industry in terms personal banking checking account balances by holding a market stake of 23 . 6 % . As mentioned in the previous quarterly report, for 2025 we expect to grow slightly faster than the industry in DDA balances, particularly in local - currency and personal banking, as we consider this source of funding more aligned with our liquidity adequacy objectives . In this regard, we expect to seize some market share in DDA during 2025 , particularly in local - currency balances, while keeping our market - leading position in DDA managed by our personal banking business unit on the grounds of the value offerings we have designed for current account holders, including both traditional DDA holders and FAN Account users . All in all, taking external risks apart, by the end of 2025 we expect to grow 4 . 5 % to 5 . 0 % in nominal terms in DDA balances, which is consistent with a reciprocity ratio of DDA to Total Loans of ~ 37 . 0 % . Time Deposits & Saving Accounts As of March 31 , 2025 our Time Deposits and Saving Accounts (TD hereafter) amounted to Ch $ 15 , 507 , 444 million, which is Ch $ 125 , 345 million or 0 . 8 % below the figure recorded in March 2024 . Instead, when compared to December 2024 , our TD increased Ch $ 1 , 338 , 741 million or 9 . 4 % in March 2025 .
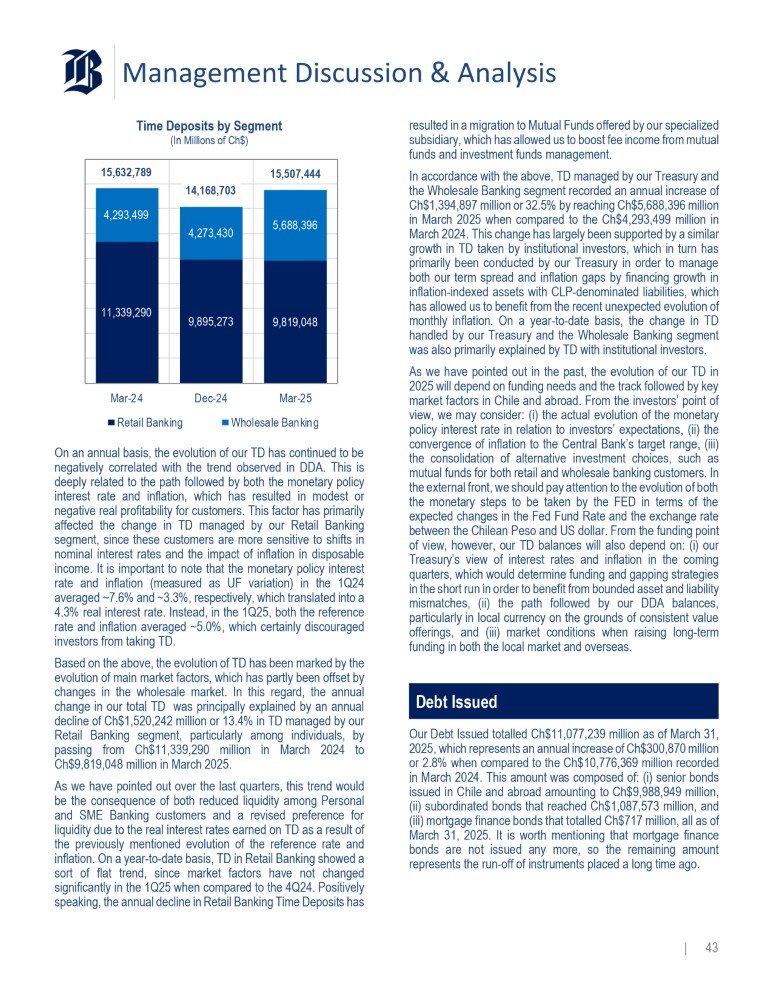
Management Discussion & Analysis Time Deposits by Segment (In Millions of Ch$) 15,507,444 14,168,703 15,632,789 4,293,499 5,688,396 4,273,430 11,339,290 9,819,048 9,895,273 Dec - 24 Mar - 25 Wholesale Banking Mar - 24 Retail Banking On an annual basis, the evolution of our TD has continued to be negatively correlated with the trend observed in DDA . This is deeply related to the path followed by both the monetary policy interest rate and inflation, which has resulted in modest or negative real profitability for customers . This factor has primarily affected the change in TD managed by our Retail Banking segment, since these customers are more sensitive to shifts in nominal interest rates and the impact of inflation in disposable income . It is important to note that the monetary policy interest rate and inflation (measured as UF variation) in the 1 Q 24 averaged ~ 7 . 6 % and ~ 3 . 3 % , respectively, which translated into a 4 . 3 % real interest rate . Instead, in the 1 Q 25 , both the reference rate and inflation averaged ~ 5 . 0 % , which certainly discouraged investors from taking TD . Based on the above, the evolution of TD has been marked by the evolution of main market factors, which has partly been offset by changes in the wholesale market . In this regard, the annual change in our total TD was principally explained by an annual decline of Ch $ 1 , 520 , 242 million or 13 . 4 % in TD managed by our Retail Banking segment, particularly among individuals, by passing from Ch $ 11 , 339 , 290 million in March 2024 to Ch $ 9 , 819 , 048 million in March 2025 . As we have pointed out over the last quarters, this trend would be the consequence of both reduced liquidity among Personal and SME Banking customers and a revised preference for liquidity due to the real interest rates earned on TD as a result of the previously mentioned evolution of the reference rate and inflation . On a year - to - date basis, TD in Retail Banking showed a sort of flat trend, since market factors have not changed significantly in the 1 Q 25 when compared to the 4 Q 24 . Positively speaking, the annual decline in Retail Banking Time Deposits has | 43 resulted in a migration to Mutual Funds offered by our specialized subsidiary, which has allowed us to boost fee income from mutual funds and investment funds management . In accordance with the above, TD managed by our Treasury and the Wholesale Banking segment recorded an annual increase of Ch $ 1 , 394 , 897 million or 32 . 5 % by reaching Ch $ 5 , 688 , 396 million in March 2025 when compared to the Ch $ 4 , 293 , 499 million in March 2024 . This change has largely been supported by a similar growth in TD taken by institutional investors, which in turn has primarily been conducted by our Treasury in order to manage both our term spread and inflation gaps by financing growth in inflation - indexed assets with CLP - denominated liabilities, which has allowed us to benefit from the recent unexpected evolution of monthly inflation . On a year - to - date basis, the change in TD handled by our Treasury and the Wholesale Banking segment was also primarily explained by TD with institutional investors . As we have pointed out in the past, the evolution of our TD in 2025 will depend on funding needs and the track followed by key market factors in Chile and abroad . From the investors’ point of view, we may consider : (i) the actual evolution of the monetary policy interest rate in relation to investors’ expectations, (ii) the convergence of inflation to the Central Bank’s target range, (iii) the consolidation of alternative investment choices, such as mutual funds for both retail and wholesale banking customers . In the external front, we should pay attention to the evolution of both the monetary steps to be taken by the FED in terms of the expected changes in the Fed Fund Rate and the exchange rate between the Chilean Peso and US dollar . From the funding point of view, however, our TD balances will also depend on : (i) our Treasury’s view of interest rates and inflation in the coming quarters, which would determine funding and gapping strategies in the short run in order to benefit from bounded asset and liability mismatches, (ii) the path followed by our DDA balances, particularly in local currency on the grounds of consistent value offerings, and (iii) market conditions when raising long - term funding in both the local market and overseas . Debt Issued Our Debt Issued totalled Ch $ 11 , 077 , 239 million as of March 31 , 2025 , which represents an annual increase of Ch $ 300 , 870 million or 2 . 8 % when compared to the Ch $ 10 , 776 , 369 million recorded in March 2024 . This amount was composed of : (i) senior bonds issued in Chile and abroad amounting to Ch $ 9 , 988 , 949 million, (ii) subordinated bonds that reached Ch $ 1 , 087 , 573 million, and (iii) mortgage finance bonds that totalled Ch $ 717 million, all as of March 31 , 2025 . It is worth mentioning that mortgage finance bonds are not issued any more, so the remaining amount represents the run - off of instruments placed a long time ago .
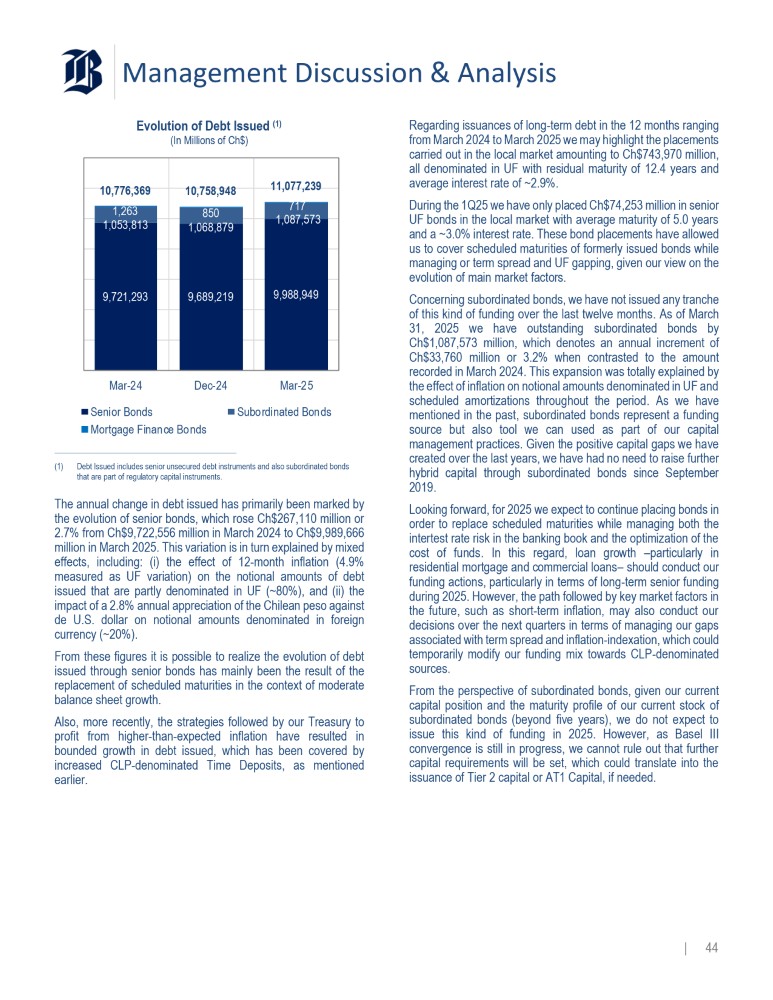
Management Discussion & Analysis Evolution of Debt Issued (1) (In Millions of Ch$) 9,721,293 9,689,219 9,988,949 1,087,573 717 10,758,948 10,776,369 850 1,263 1,068,879 1,053,813 11,077,239 Mar - 24 Senior Bonds Dec - 24 Mar - 25 Subordinated Bonds Mortgage Finance Bonds (1) Debt Issued includes senior unsecured debt instruments and also subordinated bonds that are part of regulatory capital instruments. The annual change in debt issued has primarily been marked by the evolution of senior bonds, which rose Ch $ 267 , 110 million or 2 . 7 % from Ch $ 9 , 722 , 556 million in March 2024 to Ch $ 9 , 989 , 666 million in March 2025 . This variation is in turn explained by mixed effects, including : (i) the effect of 12 - month inflation ( 4 . 9 % measured as UF variation) on the notional amounts of debt issued that are partly denominated in UF (~ 80 % ), and (ii) the impact of a 2 . 8 % annual appreciation of the Chilean peso against de U . S . dollar on notional amounts denominated in foreign currency (~ 20 % ) . From these figures it is possible to realize the evolution of debt issued through senior bonds has mainly been the result of the replacement of scheduled maturities in the context of moderate balance sheet growth . Also, more recently, the strategies followed by our Treasury to profit from higher - than - expected inflation have resulted in bounded growth in debt issued, which has been covered by increased CLP - denominated Time Deposits, as mentioned earlier . | 44 Regarding issuances of long - term debt in the 12 months ranging from March 2024 to March 2025 we may highlight the placements carried out in the local market amounting to Ch $ 743 , 970 million, all denominated in UF with residual maturity of 12 . 4 years and average interest rate of ~ 2 . 9 % . During the 1 Q 25 we have only placed Ch $ 74 , 253 million in senior UF bonds in the local market with average maturity of 5 . 0 years and a ~ 3 . 0 % interest rate . These bond placements have allowed us to cover scheduled maturities of formerly issued bonds while managing or term spread and UF gapping, given our view on the evolution of main market factors . Concerning subordinated bonds, we have not issued any tranche of this kind of funding over the last twelve months . As of March 31 , 2025 we have outstanding subordinated bonds by Ch $ 1 , 087 , 573 million, which denotes an annual increment of Ch $ 33 , 760 million or 3 . 2 % when contrasted to the amount recorded in March 2024 . This expansion was totally explained by the effect of inflation on notional amounts denominated in UF and scheduled amortizations throughout the period . As we have mentioned in the past, subordinated bonds represent a funding source but also tool we can used as part of our capital management practices . Given the positive capital gaps we have created over the last years, we have had no need to raise further hybrid capital through subordinated bonds since September 2019 . Looking forward, for 2025 we expect to continue placing bonds in order to replace scheduled maturities while managing both the intertest rate risk in the banking book and the optimization of the cost of funds . In this regard, loan growth – particularly in residential mortgage and commercial loans – should conduct our funding actions, particularly in terms of long - term senior funding during 2025 . However, the path followed by key market factors in the future, such as short - term inflation, may also conduct our decisions over the next quarters in terms of managing our gaps associated with term spread and inflation - indexation, which could temporarily modify our funding mix towards CLP - denominated sources . From the perspective of subordinated bonds, given our current capital position and the maturity profile of our current stock of subordinated bonds (beyond five years), we do not expect to issue this kind of funding in 2025 . However, as Basel III convergence is still in progress, we cannot rule out that further capital requirements will be set, which could translate into the issuance of Tier 2 capital or AT 1 Capital, if needed .
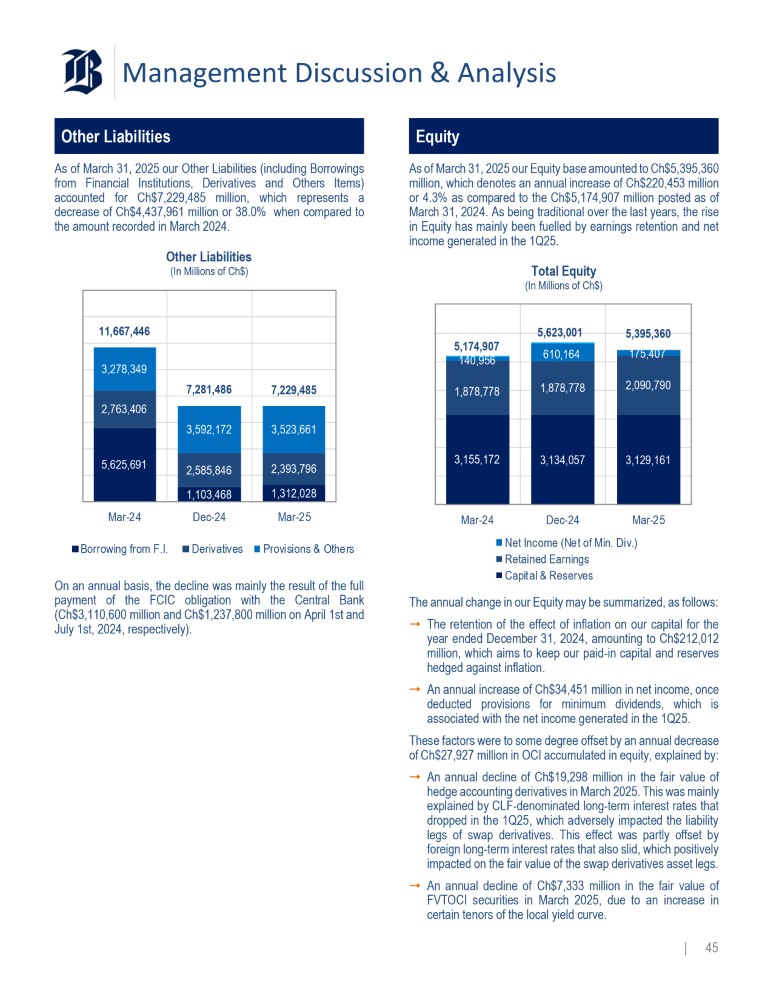
Management Discussion & Analysis Other Liabilities As of March 31 , 2025 our Other Liabilities (including Borrowings from Financial Institutions, Derivatives and Others Items) accounted for Ch $ 7 , 229 , 485 million, which represents a decrease of Ch $ 4 , 437 , 961 million or 38 . 0 % when compared to the amount recorded in March 2024 . Other Liabilities (In Millions of Ch$) 11,667,446 3,278,349 7,229,485 7,281,486 2,763,406 3,523,661 3,592,172 5,625,691 2,393,796 2,585,846 1,312,028 1,103,468 Mar - 24 Dec - 24 Mar - 25 Borrowing from F.I. Derivatives Provisions & Others On an annual basis, the decline was mainly the result of the full payment of the FCIC obligation with the Central Bank (Ch $ 3 , 110 , 600 million and Ch $ 1 , 237 , 800 million on April 1 st and July 1 st, 2024 , respectively) . Equity As of March 31 , 2025 our Equity base amounted to Ch $ 5 , 395 , 360 million, which denotes an annual increase of Ch $ 220 , 453 million or 4 . 3 % as compared to the Ch $ 5 , 174 , 907 million posted as of March 31 , 2024 . As being traditional over the last years, the rise in Equity has mainly been fuelled by earnings retention and net income generated in the 1 Q 25 . Total Equity (In Millions of Ch$) 5,623,001 5,395,360 175,407 5,174,907 610,164 2,090,790 1,878,778 140,956 1,878,778 3,129,161 3,134,057 3,155,172 Mar - 24 Dec - 24 Mar - 25 Net Income (Net of Min. Div.) Retained Earnings Capital & Reserves The annual change in our Equity may be summarized, as follows : ⭬ The retention of the effect of inflation on our capital for the year ended December 31 , 2024 , amounting to Ch $ 212 , 012 million, which aims to keep our paid - in capital and reserves hedged against inflation . ⭬ An annual increase of Ch $ 34 , 451 million in net income, once deducted provisions for minimum dividends, which is associated with the net income generated in the 1 Q 25 . These factors were to some degree offset by an annual decrease of Ch $ 27 , 927 million in OCI accumulated in equity, explained by : | 45 ⭬ An annual decline of Ch $ 19 , 298 million in the fair value of hedge accounting derivatives in March 2025 . This was mainly explained by CLF - denominated long - term interest rates that dropped in the 1 Q 25 , which adversely impacted the liability legs of swap derivatives . This effect was partly offset by foreign long - term interest rates that also slid, which positively impacted on the fair value of the swap derivatives asset legs . ⭬ An annual decline of Ch $ 7 , 333 million in the fair value of FVTOCI securities in March 2025 , due to an increase in certain tenors of the local yield curve .
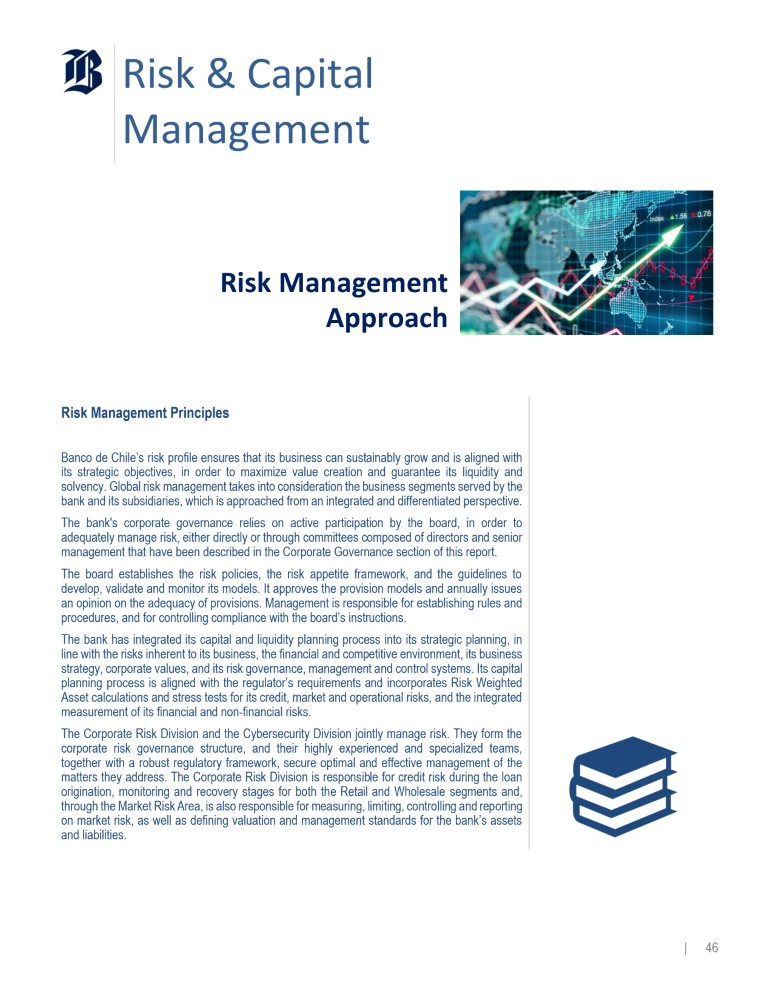
Risk & Capital Management Risk Management Approach Risk Management Principles Banco de Chile’s risk profile ensures that its business can sustainably grow and is aligned with its strategic objectives, in order to maximize value creation and guarantee its liquidity and solvency . Global risk management takes into consideration the business segments served by the bank and its subsidiaries, which is approached from an integrated and differentiated perspective . The bank's corporate governance relies on active participation by the board, in order to adequately manage risk, either directly or through committees composed of directors and senior management that have been described in the Corporate Governance section of this report . The board establishes the risk policies, the risk appetite framework, and the guidelines to develop, validate and monitor its models . It approves the provision models and annually issues an opinion on the adequacy of provisions . Management is responsible for establishing rules and procedures, and for controlling compliance with the board’s instructions . The bank has integrated its capital and liquidity planning process into its strategic planning, in line with the risks inherent to its business, the financial and competitive environment, its business strategy, corporate values, and its risk governance, management and control systems . Its capital planning process is aligned with the regulator’s requirements and incorporates Risk Weighted Asset calculations and stress tests for its credit, market and operational risks, and the integrated measurement of its financial and non - financial risks . The Corporate Risk Division and the Cybersecurity Division jointly manage risk . They form the corporate risk governance structure, and their highly experienced and specialized teams, together with a robust regulatory framework, secure optimal and effective management of the matters they address . The Corporate Risk Division is responsible for credit risk during the loan origination, monitoring and recovery stages for both the Retail and Wholesale segments and, through the Market Risk Area, is also responsible for measuring, limiting, controlling and reporting on market risk, as well as defining valuation and management standards for the bank’s assets and liabilities .
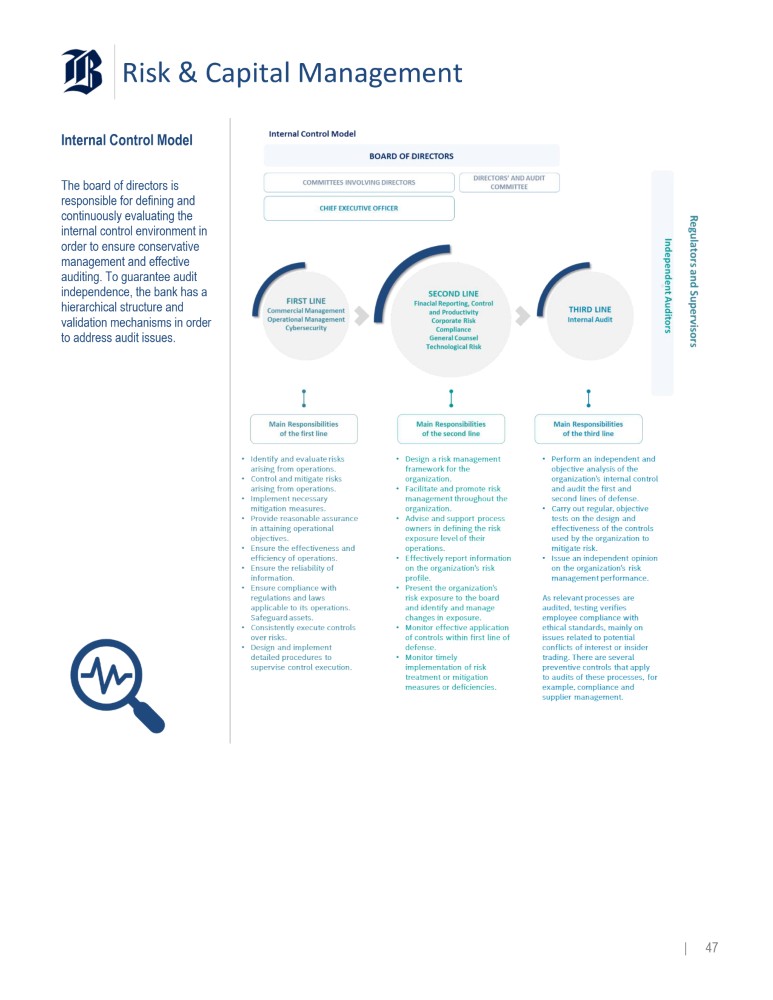
| 46 Risk & Capital Management Internal Control Model The board of directors is responsible for defining and continuously evaluating the internal control environment in order to ensure conservative management and effective auditing. To guarantee audit independence, the bank has a hierarchical structure and validation mechanisms in order to address audit issues.
| 47 Risk & Capital Management Credit Risk Credit risk assesses the probability that the counterparty in a credit transaction does not meet its contractual obligation because of payment incapacity or financial insolvency, and that leads to a potential loan loss. The bank seeks an adequate risk - return and an appropriate risk balance, through careful credit risk management, which covers the loan origination, monitoring and recovery processes . It also continuously manages risk knowledge using an integral approach, in order to contribute to the business and anticipate threats that may damage its solvency or the quality of its loan portfolio, by developing a unique risk awareness culture throughout the corporation . This requires developing a risk management framework for the business segments served by the bank, responding to regulatory requirements and commercial dynamism, contributing to digital transformation, and contributing to the bank’s businesses from a risk management perspective . It adopts a portfolio perspective that efficiently and proactively manages, resolves and controls the business approval process . The bank integrates socio - environmental criteria into its evaluations for granting financing for domestic and regional projects that might generate such an impact, wherever executed . Projects must have all the permits, authorizations, licenses and studies required for their impacts in order to qualify for financing . For large customers, the bank also has specialized customer service units involved in the process of financing large - scale projects such as public works concessions that include building infrastructure and mining, power or real estate developments, all of which may have an environmental impact . Credit policies and processes are based on the following management principles, which use a specialized approach according to the characteristics of the bank’s markets and segments, and acknowledges their peculiarities : Perform a rigorous evaluation during the loan origination process Implement a continuous, robust portfolio monitoring process Develop credit risk modelling guidelines, covering regulatory and management aspects, for efficient decision making at each stage of the lending process. Implement a timely, flexible, efficient collections structure Efficiently manage teams, tools and information availability Our Corporate Risk division use these management principles to contribute to the business and anticipate threats that may affect solvency and portfolio quality, based on a segmentation by business, as follows : Retail Banking Segment Loan origination for these segments is mainly managed using risk evaluation scoring tools, supported by an appropriate credit attribution model, which is required to approve each transaction . These evaluations examine factors such as total borrowings, payment capacity and maximum acceptable exposure for the customer . Wholesale Banking Segment Origination management for this segment involves an individual assessment of the customer and if it belongs to a group of companies then this takes into consideration the bank’s relationship with the rest of the group . This individual assessment considers income - generating capacity, financial capacity with emphasis on solvency, exposure levels, industry variables, an evaluation of the partners and management and aspects particular to the transaction such as the financing structure, terms, products and any guarantees .
| 48 Risk & Capital Management The Bank separates this risk based on three types of market factors : spot prices, interest rates and option volatility . The Bank has a Market Risk Management policy, which is annually approved by the Board of Directors, where the types of internal limits and alerts are established, in addition to the regulatory ones, for the measurement of financial exposures and/or price risks . The measurement and control of the price risk, for management purposes, is carried out through various internal metrics and reports that differ from each other, depending on whether they are used for exposures in the Trading and Currency Book or for those belonging to the Accrual Book . Regarding the internal tools designed for the Trading and Currency Book, the price risk management is deployed through the calculation and reporting of financial exposures through their sensitivities or greeks and the risk of the entire portfolio by means of the VaR model . Additionally, the Bank has established internal metrics for the management of the price risk of the Accrual Book, defining limits and alerts for interest rate exposures . The Bank measures interest rate exposures through the Interest Rate Exposure (IRE) metric, and interest rate risk for the Accrual Book using the EaR 12 M (Earnings at Risk 12 months) methodology . In addition, internal policies establish the periodic carrying out of stress exercises on the positions of the Trading and Currency Book, and the Accrual Book, which are used to contrast them against the maximum price risk tolerance defined by the Board of Directors . Limit usage and alert status are regularly reported to the respective business units . Likewise, the Bank's Senior Management is immediately notified in the case of excess limits or activation of alerts, including the monitoring of corrective action plans, if necessary . This information is reported monthly to the Finance, International and Market Risk Committee and on a quarterly basis to the Board of Directors . Price Risk Price risk can be defined as the risk of losses in the Trading and / or the Banking Book, arising from adverse movements in market factors. The Bank has a Liquidity Risk Management Policy, reviewed and approved at least annually by the Board, which establishes the main guidelines for measuring, limiting, reporting and controlling liquidity risk . Funding liquidity is measured, reported and controlled by means of using internal metrics, including the Market Access Report (MAR) . MAR limits are established to ensure that funding can be obtained and / or renewed in professional markets under normal business conditions, in different time horizons and currencies . The Bank also sets a minimum amount of highly liquid assets (or liquidity buffer), and a limit of the cross - currency funding position . Concentration ratios and other complementary metrics are also periodically measured, reported and controlled against warning levels . In addition, the Bank reports standardized metrics to regulators in accordance with their guidelines, such as the Liquidity Coverage Ratio (LCR) and the Net Stable Financing Ratio (NSFR) . It also continuously monitors and tracks market variables and/or material events that could affect our liquidity position . In accordance with its Liquidity Risk Management Policy, the Bank performs regular stress testing in order to quantify its cash needs in the event of adverse scenarios of varying severity, which are contrasted against potentially available action plans detailed within the Liquidity Contingency Plan . These results are daily reported, monitored and controlled based on the maximum liquidity risk appetite defined by the Board . On the other hand, trading liquidity is assured by using limits with certain specific maturities based on the amounts that are normally traded in professional markets for interest rate exposure generated by debt instruments and derivatives . The same process is used to limit the Bank's overall exposure to each currency and to exchange rate volatility with varying maturities . These internal and regulatory metrics are regularly reported to the business units responsible for managing liquidity risk . Similarly, senior management is immediately notified if the limits are exceeded or triggers are breached, including, if necessary, monitoring of corrective action plans . Finally, the general status of liquidity risk is reported to the Asset and Liabilities Committee on a monthly basis and to the Board on a quarterly basis . Liquidity Risk Liquidity risk can arise either due to a reduction in the bank’s funding capacity (funding liquidity risk) or a reduction in the traded value of its assets that can be liquidated or its market factors from derivatives held in its portfolios (transaction or trading liquidity risk).
| 49 Risk & Capital Management Operational risk is inherent to all activities, products and systems, as well as strategic, business and support processes throughout the organization . All bank employees are appropriately responsible for the management and control of operational risks inherent to their duties, since these risks may result in direct or indirect financial losses . The bank controls and manages operational risk by developing a regulatory and governance framework adapted to the complexity of its business . The Operational Risk Policy defines a comprehensive management framework that includes identifying, evaluating, controlling, mitigating, monitoring and reporting these risks . This requires executing several processes as follows : Process Assessment Supplier Management Fraud Management Management of Operational Events and Operational Losses Operational Risk Assessment for Projects Control Testing Risk Appetite Profile and Framework Self - Assessment Matrix Relations with External Entities and Corporate Training Plan Operational Risk Operational risk is the risk of loss resulting from deficiencies or failures in internal processes, staff or systems, or from external events. This definition includes legal risks and excludes strategic and reputation risks. Being prepared to face any emergency is key to providing exceptional services to our customers . Therefore, we have developed a robust, consistent Business Continuity Plan to safeguard the bank and its subsidiaries . The objective of the plan is to establish general guidelines for ensuring the safety of our employees, protecting the organization's capital from catastrophic events, maintaining and updating documentation, and conducting training and testing . To comply with these guidelines, the bank has developed a strategy to meet this objective that covers the following areas: Document Management Business Continuity Testing Crisis Management Critical Supplier Management Management of Alternative Sites Relationship with Subsidiaries and External Organizations Continuous Improvement Training Information Security Officer (ISO) Business Continuity Different situations that could affect the business continuity of the organization or the country, which requires to be constantly prepared to keep operating the products and services that are critical to its customers.
| 50 Risk & Capital Management Society is increasingly digitalized, so customer privacy and cybersecurity risk management is a priority for Banco de Chile . Therefore, the bank has developed a Strategic Cybersecurity Plan, which is aligned with the bank's business strategy . The main objectives of this plan are to protect customer and employee data, safeguard the bank's data, manage technological, cybersecurity and data security risks, and strengthen the risk prevention culture . This plan complies with the appropriate regulations, which include the Personal Data Protection Law 21 , 096 , the Protection of Privacy Law 19 , 628 and the provisions published in the Updated Compilation of Rules (RAN) issued by the Financial Market Commission (CMF) . This plan has been approved by senior management, who regularly receive associated progress reports . Data security and cybersecurity policies at Banco de Chile establish guidelines regarding the responsibility for and protection of data and its associated risk management, based on both regulatory aspects and international standards . These policies are reviewed annually and apply to employees, outsourced personnel, as well as suppliers and contractors of services who access its facilities or have access to bank and subsidiary data . The controls that protect this information and IT assets are defined by regulations, processes and the bank’s internal procedures . Technological Risk, Cybersecurity and Data Protection Banco de Chile knows that sound ethical management is essential for its industry leading position . Therefore, the bank has diverse protocols, systems and models to ensure ethical behavior of all its employees . The Code of Conduct is the key guideline and essential component of the bank's corporate ethics . It contains the general principles and instructions that guide the ethical - professional conduct of the employees, directors and board advisors . The purpose of the code is to safeguard the fundamental values to properly conduct the bank's business, in accordance with the bank's corporate philosophy . The Ethics Committee is responsible for overseeing its implementation within the bank . Preventing corruption and the use of the bank and its subsidiaries to engage in unlawful practices has been a concern over the last few decades for Banco de Chile . Awareness - raising measures and controls have been intensified during the recent years, in order to prevent this kind of behavior . The bank has approved a Code of Conduct, a Prevention of Dishonest Practices Policy and a Handling Conflicts of Interest Policy, which describe the main roles and responsibilities to avoid that anything may be interpreted as a violation of ethical conduct or imply the risk of corruption or bribery . The Compliance Division by means of its Regulatory Compliance Area and the Ethics Committee are responsible for ensuring compliance with the conduct described in these policies . Conduct Risk and Anti - Money Laundering Its purpose is to manage the risks associated with models and their processes, so it relies on the model validation, model risk management and internal control functions . Model validation is responsible for performing an independent review of risk models, including risk - weighted assets and stress testing, during their construction and implementation stages . It validates compliance with board - approved guidelines and addresses aspects such as governance, data quality, modeling techniques, methodological and parametric implementation analysis and documentation . The results of these reviews are submitted to the respective committees . Model risk management is responsible for monitoring models and ensuring that they fulfill their life cycle status . The Model Risk Management Committee was created in July 2023 and is composed of members of the Bank’ senior management .

Model Risk and Internal Control | 51 Risk & Capital Management The Bank supervises and manages its capital adequacy based on the principles and objectives set forth in its Corporate Capital Management Policy and current risk appetite framework, ensuring that its capital base provides adequate coverage for the material risks of the business and complies with the requirements established by the CMF on this matter . Through its Policy, the Bank seeks to ensure the adequacy and quality of the Bank's capital, establish sufficient capital levels, through the definition of internal capital targets, ensure that capital metrics meet the internal capital targets defined by the Bank in the short and medium term, establish periodic and timely reports, to meet the objectives set on this matter and ensure the existence of a governance structure with clear roles and responsibilities within the organization . In terms of capital management, Banco de Chile is governed by, among others, the following principles : (i) ensuring the solvency of the Bank, without losing focus on the profitability of the capital invested by shareholders, (ii) considering capital as a scarce resource, so business and investment decisions should be oriented towards value creation by optimizing the capital invested, (iii) the Board of Directors is ultimately responsible for strategies and decisions that affect capital management, (iv) having a comprehensive capital management model that allows monitoring and control, (v) implementing an annual capital planning process, consistent and aligned with the definition of the risk appetite and strategic goals, and (vi) ensuring the accuracy, reasonability, quality and integrity of information related to capital management . Regarding Governance Structure, Banco de Chile has an adequate segregation of duties that allows activities related to business, control and monitoring, risk measurement and assessment, and capital adequacy, to be executed and reported with sufficient independence and in alignment with best risk and capital management practices . The key participants in the Bank's corporate governance structure for capital management are : Board of Directors : Is the Bank's highest decision - making body, responsible for the supervision of capital management, including regulatory and internal compliance, through the approval of the Policy, the definition of general guidelines for capital management based on the risk profile assumed by the Bank, as well as the approval of internal targets and capital planning, the Risk Internal Assessment Measurement (RIA), the Risk Appetite Framework (RAF) and associated contingency plans, among other elements . Capital Management Committee : Among other matters, the main function of Committee is to oversee and supervise capital management while being responsible for reviewing and proposing changes to the Policy, at least once a year ; reviewing and approving governance documentation associated with capital management ; ensuring that the Bank has sufficient capital to meet both its current needs and those arising from stress scenarios .
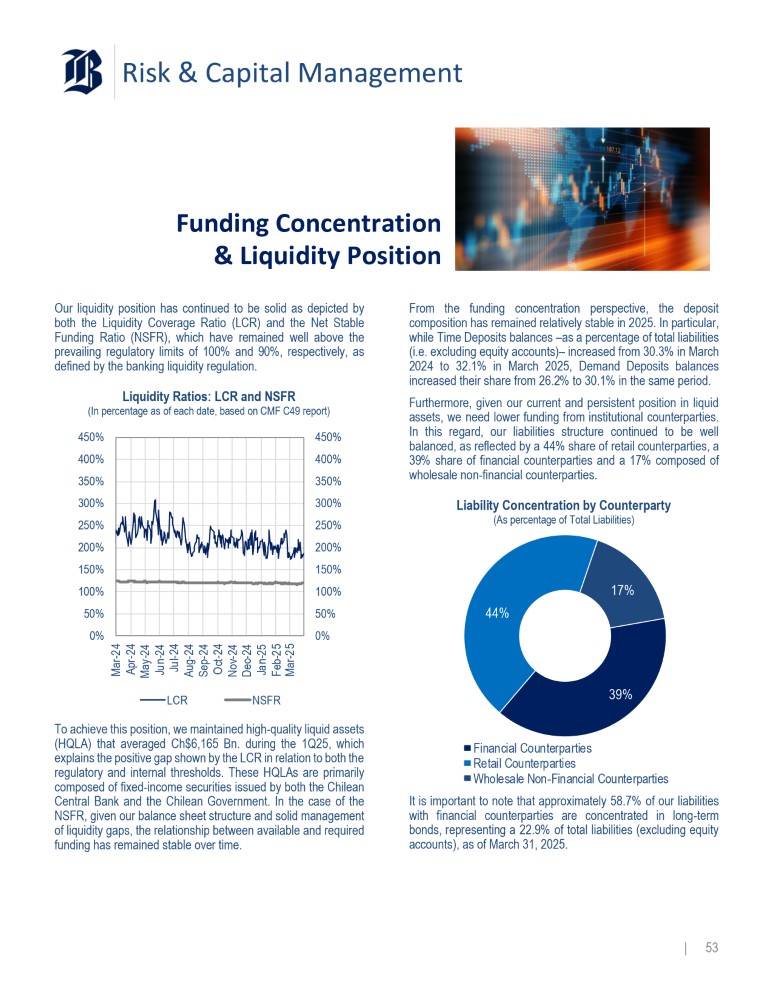
Capital Management | 52 Risk & Capital Management Funding Concentration & Liquidity Position Our liquidity position has continued to be solid as depicted by both the Liquidity Coverage Ratio (LCR) and the Net Stable Funding Ratio (NSFR), which have remained well above the prevailing regulatory limits of 100 % and 90 % , respectively, as defined by the banking liquidity regulation . Liquidity Ratios: LCR and NSFR (In percentage as of each date, based on CMF C49 report) 450% 400% 350% 300% 250% 200% 150% 100% 50% 0% 450% 400% 350% 300% 250% 200% 150% 100% 50% 0% Mar - 24 Apr - 24 May - 24 Jun - 24 Jul - 24 Aug - 24 Sep - 24 Oct - 24 Nov - 24 Dec - 24 Jan - 25 Feb - 25 Mar - 25 LCR NSFR To achieve this position, we maintained high - quality liquid assets (HQLA) that averaged Ch $ 6 , 165 Bn . during the 1 Q 25 , which explains the positive gap shown by the LCR in relation to both the regulatory and internal thresholds . These HQLAs are primarily composed of fixed - income securities issued by both the Chilean Central Bank and the Chilean Government . In the case of the NSFR, given our balance sheet structure and solid management of liquidity gaps, the relationship between available and required funding has remained stable over time . From the funding concentration perspective, the deposit composition has remained relatively stable in 2025 . In particular, while Time Deposits balances – as a percentage of total liabilities (i . e . excluding equity accounts) – increased from 30 . 3 % in March 2024 to 32 . 1 % in March 2025 , Demand Deposits balances increased their share from 26 . 2 % to 30 . 1 % in the same period . Furthermore, given our current and persistent position in liquid assets, we need lower funding from institutional counterparties . In this regard, our liabilities structure continued to be well balanced, as reflected by a 44 % share of retail counterparties, a 39 % share of financial counterparties and a 17 % composed of wholesale non - financial counterparties . Liability Concentration by Counterparty (As percentage of Total Liabilities) 39% 44% 17% Financial Counterparties Retail Counterparties Wholesale Non - Financial Counterparties It is important to note that approximately 58 . 7 % of our liabilities with financial counterparties are concentrated in long - term bonds, representing a 22 . 9 % of total liabilities (excluding equity accounts), as of March 31 , 2025 .
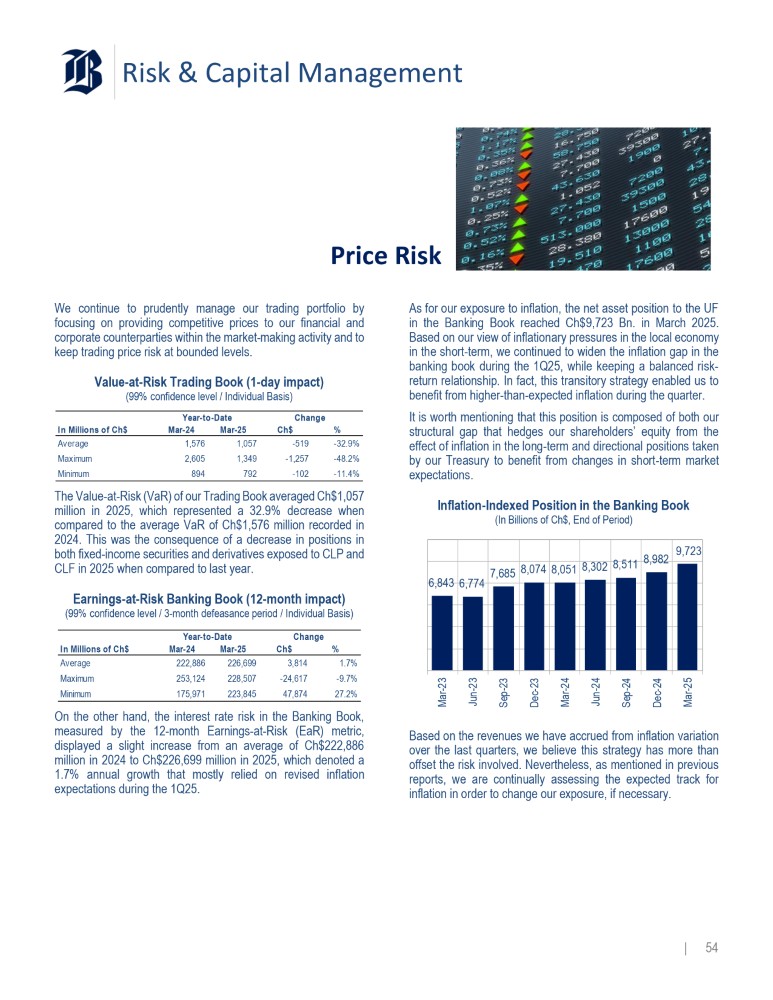
| 53 Risk & Capital Management Price Risk We continue to prudently manage our trading portfolio by focusing on providing competitive prices to our financial and corporate counterparties within the market - making activity and to keep trading price risk at bounded levels . Value - at - Risk Trading Book (1 - day impact) (99% confidence level / Individual Basis) Year - to - Date Change In Millions of Ch$ Mar - 24 Mar - 25 Ch$ % Average 1,576 1,057 - 519 - 32.9% The Value - at - Risk (VaR) of our Trading Book averaged Ch $ 1 , 057 million in 2025 , which represented a 32 . 9 % decrease when compared to the average VaR of Ch $ 1 , 576 million recorded in 2024 . This was the consequence of a decrease in positions in both fixed - income securities and derivatives exposed to CLP and CLF in 2025 when compared to last year . 1.7% 3,814 226,699 222,886 Average - 9.7% - 24,617 228,507 253,124 Maximum 27.2% 47,874 223,845 175,971 Minimum On the other hand, the interest rate risk in the Banking Book, measured by the 12 - month Earnings - at - Risk (EaR) metric, displayed a slight increase from an average of Ch $ 222 , 886 million in 2024 to Ch $ 226 , 699 million in 2025 , which denoted a 1 . 7 % annual growth that mostly relied on revised inflation expectations during the 1 Q 25 . As for our exposure to inflation, the net asset position to the UF in the Banking Book reached Ch $ 9 , 723 Bn . in March 2025 . Based on our view of inflationary pressures in the local economy in the short - term, we continued to widen the inflation gap in the banking book during the 1 Q 25 , while keeping a balanced risk - return relationship . In fact, this transitory strategy enabled us to benefit from higher - than - expected inflation during the quarter . It is worth mentioning that this position is composed of both our structural gap that hedges our shareholders’ equity from the effect of inflation in the long - term and directional positions taken by our Treasury to benefit from changes in short - term market - 48.2% - 1,257 1,349 2,605 Maximum expectations. - 11.4% - 102 792 894 Minimum Inflation - Indexed Position in the Banking Book (In Billions of Ch$, End of Period) 6,843 6,774 Earnings - at - Risk Banking Book (12 - month impact) (99% confidence level / 3 - month defeasance period / Individual Basis) Year - to - Date Change In Millions of Ch$ Mar - 24 Mar - 25 Ch$ % 7,685 8,074 8,051 8,302 9,723 8,511 8,982 Mar - 23 Jun - 23 Sep - 23 Dec - 23 Mar - 24 Jun - 24 Sep - 24 Dec - 24 Mar - 25 Based on the revenues we have accrued from inflation variation over the last quarters, we believe this strategy has more than offset the risk involved . Nevertheless, as mentioned in previous reports, we are continually assessing the expected track for inflation in order to change our exposure, if necessary .
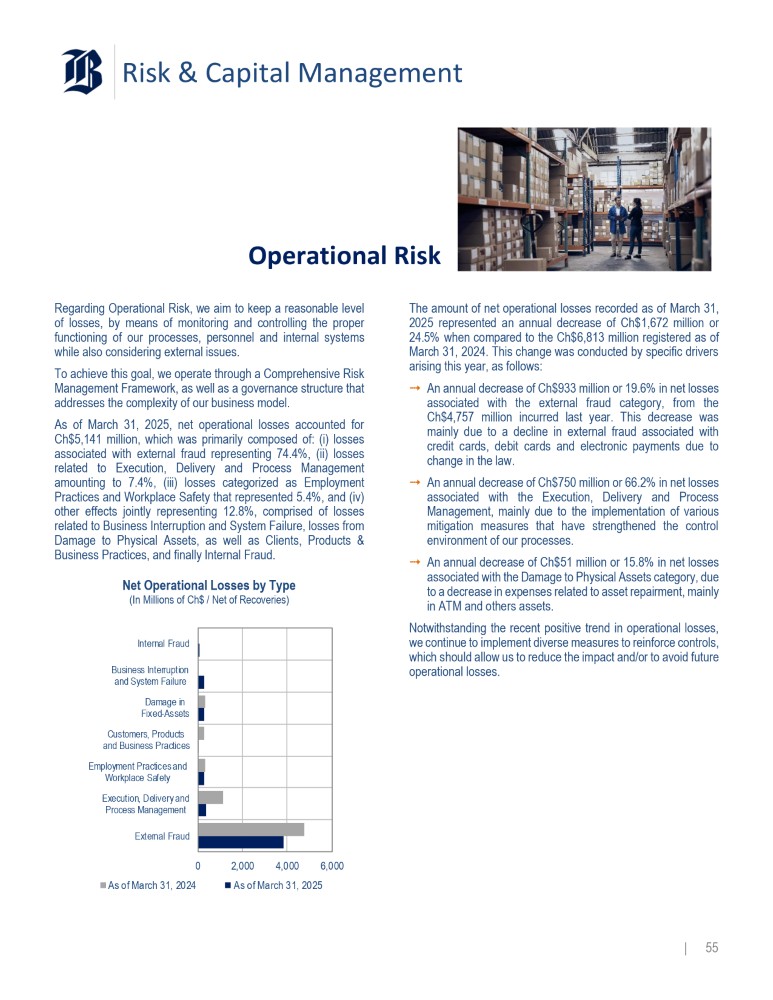
| 54 Risk & Capital Management Operational Risk Regarding Operational Risk, we aim to keep a reasonable level of losses, by means of monitoring and controlling the proper functioning of our processes, personnel and internal systems while also considering external issues . To achieve this goal, we operate through a Comprehensive Risk Management Framework, as well as a governance structure that addresses the complexity of our business model . As of March 31 , 2025 , net operational losses accounted for Ch $ 5 , 141 million, which was primarily composed of : (i) losses associated with external fraud representing 74 . 4 % , (ii) losses related to Execution, Delivery and Process Management amounting to 7 . 4 % , (iii) losses categorized as Employment Practices and Workplace Safety that represented 5 . 4 % , and (iv) other effects jointly representing 12 . 8 % , comprised of losses related to Business Interruption and System Failure, losses from Damage to Physical Assets, as well as Clients, Products & Business Practices, and finally Internal Fraud . Net Operational Losses by Type (In Millions of Ch$ / Net of Recoveries) Internal Fraud Business Interruption and System Failure Damage in Fixed - Assets Customers, Products and Business Practices Employment Practices and Workplace Safety Execution, Delivery and Process Management External Fraud 0 As of March 31, 2024 2,000 4,000 6,000 As of March 31, 2025 The amount of net operational losses recorded as of March 31 , 2025 represented an annual decrease of Ch $ 1 , 672 million or 24 . 5 % when compared to the Ch $ 6 , 813 million registered as of March 31 , 2024 . This change was conducted by specific drivers arising this year, as follows : ⭬ An annual decrease of Ch $ 933 million or 19 . 6 % in net losses associated with the external fraud category, from the Ch $ 4 , 757 million incurred last year . This decrease was mainly due to a decline in external fraud associated with credit cards, debit cards and electronic payments due to change in the law . ⭬ An annual decrease of Ch $ 750 million or 66 . 2 % in net losses associated with the Execution, Delivery and Process Management, mainly due to the implementation of various mitigation measures that have strengthened the control environment of our processes . ⭬ An annual decrease of Ch $ 51 million or 15 . 8 % in net losses associated with the Damage to Physical Assets category, due to a decrease in expenses related to asset repairment, mainly in ATM and others assets . Notwithstanding the recent positive trend in operational losses, we continue to implement diverse measures to reinforce controls, which should allow us to reduce the impact and/or to avoid future operational losses . | 55 Risk Capital Management | 56 Capital Adequacy and Risk Ratings Capital Adequacy Our Total Capital Ratio accounted for 17.40% as of March 31, 2025, which denotes an increase of 46 bp.
when compared to the level reached a year ago. Likewise, both the CET1 ratio and the Tier 1 ratio were at 13.64% in March 2025, which was 37 bp. above the ratios recorded in 2024. Capital Adequacy Ratios (As percentage as of each date) 8.8% 13.3% 13.3% 16.9% 9.5% 13.6% 13.6% 17.4% +69 bp +37 bp +37 bp +46 bp (100, 00) bp (80,00) bp (60,00) bp (40,00) bp (20,00) bp +0 bp 0.0% 5.0% 10 .0% 15 .0% 20 .0% 25 .0% Common Equity Tier 1 Total Assets Common Equity Tier 1 RWA Tier 1 Capital RWA Total Capital RWA Mar-24 Mar-25 In this regard, the CET1 Capital increased Ch$154,494 million or 3.0% on an annual basis, by reaching Ch$5,275,648 million in March 2025, which was the main component of the annual Ch$193,148 million or 3.0% increment posted by our Total Capital, which amounted to Ch$6,728,532 million in March 2025. The capital enhancement mainly relied on the net income generated during the FY2024 and the 1Q25, once provisions for minimum dividends are deducted. From the risk exposures standpoint, our Total RWA posted a slight annual rise of Ch$78,902 million or 0.2% by totalling Ch$38,663,733 million in March 2025. This minor increment had to do with both a moderate expansion in the recurrent balance sheet exposures to credit risk, given the weak evolution of the loan book due to the dynamics seen across the board, and an annual decrease in market risk exposure in the trading book. In the case of the leverage ratio, the stronger improvement in relation to other ratios had mainly to do with the downsize experienced by our balance sheet once the FCIC was fully repaid in July 2024. As a result, the total exposures in the balance sheet decreased Ch$2,618,458 million or 4.5% by reaching Ch$55,489,490 million in March 2025. This change, in combination with the already mentioned increase in CET1 Capital, translated into an annual increase of 69 bp. in our Leverage ratio that reached 9.51% in March 2025. Based on the above, as of March 31, 2025 we fully complied with all mandatory limits of 3.0% for the leverage ratio, 8.5% for the CET1 ratio, 10.0% for the Tier1 ratio and 12.1% for the Total Capital ratio. As we have pointed out in the past, our current capital position enables us to be poised to address the final steps of Basel III implementation. As of March 31, 2025, we have already achieved fully-loaded thresholds for: (i) the 0.5% countercyclical buffer over RWA as defined by the Central Bank in May 2023 (since May 2024) and at least temporarily reaffirmed in November 2024, and (ii) the conservation buffer of 2.5% over RWA. Furthermore, as of the same date we have achieved: (i) three quarters of the systemic buffer of 1.25% reaffirmed by CMF for us on April 1, 2025, and (ii) the 0.13% Pillar 2 capital charge set by CMF for us in January 2025. Finally, it is worth noting that on October 11, 2024 the CMF published for comment a set of amendments to RAN 21-13 that define a new framework for the definition of outlier banks and IRRBB measurement, among other matters, from which further Pillar 2 capital requirements could be imposed in the future.
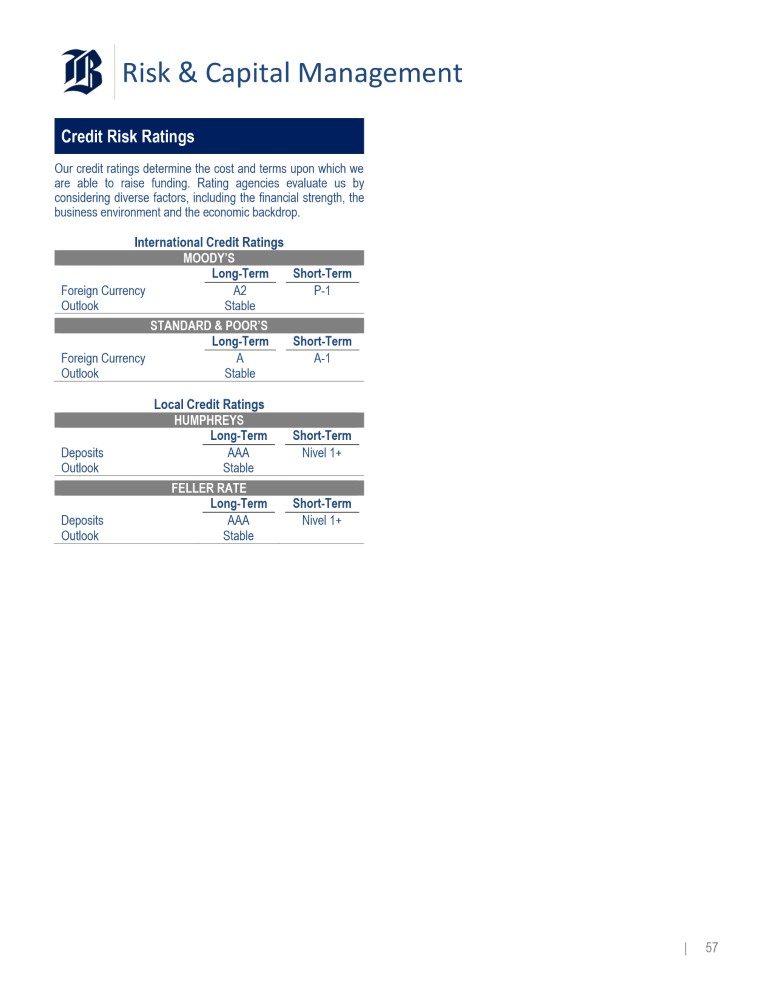
The final regulation has not been published yet.56 Risk & Capital Management Credit Risk Ratings Our credit ratings determine the cost and terms upon which we are able to raise funding . Rating agencies evaluate us by considering diverse factors, including the financial strength, the business environment and the economic backdrop .
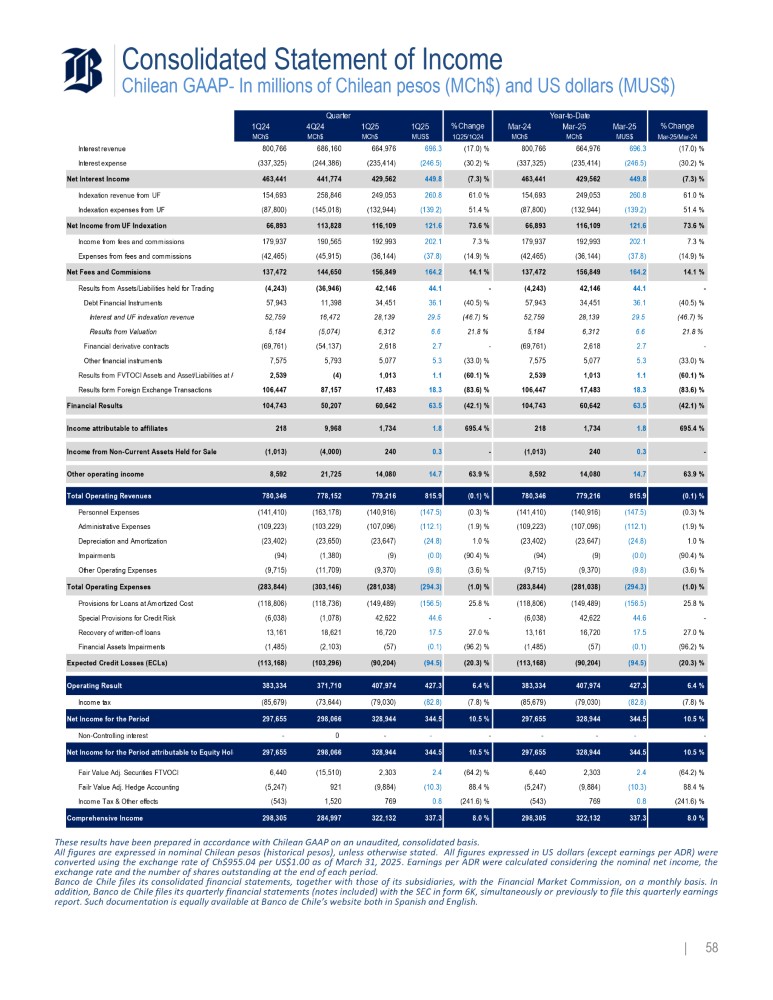
International Credit Ratings MOODY’S Short - Term Long - Term P - 1 A2 Foreign Currency Stable Outlook STANDARD & POOR’S Short - Term Long - Term A - 1 A Foreign Currency Stable Outlook Local Credit Ratings HREYS HUMP Short - Term Long - Term Nivel 1+ AAA Deposits Stable Outlook R RATE FELLE Short - Term Long - Term Nivel 1+ AAA Deposits Stable Outlook | 57 Consolidated Statement of Income Chilean GAAP - In millions of Chilean pesos (MCh$) and US dollars (MUS$) Year - to - Date Quarter % Change Mar - 25 Mar - 25 Mar - 24 % Change 1Q25 1Q25 4Q24 1Q24 Mar - 25/Mar - 24 MUS$ MCh$ MCh$ 1Q25/1Q24 MUS$ MCh$ MCh$ MCh$ (17.0) % 696.3 664,976 800,766 (17.0) % 696.3 664,976 686,160 800,766 Interest revenue (30.2) % (246.5) (235,414) (337,325) (30.2) % (246.5) (235,414) (244,386) (337,325) Interest expense (7.3) % 449.8 429,562 463,441 (7.3) % 449.8 429,562 441,774 463,441 Net Interest Income 61.0 % 260.8 249,053 154,693 61.0 % 260.8 249,053 258,846 154,693 Indexation revenue from UF 51.4 % (139.2) (132,944) (87,800) 51.4 % (139.2) (132,944) (145,018) (87,800) Indexation expenses from UF 73.6 % 121.6 116,109 66,893 73.6 % 121.6 116,109 113,828 66,893 Net Income from UF Indexation 7.3 % 202.1 192,993 179,937 7.3 % 202.1 192,993 190,565 179,937 Income from fees and commissions (14.9) % (37.8) (36,144) (42,465) (14.9) % (37.8) (36,144) (45,915) (42,465) Expenses from fees and commissions 14.1 % 164.2 156,849 137,472 14.1 % 164.2 156,849 144,650 137,472 Net Fees and Commisions - 44.1 42,146 (4,243) - 44.1 42,146 (36,946) (4,243) Results from Assets/Liabilities held for Trading (40.5) % 36.1 34,451 57,943 (40.5) % 36.1 34,451 11,398 57,943 Debt Financial Instruments (46.7) % 29.5 28,139 52,759 (46.7) % 29.5 28,139 16,472 52,759 Interest and UF indexation revenue 21.8 % 6.6 6,312 5,184 21.8 % 6.6 6,312 (5,074) 5,184 Results from Valuation - 2.7 2,618 (69,761) - 2.7 2,618 (54,137) (69,761) Financial derivative contracts (33.0) % 5.3 5,077 7,575 (33.0) % 5.3 5,077 5,793 7,575 Other financial instruments (60.1) % 1.1 1,013 2,539 (60.1) % 1.1 1,013 (4) 2,539 Results from FVTOCI Assets and Asset/Liabilities at A (83.6) % 18.3 17,483 106,447 (83.6) % 18.3 17,483 87,157 106,447 Results form Foreign Exchange Transactions (42.1) % 63.5 60,642 104,743 (42.1) % 63.5 60,642 50,207 104,743 Financial Results 695.4 % 1.8 1,734 218 695.4 % 1.8 1,734 9,968 218 Income attributable to affiliates - 0.3 240 (1,013) - 0.3 240 (4,000) (1,013) Income from Non - Current Assets Held for Sale 63.9 % 14.7 14,080 8,592 63.9 % 14.7 14,080 21,725 8,592 Other operating income (0.1) % 815.9 779,216 780,346 (0.1) % 815.9 779,216 778,152 780,346 Total Operating Revenues (0.3) % (147.5) (140,916) (141,410) (0.3) % (147.5) (140,916) (163,178) (141,410) Personnel Expenses (1.9) % (112.1) (107,096) (109,223) (1.9) % (112.1) (107,096) (103,229) (109,223) Administrative Expenses 1.0 % (24.8) (23,647) (23,402) 1.0 % (24.8) (23,647) (23,650) (23,402) Depreciation and Amortization (90.4) % (0.0) (9) (94) (90.4) % (0.0) (9) (1,380) (94) Impairments (3.6) % (9.8) (9,370) (9,715) (3.6) % (9.8) (9,370) (11,709) (9,715) Other Operating Expenses (1.0) % (294.3) (281,038) (283,844) (1.0) % (294.3) (281,038) (303,146) (283,844) Total Operating Expenses 25.8 % (156.5) (149,489) (118,806) 25.8 % (156.5) (149,489) (118,736) (118,806) Provisions for Loans at Amortized Cost - 44.6 42,622 (6,038) - 44.6 42,622 (1,078) (6,038) Special Provisions for Credit Risk 27.0 % 17.5 16,720 13,161 27.0 % 17.5 16,720 18,621 13,161 Recovery of written - off loans (96.2) % (0.1) (57) (1,485) (96.2) % (0.1) (57) (2,103) (1,485) Financial Assets Impairments (20.3) % (94.5) (90,204) (113,168) (20.3) % (94.5) (90,204) (103,296) (113,168) Expected Credit Losses (ECLs) 6.4 % 427.3 407,974 383,334 6.4 % 427.3 407,974 371,710 383,334 Operating Result (7.8) % (82.8) (79,030) (85,679) (7.8) % (82.8) (79,030) (73,644) (85,679) Income tax 10.5 % 344.5 328,944 297,655 10.5 % 344.5 328,944 298,066 297,655 Net Income for the Period - - - - - - - 0 - Non - Controlling interest 10.5 % 344.5 328,944 297,655 10.5 % 344.5 328,944 298,066 297,655 Net Income for the Period attributable to Equity Hol (64.2) % 2.4 2,303 6,440 (64.2) % 2.4 2,303 (15,510) 6,440 Fair Value Adj. Securities FTVOCI 88.4 % (10.3) (9,884) (5,247) 88.4 % (10.3) (9,884) 921 (5,247) Failr Value Adj. Hedge Accounting (241.6) % 0.8 769 (543) (241.6) % 0.8 769 1,520 (543) Income Tax & Other effects 8.0 % 337.3 322,132 298,305 8.0 % 337.3 322,132 284,997 298,305 Comprehensive Income | 58 These results have been prepared in accordance with Chilean GAAP on an unaudited, consolidated basis . All figures are expressed in nominal Chilean pesos (historical pesos), unless otherwise stated . All figures expressed in US dollars (except earnings per ADR) were converted using the exchange rate of Ch $ 955 . 04 per US $ 1 . 00 as of March 31 , 2025 . Earnings per ADR were calculated considering the nominal net income, the exchange rate and the number of shares outstanding at the end of each period . Banco de Chile files its consolidated financial statements, together with those of its subsidiaries, with the Financial Market Commission, on a monthly basis . In addition, Banco de Chile files its quarterly financial statements (notes included) with the SEC in form 6 K, simultaneously or previously to file this quarterly earnings report . Such documentation is equally available at Banco de Chile’s website both in Spanish and English .

Consolidated Balance Sheet Chilean GAAP - In millions of Chilean pesos (MCh$) and US dollars (MUS$) % Change Mar - 25/Mar - 24 Mar - 25 MUS$ Mar - 25 MCh$ Dec - 24 MCh$ Mar - 24 MCh$ ASSETS (28.2) % 2,441.0 2,331,207 2,699,076 3,248,501 Cash and due from banks (3.9) % 373.5 356,737 372,456 371,068 Transactions in the course of collection 9.6 % 5,368.8 5,127,407 4,429,423 4,678,580 Financial Assets for Trading at Fair Value through P&L (19.1) % 2,140.8 2,044,549 2,303,353 2,526,743 Derivative instruments 47.0 % 2,880.0 2,750,521 1,714,381 1,870,975 Debt Securities 18.3 % 348.0 332,337 411,689 280,862 Other (39.1) % 2,039.4 1,947,733 2,088,345 3,196,366 Financial Assets at Fair Value Through OCI (39.1) % 2,039.4 1,947,733 2,088,345 3,196,366 Debt Securities (63.0) % 49.3 47,108 73,959 127,182 Derivative Intruments for Hedge Accounting (3.3) % 43,167.2 41,226,416 39,787,216 42,647,407 Financial Assets at Amortized Cost 75.6 % 104.0 99,283 87,291 56,530 Receivables from repurchase agreements and security borrowings (77.2) % 973.0 929,266 944,074 4,071,555 Debt Securities 39.7 % 1,779.9 1,699,865 666,815 1,216,747 Loans and advances to Banks 0.1 % 21,227.0 20,272,606 20,105,228 20,258,177 Commercial loans 8.1 % 14,134.9 13,499,416 13,218,586 12,489,637 Residential mortgage loans 3.9 % 5,809.5 5,548,313 5,551,306 5,341,352 Consumer loans 4.5 % (861.0) (822,333) (786,084) (786,591) Allowances for loan losses 1.6 % 82.6 78,911 76,769 77,703 Investments in other companies 12.6 % 170.1 162,412 158,556 144,238 Intangible assets (5.7) % 195.4 186,610 189,073 197,908 Property and Equipment (11.0) % 96.7 92,361 96,879 103,737 Leased assets (38.1) % 155.7 148,726 159,869 240,148 Current tax assets 6.8 % 579.3 553,227 556,829 518,060 Deferred tax assets 21.8 % 1,582.2 1,511,049 1,406,991 1,240,573 Other assets (5.3) % 56,301.2 53,769,904 52,095,441 56,791,471 Total Assets | 59 % Change Mar - 25/Mar - 24 Mar - 25 MUS$ Mar - 25 MCh$ Dec - 24 MCh$ Mar - 24 MCh$ LIABILITIES & EQUITY Liabilities Transactions in the course of payment Financial Liabilities for Trading at Fair Value through P&L Derivative instruments Other Derivative Intruments for Hedge Accounting Financial Liabilities at Amortized Cost Current accounts and other demand deposits Saving accounts and time deposits Payables from repurchase agreements and security lending Borrowings from financial institutions Debt Issued Other financial obligations Lease liabilities Instruments Issued for Regulatory Capital Provisions Current tax liabilities Deferred tax liabilities Other liabilities 80.2 % (18.2) % (18.3) % 73.3 % 155.3 % (7.0) % 7.5 % (0.8) % (23.4) % (76.7) % 2.7 % 17.1 % (9.5) % 3.2 % (4.7) % 167.2 % (5.7) % 4.5 % 559.8 2,303.0 2,296.2 6.8 210.3 43,801.3 15,245.8 16,237.5 148.5 1,373.8 10,459.9 335.8 91.3 1,138.8 1,082.7 1.47 1.8 1,461.3 534,594 2,199,476 2,192,952 6,524 200,844 41,832,013 14,560,376 15,507,444 141,790 1,312,028 9,989,666 320,709 87,208 1,087,573 1,034,049 1,400 1,760 1,395,627 283,605 2,445,796 2,444,806 990 141,040 39,619,816 14,263,303 14,168,703 109,794 1,103,468 9,690,069 284,479 91,429 1,068,879 1,566,165 132 166 1,255,412 296,700 2,688,497 2,684,732 3,765 78,674 44,980,113 13,539,960 15,632,789 185,126 5,625,691 9,722,556 273,991 96,404 1,053,813 1,084,658 524 1,867 1,335,314 (6.3) % 50,651.9 48,374,544 46,472,440 51,616,564 Total liabilities 0.0 % 0.3 % (112.2) % 11.3 % 10.5 % (2.0) % (100.0) % 2,534.5 745.2 (3.2) 2,189.2 344.4 (160.8) 0 2,420,538 711,658 (3,035) 2,090,790 328,944 (153,537) 2 2,420,538 709,742 3,777 1,878,778 1,207,392 (597,228) 2 2,420,538 709,742 24,892 1,878,778 297,655 (156,699) 1 Equity of the Bank's owners Capital Reserves Other com prehensive incom e Retained earnings from previous periods Incom e for the period Provisions for minimum dividends Non - Controlling Interest 4.3 % 5,649.4 5,395,360 5,623,001 5,174,907 Total equity (5.3) % 56,301.2 53,769,904 52,095,441 56,791,471 Total Liabilities & Equity These results have been prepared in accordance with Chilean GAAP on an unaudited, consolidated basis . All figures are expressed in nominal Chilean pesos (historical pesos), unless otherwise stated . All figures expressed in US dollars (except earnings per ADR) were converted using the exchange rate of Ch $ 955 . 04 per US $ 1 . 00 as of March 31 , 2025 . Earnings per ADR were calculated considering the nominal net income, the exchange rate and the number of shares outstanding at the end of each period . Banco de Chile files its consolidated financial statements, together with those of its subsidiaries, with the Financial Market Commission, on a monthly basis . In addition, Banco de Chile files its quarterly financial statements (notes included) with the SEC in form 6 K, simultaneously or previously to file this quarterly earnings report . Such documentation is equally available at Banco de Chile’s website both in Spanish and English .
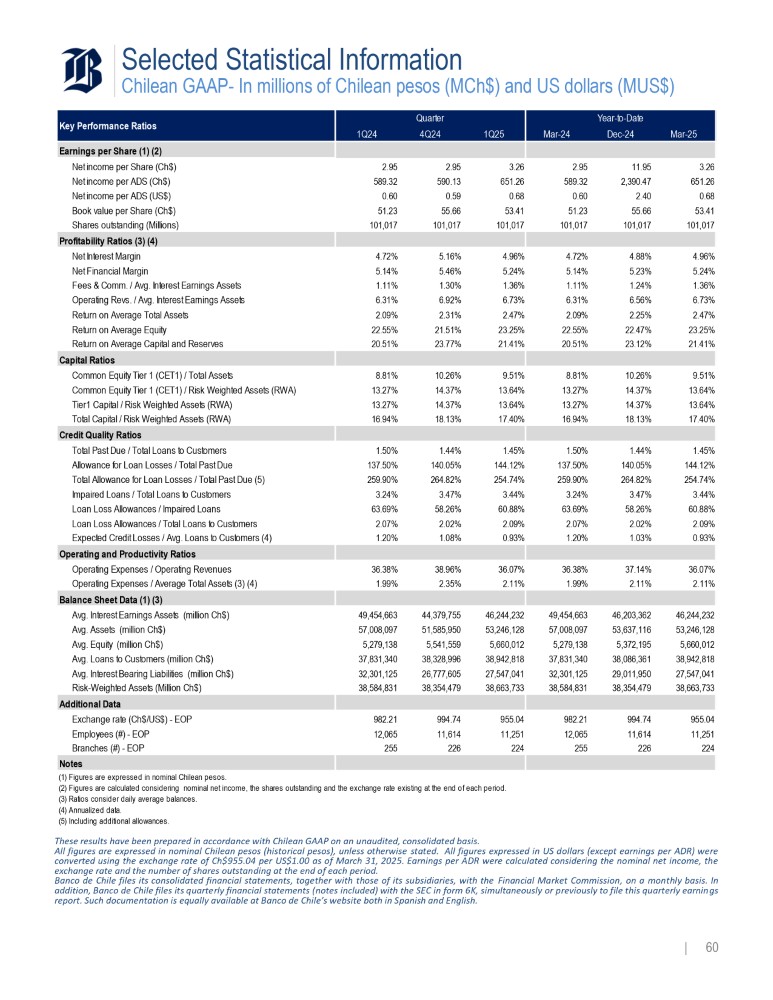
Selected Statistical Information Chilean GAAP - In millions of Chilean pesos (MCh$) and US dollars (MUS$) Mar - 25 Year - to - Date Dec - 24 Mar - 24 1Q25 Quarter 4Q24 1Q24 Key Performance Ratios Earnings per Share (1) (2) 3.26 11.95 2.95 3.26 2.95 2.95 Net income per Share (Ch$) 651.26 2,390.47 589.32 651.26 590.13 589.32 Net income per ADS (Ch$) 0.68 2.40 0.60 0.68 0.59 0.60 Net income per ADS (US$) 53.41 55.66 51.23 53.41 55.66 51.23 Book value per Share (Ch$) 101,017 101,017 101,017 101,017 101,017 101,017 Shares outstanding (Millions) Profitability Ratios (3) (4) 4.96% 4.88% 4.72% 4.96% 5.16% 4.72% Net Interest Margin 5.24% 5.23% 5.14% 5.24% 5.46% 5.14% Net Financial Margin 1.36% 1.24% 1.11% 1.36% 1.30% 1.11% Fees & Comm. / Avg. Interest Earnings Assets 6.73% 6.56% 6.31% 6.73% 6.92% 6.31% Operating Revs. / Avg. Interest Earnings Assets 2.47% 2.25% 2.09% 2.47% 2.31% 2.09% Return on Average Total Assets 23.25% 22.47% 22.55% 23.25% 21.51% 22.55% Return on Average Equity 21.41% 23.12% 20.51% 21.41% 23.77% 20.51% Return on Average Capital and Reserves Capital Ratios 9.51% 10.26% 8.81% 9.51% 10.26% 8.81% Common Equity Tier 1 (CET1) / Total Assets 13.64% 14.37% 13.27% 13.64% 14.37% 13.27% Common Equity Tier 1 (CET1) / Risk Weighted Assets (RWA) 13.64% 14.37% 13.27% 13.64% 14.37% 13.27% Tier1 Capital / Risk Weighted Assets (RWA) 17.40% 18.13% 16.94% 17.40% 18.13% 16.94% Total Capital / Risk Weighted Assets (RWA) Credit Quality Ratios 1.45% 1.44% 1.50% 1.45% 1.44% 1.50% Total Past Due / Total Loans to Customers 144.12% 140.05% 137.50% 144.12% 140.05% 137.50% Allowance for Loan Losses / Total Past Due 254.74% 264.82% 259.90% 254.74% 264.82% 259.90% Total Allowance for Loan Losses / Total Past Due (5) 3.44% 3.47% 3.24% 3.44% 3.47% 3.24% Impaired Loans / Total Loans to Customers 60.88% 58.26% 63.69% 60.88% 58.26% 63.69% Loan Loss Allowances / Impaired Loans 2.09% 2.02% 2.07% 2.09% 2.02% 2.07% Loan Loss Allowances / Total Loans to Customers 0.93% 1.03% 1.20% 0.93% 1.08% 1.20% Expected Credit Losses / Avg. Loans to Customers (4) Operating and Productivity Ratios 36.07% 37.14% 36.38% 36.07% 38.96% 36.38% Operating Expenses / Operating Revenues 2.11% 2.11% 1.99% 2.11% 2.35% 1.99% Operating Expenses / Average Total Assets (3) (4) Balance Sheet Data (1) (3) 46,244,232 46,203,362 49,454,663 46,244,232 44,379,755 49,454,663 Avg. Interest Earnings Assets (million Ch$) 53,246,128 53,637,116 57,008,097 53,246,128 51,585,950 57,008,097 Avg. Assets (million Ch$) 5,660,012 5,372,195 5,279,138 5,660,012 5,541,559 5,279,138 Avg. Equity (million Ch$) 38,942,818 38,086,361 37,831,340 38,942,818 38,328,996 37,831,340 Avg. Loans to Customers (million Ch$) 27,547,041 29,011,950 32,301,125 27,547,041 26,777,605 32,301,125 Avg. Interest Bearing Liabilities (million Ch$) 38,663,733 38,354,479 38,584,831 38,663,733 38,354,479 38,584,831 Risk - Weighted Assets (Million Ch$) Additional Data 955.04 994.74 982.21 955.04 994.74 982.21 Exchange rate (Ch$/US$) - EOP 11,251 11,614 12,065 11,251 11,614 12,065 Employees (#) - EOP 224 226 255 224 226 255 Branches (#) - EOP Notes (1) Figures are expressed in nominal Chilean pesos. (2) Figures are calculated considering nominal net income, the shares outstanding and the exchange rate existing at the end of each period. (3) Ratios consider daily average balances. (4) Annualized data. (5) Including additional allowances. | 60 These results have been prepared in accordance with Chilean GAAP on an unaudited, consolidated basis . All figures are expressed in nominal Chilean pesos (historical pesos), unless otherwise stated . All figures expressed in US dollars (except earnings per ADR) were converted using the exchange rate of Ch $ 955 . 04 per US $ 1 . 00 as of March 31 , 2025 . Earnings per ADR were calculated considering the nominal net income, the exchange rate and the number of shares outstanding at the end of each period . Banco de Chile files its consolidated financial statements, together with those of its subsidiaries, with the Financial Market Commission, on a monthly basis . In addition, Banco de Chile files its quarterly financial statements (notes included) with the SEC in form 6 K, simultaneously or previously to file this quarterly earnings report . Such documentation is equally available at Banco de Chile’s website both in Spanish and English .