FORM 6-K
SECURITIES AND EXCHANGE COMMISSION
Washington, D.C. 20549
Report of Foreign Private Issuer
Pursuant
to Rule 13a-16 or 15d-16
of the Securities Exchange Act of 1934
For the month of April, 2025
Commission File Number 001-15266
BANK OF CHILE
(Translation of registrant's name into English)
Ahumada 251
Santiago, Chile
(Address of principal executive offices)
Indicate by check mark whether the registrant files or will file annual reports under cover Form 20-F or Form 40-F.
Form 20-F þ Form 40-F ☐
Indicate by check mark whether by furnishing the
information contained in this Form, the
registrant is also thereby furnishing the information to the Commission pursuant to Rule
12g3-2(b) under the Securities Exchange Act of 1934.
Yes ☐ No þ
If "Yes" is marked, indicate below the
file number assigned to the registrant in
connection with Rule 12g3-2(b): 82- ________
BANCO DE CHILE AND SUBSIDIARIES
(Free translation of Consolidated Financial Statements originally issued in Spanish)
INDEX
| I. | Interim Consolidated Statements of Financial Position | |
| II. | Interim Consolidated Statements of Income | |
| III. | Interim Consolidated Statements of Other Comprehensive Income | |
| IV. | Interim Consolidated Statements of Cash Flows | |
| V. | Interim Consolidated Statements of Changes in Equity | |
| VI. | Notes to the Interim Consolidated Financial Statements | |
| MCh$ | = | Millions of Chilean pesos |
| BCh$ | = | Billions of Chilean pesos |
| MUS$ | = | Millions of U.S. dollars |
| ThUS$ | = | Thousands of U.S. dollars |
| UF or CLF | = | Unidad de Fomento |
| (The UF is an inflation-indexed, Chilean peso denominated monetary unit set daily in advance on the basis of the previous month’s inflation rate). | ||
| Ch$ or CLP | = | Chilean pesos |
| US$ or USD | = | U.S. dollar |
| JPY | = | Japanese yen |
| EUR | = | Euro |
| HKD | = | Hong Kong dollar |
| CHF | = | Swiss Franc |
| PEN | = | Peruvian sol |
| AUD | = | Australian dollar |
| NOK | = | Norwegian krone |
| MXN | = | Mexican peso |
| IFRS | = | International Financial Reporting Standards |
| IAS | = | International Accounting Standards |
| RAN | = | Actualized Standards Compilation issued by the Chilean Commission for the Financial Market (“CMF”) |
| IFRIC | = | International Financial Reporting Interpretations Committee |
| SIC | = | Standards Interpretation Committee |
BANCO DE CHILE AND SUBSIDIARIES
INDEX

BANCO DE CHILE AND SUBSIDIARIES
INTERIM CONSOLIDATED STATEMENTS OF FINANCIAL POSITION
For the periods ended March 31, 2025 and December 31, 2024
(Free translation of Interim Consolidated Financial Statements originally issued in Spanish)
| March | December | |||||||||||
| Notes | 2025 | 2024 | ||||||||||
| ASSETS | MCh$ | MCh$ | ||||||||||
| Cash and due from banks | 7 | 2,331,207 | 2,699,076 | |||||||||
| Transactions in the course of collection | 7 | 356,737 | 372,456 | |||||||||
| Financial assets held for trading at fair value through profit or loss: | ||||||||||||
| Derivative financial instruments | 8 | 2,044,549 | 2,303,353 | |||||||||
| Debt financial instruments | 8 | 2,750,521 | 1,714,381 | |||||||||
| Others | 8 | 332,337 | 411,689 | |||||||||
| Non-trading financial assets mandatorily measured at fair value through profit or loss | 9 | — | — | |||||||||
| Financial assets at fair value through profit or loss | 10 | — | — | |||||||||
| Financial assets at fair value through other comprehensive income: | ||||||||||||
| Debt financial instruments | 11 | 1,947,733 | 2,088,345 | |||||||||
| Others | 11 | — | — | |||||||||
| Derivative financial instruments for hedging purposes | 12 | 47,108 | 73,959 | |||||||||
| Financial assets at amortized cost: | ||||||||||||
| Rights from resale agreements and securities lending | 13 | 99,283 | 87,291 | |||||||||
| Debt financial instruments | 13 | 929,266 | 944,074 | |||||||||
| Loans and advances to Banks | 13 | 1,699,865 | 666,815 | |||||||||
| Loans to customers - Commercial loans | 13 | 19,889,443 | 19,724,933 | |||||||||
| Loans to customers - Residential mortgage loans | 13 | 13,459,612 | 13,180,186 | |||||||||
| Loans to customers - Consumer loans | 13 | 5,148,947 | 5,183,917 | |||||||||
| Investments in other companies | 14 | 78,911 | 76,769 | |||||||||
| Intangible assets | 15 | 162,412 | 158,556 | |||||||||
| Property and equipment | 16 | 186,610 | 189,073 | |||||||||
| Right-of-use assets | 17 | 92,361 | 96,879 | |||||||||
| Current tax assets | 18 | 148,726 | 159,869 | |||||||||
| Deferred tax assets | 18 | 553,227 | 556,829 | |||||||||
| Other assets | 19 | 1,477,960 | 1,373,541 | |||||||||
| Non-current assets and disposal groups held for sale | 20 | 33,089 | 33,450 | |||||||||
| TOTAL ASSETS | 53,769,904 | 52,095,441 | ||||||||||
The accompanying notes 1 to 49 are an integral part of these interim consolidated financial statements
BANCO DE CHILE AND SUBSIDIARIES
INTERIM CONSOLIDATED STATEMENTS OF FINANCIAL POSITION
For the periods ended March 31, 2025 and December 31, 2024
(Free translation of Interim Consolidated Financial Statements originally issued in Spanish)
| March | December | |||||||||||
| Notes | 2025 | 2024 | ||||||||||
| LIABILITIES | MCh$ | MCh$ | ||||||||||
| Transactions in the course of payment | 7 | 534,594 | 283,605 | |||||||||
| Financial liabilities held for trading at fair value through profit or loss: | ||||||||||||
| Derivative financial instruments | 21 | 2,192,952 | 2,444,806 | |||||||||
| Others | 21 | 6,524 | 990 | |||||||||
| Financial liabilities designated as at fair value through profit or loss | 10 | — | — | |||||||||
| Derivative Financial Instruments for hedging purposes | 12 | 200,844 | 141,040 | |||||||||
| Financial liabilities at amortized cost: | ||||||||||||
| Current accounts and other demand deposits | 22 | 14,560,376 | 14,263,303 | |||||||||
| Saving accounts and time deposits | 22 | 15,507,444 | 14,168,703 | |||||||||
| Obligations by repurchase agreements and securities lending | 22 | 141,790 | 109,794 | |||||||||
| Borrowings from financial institutions | 22 | 1,312,028 | 1,103,468 | |||||||||
| Debt financial instruments issued | 22 | 9,989,666 | 9,690,069 | |||||||||
| Other financial obligations | 22 | 320,709 | 284,479 | |||||||||
| Lease liabilities | 17 | 87,208 | 91,429 | |||||||||
| Financial instruments of regulatory capital issued | 23 | 1,087,573 | 1,068,879 | |||||||||
| Provisions for contingencies | 24 | 149,669 | 194,753 | |||||||||
| Provision for dividends, interests and reappraisal of financial instruments of regulatory capital issued | 25 | 153,537 | 597,228 | |||||||||
| Special provisions for credit risk | 26 | 730,843 | 774,184 | |||||||||
| Currents tax liabilities | 18 | 1,400 | 132 | |||||||||
| Deferred tax liabilities | 18 | 1,760 | 166 | |||||||||
| Other liabilities | 27 | 1,395,627 | 1,255,412 | |||||||||
| Liabilities included in disposal groups held for sale | 20 | — | — | |||||||||
| TOTAL LIABILITIES | 48,374,544 | 46,472,440 | ||||||||||
| EQUITY | ||||||||||||
| Capital | 28 | 2,420,538 | 2,420,538 | |||||||||
| Reserves | 28 | 711,658 | 709,742 | |||||||||
| Accumulated other comprehensive income | ||||||||||||
| Elements that are not reclassified in profit and loss | 28 | 5,897 | 7,552 | |||||||||
| Elements that can be reclassified in profit and loss | 28 | (8,932 | ) | (3,775 | ) | |||||||
| Retained earnings from previous period | 28 | 2,090,790 | 1,878,778 | |||||||||
| Income for the period | 28 | 328,944 | 1,207,392 | |||||||||
| Less: Provision for dividends, interests and reappraisal of financial instruments of regulatory capital issued | 28 | (153,537 | ) | (597,228 | ) | |||||||
| Shareholders of the Bank | 28 | 5,395,358 | 5,622,999 | |||||||||
| Non-controlling interests | 28 | 2 | 2 | |||||||||
| TOTAL EQUITY | 5,395,360 | 5,623,001 | ||||||||||
| TOTAL LIABILITIES AND EQUITY | 53,769,904 | 52,095,441 | ||||||||||
The accompanying notes 1 to 49 are an integral part of these interim consolidated financial statements
BANCO DE CHILE AND SUBSIDIARIES
INTERIM CONSOLIDATED STATEMENTS OF INCOME
for the period between January 1, and March 31,
(Free translation of Interim Consolidated Financial Statements originally issued in Spanish)
| March | March | |||||||||||
| Notes | 2025 | 2024 | ||||||||||
| MCh$ | MCh$ | |||||||||||
| Interest revenue | 30 | 664,976 | 800,766 | |||||||||
| Interest expense | 30 | (235,414 | ) | (337,325 | ) | |||||||
| Net interest income | 429,562 | 463,441 | ||||||||||
| UF indexation revenue | 31 | 249,053 | 154,693 | |||||||||
| UF indexation expenses | 31 | (132,944 | ) | (87,800 | ) | |||||||
| Net income from UF indexation | 116,109 | 66,893 | ||||||||||
| Income from commissions | 32 | 192,993 | 179,937 | |||||||||
| Expenses from commissions | 32 | (36,144 | ) | (42,465 | ) | |||||||
| Net income from commissions | 156,849 | 137,472 | ||||||||||
| Financial income (expense) for: | ||||||||||||
| Financial assets and liabilities held for trading | 33 | 42,146 | (4,243 | ) | ||||||||
| Non-trading financial assets mandatorily measured at fair value through profit or loss | 33 | — | — | |||||||||
| Financial assets and liabilities designated as at fair value through profit or loss | 33 | — | — | |||||||||
| Result from derecognition of financial assets and liabilities at amortized cost and financial assets at fair value through other comprehensive income | 33 | 1,013 | 2,539 | |||||||||
| Exchange, indexation and accounting hedging of foreign currency | 33 | 17,483 | 106,447 | |||||||||
| Reclassification of financial assets for changes in the business model | 33 | — | — | |||||||||
| Other financial result | 33 | — | — | |||||||||
| Net Financial income (expense) | 33 | 60,642 | 104,743 | |||||||||
| Income attributable to investments in other companies | 34 | 1,734 | 218 | |||||||||
| Result from non-current assets and disposal groups held for sale not admissible as discontinued operations | 35 | 240 | (1,013 | ) | ||||||||
| Other operating income | 36 | 14,080 | 8,592 | |||||||||
| TOTAL OPERATING INCOME | 779,216 | 780,346 | ||||||||||
| Expenses from salaries and employee benefits | 37 | (140,916 | ) | (141,410 | ) | |||||||
| Administrative expenses | 38 | (107,096 | ) | (109,223 | ) | |||||||
| Depreciation and amortization | 39 | (23,647 | ) | (23,402 | ) | |||||||
| Impairment of non-financial assets | 40 | (9 | ) | (94 | ) | |||||||
| Other operating expenses | 36 | (9,370 | ) | (9,715 | ) | |||||||
| TOTAL OPERATING EXPENSES | (281,038 | ) | (283,844 | ) | ||||||||
| OPERATING RESULT BEFORE CREDIT LOSSES | 498,178 | 496,502 | ||||||||||
The accompanying notes 1 to 49 are an integral part of these interim consolidated financial statements
BANCO DE CHILE AND SUBSIDIARIES
INTERIM CONSOLIDATED STATEMENTS OF INCOME
for the period between January 1, and March 31,
(Free translation of Interim Consolidated Financial Statements originally issued in Spanish)
| March | March | |||||||||||
| Notes | 2025 | 2024 | ||||||||||
| MCh$ | MCh$ | |||||||||||
| Credit loss expense for: | ||||||||||||
| Provisions for credit risk of loans and advances to banks and loans to customers | 41 | (149,489 | ) | (118,806 | ) | |||||||
| Special provisions for credit risk | 41 | 42,622 | (6,038 | ) | ||||||||
| Recovery of written-off credits | 41 | 16,720 | 13,161 | |||||||||
| Impairments for credit risk from other financial assets at amortized cost and financial assets at fair value through other comprehensive income | 41 | (57 | ) | (1,485 | ) | |||||||
| Credit loss expense | 41 | (90,204 | ) | (113,168 | ) | |||||||
| NET OPERATING INCOME | 407,974 | 383,334 | ||||||||||
| Income from continuing operations before tax | 407,974 | 383,334 | ||||||||||
| Income tax | 18 | (79,030 | ) | (85,679 | ) | |||||||
| Income from continuing operations after tax | 328,944 | 297,655 | ||||||||||
| Income from discontinued operations before tax | — | — | ||||||||||
| Income tax from discontinued operations | 18 | — | — | |||||||||
| Income from discontinued operations after tax | 42 | — | — | |||||||||
| NET INCOME FOR THE PERIOD | 28 | 328,944 | 297,655 | |||||||||
| Attributable to: | ||||||||||||
| Shareholders of the Bank | 28 | 328,944 | 297,655 | |||||||||
| Non-controlling interests | — | — | ||||||||||
| Earnings per share: | $ | $ | ||||||||||
| Basic earnings | 28 | 3.26 | 2.95 | |||||||||
| Diluted earnings | 28 | 3.26 | 2.95 | |||||||||
The accompanying notes 1 to 49 are an integral part of these interim consolidated financial statements
BANCO DE CHILE AND SUBSIDIARIES
INTERIM CONSOLIDATED STATEMENTS OF
OTHER COMPREHENSIVE INCOME
for the period between January 1, and March 31,
(Free translation of Interim Consolidated Financial Statements originally issued in Spanish)
| March | March | |||||||||||
| Notes | 2025 | 2024 | ||||||||||
| MCh$ | MCh$ | |||||||||||
| NET INCOME FOR THE PERIOD | 28 | 328,944 | 297,655 | |||||||||
| ITEMS NOT TO BE RECLASSIFIED TO PROFIT OR LOSS | ||||||||||||
| Re-measurement of the liability (asset) for net defined benefits and actuarial results for other employee benefit plans | 28 | (62 | ) | 115 | ||||||||
| Fair value changes of equity instruments designated as at fair value through other comprehensive income | 28 | (1,492 | ) | 518 | ||||||||
| Fair value changes of financial liabilities designated as at fair value through profit or loss attributable to changes in the credit risk of the financial liability | 28 | — | — | |||||||||
| Others | 28 | — | — | |||||||||
| OTHER COMPREHENSIVE INCOME THAT WILL NOT BE RECLASSIFIED TO PROFIT OR LOSS BEFORE TAX | (1,554 | ) | 633 | |||||||||
| Income tax on other comprehensive income that will not be reclassified to profit or loss | 18 | (101 | ) | (171 | ) | |||||||
| TOTAL OTHER COMPREHENSIVE INCOME THAT WILL NOT BE RECLASSIFIED TO INCOME AFTER TAXES | 28 | (1,655 | ) | 462 | ||||||||
| ELEMENTS THAT CAN BE RECLASSIFIED TO PROFIT OR LOSS | ||||||||||||
| Fair value changes of financial assets at fair value through other comprehensive income | 28 | 2,303 | 6,440 | |||||||||
| Cash flow hedges | 28 | (9,884 | ) | (5,247 | ) | |||||||
| Participation in other comprehensive income of entities registered under the equity method | 28 | 5 | 7 | |||||||||
| OTHER COMPREHENSIVE INCOME THAT WILL BE RECLASSIFIED TO INCOME BEFORE TAXES | (7,576 | ) | 1,200 | |||||||||
| Income tax on other comprehensive income that can be reclassified to profit or loss | 28 | 2,419 | (1,012 | ) | ||||||||
| TOTAL OTHER COMPREHENSIVE INCOME THAT WILL BE RECLASSIFIED TO PROFIT OR LOSS AFTER TAX | 28 | (5,157 | ) | 188 | ||||||||
| TOTAL OTHER COMPREHENSIVE INCOME FOR THE PERIOD | 28 | (6,812 | ) | 650 | ||||||||
| CONSOLIDATED COMPREHENSIVE INCOME FOR THE PERIOD | 322,132 | 298,305 | ||||||||||
| Attributable to: | ||||||||||||
| Shareholders of the Bank | 322,132 | 298.305 | ||||||||||
| Non-controlling interests | — | — | ||||||||||
The accompanying notes 1 to 49 are an integral part of these interim consolidated financial statements
BANCO DE CHILE AND SUBSIDIARIES
INTERIM CONSOLIDATED STATEMENTS OF CASH FLOWS
for the period between January 1, and March 31,
(Free translation of Interim Consolidated Financial Statements originally issued in Spanish)
| March | March | |||||||||||
| Notes | 2025 | 2024 | ||||||||||
| CASH FLOWS FROM OPERATING ACTIVITIES: | MCh$ | MCh$ | ||||||||||
| Profit for the period before taxes | 407,974 | 383,334 | ||||||||||
| Income tax | 18 | (79,030 | ) | (85,679 | ) | |||||||
| Profit for the period after taxes | 328,944 | 297,655 | ||||||||||
| Charges (credits) to income (loss) that do not represent cash flows: | ||||||||||||
| Depreciation and amortization | 39 | 23,647 | 23,402 | |||||||||
| Impairment of non-financial assets | 40 | 9 | 94 | |||||||||
| Provisions for credit losses | 148,727 | 123,628 | ||||||||||
| Provisions for contingencies | 41 | 27,232 | 2,701 | |||||||||
| Additional provisions | 41 | (69,035 | ) | — | ||||||||
| Fair value of debt financial instruments held for trading at fair value through in profit or loss | (2,016 | ) | (476 | ) | ||||||||
| Change in deferred tax assets and liabilities | 18 | 4,862 | 21,025 | |||||||||
| Net (income) loss from investments in companies with significant influence | 34 | (1,734 | ) | (189 | ) | |||||||
| Net (income) loss on sale of assets received in payments | (303 | ) | (266 | ) | ||||||||
| Net (income) loss on sale of sale of fixed assets | 35 | (2,111 | ) | (88 | ) | |||||||
| Write-offs of assets received in payment | 35 | 5,459 | 2,511 | |||||||||
| Other charges (credits) that do not represent cash flows | 4,944 | 8,431 | ||||||||||
| Net change in exchange rates, interest, readjustments and commissions accrued on assets and liabilities | 55,611 | 90,792 | ||||||||||
| Changes due to (increase) decrease in assets and liabilities affecting the operating flow: | ||||||||||||
| Net ( increase ) decrease in accounts receivable from banks | (1,029,784 | ) | 1,302,631 | |||||||||
| Net ( increase ) decrease in loans and accounts receivables from customers | (458,810 | ) | (554,092 | ) | ||||||||
| Net ( increase ) decrease of debt financial instruments held for trading at fair value through profit or loss | 108,394 | 137,551 | ||||||||||
| Net ( increase ) decrease in other assets and liabilities | 83,741 | (222,838 | ) | |||||||||
| Increase ( decrease ) in deposits and other demand obligations | 296,116 | 218,754 | ||||||||||
| Increase ( decrease ) in repurchase agreements and securities loans | 41,663 | 32,265 | ||||||||||
| Increase ( decrease ) in deposits and other time deposits | 1,332,842 | 272,266 | ||||||||||
| Sale of assets received in lieu of payment | 4,756 | 4,161 | ||||||||||
| Increase ( decrease ) in obligations with foreign banks | 202,383 | 256,338 | ||||||||||
| Increase ( decrease ) in other financial obligations | 36,230 | (65,302 | ) | |||||||||
| Increase ( decrease ) in obligations with the Central Bank of Chile | — | — | ||||||||||
| Net increase ( decrease ) of debt financial instruments at fair value through other comprehensive income | 142,190 | 569,761 | ||||||||||
| Net (increase) decrease of financial instruments at amortized cost | 18,585 | (2,607,287 | ) | |||||||||
| Total net cash flows provided by (used in) operating activities | 1,302,542 | (86,572 | ) | |||||||||
| CASH FLOWS FROM INVESTING ACTIVITIES: | ||||||||||||
| Leasehold improvements | 17 | (13 | ) | (558 | ) | |||||||
| Fixed assets purchase | 16 | (4,483 | ) | (4,050 | ) | |||||||
| Fixed assets sale | 2,779 | 292 | ||||||||||
| Disposal of investments in companies | — | — | ||||||||||
| Acquisition of intangibles | 15 | (13,884 | ) | (15,592 | ) | |||||||
| Dividend received of investments in companies | — | 29 | ||||||||||
| Total net cash flows from (used in) investing activities | (15,601 | ) | (19,879 | ) | ||||||||
| CASH FLOW FROM FINANCING ACTIVITIES: | ||||||||||||
| Attributable to the interest of the owners: | ||||||||||||
| Redemption and payment of interest of letters of credit | (141 | ) | (192 | ) | ||||||||
| Redemption and payment of interest on current bonds | (172,606 | ) | (264,766 | ) | ||||||||
| Redemption and payment of interest on subordinated bonds | (3,140 | ) | (3,008 | ) | ||||||||
| Current bonds issuance | 22 | 373,284 | 314,872 | |||||||||
| Subordinated bonds issuance | — | — | ||||||||||
| Payment of common stock dividends | 28 | (995,380 | ) | (815,932 | ) | |||||||
| Principal and interest payments for obligations under lease contracts | 17 | (7,712 | ) | (7,245 | ) | |||||||
| Attributable to non-controlling interest: | ||||||||||||
| Dividend payment and/or withdrawals of paid-in capital in respect of the subsidiaries corresponding to the non-controlling interest | — | — | ||||||||||
| Total net cash flows from (used in) financing activities | (805,695 | ) | (776,271 | ) | ||||||||
| VARIATION IN CASH AND CASH EQUIVALENTS DURING THE PERIOD | 481,246 | (882,722 | ) | |||||||||
| Effect of exchange rate changes on cash and cash equivalents | (37,865 | ) | 185,810 | |||||||||
| Opening balance of cash and cash equivalent | 7 | 4,489,586 | 5,544,147 | |||||||||
| Final balance of cash and cash equivalent | 7 | 4,932,967 | 4,847,235 | |||||||||
| March | March | |||||||
| 2025 | 2024 | |||||||
| MCh$ | MCh$ | |||||||
| Interest operating cash flow: | ||||||||
| Interest and readjustments received | 797,844 | 899,330 | ||||||
| Interest and readjustments paid | (270,408 | ) | (375,586 | ) | ||||
The accompanying notes 1 to 49 are an integral part of these interim consolidated financial statements
BANCO DE CHILE AND SUBSIDIARIES
INTERIM CONSOLIDATED STATEMENTS OF CASH FLOWS
for the period between January 1, and March 31,
(Free translation of Interim Consolidated Financial Statements originally issued in Spanish)
Reconciliation of liabilities arising from financing activities:
| Changes other than Cash | ||||||||||||||||||||||||
| 12.31.2024 | Net Cash Flow |
Acquisition / (Disposals) |
Foreign currency |
UF Movement | 03.31.2025 | |||||||||||||||||||
| MCh$ | MCh$ | MCh$ | MCh$ | MCh$ | MCh$ | |||||||||||||||||||
| Letters of credit | 850 | (141 | ) | — | — | 8 | 717 | |||||||||||||||||
| Bonds | 10,758,098 | 197,538 | — | (54,918 | ) | 175,804 | 11,076,522 | |||||||||||||||||
| Dividends paid | — | (995,380 | ) | — | — | — | (995,380 | ) | ||||||||||||||||
| Obligations for lease contracts | 91,429 | (7,712 | ) | 1,953 | — | 1,538 | 87,208 | |||||||||||||||||
| Dividend payment and/or withdrawals of paid-in capital in respect of the subsidiaries corresponding to the non-controlling interest | — | — | — | — | — | — | ||||||||||||||||||
| Total liabilities from financing activities | 10,850,377 | (805,695 | ) | 1,953 | (54,918 | ) | 177,350 | 10,169,067 | ||||||||||||||||
The accompanying notes 1 to 49 are an integral part of these interim consolidated financial statements
BANCO DE CHILE AND SUBSIDIARIES
INTERIM CONSOLIDATED STATEMENTS OF CHANGES IN EQUITY
for the period between January 1, and March 31, 2025 and 2024
(Free translation of Interim Consolidated Financial Statements originally issued in Spanish)
| Attributable to shareholders of the Bank | ||||||||||||||||||||||||||||||||
| Note | Capital | Reserves | Accumulated other comprehensive income |
Retained earnings from previous years and income (loss) for the years |
Total | Non- controlling interests |
Total Equity |
|||||||||||||||||||||||||
| MCh$ | MCh$ | MCh$ | MCh$ | MCh$ | MCh$ | MCh$ | ||||||||||||||||||||||||||
| Opening balances as of January 1, 2024 | 2,420,538 | 709,742 | 24,242 | 2,082,761 | 5,237,283 | 2 | 5,237,285 | |||||||||||||||||||||||||
| Dividends distributed and paid | 28 | — | — | — | (815,932 | ) | (815,932 | ) | (1 | ) | (815,933 | ) | ||||||||||||||||||||
| Application of provision for payment of common stock dividends | — | — | — | 611,949 | 611,949 | — | 611,949 | |||||||||||||||||||||||||
| Provision for payment of common stock dividends | 28 | — | — | — | (156,699 | ) | (156,699 | ) | — | (156,699 | ) | |||||||||||||||||||||
| Subtotal: transactions with owners during the period | — | — | — | (360,682 | ) | (360,682 | ) | (1 | ) | (360,683 | ) | |||||||||||||||||||||
| Income for the period 2024 | 28 | — | — | — | 297,655 | 297,655 | — | 297,655 | ||||||||||||||||||||||||
| Other comprehensive income for the period | 28 | — | — | 650 | — | 650 | — | 650 | ||||||||||||||||||||||||
| Subtotal: Comprehensive income for the period | — | — | 650 | 297,655 | 298,305 | — | 298,305 | |||||||||||||||||||||||||
| Balances as of March 31, 2024 | 2,420,538 | 709,742 | 24,892 | 2,019,734 | 5,174,906 | 1 | 5,174,907 | |||||||||||||||||||||||||
| Dividends distributed and paid | — | — | — | — | — | 1 | 1 | |||||||||||||||||||||||||
| Application of provision for payment of common stock dividends | — | — | — | — | — | — | — | |||||||||||||||||||||||||
| Provision for payment of common stock dividends | — | — | — | (440,529 | ) | (440,529 | ) | — | (440,529 | ) | ||||||||||||||||||||||
| Subtotal: transactions with owners during the period | — | — | — | (440,529 | ) | (440,529 | ) | 1 | (440,528 | ) | ||||||||||||||||||||||
| Income for the period 2024 | — | — | — | 909,737 | 909,737 | — | 909,737 | |||||||||||||||||||||||||
| Other comprehensive income for the period | — | — | (21,115 | ) | — | (21,115 | ) | — | (21,115 | ) | ||||||||||||||||||||||
| Subtotal: Comprehensive income for the period | — | — | (21,115 | ) | 909,737 | 888,622 | — | 888,622 | ||||||||||||||||||||||||
| Balances as of December 31, 2024 | 2,420,538 | 709,742 | 3,777 | 2,488,942 | 5,622,999 | 2 | 5,623,001 | |||||||||||||||||||||||||
| Dividends distributed and paid | 28 | — | — | — | (995,380 | ) | (995,380 | ) | — | (995,380 | ) | |||||||||||||||||||||
| Application of provision for payment of common stock dividends | 28 | — | — | — | 597,228 | 597,228 | — | 597,228 | ||||||||||||||||||||||||
| Provision for payment of common stock dividends | 28 | — | — | — | (153,537 | ) | (153,537 | ) | — | (153,537 | ) | |||||||||||||||||||||
| Subtotal: transactions with owners during the period | — | — | — | (551,689 | ) | (551,689 | ) | — | (551,689 | ) | ||||||||||||||||||||||
| Income for the period 2025 | 28 | — | — | — | 328,944 | 328,944 | — | 328,944 | ||||||||||||||||||||||||
| Other comprehensive income for the period | 28 | — | 1,916 | (6,812 | ) | — | (4,896 | ) | — | (4,896 | ) | |||||||||||||||||||||
| Subtotal: Comprehensive income for the period | — | 1,916 | (6,812 | ) | 328,944 | 324,048 | — | 324,048 | ||||||||||||||||||||||||
| Balances as of March 31, 2025 | 2,420,538 | 711,658 | (3,035 | ) | 2,266,197 | 5,395,358 | 2 | 5,395,360 | ||||||||||||||||||||||||
The accompanying notes 1 to 49 are an integral part of these interim consolidated financial statements
BANCO DE CHILE AND SUBSIDIARIES
NOTES TO THE INTERIM CONSOLIDATED FINANCIAL STATEMENTS
(Free translation of Consolidated Financial Statements originally issued in Spanish)
| 1. | Company information: |
Banco de Chile is authorized to operate as a commercial bank since September 17, 1996, being, in conformity with the stipulations of article 25 of Law No. 19,396, the legal continuation of Banco de Chile resulting from the merger of the Banco Nacional de Chile, Banco Agrícola and Banco de Valparaiso, which was constituted by public deed dated October 28, 1893, granted before the Notary Public of Santiago, Mr. Eduardo Reyes Lavalle, authorized by Supreme Decree of November 28, 1893.
The Bank is a Corporation organized under the laws of the Republic of Chile, regulated by the Chilean Commission for the Financial Market (“CMF”). Since 2001, it is subject to the supervision of the Securities and Exchange Commission of the United States of America (“SEC”), in consideration of the fact that the Bank is registered on the New York Stock Exchange (“NYSE”), through a program of American Depositary Receipt (“ADR”).
Banco de Chile offers a broad range of banking services to its customers, ranging from individuals to large corporations. Additionally, the Bank offers international as well as treasury banking services, in addition to those offered by subsidiaries that include securities brokerage, mutual fund and investment management, insurance brokerage and financial advisory services.
Banco de Chile’s legal address is Ahumada 251, Santiago, Chile and its website is www.bancochile.cl.
NOTES TO THE INTERIM CONSOLIDATED FINANCIAL STATEMENTS, continued
| 2. | Main Accounting Criteria Used: |
| (a) | Legal Dispositions: |
Decree Law No. 3,538 of 1980, according to the text replaced by the first article of Law No. 21,000 that “Creates the Commission for the Financial Market”, provides in numeral 6 of its article 5 that the Commission for the Market Financial (“CMF”) may “set the standards for the preparation and presentation of reports, balance sheets, statements of situation and other financial statements of the audited entities and determine the principles under which they must keep their accounting”.
According to the current legal framework, banks must use the accounting principles provided by the CMF and in everything that is not dealt with by it or in contravention of its instructions, they must adhere to the generally accepted accounting principles, which correspond to the technical standards issued by the College of Accountants of Chile AG, coinciding with the International Financial Reporting Standards (“IFRS”) agreed by the International Accounting Standards Board (“IASB”). If there are discrepancies between these accounting principles of general acceptance and the accounting criteria issued by the CMF, the latter shall prevail.
The notes to the Interim Consolidated Financial Statements contain additional information to that presented in the Consolidated Statement of Financial Position, Consolidated Statement of Income, Consolidated Statement of Other Comprehensive Income, Consolidated Statement of Changes in Equity and Consolidated Statement of Cash Flows. They provide narrative descriptions or disaggregation of such statements in a clear, relevant, reliable and comparable way.
| (b) | Basis of Consolidation: |
The Interim Consolidated Financial Statements of Banco de Chile as of March 31, 2025 and 2024, have been consolidated with its subsidiaries, using the global integration method (line-by-line). They include preparation of individual Financial Statements of the Bank and companies that participate in the consolidation and it include adjustments and reclassifications necessary to homologue accounting policies and valuation criteria applied by the Bank. The Interim Consolidated Financial Statements have been prepared using the same accounting policies for similar transactions and other events, in equivalent circumstances.
Significant intercompany transactions and balances (assets and liabilities, equity, income, expenses and cash flows) originated in operations performed between the Bank and its subsidiaries and between subsidiaries have been eliminated in the consolidation process. The non-controlling interest corresponding to the participation percentage of third parties in subsidiaries, which the Bank does not own directly or indirectly, has been recognized and is shown separately in the consolidated shareholders’ equity and consolidated income statement of Banco de Chile.
NOTES TO THE INTERIM CONSOLIDATED FINANCIAL STATEMENTS, continued
| 2. | Main Accounting Criteria Used, continued: |
| − | Controlled companies (Subsidiaries): |
Interim Consolidated Financial Statements as of of March 31, 2025 and 2024 incorporate Financial Statements of the Bank and the controlled companies (subsidiaries) in accordance with IFRS 10 “Consolidated Financial Statements”.
The entities controlled by the Bank and which form parts of the consolidation are detailed as follows:
| Interest Owned | ||||||||||||||||||||||||||||||
| Direct | Indirect | Total | ||||||||||||||||||||||||||||
| Functional | March | December | March | December | March | December | ||||||||||||||||||||||||
| Rut | Entity | Country | Currency | 2025 | 2024 | 2025 | 2024 | 2025 | 2024 | |||||||||||||||||||||
| % | % | % | % | % | % | |||||||||||||||||||||||||
| 96,767,630-6 | Banchile Administradora General de Fondos S.A. | Chile | Ch$ | 99.98 | 99.98 | 0.02 | 0.02 | 100.00 | 100.00 | |||||||||||||||||||||
| 96,543,250-7 | Banchile Asesoría Financiera S.A. | Chile | Ch$ | 99.96 | 99.96 | — | — | 99.96 | 99.96 | |||||||||||||||||||||
| 77,191,070-K | Banchile Corredores de Seguros Ltda. | Chile | Ch$ | 99.83 | 99.83 | 0.17 | 0.17 | 100.00 | 100.00 | |||||||||||||||||||||
| 96,571,220-8 | Banchile Corredores de Bolsa S.A. | Chile | Ch$ | 99.70 | 99.70 | 0.30 | 0.30 | 100.00 | 100.00 | |||||||||||||||||||||
| 96,645,790-2 | Socofin S.A. (**) | Chile | Ch$ | 99.00 | 99.00 | 1.00 | 1.00 | 100.00 | 100.00 | |||||||||||||||||||||
| 77,955,969-6 | Operadora de Tarjetas B-Pago S.A. (*) | Chile | Ch$ | 99.90 | 99.90 | 0.10 | 0.10 | 100.00 | 100.00 | |||||||||||||||||||||
| (*) | On July 29, 2024, the public deed of incorporation of the subsidiary company of Banco de Chile was signed, Operadora de Tarjetas B-Pago S.A. |
| (**) | See Note No. 49 letter (b) on Subsequent Events. |
| − | Investments in associates and joint ventures: |
Associated entities are those over which the Bank has the capacity to exercise significant influence, without having control over the associate.
Investments in associates where exists significant influence, are accounted for using the equity method (Note No. 14 Investments in other companies).
Joint Ventures are joint arrangements whereby the parties that have joint control of the arrangement have rights to the net assets of the arrangement. Joint control exists only when decisions about the relevant activities require the unanimous consent of the parties sharing control.
Investments defined as a “Joint Venture” will be registered according to the equity method.
The investment in other companies that, due to its characteristics, is defined as “Joint Venture” is Servipag Ltda.
| − | Minority investments in other companies: |
On initial recognition, the Bank and subsidiaries may make an irrevocable election to present in other comprehensive income subsequent changes in the fair value of an investment in an equity instrument that is not held for trading and is not contingent consideration recognized by an acquirer in a business combination to which IFRS 3 applies.
NOTES TO THE INTERIM CONSOLIDATED FINANCIAL STATEMENTS, continued
| 2. | Main Accounting Criteria Used, continued: |
| − | Fund administration: |
The Bank and its subsidiaries manage and administer assets held in mutual funds and other investment products on behalf of investors, perceiving a payment according to the service provided and market conditions. Managed resources are owned by third parties and, therefore, not included in the Consolidated Statements of Financial Position.
According to established in IFRS 10, for consolidation purposes is necessary to assess the role of the Bank and its subsidiaries with respect to the funds they manage, must determine whether that role is Agent or Principal.
The Bank and its subsidiaries manage on behalf and for the benefit of investors, acting in that relationship only as Agent. Under this category, and as provided in the aforementioned regulation, it does not control such funds when exercise its authority to make decisions. Therefore, as of March 31, 2025 and 2024 act as agent, and therefore do not consolidate any fund, no funds are part of the consolidation.
| (c) | Non-controlling interest: |
Non-controlling interest represents the share of losses, income and net assets of which, directly or indirectly, the Bank does not own. It is presented separately from the equity of the owners of the Bank in the Consolidated Statements of Income and the Consolidated Statements of Financial Position.
| (d) | Use of Estimates and Judgment: |
Preparing Interim Consolidated Financial Statements requires Management to make judgments, estimations and assumptions that affect the application of accounting policies and the valuation of assets, liabilities, income and expenses presented. Real results could differ from these estimated amounts. The estimates made refer to:
| - | Losses due to impairment of assets and liabilities (Notes No. 11, 13, 15, 16, 17 and No. 40); |
| - | Provision for credit risk (Notes No. 13, 26 and 41); |
| - | Expenses for amortization of intangible assets, depreciation of property and equipment and leased assets and lease liabilities (Notes No. 15, 16 and 17); |
| - | Income taxes and deferred taxes (Note No. 18); |
| - | Provisions (Note No. 24); |
| - | Contingencies and Commitments (Note No. 29); |
| - | Fair value of financial assets and liabilities (Notes No. 8, 11, 12, 21 and 44). |
Estimates and relevant assumptions are regularly reviewed by the management in order to quantify certain assets, liabilities, income, expenses and commitments.
During the period ended March 31, 2025 there have been no significant changes in the estimates made with the exception of what is indicated in Note No. 4 Accounting Changes.
NOTES TO THE INTERIM CONSOLIDATED FINANCIAL STATEMENTS, continued
| 2. | Main Accounting Criteria Used, continued: |
| (e) | Financial Assets: |
The classification, measurement and presentation of financial assets has been carried out based on the standards issued by the CMF in the Compendium of Accounting Standards for Banks or “CNCB” (as abbreviated in Spanish), considering the criteria described below:
Classification of financial assets:
On initial recognition, a financial asset is classified within the following categories: Financial assets held for trading at fair value through profit or loss; Financial assets not held for trading mandatorily valued at fair value through profit or loss; Financial assets designated as at fair value through profit or loss; Financial assets at fair value through other comprehensive income and Financial assets at amortized cost.
The criteria for classifying financial assets, which incorporates the standards defined in IFRS 9, depends on the business model with which the entity manages the assets and the contractual characteristics of the cash flows, commonly known as “Solely Payments of Principal and Interest” (SPPI) criterion.
The valuation of these assets should reflect how the Bank manages groups of financial assets and does not depend on the intent for an individual instrument.
A financial asset should be valued at amortized cost if both of the following conditions are met:
| - | It is held within a business model whose objective is to hold financial assets in order to collect contractual cash flows and |
| - | The contractual terms of the financial asset give rise to cash flows that are solely payments of principal and interest. |
A debt financial instrument must be valued at fair value with changes in “Other comprehensive income” if the following two conditions are met:
| - | It is held within a business model whose objective is achieved by both collecting contractual cash flows and selling financial assets and |
| - | The contractual terms of the financial asset give rise to cash flows that are solely payments of principal and interest on the principal amount outstanding. |
A debt financial instrument will be classified at fair value through profit or loss whenever, due to the business model or the characteristics of its contractual cash flows, it is not appropriate to classify it in any of the other categories described.
NOTES TO THE INTERIM CONSOLIDATED FINANCIAL STATEMENTS, continued
| 2. | Main Accounting Criteria Used, continued: |
Valuation of financial assets:
Initial recognition:
Financial assets are initially recognized at fair value plus, in the case of a financial asset that is not carried at fair value through profit or loss, the transaction costs that are directly attributable to its purchase or issuance, using the Effective Interest Rate method (EIT). The calculation of the EIT includes all fees and other items paid or received that are part of the EIT. Transaction costs include incremental costs that are directly attributable to the acquisition or issuance of a financial asset.
Post measurement:
All variations in the value of financial assets due to the accrual of interest and items assimilated to interest are recorded in “Interest income” or “Interest expense” of the Consolidated Income Statement for the year in which the accrual occurred, except for trading derivatives that are not part of accounting hedges.
The changes in the valuations that occur after the initial registration for reasons other than those mentioned in the previous paragraph, are treated as described below, based on the categories in which the financial assets are classified.
Financial assets held for trading at fair value through profit or loss, Financial assets not held for trading mandatorily valued at fair value through profit or loss and Financial assets designated as at fair value through profit or loss:
In “Financial assets held for trading at fair value through profit or loss” will record financial assets whose business model aims to generate profits through purchases and sales or to generate results in the short term.
The financial assets recorded under “Financial assets not held for trading mandatorily valued at fair value through profit or loss” are assigned to a business model whose objective is achieved by obtaining contractual cash flows and/or selling financial assets but where the cash flows contracts have not met the conditions of the SPPI test.
In “Financial assets designated as at fair value through profit or loss” financial assets will be classified only when such designation eliminates or significantly reduces the inconsistency in the valuation or in the recognition that would arise from valuing or recognizing the assets on a different basis.
The assets recorded in these items are valued after their acquisition at their fair value and changes in their value are recorded, at their net amount, under “Financial assets and liabilities held for trading”, “Financial assets and liabilities financial assets not held for trading mandatorily valued at fair value through profit or loss” and “Financial assets and liabilities designated as at fair value through profit or loss” of the Consolidated Income Statement. Variations originated from exchange differences are recorded under “Foreign currency changes, UF indexation and accounting hedge” in the Consolidated Income Statement.
NOTES TO THE INTERIM CONSOLIDATED FINANCIAL STATEMENTS, continued
| 2. | Main Accounting Criteria Used, continued: |
Financial assets at fair value through other comprehensive income:
| − | Debt financial instruments: |
The assets recorded in this item are valued at their fair value, interest income and UF indexation of these instruments, as well as exchange differences and impairment arising, are recorded in the Consolidated Statement of Income, while subsequent variations in their valuation are temporarily recorded (for its amount net of taxes) in “Changes in the fair value of financial assets at fair value through other comprehensive income” of the Consolidated Statements of Other Comprehensive Income.
The amounts recorded in “Changes in the fair value of financial assets at fair value through other comprehensive income” continue to form part of the Bank’s consolidated equity until the asset is derecognized in the consolidated balance. In the case of selling these assets, the result is recognized in “Financial result for derecognizing financial assets and liabilities at amortized cost and financial assets at fair value with changes in others comprehensive income” of the Consolidated Income Statement.
Net losses due to impairment of financial assets at fair value through other comprehensive income produced in the year are recorded in “Impairment due to credit risk of other financial assets at amortized cost and financial assets at fair value through other comprehensive income” of the Consolidated Income Statement.
| − | Equity financial instruments: |
At the time of initial recognition, the Bank may make the irrevocable decision to present subsequent changes in fair value in other comprehensive income. Subsequent variations in this valuation will be recognized in “Changes in the fair value of equity instruments designated as at fair value through other comprehensive income”. The dividends received from these investments are recorded in “Income from investments in companies” of the Consolidated Income Statement. These instruments are not subject to the impairment model of IFRS 9.
| − | Financial assets at amortized cost: |
The assets recorded in this item of the Consolidated Statement of Financial Position are valued after their acquisition at their “amortized cost”, in accordance with the “effective interest rate” method. They are subdivided according to the following:
| - | Investment under resale agreements and securities loans (Note No. 13 (a)). |
| - | Debt financial instruments (Note No. 13 (b)). |
| - | Due from banks (Note No. 13 (c)). |
| - | Loans and accounts receivable from customers (Note No. 13 (d)). |
Losses due to impairment of these assets generated in each year are recorded in “Provisions for credit risk and loans and accounts receivable from customers” and “Impairment due to credit risk of other financial assets at amortized cost and financial assets at fair value through other comprehensive income” of the Consolidated Income Statement.
NOTES TO THE INTERIM CONSOLIDATED FINANCIAL STATEMENTS, continued
| 2. | Main Accounting Criteria Used, continued: |
| − | Investment under resale agreements, obligations under repurchase agreements and securities loans: |
Resale agreement operations are carried out as a form of investment. Under these agreements, financial instruments are purchased, which are included as assets in “Investment under resale agreements and securities loans”, which are valued according to the interest rate of the agreement through the amortized cost method. In accordance with current regulations, the Bank does not record as its own portfolio those papers purchased under resale agreements.
Repurchase agreement operations are also carried out as a form of financing, which are included as liabilities in “Obligations for repurchase agreements and securities loans”. In this regard, the investments that are sold subject to a repurchase obligation and that serve as collateral for the loan correspond to debt financial instruments. The obligation to repurchase the investment is classified in liabilities as “Obligations under repurchase agreements and securities loans” and is valued according to the interest rate of the agreement.
| − | Debt financial instruments at amortized cost: |
These instruments are recorded at their cost value plus accrued interest and UF indexation, less provision for impairment constituted when their recorded amount is greater than the estimated amount of recovery. Interest and UF indexation of debt financial instrument at amortized cost are included in “Interest income” and “UF indexation income”.
| − | Loans and Advances to Banks: |
This item shows the balances of operations with local and abroad banks, including the Central Bank of Chile and foreign Central Banks.
| − | Loans and accounts receivable from customers: |
Loans to customers include originated and purchased non-derivative financial assets with fixed or determinable payments that are not quoted in an active market and which the Bank does not intend to sell immediately or in the short term.
| (i) | Valuation method |
They are initially measured at cost plus incremental transaction costs and income, and subsequently measured at amortized cost, using the effective interest rate method, less any impairment loss, except when the Bank defined some loans as hedged items, measured at fair value through profit or loss as described in letter (p) of this note.
| (ii) | Lease contracts |
These are included under the item “Loans to customers” correspond to periodic rent installments of contracts which meet the definition to be classified as financial leases and are presented at their nominal value net of unearned interest as of each year-end.
NOTES TO THE INTERIM CONSOLIDATED FINANCIAL STATEMENTS, continued
| 2. | Main Accounting Criteria Used, continued: |
| (iii) | Factoring transactions |
They are valued for the amounts disbursed by the Bank in exchange for invoices or other commercial instruments representative of credit, with or without responsibility of the grantor, received in discount. Price differences between the amounts disbursed and the nominal value of the credits are recorded in the result as interest income, through the effective interest method, during the financing period. In those cases, where the transfer of these instruments it was made without responsibility of the grantor, it is the Bank who assumes the insolvency risks of those required to pay.
| (f) | Credit risk allowance: |
The Bank permanently evaluates the entire portfolio of loans and contingent loans, with the aim of establishing the necessary and sufficient provisions in a timely manner to cover the expected losses associated with the characteristics of the debtors and their credits, based on the payment and subsequent recovery.
Allowances are required to cover the risk of loan losses have been established in accordance with the instructions issued by the CMF. The loans are presented net of those allowances and, in the case of contingent loans are shown in liabilities under the item “Special provisions for credit risk”.
In accordance with what is stipulated by the CMF, models or methods are used based on an individual and group analysis of debtors, to establish allowance for loan losses. The Bank’s Board of Directors approves said models, as well as modifications to their design and application.
| (i) | Allowance for individual evaluations: |
An individual analysis of debtors is applied to companies that are of such significance with respect to size, complexity or level of exposure to the bank, that they must be analyzed in detail.
Likewise, the analysis of borrowers focuses on its credit quality related to the capacity and willingness to meet their credit obligations, through sufficient and reliable information, and should also be analyzed in terms of guarantees, terms, interest rates, currency and revaluation, etc.
For purposes of establish the allowances, the banks must assess the credit quality, then classify to one of three categories of loans portfolio: Normal, Substandard and Non-Complying Loans, it must classify the debtors and their operations related to loans and contingent loans in the categories that apply.
NOTES TO THE INTERIM CONSOLIDATED FINANCIAL STATEMENTS, continued
| 2. | Main Accounting Criteria Used, continued: |
| − | Normal Loans and Substandard Loans: |
Normal loans: includes those debtors whose payment capacity allows them to meet their obligations and commitments, and according to the evaluation of their economic-financial situation no change in this condition are displayed. Loans classified in categories A1 through A6.
Substandard loans: includes all borrowers with insufficient payment capacity or significant deterioration of payment capacity that may be reasonably expected not to comply with all principal and interest payments obligations set forth in the credit agreement, showing a low flexibility to meet its financial obligations in the short term.
They are also part of the Substandard Portfolio those debtors who have shown arrears of more than 30 days guarantor. In no case may the guaranteed securities be discounted from in the recent past. The classifications assigned to this portfolio are categories B1 to B4 of the rating scale.
As a result of individual analysis of the debtors, the Bank must classify them in the following categories, assigning, subsequently, the percentage of probability of default and loss given default resulting in the following percentage of expected loss:
| Type of portfolio |
Category of the debtors |
Probability of default (%) PD |
Loss given default (%) LGD |
Expected loss (%) EL |
|||||||
| A1 | 0.04 | 90.0 | 0.03600 | ||||||||
| A2 | 0.10 | 82.5 | 0.08250 | ||||||||
| Normal Loans | A3 | 0.25 | 87.5 | 0.21875 | |||||||
| A4 | 2.00 | 87.5 | 1.75000 | ||||||||
| A5 | 4.75 | 90.0 | 4.27500 | ||||||||
| A6 | 10.00 | 90.0 | 9.00000 | ||||||||
| B1 | 15.00 | 92.5 | 13.87500 | ||||||||
| Substandard Loans | B2 | 22.00 | 92.5 | 20.35000 | |||||||
| B3 | 33.00 | 97.5 | 32.17500 | ||||||||
| B4 | 45.00 | 97.5 | 43.87500 |
Allowances for Normal and Substandard Loans:
To determine the amount of allowances to be constitute for normal and substandard portfolio, previously should be estimated the exposure to subject to the allowances, which will be applied to respective expected loss, which consist of probability of default (PD) and loss given default (LGD) established for the category in which the debtor and/or guarantor belong, as appropriate.
The exposure affects to allowances applicable to loans plus contingent loans minus the amounts to be recovered by way of the foreclosure of financial or real guarantees of the operations. Loans mean the book value of credit of the respective debtor, while for contingent loans, the value resulting from to apply the indicated in No. 3 of Chapter B-3 of the CNCB.
NOTES TO THE INTERIM CONSOLIDATED FINANCIAL STATEMENTS, continued
| 2. | Main Accounting Criteria Used, continued: |
In the case of real guarantees, the Bank must demonstrate that the value assigned to this deduction reasonably reflects the value that it would obtain in the sale of the assets or capital instruments. Also, in qualified cases, the direct debtor’s credit risk may be substituted for the credit quality of the guarantor. In no case may the guaranteed securities be discounted from the amount of the exposure, since this procedure is only applicable when it comes to financial or real guarantees.
For calculation purposes, the following must be considered:
Provision debtor = (ESA-GE) x (PDdebtor /100) x (LGDdebtor /100) + GE x (PDguarantor /100) x (LGDguarantor /100)
Where:
| ESA | = | Exposure subject to allowances, (Loans + Contingent Loans) – Financial Guarantees or real |
| GE | = | Guaranteed exposure |
However, the Bank must maintain a minimum provision level of 0.50% over normal portfolio and contingent loans.
| − | Non-complying Loans: |
The non-complying portfolio includes the debtors and their credits for which their recovery is considered remote, as they show an impaired or no payment capacity. This category comprises all debtors who have stopped paying their creditors or with visible evidence that they will stop doing so, as well as those for which a forced restructuring of their debts is necessary, reducing the obligation or postponing the payment of the principal or interest and, in addition, any debtor that has 90 days overdue or more in the payment of interest or principal of any credit. This portfolio is composed of the debtors belonging to categories C1 to C6 of the rating scale and all credits, including 100% of the amount of contingent loans, held by those same debtors.
For purposes to establish the allowances on the non-complying loans, the Bank disposes the use of percentage of allowances to be applied on the amount of exposure, which corresponds to the amount of loans and contingent loans that maintain the same debtor. To apply that percentage, must be estimated an expected loss rate, less the amount of the exposure the recoveries by way of foreclosure of financial or real guarantees that to support the operation and, if there are available specific background, also must be deducting present value of recoveries obtainable exerting collection actions, net of expenses associated with them. This loss percentage must be categorized in one of the six levels defined by the range of expected actual losses by the Bank for all transactions of the same debtor.
NOTES TO THE INTERIM CONSOLIDATED FINANCIAL STATEMENTS, continued
| 2. | Main Accounting Criteria Used, continued: |
These categories, their range of loss as estimated by the Bank and the percentages of allowance that must be applied on the amount of exposures, are listed in the following table:
| Type of portfolio | Scale of risk | Expected Loss Range | Allowance (%) | |||||
| C1 | Up to 3% | 2 | ||||||
| C2 | More than 3% up to 20% | 10 | ||||||
| Non-complying loans | C3 | More than 20% up to 30% | 25 | |||||
| C4 | More than 30 % up to 50% | 40 | ||||||
| C5 | More than 50% up to 80% | 65 | ||||||
| C6 | More than 80% | 90 |
For calculation purposes, the following must be considered:
| Expected Loss Rate | = | (E−R)/E | |
| Allowance | = | E × (AP/100) |
Where:
| E | = | Exposure Amount |
| R | = | Recoverable Amount |
| AP | = | Allowance Percentage (according to the category in which the Expected Loss Rate should be assigned). |
All credits of the debtor must be kept in the Default Portfolio until there is a normalization of their ability or payment behavior, without prejudice to punishment of each particular credit that meets the condition indicated in Title II of Chapter B-2 of the Compendium of Accounting Standards for Banks. To remove a debtor from the Default Portfolio, once the circumstances that lead to classification in this portfolio according to these regulations have been overcome, at least the following copulative conditions must be met:
| - | No obligation of the debtor with the bank with more than 30 calendar days overdue. |
| - | No new refinances granted to pay its obligations. |
| - | At least one of the payments includes amortization of capital. |
| - | If the debtor has a credit with partial payment periods less than six months, has already made two payments. |
| - | If the debtor must pay monthly fees for one or more credits, has paid four consecutive dues. |
| - | The debtor does not have direct debts unpaid in the CMF recast information, except in the case of insignificant amounts. |
NOTES TO THE INTERIM CONSOLIDATED FINANCIAL STATEMENTS, continued
| 2. | Main Accounting Criteria Used, continued: |
| (ii) | Allowances for group evaluations |
Group evaluations are relevant for residential mortgage and consumer loan exposures, in addition to commercial exposures related to student loans and exposures with debtors that simultaneously meet the following conditions:
| - | The Bank has an aggregate exposure to the same counterparty of less than 20,000 UF. The aggregate exposure should require gross provisions or other mitigations. In addition, for its computation, mortgage loans must be excluded. In the case of off-balance sheet items, the gross amount is calculated by applying the credit conversion factors, defined in chapter B-3 of the CNCB. To determine the aggregate exposure, the bank must consider the definition of corporate group established in Title II of Chapter 12-16 of the Actualized Standards Compilation. |
Banks must carry out a complete and permanent monitoring of all operations with entities belonging to business groups. Considering the costs that may result the conformation of groups for all debtors, the bank must at least keep control and form groups, if applicable, for all debtors who maintain a current exposure greater than a minimum amount established by the banking institution which may not be greater than 1% of its effective equity at the time the definition of the group portfolio is made.
| - | Each aggregate exposure to the same counterparty does not exceed 0.2% of the total commercial group portfolio. To avoid circular computation, the criterion will be checked only once. |
For the remaining commercial credit exposures, the individual analysis model of the debtors must be applied.
The determination of the type of analysis (group or individual) must be carried out at the global consolidated level, once a year, or after significant adjustments in the Bank’s portfolio, such as mergers, acquisitions, purchases or significant portfolio sales.
To determine the allowances, the group evaluations require the formation of groups of loans with similar characteristics in terms of type of debtors and conditions agreed, to establish technically based estimates by prudential criteria and following both the payment behavior of the group that concerned as recoveries of defaulted loans and consequently provide the necessary provisions to cover the risk of the portfolio.
To determine its provisions, the Bank segments its debtors into homogeneous groups, according described above, associating to each group a determined probability of default and a percentage of recovery based in a historic analysis. The amount of provisions to register it will be obtained multiplied the total loans of respective group by the percentages of estimated default and of loss given the default, the estimated losses must be related to the type of portfolio and the term of the operations.
The Bank discriminates between provisions on the normal portfolio and on the portfolio in default, and those that protect the risks of contingent credits associated with those portfolios.
NOTES TO THE INTERIM CONSOLIDATED FINANCIAL STATEMENTS, continued
| 2. | Main Accounting Criteria Used, continued: |
| − | Standard method of provisions for group portfolio |
The standard methodologies presented below establish the variables and parameters that determine the provision factor for each type of portfolio that the CMF has defined as representative, according to the common characteristics shared by the operations that comprise them.
| (a) | Residential mortgage portfolio |
The provision factor applicable, represented by expected loss over the mortgage loans, it will depend to the past due of each credit and the relation, at the end of month, between outstanding capital and the value of the mortgage guarantees (CMG), according the following table:
| Provision factor applicable according to delinquency and CMG | |||||||||||||
| Days of default at the end of the month | |||||||||||||
| CMG section | Concept | 0 | 1-29 | 30-59 | 60-89 | Non-Complying Portfolio | |||||||
| CMG ≤ 40% | PD (%) | 1.0916 | 21.3407 | 46.0536 | 75.1614 | 100.0000 | |||||||
| LGD (%) | 0.0225 | 0.0441 | 0.0482 | 0.0482 | 0.0537 | ||||||||
| EAD (%) | 0.0002 | 0.0094 | 0.0222 | 0.0362 | 0.0537 | ||||||||
| 40% < CMG≤ 80% | PD (%) | 1.9158 | 27.4332 | 52.0824 | 78.9511 | 100.0000 | |||||||
| LGD (%) | 2.1955 | 2.8233 | 2.9192 | 2.9192 | 3.0413 | ||||||||
| EAD (%) | 0.0421 | 0.7745 | 1.5204 | 2.3047 | 3.0413 | ||||||||
| 80% < CMG≤ 90% | PD (%) | 2.5150 | 27.9300 | 52.5800 | 79.6952 | 100.0000 | |||||||
| LGD (%) | 21.5527 | 21.6600 | 21.9200 | 22.1331 | 22.2310 | ||||||||
| EAD (%) | 0.5421 | 6.0496 | 11.5255 | 17.6390 | 22.2310 | ||||||||
| CMG > 90% | PD (%) | 2.7400 | 28.4300 | 53.0800 | 80.3677 | 100.0000 | |||||||
| LGD (%) | 27.2000 | 29.0300 | 29.5900 | 30.1558 | 30.2436 | ||||||||
| EAD (%) | 0.7453 | 8.2532 | 15.7064 | 24.2355 | 30.2436 | ||||||||
Where:
| PD | : | Probability of default |
| LGD | : | Loss given default |
| EAD | : | Exposure at default |
| CMG | : | Outstanding loan capital /Mortgage Guarantee value |
| (b) | Commercial portfolio |
To determine these allowances, the Bank considers the standard methods presented below, as applicable to commercial leasing operations or other types of commercial loans. Then, the applicable provision factor will be assigned considering the parameters defined for each method.
NOTES TO THE INTERIM CONSOLIDATED FINANCIAL STATEMENTS, continued
| 2. | Main Accounting Criteria Used, continued: |
| ● | Commercial Leasing Operations |
The provision factor applies to the current value of commercial leasing operations (including the purchase option) and will depends on the default of each operation, the type of leased asset and the relationship between the current value of each operation and the leased asset value (PVB) at each month-end, as indicated in the following tables:
| Probability of default (PD) applicable according to default and type of asset (%) | ||||
| Type of asset | ||||
| Days
of default of the operation at the month-end |
Real estate | Non-real estate | ||
| 0 | 0.79 | 1.61 | ||
| 1-29 | 7.94 | 12.02 | ||
| 30-59 | 28.76 | 40.88 | ||
| 60-89 | 58.76 | 69.38 | ||
| Portfolio in default | 100.00 | 100.00 | ||
| Loss given the default (LGD) applicable according to PVB section and type of asset (%) | ||||
| PVB = Current value of the operation / Value of the leased asset | ||||
| PVB section | Real estate | Non-real estate | ||
| PVB ≤ 40% | 0.05 | 18.20 | ||
| 40% < PVB ≤ 50% | 0.05 | 57.00 | ||
| 50% < PVB ≤ 80% | 5.10 | 68.40 | ||
| 80% < PVB ≤ 90% | 23.20 | 75.10 | ||
| PVB > 90% | 36.20 | 78.90 | ||
The determination of the PVB relationship is made considering the appraisal value expressed in UF for real estate and in Chilean pesos for non-real estate, recorded at the time of the respective loan granting, taking into account possible situations that may be causing temporary increases in the assets prices at that time.
| ● | Generic commercial loans and factoring |
For the factoring operations and other commercial loans, other than those indicated above, the provision factor, applicable to the amount of the placement and the exposure of the contingent loan risk, will depends on the default of each operation and the relationship that exists at the end of each month, between the obligations that the debtor has with the bank and the value of the collateral that protect them (PTVG), as indicated in the following tables:
| Probability of default (PD) applicable according to default and PTVG section (%) | |||||||||
| With collateral | |||||||||
| Days of default at the month-end |
PTVG≤100% | PTVG>100% | Without collateral |
||||||
| 0 | 1.86 | 2.68 | 4.91 | ||||||
| 1-29 | 11.60 | 13.45 | 22.93 | ||||||
| 30-59 | 25.33 | 26.92 | 45.30 | ||||||
| 60-89 | 41.31 | 41.31 | 61.63 | ||||||
| Portfolio in default | 100.00 | 100.00 | 100.00 | ||||||
NOTES TO THE INTERIM CONSOLIDATED FINANCIAL STATEMENTS, continued
| 2. | Main Accounting Criteria Used, continued: |
| Loss given the default (LGD) applicable according to PTVG section (%) | ||||||||
| Collateral (with / without) |
PTVG section | Generic commercial operations or factoring without the responsibility of the transferor |
Factoring with the responsibility of the transferor |
|||||
| With collateral | PTVG ≤ 60% | 5.00 | 3.20 | |||||
| 60% < PTVG≤ 75% | 20.30 | 12.80 | ||||||
| 75% < PTVG ≤ 90% | 32.20 | 20.30 | ||||||
| 90% < PTVG | 43.00 | 27.10 | ||||||
| Without collateral | 56.90 | 35.90 | ||||||
The collaterals used for the purposes of calculating the PTVG relationship of this method may be specific or general, including those that are simultaneously specific and general. Collateral can only be considered if, according to the respective coverage clauses, it was constituted in the first degree of preference in favor of the Bank and only guarantees the debtor’s credits with respect to which it is imputed (not shared with other debtors).
The invoices assigned in the factoring operations will not be considered for purposes of calculating the PTVG. The excess of collateral associated with mortgage loans referred to in numeral 3.1.1 Residential mortgage portfolio in Chapter B-1 of CNCB may be considered, computed as the difference between 80% of the property commercial value, according to with the conditions set out in that framework, and the mortgage loan that guarantees.
For the calculation of the PTVG ratio, the following considerations must be taken into account:
| i. | Transactions with specific collaterals: when the debtor granted specific collateral for generic commercial loans and factoring, the PTVG ratio is calculated independently for each covered transaction, such as the division between the amount of the loans and the contingent loans exposure and the collateral’s value of the covered product. |
| ii. | Transactions with general collaterals: when the debtor granted general or general and specific collaterals, the Bank calculates the respective PTVG, jointly for all generic commercial loans and factoring and not contemplated in the preceding paragraph i), as the quotient between the sum of the amounts of the loans and exposures of contingent loans and the general, or general and specific collateral that, according to the scope of the remaining coverage clauses, safeguard the loans considered in the numerator aforementioned coverage ratio. |
NOTES TO THE INTERIM CONSOLIDATED FINANCIAL STATEMENTS, continued
| 2. | Main Accounting Criteria Used, continued: |
The amounts of the guarantees used in the PTVG ratio of numerals i) and ii), different from those associated with excess guarantees from mortgage loans to which the residential mortgage portfolio refers, must be determined according to:
| - | The last valuation of the collateral, be it appraisal or fair value, according to the type of real guarantee in question. For the determination of fair value, the criteria indicated in Chapter 7-12 (Fair Value of Financial Instruments) of the RAN should be considered. |
| - | Possible situations that could be causing temporary increases in the values of the collaterals. |
| - | Limitations on the amount of coverage established in their respective clauses. |
| (c) | Consumer Portfolio |
The allowance factor, represented by the expected loss (EL), corresponds to the probability of default (PD) together with the loss given the default occurred (LGD). This factor is applied uniformly to all contingent consumer loans and consumer credits held by the debtor with the bank and its subsidiaries established in Chile, including consumer leasing transactions. In the case of contingent transactions, the exposure measure is calculated according to the provisions established in Chapter B-3 of the CNC will be considered.
To define the value of the PD, the following factors are calculated for each debtor:
| ● | Bank default rate: This corresponds to the maximum default rate (in days) for the consumer portfolio, including consumer leasing transactions, that the debtor has with the bank at the end of the month for which provisions are being determined. For clients with more than one transaction, the maximum value obtained from all of them is used. This variable is measured by considering all entities that comprise the institution’s overall consolidated level. |
| ● | 30 days in default in the financial system: This variable applies to whether the debtor has at least one direct debt in default for 30 days or more in any of the three months prior to the date on which the provisions are calculated. This variable is calculated based on the debtor’s defaults with all credit providers for which information is available. This variable includes the list of debtors reported by the CMF, as well as the bank itself at a global consolidated level, and the various financial products. It excludes only loans subject to a communication ban under Law No. 19,628 on the Protection of Privacy. |
| ● | Having a mortgage Loan: This variable determines whether the borrower has a current mortgage loan in the financial system. In this case, the bank uses the most recent information available at the date the provisions are being calculated, considering the list of borrowers reported by the CMF, in addition to the bank’s own consolidated data. |
NOTES TO THE INTERIM CONSOLIDATED FINANCIAL STATEMENTS, continued
| 2. | Main Accounting Criteria Used, continued: |
The table of factors considered to define the PD is as follows:
| With a mortgage loan for housing in the system | No mortgage loan for housing in the system | |||||||||||
| Maximum default level in the month and bank (range in days that includes extremes | No default greater than 30 days in the system |
With a default greater than 30 days in the system |
No default greater than 30 days in the system |
With a default greater than 30 days in the system |
||||||||
| 0 and 7 | 3.3% | 14.6% | 6.6% | 19.8% | ||||||||
| 8 and 30 | 20.4% | 41.6% | 30.6% | 48.5% | ||||||||
| 31 and 60 | 50.2% | 63.0% | 65.1% | 66.3% | ||||||||
| 61 and 89 | 62.6% | 81.7% | 72.3% | 86.9% | ||||||||
In the event that the debtor is in default, the assigned LGD will be 100%.
To determine the value of the LGD, it is determined whether or not the debtor has a mortgage loan for the home in the system as defined for the value of the PD, and the type of loan involved
The LGD to be used is defined according to the following table:
| Automotive leasing and credit operations | Credits in installments | Credit cards and lines, and other consumer products | ||||||||||
| With a mortgage loan for housing in the system | 33,2 | % | 47,7 | % | 49,5 | % | ||||||
| No mortgage loan for housing in the system | 33,2 | % | 56,6 | % | 60,3 | % | ||||||
The allocation of the LGD value is carried out according to the following guidelines:
| ● | “Automotive leasing and credit operations” will be considered those loans where the transaction is intended to finance the acquisition of private vehicles, which remain as collateral (pledge) in favor of the institution. Consumer financial leasing operations are also considered in this category. |
| ● | “Installment Credits” will correspond to those registered in the item Consumer Credits in Installments of Chapter C-3 of the CNC, to the extent that these have been granted upon signing of a promissory note that clearly establishes the amount of capital, term, rate and number of installments, without a predefined use of the funds (free disposal) and does not correspond to the previous category. |
| ● | If a loan does not fall under either of the two previous definitions, but is classified as consumer loans, the LGD value assigned to the “Credit cards and lines, and other consumer loans” category must be applied. |
NOTES TO THE INTERIM CONSOLIDATED FINANCIAL STATEMENTS, continued
| 2. | Main Accounting Criteria Used, continued: |
| − | Portfolio in default. |
Includes all placements and 100% of the amount of the contingent loans, of the debtors that the closing of a month presents a delay equal to or greater than 90 days in the payment of the interest of the capital of any credit. It will also include debtors who are granted a credit to leave an operation that has more than 60 days of delay in their payment, as well as those debtors who were subject to forced restructuring or partial forgiveness of a debt.
They may exclude from the portfolio in default: a) mortgage loans for housing, which delinquent less than 90 days, unless the debtor has another loan of the same type with greater delinquency; and, b) credits for financing higher studies of Law No. 20,027, which do not yet present the non-compliance conditions indicated in Circular No. 3,454 of December 10, 2008.
All credits of the debtor must be kept in the Default Portfolio until there is a normalization of their ability or payment behavior, without prejudice to punishment of each particular credit that meets the condition indicated in Title II of Chapter B-2 of the CNCB. To remove a debtor from the Default Portfolio, once the circumstances that lead to classification in this portfolio according to the present rules have been overcome, at least the following copulative conditions must be met:
| - | No obligation of the debtor with the bank with more than 30 calendar days overdue. |
| - | No new refinances granted to pay its obligations. |
| - | At least one of the payments includes amortization of capital. |
| - | If the debtor has a credit with partial payment periods less than six months, has already made two payments. |
| - | If the debtor must pay monthly fees for one or more credits, has paid four consecutive dues. |
| - | The debtor does not appear with unpaid debts direct according to the information recast by CMF, except for insignificant amounts. |
| (iii) | Provisions related to financing with FOGAPE COVID-19 guarantee. |
On July 17, 2020, the CMF requested to determine specific provisions of the credits guaranteed by the FOGAPE COVID-19 guarantee, for which the expected losses were determined estimating the risk of each operation, without considering the substitution of credit quality of the guarantee, according to the corresponding individual or group analysis method, in accordance with the provisions of Chapter B-1 of the CNCB. This procedure must be carried out in an aggregate manner, grouping all those operations to which the same deductible percentage is applicable.
The deductible is applied by the Fund Administrator, which must be borne by each financial institution and does not depend on each particular operation, but is determined based on the total of the balances guaranteed by the Fund, for each group of companies that have the same coverage, according to their net sales size.
NOTES TO THE INTERIM CONSOLIDATED FINANCIAL STATEMENTS, continued
| 2. | Main Accounting Criteria Used, continued: |
| (iv) | Provisions related to financing with FOGAPE Reactivation guarantee. |
To determine the provisions of the amounts guaranteed by the FOGAPE Reactivation, the Bank considers the substitution of the credit quality of the debtors for that of the FOGAPE, for all the types of financing indicated, up to the amount covered by the aforementioned guarantee. Naturally, the option to consider the risk attributable to FOGAPE may be made while said guarantee remains in force, without considering the capitalized interest, in accordance with the provisions of article 17 of the Fund Regulations.
Likewise, for the computation of the provisions of the amount not covered by the guarantee, corresponding to the debtors, the treatment must be differentiated according to the level of default of the refinanced credit and the grace period, which must consider the cumulative consecutive months grace period between the refinanced loan and other prior measures.
For this purpose, the following situations should be considered:
| ● | Refinancing with less than 60 days past due and less than 180 days of grace. |
When the Bank grants the refinancing and is the current creditor, depending on the methodology used in accounting for provisions (standard or internal method) for the group portfolio, the computation of default and the expected loss parameters remain constant at the time to carry out the refinancing, as long as no payment is due.
In the case of debtors evaluated on an individual basis, their risk category is maintained at the time of rescheduling, which does not prevent them from being reclassified to the category that corresponds to them, in the event of a worsening of their payment capacity.
| ● | Refinancing with past due between 60 and 89 days or grace periods greater than 180 days and less than 360 days. |
The provisions established in the previous point apply, and at least one of the following conditions must also be met:
| i. | In its credit granting policies, the Bank considers at least the following aspects: |
| - | A robust procedure for the categorization of viable debtors, which considers at least the sector and its solvency and liquidity situation. |
| - | Efficient mechanisms for monitoring the debtor’s situation, with formally defined internal governance. |
| ii. | Interest is charged in the months of grace, in accordance with the guidelines established in article 15 letter a) of the Regulation, or there is a demand for payment in another credit with the bank. In the latter case, if noncompliance is observed, the carry forward rules contained in numerals 2.2 and 3.2 of Chapter B-1 of the CNCB must be considered, depending on whether it is a credit subject to individual or group evaluation, respectively. |
NOTES TO THE INTERIM CONSOLIDATED FINANCIAL STATEMENTS, continued
| 2. | Main Accounting Criteria Used, continued: |
| ● | Refinancing with grace periods greater than 360 days. |
The Bank must apply the provisions established in Chapter B-1 of the CNCB, considering the operation as a forced renegotiation and, therefore, apply the provisions that correspond to the portfolio in default.
| (v) | Impairment of loans. |
The impaired loans include the following assets, according to Chapter B-1 of the CNCB of the CMF:
| - | In case of debtors subject to individual assessment, includes credits from “Non-complying loans” those classified in categories B3 and B4 of “Substandard loans”. |
| - | Debtors subject to assessment group evaluation, the impaired portfolio includes all credits of the “Non-complying loans”. |
| (vi) | Charge-offs. |
As a general rule, the charge-offs are produced when the contractual rights on cash flows end. In case of loans, even if the above does not happen, it will proceed to charge-offs the respective asset balances.
The charge-off refers to derecognition of the assets in the Consolidated Statement of Financial Position, related to the respective transaction and, therefore, the part that could not be past-due if a loan is payable in installments, or a lease.
| − | Charge-offs of loans to customers |
The charge-off must be to make using credit risk provisions constituted, whatever the cause for which the charge-off was produced.
Write-offs for loans to customers and accounts receivable, other than from leasing operations, should be made in the following circumstances, whichever occurs first:
| - | The Bank, based on all available information, concludes that will not obtain any cash flow of the credit recorded as an asset. |
| - | When the debt without executive title expires 90 days after it was recorded in asset. |
| - | At the expiration of the statute of limitations for actions to demand payment through an executive trial, or at the time of rejection or abandonment of the execution of the judgment by final court resolution. |
| - | When past-due term of a transaction reaches the charge-off term disposed below: |
| Type of Loan | Term | ||
| Consumer loans - secured and unsecured | 6 months | ||
| Other transactions - unsecured | 24 months | ||
| Commercial loans - secured | 36 months | ||
| Residential mortgage loans | 48 months |
The term represents the time elapsed since the date on which payment of all or part of the obligation in default became due.
NOTES TO THE INTERIM CONSOLIDATED FINANCIAL STATEMENTS, continued
| 2. | Main Accounting Criteria Used, continued: |
| − | Charge-offs of lease operations |
These assets must be charge-offs against the following circumstances, whichever occurs first:
| - | The Bank concludes that there is no possibility of the rent recoveries and the value of the property cannot be considered for purposes of recovery of the contract, either because the lessee has not the asset, for the property’s conditions, for expenses that involve its recovery, transfer and maintenance, due to technological obsolescence or absence of a history of your location and current situation. |
| - | When it complies the prescription term of actions to demand the payment through executory or upon rejection or abandonment of executory by court. |
| - | When a contract has been in default reach the period of time indicated below: |
| Type of Loan | Term | ||
| Consumer leases | 6 months | ||
| Other non-real estate lease transactions | 12 months | ||
| Real estate leases (commercial or residential) | 36 months |
The term represents the time elapsed since the date on which payment of all or part of the obligation in default became due.
| (vii) | Written-off loans recoveries |
Cash recoveries on charge-off loans including loans that were reacquired are recorded directly in income in the Consolidated Statement of Income, as a reduction of the “Recoveries of written-off loans” item.
In the event of recoveries of assets, the income will be recognized in the results for the amount by which they are incorporated into the asset. The same criterion will be followed if the leased assets were recovered after the charge-off for a leasing operation, when such assets are incorporated into the asset.
Any renegotiation of a credit already written off does not give rise to income, as long as the operation remains to have an impaired quality; the actual payments received must be treated as recoveries of credits written off, as indicated above.
Therefore, renegotiated credit can be recorded as an asset only if it has not deteriorated quality; also recognizing revenue from activation must be recorded like recovery of loans.
The same criteria should apply in the case that was give credit to pay a charge-off loan.
NOTES TO THE INTERIM CONSOLIDATED FINANCIAL STATEMENTS, continued
| 2. | Main Accounting Criteria Used, continued: |
| (g) | Impairment due to credit risk of Financial assets at amortized cost and Financial assets at fair value through other comprehensive income (FVOCI): |
In accordance with the established in Chapter A-2 of the CNCB of the CMF, the impairment model of IFRS 9 will not be applied to loans in the category “Financial assets at amortized cost” (“Due from banks” and “Loans and accounts receivable from customers”), nor on “Contingent loans”, since the criteria for these instruments are defined in Chapters B-1 to B-3 of the CNCB.
For the rest of the financial assets measured at Amortized Cost or FVOCI, the model on which impairment losses must be calculated corresponds to one of Expected Credit Loss (ECL) as established in IFRS 9.
Debt financial instruments whose subsequent valuation is at amortized cost or at FVOCI will be subject to impairment due to credit risk. On the contrary, those instruments at fair value through profit or loss do not require this measurement.
The measurement of impairment is carried out in accordance with a general impairment model that is based on the existence of 3 possible phases of the financial asset, the existence or not of a significant increase in credit risk and the condition of impairment. The 3 phases determine the amount of impairment that will be recognized as an expected credit loss, as well as the interest income that will be recorded at each reporting date. Each phase is listed below:
Phase 1: Incorporates financial assets whose credit risk has not increased significantly since initial recognition. Expected credit losses are recognized to 12-month. Interest is recognized based on the gross amount on the balance sheet.
Phase 2: Incorporates financial assets whose credit risk has increased significantly since initial recognition. Expected credit losses are recognized throughout the life of the financial asset. Interest is recognized based on the gross amount on the balance sheet.
Phase 3: Incorporates impaired financial assets. Expected credit losses are recognized throughout the life of the financial asset. Interest is recognized based on the net amount (gross amount on the balance sheet less allowance for credit risk).
| − | Impairment of debt financial instruments measured at fair value through other comprehensive income. |
The Bank applies the value impairment requirements for the recognition and measurement of a value correction for losses to financial assets that are measured at fair value through other comprehensive income in accordance with IFRS 9. This value adjustment for losses is recognized in Other Comprehensive Income (OCI) and does not reduce the carrying amount of the financial asset in the Consolidated Statement of Financial Position. The accumulated loss recognized in OCI is recycled in results when derecognizing the financial assets.
NOTES TO THE INTERIM CONSOLIDATED FINANCIAL STATEMENTS, continued
| 2. | Main Accounting Criteria Used, continued: |
| (h) | Financial liabilities: |
Classification of financial liabilities:
Financial liabilities are classified in the following categories:
| - | Financial liabilities at amortized cost. |
| - | Financial liabilities held for trading at fair value through profit or loss: Financial instruments are recorded in this item when the Bank’s objective is to generate profits through purchases and sales with these instruments. This item includes financial derivative trading contracts that are liabilities, which will be measured subsequently at fair value. |
| - | Financial liabilities designated as at fair value through profit or loss: The Bank has the option to irrevocably designate, at the time of initial recognition, a financial liability as measured at fair value through profit or loss if the application of this criterion eliminates or significantly reduces inconsistencies in the measurement or recognition, or if it is a group of financial liabilities, or a group of financial assets and liabilities, that is managed, and its performance evaluated, based on fair value in line with a risk management or investment strategy. |
Valuation of financial liabilities:
Initial valuation:
They are initially recorded at fair value, less transaction costs that are directly attributable to the issuance of the instruments. Variations in the value of financial liabilities due to the accrual of interest, UF indexation and similar concepts are recorded under the headings “Interest expenses” and “UF indexation expenses” of the Consolidated Income Statement for the period in which the accrual occurred (see Note No. 30 and No. 31).
Subsequent valuation:
The changes in the valuations that will occur after the initial registration due to reasons other than those mentioned in the previous paragraph, are treated as described below, based on the categories in which the financial liabilities are classified.
Financial liabilities at amortized cost:
The liabilities recorded in this item are valued after their acquisition at their amortized cost, which is determined in accordance with the effective interest rate method (EIR).
NOTES TO THE INTERIM CONSOLIDATED FINANCIAL STATEMENTS, continued
| 2. | Main Accounting Criteria Used, continued: |
| (i) | Derecognition of financial assets and liabilities: |
The Bank and its subsidiaries derecognize a financial asset from its Statement of Financial Position, when the contractual rights to the cash flows of the financial asset have expired or when the contractual rights to receive the cash flows of the financial asset are transferred during a transaction in which all ownership risks and rewards of the financial asset are transferred. Any portion of transferred financial assets that is created or retained by the Bank is recognized as a separate asset or liability.
When the Bank transfers a financial asset, it assesses to what extent it has retained the risks and rewards of ownership. In this case:
| − | If substantially all risks and rewards of ownership of the financial asset have been transferred, it is derecognized, and any rights or obligations created or retained upon transfer are recognized separately as assets or liabilities. |
| − | If substantially all risks and rewards of ownership of the financial asset have been retained, the Bank continues to recognize it. |
| − | If substantially all risks and rewards of ownership of the financial asset are neither transferred nor retained, the Bank will determine if it has retained control of the financial asset. In this case: |
| - | If the Bank has not retained control, the financial asset will be derecognized, and any rights or obligations created or retained upon transfer will be recognized separately as assets or liabilities. |
| - | If the Bank has retained control, it will continue to recognize the financial asset in the Consolidated Financial Statement by an amount equal to its exposure to changes in value that can experience and recognize a financial liability associated to the transferred financial asset. |
The Bank derecognizes a financial liability (or a portion thereof) from its Consolidated Statement of Financial Position if, and only if, it has extinguished or, in other words, when the obligation specified in the corresponding contract has been paid or settled or has expired.
NOTES TO THE INTERIM CONSOLIDATED FINANCIAL STATEMENTS, continued
| 2. | Main Accounting Criteria Used, continued: |
| (j) | Compensation of financial assets and liabilities: |
Financial assets and liabilities are subject to compensation, so that their net amount is presented in the Consolidated Statement of Financial Position, when and only when the Bank has the right, legally enforceable, to offset the recognized amounts and intends to settle the net amount, or to realize the asset and settle the liability simultaneously.
Income and expenses are presented net only when permitted by accounting standards, or in the case of gains and losses arising from a group of similar transactions such as the Bank’s trading and foreign exchange activity.
| (k) | Functional currency: |
The items included in the Interim Consolidated Financial Statements of Banco de Chile and its subsidiaries are valued using the currency of the primary economic environment in which it operates (functional currency). The functional and presentation currency of the Interim Consolidated Financial Statements of Banco de Chile is the Chilean peso, which is the currency of the primary economic environment in which the Bank operates, and also obeys the currency that influences the cost and income structure.
| (l) | Transactions in foreign currency: |
Transactions in currencies other than the functional currency are considered to be in foreign currency and are initially recorded at the exchange rate of the functional currency on the transaction date. Monetary assets and liabilities denominated in foreign currencies are converted using the exchange rate of the functional currency as of the date of the Consolidated Statement of Financial Position. All differences are recorded as a debit or credit to income.
As of March 31, 2025 and 2024, the Bank and its subsidiaries applied the exchange rate of accounting representation according to the standards issued by the CMF, for which the assets in dollars are shown at their equivalent value in Chilean pesos calculated using the following market exchange rate Ch$955.04 per US$1 (Ch$982.21 per US$1 as of March 31, 2024).
As of March 31, 2025, the amount of Ch$17,483 million corresponding to a net financial profit from exchange, indexation and accounting hedging of foreign currency (net gain of Ch$106,447 million as of March 31, 2024) shown in the Consolidated Statements of Income, includes the result from exchange operations, indexation and accounting hedges of foreign currency, including the conversion of assets and liabilities in foreign currency or indexed to the exchange rate.
NOTES TO THE INTERIM CONSOLIDATED FINANCIAL STATEMENTS, continued
| 2. | Main Accounting Criteria Used, continued: |
| (m) | Operating Segments: |
The Bank discloses information by segment in accordance with IFRS 8 (Note No. 6). The Bank’s operating segments are determined based on its different business units, considering the following:
| - | That it conducts business activities from which income is obtained and expenses are incurred (including income and expenses relating to transactions with other components of the same entity). |
| - | That its operating results are reviewed regularly by the entity’s highest decision-making authority for operating decisions, to decide about resource allocation for the segment and evaluate its performance; and |
| - | For which separate financial information available. |
| (n) | Statement of cash flows: |
The Consolidated Statement of Cash Flows shows the changes in cash and cash equivalents derived from operating activities, investment and financing activities during the year. The indirect method has been used in the preparation of this statement of cash flows.
For the preparation of Consolidated Financial Statements of Cash Flow, it is considered the following concepts:
| - | Cash and cash equivalents: corresponds to the item “Cash and deposits in banks”, plus (minus) the net balance corresponding to operations with liquidation in progress that are shown in the Consolidated Statement of Financial Position, plus other cash equivalents such as investments in short-term debt financial instruments that meet the criteria to be considered “cash equivalents”, for which they must have an original maturity of 90 days or less from the date of acquisition, be highly liquid, easily convertible into amounts known amounts of cash as of the date of the initial investment, and that the financial instruments are exposed to an insignificant risk of changes in value. |
| - | Operating activities: corresponds to normal activities of the Bank, as well as other activities that cannot classify like investing or financing activities. |
| - | Investing activities: correspond to the acquisition, sale or disposition other forms, of long-term assets and other investments not included in cash and cash equivalents. |
| - | Financing activities: corresponds to the activities that produce changes in the amount and composition of the equity and the liabilities that are not included in the operating or investing activities. |
NOTES TO THE INTERIM CONSOLIDATED FINANCIAL STATEMENTS, continued
| 2. | Main Accounting Criteria Used, continued: |
| (o) | Financial derivative contracts: |
A “Financial Derivative” is a financial instrument whose value changes in response to changes in an observable market variable (such as an interest rate, exchange rate, the price of a financial instrument or a market index, including credit ratings), whose initial investment is very small in relation to other financial instruments with a similar response to changes in market conditions and which is generally settled at a future date.
The Bank maintains contracts of Derivative financial instruments, for cover the exposition of risk of foreign currency and interest rate. These contracts are recorded in the Consolidated Statement of Financial Position at their cost (included transactions costs) and subsequently measured at fair value. Derivative instruments are reported as an asset when their fair value is positive and as a liability when negative under the item “Derivative Instruments”.
Changes in fair value of derivative contracts held for trading purpose are included under “Financial Assets and Liabilities held for Trading”, on the Consolidated Statement of Income.
Additionally, the Bank includes in the valuation of the derivatives “Counterparty Credit Risk Adjustments, including: “CVA” or Credit Valuation Adjustment to reflect the counterparty credit risk in determining the fair value, as well as the “DVA” o Debit Valuation Adjustment to reflect the Bank’s own credit risk. Likewise, the Bank incorporates “Financing Adjustment”, also called “FVA” or Funding Valuation Adjustment, which captures the expected cost (or benefit) of financing (reinvesting) the cash flows of the derivative, with respect to a reference discount rate, when there are no collaterals (or they are imperfect).
Certain embedded derivatives in other financial instruments are treated as separate derivatives when their risk and characteristics are not closely related to those of the main contract and if the contract in its entirety is not recorded at its fair value with its unrealized gains and losses included in income.
| (p) | Financial derivative contracts for accounting hedges: |
The Bank has chosen to continue applying the hedge accounting requirements of IAS 39 when adopting IFRS 9.
At the moment of subscription of a derivative contract must be designated by the Bank as a derivative instrument for trading or hedging purposes.
If a derivative instrument is classified as a hedging instrument, it can be:
| - | A hedge of the fair value of existing assets or liabilities or firm commitments, or; |
| - | A hedge of cash flows related to existing assets or liabilities or forecasted transactions. |
A hedge relationship for accounting hedges purposes must comply with all of the following conditions:
| - | at its inception, the hedge relationship has been formally documented; |
| - | it is expected that the hedge will be highly effective; |
| - | the effectiveness of the hedge can be measured in a reasonable manner; and |
| - | the hedge is highly effective with respect to the hedged risk on an ongoing basis and throughout the entire hedge relationship. |
NOTES TO THE INTERIM CONSOLIDATED FINANCIAL STATEMENTS, continued
| 2. | Main Accounting Criteria Used, continued: |
The Bank presents and measures individual hedges (where there is a specific identification of hedged item and hedged instruments) by classification, according to the following criteria:
Fair value hedges: Changes in the fair value of a derivative hedging instrument, designated as a fair value hedge, are recognized in income under the lines “Net interest income” and “Net indexation income” and/or “Foreign currency changes, UF indexation and accounting hedge”, depending on the type of risk covered. The hedged item is also presented at fair value in relation to the risk being hedged; gains or losses attributable to the hedged risk are recognized in income under the lines “Net interest income” and “Net income from UF indexation” and adjust the book value of the item subject to the hedge.
Cash flow hedge: Changes in the fair value of financial instruments derivative designated like “cash flow hedge” are recognized in “Cash flow accounting hedge” included in the Consolidated Other Comprehensive Income, to the extent that hedge is effective and hedge is reclassified to income in the item “Net interest income” and “Net income from UF indexation” and/or “Foreign currency changes, UF indexation and accounting hedge”, when hedged item affects the income of the Bank produced for the “interest rate risk” or “foreign exchange risk”, respectively. If the hedge is not effective, the changes in the fair value are recognized directly in the results of the year under the caption “Other financial result”.
If the hedged instruments do not comply with criteria of cash flow accounting hedges, it expires or is sold, it suspends or executed, this hedge must be discontinued prospectively. Accumulated gains or losses recognized previously in the equity are maintained there until projected transactions occur, in that moment will be registered in Consolidated Statement of Income (in the item “Net interest income” and “Net income from UF indexation” and/or “Foreign currency changes, UF indexation and accounting hedge”, depend of the hedge), lesser than it foresees that the transaction will not execute, in this case it will be registered immediately in Consolidated Statement of Income (in the item “Net interest income” and “Net income from UF indexation” and/or “Foreign currency changes, UF indexation and accounting hedge”, depending on the hedge).
| (q) | Intangible Assets: |
Intangible assets (Note No. 15) are initially recognized at their acquisition cost, and are subsequently measured at their cost less any accumulated amortization or less any accumulated impairment losses.
Software or computer programs purchased by the Bank and its subsidiaries are accounted for at cost less accumulated amortization and impairment losses.
The subsequent expense in software assets is capitalized only when it increases the future economic benefit for the specific asset. All other expenses are recorded as an expense as incurred.
Amortization is recorded in income using the straight-line amortization method based on the estimated useful life of the software, from the date on which it is available for use. The estimated useful life of software is a maximum of 6 years.
NOTES TO THE INTERIM CONSOLIDATED FINANCIAL STATEMENTS, continued
| 2. | Main Accounting Criteria Used, continued: |
| (r) | Property and equipment: |
Property and equipment (Note No. 16) includes the amount of land, real estate, furniture, computer equipment and other installations owned by the consolidated entities and which are for own use. These assets are stated at historical cost less depreciation and accumulated impairment. This cost includes expenses that have been directly attributed to the asset’s acquisition.
Depreciation is recognized in the Consolidated Statements of Income on a straight-line basis over the estimated useful lives of each part of an item of property and equipment.
The estimated average useful lives for the periods 2025 and 2024 are as follows:
| - Buildings | 50 years |
| - Installations | 10 years |
| - Equipment | 5 years |
| - Supplies and accessories | 5 years |
Maintenance expenses related to those assets held for own uses are recorded as expenses in the year in which they are incurred.
| (s) | Deferred taxes and income taxes: |
The income tax provision of the Bank and its subsidiaries has been determined in conformity with current legal regulations.
The Bank and its subsidiaries recognize, when appropriate, deferred tax assets and liabilities for future estimates of tax effects attributable to temporary differences between the book and tax values of assets and liabilities. Deferred tax assets and liabilities are measured based on the tax rate expected to be applied, in accordance with current tax law, in the year that deferred tax assets are realized or liabilities are settled. The effects of future changes in tax legislation or tax rates are recognized in deferred taxes starting on the date of publication of the law approving such changes (Note No. 18).
Deferred tax assets are recognized only when it is likely that future tax profits will be sufficient to recover deductions for temporary differences. According to instructions from the CMF, deferred taxes are presented in the Consolidated Statement of Financial Position according with IAS 12 “Income Tax”.
NOTES TO THE INTERIM CONSOLIDATED FINANCIAL STATEMENTS, continued
| 2. | Main Accounting Criteria Used, continued: |
| (t) | Provisions, contingent assets and liabilities: |
Provisions are liabilities involving uncertainty about their amount or maturity. They are recorded in the Consolidated Statement of Financial Position when the following requirements are jointly met:
| - | a present obligation has arisen from a past event; |
| - | as of the date of the Financial Statements it is probable that the Bank or its subsidiaries have to disburse resources to settle the obligation; and |
| - | the amount of these resources can be reliably measured. |
A contingent asset or liability is any right or obligation arising from past events whose existence will be confirmed by one or more uncertain future events which are not within the control of the Bank.
Contingent credits are understood as operations or commitments in which the Bank assumes a credit risk by committing itself to third parties, in the event of a future event, to make a payment or disbursement that must be recovered from its clients.
The following are classified as contingent credits in off-balance sheet information:
| - | Undrawn credit lines: Considers the unused amounts of lines of credit that allow customers to make use of credit without prior decisions by the bank. |
| - | Undrawn credit lines with immediate termination: Considers those undrawn credit lines, defined in the previous numeral, that the bank can unconditionally cancel at any time and without prior notice, or for which its automatic cancellation is contemplated in case of deterioration of the debtor’s solvency, as permitted by the current legal framework and the contractual conditions established between the parties. |
| - | Contingent credits linked to the CAE: Correspond to credit commitments granted in accordance with Law No. 20,027 (“CAE”). |
| - | Letters of credit for goods circulation operations: Considers the commitments that arise, both to the issuing bank and to the confirming bank, from self-settled commercial letters of credit with a maturity period of less than 1 year, arising from merchandise circulation operations (for example, confirmed foreign or documentary letters of credit). Includes documentary letters of credit issued by the Bank, which have not yet been negotiated. |
| - | Debt purchase commitments in local currency abroad: Note issuance facility (NIF) and revolving underwriting facility (RUF) are considered. |
NOTES TO THE INTERIM CONSOLIDATED FINANCIAL STATEMENTS, continued
| 2. | Main Accounting Criteria Used, continued: |
| - | Transactions related to contingent events: Guarantee bonds with promissory notes referred to in Chapter 8-11 of the Actualized Standards Compilation are considered. |
| - | Warranty by endorsement and sureties: Includes warranty by endorsement, sureties and standby letters of credit referred to in Chapter 8-10 of the Actualized Standards Compilation. In addition, it includes the payment guarantees of buyers in factoring operations, as indicated in Chapter 8-38 of that Compilation. |
| - | Other credit commitments: It includes the unplaced amounts of committed loans that are to be disbursed on an agreed future date or triggered by events contractually defined with the client, as is the case with irrevocable credit lines tied to the progress of projects (for provisions purposes, both the gross exposure referred to in No. 3 and future increases in the amount of guarantees associated with committed disbursements must be considered). |
Exposure to credit risk on contingent loans:
To calculate provisions for contingent credits, the amount of exposure to be considered will be equivalent to the percentage of the amounts of the contingent credits indicated below:
| Type of contingent credit | Credit Conversion Factor | |||
| Undrawn credit lines with immediate termination | 10 | % | ||
| Contingent credits linked to the CAE | 15 | % | ||
| Letters of credit for goods circulation operations | 20 | % | ||
| Other undrawn credit lines | 40 | % | ||
| Debt purchase commitments in local currency abroad | 50 | % | ||
| Transactions related to contingent events | 50 | % | ||
| Warranty by endorsement and sureties | 100 | % | ||
| Other credit commitments | 100 | % | ||
| Other contingent loans | 100 | % | ||
When dealing with transactions performed with customers with overdue loans, that exposure shall be equivalent to 100% of its contingent loans.
| (u) | Provisions for minimum dividends: |
According with the CNCB of the CMF, the Bank records within liabilities the portion of net income for the year that should be distributed to comply with the Corporations Law or its dividend policy. For these purposes, the Bank establishes a provision in a complementary equity account within retained earnings (Note No. 25).
For purposes of calculating the provision of minimum dividends, the distributable net income is considered, which is defined as that which results from reducing or adding to the net income for the year, the correction of the value of the paid-in capital and reserves, due to the effects of the variation of the Consumer Price Index.
NOTES TO THE INTERIM CONSOLIDATED FINANCIAL STATEMENTS, continued
| 2. | Main Accounting Criteria Used, continued: |
| (v) | Employee benefits: |
Employee benefits are all forms of consideration granted by an entity in exchange for services provided by employees or severance pay.
Short-term employee benefits are employee benefits (other than termination benefits) that are expected to be settled in full before twelve months after the end of the annual reporting period in which the employees have rendered the related services (Note No. 24 letter (c)).
| - | Staff vacations |
The annual costs of vacations and staff benefits are recognized on an accrual basis.
| - | Other short-term benefits |
The entity contemplates for its employees an annual incentive plan for meeting objectives and individual contribution to the company’s results, which are eventually delivered, consisting of a certain number or portion of monthly salaries and are provisioned based on the estimated amount to be distributed.
Other long-term employee benefits are all employee benefits other than short-term employee benefits, post-employment benefits, and termination benefits.
| - | Employee benefits for termination of employment contract |
The Bank has agreed with part of the staff the payment of compensation to those who have completed 30 or 35 years of permanence, in the event that they retired from the Institution. The proportional part accrued by those employees who will have access to exercise the right to this benefit and who at the end of the year have not yet acquired it has been incorporated into this obligation.
The obligations of this benefit plan are valued according to the projected credit unit method, including as variables the staff turnover rate, the expected salary growth and the probability of using this benefit, discounted at the current rate for long-term operations (5.71% as of March 31, 2025 and December 31, 2024).
The discount rate used corresponds to the rate of 10-year Bonds in pesos of the Central Bank of Chile (BCP).
Gains and losses arising from changes in actuarial variables are recognized in Other Comprehensive Income. There are no other additional costs that should be recognized by the Bank.
NOTES TO THE INTERIM CONSOLIDATED FINANCIAL STATEMENTS, continued
| 2. | Main Accounting Criteria Used, continued: |
| (w) | Earnings per share: |
The basic earnings per share is determined by dividing the net income attributed to the Bank’s owners in a period and the weighted average number of shares outstanding during that period.
Diluted earnings per share are determined similarly to basic earnings, but the weighted average number of outstanding shares is adjusted to take into account the potential dilutive effect of the options on shares, warrants and convertible debt. At the end of the periods ended March 31, 2025 and 2024 there are no concepts to adjust.
| (x) | Interest revenue and expense and UF indexation: |
Interest income and expenses and UF indexation (Notes No. 30 and No. 31) are recognized in the Consolidated Statement of Income using the effective interest rate method. The effective interest rate is the rate which exactly discounts estimated future cash payments or receipts through the expected life of the financial instrument (or, where appropriate, in a shorter period), to the carrying amount of the financial asset or financial liability. To calculate the effective interest rate, the Bank determines cash flows by taking into account all contractual conditions of the financial instrument, excluding future credit losses.
The effective interest rate calculation includes all fees and other amounts paid or received that form part of the effective interest rate. Transaction costs include incremental costs that are directly attributable to the purchase or issuance of a financial asset or liability.
In the case of the impaired portfolio and current loans with a high risk of irrecoverability of loans and accounts receivable from customers, the Bank has applied a conservative position of discontinuing the accrual of interest and UF indexation on an accrual basis in the Consolidated Statement of Income, when the credit or one of its installments has been 90 days default in its payment.
| (y) | Commission income and expenses: |
Revenue and expenses from fees (Note No. 32) are recognized in the Consolidated Income Statement using the criteria established in IFRS 15 “Revenue from contracts with customers”.
Under IFRS 15, revenues are recognized considering the terms of the contract with customers. Revenue is recognized when or as the performance obligation is satisfied by transferring the goods or services committed to the customer.
Under IFRS 15, revenues are recognized using different criteria depending on their nature. The most significant are:
| − | Those that correspond to a singular act, when the act that originates them takes place. |
| − | Those that originate in transactions or services that are extended over time, during the life of such transactions or services. |
| − | Commissions on loan commitments and other fees related to credit operations are deferred (together with the incremental costs directly related to the placement) and recognized as an adjustment to the effective interest rate of the placement. In the case of loan commitments, when there is no certainty of the date of effective placement, the commissions are recognized in the period of the commitment that originates it on a linear basis. |
NOTES TO THE INTERIM CONSOLIDATED FINANCIAL STATEMENTS, continued
| 2. | Main Accounting Criteria Used, continued: |
The fees registered as income by the Bank correspond mainly to:
| − | Commissions for credit prepayment: These commissions are accrued at the time the credits are prepaid. |
| − | Commissions for lines of credit and overdrafts: These commissions are accrued in the period related to the granting of lines of credit and overdrafts in checking accounts. |
| − | Commissions for warranty by endorsement and letters of credit: These commissions are accrued in the period related to the granting by the bank of payment guarantees for real or contingent obligations of third parties. |
| − | Commissions for card services: Correspond to commissions accrued for the period, related to the use of credit cards, debit cards and other. |
| − | Commissions for account management: Includes commissions that accrue in the period related to the maintenance of current accounts and other deposit accounts. |
| − | Commissions for collections and payments: Includes commissions generated by the collection and payment services provided by the Bank. |
| − | Commissions for intermediation and management of securities: correspond to income from brokerage service, placements, administration and custody of securities. |
| − | Remuneration for administration of mutual funds, investment funds or others: corresponds to the commissions from the General Fund Administrator for the administration of third-party funds. |
| − | Remuneration for brokerage and insurance consulting services: Income from brokerage and insurance advice by the Bank or its subsidiaries is included. |
| − | Commissions for factoring operations services: Commissions for factoring operations services performed by the Bank are included. |
| − | Commissions for financial consulting services: commissions for financial advisory services performed by the Bank and its subsidiary are included. |
| − | Other commissions earned: includes income generated from foreign currency exchange, issuance bank guarantees, issuance of bank check, use of distribution channels, agreement on the use of a brand and placement of financial products and cash transfers, and recognition of payments associated with commercial alliances, among others. |
Commission expenses include:
| − | Commissions for card operations: commissions paid for credit and debit card operations are included. |
| − | Commissions for licensing the use of card brands. |
| − | Expenses for obligations of loyalty and merits programs for card customers. |
| − | Commissions for operations with securities: commissions for deposit and custody of securities and brokerage of securities are included. |
| − | Other commissions for services received: Commissions are included for guarantees and endorsements of Bank obligations, for foreign trade operations, for correspondent banks in the country and abroad, for ATMs and electronic fund transfer services. |
| − | Commissions for compensation of large value payments: corresponds to commissions paid to entities such as ComBanc, CCLV Contraparte Central, etc. |
NOTES TO THE INTERIM CONSOLIDATED FINANCIAL STATEMENTS, continued
| 2. | Main Accounting Criteria Used, continued: |
| (z) | Impairment of non-financial assets: |
The carrying amounts of the non-financial assets of the Bank and its subsidiaries, are reviewed throughout the year and especially at each reporting date, to determine if any indication of impairment exists. If such indication exists, the recoverable amount of the asset is then estimated.
| (aa) | Financial and operating leases: |
| − | The Bank acting as lessor |
Assets leased to customers under agreements which transfer substantially all the risks and rewards of ownership, with or without ultimate legal title, are classified as finance leases. When assets held are subject to a finance lease, the leased assets are derecognized and a receivable is recognized which is equal to the present value of the minimum lease payments, discounted at the interest rate implicit in the lease. Initial direct costs incurred in negotiating, and arranging a finance lease are incorporated into the receivable through the discount rate applied to the lease. Finance lease income is recognized over the lease term based on a pattern reflecting a constant periodic rate of return on the net investment in the finance lease.
Assets leased to customers under agreements, which do not transfer substantially all the risks, and rewards of ownership are classified as operating leases.
The leased investment properties, under the operating lease modality, are included in the Consolidated Statement of Financial Position as “Other assets” and depreciation is determined on the book value of these assets, applying a proportion of the value in a systematic way on the economic use of the estimated useful life. Lease income is recognized on a straight-line basis over the lease term.
| − | The Bank acting as lessee |
A contract is, or contains a lease, if one party has the right to control the use of an identified asset for a period of time in exchange for a regular payment (Note No. 17).
On the start date of a lease, a right-to-use assets leased is determined at cost, which includes the amount of the initial measurement of the lease liability plus other disbursements made.
The amount of the lease liability is measured at the present value of future lease payments that have not been paid on that date, which are discounted using the Bank’s incremental financing interest rate.
The right-of-use asset is measured using the cost model, less accumulated depreciation and accumulated losses due to impairment of value, depreciation of the right-of-use asset, is recognized in the Consolidated Statements of Income based on the linear depreciation method from the start date and until the end of the lease term.
NOTES TO THE INTERIM CONSOLIDATED FINANCIAL STATEMENTS, continued
| 2. | Main Accounting Criteria Used, continued: |
The monthly variation of the UF for the contracts established in said monetary unit should be treated as a new measurement, therefore the UF readjustment modifies the value of the lease liability, and in parallel, the amount of the right-of-use asset must be adjusted by this effect.
After the start date, the lease liability is measured by lowering the carrying amount to reflect the lease payments made and the modifications to the lease.
According to IFRS 16 “Leases” the Bank does not apply this rule to contracts whose duration is 12 months or less and those that contain an underlying asset of low value. In these cases, payments are recognized as a lease expense.
| (ab) | Additional provisions: |
In accordance to the CMF regulations, the banks have recorded additional allowances for its individually evaluated loan portfolio, taking into consideration the expected impairment of this portfolio. The calculation of this allowance is performed based on the Bank’s historical experience and considering possible future adverse macroeconomic conditions or circumstances that could affect a specific sector.
The provisions made in order to forestall the risk of macroeconomic fluctuations should anticipate situations reversal of expansionary economic cycles in the future, could translate into a worsening in the conditions of the economic environment and thus, function as a countercyclical mechanism accumulation of additional provisions when the scenario is favorable and release or assignment to specific provisions when environmental conditions deteriorate.
According to the above, additional provisions must always correspond to general provisions on commercial, consumer or mortgage loans, or segments identified, and in no case may be used to offset weaknesses of the models used by the Bank (Note No. 26).
As of March 31, 2025, the balance of additional provisions amounts to Ch$631,217 million (Ch$700,252 million in December 2024), which are presented in the caption “Special Provisions for Credit Risk” of liabilities in the Interim Consolidated Statement of Financial Position.
| (ac) | Fair value measurement: |
“Fair value” is understood as the amount that would be received to sell an asset or paid to transfer a liability in an orderly transaction between participants in a principal (or more advantageous) market at the measurement date under current market conditions, independent whether that price is directly observable or estimated using another valuation technique. The most objective and usual reference of fair value is the price that would be paid in an active, transparent and deep market (“quoted price” or “market price”).
When available, the Bank estimates the fair value of an instrument using quoted prices in an active market for that instrument. A market is considered active if quoted prices are readily and regularly available and represent actual and regularly occurring market transactions on an arm’s length basis.
NOTES TO THE INTERIM CONSOLIDATED FINANCIAL STATEMENTS, continued
| 2. | Main Accounting Criteria Used, continued: |
If a market for a financial instrument is not active, the Bank establishes fair value using a valuation technique. These valuation techniques include the use of recent market transactions between knowledgeable, willing parties in an arm’s length transaction, if available, as well as references to the fair value of other instruments that are substantially the same, discounted cash flows and options pricing models.
The chosen valuation technique makes maximum use of information obtained in the market, using the least possible amount of data estimated by the Bank, incorporates all the factors that market participants would consider to establish the price, and will be consistent with generally accepted economic methodologies for calculating the price of financial instruments. The variables used by the valuation technique reasonably represent market expectations and reflect the return-risk factors inherent to the financial instrument. Periodically, the Bank calibrates the valuation techniques and tests it for validity using prices from observable current market transaction in the same instrument or based on available observable market information.
The best evidence of the fair value of a financial instrument at initial recognition is the transaction price (i.e. the fair value of the consideration given or received) unless the fair value of that instrument is evidenced by comparison with other observable current market transactions in the same instrument (i.e. without modification or repackaging) or based on a valuation technique whose variables include only data from observable markets. However, when transaction price provides the best evidence of fair value at initial recognition, the financial instrument is initially measured at the transaction price and any difference between this price and the value initially obtained from a valuation model is subsequently recognized in incomes.
On the other hand, it should be noted that the Bank has financial assets and liabilities offset each other’s market risks, based on which average market prices are used as a basis for determining their fair value.
Then, the fair value estimates obtained from models are adjusted for any other factors, such as liquidity risk or model uncertainties; to the extent that the Bank believes that a third-party market participant would take them into account in pricing a transaction.
The Bank’s fair value disclosures are included in Note No. 44.
NOTES TO THE INTERIM CONSOLIDATED FINANCIAL STATEMENTS, continued
| 3. | New Accounting Pronouncements Issued and Adopted, or Issued that have not yet been Adopted: |
Standards approved and/or modified by the International Accounting Standards Board (IASB) and by the Commission for the Financial Market (CMF):
Standards and interpretations that have been adopted in these Interim Consolidated Financial Statements.
As of the date of issuance of these Interim Consolidated Financial Statements, the new accounting pronouncements issued by both the IASB and the CMF, which have been adopted by the Bank and its subsidiaries, are detailed below:
- Accounting standards issued by IASB.
IAS 21 Effects of Changes in Foreign Exchange Rates.
In August 2023, the IASB published amendments to IAS 21. These amendments set out criteria that will allow companies to assess whether a currency is exchangeable and when it is not so, they can determine the exchange rate to use and the disclosures to provide.
The amendments were effective for periods beginning on or after January 1, 2025.
The implementation of this new standard had no impact on the Bank or its subsidiaries.
- Accounting standards issued by CMF.
Circular No. 2,346. Standard model of provisions for consumer loans. Modifies Chapter B-1 “Provisions for credit risk” and Chapter E “Transitional disposition” of the CNCB.
On March 6, 2024, the CMF published this circular that introduces the regulations that establish the Standardized Methodology for computing Provisions for Consumer Loans in Chapter B-1 of the CNCB.
The regulations establish matrices for determining the Probability of Default (PD) and Loss Given Default (LGD) parameters that must be used to calculate the minimum level of provisions.
The PD matrix is determined based on three factors (default in the bank, in the financial system and the possession of a mortgage loan).
Regarding the LGD, the model allows differentiation according to the type of credit (leasing or automotive, installments, cards and lines or other consumer) and also distinguishes those debtors with mortgage credit for housing in the system, allowing banks recognize a loss level adjusted to the specific characteristics of each operation.
The regulations of the standard provision model for consumer loans will come into force as of the accounting close of January 2025. Until that date, banks will continue to estimate the provisions of this portfolio only through their internal methodologies. The impact of the first application must be recorded in the entity’s income statement.
The new methodology was implemented in January 2025 and will impact on result before tax charge of approximately $69,000 millon in the year 2025.
NOTES TO THE INTERIM CONSOLIDATED FINANCIAL STATEMENTS, continued
| 3. | New Accounting Pronouncements Issued and Adopted, or Issued that have not yet been Adopted, continued: |
New Standards and interpretations that have been issued but their application date is not yet in force:
The following is a summary of new standards, interpretations and improvements to the International Financial Reporting Standards issued by the International Accounting Standards Board (IASB) and the CMF that are not yet effective as of March 31, 2025, as follows:
| - | Accounting standards issued by IASB. |
IAS 28 Investments in Associates and Joint Venture and IFRS 10 Consolidated Financial Statements.
In September 2014, the IASB published this modification, which clarifies the scope of the profits and losses recognized in a transaction, that involves an associate or joint venture, and that this depends on whether the asset sold or contribution constitutes a business. Therefore, the IASB concluded that all gains or losses must be recognized against loss of control of a business.
Likewise, the gains or losses that result from the sale or contribution of a subsidiary that does not constitute a business (definition of IFRS 3) to an associate or joint venture must be recognized only to the extent of unrelated interests in the associate or joint venture.
During December 2015, the IASB agreed to set the effective date of this modification in the future, allowing its immediate application.
Banco de Chile and its subsidiaries will have no impact on the Consolidated Financial Statements as a result of the application of this amendment.
IFRS 18 – Presentation and Disclosure in Financial Statements.
In April 2024, IASB published a new accounting standard, IFRS 18 Presentation and Disclosure in Financial Statements, replacing the IAS 1 Presentation of Financial Statements.
This new standard aims to improve the usefulness of the presented and disclosed information so that the comparability of the financial information is enhanced, complying with the qualitative characteristics defined in the conceptual framework of the International Financial Reporting Standards (IFRS).
According to the information provided by IASB, the standard introduces three new requirements:
| - | Improvement comparability of the income statement. |
| - | Higher transparency in measuring the performance defined by the management. |
| - | More useful grouping of the information in the financial statements. |
The standard will be effective for annual accounting periods beginning on or after January 1, 2027.
Due to these Interim Consolidated Financial Statements being prepared according to CMF norms defined in CNCB, the adoption of this standard is conditional to the modification of the CNCB.
NOTES TO THE INTERIM CONSOLIDATED FINANCIAL STATEMENTS, continued
| 3. | New Accounting Pronouncements Issued and Adopted, or Issued that have not yet been Adopted, continued: |
IFRS 19 – Subsidiaries without Public Accountability: Disclosures
In May 2024, the IASB published the new accounting standard IFRS 19 Subsidiaries without Public Accountability and Disclosures, which will come into effect on January 1, 2027 with earlier application permitted.
This new standard allows to save in the preparation costs of the financial statements of subsidiaries without public interest, making possible to disclose less information and adapt the financial statements to the needs of the users when certain conditions are met.
The standard establishes that a subsidiary is in the public interest if:
| - | It has debt instruments or capital that is subject to trade on a public market or if it is in the process of issuing such instruments to negotiate on a public market; or |
| - | Manages fiduciary assets for a broad group of external people as one of its principal businesses. |
A subsidiary is eligible and can apply IFRS 19 in its consolidated or individual financial statements if:
| - | It does not have public responsability; and |
| - | Its ultimate parent company or any other intermediate parent company issued consolidated financial statements that are available for public use and comply with the IFRS. |
This new standard will not have impact on the Interim Consolidated Financial Statements.
IFRS 9 and IFRS 7 Classification and Measurement of Financial Instruments
In May 2024, the IASB issued amendments to the classification and measurement requirements of IFRS 9, “Financial Instruments”, and to the disclosure requirements required by IFRS 7, “Financial Instruments: Disclosure Information” according to the following:
Derecognition of financial liabilities settled by electronic transfer.
The amendment allows an entity to consider that a financial liability (or part of it) that is settled using an electronic payment system is cancelled, expires or the liability otherwise qualifies for derecognition before the settlement date, if certain specified criteria are met. An entity that chooses to apply the deregistration option would be required to apply it to all settlements made through the same electronic payment system.
Classification of financial assets
The amendment provides guidance on how an entity can evaluate whether the contractual cash flows of a financial asset are consistent with a basic loan agreement, for classification and measurement purposes.
The amendment also improves the description of the term “non-recourse”, meaning that a financial asset has “non-recourse” characteristics if an entity’s ultimate right to receive cash flows is contractually limited to the cash flows generated by specific assets.
NOTES TO THE INTERIM CONSOLIDATED FINANCIAL STATEMENTS, continued
| 3. | New Accounting Pronouncements Issued and Adopted, or Issued that have not yet been Adopted, continued: |
Disclosures
For investments in equity financial instruments designated at fair value through other comprehensive income, an entity is required to disclose the fair value gain or loss presented in other comprehensive income during the period, separately demonstrating the fair value gain or loss that relates to investments derecognised in the period and the fair value gain or loss of the fair value that relates to the investments held at the end of the period.
Additional disclosures are required for financial assets and liabilities with contractual terms that reference a contingent event (including those that are linked to Environmental, Social and Governance factor (ESG)).
The amendments are effective for annual periods beginning on or after January 1, 2026. Early application is permitted.
The Bank is in the process of analyzing the impact of this new regulation.
Circular No. 2,347. Precisions of information requirements on subsidiaries, branches abroad and Banking Support Companies.
On April 24, 2024, the CMF published this circular that unifies and establishes in the General Background section of the MSI the instructions regarding the information requirements that banks must prepare and send to the CMF, regarding subsidiaries, branches in the abroad and Banking Support Companies (SAG), which include accounting, debtor, risk and other information.
The first shipment of the new information requirements will be from the first quarter of 2025.
As of the date of issue of these Interim Consolidated Financial Statements, the Bank implemented this information requirement.
| 4. | Accounting Changes: |
As directed by the Financial Market Commission, the Bank adopted the new standard provisioning model for consumer loans beginning in January 2025. The impact will represent a pre-tax charge of approximately Ch$69,000 million in fiscal year 2025.
During the period ended March 31, 2025, there have been no others material or relative importance changes in accounting that affect the presentation of these Interim Consolidated Financial Statements.
NOTES TO THE INTERIM CONSOLIDATED FINANCIAL STATEMENTS, continued
| 5. | Relevant Events: |
| (a) | On January 17, 2025, Banco de Chile reported that the Financial Market Commission informed the Bank that it resolved to maintain as a capital requirement for Pillar II risk, the charge already constituted corresponding to 0.13% of the risk-weighted assets net of required provisions, in accordance with article 66 quinquies of the General Banking Law. |
| (b) | On January 23, 2025, the subsidiary Banchile Corredores de Bolsa reported that the Board of Directors agreed to appoint Mr. José Antonio Díaz Orellana as General Manager of Banchile Corredores de Bolsa S.A., who until that date served as Interim General Manager. |
| (c) | On February 11, 2025, the Board of Directors of Banco de Chile agreed to convene an Ordinary Shareholders’ Meeting for March 27, 2025 in order to propose, among other matters, the following distribution of profits for the year ended on December 31, 2024: |
| a) | Deduct and withhold from the net income of the year, an amount equivalent to the effect of inflation of the paid capital and reserves according to the variation of the Consumer Price Index that occurred between November 2023 and November 2024, amounting to Ch$212,012,307,434 which will be added to retained earnings from previous periods. |
| b) | Distribute in the form of dividend the remaining profit, corresponding to a dividend of Ch$9.85357420889 to each of the 101,017,081,114 shares of the Bank. |
Consequently, it will be proposed a distribution as dividend of 82.4% of the profits for the year ended December 31, 2024.
| (d) | During the period 2025 Banco de Chile has reported as essential fact the following placements in the local market of senior, dematerialized and bearer bonds issued by Banco de Chile and registered in the Securities Registry of the Financial Market Commission: |
| Date | Registration number in the Securities Registry |
Serie | Amount | Currency | Maturity date |
Average rate | ||||||||||
| March 17, 2025 | 11/2022 | FC | 600,000 | UF | 01/01/2030 | 2.97 | % | |||||||||
| March 20, 2025 | 11/2022 | FC | 300,000 | UF | 01/01/2030 | 2.97 | % | |||||||||
| March 21, 2025 | 11/2022 | FC | 1,050,000 | UF | 01/01/2030 | 2.97 | % | |||||||||
NOTES TO THE INTERIM CONSOLIDATED FINANCIAL STATEMENTS, continued
| 6. | Business Segments: |
For management purposes, the Bank is organized into four segments, which are defined based on the types of products and services offered, and the type of client in which focuses as described below:
| Retail: | This segment focuses on individuals and small and medium-sized companies (SMEs) with annual sales up to UF 70,000, where the product offering focuses primarily on consumer loans, commercial loans, checking accounts, credit cards, credit lines and Residential mortgage loans. |
| Wholesale: | This segment focused on corporate clients and large companies, whose annual revenue exceed UF 70,000, where the product offering focuses primarily on commercial loans, checking accounts and liquidity management services, debt instruments, foreign trade, derivative contracts and leases. |
| Treasury: | This segment includes the associated revenues to the management of the investment portfolio and the business of financial transactions and currency trading. |
Transactions with customers carried out by the Treasury are reflected in the respective aforementioned segments. These products are highly transaction-focused and include foreign exchange transactions, derivatives and financial instruments in general, among others.
| Subsidiaries: | Corresponds to the businesses generated by the companies controlled by the Bank, which carry out activities complementary to the bank business. The companies that comprise this segment are: |
| - | Banchile Administradora General de Fondos S.A. |
| - | Banchile Asesoría Financiera S.A. |
| - | Banchile Corredores de Seguros Ltda. |
| - | Banchile Corredores de Bolsa S.A. |
| - | Socofin S.A. (*) |
| - | Operadora de Tarjetas B-Pago S.A. |
| (*) | See Note No. 49 letter (b) on Subsequent Events. |
NOTES TO THE INTERIM CONSOLIDATED FINANCIAL STATEMENTS, continued
| 6. | Business Segments, continued: |
The financial information used to measure the performance of the Bank’s business segments is not comparable with similar information from other financial institutions because each institution relies on its own definitions. The accounting policies applied to the segments is the same as those described in the summary of accounting principles. The Bank obtains the majority of the results from: interest, indexation and commissions and financial operations and changes, discounting provisions for credit risk and operating expenses. Management is mainly based on these concepts to evaluate the performance of the segments and make decisions about the goals and allocations of resources of each unit. Although the results of the segments reconcile with those of the Bank at the total level, this is not necessarily the case in terms of the different concepts, given that management is measured and controlled individually and not on a consolidated basis, applying the following criteria:
| ● | The net interest margin of loans and deposits is obtained aggregating the net financial margins of each individual operation of credit and uptake made by the bank. For these purposes, the volume of each operation and its contribution margin are considered, which in turn corresponds to the difference between the effective rate of the customer and the internal transfer price established according to the term and currency of each operation. Additionally, the net margin includes the result of interest and indexation from the accounting hedges. |
| ● | Provisions for credit risk are determined at the customer and counterparty level based on the characteristics of each of their operations. In the case of additional provisions, these are assigned to the different business segments based on the credit risk weighted assets that each segment has. |
| ● | The capital and its financial impacts on outcome have been assigned to each segment based on the risk-weighted assets. |
| ● | Operational expenses are reflected at the level of the different functional areas of the Bank. The allocation of expenses from functional areas to business segments is done using different allocation criteria, at the level of the different concepts and expense items. |
Taxes are managed at a corporate level and are not allocated to business segments.
For the periods ended March 31, 2025 and 2024 there was no income from transactions with a customer or counterparty that accounted for 10% or more of the Bank’s total revenues.
NOTES TO THE INTERIM CONSOLIDATED FINANCIAL STATEMENTS, continued
| 6. | Business Segments, continued: |
The following table presents the income by segment for the periods ended between January 1, and March 31, 2025 and 2024 for each of the segments defined above:
| Retail | Wholesale | Treasury | Subsidiaries | Subtotal |
Consolidation adjustment |
Total | ||||||||||||||||||||||||||||||||||||||||||||||||||
| March | March | March | March | March | March | March | March | March | March | March | March | March | March | |||||||||||||||||||||||||||||||||||||||||||
| 2025 | 2024 | 2025 | 2024 | 2025 | 2024 | 2025 | 2024 | 2025 | 2024 | 2025 | 2024 | 2025 | 2024 | |||||||||||||||||||||||||||||||||||||||||||
| MCh$ | MCh$ | MCh$ | MCh$ | MCh$ | MCh$ | MCh$ | MCh$ | MCh$ | MCh$ | MCh$ | MCh$ | MCh$ | MCh$ | |||||||||||||||||||||||||||||||||||||||||||
| Net interest revenue (expense) and UF indexation | 384,756 | 388,284 | 181,526 | 199,289 | (20,415 | ) | (55,139 | ) | (746 | ) | (2,675 | ) | 545,121 | 529,759 | 550 | 575 | 545,671 | 530,334 | ||||||||||||||||||||||||||||||||||||||
| Net commissions revenue (expense) | 91,051 | 76,600 | 23,522 | 23,846 | 694 | 662 | 50,745 | 45,181 | 166,012 | 146,289 | (9,163 | ) | (8,817 | ) | 156,849 | 137,472 | ||||||||||||||||||||||||||||||||||||||||
| Profit (loss) of financial operations | 98 | 81 | 4,591 | 3,267 | 30,926 | (14,745 | ) | 8,094 | 10,268 | 43,709 | (1,129 | ) | (550 | ) | (575 | ) | 43,159 | (1,704 | ) | |||||||||||||||||||||||||||||||||||||
| Foreign currency changes, indexation and accounting hedge | 599 | 7,534 | 7,894 | 7,605 | 2,269 | 83,989 | 6,721 | 7,319 | 17,483 | 106,447 | — | — | 17,483 | 106,447 | ||||||||||||||||||||||||||||||||||||||||||
| Other income | 12,127 | 7,535 | 4,180 | 1,749 | — | — | 723 | 975 | 17,030 | 10,259 | (2,710 | ) | (2,680 | ) | 14,320 | 7,579 | ||||||||||||||||||||||||||||||||||||||||
| Income attributable to investments in other companies | 1,309 | (466 | ) | 328 | 583 | 58 | 66 | 39 | 35 | 1,734 | 218 | — | — | 1,734 | 218 | |||||||||||||||||||||||||||||||||||||||||
| Total operating revenue | 489,940 | 479,568 | 222,041 | 236,339 | 13,532 | 14,833 | 65,576 | 61,103 | 791,089 | 791,843 | (11,873 | ) | (11,497 | ) | 779,216 | 780,346 | ||||||||||||||||||||||||||||||||||||||||
| Expenses from salaries and employee benefits | (91,063 | ) | (91,564 | ) | (27,647 | ) | (26,963 | ) | (1,128 | ) | (1,074 | ) | (21,083 | ) | (21,814 | ) | (140,921 | ) | (141,415 | ) | 5 | 5 | (140,916 | ) | (141,410 | ) | ||||||||||||||||||||||||||||||
| Administrative expenses | (87,053 | ) | (88,593 | ) | (19,773 | ) | (19,772 | ) | (590 | ) | (519 | ) | (11,276 | ) | (11,607 | ) | (118,692 | ) | (120,491 | ) | 11,596 | 11,268 | (107,096 | ) | (109,223 | ) | ||||||||||||||||||||||||||||||
| Depreciation and amortization | (19,486 | ) | (19,368 | ) | (2,146 | ) | (1,995 | ) | (191 | ) | (196 | ) | (1,824 | ) | (1,843 | ) | (23,647 | ) | (23,402 | ) | — | — | (23,647 | ) | (23,402 | ) | ||||||||||||||||||||||||||||||
| Impairment of non-financial assets | (5 | ) | — | — | — | — | — | (4 | ) | (94 | ) | (9 | ) | (94 | ) | — | — | (9 | ) | (94 | ) | |||||||||||||||||||||||||||||||||||
| Other operating expenses | (7,132 | ) | (7,582 | ) | (2,102 | ) | (1,992 | ) | (11 | ) | (15 | ) | (397 | ) | (350 | ) | (9,642 | ) | (9,939 | ) | 272 | 224 | (9,370 | ) | (9,715 | ) | ||||||||||||||||||||||||||||||
| Total operating expenses | (204,739 | ) | (207,107 | ) | (51,668 | ) | (50,722 | ) | (1,920 | ) | (1,804 | ) | (34,584 | ) | (35,708 | ) | (292,911 | ) | (295,341 | ) | 11,873 | 11,497 | (281,038 | ) | (283,844 | ) | ||||||||||||||||||||||||||||||
| Expenses for credit losses | (82,177 | ) | (93,132 | ) | (7,970 | ) | (18,551 | ) | (57 | ) | (1,485 | ) | — | — | (90,204 | ) | (113,168 | ) | — | — | (90,204 | ) | (113,168 | ) | ||||||||||||||||||||||||||||||||
| Income from operations | 203,024 | 179,329 | 162,403 | 167,066 | 11,555 | 11,544 | 30,992 | 25,395 | 407,974 | 383,334 | — | — | 407,974 | 383,334 | ||||||||||||||||||||||||||||||||||||||||||
| Income taxes | (79,030 | ) | (85,679 | ) | ||||||||||||||||||||||||||||||||||||||||||||||||||||
| Income after income taxes | 328,944 | 297,655 | ||||||||||||||||||||||||||||||||||||||||||||||||||||||
The following table presents assets and liabilities of the periods ended March 31, 2025 and December 31, 2024 by each segment defined above:
| Retail | Wholesale | Treasury | Subsidiaries | Subtotal |
Consolidation adjustment |
Total | ||||||||||||||||||||||||||||||||||||||||||||||||||
| March | December | March | December | March | December | March | December | March | December | March | December | March | December | |||||||||||||||||||||||||||||||||||||||||||
| 2025 | 2024 | 2025 | 2024 | 2025 | 2024 | 2025 | 2024 | 2025 | 2024 | 2025 | 2024 | 2025 | 2024 | |||||||||||||||||||||||||||||||||||||||||||
| MCh$ | MCh$ | MCh$ | MCh$ | MCh$ | MCh$ | MCh$ | MCh$ | MCh$ | MCh$ | MCh$ | MCh$ | MCh$ | MCh$ | |||||||||||||||||||||||||||||||||||||||||||
| Assets | 25,082,720 | 24,832,432 | 13,418,177 | 13,259,610 | 13,684,486 | 12,589,488 | 1,109,611 | 924,392 | 53,294,994 | 51,605,922 | (227,043 | ) | (227,179 | ) | 53,067,951 | 51,378,743 | ||||||||||||||||||||||||||||||||||||||||
| Current and deferred taxes | 701,953 | 716,698 | ||||||||||||||||||||||||||||||||||||||||||||||||||||||
| Total assets | 53,769,904 | 52,095,441 | ||||||||||||||||||||||||||||||||||||||||||||||||||||||
| Liabilities | 17,979,919 | 18,015,015 | 10,875,380 | 10,790,972 | 18,836,648 | 17,198,350 | 906,480 | 694,984 | 48,598,427 | 46,699,321 | (227,043 | ) | (227,179 | ) | 48,371,384 | 46,472,142 | ||||||||||||||||||||||||||||||||||||||||
| Current and deferred taxes | 3,160 | 298 | ||||||||||||||||||||||||||||||||||||||||||||||||||||||
| Total liabilities | 48,374,544 | 46,472,440 | ||||||||||||||||||||||||||||||||||||||||||||||||||||||
NOTES TO THE INTERIM CONSOLIDATED FINANCIAL STATEMENTS, continued
| 7. | Cash and Cash Equivalents: |
The detail of the balances included under cash and cash equivalents as follows:
| March | December | |||||||
| 2025 | 2024 | |||||||
| MCh$ | MCh$ | |||||||
| Cash and due from banks: | ||||||||
| Cash | 889,904 | 879,130 | ||||||
| Deposit in Chilean Central Bank (*) | 315,366 | 1,036,476 | ||||||
| Deposit in abroad Central Bank | — | — | ||||||
| Deposits in domestic banks | 15,194 | 12,767 | ||||||
| Deposits in abroad banks | 1,110,743 | 770,703 | ||||||
| Subtotal – Cash and due from banks | 2,331,207 | 2,699,076 | ||||||
| Net transactions in the course of settlement (**) | (177,857 | ) | 88,851 | |||||
| Others cash equivalents (***) | 2,779,617 | 1,701,659 | ||||||
| Total cash and cash equivalents | 4,932,967 | 4,489,586 | ||||||
The detail of the balances included under net ongoing clearance operations is as follows:
| March | December | |||||||
| 2025 | 2024 | |||||||
| MCh$ | MCh$ | |||||||
| Assets | ||||||||
| Documents drawn on other banks (clearing) | 85,403 | 109,635 | ||||||
| Funds receivable | 271,334 | 262,821 | ||||||
| Subtotal - assets | 356,737 | 372,456 | ||||||
| Liabilities | ||||||||
| Funds payable | (534,594 | ) | (283,605 | ) | ||||
| Subtotal - liabilities | (534,594 | ) | (283,605 | ) | ||||
| Net transactions in the course of settlement | (177,857 | ) | 88,851 | |||||
| (*) | The level of funds in cash and in the Central Bank of Chile responds to regulations on reserve requirements that the bank must maintain on average in monthly periods. |
| (**) | Ongoing clearance operations correspond to transactions in which only the settlement remains that will increase or decrease the funds in the Central Bank of Chile or in foreign banks, normally within 12 or 24 business hours. |
| (***) | Refers to financial instruments that meet the criteria to be considered as “cash equivalents” as defined by IAS 7, i.e., to qualify as “cash equivalents” investments in debt financial instruments must be: short-term with an original maturity of 90 days or less from the date of acquisition, highly liquid, readily convertible to known amounts of cash from the date of initial investment, and that the financial instruments are exposed to an insignificant risk of changes in their value. |
NOTES TO THE INTERIM CONSOLIDATED FINANCIAL STATEMENTS, continued
| 8. | Financial Assets Held for Trading at Fair Value through Profit or Loss: |
The item detail is as follows:
| March | December | |||||||
| 2025 | 2024 | |||||||
| MCh$ | MCh$ | |||||||
| Financial derivative contracts | 2,044,549 | 2,303,353 | ||||||
| Debt Financial Instruments | 2,750,521 | 1,714,381 | ||||||
| Other financial instruments | 332,337 | 411,689 | ||||||
| Total | 5,127,407 | 4,429,423 | ||||||
| (a) | The Bank as of March 31, 2025 and December 31, 2024, maintains the following asset portfolio of derivative instruments: |
| Notional amount of contract with final expiration date in | ||||||||||||||||||||||||||||||||||||||||||||||||||||||||||||||||||||||||
| Demand | Up to 1 month | Over 1 month and up to 3 months |
Over 3 months and up to 12 months |
Over 1 year and up to 3 years |
Over 3 year and up to 5 years |
Over 5 years | Total |
Fair Value Assets |
||||||||||||||||||||||||||||||||||||||||||||||||||||||||||||||||
| March | December | March | December | March | December | March | December | March | December | March | December | March | December | March | December | March | December | |||||||||||||||||||||||||||||||||||||||||||||||||||||||
| 2025 | 2024 | 2025 | 2024 | 2025 | 2024 | 2025 | 2024 | 2025 | 2024 | 2025 | 2024 | 2025 | 2024 | 2025 | 2024 | 2025 | 2024 | |||||||||||||||||||||||||||||||||||||||||||||||||||||||
| MCh$ | MCh$ | MCh$ | MCh$ | MCh$ | MCh$ | MCh$ | MCh$ | MCh$ | MCh$ | MCh$ | MCh$ | MCh$ | MCh$ | MCh$ | MCh$ | MCh$ | MCh$ | |||||||||||||||||||||||||||||||||||||||||||||||||||||||
| Currency forward | — | — | 4,963,352 | 3,289,559 | 1,510,820 | 1,712,274 | 4,221,778 | 2,589,278 | 499,008 | 916,016 | 30,689 | 26,575 | — | 4,442 | 11,225,647 | 8,538,144 | 240,533 | 227,670 | ||||||||||||||||||||||||||||||||||||||||||||||||||||||
| Interest rate swap | — | — | 598,990 | 376,933 | 1,778,316 | 2,249,606 | 6,092,564 | 5,133,205 | 7,778,828 | 7,253,517 | 4,259,103 | 4,172,518 | 4,178,427 | 4,250,312 | 24,686,228 | 23,436,091 | 593,420 | 732,395 | ||||||||||||||||||||||||||||||||||||||||||||||||||||||
| Interest rate and cross currency swap | — | — | 225,283 | 107,571 | 623,992 | 249,871 | 1,776,997 | 2,198,760 | 2,120,309 | 2,164,528 | 1,537,302 | 1,449,064 | 2,729,616 | 2,686,049 | 9,013,499 | 8,855,843 | 1,206,803 | 1,338,086 | ||||||||||||||||||||||||||||||||||||||||||||||||||||||
| Call currency options | — | — | 24,429 | 11,551 | 37,867 | 42,692 | 47,696 | 57,908 | 7,028 | 11,340 | — | — | — | — | 117,020 | 123,491 | 2,655 | 4,949 | ||||||||||||||||||||||||||||||||||||||||||||||||||||||
| Put currency options | — | — | 23,480 | 10,208 | 22,789 | 16,989 | 19,135 | 23,301 | — | — | — | — | — | — | 65,404 | 50,498 | 1,138 | 253 | ||||||||||||||||||||||||||||||||||||||||||||||||||||||
| Total | — | — | 5,835,534 | 3,795,822 | 3,973,784 | 4,271,432 | 12,158,170 | 10,002,452 | 10,405,173 | 10,345,401 | 5,827,094 | 5,648,157 | 6,908,043 | 6,940,803 | 45,107,798 | 41,004,067 | 2,044,549 | 2,303,353 | ||||||||||||||||||||||||||||||||||||||||||||||||||||||
NOTES TO THE INTERIM CONSOLIDATED FINANCIAL STATEMENTS, continued
| 8. | Financial Assets Held for Trading at Fair Value through Profit or Loss, continued: |
| b) | The detail of the Debt Financial Instruments is the following: |
| March | December | |||||||
| 2025 | 2024 | |||||||
| MCh$ | MCh$ | |||||||
| Instruments issued by the Chilean Government and Central Bank of Chile | ||||||||
| Debt financial instruments from the Central Bank of Chile | 2,365,167 | 1,217,317 | ||||||
| Bonds and Promissory notes from the General Treasury of the Republic | 229,763 | 278,140 | ||||||
| Other fiscal debt financial instruments | — | — | ||||||
| Other Instruments Issued in Chile | ||||||||
| Debt financial instruments from other domestic banks | 155,591 | 217,948 | ||||||
| Bonds and trade effects from domestic companies | — | — | ||||||
| Other debt financial instruments issued in the country | — | — | ||||||
| Instruments Issued Abroad | ||||||||
| Financial instruments from foreign governments or Central Banks | — | 976 | ||||||
| Financial debt instruments from foreign goverments and fiscal entities | — | — | ||||||
| Debt financial instruments from other foreign banks | — | — | ||||||
| Bonds and trade effects from foreign companies | — | — | ||||||
| Total | 2,750,521 | 1,714,381 | ||||||
Under instruments of the State and Central Bank of Chile are classified instruments sold under repurchase agreements to clients and financial institutions, by an amount of Ch$6,932 million as of March 31, 2025 (Ch$10,038 million as of December 31, 2024). The repurchase agreements have an average maturity of 1 day as of March 31, 2025 (2 days in December 2024).
Instruments sold under repurchase agreements to clients and financial institutions include other debt financial instruments issued in the country, by an amount of Ch$119,133 million as of March 31, 2025 (Ch$89,223 million in December 2024). The repurchase agreements have an average maturity of 20 days at the end of the period 2025 (7 days in December 2024).
Additionally, the Bank has investments in own-issued letters of credit for an amount equivalent to Ch$819 million as of March 31, 2025 (Ch$998 million in December 2024), which are presented as a reduction of the liability item “Debt Financial Instruments Issued”.
NOTES TO THE INTERIM CONSOLIDATED FINANCIAL STATEMENTS, continued
| 8. | Financial Assets Held for Trading at Fair Value through Profit or Loss, continued: |
| c) | The detail of other financial instruments is as follows: |
| March | December | |||||||
| 2025 | 2024 | |||||||
| MCh$ | MCh$ | |||||||
| Mutual fund investments | ||||||||
| Funds managed by related companies | 322,111 | 408,121 | ||||||
| Funds managed by third-parties | — | — | ||||||
| Equity instruments | ||||||||
| Domestic equity instruments | 2,569 | 1,039 | ||||||
| Foreign equity instruments | 4,821 | — | ||||||
| Loans originated and acquired by the entity | — | — | ||||||
| Others | 2,836 | 2,529 | ||||||
| Total | 332,337 | 411,689 | ||||||
| 9. | Non-trading Financial Assets mandatorily measured at Fair Value through Profit or Loss: |
As of March 31, 2025 and December 31, 2024, the Bank does not hold any non-trading financial assets mandatorily measured at fair value through profit or loss.
| 10. | Financial Assets and Liabilities designated as at Fair Value through Profit or Loss: |
As of March 31, 2025 and December 31, 2024, the Bank does not hold financial assets and liabilities designated as at fair value through profit or loss.
NOTES TO THE INTERIM CONSOLIDATED FINANCIAL STATEMENTS, continued
| 11. | Financial Assets at Fair Value through Other Comprehensive Income: |
The item detail is as follows:
| March | December | |||||||
| 2025 | 2024 | |||||||
| MCh$ | MCh$ | |||||||
| Debt Financial Instruments | 1,947,733 | 2,088,345 | ||||||
| Other financial instruments | — | — | ||||||
| Total | 1,947,733 | 2,088,345 | ||||||
| (a) | As of March 31, 2025 and December 31, 2024, the detail of debt financial instruments is as follows: |
| March | December | |||||||
| 2025 | 2024 | |||||||
| MCh$ | MCh$ | |||||||
| Instruments issued by the Chilean Government and Central Bank of Chile | ||||||||
| Debt financial instruments from the Central Bank of Chile | — | — | ||||||
| Bonds and Promissory notes from the General Treasury of the Republic | 633,381 | 660,321 | ||||||
| Other fiscal debt financial instruments | 325 | 456 | ||||||
| Other Instruments Issued in Chile | ||||||||
| Debt financial instruments from other domestic banks | 1,162,383 | 1,321,030 | ||||||
| Bonds and trade effects from domestic companies | 64,964 | 54,600 | ||||||
| Other debt financial instruments issued in the country | — | — | ||||||
| Instruments Issued Abroad | ||||||||
| Financial instruments from foreign Central Banks | — | — | ||||||
| Financial instruments from foreign governments and fiscal entities | 75,940 | 48,883 | ||||||
| Debt financial instruments from other foreign banks | 9,792 | — | ||||||
| Bonds and trade effects from foreign companies | 948 | 3,055 | ||||||
| Other debt financial instruments issued abroad | — | — | ||||||
| Total | 1,947,733 | 2,088,345 | ||||||
Instruments of the Government and the Central Bank of Chile include instruments sold under repurchase agreements to clients and financial institutions for an amount of Ch$6,600 million in March 2025 (Ch$10,001 million in December 2024). The repurchase agreements have an average maturity of 1 day in March 2025 (2 days in December 2024).
Under the same item, instruments that guarantee margins for cleared derivatives transactions are classified through Comder Contraparte Central S.A. for an amount of Ch$36,792 million as of March 31, 2025 (Ch$22,719 million as of December 31, 2024).
NOTES TO THE INTERIM CONSOLIDATED FINANCIAL STATEMENTS, continued
| 11. | Financial Assets at Fair Value through Other Comprehensive Income, continued: |
As of March 31, 2025 the accumulated credit impairment for debt instruments at fair value through other comprehensive income was Ch$4,042 million (Ch$4,226 million as of December 31, 2024).
| (b) | The analysis of changes in fair value and expected losses of debt instruments measured at fair value is as follows: |
| Phase 1 Individual | Phase 2 Individual | Phase 3 Individual | Total | |||||||||||||||||||||||||||||
| Fair value | Impairment | Fair value | Impairment | Fair value | Impairment | Fair value | Impairment | |||||||||||||||||||||||||
| MCh$ | MCh$ | MCh$ | MCh$ | MCh$ | MCh$ | MCh$ | MCh$ | |||||||||||||||||||||||||
| Balance as of January 1, 2024 | 3,786,525 | 5,500 | — | — | — | — | 3,786,525 | 5,500 | ||||||||||||||||||||||||
| Net change in balance | (1,694,790 | ) | (1,274 | ) | — | — | — | — | (1,694,790 | ) | (1,274 | ) | ||||||||||||||||||||
| Change in fair value | (3,390 | ) | — | — | — | — | — | (3,390 | ) | — | ||||||||||||||||||||||
| Transfer to Phase 1 | — | — | — | — | — | — | — | — | ||||||||||||||||||||||||
| Transfer to Phase 2 | — | — | — | — | — | — | — | — | ||||||||||||||||||||||||
| Transfer to Phase 3 | — | — | — | — | — | — | — | — | ||||||||||||||||||||||||
| Impact due to transfer between phases | — | — | — | — | — | — | — | — | ||||||||||||||||||||||||
| Net impact due to impairment | — | — | — | — | — | — | — | — | ||||||||||||||||||||||||
| Balance as of December 31, 2024 | 2,088,345 | 4,226 | — | — | — | — | 2,088,345 | 4,226 | ||||||||||||||||||||||||
| Balance as of January 1, 2025 | 2,088,345 | 4,226 | — | — | — | — | 2,088,345 | 4,226 | ||||||||||||||||||||||||
| Net change in balance | (143,099 | ) | (184 | ) | — | — | — | — | (143,099 | ) | (184 | ) | ||||||||||||||||||||
| Change in fair value | 2,487 | — | — | — | — | — | 2,487 | — | ||||||||||||||||||||||||
| Transfer to Phase 1 | — | — | — | — | — | — | — | — | ||||||||||||||||||||||||
| Transfer to Phase 2 | — | — | — | — | — | — | — | — | ||||||||||||||||||||||||
| Transfer to Phase 3 | — | — | — | — | — | — | — | — | ||||||||||||||||||||||||
| Impact due to transfer between phases | — | — | — | — | — | — | — | — | ||||||||||||||||||||||||
| Net impact due to impairment | — | — | — | — | — | — | — | — | ||||||||||||||||||||||||
| Balance as of March 31, 2025 | 1,947,733 | 4,042 | — | — | — | — | 1,947,733 | 4,042 | ||||||||||||||||||||||||
| (c) | Realized and unrealized gains and losses: |
As of March 31, 2025, the portfolio of debt financial instruments includes an accumulated unrealized gain of Ch$6,781 million (unrealized gain of Ch$4,478 million as of December 31, 2024), recorded as an equity valuation adjustment.
Gross realized gains and losses on the sale of debt financial instruments, as of March 31, 2025 and 2024 are reported under “Net Financial income (expense)” (See Note No. 33).
The changes in realized gains and losses at the end of both periods are the following:
| March | March | |||||||
| 2025 | 2024 | |||||||
| MCh$ | MCh$ | |||||||
| Unrealized gains (losses) | 3,316 | 8,979 | ||||||
| Realized losses (gains) reclassified to income | (1,013 | ) | (2,539 | ) | ||||
| Subtotal | 2,303 | 6,440 | ||||||
| Income tax on other comprehensive income | (250 | ) | (2,429 | ) | ||||
| Net effect in equity | 2,053 | 4,011 | ||||||
NOTES TO THE INTERIM CONSOLIDATED FINANCIAL STATEMENTS, continued
| 12. | Derivative Financial Instruments for hedging purposes: |
| (a.1) | As of March 31, 2025 and December 31, 2024, the Bank has the following asset portfolio of financial derivative instruments for accounting hedging purposes: |
| Notional amount of contract with final expiration date in | ||||||||||||||||||||||||||||||||||||||||||||||||||||||||||||||||||||||||
| Demand | Up to 1 month | Over 1 month and up to 3 months |
Over 3 months and up to 12 months |
Over 1 year and up to 3 years |
Over 3 year and up to 5 years |
Over 5 years | Total | Fair
value Assets |
||||||||||||||||||||||||||||||||||||||||||||||||||||||||||||||||
| March | December | March | December | March | December | March | December | March | December | March | December | March | December | March | December | March | December | |||||||||||||||||||||||||||||||||||||||||||||||||||||||
| 2025 | 2024 | 2025 | 2024 | 2025 | 2024 | 2025 | 2024 | 2025 | 2024 | 2025 | 2024 | 2025 | 2024 | 2025 | 2024 | 2025 | 2024 | |||||||||||||||||||||||||||||||||||||||||||||||||||||||
| MCh$ | MCh$ | MCh$ | MCh$ | MCh$ | MCh$ | MCh$ | MCh$ | MCh$ | MCh$ | MCh$ | MCh$ | MCh$ | MCh$ | MCh$ | MCh$ | MCh$ | MCh$ | |||||||||||||||||||||||||||||||||||||||||||||||||||||||
| Derivatives held for fair value hedges | — | — | — | — | — | — | — | — | — | — | — | — | — | — | — | — | — | — | ||||||||||||||||||||||||||||||||||||||||||||||||||||||
| Cash flow hedge derivatives | ||||||||||||||||||||||||||||||||||||||||||||||||||||||||||||||||||||||||
| Interest rate swap and cross currency swap | — | — | — | — | — | — | 47,303 | 131,987 | 135,286 | 274,935 | 123,566 | 122,041 | 150,362 | 306,460 | 456,517 | 835,423 | 47,108 | 73,959 | ||||||||||||||||||||||||||||||||||||||||||||||||||||||
| Total | — | — | — | — | — | — | 47,303 | 131,987 | 135,286 | 274,935 | 123,566 | 122,041 | 150,362 | 306,460 | 456,517 | 835,423 | 47,108 | 73,959 | ||||||||||||||||||||||||||||||||||||||||||||||||||||||
| (a.2) | As of March 31, 2025 and December 31, 2024, the Bank has the following debt portfolio of financial derivative instruments for accounting hedging purposes: |
| Notional amount of contract with final expiration date in | ||||||||||||||||||||||||||||||||||||||||||||||||||||||||||||||||||||||||
| Demand | Up to 1 month | Over 1 month and up to 3 months |
Over 3 months and up to 12 months |
Over 1 year and up to 3 years |
Over 3 year and up to 5 years |
Over 5 years | Total | Fair value Liabilities | ||||||||||||||||||||||||||||||||||||||||||||||||||||||||||||||||
| March | December | March | December | March | December | March | December | March | December | March | December | March | December | March | December | March | December | |||||||||||||||||||||||||||||||||||||||||||||||||||||||
| 2025 | 2024 | 2025 | 2024 | 2025 | 2024 | 2025 | 2024 | 2025 | 2024 | 2025 | 2024 | 2025 | 2024 | 2025 | 2024 | 2025 | 2024 | |||||||||||||||||||||||||||||||||||||||||||||||||||||||
| MCh$ | MCh$ | MCh$ | MCh$ | MCh$ | MCh$ | MCh$ | MCh$ | MCh$ | MCh$ | MCh$ | MCh$ | MCh$ | MCh$ | MCh$ | MCh$ | MCh$ | MCh$ | |||||||||||||||||||||||||||||||||||||||||||||||||||||||
| Derivatives held for fair value hedges | — | — | — | — | — | — | — | — | — | — | — | — | — | — | — | — | — | — | ||||||||||||||||||||||||||||||||||||||||||||||||||||||
| Cash flow hedge derivatives | ||||||||||||||||||||||||||||||||||||||||||||||||||||||||||||||||||||||||
| Interest rate swap and cross currency swap | — | — | — | — | 38,662 | — | 184,161 | 134,806 | 177,568 | 34,060 | 133,917 | 132,265 | 1,046,482 | 875,618 | 1,580,790 | 1,176,749 | 200,844 | 141,040 | ||||||||||||||||||||||||||||||||||||||||||||||||||||||
| Total | — | — | — | — | 38,662 | — | 184,161 | 134,806 | 177,568 | 34,060 | 133,917 | 132,265 | 1,046,482 | 875,618 | 1,580,790 | 1,176,749 | 200,844 | 141,040 | ||||||||||||||||||||||||||||||||||||||||||||||||||||||
NOTES TO THE INTERIM CONSOLIDATED FINANCIAL STATEMENTS, continued
| 12. | Derivative Financial Instruments for hedging purposes, continued: |
| (b) | Fair value Hedges: |
As of March 31, 2025 and December 31, 2024, no fair value hedges are held.
| (c) | Cash flow Hedges: |
| (c.1) | The Bank uses cross currency swaps to hedge the risk from variability of cash flows attributable to changes in the interest rates and foreign exchange of foreign banks obligations and bonds issued abroad in US Dollars, Hong Kong dollars, Swiss Franc, Japanese Yens, Peruvian Sol, Australian Dollars, Euros, Norwegian kroner and Mexican peso. The cash flows of the cross currency swaps equal the cash flows of the hedged items, which modify uncertain cash flows to known cash flows derived from a fixed interest rate. |
Additionally, these cross currency swap contracts are used to hedge the risk from variability of the Unidad de Fomento (“CLF”) in assets flows denominated in CLF until a nominal amount equal to the portion notional of the hedging instrument CLF, whose readjustment impact the item “Interest Revenue” of the Income Financial Statements.
NOTES TO THE INTERIM CONSOLIDATED FINANCIAL STATEMENTS, continued
| 12. | Derivative Financial Instruments for hedging purposes, continued: |
| (c) | Cash flow Hedges, continued: |
| (c.2) | Below are the cash flows from bonds issued abroad objects of this hedge and the cash flows of the asset part of the derivative instrument: |
| Demand | Up to 1 month | Over
1 month and up to 3 months |
Over
3 months and up to 12 months |
Over
1 year and up to 3 years |
Over
3 years and up to 5 years |
Over 5 years | Total | |||||||||||||||||||||||||||||||||||||||||||||||||||||||||
| March | December | March | December | March | December | March | December | March | December | March | December | March | December | March | December | |||||||||||||||||||||||||||||||||||||||||||||||||
| 2025 | 2024 | 2025 | 2024 | 2025 | 2024 | 2025 | 2024 | 2025 | 2024 | 2025 | 2024 | 2025 | 2024 | 2025 | 2024 | |||||||||||||||||||||||||||||||||||||||||||||||||
| MCh$ | MCh$ | MCh$ | MCh$ | MCh$ | MCh$ | MCh$ | MCh$ | MCh$ | MCh$ | MCh$ | MCh$ | MCh$ | MCh$ | MCh$ | MCh$ | |||||||||||||||||||||||||||||||||||||||||||||||||
| Hedge element | ||||||||||||||||||||||||||||||||||||||||||||||||||||||||||||||||
| Outflows: | ||||||||||||||||||||||||||||||||||||||||||||||||||||||||||||||||
| Corporate Bond | — | — | (1,972 | ) | (472 | ) | (48,354 | ) | (7,576 | ) | (166,788 | ) | (213,764 | ) | (430,138 | ) | (444,033 | ) | (350,227 | ) | (357,141 | ) | (1,253,842 | ) | (1,297,164 | ) | (2,251,321 | ) | (2,320,150 | ) | ||||||||||||||||||||||||||||||||||
| Obligation USD | — | — | (2,508 | ) | — | — | — | (97,828 | ) | (104,466 | ) | — | — | — | — | — | — | (100,336 | ) | (104,466 | ) | |||||||||||||||||||||||||||||||||||||||||||
| Hedge instrument | ||||||||||||||||||||||||||||||||||||||||||||||||||||||||||||||||
| Inflows: | ||||||||||||||||||||||||||||||||||||||||||||||||||||||||||||||||
| Cross Currency Swap | — | — | 4,480 | 472 | 48,354 | 7,576 | 264,616 | 318,230 | 430,138 | 444,033 | 350,227 | 357,141 | 1,253,842 | 1,297,164 | 2,351,657 | 2,424,616 | ||||||||||||||||||||||||||||||||||||||||||||||||
| Net cash flows | — | — | — | — | — | — | — | — | — | — | — | — | — | — | — | — | ||||||||||||||||||||||||||||||||||||||||||||||||
| (c.3) | Below are the cash flows from underlying assets and the cash flows of the liability part of the derivative instrument: |
| Demand | Up to 1 month | Over 1 month and up to 3 months |
Over 3 months and up to 12 months |
Over 1
year and up to 3 years |
Over 3
years and up to 5 years |
Over 5 years | Total | |||||||||||||||||||||||||||||||||||||||||||||||||||||||||
| March | December | March | December | March | December | March | December | March | December | March | December | March | December | March | December | |||||||||||||||||||||||||||||||||||||||||||||||||
| 2025 | 2024 | 2025 | 2024 | 2025 | 2024 | 2025 | 2024 | 2025 | 2024 | 2025 | 2024 | 2025 | 2024 | 2025 | 2024 | |||||||||||||||||||||||||||||||||||||||||||||||||
| MCh$ | MCh$ | MCh$ | MCh$ | MCh$ | MCh$ | MCh$ | MCh$ | MCh$ | MCh$ | MCh$ | MCh$ | MCh$ | MCh$ | MCh$ | MCh$ | |||||||||||||||||||||||||||||||||||||||||||||||||
| Hedge element | ||||||||||||||||||||||||||||||||||||||||||||||||||||||||||||||||
| Inflows: | ||||||||||||||||||||||||||||||||||||||||||||||||||||||||||||||||
| Cash flows in CLF | — | — | 2,794 | 1,588 | 49,720 | 2,804 | 262,244 | 306,543 | 380,819 | 377,477 | 308,569 | 304,794 | 1,293,281 | 1,280,412 | 2,297,427 | 2,273,618 | ||||||||||||||||||||||||||||||||||||||||||||||||
| Hedge instrument | ||||||||||||||||||||||||||||||||||||||||||||||||||||||||||||||||
| Outflows: | ||||||||||||||||||||||||||||||||||||||||||||||||||||||||||||||||
| Cross Currency Swap | — | — | (2,794 | ) | (1,588 | ) | (49,720 | ) | (2,804 | ) | (262,244 | ) | (306,543 | ) | (380,819 | ) | (377,477 | ) | (308,569 | ) | (304,794 | ) | (1,293,281 | ) | (1,280,412 | ) | (2,297,427 | ) | (2,273,618 | ) | ||||||||||||||||||||||||||||||||||
| Net cash flows | — | — | — | — | — | — | — | — | — | — | — | — | — | — | — | — | ||||||||||||||||||||||||||||||||||||||||||||||||
NOTES TO THE INTERIM CONSOLIDATED FINANCIAL STATEMENTS, continued
| 12. | Derivative Financial Instruments for hedging purposes, continued: |
| (c) | Cash flow Hedges, continued: |
With respect to UF assets hedged; these are revalued monthly according to the variation of the UF, which is equivalent to monthly reinvest the assets until maturity of the relationship hedging.
| (c.4) | The unrealized results generated during the period 2025 by those derivative contracts that conform the hedging instruments in this cash flow hedging strategy, have been recorded with charge to equity amounting to Ch$9,884 million (charge to equity of Ch$5,247 million in March 2024). The net effect of taxes charge to equity amounts to Ch$7,215 million (charge to equity of Ch$3,830 million during March 2024). |
The accumulated balance for this concept as of March 31, 2025 corresponds to a charge in equity amounted to Ch$22,281 million (charge to equity of Ch$12,397 million as of December 2024).
| (c.5) | The effect of the cash flow hedging derivatives that offset the result of the hedged instruments corresponds to a charge to income of Ch$72,074 million during the period 2025 (credit to results for Ch$169,104 million during March 2024). |
| (c.6) | As of March 31, 2025 and 2024, there is not any inefficiency in the cash flow hedge, because both, hedged item and hedge instruments, are mirrors of each other, it means that all variation of value attributable to rate and revaluation components are netted totally. |
| (c.7) | As of March 31, 2025 and 2024, the Bank does not have hedges of net investments in foreign business. |
| 13. | Financial assets at amortized cost: |
The item detail is as follows:
| March | December | |||||||
| 2025 | 2024 | |||||||
| MCh$ | MCh$ | |||||||
| Rights from resale agreements and securities lending | 99,283 | 87,291 | ||||||
| Debt financial instruments | 929,266 | 944,074 | ||||||
| Loans and advances to Banks | 1,699,865 | 666,815 | ||||||
| Loans to customers: | ||||||||
| Commercial loans | 20,272,606 | 20,105,228 | ||||||
| Residential mortgage loans | 13,499,416 | 13,218,586 | ||||||
| Consumer loans | 5,548,313 | 5,551,306 | ||||||
| Provisions established for credit risk (*) | ||||||||
| Commercial loans provisions | (383,163 | ) | (380,295 | ) | ||||
| Mortgage loans provisions | (39,804 | ) | (38,400 | ) | ||||
| Consumer loans provisions | (399,366 | ) | (367,389 | ) | ||||
| Total | 41,226,416 | 39,787,216 | ||||||
| (*) | In addition to these provisions for credit risk, country risk provisions are maintained to cover foreign operations and additional provisions agreed by the Board of Directors, which are presented in liabilities under the item Special provisions for credit risk (See Note No. 26). |
NOTES TO THE INTERIM CONSOLIDATED FINANCIAL STATEMENTS, continued
| 13. | Financial assets at amortized cost, continued: |
| (a) | Rights from resale agreements and securities lending: |
The Bank provides financing to its customers through resale agreements and securities lending, in which the financial instrument serves as collateral. As of March 31, 2025 and December 31, 2024, the detail is as follows:
| March | December | |||||||
| 2025 | 2024 | |||||||
| MCh$ | MCh$ | |||||||
| Transaction with domestic banks | — | — | ||||||
| Transaction with foreign banks | — | — | ||||||
| Transaction with other domestic entities | ||||||||
| Resale agreements | 99,283 | 87,291 | ||||||
| Rights from securities lending | — | — | ||||||
| Transaction with other foreign entities | — | — | ||||||
| Accumulated Impairment Value of Financial Assets at Amortized Cost - Rights from resale agreements and securities lending | — | — | ||||||
| Total | 99,283 | 87,291 | ||||||
The Bank and its subsidiaries have received financial instruments that they can sell or give as collateral in case the owner of these instruments enters into default or in bankruptcy. As of March 31, 2025, the fair value of the instruments received amounts to Ch$102,326 million (Ch$87,157 million in December 2024).
| (b) | Debt financial instruments: |
At the end of each period, the balances presented under this item are as follows:
| March | December | |||||||
| 2025 | 2024 | |||||||
| MCh$ | MCh$ | |||||||
| Instruments issued by the Chilean Government and Central Bank of Chile | ||||||||
| Debt financial instruments from the Central Bank of Chile | — | — | ||||||
| Bonds and promissory notes from the General Treasury of the Republic | 929,301 | 944,109 | ||||||
| Other fiscal debt financial instruments | — | — | ||||||
| Other Finacial Instruments issued in Chile | — | — | ||||||
| Financial Instruments issued Abroad | — | — | ||||||
| Accumulated Impairment Value of Financial Assets at Amortized Cost Debt Financial Instruments | ||||||||
| Financial assets with no significant increase in credit risk since initial recognition (phase 1) | (35 | ) | (35 | ) | ||||
| Financial assets with a significant increase in credit risk since initial recognition, but without credit impairment (phase 2) | — | — | ||||||
| Financial assets with credit impairment (phase 3) | — | — | ||||||
| Total | 929,266 | 944,074 | ||||||
NOTES TO THE INTERIM CONSOLIDATED FINANCIAL STATEMENTS, continued
| 13. | Financial assets at amortized cost, continued: |
| (c) | Loans and advances to Banks: At the end of each period, the balances presented under this item are as follows: |
| Assets before allowances | Allowances established | |||||||||||||||||||||||||||||||||||
| Normal Portfolio | Substandard Portfolio | Non-Complying Portfolio | Normal Portfolio | Substandard Portfolio | Non-Complying Portfolio | Net | ||||||||||||||||||||||||||||||
| As of March 31, 2025 | Individual Evaluation | Individual Evaluation | Individual Evaluation | Total | Individual Evaluation | Individual Evaluation | Individual Evaluation | Total | Financial Asset |
|||||||||||||||||||||||||||
| MCh$ | MCh$ | MCh$ | MCh$ | MCh$ | MCh$ | MCh$ | MCh$ | MCh$ | ||||||||||||||||||||||||||||
| Domestic Banks | ||||||||||||||||||||||||||||||||||||
| Interbank loans of liquidity | 200,000 | — | — | 200,000 | (72 | ) | — | — | (72 | ) | 199,928 | |||||||||||||||||||||||||
| Interbank loans commercial | — | — | — | — | — | — | — | — | — | |||||||||||||||||||||||||||
| Current accounts overdrafts | — | — | — | — | — | — | — | — | — | |||||||||||||||||||||||||||
| Chilean exports foreign trade loans | — | — | — | — | — | — | — | — | — | |||||||||||||||||||||||||||
| Chilean imports foreign trade loans | — | — | — | — | — | — | — | — | — | |||||||||||||||||||||||||||
| Credits with third countries | — | — | — | — | — | — | — | — | — | |||||||||||||||||||||||||||
| Non-transferable deposits in domestic banks | — | — | — | — | — | — | — | — | — | |||||||||||||||||||||||||||
| Other debts with domestic banks | — | — | — | — | — | — | — | — | — | |||||||||||||||||||||||||||
| Foreign Banks | ||||||||||||||||||||||||||||||||||||
| Interbank loans of liquidity | — | — | — | — | — | — | — | — | — | |||||||||||||||||||||||||||
| Interbank loans commercial | 262,217 | — | — | 262,217 | (574 | ) | — | — | (574 | ) | 261,643 | |||||||||||||||||||||||||
| Current accounts overdrafts | — | — | — | — | — | — | — | — | — | |||||||||||||||||||||||||||
| Chilean exports foreign trade loans | 138,548 | — | — | 138,548 | (254 | ) | — | — | (254 | ) | 138,294 | |||||||||||||||||||||||||
| Chilean imports foreign trade loans | — | — | — | — | — | — | — | — | — | |||||||||||||||||||||||||||
| Credits with third countries | — | — | — | — | — | — | — | — | — | |||||||||||||||||||||||||||
| Current account deposits with foreign banks for derivatives transactions | — | — | — | — | — | — | — | — | — | |||||||||||||||||||||||||||
| Other non-transferable deposits with foreign banks | — | — | — | — | — | — | — | — | — | |||||||||||||||||||||||||||
| Other debts with foreign banks | — | — | — | — | — | — | — | — | — | |||||||||||||||||||||||||||
| Subtotal Domestic Bank and Foreign | 600,765 | — | — | 600,765 | (900 | ) | — | — | (900 | ) | 599,865 | |||||||||||||||||||||||||
| Central Bank of Chile | ||||||||||||||||||||||||||||||||||||
| Current account deposits for derivative transactions with a central counterparty | — | — | — | — | — | — | — | — | — | |||||||||||||||||||||||||||
| Other deposits not available | 1,100,000 | — | — | 1,100,000 | — | — | — | — | 1,100,000 | |||||||||||||||||||||||||||
| Other receivables | — | — | — | — | — | — | — | — | — | |||||||||||||||||||||||||||
| Foreign Central Banks | ||||||||||||||||||||||||||||||||||||
| Current account deposits foreign for derivatives transactions | — | — | — | — | — | — | — | — | — | |||||||||||||||||||||||||||
| Other foreign deposits not available | — | — | — | — | — | — | — | — | — | |||||||||||||||||||||||||||
| Other foreign receivables | — | — | — | — | — | — | — | — | — | |||||||||||||||||||||||||||
| Subtotal Central Bank of Chile and Foreign Central Banks | 1,100,000 | — | — | 1,100,000 | — | — | — | — | 1,100,000 | |||||||||||||||||||||||||||
| Total | 1,700,765 | — | — | 1,700,765 | (900 | ) | — | — | (900 | ) | 1,699,865 | |||||||||||||||||||||||||
NOTES TO THE INTERIM CONSOLIDATED FINANCIAL STATEMENTS, continued
| 13. | Financial assets at amortized cost, continued: |
| (c) | Loans and advances to Banks, continued: |
| Assets before allowances | Allowances established | |||||||||||||||||||||||||||||||||||
| Normal Portfolio | Substandard Portfolio | Non-Complying Portfolio | Normal Portfolio | Substandard Portfolio | Non-Complying Portfolio | Net | ||||||||||||||||||||||||||||||
| As of December 31, 2024 | Individual Evaluation | Individual Evaluation | Individual Evaluation | Total | Individual Evaluation | Individual Evaluation | Individual Evaluation | Total | Financial Asset |
|||||||||||||||||||||||||||
| MCh$ | MCh$ | MCh$ | MCh$ | MCh$ | MCh$ | MCh$ | MCh$ | MCh$ | ||||||||||||||||||||||||||||
| Domestic Banks | ||||||||||||||||||||||||||||||||||||
| Interbank loans of liquidity | 300,042 | — | — | 300,042 | (154 | ) | — | — | (154 | ) | 299,888 | |||||||||||||||||||||||||
| Interbank loans commercial | — | — | — | — | — | — | — | — | — | |||||||||||||||||||||||||||
| Current accounts overdrafts | — | — | — | — | — | — | — | — | — | |||||||||||||||||||||||||||
| Chilean exports foreign trade loans | — | — | — | — | — | — | — | — | — | |||||||||||||||||||||||||||
| Chilean imports foreign trade loans | — | — | — | — | — | — | — | — | — | |||||||||||||||||||||||||||
| Credits with third countries | — | — | — | — | — | — | — | — | — | |||||||||||||||||||||||||||
| Non-transferable deposits in domestic banks | — | — | — | — | — | — | — | — | — | |||||||||||||||||||||||||||
| Other debts with foreign banks | — | — | — | — | — | — | — | — | — | |||||||||||||||||||||||||||
| Foreign Banks | ||||||||||||||||||||||||||||||||||||
| Interbank loans of liquidity | — | — | — | — | — | — | — | — | — | |||||||||||||||||||||||||||
| Interbank loans commercial | 269,191 | — | — | 269,191 | (589 | ) | — | — | (589 | ) | 268,602 | |||||||||||||||||||||||||
| Current accounts overdrafts | — | — | — | — | — | — | — | — | — | |||||||||||||||||||||||||||
| Chilean exports foreign trade loans | 98,470 | — | — | 98,470 | (145 | ) | — | — | (145 | ) | 98,325 | |||||||||||||||||||||||||
| Chilean imports foreign trade loans | — | — | — | — | — | — | — | — | — | |||||||||||||||||||||||||||
| Credits with third countries | — | — | — | — | — | — | — | — | — | |||||||||||||||||||||||||||
| Current account deposits with foreign banks for derivatives transactions | — | — | — | — | — | — | — | — | — | |||||||||||||||||||||||||||
| Other non-transferable deposits with foreign banks | — | — | — | — | — | — | — | — | — | |||||||||||||||||||||||||||
| Other debts with foreign banks | — | — | — | — | — | — | — | — | — | |||||||||||||||||||||||||||
| Subtotal Domestic Bank and Foreign | 667,703 | — | — | 667,703 | (888 | ) | — | — | (888 | ) | 666,815 | |||||||||||||||||||||||||
| Central Bank of Chile | ||||||||||||||||||||||||||||||||||||
| Current account deposits for derivative transactions with a central counterparty | — | — | — | — | — | — | — | — | — | |||||||||||||||||||||||||||
| Other deposits not available | — | — | — | — | — | — | — | — | — | |||||||||||||||||||||||||||
| Other receivables | — | — | — | — | — | — | — | — | — | |||||||||||||||||||||||||||
| Foreign Central Banks | ||||||||||||||||||||||||||||||||||||
| Current account deposits foreign for derivatives transactions | — | — | — | — | — | — | — | — | — | |||||||||||||||||||||||||||
| Other foreign deposits not available | — | — | — | — | — | — | — | — | — | |||||||||||||||||||||||||||
| Other foreign receivables | — | — | — | — | — | — | — | — | — | |||||||||||||||||||||||||||
| Subtotal Central Bank of Chile and Foreign Central Banks | — | — | — | — | — | — | — | — | — | |||||||||||||||||||||||||||
| Total | 667,703 | — | — | 667,703 | (888 | ) | — | — | (888 | ) | 666,815 | |||||||||||||||||||||||||
NOTES TO THE INTERIM CONSOLIDATED FINANCIAL STATEMENTS, continued
| 13. | Financial assets at amortized cost, continued: |
| (d) | Loans to Customers: At the end of each period, the balances presented under this item are as follows: |
| Asstets before allowances | Allowances established | |||||||||||||||||||||||||||||||||||||||||||||||||||||||||||
| Loans to Customers | Normal Portfolio Evaluation |
Substandard Portfolio Evaluation |
Non-Complying Portfolio Evaluation |
Normal Portfolio Evaluation |
Substandard Portfolio Evaluation |
Non-Complying Portfolio Evaluation |
Deductible Warranties Fogape |
Net Financial | ||||||||||||||||||||||||||||||||||||||||||||||||||||
| As of March 31, 2025 | Individual | Group | Individual | Individual | Group | Total | Individual | Group | Individual | Individual | Group | Sub Total | Covid-19 | Total | Asset | |||||||||||||||||||||||||||||||||||||||||||||
| MCh$ | MCh$ | MCh$ | MCh$ | MCh$ | MCh$ | MCh$ | MCh$ | MCh$ | MCh$ | MCh$ | MCh$ | MCh$ | MCh$ | MCh$ | ||||||||||||||||||||||||||||||||||||||||||||||
| Commercial loans | ||||||||||||||||||||||||||||||||||||||||||||||||||||||||||||
| Commercial loans | 10,884,272 | 3,841,271 | 184,179 | 213,657 | 353,102 | 15,476,481 | (97,549 | ) | (26,641 | ) | (2,207 | ) | (58,647 | ) | (75,922 | ) | (260,966 | ) | (2,568 | ) | (263,534 | ) | 15,212,947 | |||||||||||||||||||||||||||||||||||||
| Chilean exports foreign trade loans | 1,185,909 | 3,243 | 9,365 | 9,348 | 244 | 1,208,109 | (26,923 | ) | (77 | ) | (736 | ) | (1,519 | ) | (132 | ) | (29,387 | ) | — | (29,387 | ) | 1,178,722 | ||||||||||||||||||||||||||||||||||||||
| Accrediting foreign trade loans negotiated in terms of Chilean imports | 261 | — | — | — | — | 261 | (23 | ) | — | — | — | — | (23 | ) | — | (23 | ) | 238 | ||||||||||||||||||||||||||||||||||||||||||
| Chilean imports foreign trade loans | 473,797 | 43,832 | 6,755 | 3,118 | 2,558 | 530,060 | (20,086 | ) | (1,188 | ) | (1,097 | ) | (2,252 | ) | (1,431 | ) | (26,054 | ) | — | (26,054 | ) | 504,006 | ||||||||||||||||||||||||||||||||||||||
| Foreign trade credits for operations with to third countries | — | — | — | — | — | — | — | — | — | — | — | — | — | — | — | |||||||||||||||||||||||||||||||||||||||||||||
| Current account debtors | 82,719 | 88,920 | 5,095 | 4,094 | 2,098 | 182,926 | (2,643 | ) | (2,128 | ) | (576 | ) | (2,055 | ) | (987 | ) | (8,389 | ) | — | (8,389 | ) | 174,537 | ||||||||||||||||||||||||||||||||||||||
| Credit card debtors | 27,715 | 85,454 | 1,061 | 1,377 | 11,536 | 127,143 | (1,155 | ) | (2,825 | ) | (157 | ) | (823 | ) | (6,305 | ) | (11,265 | ) | — | (11,265 | ) | 115,878 | ||||||||||||||||||||||||||||||||||||||
| Factoring transactions | 627,434 | 35,809 | 7,301 | 98 | 46 | 670,688 | (12,644 | ) | (771 | ) | (581 | ) | (4 | ) | (17 | ) | (14,017 | ) | — | (14,017 | ) | 656,671 | ||||||||||||||||||||||||||||||||||||||
| Commercial lease transactions (1) | 1,630,611 | 293,701 | 31,540 | 37,849 | 14,199 | 2,007,900 | (3,558 | ) | (1,749 | ) | (121 | ) | (10,541 | ) | (2,848 | ) | (18,817 | ) | (397 | ) | (19,214 | ) | 1,988,686 | |||||||||||||||||||||||||||||||||||||
| Student loans | — | 48,097 | — | — | 3,230 | 51,327 | — | (2,142 | ) | — | — | (2,260 | ) | (4,402 | ) | — | (4,402 | ) | 46,925 | |||||||||||||||||||||||||||||||||||||||||
| Other loans and accounts receivable | 8,169 | 936 | 121 | 7,514 | 971 | 17,711 | (252 | ) | (4 | ) | (18 | ) | (6,177 | ) | (427 | ) | (6,878 | ) | — | (6,878 | ) | 10,833 | ||||||||||||||||||||||||||||||||||||||
| Subtotal | 14,920,887 | 4,441,263 | 245,417 | 277,055 | 387,984 | 20,272,606 | (164,833 | ) | (37,525 | ) | (5,493 | ) | (82,018 | ) | (90,329 | ) | (380,198 | ) | (2,965 | ) | (383,163 | ) | 19,889,443 | |||||||||||||||||||||||||||||||||||||
| Residential mortgage loans | ||||||||||||||||||||||||||||||||||||||||||||||||||||||||||||
| Loans with letters of credit for mortgage | — | 1,138 | — | — | 117 | 1,255 | — | (3 | ) | — | — | (6 | ) | (9 | ) | — | (9 | ) | 1,246 | |||||||||||||||||||||||||||||||||||||||||
| Endorsable mortgage loans | — | 10,148 | — | — | 445 | 10,593 | — | (8 | ) | — | — | (38 | ) | (46 | ) | — | (46 | ) | 10,547 | |||||||||||||||||||||||||||||||||||||||||
| Loans with mutual funds financed by mortgage bonds | — | — | — | — | — | — | — | — | — | — | — | — | — | — | — | |||||||||||||||||||||||||||||||||||||||||||||
| Other residential lending | — | 12,973,790 | — | — | 349,493 | 13,323,283 | — | (16,053 | ) | — | — | (22,517 | ) | (38,570 | ) | — | (38,570 | ) | 13,284,713 | |||||||||||||||||||||||||||||||||||||||||
| Residential lease transactions (1) | — | — | — | — | — | — | — | — | — | — | — | — | — | — | — | |||||||||||||||||||||||||||||||||||||||||||||
| Other loans and accounts receivable | — | 153,897 | — | — | 10,388 | 164,285 | — | (221 | ) | — | — | (958 | ) | (1,179 | ) | — | (1,179 | ) | 163,106 | |||||||||||||||||||||||||||||||||||||||||
| Subtotal | — | 13,138,973 | — | — | 360,443 | 13,499,416 | — | (16,285 | ) | — | — | (23,519 | ) | (39,804 | ) | — | (39,804 | ) | 13,459,612 | |||||||||||||||||||||||||||||||||||||||||
| Consumer loans | ||||||||||||||||||||||||||||||||||||||||||||||||||||||||||||
| Consumer loans in installments | — | 3,032,074 | — | — | 231,545 | 3,263,619 | — | (141,748 | ) | — | — | (127,259 | ) | (269,007 | ) | — | (269,007 | ) | 2,994,612 | |||||||||||||||||||||||||||||||||||||||||
| Current account debtors | — | 269,614 | — | — | 13,008 | 282,622 | — | (16,526 | ) | — | — | (7,483 | ) | (24,009 | ) | — | (24,009 | ) | 258,613 | |||||||||||||||||||||||||||||||||||||||||
| Credit card debtors | — | 1,971,857 | — | — | 28,761 | 2,000,618 | — | (89,211 | ) | — | — | (16,570 | ) | (105,781 | ) | — | (105,781 | ) | 1,894,837 | |||||||||||||||||||||||||||||||||||||||||
| Consumer lease transactions (1) | — | 425 | — | — | — | 425 | — | (6 | ) | — | — | — | (6 | ) | — | (6 | ) | 419 | ||||||||||||||||||||||||||||||||||||||||||
| Other loans and accounts receivable | — | 4 | — | — | 1,025 | 1,029 | — | (1 | ) | — | — | (562 | ) | (563 | ) | — | (563 | ) | 466 | |||||||||||||||||||||||||||||||||||||||||
| Subtotal | — | 5,273,974 | — | — | 274,339 | 5,548,313 | — | (247,492 | ) | — | — | (151,874 | ) | (399,366 | ) | — | (399,366 | ) | 5,148,947 | |||||||||||||||||||||||||||||||||||||||||
| Total | 14,920,887 | 22,854,210 | 245,417 | 277,055 | 1,022,766 | 39,320,335 | (164,833 | ) | (301,302 | ) | (5,493 | ) | (82,018 | ) | (265,722 | ) | (819,368 | ) | (2,965 | ) | (822,333 | ) | 38,498,002 | |||||||||||||||||||||||||||||||||||||
| (1) | In this item, the Bank finances its clients the acquisition of movable and immovable property through financial lease agreements. As of March 31, 2025, Ch$983,534 million correspond to finance leases on real estate assets and Ch$1,024,791 million correspond to finance leases on movable property. |
NOTES TO THE INTERIM CONSOLIDATED FINANCIAL STATEMENTS, continued
| 13. | Financial assets at amortized cost, continued: |
| (d) | Loans to Customers, continued: |
| Assets before allowances | Allowances established | |||||||||||||||||||||||||||||||||||||||||||||||||||||||||||||
| Loans to Customers | Normal
Portfolio Evaluation |
Substandard
Portfolio Evaluation |
Non-Complying Portfolio Evaluation |
Normal
Portfolio Evaluation |
Substandard Portfolio Evaluation |
Non-Complying Portfolio Evaluation |
Sub | Deductible Warranties Fogape |
Net Financial |
|||||||||||||||||||||||||||||||||||||||||||||||||||||
| As of December 31, 2024 | Individual | Group | Individual | Individual | Group | Total | Individual | Group | Individual | Individual | Group | Total | Covid-19 | Total | Asset | |||||||||||||||||||||||||||||||||||||||||||||||
| MCh$ | MCh$ | MCh$ | MCh$ | MCh$ | MCh$ | MCh$ | MCh$ | MCh$ | MCh$ | MCh$ | MCh$ | MCh$ | MCh$ | MCh$ | ||||||||||||||||||||||||||||||||||||||||||||||||
| Commercial loans | ||||||||||||||||||||||||||||||||||||||||||||||||||||||||||||||
| Commercial loans | 10,512,364 | 3,835,557 | 194,728 | 219,467 | 350,892 | 15,113,008 | (96,621 | ) | (25,815 | ) | (2,150 | ) | (62,373 | ) | (75,510 | ) | (262,469 | ) | (2,764 | ) | (265,233 | ) | 14,847,775 | |||||||||||||||||||||||||||||||||||||||
| Chilean exports foreign trade loans | 1,428,828 | 3,006 | 7,008 | 10,473 | 395 | 1,449,710 | (21,952 | ) | (79 | ) | (443 | ) | (1,783 | ) | (208 | ) | (24,465 | ) | — | (24,465 | ) | 1,425,245 | ||||||||||||||||||||||||||||||||||||||||
| Accrediting foreign trade loans negotiated in terms of Chilean imports | 162 | — | — | — | — | 162 | (15 | ) | — | — | — | — | (15 | ) | — | (15 | ) | 147 | ||||||||||||||||||||||||||||||||||||||||||||
| Chilean imports foreign trade loans | 503,824 | 46,538 | 5,694 | 3,203 | 3,038 | 562,297 | (21,019 | ) | (1,255 | ) | (799 | ) | (2,064 | ) | (1,722 | ) | (26,859 | ) | — | (26,859 | ) | 535,438 | ||||||||||||||||||||||||||||||||||||||||
| Foreign trade credits for operations with to third countries | — | — | — | — | — | — | — | — | — | — | — | — | — | — | — | |||||||||||||||||||||||||||||||||||||||||||||||
| Current account debtors | 97,422 | 87,836 | 5,269 | 4,051 | 2,241 | 196,819 | (2,672 | ) | (2,102 | ) | (497 | ) | (2,102 | ) | (1,062 | ) | (8,435 | ) | — | (8,435 | ) | 188,384 | ||||||||||||||||||||||||||||||||||||||||
| Credit card debtors | 25,500 | 84,721 | 1,120 | 1,441 | 10,968 | 123,750 | (1,061 | ) | (2,910 | ) | (157 | ) | (917 | ) | (5,999 | ) | (11,044 | ) | — | (11,044 | ) | 112,706 | ||||||||||||||||||||||||||||||||||||||||
| Factoring transactions | 555,766 | 36,830 | 4,114 | 27 | 175 | 596,912 | (10,887 | ) | (787 | ) | (292 | ) | (25 | ) | (63 | ) | (12,054 | ) | — | (12,054 | ) | 584,858 | ||||||||||||||||||||||||||||||||||||||||
| Commercial lease transactions (1) | 1,614,628 | 296,248 | 28,243 | 37,964 | 13,941 | 1,991,024 | (3,808 | ) | (2,086 | ) | (99 | ) | (10,831 | ) | (2,967 | ) | (19,791 | ) | (397 | ) | (20,188 | ) | 1,970,836 | |||||||||||||||||||||||||||||||||||||||
| Student loans | — | 48,804 | — | — | 3,476 | 52,280 | — | (2,148 | ) | — | — | (2,417 | ) | (4,565 | ) | — | (4,565 | ) | 47,715 | |||||||||||||||||||||||||||||||||||||||||||
| Other loans and accounts receivable | 8,764 | 965 | 121 | 8,141 | 1,275 | 19,266 | (300 | ) | (18 | ) | (11 | ) | (6,620 | ) | (488 | ) | (7,437 | ) | — | (7,437 | ) | 11,829 | ||||||||||||||||||||||||||||||||||||||||
| Subtotal | 14,747,258 | 4,440,505 | 246,297 | 284,767 | 386,401 | 20,105,228 | (158,335 | ) | (37,200 | ) | (4,448 | ) | (86,715 | ) | (90,436 | ) | (377,134 | ) | (3,161 | ) | (380,295 | ) | 19,724,933 | |||||||||||||||||||||||||||||||||||||||
| Residential mortgage loans | ||||||||||||||||||||||||||||||||||||||||||||||||||||||||||||||
| Loans with letters of credit for mortgage | — | 1,267 | — | — | 123 | 1,390 | — | (2 | ) | — | — | (7 | ) | (9 | ) | — | (9 | ) | 1,381 | |||||||||||||||||||||||||||||||||||||||||||
| Endorsable mortgage loans | — | 10,603 | — | — | 446 | 11,049 | — | (7 | ) | — | — | (39 | ) | (46 | ) | — | (46 | ) | 11,003 | |||||||||||||||||||||||||||||||||||||||||||
| Loans with mutual funds financed by mortgage bonds | — | — | — | — | — | — | — | — | — | — | — | — | — | — | — | |||||||||||||||||||||||||||||||||||||||||||||||
| Other residential lending | — | 12,714,211 | — | — | 327,154 | 13,041,365 | — | (15,623 | ) | — | — | (21,520 | ) | (37,143 | ) | — | (37,143 | ) | 13,004,222 | |||||||||||||||||||||||||||||||||||||||||||
| Residential lease transactions (1) | — | — | — | — | — | — | — | — | — | — | — | — | — | — | — | |||||||||||||||||||||||||||||||||||||||||||||||
| Other loans and accounts receivable | — | 154,542 | — | — | 10,240 | 164,782 | — | (227 | ) | — | — | (975 | ) | (1,202 | ) | — | (1,202 | ) | 163,580 | |||||||||||||||||||||||||||||||||||||||||||
| Subtotal | — | 12,880,623 | — | — | 337,963 | 13,218,586 | — | (15,859 | ) | — | — | (22,541 | ) | (38,400 | ) | — | (38,400 | ) | 13,180,186 | |||||||||||||||||||||||||||||||||||||||||||
| Consumer loans | ||||||||||||||||||||||||||||||||||||||||||||||||||||||||||||||
| Consumer loans in installments | — | 3,007,298 | — | — | 246,349 | 3,253,647 | — | (137,888 | ) | — | — | (142,358 | ) | (280,246 | ) | — | (280,246 | ) | 2,973,401 | |||||||||||||||||||||||||||||||||||||||||||
| Current account debtors | — | 270,268 | — | — | 13,657 | 283,925 | — | (12,566 | ) | — | — | (5,433 | ) | (17,999 | ) | — | (17,999 | ) | 265,926 | |||||||||||||||||||||||||||||||||||||||||||
| Credit card debtors | — | 1,981,073 | — | — | 30,976 | 2,012,049 | — | (49,598 | ) | — | — | (18,229 | ) | (67,827 | ) | — | (67,827 | ) | 1,944,222 | |||||||||||||||||||||||||||||||||||||||||||
| Consumer lease transactions (1) | — | 320 | — | — | — | 320 | — | (4 | ) | — | — | — | (4 | ) | — | (4 | ) | 316 | ||||||||||||||||||||||||||||||||||||||||||||
| Other loans and accounts receivable | — | 4 | — | — | 1,361 | 1,365 | — | (1 | ) | — | — | (1,312 | ) | (1,313 | ) | — | (1,313 | ) | 52 | |||||||||||||||||||||||||||||||||||||||||||
| Subtotal | — | 5,258,963 | — | — | 292,343 | 5,551,306 | — | (200,057 | ) | — | — | (167,332 | ) | (367,389 | ) | — | (367,389 | ) | 5,183,917 | |||||||||||||||||||||||||||||||||||||||||||
| Total | 14,747,258 | 22,580,091 | 246,297 | 284,767 | 1,016,707 | 38,875,120 | (158,335 | ) | (253,116 | ) | (4,448 | ) | (86,715 | ) | (280,309 | ) | (782,923 | ) | (3,161 | ) | (786,084 | ) | 38,089,036 | |||||||||||||||||||||||||||||||||||||||
| (1) | In this item, the Bank finances its clients the acquisition of movable and immovable property through financial lease agreements. As of December 31, 2024, Ch$992,848 million correspond to finance leases on real estate assets and Ch$998,496 million correspond to finance leases on movable property. |
NOTES TO THE INTERIM CONSOLIDATED FINANCIAL STATEMENTS, continued
| 13. | Financial assets at amortized cost, continued: |
| (e) | Contingent loan: At the close of each reporting period, the contingent credit risk exposure is as follows: |
| Outstanding exposure before provisions | Provisions established | Net exposure | ||||||||||||||||||||||||||||||||||||||||||||||||||
| Normal Portfolio Evaluation |
Substandard Portfolio Evaluation |
Non-Complying Portfolio Evaluation |
Normal
Portfolio Evaluation |
Substandard Portfolio Evaluation |
Non-Complying Portfolio Evaluation |
for credit risk of contingent | ||||||||||||||||||||||||||||||||||||||||||||||
| As of March 31, 2025 | Individual | Group | Individual | Individual | Group | Total | Individual | Group | Individual | Individual | Group | Total | loans | |||||||||||||||||||||||||||||||||||||||
| MCh$ | MCh$ | MCh$ | MCh$ | MCh$ | MCh$ | MCh$ | MCh$ | MCh$ | MCh$ | MCh$ | MCh$ | MCh$ | ||||||||||||||||||||||||||||||||||||||||
| Warranty by endorsement and sureties | 356,504 | 622 | 573 | — | — | 357,699 | (4,771 | ) | (6 | ) | (79 | ) | — | — | (4,856 | ) | 352,843 | |||||||||||||||||||||||||||||||||||
| Letters of credit for goods circulation operations | 455,491 | 404 | 56 | — | — | 455,951 | (1,229 | ) | (2 | ) | (2 | ) | — | — | (1,233 | ) | 454,718 | |||||||||||||||||||||||||||||||||||
| Commitments to purchase local currency debt abroad | — | — | — | — | — | — | — | — | — | — | — | — | — | |||||||||||||||||||||||||||||||||||||||
| Contingent event transactions | 2,771,921 | 63,839 | 33,064 | 21,888 | 422 | 2,891,134 | (30,470 | ) | (656 | ) | (2,810 | ) | (13,417 | ) | (169 | ) | (47,522 | ) | 2,843,612 | |||||||||||||||||||||||||||||||||
| Undrawn credit lines with immediate termination | 1,523,181 | 9,667,967 | 5,334 | 1,282 | 7,076 | 11,204,840 | (2,908 | ) | (32,138 | ) | (66 | ) | (762 | ) | (3,927 | ) | (39,801 | ) | 11,165,039 | |||||||||||||||||||||||||||||||||
| Undrawn credit lines | — | — | — | — | — | — | — | — | — | — | — | — | — | |||||||||||||||||||||||||||||||||||||||
| Other irrevocable loan commitments | 40,764 | — | — | — | — | 40,764 | (638 | ) | — | — | — | — | (638 | ) | 40,126 | |||||||||||||||||||||||||||||||||||||
| Other contingent loans | — | — | — | — | — | — | — | — | — | — | — | — | — | |||||||||||||||||||||||||||||||||||||||
| Total | 5,147,861 | 9,732,832 | 39,027 | 23,170 | 7,498 | 14,950,388 | (40,016 | ) | (32,802 | ) | (2,957 | ) | (14,179 | ) | (4,096 | ) | (94,050 | ) | 14,856,338 | |||||||||||||||||||||||||||||||||
| Outstanding exposure before provisions | Provisions established | Net exposure | ||||||||||||||||||||||||||||||||||||||||||||||||||
| Normal Portfolio Evaluation |
Substandard Portfolio Evaluation |
Non-Complying Portfolio Evaluation |
Normal
Portfolio Evaluation |
Substandard Portfolio Evaluation |
Non-Complying Portfolio Evaluation |
for credit risk of contingent | ||||||||||||||||||||||||||||||||||||||||||||||
| As of December 31, 2024 | Individual | Group | Individual | Individual | Group | Total | Individual | Group | Individual | Individual | Group | Total | loans | |||||||||||||||||||||||||||||||||||||||
| MCh$ | MCh$ | MCh$ | MCh$ | MCh$ | MCh$ | MCh$ | MCh$ | MCh$ | MCh$ | MCh$ | MCh$ | MCh$ | ||||||||||||||||||||||||||||||||||||||||
| Warranty by endorsement and sureties | 335,420 | 705 | 597 | 15 | — | 336,737 | (4,855 | ) | (8 | ) | (83 | ) | (10 | ) | — | (4,956 | ) | 331,781 | ||||||||||||||||||||||||||||||||||
| Letters of credit for goods circulation operations | 441,899 | 240 | 77 | — | — | 442,216 | (1,037 | ) | — | (2 | ) | — | — | (1,039 | ) | 441,177 | ||||||||||||||||||||||||||||||||||||
| Commitments to purchase local currency debt abroad | — | — | — | — | — | — | — | — | — | — | — | — | — | |||||||||||||||||||||||||||||||||||||||
| Contingent event transactions | 3,002,848 | 64,429 | 33,791 | 23,155 | 403 | 3,124,626 | (30,827 | ) | (669 | ) | (2,736 | ) | (13,595 | ) | (153 | ) | (47,980 | ) | 3,076,646 | |||||||||||||||||||||||||||||||||
| Undrawn credit lines with immediate termination | 1,516,269 | 9,594,526 | 5,762 | 1,333 | 7,410 | 11,125,300 | (2,916 | ) | (4,666 | ) | (73 | ) | (795 | ) | (3,539 | ) | (11,989 | ) | 11,113,311 | |||||||||||||||||||||||||||||||||
| Undrawn credit lines | — | — | — | — | — | — | — | — | — | — | — | — | — | |||||||||||||||||||||||||||||||||||||||
| Other irrevocable loan commitments | 51,889 | — | — | — | — | 51,889 | (1,573 | ) | — | — | — | — | (1,573 | ) | 50,316 | |||||||||||||||||||||||||||||||||||||
| Other contingent loans | — | — | — | — | — | — | — | — | — | — | — | — | — | |||||||||||||||||||||||||||||||||||||||
| Total | 5,348,325 | 9,659,900 | 40,227 | 24,503 | 7,813 | 15,080,768 | (41,208 | ) | (5,343 | ) | (2,894 | ) | (14,400 | ) | (3,692 | ) | (67,537 | ) | 15,013,231 | |||||||||||||||||||||||||||||||||
NOTES TO THE INTERIM CONSOLIDATED FINANCIAL STATEMENTS, continued
| 13. | Financial assets at amortized cost, continued: |
| (f) | Provisions: |
Summary of changes in due from banks provisions constituted by credit risk portfolio in the period:
| Changes in provisions constituted by portfolio in the period | ||||||||||||||||
| Individual Evaluation | ||||||||||||||||
| Normal Portfolio |
Substandard Portfolio |
Non-Complying Portfolio |
Total | |||||||||||||
| MCh$ | MCh$ | MCh$ | MCh$ | |||||||||||||
| Loans and advances to Banks | ||||||||||||||||
| Balance as of January 1, 2025 | 888 | — | — | 888 | ||||||||||||
| Allowances established/ released: | ||||||||||||||||
| Change in measurement without portfolio reclassification during the period | 7 | — | — | 7 | ||||||||||||
| Change in measurement without portfolio reclassification from the beginning to the end of the period (portfolio from (-) until (+)): | ||||||||||||||||
| Transfer from Normal individual to Substandard | — | — | — | — | ||||||||||||
| Transfer from Normal individual to Non-Complying individual | — | — | — | — | ||||||||||||
| Transfer from Substandard to Non-Complying individual | — | — | — | — | ||||||||||||
| Transfer from Substandard to Normal individual | — | — | — | — | ||||||||||||
| Transfer from Non-Complying individual to Substandard | — | — | — | — | ||||||||||||
| Transfer from Non-Complying individual to Normal individual | — | — | — | — | ||||||||||||
| New credits originated | 397 | — | — | 397 | ||||||||||||
| New credits for conversion of contingent to loan | — | — | — | — | ||||||||||||
| New credits purchased | — | — | — | — | ||||||||||||
| Sales or transfers of credits | — | — | — | — | ||||||||||||
| Payment of credit | (495 | ) | — | — | (495 | ) | ||||||||||
| Provisions for write-offs | — | — | — | — | ||||||||||||
| Recovery of written-off loans | — | — | — | — | ||||||||||||
| Foreign exchange differences | (28 | ) | — | — | (28 | ) | ||||||||||
| Other changes in allowances | 131 | — | — | 131 | ||||||||||||
| Balance as of March 31, 2025 | 900 | — | — | 900 | ||||||||||||
| Changes in provisions constituted by portfolio in the year | ||||||||||||||||
| Individual Evaluation | ||||||||||||||||
| Normal Portfolio |
Substandard Portfolio |
Non-Complying Portfolio |
Total | |||||||||||||
| MCh$ | MCh$ | MCh$ | MCh$ | |||||||||||||
| Loans and advances to Banks | ||||||||||||||||
| Balance as of January 1, 2024 | 751 | — | — | 751 | ||||||||||||
| Allowances established/ released: | ||||||||||||||||
| Change in measurement without portfolio reclassification during the year | 75 | — | — | 75 | ||||||||||||
| Change in measurement without portfolio reclassification from the beginning to the end of the year (portfolio from (-) until (+)): | ||||||||||||||||
| Transfer from Normal individual to Substandard | — | — | — | — | ||||||||||||
| Transfer from Normal individual to Non-Complying individual | — | — | — | — | ||||||||||||
| Transfer from Substandard to Non-Complying individual | — | — | — | — | ||||||||||||
| Transfer from Substandard to Normal individual | — | — | — | — | ||||||||||||
| Transfer from Non-Complying individual to Substandard | — | — | — | — | ||||||||||||
| Transfer from Non-Complying individual to Normal individual | — | — | — | — | ||||||||||||
| New credits originated | 1,606 | — | — | 1,606 | ||||||||||||
| New credits for conversion of contingent to loan | — | — | — | — | ||||||||||||
| New credits purchased | — | — | — | — | ||||||||||||
| Sales or transfers of credits | — | — | — | — | ||||||||||||
| Payment of credit | (2,540 | ) | — | — | (2,540 | ) | ||||||||||
| Provisions for write-offs | — | — | — | — | ||||||||||||
| Recovery of written-off loans | — | — | — | — | ||||||||||||
| Foreign exchange differences | 114 | — | — | 114 | ||||||||||||
| Other changes in allowances | 882 | — | — | 882 | ||||||||||||
| Balance as of December 31, 2024 | 888 | — | — | 888 | ||||||||||||
NOTES TO THE INTERIM CONSOLIDATED FINANCIAL STATEMENTS, continued
| 13. | Financial assets at amortized cost, continued: |
| (f) | Provisions, continued: |
Summary of changes in commercial loan provisions constituted by credit risk portfolio in the period:
| Changes in provisions constituted by portfolio in the period | ||||||||||||||||||||||||||||||||
| Normal Portfolio Evaluation |
Substandard Portfolio Evaluation |
Non-Complying Portfolio Evaluation |
Sub | Deductible Warranties FOGAPE |
||||||||||||||||||||||||||||
| Individual | Grupal | Individual | Individual | Grupal | total | Covid-19 | Total | |||||||||||||||||||||||||
| MCh$ | MCh$ | MCh$ | MCh$ | MCh$ | MCh$ | MCh$ | MCh$ | |||||||||||||||||||||||||
| Commercial loans | ||||||||||||||||||||||||||||||||
| Balance as of January 1, 2025 | 158,335 | 37,200 | 4,448 | 86,715 | 90,436 | 377,134 | 3,161 | 380,295 | ||||||||||||||||||||||||
| Provisions established/ released: | ||||||||||||||||||||||||||||||||
| Change in measurement without portfolio reclassification during the period | (1,498 | ) | 5,361 | 687 | 2,219 | 1,100 | 7,869 | — | 7,869 | |||||||||||||||||||||||
| Change in measurement without portfolio reclassification from the beginning to the end of the period (portfolio from (-) until (+)): | ||||||||||||||||||||||||||||||||
| Transfer from Normal individual to Substandard | (472 | ) | — | 1,032 | — | — | 560 | — | 560 | |||||||||||||||||||||||
| Transfer from Normal individual to Non-Complying individual | (51 | ) | — | — | 269 | — | 218 | — | 218 | |||||||||||||||||||||||
| Transfer from Substandard to Non-Complying individual | — | — | (514 | ) | 1,389 | — | 875 | — | 875 | |||||||||||||||||||||||
| Transfer from Substandard to Normal individual | 97 | — | (166 | ) | — | — | (69 | ) | — | (69 | ) | |||||||||||||||||||||
| Transfer from Non-Complying individual to Substandard | — | — | 1 | (4 | ) | — | (3 | ) | — | (3 | ) | |||||||||||||||||||||
| Transfer from Non-Complying individual to Normal individual | 6 | — | — | (61 | ) | — | (55 | ) | — | (55 | ) | |||||||||||||||||||||
| Transfer from Normal group to Non-Complying group | — | (3,515 | ) | — | — | 9,538 | 6,023 | — | 6,023 | |||||||||||||||||||||||
| Transfer from Non-Complying group to Normal group | — | 157 | — | — | (2,733 | ) | (2,576 | ) | — | (2,576 | ) | |||||||||||||||||||||
| Transfer from Individual (normal, substandard, non-complying) to Group (normal, non-complying) | — | — | — | — | — | — | — | — | ||||||||||||||||||||||||
| Transfer from Group (normal, non-complying) to Individual (normal, substandard, non-complying) | 183 | (161 | ) | 6 | — | — | 28 | — | 28 | |||||||||||||||||||||||
| New credits originated | 66,396 | 6,344 | 1,810 | 704 | 3,938 | 79,192 | — | 79,192 | ||||||||||||||||||||||||
| New credits for conversion of contingent to loan | 3,204 | 2,592 | 309 | 371 | 325 | 6,801 | — | 6,801 | ||||||||||||||||||||||||
| New credits purchased | — | — | — | — | — | — | — | — | ||||||||||||||||||||||||
| Sales or transfers of credits | — | — | — | — | — | — | — | — | ||||||||||||||||||||||||
| Payment of credit | (58,864 | ) | (10,458 | ) | (2,047 | ) | (4,857 | ) | (6,049 | ) | (82,275 | ) | — | (82,275 | ) | |||||||||||||||||
| Provisions for write-offs | — | — | — | (4,181 | ) | (6,142 | ) | (10,323 | ) | — | (10,323 | ) | ||||||||||||||||||||
| Recovery of written-off loans | — | 61 | — | — | — | 61 | — | 61 | ||||||||||||||||||||||||
| Changes to models and assumptions | — | — | — | — | — | — | — | — | ||||||||||||||||||||||||
| Foreign exchange differences | (2,503 | ) | (56 | ) | (73 | ) | (546 | ) | (84 | ) | (3,262 | ) | — | (3,262 | ) | |||||||||||||||||
| Other changes in allowances | — | — | — | — | — | — | (196 | ) | (196 | ) | ||||||||||||||||||||||
| Balance as of March 31, 2025 | 164,833 | 37,525 | 5,493 | 82,018 | 90,329 | 380,198 | 2,965 | 383,163 | ||||||||||||||||||||||||
NOTES TO THE INTERIM CONSOLIDATED FINANCIAL STATEMENTS, continued
| 13. | Financial assets at amortized cost, continued: |
| (f) | Provisions, continued: |
| Changes in provisions constituted by portfolio in the year | ||||||||||||||||||||||||||||||||
| Normal Portfolio Evaluation |
Substandard Portfolio Evaluation |
Non-Complying Portfolio Evaluation |
Sub | Deductible Warranties FOGAPE |
||||||||||||||||||||||||||||
| Individual | Grupal | Individual | Individual | Grupal | total | Covid-19 | Total | |||||||||||||||||||||||||
| MCh$ | MCh$ | MCh$ | MCh$ | MCh$ | MCh$ | MCh$ | MCh$ | |||||||||||||||||||||||||
| Commercial loans | ||||||||||||||||||||||||||||||||
| Balance as of January 1, 2024 | 148,685 | 36,590 | 9,317 | 74,645 | 87,837 | 357,074 | 9,131 | 366,205 | ||||||||||||||||||||||||
| Provisions established/ released: | ||||||||||||||||||||||||||||||||
| Change in measurement without portfolio reclassification during the year | 12,273 | 23,728 | 2,975 | 30,966 | 9,947 | 79,889 | — | 79,889 | ||||||||||||||||||||||||
| Change in measurement without portfolio reclassification from the beginning to the end of the year (portfolio from (-) until (+)): | ||||||||||||||||||||||||||||||||
| Transfer from Normal individual to Substandard | (2,926 | ) | — | 4,955 | — | — | 2,029 | — | 2,029 | |||||||||||||||||||||||
| Transfer from Normal individual to Non-Complying individual | (311 | ) | — | — | 2,348 | — | 2,037 | — | 2,037 | |||||||||||||||||||||||
| Transfer from Substandard to Non-Complying individual | — | — | (6,562 | ) | 17,295 | — | 10,733 | — | 10,733 | |||||||||||||||||||||||
| Transfer from Substandard to Normal individual | 438 | — | (676 | ) | — | — | (238 | ) | — | (238 | ) | |||||||||||||||||||||
| Transfer from Non-Complying individual to Substandard | — | — | 279 | (2,159 | ) | — | (1,880 | ) | — | (1,880 | ) | |||||||||||||||||||||
| Transfer from Non-Complying individual to Normal individual | 5 | — | — | (34 | ) | — | (29 | ) | — | (29 | ) | |||||||||||||||||||||
| Transfer from Normal group to Non-Complying group | — | (16,109 | ) | — | — | 43,775 | 27,666 | — | 27,666 | |||||||||||||||||||||||
| Transfer from Non-Complying group to Normal group | — | 646 | — | — | (9,551 | ) | (8,905 | ) | — | (8,905 | ) | |||||||||||||||||||||
| Transfer from Individual (normal, substandard, non-complying) to Group (normal, non-complying) | — | — | — | — | — | — | — | — | ||||||||||||||||||||||||
| Transfer from Group (normal, non-complying) to Individual (normal, substandard, non-complying) | 677 | (958 | ) | 343 | 223 | (146 | ) | 139 | — | 139 | ||||||||||||||||||||||
| New credits originated | 225,544 | 24,756 | 5,359 | 19,371 | 16,253 | 291,283 | — | 291,283 | ||||||||||||||||||||||||
| New credits for conversion of contingent to loan | 13,527 | 9,197 | 1,178 | 2,067 | 1,090 | 27,059 | — | 27,059 | ||||||||||||||||||||||||
| New credits purchased | — | — | — | — | — | — | — | — | ||||||||||||||||||||||||
| Sales or transfers of credits | (46 | ) | (163 | ) | — | (240 | ) | — | (449 | ) | — | (449 | ) | |||||||||||||||||||
| Payment of credit | (247,038 | ) | (40,754 | ) | (12,902 | ) | (34,187 | ) | (30,359 | ) | (365,240 | ) | — | (365,240 | ) | |||||||||||||||||
| Provisions for write-offs | — | — | — | (25,666 | ) | (28,663 | ) | (54,329 | ) | — | (54,329 | ) | ||||||||||||||||||||
| Recovery of written-off loans | — | 87 | — | — | — | 87 | — | 87 | ||||||||||||||||||||||||
| Changes to models and assumptions | — | — | — | — | — | — | — | — | ||||||||||||||||||||||||
| Foreign exchange differences | 7,507 | 180 | 182 | 2,086 | 253 | 10,208 | — | 10,208 | ||||||||||||||||||||||||
| Other changes in allowances | — | — | — | — | — | — | (5,970 | ) | (5,970 | ) | ||||||||||||||||||||||
| Balance as of December 31, 2024 | 158,335 | 37,200 | 4,448 | 86,715 | 90,436 | 377,134 | 3,161 | 380,295 | ||||||||||||||||||||||||
NOTES TO THE INTERIM CONSOLIDATED FINANCIAL STATEMENTS, continued
| 13. | Financial assets at amortized cost, continued: |
| (f) | Provisions, continued: |
Summary of changes in residential mortgage loan provisions constituted by credit risk portfolio in the period:
| Changes in provisions constituted by portfolio in the period | ||||||||||||
| Group Evaluation | ||||||||||||
| Normal Portfolio |
Non-Complying Portfolio |
Total | ||||||||||
| MCh$ | MCh$ | MCh$ | ||||||||||
| Residential mortgage loans | ||||||||||||
| Balance as of January 1, 2025 | 15,859 | 22,541 | 38,400 | |||||||||
| Allowances established/ released: | ||||||||||||
| Change in measurement without portfolio reclassification during the period | 1,350 | 213 | 1,563 | |||||||||
| Change in measurement without portfolio reclassification from the beginning to the end of the period (portfolio from (-) until (+)): | ||||||||||||
| Transfer from Normal group to Non-Complying group | (1,214 | ) | 2,713 | 1,499 | ||||||||
| Transfer from Non-Complying group to Normal group | 128 | (541 | ) | (413 | ) | |||||||
| New credits originated | 364 | 10 | 374 | |||||||||
| New credits purchased | — | — | — | |||||||||
| Sales or transfers of credits | — | — | — | |||||||||
| Payment of credit | (202 | ) | (1,246 | ) | (1,448 | ) | ||||||
| Provisions for write-offs | — | (171 | ) | (171 | ) | |||||||
| Recovery of written-off loans | — | — | — | |||||||||
| Changes to models and assumptions | — | — | — | |||||||||
| Foreign exchange differences | — | — | — | |||||||||
| Other changes in allowances | — | — | — | |||||||||
| Balance as of March 31, 2025 | 16,285 | 23,519 | 39,804 | |||||||||
| Changes in provisions constituted by portfolio in the year | ||||||||||||
| Group Evaluation | ||||||||||||
| Normal Portfolio |
Non-Complying Portfolio |
Total | ||||||||||
| MCh$ | MCh$ | MCh$ | ||||||||||
| Residential mortgage loans | ||||||||||||
| Balance as of January 1, 2024 | 16,188 | 17,818 | 34,006 | |||||||||
| Allowances established/ released: | ||||||||||||
| Change in measurement without portfolio reclassification during the year | 3,314 | 1,846 | 5,160 | |||||||||
| Change in measurement without portfolio reclassification from the beginning to the end of the year (portfolio from (-) until (+)): | ||||||||||||
| Transfer from Normal group to Non-Complying group | (4,346 | ) | 9,780 | 5,434 | ||||||||
| Transfer from Non-Complying group to Normal group | 442 | (1,819 | ) | (1,377 | ) | |||||||
| New credits originated | 1,505 | 192 | 1,697 | |||||||||
| New credits purchased | — | — | — | |||||||||
| Sales or transfers of credits | — | — | — | |||||||||
| Payment of credit | (1,244 | ) | (4,632 | ) | (5,876 | ) | ||||||
| Provisions for write-offs | — | (644 | ) | (644 | ) | |||||||
| Recovery of written-off loans | — | — | — | |||||||||
| Changes to models and assumptions | — | — | — | |||||||||
| Foreign exchange differences | — | — | — | |||||||||
| Other changes in allowances | — | — | — | |||||||||
| Balance as of December 31, 2024 | 15,859 | 22,541 | 38,400 | |||||||||
NOTES TO THE INTERIM CONSOLIDATED FINANCIAL STATEMENTS, continued
| 13. | Financial assets at amortized cost, continued: |
| (f) | Provisions, continued: |
Summary of changes in consumer loan provisions constituted by credit risk portfolio in the period:
| Changes in provisions constituted by portfolio in the period | ||||||||||||
| Group Evaluation | ||||||||||||
| Normal Portfolio |
Non-Complying Portfolio | Total | ||||||||||
| MCh$ | MCh$ | MCh$ | ||||||||||
| Consumer loans | ||||||||||||
| Balance as of January 1, 2025 | 200,057 | 167,332 | 367,389 | |||||||||
| Allowances established/ released: | ||||||||||||
| Change in measurement without portfolio reclassification during the period | 23,214 | 13,353 | 36,567 | |||||||||
| Change in measurement without portfolio reclassification from the beginning to the end of the period (portfolio from (-) until (+)): | ||||||||||||
| Transfer from Normal group to Non-Complying group | (31,890 | ) | 39,269 | 7,379 | ||||||||
| Transfer from Non-Complying group to Normal group | 1,517 | (9,578 | ) | (8,061 | ) | |||||||
| New credits originated | 20,967 | 22,117 | 43,084 | |||||||||
| New credits for conversion of contingent to loan | 51,883 | 391 | 52,274 | |||||||||
| New credits purchased | — | — | — | |||||||||
| Sales or transfers of credits | — | — | — | |||||||||
| Payment of credit | (62,449 | ) | (23,540 | ) | (85,989 | ) | ||||||
| Provisions for write-offs | — | (50,141 | ) | (50,141 | ) | |||||||
| Recovery of written-off loans | 293 | — | 293 | |||||||||
| Changes to models and assumptions | 43,987 | (7,328 | ) | 36,659 | ||||||||
| Foreign exchange differences | (87 | ) | (1 | ) | (88 | ) | ||||||
| Other changes in allowances | — | — | — | |||||||||
| Balance as of March 31, 2025 | 247,492 | 151,874 | 399,366 | |||||||||
| Changes in provisions constituted by portfolio in the year | ||||||||||||
| Group Evaluation | ||||||||||||
| Normal Portfolio |
Non-Complying Portfolio | Total | ||||||||||
| MCh$ | MCh$ | MCh$ | ||||||||||
| Consumer loans | ||||||||||||
| Balance as of January 1, 2024 | 214,873 | 153,884 | 368,757 | |||||||||
| Allowances established/ released: | ||||||||||||
| Change in measurement without portfolio reclassification during the year | 169,484 | 78,923 | 248,407 | |||||||||
| Change in measurement without portfolio reclassification from the beginning to the end of the year (portfolio from (-) until (+)): | ||||||||||||
| Transfer from Normal group to Non-Complying group | (129,215 | ) | 167,500 | 38,285 | ||||||||
| Transfer from Non-Complying group to Normal group | 15,115 | (38,102 | ) | (22,987 | ) | |||||||
| New credits originated | 92,911 | 78,148 | 171,059 | |||||||||
| New credits for conversion of contingent to loan | 79,922 | 2,539 | 82,461 | |||||||||
| New credits purchased | — | — | — | |||||||||
| Sales or transfers of credits | — | — | — | |||||||||
| Payment of credit | (245,469 | ) | (65,987 | ) | (311,456 | ) | ||||||
| Provisions for write-offs | — | (209,577 | ) | (209,577 | ) | |||||||
| Recovery of written-off loans | 2,310 | — | 2,310 | |||||||||
| Changes to models and assumptions | — | — | — | |||||||||
| Foreign exchange differences | 126 | 4 | 130 | |||||||||
| Other changes in allowances | — | — | — | |||||||||
| Balance as of December 31, 2024 | 200,057 | 167,332 | 367,389 | |||||||||
NOTES TO THE INTERIM CONSOLIDATED FINANCIAL STATEMENTS, continued
| 13. | Financial assets at amortized cost, continued: |
| (f) | Provisions, continued: |
Summary of changes in contingent credit risk provisions constituted by credit risk portfolio in the period:
| Changes in provisions constituted by portfolio in the period | ||||||||||||||||||||||||
| Normal Portfolio Evaluation |
Substandard Portfolio Evaluation |
Non-Complying Portfolio Evaluation | ||||||||||||||||||||||
| Individual | Group | Individual | Individual | Group | Total | |||||||||||||||||||
| MCh$ | MCh$ | MCh$ | MCh$ | MCh$ | MCh$ | |||||||||||||||||||
| Contingent loan exposure | ||||||||||||||||||||||||
| Balance as of January 1, 2025 | 41,208 | 5,343 | 2,894 | 14,400 | 3,692 | 67,537 | ||||||||||||||||||
| Provisions established/ released: | ||||||||||||||||||||||||
| Change in measurement without portfolio reclassification during the period | 1,273 | 3,299 | 94 | 488 | 484 | 5,638 | ||||||||||||||||||
| Change in measurement without portfolio reclassification from the beginning to the end of the period (portfolio from (-) until (+)): | ||||||||||||||||||||||||
| Transfer from Normal individual to Substandard | (12 | ) | — | 27 | — | — | 15 | |||||||||||||||||
| Transfer from Normal individual to Non-Complying individual | — | — | — | 21 | — | 21 | ||||||||||||||||||
| Transfer from Substandard to Non-Complying individual | — | — | (3 | ) | 52 | — | 49 | |||||||||||||||||
| Transfer from Substandard to Normal individual | 4 | — | (6 | ) | — | — | (2 | ) | ||||||||||||||||
| Transfer from Non-Complying individual to Substandard | — | — | — | (17 | ) | — | (17 | ) | ||||||||||||||||
| Transfer from Non-Complying individual to Normal individual | — | — | — | (18 | ) | — | (18 | ) | ||||||||||||||||
| Transfer from Normal group to Non-Complying group | — | (63 | ) | — | — | 727 | 664 | |||||||||||||||||
| Transfer from Non-Complying group to Normal group | — | 6 | — | — | (396 | ) | (390 | ) | ||||||||||||||||
| Transfer from Individual (normal, substandard, non-complying) to Group (normal, non-complying ) | — | — | — | — | — | — | ||||||||||||||||||
| Transfer from Group (normal, non-complying) to Individual (normal, substandard, non-complying) | 7 | (8 | ) | — | — | — | (1 | ) | ||||||||||||||||
| New contingent loan granted | 8,925 | 684 | 1,331 | 24 | 67 | 11,031 | ||||||||||||||||||
| Contingent credits for conversion | (403 | ) | 3,637 | (33 | ) | (334 | ) | (386 | ) | 2,481 | ||||||||||||||
| Changes to models and assumptions | — | 27,208 | — | — | 531 | 27,739 | ||||||||||||||||||
| Foreign exchange differences | (296 | ) | (348 | ) | (4 | ) | (9 | ) | (62 | ) | (719 | ) | ||||||||||||
| Other changes in provisions | (10,690 | ) | (6,956 | ) | (1,343 | ) | (428 | ) | (561 | ) | (19,978 | ) | ||||||||||||
| Balance as of March 31, 2025 | 40,016 | 32,802 | 2,957 | 14,179 | 4,096 | 94,050 | ||||||||||||||||||
| Changes in provisions constituted by portfolio in the year | ||||||||||||||||||||||||
| Normal Portfolio Evaluation |
Substandard Portfolio Evaluation | Non-Complying Portfolio Evaluation |
||||||||||||||||||||||
| Individual | Group | Individual | Individual | Group | Total | |||||||||||||||||||
| MCh$ | MCh$ | MCh$ | MCh$ | MCh$ | MCh$ | |||||||||||||||||||
| Contingent loan exposure | ||||||||||||||||||||||||
| Balance as of January 1, 2024 | 42,022 | 4,967 | 4,017 | 6,102 | 4,119 | 61,227 | ||||||||||||||||||
| Provisions established/ released: | ||||||||||||||||||||||||
| Change in measurement without portfolio reclassification during the year | 9,096 | 4,119 | 178 | 3,755 | 2,566 | 19,714 | ||||||||||||||||||
| Change in measurement without portfolio reclassification from the beginning to the end of the year (portfolio from (-) until (+)): | ||||||||||||||||||||||||
| Transfer from Normal individual to Substandard | (173 | ) | — | 279 | — | — | 106 | |||||||||||||||||
| Transfer from Normal individual to Non-Complying individual | (6 | ) | — | — | 65 | — | 59 | |||||||||||||||||
| Transfer from Substandard to Non-Complying individual | — | — | (1,086 | ) | 9,064 | — | 7,978 | |||||||||||||||||
| Transfer from Substandard to Normal individual | 65 | — | (107 | ) | — | — | (42 | ) | ||||||||||||||||
| Transfer from Non-Complying individual to Substandard | — | — | 5 | (74 | ) | — | (69 | ) | ||||||||||||||||
| Transfer from Non-Complying individual to Normal individual | — | — | — | (9 | ) | — | (9 | ) | ||||||||||||||||
| Transfer from Normal group to Non-Complying group | — | (125 | ) | — | — | 3,303 | 3,178 | |||||||||||||||||
| Transfer from Non-Complying group to Normal group | — | 3 | — | — | (2,647 | ) | (2,644 | ) | ||||||||||||||||
| Transfer from Individual (normal, substandard, non-complying) to Group (normal, non-complying ) | — | — | — | — | — | — | ||||||||||||||||||
| Transfer from Group (normal, non-complying) to Individual (normal, substandard, non-complying) | 64 | (48 | ) | 5 | 4 | (17 | ) | 8 | ||||||||||||||||
| New contingent loan granted | 35,457 | 1,687 | 13,543 | 559 | 534 | 51,780 | ||||||||||||||||||
| Contingent credits for conversion | (1,382 | ) | (3,100 | ) | (135 | ) | (1,220 | ) | (1,436 | ) | (7,273 | ) | ||||||||||||
| Changes to models and assumptions | — | — | — | — | — | — | ||||||||||||||||||
| Foreign exchange differences | 971 | 226 | 13 | 27 | 190 | 1,427 | ||||||||||||||||||
| Other changes in provisions | (44,906 | ) | (2,386 | ) | (13,818 | ) | (3,873 | ) | (2,920 | ) | (67,903 | ) | ||||||||||||
| Balance as of December 31, 2024 | 41,208 | 5,343 | 2,894 | 14,400 | 3,692 | 67,537 | ||||||||||||||||||
NOTES TO THE INTERIM CONSOLIDATED FINANCIAL STATEMENTS, continued
| 13. | Financial assets at amortized cost, continued: |
| g) | Industry sector: |
At the closing of each reporting period, the composition of economic activity for loans, contingent loans exposure and provisions constituted are as follows:
| Credit and Contingent loans Exposure | Allowances Established | |||||||||||||||||||||||||||||||||||||||||||||||
| Domestic loans | Foreign loans | Total | Total | Domestic loans | Foreign loans | Total | Total | |||||||||||||||||||||||||||||||||||||||||
| March | December | March | December | March | December | March | December | March | December | March | December | |||||||||||||||||||||||||||||||||||||
| 2025 | 2024 | 2025 | 2024 | 2025 | 2024 | 2025 | 2024 | 2025 | 2024 | 2025 | 2024 | |||||||||||||||||||||||||||||||||||||
| MCh$ | MCh$ | MCh$ | MCh$ | MCh$ | MCh$ | MCh$ | MCh$ | MCh$ | MCh$ | MCh$ | MCh$ | |||||||||||||||||||||||||||||||||||||
| Loans and advances to Banks | 1,300,000 | 300,042 | 400,765 | 367,661 | 1,700,765 | 667,703 | (72) | (154) | (828) | (734) | (900) | (888) | ||||||||||||||||||||||||||||||||||||
| Commercial loans | ||||||||||||||||||||||||||||||||||||||||||||||||
| Agriculture and livestock | 735,947 | 750,478 | — | — | 735,947 | 750,478 | (12,301 | ) | (13,556 | ) | — | — | (12,301 | ) | (13,556 | ) | ||||||||||||||||||||||||||||||||
| Fruit | 743,708 | 729,645 | — | — | 743,708 | 729,645 | (11,572 | ) | (11,755 | ) | — | — | (11,572 | ) | (11,755 | ) | ||||||||||||||||||||||||||||||||
| Forestry | 89,122 | 89,520 | — | — | 89,122 | 89,520 | (4,055 | ) | (4,100 | ) | — | — | (4,055 | ) | (4,100 | ) | ||||||||||||||||||||||||||||||||
| Fishing | 28,661 | 29,364 | — | — | 28,661 | 29,364 | (2,861 | ) | (2,890 | ) | — | — | (2,861 | ) | (2,890 | ) | ||||||||||||||||||||||||||||||||
| Mining | 579,107 | 864,692 | — | — | 579,107 | 864,692 | (2,781 | ) | (4,781 | ) | — | — | (2,781 | ) | (4,781 | ) | ||||||||||||||||||||||||||||||||
| Oil and natural gas | 607 | 211 | — | — | 607 | 211 | (7 | ) | (8 | ) | — | — | (7 | ) | (8 | ) | ||||||||||||||||||||||||||||||||
| Product manufacturing industries; | ||||||||||||||||||||||||||||||||||||||||||||||||
| Foods, beverages and tobacco | 778,991 | 656,889 | — | — | 778,991 | 656,889 | (13,634 | ) | (11,773 | ) | — | — | (13,634 | ) | (11,773 | ) | ||||||||||||||||||||||||||||||||
| Textiles, leather goods and footwear | 27,187 | 28,712 | — | — | 27,187 | 28,712 | (827 | ) | (910 | ) | — | — | (827 | ) | (910 | ) | ||||||||||||||||||||||||||||||||
| Woods and furnitures | 88,132 | 89,196 | — | — | 88,132 | 89,196 | (2,348 | ) | (2,479 | ) | — | — | (2,348 | ) | (2,479 | ) | ||||||||||||||||||||||||||||||||
| Cellulose, Paper and printing | 13,191 | 15,838 | — | — | 13,191 | 15,838 | (318 | ) | (442 | ) | — | — | (318 | ) | (442 | ) | ||||||||||||||||||||||||||||||||
| Chemicals and petroleum products | 309,908 | 321,593 | — | — | 309,908 | 321,593 | (7,179 | ) | (7,422 | ) | — | — | (7,179 | ) | (7,422 | ) | ||||||||||||||||||||||||||||||||
| Metal, non-metal, machine or others | 484,575 | 481,778 | — | — | 484,575 | 481,778 | (12,575 | ) | (10,848 | ) | — | — | (12,575 | ) | (10,848 | ) | ||||||||||||||||||||||||||||||||
| Electricity, gas and water | 202,959 | 241,941 | 105,896 | 104,988 | 308,855 | 346,929 | (2,933 | ) | (3,078 | ) | (147 | ) | (149 | ) | (3,080 | ) | (3,227 | ) | ||||||||||||||||||||||||||||||
| Residential construction | 179,018 | 193,923 | — | — | 179,018 | 193,923 | (5,455 | ) | (5,608 | ) | — | (5,455 | ) | (5,608 | ) | |||||||||||||||||||||||||||||||||
| Non-residential construction (office, civil engineering) | 483,905 | 481,437 | — | — | 483,905 | 481,437 | (10,986 | ) | (10,462 | ) | — | — | (10,986 | ) | (10,462 | ) | ||||||||||||||||||||||||||||||||
| Wholesale | 1,472,056 | 1,578,109 | — | — | 1,472,056 | 1,578,109 | (49,236 | ) | (47,598 | ) | — | — | (49,236 | ) | (47,598 | ) | ||||||||||||||||||||||||||||||||
| Retail, restaurants and hotels | 1,078,282 | 1,038,501 | — | — | 1,078,282 | 1,038,501 | (44,240 | ) | (41,042 | ) | — | — | (44,240 | ) | (41,042 | ) | ||||||||||||||||||||||||||||||||
| Transport and storage | 1,046,084 | 1,033,066 | — | — | 1,046,084 | 1,033,066 | (26,042 | ) | (28,039 | ) | — | — | (26,042 | ) | (28,039 | ) | ||||||||||||||||||||||||||||||||
| Communications | 221,763 | 213,992 | — | — | 221,763 | 213,992 | (3,357 | ) | (3,015 | ) | — | — | (3,357 | ) | (3,015 | ) | ||||||||||||||||||||||||||||||||
| Financial services | 2,948,267 | 2,994,709 | — | — | 2,948,267 | 2,994,709 | (25,849 | ) | (27,470 | ) | — | — | (25,849 | ) | (27,470 | ) | ||||||||||||||||||||||||||||||||
| Business services | 2,339,637 | 1,965,847 | — | — | 2,339,637 | 1,965,847 | (54,507 | ) | (53,499 | ) | — | — | (54,507 | ) | (53,499 | ) | ||||||||||||||||||||||||||||||||
| Real estate services | 3,447,261 | 3,345,600 | 12,695 | 14,882 | 3,459,956 | 3,360,482 | (24,046 | ) | (23,908 | ) | (417 | ) | (819 | ) | (24,463 | ) | (24,727 | ) | ||||||||||||||||||||||||||||||
| Student loans | 51,326 | 52,280 | — | — | 51,326 | 52,280 | (4,402 | ) | (4,564 | ) | — | — | (4,402 | ) | (4,564 | ) | ||||||||||||||||||||||||||||||||
| Government administration, defence and police force | 27,523 | 16,882 | — | — | 27,523 | 16,882 | (230 | ) | (207 | ) | — | — | (230 | ) | (207 | ) | ||||||||||||||||||||||||||||||||
| Social services and other community services | 906,131 | 898,419 | — | — | 906,131 | 898,419 | (17,992 | ) | (16,821 | ) | — | — | (17,992 | ) | (16,821 | ) | ||||||||||||||||||||||||||||||||
| Personal services | 1,870,667 | 1,872,736 | — | — | 1,870,667 | 1,872,736 | (42,866 | ) | (43,052 | ) | — | — | (42,866 | ) | (43,052 | ) | ||||||||||||||||||||||||||||||||
| Subtotal | 20,154,015 | 19,985,358 | 118,591 | 119,870 | 20,272,606 | 20,105,228 | (382,599 | ) | (379,327 | ) | (564 | ) | (968 | ) | (383,163 | ) | (380,295 | ) | ||||||||||||||||||||||||||||||
| Residential mortgage loans | 13,499,416 | 13,218,586 | — | — | 13,499,416 | 13,218,586 | (39,804 | ) | (38,400 | ) | — | — | (39,804 | ) | (38,400 | ) | ||||||||||||||||||||||||||||||||
| Consumer loans | 5,548,313 | 5,551,306 | — | — | 5,548,313 | 5,551,306 | (399,366 | ) | (367,389 | ) | — | — | (399,366 | ) | (367,389 | ) | ||||||||||||||||||||||||||||||||
| Contingent loan exposure | 14,950,388 | 15,080,768 | — | — | 14,950,388 | 15,080,768 | (94,050 | ) | (67,537 | ) | — | — | (94,050 | ) | (67,537 | ) | ||||||||||||||||||||||||||||||||
NOTES TO THE INTERIM CONSOLIDATED FINANCIAL STATEMENTS, continued
| 13. | Financial assets at amortized cost, continued: |
| (h) | Residential mortgage loans and its provisions established by insolvent tranche of the loan on the value of the mortgage guarantee (PVG) and days of default respectively: |
As of March 31, 2025
| Residential mortgage loans (MCh$) | Allowances established of Residential mortgage loans (MCh$) |
|||||||||||||||||||||||||||||||||||||||||||||||
| Days in default at the end of the period | Days in default at the end of the period | |||||||||||||||||||||||||||||||||||||||||||||||
| Loan Tranche / Guarantee Value (%) | 0 | 1 to 29 | 30 to 59 | 60 to 89 | > = 90 | Total | 0 | 1 to 29 | 30 to 59 | 60 to 89 | > = 90 | Total | ||||||||||||||||||||||||||||||||||||
| PVG <=40% | 1,994,503 | 35,223 | 16,601 | 7,774 | 19,410 | 2,073,511 | (1,523 | ) | (507 | ) | (454 | ) | (260 | ) | (1,081 | ) | (3,825 | ) | ||||||||||||||||||||||||||||||
| 40% < PVG <= 80% | 9,719,337 | 213,342 | 114,667 | 42,735 | 164,176 | 10,254,257 | (11,265 | ) | (3,711 | ) | (3,597 | ) | (1,788 | ) | (9,778 | ) | (30,139 | ) | ||||||||||||||||||||||||||||||
| 80% < PVG <= 90% | 645,438 | 10,866 | 4,080 | 1,588 | 7,367 | 669,339 | (1,627 | ) | (313 | ) | (292 | ) | (145 | ) | (1,212 | ) | (3,589 | ) | ||||||||||||||||||||||||||||||
| PVG > 90% | 496,386 | 2,068 | 652 | 142 | 3,061 | 502,309 | (1,372 | ) | (116 | ) | (36 | ) | (24 | ) | (703 | ) | (2,251 | ) | ||||||||||||||||||||||||||||||
| Total | 12,855,664 | 261,499 | 136,000 | 52,239 | 194,014 | 13,499,416 | (15,787 | ) | (4,647 | ) | (4,379 | ) | (2,217 | ) | (12,774 | ) | (39,804 | ) | ||||||||||||||||||||||||||||||
As of December 31, 2024
| Residential mortgage loans (MCh$) | Allowances established of Residential mortgage loans (MCh$) |
|||||||||||||||||||||||||||||||||||||||||||||||
| Days in default at the end of the year | Days in default at the end of the year | |||||||||||||||||||||||||||||||||||||||||||||||
| Loan Tranche / Guarantee Value (%) | 0 | 1 to 29 | 30 to 59 | 60 to 89 | > = 90 | Total | 0 | 1 to 29 | 30 to 59 | 60 to 89 | > = 90 | Total | ||||||||||||||||||||||||||||||||||||
| PVG <=40% | 1,936,055 | 32,620 | 15,536 | 6,165 | 17,148 | 2,007,524 | (1,404 | ) | (480 | ) | (427 | ) | (226 | ) | (964 | ) | (3,501 | ) | ||||||||||||||||||||||||||||||
| 40% < PVG <= 80% | 9,566,995 | 232,095 | 106,604 | 46,471 | 147,162 | 10,099,327 | (10,565 | ) | (4,022 | ) | (3,335 | ) | (1,893 | ) | (8,749 | ) | (28,564 | ) | ||||||||||||||||||||||||||||||
| 80% < PVG <= 90% | 623,624 | 10,068 | 3,846 | 1,801 | 7,690 | 647,029 | (1,650 | ) | (352 | ) | (309 | ) | (184 | ) | (1,279 | ) | (3,774 | ) | ||||||||||||||||||||||||||||||
| PVG > 90% | 457,769 | 1,442 | 442 | 591 | 4,462 | 464,706 | (1,432 | ) | (62 | ) | (37 | ) | (51 | ) | (979 | ) | (2,561 | ) | ||||||||||||||||||||||||||||||
| Total | 12,584,443 | 276,225 | 126,428 | 55,028 | 176,462 | 13,218,586 | (15,051 | ) | (4,916 | ) | (4,108 | ) | (2,354 | ) | (11,971 | ) | (38,400 | ) | ||||||||||||||||||||||||||||||
NOTES TO THE INTERIM CONSOLIDATED FINANCIAL STATEMENTS, continued
| 13. | Financial assets at amortized cost, continued: |
| (i) | Loans and advances to Banks and Commercial loans and their allowances established by classification category: |
Below is the concentration of loans and advances to banks and commercial loans and their provisions constituted by classification category:
|
Individual |
Group | Provisions of deductible | ||||||||||||||||||||||||||||||||||||||||||||||||||||||||||||||||||||||||||||||||||||||||||||||||||
| Normal Portfolio | Substandard Portfolio | Non-Complying Portfolio | Portfolio | Portfolio Non- | warranties Fogape |
|||||||||||||||||||||||||||||||||||||||||||||||||||||||||||||||||||||||||||||||||||||||||||||||
| As of March 31, 2025 | A1 | A2 | A3 | A4 | A5 | A6 | Subtotal | B1 | B2 | B3 | B4 | Subtotal | C1 | C2 | C3 | C4 | C5 | C6 | Subtotal | Total | Normal |
Complying |
Total | Total |
Covid 19 |
|||||||||||||||||||||||||||||||||||||||||||||||||||||||||||||||||||||||||||
| MCh$ | MCh$ | MCh$ | MCh$ | MCh$ | MCh$ | MCh$ | MCh$ | MCh$ | MCh$ | MCh$ | MCh$ | MCh$ | MCh$ | MCh$ | MCh$ | MCh$ | MCh$ | MCh$ | MCh$ | MCh$ | MCh$ | MCh$ | MCh$ | MCh$ | ||||||||||||||||||||||||||||||||||||||||||||||||||||||||||||||||||||||||||||
| Loans and advances to Banks | ||||||||||||||||||||||||||||||||||||||||||||||||||||||||||||||||||||||||||||||||||||||||||||||||||||
| Interbank loans for liquidity | 200,000 | — | — | — | — | — | 200,000 | — | — | — | — | — | — | — | — | — | — | — | — | 200,000 | — | — | — | 200,000 | — | |||||||||||||||||||||||||||||||||||||||||||||||||||||||||||||||||||||||||||
| Interbank commercial loans | — | — | 262,217 | — | — | — | 262,217 | — | — | — | — | — | — | — | — | — | — | — | — | 262,217 | — | — | — | 262,217 | — | |||||||||||||||||||||||||||||||||||||||||||||||||||||||||||||||||||||||||||
| Current accounts overdrafts | — | — | — | — | — | — | — | — | — | — | — | — | — | — | — | — | — | — | — | — | — | — | — | — | — | |||||||||||||||||||||||||||||||||||||||||||||||||||||||||||||||||||||||||||
| Chilean exports foreign trade loans | 21,334 | 60,840 | 51,599 | 4,775 | — | — | 138,548 | — | — | — | — | — | — | — | — | — | — | — | — | 138,548 | — | — | — | 138,548 | — | |||||||||||||||||||||||||||||||||||||||||||||||||||||||||||||||||||||||||||
| Chilean imports foreign trade loans | — | — | — | — | — | — | — | — | — | — | — | — | — | — | — | — | — | — | — | — | — | — | — | — | — | |||||||||||||||||||||||||||||||||||||||||||||||||||||||||||||||||||||||||||
| Foreign trade loans between third countries | — | — | — | — | — | — | — | — | — | — | — | — | — | — | — | — | — | — | — | — | — | — | — | — | — | |||||||||||||||||||||||||||||||||||||||||||||||||||||||||||||||||||||||||||
| Current account deposits in foreign banks for derivative operations | — | — | — | — | — | — | — | — | — | — | — | — | — | — | — | — | — | — | — | — | — | — | — | — | — | |||||||||||||||||||||||||||||||||||||||||||||||||||||||||||||||||||||||||||
| Other non-transferable deposits in banks | — | — | — | — | — | — | — | — | — | — | — | — | — | — | — | — | — | — | — | — | — | — | — | — | — | |||||||||||||||||||||||||||||||||||||||||||||||||||||||||||||||||||||||||||
| Other debts with banks | — | — | — | — | — | — | — | — | — | — | — | — | — | — | — | — | — | — | — | — | — | — | — | — | — | |||||||||||||||||||||||||||||||||||||||||||||||||||||||||||||||||||||||||||
| Subtotal | 221,334 | 60,840 | 313,816 | 4,775 | — | — | 600,765 | — | — | — | — | — | — | — | — | — | — | — | — | 600,765 | — | — | — | 600,765 | — | |||||||||||||||||||||||||||||||||||||||||||||||||||||||||||||||||||||||||||
| Allowances established | 80 | 50 | 686 | 84 | — | — | 900 | — | — | — | — | — | — | — | — | — | — | — | — | 900 | — | — | — | 900 | — | |||||||||||||||||||||||||||||||||||||||||||||||||||||||||||||||||||||||||||
| % Allowances established | 0.04 | % | 0.08 | % | 0.22 | % | 1.76 | % | — | — | 0.15 | % | — | — | — | — | — | — | — | — | — | — | — | — | 0.15 | % | — | — | — | 0.15 | % | — | ||||||||||||||||||||||||||||||||||||||||||||||||||||||||||||||||||||
| Commercial loans | ||||||||||||||||||||||||||||||||||||||||||||||||||||||||||||||||||||||||||||||||||||||||||||||||||||
| Commercial loans | — | 1,210,630 | 1,691,833 | 2,105,435 | 3,602,342 | 2,274,032 | 10,884,272 | 92,171 | 47,496 | 36,209 | 8,303 | 184,179 | 85,046 | 39,682 | 12,255 | 32,250 | 11,870 | 32,554 | 213,657 | 11,282,108 | 3,841,271 | 353,102 | 4,194,373 | 15,476,481 | 2,568 | |||||||||||||||||||||||||||||||||||||||||||||||||||||||||||||||||||||||||||
| Chilean exports foreign trade loans | — | 212,219 | 300,012 | 205,720 | 269,151 | 198,807 | 1,185,909 | 6,279 | 3,086 | — | — | 9,365 | 7,592 | — | — | 427 | — | 1,329 | 9,348 | 1,204,622 | 3,243 | 244 | 3,487 | 1,208,109 | — | |||||||||||||||||||||||||||||||||||||||||||||||||||||||||||||||||||||||||||
| Accrediting foreign trade loans negotiated in terms of Chilean imports | — | — | — | — | — | 261 | 261 | — | — | — | — | — | — | — | — | — | — | — | — | 261 | — | — | — | 261 | — | |||||||||||||||||||||||||||||||||||||||||||||||||||||||||||||||||||||||||||
| Chilean imports foreign trade loans | — | 4,471 | 40,614 | 96,475 | 170,090 | 162,147 | 473,797 | 5,256 | 462 | 1,037 | — | 6,755 | 26 | — | — | 135 | 1,856 | 1,101 | 3,118 | 483,670 | 43,832 | 2,558 | 46,390 | 530,060 | — | |||||||||||||||||||||||||||||||||||||||||||||||||||||||||||||||||||||||||||
| Foreign trade credits to third countries | — | — | — | — | — | — | — | — | — | — | — | — | — | — | — | — | — | — | — | — | — | — | — | — | — | |||||||||||||||||||||||||||||||||||||||||||||||||||||||||||||||||||||||||||
| Current account debtors | — | 5 | 1,696 | 36,625 | 21,645 | 22,748 | 82,719 | 3,173 | 1,127 | 597 | 198 | 5,095 | 583 | 98 | 1,070 | 613 | 145 | 1,585 | 4,094 | 91,908 | 88,920 | 2,098 | 91,018 | 182,926 | — | |||||||||||||||||||||||||||||||||||||||||||||||||||||||||||||||||||||||||||
| Credit card debtors | — | 450 | 1,596 | 4,040 | 10,950 | 10,679 | 27,715 | 675 | 278 | 95 | 13 | 1,061 | 260 | 82 | 60 | 77 | 175 | 723 | 1,377 | 30,153 | 85,454 | 11,536 | 96,990 | 127,143 | — | |||||||||||||||||||||||||||||||||||||||||||||||||||||||||||||||||||||||||||
| Factoring transactions | 3,556 | 174,258 | 120,994 | 36,182 | 193,752 | 98,692 | 627,434 | 7,127 | 75 | 99 | — | 7,301 | 78 | 20 | — | — | — | — | 98 | 634,833 | 35,809 | 46 | 35,855 | 670,688 | — | |||||||||||||||||||||||||||||||||||||||||||||||||||||||||||||||||||||||||||
| Commercial lease transactions | — | 47,716 | 81,421 | 318,610 | 663,574 | 519,290 | 1,630,611 | 18,680 | 8,433 | 3,263 | 1,164 | 31,540 | 4,930 | 5,132 | 13,938 | 10,900 | 2,277 | 672 | 37,849 | 1,700,000 | 293,701 | 14,199 | 307,900 | 2,007,900 | 397 | |||||||||||||||||||||||||||||||||||||||||||||||||||||||||||||||||||||||||||
| Student loans | — | — | — | — | — | — | — | — | — | — | — | — | — | — | — | — | — | — | — | — | 48,097 | 3,230 | 51,327 | 51,327 | — | |||||||||||||||||||||||||||||||||||||||||||||||||||||||||||||||||||||||||||
| Other loans and accounts receivable | — | 407 | 1,798 | 1,172 | 2,556 | 2,236 | 8,169 | 49 | 70 | 2 | — | 121 | 223 | 10 | 121 | 212 | 787 | 6,161 | 7,514 | 15,804 | 936 | 971 | 1,907 | 17,711 | — | |||||||||||||||||||||||||||||||||||||||||||||||||||||||||||||||||||||||||||
| Subtotal | 3,556 | 1,650,156 | 2,239,964 | 2,804,259 | 4,934,060 | 3,288,892 | 14,920,887 | 133,410 | 61,027 | 41,302 | 9,678 | 245,417 | 98,738 | 45,024 | 27,444 | 44,614 | 17,110 | 44,125 | 277,055 | 15,443,359 | 4,441,263 | 387,984 | 4,829,247 | 20,272,606 | — | |||||||||||||||||||||||||||||||||||||||||||||||||||||||||||||||||||||||||||
| Allowances established | 1 | 1,090 | 3,498 | 24,947 | 55,063 | 80,234 | 164,833 | 3,514 | 680 | 840 | 459 | 5,493 | 1,975 | 4,502 | 6,861 | 17,846 | 11,121 | 39,713 | 82,018 | 252,344 | 37,525 | 90,329 | 127,854 | 380,198 | 2,965 | |||||||||||||||||||||||||||||||||||||||||||||||||||||||||||||||||||||||||||
| % Allowances established | 0.03 | % | 0.07 | % | 0.16 | % | 0.89 | % | 1.12 | % | 2.44 | % | 1.10 | % | 2.63 | % | 1.11 | % | 2.03 | % | 4.74 | % | 2.24 | % | 2.00 | % | 10.00 | % | 25.00 | % | 40.00 | % | 65.00 | % | 90.00 | % | 29.60 | % | 1.63 | % | 0.84 | % | 23.28 | % | 2.65 | % | 1.88 | % | — | |||||||||||||||||||||||||||||||||||||||||||||||||||
NOTES TO THE INTERIM CONSOLIDATED FINANCIAL STATEMENTS, continued
| 13. | Financial assets at amortized cost, continued: |
| (i) | Loans and advances to Banks and Commercial loans and their allowances established by classification category, continued: |
| Individual | Group | Provision of | ||||||||||||||||||||||||||||||||||||||||||||||||||||||||||||||||||||||||||||||||||||||||||||||||||
| Normal Portfolio | Substandard Portfolio | Non-Complying Portfolio | deductible | |||||||||||||||||||||||||||||||||||||||||||||||||||||||||||||||||||||||||||||||||||||||||||||||||
| As of December 31, 2024 | A1 | A2 | A3 | A4 | A5 | A6 | Subtotal | B1 | B2 | B3 | B4 | Subtotal | C1 | C2 | C3 | C4 | C5 | C6 | Subtotal | Total |
Portfolio Normal |
Portfolio Non- Complying |
Total | Total | warranties Fogape Covid 19 |
|||||||||||||||||||||||||||||||||||||||||||||||||||||||||||||||||||||||||||
| MCh$ | MCh$ | MCh$ | MCh$ | MCh$ | MCh$ | MCh$ | MCh$ | MCh$ | MCh$ | MCh$ | MCh$ | MCh$ | MCh$ | MCh$ | MCh$ | MCh$ | MCh$ | MCh$ | MCh$ | MCh$ | MCh$ | MCh$ | MCh$ | MCh$ | ||||||||||||||||||||||||||||||||||||||||||||||||||||||||||||||||||||||||||||
| Loans and advances to Banks | ||||||||||||||||||||||||||||||||||||||||||||||||||||||||||||||||||||||||||||||||||||||||||||||||||||
| Interbank loans for liquidity | 200,028 | 100,014 | — | — | — | — | 300,042 | — | — | — | — | — | — | — | — | — | — | — | — | 300,042 | — | — | — | 300,042 | — | |||||||||||||||||||||||||||||||||||||||||||||||||||||||||||||||||||||||||||
| Interbank commercial loans | — | — | 269,191 | — | — | — | 269,191 | — | — | — | — | — | — | — | — | — | — | — | — | 269,191 | — | — | — | 269,191 | — | |||||||||||||||||||||||||||||||||||||||||||||||||||||||||||||||||||||||||||
| Current accounts overdrafts | — | — | — | — | — | — | — | — | — | — | — | — | — | — | — | — | — | — | — | — | — | — | — | — | — | |||||||||||||||||||||||||||||||||||||||||||||||||||||||||||||||||||||||||||
| Chilean exports foreign trade loans | 14,614 | 32,260 | 51,596 | — | — | — | 98,470 | — | — | — | — | — | — | — | — | — | — | — | — | 98,470 | — | — | — | 98,470 | — | |||||||||||||||||||||||||||||||||||||||||||||||||||||||||||||||||||||||||||
| Chilean imports foreign trade loans | — | — | — | — | — | — | — | — | — | — | — | — | — | — | — | — | — | — | — | — | — | — | — | — | — | |||||||||||||||||||||||||||||||||||||||||||||||||||||||||||||||||||||||||||
| Foreign trade loans between third countries | — | — | — | — | — | — | — | — | — | — | — | — | — | — | — | — | — | — | — | — | — | — | — | — | — | |||||||||||||||||||||||||||||||||||||||||||||||||||||||||||||||||||||||||||
| Current account deposits in foreign banks for derivative operations | — | — | — | — | — | — | — | — | — | — | — | — | — | — | — | — | — | — | — | — | — | — | — | — | — | |||||||||||||||||||||||||||||||||||||||||||||||||||||||||||||||||||||||||||
| Other non-transferable deposits in banks | — | — | — | — | — | — | — | — | — | — | — | — | — | — | — | — | — | — | — | — | — | — | — | — | — | |||||||||||||||||||||||||||||||||||||||||||||||||||||||||||||||||||||||||||
| Other debts with banks | — | — | — | — | — | — | — | — | — | — | — | — | — | — | — | — | — | — | — | — | — | — | — | — | — | |||||||||||||||||||||||||||||||||||||||||||||||||||||||||||||||||||||||||||
| Subtotal | 214,642 | 132,274 | 320,787 | — | — | — | 667,703 | — | — | — | — | — | — | — | — | — | — | — | — | 667,703 | — | — | — | 667,703 | — | |||||||||||||||||||||||||||||||||||||||||||||||||||||||||||||||||||||||||||
| Allowances established | 77 | 109 | 702 | — | — | — | 888 | — | — | — | — | — | — | — | — | — | — | — | — | 888 | — | — | — | 888 | — | |||||||||||||||||||||||||||||||||||||||||||||||||||||||||||||||||||||||||||
| % Allowances established | 0.04 | % | 0.08 | % | 0.22 | % | — | — | — | 0.13 | % | — | — | — | — | — | — | — | — | — | — | — | — | 0.13 | % | — | — | — | 0.13 | % | — | |||||||||||||||||||||||||||||||||||||||||||||||||||||||||||||||||||||
| Commercial loans | ||||||||||||||||||||||||||||||||||||||||||||||||||||||||||||||||||||||||||||||||||||||||||||||||||||
| Commercial loans | — | 978,748 | 1,683,111 | 2,093,769 | 3,504,563 | 2,252,173 | 10,512,364 | 98,731 | 51,153 | 35,812 | 9,032 | 194,728 | 86,932 | 37,379 | 12,894 | 34,843 | 11,763 | 35,656 | 219,467 | 10,926,559 | 3,835,557 | 350,892 | 4,186,449 | 15,113,008 | 2,764 | |||||||||||||||||||||||||||||||||||||||||||||||||||||||||||||||||||||||||||
| Chilean exports foreign trade loans | — | 563,237 | 298,742 | 198,222 | 209,936 | 158,691 | 1,428,828 | 4,414 | 2,594 | — | — | 7,008 | 8,494 | — | — | 334 | — | 1,645 | 10,473 | 1,446,309 | 3,006 | 395 | 3,401 | 1,449,710 | — | |||||||||||||||||||||||||||||||||||||||||||||||||||||||||||||||||||||||||||
| Accrediting foreign trade loans negotiated in terms of Chilean imports | — | — | — | — | — | 162 | 162 | — | — | — | — | — | — | — | — | — | — | — | — | 162 | — | — | — | 162 | — | |||||||||||||||||||||||||||||||||||||||||||||||||||||||||||||||||||||||||||
| Chilean imports foreign trade loans | — | 10,607 | 47,176 | 98,073 | 178,454 | 169,514 | 503,824 | 5,419 | 275 | — | — | 5,694 | 384 | — | — | 141 | 1,640 | 1,038 | 3,203 | 512,721 | 46,538 | 3,038 | 49,576 | 562,297 | — | |||||||||||||||||||||||||||||||||||||||||||||||||||||||||||||||||||||||||||
| Foreign trade credits to third countries | — | — | — | — | — | — | — | — | — | — | — | — | — | — | — | — | — | — | — | — | — | — | — | — | — | |||||||||||||||||||||||||||||||||||||||||||||||||||||||||||||||||||||||||||
| Current account debtors | — | 12 | 24,388 | 31,693 | 19,000 | 22,329 | 97,422 | 3,033 | 1,124 | 923 | 189 | 5,269 | 513 | 86 | 1,061 | 593 | 151 | 1,647 | 4,051 | 106,742 | 87,836 | 2,241 | 90,077 | 196,819 | — | |||||||||||||||||||||||||||||||||||||||||||||||||||||||||||||||||||||||||||
| Credit card debtors | — | 294 | 1,291 | 3,936 | 10,178 | 9,801 | 25,500 | 664 | 332 | 112 | 12 | 1,120 | 235 | 70 | 49 | 74 | 196 | 817 | 1,441 | 28,061 | 84,721 | 10,968 | 95,689 | 123,750 | — | |||||||||||||||||||||||||||||||||||||||||||||||||||||||||||||||||||||||||||
| Factoring transactions | 2,081 | 159,861 | 108,439 | 29,667 | 163,282 | 92,436 | 555,766 | 4,041 | 73 | — | — | 4,114 | — | — | — | — | — | 27 | 27 | 559,907 | 36,830 | 175 | 37,005 | 596,912 | — | |||||||||||||||||||||||||||||||||||||||||||||||||||||||||||||||||||||||||||
| Commercial lease transactions | — | 49,621 | 77,816 | 334,046 | 636,573 | 516,572 | 1,614,628 | 16,016 | 10,619 | 1,184 | 424 | 28,243 | 4,621 | 4,616 | 14,387 | 11,241 | 2,419 | 680 | 37,964 | 1,680,835 | 296,248 | 13,941 | 310,189 | 1,991,024 | 397 | |||||||||||||||||||||||||||||||||||||||||||||||||||||||||||||||||||||||||||
| Student loans | — | — | — | — | — | — | — | — | — | — | — | — | — | — | — | — | — | — | — | — | 48,804 | 3,476 | 52,280 | 52,280 | — | |||||||||||||||||||||||||||||||||||||||||||||||||||||||||||||||||||||||||||
| Other loans and accounts receivable | — | 479 | 1,649 | 1,352 | 2,651 | 2,633 | 8,764 | 66 | 51 | 4 | — | 121 | 237 | 12 | 181 | 347 | 786 | 6,578 | 8,141 | 17,026 | 965 | 1,275 | 2,240 | 19,266 | — | |||||||||||||||||||||||||||||||||||||||||||||||||||||||||||||||||||||||||||
| Subtotal | 2,081 | 1,762,859 | 2,242,612 | 2,790,758 | 4,724,637 | 3,224,311 | 14,747,258 | 132,384 | 66,221 | 38,035 | 9,657 | 246,297 | 101,416 | 42,163 | 28,572 | 47,573 | 16,955 | 48,088 | 284,767 | 15,278,322 | 4,440,505 | 386,401 | 4,826,906 | 20,105,228 | — | |||||||||||||||||||||||||||||||||||||||||||||||||||||||||||||||||||||||||||
| Allowances established | 1 | 1,188 | 3,494 | 24,871 | 51,771 | 77,010 | 158,335 | 2,865 | 639 | 428 | 516 | 4,448 | 2,028 | 4,216 | 7,143 | 19,029 | 11,020 | 43,279 | 86,715 | 249,498 | 37,200 | 90,436 | 127,636 | 377,134 | 3,161 | |||||||||||||||||||||||||||||||||||||||||||||||||||||||||||||||||||||||||||
| % Allowances established | 0.05 | % | 0.07 | % | 0.16 | % | 0.89 | % | 1.10 | % | 2.39 | % | 1.07 | % | 2.16 | % | 0.96 | % | 1.13 | % | 5.34 | % | 1.81 | % | 2.00 | % | 10.00 | % | 25.00 | % | 40.00 | % | 65.00 | % | 90.00 | % | 30.45 | % | 1.63 | % | 0.84 | % | 23.40 | % | 2.64 | % | 1.88 | % | — | |||||||||||||||||||||||||||||||||||||||||||||||||||
NOTES TO THE INTERIM CONSOLIDATED FINANCIAL STATEMENTS, continued
| 13. | Financial assets at amortized cost, continued: |
| (j) | Loans and their provisions for loan losses by tranches of days past-due: |
The concentration of credit risk by days past due is as follows;
| Financial assets before allowances | Allowances established | |||||||||||||||||||||||||||||||||||||||||||||||||||||||||||
| Normal Portfolio | Substandard Portfolio |
Non-Complying Portfolio |
Normal Portfolio | Substandard Portfolio |
Non-Complying Portfolio |
Deductible Warranties |
Net | |||||||||||||||||||||||||||||||||||||||||||||||||||||
| Evaluation | Evaluation | Evaluation | Sub | Evaluation | Evaluation | Evaluation | Sub | FOGAPE | Financial | |||||||||||||||||||||||||||||||||||||||||||||||||||
| As of March 31, 2025 | Individual | Group | Individual | Individual | Group | Total | Individual | Group | Individual | Individual | Group | Total | Covid-19 | Total | Assets | |||||||||||||||||||||||||||||||||||||||||||||
| MCh$ | MCh$ | MCh$ | MCh$ | MCh$ | MCh$ | MCh$ | MCh$ | MCh$ | MCh$ | MCh$ | MCh$ | MCh$ | MCh$ | MCh$ | ||||||||||||||||||||||||||||||||||||||||||||||
| Loans and advances to Banks | ||||||||||||||||||||||||||||||||||||||||||||||||||||||||||||
| 0 days | 477,410 | — | — | — | — | 477,410 | (732 | ) | — | — | — | — | (732 | ) | — | (732 | ) | |||||||||||||||||||||||||||||||||||||||||||
| 1 to 29 days | 123,355 | — | — | — | — | 123,355 | (168 | ) | — | — | — | — | (168 | ) | — | (168 | ) | |||||||||||||||||||||||||||||||||||||||||||
| 30 to 59 days | — | — | — | — | — | — | — | — | — | — | — | — | — | — | ||||||||||||||||||||||||||||||||||||||||||||||
| 60 to 89 days | — | — | — | — | — | — | — | — | — | — | — | — | — | — | ||||||||||||||||||||||||||||||||||||||||||||||
| > = 90 days | — | — | — | — | — | — | — | — | — | — | — | — | — | — | ||||||||||||||||||||||||||||||||||||||||||||||
| Subtotal | 600,765 | — | — | — | — | 600,765 | (900 | ) | — | — | — | — | (900 | ) | — | (900 | ) | 599,865 | ||||||||||||||||||||||||||||||||||||||||||
| Commercial loans | ||||||||||||||||||||||||||||||||||||||||||||||||||||||||||||
| 0 days | 14,727,986 | 4,235,343 | 205,145 | 153,285 | 100,144 | 19,421,903 | (162,443 | ) | (28,688 | ) | (4,715 | ) | (44,199 | ) | (18,827 | ) | (258,872 | ) | (2,868 | ) | (261,740 | ) | ||||||||||||||||||||||||||||||||||||||
| 1 to 29 days | 188,357 | 143,118 | 24,178 | 13,609 | 36,292 | 405,554 | (2,274 | ) | (4,402 | ) | (525 | ) | (1,187 | ) | (6,892 | ) | (15,280 | ) | (42 | ) | (15,322 | ) | ||||||||||||||||||||||||||||||||||||||
| 30 to 59 days | 4,203 | 45,821 | 10,936 | 17,731 | 34,742 | 113,433 | (86 | ) | (2,870 | ) | (129 | ) | (2,878 | ) | (6,201 | ) | (12,164 | ) | (25 | ) | (12,189 | ) | ||||||||||||||||||||||||||||||||||||||
| 60 to 89 days | 341 | 16,981 | 5,153 | 5,186 | 22,636 | 50,297 | (30 | ) | (1,565 | ) | (124 | ) | (1,496 | ) | (4,412 | ) | (7,627 | ) | — | (7,627 | ) | |||||||||||||||||||||||||||||||||||||||
| > = 90 days | — | — | 5 | 87,244 | 194,170 | 281,419 | — | — | — | (32,258 | ) | (53,997 | ) | (86,255 | ) | (30 | ) | (86,285 | ) | |||||||||||||||||||||||||||||||||||||||||
| Subtotal | 14,920,887 | 4,441,263 | 245,417 | 277,055 | 387,984 | 20,272,606 | (164,833 | ) | (37,525 | ) | (5,493 | ) | (82,018 | ) | (90,329 | ) | (380,198 | ) | (2,965 | ) | (383,163 | ) | 19,889,443 | |||||||||||||||||||||||||||||||||||||
| Residential mortgage loans | ||||||||||||||||||||||||||||||||||||||||||||||||||||||||||||
| 0 days | — | 12,786,098 | — | — | 69,566 | 12,855,664 | — | (11,090 | ) | — | — | (4,697 | ) | (15,787 | ) | — | (15,787 | ) | ||||||||||||||||||||||||||||||||||||||||||
| 1 to 29 days | — | 228,071 | — | — | 33,428 | 261,499 | — | (2,557 | ) | — | — | (2,090 | ) | (4,647 | ) | — | (4,647 | ) | ||||||||||||||||||||||||||||||||||||||||||
| 30 to 59 days | — | 95,782 | — | — | 40,218 | 136,000 | — | (1,838 | ) | — | — | (2,541 | ) | (4,379 | ) | — | (4,379 | ) | ||||||||||||||||||||||||||||||||||||||||||
| 60 to 89 days | — | 29,022 | — | — | 23,217 | 52,239 | — | (800 | ) | — | — | (1,417 | ) | (2,217 | ) | — | (2,217 | ) | ||||||||||||||||||||||||||||||||||||||||||
| > = 90 days | — | — | — | — | 194,014 | 194,014 | — | — | — | — | (12,774 | ) | (12,774 | ) | — | (12,774 | ) | |||||||||||||||||||||||||||||||||||||||||||
| Subtotal | — | 13,138,973 | — | — | 360,443 | 13,499,416 | — | (16,285 | ) | — | — | (23,519 | ) | (39,804 | ) | — | (39,804 | ) | 13,459,612 | |||||||||||||||||||||||||||||||||||||||||
| Consumer loans | ||||||||||||||||||||||||||||||||||||||||||||||||||||||||||||
| 0 days | — | 5,020,289 | — | — | 87,678 | 5,107,967 | — | (188,792 | ) | — | — | (48,104 | ) | (236,896 | ) | — | (236,896 | ) | ||||||||||||||||||||||||||||||||||||||||||
| 1 to 29 days | — | 169,462 | — | — | 31,943 | 201,405 | — | (25,813 | ) | — | — | (17,766 | ) | (43,579 | ) | — | (43,579 | ) | ||||||||||||||||||||||||||||||||||||||||||
| 30 to 59 days | — | 58,377 | — | — | 38,084 | 96,461 | — | (20,757 | ) | — | — | (20,897 | ) | (41,654 | ) | — | (41,654 | ) | ||||||||||||||||||||||||||||||||||||||||||
| 60 a 89 days | — | 25,846 | — | — | 21,506 | 47,352 | — | (12,130 | ) | — | — | (12,006 | ) | (24,136 | ) | — | (24,136 | ) | ||||||||||||||||||||||||||||||||||||||||||
| > = 90 days | — | — | — | 95,128 | 95,128 | — | — | — | — | (53,101 | ) | (53,101 | ) | — | (53,101 | ) | ||||||||||||||||||||||||||||||||||||||||||||
| Subtotal | — | 5,273,974 | — | — | 274,339 | 5,548,313 | — | (247,492 | ) | — | — | (151,874 | ) | (399,366 | ) | — | (399,366 | ) | 5,148,947 | |||||||||||||||||||||||||||||||||||||||||
| Total Loans | 15,521,652 | 22,854,210 | 245,417 | 277,055 | 1,022,766 | 39,921,100 | (165,733 | ) | (301,302 | ) | (5,493 | ) | (82,018 | ) | (265,722 | ) | (820,268 | ) | (2,965 | ) | (823,233 | ) | 39,097,867 | |||||||||||||||||||||||||||||||||||||
NOTES TO THE INTERIM CONSOLIDATED FINANCIAL STATEMENTS, continued
| 13. | Financial assets at amortized cost, continued: |
| (j) | Loans and their provisions for loan losses by number of days past-due, continued: |
| Financial assets before allowances | Allowances established | |||||||||||||||||||||||||||||||||||||||||||||||||||||||||||
| Normal Portfolio | Substandard Portfolio |
Non-Complying Portfolio |
Normal Portfolio | Substandard Portfolio |
Non-Complying Portfolio |
Deductible Warranties |
Net | |||||||||||||||||||||||||||||||||||||||||||||||||||||
| Evaluation | Evaluation | Evaluation | Sub | Evaluation | Evaluation | Evaluation Sub | FOGAPE | Financial | ||||||||||||||||||||||||||||||||||||||||||||||||||||
| As of December 31, 2024 | Individual | Group | Individual | Individual | Group | Total | Individual | Group | Individual | Individual | Group | Total | Covid-19 | Total | Assets | |||||||||||||||||||||||||||||||||||||||||||||
| MCh$ | MCh$ | MCh$ | MCh$ | MCh$ | MCh$ | MCh$ | MCh$ | MCh$ | MCh$ | MCh$ | MCh$ | MCh$ | MCh$ | MCh$ | ||||||||||||||||||||||||||||||||||||||||||||||
| Loans and advances to Banks | ||||||||||||||||||||||||||||||||||||||||||||||||||||||||||||
| 0 days | 596,974 | — | — | — | — | 596,974 | (800 | ) | — | — | — | — | (800 | ) | — | (800 | ) | |||||||||||||||||||||||||||||||||||||||||||
| 1 to 29 days | 70,729 | — | — | — | — | 70,729 | (88 | ) | — | — | — | — | (88 | ) | — | (88 | ) | |||||||||||||||||||||||||||||||||||||||||||
| 30 to 59 days | — | — | — | — | — | — | — | — | — | — | — | — | — | — | ||||||||||||||||||||||||||||||||||||||||||||||
| 60 to 89 days | — | — | — | — | — | — | — | — | — | — | — | — | — | — | ||||||||||||||||||||||||||||||||||||||||||||||
| > = 90 days | — | — | — | — | — | — | — | — | — | — | — | — | — | — | ||||||||||||||||||||||||||||||||||||||||||||||
| Subtotal | 667,703 | — | — | — | — | 667,703 | (888 | ) | — | — | — | — | (888 | ) | — | (888 | ) | 666,815 | ||||||||||||||||||||||||||||||||||||||||||
| Commercial loans | ||||||||||||||||||||||||||||||||||||||||||||||||||||||||||||
| 0 days | 14,515,547 | 4,237,304 | 212,286 | 145,211 | 103,514 | 19,213,862 | (155,358 | ) | (28,184 | ) | (3,855 | ) | (35,615 | ) | (18,814 | ) | (241,826 | ) | (3,064 | ) | (244,890 | ) | ||||||||||||||||||||||||||||||||||||||
| 1 to 29 days | 218,097 | 147,190 | 22,083 | 18,360 | 36,055 | 441,785 | (2,811 | ) | (4,691 | ) | (382 | ) | (3,257 | ) | (7,207 | ) | (18,348 | ) | (56 | ) | (18,404 | ) | ||||||||||||||||||||||||||||||||||||||
| 30 to 59 days | 13,549 | 43,058 | 9,856 | 22,310 | 34,271 | 123,044 | (165 | ) | (2,900 | ) | (156 | ) | (11,012 | ) | (6,468 | ) | (20,701 | ) | — | (20,701 | ) | |||||||||||||||||||||||||||||||||||||||
| 60 to 89 days | 65 | 12,953 | 2,072 | 8,749 | 20,850 | 44,689 | (1 | ) | (1,425 | ) | (55 | ) | (1,461 | ) | (4,362 | ) | (7,304 | ) | (2 | ) | (7,306 | ) | ||||||||||||||||||||||||||||||||||||||
| > = 90 days | — | — | — | 90,137 | 191,711 | 281,848 | — | — | — | (35,370 | ) | (53,585 | ) | (88,955 | ) | (39 | ) | (88,994 | ) | |||||||||||||||||||||||||||||||||||||||||
| Subtotal | 14,747,258 | 4,440,505 | 246,297 | 284,767 | 386,401 | 20,105,228 | (158,335 | ) | (37,200 | ) | (4,448 | ) | (86,715 | ) | (90,436 | ) | (377,134 | ) | (3,161 | ) | (380,295 | ) | 19,724,933 | |||||||||||||||||||||||||||||||||||||
| Residential mortgage loans | ||||||||||||||||||||||||||||||||||||||||||||||||||||||||||||
| 0 days | — | 12,518,932 | — | — | 65,511 | 12,584,443 | — | (10,523 | ) | — | — | (4,528 | ) | (15,051 | ) | — | (15,051 | ) | ||||||||||||||||||||||||||||||||||||||||||
| 1 to 29 days | — | 240,310 | — | — | 35,915 | 276,225 | — | (2,661 | ) | — | — | (2,255 | ) | (4,916 | ) | — | (4,916 | ) | ||||||||||||||||||||||||||||||||||||||||||
| 30 to 59 days | — | 90,398 | — | — | 36,030 | 126,428 | — | (1,843 | ) | — | — | (2,265 | ) | (4,108 | ) | — | (4,108 | ) | ||||||||||||||||||||||||||||||||||||||||||
| 60 to 89 days | — | 30,983 | — | — | 24,045 | 55,028 | — | (832 | ) | — | — | (1,522 | ) | (2,354 | ) | — | (2,354 | ) | ||||||||||||||||||||||||||||||||||||||||||
| > = 90 days | — | — | — | — | 176,462 | 176,462 | — | — | — | — | (11,971 | ) | (11,971 | ) | — | (11,971 | ) | |||||||||||||||||||||||||||||||||||||||||||
| Subtotal | — | 12,880,623 | — | — | 337,963 | 13,218,586 | — | (15,859 | ) | — | — | (22,541 | ) | (38,400 | ) | — | (38,400 | ) | 13,180,186 | |||||||||||||||||||||||||||||||||||||||||
| Consumer loans | ||||||||||||||||||||||||||||||||||||||||||||||||||||||||||||
| 0 days | — | 5,010,755 | — | — | 92,973 | 5,103,728 | — | (148,953 | ) | — | — | (47,823 | ) | (196,776 | ) | — | (196,776 | ) | ||||||||||||||||||||||||||||||||||||||||||
| 1 to 29 days | — | 176,897 | — | — | 34,243 | 211,140 | — | (28,928 | ) | — | — | (19,033 | ) | (47,961 | ) | — | (47,961 | ) | ||||||||||||||||||||||||||||||||||||||||||
| 30 to 59 days | — | 53,655 | — | — | 36,266 | 89,921 | — | (15,508 | ) | — | — | (23,119 | ) | (38,627 | ) | — | (38,627 | ) | ||||||||||||||||||||||||||||||||||||||||||
| 60 a 89 days | — | 17,656 | — | — | 25,993 | 43,649 | — | (6,668 | ) | — | — | (15,490 | ) | (22,158 | ) | — | (22,158 | ) | ||||||||||||||||||||||||||||||||||||||||||
| > = 90 days | — | — | — | — | 102,868 | 102,868 | — | — | — | — | (61,867 | ) | (61,867 | ) | — | (61,867 | ) | |||||||||||||||||||||||||||||||||||||||||||
| Subtotal | — | 5,258,963 | — | — | 292,343 | 5,551,306 | — | (200,057 | ) | — | — | (167,332 | ) | (367,389 | ) | — | (367,389 | ) | 5,183,917 | |||||||||||||||||||||||||||||||||||||||||
| Total Loans | 15,414,961 | 22,580,091 | 246,297 | 284,767 | 1,016,707 | 39,542,823 | (159,223 | ) | (253,116 | ) | (4,448 | ) | (86,715 | ) | (280,309 | ) | (783,811 | ) | (3,161 | ) | (786,972 | ) | 38,755,851 | |||||||||||||||||||||||||||||||||||||
NOTES TO THE INTERIM CONSOLIDATED FINANCIAL STATEMENTS, continued
| 13. | Financial assets at amortized cost, continued: |
| (k) | Finance lease contracts: |
The cash flows to be received by the Bank from finance lease contracts have the following maturities:
| Total receivable | Deferred interest | Net balance receivable (*) | ||||||||||||||||||||||
| March | December | March | December | March | December | |||||||||||||||||||
| 2025 | 2024 | 2025 | 2024 | 2025 | 2024 | |||||||||||||||||||
| MCh$ | MCh$ | MCh$ | MCh$ | MCh$ | MCh$ | |||||||||||||||||||
| Within one year | 670,824 | 668,951 | (97,743 | ) | (99,075 | ) | 573,081 | 569,876 | ||||||||||||||||
| From 1 to 2 years | 501,669 | 501,065 | (71,634 | ) | (71,170 | ) | 430,035 | 429,895 | ||||||||||||||||
| From 2 to 3 years | 343,019 | 343,985 | (45,691 | ) | (45,055 | ) | 297,328 | 298,930 | ||||||||||||||||
| From 3 to 4 years | 214,071 | 211,905 | (30,209 | ) | (29,193 | ) | 183,862 | 182,712 | ||||||||||||||||
| From 4 to 5 years | 171,187 | 165,414 | (21,256 | ) | (20,517 | ) | 149,931 | 144,897 | ||||||||||||||||
| After 5 years | 416,020 | 401,645 | (49,052 | ) | (45,823 | ) | 366,968 | 355,822 | ||||||||||||||||
| Total | 2,316,790 | 2,292,965 | (315,585 | ) | (310,833 | ) | 2,001,205 | 1,982,132 | ||||||||||||||||
| (*) | The net balance receivable does not include past-due portfolio totaling Ch$7,120 million as of March 31, 2025 (Ch$9,212 million in December 2024). |
The Bank maintains financial lease operations associated with movable assets, vehicles, industrial machinery, transportation equipment and real estate. These leases contracts have an average term between 2 and 15 years.
| (l) | Purchase of loan portfolio: |
During the period ended as of March 31, 2025 and the year 2024 no portfolio purchases were made.
| (m) | Sale or transfer of loans from the loan portfolio: |
During the period 2024, the following sale were made:
| March 2024 | ||||||||||||||||
| Carrying amount | Allowances | Sale price | Effect on income (loss) gain |
|||||||||||||
| MM$ | MM$ | MM$ | MM$ | |||||||||||||
| Sale of current loans | 110 | — | 110 | — | ||||||||||||
| Sale of written – off loans | — | — | — | — | ||||||||||||
| Total | 110 | — | 110 | — | ||||||||||||
As of March 31, 2025, there were no sales or transfers of loans from the loan portfolio.
| (n) | Securitization of own assets: |
During the period 2025 and the year 2024, there is no securitization transactions executed involving its own assets.
NOTES TO THE INTERIM CONSOLIDATED FINANCIAL STATEMENTS, continued
| 14. | Investments in other companies: |
| (a) | In the item “Investments in other companies” include investments of Ch$78,911 million as of March 31, 2025 (Ch$76,769 million as of December 31, 2024), as follows: |
| % Ownership Interest | Assets | |||||||||||||||||
| March | December | March | December | |||||||||||||||
| Company | Shareholder | 2025 | 2024 | 2025 | 2024 | |||||||||||||
| % | % | MCh$ | MCh$ | |||||||||||||||
| Associates | ||||||||||||||||||
| Transbank S.A. | Banco de Chile | 26.16 | 26.16 | 39,399 | 38,660 | |||||||||||||
| Centro de Compensación Automatizado S.A. | Banco de Chile | 33.33 | 33.33 | 7,159 | 6,784 | |||||||||||||
| Redbanc S.A. | Banco de Chile | 38.13 | 38.13 | 5,654 | 5,447 | |||||||||||||
| Sociedad Interbancaria de Depósitos de Valores S.A. | Banco de Chile | 26.81 | 26.81 | 2,772 | 2,704 | |||||||||||||
| Administrador Financiero de Transantiago S.A. | Banco de Chile | 20.00 | 20.00 | 2,296 | 2,210 | |||||||||||||
| Servicios de Infraestructura de Mercado OTC S.A. | Banco de Chile | 12.33 | 12.33 | 1,954 | 1,902 | |||||||||||||
| Sociedad Operadora de la Cámara de Compensación de Pagos de Alto Valor S.A. | Banco de Chile | 15.00 | 15.00 | 1,364 | 1,312 | |||||||||||||
| Subtotal Associates | 60,598 | 59,019 | ||||||||||||||||
| Joint Venture | ||||||||||||||||||
| Servipag Ltda. | Banco de Chile | 50.00 | 50.00 | 8,418 | 8,258 | |||||||||||||
| Subtotal Joint Venture | 8,418 | 8,258 | ||||||||||||||||
| Subtotal | 69,016 | 67,277 | ||||||||||||||||
| Minority Investments | ||||||||||||||||||
| Holding Bursátil Regional S.A. (1) | Banchile Corredores de Bolsa | 7,353 | 6,920 | |||||||||||||||
| Banco Latinoamericano de Comercio Exterior S.A. (Bladex) (1) | Banco de Chile | 2,077 | 2,103 | |||||||||||||||
| Bolsa Electrónica de Chile, Bolsa de Valores (1) | Banchile Corredores de Bolsa | 349 | 349 | |||||||||||||||
| Sociedad de Telecomunicaciones Financieras Interbancarias Mundiales (Swift) | Banco de Chile | 108 | 112 | |||||||||||||||
| CCLV Contraparte Central S.A. | Banchile Corredores de Bolsa | 8 | 8 | |||||||||||||||
| Subtotal Minority Investments | 9,895 | 9,492 | ||||||||||||||||
| Total | 78,911 | 76,769 | ||||||||||||||||
| (1) | Investments in shares have been irrevocably designated as at fair value through other comprehensive income and, therefore, are recorded at market value in accordance with IFRS 9. |
| (b) | The change of investments in companies registered under the equity method in the period of 2025 and 2024, are as follows: |
| March | March | |||||||
| 2025 | 2024 | |||||||
| MCh$ | MCh$ | |||||||
| Balance as of January 1, | 67,277 | 65,082 | ||||||
| Acquisition of investments in companies | — | — | ||||||
| Participation on income in companies with significant influence and joint control | 1,734 | 189 | ||||||
| Dividends received | — | — | ||||||
| Sale of participation in Artikos S.A. | — | — | ||||||
| Others | 5 | (1 | ) | |||||
| Total | 69,016 | 65,270 | ||||||
| (c) | During the period ended as of March 31, 2025 and 2024 no impairment has incurred in these investments. |
NOTES TO THE INTERIM CONSOLIDATED FINANCIAL STATEMENTS, continued
| 14. | Investments in other companies, continued: |
| (d) | Summarized Financial Information of Associates and Joint Ventures |
| Associates | Joint Venture | |||||||||||||||||||||||||||||||
| March 2025 | Centro de Compensación Automatizado S.A. |
Sociedad Operadora de la Cámara de Compensación de Pagos de Alto Valor S.A. |
Sociedad Interbancaria de Depósito de Valores S.A. |
Redbanc S.A. |
Transbank S.A. | Administrador Financiero de Transantiago S.A. |
Servicios de Infraestructura de Mercado OTC S.A. |
Servipag Ltda. | ||||||||||||||||||||||||
| MCh$ | MCh$ | MCh$ | MCh$ | MCh$ | MCh$ | MCh$ | MCh$ | |||||||||||||||||||||||||
| Current assets | 14,657 | 1,681 | 48 | 12,992 | 1,322,537 | 64,923 | 24,941 | 68,132 | ||||||||||||||||||||||||
| Non-current assets | 9,679 | 8,412 | 10,295 | 15,034 | 154,069 | 867 | 10,741 | 20,729 | ||||||||||||||||||||||||
| Total Assets | 24,336 | 10,093 | 10,343 | 28,026 | 1,476,606 | 65,790 | 35,682 | 88,861 | ||||||||||||||||||||||||
| Current liabilities | 3,422 | 1,022 | 542 | 11,336 | 1,316,292 | 52,964 | 19,572 | 64,926 | ||||||||||||||||||||||||
| Non-current liabilities | 108 | 362 | — | 2,092 | 10,671 | 2,389 | 739 | 7,099 | ||||||||||||||||||||||||
| Total Liabilities | 3,530 | 1,384 | 542 | 13,428 | 1,326,963 | 55,353 | 20,311 | 72,025 | ||||||||||||||||||||||||
| Equity | 20,806 | 8,709 | 9,801 | 14,598 | 149,643 | 10,437 | 15,362 | 16,836 | ||||||||||||||||||||||||
| Minority interest | — | — | — | — | — | — | 9 | — | ||||||||||||||||||||||||
| Total Liabilities and Equity | 24,336 | 10,093 | 10,343 | 28,026 | 1,476,606 | 65,790 | 35,682 | 88,861 | ||||||||||||||||||||||||
| Operating income | 3,628 | 1,281 | — | 10,465 | 147,467 | 858 | 1,806 | 6,943 | ||||||||||||||||||||||||
| Operating expenses | (2,392 | ) | (942 | ) | (2 | ) | (9,758 | ) | (122,070 | ) | (422 | ) | (1,446 | ) | (6,788 | ) | ||||||||||||||||
| Other expenses or income | 145 | 55 | 294 | 7 | (22,089 | ) | 152 | 132 | 266 | |||||||||||||||||||||||
| Gain (loss) before tax | 1,381 | 394 | 292 | 714 | 3,308 | 588 | 492 | 421 | ||||||||||||||||||||||||
| Income tax | (289 | ) | (83 | ) | — | (158 | ) | (482 | ) | (159 | ) | (106 | ) | (101 | ) | |||||||||||||||||
| Gain for the period | 1,092 | 311 | 292 | 556 | 2,826 | 429 | 386 | 320 | ||||||||||||||||||||||||
| Associates | Joint Venture | |||||||||||||||||||||||||||||||
| December 2024 | Centro de Compensación Automatizado S.A. |
Sociedad Operadora de la Cámara de Compensación de Pagos de Alto Valor S.A. |
Sociedad Interbancaria de Depósito de Valores S.A. |
Redbanc S.A. |
Transbank S.A. |
Administrador Financiero de Transantiago S.A. |
Servicios de Infraestructura de Mercado OTC S.A. |
Servipag Ltda. | ||||||||||||||||||||||||
| MCh$ | MCh$ | MCh$ | MCh$ | MCh$ | MCh$ | MCh$ | MCh$ | |||||||||||||||||||||||||
| Current assets | 13,958 | 1,737 | 60 | 15,347 | 1,814,213 | 58,605 | 11,562 | 101,289 | ||||||||||||||||||||||||
| Non-current assets | 9,462 | 8,223 | 10,036 | 14,062 | 161,533 | 887 | 11,538 | 21,034 | ||||||||||||||||||||||||
| Total Assets | 23,420 | 9,960 | 10,096 | 29,409 | 1,975,746 | 59,492 | 23,100 | 122,323 | ||||||||||||||||||||||||
| Current liabilities | 3,585 | 1,120 | 551 | 13,366 | 1,811,753 | 46,985 | 7,285 | 98,808 | ||||||||||||||||||||||||
| Non-current liabilities | 43 | 384 | — | 1,932 | 17,176 | 2,371 | 748 | 6,999 | ||||||||||||||||||||||||
| Total Liabilities | 3,628 | 1,504 | 551 | 15,298 | 1,828,929 | 49,356 | 8,033 | 105,807 | ||||||||||||||||||||||||
| Equity | 19,792 | 8,456 | 9,545 | 14,111 | 146,817 | 10,136 | 15,058 | 16,516 | ||||||||||||||||||||||||
| Minority interest | — | — | — | — | — | — | 9 | — | ||||||||||||||||||||||||
| Total Liabilities and Equity | 23,420 | 9,960 | 10,096 | 29,409 | 1,975,746 | 59,492 | 23,100 | 122,323 | ||||||||||||||||||||||||
| Operating income | 21,282 | 6,651 | 9 | 60,139 | 888,114 | 5,023 | 8,979 | 44,161 | ||||||||||||||||||||||||
| Operating expenses | (14,545 | ) | (5,843 | ) | (54 | ) | (58,167 | ) | (722,391 | ) | (2,541 | ) | (8,557 | ) | (40,929 | ) | ||||||||||||||||
| Other expenses or income | 741 | 390 | 1,848 | 234 | (154,142 | ) | 1,424 | 1,002 | 1,185 | |||||||||||||||||||||||
| Gain (loss) before tax | 7,478 | 1,198 | 1,803 | 2,206 | 11,581 | 3,906 | 1,424 | 4,417 | ||||||||||||||||||||||||
| Income tax | (1,853 | ) | (231 | ) | — | (467 | ) | (1,736 | ) | (855 | ) | (202 | ) | (1,066 | ) | |||||||||||||||||
| Gain for the year | 5,625 | 967 | 1,803 | 1,739 | 9,845 | 3,051 | 1,222 | 3,351 | ||||||||||||||||||||||||
NOTES TO THE INTERIM CONSOLIDATED FINANCIAL STATEMENTS, continued
| 15. | Intangible Assets: |
| (a) | The composition of intangible assets as of March 31, 2025 and December 31, 2024, are as follows: |
Average useful Life |
Average remaining amortization | Gross balance | Accumulated Amortization | Net balance | ||||||||||||||||||||||||||||||||||||
| March | December | March | December | March | December | March | December | March | December | |||||||||||||||||||||||||||||||
| 2025 | 2024 | 2025 | 2024 | 2025 | 2024 | 2025 | 2024 | 2025 | 2024 | |||||||||||||||||||||||||||||||
| Years | Years | Years | Years | MCh$ | MCh$ | MCh$ | MCh$ | MCh$ | MCh$ | |||||||||||||||||||||||||||||||
| Other independently originated intangible assets | 6 | 6 | 4 | 4 | 392,890 | 379,546 | (230,478 | ) | (220,990 | ) | 162,412 | 158,556 | ||||||||||||||||||||||||||||
| Total | 392,890 | 379,546 | (230,478 | ) | (220,990 | ) | 162,412 | 158,556 | ||||||||||||||||||||||||||||||||
| (b) | The change of intangible assets during the period ended as of March 31, 2025 and December 31, 2024, are as follows: |
| March | December | |||||||
| 2025 | 2024 | |||||||
| MCh$ | MCh$ | |||||||
| Gross Balance | ||||||||
| Balance as of January 1, | 379,546 | 322,148 | ||||||
| Acquisition | 13,884 | 57,617 | ||||||
| Disposals/ write-downs | (538 | ) | (219 | ) | ||||
| Reclassification | (2 | ) | — | |||||
| Impairment (*) | — | — | ||||||
| Total | 392,890 | 379,546 | ||||||
| Accumulated Amortization | ||||||||
| Balance as of January 1, | (220,990 | ) | (184,944 | ) | ||||
| Amortization for the period (**) | (10,026 | ) | (36,265 | ) | ||||
| Disposals/ write-downs | 538 | 219 | ||||||
| Impairment (*) | — | — | ||||||
| Total | (230,478 | ) | (220,990 | ) | ||||
| Balance Net | 162,412 | 158,556 | ||||||
| (*) | See Note No. 40 Impairment of non-financial assets. |
| (**) | See Note No. 39 Depreciation and Amortization. |
| (c) | As of March 31, 2025, the Bank maintains Ch$11,586 million (Ch$13,889 million as of December 31, 2024) of assets associated with technological developments in progress. |
| (d) | As of March 31, 2025 and December 31, 2024, there are no restrictions on the intangible assets of the Bank. Furthermore, there are no intangible assets held as collateral for the fulfillment of obligations. |
NOTES TO THE INTERIM CONSOLIDATED FINANCIAL STATEMENTS, continued
| 16. | Property and equipment: |
| (a) | The properties and equipment as of March 31, 2025 and December 31, 2024 are composed as follows: |
Average useful Life |
Average remaining depreciation | Gross balance | Accumulated Depreciation | Net balance | ||||||||||||||||||||||||||||||||||||
| March | December | March | December | March | December | March | December | March | December | |||||||||||||||||||||||||||||||
| 2025 | 2024 | 2025 | 2024 | 2025 | 2024 | 2025 | 2024 | 2025 | 2024 | |||||||||||||||||||||||||||||||
| Years | Years | Years | Years | MCh$ | MCh$ | MCh$ | MCh$ | MCh$ | MCh$ | |||||||||||||||||||||||||||||||
| Type of property and equipment: | ||||||||||||||||||||||||||||||||||||||||
| Land and Buildings | 25 | 26 | 17 | 18 | 327,551 | 327,862 | (174,932 | ) | (173,132 | ) | 152,619 | 154,730 | ||||||||||||||||||||||||||||
| Equipment | 5 | 5 | 3 | 3 | 262,750 | 261,142 | (238,398 | ) | (236,146 | ) | 24,352 | 24,996 | ||||||||||||||||||||||||||||
| Others | 7 | 7 | 4 | 4 | 63,805 | 63,198 | (54,166 | ) | (53,851 | ) | 9,639 | 9,347 | ||||||||||||||||||||||||||||
| Total | 654,106 | 652,202 | (467,496 | ) | (463,129 | ) | 186,610 | 189,073 | ||||||||||||||||||||||||||||||||
| (b) | The changes in properties and equipment as of March 31, 2025 and December 31, 2024, are as follows: |
| March 2025 | ||||||||||||||||
| Land and Buildings |
Equipment | Others | Total | |||||||||||||
| MCh$ | MCh$ | MCh$ | MCh$ | |||||||||||||
| Gross Balance | ||||||||||||||||
| Balance as of January 1, 2025 | 327,862 | 261,142 | 63,198 | 652,202 | ||||||||||||
| Additions | 1,083 | 2,469 | 931 | 4,483 | ||||||||||||
| Write-downs and sales of the period | (1,394 | ) | (856 | ) | (324 | ) | (2,574 | ) | ||||||||
| Impairment (**) | — | (5 | ) | — | (5 | ) | ||||||||||
| Total | 327,551 | 262,750 | 63,805 | 654,106 | ||||||||||||
| Accumulated Depreciation | ||||||||||||||||
| Balance as of January 1, 2025 | (173,132 | ) | (236,146 | ) | (53,851 | ) | (463,129 | ) | ||||||||
| Depreciation of the period (*) | (2,458 | ) | (3,105 | ) | (630 | ) | (6,193 | ) | ||||||||
| Write-downs and sales of the period | 658 | 853 | 315 | 1,826 | ||||||||||||
| Total | (174,932 | ) | (238,398 | ) | (54,166 | ) | (467,496 | ) | ||||||||
| Balance as of March 31, 2025 | 152,619 | 24,352 | 9,639 | 186,610 | ||||||||||||
| December 2024 | ||||||||||||||||
| Land and Buildings |
Equipment | Others | Total | |||||||||||||
| MCh$ | MCh$ | MCh$ | MCh$ | |||||||||||||
| Gross Balance | ||||||||||||||||
| Balance as of January 1, 2024 | 322,766 | 256,933 | 61,118 | 640,817 | ||||||||||||
| Additions | 7,369 | 5,286 | 3,699 | 16,354 | ||||||||||||
| Write-downs and sales of the year | (2,273 | ) | (1,075 | ) | (1,619 | ) | (4,967 | ) | ||||||||
| Impairment (***) | — | (2 | ) | — | (2 | ) | ||||||||||
| Total | 327,862 | 261,142 | 63,198 | 652,202 | ||||||||||||
| Accumulated Depreciation | ||||||||||||||||
| Balance as of January 1, 2024 | (165,286 | ) | (221,083 | ) | (52,791 | ) | (439,160 | ) | ||||||||
| Depreciation of the year | (9,725 | ) | (15,881 | ) | (2,566 | ) | (28,172 | ) | ||||||||
| Write-downs and sales of the year | 1,879 | 818 | 1,506 | 4,203 | ||||||||||||
| Total | (173,132 | ) | (234,146 | ) | (53,851 | ) | (463,129 | ) | ||||||||
| Balance as of December 31, 2024 | 154,730 | 24,996 | 9,347 | 189,073 | ||||||||||||
| (*) | See Note No. 39 Depreciation and Amortization. |
| (**) | See Note No. 40 Impairment of non-financial assets. |
| (***) | Does not include provision for write-off of Property for Ch$1,119 million as of December 31, 2024. |
| (c) | As of March 31, 2025, the Bank records Ch$8,296 million (Ch$5,510 million as of December 31, 2024) in assets under construction. |
| (d) | As of March 31, 2025 and December 31, 2024, there are no restrictions on the properties and equipment of the Bank and its subsidiaries. Furthermore, there are no properties and equipment held as collateral for the fulfillment of obligations. |
NOTES TO THE INTERIM CONSOLIDATED FINANCIAL STATEMENTS, continued
| 17. | Right-of-use assets and Lease liabilities: |
| (a) | The composition of the rights over leased assets as of March 31, 2025 and December 31, 2024, is as follows: |
Gross Balance |
Accumulated Depreciation | Net Balance |
||||||||||||||||||||||
| March | December | March | December | March | December | |||||||||||||||||||
| 2025 | 2024 | 2025 | 2024 | 2025 | 2024 | |||||||||||||||||||
| MCh$ | MCh$ | MCh$ | MCh$ | MCh$ | MCh$ | |||||||||||||||||||
| Categories | ||||||||||||||||||||||||
| Buildings | 123,951 | 126,655 | (65,974 | ) | (63,657 | ) | 57,977 | 62,998 | ||||||||||||||||
| Floor space for ATMs | 38,935 | 36,080 | (11,356 | ) | (9,307 | ) | 27,579 | 26,773 | ||||||||||||||||
| Improvements to leased properties | 28,728 | 28,783 | (21,923 | ) | (21,675 | ) | 6,805 | 7,108 | ||||||||||||||||
| Total | 191,614 | 191,518 | (99,253 | ) | (94,639 | ) | 92,361 | 96,879 | ||||||||||||||||
| (b) | The changes of the rights over leased assets as of March 31, 2025 and December 31, 2024, is as follows: |
| March 2025 | ||||||||||||||||
| Buildings | Floor space for ATMs |
Improvements to leased properties |
Total | |||||||||||||
| MCh$ | MCh$ | MCh$ | MCh$ | |||||||||||||
| Gross Balance | ||||||||||||||||
| Balance as of January 1, 2025 | 126,655 | 36,080 | 28,783 | 191,518 | ||||||||||||
| Additions | 177 | 2,971 | 13 | 3,161 | ||||||||||||
| Write-downs | (2,660 | ) | (116 | ) | (68 | ) | (2,844 | ) | ||||||||
| Remeasurement | (221 | ) | — | — | (221 | ) | ||||||||||
| Other incremental | — | — | — | — | ||||||||||||
| Total | 123,951 | 38,935 | 28,728 | 191,614 | ||||||||||||
| Accumulated Depreciation | ||||||||||||||||
| Balance as of January 1, 2025 | (63,657 | ) | (9,307 | ) | (21,675 | ) | (94,639 | ) | ||||||||
| Depreciation of the period (*) | (4,910 | ) | (2,165 | ) | (264 | ) | (7,339 | ) | ||||||||
| Write-downs | 2,660 | 116 | 16 | 2,792 | ||||||||||||
| Other incremental | (67 | ) | — | — | (67 | ) | ||||||||||
| Total | (65,974 | ) | (11,356 | ) | (21,923 | ) | (99,253 | ) | ||||||||
| Balance as of March 31, 2025 | 57,977 | 27,579 | 6,805 | 92,361 | ||||||||||||
| (*) | See Note No. 39 Depreciation and Amortization. |
|
December 2024 |
||||||||||||||||
| Buildings | Floor space for ATMs |
Improvements to leased properties |
Total | |||||||||||||
| MCh$ | MCh$ | MCh$ | MCh$ | |||||||||||||
| Gross Balance | ||||||||||||||||
| Balance as of January 1, 2024 | 145,849 | 33,060 | 30,426 | 209,335 | ||||||||||||
| Additions | 13,892 | 4,385 | 872 | 19,149 | ||||||||||||
| Write-downs | (33,019 | ) | (1,197 | ) | (2,515 | ) | (36,731 | ) | ||||||||
| Remeasurement | (67 | ) | (168 | ) | — | (235 | ) | |||||||||
| Other incremental | — | — | — | — | ||||||||||||
| Total | 126,655 | 36,080 | 28,783 | 191,518 | ||||||||||||
| Accumulated Depreciation | ||||||||||||||||
| Balance as of January 1, 2024 | (75,361 | ) | (2,669 | ) | (22,416 | ) | (100,446 | ) | ||||||||
| Depreciation of the year | (20,939 | ) | (7,733 | ) | (1,135 | ) | (29,807 | ) | ||||||||
| Write-downs | 32,638 | 1,123 | 1,876 | 35,637 | ||||||||||||
| Other incremental | 5 | (28 | ) | — | (23 | ) | ||||||||||
| Total | (63,657 | ) | (9,307 | ) | (21,675 | ) | (94,639 | ) | ||||||||
| Balance as of December 31, 2024 | 62,998 | 26,773 | 7,108 | 96,879 | ||||||||||||
| (c) | Below are the future maturities (including unearned interest) of the lease liabilities as of March 31, 2025 and December 31, 2024: |
| March 2025 | ||||||||||||||||||||||||||||||||
| Demand | Up to 1 month |
Over 1 month and up to 3 months |
Over 3 months and up to 12 months |
Over 1 year and up to 3 years |
Over 3 years and up to 5 years |
Over 5 years |
Total | |||||||||||||||||||||||||
| MCh$ | MCh$ | MCh$ | MCh$ | MCh$ | MCh$ | MCh$ | MCh$ | |||||||||||||||||||||||||
| Lease associated to: | ||||||||||||||||||||||||||||||||
| Buildings | — | 1,652 | 3,323 | 13,788 | 21,321 | 12,917 | 9,262 | 62,263 | ||||||||||||||||||||||||
| ATMs | — | 770 | 1,541 | 6,848 | 16,809 | 4,183 | 54 | 30,205 | ||||||||||||||||||||||||
| Total | — | 2,422 | 4,864 | 20,636 | 38,130 | 17,100 | 9,316 | 92,468 | ||||||||||||||||||||||||
| December 2024 | ||||||||||||||||||||||||||||||||
| Demand | Up to 1 month |
Over 1 month and up to 3 months |
Over 3 months and up to 12 months |
Over 1 year and up to 3 years |
Over 3 years and up to 5 years |
Over 5 years |
Total | |||||||||||||||||||||||||
| MCh$ | MCh$ | MCh$ | MCh$ | MCh$ | MCh$ | MCh$ | MCh$ | |||||||||||||||||||||||||
| Lease associated to: | ||||||||||||||||||||||||||||||||
| Buildings | — | 1,692 | 3,374 | 14,158 | 23,675 | 14,245 | 10,657 | 67,801 | ||||||||||||||||||||||||
| ATMs | — | 699 | 1,396 | 6,228 | 15,353 | 5,532 | 28 | 29,236 | ||||||||||||||||||||||||
| Total | — | 2,391 | 4,770 | 20,386 | 39,028 | 19,777 | 10,685 | 97,037 | ||||||||||||||||||||||||
NOTES TO THE INTERIM CONSOLIDATED FINANCIAL STATEMENTS, continued
| 17. | Right-of-use assets and Lease liabilities, continued: |
The Bank and its subsidiaries maintain contracts with certain renewal options and for which there is reasonable certainty that said option shall be carried out. In such cases, the lease period used to measure the liability and assets corresponds to an estimate of future renewals.
| (d) | The changes of the obligations for lease liabilities and the flows for the periods 2025 and 2024 are as follows: |
|
Total cash flow for the period |
||||
| MCh$ | ||||
| Lease liability | ||||
| Balances as of January 1, 2024 | 101,480 | |||
| Liabilities for new lease agreements | 1,734 | |||
| Interest accrued expenses | 624 | |||
| Payments of capital and interests | (7,245 | ) | ||
| Remeasurement | (520 | ) | ||
| Derecognized contracts | (380 | ) | ||
| Readjustments | 711 | |||
| Balances as of March 31, 2024 | 96,404 | |||
| Liabilities for new lease agreements | 12,914 | |||
| Interest accrued expenses | 1,757 | |||
| Payments of capital and interests | (22,746 | ) | ||
| Remeasurement | 285 | |||
| Derecognized contracts | (77 | ) | ||
| Readjustments | 2,892 | |||
| Balances as of December 31, 2024 | 91,429 | |||
| Liabilities for new lease agreements | 2,175 | |||
| Interest accrued expenses | 564 | |||
| Payments of capital and interests | (7,712 | ) | ||
| Remeasurement | (221 | ) | ||
| Derecognized contracts | — | |||
| Readjustments | 973 | |||
| Balances as of March 31, 2025 | 87,208 | |||
| (e) | The future cash flows related to short-term lease agreements in effect as of March 31, 2025 correspond to Ch$3,240 million (Ch$3,557 million as of December 31, 2024). |
| (f) | As of March 31, 2025, the minimum future rental income to be received from operating leases amounts to Ch$21,613 million (Ch$14,101 million as of December 31, 2024). |
NOTES TO THE INTERIM CONSOLIDATED FINANCIAL STATEMENTS, continued
| 18. | Taxes: |
| (a) | Current Taxes: |
The Bank and its subsidiaries at the end of each period, have constituted a First Category Income Tax Provision, which was determined based on current tax regulations, and has been reflected in the Interim Statement of Financial Position net of taxes to be recovered or payable, as applicable, as of March 31, 2025 and December 31, 2024 according to the following detail:
| March | December | |||||||
| 2025 | 2024 | |||||||
| MCh$ | MCh$ | |||||||
| Income tax | (71,499 | ) | (333,719 | ) | ||||
| Tax Previous year | 160,002 | — | ||||||
| Less: | ||||||||
| Monthly prepaid taxes | 58,023 | 483,615 | ||||||
| Credit for training expenses | — | 1,820 | ||||||
| Others | 800 | 8,021 | ||||||
| Total Tax Refundable (net) | 147,326 | 159,737 | ||||||
| Tax rate | 27 | % | 27 | % | ||||
| March | December | |||||||
| 2025 | 2024 | |||||||
| MCh$ | MCh$ | |||||||
| Current tax assets | 148,726 | 159,869 | ||||||
| Current tax liabilities | (1,400 | ) | (132 | ) | ||||
| Total tax receivable (payable), net | 147,326 | 159,737 | ||||||
| (b) | Income Tax: |
The effect of the tax expense during the periods between January 1 and March 31, 2025 and 2024, are broken down as follows:
| March | March | |||||||
| 2025 | 2024 | |||||||
| MCh$ | MCh$ | |||||||
| Income tax expense: | ||||||||
| Current year tax | 74,168 | 64,470 | ||||||
| Subtotal | 74,168 | 64,470 | ||||||
| (Credit) Debit for deferred taxes: | ||||||||
| Origin and reversal of temporary differences | 4,862 | 21,025 | ||||||
| Subtotal | 4,862 | 21,025 | ||||||
| Others | — | 184 | ||||||
| Net charge to income for income taxes | 79,030 | 85,679 | ||||||
NOTES TO THE INTERIM CONSOLIDATED FINANCIAL STATEMENTS, continued
| 18. | Taxes, continued: |
| (c) | Reconciliation of effective tax rate: |
The following is a reconciliation of the income tax rate to the effective rate applied to determine the Bank’s income tax expense as of March 31, 2025 and 2024:
| March 2025 | March 2024 | |||||||||||||||
| Tax rate | Tax rate | |||||||||||||||
| % | MCh$ | % | MCh$ | |||||||||||||
| Income tax calculated on net income before tax | 27.00 | 110,153 | 27.00 | 103,500 | ||||||||||||
| Additions or deductions | (0.73 | ) | (2,990 | ) | (1.17 | ) | (4,479 | ) | ||||||||
| Price-level restatement | (6.89 | ) | (28,095 | ) | (3.73 | ) | (14,293 | ) | ||||||||
| Others | (0.01 | ) | (38 | ) | 0.25 | 951 | ||||||||||
| Effective rate and income tax expense | 19.37 | 79,030 | 22.35 | 85,679 | ||||||||||||
The effective rate for income tax for the period 2025 is 19.37% (22.35% in March 2024).
| (d) | Effect of deferred taxes on income and equity: |
The Bank and its subsidiaries have recorded the effects of deferred taxes in their Interim Consolidated Financial Statements. Below are the debtor and creditor differences as of March 31, 2025:
| Balances as of December 31, |
Effect on | Balances as of March 31, |
||||||||||||||
| 2024 | Income | Equity | 2025 | |||||||||||||
| MCh$ | MCh$ | MCh$ | MCh$ | |||||||||||||
| Debit Differences: | ||||||||||||||||
| Allowances for loan losses | 384,945 | (8,038 | ) | — | 376,907 | |||||||||||
| Personnel provision | 24,636 | (9,846 | ) | — | 14,790 | |||||||||||
| Provision of undrawn credit lines | 3,237 | 7,509 | — | 10,746 | ||||||||||||
| Staff vacations provisions | 11,562 | (193 | ) | — | 11,369 | |||||||||||
| Accrued interests adjustments from impaired loans | 16,534 | 274 | — | 16,808 | ||||||||||||
| Staff severance indemnities provision | 1,004 | 11 | 17 | 1,032 | ||||||||||||
| Provision of credit cards expenses | 10,968 | (488 | ) | — | 10,480 | |||||||||||
| Provision of accrued expenses | 10,231 | (458 | ) | — | 9,773 | |||||||||||
| Adjustment for valuation of investments and equity instruments at fair value through other comprehensive income | 475 | — | (351 | ) | 124 | |||||||||||
| Leasing | 110,943 | 4,241 | — | 115,184 | ||||||||||||
| Incomes received in advance | 4,114 | (138 | ) | — | 3,976 | |||||||||||
| Exchange rate difference | — | 1,496 | — | 1,496 | ||||||||||||
| Property and equipment valuation difference | 6,800 | 728 | — | 7,528 | ||||||||||||
| Other adjustments | 23,483 | 884 | — | 24,367 | ||||||||||||
| Total Debit Differences | 608,932 | (4,018 | ) | (334 | ) | 604,580 | ||||||||||
| Credit Differences: | ||||||||||||||||
| Intangible (software and others) | 24,998 | 805 | 25,803 | |||||||||||||
| Adjustment for valuation of investments and equity instruments at fair value through other comprehensive income | — | — | — | — | ||||||||||||
| Transitory assets | 9,726 | 2,424 | — | 12,150 | ||||||||||||
| Loans accrued to effective rate | 2,333 | (27 | ) | — | 2,306 | |||||||||||
| Prepaid expenses | 6,400 | (1,137 | ) | — | 5,263 | |||||||||||
| Exchange rate difference | 801 | (801 | ) | — | ||||||||||||
| Activated bond placement expense | 4,895 | (304 | ) | — | 4,591 | |||||||||||
| Other adjustments | 3,116 | (116 | ) | — | 3,000 | |||||||||||
| Total Credit Differences | 52,269 | 844 | — | 53,113 | ||||||||||||
| Total, Net | 556,663 | (4,862 | ) | (334 | ) | 551,467 | ||||||||||
NOTES TO THE INTERIM CONSOLIDATED FINANCIAL STATEMENTS, continued
| 18. | Taxes, continued: |
| (d) | Effect of deferred taxes on income and equity, continued: |
Reconciliation to Interim Statement of Financial Position:
| March | December | |||||||
| 2025 | 2024 | |||||||
| MCh$ | MCh$ | |||||||
| Deferred tax assets | 553,227 | 556,829 | ||||||
| Deferred tax liabilities | (1,760 | ) | (166 | ) | ||||
| Total deferred taxes | 551,467 | 556,663 | ||||||
Below are the debtor and creditor differences as of December 31, 2024:
| Balances as of December 31, |
Effect on | Balances as of December 31, |
||||||||||||||
| 2023 | Income | Equity | 2024 | |||||||||||||
| MCh$ | MCh$ | MCh$ | MCh$ | |||||||||||||
| Debit Differences: | ||||||||||||||||
| Allowances for loan losses | 372,267 | 12,678 | — | 384,945 | ||||||||||||
| Personnel provision | 24,404 | 232 | — | 24,636 | ||||||||||||
| Provision of undrawn credit lines | 3,183 | 54 | — | 3,237 | ||||||||||||
| Staff vacations provisions | 12,025 | (463 | ) | — | 11,562 | |||||||||||
| Accrued interests adjustments from impaired loans | 14,937 | 1,597 | — | 16,534 | ||||||||||||
| Staff severance indemnities provision | 1,252 | (217 | ) | (31 | ) | 1,004 | ||||||||||
| Provision of credit cards expenses | 9,857 | 1,111 | — | 10,968 | ||||||||||||
| Provision of accrued expenses | 10,737 | (506 | ) | — | 10,231 | |||||||||||
| Adjustment for valuation of investments and equity instruments at fair value through other comprehensive income | 277 | — | 198 | 475 | ||||||||||||
| Leasing | 103,352 | 7,591 | — | 110,943 | ||||||||||||
| Incomes received in advance | 5,149 | (1,035 | ) | — | 4,114 | |||||||||||
| Exchange rate difference | — | — | — | — | ||||||||||||
| Property and equipment valuation difference | 2,876 | 3,924 | — | 6,800 | ||||||||||||
| Other adjustments | 31,009 | (7,526 | ) | — | 23,483 | |||||||||||
| Total Debit Differences | 591,325 | 17,440 | 167 | 608,932 | ||||||||||||
| Credit Differences: | ||||||||||||||||
| Intangible (software and others) | 19,085 | 5,913 | — | 24,998 | ||||||||||||
| Adjustment for valuation of investments and equity instruments at fair value through other comprehensive income | — | — | — | — | ||||||||||||
| Transitory assets | 8,874 | 852 | — | 9,726 | ||||||||||||
| Loans accrued to effective rate | 2,484 | (151 | ) | — | 2,333 | |||||||||||
| Prepaid expenses | 10,885 | (4,485 | ) | — | 6,400 | |||||||||||
| Exchange rate difference | 1,636 | (835 | ) | — | 801 | |||||||||||
| Activated bond placement expense | 5,257 | (362 | ) | — | 4,895 | |||||||||||
| Other adjustments | 3,286 | (170 | ) | — | 3,116 | |||||||||||
| Total Credit Differences | 51,507 | 762 | — | 52,269 | ||||||||||||
| Total, Net | 539,818 | 16,678 | 167 | 556,663 | ||||||||||||
NOTES TO THE INTERIM CONSOLIDATED FINANCIAL STATEMENTS, continued
| 18. | Taxes, continued: |
| (e) | For the purpose of complying with the Circular No. 47 issued by the Chilean Internal Revenue Service (SII) and No. 3,478 issued by the CMF, dated August 18, 2009 the changes and effects generated by the application of Article 31, No. 4 of the Income Tax Law are detailed below. |
As the circular requires, the information corresponds only to the Bank’s credit operations and does not consider operations of subsidiary entities that are consolidated in these Interim Consolidated Financial Statements.
| Tax value assets | ||||||||||||||||||||
|
(e.1) Loans and advance to banks and Loans to customers as of March 31, 2025 |
Book value assets (*) | Tax value assets | Past-due loans with guarantees | Past-due loans without guarantees |
Total Past-due loans |
|||||||||||||||
| MCh$ | MCh$ | MCh$ | MCh$ | MCh$ | ||||||||||||||||
| Loans and advance to banks | 1,699,865 | 1,700,765 | — | — | — | |||||||||||||||
| Commercial loans | 17,244,084 | 17,656,118 | 50,375 | 91,075 | 141,450 | |||||||||||||||
| Consumer loans | 5,148,528 | 5,645,971 | 1,015 | 33,394 | 34,409 | |||||||||||||||
| Residential mortgage loans | 13,459,612 | 13,510,567 | 15,332 | 600 | 15,932 | |||||||||||||||
| Total | 37,552,089 | 38,513,421 | 66,722 | 125,069 | 191,791 | |||||||||||||||
| Tax value assets | ||||||||||||||||||||
| (e.1) Loans and advance to banks and Loans to customers as of December 31, 2024 | Book value assets (*) | Tax value assets | Past-due loans with guarantees | Past-due loans without guarantees |
Total Past-due loans |
|||||||||||||||
| MCh$ | MCh$ | MCh$ | MCh$ | MCh$ | ||||||||||||||||
| Loans and advance to banks | 666,815 | 667,703 | — | — | — | |||||||||||||||
| Commercial loans | 17,209,033 | 17,619,880 | 48,979 | 94,025 | 143,004 | |||||||||||||||
| Consumer loans | 5,183,601 | 5,648,054 | 1,357 | 34,500 | 35,857 | |||||||||||||||
| Residential mortgage loans | 13,180,186 | 13,227,905 | 13,908 | 685 | 14,593 | |||||||||||||||
| Total | 36,239,635 | 37,163,542 | 64,244 | 129,210 | 193,454 | |||||||||||||||
| (*) | In accordance with the mentioned Circular and instructions from the SII, the value of Financial Statement assets, are presented on an individual basis (only Banco de Chile) net of allowance for loan losses and do not include lease and factoring operations. |
NOTES TO THE INTERIM CONSOLIDATED FINANCIAL STATEMENTS, continued
| 18. | Taxes, continued: |
| (e.2) Provisions on past-due loans | Balance as of January 1, 2025 |
Charge-offs against provisions |
Provisions established |
Provisions released |
Balance as of March 31, 2025 |
|||||||||||||||
| MCh$ | MCh$ | MCh$ | MCh$ | MCh$ | ||||||||||||||||
| Commercial loans | 94,025 | (16,179) | 25,742 | (12,513) | 91,075 | |||||||||||||||
| Consumer loans | 34,500 | (83,531 | ) | 86,572 | (4,147 | ) | 33,394 | |||||||||||||
| Residential mortgage loans | 685 | (416 | ) | 573 | (242 | ) | 600 | |||||||||||||
| Total | 129,210 | (100,126 | ) | 112,887 | (16,902 | ) | 125,069 | |||||||||||||
| (e.2) Provisions on past-due loans | Balance as of January 1, 2024 |
Charge-offs against provisions |
Provisions established |
Provisions released |
Balance as of December 31, 2024 |
|||||||||||||||
| MCh$ | MCh$ | MCh$ | MCh$ | MCh$ | ||||||||||||||||
| Commercial loans | 107,464 | (93,816 | ) | 123,192 | (42,815 | ) | 94,025 | |||||||||||||
| Consumer loans | 37,532 | (330,064 | ) | 348,148 | (21,116 | ) | 34,500 | |||||||||||||
| Residential mortgage loans | 586 | (1,610 | ) | 2,820 | (1,111 | ) | 685 | |||||||||||||
| Total | 145,582 | (425,490 | ) | 474,160 | (65,042 | ) | 129,210 | |||||||||||||
| March | December | |||||||
| (e.3) Charge-offs and recoveries | 2025 | 2024 | ||||||
| MCh$ | MCh$ | |||||||
| Charge-offs Art. 31 No. 4 second subparagraph | 8,815 | 26,248 | ||||||
| Write-offs resulting in provisions released | 35 | 77 | ||||||
| Recovery or renegotiation of written-off loans | 326 | 1,306 | ||||||
| March | December | |||||||
| (e.4) Application of Art. 31 No. 4 first & third subsections of the income tax law | 2025 | 2024 | ||||||
| MCh$ | MCh$ | |||||||
| Charge-offs in accordance with first subsection | — | — | ||||||
| Write-offs in accordance with third subsection | 35 | 77 | ||||||
NOTES TO THE INTERIM CONSOLIDATED FINANCIAL STATEMENTS, continued
| 19. | Other Assets: |
At the end of each period, the item is composed as follows:
| March | December | |||||||
| 2025 | 2024 | |||||||
| MCh$ | MCh$ | |||||||
| Cash collateral provided for derivative financial transactions | 361,482 | 347,788 | ||||||
| Accounts receivable from the General Treasury of the Republic and other fiscal organizations | 300,342 | 349,282 | ||||||
| Accounts receivable from third parties | 280,074 | 195,364 | ||||||
| Debtors from brokerage of financial instruments | 254,531 | 195,252 | ||||||
| Assets to be leased out as lessor (*) | 136,132 | 162,594 | ||||||
| Prepaid expenses | 57,693 | 53,645 | ||||||
| Other provided cash collateral | 39,739 | 14,806 | ||||||
| Income from regular activities from contracts with customers | 18,741 | 24,006 | ||||||
| Investment properties | 11,317 | 11,406 | ||||||
| Pending transactions | 2,683 | 3,351 | ||||||
| Accumulated impairment in respect of other assets receivable | (2,076 | ) | (1,817 | ) | ||||
| Other Assets | 17,302 | 17,864 | ||||||
| Total | 1,477,960 | 1,373,541 | ||||||
| (*) | Correspond to fixed assets to be delivered under the financial lease modality. |
NOTES TO THE INTERIM CONSOLIDATED FINANCIAL STATEMENTS, continued
| 20. | Non-current assets and disposal groups held for sale and Liabilities included in disposal groups for sale: |
| (a) | At the end of each period, the item is composed as follows: |
| March | December | |||||||
| 2025 | 2024 | |||||||
| MCh$ | MCh$ | |||||||
| Assets received in lieu of payment or awarded at judicial sale (*) | ||||||||
| Assets awarded at judicial sale | 28,957 | 27,854 | ||||||
| Assets received in lieu of payment | 3,612 | 5,075 | ||||||
| Provision for assets received in lieu of payment or awarded | (125 | ) | (82 | ) | ||||
| Non-current assets for sale | ||||||||
| Investments in other companies | — | — | ||||||
| Assets for recovery of assets transferred in financial leasing operations | 645 | 603 | ||||||
| Disposal groups held for sale | — | — | ||||||
| Total | 33,089 | 33,450 | ||||||
| (*) | Assets received in lieu of payment refer to assets accepted as payment for past-due or written-off debts owed by customers. The assets acquired in this manner does not exceed 20% of the Bank’s effective equity. |
| (b) | The changes of the provision for assets received in lieu of payment during the period 2025 and 2024 are as follows: |
| Provision for assets received in lieu of payment | MCh$ | |||
| Balance as of January 1, 2024 | 60 | |||
| Provisions used | (360 | ) | ||
| Provisions established | 388 | |||
| Provisions released | — | |||
| Balance as of March 31, 2024 | 88 | |||
| Provisions used | (1,530 | ) | ||
| Provisions established | 1,524 | |||
| Provisions released | — | |||
| Balance as of December 31, 2024 | 82 | |||
| Provisions used | (394 | ) | ||
| Provisions established | 437 | |||
| Provisions released | — | |||
| Balance as of March 31, 2025 | 125 | |||
| (c) | The Bank does not present liabilities classified in the disposal group for sale during the periods March 2025 and December 2024. |
NOTES TO THE INTERIM CONSOLIDATED FINANCIAL STATEMENTS, continued
| 21. | Financial liabilities held for trading at fair value through profit or loss: |
The item detail is as follows:
| March | December | |||||||
| 2025 | 2024 | |||||||
| MCh$ | MCh$ | |||||||
| Financial derivative contracts | 2,192,952 | 2,444,806 | ||||||
| Other financial instruments | 6,524 | 990 | ||||||
| Total | 2,199,476 | 2,445,796 | ||||||
| a) | As of March 31, 2025 and December 31, 2024, the Bank maintains the following debt portfolio of derivative instruments: |
| Notional amount of contract with final expiration date in | ||||||||||||||||||||||||||||||||||||||||||||||||||||||||||||||||||||||||
| Demand | Up to 1 month | Over 1 month and up to 3 months | Over 3 months and up to 12 months |
Over 1 year and up to 3 years |
Over 3 year and up to 5 years |
Over 5 years | Total | Fair value Liabilities |
||||||||||||||||||||||||||||||||||||||||||||||||||||||||||||||||
| March | December | March | December | March | December | March | December | March | December | March | December | March | December | March | December | March | December | |||||||||||||||||||||||||||||||||||||||||||||||||||||||
| 2025 | 2024 | 2025 | 2024 | 2025 | 2024 | 2025 | 2024 | 2025 | 2024 | 2025 | 2024 | 2025 | 2024 | 2025 | 2024 | 2025 | 2024 | |||||||||||||||||||||||||||||||||||||||||||||||||||||||
| MCh$ | MCh$ | MCh$ | MCh$ | MCh$ | MCh$ | MCh$ | MCh$ | MCh$ | MCh$ | MCh$ | MCh$ | MCh$ | MCh$ | MCh$ | MCh$ | MCh$ | MCh$ | |||||||||||||||||||||||||||||||||||||||||||||||||||||||
| Currency forward | — | — | 4,424,872 | 3,638,001 | 1,083,811 | 2,003,870 | 4,099,942 | 2,583,070 | 668,085 | 863,850 | 19,965 | — | — | — | 10,296,675 | 9,088,791 | 229,323 | 241,632 | ||||||||||||||||||||||||||||||||||||||||||||||||||||||
| Interest rate swap | — | — | 1,598,522 | 619,104 | 1,699,212 | 1,627,918 | 5,395,799 | 4,583,573 | 7,404,227 | 7,622,130 | 3,984,429 | 3,963,087 | 3,546,287 | 3,921,627 | 23,628,476 | 22,337,439 | 531,303 | 650,580 | ||||||||||||||||||||||||||||||||||||||||||||||||||||||
| Interest rate swap and cross currency swap | — | — | 265,540 | 96,844 | 764,939 | 198,892 | 2,009,813 | 2,331,613 | 2,924,153 | 2,909,482 | 2,017,987 | 1,978,681 | 3,004,977 | 2,879,356 | 10,987,409 | 10,394,868 | 1,428,727 | 1,547,488 | ||||||||||||||||||||||||||||||||||||||||||||||||||||||
| Call currency options | — | — | 5,979 | 10,499 | 20,969 | 38,376 | 27,731 | 18,825 | 157 | — | — | — | — | — | 54,836 | 67,700 | 1,587 | 4,151 | ||||||||||||||||||||||||||||||||||||||||||||||||||||||
| Put currency options | — | — | 5,330 | 4,761 | 38,252 | 46,913 | 46,563 | 64,449 | 6,871 | 11,340 | — | — | — | — | 97,016 | 127,463 | 2,012 | 955 | ||||||||||||||||||||||||||||||||||||||||||||||||||||||
| Total | — | — | 6,300,243 | 4,369,209 | 3,607,183 | 3,915,969 | 11,579,848 | 9,581,530 | 11,003,493 | 11,406,802 | 6,022,381 | 5,941,768 | 6,551,264 | 6,800,983 | 45,064,412 | 42,016,261 | 2,192,952 | 2,444,806 | ||||||||||||||||||||||||||||||||||||||||||||||||||||||
| b) | Other instruments or financial liabilities: |
| March | December | |||||||
| 2025 | 2024 | |||||||
| MCh$ | MCh$ | |||||||
| Current accounts and other demand deposits | — | — | ||||||
| Savings accounts and other time deposits | — | — | ||||||
| Debt instruments issued | — | — | ||||||
| Others | 6,524 | 990 | ||||||
| Total | 6,524 | 990 | ||||||
NOTES TO THE INTERIM CONSOLIDATED FINANCIAL STATEMENTS, continued
| 22. | Financial liabilities at amortized cost: |
The item detail is as follows:
| March | December | |||||||
| 2025 | 2024 | |||||||
| MCh$ | MCh$ | |||||||
| Current accounts and other demand deposits | 14,560,376 | 14,263,303 | ||||||
| Saving accounts and time deposits | 15,507,444 | 14,168,703 | ||||||
| Obligations by repurchase agreements and securities lending | 141,790 | 109,794 | ||||||
| Borrowings from financial institutions | 1,312,028 | 1,103,468 | ||||||
| Debt financial instruments issued | 9,989,666 | 9,690,069 | ||||||
| Other financial obligations | 320,709 | 284,479 | ||||||
| Total | 41,832,013 | 39,619,816 | ||||||
| (a) | Current accounts and other demand deposits: |
At the end of each period, the composition of current accounts and other demand deposits is as follows:
| March | December | |||||||
| 2025 | 2024 | |||||||
| MCh$ | MCh$ | |||||||
| Current accounts | 11,605,548 | 11,769,419 | ||||||
| Other demand obligations | 1,840,697 | 1,382,554 | ||||||
| Demand deposits accounts | 653,228 | 652,075 | ||||||
| Other demand deposits | 460,903 | 459,255 | ||||||
| Total | 14,560,376 | 14,263,303 | ||||||
| (b) | Saving accounts and time deposits: |
At the end of each period, the composition of saving accounts and time deposits is as follows:
| March | December | |||||||
| 2025 | 2024 | |||||||
| MCh$ | MCh$ | |||||||
| Time deposits | 15,096,815 | 13,764,830 | ||||||
| Term savings accounts | 388,232 | 374,593 | ||||||
| Other term balances payable | 22,397 | 29,280 | ||||||
| Total | 15,507,444 | 14,168,703 | ||||||
NOTES TO THE INTERIM CONSOLIDATED FINANCIAL STATEMENTS, continued
| 22. | Financial liabilities at amortized cost, continued: |
| (c) | Obligations by repurchase agreements and securities lending: |
The Bank obtains financing by selling financial instruments and agreeing to repurchase them in the future, plus interest at a prefixed rate. As of March 31, 2025 and December 31, 2024, the repurchase agreements are the following:
| March | December | |||||||
| 2025 | 2024 | |||||||
| MCh$ | MCh$ | |||||||
| Transaction with domestic banks | — | — | ||||||
| Transaction with foreign banks | — | — | ||||||
| Transaction with other domestic entities | ||||||||
| Repurchase agreements | 141,790 | 109,794 | ||||||
| Transaction with other foreign entities | — | — | ||||||
| Total | 141,790 | 109,794 | ||||||
The fair value of the financial instruments delivered as collateral by the Bank and its subsidiaries, in sales transactions with repurchase agreement and securities lending as of March 31, 2025 amounts to Ch$141,627 million (Ch$109,505 million in December 2024). In the event that the Bank and its subsidiaries enter into default or bankruptcy, the counterparty is authorized to sell or deliver these investments as collateral.
| (d) | Borrowings from Financial Institutions: |
At the end of each period, borrowings from financial institutions are detailed as follows:
| March | December | |||||||
| 2025 | 2024 | |||||||
| MCh$ | MCh$ | |||||||
| Foreign banks | ||||||||
| Foreign trade financing | ||||||||
| HSBC Bank | 327,104 | 245,469 | ||||||
| Bank of New York Mellon | 230,966 | 240,008 | ||||||
| Bank of America | 214,859 | 124,057 | ||||||
| Zurcher Kantonalbank | 144,422 | 90,386 | ||||||
| Caixabank S.A. | 144,407 | 201,802 | ||||||
| Citibank N.A. United States | 49,636 | 2,189 | ||||||
| DZ Bank AG Deutsche | 40,370 | 41,646 | ||||||
| Standard Chartered Bank | 2,530 | 2,685 | ||||||
| Commerzbank AG | 1,721 | 1,417 | ||||||
| Wells Fargo Bank | 348 | 1,890 | ||||||
| Others | 46 | 71 | ||||||
| Borrowings and other obligations | ||||||||
| Wells Fargo Bank | 146,903 | 150,775 | ||||||
| Deutsche Bank Trust Company Americas | 8,416 | 87 | ||||||
| Citibank N.A. United Kingdom | 300 | 986 | ||||||
| Subtotal foreign banks | 1,312,028 | 1,103,468 | ||||||
| Chilean Central Bank (*) | — | — | ||||||
| Total | 1,312,028 | 1,103,468 | ||||||
NOTES TO THE INTERIM CONSOLIDATED FINANCIAL STATEMENTS, continued
| 22. | Financial liabilities at amortized cost, continued: |
| (e) | Debt financial instruments issued: |
At the end of each period, the composition of debt financial instruments issued as follows:
| March | December | |||||||
| 2025 | 2024 | |||||||
| MCh$ | MCh$ | |||||||
| Letters of credit | ||||||||
| Letters of credit for housing | 717 | 849 | ||||||
| Letters of credit for general purposes | — | 1 | ||||||
| Bonds | ||||||||
| Current Bonds | 9,988,949 | 9,689,219 | ||||||
| Mortgage bonds | — | — | ||||||
| Total | 9,989,666 | 9,690,069 | ||||||
During the period ended March 31, 2025 Banco de Chile has placed bonds for Ch$373,284 million, which corresponds to Short-Term Current Bonds and Long-Term Bonds for amounts of Ch$299,031 and Ch$74,253 million respectively, according to the following details:
Short-term Bonds
| Counterparty | Currency | Amount MCh$ |
Annual interest rate % |
Issued date |
Maturity date |
|||||||||
| Wells Fargo Bank | USD | 98,630 | 4.68 | 01/27/2025 | 05/02/2025 | |||||||||
| Wells Fargo Bank | USD | 98,630 | 4.65 | 01/27/2025 | 08/01/2025 | |||||||||
| Wells Fargo Bank | USD | 92,519 | 4.55 | 03/07/2025 | 04/07/2025 | |||||||||
| Wells Fargo Bank | USD | 9,252 | 4.45 | 03/07/2025 | 09/05/2025 | |||||||||
| Total | 299,031 | |||||||||||||
Long-Term Bonds
| Serie | Currency | Amount MCh$ |
Terms Years |
Annual interest rate % |
Issued date |
Maturity date |
||||||||||||
| BCHIFC0721 | UF | 22,830 | 5 | 2.97 | 03/17/2025 | 01/01/2030 | ||||||||||||
| BCHIFC0721 | UF | 11,422 | 5 | 2.97 | 03/20/2025 | 01/01/2030 | ||||||||||||
| BCHIFC0721 | UF | 40,001 | 5 | 2.97 | 03/21/2025 | 01/01/2030 | ||||||||||||
| Total | 74,253 | |||||||||||||||||
NOTES TO THE INTERIM CONSOLIDATED FINANCIAL STATEMENTS, continued
| 22. | Financial liabilities at amortized cost, continued: |
During the year ended December 31, 2024 Banco de Chile has placed bonds for Ch$1,012,638 million, which corresponds to Short-Term Current Bonds and Long-Term Bonds for amounts of Ch$28,049 and Ch$984,589 million respectively, according to the following details:
Short-term Bonds
| Counterparty | Currency | Amount MCh$ |
Annual interest rate % |
Issued date |
Maturity date |
|||||||||
| Wells Fargo Bank | USD | 28,049 | 5.46 | 05/07/2024 | 08/07/2024 | |||||||||
| Total | 28,049 | |||||||||||||
Long-Term Bonds
| Serie | Currency | Amount MCh$ |
Terms Years |
Annual interest rate % |
Issued date |
Maturity date |
||||||||||||
| BCHIEZ1121 | UF | 107,462 | 4 | 3.72 | 01/15/2024 | 05/01/2028 | ||||||||||||
| BCHIEZ1121 | UF | 31,197 | 4 | 3.72 | 01/16/2024 | 05/01/2028 | ||||||||||||
| BCHICE1215 | UF | 21,998 | 7 | 3.20 | 01/31/2024 | 12/01/2031 | ||||||||||||
| BCHICH1215 | UF | 7,350 | 8 | 3.15 | 02/08/2024 | 12/01/2032 | ||||||||||||
| BCHIFA0222 | UF | 32,349 | 4 | 3.25 | 03/15/2024 | 08/01/2028 | ||||||||||||
| BCHIFA0222 | UF | 19,518 | 4 | 3.32 | 03/21/2024 | 08/01/2028 | ||||||||||||
| BCHIEY1021 | UF | 12,474 | 4 | 3.29 | 03/22/2024 | 04/01/2028 | ||||||||||||
| BCHIFA0222 | UF | 14,228 | 4 | 3.29 | 03/25/2024 | 08/01/2028 | ||||||||||||
| BCHIGG1121 | UF | 12,345 | 11 | 3.35 | 03/26/2024 | 05/01/2035 | ||||||||||||
| BCHIFA0222 | UF | 3,566 | 4 | 3.24 | 03/27/2024 | 08/01/2028 | ||||||||||||
| BCHIEY1021 | UF | 17,696 | 4 | 3.28 | 04/04/2024 | 04/01/2028 | ||||||||||||
| BCHIEX0122 | UF | 9,231 | 1 | 3.10 | 04/12/2024 | 07/01/2025 | ||||||||||||
| BCHIEX0122 | UF | 14,793 | 1 | 3.02 | 04/17/2024 | 07/01/2025 | ||||||||||||
| BCHIHX1223 | UF | 32,225 | 20 | 3.49 | 05/08/2024 | 12/01/2044 | ||||||||||||
| BCHIHX1223 | UF | 11,376 | 20 | 3.49 | 05/09/2024 | 12/01/2044 | ||||||||||||
| BCHIHX1223 | UF | 5,727 | 20 | 3.46 | 05/17/2024 | 12/01/2044 | ||||||||||||
| BCHIHX1223 | UF | 15,283 | 20 | 3.46 | 05/22/2024 | 12/01/2044 | ||||||||||||
| BCHIHX1223 | UF | 37,202 | 20 | 3.55 | 06/04/2024 | 12/01/2044 | ||||||||||||
| BCHIFO0721 | UF | 3,575 | 8 | 3.48 | 06/06/2024 | 01/01/2032 | ||||||||||||
| BCHIEY1021 | UF | 3,606 | 4 | 3.20 | 06/10/2024 | 04/01/2028 | ||||||||||||
| BCHIGG1121 | UF | 8,366 | 11 | 3.53 | 06/11/2024 | 05/01/2035 | ||||||||||||
| BCHIFB1021 | UF | 21,220 | 5 | 3.35 | 06/12/2024 | 04/01/2029 | ||||||||||||
| BCHIEY1021 | UF | 12,648 | 4 | 3.29 | 07/09/2024 | 04/01/2028 | ||||||||||||
| BCHIFB1021 | UF | 39,504 | 5 | 3.50 | 07/09/2024 | 04/01/2029 | ||||||||||||
| BCHIFB1021 | UF | 1,796 | 5 | 3.49 | 07/09/2024 | 04/01/2029 | ||||||||||||
| BCHIFB1021 | UF | 5,399 | 5 | 3.45 | 07/10/2024 | 04/01/2029 | ||||||||||||
| BCHIFC0721 | UF | 37,442 | 6 | 3.47 | 07/11/2024 | 01/01/2030 | ||||||||||||
| BCHIFC0721 | UF | 7,147 | 6 | 3.43 | 07/12/2024 | 01/01/2030 | ||||||||||||
| BCHIHX1223 | UF | 7,550 | 20 | 3.50 | 07/18/2024 | 12/01/2044 | ||||||||||||
| BCHIFB1021 | UF | 25,454 | 5 | 3.23 | 07/23/2024 | 04/01/2029 | ||||||||||||
| BCHIFA0222 | UF | 18,404 | 4 | 3.04 | 07/24/2024 | 08/01/2028 | ||||||||||||
| BCHIFO0721 | UF | 19,198 | 8 | 2.50 | 09/27/2024 | 01/01/2032 | ||||||||||||
| BCHIHX1223 | UF | 94,840 | 20 | 2.36 | 09/30/2024 | 12/01/2044 | ||||||||||||
| BCHIHP1223 | UF | 220,035 | 16 | 2.37 | 10/01/2024 | 12/01/2040 | ||||||||||||
| Subtotal | 932,204 | |||||||||||||||||
| BONO HKD | HKD | 52,385 | 10 | 4.22 | 02/02/2024 | 02/09/2034 | ||||||||||||
| Subtotal other currencies | 52,385 | |||||||||||||||||
| Total | 984,589 | |||||||||||||||||
NOTES TO THE INTERIM CONSOLIDATED FINANCIAL STATEMENTS, continued
| 22. | Financial liabilities at amortized cost, continued: |
As of March 31, 2025 and December 31, 2024, the Bank has not presented defaults in the payment of principal and interest on its debt instruments. Likewise, there have been no breaches of covenants and other commitments associated with the debt instruments issued.
| (f) | Other Financial Obligations: |
At the end of each period, the composition of other financial obligations as follows:
| March | December | |||||||
| 2025 | 2024 | |||||||
| MCh$ | MCh$ | |||||||
| Other Chilean financial obligations | 320,709 | 284,479 | ||||||
| Other financial obligations with the Public sector | — | — | ||||||
| Total | 320,709 | 284,479 | ||||||
| 23. | Financial instruments of regulatory capital issued: |
| a) | At the end of each period, this item is composed as follows: |
| March | December | |||||||
| 2025 | 2024 | |||||||
| MCh$ | MCh$ | |||||||
| Subordinated bonds | ||||||||
| Subordinated bonds with transitory recognition | — | — | ||||||
| Subordinated bonds | 1,087,573 | 1,068,879 | ||||||
| Bonds with no fixed term of maturity | — | — | ||||||
| Preferred stock | — | — | ||||||
| Total | 1,087,573 | 1,068,879 | ||||||
| b) | Issuances of regulatory capital financial instruments in the period: |
As of March 31, 2025 and December 31, 2024, no issues of regulatory capital financial instruments have been made.
NOTES TO THE INTERIM CONSOLIDATED FINANCIAL STATEMENTS, continued
| 23. | Financial instruments of regulatory capital issued, continued: |
| c) | Changes in regulatory capital financial instruments: |
| Subordinated bonds |
Bonds with no maturity |
Preferred shares |
||||||||||
| MCh$ | MCh$ | MCh$ | ||||||||||
| Balance as of January 1, 2024 | 1,039,814 | — | — | |||||||||
| Emissions made | — | — | — | |||||||||
| Transaction costs | — | — | — | |||||||||
| Transaction costs amortization | — | — | — | |||||||||
| Accrued interest | 34,551 | — | — | |||||||||
| Acquisition or redemption by the issuer | — | — | — | |||||||||
| Modification of the issuance conditions | — | — | — | |||||||||
| Interest and UF indexation payments to the holder | (41,432 | ) | — | — | ||||||||
| Principal payments to the holder | (9,205 | ) | — | — | ||||||||
| Accrued UF indexation | 45,151 | — | — | |||||||||
| Exchange rate differences | — | — | — | |||||||||
| Depreciation | — | — | — | |||||||||
| Reappraisal | — | — | — | |||||||||
| Expiration | — | — | — | |||||||||
| Conversion to common shares | — | — | — | |||||||||
| Balance as of December 31, 2024 | 1,068,879 | — | — | |||||||||
| Balance as of January 1, 2025 | 1,068,879 | — | — | |||||||||
| Emissions made | — | — | — | |||||||||
| Transaction costs | — | — | — | |||||||||
| Transaction costs amortization | — | — | — | |||||||||
| Accrued interest | 8,704 | — | — | |||||||||
| Acquisition or redemption by the issuer | — | — | — | |||||||||
| Modification of the issuance conditions | — | — | — | |||||||||
| Interest and UF indexation payments to the holder | (2,269 | ) | — | — | ||||||||
| Principal payments to the holder | (871 | ) | — | — | ||||||||
| Accrued UF indexation | 13,130 | — | — | |||||||||
| Exchange rate differences | — | — | — | |||||||||
| Depreciation | — | — | — | |||||||||
| Reappraisal | — | — | — | |||||||||
| Expiration | — | — | — | |||||||||
| Conversion to common shares | — | — | — | |||||||||
| Balance as of March 31, 2025 | 1,087,573 | — | — | |||||||||
NOTES TO THE INTERIM CONSOLIDATED FINANCIAL STATEMENTS, continued
| 23. | Financial instruments of regulatory capital issued, continued: |
| d) | Below is the detail of the subordinated bonds due as of March 31, 2025 and December 31, 2024: |
| March 2025 | ||||||||||||||||||
| Serie | Currency | Issuance currency amount | Interest rate % |
Registration date | Maturity date | Balance due MCh$ |
||||||||||||
| C1 | UF | 300,000 | 7.5 | 12/06/1999 | 01/01/2030 | 4,376 | ||||||||||||
| C1 | UF | 200,000 | 7.4 | 12/06/1999 | 01/01/2030 | 2,921 | ||||||||||||
| C1 | UF | 530,000 | 7.1 | 12/06/1999 | 01/01/2030 | 7,788 | ||||||||||||
| C1 | UF | 300,000 | 7.1 | 12/06/1999 | 01/01/2030 | 4,410 | ||||||||||||
| C1 | UF | 50,000 | 6.5 | 12/06/1999 | 01/01/2030 | 744 | ||||||||||||
| C1 | UF | 450,000 | 6.6 | 12/06/1999 | 01/01/2030 | 6,696 | ||||||||||||
| D1 | UF | 2,000,000 | 3.6 | 06/20/2002 | 04/01/2026 | 10,556 | ||||||||||||
| F | UF | 1,000,000 | 5.0 | 11/28/2008 | 11/01/2033 | 38,280 | ||||||||||||
| F | UF | 1,500,000 | 5.0 | 11/28/2008 | 11/01/2033 | 57,420 | ||||||||||||
| F | UF | 759,000 | 4.5 | 11/28/2008 | 11/01/2033 | 30,054 | ||||||||||||
| F | UF | 241,000 | 4.5 | 11/28/2008 | 11/01/2033 | 9,543 | ||||||||||||
| F | UF | 4,130,000 | 4.2 | 11/28/2008 | 11/01/2033 | 166,351 | ||||||||||||
| F | UF | 1,000,000 | 4.3 | 11/28/2008 | 11/01/2033 | 40,278 | ||||||||||||
| F | UF | 70,000 | 4.2 | 11/28/2008 | 11/01/2033 | 2,827 | ||||||||||||
| F | UF | 4,000,000 | 3.9 | 11/28/2008 | 11/01/2033 | 165,591 | ||||||||||||
| F | UF | 2,300,000 | 3.8 | 11/28/2008 | 11/01/2033 | 95,543 | ||||||||||||
| G | UF | 600,000 | 4.0 | 11/29/2011 | 11/01/2036 | 23,201 | ||||||||||||
| G | UF | 50,000 | 4.0 | 11/29/2011 | 11/01/2036 | 1,933 | ||||||||||||
| G | UF | 80,000 | 3.9 | 11/29/2011 | 11/01/2036 | 3,113 | ||||||||||||
| G | UF | 450,000 | 3.9 | 11/29/2011 | 11/01/2036 | 17,527 | ||||||||||||
| G | UF | 160,000 | 3.9 | 11/29/2011 | 11/01/2036 | 6,232 | ||||||||||||
| G | UF | 1,000,000 | 2.7 | 11/29/2011 | 11/01/2036 | 43,582 | ||||||||||||
| G | UF | 300,000 | 2.7 | 11/29/2011 | 11/01/2036 | 13,075 | ||||||||||||
| G | UF | 1,360,000 | 2.6 | 11/29/2011 | 11/01/2036 | 59,436 | ||||||||||||
| J | UF | 1,400,000 | 1.0 | 11/29/2011 | 11/01/2042 | 79,007 | ||||||||||||
| J | UF | 1,500,000 | 1.0 | 11/29/2011 | 11/01/2042 | 84,762 | ||||||||||||
| J | UF | 1,100,000 | 1.0 | 11/29/2011 | 11/01/2042 | 62,584 | ||||||||||||
| I | UF | 900,000 | 1.0 | 11/29/2011 | 11/01/2040 | 49,743 | ||||||||||||
| Total subordinated bonds due | 1,087,573 | |||||||||||||||||
NOTES TO THE INTERIM CONSOLIDATED FINANCIAL STATEMENTS, continued
| 23. | Financial instruments of regulatory capital issued, continued: |
| December 2024 | ||||||||||||||||||
| Serie | Currency | Issuance currency amount |
Interest rate % |
Registration date | Maturity date | Balance due MCh$ |
||||||||||||
| C1 | UF | 300,000 | 7.5 | 12/06/1999 | 01/01/2030 | 4,761 | ||||||||||||
| C1 | UF | 200,000 | 7.4 | 12/06/1999 | 01/01/2030 | 3,178 | ||||||||||||
| C1 | UF | 530,000 | 7.1 | 12/06/1999 | 01/01/2030 | 8,472 | ||||||||||||
| C1 | UF | 300,000 | 7.1 | 12/06/1999 | 01/01/2030 | 4,797 | ||||||||||||
| C1 | UF | 50,000 | 6.5 | 12/06/1999 | 01/01/2030 | 809 | ||||||||||||
| C1 | UF | 450,000 | 6.6 | 12/06/1999 | 01/01/2030 | 7,283 | ||||||||||||
| D1 | UF | 2,000,000 | 3.6 | 06/20/2002 | 04/01/2026 | 10,335 | ||||||||||||
| F | UF | 1,000,000 | 5.0 | 11/28/2008 | 11/01/2033 | 37,358 | ||||||||||||
| F | UF | 1,500,000 | 5.0 | 11/28/2008 | 11/01/2033 | 56,037 | ||||||||||||
| F | UF | 759,000 | 4.5 | 11/28/2008 | 11/01/2033 | 29,365 | ||||||||||||
| F | UF | 241,000 | 4.5 | 11/28/2008 | 11/01/2033 | 9,324 | ||||||||||||
| F | UF | 4,130,000 | 4.2 | 11/28/2008 | 11/01/2033 | 162,631 | ||||||||||||
| F | UF | 1,000,000 | 4.3 | 11/28/2008 | 11/01/2033 | 39,377 | ||||||||||||
| F | UF | 70,000 | 4.2 | 11/28/2008 | 11/01/2033 | 2,764 | ||||||||||||
| F | UF | 4,000,000 | 3.9 | 11/28/2008 | 11/01/2033 | 162,042 | ||||||||||||
| F | UF | 2,300,000 | 3.8 | 11/28/2008 | 11/01/2033 | 93,507 | ||||||||||||
| G | UF | 600,000 | 4.0 | 11/29/2011 | 11/01/2036 | 22,697 | ||||||||||||
| G | UF | 50,000 | 4.0 | 11/29/2011 | 11/01/2036 | 1,891 | ||||||||||||
| G | UF | 80,000 | 3.9 | 11/29/2011 | 11/01/2036 | 3,046 | ||||||||||||
| G | UF | 450,000 | 3.9 | 11/29/2011 | 11/01/2036 | 17,149 | ||||||||||||
| G | UF | 160,000 | 3.9 | 11/29/2011 | 11/01/2036 | 6,097 | ||||||||||||
| G | UF | 1,000,000 | 2.7 | 11/29/2011 | 11/01/2036 | 42,768 | ||||||||||||
| G | UF | 300,000 | 2.7 | 11/29/2011 | 11/01/2036 | 12,831 | ||||||||||||
| G | UF | 1,360,000 | 2.6 | 11/29/2011 | 11/01/2036 | 58,330 | ||||||||||||
| J | UF | 1,400,000 | 1.0 | 11/29/2011 | 11/01/2042 | 77,836 | ||||||||||||
| J | UF | 1,500,000 | 1.0 | 11/29/2011 | 11/01/2042 | 83,509 | ||||||||||||
| J | UF | 1,100,000 | 1.0 | 11/29/2011 | 11/01/2042 | 61,667 | ||||||||||||
| I | UF | 900,000 | 1.0 | 11/29/2011 | 11/01/2040 | 49,018 | ||||||||||||
| Total subordinated bonds due | 1,068,879 | |||||||||||||||||
| 24. | Provisions for contingencies: |
| (a) | At the end of each period, this item is composed as follows: |
| March | December | |||||||
| 2025 | 2024 | |||||||
| MCh$ | MCh$ | |||||||
| Provisions for employee benefit obligations | 108,450 | 151,633 | ||||||
| Provisions for obligations of customer loyalty and merit programs | 38,816 | 40,621 | ||||||
| Provisions for lawsuits and litigation | 1,849 | 1,592 | ||||||
| Provisions for operational risk | 554 | 907 | ||||||
| Provisions of a bank branch abroad for profit remittances to its parent company | — | — | ||||||
| Provisions for reestructuring plans | — | — | ||||||
| Other provisions for contingencies | — | — | ||||||
| Total | 149,669 | 194,753 | ||||||
NOTES TO THE INTERIM CONSOLIDATED FINANCIAL STATEMENTS, continued
| 24. | Provisions for contingencies, continued; |
| (b) | The following table shows the changes in provisions during the period 2025 and 2024: |
| Provisions for employee benefit obligations |
Provisions of a bank branch abroad for profit remittances to its parent company |
Provisions for reestructuring plans |
Provisions for lawsuits and litigation |
Provisions for obligations of customer loyalty and merit programs |
Provisions for operational risk |
Other provisions for contingencies |
Total | |||||||||||||||||||||||||
| MCh$ | MCh$ | MCh$ | MCh$ | MCh$ | MCh$ | MCh$ | MCh$ | |||||||||||||||||||||||||
| Balances as of January 1, 2024 | 154,132 | — | — | 1,173 | 36,242 | 341 | 264 | 192,152 | ||||||||||||||||||||||||
| Provisions established | 27,899 | — | — | 220 | 4,207 | 81 | — | 32,407 | ||||||||||||||||||||||||
| Provisions used | (72,742 | ) | — | — | (225 | ) | — | (82 | ) | — | (73,049 | ) | ||||||||||||||||||||
| Provisions released | — | — | — | (64 | ) | — | (23 | ) | — | (87 | ) | |||||||||||||||||||||
| Balances as of March 31, 2024 | 109,289 | — | — | 1,104 | 40,449 | 317 | 264 | 151,423 | ||||||||||||||||||||||||
| Provisions established | 90,103 | — | — | 818 | 172 | 755 | — | 91,848 | ||||||||||||||||||||||||
| Provisions used | (47,759 | ) | — | — | (257 | ) | — | (75 | ) | — | (48,091 | ) | ||||||||||||||||||||
| Provisions released | — | — | — | (73 | ) | — | (90 | ) | (264 | ) | (427 | ) | ||||||||||||||||||||
| Balances as of December 31, 2024 | 151,633 | — | — | 1,592 | 40,621 | 907 | — | 194,753 | ||||||||||||||||||||||||
| Provisions established | 27,610 | — | — | 406 | — | 184 | — | 28,200 | ||||||||||||||||||||||||
| Provisions used | (70,793 | ) | — | — | (52 | ) | — | (537 | ) | — | (71,382 | ) | ||||||||||||||||||||
| Provisions released | — | — | — | (97 | ) | (1,805 | ) | — | — | (1,902 | ) | |||||||||||||||||||||
| Balances as of March 31, 2025 | 108,450 | — | — | 1,849 | 38,816 | 554 | — | 149,669 | ||||||||||||||||||||||||
| (c) | Provisions for employee benefit obligations: |
| March | December | |||||||
| 2025 | 2024 | |||||||
| MCh$ | MCh$ | |||||||
| Provision of short-term employee benefits | 99,778 | 143,305 | ||||||
| Provision of benefits to employees for contract termination | 8,672 | 8,328 | ||||||
| Provisión of benefits to post-employment employees | — | — | ||||||
| Provision of long-term employee benefits | — | — | ||||||
| Provision of share-based employee benefits | — | — | ||||||
| Provisión for obligations for defined contribution post-employment plans | — | — | ||||||
| Provisión for obligations for post-employment defined benefit plans | — | — | ||||||
| Provision for other employee obligations | — | — | ||||||
| Total | 108,450 | 151,633 | ||||||
NOTES TO THE INTERIM CONSOLIDATED FINANCIAL STATEMENTS, continued
| 24. | Provisions for contingencies, continued; |
| (d) | Provision of short-term employee benefits: |
| (i) | Compliance bonuses provision: |
| March | March | |||||||
| 2025 | 2024 | |||||||
| MCh$ | MCh$ | |||||||
| Balances as of January 1 | 68,356 | 71,102 | ||||||
| Net provisions established | 13,938 | 15,313 | ||||||
| Provisions used | (55,619 | ) | (57,626 | ) | ||||
| Total | 26,675 | 28,789 | ||||||
| (ii) | Vacation provision: |
| March | March | |||||||
| 2025 | 2024 | |||||||
| MCh$ | MCh$ | |||||||
| Balances as of January 1 | 42,824 | 43,257 | ||||||
| Net provisions established | 1,756 | 2,725 | ||||||
| Provisions used | (2,459 | ) | (3,042 | ) | ||||
| Total | 42,121 | 42,940 | ||||||
| (iii) | Provision of other benefits to personnel: |
| March | March | |||||||
| 2025 | 2024 | |||||||
| MCh$ | MCh$ | |||||||
| Balances as of January 1 | 32,125 | 30,096 | ||||||
| Net provisions established | 11,532 | 8,941 | ||||||
| Provisions used | (12,675 | ) | (11,691 | ) | ||||
| Total | 30,982 | 27,346 | ||||||
| (e) | Provision of benefits to employees for contract termination: |
| (i) | Changes of the provision for employee benefits due to the termination of the employment contract: |
| March | March | |||||||
| 2025 | 2024 | |||||||
| MCh$ | MCh$ | |||||||
| Present value of the obligations at the beginning of the period | 8,328 | 9,677 | ||||||
| Increase in provision | 322 | 1,035 | ||||||
| Benefit paid | (40 | ) | (383 | ) | ||||
| Effect of change in actuarial factors | 62 | (115 | ) | |||||
| Total | 8,672 | 10,214 | ||||||
NOTES TO THE INTERIM CONSOLIDATED FINANCIAL STATEMENTS, continued
| 24. | Provisions for contingencies, continued; |
| (e) | Provision of benefits to employees for contract termination, continued: |
| (ii) | Net benefits expenses: |
| March | March | |||||||
| 2025 | 2024 | |||||||
| MCh$ | MCh$ | |||||||
| Increase (decrease) in provisions | (151 | ) | 499 | |||||
| Interest cost of benefits obligations | 473 | 536 | ||||||
| Effect of change in actuarial factors | 62 | (115 | ) | |||||
| Net benefit expenses | 384 | 920 | ||||||
| (iii) | Factors used in the calculation of the provision: |
The main assumptions used in the determination of severance indemnity obligations for the Bank’s plan are shown below:
|
March 31, 2025 |
December 31, 2024 |
|||||||
| % | % | |||||||
| Discount rate | 5.71 | 5.71 | ||||||
| Salary increase rate | 5.50 | 4.50 | ||||||
| Payment probability | 99.99 | 99.99 | ||||||
The most recent actuarial valuation of the staff severance indemnities provision was carried out during the first quarter of 2025.
| (f) | Employee benefits share-based provision: |
As of March 31, 2025 and December 31, 2024, the Bank and its subsidiaries do not have a stock-based compensation plan.
NOTES TO THE INTERIM CONSOLIDATED FINANCIAL STATEMENTS, continued
| 25. | Provision for dividends, interests and reappraisal of financial instruments of regulatory capital issued: |
| (a) | The item detail is as follows: |
| March | December | |||||||
| 2025 | 2024 | |||||||
| MCh$ | MCh$ | |||||||
| Provisions for dividends | 153,537 | 597,228 | ||||||
| Provisions for payment of interest on bonds with no fixed maturity date | — | — | ||||||
| Provision for revaluation of bonds without a fixed term of maturity | — | — | ||||||
| Total | 153,537 | 597,228 | ||||||
| (b) | The changes at the end of each period are as follows: |
| Provisions for dividends |
Provisions for payment of interest on bonds with no fixed maturity date |
Provision for revaluation of bonds without a fixed term of maturity |
Total | |||||||||||||
| MCh$ | MCh$ | MCh$ | MCh$ | |||||||||||||
| Balances as of January 1, 2024 | 611,949 | — | — | 611,949 | ||||||||||||
| Provisions established | 156,699 | — | — | 156,699 | ||||||||||||
| Provisions used | (611,949 | ) | — | — | (611,949 | ) | ||||||||||
| Provisions released | — | — | — | — | ||||||||||||
| Balances as of March 31, 2024 | 156,699 | — | — | 156,699 | ||||||||||||
| Provisions established | 440,529 | — | — | 440,529 | ||||||||||||
| Provisions used | — | — | — | — | ||||||||||||
| Provisions released | — | — | — | — | ||||||||||||
| Balances as of December 31, 2024 | 597,228 | — | — | 597,228 | ||||||||||||
| Provisions established | 153,537 | — | — | 153,537 | ||||||||||||
| Provisions used | (597,228 | ) | — | — | (597,228 | ) | ||||||||||
| Provisions released | — | — | — | — | ||||||||||||
| Balances as of March 31, 2025 | 153,537 | — | — | 153,537 | ||||||||||||
NOTES TO THE INTERIM CONSOLIDATED FINANCIAL STATEMENTS, continued
| 26. | Special provisions for credit risk: |
| a) | At the end of each period, this item is composed as follows: |
| March | December | |||||||
| 2025 | 2024 | |||||||
| MCh$ | MCh$ | |||||||
| Additional loan provisions (*) | 631,217 | 700,252 | ||||||
| Provisions for credit risk for contingent loans (**) | 94,050 | 67,537 | ||||||
| Provisions for country risk for transactions with debtors with residence abroad | 5,576 | 6,395 | ||||||
| Special provisions for loans abroad | — | — | ||||||
| Provisions for adjustments to the minimum provision required for normal portfolio with individual evaluation | — | — | ||||||
| Provisions constituted by credit risk as a result of additional prudential requirements | — | — | ||||||
| Total | 730,843 | 774,184 | ||||||
| (*) | To address the impact of applying the standard provisioning model for consumer loans, additional provisions of Ch$69,035 million were released in January 2025. See Note No. 4, Accounting Changes. |
| (**) | The changes of provisions for credit risk for contingent loans is disclosed in Note No. 13 letter (f). |
| b) | The changes of provisions for special credit risk is as follows: |
| Additional loan provisions |
Provisions for credit risk for contingent loans |
Provisions for country risk for transactions with debtors with residence abroad |
Total | |||||||||||||
| MCh$ | MCh$ | MCh$ | MCh$ | |||||||||||||
| Balances as of January 1, 2024 | 700,252 | 61,227 | 7,668 | 769,147 | ||||||||||||
| Provisions established | — | 2,701 | 3,337 | 6,038 | ||||||||||||
| Provisions used | — | — | — | — | ||||||||||||
| Provisions released | — | — | — | — | ||||||||||||
| Foreign exchange differences | — | 1,351 | — | 1,351 | ||||||||||||
| Balances as of March 31, 2024 | 700,252 | 65,279 | 11,005 | 776,536 | ||||||||||||
| Provisions established | — | 2,182 | — | 2,182 | ||||||||||||
| Provisions used | — | — | — | — | ||||||||||||
| Provisions released | — | — | (4,610 | ) | (4,610 | ) | ||||||||||
| Foreign exchange differences | — | 76 | — | 76 | ||||||||||||
| Balances as of December 31, 2024 | 700,252 | 67,537 | 6,395 | 774,184 | ||||||||||||
| Provisions established | — | 27,232 | — | 27,232 | ||||||||||||
| Provisions used | — | — | — | — | ||||||||||||
| Provisions released | (69,035 | ) | — | (819 | ) | (69,854 | ) | |||||||||
| Foreign exchange differences | — | (719 | ) | — | (719 | ) | ||||||||||
| Balances as of March 31, 2025 | 631,217 | 94,050 | 5,576 | 730,843 | ||||||||||||
NOTES TO THE INTERIM CONSOLIDATED FINANCIAL STATEMENTS, continued
| 27. | Other Liabilities: |
At the end of each period, this item is composed as follows:
| March | December | |||||||
| 2025 | 2024 | |||||||
| MCh$ | MCh$ | |||||||
| Accounts payable to third parties | 500,365 | 425,733 | ||||||
| Obligations for mortgage loans granted to be remit to other banks and/or real estate companies | 381,370 | 362,021 | ||||||
| Creditors for intermediation of financial instruments | 251,395 | 193,171 | ||||||
| Cash guarantees received for derivative financial transactions | 162,237 | 176,520 | ||||||
| Liability for income from usual activities from contracts with customers | 38,172 | 39,783 | ||||||
| Agreed dividends payable | 17,998 | 13,467 | ||||||
| VAT debit | 10,493 | 4,077 | ||||||
| Outstanding transactions | 1,681 | 1,532 | ||||||
| Other cash guarantees received | 489 | 483 | ||||||
| Securities to be settled | — | 3,633 | ||||||
| Other liabilities | 31,427 | 34,992 | ||||||
| Total | 1,395,627 | 1,255,412 | ||||||
NOTES TO THE INTERIM CONSOLIDATED FINANCIAL STATEMENTS, continued
| 28. | Equity: |
| (a) | Capital: |
| (i) | Authorized, subscribed and paid shares: |
As of March 31, 2025, the paid-in capital of Banco de Chile is represented by 101,017,081,114 registered shares (101,017,081,114 shares as of December 31, 2024), with no par value, subscribed and fully paid.
| As of March 31, 2025 | ||||||||
| Number of Shares | % of Equity Holding | |||||||
| Corporate Name or Shareholders’s name | ||||||||
| LQ Inversiones Financieras S.A. | 46,815,289,329 | 46.344 | % | |||||
| Banco de Chile on behalf of State Street | 5,883,852,269 | 5.825 | % | |||||
| Banchile Corredores de Bolsa S.A | 5,232,569,265 | 5.180 | % | |||||
| Inversiones LQ-SM Limitada | 4,854,988,014 | 4.806 | % | |||||
| Banco Santander on behalf of foreign investors | 4,795,357,238 | 4.747 | % | |||||
| JP Morgan Chase Bank | 2,820,104,708 | 2.792 | % | |||||
| Banco de Chile on behalf of non-resident third parties | 2,550,281,331 | 2.525 | % | |||||
| Ever Chile SPA | 1,888,369,814 | 1.869 | % | |||||
| Banco Santander Chile | 1,647,612,410 | 1.631 | % | |||||
| Ever 1 BAE SPA | 1,166,584,950 | 1.155 | % | |||||
| BCI Corredores de Bolsa S.A. | 1,024,327,875 | 1.014 | % | |||||
| Larraín Vial S.A. Corredora de Bolsa | 959,698,802 | 0.950 | % | |||||
| Banco de Chile on behalf of Citibank New York | 890,889,180 | 0.882 | % | |||||
| Inversiones Avenida Borgoño Limitada | 728,439,279 | 0.721 | % | |||||
| A.F.P Habitat S.A. for A Fund | 681,274,358 | 0.674 | % | |||||
| Santander Corredores de Bolsa Limitada | 619,644,666 | 0.613 | % | |||||
| Valores Security S.A. Corredores de Bolsa | 521,900,490 | 0.517 | % | |||||
| BTG Pactual Chile S.A. Corredores de Bolsa | 510,201,884 | 0.505 | % | |||||
| A.F.P Cuprum S.A. for A Fund | 492,665,765 | 0.488 | % | |||||
| Inversiones CDP SPA | 487,744,912 | 0.482 | % | |||||
| Subtotal | 84,571,796,539 | 83.720 | % | |||||
| Other shareholders | 16,445,284,575 | 16.280 | % | |||||
| Total | 101,017,081,114 | 100.000 | % | |||||
NOTES TO THE INTERIM CONSOLIDATED FINANCIAL STATEMENTS, continued
| 28. | Equity, continued: |
| (a) | Capital, continued: |
| (i) | Authorized, subscribed and paid shares, continued: |
| As of December 31, 2024 | ||||||||
| Number of Shares | % of Equity Holding | |||||||
| Corporate Name or Shareholders’s name | ||||||||
| LQ Inversiones Financieras S.A. | 46,815,289,329 | 46.344 | % | |||||
| Banco de Chile on behalf of State Street | 6,125,765,969 | 6.064 | % | |||||
| Banchile Corredores de Bolsa S.A | 5,123,539,720 | 5.072 | % | |||||
| Banco Santander on behalf of foreign investors | 5,080,833,862 | 5.030 | % | |||||
| Inversiones LQ-SM Limitada | 4,854,988,014 | 4.806 | % | |||||
| JP Morgan Chase Bank | 3,041,703,508 | 3.011 | % | |||||
| Banco de Chile on behalf of non-resident third parties | 2,666,777,747 | 2.640 | % | |||||
| Banco Santander Chile | 1,941,976,163 | 1.922 | % | |||||
| Ever Chile SPA | 1,888,369,814 | 1.869 | % | |||||
| Ever 1 BAE SPA | 1,166,584,950 | 1.155 | % | |||||
| Larraín Vial S.A. Corredora de Bolsa | 1,042,343,304 | 1.032 | % | |||||
| Banco de Chile on behalf of Citibank New York | 1,038,850,995 | 1.028 | % | |||||
| BCI Corredores de Bolsa S.A. | 989,711,426 | 0.980 | % | |||||
| Inversiones Avenida Borgoño Limitada | 728,439,279 | 0.721 | % | |||||
| Santander Corredores de Bolsa Limitada | 581,788,686 | 0.576 | % | |||||
| A.F.P Habitat S.A. for A Fund | 527,598,687 | 0.522 | % | |||||
| Valores Security S.A. Corredores de Bolsa | 516,192,449 | 0.511 | % | |||||
| A.F.P Cuprum S.A. for A Fund | 492,665,765 | 0.488 | % | |||||
| Inversiones CDP SPA | 487,744,912 | 0.483 | % | |||||
| BTG Pactual Chile S.A. Corredores de Bolsa | 463,503,644 | 0.459 | % | |||||
| Subtotal | 85,574,668,223 | 84.713 | % | |||||
| Other shareholders | 15,442,412,891 | 15.287 | % | |||||
| Total | 101,017,081,114 | 100.000 | % | |||||
NOTES TO THE INTERIM CONSOLIDATED FINANCIAL STATEMENTS, continued
| 28. | Equity, continued: |
| (a) | Capital, continued: |
| (ii) | Shares: |
The following table shows the changes in shares from December 31, 2024 to March 31, 2025:
| Total | |||||
| Ordinary | |||||
| Shares | |||||
| Total shares as of December 31, 2024 | 101,017,081,114 | ||||
| Total shares as of March 31, 2025 | 101,017,081,114 |
| (b) | Approval and payment of dividends: |
At the Bank Ordinary Shareholders’ Meeting held on March 27, 2025 it was approved the distribution and payment of dividend No. 213 of Ch$9.85357420889 per share of the Banco de Chile, with charge to the net distributable income for the year 2024. The dividends paid in the in the period 2025 amounted to Ch$995,380 million.
At the Bank Ordinary Shareholders’ Meeting held on March 28, 2024 it was approved the distribution and payment of dividend No. 212 of Ch$8.07716286860 per share of the Banco de Chile, with charge to the net distributable income for the year 2023. The dividends paid in the in the period 2024 amounted to Ch$815,932 million.
| (c) | Provision for minimum dividends: |
The Board of Directors of Banco de Chile agreed for the purposes of minimum dividends, to establish a provision of 60% of the net income resulting from reducing or adding to the net income for the corresponding year, the value effect of the monetary unit of paid capital and reserves, as a result of any change in the Consumer Price Index (CPI) between the month prior to the current month and the month of November of the previous year. The amount to be reduced of the liquid income for the period ended as of March 31, 2025 amounted to Ch$73,050 million (Ch$212,012 million as of December 31, 2024).
As indicated, as of March 31, 2025, the amount of the net income determined in accordance with the preceding paragraph is equivalent to Ch$255,894 million (Ch$995,380 million as of December 31, 2024). Consequently, the Bank recorded a provision for minimum dividends under “Provision for dividends, interests and reappraisal of financial instruments of regulatory capital issued” as of March 31, for an amount of Ch$153,537 million (Ch$597,228 million in December 2024), which reflects as a counterpart an equity reduction for the same amount in the item “Retained earnings”.
NOTES TO THE INTERIM CONSOLIDATED FINANCIAL STATEMENTS, continued
| 28. | Equity, continued: |
| (d) | Earnings per share: |
| (i) | Basic earnings per share: |
Basic earnings per share are determined by dividing the net income attributable to the Bank ordinary equity holders in a year between the weighted average number of shares outstanding during that year, excluding the average number of own shares held throughout the period.
| (ii) | Diluted earnings per share: |
In order to calculate the diluted earnings per share, both the amount of income attributable to common shareholders and the weighted average number of shares outstanding, net of own shares, must be adjusted for all the inherent dilutive effects to the potential common shares (stock options, warrants and convertible debt).
Accordingly, the basic and diluted earnings per share as of March 31, 2025 and 2024 were determined as follows:
| March | March | |||||||
| 2025 | 2024 | |||||||
| Basic earnings per share: | ||||||||
| Net profits attributable to ordinary equity holders of the bank (in million of Chilean pesos) | 328,944 | 297,655 | ||||||
| Weighted average number of ordinary shares | 101,017,081,114 | 101,017,081,114 | ||||||
| Earning per shares (in Chilean pesos) | 3.26 | 2.95 | ||||||
| Diluted earnings per share: | ||||||||
| Net profits attributable to ordinary equity holders of the bank (in million of Chilean pesos) | 328,944 | 297,655 | ||||||
| Weighted average number of ordinary shares | 101,017,081,114 | 101,017,081,114 | ||||||
| Assumed conversion of convertible debt | — | — | ||||||
| Adjusted number of shares | 101,017,081,114 | 101,017,081,114 | ||||||
| Diluted earnings per share (in Chilean pesos) | 3.26 | 2.95 | ||||||
As of March 31, 2025 and 2024, the Bank does not have instruments that generate dilutive effects.
NOTES TO THE INTERIM CONSOLIDATED FINANCIAL STATEMENTS, continued
| 28. | Equity, continued: |
| (e) | Other comprehensive income: |
Below is the composition and changes of accumulated other comprehensive income as of March 31, 2025 and 2024:
| Elements that will not be reclassified in profit or loss | Elements that can be reclassified in profit or loss | |||||||||||||||||||||||||||||||||||||||
| New measurements of net defined benefit liability and actuarial results for other employee benefit plans |
Fair value changes of equity instruments designated as at fair value through other comprehensive income |
Income tax |
Subtotal | Fair value changes of financial assets at fair value through other comprehensive income |
Cash flow accounting hedge |
Participation in other comprehensive income of entities registered under the equity method |
Income tax |
Subtotal | Total | |||||||||||||||||||||||||||||||
| MCh$ | MCh$ | MCh$ | MCh$ | MCh$ | MCh$ | MCh$ | MCh$ | MCh$ | MCh$ | |||||||||||||||||||||||||||||||
| Opening balances as of January 1, 2024 | (413 | ) | 9,668 | (2,499 | ) | 6,756 | 9,142 | 9,401 | (74 | ) | (983 | ) | 17,486 | 24,242 | ||||||||||||||||||||||||||
| Other comprehensive income for the period | 115 | 518 | (171 | ) | 462 | 6,440 | (5,247 | ) | 7 | (1,012 | ) | 188 | 650 | |||||||||||||||||||||||||||
| Balances as of March 31, 2024 | (298 | ) | 10,186 | (2,670 | ) | 7,218 | 15,582 | 4,154 | (67 | ) | (1,995 | ) | 17,674 | 24,892 | ||||||||||||||||||||||||||
| Opening balances as of January 1, 2025 | (298 | ) | 9,456 | (1,606 | ) | 7,552 | 4,478 | (12,397 | ) | (48 | ) | 4,192 | (3,775 | ) | 3,777 | |||||||||||||||||||||||||
| Other comprehensive income for the period | (62 | ) | (1,492 | ) | (101 | ) | (1,655 | ) | 2,303 | (9,884 | ) | 5 | 2,419 | (5,157 | ) | (6,812 | ) | |||||||||||||||||||||||
| Balances as of March 31, 2025 | (360 | ) | 7,964 | (1,707 | ) | 5,897 | 6,781 | (22,281 | ) | (43 | ) | 6,611 | (8,932 | ) | (3,035 | ) | ||||||||||||||||||||||||
During 2025, a reclassification was made from comprehensive income to equity reserves as a result of the sale of equity instruments irrevocably designated at fair value for Ch$1,916 million.
| (e) | Retained earnings from previous years: |
During the year 2025, the Ordinary Shareholders Meeting of Banco de Chile agreed to deduct and withhold from the year 2024 liquid income, an amount equivalent to the value effect of the monetary unit of paid capital and reserves according to the variation in the Consumer Price Index, which occurred between November 2023 and November 2024, amounting to Ch$212,012 million.
NOTES TO THE INTERIM CONSOLIDATED FINANCIAL STATEMENTS, continued
| 29. | Contingencies and Commitments: |
| (a) | The Bank and its subsidiaries have exposures associated with contingent loans and other liabilities according to the following detail: |
| (a.1) | Contingent loans: |
| March | December | |||||||
| 2025 | 2024 | |||||||
| MCh$ | MCh$ | |||||||
| Guarantees and sureties | ||||||||
| Guarantees and sureties in chilean currency | — | — | ||||||
| Guarantees and sureties in foreign currency | 357,699 | 336,737 | ||||||
| Letters of credit for goods circulation operations | 455,951 | 442,216 | ||||||
| Debt purchase commitments in local currency abroad | — | — | ||||||
| Transactions related to contingent events | ||||||||
| Transactions related to contingent events in chilean currency | 2,315,123 | 2,544,288 | ||||||
| Transactions related to contingent events in foreign currency | 576,011 | 580,338 | ||||||
| Undrawn credit lines with immediate termination | ||||||||
| Balance of lines of credit and agreed overdraft in current account – commercial loans | 1,651,189 | 1,642,163 | ||||||
| Balance of lines of credit on credit card – commercial loans | 353,196 | 359,638 | ||||||
| Balance of lines of credit and agreed overdraft in current account – consumer loans | 1,506,143 | 1,497,076 | ||||||
| Balance of lines of credit on credit card – consumer loans | 7,694,312 | 7,626,423 | ||||||
| Balance of lines of credit and agreed overdraft in current account – due from banks loans | — | — | ||||||
| Undrawn credit lines | — | — | ||||||
| Other commitments | ||||||||
| Credits for higher studies Law No. 20,027 (CAE) | — | — | ||||||
| Other irrevocable credit commitments | 40,764 | 51,889 | ||||||
| Other credit commitments | — | — | ||||||
| Total | 14,950,388 | 15,080,768 | ||||||
| (a.2) | Responsibilities assumed to meet customer needs: |
| March | December | |||||||
| 2025 | 2024 | |||||||
| MCh$ | MCh$ | |||||||
| Transactions on behalf of third parties | ||||||||
| Collections | 174,833 | 214,446 | ||||||
| Placement or sale of financial instruments | — | — | ||||||
| Transferred financial assets managed by the bank | — | — | ||||||
| Third-party resources managed by the bank | 1,149,320 | 1,147,660 | ||||||
| Subtotal | 1,324,153 | 1,362,106 | ||||||
| Securities custody | ||||||||
| Securities safekept by a banking subsidiary | 8,203,591 | 7,443,549 | ||||||
| Securities safekept by the Bank | 3,962,122 | 3,318,810 | ||||||
| Securities safekept deposited in another entity | 20,794,274 | 19,509,831 | ||||||
| Securities issued by the bank | — | — | ||||||
| Subtotal | 32,959,987 | 30,272,190 | ||||||
| Total | 34,284,140 | 31,634,296 | ||||||
NOTES TO THE INTERIM CONSOLIDATED FINANCIAL STATEMENTS, continued
| 29. | Contingencies and Commitments, continued: |
| (b) | Lawsuits and legal proceedings: |
| (b.1) | Normal judicial contingencies in the industry: |
At the date of issuance of these Interim Consolidated Financial Statements, there are legal actions filed against the Bank related with the ordinary course operations. As of March 31, 2025, the Bank maintain provisions for judicial contingencies amounting to Ch$1,849 million (Ch$1,592 million as of December 2024), which are part of the item “Provisions for contingencies” in the Statement of Financial Position.
The estimated end dates of the respective legal contingencies are as follows:
| As of March 31, 2025 | ||||||||||||||||||||||||
| 2025 | 2026 | 2027 | 2028 | 2029 | Total | |||||||||||||||||||
| MCh | $MCh | $MCh | $MCh | $MCh | $MCh$ | |||||||||||||||||||
| Legal contingencies | 954 | 488 | 407 | — | — | 1,849 | ||||||||||||||||||
| (b.2) | Contingencies for significant lawsuits in courts: |
As of March 31, 2025 and December 31, 2024, there are not significant lawsuits in court that affect or may affect these Interim Consolidated Financial Statements.
| (c) | Guarantees granted by operations: |
| i. | In subsidiary Banchile Administradora General de Fondos S.A.: |
In compliance with Article No, 12 of Law No. 20,712, Banchile Administradora General de Fondos S.A., has designated Banco de Chile as the representative of the beneficiaries of the guarantees it has established, and in such role the Bank has issued bank guarantees totaling UF 4,872,400 maturing January 7, 2026. The subsidiary took a policy with Mapfre Seguros Generales S.A. for the Real State Funds by a guaranteed amount of UF 722,700.
As of March 31, 2025 and 2024, the Bank has not guaranteed mutual funds.
| ii. | In subsidiary Banchile Corredores de Bolsa S.A.: |
For the purposes of ensuring correct and complete compliance with all of its obligations as broker-dealer entity, in conformity with the provisions from Article 30 and subsequent of Law No. 18,045 on Securities Markets, the subsidiary established a guarantee in an insurance policy for UF 20,000, insured by Mapfre Seguros Generales S.A., that matures April 22, 2026, whereby the Securities Exchange of the Santiago Stock Exchange was appointed as the subsidiary’s creditor representative.
NOTES TO THE INTERIM CONSOLIDATED FINANCIAL STATEMENTS, continued
| 29. | Contingencies and Commitments, continued: |
| (c) | Guarantees granted by operations, continued: |
| March | December | |||||||
| 2025 | 2024 | |||||||
| MCh$ | MCh$ | |||||||
| Guarantees: | ||||||||
| Shares received as collateral for simultaneous operations: | ||||||||
| Santiago Securities Exchange, Stock Exchange | 13,909 | 9,171 | ||||||
| Electronic Chilean Securities Exchange, Stock Exchange | 46,807 | 32,024 | ||||||
| Fixed income securities delivered to guarantee CCLV system: | ||||||||
| Santiago Securities Exchange, Stock Exchange | 7,843 | 7,843 | ||||||
| Fixed income securities as collateral for the Santiago Stock Exchange | 2,148 | 2,148 | ||||||
| Shares delivered to guarantee equity lending and short-selling: | ||||||||
| Santiago Securities Exchange, Stock Exchange | 8,626 | 4,744 | ||||||
| Cash guarantees received for operations with derivatives | 3,871 | 3,931 | ||||||
| Cash guarantees for operations with derivatives | 2,693 | 4,043 | ||||||
| Equity securities received for operations with derivatives: | ||||||||
| Electronic Chilean Securities Exchange, Stock Exchange | — | 101 | ||||||
| Depósito Central de Valores S.A. | 848 | 2,227 | ||||||
| Total | 86,745 | 66,232 | ||||||
In conformity with the internal regulation of the stock exchanges in which it participates, and for the purpose of ensuring its proper performance, the subsidiary Banchile Corredores de Bolsa S.A maintains in favor of the Santiago Stock Exchange a guarantee in fixed income financial instruments equivalent to Ch$2,148 million. It also maintains a pledge in favor of the Electronic Stock Exchange for three hundred thousand shares of said institution.
Banchile Corredores de Bolsa S.A. keeps an insurance policy current with Chubb Seguros Chile S.A. that expires June 30, 2025, this considers matters of employee fidelity, physical losses, falsification or adulteration, and currency fraud with a coverage amount equivalent to US$20,000,000.
It also provided a bank guarantee in the amount of UF 410,800 for the benefits of investors in portfolio management contracts. This bank guarantee is revaluated in UF to fixed term, non-endorsable and has a maturity date of January 8, 2026.
It also provided a cash guarantee in the amount of US$122,494.32 for the purpose of complying with the obligations to Pershing, for any operations conducted through that broker, additionally, there are US$1,376,176.42 for variable income operations.
NOTES TO THE INTERIM CONSOLIDATED FINANCIAL STATEMENTS, continued
| 29. | Contingencies and Commitments, continued: |
| (c) | Guarantees granted by operations, continued: |
A guarantee corresponding to UF 10,000 has been constituted, to guarantee compliance with the investment portfolio management service contract. Said guarantee corresponds to a non-endorsable fixed-term readjustable bond in UF issued by Banco de Chile with validity until January 27, 2026.
iii. In subsidiary Banchile Corredores de Seguros Ltda.:
According to established in article 58, letter D of D.F.L. 251, as of March 31, 2025 the entity maintains two insurance policies with effect from April 15, 2024 to April 14, 2025 which protect it against of potential damages caused by infractions of the law, regulations and complementary rules that regulate insurance brokers, especially when the non-compliance comes from acts, errors or omissions of the broker, its representatives, agents or dependents that participate in the intermediation.
The policies contracted are:
| Matter insured | Amount Insured (UF) | |||
| Errors and omissions liability policy (*) | 500 | |||
| Civil liability policy (*) | 60,000 |
| (*) | The new policies contracted will come into effect as of April 15, 2025, both expiring on April 14, 2026. |
| (d) | Exempt Resolution No. 270 dated October 30, 2014, the Superintendency of Securities and Insurance (current Commission for the Financial Market) imposed a fine of UF 50,000 to Banchile Corredores de Bolsa S.A. for violations of the second paragraph of article 53 of the Securities Market Law, said company filed a claim with the competent Civil Court requesting the annulment of the fine. On December 10, 2019, a judgement in the case was issued reducing the fine to the amount of UF 7,500, which was confirmed in the second instance by the Illustrious Court of Appeals of Santiago. The intervening parties filed cassation appeals in form and substance before the Supreme Court against the sentence in second instance. On August 13, 2024 the Supreme Court ordered the hearing of the case, which is pending as of this date. |
The company has not made provisions considering that the Bank’s legal advisors in charge of the procedure estimate that there are solid grounds that the claim filed by Banchile Corredores de Bolsa S.A. can be accepted.
NOTES TO THE INTERIM CONSOLIDATED FINANCIAL STATEMENTS, continued
| 30. | Interest Revenue and Expenses: |
| (a) | At the end of the period, the summary of interest is as follows: |
| March | March | |||||||
| 2025 | 2024 | |||||||
| MCh$ | MCh$ | |||||||
| Interest revenue | 664,976 | 800,766 | ||||||
| Interest expenses | (235,414 | ) | (337,325 | ) | ||||
| Total net interest income | 429,562 | 463,441 | ||||||
| (b) | The composition of interest revenue is as follows: |
| March | March | |||||||
| 2025 | 2024 | |||||||
| MCh$ | MCh$ | |||||||
| Financial assets at amortized cost: | ||||||||
| Rights from resale agreements and securities lending | 1,374 | 1,231 | ||||||
| Debt financial instruments | 3,403 | 33,919 | ||||||
| Loans and advances to Banks | 13,907 | 30,640 | ||||||
| Commercial loans | 308,207 | 359,935 | ||||||
| Residential mortgage loans | 109,546 | 98,109 | ||||||
| Consumer Loans | 203,823 | 207,712 | ||||||
| Other financial instruments | 10,851 | 19,152 | ||||||
| Financial assets at fair value through other comprehensive income: | ||||||||
| Debt financial instruments | 23,701 | 60,339 | ||||||
| Other financial instruments | — | — | ||||||
| Income of accounting hedges of interest rate risk | (9,836 | ) | (10,271 | ) | ||||
| Total | 664,976 | 800,766 | ||||||
| (b.1) | At the end of the period, the stock of interest not recognized in income is as follows: |
| March | March | |||||||
| 2025 | 2024 | |||||||
| MCh$ | MCh$ | |||||||
| Commercial loans | 37,536 | 39,847 | ||||||
| Residential mortgage loans | 7,267 | 4,558 | ||||||
| Consumer Loans | 3,280 | 4,505 | ||||||
| Total | 48,083 | 48,910 | ||||||
NOTES TO THE INTERIM CONSOLIDATED FINANCIAL STATEMENTS, continued
| 30. | Interest Revenue and Expenses, continued: |
| (c) | The composition of interest expenses is as follows: |
| March | March | |||||||
| 2025 | 2024 | |||||||
| MCh$ | MCh$ | |||||||
| Financial liabilities at amortized cost: | ||||||||
| Current accounts and other demand deposits | 267 | 542 | ||||||
| Saving accounts and time deposits | 156,503 | 253,119 | ||||||
| Obligations by repurchase agreements and securities lending | 2,346 | 4,167 | ||||||
| Borrowings from financial institutions | 15,470 | 21,726 | ||||||
| Debt financial instruments issued | 66,570 | 63,424 | ||||||
| Other financial obligations | — | — | ||||||
| Lease liabilities | 564 | 624 | ||||||
| Financial instruments of regulatory capital issued | 8,704 | 8,505 | ||||||
| Income of accounting hedges of interest rate risk | (15,010 | ) | (14,782 | ) | ||||
| Total | 235,414 | 337,325 | ||||||
| (d) | As of March 31, 2025 and 2024, the Bank uses cross currency and interest rate swaps to hedge its position on changes on the fair value of corporate bonds and commercial loans and cross currency swaps to hedge the risk of variability of obligations flows with foreign banks and bonds issued in foreign currency |
| March 2025 | March 2024 | |||||||||||||||||||||||
| Income | Expense | Total | Income | Expense | Total | |||||||||||||||||||
| MCh$ | MCh$ | MCh$ | MCh$ | MCh$ | MCh$ | |||||||||||||||||||
| Gain from fair value accounting hedges | — | — | — | — | — | — | ||||||||||||||||||
| Loss from fair value accounting hedges | — | — | — | — | — | — | ||||||||||||||||||
| Gain from cash flow accounting hedges | 4,062 | 22,010 | 26,072 | 2,790 | 19,904 | 22,694 | ||||||||||||||||||
| Loss from cash flow accounting hedges | (13,898 | ) | (7,000 | ) | (20,898 | ) | (13,061 | ) | (5,122 | ) | (18,183 | ) | ||||||||||||
| Net gain on hedge items | — | — | — | — | — | — | ||||||||||||||||||
| Total | (9,836 | ) | 15,010 | 5,174 | (10,271 | ) | 14,782 | 4,511 | ||||||||||||||||
NOTES TO THE INTERIM CONSOLIDATED FINANCIAL STATEMENTS, continued
| 31. | UF indexation revenue and expenses: |
| (a) | At the end of the period, the summary of UF indexation is as follows: |
| March | March | |||||||
| 2025 | 2024 | |||||||
| MCh$ | MCh$ | |||||||
| UF indexation revenue | 249,053 | 154,693 | ||||||
| UF indexation expenses | (132,944 | ) | (87,800 | ) | ||||
| Total net income from UF indexation | 116,109 | 66,893 | ||||||
| (b) | The composition of UF indexation revenue is as follows |
| March | March | |||||||
| 2025 | 2024 | |||||||
| MCh$ | MCh$ | |||||||
| Financial assets at amortized cost: | ||||||||
| Rights from resale agreements and securities lending | — | — | ||||||
| Debt financial instruments | 7,654 | 4,936 | ||||||
| Loans and advances to Banks | — | — | ||||||
| Commercial loans | 93,604 | 59,326 | ||||||
| Residential mortgage loans | 162,910 | 101,460 | ||||||
| Consumer Loans | 354 | 263 | ||||||
| Other financial instruments | 718 | 1,020 | ||||||
| Financial assets at fair value through other comprehensive income: | ||||||||
| Debt financial instruments | 8,821 | 4,886 | ||||||
| Other financial instruments | — | — | ||||||
| Income of accounting hedges of UF, IVP, IPC indexation risk | (25,008 | ) | (17,198 | ) | ||||
| Total | 249,053 | 154,693 | ||||||
| (b.1) | At the end of the period, the stock of UF indexation not recognized in results is as follows: |
| March | March | |||||||
| 2025 | 2024 | |||||||
| MCh$ | MCh$ | |||||||
| Commercial loans | 4,764 | 4,717 | ||||||
| Residential mortgage loans | 9,266 | 6,385 | ||||||
| Consumer Loans | 11 | 12 | ||||||
| Total | 14,041 | 11,114 | ||||||
NOTES TO THE INTERIM CONSOLIDATED FINANCIAL STATEMENTS, continued
| 31. | UF indexation revenue and expenses, continued: |
| (c) | The composition of UF indexation expenses is as follows: |
| March | March | |||||||
| 2025 | 2024 | |||||||
| MCh$ | MCh$ | |||||||
| Financial liabilities at amortized cost: | ||||||||
| Current accounts and other demand deposits | 6,695 | 4,028 | ||||||
| Saving accounts and time deposits | 20,836 | 15,313 | ||||||
| Obligations by repurchase agreements and securities lending | — | — | ||||||
| Borrowings from financial institutions | — | — | ||||||
| Debt financial instruments issued | 92,283 | 59,957 | ||||||
| Other financial obligations | — | — | ||||||
| Financial instruments of regulatory capital issued | 13,130 | 8,502 | ||||||
| Income of accounting hedges of UF, IVP, IPC indexation risk | — | — | ||||||
| Total | 132,944 | 87,800 | ||||||
| (d) | As of March 31, 2025 and 2024, the Bank uses cross currency swaps to hedge the risk of variability of obligations flows with foreign banks and bonds issued in foreign currency. |
| March 2025 | March 2024 | |||||||||||||||||||||||
| Income | Expense | Total | Income | Expense | Total | |||||||||||||||||||
| MCh$ | MCh$ | MCh$ | MCh$ | MCh$ | MCh$ | |||||||||||||||||||
| Gain from fair value accounting hedges | — | — | — | — | — | — | ||||||||||||||||||
| Loss from fair value accounting hedges | — | — | — | — | — | — | ||||||||||||||||||
| Gain from cash flow accounting hedges | 1,691 | — | 1,691 | 3,087 | — | 3,087 | ||||||||||||||||||
| Loss from cash flow accounting hedges | (26,699 | ) | — | (26,699 | ) | (20,285 | ) | — | (20,285 | ) | ||||||||||||||
| Net gain on hedge items | — | — | — | — | — | — | ||||||||||||||||||
| Total | (25,008 | ) | — | (25,008 | ) | (17,198 | ) | — | (17,198 | ) | ||||||||||||||
NOTES TO THE INTERIM CONSOLIDATED FINANCIAL STATEMENTS, continued
| 32. | Income and Expenses from commissions: |
The income and expenses for commissions that are shown in the Interim Consolidated Statement of Income for the period is as following:
| March | March | |||||||
| 2025 | 2024 | |||||||
| MCh$ | MCh$ | |||||||
| Income from commissions and services rendered | ||||||||
| Comissions from card services | 64,176 | 56,716 | ||||||
| Remuneration from administration of mutual funds, investment funds or others | 39,796 | 32,396 | ||||||
| Comissions from collections and payments | 18,670 | 20,011 | ||||||
| Comissions from portfolio management | 17,797 | 17,104 | ||||||
| Comissions from guarantees and letters of credit | 10,271 | 10,033 | ||||||
| Brand use agreement | 7,732 | 6,903 | ||||||
| Insurance not related to the granting of credits to natural persons | 6,391 | 6,184 | ||||||
| Comissions from trading and securities management | 5,589 | 4,710 | ||||||
| Use of distribution channel | 4,936 | 7,623 | ||||||
| Comissions from credit prepayments | 3,585 | 3,478 | ||||||
| Insurance related to the granting of credits to natural persons | 1,989 | 3,931 | ||||||
| Insurance not related to the granting of credits to legal entities | 1,631 | 1,695 | ||||||
| Financial advisory services | 1,249 | 88 | ||||||
| Comissions from lines of credit and current account overdrafts | 1,231 | 1,246 | ||||||
| Insurance related to the granting of credits to legal entities | 444 | 409 | ||||||
| Comissions from factoring operations services | 307 | 322 | ||||||
| Loan commissions with letters of credit | 6 | 18 | ||||||
| Other commission earned | 7,193 | 7,070 | ||||||
| Total | 192,993 | 179,937 | ||||||
| Expenses from commissions and services received | ||||||||
| Commissions from card transactions | (17,360 | ) | (14,790 | ) | ||||
| Interbank transactions | (6,574 | ) | (9,466 | ) | ||||
| Expenses from obligations of loyalty and merit card customers programs | (6,089 | ) | (12,548 | ) | ||||
| Commissions from use of card brands license | (2,571 | ) | (2,055 | ) | ||||
| Comissions from securities transaction | (1,461 | ) | (1,397 | ) | ||||
| Collections and payments | (1,028 | ) | (1,055 | ) | ||||
| Other commissions from services received | (1,061 | ) | (1,154 | ) | ||||
| Total | (36,144 | ) | (42,465 | ) | ||||
| Total Net | 156,849 | 137,472 | ||||||
NOTES TO THE INTERIM CONSOLIDATED FINANCIAL STATEMENTS, continued
| 33. | Net Financial income (expense): |
| (a) | The amount of net financial income (expense) shown in the Interim Consolidated Income Statement for the period corresponds to the following concepts: |
| March | March | |||||||
| 2025 | 2024 | |||||||
| MCh$ | MCh$ | |||||||
| Financial result from: | ||||||||
| Financial assets held for trading at fair value through profit or loss: | ||||||||
| Financial derivative contracts | 422,477 | 1,485,184 | ||||||
| Debt Financial Instruments | 34,451 | 57,943 | ||||||
| Other financial instruments | 5,188 | 8,048 | ||||||
| Financial liabilities held for trading at fair value through profit or loss: | ||||||||
| Financial derivative contracts | (419,859 | ) | (1,554,945 | ) | ||||
| Other financial instruments | (111 | ) | (473 | ) | ||||
| Subtotal | 42,146 | (4,243 | ) | |||||
| Non-trading financial assets mandatorily measured at fair value through profit or loss: | ||||||||
| Debt Financial Instruments | — | — | ||||||
| Other financial instruments | — | — | ||||||
| Financial assets designated as at fair value through profit or loss: | ||||||||
| Debt Financial Instruments | — | — | ||||||
| Other financial instruments | — | — | ||||||
| Financial liabilities designated as at fair value through profit or loss: | ||||||||
| Current accounts and other demand deposits and savings accounts and other time deposits | — | — | ||||||
| Debt instruments issued | — | — | ||||||
| Others | — | — | ||||||
| Derecognition of financial assets and liabilities at amortized cost and financial assets at fair value through other comprehensive income: | ||||||||
| Financial assets at amortized cost | — | — | ||||||
| Financial assets at fair value through other comprehensive income | 1,013 | 2,539 | ||||||
| Financial liabilities at amortized cost | — | — | ||||||
| Financial instruments of regulatory capital issued | — | — | ||||||
| Subtotal | 1,013 | 2,539 | ||||||
| Exchange, indexation and accounting hedging of foreign currency: | ||||||||
| Gain (loss) from foreign currency exchange | 77,993 | (92,553 | ) | |||||
| Gain (loss) from indexation for exchange rate | (8,270 | ) | 17,209 | |||||
| Net gain (loss) from derivatives in accounting hedges of foreign currency risk | (52,240 | ) | 181,791 | |||||
| Subtotal | 17,483 | 106,447 | ||||||
| Reclassification of financial assets for changes to business models: | ||||||||
| From financial assets at amortized cost to financial assets held for trading at fair value through profit or loss | — | — | ||||||
| From financial assets at fair value through other comprehensive income to financial assets held for trading at fair value through profit or loss | — | — | ||||||
| Modifications of financial assets and liabilities: | ||||||||
| Financial assets at amortized cost | — | — | ||||||
| Financial assets at fair value through other comprehensive income | — | — | ||||||
| Financial liabilities at amortized cost | — | — | ||||||
| Lease liabilities | — | — | ||||||
| Financial instruments of regulatory capital issued | — | — | ||||||
| Ineffective accounting hedges: | ||||||||
| Gain (loss) from ineffective cash flow accounting hedges | — | — | ||||||
| Gain (loss) from ineffective accounting hedges of net investment abroad | — | — | ||||||
| Other type of accounting hedges: | ||||||||
| Hedges of other types of financial assets | — | — | ||||||
| Total | 60,642 | 104,743 | ||||||
NOTES TO THE INTERIM CONSOLIDATED FINANCIAL STATEMENTS, continued
| 33. | Net Financial income (expense), continued: |
| (b) | Below is a detail of the income (expense) associated with the changes of provisions constituted for credit risk related to loans and contingent loans denominated in foreign currency, which is reflected in “Exchange, indexation and accounting hedging of foreign currency”. |
| March | March | |||||||
| 2025 | 2024 | |||||||
| MCh$ | MCh$ | |||||||
| Loans and advances to Banks | 28 | (85 | ) | |||||
| Commercial loans | 3,262 | (9,413 | ) | |||||
| Residential mortgage loans | — | — | ||||||
| Consumer loans | 88 | (114 | ) | |||||
| Contingent loans | 719 | (1,351 | ) | |||||
| Total | 4,097 | (10,963 | ) | |||||
| 34. | Income attributable to investments in other companies: |
The income obtained from investments in companies detailed in note No. 14 corresponds to the following:
| March | March | |||||||||
| Company | Shareholder | 2025 | 2024 | |||||||
| MCh$ | MCh$ | |||||||||
| Income attributable to investments in other companies: | ||||||||||
| Associates | ||||||||||
| Transbank S.A. | Banco de Chile | 739 | (1,058 | ) | ||||||
| Centro de Compensación Automatizado S.A. | Banco de Chile | 364 | 263 | |||||||
| Redbanc S.A. | Banco de Chile | 212 | 184 | |||||||
| Administrador Financiero de Transantiago S.A. | Banco de Chile | 86 | 102 | |||||||
| Sociedad Interbancaria de Depósitos de Valores S.A. | Banco de Chile | 78 | 70 | |||||||
| Servicios de Infraestructura de Mercado OTC S.A. | Banco de Chile | 48 | 21 | |||||||
| Sociedad Operadora de la Cámara de Compensación de Pagos de Alto Valor S.A. | Banco de Chile | 47 | 6 | |||||||
| Subtotal Associates | 1,574 | (412 | ) | |||||||
| Joint Ventures | ||||||||||
| Servipag Ltda. | Banco de Chile | 160 | 459 | |||||||
| Artikos Chile S.A.(*) | Banco de Chile | — | 142 | |||||||
| Subtotal Joint Ventures | 160 | 601 | ||||||||
| Subtotal | 1,734 | 189 | ||||||||
| Minority Investments | ||||||||||
| Banco Latinoamericano de Comercio Exterior S.A. (Bladex) | Banco de Chile | — | 29 | |||||||
| Subtotal Minority Investments | — | 29 | ||||||||
| Total Investments in other companies | 1,734 | 218 | ||||||||
(*) On September 26, 2024, at a Board meeting, it was agreed to accept the binding purchase offer presented by the Santiago Chamber of Commerce A.G. for 100% of the shares of Artikos Chile S.A. (“Artikos”).
NOTES TO THE INTERIM CONSOLIDATED FINANCIAL STATEMENTS, continued
| 35. | Result from non-current assets and disposal groups held for sale not admissible as discontinued operations: |
The composition of the results of non-current assets and disposal groups not eligible as discontinued operations during the periods 2025 and 2024 is as follows:
| March | March | |||||||
| 2025 | 2024 | |||||||
| MCh$ | MCh$ | |||||||
| Net income from assets received in payment or adjudicated in judicial auction | ||||||||
| Gain (loss) on sale of assets received in lieu of payment or foreclosed at judicial auction | 3,113 | 1,874 | ||||||
| Other income from assets received in payment or foreclosed at judicial auction | 9 | 3 | ||||||
| Provisions for adjustments to net realizable value of assets received in lieu of payment or foreclosed at judicial auction | (438 | ) | (388 | ) | ||||
| Charge-off assets received in lieu of payment or foreclosed at judicial auction | (5,459 | ) | (2,511 | ) | ||||
| Expenses to maintain assets received in lieu of payment or foreclosed at judicial auction | (138 | ) | (174 | ) | ||||
| Non-current assets held for sale | ||||||||
| Investments in other companies | — | — | ||||||
| Intangible assets | — | — | ||||||
| Property and equipment | 2,111 | 88 | ||||||
| Assets for recovery of assets transferred in financial leasing operations | 1,042 | 95 | ||||||
| Other assets | — | — | ||||||
| Disposal groups held for sale | — | — | ||||||
| Total | 240 | (1,013 | ) | |||||
| 36. | Other operating Income and Expenses: |
| a) | During the periods 2024 and 2024, the Bank and its subsidiaries present other operating income, according to the following: |
| March | March | |||||||
| 2025 | 2024 | |||||||
| MCh$ | MCh$ | |||||||
| Expense recovery | 6,760 | 6,226 | ||||||
| Revaluation of tax refunds from previous years | 5,300 | — | ||||||
| Income from investment properties | 1,726 | 1,703 | ||||||
| Revaluation of prepaid monthly payments | 119 | 427 | ||||||
| Foreign trade income | 23 | 26 | ||||||
| Others income | 152 | 210 | ||||||
| Total | 14,080 | 8,592 | ||||||
NOTES TO THE INTERIM CONSOLIDATED FINANCIAL STATEMENTS, continued
| 36. | Other operating Income and Expenses, continued: |
| b) | During the periods 2025 and 2024, the Bank and its subsidiaries present other operating expenses, according to the following: |
| March | March | |||||||
| 2025 | 2024 | |||||||
| MCh$ | MCh$ | |||||||
| Write-offs for operating risks | 7,261 | 7,995 | ||||||
| Insurance premiums expense to cover operational risk events | 1,564 | 1,528 | ||||||
| Expenses for credit operations of financial leasing | 1,547 | 1,392 | ||||||
| Card administration | 924 | 315 | ||||||
| Legal expenses and trials | 433 | 1,253 | ||||||
| Provision for pending operations (90 days) | 307 | 101 | ||||||
| Provisions for trials and litigation | 257 | (69 | ) | |||||
| Write-offs for commercial decisions | 154 | 50 | ||||||
| Valuation expense | 85 | 60 | ||||||
| Life insurance | 79 | 73 | ||||||
| Renegotiated loan insurance premium | 51 | 63 | ||||||
| Expenses for charge-off leased assets recoveries | 8 | 33 | ||||||
| (Release) expense of provisions for operational risk | (353 | ) | — | |||||
| Expense recovery from operational risk events | (3,076 | ) | (3,054 | ) | ||||
| Other expenses | 129 | (25 | ) | |||||
| Total | 9,370 | 9,715 | ||||||
| 37. | Expenses from salaries and employee benefits: |
The composition of the expense for employee benefit obligations during the periods 2025 and 2024 is as follows:
| March | March | |||||||
| 2025 | 2024 | |||||||
| MCh$ | MCh$ | |||||||
| Expenses for short-term employee benefit | 130,600 | 132,760 | ||||||
| Expenses for employee benefits due to termination of employment contract | 7,311 | 5,480 | ||||||
| Training expenses | 777 | 904 | ||||||
| Expenses for nursery and kindergarten | 406 | 376 | ||||||
| Other personnel expenses | 1,822 | 1,890 | ||||||
| Total | 140,916 | 141,410 | ||||||
NOTES TO THE INTERIM CONSOLIDATED FINANCIAL STATEMENTS, continued
| 38. | Administrative expenses: |
This item is composed as follows:
| March | March | |||||||
| 2025 | 2024 | |||||||
| MCh$ | MCh$ | |||||||
| General administrative expenses | ||||||||
| Information technology and communications | 39,928 | 39,166 | ||||||
| Maintenance and repair of property and equipment | 12,397 | 13,722 | ||||||
| Surveillance and securities transport services | 3,043 | 3,117 | ||||||
| Office supplies | 2,476 | 2,159 | ||||||
| External financial information and fraud prevention service | 2,365 | 2,025 | ||||||
| External advisory services and professional services fees | 2,232 | 2,142 | ||||||
| Energy, heating and other utilities | 1,783 | 1,579 | ||||||
| Legal and notary expenses | 1,533 | 1,267 | ||||||
| External service of custody of documentation | 1,299 | 1,105 | ||||||
| Expenses for short-term leases | 1,112 | 651 | ||||||
| Postal box, mail, postage and home delivery services | 1,092 | 1,523 | ||||||
| Other expenses of obligations for lease contracts | 973 | 1,165 | ||||||
| Insurance premiums except to cover operational risk events | 963 | 1,141 | ||||||
| Representation and travel expenses | 682 | 627 | ||||||
| Donations | 663 | 1,383 | ||||||
| Card embossing service | 457 | 555 | ||||||
| Fees for other technical reports | 226 | 260 | ||||||
| Fees for review and audit of the financial statements by the external auditor | 226 | 201 | ||||||
| Expenses for leases low value | 134 | 138 | ||||||
| Fines applied by other agencies | 12 | 7 | ||||||
| Title classification fees | 7 | 19 | ||||||
| Other general administrative expenses | 5,068 | 5,275 | ||||||
| Outsource services | ||||||||
| Technological developments expenses, certification and technology testing | 5,347 | 6,479 | ||||||
| Data processing | 2,635 | 2,618 | ||||||
| External credit evaluation service | 1,360 | 1,202 | ||||||
| External collection service | 1,137 | 1,209 | ||||||
| External human resources administration services and supply of external personnel | 547 | 535 | ||||||
| Call Center service for sales, marketing, quality control customer service | 197 | 568 | ||||||
| External cleaning service, casino, custody of files and documents, storage of furniture and equipment | 54 | 126 | ||||||
| Other outsource services | 284 | 198 | ||||||
| Board expenses | ||||||||
| Board of Directors Compensation | 846 | 810 | ||||||
| Other Board expenses | 17 | 16 | ||||||
| Marketing | 9,544 | 9,604 | ||||||
| Taxes, contributions and other legal charges | ||||||||
| Contribution to the banking regulator | 3,610 | 3,808 | ||||||
| Property taxes | 1,661 | 1,666 | ||||||
| Taxes other than income tax | 736 | 670 | ||||||
| Municipal patents | 435 | 471 | ||||||
| Other legal charges | 15 | 16 | ||||||
| Total | 107,096 | 109,223 | ||||||
NOTES TO THE INTERIM CONSOLIDATED FINANCIAL STATEMENTS, continued
| 39. | Depreciation and Amortization: |
The amounts corresponding to charges to results for depreciation and amortization during the periods 2025 and 2024, are detailed as follows:
| March | March | |||||||
| 2025 | 2024 | |||||||
| MCh$ | MCh$ | |||||||
| Amortization of intangibles assets | ||||||||
| Other intangible assets arising from business combinations | — | — | ||||||
| Other independently originated intangible assets | 10,026 | 8,558 | ||||||
| Depreciation of property and equipment | ||||||||
| Buildings and land | 2,458 | 2,417 | ||||||
| Other property and equipment | 3,735 | 5,146 | ||||||
| Depreciation and impairment of leased assets | ||||||||
| Buildings and land | 7,075 | 6,910 | ||||||
| Other property and equipment | — | — | ||||||
| Depreciation for improvements in leased real estate as leased of right-to-use assets | 264 | 282 | ||||||
| Amortization for the right-to-use other intangible assets under lease | — | — | ||||||
| Depreciation of other assets for investment properties | 89 | 89 | ||||||
| Amortization of other assets per activity income asset | — | — | ||||||
| Total | 23,647 | 23,402 | ||||||
| 40. | Impairment of non-financial assets: |
As of March 31, 2025 and 2024, the composition of the item for impairment of non-financial assets is composed as follows:
| March | March | |||||||
| 2025 | 2024 | |||||||
| MCh$ | MCh$ | |||||||
| Impairment of intangible assets | — | — | ||||||
| Impairment of property and equipment | 5 | — | ||||||
| Impairment of assets from income from ordinary activities from contracts with customers | 4 | 94 | ||||||
| Total | 9 | 94 | ||||||
NOTES TO THE INTERIM CONSOLIDATED FINANCIAL STATEMENTS, continued
| 41. | Credit loss expense: |
| (a) | The composition is as follows: |
| March | March | |||||||
| 2025 | 2024 | |||||||
| MCh$ | MCh$ | |||||||
| Expense of provisions established for loan credit risk | 149,489 | 118,806 | ||||||
| Expense of special provisions for credit risk | (42,622 | ) | 6,038 | |||||
| Recovery of written-off credits | (16,720 | ) | (13,161 | ) | ||||
| Impairments for credit risk from financial assets at fair value through other comprehensive income | 57 | 1,485 | ||||||
| Total | 90,204 | 113,168 | ||||||
| (b) | Summary of the expense of provisions constituted for credit risk and expense for credit losses: |
| Expense of loans provisions constituted in the period | ||||||||||||||||||||||||||||||||
| Normal Portfolio | Substandard Portfolio | Non-Complying Portfolio | Deductible warranty |
|||||||||||||||||||||||||||||
| Evaluation | Evaluation | Evaluation | Fogape | |||||||||||||||||||||||||||||
| As of March 31, 2025 | Individual | Group | Individual | Individual | Group | Subtotal | Covid-19 | Total | ||||||||||||||||||||||||
| MCh$ | MCh$ | MCh$ | MCh$ | MCh$ | MCh$ | MCh$ | MCh$ | |||||||||||||||||||||||||
| Loans and advances to Banks | ||||||||||||||||||||||||||||||||
| Provisions established | 40 | — | — | — | — | 40 | — | 40 | ||||||||||||||||||||||||
| Provisions released | — | — | — | — | — | — | — | — | ||||||||||||||||||||||||
| Subtotal | 40 | — | — | — | — | 40 | — | 40 | ||||||||||||||||||||||||
| Commercial loans | ||||||||||||||||||||||||||||||||
| Provisions established | 9,007 | 383 | 1,117 | 2,242 | 15,287 | 28,036 | — | 28,036 | ||||||||||||||||||||||||
| Provisions released | — | — | — | — | — | — | (196 | ) | (196 | ) | ||||||||||||||||||||||
| Subtotal | 9,007 | 383 | 1,117 | 2,242 | 15,287 | 28,036 | (196 | ) | 27,840 | |||||||||||||||||||||||
| Residential mortgage loans | ||||||||||||||||||||||||||||||||
| Provisions established | — | 425 | — | — | 2,693 | 3,118 | — | 3,118 | ||||||||||||||||||||||||
| Provisions released | — | — | — | — | — | — | — | — | ||||||||||||||||||||||||
| Subtotal | — | 425 | — | — | 2,693 | 3,118 | — | 3,118 | ||||||||||||||||||||||||
| Consumer loans | ||||||||||||||||||||||||||||||||
| Provisions established | — | 47,521 | — | — | 70,970 | 118,491 | — | 118,491 | ||||||||||||||||||||||||
| Provisions released | — | — | — | — | — | — | — | — | ||||||||||||||||||||||||
| Subtotal | — | 47,521 | — | — | 70,970 | 118,491 | — | 118,491 | ||||||||||||||||||||||||
| Expense (release) of provisions for credit risk | 9,047 | 48,329 | 1,117 | 2,242 | 88,950 | 149,685 | (196 | ) | 149,489 | |||||||||||||||||||||||
| Recovery of written-off credits | ||||||||||||||||||||||||||||||||
| Loans and advances to Banks | — | |||||||||||||||||||||||||||||||
| Commercial loans | (3,237 | ) | ||||||||||||||||||||||||||||||
| Residential mortgage loans | (2,479 | ) | ||||||||||||||||||||||||||||||
| Consumer loans | (11,004 | ) | ||||||||||||||||||||||||||||||
| Subtotal | (16,720 | ) | ||||||||||||||||||||||||||||||
| Loan credit loss expenses | 132,769 | |||||||||||||||||||||||||||||||
NOTES TO THE INTERIM CONSOLIDATED FINANCIAL STATEMENTS, continued
| 41. | Credit loss expense, continued: |
| (b) | Summary of the expense of provisions constituted for credit risk and expense for credit losses, continued; |
| Expense of loans provisions constituted in the period | ||||||||||||||||||||||||||||||||
| Normal Portfolio | Normal Portfolio | Non-Complying Portfolio | Deductible warranty |
|||||||||||||||||||||||||||||
| Evaluation | Evaluation | Evaluation | Fogape | |||||||||||||||||||||||||||||
| As of March 31, 2024 | Individual | Group | Individual | Individual | Group | Subtotal | Covid-19 | Total | ||||||||||||||||||||||||
| MCh$ | MCh$ | MCh$ | MCh$ | MCh$ | MCh$ | MCh$ | MCh$ | |||||||||||||||||||||||||
| Loans and advances to Banks | ||||||||||||||||||||||||||||||||
| Provisions established | — | — | — | — | — | — | — | — | ||||||||||||||||||||||||
| Provisions released | — | — | — | — | — | — | — | — | ||||||||||||||||||||||||
| Subtotal | — | — | — | — | — | — | — | — | ||||||||||||||||||||||||
| Commercial loans | ||||||||||||||||||||||||||||||||
| Provisions established | 8,315 | 647 | — | 9,426 | 15,732 | 34,120 | — | 34,120 | ||||||||||||||||||||||||
| Provisions released | — | — | (136 | ) | — | — | (136 | ) | (2,302 | ) | (2,438 | ) | ||||||||||||||||||||
| Subtotal | 8,315 | 647 | (136 | ) | 9,426 | 15,732 | 33,984 | (2,302 | ) | 31,682 | ||||||||||||||||||||||
| Residential mortgage loans | ||||||||||||||||||||||||||||||||
| Provisions established | — | 42 | — | — | 2,264 | 2,306 | — | 2,306 | ||||||||||||||||||||||||
| Provisions released | — | — | — | — | — | — | — | — | ||||||||||||||||||||||||
| Subtotal | — | 42 | — | — | 2,264 | 2,306 | — | 2,306 | ||||||||||||||||||||||||
| Consumer loans | ||||||||||||||||||||||||||||||||
| Provisions established | — | — | — | — | 93,563 | 93,563 | — | 93,563 | ||||||||||||||||||||||||
| Provisions released | — | (8,745 | ) | — | — | — | (8,745 | ) | — | (8,745 | ) | |||||||||||||||||||||
| Subtotal | — | (8,745 | ) | — | — | 93,563 | 84,818 | — | 84,818 | |||||||||||||||||||||||
| Expense (release) of provisions for credit risk | 8,315 | (8,056 | ) | (136 | ) | 9,426 | 111,559 | 121,108 | (2,302 | ) | 118,806 | |||||||||||||||||||||
| Recovery of written-off credits | ||||||||||||||||||||||||||||||||
| Loans and advances to Banks | — | |||||||||||||||||||||||||||||||
| Commercial loans | (3,138 | ) | ||||||||||||||||||||||||||||||
| Residential mortgage loans | (1,423 | ) | ||||||||||||||||||||||||||||||
| Consumer loans | (8,600 | ) | ||||||||||||||||||||||||||||||
| Subtotal | (13,161 | ) | ||||||||||||||||||||||||||||||
| Loan credit loss expenses | 105,645 | |||||||||||||||||||||||||||||||
NOTES TO THE INTERIM CONSOLIDATED FINANCIAL STATEMENTS, continued
| 41. | Credit loss expense, continued: |
| (c) | Summary of expense for special provisions for credit risk: |
| March | March | |||||||
| 2025 | 2024 | |||||||
| MCh$ | MCh$ | |||||||
| Expenses of provisions for contingent loans: | ||||||||
| Loans and advances to Banks | — | — | ||||||
| Commercial loans | (1,006 | ) | 3,017 | |||||
| Consumer loans | 28,238 | (316 | ) | |||||
| Expenses form provisions for country risk for transactions with debtors with residence abroad | (819 | ) | 3,337 | |||||
| Expense of special provisions for loans abroad | — | — | ||||||
| Expenses of additional loan provisions: | ||||||||
| Commercial loans | (69,035 | ) | — | |||||
| Residential mortgage loans | — | — | ||||||
| Consumer loans | — | — | ||||||
| Expense of other special provisions established for credit risk | (42,622 | ) | 6,038 | |||||
| 42. | Income from discontinued operations: |
As of March 31, 2025 and 2024, the Bank does not maintain income from discontinued operations.
| 43. | Related Party Disclosures: |
Related parties are considered to be those natural or legal persons who are in positions to directly or indirectly have significant influence through their ownership or management of the Bank and its subsidiaries, as set out in the Compendium of Accounting Standards for Banks and Chapter 12-4 of the current Compilation of Standards issued by the CMF.
According to the above, the Bank has considered as related parties those natural or legal persons who have a direct participation or through third parties on Bank ownership, where such participation exceeds 5% of the shares, and also people who, regardless of ownership, have authority and responsibility for planning, management and control of the activities of the entity or its subsidiaries. There also are considered as related the companies in which the parties related by ownership or management of the Bank have a share which reaches or exceeds 5%, or has the position of director, general manager or equivalent.
NOTES TO THE INTERIM CONSOLIDATED FINANCIAL STATEMENTS, continued
| 43. | Related Party Disclosures, continued: |
| (a) | Assets and liabilities with related parties: |
| Related Party Type | ||||||||||||||||||||
| Type of current assets and liabilities with related parties As of March 31, 2025 | Parent Entity | Other Legal Entity |
Key Personnel of the Consolidated Bank |
Other Related Parties |
Total | |||||||||||||||
| MCh$ | MCh$ | MCh$ | MCh$ | MCh$ | ||||||||||||||||
| ASSETS | ||||||||||||||||||||
| Financial assets held for trading at fair value through profit or loss: | ||||||||||||||||||||
| Derivative Financial Instruments | — | 264,771 | — | — | 264,771 | |||||||||||||||
| Debt financial instruments | — | — | — | — | — | |||||||||||||||
| Other financial instruments | — | 4,670 | — | — | 4,670 | |||||||||||||||
| Non-trading financial assets mandatorily measured at fair value through profit or loss | — | — | — | — | — | |||||||||||||||
| Financial assets designated as at fair value through profit or loss | — | — | — | — | — | |||||||||||||||
| Financial assets at fair value through other comprehensive income | — | 5,504 | — | — | 5,504 | |||||||||||||||
| Derivative Financial Instruments for hedging purposes | — | — | — | — | — | |||||||||||||||
| Financial assets at amortized cost: | ||||||||||||||||||||
| Rights from resale agreements and securities lending | — | — | — | — | — | |||||||||||||||
| Debt financial instruments | — | — | — | — | — | |||||||||||||||
| Commercial loans | — | 166,151 | 1,901 | 10,096 | 178,148 | |||||||||||||||
| Residential mortgage loans | — | — | 15,030 | 58,389 | 73,419 | |||||||||||||||
| Consumer Loans | — | — | 1,590 | 10,416 | 12,006 | |||||||||||||||
| Allowances established – loans | — | (1,522 | ) | (55 | ) | (404 | ) | (1,981 | ) | |||||||||||
| Other assets | 16 | 178,698 | 4 | 42 | 178,760 | |||||||||||||||
| Contingent loans | — | 141,257 | 4,163 | 17,619 | 163,039 | |||||||||||||||
| LIABILITIES | ||||||||||||||||||||
| Financial liabilities held for trading at fair value through profit or loss: | ||||||||||||||||||||
| Derivative Financial Instruments | — | 298,862 | — | — | 298,862 | |||||||||||||||
| Financial liabilities designated as at fair value through profit or loss | — | — | — | — | — | |||||||||||||||
| Derivative Financial Instruments for hedging purposes | — | 5,208 | — | — | 5,208 | |||||||||||||||
| Financial liabilities at amortized cost: | ||||||||||||||||||||
| Current accounts and other demand deposits | 229 | 136,775 | 2,847 | 6,279 | 146,130 | |||||||||||||||
| Saving accounts and time deposits | 246,306 | 106,605 | 4,366 | 21,496 | 378,773 | |||||||||||||||
| Obligations by repurchase agreements and securities lending | — | 2,001 | — | — | 2,001 | |||||||||||||||
| Borrowings from financial institutions | — | 49,936 | — | — | 49,936 | |||||||||||||||
| Debt financial instruments issued | — | — | — | — | — | |||||||||||||||
| Other financial obligations | — | — | — | — | — | |||||||||||||||
| Lease liabilities | — | 8,761 | — | — | 8,761 | |||||||||||||||
| Other liabilities | — | 151,804 | 130 | 6 | 151,940 | |||||||||||||||
NOTES TO THE INTERIM CONSOLIDATED FINANCIAL STATEMENTS, continued
| 43. | Related Party Disclosures, continued: |
| (a) | Assets and liabilities with related parties, continued: |
| Related Party Type | ||||||||||||||||||||
| Type of current assets and liabilities with related parties As of December 31, 2024 | Parent Entity | Other Legal Entity |
Key Personnel of the Consolidated Bank |
Other Related Parties |
Total | |||||||||||||||
| MCh$ | MCh$ | MCh$ | MCh$ | MCh$ | ||||||||||||||||
| ASSETS | ||||||||||||||||||||
| Financial assets held for trading at fair value through profit or loss: | ||||||||||||||||||||
| Derivative Financial Instruments | — | 273,492 | — | — | 273,492 | |||||||||||||||
| Debt financial instruments | — | — | — | — | — | |||||||||||||||
| Other financial instruments | — | — | — | — | — | |||||||||||||||
| Non-trading financial assets mandatorily measured at fair value through profit or loss | — | — | — | — | — | |||||||||||||||
| Financial assets designated as at fair value through profit or loss | — | — | — | — | — | |||||||||||||||
| Financial assets at fair value through other comprehensive income | — | 5,388 | — | — | 5,388 | |||||||||||||||
| Derivative Financial Instruments for hedging purposes | — | — | — | — | — | |||||||||||||||
| Financial assets at amortized cost: | ||||||||||||||||||||
| Rights from resale agreements and securities lending | — | — | — | — | — | |||||||||||||||
| Debt financial instruments | — | — | — | — | — | |||||||||||||||
| Commercial loans | — | 266,912 | 1,291 | 9,967 | 278,170 | |||||||||||||||
| Residential mortgage loans | — | — | 14,694 | 59,861 | 74,555 | |||||||||||||||
| Consumer Loans | — | — | 1,656 | 11,482 | 13,138 | |||||||||||||||
| Allowances established – loans | — | (1,291 | ) | (30 | ) | (326 | ) | (1,647 | ) | |||||||||||
| Other assets | 16 | 132,549 | 38 | 7 | 132,610 | |||||||||||||||
| Contingent loans | — | 159,749 | 3,822 | 17,761 | 181,332 | |||||||||||||||
| LIABILITIES | ||||||||||||||||||||
| Financial liabilities held for trading at fair value through profit or loss: | ||||||||||||||||||||
| Derivative Financial Instruments | — | 300,756 | — | — | 300,756 | |||||||||||||||
| Financial liabilities designated as at fair value through profit or loss | — | — | — | — | — | |||||||||||||||
| Derivative Financial Instruments for hedging purposes | — | 3,137 | — | — | 3,137 | |||||||||||||||
| Financial liabilities at amortized cost: | ||||||||||||||||||||
| Current accounts and other demand deposits | 170 | 141,497 | 2,860 | 6,844 | 151,371 | |||||||||||||||
| Saving accounts and time deposits | 151,595 | 78,618 | 3,093 | 19,082 | 252,388 | |||||||||||||||
| Obligations by repurchase agreements and securities lending | — | — | — | — | — | |||||||||||||||
| Borrowings from financial institutions | — | 3,175 | — | — | 3,175 | |||||||||||||||
| Debt financial instruments issued | — | — | — | — | — | |||||||||||||||
| Other financial obligations | — | — | — | — | — | |||||||||||||||
| Lease liabilities | — | 9,200 | — | — | 9,200 | |||||||||||||||
| Other liabilities | — | 140,479 | 532 | 5 | 141,016 | |||||||||||||||
NOTES TO THE INTERIM CONSOLIDATED FINANCIAL STATEMENTS, continued
| 43. | Related Party Disclosures, continued: |
| (b) | Income and expenses from related party transactions (*): |
| As of March 31, 2025 | Parent Entity | Other Legal Entity | Key personnel of the consolidated Bank | Other Related parties | Total | |||||||||||||||
| MCh$ | MCh$ | MCh$ | MCh$ | MCh$ | ||||||||||||||||
| Interest revenue | — | 7,858 | 124 | 735 | 8,717 | |||||||||||||||
| UF indexation revenue | — | 572 | 201 | 837 | 1,610 | |||||||||||||||
| Income from commissions | 43 | 23,617 | 12 | 12 | 23,684 | |||||||||||||||
| Net Financial income (expense) | — | 19,885 | — | — | 19,885 | |||||||||||||||
| Other income | — | — | — | — | — | |||||||||||||||
| Total Income | 43 | 51,932 | 337 | 1,584 | 53,896 | |||||||||||||||
| Interest expense | 528 | 604 | 40 | 227 | 1,399 | |||||||||||||||
| UF indexation expenses | — | — | — | — | — | |||||||||||||||
| Expenses from commissions | — | 7,400 | — | — | 7,400 | |||||||||||||||
| Expenses credit losses (gains) | — | 135 | 30 | 111 | 276 | |||||||||||||||
| Expenses from salaries and employee benefits | — | — | 18,291 | 31,791 | 50,082 | |||||||||||||||
| Administrative expenses | — | 2,328 | 882 | 9 | 3,219 | |||||||||||||||
| Other expenses | — | — | — | — | — | |||||||||||||||
| Total Expenses | 528 | 10,467 | 19,243 | 32,138 | 62,376 | |||||||||||||||
| As of March 31, 2024 | Parent Entity | Other Legal Entity | Key personnel of the consolidated Bank | Other Related parties | Total | |||||||||||||||
| MCh$ | MCh$ | MCh$ | MCh$ | MCh$ | ||||||||||||||||
| Interest revenue | — | 3,892 | 141 | 740 | 4,773 | |||||||||||||||
| UF indexation revenue | — | 342 | 156 | 573 | 1,071 | |||||||||||||||
| Income from commissions | 27 | 23,454 | 11 | 22 | 23,514 | |||||||||||||||
| Net Financial income (expense) | — | 19,299 | — | — | 19,299 | |||||||||||||||
| Other income | — | — | — | — | — | |||||||||||||||
| Total Income | 27 | 46,987 | 308 | 1,335 | 48,657 | |||||||||||||||
| Interest expense | 746 | 3,112 | 99 | 448 | 4,405 | |||||||||||||||
| UF indexation expenses | — | — | 3 | — | 3 | |||||||||||||||
| Expenses from commissions | — | 5,377 | — | — | 5,377 | |||||||||||||||
| Expenses credit losses (gains) | — | 851 | (2 | ) | (36 | ) | 813 | |||||||||||||
| Expenses from salaries and employee benefits | — | 16 | 19,917 | 32,676 | 52,609 | |||||||||||||||
| Administrative expenses | — | 2,107 | 935 | 34 | 3,076 | |||||||||||||||
| Other expenses | — | — | — | 3 | 3 | |||||||||||||||
| Total Expenses | 746 | 11,463 | 20,952 | 33,125 | 66,286 | |||||||||||||||
| (*) | This does not constitute a Statement of Income from operations with related parties since the assets with these parties are not necessarily equal to the liabilities and in each of them the total income and expenses are reflected and not those corresponding to matched operations. |
NOTES TO THE INTERIM CONSOLIDATED FINANCIAL STATEMENTS, continued
| 43. | Related Party Disclosures, continued: |
| (c) | Transactions with related parties: Below are the individual transactions in the period with related parties that are legal entities, which do not correspond to the usual operations of the line of business carried out with customers in general and when said individual transactions consider a transfer of resources, services or obligations greater than UF 2,000. |
As of March 31, 2025
| Nature of the relationship | Description of the transaction | Transactions under equivalent conditions to those transactions
with mutual independence |
Effect on Income |
Effect on Financial position |
||||||||||||||||||||||||||
| Company name | with the Bank | Type of service | Term | Renewal conditions | between the parties |
Amount MCh$ |
Income MCh$ |
Expenses MCh$ |
Accounts receivable MCh$ |
Accounts payable MCh$ |
||||||||||||||||||||
| Servipag Ltda. | Joint venture | Collection services | 30 days | Contract | Yes | 1,017 | — | 1,017 | — | 338 | ||||||||||||||||||||
| Bolsa de Comercio de Santiago, Bolsa de Valores | Minority investments | Brokerage commission | 30 days | Contract | Yes | 105 | — | 105 | — | 72 | ||||||||||||||||||||
| Enex S.A. | Other related parties | Rent spaces for ATM | 30 days | Contract | Yes | 663 | — | 663 | — | 383 | ||||||||||||||||||||
| Redbanc S.A. | Associates | Electronic transaction management services | 30 days | Contract | Yes | 4,701 | — | 4,701 | — | 1,617 | ||||||||||||||||||||
| IT services | 30 days | Contract | Yes | 98 | — | 98 | — | — | ||||||||||||||||||||||
| Depósito Central de Valores S.A. | Other related parties | Quality control and custodial services | 30 days | Contract | Yes | 170 | — | 170 | — | 96 | ||||||||||||||||||||
| Custodial services | 30 days | Contract | Yes | 317 | — | 317 | — | — | ||||||||||||||||||||||
| CCLV Contraparte Central S.A. | Minority investments | Brokerage commission | 30 days | Contract | Yes | 97 | — | 97 | — | 24 | ||||||||||||||||||||
| Sociedad Operadora de la Cámara de Compensación de Pagos de Alto Valor S.A. | Associates | Collection services | 30 days | Contract | Yes | 344 | — | 344 | — | 88 | ||||||||||||||||||||
| Comder Contraparte Central S.A. | Other related parties | Securities clearing services | 30 days | Contract | Yes | 135 | — | 135 | — | — | ||||||||||||||||||||
| Citigroup Global Markets INC | Other related parties | Brokerage commission | 30 days | Contract | Yes | 121 | — | 121 | — | 57 | ||||||||||||||||||||
| Transbank S.A. | Associates | Card processing | 30 days | Contract | Yes | 148 | — | 148 | — | 74 | ||||||||||||||||||||
| Exchange commission | 30 days | Contract | Yes | 20,595 | 20,595 | — | — | — | ||||||||||||||||||||||
| Centro de Compensación Automatizado S.A. | Associates | Fraud prevention services | 30 days | Contract | Yes | 332 | — | 332 | — | — | ||||||||||||||||||||
| Transfer services | 30 days | Contract | Yes | 688 | — | 688 | — | 330 | ||||||||||||||||||||||
| Artikos Chile S.A. | Joint venture | IT services | 30 days | Contract | Yes | 79 | — | 79 | — | 1 | ||||||||||||||||||||
| Citibank N.A. | Other related parties | Connectivity business commissions | Quarterly | Contract | Yes | 1,635 | 1,635 | — | 3,441 | — | ||||||||||||||||||||
| Nuevos Desarrollos S.A. | Other related parties | Financial lease agreements | 30 days | Contract | Yes | 49 | — | — | — | 455 | ||||||||||||||||||||
| Plaza Vespucio SPA | Other related parties | Financial lease agreements | 30 days | Contract | Yes | 33 | — | — | — | 125 | ||||||||||||||||||||
| Plaza Oeste SPA | Other related parties | Financial lease agreements | 30 days | Contract | Yes | 67 | — | — | — | 758 | ||||||||||||||||||||
| Plaza del Trebol SPA | Other related parties | Financial lease agreements | 30 days | Contract | Yes | 64 | — | — | — | 71 | ||||||||||||||||||||
| Plaza Tobalaba SPA | Other related parties | Financial lease agreements | 30 days | Contract | Yes | 36 | — | — | — | 80 | ||||||||||||||||||||
| Plaza La Serena SPA | Other related parties | Financial lease agreements | 30 days | Contract | Yes | 63 | — | — | — | 558 | ||||||||||||||||||||
| Inmobiliaria Mall Calama S.A. | Other related parties | Financial lease agreements | 30 days | Contract | Yes | 36 | — | — | — | 105 | ||||||||||||||||||||
NOTES TO THE INTERIM CONSOLIDATED FINANCIAL STATEMENTS, continued
| 43. | Related Party Disclosures, continued: |
| (c) | Transactions with related parties, continued: |
As of December 31, 2024
| Nature of the relationship | Description of the transaction | Transactions under equivalent conditions to those transactions
with mutual independence |
Effect on Income |
Effect on Financial position |
||||||||||||||||||||||||||
| Company name | with the Bank | Type of service | Term | Renewal conditions | between the parties |
Amount MCh$ |
Income MCh$ |
Expenses MCh$ |
Accounts receivable MCh$ |
Accounts payable MCh$ |
||||||||||||||||||||
| Ionix SPA | Other related parties | IT support services | 30 days | Contract | Yes | 141 | — | 141 | — | — | ||||||||||||||||||||
| Servipag Ltda. | Joint venture | IT support services | 30 days | Contract | Yes | 367 | — | 367 | — | — | ||||||||||||||||||||
| Collection services | 30 days | Contract | Yes | 4,235 | — | 4,235 | — | 387 | ||||||||||||||||||||||
| Bolsa de Comercio de Santiago, Bolsa de Valores | Minority investments | Service of financial information | 30 days | Contract | Yes | 356 | — | 356 | — | 25 | ||||||||||||||||||||
| Brokerage commission | 30 days | Contract | Yes | 423 | — | 423 | — | — | ||||||||||||||||||||||
| IT support services | 30 days | Contract | Yes | 256 | — | 256 | — | — | ||||||||||||||||||||||
| Enex S.A. | Other related parties | Rent spaces for ATM | 30 days | Contract | Yes | 1,740 | — | 1,740 | — | 498 | ||||||||||||||||||||
| Universidad del Desarrollo | Other related parties | Advertising service | 30 days | Contract | Yes | 126 | — | 126 | — | — | ||||||||||||||||||||
| Universidad Adolfo Ibáñez | Other related parties | Training | 30 days | Contract | Yes | 272 | — | 272 | — | — | ||||||||||||||||||||
| Bolsa Electrónica de Chile S.A. | Minority investments | Brokerage commission | 30 days | Contract | Yes | 203 | — | 203 | — | 1 | ||||||||||||||||||||
| Service of financial information | 30 days | Contract | Yes | 117 | — | 117 | — | — | ||||||||||||||||||||||
| DCV Registros S.A. | Other related parties | IT services | 30 days | Contract | Yes | 294 | — | 294 | — | — | ||||||||||||||||||||
| Redbanc S.A. | Associates | Electronic transaction management services | 30 days | Contract | Yes | 17,658 | — | 17,658 | — | 1,707 | ||||||||||||||||||||
| IT proyect services | 30 days | Contract | Yes | 132 | — | 132 | — | — | ||||||||||||||||||||||
| Installation services | 30 days | Contract | Yes | 81 | — | 81 | — | — | ||||||||||||||||||||||
| Fraud prevention services | 30 days | Contract | Yes | 108 | — | 108 | — | — | ||||||||||||||||||||||
| IT services | 30 days | Contract | Yes | 442 | — | 442 | — | — | ||||||||||||||||||||||
| Depósito Central de Valores S.A. | Other related parties | Quality control and custodial services | 30 days | Contract | Yes | 833 | — | 833 | — | 90 | ||||||||||||||||||||
| Custodial services | 30 days | Contract | Yes | 1,357 | — | 1,357 | — | — | ||||||||||||||||||||||
| CCLV Contraparte Central S.A. | Minority investments | Brokerage commission | 30 days | Contract | Yes | 352 | — | 352 | — | 22 | ||||||||||||||||||||
| Manantial S.A. | Other related parties | General expenses | 30 days | Contract | Yes | 379 | — | 379 | — | — | ||||||||||||||||||||
| Sociedad Operadora de la Cámara de Compensación de Pagos de Alto Valor S.A. | Associates | Collection services | 30 days | Contract | Yes | 881 | — | 881 | — | 91 | ||||||||||||||||||||
| Comder Contraparte Central S.A. | Other related parties | Securities clearing services | 30 days | Contract | Yes | 529 | — | 529 | — | — | ||||||||||||||||||||
| Citigroup Global Markets INC | Other related parties | Brokerage commission | 30 days | Contract | Yes | 387 | — | 387 | — | 29 | ||||||||||||||||||||
| Transbank S.A. | Associates | Card processing | 30 days | Contract | Yes | 498 | — | 498 | — | 97 | ||||||||||||||||||||
| Project consultation | 30 days | Contract | Yes | 114 | — | 114 | — | — | ||||||||||||||||||||||
| Fraud prevention services | 30 days | Contract | Yes | 87 | — | 87 | — | — | ||||||||||||||||||||||
| Exchange commission | 30 days | Contract | Yes | 79,025 | 79,025 | — | — | — | ||||||||||||||||||||||
| Centro de Compensación Automatizado S.A. | Associates | Fraud prevention services | 30 days | Contract | Yes | 657 | — | 657 | — | 333 | ||||||||||||||||||||
| Collection services | 30 days | Contract | Yes | 187 | — | 187 | — | — | ||||||||||||||||||||||
| Transfer services | 30 days | Contract | Yes | 2,803 | — | 2,803 | — | — | ||||||||||||||||||||||
| Artikos Chile S.A. | Joint venture | IT support services | 30 days | Contract | Yes | 422 | — | 422 | — | 2 | ||||||||||||||||||||
| IT services | 30 days | Contract | Yes | 465 | — | 465 | — | — | ||||||||||||||||||||||
| Citibank N.A. | Other related parties | Connectivity business commissions | Quarterly | Contract | Yes | 8,065 | 8,065 | — | 3,272 | — | ||||||||||||||||||||
| Fundación Teletón | Other related parties | Advertising services | 30 days | Contract | Yes | 449 | — | 449 | — | 121 | ||||||||||||||||||||
| Donations | 30 days | Contract | Yes | 1,599 | — | 1,599 | — | — | ||||||||||||||||||||||
| Canal 13 | Other related parties | Advertising service | 30 days | Contract | Yes | 202 | — | 202 | — | 73 | ||||||||||||||||||||
| Inmobiliaria e Inversiones Capitolio S.A. | Other related parties | Leases | 30 days | Contract | Yes | 84 | — | 84 | — | — | ||||||||||||||||||||
| Nuevos Desarrollos S.A. | Other related parties | Financial lease agreements | 30 days | Contract | Yes | 180 | — | — | — | 496 | ||||||||||||||||||||
| Plaza Vespucio SPA | Other related parties | Financial lease agreements | 30 days | Contract | Yes | 127 | — | — | — | 154 | ||||||||||||||||||||
| Plaza Oeste SPA | Other related parties | Financial lease agreements | 30 days | Contract | Yes | 254 | — | — | — | 810 | ||||||||||||||||||||
| Plaza del Trebol SPA | Other related parties | Financial lease agreements | 30 days | Contract | Yes | 270 | — | — | — | 73 | ||||||||||||||||||||
| Plaza Tobalaba SPA | Other related parties | Financial lease agreements | 30 days | Contract | Yes | 135 | — | — | — | 113 | ||||||||||||||||||||
| Plaza La Serena SPA | Other related parties | Financial lease agreements | 30 days | Contract | Yes | 223 | — | — | — | 543 | ||||||||||||||||||||
| Inmobiliaria Mall Calama S.A. | Other related parties | Financial lease agreements | 30 days | Contract | Yes | 141 | — | — | — | 137 | ||||||||||||||||||||
NOTES TO THE INTERIM CONSOLIDATED FINANCIAL STATEMENTS, continued
| 43. | Related Party Disclosures, continued: |
| (d) | Payments to the Board of Directors and to key personnel of the management of the Bank and its subsidiaries: |
| March | March | |||||||
| 2025 | 2024 | |||||||
| MCh$ | MCh$ | |||||||
| Directory: | ||||||||
| Payment of remuneration and attendance fees of the Board of Directors - Bank and its subsidiaries | 846 | 810 | ||||||
| Other Board expenses | 17 | 14 | ||||||
| Key Personnel of the Management of the Bank and its Subsidiaries: | ||||||||
| Payment for short-term employees benefits | 18,196 | 19,297 | ||||||
| Payment for severance | 95 | 620 | ||||||
| Payment for benefits to post-employment employees | — | — | ||||||
| Payment for benefits to long-term employees | — | — | ||||||
| Payment to employees based on shares or equity instruments | — | — | ||||||
| Payment for obligations for defined contribution post-employment plans | — | — | ||||||
| Payment for obligations for post-employment defined benefit plans | — | — | ||||||
| Payment for other staff obligations | — | — | ||||||
| Subtotal | 18,291 | 19,917 | ||||||
| Total | 19,154 | 20,741 | ||||||
| (e) | Composition of the Board of Directors and key personnel of the Management of the Bank and its subsidiaries: |
| March | March | |||||||
| 2025 | 2024 | |||||||
| Directory: | No. Executives | |||||||
| Directors – Bank and its subsidiaries | 17 | 16 | ||||||
| Key Personnel of the Management of the Bank and its Subsidiaries: | ||||||||
| CEO – Bank | 1 | 1 | ||||||
| CEOs – Subsidiaries | 6 | 5 | ||||||
| Division Managers / Area – Bank | 73 | 88 | ||||||
| Division Managers / Area – Subsidiaries | 37 | 29 | ||||||
| Subtotal | 117 | 123 | ||||||
| Total | 134 | 139 | ||||||
NOTES TO THE INTERIM CONSOLIDATED FINANCIAL STATEMENTS, continued
| 44. | Fair Value of Financial Assets and Liabilities: |
Banco de Chile and its subsidiaries have defined a corporate framework for valuation and control related with the process to the fair value measurement.
Within the established framework includes the Product Control Unit, which is independent of the business areas and reports to the Financial Management Control and Division Manager. This function befall to the Financial Control, Treasury and Capital Manager, through the Financial Risk Information and Control Section, is responsible for independent verification of price and results of trading (including derivatives) and investment operations and all fair value measurements.
To achieve the appropriate measurements and controls, the Bank and its subsidiaries, take into account at least the following aspects:
| (i) | Industry standard valuation. |
To value financial instruments, Banco de Chile uses industry standard modeling; quota value, share price, discounted cash flows and valuation of options through Black-Scholes-Merton, according to the case.
The input parameters for the valuation of fixed income instruments and options correspond to rates, prices and volatility levels for different terms and market factors that are traded in the national and international market and that are provided by the main sources of the market.
In the case of the valuation of derivatives under a CSA (Credit Support Annex Discounting) agreement, the rates used to discount the flows correspond to the CSA Discounting methodology, where the discount factors used depend on the collateral agreement that exists with each counterparty.
| (ii) | Quoted prices in active markets. |
The fair value for instruments with quoted prices in active markets is determined using daily quotes from electronic systems information (such as Bolsa de Comercio de Santiago, Bloomberg, LVA and Risk America, etc). This quote represents the price at which these instruments are regularly traded in the financial markets.
| (iii) | Valuation techniques. |
If no specific quotes are available for the instrument to be valued, valuation techniques will be used to determine the fair value.
Due to, in general, the valuation models require a set of market parameters as inputs, the aim is to maximize information based on observable or price-related quotations for similar instruments in active markets. To the extent there is no information in direct from the markets, data from external suppliers of information, prices of similar instruments and historical information are used to validate the valuation parameters.
NOTES TO THE INTERIM CONSOLIDATED FINANCIAL STATEMENTS, continued
| 44. | Fair Value of Financial Assets and Liabilities, continued: |
| (iv) | Fair value adjustments. |
Part of the fair value process considers four adjustments to the market value, calculated based on the market parameters, including; a liquidity adjustment, a Bid/Offer adjustment, an adjustment for derivative credit risk (CVA and DVA), and an adjustment for the funding of the derivative cash flows (FVA). Likewise, for certain fixed income instruments held in investment portfolios measured at fair value through other comprehensive income or at amortized cost, the portion of the fair value adjustment explained by impairment due to counterparty credit risk is determined.
The calculation of the liquidity adjustment considers the size of the position in each factor, the particular liquidity of each factor, the relative size of Banco de Chile with respect to the market, and the liquidity observed in transactions recently carried out in the market. In turn, the Bid/Offer adjustment, represents the impact on the valuation of an instrument depending on whether the position corresponds to a long (bought) or a short (sold). To calculate this adjustment is used the direct quotes from active markets or indicative prices or derivatives of similar assets depending on the instrument, considering the Bid, Mid and Offer, respectively. Finally, the adjustment made for CVA and DVA for derivatives corresponds to the credit risk recognition of the issuer, either of the counterparty (CVA) or of Banco de Chile (DVA). Similarly, the determination of credit risk impairment is determined based on the counterparty risk implicit in the instrument’s market rate. Finally, the FVA adjustment for derivatives corresponds to a value adjustment that reflects the expected cost (or benefit) of financing (reinvesting) the cash flows of the derivative, with respect to a reference discount rate, when there are no collaterals or this one is imperfect.
It should be noted that there is also the concept of COLVA for derivatives, which is a valuation adjustment if a derivative is valued using parameters other than those used in the aforementioned CSA Discounting methodology. Since Banco de Chile uses CSA Discounting as the valuation methodology, COLVA is already part of the derivative’s Mark-to-Market (MTM), and no additional adjustment is required for this concept. In any case, the Bank measures COLVA for internal management purposes, relative to a SOFR Discounting scenario (scenario where all derivatives have USD SOFR collateral).
Liquidity value adjustments are made to trading instruments (including derivatives) only, while Bid/Offer adjustments are made for trading instruments and Financial instrument at fair value through Other Comprehensive Income. Adjustments for CVA / DVA/FVA/COLVA are carried out only for derivatives. For its part, credit risk impairment is computed only for fixed income instruments measured at fair value through other comprehensive income and fixed income instruments measured at amortized cost.
NOTES TO THE INTERIM CONSOLIDATED FINANCIAL STATEMENTS, continued
| 44. | Fair Value of Financial Assets and Liabilities, continued: |
| (v) | Fair value control. |
A process of independent verification of prices and interest rates is executed daily, in order to control that the market parameters used by Banco de Chile in the valuation of the financial instruments relating to the current state of the market and from them the best estimate derived of the fair value. The objective of this process is to control that the official market parameters provided by the respective business areas, before being entered into the valuation, are within acceptable ranges of differences when compared to the same set of parameters prepared independently by the Financial Risk Information and Control Section. As a result, value differences are obtained at the level of currency, product and portfolio. In the event significant differences exist, these differences are scaled according to the amount of individual materiality of each market factor and aggregated at the portfolio level, according to the grouping levels within previously defined ranges. These ranges are approved by the Finance, International and Financial Risk Committee.
Complementary and in parallel, the Financial Risk Information and Control Section generates and reports on a daily basis Profit and Loss (“P&L”) and Exposure to Market Risks, which allow for proper control and consistency of the parameters used in the valuation.
| (vi) | Judgmental analysis and information to Management. |
In particular cases, where there are no market quotations for the instrument to be valued and there are no prices for similar transactions instruments or indicative parameters, a specific control and a reasoned analysis must be carried out in order to estimate the fair value of the operation. Within the valuation framework described in the Reasonable Value Policy (and its procedure) approved by the Board of Directors of Banco de Chile, a required level of approval is set in order to carry out transactions where market information is not available or it is not possible to infer prices or rates from it.
| (a) | Hierarchy of instruments valued at Fair value: |
Banco de Chile and its subsidiaries, classify all the financial instruments among the following levels:
| Level 1: | These are financial instruments whose fair value is calculated at quoted prices (unadjusted) in extracted from liquid and deep markets. For these instruments there are quotes or prices (return internal rates, quote value, price) the observable market, so that assumptions are not required to determine the value. |
| In this level, the following instruments are considered: currency futures, debt instruments issued by the Treasury and the Central Bank of Chile, which belong to benchmarks, mutual fund investments and equity shares. |
| For the instruments of the Central Bank of Chile and the General Treasury of the Republic, all those mnemonics belonging to a Benchmark, in other words corresponding to one of the following categories published by the Santiago Stock Exchange, will be considered as Level 1: Pesos-02, Pesos-03, Pesos-04, Pesos-05, Pesos-07, Pesos-10, UF-02, UF-04, UF-05, UF-07, UF-10, UF-20, UF-30. |
NOTES TO THE INTERIM CONSOLIDATED FINANCIAL STATEMENTS, continued
| 44. | Fair Value of Financial Assets and Liabilities, continued: |
A Benchmark corresponds to a group of mnemonics that are similar in duration and are traded in an equivalent way, i.e., the price (return internal rates in this case) obtained is the same for all the instruments that make up a Benchmark. This feature defines a greater depth of market, with daily quotations that allow classifying these instruments as Level 1.
In the case of debt issued by the Chilean Government, the internal rate of return of the market is used to discount all flows to present value. In the case of mutual funds and equity shares, the current market price per share, which multiplied by the number of instruments results in the fair value.
The preceding described valuation methodology is equivalent to the one used by the Bolsa de Comercio de Santiago (Santiago Stock Exchange) and correspond to the standard methodology used in the market.
| Level 2: | They are financial instruments whose fair value is calculated based on prices other than in quoted in Level 1 that are observable for the asset or liability, directly (that is, as prices or internal rates of return) or indirectly (that is, derived from prices or internal rates of return from similar instruments). These categories include: |
| a) | Quoted prices for similar assets or liabilities in active markets. |
| b) | Quoted prices for identical or similar assets or liabilities in markets that are not active. |
| c) | Inputs data other than quoted prices that are observable for the asset or liability. |
| d) | Inputs data corroborated by the market. |
At this level there are mainly derivatives instruments, debt issued by banks, debt issues of Chilean and foreign companies, issued in Chile or abroad, mortgage claims, financial brokerage instruments and some issuances by the Central Bank of Chile and the General Treasury of the Republic, which do not belong to benchmarks.
To value derivatives, depends on whether they are impacted by volatility as a relevant market factor in standard valuation methodologies; for options the Black-Scholes-Merton formula is used; for the rest of the derivatives, forwards and swaps, discounted cash flows method is used.
For the remaining instruments at this level, as for debt issues of level 1, the valuation is done through cash flows model by using an internal rate of return that can be derived or estimated from internal rates of return of similar securities as mentioned above.
In the event that there is no observable price for an instrument in a specific term, the price will be inferred from the interpolation between periods that have observable quoted price in active markets. These models incorporate various market variables, including the credit quality of counterparties, exchange rates and interest rate curves.
NOTES TO THE INTERIM CONSOLIDATED FINANCIAL STATEMENTS, continued
| 44. | Fair Value of Financial Assets and Liabilities, continued: |
Valuation Techniques and Inputs for Level 2 Instrument:
|
Type of Financial Instrument |
Valuation Method | Description: Inputs and Sources |
|
Local Bank and Corporate Bonds |
Discounted cash flows model
|
Prices (internal rates of return) are provided by third party price providers that are widely used in the Chilean market.
Model is based on a Base Yield (Central Bank Bonds) and issuer spread.
The model is based on daily prices and risk/maturity similarities between Instruments. |
|
Offshore Bank and Corporate Bonds |
Prices are provided by third party price providers that are widely used in the Chilean market.
Model is based on daily prices. |
|
|
Local Central Bank and Treasury Bonds |
Prices (internal rates of return) are provided by third party price providers that are widely used in the Chilean market.
Model is based on daily prices. |
|
|
Mortgage Notes |
Prices (internal rates of return) are provided by third party price providers that are widely used in the Chilean market.
Model is based on a Base Yield (Central Bank Bonds) and issuer spread.
The model takes into consideration daily prices and risk/maturity similarities between instruments. |
|
|
Time Deposits |
Prices (internal rates of return) are provided by third party price providers that are widely used in the Chilean market.
Model is based on daily prices and considers risk/maturity similarities between instruments. |
|
|
Cross Currency Swaps, Interest Rate Swaps, FX Forwards, Inflation Forwards |
Forward Points, Inflation forecast and local swap rates are provided by market brokers that are widely used in the Chilean market.
Offshore rates and spreads are obtained from third party price providers that are widely used in the Chilean market.
Zero Coupon rates are calculated by using the bootstrapping method over swap rates.
|
|
| FX Options |
Black-Scholes Model |
Prices for volatility surface estimates are obtained from market brokers that are widely used in the Chilean market. |
NOTES TO THE INTERIM CONSOLIDATED FINANCIAL STATEMENTS, continued
| 44. | Fair Value of Financial Assets and Liabilities, continued: |
| Level 3: | These are financial instruments whose fair value is determined using non-observable inputs data neither for the assets or liabilities under analysis nor for similar instruments. An adjustment to an input that is significant to the entire measurement can result in a fair value measurement classified within Level 3 of the fair value hierarchy, if the adjustment uses significant non-observable data entry. |
The instruments likely to be classified as level 3 are mainly Corporate Debt by Chilean and foreign companies, issued both in Chile and abroad.
Valuation Techniques and Inputs for Level 3 Instrument:
| Type of Financial Instrument | Valuation Method | Description: Inputs and Sources |
|
Local Bank and Corporate Bonds |
Discounted cash flows model
|
Since inputs for these types of securities are not observable by the market, we model interest rate of returns for them based on a Base Yield (Central Bank Bonds) and issuer spread. These inputs (base yield and issuer spread) are provided on a daily basis by third party price providers that are widely used in the Chilean market.
|
| Offshore Bank and Corporate Bonds |
Discounted cash flows model
|
Since inputs for these types of securities are not observable by the market, we model interest rate of returns for them based on a Base Yield and issuer spread. These inputs (base yield and issuer spread) are provided on a weekly basis by third party price providers that are widely used in the Chilean market.
|
NOTES TO THE INTERIM CONSOLIDATED FINANCIAL STATEMENTS, continued
| 44. | Fair Value of Financial Assets and Liabilities, continued: |
| (b) | Level chart: |
The following table shows the classification by levels, for financial instruments registered at fair value.
| Level 1 | Level 2 | Level 3 | Total | |||||||||||||||||||||||||||||
| March | December | March | December | March | December | March | December | |||||||||||||||||||||||||
| 2025 | 2024 | 2025 | 2024 | 2025 | 2024 | 2025 | 2024 | |||||||||||||||||||||||||
| MCh$ | MCh$ | MCh$ | MCh$ | MCh$ | MCh$ | MCh$ | MCh$ | |||||||||||||||||||||||||
| Financial Assets | ||||||||||||||||||||||||||||||||
| Financial Assets held for trading at fair value through profit or loss | ||||||||||||||||||||||||||||||||
| Financial Derivative contracts: | ||||||||||||||||||||||||||||||||
| Forwards | — | — | 240,533 | 227,670 | — | — | 240,533 | 227,670 | ||||||||||||||||||||||||
| Swaps | — | — | 1,800,223 | 2,070,481 | — | — | 1,800,223 | 2,070,481 | ||||||||||||||||||||||||
| Call Options | — | — | 2,655 | 4,949 | — | — | 2,655 | 4,949 | ||||||||||||||||||||||||
| Put Options | — | — | 1,138 | 253 | — | — | 1,138 | 253 | ||||||||||||||||||||||||
| Futures | — | — | — | — | — | — | — | — | ||||||||||||||||||||||||
| Subtotal | — | — | 2,044,549 | 2,303,353 | — | — | 2,044,549 | 2,303,353 | ||||||||||||||||||||||||
| Debt Financial Instruments: | ||||||||||||||||||||||||||||||||
| From the Chilean Government and Central Bank | 202,286 | 210,418 | 2,392,644 | 1,285,039 | — | — | 2,594,930 | 1,495,457 | ||||||||||||||||||||||||
| Other debt financial instruments issued in Chile | — | — | 148,040 | 206,675 | 7,551 | 11,273 | 155,591 | 217,948 | ||||||||||||||||||||||||
| Financial debt instruments issued Abroad | — | — | — | 976 | — | — | — | 976 | ||||||||||||||||||||||||
| Subtotal | 202,286 | 210,418 | 2,540,684 | 1,492,690 | 7,551 | 11,273 | 2,750,521 | 1,714,381 | ||||||||||||||||||||||||
| Others | 332,337 | 411,689 | — | — | — | — | 332,337 | 411,689 | ||||||||||||||||||||||||
| Financial Assets at fair value through Other Comprehensive Income | ||||||||||||||||||||||||||||||||
| Debt Financial Instruments: (1) | ||||||||||||||||||||||||||||||||
| From the Chilean Government and Central Bank | 567,572 | 550,418 | 66,134 | 110,359 | — | — | 633,706 | 660,777 | ||||||||||||||||||||||||
| Other debt financial instruments issued in Chile | — | — | 1,155,268 | 1,303,708 | 72,079 | 71,922 | 1,227,347 | 1,375,630 | ||||||||||||||||||||||||
| Financial debt instruments issued Abroad | — | — | 86,680 | 51,938 | — | — | 86,680 | 51,938 | ||||||||||||||||||||||||
| Subtotal | 567,572 | 550,418 | 1,308,082 | 1,466,005 | 72,079 | 71,922 | 1,947,733 | 2,088,345 | ||||||||||||||||||||||||
| Financial Derivative contracts for hedging purposes | ||||||||||||||||||||||||||||||||
| Forwards | — | — | — | — | — | — | — | — | ||||||||||||||||||||||||
| Swaps | — | — | 47,108 | 73,959 | — | — | 47,108 | 73,959 | ||||||||||||||||||||||||
| Call Options | — | — | — | — | — | — | — | — | ||||||||||||||||||||||||
| Put Options | — | — | — | — | — | — | — | — | ||||||||||||||||||||||||
| Futures | — | — | — | — | — | — | — | — | ||||||||||||||||||||||||
| Subtotal | — | — | 47,108 | 73,959 | — | — | 47,108 | 73,959 | ||||||||||||||||||||||||
| Total | 1,102,195 | 1,172,525 | 5,940,423 | 5,336,007 | 79,630 | 83,195 | 7,122,248 | 6,591,727 | ||||||||||||||||||||||||
| Financial Liabilities | ||||||||||||||||||||||||||||||||
| Financial liabilities held for trading at fair value through profit or loss: | ||||||||||||||||||||||||||||||||
| Financial Derivative contracts: | ||||||||||||||||||||||||||||||||
| Forwards | — | — | 229,323 | 241,632 | — | — | 229,323 | 241,632 | ||||||||||||||||||||||||
| Swaps | — | — | 1,960,030 | 2,198,068 | — | — | 1,960,030 | 2,198,068 | ||||||||||||||||||||||||
| Call Options | — | — | 1,587 | 4,151 | — | — | 1,587 | 4,151 | ||||||||||||||||||||||||
| Put Options | — | — | 2,012 | 955 | — | — | 2,012 | 955 | ||||||||||||||||||||||||
| Futures | — | — | — | — | — | — | — | — | ||||||||||||||||||||||||
| Subtotal | — | — | 2,192,952 | 2,444,806 | — | — | 2,192,952 | 2,444,806 | ||||||||||||||||||||||||
| Others | — | — | 6,524 | 990 | — | — | 6,524 | 990 | ||||||||||||||||||||||||
| Financial derivative contracts for hedging purposes | ||||||||||||||||||||||||||||||||
| Forwards | — | — | — | — | — | — | — | — | ||||||||||||||||||||||||
| Swaps | — | — | 200,844 | 141,040 | — | — | 200,844 | 141,040 | ||||||||||||||||||||||||
| Call Options | — | — | — | — | — | — | — | — | ||||||||||||||||||||||||
| Put Options | — | — | — | — | — | — | — | — | ||||||||||||||||||||||||
| Futures | — | — | — | — | — | — | — | — | ||||||||||||||||||||||||
| Subtotal | — | — | 200,844 | 141,040 | — | — | 200,844 | 141,040 | ||||||||||||||||||||||||
| Total | — | — | 2,400,320 | 2,586,836 | — | — | 2,400,320 | 2,586,836 | ||||||||||||||||||||||||
| (1) | As of March 31, 2025, 100% of instruments of Level 3 have denomination “Investment Grade”. Also, 100% of total of these financial instruments correspond to domestic issuers. |
NOTES TO THE INTERIM CONSOLIDATED FINANCIAL STATEMENTS, continued
| 44. | Fair Value of Financial Assets and Liabilities, continued: |
| (c) | Level 3 reconciliation: |
The following table shows the reconciliation between the balances at the beginning and at the end of period for those instruments classified in Level 3, whose fair value is reflected in the Interim Consolidated Financial Statements:
| March 2025 | ||||||||||||||||||||||||||||||||
| Balance as of January 1, 2025 | Gain (Loss) Recognized in Income (1) | Gain (Loss) Recognized in Equity (2) | Purchases | Sales | Transfer from Level 1 and 2 | Transfer to Level 1 and 2 | Balance as of March 31, 2025 |
|||||||||||||||||||||||||
| MCh$ | MCh$ | MCh$ | MCh$ | MCh$ | MCh$ | MCh$ | MCh$ | |||||||||||||||||||||||||
| Financial Assets held for trading at fair value through profit or loss | ||||||||||||||||||||||||||||||||
| Debt Financial Instruments: | ||||||||||||||||||||||||||||||||
| Other debt financial instruments issued in Chile | 11,273 | 275 | — | — | (3,997 | ) | — | — | 7,551 | |||||||||||||||||||||||
| Subtotal | 11,273 | 275 | — | — | (3,997 | ) | — | — | 7,551 | |||||||||||||||||||||||
| Financial Assets at fair value through Other Comprehensive Income | ||||||||||||||||||||||||||||||||
| Debt Financial Instruments: | ||||||||||||||||||||||||||||||||
| Other debt financial instruments issued in Chile | 71,922 | 488 | (331 | ) | — | — | — | — | 72,079 | |||||||||||||||||||||||
| Subtotal | 71,922 | 488 | (331 | ) | — | — | — | — | 72,079 | |||||||||||||||||||||||
| Total | 83,195 | 763 | (331 | ) | — | (3,997 | ) | — | — | 79,630 | ||||||||||||||||||||||
| December 2024 | ||||||||||||||||||||||||||||||||
| Balance as of January 1, 2024 | Gain (Loss) Recognized in Income (1) | Gain (Loss) Recognized in Equity (2) | Purchases | Sales | Transfer from Level 1 and 2 | Transfer to Level 1 and 2 | Balance as of December 31, 2024 | |||||||||||||||||||||||||
| MCh$ | MCh$ | MCh$ | MCh$ | MCh$ | MCh$ | MCh$ | MCh$ | |||||||||||||||||||||||||
| Financial Assets held for trading at fair value through profit or loss | ||||||||||||||||||||||||||||||||
| Debt Financial Instruments: | ||||||||||||||||||||||||||||||||
| Other debt financial instruments issued in Chile | 34,363 | 1,409 | — | 25,279 | (56,736 | ) | 6,958 | — | 11,273 | |||||||||||||||||||||||
| Subtotal | 34,363 | 1,409 | — | 25,279 | (56,736 | ) | 6,958 | — | 11,273 | |||||||||||||||||||||||
| Financial Assets at fair value through Other Comprehensive Income | ||||||||||||||||||||||||||||||||
| Debt Financial Instruments: | ||||||||||||||||||||||||||||||||
| Other debt financial instruments issued in Chile | 88,483 | 586 | 1,682 | 58,608 | (27,961 | ) | 11,268 | (60,744 | ) | 71,922 | ||||||||||||||||||||||
| Subtotal | 88,483 | 586 | 1,682 | 58,608 | (27,961 | ) | 11,268 | (60,744 | ) | 71,922 | ||||||||||||||||||||||
| Total | 122,846 | 1,995 | 1,682 | 83,887 | (84,697 | ) | 18,226 | (60,744 | ) | 83,195 | ||||||||||||||||||||||
| (1) | Recorded in income under item “Net Financial income (expense)”. |
| (2) | Recorded in equity under item “Accumulated other comprehensive income”. |
NOTES TO THE INTERIM CONSOLIDATED FINANCIAL STATEMENTS, continued
| 44. | Fair Value of Financial Assets and Liabilities, continued: |
| (d) | Sensitivity of instruments classified in Level 3 to changes in key assumptions of models: |
The following table shows the sensitivity, by type of instrument, of those instruments classified in Level 3 using alternative in key valuation assumptions:
| As of March 31, 2025 | As of December 31, 2024 | |||||||||||||||
| Level 3 | Sensitivity to changes in key assumptions of models |
Level 3 | Sensitivity to changes in key assumptions of models |
|||||||||||||
| MCh$ | MCh$ | MCh$ | MCh$ | |||||||||||||
| Financial Assets held for trading at fair value through profit or loss | ||||||||||||||||
| Debt Financial Instruments: | ||||||||||||||||
| Other debt financial instruments issued in Chile | 7,551 | (161 | ) | 11,273 | (255 | ) | ||||||||||
| Subtotal | 7,551 | (161 | ) | 11,273 | (255 | ) | ||||||||||
| Financial Assets at fair value through Other Comprehensive Income | ||||||||||||||||
| Debt Financial Instruments: | ||||||||||||||||
| Other debt financial instruments issued in Chile | 72,079 | (2,308 | ) | 71,922 | (2,320 | ) | ||||||||||
| Subtotal | 72,079 | (2,308 | ) | 71,922 | (2,320 | ) | ||||||||||
| Total | 79,630 | (2,469 | ) | 83,195 | (2,575 | ) | ||||||||||
With the purpose of determining the sensitivity of the financial investments to changes in significant market factors, the Bank has made alternative calculations at fair value, changing those key parameters for the valuation and which are not directly observable in screens. In the case of the financial assets listed in the table above, which correspond to Bank Bonds and Corporate Bonds, it was considered that, since there are no current observables prices, the input prices will be based on brokers’ quotes. The prices are usually calculated as a base rate plus a spread. For Local Bonds it was determined to apply a 10% impact on the price. The 10% impact is considered reasonable, taking into account the market performance of these instruments and comparing it against the bid/offer adjustment that is provisioned by these instruments.
NOTES TO THE INTERIM CONSOLIDATED FINANCIAL STATEMENTS, continued
| 44. | Fair Value of Financial Assets and Liabilities, continued: |
| (e) | Other assets and liabilities: |
The following table summarizes the fair values of the Bank’s main financial assets and liabilities that are not recorded at fair value in the Interim Consolidated Statement of Financial Position. The values shown in this note are not attempt to estimate the value of the Bank’s income-generating assets, nor forecast their future behavior. The estimated fair value is as follows:
| Book Value | Estimated Fair Value | |||||||||||||||
| March | December | March | December | |||||||||||||
| 2025 | 2024 | 2025 | 2024 | |||||||||||||
| MCh$ | MCh$ | MCh$ | MCh$ | |||||||||||||
| Assets | ||||||||||||||||
| Cash and due from banks | 2,331,207 | 2,699,076 | 2,331,207 | 2,699,076 | ||||||||||||
| Transactions in the course of collection | 356,737 | 372,456 | 356,737 | 372,456 | ||||||||||||
| Subtotal | 2,687,944 | 3,071,532 | 2,687,944 | 3,071,532 | ||||||||||||
| Financial assets at amortized cost: | ||||||||||||||||
| Rights from resale agreements and securities lending | 99,283 | 87,291 | 99,283 | 87,291 | ||||||||||||
| Debt financial instruments | 929,266 | 944,074 | 888,454 | 892,550 | ||||||||||||
| Loans and advances to Banks: | ||||||||||||||||
| Domestic banks | 1,100,000 | 299,888 | 1,100,000 | 299,888 | ||||||||||||
| Central Bank of Chile | 199,928 | — | 199,928 | — | ||||||||||||
| Foreign banks | 399,937 | 366,927 | 396,960 | 366,245 | ||||||||||||
| Subtotal | 2,728,414 | 1,698,180 | 2,684,625 | 1,645,974 | ||||||||||||
| Loans to customers, net: | ||||||||||||||||
| Commercial loans | 19,889,443 | 19,724,933 | 19,677,068 | 19,561,279 | ||||||||||||
| Residential mortgage loans | 13,459,612 | 13,180,186 | 13,299,695 | 13,000,178 | ||||||||||||
| Consumer loans | 5,148,947 | 5,183,917 | 5,277,269 | 5,247,985 | ||||||||||||
| Subtotal | 38,498,002 | 38,089,036 | 38,254,032 | 37,809,442 | ||||||||||||
| Total | 43,914,360 | 42,858,748 | 43,626,601 | 42,526,948 | ||||||||||||
| Liabilities | ||||||||||||||||
| Transactions in the course of payment | 534,594 | 283,605 | 534,594 | 283,605 | ||||||||||||
| Financial liabilities at amortized cost: | ||||||||||||||||
| Current accounts and other demand deposits | 14,560,376 | 14,263,303 | 14,560,376 | 14,263,303 | ||||||||||||
| Saving accounts and time deposits | 15,507,444 | 14,168,703 | 15,504,879 | 14,170,156 | ||||||||||||
| Obligations by repurchase agreements and securities lending | 141,790 | 109,794 | 141,790 | 109,794 | ||||||||||||
| Borrowings from financial institutions | 1,312,028 | 1,103,468 | 1,278,625 | 1,071,097 | ||||||||||||
| Debt financial instruments issued: | ||||||||||||||||
| Letters of credit for residential purposes | 717 | 849 | 832 | 946 | ||||||||||||
| Letters of credit for general purposes | — | 1 | — | 1 | ||||||||||||
| Bonds | 9,988,949 | 9,689,219 | 9,949,321 | 9,596,699 | ||||||||||||
| Other financial obligations | 320,709 | 284,479 | 320,709 | 284,479 | ||||||||||||
| Subtotal | 41,832,013 | 39,619,816 | 41,756,532 | 39,496,475 | ||||||||||||
| Financial instruments of regulatory capital issued: | ||||||||||||||||
| Subordinate bonds | 1,087,573 | 1,068,879 | 1,072,468 | 1,057,509 | ||||||||||||
| Total | 43,454,180 | 40,972,300 | 43,363,594 | 40,837,589 | ||||||||||||
Other financial assets and liabilities not measured at their fair value, but for which a fair value is estimated, even if not managed based on such value, include assets and liabilities such as placements, deposits and other time deposits, debt issued, and other financial assets and obligations with different maturities and characteristics. The fair value of these assets and liabilities is calculated using the Discounted Cash Flow model and the use of various data sources such as yield curves, credit risk spreads, etc. In addition, due to some of these assets and liabilities are not traded on the market, periodic reviews and analyzes are required to determine the suitability of the inputs and determined fair values.
NOTES TO THE INTERIM CONSOLIDATED FINANCIAL STATEMENTS, continued
| 44. | Fair Value of Financial Assets and Liabilities, continued: |
| (f) | Levels of other assets and liabilities: |
The following table shows the estimated fair value of financial assets and liabilities not valued at their fair value, as of March 31, 2025 and December 31, 2024:
| Level 1 estimated fair value |
Level 2 estimated fair value |
Level 3 estimated fair value |
Total estimated fair value |
|||||||||||||||||||||||||||||
| March | December | March | December | March | December | March | December | |||||||||||||||||||||||||
| 2025 | 2024 | 2025 | 2024 | 2025 | 2024 | 2025 | 2024 | |||||||||||||||||||||||||
| MCh$ | MCh$ | MCh$ | MCh$ | MCh$ | MCh$ | MCh$ | MCh$ | |||||||||||||||||||||||||
| Assets | ||||||||||||||||||||||||||||||||
| Cash and due from banks | 2,331,207 | 2,699,076 | — | — | — | — | 2,331,207 | 2,699,076 | ||||||||||||||||||||||||
| Transactions in the course of collection | 356,737 | 372,456 | — | — | — | — | 356,737 | 372,456 | ||||||||||||||||||||||||
| Subtotal | 2,687,944 | 3,071,532 | — | — | — | — | 2,687,944 | 3,071,532 | ||||||||||||||||||||||||
| Financial assets at amortized cost: | ||||||||||||||||||||||||||||||||
| Rights from resale agreements and securities lending | 99,283 | 87,291 | — | — | — | — | 99,283 | 87,291 | ||||||||||||||||||||||||
| Debt financial instruments | 888,454 | 892,550 | — | — | — | — | 888,454 | 892,550 | ||||||||||||||||||||||||
| Loans and advances to Banks: | ||||||||||||||||||||||||||||||||
| Domestic banks | 1,100,000 | 299,888 | — | — | — | — | 1,100,000 | 299,888 | ||||||||||||||||||||||||
| Central Bank of Chile | 199,928 | — | — | — | — | — | 199,928 | — | ||||||||||||||||||||||||
| Foreign banks | — | — | — | — | 396,960 | 366,245 | 396,960 | 366,245 | ||||||||||||||||||||||||
| Subtotal | 2,287,665 | 1,279,729 | — | — | 396,960 | 366,245 | 2,684,625 | 1,645,974 | ||||||||||||||||||||||||
| Loans to customers, net: | ||||||||||||||||||||||||||||||||
| Commercial loans | — | — | — | — | 19,677,068 | 19,561,279 | 19,677,068 | 19,561,279 | ||||||||||||||||||||||||
| Residential mortgage loans | — | — | — | — | 13,299,695 | 13,000,178 | 13,299,695 | 13,000,178 | ||||||||||||||||||||||||
| Consumer loans | — | — | — | — | 5,277,269 | 5,247,985 | 5,277,269 | 5,247,985 | ||||||||||||||||||||||||
| Subtotal | — | — | — | — | 38,254,032 | 37,809,442 | 38,254,032 | 37,809,442 | ||||||||||||||||||||||||
| Total | 4,975,609 | 4,351,261 | — | — | 38,650,992 | 38,175,687 | 43,626,601 | 42,526,948 | ||||||||||||||||||||||||
| Liabilities | ||||||||||||||||||||||||||||||||
| Transactions in the course of payment | 534,594 | 283,605 | — | — | — | — | 534,594 | 283,605 | ||||||||||||||||||||||||
| Financial liabilities at amortized cost: | ||||||||||||||||||||||||||||||||
| Current accounts and other demand deposits | 14,560,376 | 14,263,303 | — | — | — | — | 14,560,376 | 14,263,303 | ||||||||||||||||||||||||
| Saving accounts and time deposits | — | — | — | — | 15,504,879 | 14,170,156 | 15,504,879 | 14,170,156 | ||||||||||||||||||||||||
| Obligations by repurchase agreements and securities lending | 141,790 | 109,794 | — | — | — | — | 141,790 | 109,794 | ||||||||||||||||||||||||
| Borrowings from financial institutions | — | — | — | — | 1,278,625 | 1,071,097 | 1,278,625 | 1,071,097 | ||||||||||||||||||||||||
| Debt financial instruments issued: | ||||||||||||||||||||||||||||||||
| Letters of credit for residential purposes | — | — | 832 | 946 | — | — | 832 | 946 | ||||||||||||||||||||||||
| Letters of credit for general purposes | — | — | — | 1 | — | — | — | 1 | ||||||||||||||||||||||||
| Bonds | — | — | 9,949,321 | 9,596,699 | — | — | 9,949,321 | 9,596,699 | ||||||||||||||||||||||||
| Other financial obligations | — | — | — | — | 320,709 | 284,479 | 320,709 | 284,479 | ||||||||||||||||||||||||
| Subtotal | 14,702,166 | 14,373,097 | 9,950,153 | 9,597,646 | 17,104,213 | 15,525,732 | 41,756,532 | 39,496,475 | ||||||||||||||||||||||||
| Financial instruments of regulatory capital issued: | ||||||||||||||||||||||||||||||||
| Subordinate bonds | — | — | — | — | 1,072,468 | 1,057,509 | 1,072,468 | 1,057,509 | ||||||||||||||||||||||||
| Total | 15,236,760 | 14,656,702 | 9,950,153 | 9,597,646 | 18,176,681 | 16,583,241 | 43,363,594 | 40,837,589 | ||||||||||||||||||||||||
NOTES TO THE INTERIM CONSOLIDATED FINANCIAL STATEMENTS, continued
| 44. | Fair Value of Financial Assets and Liabilities, continued: |
| (f) | Levels of other assets and liabilities, continued: |
The Bank determines the fair value of these assets and liabilities according to the following:
| ● | Short-term assets and liabilities: For assets and liabilities with short-term maturity, it is assumed that the book values approximate to their fair value. This assumption is applied to the following assets and liabilities: |
| Assets: | Liabilities: | |
| - Cash and deposits in banks | - Current accounts and other demand deposits | |
| - Transactions in the course of collection | - Transactions in the course of payments | |
| - Investment under resale agreements and securities loans | - Obligations under repurchase agreements and securities loans | |
| - Loans and advance to domestic banks (including the Central Bank of Chile) |
| ● | Loans to Customers and Advances to foreign banks: Fair value is determined by using the discounted cash flow model and internally generated discount rates, based on internal transfer rates derived from our internal transfer price process. Once the present value is determined, we deduct the related loan loss allowances in order to incorporate the credit risk associated with each contract or loan. As we use internally generated parameters for valuation purposes, we categorize these instruments in Level 3. |
| ● | Debt financial instruments at amortized cost: The fair value is calculated with the methodology of the Stock Exchange, using the IRR observed in the market. Because the instruments that are in this category correspond to Treasury Bonds that are Benchmark, they are classified in Level 1. |
| ● | Letters of Credit and Bonds: In order to determine the present value of contractual cash flows, we apply the discounted cash flow model by using market interest rates that are available in the market, either for the instruments under valuation or instruments with similar features that fit valuation needs in terms of currency, maturities and liquidity. The market interest rates are obtained from third party price providers widely used by the market. As a result of the valuation technique and the quality of inputs (observable) used for valuation, we categorize these financial liabilities in Level 2. |
| ● | Saving Accounts, Time Deposits, Borrowings from Financial Institutions (including the Central Bank of Chile), Subordinated Bonds and Other borrowings financial: The discounted cash flow model is used to obtain the present value of committed cash flows by applying a bucket approach and average adjusted discount rates that derived from both market rates for instruments with similar features and our internal transfer price process. As we use internally generated parameters and/or apply significant judgmental analysis for valuation purposes, we categorize these financial liabilities in Level 3. |
NOTES TO THE INTERIM CONSOLIDATED FINANCIAL STATEMENTS, continued
| 45. | Maturity according to their remaining Terms of Financial Assets and Liabilities: |
The table below details the main financial assets and liabilities grouped in accordance with their remaining maturity, including capitals and accrued interest as of March 31, 2025 and December 31, 2024. As these are for trading and Financial instrument at fair value through other comprehensive income are included at their fair value:
| March 2025 | ||||||||||||||||||||||||||||||||||||||||
| Demand | Up to 1 month |
Over 1 month and up to 3 months |
Over 3 month and up to 12 months |
Subtotal up to 1 year |
Over 1 year and up to 3 years |
Over 3 year and up to 5 years |
Over 5 years |
Subtotal over 1 year |
Total | |||||||||||||||||||||||||||||||
| MCh$ | MCh$ | MCh$ | MCh$ | MCh$ | MCh$ | MCh$ | MCh$ | MCh$ | MCh$ | |||||||||||||||||||||||||||||||
| Assets | ||||||||||||||||||||||||||||||||||||||||
| Cash and due from banks | 2,331,207 | — | — | — | 2,331,207 | — | — | — | — | 2,331,207 | ||||||||||||||||||||||||||||||
| Transactions in the course of collection | — | 356,737 | — | — | 356,737 | — | — | — | — | 356,737 | ||||||||||||||||||||||||||||||
| Financial assets held for trading at fair value through profit or loss: | ||||||||||||||||||||||||||||||||||||||||
| Derivative contracts financial | — | 146,238 | 154,165 | 333,637 | 634,040 | 449,429 | 365,449 | 595,631 | 1,410,509 | 2,044,549 | ||||||||||||||||||||||||||||||
| Debt financial instruments | — | 2,750,521 | — | — | 2,750,521 | — | — | — | — | 2,750,521 | ||||||||||||||||||||||||||||||
| Others | — | 332,337 | — | — | 332,337 | — | — | — | — | 332,337 | ||||||||||||||||||||||||||||||
| Financial assets at fair value through other comprehensive income | — | 15,619 | 176,799 | 809,040 | 1,001,458 | 56,547 | 614,691 | 275,037 | 946,275 | 1,947,733 | ||||||||||||||||||||||||||||||
| Derivative contracts financial for hedging purposes | — | — | — | 226 | 226 | 18,099 | 9,483 | 19,300 | 46,882 | 47,108 | ||||||||||||||||||||||||||||||
| Financial assets at amortized cost: | ||||||||||||||||||||||||||||||||||||||||
| Rights from resale agreements and securities lending | — | 59,986 | 37,936 | 1,361 | 99,283 | — | — | — | — | 99,283 | ||||||||||||||||||||||||||||||
| Debt financial instruments (*) | — | — | — | 480,745 | 480,745 | — | 132,307 | 316,249 | 448,556 | 929,301 | ||||||||||||||||||||||||||||||
| Loans and advances to Banks (**) | — | 1,524,797 | 171,193 | 4,775 | 1,700,765 | — | — | — | — | 1,700,765 | ||||||||||||||||||||||||||||||
| Loans to customers, net (**) | — | 5,381,846 | 3,535,816 | 6,738,445 | 15,656,107 | 6,797,394 | 4,442,779 | 12,424,055 | 23,664,228 | 39,320,335 | ||||||||||||||||||||||||||||||
| Total financial assets | 2,331,207 | 10,568,081 | 4,075,909 | 8,368,229 | 25,343,426 | 7,321,469 | 5,564,709 | 13,630,272 | 26,516,450 | 51,859,876 | ||||||||||||||||||||||||||||||
NOTES TO THE INTERIM CONSOLIDATED FINANCIAL STATEMENTS, continued
| 45. | Maturity according to their remaining Terms of Financial Assets and Liabilities, continued: |
| March 2025 | ||||||||||||||||||||||||||||||||||||||||
| Demand | Up to 1 month |
Over 1 month and
up to 3 months |
Over 3 month and up to 12 months |
Subtotal up
to 1 year |
Over 1 year and up to 3 years |
Over 3 year and up to 5 years |
Over 5 years |
Subtotal over 1 year |
Total | |||||||||||||||||||||||||||||||
| MCh$ | MCh$ | MCh$ | MCh$ | MCh$ | MCh$ | MCh$ | MCh$ | MCh$ | MCh$ | |||||||||||||||||||||||||||||||
| Liabilities | ||||||||||||||||||||||||||||||||||||||||
| Transactions in the course of payment | — | 534,594 | — | — | 534,594 | — | — | — | — | 534,594 | ||||||||||||||||||||||||||||||
| Financial liabilities held for trading at fair value through profit or loss: | ||||||||||||||||||||||||||||||||||||||||
| Derivative contracts financial | — | 128,899 | 145,227 | 330,335 | 604,461 | 567,031 | 443,418 | 578,042 | 1,588,491 | 2,192,952 | ||||||||||||||||||||||||||||||
| Others | — | 5,788 | — | 736 | 6,524 | — | — | — | — | 6,524 | ||||||||||||||||||||||||||||||
| Derivative contracts financial for hedging purposes | — | — | 126 | 15,291 | 15,417 | 6,494 | 30,022 | 148,911 | 185,427 | 200,844 | ||||||||||||||||||||||||||||||
| Financial liabilities at amortized cost: | ||||||||||||||||||||||||||||||||||||||||
| Current accounts and other demand deposits | 14,560,376 | — | — | — | 14,560,376 | — | — | — | — | 14,560,376 | ||||||||||||||||||||||||||||||
| Saving accounts and time deposits (***) | — | 9,483,533 | 3,158,687 | 2,304,573 | 14,946,793 | 171,552 | 326 | 541 | 172,419 | 15,119,212 | ||||||||||||||||||||||||||||||
| Obligations by repurchase agreements and securities lending | — | 102,292 | 39,498 | — | 141,790 | — | — | — | — | 141,790 | ||||||||||||||||||||||||||||||
| Borrowings from financial institutions | — | 102,823 | 379,078 | 830,127 | 1,312,028 | — | — | — | — | 1,312,028 | ||||||||||||||||||||||||||||||
| Debt financial instruments issued: | ||||||||||||||||||||||||||||||||||||||||
| Letters of credit | — | 61 | 135 | 98 | 294 | 69 | 84 | 270 | 423 | 717 | ||||||||||||||||||||||||||||||
| Bonds | — | 101,952 | 428,490 | 1,062,356 | 1,592,798 | 2,429,057 | 2,191,478 | 3,775,616 | 8,396,151 | 9,988,949 | ||||||||||||||||||||||||||||||
| Other financial obligations | — | 320,709 | — | — | 320,709 | — | — | — | — | 320,709 | ||||||||||||||||||||||||||||||
| Lease liabilities | — | 2,294 | 5,010 | 19,236 | 26,540 | 35,925 | 15,925 | 8,818 | 60,668 | 87,208 | ||||||||||||||||||||||||||||||
| Financial instruments of regulatory capital issued | — | 3,496 | 104,947 | 7,914 | 116,357 | 14,105 | 11,958 | 945,153 | 971,216 | 1,087,573 | ||||||||||||||||||||||||||||||
| Total financial liabilities | 14,560,376 | 10,786,441 | 4,261,198 | 4,570,666 | 34,178,681 | 3,224,233 | 2,693,211 | 5,457,351 | 11,374,795 | 45,553,476 | ||||||||||||||||||||||||||||||
| Mismatch | (12,229,169 | ) | (218,360 | ) | (185,289 | ) | 3,797,563 | (8,835,255 | ) | 4,097,236 | 2,871,498 | 8,172,921 | 15,141,655 | 6,306,400 | ||||||||||||||||||||||||||
| (*) | These balances are presented without deduction of impairment, wich amount to Ch$35 million. |
| (**) | These balances are presented without deduction of their respective provisions, which amount to Ch$822,333 million for loans to customers and Ch$900 million for borrowings from financial institutions. |
| (***) | Excludes term saving accounts, which amount to Ch$388,232 million. |
NOTES TO THE INTERIM CONSOLIDATED FINANCIAL STATEMENTS, continued
| 45. | Maturity according to their remaining Terms of Financial Assets and Liabilities, continued: |
| December 2024 | ||||||||||||||||||||||||||||||||||||||||
| Demand | Up to 1 month |
Over 1 month and up to 3 months |
Over 3 month and
up to 12 months |
Subtotal up
to 1 year |
Over 1 year and up to 3 years |
Over 3 year and up to 5 years |
Over 5 years |
Subtotal over 1 year |
Total | |||||||||||||||||||||||||||||||
| MCh$ | MCh$ | MCh$ | MCh$ | MCh$ | MCh$ | MCh$ | MCh$ | MCh$ | MCh$ | |||||||||||||||||||||||||||||||
| Assets | ||||||||||||||||||||||||||||||||||||||||
| Cash and due from banks | 2,699,076 | — | — | — | 2,699,076 | — | — | — | — | 2,699,076 | ||||||||||||||||||||||||||||||
| Transactions in the course of collection | — | 372,456 | — | — | 372,456 | — | — | — | — | 372,456 | ||||||||||||||||||||||||||||||
| Financial assets held for trading at fair value through profit or loss: | ||||||||||||||||||||||||||||||||||||||||
| Derivative contracts financial | — | 87,403 | 120,813 | 465,718 | 673,934 | 540,872 | 405,243 | 683,304 | 1,629,419 | 2,303,353 | ||||||||||||||||||||||||||||||
| Debt financial instruments | — | 1,714,381 | — | — | 1,714,381 | — | — | — | — | 1,714,381 | ||||||||||||||||||||||||||||||
| Others | — | 411,689 | — | — | 411,689 | — | — | — | — | 411,689 | ||||||||||||||||||||||||||||||
| Financial assets at fair value through other comprehensive income | — | 123,164 | 250,542 | 683,008 | 1,056,714 | 196,319 | 590,462 | 244,850 | 1,031,631 | 2,088,345 | ||||||||||||||||||||||||||||||
| Derivative contracts financial for hedging purposes | — | — | — | 4,783 | 4,783 | 25,936 | 15,741 | 27,499 | 69,176 | 73,959 | ||||||||||||||||||||||||||||||
| Financial assets at amortized cost: | ||||||||||||||||||||||||||||||||||||||||
| Rights from resale agreements and securities lending | — | 55,295 | 31,242 | 754 | 87,291 | — | — | — | — | 87,291 | ||||||||||||||||||||||||||||||
| Debt financial instruments (*) | — | — | 16,833 | — | 16,833 | 477,895 | 131,070 | 318,311 | 927,276 | 944,109 | ||||||||||||||||||||||||||||||
| Loans and advances to Banks (**) | — | 398,512 | 57,306 | 211,885 | 667,703 | — | — | — | — | 667,703 | ||||||||||||||||||||||||||||||
| Loans to customers, net (**) | — | 5,344,299 | 2,853,497 | 7,464,859 | 15,662,655 | 6,849,850 | 4,175,945 | 12,186,670 | 23,212,465 | 38,875,120 | ||||||||||||||||||||||||||||||
| Total financial assets | 2,699,076 | 8,507,199 | 3,330,233 | 8,831,007 | 23,367,515 | 8,090,872 | 5,318,461 | 13,460,634 | 26,869,967 | 50,237,482 | ||||||||||||||||||||||||||||||
NOTES TO THE INTERIM CONSOLIDATED FINANCIAL STATEMENTS, continued
| 45. | Maturity according to their remaining Terms of Financial Assets and Liabilities, continued: |
| December 2024 | ||||||||||||||||||||||||||||||||||||||||
| Demand | Up to 1 month | Over 1 month and
up to 3 months |
Over 3 month and
up to 12 months |
Subtotal up
to 1 year |
Over 1 year and up to 3 years |
Over 3 year and up to 5 years |
Over 5 years |
Subtotal over
1 year |
Total | |||||||||||||||||||||||||||||||
| MCh$ | MCh$ | MCh$ | MCh$ | MCh$ | MCh$ | MCh$ | MCh$ | MCh$ | MCh$ | |||||||||||||||||||||||||||||||
| Liabilities | ||||||||||||||||||||||||||||||||||||||||
| Transactions in the course of payment | — | 283,605 | — | — | 283,605 | — | — | — | — | 283,605 | ||||||||||||||||||||||||||||||
| Financial liabilities held for trading at fair value through profit or loss: | ||||||||||||||||||||||||||||||||||||||||
| Derivative contracts financial | — | 80,209 | 103,327 | 450,350 | 633,886 | 674,660 | 475,577 | 660,683 | 1,810,920 | 2,444,806 | ||||||||||||||||||||||||||||||
| Others | — | 580 | — | — | 580 | 410 | — | — | 410 | 990 | ||||||||||||||||||||||||||||||
| Derivative contracts financial for hedging purposes | — | — | — | 10,741 | 10,741 | 241 | 28,906 | 101,152 | 130,299 | 141,040 | ||||||||||||||||||||||||||||||
| Financial liabilities at amortized cost: | ||||||||||||||||||||||||||||||||||||||||
| Current accounts and other demand deposits | 14,263,303 | — | — | — | 14,263,303 | — | — | — | — | 14,263,303 | ||||||||||||||||||||||||||||||
| Saving accounts and time deposits (***) | — | 9,029,159 | 2,636,427 | 2,073,931 | 13,739,517 | 53,594 | 452 | 547 | 54,593 | 13,794,110 | ||||||||||||||||||||||||||||||
| Obligations by repurchase agreements and securities lending | — | 109,214 | 65 | 515 | 109,794 | — | — | — | — | 109,794 | ||||||||||||||||||||||||||||||
| Borrowings from financial institutions | — | 7,945 | 161,196 | 783,552 | 952,693 | 150,775 | — | — | 150,775 | 1,103,468 | ||||||||||||||||||||||||||||||
| Debt financial instruments issued: | ||||||||||||||||||||||||||||||||||||||||
| Letters of credit | — | 138 | 140 | 161 | 439 | 40 | 86 | 285 | 411 | 850 | ||||||||||||||||||||||||||||||
| Bonds | — | 4,451 | 134,852 | 1,033,995 | 1,173,298 | 2,577,932 | 2,043,457 | 3,894,532 | 8,515,921 | 9,689,219 | ||||||||||||||||||||||||||||||
| Other financial obligations | — | 284,479 | — | — | 284,479 | — | — | — | — | 284,479 | ||||||||||||||||||||||||||||||
| Lease liabilities | — | 2,252 | 4,728 | 19,046 | 26,026 | 36,552 | 18,746 | 10,105 | 65,403 | 91,429 | ||||||||||||||||||||||||||||||
| Financial instruments of regulatory capital issued | — | 1,815 | — | 112,095 | 113,910 | 13,514 | 11,365 | 930,090 | 954,969 | 1,068,879 | ||||||||||||||||||||||||||||||
| Total financial liabilities | 14,263,303 | 9,803,847 | 3,040,735 | 4,484,386 | 31,592,271 | 3,507,718 | 2,578,589 | 5,597,394 | 11,683,701 | 43,275,972 | ||||||||||||||||||||||||||||||
| Mismatch | (11,564,227 | ) | (1,296,648 | ) | 289,498 | 4,346,621 | (8,224,756 | ) | 4,583,154 | 2,739,872 | 7,863,240 | 15,186,266 | 6,961,510 | |||||||||||||||||||||||||||
| (*) | These balances are presented without deduction of impairment, wich amount to Ch$35 million. |
| (**) | These balances are presented without deduction of their respective provisions, which amount to Ch$786,084 million for loans to customers and Ch$888 million for borrowings from financial institutions. |
| (***) | Excludes term saving accounts, which amount to Ch$374,593 million. |
NOTES TO THE INTERIM CONSOLIDATED FINANCIAL STATEMENTS, continued
| 46. | Financial and Non-Financial Assets and Liabilities by Currency: |
| As of March 31, 2025 | CLP | CLF | FX Indexation | USD | COP | GBP | EUR | CHF | JPY | CNY | Others | TOTAL | ||||||||||||||||||||||||||||||||||||
| MCh$ | MCh$ | MCh$ | MCh$ | MCh$ | MCh$ | MCh$ | MCh$ | MCh$ | MCh$ | MCh$ | MCh$ | |||||||||||||||||||||||||||||||||||||
| Assets | ||||||||||||||||||||||||||||||||||||||||||||||||
| Financial assets | 22,456,038 | 22,825,052 | 168,082 | 5,212,630 | — | 33,603 | 270,598 | 5,171 | 13,485 | 30,549 | 21,400 | 51,036,608 | ||||||||||||||||||||||||||||||||||||
| Non-Financial assets | 2,195,615 | 31,278 | 11,936 | 491,499 | — | — | 2,950 | — | — | — | 18 | 2,733,296 | ||||||||||||||||||||||||||||||||||||
| Total Assets | 24,651,653 | 22,856,330 | 180,018 | 5,704,129 | — | 33,603 | 273,548 | 5,171 | 13,485 | 30,549 | 21,418 | 53,769,904 | ||||||||||||||||||||||||||||||||||||
| Liabilities | ||||||||||||||||||||||||||||||||||||||||||||||||
| Financial liabilities | 27,036,178 | 10,564,272 | 394 | 6,788,647 | — | 9,876 | 334,355 | 140,499 | 232,002 | 9,163 | 826,322 | 45,941,708 | ||||||||||||||||||||||||||||||||||||
| Non-Financial liabilities | 1,703,967 | 394,393 | 1,361 | 325,859 | — | 1,487 | 5,530 | 2 | 13 | 157 | 67 | 2,432,836 | ||||||||||||||||||||||||||||||||||||
| Total Liabilities | 28,740,145 | 10,958,665 | 1,755 | 7,114,506 | — | 11,363 | 339,885 | 140,501 | 232,015 | 9,320 | 826,389 | 48,374,544 | ||||||||||||||||||||||||||||||||||||
| Mismatch of Financial Assets and Liabilities (*) | (4,580,140 | ) | 12,260,780 | 167,688 | (1,576,017 | ) | — | 23,727 | (63,757 | ) | (135,328 | ) | (218,517 | ) | 21,386 | (804,922 | ) | 5,094,900 | ||||||||||||||||||||||||||||||
| (*) | This value does not consider non-financial assets and liabilities and the notional values of derivative instruments, which are disclosed at fair value. |
| As of December 31, 2024 | CLP | CLF | FX Indexation | USD | COP | GBP | EUR | CHF | JPY | CNY | Others | TOTAL | ||||||||||||||||||||||||||||||||||||
| MCh$ | MCh$ | MCh$ | MCh$ | MCh$ | MCh$ | MCh$ | MCh$ | MCh$ | MCh$ | MCh$ | MCh$ | |||||||||||||||||||||||||||||||||||||
| Assets | ||||||||||||||||||||||||||||||||||||||||||||||||
| Financial assets | 21,227,721 | 22,318,337 | 171,396 | 5,307,621 | — | 35,762 | 280,162 | 62,903 | 18,750 | 5,462 | 22,361 | 49,450,475 | ||||||||||||||||||||||||||||||||||||
| Non-Financial assets | 2,153,271 | 49,318 | 11,699 | 429,341 | — | — | 1,273 | — | — | — | 64 | 2,644,966 | ||||||||||||||||||||||||||||||||||||
| Total Assets | 23,380,992 | 22,367,655 | 183,095 | 5,736,962 | — | 35,762 | 281,435 | 62,903 | 18,750 | 5,462 | 22,425 | 52,095,441 | ||||||||||||||||||||||||||||||||||||
| Liabilities | ||||||||||||||||||||||||||||||||||||||||||||||||
| Financial liabilities | 25,758,304 | 10,716,291 | 176 | 5,624,828 | — | 6,837 | 297,367 | 170,907 | 230,051 | — | 845,804 | 43,650,565 | ||||||||||||||||||||||||||||||||||||
| Non-Financial liabilities | 2,143,825 | 373,949 | 1,252 | 299,241 | — | 26 | 3,375 | 2 | 34 | — | 171 | 2,821,875 | ||||||||||||||||||||||||||||||||||||
| Total Liabilities | 27,902,129 | 11,090,240 | 1,428 | 5,924,069 | — | 6,863 | 300,742 | 170,909 | 230,085 | — | 845,975 | 46,472,440 | ||||||||||||||||||||||||||||||||||||
| Mismatch of Financial Assets and Liabilities (*) | (4,530,583 | ) | 11,602,046 | 171,220 | (317,207 | ) | — | 28,925 | (17,205 | ) | (108,004 | ) | (211,301 | ) | 5,462 | (823,443 | ) | 5,799,910 | ||||||||||||||||||||||||||||||
| (*) | This value does not consider non-financial assets and liabilities and the notional values of derivative instruments, which are disclosed at fair value. |
NOTES TO THE INTERIM CONSOLIDATED FINANCIAL STATEMENTS, continued
| 47. | Risk Management and Report: |
| (1) | Introduction: |
Banco de Chile seeks to maintain a risk profile that ensures the sustainable growth that is aligned with its strategic objectives, maximizing value creation and guarantee its long-term solvency. Global risk management takes into consideration the different business segments served by the Bank, being approached from a comprehensive and differentiated perspective.
Our risk management policies are established in order to identify and analyze the risks faced by the Bank, set appropriate risk limits, alerts and controls, monitor risks and compliance with limits and alerts in order to carry out the necessary action plans. Through its administration policies and procedures, the Bank develops a disciplined and constructive control environment. Policies as well as risk management standards, procedures and systems are regularly reviewed, and with strict adherence to compliance with the current regulatory framework.
For this, the Bank has teams with extensive experience and knowledge in each area associated with risks, ensuring comprehensive and consolidated management of the same, including the Bank and its subsidiaries.
| (a) | Risk Management Structure |
Credit, Market and Operational Risk Management are at all levels of the Organization, with a Corporate Governance structure that recognizes the relevance of the different risk areas that exist.
The Bank’s Board of Directors as the maximum authority is responsible for establishing risk policies, the Risk Appetite Framework, and the guidelines for the measurement criteria and follow up of risks. Also, it approves the risk limits and contingency plans for each of the risks. Moreover, it approves the following policies: Credit risk policy, policy for complex products and services, operational risk policy, business continuation policy, outsourcing policy, market risk policy and liquidity risk policy. Likewise, it approves the provision models, Additional Provisions Policy and pronounces annually on the sufficient provisions. Additionally, approves the policy of capital management for the monitoring, control, administration and the management of the bank´s capital. Also, it ratifies the strategies, functional structure and comprehensive management model of Operational Risk and guarantees the consistency of this model with the Bank’s strategy and proper implementation of the model in the organization. Along with this, it has approved the risk management policy of the model together with the development framework, validation and follow up of the models. Furthermore, it establishes the Subsidiary Risk Control Policy, describing the supervision scheme that the Bank applies to the relevant subsidiaries to control the risks that affect them. For its part, the Administration is responsible both for the establishment of standards and associated procedures as well as for the control and compliance with the disposed by the Board of Directors, ensuring that there is consistency between the criteria applied by the Bank and its subsidiaries, maintaining strict coordination at the corporate level and informing the Board of Directors in the defined instances.
The Bank’s Corporate Governance considers the active participation of the Board, acting directly or through different committees made up of Directors and Senior Management. It is permanently informed and becomes aware of the evolution of the different risk management areas, participating through its Finance, International and Financial Risk, Credit, Portfolio Risk Committee, Higher Committee of Operational Risk and Capital Management, in which the status of credit, market and operational risks and the Bank’s capital management are reviewed.
NOTES TO THE INTERIM CONSOLIDATED FINANCIAL STATEMENTS, continued
| 47. | Risk Management and Report, continued: |
In addition to the Directors’ Committees, the Bank’s Administration has the Technical Committee for the Supervision of Internal Models, the Model Risk Management Committee and the Operational Risk Committee, related to specific matters.
The following sections describe the different committees of Directors and Administration mentioned.
Risk Management is developed by the Corporate Risk Division, which by having highly experienced and specialized teams, together with a solid regulatory framework, allows for optimal and effective management of the matters they address.
The Corporate Risk Division contributes to providing effective governance to the Corporation’s main risks, with a focus on optimizing the risk-return relationship, ensuring business continuity and generating a robust risk culture, identifying potential losses derived from the non-compliance of counterparties, movements in market factors or the lack of adequacy of processes, people or systems, contributing comprehensively to capital management.
Likewise, it continually manages risk knowledge from a comprehensive approach, in order to contribute to the business anticipating threats that may damage the solvency and quality of the portfolio, promoting a unique risk culture towards the Corporation through training and permanent education.
Within this Division, the Bank’s risk functions are integrated as follows, ensuring, at the same time, the correct segregation of functions and independence:
| - | Market Risk: Is responsible for developing the function of measuring, limiting, controlling and reporting market risk, along with defining valuation standards and managing the Bank’s assets and liabilities. Moreover, this management is responsible for taking care of the compliance of market risk management policies, liquidity management, investment in debt instruments approved by the board and to communicate promptly the status of market risks in detail accordingly. |
| - | Wholesale Credit Risk Admission: is responsible for managing, resolving and controlling the approval process of businesses related to the Wholesale segment portfolio, including specific sectors and products for this portfolio, ensuring coherence, compliance and consistency of policies. of credit risk both in the bank and in its subsidiaries. |
| - | Retail Admission, Regulations and Risk Transformation: Responsible for defining the credit risk management framework, both for reactive and proactive retail origination, within the defined regulatory scope and risk appetite established by the Bank. Also, the maintenance and implementation of all credit risk strategies associated with the automatic evaluation. |
Manages the regulatory body, policies, standards and procedures of credit risk, adapting the established requirements and processes, for all segments transversally in the Bank. Likewise, it carries out reviews of the quality of the credit process applied to retail banks and the continuous training of executives.
| - | Special Asset Management: is responsible for the collection of credits from all of the Bank’s customer segments, with differentiated management in accordance with institutional policies. |
In addition, it is responsible for managing the sale of assets recovered by the Bank, coming from credit recovery processes.
| - | Risk Management Monitoring, Reporting and Control: is responsible for managing and reporting credit risk, especially through monitoring the main portfolio indicators and in-depth analysis of situations and scenarios of special attention, timely detecting problems that may affect certain products, debtors or sectors, with the aim of minimizing the risk assumed and anticipating situations that could lead to credit losses. |
NOTES TO THE INTERIM CONSOLIDATED FINANCIAL STATEMENTS, continued
| 47. | Risk Management and Report, continued: |
Likewise, it provides information to the different government bodies and areas involved in decision-making, and contributes to providing effective governance to the Corporate Risk Division projects, ensuring regulatory compliance and the correct execution of the projects. themselves, as well as being responsible for the management control of the Corporate Risk Division.
| - | Risk Models: is responsible for developing, maintaining and updating credit risk models, whether for regulatory or management uses, in accordance with local and international regulations, determining the functional specifications and the most appropriate statistical techniques for the development of the required models. These models are immersed in the measurement and management of model risk carried out by the Model Risk and Internal Control Management, and presented to the corresponding government bodies, such as the Technical Committee for the Supervision of Internal Models, the Portfolio Risk Committee or the Board of Directors, as appropriate. |
Additionally, this Area is responsible for managing the process of calculating provisions for credit risk, ensuring the correct execution of the processes and analysis of the results obtained.
| - | Model Risk and Internal Control: Its purpose is to manage the risks associated with models and processes, for this it is supported by the functions of model validation and monitoring, model risk management, and internal control. |
Conducts an independent review, evaluating the quality of the data, modeling techniques, compliance with regulatory provisions, its insertion within the institution and existing documentation. It monitors the performance of the models and monitors each stage of the life cycle of the models within its scope, with the final purpose of generating mechanisms that allow it to measure and manage the level of model risk to which the Bank is exposed.
Finally, the internal control function has the responsibility of carrying out an evaluation of the design and operational effectiveness of controls, to comply with regulatory requirements.
| - | Global Control: Address the operational risk environment and continuity of the business. This management is responsible for managing and supervising the application of policies, standards and procedures in each of the areas within the Bank and Subsidiaries. In relation to the area of Operational Risk, it is in charge for guaranteeing the identification and efficient management of operational risks and promoting a risk culture to prevent financial losses and improve the quality of processes, proposing continuous improvements to risk management, aligned with regulatory requirements of Basel III and business objectives. |
As part of the Global Control Management, there is the Business Continuity Management, which is responsible for managing, controlling and administering recovery strategies in the event of contingency situations, and is also responsible for maintaining the crisis governance model, sustains the continuity of services and related critical operations to the Bank’s payment chain, through a comprehensive and resilient model that includes plans and controlled tests in order to reduce the impact of disruptive events that may affect the bank. Additionally, there is the role and responsibilities of the Information Security Officer (ISO), with an independent function in charge of designing and implementing through monitoring of realized tasks of the organizational units responsible for the information security, cybersecurity and technological risks.
Additionally, the Bank has the Cybersecurity Division, which is responsible for defining, implementing and reporting the progress of the Strategic Cybersecurity Plan in line with the Bank’s business strategy, with one of its main focuses being to protect internal information, of its clients and collaborators.
This Division is made up of the Cybersecurity Engineering and Architecture Management, the Cyber Defense Management and the Technological Risk and Cyber Intelligence Management. The Cybersecurity Management and Subsidiaries Control Department is also part of the division, as a control unit. Section 5 of this Note describes the responsibilities of the indicated Managements.
NOTES TO THE INTERIM CONSOLIDATED FINANCIAL STATEMENTS, continued
| 47. | Risk Management and Report, continued: |
Committees of Directors and Bank Administration
(i) Finance, International and Financial Risk Committee
In general terms, the objectives of this committee are to monitor and continuously review the liquidity status and, trends in the most important financial positions, as well as the their associated results, and and their price and liquidity risks that will be generated. Some of its specific functions include, the review of the proposal to the Board of Directors of the Risk Appetite Framework (RAF), the Financing Plan and the structure of limits and alerts for price and liquidity risks, reviewing and approving the Comprehensive Risk Measurement (CRM) for subsequent due review in the Capital Management Committee and approval by the Board of Directors, the design of policies and procedures related to the establishment of limits and alerts for price risk and liquidity risk; reviewing the evolution of financial positions and market risks; monitoring limit excesses and alert activations; ensuring adequate identification of risk factors in financial positions; ensuring that the price and liquidity risk management guidelines in the Bank’s subsidiaries are consistent with those of the latter, and that these are reflected in their own policies and procedures.
(ii) Credit Committees
The credit approval process is done mainly through various credit committees, which are composed of qualified professionals and with the sufficient attributions to take decisions required.
Each committee defines the terms and conditions under which the Bank accepts counterparty risks and the Corporate Risk Division participate independently and autonomously of the commercial areas. They are constituted according to the commercial segments and the amounts to approve and have different meeting periodicities.
Within the risk management structure of the Bank, the maximum approval instance is the Credit Committee of Directors. Its functions are to resolve all credit transactions associated with customers and economic groups with approved lines of credit in excess of UF750,000, and to approve all credit transactions where the bank’s internal regulations require approval from this Committee, except for any special powers delegated by the board to management.
NOTES TO THE INTERIM CONSOLIDATED FINANCIAL STATEMENTS, continued
| 47. | Risk Management and Report, continued: |
(iii) Portfolio Risk Committee
The Portfolio Risk Committee must understand the composition, concentration and risks attached to the bank’s loan portfolio, from a global, sectoral and business unit perspective, review and approve the comprehensive risk measurement (CRM) and the Credit Risk Appetite Framework (RAF) in the area of credit risk; It must review the main debtors, their delinquency, past-due portfolio and impairment indicators, together with the write-offs and loan portfolio provisions for each segment. It must propose differentiated management strategies, as well as analyzing and agreeing on the and analyze credit policy proposals that will be approved by theto be approved by the board of directors. This committee also reviews and ratifies the approvals of management models and methodologies Also, this committee is responsible for reviewing and ratifying the approvals of management models and methodologies previously carried out by the Technical Committee for the Supervision of Internal Models, as well as proposing the regulatory models and methodologies for final approval by the Board of Directors.
(iv) Senior Operational Risk
The Senior Operational Risk Committee makes any necessary changes to the processes, controls and information systems that support the bank’s transactions, in order to mitigate operational risks, and assure that areas can appropriately manage and control these risks.
This Committee has many functions dedicated to supervising appropriate operational risk management at the bank and its subsidiaries, and for implementing the policies, standards and methods associated with the bank’s comprehensive operational risk management model. It plans initiatives to develop it and publishes them throughout the bank. It promotes a culture of operational risk management within the bank and its subsidiaries; review and approve the comprehensive risk measurement regarding Operational Risk. It approves the bank’s operational risk appetite framework; ensures compliance with the current regulatory framework, in matters that are limited to Operational Risk; become aware of the main frauds, incidents, events and their root causes, impacts and corrective measures accordingly; ensure the long-term solvency of the Organization (business continuity plans, informations security and cybersecurity, controls, among others), avoiding risk factors that may jeopardize the continuity of the Bank. To decide about new products and services, and to verify the consistency of the operational risk management policies, business continuation, information security and cyber security across the bank’s subsidiaries, monitors their compliance, and reviews operational risk management at subsidiaries; become aware of the level of risk to which the bank is exposed in its outsourced services, sanction the selection of the model to carry out stress tests and scenario selection methodologies and evaluate the results, among others.
NOTES TO THE INTERIM CONSOLIDATED FINANCIAL STATEMENTS, continued
| 47. | Risk Management and Report, continued: |
(v) Capital Management Committee
The main purpose of this committee is to assess, monitor and review capital adequacy in accordance with the principles in the bank’s capital management policy and its risk framework, to ensure that capital resources are adequately managed, the CMF’s principles are respected, and the bank’s medium-term sustainability.
(vi) Technical Committee for the Supervision of Internal Models
Among other functions, this committee must ensure compliance with the main guidelines to be used for the construction of models; analyze the adopted criteria and review and approve methodologies associated with non-regulatory models, which must be submitted to the Portfolio Risk Committee for consideration, for final ratification; In the case of regulatory models, this Committee is limited to its review, leaving approval in the hands of the Portfolio Risk Committee and subsequently the Board of Directors. He is also in charge of ensuring compliance with the model monitoring guidelines, which are also approved by the board of directors.
(vii) Model Risk Management Committee
Its main function is to establish and supervise the model risk management framework the corresponding at the institutional level. Among other matters, this committee reviews and discusses the identification and evaluation of model risk based on aggregate results, ensures the updating of the institutional inventory of institutional models and methodologies, and submits the Model Risk Management Policy to the Board of Directors for review and approval.
(viii) Operational Risk Committee
The Committee is empowered to trigger the necessary changes in the processes, procedures, controls and information systems that support the operation of Banco de Chile, in order to mitigate its operational risks, ensuring that the different areas properly manage and control these risks. Among the main functions of the Operational Risk Committee are: regarding the development of the Comprehensive Operational Risk Management Model, ensure the implementation and/or updating the Regulatory Framework, plans and initiatives for the development of the model and its dissemination in the Organization; promote a culture of operational risk management at all levels of the Bank; gather information on the results obtained from the comprehensive measurement of operational risk; review the Operational Risk Appetite Framework; ensure the current regulatory framework in matters related to operational risk; review the Bank’s level of exposure to operational risk and the main operational risks to which it is exposed; acquire knowledge of the main frauds, incidents, operational events and their root causes, impacts and corrective measures, as appropriate, as well as operational risk assessments; propose, agree on and/or prioritize strategies to mitigate the main operational risks; ensure the long-term solvency of the organization; ensure that Operational Risk policies are aligned with the Bank’s objectives and strategies; agree on the development of new products and services; acquire knowledge of the level of risk to which the Bank is exposed in its outsourced services, among others.
NOTES TO THE INTERIM CONSOLIDATED FINANCIAL STATEMENTS, continued
| 47. | Risk Management and Report, continued: |
| (b) | Internal Audit |
The risk management processes of the entire Bank are permanently audited by the Internal Audit Area, which examines the sufficiency of the procedures and their compliance. Internal Audit discusses the results of all evaluations with the administration and reports its findings and recommendations to the Board of Directors through the Audit Committee.
| (c) | Measurement Methodology |
Regarding to Credit Risk, provision levels and portfolio expenses are the basic measures for determining the credit quality of our portfolio.
Banco de Chile permanently evaluates its loan portfolio, timely recognizing the associated level of risk of the loan portfolio. To this end, there are guidelines for the generation of credit risk models, covering management models (reactive and proactive admission models and collection models), provision models (both under local regulations in accordance with the instructions issued by the CMF, as well as under IFRS criteria) and stress tests that are part of the Bank’s effective equity self-assessment process. The Board of Directors approves these guidelines and the models developed.
For the purposes of covering losses in the event of customers payment default, the Bank determines the level of provisions that must be established based on the following:
| - | Individual evaluation: mainly applies to the Bank’s portfolio of legal persons that, due to their size, complexity or indebtedness, requires a more detailed level of knowledge and a case-by-case analysis. Each debtor is assigned one of the 16 risk categories defined by the CMF, in order to establish the provisions in a timely and appropriate manner. The review of the portfolio risk classifications is carried out permanently considering the financial situation, payment behavior and the environment of each client. |
| - | Group evaluation: mainly applies to the portfolio of natural persons and smaller companies. These assessments are carried out monthly through statistical models that allow estimating the level of provisions necessary to cover the portfolio risk; in the case of commercial and mortgage portfolios, these results are contrasted with the standard models provided by the regulator, with the resulting provision being the largest between both methods. The consistency analysis of the models is carried out through an independent validation of the unit that develops them and, subsequently, through the analysis of retrospective tests that allow to compare the real losses with the expected ones. In March 2024, the CMF issued the regulations that establish the Standardized Methodology for computing Provisions for Consumer Loans, whose provisions began to apply from the accounting closing of January 2025. |
In order to validate the quality and robustness of the risk assessment processes, the Bank annually performs a test of the sufficiency of provisions for the total loan portfolio, thus verifying that the provisions established are sufficient to cover the losses that could derive from the credit operations granted. The result of this analysis is presented to the Board of Directors, who manifests itself on the sufficiency of the provisions in each fiscal year.
NOTES TO THE INTERIM CONSOLIDATED FINANCIAL STATEMENTS, continued
| 47. | Risk Management and Report, continued: |
Banco de Chile establishes additional provisions with the objective of protecting itself from the risk of unpredictable economic fluctuations that may affect the macroeconomic environment or the situation of a specific economic sector. At least once a year, the amount of additional provisions to be constituted or released is annually proposed to the Portfolio Risk Committee and subsequently to the Board of Directors for approval.
In this context, in January 2025, the Bank released additional provisions in response to the impact of the regulatory implementation of the standard consumer matrix.
The monitoring and control of risks are carried out mainly based on limits established by the Board of Directors. These limits reflect the Bank’s business and market strategy, as well as the level of risk that it is willing to accept, with additional emphasis on the selected industries.
The Bank develops its capital planning process in an integrated manner with its strategic planning, in line with the risks inherent to its activity, the economic and competitive environment, its business strategy, corporate values, as well as its governance, management and risk control. As part of the capital planning process and, in line with what is required by the regulator, Risk-Weighted Assets and stress tests are obtained in the dimensions of credit, market and operational risk, as well as the Comprehensive Measurement of financial and non-financial risks.
The Bank annually reviews and updates its Risk Appetite Framework, approved by the Board of Directors, that makes possible to identify, evaluate, measure, mitigate and control proactively and in advance all relevant risks that could materialize in the normal course of their business. To this end, the Bank uses different management tools and defines an adequate structure of alerts and limits, which are part of said Framework allowing it to constantly monitor the performance of different indicators and to implement timely corrective actions, in case those are needed. The result of these activities is part of the annual self-assessment report of effective equity approved by the Board of Directors and reported to the CMF.
NOTES TO THE INTERIM CONSOLIDATED FINANCIAL STATEMENTS, continued
| 47. | Risk Management and Report, continued: |
| (2) | Credit Risk: |
Credit risk considers the likelihood that the counterparty in the credit operation will not be able to fulfill its contractual obligation due to incapacity or financial insolvency, and this leads to a potential credit loss.
The Bank seeks an adequate risk-return relation and an appropriate balance of the risks assumed, through a permanent credit risk management considering the processes of admission, monitoring and recovery of the loans granted. Establishes the risk management framework for the different business segments it serves, responding to regulatory demands and commercial dynamism, being part of the digital transformation and contributing from a risk perspective to the various businesses addressed, through a vision of the portfolio that allows managing, resolving and controlling the business approval and monitoring process in an efficient and proactive manner.
In the business segments, the application of additional management processes is taken into consideration, to the extent required, for those financing requests that that will have a greater exposure to environmental and/or social risks.
The Bank integrates the socio-environmental criteria in its evaluations for the granting of financing destined to the development of projects, whether national or regional and that can generate an impact of this type, where they are executed. For the financing of projects, they must have the corresponding permits, authorizations, patents and studies, according to the impact they generate. In addition, the Bank has specialized units for serving large clients, through which the financing of project development is concentrated, including those of Public Works concessions that contemplate the construction of infrastructure, mining, electrical, real estate developments that can generate an environmental impact.
During 2024, progress was made in identifying the risks associated with climate change, generating heat maps for the individual portfolio, associated with exposure to Physical and Transition Risks. Likewise, within the framework of the development of the first National Taxonomy commanded by the Ministry of Finance, the Bank has advanced in the construction of a Classification Framework for Sustainable Financial Products and Services, with the objective of classifying the economic activities associated with said loans, using predefined selection criteria.
Credit policies and processes materialize in the following management principles, which are addressed with a specialized approach according to the characteristics of the different markets and segments served, recognizing the singularities of each one of them:
| 1. | Apply a rigorous evaluation in the admission process, based on established credit policies, standards and procedures, together with the availability of sufficient and accurate information. Thus, it corresponds to analyze the generation of flows and solvency of the client to meet their payment commitments and, when the characteristics of the operation merit it, must constitute adequate collateral that allow mitigating the risk incurred with the client. |
NOTES TO THE INTERIM CONSOLIDATED FINANCIAL STATEMENTS, continued
| 47. | Risk Management and Report, continued: |
| 2. | Have permanent and robust portfolio tracking processes, through procedures and systems that alert both the potential signs of impairment of clients, with respect to the conditions of origin, and also the possible business opportunities with those that present a better payments quality and behavior. |
| 3. | To develop credit risk modeling guidelines, in regulatory aspects and management, for efficient decision-making at different stages of the credit process. |
| 4. | Have a collection structure with timely, agile and effective processes that allow management to be carried out in accordance with the different types of clients and the types of breaches that arise, always in strict adherence to the regulatory framework and the Bank’s reputational definitions. |
| 5. | Maintain an efficient administration in work teams organization, tools and availability of information that allow an optimal credit risk management. |
Based on these management principles, the Corporate Risk Division contributes to the business and anticipates threats that may affect the solvency and quality of the portfolio, delivering timely responses to clients, maintaining the solid fundamentals that characterize the Bank’s portfolio in its different segments. and products.
The credit risk management process consists of the stages of Admission, Monitoring and Recovery or Collection for the retail and wholesale business segments served by the Bank.
| (a) | Admission: |
In the retail segments, admission management is carried out mainly through a risk evaluation that uses scoring tools and credit attribution to approve each operation. These evaluations, for natural persons without a business line and clients in the SME segment, take into consideration the level of indebtedness, the payment capacity and the maximum acceptable exposure for the client, through information on payment behavior, indebtedness in the financial system and business and financial information, as applicable.
Additionally, the bank has proactive admission processes for a diverse portfolio of clients. These consist of mass evalution of clients through statistical models of eligibility and payment capacity, generating credit offers aligned with the strategies defined. This makes possible to have preapproved credit offers available through multiple channels taking into consideration the business plan and the relation between risk and return.
NOTES TO THE INTERIM CONSOLIDATED FINANCIAL STATEMENTS, continued
| 47. | Risk Management and Report, continued: |
While in the Wholesale segments, the management of admission is carried out through an individual analysis of the client, also the relationship with the rest of the entities is also considered if applicable. This analysis takes into consideration among other factors the capacity to generate cash, the financial situation with emphasize on the equity solvency, the levels of exposure, variables of the industry, evaluation of the shareholders and the management, the specific aspects of the operations like the structure and term of the financing, products and guarantees. The mentioned evaluation is supported by a rating model that permits greater homogeneity in the client analysis and their group.
There are also specialized areas of segments that by their nature need the knowledge of an expert, such as real estate, construction, agriculture, finance, international, among others. These experts support the preparation of the operations having certain tools designed to meet the needs of the specific characteristics of the businesses and their respective risks.
| (b) | Follow Up: |
From granting a credit until it expires, it is necessary to have a follow up of the behaviour and financial situation of the debtor with emphasis on its payment capacity, as the situation of the client and associated risk change over time. Portfolio monitoring allows the bank to act proactively if signs of overall impairment are detected or if the debtor’s ability to meet its obligations is affected.
In order to properly follow up, methodologies and tools for diverse segments that the bank participates, have been developed, those then permit a proper management of its credit portfolio.
In the retails segments, the control and follow up concentrate on monitoring the main indicators of the portfolio and analysis of the groups, reported in the management reports, generating relevant information for the decisión making in different occasions defined. At the same time special follow ups are generated according to the relevants facts of the environment.
While in the wholesale segments, a permanent follow up is carried out through management tools at individual level taking into consideration the business segments, economical sectors. Through this process the alarms are generated that guarantee the correct and prompt recognition of the risk in the portfolio of individuals. The specific conditions established in the admission at the moment of approval like the financial covenants, coverage of certain guarantees and others, are monitored.
Additionally, in the admission area, simultaneous follow up tasks are carried out that permit the monitoring of the development of the operations from the beginning until recovering the capital, having as the objective to make sure that the portfolio´s risks are correctly and promptly identified, at the same time managing proactively the cases with higher risks.
NOTES TO THE INTERIM CONSOLIDATED FINANCIAL STATEMENTS, continued
| 47. | Risk Management and Report, continued: |
| (c) | Recovery and collection: |
The Bank has specific regulations related to customer collection and normalization, which ensure the quality of the portfolio in accordance with credit policies, and the desired risk appetite framework and strict adherence to the current regulatory framework. Through collection management, the clients with temporary cash flow problems are favored, debt normalization plans are proposed for viable clients, so that it is possible to maintain the relationship in the long term once their situation is regularized. The recovery of assets at risk is maximized and the necessary collection actions are carried out, in a timely manner, to ensure the recovery of debts or reduce the potential loss.
In the retail segments, the Bank defines refinancing criteria through the establishment of predefined renegotiation guidelines to resolve the debt issues of viable clients with payment intentions, maintaining an adequate risk-return relationship, along with the incorporation of robust tools to differentiated collection management.
For its part, in the wholesale segments, when detecting clients that show signs of deterioration or non-compliance with any type or condition, the commercial area to which the client belongs, together with the Corporate Risk Division, establish action plans for their regularization. In those cases of greater complexity where specialized management is required, the Special Asset Management area, is directly in charge of collection management, establishing action plans and negotiations based on the particular characteristics of each customer.
NOTES TO THE INTERIM CONSOLIDATED FINANCIAL STATEMENTS, continued
| 47. | Risk Management and Report, continued: |
| (d) | Portfolio Concentration: |
The maximum exposure to credit risk, by client or counterparty, without taking into account guarantees or other credit enhancements as of March 31, 2025 and December 31, 2024, does not exceed 10% of the Bank’s effective equity.
The following tables show credit risk exposure per balance sheet item, including derivatives, detailed by both geographic region and industry sector as of March 31, 2025:
| Chile | United States | England | Brazil | Others | Total | |||||||||||||||||||
| MCh$ | MCh$ | MCh$ | MCh$ | MCh$ | MCh$ | |||||||||||||||||||
| Financial Assets | ||||||||||||||||||||||||
| Cash and Due from Banks | 1,220,464 | 1,043,988 | 16,230 | 8 | 50,517 | 2,331,207 | ||||||||||||||||||
| Financial assets held for trading at fair value through profit or loss: | ||||||||||||||||||||||||
| Derivative contracts financial | ||||||||||||||||||||||||
| Forwards (*) | 129,900 | 6,294 | 62,747 | — | 41,592 | 240,533 | ||||||||||||||||||
| Swaps (**) | 812,530 | 59,073 | 796,566 | — | 132,054 | 1,800,223 | ||||||||||||||||||
| Call Options | 1,595 | — | 837 | — | 223 | 2,655 | ||||||||||||||||||
| Put Options | 1,069 | — | 57 | — | 12 | 1,138 | ||||||||||||||||||
| Futures | — | — | — | — | — | — | ||||||||||||||||||
| Subtotal | 945,094 | 65,367 | 860,207 | — | 173,881 | 2,044,549 | ||||||||||||||||||
| Debt Financial Instruments | ||||||||||||||||||||||||
| From the Chilean Government and Central Bank | 2,594,930 | — | — | — | — | 2,594,930 | ||||||||||||||||||
| Other debt financial instruments issued in Chile | 155,591 | — | — | — | — | 155,591 | ||||||||||||||||||
| Financial debt instruments issued Abroad | — | — | — | — | — | — | ||||||||||||||||||
| Subtotal | 2,750,521 | — | — | — | — | 2,750,521 | ||||||||||||||||||
| Others Financial Instruments | ||||||||||||||||||||||||
| Investments in mutual funds | 322,111 | — | — | — | — | 322,111 | ||||||||||||||||||
| Equity instruments | 2,569 | 4,821 | — | — | — | 7,390 | ||||||||||||||||||
| Others | 1,495 | 1,341 | — | — | — | 2,836 | ||||||||||||||||||
| Subtotal | 326,175 | 6,162 | — | — | — | 332,337 | ||||||||||||||||||
| Financial Assets at fair value through other comprehensive income: | ||||||||||||||||||||||||
| Debt Financial Instruments | ||||||||||||||||||||||||
| From the Chilean Government and Central Bank | 633,706 | — | — | — | — | 633,706 | ||||||||||||||||||
| Other debt financial instruments issued in Chile | 1,227,347 | — | — | — | — | 1,227,347 | ||||||||||||||||||
| Financial debt instruments issued Abroad | — | 86,680 | — | — | — | 86,680 | ||||||||||||||||||
| Subtotal | 1,861,053 | 86,680 | — | — | — | 1,947,733 | ||||||||||||||||||
| Derivative contracts financial for hedging purposes | ||||||||||||||||||||||||
| Forwards | — | — | — | — | — | — | ||||||||||||||||||
| Swaps | — | 19,073 | 28,035 | — | — | 47,108 | ||||||||||||||||||
| Call Options | — | — | — | — | — | — | ||||||||||||||||||
| Put Options | — | — | — | — | — | — | ||||||||||||||||||
| Futures | — | — | — | — | — | - | ||||||||||||||||||
| Subtotal | — | 19,073 | 28,035 | — | — | 47,108 | ||||||||||||||||||
| Financial assets at amortized cost: | ||||||||||||||||||||||||
| Rights from resale agreements and securities lending | 99,283 | — | — | — | — | 99,283 | ||||||||||||||||||
| Debt Financial Instruments | ||||||||||||||||||||||||
| From the Chilean Government and Central Bank | 929,301 | — | — | — | — | 929,301 | ||||||||||||||||||
| Subtotal | 929,301 | — | — | — | — | 929,301 | ||||||||||||||||||
| Loans and advances to Banks | ||||||||||||||||||||||||
| Central Bank of Chile | 1,100,000 | — | — | — | — | 1,100,000 | ||||||||||||||||||
| Domestic banks | 200,000 | — | — | — | — | 200,000 | ||||||||||||||||||
| Foreign Banks (***) | — | 4,775 | — | 262,217 | 133,773 | 400,765 | ||||||||||||||||||
| Subtotal | 1,300,000 | 4,775 | — | 262,217 | 133,773 | 1,700,765 | ||||||||||||||||||
| Loans to Customers, Net | ||||||||||||||||||||||||
| Commercial loans | 20,154,015 | — | — | — | 118,591 | 20,272,606 | ||||||||||||||||||
| Residential mortgage loans | 13,499,416 | — | — | — | — | 13,499,416 | ||||||||||||||||||
| Consumer loans | 5,548,313 | — | — | — | — | 5,548,313 | ||||||||||||||||||
| Subtotal | 39,201,744 | — | — | — | 118,591 | 39,320,335 | ||||||||||||||||||
| (*) | Others includes: France Ch$38,522 million, Switzerland Ch$2,654 and Belgium Ch$416 million. |
| (**) | Others includes: France Ch$33,011 million, Spain Ch$26,377 million and Canada Ch$72,666 million. |
| (***) | Others includes: China Ch$54,306 million, Netherlands Ch$25,569 million, South Korea Ch$27,868 and Switzerland Ch$26,030. |
NOTES TO THE INTERIM CONSOLIDATED FINANCIAL STATEMENTS, continued
| 47. | Risk Management and Report, continued: |
| Central Bank of Chile |
Government | Retail (Individuals) |
Financial Services |
Trade | Manufacturing | Mining | Electricity, Gas and Water |
Agriculture and Livestock |
Fishing |
Transportation and Telecom |
Construction | Services | Others | Total | ||||||||||||||||||||||||||||||||||||||||||||||
| MCh$ | MCh$ | MCh$ | MCh$ | MCh$ | MCh$ | MCh$ | MCh$ | MCh$ | MCh$ | MCh$ | MCh$ | MCh$ | MCh$ | MCh$ | ||||||||||||||||||||||||||||||||||||||||||||||
| Cash and Due from Banks | 315,366 | — | — | 2,015,841 | — | — | — | — | — | — | — | — | — | — | 2,331,207 | |||||||||||||||||||||||||||||||||||||||||||||
| Financial Assets held for trading at fair value through profit or loss: | ||||||||||||||||||||||||||||||||||||||||||||||||||||||||||||
| Derivative contracts Financial | ||||||||||||||||||||||||||||||||||||||||||||||||||||||||||||
| Forwards | — | — | — | 222,012 | 4,991 | 6,611 | 158 | 1,692 | 791 | 87 | 2,504 | 854 | 833 | — | 240,533 | |||||||||||||||||||||||||||||||||||||||||||||
| Swaps | — | — | — | 1,715,341 | 1,031 | 2,375 | — | 15,409 | 18,220 | 1,035 | 36,977 | 5,240 | 4,595 | — | 1,800,223 | |||||||||||||||||||||||||||||||||||||||||||||
| Call Options | — | — | — | 1,142 | 404 | 504 | — | — | 574 | — | 24 | — | 7 | — | 2,655 | |||||||||||||||||||||||||||||||||||||||||||||
| Put Options | — | — | — | 438 | 593 | 105 | — | — | 2 | — | — | — | — | — | 1,138 | |||||||||||||||||||||||||||||||||||||||||||||
| Futures | — | — | — | — | — | — | — | — | — | — | — | — | — | — | — | |||||||||||||||||||||||||||||||||||||||||||||
| Subtotal | — | — | — | 1,938,933 | 7,019 | 9,595 | 158 | 17,101 | 19,587 | 1,122 | 39,505 | 6,094 | 5,435 | — | 2,044,549 | |||||||||||||||||||||||||||||||||||||||||||||
| Debt Financial Instruments | ||||||||||||||||||||||||||||||||||||||||||||||||||||||||||||
| From the Chilean Government and Central Bank | 2,365,167 | 229,763 | — | — | — | — | — | — | — | — | — | — | — | — | 2,594,930 | |||||||||||||||||||||||||||||||||||||||||||||
| Other debt financial instruments issued in Chile | — | — | — | 155,591 | — | — | — | — | — | — | — | — | — | — | 155,591 | |||||||||||||||||||||||||||||||||||||||||||||
| Financial debt instruments issued Abroad | — | — | — | — | — | — | — | — | — | — | — | — | — | — | — | |||||||||||||||||||||||||||||||||||||||||||||
| Subtotal | 2,365,167 | 229,763 | — | 155,591 | — | — | — | — | — | — | — | — | — | — | 2,750,521 | |||||||||||||||||||||||||||||||||||||||||||||
| Others Financial Instruments | ||||||||||||||||||||||||||||||||||||||||||||||||||||||||||||
| Investments in mutual funds | — | — | — | 322,111 | — | — | — | — | — | — | — | — | — | — | 322,111 | |||||||||||||||||||||||||||||||||||||||||||||
| Equity instruments | — | — | — | 7,390 | — | — | — | — | — | — | — | — | — | — | 7,390 | |||||||||||||||||||||||||||||||||||||||||||||
| Others | — | — | — | 2,836 | — | — | — | — | — | — | — | — | — | — | 2,836 | |||||||||||||||||||||||||||||||||||||||||||||
| Subtotal | — | — | — | 332,337 | — | — | — | — | — | — | — | — | — | — | 332,337 | |||||||||||||||||||||||||||||||||||||||||||||
| Financial Assets at fair value through Other Comprehensive Income | ||||||||||||||||||||||||||||||||||||||||||||||||||||||||||||
| Debt Financial Instruments | ||||||||||||||||||||||||||||||||||||||||||||||||||||||||||||
| From the Chilean Government and Central Bank | — | 633,706 | — | — | — | — | — | — | — | — | — | — | — | — | 633,706 | |||||||||||||||||||||||||||||||||||||||||||||
| Other debt financial instruments issued in Chile | — | — | — | 1,193,705 | 5,320 | — | — | 11,431 | 11,738 | — | 5,153 | — | — | — | 1,227,347 | |||||||||||||||||||||||||||||||||||||||||||||
| Financial debt instruments issued Abroad | — | — | — | 86,680 | — | — | — | — | — | — | — | — | — | — | 86,680 | |||||||||||||||||||||||||||||||||||||||||||||
| Subtotal | — | 633,706 | — | 1,280,385 | 5,320 | — | — | 11,431 | 11,738 | — | 5,153 | — | — | — | 1,947,733 | |||||||||||||||||||||||||||||||||||||||||||||
| Financial Derivative contracts for hedging purposes | ||||||||||||||||||||||||||||||||||||||||||||||||||||||||||||
| Forwards | — | — | — | — | — | — | — | — | — | — | — | — | — | — | — | |||||||||||||||||||||||||||||||||||||||||||||
| Swaps | — | — | — | 47,108 | — | — | — | — | — | — | — | — | — | — | 47,108 | |||||||||||||||||||||||||||||||||||||||||||||
| Call Options | — | — | — | — | — | — | — | — | — | — | — | — | — | — | — | |||||||||||||||||||||||||||||||||||||||||||||
| Put Options | — | — | — | — | — | — | — | — | — | — | — | — | — | — | — | |||||||||||||||||||||||||||||||||||||||||||||
| Futures | — | — | — | — | — | — | — | — | — | — | — | — | — | — | — | |||||||||||||||||||||||||||||||||||||||||||||
| Subtotal | — | — | — | 47,108 | — | — | — | — | — | — | — | — | — | — | 47,108 | |||||||||||||||||||||||||||||||||||||||||||||
| Financial assets at amortized cost (*) | ||||||||||||||||||||||||||||||||||||||||||||||||||||||||||||
| Rights from resale agreements | — | — | — | 93,671 | — | — | — | — | — | — | — | — | 5,612 | — | 99,283 | |||||||||||||||||||||||||||||||||||||||||||||
| Debt financial instruments | ||||||||||||||||||||||||||||||||||||||||||||||||||||||||||||
| From the Chilean Government and Central Bank | — | 929,301 | — | — | — | — | — | — | — | — | — | — | — | — | 929,301 | |||||||||||||||||||||||||||||||||||||||||||||
| Subtotal | — | 929,301 | — | — | — | — | — | — | — | — | — | — | — | — | 929,301 | |||||||||||||||||||||||||||||||||||||||||||||
| Loans and advances to Banks | ||||||||||||||||||||||||||||||||||||||||||||||||||||||||||||
| Central Bank of Chile | 1,100,000 | — | — | — | — | — | — | — | — | — | — | — | — | — | 1,100,000 | |||||||||||||||||||||||||||||||||||||||||||||
| Domestic banks | — | — | — | 200,000 | — | — | — | — | — | — | — | — | — | — | 200,000 | |||||||||||||||||||||||||||||||||||||||||||||
| Foreign banks | — | — | — | 400,765 | — | — | — | — | — | — | — | — | — | — | 400,765 | |||||||||||||||||||||||||||||||||||||||||||||
| Subtotal | 1,100,000 | — | — | 600,765 | — | — | — | — | — | — | — | — | — | — | 1,700,765 | |||||||||||||||||||||||||||||||||||||||||||||
| (*) | Economic activity of Loans and accounts receivable from customers disclosed in Note No. 13 letter (g). |
NOTES TO THE INTERIM CONSOLIDATED FINANCIAL STATEMENTS, continued
| 47. | Risk Management and Report, continued: |
The following tables show credit risk exposure per balance sheet item, including derivatives, detailed by both geographic region and industry sector as of December 31, 2024:
| Chile | United States | England | Brazil | Others | Total | |||||||||||||||||||
| MCh$ | MCh$ | MCh$ | MCh$ | MCh$ | MCh$ | |||||||||||||||||||
| Financial Assets | ||||||||||||||||||||||||
| Cash and Due from Banks | 1,928,373 | 652,953 | 20,508 | 8 | 97,234 | 2,699,076 | ||||||||||||||||||
| Financial assets held for trading at fair value through profit or loss: | ||||||||||||||||||||||||
| Derivative contracts financial | ||||||||||||||||||||||||
| Forwards (*) | 161,046 | 4,215 | 30,380 | — | 32,029 | 227,670 | ||||||||||||||||||
| Swaps (**) | 927,824 | 57,428 | 917,837 | — | 167,392 | 2,070,481 | ||||||||||||||||||
| Call Options | 3,937 | — | 1,012 | — | — | 4,949 | ||||||||||||||||||
| Put Options | 250 | — | 3 | — | — | 253 | ||||||||||||||||||
| Futures | — | — | — | — | — | — | ||||||||||||||||||
| Subtotal | 1,093,057 | 61,643 | 949,232 | — | 199,421 | 2,303,353 | ||||||||||||||||||
| Debt Financial Instruments | ||||||||||||||||||||||||
| From the Chilean Government and Central Bank | 1,495,457 | — | — | — | — | 1,495,457 | ||||||||||||||||||
| Other debt financial instruments issued in Chile | 217,948 | — | — | — | — | 217,948 | ||||||||||||||||||
| Financial debt instruments issued Abroad | — | 976 | — | — | — | 976 | ||||||||||||||||||
| Subtotal | 1,713,405 | 976 | — | — | — | 1,714,381 | ||||||||||||||||||
| Others Financial Instruments | ||||||||||||||||||||||||
| Investments in mutual funds | 408,121 | — | — | — | — | 408,121 | ||||||||||||||||||
| Equity instruments | 1,039 | — | — | — | — | 1,039 | ||||||||||||||||||
| Others | 1,930 | 599 | — | — | — | 2,529 | ||||||||||||||||||
| Subtotal | 411,090 | 599 | — | — | — | 411,689 | ||||||||||||||||||
| Financial Assets at fair value through other comprehensive income: | ||||||||||||||||||||||||
| Debt Financial Instruments | ||||||||||||||||||||||||
| From the Chilean Government and Central Bank | 660,777 | — | — | — | — | 660,777 | ||||||||||||||||||
| Other debt financial instruments issued in Chile | 1,375,630 | — | — | — | — | 1,375,630 | ||||||||||||||||||
| Financial debt instruments issued Abroad | — | 51,938 | — | — | — | 51,938 | ||||||||||||||||||
| Subtotal | 2,036,407 | 51,938 | — | — | — | 2,088,345 | ||||||||||||||||||
| Derivative contracts financial for hedging purposes | ||||||||||||||||||||||||
| Forwards | — | — | — | — | — | — | ||||||||||||||||||
| Swaps | — | 28,599 | 40,794 | — | 4,566 | 73,959 | ||||||||||||||||||
| Call Options | — | — | — | — | — | — | ||||||||||||||||||
| Put Options | — | — | — | — | — | — | ||||||||||||||||||
| Futures | — | — | — | — | — | — | ||||||||||||||||||
| Subtotal | — | 28,599 | 40,794 | — | 4,566 | 73,959 | ||||||||||||||||||
| Financial assets at amortized cost: | ||||||||||||||||||||||||
| Rights from resale agreements and securities lending | 87,291 | — | — | — | — | 87,291 | ||||||||||||||||||
| Debt Financial Instruments | ||||||||||||||||||||||||
| From the Chilean Government and Central Bank | 944,109 | — | — | — | — | 944,109 | ||||||||||||||||||
| Subtotal | 944,109 | — | — | — | — | 944,109 | ||||||||||||||||||
| Loans and advances to Banks | ||||||||||||||||||||||||
| Central Bank of Chile | — | — | — | — | — | — | ||||||||||||||||||
| Domestic banks | 300,042 | — | — | — | — | 300,042 | ||||||||||||||||||
| Foreign Banks (***) | — | — | — | 269,191 | 98,470 | 367,661 | ||||||||||||||||||
| Subtotal | 300,042 | — | — | 269,191 | 98,470 | 667,703 | ||||||||||||||||||
| Loans to Customers, Net | ||||||||||||||||||||||||
| Commercial loans | 19,985,358 | — | — | — | 119,870 | 20,105,228 | ||||||||||||||||||
| Residential mortgage loans | 13,218,586 | — | — | — | — | 13,218,586 | ||||||||||||||||||
| Consumer loans | 5,551,306 | — | — | — | — | 5,551,306 | ||||||||||||||||||
| Subtotal | 38,755,250 | — | — | — | 119,870 | 38,875,120 | ||||||||||||||||||
| (*) | Others includes: France Ch$28,892 million and Spain Ch$2,313 million. |
| (**) | Others includes: France Ch$43,194 million, Spain Ch$31,437 million and Canada Ch$92,761 million. |
| (***) | Others includes: China Ch$32,260 million and Netherlands Ch$26,931 million. |
NOTES TO THE INTERIM CONSOLIDATED FINANCIAL STATEMENTS, continued
| 47. | Risk Management and Report, continued: |
| Central Bank of Chile | Government | Retail (Individuals) | Financial Services | Trade | Manufacturing | Mining | Electricity, Gas and Water | Agriculture and Livestock | Fishing |
Transportation and Telecom |
Construction | Services | Others | Total | ||||||||||||||||||||||||||||||||||||||||||||||
| MCh$ | MCh$ | MCh$ | MCh$ | MCh$ | MCh$ | MCh$ | MCh$ | MCh$ | MCh$ | MCh$ | MCh$ | MCh$ | MCh$ | MCh$ | ||||||||||||||||||||||||||||||||||||||||||||||
| Cash and Due from Banks | 1,036,476 | — | — | 1,662,600 | — | — | — | — | — | — | — | — | — | — | 2,699,076 | |||||||||||||||||||||||||||||||||||||||||||||
| Financial Assets held for trading at fair value through profit or loss: | ||||||||||||||||||||||||||||||||||||||||||||||||||||||||||||
| Derivative contracts Financial | ||||||||||||||||||||||||||||||||||||||||||||||||||||||||||||
| Forwards | — | — | — | 199,429 | 3,890 | 13,094 | 200 | 2,394 | 5,024 | 315 | 1,183 | 638 | 1,503 | — | 227,670 | |||||||||||||||||||||||||||||||||||||||||||||
| Swaps | — | — | — | 1,972,003 | 1,079 | 7,970 | — | 13,947 | 23,613 | 1,756 | 37,459 | 7,758 | 4,896 | — | 2,070,481 | |||||||||||||||||||||||||||||||||||||||||||||
| Call Options | — | — | — | 1,182 | 1,036 | 1,159 | — | — | 1,483 | — | 76 | — | 13 | — | 4,949 | |||||||||||||||||||||||||||||||||||||||||||||
| Put Options | — | — | — | 90 | 137 | 26 | — | — | — | — | — | — | — | — | 253 | |||||||||||||||||||||||||||||||||||||||||||||
| Futures | — | — | — | — | — | — | — | — | — | — | — | — | — | — | — | |||||||||||||||||||||||||||||||||||||||||||||
| Subtotal | — | — | — | 2,172,704 | 6,142 | 22,249 | 200 | 16,341 | 30,120 | 2,071 | 38,718 | 8,396 | 6,412 | — | 2,303,353 | |||||||||||||||||||||||||||||||||||||||||||||
| Debt Financial Instruments | ||||||||||||||||||||||||||||||||||||||||||||||||||||||||||||
| From the Chilean Government and Central Bank | 1,217,317 | 278,140 | — | — | — | — | — | — | — | — | — | — | — | — | 1,495,457 | |||||||||||||||||||||||||||||||||||||||||||||
| Other debt financial instruments issued in Chile | — | — | — | 217,948 | — | — | — | — | — | — | — | — | — | — | 217,948 | |||||||||||||||||||||||||||||||||||||||||||||
| Financial debt instruments issued Abroad | — | — | — | 976 | — | — | — | — | — | — | — | — | — | — | 976 | |||||||||||||||||||||||||||||||||||||||||||||
| Subtotal | 1,217,317 | 278,140 | — | 218,924 | — | — | — | — | — | — | — | — | — | — | 1,714,381 | |||||||||||||||||||||||||||||||||||||||||||||
| Others Financial Instruments | ||||||||||||||||||||||||||||||||||||||||||||||||||||||||||||
| Investments in mutual funds | — | — | — | 408,121 | — | — | — | — | — | — | — | — | — | — | 408,121 | |||||||||||||||||||||||||||||||||||||||||||||
| Equity instruments | — | — | — | 1,039 | — | — | — | — | — | — | — | — | — | — | 1,039 | |||||||||||||||||||||||||||||||||||||||||||||
| Others | — | — | — | 2,529 | — | — | — | — | — | — | — | — | — | — | 2,529 | |||||||||||||||||||||||||||||||||||||||||||||
| Subtotal | — | — | — | 411,689 | — | — | — | — | — | — | — | — | — | — | 411,689 | |||||||||||||||||||||||||||||||||||||||||||||
| Financial Assets at fair value through Other Comprehensive Income | ||||||||||||||||||||||||||||||||||||||||||||||||||||||||||||
| Debt Financial Instruments | ||||||||||||||||||||||||||||||||||||||||||||||||||||||||||||
| From the Chilean Government and Central Bank | — | 660,777 | — | — | — | — | — | — | — | — | — | — | — | — | 660,777 | |||||||||||||||||||||||||||||||||||||||||||||
| Other debt financial instruments issued in Chile | — | — | — | 1,342,558 | 5,202 | — | — | 11,315 | 11,503 | — | 5,052 | — | — | — | 1,375,630 | |||||||||||||||||||||||||||||||||||||||||||||
| Financial debt instruments issued Abroad | — | — | — | 51,938 | — | — | — | — | — | — | — | — | — | — | 51,938 | |||||||||||||||||||||||||||||||||||||||||||||
| Subtotal | — | 660,777 | — | 1,394,496 | 5,202 | — | — | 11,315 | 11,503 | — | 5,052 | — | — | — | 2,088,345 | |||||||||||||||||||||||||||||||||||||||||||||
| Financial Derivative contracts for hedging purposes | ||||||||||||||||||||||||||||||||||||||||||||||||||||||||||||
| Forwards | — | — | — | — | — | — | — | — | — | — | — | — | — | — | — | |||||||||||||||||||||||||||||||||||||||||||||
| Swaps | — | — | — | 73,959 | — | — | — | — | — | — | — | — | — | — | 73,959 | |||||||||||||||||||||||||||||||||||||||||||||
| Call Options | — | — | — | — | — | — | — | — | — | — | — | — | — | — | — | |||||||||||||||||||||||||||||||||||||||||||||
| Put Options | — | — | — | — | — | — | — | — | — | — | — | — | — | — | — | |||||||||||||||||||||||||||||||||||||||||||||
| Futures | — | — | — | — | — | — | — | — | — | — | — | — | — | — | — | |||||||||||||||||||||||||||||||||||||||||||||
| Subtotal | — | — | — | 73,959 | — | — | — | — | — | — | — | — | — | — | 73,959 | |||||||||||||||||||||||||||||||||||||||||||||
| Financial assets at amortized cost (*) | ||||||||||||||||||||||||||||||||||||||||||||||||||||||||||||
| Rights from resale agreements | — | — | — | 82,505 | — | — | — | — | — | — | — | — | 4,786 | — | 87,291 | |||||||||||||||||||||||||||||||||||||||||||||
| Debt financial instruments | ||||||||||||||||||||||||||||||||||||||||||||||||||||||||||||
| From the Chilean Government and Central Bank | — | 944,109 | — | — | — | — | — | — | — | — | — | — | — | — | 944,109 | |||||||||||||||||||||||||||||||||||||||||||||
| Subtotal | — | 944,109 | — | — | — | — | — | — | — | — | — | — | — | — | 944,109 | |||||||||||||||||||||||||||||||||||||||||||||
| Loans and advances to Banks | ||||||||||||||||||||||||||||||||||||||||||||||||||||||||||||
| Central Bank of Chile | — | — | — | — | — | — | — | — | — | — | — | — | — | — | — | |||||||||||||||||||||||||||||||||||||||||||||
| Domestic banks | — | — | — | 300,042 | — | — | — | — | — | — | — | — | — | — | 300,042 | |||||||||||||||||||||||||||||||||||||||||||||
| Foreign banks | — | — | — | 367,661 | — | — | — | — | — | — | — | — | — | — | 367,661 | |||||||||||||||||||||||||||||||||||||||||||||
| Subtotal | — | — | — | 667,703 | — | — | — | — | — | — | — | — | — | — | 667,703 | |||||||||||||||||||||||||||||||||||||||||||||
| (*) | Economic activity of Loans and accounts receivable from customers disclosed in Note No. 13 letter (g). |
NOTES TO THE INTERIM CONSOLIDATED FINANCIAL STATEMENTS, continued
| 47. | Risk Management and Report, continued: |
| (e) | Collaterals and Other Credit Enhancements: |
The amount and type of collateral required depends on the counterparty’s credit risk assessment.
The Bank has guidelines regarding the acceptability of types of collateral and valuation parameters.
The main types of collateral obtained are:
| ● | For commercial loans: Residential and non-residential real estate, liens and inventory. |
| ● | For retail loans: Mortgages loans on residential property. |
The Bank also obtains collateral from parent companies for loans granted to their subsidiaries.
Management makes sure its collateral is acceptable according to both external standards and internal policies guidelines and parameters. The Bank has approximately 252,786 collateral assets as of March 31, 2025 (248,807 in December 2024), the majority of which consist of real estate. The following table contains guarantees value:
| Guarantee | ||||||||||||||||||||||||
March 2025 |
Loans | Mortgages | Pledges | Securities | Warrants | Total | ||||||||||||||||||
| MCh$ | MCh$ | MCh$ | MCh$ | MCh$ | MCh$ | |||||||||||||||||||
| Corporate Lending | 15,443,297 | 4,036,185 | 159,149 | 603,034 | 1,854 | 4,800,222 | ||||||||||||||||||
| Small Business Lending | 4,829,309 | 3,503,833 | 15,254 | 9,548 | — | 3,528,635 | ||||||||||||||||||
| Consumer Lending | 5,548,313 | 382,486 | 544 | 2,571 | — | 385,601 | ||||||||||||||||||
| Mortgage Lending | 13,499,416 | 12,958,295 | 110 | — | — | 12,958,405 | ||||||||||||||||||
| Total | 39,320,335 | 20,880,799 | 175,057 | 615,153 | 1,854 | 21,672,863 | ||||||||||||||||||
| Guarantee | ||||||||||||||||||||||||
December2024 |
Loans | Mortgages | Pledges | Securities | Warrants | Total | ||||||||||||||||||
| MCh$ | MCh$ | MCh$ | MCh$ | MCh$ | MCh$ | |||||||||||||||||||
| Corporate Lending | 15,278,242 | 3,985,392 | 137,504 | 559,132 | 1,345 | 4,683,373 | ||||||||||||||||||
| Small Business Lending | 4,826,986 | 3,465,474 | 14,464 | 10,240 | — | 3,490,178 | ||||||||||||||||||
| Consumer Lending | 5,551,306 | 387,195 | 552 | 2,500 | — | 390,247 | ||||||||||||||||||
| Mortgage Lending | 13,218,586 | 12,711,594 | 120 | — | — | 12,711,714 | ||||||||||||||||||
| Total | 38,875,120 | 20,549,655 | 152,640 | 571,872 | 1,345 | 21,275,512 | ||||||||||||||||||
The Bank also uses mitigating tactics for credit risk on derivative transactions. To date, the following mitigating tactics are used:
| ● | Accelerating transactions and net payment using market values at the date of default of one of the parties. |
| ● | Option for both parties to terminate early any transactions with a counterparty at a given date, using market values as of the respective date. | |
| Margins established with time deposits by customers who have FX forwards with subsidiary Banchile Corredores de Bolsa S.A. |
NOTES TO THE INTERIM CONSOLIDATED FINANCIAL STATEMENTS, continued
| 47. | Risk Management and Report, continued: |
| (e) | Collaterals and Other Credit Enhancements, continued: |
The value of the guarantees that the Bank maintains related to the loans individually classified as impaired as of March 31, 2025 and December 31, 2024 amounted Ch$178,791 million and Ch$183,021 million, respectively.
The value guarantees related to past due loans but no impaired as of March 31, 2025 and December 31, 2024 amounted Ch$543,799 million and Ch$521,142 million respectively.
| (f) | Credit Quality by Asset Class: |
The Bank determines the credit quality of financial assets using internal credit ratings. The rating process is linked to the Bank’s approval and monitoring processes and is carried out in accordance with risk categories established by current standards. Credit quality is continuously updated based on any favorable or unfavorable developments to customers or their environments, considering aspects such as commercial and payment behavior as well as financial information.
The Bank also carries out reviews focused on companies that participate in specific economic sectors, which are affected either by macroeconomic variables or variables of the sector. In this way, it is possible to timely establish the necessary and sufficient level of provisions to cover the losses due to the eventual non-recoverability of the credits granted.
The credit quality by asset class for Consolidated Statements of Financial Position sheet items, based on the Bank’s credit rating system, is presented in Note No. 13 letter (d).
Below is the detail of the default but not impaired portfolio:
| Past due but no impaired (*) | ||||||||||||||||
| 1 to 29 days |
30 to 59 days |
60 to 89 days |
90 or more days | |||||||||||||
| MCh$ | MCh$ | MCh$ | MCh$ | |||||||||||||
| March 2025 | 838,263 | 212,382 | 75,053 | — | ||||||||||||
| December 2024 | 837,159 | 207,787 | 62,454 | — | ||||||||||||
| (*) | These amounts include the overdue portion and the remaining balance of loans in default. |
| (g) | Assets Received in Lieu of Payment: |
The Bank has received assets in lieu of payment totaling Ch$32,569 million and Ch$32,929 million as of March 31, 2025 and December 31, 2024, respectively, the majority of which are properties. All of these assets are managed for sale.
NOTES TO THE INTERIM CONSOLIDATED FINANCIAL STATEMENTS, continued
| 47. | Risk Management and Report, continued: |
| (h) | Renegotiated Assets: |
The loans are presented as renegotiated in the balance sheet correspond to those in which the corresponding financial commitments have been restructured and the Bank assesses the probability of recovery as sufficiently high.
The following table details the book value of loans with renegotiated terms per financial asset class:
| March | December | |||||||
| 2025 | 2024 | |||||||
| Financial Assets | MCh$ | MCh$ | ||||||
| Loans and advances to banks | ||||||||
| Central Bank of Chile | — | — | ||||||
| Domestic banks | — | — | ||||||
| Foreign banks | — | — | ||||||
| Subtotal | — | — | ||||||
| Loans to customers, net | ||||||||
| Commercial loans | 506,804 | 484,156 | ||||||
| Residential mortgage loans | 307,301 | 299,599 | ||||||
| Consumer loans | 365,849 | 369,183 | ||||||
| Subtotal | 1,179,954 | 1,152,938 | ||||||
| Total renegotiated financial assets | 1,179,954 | 1,152,938 | ||||||
| (i) | Compliance with credit limit granted to related debtors: |
Below are detailed the figures for compliance with the credit limit granted to debtors related to the ownership or management of the Bank and subsidiaries, in accordance with the Article 84 No. 2 of the General Banking Law, which establishes that in no case the total of these credits may exceed the amount of its Total or Regulatory Capital:
| March 2025 |
December 2024 |
|||||||
| MCh$ | MCh$ | |||||||
| Total related debt | 462,428 | 579,923 | ||||||
| Consolidated Total or Regulatory Capital | 6,728,532 | 6,955,292 | ||||||
| Limit used % | 6.87 | % | 8.34 | % | ||||
NOTES TO THE INTERIM CONSOLIDATED FINANCIAL STATEMENTS, continued
| 47. | Risk Management and Report, continued: |
| (3) | Market Risk: |
Market Risk refers to the loss that the Bank could face due to a liquidity shortage to honor the payments, or to close financial transactions in a timely manner (Liquidity Risk), or due to adverse movements in the values of market variables (Risk Price). For its correct management, the guidelines of the Liquidity Risk Management Policy and the Market Risk Management Policy are considered, both are subject to review, at least annually, by the Market Risk Manager and approval by the Bank’s Board of Directors, at least annually.
| a) | Liquidity Risk: |
Liquidity Risk Measurement and Limits
The Bank manages the Liquidity Risk in accordance with the established on the Liquidity Risk Management Policy, managing separately for each sub-category thereof; this is for Trading Liquidity Risk and Funding Liquidity Risk.
Trading Liquidity Risk is the inability to close, at current market prices, the financial positions opened mainly from the Trading Book (which is daily valued at market prices and the value differences instantly reflected in the Income Statement). This risk is controlled by establishing limits on the positions amounts of the Trading Book in accordance with what is estimated to be closed in a short time period. Additionally, the Bank incorporates a negative impact on the Income Statement whenever it considers that the size of a certain position in the Trading Book exceeds the reasonable amount, negotiated in the secondary markets, which would allow the exposure to be offset without altering market prices.
Funding Liquidity Risk refers to the Bank’s inability to obtain sufficient cash to meet its immediate obligations. This risk is managed by a minimum amount of highly liquid assets called liquidity buffer, and establishing limits and controls of internal metrics, among which the Market Access Report (“MAR”) stands out, which estimates the amount of funding that the Bank would need from wholesale financial counterparties, for the next 30 and 90 days in each of the relevant currencies of the balance sheet, to face a cash need as a result of the operation under business as usual conditions.
NOTES TO THE INTERIM CONSOLIDATED FINANCIAL STATEMENTS, continued
| 47. | Risk Management and Report, continued: |
| (3) | Market Risk, continued: |
| (a) | Liquidity Risk, continued: |
The use as of March within 2025 is illustrated below (LCCY = local currency; FCCY = foreign currency):
|
MAR LCCY + FCCY BCh$ |
MAR FCCY MUS$ |
|||||||||||||
| 1 - 30 days | 1 - 90 days | 1 - 30 days | ||||||||||||
| Maximum | 2,250 | 4,565 | Maximum | 1,007 | ||||||||||
| Minimum | 1,068 | 3,455 | Minimum | 192 | ||||||||||
| Average | 1,661 | 3,911 | Average | 679 | ||||||||||
The Bank also monitors the amount of assets denominated in local currency that is funded by liabilities denominated in foreign currency, including all tenors and the cash flows generated by full delivery derivatives payments. This metric is referred to as Cross Currency Funding. The bank oversees and limits this amount in order to take precautions against not only Banco de Chile’s event but also against a systemic adverse environment generated by a country risk event that might trigger lack of foreign currency funding.
The use of Cross Currency Funding within the year 2025 is illustrated below:
|
Cross Currency Funding MUS$ |
||||
| Maximum | 2,332 | |||
| Minimum | 604 | |||
| Average | 1,584 | |||
The Bank establishes thresholds that alert behaviors outside the expected ranges at a normal or prudent level of operation, in order to protect other dimensions of liquidity risk such as, for example, maturities concentration of fund providers, the diversification of sources of funds either by type of counterparty or type of product, among others.
The evolution over time of the statement of financial ratios of the Bank is monitored in order to detect structural changes in the characteristics of the balance sheet, such as those presented in the following table and whose relevant values of use during the year 2025 are shown below:
| Funding Financial Counterparties/ Assets |
Deposits/ Loans |
|||||||
| Maximum | 36 | % | 64 | % | ||||
| Minimum | 36 | % | 61 | % | ||||
| Average | 36 | % | 62 | % | ||||
NOTES TO THE INTERIM CONSOLIDATED FINANCIAL STATEMENTS, continued
| 47. | Risk Management and Report, continued: |
| (3) | Market Risk, continued: |
| (a) | Liquidity Risk, continued: |
Additionally, some market index, prices and monetary decisions taken by the Central Bank of Chile are monitored to detect structural changes in market conditions that can trigger a liquidity shortage or even a financial crisis.
Furthermore, the Liquidity Risk Management Policy enforces to perform stress tests periodically which are controlled against potentially accessible action plans in each modeled scenario, according with the guidelines established in the Liquidity Contingency Plan. This process is essential in determining the liquidity risk appetite framework of the institution.
The Bank measures and controls the mismatch of cash flows under regulatory standards with the C46 index report, which represents the net cash flows expected over time as a result of the contractual maturity of almost all assets and liabilities. Additionally, the Commission for the Financial Market (hereinafter, “CMF”) authorized Banco de Chile, among others, to report the adjusted C46 index. This allows the Bank to report, in addition to the regular C46 index, outflow behavior assumptions of certain specific elements of the liability, such as demand deposits and time deposits. In addition, the regulator also requires some rollover assumptions for the loan portfolio.
To date, the CMF establish the following dispositions for the C46 index:
Foreign Currency balance sheet items: 1-30 days, Regulatory Limit C46 index < 1 x Tier-1 Capital
The levels of use of this index during the year 2025 is illustrated below:
|
Adjusted C46 CCY and FCCY as part of Basic Capital |
Adjusted C46 FCCY as part of Basic Capital |
|||||||||||
| 1 - 30 days | 1 - 90 days | 1 - 30 days | ||||||||||
| Maximum | 0.21 | 0.20 | 0.24 | |||||||||
| Minimum | 0.09 | 0.07 | 0.20 | |||||||||
| Average | 0.16 | 0.12 | 0.22 | |||||||||
| Regulatory Limit | N/A | N/A | 1.0 | |||||||||
NOTES TO THE INTERIM CONSOLIDATED FINANCIAL STATEMENTS, continued
| 47. | Risk Management and Report, continued: |
| (3) | Market Risk, continued: |
| (a) | Liquidity Risk, continued: |
The individual and consolidated term liquidity gap are presented below:
| QUARTERLY STATEMENT OF INDIVIDUAL LIQUIDITY SITUATION | ||||||||||||||||
| AS OF MARCH 31, 2025 CONTRACTUAL BASIS | ||||||||||||||||
| Values in MCh$ | ||||||||||||||||
| CONSOLIDATED CURRENCY | From 0 to 7 days | From 0 to 15 days | From 0 to 30 days | From 0 to 90 days | ||||||||||||
| Cash flow receivable (assets) and income | 9,453,065 | 11,073,035 | 12,284,356 | 16,533,662 | ||||||||||||
| Cash flow payable (liabilities) and expenses | 20,167,146 | 22,524,618 | 26,177,907 | 30,176,234 | ||||||||||||
| Liquidity Gap | 10,714,081 | 11,451,583 | 13,893,551 | 13,642,572 | ||||||||||||
| FOREIGN CURRENCY | From 0 to 7 days | From 0 to 15 days | From 0 to 30 days | From 0 to 90 days | ||||||||||||
| Cash flow receivable (assets) and income | 1,684,517 | 1,924,015 | 1,988,949 | 2,694,088 | ||||||||||||
| Cash flow payable (liabilities) and expenses | 3,229,349 | 3,592,814 | 4,155,564 | 5,137,215 | ||||||||||||
| Liquidity Gap | 1,544,832 | 1,668,799 | 2,166,615 | 2,443,127 | ||||||||||||
| Limits: | ||||||||||||||||
| One time capital | 5,275,648 | |||||||||||||||
| AVAILABLE MARGIN | 3,109,033 | |||||||||||||||
| * | In the limit up to 30 days, in consolidated currency, the Bank has a liquidity situation of Ch$3,109,032,028,243. |
| QUARTERLY STATEMENT OF INDIVIDUAL LIQUIDITY SITUATION | ||||||||||||||||
| AS OF MARCH 31, 2025 ADJUSTED BASIS | ||||||||||||||||
| Values in MCh$ | ||||||||||||||||
| CONSOLIDATED CURRENCY | From 0 to 7 days | From 0 to 15 days | From 0 to 30 days | From 0 to 90 days | ||||||||||||
| Cash flow receivable (assets) and income | 9,038,994 | 10,316,041 | 10,983,489 | 13,651,449 | ||||||||||||
| Cash flow payable (liabilities) and expenses | 9,988,447 | 10,917,464 | 12,353,417 | 14,941,002 | ||||||||||||
| Liquidity Gap | 949,453 | 601,423 | 1,369,928 | 1,289,553 | ||||||||||||
| FOREIGN CURRENCY | From 0 to 7 days | From 0 to 15 days | From 0 to 30 days | From 0 to 90 days | ||||||||||||
| Cash flow receivable (assets) and income | 1,528,438 | 1,648,134 | 1,538,167 | 1,748,342 | ||||||||||||
| Cash flow payable (liabilities) and expenses | 2,189,528 | 2,447,634 | 2,870,553 | 3,747,355 | ||||||||||||
| Liquidity Gap | 661,090 | 799,500 | 1,332,386 | 1,999,013 | ||||||||||||
| Limits: | ||||||||||||||||
| One time capital | 5,275,648 | |||||||||||||||
| AVAILABLE MARGIN | 3,943,262 | |||||||||||||||
| * | In the limit up to 30 days, in consolidated currency, the Bank has a liquidity situation of Ch$3,943,262,801,920. |
NOTES TO THE INTERIM CONSOLIDATED FINANCIAL STATEMENTS, continued
| 47. | Risk Management and Report, continued: |
| (3) | Market Risk, continued: |
| (a) | Liquidity Risk, continued: |
| QUARTERLY STATEMENT OF CONSOLIDATED LIQUIDITY SITUATION | ||||||||||||||||
| AS OF MARCH 31, 2025 CONTRACTUAL BASIS | ||||||||||||||||
| Values in MCh$ | ||||||||||||||||
| CONSOLIDATED CURRENCY | From 0 to 7 days | From 0 to 15 days | From 0 to 30 days | From 0 to 90 days | ||||||||||||
| Cash flow receivable (assets) and income | 10,297,499 | 11,923,461 | 13,145,752 | 17,433,342 | ||||||||||||
| Cash flow payable (liabilities) and expenses | 20,851,598 | 23,209,071 | 26,868,739 | 30,906,433 | ||||||||||||
| Liquidity Gap | 10,554,099 | 11,285,610 | 13,722,987 | 13,473,091 | ||||||||||||
| FOREIGN CURRENCY | From 0 to 7 days | From 0 to 15 days | From 0 to 30 days | From 0 to 90 days | ||||||||||||
| Cash flow receivable (assets) and income | 1,684,580 | 1,924,079 | 1,989,012 | 2,694,153 | ||||||||||||
| Cash flow payable (liabilities) and expenses | 3,229,349 | 3,592,814 | 4,155,564 | 5,137,279 | ||||||||||||
| Liquidity Gap | 1,544,769 | 1,668,735 | 2,166,552 | 2,443,126 | ||||||||||||
| Limits: | ||||||||||||||||
| One time capital | 5,275,647 | |||||||||||||||
| AVAILABLE MARGIN | 3,109,095 | |||||||||||||||
| * | In the limit up to 30 days, in consolidated currency, the Bank has a liquidity situation of Ch$3,109,095,287,626. |
| QUARTERLY STATEMENT OF CONSOLIDATED LIQUIDITY SITUATION | ||||||||||||||||
| AS OF MARCH 31, 2025 ADJUSTED BASIS | ||||||||||||||||
| Values in MCh$ | ||||||||||||||||
| CONSOLIDATED CURRENCY | From 0 to 7 days | From 0 to 15 days | From 0 to 30 days | From 0 to 90 days | ||||||||||||
| Cash flow receivable (assets) and income | 9,883,428 | 11,166,467 | 11,844,886 | 14,551,129 | ||||||||||||
| Cash flow payable (liabilities) and expenses | 10,672,900 | 11,601,916 | 13,044,249 | 15,671,201 | ||||||||||||
| Liquidity Gap | 789,472 | 435,449 | 1,199,363 | 1,120,072 | ||||||||||||
| FOREIGN CURRENCY | From 0 to 7 days | From 0 to 15 days | From 0 to 30 days | From 0 to 90 days | ||||||||||||
| Cash flow receivable (assets) and income | 1,528,501 | 1,648,197 | 1,538,230 | 1,748,407 | ||||||||||||
| Cash flow payable (liabilities) and expenses | 2,189,528 | 2,447,634 | 2,870,553 | 3,747,419 | ||||||||||||
| Liquidity Gap | 661,027 | 799,437 | 1,332,323 | 1,999,012 | ||||||||||||
| Limits: | ||||||||||||||||
| One time capital | 5,275,648 | |||||||||||||||
| AVAILABLE MARGIN | 3,943,325 | |||||||||||||||
| * | In the limit up to 30 days, in consolidated currency, the Bank has a liquidity situation of Ch$3,943,325,061,299. |
NOTES TO THE INTERIM CONSOLIDATED FINANCIAL STATEMENTS, continued
| 47. | Risk Management and Report, continued: |
| (3) | Market Risk, continued: |
| (a) | Liquidity Risk, continued: |
Liquid Assets Consolidated Balance Statement as of March 31, 2025, values in BCh$
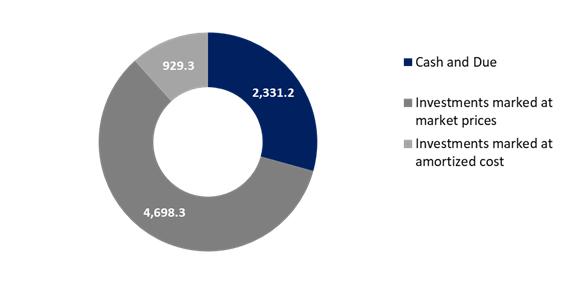
Source: Financial Statements Banco de Chile as of March 31, 2025
Additionally, the regulatory entities have introduced other metrics that the Bank uses in its management, such as the Liquidity Coverage Ratio (“LCR”) and Net Stable Financing Ratio (“NSFR”), using assumptions similar to those used in the international banking. For the first, the minimum level required is 1 time (100%) of the LCR indicator, while for the second the limit requirement is 0.9 times (90%) of the NSFR indicator. The evolution of the LCR and NSFR metrics during the year 2025 are shown below:
| LCR | NSFR | |||||||
| Maximum | 2.03 | 1.22 | ||||||
| Minimum | 1.86 | 1.19 | ||||||
| Average | 1.93 | 1.20 | ||||||
| Regulatory Limit | 1.00 | 0.9 | (*) | |||||
| (*) | By transitory disposition of the Central Bank of Chile, in Chapter III.B.2.1 of the Compendium of Accounting Standards for Banks, this limit will gradually increase until reaching 1.0 in January 2026. |
NOTES TO THE INTERIM CONSOLIDATED FINANCIAL STATEMENTS, continued
| 47. | Risk Management and Report, continued: |
| (3) | Market Risk, continued: |
| (a) | Liquidity Risk, continued: |
The contractual maturity profile of the financial liabilities of Banco de Chile and its subsidiaries (consolidated basis), to March 2025 and December 2024, is as follows:
|
Up to 1 month |
1 to 3 months |
3 to 12 months |
1 to 3 years |
3 to 5 years |
Over 5 years |
Total |
||||||||||||||||||||||
| MCh$ | MCh$ | MCh$ | MCh$ | MCh$ | MCh$ | MCh$ | ||||||||||||||||||||||
| Liabilities as of March 31, 2025 | ||||||||||||||||||||||||||||
| Transactions in the course of payment | 534,594 | — | — | — | — | — | 534,594 | |||||||||||||||||||||
| Full delivery derivative transactions | 442,673 | 448,059 | 798,097 | 1,096,313 | 820,650 | 1,509,708 | 5,115,500 | |||||||||||||||||||||
| Financial liabilities at amortized cost: | ||||||||||||||||||||||||||||
| Current accounts and other demand deposits | 14,560,376 | — | — | — | — | — | 14,560,376 | |||||||||||||||||||||
| Saving accounts and time deposits | 9,885,963 | 3,200,836 | 2,370,918 | 182,209 | 326 | 554 | 15,640,806 | |||||||||||||||||||||
| Obligations by repurchase agreements and securities lending | 102,341 | 39,866 | — | — | — | — | 142,207 | |||||||||||||||||||||
| Borrowings from financial institutions | 99,346 | 374,356 | 817,587 | — | — | — | 1,291,289 | |||||||||||||||||||||
| Debt financial instruments issued (all currencies) | 112,667 | 428,273 | 1,229,759 | 2,822,223 | 2,467,200 | 4,328,144 | 11,388,266 | |||||||||||||||||||||
| Other financial obligations | 320,709 | — | — | — | — | — | 320,709 | |||||||||||||||||||||
| Financial instruments of regulatory capital issued (subordinated bonds) | 3,582 | 19,460 | 29,399 | 94,136 | 90,554 | 1,164,522 | 1,401,653 | |||||||||||||||||||||
| Total (excluding non-delivery derivative transactions) | 26,062,251 | 4,510,850 | 5,245,760 | 4,194,881 | 3,378,730 | 7,002,928 | 50,395,400 | |||||||||||||||||||||
| Non-delivery derivative transactions | 324,302 | 218,795 | 1,534,108 | 1,010,958 | 836,504 | 1,912,627 | 5,837,294 | |||||||||||||||||||||
|
Up to 1 month |
1 to 3 months | 3 to 12 months | 1 to 3 years |
3 to 5 years |
Over 5 years |
Total |
||||||||||||||||||||||
| MCh$ | MCh$ | MCh$ | MCh$ | MCh$ | MCh$ | MCh$ | ||||||||||||||||||||||
| Liabilities as of December 31, 2024 | ||||||||||||||||||||||||||||
| Transactions in the course of payment | 283,605 | — | — | — | — | — | 283,605 | |||||||||||||||||||||
| Full delivery derivative transactions | 728,329 | 328,138 | 972,304 | 1,202,183 | 861,833 | 1,490,511 | 5,583,298 | |||||||||||||||||||||
| Financial liabilities at amortized cost: | ||||||||||||||||||||||||||||
| Current accounts and other demand deposits | 14,263,303 | — | — | — | — | — | 14,263,303 | |||||||||||||||||||||
| Saving accounts and time deposits | 9,437,781 | 2,670,440 | 2,138,233 | 56,593 | 450 | 562 | 14,304,059 | |||||||||||||||||||||
| Obligations by repurchase agreements and securities lending | 109,280 | 66 | 527 | — | — | — | 109,873 | |||||||||||||||||||||
| Borrowings from financial institutions | 22,207 | 159,438 | 921,822 | — | — | — | 1,103,467 | |||||||||||||||||||||
| Debt financial instruments issued (all currencies) | 13,893 | 158,375 | 1,178,285 | 2,983,446 | 2,328,034 | 4,472,111 | 11,134,144 | |||||||||||||||||||||
| Other financial obligations | 284,479 | — | — | — | — | — | 284,479 | |||||||||||||||||||||
| Financial instruments of regulatory capital issued (subordinated bonds) | 3,140 | — | 48,654 | 92,974 | 89,437 | 1,153,294 | 1,387,499 | |||||||||||||||||||||
| Total (excluding non-delivery derivative transactions) | 25,146,017 | 3,316,457 | 5,259,825 | 4,335,196 | 3,279,754 | 7,116,478 | 48,453,727 | |||||||||||||||||||||
| Non-delivery derivative transactions | 153,172 | 399,612 | 1,201,809 | 1,385,711 | 894,295 | 1,912,040 | 5,946,639 | |||||||||||||||||||||
NOTES TO THE INTERIM CONSOLIDATED FINANCIAL STATEMENTS, continued
| 47. | Risk Management and Report, continued: |
| (3) | Market Risk, continued: |
| (b) | Price Risk: |
The Price Risk measurement and management processes are carried out in accordance with the established on the Market Risk Management Policy, by using internal metrics developed by the Bank, both for the Trading Book and for the Banking Book (the Banking Book includes all balance sheet items, including those in the Trading Book but in such case these are reported at an interest rate adjustment term of one day, thus not generating accrual interest rate risk). In addition, the portfolio recorded under the Fair Value Through Other Comprehensive Income (hereinafter FVOCI) is considered, which is a sub-set of the Banking Book, which given its nature is relevant to measure it independently. In addition, the Bank reports metrics to regulatory entities according to the models defined by them.
The Bank has established internal limits for the exposures of the Trading Book. In fact, FX positions (FX delta), interest rate sensitivities generated by the derivatives and debt securities portfolios (DV01 or also referred as to rho) and the FX options volatility sensitivity (vega) are measured, reported and controlled against their limits. Limits are established on an aggregate basis but also for some specific tenor points. The use of these limits is daily monitored, controlled and reported by independent control functions to the senior management of the bank. The internal governance framework also establishes that these limits must be approved by the board and reviewed at least annually.
The Bank measures and controls the risk for the Trading Book portfolios using the Value-at-Risk (VaR). The model uses a 99% confidence level and the most recent one-year observed rates, prices and yields data.
The use of VaR within the year 2025 is illustrated below:
|
Value-at-Risk 99% one-day confidence level |
||||
| MCh$ | ||||
| Maximum | 1,349 | |||
| Minimum | 792 | |||
| Average | 1,057 | |||
Additionally, the Bank performs measuring, limiting, controlling and reporting interest rate exposures and risks for the Banking Book using internally developed methodologies based on the differences in the amounts of assets and liabilities considering the interest rate repricing dates. Exposures are measured according to the Interest Rate Exposure or IRE metric and their corresponding risks using the Earnings-at-Risk or EaR metric. Within these metrics, Prepayment Risk is considered, which corresponds to the customer’s ability to pay, totally or partially, their debt before maturity. For this, a loan flow allocation model is generated with exposure to interest rate fluctuations, according to their prepayment behavior, finally reflecting a decrease in their average maturity term.
NOTES TO THE INTERIM CONSOLIDATED FINANCIAL STATEMENTS, continued
| 47. | Risk Management and Report, continued: |
| (3) | Market Risk, continued: |
| (b) | Price Risk, continued: |
The use of EaR within the year 2025 is illustrated below:
|
12- months Earnings-at-Risk 99% confidence level 3 months closing period |
||||
| MCh$ | ||||
| Maximum | 228,505 | |||
| Minimum | 223,845 | |||
| Average | 226,699 | |||
The regulatory risk measurement for the Trading Book (Market Risk Weighted Assets report or mRWA) is produced by utilizing guidelines provided by the Central Bank of Chile (hereinafter, “BCCh”) and the CMF. The referred methodologies estimate the potential loss that the bank may incur considering standardized fluctuations of the value of market factors such as FX rates, interest rates and volatilities that may adversely impact the value of FX spot positions, interest rate exposures, and volatility exposures, respectively. Interest rates changes are provided by the regulatory entity; moreover, correlation factors and very conservative term are included to explain non-parallel changes in the yield curve.
The risk measurement for the Banking Book, according to regulatory guidelines (RMLB report by its Spanish initials), as a result of interest rate fluctuations is carried out through the use of standardized methodologies provided by regulatory entities (BCCh and CMF). The report includes models for reporting interest rate gaps and how their value varies, according to rate fluctuations that are defined by the scenarios provided by the regulations. In addition to this, the regulatory entity has requested banks to establish internal limits, separately for short-term and long-term balances, NII and EVE respectively, for these regulatory measurements.
The results effectively realized during the month for trading activities are controlled against defined loss levels and if these levels are exceeded, senior management is notified in order to evaluate potential corrective actions.
Finally, the Market Risk Management Policy of Banco de Chile enforces to perform daily stress tests for the Trading Book and monthly for the Banking Book. Additionally, the stress test for the FVOCI portfolio is included, which is reported daily. The output of the stress testing process is monitored against corresponding alert levels; in the case those triggers are breached, the senior management is notified in order to implement further actions, if necessary. Additionally, these book tests are a fundamental part of establishing the Bank’s price risk appetite framework.
NOTES TO THE INTERIM CONSOLIDATED FINANCIAL STATEMENTS, continued
| 47. | Risk Management and Report, continued: |
| (3) | Market Risk, continued: |
| (b) | Price Risk, continued: |
|
Up to 1 month |
1 to 3 months |
3 to 12 months |
1 to 3 years |
3 to 5 years |
Over 5 years |
Total |
||||||||||||||||||||||
| MCh$ | MCh$ | MCh$ | MCh$ | MCh$ | MCh$ | MCh$ | ||||||||||||||||||||||
| Assets as of March 31, 2025 | ||||||||||||||||||||||||||||
| Cash and due from banks | 2,309,525 | — | — | — | — | — | 2,309,525 | |||||||||||||||||||||
| Transactions in the course of collection | 345,996 | — | — | — | — | — | 345,996 | |||||||||||||||||||||
| Financial assets at fair value through other comprehensive income: | ||||||||||||||||||||||||||||
| Debt financial instruments | 92,126 | 187,081 | 915,260 | 414,634 | 229,320 | 109,311 | 1,947,732 | |||||||||||||||||||||
| Derivative financial instruments for hedging purposes | 4,728 | 44,091 | 261,045 | 423,555 | 329,884 | 859,529 | 1,922,832 | |||||||||||||||||||||
| Financial assets at amortized cost: | ||||||||||||||||||||||||||||
| Rights from resale agreements and securities lending | — | — | — | — | — | — | — | |||||||||||||||||||||
| Debt financial instruments | 1,203 | — | 495,476 | 26,536 | 159,432 | 302,547 | 985,194 | |||||||||||||||||||||
| Loans and advances to Banks | 1,521,572 | 172,874 | 4,775 | — | — | — | 1,699,221 | |||||||||||||||||||||
| Loans to customers, net | 5,423,358 | 3,845,455 | 7,900,625 | 8,871,118 | 5,681,550 | 15,406,256 | 47,128,362 | |||||||||||||||||||||
| Total Assets | 9,698,508 | 4,249,501 | 9,577,181 | 9,735,843 | 6,400,186 | 16,677,643 | 56,338,862 | |||||||||||||||||||||
|
Up to 1 month |
1 to 3 months |
3 to 12 months |
1 to 3 years |
3 to 5 years |
Over 5 years |
Total |
||||||||||||||||||||||
| MCh$ | MCh$ | MCh$ | MCh$ | MCh$ | MCh$ | MCh$ | ||||||||||||||||||||||
| Assets as of December 31, 2024 | ||||||||||||||||||||||||||||
| Cash and due from banks | 2,677,676 | — | — | — | — | — | 2,677,676 | |||||||||||||||||||||
| Transactions in the course of collection | 382,677 | — | — | — | — | — | 382,677 | |||||||||||||||||||||
| Financial assets at fair value through other comprehensive income: | ||||||||||||||||||||||||||||
| Debt financial instruments | 143,990 | 272,612 | 867,605 | 490,101 | 217,174 | 96,808 | 2,088,290 | |||||||||||||||||||||
| Derivative financial instruments for hedging purposes | 747 | 8,544 | 311,890 | 442,555 | 337,594 | 893,516 | 1,994,846 | |||||||||||||||||||||
| Financial assets at amortized cost: | ||||||||||||||||||||||||||||
| Rights from resale agreements and securities lending | — | — | — | — | — | — | — | |||||||||||||||||||||
| Debt financial instruments | — | 25,951 | 11,478 | 500,385 | 159,001 | 306,586 | 1,003,401 | |||||||||||||||||||||
| Loans and advances to Banks | 398,595 | 58,098 | 216,769 | — | — | — | 673,462 | |||||||||||||||||||||
| Loans to customers, net | 5,417,405 | 3,126,005 | 8,684,037 | 8,875,282 | 5,369,386 | 15,070,223 | 46,542,338 | |||||||||||||||||||||
| Total Assets | 9,021,090 | 3,491,210 | 10,091,779 | 10,308,323 | 6,083,155 | 16,367,133 | 55,362,690 | |||||||||||||||||||||
NOTES TO THE INTERIM CONSOLIDATED FINANCIAL STATEMENTS, continued
| 47. | Risk Management and Report, continued: |
| (3) | Market Risk, continued: |
| (b) | Price Risk, continued: |
|
Up to 1 month |
1 to 3 months |
3 to 12 months |
1 to 3 years |
3 to 5 years |
Over 5 years |
Total |
||||||||||||||||||||||
| MCh$ | MCh$ | MCh$ | MCh$ | MCh$ | MCh$ | MCh$ | ||||||||||||||||||||||
| Liabilities as of March 31, 2025 | ||||||||||||||||||||||||||||
| Transactions in the course of payment | 502,225 | — | — | — | — | — | 502,225 | |||||||||||||||||||||
| Derivative Financial Instruments for hedging purposes | 2,804 | 44,744 | 260,300 | 381,864 | 346,044 | 1,175,252 | 2,211,008 | |||||||||||||||||||||
| Financial liabilities at amortized cost: | ||||||||||||||||||||||||||||
| Current accounts and other demand deposits | 14,589,822 | — | — | — | — | — | 14,589,822 | |||||||||||||||||||||
| Saving accounts and time deposits | 9,885,963 | 3,200,836 | 2,370,918 | 182,209 | 326 | 554 | 15,640,806 | |||||||||||||||||||||
| Obligations by repurchase agreements and securities lending | 6,608 | — | — | — | — | — | 6,608 | |||||||||||||||||||||
| Borrowings from financial institutions | 99,346 | 374,356 | 817,587 | — | — | — | 1,291,289 | |||||||||||||||||||||
| Debt financial instruments issued (*) | 112,667 | 428,273 | 1,229,759 | 2,822,223 | 2,467,200 | 4,328,144 | 11,388,266 | |||||||||||||||||||||
| Other financial obligation | 320,709 | — | — | — | — | — | 320,709 | |||||||||||||||||||||
| Financial instruments of regulatory capital issued (subordinated bonds) | 3,582 | 19,460 | 29,399 | 94,136 | 90,554 | 1,164,522 | 1,401,653 | |||||||||||||||||||||
| Total liabilities | 25,523,726 | 4,067,669 | 4,707,963 | 3,480,432 | 2,904,124 | 6,668,472 | 47,352,386 | |||||||||||||||||||||
|
Up to 1 month |
1 to 3 months | 3 to 12 months | 1 to 3 years | 3 to 5 years |
Over 5 years |
Total |
||||||||||||||||||||||
| MCh$ | MCh$ | MCh$ | MCh$ | MCh$ | MCh$ | MCh$ | ||||||||||||||||||||||
| Liabilities as of December 31, 2024 | ||||||||||||||||||||||||||||
| Transactions in the course of payment | 297,983 | — | — | — | — | — | 297,983 | |||||||||||||||||||||
| Derivative Financial Instruments for hedging purposes | 1,588 | 2,755 | 303,336 | 381,790 | 343,096 | 1,133,338 | 2,165,903 | |||||||||||||||||||||
| Financial liabilities at amortized cost: | ||||||||||||||||||||||||||||
| Current accounts and other demand deposits | 14,287,507 | — | — | — | — | — | 14,287,507 | |||||||||||||||||||||
| Saving accounts and time deposits | 9,437,781 | 2,670,440 | 2,138,233 | 56,593 | 450 | 562 | 14,304,059 | |||||||||||||||||||||
| Obligations by repurchase agreements and securities lending | 9,984 | — | — | — | — | — | 9,984 | |||||||||||||||||||||
| Borrowings from financial institutions | 21,222 | 159,438 | 921,822 | — | — | — | 1,102,482 | |||||||||||||||||||||
| Debt financial instruments issued (*) | 13,893 | 158,375 | 1,178,285 | 2,983,446 | 2,328,034 | 4,472,111 | 11,134,144 | |||||||||||||||||||||
| Other financial obligation | 284,479 | — | — | — | — | — | 284,479 | |||||||||||||||||||||
| Financial instruments of regulatory capital issued (subordinated bonds) | 3,140 | — | 48,654 | 92,974 | 89,437 | 1,153,294 | 1,387,499 | |||||||||||||||||||||
| Total liabilities | 24,357,577 | 2,991,008 | 4,590,330 | 3,514,803 | 2,761,017 | 6,759,305 | 44,974,040 | |||||||||||||||||||||
| (*) | Amounts shown here are different from those reported in the liabilities report which is part of the liquidity analysis, due to differences in the treatment of mortgage bonds issued by the Bank in both reports. |
NOTES TO THE INTERIM CONSOLIDATED FINANCIAL STATEMENTS, continued
| 47. | Risk Management and Report, continued: |
| (3) | Market Risk, continued: |
| (b) | Price Risk, continued: |
Price Risk Sensitivity Analysis
The Bank uses stress tests as the main sensitivity analysis tool for Price Risk. The analysis is implemented for the Trading Book, Banking Book and the FVOCI portfolio separately. The Bank has adopted this tool as it is considered more useful than fluctuations in business as usual scenario, such as VaR or EaR, given that:
| (i) | The financial crisis show market factors fluctuations that are materially larger than those used in the VaR with 99% of confidence level or EaR with 99% of confidence level. |
| (ii) | The financial crisis also show that correlations between these fluctuations are materially different from those used in the VaR computation, since a crisis precisely indicates severe disconnections between the behaviors of market factors fluctuations respect to the patterns observed under normal conditions. |
| (iii) | Trading liquidity dramatically diminishes during financial distress and especially in emerging markets. Therefore, the overnight VaR number might not be representative of the loss for trading portfolios in such environment since closing exposures period may exceed one business day. This may also happen when calculating EaR, even considering three months as the closing period. |
The impacts are determined by mathematical simulations of fluctuations in the values of market factors, and also, estimating the changes of the economic and /or accounting value of the financial positions.
NOTES TO THE INTERIM CONSOLIDATED FINANCIAL STATEMENTS, continued
| 47. | Risk Management and Report, continued: |
| (3) | Market Risk, continued: |
| (b) | Price Risk, continued: |
In order to comply with IFRS 9, the following exercise was included illustrating an estimation of the impact of extreme but reasonable fluctuations of interest rates, swaps yields, FX rates and exchange volatility, which are used for valuing Trading Book, Banking Book and the FVOCI portfolio. Given that the Bank’s portfolio includes positions denominated in nominal and real interest rates, these fluctuations must be aligned with extreme but realistic Chilean inflation changes forecasts.
For the Trading Book, the exercise is implemented by multiplying the sensitivities by the fluctuations obtained as the results of mathematical simulations over a two-week time horizon and using the maximum historical volatility, within a significant period of time, in each of the market factor present. In the case of the FVOCI portfolio a four-week time horizon is used due to liquidity constrains; Banking Book impacts are estimated by multiplying cumulative gaps by forward interest rates fluctuations modeled over a three-month time horizon and using the maximum historical volatility of interest fluctuations but limited by maximum fluctuations and / or levels observed within a significant period of time. It is relevant to note that the methodology might ignore some portion of the interest rates convexity, since it is not captured properly when large fluctuations are modeled. In any case, given the magnitude of the changes, the methodology may be reasonable enough for the purposes and scope of the analysis.
The following table illustrates the fluctuations resulting from the main market factors in the maximum stress test exercise, or more adverse, for the Trading Book.
The directions or signs of these fluctuations are those that correspond to those that generate the most adverse impact at the aggregate level.
| Average Fluctuations of Market Factors for Maximum Stress Scenario Trading Book |
||||||||||||||||||||||||
| CLP Derivatives (bps) |
CLP Bonds (bps) |
CLF Derivatives (bps) |
CLF Bonds (bps) |
USD Offshore SOFR Derivatives (bps) |
Spread USD On/Off Derivatives (bps) |
|||||||||||||||||||
| Less than 1 year | 30 | 199 | 125 | 161 | 10 | (92 | ) | |||||||||||||||||
| Greater than 1 year | 21 | 125 | 17 | 118 | 14 | (27 | ) | |||||||||||||||||
bps = basis points.
NOTES TO THE INTERIM CONSOLIDATED FINANCIAL STATEMENTS, continued
| 47. | Risk Management and Report, continued: |
| (3) | Market Risk, continued: |
| (b) | Price Risk, continued: |
The worst impact on the Bank’s Trading Book as of March 31, 2025, as a result of the simulation process described above, is as follows:
| Most Adverse Stress Scenario P&L Impact Trading Book (MCh$) | ||||||||
| CLP Interest Rate | (10,707 | ) | ||||||
| Derivatives | (791 | ) | ||||||
| Debt instruments | (9,916 | ) | ||||||
| CLF Interest Rate | (1,186 | ) | ||||||
| Derivatives | 91 | |||||||
| Debt instruments | (1,277 | ) | ||||||
| Interest rate USD offshore | (39 | ) | ||||||
| Domestic/offshore interest rate spread USD | (984 | ) | ||||||
| Total Interest rates | (12,916 | ) | ||||||
| Banking spread | (25 | ) | ||||||
| Total FX and FX Options | 20 | |||||||
| Total | (12,921 | ) | ||||||
The modeled scenario would generate losses in the Trading Book for Ch$12,921 million. In any case, such fluctuations would not result in material losses compared to Basic Capital or to the P&L estimate for the next 12-months.
The impact on the Banking Book as of March 31, 2025, which does not necessarily mean a net loss(gain) but a lower (greater) net income from funds generation (resulting net interest rate generation), is illustrated below:
| Most Adverse Stress Scenario 12-Month Revenue Banking Book (MCh$) |
||||
| Impact by Base Interest Rate shocks | (334,755 | ) | ||
| Impact due to Spreads Shocks | (31,762 | ) | ||
| Higher / (Lower) Net revenues | (366,517 | ) | ||
NOTES TO THE INTERIM CONSOLIDATED FINANCIAL STATEMENTS, continued
| 47. | Risk Management and Report, continued: |
| (3) | Market Risk, continued: |
| (b) | Price Risk, continued: |
The impact on the FVOCI portfolio it is show in the followings tables. First are the main fluctuation in the market factors, due to the scenarios provided for the stress test meltdown (more adverse), for this portfolio.
The sign of the fluctuation below, correspond to the ones that generate the most adverse impact.
| Average Fluctuations of Market Factors for Maximum
Stress Scenario FVOCI Portfolio |
||||||||||||||||
| CLP Bonds (bps) |
CLF Bonds (bps) |
USD Offshore SOFR Derivatives (bps) |
Spread USD On/Off Derivatives (bps) |
|||||||||||||
| Less than 1 year | 261 | 450 | 24 | 17 | ||||||||||||
| Greater than 1 year | 137 | 210 | 19 | 4 | ||||||||||||
bps = basis points
The worst impact on the Bank’s FVOCI portfolio as of March 31, 2025, as a result of the simulation process described above, is as follows:
| Most Adverse Stress Scenario P&L Impact FVOCI portfolio (MCh$) |
||||
| CLP Debt Instrument | (25,212 | ) | ||
| CLF Debt Instrument | (59,818 | ) | ||
| Interest rate USD offshore | (543 | ) | ||
| Banking spread | (1,297 | ) | ||
| Corporative spread | (2,018 | ) | ||
| Total | (88,888 | ) | ||
The modeled for the FVTOCI Portfolio would generate potential impacts on equity accounts for Ch$88,888 million.
The main negative impact on the Trading Book would occur as a result of an increase in rates on debt instruments in CLP over 1 year, while in the case of the FVTOCI portfolio the main impact comes from upward fluctuations in interest rates of debt instruments in CLF and CLP greater than 1 year. For its part, the lowest potential income in the next 12 months in the Banking Book would occur in a scenario of a sharp inflation rates and a limited fall in nominal interest rates.
NOTES TO THE INTERIM CONSOLIDATED FINANCIAL STATEMENTS, continued
| 47. | Risk Management and Report, continued: |
| (4) | Other Information related to Financial Risks: |
Offsetting of financial assets and liabilities:
The Bank trades financial derivatives with foreign counterparties using ISDA Master Agreement (International Swaps and Derivatives Association, Inc.), under legal jurisdiction of the City of New York – USA or London – United Kingdom. Legal framework in these jurisdictions, along with documentation mentioned, it allows Banco de Chile the right to anticipate the maturity of the transaction and then, offset the net value of those transactions in case of default of counterparty. Additionally, the Bank has negotiated with these counterparties an additional annex (CSA Credit Support Annex), that includes other credit mitigating, such as entering margins on a certain amount of net value of transactions, early termination (optional or mandatory) of transactions at certain dates in the future, coupon adjustment of transaction in exchange for payment of the debtor counterpart over a certain threshold amount, etc.
Below are detail the contracts susceptible to offset:
| Fair Value | Negative Fair Value of contracts with right to offset |
Positive Fair Value of contracts with right to offset |
Financial Collateral | Net Fair Value | ||||||||||||||||||||||||||||||||||||
| March | December | March | December | March | December | March | December | March | December | |||||||||||||||||||||||||||||||
| 2025 | 2024 | 2025 | 2024 | 2025 | 2024 | 2025 | 2024 | 2025 | 2024 | |||||||||||||||||||||||||||||||
| MCh$ | MCh$ | MCh$ | MCh$ | MCh$ | MCh$ | MCh$ | MCh$ | MCh$ | MCh$ | |||||||||||||||||||||||||||||||
| Derivative financial assets | 2,091,657 | 2,377,312 | (837,895 | ) | (817,430 | ) | (900,976 | ) | (1,103,430 | ) | (144,897 | ) | (169,344 | ) | 207,889 | 287,108 | ||||||||||||||||||||||||
| Derivative financial liabilities | 2,393,796 | 2,585,846 | (837,895 | ) | (817,430 | ) | (900,976 | ) | (1,103,430 | ) | (345,033 | ) | (334,897 | ) | 309,892 | 330,089 | ||||||||||||||||||||||||
NOTES TO THE INTERIM CONSOLIDATED FINANCIAL STATEMENTS, continued
| 47. | Risk Management and Report, continued: |
| (4) | Operational risk: |
One of the Bank’s objectives is to monitor, control and maintain at adequate levels, the risk of losses resulting from a lack of adequacy or a failure of processes, personnel and/or internal systems, or due to external events. This definition includes legal risk and excludes strategic and reputational risk.
Operational risk is inherent to all activities, products, and systems, and is transversal to the entire organization, encompassing its strategic, business, and support processes. All Bank collaborators are responsible, within their respective areas of responsibility, for managing and controlling the operational risk inherent in their activities, as its materialization can generate direct or indirect financial losses.
To face this risk, the Bank has defined a Regulatory Framework and a governance structure according to the volume and complexity of its activities. The Corporate Risk Division administer the management of this risk, through the establishment of a Global Control Management. Likewise, the “Superior Committee for Operational Risk” and the “Committee for Operational Risk” supervise it.
The Operational Risk Policy defines a comprehensive management model based on four main processes that ensure an adequate control environment in the organization.
These processes are implemented in the different areas of Operational Risk action, using various management and control tools.
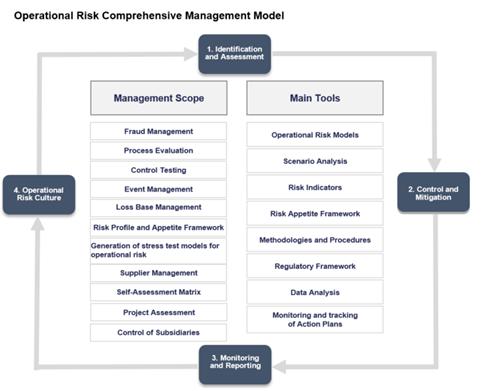
NOTES TO THE INTERIM CONSOLIDATED FINANCIAL STATEMENTS, continued
| 47. | Risk Management and Report, continued: |
| (5) | Operational risk, continued: |
The aforementioned processes correspond to:
1. Identification and Evaluation: At Banco de Chile, this process considers internal and external factors, which allows us to better understand operational risk, and thus allocate resources and define strategies efficiently and effectively.
The Bank promotes the use of methodologies and procedures with the objective of guaranteeing an adequate identification and evaluation of these risks, both inherent and residual. These are executed with a frequency that allows knowing the operational risks in a timely manner.
2. Control and Mitigation: Determination of acceptable risk levels and mitigation actions to be applied in case of deviation from these levels. This process aims to maintain risk at adequate levels.
Banco de Chile will execute a set of control and mitigation tools in the different areas of management, which will make it possible to alert deviations in exposure to operational risk, where mitigation measures will be evaluated to solve them.
3. Monitoring and Reporting: This process aims to guarantee the monitoring of the main risks and inform the different interested parties.
At Banco de Chile, monitoring and reporting will consider information related to the different areas of management. If necessary, the results of the monitoring activities will be included in the relevant government instances.
4. Operational Risk Culture: The Global Control Management plans operational risk culture programs, aimed at raising awareness and training Bank employees in risk identification, control effectiveness, and event detection in their normal operating activities, so that each collaborator contributes to reduce the occurrence of risk events and mitigate their impact on the business.
Additionally, the comprehensive management of Operational Risk considers the following areas:
| − | Fraud Management |
| − | Process Assessment |
| − | Testing of Controls |
| − | Event Management |
| − | Loss Base Management |
| − | Profile and Risk Appetite Framework |
| − | Generation of stress test models for Operational Risk |
| − | Supplier Management |
| − | Management Self-Assessment Matrix |
| − | Operational Risk Assessment for Projects |
| − | Subsidiary Control |
NOTES TO THE INTERIM CONSOLIDATED FINANCIAL STATEMENTS, continued
| 47. | Risk Management and Report, continued: |
| (5) | Operational risk, continued: |
All areas previously mentioned, together with the corresponding Regulatory Framework and governance structure, constitute the overall management of Operational Risk. In this way, Banco de Chile and its Subsidiaries ensure an adequate environment for the management of operational risk.
Below is the exposure to net loss, gross loss and recoveries due to operational risk events as of March 31, 2025 and 2024:
| March 2025 | March 2024 | |||||||||||||||||||||||
| Category | Lost Gross | Recoveries | Lost Net | Lost Gross | Recoveries | Lost Net | ||||||||||||||||||
| MCh$ | MCh$ | MCh$ | MCh$ | MCh$ | MCh$ | |||||||||||||||||||
| Internal fraud | 84 | — | 84 | 5 | — | 5 | ||||||||||||||||||
| External fraud | 6,993 | (3,170 | ) | 3,823 | 7,819 | (3,062 | ) | 4,757 | ||||||||||||||||
| Work practices and safety in the business position | 280 | — | 280 | 302 | — | 302 | ||||||||||||||||||
| Customers, products and business practices | 35 | — | 35 | 258 | — | 258 | ||||||||||||||||||
| Damage to physical assets | 271 | — | 271 | 372 | (51 | ) | 321 | |||||||||||||||||
| Business interruption and system failures | 266 | — | 266 | 45 | (6 | ) | 39 | |||||||||||||||||
| Execution, delivery and process management | 384 | (2 | ) | 382 | 1,136 | (4 | ) | 1,132 | ||||||||||||||||
| Total | 8,313 | (3,172 | ) | 5,141 | 9,937 | (3,123 | ) | 6,814 | ||||||||||||||||
Cybersecurity
The Cybersecurity Engineering and Architecture Management is in charge of defining, implementing and maximizing existing cyber threat protection technologies, and defining and maintaining the security architecture. The Cyber Defense Management is responsible for safeguarding information assets by proactively detecting, responding and containing threats. Likewise, this department is responsible for managing cybersecurity incidents in an assertive and timely manner, minimizing the impact and improving response times, with the aim of protecting the Bank’s operations.
On the other hand, the Technological Risk and Cyber Intelligence Management aims to ensure security and the integration of information security and cybersecurity risks, preventing attacks perpetuated by different threat agents. Manage and respond to cyber intelligence requirements that allow strengthening strategic decision-making within the organization through analytical models, in order to provide support to processes and mechanisms that seek to achieve greater security, protection and resilience against the current threat landscape.
Finally, the Cybersecurity Management and Subsidiary Control Management is in charge of defining, managing and carrying out the strategic plan of the cybersecurity division. Their responsibilities include ensuring optimal and efficient use of resources, as well as providing and supervising cybersecurity policies to suppliers, among other matters. Likewise, management must guarantee the implementation of guidelines and controls that establish cybersecurity regulations, in addition to managing the regulatory framework of the Division’s processes. Also, he is responsible for strengthening the cybersecurity culture within the organization and supporting the management of cross-functional functions and initiatives related to cybersecurity. Finally, it has the task of establishing and controlling cybersecurity management in the bank’s subsidiaries.
NOTES TO THE INTERIM CONSOLIDATED FINANCIAL STATEMENTS, continued
| 47. | Risk Management and Report, continued: |
The Bank in the management for the compliance with the objectives related to the delivery of the service of attention to its clients, has the Management of Business Continuity that through its policy and norm establishes the guidelines to manage, control and administrate the strategies for recovering from contingency situations, maintains the crisis governance model, sustain the continuity of services and critical operations related to the payment chain, through a comprehensive resilient model that includes plans and controlled tests to reduce the impact of disruptive events that may affect the Bank. Additionally, there is the role and responsibilities of the Information Security Officer (ISO), with an independent function in charge of designing and implementing controls, by monitoring the tasks carried out by the organizational units responsible for information security, cybersecurity and technological risk.
That is why Business Continuity has methodologies and controls that contribute to the application of the comprehensive model within the corporation, mainly represented in the following management areas:
| − | Document Management: It consists of carrying out methodological processes of updating the documentation that supports Business Continuity in operational and technological areas, with the aim of keeping the strategy implemented in the Bank up to date and in accordance with the guidelines of Business Continuity Management (BCM). |
| − | Business Continuity Tests: It refers to annually scheduled contingency simulations that address the 5 risk scenarios defined for the Bank (Failure in Technology Infrastructure, Failure in Physical Infrastructure, Massive Absence of Personnel, Failure in Critical Supplier Service and Cybersecurity), allowing to maintain constant training and integration of critical personnel operating the payment chain, under the defined contingency procedures that support the Bank’s critical products and services. |
| − | Crisis Management: Internal process of the Bank that maintains and trains the key executive roles associated with the Crisis Groups in conjunction with the main recovery strategies and structures defined in the BCM model. In this way, it constantly strengthens the different areas necessary for preparation, execution and monitoring, that will allow facing crisis events in the Bank. |
| − | Critical Supplier Management: This involves the management, control and testing of Business Continuity Plans implemented by the suppliers involved in the processing of critical products and services for the Bank, associated with the risk scenarios established in direct relation to the contracted service. |
NOTES TO THE INTERIM CONSOLIDATED FINANCIAL STATEMENTS, continued
| 47. | Risk Management and Report, continued: |
Business Continuity, continued:
| − | Alternative Site Management: It includes the continuous management and control of secondary physical locations for the Bank’s critical units, to keep the operation active in case of failure in the main work location. The objective is to protect and maintain the technological and operational functionalities of the alternative sites, to reduce recovery times in case of crisis and that activation is effective when its use is required. |
| − | Relations with subsidiaries and External Entities: It consists of the permanent control, management and leveling on the compliance of Subsidiaries under the methodology and strategic lines established by the Bank in crisis environments and Business Continuity Management. It also includes the global management with the requirements of internal and external regulators. |
| − | Continuous Improvement: considers the application of processes, automation and the adaptation of resources used in the internal processes of the business continuity model, with the objective of improving response in the delivery and analysis of information in contingencies, complementing the managed processes of the BCM. |
| − | Training: It includes the development and implementation of processes and instances prepared under different learning methodologies to strengthen and empower employees on the areas of the business continuity model. |
| − | Cybersecurity Control: Design and implement independent controls by monitoring the tasks carried out by the organizational units responsible for the Bank’s information security, cybersecurity and technological risk. |
The management and unification of the described areas, together with the compliance of the implemented regulations and the structured governability, constitute the Business Continuity Model of the Bank of Chile.
NOTES TO THE INTERIM CONSOLIDATED FINANCIAL STATEMENTS, continued
| 48. | Information on Regulatory Capital and Capital Adequacy Ratios: |
Requirements and Capital Management:
The main objectives of the Bank’s capital management are to ensure the adequacy and quality of its capital, at a consolidated level, based on the adequate management of the risks it faces in its operations, establishing sufficient capital levels, through the definition of internal objectives, that supports both the business strategy in both normal and stress scenarios in the short and medium term, thus ensuring compliance with regulatory requirements, coverage of its material risks, a solid credit classification and the generation of adequate capital clearances. During 2025, the Bank has met the required capital requirements and its internal sufficiency objectives.
As part of its Capital Management Policy, the Bank has established capital sufficiency alerts and limits approved by the Board of Directors, which are monitored by the governance structures that the Bank has established for these purposes, including the Capital Management Committee. During 2025, none of the internal alerts defined by the Bank were activated as part of the Capital Risk Appetite Framework. In this sense, the Bank manages capital based on its strategic objectives, its risk profile and its ability to generate cash flows, as well as the economic and business context in which it operates. If it requires strengthening its capital structure, the Bank may, among other options, propose to its shareholders meeting modifications to the dividend payment ratio, as well as issue basic capital, additional tier 1 capital or tier 2 capital instruments.
Capital Requirements
In accordance with the General Banking Law, the effective equity of a bank may not be less than 8% of its risk-weighted assets (RWA), net of required provisions. Additionally, it establishes that the Basic Capital may not be less than 4.5% of its APR or 3% of its total assets, net of required provisions. Regarding Tier 1 capital, corresponding to the sum of Basic Capital and Additional Tier 1 Capital, the latter in the form of bonds with no maturity date and preferred shares, it is established that it may not be less than 6% of their RWAs, net of required provisions. Likewise, banking entities must comply, as established by current regulations or regulators, with buffers and capital charges, such as the conservation buffer, the countercyclical buffer and capital charges by the systemically important buffer and/or Pillar 2.
On May, 2023, the Central Bank reported that its board agreed to activate the counter-cyclical core capital requirement for banks, at a local banking industry level, equivalent to 0.5% of the risk-weighted assets of banking institutions, required starting from the month of May 2024. In the monetary policy meeting of November 2024, the central bank agreed to maintain the same level of 0.5% requirement.
On January 16, 2024, the Financial Market Commission (CMF) reported that, as a result of the supervision process, it resolved to apply additional capital requirements of Pillar 2 of 0.5% for Banco de Chile within an implementation period of four years. This requirement must be constituted in a ratio of 25% no later than June 30, 2024. Likewise, this requirement must be recognized at least 56.3% with basic capital in proportion to the minimum legal requirements. On January 17, 2025 the CMF communicated that, as a result of the supervisory process, it decided to maintain the additional capital requirement for Pillar 2 in effect for Banco de Chile as of that date, equivalent to 0.13% of the APR, which must be fully constituted as of June 30, 2025.
On April 1, 2025, the CMF reported the result of the annual review of the systemic importance rating for local banks, maintaining an additional basic capital charge of 1.25% of the APR for Banco de Chile, payable in accordance to the gradualness defined by the regulations, so the capital charge required as of December 2025 is equivalent to 100% of said percentage.
It should be noted that the Basel III banking solvency standards still consider a series of transitory regulations. These measures include: i) the gradual adoption of requirements for systemic banks, ii) the gradual application of adjustments to regulatory capital, iii) gradualness to continue recognizing subordinated bonds issued by banking subsidiaries as effective equity, among other matters. It is important to mention that on December 1, 2024 the gradual adaption of the conservation buffer, reaching 2.5% of risk-weighted assets, which is fully constituted by Banco de Chile.
NOTES TO THE INTERIM CONSOLIDATED FINANCIAL STATEMENTS, continued
| 48. | Information on Regulatory Capital and Capital Adequacy Ratios, continued: |
Information on regulatory capital and capital adequacy indicators is presented below:
| Total assets, risk-weighted assets and components of the effective equity according to Basel III |
Local and Overall consolidated March -2025 |
Local and Overall consolidated Dec-2024 |
||||||||||
| Item No. | Item description | Note | MCh$ | MCh$ | ||||||||
| 1 | Total assets according to the statement of financial position | 53,769,904 | 52,095,441 | |||||||||
| 2 | Non-consolidated investment in subsidiaries | a | — | — | ||||||||
| 3 | Assets discounted from regulatory capital, other than item 2 | b | 2,279,464 | 2,544,175 | ||||||||
| 4 | Derivative credit equivalents | c | 1,018,528 | 1,056,941 | ||||||||
| 5 | Contingent loans | d | 2,980,522 | 3,104,187 | ||||||||
| 6 | Assets generated by the intermediation of financial instruments | e | — | — | ||||||||
| 7 | = (1-2-3+4+5-6) Total assets for regulatory purposes | 55,489,490 | 53,712,394 | |||||||||
| 8.a | Credit risk weighted assets, estimated according to the standard methodology (CRWA) | f | 32,878,977 | 32,704,910 | ||||||||
| 8.b | Credit risk weighted assets, estimated according to internal methodologies (CRWA) | f | — | — | ||||||||
| 9 | Market risk weighted assets (MRWA) | h | 1,407,442 | 1,309,590 | ||||||||
| 10 | Operational risk weighted assets (ORWA) | g | 4,377,313 | 4,339,979 | ||||||||
| 11.a | = (8.a/8.b+9+10) Risk-weighted assets (RWA) | 38,663,732 | 38,354,479 | |||||||||
| 11.b | = (8.a/8.b+9+10) Risk-weighted assets, after application of the output floor (RWA) | 38,663,732 | 38,354,479 | |||||||||
| 12 | Owner’s equity | 5,395,358 | 5,622,999 | |||||||||
| 13 | Non-controlling interest | i | 2 | 2 | ||||||||
| 14 | Goodwill | j | — | — | ||||||||
| 15 | Excess minority investments | k | — | — | ||||||||
| 16 | = (12+13-14-15) Core Tier 1 Capital (CET1) | 5,395,360 | 5,623,001 | |||||||||
| 17 | Additional deductions to core tier 1 capital, other than item 2 | l | 119,712 | 111,087 | ||||||||
| 18 | = (16-17-2) Core Tier 1 Capital (CET1) | 5,275,648 | 5,511,914 | |||||||||
| 19 | Voluntary provisions (additional) imputed as additional Tier 1 capital (AT1) | m | — | — | ||||||||
| 20 | Subordinated bonds imputed as additional tier 1 capital (AT1) | m | — | — | ||||||||
| 21 | Preferred shares allocated to additional tier 1 capital (AT1) | — | — | |||||||||
| 22 | Bonds without a fixed term of maturity imputed to additional tier 1 capital (AT1) | — | — | |||||||||
| 23 | Discounts applied to AT1 | l | — | — | ||||||||
| 24 | = (19+20+21+22-23) Additional Tier 1 Capital (AT1) | — | — | |||||||||
| 25 | = (18+24) Tier 1 Capital | 5,275,648 | 5,511,914 | |||||||||
| 26 | Voluntary provisions (additional) imputed as Tier 2 capital (T2) | n | 410,987 | 408,811 | ||||||||
| 27 | Subordinated bonds imputed as Tier 2 capital (T2) | n | 1,041,897 | 1,034,567 | ||||||||
| 28 | = (26+27) Equivalent tier 2 capital (T2) | 1,452,884 | 1,443,378 | |||||||||
| 29 | Discounts applied to T2 | l | — | — | ||||||||
| 30 | = (28-29) Tier 2 capital (T2) | 1,452,884 | 1,443,378 | |||||||||
| 31 | = (25+30) Effective equity | 6,728,532 | 6,955,292 | |||||||||
| 32 | Additional basic capital required for the constitution of the conservation buffer | o | 966,593 | 958,862 | ||||||||
| 33 | Additional basic capital required to set up the countercyclical buffer | p | 193,319 | 191,772 | ||||||||
| 34 | Additional basic capital required for banks qualified as systemic | q | 362,472 | 359,573 | ||||||||
| 35 | Additional capital required for the evaluation of the adequacy of effective equity (Pillar 2) | r | 36,247 | 47,943 | ||||||||
| a) | Corresponds the value of the investment in subsidiaries that are not consolidated. Applies only in the local consolidation when the bank has foreign subsidiaries, subtracting totally its value in assets and CET1. |
NOTES TO THE INTERIM CONSOLIDATED FINANCIAL STATEMENTS, continued
| 48. | Information on Regulatory Capital and Capital Adequacy Ratios, continued: |
| b) | Corresponds the value of the asset items that are subtracted from the regulatory capital, in accordance with the paragraph(a) of title N°3 of chapter 21-30 of the RAN. |
| c) | Corresponds the credit equivalents of the derivative instruments, in accordance with the paragraph (b) of title N°3 of chapter 21-30 of the RAN. |
| d) | Corresponds the contingent exposure according to the paragraph c) of the title N°3 of chapter 21-30 of the RAN. |
| e) | Corresponds the intermediation of financial instrument assets in the name of the bank on behalf of third parties that are consolidated as established in the paragraph d) of the title N°3 of chapter 21-30 of the RAN. |
| f) | Corresponds the estimated credit risk weighted assets according to the chapter 21-6 of RAN. If the bank does not have the authorization to apply internal methodologies, needs to inform the field 8.b as zero. |
| g) | Corresponds the estimated market risk weighted assets according to the chapter 21-7 of the RAN. |
| h) | Corresponds the estimated operational risk weighted assets according to the chapter 21-8 of the RAN. |
| i) | Corresponds to the non-controlling interest, depending on the level of consolidation, up to 20% of the owners’ assets. |
| j) | Assets that correspond to goodwill. |
| k) | Corresponds to the balances of investment assets in non-business support companies that do not participate in the consolidation, above 5% of the owners’ equity. |
| l) | In the case of CET1 and T2, banks must estimate the equivalent value for each tier of capital, as well as that obtained by fully applying Chapter 21-1 of the RAN. Then, the difference between the equivalent value and the fully applied value must be weighted by the discount factor in force on the reporting date according to the transitional provisions of Chapter 21-1 of the RAN, and reported in this row. In the case of the AT1, the discounts apply directly if they exist |
| m) | Provisions and subordinated bonds allocated to additional capital tier 1 (AT1), as established in Chapter 21-2 of the RAN. |
| n) | Provisions and subordinated bonds attributed to the equivalent definition of tier 2 capital (T2), as established in Chapter 21-1 of the RAN. |
| o) | Corresponds to the additional basic capital (CET1) for the constitution of the conservation buffer, as established in Chapter 21-12 of the RAN. |
| p) | Corresponds to the additional basic capital (CET1) for the constitution of the counter-cyclical buffer, as established in Chapter 21-12 of the RAN. |
| q) | Corresponds to the additional basic capital (CET1) for banks qualified as systemic, as established in Chapter 21-11 of the RAN. |
| r) | Corresponds to the additional capital for the evaluation of the sufficiency of the effective equity (Pillar 2) of the bank, as established in Chapter 21-13 of the RAN. |
NOTES TO THE INTERIM CONSOLIDATED FINANCIAL STATEMENTS, continued
| 48. | Information on Regulatory Capital and Capital Adequacy Ratios, continued: |
| Capital Adequacy Ratios and Regulatory Compliance | Local and Overall consolidated March -2025 |
Local and Overall consolidated Dec-2024 |
||||||||||
| Item No. | according to Basel III | Note | % | % | ||||||||
| 1 | Leverage Ratio (T1 I18/T1 I7) | 9.51 | % | 10.26 | % | |||||||
| 1.a | Leverage Ratio that the bank must meet, considering the minimum requirements | a | 3 | % | 3 | % | ||||||
| 2 | CET 1 Capital Ratio (T1 I18/T1 I11.b) | 13.64 | % | 14.37 | % | |||||||
| 2.a | CET 1 Capital Ratio that the bank must meet, considering the minimum requirements | a | 5.51 | % | 5.51 | % | ||||||
| 2.b | Capital buffer shortfall | b | — | — | ||||||||
| 3 | Tier 1 Capital Ratio (T1 I25/T1 I11.b) | 13.64 | % | 14.37 | % | |||||||
| 3.a | Tier 1 Capital Ratio that the bank must meet, considering the minimum requirements | a | 7.03 | % | 7.03 | % | ||||||
| 4 | Regulatory Capital Ratio (T1 I31/T1 I11.b) | 17.40 | % | 18.13 | % | |||||||
| 4.a | Regulatory Capital Ratio that the bank must meet, considering the minimum requirements | a | 9.06 | % | 9.06 | % | ||||||
| 4.b | Regulatory Capital Ratio that the bank must meet, considering the charge for article 35 bis | c | — | N/A | ||||||||
| 4.c | Regulatory Capital Ratio that the bank must meet, considering the minimum requirements, conservation buffer and countercyclical buffer | b | 12.06 | % | 12.06 | % | ||||||
| 5 | Credit rating | d | A | A | ||||||||
| Regulatory compliance for Capital Adequacy | ||||||||||||
| 6 | Additional provisions computed in Tier 2 capital (T2) in relation to CRWA (T1 I26/T1 I8.a) | e | 1.25 | % | 1.25 | % | ||||||
| 7 | Subordinated bonds computed as Tier 2 capital (T2) in relation to CET 1 Capital | f | 19.31 | % | 18.40 | % | ||||||
| 8 | Additional Tier 1 Capital (AT1) in relation to CET 1 Capital (T1 I24/T1 I18) | g | — | — | ||||||||
| 9 | Voluntary (additional) provisions and subordinated bonds computed as AT1 in relation to RWAs ((T1 I19+T1 I20)/T1 I11.b) | h | N/A | N/A | ||||||||
| (*) | T1 Ix: corresponds to item x of the previous table. |
| a) | In the case of the leverage indicator, the requirement is 3% without prejudice to the additional requirements for systemic banks that could be set according to the provisions of Chapter 21-30 of the RAN. |
In the case of core capital, the bank considers a charge of 4.5% of risk-weighted assets (RWA) plus the systemic charge and Pillar 2 requirements.
In Tier 1 capital, a value of 6% plus the systemic bank charge and Pillar 2 charge is considered the minimum requirement.
For effective equity, 8% of the RWA is considered, adding to this value the additional charges for systemic bank and Pillar 2.
The systemic bank and Pillar 2 requirements for Banco de Chile are equivalent to 1.25% and 0.5%, respectively. The transitional provisions require 75% of the capital charge per systemic bank and 25% of the charge for Pillar 2, which is covered by 56.3% with basic capital.
| b) | The capital buffer deficit must be estimated according to the provisions of Chapter 21-12 of the RAN. This value defines the restriction on the distribution of dividends, as provided in the Chapter mentioned above. |
In the case of effective equity, the requirement of 100% of the conservation buffer of 2.5% and a counter-cyclical capital charge are added to the value reported in note 4.a). of 0.5%.
| c) | It corresponds to the effective equity requirement in force by article 35 bis of the General Banking Law. |
| d) | It corresponds to the solvency classification as established in article 61 of the general banking law. |
| e) | Limit is equivalent to 1.25% when using standard methodology for determining CRWAs. |
| f) | Limit is equivalent to 50% of the basic capital, considering the discounts applied to these instruments according to Chapter 21-1 of the RAN. |
| g) | Additional Tier 1 capital cannot exceed 1/3 of core capital. |
| h) | Additional provisions and subordinated bonds could be temporarily allocated until November 2023 to AT 1 for up to 1% of the RWA as of December 1, 2021. This value decreased annually by 0.5% in accordance with the transitional provisions of Chapter 21-2 of the RAN. |
NOTES TO THE INTERIM CONSOLIDATED FINANCIAL STATEMENTS, continued
| 49. | Subsequent Events: |
| (a) | During the month of April 2025 Banco de Chile has reported as essential fact the following placements in the local market of senior, dematerialized and bearer bonds issued by Banco de Chile and registered in the Securities Registry of the Financial Market Commission: |
| Date | Registration number in the Securities Registry |
Serie | Amount | Currency | Maturity date | Average rate | ||||||||||
| April 1, 2025 | 11/2022 | FC | 800,000 | UF | 01/01/2030 | 2.96 | % | |||||||||
| April 3, 2025 | 11/2022 | FO | 900,000 | UF | 01/01/2032 | 2.92 | % | |||||||||
| April, 15, 2025 | 11/2022 | FH | 850,000 | UF | 12/01/2030 | 2.84 | % | |||||||||
| April, 17, 2025 | 11/2022 | GG | 1,000,000 | UF | 05/01/2035 | 3.03 | % | |||||||||
| April, 17, 2025 | 20240002 | HD | 2,000,000 | UF | 10/01/2034 | 3.03 | % | |||||||||
| (b) | On April 10, 2025, at a meeting of the Board of Directors of Banco de Chile, it was agreed, subject to prior authorization from the Financial Market Commission, to absorb the subsidiary company Socofin S.A., by purchasing the shares issued by it whose owner is Banchile Asesoría Financiera S.A. and, in this way, dissolve Socofin S.A. in accordance with the provisions of section 2 of article 103 of Law 18,046. Likewise, once the dissolution of the aforementioned company occurs, the Bank will have the character of a legal successor of the entity. |
The Interim Consolidated Financial Statements of Banco de Chile for the period ended March 31, 2025 were approved by the Directors on April 24, 2025.
In Management’s opinion, there are no others significant subsequent events that affect or could affect the Interim Consolidated Financial Statements of Banco de Chile and its subsidiaries between March 31, 2025 and the date of issuance of these Interim Consolidated Financial Statements.
 |
 |
|
| Héctor Hernández G. General Accounting Manager |
Eduardo Ebensperger O. Chief Executive Officer |
SIGNATURE
Pursuant to the requirements of the Securities Exchange Act of 1934, the registrant has duly caused this report to be signed on its behalf by the undersigned, thereunto duly authorized.
| Date: April 29, 2025 | ||
| Banco de Chile | ||
| /S/ Eduardo Ebensperger O. | ||
| By: | Eduardo Ebensperger O. | |
| CEO |