UNITED STATES
SECURITIES AND EXCHANGE COMMISSION
Washington, D.C. 20549
Form 6-K
Report of Foreign Private Issuer
Pursuant to Rules 13a-16 or 15d-16 under
the Securities Exchange Act of 1934
For the month of April 2025
Commission File Number: 001-41586
MOOLEC SCIENCE SA
(Exact name of Registrant as Specified in Its Charter)
17, Boulevard F. W. Raiffeisen
L-2411 Luxembourg,
Grand Duchy of Luxembourg
(Address of principal executive offices)
Indicate by check mark whether the registrant files or will file annual reports under cover Form 20-F or Form 40-F.
Form 20-F ☒ Form 40-F ☐
EXPLANATORY NOTE
This Form 6-K is incorporated by reference into our registration statements on Form F-3 (Registration No. 333-283113) and Form S-8 (Registration No. 333-282263).
The exhibits to this Form 6-K contain important information relating to the business combination and the contributed entities, including:
| ● | information relating to the structure of the business combination, the Business Combination Agreement, the businesses and assets of each of Bioceres Group PLC, Nutrecon LLC and Gentle Technologies Corp and certain risk factors. See “Exhibit 99.1—Background of the Business Combination,” “Exhibit 99.1—The Business Combination Agreement,” “Exhibit 99.1—Business of the Contributed Entities” and “Exhibit 99.1—Risk Factors”); |
| ● | the unaudited proforma condensed combined consolidated financial information for the year ended June 30, 2024 and unaudited pro forma condensed combined consolidated financial information as of and for the six-month period ended December 31, 2024. See “Exhibit 99.1—Unaudited Pro Forma Condensed Combined Consolidated Financial Information”; |
| ● | the audited consolidated financial statements of Bioceres Group PLC June 30, 2024 and 2023 and for the years ended June 30, 2024, 2023 and 2022. See “Exhibit 99.3”; |
| ● | the unaudited interim consolidated financial statements of Bioceres Group PLC as of December 31, 2024 and for the six-month period ended December 31, 2024 and 2023. See “Exhibit 99.4”; and |
| ● | the annual report on Form 20-F of Bioceres Crop Solutions Corp. for the year ended June 30, 2024 filed with the SEC on October 30, 2024. See “Exhibit 99.5”; and |
| ● | the unaudited consolidated financial statements of Bioceres Crop Solutions Corp. as of and for the six-month period ended December 31, 2024. See “Exhibit 99.6.” |
On April 9, 2025, Bioceres Group PLC converted from a public limited company to a private limited company and changed its name to Bioceres Group Limited. Therefore, the exhibits hereto containing financial statements of Bioceres Group Limited for periods ended prior to April 9, 2025 refer to those financial statements as the financial statements of Bioceres Group PLC.
On March 4, 2025, we received a letter from the staff of the United States Securities and Exchange Commission, which, pursuant to its authority under Rule 3-13 of Regulation S-K, granted us relief from the requirement to include in our registration statements the financial statements of Gentle Technologies Corp and Nutrecon LLC, as required by Rule 3-05 of Regulation S-X, along with related pro forma information.
Unless otherwise stated, references contained in the exhibits hereto to “the Form 6-K” are references to this Form 6-K.
Forward-Looking Statements
This current report on Form 6-K contains “forward-looking statements.” Forward-looking statements may be identified by the use of words such as “forecast,” “intend,” “seek,” “target,” “anticipate,” “believe,” “expect,” “estimate,” “plan,” “outlook,” and “project” and other similar expressions that predict or indicate future events or trends or that are not statements of historical matters. Such forward-looking statements with respect to performance, prospects, revenues, and other aspects of our or the contributed entities are predictions, projections and other statements about future events that are based on current expectations and assumptions and, as a result, are subject to risks and uncertainties. Although we believe that we have a reasonable basis for each forward-looking statement contained in this current report on Form 6-K, we caution you that these statements are based on a combination of facts and factors, about which we cannot be certain. We cannot assure you that the forward-looking statements in this publication will prove accurate. These forward-looking statements are subject to a number of significant risks and uncertainties that could cause actual results to differ materially from expected results, including, among others, changes in applicable laws or regulations, the possibility that we may be adversely affected by economic, business and/or other competitive factors, costs related to the scaling up of our or the acquired businesses and other risks and uncertainties, including those included under the header “Risk Factors” in our Annual Report on Form 20-F filed with the SEC, as well as our other filings with the SEC. Should one or more of these risks or uncertainties materialize, or should any of our assumptions prove incorrect, actual results may vary in material respects from those projected in these forward-looking statements. We undertake no obligation to update or revise any forward-looking statements, whether as a result of new information, future events or otherwise, except as may be required under applicable securities laws. Accordingly, you should not put undue reliance on these statements.
Exhibit List
SIGNATURES
Pursuant to the requirements of the Securities Exchange Act of 1934, the registrant has duly caused this report to be signed on its behalf by the undersigned, thereunto duly authorized.
| MOOLEC SCIENCE SA | ||
| (Registrant) | ||
| Dated: April 17, 2025 | By: | /s/ Gastón Paladini |
| Name: | Gastón Paladini | |
| Title: | Chief Executive Officer | |
3
Exhibit 99.1
Disclosure Statement relating to the Business Combination
TABLE OF CONTENTS
SUMMARY OF THE BUSINESS COMBINATION
Overview of the Business Combination
The business combination (the “Business Combination”) consists of Moolec Science SA’s (“Moolec”) strategic business combination with Bioceres Group Limited (formerly, Bioceres Group PLC) (“Bioceres Group”), Gentle Technologies Corp (“Gentle Tech”), and Nutrecon LLC (“Nutrecon”), resulting in an enlarged company structure with Moolec as the parent company. Moolec is a public limited liability company (societé anonyme) governed by the laws of the Grand Duchy of Luxembourg and has its ordinary shares and warrants listed on Nasdaq.1 Subject to the terms and conditions of the Business Combination Agreement (the “Business Combination Agreement” or the “BCA”), which was signed on April 17, 2025, several parties will transfer their respective holdings in Bioceres Group, Nutrecon and Gentle Tech (together, the “Contributed Entities”) to Moolec (Cayman Islands). In exchange, Moolec (Cayman Islands) will issue a combination of newly issued shares and warrants of Moolec (Cayman Islands) to the shareholders of the Contributed Entities, as more fully described below.
Moolec Structure Pre-Business Combination
The expected corporate structure of Moolec (Cayman Islands) immediately prior to the closing of Business Combination (the “Closing”) is as shown below:
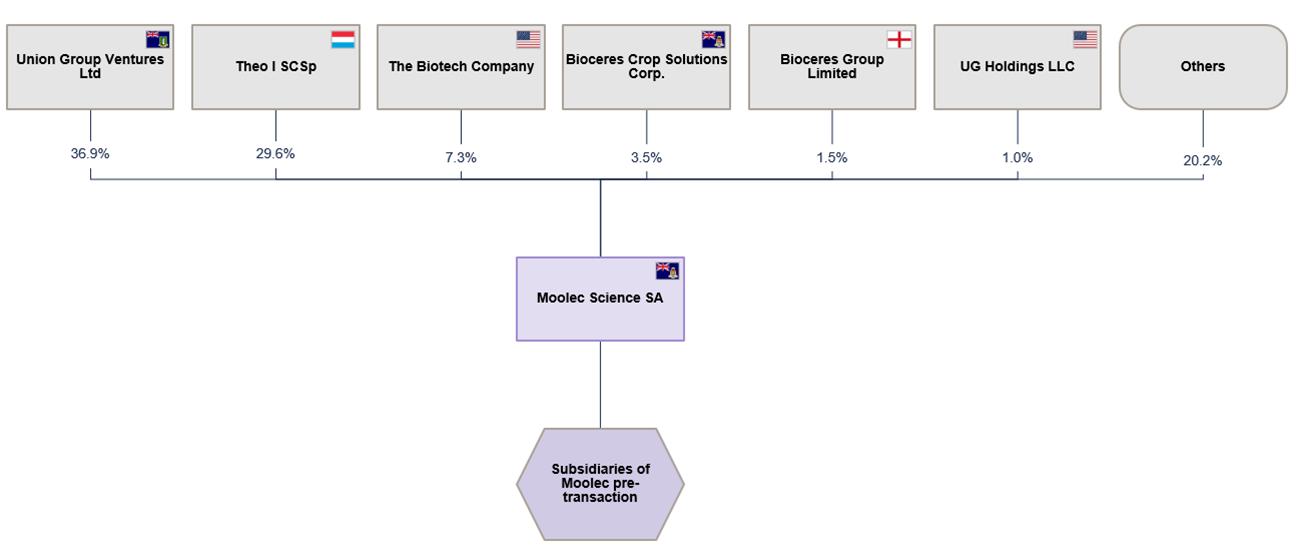
| 1 | Moolec is proposing to change its jurisdiction by discontinuing from the Grand Duchy of Luxembourg and transferring by way of continuation to the Cayman Islands as an exempted company limited by shares registered under the laws of the Cayman Islands (the “Redomiciliation”). An extraordinary general meeting has been called for April 22, 2025 to vote on the Redomiciliation (the “Extraordinary General Meeting”). The re-domiciled Cayman Islands entity is referred to herein as “Moolec (Cayman Islands).” In connection with the Redomiciliation, all of the ordinary shares of Moolec, with nominal value of $0.01 per share, will by operation of law become shares of Moolec (Cayman Islands), par value $0.01 per share (the “Shares”). It is anticipated that the Redomiciliation will occur prior to the Closing. |
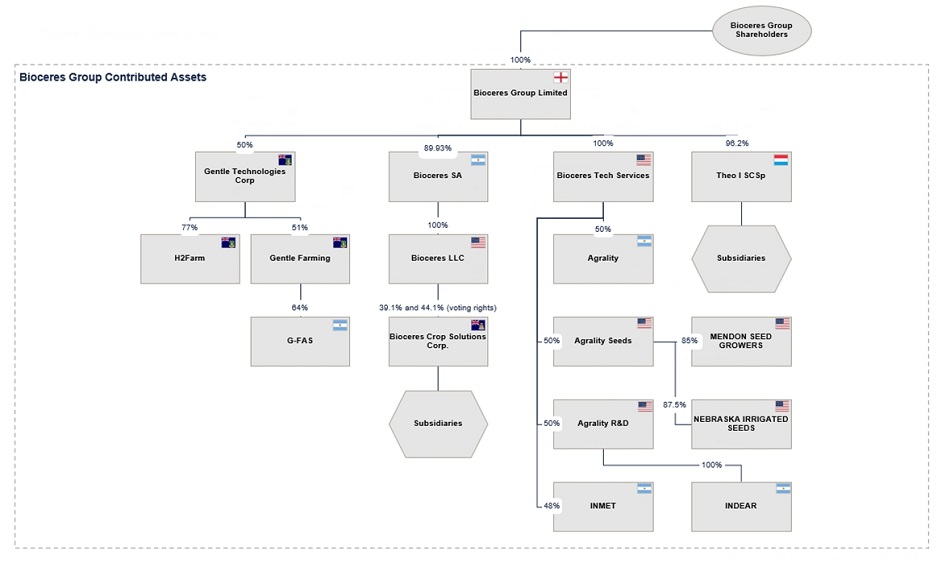
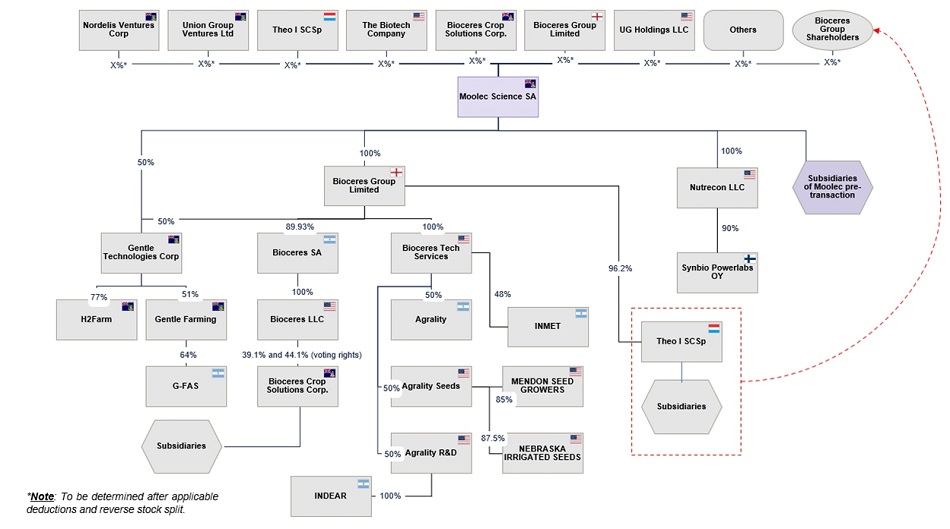
Bioceres Group Pre-Business Combination
The corporate structure of Bioceres Group prior to the Business Combination is as shown below. As noted in the section entitled “The Business Combination Agreement—Post-closing carve-out of Theo,” Theo I SC Sp (“Theo”) is being excluded from the Business Combination and will be transferred to Bioceres Group’s shareholders following the Closing. Also note that 50% of the shares of Gentle Tech are held by Bioceres Group and will be contributed as part of the contribution of Bioceres Group to Moolec (Cayman Islands).
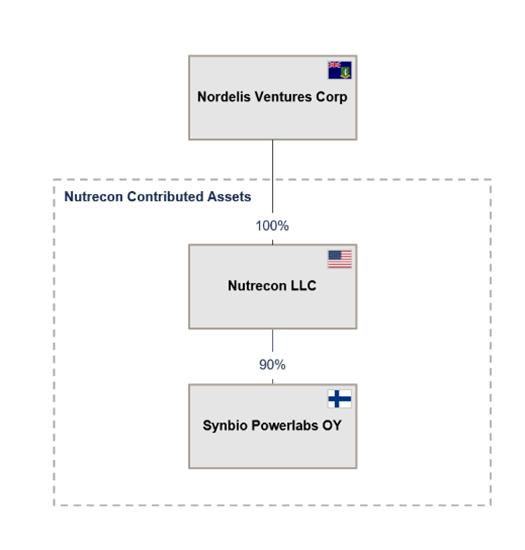
Nutrecon Structure Pre-Business Combination
The corporate structure of Nutrecon prior to the Business Combination is as shown below:
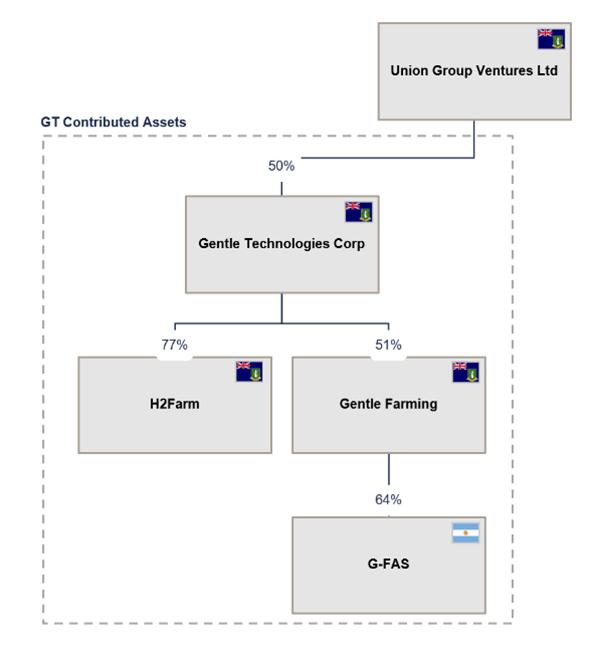
Gentle Tech Structure Pre-Business Combination
The remaining 50% of the shares of Gentle Tech is held by Union Group Ventures Ltd (“Union Group”) and the relevant corporate structure prior to the Business Combination is as shown below:
Consideration for Contribution of Contributed Entities
At the Closing, under the terms and conditions of the BCA, including the indemnity and deduction provisions, the following will occur: (i) Moolec (Cayman Islands) will issue to Bioceres Group shareholders 3.15 Shares for each Bioceres Group share exchanged; (ii) Moolec (Cayman Islands) will issue 5,000,000 Shares and grant 5,000,000 warrants to buy Shares at a price of $2.00 per share, exercisable within three years after the Closing, to Nordelis Ventures Ltd (“Nordelis”) in exchange for 50,000 Nutrecon units; (iii) Moolec (Cayman Islands) will issue 1,475,000 Shares to Union Group in exchange for 1,000,000 issued and outstanding ordinary shares of Gentle Tech (which represent 50% of the outstanding ordinary shares of Gentle Tech). Pursuant to the BCA, the ratio referred to in (i) above and the Share and warrant numbers referred to in (ii) and (iii) above will be adjusted proportionally to reflect the completion of the reverse share split, which is a condition to Closing.
The parties further agreed that (x) the ratio of 3.15 set forth above, as well as any other issuances pursuant to the Business Combination that consider this ratio as a reference, and (y) the number of Shares and the number and exercise price of warrants set forth above, as well as any other issuances pursuant to the Business Combination that consider these numbers or exercise price as references might be adjusted based on the ratio selected at the Extraordinary General Meeting of the shareholders of Moolec which will be held, among other matters, to approve the reverse share split.
Applicable Deductions
The parties have agreed on certain arrangements regarding the Shares to be issued at Closing. Firstly, the Bioceres Group shareholders who are parties to the Moolec Subscription Agreement dated December 20, 2022 (the “Moolec Subscription Agreement”) will see a reduction in the number of Shares they receive, intended to account for the amount owed to Moolec pursuant to the Moolec Subscription Agreement. This adjustment will be calculated based on the greater of the two values (i) the 20-day Volume Weighted Average Price (“VWAP”) for Shares as of two business days before Closing, or (ii) a set price of $2.00 per Share (subject to adjustment to reflect the completion of the reverse share split). Secondly, each Bioceres Group shareholder will have the number of Shares they receive adjusted downward to accommodate the payment of UK stamp tax applicable to the transfer of Bioceres Group shares.
Holdback
Pursuant to the terms and conditions of the BCA, the Bioceres Group shareholders, Nordelis and Union Group will be responsible for defending, indemnifying, and holding harmless Moolec, its affiliates, and their representatives against any liabilities that may arise, including third-party claims. These liabilities, referred to as “Losses”, could be incurred during investigations or defenses, or in maintaining or enforcing their rights under the BCA. Losses may result from a breach or inaccuracy in any representation or warranty made by Bioceres Group shareholders, Bioceres Group, Nordelis, Nutrecon, Gentle Tech and Union Group, or from any tax-related issues. At Closing, Moolec (Cayman Islands) will withhold 10% of the exchange consideration (the “Holdback Amount”), to cover any potential claims.
The Holdback Amount serves as a protection for any claims that may arise. One year after the Closing, Moolec (Cayman Islands) will issue and distribute the Holdback Amount less any amount of Shares corresponding to any claim for Losses (the “Returning Holdback Amount”) pro rata to the Bioceres Group shareholders, Nordelis and Union Group. If any Losses arise, Moolec will inform Bioceres Group shareholders, Nordelis and Union Group in writing, explaining the nature and amount of the claims, along with the deductions from the Holdback Amount due to any claim for Losses, which will be calculated by Moolec in good faith.
Moolec Structure following Closing of the Business Combination
Immediately following the Closing of the Business Combination, the corporate structure of Moolec (Cayman Islands), including the Contributed Entities, will be as shown below. Note that the carve out of Theo from Bioceres Group (the “Theo Carve-Out”), will occur post-Closing of the Business Combination. See the section entitled “The Business Combination Agreement—Post-closing carve-out of Theo.”
It is anticipated that the Theo spin-off will comprise the pro-rata transfer of Bioceres Group Limited’s holdings in Theo to the Bioceres Group shareholders, such that each Bioceres Group shareholder will hold Theo interests proportionate to their percentage shareholding in Bioceres Group Limited prior to the Business Combination.
Reasoning for Moolec Board Approval of the Business Combination
The following discussion sets forth material factors considered by Moolec’s board of directors (the “Board”) in reaching its determination to approve the terms and authorize the execution of the BCA for the purpose of implementing the Business Combination; however, it may not include all of the factors considered. Because of the number and wide variety of factors considered in connection with its evaluation of the BCA, the Board did not consider it practicable to quantify or otherwise assign relative weights to the specific factors it considered in reaching its determination, and did not attempt to do so. The Board viewed its position and determinations as being based on all of the information available and the factors presented to and considered by it. Individual directors may have given different weight to different factors.
This explanation of the reasons for the approval of the Business Combination by the Board and all related information provided in this section constitutes forward-looking information and should be read in conjunction with the section titled “Forward-Looking Statements” in the explanatory note in the Form 6-K.
Main Factors Considered
In the course of reaching its decision to approve the terms and authorize the execution of the BCA for the purpose of consummating the Business Combination, the Board consulted with Moolec senior management, internal legal counsel, external legal counsel and other advisors and reviewed a significant amount of information and considered a number of factors, including, without limitation, the following:
| ● | Moolec’s prospects if it remained a small public company, including its present cash runway and ability to raise additional required capital to continue funding the scale up of the operations until becoming cash flow positive; |
| ● | the fact that the non-binding letter of intent signed on the December 27, 2024 relating to the Business Combination arose from a proposal made by existing shareholders representing more than 70% of our outstanding shares; |
| ● | that Moolec, under the direction of the Board, had conducted an active process previously to identify alternative transactions and determined that the likelihood, if any, of any superior alternative strategic transaction being or becoming available in the near term in view of Moolec’s available capital and sources of additional capital was challenging; |
| ● | the fact that the counterparties are assigning a value of $2.00 per share for Moolec which represents a significant premium considering the current share price in the range of $0.60 per share; |
| ● | the expectation that additional capital resources would be available for Moolec as a result of the Business Combination; |
| ● | The belief that the combined company will be able to benefit Moolec’s existing shareholders by a combination of synergistic assets in the ingredients business, agricultural sector and biotech space; |
| ● | the fact that the principal components of the Business Combination, including issuance of shares pursuant to the BCA would be submitted to the Moolec shareholders for approval at an extraordinary general meeting; |
| ● | the benefit of incorporating the Contributed Entities that follow the Business Combination would cause Moolec to be vertically integrated and with significantly increased revenues and growth going forward; |
| ● | the expectation that the Business Combination provides the combined company with an experienced and qualified management team with a demonstrated record of success; |
| ● | the expectation that the Business Combination would provide a solid large operational platform for Moolec’s management and scientific team to continue scaling up Moolec’s most important projects such as GLASO™, PiggySooy™, Peea1 and fermentation joint ventures projects and products; |
| ● | the results of Moolec’s due diligence review of the most important contributed assets and prospects for value creation for Moolec shareholders in connection with the Business Combination; |
| ● | the Board’s belief that the Business Combination would provide the existing Moolec shareholders with an opportunity to participate in the potential growth of the combined company following the Business Combination and the potential long-term value of the Contributed Entities; and |
| ● | the financial presentation and opinion of Evans & Evans to the Board as to the fairness to Moolec, from a financial point of view, of the consideration to be received under the Business Combination, which opinion was based upon and subject to the factors, assumptions, limitations and qualifications set forth in the section titled “—Fairness Opinion of Evans & Evans.” |
Potential Risks Considered
The Board also considered a number of uncertainties and risks in its deliberations concerning the Business Combination by the BCA, including the following:
| ● | the prohibition on Moolec to solicit alternative acquisition proposals from the signing of the BCA through the Closing; |
| ● | the fact that the Business Combination contributes quality assets but also a significant amount of debt; |
| ● | the possible volatility of the trading price of the Shares resulting from the announcement, pendency or Closing of the Business Combination; |
| ● | the fact that Moolec’s shareholders would experience significant dilution by virtue of the exchange ratio that is central to the Business Combination; |
| ● | the risk to Moolec’s business, operations and financial results in the event that the Business Combination is not consummated in a timely manner or at all; |
| ● | the capital requirements of the combined company and the risk that the combined company may not be able to obtain debt or equity financing sufficient to fund the anticipated needs of the combined company after the Closing; |
| ● | the risk that the combined company will not be successful in scaling up some of the assets of the Contributed Entities such as Gentle Tech and other projects; |
| ● | the risk that revenues from Contributed Entities’ future products and services may be less than expected; |
| ● | the risks, challenges and costs inherent in combining the operations of the all the Contributed Entities; |
| ● | the fact that certain of Moolec’s directors and executive officers may have different opinions in terms of the best path forward for Moolec and the developments of its assets; and |
| ● | various other risks associated with the combined company and the Business Combination. |
Conclusion
The Board weighed the benefits, advantages and opportunities of a potential transaction against the uncertainties and risks described above, as well as the possible diversion of management attention for an extended period of time. After taking into account these and other factors, the Board unanimously concluded that the benefits of the Business Combination outweighed the risks, determined that the Business Combination was in the best interests of Moolec and its shareholders and approved the terms and authorized the execution of the BCA for the purpose of implementing the Business Combination.
Fairness Opinion of Evans & Evans
Moolec retained Evans & Evans to evaluate the fairness, from a financial point of view, to Moolec shareholders of the consideration to be paid to such holders in the Transaction.
On March 19, 2025, at a meeting of the Moolec board of directors, Evans & Evans rendered to the Board an oral opinion, which has been confirmed by delivery of a written opinion dated April 16, 2025, to the effect that, as of that date and based on and subject to the assumptions made, procedures followed, matters considered and qualifications and limitations on the review undertaken described in such opinion that the consideration in the BCA is fair from a financial point of view to the Moolec shareholders.
The summary of the written opinion of Evans & Evans, dated April 16, 2025, set forth in this disclosure statement is qualified in its entirety by reference to the full text of Evans & Evans’ opinion. Evans & Evans’ opinion was rendered to the Board in connection with its evaluation of the BCA and did not address any terms or other aspects (other than the consideration to the extent expressly specified in Evans & Evans’ opinion) of the transactions contemplated by the BCA. Evans & Evans’ opinion did not address Moolec’s underlying business decision to effect such transactions or the relative merits of such transactions as compared to any alternative business strategies or transactions that might be available to Moolec and did not address any legal, regulatory, tax, or accounting matters. Evans & Evans’ opinion is not intended to and does not constitute a recommendation to any Moolec shareholder as to how such shareholder should vote or act with respect to the Business Combination or any matter relating thereto.
With respect to the bullets listed below and in connection with rendering its opinion, although Evans & Evans considered internal information provided to it with respect to the business, earnings, cash flow, assets and liabilities of Moolec, the Contributed Entities and discussions conducted with the management and representatives of Moolec and the Contributed Entities, Evans & Evans created its own financial models that served as the basis for its analysis set forth below and the opinion it rendered to the Board.
In connection with its opinion, Evans & Evans:
| ● | reviewed certain internal information relating to the business, earnings, cash flow, assets and liabilities of Moolec furnished to Evans & Evans by Moolec; |
| ● | prepared financial models and discussed with the management of Moolec the assumptions contained therein; |
| ● | reviewed prospective financial information for the Contributed Entities prepared by management of the Contributed Entities; |
| ● | reviewed consensus prospective financial information for Moolec and Bioceres Crop Solutions Corp. (“BIOX”); |
| ● | conducted discussions with members of the management and representatives of Moolec concerning the information described in the two foregoing bullet points; |
| ● | reviewed publicly available financial and stock market data of certain other companies in lines of business that Evans & Evans deemed relevant for Moolec and the Contributed Entities; |
| ● | reviewed corporate organization charts for the Contributed Entities as provided by management of the Contributed Entities; |
| ● | reviewed trading data for Moolec and BIOX; |
| ● | reviewed websites and investor presentations on Moolec and the Contributed Entities as prepared by their respective management teams; |
| ● | reviewed certain incorporation documents of the Contributed Entities; |
| ● | reviewed broker reports pertaining to Moolec and BIOX; |
| ● | reviewed certain internal information relating to the business, earnings, cash flow, assets and liabilities of the Contributed Entities furnished to Evans & Evans by management of the Contributed Entities; |
| ● | conducted discussions with members of the management and representatives of the Contributed Entities regarding past and prospective future operations; |
| ● | reviewed Moolec’s capital structure furnished to Evans & Evans by the management of Moolec both on a standalone basis pre-transaction and on a pro forma basis giving effect to the transaction contemplated by the BCA; |
| ● | reviewed the BCA; and |
| ● | conducted such other financial studies and analyses and took into account such other information as Evans & Evans deemed appropriate. |
Evans & Evans, with Moolec’s consent, relied upon the information supplied to, discussed with or reviewed by Evans & Evans for purposes of its opinion being complete and accurate in all material respects. Evans & Evans did not assume any responsibility for independent verification of, and did not independently verify, any of such information.
With Moolec’s consent, Evans & Evans relied upon, without independent verification, the assessment by Moolec and its legal, tax and regulatory with respect to legal, tax and regulatory matters. In addition, Evans & Evans relied upon, with Moolec’s consent, the assessments of the management of Moolec as to the existing technology, products and services of the Contributed Entities and the validity of, and risks associated with, the future technology, products and services of the Contributed Entities. Evans & Evans assumed, with Moolec’s consent, that there will be no developments with respect to any of the foregoing that would affect Evans & Evans’ analyses or opinion. With Moolec’s consent, Evans & Evans assumed that any adjustments to the consideration in accordance with the BCA or otherwise would not be material to Evans & Evans’ analysis or its opinion. In addition, Evans & Evans relied upon, with Moolec’s consent, the assessments of the management of Moolec as to Moolec’s ability to retain key employees of the Contributed Entities. In addition, with Moolec’s consent, Evans & Evans did not make any independent evaluation or appraisal of any of the assets or liabilities (contingent, derivative, off-balance-sheet, or otherwise) of Moolec or the Contributed Entities, nor had Evans & Evans been furnished with any such evaluation or appraisal.
Further, Evans & Evans’ opinion was necessarily based on economic, monetary, market and other conditions as in effect on, and the information made available to Evans & Evans as of the date of its opinion. Evans & Evans assumed no responsibility for updating its opinion based on developments after the date of its opinion. As stated above, Evans & Evans’ opinion did not address the underlying business decision to effect the transactions contemplated by the BCA or the relative merits of the same as compared to any alternative business strategies or transactions that might be available to Moolec and does not address any legal, regulatory, tax, or accounting matters.
With Moolec’s consent, Evans & Evans did not opine on what the value of the shares of Moolec would be when issued pursuant to the transactions contemplated by the BCA. Evans & Evans did not express any opinion as to fair value or the solvency of Moolec, the Contributed Entities or Moolec following the Closing. In rendering its opinion, Evans & Evans assumed, with Moolec’s consent, that the transaction contemplated by the BCA, will be consummated in accordance with its terms without any waiver or modification that could be material to Evans & Evans’ analysis, and that the parties to the BCA will comply with all the material terms of the BCA. Evans & Evans assumed, with Moolec’s consent, that all governmental, regulatory, or other consents and approvals necessary for the completion of the transaction contemplated by the BCA will be obtained except to the extent that could not be material to Evans & Evans’ analysis.
The prospective financial information referred to in the fairness opinion has been prepared by, and is the responsibility of, the Company’s management. Price Waterhouse & Co. S.R.L. has not audited, reviewed, examined, compiled nor applied agreed-upon procedures with respect to the accompanying prospective financial information and, accordingly, Price Waterhouse & Co. S.R.L. does not express an opinion or any other form of assurance with respect thereto. The Price Waterhouse & Co. S.R.L. reports included in this document relates to the previously issued financial statements of Bioceres Group plc and Bioceres Crop Solutions Corp. The reports do not extend to the prospective financial information and should not be read to do so.
The prospective financial information referred to below was not prepared with a view toward compliance with published guidelines of the Securities and Exchange Commission or the guidelines established by the American Institute of Certified Public Accountants for preparation or presentation of prospective financial information.
Summary of the Financial Analyses of Evans & Evans
In preparing its opinion to the Board, Evans & Evans performed a variety of financial and comparative analyses, and, for purposes of its opinion, used only those financial models that Evans & Evans created. The summary set forth below does not purport to be a complete description of the financial analyses performed or factors considered by, and underlying Evans & Evans’ opinion, nor does the order of the financial analyses described represent the relative importance or weight given to those financial analyses. The preparation of a financial opinion or analysis is a complex process involving various determinations as to the most appropriate and relevant methods of financial analysis and the application of those methods to the particular circumstances and, therefore, a financial opinion or analysis is not readily susceptible to summary description. In arriving at its opinion, Evans & Evans considered the results of all of the analyses undertaken by it and assessed as a whole and did not draw, in isolation, conclusions from or with regard to any particular factor or method of analysis considered by it. Rather, Evans & Evans made its determination as to fairness on the basis of its experience and professional judgment after considering the results of all of the analyses. Accordingly, Evans & Evans believes that its analyses and factors summarized below must be considered as a whole and in context. Evans & Evans further believes that selecting portions of its analyses and factors or focusing on information presented in tabular format, without considering all analyses and factors or the narrative description of the analyses and factors, could create a misleading or incomplete view of the processes underlying its analyses and opinion.
In performing its analyses, Evans & Evans considered industry performance, general business, economic, market and financial conditions and other matters, existing as of the date of its opinion, many of which are beyond the control of Moolec and the Contributed Entities. No company, business or transaction reviewed is identical or directly comparable to Moolec, the Contributed Entities or their respective businesses or the Business Combination. Accordingly, an evaluation of these analyses is not entirely mathematical. Rather, the analyses involve complex considerations and judgments concerning business, financial and operating characteristics and other factors that could affect the public trading, acquisition or other values of the companies, businesses or transactions reviewed or views regarding the comparability of such companies, businesses or transactions. Accordingly, such analyses may not necessarily include all companies, businesses or transactions that could be deemed relevant. The estimates of the future performance of Moolec and the Contributed Entities in or underlying Evans & Evans’ analyses and the ranges of valuations resulting from any particular analysis are not necessarily indicative of actual values or predictive of future results or values, which may be significantly more or less favorable than those estimates or those suggested by the analyses. In addition, analyses relating to the value of businesses or securities do not purport to be appraisals or to reflect the prices at which a company may actually be sold or the prices at which any securities have traded or may trade at any time in the future. Accordingly, the assumptions and estimates used in, and the ranges of valuations resulting from, any particular analysis described below are inherently subject to substantial uncertainty and should not be taken as the views of Evans & Evans regarding the actual values of Moolec or any of the Contributed Entities. Except as otherwise noted, the following quantitative information, to the extent that it is based on market data, is based on market data as it existed on or before April 7, 2025 and is not necessarily indicative of current market conditions.
The type and amount of consideration payable in the transaction contemplated by the BCA was determined through negotiations between Moolec, Bioceres Group, Nutrecon, and Gentle Tech, rather than by any financial advisor, and was approved by the Board. The decision to enter into the BCA was solely that of the Board. Receipt of Evans & Evans’ opinion and analyses should not be viewed as determinative of the views of the Board or management with respect to the transaction or the consideration payable in the transaction.
Financial Analyses
The summary of the financial analyses described in this section entitled “— Financial Analyses” is a summary of the material financial analyses provided by Evans & Evans in connection with its opinion, dated April 17, 2025, to the Board. The summary set forth below is not a comprehensive description of all analyses undertaken by Evans & Evans in connection with its opinion, nor does the order of the analyses in the summary below indicate that any analysis was given greater weight than any other analysis. The financial analyses summarized below include information presented in tabular format. In order to fully understand Evans & Evans’ financial analyses, the tables must be read together with the text of each summary. The tables alone do not constitute a complete description of the financial analyses performed by Evans & Evans. Considering the data set forth in the tables below without considering the full narrative description of the financial analyses, including the methodologies and assumptions underlying the analyses, could create a misleading or incomplete view of the financial analyses performed by Evans & Evans. Future results may differ from those described and such differences may be material.
The financial data utilized for Moolec and the Contributed Entities in the financial analyses described below were based on, among other things: (i) certain internal information relating to the business, earnings, cash flow, assets and liabilities of Moolec and the Contributed Entities furnished to Evans & Evans by Moolec and the Contributed Entities; (ii) certain internal information relating to expenses expected to result from the transaction furnished to Evans & Evans by Moolec; (iii) Moolec’s capital structure furnished to us by the management of Moolec both on a standalone basis pre-transaction and on a pro forma basis giving effect to the transaction; (iv) publicly available financial and stock market data of certain other companies in lines of business that Evans & Evans deemed relevant; and (v) such other financial studies and analyses and such other information as Evans & Evans deemed appropriate.
In undertaking the Guideline Public Company (“GPC”) Analyses outlined below, Evans & Evans did not have access to non-public information of any of the selected guideline public companies (collectively the “GPCs”). Accordingly, a complete valuation analysis of Moolec or any of the Contributed Entities cannot rely solely upon a quantitative review of the GPCs selected for each entity but involves complex considerations and judgments concerning differences in financial and operating characteristics of such companies, as well as other factors that could affect their value relative to that of the company under review. Therefore, the GPC Analysis is subject to certain limitations.
A GPC analysis is a valuation technique that provides an estimation of value by applying a valuation multiple to a specific financial metric for the subject company. These valuation multiples are either observed or derived from market prices of actively traded public companies, publicly available historical financial information, and consensus equity research analyst estimates of future financial performance. The valuation process includes, but is not limited to, a comparison of various quantitative and qualitative factors between the subject business and other similar businesses.
Evans & Evans also conducted Discounted Cash Flow (“DCF”) Analyses with respect to Moolec and the Contributed Entities as summarized below. Determination of an appropriate discount rate to use in the DCF Analysis requires a degree of judgment. Evans & Evans considered a number of factors in determining the discount rate range for each of the entities, including the results of published studies on discount rates, industry reports, broker reports and professional judgement. In developing the weighted average cost of capital (“WACC”) for each of Moolec and the Contributed Entities, Evans & Evans used a build-up method for the cost of equity. The build up method for equity considers the risk free rate, a large cap equity risk premium and a small cap equity risk premium based on the Kroll Cost of Capital Navigator data, a country specific risk premium based on industry date, an industry specific risk premium based on the average betas of the GPCs and a company specific risk premium (“CSRP”). Where possible, the cost of debt was estimated using each respective entities own cost of debt. For entities with no debt, or where the cost of existing debt was not made available to Evans & Evans, a build up method was used. The build up method includes market data on corporate bonds, a country risk default spread based on industry studies, and a CSRP.
Moolec Analyses
Trading Price Analysis (Market Approach)
Evans & Evans reviewed Moolec’s trading prices over the 10, 30, 90 and 180 trading days preceding the date of the opinion. Using the 10-day and 30-day VWAP of Moolec as of the date of the opinion, Evans & calculated the equity value of Moolec in the range of $26 million to $29 million.
Guideline Public Companies Analysis (Market Approach)
Using public filings and other publicly available information, Evans & Evans compared certain financial information of Moolec to corresponding financial information GPCs that, based on Evans & Evans’ professional judgment and experience, were considered generally relevant for purposes of analysis. Evans & Evans included companies in the plant-based products, ingredients and bioscience industries. In the view of Evans & Evans, Moolec is at such an early stage with respect to revenue generation as compared to the GPCs, that the analysis is limited in its applicability. Evans & Evans selected the companies above because, among other things, the selected companies operate businesses similar in certain respects to the business of Moolec.
Evans & Evans utilized the Selected GPC Analysis to select a weighting of fiscal 2025 and 2026 revenue multiples to estimate a range of enterprise values for Moolec. Evans & Evans initially identified 17 companies whose shares trade on recognized stock exchanges and thereafter upon further review of financial and operating results selected eight publicly traded companies that it deemed relevant in its analysis (the “Moolec GPCs”). Evans & Evans selected the Moolec GPCs based on their relative similarity, primarily in terms of business focus, revenue growth history and outlook, products, profit margins and other characteristics, to that of Moolec. Companies were removed from the analysis for the following reasons: (1) early stage companies with limited relevant operating metrics; (2) target markets that did not have sufficient overlap with Moolec; (3) broader international customer base; and (4) a lack of forward looking data.
Evans & Evans noted that none of the Moolec GPCs are perfectly comparable to Moolec. The tables below summarize certain observed historical and projected financial performance and trading multiples of the Moolec GPCs (“N/A” denotes not publicly available).
| 2025 E | 2026 E | 2027 E | 2025 E | 2026 E | 2027 E | |||||||||||||||||||
| Revenue | Revenue | Revenue | EBITDA | EBITDA | EBITDA | |||||||||||||||||||
| Growth | Growth | Growth | Growth | Growth | Growth | |||||||||||||||||||
| Beyond Meat, Inc. | -0.4 | % | 2.7 | % | 5.3 | % | -49.3 | % | -23.9 | % | -110.3 | % | ||||||||||||
| Simply Better Brands Corp. | -38.9 | % | 59.0 | % | N/A | -135.7 | % | 180.0 | % | N/A | ||||||||||||||
| SunOpta Inc. | 9.2 | % | 8.2 | % | N/A | 29.8 | % | 15.7 | % | N/A | ||||||||||||||
| Ingredion Incorporated | 1.0 | % | 2.7 | % | 1.1 | % | 5.5 | % | 3.2 | % | -2.1 | % | ||||||||||||
| Givaudan SA | 11.3 | % | 4.9 | % | 5.2 | % | 21.3 | % | 4.8 | % | 4.9 | % | ||||||||||||
| International Flavors & Fragrances Inc. | -5.5 | % | -0.9 | % | 4.3 | % | 20.6 | % | 2.0 | % | 6.6 | % | ||||||||||||
| DSM-Firmenich AG | 9.8 | % | 2.6 | % | 4.3 | % | 60.9 | % | 2.3 | % | 6.5 | % | ||||||||||||
| MGP Ingredients, Inc. | -24.5 | % | -2.1 | % | N/A | -41.9 | % | 8.3 | % | N/A | ||||||||||||||
| Average | -4.7 | % | 9.6 | % | 4.0 | % | -11.1 | % | 24.1 | % | -18.9 | % | ||||||||||||
| Median | 0.3 | % | 2.7 | % | 4.3 | % | 13.0 | % | 4.0 | % | 4.9 | % | ||||||||||||
Sources: S&P Capital IQ, SEC Filings, Annual and Interim Reports, Investor Presentations
| 2024A | 2025E | 2026E | TTM | TTM Capital |
||||||||||||||||
| EBITDA | EBITDA | EBITDA | Debt/ | Expenditure / | ||||||||||||||||
| Margin | Margin | Margin | Total Capital | Revenue | ||||||||||||||||
| Beyond Meat, Inc. | -38.4 | % | -19.6 | % | -14.5 | % | 83.8 | % | 3.4 | % | ||||||||||
| Simply Better Brands Corp. | -8.8 | % | 5.1 | % | 9.0 | % | 7.9 | % | N/A | |||||||||||
| SunOpta Inc. | 10.7 | % | 12.7 | % | 13.6 | % | 31.2 | % | 4.4 | % | ||||||||||
| Ingredion Incorporated | 16.4 | % | 17.1 | % | 17.2 | % | 18.5 | % | 4.1 | % | ||||||||||
| Givaudan SA | 22.3 | % | 24.3 | % | 24.3 | % | 11.2 | % | 3.2 | % | ||||||||||
| International Flavors & Fragrances Inc. | 15.1 | % | 19.3 | % | 19.9 | % | 33.1 | % | 4.0 | % | ||||||||||
| DSM-Firmenich AG | 12.5 | % | 18.3 | % | 18.3 | % | 16.7 | % | 5.0 | % | ||||||||||
| MGP Ingredients, Inc. | 26.5 | % | 20.4 | % | 22.6 | % | 36.1 | % | 10.1 | % | ||||||||||
| Average | 7.0 | % | 12.2 | % | 13.8 | % | 29.8 | % | 4.9 | % | ||||||||||
| Median | 13.8 | % | 17.7 | % | 17.7 | % | 24.8 | % | 4.1 | % | ||||||||||
Sources: S&P Capital IQ, SEC Filings, Annual and Interim Reports, Investor Presentations
| EV/ | EV/ | EV/ | EV/ | EV/ | EV/ | |||||||||||||||||||
| TTM | 2025E | 2026E | TTM | 2025E | 2026E | |||||||||||||||||||
| EBITDA | EBITDA | EBITDA | Revenue | Revenue | Revenue | |||||||||||||||||||
| Beyond Meat, Inc. | N/A | N/A | N/A | 3.77 | (x) | 3.78 | (x) | 3.68 | (x) | |||||||||||||||
| Simply Better Brands Corp. | N/A | 26.48 | (x) | 9.46 | (x) | .76 | (x) | 1.36 | (x) | .85 | (x) | |||||||||||||
| SunOpta Inc. | 9.01 | (x) | 6.94 | (x) | 6. | (x) | .96 | (x) | .88 | (x) | .81 | (x) | ||||||||||||
| Ingredion Incorporated | 7.29 | (x) | 6.91 | (x) | 6.7 | (x) | 1.2 | (x) | 1.18 | (x) | 1.15 | (x) | ||||||||||||
| Givaudan SA | 23.05 | (x) | 18.99 | (x) | 18.12 | (x) | 5.14 | (x) | 4.62 | (x) | 4.4 | (x) | ||||||||||||
| International Flavors & Fragrances Inc. | 15.32 | (x) | 12.7 | (x) | 12.45 | (x) | 2.32 | (x) | 2.45 | (x) | 2.47 | (x) | ||||||||||||
| DSM-Firmenich AG | 16.15 | (x) | 10.04 | (x) | 9.81 | (x) | 2.02 | (x) | 1.84 | (x) | 1.79 | (x) | ||||||||||||
| MGP Ingredients, Inc. | 4.67 | (x) | 8.04 | (x) | 7.42 | (x) | 1.24 | (x) | 1.64 | (x) | 1.68 | (x) | ||||||||||||
| Average | 12.58 | (x) | 12.87 | (x) | 9.99 | (x) | 2.17 | (x) | 2.22 | (x) | 2.11 | (x) | ||||||||||||
| Median | 12.17 | (x) | 10.04 | (x) | 9.46 | (x) | 1.63 | (x) | 1.74 | (x) | 1.73 | (x) | ||||||||||||
Historical and projected years indicate 12-month periods ending December 31
TTM = Trailing Twelve Months
EV: Enterprise Value = Market capitalization plus debt, net of cash and cash equivalents
Based on the data shown in the tables above, Evans & Evans selected a range of valuation multiples to apply to a weighting of Moolec’s fiscal year 2025 and 2026 forecast revenues.
Evans & Evans considered the multiple for the Moolec GPCs as outlined in the tables above in its determination of reasonable multiples for Moolec given the Moolec GPCs’ relative similarities to Moolec. Evans & Evans analyzed 2024 through 2026 EBITDA and revenue growth and 2024 through 2026 EBITDA margins for the Moolec GPCs and compared these metrics to those of Moolec for fiscal years 2024, 2025 and 2026. Evans & Evans used these comparisons and the multiples of enterprise value (“EV”) to 2025 revenue and EV to 2026 revenue for the Moolec GPCs to select revenue multiple range of 2.70x to 2.85x to apply to Moolec’s forecast fiscal year 2025 revenues and a multiple of 2.48x to 2.61x to apply to Moolec’s fiscal year 2026 revenues to arrive at an EV range for each set of multiples. Evans & Evans then weighted the two EV ranges resulting in an estimated current enterprise value range for Moolec. Evans & Evans selected multiples that, in its judgment, reflected Moolec’s revenue growth outlook, capital requirements, profit margins, management experience and other characteristics relative to the Moolec GPCs.
Evans & Evans’ GPC Analysis resulted in an estimated equity value range, after adding cash and deducting debt, for Moolec of $9.0 million to $10.5 million, which is significantly lower than Moolec’s market capitalization. In the view of Evans & Evans, limited weighting should be placed on the GPC analysis as Moolec is not at the stage of commercialization where its growth rate has stabilized.
Precedent Transactions Analysis (Market Approach)
Evans & Evans did not identify transactions involving companies with publicly available financial information that Evans & Evans believed, based on its experience and professional judgment, to be generally relevant for purposes of this analysis.
Discounted Cash Flow Analysis (Income Approach)
Evans & Evans performed a DCF Analysis of Moolec using a financial forecast that Evans & Evans developed with the guidance of Moolec’s management and other information and data provided by Moolec’s management to calculate the estimated present value of the future unlevered after-tax free cash flows projected to be generated by Moolec through the end of fiscal year 2033.
Evans & Evans assessed the reasonableness of the Moolec model by comparing Moolec’s revenue growth, EBITDA growth, and EBITDA margins of the Moolec GPCs and professional judgement. Capital expenditures considered in the analysis were estimated by Evans & Evans using industry benchmarking. Annual working capital requirements were based on benchmarking of the Moolec GPCs and professional judgement. Evans & Evans assumed that annually Moolec would require an amount of debt-free-net-working capital equal to 17.5% of revenues.
In developing the CSRP Evans & Evans also considered (i) Moolec’s business plan, (ii) Moolec’s projected financial performance and growth and (iii) risks facing Moolec in order to achieve projected results, including execution risk, financing, tariffs, regulatory and competitive risks, among others. Evans & Evans also considered the experience of the management team and the ability to secure future financing to fund operations. Based on these factors, Evans & Evans used discount rates ranging from 20% to 21% to discount the projected unlevered free cash flows and the terminal value. Evans & Evans believes that this range of discount rates is consistent with the rate of return that shareholders would require on alternative investment opportunities with similar risk profiles, including risks of achieving the projected cash flows based. In developing the discount rate, Evans & Evans considered a capital structure of 25% debt and 75% equity based on benchmarking of the Moolec GPCs and professional judgement.
In determining the unlevered cash flows, Evans & Evans deducted approximately $16 million in capital expenditures over approximately 8 years.
A tax rate of approximately 23.9% was used in the analysis along with an expected long-term growth rate (“LTGR”) of 2.0% and an industry beta of 1.07.
In performing the DCF analysis of Moolec Evans & Evans considered a terminal value multiple of 5.5x free cash flow in the terminal year as a midpoint. The terminal multiple was compared to the EBITDA multiples of the selected GPCs and was found to be conservative. The terminal value represents approximately 61% of Moolec’s enterprise value. After-tax free cash flows from each period in each set were discounted to April 7, 2025 using the mid-period convention.
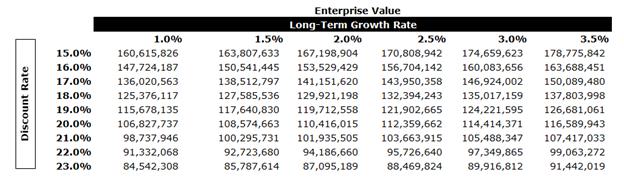
The equity value of Moolec under the DCF Analysis was determined to be in the range of $87.3 million to $94.3 million.
A sensitivity analysis on Moolec’s EV was calculated as outlined below using various LTGRs and discount rates.
Moolec Conclusion
Evans & Evans calculated the equity value of Moolec using the DCF Analysis, the GPC Analysis and the Trading Price Analysis. Evans & Evans then weighted the DCF Analysis and the Trading Price Analysis calculate an equity value of $44.4 million to $48.6 million, which represents a 71% to 87% premium to the Moolec market capitalization as of the date of the opinion.
BIOX Analyses
Trading Price Analysis (Market Approach)
Evans & Evans reviewed BIOX’s trading prices over the 10, 30, 90 and 180 trading days preceding the date of the opinion. Using the 10-day and 60-day VWAP of BIOX as of the date of the opinion, Evans & calculated the equity value of BIOX in the range of $282.4 million to $324.4 million.
Guideline Public Companies Analysis (Market Approach)
Using public filings and other publicly available information, Evans & Evans compared certain financial information of BIOX to corresponding financial information for selected GPCs that, based on Evans & Evans’ professional judgment and experience, Evans & Evans considered generally relevant for purposes of analysis. Evans & Evans included companies in the crop services, agriculture science, specialty chemicals and crop protection industries.
Evans & Evans selected the companies above because, among other things, the selected companies operate businesses similar in certain respects to the business of BIOX.
Evans & Evans utilized the GPC Analysis to select a weighting of trailing 12 month (“TTM”) and 2025 expected EBITDA multiples to estimate a range of enterprise values for BIOX.
Evans & Evans identified 11 companies whose shares trade on recognized stock exchanges which, after review of financial and operating results were deemed relevant in its analysis (the “BIOX GPCs”). Evans & Evans selected the BIOX GPCs based on their relative similarity, primarily in terms of business focus, revenue growth history and outlook, capital requirements, profit margins and other characteristics, to that of BIOX.
Evans & Evans noted that none of the BIOX GPCs are perfectly comparable to BIOX.
The tables below summarize certain observed historical and projected financial performance and trading multiples of the BIOX GPCs.
| 2025 E | 2026 E | 2027 E | 2025 E | 2026 E | 2027 E | |||||||||||||||||||
| Revenue | Revenue | Revenue | EBITDA | EBITDA | EBITDA | |||||||||||||||||||
| Growth | Growth | Growth | Growth | Growth | Growth | |||||||||||||||||||
| Corteva, Inc. | 2.3 | % | 3.4 | % | 2.8 | % | 17.5 | % | 8.4 | % | 8.2 | % | ||||||||||||
| American Vanguard Corporation | -5.0 | % | 4.6 | % | 2.8 | % | -9.6 | % | 17.8 | % | 15.9 | % | ||||||||||||
| Bayer CropScience Limited | 1.8 | % | 10.5 | % | 10.7 | % | -33.8 | % | 52.3 | % | 17.7 | % | ||||||||||||
| FMC Corporation | -1.8 | % | 7.0 | % | 5.5 | % | 10.5 | % | 10.9 | % | 6.9 | % | ||||||||||||
| Nufarm Limited | -7.4 | % | 8.4 | % | 5.6 | % | 86.2 | % | 18.0 | % | 8.6 | % | ||||||||||||
| Evogene Ltd. | 65.3 | % | 52.7 | % | 85.1 | % | -37.3 | % | -22.7 | % | -72.0 | % | ||||||||||||
| Rallis India Limited | -1.1 | % | 12.5 | % | 12.9 | % | 3.3 | % | 21.0 | % | 19.3 | % | ||||||||||||
| Bayer Aktiengesellschaft | 5.4 | % | 1.5 | % | 1.6 | % | 9.2 | % | 4.8 | % | 2.2 | % | ||||||||||||
| Dow Inc. | -0.4 | % | 4.6 | % | 3.8 | % | 2.2 | % | 16.9 | % | 10.0 | % | ||||||||||||
| UPL Limited | 4.3 | % | 7.9 | % | 8.4 | % | 89.2 | % | 20.1 | % | 13.7 | % | ||||||||||||
| Eden Research plc | 32.4 | % | 18.3 | % | N/A | |||||||||||||||||||
| Average | 8.7 | % | 11.9 | % | 13.9 | % | 13.7 | % | 14.8 | % | 3.0 | % | ||||||||||||
| Median | 1.8 | % | 7.9 | % | 5.6 | % | 6.2 | % | 17.3 | % | 9.3 | % | ||||||||||||
Sources: S&P Capital IQ, SEC Filings, Annual and Interim Reports, Investor Presentations
| 2024A | 2025E | 2026E | TTM | TTM Capital |
||||||||||||||||
| EBITDA | EBITDA | EBITDA | Debt/ | Expenditure / | ||||||||||||||||
| Margin | Margin | Margin | Total Capital | Revenue | ||||||||||||||||
| Corteva, Inc. | 18.8 | % | 21.6 | % | 22.6 | % | 6.6 | % | 3.5 | % | ||||||||||
| American Vanguard Corporation | 8.1 | % | 7.7 | % | 8.7 | % | 62.3 | % | 1.7 | % | ||||||||||
| Bayer CropScience Limited | 18.4 | % | 12.0 | % | 16.5 | % | 0.0 | % | n/a | |||||||||||
| FMC Corporation | 19.1 | % | 21.5 | % | 22.3 | % | 43.2 | % | 1.6 | % | ||||||||||
| Nufarm Limited | 5.3 | % | 10.6 | % | 11.6 | % | 39.9 | % | 3.8 | % | ||||||||||
| Evogene Ltd. | -240.9 | % | -91.3 | % | -46.3 | % | 0.0 | % | 7.4 | % | ||||||||||
| Rallis India Limited | 11.3 | % | 11.8 | % | 12.7 | % | 0.0 | % | n/a | |||||||||||
| Bayer Aktiengesellschaft | 19.6 | % | 20.3 | % | 21.0 | % | 65.7 | % | 6.0 | % | ||||||||||
| Dow Inc. | 11.8 | % | 12.1 | % | 13.5 | % | 43.7 | % | 7.6 | % | ||||||||||
| UPL Limited | 9.6 | % | 17.4 | % | 19.4 | % | 0.0 | % | n/a | |||||||||||
| Eden Research plc | -51.1 | % | -30.2 | % | -24.0 | % | 0.0 | % | 3.8 | % | ||||||||||
| Average | -15.5 | % | 1.2 | % | 7.1 | % | 23.8 | % | 4.4 | % | ||||||||||
| Median | 11.3 | % | 12.0 | % | 13.5 | % | 6.6 | % | 3.8 | % | ||||||||||
Sources: S&P Capital IQ, SEC Filings, Annual and Interim Reports, Investor Presentations
| EV/ | EV/ | EV/ | EV/ | EV/ | EV/ | |||||||||||||||||||
| TTM | 2025E | 2026E | TTM | 2025E | 2026E | |||||||||||||||||||
| EBITDA | EBITDA | EBITDA | Revenue | Revenue | Revenue | |||||||||||||||||||
| Corteva, Inc. | 11.87 | (x) | 10.1 | (x) | 9.32 | (x) | 2.23 | (x) | 2.18 | (x) | 2.11 | (x) | ||||||||||||
| American Vanguard Corporation | 13.97 | (x) | 6.49 | (x) | 5.51 | (x) | .5 | (x) | .5 | (x) | .48 | (x) | ||||||||||||
| Bayer CropScience Limited | 33.1 | (x) | 31.48 | (x) | 20.66 | (x) | 3.85 | (x) | 3.77 | (x) | 3.41 | (x) | ||||||||||||
| FMC Corporation | 9.15 | (x) | 8.28 | (x) | 7.46 | (x) | 1.75 | (x) | 1.78 | (x) | 1.66 | (x) | ||||||||||||
| Nufarm Limited | 10.15 | (x) | 5.45 | (x) | 4.62 | (x) | .54 | (x) | .58 | (x) | .54 | (x) | ||||||||||||
| Evogene Ltd. | n/a | n/a | n/a | .94 | (x) | .57 | (x) | .37 | (x) | |||||||||||||||
| Rallis India Limited | 12.32 | (x) | 11.82 | (x) | 9.76 | (x) | 1.4 | (x) | 1.39 | (x) | 1.24 | (x) | ||||||||||||
| Bayer Aktiengesellschaft | 5.91 | (x) | 5.41 | (x) | 5.17 | (x) | 1.16 | (x) | 1.1 | (x) | 1.08 | (x) | ||||||||||||
| Dow Inc. | 6.46 | (x) | 6.33 | (x) | 5.41 | (x) | .76 | (x) | .77 | (x) | .73 | (x) | ||||||||||||
| UPL Limited | 16.17 | (x) | 10.93 | (x) | 9.1 | (x) | 1.95 | (x) | 1.91 | (x) | 1.77 | (x) | ||||||||||||
| Eden Research plc | n/a | n/a | n/a | 1.95 | (x) | 1.8 | (x) | 1.52 | (x) | |||||||||||||||
| Average | 13.23 | (x) | 10.7 | (x) | 8.56 | (x) | 1.55 | (x) | 1.49 | (x) | 1.36 | (x) | ||||||||||||
| Median | 11.87 | (x) | 8.28 | (x) | 7.46 | (x) | 1.4 | (x) | 1.39 | (x) | 1.24 | (x) | ||||||||||||
Historical and projected years indicate 12-month periods ending December 31
TTM = Trailing Twelve Months
EV: Enterprise Value = Market capitalization plus debt, net of cash and cash equivalents
Based on the data shown in the tables above, Evans & Evans also selected a range of valuation multiples to apply to a weighting of BIOX’s TTM EBITDA and fiscal year consensus estimated 2025 EBITDA. EBITDA was selected as the appropriate measure for BIOX given its results have stabilized.
Evans & Evans considered the multiple for the BIOX GPCs as outlined in the tables above in its determination of reasonable multiples for BIOX given the BIOX GPCs relative similarities to BIOX. Evans & Evans analyzed TTM and current fiscal year (2025) EBITDA and revenue growth and 2024 through 2026 EBITDA margins for the BIOX GPCs and compared these metrics to those of BIOX for the comparative periods. Evans & Evans used these comparisons and the multiples of EV to TTM EBITDA and EV to 2025 forecast EBITDA for the BIOX GPCs to select an EBITDA multiple range of 12.5x to 13.0x to apply to BIOX’s TTM EBITDA and a multiple of 10.0x to 10.5x to apply to BIOX’s fiscal year 2025 consensus EBITDA to arrive at an EV range for each set of multiples. Evans & Evans then weighted the two EV ranges resulting in an estimated current EV range for BIOX. Evans & Evans selected multiples that, in its judgment, reflected BIOX’s revenue growth outlook, capital requirements, profit margins, management experience and other characteristics relative to the BIOX GPCs.
Evans & Evans’ GPC Analysis resulted in an estimated equity value range, after adding cash and deducting debt, for BIOX of $467.9 million to $501.9 million, which is significantly above BIOX’s market capitalization. In the view of Evans & Evans, weighting of the GPC Analysis was appropriate as BIOX does appear to be trading below that of its peers.
Precedent Transactions Analysis (Market Approach)
Evans & Evans did not identify transactions involving companies with publicly available financial information that Evans & Evans believed, based on its experience and professional judgment, to be generally relevant for purposes of this analysis.
Discounted Cash Flow Analysis (Income Approach)
Evans & Evans performed a DCF analysis of BIOX using a financial forecast that Evans & Evans developed based on consensus estimates of future results to calculate the estimated present value of the future unlevered after-tax free cash flows projected to be generated by BIOX through the end of fiscal year 2034.
Evans & Evans assessed the reasonableness of the BIOX model by comparing BIOX’s revenue growth, EBITDA growth, and EBITDA margins of the BIOX GPCs and professional judgment. Capital expenditures considered in the analysis were estimated by Evans & Evans based on consensus estimates. Annual working capital requirements were based on benchmarking of the BIOX GPCs and professional judgement. Evans & Evans assumed that annually BIOX would require an amount of debt-free-net-working capital of 34.4% of revenues, based on BIOX historical working capital levels and with reference to benchmarking against the BIOX GPCs.
In developing the CSRP Evans & Evans also considered (i) BIOX historical performance against consensus estimates, (ii) historical financial performance and growth and (iii) risks facing BIOX in order to achieve projected results, including execution risk, financing, tariffs, regulatory and competitive risks, among others. Evans & Evans also considered the experience of the management team and the ability to secure future financing to fund operations given the current debt level. Based on these factors, Evans & Evans used discount rates ranging from 12% to 13% to discount the projected unlevered free cash flows and the terminal value. Evans & Evans believes that this range of discount rates is consistent with the rate of return that shareholders would require on alternative investment opportunities with similar risk profiles, including risks of achieving the projected cash flows based. In developing the discount rate, Evans & Evans considered a capital structure of 35% debt and 65% equity based on benchmarking of the BIOX GPCs and professional judgement.
In determining the unlevered cash flows, Evans & Evans deducted approximately $91 million in capital expenditures over the approximately nine years.
A tax rate of approximately 35% was used in the analysis along with an expected LTGR of 2.0% and an industry beta of 0.84.
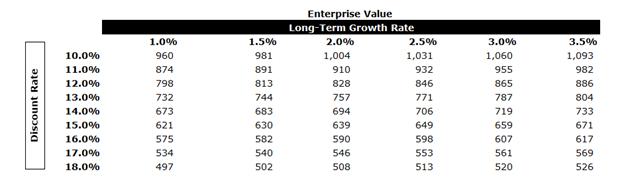
In performing the DCF analysis of BIOX Evans & Evans considered a terminal value multiple of 10x free cash flow in the terminal year as a midpoint. The terminal multiple was compared to the EBITDA multiples of the selected GPCs and was found to be in line with current multiples. The terminal value represents approximately 60% of BIOX’s entity value. The equity value of BIOX under the DCF Analysis was determined to be in the range of $519.6 million to $571.2 million.
After-tax free cash flows from each period in each set were discounted to April 7, 2025 using the mid-period convention.
A sensitivity analysis on BIOX’s EV was calculated as outlined below using various LTGRs and discount rates.
BIOX Conclusion
Evans & Evans calculated the equity value of BIOX using the DCF Analysis, the GPC Analysis and the Trading Price Analysis. Evans & Evans then weighted the three analyses to calculate an equity value of $451.5 million to $494.1 million. The concluded equity value represents a premium of 60% to 75% to BIOX’s market capitalization.
Upon arriving at the equity value of 100% of BIOX, Evans & Evans calculated the pro rata portion being contributed per the transaction terms. Lastly, Evans & Evans applied a control premium, based on a review of various control premium studies, of 10%.
Agrality Analyses
Evans & Evans was provided with select information on the Agrality group of companies (“Agrality”) and as such considered the group on a consolidated basis and did not perform an analysis of each entity within Agrality.
Guideline Public Companies Analysis (Market Approach)
Using public filings and other publicly available information, Evans & Evans compared certain financial information of Agrality to corresponding financial information for selected GPCs that, based on Evans & Evans’ professional judgment and experience, Evans & Evans considered generally relevant for purposes of analysis. Evans & Evans included companies in the agriculture science, seed development and crop protection industries.
Evans & Evans selected the companies above because, among other things, the selected companies operate businesses similar in certain respects to the business of Agrality.
Evans & Evans utilized the Selected GPC Analysis to select a weighting of TTM and 2025 expected EBITDA multiples to estimate a range of enterprise values for Agrality.
Evans & Evans identified 14 companies whose shares trade on recognized stock exchanges which, after review of financial and operating results were deemed relevant in its analysis (the “Agrality GPCs”). Evans & Evans selected the Agrality GPCs based on their relative similarity, primarily in terms of business focus, revenue growth history and outlook, capital requirements, profit margins and other characteristics, to that of Agrality.
Evans & Evans noted that none of the Agrality GPCs are perfectly comparable to Agrality.
The tables below summarize certain observed historical and projected financial performance and trading multiples of the Agrality GPCs.
| 2025 E | 2026 E | 2027 E | 2025 E | 2026 E | 2027 E | |||||||||||||||||||
| Revenue | Revenue | Revenue | EBITDA | EBITDA | EBITDA | |||||||||||||||||||
| Growth | Growth | Growth | Growth | Growth | Growth | |||||||||||||||||||
| Cibus, Inc. | 134.6 | % | 51.0 | % | 293.4 | % | -36.4 | % | -22.2 | % | -224.2 | % | ||||||||||||
| Evogene Ltd. | 50.9 | % | 65.3 | % | 52.7 | % | -37.3 | % | -22.7 | % | -72.0 | % | ||||||||||||
| S&W Seed Company | -17.8 | % | -40.6 | % | 14.3 | % | -50.4 | % | N/A | N/A | ||||||||||||||
| Sadot Group Inc. | -2.3 | % | 10.5 | % | 5.5 | % | -122.0 | % | 100.6 | % | N/A | |||||||||||||
| Wanxiang Doneed Co., ltd | 32.2 | % | N/A | N/A | N/A | N/A | N/A | |||||||||||||||||
| Arcadia Biosciences, Inc. | 13.3 | % | 28.8 | % | 21.5 | % | -37.3 | % | -20.0 | % | N/A | |||||||||||||
| Nath Bio-Genes (India) Limited | 8.8 | % | N/A | N/A | N/A | N/A | N/A | |||||||||||||||||
| Vietnam National Seed Group Joint Stock Company | 14.5 | % | N/A | N/A | N/A | N/A | N/A | |||||||||||||||||
| Bombay Super Hybrid Seeds Limited | 11.1 | % | N/A | N/A | N/A | N/A | N/A | |||||||||||||||||
| PT BISI International Tbk | -43.0 | % | N/A | N/A | N/A | N/A | N/A | |||||||||||||||||
| KWS SAAT SE & Co. KGaA | 9.8 | % | 3.3 | % | 4.0 | % | 1.8 | % | 0.0 | % | 7.2 | % | ||||||||||||
| Arcadia Biosciences, Inc. | 13.3 | % | 28.8 | % | 21.5 | % | -37.3 | % | -20.0 | % | N/A | |||||||||||||
| Origin Agritech Limited | 26.4 | % | N/A | N/A | N/A | N/A | N/A | |||||||||||||||||
| Mangalam Seeds Limited | 69.4 | % | N/A | N/A | N/A | N/A | N/A | |||||||||||||||||
| Average | 22.9 | % | 21.0 | % | 59.0 | % | -45.6 | % | 2.6 | % | -96.3 | % | ||||||||||||
| Median | 13.3 | % | 28.8 | % | 21.5 | % | -37.3 | % | -20.0 | % | -72.0 | % | ||||||||||||
Sources: S&P Capital IQ, SEC Filings, Annual and Interim Reports, Investor Presentations
| 2024A | 2025E | 2026E | TTM | TTM Capital |
||||||||||||||||
| EBITDA | EBITDA | EBITDA | Debt/ | Expenditure / | ||||||||||||||||
| Margin | Margin | Margin | Total Capital | Revenue | ||||||||||||||||
| Cibus, Inc. | -692.9 | % | -137.0 | % | 49.2 | % | 1.1 | % | 19.0 | % | ||||||||||
| Evogene Ltd. | -91.3 | % | -46.3 | % | -7.0 | % | 0.0 | % | 7.4 | % | ||||||||||
| S&W Seed Company | -13.9 | % | N/A | N/A | 52.1 | % | 2.7 | % | ||||||||||||
| Sadot Group Inc. | 0.3 | % | 0.6 | % | N/A | 32.1 | % | 0.0 | % | |||||||||||
| Wanxiang Doneed Co., ltd | N/A | N/A | N/A | 0.0 | % | 1.2 | % | |||||||||||||
| Arcadia Biosciences, Inc. | -70.8 | % | -46.6 | % | N/A | 0.0 | % | 0.3 | % | |||||||||||
| Nath Bio-Genes (India) Limited | N/A | N/A | N/A | 0.0 | % | N/A | ||||||||||||||
| Vietnam National Seed Group Joint Stock Company | N/A | N/A | N/A | 11.5 | % | 3.8 | % | |||||||||||||
| Bombay Super Hybrid Seeds Limited | N/A | N/A | N/A | 0.0 | % | N/A | ||||||||||||||
| PT BISI International Tbk | N/A | N/A | N/A | 0.0 | % | 6.9 | % | |||||||||||||
| KWS SAAT SE & Co. KGaA | 22.8 | % | 21.9 | % | 22.5 | % | 23.0 | % | 8.4 | % | ||||||||||
| Arcadia Biosciences, Inc. | -70.8 | % | -46.6 | % | N/A | 0.0 | % | 0.3 | % | |||||||||||
| Origin Agritech Limited | N/A | N/A | N/A | 39.1 | % | 4.4 | % | |||||||||||||
| Mangalam Seeds Limited | N/A | N/A | N/A | 0.0 | % | N/A | ||||||||||||||
| Average | -131.0 | % | -42.3 | % | 21.6 | % | 11.4 | % | 4.9 | % | ||||||||||
| Median | -70.8 | % | -46.4 | % | 22.5 | % | 0.0 | % | 3.8 | % | ||||||||||
Sources: S&P Capital IQ, SEC Filings, Annual and Interim Reports, Investor Presentations
| EV/ | EV/ | EV/ | EV/ | EV/ | EV/ | |||||||||||||||||||
| TTM | 2025E | 2026E | TTM | 2025E | 2026E | |||||||||||||||||||
| EBITDA | EBITDA | EBITDA | Revenue | Revenue | Revenue | |||||||||||||||||||
| Cibus, Inc. | N/A | N/A | N/A | 10.28 | (X) | 6.8 | (X) | 1.73 | (X) | |||||||||||||||
| Evogene Ltd. | N/A | N/A | N/A | .94 | (X) | .57 | (X) | .37 | (X) | |||||||||||||||
| S&W Seed Company | N/A | N/A | N/A | .61 | (X) | .93 | (X) | .82 | (X) | |||||||||||||||
| Sadot Group Inc. | N/A | 8.61 | (X) | 4.29 | (X) | .03 | (X) | .03 | (X) | .03 | (X) | |||||||||||||
| Wanxiang Doneed Co., ltd | 57.61 | (X) | N/A | N/A | 6.39 | (X) | N/A | N/A | ||||||||||||||||
| Arcadia Biosciences, Inc. | N/A | N/A | N/A | N/A | N/A | N/A | ||||||||||||||||||
| Nath Bio-Genes (India) Limited | 7.81 | (X) | N/A | N/A | 1.14 | (X) | N/A | N/A | ||||||||||||||||
| Vietnam National Seed Group Joint Stock Company | 3.81 | (X) | N/A | N/A | .58 | (X) | N/A | N/A | ||||||||||||||||
| Bombay Super Hybrid Seeds Limited | 42.42 | (X) | N/A | N/A | 3.75 | (X) | N/A | N/A | ||||||||||||||||
| PT BISI International Tbk | 9.95 | (X) | N/A | N/A | 1.88 | (X) | N/A | N/A | ||||||||||||||||
| KWS SAAT SE & Co. KGaA | 5.8 | (X) | 5.39 | (X) | 5.4 | (X) | 1.3 | (X) | 1.23 | (X) | 1.18 | (X) | ||||||||||||
| Arcadia Biosciences, Inc. | N/A | N/A | N/A | N/A | N/A | N/A | ||||||||||||||||||
| Origin Agritech Limited | N/A | N/A | N/A | .74 | (X) | N/A | N/A | |||||||||||||||||
| Mangalam Seeds Limited | 15.07 | (X) | N/A | N/A | 2.37 | (X) | N/A | N/A | ||||||||||||||||
| Average | ||||||||||||||||||||||||
| Average | 20.35 | (x) | 7. (x) | 4.84 | (x) | 2.5 | (x) | 1.91 | (x) | .83 | (x) | |||||||||||||
| Median | 9.95 | (x) | 7. (x) | 4.84 | (x) | 1.22 | (x) | .93 | (x) | .82 | (x) | |||||||||||||
Historical and projected years indicate 12-month periods ending December 31
TTM = Trailing Twelve Months
EV: Enterprise Value = Market capitalization plus debt, net of cash and cash equivalents
Based on the data shown in the tables above, Evans & Evans also selected a range of valuation multiples to apply to a weighting of Agrality’s TTM results and fiscal year 2025 forecast EBITDA. EBITDA was selected as the appropriate measure for Agrality given its does have a history of positive EBITDA.
Evans & Evans considered the multiple for the Agrality GPCs as outlined in the tables above in its determination of reasonable multiples for Agrality given the Agrality GPCs relative similarities to Agrality. Evans & Evans analyzed TTM and current fiscal year (2025) EBITDA and revenue growth and 2024 through 2026 EBITDA margins for the Agrality GPCs and compared these metrics to those of Agrality for the comparative periods. Evans & Evans used these comparisons and the multiples of EV to TTM EBITDA and EV to 2025 forecast EBITDA for the Agrality GPCs to select an EBITDA multiple range of 9.3x to 9.5x to apply to Agrality’s TTM EBITDA and a multiple of 7.44x to 7.6x to apply to Agrality’s fiscal year 2025 forecast EBITDA to arrive at an EV range for each set of multiples. Evans & Evans then weighted the two EV ranges resulting in an estimated current EV range for Agrality. Evans & Evans selected multiples that, in its judgment, reflected Agrality’s revenue growth outlook, capital requirements, profit margins, management experience and other characteristics relative to the Agrality GPCs.
Evans & Evans’ Selected GPC Analysis resulted in an estimated equity value range, after adding cash and deducting debt, for Agrality of $123.6 million to $126.6 million.
Precedent Transactions Analysis (Market Approach)
Evans & Evans did not identify transactions involving companies with publicly available financial information that Evans & Evans believed, based on its experience and professional judgment, to be generally relevant for purposes of this analysis.
Discounted Cash Flow Analysis (Income Approach)
Evans & Evans performed a DCF analysis of Agrality using a financial forecast provided by Agrality management to calculate the estimated present value of the future unlevered after-tax free cash flows projected to be generated by Agrality through the end of fiscal year 2029.
Evans & Evans assessed the reasonableness of the Agrality model by comparing Agrality’s revenue growth, EBITDA growth, and EBITDA margins of the Agrality GPCs and professional judgment. Capital expenditures considered in the analysis were provided by Agrality management. Annual working capital requirements were based on benchmarking of the Agrality GPCs, actual working capital amounts and professional judgement. Evans & Evans assumed that annually Agrality would require an amount of debt-free-net-working capital of 21.3% of revenues, based on Agrality historical working capital levels and with reference to benchmarking against the Agrality GPCs.
In developing the CSRP Evans & Evans considered (i) historical financial performance and growth; (ii) country specific risks related to inflation and defaults; and (iii) risks facing Agrality in order to achieve projected results, including execution risk, financing, tariffs, regulatory and competitive risks, among others. Evans & Evans also considered the experience of the management team and the ability to secure future financing to fund operations. Based on these factors, Evans & Evans used discount rates ranging from 14% to 15% to discount the projected unlevered free cash flows and the terminal value. Evans & Evans believes that this range of discount rates is consistent with the rate of return that shareholders would require on alternative investment opportunities with similar risk profiles, including risks of achieving the projected cash flows based. In developing the discount rate, Evans & Evans considered a capital structure of 11% debt and 89% equity based on benchmarking of the Agrality GPCs and professional judgement.
In determining the unlevered cash flows, Evans & Evans deducted approximately $6 million in capital expenditures over the approximately nine years.
A tax rate of approximately 35% was used in the analysis along with an expected LTGR of 2.0% and an industry beta of 0.88.
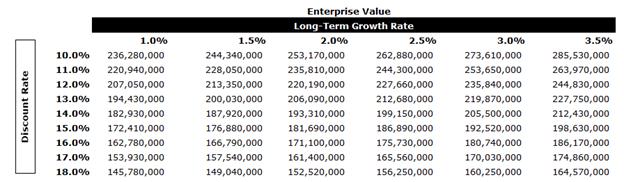
In performing the DCF analysis of Agrality Evans & Evans considered a terminal value multiple of 8.33x free cash flow in the terminal year as a midpoint. The terminal multiple was compared to the EBITDA multiples of the selected GPCs and was found to be in line with current multiples. The terminal value represents approximately 73% of Agrality’s enterprise value. The equity value of Agrality under the DCF Analysis was determined to be in the range of $183.1 million to $189.7 million.
After-tax free cash flows from each period in each set were discounted to April 7, 2025 using the mid-period convention.
A sensitivity analysis on Agrality’s EV was calculated as outlined below using various LTGRs and discount rates.
Agrality Conclusion
Evans & Evans calculated the equity value of Agrality using the DCF Analysis and the GPC Analysis. Evans & Evans then weighted the two equity value ranges to calculate an equity value of $153.4 million to $158.1 million.
Upon arriving at the equity value of 100% of Agrality, Evans & Evans calculated the pro rata portion being contributed per the transaction terms. Given Moolec is acquiring 50% of Agrality, no control premium was applied.
Nutrecon Analysis
In reviewing Nutrecon, Evans & Evans first determined the value of Nutrecon’s 90% subsidiary Synbio Powerlabs OY (“Synbio”) and then adjusted the book value of Nutrecon to arrive at an equity value for Nutrecon.
Guideline Public Companies Analysis (Market Approach)
Evans & Evans did not conduct a GPC Analysis for Nutrecon. Evans & Evans conducted several searches and did not believe a reasonable set of GPCs could be developed to appropriate assess Nutrecon given its unique service, hybrid business model and pre-revenue stage of development.
Precedent Transactions Analysis (Market Approach)
Evans & Evans did not identify transactions involving companies with publicly available financial information that Evans & Evans believed, based on its experience and professional judgment, to be generally relevant for purposes of this analysis.
Discounted Cash Flow Analysis (Income Approach)
Evans & Evans performed a DCF analysis of Nutrecon using a financial forecast provided by Nutrecon management to calculate the estimated present value of the future unlevered after-tax free cash flows projected to be generated by Nutrecon through the end of fiscal year 2029.
Evans & Evans assessed the reasonableness of the Nutrecon model by comparing Nutrecon’s revenue growth, EBITDA growth, and EBITDA margins of a group of GPCs in the plant based food market and specialty chemicals market (the “Nutrecon GPCs”) and professional judgment. Capital expenditures considered in the analysis were provided by Nutrecon management for fiscal year 2025 and then estimated by Evans & Evans using professional judgement thereafter. Annual working capital requirements were based on benchmarking of the Nutrecon GPCs, actual working capital amounts and professional judgement. Evans & Evans assumed that annually Nutrecon would require an amount of debt-free-net-working capital of 16% of revenues, with reference to benchmarking against industry metrics.
In developing the CSRP Evans & Evans considered (i) the early stage of operations; (ii) projected growth in revenues against the growth rates in which Nutrecon operates; and (iii) risks facing Nutrecon in order to achieve projected results, including execution risk, financing, tariffs, regulatory and competitive risks, among others. Evans & Evans also considered the experience of the management team and the ability to secure future financing to fund operations. Based on these factors, Evans & Evans used discount rates ranging from 30% to 32% to discount the projected unlevered free cash flows and the terminal value. Evans & Evans believes that this range of discount rates is consistent with the rate of return that shareholders would require on alternative investment opportunities with similar risk profiles, including risks of achieving the projected cash flows based. In developing the discount rate, Evans & Evans considered a capital structure of 30% debt and 70% equity based on the capital-intensive nature of the operations.
In determining the unlevered cash flows, Evans & Evans deducted approximately $9 million in capital expenditures over the approximately nine years.
A tax rate of approximately 20% was used in the analysis along with an expected LTGR of 2.0% and an industry beta of 1.21.
In performing the DCF analysis of Nutrecon, Evans & Evans considered a terminal value multiple of 3.5x free cash flow in the terminal year as a midpoint. The terminal value represents approximately 23% of Nutrecon’s enterprise value. The equity value of Nutrecon under the DCF Analysis was determined to be in the range of $32.1 million to $34.8 million.
After-tax free cash flows from each period in each set were discounted to April 7, 2025 using the mid-period convention.
A sensitivity analysis on Nutrecon’s EV was calculated as outlined below using various LTGRs and discount rates.
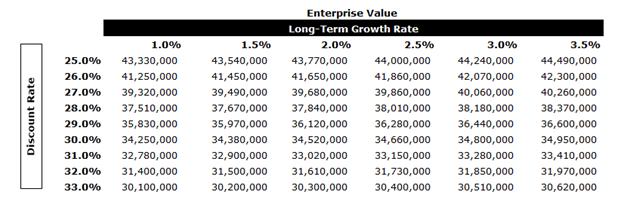
Nutrecon Conclusion
Evans & Evans calculated the equity value of Synbio using solely the DCF Analysis and thereafter adjusted for net debt at the Nutrecon level and the 10% minority interest. No control premium was applied.
Gentle Tech Analyses
Evans & Evans was provided with select information on Gentle Tech and its subsidiaries. Evans & Evans separately determined the equity values of G FAS SAS (“G-FAS”) and GentleFarming Inc. (“Gentle Farming”) and thereafter accounted for the pro rata share of ownership of Gentle Tech in each entity and the net debt of the consolidated entity.
Guideline Public Companies Analysis (Market Approach)
Using public filings and other publicly available information, Evans & Evans compared certain financial information of G-FAS and Gentle Farming to corresponding financial information for selected GPCs that, based on Evans & Evans’ professional judgment and experience, Evans & Evans considered generally relevant for purposes of analysis. Evans & Evans included companies in the agriculture equipment manufacturing sector.
Evans & Evans selected the companies above because, among other things, the selected companies operate businesses similar in certain respects to the business of G-FAS and Gentle Farming.
Evans & Evans identified 10 companies whose shares trade on recognized stock exchanges which, after review of financial and operating results were deemed relevant in its analysis (the “Gentle Tech GPCs”). Evans & Evans selected the Gentle Tech GPCs based on their relative similarity, primarily in terms of business focus, revenue growth history and outlook, capital requirements, profit margins and other characteristics, to that of G-FAS and Gentle Farming.
Evans & Evans noted that none of the Gentle Tech GPCs are perfectly comparable to G-FAS and Gentle Farming.
The tables below summarize certain observed historical and projected financial performance and trading multiples of the Gentle Tech GPCs.
| 2025 E | 2026 E | 2027 E | 2025 E | 2026 E | 2027 E | |||||||||||||||||||
| Revenue | Revenue | Revenue | EBITDA | EBITDA | EBITDA | |||||||||||||||||||
| Growth | Growth | Growth | Growth | Growth | Growth | |||||||||||||||||||
| Deere & Company | -26.1 | % | 7.1 | % | 9.5 | % | -34.2 | % | 18.8 | % | 16.3 | % | ||||||||||||
| Caterpillar Inc. | -2.6 | % | 5.7 | % | 7.4 | % | -11.2 | % | 8.9 | % | 9.0 | % | ||||||||||||
| AGCO Corporation | -17.8 | % | 7.1 | % | 7.0 | % | -21.7 | % | 19.6 | % | 18.2 | % | ||||||||||||
| The Toro Company | 0.6 | % | 2.9 | % | 3.0 | % | 7.8 | % | 6.6 | % | 5.6 | % | ||||||||||||
| Ag Growth International Inc. | -4.3 | % | 7.4 | % | 10.1 | % | 7.6 | % | 14.2 | % | 17.3 | % | ||||||||||||
| Alamo Group Inc. | -0.6 | % | 3.8 | % | N/A | 3.4 | % | 11.0 | % | N/A | ||||||||||||||
| Art’s-Way Manufacturing Co., Inc. | N/A | N/A | N/A | N/A | N/A | N/A | ||||||||||||||||||
| TerraVest Industries Inc. | 48.5 | % | 32.0 | % | N/A | 38.3 | % | 30.8 | % | N/A | ||||||||||||||
| Water Ways Technologies Inc. | N/A | N/A | N/A | N/A | N/A | N/A | ||||||||||||||||||
| CNH Industrial N.V. | -12.8 | % | 5.3 | % | 2.4 | % | -36.8 | % | 21.3 | % | 15.0 | % | ||||||||||||
| Average | -1.9 | % | 8.9 | % | 6.6 | % | -5.9 | % | 16.4 | % | 13.6 | % | ||||||||||||
| Median | -3.5 | % | 6.4 | % | 7.2 | % | -3.9 | % | 16.5 | % | 15.7 | % | ||||||||||||
Sources: S&P Capital IQ, SEC Filings, Annual and Interim Reports, Investor Presentations
| 2024A | 2025E | 2026E | TTM | TTM Capital |
||||||||||||||||
| EBITDA | EBITDA | EBITDA | Debt/ | Expenditure / | ||||||||||||||||
| Margin | Margin | Margin | Total Capital | Revenue | ||||||||||||||||
| Deere & Company | 19.6 | % | 21.7 | % | 23.1 | % | 8.2 | % | 10.0 | % | ||||||||||
| Caterpillar Inc. | 22.0 | % | 22.7 | % | 23.0 | % | 6.0 | % | 5.0 | % | ||||||||||
| AGCO Corporation | 10.2 | % | 11.4 | % | 12.6 | % | 30.1 | % | 3.4 | % | ||||||||||
| The Toro Company | 15.5 | % | 16.0 | % | 16.4 | % | 14.7 | % | 2.3 | % | ||||||||||
| Ag Growth International Inc. | 17.2 | % | 18.3 | % | 19.5 | % | 58.7 | % | 1.6 | % | ||||||||||
| Alamo Group Inc. | 13.9 | % | 14.9 | % | N/A | 10.2 | % | 1.5 | % | |||||||||||
| Art’s-Way Manufacturing Co., Inc. | N/A | N/A | N/A | 35.5 | % | 3.0 | % | |||||||||||||
| TerraVest Industries Inc. | 18.3 | % | 18.1 | % | N/A | 6.5 | % | 6.3 | % | |||||||||||
| Water Ways Technologies Inc. | N/A | N/A | N/A | 91.6 | % | 0.2 | % | |||||||||||||
| CNH Industrial N.V. | 7.8 | % | 8.9 | % | 10.0 | % | 23.3 | % | 6.0 | % | ||||||||||
| Average | 15.6 | % | 16.5 | % | 17.5 | % | 28.5 | % | 3.9 | % | ||||||||||
| Median | 16.3 | % | 17.1 | % | 18.0 | % | 19.0 | % | 3.2 | % | ||||||||||
Sources: S&P Capital IQ, SEC Filings, Annual and Interim Reports, Investor Presentations
| EV/ | EV/ | EV/ | EV/ | EV/ | EV/ | |||||||||||||||||||
| TTM | 2025E | 2026E | TTM | 2025E | 2026E | |||||||||||||||||||
| EBITDA | EBITDA | EBITDA | Revenue | Revenue | Revenue | |||||||||||||||||||
| Deere & Company | 17.35 | (X) | 23.43 | (X) | 19.72 | (X) | 3.65 | (X) | 4.59 | (X) | 4.29 | (X) | ||||||||||||
| Caterpillar Inc. | 10.61 | (X) | 11.95 | (X) | 10.98 | (X) | 2.56 | (X) | 2.63 | (X) | 2.49 | (X) | ||||||||||||
| AGCO Corporation | 6.52 | (X) | 8.33 | (X) | 6.97 | (X) | .7 | (X) | .85 | (X) | .8 | (X) | ||||||||||||
| The Toro Company | 11. | (X) | 10.32 | (X) | 9.67 | (X) | 1.61 | (X) | 1.6 | (X) | 1.55 | (X) | ||||||||||||
| Ag Growth International Inc. | 6.4 | (X) | 5.94 | (X) | 5.2 | (X) | .98 | (X) | 1.02 | (X) | .95 | (X) | ||||||||||||
| Alamo Group Inc. | 9.05 | (X) | 8.75 | (X) | 7.88 | (X) | 1.21 | (X) | 1.22 | (X) | 1.17 | (X) | ||||||||||||
| Art’s-Way Manufacturing Co., Inc. | 8.53 | (X) | N/A | N/A | .46 | (X) | N/A | N/A | ||||||||||||||||
| TerraVest Industries Inc. | 15.39 | (X) | 10.37 | (X) | 7.93 | (X) | 2.98 | (X) | 1.9 | (X) | 1.44 | (X) | ||||||||||||
| Water Ways Technologies Inc. | N/A | N/A | N/A | .57 | (X) | N/A | N/A | |||||||||||||||||
| CNH Industrial N.V. | 17.95 | (X) | 28.42 | (X) | 23.42 | (X) | 1.92 | (X) | 2.2 | (X) | 2.09 | (X) | ||||||||||||
| Average | 11.42 | (X) | 13.44 | (X) | 11.47 | (X) | 1.66 | (X) | 2. | (X) | 1.85 | (X) | ||||||||||||
| Median | 10.61 | (X) | 10.34 | (X) | 8.8 | (X) | 1.41 | (X) | 1.75 | (X) | 1.49 | (X) | ||||||||||||
Historical and projected years indicate 12-month periods ending December 31
TTM = Trailing Twelve Months
EV: Enterprise Value = Market capitalization plus debt, net of cash and cash equivalents
G-FAS Analysis
Evans & Evans utilized the GPC Analysis to select a weighting of expected 2025 revenue and EBITDA of G-FAS. A weighting of revenues and EBITDA was selected as G-FAS is still at a stage where EBITDA is growing and not yet stabilized.
Based on the data shown in the tables above, Evans & Evans also selected a range of valuation multiples to apply to a weighting of G-FAS’ forecast fiscal year 2025 revenues and EBITDA.
Evans & Evans considered the multiples for the Gentle Tech GPCs as outlined in the tables above in its determination of reasonable multiples for G-FAS given the Gentle Tech GPCs relative similarities to G-FAS. Evans & Evans analyzed TTM and current fiscal year (2025) EBITDA and revenue growth and 2024 through 2026 EBITDA margins for the Gentle Tech GPCs and compared these metrics to those of G-FAS for the comparative periods. Evans & Evans used these comparisons and the multiples of EV to 2025 forecast EBITDA and EV to 2025 forecast revenue for the Gentle Tech GPCs to select an EBITDA multiple range of 7.65x to 8.1x to apply to G-FAS’s fiscal year 2025 expected EBITDA and a multiple of 1.70x to 1.80x to apply to G-FAS’s fiscal year 2025 forecast revenue to arrive at an EV range for each set of multiples. Evans & Evans then weighted the two EV ranges resulting in an estimated current EV range for G-FAS. Evans & Evans selected multiples that, in its judgment, reflected G-FAS’s revenue growth outlook, sales model, profit margins, management experience and other characteristics relative to the Gentle Tech GPCs.
Evans & Evans’ GPC Analysis resulted in an estimated equity value range, after adding cash and deducting debt, for G-FAS of $16.9 million to $17.9 million.
Gentle Farming Analysis
As Gentle Farming is still in the development stage, with revenues not expected until fiscal 2028, Evans & Evans did not believe a GPC Analysis was appropriate.
Discounted Cash Flow Analysis (Income Approach)
Evans & Evans performed independent DCF Analyses for both G-FAS and Gentle Farming given the differing stage of development of both companies and the resulting differing risk profiles. The financial forecast for both G-FAS and Gentle Farming was provided by management of Gentle Tech.
G-FAS DCF Analysis
Evans & Evans assessed the reasonableness of the G-FAS model by comparing the projected revenue growth, EBITDA growth, and EBITDA margins of G-FAS to its historical results, the consensus forecast of the Gentle Tech GPCs and professional judgment. Capital expenditures considered in the analysis were benchmarked at 3.5% of revenues based on a review of the Gentle Tech GPCs and professional judgement. Annual working capital requirements were based on benchmarking of the Gentle Tech GPCs, actual working capital amounts and professional judgement. Evans & Evans assumed that annually G-FAS would require an amount of debt-free-net-working capital of 25% of revenues.
In developing the CSRP Evans & Evans considered (i) historical financial performance and growth; (ii) country specific risks related to inflation and defaults; (iii) tariffs; and (iv) risks facing G-FAS in order to achieve projected results, including execution risk, financing, regulatory and competitive risks, among others. Evans & Evans also considered the experience of the management team. Based on these factors, Evans & Evans used discount rates ranging from 25% to 27% to discount the projected unlevered free cash flows and the terminal value. Evans & Evans believes that this range of discount rates is consistent with the rate of return that shareholders would require on alternative investment opportunities with similar risk profiles, including risks of achieving the projected cash flows based. In developing the discount rate, Evans & Evans considered a capital structure of 30% debt and 70% equity based on benchmarking of the Gentle Tech GPCs and professional judgement.
In determining the unlevered cash flows, Evans & Evans deducted approximately $11.6 million in capital expenditures over the approximately nine years.
A tax rate of approximately 35% was used in the analysis along with an expected LTGR of 2.0% and an industry beta of 1.01.
In performing the DCF analysis of G-FAS Evans & Evans considered a terminal value multiple of 4.25x free cash flow in the terminal year as a midpoint. The terminal multiple was compared to the EBITDA multiples of the selected GPCs and was found to be in line with current multiples. The terminal value represents approximately 36% of G-FAS’s enterprise value. The equity value of G-FAS under the DCF Analysis was determined to be in the range of $23.0 million to $25. 4 million.
After-tax free cash flows from each period in each set were discounted to April 7, 2025 using the mid-period convention.
A sensitivity analysis on G-FAS’s EV was calculated as outlined below using various LTGRs and discount rates.
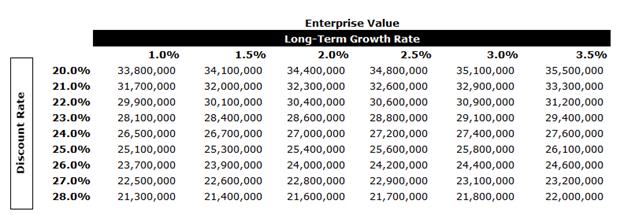
Gentle Farming DCF Analysis
Evans & Evans assessed the reasonableness of the Gentle Farming model by comparing the projected revenue growth, EBITDA growth, and EBITDA margins of Gentle Farming to G-FAS’s historical results given its similar profile, the consensus forecast of the Gentle Tech GPCs and professional judgment. Capital expenditures considered in the analysis benchmarked at 1.0% of revenues based on a review of the Gentle Tech GPCs and professional judgement. Annual working capital requirements were based on benchmarking of the Gentle Tech GPCs, actual working capital amounts and professional judgement. Evans & Evans assumed that annually Gentle Farming would require an amount of debt-free-net-working capital of 25% of revenues.
In developing the CSRP Evans & Evans considered (i) lack of commercialization; (ii) country specific risks related to inflation and defaults; (iii) tariffs; and (iv) risks facing Gentle Tech in order to achieve projected results, including execution risk, financing, regulatory and competitive risks, among others. Evans & Evans also considered the experience of the management team. Based on these factors, Evans & Evans used discount rates ranging from 31% to 33% to discount the projected unlevered free cash flows and the terminal value. Evans & Evans believes that this range of discount rates is consistent with the rate of return that shareholders would require on alternative investment opportunities with similar risk profiles, including risks of achieving the projected cash flows based. In developing the discount rate, Evans & Evans considered a capital structure of 30% debt and 70% equity based on benchmarking of the Gentle Tech GPCs and professional judgement.
In determining the unlevered cash flows, Evans & Evans deducted approximately $54 million in capital expenditures over the approximately 12 years.
A tax rate of approximately 35% was used in the analysis along with an expected LTGR of 2.0% and an industry beta of 1.01.
In performing the DCF analysis of Gentle Tech Evans & Evans considered a terminal value multiple of 3.4x free cash flow in the terminal year as a midpoint. The terminal multiple was compared to the EBITDA multiples of the selected GPCs and was found to be appropriate given the risk profile. The terminal value represents approximately 175% of Gentle Tech’s enterprise value given the losses experienced prior to commercialization. The equity value of Gentle Tech under the DCF Analysis was determined to be in the range of $3.3 million to $5.3 million.
After-tax free cash flows from each period in each set were discounted to April 7, 2025 using the mid-period convention.
A sensitivity analysis on Gentle Tech’s EV was calculated as outlined below using various LTGRs and discount rates.
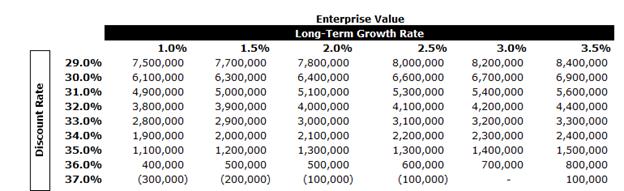
Precedent Transactions Analysis (Market Approach)
Evans & Evans did not identify a sufficient number of transactions involving companies with publicly available financial information that Evans & Evans believed, based on its experience and professional judgment, to be generally relevant for purposes of this analysis for G-FAS and Gentle Farming.
Gentle Tech Conclusion
Evans & Evans calculated the equity value of G-FAS using the DCF Analysis and the GPC Analysis. Evans & Evans then weighted the two equity value ranges to calculate an equity value of $21.2 million to $21.7 million. The equity value of Gentle Farming was determined to be in the range of $3.3 to $5.3 million based on the DCF Analysis.
Evans & Evans then adjusted the book value of Gentle Tech to reflect the calculated values of the interests in G-FAS and Gentle Farming held by Gentle Tech. The value of 100% of the equity in Gentle Tech was determined to be in the range of $8.6 to $9.8 million.
INMET Analyses
Guideline Public Companies Analysis (Market Approach)
Using public filings and other publicly available information, Evans & Evans compared certain financial information of INMET to corresponding financial information for selected GPCs that, based on Evans & Evans’ professional judgment and experience, Evans & Evans considered generally relevant for purposes of analysis. Evans & Evans included companies in the specialty chemicals, engineered polymers and catalysts industries.
Evans & Evans selected the companies above because, among other things, the selected companies operate businesses similar in certain respects to the business of INMET.
Evans & Evans utilized the GPC Analysis to select a weighting of forecast fiscal year 2028 expected revenue and EBITDA multiples to estimate a range of enterprise values for INMET. Forward looking multiples were used as INMET is not forecasting material revenues until fiscal 2028 when its plant has its first full year of operations.
Evans & Evans identified seven companies whose shares trade on recognized stock exchanges which, after review of financial and operating results were deemed relevant in its analysis (the “INMET GPCs”). Evans & Evans selected the INMET GPCs based on their relative similarity, primarily in terms of business focus, revenue growth history and outlook, capital requirements, profit margins and other characteristics, to that of INMET. Evans & Evans noted that none of the INMET GPCs are perfectly comparable to INMET.
The tables below summarize certain observed historical and projected financial performance and trading multiples of the INMET GPCs.
| 2025 E | 2026 E | 2027 E | 2025 E | 2026 E | 2027 E | |||||||||||||||||||
| Revenue | Revenue | Revenue | EBITDA | EBITDA | EBITDA | |||||||||||||||||||
| Growth | Growth | Growth | Growth | Growth | Growth | |||||||||||||||||||
| Eastman Chemical Company | 2.1 | % | 3.9 | % | 3.3 | % | -1.1 | % | 6.8 | % | 5.4 | % | ||||||||||||
| Celanese Corporation | -5.2 | % | 4.3 | % | 4.0 | % | 11.6 | % | 11.6 | % | 8.6 | % | ||||||||||||
| PureCycle Technologies, Inc. | n/a | 169.8 | % | 183.1 | % | -71.2 | % | -250.3 | % | 240.0 | % | |||||||||||||
| Ingevity Corporation | -2.6 | % | 4.6 | % | 5.3 | % | 7.3 | % | 7.5 | % | 8.1 | % | ||||||||||||
| Stepan Company | 5.4 | % | 6.1 | % | 5.1 | % | 35.3 | % | 14.9 | % | n/a | |||||||||||||
| Ecovyst Inc. | 10.4 | % | 5.1 | % | 4.2 | % | 24.3 | % | 11.7 | % | 6.0 | % | ||||||||||||
| EcoSynthetix Inc. | n/a | n/a | n/a | n/a | n/a | n/a | ||||||||||||||||||
| Loop Industries, Inc. | 53.1 | % | 308.1 | % | 3304.8 | % | -6.6 | % | -44.2 | % | -0.5 | % | ||||||||||||
| Average | 10.5 | % | 71.7 | % | 501.4 | % | -0.1 | % | -34.6 | % | 44.6 | % | ||||||||||||
| Median | 3.8 | % | 5.1 | % | 5.1 | % | 7.3 | % | 7.5 | % | 7.0 | % | ||||||||||||
Sources: S&P Capital IQ, SEC Filings, Annual and Interim Reports, Investor Presentations
| 2024A | 2025E | 2026E | 2027E | TTM | TTM Capital |
|||||||||||||||||||
| EBITDA | EBITDA | EBITDA | EBITDA | Debt/ | Expenditure / | |||||||||||||||||||
| Margin | Margin | Margin | Margin | Total Capital | Revenue | |||||||||||||||||||
| Eastman Chemical Company | 20.2 | % | 19.5 | % | 20.1 | % | 20.5 | % | 37.2 | % | 6.4 | % | ||||||||||||
| Celanese Corporation | 17.5 | % | 20.6 | % | 22.0 | % | 23.0 | % | 71.5 | % | 4.2 | % | ||||||||||||
| PureCycle Technologies, Inc. | n/a | -62.6 | % | 34.9 | % | 41.9 | % | 24.7 | % | n/a | ||||||||||||||
| Ingevity Corporation | 26.6 | % | 29.3 | % | 30.2 | % | 31.0 | % | 52.9 | % | 5.5 | % | ||||||||||||
| Stepan Company | 8.4 | % | 10.8 | % | 11.7 | % | n/a | 36.8 | % | 5.6 | % | |||||||||||||
| Ecovyst Inc. | 27.7 | % | 31.1 | % | 33.1 | % | 33.7 | % | 57.0 | % | 9.8 | % | ||||||||||||
| EcoSynthetix Inc. | -12.4 | % | n/a | n/a | n/a | 0.0 | % | 4.7 | % | |||||||||||||||
| Loop Industries, Inc. | -13865.4 | % | -8460.6 | % | -1156.7 | % | -33.8 | % | 10.4 | % | 69.0 | % | ||||||||||||
| Average | -1968.2 | % | -1201.7 | % | -143.5 | % | 19.4 | % | 36.3 | % | 15.0 | % | ||||||||||||
| Median | 17.5 | % | 19.5 | % | 22.0 | % | 27.0 | % | 37.0 | % | 5.6 | % | ||||||||||||
Sources: S&P Capital IQ, SEC Filings, Annual and Interim Reports, Investor Presentations
| EV/ | EV/ | EV/ | EV/ | EV/ | EV/ | |||||||||||||||||||
| TTM | 2025E | 2026E | TTM | 2025E | 2026E | |||||||||||||||||||
| EBITDA | EBITDA | EBITDA | Revenue | Revenue | Revenue | |||||||||||||||||||
| Eastman Chemical Company | 1.36 | (x) | 6.83 | (x) | 6.4 | (x) | 1.36 | (x) | 1.33 | (x) | 1.29 | (x) | ||||||||||||
| Celanese Corporation | 1.6 | (x) | 8.19 | (x) | 7.34 | (x) | 1.6 | (x) | 1.69 | (x) | 1.62 | (x) | ||||||||||||
| PureCycle Technologies, Inc. | n/a | n/a | 29.55 | (x) | n/a | 27.8 | (x) | 10.31 | (x) | |||||||||||||||
| Ingevity Corporation | 1.7 | (x) | 5.95 | (x) | 5.53 | (x) | 1.7 | (x) | 1.74 | (x) | 1.67 | (x) | ||||||||||||
| Stepan Company | .73 | (x) | 6.45 | (x) | 5.61 | (x) | .73 | (x) | .7 | (x) | .66 | (x) | ||||||||||||
| Ecovyst Inc. | 1.93 | (x) | 5.61 | (x) | 5.02 | (x) | 1.93 | (x) | 1.75 | (x) | 1.66 | (x) | ||||||||||||
| EcoSynthetix Inc. | 6.67 | (x) | n/a | n/a | 6.67 | (x) | n/a | n/a | ||||||||||||||||
| Loop Industries, Inc. | 423.27 | (x) | n/a | n/a | 423.27 | (x) | 227.67 | (x) | 55.79 | (x) | ||||||||||||||
| Average | 62.47 | (x) | 6.61 | (x) | 9.91 | (x) | 62.47 | (x) | 37.53 | (x) | 10.43 | (x) | ||||||||||||
| Median | 1.7 | (x) | 6.45 | (x) | 6.01 | (x) | 1.7 | (x) | 1.74 | (x) | 1.66 | (x) | ||||||||||||
Historical and projected years indicate 12-month periods ending December 31
TTM = Trailing Twelve Months
EV: Enterprise Value = Market capitalization plus debt, net of cash and cash equivalents
Based on the data shown in the tables above, Evans & Evans also selected a range of valuation multiples to apply to a weighting of INMET’s forecast fiscal year 2028 revenue and EBITDA.
Evans & Evans considered the multiple for the INMET GPCs as outlined in the tables above in its determination of reasonable multiples for INMET given the INMET GPCs relative similarities to INMET. Evans & Evans analyzed historical results and forecast growth rates of the INMET GPCs and compared these metrics to those of INMET for its first years of commercialization. Evans & Evans used these comparisons and the multiples of EV to consensus forecast 2027 and 2028 EBITDA and revenue (where available). Evans & Evans selected a forecast EV to EBITDA multiple for INMET of 8.0x to 8.5x and EV to forecast revenue multiple of 3.2x to 4.0x to arrive at an EV range for each set of multiples. Evans & Evans then weighted the two EV ranges resulting in an estimated enterprise value range for INMET. Evans & Evans selected multiples that, in its judgment, reflected INMET’s revenue growth outlook, capital requirements, profit margins, management experience and other characteristics relative to the INMET GPCs. Upon arriving the implied enterprise value, Evans & Evans then deducted the approximately $24.2 million in capital expenditures required to achieve the results and discounted the adjusted enterprise value to the current date using the WACC as outlined below.
Evans & Evans’ GPC Analysis resulted in an estimated equity value range, after adding cash and deducting debt, for INMET of $23.4 million to $25.7 million.
Precedent Transactions Analysis (Market Approach)
Evans & Evans did not identify transactions involving companies with publicly available financial information that Evans & Evans believed, based on its experience and professional judgment, to be generally relevant for purposes of this analysis.
Discounted Cash Flow Analysis (Income Approach)
Evans & Evans performed a DCF analysis of INMET using a financial forecast provided by INMET management to calculate the estimated present value of the future unlevered after-tax free cash flows projected to be generated by INMET through the end of fiscal year 2029. As of fiscal 2029, INMET’s results are expected to stabilize as the first plant will reach capacity.
Evans & Evans assessed the reasonableness of the INMET model by comparing INMET’s revenue growth, EBITDA growth, and EBITDA margins of the INMET GPCs and professional judgment. Capital expenditures considered in the analysis were provided by INMET management for the start up and thereafter were estimated by Evans & Evans based on industry benchmarking. Annual working capital requirements were based on benchmarking of the INMET GPCs and professional judgement. Evans & Evans assumed that annually INMET would require an amount of debt-free-net-working capital of 15%.
In developing the CSRP Evans & Evans considered (i) historical financial performance and growth; (ii) country specific risks related to inflation and defaults; and (iii) risks facing INMET in order to achieve projected results, including execution risk, financing, tariffs, regulatory and competitive risks, among others. Evans & Evans also considered the experience of the management team and the ability to secure future financing to fund operations given the current debt level. Based on these factors, Evans & Evans used discount rates ranging from 22% to 24% to discount the projected unlevered free cash flows and the terminal value. Evans & Evans believes that this range of discount rates is consistent with the rate of return that shareholders would require on alternative investment opportunities with similar risk profiles, including risks of achieving the projected cash flows based. In developing the discount rate, Evans & Evans considered a capital structure of 40% debt and 60% equity based on benchmarking of the INMET GPCs and professional judgement.
In determining the unlevered cash flows, Evans & Evans deducted approximately $25.4 million in capital expenditures over the approximately five years.
A tax rate of approximately 35% was used in the analysis along with an expected LTGR of 2.0% and an industry beta of 1.2.
In performing the DCF analysis of INMET Evans & Evans considered a terminal value multiple of 4.9x free cash flow in the terminal year as a midpoint. The terminal multiple was compared to the EBITDA multiples of the selected GPCs and was found to be in line with current multiples given INMET’s risk profile. The equity value of INMET under the DCF Analysis was determined to be in the range of $nil to $500,000 given the significant capital expenditures in the short-term and the timeline to stabilized EBITDA.
After-tax free cash flows from each period in each set were discounted to April 7, 2025 using the mid-period convention.
A sensitivity analysis on INMET’s EV was calculated as outlined below using various LTGRs and discount rates.
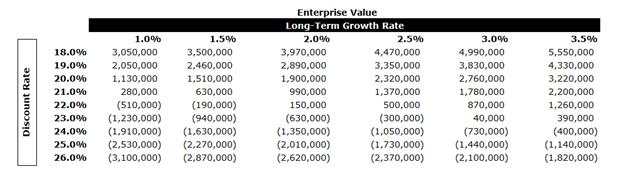
INMET Conclusion
Evans & Evans calculated the equity value of INMET using the DCF Analysis and the GPC Analysis. Evans & Evans then weighted the two equity value ranges to calculate an equity value of $12.0 million to $13.0 million.
Overall Conclusion
Upon arriving at the equity values for each of the Contributed Entities and the determining the equity value of the ownership being acquired under the BCA, Evans & Evans calculated the consideration being issued by Moolec in the form of Moolec common stock and the assumption of debt. For each of the entities outlined above, Evans & Evans deducted net debt (i.e., cash less debt) from the EV to arrive at the equity value. The additional debt assumed by Moolec results from the acquisition of the Bioceres Holdings. Evans & Evans then compared the value of the consideration being offered based on the calculated value of Moolec and based on the current market price in arriving its conclusions as to fairness.
General
In connection with Evans & Evans’ services as a financial advisor to the Moolec board of directors, Moolec agreed to pay, and has paid in full, Evans & Evans an aggregate fee of $75,000. In addition, Moolec has agreed to reimburse certain of Evans & Evans’ expenses arising, and to indemnify Evans & Evans against certain liabilities that may arise, out of Evans & Evans’ engagement.
Evans & Evans, as part of its corporate finance advisory business, is continually engaged in the valuation of businesses and their securities in connection with mergers and acquisitions, private placements, leveraged buyouts, and valuations for estate, corporate and other purposes. In the two-year period prior to the date of Evans & Evans’ opinion, Evans & Evans has not provided any investment banking services to Moolec. In the two-year period prior to the date of Evans & Evans’ opinion, Evans & Evans has not been engaged to provide financial advisory or other services to Moolec and Evans & Evans has not received any compensation from Moolec during this period. In addition, in the ordinary course, Evans & Evans’ employees may trade securities of Moolec, the Contributed Entities and certain of their respective affiliates for their own accounts and, accordingly, may at any time hold a long or short position in such securities. The issuance of Evans & Evans’ opinion was approved by the Principal and Managing Parter of Evans & Evans.
Evans & Evans is a Canadian boutique investment banking firm with offices and affiliates in Canada, the United States and Asia. It offers a range of independent and advocate services including mergers & acquisitions advice, valuation and fairness opinions, business due diligence, business planning and market research. Since 1989, Evans & Evans has worked in a broad range of sectors locally, regionally and internationally. As chartered business valuators and accredited senior appraisers, Evans & Evans is actively involved in the areas merger & acquisitions and preparing valuations and fairness opinions in connection with mergers and acquisitions and other corporate transactions. Evans & Evans was selected to act as financial advisor to Moolec because of its qualifications, expertise and reputation in the valuation industry and experience with companies similar to Moolec.
Legal and Accounting Treatment of the Business Combination
Legal Treatment of the Business Combination
Pursuant to the terms of the BCA and from a legal perspective, the Business Combination has been structured as a forward acquisition by Moolec (Cayman Islands) of the Contributed Entities. The Business Combination does not constitute a merger from a legal or corporate perspective. Following the Closing of the Business Combination, Moolec (Cayman Islands) will hold each of the Contributed Entities as wholly-owned subsidiaries and will continue to be the registrant with reporting obligations to the SEC and the entity listed on Nasdaq. The issuance of Shares and warrants of Moolec (Cayman Islands) in exchange for the shares of the Contributed Entities is expected to be structured as an offshore transaction in reliance on Regulation S under the Securities Act of 1933.
Accounting Treatment of the Business Combination
The financial statements included in the Form 6-K have been prepared in accordance with IFRS Accounting Standards (“IFRS”), as issued by the International Accounting Standards Board (“IASB”). The Business Combination described in this disclosure statement has been accounted for as a reverse acquisition under IFRS 3, Business Combinations.
Under IFRS 3, a reverse acquisition occurs when the legal acquirer is identified as the accounting acquiree, and the accounting acquirer is identified as the legal acquiree. In this transaction, Moolec (Cayman Islands) (the “Acquirer”) has been identified as the legal acquirer, but Bioceres Group (the “Target”) is considered the accounting acquirer because it will be deemed to obtain control of the combined entity, due among others to its larger relative size and the ability to direct operations.
As a result, the Business Combination has been accounted for as a reverse acquisition, where the financial statements reflect the assets, liabilities, and operations of the Target as if it had acquired the Acquirer. The financial information of the Target will be presented, with the results of operations for the combined entity being reported as if the Target had been the acquirer. This accounting treatment results in a revaluation of the Acquirer’s assets and liabilities at fair value as of the acquisition date.
After Closing, the financial statements will reflect the consolidated financial position and results of operations of the Target and the Acquirer, including the fair value adjustments made at the acquisition date. The legal acquirer’s equity structure will be presented as that of the accounting acquiree, and the consolidated financial statements include the financial position and results of operations of the accounting acquirer (Target) and the legal acquirer (Acquirer) from the date of the Business Combination.
In accordance with IFRS 3, goodwill arising from the reverse acquisition represents the difference between the fair value of the consideration transferred by the accounting acquirer (Target) and the fair value of the identifiable assets and liabilities of the legal acquirer (Acquirer) at the Business Combination. Any identifiable intangible assets acquired will be recorded at fair value at the date of the Business Combination.
Material Tax Considerations
Certain U.S. Federal Income Tax Considerations
The following is a summary of certain U.S. federal income tax considerations in respect of the Business Combination. The discussion below does not cover all aspects of U.S. federal income taxation that may be relevant to, or the actual tax effect that any of the matters described herein will have on particular investors, and does not address state, local, non-U.S. or other tax laws (such as estate or gift tax laws). This summary also does not describe all of the tax consequences that may be relevant to holders that own (directly, indirectly or by attribution) 10% or more of the Shares by vote or value, nor does this summary discuss all of the tax considerations that may be relevant to certain types of holders subject to special rules under the U.S. federal income tax laws, such as financial institutions or financial services entities; insurance companies; entities or arrangements treated as partnerships for U.S. federal income tax purposes, individual retirement accounts or other tax-deferred accounts; regulatory agencies or instrumentalities thereof; regulated investment companies and real estate investment trusts; persons that have ceased to be U.S. citizens or lawful permanent residents of the United States; U.S. citizens or lawful permanent residents living abroad; persons that acquired Shares pursuant to an exercise of employee share options, in connection with employee share incentive plans or otherwise as compensation; dealers or traders subject to a mark-to-market method of tax accounting with respect to the Shares; persons holding Shares as part of a “straddle,” constructive sale, hedging transactions, integrated transactions or similar transactions for U.S. federal income tax purposes; U.S. holders whose functional currency is not the U.S. dollar; holders that are controlled foreign corporations or passive foreign investment companies; or tax-exempt organizations.
This discussion is based on the tax laws of the United States, including the U.S. Internal Revenue Code of 1986, as amended (the “Code”), its legislative history, existing and proposed Treasury regulations thereunder, published rulings and court decisions, all as of the date hereof and all subject to change at any time, possibly with retroactive effect. No rulings have been requested from the U.S. Internal Revenue Service (the “IRS”) and there can be no guarantee that the IRS would not challenge, possibly successfully, the treatment described below.
THE SUMMARY OF U.S. FEDERAL INCOME TAX CONSEQUENCES SET OUT BELOW IS FOR GENERAL INFORMATION ONLY. ALL HOLDERS SHOULD CONSULT THEIR TAX ADVISORS AS TO THE PARTICULAR TAX CONSEQUENCES TO THEM OF THE BUSINESS COMBINATION, INCLUDING THE APPLICABILITY AND EFFECT OF STATE, LOCAL, NON-U.S. AND OTHER TAX LAWS AND POSSIBLE CHANGES IN TAX LAW.
The Business Combination will involve certain contributions that should be treated as taxable exchanges for the contributing shareholders—whereby the contributing shareholders would be treated as exchanging shares in the Contributed Entities in exchange for Shares—and certain contributions that should be treated as tax-deferred reorganizations described under Section 368(a) of the Code, in each case, for U.S. federal income tax purposes. Notwithstanding that certain contributions under the Business Combination are expected to be treated as taxable exchanges, the Business Combination is not expected to result in Moolec (Cayman Islands) recognizing income that would be subject to U.S. federal income tax.
Additionally, the Business Combination should not result in a recognition of any taxable gain or loss for Moolec (Cayman Islands)’s current shareholders. Moolec (Cayman Islands)’s current shareholders should continue to have the same tax basis in, and holding period for, Shares as they had prior to the Business Combination.
THE BUSINESS COMBINATION AGREEMENT
The Business Combination Agreement
The BCA was signed on April 17, 2025 among Moolec, the Bioceres Group shareholders, Union Group, Nordelis, Bioceres Group, Theo, Gentle Tech and Nutrecon (collectively, the “Parties”). The Board approved the Business Combination and authorized execution of the BCA on April 16, 2025. For an overview of the Business Combination, including a summary of the terms of the BCA relating to consideration, applicable deductions and the holdback, see the section entitled “Summary of the Business Combination—Overview of the Business Combination.” The following summarizes the other material provisions of the BCA. This summary should be read together with the full text of the BCA, which is included in Exhibit 99.2 to the Form 6-K.
Conditions precedent to Closing
The obligation of the Parties to consummate the Business Combination are subject to the satisfaction or waiver of customary closing conditions at or prior to Closing, including (i) the approval of the Business Combination by Moolec’s shareholders; (ii) Moolec’s completion of (x) the reverse share split, and (y) its change of jurisdiction by discontinuing from the Grand Duchy of Luxembourg and transferring by way of continuation to the Cayman Islands as an exempted company limited by shares registered under the laws of the Cayman Islands; (iii) the cancelation of awards approved by the Board on December 12, 2024, (iv) the approval by Moolec and its shareholders of 1,465,757 stock options to be accelerated and converted to Shares at $2.00 per share and the related Shares shall be issued prior to Closing and (v) the adherence by the totality of the Bioceres Group shareholders to the BCA, including by means of the drag along rights set out in Bioceres Group’s new articles of association adopted by a special resolution of certain Bioceres Group shareholders at a general shareholders meeting held on April 1, 2025.
The obligations of the Parties to consummate the Business Combination are subject to certain additional conditions at or prior to closing, including (i) the accuracy of certain representations and warranties of the Parties; (ii) the performance or compliance in all material respects with all agreements and covenants required by the BCA; (iii) the delivery of certifications as to the satisfaction of the conditions; and (iv) the absence of a material adverse effect in connection with the Contributed Entities.
Representations and Warranties
The BCA contains customary representations and warranties of certain Bioceres Group shareholders, Nordelis, Union Group and the Contributed Entities, including but not limited to Bioceres Group, relating to, among other things, their ability to enter into the BCA. The representations and warranties of the Parties contained in the BCA will terminate and be of no further force and effect as of the Closing, expect for the representations and warranties contained in sections 3, 4 and 8 of the BCA, which shall survive for a period ending on the first anniversary of the Closing.
Covenants
The BCA contains customary covenants of the Parties, including, among others, covenants providing for (i) the operation of the Parties’ respective businesses prior to consummation of the Business Combination, and (ii) the Parties’ efforts to satisfy conditions to consummate the Business Combination. The covenants of the Parties contained in the BCA will terminate and be of no further force and effect as of the Closing of the Business Combination, except for those covenants that by their terms require performance after Closing.
Squeeze Out Rights
In the event that any of the Bioceres Group ordinary shares are to be transferred to Moolec pursuant to the “squeeze out” rights in section 979 Companies Act 2006, Moolec and Bioceres Group will comply with statutory procedures outlined for transferring shares of Bioceres Group pursuant to such “squeeze out” rights. This process ensures lawful execution of shares transferred under the squeeze out provisions, safeguarding Moolec’s consolidation efforts. The BCA does not apply to the transfer of squeezed shares. Any sections in the BCA or associated agreements pertaining to squeezed shares are disregarded, provided the shares are transferred under the legal squeeze out procedure. This exclusion ensures the statutory process can proceed unimpeded by contractual provisions. Holders of squeezed shares are not obligated by terms of the BCA unless they are involved in a capacity other than as holders of squeezed shares.
Termination
The BCA can be terminated any time before Closing under the following conditions:
| (i) | by a written agreement among Moolec, the Bioceres Group shareholders’ representative (the “Representative”), Union Group and Nordelis; |
| (ii) | by either Moolec, the Representative, Union Group or Nordelis with written notice to the other Parties if the planned Business Combination is not completed by 5:00 p.m. (UTC-3) on September 9, 2025, unless mutually agreed in writing by the involved Parties to extend this date; |
| (iii) | by either Moolec, the Representative, Union Group or Nordelis with written notice to the other Parties if a governmental authority has issued an order that permanently restrains, enjoins, or otherwise blocks the completion of the transactions planned by the BCA, and this order is final and non-appealable, despite the Parties’ commercially reasonable efforts to lift the order; and |
| (iv) | by either Moolec, the Representative, Union Group or Nordelis with written notice to the other Parties if an event, fact, or condition arises that makes it impossible to fulfil a condition required for the terminating party to complete the transactions under the BCA, unless this event is due to the terminating party neglecting to fulfil or comply with any prior obligations, agreements, or conditions under the BCA. |
If the BCA is terminated as described above, it will become void with no further effect, eliminating liability for any Party or its subsidiaries, affiliates, or representatives concerning the BCA or the transactions it contemplates. Exceptions apply as detailed in sections 11.1, 11.7, 11.14, and 11.15 of the BCA, and for any liability arising from a Party’s breach of the BCA.
Post-closing carve-out of Theo
Pursuant to the BCA, after Closing, Moolec (Cayman Islands) has the obligation to complete the Theo Carve-Out. The Theo Carve-Out involves transferring the 96.2% interest that Bioceres Group holds in Theo to the Bioceres Group shareholders based on their proportionate shareholding in Bioceres Group immediately prior to the Closing of the Business Combination. The Theo Carve-Out must be completed by Moolec (Cayman Islands) within 12 months following the Closing.
Shareholder Approval Required for Closing
Bioceres Group
On April 1, 2025, Bioceres Group held a general shareholders meeting to discuss and approve the following special resolutions: (i) re-register Bioceres Group as a private company limited by shares within the meaning of the Companies Act 2006, (ii) change the name of Bioceres Group PLC to Bioceres Group Limited, and (iii) adopt new articles of association for Bioceres Group, including drag along rights. Special resolutions require at least 75% of the votes cast to be in favor of the resolution. Votes withheld do not count towards the total votes cast for or against a resolution. All three resolutions were unanimously approved by the votes cast at the general shareholders meeting, and the re-registration of Bioceres Group PLC as a private company limited by shares took effect on April 9, 2025.
Further, with regard to the execution of the BCA, Bioceres Group sent a circular to its shareholders on March 7, 2025 to present the BCA structure and request that the shareholders grant a power of attorney (the “Power of Attorney”) to the Representative allowing the Representative to sign the BCA on their behalf. From March 7, 2025 through the signing of the BCA, shareholders representing approximately 87% of Bioceres Group’s share capital have granted the Power of Attorney to the Representative pursuant to which the Representative signed the BCA. The board of directors of Bioceres Group approved the Business Combination and authorized execution of the BCA on April 2, 2025. No other Bioceres Group shareholder approvals are required for the Closing of the Business Combination.
Moolec
Although not required to do so, Moolec intends to put the Business Combination to a shareholder vote at an extraordinary general meeting, such vote to be passed by way of ordinary resolution of the shareholders of Moolec. Under the articles of association of Moolec proposed to be adopted by Moolec on effectiveness of the Redomiciliation, a simple majority (i.e., more than 50%) of votes cast by members who (being entitled to do so) vote in person or by proxy at an extraordinary general meeting must be obtained to approve a shareholder resolution of this type at an extraordinary general meeting. Given that together Bioceres Group, Union Group and their affiliates hold more than 50% of the voting capital of Moolec, we expect the Business Combination to be approved at the extraordinary general meeting that will be convened within a short period after the signing of the BCA.
SUMMARY HISTORICAL FINANCIAL INFORMATION FOR BIOCERES GROUP PLC
The following tables present Bioceres Group’s summary historical financial data, prepared in accordance with IFRS, on a consolidated basis, as of and for the periods indicated below. The financial information as of June 30, 2024 and 2023 and for the years ended June 30, 2024, 2023 and 2022 has been derived from and should be read in conjunction with the audited consolidated financial statements of Bioceres Group and the accompanying notes thereto included in Exhibit 99.3 to the Form 6-K. The financial information as of December 31, 2024 and for the six months ended December 31, 2024 and 2023 has been derived from and should be read in conjunction with the interim unaudited consolidated financial statements of Bioceres Group and the accompanying notes thereto included in Exhibit 99.4 to the Form 6-K.
| As of December 31, 2024 |
As of June 30, 2024 |
As of June 30, 2023 |
||||||||||
| (In US$ except as otherwise indicated) | ||||||||||||
| ASSETS | ||||||||||||
| NON-CURRENT ASSETS | ||||||||||||
| Other financial assets | 373,520 | 190,517 | 1,826 | |||||||||
| Other receivables | 27,128,645 | 27,887,034 | 8,022,723 | |||||||||
| Income taxes | 15,379 | 10,889 | 24,486 | |||||||||
| Deferred tax assets | 19,975,796 | 14,476,230 | 28,433,321 | |||||||||
| Investments in joint ventures and associates | 64,991,989 | 92,795,851 | 118,342,963 | |||||||||
| Property, plant and equipment | 74,935,727 | 74,612,434 | 68,159,339 | |||||||||
| Investment properties | 560,783 | 560,783 | 3,589,749 | |||||||||
| Intangible assets | 176,760,919 | 177,331,280 | 175,292,219 | |||||||||
| Goodwill | 112,163,432 | 112,163,432 | 112,163,432 | |||||||||
| Right of use asset | 16,335,484 | 11,601,752 | 13,936,575 | |||||||||
| Total non-current assets | 493,241,674 | 511,630,202 | 527,966,633 | |||||||||
| CURRENT ASSETS | ||||||||||||
| Cash and cash equivalents | 33,201,142 | 52,994,865 | 49,265,020 | |||||||||
| Other financial assets | 9,597,877 | 14,667,607 | 19,829,014 | |||||||||
| Trade receivables | 228,437,463 | 209,007,195 | 159,376,782 | |||||||||
| Other receivables | 38,376,133 | 34,657,383 | 38,197,456 | |||||||||
| Recoverable income tax | 1,500,924 | 655,691 | 9,537,799 | |||||||||
| Inventories | 101,809,489 | 125,929,768 | 140,437,616 | |||||||||
| Biological assets | 4,398,841 | 294,134 | 146,842 | |||||||||
| Total current assets | 417,321,869 | 438,206,643 | 416,790,529 | |||||||||
| Total assets | 910,563,543 | 949,836,845 | 944,757,162 | |||||||||
| As of December 31, 2024 |
As of June 30, 2024 |
As of June 30, 2023 |
||||||||||
| (In US$ except as otherwise indicated) | ||||||||||||
| EQUITY | ||||||||||||
| Issued capital | 2,382,321 | 2,371,453 | 2,096,534 | |||||||||
| Own shares held | (444,473 | ) | (444,473 | ) | - | |||||||
| Shares trading premium | (7,020,546 | ) | (7,289,991 | ) | (13,587,790 | ) | ||||||
| Stock options and share based incentives | 6,645,791 | 6,222,175 | 1,853,856 | |||||||||
| Retained deficit/earnings | (31,960,439 | ) | 1,142,761 | 33,828,159 | ||||||||
| Revaluation of property, plant and equipment reserve | (1,323,916 | ) | (1,323,916 | ) | (1,323,916 | ) | ||||||
| Foreign currency translation reserve | (782,649 | ) | 534,827 | 724,779 | ||||||||
| Equity attributable to owners of the parent | (32,503,911 | ) | 1,212,836 | 23,591,622 | ||||||||
| Non-controlling interest | 244,356,305 | 248,788,534 | 234,978,480 | |||||||||
| Total equity | 211,852,394 | 250,001,370 | 258,570,102 | |||||||||
| LIABILITIES | ||||||||||||
| NON-CURRENT LIABILITIES | ||||||||||||
| Borrowings | 151,769,309 | 127,248,305 | 152,445,700 | |||||||||
| Deferred revenue and advances from customers | 1,879,736 | 1,925,138 | 2,057,805 | |||||||||
| Government grants | 1,986 | 782 | 127,285 | |||||||||
| Joint ventures and associates | 749,269 | 296,455 | 622,823 | |||||||||
| Deferred tax liabilities | 32,950,920 | 34,500,445 | 53,272,466 | |||||||||
| Provisions | 17,307,170 | 17,484,715 | 16,901,773 | |||||||||
| Consideration for acquisition | 1,929,241 | 2,005,143 | 3,166,720 | |||||||||
| Convertible notes | 83,400,171 | 80,809,686 | 75,213,146 | |||||||||
| Lease liabilities | 10,848,789 | 8,161,359 | 10,030,524 | |||||||||
| Total non-current liabilities | 300,836,591 | 272,432,028 | 313,838,242 | |||||||||
| CURRENT LIABILITIES | ||||||||||||
| Trade and other payables | 144,082,550 | 168,937,536 | 151,520,304 | |||||||||
| Borrowings | 228,081,833 | 234,510,751 | 180,000,607 | |||||||||
| Employee benefits and social security | 8,421,333 | 7,506,831 | 9,950,862 | |||||||||
| Deferred revenue and advances from customers | 2,931,008 | 3,924,801 | 24,893,396 | |||||||||
| Income tax payable | 5,898,060 | 4,825,271 | 509,034 | |||||||||
| Government grants | 4,933 | 3,655 | 222,713 | |||||||||
| Consideration for acquisition | 3,165,618 | 4,571,824 | 1,393,203 | |||||||||
| Lease liabilities | 5,289,223 | 3,122,778 | 3,858,699 | |||||||||
| Total current liabilities | 397,874,558 | 427,403,447 | 372,348,818 | |||||||||
| Total liabilities | 698,711,149 | 699,835,475 | 686,187,060 | |||||||||
| Total equity and liabilities | 910,563,543 | 949,836,845 | 944,757,162 | |||||||||
| For the six-months ended December 31, 2024 |
For the six-months ended December 31, 2023 |
For the year ended June 30, 2024 |
For the year ended June 30, 2023 |
For the year ended June 30, 2022 |
||||||||||||||||
| (In US$ except as otherwise indicated) | ||||||||||||||||||||
| Revenues from contracts with customers | 199,478,869 | 256,984,240 | 466,376,330 | 420,867,429 | 329,517,122 | |||||||||||||||
| Government grants | 10,154 | 74,723 | 197,519 | 93,509 | 120,693 | |||||||||||||||
| Initial recognition and changes in the fair value of biological assets at the point of harvest | 588,053 | 338,128 | (45,746 | ) | 610,554 | 6,388,030 | ||||||||||||||
| Cost of sales | (117,374,985 | ) | (160,375,954 | ) | (279,368,328 | ) | (235,464,072 | ) | (208,371,368 | ) | ||||||||||
| Changes in the net realizable value of agricultural products after harvest | (204,910 | ) | (2,192,558 | ) | (2,385,069 | ) | (4,351,433 | ) | (42,523 | ) | ||||||||||
| Research and development expenses | (8,797,433 | ) | (8,605,575 | ) | (17,422,487 | ) | (15,943,987 | ) | (7,378,941 | ) | ||||||||||
| Selling, general and administrative expenses | (64,731,412 | ) | (66,145,040 | ) | (126,340,822 | ) | (116,531,274 | ) | (84,336,898 | ) | ||||||||||
| Share of profit or loss of joint ventures and associates | (27,778,758 | ) | (21,206,303 | ) | (21,023,150 | ) | 47,709,605 | (1,000,737 | ) | |||||||||||
| Other income or expenses, net | 164,944 | (2,398,240 | ) | (703,265 | ) | 1,055,299 | (3,304,166 | ) | ||||||||||||
| Operating loss | (18,645,478 | ) | (3,526,579 | ) | 19,284,982 | 98,045,630 | 31,591,212 | |||||||||||||
| Financial cost | (20,183,299 | ) | (16,757,516 | ) | (37,498,668 | ) | (33,576,632 | ) | (22,762,427 | ) | ||||||||||
| Other financial results | (1,086,189 | ) | (10,980,849 | ) | (9,744,466 | ) | (13,674,756 | ) | (11,790,899 | ) | ||||||||||
| Loss before income tax | (39,914,966 | ) | (31,264,944 | ) | (27,958,152 | ) | 50,794,242 | (2,962,114 | ) | |||||||||||
| Income tax | 3,091,074 | (7,444,529 | ) | (1,103,152 | ) | 2,328,366 | (17,026,303 | ) | ||||||||||||
| Loss for the year | (36,823,892 | ) | (38,709,473 | ) | (29,061,304 | ) | 53,122,608 | (19,988,417 | ) | |||||||||||
| Other comprehensive income | ||||||||||||||||||||
| Items that may be subsequently reclassified to profit and loss | (1,518,743 | ) | 6,579,570 | (1,092,833 | ) | (911,896 | ) | 28,568,482 | ||||||||||||
| Foreign exchange differences on translation of foreign operations from joint ventures | (477,918 | ) | 1,250,603 | 977,482 | (46,541 | ) | 1,645,772 | |||||||||||||
| Foreign exchange differences on translation of foreign operations | (1,040,825 | ) | 5,328,967 | (2,070,315 | ) | (865,355 | ) | 26,922,710 | ||||||||||||
| Items that will not be subsequently reclassified to loss and profit | - | - | - | (1,467,349 | ) | (6,017,329 | ) | |||||||||||||
| Revaluation of property, plant and equipment, net of tax, of joint ventures and associates | - | - | - | (184,630 | ) | (586,268 | ) | |||||||||||||
| Revaluation of property, plant and equipment, net of tax | - | - | - | (1,282,719 | ) | (5,431,061 | ) | |||||||||||||
| Total comprehensive loss | (38,342,635 | ) | (32,129,903 | ) | (30,154,137 | ) | 50,743,363 | 2,562,736 | ||||||||||||
| Loss for the period attributable to: | ||||||||||||||||||||
| Equity holders of the parent | (33,103,200 | ) | (36,504,783 | ) | (32,685,398 | ) | 40,435,923 | (6,607,764 | ) | |||||||||||
| Non-controlling interests | (3,720,692 | ) | (2,204,690 | ) | 3,624,094 | 12,686,685 | (13,380,653 | ) | ||||||||||||
| (36,823,892 | ) | (38,709,473 | ) | (29,061,304 | ) | 53,122,608 | (19,988,417 | ) | ||||||||||||
| Total comprehensive loss attributable to: | ||||||||||||||||||||
| Equity holders of the parent | (34,420,676 | ) | (30,785,132 | ) | (32,875,350 | ) | 39,068,323 | (5,839,301 | ) | |||||||||||
| Non-controlling interests | (3,921,959 | ) | (1,344,771 | ) | 2,721,213 | 11,675,040 | (9,128,109 | ) | ||||||||||||
| (38,342,635 | ) | (32,129,903 | ) | (30,154,137 | ) | 50,743,363 | (14,967,410 | ) | ||||||||||||
| Weighted average number of shares | 19,038,163 | 18,046,322 | 18,481,014 | 14,581,657 | 2,197,716 | |||||||||||||||
| Loss per share | ||||||||||||||||||||
| Basic loss attributable to ordinary equity holders of the parent | (1.7388 | ) | (2.0228 | ) | (1.7686 | ) | 2.7731 | (3.0067 | ) | |||||||||||
| Diluted loss attributable to ordinary equity holders of the parent | (1.7388 | ) | (2.0228 | ) | (1.7686 | ) | 2.7731 | (3.0067 | ) | |||||||||||
UNAUDITED PRO FORMA CONDENSED COMBINED CONSOLIDATED FINANCIAL INFORMATION
Introduction
Moolec is providing the following unaudited pro forma condensed combined financial information to aid you in your analysis of the financial aspects of the BCA.
The following unaudited pro forma consolidated financial information is presented to give effect to the BCA. For more information about the Business Combination see the section titled “The Business Combination.”. The unaudited pro forma consolidated statement of financial position as of December 31, 2024, the unaudited pro forma consolidated statement of income for the six-months ended December 31, 2024 and the unaudited pro forma consolidated statement of income for the year ended June 30, 2024 (together, the “Unaudited Pro Forma Information”) are based upon, derived from, and should be read in conjunction with (i) the Moolec 2024 Audited Financial Statements, which are included in the Moolec 2024 20-F filed with the SEC on October 30, 2024, (ii) the Bioceres Group 2024 Audited Financial Statements, which are included in this 6-K, (iii) the Moolec December 2024 Interim Unaudited Financial Statements, which are included in the Form 6-K and (iv) the Bioceres Group December 2024 Interim Unaudited Financial Statements, which are included in the Form 6-K.
The accompanying Unaudited Pro Forma Information give effect to adjustments that are (i) directly attributable to the Business Combination, (ii) factually supportable, and (iii) with respect to the unaudited pro forma consolidated statement of income, expected to have a continuing impact on the consolidated results. The unaudited pro forma consolidated statement of financial position assumes that the Business Combination was consummated on December 31, 2024, the unaudited pro forma consolidated income statements assume that the Business Combination was consummated on July 1, 2023.
The BCA will be accounted for as a business combination using the acquisition method of accounting under the provisions of IFRS 3 “Business Combinations” (“IFRS 3”), with Bioceres Group determined to be the accounting acquirer under this guidance.
Under IFRS 3, all assets acquired and liabilities assumed are generally recorded at their acquisition date fair value. For the purposes of preparing the Unaudited Pro Forma Information, the fair value of Moolec’s identifiable tangible and intangible assets acquired and liabilities assumed are based on a preliminary estimate of fair value. Certain preliminary estimates were used which will be updated upon finalization of the purchase accounting in our historical financial statements for periods reflecting the acquisition. Management believes the estimated fair values used for the assets to be acquired and liabilities to be assumed are based on reasonable assumptions. Preliminary fair value estimates may change as additional information becomes available and such changes could be material.
The Unaudited Pro Forma Information has been prepared by management in accordance with the bases outlined herein and is not necessarily indicative of the consolidated financial position or results of operations that would have been realized had the Business Combination occurred as of the dates indicated, nor is it meant to be indicative of any anticipated consolidated financial position or future results of operations that we will experience after the Business Combination. In addition, the accompanying unaudited pro forma consolidated statements of income do not include any expected cost savings or operating synergies, which may be realized subsequent to the Business Combination or integration-related items.
We prepared the following Unaudited Pro Forma Information in accordance with Article 11 or Regulation S-X by applying certain pro forma adjustments to Moolec and Bioceres Group historical consolidated financial statements. We have based the pro forma adjustments on available information and certain assumptions that we believe are reasonable under the circumstances. The actual adjustments to the Moolec consolidated financial statements for future periods will depend upon a number of factors and additional information that is not yet available. Accordingly, the actual adjustments that will appear in the Moolec consolidated financial statements for future periods will differ from these pro forma adjustments, and those differences may be material.
UNAUDITED PROFORMA CONDENSED COMBINED STATEMENTS
OF OPERATIONS
FOR THE TWELVE-MONTH PERIOD ENDED JUNE 30, 2024
(In United States Dollars)
| Column I Bioceres Group PLC |
Column II Moolec Science SA |
Column III Theo |
Column IV Reclassifications |
Column V Pro-forma Adjustments |
Ref | Column VI Pro-forma consolidated combined information |
||||||||||||||||||||
| Revenues from contracts with customers | 466,376,330 | 5,625,124 | - | - | - | 472,001,454 | ||||||||||||||||||||
| Government Grants | 197,519 | - | - | - | - | 197,519 | ||||||||||||||||||||
| Initial recognition and changes in the fair value of biological assets | (45,746 | ) | - | - | - | - | (45,746 | ) | ||||||||||||||||||
| Cost of sales | (279,368,328 | ) | (5,152,543 | ) | - | - | - | (284,520,871 | ) | |||||||||||||||||
| Other Income | - | 495,468 | - | - | - | 495,468 | ||||||||||||||||||||
| Changes in the net realizable value of agricultural products after harvest | (2,385,069 | ) | - | - | - | - | (2,385,069 | ) | ||||||||||||||||||
| Research and development expenses | (17,422,487 | ) | (1,772,273 | ) | - | - | (682,635 | ) | I.b) | (19,877,395 | ) | |||||||||||||||
| Selling, general and administrative expenses | (126,340,822 | ) | (7,522,850 | ) | - | (643,060 | ) | - | (134,506,732 | ) | ||||||||||||||||
| Marketing expenses | - | (643,060 | ) | - | 643,060 | - | - | |||||||||||||||||||
| Share of profit or loss of joint ventures and associates | (21,023,150 | ) | - | 28,770,462 | (19,940 | ) | - | 7,727,372 | ||||||||||||||||||
| Other income or expenses, net | (703,265 | ) | (72,717 | ) | - | - | - | (775,982 | ) | |||||||||||||||||
| Operating profit (loss) | 19,284,982 | (9,042,851 | ) | 28,770,462 | (19,940 | ) | (682,635 | ) | 38,310,018 | |||||||||||||||||
| - | ||||||||||||||||||||||||||
| Other financial results | (9,744,466 | ) | 1,868,964 | - | - | 1,703,223 | I.a) | (6,172,279 | ) | |||||||||||||||||
| Finance costs | (37,498,668 | ) | (1,165,418 | ) | - | - | - | (38,664,086 | ) | |||||||||||||||||
| Share of profit or loss of joint ventures and associates | - | (19,940 | ) | - | 19,940 | - | - | |||||||||||||||||||
| Profit (loss) before income tax | (27,958,152 | ) | (8,359,245 | ) | 28,770,462 | - | 1,020,588 | (6,526,347 | ) | |||||||||||||||||
| Income tax | (1,103,152 | ) | 1,046,985 | - | - | 143,353 | I.c) | 87,186 | ||||||||||||||||||
| Profit (loss) for the period | (29,061,304 | ) | (7,312,260 | ) | 28,770,462 | - | 1,163,941 | (6,439,161 | ) | |||||||||||||||||
| Shares | 18,481,014 | 37,870,351 | - | - | - | 127,831,148 | ||||||||||||||||||||
| Loss per share | (1.77 | ) | (0.19 | ) | - | - | - | (0.05 | ) | |||||||||||||||||
We provide the unaudited pro forma consolidated statements of operations for informational purposes only. The unaudited pro forma consolidated statements of operations do not purport to represent what our results of operations would have been had the Business Combination actually occurred on the assumed dates or project our results of operations for any future period or future date.
UNAUDITED PROFORMA CONDENSED COMBINED STATEMENTS
OF FINANCIAL POSITION
AS OF DECEMBER 31, 2024
(In United States Dollars)
|
Column I Bioceres |
Column II Moolec |
Column III Theo |
Column IV Reclassifications |
Column V Pro-forma Adjustments |
Ref |
Column VI Pro-forma |
|||||||||||||||||||||
| Investments in joint ventures and associates | 64,991,989 | - | (7,087,172 | ) | - | - | 57,904,817 | ||||||||||||||||||||
| Property, plant and equipment | 74,935,727 | 1,263,344 | - | - | - | 76,199,071 | |||||||||||||||||||||
| Intangible assets | 176,760,919 | 9,055,855 | - | - | 33,114,490 | II.b) 1) & II.b) 4) | 218,931,264 | ||||||||||||||||||||
| Goodwill | 112,163,432 | 281,034 | - | - | 28,941,322 | II.b) 1) | 141,385,788 | ||||||||||||||||||||
| Other non-current assets | 64,389,607 | 11,236,528 | - | (8,997,476 | ) | - | 66,628,659 | ||||||||||||||||||||
| Total non-current assets | 493,241,674 | 21,836,761 | (7,087,172 | ) | (8,997,476 | ) | 62,055,813 | 561,049,600 | |||||||||||||||||||
| Cash and cash equivalents | 33,201,142 | 1,929,911 | - | - | - | 35,131,053 | |||||||||||||||||||||
| Trade receivables | 228,437,463 | 1,929,807 | - | - | - | 230,367,270 | |||||||||||||||||||||
| Inventories | 101,809,489 | 4,844,773 | - | - | - | 106,654,262 | |||||||||||||||||||||
| Other current assets | 53,873,775 | 840,111 | - | (2,149,600 | ) | - | 52,564,286 | ||||||||||||||||||||
| Total current assets | 417,321,869 | 9,544,602 | - | (2,149,600 | ) | - | 424,716,871 | ||||||||||||||||||||
| Total assets | 910,563,543 | 31,381,363 | (7,087,172 | ) | (11,147,076 | ) | 62,055,813 | 985,766,471 | |||||||||||||||||||
| Borrowings | 151,769,309 | 19,372,053 | - | (6,796,406 | ) | - | 164,344,956 | ||||||||||||||||||||
| Accounts payable | - | 2,201,070 | - | (2,201,070 | ) | - | - | ||||||||||||||||||||
| Convertible notes | 83,400,171 | - | - | - | - | 83,400,171 | |||||||||||||||||||||
| Other non-current liabilities | 65,667,111 | 553,707 | - | - | 6,954,043 | II.b) 2) | 73,174,861 | ||||||||||||||||||||
| Total non-current liabilities | 300,836,591 | 22,126,830 | - | (8,997,476 | ) | 6,954,043 | 320,919,988 | ||||||||||||||||||||
| Trade and other payables | 144,082,550 | - | - | 2,641,716 | - | 146,724,266 | |||||||||||||||||||||
| Borrowings | 228,081,833 | 2,365,894 | - | - | - | 230,447,727 | |||||||||||||||||||||
| Accounts payable | - | 3,133,610 | - | (3,133,610 | ) | - | - | ||||||||||||||||||||
| Other current liabilities | 25,710,175 | 958,451 | - | - | (126,654 | ) | II.b) 3) | 26,541,972 | |||||||||||||||||||
| Total current liabilities | 397,874,558 | 6,457,955 | - | (491,894 | ) | (126,654 | ) | 403,713,965 | |||||||||||||||||||
| Total liabilities | 698,711,149 | 28,584,785 | - | (9,489,370 | ) | 6,827,389 | 724,633,953 | ||||||||||||||||||||
| Equity attributable to the parent | (32,503,911 | ) | 2,796,578 | (7,087,172 | ) | (1,657,706 | ) | 55,228,424 | II.b) |
16,776,213 | |||||||||||||||||
| Non-controlling interest | 244,356,305 | - | - | - | - | 244,356,305 | |||||||||||||||||||||
| Total equity | 211,852,394 | 2,796,578 | (7,087,172 | ) | (1,657,706 | ) | 55,228,424 | 261,132,518 | |||||||||||||||||||
| Total liabilities and Equity | 910,563,543 | 31,381,363 | (7,087,172 | ) | (11,147,076 | ) | 62,055,813 | 985,766,471 | |||||||||||||||||||
UNAUDITED PRO FORMA CONDENSED COMBINED STATEMENTS
OF OPERATIONS
FOR THE SIX-MONTH PERIOD ENDED DECEMBER 31, 2024
(In United States Dollars)
|
Column I Bioceres |
Column II Moolec Science SA |
Column III Theo |
Column IV Reclassifications |
Column V Pro-forma Adjustments |
Ref | Column VI Pro-forma consolidated combined information |
|||||||||||||||||||||
| Revenues from contracts with customers | 199,478,869 | 4,199,966 | - | - | - | 203,678,835 | |||||||||||||||||||||
| Government Grants | 10,154 | - | - | - | - | 10,154 | |||||||||||||||||||||
| Initial recognition and changes in the fair value of biological assets | 588,053 | - | - | - | - | 588,053 | |||||||||||||||||||||
| Cost of sales | (117,374,985 | ) | (4,859,562 | ) | - | - | - | (122,234,547 | ) | ||||||||||||||||||
| Other Income | - | 122,468 | - | - | - | 122,468 | |||||||||||||||||||||
| Changes in the net realizable value of agricultural products after harvest | (204,910 | ) | - | - | - | - | (204,910 | ) | |||||||||||||||||||
| Research and development expenses | (8,797,433 | ) | (723,545 | ) | - | - | (341,317 | ) | III.b) | (9,862,295 | ) | ||||||||||||||||
| Selling, general and administrative expenses | (64,731,412 | ) | (2,545,182 | ) | - | (332,310 | ) | - | (67,608,904 | ) | |||||||||||||||||
| Marketing expenses | - | (332,310 | ) | - | 332,310 | - | - | ||||||||||||||||||||
| Share of profit or loss of joint ventures and associates | (27,778,758 | ) | - | 29,448,429 | (40,850 | ) | - | 1,628,821 | |||||||||||||||||||
| Other income or expenses, net | 164,944 | (22,794 | ) | - | - | - | 142,150 | ||||||||||||||||||||
| Operating profit (loss) | (18,645,478 | ) | (4,160,959 | ) | 29,448,429 | (40,850 | ) | (341,317 | ) | 6,259,825 | |||||||||||||||||
| Other financial results | (1,086,189 | ) | 1,326,093 | - | (196,406 | ) | 417,375 | III.a) | 460,873 | ||||||||||||||||||
| Finance costs | (20,183,299 | ) | (1,214,190 | ) | - | 196,406 | - | (21,201,083 | ) | ||||||||||||||||||
| Share of profit or loss of joint ventures and associates | - | (40,850 | ) | - | 40,850 | - | - | ||||||||||||||||||||
| Profit (loss) before income tax | (39,914,966 | ) | (4,089,906 | ) | 29,448,429 | - | 76,058 | (14,480,385 | ) | ||||||||||||||||||
| Income tax | 3,091,074 | (252,900 | ) | - | - | 71,677 | III.c) | 2,909,851 | |||||||||||||||||||
| Profit (loss) for the period | (36,823,892 | ) | (4,342,806 | ) | 29,448,429 | - | 147,734 | (11,570,535 | ) | ||||||||||||||||||
| Shares | 19,038,163 | 38,822,121 | - | - | - | 127,831,148 | |||||||||||||||||||||
| Loss per share | (1.74 | ) | (0.11 | ) | - | - | - | (0.11 | ) | ||||||||||||||||||
We provide the unaudited pro forma consolidated statements of operations for informational purposes only. The unaudited pro forma consolidated statements of operations do not purport to represent what our results of operations would have been had the Business Combination actually occurred on the assumed dates or project our results of operations for any future period or future date.
NOTES TO UNAUDITED PROFORMA CONDENSED COMBINED FINANCIAL INFORMATION
Description of the Transaction
The Business Combination consists of Moolec’s strategic business combination with Bioceres Group, Gentle Tech, and Nutrecon, resulting in an enlarged company structure with Moolec as the parent company. Subject to the terms and conditions of the BCA, several parties will transfer their respective holdings in the Contributed Entities to Moolec (Cayman Islands). In exchange, Moolec (Cayman Islands) will issue a combination of newly issued shares and warrants of Moolec (Cayman Islands) to the shareholders of the Contributed Entities.
For more information on the Business Combination, please see the section entitled “The Business Combination Agreement.”
Accounting for the Business Combination – basis of presentation
The Unaudited Pro Forma Information has been prepared using the acquisition method of accounting under the provisions of IFRS 3 and is based on the historical financial information of Moolec and Bioceres Group. Acquisition accounting is dependent upon certain valuations and other studies that have yet to be completed. Accordingly, the purchase price allocation included herein is preliminary and has been presented solely for the purpose of providing pro forma financial information. The actual purchase price allocation used by the preparation of the Unaudited Pro Forma Information will be revised as additional information becomes available and as additional analyses are performed. The process for estimating the fair values of identifiable intangible assets and certain tangible assets requires the use of judgment in determining the appropriate assumptions and estimates. Differences between preliminary estimates in the Unaudited Pro Forma Information and the final acquisition accounting will materialize and could have a material impact on the accompanying pro forma condensed consolidated financial information and the combined company’s future consolidated financial statements.
The Business Combination will be accounted for as a business combination using the acquisition method of accounting under the provisions of IFRS 3, with Bioceres Group determined to be the accounting acquirer under this guidance. The factors that were considered in determining that Bioceres Group should be treated as the accounting acquirer in the Business Combination were (i) the relative voting rights in the surviving entity (approximately 63% for the former shareholders of Bioceres Group and approximately 31% for the former shareholders of Moolec), (ii) the potential composition of the board of directors in the surviving entity and other committees (audit, compensating and nominating), (iii) the relative fair value assigned to Bioceres Group and Moolec, and (iv) the potential composition of senior management of the surviving entity.
I. Unaudited ProForma Condensed Combined Statement of Operations for the Year Ended June 30, 2024
Column I is derived from the historical audited consolidated financial data of Bioceres Group for the year ended June 30, 2024 derived from Bioceres Group 2024 Audited Financial Statements.
Column II is derived from the historical audited consolidated financial data of Moolec for the year ended June 30, 2024 derived from the Moolec 2024 Audited Financial Statements.
Column III shows the effect of the transfer of Bioceres Group’s 96.2% participation in Theo to the Bioceres Group shareholders (pro rata to the Bioceres Group shareholders’ holding of ordinary shares in Bioceres Group which will take place after Closing).
Column IV provides for certain reclassifications that have been made to the historical income statement in order to conform to presentation standards to be used after the Business Combination.
Column V shows the transaction pro forma adjustments, which comprise mainly the following:
| (a) | Lower results of investments associated with outstanding shares of Moolec in the portfolio of one of the subsidiaries of Bioceres Group. |
| (b) | Higher amortization charges resulting from the increase in value of Moolec’s “Intangible assets”, as a consequence of the purchase price allocation. Useful lives of “Intangible assets” subject to amortization recorded as a consequence of the purchase price allocation are the same as those disclosed in the Moolec 2024 Audited Financial Statements. |
| (c) | The related income tax effects on the adjustments described in (b) above based on the enacted tax law in effect as of the end of 2024 (21%). |
| (d) | The number of ordinary shares has been calculated assuming that changes in issued share capital described in II.(a) below to be materialized on consummation of the BCA. |
Column VI shows the unaudited interim consolidated combined financial data of Bioceres Group and Moolec for the year ended June 30, 2024, after giving effect to the adjustments and reclassifications of Columns III, IV and V.
The unaudited pro forma loss per share data is computed by dividing the unaudited pro forma consolidated net income for the year attributable to the controlling shareholder by the number of Moolec’s outstanding shares after giving effect to the Business Combination, including up to 87,827,474 ordinary shares to be issued by Moolec to effect the BCA.
II. Unaudited ProForma Condensed Combined Statement of Financial Position as of December 31, 2024
Column I is derived from the historical unaudited consolidated financial data of Bioceres Group derived from the Bioceres Group December 2024 Interim Unaudited Financial Statements.
Column II is derived from the historical unaudited consolidated financial data of Moolec derived from the Moolec December 2024 Interim Unaudited Financial Statements.
Column III shows the effect of the transfer of Bioceres Group’s 96.2% participation in Theo to the Bioceres Group shareholders (pro rata to the Bioceres Group shareholders’ holding of ordinary shares in Bioceres Group which will take place after Closing).
Column IV provides for the elimination of certain transactions between Bioceres Group and Moolec as of December 31, 2024 related to intercompany financial debt.
Column V shows the transaction pro forma adjustments derived from accounting for the BCA under the following assumptions:
| (a) | Consideration for the business combination amounted to approximately $64.7 million, which will be consummated through an equity exchange as follows: |
| 1) | Bioceres Group shareholders will surrender their share ownership in Bioceres Group and will receive in exchange up to 80,590,280 of the surviving entity. |
| 2) | The shareholders of 100% fully owned Nutrecon and 50% owned Gentle Tech will surrender their ownership in these two entities and will receive in exchange 6,475,000 shares and 5,000,000 warrants of the surviving entity. The historical information of these two entities have not been included due to its immateriality. |
| 3) | The equity structure reflects the accounting acquiree’s equity structure, including the equity instruments issued by the accounting acquiree to effect the BCA. |
| 4) | Under the terms of the BCA, each share of Bioceres Group will be exchanged by 3.15 Shares of Moolec. Also the shareholders of the other contributed entities will receive 6,475,000 new shares and 5,000,000 of warrants at a strike price of $2.00 per warrant. |
| New shares to be issued in connection with the exchange to Bioceres Group Limited | 80,590,280 | |||
| New shares to be issued in connection with the exchange to Nutrecon and Gentle Tech shareholders | 6,475,000 | |||
| New warrants to be issued in connection with the exchange to Nutrecon and Gentle Tech shareholders | 5,000,000 | |||
| Fair value of MLEC share as of April 14, 2025 | $ | 0.72 | ||
| Fair value of new shares to be issued | $ | 62,687,002 | ||
| Fair value of new warrants to be issued | $ | 2,000,000 | ||
| Total consideration exchanged | $ | 64,687,002 |
| (b) | Consideration paid has been allocated to identifiable assets and liabilities of Moolec (the accounting acquiree) based on their estimated fair value. Adjustments to book value as a result of the purchase price allocation is as follows: |
| 1) | $33.1 million to “Intangible assets” based on the discounted cash flow method allocated to PiggySooy and GLASO technologies. PiggySooy intangible is not being amortized and GLASO intangible is being amortized over the remaining useful life of approximately 20 years. See “Item 4—B. Business overview—Our Segments and Key Products” in our annual report on Form 20-F for the year ended June 30, 2024 filed with the SEC on October 30, 2024. A decrease in previously registered goodwill of $(0.3) million and an increase in goodwill arising from the BCA for approximately $29.2 million. See 4) below. |
| 2) | $7.0 million to “Deferred income tax liabilities” as a result of applying the enacted tax law as of the end of 2024 using the statutory income tax rate to be in force in the United States (21%) to temporary differences arising from the pro forma adjustments of intangibles. |
| 3) | $(0.1) million to “Warrants” as a result of revaluation outstanding Moolec warrants. |
| 4) | Bioceres Group has performed a preliminary valuation analysis of the fair market value of Moolec’s assets and liabilities, based on the quotation price of Moolec. The following table summarizes the preliminary purchase price allocation of the acquisition: |
| In US$ | ||||
| Total consideration exchanged | 64,687,002 | |||
| Cash and cash equivalents | 1,929,911 | |||
| Trade and other receivables | 13,637,475 | |||
| Property, plant and equipment | 1,263,344 | |||
| Intangible assets | 42,170,338 | |||
| Right of use assets | 368,970 | |||
| Inventories | 4,844,773 | |||
| Borrowings / Financial debt | (21,737,947 | ) | ||
| Accounts payable | (5,334,680 | ) | ||
| Lease liabilities | (347,832 | ) | ||
| Warrant liabilities | (155,540 | ) | ||
| Deferred tax liabilities | (7,270,073 | ) | ||
| Other liabilities | (566,093 | ) | ||
| Total net assets | 28,802,645 | |||
| Goodwill | 29,222,356 | |||
| Total consideration for MLEC (*) | 58,025,002 | |||
| (*) |
The difference between “Total consideration exchanged” and “Total consideration for MLEC” is related to the consideration assigned to Nutrecon and Gentle Tech, which were not included in the Unaudited Pro Forma Condensed Combined Consolidated Financial Information due to their immateriality. |
Column VI shows the unaudited interim consolidated combined financial data of Bioceres Group and Moolec as of December 31, 2024, after giving effect to the adjustments of Columns III, IV and V.
III. Unaudited ProForma Condensed Combined Statement of Operations for the Six-Month Period Ended December 31, 2024
Column I is derived from the historical unaudited interim consolidated financial data of Bioceres Group for the six-month period ended December 31, 2024 derived from the Bioceres Group December 2024 Interim Unaudited Financial Statements.
Column II is derived from the historical unaudited consolidated financial data of Moolec for the six-month period ended December 31, 2024 derived from the Moolec December 2024 Interim Unaudited Financial Statements.
Column III shows the effect of the transfer of Bioceres Group’s 96.2% participation in Theo to the Bioceres Group shareholders (pro rata to the Bioceres Group shareholders’ holding of ordinary shares in Bioceres Group which will take place after Closing).
Column IV provides for the elimination of certain transactions between Bioceres Group and Moolec for the year ended June 30, 2024 mainly related to intercompany transactions. Also, certain reclassifications have been made to the historical statement of operations in order to conform to presentation standards to be used after the Business Combination.
Column V shows the transaction pro forma adjustments, which comprise mainly the following:
| (a) | Lower results of investments associated with outstanding shares of Moolec in the portfolio of one of the subsidiaries of Bioceres Group. |
| (b) | Higher amortization charges resulting from the increase in value of Moolec’s “Intangible assets”, as a consequence of the purchase price allocation. Useful lives of “Intangible assets” subject to amortization recorded as a consequence of the purchase price allocation are the same as those disclosed in the Moolec 2024 Audited Financial Statements. |
| (c) | The related income tax effects on the adjustments described in (b) above based on the enacted tax law in effect as of the end of 2024 (21%). |
| (d) | The number of ordinary shares has been calculated assuming that changes in issued share capital described in II.(a) above to be materialized on consummation of the BCA. |
Column VI shows the unaudited interim consolidated combined financial data of Bioceres Group and Moolec for the six-month period ended December 31, 2024, after giving effect to the adjustments and reclassifications of Columns III, IV and V.
The unaudited pro forma loss per share data is computed by dividing the unaudited pro forma consolidated net income for the year attributable to the controlling shareholder by the number of Moolec’s outstanding shares after giving effect to the Business Combination, including up to 87,827,474 ordinary shares to be issued by Moolec to effect the BCA.
RISK FACTORS
The risks and uncertainties described below are not the only risks and uncertainties that we may face in connection with the Business Combination. There may be additional risks and uncertainties that are either unknown to us or considered immaterial at present that could adversely impact the business, financial condition, operating results, prospects, and profits of the Contributed Entities and us. If any of the risks described below actually occur, our business, financial condition, results of operations, prospects, profits and share price could be materially adversely affected. You should also consider the other information in this disclosure statement, our Annual Report on Form 20-F filed with the SEC and the Annual Report on Form 20-F of BIOX included in Exhibit 99.5 to the Form 6-K.
Risks Related to the Business Combination and the Contributed Entities
The Business Combination may not be completed and the BCA may be terminated in accordance with its terms.
The Business Combination is subject to a number of conditions that must be satisfied or waived prior to the completion of the Business Combination, which are described in the section entitled “The Business Combination Agreement — Conditions to the Completion of the Business Combination.” These conditions to the completion of the Business Combination may not be satisfied or waived in a timely manner or at all, and, accordingly, the business combination may be delayed or may not be completed.
In addition, if the Business Combination is not completed by September 9, 2025, any of the parties to the BCA may choose not to proceed with the Business Combination by terminating the BCA, and the parties can mutually decide to terminate the BCA at any time. In addition, either we or other parties to the BCA may elect to terminate the BCA in certain other circumstances as further detailed in the section entitled “The Business Combination Agreement — Termination”.
If the Business Combination is not completed for any reason, including the failure to receive the required approval of our shareholders, our businesses and financial results may be adversely affected, including as follows:
| ● | we may experience negative reactions from the financial markets, including negative impacts on the market price of our ordinary shares; |
| ● | the manner in which industry contacts, business partners and other third parties perceive us may be negatively impacted, which in turn could affect our marketing operations or our ability to compete for new business or obtain renewals in the marketplace more broadly; |
| ● | we may experience negative reactions from employees; and |
| ● | we will have expended time and resources that could otherwise have been spent on our existing businesses and the pursuit of other opportunities that could have been beneficial to us, and our ongoing business and financial results may be adversely affected. |
In addition to the above risks, if the BCA is terminated and our board seeks an alternative transaction, our shareholders cannot be certain that we will be able to find a party willing to engage in a transaction on more attractive terms than the business combination. For a description of these circumstances, see the section entitled “The Business Combination Agreement — Termination.”
The Business Combination may be more difficult, costly or time consuming than expected and we may fail to realize the anticipated benefits of the Business Combination.
The success of the Business Combination will depend, in part, on the ability to realize the anticipated synergies, operating efficiencies, and cost savings from combining us with the Contributed Entities. To realize the anticipated benefits and cost savings from the Business Combination, we must integrate and combine the Contributed Entities’ business in a manner that permits these cost savings to be realized, without adversely affecting current revenues and future growth. If we are not able to successfully achieve these objectives, the anticipated benefits of the Business Combination may not be realized fully or at all or may take longer to realize than expected. In addition, the actual cost savings of the Business Combination could be less than anticipated, the costs associated with effecting the Business Combination may be more than anticipated, and integration may result in additional and unforeseen expenses.
An inability to realize the full extent of the anticipated benefits of the Business Combination and the other transactions contemplated by the BCA, as well as any delays encountered in the integration process, could have an adverse effect upon our revenues, levels of expenses and operating results and financial condition, which may adversely affect the value of our ordinary shares after the completion of the Business Combination.
We and the Contributed Entities have operated and, until the completion of the Business Combination, must continue to operate, independently. It is possible that the integration process could result in the loss of key associates, the disruption of each company’s ongoing businesses or inconsistencies in standards, controls, procedures and policies that adversely affect our ability to maintain relationships with clients, customers and other business parties or to achieve the anticipated benefits and cost savings of the Business Combination. Integration efforts between us and the Contributed Entities may also divert management attention and resources. These integration matters could have an adverse effect on us during this transition period and for an undetermined period after completion of the Business Combination.
Our directors and executive officers have potential conflicts of interest in the Business Combination, including when exercising discretion in agreeing to changes to the terms of or waivers of closing conditions in the BCA.
Our directors and executive officers have the potential for conflicts of interest in the Business Combination and related decisions. These individuals have interests in the Business Combination that differ from, or are additional to, those of our shareholders, including the potential continuation of certain directors post-Closing, the treatment of outstanding equity awards, and severance benefits and acceleration of equity awards upon certain employment terminations. These interests might influence their decisions, including voting in favor of the business combination agreement.
Moreover, the discretionary actions by our directors and officers in agreeing to modifications or waiving closing conditions within the BCA may result in conflicts when assessing whether such changes or waivers are appropriate and in our shareholders’ best interests. Leading up to the Closing, situations may arise requiring us to amend the BCA, consent to actions, or waive rights due to changes in the Contributed Entities’ business or requests by our counterparties under the BCA to implement actions typically prohibited by the BCA’s terms. The board’s discretion in granting consent or waiving rights might be swayed by directors’ financial and personal interests, potentially conflicting between what they believe is best for us and our shareholders, versus what might benefit them or their affiliates.
The Contributed Entities’ shareholders and their affiliates currently control a significant number of our ordinary shares and, after the closing, will continue to control a significant number of our ordinary shares, providing the shareholders of Bioceres Group and Union Group and their affiliates with substantial influence over us. Our other existing shareholders will have a reduced ownership and voting interest after consummation of the Business Combination and will exercise less influence over management.
Upon completion of the Business Combination, Union Group and its affiliates are expected to beneficially own approximately 16.9% of our Shares and become our largest shareholder. As a result, Union Group and its affiliates may have substantial influence over matters requiring approval by our shareholders, including the election and removal of directors, amendments to our memorandum and articles of association, any proposed merger, consolidation or sale of all or substantially all of our assets and other corporate transactions. Union Group and its affiliates may have interests that are different from those of our other shareholders. After the completion of the Business Combination, our other existing shareholders will own a smaller percentage of us than they currently own. Accordingly, it may be more difficult for our other existing shareholders to influence us after the Closing through the exercise of their shareholders’ rights.
The ownership of our ordinary shares by Union Group and its affiliates may adversely affect the trading price for our ordinary shares after the Business Combination in the event Union Group takes any action with its shares that could result in an adverse impact on the price of our ordinary shares, including a sale of such shares.
Holders of our Shares will not have dissenters’ rights or appraisal rights with respect to the Business Combination.
No appraisal or dissenters’ rights are available to holders of Shares in connection with the Business Combination. Under section 238 of the Companies Act (Revised) of the Cayman Islands (the “Companies Act”), shareholders of a Cayman Islands exempted company ordinarily have dissenters’ rights upon dissenting from a merger or consolidation in accordance with the Companies Act. However, as the Business Combination is not being effected by means of a merger or consolidation of Moolec (Cayman Islands), the said holders of Shares immediately prior to the Business Combination will not benefit from, or be entitled to exercise, the rights of dissenters set out in section 238 of the Companies Act.
The unaudited pro forma combined consolidated financial information included in this disclosure statement will not represent our actual financial position or results of operations following the completion of the Business Combination. Our future results may differ, possibly materially, from the unaudited pro forma combined consolidated financial information presented in this disclosure statement.
This disclosure statement contains unaudited pro forma combined consolidated financial information, which is presented for illustrative purposes only, contains a variety of adjustments, assumptions and preliminary estimates and does not represent the actual financial position or results of operations of Moolec and Bioceres Group prior to the Business Combination or that of Moolec (Cayman Islands) following the Business Combination for several reasons. For example, the unaudited pro forma combined consolidated financial information does not reflect the effect of any additional potential financing activity that may occur prior to or subsequent to the completion of the Business Combination or integration costs. In addition, the Business Combination and post-Business Combination integration process may give rise to unexpected liabilities and costs, including costs associated with the defense and resolution of transaction-related litigation or other claims. Unexpected delays in completing the Business Combination or in connection with the post-Business Combination integration process may significantly increase the related costs and expenses incurred by us. Our actual financial position and results of operations prior to the Business Combination and that of the combined company following the Business Combination may be different, possibly materially, from the unaudited pro forma combined consolidated financial information included in this disclosure statement. In addition, the assumptions used in preparing the unaudited pro forma combined consolidated financial information included in this disclosure statement may not prove to be accurate and may be affected by other factors. For additional information, see the section entitled “Unaudited Pro Forma Combined Consolidated Financial Information.”
As the assumptions used for unaudited pro forma combined consolidated financial information are subject to uncertainties, and because our and Bioceres Group’s actual financial situations differ materially, the unaudited pro forma combined consolidated financial information does not necessarily reflect future costs, cash flows or other results of operations of Moolec, Bioceres Group or the combined company following the Closing. Moreover, we will not provide any report or analysis of any differences between the unaudited pro forma combined consolidated financial information contained herein and actual results later achieved.
Our debt levels after the Closing may limit our financial flexibility.
As of December 31, 2024, we had approximately $21.7 million of outstanding financial indebtedness. As of December 31, 2024, Bioceres Group and its consolidated subsidiaries had approximately $463.3 million of outstanding financial indebtedness, approximately $160.8 million of which is financial indebtedness of Bioceres Group’s subsidiaries Bioceres S.A. and Bioceres LLC and the remainder of which is financial indebtedness of BIOX and its subsidiaries. No financial indebtedness of Moolec or the Contributed Entities is expected to mature and be repaid in connection with the consummation of the Business Combination.
Our pro forma financial indebtedness as of December 31, 2024, assuming Closing of the Business Combination had occurred on such date and the assumption of the outstanding Bioceres Group’s consolidated financial indebtedness and repayment of amounts that will mature in connection therewith, is approximately $478.2 million, representing an increase in comparison to our financial indebtedness on a recent historical basis. Any increase in the Bioceres Group’s consolidated financial indebtedness could have adverse effects on its financial condition and results of operations, including:
| ● | imposing additional cash requirements on the Bioceres Group in order to support interest payments, which reduces the amount the Bioceres Groups has available to fund its operations and other business activities; |
| ● | increasing the risk that the Bioceres Group may default on its debt obligations and that secured creditors enforce their loan agreements or security interest on collateral, including BIOX shares owned by the Bioceres Group; |
| ● | increasing the risk that the Bioceres Group may default on its debt obligations and that secured creditors enforce guarantees under their debt agreements or their security interest on collateral, including BIOX shares owned by the Bioceres Group; |
| ● | limiting the Bioceres Group’s ability to sell assets, engage in strategic transactions or obtain additional financing for working capital, capital expenditures, general corporate and other purposes; |
| ● | limiting the Bioceres Group’s flexibility in planning for or reacting to changes in its business and the industry in which it operates; and |
| ● | increasing the Bioceres Group’s exposure to a rise in interest rates, which will generate greater interest expense to the extent it does not have applicable interest rate fluctuation hedges. |
Following the Closing, certain secured creditors of Bioceres Group’s subsidiaries may enforce their security interest on shares of BIOX that have been pledged, and we could lose a portion or all of this asset.
As of March 31, 2025, Bioceres Group and Bioceres LLC held 21,111,039 shares of BIOX. As of March 31, 2025, Bioceres S.A. and Bioceres LLC, has approximately $160.8 million in outstanding principal and accrued interest under various debt instruments secured by 18,775,999 shares of BIOX. Presently, Bioceres Group exercises significant control over BIOX, controlling 44.1% of BIOX’s issued and outstanding capital stock. This level of control over BIOX allows Bioceres Group to influence major corporate decisions and policies that align with its interests.
Should these secured creditors enforce their security interest in the shares of BIOX following the Business Combination, not only could we lose this asset, but our interest in BIOX would also be reduced considerably and there exists a substantial risk that we could lose our ability to exercise control over BIOX. This loss of control may diminish our capacity to guide strategic direction and decision-making within BIOX, impacting long-term plans, growth potential and expected synergies.
Additionally, if the collateral becomes insufficient to satisfy the outstanding debts under Bioceres Group’s subsidiaries’ secured debt facilities, certain lenders will hold an unsecured claim against us. In the event of a default on these debt obligations, third-party creditors may seize the pledged assets, adversely affecting our financial health and operational capabilities. This could result in a disruption in key business activities and in available capital, and the possible necessity of further borrowing, which may not be available on commercially reasonable terms and may divert management’s time for running the business.
Changes in facts and circumstances may affect Bioceres Group’s accounting consolidation over BIOX. After the Closing, we may be required to deconsolidated BIOX from an accounting perspective.
As of March 31, 2025, Bioceres Group and Bioceres LLC owned 44.1% of the outstanding common shares of BIOX. Bioceres Group concluded that on accounting basis it exercises “de facto control” on BIOX, based on the following: (i) the percentage and concentration of its voting rights, and the absence of the shareholders with significant voting rights (ii) the record of attendance to shareholders’ meetings and the record of votes cast by the other shareholders; and (iii) the effective control exercised by Bioceres Group to direct BIOX’s relevant activities through the board of directors, where the Bioceres Group appointed five out of seven board members. However, changes in fact pattern that Bioceres Group assessed, or that we may assess after the Closing, might result in deconsolidation from an accounting perspective.
The market price of our ordinary shares may decline in the future because of the sale of our ordinary shares held by the Contributed Entities’ former shareholders or our current shareholders.
In connection with the Business Combination, we expect to issue up to 87,827,474 Shares and 5,000,000 warrants purchase to Shares (subject to adjustment resulting from the reverse share split). Following their receipt of our Shares in the Business Combination, the Contributed Entities’ former shareholders may seek to sell their Shares, and the BCA contains no restriction on the ability of the Contributed Entities’ former shareholders to sell such Shares following completion of the Business Combination. Other shareholders may also seek to sell Shares held by them following, or in anticipation of, completion of the Business Combination. These sales (or the perception that these sales may occur), coupled with the increase in the outstanding number of Shares, may affect the market for, and the market price of, Shares in an adverse manner.
Completion of the Business Combination may trigger a change in control or other provisions, if any, in certain agreements to which Bioceres Group or one of its subsidiaries is a party.
The completion of the Business Combination may trigger a “change in control” and other provisions, if any, in certain agreements to which Bioceres Group is a party. If Bioceres Group is unable to negotiate waivers of those provisions, if any, the counterparties may exercise their rights and remedies under the agreements, potentially terminating the agreements or seeking monetary damages or equitable remedies. Even if Bioceres Group is able to negotiate consents or waivers, the counterparties may require a fee for such waivers or seek to renegotiate the agreements on terms less favorable to Bioceres Group. There is no assurance that such counterparties will not exercise their rights under the agreements, including termination rights where available, that the exercise of any such rights will not result in a material adverse effect or that any modifications of such agreements will not result in a material adverse effect.
Shareholder litigation could prevent or delay the completion of the Business Combination or otherwise negatively impact our business and operations.
Transactions like the Business Combination are frequently the subject of litigation or other legal proceedings, including actions alleging that either parties’ board of directors breached their respective duties to their shareholders by entering into a business combination agreement, by failing to obtain a greater value in a transaction for their shareholders or any other claims (contractual or otherwise) arising out of a business combination or the transactions related thereto. Holders of our ordinary shares may file lawsuits against us, and/or our directors and officers in connection with the Business Combination. One of the conditions to the Closing of the Business Combination is that no governmental entity of competent jurisdiction shall have enacted any law that has the effect of prohibiting the Closing of the Business Combination or issued any order, injunction or decree that has the effect of prohibiting the Closing of the Business Combination. If any plaintiff were successful in obtaining an injunction prohibiting us from consummating the Business Combination or any of the other transactions contemplated by the BCA, then such injunction may delay or prevent the Closing and could result in significant costs to us. We may incur costs in connection with the defense or settlement of any shareholder lawsuits filed in connection with the Business Combination. Such litigation could have an adverse effect on our ability to consummate the Business Combination or on our respective financial condition, results of operations and growth prospects, including through the possible diversion of our resources or distraction of key personnel.
Uncertainty about the Business Combination may adversely affect relationships with distributors, suppliers, business partners, and employees, whether or not the Business Combination is completed.
Uncertainty about the Business Combination and our efforts to complete the Business Combination could create uncertainty surrounding and significantly disrupt our business. Uncertainty regarding our future could also adversely affect our relationships with existing and potential customers, distributors, suppliers, vendors, strategic partners and employees. For example, clients, distributors, and other counterparties may delay or defer decisions concerning entering into contracts or otherwise working with us, seek to change our existing business relationships or consider doing business with other companies rather than us. Competitors may also target our customers by highlighting potential uncertainties and other risks related to the Business Combination. The pendency of the Business Combination may also divert attention and resources from our management towards completing the Business Combination and preparing for integration activities and away from ongoing business and operations. Uncertainty as to whether the Business Combination will be completed may also affect our ability to recruit prospective employees or to retain and motivate existing employees. Employee retention may be particularly challenging while the Business Combination is pending because employees may experience uncertainty about their roles following the Business Combination. These risks and the resulting adverse effects on business, financial condition and results of operations could be exacerbated by any delays in completion of the Business Combination or termination of the BCA.
We may be unable to complete the Theo Carve-out Post-Business Combination Closing
We may face challenges in completing the planned Theo Carve-Out, which is expected to take place after the Closing of the Business Combination. The success of the Theo Carve-Out relies on our ability to negotiate and finalize definitive agreements with the involved parties and to meet the required closing conditions, including creating positive distributable reserves. The Theo Carve-Out process can be complex and time-consuming, potentially causing disruptions to our operations. These disruptions might impact our relationships with customers and suppliers, distract our management from the company’s primary business activities, and affect employee retention and motivation. Furthermore, unforeseen factors such as changes in market conditions, regulatory challenges, or adverse economic developments could hinder the execution of the Theo Carve-Out.
During the execution of the Theo Carve-Out, we may also uncover undisclosed liabilities related to Theo. Until the completion of the Theo Carve-Out, we would be required to recognize these liabilities on our balance sheet, which could affect our financial position. We may not be able to identify and manage these liabilities in an adequate manner.
Failure to complete the Theo Carve-Out could adversely impact our financial position and operational results. If we encounter significant difficulties or delays in this process, we may not realize the anticipated benefits of the Business Combination, affecting our long-term strategic goals and shareholder value. Additionally, any failure in managing these risks effectively could expose us to potential litigation or reputational harm.
Nutrecon and Gentle Tech are early-stage capital intensive businesses that do not generate revenue
Nutrecon and Gentle Tech are early-stage companies that have not begun generating revenue and require substantial capital to maintain and expand their operations. This situation presents several risks that could impact our financial condition and results of operations. The development of these businesses is capital-intensive, necessitating significant investment in research and development and business operations to realize their potential. Without sufficient revenue streams, maintaining the necessary cash flow can present challenges, and we may need to raise additional capital sooner than anticipated. If we are unable to secure the necessary funding, we may be forced to delay, limit, or significantly reduce development efforts for these businesses.
The absence of revenue generation coupled with high operational costs could lead to sustained operating losses. We expect these businesses to incur significant expenses and record losses as they progress through design, development, and manufacturing stages.
Additionally, the availability of financing might be constrained by external factors, such as market volatility, global economic conditions, or geopolitical tensions, which could adversely affect access to credit and capital markets. Consequently, the inability to obtain financing on favorable terms, or at all, may hinder our ability to pursue business objectives and strategic opportunities. Furthermore, if these businesses fail to achieve revenue generation or profitability, this could materially undermine our financial position and ability to sustain their operations, affecting shareholder value and overall business performance.
BUSINESS OF THE CONTRIBUTED ENTITIES
Background on the Contributed Entities
The Contributed Entities consist of Bioceres Group and its subsidiaries, Nutrecon and its subsidiaries and Gentle Tech and its subsidiaries. 50% of the share capital of Gentle Tech is held by Bioceres Group and will be contributed to Moolec as part of the contribution of Bioceres Group, and 50% of the share capital of Gentle Tech is held and will be contributed to Moolec by Union Group. See the section entitled “Summary of the Business Combination” for corporate charts showing the subsidiaries held by Bioceres Group, Nutrecon and Gentle Tech.
The most significant asset held by the Contributed Entities are the shares of Bioceres Crop Solutions Corp. (“BIOX”), which are held by Bioceres Group. BIOX is incorporated in the Cayman Islands and its ordinary shares are listed on Nasdaq under the symbol “BIOX.” As of March 31, 2025, Bioceres Group held 44.1% of the outstanding common shares of BIOX, owning a controlling interest that allows it to consolidate BIOX through “de facto” control in its financial statements.
As of December 31, 2024, BIOX represents approximately 99.9% and 91.7% of the total revenues and total assets, respectively, of the Contributed Entities. As of December 31, 2024, BIOX and Bioceres Group held approximately 70% and 30%, respectively, of the total indebtedness of the Contributed Entities. As BIOX represents such a significant part of the Contributed Entities, we have included the Annual Report on Form 20-F of BIOX and the interim unaudited financial statements of BIOX as of and for the six months ended December 31, 2024 in Exhibits 99.5 and 99.6 to the Form 6-K, respectively. You should carefully review the information relating to BIOX contained in such Exhibits.
In general, Bioceres Group is a holding company that has subsidiaries that are operating companies. The information presented below focuses on the business of Bioceres Tech Services LLC (“Bioceres Tech”), which is a business line held by Bioceres Group, Nutrecon and Gentle Tech. Each of Bioceres Tech, Nutrecon and Gentle Tech are or hold early-stage or pre-revenue enterprises, and therefore the amount of information presented for each is significantly less detailed than the information relating to BIOX presented in Exhibits 99.5 and 99.6 to the Form 6-K. In addition, where appropriate, we describe below certain material agreements and material assets held at the Bioceres Group level and at other levels in the corporate structures of the Contributed Entities.
General Overview
Bioceres Tech
Bioceres Tech owns a substantial 50% of the share capital of Agrality. Agrality is a dynamic company that excels in providing a broad range of agricultural services and capabilities. These services are pivotal for the success of its partners in delivering pioneering products and technologies across various industries. The company’s operations are strategically located in Argentina, Brazil, and the United States, fostering collaborative innovation that transcends borders.
Agrality’s key assets include its research and development labs situated at INDEAR in Rosario and its headquarters located in Buenos Aires. The company is proud of its state-of-the-art warehousing facilities present at its seed production plants, along with an experimental field station in Pergamino, Buenos Aires. Its global operations are supported by comprehensive infrastructure, including seed production plants in Miramar (Argentina); Lafayette, Mendon, Fremont, Nickerson, North Bend (United States); and Paracatu (Brazil), which are equipped with advanced transportation and testing machinery integrated with electronic data collection systems.
The company employs approximately 120 full-time staff members, primarily engaged in contract research organization (“CRO”) services. Agrality operates as a self-financed entity, maintaining a total net debt of $29.4 million as of December 31, 2024, which underscores its effective financial management strategies. The business model of Agrality emphasizes supplying full-spectrum capabilities intended to comprehensively meet farmers’ needs.
Agrality offers a wide range of biotechnology services, which include molecular biology for genotyping assistance in plant breeding, plant transformation, and tissue culture for the enhancement of crop genetics. Its regulatory affairs support ensures smooth navigation through the registration and approval processes, facilitating successful market entries for projects.
The company provides breeding and field-testing solutions that encompass all aspects of breeding programs—from nursery management to performance trials—ensuring optimal outcomes. Agrality’s specialized machinery enables the achievement of high purity levels in crop production and satisfies stringent isolation requirements. All seed production operations are conducted in fields that are 100% irrigated, enabling the company to realize the highest potential for large-scale production.
Agrality extends its capabilities to processing and manufacturing, with several facilities that enable multi-crop drying, processing, and conditioning. Its warehousing and distribution operations include expansive storage capacities of 300,000 square feet, capable of managing and timely shipping up to 1.1 million units.
The company’s crop portfolio is diverse and comprehensive, covering corn, soybean, sunflower, sorghum, wheat, alfalfa, amaranth, barley, bean, canola, chickpea, cotton, lentil, peanut, rice, safflower, tobacco, and peas. This extensive offering reflects Agrality’s commitment to supporting global agricultural production.
Nutrecon
Nutrecon is an early-stage, cutting-edge biotechnology company headquartered in Helsinki, Finland. With state-of-the-art laboratories in Helsinki, Espoo, and Lappeenranta, Nutrecon provides comprehensive support and services in research and development, as well as in quality control. In Lappeenranta, Nutrecon also operates a pilot-to-industrial scale fermentation facility designed to serve industrial, academic, and R&D needs—particularly within the food and biotech sectors. The facility enables efficient process scaling and test material production, with a total fermentation capacity of up to 27,000 liters. It operates in full compliance with current Good Manufacturing Practice (cGMP) regulations for food products, covering all aspects of plant design, operational procedures, protocols, and personnel management.
Nutrecon’s asset base consists of a 90% ownership stake in Synbio Powerlabs, as well as in the intellectual property assets— including trademarks and patent applications—originally developed by Eternal (Mycofood US LLC). (trademarks and patent applications) from Eternal (Mycofood US LLC).
Nutrecon serves two critical roles: as a Research and Technology Organization (“RTO”) and a Contract Development and Manufacturing Organization (“CDMO”). This dual positioning enables Nutrecon to effectively bridge the gap between biotechnology research and industrial applications.
Nutrecon operates on a revenue model comprising service fees and revenue-sharing schemes. The first revenues are anticipated by the end of calendar year 2025, reflecting its strategic financial planning. Its RTO and CDMO roles are key to facilitating the transition of biotechnology innovations from laboratory settings to full industrial-scale production. This approach ensures the transformation of advanced research outputs into commercially viable solutions.
Nutrecon supports a range of activities from Research and Development (“R&D”) to industrial processing through state-of-the-art facilities:
| ● | The Helsinki and Espoo laboratories offer lab-scale services equipped with advanced technology capable of handling both fermentative and mammalian processes. These facilities specialize in early-stage development, including inoculum preparation, with process capacities scaling up to 15 liters—making them ideal for proof-of-concept and small-scale optimization work. |
| ● | Lappeenranta Facility: Currently in planning, this facility will focus on pilot and industrial services, supporting process development, optimization, scale-up, and validation. It will feature comprehensive bioreactor systems with capacities of 50, 500, 10,000, and 27,000 liters. Completion is expected in the third quarter of calendar year 2025, offering downstream and analytical services to enhance operational workflows. |
Nutrecon’s financial outlook for the next eighteen months includes managing an overhead cash burn rate of approximately $110,000 annually. This comprises $40,000 for payroll and contractors and $70,000 in fixed costs. The total capital expenditure forecast for 2024/2025 is €7 million (approximately $7.35 million). Additionally, a pending investment of $2.1 million is slated for funding through the Business Finland grant, which supports Nutrecon’s growth and expansion of innovative capabilities.
Gentle Tech
Gentle Tech is an early-stage, pioneering company dedicated to designing sustainable agricultural equipment that reduces environmental impact. By utilizing materials science, information technologies, and alternative energy sources, Gentle Tech focuses on creating machinery that maximizes agricultural efficiency while minimizing the carbon footprint typical of traditional farming activities.
The company holds a controlling stake of 51% in Gentle Farming and 64% in G-FAS through Gentle Farming. Both subsidiaries possess patents for innovative machinery that are set to redefine agricultural processes. With operations based primarily in Argentina, Gentle Tech is co-owned equally by Bioceres Group and Union Group, each with a 50% share.
A lean team comprises three full-time employees and one part-time employee, including two of the original founders who now spearhead operations at the G-FAS subsidiary. G-FAS serves as the primary operational arm, featuring advanced technological pipelines for tool carriers and harvesting heads.
Gentle Tech does not own operational facilities but relies on third-party services for most equipment production, allowing the company to concentrate on innovation and building intellectual property while maintaining production flexibility.
The business model splits into two units: G-FAS operates on a business-to-consumer model, directly selling harvesting heads to farmers and large agricultural companies. Gentle Farming focuses on developing a technology pipeline, concentrating first on intellectual property before generating revenue. An annual cash injection of around $120,000 is required to cover payroll, corporate purposes, and IP maintenance.
G-FAS’s signature product, a revolutionary harvesting head, offers substantial advantages over conventional equipment. It reduces soil compaction by 80%, energy needs by 85%, and greenhouse gas emissions by 95%. Additionally, it uses 40% less fuel and is 70% lighter, significantly boosting efficiency and lowering agriculture’s environmental impact.
Through Gentle Farming, the company pioneers the development of next-generation agricultural machinery designed to address the most pressing challenges in the sector. By combining autonomous operation, energy-transition technologies, and innovative sustainable materials, Gentle Farming is redefining how agricultural equipment is conceived and built.
Gentle Farming’s strategic vision addresses core agricultural challenges, prioritizing sustainability and efficiency. The lightweight machinery it develops reduces soil compaction and energy use, integrating cutting-edge smart technologies to enhance industry competitiveness and manage labor shortages effectively.
Strengths and Strategies
The following sets forth the main strengths and strategies of the Contributed Entities.
Bioceres Tech
Comprehensive Service Offering
Agrality distinguishes itself in the agricultural sector with a suite of services and capabilities that address diverse industry needs. This broad strategic approach positions Agrality as an indispensable partner for pioneering agricultural technologies and solutions. A major strength is its robust infrastructure and expansive global reach across Argentina, Brazil, and the United States. This geographical footprint facilitates seamless cross-border collaboration and innovation, establishing Agrality as a key player in the agricultural domain.
Research and Development Excellence
A core strength of Agrality lies in its extensive research and development facilities, highlighted by state-of-the-art labs at INDEAR in Rosario. The company’s focus on R&D drives cutting-edge innovation, enabling Agrality to maintain a competitive edge through advancements in agricultural products and technologies. With headquarters in Buenos Aires and strategically located seed production plants, Agrality assures operational support to maximize efficiency in agricultural production and distribution.
Biotechnology Services as Cornerstone
Agrality’s dedication to biotechnology services is central to its competitive strategy. By leveraging molecular biology for genotyping and tissue culture for crop genetic enhancement, Agrality significantly boosts clients’ breeding efforts. Specialized regulatory affairs support ensures smooth navigation through market entry challenges, positioning Agrality as a trusted partner in transforming innovation into ready-for-market solutions.
Field Testing and Breeding Solutions
Agrality’s field-testing and breeding solutions further strengthen its strategic position by offering comprehensive support in breeding programs, from nursery management to performance trials. This holistic approach ensures optimal outcomes reinforced by high-purity crop production, achieved through advanced machinery and stringent isolation standards.
Processing, Manufacturing, and Distribution Capacity
On the processing and manufacturing front, Agrality leverages expansive facilities for multi-crop drying, processing, and conditioning. Coupled with warehousing and distribution capabilities, Agrality manages up to 1.1 million units for timely shipping. With 300,000 square feet of storage, Agrality offers a unique value proposition for partners seeking efficient, large-scale agricultural operations.
Diversified Crop Portfolio
Agrality differentiates itself with a diverse crop portfolio, encompassing over 21 essential crops. This diversity positions Agrality as a significant contributor to global agricultural productivity. Strongly serving the North American market through US-based seed production sites and maintaining a significant operational presence in Brazil and Argentina, Agrality aligns its strategic focus toward global market leadership.
Nutrecon
Strategic Position and Asset Portfolio
Nutrecon uses its strategic position and asset portfolio to gain a competitive edge. Based in Finland, with facilities in Helsinki, Espoo, and Lappeenranta, the company leads in biotech research and innovation. Important assets include a 90% stake in Synbio Powerlabs and intellectual property from Eternal, originally developed by Mycofood US LLC, allowing Nutrecon to advance breakthroughs in food tech and biotech.
Unique Functionalities and Competitive Strategy
Nutrecon’s dual role as an RTO and CDMO bridges biotech research and industrial application, transitioning innovations to scalable, commercial solutions and adding value for clients and partners.
Facility Capabilities
State-of-the-art facilities in Helsinki and Espoo support diverse activities. They offer high-precision lab services for fermentative and mammalian processes, crucial for inoculum preparation and process development, scaling up to 15 liters.
Upcoming Expansion
The new Lappeenranta facility will enhance strategic advantage with pilot and industrial capabilities focused on development, optimization, scale-up, and validation. With bioreactors between 50 and 27,000 liters, comprehensive services will be available from Q3 2025, improving workflows and competitiveness.
Gentle Tech
Sustainable Innovation and Competitive Strategy
Gentle Tech leads in sustainable agricultural innovation using materials science, information technologies, and alternative energy sources. This innovative approach forms its competitive strategy, offering solutions that reduce environmental impact while boosting farming efficiency.
Strategic Asset Management
The company’s strategic asset management includes controlling stakes in subsidiaries Gentle Farming (51%) and G-FAS (64%), which hold crucial intellectual property rights with transformative machinery patents, based in Buenos Aires and Rosario, Argentina.
Agility and Focus in Operational Model
Gentle Tech’s operational model emphasizes agility, with a lean team of three full-time employees, including two founders. Involvement at G-FAS ensures innovation continuity, while third-party equipment production maintains flexibility and focus on intellectual property.
Innovative Products and Environmental Benefits
G-FAS’s advanced harvesting head significantly lowers environmental impacts, reducing soil compaction, energy usage, greenhouse gas emissions, and fuel consumption.
Focus on Smart Agricultural Machinery
Through Gentle Farming, Gentle Tech develops next-generation machinery with autonomous operation and sustainable materials, cutting power needs and embracing energy transitions for smart crop production.
Strategic Position in the Evolving Market
Gentle Tech’s focus on lightweight, smart technology-enhanced machinery places it strategically in the evolving agricultural equipment market projected at $297 billion by 2030.
Products and Addressable Markets
Bioceres Tech
Product Offerings
Agrality provides a wide array of biotechnology solutions tailored for the global agricultural sector. Its core products include:
| ● | Molecular Biology Services: assistance for genotyping in plant breeding, and molecular characterization of GM crops. |
| ● | Plant Transformation Techniques: methods for enhancing crop genetics, by means of obtaining GM events and gene editing techniques. |
| ● | Tissue Cultures: support for genetic improvement of crops. |
In addition to these biotechnology products, Agrality offers breeding and field-testing solutions, covering all aspects from nursery management to performance trials, ensuring high-purity levels in crop production.
Processing and Manufacturing
Agrality has strong capabilities in processing and manufacturing, including facilities for multi-crop drying, processing, and conditioning. Efficient warehousing and distribution are supported by a storage capacity of 300,000 square feet, handling and shipping up to 1.1 million units.
Addressable Markets
Agrality operates in the agribusiness solutions sector across North and South America, offering services such as biotechnology, regulatory affairs, field testing and breeding, seed production, and seed processing.
| ● | North America: the agricultural market in North America was valued at approximately $10.65 billion in 2024, accounting for 56.1% of the global market. It is projected to reach $51.8 billion by 2033, with a CAGR of 19.2% from 2025 to 2033. This growth reflects the strong demand for advanced agricultural technologies and services in the U.S. and Canada—core markets where Agrality operates, especially after its acquisition of Nebraska Irrigated Seeds and Mendon Seed Growers. |
| ● | South America: the agricultural market value in South America is projected to reach $389.87 billion in 2025, with an expected annual growth rate of 5.28%. The Latin American agrochemicals market, which often overlaps with biotech and seed services, is expected to grow to $64.4 billion by 2030, with a CAGR of 4.9% between 2024 and 2030. Particularly Argentina and Brazil, where Agrality has a strong presence, represents a key growth region for field trials, seed production, and biotech validation, making it a significant part of the company’s addressable market. |
Nutrecon
Product Offerings
Nutrecon operates at the cutting edge of biotechnology, offering innovative products and services that bridge the gap between research and industrial applications. The company leverages its dual roles as a RTO and a CDMO to provide comprehensive biotechnology services.
Key offerings include:
| ● | Advanced R&D Capabilities: at its state-of-the-art facilities in Helsinki and Espoo, Nutrecon handles complex fermentative and mammalian processes, with lab-scale services supporting initial inoculum preparation and potential scale-up to 15 liters. |
| ● | Pilot and Industrial Services: an upcoming facility in Lappeenranta, with completion anticipated by the third quarter of 2025, will support process development, optimization, scale-up, and validation. Featuring bioreactors with capacities of 50, 500, 10,000, and 27,000 liters, this facility will provide essential downstream and analytical services for efficiency. |
Products on the Market
Nutrecon’s products are offered under the ETERNAL brand, featuring sustainable, fungi-based ingredients derived from the filamentous fungus Fusarium venenatum (A3/5, ATCC PTA-2684), which was approved by the US Food and Drug Administration (FDA) and the European Food Safety Authority (EFSA) for human consumption.
ETERNAL has two presentations of Food Grade Biomass: wet and dried.
| ● | Wet Biomass: this product has between 18-25% dry matter and a pH between 5-6 in water. The structure and consistency of this product is tuna like paste with a light mushroom smell and taste. |
| ● | Dry Biomass: this product has more than 95% of dry matter and a pH between 5-6 in water. The structure and consistency of this product is a free-flowing powder with a similar odor and taste of wet, but more intense. |
Addressable Markets
Nutrecon targets a broad spectrum within the biotechnology sector, accommodating clients ranging from early-stage research entities to established industrial applications.
Nutrecon and Synbio operate within sectors of synthetic biology that are experiencing significant growth:
| ● | Synthetic Biology Market |
The global synthetic biology market was valued at approximately $16.2 billion in 2024. It is projected to grow to approximately $42.1 billion by 2030, reflecting a CAGR of 17.3%. This market includes applications in agriculture, healthcare, food, and industrial biotechnology.
| ● | Precision Fermentation |
The global precision fermentation market was valued at $3.03 billion in 2024 and is expected to reach $57 billion by 2032, growing at a CAGR of 44.3%. Key applications include the production of alternative proteins, enzymes, dairy substitutes, and other functional ingredients.
| ● | Cultivated Meat |
The global cultivated meat market was valued at $1.2 billion in 2025 and is projected to grow to over $10.7 billion by 2033, with a CAGR of 16.5%. This market focuses on animal-free meat production using cell-based technologies, offering a sustainable alternative to traditional livestock.
With regard to biomass, the current markets are Europe (Germany, Holland, Greece, Estonia) and Mexico.
Gentle Tech
Product Offerings
Gentle Tech is at the forefront of sustainable agricultural technology, with a focus on producing equipment that optimizes farming efficiency and reduces environmental impact. Its product offerings utilize advancements in materials science, information technology, and alternative energy to enhance performance while meeting the need for eco-friendly farming solutions.
Key products include:
| ● | Revolutionary Harvesting Head: Engineered by its subsidiary G-FAS, this carbon fiber product transforms conventional farming practices by reducing soil compaction by 80%, energy consumption by 85%, and greenhouse gas emissions by 95%. It also cuts fuel usage by 40% and is 70% lighter, boosting agricultural productivity and sustainability. |
| ● | Smart Agricultural Machinery: Through its subsidiary Gentle Farming, the company develops machinery that promotes autonomy and intelligent management solutions. These innovations reduce power needs by 85% and lighten equipment by 70%, showcasing a commitment to energy-efficient farming. The adoption of alternative energy fosters resource optimization and cost reduction, supporting the transition to sustainable crop-production systems with smart, electric, driver-optional equipment. |
Addressable Markets
Gentle Tech targets the global agricultural equipment market, which is experiencing steady growth, driven by the increasing demand for mechanization to enhance productivity and meet the food requirements of a growing population. In 2024, the market was valued at approximately $193.46 billion and is projected to reach $344.73 billion by 2032, reflecting a CAGR of 7.5% during that period. This expansion is fueled by advancements in technology, including precision farming and autonomous machinery, which aim to optimize agricultural practices and resource utilization.
Development Timelines
Bioceres Tech
Agrality does not provide development timelines for products in the pipeline, as the company operates strictly as a Contract Research Organization (CRO). It does not own or manage proprietary product development, but instead offers services that support third-party R&D and commercialization efforts across the biotech industries.
Nutrecon
Nutrecon does not provide development timelines for products in the pipeline, as the company operates strictly as a Contract Research Organization (CRO). It does not own or manage proprietary product development, but instead offers services that support third-party R&D and commercialization efforts across the biotech industries.
Gentle Tech
The first working prototypes of Gentle Farming’s technologies are expected to be developed within the next 2 to 3 years, depending on the complexity and maturity of the technologies involved. Given the early stage of the company and the focus on foundational R&D, it is still too soon to provide definitive timelines for final market-ready products. The priority remains on advancing core innovations through rigorous testing and validation before moving toward commercialization.
Marketing and Sales
Bioceres Tech
Agrality’s marketing and sales strategy is centered on positioning itself as a comprehensive partner for seed and biotech companies, offering end-to-end solutions from early development through large-scale production. Rather than competing on isolated services, it markets its integrated model as a differentiator—combining biotechnology, regulatory affairs, breeding, seed production, and logistics. This approach appeals to clients looking to simplify operations and ensure consistency across geographies.
Its strong presence in North and South America—with facilities in Argentina, Brazil, and the U.S.—allows Agrality to emphasize proximity, scalability, and regional expertise. The company also plays an active role in major agricultural and seed industry events across these three geographies, helping build trust and close relationships with local producers.
Sales efforts are likely focused on high-value crops like corn and soybeans, with messaging built around reliability, regulatory experience, and production capacity. The company also highlights its rigorous quality standards and modern facilities, which serve as trust-building tools in client conversations. A key advantage is Agrality’s ability to provide both season and off-season services across hemispheres, allowing clients to work with a single partner year-round instead of coordinating with multiple CROs. Financial projections show consistent growth, suggesting a steady, service-driven expansion rather than aggressive diversification. Overall, Agrality’s strategy combines technical depth, regional reach, and operational excellence to win and retain global agribusiness clients.
Nutrecon
Nutrecon / Synbio Powerlabs’ marketing and sales strategy is grounded in a clear market need: the global bottleneck in pre-commercial scale-up for synthetic biology innovations. The company positions itself not just as a service provider but as a critical partner in taking biotech ideas from lab to industrial scale. Commercial efforts focus on securing long-term partnerships with startups, corporates, research and governmental institutions that lack internal capacity for fermentation piloting and bioprocess optimization. Rather than mass outreach, the strategy emphasizes targeted engagement with high-potential customers through tailored development packages, a modular piloting platform, and demonstrated technical capacity - from lab-scale to 27,000-liter bioreactors.
This strategic positioning is further reinforced by active participation in key European biotech networks and funding ecosystems, enhancing Nutrecon’s credibility, visibility, and access to collaborative opportunities. The combined value proposition of Nutrecon and Synbio Powerlabs—transforming underutilized feedstocks into high-value outputs—strongly resonates with organizations focused on sustainability, circular economy models, and the development of alternative proteins. This alignment with global priorities positions Nutrecon as a valuable partner for forward-thinking companies driving the future of biotechnology.
Gentle Tech
Gentle Tech’s business model divides its operations into two principal units, each with tailored sales strategies.
G-FAS follows a direct-to-grower commercial strategy, developing and selling its products primarily to individual producers and large agricultural companies. The company maintains a close relationship with farmers, providing hands-on training and support to ensure proper implementation and optimal use of its equipment. This direct engagement also enables G-FAS to showcase its solutions in real-world conditions, leveraging producer networks to generate visibility and drive regional sales. Demonstrating consistent performance across both summer and winter crops has been key to validating the versatility of its machinery. Participation in local agricultural fairs further supports outreach and customer acquisition. This approach has allowed G-FAS to steadily grow its market presence in Argentina and begin expanding operations into Uruguay and Paraguay.
As a pre-revenue initiative, Gentle Farming is currently focused on the development of proprietary technologies and machinery prototypes. The company has not yet launched commercial sales and does not have an active marketing strategy in place. Its efforts remain concentrated on refining core innovations and building a robust intellectual property portfolio to support future market entry.
Intellectual Property
Our success depends mostly on our ability to obtain and maintain intellectual property protection for our products and technologies, defend and enforce our intellectual property rights (in particular, our patent rights, trademarks and trade secrets), preserve the confidentiality of our intellectual property and operate without infringing valid and enforceable intellectual property rights of others.
We seek to protect our proprietary products, technology, and trade secrets, in part, by entering into confidential disclosure agreements with our employees, consultants and potential and actual third-party collaborators.
Bioceres Group
Bioceres co-owns and owns the HB4 patent portfolio. The patents for the HB4 soy and HB4 wheat expire in 2039 and 2040, respectively. HB4 technology, which has now been approved in multiple countries for food and feed uses and for cultivation, is the first in the world that confers tolerance to climate changes in soybeans and wheat by allowing these crops to tolerate drought and soil salinity conditions that are a significant threat to the world’s food supply.
Bioceres also co-owns patents for the Coxc5-1 family in 2027 and for the HB10 family in 2026.
The main countries in which HB4 technology has patent protection are the United States, Canada, Brazil, Argentina, Bolivia, Paraguay, Uruguay, Mexico, South Africa, Australia, India, China, Ukraine, Russia, and certain other countries in Europe.
Nutrecon
Nutrecon’s assets include the intellectual property portfolio—comprising trademarks and four patent applications—originally developed by Eternal (Mycofood US LLC). As an innovation platform, Eternal leverages state-of-the-art technologies to create advanced systems across biotechnology, artificial intelligence, computer vision, and foodtech. This strong IP foundation further strengthens Nutrecon’s ability to deliver innovative, future-focused solutions in a competitive and rapidly evolving market.
Gentle Tech
Gentle Farming is building a solid IP portfolio with six patents focused on planting and harvesting technologies. These include ultra-light harvesting headers made with carbon fiber, multi-crop harvesting systems, and several seeding devices designed to drastically reduce pulling power and soil compaction. There are also precision solutions like individual hole seeders and georeferenced Cartesian-positioning systems. The patents for ultra-light harvesting headers expire in 2041 and the others were filed in 2024. This 6-family patents portfolio reflects Gentle Farming’s commitment to developing disruptive, farmer-centric technologies.
Research and Development
Bioceres Tech
Agrality’s R&D capabilities are built around three core pillars: biotechnology, regulatory affairs, and breeding & field testing. The company supports clients across the full innovation lifecycle—from proof of concept through advanced development—offering services such as GMO characterization, plant transformation, regulatory trial design, and multi-location performance testing. With state-of-the-art labs, experienced scientific teams, and a strong track record of regulatory approvals, Agrality enables faster, more reliable advancement of biotech traits and seed technologies toward commercialization.
Nutrecon
Nutrecon and Synbio place R&D at the core of their value creation strategy, combining advanced microbial engineering with precision fermentation to accelerate the development of sustainable bioproducts. Synbio offers end-to-end R&D services—from strain development to scale-up—supported by state-of-the-art laboratories and pilot-scale bioreactors up to 27,000 liters.
Their approach focuses on converting alternative feedstocks into high-value materials, food, and chemicals, enabling partners to move from concept to commercialization with speed and technical rigor.
Gentle Tech
Gentle Farming’s R&D strategy is centered on building a robust pipeline of next-generation agricultural technologies, with a strong emphasis on automation, alternative energy integration, and the use of sustainable materials. The company prioritizes early-stage prototyping and iterative field validation to ensure practical applicability and farmer-centric design. A key component of this approach is the development of a solid intellectual property portfolio, with multiple patents filed and others in preparation, aimed at protecting core innovations and strengthening the company’s long-term competitive position.
Material Agreements
Bioceres Group
Debt instruments
For information on the debt instruments and outstanding financial indebtedness of BIOX, please see the Annual Report on Form 20-F of BIOX included in Exhibit 99.5 to the Form 6-K.
Bioceres S.A. and Bioceres LLC have approximately $160.8 million in outstanding principal and accrued interest under a variety of debt instruments. The table below indicates the lender, principal and accrued interest, interest rate and number of BIOX shares pledged under each debt instrument as of March 31, 2025.
| Principal + Accrued Interest | Bioceres LLC | Bioceres S.A. | Total | Rate | Collateral (BIOX Shares) |
|||||||||||||
| BAF Credit Fund | $ | 19.6 M | $ | 0.0 M | $ | 19.6 M | 13.5%-14.5% | 3,461,430 | ||||||||||
| Granosur | $ | 8.2 M | $ | 0.0 M | $ | 8.2 M | 15% | 4,200,000 | ||||||||||
| Draco | $ | 66.1 M | $ | 0.0 M | $ | 66.1 M | 8% | 3,500,000 | ||||||||||
| Britannia | $ | 7.5 M | $ | 0.0 M | $ | 7.5 M | 12% | 3,145,000 | ||||||||||
| AV Securities/Port Delphi | $ | 9.8 M | $ | 0.0 M | $ | 9.8 M | 9.5%-10.5% | 4,313,427 | ||||||||||
| Termina La Quincena | $ | 1.5 M | $ | 0.0 M | $ | 1.5 M | 20% | 156,142 | ||||||||||
| Promissory Notes | $ | 0.0 M | $ | 48.1 M | $ | 48.1 M | 0%-10% | 0 | ||||||||||
| TOTAL | $ | 112.7 M | $ | 48.1 M | $ | 160.8 M | 18,775,999 | |||||||||||
Preferred Equity Instrument with Agriculture Investment Group Corp
On December 9, 2024, Bioceres Group and Agriculture Investment Group Corp (“Agriculture Investment”) executed a Subscription Agreement pursuant to which Agriculture Investment agreed to subscribe on December 12, 2024 (the “Completion Date”) 2,380,952 preference shares of Bioceres Group (the “Subscription Shares”) in exchange for $15 million (the “Subscription Price”). The instrument accrues a PIK amount of 9% per annum (the “PIK Amount”). Pursuant to the terms and conditions of the agreement, within the first 24 months following the closing of the Business Combination, Agriculture Investment has the option to convert all or part of the Base Amount (defined as the Subscription Price plus the PIK Amount) into Shares. If the Business Combination does not close by September 12, 2025, Agriculture Investment can request conversion of the Subscription Shares into Bioceres Group ordinary shares. Alternatively, Agriculture Investment can receive the Subscription Price plus the accrued PIK Amount and return the Subscription Shares to Bioceres Group for no consideration (the “Repayment”). In connection with this agreement, Bioceres Group executed an Escrow Agreement identifying Agriculture Investment as the sole beneficiary and placed 1.7 million BIOX shares it holds to secure the Repayment.
Bioceres Tech, Nutrecon and Gentle Tech are not party to any material agreements.
Legal Proceedings
As of the date of this disclosure statement, none of Bioceres Group, Bioceres Tech, Nutrecon or Gentle Tech were involved in or the subject of any material actual or threatened legal claims, suits or other proceedings. For a summary of the legal proceedings of BIOX, please see the Annual Report on Form 20-F of BIOX included in Exhibit 99.5 to the Form 6-K.
68
Exhibit 99.2
Execution Version
Dated April 17, 2025
BUSINESS COMBINATION AGREEMENT
by and among
Moolec Science SA,
Bioceres Group Initial Shareholders named herein,
Bioceres Group Limited,
Nutrecon LLC,
Nordelis Ventures Corp,
Union Group Ventures Ltd, and
Gentle Technologies Corp.
Table of Contents
| W I T N E S S E T H | 1 | ||
| 1 | Definitions | 2 | |
| 1.1 | Definition of Certain Terms | 2 | |
| 1.2 | Construction | 15 | |
| 2 | Contribution and Exchange | 15 | |
| 2.1 | Contribution and Exchange | 15 | |
| 2.2 | Deductions from the Exchange Consideration | 16 | |
| 2.3 | Closing | 17 | |
| 2.4 | Squeeze Out Rights | 18 | |
| 3 | Representations and Warranties of Certain Transferors | 18 | |
| 3.1 | Organization and Good Standing | 18 | |
| 3.2 | Capacity and Authority: Binding Effect | 18 | |
| 3.3 | No Conflict | 19 | |
| 3.4 | Bioceres Group Original Shares | 20 | |
| 3.5 | Nutrecon Membership Interests | 20 | |
| 3.6 | Gentle Tech Union Shares | 20 | |
| 3.7 | Investment Purpose | 20 | |
| 3.8 | No General Solicitation | 21 | |
| 3.9 | No Reliance | 21 | |
| 3.10 | Brokers and Finders | 21 | |
| 3.11 | No Other Representations or Warranties | 21 | |
| 4 | Representations and Warranties of Bioceres Group, Nordelis, Union Group, Nutrecon and Gentle Tech | 22 | |
| 4.1 | Corporate Status | 22 | |
| 4.2 | Subsidiaries | 23 | |
| 4.3 | Governmental Approvals and Consents | 23 | |
| 4.4 | Financial Statements | 23 | |
| 4.5 | Absence of Undisclosed Liabilities | 24 | |
| 4.6 | Absence of Changes | 24 | |
| 4.7 | Material Contracts | 25 | |
| 4.8 | Assets; Real Property | 26 | |
| 4.9 | Intellectual Property | 27 | |
| 4.10 | Litigation | 30 | |
| 4.11 | Compliance with Laws; Consents | 30 | |
| 4.12 | Environmental Matters | 31 | |
| 4.13 | Employees; Labor Matters | 32 | |
| 4.14 | Taxes | 33 | |
| 4.15 | Insurance | 36 | |
| 4.16 | Customers and Suppliers | 36 | |
| 4.17 | Accounts Receivable | 36 | |
| 4.18 | Affiliate Transactions; Guaranties | 36 | |
| 4.19 | State Takeover Statutes | 37 | |
| 4.20 | Brokers and Finders | 37 | |
| 4.21 | Full Disclosure | 37 | |
| 4.22 | No Other Representations or Warranties | 37 | |
| 5 | Representations and Warranties of Moolec | 38 | |
| 5.1 | Corporate Status; Authorization; Binding Effect | 38 | |
| 5.2 | Governmental Approvals | 38 | |
| 5.3 | Moolec Shares | 38 | |
| 5.4 | No Conflicts | 39 | |
| 5.5 | Purchase for Investment | 39 | |
| 5.6 | Litigation | 39 | |
| 5.7 | Brokers and Finders | 39 | |
| 5.8 | Moolec SEC Documents | 40 | |
| 5.9 | Subsidiaries | 41 | |
| 5.10 | Material Contracts | 41 | |
| 5.11 | Assets; Real Property | 43 | |
| 5.12 | Intellectual Property | 44 | |
| 5.13 | Compliance with Laws; Consents | 46 | |
| 5.14 | Environmental Matters | 47 | |
| 5.15 | Employees; Labor Matters | 48 | |
| 5.16 | Taxes | 49 | |
| 5.17 | Insurance | 51 | |
| 5.18 | Customers and Suppliers | 51 | |
| 5.19 | Affiliate Transactions; Guaranties | 52 | |
| 5.20 | No Other Representations or Warranties | 52 | |
| 6 | Covenants | 52 | |
| 6.1 | Covenants of Bioceres Group, Nordelis, Union Group, Nutrecon and Gentle Tech | 52 | |
| 6.2 | Covenants of Moolec | 57 | |
| 7 | Conditions Precedent | 60 | |
| 7.1 | Conditions to Obligations of Each Party | 60 | |
| 7.2 | Conditions to Obligations of Moolec | 60 | |
| 7.3 | Conditions to Obligations of the Transferors | 62 | |
| 8 | Tax Matters | 63 | |
| 8.1 | Tax Returns | 63 | |
| 8.2 | Payment of Taxes | 64 | |
| 8.3 | Allocation of Tax Liability | 64 | |
| 8.4 | Cooperation on Tax Matters | 65 | |
| 8.5 | Tax Sharing Agreements | 65 | |
| 8.6 | Indemnification | 65 | |
| 8.7 | Contests | 66 | |
| 8.8 | Withholding | 66 | |
| 9 | Termination | 66 | |
| 9.1 | Termination | 66 | |
| 9.2 | Effect of Termination | 67 | |
| 10 | Indemnification and Holdback | 67 | |
| 10.1 | Indemnification by the Transferors | 67 | |
| 10.2 | Holdback Provision | 68 | |
| 10.3 | Claims Against Holdback | 68 | |
| 10.4 | Survival of Representations and Warranties | 68 | |
| 11 | Miscellaneous | 68 | |
| 11.1 | Fees and Expenses | 68 | |
| 11.2 | Appointment and Role of Bioceres Group Shareholders Representative | 69 | |
| 11.3 | Dragged Bioceres Group Shareholders’ Undertaking | 70 | |
| 11.4 | Notices | 71 | |
| 11.5 | Entire Agreement | 72 | |
| 11.6 | Schedules | 72 | |
| 11.7 | Confidentiality | 73 | |
| 11.8 | Amendment; Waivers | 73 | |
| 11.9 | Severability | 73 | |
| 11.10 | Counterparts | 73 | |
| 11.11 | Binding Effect | 74 | |
| 11.12 | Assignment | 74 | |
| 11.13 | No Third Party Beneficiaries | 74 | |
| 11.14 | Governing Law | 74 | |
| 11.15 | Waiver of Jury Trial | 74 | |
Exhibit A - Closing Allocation Template
Exhibit B - Term of Adherence
Exhibit C - Equity Incentive Plan
BUSINESS COMBINATION AGREEMENT, dated as of April 17, 2025, among:
| (1) | Moolec Science SA, a public limited liability company (societé anonyme) governed by the laws of the Grand Duchy of Luxembourg, having its registered office at 17, boulevard F.W. Raiffeisen, L-2411 Luxembourg, Grand Duchy of Luxembourg, and registered with the Luxembourg Register of Commerce and Companies (Registre de Commerce et des Sociétés de Luxembourg) under registration number B268440 (“Moolec”), |
| (2) | Each of the shareholders of Bioceres Group whose names are set out in Schedule 1.1 (the “Bioceres Group Initial Shareholders”), |
| (3) | Union Group Ventures Ltd, a company incorporated under the laws of the British Virgin Islands (“Union Group”), |
| (4) | Nordelis Ventures Corp, a company incorporated under the laws of the British Virgin Islands (“Nordelis”), |
| (5) | Bioceres Group Limited, a company incorporated under the laws of England and Wales (“Bioceres Group”), |
| (6) | Gentle Technologies Corp, a company incorporated under the laws of the British Virgin Islands (“Gentle Tech”), |
| (7) | Nutrecon LLC, a limited liability company formed under the laws of the State of Delaware (“Nutrecon”), and |
| (8) | Theo I SCSp, a special limited partnership (société en commandite spéciale) governed by the laws of the Grand Duchy of Luxembourg, having its registered office at 30, Boulevard Royal, L-2449 Luxembourg, Grand Duchy of Luxembourg, and registered with the Luxembourg Register of Commerce and Companies (Registre de Commerce et des Sociétés de Luxembourg) under registration number B257706 (“Theo”), as intervening consenting party. |
Each of Moolec, Bioceres Group Initial Shareholders, Union Group, Nordelis, Bioceres Group, Gentle Tech and Nutrecon shall individually be referred to herein as a “Party” and, collectively, the “Parties”. Capitalized terms used herein without definition are defined in Section 1.1.
Whereas:
| (A) | On the date hereof, the Bioceres Group Initial Shareholders own the totality of the (i) Bioceres Group Initial Ordinary Shares, and (ii) Bioceres Group Preference Shares, and the Bioceres Group Additional Shareholders own the totality of the Bioceres Group Additional Ordinary Shares; |
| (B) | On the date hereof, Nordelis owns all of the 50,000 issued and outstanding membership interests of Nutrecon (the “Nutrecon Membership Interests”); |
| (C) | On the date hereof, Bioceres Group and Union Group each own 50% of the 2,000,000 issued and outstanding ordinary shares, no par value per share, of Gentle Tech; |
| (D) | As a condition precedent to Closing, subject to the terms and conditions of the Agreement, Bioceres Group shall procure that all the Bioceres Group Additional Shareholders adhere to this Agreement pursuant to the Bioceres Group New Articles; |
| (E) | As a condition precedent to Closing, subject to the terms and conditions of the Agreement, Moolec shall complete the RSS and the Redomiciliation; |
| (F) | The board of directors of each Party (or equivalent governing body), after consulting with their respective advisors, including but not limited to legal and financial advisors, has determined that (i) the execution of this Agreement, (ii) the consummation of the Contribution and Exchange, and (iii) the compliance with the obligations set forth in this Agreement are in each Party’s and its stakeholders’ best interests; |
| (G) | At Closing, subject to the terms and conditions of the Agreement (i) the Bioceres Group Initial Shareholders shall transfer the Bioceres Group Initial Ordinary Shares and the Bioceres Group Preference Shares to Moolec, the consideration for which will be the issuance by Moolec of newly issued Moolec Shares, (ii) the Bioceres Group Additional Shareholders, to the extent they adhere to this Agreement, shall transfer the Bioceres Group Additional Ordinary Shares to Moolec, the consideration for which will be the issuance by Moolec of newly issued Moolec Shares, (iii) Nordelis shall transfer the Nutrecon Membership Interests to Moolec, the consideration for which will be the issuance by Moolec of newly issued Moolec Shares and Moolec Warrants, and (iv) Union Group shall transfer the 1,000,000 issued and outstanding ordinary shares it holds in Gentle Tech (the “Gentle Tech Union Shares”) to Moolec, the consideration for which will be the issuance by Moolec of newly issued Moolec Shares (all together, the “Contribution and Exchange”); and |
| (H) | The Transferors and Moolec agree that, pursuant to the Contribution and Exchange, the Contributed Entities will become Subsidiaries of Moolec and each Transferor will be issued Moolec Shares pursuant to the terms of this Agreement. |
NOW, THEREFORE, in consideration of the mutual promises and covenants set forth below and for other good and valuable consideration, the receipt and sufficiency of which is hereby acknowledged, and intending to be legally bound, the Parties agree as follows:
| 1 | Definitions |
| 1.1 | Definition of Certain Terms |
The following terms, as used herein, have the following meanings:
“Accounts Receivable” means the amounts owed to the Contributed Entities, as applicable, as of the Closing Date for goods sold or services rendered prior to Closing, whether or not the Contributed Entities have submitted an invoice for such goods or services, or for goods to be sold or services to be provided after the Closing for which the Contributed Entities have submitted an invoice.
“Affiliate” of a Person means any Person that, directly or indirectly through one or more intermediaries, controls, is controlled by, or is under common control with, the first Person. “Control” (including the terms “controlled by” and “under common control with”) means the possession, directly or indirectly, of the power to direct or cause the direction of the management policies of a Person, whether through the ownership of voting securities, by contract or credit arrangement, as trustee or executor, or otherwise.
“Affiliate Transaction” has the meaning given in Section 4.18.1.
“Agreement” means this Business Combination Agreement, including the Schedules and Exhibits.
“Assets” has the meaning given in Section 4.8.1.
“Balance Sheet” means the balance sheet contained in the Financial Statements.
“Balance Sheet Date” means June 30, 2024, for Bioceres Group and its Subsidiaries, June 30, 2024, for Gentle Tech and its Subsidiaries and December 31, 2023, for Nutrecon and its Subsidiaries.
“Bioceres Group” has the meaning given in the recitals to this Agreement.
“Bioceres Group Additional Ordinary Shares” means the 2,936,713 issued and outstanding ordinary shares of Bioceres Group held by the Bioceres Group Additional Shareholders.
“Bioceres Group Additional Shareholder” means each of the shareholders of Bioceres Group whose names are set out in Schedule 1.2 as they adhere hereto pursuant to Bioceres Group New Articles and in observance to Section 7.2.2.
“Bioceres Group Financial Statements” has the meaning given in Section 4.4.1.
“Bioceres Group Initial Ordinary Shares” means the 19,593,875 issued and outstanding ordinary shares of Bioceres Group held by the Bioceres Group Initial Shareholders.
“Bioceres Group Initial Shareholders” has the meaning given in the recitals to this Agreement.
“Bioceres Group New Articles” means the new articles of association of Bioceres Group adopted by a special resolution of certain Bioceres Group Shareholders at the General Meeting held on April 1, 2025.
“Bioceres Group Ordinary Shares” means 22,530,588 issued and outstanding ordinary shares of Bioceres Group, composed by the Bioceres Group Initial Ordinary Shares and the Bioceres Group Additional Ordinary Shares.
“Bioceres Group Original Shares” means the Bioceres Group Ordinary Shares and the Bioceres Group Preference Shares.
“Bioceres Group Preference Shares” means 50,000 redeemable preference shares of Bioceres Group being 25,000 redeemable preference shares held by Ms. Gloria Montaron Estrada and 25,000 redeemable preference shares held by Mr. Federico Trucco.
“Bioceres Group Promissory Note” means the promissory note executed between Bioceres and Moolec on January 1, 2025, as assigned to Theo, in the amount of U.S.$491,894,000, plus interests.
“Bioceres Group Shareholders” means (i) the Bioceres Group Initial Shareholders, and (ii) the Bioceres Group Additional Shareholders to the extent they adhere to this Agreement.
“Bioceres Group Shareholders Representatives” means Ms. Gloria Montaron Estrada and Mr. Federico Trucco, who (i) were severally appointed by the Bioceres Group Initial Shareholders, and (ii) shall be severally appointed by certain Bioceres Group Additional Shareholders to act on their behalf pursuant to Section 11.2.
“BIOX” means Bioceres Crop Solutions Corp.
“BIOX 20-F” means the form 20-F filed by BIOX with the SEC on October 30, 2024.
“BIOX 6-K” means the form 6-K filed by BIOX with the SEC on February 28, 2025.
“Business” means the business as conducted by the Contributed Entities, taken as a whole, immediately prior to the date of this Agreement.
“Business Day” means a day other than a Saturday, Sunday or other day on which commercial banks in New York (United States), George Town (Cayman Islands), London (England) and Buenos Aires (Argentina) are authorized or required to close.
“Claims Against Holdback” has the meaning given in Section 10.3.
“Closing” has the meaning given in Section 2.3.1.
“Closing Allocation List” means certain list to be provided by the Bioceres Group Shareholders Representative, Nordelis and Union Group to Moolec for review and approval prior to the Closing Date in the form of Exhibit A.
“Closing Date” has the meaning given in Section 2.3.1.
“Code” means the Internal Revenue Code of 1986, as amended, and the rules and regulations promulgated thereunder.
“Confidentiality Agreement” means that certain Confidentiality Agreement, dated as of December 23, 2024, between Moolec and Bioceres Group.
“Consent” means any consent, approval, authorization, novation, waiver, permit, grant, variance, franchise, concession, agreement, license, exemption or order of, registration, certificate, declaration or filing with, or report or notice to, any Person.
“Contract” means any contract, subcontract, agreement, arrangement, franchise, warranty, purchase order, note, mortgage, indenture, license, lease, sublease, plan, commitment or other instrument, obligation or understanding, whether written or oral of any kind or character.
“Contributed Entities” means Bioceres Group and its Subsidiaries, Nutrecon and its Subsidiaries and Gentle Tech and its Subsidiaries.
“Contributed Entities Benefit Plans” means any agreement, plan, program, fund, policy, contract, arrangement or understanding (either written or unwritten and whether or not legally binding) providing compensation, benefits, pension, retirement, profit sharing, stock bonus, stock option, stock purchase, stock ownership, stock appreciation right, phantom or stock equivalent, bonus, incentive, deferred compensation, hospitalization, medical, dental, vision, retirement, vacation, insurance, sick pay, disability, death benefit, severance, worker’s compensation, supplementary unemployment benefits, perquisites, or similar employee benefits, or any salary reduction agreement, change-of-control agreement, retention agreement, employment agreement or consulting agreement, for the benefit of any current or former employee, officer, director or independent contractor (who is an individual) of the Contributed Entities and the beneficiaries and dependents thereof, which is now or previously has been entered into, maintained or contributed to, as the case may be, or with respect to which any withdrawal liability (within the meaning of section 4201 of ERISA) has been incurred, by the Contributed Entities, or any ERISA Affiliate, or pursuant to which the Contributed Entities or ERISA Affiliates has or may have any Liability, including (i) any “employee benefit plan” (as defined in section 3(3) of ERISA), and (ii) any “multiemployer plan” (as defined in section 3(7) of ERISA).
“Contributed Entities Intellectual Property” has the meaning given in Section 4.9.2.
“Contributed Entities IP Agreements” has the meaning given in Section 4.9.7.
“Contributed Entities Labor Agreements” has the meaning given in Section 4.13.1.
“Contribution and Exchange” has the meaning given in the recitals to this Agreement.
“Current Options” has the meaning given in Section 5.3.1.
“Derivative Securities” means (i) shares of capital stock of or other equity interests, (ii) securities convertible into or exercisable or exchangeable for shares of capital stock of or other equity interests, (iii) options, warrants or stock appreciation, phantom stock, preemptive or other rights or agreements, commitments or understandings of any kind, including rights of first refusal or first offer, or other obligation to issue, transfer or sell any capital stock, of or other equity interests in or securities convertible into or exercisable or exchangeable for capital stock of or other equity interests, (iv) obligations measured by the price or value of any shares of capital stock of or other equity interests, (v) voting trusts, proxies, shareholder agreements or other similar Contracts, or (vi) Contracts restricting the transfer of, or requiring the registration for sale of, any shares of capital stock of or other equity interests.
“Disabling Devices” means any computer software viruses, time bombs, logic bombs, Trojan horses, trap doors, back doors, ransomware, spyware, adware, scareware, or other computer instructions, intentional devices or techniques that are designed to threaten, infect, assault, vandalize, defraud, disrupt, damage, disable, maliciously encumber, hack into, incapacitate, infiltrate, slow or shut down a computer system or any component of such computer system, including any such device affecting system security or compromising, disrupting access to, or disclosing data, files or other information.
“Drag Rights” means the drag along rights set out in the Bioceres Group New Articles.
“Dragged Bioceres Group Shareholder” means each shareholder in Bioceres Group whose shares will be transferred pursuant to the Drag Rights.
“Environmental Law” means any Law regulating or relating to the protection of human health and safety, natural resources or the environment, including Laws relating to contamination and the use, generation, management, handling, transport, treatment, disposal, storage, Release or threatened Release of Hazardous Substances.
“Environmental Permit” means any permit, lease, license or other Consent required pursuant to applicable Environmental Law.
“Equity Incentive Plans” has the meaning given in Section 7.2.3.
“ERISA” means the Employee Retirement Income Security Act of 1974, as amended, and the rules and regulations promulgated thereunder.
“ERISA Affiliate” means, with respect to any entity, trade or business, any other entity, trade or business that is a member of a group described in section 414(b), (c), (m) or (o) of the Code or section 4001(b)(1) of ERISA that includes the first entity, trade or business, or that is a member of the same “controlled group” as the first entity, trade or business pursuant to section 4001(a)(14) of ERISA.
“Exchange Act” means the Securities Exchange Act of 1934, as amended.
“Exchange Consideration” has the meaning given in Section 2.1.1(iv).
“Financial Statements” means Bioceres Group Financial Statements, Nutrecon Financial Statements and Gentle Tech Financial Statements.
“First Exchange Consideration” has the meaning given in Section 2.1.1.
“Gentle Tech” has the meaning given in the recitals to this Agreement.
“Gentle Tech Financial Statements” has the meaning given in Section 4.4.3.
“Governmental Approval” means any Consent of, with or to any Governmental Authority.
“Governmental Authority” means any international, supranational or national government, any state, provincial, local or other political subdivision thereof, any entity, authority or body exercising executive, legislative, judicial, regulatory or administrative functions of or pertaining to government, including any government authority, agency, department, board, commission or instrumentality of the United States or a foreign nation or jurisdiction, any State of the United States or any political subdivision of any thereof, any court, tribunal or arbitration panel, or any self-regulatory organization.
“Hazardous Substances” means any substance, chemical, waste, material, pollutant or contaminant that: (i) is or contains asbestos, urea formaldehyde insulation, polychlorinated biphenyls, petroleum or petroleum products, or constituents thereof, radon gas, microbiological contamination or related materials; (ii) requires Remedial Action pursuant to any Environmental Law; (iii) is defined, listed or identified as a “hazardous waste,” “hazardous substance,” “toxic substance” or words of similar import thereunder; or (iv) is regulated under any Environmental Law.
“Holdback Amount” means 10% of the amount of the Exchange Consideration.
“Holdback Provision” the meaning given in Section 10.2.1.
“Indebtedness” means, with respect to any Person, all (i) obligations of such Person for borrowed money, whether current or funded, secured or unsecured, or with respect to deposits or advances of any kind; (ii) obligations of such Person evidenced by bonds, debentures, notes or similar instruments and all liabilities in respect of mandatorily redeemable capital stock or securities convertible into capital stock; (iii) obligations of such Person upon which interest charges are customarily paid (other than trade payables incurred in the Ordinary Course of Business); (iv) obligations of such Person under conditional sale or other title retention agreements relating to any property purchased by such Person; (v) obligations of such Person issued or assumed as the deferred purchase price of assets, property or services; (vi) lease obligations of such Person capitalized on the books and records of such Person; (vii) obligations of others secured by a Lien on property or assets owned or acquired by such Person, whether or not the obligations secured thereby have been assumed; (viii) obligations of such Person under interest rate, currency or commodity derivatives or hedging transactions; (ix) letters of credit or performance bonds issued for the account of such Person and (x) guarantees and support and keep well arrangements having the economic effect of a guarantee of such Person of any Indebtedness of any other Person, in each case, including the outstanding principal amount of such Indebtedness, together with all interest accrued thereon and all costs and charges associated therewith.
“Intellectual Property” shall mean any and all intellectual property rights of any kind or nature throughout the world, including: (a) all issued or pending U.S. and foreign patents and utility models, patent applications, including any extensions, reexaminations and reissues, divisionals, continuations and continuations-in-part, statutory invention registrations, registered designs or similar rights anywhere in the world in inventions and designs and discoveries, including invention disclosures (“Patents”); (b) trademarks, service marks, trade dress, trade names, slogans, logos and corporate names and similar indicia of origin and all registrations and applications for registration thereof and all goodwill connected with the use of and symbolized by any of the foregoing (“Trademarks”); (c) World Wide Web addresses, domain names, social media identifiers (such as X (formerly known as Twitter®), Threads® or Instagram® handles) and applications and registrations thereof (“Internet Properties”); (d) all copyrights, copyrights registrations and applications therefor and any equivalent rights in copyrightable works and works of authorship (“Copyrights”); (e) rights in Software, databases and data collections; and (f) trade secrets, confidential, proprietary and technical information, methods, processes, algorithms, formulae, customer data, customer data and supplier lists and price and cost information, and other rights in know-how (“Trade Secrets”).
“Key Employees” has the meaning given in Section 4.13.5 with regard to the Contributed Entities or in Section 5.15.5 with regard to Moolec.
“Knowledge of Bioceres Group” means with respect to any fact, circumstance, event or other matter in question, (a) the actual knowledge of such fact, circumstance, event or other matter, or (b) the knowledge of such fact, circumstance, event or other matter that would have been ascertained after reasonable inquiry, consistent with such Person’s title and responsibilities, in either case, by any of the following individuals with respect to such Party or the Party’s employees who directly report to such individuals: Mr. Federico Trucco.
“Knowledge of Moolec” means with respect to any fact, circumstance, event or other matter in question, (a) the actual knowledge of such fact, circumstance, event or other matter, or (b) the knowledge of such fact, circumstance, event or other matter that would have been ascertained after reasonable inquiry, consistent with such Person’s title and responsibilities, in either case, by any of the following individuals with respect to such Party or the Party’s employees who directly report to such individuals: Mr. Gastón Paladini and Mr. José Lopez Lecube.
“Knowledge of the Contributed Entities” means with respect to any fact, circumstance, event or other matter in question, (a) the actual knowledge of such fact, circumstance, event or other matter, or (b) the knowledge of such fact, circumstance, event or other matter that would have been ascertained after reasonable inquiry, consistent with such Person’s title and responsibilities, in either case, by any of the following individuals with respect to such Party or the Party’s employees who directly report to such individuals: Mr. Federico Trucco and Mr. Juan Presa.
“Law” means any federal, state, local, foreign, international or supranational law (including common law), statute, treaty, ordinance, rule, regulation, Order, code, governmental restriction or other legally binding requirement.
“Leased Real Property” has the meaning given in Section 4.8.4.
“Leases” has the meaning given in Section 4.8.4.
“Liabilities” means any and all debts, losses, liabilities, Litigation, fines, costs, royalties, deficiencies or obligations of any nature, whether known or unknown, absolute, accrued, off-balance sheet, contingent or otherwise and whether due or to become due, and any out-of-pocket costs and expenses (including attorneys’, accountants’ or other fees and expenses).
“Lien” means any mortgage, pledge, hypothecation, assignment, right of others, claim, charge, security interest, license, encumbrance, adverse claim or interest, easement, covenant, encroachment, servitude, option, lien, put or call right, right of first offer or refusal, voting right or other restrictions or limitations of any nature whatsoever.
“Litigation” means any action, cause of action, claim, cease and desist letter, demand, suit, proceeding, hearing, arbitration, citation, summons, subpoena or investigation of any nature, civil, criminal, regulatory or otherwise, in law or in equity.
“Losses” has the meaning given in Section 10.1.
“Material Adverse Effect” means any fact, circumstance, change, development, condition, event, occurrence or effect that has had, or would reasonably be expected to have, individually or in the aggregate, (a) a material adverse effect on the business, results of operations, assets or condition (financial or otherwise) of the Contributed Entities, taken as a whole, or (b) a material adverse effect on, or that prevents or materially delays, the ability of the Contributed Entities to perform its obligations under, and to consummate the Contribution and Exchange; provided, that, in the case of clause (a), a “Material Adverse Effect” shall not be deemed to include any fact, circumstance, change, development, condition, event, occurrence or effect to the extent resulting from or arising out of any of the following:
| (i) | any facts, circumstances, changes, developments, conditions, events, occurrences or effects generally affecting (A) any of the industries in which the Contributed Entities operate or (B) the economy, credit, debt, securities or financial or capital markets in the United States or elsewhere in the world, including changes in interest or exchange rates or deterioration in the credit markets generally; or |
| (ii) | any facts, circumstances, changes, developments, conditions, events, occurrences or effects resulting from or attributable to (A) changes or proposed changes in Law, in accounting standards, or any changes or proposed changes in the interpretation or enforcement of any of the foregoing, (B) the execution and delivery of this Agreement or the public announcement, pendency or consummation of the Contribution and Exchange, or the performance of this Agreement and the Contribution and Exchange (including compliance with the covenants set forth herein and any action taken or omitted to be taken by the Contributed Entities at the request of or with the consent of Moolec), or the identity of Moolec, (C) acts of war (whether or not declared) or any outbreak of hostilities, sabotage or terrorism, or any escalation or worsening of any such acts of war (whether or not declared), outbreak of hostilities, sabotage or terrorism, (D) weather, earthquakes, hurricanes, tornados, natural disasters, climatic conditions, epidemics, pandemics or outbreaks of illness or other public health events (or any escalation or worsening of any such illnesses or events, including, in each case, the response of Governmental Authorities thereto) or other natural or man-made disasters, (E) any civil unrest, or any changes in political conditions (including any government shutdowns or debt payment defaults of any government), or any response of any Governmental Authority thereto, (F) any Contribution and Exchange Litigation; provided, that facts, circumstances, changes, developments, conditions, events, occurrences or effects set forth in clauses (i), (ii)(A), (ii)(C) and (ii)(D) above may be taken into account in determining whether there has been, or would reasonably be expected to be, a Material Adverse Effect to the extent such facts, circumstances, changes, developments, conditions, events, occurrences or effects have a disproportionate adverse effect on the Contributed Entities, taken as a whole, compared to other similarly situated companies that operate in the industries in which the Contributed Entities operate (provided, that only the incremental disproportionate adverse effects of such facts, circumstances, changes, developments, conditions, events, occurrences or effects may be taken into account in determining whether there has been, or would reasonably be expected to be, a Material Adverse Effect). |
“Material Contract” has the meaning given in Section 4.7.2 with regard to the Contributed Entities or in Section 5.10.2 with regard to Moolec.
“Moolec” has the meaning given in the recitals to this Agreement.
“Moolec Benefit Plans” means any agreement, plan, program, fund, policy, contract, arrangement or understanding (either written or unwritten and whether or not legally binding) providing compensation, benefits, pension, retirement, profit sharing, stock bonus, stock option, stock purchase, stock ownership, stock appreciation right, phantom or stock equivalent, bonus, incentive, deferred compensation, hospitalization, medical, dental, vision, retirement, vacation, insurance, sick pay, disability, death benefit, severance, worker’s compensation, supplementary unemployment benefits, perquisites, or similar employee benefits, or any salary reduction agreement, change-of-control agreement, retention agreement, employment agreement or consulting agreement, for the benefit of any current or former employee, officer, director or independent contractor (who is an individual) of the Contributed Entities and the beneficiaries and dependents thereof, which is now or previously has been entered into, maintained or contributed to, as the case may be, or with respect to which any withdrawal liability (within the meaning of section 4201 of ERISA) has been incurred, by the Contributed Entities, or any ERISA Affiliate, or pursuant to which the Contributed Entities or ERISA Affiliates has or may have any Liability, including (i) any “employee benefit plan” (as defined in section 3(3) of ERISA), and (ii) any “multiemployer plan” (as defined in section 3(7) of ERISA).
“Moolec Board Resolutions” the resolutions of the board of directors of Moolec (i) prior to the Redomiciliation approving the execution of this Agreement, and (ii) following the Redomiciliation approving (a) the issuance of the Exchange Consideration (including the grant of Moolec Warrants and the issuance of any Moolec Shares upon the exercise of the Moolec Warrants), (b) any filing required in connection with the Contribution and Exchange, and (c) instructing the maintainer of Moolec’s register of members to update the register of members.
“Moolec EGM” means the Extraordinary General Meeting of the shareholders of Moolec which will be held, among other matters, to approve the RSS.
“Moolec IP Agreements” has the meaning given in Section 5.12.7.
“Moolec Key Employees” has the meaning given in Section 5.15.5.
“Moolec Labor Agreements” has the meaning given in Section 5.15.1.
“Moolec Registered Intellectual Property” has the meaning given in Section 5.12.1.
“Moolec SEC Documents” has the meaning given in Section 5.8.
“Moolec Shares” means shares of Moolec.
“Moolec Subscription Agreement” means that certain Subscription Agreement entered into by and among Moolec and certain Bioceres Group Shareholders on December 20, 2022, pursuant to which certain Bioceres Group Shareholders subscribed for shares in Moolec at the time of Moolec’s admission to trade on Nasdaq.
“Moolec Subscription Agreement Shareholders” means the Bioceres Group Shareholders who subscribed for shares in Moolec pursuant to the Moolec Subscription Agreement and have not yet paid up the subscription amount on such shares in Moolec.
“Moolec Warrants” means 5,000,000 warrants to acquire Moolec Shares at an exercise price per Moolec Share of U.S.$2.00, which may be adjusted based on the ratio selected by Moolec’s board of directors in furtherance of the decisions taken at the Moolec EGM, to be exercised within three years of the Closing Date.
“Nordelis” has the meaning given in the recitals to this Agreement.
“Notice” has the meaning given in Section 11.4.1.
“Nutrecon” has the meaning given in the recitals to this Agreement.
“Nutrecon Financial Statements” has the meaning given in Section 4.4.2.
“Order” means any judgment, order, administrative order, writ, directive, stipulation, injunction (whether permanent or temporary), award, decree or similar legal restraint of, or binding settlement having the same effect with, any Governmental Authority.
“Ordinary Course” or “Ordinary Course of Business” means the conduct of the Business in accordance with the Contributed Entities and Moolec’s normal day-to-day customs, practices and procedures, consistent with past practice (including with respect to quantity and frequency).
“Outstanding Subscription Amount” means the outstanding amount owed to Moolec pursuant to the Moolec Subscription Agreement, which shall be re-calculated by applying the highest of (i) the 20-day VWAP for Moolec Shares on the date that is 2 Business Days prior to Closing, or (ii) U.S.$2.00 per share, which may be adjusted based on the ratio selected by Moolec’s board of directors in furtherance of the decisions taken at the Moolec EGM.
“Owned Intellectual Property” means any Intellectual Property, including the Registered Intellectual Property, that are owned by or purported to be owned by the Contributed Entities.
“Owned Real Property” means all real property owned by a Person (together with all improvements and fixtures located thereon or attached or appurtenant thereto and all easements, licenses, rights and appurtenances relating thereto.
“Parties” has the meaning given in the recitals to this Agreement.
“Permitted Liens” means (i) Liens specifically reserved against in the Audited Financial Statements, to the extent so reserved; (ii) Liens for Taxes not yet due and payable or that are being contested in good faith and by appropriate proceedings to the extent that adequate reserves with respect thereto are maintained in accordance with the applicable accounting standards; (iii) Liens of warehousemen, mechanics and materialmen and other similar Liens arising by operation of Law in the Ordinary Course of Business; (iv) exclusive, non-exclusive licenses of Intellectual Property granted in the Ordinary Course of Business; (v) Liens that, individually and in the aggregate, do not and would not materially detract from the value of any of the assets or Real Property or materially interfere with the use thereof in the Ordinary Course of Business; or (vi) Liens granted by Bioceres Group or its Subsidiaries in connection with debt incurred by Bioceres Group or its Subsidiaries to repay any outstanding Indebtedness from Bioceres Group or its Subsidiaries, as long as the Indebtedness is disclosed in Schedule 4.7.1.
“Person” means any individual, firm, limited liability company, general or limited partnership, association, corporation (including not for profit), unincorporated organization, company, joint venture, trust, Governmental Authority or other entity of any kind or nature.
“POA Bioceres Group Additional Shareholders” means the Bioceres Group Additional Shareholders that execute on or prior to Closing the powers of attorney appointing the Bioceres Group Shareholders Representative to act on their behalf.
“Post-Closing Tax Periods” means any taxable period beginning after the Closing Date.
“Pre-Closing Tax Period” means any taxable period ending on or before the Closing Date.
“Real Property” means the Owned Real Property and the Leased Real Property.
“Redomiciliation” means the change of Moolec’s jurisdiction by discontinuing from the Grand Duchy of Luxembourg and transferring by way of continuation to the Cayman Islands as an exempted company limited by shares registered under the laws of the Cayman Islands.
“Related to the Business” means required or necessary for, primarily related to, used or held for use in connection with, useful in, or otherwise material to the Business as conducted by the Contributed Entities prior to the Closing.
“Release” means any releasing, disposing, discharging, injecting, spilling, leaking, leaching, pumping, dumping, emitting, escaping, emptying, seeping, dispersal, migration, transporting, placing and the like, including the moving of any materials through, into or upon, any land, soil, surface water, groundwater or air, or otherwise entering into the indoor or outdoor environment.
“Remedial Action” means all actions required to (i) clean up, remove, treat or in any other way remediate any Hazardous Substances; (ii) prevent the release of Hazardous Substances so that they do not migrate or endanger or threaten to endanger public health or welfare or the environment or (iii) perform studies, investigations and care related to any such Hazardous Substances.
“Representatives” means, with respect to any Person, such Person’s accountants, counsel, financial and other advisers, representatives, consultants, directors, officers, employees, stockholders, partners, members and agents.
“Returning Holdback Amount” means the Holdback Amount less any amount of Moolec Shares corresponding to any Claim Against Holdback pursuant to Section 10.3.
“RSS” means the reverse stock split to be approved by Moolec’s shareholders and executed by Moolec to regain and thereafter maintain compliance with Nasdaq Listing Rule 5550(a)(2).
“Sanctioned Person” means a person, organization or entity:
| (i) | designated on any Sanctions List; |
| (ii) | that is, or is part of (including any agency or instrumentality of), a government of a Sanctioned Territory; |
| (iii) | directly or indirectly owned or controlled (as such terms, including any applicable ownership and control requirements, are defined and construed in the applicable Sanctions Law or in any related official guidance) by any of the foregoing; |
| (iv) | located, organized, operating from, incorporated under the laws of or residing in any Sanctioned Territory; or |
| (v) | otherwise a target of any Sanctions Law, or is acting on behalf of any of the persons listed in paragraphs (i) to (iv) above, for the purpose of evading or avoiding, or having the intended effect of or intending to evade or avoid or facilitating the evasion or avoidance of any Sanctions Law. |
“Sanctioned Territory” means any country or other territory subject to a comprehensive export, import, financial or investment embargo under any Sanctions Law, which as at the date of this Agreement currently comprise Cuba, Iran, North Korea, Syria, the Crimea region of Ukraine/Sevastopol and the so-called Luhansk and Donetsk People’s Republics.
“Sanctions Authority” means (i) the United States, (ii) the United Nations Security Council, (iii) the European Union or any member state thereof, (iv) the United Kingdom or (v) the respective governmental institutions of any of the foregoing including, without limitation, the Office of Foreign Assets Control of the U.S. Department of Treasury (“OFAC”), the U.S. Department of Commerce, the U.S. Department of State, any other agency of the U.S government, and HM Treasury.
“Sanctions Law” means economic or financial sanctions, restrictive measures, trade embargoes or export control laws imposed, administered or enforced from time to time by any Sanctions Authority including, for the avoidance of doubt, any Sectoral Sanctions.
“Sanctions List” means any of the lists of asset-freeze designated or sanctioned individuals or entities (or equivalent) issued by any Sanctions Authority, each as amended, supplemented or substituted from time to time, including, without limitation, the List of Specially Designated Nationals and Blocked Persons, and the Foreign Sanctions Evaders List, and Sectoral Sanctions Identifications List, each administered by OFAC; the Consolidated List of Persons, Groups and Entities Subject to EU Financial Sanctions; and the Consolidated List of Financial Sanctions Targets in the UK administered by HM Treasury.
“SEC” means the U.S. Securities and Exchange Commission.
“Second Exchange Consideration” has the meaning given in Section 2.1.1(iii).
“Sectoral Sanctions” means sanctions imposed by any Sanctions Authority which do not freeze the assets of or prohibit the provision of any funds or economic resources to a designated person but merely restrict the ability of certain individuals or entities to access financing or export or import goods, technology, or services.
“Securities Act” means the Securities Act of 1933, as amended, and the rules and regulations promulgated thereunder.
“Software” means all computer software (in object code or source code format), operating systems, tools, firmware, middleware, modules, models, algorithms and routines, application systems, interfaces, data and databases, and all related documentation and materials.
“Squeezed Shares” has the meaning given in Section 2.4.
“Straddle Period” means any taxable period beginning on or prior to and ending after the Closing Date.
“Subsidiaries” means each corporation or other Person in which a Person (i) owns or controls, directly or indirectly, capital stock or other equity interests representing the majority of the outstanding voting stock or other equity interests, (ii) has the right to appoint or remove a majority of its board of directors or equivalent managing body or (iii) otherwise has the power, directly or indirectly, to direct or cause the direction of management and policies.
“Tax” means any federal, state, local, foreign or other taxes, fees and charges of any nature whatsoever imposed by any jurisdiction or governmental or taxing authority thereof or therein (including income (net or gross), gross receipts, profits, alternative or add-on minimum, franchise, license, capital, capital stock, intangible, services, premium, mining, transfer, sales, use, ad valorem, payroll, wage, severance, windfall profits, import, excise, custom, stamp, withholding or estimated taxes), fees, duties, assessments, withholding or governmental charges of any kind whatsoever (including interest, penalties, additions to tax or additional amounts with respect to such items).
“Tax Loss” has the meaning given in Section 8.6.
“Tax Return” means any return, report, declaration, form, claim for refund or information return or statement relating to Taxes, including any schedule or attachment thereto, and including any amendment thereof.
“Term of Adherence” means the joinder to be signed by (i) the Bioceres Group Shareholders Representatives on behalf of each POA Bioceres Group Additional Shareholder, and (ii) Bioceres Group on behalf of each Dragged Bioceres Group Shareholder, agreeing and undertaking to adhere to the terms of this Agreement, in accordance with the template set forth in Exhibit B.
“Termination Date” has the meaning given in Section 9.1.2.
“Theo” has the meaning given in the recitals to this Agreement.
“Theo Carve-Out” means the transfer of Bioceres Group’s 96.2% participation in Theo to the Bioceres Group Shareholders (pro rata to the Bioceres Group Shareholders’ holding of Ordinary Shares in Bioceres Group immediately prior to Closing) in accordance with Schedule 6.2.4(ii).
“Third Exchange Consideration” has the meaning given in Section 2.1.1(iv).
“Transferors” means the Bioceres Group Shareholders, Nordelis and Union Group.
“Union Group” has the meaning given in the recitals to this Agreement.
“Union Group Promissory Note” means the promissory note executed between Union Group and Moolec on July 26, 2022, as amended, in the amount of U.S.$500,000, plus interests.
| 1.2 | Construction |
The Parties have participated jointly in negotiating and drafting this Agreement. In the event that an ambiguity or a question of intent or interpretation arises, this Agreement shall be construed as if drafted jointly by the Parties, and no presumption or burden of proof shall arise favoring or disfavoring any Party by virtue of the authorship of any provision of this Agreement. Where a reference in this Agreement is made to a Section or Exhibit, such reference shall be to a Section of or Exhibit to this Agreement unless otherwise indicated. Whenever the words “include,” “includes” or “including” are used in this Agreement, they shall be deemed to be followed by the words “without limitation.” The words “hereof,” “herein” and “hereunder” and words of similar import when used in this Agreement shall refer to this Agreement as a whole and not to any particular provision of this Agreement. The word “or” shall be deemed to mean “and/or.” The phrase “ordinary course of business” shall be deemed to be followed by the words “consistent with past practice” whether or not such words actually follow such phrase. Terms defined in the text of this Agreement as having a particular meaning have such meaning throughout this Agreement, except as otherwise indicated in this Agreement. The definitions contained in this Agreement are applicable to the singular as well as the plural forms of such terms and to the masculine as well as to the feminine and neuter genders of such term. Any statute defined or referred to herein means such statute as from time to time amended, modified or supplemented, including by succession of comparable successor statutes. This Agreement shall not be interpreted or construed to require any Person to take any action, or fail to take any action, if to do so would violate any applicable Law. All references to dollar amount in this Agreement shall be references to U.S. dollars unless otherwise expressly set forth herein. References to “days” shall mean “calendar days” unless expressly stated otherwise. No specific provision, representation or warranty shall limit the applicability of a more general provision, representation or warranty. Any reference in this Agreement to a date or time shall be deemed to be such date or time in the City of New York, New York, U.S.A., unless otherwise specified.
| 2 | Contribution and Exchange |
| 2.1 | Contribution and Exchange |
| 2.1.1 | At Closing, subject to the terms and conditions of this Agreement, including but not limited to the Holdback Provision and the deductions set forth in Section 2.2: |
| (i) | the Bioceres Group Initial Shareholders shall transfer each Bioceres Group Initial Ordinary Share and each Bioceres Group Preference Share held by each of them to Moolec in exchange for 3.15 Moolec Shares and Moolec shall issue these Moolec Shares to the Bioceres Group Initial Shareholders as consideration for the transfer of the Bioceres Group Initial Ordinary Shares and the Bioceres Group Preference Shares, and |
| (ii) | the Bioceres Group Additional Shareholders shall transfer each Bioceres Group Additional Ordinary Share held by each of them to Moolec in exchange for 3.15 Moolec Shares and Moolec shall issue these Moolec Shares to the Bioceres Group Additional Shareholders as consideration for the transfer of the Bioceres Group Additional Ordinary Shares, |
(the Moolec Shares to be issued to the Bioceres Group Initial Shareholders and Bioceres Group Additional Shareholders, the “First Exchange Consideration”).
| (iii) | Nordelis shall transfer the totality of the Nutrecon Membership Interests to Moolec and Moolec shall issue 5,000,000 newly issued Moolec Shares and grant the Moolec Warrants to Nordelis as consideration for the transfer of the Nutrecon Membership Interests (the Moolec Shares to be issued to Nordelis, the “Second Exchange Consideration”), and |
| (iv) | Union Group shall transfer the Gentle Tech Union Shares to Moolec and Moolec shall issue 1,475,000 newly issued Moolec Shares as consideration for the transfer of the Gentle Tech Union Shares (the Moolec Shares to be issued to Union Group, the “Third Exchange Consideration”, and, together with the First Exchange Consideration and the Second Exchange Consideration, the “Exchange Consideration”). |
| 2.1.2 | The Parties agree that (x) the ratio of 3.15 set forth in Sections 2.1.1(i) and 2.1.1(ii), as well as any other issuances pursuant to this Agreement that consider this ratio as a reference, and (y) the number of Moolec Shares and the number and exercise price of Moolec Warrants set forth in Sections 2.1.1(iii) and 2.1.1(iv), as well as any other issuances pursuant to this Agreement that consider these numbers or exercise price as references might be adjusted based on the ratio selected by Moolec’s board of directors in furtherance of the decisions taken at the Moolec EGM. |
| 2.2 | Deductions from the Exchange Consideration |
| 2.2.1 | The Parties agree that the number of Moolec Shares that the Moolec Subscription Agreement Shareholders will receive at Closing will be reduced to settle the Outstanding Subscription Amount. |
| 2.2.2 | The Parties agree that the number of Moolec Shares that each Bioceres Group Shareholder will receive will be subject to a deduction in an amount equal to the stamp tax payable on the transfer by that Bioceres Group Shareholder of its shareholding in Bioceres Group to Moolec. |
| 2.2.3 | Schedule 2.2.3 sets forth the mechanics of the deductions described in Sections 2.1.1 and 2.2.2, which will serve as basis for the elaboration of the Closing Allocation List. |
| 2.2.4 | The Parties agree that no fraction of Moolec Shares will be issued in connection with the Exchange Consideration and each Transferor who would otherwise be entitled to a fraction of a share (after aggregating all such fractional shares that otherwise would be received by such Transferor) shall instead have the number of Moolec Shares issued to such Transferor rounded down in the aggregate to the nearest whole number. |
| 2.3 | Closing |
| 2.3.1 | The closing of the Contribution and Exchange (the “Closing”) shall take place at 12:00 p.m. (ARG) on the date that is two Business Days after the conditions set forth in Section 7 have been satisfied or waived (other than conditions that by their terms are to be satisfied at Closing but subject to the satisfaction or waiver of such conditions), or on such other date as the Parties may agree to in writing (the “Closing Date”). |
| 2.3.2 | At Closing, the Contributed Entities, Nordelis and Union Group, as applicable, shall deliver or cause to be delivered to Moolec the following documents to attest the transfer of: |
| (i) | with respect to the Bioceres Group Original Shares, as described in Schedule 2.3.2(i) |
| (ii) | With respect to the Nutrecon Membership Interests, a duly executed Second Amended and Restated Operating Agreement reflecting Moolec’s ownership of the Nutrecon Membership Interests and a Membership Interest Assignment Agreement, as applicable. |
| (iii) | With respect to the Gentle Tech Union Shares, duly executed amended corporate documents, as applicable, reflecting Moolec’s ownership of the Gentle Tech Union Shares and any additional transfer agreement, as applicable. |
| 2.3.3 | At Closing, Moolec shall: (i) issue the Moolec Shares representing the Exchange Consideration, except for the Holdback Amount and the deductions set forth in Section 2.2.1 and 2.2.2, and the Transferors shall receive Moolec Shares pursuant to the Closing Allocation List. |
| 2.3.4 | At Closing, the Contributed Entities, Nordelis and Union Group, as applicable, shall deliver or cause to be delivered to Moolec all the books and records of the Contributed Entities that are held by the Transferors or the Contributed Entities; and |
| 2.3.5 | At Closing, the Contributed Entities, Nordelis and Union Group, as applicable, and Moolec shall each deliver all other instruments, agreements, certificates and documents required to be delivered by such Party on or prior to the Closing Date pursuant to this Agreement. |
| 2.4 | Squeeze Out Rights |
| 2.4.1 | If any of the Bioceres Group Ordinary Shares are to be transferred to Moolec pursuant to the “squeeze out” rights in section 979 Companies Act 2006 (“Squeezed Shares”): |
| (i) | Bioceres Group and Moolec will observe the statutory process for transferring the Squeezed Shares; |
| (ii) | this Agreement shall not apply to the transfer of the Squeezed Shares and any provision which purports to apply to the Squeezed Shares shall be deemed to disregard the Squeezed Shares provided always that the Squeezed Shares are transferred to Moolec pursuant to such squeeze out procedure; |
| (iii) | the holders of the Squeezed Shares will not be bound by any of the provisions of this Agreement (unless and to the extent that they are a party to it in a capacity other than as a holder of Squeezed Shares); and |
| (iv) | any item of this Agreement which may apply to the Squeezed Shares shall be subject to this section 2.4. |
| 3 | Representations and Warranties of Certain Transferors |
As of the date hereof and as of the Closing Date, each of the Bioceres Group Initial Shareholders, Nordelis, Union Group, Bioceres Group, Nutrecon and Gentle Tech, as applicable, in respect of itself only, unless otherwise indicated below, severally represent and warrant to Moolec as follows:
| 3.1 | Organization and Good Standing |
| 3.1.1 | If the Bioceres Group Initial Shareholder is an entity, it is duly organized, validly existing and in good standing under the laws of its jurisdiction of formation, with full power and authority to conduct its business as it is now being conducted and to own or use the properties or assets that it purports to own or use. |
| 3.1.2 | Nordelis and Union Group are duly organized, validly existing and in good standing under the laws of their jurisdiction of formation, with full power and authority to conduct its business as it is now being conducted and to own or use the properties or assets that it purports to own or use. |
| 3.2 | Capacity and Authority: Binding Effect |
| 3.2.1 | If the Bioceres Group Initial Shareholder is an entity, it has all right, power and authority to execute and deliver this Agreement and to perform its obligations hereunder. If the Bioceres Group Initial Shareholder is a natural person, he/she is of legal age and has the capacity to execute and deliver this Agreement and to perform his/her obligations hereunder. |
| 3.2.2 | Nordelis and Union Group have all right, power and authority to execute and deliver this Agreement and to perform their obligations hereunder. |
| 3.2.3 | This Agreement constitute the legal, valid, and binding obligation, enforceable against each of the Bioceres Group Initial Shareholders, Union Group and Nordelis. |
| 3.2.4 | If the Bioceres Group Initial Shareholder is an entity, it has taken all corporate action required by it to authorize it to enter into and to perform this Agreement, as applicable. |
| 3.2.5 | Nordelis and Union Group have taken all corporate action required to authorize them to enter into and to perform this Agreement, as applicable. |
| 3.2.6 | Each of the Bioceres Group Initial Shareholders, Nordelis and Union Group is either: (i) an “accredited investor” (as defined in Rule 501(a) of Regulation D under the Securities Act of 1933 (as amended)) or (ii) not a U.S. Person and is located outside of the United States, as such terms are defined in Rule 902 of Regulation S under the Securities Act of 1933 (as amended). |
| 3.3 | No Conflict |
| 3.3.1 | Bioceres Group represents and warrants that the execution, delivery and performance of this Agreement will not, directly or indirectly (with or without notice or lapse of time) (a) if the Bioceres Group Initial Shareholder is an entity, contravene, conflict with, or result in a violation of (i) any provision of their organizational documents or (ii) any resolution adopted by their governing body or equity holders, (b) contravene, conflict with, or result in a violation any law, injunction, judgment, order, decree, ruling, charge, or other restriction of any Governmental Authority, or (c) conflict with, result in a breach of, constitute a default under, result in the acceleration of any obligation under, or create in any person the right to accelerate any obligation under, terminate, modify, or cancel, any agreement, contract, lease, license, instrument, or other arrangement to which it is a party or by which it is bound or to which any of its assets are subject. |
| 3.3.2 | Nordelis and Union Group severally represent and warrant that the execution, delivery and performance of this Agreement will not, directly or indirectly (with or without notice or lapse of time) (a) contravene, conflict with, or result in a violation of (i) any provision of their organizational documents or (ii) any resolution adopted by their governing body or equity holders, (b) contravene, conflict with, or result in a violation any law, injunction, judgment, order, decree, ruling, charge, or other restriction of any Governmental Authority, or (c) conflict with, result in a breach of, constitute a default under, result in the acceleration of any obligation under, or create in any person the right to accelerate any obligation under, terminate, modify, or cancel, any agreement, contract, lease, license, instrument, or other arrangement to which each of them is a party or by which each of them is bound or to which any of their assets are subject. |
| 3.4 | Bioceres Group Original Shares |
| 3.4.1 | Bioceres Group represents and warrants to Moolec that the Bioceres Group Original Shares represent validly issued, fully paid and non-assessable ordinary or preferential shares, as applicable, of Bioceres Group and are being delivered free and clear of all liens and encumbrances, subject to securities Laws. |
| 3.4.2 | Bioceres Group represents and warrants to Moolec that, except for this Agreement (i) the Bioceres Group Original Shares are not subject to any pre-emptive rights, rights of first refusal, rights of rescission, or similar rights and (ii) there are no outstanding equity awards, options, warrants, calls, rights, exchangeable or convertible securities, commitments or agreements of any character, written or oral, relating to such Bioceres Group Original Shares, except as listed in Schedule 3.4.2. |
| 3.5 | Nutrecon Membership Interests |
| 3.5.1 | Nordelis represents and warrants to Moolec that the Nutrecon Membership Interests represent validly issued, fully paid and non-assessable membership interests of Nutrecon and are being delivered free and clear of all liens and encumbrances, subject to securities Laws. |
| 3.5.2 | Nordelis represents and warrants to Moolec that, except for this Agreement (i) the Nutrecon Membership Interests are not subject to any pre-emptive rights, rights of first refusal, rights of rescission, or similar rights and (ii) there are no outstanding equity awards, options, warrants, calls, rights, exchangeable or convertible securities, commitments or agreements of any character, written or oral, relating to such Nutrecon Membership Interests. |
| 3.6 | Gentle Tech Union Shares |
| 3.6.1 | Union Group represents and warrants to Moolec that the Gentle Tech Union Shares represent validly issued, fully paid and non-assessable ordinary shares of Gentle Tech and are being delivered free and clear of all liens and encumbrances, subject to securities Laws. |
| 3.6.2 | Union Group represents and warrants to Moolec that, except for this Agreement (i) the Gentle Tech Union Shares are not subject to any pre-emptive rights, rights of first refusal, rights of rescission, or similar rights, and (ii) there are no outstanding equity awards, options, warrants, calls, rights, exchangeable or convertible securities, commitments or agreements of any character, written or oral, relating to such Gentle Tech Union Shares. |
| 3.7 | Investment Purpose |
| 3.7.1 | Nordelis, Union Group and Bioceres Group represent and warrant that the Bioceres Group Initial Shareholders, Nordelis and Union Group are acquiring the Moolec Shares representing the Exchange Consideration for their own investment account as principal, for investment purposes only, not for any other person or entity and not for the purpose of resale or distribution, except pursuant to sales registered or exempted under the Securities Act. Each of them has no present arrangement to effect any distribution of the Moolec Shares representing the Exchange Consideration to or through any other person or entity. |
| 3.7.2 | Nordelis, Union Group and Bioceres Group represent and warrant that each of the Bioceres Group Initial Shareholders, Nordelis and Union Group acknowledges that the Moolec Shares representing the Exchange Consideration are not registered under the Securities Act of 1933, as amended, or any state securities laws, and that the Moolec Shares representing the Exchange Consideration may not be transferred or sold except pursuant to the registration provisions of the Securities Act of 1933, as amended or pursuant to an applicable exemption therefrom and subject to state securities laws and regulations, as applicable. |
| 3.8 | No General Solicitation |
Nordelis, Union Group and Bioceres Group represent and warrant that the Bioceres Group Initial Shareholders, Nordelis and Union Group have received no general solicitation or general advertisement in connection with the transactions contemplated by this Agreement or investment in Moolec. Each of them has received no other representations or warranties from Moolec or any other person acting on behalf of Moolec, other than those contained in this Agreement.
| 3.9 | No Reliance |
Nordelis, Union Group and Bioceres Group represent and warrant that the Bioceres Group Initial Shareholders, Nordelis and Union Group have not relied upon Moolec’s or any of its Affiliates, directors, officers, employees or representatives for advice about tax, financial or legal consequences of a purchase of or investment in the Moolec Shares representing the Exchange Consideration, and neither Moolec nor any of its affiliates, managers, officers, employees or representatives has made or is making any representations to them about, or guaranties of, tax, financial or legal outcomes of a purchase of, or an investment in, the Moolec Shares representing the Exchange Consideration.
| 3.10 | Brokers and Finders |
Nordelis, Union Group and Bioceres Group represent and warrant that no investment banker, broker, finder or other intermediary has been retained by or is authorized to act on behalf of the Bioceres Group Initial Shareholders, Nordelis and Union Group, and no such Person is entitled to any fee or commission from Moolec or any of its Affiliates, in connection with the transactions contemplated by this Agreement.
| 3.11 | No Other Representations or Warranties |
Except for the representations and warranties expressly set forth in this Section 3, none of Nordelis, Union Group, the Bioceres Group Initial Shareholders, Bioceres Group, Nutrecon and Gentle Tech makes or has made any other representation or warranty, express or implied, at law or in equity, in their respect, the Contributed Entities or any of their respective Subsidiaries.
| 4 | Representations and Warranties of Bioceres Group, Nordelis, Union Group, Nutrecon and Gentle Tech |
As of the date hereof and as of the Closing Date, Bioceres Group (for BIOX, except as otherwise disclosed in the BIOX 20-F and/or the BIOX 6-K), Nordelis, Union Group, Nutrecon and Gentle Tech represent and warrant to Moolec as follows:
| 4.1 | Corporate Status |
| 4.1.1 | Each of the Contributed Entities is an entity duly organized, validly existing and in good standing under the laws of the jurisdiction of its incorporation with full corporate power and authority to conduct the Business and to own or lease and to operate its properties as and in the places where the Business is conducted and such properties are owned, leased or operated. |
| 4.1.2 | Each of the Contributed Entities is duly qualified or licensed to do business and in good standing in each of its jurisdiction of incorporation, which is the only jurisdiction in which the operation of the Business or the character of the properties owned, leased or operated by it in connection with the Business makes such qualification or licensing necessary. |
| 4.1.3 | Bioceres Group, Nordelis, Union Group, Nutrecon and Gentle Tech, as applicable, have delivered to Moolec complete and correct copies of the certificate of incorporation/formation and by-laws/operating agreement or other organizational documents of the Contributed Entities, in each case, as amended and in effect on the date hereof. None of the Contributed Entities is in violation of any of the provisions of its certificate of incorporation/formation or by-laws/operating agreement or other organizational documents. |
| 4.1.4 | The execution, delivery and performance by Bioceres Group, Nutrecon and Gentle Tech of this Agreement, and the consummation of the transactions contemplated hereby have been duly and validly authorized in accordance with their board of directors (or similar governing body), which after consulting with their respective advisors, including but not limited to legal and financial advisors, has determined that (i) the execution of this Agreement, (ii) the consummation of the Contribution and Exchange, and (iii) the compliance with the obligations set forth in this Agreement are in their and their stakeholders’ best interests. |
| 4.2 | Subsidiaries |
| 4.2.1 | The authorized, issued and outstanding shares of capital stock of or other equity interests in all Subsidiaries of Bioceres Group, Subsidiaries of Nutrecon and Subsidiaries of Gentle Tech, their respective jurisdictions of formation/incorporation and Bioceres Group’s, Nutrecon’s and Gentle Tech’s direct or indirect percentage ownership interest in such Subsidiaries, as applicable, are identified on Schedule 4.2. All of the outstanding shares of capital stock of or other equity interests in each Subsidiary of Bioceres Group, Nutrecon and Gentle Tech (i) are duly authorized, validly issued, fully paid and non-assessable and were not issued in contravention of any preemptive rights, rights of first refusal or first offer or similar rights or any federal or state securities laws and (ii) are owned beneficially and of record by Bioceres Group or one of its Subsidiaries, Nutrecon or one of its Subsidiaries, or Gentle Tech or one of its Subsidiaries, as set forth on Schedule 4.2, free and clear of any Liens. Neither Bioceres Group nor any of its Subsidiaries, Nutrecon nor any of its Subsidiaries, Gentle Tech nor any of its Subsidiaries owns any shares of capital stock of or other equity interests in any other Person, except as set forth on Schedule 4.2. Except as set forth on Schedule 4.2, there are no outstanding Derivative Securities with respect to any shares of capital stock of or other equity interests in any Subsidiary of Bioceres Group, Subsidiary of Nutrecon and Subsidiary of Gentle Tech and there are no outstanding obligations of Bioceres Group or any of its Subsidiaries, Nutrecon or any of its Subsidiaries, or Gentle Tech or any of its Subsidiaries to repurchase, redeem or otherwise acquire any such Derivative Securities. |
| 4.2.2 | Bioceres Group represents and warrants to Moolec that it has conducted all necessary legal analyses, assessments, and due diligence to determine the feasibility of performing the Theo Carve-Out. Bioceres Group further represents and warrants that, pursuant to the analysis, there are no legal impediments or restrictions, under applicable laws or regulations, that would prevent the execution of the Theo Carve-Out by Moolec pursuant to Schedule 6.2.4(ii). |
| 4.3 | Governmental Approvals and Consents |
The execution, delivery and performance by Nordelis, Union Group, and the Contributed Entities of this Agreement, and the consummation of the transactions contemplated hereby, does not require (i) any Governmental Approvals, or (ii) any Consents of third parties.
| 4.4 | Financial Statements |
| 4.4.1 | Attached as Schedule 4.4.1 are complete and correct copies of the audited consolidated financial statements of Bioceres Group and its Subsidiaries, as at the Balance Sheet Date, together with a report thereon by Price Waterhouse & Co. S.R.L., Bioceres Group’s independent public accountants (the “Bioceres Group Financial Statements”). |
| 4.4.2 | Attached as Schedule 4.4.2 are complete and correct copies of the unaudited consolidated financial statements of Synbio Powerlabs Oy, Nutrecon’s subsidiary, as at the Balance Sheet Date (“Nutrecon Financial Statements”). |
| 4.4.3 | Attached as Schedule 4.4.3 are correct copies of the unaudited consolidated statement of financial position as of June 30, 2024 and consolidated statement of comprehensive income for the year ended June 30, 2024 of Gentle Tech and its Subsidiaries (the “Gentle Tech Financial Statements”). |
| 4.4.4 | The financial statements of Bioceres Group and Gentle Tech were prepared using International Financial Reporting Standards (IFRS) and the financial statements of Synbio Powerlabs Oy was prepared using PMA Chapter 4 Micro-enterprise Code. Financial Statements represent in all material respects Bioceres Group’s, Synbio Powerlabs Oy’s and Gentle Tech’s financial status as at the Balance Sheet Date. |
| 4.4.5 | As at the Balance Sheet Date, the Financial Statements include all liabilities, recognize all provisions and disclose all contingent liabilities. |
| 4.5 | Absence of Undisclosed Liabilities |
None of the Contributed Entities has any liabilities or obligations of any nature (whether accrued, absolute, contingent or otherwise), whether or not required by the applicable accounting standards to be reflected in the Bioceres Group Financial Statements, Nutrecon Financial Statements or Gentle Tech Financial Statements, other than liabilities and obligations (a) reserved against or reflected in Bioceres Group Financial Statements, Nutrecon Financial Statements or Gentle Tech Financial Statements, as the case may be, for the Balance Sheet Date (including in the notes thereto), (b) incurred in the Ordinary Course of Business since the Balance Sheet Date, (c) incurred in connection with Bioceres Group’s, Nutrecon’s or Gentle Tech’s contribution process, including this Agreement, or (d) that would not constitute a Material Adverse Effect.
| 4.6 | Absence of Changes |
Except as set forth on Schedule 4.6, since the Balance Sheet Date the Contributed Entities have conducted the Business only in the Ordinary Course and, without limiting the foregoing, there has not been any:
| 4.6.1 | event, development or state of circumstances experienced by the Contributed Entities or, to the Knowledge of the Contributed Entities, threatened that has had or could reasonably be expected to have, individually or in the aggregate, a Material Adverse Effect; |
| 4.6.2 | declaration, setting aside or payment of any dividend or other distribution with respect to any shares of capital stock of Bioceres Group, Nutrecon or Gentle Tech or any repurchase or redemption by Bioceres Group, Nutrecon or Gentle Tech of any shares of its capital stock; |
| 4.6.3 | (i) incurrence, assumption or guarantee of any Indebtedness by any of the Contributed Entities (excluding BIOX), and (ii) to the Knowledge of Bioceres Group, incurrence, assumption or guarantee of any Indebtedness by BIOX; |
| 4.6.4 | (i) creation or other incurrence by the Contributed Entities (excluding BIOX) of any Lien on any material asset, other than Permitted Liens, and (ii) to the Knowledge of Bioceres Group, creation or other incurrence by BIOX of any Lien on any material asset, other than Permitted Liens; |
| 4.6.5 | material damage, destruction or other casualty loss (whether or not covered by insurance); |
| 4.6.6 | change in any accounting principle, policy, method or procedure by the Contributed Entities or any revaluation of any material assets; |
| 4.6.7 | (i) capital expenditures in an amount in excess of U.S.$1,000,000 in the aggregate for the Contributed Entities (excluding BIOX), and (ii) capital expenditures in an amount in excess of U.S.$2,000,000 in the aggregate for BIOX; |
| 4.6.8 | sale, transfer, lease or other disposition of any material assets, other than inventory sold in the Ordinary Course of Business, or any acquisition of any other Person, whether by merger or consolidation or by purchasing all or a material portion of the capital stock or assets of such Person, or by any other manner; |
| 4.6.9 | (i) any making of any loan, advance or capital contributions to or investment in any Person by the Contributed Entities (excluding BIOX), and (ii) to the Knowledge of Bioceres Group, any making of any loan, advance or capital contributions to or investment in any Person by BIOX; |
| 4.6.10 | agreement or commitment to do any of the foregoing, or any action or omission that would reasonably be expected to result in any of the foregoing. |
| 4.7 | Material Contracts |
| 4.7.1 | Except as set forth on Schedule 4.7.1, none of the Contributed Entities is bound by or a party to any: |
| (i) | Contract relating to Indebtedness (in each case, whether incurred, assumed, guaranteed or secured by any asset); |
| (ii) | joint venture, partnership, limited liability company or other similar Contract; |
| (iii) | material lease for personal property; |
| (iv) | (x) sales, distribution, agency and marketing Contract (or series of related Contracts) in excess of U.S.$100,000 in any annual period for the Contributed Entities (excluding BIOX), and (y) sales, distribution, agency and marketing Contract (or series of related Contracts) in excess of U.S.$1,000,000 in any annual period for BIOX; |
| (v) | For the Contributed Entities (excluding BIOX), Contract (or series of related Contracts) relating to any outstanding commitment for capital expenditures in excess of U.S.$300,000 individually or U.S.$700,000 in the aggregate, and for BIOX, Contract (or series of related Contracts) relating to any outstanding commitment for capital expenditures in excess of U.S.$1,000,000 individually or U.S.$3,000,000 in the aggregate, |
| (vi) | Contract (or series of related Contracts) with any of the Persons listed on Schedule 4.16.1 or Schedule 4.16.2; |
| (vii) | Contract (or series of related Contracts) relating to the acquisition, disposition or lease of any Person, business or material real property or other material assets (whether by merger, sale of stock, sale of assets or otherwise); |
| (viii) | Contract containing any “change of control”, anti-assignment or similar provisions; |
| (ix) | Contract that (A) limits the freedom of the Contributed Entities (excluding BIOX) to compete in any line of business or with any Person or in any geographic area or (B) contains exclusivity obligations or restrictions binding on the Contributed Entities (excluding BIOX), in each case, whether before or after the Closing; |
| (x) | To the Knowledge of Bioceres Group, Contract that (A) limits the freedom of the BIOX to compete in any line of business or with any Person or in any geographic area or (B) contains exclusivity obligations or restrictions binding on BIOX, in each case, whether before or after the Closing; |
| (xi) | Contributed Entities IP Agreements; |
| (xii) | Contract (including any “take-or-pay” or keepwell agreement) under which (A) any Person has directly or indirectly guaranteed any liabilities or obligations of any of the Contributed Entities (excluding BIOX) or (B) the Contributed Entities (excluding BIOX) have directly or indirectly guaranteed liabilities or obligations of any other Person; |
| (xiii) | To the Knowledge of Bioceres Group, Contract (including any “take-or-pay” or keepwell agreement) under which (A) any Person has directly or indirectly guaranteed any liabilities or obligations of any of BIOX or (B) BIOX has directly or indirectly guaranteed liabilities or obligations of any other Person; or |
| (xiv) | other Contract that is (A) not made in the Ordinary Course of Business or (B) material to the Business. |
| 4.7.2 | Each Contract disclosed or required to be disclosed pursuant to this Section or Sections 4.8, 4.9, 4.11, 4.13, 4.14, or 4.15, (each, a “Material Contract”) is a legal, valid, binding and enforceable agreement of the Contributed Entities, as applicable, and is in full force and effect, and neither the Contributed Entities or, to the Knowledge of the Contributed Entities, any other party thereto is in default or breach under the terms of, or has provided any notice of any intention to terminate or modify, any such Material Contract, and, to the Knowledge of the Contributed Entities, no event or circumstance has occurred that, with notice or lapse of time or both, would constitute a breach thereof or a default thereunder or would result in a termination, modification, acceleration or vesting of any rights or obligations or loss of benefits thereunder. Complete and correct copies of (i) each Material Contract (including all waivers thereunder) and (ii) all form Contracts that are Related to the Business have been made available to Moolec. |
| 4.8 | Assets; Real Property |
| 4.8.1 | The Contributed Entities have good and valid title to, or otherwise has the right to use pursuant to a valid and enforceable lease, license or similar contractual arrangement, all of the tangible and intangible assets, properties and rights that are Related to the Business (the “Assets”), in each case free and clear of any Liens, other than Permitted Liens. |
| 4.8.2 | The Assets constitute all of the Assets, properties and rights that are required for or material to the continued conduct of the Business on a stand-alone basis. The plants, buildings, structures, material equipment and other material tangible personal property included in the Assets are in good repair, working order and operating condition, subject only to ordinary wear and tear, and are adequate and suitable for the purposes for which they are presently being used or held for use. To the Knowledge of the Contributed Entities, there are no facts or conditions affecting any material Assets that could reasonably be expected, individually or in the aggregate, to interfere in any material respect with the current use, occupancy or operation of such Assets. |
| 4.8.3 | The Contributed Entities have no Owned Real Property. |
| 4.8.4 | Schedule 4.8.4 sets forth a complete and correct list of all the real property leased by the Contributed Entities (the “Leases,” and together with all interests leased pursuant to the Leases, the “Leased Real Property”), including the address, landlord and tenant for each Lease. The Contributed Entities have delivered to Moolec complete and correct copies of each Lease. None of the Contributed Entities is a sublessor or grantor under any sublease or other instrument granting to another Person any right to the possession, lease, occupancy or enjoyment of the Leased Real Property. |
| 4.8.5 | The Real Property represents all of the real property that is Related to the Business. The use and operation of the Real Property in the conduct of the Business do not violate in any material respect any Law, Consent, Lien or agreement of any Governmental Authority. No material improvements constituting a part of the Real Property encroach on any real property not owned or leased by the Contributed Entities to the extent that removal of such encroachment would reasonably be expected to materially impair the manner and extent of the current use, occupancy and operation of such improvements. There are no Liens affecting the Real Property that materially impair the ability of the Contributed Entities to use such property in the operation of the Business in the Ordinary Course. |
| 4.9 | Intellectual Property |
| 4.9.1 | Schedule 4.9.1 sets forth a complete and correct list as of the date hereof of each (i) Patent, (ii) Trademark, (iii) Copyright, (iv) Internet Property and (v) any other Intellectual Property , in each case that is the subject of an application, certificate, filing, registration or other document issued by, registered with, filed with, submitted to or recorded by, any Governmental Authority or other organization or entity having authority over the issuance and maintenance thereof and that are owned by or purported to be owned by, filed in the name of, or applied for, by one of the Contributed Entities (the “Registered Intellectual Property”). One of the Contributed Entities Intellectual Property is listed in the records of the appropriate U.S., state or non-U.S. registry or Governmental Authority as the sole current owner of, or registrant with respect to, each application or registration identified in Schedule 4.9.1. Each of the Contributed Entities is in compliance with all legal, regulatory, administrative or contractual requirements of the Governmental Authority or other entity with respect to each item of Registered Intellectual Property, including payment of all maintenance and filing fees, and no filings or payment to any registry or Governmental Authority is due within ninety (90) days of the date hereof. All Registered Intellectual Property is valid, enforceable and subsisting. |
| 4.9.2 | Except as set forth on Schedule 4.9.2, the Contributed Entities own solely and exclusively, free and clear of all Liens, other than Permitted Liens, all Owned Intellectual Property and the Contributed Entities license or otherwise have a valid right to use, all other Intellectual Property used in the operation of the business of the Contributed Entities as presently conducted (collectively, the “Contributed Entities Intellectual Property”). The Contributed Entities Intellectual Property constitutes all the Intellectual Property used in, held for use in or necessary for the conduct of the Business as currently conducted and is sufficient for Moolec to operate the Business from and after the Closing Date in all material respects as operated immediately prior to the Closing Date. The consummation of the Transactions contemplated by this Agreement will not (i) impair any right of the Moolec in or to any Contributed Entities Intellectual Property in existence immediately prior thereto and will not require the payment of any material additional amounts or consideration other than ongoing fees, royalties or payments that the Contributed Entities would otherwise be required to pay or (ii) or result in any Person being granted any rights to any Owned Intellectual Property that are in addition to, or greater than, the rights such Person currently has under such Owned Intellectual Property. |
| 4.9.3 | Each present or past employee, officer, consultant or any other Person who created or contributed to any Intellectual Property for or on behalf of the Contributed Entities has assigned, including by operation of law, to Contributed Entity such Person’s right, title and interest in and to all such Intellectual Property that was developed by such Person in connection with such Person’s employment or engagement by such Contributed Entity. |
| 4.9.4 | Except as set forth on Schedule 4.9.4, no funding, facilities or resources of a university, college, other educational institution, research center or Governmental Authority was used in the development of the Owned Intellectual Property, and no Governmental Authority, university, college or other educational institution or research center has any claim or right in or to the Owned Intellectual Property. |
| 4.9.5 | To the Knowledge of the Contributed Entities, the operation of the respective businesses of the Contributed Entities as currently conducted does not infringe, misappropriate, violate or otherwise conflict with, and since the date that is six (6) years prior to the date hereof, has not infringed, misappropriated, violated or otherwise conflicted with, any Intellectual Property of any other Person, and no Person is currently infringing upon, misappropriating, violating or otherwise conflicting with any Owned Intellectual Property, and since the date that is six (6) years prior to the date hereof, has not infringed, misappropriated, violated or otherwise conflicted with any Owned Intellectual Property. The Contributed Entities have not received any written notice, cease and desist or offer to take a license or any other claim since the date that is six (6) years prior to the date hereof alleging that any of the Business operations infringe, misappropriate, violate or otherwise conflict with the Intellectual Property of any other Person. |
| 4.9.6 | There is no opposition or cancellation Litigation pending against the Contributed Entities concerning the ownership, validity or enforceability of any Registered Intellectual Property (other than ordinary course proceedings related to the application before a Governmental Authority). There is no Litigation pending or threatened alleging any infringement or violation or challenging the Contributed Entities’ rights in or to any Contributed Entities Intellectual Property, and there is no existing fact or circumstance that would be reasonably expected to give rise to any such Litigation. There is no written allegation made by the Contributed Entities relating to infringement or misappropriation, or other violation by a third party of any Owned Intellectual Property. No Contributed Entities Intellectual Property is subject to any Order adversely affecting the use thereof or rights thereto by or of the Contributed Entities or that restricts in any manner the use, transfer or licensing thereof by the Contributed Entities or may affect the validity, use or enforceability of such Contributed Entities Intellectual Property. |
| 4.9.7 | Schedule 4.9.7 sets forth a list of any Contract pursuant to which (i) any Contributed Entity has granted to any third party any right in or to any Contributed Entities Intellectual Property or (ii) any Contributed Entity uses or has been granted right to any Intellectual Property of any third party, in each case of (i) and (ii) other than (a) commercially available “off-the-shelf” software licenses under which software is licensed to the Contributed Entities on standardized, generally available terms and that have not been modified or customized specifically for the Contributed Entities or (ii) licenses that are incidental to agreements or arrangements relating to the Contributed Entities’ purchase, lease, license, or other receipt of goods or services (collectively, the “Contributed Entities IP Agreements”). |
| 4.9.8 | Each of the Contributed Entities have taken commercially reasonable actions to maintain and preserve the confidentiality of any Trade Secrets included in the Contributed Entities Intellectual Property, including requiring all current and former employees and other Persons provided with access to such Trade Secrets to execute written agreements that contain confidentiality provisions, and to there have been no unauthorized uses or disclosures of any such Trade Secrets. |
| 4.9.9 | To the Knowledge of the Contributed Entities, no source code of any Software included in the Owned Intellectual Property (“Owned Software”) has been disclosed, escrowed or made available to or for any Person, other than under a written agreement with Persons working on the development of such Owned Software that protects the Contributed Entities rights in and to such source code and the consummation of the transactions contemplated under this Agreement will not result in the disclosure or release of or otherwise require any Contributed Entities to make available to any Person any source code to any Owned Software. The Contributed Entities is in actual possession and control of the applicable source code, object code, notes, documentation, and know-how to the extent required for use, development, enhancement, maintenance and support of such Owned Software. No Owned Software incorporates, includes, embeds, links with or is distributed with, Open Source Software in a manner that would, as a result of any requirement in the license with respect to such Open Source Software, (i) restrict the Contributed Entities from charging a fee for such Owned Software or (ii) require or obligate that the source code to any Owned Software be disclosed, distributed, licensed or otherwise be made available to any Person, including for the purpose of making modifications or derivative works. |
| 4.9.10 | To the Knowledge of the Contributed Entities, no Owned Software (i) contains any Disabling Devices, (ii) contains any errors or defects (other than those errors or defects that were timely remedied and which did not, individually or in the aggregate, cause the Contributed Entities or any licensee thereof to suffer any material harm), and (iii) has suffered from any material or recurring malfunctions. |
| 4.10 | Litigation |
Except as set forth on Schedule 4.10, there is no Litigation pending or, to the Knowledge of the Contributed Entities, threatened against or affecting the Contributed Entities or relating to the transactions contemplated hereby. There are no settlement agreements or similar written Contracts with any Governmental Authority and no outstanding Orders entered or issued by or subject to any Governmental Authority against or affecting the Contributed Entities.
| 4.11 | Compliance with Laws; Consents |
| 4.11.1 | The conduct by the Contributed Entities of the Business is and has been in compliance with all applicable Laws, except for violations or failures so to comply, if any, that, individually and in the aggregate, have not had and would not reasonably be expected to (i) have a Material Adverse Effect, (ii) give rise to material fines or other material civil penalties or any criminal Liabilities or (iii) cause the Contributed Entities to lose any material benefit or incur any material Liability. None of the Contributed Entities has received any notice or other communications relating to any alleged violation of any applicable Law from any Governmental Authority, or of any investigation with respect thereto, except for violations, if any, that, individually and in the aggregate, have not had and would not reasonably be expected to (i) have a Material Adverse Effect or (ii) give rise to material fines or other material civil penalties or any criminal Liabilities. Without limiting the foregoing, none of the Contributed Entities, nor any of their respective Subsidiaries or Representatives has, directly or indirectly: |
| (i) | improperly or unlawfully made any payment or offered anything of value to any foreign or domestic officials or employees or to any foreign or domestic political parties or campaigns, whether to obtain or retain business or otherwise; |
| (ii) | made or authorized any payment, contribution or gift of money, property or services involving the direct or indirect use of funds of the Transferors or the Contributed Entities (including entertainment or other expenses), whether or not in contravention of applicable Law, (A) as a “kickback” or bribe to any Person or (B) to any political organization or the holder of (or person who seeks) any elective or appointive public office related to political activity or otherwise related to political activity; or |
| (iii) | violated any applicable export control, money laundering or anti-terrorism Law or taken any action that could reasonably be expected, individually or in the aggregate, to cause any of the Transferors or the Contributed Entities to be in violation of the U.S. Foreign Corrupt Practices Act of 1977, as amended, any act enforced by the Office of Foreign Asset Control of the U.S. Department of Treasury or any applicable Law of similar effect. |
| 4.11.2 | The Contributed Entities hold all the required Consents for the conduct of the Business, other than such Consents the absence of which has not had and would not reasonably be expected to have, individually or in the aggregate, a Material Adverse Effect or materially impair the ability of Moolec to conduct the Business following the Closing. |
| 4.11.3 | None of the Contributed Entities, or so far as the Contributed Entities are aware, any of its directors, officers or employees, nor any other person acting on their behalf: |
| (i) | is engaging or has engaged in any activity or conduct that has resulted or will result in a violation of: |
| (a) | any Anti-Corruption Laws; or |
| (b) | any Sanctions Laws; or |
| (ii) | has received written notice of, or is otherwise aware of, any claim, action, suit, proceedings or investigation involving it with respect to Anti-Corruption Laws or Sanctions Laws; |
| (iii) | is a Sanctioned Person or has engaged in any transaction, activity or conduct that would reasonably be expected to result in its being designated as a Sanctioned Person; or |
| (iv) | engages or has engaged in any transaction or dealing with any Sanctioned Person or with any Sanctioned Territory. |
| 4.12 | Environmental Matters |
| 4.12.1 | Each of the Contributed Entities has complied during the past 5 years and is in compliance in all material respects with all applicable Environmental Laws and has obtained and is in compliance in all material respects with all applicable Environmental Permits. None of the Environmental Permits held or required to be held by the Contributed Entities restricts in any material respect the Contributed Entities from operating any equipment covered by such Environmental Permit as currently conducted. No notice of violation, notification of liability or request for information has been received by the Contributed Entities and no Litigation is pending or, to the Knowledge of the Contributed Entities, threatened by any Person against the Contributed Entities relating to or arising out of any Environmental Law. No Order has been issued and is currently in effect, and the past 5 years no penalty or fine has been assessed, against the Contributed Entities relating to or arising out of any Environmental Law. |
| 4.12.2 | No Hazardous Substances are located, and no Releases of Hazardous Substances have occurred, at, on, above, under or from the Real Property or any properties currently or formerly owned, leased, operated or used by the Contributed Entities that has resulted or could reasonably be expected, individually or in the aggregate, to result in any material Liability of the Contributed Entities under any Environmental Law. |
| 4.12.3 | None of the Contributed Entities nor, to the Knowledge of the Contributed Entities, any other Person, has caused or taken any action that has resulted or could reasonably be expected to result, individually or in the aggregate, in any material Liability relating to (x) the environmental conditions at, on, above, under, or about the Real Property or any properties or assets currently or formerly owned, leased, operated or used by the Contributed Entities, (y) the past or present use, management, handling, transport, treatment, generation, storage, disposal, Release or threatened Release of Hazardous Substances or (z) any Remedial Action at any of the Real Property. |
| 4.13 | Employees; Labor Matters |
| 4.13.1 | None of the Contributed Entities (excluding BIOX) and, to the Knowledge of Bioceres Group neither BIOX, is a party to or bound by any Contract with any labor union, labor organization, works council or other employee representatives (collectively, “Contributed Entities Labor Agreements”) and there are no labor unions or other organizations or groups representing or purporting or attempting to represent any employees employed by the Contributed Entities. There has not occurred or, to the Knowledge of the Contributed Entities, been threatened any material strike, slowdown, picketing, work stoppage, concerted refusal to work or other similar labor activity with respect to any such employees of the Contributed Entities. There are no labor disputes currently subject to any grievance procedure or Litigation or, to the Knowledge of the Contributed Entities, threatened with respect to any such employee. Neither the Contributed Entities has engaged in any unfair labor practices (within the meaning of the National Labor Relations Act) that would reasonably be expected to, individually or in the aggregate, directly or indirectly result in a material Liability to the Contributed Entities. The Contributed Entities are in compliance with all statutory obligations to inform and consult with their employees and/or their representatives as might be imposed under applicable Law. Neither the announcement nor the consummation of the transactions contemplated by this Agreement will entitle any third party (including any labor union, labor organization, works council or other employee representatives) to notice or consultation rights under any labor agreements. |
| 4.13.2 | Schedule 4.13.2 contains complete and correct details (to the extent permissible by applicable Law), in relation to the Contributed Entities, of the total number of employees of the Contributed Entities. There are no terms of employment for employees that provide that a change in control of the Contributed Entities (however “change in control” may be defined in the applicable document, if at all) shall entitle such employees to treat the change in control as amounting to a breach of the contract or entitling him or her to any payment or benefit whatsoever or entitling him or her to treat himself as redundant or dismissed or released from any obligation. |
| 4.13.3 | None of the Contributed Entities (excluding BIOX) and, to the Knowledge of Bioceres Group neither BIOX, is the subject of any pending or threatened action involving one or more employees of the Contributed Entities that individually or in the aggregate would be material. |
| 4.13.4 | The Contributed Entities are in compliance with all Laws applicable to the Business with respect to their respective employees and its own policies respecting employment and employment practices, harassment, whistleblowing, terms and conditions of employment, wages and hours, equal opportunity, civil rights, labor relations, occupational health and safety and income and payroll taxes with respect to the employees. None of the Contributed Entities are in receipt of a complaint, demand letter or charge issued by a Governmental Authority that alleges a violation by the Contributed Entities of any applicable Law respecting employment and employment practices, terms and conditions of employment, wages and hours, equal opportunity, civil rights, labor relations, occupational health and safety or payroll taxes with respect to its employees. None of the Contributed Entities has (i) engaged in any plant closing, work force reduction or other action that has resulted or could reasonably be expected to result in material Liability under the Workers Adjustment and Retraining Notification Act or any other applicable foreign, state or local Law, requiring notice to employees in the event of a plant closing or layoff, or (ii) been issued any notice that any such action is to occur in the future with respect to the employees. |
| 4.13.5 | Schedule 4.13.5 sets forth a list by employee identification number of all Contributed Entities employees with an annual base cash compensation in excess of U.S.$200,000 (the “Key Employees”). |
| 4.13.6 | Schedule 4.13.6 sets forth the Contributed Entities Benefit Plans currently in place. |
| 4.14 | Taxes |
| 4.14.1 | Subject to Section 4.14.18, each Contributed Entity has timely filed or caused to be timely filed (after taking into account all appliable extensions) all material Tax Returns that are required to be filed by them, and all such Tax Returns are true, correct and complete in all material aspects. |
| 4.14.2 | Subject to Section 4.14.18, the Contributed Entities have timely paid, or caused to be timely paid, all material Taxes due and payable (whether or not shown on any Tax Return). The Contributed Entities have established adequate reserves on the applicable Financial Statements for Taxes accrued but not yet due. All Taxes that the Contributed Entities are required by Law to withhold or collect have been duly withheld or collected, and have been timely paid, or caused to be timely paid, to the appropriate Governmental Authorities to the extent due and payable. |
| 4.14.3 | Subject to Section 4.14.18, there are no Consents currently in effect for the extension or waiver of the time (i) to file any Tax Return or (ii) for assessment or collection of any Taxes relating thereto, and no Person has been requested in writing to enter into any such Consent. No claim has ever been made in writing by a Governmental Authority in a jurisdiction in which the Contributed Entities do not file Tax Returns that the Contributed Entities are or may be subject to taxation by that jurisdiction. There is no Litigation currently pending, or, to the Knowledge of the Contributed Entities, threatened, regarding any Taxes relating to the Contributed Entities. |
| 4.14.4 | Subject to Section 4.14.18, no Governmental Authority has asserted in writing any deficiency or proposed adjustment for any Taxes of the Contributed Entity, which deficiency or proposed adjustment has not been fully paid, settled, withdrawn or otherwise contested and for which adequate reserves have provided for on the applicable Financial Statement, if necessary. No audits, examinations, investigations or other proceedings by a Governmental Authority are ongoing or pending with respect to Taxes of any Contributed Entity. No written notification has been received by any Contributed Entity (or its Affiliate) that any such audit, examination, investigation or other proceeding in respect of Taxes is proposed or threatened. |
| 4.14.5 | Subject to Section 4.14.18, none of the Contributed Entities has agreed, and is not required, to make any adjustment under section 481(a) of the Code (or any comparable provision of state, local, or foreign Law) by reason of a change in accounting method or otherwise. |
| 4.14.6 | Subject to Section 4.14.18, no power of attorney is currently in effect, and no income tax ruling has been requested of any Governmental Authority, with respect to any Tax matter relating to the Contributed Entities. |
| 4.14.7 | Subject to Section 4.14.18, none of the Contributed Entities is now or has ever been included in any “affiliated group” within the meaning of section 1504(a) of the Code (or any similar group defined under a similar provision of applicable Law) filing a consolidated federal income Tax Return. |
| 4.14.8 | Subject to Section 4.14.18, none of the Contributed Entities is now or has ever been included in any “affiliated group” within the meaning of section 1504(a) of the Code (or any similar group defined under a similar provision of applicable Law) filing a consolidated federal income Tax Return or has any liability for any Taxes pursuant to Treasury Regulation Section 1.1502-6 (or any comparable provision of state, local or non-U.S. Law) or as a transferee or successor. |
| 4.14.9 | Subject to Section 4.14.18, none of the Contributed Entities has any Liability for the Taxes of any Person as a transferee or successor, by Contract or otherwise. |
| 4.14.10 | There are no Liens for Taxes (other than Permitted Liens) upon any of the assets of the Contributed Entities. |
| 4.14.11 | Subject to Section 4.14.18, none of the Contributed Entities has been a United States real property holding corporation within the meaning of section 897(c)(2) of the Code during the applicable period specified in section 897(c)(1)(A)(ii) of the Code. |
| 4.14.12 | Subject to Section 4.14.18, none of the Contributed Entities will be required to include any item of income in, or exclude any item of deduction from, taxable income for any taxable period (or portion thereof) ending after the Closing Date as a result of any: (i) change in method of accounting for a taxable period ending on or prior to the Closing Date; (ii) “closing agreement” as described in section 7121 of the Code (or any corresponding or similar provision of state, local or foreign income Tax law) executed on or prior to the Closing Date; (iii) intercompany transaction or excess loss account described in United States Treasury Regulations under section 1502 of the Code (or any corresponding or similar provision of state, local or foreign income Tax Law); (iv) installment sale or open transaction disposition made on or prior to the Closing Date; (v) prepaid amount received on or prior to the Closing Date outside the Ordinary Course of Business or (vi) election under Section 965(h) of the Code. |
| 4.14.13 | Subject to Section 4.14.18, no Contributed Entity has participated in a “listed transaction” within the meaning of Treasury Regulation Section 1.6011-4(b)(2). |
| 4.14.14 | Subject to Section 4.14.18, no Contributed Entity has constituted either a “distributing corporation” or a “controlled corporation” in a distribution of stock intended to qualify for tax-free treatment under Section 355 of the Code in the two-year period ending on the date of this Agreement. |
| 4.14.15 | Subject to Section 4.14.18, there are no income Tax or other material Tax rulings, requests for rulings, technical advice memoranda, closing agreements or similar agreements or rulings relating to Taxes that have been issued to or with respect to the Contributed Companies or into which any Contributed Company has entered into that would be binding on any of any Contributed Company in any taxable period (or portion thereof) after the Closing Date, in each case which agreement or ruling would be effective after the Closing Date. |
| 4.14.16 | Since its inception, Nutrecon has been treated as an entity disregarded as separate from its owner and has not been treated as engaged in a trade or business within the United States for U.S. federal income tax purposes. Nutrecon’s only assets consist of shares of stock of a non-U.S. corporation. Each of Bioceres Group and Gentle Tech have been treated as non-U.S. corporations since their inception. |
| 4.14.17 | Subject to Section 4.14.18, no Contributed Company organized or formed under the laws of a jurisdiction outside of the United States (i) is a “surrogate foreign corporation” or “expatriated entity” within the meaning of Section 7874 of the Code (or any corresponding or similar provision of state, local or non-U.S. Tax Law) or is treated as a U.S. corporation for U.S. federal Tax purposes by reason of the application of Sections 269B or 7874(b) of the Code (or any corresponding or similar provision of state, local or non-U.S. Tax Law) or (ii) was created or organized in the United States such that such entity would be taxable in the United States as a domestic entity pursuant to the dual charter provision of Treasury Regulation Section 301.7701-5(a) (or any corresponding or similar provision of state, local or non-U.S. income Tax Law). |
| 4.14.18 | Solely for BIOX, the representations set forth in Section 4.14 are given based on the Knowledge of Bioceres Group. |
| 4.15 | Insurance |
| 4.15.1 | Schedule 4.15 sets forth a complete and correct list of all insurance policies and self-insurance programs relating to the Bioceres Group, Nutrecon and Gentle Tech or their respective employees, officers or directors, including, with respect to each policy, the carrier, policy number, expiration date and a general description of the type of coverage provided. All such policies are in full force and effect. There is no pending claim by Bioceres Group, Nutrecon and Gentle Tech under any such policies with respect to which coverage has been questioned, denied or disputed by the underwriters of such policies. Except as set forth on Schedule 4.15, all premiums payable under such policies have been timely paid and Bioceres Group, Nutrecon and Gentle Tech have otherwise complied in all material respects with the terms and conditions of such policies. Such policies are of the type and in amounts customarily carried by Persons conducting businesses similar to the Business. To the Knowledge of Bioceres Group, Nutrecon and Gentle Tech, there has been no threatened termination or non-renewal of, premium increase with respect to, or alteration of coverage under, any of such policies. |
| 4.15.2 | To the Knowledge of Bioceres Group, all insurance policies for BIOX are in full force and effect. There is no pending claim by BIOX under any insurance policy with respect to which coverage has been questioned, denied or disputed by the underwriters of such policies. To the Knowledge of Bioceres Group, all premiums payable under such policies have been timely paid and BIOX has otherwise complied in all material respects with the terms and conditions of such policies. Such policies are of the type and in amounts customarily carried by Persons conducting businesses similar to the Business. To the Knowledge of Bioceres Group, there has been no threatened termination or non-renewal of, premium increase with respect to, or alteration of coverage under, any of such policies. |
| 4.16 | Customers and Suppliers |
| 4.16.1 | Schedule 4.16.1 sets forth a complete and correct list of the names of the main customers of Bioceres Group, Nutrecon and Gentle Tech (based on the aggregate purchase price of products and services provided). |
| 4.16.2 | Schedule 4.16.2 sets forth a complete and correct list of the names of the top main suppliers to Bioceres Group, Nutrecon and Gentle Tech (based on the aggregate purchase price of raw materials, supplies or other products or services ordered). |
| 4.17 | Accounts Receivable |
All Accounts Receivable reflected on the Balance Sheet have been generated in the Ordinary Course of Business and reflect a bona fide obligation for the payment of goods or services provided by the Contributed Entities.
| 4.18 | Affiliate Transactions; Guaranties |
| 4.18.1 | Schedule 4.18.1 sets forth a complete and correct list of all Contracts or other transactions between Bioceres Group, Nutrecon and Gentle Tech, to which such Person is or has been a party or is otherwise bound or affected and that (i) were entered into in the prior three calendar years, (ii) are currently pending or in effect or (iii) involve continuing liabilities or obligations that, individually or in the aggregate, have been or would reasonably be expected to be material to Bioceres Group, Nutrecon and Gentle Tech (each, an “Affiliate Transaction”). |
| 4.18.2 | Each such Affiliate Transaction and, to the Knowledge of Bioceres Group each Affiliate Transaction of BIOX, was on terms and conditions no more favorable to such Affiliate than would have been obtainable at the time in a comparable arm’s-length transaction with a Person other than the Contributed Entities. No stockholder, officer, director or employee of or consultant to the Contributed Entities, or any family member, relative or Affiliate of any such stockholder, officer, director or employee or consultant, (i) owns, directly or indirectly, any interest in (x) any asset or other property used or held for use in the Business or (y) any Person that is a supplier, customer or competitor of the Contributed Entities, (ii) serves as an officer, director or employee of or consultant to any Person that is a supplier, customer or competitor of the Contributed Entities or (iii) is a debtor or creditor of the Contributed Entities. |
| 4.18.3 | Except as set forth on Schedule 4.18.2, none of the obligations or liabilities of Bioceres Group, Nutrecon and Gentle Tech is guaranteed by or subject to a similar contingent obligation of any other Person. Except as set forth on Schedule 4.18.2, none of Bioceres Group, Nutrecon and Gentle Tech has guaranteed or become subject to a similar contingent obligation in respect of the obligations or liabilities of any other Person. There are no outstanding letters of credit, surety bonds or similar instruments of Bioceres Group, Nutrecon and Gentle Tech or any of their Subsidiaries in connection with operation of the Business as currently conducted. |
| 4.18.4 | To the Knowledge of Bioceres Group, none of the obligations or liabilities of BIOX are guaranteed by or subject to a similar contingent obligation of any other Person and BIOX has not guaranteed or become subject to a similar contingent obligation in respect of the obligations or liabilities of any other Person. There are no outstanding letters of credit, surety bonds or similar instruments of BIOX in connection with operation of the Business as currently conducted. |
| 4.19 | State Takeover Statutes |
No “fair price,” “moratorium,” “control share acquisition,” or other anti-takeover statute or similar statute or regulation, including section 203 of the Delaware General Corporation Law, applies or purports to apply to this Agreement or any of the transactions contemplated hereby.
| 4.20 | Brokers and Finders |
No investment banker, broker, finder or other intermediary has been retained by or is authorized to act on behalf of the Bioceres Group, Gentle Tech, or Nutrecon, or any of their Subsidiaries, and no such Person is entitled to any fee or commission from Moolec or any of its Affiliates, in connection with the transactions contemplated by this Agreement.
| 4.21 | Full Disclosure |
The disclosures made in this Agreement and any other document furnished or to be furnished to Moolec in connection with the Contribution and Exchange, including but not limited to the SEC Form 6-K, do not (i) contain any untrue statement of a material fact, or (i) omit to state a material fact necessary to make the statements contained therein, in light of the circumstances in which they are made, not misleading.
| 4.22 | No Other Representations or Warranties |
Except for the representations and warranties expressly set forth in this Section 4, none of Bioceres Group, Gentle Tech and Nutrecon makes or has made any other representation or warranty, express or implied, at law or in equity, in respect of the Contributed Entities or any of their respective Subsidiaries.
| 5 | Representations and Warranties of Moolec |
As of the date hereof and as of the Closing Date, Moolec represents and warrants to the Transferors as follows:
| 5.1 | Corporate Status; Authorization; Binding Effect |
| 5.1.1 | (i) as of the date hereof, Moolec is a public limited liability company (societé anonyme) governed by the laws of the Grand Duchy of Luxembourg, validly existing and in good standing, with full corporate power and authority to execute and deliver this Agreement, to perform its obligations hereby and to consummate the transactions contemplated hereby, and (ii) as of the Closing Date, Moolec will be an exempted company registered under the laws of the Cayman Islands, validly existing and in good standing, with full corporate power and authority to perform its obligations under this Agreement and to consummate the transactions contemplated hereby. |
| 5.1.2 | The execution, delivery and performance by Moolec of this Agreement, and the consummation of the transactions contemplated hereby have been or, further to the Redomiciliation being effective, will be, duly and validly authorized in accordance with the Moolec Board Resolutions by Moolec’s board of directors, which after consulting with their respective advisors, including but not limited to legal and financial advisors, has determined that (i) the execution of this Agreement, (ii) the consummation of the Contribution and Exchange, and (iii) the compliance with the obligations set forth in this Agreement are in Moolec’s and its stakeholders’ best interests. |
| 5.1.3 | Moolec has duly executed and delivered this Agreement. This Agreement is a legal, valid, binding and enforceable obligation of Moolec, enforceable against Moolec in accordance with its respective terms. |
| 5.2 | Governmental Approvals |
The execution, delivery and performance by Moolec of this Agreement to which it will be a party, and the consummation of the transactions contemplated hereby and thereby, require no Governmental Approvals.
| 5.3 | Moolec Shares |
| 5.3.1 | Moolec represents and warrants that, as of the date hereof, (i) 40,003,674 shares par value U.S.$0.01 per share are currently outstanding; (ii) 123,166 shares par value U.S.$0.01 per share are currently being held in treasury; (iii) 11,110,000 public and private warrants are currently outstanding; and (iii) there are currently 1,465,757 stock options to acquire shares at U.S.$0.95 (the “Current Options”) as set forth in Schedule 5.3.1 (a). |
| 5.3.2 | All Moolec Shares representing the Exchange Consideration when (i) issued by Moolec against payment in full of the consideration therefore in accordance with the terms of this Agreement, the Moolec Board Resolutions and the amended and restated memorandum and articles of association of Moolec; and (ii) duly registered in Moolec’s register of members as fully paid shares, will be duly authorized, validly issued and fully paid shares of Moolec, free and clear of all liens and encumbrances, subject to securities Laws. |
| 5.4 | No Conflicts |
The execution, delivery and performance by Moolec of this Agreement, and the consummation of the transactions contemplated hereby, do not and will not conflict with or result in a violation or breach of or default under (i) any applicable Law, (ii) the certificate of incorporation or by-laws or other organizational documents of Moolec or (iii) any contract, agreement or other instrument applicable to Moolec or any of its properties or assets, except, in the case of clause (iii), for violations and defaults that, individually and in the aggregate, have not and will not materially impair or delay the ability of Moolec to perform its obligations under this Agreement.
| 5.5 | Purchase for Investment |
Moolec is acquiring the Bioceres Group Original Shares, Nutrecon Membership Interests, and Gentle Tech Union Shares for investment and not with a view toward any resale or distribution thereof except in compliance with the Securities Act. Moolec hereby acknowledges that these shares have not been registered pursuant to the Securities Act and may not be transferred in the absence of such registration or an exemption therefrom under the Securities Act.
| 5.6 | Litigation |
There is no Litigation pending, or to the Knowledge of Moolec, threatened against or affecting Moolec relating to the transactions contemplated hereby.
| 5.7 | Brokers and Finders |
No investment banker, broker, finder or other intermediary has been retained by or is authorized to act on behalf of Moolec or any of its Affiliates, and no such Person is entitled to any fee or commission from the Transferors or any of their Subsidiaries in connection with the transactions contemplated by this Agreement.
| 5.8 | Moolec SEC Documents |
| 5.8.1 | Since January 1, 2023, Moolec has timely filed with or furnished all forms, reports, statements, schedules and other documents required to be filed with or furnished by Moolec to the SEC (the “Moolec SEC Documents”) under the Securities Act or the Exchange Act, as the case may be. As of their respective filing dates (or if amended, as of the date of such amendment with respect to the portions that were amended), and in the case of registration statements and proxy statements, as of the dates of effectiveness and the dates of mailing, respectively, the Moolec SEC Documents (i) complied as to form and substance in all material respects with the applicable requirements of the Securities Act and the Exchange Act, as the case may be, and, in each case, the rules and regulations promulgated thereunder, each as in effect on the date so filed (or amended), and (ii) did not, at the time they were filed, or, if amended prior to the date hereof, as of the date of such amendment, contain any untrue statement of a material fact or omit to state a material fact required to be stated therein or necessary in order to make the statements made therein, in light of the circumstances under which they were made, not misleading. |
| 5.8.2 | The consolidated financial statements of Moolec included in the Moolec SEC Documents (including the related notes and schedules thereto) when filed complied in all material respects with the rules and regulations of the SEC with respect thereto, except to the extent disclosed in any such Moolec SEC Documents, and were prepared in all material respects in accordance with the applicable accounting principles (except, in the case of the unaudited quarterly financial statements, as permitted by the rules and regulations of the SEC) applied on a consistent basis during the periods involved (except as may be indicated therein or in the notes thereto) and, on that basis, fairly present in all material respects the consolidated financial position of Moolec and Moolec’s Subsidiaries as of the dates thereof and the consolidated results of their operations and cash flows for the periods shown (subject, in the case of unaudited quarterly financial statements, to normal year-end adjustments and to any other adjustments described therein, including the notes thereto, which, individually or in the aggregate, are not material in amount). |
| 5.8.3 | Moolec has established and maintains disclosure controls and procedures (as defined in Rule 13a-15(e) or Rule 15d-15(e) under the Exchange Act) as required by Rule 13a-15(a) or Rule 15d-15(a) under the Exchange Act, and Moolec has established and maintains internal control over financial reporting (as defined in Rule 13a-15(f) or Rule 15d-15(f) under the Exchange Act) as required by Rule 13a-15(a) or Rule 15d-15(a) under the Exchange Act. Such disclosure controls and procedures are reasonably designed to ensure that material information required to be disclosed by Moolec in the reports that it files or submits under the Exchange Act is recorded, processed, summarized and reported within the time periods specified in the SEC’s rules and forms. Moolec has disclosed, based on the most recent evaluation by its Chief Executive Officer and its Chief Financial Officer, to Moolec’s auditors and the audit committee of Moolec’s board (i) any significant deficiencies and material weaknesses in the design or operation of internal control over financial reporting that are reasonably likely to adversely affect in any material respect Moolec’s ability to record, process, summarize and report financial information; and (ii) any fraud, whether or not material, that involves management or other employees who have a significant role in Moolec’s internal control over financial reporting. |
| 5.8.4 | Neither Moolec, nor any of Moolec’s Subsidiaries is a party to, or has any commitment to become a party to, any securitization transaction, joint venture, off-balance sheet partnership or similar Contract (including any Contract or arrangement relating to any transaction or relationship between or among Moolec, on the one hand, and any unconsolidated Affiliate, including any structured finance, special purpose or limited purpose entity or Person, on the other hand), or any “off-balance sheet arrangements” (as defined in Item 303(a) of Regulation S-K promulgated by the SEC), where the result, purpose or intended effect of such Contract is to avoid disclosure of any material transaction involving, or material liabilities of, Moolec or any of Moolec’s Subsidiaries in Moolec’s consolidated financial statements included in the Moolec SEC Documents. |
| 5.8.5 | Except as described in Schedule 5.8.5, subject to any applicable grace periods, Moolec has been since January 1, 2023, and is currently in compliance in all material respects with the applicable provisions of the applicable rules and regulations of Nasdaq. |
| 5.8.6 | As of the date of this Agreement, there are no material outstanding or unresolved comments in comment letters received from the SEC staff with respect to any Moolec SEC Document and, none of the Moolec SEC Documents is, to the Knowledge of Moolec, the subject of ongoing SEC review. |
| 5.9 | Subsidiaries |
The authorized, issued and outstanding shares of capital stock of or other equity interests in all Subsidiaries of Moolec, their respective jurisdictions of formation/incorporation and Moolec direct or indirect percentage ownership interest in such Subsidiaries, as applicable, are identified on Schedule 5.9. All of the outstanding shares of capital stock of or other equity interests in each Subsidiary of Moolec (i) are duly authorized, validly issued, fully paid and non-assessable and were not issued in contravention of any preemptive rights, rights of first refusal or first offer or similar rights or any federal or state securities laws and (ii) are owned beneficially and of record by Moolec, as set forth on Schedule 5.9, free and clear of any Liens. Neither Moolec nor any of its Subsidiaries owns any shares of capital stock of or other equity interests in any other Person, except as set forth on Schedule 5.9. Except as set forth on Schedule 5.9, there are no outstanding Derivative Securities with respect to any shares of capital stock of or other equity interests in any Subsidiary of Moolec and there are no outstanding obligations of Moolec to repurchase, redeem or otherwise acquire any such Derivative Securities.
| 5.10 | Material Contracts |
| 5.10.1 | Except as set forth on Schedule 5.10.1, Moolec is not bound by or a party to any: |
| (i) | Contract relating to Indebtedness (in each case, whether incurred, assumed, guaranteed or secured by any asset) in excess of U.S.$500,000 in any annual period; |
| (ii) | joint venture, partnership, limited liability company or other similar Contract; |
| (iii) | material lease for personal property; |
| (iv) | sales, distribution, agency and marketing Contract (or series of related Contracts) in excess of U.S.$100,000 in any annual period; |
| (v) | Contract (or series of related Contracts) relating to any outstanding commitment for capital expenditures in excess of U.S.$300,000 individually or U.S.$700,000 in the aggregate; |
| (vi) | Contract (or series of related Contracts) relating to the acquisition, disposition or lease of any Person, business or material real property or other assets (whether by merger, sale of stock, sale of assets or otherwise); |
| (vii) | Contract containing any “change of control”, anti-assignment or similar provisions; |
| (viii) | Contract that (A) limits the freedom of Moolec to compete in any line of business or with any Person or in any geographic area or (B) contains exclusivity obligations or restrictions binding on Moolec, in each case, whether before or after the Closing; |
| (ix) | Moolec IP Agreements; |
| (x) | Contract (including any “take-or-pay” or keepwell agreement) under which (A) any Person has directly or indirectly guaranteed any liabilities or obligations of any of Moolec or (B) Moolec has directly or indirectly guaranteed liabilities or obligations of any other Person; or |
| (xi) | other Contract that is (A) not made in the Ordinary Course of Business or (B) material to the Business. |
| 5.10.2 | Each Contract disclosed or required to be disclosed pursuant to this Section (each, a “Material Contract”) is a legal, valid, binding and enforceable agreement of Moolec, as applicable, and is in full force and effect, and neither Moolec or, to the Knowledge of Moolec, any other party thereto is in default or breach under the terms of, or has provided any notice of any intention to terminate or modify, any such Moolec Material Contract, and, to the Knowledge of Moolec, no event or circumstance has occurred that, with notice or lapse of time or both, would constitute a breach thereof or a default thereunder or would result in a termination, modification, acceleration or vesting of any rights or obligations or loss of benefits thereunder. |
| 5.11 | Assets; Real Property |
| 5.11.1 | Moolec has good and valid (and, in the case of Owned Real Property, good, valid and marketable fee simple) title to, or otherwise has the right to use pursuant to a valid and enforceable lease, license or similar contractual arrangement, all of the Assets, in each case free and clear of any Liens, other than Permitted Liens. |
| 5.11.2 | The Assets constitute all of the Assets, properties and rights that are required for or material to the continued conduct of the Business on a stand-alone basis. The plants, buildings, structures, material equipment and other material tangible personal property included in the Assets are in good repair, working order and operating condition, subject only to ordinary wear and tear, and are adequate and suitable for the purposes for which they are presently being used or held for use. To the Knowledge of Moolec, there are no facts or conditions affecting any material Assets that could reasonably be expected, individually or in the aggregate, to interfere in any material respect with the current use, occupancy or operation of such Assets. |
| 5.11.3 | Schedule 5.11.3 sets forth a complete and correct list of all the Owned Real Property by Moolec. Schedule 5.11.3 lists the address and owner of each parcel of Owned Real Property and describes all improvements thereon. There are no outstanding options or rights of first refusal to purchase or lease the Owned Real Property or any portion thereof or interest therein. There is no pending or, to the Knowledge of Moolec, threatened condemnation proceedings before any Governmental Authority with respect to any Owned Real Property. |
| 5.11.4 | Schedule 5.11.4 sets forth a complete and correct list of all Leased Real Property, including the address, landlord and tenant for each Lease. Moolec is not a sublessor or grantor under any sublease or other instrument granting to another Person any right to the possession, lease, occupancy or enjoyment of the Leased Real Property. |
| 5.11.5 | The Real Property represents all of the real property that is Related to the Business. The use and operation of the Real Property in the conduct of the Business do not violate in any material respect any Law, Consent, Lien or agreement of any Governmental Authority. No material improvements constituting a part of the Real Property encroach on any real property not owned or leased by Moolec to the extent that removal of such encroachment would reasonably be expected to materially impair the manner and extent of the current use, occupancy and operation of such improvements. There are no Liens affecting the Real Property that materially impair the ability of the Moolec to use such property in the operation of the Business in the Ordinary Course. |
| 5.12 | Intellectual Property |
| 5.12.1 | Schedule 5.12.1 sets forth a complete and correct list as of the date hereof of each (i) Patent, (ii) Trademark, (iii) Copyright, (iv) Internet Property and (v) any other Intellectual Property, in each case that is the subject of an application, certificate, filing, registration or other document issued by, registered with, filed with, submitted to or recorded by, any Governmental Authority or other organization or entity having authority over the issuance and maintenance thereof and that are owned by or purported to be owned by, filed in the name of, or applied for, by Moolec (the “Moolec Registered Intellectual Property”). Moolec Intellectual Property is listed in the records of the appropriate U.S., state or non-U.S. registry or Governmental Authority as the sole current owner of, or registrant with respect to, each application or registration identified in Schedule 5.12.1. Moolec is in compliance with all legal, regulatory, administrative or contractual requirements of the Governmental Authority or other entity with respect to each item of Moolec Registered Intellectual Property, including payment of all maintenance and filing fees, and no filings with nor payment to any registry or Governmental Authority is due within ninety (90) days of the date hereof. All Moolec Registered Intellectual Property is valid, enforceable and subsisting. |
| 5.12.2 | Except as set forth on Schedule 5.12.2, Moolec owns solely and exclusively, free and clear of all Liens, other than Permitted Liens, all Owned Intellectual Property and Moolec licenses or otherwise has a valid right to use, all other Intellectual Property used in the operation of the business of Moolec as presently conducted (collectively, the “Moolec Intellectual Property”). The Moolec Intellectual Property constitutes all the Intellectual Property used in, held for use in or necessary for the conduct of the Business as currently conducted and is sufficient for Moolec to operate the Business from and after the Closing Date in all material respects as operated immediately prior to the Closing Date. |
| 5.12.3 | Each present or past employee, officer, consultant or any other Person who created or contributed to any Intellectual Property for or on behalf Moolec has assigned, including by operation of law, to Moolec such Person’s right, title and interest in and to all such Intellectual Property that was developed by such Person in connection with such Person’s employment or engagement by Moolec. |
| 5.12.4 | No funding, facilities or resources of a university, college, other educational institution, research center or Governmental Authority was used in the development of the Owned Intellectual Property, and no Governmental Authority, university, college or other educational institution or research center has any claim or right in or to the Owned Intellectual Property. |
| 5.12.5 | To the Knowledge of Moolec, the operation of the respective businesses of Moolec as currently conducted does not infringe, misappropriate, violate or otherwise conflict with, and since the date that is six (6) years prior to the date hereof, has not infringed, misappropriated, violated or otherwise conflicted with, any Intellectual Property of any other Person, and no Person is currently infringing upon, misappropriating, violating or otherwise conflicting with any Owned Intellectual Property, and since the date that is six (6) years prior to the date hereof, has not infringed, misappropriated, violated or otherwise conflicted with any Owned Intellectual Property. Moolec has not received any written notice, cease and desist or offer to take a license or any other claim since the date that is six (6) years prior to the date hereof alleging that any of the Business operations infringe, misappropriate, violate or otherwise conflict with the Intellectual Property of any other Person. |
| 5.12.6 | There is no opposition or cancellation Litigation pending against Moolec concerning the ownership, validity or enforceability of any Moolec Registered Intellectual Property (other than ordinary course proceedings related to the application before a Governmental Authority). There is no Litigation pending or threatened alleging any infringement or violation or challenging Moolec’s rights in or to any Moolec Intellectual Property, and there is no existing fact or circumstance that would be reasonably expected to give rise to any such Litigation. There is no written allegation made by Moolec relating to infringement or misappropriation, or other violation by a third party of any Owned Intellectual Property. Moolec Intellectual Property is not subject to any Order adversely affecting the use thereof or rights thereto by or of Moolec or that restricts in any manner the use, transfer or licensing thereof by Moolec or may affect the validity, use or enforceability of Moolec Intellectual Property. |
| 5.12.7 | Schedule 5.12.7 sets forth a list of any Contract pursuant to which (i) Moolec has granted to any third party any right in or to Moolec Intellectual Property or (ii) Moolec uses or has been granted right to any Intellectual Property of any third party, in each case of (i) and (ii) other than (a) commercially available “off-the-shelf” software licenses under which software is licensed to Moolec on standardized, generally available terms and that have not been modified or customized specifically for Moolec or (ii) licenses that are incidental to agreements or arrangements relating to Moolec’s purchase, lease, license, or other receipt of goods or services (collectively, the “Moolec IP Agreements”). |
| 5.12.8 | Moolec has taken commercially reasonable actions to maintain and preserve the confidentiality of any Trade Secrets included in Moolec Intellectual Property, including requiring all current and former employees and other Persons provided with access to such Trade Secrets to execute written agreements that contain confidentiality provisions, and to there have been no unauthorized uses or disclosures of any such Trade Secrets. |
| 5.12.9 | To the Knowledge of Moolec, no Owned Software has been disclosed, escrowed or made available to or for any Person, other than under a written agreement with Persons working on the development of such Owned Software that protects Moolec’s rights in and to such source code and the consummation of the transactions contemplated under this Agreement will not result in the disclosure or release of or otherwise require Moolec to make available to any Person any source code to any Owned Software. Moolec is in actual possession and control of the applicable source code, object code, notes, documentation, and know-how to the extent required for use, development, enhancement, maintenance and support of such Owned Software. No Owned Software incorporates, includes, embeds, links with or is distributed with, Open Source Software in a manner that would, as a result of any requirement in the license with respect to such Open Source Software, (i) restrict Moolec from charging a fee for such Owned Software or (ii) require or obligate that the source code to any Owned Software be disclosed, distributed, licensed or otherwise be made available to any Person, including for the purpose of making modifications or derivative works. |
| 5.12.10 | To the Knowledge of Moolec, no Owned Software (i) contains any Disabling Devices, (ii) contains any errors or defects (other than those errors or defects that were timely remedied and which did not, individually or in the aggregate, cause Moolec or any licensee thereof to suffer any material harm), and (iii) has suffered from any material or recurring malfunctions. |
| 5.13 | Compliance with Laws; Consents |
| 5.13.1 | The conduct by Moolec of the Business is and has been in compliance with all applicable Laws, except for violations or failures so to comply, if any, that, individually and in the aggregate, have not had and would not reasonably be expected to (i) have a Material Adverse Effect, (ii) give rise to material fines or other material civil penalties or any criminal Liabilities or (iii) cause Moolec to lose any material benefit or incur any material Liability. Moolec has not received any notice or other communications relating to any alleged violation of any applicable Law from any Governmental Authority, or of any investigation with respect thereto, except for violations, if any, that, individually and in the aggregate, have not had and would not reasonably be expected to (i) have a Material Adverse Effect or (ii) give rise to material fines or other material civil penalties or any criminal Liabilities. Without limiting the foregoing, neither Moolec, or any of their respective Affiliates or Representatives has, directly or indirectly: |
| (i) | improperly or unlawfully made any payment or offered anything of value to any foreign or domestic officials or employees or to any foreign or domestic political parties or campaigns, whether to obtain or retain business or otherwise; |
| (ii) | made or authorized any payment, contribution or gift of money, property or services involving the direct or indirect use of funds of Moolec (including entertainment or other expenses), whether or not in contravention of applicable Law, (A) as a “kickback” or bribe to any Person or (B) to any political organization or the holder of (or person who seeks) any elective or appointive public office related to political activity or otherwise related to political activity; or |
| (iii) | violated any applicable export control, money laundering or anti-terrorism Law or taken any action that could reasonably be expected, individually or in the aggregate, to cause Moolec to be in violation of the U.S. Foreign Corrupt Practices Act of 1977, as amended, any act enforced by the Office of Foreign Asset Control of the U.S. Department of Treasury or any applicable Law of similar effect. |
| 5.13.2 | Moolec holds all the required Consents for the conduct of the Business, other than such Consents the absence of which has not had and would not reasonably be expected to have, individually or in the aggregate, a Material Adverse Effect. |
| 5.13.3 | Moolec is not, or so far as Moolec is aware, any of its directors, officers or employees, nor any other person acting on their behalf: |
| (i) | is engaging or has engaged in any activity or conduct that has resulted or will result in a violation of: |
| (a) | any Anti-Corruption Laws; or |
| (b) | any Sanctions Laws; or |
| (ii) | has received written notice of, or is otherwise aware of, any claim, action, suit, proceedings or investigation involving it with respect to Anti-Corruption Laws or Sanctions Laws; |
| (iii) | is a Sanctioned Person or has engaged in any transaction, activity or conduct that would reasonably be expected to result in its being designated as a Sanctioned Person; or |
| (iv) | engages or has engaged in any transaction or dealing with any Sanctioned Person or with any Sanctioned Territory. |
| 5.14 | Environmental Matters |
| 5.14.1 | Moolec has complied during the past 5 years and is in compliance in all material respects with all applicable Environmental Laws and has obtained and is in compliance in all material respects with all applicable Environmental Permits. None of the Environmental Permits held or required to be held by Moolec restricts in any material respect Moolec from operating any equipment covered by such Environmental Permit as currently conducted. No notice of violation, notification of liability or request for information has been received by Moolec and no Litigation is pending or, to the Knowledge of Moolec, threatened by any Person against Moolec relating to or arising out of any Environmental Law. No Order has been issued and is currently in effect, and the past 5 years no penalty or fine has been assessed, against Moolec relating to or arising out of any Environmental Law. |
| 5.14.2 | No Hazardous Substances are located, and no Releases of Hazardous Substances have occurred, at, on, above, under or from the Real Property or any properties currently or formerly owned, leased, operated or used by Moolec that has resulted or could reasonably be expected, individually or in the aggregate, to result in any material Liability of Moolec under any Environmental Law. |
| 5.14.3 | Moolec has not or, to the Knowledge of Moolec, any other Person, has caused or taken any action that has resulted or could reasonably be expected to result, individually or in the aggregate, in any material Liability relating to (x) the environmental conditions at, on, above, under, or about the Real Property or any properties or assets currently or formerly owned, leased, operated or used by Moolec, (y) the past or present use, management, handling, transport, treatment, generation, storage, disposal, Release or threatened Release of Hazardous Substances or (z) any Remedial Action at any of the Real Property. |
| 5.15 | Employees; Labor Matters |
| 5.15.1 | Moolec is not a party to or bound by any Contract with any labor union, labor organization, works council or other employee representatives (collectively, “Moolec Labor Agreements”) and there are no labor unions or other organizations or groups representing or purporting or attempting to represent any employees employed by Moolec. There has not occurred or, to the Knowledge of Moolec, been threatened any material strike, slowdown, picketing, work stoppage, concerted refusal to work or other similar labor activity with respect to any such employees of Moolec. There are no labor disputes currently subject to any grievance procedure or Litigation or, to the Knowledge of Moolec, threatened with respect to any such employee. Moolec has not engaged in any unfair labor practices (within the meaning of the National Labor Relations Act) that would reasonably be expected to, individually or in the aggregate, directly or indirectly result in a material Liability to Moolec. Moolec is in compliance with all statutory obligations to inform and consult with their employees and/or their representatives as might be imposed under applicable Law. Neither the announcement nor the consummation of the transactions contemplated by this Agreement will entitle any third party (including any labor union, labor organization, works council or other employee representatives) to notice or consultation rights under any labor agreements. |
| 5.15.2 | Schedule 5.15.2 contains complete and correct details (to the extent permissible by applicable Law), in relation to Moolec, of the total number of employees of Moolec. There are no terms of employment for employees that provide that a change in control of Moolec (however “change in control” may be defined in the applicable document, if at all) shall entitle such employees to treat the change in control as amounting to a breach of the contract or entitling him or her to any payment or benefit whatsoever or entitling him or her to treat himself as redundant or dismissed or released from any obligation. |
| 5.15.3 | Moolec is not the subject of any pending or threatened action involving one or more employees of Moolec that individually or in the aggregate would be material. |
| 5.15.4 | Moolec is in compliance with all Laws applicable to the Business with respect to their respective employees and its own policies respecting employment and employment practices, harassment, whistleblowing, terms and conditions of employment, wages and hours, equal opportunity, civil rights, labor relations, occupational health and safety and income and payroll taxes with respect to the employees. Moolec is not in receipt of a complaint, demand letter or charge issued by a Governmental Authority that alleges a violation by Moolec of any applicable Law respecting employment and employment practices, terms and conditions of employment, wages and hours, equal opportunity, civil rights, labor relations, occupational health and safety or payroll taxes with respect to its employees. Moolec has not (i) engaged in any plant closing, work force reduction or other action that has resulted or could reasonably be expected to result in material Liability under the Workers Adjustment and Retraining Notification Act or any other applicable foreign, state or local Law, requiring notice to employees in the event of a plant closing or layoff, or (ii) been issued any notice that any such action is to occur in the future with respect to the employees. |
| 5.15.5 | Schedule 5.15.5 sets forth a list by employee identification number of Moolec’s employees with an annual base cash compensation in excess of U.S.$200,000 (the “Key Employees”). |
| 5.15.6 | Schedule 5.15.6 sets forth Moolec Benefit Plans currently in place. |
| 5.16 | Taxes |
| 5.16.1 | Moolec has timely filed or caused to be timely filed (after taking into account all appliable extensions) all material Tax Returns that are required to be filed by them, and all such Tax Returns are true, correct and complete in all material aspects. |
| 5.16.2 | Moolec has timely paid, or caused to be timely paid, all material Taxes due and payable (whether or not shown on any Tax Return). Moolec has established adequate reserves on the applicable Financial Statements for Taxes accrued but not yet due. All Taxes that Moolec is required by Law to withhold or collect have been duly withheld or collected, and have been timely paid, or caused to be timely paid, to the appropriate Governmental Authorities to the extent due and payable. |
| 5.16.3 | There are no Consents currently in effect for the extension or waiver of the time (i) to file any Tax Return or (ii) for assessment or collection of any Taxes relating thereto, and no Person has been requested in writing to enter into any such Consent. No claim has ever been made in writing by a Governmental Authority in a jurisdiction in which Moolec does not file Tax Returns that Moolec is or may be subject to taxation by that jurisdiction. There is no Litigation currently pending, or, to the Knowledge of Moolec, threatened, regarding any Taxes relating to Moolec. |
| 5.16.4 | No Governmental Authority has asserted in writing any deficiency or proposed adjustment for any Taxes of Moolec, which deficiency or proposed adjustment has not been fully paid, settled, withdrawn or otherwise contested and for which adequate reserves have provided for on the applicable Financial Statement, if necessary. No audits, examinations, investigations or other proceedings by a Governmental Authority are ongoing or pending with respect to Taxes of Moolec. No written notification has been received by Moolec (or its Affiliate) that any such audit, examination, investigation or other proceeding in respect of Taxes is proposed or threatened. |
| 5.16.5 | Moolec has not agreed, and is not required, to make any adjustment under section 481(a) of the Code (or any comparable provision of state, local, or foreign Law) by reason of a change in accounting method or otherwise. |
| 5.16.6 | No power of attorney is currently in effect, and no income tax ruling has been requested of any Governmental Authority, with respect to any Tax matter relating to Moolec. |
| 5.16.7 | Moolec is not now or has ever been included in any “affiliated group” within the meaning of section 1504(a) of the Code (or any similar group defined under a similar provision of applicable Law) filing a consolidated federal income Tax Return. |
| 5.16.8 | Moolec is not now or has ever been included in any “affiliated group” within the meaning of section 1504(a) of the Code (or any similar group defined under a similar provision of applicable Law) filing a consolidated federal income Tax Return or has any liability for any Taxes pursuant to Treasury Regulation Section 1.1502-6 (or any comparable provision of state, local or non-U.S. Law) or as a transferee or successor. |
| 5.16.9 | Moolec has no Liability for the Taxes of any Person as a transferee or successor, by Contract or otherwise. |
| 5.16.10 | There are no Liens for Taxes (other than Permitted Liens) upon any of the assets of Moolec. |
| 5.16.11 | Moolec has not been a United States real property holding corporation within the meaning of section 897(c)(2) of the Code during the applicable period specified in section 897(c)(1)(A)(ii) of the Code. |
| 5.16.12 | Moolec will not be required to include any item of income in, or exclude any item of deduction from, taxable income for any taxable period (or portion thereof) ending after the Closing Date as a result of any: (i) change in method of accounting for a taxable period ending on or prior to the Closing Date; (ii) “closing agreement” as described in section 7121 of the Code (or any corresponding or similar provision of state, local or foreign income Tax law) executed on or prior to the Closing Date; (iii) intercompany transaction or excess loss account described in United States Treasury Regulations under section 1502 of the Code (or any corresponding or similar provision of state, local or foreign income Tax Law); (iv) installment sale or open transaction disposition made on or prior to the Closing Date; (v) prepaid amount received on or prior to the Closing Date outside the Ordinary Course of Business or (vi) election under Section 965(h) of the Code. |
| 5.16.13 | Moolec has not participated in a “listed transaction” within the meaning of Treasury Regulation Section 1.6011-4(b)(2). |
| 5.16.14 | Moolec has not constituted either a “distributing corporation” or a “controlled corporation” in a distribution of stock intended to qualify for tax-free treatment under Section 355 of the Code in the two-year period ending on the date of this Agreement. |
| 5.16.15 | There are no income Tax or other material Tax rulings, requests for rulings, technical advice memoranda, closing agreements or similar agreements or rulings relating to Taxes that have been issued to or with respect to Moolec or into which Moolec has entered into that would be binding on any of Moolec in any taxable period (or portion thereof) after the Closing Date, in each case which agreement or ruling would be effective after the Closing Date. |
| 5.16.16 | Moolec has been treated as non-U.S. corporations since its inception. |
| 5.16.17 | Moolec (i) is not a “surrogate foreign corporation” or “expatriated entity” within the meaning of Section 7874 of the Code (or any corresponding or similar provision of state, local or non-U.S. Tax Law) or is treated as a U.S. corporation for U.S. federal Tax purposes by reason of the application of Sections 269B or 7874(b) of the Code (or any corresponding or similar provision of state, local or non-U.S. Tax Law) or (ii) was not created or organized in the United States such that such entity would be taxable in the United States as a domestic entity pursuant to the dual charter provision of Treasury Regulation Section 301.7701-5(a) (or any corresponding or similar provision of state, local or non-U.S. income Tax Law). |
| 5.17 | Insurance |
Schedule 5.17 sets forth a complete and correct list of all insurance policies and self-insurance programs relating to Moolec or their respective employees, officers or directors, including, with respect to each policy, the carrier, policy number, expiration date and a general description of the type of coverage provided. All such policies are in full force and effect. There is no pending claim by Moolec under any of such policies with respect to which coverage has been questioned, denied or disputed by the underwriters of such policies. Except as set forth on Schedule 5.17, all premiums payable under such policies have been timely paid and Moolec has otherwise complied in all material respects with the terms and conditions of such policies. Such policies are of the type and in amounts customarily carried by Persons conducting businesses similar to the Business. To the Knowledge of Moolec, there has been no threatened termination or non-renewal of, premium increase with respect to, or alteration of coverage under, any of such policies.
| 5.18 | Customers and Suppliers |
| 5.18.1 | Schedule 5.18.1 sets forth a complete and correct list of the names and addresses of the key customers of Moolec (based on the aggregate purchase price of products and services provided). |
| 5.18.2 | Schedule 5.18.2 sets forth a complete and correct list of (i) the names and addresses of the key suppliers to Moolec (based on the aggregate purchase price of raw materials, supplies or other products or services ordered). |
| 5.19 | Affiliate Transactions; Guaranties |
| 5.19.1 | No stockholder, officer, director or employee of or consultant to the Moolec or any of their Affiliates, or any family member, relative or Affiliate of any such stockholder, officer, director or employee or consultant, (i) owns, directly or indirectly, any interest in (x) any asset or other property used or held for use in the Business or (y) any Person that is a supplier, customer or competitor of Moolec, (ii) serves as an officer, director or employee of or consultant to any Person that is a supplier, customer or competitor of Moolec or (iii) is a debtor or creditor of Moolec. |
| 5.19.2 | Except as set forth on Schedule 5.19.2, none of the obligations or liabilities of Moolec is guaranteed by or subject to a similar contingent obligation of any other Person. Except as set forth on Schedule 5.19.2, Moolec has not guaranteed or become subject to a similar contingent obligation in respect of the obligations or liabilities of any other Person. There are no outstanding letters of credit, surety bonds or similar instruments of Moolec or any of their Affiliates in connection with operation of the Business as currently conducted. |
| 5.20 | No Other Representations or Warranties |
Except for the representations and warranties expressly set forth in this Section 5, Moolec does not make or has not made any other representation or warranty, express or implied, at law or in equity, in respect of Moolec or any of its respective Affiliates.
| 6 | Covenants |
| 6.1 | Covenants of Bioceres Group, Nordelis, Union Group, Nutrecon and Gentle Tech |
| 6.1.1 | Conduct of Business |
| (i) | From the date hereof until the Closing, the Contributed Entities shall conduct the Business in the Ordinary Course, use its commercially reasonable efforts to preserve intact the Business, the assets and the relationships of the Contributed Entities with their respective customers and suppliers and others having business dealings with them, and keep available the services of the present officers and significant employees of the Contributed Entities. |
| (ii) | Without limiting the generality of the foregoing, from the date hereof until the Closing, none of the Contributed Entities shall: |
| (a) | declare, set aside or pay any dividends on, or make any other distributions in respect of, any of its capital stock or equity interests; |
| (b) | split, combine, subdivide, adjust, amend the terms of or reclassify any of its capital stock or equity interests; |
| (c) | sell or transfer any share it holds in any entity, including BIOX, unless the proceeds of this sale or transfer are used to repay any outstanding Indebtedness disclosed in Schedule 4.7.1. The proof of repayment shall be promptly shared with Moolec; |
| (d) | issue, deliver, sell, pledge, grant, transfer or otherwise encumber any shares of its capital stock or other equity securities or any option, warrant or other right to acquire or receive any shares of its capital stock or other equity securities, or redeem, purchase or otherwise acquire any shares of its capital stock or other equity securities; |
| (e) | amend its certificate of incorporation or bylaws, or amend other similar organizational documents, except for the Bioceres Group New Articles; |
| (f) | acquire (by merger, consolidation, purchase of stock or assets or otherwise) any company, corporation, entity, business or assets that constitute a business or any other business organization or any division of any Person; |
| (g) | (a) create, incur, repurchase, prepay or assume any Indebtedness for borrowed money or issue or sell options, warrants, calls or other rights to acquire any debt securities of any of the Contributed Entities, (b) enter into any “keep well” or other Contract to maintain any financial statement or similar condition of another Person, (c) make any loans, advances or capital contributions to or investments in any Person, or (d) assume, guarantee, endorse or otherwise become liable or responsible for the Indebtedness or other obligations of another Person, |
| (h) | merge, combine or consolidate any of the Contributed Entities with and into any other Person; |
| (i) | adopt or enter into a plan of complete or partial liquidation, restructuring, capitalization, reorganization or dissolution; |
| (j) | increase the compensation, the benefits, or any severance entitlements of any director, officer or Key Employee of the Contributed Entities; |
| (k) | make any change in financial accounting methods, principles, policies or practices of the Contributed Entities, except insofar as may be required by applicable Law; |
| (l) | (a) make, change or revoke any material Tax election in a manner materially inconsistent with past practice, (b) settle or compromise any Tax liability for an amount materially in excess of the amount accrued or reserved therefor in the financial statements, (c) file a material amendment with respect to any material Tax Return unless required by applicable Law, (d) adopt or change any method of Tax accounting or annual Tax accounting period, (e) enter into any “closing agreement” (within the meaning of Section 7121 of the Code) or Tax sharing or similar agreement relating to any material Tax liability, (f) agree to extend or waive the statute of limitations in respect of any material amount of Taxes (other than an extension in the Ordinary Course of Business or as a result of the extension of the due date for filing any Tax Return), (g) file any income or other material Tax Return in a manner inconsistent with past practice unless required by applicable Law, or (h) surrender any right to claim a material Tax refund; |
| (m) | other than in the Ordinary Course of Business, enter into, amend, waive, release, assign, settle any rights, claims, or benefits under, or voluntarily terminate any Material Contract; |
| (n) | enter into or adopt any “poison pill” or similar stockholder rights plan; |
| (o) | authorize, or make any commitment with respect to, capital expenditures that would exceed U.S.$1,000,000 individually or U.S.$2,000,000 in the aggregate; or |
| (p) | sell, assign, transfer, lease, license, pledge, dispose of, encumber or allow to lapse any rights (including failing to take any action necessary to maintain or renew) any Contributed Entities Intellectual Property (other than non-exclusive licenses of Owned Intellectual Property entered into in the Ordinary Course of Business consistent with past practices) |
| 6.1.2 | No Solicitation |
Until the earlier of the termination of this Agreement and the Closing, Bioceres Group, Nordelis and Union Group shall not, and shall cause any Persons acting on its behalf not to, directly or indirectly, (i) solicit, initiate, facilitate or encourage any inquiries or proposals for, or continue or enter into any discussions, negotiations, understanding, arrangements or agreements with respect to, the acquisition of any Bioceres Group Original Share, Nutrecon Membership Interest, Gentle Tech Union Share or any portion of the assets or the Business, whether by sale, merger or otherwise, other than sales of inventory in the Ordinary Course of Business, or (ii) furnish or cause to be furnished any material non-public information concerning the Contributed Entities to any Person (other than Moolec and its Representatives), other than as required by applicable Law and after prior written notice to Moolec. If Nordelis, Union Group, the Contributed Entities or any of their Subsidiaries receives an offer for any such transaction, Nordelis, Union Group or the Contributed Entities shall promptly provide Moolec with written notice thereof after such receipt, which notice shall include the identity of the prospective buyer and a summary of the material terms and conditions of the offer.
| 6.1.3 | Access and Information |
| (i) | From the date hereof until the earlier of the termination of this Agreement and the Closing, Bioceres Group, Nutrecon and Gentle Tech shall cause the Contributed Entities and their respective Representatives to, (A) provide Moolec, its prospective financing sources and their respective Representatives with full access during normal business hours to, and furnish them with all documents, records, work papers and information with respect to, the properties, assets, books and records, Contracts and Governmental Approvals relating to the Contributed Entities as Moolec shall reasonably request from time to time, and (B) deliver to Moolec copies of such financial information and operating data and reports as are customarily prepared by or for the management of the Contributed Entities in the Ordinary Course of Business. All information received pursuant to this Section 6.1.3 shall be governed by the terms of the Confidentiality Agreement. In addition, Bioceres Group, Nutrecon and Gentle Tech shall provide Moolec and its Representatives with access to such personnel of the Contributed Entities during normal business hours as Moolec may reasonably request from time to time. |
| (ii) | Bioceres Group, Nutrecon and Gentle Tech shall, and shall cause the Contributed Entities to, and the Contributed Entities shall retain all books and records that are Related to the Business in accordance with their record retention policies as presently in effect. During the seven-year period beginning on the Closing Date, the Contributed Entities shall not dispose, or permit the disposal, of any such books and records not required to be retained under such policies without giving 60 days’ prior written notice to Moolec offering to deliver the same to Moolec at Moolec’s expense. |
| 6.1.4 | Public Announcements |
Bioceres Group, Nutrecon and Gentle Tech and the Contributed Entities shall not, and shall not permit any of their Subsidiaries to, make any public announcement in respect of this Agreement or the transactions contemplated hereby or thereby without the prior written consent of Moolec, except as required by applicable Law or by the rules and regulations of any securities exchange or national market system, in which case the Bioceres Group, Nutrecon and Gentle Tech and the Contributed Entities shall use commercially reasonable efforts to provide Moolec with sufficient time, consistent with such requirements, to review the nature of such requirements and to comment upon such disclosure prior to publication.
| 6.1.5 | Further Actions |
| (i) | Bioceres Group, Nutrecon and Gentle Tech and the Contributed Entities shall use commercially reasonable efforts to take all actions and to do all things necessary, proper or advisable to consummate the transactions contemplated hereby by the Closing Date. |
| (ii) | Bioceres Group, Nutrecon and Gentle Tech and the Contributed Entities shall, as promptly as practicable, file or supply, or cause to be filed or supplied, all applications, notifications and information required to be filed or supplied by the Contributed Entities pursuant to applicable Law in connection with this Agreement and the consummation of the other transactions contemplated hereby and thereby. |
| (iii) | Bioceres Group, Nutrecon and Gentle Tech and the Contributed Entities shall, as promptly as practicable, use commercially reasonable efforts to obtain, or cause to be obtained, all Consents (including all Governmental Approvals and all Consents required under Material Contracts) necessary to be obtained in order to consummate the transactions contemplated by this Agreement. |
| (iv) | Bioceres Group, Nutrecon and Gentle Tech and the Contributed Entities shall, and shall cause their Subsidiaries to, coordinate and cooperate with Moolec in exchanging such information and supplying such assistance as may be reasonably requested by Moolec in connection with the filings and other actions contemplated by Section 6.2.3. |
| (v) | At all times prior to the Closing, Bioceres Group, Nutrecon and Gentle Tech and the Contributed Entities shall notify Moolec in writing of any condition or occurrence that would or may result in the failure of any of the conditions contained in Sections 7.1 and 7.2 to be satisfied, promptly upon becoming aware of the same. |
| 6.1.6 | Further Assurances |
| (i) | Following the Closing, Bioceres Group, Nutrecon and Gentle Tech shall, and shall cause their Subsidiaries, from time to time, to, execute and deliver such additional instruments, documents, conveyances or assurances and take such other actions as shall be necessary, or otherwise reasonably requested by Moolec, to confirm and assure the rights and obligations provided for in this Agreement and render effective the consummation of the transactions contemplated hereby and thereby. |
| (ii) | Following the Closing, Moolec and its shareholders, as applicable, shall approve the amendments to Moolec’s Equity Incentive Plan and related awards (the “Equity Incentive Plan”) as set forth in Exhibit C hereto. |
| 6.1.7 | Intercompany Accounts; Affiliate Transactions |
At or prior to the Closing: (i) all intercompany accounts between the Contributed Entities, other than trade accounts payable arising in the Ordinary Course of Business, shall be paid in full in cash or otherwise canceled, except in Schedule 6.1.7.
| 6.1.8 | SEC Filings |
The Nordelis, Union Group and the Contributed Entities shall provide all reasonable assistance and furnish all required documents to Moolec as necessary to ensure the timely completion and filing of all required documents, reports, and other filings with the SEC that arise out of or relate to the transaction contemplated by this Agreement, including but not limited to any accounting, financial or audit related requirement or document.
| 6.1.9 | Capital Raise, Bridge Loan and Promissory Notes |
| (i) | Prior to the Closing Date, Moolec and its shareholders shall use their best efforts to approve and consummate a capital raise in Moolec of at least U.S.$20,000,000. |
| (ii) | Prior to the Closing Date, Bioceres Group and Union Group shall use their best efforts to enter into a bridge loan with Moolec in the amount of U.S.$600,000.00 per month up to the Closing Date. |
| (iii) | Prior to the Closing Date, Union Group and Theo shall use their best efforts to convert the Union Group Promissory Note and the Bioceres Group Promissory Note into equity. |
| 6.2 | Covenants of Moolec |
| 6.2.1 | Conduct of Business |
| (i) | From the date hereof until the Closing, Moolec shall conduct the Business in the Ordinary Course, use its commercially reasonable efforts to preserve intact the Business, the assets and the relationships with their respective customers and suppliers and others having business dealings with them, and keep available the services of the present officers and significant employees of Moolec. |
| (ii) | Without limiting the generality of the foregoing, from the date hereof until the Closing, except in connection with the Moolec EGM, RSS, Redomiciliation or any provision of this Agreement that requires Moolec to perform any of the actions below, Moolec shall not: |
| (a) | declare, set aside or pay any dividends on, or make any other distributions in respect of, any of its capital stock or equity interests; |
| (b) | split, combine, subdivide, adjust, amend the terms of or reclassify any of its capital stock or equity interests; |
| (c) | sell or transfer any share it holds in any entity; |
| (d) | [Reserved]; |
| (e) | amend its certificate of incorporation or bylaws, or amend other similar organizational documents; |
| (f) | acquire (by merger, consolidation, purchase of stock or assets or otherwise) any company, corporation, entity, business or assets that constitute a business or any other business organization or any division of any Person; |
| (g) | [Reserved]; |
| (h) | merge, combine or consolidate with and into any other Person; |
| (i) | adopt or enter into a plan of complete or partial liquidation, restructuring, capitalization, reorganization or dissolution; |
| (j) | increase the compensation, the benefits, or any severance entitlements of any director, or officer; |
| (k) | make any change in financial accounting methods, principles, policies or practices, except insofar as may be required by applicable Law; |
| (l) | (a) make, change or revoke any material Tax election in a manner materially inconsistent with past practice, (b) settle or compromise any Tax liability for an amount materially in excess of the amount accrued or reserved therefor in the financial statements, (c) file a material amendment with respect to any material Tax Return unless required by applicable Law, (d) adopt or change any method of Tax accounting or annual Tax accounting period, (e) enter into any “closing agreement” (within the meaning of Section 7121 of the Code) or Tax sharing or similar agreement relating to any material Tax liability, (f) agree to extend or waive the statute of limitations in respect of any material amount of Taxes (other than an extension in the Ordinary Course of Business or as a result of the extension of the due date for filing any Tax Return), (g) file any income or other material Tax Return in a manner inconsistent with past practice unless required by applicable Law, or (h) surrender any right to claim a material Tax refund; |
| (m) | other than in the Ordinary Course of Business, enter into, amend, waive, release, assign, settle any rights, claims, or benefits under, or voluntarily terminate any Moolec Material Contract; |
| (n) | enter into or adopt any “poison pill” or similar stockholder rights plan; |
| (o) | authorize, or make any commitment with respect to, capital expenditures that would exceed U.S.$100,000 individually or U.S.$200,000 in the aggregate; or |
| (p) | sell, assign, transfer, lease, license, pledge, dispose of, encumber or allow to lapse any rights (including failing to take any action necessary to maintain or renew) any Moolec Intellectual Property (other than non-exclusive licenses of Owned Intellectual Property entered into in the Ordinary Course of Business consistent with past practices). |
| 6.2.2 | Public Announcements |
Moolec shall not, and shall not permit any Affiliate to, make any public announcement in respect of this Agreement or the transactions contemplated hereby without the prior written consent of the Bioceres Group Shareholders Representative, Union Group and Nordelis except as required by applicable Law or by the rules and regulations of any securities exchange or national market system upon which the securities of Moolec are listed, in which case Moolec shall use its commercially reasonable efforts to provide the Bioceres Group Shareholders Representative, Union Group and Nordelis with sufficient time, consistent with such requirements, to review the nature of such requirements and to comment upon such disclosure prior to publication.
| 6.2.3 | Further Actions |
| (i) | Moolec shall use its commercially reasonable efforts to take all actions and to do all things necessary, proper or advisable to consummate the transactions contemplated hereby by the Closing Date. |
| (ii) | Moolec shall, as promptly as practicable, file or supply, or cause to be filed or supplied, all applications, notifications and information required to be filed or supplied by Moolec pursuant to applicable Law in connection with this Agreement and the consummation of the transactions contemplated hereby. |
| (iii) | Moolec shall coordinate and cooperate with the Nordelis, Union Group and Bioceres Group in exchanging such information and supplying such assistance as may be reasonably requested by Nordelis, Union Group and Bioceres Group in connection with the filings and other actions contemplated by Section 6.1.5. Moolec shall promptly inform Nordelis, Union Group and Bioceres Group of any communication, and any proposed understanding, undertaking or agreement, with any Governmental Authority regarding any filings or other actions contemplated by this Section 6.2.3. |
| (iv) | At all times prior to the Closing, Moolec shall notify Bioceres Group Shareholders Representative, Union Group and Nordelis in writing of any condition or occurrence that would be reasonably likely to result in the failure of any of the conditions contained in Section 7.1 and 7.3 to be satisfied, promptly upon becoming aware of the same. |
| 6.2.4 | Further Assurances |
| (i) | Following the Closing, Moolec shall, from time to time, execute and deliver such additional instruments, documents, conveyances or assurances and take such other actions as shall be necessary, or otherwise reasonably requested by Nordelis, Union Group and Bioceres Group to confirm and assure the rights and obligations provided for in this Agreement and render effective the consummation of the transactions contemplated hereby. |
| (ii) | Following the Closing and within 12 months of the Closing Date, Moolec shall complete the Theo Carve-Out pursuant to the plan set forth in Schedule 6.2.4(ii) . |
| 7 | Conditions Precedent |
| 7.1 | Conditions to Obligations of Each Party |
The obligations of the Parties to consummate the transactions contemplated hereby shall be subject to the satisfaction or waiver (except for 7.1.3 which may only be waived with Moolec’s prior written consent) on or prior to the Closing Date of the following conditions:
| 7.1.1 | No Injunctions |
The consummation of the transactions contemplated hereby shall not have been enjoined or prohibited by applicable Law and no proceeding by or before any Governmental Authority challenging such transactions shall have been initiated or threatened.
| 7.1.2 | Current Options |
Prior to the Closing Date, Moolec, Bioceres and its Subsidiaries, and Union Group shall approve and take all required actions to cause the Current Options to be accelerated and converted to Moolec Shares at U.S.$2.00 per share, which may be adjusted based on the ratio selected by Moolec’s board of directors in furtherance of the decisions taken at the Moolec EGM. The related Moolec Shares shall be issued prior to the Closing Date.
| 7.1.3 | Completion of RSS and Redomiciliation |
Prior to the Closing Date, Moolec shall have completed the RSS and the Redomiciliation.
| 7.2 | Conditions to Obligations of Moolec |
The obligations of Moolec to consummate the transactions contemplated hereby shall be subject to the satisfaction (or waiver by Moolec) on or prior to the Closing Date of the following additional conditions:
| 7.2.1 | The Adherence of the Bioceres Group Additional Shareholders |
Prior to the Closing Date, Bioceres Group shall have caused the totality, and no less than the totality, of the Bioceres Group Additional Shareholders to adhere to this Agreement pursuant to the Bioceres Group New Articles and deliver to Moolec the Term of Adherence.
| 7.2.2 | Representations and Warranties |
| (i) | The representations and warranties set forth in Section 3 of this Agreement shall be true and correct in all respects as of the Closing Date with the same effect as though made on such date (except for such representations and warranties that are made as of a specific date, which shall speak only as of such date). |
| (ii) | The representations and warranties contained in Section 4 of this Agreement shall be true and correct in all respects (in the case of any representation or warranty containing any materiality qualification) or in all material respects (in the case of any representation or warranty without any materiality qualification) as of the Closing Date with the same effect as though made on such date (except for such representations and warranties that are made as of a specific date, which shall speak only as of such date). |
| 7.2.3 | Covenants |
The Contributed Entities shall have duly performed and complied in all material respects with all agreements and conditions required by this Agreement to be performed or complied with by it prior to or on the Closing Date.
| 7.2.4 | Certificate |
The Bioceres Group Shareholders Representative, Nordelis, Union Group as well as Bioceres Group, Nutrecon and Gentle Tech shall have delivered to Moolec a certificate, dated the Closing Date to the effect that the conditions set forth in Sections 7.2.1 to 7.2.3 have been satisfied.
| 7.2.5 | Consents |
The Contributed Entities shall have obtained and shall have delivered to Moolec complete and correct copies of (i) all Governmental Approvals required to be obtained by the Contributed Entities in connection with the execution and delivery of this Agreement and the consummation of the transactions contemplated hereby, and (ii) all Consents (including all Consents required under Material Contracts) necessary to be obtained in order to consummate the Contribution and Exchange pursuant to this Agreement and consummation of the other transactions contemplated hereby, and all such Government Approvals and Consents shall be in full force and effect.
| 7.2.6 | No Material Adverse Effect |
No event, development or state of circumstances shall have occurred or come to exist since the Balance Sheet Date, that, individually or in the aggregate, has had or could reasonably be expected to have or result in a Material Adverse Effect.
| 7.2.7 | Corporate Proceedings |
All corporate or other proceedings of the Contributed Entities in connection with the transactions contemplated by this Agreement shall be reasonably satisfactory to Moolec and its counsel, and Moolec and its counsel shall have received copies of all documents and instruments incident thereto, as may be reasonably requested.
| 7.3 | Conditions to Obligations of the Transferors |
The obligation of the Transferors to consummate the transactions contemplated hereby shall be subject to the satisfaction (or waiver by the Transferors), on or prior to the Closing Date, of the following additional conditions:
| 7.3.1 | Approval of the Transaction by Moolec’s shareholders |
Moolec shall obtain the approval of the Transaction by its shareholders.
The Board of Directors of Moolec shall call for the shareholders meeting once the RSS and the Redomiciliation are approved by Moolec’s shareholders.
| 7.3.2 | Cancelation of Awards |
Prior to the Closing Date, the awards approved by Moolec’s Board of Directors on December 12, 2024, shall be cancelled.
| 7.3.3 | Representations and Warranties |
The representations and warranties of Moolec set forth in Section 5 of this Agreement shall be true and correct in all respects as of the Closing Date with the same effect as though made on such date (except for such representations and warranties that are made as of a specific date, which shall speak only as of such date).
| 7.3.4 | Covenants |
Moolec shall have duly performed and complied in all material respects with all agreements and conditions required by this Agreement and to be performed or complied with by it prior to or on the Closing Date.
| 7.3.5 | Certificate |
Moolec shall have delivered to the Transferors a certificate, dated the Closing Date and signed by its duly authorized officer, to the effect that the conditions set forth in Sections 7.3.1 to 7.3.4 have been satisfied.
| 7.3.6 | Consents and Approvals |
The Transferors shall have obtained all Governmental Approvals necessary to consummate the transactions contemplated hereby, which shall be in full force and effect.
| 7.3.7 | Corporate Proceedings |
All corporate or other proceedings of Moolec in connection with the transactions contemplated by this Agreement shall be reasonably satisfactory to Bioceres Group Shareholders Representative, Union Group, Nordelis, Agriculture Investments and their counsels, and the Transferors and its counsel shall have received copies of all documents and instruments incident thereto, as may be reasonably requested.
| 8 | Tax Matters |
| 8.1 | Tax Returns |
| 8.1.1 | Nordelis, Union Group and Bioceres Group shall prepare and file, or cause to be prepared and filed, all Tax Returns with respect to the Contributed Entities for each Pre-Closing Tax Period. Nordelis, Union Group and Bioceres Group shall provide Moolec and its Representatives with a copy of such completed Tax Returns together with appropriate supporting information and schedules at least 30 days prior to the due date (including any extension thereof) for the filing of such Tax Return, and Moolec and its Representatives shall have the right to review and comment on such Tax Return and statement prior to the filing of such Tax Return. If Moolec (or its authorized representative) submits comments to Nordelis, Union Group and Bioceres Group, the Parties shall proceed in good faith to resolve any disputed items, and, if they are unable to resolve any such disputed items, the unresolved disputed items shall be referred by the Parties to an accounting firm for resolution at least three Business Days prior to the due date for filing such Tax Return. The applicable Tax Return shall be finalized on a basis reflecting such resolution. The fees and expenses of the accounting firm shall be borne one-half by Nordelis, Union Group and Bioceres Group and one-half by Moolec. Nothing in this Section 8.1.1 shall relieve any Party of its obligation to provide indemnification as required under this Section 8. Moolec shall prepare and file, or cause to be prepared and filed, all Tax Returns with respect to the Contributed Entities for any Straddle Periods. Moolec shall provide the Transferors with a statement setting forth the allocation of liability for Taxes shown on such Tax Returns between the portion of the Straddle Period ending on the Closing Date and the portion of the Straddle Period beginning after the Closing Date in accordance with Section 8.3. |
| 8.2 | Payment of Taxes |
| 8.2.1 | Nordelis, Union Group and Bioceres Group pay, or cause to be paid, all Taxes shown on the Tax Returns required to be filed by the Contributed Entities pursuant to Section 8.1.1 on or prior to the due date for payment thereof. |
| 8.2.2 | Moolec shall pay, or cause to be paid, all Taxes for any Straddle Period shown on the Tax Returns required to be filed by Moolec pursuant to Section 8.1.1 on or prior to the due date for payment thereof. Subject to the Holdback Provision and the deductions in accordance with Section 2.2, the Transferors shall reimburse to Moolec, or if requested by Moolec, to the Contributed Entities, all such Taxes paid or caused to have been paid by Moolec within three Business Days after payment of such Taxes by Moolec. The portion of such Taxes required to be reimbursed by the Transferors pursuant to this Section 8.2.2 shall be determined in the manner set forth in Section 8.3. |
| 8.3 | Allocation of Tax Liability |
| 8.3.1 | For purposes of this Section 8, the Parties agree to allocate Tax items between Pre-Closing Tax Periods and Post-Closing Tax Periods that end and begin, respectively, on the Closing Date on the basis of a “closing of the books” on the Closing Date. |
| 8.3.2 | For purposes of this Section 8, in the case of any Taxes that are imposed with respect to a Straddle Period the portion of such Tax related to the portion of such Tax period ending on and including the Closing Date shall (x) in the case of any Taxes other than gross receipts, sales or use Taxes and Taxes based upon or related to income, be deemed to be the amount of such Tax for the entire Tax period multiplied by a fraction the numerator of which is the number of days in the Tax period ending on and including the Closing Date and the denominator of which is the number of days in the entire Tax period, and (y) in the case of any Tax based upon or related to income and any gross receipts, sales or use Tax, be deemed equal to the amount which would be payable if the relevant Tax period ended on and included the Closing Date and was therefore subject to Section 8.3.1. All determinations necessary to give effect to the allocation set forth in the foregoing clause (y) shall be made in a manner consistent with prior practice of the Contributed Entities. |
| 8.4 | Cooperation on Tax Matters |
Moolec and Nordelis, Union Group and Bioceres Group agree to furnish or cause to be furnished to each other, upon request, as promptly as practicable, such information (including access to books and records) and assistance relating to the Contributed Entities as is reasonably necessary for the filing of any Tax Return, amended Tax Return or claim for refund, determining a liability for Taxes or a right to a refund of Taxes or the preparation for, or participating in or conducting, any auditor or other proceeding in respect of Taxes or making representations to or furnishing information to parties subsequently desiring to purchase the Contributed Entities or any assets of the Contributed Entities from Moolec. Such cooperation and information shall include providing copies of relevant Tax Returns or portions thereof, together with related work papers and documents relating to rulings or other determinations by taxing authorities. Moolec and the Transferors agree to retain or cause to be retained all books and records pertinent to the Contributed Entities for all Pre-Closing Tax Periods and any Straddle Periods until the applicable period for assessment under applicable law (giving effect to any and all extensions or waivers) has expired, and to abide by or cause the abidance with all record retention agreements entered into with any taxing authority, provided that in the case of Moolec, it shall only be required to retain such materials or abide with such agreements to the extent it has been informed in writing of such requirement by the Transferors on or before the Closing Date. To the extent applicable, each Party agrees to reasonably cooperate with the other Party, and shall provide any information as shall be reasonably requested by the other Party, in connection with obtaining an opinion from its tax advisors with respect to the U.S. federal income tax treatment of the Contribution and Exchange.
| 8.5 | Tax Sharing Agreements |
Any and all existing Tax sharing agreements between the Contributed Entities and any of their Subsidiaries shall be terminated as of the Closing Date. After such date, none of the Contributed Entities, or their Subsidiaries, shall have any further rights or liabilities thereunder. This Agreement shall be the sole Tax sharing agreement relating to the Contributed Entities for all Pre-Closing Tax Periods and Straddle Periods.
| 8.6 | Indemnification |
The Transferors shall indemnify Moolec pursuant to the Holdback Provision, each of its Affiliates and each of the Contributed Entities and hold them harmless from and against, any Liability attributable to (i) all Taxes (or the non-payment thereof) of the Contributed Entities for all Pre-Closing Tax Periods (including, for the avoidance of doubt, the portion of any Straddle Period ending on the Closing Date to the extent such amounts were not previously reimbursed in accordance with Section 8.2.2), (ii) all Taxes of any member of an affiliated, consolidated, combined or unitary group of which Contributed Entities (or any predecessor of any of the foregoing) is or was a member on or prior to the Closing Date, including pursuant to Treasury Regulation §1.1502-6 or any analogous or similar state, local, or foreign Law, (iii) any and all Taxes of any Person (other than the Contributed Entities) imposed on the Contributed Entities as a transferee or successor, by contract or pursuant to any Law, which Taxes relate to an event or transaction occurring on or before the Closing Date, (iv) all Liabilities (including reasonable expenses of investigation and attorneys’ fees and expenses) arising out of or incident to the imposition, assessment or assertion of any such Tax, including those incurred in any contest relating to the imposition, assessment or assertion of any such Tax, and (v) any breach of or inaccuracy in any representation or warranty in Section 4.14 (a “Tax Loss”).
| 8.7 | Contests |
| 8.7.1 | If any notice of audit, claim or demand (including any requests for information, IDRs or similar preliminary administrative action) relating to Taxes in respect of which indemnity may be sought pursuant to Section 8.6 is asserted in writing against Moolec, its Affiliates or the Contributed Entities, Moolec shall (i) notify the Transferors of such notice, claim or demand within ten Business Days of receipt thereof and (ii) furnish the Transferors with copies of all correspondence received from a taxing authority in connection with any such notice; provided that the failure to give such notice or furnish such copies will not affect Moolec’s right to indemnification under this Agreement. |
| 8.7.2 | In the case of an audit or administrative or judicial proceeding with respect to a Pre-Closing Tax Period, the Transferors shall have the right, at their expense, to participate in and control the conduct of such audit or proceeding, but only to the extent that such audit or proceeding relates solely to a potential adjustment for which the Transferors have acknowledged, in writing, its liability under this Agreement to hold Moolec and its Affiliates harmless against the full amount of any adjustment which may be made as a result of such audit or proceeding. Moolec also may participate in any such audit or proceeding, and, if the Transferors do not assume the defense of any such audit or proceeding, Moolec may defend the same in such manner as it may deem appropriate, including settling such audit or proceeding after 20 days’ prior written notice to the Transferors setting forth the terms and conditions of settlement. |
| 8.7.3 | With respect to any audit or proceeding for a Pre-Closing Tax Period, the Transferors shall not enter into any compromise or agree to settle any claim pursuant to such audit or proceeding which could reasonably be expected to adversely affect Moolec or any of its Affiliates or the Contributed Entities for a subsequent taxable period without the prior written consent of Moolec. |
| 8.8 | Withholding |
Notwithstanding anything in this Agreement to the contrary, Moolec, its Affiliates and the Contributed Entities shall each be entitled at any time to deduct and withhold from any amount otherwise payable pursuant to this Agreement in respect of the transactions contemplated hereunder any amounts such entity is required under applicable Tax Law to deduct and withhold and pay over to the applicable taxing authorities in connection with the payment of the applicable consideration. To the extent that amounts are so withheld, such amounts shall be paid over to the applicable taxing authorities, provided that any withheld amounts shall be treated for all purposes of this Agreement as having been paid to the Person in respect of whom the withholding was made. Each Party shall provide the other Parties with any forms reasonably requested by any such other Party for purposes of complying with any applicable withholding Law.
| 9 | Termination |
| 9.1 | Termination |
This Agreement may be terminated at any time prior to the Closing:
| 9.1.1 | by the written agreement of Moolec, the Bioceres Group Shareholders Representative, Union Group, and Nordelis; |
| 9.1.2 | by either Moolec, the Bioceres Group Shareholders Representative, Union Group or Nordelis by written notice to the other Parties if the transactions contemplated hereby shall not have been consummated pursuant hereto by 5:00 p.m. (UTC-3) on September 9, 2025 (the “Termination Date”), unless such date shall be extended by the mutual written consent of the Bioceres Group Shareholders Representative, Union Group, Nordelis and Moolec; or |
| 9.1.3 | by either the Bioceres Group Shareholders Representative, Union Group, Nordelis, or Moolec by written notice to the other Parties if any Governmental Authority shall have issued an Order (which Order the Parties shall use their commercially reasonable efforts to lift), in each case permanently restraining, enjoining or otherwise prohibiting the consummation of the transactions contemplated by this Agreement and such Order shall have become final and non-appealable; |
| 9.1.4 | by either the Bioceres Group Shareholders Representative, Union Group, Nordelis, or Moolec by written notice to the other Parties if any event, fact or condition shall occur or exist that shall have made it impossible to satisfy a condition precedent to the terminating Party’s obligations to consummate the transactions contemplated by this Agreement, unless the occurrence or existence of such event, fact or condition shall be due to the failure of the terminating Party to perform or comply with any of the agreements, covenants or conditions hereof to be performed or complied with by such Party prior to the Closing. |
| 9.2 | Effect of Termination |
In the event of the termination of this Agreement pursuant to the provisions of Section 9.1, this Agreement shall become void and have no effect, without any liability to any Person in respect hereof or of the transactions contemplated hereby on the part of any Party, or any of its Subsidiaries, Affiliates or Representatives, as the case may be except as specified in Sections 11.1, 11.7, 11.14 and 11.15 and except for any liability resulting from such Party’s breach of this Agreement.
| 10 | Indemnification and Holdback |
| 10.1 | Indemnification by the Transferors |
The Transferors shall defend, indemnify and hold harmless each of Moolec and its Affiliates and their respective Representatives from and against any and all Liabilities, whether or not relating to third party claims, incurred in the investigation or defense of any of the same or in asserting, preserving or enforcing any of their respective rights hereunder (collectively, “Losses”), resulting from, arising out of or relating to (i) any breach of or inaccuracy in any representation or warranty when made or deemed made by any of the Transferors in or pursuant to this Agreement or in any certificate furnished by the Transferors hereunder or thereunder, and (ii) any Tax Loss.
| 10.2 | Holdback Provision |
| 10.2.1 | At the Closing Date, subject to the terms and conditions of this Agreement, Moolec shall withhold the Holdback Amount of the Exchange Consideration to cover any Claims Against Holdback. |
| 10.2.2 | On the first anniversary of the Closing Date, subject to the terms and conditions of this Agreement, Moolec shall issue and release the Returning Holdback Amount pro rata to the Transferors. |
| 10.3 | Claims Against Holdback |
In the event that any Losses arise as set forth in Section 10.1 (the “Claims Against Holdback”), Moolec shall notify the Transferors in writing, detailing the nature, amount of such claims, and the corresponding deduction that the Claim Against Holdback will cause to the Holdback Amount. Moolec shall calculate any Claims Against Holdback in good faith.
| 10.4 | Survival of Representations and Warranties |
All claims for indemnification under Section 10 with respect to the representations and warranties contained herein must be asserted on or prior to the date that is 30 days after the termination of the respective survival periods set forth in this Section 10.4. The representations and warranties contained in this Agreement shall survive the execution and delivery of this Agreement, any examination by or on behalf of the Parties and the completion of the transactions contemplated herein, but only to the extent specified below:
| 10.4.1 | except as set forth below, the representations and warranties contained in Sections 3, 4, and 8 shall survive for a period ending on the first anniversary of the Closing Date. |
Notwithstanding the expiration of any such survival period, if the harmed Party has provided notice with respect to a breach of representation or warranty within the applicable survival period, the relevant representation or warranty shall survive, solely with respect to such claim as is asserted in such notice, until the claim has been finally resolved. The covenants, obligations and agreements of each Party contained in this Agreement shall survive the Closing Date indefinitely in accordance with their respective terms.
| 11 | Miscellaneous |
| 11.1 | Fees and Expenses |
| 11.1.1 | Except as otherwise provided in this Agreement, the Transferors, on the one hand, and Moolec, on the other hand, shall bear their respective expenses, costs and fees (including attorneys’ and auditors’) in connection with the transactions contemplated hereby, including the preparation, execution and delivery of this Agreement and compliance herewith and therewith, whether or not the transactions contemplated hereby shall be consummated. |
| 11.1.2 | The Parties acknowledge and hereby agree that the covenants and agreements set forth in this Section 11.1 are an integral part of the transactions contemplated by this Agreement, and that without these agreements, the Parties would not have entered into this Agreement, and that any amounts payable pursuant to Section 11.1.1 do not constitute a penalty. |
| 11.2 | Appointment and Role of Bioceres Group Shareholders Representative |
| 11.2.1 | Notwithstanding any other provision under this Agreement, each of the Bioceres Group Initial Shareholders, hereby irrevocably appoints the Bioceres Group Shareholders Representative as its representative to act in its name and on its behalf for all purposes under this Agreement, including for the purposes of: |
| (i) | accepting and giving notices on behalf of the Bioceres Group Initial Shareholders in accordance with Section 11.4.3; |
| (ii) | taking any and all actions that may be necessary or desirable, as determined by the Bioceres Group Shareholders Representative in its sole discretion, in connection with the payment of the costs and expenses incurred in connection with this Agreement; |
| (iii) | taking any and all actions on behalf of and in the name of such Bioceres Group Initial Shareholders that may be necessary or desirable, as determined by the Bioceres Group Shareholders Representative in its sole discretion, in connection with any of the provisions in Section 2, as applicable, and the transfers of the shares held by such Bioceres Group Initial Shareholders in favor of Moolec at Closing; |
| (iv) | granting any consent, waiver, confirmation or approval on behalf of the Bioceres Group Initial Shareholders under or in connection with this Agreement; |
| (v) | taking any and all action on behalf of and in the name of such Bioceres Group Initial Shareholders from time to time as the Bioceres Group Shareholders Representative may deem necessary or desirable to resolve and/or settle any claims under, or in connection with, this Agreement, including consenting to, pursuing, defending, compromising or settling any claim, conducting negotiations with Moolec regarding any such claim and engaging counsel, accountants or other agents in connection with any of the foregoing; and |
| (vi) | generally taking any and all other actions and doing any and all other things provided in or contemplated by this Agreement to be performed by the Bioceres Group Initial Shareholders. |
| 11.2.2 | Moolec shall be entitled to rely on the exercise of the powers and authorities conferred on the Bioceres Group Shareholders Representative as if the relevant Bioceres Group Initial Shareholders is exercising such powers and authorities. |
| 11.2.3 | The Bioceres Group Initial Shareholders may appoint a replacement Bioceres Group Shareholders Representative, provided that the Bioceres Group Initial Shareholders give five Business Days’ notice to Moolec. The Bioceres Group Shareholders Representative shall take all actions necessary to ensure that upon his death, disability or incapacity, the Bioceres Group Shareholders Representative’s legal representative or attorney, as the case may be, shall, within 10 Business Days thereof, appoint such person (whose identity shall be subject to Moolec’s prior approval, acting reasonably) as he reasonably believes appropriate to carry out the duties and perform the obligations of the Bioceres Group Shareholders Representative pursuant to this Agreement as if it had been appointed hereunder and the provisions of Section 11.2 shall apply as if such person had been so appointed, and shall procure that such replacement Bioceres Group Shareholders Representative shall accede to the terms of this Agreement in writing in a form satisfactory to Moolec (acting reasonably). |
| 11.2.4 | Save in the case of fraud or willful default, the Bioceres Group Shareholders Representative shall not be liable to any of the Bioceres Group Initial Shareholders for any act or omission undertaken or committed by it in its capacity as Bioceres Group Shareholders Representative under this Agreement. |
| 11.3 | Dragged Bioceres Group Shareholders’ Undertaking |
| 11.3.1 | Without prejudice to the appointment of the Bioceres Group Shareholders Representative, each Dragged Bioceres Group Shareholder undertakes to Moolec that following Closing it will exercise all rights, powers and privileges which that Dragged Bioceres Group Shareholder is entitled to exercise in relation to the Bioceres Group Original Shares transferred by it to Moolec, as Moolec may in its absolute discretion direct, including (but not limited to): |
| (i) | receiving notice (and consenting to the holding on short notice) of, and appointing a proxy to attend and vote at, any general meeting of the members of Bioceres Group, including meetings of the members or any particular class of member, and all or any adjournments of such meetings; |
| (ii) | approving, completing, signing and delivering any written resolution of the members of Bioceres Group or of the holders of any class of shares in the capital of Bioceres Group, and any other document required to be signed by the registered holder of the Bioceres Group Original Shares; |
| (iii) | dealing with and giving directions as to any moneys, securities, benefits, documents, notices or other communications (in whatever form) arising by right of the Bioceres Group Original Shares or received in connection with the Bioceres Group Original Shares from Bioceres Group or any other person; and |
| (iv) | otherwise executing, delivering and doing all deeds, instruments and acts in that Dragged Bioceres Group Shareholder’s name insofar as may be done in that Dragged Bioceres Group Shareholder’s capacity as registered holder of Bioceres Group Original Shares. |
| 11.3.2 | Each Dragged Bioceres Group Shareholder further undertakes to Moolec in respect of the Bioceres Group Original Shares transferred by that Dragged Bioceres Group Shareholder to Moolec: |
| (i) | not to exercise any rights attaching to the shares without Moolec’s prior written consent; and |
| (ii) | to act promptly in accordance with Moolec’s instructions in relation to any rights exercisable or anything received by that Dragged Bioceres Group Shareholder in their capacity as registered holder of such shares. |
| 11.4 | Notices |
| 11.4.1 | Any notice or other communication in connection with this Agreement (each, a “Notice”) shall be: |
| (i) | in writing in English; and |
| (ii) | delivered by email, registered post or by courier using an internationally recognized courier company. |
| 11.4.2 | A Notice to Moolec shall be sent to at the following address, or such other person or address as Moolec may notify the Bioceres Group Shareholders Representative, Nordelis and Union Group from time to time: |
Moolec Science SA
17, Boulevard F.W. Raiffeisen
L-2411 Luxembourg
Grand Duchy of Luxembourg
Tel: +54 91161551069
Attention: José Lopez Lecube
with a copy to:
Linklaters LLP 1290 Avenue of the Americas New York, NY 10104 Tel: (212) 903-9000 Attention: Matthew Poulter and Pierre-Emmanuel Perais Ms. Gloria Montaron Estrada Ocampo 210bis Rosario, Argentina 2000 Tel: +54 341 4861100 Email: gloria.montaron@bioceresgroup.com
| 11.4.3 | A Notice to the Bioceres Group Initial Shareholders, Nordelis and Union Group shall be sent to the Bioceres Group Shareholders Representative (on behalf of the Bioceres Group Initial Shareholders), Nordelis and Union Group at the following address, or such other person or address as the Bioceres Group Shareholders Representative, Nordelis and Union Group may notify to Moolec from time to time: |
Bioceres Group Shareholders Representative
Nordelis
Att. Juan Presa
Craigmuir Chambers, Road Town, Tortola, VG1110, British Virgin Islands
Tel: +34 610 040 639
Email: juan.presa@uniongrp.com
Union Group
Att. Juan Presa
Craigmuir Chambers, Road Town, Tortola, VG1110, British Virgin Islands
Tel: +34 610 040 639
Email: juan.presa@uniongrp.com
| 11.4.4 | A Notice shall be effective upon receipt and shall be deemed to have been received at the time of delivery, if delivered by email, hand, registered post or courier, provided that if a Notice would become effective under the above provisions after 5:30 p.m. on any Business Day, then it shall be deemed instead to become effective at 9:30 a.m. on the next Business Day. References in this Agreement to time are to local time at the location of the addressee as set out in the Notice. |
| 11.5 | Entire Agreement |
This Agreement (including the Schedules hereto), the Confidentiality Agreement (when executed and delivered) constitute the entire agreement and supersede all prior agreements and understandings, both written and oral, between the Parties with respect to the subject matter hereof and thereof.
| 11.6 | Schedules |
The disclosure of any matter in the Schedules referenced by a particular Section shall be deemed to be disclosed with respect to any other Section as and to the extent that the relevance of such matter to such other Section is readily apparent on the face of such disclosure.
| 11.7 | Confidentiality |
The Parties agree that with respect to the disclosure of information furnished hereunder or in connection herewith, the Parties shall continue to be bound by the Confidentiality Agreement. The Transferors agree to cause each of their Representatives to comply with the provisions of the Confidentiality Agreement as if each of them were parties to such agreement. From and after the Closing Date, Moolec and its Affiliates and Representatives shall have no further liability or obligation under the Confidentiality Agreement with respect to information, agreements or documents relating to the Contributed Entities.
| 11.8 | Amendment; Waivers |
No amendment, modification or discharge of this Agreement, and no waiver hereunder, shall be valid or binding unless set forth in writing and duly executed by the Party against whom enforcement of the amendment, modification, discharge or waiver is sought. Any such waiver shall constitute a waiver only with respect to the specific matter described in such writing and shall in no way impair the rights of the Party granting such waiver in any other respect or at any other time. Neither the waiver by any of the Parties of a breach of or a default under any of the provisions of this Agreement, nor the failure by any of the Parties, on one or more occasions, to enforce any of the provisions of this Agreement or to exercise any right or privilege hereunder, shall be construed as a waiver of any other breach or default of a similar nature, or as a waiver of any of such provisions, rights or privileges hereunder. The rights and remedies herein provided are cumulative and are not exclusive of any rights or remedies that either Party may otherwise have at law or in equity.
| 11.9 | Severability |
If any provision of this Agreement, including any phrase, sentence, clause, Section or subsection, is inoperative or unenforceable for any reason, such circumstances shall not have the effect of rendering the provision in question inoperative or unenforceable in any other case or circumstance, or of rendering any other provision or provisions herein contained invalid, inoperative, or unenforceable to any extent whatsoever. If any provision of this Agreement shall be adjudged to be excessively broad as to duration, geographical scope, activity or subject, the Parties intend that such provision shall be deemed modified to the minimum degree necessary to make such provision valid and enforceable under applicable Law and that such modified provision shall thereafter be enforced to the fullest extent possible.
| 11.10 | Counterparts |
This Agreement may be executed in several counterparts (including by electronic transmission), each of which shall be deemed an original and all of which shall together constitute one and the same instrument.
| 11.11 | Binding Effect |
This Agreement shall be binding upon and inure to the benefit of the Parties and their respective heirs, successors and permitted assigns.
| 11.12 | Assignment |
This Agreement shall not be assignable or otherwise transferable by any Party without the prior written consent of the other Party.
| 11.13 | No Third Party Beneficiaries |
Except as provided in Section 10 with respect to indemnification of Indemnified Parties hereunder, nothing in this Agreement shall confer any rights upon any person or entity other than the Parties and their respective heirs, successors and permitted assigns.
| 11.14 | Governing Law |
This Agreement shall be governed in all respects by the laws of the State of New York, without giving effect to the conflict of laws rules thereof to the extent such rules would require or permit the application of the laws of another jurisdiction. The Parties hereby irrevocably submit to the exclusive jurisdiction of the courts of the State of New York and the Federal courts of the United States of America located in the State, City and County of New York, and hereby waive, and agree not to assert, as a defense in any action, suit or proceeding for the interpretation or enforcement hereof, that it is not subject thereto or that such action, suit or proceeding may not be brought or is not maintainable in said courts or that the venue thereof may not be appropriate or that this Agreement or any of such document may not be enforced in or by said courts, and the Parties irrevocably agree that all claims with respect to such action or proceeding shall be heard and determined in such a New York State or Federal court. The Parties hereby consent to and grant any such court jurisdiction over the person of such Parties and over the subject matter of any such dispute and agree that mailing of process or other papers in connection with any such action or proceeding in the manner provided in Section 11.2, or in such other manner as may be permitted by applicable Law, shall be valid and sufficient service thereof.
| 11.15 | Waiver of Jury Trial |
EACH PARTY ACKNOWLEDGES AND AGREES THAT ANY CONTROVERSY THAT MAY ARISE UNDER THIS AGREEMENT IS LIKELY TO INVOLVE COMPLICATED AND DIFFICULT ISSUES, AND THEREFORE EACH SUCH PARTY HEREBY IRREVOCABLY AND UNCONDITIONALLY WAIVES ANY RIGHT SUCH PARTY MAY HAVE TO A TRIAL BY JURY IN RESPECT OF ANY LITIGATION DIRECTLY OR INDIRECTLY ARISING OUT OF OR RELATING TO THIS AGREEMENT OR THE TRANSACTIONS CONTEMPLATED BY THIS AGREEMENT. EACH PARTY CERTIFIES AND ACKNOWLEDGES THAT (A) NO REPRESENTATIVE, AGENT OR ATTORNEY OF ANY OTHER PARTY HAS REPRESENTED, EXPRESSLY OR OTHERWISE, THAT SUCH OTHER PARTY WOULD NOT, IN THE EVENT OF LITIGATION, SEEK TO ENFORCE THE FOREGOING WAIVER, (B) EACH SUCH PARTY UNDERSTANDS AND HAS CONSIDERED THE IMPLICATIONS OF THIS WAIVER, (C) EACH SUCH PARTY MAKES THIS WAIVER VOLUNTARILY AND (D) EACH SUCH PARTY HAS BEEN INDUCED TO ENTER INTO THIS AGREEMENT BY, AMONG OTHER THINGS, THE MUTUAL WAIVERS AND CERTIFICATIONS IN THIS SECTION 11.15.
In witness whereof, the parties have duly executed this Agreement as of the date first above written.
| MOOLEC SCIENCE SA | Union Group Ventures Ltd | |||||
| By: | By: | |||||
| Name: | Gastón Paladini |
Name: | Oscar Alejandro Leon Betancor |
|||
| Title: | Chief Executive Officer |
Title: | Sole Director | |||
| Bioceres Group Initial Shareholders | Nordelis Ventures Corp | |||||
| By: | By: | |||||
| Name: | Gloria Montaron Estrada | Name: | Alejandro Antalich | |||
| Title: | Bioceres Group Shareholders Representative | Title: | Chief Executive Officer | |||
| By: | ||||||
| Name: | Federico Trucco | |||||
| Title: | Bioceres Group Shareholders Representative | |||||
| Bioceres Group Initial Shareholders (Bioceres Group Preference Shares) |
Bioceres Group Limited | |||||
| By: | By: | |||||
| Name: | Gloria Montaron Estrada | Name: | Federico Trucco |
|||
| Title: | Director | |||||
| By: | ||||||
| Name: | Federico Trucco | |||||
| Gentle Technologies Corp | Nutrecon LLC | |||||
| By: | By: | |||||
| Name: | Oscar Alejandro Leon Betancor | Name: | Alejandro Antalich | |||
| Title: | Director | Title: | Sole Manager | |||
| Theo I SCSp (as intervening consenting party) represented by its general partner, Theo Partners S.à.r.l. | ||||
| By: | ||||
| Name: | Federico Trucco | |||
| Title: | Manager | |||
75
Exhibit 99.3
BIOCERES GROUP PLC
Registration number: 13310943

BIOCERES GROUP PLC
Consolidated financial statements
as of
June 30, 2024 and 2023 and for the
years ended June 30, 2024, 2023 and 2022.
BIOCERES GROUP PLC
Registration number: 13310943
CONTENTS
| Consolidated financial statements as of June 30, 2024 and 2023 and for the years ended June 30, 2024, 2023 and 2022. | |
| Company information | |
| Report of Independent Registered Public Accounting Firm | 3 |
| Consolidated statements of comprehensive income | 5 |
| Consolidated statements of financial position | 6 |
| Consolidated statements of changes in equity | 8 |
| Consolidated statements of cash flows | 11 |
| Notes to the consolidated financial statements | 13 |

Report of Independent Registered Public Accounting Firm
To the Board of directors and shareholders of Bioceres Group Limited
Opinion on the Financial Statements
We have audited the accompanying consolidated statements of financial position of Bioceres Group PLC and its subsidiaries (the “Company”) as of June 30, 2024 and 2023, and the related consolidated statements of comprehensive income, of changes in equity and of cash flows for each of the three years in the period ended June 30, 2024, including the related notes (collectively referred to as the “consolidated financial statements”). In our opinion, the consolidated financial statements present fairly, in all material respects, the financial position of the Company as of June 30, 2024 and 2023, and the results of its operations and its cash flows for each of the three years in the period ended June 30, 2024 in conformity with International Financial Reporting Standards as issued by the International Accounting Standards Board.
Basis for Opinion
These consolidated financial statements are the responsibility of the Company’s management. Our responsibility is to express an opinion on the Company’s consolidated financial statements based on our audits. We are a public accounting firm registered with the Public Company Accounting Oversight Board (United States) (PCAOB) and are required to be independent with respect to the Company in accordance with the U.S. federal securities laws and the applicable rules and regulations of the Securities and Exchange Commission and the PCAOB.
We conducted our audits of these consolidated financial statements in accordance with the standards of the PCAOB. Those standards require that we plan and perform the audits to obtain reasonable assurance about whether the consolidated financial statements are free of material misstatement, whether due to error or fraud.
Our audits included performing procedures to assess the risks of material misstatement of the consolidated financial statements, whether due to error or fraud, and performing procedures that respond to those risks. Such procedures included examining, on a test basis, evidence regarding the amounts and disclosures in the consolidated financial statements. Our audits also included evaluating the accounting principles used and significant estimates made by management, as well as evaluating the overall presentation of the consolidated financial statements. We believe that our audits provide a reasonable basis for our opinion.
Critical Audit Matters
The critical audit matter communicated below is a matter arising from the current period audit of the consolidated financial statements that was communicated or required to be communicated to the audit committee and that (i) relates to accounts or disclosures that are material to the consolidated financial statements and (ii) involved our especially challenging, subjective, or complex judgments. The communication of critical audit matters does not alter in any way our opinion on the consolidated financial statements, taken as a whole, and we are not, by communicating the critical audit matter below, providing a separate opinion on the critical audit matter or on the accounts or disclosures to which it relates.
Impairment Tests on Goodwill (Pro Farm Group, Inc., Rizobacter S.A. and Bioceres Crops S.A. Cash Generating Units) and Intangible Assets Not yet available for use or with indefinite useful lives.
As described in Notes 4.7, 7.8 and 7.9 to the consolidated financial statements, the Company’s goodwill associated with the Pro Farm Group, Inc. Rizobacter S.A. and Bioceres Crop S.A. cash generating units (“CGU”) and intangible assets not yet available for use or with indefinite useful lives amounted to $76.1 million, $28.1 million, $7,5 million and $25.5 million, respectively, as of June 30, 2024. Impairment tests on goodwill and intangible assets not yet available for use or with indefinite useful lives are undertaken annually at the end of the reporting period. Where the carrying value of an asset exceeds its recoverable amount (i.e. the higher of value in use and fair value less costs to sell), the asset is written down to its recoverable amount. In each case, management determined the recoverable amount based on value in use calculations prepared by management. The determination of the recoverable amount of the CGU’s and intangible assets not yet available for use or with indefinite useful lives includes significant and numerous judgments and assumptions that are subject to various risks and uncertainties.
The principal assumptions used in management’s models consisted of (i) budgeted market shares of joint ventures and other customers, (ii) budgeted product prices, (iii) growth rates used to extrapolate future cash flow projections to the terminal period and (iv) discount rates.
The principal considerations for our determination that performing procedures relating to impairment tests on goodwill (Pro Farm Group, Inc., Rizobacter S.A. and Bioceres Crops S.A. cash generating units) and intangible assets not yet available for use or with indefinite useful lives is a critical audit matter are (i) the significant judgment by management when developing the recoverable amount of the CGUs and intangible assets not yet available for use or with indefinite useful lives; (ii) a high degree of auditor judgment, subjectivity and effort in performing procedures and evaluating management’s significant assumptions used in the models related to the (i) budgeted market shares of joint ventures and other customers, (ii) budgeted product prices, (iii) growth rates used to extrapolate future cash flow projections to the terminal period, (iv) discount rates; and (v) the audit effort involved the use of professionals with specialized skill and knowledge.
Addressing the matter involved performing procedures and evaluating audit evidence in connection with forming our overall opinion on the consolidated financial statements. These procedures included testing the effectiveness of controls relating to management’s impairment tests on goodwill and intangible assets not yet available for use or with indefinite useful lives, including controls over the determination of the recoverable amounts for the CGUs and intangible assets not yet available for use or with indefinite useful lives. These procedures also included, among others (i) testing management’s process for developing the recoverable amounts of CGUs and intangible assets not yet available for use or with indefinite useful lives; (ii) evaluating the appropriateness of the models used; (iii) testing the completeness and accuracy of underlying data used in the models; (iv) evaluating the reasonableness of the significant assumptions used by management in the models related to budgeted market shares of joint ventures and other customers, budgeted product prices, growth rates used to extrapolate future cash flow projections to the terminal period and discount rates. Evaluating management’s assumptions used in the models related to budgeted market shares of joint ventures and other customers, budgeted product prices, growth rates used to extrapolate future cash flow projections to the terminal period and discount rates involved evaluating whether the assumptions used by management were reasonable considering (i) the current and past performance of the CGUs and the Company’s business; (ii) the consistency with external market and industry data; and (iii) whether these assumptions were consistent with evidence obtained in other areas of the audit. Professionals with specialized skill and knowledge were used to assist in the evaluation of the Company’s discounted cash flow model and the discount rate assumptions.
| /s/ Price Waterhouse & Co. S.R.L. | |
| /s/ Guillermo Miguel Bosio | |
| Guillermo Miguel Bosio | |
|
Partner |
|
|
Rosario, Argentina |
|
| April 15, 2025 |
We have served as the Company’s auditor since 2021.
Registration number: 13310943
CONSOLIDATED SATEMENT OF COMPREHENSIVE INCOME
For the years ended June 30, 2024, 2023 and 2022
(Amounts in US$)
| Notes | 06/30/2024 | 06/30/2023 | 06/30/2022 | |||||||||||
| Revenues from contracts with customers | 8.1 | 466,376,330 | 420,867,429 | 329,517,122 | ||||||||||
| Government grants | 7.18 | 197,519 | 93,509 | 120,693 | ||||||||||
| Initial recognition and changes in the fair value of biological assets at the point of harvest | (45,746 | ) | 610,554 | 6,388,030 | ||||||||||
| Cost of sales | (279,368,328 | ) | (235,464,072 | ) | (208,371,368 | ) | ||||||||
| Changes in the net realizable value of agricultural products after harvest | (2,385,069 | ) | (4,351,433 | ) | (42,523 | ) | ||||||||
| Research and development expenses | 8.3 | (17,422,487 | ) | (15,943,987 | ) | (7,378,941 | ) | |||||||
| Selling, general and administrative expenses | 8.4 | (126,340,822 | ) | (116,531,274 | ) | (84,336,898 | ) | |||||||
| Share of profit or loss of joint ventures and associates | 13 | (21,023,150 | ) | 47,709,605 | (1,000,737 | ) | ||||||||
| Other income or expenses, net | (703,265 | ) | 1,055,299 | (3,304,166 | ) | |||||||||
| Operating profit | 19,284,982 | 98,045,630 | 31,591,212 | |||||||||||
| Financial cost | 8.5 | (37,498,668 | ) | (33,576,632 | ) | (22,762,427 | ) | |||||||
| Other financial results | 8.5 | (9,744,466 | ) | (13,674,756 | ) | (11,790,899 | ) | |||||||
| (Loss) Profit before income tax | (27,958,152 | ) | 50,794,242 | (2,962,114 | ) | |||||||||
| Income tax | 9 | (1,103,152 | ) | 2,328,366 | (17,026,303 | ) | ||||||||
| (Loss) Profit for the year | (29,061,304 | ) | 53,122,608 | (19,988,417 | ) | |||||||||
| Other comprehensive income | ||||||||||||||
| Items that may be subsequently reclassified to profit and loss | (1,092,833 | ) | (911,896 | ) | 28,568,482 | |||||||||
| Foreign exchange differences on translation of foreign operations from joint ventures | 977,482 | (46,541 | ) | 1,645,772 | ||||||||||
| Foreign exchange differences on translation of foreign operations | (2,070,315 | ) | (865,355 | ) | 26,922,710 | |||||||||
| Items that will not be subsequently reclassified to loss and profit | - | (1,467,349 | ) | (6,017,329 | ) | |||||||||
| Revaluation of property, plant and equipment, net of tax, of joint ventures and associates | - | (184,630 | ) | (586,268 | ) | |||||||||
| Revaluation of property, plant and equipment, net of tax | - | (1,282,719 | ) | (5,431,061 | ) | |||||||||
| Total comprehensive (loss) profit | (30,154,137 | ) | 50,743,363 | 2,562,736 | ||||||||||
| (Loss) / profit for the year attributable to: | ||||||||||||||
| Equity holders of the parent | (32,685,398 | ) | 40,435,923 | (6,607,764 | ) | |||||||||
| Non-controlling interests | 3,624,094 | 12,686,685 | (13,380,653 | ) | ||||||||||
| (29,061,304 | ) | 53,122,608 | (19,988,417 | ) | ||||||||||
| Total comprehensive (loss) / loss attributable to: | ||||||||||||||
| Equity holders of the parent | (32,875,350 | ) | 39,068,323 | (5,839,301 | ) | |||||||||
| Non-controlling interests | 2,721,213 | 11,675,040 | (9,128,109 | ) | ||||||||||
| (30,154,137 | ) | 50,743,363 | (14,967,410 | ) | ||||||||||
| (Loss) /Profit per share | ||||||||||||||
| Basic (loss) / profit attributable to ordinary equity holders of the parent | 8 | (1.7686 | ) | 2.7731 | (3.0067 | ) | ||||||||
| Diluted (loss) / profit attributable to ordinary equity holders of the parent | 8 | (1.7686 | ) | 2.7731 | (3.0067 | ) | ||||||||
The accompanying Notes are an integral part of these consolidated financial statements. Related parties balances and transactions are disclosed in Note 17.
Registration number: 13310943
CONSOLIDATED STATEMENT OF FINANCIAL POSITION
As of June 30, 2024 and 2023
(Amounts in US$)
| Notes | 06/30/2024 | 06/30/2023 | ||||||||
| ASSETS | ||||||||||
| NON-CURRENT ASSETS | ||||||||||
| Other financial assets | 7.2 | 190,517 | 1,826 | |||||||
| Other receivables | 7.4 | 27,887,034 | 8,022,723 | |||||||
| Income taxes | 10,889 | 24,486 | ||||||||
| Deferred tax assets | 9 | 14,476,230 | 28,433,321 | |||||||
| Investments in joint ventures and associates | 13 | 92,795,851 | 118,342,963 | |||||||
| Property, plant and equipment | 7.7 | 74,612,434 | 68,159,339 | |||||||
| Investment properties | 7.10 | 560,783 | 3,589,749 | |||||||
| Intangible assets | 7.8 | 177,331,280 | 175,292,219 | |||||||
| Goodwill | 7.9 | 112,163,432 | 112,163,432 | |||||||
| Right of use asset | 16 | 11,601,752 | 13,936,575 | |||||||
| Total non-current assets | 511,630,202 | 527,966,633 | ||||||||
| CURRENT ASSETS | ||||||||||
| Cash and cash equivalents | 7.1 | 52,994,865 | 49,265,020 | |||||||
| Other financial assets | 7.2 | 14,667,607 | 19,829,014 | |||||||
| Trade receivables | 7.3 | 209,007,195 | 159,376,782 | |||||||
| Other receivables | 7.4 | 34,657,383 | 38,197,456 | |||||||
| Recoverable income tax | 655,691 | 9,537,799 | ||||||||
| Inventories | 7.5 | 125,929,768 | 140,437,616 | |||||||
| Biological assets | 7.6 | 294,134 | 146,842 | |||||||
| Total current assets | 438,206,643 | 416,790,529 | ||||||||
| Total assets | 949,836,845 | 944,757,162 | ||||||||
The accompanying Notes are an integral part of these Consolidated financial statements. Related parties balances and transactions are disclosed in Note 17.
BIOCERES GROUP PLC
Registration number: 13310943
CONSOLIDATED STATEMENT OF FINANCIAL POSITION
As of June 30, 2024 and 2023
(Amounts in US$)
| Notes |
06/30/2024 |
06/30/2023 | ||||||||
| EQUITY | ||||||||||
| Issued capital | 11 | 2,371,453 | 2,096,534 | |||||||
| Own shares held | (444,473 | ) | - | |||||||
| Shares trading premium | (7,289,991 | ) | (13,587,790 | ) | ||||||
| Stock options and share based incentives | 6,222,175 | 1,853,856 | ||||||||
| Retained earnings / (deficit) | 1,142,761 | 33,828,159 | ||||||||
| Revaluation of property, plant and equipment reserve | (1,323,916 | ) | (1,323,916 | ) | ||||||
| Foreign currency translation reserve | 534,827 | 724,779 | ||||||||
| Equity attributable to owners of the parent | 1,212,836 | 23,591,622 | ||||||||
| Non-controlling interest | 248,788,534 | 234,978,480 | ||||||||
| Total equity | 250,001,370 | 258,570,102 | ||||||||
| LIABILITIES | ||||||||||
| NON-CURRENT LIABILITIES | ||||||||||
| Borrowings | 7.12 | 127,248,305 | 152,445,700 | |||||||
| Deferred revenue and advances from customers | 7.15 | 1,925,138 | 2,057,805 | |||||||
| Government grants | 7.18 | 782 | 127,285 | |||||||
| Joint ventures and associates | 13 | 296,455 | 622,823 | |||||||
| Deferred tax liabilities | 9 | 34,500,445 | 53,272,466 | |||||||
| Provisions | 7.16 | 17,484,715 | 16,901,773 | |||||||
| Consideration for acquisition | 2,005,143 | 3,166,720 | ||||||||
| Convertible notes | 80,809,686 | 75,213,146 | ||||||||
| Lease liabilities | 16 | 8,161,359 | 10,030,524 | |||||||
| Total non-current liabilities | 272,432,028 | 313,838,242 | ||||||||
| CURRENT LIABILITIES | ||||||||||
| Trade and other payables | 7.11 | 168,937,536 | 151,520,304 | |||||||
| Borrowings | 7.12 | 234,510,751 | 180,000,607 | |||||||
| Employee benefits and social security | 7.14 | 7,506,831 | 9,950,862 | |||||||
| Deferred revenue and advances from customers | 7.15 | 3,924,801 | 24,893,396 | |||||||
| Income tax payable | 4,825,271 | 509,034 | ||||||||
| Government grants | 7.18 | 3,655 | 222,713 | |||||||
| Consideration for acquisition | 4,571,824 | 1,393,203 | ||||||||
| Lease liabilities | 16 | 3,122,778 | 3,858,699 | |||||||
| Total current liabilities | 427,403,447 | 372,348,818 | ||||||||
| Total liabilities | 699,835,475 | 686,187,060 | ||||||||
| Total equity and liabilities | 949,836,845 | 944,757,162 | ||||||||
The accompanying Notes are an integral part of these Consolidated financial statements. Related parties balances and transactions are disclosed in Note 17.
Registration number: 13310943
CONSOLIDATED STATEMENT OF CHANGES IN EQUITY
For the years ended June 30, 2024, 2023 and
2022
(Amounts in US$)
| Attributable to the equity holders of the parent | ||||||||||||||||||||||||||||||||||||||||
| Issued capital | Own shares held | Shares trading premium | Stock options and share based incentives | Retained earnings | Foreign currency translation reserve | Revaluation of PP&E and effect of tax rate change | Attributable to the equity holders of the parent | Non-controlling Interests | Total equity | |||||||||||||||||||||||||||||||
| 06/30/2023 | 2,096,534 | - | (13,587,790 | ) | 1,853,856 | 33,828,159 | 724,779 | (1,323,916 | ) | 23,591,622 | 234,978,480 | 258,570,102 | ||||||||||||||||||||||||||||
| Increase in capital | 274,919 | (7,319 | ) | - | - | - | - | - | 267,600 | - | 267,600 | |||||||||||||||||||||||||||||
| Changes in ownership interests in subsidiaries | - | (437,154 | ) | 6,297,799 | - | - | - | - | 5,860,645 | 557,267 | 6,417,912 | |||||||||||||||||||||||||||||
| Share-based incentives of subsidiaries | - | - | - | 4,368,319 | - | - | - | 4,368,319 | 9,592,291 | 13,960,610 | ||||||||||||||||||||||||||||||
| Business combination | - | - | - | - | - | - | - | - | 1,114,083 | 1,114,083 | ||||||||||||||||||||||||||||||
| Distribution of dividends | - | - | - | - | - | - | - | - | (174,800 | ) | (174,800 | ) | ||||||||||||||||||||||||||||
| (Loss) /profit for the year | - | - | - | - | (32,685,398 | ) | - | - | (32,685,398 | ) | 3,624,094 | (29,061,304 | ) | |||||||||||||||||||||||||||
| Other comprehensive loss | - | - | - | - | - | (189,952 | ) | - | (189,952 | ) | (902,881 | ) | (1,092,833 | ) | ||||||||||||||||||||||||||
| 06/30/2024 | 2,371,453 | (444,473 | ) | (7,289,991 | ) | 6,222,175 | 1,142,761 | 534,827 | (1,323,916 | ) | 1,212,836 | 248,788,534 | 250,001,370 | |||||||||||||||||||||||||||
The accompanying Notes are an integral part of these consolidated financial statements. Related parties balances and transactions are disclosed in Note 17.
BIOCERES GROUP PLC
Registration number: 13310943
CONSOLIDATED STATEMENT OF CHANGES IN EQUITY
For the years ended June 30, 2024, 2023 and 2022
(Amounts in US$)
| Attributable to the equity holders of the parent | ||||||||||||||||||||||||||||||||||||
| Issued capital | Shares trading premium | Stock options and share based incentives | Retained (deficit) / earnings | Foreign currency translation reserve | Revaluation of PP&E and effect of tax rate change | Attributable to the equity holders of the parent | Non-controlling Interests | Total equity | ||||||||||||||||||||||||||||
| 06/30/2022 | 1,337,298 | (8,577,547 | ) | 777,376 | (6,607,764 | ) | 1,773,218 | (1,004,755 | ) | (12,302,174 | ) | 137,171,291 | 124,869,117 | |||||||||||||||||||||||
| Increase in capital | 759,236 | - | - | - | - | - | 759,236 | - | 759,236 | |||||||||||||||||||||||||||
| Changes in ownership interests in subsidiaries | - | (29,474,351 | ) | - | - | - | - | (29,474,351 | ) | (46,940,078 | ) | (76,414,429 | ) | |||||||||||||||||||||||
| Business combination | - | 24,464,108 | - | - | - | - | 24,464,108 | 130,515,236 | 154,979,344 | |||||||||||||||||||||||||||
| Share-based incentives of subsidiaries | - | - | 1,076,480 | - | - | - | 1,076,480 | 3,009,120 | 4,085,600 | |||||||||||||||||||||||||||
| Distribution of dividends | - | - | - | - | - | - | - | (452,129 | ) | (452,129 | ) | |||||||||||||||||||||||||
| Profit for the year | - | - | - | 40,435,923 | - | - | 40,435,923 | 12,686,685 | 53,122,608 | |||||||||||||||||||||||||||
| Other comprehensive loss | - | - | - | - | (1,048,439 | ) | (319,161 | ) | (1,367,600 | ) | (1,011,645 | ) | (2,379,245 | ) | ||||||||||||||||||||||
| 06/30/2023 | 2,096,534 | (13,587,790 | ) | 1,853,856 | 33,828,159 | 724,779 | (1,323,916 | ) | 23,591,622 | 234,978,480 | 258,570,102 | |||||||||||||||||||||||||
The accompanying Notes are an integral part of these consolidated financial statements. Related parties balances and transactions are disclosed in Note 17.
BIOCERES GROUP PLC
Registration number: 13310943
CONSOLIDATED STATEMENT OF CHANGES IN EQUITY
For the years ended June 30, 2024, 2023 and 2022
(Amounts in US$)
| Attributable to the equity holders of the parent | ||||||||||||||||||||||||||||||||||||
| Issued capital | Shares trading premium | Stock options and share based incentives | Retained deficit | Foreign currency translation reserve | Revaluation of PP&E and effect of tax rate change | Attributable to the equity holders of the parent | Non-controlling Interests | Total equity | ||||||||||||||||||||||||||||
| 06/30/2021 | - | - | - | - | - | - | - | 77,127,989 | 77,127,989 | |||||||||||||||||||||||||||
| Opening capital | 1 | - | - | - | - | - | 1 | - | 1 | |||||||||||||||||||||||||||
| Intragroup reorganization - Steps 2,3 and 4 (Note 6) | - | (54,864,842 | ) | - | - | - | - | (54,864,842 | ) | 60,325,528 | 5,460,686 | |||||||||||||||||||||||||
| Intragroup reorganization - Exchange (Note 6) | 1,337,297 | 46,287,295 | - | - | - | - | 47,624,592 | (47,624,592 | ) | - | ||||||||||||||||||||||||||
| Share-based incentives of subsidiaries | - | - | 777,376 | - | - | - | 777,376 | 1,671,588 | 2,448,964 | |||||||||||||||||||||||||||
| Capitalization of convertible notes in BIOX | - | - | - | - | - | - | - | 36,244,460 | 36,244,460 | |||||||||||||||||||||||||||
| Changes in ownership interests in subsidiaries | - | - | - | - | - | - | - | 1,024,281 | 1,024,281 | |||||||||||||||||||||||||||
| Loss for the year | - | - | - | (6,607,764 | ) | - | - | (6,607,764 | ) | (13,380,653 | ) | (19,988,417 | ) | |||||||||||||||||||||||
| Other comprehensive income / (loss) | - | - | - | - | 1,773,218 | (1,004,755 | ) | 768,463 | 21,782,690 | 22,551,153 | ||||||||||||||||||||||||||
| 06/30/2022 | 1,337,298 | (8,577,547 | ) | 777,376 | (6,607,764 | ) | 1,773,218 | (1,004,755 | ) | (12,302,174 | ) | 137,171,291 | 124,869,117 | |||||||||||||||||||||||
The accompanying Notes are an integral part of these consolidated financial statements. Related parties balances and transactions are disclosed in Note 17.
Registration number: 13310943
CONSOLIDATED STATEMENT OF CASH FLOWS
For the years ended June 30, 2024, 2023 and
2022
(Amounts in US$)
| Notes | 06/30/2024 | 06/30/2023 | 06/30/2022 | |||||||||||
| OPERATING ACTIVITIES | ||||||||||||||
| (Loss) / profit for the year | (29,061,304 | ) | 53,122,608 | (19,988,417 | ) | |||||||||
| Adjustments to reconcile profit to net cash flows | ||||||||||||||
| Income tax | 1,103,152 | (2,328,366 | ) | 17,026,303 | ||||||||||
| Depreciation of property, plant and equipment | 8.3/8.4 | 5,799,998 | 4,938,927 | 3,867,337 | ||||||||||
| Amortization of intangible assets | 8.3/8.4 | 12,113,223 | 11,004,584 | 4,227,457 | ||||||||||
| Depreciation of leased assets | 3,418,956 | 3,565,894 | 1,257,538 | |||||||||||
| Share-based incentive and stock options | 14,199,480 | 3,480,178 | 1,508,159 | |||||||||||
| Share of profit or loss of joint ventures and associates | 13 | 21,023,150 | (47,709,605 | ) | 1,000,737 | |||||||||
| Provisions for contingencies | 653,574 | 239,292 | 330,754 | |||||||||||
| Allowance for impairment of trade debtors | 753,428 | 1,327,385 | 1,598,042 | |||||||||||
| Allowance for obsolescence | 586,515 | 1,066,777 | 849,641 | |||||||||||
| Initial recognition and changes in the fair value of biological assets | 45,746 | (610,554 | ) | (6,388,030 | ) | |||||||||
| Changes in the net realizable value of agricultural products after harvest | 2,385,069 | 4,351,433 | 42,523 | |||||||||||
| Financial results | 47,243,134 | (47,251,388 | ) | 34,553,326 | ||||||||||
| Gain on sale of equipment and intangible assets | (125,464 | ) | - | (1,944,308 | ) | |||||||||
| Working capital adjustments | ||||||||||||||
| Trade receivables | (41,256,269 | ) | (14,179,711 | ) | (28,296,868 | ) | ||||||||
| Other receivables | (6,338,099 | ) | (36,705,492 | ) | (13,906,047 | ) | ||||||||
| Inventories and biological assets | 15,285,866 | (8,572,529 | ) | (60,555,267 | ) | |||||||||
| Trade and other payables | 16,286,414 | 14,172,818 | 48,407,307 | |||||||||||
| Employee benefits and social security | (2,413,413 | ) | 2,074,795 | 1,609,043 | ||||||||||
| Government grants | (188,518 | ) | (93,091 | ) | 50,693 | |||||||||
| Income tax paid | (853,299 | ) | (4,072,347 | ) | (8,664,456 | ) | ||||||||
| Deferred revenue and advances from customers | (21,103,777 | ) | 21,019,535 | (2,183,082 | ) | |||||||||
| Net cash flows generated by / (used in) operating activities | 39,557,562 | (41,158,857 | ) | (25,597,615 | ) | |||||||||
The accompanying Notes are an integral part of these consolidated financial statements. Related parties balances and transactions are disclosed in Note 17.
BIOCERES GROUP PLC
Registration number: 13310943
CONSOLIDATED STATEMENT OF CASH FLOWS
For the years ended June 30, 2024, 2023 and
2022
(Amounts in US$)
| Notes | 06/30/2024 | 06/30/2023 | 06/30/2022 | |||||||||||
| INVESTMENT ACTIVITIES | ||||||||||||||
| Proceeds from sale of property, plant and equipment | 336,726 | 137,357 | 2,046,771 | |||||||||||
| Investment in joint ventures and associates | 13 | - | 1,085,676 | (3,220,214 | ) | |||||||||
| Net cash received from business combination | 37,508 | 4,373,265 | - | |||||||||||
| Loss of controlling interest | (18,097 | ) | (1,081,808 | ) | - | |||||||||
| Proceeds from financial assets | 62,836,432 | 1,316,980 | 12,331,390 | |||||||||||
| Investment in financial assets | (65,567,062 | ) | (8,488,144 | ) | (2,055,878 | ) | ||||||||
| Purchase of property, plant and equipment | 7.7 | (9,936,611 | ) | (11,491,899 | ) | (3,480,708 | ) | |||||||
| Capitalized development expenditures | 7.8 | (11,855,766 | ) | (10,753,047 | ) | (5,130,095 | ) | |||||||
| Purchase of intangible assets | 7.8 | (3,233,316 | ) | (688,287 | ) | (389,039 | ) | |||||||
| Net cash flows (used in) / generated by investing activities | (27,400,186 | ) | (25,589,907 | ) | 102,227 | |||||||||
| FINANCING ACTIVITIES | ||||||||||||||
| Proceeds from borrowings | 187,994,310 | 150,631,747 | 159,642,301 | |||||||||||
| Repayment of borrowings and financed payments | (145,044,508 | ) | (38,457,281 | ) | (128,310,467 | ) | ||||||||
| Interest payments | (36,803,697 | ) | (25,639,013 | ) | (13,009,834 | ) | ||||||||
| Leased assets payments | (4,879,108 | ) | (3,855,517 | ) | (1,034,764 | ) | ||||||||
| Cash dividend distributed by non-controlling interest | (174,800 | ) | (452,129 | ) | - | |||||||||
| Other financial payments | (1,850,252 | ) | (3,007,154 | ) | (3,072,792 | ) | ||||||||
| Purchase of own shares | (734,388 | ) | (2,996,947 | ) | - | |||||||||
| Net cash flows (used in) / generated by financing activities | (1,492,443 | ) | 76,223,706 | 14,214,444 | ||||||||||
| Net increase / (decrease) in cash and cash equivalents | 10,664,933 | 9,474,942 | (11,280,944 | ) | ||||||||||
| Inflation effects on cash and cash equivalents | (189,309 | ) | (195,181 | ) | (9,624,750 | ) | ||||||||
| Cash and cash equivalents as of beginning of the year | 7.1 | 49,265,020 | 34,851,505 | 48,914,510 | ||||||||||
| Effect of exchange rate changes on cash and equivalents | (6,745,779 | ) | 5,133,754 | 6,842,689 | ||||||||||
| Cash and cash equivalents as of the end of the year | 52,994,865 | 49,265,020 | 34,851,505 | |||||||||||
The accompanying Notes are an integral part of these consolidated financial statements. Related parties balances and transactions are disclosed in Note 17.
NOTES TO THE CONSOLIDATED FINANCIAL STATEMENTS
As of June 30, 2024 and 2023 and for the years ended June 30, 2024, 2023 and 2022
(Amounts in US$, except otherwise indicated)
Index
| 1. | General information. | |
| 2. | Accounting standards and basis of preparation. | |
| 3. | New standards, amendments and interpretations issued by the IASB. | |
| 4. | Summary of significant accounting policies. | |
| 5. | Critical accounting judgments and estimates. | |
| 6. | Acquisitions and other significant transactions | |
| 7. | Information about components of consolidated statement of financial position. | |
| 8. | Information about components of consolidated statement of comprehensive income. | |
| 9. | Taxation. | |
| 10. | Earnings per share. | |
| 11. | Information about components of equity. | |
| 12. | Cash flow information. | |
| 13. | Joint ventures and associates. | |
| 14. | Segment information | |
| 15. | Financial instruments – Risk management. | |
| 16. | Leases. | |
| 17. | Shareholders and other related parties’ balances and transactions. | |
| 18. | Key management personnel compensation. | |
| 19. | Share-based payments. | |
| 20. | Contingencies, commitments and restrictions on the distribution of profits. | |
| 21. | Events occurring after the reporting period. |
BIOCERES GROUP PLC
NOTES TO THE CONSOLIDATED FINANCIAL STATEMENTS
As of June 30, 2024 and 2023 and for the years ended June 30, 2024, 2023 and 2022
(Amounts in US$, except otherwise indicated)
1. GENERAL INFORMATION
Bioceres Group PLC is a fully integrated company incorporated on April 3, 2021, in England and Wales, whose registered office is at Highdown House, Yeoman Way, Worthing, West Sussex, United Kingdom.
On April 1, 2025, the Company changed its legal name from Bioceres Group PLC to Bioceres Group Limited. (Note 21).
Unless the context otherwise requires, “we,” “us,” “our,” and “Bioceres Group” will refer to Bioceres Group PLC and its subsidiaries.
2. ACCOUNTING STANDARDS AND BASIS OF PREPARATION
Statement of compliance with IFRS as issued by IASB
These consolidated financial statements of the Group have been prepared in accordance with International Financial Reporting Standards (“IFRS”) as issued by International Accounting Standard Board (“IASB”) following the accounting policies as set forth and summarized in Note 4. All IFRS issued by the IASB, effective at the time of preparing these consolidated financial statements have been applied.
Authorization for the issue of the Consolidated financial statements
These consolidated financial statements of the Group as of June 30, 2024 and 2023 and for the years ended June 30, 2024, 2023 and 2022 have been authorized by the Board of Directors of Bioceres Group on April 15, 2025.
Basis of measurement
The consolidated financial statements of the Group have been prepared using:
| ● | Going concern basis of accounting, considering the conclusion of the assessment made by the Group’s Management about the ability of the Group and its subsidiaries to continue as a going concern, in accordance with the requirements of paragraph 25 of IAS 1, “Presentation of Financial Statements”. |
| ● | Accrual basis of accounting (except for cash flows information). Under this basis of accounting, the effects of transactions and other events are recognized as they occur, even when there are no cash flows. |
Functional currency and presentation currency
a) Functional currency
Items included in the financial statements of each of the Group’s entities are measured using the currency of the primary economic market in which the entity operates (i.e., “the functional currency”).
The Company and the Main Argentinian subsidiaries of the Group have United States Dollars as functional currency
From July 1, 2022, the main Argentinian subsidiaries of the Group have changed their functional currency from Argentine Pesos to United States Dollars as a result of changes in events and conditions relevant to their business operations, which include a hyper inflationary macroeconomic context and the depreciation of the Argentine Peso, in addition to the effects on our business of certain business combination transactions, as discussed below.
Macroeconomic context – in recent years Argentina’s macroeconomic scenario has featured a misalignment between inflation rates and the devaluation of the Argentine peso, which became more pronounced during the first half of the year ended June 30, 2022. Notwithstanding such misalignment, our Argentine subsidiaries have been able to continue pricing their products in U.S. dollars as the costs of products and services are set in U.S. dollars. This has also been achievable as the demand for the type of products we commercialize is relatively inelastic when compared to non-essential goods and services. Further, Argentina’s significant economic volatility has caused materials, and other costs of providing goods that we acquire from the Argentine domestic market, to become increasingly indexed to the U.S. dollar (i.e., denominated in Argentine Pesos but indexed to the U.S. dollar exchange rate).
BIOCERES GROUP PLC
NOTES TO THE CONSOLIDATED FINANCIAL STATEMENTS
As of June 30, 2024 and 2023 and for the years ended June 30, 2024, 2023 and 2022
(Amounts in US$, except otherwise indicated)
Business effects – following the merger with Pro Farm (see Note 6), which closed at the beginning of the fiscal year ended June 30, 2023, in addition to other business combination transactions, we established a global commercial strategy with a view to unifying pricing policies for the commercialization of our products.
In accordance with IAS 21, we have considered the following primary factors to determine the functional currency of our main Argentine subsidiaries: (i) the sales prices for goods and services, which are mainly influenced and determined by the U.S. dollar; and (ii) the increasing influence of transactions indexed to the U.S. dollar related to labor, materials, and other costs of providing goods.
Taking into account the analysis of the primary factors provided by IAS 21 in determining the functional currency of our main Argentine subsidiaries (in particular the increased influence of exchange rates on their costs of operations, which are indexed to the U.S. dollar), we identified that there is strong evidence that their functional currency had changed to the U.S. dollar.
As discussed above, we assessed primary indicators and determined that they were conclusive for the analyzed period; however, consideration was also given to secondary indicators. The result of such analysis also leads to the conclusion that the U.S. dollar is the relevant currency for cash generation from operating and financing activities of our main Argentine subsidiaries.
For the years ended 30th June 2024, 2023 and 2022, others Argentinian subsidiaries, that have Argentine Pesos as functional currency, had applied IAS 29 “Financial reporting in hyperinflationary economies” requires that the financial statements of an entity whose functional currency is the currency of a hyperinflationary economy, whether these are based on the historical cost method or the current cost method, be stated in terms of the measuring unit current at the closing date of the reporting period. For such purpose, the inflation produced since the acquisition date or the revaluation date, as applicable, must be computed in non-monetary items. The standard details a series of factors to be considered for concluding whether an economy is hyperinflationary, including, but not limited to, a cumulative inflation rate over a three-year period that approaches or exceeds 100%. Inflation accumulated in three years, as of 30th June 2018, was over 100%. It was for this reason that, in accordance with IAS 29, the Argentine economy had to be considered as hyperinflationary since 1st July 2018. Consequently, the Group has applied IAS 29 to these financial statements.
During an inflationary period, any entity that maintains an excess of monetary assets over monetary liabilities will lose purchasing power, and any entity that maintains an excess of monetary liabilities over monetary assets will gain purchasing power, provided that such items are not subject to an adjustment mechanism.
Briefly, the restatement mechanism of IAS 29 establishes that monetary assets and liabilities will not be restated because they are already expressed in a current unit of measurement at the end of the reporting period. Assets and liabilities subject to adjustments based on specific agreements, will be adjusted according to those agreements. Non-monetary items measured at their current values at the end of the reporting period, such as the net realizable value or others, do not need to be restated. The remaining non-monetary assets and liabilities will be restated according to a general price index. The loss or gain for the net monetary position will be included in the net result of the reporting period, revealing this information in a separate line item.
Presentation currency
The consolidated financial statements of the Group are presented in US dollars.
BIOCERES GROUP PLC
NOTES TO THE CONSOLIDATED FINANCIAL STATEMENTS
As of June 30, 2024 and 2023 and for the years ended June 30, 2024, 2023 and 2022
(Amounts in US$, except otherwise indicated)
Foreign currency
Transactions entered into by Group entities in a currency other than their functional currency are recorded at the relevant exchange rates as of the date upon which such transactions occur. Foreign currency monetary assets and liabilities are translated at the prevailing exchanges rates as of the final day of each reporting period. Exchange differences arising on the retranslation of unsettled monetary assets and liabilities are recognized immediately in profit or loss, except for foreign currency borrowings qualifying as a hedge of a net investment in a foreign operation for which exchange differences are recognized in other comprehensive income and accumulated in the foreign exchange reserve along with the exchange differences arising on the retranslation of the foreign operation. Upon the disposal of a foreign operation, the cumulative exchange differences recognized in the foreign exchange reserve relating to such operation up to the date of disposal are transferred to the Consolidated statement of profit or loss and other comprehensive income as part of the profit or loss reorganized upon such disposal.
Subsidiaries
Where the Group holds a controlling interest in an entity, such entity is classified as a subsidiary. The Group exercises control over such an entity if all three of the following elements are present: (i) the Group has the power to direct or cause the direction of the management and policies of the entity; (ii) the Group is exposed to the variable returns of such entity; and (iii) the Group has power to affect the variability of such returns. Control is reassessed whenever facts and circumstances indicate that there may be a change in any of these elements of control.
De-facto control exists in situations where the Group has the practical ability to direct the relevant activities of an entity without holding the majority of the voting rights. In determining whether de facto control exists, the Group considers all relevant facts and circumstances, including:
| - | The relative share of the Group’s voting rights with respect both the size and dispersion of other parties who hold voting rights; |
| - | Substantive potential voting rights held by the Group and by other parties; |
| - | Other contractual arrangements; and |
| - | Historic patterns in voting attendance. |
BIOCERES GROUP PLC
NOTES TO THE CONSOLIDATED FINANCIAL STATEMENTS
As of June 30, 2024 and 2023 and for the years ended June 30, 2024, 2023 and 2022
(Amounts in US$, except otherwise indicated)
The subsidiaries of the Group, all of which have been included in the consolidated financial statements of the Group, are as follows:
| Country of incorporation and principal place of |
% Equity interest | % Equity interest | ||||||||||||
| Name | Principal activities | business | Ref | 06/30/2024 | 06/30/2023 | |||||||||
| BCS Holding LLC | Investment in subsidiaries | United States | b) | 28.75 | % | 27.33 | % | |||||||
| Bioceres Crop Solutions (BIOX) | Research and development | United States | b) | 28.75 | % | 27.33 | % | |||||||
| Bioceres Crops Do Brasil Ltda. | Selling of agricultural inputs | Brazil | b) | 28.75 | % | 27.33 | % | |||||||
| Bioceres Crops S.A. | Research and development | Argentina | b) | 25.87 | % | 24.59 | % | |||||||
| Bioceres LLC | Investment in subsidiaries | United States | a) | 79.72 | % | 73.47 | % | |||||||
| Bioceres S.A. | Investment in subsidiaries | Argentina | a) | 79.72 | % | 73.47 | % | |||||||
| Bioceres Semillas S.A.U. | Production and commercialization of seeds | Argentina | b) | 28.75 | % | 27.33 | % | |||||||
| Bioceres Tech Services LLC. | Investment in subsidiaries | United States | a) | 100.00 | % | 100.00 | % | |||||||
| Comer. Agrop. Rizobacter de Bolivia S.A. | Selling of agricultural inputs | Bolivia | b) | 23.00 | % | 21.86 | % | |||||||
| Ingeniería Metabólica S.A. (“INMET”) | Research and development | Argentina | c) | 47.98 | % | 60.00 | % | |||||||
| Insumos Agroquímicos S.A. | Selling of agricultural inputs | Argentina | b) | 17.63 | % | 16.76 | % | |||||||
| Natal Agro S.R.L. | Production and commercialization of agricultural inputs | Argentina | d) | 14.66 | % | - | ||||||||
| Pro Farm Group Inc. | Development and sale of biological products | United States | b) | 28.75 | % | 27.33 | % | |||||||
| Rasa Holding, LLC | Investment in subsidiaries | United States | b) | 28.75 | % | 27.33 | % | |||||||
| Rizobacter Argentina S.A. | Microbiology Business | Argentina | b) | 23.00 | % | 21.86 | % | |||||||
| Rizobacter Colombia SAS | Selling of agricultural inputs | Colombia | b) | 23.00 | % | 21.86 | % | |||||||
| Rizobacter del Paraguay S.A. | Selling of agricultural inputs | Paraguay | b) | 23.00 | % | 21.86 | % | |||||||
| Rizobacter do Brasil Ltda. | Selling of agricultural inputs | Brazil | b) | 23.00 | % | 21.86 | % | |||||||
| Rizobacter France SAS | Research and development | France | b) | 23.00 | % | 21.86 | % | |||||||
| Rizobacter South Africa | Selling of agricultural inputs | South Africa | b) | 21.85 | % | 20.77 | % | |||||||
| Rizobacter Uruguay | Selling of agricultural inputs | Uruguay | b) | 23.00 | % | 21.86 | % | |||||||
| Rizobacter USA, LLC | Selling of agricultural inputs | United States | b) | 23.00 | % | 21.86 | % | |||||||
| Verdeca LLC | Research and development | United States | b) | 28.75 | % | 27.33 | % | |||||||
| a) | Direct interests held by Bioceres Group Limited. |
| b) | Since 2023, the Group exercises “de facto control” over Bioceres Crop Solutions Corp. as a result of (i) the percentage and concentration of voting rights of the Group, the voting agreement and the absence of other shareholders with significant voting rights, (ii) the absence of a voting agreement among the other shareholders to vote together as a group, (iii) the record of attendance to Shareholders’ Meetings and the record of votes casted by the other shareholders; and (iv) the effective control exercised by the Group to direct BIOX’s relevant activities through its seat in the Board of Directors. (Note 5). |
| c) | During the current fiscal year, the Group lost control over INMET as a result of a capital increase in which the Group waived its preemptive and subscription rights. Consequently, the Group’s ownership interest in Inmet decreased, leading to a loss of control. |
| d) | On June 1, 2024 we acquired a controlling interest in Natal Agro S.R.L (“Natal”). See Note 6. |
Special purpose and structured entities (“SPE”)
A structured entity is an entity that has been designed so that voting or similar rights are not the dominant factor in deciding who controls the entity and the relevant activities are directed by means of contractual arrangements. In these cases, we consider the purpose and design of the SPE, including a consideration of the risks the SPE was expected to be exposed to, the risks it was designed to pass on to the parties involved with the SPE and whether we are exposed to some or all of those risks or potential returns. One then considers which activities have a significant impact on the SPE’s returns and determines which parties have an ability to direct each of those activities.
BIOCERES GROUP PLC
NOTES TO THE CONSOLIDATED FINANCIAL STATEMENTS
As of June 30, 2024 and 2023 and for the years ended June 30, 2024, 2023 and 2022
(Amounts in US$, except otherwise indicated)
The Group controls an SPE when is exposed, or has rights, to variable returns from its involvement with the SPE and has the ability to affect those returns through its power over the SPE.
3. NEW STANDARDS, AMENDMENTS AND INTERPRETATIONS ISSUED BY THE IASB
New standards and interpretations adopted by the Group
The following new standards became applicable for the current reporting period and adopted by the Group.
Amendments to IAS 12- Deferred Tax related to Assets and Liabilities arising from a Single Transaction
The IASB has amended IAS 12, ‘Income taxes’, to require companies to recognize deferred tax on particular transactions that, on initial recognition, give rise to equal amounts of taxable and deductible temporary differences.
IAS 12 was amended to include an additional condition where the initial recognition exemption is not applied. According to the amended guidance, a temporary difference that arises on initial recognition of an asset or liability is not subject to the initial recognition exemption if that transaction gave rise to equal amounts of taxable and deductible temporary differences.
The amendments are effective for financial years beginning on or after January 1, 2023.
International Tax Reform—Pillar Two Model Rules (Amendments to IAS 12)
The amendments give companies temporary relief from accounting for deferred taxes arising from the Organization for Economic Co-operation and Development’s (OECD) international tax reform.
The amendments will introduce (i) a temporary exception to the accounting for deferred taxes arising from jurisdictions implementing the global tax rules. This will help to ensure consistency in the financial statements while easing into the implementation of the rules; (ii) and targeted disclosure requirements to help investors better understand a company’s exposure to income taxes arising from the reform, particularly before legislation implementing the rules is in effect.
Companies can benefit from the temporary exception immediately but are required to provide the disclosures to investors for annual reporting periods beginning on or after January 1, 2023.
Amendments to IAS 1 and IFRS Practice Statement 2- Disclosure of Accounting Policies
An entity is now required to disclose its material accounting policy information instead of its significant accounting policies. The amendments clarify that accounting policy information may be material because of its nature, even if the related amounts are immaterial.
The amendments are applied prospectively and are effective for annual periods beginning on or after January 1, 2023. Earlier application is permitted.
Amendments to IAS 8-Definition of Accounting Estimates
These amendments help entities to distinguish between accounting policies and accounting estimates making a distinction between how an entity should present and disclose different types of accounting changes in its financial statements. Under the new definition, accounting estimates are “monetary amounts in financial statements that are subject to measurement uncertainty”
BIOCERES GROUP PLC
NOTES TO THE CONSOLIDATED FINANCIAL STATEMENTS
As of June 30, 2024 and 2023 and for the years ended June 30, 2024, 2023 and 2022
(Amounts in US$, except otherwise indicated)
The amendments are effective for annual periods beginning on or after January 1, 2023 and changes in accounting policies and changes in accounting estimates that occur on or after the start of that period. Earlier application is permitted.
These amendments did not have any material impact on the Group.
New standards and interpretations not yet adopted by the Group
Amendments to IFRS 16- Lease Liability in a Sale and Leaseback.
The amendment requires a seller-lessee to subsequently measure lease liabilities arising from a leaseback in a way that it does not recognize any amount of the gain or loss that relates to the right of use it retains. The new requirements do not prevent a seller-lessee from recognizing in profit or loss any gain or loss relating to the partial or full termination of lease.
The amendments are effective for financial years beginning on or after January 1, 2024. Earlier application is permitted.
Amendments to IAS1 – Non-current liabilities with covenants.
The amendments modify the requirements introduced by Classification of Liabilities as Current or Non-current on how an entity classifies debt and other financial liabilities as current or non-current in particular circumstances. Only covenants with which an entity is required to comply on or before the reporting date affect the classification of a liability as current or non-current. In addition, an entity must disclose information in the notes that enables users of financial statements to understand the risk that non-current liabilities with covenants could become repayable within twelve months.
The amendments apply retrospectively for annual reporting periods beginning on or after January 1, 2024, with early application permitted.
Amendment to IAS 7 and IFRS 7 - Supplier Financing.
The amendments are effective for annual periods beginning on or after January 1, 2024.
Amendments to IAS 7- Statement of Cash Flows & to IFRS 7- Financial Instruments: Disclosures.
The amendments introduce new disclosure requirements in IFRS Standards to enhance the transparency and, thus, the usefulness of the information provided by entities about supplier finance arrangements.
The disclosure requirements in the amendments enhance the current requirements and are intended to assist users of financial statements in understanding the effects of supplier finance arrangements on an entity’s liabilities, cash flows and exposure to liquidity risk.
The amendments are effective for annual reporting periods beginning on or after January 1, 2024. Early application of the amendments is permitted
IFRS 19 – Subsidiaries without Public Accountability.
The standard is effective for annual periods beginning on or after January 1, 2027.
Amendments to IFRS 9 and IFRS 7 - Amendments to the Classification and Measurement of Financial Instruments.
The amendments are effective for reporting periods beginning on or after January 1, 2026.
BIOCERES GROUP PLC
NOTES TO THE CONSOLIDATED FINANCIAL STATEMENTS
As of June 30, 2024 and 2023 and for the years ended June 30, 2024, 2023 and 2022
(Amounts in US$, except otherwise indicated)
Amendments to IFRS 9 and IFRS 7 – Contracts Referencing Nature-dependent Electricity.
The amendments are effective for annual periods beginning on or after January 1, 2026.
Annual Improvements to IFRS Accounting Standards—Volume 11.
The amendments are effective for annual periods beginning on or after January 1, 2026.
These amendments are not expected to have material impact on the Group.
IFRS 18 - Presentation and Disclosure in Financial Statements
This standard sets out requirements for the presentation and disclosure of information in general purpose financial statements to help ensure they provide relevant information that faithfully represents an entity’s assets, liabilities, equity, income and expenses. It is effective for annual periods beginning on or after January 1, 2027.
Amendments to IAS 21- The Effects of Changes in Foreign Exchange Rates titled Lack of Exchangeability.
The amendments are effective for annual reporting periods beginning on or after January 1, 2025.
The Group is currently analyzing the potential impact of these new standard on our financial statements.
4. SUMMARY OF SIGNIFICANT ACCOUNTING POLICIES
4.1. Cash and cash equivalents
For the purposes of the statements of financial position and statements of cash flows, cash and cash equivalents include cash on hand and in banks and short-term highly liquid investments. Investments can be readily convertible to known amounts of cash and they are subject to insignificant risk of changes in value. In the consolidated statements of financial position, bank overdrafts are included in borrowings within current liabilities.
| 4.2. | Financial assets and liabilities |
The Group measures its financial assets at initial recognition at fair value and subsequently at amortized cost using the effective interest method.
The Group has not irrevocably designated a financial asset as measured at fair value through profit or loss to eliminate or significantly reduce a measurement or recognition inconsistency.
Financial assets at fair value through profit or loss are measured at fair value through profit and loss due to the business model used in their negotiation and/or the contractual characteristics of their cash flows.
Estimates
The Group makes estimates of uncollectability of its recorded receivables. Management analyzes trade account receivables in accordance with conventional criteria, adjusting the amount through a charge of an allowance for bad debts upon recognition of the inability of third parties to afford their financial obligations to the Group. Management specifically analyzes the accounts receivable, the historical bad debts, solvency of customers, current economic trends and the changes to the payment conditions of customers to assess the adequate allowance for bad debts.
BIOCERES GROUP PLC
NOTES TO THE CONSOLIDATED FINANCIAL STATEMENTS
As of June 30, 2024 and 2023 and for the years ended June 30, 2024, 2023 and 2022
(Amounts in US$, except otherwise indicated)
Offsetting of financial assets with financial liabilities
Financial assets and liabilities are offset and presented for their net amount in the statements of financial position only when the Group has the right, legally enforceable, to compensate the recognized amounts and has the intention to liquidate for the net amount or to settle the asset and cancel the liability simultaneously.
4.3. Inventories
Inventories are recognized at cost initially and subsequently at the lower of cost and net realizable value. Cost comprises all costs of purchase and conversion as well as other costs incurred in bringing the inventories to their present location and condition.
Weighted average cost is used to determine the cost of ordinarily interchangeable items.
Estimates
The Group assesses the recoverability of inventories considering their sale price, whether the inventories are damaged and whether they have become obsolete in whole or in part.
Net realizable value is the sale price estimated to be attained in the ordinary course of business, less costs of completion and other selling expenses.
The Group sets up an allowance for obsolescence or slow-moving inventories in relation to finished and in-process products. The allowance for obsolescence or slow-moving inventories is recognized for finished products and in-process products based on an analysis by Management of the aging of inventory stocks.
4.4. Biological assets
Within current assets, growing crops are included as biological assets, from the moment of sowing until the moment of harvest (approximately 5 to 7 months depending on the crop). At harvest time the biological assets are transformed into agricultural products, including seed varieties for resale, and incorporated into the inventory.
Costs are capitalized as biological assets if, and only if, (a) it is probable that future economic benefits will flow to the entity, and (b) the cost can be measured reliably. The Group capitalizes costs such as: planting, harvesting, weeding, seedlings, irrigation, agrochemicals, fertilizers and a systematic allocation of fixed and variable production overheads that are directly attributable to the management of biological assets, among others.
Biological assets, both at initial recognition and at each subsequent reporting date, are measured at fair value less costs to sell, except where fair value cannot be reliably measured. Cost approximates fair value when little biological transformation has taken place since the costs were originally incurred or the impact of biological transformation on price is not expected to be material.
Gains and losses that arise from measuring biological assets at fair value less costs to sell and measuring agricultural produce at the point of harvest at fair value less costs to sell are recognized in the statement of income in the period in which they arise in the line item “Initial recognition and changes in fair value of biological assets”.
From the harvest time, agricultural products are valued at net realizable value because there is a market asset, and the risk of non-sale is non-significant.
BIOCERES GROUP PLC
NOTES TO THE CONSOLIDATED FINANCIAL STATEMENTS
As of June 30, 2024 and 2023 and for the years ended June 30, 2024, 2023 and 2022
(Amounts in US$, except otherwise indicated)
Generally, the estimation of the fair value of biological assets is based on models or inputs that are not observable in the market and the use of unobservable inputs is significant to the overall valuation of the assets. Unobservable inputs are determined based on the best information available. Key assumptions include future market prices, estimated yields at the point of harvest, estimated production cycle, future cash flows, future costs of harvesting and other costs, and estimated discount rate.
Market prices are generally determined by reference to observable data in the principal market for the agricultural produce. Harvesting costs and other costs are estimated based on historical and statistical data. Yields are estimated based on several factors, including the location of the farmland and soil type, environmental conditions, infrastructure and other restrictions and growth at the time of measurement. Yields are subject to a high degree of uncertainty and may be affected by several factors out of the Group’s control including but not limited to extreme or unusual weather conditions, plagues and other crop diseases, among other factors.
4.5. Business combinations
The Group applies the acquisition method to account for business combinations. The acquisition cost is measured as the aggregate of the consideration transferred for the acquisition of a subsidiary, which is measured at fair value at the acquisition date, and the amount of any non-controlling interest in such subsidiary. The Group recognizes any non-controlling interest in a subsidiary at the non-controlling interest’s proportionate share of the recognized amounts of subsidiary’s identifiable net assets. The acquisition related costs are expensed as incurred.
Any contingent consideration to be transferred by the Group is recognized at fair value at the acquisition date. The contingent consideration is classified as an asset or liability that is a financial instrument under IFRS 9 is measured at fair value through profit or loss.
Goodwill is initially measured at cost, which is the excess of the aggregate of the consideration transferred and the amount of the non-controlling interest and any previous interest carried over the net identifiable assets acquired, and liabilities assumed.
After initial recognition, goodwill is measured at cost less any accumulated impairment losses. For impairment testing, goodwill acquired in a business combination is, as of the acquisition date, allocated to each of the cash-generating units of the Group that is expected to benefit from the synergies of the combination, without considering whether other assets or liabilities of the subsidiary are allocated to those units.
Any impairment in the carrying value is recognized in the consolidated statement of comprehensive income. In the case of acquisitions in stages, prior to the write-off of the previously held equity interest in the subsidiary, said interest is re-measured at fair value as of the date of acquisition of control over the subsidiary. The result of the re-measurement at fair value is recognized in profit or loss.
When a seller in a business combination has contractually agreed to indemnify the Group for the result of a contingency or uncertainty related to the entirety or a portion of an asset or liability, the Group recognizes an indemnification asset. The indemnification asset is measured on the same basis as the indemnification item. At the end of each period, the Group measures the indemnification assets recognized at the acquisition date on the same basis as the indemnified liability, subject to any contractual limitation on the amount and, for an indemnification asset that is not periodically measured at fair value, based on Management’s assessment of the recoverability of the indemnification asset. The Group derecognizes the indemnification asset when it collects or sells it, or when it loses the right over it.
4.6. Intragroup Reorganization
Intragroup reorganizations are excluded from the scope of IFRS 3 and are not specifically addressed in IFRS guidance. Therefore, judgement is required to develop an accounting policy that provides relevant and reliable information in accordance with IAS 8, and such accounting policy shall be applied consistently to all similar transactions. Management has elected to account for intragroup reorganizations using the “Predecessor accounting”. Predecessor accounting involves accounting for the assets and liabilities of the acquired business using the predecessor carrying values. Differences between the carrying value and the amount payable is accounted for in equity (as a contribution or distribution, as it may correspond).
BIOCERES GROUP PLC
NOTES TO THE CONSOLIDATED FINANCIAL STATEMENTS
As of June 30, 2024 and 2023 and for the years ended June 30, 2024, 2023 and 2022
(Amounts in US$, except otherwise indicated)
The intragroup reorganization described in Note 6 was accounted for using predecessor accounting, as further explained in that note.
4.7. Impairment assessment of Goodwill and Intangibles
Impairment tests on goodwill and intangible assets not yet available for use or with indefinite useful lives, are undertaken annually at the end of the reporting period. Other non-financial assets are subject to impairment tests whenever events or changes in circumstances indicate that their carrying amount may not be recoverable. Where the carrying value of an asset exceeds its recoverable amount (i.e. the higher of value in use and fair value less costs to sell), the asset is written down accordingly.
Where it is not possible to estimate the recoverable amount of an individual asset, the impairment test is carried out on the smallest group of assets to which it belongs for which there are separately identifiable cash flows (its Cash Generating Unit or CGU). Goodwill is allocated on initial recognition to each of the Group’s CGUs that are expected to benefit from a business combination that gives rise to the goodwill.
Impairment charges are included in profit or loss, except to the extent they reverse gains previously recognized in other comprehensive income. An impairment loss recognized for goodwill is not reversed.
Estimates
Impairment testing of goodwill and intangible assets not yet available for use or with indefinite useful lives, requires the use of significant assumptions for the estimation of future cash flows and the determination of discount rates. The significant assumptions and the determination of discount rates for the impairment testing of goodwill are further explained in Note 7.9.
4.8. Associate and joint arrangements
An associate is an entity over which the Group exerts significant influence. Significant influence is the power to participate in financial and operating policy decision-making at such entity, but it does not involve control or joint control over those policies.
The Group is a party to a joint arrangement when there is a contractual arrangement that confers joint control over the relevant activities of the arrangement to the Group and at least one other party. Joint control is assessed under the same principles as control over subsidiaries.
The Group classifies its interests in joint arrangements as either:
| - | Joint ventures: where the group has rights to only the net assets of the joint arrangement. |
| - | Joint operations: where the group has both the rights to the assets and obligations for the liabilities of the joint arrangement. |
In assessing the classification of interests in joint arrangements, the Group considers:
| - | The structure of the joint arrangement; |
| - | The legal form of joint arrangements structured through a separate vehicle; |
| - | The contractual terms of the joint arrangement agreement; and |
| - | Any other facts and circumstances (including any other contractual arrangements). |
BIOCERES GROUP PLC
NOTES TO THE CONSOLIDATED FINANCIAL STATEMENTS
As of June 30, 2024 and 2023 and for the years ended June 30, 2024, 2023 and 2022
(Amounts in US$, except otherwise indicated)
The Group accounts for its interests in joint ventures and associates using the equity method, where the Group’s share of post-acquisition profits and losses and other comprehensive income is recognized in the Consolidated statement of profit and loss and other comprehensive income.
Losses in excess of the Group’s investment in the joint venture and associates are recognized only to the extent that the Group has incurred legal or constructive obligations or made payments on behalf of the joint venture.
Profits and losses arising on transactions between the Group and its joint ventures and associates are recognized only to the extent of unrelated investors’ interests in the joint venture and/or associates. The Group’s share in a joint venture and/or associates’ profits and losses resulting from a transaction is eliminated against the carrying amount of investment in the joint venture and/or associates through the line “share of profit (or loss) of joint ventures and associates” in the Consolidated statements of profit or loss and other comprehensive income.
Any premium paid for an investment in a joint venture and/or associates above the fair value of the Group’s share of the identifiable assets, liabilities and contingent liabilities acquired is capitalized and included in the carrying amount of the investment in the joint venture and/or associates. Where there is objective evidence that the investment in a joint venture and/or associates has been impaired, the carrying amount of the investment is tested for impairment in the same way as other non-financial assets.
When the Group loses significant influence in an associate or joint control over a joint venture, it measures and recognizes any investment held at fair value. Any difference between the carrying amount of the associate or joint venture when losing significant influence or joint control and the fair value of the held investment and sale revenue are recognized in profit or loss.
The Group accounts for its interests in joint operations by recognizing its share of assets, liabilities, revenues and expenses in accordance with its contractually conferred rights and obligations.
For all joint arrangements structured in separate vehicles the Group must assess the substance of the joint arrangement in determining whether it is classified as a joint venture or joint operation. This assessment requires the Group to consider whether it has rights to the joint arrangement’s net assets (in which case it is classified as a joint venture), or rights to and obligations for specific assets, liabilities, expenses, and revenues (in which case it is classified as a joint operation).
Paragraph 18 of IAS 28 states when an investment in an associate or a joint venture is held by, or is held indirectly through, an entity that is a venture capital organization, or a mutual fund, unit trust and similar entities, the entity may elect to measure that investment al fair value through profit or loss in accordance with IFRS 9.
Bioceres Group PLC has elected to measure the investment in associates held through Theo I SCS a fair value through profit or loss in accordance with IFRS 9.
Estimates
There is uncertainty regarding Management’s estimates of the Group’s ability to recover the carrying amounts of the investments in joint ventures, since such estimates depend on the joint ventures’ ability to generate sufficient funds to complete the development projects, the future outcome of the project deregulation process and the amounts and timing of the cash flows from projects, among other future events.
Management assesses whether there are impairment indicators and, if any, it performs a recoverability analysis.
BIOCERES GROUP PLC
NOTES TO THE CONSOLIDATED FINANCIAL STATEMENTS
As of June 30, 2024 and 2023 and for the years ended June 30, 2024, 2023 and 2022
(Amounts in US$, except otherwise indicated)
Management estimates of the recoverability of these investments represent the best estimate based on available evidence, the existing facts and circumstances, using reasonable and provable assumptions in the cash flow projections.
Therefore, the consolidated financial statements do not include adjustments that would be required if the Group were unable to recover the carrying amount of the above-mentioned assets by generating sufficient economic benefits in the future.
4.9. Property, plant and equipment
Property, plant and equipment items are initially recognized at cost. In addition to the purchase price, cost also includes costs directly attributable to such property, plant and equipment items. There are no unavoidable costs with respect to dismantling and removing items. The cost of property, plant and equipment items acquired in a business combination is their fair value at the acquisition date.
Depreciation is calculated using the straight-line method to allocate the property, plant or equipment items’ cost or revalued amounts, net of their residual values, over their estimated useful lives or, in the case of leasehold improvements and certain leased plant and equipment, the shorter lease term as follows:
Research instruments: 3 to 10 years
Office equipment: 5 to 10 years
Vehicles: 5 years
Computer equipment and software: 3 years
Fixture and fittings: 10 years
Machinery and equipment: 5 to 10 years
Buildings: 50 years
Useful lives and depreciation methods are reviewed every year as required by IAS 16.
Assets under items Land and Buildings, are accounted for at fair value arising from the last revaluation performed, applying the revaluation model indicated by IAS 16. Starting with the fiscal year ended on June 30, 2024, the Group modified its Property, Plant, and Equipment valuation policy by changing the revaluation frequency for items classified under Buildings and Land. The revaluation must never exceed five years between each occurrence, in compliance with the maximum periods established by accounting standards, or whenever there are indications that the carrying amount differs significantly from the amount that could be determined using fair value at the end of the reporting year.
To obtain fair values, the existence or not of an active market is considered for the assets in their current status. For those assets for which an active market in their current status exists, the fair values were determined based on their market values. For the remaining cases, the market values of comparable new assets are analyzed, applying a discount based on the status and wear of each asset and considering the characteristics of each of the revalued assets (for example, improvements made, maintenance status, level of productivity, use, etc.
Estimates
The Group carries certain classes of property, plant and equipment under the revaluation model under IAS 16. The revaluation model requires that the Group carry property, plant and equipment at revalued amounts, being fair value at the date of revaluation less any subsequent accumulated depreciation and any subsequent accumulated impairment losses. IAS 16 requires that the Group carry out these revaluations with sufficient regularity so that the carrying amounts of its property, plant and equipment do not differ materially from that which would be determined using fair value at the end of a reporting period. The determination of fair value at the date of revaluation requires judgments, estimates and assumptions based on market conditions prevailing at the time of any such revaluation. Changes to any of the Group’s judgments, estimates or assumptions or to the market conditions subsequent to a revaluation will result in changes to the fair value of property, plant and equipment.
BIOCERES GROUP PLC
NOTES TO THE CONSOLIDATED FINANCIAL STATEMENTS
As of June 30, 2024 and 2023 and for the years ended June 30, 2024, 2023 and 2022
(Amounts in US$, except otherwise indicated)
The Group prepares the corresponding revaluations on a regular basis taking into account the work of independent appraisers. The Group uses different valuation techniques depending on the class of property being valued. Generally, the Group determines the fair value of its industrial buildings and warehouses based on a depreciated replacement cost approach. The Group determines the fair value of its land based on active market prices adjusted, if necessary, for differences in the nature, location or condition of the specific asset. If this information is not available, the Group may use alternative valuation methods, such as recent prices in less active markets.
Property valuation is a significant area of estimation uncertainty. Fair values are prepared regularly by Management, taking into account independent valuations. The determination of fair value for the different classes of property, plant and equipment is sensitive to the selection of various significant assumptions and estimates. Changes in those significant assumptions and estimates could materially affect the determination of the revalued amounts of property, plant and equipment. The Group utilizes historical experience, market information and other internal information to determine and/or review the appropriate revalued amounts.
The following are the most significant assumptions used in the preparation of the revalued amounts for its classes of property, plant and equipment:
a) Land: The Group generally uses the market price of a square meter of land for the same or similar location as the most significant assumption to determine the revalued amount. The Group typically uses comparable land sales in the same location to assess appropriateness of the value of its land.
b) Industrial buildings and warehouses: The Group generally determines the construction cost of a new asset and then the Group adjusts it for normal wear and tear. Construction prices may include, but are not limited to, construction materials, labor costs, installation and assembly costs, site preparation, professional fees and applicable taxes. Construction costs may differ significantly from year to year and are subject to macroeconomic changes in the economy where the Group operates, such as the impact of inflation and foreign exchange rates. The construction cost of its industrial buildings and warehouses is determined on a US dollar per constructed square meter basis, while the construction cost of its mills, facilities and grain storage facilities is determined by reference to their total capacity measured in tons milled or stored, respectively. A 5% increase or decrease in the construction costs or the estimate of normal wear and tear relating to such assets could have an impact of $ 1.2 million on their revalued amounts.
Increases in the carrying amounts arising on revaluation of land and buildings are recognized, net of tax, in other comprehensive income and accumulated in reserves in shareholders’ equity. To the extent that the increase reverses a decrease previously recognized in profit or loss, the increase is first recognized in profit or loss. Decreases that reverse previous increases of the same asset are first recognized in other comprehensive income to the extent of the remaining surplus attributable to the asset; all other decreases are charged to profit or loss.
4.10. Leased assets
Leases are recognized as a right-of-use asset and corresponding liability at the date of which the leased asset is available for use by the Group. Each lease payment is allocated between the liability and finance cost. The finance cost is charged to profit or loss over the lease period so as to produce a constant periodic rate of interest on the remaining balance of the liability for each period. The right-of-use asset is depreciated over the shorter of the asset’s useful life and the lease term on a straight-line basis.
In determining the lease term, we consider all facts and circumstances that create an economic incentive to exercise an extension option or not exercise a termination option. Extension options (or periods after termination options) are only included in the lease term if the lease is reasonably certain to be extended (or not terminated).
BIOCERES GROUP PLC
NOTES TO THE CONSOLIDATED FINANCIAL STATEMENTS
As of June 30, 2024 and 2023 and for the years ended June 30, 2024, 2023 and 2022
(Amounts in US$, except otherwise indicated)
Short term leases are recognized on a straight-line basis as an expense in the income statement.
At initial recognition, the right-of-use asset is measured considering the value of the initial measurement of the lease liability; any lease payments made at or before the commencement date, less any lease incentives; and any initial direct costs incurred by the lessee. After initial recognition, the right-of-use assets are measured at cost, less any accumulated depreciation and/or impairment losses, and adjusted for any re-measurement of the lease liability. Depreciation of the right-of-use asset is calculated using the straight-line method over the estimated duration of the lease contract.
The lease liability is initially measured at the present value of the lease payments that are not paid at such date, including variable lease payments that depend on an index or rate, initially measured using the index or rate as of the commencement date; amounts expected to be payable by the lessee under residual value guarantees; the exercise price of a purchase option if the lessee is reasonably certain to exercise that option; payments of penalties for terminating the lease, if the lease term reflects the lessee exercising an option to terminate the lease; and fixed payments, less any lease incentives receivable. After the commencement date, we measure the lease liability by increasing the carrying amount to reflect interest on the lease liability; reducing the carrying amount to reflect lease payments made; and re-measuring the carrying amount to reflect any reassessment or lease modifications.
The above-mentioned inputs for the valuation of the right of use assets and lease liabilities including the determination of the contracts within the scope of the standard, the contract term ant interest rate used in the discounted cash flow involved a management’s estimations.
4.11. Intangible assets
a) Externally acquired intangible assets
Externally acquired intangible assets are initially recognized at acquisition date fair value (which is considered as their cost). After initial recognition, those assets are measured at cost less accumulated amortization and accumulated impairment losses.
Intangible assets acquired from third parties have an estimated useful life as follows (in years):
Software: 3 years
Trademarks and patents: 5 years
Certification ISO Standards: 3 years
Useful lives and amortization methods are reviewed every year as required by IAS 38.
Estimates
To value acquired intangible assets, valuation techniques generally accepted in the market are applied, based mainly on the revenue approach (such as excess earnings, relief from royalty, and with or without), considering the characteristics of the assets to be valued and available information to estimate their acquisition date fair value. Application of these valuation techniques requires the use of several assumptions related to future cash flows and the discount rate.
BIOCERES GROUP PLC
NOTES TO THE CONSOLIDATED FINANCIAL STATEMENTS
As of June 30, 2024 and 2023 and for the years ended June 30, 2024, 2023 and 2022
(Amounts in US$, except otherwise indicated)
b) Internally generated intangible assets (development costs)
Expenditure on internally developed products is capitalized if it can be demonstrated that:
| - | It is technically feasible to develop the product for it to be sold; |
| - | Adequate resources are available to complete the development; |
| - | There is an intention to complete and sell the product; |
| - | The Group is able to sell the product; |
| - | Sale of the product will generate future economic benefits; and |
| - | Expenditure on the project can be measured reliably. |
Development expenditure not satisfying the above criteria and expenditure on the research phase of internal projects are recognized in the consolidated statement of profit or loss and other comprehensive income as incurred (Note 8.3).
Capitalized development costs are amortized using the straight-line method over the periods the Group expects to benefit from selling the products developed (Note 7.8).
Useful lives and amortization methods are reviewed every year as required by IAS 38.
The research and development process can be divided into several discrete steps or phases, which generally begin with discovery, validation and development and end with regulatory approval and commercial launch. The process for developing seed traits is relatively similar for both GM and non-GM traits. However, the two differ significantly in later phases of development. For example, obtaining regulatory approval for GM seeds is a far more comprehensive and lengthy process than for non-GM seeds. Although breeding programs and industrial biotechnology solutions may have shorter or simpler phases than those described below, the Group has used the industry consensus for seed-trait development phases to characterize its technology portfolios, which is generally divided into the following six phases:
i) Discovery: The first phase in the technology development process is the discovery or identification of candidate genes or genetic systems, metabolites, or microorganisms potentially capable of enhancing specified plant characteristics or enabling an agro-industrial biotech solution.
ii) Proof of concept: Upon successful validation of the technologies in model systems (in vitro or in vivo), promising technologies graduate from discovery and are advanced to the proof of concept phase. The goal of this phase is to validate a technology within the targeted organism before moving forward with technology escalation activities or extensive field validation.
iii) Early development: In this phase, field tests commenced in the proof of concept phase are expanded to evaluate various permutations of a technology in multiple geographies and growing cycles, as well as other characteristics in order to optimize the technology’s performance in the targeted organisms. The goal of the early development phase is to identify the best mode of use of a technology to define its performance concept.
iv) Advanced development and deregulation: In this phase, extensive field tests are used to demonstrate the effectiveness of the technology for its intended purpose. In the case of GM traits, the process of obtaining regulatory approvals from government authorities is also initiated during this phase, and tests are performed to evaluate the potential environmental impact of modified plants. For solutions involving microbial fermentation, industrial-scale runs are conducted.
v) Pre-launch: This phase involves finalizing the regulatory approval process and preparing for the launch and commercialization of the technology. The range of activities in this phase includes seed increases, pre-commercial production, and product and solution testing with selected customers. Usually, a more detailed marketing strategy and preparation of marketing materials occur during this phase.
BIOCERES GROUP PLC
NOTES TO THE CONSOLIDATED FINANCIAL STATEMENTS
As of June 30, 2024 and 2023 and for the years ended June 30, 2024, 2023 and 2022
(Amounts in US$, except otherwise indicated)
vi) Product launch: In general, this phase, which is the last milestone of the research and development process, is carried out by the Group, the joint ventures and/or the Group’s technology licensees. When technology is commercialized through the joint ventures or technology licensees, a successful product launch will trigger royalty payments to the Group, which are generally calculated as a percentage of the net sales realized by the technology and captured upon commercialization.
Demonstrability of technical feasibility generally occurs when the project reaches the “advanced development and deregulation” phase because at this stage success is considered to be probable.
c) Intangible assets acquired in a business combination
Intangible assets acquired in a business combination and recognized separately from goodwill are initially recognized at acquisition date fair value (which is considered as their cost). After initial recognition, those assets are measured at cost less accumulated amortization and accumulated impairment losses in the same manner as intangible assets acquired separately.
Intangible assets acquired in a business combination have an estimated useful life as follows (in years):
Product development: 5 – 15 years
Trademarks: 20 years
Customer loyalty: 14 - 26 years
Estimates
To value intangible assets acquired from a business combination, valuation techniques generally accepted in the market were applied, based mainly on the revenue approach (such as excess earnings, relief from royalty, and with or without), considering the characteristics of the assets to be valued and available information to estimate their acquisition date fair value. Application of these valuation techniques requires the use of several assumptions related to future cash flows and the discount rate.
4.12. Investment properties
Investment properties shall be measured initially at its cost. The cost of a purchased investment property comprises its purchase price and any directly attributable expenditure. Directly attributable expenditure includes, for example, professional fees for legal services, property transfer taxes and other transaction costs.
In the measurement after initial recognition, the Group has chosen the cost model for all investment property.
4.13. Borrowings
The Group measures its borrowings at initial recognition at fair value and, subsequently, are measured at amortized cost using the effective interest rate method.
Borrowing costs, either generic or specific, attributable to the acquisition, construction or production of assets that necessarily take a substantial period of time to get ready for their intended use or sale (qualifying assets) are included in the cost of the assets until the moment that they are substantially ready for use or sale. Income earned on the temporary investments of funds generated in specific borrowings still pending use in the qualifying assets, are deducted from the total of financing costs potentially eligible for capitalization.
All other loan costs are recognized under financial costs, through profit and loss.
BIOCERES GROUP PLC
NOTES TO THE CONSOLIDATED FINANCIAL STATEMENTS
As of June 30, 2024 and 2023 and for the years ended June 30, 2024, 2023 and 2022
(Amounts in US$, except otherwise indicated)
4.14. Convertibles notes
The Convertible notes were classified as compound instruments, a non-derivative financial instrument that contains both a liability and an equity component. The equity component was measured as the residual amount that results from deducting the fair value of the liability component from the initial carrying amount of the instrument. The fair value of the consideration of the liability component was measured first at the fair value of a similar liability (including any embedded non-equity derivative features, such as an issuer’s call option to redeem the bond early) that does not have any associated equity conversion option.
The Group considers that if the instrument meets the ‘fixed for fixed’ condition, as the strike price is pre-determined at inception and only varies over time, and it is therefore classified as equity. As regards to the mandatory conversion feature, as it is a contingent settlement provision, the Group decided to measure the liability component at initial recognition, based on its best estimate of the present value of the redemption amount and allocated the residual to the equity component.
4.15. Employee benefits
Employee benefits are expected to be settled wholly within 12 months after the end of the reporting period and are presented as current liabilities.
The accounting policies related to incentive payments based on shares are detailed in Note 4.22.
4.16. Provisions
The Group has recognized provisions for liabilities of uncertain timing or amount. The provision is measured at the best estimate of the expenditure required to settle the obligation at the end of the reporting period, discounted at a pre-tax rate reflecting current market assessments of the time value of money and risks specific to the liability.
4.17. Change in ownership interest in subsidiaries without change of control
Transactions with non-controlling interest that do not result in a loss of control are accounted for as equity transactions - i.e., as transactions with the owners in their capacity as owners. The recorded value corresponds to the difference between the fair value of the consideration paid and/or received and the relevant share acquired and/or transferred of the carrying value of the net assets of the subsidiary.
4.18. Revenue recognition
Revenue is recognized when control has been transferred to the buyer. Transfers of control vary depending on the individual terms of the sales contract. Revenues are recognized when control of the products has been transferred, which generally means that the products have been delivered to the customer and there is no unfulfilled obligation that could affect a customer’s acceptance of the products. Generally, acceptance occurs upon shipment or delivery, but ultimately depends on the terms of the underlying contracts. The customer is then invoiced at the agreed-upon price with the usual payment terms for each geographical region. Those payment terms do not contain a significant financing component.
The timing of performance sometimes differs from the timing that the associated consideration is received from the customer, thus resulting in the recognition of a contract asset or contract liability. We recognize a contract liability if the customer’s payment of consideration is received prior to completion of our related performance obligation.
As a part of our customary business practices, we offer a number of sales incentives to our customers, including volume discounts, retailer incentives, prepayment options and other product rebates. For all such contracts that include any variable consideration, we estimate the amount of variable consideration that should be included in the transaction price utilizing either the expected value method or the most likely amount method, depending on the nature of the variable consideration. Variable consideration is included in the transaction price if, in our judgment, it is probable that a significant future reversal of cumulative revenue under the contract will not occur. Although determining the transaction price for consideration requires significant judgment, we have meaningful historical experience with incentives provided to customers and estimate the expected consideration in view of historical patterns of incentive payouts. These estimates are reassessed each reporting period.
BIOCERES GROUP PLC
NOTES TO THE CONSOLIDATED FINANCIAL STATEMENTS
As of June 30, 2024 and 2023 and for the years ended June 30, 2024, 2023 and 2022
(Amounts in US$, except otherwise indicated)
We also offer an assurance warranty, which gives customers a refund or exchange right in the case the delivered product does not conform to specifications. Replacement products are accounted for under the warranty guidance if the customer exchanges one product for another of the same type, quality, and price. We have significant experience with historical return patterns and use this experience to include returns in the estimate of transaction price.
With respect to services, we mainly provide R&D and seed treatment services. Revenue associated with services is recognized by reference to the stage of completion of the transaction at the end of the reporting period. Each of the services to be provided has a detailed work plan in which all activities to be rendered are listed. The stage of completion for services is determined in accordance with the execution of the performed tasks listed in the respective work plan. The level of execution of such services is provided by our technical experts, who provide information relating to the transfer of goods or services. We have no material revenue for services that cannot be reliably estimated.
Revenue for usage-based royalties relating to licensed intellectual property rights is recognized at the later of when the performance obligation is satisfied and when a sale or use occurs.
Typically, our average payment terms range from 130 to 160 days at a consolidated level. Longer terms may be granted in limited circumstances; however, the effects of such sales are not material to our consolidated financial statements. Those payment terms do not contain a significant financing component.
4.19. Government grants
Government grants are recognized where there is reasonable assurance that the grant will be received and all attached conditions will be complied with. When the grant relates to an expense item, it is recognized as income on a systematic basis over the periods that the related costs, for which it is intended to compensate, are expensed. When the grant relates to an asset, it is recognized as income in equal amounts over the expected useful life of the related asset. Management elected this accounting policy because the Group determined it better shows the financial effect of government grants in the consolidated financial statements.
When the Group receives grants of non-monetary assets, the asset and the grant are recorded at nominal amounts and released to profit or loss over the expected useful life of the asset.
The difference between the money obtained under government loans at subsidized rates and the carrying amount of those loans is treated as a government grant, in accordance with IAS 20.
4.20. Income tax
Deferred tax assets and liabilities are recognized where the carrying amount of an asset or liability in the Consolidated statement of financial position differs from its tax base, except for differences arising on:
| - | The initial recognition of goodwill; |
| - | The initial recognition of an asset or liability in a transaction which is not a business combination and at the time of the transaction affects neither accounting or taxable profit; and |
| - | Investments in subsidiaries and jointly controlled entities where the Group is able to control the timing of the reversal of the difference and it is probable that the difference will not reverse in the foreseeable future. |
BIOCERES GROUP PLC
NOTES TO THE CONSOLIDATED FINANCIAL STATEMENTS
As of June 30, 2024 and 2023 and for the years ended June 30, 2024, 2023 and 2022
(Amounts in US$, except otherwise indicated)
Recognition of deferred tax assets is restricted to those instances where it is probable that taxable profit will be available against which the difference can be utilized.
The amount of the asset or liability is determined using tax rates that have been enacted or substantively enacted by the end of the reporting period and are expected to apply when the deferred tax liabilities / (assets) are settled / (recovered).
Deferred tax assets and liabilities are offset when the Group has a legally enforceable right to offset current tax assets and liabilities and the deferred tax assets and liabilities relate to taxes levied by the same tax authority on either:
| - | The same taxable entity within the Group, or |
| - | Different entities within the Group which intend either to settle current tax assets and liabilities on a net basis, or to realize the assets and settle the liabilities simultaneously, in each future period in which significant amounts of deferred tax assets or liabilities are expected to be settled or recovered. |
4.21. Share-based payments
Certain executives and directors of the Group were granted incentives in the form of shares and options to purchase shares as consideration for services.
The cost of these share-based transactions is determined based on their fair value at the date upon which such incentives are granted using a valuation model that is appropriate in the circumstances.
This cost is recognized as an expense together with an increase in equity throughout the period in which the service or performance conditions are satisfied (i.e., the vesting period). The accumulated expense recorded in connection with these transactions at the end of each year until the vesting date reflects the time elapsed between the vesting period and Management’s best estimate of the number of equity instruments that will vest. The charge to income/loss for the period represents the variation in the accumulated expense recorded between the beginning and the end of the year.
Non-market related service and performance conditions are not taken into account when determining the grant date fair value of the equity instruments, but the probability that the conditions are fulfilled is assessed as part of Management’s best estimate of the number of equity instruments that will vest. Market-related performance conditions are reflected in the grant date fair value. Any other conditions related to equity-settled share-based payment transactions but without a service requirement are considered as non-vesting conditions. Non-vesting conditions are reflected in the fair value of the equity instruments and are charged to income/loss immediately unless there are service and/or performance conditions as well.
No amount is recognized for transactions that will not vest because non-market related performance conditions and/or service conditions were not satisfied. When transactions include market-related conditions or non-vesting conditions, the transactions are considered to be vested, irrespective of whether a market-related condition or the non-vesting condition is satisfied, provided that all the other performance and/or service conditions are met.
When the terms and conditions of an equity-settled share-based payment transaction are modified, the minimum expense recognized is the grant date fair value, unmodified, provided that the original terms have been complied with. An additional expense, measured at the date of modification, is recognized for any modification that increases the total fair value of the share-based payment transaction, or is otherwise beneficial to the employee.
When the transaction is settled by the Group or by the counterparty, any remainder of the fair value is charged to income immediately.
BIOCERES GROUP PLC
NOTES TO THE CONSOLIDATED FINANCIAL STATEMENTS
As of June 30, 2024 and 2023 and for the years ended June 30, 2024, 2023 and 2022
(Amounts in US$, except otherwise indicated)
The dilutive effect of current options is considered in the calculation of the diluted earnings per share.
Estimates
The estimate of the fair value of equity-settled share-based payment transactions requires a determination to be made of the most adequate option pricing model to apply depending on the terms and conditions of the arrangement. This estimate also requires a determination of those factors most appropriate to the pricing model, including the expected life of the option and the expected volatility of the share price upon the basis of which hypotheses are made. The Group measures the fair value of these transactions at the grant date applying the Black-Scholes formula adjusted to consider the possible dilutive effect of the future exercise of the share options granted on their estimated fair value at grant date, as established in paragraph B41 of IFRS 2. The hypotheses used for the estimate of the fair value of these transactions are disclosed in Note 16 and will not necessarily take place in the future.
5. CRITICAL ACCOUNTING JUDGMENTS AND ESTIMATES
The Group makes certain estimates and assumptions regarding the future. Estimates and judgments are continually evaluated based on historical experience and other factors, including expectations of future events that are believed to be reasonable under the circumstances. In the future, actual experience may differ from these estimates and assumptions. The estimates and assumptions that have a significant risk of causing a material adjustment to the carrying amounts of assets and liabilities within the next financial year are listed below.
Critical judgements
| - | De facto control over BIOX Corp (Note 2). |
Critical estimates
| - | Impairment of goodwill (Notes 4.7). |
| - | Impairment testing of intangible assets not yet available for use or with indefinite useful lives. |
| - | Identification and fair value of identifiable intangible assets arising in acquisitions |
6. ACQUISITIONS AND OTHER SIGNIFICANT TRANSACTIONS
Pro Farm Group, Inc
On July 12, 2022, BIOX announced the closing of the merger (the “Pro Farm Merger”) with Pro Farm Group, Inc. (formerly Marrone Bio Innovations Inc.), pursuant to the Agreement and Plan of Merger (the “Merger Agreement”) dated March 16, 2022, among us, BCS Merger Sub, Inc., a wholly owned subsidiary of BIOX, and Pro Farm Group, Inc. Upon the closing of the Pro Farm Merger, Pro Farm Group, Inc. became a wholly owned subsidiary of BIOX and each share of Pro Farm Group, Inc. common stock was exchanged for our ordinary shares at a fixed exchange ratio of 0.088.
Pro Farm Group, Inc. leads the movement to environmentally sustainable farming practices through the discovery, development and sale of innovative biological products for crop protection, crop health and crop nutrition. The company’s commercial products are sold globally and supported by more than 343 patents and patent applications. Pro Farm Group, Inc. develops novel, environmentally sound solutions for agriculture using proprietary technologies to isolate and screen naturally occurring microorganisms and plant extracts.
The combined company has a diverse customer base, product portfolio and geographic reach across a wide range of crops, positioned to serve the massive market opportunity emerging from the bio-reduction and replacement of chemical ag inputs. The merger combines our expertise in bio nutrition and seed care products with Pro Farm Group’s leadership in the development of biological crop protection and plant health solutions, creating a global leader in the development and commercialization of sustainable agricultural solutions.
BIOCERES GROUP PLC
NOTES TO THE CONSOLIDATED FINANCIAL STATEMENTS
As of June 30, 2024 and 2023 and for the years ended June 30, 2024, 2023 and 2022
(Amounts in US$, except otherwise indicated)
The consideration of payment was measured at fair value, which was calculated as the sum of the acquisition-date fair values of the assets transferred, and the liabilities incurred.
Consideration of payment (amounts in thousands of dollars):
| Shares issued | 154,795 | |||
| Assumed RSU & Stock options | 1,620 | |||
| Cash payment | 29 | |||
| Total consideration | 156,444 |
Assets acquired and liabilities assumed (amounts in thousands of dollars):
| Net assets incorporated | ||||
| Cash and cash equivalents | 4,402 | |||
| Trade receivables | 6,855 | |||
| Other receivables | 1,423 | |||
| Inventories | 11,183 | |||
| Property, plant and equipment | 12,607 | |||
| Right of use assets, net | 3,005 | |||
| Intangible assets | 17,766 | |||
| Restricted cash | 1,560 | |||
| Other assets | 683 | |||
| Trade and other payables | (22,653 | ) | ||
| Lease liabilities | (3,245 | ) | ||
| Borrowings | (25,586 | ) | ||
| Other liabilities | (857 | ) | ||
| Revaluation of existing assets | ||||
| Property, plant and equipment | 494 | |||
| Intangible assets | 79,053 | |||
| Deferred tax | (6,336 | ) | ||
| Total net assets identified | 80,354 | |||
| Goodwill | 76,090 | |||
| Total consideration | 156,444 | |||
Goodwill is not expected to be deductible for tax purposes.
The amounts of revenue and net profit of the acquiree since the merger date included in the consolidated statement of comprehensive income for the year ended June 30, 2023, were $42.3 million and $5.4 million, respectively.
The pro forma revenue and net profit of the combined entity for the year ended June 30, 2023 as though the date for the merger had been as of the beginning of the reporting period amount to $42.6 million and $3.1 million, respectively.
BIOCERES GROUP PLC
NOTES TO THE CONSOLIDATED FINANCIAL STATEMENTS
As of June 30, 2024 and 2023 and for the years ended June 30, 2024, 2023 and 2022
(Amounts in US$, except otherwise indicated)
Syngenta Seedcare Agreement
On September 12, 2022, BIOX entered into a ten-year Exclusive Global Distribution Agreement with Syngenta Crop Protection AG (“Syngenta”), pursuant to which Syngenta will be the exclusive global distributor of certain of our biological solutions for seed care applications (the “Agreement”). Products included within the scope of the Agreement include nitrogen-fixing Rhizobia seed treatment solutions (inoculants), and other biological seed and soil treatment solutions. We have retained global rights for the use of products for HB4® crops; and, in the United States, Syngenta rights are non-exclusive for upstream applications. Pro Farm’s biological solutions are not included within the scope of the Agreement. On October 6, 2022, Syngenta made an upfront payment of $50 million as consideration under the Agreement. Concurrently with the Agreement, we entered into an R&D Collaboration Agreement and a Supply Agreement with Syngenta, which are discussed below.
The exclusive commercial collaboration is applicable for all countries, except for Argentina where both parties will continue to work under the existing framework. The Agreement is effective as of January 1, 2023, but its implementation was staggered as we continued distributing our products in certain countries during calendar year 2023. Syngenta will cover all operating expenses incurred in connection with marketing and sales in the exclusive territory.
In addition, concurrently with the Agreement, BIOX entered into a Supply Agreement with Syngenta, whereby we act as the exclusive supplier of the products under the Agreement. The manufactured products will be purchased by Syngenta at a price equivalent to the production cost plus a profit margin, to be agreed upon by the parties in compliance with applicable laws. Consequently, for purposes of complying with transfer pricing regulations, the price to be paid will be a price equivalent to market conditions for an exclusive supply agreement and Syngenta will determine the resale price for end-customers.
Further, BIOX entered into an R&D Collaboration Agreement that establishes a joint R&D program to accelerate the global development and registration of our products pipeline and new solutions for seed treatment, foliar and other applications. Except for “late development products” (as defined in the Agreement) which will be funded by us, funding of the R&D program will be shared between Syngenta and us, with Syngenta contributing up to 70% of the investment. The R&D Collaboration Agreement falls within the provisions of IFRS 11, as a joint operation agreement, based on the contractual rights and obligations of each party. We recognize our direct right to and share of any jointly held or incurred: assets, liabilities, revenues and expenses. The R&D activities relating to “late development products,” the cost of which will be funded by us, are within the scope of IFRS 15.
In accordance with IFRS 15, we have determined three performance obligations which are distinct from each other: (i) licensing of intellectual property rights; (ii) manufacturing; and (iii) R&D services. The license, the manufacturing and R&D services are not inputs to a combined item and they are separately identifiable. Syngenta can benefit from the license together with readily available resources other than the manufacturing and R&D services. The manufacturing process used to produce the products and R&D services are not unique or specialized and several other entities can also manufacture the product and provide the services to Syngenta.
(i) Licensing of biological intellectual property rights
We identified a right to use license of intellectual property rights, which relates to biological products, such as patents, inventions, information, data (including registration data), know-how, among others. The license granted has significant independent functionality and it is not expected that we will undertake activities that significantly affect the intellectual property to which Syngenta has rights, and Syngenta will benefit from such intellectual property rights, as available, from the effective date.
To determine the suitable method for estimating the standalone selling price of the license, we considered that the license has no observable price. Therefore, we determined that the residual approach should be applied as the standalone selling price for the license is highly uncertain. We have not yet licensed such rights to other third parties and have not yet established a price for such license. The residual approach involves estimating a standalone selling price for the remaining goods or services by deducting from the total transaction price the sum of the estimated or observable standalone selling prices of other goods and services in the contract. The standalone selling price for the license was estimated based on the residual approach given that the remaining good and services in the Agreement are sold at estimated or observable standalone selling prices.
BIOCERES GROUP PLC
NOTES TO THE CONSOLIDATED FINANCIAL STATEMENTS
As of June 30, 2024 and 2023 and for the years ended June 30, 2024, 2023 and 2022
(Amounts in US$, except otherwise indicated)
Furthermore, the intellectual property license, pursuant to which we have assigned the right of use intellectual property rights, has a variable consideration component, which is calculated as 30% to 50% (depending on the years and territories) of the gross margin (calculated as revenue that Syngenta obtains from the commercialization of biological products, less the cost of sale of such biological products).
The transaction price includes fixed and variable consideration components. The fixed consideration amounts to $48.6 million (from the upfront fee mentioned above) and relates to the stand-alone selling price of the license, and the variable consideration corresponds to 30% to 50% of the gross profits from the sale of licensed products.
As a right-of-use license, revenue is recognized when Syngenta has the right to use and benefit from such license. The amount of the upfront fee calculated in consideration for the transfer of the promised license was recognized according to the relevant territories. $32.9 million was recognized as revenue in January 2023 relating to the countries where Syngenta may use the license for existing products, and $15.7 million related to the remaining territories was recognized as revenue in January 2024. We estimated the split based on gross margin projections for the products in the relevant territories.
For the variable consideration component, we will apply the exception for sales-based royalties. Sales-based royalties are recognized when the sale occurs. We use information periodically provided by Syngenta for our estimates.
(ii) Manufacturing
This performance obligation is satisfied at a point in time when control of the products is transferred to Syngenta. This performance obligation includes the right to use the commercial name of the products and is remunerated as part of the sale of such products. Syngenta may only use our trademark when selling our products pursuant to the Exclusive Global Distribution Agreement.
(iii) R&D Services
We recognize revenue by reference to the stage of completion of R&D services at the end of the reporting period that is determined by our staff and is previously agreed with Syngenta. The stage of completion for services is determined according to the execution of the performed tasks listed in the respective service work plan. Each service has a detailed technical work plan which lists all activities and tasks to be performed.
The Agreement has a “Clawback” clause, pursuant to which we shall pay a penalty to Syngenta, in the event of certain breaches or events. The termination events that would trigger the payment of a penalty are under our control as they relate to our unilateral decision to terminate the Exclusive Global Distribution Agreement or a decision to sell our biological products business. Considering that there is no past event that would trigger the recognition of a liability, and that such decisions are under our control, no accounting impact has been recognized for such clauses.
BIOCERES GROUP PLC
NOTES TO THE CONSOLIDATED FINANCIAL STATEMENTS
As of June 30, 2024 and 2023 and for the years ended June 30, 2024, 2023 and 2022
(Amounts in US$, except otherwise indicated)
Natal Agro S.R.L.
On June 10, 2024, we acquired a controlling interest in Natal Agro S.R.L (“Natal”), an Argentine company that breeds and develops corn varieties. The interest acquired is represented by a total of 116,225 shares of AR$ 10 nominal value each, representing 51% of equity and voting interest.
The consideration for the acquisition was $0.22 million in cash and the commitment to carrying out, at our own expense, the regulatory activities for HB4 corn to obtain authorization for its commercialization in Argentina, and the regulatory activities for HB4 corn in Brazil, once the commercialization strategy of HB4 corn in Brazil has been defined by the Company.
Fair value of the consideration of payment
| Cash payment | 215,415 | |||
| Regulatory activities | 727,985 | |||
| Total consideration | 943,400 |
The consideration of payment was measured at fair value, which was calculated as the sum of cash paid and the acquisition-date fair values of the regulatory services to be provided. The fair values measured were based on discounting future cash flow using market discount rates. The difference between fair value and nominal value of consideration will be recognized as finance cost over the period the consideration will be paid.
Assets acquired, liabilities assumed, and non-controlling interest recognized
| Cash and cash equivalents | 252,923 | |||
| Other financial assets | 73,950 | |||
| Trade receivables | 596,463 | |||
| Other receivables | 288,861 | |||
| Income and minimum presumed recoverable income taxes | 19,998 | |||
| Inventories | 4,031,412 | |||
| Property, plant and equipment | 816,576 | |||
| Intangible assets | 2,217,985 | |||
| Right of use asset | 168,988 | |||
| Trade and other payables | (2,302,332 | ) | ||
| Borrowings | (743,279 | ) | ||
| Employee benefits and social security | (23,346 | ) | ||
| Deferred revenue and advances from customers | (2,515 | ) | ||
| Provisions | (355,898 | ) | ||
| Lease liabilities | (168,988 | ) | ||
| Deferred tax liabilities | (996,824 | ) | ||
| Total net assets identified | 3,873,974 | |||
| Non-controlling interest | (1,898,247 | ) | ||
| Gain from a bargain purchase | (1,032,327 | ) | ||
| Total consideration | 943,400 |
The business combination was executed in a context of financial setbacks faced by the acquired company. To address these, in addition to the initial cash payment, Bioceres has committed to providing a working capital loan of up to $3 million to help alleviate the financial strain.
BIOCERES GROUP PLC
NOTES TO THE CONSOLIDATED FINANCIAL STATEMENTS
As of June 30, 2024 and 2023 and for the years ended June 30, 2024, 2023 and 2022
(Amounts in US$, except otherwise indicated)
Bioceres will also provide regulatory services related to its proprietary technologies, which will enable strategic business development for Natal and create a new product pipeline leveraging Bioceres’ technology. Specifically, Bioceres has agreed to grant Natal an exclusive license for certain technologies to be applied to corn, with Natal committing to pay 15% of the revenues generated from this technology.
Intragroup reorganization
On August 18, 2021, the Board of Directors of the Company approved an intragroup reorganization (the “Reorganization”) involving the Company and several other entities within the Bioceres Group. The reorganization was executed through a series of steps referred to as the “Steps Plan Bioceres S.A. Reorganization” (the “Steps Plan”).
Bioceres Group PLC (“PLC” or “the company”) is a public limited company incorporated, domiciled, and registered in England and Wales under the “Companies Act 2006” created on April 3, 2021 as a wholly owned subsidiary of Bioceres S.A. The primary activity of PLC is investing in biotechnology-related projects and assets, as well as technologies associated with the food, agriculture, and health industries. (“Step 1 SPA”). As part of the Steps Plan, on August 18, 2021, Bioceres S.A (“BSA”) and the company entered into a share purchase agreement pursuant to which the Company purchased from Bioceres S.A (“Step 2 SPA”) the following businesses:
| Name of Company | Percentage of total issued share capital of the relevant Company | |||
| Bioceres Tech Services LLC | 100 | % | ||
| BG Farming Technologies Limited | 80 | % | ||
| Heritas Corp. | 40 | % | ||
The consideration for the Step 2 SPA was $11,272,920, to be paid in three years after the signing date (i.e., August 18, 2021) with an annual interest rate of 5.5 % (“Step 2 Loan”).
On August 25, 2021, the company and THEO I SCSp, a special limited partnership incorporated in the Grand Duchy of Luxembourg, 100% owned by the Company (“Theo”), entered into a share purchase agreement pursuant to which Theo purchase from the company (“Step 3 SPA”) the following businesses:
| Name of Company | Percentage of total issued share capital of the relevant Company | Allocated Consideration | ||||
| BG Farming Technologies Limited | 80 | % | 2,300,000 units | |||
| Heritas Corp. | 40 | % | 128,497 units | |||
The acquisition was completed through the issuance of interest in Theo (Units) representing an amount of $ 2,431,600.
On September 2, 2021, Bioceres LLC (“LLC”) and the company entered into a share purchase agreement pursuant to which the company purchased from LLC (the “Step 4 SPA”) 24.9% of equity interest of Bioceres S.A., valued at $52,134,723, and assumed financial liabilities for $32,097,525. The difference between the value of the business acquired and liabilities assumed of $20,037,198, is to be paid in three years as from the signing date (i.e., September 2, 2021) with an annual interest rate of 5.5 % (“Step 4 Loan”)-
On October 4, 2021, Bioceres LLC (“LLC”) and the Company entered into a share purchase agreement pursuant to which the Company purchased from LLC (the “Step 4 SPA”) 1,000,000 shares of Bioceres Crop Solutions Corp. The consideration for the Step 4 SPA was $13,310,000, to be paid in three years after the signing date (i.e., October 4, 2021) with an annual interest rate of 5.5 %.
BIOCERES GROUP PLC
NOTES TO THE CONSOLIDATED FINANCIAL STATEMENTS
As of June 30, 2024 and 2023 and for the years ended June 30, 2024, 2023 and 2022
(Amounts in US$, except otherwise indicated)
On October 4, 2021, the Company and THEO I SCSp, entered into an agreement (the “Subscription Agreement”) in which the company subscribes to Units in kind for a total amount equal to 1,000,000 ordinary shares of Bioceres Crop Solutions Corp. The consideration for the Step 4 SPA was $13,301,000.
As part of the reorganization, Bioceres Group offered to exchange the entire issued share capital of Bioceres S.A. on a 1 to 1 share exchange for PLC shares (“the exchange”) for a period of one year commencing on January 1, 2022.
As a result of the exchange, as of June 30, 2022, Bioceres Group held 16,148,562 shares of common stock with a face value of AR$ 1 representing approximately 54.83% of the issued share capital of Bioceres S.A. As of that date, Bioceres Group acquired control of Bioceres S.A. As of June 30, 2024 and 2023 the Company held an equity interest of 79,72% and 73.47% respectively on Bioceres S.A.
Accounting Treatment
The transaction is an intragroup reorganization between Bioceres S.A. (the originator), Bioceres Group PLC and other companies within the same economic group, performed in a series of steps, as described above.
The ultimate objective of the Reorganization is that Bioceres PLC, a newly created entity as detailed in Step 1 above, takes control of Bioceres S.A. and its subsidiaries, including the acquisition of certain other businesses (Step 3 above).
The shareholders of Bioceres S.A. prior to the Reorganizations, as well as those of PLC are predominantly individuals who did not, and do not, individually or collectively, have control over those entities. Consequently, there was no ultimate controlling party in Bioceres S.A. before the Reorganization or in PLC after it.
Through the Exchange explained above, PLC, becomes the parent company of the group (“TopCo”), no new shareholders were incorporated in such exchange.
Given that there is no controlling party over Bioceres S.A. and PLC before and after the Reorganization, respectively: such transaction does not meet the definition of a Business Combination Under Common Control, as it is not a business combination in which all combining entities are ultimately controlled by the same party or parties, both before and after the business combination.
It is important to note that, although the Exchange was not contractually committed, the substance and economic intent of the transaction was to place PLC at the top of the existing group structure, as occurred in June 2022. There is no specific guidance in IFRS 3 when a new entity, is placed on top of an existing group as a result of a corporate reorganization, where there is no economic substance or results passed on to third parties in the corporate transactions carried out, and the TopCo is not controlled by one or more shareholders. Therefore, management needs to apply judgment to develop an accounting policy that provides relevant and reliable information in accordance with IAS 8.
| ● | Management determined that the Reorganization should be accounted for using the predecessor accounting, explained in Note 4.6. |
| ● | The Company is reflecting the operations of Bioceres S.A in its consolidated statement of comprehensive income and consolidated statement of cash flows for the year ended June 30. 2022, reflecting the corresponding non-controlling interest for such period. |
BIOCERES GROUP PLC
NOTES TO THE CONSOLIDATED FINANCIAL STATEMENTS
As of June 30, 2024 and 2023 and for the years ended June 30, 2024, 2023 and 2022
(Amounts in US$, except otherwise indicated)
7. INFORMATION ABOUT COMPONENTS OF CONSOLIDATED STATEMENTS OF FINANCIAL POSITION
7.1 Cash and cash equivalents
| 06/30/2024 | 06/30/2023 | |||||||
| Cash at bank and on hand | 27,210,070 | 48,418,060 | ||||||
| Mutual funds | 25,784,795 | 846,960 | ||||||
| 52,994,865 | 49,265,020 | |||||||
7.2 Other financial assets
| 06/30/2024 | 06/30/2023 | |||||||
| Current | ||||||||
| Restricted short-term deposits | - | 212,703 | ||||||
| Investments at fair value | 2,191,286 | - | ||||||
| US Treasury bills | - | 9,163,298 | ||||||
| Mutual funds | 6,658,805 | 7,594,276 | ||||||
| Other investments | 5,817,516 | 2,858,737 | ||||||
| 14,667,607 | 19,829,014 | |||||||
| Non-current | ||||||||
| Mutual funds | 190,080 | 274 | ||||||
| Investments at fair value | 437 | 1,552 | ||||||
| 190,517 | 1,826 | |||||||
The book value is reasonably approximate to the fair value given its short-term nature.
7.3 Trade receivables
| 06/30/2024 | 06/30/2023 | |||||||
| Current | ||||||||
| Trade debtors | 205,490,518 | 160,761,923 | ||||||
| Allowance for impairment of trade debtors (Note 7.17) | (7,050,280 | ) | (7,425,604 | ) | ||||
| Shareholders and other related parties (Note 17) | 37 | - | ||||||
| Allowance for credit notes to be issued | (2,905,624 | ) | (3,694,019 | ) | ||||
| Trade debtors - Joint ventures and associates (Note 17) | 2,176,622 | 1,743,245 | ||||||
| Deferred checks | 11,295,922 | 7,991,237 | ||||||
| 209,007,195 | 159,376,782 | |||||||
The book value is reasonably approximate to the fair value given its short-term nature.
BIOCERES GROUP PLC
NOTES TO THE CONSOLIDATED FINANCIAL STATEMENTS
As of June 30, 2024 and 2023 and for the years ended June 30, 2024, 2023 and 2022
(Amounts in US$, except otherwise indicated)
7.4 Other receivables
| 06/30/2024 | 06/30/2023 | |||||||
| Current | ||||||||
| Taxes | 5,475,685 | 6,561,545 | ||||||
| Insurance to be accrued | 1,595,319 | 1,302,856 | ||||||
| Other receivables - Joint ventures and associates (Note 17) | 12,162,870 | 16,508,303 | ||||||
| Prepayments to suppliers | 7,236,905 | 10,989,935 | ||||||
| Shareholders and other related parties (Note 17) | 47,348 | 19,049 | ||||||
| Government grants receivable | 608 | 2,160 | ||||||
| Reimbursements over exports | - | 10,558 | ||||||
| Prepaid expenses and other receivables | 3,736,808 | 61,686 | ||||||
| Loans receivables | 1,800,572 | 68,274 | ||||||
| Miscellaneous | 2,601,268 | 2,673,090 | ||||||
| 34,657,383 | 38,197,456 | |||||||
| Non-current | ||||||||
| Taxes | 752,045 | 617,107 | ||||||
| Expenses paid in advance | - | 152,315 | ||||||
| Other receivables | 230,000 | - | ||||||
| Reimbursements over exports | 1,461,042 | 1,290,213 | ||||||
| Other receivables - Joint ventures and associates (Note 17) | 25,423,142 | 5,963,088 | ||||||
| Miscellaneous | 20,805 | - | ||||||
| 27,887,034 | 8,022,723 | |||||||
The book value of financial assets is reasonably approximate to the fair value given its short-term nature.
7.5 Inventories
| 06/30/2024 | 06/30/2023 | |||||||
| Seeds | 5,967,231 | 1,542,159 | ||||||
| Resale products | 53,788,333 | 58,544,931 | ||||||
| Manufactured products | 26,081,250 | 25,881,761 | ||||||
| Goods in transit | 5,618,540 | 3,620,606 | ||||||
| Supplies | 22,546,093 | 24,903,828 | ||||||
| Agricultural products | 15,015,884 | 28,436,830 | ||||||
| Allowance for obsolescence (Note 7.17) | (3,087,563 | ) | (2,492,499 | ) | ||||
| 125,929,768 | 140,437,616 | |||||||
| Net of agricultural products | 110,913,884 | 112,000,786 | ||||||
The roll-forward of allowance for obsolescence is in Note 7.18. Inventories recognized as an expense during the years ended June 30, 2024 and 2023 amounted to $255.6 and $200.2 million respectively. Those expenses were included in cost of sales.
BIOCERES GROUP PLC
NOTES TO THE CONSOLIDATED FINANCIAL STATEMENTS
As of June 30, 2024 and 2023 and for the years ended June 30, 2024, 2023 and 2022
(Amounts in US$, except otherwise indicated)
7.6 Biological assets
Changes in Biological assets:
| Soybean | Corn | Wheat | Barley | Sunflower | Total | |||||||||||||||||||
| Beginning of the year | - | - | 87,785 | 59,057 | - | 146,842 | ||||||||||||||||||
| Initial recognition and changes in the fair value of biological assets at the point of harvest | (352,199 | ) | (32,674 | ) | 231,526 | 106,605 | 996 | (45,746 | ) | |||||||||||||||
| Costs incurred during the year | 1,423,732 | 792,235 | 220,679 | 73,452 | 137,680 | 2,647,778 | ||||||||||||||||||
| Decrease due to harvest/disposals | (1,071,533 | ) | (759,561 | ) | (319,308 | ) | (165,662 | ) | (138,676 | ) | (2,454,740 | ) | ||||||||||||
| Year ended June 30, 2024 | - | - | 220,682 | 73,452 | - | 294,134 | ||||||||||||||||||
| Soybean | Corn | Wheat | Barley | Sunflower | Total | |||||||||||||||||||
| Beginning of the year | - | - | 44,413 | 12,900 | - | 57,313 | ||||||||||||||||||
| Initial recognition and changes in the fair value of biological assets at the point of harvest | 147,553 | 55,348 | 191,481 | 159,996 | 56,176 | 610,554 | ||||||||||||||||||
| Costs incurred during the year | 986,505 | 721,294 | 477,102 | 185,360 | 83,651 | 2,453,912 | ||||||||||||||||||
| Decrease due to harvest/disposals | (1,134,058 | ) | (776,642 | ) | (625,211 | ) | (299,199 | ) | (139,827 | ) | (2,974,937 | ) | ||||||||||||
| Year ended June 30, 2023 | - | - | 87,785 | 59,057 | - | 146,842 | ||||||||||||||||||
7.7 Property, plant and equipment
Property, plant and equipment as of June 30, 2024 and 2023, included the following:
| Class | Net carrying amount 06/30/2023 | Additions | Reclassification from Investment properties | Disposals | Depreciation of the year | Foreign currency translation | Loss of control (*) | Net carrying amount 06/30/2024 | ||||||||||||||||||||||||
| Research instruments | 66,131 | - | - | - | - | - | (66,131 | ) | - | |||||||||||||||||||||||
| Office equipment | 360,575 | 238,679 | - | - | (81,507 | ) | (13,324 | ) | (473 | ) | 503,950 | |||||||||||||||||||||
| Vehicles | 2,053,263 | 1,077,988 | - | (1,677 | ) | (908,040 | ) | (775 | ) | (28,132 | ) | 2,192,627 | ||||||||||||||||||||
| Equipment and computer software | 198,364 | 725,706 | - | (8,184 | ) | (354,379 | ) | (27,650 | ) | (5,041 | ) | 528,816 | ||||||||||||||||||||
| Fixtures and fittings | 2,925,032 | 731,699 | - | 6,295 | (812,810 | ) | (1,663 | ) | (43,477 | ) | 2,805,076 | |||||||||||||||||||||
| Machinery and equipment | 14,586,768 | 5,460,655 | - | (154,492 | ) | (2,661,097 | ) | (409,769 | ) | (99,423 | ) | 16,722,642 | ||||||||||||||||||||
| Land and buildings | 36,211,957 | 1,835,054 | 3,222,044 | 53,217 | (982,165 | ) | (595,040 | ) | - | 39,745,067 | ||||||||||||||||||||||
| Buildings in progress | 11,757,249 | 683,406 | - | (106,421 | ) | - | (207,757 | ) | (12,221 | ) | 12,114,256 | |||||||||||||||||||||
| Total | 68,159,339 | 10,753,187 | 3,222,044 | (211,262 | ) | (5,799,998 | ) | (1,255,978 | ) | (254,898 | ) | 74,612,434 | ||||||||||||||||||||
| (**) | USD (254,898) correspond to the loss of control of Inmet S.A. |
BIOCERES GROUP PLC
NOTES TO THE CONSOLIDATED FINANCIAL STATEMENTS
As of June 30, 2024 and 2023 and for the years ended June 30, 2024, 2023 and 2022
(Amounts in US$, except otherwise indicated)
| Class | Net carrying amount 06/30/2022 | Additions | Transfers | Disposals | Depreciation of the year | Foreign currency translation | Revaluation | Net carrying amount 06/30/2023 | ||||||||||||||||||||||||
| Research instruments | 33,841 | 60,449 | - | - | (29,908 | ) | 1,749 | - | 66,131 | |||||||||||||||||||||||
| Office equipment | 289,294 | 57,835 | 80,421 | (520 | ) | (72,226 | ) | 5,771 | - | 360,575 | ||||||||||||||||||||||
| Vehicles | 2,693,397 | 353,886 | - | (20,260 | ) | (969,256 | ) | (4,504 | ) | - | 2,053,263 | |||||||||||||||||||||
| Equipment and computer software | 260,325 | 127,258 | - | (21,127 | ) | (171,954 | ) | 3,862 | - | 198,364 | ||||||||||||||||||||||
| Fixtures and fittings | 3,546,942 | 99,967 | 18,581 | - | (742,647 | ) | 2,189 | - | 2,925,032 | |||||||||||||||||||||||
| Machinery and equipment | 5,963,428 | 10,581,626 | - | (30,555 | ) | (2,015,838 | ) | 88,107 | - | 14,586,768 | ||||||||||||||||||||||
| Land and buildings | 34,240,388 | 4,754,234 | 67,163 | - | (937,098 | ) | 73,076 | (1,985,806 | ) | 36,211,957 | ||||||||||||||||||||||
| Buildings in progress | 3,154,393 | 8,483,401 | (166,165 | ) | - | - | 285,620 | - | 11,757,249 | |||||||||||||||||||||||
| Total | 50,182,008 | 24,518,656 | - | (72,462 | ) | (4,938,927 | ) | 455,870 | (1,985,806 | ) | 68,159,339 | |||||||||||||||||||||
The depreciation charge is included in Notes 8.3 and 8.4. The Group has no commitments to purchase property, plant and equipment items.
Revaluation of property, plant and equipment
The Group updates frequently their assessment of the fair value of its land and buildings taking into account the most recent independent valuations and market data. Last valuations were performed as of June 30, 2023. Management determined the property, plant and equipment’s value within a range of reasonable fair value estimates.
All resulting fair value estimates for properties are included in level 2 or 3 depending on the methodology used.
The following are the carrying amounts that would have been recognized if land and building were stated at cost.
| Value at cost | ||||||
| Class of property | 06/30/2024 | 06/30/2023 | ||||
| Land and buildings | 27,876,636 | 21,161,294 | ||||
BIOCERES GROUP PLC
NOTES TO THE CONSOLIDATED FINANCIAL STATEMENTS
As of June 30, 2024 and 2023 and for the years ended June 30, 2024, 2023 and 2022
(Amounts in US$, except otherwise indicated)
7.8 Intangible assets
Intangible assets as of June 30, 2024 and 2023 included the following:
| Class | Net carrying amount 06/30/2023 | Additions | Additions from business combinations/ (disposals from loss of control)(*) | Transfers/ Disposals | Amortization of the year | Foreign currency translation | Net carrying amount 06/30/2024 | |||||||||||||||||||||
| Seed and integrated products | ||||||||||||||||||||||||||||
| Alfalfa Genuity Har Xstra | 419,061 | - | - | - | - | 18,968 | 438,029 | |||||||||||||||||||||
| Bacillus-PHAs | 1,089,536 | - | (1,089,536 | ) | - | - | - | - | ||||||||||||||||||||
| HB4 soy and breeding program | 31,679,114 | 5,987,247 | - | - | (2,091,992 | ) | - | 35,574,369 | ||||||||||||||||||||
| Integrated seed products | 2,841,008 | - | - | - | (191,559 | ) | 32,377 | 2,681,826 | ||||||||||||||||||||
| Crop nutrition | ||||||||||||||||||||||||||||
| Microbiological products | 37,295,460 | - | - | 7,610,115 | (3,718,326 | ) | - | 41,187,249 | ||||||||||||||||||||
| Microbiological products in progress | 12,213,341 | 5,869,084 | - | (7,610,115 | ) | - | (19,449 | ) | 10,452,861 | |||||||||||||||||||
| Other intangible assets | - | |||||||||||||||||||||||||||
| Trademarks and patents | 51,933,444 | 44,073 | - | - | (670,514 | ) | 9,857 | 51,316,860 | ||||||||||||||||||||
| Trademarks and patents with indefinite useful life | 7,827,309 | - | 2,217,985 | - | - | - | 10,045,294 | |||||||||||||||||||||
| Software | 1,638,752 | 585,313 | - | 276,128 | (1,369,379 | ) | (11,320 | ) | 1,119,494 | |||||||||||||||||||
| Software in progress | 349,171 | 507,685 | - | (276,128 | ) | - | - | 580,728 | ||||||||||||||||||||
| Customer loyalty | 23,006,023 | - | - | - | (4,071,453 | ) | - | 18,934,570 | ||||||||||||||||||||
| RG/RS/OX Wheat | 5,000,000 | - | - | - | - | - | 5,000,000 | |||||||||||||||||||||
| Total | 175,292,219 | 12,993,402 | 1,128,449 | - | (12,113,223 | ) | 30,433 | 177,331,280 | ||||||||||||||||||||
| (*) | USD 1,089,768 correspond to the loss of control of Inmet S.A. |
| Class | Net carrying amount 06/30/2022 | Additions | Additions from business combinations/ Disposals from loss of control | Transfers/ Disposals | Amortization of the year | Foreign currency translation | Net carrying amount 06/30/2023 | |||||||||||||||||||||
| Seed and integrated products | ||||||||||||||||||||||||||||
| Alfalfa Genuity Har Xstra | 398,468 | - | - | - | - | 20,593 | 419,061 | |||||||||||||||||||||
| Bacillus-PHAs | 920,991 | 120,949 | - | - | - | 47,596 | 1,089,536 | |||||||||||||||||||||
| HB4 soy and breeding program | 29,803,610 | 3,585,694 | - | - | (1,710,190 | ) | - | 31,679,114 | ||||||||||||||||||||
| Integrated seed products | 3,148,037 | - | - | - | (345,682 | ) | 38,653 | 2,841,008 | ||||||||||||||||||||
| Crop nutrition | ||||||||||||||||||||||||||||
| Microbiological products | 558,027 | 128,161 | 39,613,280 | 62,785 | (3,073,154 | ) | 6,361 | 37,295,460 | ||||||||||||||||||||
| Microbiological products in progress | 5,234,321 | 7,037,549 | - | (62,785 | ) | - | 4,256 | 12,213,341 | ||||||||||||||||||||
| Other intangible assets | ||||||||||||||||||||||||||||
| Trademarks and patents | 3,439,732 | 49,748 | 52,420,441 | - | (3,976,477 | ) | - | 51,933,444 | ||||||||||||||||||||
| Trademarks and patents with indefinite useful life | 7,827,309 | - | - | - | - | - | 7,827,309 | |||||||||||||||||||||
| Software | 3,682,805 | 105,229 | (1,598,930 | ) | 29,868 | (582,064 | ) | 1,844 | 1,638,752 | |||||||||||||||||||
| Software in progress | 84,343 | 294,696 | - | (29,868 | ) | - | - | 349,171 | ||||||||||||||||||||
| Customer loyalty | 22,537,803 | - | 1,785,237 | - | (1,317,017 | ) | - | 23,006,023 | ||||||||||||||||||||
| RG/RS/OX Wheat | 5,000,000 | - | - | - | - | - | 5,000,000 | |||||||||||||||||||||
| Total | 82,635,446 | 11,322,026 | 92,220,028 | - | (11,004,584 | ) | 119,303 | 175,292,219 | ||||||||||||||||||||
The amortization charge is included in Notes 8.3 and 8.4.
BIOCERES GROUP PLC
NOTES TO THE CONSOLIDATED FINANCIAL STATEMENTS
As of June 30, 2024 and 2023 and for the years ended June 30, 2024, 2023 and 2022
(Amounts in US$, except otherwise indicated)
There are no intangibles assets whose use has been restricted or which have been delivered as a guarantee. The Group has not assumed any commitments to acquire new intangibles.
Estimates
There is an inherent material uncertainty related to Management’s estimation of the ability of the Group to recover the carrying amounts of internally generated intangible assets related to biotechnology projects because it is dependent upon Group’s ability to raise sufficient funds to complete the projects development, the future outcome of the regulatory process, and the timing and amount of the future cash flows generated by the projects, among other future events.
Management’s estimations about the demonstrability of the recognition criteria for these assets and the subsequent recoverability represent the best estimate that can be made based on all the available evidence, existing facts and circumstances and using reasonable and supportable assumptions in cash flow projections. Therefore, the Consolidated financial statements do not include any adjustments that would result if the Group were unable to recover the carrying amount of the above-mentioned assets through the generation of enough future economic benefits.
7.9 Goodwill
| 06/30/2024 | 06/30/2023 | |||||||
| Rizobacter Argentina S.A. | 28,080,271 | 28,080,271 | ||||||
| Bioceres Crops S.A. | 7,523,322 | 7,523,322 | ||||||
| Insumos Agroquímicos S.A. | 470,090 | 470,090 | ||||||
| Pro Farm Group | 76,089,749 | 76,089,749 | ||||||
| 112,163,432 | 112,163,432 | |||||||
The Group is required to test whether goodwill has suffered any impairment on an annual basis. The recoverable amount is determined based on value in use calculations. The use of this method requires the estimation of future cash flows and the determination of a discount rate in order to calculate the present value of the cash flows.
Rizobacter CGU. This CGU is composed of all revenues collected through Rizobacter from the production and sale of proprietary and third-party products, both in the domestic and international markets. Additionally, Rizobacter generates revenue from the formulation, fragmentation and resale of third-party products.
Bioceres Crops CGU. This CGU is composed of the expected revenues from the commercialization of intensive R&D products that previously were allocated on the equity participation.
Insuagro CGU. This CGU is composed of all revenues collected through Insuagro from the production and sale of proprietary and third-party products, both in the domestic markets.
Pro Farm Group Inc CGU. This CGU is composed of all revenues collected through Pro Farm from the production and sale of proprietary and third-party products, both in the domestic and international markets.
BIOCERES GROUP PLC
NOTES TO THE CONSOLIDATED FINANCIAL STATEMENTS
As of June 30, 2024 and 2023 and for the years ended June 30, 2024, 2023 and 2022
(Amounts in US$, except otherwise indicated)
Management has made the estimates considering the cash flow projections projected by the management and third-party valuation reports on the assets, intangible assets and liabilities assumed. The key assumptions utilized are the following:
|
Key assumption |
Management’s approach |
| Discount rate |
The discount rate used ranges was 15.30 % for Rizobacter, Bioceres Crops, and Insuagro and 9.9 % for Pro Farm.
The weighted average cost of capital (“WACC”) rate has been estimated based on the market capital structure. For the cost of debt, the indebtedness cost of the CGUs was used.
For the cost of equity, the discount rate is estimated based on the Capital Asset Pricing Model (CAPM).
The value assigned is consistent with external sources of information.
|
| Budgeted market share of joint ventures and other customers |
The projected revenue from the products and services of the CGUs has been estimated by the management based on market penetration data for comparable products and technologies and on future expectations of foreseen economic and market conditions.
The value assigned is consistent with external sources of information.
|
| Budgeted product prices |
The prices estimated in the revenue projections are based on current and projected market prices for the products and services of the CGUs.
The value assigned is consistent with external sources of information.
|
| Growth rate used to extrapolate future cash flow projections to terminal period |
The growth rate used to extrapolate the future cash flow projections to terminal period is 2%.
The value assigned is consistent with external sources of information.
|
Management believes that any reasonably possible change in any of these key assumptions would not cause the aggregate carrying amount of the CGU to exceed its recoverable amount.
7.10 Investment properties
| 06/30/2024 | 06/30/2023 | |||||||
| Investment properties | 560,783 | 3,589,749 | ||||||
| 560,783 | 3,589,749 | |||||||
The decrease for the year is attributed to the reclassification of an investment property to Property, Plant, and Equipment for operational use.
The book value of the investment property does not differ significantly from its fair value.
BIOCERES GROUP PLC
NOTES TO THE CONSOLIDATED FINANCIAL STATEMENTS
As of June 30, 2024 and 2023 and for the years ended June 30, 2024, 2023 and 2022
(Amounts in US$, except otherwise indicated)
7.11 Trade and other payables
| 06/30/2024 | 06/30/2023 | |||||||
| Current | ||||||||
| Trade creditors | 108,922,112 | 104,947,888 | ||||||
| Shareholders and other related parties (Note 17) | 37,985 | 35,292 | ||||||
| Trade creditors - Joint ventures and associates (Note 17) | 52,778,206 | 41,479,606 | ||||||
| Taxes | 5,877,930 | 3,579,193 | ||||||
| Miscellaneous | 1,321,303 | 1,478,325 | ||||||
| 168,937,536 | 151,520,304 | |||||||
The book value of financial liabilities is reasonably approximate to the fair value given its short-term nature.
7.12 Borrowings
| 06/30/2024 | 06/30/2023 | |||||||
| Current | ||||||||
| Bank borrowings | 94,711,273 | 68,600,458 | ||||||
| Corporate bonds | 42,035,925 | 35,547,510 | ||||||
| Net loans payables- Joint ventures and associates (Note 17) | 1,860,058 | 1,854,680 | ||||||
| Financial borrowings | 95,903,495 | 73,997,959 | ||||||
| 234,510,751 | 180,000,607 | |||||||
| Non-current | ||||||||
| Bank borrowings | 17,033,059 | - | ||||||
| Corporate bonds | 25,071,823 | 50,007,680 | ||||||
| Financial borrowings | 85,143,423 | 91,774,754 | ||||||
| Other finance debt | - | 10,663,266 | ||||||
| 127,248,305 | 152,445,700 | |||||||
The carrying value of some borrowings as of June 30, 2024 and 2023, are measured at amortized cost differ from their fair value. The following fair values measured are based on discounted cash flows (Level 3) due to the use of unobservable inputs, including own credit risk.
Bioceres SA is the guarantor of the stock purchase agreement signed on October 28, 2022, between Theo I SCSp and DRACO I LATAM SPC LTD, as well as the subsequent credit line agreement signed on December 11, 2023, which are included in the investment in Theo I SCSp, as indicated in Note 11.
| 06/30/2024 | 06/30/2023 | |||||||||||||||
| Amortized Cost | Fair value | Amortized Cost | Fair value | |||||||||||||
| Current | ||||||||||||||||
| Bank borrowings | 94,711,273 | 93,301,194 | 68,600,458 | 64,505,601 | ||||||||||||
| Corporate bonds | 42,035,925 | 41,492,963 | 35,547,510 | 34,725,828 | ||||||||||||
| Financial borrowings | 95,903,495 | 95,480,681 | 73,997,959 | 73,795,070 | ||||||||||||
| Non current | ||||||||||||||||
| Bank borrowings | 17,033,059 | 12,206,794 | - | - | ||||||||||||
| Corporate bonds | 25,071,823 | 23,845,583 | 50,007,680 | 47,014,542 | ||||||||||||
| Financial borrowings | 85,143,423 | 81,120,125 | 91,774,754 | 90,644,569 | ||||||||||||
BIOCERES GROUP PLC
NOTES TO THE CONSOLIDATED FINANCIAL STATEMENTS
As of June 30, 2024 and 2023 and for the years ended June 30, 2024, 2023 and 2022
(Amounts in US$, except otherwise indicated)
7.13 Secured Notes
Secured Guaranteed Notes
The Secured Guaranteed Notes due 2026 mature 48 months after the issue date and bear interest at 9.0% from the issue date through 24 months after the issue date, 13.0% from 25 through 36 months after the issue date and 14.0% from 37 through 48 months after the issue date. Interest is payable semi-annually. The Secured Guaranteed Notes due 2026 have no conversion rights into our ordinary shares.
The carrying value the Secured Guaranteed Notes as of June 30, 2024 are measured at amortized cost. Its fair value based on discounted cash flows, using a fair interest rate, would amount to $25.7 million.
Secured Convertible Guaranteed Notes
The Secured Guaranteed Convertible Notes were issued for a total principal amount of $55 million. The notes have a 4- year maturity and accrue interest at an annual interest rate of 9%, of which 5% is payable in cash and 4% in-kind. At any time up to maturity the note holders might opt to convert the outstanding principal amount into common shares of BIOX at a strike price of $18 per share. BIOX can repurchase the notes voluntarily 30 months after the issue date.
At inception, the fair value of the liability component of the Secured Convertible Guaranteed Notes was measured using a discount rate of 13.57%.
The carrying value the Secured Convertible Guaranteed Notes as of June 30, 2024 are measured at amortized cost. Its fair value based on discounted cash flows, using a fair interest rate, would amount to $53.4 million.
Under the terms of the Secured Convertible Guaranteed Notes, the Group is in compliance with covenants.
7.14 Employee benefits and social security
| 06/30/2024 | 06/30/2023 | |||||||
| Current | ||||||||
| Salaries, accrued incentives, vacations and social security | 7,280,129 | 9,660,531 | ||||||
| Key management personnel (Note 17) | 226,702 | 290,331 | ||||||
| 7,506,831 | 9,950,862 | |||||||
The book value is reasonably approximate to the fair value given its short-term nature.
7.15 Deferred revenue and advances from customers
| 06/30/2024 | 06/30/2023 | |||||||
| Current | ||||||||
| Advances from customers | 3,335,740 | 9,233,766 | ||||||
| Deferred revenue (Note 6) | 589,061 | 15,659,630 | ||||||
| 3,924,801 | 24,893,396 | |||||||
| Non current | ||||||||
| Advances from customers | 52,511 | 620,893 | ||||||
| Deferred revenue (Note 6) | 1,872,627 | 1,436,912 | ||||||
| 1,925,138 | 2,057,805 | |||||||
BIOCERES GROUP PLC
NOTES TO THE CONSOLIDATED FINANCIAL STATEMENTS
As of June 30, 2024 and 2023 and for the years ended June 30, 2024, 2023 and 2022
(Amounts in US$, except otherwise indicated)
7.16 Provisions
| 06/30/2024 | 06/30/2023 | |||||||
| Conditional payment Rizobacter SA | 15,916,116 | 15,916,116 | ||||||
| Provisions for contingencies | 1,568,599 | 985,657 | ||||||
| 17,484,715 | 16,901,773 | |||||||
The Group has recorded a provision for probable administrative, judicial and out-of-court proceedings that could arise in the ordinary course of business, based on a prudent criterion according to its professional advisors and on Management’s assessment of the best estimate of the amount of possible claims. These potential claims are not likely to have a material impact on the results of the Group’s operations, its cash flow or financial position.
Management considers that the objective evidence is not enough to determine the date of the eventual cash outflow due to a lack of experience in any similar cases. However, the provision was classified under current or non-current liabilities, applying the best prudent criterion based on Management’s estimates.
There are no expected reimbursements related to the provisions.
In order to assess the need for provisions and disclosures in its consolidated financial statements, Management considers the following factors: (i) nature of the claim and potential level of damages in the jurisdiction in which the claim has been brought; (ii) the progress of the eventual case; (iii) the opinions or views of tax and legal advisers; (iv) experience in similar cases; and (v) any decision of the Group’s management as to how it will respond to the eventual claim.
Conditional payment Rizobacter S.A.
The Group agreed with certain sellers of Rizobacter, a contingent payment of $17.3 million (current value of $15.9 million) conditional on obtaining a favorable resolution that totally rejects the claim of the plaintiff in the nullity trials, file “Harnan Miguel, Marcos and Martina c /ac Mullen Jorge and others s/ Annulment Action”, file No. 76,806 and in the embargo, file “Harnan Miguel, Marcos and Martina c/ Mac Mullen Jorge and others s/ Precautionary Measures”, file No. 76,745. In said cause, 44% of the capital of Rizobacter Argentina S.A. is seized and 30% of the dividends that the taxed shares produce.
If the injunction is lifted, the Group will be required to pay within 12 months of notification, a contingent purchase price of $17.3 million to certain selling shareholders of Rizobacter.
7.17 Changes in allowances and provisions
| Item | 06/30/2023 | Additions | Additions from business combination | Uses and reversals | Currency conversion difference | 06/30/2024 | ||||||||||||||||||
| DEDUCTED FROM ASSETS | ||||||||||||||||||||||||
| Allowance for impairment of trade debtors | 7,425,604 | 753,428 | - | (777,558 | ) | (351,194 | ) | 7,050,280 | ||||||||||||||||
| Allowance for obsolescence | 2,492,499 | 586,515 | - | (69,582 | ) | 78,131 | 3,087,563 | |||||||||||||||||
| Total deducted from assets | 9,918,103 | 1,339,943 | - | (847,140 | ) | (273,063 | ) | 10,137,843 | ||||||||||||||||
| INCLUDED IN LIABILITIES | ||||||||||||||||||||||||
| Provisions for contingencies | 16,901,773 | 653,574 | 355,898 | (393,073 | ) | (33,457 | ) | 17,484,715 | ||||||||||||||||
| Total included in liabilities | 16,901,773 | 653,574 | 355,898 | (393,073 | ) | (33,457 | ) | 17,484,715 | ||||||||||||||||
| Total | 26,819,876 | 1,993,517 | 355,898 | (1,240,213 | ) | (306,520 | ) | 27,622,558 | ||||||||||||||||
BIOCERES GROUP PLC
NOTES TO THE CONSOLIDATED FINANCIAL STATEMENTS
As of June 30, 2024 and 2023 and for the years ended June 30, 2024, 2023 and 2022
(Amounts in US$, except otherwise indicated)
| Item | 06/30/2022 | Additions | Additions from business combination | Uses and reversals | Currency conversion difference | 06/30/2023 | ||||||||||||||||||
| DEDUCTED FROM ASSETS | ||||||||||||||||||||||||
| Allowance for impairment of trade debtors | 7,142,252 | 1,327,385 | - | (1,797,648 | ) | 753,615 | 7,425,604 | |||||||||||||||||
| Allowance for obsolescence | 1,104,750 | 1,066,777 | 531,232 | (690,503 | ) | 480,243 | 2,492,499 | |||||||||||||||||
| Total deducted from assets | 8,247,002 | 2,394,162 | 531,232 | (2,488,151 | ) | 1,233,858 | 9,918,103 | |||||||||||||||||
| INCLUDED IN LIABILITIES | ||||||||||||||||||||||||
| Provisions for contingencies | 16,674,115 | 239,292 | 393,073 | - | (404,707 | ) | 16,901,773 | |||||||||||||||||
| Total included in liabilities | 16,674,115 | 239,292 | 393,073 | - | (404,707 | ) | 16,901,773 | |||||||||||||||||
| Total | 24,921,117 | 2,633,454 | 924,305 | (2,488,151 | ) | 829,151 | 26,819,876 | |||||||||||||||||
7.18 Government Grants
| 06/30/2024 | 06/30/2023 | |||||||
| At of the beginning of the year/inception | 349,998 | 443,089 | ||||||
| (Loss of control) / business combination (*) | (157,043 | ) | - | |||||
| Received during the year | - | 9,825 | ||||||
| Currency conversion difference | 9,001 | (9,407 | ) | |||||
| Released to the statement of profit or loss | (197,519 | ) | (93,509 | ) | ||||
| At the end of the year | 4,437 | 349,998 | ||||||
| (*) | Correspond to the loss of control of Inmet S.A |
8. INFORMATION ABOUT COMPONENT OF CONSOLIDATED STATEMENTS OF COMPREHENSIVE INCOME
8.1 Revenue from contracts with customers
| 06/30/2024 | 06/30/2023 | 06/30/2022 | ||||||||||
| Sale of goods and services | 444,149,141 | 385,976,753 | 327,314,464 | |||||||||
| Royalties | 986,602 | 1,247,567 | 1,995,584 | |||||||||
| Rendering of services with related parties | 952,742 | 739,651 | 207,074 | |||||||||
| Right of use licenses | 20,287,845 | 32,903,458 | - | |||||||||
| 466,376,330 | 420,867,429 | 329,517,122 | ||||||||||
Transactions of sales of goods and services with joint ventures and with shareholders and other related parties are reported in Note 17.
BIOCERES GROUP PLC
NOTES TO THE CONSOLIDATED FINANCIAL STATEMENTS
As of June 30, 2024 and 2023 and for the years ended June 30, 2024, 2023 and 2022
(Amounts in US$, except otherwise indicated)
8.2 Cost of sales
| Item | 06/30/2024 | 06/30/2023 | 06/30/2022 | |||||||||
| Inventories as of the beginning of the year | 112,000,786 | 78,775,003 | 39,068,318 | |||||||||
| Business combination | 4,020,771 | 11,182,602 | - | |||||||||
| Purchases of the year | 249,648,267 | 233,465,488 | 229,990,487 | |||||||||
| Production costs | 25,819,152 | 23,234,862 | 15,764,012 | |||||||||
| Foreign currency translation | (1,206,764 | ) | 806,903 | 2,323,554 | ||||||||
| Subtotal | 390,282,212 | 347,464,858 | 287,146,371 | |||||||||
| Inventories as of the end of the year (*) | (110,913,884 | ) | (112,000,786 | ) | (78,775,003 | ) | ||||||
| Cost of sales | 279,368,328 | 235,464,072 | 208,371,368 | |||||||||
| (*) | Net of agricultural products |
8.3 R&D classified by nature
| Research and development expenses | ||||||||||||
| Item | 06/30/2024 | 06/30/2023 | 06/30/2022 | |||||||||
| Amortization of intangible assets | 5,923,389 | 4,804,768 | 2,348,822 | |||||||||
| Analysis and storage | 5,302 | 52,660 | 31,214 | |||||||||
| Commissions and royalties | - | 16,257 | 57,662 | |||||||||
| Import and export expenses | - | 855 | - | |||||||||
| Depreciation of leased assets | - | 68,321 | 36,426 | |||||||||
| Depreciation of property, plant and equipment | 618,627 | 637,734 | 491,877 | |||||||||
| Freight and haulage | 30,450 | 17,707 | 377 | |||||||||
| Employee benefits and social securities | 4,727,340 | 4,781,678 | 2,003,216 | |||||||||
| Insurance | 48,872 | 78,673 | 12,541 | |||||||||
| Energy and fuel | 8,101 | 111,481 | 59,170 | |||||||||
| Maintenance | 283,895 | 475,868 | 111,833 | |||||||||
| Supplies and materials | 2,361,380 | 3,078,403 | 1,579,157 | |||||||||
| Licenses & Patents | 67,188 | 181,264 | 178,659 | |||||||||
| Mobility and travel | 205,741 | 245,875 | 145,730 | |||||||||
| Publicity and advertising | 23,383 | - | - | |||||||||
| Systems expenses | 29,026 | 31,410 | 5,833 | |||||||||
| Vehicles expenses | 30,883 | 8,252 | 5,863 | |||||||||
| Share-based incentives | 510,162 | 136,754 | 48,934 | |||||||||
| Surveillance expenses | - | 11,145 | 13,460 | |||||||||
| Professional fees and outsourced services | 1,325,361 | 550,585 | 204,081 | |||||||||
| Professional fees related parties | 256,877 | 542,551 | - | |||||||||
| Office supplies | 696,760 | 111,618 | 32,830 | |||||||||
| Miscellaneous | 269,750 | 128 | 11,256 | |||||||||
| Total | 17,422,487 | 15,943,987 | 7,378,941 | |||||||||
| 06/30/2024 | 06/30/2023 | 06/30/2022 | ||||||||||
| R&D capitalized (Note 7.8) | 11,856,331 | 10,753,047 | 5,149,684 | |||||||||
| R&D profit and loss | 17,422,487 | 15,943,987 | 7,378,941 | |||||||||
| Total | 29,278,818 | 26,697,034 | 12,528,625 | |||||||||
BIOCERES GROUP PLC
NOTES TO THE CONSOLIDATED FINANCIAL STATEMENTS
As of June 30, 2024 and 2023 and for the years ended June 30, 2024, 2023 and 2022
(Amounts in US$, except otherwise indicated)
8.4 Expenses classified by nature and function
| Item | Production and services costs | Selling, general and administrative expenses | Total 06/30/2024 | |||||||||
| Amortization of intangible assets | 239,545 | 5,950,289 | 6,189,834 | |||||||||
| Analysis and storage | 598 | 160,133 | 160,731 | |||||||||
| Commissions and royalties | 217,000 | 1,745,169 | 1,962,169 | |||||||||
| Import and export expenses | 147,392 | 734,026 | 881,418 | |||||||||
| Depreciation of property, plant and equipment | 3,018,014 | 2,163,357 | 5,181,371 | |||||||||
| Impairment of receivables | - | 753,428 | 753,428 | |||||||||
| Freight and haulage | 282,936 | 10,438,823 | 10,721,759 | |||||||||
| Logistics | 644,974 | 1,392,386 | 2,037,360 | |||||||||
| Employee benefits and social securities | 11,162,207 | 38,799,972 | 49,962,179 | |||||||||
| Taxes | 285,791 | 14,442,557 | 14,728,348 | |||||||||
| Maintenance | 2,074,352 | 1,666,524 | 3,740,876 | |||||||||
| Energy and fuel | 997,066 | 514,422 | 1,511,488 | |||||||||
| Supplies and materials | 1,031,386 | 3,520,386 | 4,551,772 | |||||||||
| Mobility and travel | 143,046 | 4,391,952 | 4,534,998 | |||||||||
| Allowance for obsolescence | 581,804 | 4,711 | 586,515 | |||||||||
| Publicity and advertising | 233 | 5,065,506 | 5,065,739 | |||||||||
| Systems expenses | 35,526 | 3,857,779 | 3,893,305 | |||||||||
| Vehicles expenses | 59,764 | 925,186 | 984,950 | |||||||||
| Share-based incentives | - | 8,781,821 | 8,781,821 | |||||||||
| Share-based incentives for employees | 1,111,919 | 3,795,578 | 4,907,497 | |||||||||
| Surveillance expenses | 368 | 468,090 | 468,458 | |||||||||
| Professional fees and outsourced services | 189,090 | 9,131,891 | 9,320,981 | |||||||||
| Professional fees related parties (Note 17) | - | 243,827 | 243,827 | |||||||||
| Office supplies | 242,790 | 1,743,957 | 1,986,747 | |||||||||
| Insurance | 199,109 | 2,133,572 | 2,332,681 | |||||||||
| Depreciation of leased assets | 1,312,849 | 2,106,107 | 3,418,956 | |||||||||
| Contingencies | 66,682 | 586,892 | 653,574 | |||||||||
| Environmental Impact Treatment | 1,770,857 | 14,208 | 1,785,065 | |||||||||
| Miscellaneous | 3,854 | 808,273 | 812,127 | |||||||||
| Total | 25,819,152 | 126,340,822 | 152,159,974 | |||||||||
BIOCERES GROUP PLC
NOTES TO THE CONSOLIDATED FINANCIAL STATEMENTS
As of June 30, 2024 and 2023 and for the years ended June 30, 2024, 2023 and 2022
(Amounts in US$, except otherwise indicated)
| Item | Production and services costs | Selling, general and administrative expenses | Total 06/30/2023 | |||||||||
| Amortization of intangible assets | 173,032 | 6,026,784 | 6,199,816 | |||||||||
| Analysis and storage | 4,496 | 700,671 | 705,167 | |||||||||
| Commissions and royalties | 127,771 | 1,396,750 | 1,524,521 | |||||||||
| Import and export expenses | 150,402 | 794,561 | 944,963 | |||||||||
| Depreciation of property, plant and equipment | 2,161,236 | 2,139,957 | 4,301,193 | |||||||||
| Impairment of receivables | - | 1,327,385 | 1,327,385 | |||||||||
| Freight and haulage | 1,176,141 | 8,685,111 | 9,861,252 | |||||||||
| Logistics | 1,251,155 | 961,027 | 2,212,182 | |||||||||
| Employee benefits and social securities | 10,033,252 | 39,593,472 | 49,626,724 | |||||||||
| Taxes | 255,227 | 12,001,149 | 12,256,376 | |||||||||
| Maintenance | 1,157,887 | 956,916 | 2,114,803 | |||||||||
| Energy and fuel | 967,412 | 397,305 | 1,364,717 | |||||||||
| Supplies and materials | 1,075,909 | 1,048,056 | 2,123,965 | |||||||||
| Mobility and travel | 90,848 | 4,310,521 | 4,401,369 | |||||||||
| Allowance for obsolescence | 1,012,788 | 53,989 | 1,066,777 | |||||||||
| Publicity and advertising | 2,528 | 5,775,012 | 5,777,540 | |||||||||
| Systems expenses | 11,556 | 3,158,735 | 3,170,291 | |||||||||
| Vehicles expenses | 37,224 | 1,120,802 | 1,158,026 | |||||||||
| Share-based incentives | - | 114,994 | 114,994 | |||||||||
| Based incentive stock | - | 1,616,682 | 1,616,682 | |||||||||
| Share-based incentives for employees | - | 1,661,672 | 1,661,672 | |||||||||
| Surveillance expenses | 105,988 | 392,631 | 498,619 | |||||||||
| Professional fees and outsourced services | 100,308 | 13,807,495 | 13,907,803 | |||||||||
| Professional fees related parties (Note 17) | - | 196,101 | 196,101 | |||||||||
| Office supplies | 229,500 | 976,350 | 1,205,850 | |||||||||
| Insurance | 230,388 | 3,137,598 | 3,367,986 | |||||||||
| Licenses & Patents | - | 37,015 | 37,015 | |||||||||
| Depreciation of leased assets | 468,524 | 3,029,049 | 3,497,573 | |||||||||
| Contingencies | - | 239,292 | 239,292 | |||||||||
| Environmental Impact Treatment | 2,369,838 | - | 2,369,838 | |||||||||
| Miscellaneous | 41,452 | 874,192 | 915,644 | |||||||||
| Total | 23,234,862 | 116,531,274 | 139,766,136 | |||||||||
BIOCERES GROUP PLC
NOTES TO THE CONSOLIDATED FINANCIAL STATEMENTS
As of June 30, 2024 and 2023 and for the years ended June 30, 2024, 2023 and 2022
(Amounts in US$, except otherwise indicated)
| Item | Production and services costs | Selling, general and administrative expenses | Total 06/30/2022 | |||||||||
| Import and export expenses | 241,301 | 851,384 | 1,092,685 | |||||||||
| Depreciation of property, plant and equipment | 1,243,606 | 2,131,854 | 3,375,460 | |||||||||
| Freight and haulage | 277,414 | 8,848,545 | 9,125,959 | |||||||||
| Employee benefits and social securities | 7,756,683 | 24,290,768 | 32,047,451 | |||||||||
| Taxes | 47,296 | 11,147,347 | 11,194,643 | |||||||||
| Supplies and materials | 774,816 | 2,103,889 | 2,878,705 | |||||||||
| Systems expenses | 1,002 | 1,916,997 | 1,917,999 | |||||||||
| Professional fees and outsourced services | 62,097 | 11,296,699 | 11,358,796 | |||||||||
| Professional fees related parties (Note 14) | - | 222,331 | 222,331 | |||||||||
| Office supplies | 197,033 | 1,121,827 | 1,318,860 | |||||||||
| Insurance | 99,001 | 1,669,271 | 1,768,272 | |||||||||
| Amortization of intangible assets | 177,782 | 1,700,853 | 1,878,635 | |||||||||
| Depreciation of leased assets | 249,230 | 971,882 | 1,221,112 | |||||||||
| Energy and fuel | 555,066 | 53,146 | 608,212 | |||||||||
| Commissions and royalties | 165,013 | 1,661,984 | 1,826,997 | |||||||||
| Contingencies | - | 330,754 | 330,754 | |||||||||
| Impairment of receivables | - | 1,598,042 | 1,598,042 | |||||||||
| Surveillance expenses | 119,619 | 213,614 | 333,233 | |||||||||
| Vehicles expenses | 29,810 | 797,345 | 827,155 | |||||||||
| Share-based incentives | - | 725,674 | 725,674 | |||||||||
| Based incentive stock | - | 733,551 | 733,551 | |||||||||
| Maintenance | 899,790 | 732,361 | 1,632,151 | |||||||||
| Mobility and travel | 60,326 | 2,503,444 | 2,563,770 | |||||||||
| Publicity and advertising | - | 5,548,646 | 5,548,646 | |||||||||
| Allowance for obsolescence | 849,641 | - | 849,641 | |||||||||
| Logistics | 654,189 | 680,190 | 1,334,379 | |||||||||
| Environmental Impact Treatment | 1,301,911 | - | 1,301,911 | |||||||||
| Miscellaneous | 1,386 | 484,500 | 485,886 | |||||||||
| Total | 15,764,012 | 84,336,898 | 100,100,910 | |||||||||
BIOCERES GROUP PLC
NOTES TO THE CONSOLIDATED FINANCIAL STATEMENTS
As of June 30, 2024 and 2023 and for the years ended June 30, 2024, 2023 and 2022
(Amounts in US$, except otherwise indicated)
8.5 Finance results
| 06/30/2024 | 06/30/2023 | 06/30/2022 | ||||||||||
| Financial cost | ||||||||||||
| Interest expenses with related parties | 135,485 | - | - | |||||||||
| Interest expenses | (35,783,901 | ) | (30,569,478 | ) | (19,689,635 | ) | ||||||
| Financial commissions | (1,850,252 | ) | (3,007,154 | ) | (3,072,792 | ) | ||||||
| (37,498,668 | ) | (33,576,632 | ) | (22,762,427 | ) | |||||||
| Other financial results | ||||||||||||
| Exchange differences generated by assets | (7,519,875 | ) | (19,758,444 | ) | 33,413,927 | |||||||
| Exchange differences generated by liabilities | (20,499,620 | ) | (3,886,408 | ) | (51,206,853 | ) | ||||||
| Changes in fair value of financial assets or liabilities and other financial results | (10,455,775 | ) | (341,341 | ) | 5,436,247 | |||||||
| Net gain of inflation effect on monetary items | 28,730,804 | 10,311,437 | 565,780 | |||||||||
| (9,744,466 | ) | (13,674,756 | ) | (11,790,899 | ) | |||||||
| Total net financial cost | (47,243,134 | ) | (47,251,388 | ) | (34,553,326 | ) | ||||||
9. TAXATION
The balances of income tax recoverable and payable are as follows:
| 06/30/2024 | 06/30/2023 | |||||||
| Deferred tax assets | ||||||||
| Tax Loss-Carry Forward | 26,988,067 | 21,215,789 | ||||||
| Others financial assets | 813,780 | 1,336,260 | ||||||
| Others | 2,516,719 | 3,402,846 | ||||||
| Royalties | 764,888 | 723,082 | ||||||
| Trade receivables | 532,106 | 447,449 | ||||||
| Allowances | 942,587 | 1,213,899 | ||||||
| Government grants | 15,090 | 93,996 | ||||||
| Total deferred tax assets | 32,573,237 | 28,433,321 | ||||||
| Deferred tax liabilities | ||||||||
| Intangible assets | (28,444,095 | ) | (29,117,986 | ) | ||||
| Property, plant and equipment depreciation | (14,608,912 | ) | (13,678,341 | ) | ||||
| Inventories | (8,041,220 | ) | (6,461,576 | ) | ||||
| Others financial assets | (464,404 | ) | (2,154,504 | ) | ||||
| Right-of-use leased asset | (190,088 | ) | (120,442 | ) | ||||
| Inflation tax adjustment | (302,456 | ) | (1,131,895 | ) | ||||
| Others | (546,277 | ) | (607,722 | ) | ||||
| Total deferred tax liabilities | (52,597,452 | ) | (53,272,466 | ) | ||||
| Net deferred tax | (20,024,215 | ) | (24,839,145 | ) | ||||
BIOCERES GROUP PLC
NOTES TO THE CONSOLIDATED FINANCIAL STATEMENTS
As of June 30, 2024 and 2023 and for the years ended June 30, 2024, 2023 and 2022
(Amounts in US$, except otherwise indicated)
The roll forward of deferred tax assets and liabilities as of June 30, 2024, 2023, and 2022 are as follows:
| Balance 06/30/2023 | Business combination / (loss) of control | Income tax provision | Conversion difference | Charge to OCI | Balance 06/30/2024 | |||||||||||||||||||
| Deferred tax assets | ||||||||||||||||||||||||
| Tax Loss-Carry Forward | 21,215,789 | (62,585 | ) | 7,752,424 | (694,718 | ) | (1,222,843 | ) | 26,988,067 | |||||||||||||||
| Others financial assets | 1,336,260 | (2,299 | ) | (423,116 | ) | (97,065 | ) | - | 813,780 | |||||||||||||||
| Trade receivables | 447,449 | - | 214,734 | (130,077 | ) | - | 532,106 | |||||||||||||||||
| Royalties | 723,082 | - | 48,310 | (6,504 | ) | - | 764,888 | |||||||||||||||||
| Allowances | 1,213,899 | - | (221,106 | ) | (50,206 | ) | - | 942,587 | ||||||||||||||||
| Government grants | 93,996 | (39,261 | ) | (42,199 | ) | 2,554 | - | 15,090 | ||||||||||||||||
| Others | 3,402,846 | 765,384 | (1,651,511 | ) | - | - | 2,516,719 | |||||||||||||||||
| Total deferred tax assets | 28,433,321 | 661,239 | 5,677,536 | (976,016 | ) | (1,222,843 | ) | 32,573,237 | ||||||||||||||||
| Deferred tax liabilities | ||||||||||||||||||||||||
| Intangible assets | (29,117,986 | ) | (301,659 | ) | 867,636 | 107,914 | - | (28,444,095 | ) | |||||||||||||||
| Property, plant and equipment depreciation | (13,678,341 | ) | (174,228 | ) | (773,812 | ) | 17,469 | - | (14,608,912 | ) | ||||||||||||||
| Inventories | (6,461,576 | ) | (939,250 | ) | (640,394 | ) | - | - | (8,041,220 | ) | ||||||||||||||
| Others financial assets | (2,154,504 | ) | - | 1,690,100 | - | - | (464,404 | ) | ||||||||||||||||
| Right-of-use leased asset | (120,442 | ) | (115,495 | ) | 30,998 | 14,851 | - | (190,088 | ) | |||||||||||||||
| Inflation tax adjustment | (1,131,895 | ) | 10,732 | 827,211 | (8,504 | ) | - | (302,456 | ) | |||||||||||||||
| Others | (607,722 | ) | - | 111,773 | (50,328 | ) | - | (546,277 | ) | |||||||||||||||
| Total deferred tax liabilities | (53,272,466 | ) | (1,519,900 | ) | 2,113,512 | 81,402 | - | (52,597,452 | ) | |||||||||||||||
| Net deferred tax | (24,839,145 | ) | (858,661 | ) | 7,791,048 | (894,614 | ) | (1,222,843 | ) | (20,024,215 | ) | |||||||||||||
| Balance 06/30/2022 | Additions for business combination | Income tax provision | Conversion difference | Charge to OCI | Transfer of deferred tax assets/liabilities | Balance 06/30/2023 | ||||||||||||||||||||||
| Deferred tax assets | ||||||||||||||||||||||||||||
| Tax Loss-Carry Forward | 7,149,212 | 10,369,053 | 3,972,796 | (222,491 | ) | (23,244 | ) | (29,537 | ) | 21,215,789 | ||||||||||||||||||
| Others financial assets | 2,039,957 | - | (708,540 | ) | 1,127 | - | 3,716 | 1,336,260 | ||||||||||||||||||||
| Trade receivables | 131,946 | - | 123,114 | 192,389 | - | - | 447,449 | |||||||||||||||||||||
| Royalties | 5,766 | - | 200,979 | (2,953 | ) | - | 519,290 | 723,082 | ||||||||||||||||||||
| Allowances | 65,109 | - | 95,458 | (30,543 | ) | - | 1,083,875 | 1,213,899 | ||||||||||||||||||||
| Government grants | 59,489 | - | 15,081 | (13,857 | ) | - | 33,283 | 93,996 | ||||||||||||||||||||
| Others | (3,028,455 | ) | - | 2,289,075 | - | - | 4,142,226 | 3,402,846 | ||||||||||||||||||||
| Total deferred tax assets | 6,423,024 | 10,369,053 | 5,987,963 | (76,328 | ) | (23,244 | ) | 5,752,853 | 28,433,321 | |||||||||||||||||||
| Deferred tax liabilities | ||||||||||||||||||||||||||||
| Intangible assets | (13,814,403 | ) | (16,601,120 | ) | 1,265,841 | 120,253 | - | (88,557 | ) | (29,117,986 | ) | |||||||||||||||||
| Property, plant and equipment depreciation | (14,198,236 | ) | (103,650 | ) | 23,609 | (70,746 | ) | 712,458 | (41,776 | ) | (13,678,341 | ) | ||||||||||||||||
| Inventories | (2,019,126 | ) | - | (4,441,900 | ) | 576 | - | (1,126 | ) | (6,461,576 | ) | |||||||||||||||||
| Contingencies | 1,053,272 | - | - | - | - | (1,053,272 | ) | - | ||||||||||||||||||||
| Biological assets | (26,876 | ) | - | - | - | - | 26,876 | - | ||||||||||||||||||||
| Others financial assets | (404,718 | ) | - | (1,749,786 | ) | - | - | - | (2,154,504 | ) | ||||||||||||||||||
| Right-of-use leased asset | (113,996 | ) | - | (6,446 | ) | - | - | - | (120,442 | ) | ||||||||||||||||||
| Inflation tax adjustment | (3,774,606 | ) | - | 2,743,452 | (70,718 | ) | - | (30,023 | ) | (1,131,895 | ) | |||||||||||||||||
| Others | 4,178,750 | - | (182,861 | ) | - | - | (4,603,611 | ) | (607,722 | ) | ||||||||||||||||||
| Total deferred tax liabilities | (29,119,939 | ) | (16,704,770 | ) | (2,348,091 | ) | (20,635 | ) | 712,458 | (5,791,489 | ) | (53,272,466 | ) | |||||||||||||||
| Net deferred tax | (22,696,915 | ) | (6,335,717 | ) | 3,639,872 | (96,963 | ) | 689,214 | (38,636 | ) | (24,839,145 | ) | ||||||||||||||||
BIOCERES GROUP PLC
NOTES TO THE CONSOLIDATED FINANCIAL STATEMENTS
As of June 30, 2024 and 2023 and for the years ended June 30, 2024, 2023 and 2022
(Amounts in US$, except otherwise indicated)
The following table provides a reconciliation of the statutory tax rate to the effective tax rate. As the operations of the Group’s Argentine subsidiaries are the most significant source of profit or loss before tax, the following reconciliation has been prepared using the Argentine statutory tax rate:
| 06/30/2024 | 06/30/2023 | 06/30/2022 | ||||||||||
| (Loss) / earnings before income tax-rate | (27,958,152 | ) | 50,794,242 | (2,962,114 | ) | |||||||
| Income tax expense by applying tax rate in force in the respective countries | 7,224,973 | (7,628,367 | ) | (10,985,247 | ) | |||||||
| Share of profit or loss of subsidiaries, joint ventures and associates | (5,141,460 | ) | 12,645,224 | 6,443,174 | ||||||||
| Puttable instruments charge | - | (3,645 | ) | (12,447 | ) | |||||||
| Stock options charge | (1,366,999 | ) | (586,774 | ) | (75,581 | ) | ||||||
| Allowance for unused tax loss | (94,189 | ) | 428,530 | (562,713 | ) | |||||||
| Mutual funds adjustments | 27,560 | - | - | |||||||||
| Non-deductible expenses | (1,469,872 | ) | (373,655 | ) | (141,364 | ) | ||||||
| Result of inflation effect on monetary items and other finance results | (5,113,890 | ) | (7,872,801 | ) | (12,071,690 | ) | ||||||
| Tax inflation adjustment | 4,278,344 | 5,916,143 | (314,243 | ) | ||||||||
| Rate change adjustment (*) | 118,060 | (192,127 | ) | 171,355 | ||||||||
| Others | 434,321 | (4,162 | ) | 522,453 | ||||||||
| Income tax expenses | (1,103,152 | ) | 2,328,366 | (17,026,303 | ) | |||||||
| 06/30/2024 | 06/30/2023 | 06/30/2022 | ||||||||||
| Current tax expense | (8,894,200 | ) | (1,311,506 | ) | (19,004,369 | ) | ||||||
| Deferred tax | 7,791,048 | 3,639,872 | 1,978,066 | |||||||||
| (1,103,152 | ) | 2,328,366 | (17,026,303 | ) | ||||||||
The income tax expense was calculated by applying the tax rate in force in the respective countries, as follows:
| Tax jurisdiction | Earning before income tax-rate | Weight average applicable tax rate | Income tax as of June 30, 2024 | |||||||||
| Low or null taxation jurisdictions | 13,131,953 | 0.0 | % | - | ||||||||
| Profit-making entities | 32,251,706 | 32.2 | % | (10,370,389 | ) | |||||||
| Loss-making entities | (73,341,811 | ) | 24.0 | % | 17,595,362 | |||||||
| (27,958,152 | ) | 7,224,973 | ||||||||||
| Tax jurisdiction | Earning before income tax-rate | Weight average applicable tax rate | Income tax as of June 30, 2023 | |||||||||
| Low or null taxation jurisdictions | 30,921,548 | 0.0 | % | - | ||||||||
| Profit-making entities | 73,999,737 | 21.5 | % | (15,899,829 | ) | |||||||
| Loss-making entities | (54,127,043 | ) | 15.3 | % | 8,271,462 | |||||||
| 50,794,242 | (7,628,367 | ) | ||||||||||
| Tax jurisdiction | Earning before income tax-rate | Weight average applicable tax rate | Income tax as of June 30, 2022 | |||||||||
| Low or null taxation jurisdictions | (10,954,972 | ) | 0.0 | % | - | |||||||
| Profit-making entities | 34,020,753 | 36.5 | % | (12,415,073 | ) | |||||||
| Loss-making entities | (26,027,895 | ) | 5.5 | % | 1,429,826 | |||||||
| (2,962,114 | ) | (10,985,247 | ) | |||||||||
BIOCERES GROUP PLC
NOTES TO THE CONSOLIDATED FINANCIAL STATEMENTS
As of June 30, 2024 and 2023 and for the years ended June 30, 2024, 2023 and 2022
(Amounts in US$, except otherwise indicated)
The charge for income tax charged directly to profit or loss and the amount and expiry date of carry forward tax losses as of June 30 2024, are as follows:
| Fiscal year | Tax-Loss Carry forward | Tax-Loss | Prescription | Tax jurisdiction | ||||||||
| 2020 | 201,516 | 650,131 | 2025 | Argentina | ||||||||
| 2020 | 47,040 | 223,999 | 2025 | United States of America | ||||||||
| 2021 | 313,555 | 971,688 | 2026 | Argentina | ||||||||
| 2021 | 278,187 | 1,080,844 | 2026 | United States of America | ||||||||
| 2022 | 121,717 | 450,151 | 2027 | Argentina | ||||||||
| 2022 | 225,154 | 1,072,159 | 2027 | United States of America | ||||||||
| 2022 | 779,666 | 4,103,505 | 2027 | United Kingdom | ||||||||
| 2023 | 545,425 | 1,711,001 | 2028 | Argentina | ||||||||
| 2023 | 11,491,796 | 54,219,164 | 2028 | United States of America | ||||||||
| 2023 | 1,116,065 | 5,874,028 | 2028 | United Kingdom | ||||||||
| 2023 | 1,223,362 | 3,598,124 | 2028 | Brasil | ||||||||
| 2024 | 1,991,395 | 6,374,558 | 2029 | Argentina | ||||||||
| 2024 | 4,807,969 | 22,735,699 | 2029 | United States of America | ||||||||
| 2024 | 772,001 | 4,063,161 | 2029 | United Kingdom | ||||||||
| 2024 | 200,858 | 803,432 | 2029 | France | ||||||||
| 2024 | 2,872,361 | 8,448,123 | 2029 | Brasil | ||||||||
| 26,988,067 | 116,379,767 | |||||||||||
The amount of tax losses for the fiscal year ended on June 30 2024, is an estimate of the amount to be presented in the tax return.
Estimates
There is an inherent material uncertainty related to management’s estimation of the ability of the Group to use the deferred tax assets (both carryforward of unused tax losses and deductible temporary differences) and the credit of minimum presumed income tax because their future utilization depends on the generation of enough future taxable income by the entities within the Group during the periods in which those temporary differences are deductible or when the unused tax losses can be used.
Based on the projections of future taxable income for the periods in which the deferred tax assets are deductible, the Group’s management estimates that, except for the part of deferred tax asset that were unrecognized, it is probable that the entities within the Group can utilize those deferred tax assets, which depends, among other factors, on the success of the current projects of agricultural biotechnology, the future market price of commodities and the market share of the entities within the Group.
The estimates of Management about the demonstrability of the recognition criteria for these deferred tax assets and their subsequent recoverability represent the best estimate that can be made based on all the available evidence, existing facts and circumstances and the use of reasonable and supportable assumptions in the projections of future taxable income. Therefore, the consolidated financial statements do not include adjustments that could result if the entities within the Group would not be able to recover the deferred tax assets through the generation of enough future taxable income.
BIOCERES GROUP PLC
NOTES TO THE CONSOLIDATED FINANCIAL STATEMENTS
As of June 30, 2024 and 2023 and for the years ended June 30, 2024, 2023 and 2022
(Amounts in US$, except otherwise indicated)
10. EARNING PER SHARE
| 06/30/2024 | 06/30/2023 | 06/30/2022 | ||||||||||
| Numerator | ||||||||||||
| Loss/Profit for the year (basic EPS) | (32,685,398 | ) | 40,435,923 | (6,607,764 | ) | |||||||
| Loss/Profit for the year (diluted EPS) | (32,685,398 | ) | 40,435,923 | (6,607,764 | ) | |||||||
| Denominator | ||||||||||||
| Weighted average number of shares (basic EPS) | 18,481,014 | 14,581,657 | 2,197,716 | |||||||||
| Weighted average number of shares (diluted EPS) | 18,481,014 | 14,581,657 | 2,197,716 | |||||||||
| Basic loss/profit attributable to ordinary equity holders of the parent | (1.7686 | ) | 2.7731 | (3.0067 | ) | |||||||
| Diluted loss/profit attributable to ordinary equity holders of the parent | (1.7686 | ) | 2.7731 | (3.0067 | ) | |||||||
The Group had no dilutive potential shares during these years.
11. INFORMATION ABOUT COMPONENTS OF EQUITY
Capital issued
The numbers of shares issued as of June 30, 2024, 2023, and 2022 is the following:
| Year ended | Class | Number of Shares | Nominal Value | Subscribed capital | ||||||||||||||||
| 06/30/2022 | Ordinary | 10,371,228 | £ | 0,10 | 1,337,298 | £ | 1,037,123 | |||||||||||||
| 06/30/2023 | Ordinary | 16,830,795 | £ | 0,10 | 2,096,534 | £ | 1,683,080 | |||||||||||||
| 06/30/2024(*) | Ordinary | 18,995,832 | £ | 0,10 | 2,371,453 | £ | 1,899,583 | |||||||||||||
| (*) | Of the total number of shares, 57.600 shares are held by Rizobacter Argentina S.A. |
| Year ended | Class | Number of Shares | Nominal Value | Amount payable per-share | |||||||||||
| 06/30/2022 | Redeemable preference | 50,000 | £ | 1 | £ | 50,000 | |||||||||
| 06/30/2023 | Redeemable preference | 50,000 | £ | 1 | £ | 50,000 | |||||||||
| 06/30/2024 | Redeemable preference | 50,000 | £ | 1 | £ | 50,000 | |||||||||
Holders of the ordinary shares are entitled to one vote for each ordinary share.
Non-controlling interests
The subsidiaries whose non-controlling interest is significant as of June 30, 2024 and 2023 are:
| Name | 06/30/2024 | 06/30/2023 | ||||||
| Bioceres S.A. | 20.28 | % | 26.53 | % | ||||
| Bioceres Crop Solutions | 71.25 | % | 72.67 | % | ||||
BIOCERES GROUP PLC
NOTES TO THE CONSOLIDATED FINANCIAL STATEMENTS
As of June 30, 2024 and 2023 and for the years ended June 30, 2024, 2023 and 2022
(Amounts in US$, except otherwise indicated)
Below is a detail of the summarized financial information of Bioceres S.A., prepared in accordance with IFRS, and modified due to fair value adjustments at the acquisition date and differences in accounting policies. The information is presented prior to eliminations between that subsidiary and other Group companies.
Bioceres SA
Summary financial statements:
| 06/30/2024 | 06/30/2023 | |||||||
| Current assets | 37,499,373 | 37,022,845 | ||||||
| Non-current assets | 78,742,912 | 69,456,390 | ||||||
| Total assets | 116,242,285 | 106,479,235 | ||||||
| Current liabilities | 47,526,407 | 24,776,546 | ||||||
| Non-current liabilities | 14,689,742 | 30,094,495 | ||||||
| Total liabilities | 62,216,149 | 54,871,041 | ||||||
| Total equity | 54,026,136 | 51,608,194 | ||||||
| Total liabilities and equity | 116,242,285 | 106,479,235 | ||||||
| Summary statements of comprehensive income or loss | ||||||||
| 06/30/2024 | 06/30/2023 | |||||||
| Revenues | 1,422,707 | 1,074,655 | ||||||
| Government grants | 197,519 | 49,185 | ||||||
| Gross margin | 1,620,226 | 1,123,840 | ||||||
| Research and development expenses | (239,446 | ) | (175,737 | ) | ||||
| Selling, general and administrative expenses | (3,248,643 | ) | (3,287,433 | ) | ||||
| Share of profit or loss of subsidiaries | (3,285,724 | ) | 5,287,879 | |||||
| Share of profit or loss of joint ventures and associates | (2,592 | ) | (3,917 | ) | ||||
| Other income | 11,126 | 249,372 | ||||||
| Operating profit | (5,145,053 | ) | 3,194,004 | |||||
| Financial results | (1,128,752 | ) | (4,327,324 | ) | ||||
| Profit before taxes | (6,273,805 | ) | (1,133,320 | ) | ||||
| Income tax expense | 471,416 | (463,175 | ) | |||||
| Result for the year | (5,802,389 | ) | (1,596,495 | ) | ||||
| Foreign exchange differences on translation of foreign operations | (3,865,328 | ) | (5,182,181 | ) | ||||
| Revaluation of property, plant and equipment, net of tax | - | (434,390 | ) | |||||
| Total comprehensive result | (9,667,717 | ) | (7,213,066 | ) | ||||
BIOCERES GROUP PLC
NOTES TO THE CONSOLIDATED FINANCIAL STATEMENTS
As of June 30, 2024 and 2023 and for the years ended June 30, 2024, 2023 and 2022
(Amounts in US$, except otherwise indicated)
Bioceres Crop Solutions
Summary financial statements:
| 06/30/2024 | 06/30/2023 | |||||||
| Current assets | 408,668,037 | 397,114,401 | ||||||
| Non-current assets | 441,960,310 | 420,944,757 | ||||||
| Total assets | 850,628,347 | 818,059,158 | ||||||
| Current liabilities | 329,505,846 | 298,712,534 | ||||||
| Non-current liabilities | 171,558,140 | 188,850,517 | ||||||
| Total liabilities | 501,063,986 | 487,563,051 | ||||||
| Total equity | 349,564,361 | 330,496,107 | ||||||
| Total liabilities and equity | 850,628,347 | 818,059,158 | ||||||
Summary statements of comprehensive income or loss
| 06/30/2024 | 06/30/2023 | |||||||
| Revenues | 464,828,548 | 419,446,439 | ||||||
| Initial recognition and changes in the fair value of biological assets at the point of harvest | (45,746 | ) | 610,554 | |||||
| Cost of sales | (278,221,812 | ) | (235,457,053 | ) | ||||
| Changes in the net realizable value of agricultural products after harvest | (2,385,069 | ) | (4,351,433 | ) | ||||
| Research and development expenses | (17,183,041 | ) | (15,345,315 | ) | ||||
| Selling, general and administrative expenses | (123,690,910 | ) | (113,002,747 | ) | ||||
| Share of profit or loss of joint ventures and associates | 4,049,508 | 1,198,628 | ||||||
| Other income or expenses, net | (2,530,882 | ) | 1,084,892 | |||||
| Operating profit | 44,820,596 | 54,183,965 | ||||||
| Financial results | (34,785,325 | ) | (35,078,018 | ) | ||||
| Profit before taxes | 10,035,271 | 19,105,947 | ||||||
| Income tax | (3,778,615 | ) | 1,068,652 | |||||
| Result for the year | 6,256,656 | 20,174,599 | ||||||
| Foreign exchange differences on translation of foreign operations | (787,354 | ) | 631,500 | |||||
| Revaluation of property, plant and equipment, net of tax | - | (1,467,349 | ) | |||||
| Total comprehensive result | 5,469,302 | 19,338,750 | ||||||
BIOCERES GROUP PLC
NOTES TO THE CONSOLIDATED FINANCIAL STATEMENTS
As of June 30, 2024 and 2023 and for the years ended June 30, 2024, 2023 and 2022
(Amounts in US$, except otherwise indicated)
12. CASH FLOW INFORMATION
Significant non-cash transactions related to investing and financing activities are as follows:
| 06/30/2024 | 06/30/2023 | 06/30/2022 | ||||||||||
| Investment activities | ||||||||||||
| Net assets acquisition by business combination (Note 6) | 1,297,882 | 152,070,313 | - | |||||||||
| Investment in-kind in other related parties (Note 13) | 2,409,244 | 1,163,384 | 1,580,556 | |||||||||
| Non-monetary contributions in joint ventures and associates | - | - | 3,000 | |||||||||
| Changes in ownership interests in subsidiaries | - | - | 39,892,864 | |||||||||
| Issuance of shares | 267,600 | 759,236 | 2,836,565 | |||||||||
| Own shares held | (437,154 | ) | - | - | ||||||||
| Financed sale of property, plant and equipment | - | - | 1,734,281 | |||||||||
| Capitalization of interest on buildings in progress | 124,098 | 74,710 | - | |||||||||
| Right-of-use leased asset additions (Note 16) | - | 3,154,950 | - | |||||||||
| Reclassification from Investment properties to property, plant and equipment | - | 3,589,749 | - | |||||||||
| Sale of equity investee (Note 13) | (900,000 | ) | (133,079 | ) | - | |||||||
| 2,761,670 | 160,679,263 | 46,047,266 | ||||||||||
| Financing activities | ||||||||||||
| Capitalization of convertible notes | - | 12,211,638 | 36,244,460 | |||||||||
| Acquisition of interest in subsidiaries by financed debts | 6,417,912 | 81,965,022 | - | |||||||||
| Lease liabilities additions (Note 16) | - | (3,154,950 | ) | - | ||||||||
| 6,417,912 | 91,021,710 | 36,244,460 | ||||||||||
The Group has incorporated the assets and liabilities from Natal Agro S.R.L. and Pro Farm Group Inc mentioned in Note 6.
Disclosure of changes in liabilities arising from financing activities:
| Financing activities | Borrowings | Consideration for acquisition | Convertible notes | Total | ||||||||||||
| As of June 30, 2022 | 211,426,056 | 12,326,110 | 12,559,071 | 236,311,237 | ||||||||||||
| Proceeds | 200,185,822 | - | 55,000,000 | 255,185,822 | ||||||||||||
| Payments | (35,308,664 | ) | (3,148,617 | ) | - | (38,457,281 | ) | |||||||||
| Conversion of Convertible Notes (Note 7.13) | - | - | (9,109,516 | ) | (9,109,516 | ) | ||||||||||
| Interest payment | (20,465,271 | ) | - | (5,173,742 | ) | (25,639,013 | ) | |||||||||
| Exchange differences, currency translation differences and other financial results | (23,391,636 | ) | (4,617,570 | ) | 21,937,333 | (6,071,873 | ) | |||||||||
| As of June 30, 2023 | 332,446,307 | 4,559,923 | 75,213,146 | 412,219,376 | ||||||||||||
| Proceeds | 187,994,310 | - | - | 187,994,310 | ||||||||||||
| Payments | (142,866,725 | ) | (2,912,171 | ) | - | (145,778,896 | ) | |||||||||
| Financing for assets acquisitions | 743,279 | 1,119,975 | - | 1,863,254 | ||||||||||||
| Interest payment | (32,631,369 | ) | - | (4,172,328 | ) | (36,803,697 | ) | |||||||||
| Exchange differences, currency translation differences and other financial results | 16,073,254 | 3,809,240 | 9,768,868 | 29,651,362 | ||||||||||||
| As of June 30, 2024 | 361,759,056 | 6,576,967 | 80,809,686 | 449,145,709 | ||||||||||||
BIOCERES GROUP PLC
NOTES TO THE CONSOLIDATED FINANCIAL STATEMENTS
As of June 30, 2024 and 2023 and for the years ended June 30, 2024, 2023 and 2022
(Amounts in US$, except otherwise indicated)
13. JOINT VENTURES AND ASSOCIATES
| Assets | 06/30/2024 | 06/30/2023 | ||||||
| Measured at equity value method | ||||||||
| Synertech Industrias S.A. | 39,749,850 | 36,026,710 | ||||||
| Agrality Argentina S.A. | 7,758,886 | 5,052,087 | ||||||
| Agrality US Inc. | 3,521,791 | 3,586,113 | ||||||
| Agrality Seeds Inc. | 4,812,389 | 4,936,857 | ||||||
| SW Semillas S.A. | 955 | 3,389 | ||||||
| Moolec Science SA | - | 3,395,241 | ||||||
| Alfalfa Technologies S.R.L. | 36,503 | 36,503 | ||||||
| Inmet S.A | 379,876 | - | ||||||
| 56,260,250 | 53,036,900 | |||||||
| Measured at Fair value | ||||||||
| Theo I SCS | 36,535,601 | 65,306,063 | ||||||
| 36,535,601 | 65,306,063 | |||||||
| Liabilities | 06/30/2024 | 06/30/2023 | ||||||
| Measured at equity value method | ||||||||
| Trigall Genetics S.A. | 296,455 | 622,823 | ||||||
| 296,455 | 622,823 | |||||||
Changes in joint ventures investments and affiliates:
| 06/30/2024 | 06/30/2023 | |||||||
| As of the beginning | 117,720,140 | 63,781,938 | ||||||
| Non-monetary contributions (Note 12) | - | 7,541,619 | ||||||
| Changes in equity interest | 9,958 | (952,597 | ) | |||||
| Sale of equity investment | (900,000 | ) | (133,079 | ) | ||||
| Reclassification of Moolec Science S.A. | (2,560,472 | ) | - | |||||
| Revaluation of property, plant and equipment | - | (184,630 | ) | |||||
| Share-based incentives | 65,470 | 3,825 | ||||||
| Dividends distribution | (1,790,032 | ) | - | |||||
| Foreign currency translation | 977,482 | (46,541 | ) | |||||
| Share of profit or loss measured at equity value method | 7,747,312 | (2,076,234 | ) | |||||
| Share of profit or loss measured at fair value | (28,770,462 | ) | 49,785,839 | |||||
| As of the end of the year | 92,499,396 | 117,720,140 | ||||||
BIOCERES GROUP PLC
NOTES TO THE CONSOLIDATED FINANCIAL STATEMENTS
As of June 30, 2024 and 2023 and for the years ended June 30, 2024, 2023 and 2022
(Amounts in US$, except otherwise indicated)
Share of profit or loss of joint ventures and affiliates:
| Profit and losses | 06/30/2024 | 06/30/2023 | 06/30/2022 | |||||||||
| Measured at equity value method | ||||||||||||
| Synertech Industrias S.A. | 3,723,140 | 564,598 | 856,006 | |||||||||
| Agrality Argentina S.A. | 3,519,639 | 2,126,492 | 739,342 | |||||||||
| Agrality US Inc. | (64,322 | ) | (2,940,435 | ) | 193,961 | |||||||
| Agrality Seeds Inc. | (124,468 | ) | 2,187,415 | 112,987 | ||||||||
| Héritas Corp. | - | - | (1,059,355 | ) | ||||||||
| Indrasa Biotecnología S.A. | - | 62,613 | 1,794 | |||||||||
| Moolec Science SA | - | (4,176,703 | ) | (2,511,092 | ) | |||||||
| SW Semillas S.A. | (2,592 | ) | (3,917 | ) | (4,445 | ) | ||||||
| Trigall Genetics | 326,368 | 103,703 | 670,065 | |||||||||
| Inmet S.A. | 369,547 | - | - | |||||||||
| 7,747,312 | (2,076,234 | ) | (1,000,737 | ) | ||||||||
| Measured at Fair value | ||||||||||||
| Theo I SCS | (28,770,462 | ) | 49,785,839 | - | ||||||||
| (28,770,462 | ) | 49,785,839 | - | |||||||||
Bioceres Group PLC has elected to measure the investment in associates held through Theo (Héritas Corp, BG Farming, Moolec Science S.A., Gentle Farming, SF500) at fair value through profit or loss in accordance with IFRS 9.
There are no significant restrictions on the ability of the joint ventures and affiliates to transfer funds to the Group for cash dividends, or to repay loans or advances made by the Group, except for the legal obligation to establish a legal reserve for 5% of the profit for the year until reaching 20% of the capital for Argentinian entities.
Summarized financial information prepared in accordance with International Financial Reporting Standards (“IFRS”) in relation to the significant joint ventures is presented below:
| Name | Date | Current assets | Non-current assets |
Current liabilities | Non-current liabilities | Equity | Sales | (Loss)/Profit of the year | ||||||||||||||||||||||
| Synertech Industrias S.A. | 06/30/2024 | 55,963,591 | 11,195,394 | 27,610,517 | 3,447,008 | 36,101,460 | 61,815,678 | 7,236,901 | ||||||||||||||||||||||
| 06/30/2023 | 50,602,942 | 12,351,672 | 30,248,685 | 3,841,374 | 28,864,555 | 62,798,136 | 3,980,995 | |||||||||||||||||||||||
| 06/30/2022 | 39,548,944 | 13,846,826 | 24,679,402 | 3,342,325 | 25,374,043 | 61,117,486 | (2,429,401 | ) | ||||||||||||||||||||||
| Agrality Argentina S.A. | 06/30/2024 | 22,098,808 | 20,002,212 | 22,984,897 | 8,640,513 | 10,475,610 | 22,757,410 | 3,935,787 | ||||||||||||||||||||||
| 06/30/2023 | 14,203,372 | 24,832,433 | 14,591,700 | 19,382,094 | 5,062,012 | 20,540,979 | 2,071,653 | |||||||||||||||||||||||
| 06/30/2022 | 8,998,593 | 6,142,495 | 11,501,606 | 2,830,455 | 809,026 | 13,296,219 | 802,823 | |||||||||||||||||||||||
| Theo I S.C.S | 06/30/2024 | - | 108,456,044 | 13,405,755 | 57,060,813 | 37,989,476 | - | (32,213,331 | ) | |||||||||||||||||||||
| 06/30/2023 | - | 135,533,950 | 11,998,548 | 55,630,592 | 67,904,810 | - | (10,632,802 | ) | ||||||||||||||||||||||
| 06/30/2022 | - | 22,129,078 | 5,991,252 | - | 16,137,826 | - | 61,387,821 | |||||||||||||||||||||||
BIOCERES GROUP PLC
NOTES TO THE CONSOLIDATED FINANCIAL STATEMENTS
As of June 30, 2024 and 2023 and for the years ended June 30, 2024, 2023 and 2022
(Amounts in US$, except otherwise indicated)
14. SEGMENT INFORMATION
The Group is organized into four main operating segments:
Seed and integrated products
The seed and integrated products segment focuses mainly on the development and commercialization of seed technologies and products that increase yield per hectare, with a focus on the provision of seed technologies integrated with crop protection and crop nutrition products designed to control weeds, insects or diseases, to increase their quality characteristics, to improve nutritional value and other benefits. The segment focuses on the commercialization of integrated products that combine three complementary components biotechnological events, germplasm and seed treatments—in order to increase crop productivity and create value for customers. While each component can increase yield independently, through an integrated technology strategy the segment offers products that complement and integrate with each other to generate higher yields in crops.
Currently the segment generates revenue from ordinary activities through the sale of seeds, integrated product packs, royalties and licenses charged to third parties, among others.
Crop protection
The crop protection segment mainly includes the development, production and marketing of high-tech adjuvants and a full range of pest control molecules and biocontrol products. Adjuvants are used in mixtures to facilitate the application and effectiveness of active ingredients, such as insecticides, leading to better performance, reduced usage rates and lower residue levels Insecticides and fungicides are applied to control pests and significantly reduce disease during the germination period.
The segment currently generates revenue from ordinary activities through the sale of adjuvants, insecticides, fungicides, and baits, among others.
Crop nutrition
The crop nutrition segment focuses mainly on the development, production and commercialization of inoculants that allow the biological fixation of nitrogen in the crops, and of fertilizers including biofertilizers and microgranulated fertilizers that optimize the productivity and yield of the crops.
Currently the segment generates income from ordinary activities through the sale of inoculants, bio-inductors, biological fertilizers and microgranulated fertilizers, among others.
The measurement principles for the Group’s segment reporting structure are based on the IFRS principles adopted in the Consolidated financial statements. Revenue generated by products and services exchanged between segments and entities within the Group are calculated based on market prices.
Emerging solutions
The emerging solution segment is based on providing R&D services, biotechnology capabilities and specialised expertise to facilitate the integration of technologies and product development efforts within the Group, as well as R&D services to third parties.
This segment includes revenue sources primarily related to agro-industrial biotechnology businesses, such as those generated by the production and commercialization of industrial enzymes and fermentation technology to convert sugars and oils into high-value molecules or compounds.
BIOCERES GROUP PLC
NOTES TO THE CONSOLIDATED FINANCIAL STATEMENTS
As of June 30, 2024 and 2023 and for the years ended June 30, 2024, 2023 and 2022
(Amounts in US$, except otherwise indicated)
The measurement principles for the Group’s segment reporting structure are based on the IFRS principles adopted in the Consolidated financial statements. Revenue generated by products and services exchanged between segments and entities within the Group are calculated based on market prices.
The following tables present information with respect to the Group´s reporting segments:
| Year ended June 30, 2024 | Seed and integrated products | Crop protection | Crop nutrition | Emerging solutions | Consolidated | |||||||||||||||
| Revenues from contracts with customers | ||||||||||||||||||||
| Sale of goods and services | 94,457,404 | 223,538,317 | 125,558,380 | 1,547,782 | 445,101,883 | |||||||||||||||
| Royalties | 986,602 | - | - | - | 986,602 | |||||||||||||||
| Right of use licenses | 1,000,000 | - | 19,287,845 | - | 20,287,845 | |||||||||||||||
| Others | ||||||||||||||||||||
| Initial recognition and changes in the fair value of biological assets at the point of harvest | (45,746 | ) | - | - | - | (45,746 | ) | |||||||||||||
| Government grants | - | - | - | 197,519 | 197,519 | |||||||||||||||
| Total revenues | 96,398,260 | 223,538,317 | 144,846,225 | 1,745,301 | 466,528,103 | |||||||||||||||
| Cost of sales | (66,306,974 | ) | (143,807,301 | ) | (68,107,537 | ) | (1,146,516 | ) | (279,368,328 | ) | ||||||||||
| Gross profit per segment | 30,091,286 | 79,731,016 | 76,738,688 | 598,785 | 187,159,775 | |||||||||||||||
| % Gross margin | 31 | % | 36 | % | 53 | % | 34 | % | 40 | % | ||||||||||
| Year ended June 30, 2023 | Seed and integrated products | Crop protection | Crop nutrition | Emerging solutions | Consolidated | |||||||||||||||
| Revenues from contracts with customers | ||||||||||||||||||||
| Sale of goods and services | 55,360,397 | 205,685,451 | 157,153,024 | 1,420,990 | 419,619,862 | |||||||||||||||
| Royalties | 1,247,567 | - | - | - | 1,247,567 | |||||||||||||||
| Others | ||||||||||||||||||||
| Initial recognition and changes in the fair value of biological assets at the point of harvest | 319,428 | 153,460 | 137,666 | - | 610,554 | |||||||||||||||
| Government grants | - | - | - | 93,509 | 93,509 | |||||||||||||||
| Total revenues | 56,927,392 | 205,838,911 | 157,290,690 | 1,514,499 | 421,571,492 | |||||||||||||||
| Cost of sales | (31,012,687 | ) | (137,529,299 | ) | (66,915,067 | ) | (7,019 | ) | (235,464,072 | ) | ||||||||||
| Gross profit per segment | 25,914,705 | 68,309,612 | 90,375,623 | 1,507,480 | 186,107,420 | |||||||||||||||
| % Gross margin | 46 | % | 33 | % | 57 | % | 100 | % | 44 | % | ||||||||||
BIOCERES GROUP PLC
NOTES TO THE CONSOLIDATED FINANCIAL STATEMENTS
As of June 30, 2024 and 2023 and for the years ended June 30, 2024, 2023 and 2022
(Amounts in US$, except otherwise indicated)
| Year ended June 30, 2022 | Seed and integrated products | Crop protection | Crop nutrition | Emerging solutions | Consolidated | |||||||||||||||
| Revenues from contracts with customers | ||||||||||||||||||||
| Sale of goods and services | 45,862,562 | 173,095,092 | 107,502,350 | 1,061,534 | 327,521,538 | |||||||||||||||
| Royalties | 1,995,584 | - | - | - | 1,995,584 | |||||||||||||||
| Others | ||||||||||||||||||||
| Initial recognition and changes in the fair value of biological assets at the point of harvest | 3,672,192 | 1,171,749 | 1,544,089 | - | 6,388,030 | |||||||||||||||
| Government grants | - | - | - | 120,693 | 120,693 | |||||||||||||||
| Total revenues | 51,530,338 | 174,266,841 | 109,046,439 | 1,182,227 | 336,025,845 | |||||||||||||||
| Cost of sales | (21,839,689 | ) | (124,489,307 | ) | (62,035,099 | ) | (7,273 | ) | (208,371,368 | ) | ||||||||||
| Gross profit per segment | 29,690,649 | 49,777,534 | 47,011,340 | 1,174,954 | 127,654,477 | |||||||||||||||
| % Gross margin | 58 | % | 29 | % | 43 | % | 99 | % | 38 | % | ||||||||||
| Revenue by similar group of products or services | 06/30/2024 | 06/30/2023 | 06/30/2022 | |||||||||
| Seed and integrated products | 96,398,260 | 56,927,392 | 51,530,338 | |||||||||
| Seed Treatments Packs | 29,992,052 | 32,789,080 | 32,728,468 | |||||||||
| Seed & Royalties Payments | 5,587,594 | 7,004,400 | 6,384,927 | |||||||||
| HB4 Program | 60,818,614 | 17,133,912 | 12,416,943 | |||||||||
| Crop protection | 223,538,317 | 205,838,911 | 174,266,841 | |||||||||
| Adjuvants | 56,634,128 | 52,978,705 | 51,211,406 | |||||||||
| Seed CP Products and Services | 34,877,911 | 26,080,587 | 26,478,873 | |||||||||
| Other CP Products and Services | 103,092,454 | 94,277,444 | 96,576,562 | |||||||||
| Bioprotection | 28,933,824 | 32,502,175 | - | |||||||||
| Crop nutrition | 144,846,225 | 157,290,690 | 109,046,439 | |||||||||
| Inoculants & Biofertilizers | 18,315,253 | 23,621,534 | 23,621,552 | |||||||||
| Micro-beaded Fertilizers | 91,786,942 | 90,965,380 | 85,424,887 | |||||||||
| Biostimulants | 15,456,185 | 9,800,318 | - | |||||||||
| Syngenta up-front fee | 19,287,845 | 32,903,458 | - | |||||||||
| Emerging solutions | 1,745,301 | 1,514,499 | 1,182,227 | |||||||||
| Management expenses | 1,547,782 | 1,420,990 | 1,061,534 | |||||||||
| Government grants | 197,519 | 93,509 | 120,693 | |||||||||
| Total revenues | 466,528,103 | 421,571,492 | 336,025,845 | |||||||||
As of the current period, geographical information is reported by main countries and regions. LATAM refers to Latin America countries, excluding Argentina and Brazil which are reported separately. North America includes United States of America and Canada. The EMEA region covers Europe, the Middle East and Africa. The Group has recast the comparative figures accordingly.
BIOCERES GROUP PLC
NOTES TO THE CONSOLIDATED FINANCIAL STATEMENTS
As of June 30, 2024 and 2023 and for the years ended June 30, 2024, 2023 and 2022
(Amounts in US$, except otherwise indicated)
Geographical information
| 06/30/2024 | 06/30/2023 | 06/30/2022 | ||||||||||
| Argentina | 348,320,593 | 289,957,320 | 269,195,036 | |||||||||
| Brazil | 24,175,116 | 23,690,028 | 33,049,005 | |||||||||
| LATAM | 21,952,339 | 21,044,547 | 15,340,382 | |||||||||
| North America | 27,543,558 | 30,768,912 | 5,086,007 | |||||||||
| EMEA | 21,320,535 | 22,014,855 | 12,920,323 | |||||||||
| Rest of the world | 23,215,962 | 34,095,830 | 435,092 | |||||||||
| Total revenues | 466,528,103 | 421,571,492 | 336,025,845 | |||||||||
| 06/30/2024 | 06/30/2023 | |||||||
| Non-current assets | ||||||||
| Argentina | 139,722,896 | 126,425,975 | ||||||
| Brazil | 7,698,175 | 8,398,403 | ||||||
| LATAM | 1,162,654 | 1,064,290 | ||||||
| North America | 189,199,549 | 192,129,674 | ||||||
| EMEA | 44,141 | 61,526 | ||||||
| Rest of the world | 26,279,731 | 27,535,122 | ||||||
| Total | 364,107,146 | 355,614,990 | ||||||
| Property, plant and equipment | 74,612,434 | 68,159,339 | ||||||
| Intangible assets | 177,331,280 | 175,292,219 | ||||||
| Goodwill | 112,163,432 | 112,163,432 | ||||||
| Total reportable assets | 364,107,146 | 355,614,990 | ||||||
| Total non-reportable assets | 585,729,699 | 589,142,172 | ||||||
| Total assets | 949,836,845 | 944,757,162 | ||||||
15. FINANCIAL INSTRUMENTS – RISK MANAGEMENT
The Group is exposed to a variety of financial risks that arise from its activities and from its use of financial instruments. This Note provides information on the Group’s exposure to certain main risks, the Group’s objectives, policies and processes regarding the measurement and management of each risk.
The Group does not use derivative financial instruments to hedge any of the above risks.
General objectives, policies, and processes
The Board of Directors has overall responsibility for establishing and monitoring the Group’s risk management objectives and policies and, whilst retaining ultimate responsibility for them, it has delegated the function to design and operate processes that ensure the effective implementation of the objectives and policies to the management that periodically reports to the Board of Directors on the evolution of the risk management activities and results. The overall objective of the Board of Directors is to set policies that seek to reduce risk as much as possible without unduly affecting the Group’s competitiveness and flexibility.
The Group’s risk management policy is established to identify and analyze the risks facing the Group, to set appropriate risk limits and controls and to monitor risks and adherence to limits. The risks and methods for managing the risks are reviewed regularly in order to reflect changes in market conditions and the Group’s activities. The Group, through training and management standards and procedures, aims to develop a disciplined and constructive control environment in which all the employees understand their roles and obligations.
BIOCERES GROUP PLC
NOTES TO THE CONSOLIDATED FINANCIAL STATEMENTS
As of June 30, 2024 and 2023 and for the years ended June 30, 2024, 2023 and 2022
(Amounts in US$, except otherwise indicated)
The Group seeks to use suitable means of financing to minimize the Group’s capital costs and to manage and control the Group’s financial risks effectively. There have been no substantive changes in the Group’s exposure to financial instrument risks, its objectives, policies and processes for managing those risks or the methods used to measure them from previous periods unless otherwise stated in this Note.
The Group adopted a code of ethics applicable to its principal executive, financial and accounting officers and all employees.
The principal risks and uncertainties facing the business, set out below, do not appear in any particular order of potential materiality or probability of occurrence.
Credit risk
Credit risk is the risk of financial loss to the Group if a customer or counterparty fails to meet its contractual obligations, which derives mainly from trade and other receivables, as well as from cash and deposits in financial institutions.
The credit risk to which the Group is exposed is mainly defined in the Group’s accounts receivable followed by cash and cash equivalents, with the logical importance of being able to satisfy the Group’s needs in the short term.
Trade and other receivables
Credit risk is the risk of financial loss to the Group if a customer or counterparty fails to meet its contractual obligations and derives mainly from trade receivables and other receivables generated by services and product sales. The Group is also exposed to political and economic risk events, which may cause nonpayment of local and foreign currency obligations to the Group owed by customers, partners, contractors and suppliers.
The Group sells its products to a diverse base of customers. Customers include multi-national and local agricultural companies, distributors, and farmers who purchase the Group’s products. Type and class of customers may differ depending on the Group’s business segments.
The Group’s management determines concentrations of credit risk by periodically monitoring the credit worthiness rating of existing customers and through a monthly review of the trade receivables’ aging analysis. In monitoring the customers’ credit risk, customers are grouped according to their credit characteristics.
The Group’s policy is to manage credit exposure to counterparties through a process of credit rating. The Group performs credit evaluations of existing and new customers, and every new customer is examined thoroughly regarding the quality of its credit before offering the customer transaction terms. The examination made by the Group includes outside credit rating information, if available. Additionally, and even if there is no independent outside rating, the Group assesses the credit quality of the customer taking into account its financial position, past experience, bank references and other factors. A credit limit is prescribed for each customer. These limits are examined periodically. Customers that do not meet the Group’s criteria for credit quality may do business with the Group on a prepayment basis or by furnishing collateral satisfactory to the Group. The Group may still seek collateral and guarantees as it may consider appropriate regardless the credit profile of any customer.
To cover trade receivables, the Group has a credit insurance for main subsidiaries, which periodically analyzes its customer portfolio.
The financial statements contain specific provisions for doubtful debts, which properly reflect, in Management’s estimate, the loss embedded in debts, the collection of which is doubtful. The maximum exposure to credit risk is represented by the carrying amount of each financial asset in the statement of financial position after deducting any impairment allowance.
BIOCERES GROUP PLC
NOTES TO THE CONSOLIDATED FINANCIAL STATEMENTS
As of June 30, 2024 and 2023 and for the years ended June 30, 2024, 2023 and 2022
(Amounts in US$, except otherwise indicated)
On that basis, the loss allowance as of June 30, 2024 was determined as follows:
| Gross carrying amount-trade receivables | Expected Loss rate |
Loss allowance | ||||||||||
| Current | 127,405,353 | 0.43 | % | 547,675 | ||||||||
| More than 15 days past due | 41,168,864 | 0.13 | % | 53,475 | ||||||||
| More than 30 days past due | 15,354,896 | 0.14 | % | 20,895 | ||||||||
| More than 60 days past due | 4,662,888 | 0.10 | % | 4,629 | ||||||||
| More than 90 days past due | 5,118,337 | 0.31 | % | 15,761 | ||||||||
| More than 120 days past due | 803,333 | 0.63 | % | 4,846 | ||||||||
| More than 180 days past due | 6,014,520 | 24.66 | % | 1,474,772 | ||||||||
| More than 365 days past due | 4,962,327 | 100.00 | % | 4,928,227 | ||||||||
| Total 06/30/2024 | 205,490,518 | 7,050,280 | ||||||||||
Cash and deposits in banks
The Group is exposed to counterparty credit risk on cash and cash equivalent balances. The Group holds cash on deposit with a number of financial institutions. The Group manages its credit risk exposure by limiting individual deposits to clearly defined limits. The Group only deposits with high quality banks and financial institutions.
The maximum exposure to credit risk is represented by the carrying amount of cash and cash equivalents in the statement of financial position.
Liquidity risk
Liquidity risk is the risk that the Group will encounter difficulty in meeting its financial obligations when they come due.
The Group’s approach to managing its liquidity risk is to manage the profile of debt maturities and funding sources, maintaining sufficient cash, and ensuring the availability of funding from an adequate amount of credit facilities. The Group’s ability to fund its existing and prospective debt requirements is managed by maintaining diversified funding sources.
The cash flow forecast is determined at both an entity level and consolidated level. The forecasts are reviewed by the Board of Directors in advance, enabling the Group’s cash requirements to be anticipated. The Group examines the forecasts of its liquidity requirements in order to ascertain that there is sufficient cash for the operating needs, including the amounts required in order to settle financial liabilities.
The following table sets out the contractual maturities of financial liabilities:
| As of June 30, 2024 | Up to 3 months | 3 to 12 months | Between one and three years | |||||||||
| Trade and other payables | 107,801,065 | 61,136,471 | - | |||||||||
| Borrowings | 87,538,816 | 146,971,935 | 127,248,305 | |||||||||
| Consideration for acquisition of assets | - | 4,571,824 | 2,005,143 | |||||||||
| Convertible notes | - | - | 80,809,686 | |||||||||
| Lease liability | 738,561 | 2,384,217 | 8,161,359 | |||||||||
| Total | 196,078,442 | 215,064,447 | 218,224,493 | |||||||||
BIOCERES GROUP PLC
NOTES TO THE CONSOLIDATED FINANCIAL STATEMENTS
As of June 30, 2024 and 2023 and for the years ended June 30, 2024, 2023 and 2022
(Amounts in US$, except otherwise indicated)
| As of June 30, 2023 | Up to 3 months |
3 to 12 months |
Between one and three years |
|||||||||
| Trade and other payables | 68,407,847 | 83,112,457 | - | |||||||||
| Borrowings | 35,948,268 | 144,052,339 | 152,445,700 | |||||||||
| Consideration for acquisition of assets | - | 1,393,203 | 3,166,720 | |||||||||
| Convertible notes | - | - | 75,213,146 | |||||||||
| Lease liability | 3,858,699 | - | 10,030,524 | |||||||||
| Total | 108,214,814 | 228,557,999 | 240,856,090 | |||||||||
As of June 30, 2024 and 2023, the Group had no exposure to derivative liabilities.
Currency risk
Foreign currency risk is the risk that the fair value or future cash flows of a financial instrument will fluctuate because of changes in foreign exchange rate. Currency on foreign exchange risk arises when the Group enters into transactions denominated in a currency other than its functional currency.
Part of our business activities is conducted in Argentine pesos. However, some of our subsidiaries using the Argentine peso as their functional currency also have significant transactions denominated in U.S. dollars, mainly with respect to sales and financing activities.
The table below sets forth our net exposure to currency risk as of June 30, 2024:
| Net foreign currency position | 06/30/2024 | |||
| Amount expressed in US$ | (5,767,541 | ) | ||
| Other currencies | (3,837,458 | ) | ||
The main Argentinian subsidiaries of the Group have changed their functional currency from Argentine Pesos to US Dollar (Note 2).
Considering only this net currency exposure as of June 30, 2024, if an Argentine peso/US dollar revaluation or depreciation in relation to other foreign currencies with the remaining variables remaining constant, would have a positive or a negative impact on comprehensive income as a result of foreign exchange gains or losses. We estimate that a devaluation or an appreciation of the Argentine peso against the U.S. dollar of 20% during the year ended June 30, 2024, would have resulted in the following results:
| Estimated | ||||||||
| Exchange rate variation | (-)20% | (+)20% | ||||||
| Argentine peso amount expressed in US$ | -1,921,000 | 1,921,000 | ||||||
Interest rate risk
The Group’s financing costs may be affected by interest rate volatility. Borrowings under the Group’s interest rate management policy may be fixed or floating rate. The Group maintains adequate committed borrowing facilities and holds most of its financial assets primarily in cash or checks collected from customers that are readily convertible into known amounts of cash.
The Group’s interest rate risk arises from long-term borrowings. Borrowings issued at floating rates expose the Group to cash flow interest rate risk. Borrowings issued at fixed rates expose the Group to fair value interest rate risk. The Group has not entered into derivative contracts to hedge this exposure.
The Group does not use derivative financial instruments to hedge its interest rate risk exposure.
BIOCERES GROUP PLC
NOTES TO THE CONSOLIDATED FINANCIAL STATEMENTS
As of June 30, 2024 and 2023 and for the years ended June 30, 2024, 2023 and 2022
(Amounts in US$, except otherwise indicated)
The Group’s debt composition is set out below.
| Carrying amount | 06/30/2024 | 06/30/2023 | ||||||
| Fixed-rate instruments | ||||||||
| Current financial liabilities | 187,141,491 | 159,407,546 | ||||||
| Non-current financial liabilities | 112,872,243 | 143,996,525 | ||||||
| 300,013,734 | 303,404,071 | |||||||
| Variable-rate instruments | ||||||||
| Current financial liabilities | 47,369,260 | 20,593,061 | ||||||
| Non-current financial liabilities | 14,376,062 | 8,449,175 | ||||||
| 61,745,322 | 29,042,236 | |||||||
Holding all other variables constant, including levels of our external indebtedness, as of June 30, 2024, a one percentage point increase in floating interest rates would increase interest payable by less than $0.01 million.
The Group does not use derivative financial instruments to hedge its interest rate risk exposure.
Capital risk
The Group’s objectives when managing capital are to safeguard the Group’s ability to continue as a going concern, in order to provide returns for shareholders and benefits for other stakeholders, and to maintain an optimal capital structure to reduce the cost of capital.
The Group manages its capital structure and makes adjustments to it in the light of changes in economic conditions and the risk characteristics of the underlying assets. In order to maintain or adjust the capital structure, the Group may adjust the amount of any dividends it could pay to shareholders, return capital to shareholders, issue new shares, or sell assets to reduce debt.
Financial instruments by category
The following tables show additional information required under IFRS 7 on the financial assets and liabilities recorded as of June 30, 2024 and 2023.
Financial assets by category
| Amortized cost | Mandatorily measured at fair value through profit or loss | |||||||||||||||
| Financial asset | 06/30/2024 | 06/30/2023 | 06/30/2024 | 06/30/2023 | ||||||||||||
| Cash and cash equivalents | 46,710,292 | 48,418,060 | 6,284,573 | 846,960 | ||||||||||||
| Other financial assets | - | 7,806,979 | 14,858,124 | 12,023,861 | ||||||||||||
| Trade receivables | 209,007,195 | 159,376,782 | - | - | ||||||||||||
| Other receivables (*) | 45,342,974 | 27,837,591 | - | - | ||||||||||||
| Total | 301,060,461 | 243,439,412 | 21,142,697 | 12,870,821 | ||||||||||||
| (*) | Advances expenses and tax balances are not included. |
BIOCERES GROUP PLC
NOTES TO THE CONSOLIDATED FINANCIAL STATEMENTS
As of June 30, 2024 and 2023 and for the years ended June 30, 2024, 2023 and 2022
(Amounts in US$, except otherwise indicated)
Financial liabilities by category
| Amortized cost | Mandatorily measured at fair value through profit or loss | |||||||||||||||
| Financial liability | 06/30/2024 | 06/30/2023 | 06/30/2024 | 06/30/2023 | ||||||||||||
| Trade and other payables | 156,947,744 | 143,294,796 | 11,989,792 | 8,225,508 | ||||||||||||
| Borrowings | 361,759,056 | 332,446,307 | - | - | ||||||||||||
| Consideration for acquisition of assets | 3,852,853 | 4,559,923 | 2,724,114 | - | ||||||||||||
| Convertible notes | 80,809,686 | 75,213,146 | - | - | ||||||||||||
| Lease liability | 11,284,137 | 13,889,223 | - | - | ||||||||||||
| Total | 614,653,476 | 569,403,395 | 14,713,906 | 8,225,508 | ||||||||||||
Financial instruments measured at fair value
Fair value by hierarchy
According to the requirements of IFRS 7, the Group classifies each class of financial instrument valued at fair value into three levels, depending on the relevance of the judgment associated to the assumptions used for measuring the fair value.
Level 1 comprises financial assets and liabilities with fair values determined by reference to quoted prices (unadjusted) in active markets for identical assets or liabilities.
Level 2 comprises inputs other than quoted prices included within Level 1 that are observable for the asset or liability, either directly (i.e. as prices) or indirectly (i.e. derived from prices);
Level 3 comprises financial instruments with inputs for estimating fair value that are not based on observable market data.
| Measurement at fair value at 06/30/2024 | Level 1 | Level 2 | Level 3 | |||||||||
| Financial assets at fair value | ||||||||||||
| Mutual funds | 12,943,378 | - | - | |||||||||
| Moolec Science S.A shares | 2,191,286 | - | - | |||||||||
| Investments at fair value | 2,311,604 | - | - | |||||||||
| US Treasury bills | 1,993,668 | - | - | |||||||||
| Other investments | 1,702,761 | - | - | |||||||||
| Financial liabilities valued at fair value | ||||||||||||
| Trade and other payables | - | 11,989,792 | - | |||||||||
| Consideration for acquisition | 2,724,114 | - | - | |||||||||
BIOCERES GROUP PLC
NOTES TO THE CONSOLIDATED FINANCIAL STATEMENTS
As of June 30, 2024 and 2023 and for the years ended June 30, 2024, 2023 and 2022
(Amounts in US$, except otherwise indicated)
| Measurement at fair value at 06/30/2023 | Level 1 | Level 2 | Level 3 | |||||||||
| Financial assets at fair value | ||||||||||||
| Mutual funds | 846,960 | - | - | |||||||||
| Other mutual funds | 1,698,059 | - | - | |||||||||
| US Treasury bills | 9,163,298 | - | - | |||||||||
| Other investments | 1,162,504 | - | - | |||||||||
| Financial liabilities valued at fair value | ||||||||||||
| Trade and other payables | - | 8,225,508 | - | |||||||||
Estimation of fair value
The fair value of marketable securities, mutual funds and US Treasury Bills is calculated using the market approach using quoted prices in active markets for identical assets. The quoted marked price used for financial assets held by the Group is the current bid price. These instruments are included in level 1.
The Group’s financial liabilities, which were not traded in an active market, were determined using valuation techniques that maximize the use of available market information and thus rely as little as possible on specific estimates of the entity specific estimates. If all significant inputs required to fair value an instrument are observable, the instruments are included in level 2.
If one or more of the significant inputs is not based on observable market data, the instruments are included in level 3.
The Group’s policy is to recognize transfers between different categories of the fair value hierarchy at the time they occur or when there are changes in the circumstances that cause the transfer. There were no transfers between levels of the fair value hierarchy. There were no changes in economic or business circumstances affecting fair value.
Financial instruments not measured at fair value
The financial instruments not measured at fair value include cash and cash equivalents, trade accounts receivable, other accounts receivable, trade payables and other debts, borrowings, financed payments and convertible notes.
The carrying value of financial instruments not measured at fair value does not differ significantly from their fair value, except for borrowings (Note 7.12).
Management estimates that the carrying value of the financial instruments measured at amortized cost approximates their fair value.
16. LEASES
The right-of-use asset was initially measured at the amount of the lease liability plus initial direct costs incurred, adjusted by pre-payments made in relation to the lease. The right-of-use asset was measured at cost less accumulated depreciation and accumulated impairment.
The lease liability was initially measured at the present value of the lease payments payable over the lease term, discounted at the rate implicit in the lease if it can be readily determined. If that rate cannot be readily determined, the Group uses its incremental borrowing rate.
BIOCERES GROUP PLC
NOTES TO THE CONSOLIDATED FINANCIAL STATEMENTS
As of June 30, 2024 and 2023 and for the years ended June 30, 2024, 2023 and 2022
(Amounts in US$, except otherwise indicated)
The information about the right-of-use and liabilities related with lease assets is as follows:
| 06/30/2024 | 06/30/2023 | |||||||
| Right-of-use leased asset | ||||||||
| Book value at the beginning of the year/inception | 21,163,192 | 15,828,032 | ||||||
| Additions of the year | 2,585,223 | 3,154,950 | ||||||
| Additions from business combination | 168,988 | 3,005,000 | ||||||
| Disposals | (1,284,975 | ) | (1,839,921 | ) | ||||
| Exchange differences | (1,652,831 | ) | 1,015,131 | |||||
| Book value at the end of the year | 20,979,597 | 21,163,192 | ||||||
| 06/30/2024 | 06/30/2023 | |||||||
| Depreciation | ||||||||
| Book value at the beginning of the year/inception | 7,226,617 | 3,684,006 | ||||||
| Depreciation of the year | 3,418,956 | 3,565,894 | ||||||
| Disposals | (1,092,167 | ) | (171,870 | ) | ||||
| Exchange differences | (175,561 | ) | 148,587 | |||||
| Accumulated depreciation at the end of the year | 9,377,845 | 7,226,617 | ||||||
| Total | 11,601,752 | 13,936,575 | ||||||
| 06/30/2024 | 06/30/2023 | |||||||
| Lease Liabilities | ||||||||
| Book value at the beginning of the year/inception | 13,889,223 | 11,751,284 | ||||||
| Additions of the year | 2,585,223 | 3,154,950 | ||||||
| Additions from business combination | 168,988 | 3,245,000 | ||||||
| Interest expenses, exchange differences and inflation effects | (480,189 | ) | (406,494 | ) | ||||
| Payments of the year | (4,879,108 | ) | (3,855,517 | ) | ||||
| Total | 11,284,137 | 13,889,223 | ||||||
| 06/30/2024 | 06/30/2023 | |||||||
| Lease Liabilities | ||||||||
| Current | 3,122,778 | 3,858,699 | ||||||
| Non-current | 8,161,359 | 10,030,524 | ||||||
| 11,284,137 | 13,889,223 | |||||||
| 06/30/2024 | 06/30/2023 | |||||||
| Machinery and equipment | 3,655,741 | 3,655,741 | ||||||
| Vehicles | 1,272,071 | 1,475,581 | ||||||
| Equipment and computer software | 1,130,541 | 903,306 | ||||||
| Land and buildings | 14,921,244 | 15,128,564 | ||||||
| 20,979,597 | 21,163,192 | |||||||
BIOCERES GROUP PLC
NOTES TO THE CONSOLIDATED FINANCIAL STATEMENTS
As of June 30, 2024 and 2023 and for the years ended June 30, 2024, 2023 and 2022
(Amounts in US$, except otherwise indicated)
17. SHAREHOLDERS AND OTHER RELATED PARTIES BALANCES AND TRANSACTIONS
During the year ended June 30, 2024, the transactions between the Group and related parties, and the related balances owed by and to them for the year ended June 30, 2024 and 2023 are as follows:
| Value of transactions for the year ended | ||||||||||||||
| Party | Transaction type | 06/30/2024 | 06/30/2023 | 06/30/2022 | ||||||||||
| Joint ventures and associates | Sales of goods and services | 952,742 | 739,651 | 183,243 | ||||||||||
| Purchases of goods and services | (500,704 | ) | (738,652 | ) | (628,770 | ) | ||||||||
| Net loans granted | 13,005,841 | 7,141,471 | - | |||||||||||
| Interest gain | 135,485 | 212,407 | - | |||||||||||
| Net loans received | (1,860,058 | ) | (1,854,680 | ) | - | |||||||||
| Contributions in joint ventures | - | - | 3,000 | |||||||||||
| Shareholders and other related parties | Puttable instruments | - | 4,399,631 | 5,187,058 | ||||||||||
| Net loans granted | 28,299 | 19,049 | 56,456,806 | |||||||||||
| Interest gain | - | - | 1,856,242 | |||||||||||
| Interest expenses | (2,425,703 | ) | (956,873 | ) | 481,594 | |||||||||
| Own shares held by subsidiaries | (444,473 | ) | (133,079 | ) | - | |||||||||
| In-kind contributions | 2,409,244 | 1,163,384 | 1,580,556 | |||||||||||
| Sales of goods and services | 2,911,723 | 6,565,027 | 1,027,830 | |||||||||||
| Purchases of goods and services | (1,998,349 | ) | (2,334,556 | ) | (3,158,002 | ) | ||||||||
| Key management personnel | Salaries, social security benefits and other benefits | (2,496,073 | ) | (1,995,361 | ) | (2,861,358 | ) | |||||||
| Stock options-based incentives | (8,181,849 | ) | (1,868,430 | ) | (1,508,159 | ) | ||||||||
| Total | 1,536,125 | 10,358,989 | 58,620,040 | |||||||||||
| Amounts receivable from related parties | ||||||||||
| Party | Transaction type | 06/30/2024 | 06/30/2023 | |||||||
| Joint ventures and associates | Trade debtors | 2,176,622 | 1,743,245 | |||||||
| Other receivables | 37,586,012 | 22,471,391 | ||||||||
| Shareholders and other related parties | Trade debtors | 37 | - | |||||||
| Other receivables | 47,348 | 19,049 | ||||||||
| Total | 39,810,019 | 24,233,685 | ||||||||
| Amounts payable to related parties | ||||||||||
| Party | Transaction type | 06/30/2024 | 06/30/2023 | |||||||
| Joint ventures and associates | Trade creditors | (52,778,206 | ) | (41,479,606 | ) | |||||
| Net loans payables | (1,860,058 | ) | (1,854,680 | ) | ||||||
| Shareholders and other related parties | Trade creditors | (37,985 | ) | (35,292 | ) | |||||
| Key management personnel | Salaries, social security benefits and other benefits | (226,702 | ) | (290,331 | ) | |||||
| Total | (54,902,951 | ) | (43,659,909 | ) | ||||||
BIOCERES GROUP PLC
NOTES TO THE CONSOLIDATED FINANCIAL STATEMENTS
As of June 30, 2024 and 2023 and for the years ended June 30, 2024, 2023 and 2022
(Amounts in US$, except otherwise indicated)
18. KEY MANAGEMENT PERSONNEL COMPENSATION
Key management personnel are those persons having authority and responsibility for planning, directing and controlling the activities of the Group.
The compensation of directors and other members of key management personnel, including social contributions and other benefits, were as follows for the year ended June 30, 2024 and 2023.
| 06/30/2024 | 06/30/2023 | 06/30/2022 | ||||||||||
| Short-term employee benefits | 2,496,073 | 1,995,361 | 2,861,358 | |||||||||
| Share based payment | 8,181,849 | 1,868,430 | 1,508,159 | |||||||||
| 10,677,922 | 3,863,791 | 4,369,517 | ||||||||||
The Group entered into indemnification agreements with each of its directors and executive officers. These agreements generally provide that the relevant director or officer will be indemnified by the Group to the fullest extent permitted by law against liability and against all expenses reasonably incurred or paid by him or her in connection with any claim, action, suit or proceeding which he or she becomes involved as a party or otherwise by virtue of his or her being or having been such a director or officer of the Group and against amounts paid or incurred by him or her in the settlement thereof.
The agreements are subject to certain exceptions, including that no indemnification will be provided to any director or officer against any liability to the Group or its shareholder (i) by reason of intentional fraudulent conduct, dishonesty, willful misconduct, or gross negligence on the part of the director or officer; or (ii) by reason of payment made under an insurance policy or any third party that has no recourse against the indemnitee director or officer.
The compensation of key executives is determined by the Board of Directors of Bioceres Group PLC, Bioceres S.A. and Bioceres Crop Solutions Corp., based on the performance of individuals and market trends.
Bioceres Group currently does not pay any compensation to any of its executive board members.
19. SHARE-BASED PAYMENT
| 19.1 | Bioceres S.A share based payments |
In accordance with the compensation policy defined by the Group, certain directors of Bioceres S.A. have the option of choosing to collect the annual incentive in cash or in shares of BIOX. The incentive is for up to five times the monthly salary of each one and increases by $30,000 in the event that they choose to receive the incentive in the form of shares.
As of June 30, 2023, and 2022, 8,560 and 5,929 shares of Bioceres Crop Solutions Corp, were assigned to the beneficiaries, which were granted immediately in recognition of the professional performance demonstrated during the year.
Additionally, in January 2024, in compliance with the resolution in Minute No. 256 of the Board Meeting held in December 2021, it was decided to grant the Bioceres 2021 Award. It consists of 10,000 shares of Bioceres Crops Solutions Corp for Dr. Lía Raquel Chan, a researcher at CONICET, in recognition of her leadership in the early development of HB4 technology.
BIOCERES GROUP PLC
NOTES TO THE CONSOLIDATED FINANCIAL STATEMENTS
As of June 30, 2024 and 2023 and for the years ended June 30, 2024, 2023 and 2022
(Amounts in US$, except otherwise indicated)
| 19.2 | Bioceres Crop Solutions Corp share based payments |
2023 Omnibus Equity Incentive Plan
On May 12, 2023, the board of directors of Bioceres Crop Solutions Corp approved the 2023 Omnibus Equity Incentive Plan to attract and retain the best available personnel, provide additional incentives to employees, directors and consultants and to promote the success of our business. In addition to introducing new incentive plans, it comprehensively amends and restates in entirety (i) the Employee Stock Purchase Plan, (ii) the Equity Compensation Plan, (iii) the Stand-Alone Stock Option Grant, and (iv) the Employee Stock Option Plan.
| - | Employee Stock Purchase Plan (“ESPP”): incentive plan for eligible employees with no stock compensation to purchase ordinary shares of BIOX up to a maximum of 15% percent of such employee’s monthly compensation. The number of ordinary shares subject to the ESPP shall be 200,000 ordinary shares. The purchase price will be equal to 85% of the lower of the closing price of BIOX’s ordinary shares on the first business day and the last business day of the relevant offering period. As of the date of these consolidated financial statements the ESSP is not yet implemented. |
| - | Equity Compensation Plan: annual incentive plan based on certain financial and operational targets defined by the Board of Directors upon approval of the annual budget. |
| - | Stand Alone Stock Option Grant: plan granted up to 1,200,000 underlying ordinary shares. The options have an exercise price of $4.55 and expire on October 31, 2029. Options can be exercised for a period of up to three years, with 1/3 vesting every 12 months, and on a cashless basis at their volume weighted average price (“VWAP”) of the ordinary shares during a twenty-day period to the date of exercise. |
| - | Employee Stock Option Plan: plan granted up to 100,000 underlying ordinary shares to certain key employees. The options have an exercise price of $5.55 and expire on October 23, 2030. Options can be exercised for a period of up to three years, with 1/3 vesting every 12 months, and on a cashless basis at their volume weighted average price (“VWAP”) of the ordinary shares during a twenty-day period to the date of exercise. |
| - | Past Share Option plan: immediately vested options with a strike price between $11.93 and $13.24. |
| - | Base Share Option plan: to vest and become exercisable in equal installments on June 30, 2023, June 30, 2024, and June 30, 2025, with a strike price between $10.47 and $10.79. |
| - | Performance Share Option plan: to vest and become exercisable if the Group’s fiscal year 2025 EBITDA reaches at least US$120 million, at 0% of the award, and linearly thereafter up to 100% of the awarded options when reaching at least US$150 million. These options have also a strike price of between $10.47 and $10.79. |
The fair value of the stock options at the grant date was estimated using the “Black-Scholes” model, considering the terms and conditions under which the options on shares were granted and adjusted to consider the possible dilutive effect of the future exercise of options.
BIOCERES GROUP PLC
NOTES TO THE CONSOLIDATED FINANCIAL STATEMENTS
As of June 30, 2024 and 2023 and for the years ended June 30, 2024, 2023 and 2022
(Amounts in US$, except otherwise indicated)
| Factor | Stand Alone Stock Option Grant | Employee Stock Option Plan | Past Share Option plan | Base Share Option plan | Performance Share Option plan | |||||||||||||||
| Weighted average fair value of shares | $ | 5.42 | $ | 13.98 | $ | 11.45 | $ | 10.80 | $ | 10.79 | ||||||||||
| Weighted average exercise price | $ | 4.55 | $ | 5.55 | $ | 12.48 | $ | 10.52 | $ | 10.52 | ||||||||||
| Weighted average expected volatility | 29.69 | % | 42.18 | % | 48.73 | % | 54.73 | % | 54.73 | % | ||||||||||
| Dividend rate | 0 | % | 0 | % | 0 | % | 0 | % | 0 | % | ||||||||||
| Weighted average risk-free interest rate | 1.66 | % | 1.17 | % | 4.40 | % | 4.47 | % | 4.47 | % | ||||||||||
| Weighted average expected life | 9.89 years | 9.22 years | 4.89 years | 2.97 year | 2.97 year | |||||||||||||||
| Weighted average fair value of stock options at measurement date | $ | 2.47 | $ | 10.10 | $ | 5.01 | $ | 4.46 | $ | 4.45 | ||||||||||
There are no market-related performance conditions or non-vesting conditions that should be considered for determining the fair value of options.
The Group estimated that nearly 100% of the share options will be exercised, based on historical trends of executive retention and option exercise behavior. This estimate is reviewed at the end of each annual or interim period.
2013 Stock Incentive Plan
As part of the merger described in Note 6, we have assumed the outstanding “2013 Stock Incentive Plan” from Pro Farm Group. On the merger date the total equity awards outstanding was converted consistent with the terms of the merger agreement into an aggregate of 1,191,362 option and or restricted stock units which was fully registered with the Securities and Exchange Commission on July 26, 2022. All equity awards retained their original granted terms. BIOX has not granted any additional awards under this plan during the year.
Bioceres Crop Solutions’ fair value of the grants was estimated utilizing a Black Scholes option pricing model based on the following range of assumptions which have determined consistent with BIOX’s historical methodology for such assumptions:
| July 12, 2022 | ||
| Exercise price | $7.16 - 204.66 | |
| Expected life (years) | 0.03 - 9.83 | |
| Estimated volatility factor | 34.9% - 44.4% | |
| Risk-free interest rate | 0.0% | |
| Expected dividend yield | — |
The following table shows the evolution of stock option and weighted average exercise price for the years ended June 30, 2024, and 2023:
| 06/30/2024 | 06/30/2023 | |||||||||||||||
| Number of options | W.A. Exercise price | Number of options | W.A. Exercise price | |||||||||||||
| At the beginning of the year | 1,791,000 | 15.79 | 1,047,801 | 4.63 | ||||||||||||
| Assumed for business combination | - | - | 1,046,774 | 25.65 | ||||||||||||
| Granted during the year | 5,631,894 | 10.55 | - | - | ||||||||||||
| Cancelled or expired during the year | (570 | ) | 10.07 | (36,244 | ) | 8.46 | ||||||||||
| Exercised during the year | (76,529 | ) | 10.73 | (267,331 | ) | 11.86 | ||||||||||
| Effective at the end of the year | 7,345,795 | 11.83 | 1,791,000 | 15.79 | ||||||||||||
BIOCERES GROUP PLC
NOTES TO THE CONSOLIDATED FINANCIAL STATEMENTS
As of June 30, 2024 and 2023 and for the years ended June 30, 2024, 2023 and 2022
(Amounts in US$, except otherwise indicated)
Annual compensation - Bonus
Bonus in Cash is an annual cash incentive awarded up to an amount that is five times the individual’s monthly salary, which can be increased by $30,000 in value if the recipient decides to receive the base bonus in ordinary shares, to each of the executive offices. The bonus will be granted upon the meeting by the Company of certain financial and operational objectives. Each year the Board of Directors defines the objectives upon approval of the annual budget.
Bonus in Kind is an annual in-kind incentive awarded in ordinary shares to certain executive officers, to tie a portion of their compensation to financial and operational objectives. Each year the Board of Directors will define the objectives upon approval of the annual budget.
The number of shares that can be awarded under each bonus will be determined by using a 20-day volume weighted average price (“VWAP”) of the Company’s ordinary shares, starting with the day on which the relevant financial and operational objectives are met by the Company and the bonus is granted.
50% of bonus vests immediately if the financial and operational objectives are achieved as of such date, and the remaining 50% vests in the subsequent 12-months, upon meeting of the financial and operational objectives.
20. CONTINGENCIES, COMMITMENTS AND RESTRICTIONS ON THE DISTRIBUTION OF PROFITS
The new secured guaranteed notes and the convertibles notes referenced in Note 7.13 are secured by substantially all of the assets located in the United States of Pro Farm Group, Inc. and its U.S. subsidiaries and are guaranteed by BCS Holding Inc., Bioceres Crops do Brasil Ltda., Bioceres Crops S.A., Bioceres Semillas S.A.U., Verdeca LLC, Rasa Holding LLC, Rizobacter Argentina S.A., Rizobacter del Paraguay S.A., Rizobacter do Brasil Ltda., Rizobacter South Africa, Rizobacter Uruguay, Rizobacter USA, LLC, Pro Farm Group, Inc., Pro Farm Michigan Manufacturing LLC, Pro Farm, Inc., Pro Farm Technologies Comércio de Insumo Agrícolas do Brasil Ltda., Glinatur S.A. and Pro Farm OU.
21. EVENTS OCCURRING AFTER THE REPORTING PERIOD
On November 25, 2024, our subsidiary, Rizobacter Argentina S.A., announced the issuance of Series X corporate bonds in the Argentine market, detailed as follows:
Class A: $2.4 million 7.0% p.a. bonds due November 2026
Class B: $23.5 million 8.0% p.a. bonds due November 2027
The settlement date for both classes is November 28, 2024.
In December 2024, the Company issued 2,380,952 convertible preference shares for total proceeds of $15.0 million. These preference shares accrue a 9% per annum payment-in-kind (PIK) return and include contractual conversion features into either ordinary shares or shares of the surviving entity in connection with a future listing transaction, subject to specific conditions. If certain conditions are not met, the shares may be redeemable for cash. The instrument has been classified as a financial liability in accordance with IAS 32.
Within the context of a new strategy for our seed business, on February 6, 2025 we signed an agreement with GDM for the development of new soybean solutions with exclusive rights outside the drought tolerant space. Under this ten-year agreement, GDM will use Verdeca’s patented platform to develop and market a new generation of soybean varieties with superior agronomic performance. This opportunity will leverage from the collaboration that has already started several years ago.
BIOCERES GROUP PLC
NOTES TO THE CONSOLIDATED FINANCIAL STATEMENTS
As of June 30, 2024 and 2023 and for the years ended June 30, 2024, 2023 and 2022
(Amounts in US$, except otherwise indicated)
Subsequent to June 30, 2024, the Group initiated a plan to dispose of its investment in Theo I SCSp, currently recognized as a non-current asset under the Investments in joint ventures and associates line item in the consolidated statement of financial position. The sale process is expected to be completed during the first half of fiscal year 2026.
As of the date of authorization of these consolidated financial statements, the investment meets the criteria to be classified as a disposal group held for sale under IFRS 5. Theo I SCSp is included within the Seed Development and Strategic Investment segment of the Group. The planned disposal aligns with the Group’s strategic focus and capital allocation priorities.
On April 1, 2025, pursuant to resolutions passed at a General Meeting of Shareholders, the Company re-registered as a private limited company and changed its legal name from Bioceres Group PLC to Bioceres Group Limited.
Subsequent to June 30, 2024, there have been no other situations or circumstances that may require significant adjustments or further disclosure in these consolidated financial statements that were not mentioned above.
81
Exhibit 99.4
BIOCERES GROUP PLC
Registration number: 13310943

BIOCERES GROUP PLC
Unaudited interim condensed consolidated financial statements
as of December 31, 2024 and June 30, 2024, and for the six-month
periods ended December 31, 2024 and 2023.
BIOCERES GROUP PLC
Registration number: 13310943
CONTENTS
| Unaudited interim condensed consolidated financial statements as of December 31, 2024 and June 30, 2024, and for the six-month periods ended December 31, 2024 and 2023. | |
| Unaudited interim condensed consolidated statements of financial position as of December 31, 2024 and June 30, 2024 | 3 |
| Unaudited interim condensed consolidated statements of comprehensive income for the six-month periods ended December 31, 2024 and 2023 | 5 |
| Unaudited interim condensed consolidated statements of changes in equity for the six-month periods ended December 31, 2024 and 2023 | 6 |
| Unaudited interim condensed consolidated statements of cash flows for the six-month periods ended December 31, 2024 and 2023 | 8 |
| Notes to the unaudited interim condensed consolidated financial statements | 10 |
Registration number: 13310943
UNAUDITED INTERIM CONDENSED CONSOLIDATED
STATEMENTS OF FINANCIAL POSITION
As of December 31, 2024, and June 30, 2024
(Amounts in US$)
| Notes | 12/31/2024 | 06/30/2024 | ||||||||||
| ASSETS | ||||||||||||
| NON-CURRENT ASSETS | ||||||||||||
| Other financial assets | 5.2 | 373,520 | 190,517 | |||||||||
| Other receivables | 5.4 | 27,128,645 | 27,887,034 | |||||||||
| Income taxes | 15,379 | 10,889 | ||||||||||
| Deferred tax assets | 7 | 19,975,796 | 14,476,230 | |||||||||
| Investments in joint ventures and associates | 11 | 64,991,989 | 92,795,851 | |||||||||
| Property, plant and equipment | 5.6 | 74,935,727 | 74,612,434 | |||||||||
| Investment properties | 560,783 | 560,783 | ||||||||||
| Intangible assets | 5.7 | 176,760,919 | 177,331,280 | |||||||||
| Goodwill | 5.8 | 112,163,432 | 112,163,432 | |||||||||
| Right of use asset | 14 | 16,335,484 | 11,601,752 | |||||||||
| Total non-current assets | 493,241,674 | 511,630,202 | ||||||||||
| CURRENT ASSETS | ||||||||||||
| Cash and cash equivalents | 5.1 | 33,201,142 | 52,994,865 | |||||||||
| Other financial assets | 5.2 | 9,597,877 | 14,667,607 | |||||||||
| Trade receivables | 5.3 | 228,437,463 | 209,007,195 | |||||||||
| Other receivables | 5.4 | 38,376,133 | 34,657,383 | |||||||||
| Recoverable income tax | 1,500,924 | 655,691 | ||||||||||
| Inventories | 5.5 | 101,809,489 | 125,929,768 | |||||||||
| Biological assets | 4,398,841 | 294,134 | ||||||||||
| Total current assets | 417,321,869 | 438,206,643 | ||||||||||
| Total assets | 910,563,543 | 949,836,845 | ||||||||||
The accompanying Notes are an integral part of these consolidated financial statements. Related parties balances and transactions are disclosed in Note 15.
BIOCERES GROUP PLC
Registration number: 13310943
UNAUDITED INTERIM CONDENSED CONSOLIDATED STATEMENTS OF FINANCIAL POSITION
As of December 31, 2024 and June 30, 2024
(Amounts in US$)
| Notes | 12/31/2024 | 06/30/2024 | ||||||||||
| EQUITY | ||||||||||||
| Issued capital | 9 | 2,382,321 | 2,371,453 | |||||||||
| Own shares held | (444,473 | ) | (444,473 | ) | ||||||||
| Shares trading premium | (7,020,546 | ) | (7,289,991 | ) | ||||||||
| Stock options and share based incentives | 6,645,791 | 6,222,175 | ||||||||||
| Retained deficit/earnings | (31,960,439 | ) | 1,142,761 | |||||||||
| Revaluation of property, plant and equipment reserve | (1,323,916 | ) | (1,323,916 | ) | ||||||||
| Foreign currency translation reserve | (782,649 | ) | 534,827 | |||||||||
| Equity attributable to owners of the parent | (32,503,911 | ) | 1,212,836 | |||||||||
| Non-controlling interest | 244,356,305 | 248,788,534 | ||||||||||
| Total equity | 211,852,394 | 250,001,370 | ||||||||||
| LIABILITIES | ||||||||||||
| NON-CURRENT LIABILITIES | ||||||||||||
| Borrowings | 5.10 | 151,769,309 | 127,248,305 | |||||||||
| Deferred revenue and advances from customers | 5.12 | 1,879,736 | 1,925,138 | |||||||||
| Government grants | 1,986 | 782 | ||||||||||
| Joint ventures and associates | 11 | 749,269 | 296,455 | |||||||||
| Deferred tax liabilities | 7 | 32,950,920 | 34,500,445 | |||||||||
| Provisions | 5.13 | 17,307,170 | 17,484,715 | |||||||||
| Consideration for acquisition | 1,929,241 | 2,005,143 | ||||||||||
| Convertible notes | 83,400,171 | 80,809,686 | ||||||||||
| Lease liabilities | 14 | 10,848,789 | 8,161,359 | |||||||||
| Total non-current liabilities | 300,836,591 | 272,432,028 | ||||||||||
| CURRENT LIABILITIES | ||||||||||||
| Trade and other payables | 5.9 | 144,082,550 | 168,937,536 | |||||||||
| Borrowings | 5.10 | 228,081,833 | 234,510,751 | |||||||||
| Employee benefits and social security | 5.11 | 8,421,333 | 7,506,831 | |||||||||
| Deferred revenue and advances from customers | 5.12 | 2,931,008 | 3,924,801 | |||||||||
| Income tax payable | 5,898,060 | 4,825,271 | ||||||||||
| Government grants | 4,933 | 3,655 | ||||||||||
| Consideration for acquisition | 3,165,618 | 4,571,824 | ||||||||||
| Lease liabilities | 14 | 5,289,223 | 3,122,778 | |||||||||
| Total current liabilities | 397,874,558 | 427,403,447 | ||||||||||
| Total liabilities | 698,711,149 | 699,835,475 | ||||||||||
| Total equity and liabilities | 910,563,543 | 949,836,845 | ||||||||||
The accompanying Notes are an integral part of these Consolidated financial statements. Related parties balances and transactions are disclosed in Note 15.
Registration number: 13310943
UNAUDITED INTERIM CONDENSED CONSOLIDATED STATEMENTS OF COMPREHENSIVE INCOME
For the six-month periods ended of December 31, 2024, and 2023
(Amounts in US$)
| Notes | 12/31/2024 | 12/31/2023 | ||||||||||
| Revenues from contracts with customers | 6.1 | 199,478,869 | 256,984,240 | |||||||||
| Government grants | 10,154 | 74,723 | ||||||||||
| Initial recognition and changes in the fair value of biological assets at the point of harvest | 588,053 | 338,128 | ||||||||||
| Cost of sales | 6.2 | (117,374,985 | ) | (160,375,954 | ) | |||||||
| Changes in the net realizable value of agricultural products after harvest | (204,910 | ) | (2,192,558 | ) | ||||||||
| Research and development expenses | 6.3 | (8,797,433 | ) | (8,605,575 | ) | |||||||
| Selling, general and administrative expenses | 6.4 | (64,731,412 | ) | (66,145,040 | ) | |||||||
| Share of profit or loss of joint ventures and associates | 11 | (27,778,758 | ) | (21,206,303 | ) | |||||||
| Other income or expenses, net | 164,944 | (2,398,240 | ) | |||||||||
| Operating loss | (18,645,478 | ) | (3,526,579 | ) | ||||||||
| Financial cost | 6.5 | (20,183,299 | ) | (16,757,516 | ) | |||||||
| Other financial results | 6.5 | (1,086,189 | ) | (10,980,849 | ) | |||||||
| Loss before income tax | (39,914,966 | ) | (31,264,944 | ) | ||||||||
| Income tax | 7 | 3,091,074 | (7,444,529 | ) | ||||||||
| Loss for the year | (36,823,892 | ) | (38,709,473 | ) | ||||||||
| Other comprehensive income | ||||||||||||
| Items that may be subsequently reclassified to profit and loss | (1,518,743 | ) | 6,579,570 | |||||||||
| Foreign exchange differences on translation of foreign operations from joint ventures | (477,918 | ) | 1,250,603 | |||||||||
| Foreign exchange differences on translation of foreign operations | (1,040,825 | ) | 5,328,967 | |||||||||
| Total comprehensive loss | (38,342,635 | ) | (32,129,903 | ) | ||||||||
| Loss for the period attributable to: | ||||||||||||
| Equity holders of the parent | (33,103,200 | ) | (36,504,783 | ) | ||||||||
| Non-controlling interests | (3,720,692 | ) | (2,204,690 | ) | ||||||||
| (36,823,892 | ) | (38,709,473 | ) | |||||||||
| Total comprehensive loss attributable to: | ||||||||||||
| Equity holders of the parent | (34,420,676 | ) | (30,785,132 | ) | ||||||||
| Non-controlling interests | (3,921,959 | ) | (1,344,771 | ) | ||||||||
| (38,342,635 | ) | (32,129,903 | ) | |||||||||
| Loss per share | ||||||||||||
| Basic loss attributable to ordinary equity holders of the parent | 8 | (1.7388 | ) | (2.0228 | ) | |||||||
| Diluted loss attributable to ordinary equity holders of the parent | 8 | (1.7388 | ) | (2.0228 | ) | |||||||
The accompanying Notes are an integral part of these unaudited interim condensed consolidated financial statements. Related parties’ balances and transactions are disclosed in Note 15.
Registration number: 13310943
UNAUDITED INTERIM CONDENSED CONSOLIDATED STATEMENTS OF CHANGES IN EQUITY
For the six-month periods ended of December
31, 2024, and 2023
(Amounts in US$)
| Attributable to the equity holders of the parent | ||||||||||||||||||||||||||||||||||||||||
| Issued capital | Own shares held | Shares trading premium | Stock options and share based incentives | Retained earnings / (deficit) | Foreign currency translation reserve | Revaluation of PP&E and effect of tax rate change | Attributable to the equity holders of the parent | Non-controlling interests | Total equity | |||||||||||||||||||||||||||||||
| 06/30/2024 | 2,371,453 | (444,473 | ) | (7,289,991 | ) | 6,222,175 | 1,142,761 | 534,827 | (1,323,916 | ) | 1,212,836 | 248,788,534 | 250,001,370 | |||||||||||||||||||||||||||
| Increase in capital | 10,868 | — | — | — | — | — | — | 10,868 | — | 10,868 | ||||||||||||||||||||||||||||||
| Changes in ownership interests in subsidiaries | — | — | 269,445 | — | — | — | — | 269,445 | (1,473,609 | ) | (1,204,164 | ) | ||||||||||||||||||||||||||||
| Share-based incentives of subsidiaries | — | — | — | 423,616 | — | — | — | 423,616 | 1,035,390 | 1,459,006 | ||||||||||||||||||||||||||||||
| Distribution of dividends | — | — | — | — | — | — | — | — | (72,051 | ) | (72,051 | ) | ||||||||||||||||||||||||||||
| Loss for the period | — | — | — | — | (33,103,200 | ) | — | — | (33,103,200 | ) | (3,720,692 | ) | (36,823,892 | ) | ||||||||||||||||||||||||||
| Other comprehensive loss | — | — | — | — | — | (1,317,476 | ) | — | (1,317,476 | ) | (201,267 | ) | (1,518,743 | ) | ||||||||||||||||||||||||||
| 12/31/2024 | 2,382,321 | (444,473 | ) | (7,020,546 | ) | 6,645,791 | (31,960,439 | ) | (782,649 | ) | (1,323,916 | ) | (32,503,911 | ) | 244,356,305 | 211,852,394 | ||||||||||||||||||||||||
The accompanying Notes are an integral part of these consolidated financial statements. Related parties balances and transactions are disclosed in Note 15.
BIOCERES GROUP PLC
Registration number: 13310943
UNAUDITED INTERIM CONDENSED CONSOLIDATED STATEMENTS OF CHANGES IN EQUITY
For the six-month periods ended of December 31, 2024, and 2023
(Amounts in US$)
| Attributable to the equity holders of the parent | ||||||||||||||||||||||||||||||||||||
| Issued capital | Shares trading premium | Stock options and share based incentives | Retained (deficit) / earnings | Foreign currency translation reserve | Revaluation of PP&E and effect of tax rate change | Attributable to the equity holders of the parent | Non-controlling interests | Total equity | ||||||||||||||||||||||||||||
| 06/30/2023 | 2,096,534 | (13,587,790 | ) | 1,853,856 | 33,828,159 | 724,779 | (1,323,916 | ) | 23,591,622 | 234,978,480 | 258,570,102 | |||||||||||||||||||||||||
| Increase in capital | 257,775 | - | - | - | - | - | 257,775 | - | 257,775 | |||||||||||||||||||||||||||
| Changes in ownership interests in subsidiaries | - | 2,657,780 | - | - | - | - | 2,657,780 | (5,264,579 | ) | (2,606,799 | ) | |||||||||||||||||||||||||
| Share-based incentives of subsidiaries | - | - | 1,607,529 | - | - | - | 1,607,529 | 5,154,147 | 6,761,676 | |||||||||||||||||||||||||||
| Distribution of dividends | - | - | - | - | - | - | - | (151,612 | ) | (151,612 | ) | |||||||||||||||||||||||||
| Loss for the period | - | - | - | (36,504,783 | ) | - | - | (36,504,783 | ) | (2,204,690 | ) | (38,709,473 | ) | |||||||||||||||||||||||
| Other comprehensive income | - | - | - | - | 5,719,652 | - | 5,719,652 | 859,918 | 6,579,570 | |||||||||||||||||||||||||||
| 12/31/2023 | 2,354,309 | (10,930,010 | ) | 3,461,385 | (2,676,624 | ) | 6,444,431 | (1,323,916 | ) | (2,670,425 | ) | 233,371,664 | 230,701,239 | |||||||||||||||||||||||
The accompanying Notes are an integral part of these consolidated financial statements. Related parties balances and transactions are disclosed in Note 15.
Registration number: 13310943
UNAUDITED INTERIM CONDENSED CONSOLIDATED STATEMENTS OF CASH
For the six-month periods ended of December
31, 2024, and 2023
(Amounts in US$)
| Notes | 12/31/2024 | 12/31/2023 | |||||||||
| OPERATING ACTIVITIES | |||||||||||
| Loss for the period | (36,823,892 | ) | (38,709,473 | ) | |||||||
| Adjustments to reconcile profit to net cash flows | |||||||||||
| Income tax | (3,091,074 | ) | 7,444,529 | ||||||||
| Depreciation of property, plant and equipment | 6.3/6.4 | 3,046,924 | 2,567,152 | ||||||||
| Amortization of intangible assets | 6.3/6.4 | 5,944,308 | 5,475,007 | ||||||||
| Depreciation of leased assets | 2,219,948 | 3,418,956 | |||||||||
| Share-based incentive and stock options | 2,338,406 | 8,527,214 | |||||||||
| Share of profit or loss of joint ventures and associates | 11 | 27,778,758 | 21,206,303 | ||||||||
| Provisions for contingencies | 175,487 | 49,090 | |||||||||
| Allowance for impairment of trade debtors | 1,980,726 | 296,051 | |||||||||
| Allowance for obsolescence | 477,756 | 282,836 | |||||||||
| Initial recognition and changes in the fair value of biological assets | (588,053 | ) | (338,128 | ) | |||||||
| Changes in the net realizable value of agricultural products after harvest | 204,910 | 2,192,558 | |||||||||
| Financial results | 21,269,488 | 27,738,365 | |||||||||
| Gain on sale of equipment and intangible assets | (147,199 | ) | (33,521 | ) | |||||||
| Working capital adjustments | |||||||||||
| Trade receivables | (22,597,136 | ) | (52,409,027 | ) | |||||||
| Other receivables | (6,695,312 | ) | 9,155,329 | ||||||||
| Inventories and biological assets | 19,920,959 | 13,770,674 | |||||||||
| Trade and other payables | (22,151,982 | ) | 10,600,074 | ||||||||
| Employee benefits and social security | 914,502 | (1,593,274 | ) | ||||||||
| Government grants | 2,482 | (297,966 | ) | ||||||||
| Interest collected | 3,579,162 | 1,204,931 | |||||||||
| Deferred revenue and advances from customers | (1,039,195 | ) | (2,714,109 | ) | |||||||
| Net cash flows (used in) / generated by operating activities | (3,280,027 | ) | 17,644,227 | ||||||||
The accompanying Notes are an integral part of these consolidated financial statements. Related parties balances and transactions are disclosed in Note 15.
BIOCERES GROUP PLC
Registration number: 13310943
UNAUDITED INTERIM CONDENSED CONSOLIDATED STATEMENTS OF CASH
As of December 31, 2024 and December 31, 2023
(Amounts in US$)
| Notes | 12/31/2024 | 12/31/2023 | |||||||||
| INVESTMENT ACTIVITIES | |||||||||||
| Proceeds from sale of property, plant and equipment | 155,471 | 45,268 | |||||||||
| Proceeds from financial assets | 9,655,265 | 5,997,737 | |||||||||
| Investment in financial assets | (10,406,002 | ) | (5,367,021 | ) | |||||||
| Purchase of property, plant and equipment | 5.6 | (4,082,865 | ) | (6,127,126 | ) | ||||||
| Capitalized development expenditures | 5.7 | (5,022,789 | ) | (4,454,893 | ) | ||||||
| Purchase of intangible assets | 5.7 | (284,372 | ) | (219,829 | ) | ||||||
| Net cash flows used in investing activities | (9,985,292 | ) | (10,125,864 | ) | |||||||
| FINANCING ACTIVITIES | |||||||||||
| Proceeds from borrowings | 112,394,583 | 88,495,114 | |||||||||
| Repayment of borrowings and financed payments | (114,600,002 | ) | (92,666,882 | ) | |||||||
| Interest payments | (15,493,896 | ) | (14,297,231 | ) | |||||||
| Leased assets payments | (2,497,966 | ) | (2,493,617 | ) | |||||||
| Cash dividend distributed to non-controlling interest | (72,051 | ) | (151,612 | ) | |||||||
| Purchase of own shares | (926,899 | ) | (734,388 | ) | |||||||
| Other financial payments | (2,662,021 | ) | (1,530,144 | ) | |||||||
| Proceeds from the issuance of preferred shares | 15,000,000 | - | |||||||||
| Net cash flows used in financing activities | (8,858,252 | ) | (23,378,760 | ) | |||||||
| Net decrease in cash and cash equivalents | (22,123,571 | ) | (15,671,052 | ) | |||||||
| Inflation effects on cash and cash equivalents | (12,324 | ) | (105,152 | ) | |||||||
| Cash and cash equivalents as of beginning of the year | 5.1 | 52,994,865 | 49,265,020 | ||||||||
| Effect of exchange rate changes on cash and equivalents | 2,342,172 | (6,321,148 | ) | ||||||||
| Cash and cash equivalents as of the end of the period | 33,201,142 | 27,167,668 | |||||||||
The accompanying Notes are an integral part of these consolidated financial statements. Related parties balances and transactions are disclosed in Note 15.
NOTES TO THE UNAUDITED INTERIM CONDENSED CONSOLIDATED FINANCIAL STATEMENTS
(Amounts in US$, except otherwise indicated)
Index
| 1. | General information. | |
| 2. | Accounting standards and basis of preparation. | |
| 3. | New standards, amendments and interpretations issued by the IASB. | |
| 4. | Acquisitions and other significant transactions | |
| 5. | Information about components of unaudited interim condensed consolidated statement of financial position. | |
| 6. | Information about components of unaudited interim condensed consolidated statement of comprehensive income. | |
| 7. | Taxation. | |
| 8. | Earnings per share. | |
| 9. | Information about components of equity. | |
| 10. | Cash flow information. | |
| 11. | Joint ventures and associates. | |
| 12. | Segment information | |
| 13. | Financial instruments – Risk management. | |
| 14. | Leases. | |
| 15. | Shareholders and other related parties’ balances and transactions. | |
| 16. | Key management personnel compensation. | |
| 17. | Contingencies, commitments and restrictions on the distribution of profits. | |
| 18. | Events occurring after the reporting period. |
| BIOCERES GROUP PLC |
| NOTES TO THE UNAUDITED INTERIM CONDENSED CONSOLIDATED FINANCIAL STATEMENTS |
| (Amounts in US$, except otherwise indicated) |
1. GENERAL INFORMATION
Bioceres Group PLC is a fully integrated company incorporated on April 3, 2021, in England and Wales, whose registered office is at Highdown House, Yeoman Way, Worthing, West Sussex, United Kingdom.
On April 1, 2025, the Company changed its legal name from Bioceres Group PLC to Bioceres Group Limited. (Note 18).
Unless the context otherwise requires, “we,” “us,” “our,” and “Bioceres Group” will refer to Bioceres Group PLC and its subsidiaries.
2. ACCOUNTING STANDARDS AND BASIS OF PREPARATION
Statement of compliance with IFRS as issued by IASB
These unaudited interim condensed consolidated financial statements for the six-month period ended December 31, 2024, have been prepared in accordance with Accounting Standard IAS 34 Interim Financial Reporting.
These unaudited interim condensed consolidated financial statements do not include all notes of the type normally included in an annual financial statement. Accordingly, these unaudited interim condensed consolidated financial statements are to be read in conjunction with the consolidated financial statements for the fiscal year ended June 30, 2024.
Authorization for the issue of the Consolidated financial statements
These unaudited interim condensed consolidated financial statements of the Group as of December 31, 2024, and June 30, 2024 and for the six-month periods ended December 31, 2024 and 2023 were authorized by the Board of Directors of Bioceres Group PLC on April 15, 2025.
Basis of measurement
The consolidated financial statements of the Group have been prepared using:
| ● | Going concern basis of accounting, considering the conclusion of the assessment made by the Group’s Management about the ability of the Group and its subsidiaries to continue as a going concern, in accordance with the requirements of paragraph 25 of IAS 1, “Presentation of Financial Statements”. |
| ● | Accrual basis of accounting (except for cash flows information). Under this basis of accounting, the effects of transactions and other events are recognized as they occur, even when there are no cash flows. |
Functional currency and presentation currency
a) Functional currency
Items included in the financial statements of each of the Group’s entities are measured using the currency of the primary economic market in which the entity operates (i.e., “the functional currency”).
b) Presentation currency
The consolidated financial statements of the Group are presented in US dollars.
| BIOCERES GROUP PLC |
| NOTES TO THE UNAUDITED INTERIM CONDENSED CONSOLIDATED FINANCIAL STATEMENTS |
| (Amounts in US$, except otherwise indicated) |
c) Foreign currency
Transactions entered into by Group entities in a currency other than their functional currency are recorded at the relevant exchange rates as of the date upon which such transactions occur. Foreign currency monetary assets and liabilities are translated at the prevailing exchanges rates as of the final day of each reporting period. Exchange differences arising on the retranslation of unsettled monetary assets and liabilities are recognized immediately in profit or loss, except for foreign currency borrowings qualifying as a hedge of a net investment in a foreign operation for which exchange differences are recognized in other comprehensive income and accumulated in the foreign exchange reserve along with the exchange differences arising on the retranslation of the foreign operation. Upon the disposal of a foreign operation, the cumulative exchange differences recognized in the foreign exchange reserve relating to such operation up to the date of disposal are transferred to the Consolidated statement of profit or loss and other comprehensive income as part of the profit or loss reorganized upon such disposal.
Changes in accounting policies
The accounting policies adopted in the preparation of these unaudited interim condensed consolidated financial statements are consistent with those adopted for the preparation of the consolidated financial statements as of June 30, 2024.
3. NEW STANDARDS, AMENDMENTS AND INTERPRETATIONS ISSUED BY THE IASB
New standards and interpretations adopted by the Group
a) The following new standards, amendments and interpretations became applicable for the current reporting period and adopted by the Group.
| - | Amendments to IFRS 16 - Lease Liability in a Sale and Leaseback. |
| - | Amendments to IAS1 - Non-current liabilities with covenants. |
| - | Amendments to IAS 7- Statement of Cash Flows & to IFRS 7- Financial Instruments: Disclosures. |
| - | Amendment to IAS 7 and IFRS 7 - Supplier Financing. |
These new standards and amendments did not have any material impact on the Group.
b) The following new standards are not yet adopted by the Group.
| - | Amendments to IAS 21- The Effects of Changes in Foreign Exchange Ratestitled Lack of Exchangeability. The amendments are effective for annual reporting periods beginning on or after 1 January 2025. |
| - | Amendment to IFRS 9 and IFRS 7 – Classification and measurement of financial instruments. The amendments are effective for annual periods beginning on or after January 1, 2026. |
| - | IFRS 19 - Subsidiaries without Public Accountability: Disclosures- The amendments are effective for annual periods beginning on or after January 1, 2027. |
| - | Annual Improvements to IFRS Accounting Standards—Volume 11. The amendments are effective for annual periods beginning on or after January 1, 2026. |
| - | Amendments to IFRS 9 and IFRS 7 – Contracts Referencing Nature-dependent Electricity. The amendments are effective for annual periods beginning on or after January 1, 2026. |
The above amendments are not expected to have material impact on the Group.
| - | IFRS 18 – Presentation and Disclosure in Financial Statements. This standard sets out requirements for the presentation and disclosure of information in general purpose financial statements to help ensure they provide relevant information that faithfully represents an entity’s assets, liabilities, equity, income and expenses. It is effective for annual periods beginning on or after January 1, 2027. |
The Group is analyzing the potential impact of this standard on our financial statements.
| BIOCERES GROUP PLC |
| NOTES TO THE UNAUDITED INTERIM CONDENSED CONSOLIDATED FINANCIAL STATEMENTS |
| (Amounts in US$, except otherwise indicated) |
4. ACQUISITIONS AND OTHER SIGNIFICANT TRANSACTIONS
Natal Agro S.R.L.
On June 10, 2024, we acquired a controlling interest in Natal Agro S.R.L (“Natal”), an Argentine company that breeds and develops corn varieties. The interest acquired is represented by a total of 116,225 shares of AR$ 10 nominal value each, representing 51% of equity and voting interest.
The consideration for the acquisition was $0.22 million in cash and the commitment to carrying out, at our own expense, the regulatory activities for HB4 corn to obtain authorization for its commercialization in Argentina, and the regulatory activities for HB4 corn in Brazil, once the commercialization strategy of HB4 corn in Brazil has been defined by the Company.
Fair value of the consideration of payment
| Cash payment | 215,415 | |||
| Regulatory activities | 727,985 | |||
| Total consideration | 943,400 |
The consideration of payment was measured at fair value, which was calculated as the sum of cash paid and the acquisition-date fair values of the regulatory services to be provided. The fair values measured were based on discounting future cash flow using market discount rates. The difference between fair value and nominal value of consideration will be recognized as finance cost over the period the consideration will be paid.
Assets acquired, liabilities assumed, and non-controlling interest recognized
| Cash and cash equivalents | 252,923 | |||
| Other financial assets | 73,950 | |||
| Trade receivables | 596,463 | |||
| Other receivables | 288,861 | |||
| Income and minimum presumed recoverable income taxes | 19,998 | |||
| Inventories | 4,031,412 | |||
| Property, plant and equipment | 816,576 | |||
| Intangible assets | 2,217,985 | |||
| Right of use asset | 168,988 | |||
| Trade and other payables | (2,302,332 | ) | ||
| Borrowings | (743,279 | ) | ||
| Employee benefits and social security | (23,346 | ) | ||
| Deferred revenue and advances from customers | (2,515 | ) | ||
| Provisions | (355,898 | ) | ||
| Lease liabilities | (168,988 | ) | ||
| Deferred tax liabilities | (996,824 | ) | ||
| Total net assets identified | 3,873,974 | |||
| Non-controlling interest | (1,898,247 | ) | ||
| Gain from a bargain purchase | (1,032,327 | ) | ||
| Total consideration | 943,400 |
| BIOCERES GROUP PLC |
| NOTES TO THE UNAUDITED INTERIM CONDENSED CONSOLIDATED FINANCIAL STATEMENTS |
| (Amounts in US$, except otherwise indicated) |
The business combination was executed in a context of financial setbacks faced by the acquired company. To address these, in addition to the initial cash payment, Bioceres has committed to providing a working capital loan of up to $3 million to help alleviate the financial strain.
Bioceres will also provide regulatory services related to its proprietary technologies, which will enable strategic business development for Natal and create a new product pipeline leveraging Bioceres’ technology. Specifically, Bioceres has agreed to grant Natal an exclusive license for certain technologies to be applied to corn, with Natal committing to pay 15% of the revenues generated from this technology.
5. INFORMATION ABOUT COMPONENTS OF CONSOLIDATED STATEMENTS OF FINANCIAL POSITION
5.1 Cash and cash equivalents
| 12/31/2024 | 06/30/2024 | |||||||
| Cash at bank and on hand | 17,197,598 | 27,210,070 | ||||||
| Mutual funds | 16,003,544 | 25,784,795 | ||||||
| 33,201,142 | 52,994,865 | |||||||
5.2 Other financial assets
| 12/31/2024 | 06/30/2024 | |||||||
| Current | ||||||||
| Investments at fair value | 1,657,706 | 2,191,286 | ||||||
| Mutual funds | 48,520 | 6,658,805 | ||||||
| Other investments | 7,891,651 | 5,817,516 | ||||||
| 9,597,877 | 14,667,607 | |||||||
| Non-current | ||||||||
| Mutual funds | 373,134 | 190,080 | ||||||
| Investments at fair value | 386 | 437 | ||||||
| 373,520 | 190,517 | |||||||
The book value is reasonably approximate to the fair value given its short-term nature.
5.3 Trade receivables
| 12/31/2024 | 06/30/2024 | |||||||
| Current | ||||||||
| Trade debtors | 229,160,850 | 205,490,518 | ||||||
| Allowance for impairment of trade debtors (Note 5.9) | (8,706,185 | ) | (7,050,280 | ) | ||||
| Shareholders and other related parties (Note 15) | 258 | 37 | ||||||
| Allowance for credit notes to be issued | - | (2,905,624 | ) | |||||
| Trade debtors - Joint ventures and associates (Note 15) | 1,730,524 | 2,176,622 | ||||||
| Deferred checks | 6,252,016 | 11,295,922 | ||||||
| 228,437,463 | 209,007,195 | |||||||
The book value is reasonably approximate to the fair value given its short-term nature.
| BIOCERES GROUP PLC |
| NOTES TO THE UNAUDITED INTERIM CONDENSED CONSOLIDATED FINANCIAL STATEMENTS |
| (Amounts in US$, except otherwise indicated) |
5.4 Other receivables
| 12/31/2024 | 6/30/2024 | |||||||
| Current | ||||||||
| Taxes | 7,674,012 | 5,475,685 | ||||||
| Insurance to be accrued | 1,989,722 | 1,595,319 | ||||||
| Other receivables - Joint ventures and associates (Note 15) | 19,201,838 | 12,162,870 | ||||||
| Prepayments to suppliers | 2,264,684 | 7,236,905 | ||||||
| Shareholders and other related parties (Note 15) | 106,900 | 47,348 | ||||||
| Government grants receivable | 538 | 608 | ||||||
| Prepaid expenses and other receivables | 3,297,871 | 3,736,808 | ||||||
| Loans receivables | 19,617 | 1,800,572 | ||||||
| Miscellaneous | 3,820,951 | 2,601,268 | ||||||
| 38,376,133 | 34,657,383 | |||||||
| Non-current | ||||||||
| Taxes | 383,470 | 752,045 | ||||||
| Other receivables | 230,000 | 230,000 | ||||||
| Reimbursements over exports | 1,248,507 | 1,461,042 | ||||||
| Other receivables - Joint ventures and associates (Note 15) | 24,301,539 | 25,423,142 | ||||||
| Miscellaneous | 965,129 | 20,805 | ||||||
| 27,128,645 | 27,887,034 | |||||||
5.5 Inventories
| 12/31/2024 | 06/30/2024 | |||||||
| Seeds | 6,146,855 | 5,967,231 | ||||||
| Resale products | 46,799,130 | 53,788,333 | ||||||
| Manufactured products | 18,846,502 | 26,081,250 | ||||||
| Goods in transit | 3,122,201 | 5,618,540 | ||||||
| Supplies | 20,773,539 | 22,546,093 | ||||||
| Agricultural products | 9,583,835 | 15,015,884 | ||||||
| Allowance for obsolescence | (3,462,573 | ) | (3,087,563 | ) | ||||
| 101,809,489 | 125,929,768 | |||||||
| Net of agricultural products | 92,225,654 | 110,913,884 | ||||||
| BIOCERES GROUP PLC |
| NOTES TO THE UNAUDITED INTERIM CONDENSED CONSOLIDATED FINANCIAL STATEMENTS |
| (Amounts in US$, except otherwise indicated) |
5.6 Property, plant and equipment
Property, plant and equipment as of December 31, 2024 and December 31,2023, included the following:
| Class | Net carrying amount 06/30/2024 | Additions | Transfers | Disposals | Depreciation of the period | Foreign currency translation | As of 12/31/2024 | |||||||||||||||||||||
| Office equipment | 503,950 | 17,929 | - | - | (41,037 | ) | (14,794 | ) | 466,048 | |||||||||||||||||||
| Vehicles | 2,192,627 | 29,675 | - | (8,272 | ) | (447,262 | ) | (1,330 | ) | 1,765,438 | ||||||||||||||||||
| Equipment and computer software | 528,816 | 30,324 | - | - | (128,051 | ) | (26,386 | ) | 404,703 | |||||||||||||||||||
| Fixtures and fittings | 2,805,076 | 8,834 | - | - | (454,316 | ) | 59 | 2,359,653 | ||||||||||||||||||||
| Machinery and equipment | 16,722,642 | 474,971 | 73,221 | - | (1,466,534 | ) | (365,199 | ) | 15,439,101 | |||||||||||||||||||
| Land and buildings | 39,745,067 | - | 46,431 | - | (509,724 | ) | (260,985 | ) | 39,020,789 | |||||||||||||||||||
| Buildings in progress | 12,114,256 | 3,521,132 | (119,652 | ) | - | - | (35,741 | ) | 15,479,995 | |||||||||||||||||||
| Total | 74,612,434 | 4,082,865 | - | (8,272 | ) | (3,046,924 | ) | (704,376 | ) | 74,935,727 | ||||||||||||||||||
| Class | Net carrying amount 06/30/2023 | Additions | Disposals/ Disposals from loss of control (*) | Depreciation of the period | Foreign currency translation | As of 12/31/2023 | ||||||||||||||||||
| Research instruments | 66,131 | - | (66,131 | ) | - | - | - | |||||||||||||||||
| Office equipment | 360,575 | 52,158 | (473 | ) | (35,025 | ) | (7,506 | ) | 369,729 | |||||||||||||||
| Vehicles | 2,053,263 | 556,237 | (37,145 | ) | (416,309 | ) | 13,917 | 2,169,963 | ||||||||||||||||
| Equipment and computer software | 198,364 | 110,571 | (5,041 | ) | (89,124 | ) | (8,030 | ) | 206,740 | |||||||||||||||
| Fixtures and fittings | 2,925,032 | 10,483 | (46,211 | ) | (394,798 | ) | (6,134 | ) | 2,488,372 | |||||||||||||||
| Machinery and equipment | 14,586,768 | 275,297 | (99,423 | ) | (1,189,109 | ) | (3,006 | ) | 13,570,527 | |||||||||||||||
| Land and buildings | 36,211,957 | 10,351 | - | (442,787 | ) | 33,183 | 35,812,704 | |||||||||||||||||
| Buildings in progress | 11,757,249 | 5,112,029 | (12,221 | ) | - | (55,102 | ) | 16,801,955 | ||||||||||||||||
| Total | 68,159,339 | 6,127,126 | (266,645 | ) | (2,567,152 | ) | (32,678 | ) | 71,419,990 | |||||||||||||||
| (*) | USD (254,898) correspond to the loss of control of Inmet S.A |
The depreciation charge is included in Notes 6.3 and 6.4. The Group has no commitments to purchase property, plant and equipment items.
| BIOCERES GROUP PLC |
| NOTES TO THE UNAUDITED INTERIM CONDENSED CONSOLIDATED FINANCIAL STATEMENTS |
| (Amounts in US$, except otherwise indicated) |
5.7 Intangible assets
Intangible assets as of December 31, 2024 and December 31,2023 included the following:
| Class | Net carrying amount 06/30/2024 |
Additions | Transfers/ Disposals |
Amortization of the period |
Foreign currency translation |
Net carrying amount 12/31/2024 |
||||||||||||||||||
| Seed and integrated products | ||||||||||||||||||||||||
| Alfalfa Genuity Har Xstra | 438,029 | - | - | - | 30,780 | 468,809 | ||||||||||||||||||
| HB4 soy and breeding program | 35,574,369 | 2,392,794 | - | (1,051,883 | ) | - | 36,915,280 | |||||||||||||||||
| Integrated seed products | 2,681,826 | - | - | (97,479 | ) | 47,642 | 2,631,989 | |||||||||||||||||
| Crop nutrition | ||||||||||||||||||||||||
| Microbiological products | 41,187,249 | - | - | (1,813,650 | ) | - | 39,373,599 | |||||||||||||||||
| Microbiological products in progress | 10,452,861 | 2,629,995 | - | - | (6,916 | ) | 13,075,940 | |||||||||||||||||
| Other intangible assets | ||||||||||||||||||||||||
| Trademarks and patents | 51,316,860 | 133,595 | - | (2,040,315 | ) | - | 49,410,140 | |||||||||||||||||
| Trademarks and patents with indefinite useful life | 10,045,294 | - | - | - | (4,625 | ) | 10,040,669 | |||||||||||||||||
| Software | 1,119,494 | - | 137,598 | (255,746 | ) | (95 | ) | 1,001,251 | ||||||||||||||||
| Software in progress | 580,728 | 150,777 | (137,598 | ) | - | - | 593,907 | |||||||||||||||||
| Customer loyalty | 18,934,570 | - | - | (685,235 | ) | - | 18,249,335 | |||||||||||||||||
| RG/RS/OX Wheat | 5,000,000 | - | - | - | - | 5,000,000 | ||||||||||||||||||
| Total | 177,331,280 | 5,307,161 | - | (5,944,308 | ) | 66,786 | 176,760,919 | |||||||||||||||||
| Class | Net carrying amount 06/30/2023 |
Additions | Disposals from loss of control(*) |
Amortization of the period |
Foreign currency translation |
Net carrying amount 12/31/2023 |
||||||||||||||||||
| Seed and integrated products | ||||||||||||||||||||||||
| Alfalfa Genuity Har Xstra | 419,061 | - | - | - | (143,582 | ) | 275,479 | |||||||||||||||||
| Bacillus-PHAs | 1,089,536 | - | (1,089,536 | ) | - | - | ||||||||||||||||||
| HB4 soy and breeding program | 31,679,114 | 1,729,439 | - | (855,094 | ) | - | 32,553,459 | |||||||||||||||||
| Integrated seed products | 2,841,008 | - | - | (86,762 | ) | (238,121 | ) | 2,516,125 | ||||||||||||||||
| Crop nutrition | ||||||||||||||||||||||||
| Microbiological products | 37,295,460 | 2,725,454 | - | (1,402,972 | ) | (1,661 | ) | 38,616,281 | ||||||||||||||||
| Microbiological products in progress | 12,213,341 | - | - | - | - | 12,213,341 | ||||||||||||||||||
| Other intangible assets | ||||||||||||||||||||||||
| Trademarks and patents | 51,933,444 | 1,288 | - | (2,332,908 | ) | - | 49,601,824 | |||||||||||||||||
| Trademarks and patents with indefinite useful life | 7,827,309 | - | - | - | - | 7,827,309 | ||||||||||||||||||
| Software | 1,638,752 | 218,541 | - | (282,800 | ) | (488 | ) | 1,574,005 | ||||||||||||||||
| Software in progress | 349,171 | - | - | - | - | 349,171 | ||||||||||||||||||
| Customer loyalty | 23,006,023 | - | - | (514,471 | ) | - | 22,491,552 | |||||||||||||||||
| RG/RS/OX Wheat | 5,000,000 | - | - | - | - | 5,000,000 | ||||||||||||||||||
| Total | 175,292,219 | 4,674,722 | (1,089,536 | ) | (5,475,007 | ) | (383,852 | ) | 173,018,546 | |||||||||||||||
| (*) | USD (1,089,536) correspond to the Loss of control of Inmet S.A. |
| BIOCERES GROUP PLC |
| NOTES TO THE UNAUDITED INTERIM CONDENSED CONSOLIDATED FINANCIAL STATEMENTS |
| (Amounts in US$, except otherwise indicated) |
The amortization charge is included in Notes 6.3 and 6.4.
There are no intangibles assets whose use has been restricted or which have been delivered as a guarantee. The Group has not assumed any commitments to acquire new intangibles.
Estimates
There is an inherent material uncertainty related to Management’s estimation of the ability of the Group to recover the carrying amounts of internally generated intangible assets related to biotechnology projects because it is dependent upon Group’s ability to raise sufficient funds to complete the projects development, the future outcome of the regulatory process, and the timing and amount of the future cash flows generated by the projects, among other future events.
Management’s estimations about the demonstrability of the recognition criteria for these assets and the subsequent recoverability represent the best estimate that can be made based on all the available evidence, existing facts and circumstances and using reasonable and supportable assumptions in cash flow projections. Therefore, the Consolidated financial statements do not include any adjustments that would result if the Group were unable to recover the carrying amount of the above-mentioned assets through the generation of enough future economic benefits.
5.8 Goodwill
| 12/31/2024 | 06/30/2024 | |||||||
| Rizobacter Argentina S.A. | 28,080,271 | 28,080,271 | ||||||
| Bioceres Crops S.A. | 7,523,322 | 7,523,322 | ||||||
| Insumos Agroquímicos S.A. | 470,090 | 470,090 | ||||||
| Pro Farm Group | 76,089,749 | 76,089,749 | ||||||
| 112,163,432 | 112,163,432 | |||||||
5.9 Trade and other payables
| 12/31/2024 | 06/30/2024 | |||||||
| Current | ||||||||
| Trade creditors | 91,759,968 | 108,922,112 | ||||||
| Shareholders and other related parties (Note 15) | 49,646 | 37,985 | ||||||
| Trade creditors - Joint ventures and associates (Note 15) | 44,907,002 | 52,778,206 | ||||||
| Taxes | 6,969,417 | 5,877,930 | ||||||
| Miscellaneous | 396,517 | 1,321,303 | ||||||
| 144,082,550 | 168,937,536 | |||||||
| BIOCERES GROUP PLC |
| NOTES TO THE UNAUDITED INTERIM CONDENSED CONSOLIDATED FINANCIAL STATEMENTS |
| (Amounts in US$, except otherwise indicated) |
5.10 Borrowings
| 12/31/2024 | 06/30/2024 | |||||||
| Current | ||||||||
| Bank borrowings | 100,167,892 | 94,711,273 | ||||||
| Corporate bonds | 19,024,076 | 42,035,925 | ||||||
| Net loans payables - Joint ventures and associates (Note 15) | 1,860,222 | 1,860,058 | ||||||
| Finance borrowings | 107,029,643 | 95,903,495 | ||||||
| 228,081,833 | 234,510,751 | |||||||
| Non-current | ||||||||
| Bank borrowings | 20,429,329 | 17,033,059 | ||||||
| Corporate bonds | 46,484,304 | 25,071,823 | ||||||
| Finance borrowings | 69,789,101 | 85,143,423 | ||||||
| Convertible preference shares | 15,066,575 | - | ||||||
| 151,769,309 | 127,248,305 | |||||||
In November 2024, BIOX completed a $25.9 million public offering of Series X corporate bonds in the Argentine market. The bonds were issued in two tranches: Class A: Approximately $2.4 million 7.0% p.a. bonds due November 2026; and Class B: Approximately $23.5 million 8.0% p.a. bonds due November 2027.
Bioceres SA is the guarantor of the stock purchase agreement signed on October 28, 2022, between Theo I SCSp and DRACO I LATAM SPC LTD, as well as the subsequent credit line agreement signed on December 11, 2023, which are included in the investment in Theo I SCSp, as indicated in Note 11.
In December 2024, the Company issued 2,380,952 convertible preference shares for total proceeds of $15 million. These preference shares accrue a 9% per annum payment-in-kind (PIK) return and grant the holder specific conversion rights, including the option to convert into ordinary shares at predefined terms, mandatory conversion provisions, and redemption alternatives contingent on the occurrence of certain events.
The carrying value of some borrowings as of December 31, 2024 are measured at amortized cost differ from their fair value. The following fair values measured are based on discounted cash flows (Level 3) due to the use of unobservable inputs, including own credit risk.
| 12/31/2024 | 06/30/2024 | |||||||||||||||
| Amortized Cost |
Fair value | Amortized Cost |
Fair value | |||||||||||||
| Current | ||||||||||||||||
| Bank borrowings | 100,167,892 | 100,318,611 | 94,711,273 | 93,301,194 | ||||||||||||
| Corporate bonds | 19,024,076 | 18,783,131 | 42,035,925 | 41,492,963 | ||||||||||||
| Financial borrowings | 107,029,643 | 106,506,642 | 95,903,495 | 95,480,681 | ||||||||||||
Non current |
||||||||||||||||
| Bank borrowings | 20,429,329 | 18,521,587 | 17,033,059 | 12,206,794 | ||||||||||||
| Corporate bonds | 46,484,304 | 42,828,561 | 25,071,823 | 23,845,583 | ||||||||||||
| Financial borrowings | 69,789,101 | 64,636,735 | 85,143,423 | 81,120,125 | ||||||||||||
| BIOCERES GROUP PLC |
| NOTES TO THE UNAUDITED INTERIM CONDENSED CONSOLIDATED FINANCIAL STATEMENTS |
| (Amounts in US$, except otherwise indicated) |
5.11 Employee benefits and social security
| 12/31/2024 | 06/30/2024 | |||||||
| Current | ||||||||
| Salaries, accrued incentives, vacations and social security | 7,997,391 | 7,280,129 | ||||||
| Key management personnel (Note 15) | 423,942 | 226,702 | ||||||
| 8,421,333 | 7,506,831 | |||||||
5.12 Deferred revenue and advances from customers
| 12/31/2024 | 06/30/2024 | |||||||
| Current | ||||||||
| Advances from customers | 2,929,540 | 3,335,740 | ||||||
| Deferred revenue | 1,468 | 589,061 | ||||||
| 2,931,008 | 3,924,801 | |||||||
| Non current | ||||||||
| Advances from customers | 41,237 | 52,511 | ||||||
| Deferred revenue | 1,838,499 | 1,872,627 | ||||||
| 1,879,736 | 1,925,138 | |||||||
5.13 Provisions
| 12/31/2024 | 06/30/2024 | |||||||
| Conditional payment Rizobacter SA | 15,916,116 | 15,916,116 | ||||||
| Provisions for contingencies | 1,391,054 | 1,568,599 | ||||||
| 17,307,170 | 17,484,715 | |||||||
Conditional payment Rizobacter S.A.
The Group agreed with certain sellers of Rizobacter, a contingent payment of $17.3 million (current value of $15.9 million) conditional on obtaining a favorable resolution that totally rejects the claim of the plaintiff in the nullity trials, file “Harnan Miguel, Marcos and Martina c /ac Mullen Jorge and others s/ Annulment Action”, file No. 76,806 and in the embargo, file “Harnan Miguel, Marcos and Martina c/ Mac Mullen Jorge and others s/ Precautionary Measures”, file No. 76,745. In said cause, 44% of the capital of Rizobacter Argentina S.A. is seized and 30% of the dividends that the taxed shares produce.
If the injunction is lifted, the Group will be required to pay within 12 months of notification, a contingent purchase price of $17.3 million to certain selling shareholders of Rizobacter.
6. INFORMATION ABOUT COMPONENTS OF CONSOLIDATED STATEMENTS OF COMPREHENSIVE INCOME
6.1. Revenue from contracts with customers
| 12/31/2024 | 12/31/2023 | |||||||
| Sale of goods and services | 198,030,928 | 255,852,397 | ||||||
| Royalties | 942,756 | 649,341 | ||||||
| Rendering of services with related parties | 505,185 | 482,502 | ||||||
| 199,478,869 | 256,984,240 | |||||||
Transactions of sales of goods and services with joint ventures and with shareholders and other related parties are reported in Note 15.
| BIOCERES GROUP PLC |
| NOTES TO THE UNAUDITED INTERIM CONDENSED CONSOLIDATED FINANCIAL STATEMENTS |
| (Amounts in US$, except otherwise indicated) |
6.2 Cost of sales
| Item | 12/31/2024 | 12/31/2023 | ||||||
| Inventories as of the beginning of the period | 110,913,884 | 112,000,786 | ||||||
| Purchases of the period | 87,376,569 | 144,988,998 | ||||||
| Production costs | 11,872,011 | 13,031,307 | ||||||
| Foreign currency translation | (561,825 | ) | (28,272 | ) | ||||
| Subtotal | 209,600,639 | 269,992,819 | ||||||
| Inventories as of the end of the period (*) | (92,225,654 | ) | (109,616,865 | ) | ||||
| Cost of sales | 117,374,985 | 160,375,954 | ||||||
| (*) | Net of agricultural products |
6.3 R&D classified by nature
| Item | Research and development expenses 12/31/2024 |
Research and development expenses 12/31/2023 |
||||||
| Amortization of intangible assets | 2,748,884 | 2,453,158 | ||||||
| Analysis and storage | - | 5,302 | ||||||
| Commissions and royalties | 3,960 | - | ||||||
| Depreciation of leased assets | 37,252 | - | ||||||
| Depreciation of property, plant and equipment | 420,532 | 312,453 | ||||||
| Freight and haulage | 10,481 | 14,278 | ||||||
| Employee benefits and social securities | 2,979,027 | 2,359,420 | ||||||
| Maintenance | 140,536 | 91,708 | ||||||
| Energy and fuel | 4,352 | 5,227 | ||||||
| Supplies and materials | 917,622 | 1,243,826 | ||||||
| Mobility and travel | 108,793 | 115,111 | ||||||
| Systems expenses | 20,777 | 9,774 | ||||||
| Vehicles expenses | 7,224 | 4,555 | ||||||
| Share-based incentives | 91,097 | 143,749 | ||||||
| Professional fees and outsourced services | 884,274 | 1,084,911 | ||||||
| Professional fees related parties | 16,373 | 216,792 | ||||||
| Office supplies | 183,055 | 481,162 | ||||||
| Insurance | 23,494 | 19,586 | ||||||
| Licenses & Patents | 199,538 | 44,109 | ||||||
| Miscellaneous | 162 | 454 | ||||||
| Total | 8,797,433 | 8,605,575 | ||||||
| 12/31/2024 | 12/31/2023 | |||||||
| R&D capitalized (Note 5.7) | 5,022,789 | 4,454,893 | ||||||
| R&D profit and loss | 8,797,433 | 8,605,575 | ||||||
| Total | 13,820,222 | 13,060,468 | ||||||
| BIOCERES GROUP PLC |
| NOTES TO THE UNAUDITED INTERIM CONDENSED CONSOLIDATED FINANCIAL STATEMENTS |
| (Amounts in US$, except otherwise indicated) |
6.4 Expenses classified by nature and function
| Item | Production costs | Selling, general and administrative expenses |
Total 12/31/2024 | |||||||||
| Amortization of intangible assets | 156,124 | 3,039,300 | 3,195,424 | |||||||||
| Analysis and storage | - | 83,155 | 83,155 | |||||||||
| Commissions and royalties | 560,371 | 1,085,605 | 1,645,976 | |||||||||
| Import and export expenses | - | 655,178 | 655,178 | |||||||||
| Depreciation of property, plant and equipment | 1,378,837 | 1,247,555 | 2,626,392 | |||||||||
| Impairment of receivables | - | 1,980,726 | 1,980,726 | |||||||||
| Freight and haulage | 426,217 | 5,085,998 | 5,512,215 | |||||||||
| Logistics | 789,135 | 235,223 | 1,024,358 | |||||||||
| Employee benefits and social securities | 4,299,411 | 22,595,764 | 26,895,175 | |||||||||
| Taxes | 102,660 | 8,650,475 | 8,753,135 | |||||||||
| Rentals | - | 732 | 732 | |||||||||
| Maintenance | 838,419 | 1,106,873 | 1,945,292 | |||||||||
| Energy and fuel | 294,101 | 42,155 | 336,256 | |||||||||
| Supplies and materials | 349,722 | 1,510,587 | 1,860,309 | |||||||||
| Mobility and travel | 68,371 | 2,216,795 | 2,285,166 | |||||||||
| Allowance for obsolescence | 401,812 | 75,944 | 477,756 | |||||||||
| Publicity and advertising | - | 2,278,363 | 2,278,363 | |||||||||
| Systems expenses | 12,597 | 1,710,627 | 1,723,224 | |||||||||
| Vehicles expenses | 52,656 | 275,195 | 327,851 | |||||||||
| Share-based incentives for employees | 264,260 | 1,983,049 | 2,247,309 | |||||||||
| Surveillance expenses | 10,643 | 287,471 | 298,114 | |||||||||
| Professional fees and outsourced services | 112,630 | 4,488,332 | 4,600,962 | |||||||||
| Professional fees related parties (Note 15) | - | 10,396 | 10,396 | |||||||||
| Office supplies | 51,865 | 629,240 | 681,105 | |||||||||
| Insurance | 114,562 | 1,432,859 | 1,547,421 | |||||||||
| Licenses & Patents | - | 12,711 | 12,711 | |||||||||
| Depreciation of leased assets | 748,412 | 1,434,284 | 2,182,696 | |||||||||
| Contingencies | 55,521 | 119,966 | 175,487 | |||||||||
| Environmental Impact Treatment | 770,747 | 59,208 | 829,955 | |||||||||
| Miscellaneous | 12,938 | 397,646 | 410,584 | |||||||||
| Total | 11,872,011 | 64,731,412 | 76,603,423 | |||||||||
| BIOCERES GROUP PLC |
| NOTES TO THE UNAUDITED INTERIM CONDENSED CONSOLIDATED FINANCIAL STATEMENTS |
| (Amounts in US$, except otherwise indicated) |
| Item | Production costs | Selling, general and administrative expenses |
Total 12/31/2023 | |||||||||
| Amortization of intangible assets | 60,849 | 2,961,000 | 3,021,849 | |||||||||
| Analysis and storage | 570 | 153,163 | 153,733 | |||||||||
| Commissions and royalties | 421,677 | 1,008,251 | 1,429,928 | |||||||||
| Import and export expenses | 43,902 | 318,479 | 362,381 | |||||||||
| Depreciation of property, plant and equipment | 1,308,591 | 946,108 | 2,254,699 | |||||||||
| Impairment of receivables | - | 296,051 | 296,051 | |||||||||
| Freight and haulage | 75,002 | 6,001,970 | 6,076,972 | |||||||||
| Logistics | 559,186 | 876,395 | 1,435,581 | |||||||||
| Employee benefits and social securities | 5,985,138 | 21,896,732 | 27,881,870 | |||||||||
| Taxes | 127,760 | 7,119,629 | 7,247,389 | |||||||||
| Maintenance | 966,967 | 575,008 | 1,541,975 | |||||||||
| Energy and fuel | 500,658 | 272,547 | 773,205 | |||||||||
| Supplies and materials | 367,386 | 1,691,154 | 2,058,540 | |||||||||
| Mobility and travel | 94,476 | 2,173,971 | 2,268,447 | |||||||||
| Allowance for obsolescence | 282,836 | - | 282,836 | |||||||||
| Publicity and advertising | 1,300 | 2,333,423 | 2,334,723 | |||||||||
| Systems expenses | 27,186 | 1,973,803 | 2,000,989 | |||||||||
| Vehicles expenses | 40,428 | 585,440 | 625,868 | |||||||||
| Based incentive stock | 65,042 | 5,843,381 | 5,908,423 | |||||||||
| Share-based incentives for employees | 274,862 | 2,200,180 | 2,475,042 | |||||||||
| Surveillance expenses | 368 | 240,461 | 240,829 | |||||||||
| Professional fees and outsourced services | 57,126 | 3,683,802 | 3,740,928 | |||||||||
| Professional fees related parties (Note 14) | - | 86,022 | 86,022 | |||||||||
| Office supplies | 80,236 | 683,484 | 763,720 | |||||||||
| Insurance | 81,174 | 1,103,528 | 1,184,702 | |||||||||
| Depreciation of leased assets | 699,044 | 1,012,212 | 1,711,256 | |||||||||
| Contingencies | 1,239 | 47,851 | 49,090 | |||||||||
| Environmental Impact Treatment | 906,478 | 967 | 907,445 | |||||||||
| Miscellaneous | 1,826 | 60,028 | 61,854 | |||||||||
| Total | 13,031,307 | 66,145,040 | 79,176,347 | |||||||||
6.5 Finance results
| 12/31/2024 | 12/31/2023 | |||||||
| Financial Costs | ||||||||
| Interest expenses | (17,521,278 | ) | (15,227,372 | ) | ||||
| Financial commissions | (2,662,021 | ) | (1,530,144 | ) | ||||
| (20,183,299 | ) | (16,757,516 | ) | |||||
| Other financial results | ||||||||
| Exchange differences generated by assets | 397,445 | 12,304,261 | ||||||
| Exchange differences generated by liabilities | (3,459,235 | ) | (20,284,048 | ) | ||||
| Changes in fair value of financial assets or liabilities and other financial results | (1,908,704 | ) | (11,947,674 | ) | ||||
| Net gain of inflation effect on monetary items | 3,884,305 | 8,946,612 | ||||||
| (1,086,189 | ) | (10,980,849 | ) | |||||
| Total net financial cost | (21,269,488 | ) | (27,738,365 | ) | ||||
| BIOCERES GROUP PLC |
| NOTES TO THE UNAUDITED INTERIM CONDENSED CONSOLIDATED FINANCIAL STATEMENTS |
| (Amounts in US$, except otherwise indicated) |
7. TAXATION
Taxes on income in the interim periods are accrued using the tax rate that would be applicable to expected total annual earnings.
| 12/31/2024 | 12/31/2023 | |||||||
| Current tax expense | (4,863,336 | ) | (3,845,338 | ) | ||||
| Deferred tax | 7,954,410 | (3,599,191 | ) | |||||
| 3,091,074 | (7,444,529 | ) | ||||||
| 12/31/2024 | 12/31/2023 | |||||||
| Beginning of the period deferred tax | (20,024,215 | ) | (24,839,145 | ) | ||||
| Charge for the period | 7,954,410 | (3,599,191 | ) | |||||
| Conversion difference | (905,319 | ) | (223,133 | ) | ||||
| Total net deferred tax | (12,975,124 | ) | (28,661,469 | ) | ||||
The tax on the Group’s profit before tax differs from the theoretical amount that would arise using the weighted average tax rate applicable to profits of the consolidated entities as follows:
| 12/31/2024 | 12/31/2023 | |||||||
| Loss before income tax-rate | (39,914,966 | ) | (31,264,944 | ) | ||||
| Income tax expense by applying tax rate in force in the respective countries | 10,097,367 | 2,760,933 | ||||||
| Share of profit or loss of subsidiaries, joint ventures and associates | (6,119,447 | ) | (5,658,977 | ) | ||||
| Stock options charge | (133,846 | ) | (1,489,037 | ) | ||||
| Non-deductible expenses | (928,113 | ) | (115,997 | ) | ||||
| Result of inflation effect on monetary items and other finance results | (1,325,710 | ) | (11,000,459 | ) | ||||
| Tax inflation adjustment | 1,500,823 | 7,460,048 | ||||||
| Others | - | 598,960 | ||||||
| Income tax expenses | 3,091,074 | (7,444,529 | ) | |||||
The income tax expense was calculated by applying the tax rate in force in the respective countries, as follows:
| December 31, 2024 | December 31, 2023 | |||||||||||||||||||||||
| Tax jurisdiction | Earning before income tax- rate |
Weight average applicable tax rate |
Income tax | Earning before income tax- rate |
Weight average applicable tax rate |
Income tax |
||||||||||||||||||
| Low or null taxation jurisdictions | 6,695,356 | 0.0 | % | - | (5,056,118 | ) | 0.0 | % | - | |||||||||||||||
| Profit-making entities | 12,232,201 | 32.1 | % | (3,637,726 | ) | 28,776,271 | 31.3 | % | (9,007,794 | ) | ||||||||||||||
| Loss-making entities | (58,842,523 | ) | 22.0 | % | 13,735,093 | (54,985,097 | ) | 21.4 | % | 11,768,727 | ||||||||||||||
| (39,914,966 | ) | 10,097,367 | (31,264,944 | ) | 2,760,933 | |||||||||||||||||||
| BIOCERES GROUP PLC |
| NOTES TO THE UNAUDITED INTERIM CONDENSED CONSOLIDATED FINANCIAL STATEMENTS |
| (Amounts in US$, except otherwise indicated) |
8. EARNING PER SHARE
| 12/31/2024 | 12/31/2023 | |||||||
| Numerator | ||||||||
| Loss for the period (basic EPS) | (33,103,200 | ) | (36,504,783 | ) | ||||
| Loss for the period (diluted EPS) | (33,103,200 | ) | (36,504,783 | ) | ||||
| Denominator | ||||||||
| Weighted average number of shares (basic EPS) | 19,038,163 | 18,046,322 | ||||||
| Weighted average number of shares (diluted EPS) | 19,038,163 | 18,046,322 | ||||||
| Basic loss attributable to ordinary equity holders of the parent | (1.7388 | ) | (2.0228 | ) | ||||
| Diluted loss attributable to ordinary equity holders of the parent | (1.7388 | ) | (2.0228 | ) | ||||
For the six-month periods ended December 31, 2024 and 2023, diluted EPS was the same as basic EPS, as the effect of potential ordinary shares would be antidilutive.
9. INFORMATION ABOUT COMPONENTS OF EQUITY
Capital issued
The numbers of shares issued as of December 31, 2024, and June 30, 2024, are the following:
| Period ended | Class | Number of Shares |
Nominal Value | Subscribed capital | ||||||||||||||
| 06/30/2024(*) | Ordinary | 18,995,832 | £ | 0.1 | 2,371,453 | £ | 1,899,583 | |||||||||||
| 12/31/2024(*) | Ordinary | 19,076,966 | £ | 0.1 | 2,382,321 | £ | 1,907,697 | |||||||||||
| (*) | Of the total number of shares, 57.600 shares are held by Rizobacter Argentina S.A. |
Holders of the ordinary shares are entitled to one vote for each ordinary share.
10. CASH FLOW INFORMATION
Significant non-cash transactions related to investing and financing activities are as follows:
| 12/31/2024 | 12/31/2023 | |||||||
| Investment activities | ||||||||
| Investment in-kind in other related parties (Note 15) | 3,642,234 | - | ||||||
| Issuance of shares | 10,868 | 257,775 | ||||||
| Capitalization of interest on buildings in progress | 144,360 | 47,542 | ||||||
| 3,797,462 | 305,317 | |||||||
| 12/31/2024 | 12/31/2023 | |||||||
| Financing activities | ||||||||
| Acquisition of non-controlling interest in subsidiaries | (1,204,164 | ) | (2,606,799 | ) | ||||
| (1,204,164 | ) | (2,606,799 | ) |
| BIOCERES GROUP PLC |
| NOTES TO THE UNAUDITED INTERIM CONDENSED CONSOLIDATED FINANCIAL STATEMENTS |
| (Amounts in US$, except otherwise indicated) |
11. JOINT VENTURES AND ASSOCIATES
| Assets | 12/31/2024 | 06/30/2024 | ||||||
| Measured at equity value method | ||||||||
| Synertech Industrias S.A. | 39,976,501 | 39,749,850 | ||||||
| SW Semillas S.A. | 844 | 955 | ||||||
| Agrality Argentina S.A. | 8,293,315 | 7,758,886 | ||||||
| Agrality US Inc. | 3,612,755 | 3,521,791 | ||||||
| Agrality Seeds Inc. | 5,631,375 | 4,812,389 | ||||||
| Alfalfa Technologies S.R.L. | 36,503 | 36,503 | ||||||
| Inmet S.A | 353,524 | 379,876 | ||||||
| 57,904,817 | 56,260,250 | |||||||
| Measured at Fair value | ||||||||
| Theo I SCS | 7,087,172 | 36,535,601 | ||||||
| 7,087,172 | 36,535,601 | |||||||
| Liabilities | 12/31/2024 | 06/30/2024 | ||||||
| Measured at equity value method | ||||||||
| Trigall Genetics S.A. | 749,269 | 296,455 | ||||||
| 749,269 | 296,455 | |||||||
Changes in joint ventures investments and affiliates:
| 12/31/2024 | 12/31/2023 | |||||||
| As of the beginning | 92,499,396 | 117,720,140 | ||||||
| Share-based incentives | - | 50,383 | ||||||
| Foreign currency translation | (477,918 | ) | 1,250,603 | |||||
| Share of profit or loss measured at equity value method | 1,669,671 | 5,559,957 | ||||||
| Share of profit or loss measured at fair value | (29,448,429 | ) | (26,766,260 | ) | ||||
| As of the end of the period | 64,242,720 | 97,814,823 | ||||||
Share of profit or loss of joint ventures and affiliates:
| Profit and losses | 12/31/2024 | 12/31/2023 | ||||||
| Measured at equity value method | ||||||||
| Synertech Industrias S.A. | 226,651 | 3,178,839 | ||||||
| Agrality US Inc. | 90,964 | - | ||||||
| Agrality Argentina S.A. | 1,041,220 | 1,754,197 | ||||||
| Agrality Seeds Inc. | 818,986 | - | ||||||
| SW Semillas S.A. | (2,290 | ) | - | |||||
| Trigall Genetics | (452,814 | ) | 506,840 | |||||
| Inmet S.A. | (53,046 | ) | 120,081 | |||||
| 1,669,671 | 5,559,957 | |||||||
| Measured at Fair value | ||||||||
| Moolec Science SA | - | 3,048,310 | ||||||
| Theo I SCS | (29,448,429 | ) | (29,814,570 | ) | ||||
| (29,448,429 | ) | (26,766,260 | ) | |||||
Bioceres Group PLC has elected to measure the investment in its associate Theo I SC at fair value through profit or loss in accordance with IFRS 9.
| BIOCERES GROUP PLC |
| NOTES TO THE UNAUDITED INTERIM CONDENSED CONSOLIDATED FINANCIAL STATEMENTS |
| (Amounts in US$, except otherwise indicated) |
12. SEGMENT INFORMATION
The tables present information with respect to the Group´s reporting segments:
Year ended December 31, 2024 |
Seed and integrated products |
Crop protection |
Crop nutrition |
Emerging |
Consolidated | |||||||||||||||
| Revenues from contracts with customers | ||||||||||||||||||||
| Sale of goods and services | 42,959,645 | 100,406,986 | 55,070,802 | 98,680 | 198,536,113 | |||||||||||||||
| Royalties | 942,756 | - | - | - | 942,756 | |||||||||||||||
| Others | ||||||||||||||||||||
| Initial recognition and changes in the fair value of biological assets at the point of harvest | 588,053 | - | - | - | 588,053 | |||||||||||||||
| Government grants | - | - | - | 10,154 | 10,154 | |||||||||||||||
| Total revenues | 44,490,454 | 100,406,986 | 55,070,802 | 108,834 | 200,077,076 | |||||||||||||||
| Cost of sales | (27,868,376 | ) | (60,663,237 | ) | (28,814,839 | ) | (28,533 | ) | (117,374,985 | ) | ||||||||||
| Gross profit per segment | 16,622,078 | 39,743,749 | 26,255,963 | 80,301 | 82,702,091 | |||||||||||||||
| % Gross margin | 37 | % | 40 | % | 48 | % | 100 | % | 41 | % | ||||||||||
| Period ended December 31, 2023 | Seed and integrated products |
Crop protection |
Crop nutrition |
Emerging solutions |
Consolidated | |||||||||||||||
| Revenues from contracts with customers | ||||||||||||||||||||
| Sale of goods and services | 53,777,458 | 127,029,466 | 75,020,367 | 507,608 | 256,334,899 | |||||||||||||||
| Royalties | 649,341 | - | - | - | 649,341 | |||||||||||||||
| Others | ||||||||||||||||||||
| Initial recognition and changes in the fair value of biological assets at the point of harvest | 77,353 | 141,457 | 119,318 | - | 338,128 | |||||||||||||||
| Government grants | - | - | - | 74,723 | 74,723 | |||||||||||||||
| Total revenues | 54,504,152 | 127,170,923 | 75,139,685 | 582,331 | 257,397,091 | |||||||||||||||
| Cost of sales | (36,216,288 | ) | (81,249,196 | ) | (42,860,834 | ) | (49,636 | ) | (160,375,954 | ) | ||||||||||
| Gross profit per segment | 18,287,864 | 45,921,727 | 32,278,851 | 532,695 | 97,021,137 | |||||||||||||||
| % Gross margin | 34 | % | 36 | % | 43 | % | 91 | % | 38 | % | ||||||||||
| BIOCERES GROUP PLC |
| NOTES TO THE UNAUDITED INTERIM CONDENSED CONSOLIDATED FINANCIAL STATEMENTS |
| (Amounts in US$, except otherwise indicated) |
13. FINANCIAL INSTRUMENTS – RISK MANAGEMENT
The following tables show additional information required under IFRS 7 on the financial assets and liabilities recorded as of December 31, 2024, and June 30, 2024.
Financial assets by category
| Amortised cost | Mandatorily measured at fair value through profit or loss |
|||||||||||||||
| Financial asset | 12/31/2024 | 06/30/2024 | 12/31/2024 | 06/30/2024 | ||||||||||||
| Cash and cash equivalents | 18,081,185 | 46,710,292 | 15,119,957 | 6,284,573 | ||||||||||||
| Other financial assets | 373,134 | - | 9,598,263 | 14,858,124 | ||||||||||||
| Trade receivables | 228,437,463 | 209,007,195 | - | - | ||||||||||||
| Other receivables (*) | 45,094,878 | 45,342,974 | 6,789,863 | - | ||||||||||||
| Total | 291,986,660 | 301,060,461 | 31,508,083 | 21,142,697 | ||||||||||||
| (*) | Advances expenses and tax balances are not included. |
Financial liabilities by category
| Amortised cost | Mandatorily measured at fair value through profit or loss |
|||||||||||||||
| Financial liability | 12/31/2024 | 06/30/2024 | 12/31/2024 | 06/30/2024 | ||||||||||||
| Trade and other payables | 137,437,127 | 156,947,744 | 6,645,423 | 11,989,792 | ||||||||||||
| Borrowings | 379,851,142 | 361,759,056 | - | - | ||||||||||||
| Consideration for acquisition | 3,617,374 | 3,852,853 | 1,477,485 | 2,724,114 | ||||||||||||
| Convertible notes | 83,400,171 | 80,809,686 | - | - | ||||||||||||
| Lease liability | 16,138,012 | 11,284,137 | - | - | ||||||||||||
| Total | 620,443,826 | 614,653,476 | 8,122,908 | 14,713,906 | ||||||||||||
Financial instruments measured at fair value
| Measurement at fair value at 12/31/2024 | Level 1 | Level 2 | ||||||
| Financial assets at fair value | ||||||||
| Mutual funds | 15,119,957 | - | ||||||
| Moolec Science S.A shares | 1,657,706 | - | ||||||
| Investments at fair value | 7,083,184 | - | ||||||
| US Treasury bills | - | - | ||||||
| Other investments | 857,373 | - | ||||||
| Other receivables - Joint ventures and associates | - | 6,789,863 | ||||||
| Financial liabilities valued at fair value | ||||||||
| Trade and other payables | - | 6,645,423 | ||||||
| Consideration for acquisition | 1,477,485 | - | ||||||
| Measurement at fair value at 06/30/2024 | Level 1 | Level 2 | ||||||
| Financial assets at fair value | ||||||||
| Mutual funds | 12,943,378 | - | ||||||
| Moolec Science S.A shares | 2,191,286 | - | ||||||
| Investments at fair value | 2,311,604 | - | ||||||
| US Treasury bills | 1,993,668 | - | ||||||
| Other investments | 1,702,761 | - | ||||||
| Financial liabilities valued at fair value | ||||||||
| Trade and other payables | - | 11,989,792 | ||||||
| Consideration for acquisition | 2,724,114 | - | ||||||
| BIOCERES GROUP PLC |
| NOTES TO THE UNAUDITED INTERIM CONDENSED CONSOLIDATED FINANCIAL STATEMENTS |
| (Amounts in US$, except otherwise indicated) |
Fair value by hierarchy
According to the requirements of IFRS 7, the Group classifies each class of financial instrument valued at fair value into three levels, depending on the relevance of the judgment associated to the assumptions used for measuring the fair value.
Level 1 comprises financial assets and liabilities with fair values determined by reference to quoted prices (unadjusted) in active markets for identical assets or liabilities.
Level 2 comprises inputs other than quoted prices included within Level 1 that are observable for the asset or liability, either directly (i.e. as prices) or indirectly (i.e. derived from prices);
Level 3 comprises financial instruments with inputs for estimating fair value that are not based on observable market data.
Estimation of fair value
The fair value of marketable securities, mutual funds and US Treasury Bills is calculated using the market approach using quoted prices in active markets for identical assets. The quoted marked price used for financial assets held by the Group is the current bid price. These instruments are included in level 1.
The Group’s financial liabilities, which were not traded in an active market, were determined using valuation techniques that maximize the use of available market information and thus rely as little as possible on specific estimates of the entity specific estimates. If all significant inputs required to fair value an instrument are observable, the instruments are included in level 2.
If one or more of the significant inputs is not based on observable market data, the instruments are included in level 3.
The Group’s policy is to recognize transfers between different categories of the fair value hierarchy at the time they occur or when there are changes in the circumstances that cause the transfer. There were no transfers between levels of the fair value hierarchy. There were no changes in economic or business circumstances affecting fair value.
Financial instruments not measured at fair value
The financial instruments not measured at fair value include cash and cash equivalents, trade accounts receivable, other accounts receivable, trade payables and other debts, borrowings, financed payments and convertible notes.
The carrying value of financial instruments not measured at fair value does not differ significantly from their fair value, except for borrowings (Note 5.10).
Management estimates that the carrying value of the financial instruments measured at amortized cost approximates their fair value.
Currency risk
Foreign currency risk is the risk that the fair value or future cash flows of a financial instrument will fluctuate because of changes in foreign exchange rate. Currency on foreign exchange risk arises when the Group enters into transactions denominated in a currency other than its functional currency.
| BIOCERES GROUP PLC |
| NOTES TO THE UNAUDITED INTERIM CONDENSED CONSOLIDATED FINANCIAL STATEMENTS |
| (Amounts in US$, except otherwise indicated) |
The table below sets forth our net exposure to currency risk as of December 31, 2024:
| Net foreign currency position | 12/31/2024 | |||
| Amount expressed in US$ | 3,945,953 | |||
Considering only this net currency exposure as of December 31, 2024 if an US Dollar revaluation or depreciation in relation to other foreign currencies with the remaining variables remaining constant, would have a positive or a negative impact on comprehensive income as a result of foreign exchange gains or losses. We estimate that a devaluation or an appreciation of the US Dollar other currencies of 10% during the period ended December 31, 2024 would have resulted in a net pre-tax loss or gain of approximately $0.3 million.
14. LEASES
The right-of-use asset was initially measured at the amount of the lease liability plus initial direct costs incurred, adjusted by pre-payments made in relation to the lease. The right-of-use asset was measured at cost less accumulated depreciation and accumulated impairment.
The lease liability was initially measured at the present value of the lease payments payable over the lease term, discounted at the rate implicit in the lease if it can be readily determined. If that rate cannot be readily determined, the Group uses its incremental borrowing rate.
The information about the right-of-use and liabilities related with lease assets is as follows:
| 12/31/2024 | 06/30/2024 | |||||||
| Right-of-use leased asset | ||||||||
| Book value at the beginning of the period/inception | 20,979,597 | 21,163,192 | ||||||
| Additions of the period | 7,872,230 | 2,585,223 | ||||||
| Additions from business combination | - | 168,988 | ||||||
| Disposals | (76,298 | ) | (1,284,975 | ) | ||||
| Exchange differences | (986,508 | ) | (1,652,831 | ) | ||||
| Book value at the end of the period | 27,789,021 | 20,979,597 | ||||||
| 12/31/2024 | 06/30/2024 | |||||||
| Depreciation | ||||||||
| Book value at the beginning of the period/inception | 9,377,845 | 7,226,617 | ||||||
| Depreciation of the period | 2,219,948 | 3,418,956 | ||||||
| Disposals | (76,298 | ) | (1,092,167 | ) | ||||
| Exchange differences | (67,958 | ) | (175,561 | ) | ||||
| Accumulated depreciation at the end of the period | 11,453,537 | 9,377,845 | ||||||
| Total | 16,335,484 | 11,601,752 | ||||||
| 12/31/2024 | 06/30/2024 | |||||||
| Lease Liabilities | ||||||||
| Book value at the beginning of the period/inception | 11,284,137 | 13,889,223 | ||||||
| Additions of the period | 7,872,230 | 2,585,223 | ||||||
| Additions from business combination | - | 168,988 | ||||||
| Interest expenses, exchange differences and inflation effects | (520,389 | ) | (480,189 | ) | ||||
| Payments of the period | (2,497,966 | ) | (4,879,108 | ) | ||||
| Total | 16,138,012 | 11,284,137 | ||||||
| BIOCERES GROUP PLC |
| NOTES TO THE UNAUDITED INTERIM CONDENSED CONSOLIDATED FINANCIAL STATEMENTS |
| (Amounts in US$, except otherwise indicated) |
| 12/31/2024 | 06/30/2024 | |||||||
| Lease Liabilities | ||||||||
| Current | 5,289,223 | 3,122,778 | ||||||
| Non-current | 10,848,789 | 8,161,359 | ||||||
| 16,138,012 | 11,284,137 | |||||||
| 12/31/2024 | 06/30/2024 | |||||||
| Machinery and equipment | 3,655,741 | 3,655,741 | ||||||
| Vehicles | 1,117,687 | 1,272,071 | ||||||
| Equipment and computer software | 1,234,475 | 1,130,541 | ||||||
| Land and buildings | 21,781,118 | 14,921,244 | ||||||
| 27,789,021 | 20,979,597 | |||||||
15. SHAREHOLDERS AND OTHER RELATED PARTIES BALANCES AND TRANSACTIONS
During the period ended December 31, 2024 and 2023, the transactions between the Group and related parties, and the related balances owed by and to them as of December 31 and June 30, 2024, are as follows:
| Value of transactions for the period ended | Value of transactions for the period ended | |||||||||
| Party | Transaction type | 12/31/2024 | 12/31/2023 | |||||||
| Joint ventures and associates | Sales of goods and services | 6,773,660 | 14,320,418 | |||||||
| Purchases of goods and services | (23,377,901 | ) | (20,999,513 | ) | ||||||
| Net loans granted | 3,381,521 | 2,560,120 | ||||||||
| Interest gain | 456,086 | 337,146 | ||||||||
| Net loans received | (1,860,058 | ) | (1,859,680 | ) | ||||||
| Shareholders and other related parties | Net loans granted | 59,552 | (1,320 | ) | ||||||
| Interest expenses | (807,441 | ) | (1,493,682 | ) | ||||||
| Own shares held by subsidiaries | (444,473 | ) | - | |||||||
| Sales of goods and services | 6,463,117 | 1,643,269 | ||||||||
| Purchases of goods and services | (1,750,963 | ) | (2,178,877 | ) | ||||||
| In-kind contributions | 3,642,234 | - | ||||||||
| Key management personnel | Sales and services | 6,048 | - | |||||||
| Purchases of goods and services | 821,959 | - | ||||||||
| Salaries, social security benefits and other benefits | (1,517,990 | ) | (1,294,164 | ) | ||||||
| Stock options-based incentives | (480,450 | ) | (8,527,214 | ) | ||||||
| Total | (8,635,099 | ) | (17,493,497 | ) | ||||||
| Amounts receivable from related parties | ||||||||||
| Party | Transaction type | 12/31/2024 | 6/30/2024 | |||||||
| Joint ventures and associates | Trade debtors | 1,730,524 | 2,176,622 | |||||||
| Other receivables | 43,503,377 | 37,586,012 | ||||||||
| Shareholders and other related parties | Trade debtors | 258 | 37 | |||||||
| Other receivables | 106,900 | 47,348 | ||||||||
| Total | 45,341,059 | 39,810,019 | ||||||||
| BIOCERES GROUP PLC |
| NOTES TO THE UNAUDITED INTERIM CONDENSED CONSOLIDATED FINANCIAL STATEMENTS |
| (Amounts in US$, except otherwise indicated) |
| Amounts payable to related parties | ||||||||||
| Party | Transaction type | 12/31/2024 | 6/30/2024 | |||||||
| Joint ventures and associates | Trade creditors | (44,907,002 | ) | (52,778,206 | ) | |||||
| Net loans payables | (1,860,222 | ) | (1,860,058 | ) | ||||||
| Shareholders and other related parties | Trade creditors | (49,646 | ) | (37,985 | ) | |||||
| Key management personnel | Salaries, social security benefits and other benefits | (423,942 | ) | (226,702 | ) | |||||
| Total | (47,240,812 | ) | (54,902,951 | ) | ||||||
16. KEY MANAGEMENT PERSONNEL COMPENSATION
Key management personnel are those persons having authority and responsibility for planning, directing and controlling the activities of the Group.
The compensation of directors and other members of key management personnel, including social contributions and other benefits, were as follows for the period ended December 31, 2024 and 2023.
| 12/31/2024 | 12/31/2023 | |||||||
| Salaries, social security and other benefits | 1,517,990 | 1,294,164 | ||||||
| Share based payment | 480,450 | 8,527,214 | ||||||
| 1,998,440 | 9,821,378 | |||||||
The Group entered into indemnification agreements with each of its directors and executive officers. These agreements generally provide that the relevant director or officer will be indemnified by the Group to the fullest extent permitted by law against liability and against all expenses reasonably incurred or paid by him or her in connection with any claim, action, suit or proceeding which he or she becomes involved as a party or otherwise by virtue of his or her being or having been such a director or officer of the Group and against amounts paid or incurred by him or her in the settlement thereof.
The agreements are subject to certain exceptions, including that no indemnification will be provided to any director or officer against any liability to the Group or its shareholder (i) by reason of intentional fraudulent conduct, dishonesty, willful misconduct, or gross negligence on the part of the director or officer; or (ii) by reason of payment made under an insurance policy or any third party that has no recourse against the indemnitee director or officer.
The compensation of key executives is determined by the Board of Directors of Bioceres Group PLC, Bioceres S.A. and Bioceres Crop Solutions Corp., based on the performance of individuals and market trends.
Bioceres Group currently does not pay any compensation to any of its executive board members.
17. CONTINGENCIES, COMMITMENTS AND RESTRICTIONS ON THE DISTRIBUTION OF PROFITS 18.
There were no other significant changes to the contingencies, commitments and restrictions on the distribution of profits from the disclosure made in the Consolidated financial statement as of June 30, 2024.
| BIOCERES GROUP PLC |
| NOTES TO THE UNAUDITED INTERIM CONDENSED CONSOLIDATED FINANCIAL STATEMENTS |
| (Amounts in US$, except otherwise indicated) |
EVENTS OCCURRING AFTER THE REPORTING PERIOD
The Group initiated a plan to dispose of its investment in Theo I SCSp, currently recognized as a non-current asset under “Investments in joint ventures and associates” line. The sale process is expected to be completed during the first half of fiscal year 2026. As of the date of authorization of these interim condensed consolidated financial statements, the investment met the criteria to be classified as a disposal group held for sale under IFRS 5.
On April 1, 2025, pursuant to resolutions passed at a General Meeting of Shareholders, the Company re-registered as a private limited company and changed its legal name from Bioceres Group PLC to Bioceres Group Limited.
Subsequent to December 31, 2024, there have been no other situations or circumstances that may require significant adjustments or further disclosure in these consolidated financial statements that were not mentioned above.
33
Exhibit 99.5
UNITED STATES
SECURITIES AND EXCHANGE COMMISSION
Washington, D.C. 20549
FORM 20-F
(Mark One)
☐ REGISTRATION STATEMENT PURSUANT TO SECTION 12(b) OR (g) OF THE SECURITIES EXCHANGE ACT OF 1934
OR
☒ ANNUAL REPORT PURSUANT TO SECTION 13 OR 15(d) OF THE SECURITIES EXCHANGE ACT OF 1934
For the fiscal year ended June 30, 2024
OR
☐ TRANSITION REPORT PURSUANT TO SECTION 13 OR 15(d) OF THE SECURITIES EXCHANGE ACT OF 1934
For the transition period from to
OR
☐ SHELL COMPANY REPORT PURSUANT TO SECTION 13 OR 15(d) OF THE SECURITIES EXCHANGE ACT OF 1934
Date of event requiring this shell company report:
Commission file number: 001-38405
Bioceres Crop Solutions Corp.
(Exact name of Registrant as specified in its charter)
Cayman Islands
(Jurisdiction of incorporation)
Ocampo 210 bis, Predio CCT, Rosario
Province of Santa Fe, Argentina
(Address of principal executive offices)
Maria Paula Savanti
Head of Investor Relations
Ocampo 210 bis, Predio CCT, Rosario
Province of Santa Fe, Argentina
Phone: 54-341-4861122
Email: investorrelations@biocerescrops.com
(Name, Telephone, E-mail and/or Facsimile number and Address of Company Contact Person)
Copies to:
Matthew S. Poulter, Esq.
Emilio Minvielle, Esq.
Linklaters LLP
1290 Avenue of the Americas
New York, NY 10104
Phone: (212) 903-9000
Fax: (212) 903-9100
Securities registered or to be registered pursuant to Section 12(b) of the Act:
| Title of Each Class | Trading Symbol | Name of each exchange on which registered | ||
| Ordinary Shares, par value US$0.0001 per share | BIOX | Nasdaq Stock Market LLC |
Securities registered or to be registered pursuant to Section 12(g) of the Act:
None
Securities for which there is a reporting obligation pursuant to Section 15(d) of the Act:
Ordinary Shares
Indicate the number of outstanding shares of each of the issuer’s classes of capital stock or common stock as of the close of business covered by the annual report.
62,848,483 ordinary shares were issued and outstanding as of June 30, 2024.
Indicate by check mark if the registrant is a well-known seasoned issuer, as defined in Rule 405 of the Securities Act.
☐ Yes ☒ No
If this report is an annual or transition report, indicate by check mark if the registrant is not required to file reports pursuant to Section 13 or 15(d) of the Securities Exchange Act of 1934.
☐ Yes ☒ No
Indicate by check mark whether the registrant (1) has filed all reports required to be filed by Section 13 or 15(d) of the Securities Exchange Act of 1934 during the preceding 12 months (or for such shorter period that the registrant was required to file such reports), and (2) has been subject to such filing requirements for the past 90 days.
☒ Yes ☐ No
Indicate by check mark whether the registrant has submitted every Interactive Data File required to be submitted pursuant to Rule 405 of Regulation S-T (§232.405 of this chapter) during the preceding 12 months (or for such shorter period that the registrant was required to submit such files).
☒ Yes ☐ No
Indicate by check mark whether the registrant is a large accelerated filer, an accelerated filer, a non-accelerated filer, or an emerging growth company. See definition of “large accelerated filer,” “accelerated filer,” and “emerging growth company” in Rule 12b-2 of the Exchange Act.
| Large accelerated filer ☐ | Accelerated filer ☒ | Non-accelerated filer ☐ | Emerging growth company ☐ |
If an emerging growth company that prepares its financial statements in accordance with U.S. GAAP, indicate by check mark if the registrant has elected not to use the extended transition period for complying with any new or revised financial accounting standards† provided pursuant to Section 13(a) of the Exchange Act. ☐
† The term “new or revised financial accounting standard” refers to any update issued by the Financial Accounting Standards Board to its Accounting Standards Codification after April 5, 2012.
Indicate by check mark whether the registrant has filed a report on and attestation to its management’s assessment of the effectiveness of its internal control over financial reporting under Section 404(b) of the Sarbanes-Oxley Act (15 U.S.C. 7262(b)) by the registered public accounting firm that prepared or issued its audit report. ☒
If securities are registered pursuant to Section 12(b) of the Act, indicate by check mark whether the financial statements of the registrant included in the filing reflect the correction of an error to previously issued financial statements. ☐
Indicate by check mark whether any of those error corrections are restatements that required a recovery analysis of incentive-based compensation received by any of the registrant’s executive officers during the relevant recovery period pursuant to §240.10D-1(b). ☐
Indicate by check mark which basis of accounting the registrant has used to prepare the financial statements included in this filing:
| US GAAP ☐ | International Financial Reporting Standards as issued | Other ☐ |
| by the International Accounting Standards Board ☒ |
If “Other” has been checked in response to the previous question indicate by check mark which financial statement item the registrant has elected to follow.
☐ Item 17 ☐ Item 18
If this is an annual report, indicate by check mark whether the registrant is a shell company (as defined in Rule 12b-2 of the Exchange Act).
☐ Yes ☒No
Table of Contents
INTRODUCTORY NOTE AND PRESENTATION OF FINANCIAL AND OTHER INFORMATION
Introductory Note
Unless the context otherwise requires, “we,” “us,” “our,” “the Company,” “BIOX,” “Bioceres” and “Bioceres Crop Solutions” refers to Bioceres Crop Solutions Corp. and its subsidiaries.
Financial statement information
The consolidated statements of comprehensive income data for Bioceres for the years ended June 30, 2024, 2023 and 2022 and the consolidated statements of financial position data as of June 30, 2024 and 2023 are derived from our audited consolidated financial statements appearing elsewhere in this report. They have been prepared in accordance with International Financial Reporting Standards (“IFRS”) as issued by the International Accounting Standard Board (the “IASB”).
Our presentation currency is U.S. dollars.
We have applied the following standards and amendments for the first time for our annual reporting period commencing July 1, 2023:
| ● | Amendment to IAS 12 – Deferred tax related to assets and liabilities arising from a single transaction; |
| ● | International Tax Reform – Pillar Two Model Rules (Amendments to IAS 12); |
| ● | Amendments to IAS 1 and Practice Statement 2 – Disclosure of Accounting Policies; and |
| ● | Amendments to IAS 8 – Definition of Accounting Estimates. |
The adoption of these amendments did not have a material impact on us. For more information see Note 3 of our audited consolidated financial statements beginning on page F-1 of this annual report on Form 20-F.
CAUTIONARY NOTE REGARDING FORWARD-LOOKING STATEMENTS
We make forward-looking statements in this report that are subject to risks and uncertainties. These forward-looking statements include information about possible or assumed future results of our business, financial condition, results of operations, liquidity, anticipated growth strategies, anticipated trends in our industry, our potential growth opportunities, plans and objectives. In some cases, you can identify forward-looking statements by terminology such as “believe,” “may,” “might,” “will,” “consider,” “estimate,” “continue,” “anticipate,” “intend,” “target,” “project,” “contemplate,” “should,” “plan,” “expect,” “predict,” “potential,” or the negative of these terms or other similar terms or expressions. The statements we make regarding the following matters are forward-looking by their nature:
| ● | the impact of armed conflict in Israel and Gaza, in addition to the Ukraine, and any possible escalation of such conflicts or contagion to neighboring countries or regions; |
| ● | our beliefs with respect to the agricultural industry and related markets, including production levels, consolidation trends, and market opportunity; |
| ● | our plans and expectations regarding growth in our business, expansion to new markets, diversification of our product portfolio and strategic acquisitions and partnerships; |
| ● | our ability to integrate new products, technologies, and employee teams after any strategic acquisition; |
| ● | our ability to develop, commercialize and register biotechnology products and crop productivity technologies; |
| ● | our ability to maintain our joint venture agreements with our current partners; |
| ● | our ability to maintain a competitive position in our markets; |
| ● | our ability to protect our intellectual property; |
| ● | the success of the HB4 technology that we license and that remains subject to receipt of regulatory approval in certain jurisdictions; |
| ● | our or our collaborators’ ability to develop commercial products that incorporate our licensed seed traits and complete the regulatory approval process for such products; |
| ● | our expectations regarding the commercial value of our key products in yield and abiotic stress and biotic stress; |
| ● | our expectations regarding regulatory approval of products developed or licensed by us, our joint ventures and third-party collaborators; |
| ● | our ability to adapt to continuous technological change in our industry; |
| ● | our ability to effectively manage sales and marketing teams and distribution networks; |
| ● | our expectations regarding revenues and sales, including potential growth in sales, changes to sales mix and expectations regarding seasonality and the impact of weather-related conditions; |
| ● | our plans and expectations with regarding to manufacturing and production; |
| ● | our expectations that products containing our licensed seed traits will be commercialized and we will earn royalties from the sales of such products; |
| ● | our expectations regarding the future growth of the global agricultural, agricultural biotechnology, biological-based chemical and agro-industrial biotechnology markets; |
| ● | our ability to develop and exploit a proprietary channel for the sale of our licensed biotechnology products, as well as our proprietary products; |
| ● | our compliance with laws and regulations that impact our business and changes to such laws and regulations; |
| ● | our ability to assemble, store, integrate and analyze significant amounts of public and proprietary data; |
| ● | our ability to maintain our licensing arrangements for the third-party products that we commercialize; |
| ● | our plans and expectations relating to our debt agreements; |
| ● | our ability to influence customer perception of biological agricultural products; |
| ● | our beliefs regarding our environmental, social, and governance leadership; |
| ● | our belief regarding our access to capital resources through equity offerings, debt financings, strategic collaborations or other means; |
| ● | our expectations with respect to our future expenditures, available cash and other financial and operating results; |
| ● | our anticipated impact of certain accounting pronouncements; |
| ● | our expectations regarding market risk, including interest rate changes, foreign currency fluctuations and commodity price changes; |
| ● | our ability to respond to health epidemics and other outbreaks, including responses by governmental bodies or regulators; |
| ● | the outcome of any known and unknown litigation and regulatory proceedings; and |
| ● | various other factors, including without limitation those described under “Item 3. Key Information – D. Risk Factors.” |
The preceding list is not intended to be an exhaustive list of all of our forward-looking statements. The forward-looking statements are based on our beliefs, assumptions and expectations of future performance, taking into account the information currently available to us. These statements are only predictions based upon our current expectations and projections about future events. There are important factors that could cause our actual results, levels of activity, performance or achievements to differ materially from the results, levels of activity, performance or achievements expressed or implied by the forward-looking statements.
You should not rely upon forward-looking statements as predictions of future events. Although we believe that the expectations reflected in the forward-looking statements are reasonable, we cannot guarantee that future results, levels of activity, performance and events and circumstances reflected in the forward-looking statements will be achieved or will occur. Except as required by law, we undertake no obligation to update publicly any forward-looking statements for any reason after the date of this report or to conform these statements to actual results or to changes in our expectations.
ITEM 1. IDENTITY OF DIRECTORS, SENIOR MANAGEMENT AND ADVISERS
| A. | Directors and Senior Management |
Not applicable.
| B. | Advisors |
Not applicable.
| C. | Auditors |
Not applicable.
ITEM 2. OFFER STATISTICS AND EXPECTED TIMETABLE
| A. | Offer Statistics |
Not applicable.
| B. | Method and Expected Timetable |
Not applicable.
| A. | [RESERVED] |
| B. | Capitalization and Indebtedness |
Not applicable.
| C. | Reasons for the Offer and Use of Proceeds |
Not applicable.
| D. | Risk Factors |
The following risk factors apply to our business and operations. The occurrence of one or more of the events or circumstances described in these risk factors, alone or in combination with other events or circumstances, may have a material adverse effect on our business, cash flows, financial condition and results of operations. You should carefully consider the following risk factors in addition to the other information included in this report, including matters addressed in the section entitled “Cautionary Note Regarding Forward-Looking Statements.” We may face additional risks and uncertainties that are not presently known to us, or that we currently deem immaterial, which may also impair our business or financial condition. The following discussion should be read in conjunction with the financial statements and notes to the financial statements included herein.
Summary Risk Factors
You should carefully consider all of the information in this annual report before making an investment in our ordinary shares. Below please find a summary of the principal risks and uncertainties we face, organized under relevant headings.
Risks Related to our Business and Strategy
We are subject to the following risks in respect of our business and our strategy:
| ● | difficulties implementing our inorganic growth strategy and integrating the operations of recently acquired and future businesses, which could adversely affect our results of operations and our ability to service our debt obligations; |
| ● | we may not realize the benefits of future businesses or products we acquire or strategic alliances we form, which could have a material adverse effect on our business, financial conditions, earnings and prospects; |
| ● | acquisitions may not be successful in achieving intended benefits, cost savings and synergies and may disrupt current operations; |
| ● | we may not be successful in developing marketable or commercial technologies; |
| ● | difficulty in obtaining timely necessary regulatory approvals for the business and the commercialization of our products currently under development could affect our ability to sell our products in certain jurisdictions; |
| ● | our HB4 seed business is dependent on the success of a technology that we license; |
| ● | limited number of prospective collaborators in our market; |
| ● | our joint venture agreements or any partnerships that we may enter into in the future may not be successful, and we or our collaborators may fail to perform our respective contractual obligations, which could result in disputes; |
| ● | we may face difficulties in collecting payments or royalties which could have an adverse impact on our business; |
| ● | we may not have sufficient cash flow to service our indebtedness, including the payment of interest and principal in respect of the Notes due 2026; |
| ● | inability to attract and retain qualified scientific and business personnel, which could adversely affect our business; |
| ● | we may be unable to prevent our competitors from benefiting from the expertise of our former employees; |
| ● | global economic conditions, including as a result of the armed conflict in Israel and Gaza and the war in the Ukraine; |
| ● | ultimate impact on our results and operations of global pandemic and measures adopted by the governments of the countries in which we operate in response to global pandemics; |
| ● | the seasonal nature of crops and factors beyond our control could cause our sales and operating results to fluctuate significantly; |
| ● | circumstances beyond our control may affect our crop productivity and our results of operations; |
| ● | certain estimates of market opportunity included in this report are based on assumptions that are inherently uncertain and subject to risks and uncertainties that could have a material adverse effect on our business; |
| ● | resistance to genetically modified (“GM”) crops may negatively affect our public image and reduce sales of seeds or other products containing our licensed seed traits; |
| ● | competition in crop productivity products is intense and requires continuous technological development which could affect our business, results of operations and financial condition; |
| ● | changes in laws and regulations may materially increase our costs of operation, decrease our operating revenue and disrupt our business; |
| ● | our indebtedness could adversely affect our financial condition; |
| ● | price increases and shortages of raw materials could adversely affect our results of operations; |
| ● | exposure to market risks from commodity prices volatility; |
| ● | we may be required to pay substantial damages as a result of uninsured product liability claims; |
| ● | our operations are subject to various health and environmental risks associated with our use, handling and disposal of potentially toxic materials, which could result in fines, liability, reputation harm or otherwise adverse effects on our business; |
| ● | requirements of being a public company may strain our resources and distract our management; |
| ● | obtaining required future financing or obtaining it on favorable terms which could force us to delay, reduce or the terminate of some of our activities; |
| ● | development and commercialization of our products may incur scrutiny under the Convention on Biological Diversity Treaty; |
| ● | our failure to accurately forecast and/or manage inventory could result in unexpected shortfalls or surplus of products; |
| ● | reliance on third parties to grow our seeds which could negatively impact our business; |
| ● | IT disruptions or failures in our operating system can affect our reputation and business; |
| ● | computer system failures, cyber-attacks or a deficiency in our cybersecurity could adversely affect our business and operations; |
| ● | labor union disputes may arise which may be time consuming and distracting to our management; |
| ● | non-compliance with anti-corruption and anti-money laundering laws can subject us to criminal and civil liability; |
| ● | recently introduced economic substance legislation of the Cayman Islands may adversely impact us or our operations; |
| ● | taxation in the Cayman Islands which would negatively affect our results; and |
| ● | our “foreign private issuer” status under the rules and regulations of the United States Securities and Exchange Commission (the “SEC”) and our adherence of certain home country corporate governance practices in lieu of Nasdaq Global Market requirements. |
Risks Related to our Intellectual Property
We are subject to the following risks in respect of our intellectual property rights:
| ● | our agreements may not adequately prevent disclosure of proprietary information, which could lead to a loss of competitive advantage and negatively impact our technology and business operations; |
| ● | failure to protect our intellectual property rights throughout the world may result in the loss of proprietary information and competitive advantage globally; |
| ● | changes in Argentine and U.S. patent law could diminish the value of patents and impair our ability to protect our product candidates; |
| ● | potential litigation relating to third party intellectual property rights infringement could prevent us from using certain technologies and products; |
| ● | technological developments or challenges by competitors could affect the relevance of our technology and products or infringe on our intellectual property; and |
| ● | requirement to pay royalties to employees who develop inventions commercialized by us may increase our operational costs. |
Risks Related to Operating in Latin America
We are subject to the following risks in respect of our operations in Latin America:
| ● | adverse economic or political conditions, including considerable economic uncertainty may impact our business, financial condition, and results; |
| ● | significant government influence over the economies of the countries in which we operate could negatively impact our operational flexibility and profitability; |
| ● | fluctuations in currency exchange rates may affect our financial results and cash flows; |
| ● | currency of a hyperinflationary economy requires that we apply inflationary adjustments to our Argentine subsidiaries’ financial statements, which may affect our financial reporting and distort actual performance measurements; |
| ● | inflation in Argentina and government intervention controls can affect our operating margins and limit financial maneuverability; |
| ● | limited access of the Argentine government and the private sector to the international capital markets may restrict our ability to raise funds abroad; |
| ● | increase in export and import duties and controls may increase costs and decrease competitiveness in international markets; |
| ● | decline in the global prices of Latin America’s main commodity exports could negatively affect our revenue and profitability; |
| ● | special protections for employees in the private sector could increase our labor costs; |
| ● | taxation relating to disposition or sale of our ordinary shares in Argentina could reduce the net proceeds from such transactions, affecting shareholder value; |
| ● | taxation relating to the payment of the In-Kind Consideration under the Rizobacter Call Option in Argentina; |
| ● | exchange controls and restrictions limit access to the FX Market (as defined below) to make payments and distributions from our Argentine subsidiaries; |
| ● | mandatory repatriation of export receivables may limit our financial flexibility and expose us to currency risks; and |
| ● | changes in Argentine tax laws could adversely impact the results of our operations. |
Risks Relating to our Ordinary Shares
Our shareholders are subject to the following risks:
| ● | our share repurchase program is funded by our existing cash reserves, which may lead to a reduction of liquidity; |
| ● | compliance with listing standards of Nasdaq cannot be assured, which may result in restrictions on our listing and trading volume; |
| ● | sales of substantial number of our ordinary shares in the public market by our shareholders, which could adversely affect the market price of our ordinary shares; |
| ● | the conversion of Secured Convertible Guaranteed Notes due 2026 may result in dilution of the existing ownership percentage of our shareholders; |
| ● | transition from our status as a “controlled company”, as defined by Nasdaq rules, which may require additional disclosure obligations, unless an exemption applies; |
| ● | fluctuation in the price of our securities may create uncertainty in our trading markets; |
| ● | publicity and market recommendations may decrease the price and trading volume of our ordinary shares; |
| ● | difficulty faced by public shareholders in protecting their interests through the U.S. Federal courts, which may pose risks to shareholder rights; |
| ● | as we ceased to be an “emerging growth company”, we may incur in increased costs related to compliance and disclosure obligations with the SEC; |
| ● | our status as a foreign private issuer may pose additional risks and less regulatory protection for our shareholders in comparison to domestic issuers; |
| ● | our history of no cash dividends payments on our ordinary shares; and |
| ● | the issuance of additional securities in the future which may result in dilution to our shareholders. |
Risks Related to our Business and Strategy
We may face difficulties implementing our inorganic growth strategy, including in respect of integrating the operations of the business we have acquired or expect to acquire in the future.
From time to time, we may acquire businesses, assets, or securities of companies that we believe will provide a strategic fit with our business, such as the merger (the “Pro Farm Merger”) with Pro Farm Group, Inc. (formerly Marrone Bio Innovations Inc.) (“Pro Farm”), on July 12, 2022, and the acquisition of a majority interest in Rizobacter which is held by RASA Holding, on October 19, 2016 (the “Rizobacter Acquisition”). We integrate acquired businesses with our existing operations, our overall internal control over financial reporting processes, and our financial, operations, and information systems. If the financial performance of our business, as supplemented by the assets and businesses acquired, does not meet our expectations, our results of operations may fail to meet market expectations, and we may face difficulties servicing our debt obligations. We may not effectively assimilate the business or product offerings of acquired companies into our business or within the anticipated costs or timeframes, retain key customers and suppliers or key employees of acquired businesses, or successfully implement our business plan for the combined business. In addition, our final determinations and appraisals of the estimated fair value of assets acquired and liabilities assumed in our acquisitions may vary materially from earlier estimates and we may fail to realize fully anticipated cost savings, growth opportunities or other potential synergies. We cannot assure that the fair value of acquired businesses or investments will remain constant.
We may acquire businesses or products, or form strategic alliances, in the future, and we may not realize the benefits of such acquisitions.
We have acquired, and we may in the future acquire, other companies, employee teams, or technologies to further complement or expand our product portfolio, enhance our technical capabilities, obtain personnel, or otherwise offer growth opportunities. In addition, we plan to selectively partner, in-license or acquire key enabling technologies and businesses across our value chain that we believe will keep us on the cutting edge of our industry. We may not be able to identify appropriate targets or make acquisitions under satisfactory conditions, in particular, satisfactory price conditions. In addition, we may be unable to obtain financing for these acquisitions under other purposes in the context of existing operations. If we acquire businesses with promising markets or technologies, we may not be able to realize the benefit of acquiring such businesses if we are unable to successfully integrate them with our existing operations and company culture. We may encounter numerous difficulties in developing manufacturing and marketing any new products resulting from a strategic alliance or acquisition that delay or prevent us from realizing their expected benefits or enhancing our business. We cannot assure that, following any such acquisition, we will achieve the expected synergies to justify the transaction, which could have a material adverse effect on our business, financial conditions, earnings and prospects.
Acquisitions, such as the Pro Farm Merger and Rizobacter Acquisition, may not be successful in achieving their intended benefits, cost savings and synergies and may disrupt current operations.
One component of our growth strategy historically has been acquisitions. These involve various inherent risks and the benefits, cost savings and synergies sought that may not be realized.
The integration process of any newly acquired company may be complex, costly and time-consuming. The potential difficulties of integrating the operations of an acquired business and realizing our expectations for an acquisition, including the benefits that may be realized, include, among other things:
| ● | failure of the business to perform as planned following the acquisition or achieve anticipated revenue or profitability targets; |
| ● | delays, unexpected costs or difficulties in completing the integration of acquired companies or assets; |
| ● | higher than expected costs, lower than expected cost savings or synergies and/or a need to allocate resources to manage unexpected operating difficulties; |
| ● | difficulties assimilating the operations and personnel of acquired companies into our operations; |
| ● | diversion of the attention and resources of management or other disruptions to current operations; |
| ● | the impact on our or an acquired business’ internal controls and compliance with legal requirements; |
| ● | ineffective or inadequate controls, procedures, or policies at the acquired company; |
| ● | multiple product lines or service offerings, as a result of our acquisitions, that are offered, priced, and supported differently; |
| ● | adverse effects on our existing business relationships with business partners and customers as a result of the acquisition; |
| ● | potential write-offs of acquired assets and potential financial and credit risks associated with acquired customers; |
| ● | inability to maintain relationships with key customers, suppliers, and partners of the acquired business; |
| ● | lack of experience in new markets, products, or technologies; |
| ● | diversion of management’s attention from other business concerns; |
| ● | use of resources that are needed in other parts of our business; |
| ● | retaining key customers, suppliers and key personnel; |
| ● | retaining and obtaining required regulatory approvals, licenses and permits; |
| ● | operating risks inherent in the acquired business and our business; |
| ● | lower than anticipated demand for product offerings by us or our licensees; and |
| ● | unanticipated issues, expenses and liabilities, including those arising from existing contractual obligations or litigation matters. |
Our failure to successfully complete the integration of any acquired business and any adverse consequences associated with future acquisition activities, could have an adverse effect on our business, financial condition and operating results.
Completed acquisitions may result in additional goodwill and/or an increase in other intangible assets on our balance sheet. We are required annually, or as facts and circumstances exist, to assess goodwill and other intangible assets to determine if impairment has occurred. If the testing performed indicates that impairment has occurred, we are required to record a non-cash impairment charge for the difference between the carrying value of the goodwill or other intangible assets and the implied fair value of the goodwill or the fair value of other intangible assets in the period the determination is made. We cannot accurately predict the amount and timing of any potential future impairment of assets. Should the value of goodwill or other intangible assets become impaired, there could be a material adverse effect on our financial condition and results of operations.
Certain of the Rizobacter shares we own are subject to a judicial injunction that, if decided unfavorably to us, would require us to surrender part of our interest in Rizobacter thereby reducing our equity interest in Rizobacter.
Concurrently with the closing of business combination, the Rizobacter Call Option was exercised and we acquired 80% of Rizobacter’s capital stock, which we hold through our subsidiary RASA Holding. An injunction relating to a disputed transfer of shares that occurred in 1995 affects 29% of the shares we hold, and affects 44% of the total share capital of Rizobacter. The injunction requires that 30% of the dividends distributed on such shares be paid into a judicially created escrow account. Although the Argentine Supreme Court ruled against certain of the litigating historical shareholders, such shareholders subsequently pursued other legal recourse—including the injunction and non-innovative measure (medida de no innovar)—to further dispute the original transfer of shares. The non-innovative measure was overturned by an Argentine court of appeals on April 17, 2018.
We may not be successful in developing marketable or commercial technologies, as our product development cycle is lengthy and uncertain, and we may never generate revenues or earn royalties on the sale of our products currently in development.
Our success depends in part on our ability to identify and develop high-value crop productivity commercial products, which is an expensive, complex, prolonged, and uncertain process. Through our technology sourcing and product development collaborations, we commit substantial efforts and other resources to accomplish this. Our process of developing and commercializing technologies involves several phases and can take several years from discovery to commercialization of a product. On average, it takes between five and twelve years to develop a product for our crop productivity products. Some development initiatives may never result in a commercially viable product.
As of the date of this report, many of our products have been commercialized by Rizobacter, Bioceres Semillas and Pro Farm. There can be no assurance that our future crop productivity technologies will be viable for commercial use, or that we will be able to generate revenues from those technologies, in a significant manner or at all. If our products are unsuccessful in achieving their desired effect or otherwise fail to be commercialized, we will not receive revenues from our customers or royalty payments from the commercialization the technologies we develop or license, which could materially and adversely affect our business, financial condition, results of operations and growth strategy.
Our products may be unsuccessful or fail to achieve commercialization for any of the following reasons:
| ● | our products or licensed products may not be effective in the target crops or may have adverse effects on consumers; |
| ● | we or our joint ventures or collaborators may be unable to obtain the requisite regulatory approvals for our products; |
| ● | our competitors may develop and launch competing or more effective products; |
| ● | our products may no longer be desirable as consumer preferences, which are unpredictable and can vary greatly, may change quickly; |
| ● | a market may not exist for seeds containing our licensed seed traits or biological treatments or such products may not be commercially successful; |
| ● | our products may be difficult to produce on a large scale or will not be economical to grow; |
| ● | we or the customers to whom we sell our products may be unable to fully develop or commercialize our products in a timely manner or at all; and |
| ● | we may be unable to patent and/or obtain breeders’ rights or any other intellectual property rights on our technologies in the necessary jurisdictions. |
Our business and the commercialization of our products currently in development are subject to various government regulations and we or our collaborators may be unable to obtain, or may face delays in obtaining, necessary regulatory approvals. In addition, if we are unable to comply with applicable regulatory regimes, we may not be able to sell our products in certain jurisdictions.
We are subject to approvals, registrations and regulations relating to different jurisdictions according to the countries in which we operate, which includes, among others, the (i) Argentine regulations relating to biotechnology, food safety and registration of seeds, (ii) the regulations imposed by the U.S. Environmental Protection Agency (“EPA”), among other governmental authorities, and (iii) European Union Registration, Evaluation, Authorization, and Restriction of Chemicals regulation.
Further, our business is generally subject to two types of regulations: (i) those that apply to our operations and (ii) those that apply to products containing or based on our technology. We are responsible for applying for and maintaining the regulatory approvals necessary for our operations, particularly those covering our field trials, bio-safety evaluations and feed and food tests. Under the terms of our joint venture agreements, we and our joint venture partners are jointly responsible for obtaining and maintaining the regulatory approvals necessary for the commercialization of products that contain our licensed seed traits and other technologies in the various relevant markets. Regulatory and legislative requirements affect the development, production and sale of our products, including the testing, commercialization and planting of seeds containing our biotechnology licensed seed traits. Failure to receive such approvals or non-compliance with the applicable regulatory regime could adversely impact our operations and business strategy. Additionally, we may face difficulties in obtaining regulatory approvals in jurisdictions in which we have not previously operated or in which we have limited experience.
Regulatory regimes in some of our key target markets may be more onerous and enforced by several entities. For example, in Argentina, the Argentine government’s regulation of agricultural biotechnology is enacted and enforced primarily by three agencies; (i) the Argentine National Advisory Commission on Agricultural Biotechnology (Comisión Nacional Asesora de Biotecnología Agropecuaria), which regulates activity related to biosafety; (ii) the National Food Safety and Quality Service (Servicio Nacional de Sanidad y Calidad Agroalimentaria) which regulates activity related to food and feed safety; and (iii) the National Seed Institute (Instituto Nacional de Semillas) which controls the registries for both entities and products that are under its jurisdiction, among other functions. Additionally, the National Market Regulator (Dirección Nacional de Mercados) must conduct an economic evaluation.
In the United States, the field testing, manufacture, sale and use of crop protection, plant health and plant nutrition products are extensively regulated by the EPA and other state, local and foreign governmental authorities. As we introduce new formulations of and applications for our products, we may need to seek EPA approval prior to commercial sale. For any such approval, the EPA may require us to fulfill certain conditions within a specified period of time following initial approval. Although the EPA has in place a registration procedure for biopesticides there can be no assurance that all of our products or product extensions will be eligible for this streamlined procedure or that additional requirements will not be mandated by the EPA that could make the procedure more time consuming and costly for our future products. Furthermore, in most of our key target markets, including the United States, regulatory approvals must be received prior to the importation and commercialization of genetically modified products.
When products containing our licensed seed traits or other technology reach large-scale field trials, bio-safety evaluations and commercial approval stages, if we, our joint ventures or other collaborators are unable to obtain the requisite regulatory approvals or if there is a delay in obtaining such approvals (for example, as a result of negative market perception, consumer groups’ legal actions against genetically modified organisms (“GMO”), heightened regulatory standards or unfamiliarity with the applicable regulatory regime), such products may not be commercialized, which would negatively impact our business and results of operations.
Our HB4 seed business is dependent predominantly on the success of a technology that we license.
Many of our biotechnology licensed seed products currently under development incorporate HB4 technology, a drought-tolerant technology. We expect that the sale of biotech seeds that contain HB4 technology, our HB4 seed business, will comprise an increasing portion of our future revenues. As a result, our future growth and financial performance will be influenced by our ability to commercialize our licensed HB4 technology, and if this effort is unsuccessful our business could be materially and adversely affected.
The licenses Bioceres Group PLC has granted us for HB4 soy are globally exclusive, and for HB4 wheat they are exclusive in Argentina, Brazil, Paraguay, and Uruguay, and non-exclusive in all other territories. If this licensing agreement is declared unenforceable or invalid, we could lose access to one of our principal technologies and could become involved in costly or time-consuming legal disputes. Furthermore, the technology licensed to us by Bioceres Group PLC could become obsolete or uneconomical due to technological advances or entirely different approaches developed by one or more of our competitors. This scenario could prevent or limit our ability to generate revenues from the commercialization of our licensed seed traits and technology.
There are a limited number of prospective collaborators in the markets in which we operate.
Our Research and Development (“R&D”) and commercialization activities are costly, time-intensive and require significant infrastructure and resources. Therefore, our business strategy involves entering into collaboration and joint venture arrangements with global agricultural firms to leverage their resources, know-how and distribution channels and into collaborations with research institutions and governmental agencies to facilitate our low-cost approach to R&D. The crop productivity market is highly consolidated and dominated by a relatively small number of large companies. Additionally, there are a limited number of researchers and research institutions focused on the technologies that we seek to develop and competition for entry into collaboration arrangements with them can be challenging. Due to the small number of companies in our markets and the small number of potential collaborators, there are limited opportunities for us to pursue additional joint ventures and collaborations with new partners and collaborators. If we may cease to be attractive to prospective collaborators if our technology platform or track record is not perceived to be sufficiently developed or successful or if, in the case of prospective joint venture partners, such prospective partners view us as a competitor and choose not to collaborate with us. In addition, if we fail to develop or maintain our relationships with any of our existing collaborators, we could lose our opportunity to work with that collaborator and could be subject to reputational damage that could negatively impact our relationships with other collaborators in what is a relatively small industry community. If we are unable to enter into new joint venture agreements or collaborations, we may face higher development costs than initially anticipated, greater difficulties in achieving commercialization, challenges in expanding our portfolio of technologies and distribution networks and commercial products, or other adverse impacts, which could have a material adverse effect on our business prospects.
Our joint venture agreements or any partnerships that we may enter into in the future may not be successful, or we may fail to perform our respective contractual obligations, which could adversely affect our ability to develop and commercialize our product candidates, as well as result in disputes with our collaborators.
We may seek partnerships or joint venture arrangements with third parties for the development or commercialization of our product candidates depending on the merits of retaining commercialization rights for ourselves as compared to entering into partnerships or joint venture arrangements. We will face, to the extent that we decide to enter into partnerships or joint venture agreements, significant competition in seeking appropriate partners. Moreover, partnerships or joint venture arrangements are complex and time-consuming to negotiate document implement and maintain. We may not be successful in our efforts to establish and implement partnerships, joint ventures, or other alternative arrangements and such partnerships, joint ventures, or arrangements may not be successful. Furthermore, the terms of any partnerships, joint ventures, or other arrangements that we may establish may not be favorable to us.
Pursuant to our joint venture agreements, other agreements with our joint venture partners and collaboration arrangements, we are required to provide R&D services over a particular period of time and meet other contractual obligations. If we fail to perform our obligations under these agreements, our collaborators’ obligations to us may be reduced and, in other cases, our collaborators may seek to dissolve the corresponding joint venture or terminate their agreements with us and, as a result, our anticipated revenues may decrease. In addition, the failure of any of our collaborators to perform their contractual obligations, due to financial hardship, disagreement under the relevant agreement or for any other reason, may hinder our research collaboration, development and commercialization activities, increase our costs and materially and adversely affect our results of operations. Because some of our intellectual property has been licensed to various joint ventures for use in several different fields, the interests of each of our partners in these joint ventures may not always be aligned. As a result, it is possible that potential disputes may arise between us and our partners.
Additionally, a licensee, collaborator or third party may use our intellectual property without our permission, dispute our ownership of certain intellectual property rights or argue that our intellectual property does not cover the joint venture’s marketed product. We seek to address these concerns in our contractual agreements; however, we may not have contractual arrangements with the party in question and/or such provisions may not be effective. If these provisions prove to be ineffective, we may not be able to achieve our objectives of generating significant revenues from crop productivity products sales and royalties from our seed technologies. Furthermore, regardless of any resort to legal action, a dispute with an end-customer, a licensee or collaborator over intellectual property rights may damage our relationship with that licensee or collaborator and may also harm our reputation in the industry.
Further, our ability to generate value from our joint ventures and research collaborations will depend on, among other things, our ability to work cooperatively with our collaborators for the discovery, development and commercialization of our technology and products and we may be unable to do so. We cannot be sure that this structure will be successful in commercializing our products. Furthermore, the agreements governing our partnership and collaborations are complex and cover a range of future activities. Such a dispute may also negatively affect our relationship with one or more of our other collaborators and may hinder our ability to enter into future collaboration agreements. Any of these occurrences could negatively impact our business and results of operations.
The success of our R&D partnerships or joint venture arrangements will depend heavily on the efforts and activities of our partners. Our joint venture arrangements may present financial, managerial, and operational challenges, including potential disputes, liabilities, or contingencies and may involve risks not otherwise present when operating independently including:
| ● | partners may have business interests, goals or cultures that are or become inconsistent with our business interests, goals or culture; |
| ● | partners may have significant discretion in determining the efforts and resources that they will apply to partnerships or joint ventures; |
| ● | partners may not pursue development and commercialization of our potential products or may elect not to continue or renew development or commercialization programs based on trial results, changes in their strategic focus due to the acquisition of competitive products, availability of funding or other external factors, such as business combination that diverts resources or creates competing priorities; |
| ● | partners may delay trials, provide insufficient funding for a trial program, stop a trial, abandon a product candidate, repeat or conduct new trials or require a new formulation of a product candidate for testing; |
| ● | partners could independently develop, or develop with third parties, products that compete directly or indirectly with our products or product candidates; |
| ● | a partner with marketing manufacturing and distribution rights to one or more products may not commit sufficient resources to or otherwise not perform satisfactorily in carrying out these activities; |
| ● | we could grant exclusive rights to our partners that would prevent us from collaborating with others; |
| ● | partners may not properly maintain or defend our intellectual property rights or may use our intellectual property or proprietary information in a way that gives rise to actual or threatened litigation that could jeopardize or invalidate our intellectual property rights or proprietary information or expose us to potential liability; |
| ● | we may incur liabilities or losses as a result of an action taken by the joint venture or our joint venture partners; |
| ● | disputes may arise between us and a partner that causes the delay or termination of the research development or commercialization of our current or future products or that results in costly litigation or arbitration that diverts management attention and resources; |
| ● | our joint venture partners may act contrary to our instructions, requests, policies or objectives, which could reduce our return on investment, harm our reputation or restrict our ability to run our business; |
| ● | partnerships may be terminated, and, if terminated, may result in a need for additional capital to pursue further development or commercialization of the applicable current or future products; |
| ● | partners may own or co-own intellectual property covering our products that results from our partnering with them and in such cases, we would not have the exclusive right to develop or commercialize such intellectual property; and |
| ● | a partner’s sales and marketing activities or other operations may not comply with applicable laws resulting in civil or criminal proceedings. |
The risks described above or the failure to continue any joint venture or joint development arrangement or to resolve disagreements with our current or future joint venture partners could materially and adversely affect our ability to transact the business that is the subject of such joint venture, which would in turn negatively affect our financial condition and results of operations.
We may experience difficulties in collecting payments or royalties to which we believe we are entitled.
We sell certain of our products to distributors through Rizobacter, Bioceres Semillas and Pro Farm. We also often license the use of certain technologies to collaborators and licensees who use or will use the intellectual property to develop and commercialize seeds with improved seed traits. Additionally, we may be entitled under applicable intellectual property laws in the countries in which we operate to the payment of royalties from end users who subsequently multiply and use our seed technology. In each case, we may not actually receive the payments or royalties to which we are entitled, due to failure or refusal of the responsible parties to pay the amounts due. Failure to receive amounts owed to us could have an adverse impact on our business.
In the case of royalty payments from licensees, we rely on the good faith of the licensees to report to us the sales they earn from these products and to accurately calculate the royalties, to which we are entitled, processes that may involve complicated and difficult calculations. Under existing agreements, we have the right to inspect the inventory and accounts of multipliers of our seeds and licensees of our technologies; however, we must also rely on the good faith of end users to accurately report to us the multiplication of our seeds and remit royalty payments due in respect of the same, which may be respected to varying degrees in different jurisdictions given the absence of contractual privity and prevailing market practice.
We may face difficulty servicing our indebtedness, including the Notes due 2026.
Our ability to make scheduled payments of the principal of, to pay interest on, or to refinance our indebtedness depends on our future performance, which is subject to many factors, including economic, financial, competitive and other, beyond our control. We cannot assure you that our business will generate sufficient cash flow from operations or that future borrowings will be available to us in an amount sufficient to enable us to pay our indebtedness or to fund our other liquidity needs.
We may elect to make interest payments under the Secured Convertible Guaranteed Notes due 2026 in kind, which will be capitalized, but if the Secured Convertible Guaranteed Notes due 2026 are not converted into ordinary shares, we will be required to pay the principal thereof in cash. Our ability to refinance the Secured Convertible Guaranteed Notes due 2026, will depend on the financial markets and our financial condition at such time. We may not be able to engage in any of these activities or engage in these activities on desirable terms, which could result in a default on our debt obligations and limit our flexibility in planning for and reacting to changes in our business. Holders of the Secured Convertible Guaranteed Notes due 2026 have the right to require us to repurchase their Secured Convertible Guaranteed Notes due 2026 for cash upon the occurrence of a change of control. We cannot assure you that we will have sufficient financial resources, or will be able to arrange financing, to pay the price in cash with respect to any Secured Convertible Guaranteed Notes due 2026 surrendered by holders for repurchase upon a change of control. In addition, restrictions under our then existing credit facilities or other indebtedness, if any, may not allow us to repurchase the Secured Convertible Guaranteed Notes due 2026 upon a change of control. Our failure to repurchase the Secured Convertible Guaranteed Notes due 2026 upon a change of control when required would result in an event of default with respect to the Secured Convertible Guaranteed Notes due 2026 which could, in turn, constitute a default under the terms of our other indebtedness, if any. If the repayment of the related indebtedness were to be accelerated after any applicable notice or grace periods, we may not have sufficient funds to repurchase the Secured Convertible Guaranteed Notes due 2026 and the Noteholders may therefore enforce their security interest over the collateral pledged to them.
We depend on our key personnel and research collaborators, and we may be adversely affected if we are unable to attract and retain qualified scientific and business personnel.
Our business is dependent on our ability to recruit and maintain highly skilled and educated individuals through direct employment or collaboration arrangements, with expertise in a range of disciplines, including biology, chemistry, plant genetics, agronomy, mathematics programming and other specializations which are relevant to our business. Our ability to recruit such talent depends in part on our ability to maintain our market leadership in agricultural biotech industry in countries in which we operate. Maintaining our ability to attract highly skilled workers and leading scientific institutions depends in part on our ability to maintain a strong technology platform and state-of-the-art facilities, as well as our ability to consistently and successfully commercialize our technology. There can be no assurance that we will be able to maintain leading scientific capabilities or continue to successfully maintain advanced technology in the market.
Our success is also dependent to a significant degree upon the technical skills and continued service of certain members of our management team, in particular those of our Chief Executive Officer, Dr. Federico Trucco, who has occupied several positions at Bioceres since 2005, and has vast experience and knowledge of our business, strategy and technologies. Furthermore, he has developed and maintained strong relationships with our original shareholders. The cessation of Dr. Trucco’s employment for any reason could have a material and negative impact on us. In addition, the number of qualified and highly educated personnel in Argentina, where most of our operations are located, is limited and competition for the services of such persons may be intense.
Our inability to secure, retain or find replacements for key management and technical personnel could adversely affect our business and could have a material adverse effect on our business, operating results, financial condition and growth prospects.
We do not enter into non-compete agreements with all of our employees, and therefore we may be unable to prevent our competitors from benefiting from the expertise of our former employees.
We do not enter into non-compete agreements with all of our employees, which prevents us from limiting our key employees from joining our competitors or competing directly against us. As a result, we may be unable to prevent our competitors from benefiting from the expertise of such employees. Direct competition by a former employee could materially adversely affect our business, results of operations and ability to capitalize on our proprietary information.
Adverse changes in global economic conditions, including as a result of the armed conflict in Israel and Palestine and the war in Ukraine, may negatively affect our industry, business, and results of operations.
Our industry is affected by changes in economic conditions outside our control, which can result in a general decrease in product demand from our customers. Such economic developments, like inflationary pressures in the U.S. and elsewhere, the China trade wars, the armed conflict in Israel and Palestine and the war in Ukraine may affect our business in a number of ways. Reduced demand may drive us and our competitors to offer products at promotional prices, which would have a negative impact on our profitability. In addition, the tightening of credit in financial markets may adversely affect the ability of our customers and suppliers to obtain financing for significant purchases and operations and could result in a decrease in, or cancellation of, orders for our products. If demand for our products slows down or decreases, we will not be able to maintain our revenue and we may run the risk of failing to satisfy the financial and other restrictive covenants to which we are subject under our existing indebtedness. Reduced revenue as a result of decreased demand may also reduce our planned growth and otherwise hinder our ability to improve our performance in connection with our long-term strategy.
In addition, through Pro Farm, we maintain an indirectly wholly owned subsidiary in Russia, Pro Farm Russia, LLC, and own a 12% minority interest in a third-party manufacturing plant in Vyborg, Russia. While our revenues derived from sales to customers in Ukraine and Russia are currently immaterial, products for Pro Farm, our wholly owned subsidiary, are partially sourced by suppliers from the manufacturing plant in Russia. We may face risks associated with maintaining our subsidiary in Russia and minority ownership of the manufacturing plant, or with any international operations in Russia, including risks associated with our compliance with evolving international sanctions and potential reputational harm as a result of our operations in Russia. Further, Russia’s president Vladimir Putin has approved decrees which allow the government to seize assets owned by foreign businesses and has taken steps to invalidate intellectual property protections for U.S.-based companies operating in Russia, in addition to refraining from recognizing patent rights of companies from countries that have imposed sanctions on Russia in response to the ongoing conflict in Ukraine. Moreover, the ongoing conflict between Russia and Ukraine may increase cybersecurity risks, as a result of escalation in cyberattacks. Should the conflict escalate or be prolonged, supply chain, trade routes and agricultural markets could be adversely affected, which, in turn, could materially, adversely affect our business operations and financial performance.
While we have policies and procedures in place designed to ensure compliance with applicable sanctions and trade restrictions, our employees, contractors, and agents may take actions in violation of such policies and applicable law, and we could be held ultimately responsible. If we are held responsible for a violation of U.S. sanctions laws, we may be subject to various penalties, any of which could have a material adverse effect on our business, financial condition or results of operations.
Further, our earnings may be adversely affected by fluctuations in the price of certain commodities, such as grains, milk, meat, biofuels and biomaterials, which can be affected by adverse geopolitical conditions. As the outcomes of the ongoing international conflicts remain highly uncertain, they may contribute to significant volatility in global financial markets, and shortages and increases in the prices of commodities. If commodity prices continue to be negatively impacted, the value of our products could be directly and negatively impacted. Additionally, growers’ incomes have historically been negatively affected by commodity prices. As a result, fluctuations in commodity prices could have an impact on growers’ purchasing decisions and negatively affect their ability and decisions to purchase our seeds or products that incorporate our proprietary technology. We cannot anticipate all of the ways in which the current economic climate and financial market conditions could adversely impact our business.
The spread of global pandemics and government efforts to control the effect and spread of such pandemics have had and may have a disruptive effect on different aspects of our business.
The spread of global pandemics impacted the world economy and the jurisdictions in which we conduct our business. If such pandemics occur, the jurisdictions in which we conduct our business may impose mandates and/or regulations or implemented measures to counter the spread of viruses.
While it is not possible to predict the future impact of global pandemics and the effect of the measures adopted by governments, global pandemics have in the past and in the future may significantly affect global economic conditions. Furthermore, global pandemics and governments’ future responses to global pandemics may affect our financial position and results of operations. However, the impact of such pandemics on our business, results of operations, and financial position remains uncertain.
Our crop productivity business is highly seasonal and affected by factors beyond our control, which may cause our sales and operating results to fluctuate significantly.
The sale of our products is dependent upon planting and harvest seasons and are expected to result in highly seasonal patterns and substantial fluctuations in quarterly sales and profitability. As we increase the variety of products sold within our current markets, and expand into new markets in different geographies, the seasonality of our business may change. Therefore, our business may be more seasonal or experience seasonality in different periods than anticipated.
Weather conditions and natural disasters, such as heavy rains, hail, floods, freezing conditions, windstorms, drought or fire, affect decisions by our distributors, direct customers and end users about the types and amounts of products to use and the timing of harvesting and planting. As a result, our operating results may vary substantially from year to year and quarter to quarter beyond the regular seasonal patterns’ predictions.
Other factors may also contribute to the unpredictability of our operating results, including the size and timing of significant distributor transactions, the delay or deferral of use of our commercial technology or products and the fiscal or quarterly budget cycles of our direct customers, distributors, licensees and end users. Customers may purchase large quantities of our products in a particular quarter to store and use over long periods of time or time their purchases to manage their inventories, which may cause significant fluctuations in our operating results for a particular quarter or year.
Our results of operations from our crop productivity products may vary significantly from period to period due to circumstances beyond our control, including as a result of climate change.
The crop productivity market is affected by various factors that make their operations relatively unpredictable from period to period. The development of our products may be adversely affected by circumstances beyond our control. For our crop productivity products, factors beyond our control include weather and climatic change, such as droughts or heat stress, or other factors we are unable to identify. For example, if there were a prolonged or permanent disruption to the electricity, climate control or water supply operating systems in our greenhouses or laboratories, the plants on which we are testing our licensed seed traits and the samples we store in freezers, both of which are essential to our development activities, would be severely damaged or destroyed, adversely affecting our development activities and thereby our business and results of operations. We have experienced crop failures in the past for various reasons, which have required us to re-start field trials and delays in achieving expected results. In addition, climate change may have a negative effect on agricultural productivity in the locations where we operate, which may lead to adverse long-term impacts on our business and results of operations.
The crop productivity market is also vulnerable to crop disease and to pests, which may vary in severity and effect, depending on the stage of production at the time of infection or infestation, the type of treatment applied, climatic conditions and the risks associated with ongoing global climate change. The costs to control disease and other infestations vary depending on the severity of the damage and the extent of the plantings affected. Moreover, there can be no assurance that available technologies to control such infestations will continue to be effective. These infestations can also increase costs, decrease revenues and lead to additional charges to earnings, which may have a material adverse effect on our business, financial position and results of operations.
Any development or product failure we may experience or any inability to economically source necessary materials could result in increased cost of development of our crop productivity products, which may negatively impact our business and results of operations.
Certain estimates of market opportunity included in this report are based on assumptions that are inherently uncertain and subject to risks and uncertainties that could have a material adverse effect on our business, operating results, and financial condition.
The information regarding our market opportunities has been prepared by management and our assumptions underlying our statements about these market opportunities are inherently uncertain and are subject to significant business, economic, regulatory and competitive risks and other uncertainties that could cause actual results to differ materially from those set forth in management’s estimates. No independent third party has compiled, examined, or performed any procedures with respect to our potential market opportunities, nor has any third party expressed any opinion or any other form of assurance on the information or its achievability by us, and no independent third party has assumed responsibility for, or claimed any association with, the information we have included herein regarding such potential market opportunities. The information regarding market opportunities is not fact and should not be relied upon as being indicative of future results.
Consumer and government resistance to GM crops may negatively affect our public image and reduce sales of seeds or other products containing our licensed seed traits. In addition, Bioceres S.A., from whom we license HB4 technology, is party to a legal proceeding in Argentina, which if decided unfavorably would adversely affect our ability to sell HB4 products in Argentina.
We develop biotech seeds, including GM seeds and the successful commercialization of our products depends, in part, on public acceptance of genetically engineered agricultural products. Some consumers may reject foods made from GM seeds and production of certain GM crops is prohibited in certain countries. Any increase in negative perceptions of GM crops, or more restrictive government regulations in response thereto, could have a negative effect on our business and may delay or impair the development and commercialization of some of our products.
The commercial success of our products may be adversely affected by claims that biotechnology plant products are unsafe for consumption or use, pose risks of damage to the environment, or create legal, social and ethical dilemmas.
The high public profile of biotechnology in food production and food products and public attitudes about the safety and environmental hazards of, and ethical concerns over, genetic research and biotechnology plant products could negatively affect our public image and results of operations.
The prohibition of the production of certain GM crops in certain countries and the current resistance from consumer groups to GM crops not only limits our access to such markets but also has the potential of spreading to and influencing the acceptance of products developed through biotechnology in other regions of the world and may also influence regulators in other countries to limit or ban production of GM crops, which could limit the commercial opportunities to exploit biotechnology. For example, in the United States, no product may be labelled as “organic” if it contains any GMO. Additionally, as of 2022, the National Bioengineered Food Disclosure Standard requires that food manufacturers, importers and certain retailers label foods that are bioengineered or contain bioengineered ingredients. Such labelling may carry a negative connotation for consumers and could make it difficult and expensive for companies to use ingredients from GM crops and distribute products in compliance with the labelling requirements, each of which could in turn have an adverse impact on the sale of our licensed GM seeds.
In Argentina, a class action suit has been filed against Bioceres S.A. (from whom we license HB4 technology), certain biotechnology companies and the national government. The class action plaintiffs request that GMO foods be mandatorily labelled as such and that measures be taken to protect land use, among others. As we license HB4 technology from Bioceres S.A, if such action were to be decided unfavorably, we would no longer be able to sell products that contain HB4 technology in Argentina, which would have a significant negative impact on our revenue. As of the date of this report, the plaintiffs’ request for injunctions against GMO approvals were rejected by the Federal Court of Appeals and an injunction appealed before the Argentine Supreme Court was also rejected.
GM crops are grown principally in the United States, Brazil and Argentina, where there are fewer restrictions on the production of GM crops. If these or other countries where GM crops are grown or where we engage in business activities enact laws or regulations that ban the production of such crops or make regulations more stringent, we could experience a longer product development cycle for our products and may be forced to abandon projects related to certain crops or geographies, both of which would negatively affect our business and results of operations. Public attitudes towards ownership of genetic material and potential changes to laws regulating such ownership could weaken our intellectual property rights with respect to our genetic material and discourage R&D partners from supporting, developing or commercializing our products and technologies.
Competition in crop productivity products, including biologicals, is intense and requires continuous technological development.
We currently face significant direct and indirect competition in the markets in which we operate. The markets for crop productivity products, including biologicals, are intensely competitive and rapidly changing. Many companies engage in the development these products, and speed in commercializing a new product can be a significant competitive advantage.
As an example, some of our competitors engage in research associated with discovery and therefore have R&D budgets that are more significant than our own R&D budget and that cover more activities than those in which we engage. In addition, former collaborators, by virtue of having had access to our proprietary technology, may utilize know-how acquired while employed by us for their own development efforts.
In most segments, the number of products available to end-consumers is steadily increasing as new products are introduced. We may be unable to compete successfully against our current and future competitors, which may result in price reductions, reduced margins and the inability to achieve market acceptance for our products and technologies. In addition, many of our competitors have substantially greater financial, marketing, sales, distribution and technical resources than us and some of our competitors have more experience in R&D, regulatory matters, manufacturing and marketing. We anticipate increased competition in the future as new companies enter the market and new technologies become available. Programs to improve genetics and crop protection chemicals are generally concentrated within a relatively small number of large companies, while non-genetic approaches are underway with broader set of companies. Mergers and acquisitions in the plant science, specialty food ingredient and agricultural biotechnology seed and chemical industries may result in even more resources being concentrated among a smaller number of our competitors.
The expiration of patents covering existing products reduces the barriers to entry for competitors. Our ability to compete effectively and to achieve commercial success depends, in part, on our ability to (i) control manufacturing and marketing costs, (ii) effectively price and market our products, (iii) successfully develop an effective marketing program and an efficient supply chain, (iv) develop new products with properties attractive to food manufacturers or growers, and (v) commercialize our products quickly without incurring major regulatory costs. We may not be successful in achieving these factors and any such failure may adversely affect our business, results of operations and financial condition.
Changes in laws and regulations to which we are subject, or to which we may become subject in the future, may materially increase our costs of operation, decrease our operating revenues and disrupt our business.
Laws and regulatory standards and procedures that impact our business are continuously changing. Responding to these changes and meeting existing and new requirements may be costly and burdensome. Changes in laws and regulations may occur that could:
| ● | impair or eliminate our ability to source technology and develop our products, including validating our products through field trials and passing biosafety evaluations; |
| ● | increase our compliance and other costs of doing business through increases in the cost to protect our owned and licensed intellectual property, including know-how, trade secrets and regulatory data, or increases in the cost to obtain the necessary regulatory approvals to commercialize and market the products we develop directly or jointly; |
| ● | require significant product redesign or redevelopment; |
| ● | render our licensed seed traits and technology and products that incorporate them less profitable or less attractive compared to competing products; |
| ● | reduce the amount of revenues generated from licenses or other royalties; |
| ● | restrict or increase the costs of making payments and distributions; |
| ● | increase our export and import duties and costs or intensify controls and restrictions on our imports; and |
| ● | discourage us and other collaborators from offering, and end-markets from purchasing, products that incorporate our licensed seed traits and technology. |
Any of these events could have a material adverse effect on our business, results of operations and financial condition. As of the date hereof, we believe that we substantially comply with regulations in Argentina and other countries in which we operate relating to GM crops. However, if these regulations change, our validation trials and compliance efforts may become costly and burdensome.
Any changes in regulation in countries where GM crops are grown or exported into could result in our collaborators, other third parties or us being unable or unwilling to develop, commercialize or sell products that incorporate our licensed seed traits or technology. In addition, we rely on various forms of intellectual property rights protection. Legislation and precedents relating to intellectual property rights in the key markets where we seek protection, such as the United States, Brazil and Argentina, is evolving and changes in laws could affect our ability to obtain or maintain intellectual property rights protection for our products. Any changes to these existing laws and regulations may materially increase our costs, decrease our revenues and disrupt our business.
Our indebtedness could adversely affect our financial condition.
As of June 30, 2024, our total indebtedness was US$259.7 million, of which US$136.7 million matures in the fiscal year ending June 30, 2025. We may incur additional indebtedness in the future. Our indebtedness could have important adverse consequences, including:
| ● | limiting our ability to obtain additional financing to fund future working capital, capital expenditures, acquisitions or other general corporate requirements; |
| ● | requiring a substantial portion of our cash flows to be dedicated to debt service payments instead of other purposes, thereby reducing the amount of cash flows available for working capital, capital expenditures, acquisitions and other general corporate purposes; |
| ● | increasing our vulnerability to general adverse economic and industry conditions; |
| ● | limiting our flexibility in planning for and reacting to changes in the industry in which we compete; |
| ● | placing us at a disadvantage compared to other, less leveraged competitors; and |
| ● | increasing the cost of borrowing. |
The occurrence of any of the above may negatively impact our business and results of operations. If any of our indebtedness gets accelerated as a result of our failure to meet certain covenants, the risks described above could intensify. See “Item 5. Operating and Financial Review and Prospects—B. Liquidity and Capital Resources—Indebtedness.”
Price increases and shortages of raw materials could adversely affect our results of operations.
Our results of operations may be affected by the availability and pricing of raw materials, principally materials needed to design our technologies, such as raw glycerin. Factors such as changes in the global or regional levels of supply and demand, weather conditions, seasonal fluctuations, shortages or interruptions, changes in global climates and government regulations could substantially impact the price of raw materials. These and other factors could also cause plant shutdowns, reductions in capacity, delays and increased costs with associated manufacturers. To the extent we are unable to pass on increases in raw materials and energy prices to our customers, a substantial increase in raw material prices or a continued interruption in supply could have a material adverse effect on our business, financial condition and results of operations.
The overall agricultural industry is susceptible to commodity price volatility and, we, along with our food manufacturing customers and grower customers, are exposed to market risks from changes in commodity prices.
Volatility in the prices of certain commodity products could result in higher overall costs along the agricultural supply chain, which may negatively affect our ability to commercialize our products. We are susceptible to cost volatility in the agricultural industry as a result of factors beyond our control, such as general economic conditions, seasonal fluctuations, weather conditions, demand, food safety concerns, product recalls and government regulations. Further, we may not be able to anticipate or react to such volatility in a timely manner, which could cause our operating results to deteriorate.
We may be required to pay substantial damages as a result of uninsured product liability claims.
Product liability claims are a commercial risk for our business, particularly as we are involved in the sale of commercial technology and the supply of biotechnological products, some of which may be shown in the future to be harmful to humans and the environment. We may be held liable if any product we develop is found unsuitable during marketing, sale or consumption. We do not currently have insurance coverage for such claims. Courts have levied substantial damages in the United States and elsewhere against a number of companies in the agriculture industry in past years based upon claims for injuries allegedly caused by the use of their products. There is a possibility that a product liability case could be filed against us in Argentina, as there are precedents of cases relating to the use of pesticides, for example. However, in Argentina, damages relating to these cases may be substantial albeit potentially smaller than those typically awarded in the United States.
In addition, we may face product liability and similar claims involving cross-pollination of crops, which recently has affected other companies in our industry operating in the United States, and cross-contamination of GMO and non-GMO ingredients. Product liability claims against us, our joint ventures or third-party licensees selling products that contain our licensed seed traits or technology or allegations of product liability relating to seeds or other products containing seed traits or technology developed by us could damage our reputation, harm our relationships with our collaborators and other business counterparties and materially and adversely affect our business, results of operations, financial condition and prospects.
Our operations are subject to various health and environmental risks associated with our use, handling, storage and disposal of potentially toxic materials.
We are subject to numerous federal, state, local and foreign environmental, health and safety laws and regulations, including those governing laboratory procedures, the handling, use, storage, treatment, manufacture and disposal of hazardous materials and wastes, discharge of pollutants into the environment and human health and safety matters. As part of our technology sourcing and product development activities, we develop GMOs by inserting new genes into the genomes of certain plants and bacteria. Though we introduce these genes in order to improve plant traits, we cannot always predict the effect that these genes may have on the organism. In some cases, the genes may render the organism poisonous or toxic, or they may cause the organism to develop other dangerous characteristics that could harm the organism’s surrounding environment. Furthermore, there is a risk that, when testing GMOs, the seeds or strains of these organisms may escape the laboratory, greenhouse, industrial facility or field in which they are being tested and contaminate nearby areas. Poisonous or toxic organisms may therefore be inadvertently introduced into the environment or possibly enter the food production system, harming the people and animals who come in contact with them. Our crop protection products, which include Rizoderma, adjuvants, therapies, fungicides and insecticides, among others, bear similar risks in the development stage.
We cannot eliminate the risk of injuries or damages caused by the contamination or discharge of these materials. If these risks were to materialize, we could be subject to fines, liability, reputational harm or otherwise adverse effects on our business. We may be sued for any injury or contamination that results from our use or the use by third parties of these materials, or may otherwise be required to remedy the contamination, and our liability may exceed any insurance coverage and our total assets. Furthermore, compliance with environmental, health and safety laws and regulations may be expensive and may impair our R&D efforts. If we fail to comply with these requirements, we could incur substantial costs and liabilities, including civil or criminal fines and penalties, clean-up costs or capital expenditures for control equipment or operational changes necessary to achieve and maintain compliance. In addition, we cannot predict the impact on our business of new or amended environmental, health and safety laws or regulations or any changes in the way existing and future laws and regulations are interpreted and enforced. These current or future laws and regulations may impair our research, development or production efforts.
The requirements of being a public company may strain our resources and distract our management, which could make it difficult to manage our business.
We are required to comply with various regulatory and reporting requirements, including those required by the SEC. Complying with these reporting and regulatory requirements is time consuming, resulting in increased costs to us or other adverse consequences.
As a public company, we are subject to the reporting requirements of the Exchange Act and the requirements of the Sarbanes-Oxley Act. These requirements may place a strain on our systems and resources. The Exchange Act requires that we file annual and current reports with respect to our business and financial condition. The Sarbanes-Oxley Act requires that we maintain effective disclosure controls and procedures and internal controls over financial reporting. To maintain and improve the effectiveness of our disclosure controls and procedures, we may need to commit significant resources, hire additional staff and provide additional management oversight. We expect to implement additional procedures and processes for the purpose of addressing the applicable standards and requirements for public companies. These activities may divert management’s attention from other business concerns, which could have a material adverse effect on our business, financial condition, results of operations and cash flows.
On June 30, 2023, we ceased to be an “emerging growth company,” as defined in the JOBS Act, and we may no longer take advantage of certain temporary exemptions from various reporting requirements including, but not limited to, an exemption from compliance with the auditor attestation requirements of Section 404 of the Sarbanes-Oxley Act and the rules and regulations of the SEC thereunder. Therefore, we expect to incur additional expenses and devote increased management effort toward ensuring compliance with the additional reporting requirements that apply as we have ceased to be an “emerging growth company.” We cannot predict or estimate the amount of additional costs we may incur as a result of becoming a public company or the timing of such costs.
We may require additional financing in the future and may not be able to obtain such financing on favorable terms, if at all, which could force us to delay, reduce or terminate some of our activities.
The process of developing and commercializing products is expensive, lengthy and risky and we expect to continue investing in our R&D services to identify new potential products for development. We may require additional capital to fund our technology sourcing and product development projects and to provide working capital to fund other aspects of our business, including changes in our business strategy or the occurrence of unanticipated events other strategic opportunities.
We may seek to issue additional equity securities, which could result in dilution to our existing shareholders and could adversely affect the market price of our ordinary shares. Alternatively, we may seek to raise additional debt financing, which could subject us to restrictive covenants that limit our operating flexibility and require us to comply with certain financial ratios. However, we may not be able to raise sufficient additional funds on terms that are favorable to us, if at all. If we fail to raise the funds we require, our ability to fund our operations, take advantage of strategic opportunities, develop and commercialize products or technologies, or otherwise respond to competitive pressures could be significantly limited. In such an event, we may be forced to delay or terminate our development initiatives or the commercialization of our technology and products, curtail operations or grant licenses to our technology on terms that are not favorable to us. In addition, we may incur substantial costs in pursuing future capital financing, including investment banking fees, legal fees, accounting fees and other costs. If adequate funds are not available and on commercially reasonable terms, we may not be able to successfully execute our business strategy or continue our business.
Development and commercialization of our products may incur scrutiny under the Convention on Biological Diversity Treaty.
The Convention on Biological Diversity Treaty is an international treaty that was adopted at the Earth Summit in Rio de Janeiro, Brazil in 1992. The treaty provides that if a company uses genetic resources, such as an indigenous plant, from a participating country to develop a product, then such company must obtain the prior informed consent of the participating country and owes fair and equitable compensation to the participating country. Although the United States is not a participating country, most countries where we currently obtain or may obtain genetic resources in the future, including Argentina, have ratified the treaty and are currently participants in the Convention on Biological Diversity Treaty. We may fall under scrutiny of the Convention on Biological Diversity Treaty with respect to the development or commercialization of any of our products derived from genetic resources originating from any of the countries that are participants in the Convention on Biological Diversity Treaty. There can be no assurance that the government of a participating country will not assert that it is entitled to fair and equitable compensation from us. Such compensation, if demanded, may make commercialization of some of our products impracticable.
Our failure to accurately forecast and/or manage seed and biological inventory could result in an unexpected shortfall or surplus of products which could harm our seed and biological business.
We are required to produce inventories of certain of our products (mainly seeds and biologicals) and we monitor our inventory levels based on our own projections of future demand. Because of the significant time it takes to produce commercial quantities of seeds, production decisions must be made well in advance of sales. An inaccurate forecast of demand for any seed variety can result in the unavailability of seeds in high demand. Such unavailability may depress sales volumes and adversely affect customer relationships. Conversely, an inaccurate forecast could also result in an over-supply of seeds which may increase costs, negatively impact cash flow, reduce the quality of inventory and ultimately result in inventory write-offs, which could have a material adverse effect on our business, results of operations and financial condition.
We rely on third parties to grow our seeds. If these parties do not grow our seeds at a satisfactory quality, in a timely manner, in sufficient quantities or at an acceptable cost, our commercialization efforts could be delayed, and our business could be negatively impacted.
We rely on affiliated and unaffiliated growers to grow the majority of our proprietary seed and to sell it to us at negotiated prices each year. Our current reliance on third parties upon others for the production of our seeds may adversely affect our ability to commercialize any products on a timely and competitive basis. If our growers decline to a significant degree to plant the acreage on which we rely, and if we cannot find other growers to plant the lost acreage, our inventory of seed could be insufficient to satisfy the needs of our customers. Furthermore, growers may refuse to grow our seeds for any reason, including deterioration in our business relationship or the existence of more favorable terms with other companies. For example, if a particular crop is paying a materially higher price than has been paid in the past, growers may decide to not grow our seeds in favor of receiving a higher return from an alternative crop planted on the same acreage. If third-party growers decline to grow our seeds or if they are unable to grow our seeds at acceptable quality levels, our business, results of operations and financial condition could materially decline.
Disruption to our IT and operating system could adversely affect our reputation and have a material adverse effect on our business and results of operations.
Disruption or failure of our IT system due to technical reasons, natural disaster or other unanticipated catastrophic events, including power interruptions, storms, fires, floods, earthquakes, terrorist attacks or armed conflicts could significantly impair our ability to deliver data related to our projects to our collaborators on schedule and materially and adversely affect our relationships with our collaborators, therefore, negatively affect our business and our results of operations. If our existing or future IT system does not function properly, or if the IT system proves incompatible with our new technologies, we could experience interruptions in data transmissions and slow response times, preventing us from completing routine research and business activities. Furthermore, we can provide no assurance that our current IT system is fully protected against third-party intrusions, viruses, hacker attacks, information or data theft or other similar threats.
Our business and operations would suffer in the event of computer system failures, cyber-attacks or a deficiency in our cybersecurity.
Despite the continuous implementation of security measures, our internal computer systems, and those of third parties on which we rely, are vulnerable to damage from computer viruses, malware, natural disasters, terrorism war telecommunication and electrical failures, cyber-attacks or cyber-intrusions over the Internet, attachments to emails, persons inside our organization, or persons with access to systems inside our organization. The risk of a security breach or disruption, particularly through cyber-attacks or cyber-intrusion, including by computer hackers, foreign governments, and cyber terrorists, has generally increased as the number, intensity and sophistication of attempted attacks and intrusions from around the world have increased. This risk may be further enhanced as the techniques and tools used in cyber-attacks have evolved rapidly and now use advanced automation and artificial intelligence. In addition to the extraction of sensitive information, such attacks could include the deployment of harmful malware, ransomware, denial-of-service attacks, phishing attacks, social engineering and other means to affect service reliability. If any such event were to occur and cause interruptions in our operations, it could result in a material disruption of our product development programs. To the extent that any disruption or security breach was to result in a loss of or damage to our data or applications, or inappropriate disclosure of confidential or proprietary information, we could incur material legal claims and liability, damage to our reputation, the further development of our product candidates could be delayed, which could adversely affect our business, financial condition, and operating results, and could negatively impact our share price.
Labor unions can request, and have requested, the unionization of some of our employees.
In December 2016 and March 2017, the Argentine Trade Union of Truck Drivers (Sindicato de Choferes de Camiones) (the “SCC”) and the Argentine Union of Rural Workers and Stevedores (Unión Argentina de Trabajadores Rurales y Estibadores) (the “UATRE”), respectively requested the unionization of some employees of Rizobacter. With respect to the former, the SCC requested to unionize employees involved in logistics and operation of forklifts. UATRE requested to unionize workers engaged in the handling and storage of grain related to our seed treatment process undertaken seasonally. After negotiations, both SCC and UATRE came to an agreement with Rizobacter wherein Rizobacter agreed to hire companies to carry out the operations covered by each union. Each company agreed to indemnify Rizobacter in relation to any subsequent claims by the workers registered with the SCC or the UATRE, as the case may be, without direct cause to Rizobacter.
If new union disputes arise, they may be time consuming and distracting to management. The occurrence of a union dispute could have a material and adverse effect on our costs and business, results of operations and financial condition.
We are subject to anti-corruption and anti-money laundering laws with respect to both our domestic and international operations, and noncompliance with such laws can subject us to criminal and civil liability and harm our business.
We are subject to the U.S. Foreign Corrupt Practices Act of 1977, as amended, the U.S. domestic bribery statute contained in 18 U.S.C.§201, the U.S. Travel Act, the USA PATRIOT Act, Argentine Law No. 27,401, as amended, and possibly other anti-bribery and anti-money laundering laws in countries in which we conduct activities. Anti-corruption laws are interpreted broadly and prohibit us and our collaborators from authorizing, offering, or directly or indirectly providing improper payments or benefits to recipients in the public or private sector. We or our collaborators may have direct and indirect interactions with government agencies and state-affiliated entities and universities in the course of our business. We may also have certain matters come before public international organizations such as the United Nations. We use third-party collaborators, joint venture and strategic partners, law firms, and other representatives for regulatory compliance, patent registration, lobbying, deregulation advocacy, field testing, and other purposes in a variety of countries, including those that are known to present a high corruption risk such as India, China, and Latin American countries. We can be held liable for the corrupt or other illegal activities of these third-party collaborators, our employees, representatives, contractors, partners, and agents, even if we do not explicitly authorize such activities. In addition, although we have implemented policies and procedures to ensure compliance with anti-corruption and related laws, there can be no assurance that all of our employees, representatives, contractors, partners, or agents will comply with these laws at all times. Noncompliance with these laws could subject us to whistleblower complaints, investigations, sanctions, settlements, prosecution, other or injunctions, suspension and debarment from contracting with certain governments or other persons, the loss of export licenses, reputational harm, adverse media coverage, and other negative consequences. If any subpoenas or investigations are launched, or governmental or other sanctions are imposed, or if we do not prevail in any possible civil or criminal litigation, our business, results of operations, and financial condition could be materially harmed. In addition, responding to any action will likely result in a materially significant diversion of management’s attention and resources and significant defense costs and other professional fees. Enforcement actions and sanctions could further harm our business, results of operations, and financial condition.
Economic substance legislation of the Cayman Islands may adversely impact us or our operations.
The Cayman Islands, together with several other non-E.U. jurisdictions, have legislation aimed at addressing concerns raised by the Council of the E.U. as to offshore structures engaged in certain activities, which attract profits without real economic activity. With effect from January 1, 2019, the International Tax Cooperation (Economic Substance) Act, as revised, came into force in the Cayman Islands introducing certain economic substance requirements for in-scope Cayman Islands entities, which are engaged in certain “relevant activities”. As we are a Cayman Islands company, our compliance obligations include filing annual notifications, which need to state whether we are carrying out any relevant activities and whether we are claiming an exemption from the obligations to meet the economic substance tests to the extent required under the Substance Act (the “substance test”). If we are carrying out such relevant activities, or we are claiming such an exemption, we are further required to file annually a report as to whether we have satisfied the substance test or the basis on which we are claiming such exemption. As it is a new regime, it is anticipated that the Substance Act will evolve and be subject to further clarification and amendments. We may need to allocate additional resources to keep updated with these developments and may have to make changes to our operations in order to comply with all requirements under the Substance Act. Failure to satisfy these requirements may subject us to penalties under the Substance Act.
We may become subject to taxation in the Cayman Islands which would negatively affect our results.
We are a Cayman Islands exempted company. Exempted companies are Cayman Islands companies conducting business mainly outside the Cayman Islands and, as such, are exempted from complying with certain provisions of the Companies Act. As an exempted company, we have applied for and received a tax exemption undertaking from the Cayman Islands government that, in accordance with Section 6 of the Tax Concessions Act (As Revised) of the Cayman Islands, for a period of 20 years from the date of the undertaking, no law which is enacted in the Cayman Islands imposing any tax to be levied on profits, income, gains or appreciations will apply to us or our operations and, in addition, that no tax to be levied on profits, income, gains or appreciations or which is in the nature of estate duty or inheritance tax will be payable (i) on or in respect of the shares, debentures or other obligations we have or (ii) by way of the withholding in whole or in part of a payment of dividend or other distribution of income or capital by us to our members or a payment of principal or interest or other sums due under a debenture or other obligation we have. If we were to become subject to taxation in the Cayman Islands, our financial condition and results of operations could be materially and adversely affected. See the section titled “Material Cayman Islands Income Tax Considerations.”
As a “foreign private issuer” under the rules and regulations of the SEC, we are permitted to, and will, file less or different information with the SEC than a company incorporated in the United States or otherwise subject to these rules, and will follow certain home country corporate governance practices in lieu of certain Nasdaq requirements applicable to U.S. issuers.
We are considered a “foreign private issuer” under the Exchange Act and we are therefore exempt from certain rules under the Exchange Act, including the proxy rules, which impose certain disclosure and procedural requirements for proxy solicitations for U.S. and other issuers. Moreover, we are not required to file periodic reports and financial statements with the SEC as frequently or within the same time frames as U.S. companies with securities registered under the Exchange Act. We currently prepare our financial statements in accordance with IFRS. We will not be required to file financial statements prepared in accordance with or reconciled to the accounting principles generally accepted in the United States of America (“U.S. GAAP”) so long as our financial statements are prepared in accordance with IFRS as issued by the International Accounting Standards Board. We are not required to comply with Regulation FD, which imposes restrictions on the selective disclosure of material information to shareholders. In addition, our officers, directors and principal shareholders are exempt from the reporting and short-swing profit recovery provisions of Section 16 of the Exchange Act and the rules under the Exchange Act with respect to their purchases and sales of our securities.
In addition, as a “foreign private issuer” whose ordinary shares are listed on the Nasdaq Stock Market LLC (“Nasdaq”), we are permitted to, and will, follow certain home country corporate governance practices in lieu of certain Nasdaq Global Market requirements. A foreign private issuer must disclose in its Annual Reports filed with the Securities and Exchange Commission, or the SEC, each Nasdaq requirement with which it does not comply followed by a description of its applicable home country practice. As an exempted company incorporated in the Cayman Islands and listed on the Nasdaq, we currently intend to follow our home country practice with respect to the composition of our board of directors and nominations committee and executive sessions. Unlike the requirements of the Nasdaq, the corporate governance practice and requirements in the Cayman Islands do not require us to have a majority of our board of directors to be independent; do not require us to establish a nominations committee; and do not require us to hold regular executive sessions in which only independent directors shall be present. Such Cayman Islands home country practices may afford less protection to holders of our ordinary shares.
We could lose our status as a “foreign private issuer” under current SEC rules and regulations if more than 50% of our outstanding voting securities become directly or indirectly held of record by U.S. holders and one of the following is true: (i) the majority of our directors or executive officers are U.S. citizens or residents; (ii) more than 50% of our assets are located in the United States; or (iii) our business is administered principally in the United States. If we lose our status as a foreign private issuer in the future, we will no longer be exempt from the rules described above and, among other things, will be required to file periodic reports and annual and quarterly financial statements as if it we were a company incorporated in the United States. If this were to happen, we would likely incur substantial costs in fulfilling these additional regulatory requirements and members of our management would likely have to divert time and resources from other responsibilities to ensuring these additional regulatory requirements are fulfilled.
Risks Related to our Intellectual Property
Agreements with our collaborators and third parties may not adequately prevent disclosure of trade secrets, know-how and other proprietary information, which could materially adversely affect our technology and harm our business.
We rely on a combination of intellectual property rights laws and other agreements with our collaborators and third parties to protect and otherwise seek to control access to, and distribution of, our proprietary information. These measures may not prevent disclosure, infringement or misappropriation of our confidential information. Our confidentiality and nondisclosure agreements or covenants may not be enforceable under applicable law and, even if they are enforceable, may be breached, and we may not have adequate remedies for such a breach that would effectively prevent the dissemination of our confidential information or direct competition with us by a joint venture partner. We also have limited control over the protection of trade secrets used by our collaborators and could lose future trade secret protection if any unauthorized disclosure of such information occurs. Enforcement of any claim that a party illegally disclosed confidential information or misappropriated a trade secret is difficult, expensive and time-consuming, and the outcome is unpredictable. In addition, others may independently discover our trade secrets and proprietary information, by reverse engineering or otherwise, and in such cases, we would not be able to enjoin such parties. Laws regarding trade secret rights in certain markets where we operate may afford little or no protection of our trade secrets. If any of our trade secrets were to be disclosed to or independently developed by a competitor, or if we otherwise were to lose protection for our trade secrets or proprietary know-how, the value of this information may be greatly reduced and our business and competitive position could be harmed. Moreover, our collaborators may allege that we have disclosed their trade secrets or confidential information.
We may not be able to adequately protect our intellectual property rights throughout the world.
Our commercial success depends in part on our ability to obtain intellectual property protection and/or trade secrets protection for the technologies we develop and use. Competitors may use our technologies in jurisdictions where we have not obtained intellectual property protection to develop their own products, and we may be unable to prevent such competitors from importing those infringing products into territories where we have intellectual property protection, but enforcement is not as strong due to the exhaustion of rights. These products may compete with our product candidates and our licensed patents and other intellectual property rights may not be effective or sufficient to prevent them from competing in those jurisdictions. In addition, competitors could use our licensed patent disclosures and/or reverse engineer our trade-secret-protected products in order to produce competing products. Moreover, growers or others in the chain of commerce may raise legal challenges against our intellectual property rights or may infringe upon our intellectual property rights, including through means that may be difficult to prevent or detect.
On March 6, 2022, Russia issued a decree permitting the use of certain patents without compensation or license for inventions, industrial designs, and utility models originating in unfriendly countries, which include the United States. Currently, we have eight patents issued by the Russian Federation, which following the March 6, 2022 decree may no longer be afforded any intellectual rights protections. If third party individuals, including the majority owners of the third-party manufacturing plant in Vyborg, Russia, utilize our patents and create versions of our products we would likely have limited to no recourse and would not receive any compensation for any unauthorized use. Moreover, we have one patent granted relating to the expression of HB4 traits in soy and one patent application relating to the expression of HB4 traits in wheat.
On May 20, 2024, Russia issued a decree which introduces stringent controls on the acquisition of intellectual property rights by Russian entities from U.S. persons, including governmental approval for new intellectual property agreements with U.S. entities and government clearance for withdrawal of payments. This could significantly hinder our ability to effectively manage financial transactions and intellectual property acquisitions involving Russian parties, potentially delaying or challenging our operations and strategic initiatives in Russia.
In Argentina, legislation in respect of breeders’ rights includes a concept of a “farmer’s privilege,” which allows growers to use seeds obtained from their own harvests to be replanted on their own farm. According to the National Seed Institute of Argentina (Instituto Nacional de Semillas), the reserves of seeds kept for personal use has grown significantly in recent years, which may increase the likelihood that growers illegally claiming the privilege may use GM seeds into the market without paying royalties owed to us. During recent years, certain sectors of the Argentine agricultural industry have been requesting that the Argentine plant variety protection (“PVP”) Law No. 20,247 be amended.
The legal systems of certain countries, including China, where we have sublicensed patent applications, have not historically favored the enforcement of patents or other intellectual property rights, which could hinder us from preventing the infringement of our licensed patents or other intellectual property rights and result in substantial risks to us. Proceedings to enforce our licensed patent rights in the United States or foreign jurisdictions could result in substantial costs and divert our efforts and attention from other aspects of our business, could put our licensed patents at risk of being invalidated or interpreted narrowly and our sublicensed patent applications at risk of not issuing and could provoke third parties to assert patent infringement or other claims against us. We may not prevail in any lawsuits that we initiate, and the damages or other remedies awarded, if any, may not be commercially meaningful. Accordingly, our efforts to enforce our intellectual property rights around the world may be inadequate to obtain a significant commercial advantage from the intellectual property that we develop or license from third parties.
Changes in U.S. and Argentine patent law could diminish the value of patents in general, thereby impairing our ability to protect our product candidates.
As is the case with other biotech companies, our success is heavily dependent on intellectual property, including patents. Obtaining and enforcing biotech patents involves technological and legal complexity, and is costly, time consuming, and inherently uncertain.
The patent position of biotechnology and biochemical companies generally is highly uncertain, involves complex legal and factual questions and has in recent years been the subject of much litigation. As a result, the issuance, scope, validity, enforceability and commercial value of our patent rights are highly uncertain. Our pending and future patent applications may not result in patents being issued which protect our technology or products, in whole or in part, or which effectively prevent others from commercializing competitive technologies and products. Furthermore, our patents, and those patents for which we have license rights, may be challenged, narrowed, invalidated or circumvented. It is also not possible to patent and protect all knowledge and know-how associated with our products, so there may be areas that are not protected such as certain formulations and manufacturing processes. Costly and time-consuming litigation could be necessary to enforce and determine the scope of our proprietary rights, and failure to obtain or maintain trade secret protection could adversely affect our competitive business position. It is also possible that we will fail to identify patentable aspects of our research and development output before it is too late to obtain patent protection.
The Argentine Patent Office (Instituto Nacional de Propiedad Intelectual) issued Regulation 283/15 with guidelines for examining biotech inventions. These guidelines seriously restrict the patentability of several categories of inventions in the agricultural field. This restriction is still being followed in the practice of the Argentine Patent Office.
In September 2016, the Argentine Patent Office issued Argentine Regulation 56/16, under which the Argentine Patent Office will deem that any patent application whose examination had not begun by October 15, 2016 satisfies the substantive requirements of patentability (novelty, non-obviousness and industrial application); provided that a patent has been granted abroad for the same invention by a foreign patent office carrying out substantive examination in a country whose patent law has the same substantive requirements as Argentine law. This can result in prosecution times that are substantially shorter, and similar to those of the fastest jurisdictions. However, the patent office has applied this regulation to biotech cases only when the granted equivalent is directed to matter that is not affected by the guidelines. Furthermore, the claims of the granted equivalent must be amended so as to comply with the requirements of Regulation 283/15.
In addition, the U.S. Supreme Court has ruled on several patent cases in recent years, either narrowing the scope of patent protection available in certain circumstances or weakening the rights of patent owners in certain situations. In addition to increasing uncertainty with regard to our ability to obtain patents in the future, this combination of events has created uncertainty with respect to the value of patents, once obtained. In a recent ruling (in re “Monsanto Technology LLC c/ Instituto Nacional de la Propiedad Industrial s/ Denegatoria de Patente”, case number CCF 8044/2007), Tribunal III of the Civil and Commercial Federal Court of Appeals of the City of Buenos Aires confirmed, by revoking a decision of a lower court, the rejection of a biotechnological patent application by the Argentine Patent Office, with the understanding that the invention should be protected as a PVP and not under a patent (the patent application was for a recombinant DNA molecule and a cell transformed by such molecule). Lack of inventive activity and non-patentable matters are also mentioned as grounds in this precedent. The Court of Appeal’s decision was appealed to the court of last resort, but the Argentine Supreme Court refused to resolve the case based on the grounds that the issue was moot as the statutory term of the patent under consideration in the case had already expired. The decision of the Court of Appeals has, therefore, become a negative precedent that may adversely affect patentability of the technologies we develop in the future. Depending on decisions by the Argentine and U.S. Congresses, the federal courts in each country, the U.S. Patent and Trademark Office and the Argentine Patent Office, as well as the relevant authorities in other countries in which we hold licensed patents, the laws and regulations governing patents could change in unpredictable ways that may weaken or undermine our ability to obtain new patents or to enforce our existing licensed patents and patents we might obtain in the future.
If we or one of our collaborators or licensees are sued for infringing the intellectual property rights of a third party, such litigation could be costly and time consuming and could prevent us or our collaborators or licensees from developing or commercializing products that incorporate our technology.
Our ability to generate significant revenues from our products depends on our joint ventures and licensees’ ability to develop, market and sell products and utilize our proprietary technologies without infringing the intellectual property rights and other rights of any third parties.
As the agricultural biotech industry continues to develop, we, our collaborators or licensees may become party to, or threatened with, litigation or other adverse proceedings regarding intellectual property or proprietary rights in our technology, processes, developed seed traits or seed treatments. Third parties may assert claims based on existing or future intellectual property rights and the outcome of any proceedings is subject to uncertainties that cannot be adequately quantified in advance. Any litigation proceedings could be costly and time consuming. A negative outcome from an intellectual property infringement suit could result in liability for monetary damages, require us to indemnify our licensees for damages arising from warranties we have made in respect of the intellectual property rights we have licensed, which claims might not be subject to a cap, or treble damages and attorneys’ fees if we are found to have willfully infringed a patent. There is also no guarantee that we, our collaborators or licensees would be able to obtain a license under such infringed intellectual property rights on commercially reasonable terms or at all. A finding of infringement could prevent us, our collaborators or our licensees from developing, marketing or selling a product or force us to cease some or all of our business operations. Even if we are successful in these proceedings, we may incur substantial costs and the time and attention of our management and scientific personnel may be diverted as a result of these proceedings, which could have a material adverse effect on our operations. In some cases, our agreements with our collaborators or licensees might oblige us to pay for the enforcement of our licensed intellectual property rights, even though our collaborators or licensees may be responsible for commercializing the potentially infringing products. Claims that we have misappropriated the confidential information or trade secrets of third parties could similarly have a negative impact on our business.
The value of our intellectual property could diminish due to technological developments or challenges by competitors, making our products less competitive.
Our intellectual property rights are important to the operation of our business and the commercialization of our crop productivity products. We rely on a combination of licensed patents, PVP, trademarks, trade secret laws, confidentiality provisions and licensing arrangements to establish and protect our intellectual property. However, the importance of technology development and intellectual property protection in the crop productivity industry increases the risk that technological advances by others could render our products less competitive. Our business could be negatively affected by any of the following:
| ● | our issued licensed patents, PVP certificates and trademark registrations may be successfully challenged by our competitors; |
| ● | we may be unable to obtain intellectual property licenses that are necessary or useful to our business on favorable terms, or at all; |
| ● | new technology that is independently developed by others may supersede our technology and make our products less desirable or costlier in the marketplace; |
| ● | competitors may design around our licensed patent and/or PVP protections; and |
| ● | competitors may reverse engineer our trade secret technologies. |
We may be required to pay royalties, or other additional compensation, to employees who develop inventions that have been or will be commercialized by us, even if the rights to such inventions have been assigned to us, exclusive licenses have been granted to us or the employees have waived their rights to royalties.
Under Argentine Patent and Utility Models Law No. 24,481 and Argentine Labor Law No. 20,744, which provide the legal framework related to ownership of inventions developed during an employer-employee relationship, the employer is awarded ownership of inventions when the employee was hired for the purpose of engaging in inventive discovery or when such invention otherwise derives from the knowledge acquired by virtue of the employee’s working for the employer. Depending on the nature and the scope of an employee’s contribution to an invention and the nature of his or her hiring, he or she may be entitled to additional compensation by the employer; however, the employer will still retain ownership rights on the conditions mentioned above. If an employee was hired for a purpose other than to engage in inventive discovery and he or she creates an invention that is not related to the employer’s processes, methods or business, the employee shall be the owner of the invention.
A significant portion of our employees are dedicated to activities that may be considered inventive. As a result, a significant portion of our employees execute confidentiality and ownership rights agreements upon commencement of employment whereby they agree to classify all work undertaken by them as engagement in inventive discovery, which grants us all ownership rights in inventions created while such employees are employed by us. If these assignments or exclusive licenses were deemed invalid or unenforceable, we could be required to pay royalties to our employees who have invented intellectual property that we have commercialized, which in turn may have a material adverse effect on our results of operations. In addition, if these assignments or exclusive licenses were deemed invalid or unenforceable, it is possible that our employees could assign or license to third parties their rights in any inventions created while employed by us. This could have a material adverse effect on our results of operations.
Risks Related to Operating in Latin America
A major portion of our operations and/or development activities are based in Latin America. As of June 30, 2024, approximately 85% of our consolidated sales of goods and services were attributable to our Latin American operations. In particular, fluctuations in the economy of Latin America and actions adopted by the governments of Latin American countries have had and may continue to have a significant impact on our subsidiaries operating in those countries.
Latin America, including Argentina, has experienced, and may continue to experience, adverse economic or political conditions, including inflation, government controls, and considerable economic uncertainty that may impact our business, financial condition and results of operations.
A major portion of our operations and/or development activities are based in Latin America, notably in Argentina. Accordingly, our financial condition and results of operations are substantially dependent on economic conditions in Argentina and in the remainder of Latin America.
Latin American countries have historically experienced uneven periods of economic growth, recessions, periods of high inflation and economic instability. Economic and political developments in Latin America, including future economic changes or crises (such as inflation, currency devaluation or recession), government deadlock, political instability, civil strife, changes in laws and regulations, restrictions on the repatriation of dividends or profits, expropriation or nationalization of property, restrictions on currency convertibility, volatility of the foreign exchange market and exchange controls could impact our operations and/or the market value of the ordinary shares and have a material adverse effect on our business, financial condition and results of operations.
Further, in recent years, Argentina has confronted significant market volatility, including numerous periods of low growth or stagnation, inflationary pressures, including the depreciation of the Argentine Peso, evidenced by significantly higher fuel, energy, and food prices, among other factors. Further, the Argentine government increased its direct intervention in the economy, including through the implementation of regulation of market conditions, expropriations or nationalizations and price controls. Therefore, the inflation rate in Argentina and the government’s intervention in the economy may adversely affect our business.
According to data published by the Argentine National Institute of Statistics and Census (Instituto Nacional de Estadística y Censos) (“INDEC”), the Consumer Price Index (“CPI”) increased 95% from January through August 2024, 211% in 2023, 94.8% in 2022 and 50.9% in 2021. If inflation remains high or continues to rise towards a hyperinflation, Argentina’s economy will continue to be negatively impacted, and our results of operations could be materially adversely affected.
On November 19, 2023, general presidential elections took place in Argentina, and a new coalition La Libertad Avanza, led by Javier Milei, took office on December 10th, 2023, with a principal mandate of curbing inflation and re-aligning macroeconomic variables.
On December 20, 2023, Emergency Decree 70/2023 entitled “Bases for the Reconstruction of the Argentine Economy” (“Decree 70/2023”) was published in the Official Gazette, repealing and amending several laws to stabilize Argentina’s economy through spending cuts, devaluing the Argentine Peso and temporarily increasing import taxes and export taxes. The most relevant measures contained in the Decree 70/2023 included the declaration of public emergency in economic, financial, fiscal, administrative, social security, tariff, health and social matters until December 31, 2025, as well as measures ranging from the repeal of regulations on housing lease contracts, supply of basic necessities, commercialization of mass consumption products, to the modification of the corporate form of companies in which the State has a stake. Moreover, Decree 70/2023 contains 44 sections by means of which changes in the labor regulations in force are ordered. With respect to the latter, different precautionary measures, contained in actions for injunctive relief, have recently been admitted in order to temporarily suspend the effects of Decree 70/2023. All these precautionary measures, filed mainly by labor unions and different workers’ unions, have been appealed by the Government of Javier Milei. Currently, it is not possible to confirm what the outcome of these measures filed against Decree 70/2023 will be. In addition, Decree 70/2023 is still subject to a subsequent legislative control established in section 99, paragraph 3, of the National Constitution and in Law 26,122. According to the provisions of the latter, Decree 70/2023 will remain in force until it is rejected by both Chambers of Congress. On March 14, 2024, after failing to comply with the deadlines stipulated by Law 26,122 for the Permanent Bicameral Commission to consider Decree 70/2023, the Senate of the Nation opened special sessions in which it voted for the rejection of Decree 70/2023. Now, DNU 70/2023 awaits its treatment in the Chamber of Deputies of the Nation; in case the Chamber of Deputies votes for its rejection, it would lose its effectiveness.
Furthermore, on December 27, 2023, the Administration of President Javier Milei submitted to Congress an extensive bill entitled “Law of Bases and Starting Points for the Freedom of Argentines” (the “Bases Law”). Among the many issues dealt with in the draft of the Bases Law is a broad declaration of emergency and the delegation of legislative powers to the executive branch. In addition, the draft of the Bases Law proposes a general program of deregulation of commerce, services and industry throughout the national territory, as well as the privatization of companies under State control, such as the national airlines (Aerolineas Argentinas), the national train company (Trenes Argentinos), the national postal service (Correo Argentino) and companies engaged in strategic services such as banking, energy, water, among others. After six months of legislative work, on June 27, 2024, the Chamber of Deputies of the National Congress approved the final text of the Bases Law, finally passing the Bases Law. The consequences of such law and the economic and political reforms it introduces may cause initial uncertainty and adjustments costs which may adversely affect the Argentine economy, stock market prices, and our business, financial condition, and operational results.
On the same date, the National Congress approved Law No. 2774 on tax measures, including a moratorium and tax amnesty regimes and amendments to the Personal Assets Tax, Income Tax, and Special Regime for Small Taxpayers, among others (“Tax Package”). The aim of this bill is, among others, achieve the voluntary payment of taxes by taxpayers and responsible parties, who, if they join the regime, will obtain different benefits according to the type of adhesion and the type of debt they have.
On July 8, 2024, the executive branch issued Decrees No. 592 and 593, whereby it enacted the Bases Law along with the Tax Package.
The executive branch issued Decree No. 608 and 695 on July 12, 2024, and August 5, 2024, respectively, regulating certain rules of the Tax Package and the following four chapters of Title II of the Base Law: (i) Administrative Reorganization; (ii) Privatizations; (iii) Administrative Procedure; and (iv) Public Employment. Finally, on August 12, 2024, the executive branch published Decree No. 713 in the Official Gazette through which it moved forward with the regulation of Section of the Bases Law related to contracts and transactional agreements (including concessions).
The social, political and economic impact of the reforms and measures announced by the Argentine government to date, such as the ambitious deregulation plan intended to be implemented through Decree 70/2023 and the Bases Law, the consequences of such law and the Tax Package and the impact of future reforms, measures and policies that may be proposed by the new Argentine administration remain uncertain, and could adversely affect the Argentine economy or our business, financial condition or results of operations.
In Brazil, the economy has experienced significant volatility in recent decades, characterized by periods of low or negative growth, high and variable levels of inflation and currency devaluation. Since the pandemic-induced decline of 3.2% in 2020, Brazil’s GDP increased 4.7 in 2021, 3.0% in 2022, 2.9% in 2023, with an expectation of 2.2% growth in 2024. Historically, Brazil’s political situation has influenced the performance of the Brazilian economy, and political crisis have affected the confidence of investors and the general public. As a result, Brazil continues to face uncertainty related to the future developments in policies and whether and when such policies and regulations may be implemented.
Negative current economic conditions in these markets could have an adverse effect on our financial condition and results of operations.
Latin American governments have exercised, and continue to exercise, significant influence over the economies of the countries in which we operate, which could adversely affect our business, financial condition, results of operations and prospects.
Historically, governments in Latin America have frequently intervened in the economies of their respective countries and have occasionally made significant changes in policy and regulations. Governmental actions to control inflation and other policies and regulations have often involved, among others, price controls, currency devaluations, capital controls and tariffs. Our business, financial condition, results of operations and prospects may be adversely affected by the changes in government policies or regulations of Latin American governments, including:
| ● | exchange rates and exchange control policies; |
| ● | tariff and inflation control policies; |
| ● | foreign exchange controls and restrictions on abroad remittances and payments of dividends; |
| ● | price control policies; |
| ● | liquidity of domestic capital and lending markets; |
| ● | tax policies, royalty and tax increases and retroactive tax claims; and |
| ● | other political, diplomatic, social and economic developments in or affecting the countries in which we operate. |
In addition, between 2006 and 2012, the Argentine government conducted expropriations including mainly utilities or companies in strategic sectors of public interest, like Aguas y Saneaminentos S.A. in 2006, Aerolíneas Argentinas S.A. in 2008 and YPF S.A. in 2012. In an unprecedented case in 2020, the government unsuccessfully attempted the expropriation of a company fully involved in the private sector with no public interest, like Vicentín S.A., which is the fourth largest grain exporter in Argentina, and, in addition, was undergoing a restructuring under reorganization proceedings. However, the government desisted due to generalized massive spontaneous protests and opposition from opposing political parties and the legal and financial community. In September 2014, the Argentine Congress enacted Law No. 26,991 which amended the Supply Law No. 20,680 (Ley de Abastecimiento) that enabled the Argentine government to intervene in certain markets when it considered that any party to such market was trying to impose prices or supply restrictions in such market. The law granted broad powers to the relevant enforcing agency including to order the sale, production, distribution and/or delivery of basic needs goods throughout the country in case of a shortage of supply.
Nonetheless, Decree 70/2023 and Resolution 51/2024 issued by the Secretary of Commerce (“Resolution 51/2024”) repealed several rules related to price and inflation control policies, such as the Supply Law, Law No. 27,545, and Law No. 26,992, and several other rules and laws that hindered commercial relations between citizens and promoted an interventionist role of the Argentine government.
As significant portion of our assets are located in Argentina, we are subject to political uncertainties, including expropriation or nationalization of our business or assets, or subject to renegotiation or annulment of existing contracts and other similar risks. In the future, intervention in the economy by the Argentine government may continue or increase, the occurrence of which may adversely affect Argentina’s economy and, in turn, our business, results of operations and financial condition. We cannot assure investors that these or other measures that may be adopted by the Argentine government in the future, such as nationalizations, forced renegotiations or modifications of existing contracts, new tax policies, price fixing, regulations and reforms affecting foreign trade and investments, will not have a material adverse effect on the Argentine economy and, consequently, will not adversely affect our business, results of operations and financial condition.
Our business, results of operations and financial condition may be adversely affected by fluctuations in currency exchange rates relative to the U.S. dollar in the countries in which we operate.
The majority of our operations are based in Latin America and, accordingly, a significant portion of our costs are incurred in local currencies, while our revenues are primarily denominated in or influenced by U.S. dollars. Currencies in Argentina and Brazil have fluctuated significantly against the U.S. dollar in the past. Accordingly, fluctuations in exchange rates relative to the U.S. dollar could impair the comparability of our results from period to period and have a material adverse effect on our results of operations and financial condition.
The Argentine Peso depreciated 354% against the U.S. dollar in 2023, 70.7% in 2022, 20.0% in 2021 and 40.5% in 2020 based on the official exchange rates published by the Argentine Central Bank. In the past years, the Argentine government has imposed restrictions on the purchase of foreign currency. These measures gave rise to an unofficial market where the U.S. dollar trades at a different market value than the official Argentine Peso – U.S. Dollar exchange rate. The rigid exchange controls and transfer restrictions substantially limit the ability to obtain foreign currency or make certain payments or distributions out of Argentina. See “—Argentine exchange controls and restrictions limit access to the FX Market to make payments and distributions from our Argentine subsidiaries and receive the proceeds of any sale of our assets in Argentina”.
The Brazilian real has historically suffered frequent fluctuations. As a consequence of inflationary pressures, in the past, the Brazilian government has implemented various economic plans and adopted a number of exchange rate policies, including sudden devaluations, periodic mini devaluations during which the frequency of adjustments has ranged from daily to monthly, floating exchange rate systems, exchange controls and dual exchange rate markets. Formally the value of the real against foreign currencies is determined under a free-floating exchange rate regime, but in fact the Brazilian government is currently intervening in the market, through currency swaps and trading in the spot market, among other measures, every time the currency exchange rate is above or below the levels that the Brazilian government considers appropriate, taking into account, inflation, growth, the performance of the real against the U.S dollar in comparison with other currencies and other economic factors. Periodically, there are significant fluctuations in the value of the Brazilian real against the U.S. dollar. In 2023, the Brazilian real appreciated 8.1% against the U.S. dollar, whereas in 2022 the Brazilian real appreciated 7.3% against the U.S. dollar, following a depreciation of 9.1% in 2021 and a depreciation of 28.9% in 2020.
Our consolidated financial information included herein is presented in U.S. dollars. Fluctuations in exchange rates relative to the U.S. dollar could impair the comparability of our results from period to period and could have a material adverse effect on our results of operations and financial condition.
We are required to apply inflationary adjustments and tax indexation procedures in some of our Argentine subsidiaries, which could adversely affect our financial statements, results of operations and financial condition.
Pursuant to the International Accounting Standard 29, Financial Reporting in Hyperinflationary Economies (“IAS 29”), the financial statements of entities whose functional currency is that of a hyperinflationary economy must be adjusted for the effects of changes in a suitable general price index. IAS 29 does not prescribe when hyperinflation arises but includes several characteristics of hyperinflation. The IASB does not identify specific hyperinflationary jurisdictions. However, in June 2018, the International Practices Task Force of the Centre for Quality, which monitors “highly inflationary countries” categorized Argentina as a country with projected three-year cumulative inflation rate greater than 100%. Additionally, some of the other qualitative factors of IAS 29 were present, providing prima facie evidence that the Argentine economy is hyperinflationary for purposes of IAS 29. Therefore, Argentine companies using IFRS as adopted by the IASB are required to apply IAS 29 to their financial statements for periods ending on and after July 1, 2018.
Beginning with the period ending on December 31, 2018, Bioceres’ Argentine subsidiaries which have Argentine Peso as its functional currency began preparing financial statements in compliance with IFRS, adopting IAS 29. Effective July 1, 2022, our main subsidiaries changed their functional currency from the Argentine Peso to the United States Dollars as a result of changes in events and conditions relevant to their business operations. The effect of the functional currency change was recorded prospectively in accordance with IAS 21. As a result, from July 1, 2022, there are no longer significant effects of inflation adjustments in our financial statements. See “Item 5. Operating and Financial Review and Prospects.”
From a tax perspective, in December 2019, the Argentine Government promulgated Law 27,541. It provided that the tax rate reduction established by Law 27,430 (reduction of the income tax rate from 35% to 30% for fiscal periods beginning on January 1, 2018, until December 31, 2019, and 25% for fiscal periods beginning on or after January 1, 2020, inclusive) be suspended until the fiscal years beginning on or after January 1, 2021. Thus, the tax rate of 30% was maintained. Law 27,541 also provided that, for the first and second financial years starting on or after January 1, 2019, one-sixth of the inflation adjustment (provided by Law 27.420) will be computed in the fiscal year of the adjustment calculation and the remaining five-sixths in equal parts in the five tax periods immediately following.
On June 16, 2021, the Argentine Government enacted Law No. 27,630 which amended the Argentine Income Tax Law and replaced the fixed rate paid by Argentine companies on their corporate income from 30% to a progressive rate ranging from 25% to 35%. Depending on net incomes, companies will now have to pay a fixed amount and a progressive rate over the surplus of the minimum base rate in their category.
The reform also extends the 7% withholding tax on dividends for tax years beginning 1 January 2021 and thereafter. According to applicable law and if no additional tax reform is passed, for fiscal years beginning on or after January 1, 2021, 100% of the tax inflation adjustment (negative of positive) would be allocated by fiscal year.
We cannot predict the future impact that the application of IAS 29 and the eventual application of the tax indexation procedure and related adjustments will have on our Argentine subsidiaries’ financial statements or the effects on our business, results of operations and financial condition. Also, we cannot predict when the application of IAS 29 and the tax indexation will no longer be mandatory.
Economic and political developments in Argentina, including inflation and government controls may adversely affect the economy and our financial condition and results of operations.
In recent years, Argentina has confronted significant market volatility, including numerous periods of low growth or stagnation, inflationary pressures, including the depreciation of the Argentine Peso, evidenced by significantly higher fuel, energy, and food prices, among other factors. Further, the Argentine government increased its direct intervention in the economy, including through the implementation of regulation of market conditions, expropriations or nationalizations and price controls. Therefore, the inflation rate in Argentina and the government’s intervention in the economy may adversely affect our business.
According to data published by the Argentine National Institute of Statistics and Census (Instituto Nacional de Estadística y Censos) (“INDEC”), the Consumer Price Index (“CPI”) increased 95% from January through August 2024, 211% in 2023, 94.8% in 2022 and 50.9% in 2021. If inflation remains high or continues to rise towards a hyperinflation, Argentina’s economy will continue to be negatively impacted, and our results of operations could be materially adversely affected.
Upon taking office, in December 2023, President Milei signed a decree to stabilize Argentina’s economy through spending cuts, devaluing the Argentine Peso and temporarily increasing import taxes and export taxes. In June 2024, the Argentine National Congress approved a law that focused on mass privatization, deregulating certain sectors, and easing labor market rules. The consequences of such law and the economic and political reforms it introduces may cause initial uncertainty and adjustments costs which may adversely affect the Argentine economy, stock market prices, and our business, financial condition, and operational results. No assurances can be made as to the policies that may be implemented by the new Argentine administration, or that political developments in Argentina, will not adversely affect the Argentine economy or our business, financial condition or results of operations.
Limited access of the Argentine government and the private sector to the international capital markets could adversely affect our financial condition.
During recent years, the Argentine government and provinces have defaulted in the payment of their debt, which has limited their access as well as that of private companies to the international financial markets, or it has substantially increased their financing costs. Further, the COVID-19 pandemic has negatively impacted Argentina’s economy and deepened its recession which resulted in the need of restructuring of its sovereign debt.
ON August 4, 2023, Argentina and Qatar entered into with a loan agreement for US$775 million to assist Argentina in repaying US$1.411 billion owed to the International Monetary Fund (the “IMF”) from previous loan facilities. In addition, on August 23, 2023, the former Argentine Minister of Economy announced agreements with the World Bank for U$650 million. The World Bank’s Board of Directors approved two financings for Argentina. The first was focused on increasing access to financing for small and medium-sized enterprises to help them better mitigate and adapt to climate risks, while the second supported the strengthening of food programs.
Moreover, on June 12, 2024, the People’s Bank of China and the Central Bank of Argentina renewed the full activated portion of their currency swap agreement to RMB 35 billion (equivalent to US$ 5 billion) for a period of 12 months. Starting from that date, the Argentine Central Bank will gradually reduce the activated amount over the following 12 months, aligning with the expiration date of the current currency swap agreement. Consequently, this portion will be completely deactivated by midst of 2026.
On June 13, 2024, the IMF´s Executive Board concluded the eighth revision of the agreement under the Extended Fund Facility for Argentina. The decision of the Board permitted a disbursement of approximately U$ 800 million, with which the total disbursements in the frame of the agreement increases to U$41.4 billion. This disbursement will support the efforts of the Argentine authorities to reestablish stability and strengthen the external viability of Argentina. In this sense, the Argentine program remains firmly on course, having accomplished all quantitative objectives by March 2024. To sustain this progress, the IMF stated that it is essential for the Argentine government to enhance the quality of fiscal adjustments, initiate the first steps toward improved monetary and exchange rate policies, and implement reforms to unlock growth, formal employment, and investment.
If the Argentine government defaults again on the payment of its sovereign debt or the measures adopted and to be adopted by the Argentine government to reduce the fiscal deficit, control inflation and stabilize the foreign exchange market are not effective, Argentina’s ability to obtain international or multilateral private financing or direct foreign investment may be limited, which may in turn impair its ability to implement reforms and public policies to foster economic growth, impair the ability of private sector entities to access the international capital markets or make the terms of such financing much less favorable that those accessible by companies in other countries in the region and may accelerate the depreciation of the Peso, foster inflation and deepen the economic crisis and recession. Lack of access to international or domestic financial markets or increase in the costs of such financing could affect the projected capital expenditures for our operations in Argentina, which, in turn, may have an adverse effect on our financial condition or the results of our operations.
A decline in the global prices of Latin America’s main commodity exports could have an adverse effect on Latin America’s economic growth.
A decline in the prices of the commodities that Latin America countries export, such as wheat and soy, could have an adverse effect on the region’s economic growth. High commodity prices have contributed significantly to the increase in Latin American exports as well as governmental revenues from export taxes. However, relying on the export of certain commodities has made the Latin American economy more vulnerable to fluctuations in the prices of commodities. A decline in global commodity prices negatively impacts ability of Latin American countries to service their sovereign debt as a result of reduced government revenue and, available foreign, which may result in recessionary or inflationary pressures. Either of these results would adversely impact the prospects of economic growth in Latin America and, therefore, our financial condition and results of operations. Further, we may not be able to anticipate or react to such volatility in a timely manner, which could cause our operating results to deteriorate.
The Argentine government may order special protections for employees in the private sector.
Due to high levels of inflation, the Argentine government could order salary increases for employees in the private sector, as occurred in the past. Notwithstanding the above, no mandatory salary increase has been ordered by the Argentine government since January 2020.
As per the current context, the prohibition on terminations and duplication of severance are not in force. A company is entitled to dismiss, without cause, employees at its convenience, as long as severance is paid in duly manner and time. However, considering the current high levels of inflation and devaluation, we cannot assure that the government may create special measures against further salary depreciation.
Furthermore, during 2023, salary increases in the private sector have been more regular than previously reported. However, there have been claims by employees that the increase in salary were not following inflation rates.
On November 19, 2023, the second round (ballotage) of the presidential elections in Argentina took place, in which the ruling party Unión por la Patria, with former Minister of Economy Sergio Massa as its main candidate, obtained 44.30% of the votes, and, in contrast, the party La Libertad Avanza, led by Javier Milei, obtained a result of 55.65% of the votes. In this sense, on December 10, 2023, Javier Milei took office as the new President of the Argentine Republic for the next four years.
Also, on December 20, 2023, Decree 70/2023 repealed and amended several laws. The Title IV of the Decree 07/2023 contains labor regulations, which modify substantially the Labor Contract Law 20,744. This Title is currently suspended by judicial decision. However, Law 27,742, Law of Foundations and Starting Points for the Freedom of Argentinians, enacted on June 28, 2024 and enforced on July 9, 2024, includes many of the modifications attempted in this regulation.
The Law 27,742 introduces important amendments in labor and social security matters, which are contained in two of its titles: (i) Title IV “Promotion of Registered Employment” and (ii) Title V “Labor Modernization”.
Although the Law 27,742 is enforced, pending issues for regulation or collective bargaining include: (i) the new mechanism for labor registration and the preparation of pay slips; (ii) employment regularization; (iii) a new online platform for reporting irregular registrations; (iv) the creation of a severance fund for dismissal compensation with collaborators.
Issues for immediate application and effectiveness as of July 9, 2024 include: (i) the validity of the labor contract registration by the labor provider; (ii) exclusion of service contracts from the scope of the Labor Contract Law (LCT); (iii) non-application of the presumption of employment contracts to self-employed workers who issue invoices; (iv) implementation of the new 6-month probationary period for those hired from July 9, 2024 (up to eight (8) months in companies with six (6) to one hundred (100) workers; and up to one (1) year in companies with up to five (5) workers); (v) reduction to 10 days of the pre-birth period at the pregnant woman’s option; (vi) just cause for dismissal in cases of obstruction, blockades, or damage during strike actions; (vii) increased severance compensation in cases of discriminatory dismissal; and (viii) elimination of fines and increased severance compensation in case of misclassification and failure to register employment.
The disposition or sale of our ordinary shares may be subject to taxation in Argentina.
Under the Argentine Income Tax Law, gains realized from the indirect sale or disposal of assets located in Argentina, including shares or other equity participations in Argentine companies by an entity or individual not resident in Argentina (“Non-Argentine Resident”) are taxable under certain conditions, as if a direct sale took place (the “Tax on Indirect Sales”).
The Argentine Income Tax Law establishes a presumption of income from Argentine source on the sale or disposition by Non-Argentine Residents of shares and participations (or rights to receive such shares or participations) in foreign entities whose underlying assets are fully or partially located in Argentina, as long as the following conditions are met:
| ● | At least thirty percent (30%) of the value of the shares, participations or rights of the foreign entity, at the time of sale or in any of the 12 previous months, derives from assets that the entity owns directly or indirectly in Argentina. For this purpose, such Argentine assets or rights will be valued at their fair market value and will include, among others, shares or other forms of ownership, control or participation in the profits of a company incorporated in Argentina; and |
The securities or rights of the foreign entity being sold or disposed represent, at least, ten percent (10%) of the equity of that entity, at the time of their disposal or in any of the 12 previous months. For purposes of this calculation, ownership of related entities, spouses and other relatives must be considered jointly.
| ● | The relevant shares and participations in the foreign entity have been acquired on or after January 1, 2018. |
In case the Tax on Indirect Sales applies, the Argentine source gain on which the Tax on Indirect Sales will be calculated is a proportion to the value of the Argentine assets held by the foreign entity with respect to the total value of the securities or rights being transferred.
The Tax on Indirect Sales is levied at a 15% rate on the net capital gain (gross sale price less acquisition cost), or at a 13.5% effective rate on the gross sale price, at the option of the seller. However, such rate may be reduced if a Treaty to Avoid Double Taxation applies to the seller. If the Tax on Indirect Sales becomes applicable and the tax is applied on a net basis, pursuant to current income tax rules, the acquisition costs may be adjusted by inflation to calculate the net capital gain.
The mechanism to comply with the payment of the Tax on the Indirect Sales depends on the tax residency of the buyer: (i) if the buyer or acquirer is an Argentine corporate entity (in general, entities organized or incorporated under Argentine law, certain traders and intermediaries, local branches of foreign entities, sole proprietorships and individuals carrying on certain commercial activities in Argentina) (“Argentine Entity”) or an Argentine resident individual (“Argentine Individual”) the tax must be withheld and paid to the Argentine Tax Authority, by the Argentine Entity or Argentine Individual, (ii) if the buyer is not an Argentine Entity or an Argentine Individual, the tax has to be paid by the seller or transferor directly (through an international wire transfer or through its legal representative in Argentina, if any). There are specific rules if the non-Argentine resident is a resident in a non-cooperative jurisdiction or the funds invested proceed from a non-cooperative jurisdiction as defined in the Income Tax Law. Argentine Income Tax Law defines “Non-Cooperative Jurisdictions” as any jurisdiction that: (i) has not signed an exchange agreement with Argentina; (ii) has not signed a DTT with Argentina; or (iii) has signed either an information exchange agreement with Argentina; (ii) has not signed a DTT with Argentina; or (iii) has signed either an agreement or a convention but does not comply with its obligation to share information with Argentina. The Regulatory Decree of the Income Tax Law provides a closed list of the jurisdictions deemed to be “non-cooperative” for tax purposes.
Argentine Income Tax Law sets forth that the Tax on Indirect Sales does not apply to transfers made within the same economic group. Pursuant to the Regulatory Decree of the Argentine Income Tax Law, transfers within the same economic group would take place when the seller or sellers participate or participates, directly or indirectly, in at least 80% of the transferee’s capital, or vice versa, or when one or more entities participate, directly or indirectly, in at least 80% of the transferor’s and transferee’s capital, and such participations have been held for at least two years prior to the transfer.
The payment of the In-Kind Consideration under the Rizobacter Call Option may be subject to taxation in Argentina.
Any gain resulting from the delivery of our ordinary shares to grantors in connection with the payment of the In-Kind Consideration under the Rizobacter Call Option may be subject to the Tax on Indirect Sales at our level if all the conditions described above in section “The disposition or sale of our ordinary shares may be subject to taxation in Argentina” are verified. If applicable, the Tax on Indirect Sales would believe, at our option, either on: (i) the net gain resulting from the difference between our ordinary shares’ tax basis (acquisition cost, equal to the redemption price of such shares) and the value received by us in connection with the payment of the In-Kind Consideration at a 15% tax rate, or (ii) on the value received by us in connection with the payment of the In-Kind Consideration at a 13.5% tax rate. Any resulting Tax on Indirect Sales would be calculated on the proportion of the value that the Argentine assets represent with respect to the total value of our ordinary shares delivered and should be paid to the Argentine tax authorities by our legal representative in Argentina.
Argentine exchange controls and restrictions limit access to the FX Market to make payments and distributions from our Argentine subsidiaries and receive the proceeds of any sale of our assets in Argentina.
The Argentine government has imposed exchange controls and transfer restrictions, substantially limiting the ability of legal entities and individuals to obtain foreign currency or make certain payments or distributions out of Argentina. See “—Item 10. Additional Information—D. Exchange Controls.”
In response to the reinstatement of the foreign exchange restrictions, an unofficial U.S. dollar trading market developed in which the Peso-U.S. dollar exchange rate differs substantially from the official Peso-U.S. dollar exchange rate, and the use of blue-chip swaps expanded which, are much more expensive than acquiring foreign currency through FX Market at the official exchange rate. Exchange controls have generally affected the level of international reserves deposited with the Argentine Central Bank, which decreased to US$27.662 billion as of August 21, 2024. See “—Our business, results of operations and financial condition may be adversely affected by fluctuations in currency exchange rates relative to the U.S. dollar in the countries in which we operate.”
Since the inauguration of Javier Milei’s government, access to the FX Market has been broadened, with expectations for further liberalization. These measures reflect the administration’s commitment to easing currency controls and enhancing market fluidity, which is anticipated to have a positive impact on the business environment by facilitating foreign currency transactions and reducing associated regulatory burdens.
All these measures could lead to political and social tensions and undermine the Argentine government’s public finances, as has occurred in the past, which could adversely affect Argentina’s economy and prospects for economic growth and could adversely affect our business and results of operations.
In addition, we may be impaired from receiving payments and transfers from our Argentine subsidiaries or such payments and transfers could be subject to substantial additional costs which, in either case, could adversely affect our business and results of operations.
Foreign exchange restrictions have reinstated the mandatory repatriation of export receivables.
Since September 2, 2019, the Argentine government has reinstated the mandatory repatriation into Argentina and the conversion into Pesos through the FX Market of the proceeds from the collections of foreign currency outside of Argentina by Argentine residents in connection with exports of goods within certain specific dates. See “—Item 10. Additional Information—D. Exchange Controls.”
Regardless of the applicable maximum terms described above, upon collection of the export receivables, the proceeds thereof are subject to the mandatory repatriation within the five consecutive days computed from the date of payment or collection.
In addition, the Argentine government also reinstated the mandatory repatriation into Argentina and the conversion into Pesos through the FX Market of the receivables for export of services within five consecutive days computed from the date they are received.
The reinstatement of the repatriation of export of goods and services receivables and the additional restrictions imposed on the access to the FX Market could have a material adverse effect on our business, results of operations and financial condition.
Changes in Argentine tax laws may adversely affect the results of our operations, financial condition and cash flows.
On December 29, 2017, the Argentine government enacted the Law No. 27,430, resulting in a major tax reform of the Argentine tax system. One of such reforms was the reduction of the corporate income tax rate from 35% to 30% for fiscal years beginning on or after January 1, 2018, and 25% for fiscal years beginning on or after January 1, 2020. Additionally, the distribution of dividends was subject to income tax withholding at a 7% tax rate if the distributed profits derive from the fiscal years beginning on or after January 1, 2018, or a 13% tax rate if the distributed profits derive from fiscal years beginning on or after January 1, 2020.
However, on December 23, 2019, the Solidarity Law suspended the reduction of the corporate tax rate for Argentine Entities to 25% (with dividends being taxed at 13%) and maintained the 30% rate (with dividends being taxed at 7%) until fiscal years initiated on January 1, 2021. Consequently, the effectiveness of the 25% and 13% tax rates was delayed until tax years commencing after January 1, 2021.
Finally, on June 16, 2021, the Argentine Government enacted Law No. 27,630 which amended the Argentine Income Tax Law and replaced the 30% fixed rate paid by Argentine companies on their corporate income with a progressive rate ranging from 25% to 35%, depending on the net income of each year.
The applicable rate over dividends paid to shareholders, whether they are individuals or undivided estates residing in Argentina or non-Argentine residents, continues to be 7% in all cases, regardless of the tax rate paid by the company at the corporate level.
Therefore, as of fiscal year 2021, Argentine entities are subject to a progressive rate ranging from 25% to 35%, depending on the net income of each year. Moreover, dividends distributions to the shareholders mentioned in the paragraph above are subject to a 7% withholding rate.
Argentine companies are required to pay the personal assets tax corresponding to Argentine resident individuals, foreign individuals and foreign entities for holding equity interests in such companies as of December 31 of each year. The applicable tax rate until 2018 was 0.25% and the tax is levied on the equity stated in the latest financial statements.
Under the Solidarity Law, the tax rate applicable to shares or participations in the capital of companies governed by the Argentine General Companies Act was increased from 0.25% to 0.50% of the pro-rata equity value.
On July 8, 2024, Law 27,743 introduced certain amendments to the Personal Assets Tax applicable as a of fiscal year 2023. However, such amendments do not refer to the tax treatment applicable to shares or participations in the capital of Argentine companies.
Hence, currently, Non-Argentine residents are subject to Argentine personal assets tax for holding shares and other equity participations in Argentine companies as of December 31 of each year at a rate of 0.50%, which is levied on the proportional net worth value (valor patrimonial proporcional) of the shares arising from the last balance sheet. Argentine companies are obliged to pay the tax on behalf of their Non-Argentine resident shareholders, partners or owners and are entitled to seek reimbursement from them.
We cannot assure that the Argentine government or any of its political divisions will not adopt additional changes and reforms in tax matters, nor that these reforms and those that may be adopted in the future will not adversely affect our business, results of operations or financial condition; or our Non-Argentine Residents affiliates or subsidiaries in connection with their holding of shares and equity in Argentine companies.
Risks Related to Our Ordinary Shares
Our share repurchase program may reduce liquidity.
On May 6, 2020, our board of directors approved a program to repurchase our own securities. As described in Item 10 of this Annual Report, we may repurchase up to US$10,000,000 to enhance the allocation of capital to certain equity-finance obligations (the “Buy-Back Program”). As of June 30, 2024, we have acquired 731,562 ordinary shares under the Buy-Back Program. Future purchases, if any, would be funded from our cash balances and could reduce our financial liquidity and indirectly add to our indebtedness, as well as reduce liquidity of our ordinary shares.
There can be no assurance that we will be able to comply with the continued listing standards of the Nasdaq Global Select Market.
Our ordinary shares are currently listed on Nasdaq. Our continued eligibility for listing may depend on, among other things, the amount of “public float” (equity held by non-affiliates). If Nasdaq delists our ordinary shares from trading on its exchange for failure to meet the listing standards, our shareholders could face significant material adverse consequences including:
| ● | a limited availability of market quotations for our ordinary shares; |
| ● | reduced liquidity and in ability to sell our ordinary shares; |
| ● | a determination that our ordinary shares are a “penny stock” which will require brokers trading in our ordinary shares to adhere to more stringent rules and possibly result in a reduced level of trading activity in the secondary trading market for our ordinary shares; |
| ● | a limited amount of news and analyst coverage; and |
| ● | a decreased ability to issue additional ordinary shares or obtain additional financing in the future. |
The National Securities Markets Improvement Act of 1996, which is a federal statute, prevents or preempts the states from regulating the sale of certain securities, which are referred to as “covered securities.” Because our ordinary shares are listed on Nasdaq or another national securities exchange, they are covered securities. If our securities were no longer listed on Nasdaq, they would not be covered securities, and we would be subject to regulation in each state in which we offer securities.
Sales of a substantial number of our ordinary shares in the public market by our shareholders could adversely affect the market price of our ordinary shares.
Sales of a substantial number of our ordinary shares in the public market by our shareholders, or the perception that those sales might occur, could depress the market price of our ordinary shares and could impair our ability to raise capital through the sale of additional equity securities. We are unable to predict the effect that such sales may have on the prevailing market price of our ordinary shares.
Conversion of the Notes would increase the number of ordinary shares and result in dilution to shareholders.
On August 5, 2022, we issued an aggregate principal amount of US$55.0 million secured guaranteed convertible notes (the “Secured Convertible Guaranteed Notes due 2026”, and together with the Secured Guaranteed Notes due 2026, the “Notes”) pursuant to a note purchase agreement (the “JRL NPA”) among us, Jasper Lake Ventures One LLC, Redwood Enhanced Income Corp, Liminality Partners LP, the holders from time to time party thereto and Wilmington Savings Fund Society, FSB, as collateral agent.
The Secured Convertible Guaranteed Notes due 2026 are convertible into our ordinary shares. The issuance of a substantial number of additional ordinary shares upon conversion of the Secured Convertible Guaranteed Notes due 2026 will result in dilution to the then existing holders of our ordinary shares and will increase the number of ordinary in the public market. Sales of a substantial number of our ordinary shares in the public market could adversely affect the market price of our ordinary shares.
We ceased to be a “controlled company” for purposes of the Nasdaq rules. Accordingly, we are required to comply with the corporate governance requirements of the Nasdaq rules unless an exemption applies.
As of the date of this Annual Report, Bioceres Group PLC owns less than 50% of our outstanding shares and, therefore, we are no longer considered a “controlled company” under the Nasdaq rules. Accordingly, we must comply with the provisions of the Nasdaq rules that require a majority of our board of directors to be independent and that we have nominating and compensation committees comprised entirely of independent directors, unless we choose not to comply with such requirements in accordance with Nasdaq rule 5615. In this regard, we rely on our home country practices, in lieu of these requirements, which do not require us to have a majority of our board of directors to be independent, permit our nominating and governance committee to be comprised of shareholder representatives and do not require us to hold regular executive sessions where only independent directors shall be present. Failure to comply could result in our shares being delisted, unless we choose not to comply with such requirements in accordance with Nasdaq rule 5615. Any delisting of our shares would likely have a material adverse effect on the liquidity and trading market for our shares.
The price of our ordinary shares may fluctuate, and you may not be able to resell our ordinary shares at or above the price you paid.
Fluctuations in the price of our ordinary shares could contribute to the loss of all or part of your investment. If an active market for our ordinary shares develops and continues, the trading price of our ordinary shares could be volatile and subject to wide fluctuations in response to various factors, some of which are beyond our control. Any of the factors listed below could have a material adverse effect on your investment in our ordinary shares and our ordinary shares may trade at prices significantly below the price you paid for them. In such circumstances, the trading price of our ordinary shares may not recover and may experience a further decline.
Factors affecting the trading price of our ordinary shares may include, among others:
| ● | actual or anticipated fluctuations in our interim financial results or the interim financial results of companies perceived to be similar to us; |
| ● | our public float relative to the total number of ordinary shares that are issued and outstanding; |
| ● | announcements of technological innovations, new products or services or new commercial relationships by us or our competitors; |
| ● | disruption to our operations; |
| ● | announcements concerning our competitors or the pest management industry in general; |
| ● | our entry into, modification of or termination of key license, research and development or collaborative agreements; |
| ● | changes in the market’s expectations about our operating results; |
| ● | the public’s reaction to our press releases, our other public announcements and our filings with the SEC; |
| ● | speculation in the press or in the investment community; |
| ● | success of competitors; |
| ● | the operating results failing to meet the expectation of securities analysts or investors in a particular period; |
| ● | changes in financial estimates and recommendations by securities analysts concerning our ordinary shares or the market in general; |
| ● | operating and stock price performance of other companies that investors deem comparable to us; |
| ● | our ability to market new and enhanced products on a timely basis; |
| ● | changes in laws and regulations affecting our business; |
| ● | commencement of, or involvement in, litigation involving us; |
| ● | changes in our capital structure, such as future issuances of ordinary shares or the incurrence of additional debt; |
| ● | the volume of our ordinary shares available for public sale; |
| ● | any major change in our board of directors or management; |
| ● | sales of substantial amounts of our ordinary shares by our directors, officers or significant shareholders or the perception that such sales could occur; and |
| ● | general economic and political conditions such as recessions, interest rates, fuel prices, international currency fluctuations and acts of war or terrorism. |
Broad market and industry factors may materially harm the market price of our ordinary shares irrespective of our operating performance. The stock market in general and Nasdaq have experienced price and volume fluctuations that have often been unrelated or disproportionate to the operating performance of the particular companies affected. The trading prices and valuations of these stocks, and of our ordinary shares, may not be predictable. A loss of investor confidence in the market for the stocks of other companies which investors perceive to be similar to us could depress our share price regardless of our business, prospects, financial conditions or results of operations. A decline in the market price of our ordinary shares also could adversely affect our ability to issue additional ordinary shares and our ability to obtain additional financing in the future.
In the past, securities class action litigation has often been initiated against companies following periods of volatility in their stock price. This type of litigation could result in substantial costs and divert our management’s attention and resources and could also require us to make substantial payments to satisfy judgments or to settle litigation.
If securities or industry analysts do not publish or cease publishing research or reports about us, our business, or our market, or if they change their recommendations regarding our ordinary shares adversely, then the price and trading volume of our ordinary shares could decline.
The trading market for our ordinary shares will be influenced by the research and reports that industry or securities analysts may publish about us, our business, our market, or our competitors. Securities and industry analysts do not currently, and may never, publish research on us. If no securities or industry analysts commence coverage of us, our ordinary share price and trading volume would likely be negatively impacted. If any of the analysts who may cover our operations change their recommendation regarding our ordinary shares adversely, or provide more favorable relative recommendations about our competitors, the price of our ordinary shares would likely decline. If any analyst who may cover our operations were to cease coverage or fail to regularly publish reports on it, we could lose visibility in the financial markets, which could cause our ordinary share price or trading volume to decline.
We are incorporated under the laws of the Cayman Islands. Accordingly, you may face difficulties in protecting your interests, and your ability to protect your rights through the U.S. Federal courts may be limited.
We are an exempted company incorporated under the laws of the Cayman Islands and a majority of our officers and directors are residents of jurisdictions outside the United States. As a result, it may be difficult for investors to effect service of process within the United States upon our directors or executive officers, or enforce judgments obtained in the United States courts against our directors or officers.
Our corporate affairs are governed by our amended and restated memorandum and articles of association (the “Articles”), the Cayman Islands Companies Act (As Revised) (as the same may be supplemented or amended from time to time) or the common law of the Cayman Islands. We are also subject to the federal securities laws of the United States. The rights of shareholders to take action against the directors, actions by minority shareholders and the fiduciary responsibilities of our directors to us under Cayman Islands law are to a large extent governed by the common law of the Cayman Islands. The common law of the Cayman Islands is derived in part from comparatively limited judicial precedent in the Cayman Islands as well as from English common law, the decisions of whose courts are of persuasive authority, but are not binding on a court in the Cayman Islands. The rights of our shareholders and the fiduciary responsibilities of our directors under Cayman Islands law are different from statutes or judicial precedent in some jurisdictions in the United States, and certain states, such as Delaware, may have more fully developed and judicially interpreted bodies of corporate law. In particular, the Cayman Islands has a different body of securities laws as compared to the United States. In addition, Cayman Islands companies may not have standing to initiate a shareholders derivative action in a Federal court of the United States.
We have been advised by Maples and Calder (Cayman) LLP, our Cayman Islands legal counsel that the courts of the Cayman Islands are unlikely (i) to recognize or enforce against us judgments of courts of the United States predicated upon the civil liability provisions of the federal securities laws of the United States or any state; and (ii) in original actions brought in the Cayman Islands, to impose liabilities against us predicated upon the civil liability provisions of the federal securities laws of the United States or any state, so far as the liabilities imposed by those provisions are penal in nature. In those circumstances, although there is no statutory enforcement in the Cayman Islands of judgments obtained in the United States, the courts of the Cayman Islands will recognize and enforce a foreign money judgment of a foreign court of competent jurisdiction without retrial on the merits based on the principle that a judgment of a competent foreign court imposes upon the judgment debtor an obligation to pay the sum for which judgment has been given provided certain conditions are met. For a foreign judgment to be enforced in the Cayman Islands, such judgment must be final and conclusive and for a liquidated sum, and must not be in respect of taxes or a fine or penalty, inconsistent with a Cayman Islands judgment in respect of the same matter, impeachable on the grounds of fraud or obtained in a manner, and or be of a kind the enforcement of which is, contrary to natural justice or the public policy of the Cayman Islands (awards of punitive or multiple damages may well be held to be contrary to public policy). A Cayman Islands court may stay enforcement proceedings if concurrent proceedings are being brought elsewhere.
As a result of all of the above, public shareholders may have more difficulty in protecting their interests in the face of actions taken by management, members of the board of directors or controlling shareholders than they would as public shareholders of a United States company.
We expect to incur increased costs as a result of being a public company, particularly as we have ceased to qualify as an “emerging growth company.”
As a public company, we expect to incur significant legal, accounting and other expenses that we did not incur as a private company. The Sarbanes-Oxley Act of 2002, as well as rules subsequently implemented by the SEC and Nasdaq Global Select Market, impose various requirements on the corporate governance practices of public companies. An emerging growth company may take advantage of specified reduced reporting and other requirements that are otherwise applicable generally to public companies. These provisions include exemption from the auditor attestation requirement under Section 404 of the Sarbanes-Oxley Act of 2002, or Section 404, in the assessment of the emerging growth company’s internal control over financial reporting. The JOBS Act also permits an emerging growth company to delay adopting new or revised accounting standards until such time as those standards apply to private companies.
As we have ceased to be an “emerging growth company,” we have expect to incur significant expenses and devote substantial management effort toward ensuring compliance with the requirements of Section 404 of the Sarbanes-Oxley Act of 2002 and the other rules and regulations of the SEC. Operating as a public company also makes it more difficult and more expensive for us to obtain director and officer liability insurance, and we may be required to accept reduced policy limits and coverage or incur substantially higher costs to obtain the same or similar coverage. In addition, we expect to incur additional costs associated with our public company reporting requirements. It may also be more difficult for us to find qualified persons to serve on our board of directors or as executive officers.
As a foreign private issuer, we are exempt from certain disclosure requirements under the Exchange Act, which may afford less protection to our shareholders than they would enjoy if we were a domestic U.S. company.
As a foreign private issuer, we are exempt from, among other things, the rules prescribing the furnishing and content of proxy statements under the Exchange Act. In addition, our executive officers, directors and principal shareholders are exempt from the reporting and short swing profit recovery provisions contained in Section 16 of the Exchange Act. We are also not required under the Exchange Act to file periodic reports and financial statements with the SEC as frequently or as promptly as domestic U.S. companies with securities registered under the Exchange Act. As a result, our shareholders may be afforded less protection than they would under the Exchange Act rules applicable to domestic U.S. companies.
Historically, we have not paid any dividends.
We have not paid any cash dividends on our ordinary shares to date. The payment of cash dividends on our ordinary shares in the future will be dependent upon our future operations and earnings, capital requirements and surplus, general financial condition, contractual restrictions and other factors that our board of directors and shareholders may deem relevant. Our board of directors does not anticipate declaring any dividends on our ordinary shares in the foreseeable future. As a result, any gain you will realize on our ordinary shares will result solely from the appreciation of such shares.
We may issue additional securities in the future, which may result in dilution to our shareholders.
We are not restricted from issuing additional ordinary shares or securities convertible into or exchangeable for ordinary shares. Because we may need to raise additional capital in the future to operate and/or expand our business, we may conduct additional equity offerings. To the extent our outstanding options are exercised, or we conduct additional equity offerings, additional ordinary shares will be issued, which may result in dilution to our shareholders. Sales of a substantial number of our ordinary shares in the public market could adversely affect the market price of our ordinary shares.
ITEM 4. INFORMATION ON THE COMPANY
| A. | History and Development of the Company |
General Overview
We are a leading company in the development and commercialization of productivity solutions designed to regenerate agricultural ecosystems while making crops more resilient to climate change. We have a unique biotech platform with high-impact, licensed and patented technologies for seeds and microbial ag-inputs, as well as biological and next generation conventional crop nutrition and protection solutions.
As of June 30, 2024, we owned or licensed more than 1,600 brands and more than 579 registered products and, either exclusively or non-exclusively, over 750 patents and patent applications. Our product portfolio includes (i) biological crop nutrition products such as seed inoculants, biofertilizers or biostimulants, (ii) a full range of biocontrol products including bionematicides, biofungicides and bioinsecticides, (iii) next generation crop nutrition and crop protection products such as microbeaded fertilizers and adjuvants, and (iv) seed germplasm, GMO and non-GMO traits and ready-to-use seed pack solutions.
We are a global company, and our agricultural inputs are marketed across more than 45 countries, primarily in South America, the United States and Europe. For the year ended June 30, 2024, our total revenue was US$464.8 million, our operating profit was US$44.8 million, our GAAP net income was US$6.2 million and Adjusted EBITDA US$81.4 million. For the year ended June 30, 2023, our total revenue, net profit and adjusted EBITDA for the year ended June 30, 2023 totaled US$420.1 million, US$20.2 million and US$81.2 million, respectively. Adjusted EBITDA is a non-IFRS financial measure. See “Item 5. Operating and Financial Review and Prospects—A. Operating Results—Non-IFRS Financial Measures” and “Item 3. Key Information—D. Risk Factors—Risks Related to Our Business” for information regarding our use of Adjusted EBITDA and a reconciliation of net profit to Adjusted EBITDA.
We sell our products through our international subsidiaries and a sales and marketing team consisting of over 291 individuals. We enjoy exceptional access to the end-users (farmers) as a result of: (i) our strategic alliances and partnerships with global agriculture leaders and our joint ventures; (ii) the shareholders of Bioceres Group PLC, which is the majority holder of Bioceres S.A., who collectively control significant agricultural land in South America; and (iii) our longstanding relationships with more than 1,600 dealers and distributors. Our customers include global blue-chip companies and industry leaders, large distributors, co-ops and dealers, as well as large farmers and individual growers.
Our leading infrastructure, the success of our unique technology platform, and a commanding presence in key markets have made us a flagship agricultural solutions provider, as well as the natural partner for global conglomerates.
Our History
Bioceres Crop Solutions Corp is a Cayman Islands exempted company incorporated on November 14, 2017.
Our principal executive offices are located at Ocampo 210 bis, Predio CCT, Rosario, Province of Santa Fe, Argentina. Our telephone number at that address is +54 341 486-1100. The address of our registered office in the Cayman Islands is P.O. Box 309, Ugland House, Grand Cayman, KY1-1104, Cayman Islands. Our agent for service of process in the United States is Cogency Global Inc., located at 122 E. 42nd Street, 18th Floor, New York, NY 100168. Our website is www.biocerescrops.com and the SEC also maintains a website at http://www.sec.gov which contains reports and other information regarding registrants that file electronically with the SEC. The information on our website is not incorporated by reference into this annual report.
We have developed our business by establishing joint ventures and collaborations, in addition to implementing an acquisitive growth strategy. Our joint ventures with industry leaders, such as Florimond Desprez and De Sangosse, and non-joint venture collaborations with companies such as Syngenta, Corteva and Momentive, have allowed us to bring our products to market in an efficient and cost-effective manner. In addition, we have acquired and created multiple companies. For more details, see “Item 4. Information on the Company—B. Business Overview— Joint Ventures and Key Collaborations” and “Item 4. Information on the Company—A. History and Development of the Company—Significant Transactions.”
The timeline below illustrates the establishment of key joint ventures and our main acquisitions, which are discussed below.
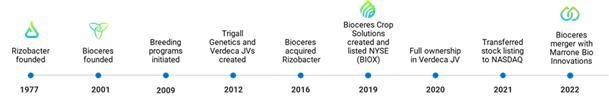
Bioceres S.A. was founded in 2001 by a group of farmers and agronomists in Argentina that partnered to address the demand for higher crop productivity in a sustainable and environmentally conscious way.
In October 2016, we acquired a controlling stake in Rizobacter S.A., a global leader in biological products and a pioneer in liquid inoculants, high-tech adjuvants, and specialty fertilizers, with more than 46 years history of excellence.
On March 14, 2019, Union Acquisition Corp. (“Union” or “UAC”) completed a business combination pursuant to a share exchange agreement, dated as of November 8, 2018 (as amended, the “Exchange Agreement”), by and among UAC and Bioceres, Inc., a company incorporated under the laws of Delaware, which converted into Bioceres LLC on February 28, 2019. Upon the consummation of the business combination, Union changed its name to Bioceres Crop Solutions Corp, and our ordinary shares and public warrants started trading on the NYSE American.
On July 27, 2020, we successfully and cost-effectively removed all 24.2 million outstanding warrants from our capital structure, with 90% of holders electing to tender their warrants and 99% of these holders choosing to receive our shares in exchange. Following completion of the offer to exchange, we implemented the amendment to the existing warrant agreement and redeemed the remaining warrants, thereby retiring all our warrants.
On November 12, 2020, we acquired from Arcadia Biosciences the remaining ownership interest in Verdeca LLC, aiming to accelerate the breeding and the go-to market strategies. As part of this transaction, we gained full access and control of Verdeca’s soybean library of genome modified materials used to develop new quality and productivity, as well as exclusive rights to all Arcadia technologies that are applicable to soybean. In addition, through this transaction, we obtained rights to Arcadia’s quality wheat traits and the related Good Wheat™ brand for Latin America and other GLA non-core assets.
On April 26, 2021, we voluntarily transferred our stock exchange listing from the NYSE American to The Nasdaq Global Select Market, in order to raise our visibility as an ag-tech company focused on sustainable solutions.
On July 12, 2022, we announced the closing of the Pro Farm Merger in which Pro Farm merged into us pursuant to the Merger Agreement. Pro Farm is a leading pure-play company in the agricultural biologicals space, with a track record of revenue growth and margin expansion. The Pro Farm Merger combined our expertise in bionutrition and seed care products with Pro Farm’s expertise in developing biological crop protection and plant health solutions, creating a global leader in the development and commercialization of sustainable agricultural solutions.
Since our founding, we believe that we have built one of the leading fully integrated biotechnology platforms of its kind to source, validate, develop and commercialize agricultural productivity technologies that regenerate agricultural ecosystems while making crops more resilient to climate change. Together with our subsidiaries, we have a diverse customer base, comprehensive product portfolio and expanded geographic reach across a wide range of crops well positioned to serve this significant market opportunity.
Competitive Strengths
Our diversified platform generates revenues through multiple technologies, customers, distribution channels and end-markets, providing us with a profitable growth trajectory. Our key competitive strengths include:
Pioneering high impact technology platform with strong IP
Our greatest competitive strength lies in the uniqueness and innovative nature of our portfolio of technologies, designed to address the large market opportunity that stems from the need to reduce agriculture’s impact on climate change and biodiversity loss.
We are pioneers in the agriculture biotechnology industry as the first and only company in the world to develop a drought-tolerant technology for soybean and wheat cropping systems. We are also the first non-governmental Latin America-based entity with an approved biotech event in a major global crop.
We are leaders in the development and commercialization of high impact, patented products that support regenerative agriculture, one of the most dynamic segments of agriculture, with one of the broadest and most innovative portfolio and pipeline for biologicals. The merger with Pro Farm combined our expertise in bionutrition and seed care products with Pro Farm’s leadership in the development of biological crop protection and plant health solutions, positioning us to serve all major agriculture input categories, conventional, organic and regenerative, with low environmental impact solutions and with our now large commercial footprint in the Americas and Europe.
Protecting our technologies and products under intellectual property rights allows us to offer the agricultural value chain unique and highly differentiated products and technologies, improving our competitiveness in the market. We believe that our patent and trademark portfolio is among the most competitive globally. As of June 30, 2024, we have identified and sought patent protection in our capacity as either title holder or licensee, or as exclusive or non-exclusive licensee, for over 750 patents or patent applications. Through our subsidiaries Rizobacter and Pro Farm, we have over 1,334 trademarks and over 290 trademarks applications globally.
Strong R&D engine to sustain long-term organic growth
Our robust R&D engine, in synergy with our subsidiaries, serves as the driving force behind our sustained, long-term organic growth.
Our strategy for acquiring technology and products relies on strategic partnerships, collaborative ventures, and enduring relationships with research institutions and scientists. Our R&D pipeline is dedicated to creating biological products that not only improve crop performance but also promote environmental sustainability. In integrating Bioceres’ legacy R&D platform with capabilities from Pro Farm, we formed what we believe is a world-class research and development team fully focused on upgrading our portfolio of commercially available technologies. We are enhancing the efficiency of adjuvants and micro-beaded fertilizers through their integration with biological inputs. Our Integrated Seed projects develop integrated products for soybean and wheat that comprise several technologies and are targeted to specific geographic regions.
With over 69 active projects, we are advancing biotechnology traits, biofungicides, bioinsecticides, bioherbicides, bio-stimulants, and inoculants, as well as developing soybean and wheat varieties. All of these endeavors exemplify our commitment to achieving sustainable organic growth.
Capital-Efficient, Risk Mitigated Development Model
Development and regulatory approval for our products and technologies requires a highly evolved and complicated process that can take more than a decade. Furthermore, capital allocation requirements can be onerous due to the expensive discovery activities usually associated with life sciences research and strict requirements for regulatory approvals.
We believe that we have created a highly competitive and capital efficient, independent platform for developing such products and technologies. We consider Bioceres Group PLC, through Bioceres S.A., to be the premier partner for advanced validation of promising research leads developed by research institutions in Argentina, most of which do not have the necessary capabilities for this purpose. During the technology sourcing process, Bioceres Group PLC designs and develops an efficient open architecture model that allows the scientific community (public institutions, other companies, entrepreneurs, etc.) to interact with it actively and productively.
Upon technology validation, we enter into joint ventures, partnerships and collaborative agreements with industry participants that agree on the merits of a new technology and pursue the business opportunity jointly with us. Partnering with others in this stage of the R&D process allows us to reduce our capital exposure while retaining a controlling interest in the product or technology under development. By co-funding projects, we not only reduce our financial burden and risk from product development activities, but we also enhance our capacity to develop multiple products.
As of June 2024, our ecosystem had more than 19 collaborations and joint initiatives with various players on a global scale. Our collaboration network includes projects with both public institutions at national and international levels as well as with other companies in the private sector. Two of our most valuable products (HB4 and Rizoderma) were incubated through such collaborations. We followed this concept when we acquired Pro Farm, which we believe possesses a cost-effective R&D platform.
Established Relationships with Key Industry Players Leading to Early and Broad Adoption of Technologies and Products
We possess a competitive advantage in commercializing our products, leveraging our strong industry relationships to bring our products to the market faster than our competitors.
We have a well-established high quality brand perception among customers, that positions us as a key reference for farmers who recognize the quality of our brands and value of our product offering. This reputation was built over our history of more than 40 years. We also have unique access to producer/end users through our parent company. Bioceres Group PLC and Bioceres S.A. (our largest shareholder as of June 30, 2024) are jointly owned by more than 400 shareholders, amongst which are some of the largest farm operators, processors, distributors and commercial participants in the Latin American agricultural sector. Bioceres Group PLC’s and Bioceres S.A.s shareholder structures also include founding members of Argentine Association of Producers in Direct Seeding (Asociación Argentina de Productores en Siembra Directa) and leading members of Argentine Association of Regional Consortia of Agricultural Experimentation (Asociación Argentina de Consorcios Regionales de Experimentación Agrícola) – early adopters and leaders in the sustainable agriculture movement. These unique relationships not only allow us to quickly bring our products to market and integrate our technologies into the broad market by creating a proprietary distribution and commercialization channel, but also provide us with a highly desired early-stage testing platform that allows us to receive direct market feedback in the testing process in order to vet and facilitate faster market penetration.
We have also become a leading choice for partnerships with global agriculture conglomerates, as evidenced by the number of development and commercial agreements. These partnerships are the result of our long-standing relationships with key distributors and major global players, which have played a key role in expanding our presence into new markets.
Highly Accomplished and Disciplined Management Team with a Unique Blend of Technical and Commercial Experience
Our management team brings a wealth of executive experience, scientific and technical knowledge, and commercial acumen to the table, setting us apart in the industry. We leverage the experience and know-how of our management to efficiently source and develop our technologies and products, pursue strategic alliances and acquisitions, and to execute our business objectives. Their combined capabilities ensure that that we remain at the forefront of innovation while strategically aligning our business goals and delivering consistently strong financial results.
Significant Transactions
We are not aware of any significant transactions requiring disclosure pursuant to this item during the past fiscal year.
Key Agreements
Corteva Agreement
On July 18, 2023, we entered into an exclusive agreement with Corteva Agriscience (“Corteva”) to advance the availability of biological solutions in Europe. Under the agreement, we will work jointly to accelerate the regulatory processes required to bring a cutting-edge bioinsecticide developed by Pro Farm, to the European market.
The product is an extremely viable biological insecticide that can be as effective as conventional insecticides and is a good fit for mainstream agriculture, with target crops including corn and other cereals, as well as sunflower and rape seeds. Once registrations are secured, Corteva will be the exclusive distributor in Europe, through their Seed Applied Technologies team and will also treat its Pioneer® brand seed products with the technology.
In addition, Corteva Agriscience will continue to commercialize Pro Farm’s Lumidapt™, a growth nutrition seed treatment for crops.
Syngenta Exclusive Global Distribution Agreement
On September 12, 2022, we entered into a 10-year agreement with Syngenta, pursuant to which Syngenta will be the exclusive global distributor of certain Rizobacter biological solutions for seed care applications. Products included within the scope of the agreement are the nitrogen-fixing Rhizobia seed treatment solutions (inoculants), and other biological seed and soil treatment solutions currently in Rizobacter’s portfolio or pipeline. The products in the agreement will be sold under the trademarks owned by us or our affiliates, or any other trademark approved by us.
Pro Farm’s biological solutions are not included within the scope of the current agreement. We have also retained global rights for use of products included in the agreement on HB4® crops and, in the United States, Syngenta rights are non-exclusive for upstream applications.
The exclusive commercial collaboration is global, except for Argentina where both parties will continue to work under the existing framework. Implementation was staggered, commencing in January 2023 for territories in the first phase, and in January 2024 for territories in the second phase, and subject to regulatory clearances.
The agreement establishes a global joint R&D program to accelerate the development and registration of our pipeline products and new solutions for seed treatment. Funding for the R&D platform will be shared, with Syngenta contributing 70% of the investment.
In consideration for the rights granted to Syngenta under the distribution agreement and the R&D collaboration, Syngenta made an upfront payment of US$50 million to us, on October 6th, 2022. Additionally, for the duration of the agreement, we will receive between 50% to 30% of the profits generated by sales conducted by Syngenta, depending on the geography and the year. The agreement sets global minimum targets for profits to be received by us, that amount to a total of US$230 million for the life of the agreement. If we fail to receive the minimum profit targets set for any rolling two calendar year period, we will have the option to terminate Syngenta’s exclusivity. Syngenta may opt to retain exclusivity by compensating for the shortfall in cash or other economic consideration. Syngenta will cover all operating expenses incurred in connection with the marketing and sale in the exclusive territory. Our subsidiary Rizobacter will act as the exclusive supplier to Syngenta for products under the agreement.
For further information on Syngenta Exclusive Global Distribution Agreement, please see Note 6 to our audited consolidated financial statements included elsewhere in this report.
Note Purchase Agreement and HB4 Soy Supply Agreement with Moolec Science SA
In September 2024, we entered into a note purchase agreement (the “Note Purchase Agreement”) and a HB4 soy supply agreement (the “HB4 Soy Supply Agreement”) with one of our affiliates, Moolec Science SA (“Moolec”). In June 2024, under the terms of the HB4 Soy Supply Agreement, we supplied to Moolec an amount of HB4 soy equivalent to US$6.6 million. In exchange, Moolec Science issued convertible notes to us in an aggregate principal amount of US$6.6 million (the “Moolec Convertible Notes”). Further, Moolec has the option to request additional deliveries of an amount of HB4 soy equivalent to US$9 million and Moolec will issue additional notes in connection with this option. HB4 soy delivered pursuant to the HB4 Soy Supply Agreement is priced at the VWAP of the Chicago Board of Trade price for soybeans on the date that delivery is made to Moolec, plus a 20% premium.
The Moolec Convertible Notes will mature 36 months after and include a “payment-in-kind” feature. If the trading price of Moolec’s ordinary shares exceeds the strike price of US$6.00 per ordinary share for 10 trading days, we have the option to exercise the early conversion option pursuant to which the principal amount outstanding under the Moolec Convertible Notes may be converted into ordinary shares of Moolec at the strike price. At maturity, Moolec has the option to convert the principal amount outstanding under the Moolec Convertible Notes into ordinary shares. In connection with our early conversion option and Moolec’s optional conversion at maturity, Moolec may deliver ordinary shares, cash, or a combination of cash and ordinary shares.
Significant Acquisitions
Pro Farm Merger
On July 12, 2022, we announced the closing of the Pro Farm Merger pursuant to which Pro Farm merged into us and became our wholly owned subsidiary. Each share of Pro Farm common stock was exchanged for our ordinary shares at a fixed exchange ratio of 0.088.
In 2019, Marrone Bio Innovations (the predecessor of Pro Farm) completed two strategic acquisitions: (i) the acquisition of Pro Farm Technologies OÜ, a Finnish entity with subsidiaries in Delaware, Brazil, Uruguay, Finland, Estonia and Russia, and (ii) the Jet-Ag and Jet-Oxide product families. Pro Farm’s business and Jet-Ag and Jet-Oxide products were integrated into Pro Farm’s operations and contributed to revenue growth and margin expansion.
As a result of the Pro Farm Merger, Pro Farm gained access to the key row crop markets of Europe and the Commonwealth of Independent States and the merger facilitated its expansion in South America, including Brazil, Uruguay and Argentina.
Rizobacter Acquisition
On October 19, 2016, RASA Holding, our wholly owned subsidiary incorporated in Delaware, acquired 20,004,000 shares of Rizobacter, an Argentine company located in Pergamino, Province of Buenos Aires, representing 50.01% of the outstanding capital stock (the “Rizobacter Acquisition”). The total purchase price was US$57.3 million. In addition, a contingent payment of US$17.3 million may be payable by Bioceres Group PLC, through Bioceres S.A., to certain of the selling shareholders of Rizobacter subject to an injunction and related ongoing litigation. The Rizobacter Acquisition was approved by the Argentine Antitrust Commission (Comisión Nacional de Defensa de la Competencia or CNDC) on August 25, 2017. See “Item 3. Key Information —D. Risk Factors—Risks Related to our Business and Strategy—Certain of the Rizobacter shares we own are subject to a judicial injunction that, if decided unfavorably to us, would require us to surrender part of our interest in Rizobacter thereby reducing our equity interest in Rizobacter” and “Item 8. Financial Information—A. Consolidated Statements and other Financial Information—Legal Proceedings—An injunction in connection with the Rizobacter Acquisition may require us to surrender part of our interest in Rizobacter.”
On October 22, 2018, RASA Holding, entered into the Rizobacter Call Option Agreement. On March 14, 2019, we exercised the Rizobacter Call Option to acquire an additional 29.99% of the capital stock of Rizobacter, thereby becoming owners of 80% of the capital stock of Rizobacter.
With a 47-year history, Rizobacter has developed a leading global position in biological products and a leading ag-input channel for high-value products. Prior to the Rizobacter Acquisition, we developed a partnership relationship with Rizobacter through a jointly owned company, Bioceres Crops S.A. (formerly Semya), a product development initiative focused on identifying customized seed treatments for our Integrated Seed products. The Rizobacter Acquisition combined Rizobacter’s experience in microbials with our pre-existing pipeline of germplasm and trait assets. This combination has provided us with a unique position with respect to biological assets for key row crops. Rizobacter also provided a unique platform that facilitates the commercial launch of new products and the continued development of our pipeline of innovations.
Verdeca Acquisition
In February 2012, we signed a joint venture agreement with Arcadia Biosciences. The resulting joint venture, Verdeca, in which we held a 50% equity interest, is engaged in the development and deregulation of soybean traits.
Our joint venture agreement provided for each of the partners the right to license or sublicense their trait technologies to Verdeca for use in soybeans. Accordingly, Bioceres Group PLC has agreed to grant us an exclusive, worldwide, sublicensable license for HB4 technologies for use in soybeans. The main product in the Verdeca pipeline is HB4 trait for soybeans.
On November 12, 2020, we acquired from Arcadia Biosciences the remaining ownership interest in Verdeca. Please see “Item 5 Operating and Financial Review and Prospects—B. Liquidity and Capital Resources—Consideration of payment of acquisitions,” for more details.
| B. | Business Overview |
Our Operational and Organizational Structure
Our principal executive offices are located in Rosario, Argentina. We own and operate manufacturing and distribution facilities in Pergamino, Argentina; Bangor, Michigan; and Londrina, Brazil. We also have a minority ownership in a third-party manufacturing facility in Vyborg, Russia. We are a light fixed asset company, well invested and with spare capacity to continue to expand internationally. See “Item 4. Information on the Company—D. Property, Plant and Equipment” for more details on our manufacturing assets and capabilities.
Our research and development facilities are in Pergamino, Argentina; Davis, California; and Helsinki, Finland. Additionally, we have sales offices or subsidiaries in 11 countries including: Argentina, Brazil, Bolivia, Colombia, Estonia, France, Paraguay, Russia, South Africa, United States and Uruguay. See “Item 4. Information on the Company—C. Organizational Structure” for our organizational chart and list of subsidiaries, affiliates and joint ventures as of June 30, 2024.
As of June 30, 2024, we had 983 full-time employees globally. See “Item 6 Directors, Senior Management and Employees—D. Employees” for more information on number of employees by role and location.
Our Segments and Key Products
We divide our business into the following three segments: crop protection, seed and integrated products, and crop nutrition.
The following table sets forth the key products, growth drivers, revenue and gross profit, and selected commercial partners for each of our segments. The segments are described in further detail below.
| Total Revenue and | ||||||||
| Gross Margin | Selected | |||||||
| (Year Ended | Commercial | |||||||
| Business Segment | Key Products | Growth Drivers | June 30, 2024) | Partners | ||||
| Crop Protection | Adjuvants Pest control molecules |
Penetration of bioprotection portfolio into mainstream row crop agriculture | US$223.5 million 35.7% Gross Margin |
Corteva Syngenta |
||||
| Adjuvant expansion in Brazil and Paraguay | DOW Nufarm |
|||||||
| Expand installed capacity utilization, particularly in Brazil | Yara Croda |
|||||||
| New registration approvals | Zschimmer & Schwarz Momentive |
|||||||
| Seed & Integrated Products | Seed treatment packs | Commercialization of HB4 technology | US$96.4 million 31.2% Gross Margin |
Florimond Desprez | ||||
| Seed traits | Corteva GDM Seeds |
|||||||
| Seed germoplasm | Syngenta TMG |
|||||||
| Crop Nutrition | Micro-bead fertilizers | International expansion of bionutrition sales | US$144.8 million 53.0% Gross Margin |
De Sangosse Syngenta |
||||
| Inoculants | Valent BioSciences | |||||||
| Biofertilizers | Corteva Biowish |
|||||||
| Crop health products and biostimulants | Spraytec Stoller |
Crop Protection
Our key crop protection products include high-tech adjuvants and a full range of pest control molecules.
Adjuvants
Adjuvants are high-tech molecules used in tank mixes to facilitate the application and effectiveness of active ingredients, such as herbicides, insecticides and fungicides, leading to a better spaying performance, reduced usage rates and lower residue levels. We distribute Silwet, a well-known high-end silicone-based adjuvant, and we are currently developing biological-based adjuvants in partnership with other companies.
Pest Control Molecules
Biopesticides are pesticides derived from natural materials such as plants, minerals, fungi or bacteria. We develop and market a portfolio of biopesticides capable of reducing the harm of insect pests and plant diseases during the lifecycle of crops, including biological fungicides, insecticides, nematicides and soil fumigants. These microbial pesticides are high-performance tools for growers which have the added benefit of being nontoxic to workers, end consumers and the environment, including pollinators and other beneficial organisms.
Seed and Integrated Products
The key products of this segment include seed traits, germplasm and seed treatment packs for healthier and higher yielding crops.
Seed Traits
Our seed trait effort is primarily focused on improving plant yields by increasing plant tolerance to abiotic stress, such as drought or soil salinity. This effort is also enhanced by a secondary focus on crop protection and quality traits. We gain access to these technologies through Bioceres Group PLC’s collaboration with the original developers of the technologies or by co-developing new events with our partners. Our HB4 technology helps increase yields by an average of 10% to 20% for soybean and wheat crops under various growing seasons and conditions, including sporadic drought episodes. HB4 does not adversely impact yields in optimal growing conditions, which is a distinct and important factor compared to other stress tolerance technologies. Additionally, through collaborations, we are expanding the use of the HB4 traits into crops that are not part of our core business but will benefit from the technology.
Other Traits
Biotech traits are positioned as core assets in our product development efforts. Our soybean trait portfolio includes new crop protection platforms for weeds that address basic farmers’ needs. However, our main focus is traits related to abiotic stress tolerance and nutrient use efficiency, that will help achieve our goal of an agriculture with lower environmental impact. For wheat, in addition to the HB4 technology, we have developed several traits oriented to consumers’ demand, such as reduced gluten content, resistant starch varieties with lower glycemic indexes and flour with increased shelf-life. We have also started R&D projects to develop genetically modified/genome edited traits to confer resistance to the main diseases that affect wheat production and limit yield potential.
Germplasms
We currently have our own breeding programs for soybean and wheat and have a pipeline to create elite germplasm and use them as a channel for our own technologies as well as meet demand for non-GMO crops and other technologies from third parties that complement our portfolio. Our soybean breeding program, operated through Verdeca, delivers varieties that are registered or are in the process of being registered in Argentina, Uruguay, Paraguay and South Africa. Our wheat breeding program is operated through our joint venture, Trigall Genetics, through which we co-develop conventional and HB4 varieties with Florimond Desprez, a global leader in wheat genetics. For both crops we are now expanding the target markets, starting to develop germplasm, or working with partners to develop germplasm, that is adapted to important regions, like the United States, Australia, and Brazil.
Seed Treatment Packs
Seed treatment packs comprise high value-added products, produced and commercialized by our subsidiary Rizobacter in partnership with Syngenta Seedcare, including our flagship soybean proprietary inoculants and biofungicides. We also offer certain customized variations for peanuts, beans and chickpeas. In addition, we are pursuing the development of next-generation biologicals, particularly for seed treatments tailored for specific germplasms, seed traits and environment combinations.
Crop Nutrition
Our main crop nutrition products include inoculants, biofertilizers, micro-beaded fertilizers and crop health products.
Inoculants
Inoculants are biological fertilizers, broadly using nitrogen-fixing bacteria, which promote growth of leguminous crops such as soybeans and alfalfa. We hold a leadership position in sales of soybean inoculants, with approximately 23% global market share as of June 30, 2024. We developed the next generation of inoculants, “Ultra High Concentrate” (“UHC”) and Extended Shelf-Life products, for professional seed treatment.
Biofertilizers
We develop and commercialize biofertilizers for foliar or seed application based on organic acids and biopolymers that are combined with nutrients in a unique organic molecular complex that allows plants to absorb various beneficial elements in a novel and effective way. Additionally, we are developing new biofertilizers, such as plant-growth promoting rhizobia bacteria, for wheat, corn, chickpeas and peas.
Micro-beaded Fertilizers
We produce and commercialize fertilizers based on formulated micro-beads. As these fertilizers can be applied next to the seed at planting, they require a lower application dose than conventional fertilizers, resulting in logistical efficiencies and environmental benefits, minimizing contamination through water runoff into lakes and streams. Approximately 20 to 30 kilograms of our microgranular fertilizers can replace 80 kilograms of a basic fertilizer, achieving similar crop productivity and quality. Currently, our production is focused on Microstar PZ, CMB, PZ Bio and CMB Bio providing nitrogen, phosphorus, sulfur and zinc to different crops by allowing immediate nutrient availability and uptake by plant seedlings. CMB Bio is the first micro-beaded fertilizer formulated with four different bacteria.
Crop Health Products and Biostimulants
These products are derived from plant extracts or microorganisms with the aim to enhance nutrition efficiency, abiotic stress tolerance and/or crop quality traits for crops. Biostimulants are substances, microorganisms, or mixtures thereof, that, when applied to seeds, plants, the rizosphere, soil or other growth media, act to support a plant’s natural processes independently of the products nutrient content, including improving nutrient availability, uptake or use efficiency, tolerance to abiotic stress and consequent growth development, quality, or yield. Our current portfolio is mainly focused on three insignia products in this space: Emergen, which optimizes conditions for plant nutrition and resistance to abiotic stress by providing additional nutrients to the plant; Pacesetter, which is a bio-based plant health product that improves chlorophyll production and increases yield; and UBP 110, a complex micronutrient fertilizer that enhances conditions which lead to increased yield and improved crop quality.
Our Business Model
Our business model covers the entire product life cycle: technology sourcing, product development, production, and market access.
In-House R&D and Technology Sourcing
The integration of Pro Farm has led to a significant transformation in our approach to innovation. Previously, our primary focus was on sourcing technology externally. However, with the integration of Pro Farm, our emphasis has shifted towards strengthening our internal R&D capabilities. Internally, we have developed a dynamic R&D team equipped with state-of-the-art laboratories and pilot-scale facilities. We now have specialized teams in entomology and nematology for the study and development of products. Our bioprocess department has been strengthened with the capability to establish optimal parameters for the production of active metabolites and conduct larger-scale fermentation processes. The chemistry department is focused on identifying active ingredients and understanding their behavior. Our formulation team explores innovative technologies to develop effective and stable formulations. Additionally, our plant science department contributes expertise in various agriculture-related areas. This team utilizes proprietary technologies to isolate and assess naturally occurring microorganisms and plant extracts, driving the development of innovative biological-based products.
Simultaneously, we engage in collaborations with leading academic and independent research institutions, startups, and third-party companies during the initial stages of technology development. This open-architecture approach enables us to identify promising technologies and establish strategic partnerships, expediting the development of market-ready innovations.
Our current strategy strikes a balance between internal innovation and external collaboration. The Pro Farm integration has significantly elevated the importance of R&D within our innovation framework. We believe that this strategic shift positions us as a leader in biotechnology, enabling us to offer a diverse portfolio of high-quality products that cater to the evolving demands of our customers and the market.
Product Development
We are continually working on product development, both internally and in collaboration with other companies. In selecting partners, we look for internationally recognized entities that can provide complementary funding, technology, sourcing, product development capabilities, intellectual property and market access.
Production and Market Access
The production and market access stage of our business model focuses on leveraging our proprietary sales channels and partnering with third parties to access and establish multiple pathways to markets and maximize market reach. Once a technology obtains the required regulatory approvals, we, our joint ventures, or our strategic partners commercialize products that employ such technology and sell them to global end-users. We also complement our direct sales efforts by licensing our technologies to other companies for inclusion in their products or production systems. This complementary approach seeks to widen the presence of our technologies in the global agriculture market and increase our revenues.
In-House R&D, Technology Sourcing and Product Development Timeline and Process
Our process for creating innovative technologies and product development encompasses various phases: discovery, proof of concept, early development, advanced development, pre-launch, and product launch. This process involves the development and integration of technologies into commercially viable products. The duration of this process varies based on the complexity of the technology and the crop type. Additionally, the timeline can influence the uncertainty of successful product development outcomes. For instance, during technology sourcing and product development, a technology may not meet the required performance criteria to advance to later stages. Competitive landscape changes can also impact the development of certain technologies.
We have strategically integrated our in-house R&D capabilities into this process, improving our ability to innovate. This incorporation of in-house R&D, significantly bolstered through our merger with Pro Farm, strengthens our capacity to navigate each phase effectively, ensuring the delivery of high-quality biological products that meet market demands.
The chart below illustrates an estimated timeline for the development of biotechnology traits (GM and Non-GM) and biological-based products, based on the phases described above:
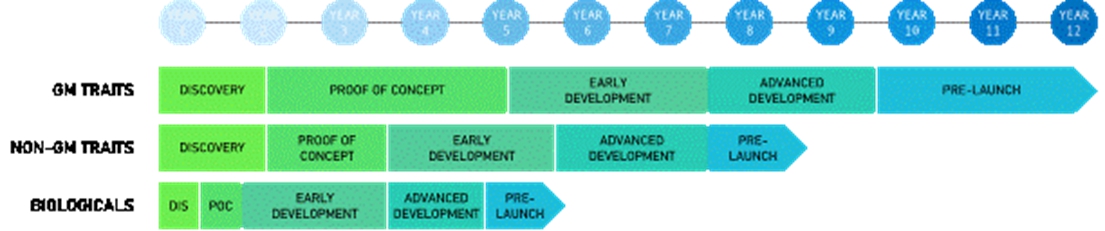
The depicted durations of each phase are based on our estimates and experience. The phases may overlap during the product development cycle and the total development time for a particular product may be longer or shorter than the duration presented above, depending on a range of factors including the type of crop and trait involved and the resources available or devoted to the development of the product. For example, although the process for developing seed traits or biological seed treatments is relatively similar, the two differ significantly in terms of development timelines. Obtaining regulatory approval for GM seeds is a far more comprehensive and lengthy process than for biological seed treatments.
Discovery: This initial project phase typically involves the identification and characterization of potential variants (genes or microorganisms) with product potential. Key activities encompass (i) project planning, (ii) screenings, and (3) isolation of potential candidates. In our experience, the discovery phase typically lasts 18 months, although it may range from as little as six months for microbial solutions to as many as 36 months for plant GM traits.
Proof of Concept: The proof-of-concept phase is aimed at validating the data gathered during the discovery stage and initiating the development of a product from selected variants. Key activities include (i) efficacy validation under controlled conditions (in-vitro and in-vivo), (ii) identification and characterization of selected variants, (iii) selection of candidate variants based on efficacy and characterization, and (iv) candidate improvement (mutagenesis or transgenesis methods). In our experience, the proof-of-concept phase typically lasts 36 months, although it may range from as little as six months for a microbial solution to as many as five years for plant GM traits.
Early Development: In this phase, project objectives become more defined, pinpointing the specific conditions a final product must meet, such as application rates and pre-inoculation days. Primary activities encompass (i) bioprocess development for variant production, (ii) formulation prototype development, and (iii) initial efficacy testing under field conditions.
At the end of the early development phase and before initiating the most financially demanding stages of product development, we tend to identify strategic partners for our technologies. For collaborations involving multiple technologies within a pipeline, we often create new entities or joint ventures with our strategic partners. Examples of such collaborations are Trigall Genetics and Synertech, dedicated to wheat technologies and micro beaded fertilizers, respectively.
Advanced Development: The advanced development phase signifies that there is substantial evidence of efficacy for the selected variant, allowing for a more precise estimation of the project’s completion date. Key activities include (i) optimization of bioprocesses for variant production, (ii) final formulation, and (iii) extensive field testing to determine the mode of use. The advanced development phase typically lasts about 24 months, with some projects requiring substantial regulatory data taking from three to five years.
Pre-Launch: Activities in this phase primarily focus on finalizing the necessary details for product launch, such as data for biological production, securing registrations and regulatory approvals, and seed increases. Key activities comprise (i) transferring bioprocesses and formulations to production and (ii) managing registries and label extensions. The pre-launch phase may last up to 24 months.
Product Launch: In general, we, our joint ventures and/or our technology licensees carry out the launch and commercialization of the technology, which is the last phase of the technology sourcing and product development process. When we commercialize technology through collaboration partners or licensees, pursuant to the respective agreements, a successful product launch triggers royalty payments, which are generally calculated as a percentage of the net sales generated by the technology and captured upon commercialization. Typically, in this phase, revenues at launch are limited by our ability to make products available, especially when dealing with seed products that need multiple seasons of multiplication before they can satisfy demand.
Sales and Marketing
Our business model is based on a multi-channel sales structure of (i) direct sales to distributors and end-users via our proprietary sales channels, (ii) B2B commercial agreements, and (iii) licensing of commercial technology to third parties.
Proprietary Channels
Rizobacter
Rizobacter commercializes its products through more than 700 distributors and retailers around the world, including Argentina, Brazil, Paraguay, Uruguay, Bolivia, Colombia, USA, Canada, Mexico, Europe (Austria, France, Germany, Italy, Russia, Ukraine, among others) and Sub-Saharan Africa (South Africa, Kenya, Zambia, Ghana, among others).
In addition to distribution network sales, Rizobacter directly caters to other businesses, particularly large end-users, which include growers or seed companies that use Rizobacter products in professional seed treatment products or for other needs.
Bioceres Semillas
Bioceres Semillas is our proprietary commercial channel for seeds, including leading wheat and soybean varieties, selling to a number of distributors and end-users under the Bioceres Semillas brand. This proprietary channel also serves as a competitive driver for third-party non-exclusive licensees of our technology seeking a rapid path to market.
HB4 Program
One of the channels through which we sell our HB4 soy and wheat seeds is through our identity preserved HB4 Program. The system requires having contracts with growers committed to maintaining the identity of the crop under a full delivery of harvested product for seed production offtake agreement or delivery of grain only at approved destinations. Under these agreements, we contribute HB4 integrated seeds and other goods to growers for a pre-agreed price (based on prevailing market prices), which are later deducted from the service fees paid to growers at the time of harvest.
Pro Farm
Pro Farm products are commercialized in the United States, primarily through its internal sales force, focused on managing distributor relationships and creating grower demand for its products. Pro Farm has a dedicated team of employees who provide technical service support to both customers and sales representatives on the use of their products in integrated pest management (“IPM”) and crop production programs, both for conventional and organic growers. Pro Farm’s sales force covers all major regions in the United States, with an emphasis on high-value specialty crops (fruits, nuts and vegetables). Crop protection product lines are sold through leading agricultural distributors, such as Albaugh, Aligned Ag, Helena Chemical, Nutrien Ag, Simplot and Wilbur Ellis. These are the same distribution partners that most major agrichemical companies use for delivering solutions to growers across the country.
B2B Commercial Agreements
We have commercial agreements with leading industry players with a market presence outside of our core geographic areas, or core crop expertise, for the exclusive or non-exclusive distribution of some of our products. See “Item 4. Information on the Company — B. Business Overview — Joint Ventures and Key Collaborations” for more details on these agreements.
Licensing to Third Parties
We also rely on third-party channels for the commercialization of our proprietary technologies and licenses, either directly or through our joint venture companies, among participants in the biotech seed and agro-industrial market. We license such technologies in each case for incorporation into non-proprietary products and subsequent sale to end-customers. Subsequent sales of products incorporating our technologies generate royalty income. See “Item 4. Information on the Company — B. Business Overview — Joint Ventures and Key Collaborations” for more details on licensing agreements.
Joint Ventures and Key Collaborations
We conduct some of our business through joint ventures and key collaborations. We participate in joint ventures to develop certain technologies and to maintain a diversified product pipeline. When a joint venture successfully develops a product, we integrate such product into our commercial offering and/or license the technology to third-party channels. We engage in non-joint venture collaborations to develop a single or otherwise limited product opportunity. We generate revenue from our non-joint venture collaborations primarily by licensing our technology for inclusion in end-products, or for the use of our technologies in industrial processes. Finally, we have relationships with third parties who have product development capabilities and/or market presence outside of our core geographies or crops, to whom we license our technologies. For our corporate chart, see “Item 4. Information on the Company—C. Organizational Structure.”
Joint Ventures and Unconsolidated Entities
Trigall Genetics S.A.
In December 2013, we formed a joint venture with the French company Florimond Desprez. The resulting joint venture, Trigall Genetics, in which we have a 50% equity interest, is engaged in the development of conventional wheat varieties and the development and deregulation of GM wheat varieties in Latin America. The first biotech trait is our HB4 technology.
Trigall genetics markets conventional wheat varieties through licenses with Bioceres Semillas, Grupo Don Mario (“GDM Seeds”), Asociación de Cooperativas Argentinas (“ACA”), among others.
Trigall Genetics had made prior investments in joint ventures that acquired Australian wheat germplasm and breeding assets from S&W Seed Company (“S&W”). In January 2023, Trigall Genetics entered into a joint venture with S&W to advance wheat breeding activities in Australia. Initially, Trigall Genetics owned 80% of the newly created joint venture company. In April 2024, Trigall acquired the remaining 20% from S&W. The program encompasses both conventional and genetically modified varieties, including our drought-tolerant HB4 technology, which aims to improve yields in a region increasingly affected by drought and soil salinization.
Synertech Industrias S.A.
Synertech, acquired as part of the Rizobacter Acquisition in 2016, was formed by Rizobacter in partnership with De Sangosse for the production and commercialization of micro-beaded fertilizers. Rizobacter, together with De Sangosse, operates the production plant for Synertech in Pergamino with an annual production capacity of 50,000 tons of microbeaded fertilizers.
Alfalfa Technologies S.R.L.
In December 2020, Bioceres Semillas and Produsem SA acquired a local start-up focused on developing biotech traits for alfalfa and other pastures. The joint venture is engaged in the development and deregulation of conventional and GM alfalfa varieties initially for Latin America market. The joint venture pipeline includes several technologies, of which HB4 and herbicides tolerance are the most advanced ones.
Moolec Science SA
On March 16, 2021, we acquired a 6% ownership interest in Moolec Science Ltd., a molecular farming company pursuing a hybrid concept between plant and cell-based technologies for the production of animal-free food solutions. In consideration for the acquisition, the license to use and commercialize GLA/ARA safflower patents was transferred to Moolec.
On June 14, 2022, Moolec entered into a business combination agreement by and among LightJump Acquisition Corporation, Moolec, and Moolec Acquisition, Inc., a Delaware corporation, providing for, among other things, LightJump and Moolec to become subsidiaries of Moolec Holdco and all stockholders of LightJump and Moolec to become shareholders of Moolec Holdco (the “Moolec Business Combination”). On December 28, 2022, we contributed all of our ownership in Moolec Science Limited to Moolec in exchange of 1,560,000 ordinary shares of Moolec. The Moolec Business Combination closed on December 30, 2022, and, as a result, Moolec’s ordinary shares began to be traded on Nasdaq. As of June 30, 2024, our ownership in Moolec was 1,391,250 ordinary shares, representing less than 4% of their issued capital stock.
In September 2024, we entered into note purchase agreement with Moolec Science. See “—Key Agreements— Note Purchase Agreement and HB4 Soy Supply Agreement with Moolec Science SA.”
Non-Joint Venture Collaborations
We engage in strategic non-joint venture collaborations for product development and commercialization with leading industry players, and with academic entities and internationally recognized research institutions with whom we collaborate in pre-competitive technology sourcing and early-stage research.
Rizobacter Non-Joint Venture Collaborations
Rizobacter has a longstanding strategic alliance with Syngenta, one of the leading global companies in the research, development, marketing and sales of seed treatment products and solutions. Syngenta placed their Seed Care Institute in Rizobacter’s principal facility located in Pergamino for the research, development and marketing of Syngenta’s seed treatment products and solutions in Argentina, including Maxim Integral, Maxim Evolution, Suren Plus, Rizopack® 420 Hc, Ekey Top, Funcion Pack and Cruiser Pack. We also purchase from Syngenta seed treatment products including Maxim XL, Maxim Integral, Maxim Evolution, Suren Plus, Compinche, Compinche SX, Tenacius, Tenacius SX, among others. The synergy of the product portfolio produced by both companies allows us to combine the most advanced technologies with a highly efficient service for agriculture producers around the world. On September 16, 2022, we announced an expansion of the collaboration through which Syngenta becomes the exclusive distributor of our biological seed treatment solutions globally, except in Argentina, see “Item 4. Information on the Company—A. History and Development of the Company—Significant Transactions—Syngenta Exclusive Global Distribution Agreement.”
Rizobacter also engages in a strategic partnership with Momentive for the exclusive distribution and commercialization of Momentive’s well-known silicone spray adjuvant, Silwet, in Argentina, Brazil, Bolivia, Uruguay, Paraguay, and non-exclusively, in the United States. Our strategic relationship with Momentive has allowed us to jointly develop the latest generation of agricultural adjuvants and to learn about technologies that add efficiency to agricultural applications.
Additionally, Rizobacter has a strategic alliance with De Sangosse Group for the exclusive distribution in Argentina of their molluscicide line.
Rizobacter also has distribution agreements with Microbial Biological Fertilizer International PYD LTD for the distribution of several products within Rizobacter’s portfolio in South Africa, with Brett Young for distribution in the U.S., and with BIOWISH for the provision of bascillus for the formulation of the biological support added to the chemical fertilizer “Microstar.”
Rizobacter also executed significant agreements for the provision of formulation services and production with several companies, among which are Syngenta, Corteva, UPL, FMC, and Summit Agro.
Pro Farm Non-Joint Venture Collaborations
Pro Farm has exclusive legacy international agreements with two major business partners: Syngenta for the distribution of biofungicides for specialty crop markets in Europe, the Middle East and Africa, and Corteva for distribution of UBP family of bionutrient products for the European market (foliar and seed treatments for row crops) and in Brazil (seed treatments for row crops). As of July 2023, we also entered into an exclusive distribution agreement with Corteva to advance the availability of a bioinsecticide developed by Pro Farm in Europe. See “Item 4. Information on the Company—A. History and Development of the Company—Significant Transactions” for more details on the agreement with Corteva.
Pro Farm also has a distribution agreement with PGG Wrightson Seed in Uruguay related to Pro Farm foliar and seed treatment product sales in the region, and has a number of distribution agreements with Agristar, Nufarm, UPL Limited, Jocanima/Great Havest, Elephant Vert, Kenya Biologics, Hoptri, Lidorr, AMC/Agrimatco, Disagro, Kyung Nong Corporation and Vive Crop Protection.
HB4 Non-Joint Venture Collaborations
We license our HB4 technology to third parties that have breeding and product development capabilities or a market presence outside of our core geographic areas and with whom we have developed and maintain strong relationships.
Through Verdeca, we entered into a series of agreements with GDM Seeds and TMG for the licensing of our biotechnology related to soy for breeding and/or sales in Argentina, Brazil, Paraguay, Uruguay and the United States.
We also have HB4 soy R&D technology license agreements with Criadero Santa Rosa and INTA in Argentina, FT Sementes, Latitude Genética and Integrado Sementes in Brazil, BAUP and INBIO in Paraguay, Prograin and Sollio in Canada, Southern Hemisphere Seeds in South Africa and Nebraska University in the United States.
Trigall licenses wheat varieties to a number of companies including ADP Uruguay, GDM, Biosemenis, ACA and Bioceres Semillas. These are “transactional” relationships, where there are no preferred partners and licenses are re-evaluated every year.
Further under Trigall, HB4 wheat has R&D agreements with EMBRAPA and OR Sementes in Brazil, and GDM in Argentina and in Brazil. We have a material transfer agreement for HB4 trait introgression with BUCK in Argentina, Stellenbosch in South Africa and ANAPO and SEMEXA in Bolivia and Colorado State University in the United States.
In addition to the licensing agreements listed above, we have two main breeding collaborations — with GDM to develop HB4 soy varieties for specific regions in the United States, for maturity groups II and below, and with TMG for the development of HB4 and non-HB4 varieties for any geographic territory.
Customers and Contracts
Below is a description of our principal customers and contracts across our main segments.
Seed and Integrated Products
In the year ended June 30, 2024, we sold our seed and integrated products to customers in Argentina, Switzerland, Uruguay, South Africa, Colombia, Paraguay, among other countries. Our top five customers in our seed and integrated products segment represented approximately 31.1% of our total revenue in this segment for the twelve-month period ended June 30, 2024.
Crop Protection
In the year ended June 30, 2024, sales from our crop protection segment were made to customers in Argentina, the United States, Brazil, Paraguay, Uruguay, among others. Our top five customers in our crop protection segment represented approximately 36.2% of our total revenue in this segment for the year ended June 30, 2024.
Crop Nutrition
In the year ended June 30, 2024, sales from our crop nutrition segment were made in Argentina, France, Switzerland, Brazil, Uruguay, Paraguay, Bolivia, South Africa, as well as other international markets. Our top five customers in our crop nutrition segment represented approximately 36.2% of our total revenue in this segment for the year ended June 30, 2024.
Industry Overview
The Market Opportunity
Agriculture and the way in which we produce food are at the center of a major global challenge —increasing food production in an affordable way, while simultaneously not only reducing but reversing its impact on climate change and biodiversity loss.
There is a pressing need for the “sustainable intensification” of global agriculture in which yields can be increased without any adverse environmental impact and without the cultivation of more land. This challenge presents a massive opportunity to be addressed through additional technological innovation — sustainable approaches that integrate climate-adaptive biotechnology, the expanded use of biological products and the integration of new data, monitoring and precision agriculture tools.
Climate smart food production
Climate change is disrupting weather patterns and leading to more frequent and extreme events such as droughts, floods, and unseasonal temperatures, all of which have negative effects on food production. The latest Intergovernmental Panel on Climate Change Report indicates with high confidence that “Climate change, including increases in frequency and intensity of extremes, has adversely impacted food security and terrestrial ecosystems, as well as contributed to the desertification and land degradation in many regions”. As global food demand continues to increase, climate change will have a negative impact on crop yields and nutritional value of the food produced, decreasing agricultural outputs. Most studies agree that the impact of climate change on crop yields will be negative from the 2030s onwards, and nearly half of those predict yield reductions greater than 10% beyond 2050. There is an opportunity, and a need, to climate proof food production by improving crop resiliency to climate change, developing crops that can tolerate abiotic stress such as drought.
Reversing climate change and biodiversity loss
Agriculture is a significant contributor to climate change, with total agri-food system emissions in 2020 corresponding to 31% of total anthropogenic emissions, according to the latest estimates of the Food and Agriculture Organization. However, agriculture is also the main industry that utilizes and relies upon valuable soil microorganisms, often referred to as the soil microbiome, that are instrumental to capture atmospheric carbon in significant amounts. Therefore agriculture, particularly those agricultural practices that are biologically based, can play a key role in mitigating climate change.
Soil conservation practices such as conservation tillage, organic production, cover cropping and crop rotations — practices that are central to the creation of Rizobacter over 40 years ago and to the now-growing regenerative agriculture movement — can drastically increase the amount of carbon stored in soils. Using higher-yielding crops or varieties, or more climate resilient crops, and maximizing the yield potential of crops can also increase soil carbon.
Addressing consumer demand for sustainable and affordable foods
Consumer attitudes and behaviors are increasingly shifting towards more sustainable lifestyles, with the expectation that brands also “do good”. These preferences are redefining the entire food system all the way through to raw material origination.
Multiple studies have shown that consumers are more likely to choose products with an environmental or environmental, social and governance (“ESG”) related claim. For example, according to McKinsey and NielsenIQ’s reports, products making ESG claims outperformed those without such claims in 68% of surveyed product categories, based on an analysis of five years of U.S. sales data from 2017 to June 2022. A 2024 public study by PwC Spain, which surveyed over 20,000 consumers from 31 countries and territories, found that despite cost-of-living and inflation concerns, consumers are willing to spend an average of 9.7% more for sustainably produced or sourced goods, as nearly nine out of ten (85%) participants reported experiencing first-hand the disruptive effects of climate change in their daily lives.
Traceability of products from “farm to fork” is becoming an increasingly important factor for consumers. Whole chain traceability can reduce information asymmetry, rebuilding public confidence in the entire food chain while delivering quality, safe, and nutritious foods. A US Food and Drug Administration (the “FDA”) regulation requires participants in the food value chain to maintain end-to-end traceability records to be made available upon request during a food-borne outbreak or food recall investigation. The regulation applies categories that are estimated to account for approximately 20% to 30% of food consumed in the United States.
Increased Regulation
Globally, the international regulatory landscape continues to place greater restrictions on the use of synthetic pesticides and other chemical crop inputs. For example, a new Sustainable Use of Pesticides Regulation was presented to the European Commission, which mandated a 50% reduction in use of chemical pesticides by 2030 in all member states. As of June 30, 2024, the proposed Sustainable Use of Pesticides Regulation was withdrawn, primarily due to opposition against the 50% mandate. The European Union is now developing a new Sustainable Use Regulation which emphasizes streamlining the approval process for biological products and promoting the adoption of integrated pest management and biological products by growers, rather than focusing on specific chemical reduction targets. Although the European Union is not establishing particular reduction targets, it continues to phase out chemical products at a significant rate.
Similarly, following years of litigation and under a December 2022 court order, the United States Environmental Protection Agency has agreed to aggressive timelines to complete Endangered Species Act assessments for several, commonly used chemical insecticides, herbicides, fungicides and nematicides. Under these reviews, EPA has recently proposed restrictions, or is expected to propose restrictions, on many chemical pesticides that currently hold a significant presence in the US market. In conjunction with an increasingly restrictive landscape for chemical pesticides, and other chemical crop inputs, the global public policy landscape continues to move towards the expedited approval of reduced risk biological crop inputs and their increased adoption, with South American countries at the forefront.
Sustainability-Driven Solutions
A variety of promising technologies exist with the potential to substantially modify the way in which we produce food, manage scarce resources, mitigate climate change and ensure the safety of our food supply chains. These technologies include the advancement of biotech crops to improve resilience, the increased utilization of microorganisms in replacement of chemical inputs, adoption of soil preserving cropping techniques, and the use of technologies such as blockchain to provide traceability and enhance the safety of the entire food system, farm to fork. We are at the forefront of this transformation of how we produce food, feed and fiber.
Biotechnology
Biotech crops have been around for more than 25 years and are planted on approximately 190 million hectares annually, according to the International Service for the Acquisition of Agri-biotech Applications (the “ISAAA”). The commercial adoption by farmers of genetically modified crops has been one of the most rapid cases of technology diffusion in the history of agriculture. Historically, biotech traits have focused on herbicide tolerance and insect resistance. However, biotechnology can deliver much more substantial agronomic, environmental, health, economic and social benefits, including increased productivity, conservation of biodiversity, improved nutrition, and mitigation of negative impacts of climate change. Our HB4 technology, which has now been approved in multiple countries for food and feed uses and for cultivation, is the first in the world that confers tolerance to climate changes in soybeans and wheat by allowing these crops to tolerate drought and soil salinity conditions that are a significant threat to the world’s food supply.
According to ISAAA’s last report, corn and soybeans represented most of the seed biotechnology market in 2019, making up approximately 80% of the global biotech seed market. The United States, Brazil and Argentina were the top planters of biotech seeds, with approximately 150 million hectares under production of biotech crops. As of 2019, the adoption of GM varieties is over 74 % for soybean, over 31% for corn and over 79% for cotton.
Until the HB4 wheat approval in Argentina, wheat had historically been an orphan crop in the sphere of biotechnology, despite being planted in 200 million hectares globally, the largest of any crop. Argentina is Latin America’s largest wheat producer, accounting for approximately 70% of wheat produced in the region. Today, drought tolerant HB4 wheat is the only genetically modified wheat approved anywhere (currently approved for cultivation in four countries: Argentina, Brazil, Paraguay and the United States) and on a commercial path to market anywhere in the world, which represents a major milestone in wheat’s global value chain.
Biologicals
Biological agricultural products, or biologicals, include bioprotection products, biofertilizers (bionutrition) and biostimulants, and occupy a unique space in agriculture as technologies that offer proven economic and environmental benefits to the consumer, the grower and the distributor. For consumers, biologicals are part of the trend toward accessible, affordable, high-quality food produced in an environmentally sustainable manner. For growers and distributors, biologicals offer alternative solutions that not only enhance crop quality but also protect natural resources and reduce carbon footprint.
Once considered a niche market, biologicals are currently the fastest-growing segment in the agricultural input market with double-digit growth industrywide, as compared with low-single-digit growth for conventional products. The market for agricultural biologicals, estimated to be approximately US$14 billion for 2023, still only represents about 3%-5% of the total agricultural inputs market for the same year, according to data from Dunham Trimmer and Woodstone Research & Consulting.
The main drivers for the strong growth performance are: regulatory policies that either encourage the adoption of bio-based products or restrict the use of chemical products; the need for products that improve soil health and nutrient utilization, yield and crop quality; insects, plant disease and weed resistance towards chemical products; need for greater convenience and flexibility in growing practices; and a need for greater R&D and innovation to meet the growing food security demands and environmental regulations.
To meet these objectives, an increasing number of growers use IPM programs to produce crops by the most economical means, and with the lowest possible risk to people, property, and the environment. Biological agricultural products and crop cultivating techniques such as crop rotation and low-or-no tillage are among the most commonly used IPM practices. Adoption of biologically based crop inputs are increasingly becoming a central component of the IPM toolbox for farmers. There is growing recognition that IPM, particularly biologically-based IPM, is an important ecosystem service that contributes to climate mitigation and biodiversity—a critical ecosystem service provided by agriculture. Recent disruptions in supply chains that significantly impacted grower access to commonly used synthetic crop inputs have resulted in new interest in integrating biologicals into existing IPM strategies that often relied solely on chemical inputs.
Our Product Portfolio Promotes Climate-Smart Outcomes
Our vast range of products not only help farmers and food companies meet growing demand for more sustainable agricultural practices, but they also preserve, and oftentimes help restore or improve the natural environment for future generations by promoting soil and soil microbiome health, enhancing on-farm carbon sequestration, safeguarding biodiversity, ensuring farmworker safety and optimizing the use of increasingly distressed and diminishing natural resources.
We develop science-driven solutions that preserve biodiversity and promote climate-smart outcomes:
| ● | Soy and wheat crops tolerant to adverse weather conditions: we develop crops that are resilient to adverse weather conditions associated with climate change such as drought and heat via the adoption of our HB4-traited drought tolerant crops and biologically based seed treatment packages that help plants better weather yield and quality-robbing environmental stresses. |
| ● | Complete portfolio of biological solutions: we enhance sequestration of GHGs in agriculture by promoting crop health and yields with effective environmentally beneficial crop protection tools, such as Rizonema, Rizoderma and MBI-306, and with microbial seed inoculants that enhance plant sustaining atmospheric nitrogen fixation, while also reducing the use rates of synthetic fertilizers – all of which reduce the negative impacts associated with runoff or soil leaching of persistent chemical compounds. |
| ● | Next generation solutions that reduce input application rates: we promote efficient resource use with products such as adjuvants and Microstar PZ. Adjuvants are high-tech molecules used to increase the effectiveness of spray applications of crop inputs and, therefore, reduce the rate of application of both biological and chemical pesticides and other agricultural inputs. Microstar PZ is a low application rate micro-beaded starter fertilizer that provides newly planted seeds necessary nutrients, like nitrogen, phosphorus, sulfur and zinc, precisely at the time of planting. Microstar’s novel micro-beaded formulation enhances nutrient uptake efficiency at a critical point in a crops growth cycle that reduces the need for additional fertilizer applications later in the crop growth cycle — which also reduces negative air and water quality issues associated with traditional fertilizers. |
HB4 Technology
HB4 technology significantly increases yields under drought conditions and positively impacts the environment through more efficient use of resources.
Biotech traits like HB4 can only be launched after a time-consuming breeding process to develop varieties that combine the technology with locally adapted, elite germplasm. We have been developing varieties that specifically target areas identified for maximum trait performance.
Our key markets for HB4 wheat in the Southern Cone comprise approximately nine million hectares of wheat planted per year, including Argentina, Latin America’s largest wheat producer and the world’s first country to adopt HB4 drought-tolerant technology, and Brazil, the second largest producer in South America and the country with the greatest potential to increase the planting area by an additional two to three million hectares. Other relevant markets for HB4 wheat are Australia, with approximately twelve million hectares planted with the crop each year and high incidence of water stress events and soil salinity, and the United States, the fourth-largest wheat producer in the world and the largest in the Americas, with approximately 15 million hectares planted per year.
For HB4 soy, our key markets include Argentina, Brazil and the United States, which collectively plant 95 million hectares of soybeans per year, approximately 70% of the world’s total soybean acreage.
Given that the HB4 trait does not incur any yield penalty under standard growing conditions, all agricultural regions within our targeted countries represent a potential market for the HB4 technology. This allows us to address all production areas, particularly as each region is vulnerable to drought events at various points in the growing season or across different seasons. Nevertheless, it is expected that certain regions will experience more pronounced benefits from the HB4 trait than others.
At the time of filing, HB4 soy is approved for cultivation and commercialization in Argentina, Brazil, Canada, Paraguay, the United States, and Uruguay, which together represent over 90% of the global soybean trade. The commercialization of HB4 soybeans for cultivation in Argentina was cleared once China’s approval for food and feed uses was obtained in April 2022. HB4 soy is also approved for food and feed uses in Australia, Colombia, Indonesia, Malaysia, New Zealand, South Africa, and Thailand. Regulatory submissions of HB4 soy are currently under review in Bolivia, and South Africa for cultivation, and for food and feed uses in India, Philippines and Vietnam.
HB4 wheat is approved for cultivation and commercialization in Argentina, Brazil, Paraguay and the United States. Additional key food and feed approvals obtained include Australia, Colombia, Chile (only for animal consumption), Indonesia, New Zealand, Nigeria, South Africa, and Thailand. Submissions for cultivation have been presented in Bolivia and Uruguay, for food and feed uses in Philippines and Vietnam, and for food uses in Chile. Additional submissions for both HB4 soybean and wheat will continue to be pursued as we advance to new territories.
The HB4 Identity Preserved Program: Our Systemic Approach to Empower Growers and Consumers Alike
The standard commercial method for genetically modified traits is based on trait licensing to multiple breeding companies. These companies commercialize their varieties with the trait through their own channels.
We follow this model, but we have also created an innovative approach called “Generation HB4” or “HB4 Program”. We have initiated the HB4 program to multiply HB4 material and at the same time to evaluate product performance, determine product positioning, and conduct field days to showcase the HB4 technology to different stakeholders in the agriculture value chain.
Through the HB4 Program, producers grow HB4 seeds under an identity preserved model, following environmentally friendly farming practices that include crop rotation, no till, and the use of carbon footprint minimizing inputs. We contribute the HB4 seeds as well as additional inputs from our current portfolio, including micro-beaded fertilizers that reduce by one quarter the use of conventional fertilizers, nitrogen fixing inoculants that act as biological fertilizers and high-tech adjuvants that reduce the need for chemicals. In addition to mitigating production losses during drought periods, HB4 technology also facilitates double cropping, which seasonally rotates soy and wheat, an environmentally friendly farming system that is otherwise limited by water availability. When combined with soil regenerative practices, such as no-till farming, HB4 double cropping system captures more carbon than conventional growing practices. Higher crop yields with HB4 also reduce the need to expand agriculture’s land use footprint, which often entails deforestation, while aiding the rehabilitation of fragile agricultural land back to its historically productive status.
The identity-preserved production system requires having contracts with growers committed to maintaining the identity of the crop under a full offtake agreement of harvested products. Under these agreements, we contribute HB4 integrated seeds and other goods to growers for a pre-agreed price (based on prevailing market prices), which are later deducted from the service fees paid to growers at the time of harvest. The grain produced by HB4 Program participants then enter a grading and selection process, where grain that meets specific quality standards is saved as seed inventory for the next growing season and the rest of the grain is sold as commodity dry products (grain). Our program includes a contract with processors who agree to process the qualifying grain and channel it to a selected market.
Digital β-platform
The HB4 Program employs robust, closed growing systems that are combined with a high level of traceability via state-of-the-art digital farming technologies and strong stewardship to ensure environmentally friendly farming practices. Growers participating in this program have access to satellite-based crop imaging, weather monitoring and crop scouting digital application platforms. The purpose of these platforms, particularly the crop imaging application, is to provide a tool to keep track of performance differences between fields planted under the HB4 program protocols versus a control group of neighboring fields that are grown under typical commercial protocols that do not include the HB4 technology package. These platforms facilitate the recording of field activities and equipment data integration and help refine our products’ positioning based on field performance.
The use of digital platforms allows us to provide traceability of HB4 crops in the identity-preserved production system, from farm to fork, and to produce specific ESG reports that provide end users with solid, traceable ESG seed and grain scoring information. We measure carbon and water footprint and generate a blended ecotoxicological score that combines Cornell University’s environmental impact quotients with the RIPEST dose-dependent pesticide risk approach. These scores consider factors such as dermal toxicity, toxicity to birds, bees, fish and beneficial arthropods, soil half-life, surface loss potential, plant surface half-life, systemic action, and leaching potential, among other factors affecting farm workers, the environment and consumers.
We believe this report will set a new industry standard. The environmental impact of exposure to different active ingredients, the carbon intensity of production processes and the water footprint of agricultural ecosystems are all key elements in designing and promoting a 21st century regenerative agriculture.
Trends and Performance by Segment
We have a top tier complementary portfolio of products addressing demand in a global market which is estimated to be worth more than US$150 billion by 2029.
Crop Protection: Adjuvants
According to Woodstone Research & Consulting, the global adjuvants market is valued at US$3.0 billion in 2023 and is projected to reach US$4.0 billion by 2029, at a CAGR of 4.8%.
Segment growth is driven by the need to maintain crop protection, while improving the efficiency and effectiveness of agrochemicals usage, given an increased awareness of the negative implications of excessive usage of agrochemicals in the environment. Growth in the segment also comes from government initiatives to promote eco-friendly agricultural products, the expansion of precision agriculture, and the development of eco-friendly and biodegradable adjuvants.
By crop type, the cereals & grains and the oilseed & pulses segments are projected to be the fastest-growing segments in the agricultural adjuvants market during the forecast period. By product type, the herbicides segment is estimated to witness the fastest growth in the agricultural adjuvants market, in terms of value.
North America, followed by Europe, is the largest market for agricultural adjuvants at present, and it is expected to account for a significant proportion of the global market in the future. The government policies adopted by European countries toward sustainable agricultural practices support consumption of adjuvants, which is a key factor driving the growth in the region. However, the Brazilian market is expected to see the largest growth rate, as adoption of improved crop protection technologies increases.
Crop Protection: Biocontrol
The global biocontrol market was estimated at US$6.2 billion for 2021 and is projected to reach more than US$15 billion by 2029, recording an estimated CAGR of 11% for the forecast period, according to Dunham Trimmer. Europe and the United States are the two largest markets for these products followed by Brazil and China.
As a result of the Pro Farm Merger, we have significantly expanded our portfolio and pipeline of biological products — with foliar, soil and seed applications — that protect both row and specialty crops against a broad range of pests.
The increasing demand for biological products can be attributed to the rise in sustainable organic farming practices and more biologically based integrated pest management strategies, as well as the need to address pest resistance, and novel invasive species. In recent years, supply chain disruptions that have restricted the availability of synthetic chemistry products and fertilizers have spurred greater grower interest in and adoption of biological products, particularly microbial-based products. Climate change has a considerable global impact on agricultural productivity and crop susceptibility to pests, making crops more vulnerable to various diseases and abiotic stresses, which significantly reduce crop yields. All of these factors have increased farmers adoption of biologically based and sustainable crop protection solutions, increasing market demand for biocontrol products.
Crop Nutrition: Biostimulants
Biostimulants are substances, microorganisms, or mixtures thereof, that, when applied to seeds, plants, the rizosphere, soil or other growth media, act to support a plant’s natural processes independently of the products nutrient content, including improving nutrient availability, uptake or use efficiency, tolerance to abiotic stress and consequent growth development, quality, or yield.
Biostimulants are among the most rapidly growing categories in agricultural inputs. The market was valued at US$3.1 billion in 2023 and is projected to grow at an estimated CAGR of 11.2% to reach US$5.9 billion by 2029, according to Dunham Trimmer. The largest markets for biostimulants are Europe, North America and China. As in other biologicals, growth is mainly attributed to the increasing impact of climate change, soil degradation and abiotic stress to crops globally.
Crop Nutrition: Biofertilizers
The biofertilizers market was valued at US$2.2 billion in 2023 and is expected to reach US$4.5 billion by 2029, growing at an estimated CAGR of 12.1% during the forecast period, according to Woodstone Research & Consulting. These novel crop nutrition products encourage better uptake of vital nutrients that allow the plant to withstand stresses and increase output.
The acquisition of Pro Farm, with its large portfolio of biofertilizers and growing customer base, has allowed us to expand our product offering in this rapidly expanding market, adding to our existing leading position in the global inoculants market.
The nitrogen-fixing seed inoculants market is projected to increase from US$1.2 billion in 2023 to US$1.8 billion in 2029, according to Markets and Markets, recording an estimated CAGR of 7.5% in value. In South America, countries like Brazil and Argentina are projected to continue to offer high-growth prospects for seed inoculants use in coming years given their leadership position in global soybean production. Currently, the adoption of seed inoculants is very low in other major markets such as India and China, but interest in these products is growing on a global scale and we expect to play a major role in developing these markets — particularly through our recently signed global collaboration with Syngenta.
Decades of cultivation practices using synthetic pesticides and fertilizers have led to a significant negative impact on groundwater reserves and on soil health and fertility — ultimately harming crop productivity. These factors have led to an increase in the adoption of sustainable farming. This trend is still in early stages, but the number of product approvals and investment in bio-ingredients is growing rapidly to support this transformation and is expected to lead to intense market competition in the future. Among biological products, biofertilizers and biostimulants are gaining significant traction as they enhance the phosphorus and zinc absorption properties of plants as well as their resistance to pathogen attacks.
Crop Nutrition: Specialty Fertilizers
Specialty fertilizers are a category of fertilizers designed to meet specific nutritional needs of crops, soil conditions, or growth stages more precisely than standard or conventional fertilizers. They are formulated to provide targeted and balanced nutrition, which can lead to improved crop yields, quality, and resource efficiency. Increasing awareness about farm resource management, affordability of farm inputs, and a focus on agricultural profitability have helped drive the rapid expansion of specialty fertilizers usage, and these currently account for nearly 17% share of the global market for plant nutrition products.
The global market for specialty fertilizers is estimated at US$42.0 billion in 2023 and is expected to reach US$75.0 billion by 2031, growing at an estimated CAGR of 7.5% for the period, according to data by Insight Ace Analytic. Demand for specialty fertilizers has been increasing as an effective alternative to conventional fertilizers, due to their lower impact on the environment.
Seed and Integrated Products: Biotech traits
Biotechnology tools are seeing a significant increase in demand across agricultural applications. These include tissue culture and micropropagation, marker-assisted selection or molecular breeding, genetically modified crops and genetic engineering, molecular diagnostic technologies, and conventional plant breeding.
A rise in the adoption of GM crops globally is expected to drive this market. This is because genetic modification allows the production of feed and food crops with enhanced characteristics, such as high nutritional value, high yield, enhanced food-processing qualities, and resistance to diseases and insects.
The global seed market size was estimated at US$69 billion in 2023 and is projected to reach US$94 billion by 2029, growing at an estimated CAGR of 5.4%, according to Mordor Intelligence. The genetically modified seed market is estimated to experience the highest growth during the period.
The global genetically modified seeds market size is estimated at approximately US$36 billion in 2023 and is projected to reach US$63 billion by 2029, growing at an estimated CAGR of 9.8%, according to Market Data Forecast. This increase in the market size of GM seeds underlines the increasing significance and need for agricultural biotechnology.
Competition
The market for agricultural biotechnology products is characterized by intense commercial and technological change and we face significant direct and indirect competition in each of our business segments.
The crop productivity sector is highly competitive and includes large companies, such as Bayer, BASF, Corteva, Syngenta AG, UPL Limited and FMC Corporation and Sumitomo Corporation. Other companies, including bio-specialized biopesticide businesses such as BioSAfe Systems, Certis Biologicals, Gowan, Novozymes and Valent Biosciences may prove to be significant competitors in the biological pest management market.
Rizobacter remains a leader in the Argentine adjuvants market with a 32% market share, differentiating itself in a competitive market by introducing new, quality products year after year. The Brazilian market is an attractive market for adjuvants, given the growth in the chemical crop protection market and the strong adoption of improved technologies for crops, and we are addressing this opportunity through a B2B and channel coverage strategy. North America, followed by Europe, are the largest markets for agricultural adjuvants at present, and they are expected to account for a significant proportion of the markets for Rizobacter products in coming years.
Within the inoculants market, Rizobacter is the global leader with an estimated global market share of 23%, followed by other key competitors including Novozymes and Becker Underwood. We expect to continue to expand internationally through our recent agreement with Syngenta. See “Item 4. Information on the Company—A. History and Development of the Company—Significant Transactions—Syngenta Exclusive Global Distribution Agreement.”
Within the fertilizer market in Argentina, Rizobacter’s focus is the phosphorous market. In this market, Rizobacter participates with a specialty product that is used at substantially lower doses than competitor’s products, with a competitive advantage in terms of storage and logistics. In Argentina, we are leaders in this niche followed by Recuperar, FYO, Red Surcos, among others. In Brazil, farmers are increasingly adopting our micro beaded fertilizers which provide logistics and storage advantages.
The market for bionutrition and crop health products is very fragmented and diverse, as it has lower regulatory barriers when compared with crop protection products. It includes larger players like Valagro (acquired by Syngenta Crop Protection), UPL Limited and Acadian Seaplants.
Competition in the seed and integrated products sector extends to each of the components that we provide for our integrated products. We face competition for our biotech traits from different companies. Companies such as Bayer and Corteva own packages of traits that focus on herbicide tolerance, which could indirectly compete with the components of HB4. BASF and Syngenta, though strong players in other crops, do not currently have commercial traits for soybeans and wheat. Other companies such as Evogene Ltd., INARI and DBNBC also engage in trait discovery and licensing technology to customers. Genome Editing is another area that is showing a significant increase in the number of companies and may develop competition to our trait packages. There are several companies offering services for editing and R&D collaborations, however, while promising, there are no large-scale technologies commercially available yet.
We also face competition for our proprietary germplasm from other companies that focus on developing proprietary germplasm in open platforms. In soybeans, the South American market is dominated by local companies such as GDM Seeds in Argentina and Brazil and TMG in Brazil, though several others have market share in specific regions. Stine Seeds, a dominant company in the United States, is setting bases to commercialize soybeans in Latin America. These companies, despite being competitors in the germplasm space, offer great opportunity to collaborate and act as licensees of our traits. See “Item 4. Information on the Company—B. Business Overview—Joint Ventures and Key Collaborations—HB4 Non-Joint Venture Collaborations.” In wheat, traditional European companies such as Limagrain, KWS and RAGT compete in South and North America along with the previously mentioned local players. The multinational companies that develop biotech traits mentioned above complete the landscape of competitors.
Our Growth Strategy
Our long-term growth strategy is based on an open-architecture approach to technology origination, identifying and accessing promising technologies from third parties, as well as forming strategic and capital-efficient partnerships that leverage each party’s strategic strengths and capabilities to bring innovations more quickly. Our near-term growth strategy includes the following:
Continue to Lead Development and Commercialization of New Agricultural Biotechnology Products in Existing and New Markets
We intend to build upon our diverse portfolio of crop productivity solutions by consolidating our position in biological assets, including microbial, seed trait and germplasm assets, and continuing to pursue an integrated approach in the development of superior yielding products.
Scale-Up Production of Rizobacter and Pro Farm Products to Accelerate Penetration in Crop Nutrition and Protection Markets
We have made significant investments in our manufacturing facilities in recent years, expanding and upgrading our manufacturing capabilities to keep pace with demand growth and expansion into new geographies. In 2023, we inaugurated a new manufacturing plant for adjuvants in Brazil. The new plant increased our manufacturing capacity four-fold, positioning us to support our expansion plans in the fast-growing Brazilian market. In Argentina, we recently expanded our biologicals production capacity, also providing us with the necessary installed capacity to meet the needs arising from the international expansion of our inoculants derived from our agreement with Syngenta.
As a result of the Pro Farm Merger, we incorporated two packaging and manufacturing facilities, one in Bangor, Michigan, and the other a third-party manufacturer in Vyborg, Russia, in which we hold a minority ownership interest. At our Bangor plant, we have made investments which aim to increase production capacity and reduce production costs.
Commercialization of HB4 Seed Products to Drive Penetration of Seed Market
HB4 wheat and HB4 soy seeds integrate the uniqueness of HB4 stress tolerance into locally adapted germplasms, customized with a seed treatment solution prescribed for specific environments. We believe that the product differentiation provided by our unique and varied technologies increase the value of our products for HB4 seed customers and will drive significant growth. In the medium-term, we expect royalties from HB4 licenses to represent a significant component of our revenue, as our strategic partnerships to develop more varieties and increase our portfolio of HB4 products, along with third-party commercial channels, will make this landmark technology more broadly adopted.
Expand our International Business by Accelerating Registration and Sales of Products Through Multiple Subsidiaries
We are a global leader in the biological market for agriculture inputs and have used this position to establish subsidiaries in Argentina, the United States, Brazil, Bolivia, Colombia, Estonia France, Paraguay, Russia, South Africa and Uruguay. We use our international footprint and sales force to continue to define our key brands by bringing our broader portfolio of crop productivity solutions to these markets. We expect international growth to be driven by continued growth in our biological business, as well as by incorporating high-value adjuvants and crop nutrition solutions.
Pursue Strategic Collaborations and Acquisitions in Key Markets
We intend to continue working with our collaboration partners to bring our products to customers in key markets. We also plan to continue pursuing acquisitions and in-licensing opportunities seeking global expansion and to gain access to validated and important later-stage products and technologies that we believe to be a strategic fit for our business.
Intellectual Property
Our success depends mostly on our ability to obtain and maintain intellectual property protection for our products and technologies, defend and enforce our intellectual property rights (in particular, our patent rights, plant varieties, trademarks and trade secrets), preserve the confidentiality of our intellectual property and operate without infringing valid and enforceable intellectual property rights of others.
We seek to protect our proprietary products, technology, and trade secrets, in part, by entering into confidential disclosure agreements with our employees, consultants and potential and actual third-party collaborators. By protecting our proprietary technologies, we can offer our customers and partners unique products unavailable from our competitors, while also preventing our competitors from using technologies that we have developed or licensed exclusively or non-exclusively, from other parties.
The main countries in which we seek patent protection are the United States, Canada, Brazil, Argentina, Bolivia, Paraguay, Uruguay, Mexico, South Africa, Australia, India, China, Ukraine, Russia and certain other countries in Europe.
As of the date of this annual report, we, in our capacity as sublicensee (either as exclusive or non-exclusive licensee), have over 750 patents and patent applications. In some instances, our patents and our sublicenses are limited in terms of duration, geography and/or field of use.
Our licensed patents for the HB4 soy and HB4 wheat expire in 2039 and 2040, respectively, for the Coxc5-1 family in 2027 and for the HB10 family in 2030. We are the exclusive sublicensees and non-exclusive licensees of the following patents: herbicide resistant patents which expire in 2028; LXR®, a delayed senescence technology which expires in 2028; ZFP® technology, which expires in 2033; RS (Hexapolid and Tetraploid) technology which expires in 2033; RG (Reduced gluten) technology which expires in 2036; OX technology which expires in 2037; and UHC technology ultra-highly concentrated bacterial liquid soybean inoculant technology, which expires in 2040.
During 2019 and 2020, Bioceres Group PLC filed patent applications covering the HB4 soy event which expires in 2039 and the HB4 wheat event which expires in 2040, respectively, within the main countries where we will launch our products once regulatory approvals are received.
Our other patents include patents around our products Regalia, Grandevo, Venerate, Emergen, Majestene, Stargus, Zelto, Pacesetter, Zequanox, Ennoble, Haven and the UBP bionutrient portfolio.
Crop Protection: the crop protection segment boasts a diverse product range, including fungicides Regalia® (Reynoutria sachalinensis) Rizoderma® and Stargus® (Bacillus amyloliquefaciens F727), insecticides Grandevo® (Chromobacterium subtsugae sp. nov.) and Venerate® (Burkholderia sp. A369), nematicides Majestene® and Zelto® (Burkholderia sp. A369), and sun and heat stress protector Haven® (stearyl alcohol). The segment, also featuring biocides, molluscicides, fumigants, and bioherbicides, holds over 450 patents.
Crop Health: Focusing on nurturing crop development, this segment spotlights Pacesetter®, a growth regulator that stimulates root development and boosts fungicides like Regalia® (Reynoutria sachalinensis). The segment holds over 20 patents.
Crop Nutrition: we deliver innovative crop nutrition solutions, spanning both foliar treatments and seed treatments. Standout products include Foramin® and Foramin ST®, Emergen®, Rizofos®and UBP 110® for foliar applications, as well as Rizoliq®, UHC® Inoculants, Lumibio Optima® and Ympact® for seed treatments. Our excellence in this area is reflected in the over 30 patents we have registered.
We seek additional protection of our seed and germplasm intellectual property through PVP certificates, which preserve a variety owner’s exclusive rights to sell, reproduce, import, and export a plant variety and our seed. The duration of PVP protection varies among jurisdictions and is 20 years from the time of issue in the United States and 20 and 15 years from the time of issue in Argentina and Brazil, respectively. As of the date of this report, we do not have PVP certificates in the United States. In addition, in Argentina, we have received, as owner and/or as licensee, registrations with the National Cultivar Registry (Registro Nacional de Cultivares) (“RNC”) for 16 wheat varieties, 20 soybean varieties, two sunflower hybrids, three corn hybrids, and two Amaranthus varieties, all of which are authorized for our marketing in Argentina. We are currently seeking registration for four soybean varieties and three wheat varieties at the RNC. We have also received, as owner and/or as licensee registrations with the Argentinian National Registry of Cultivar Ownership (Registro Nacional de la Propiedad de Cultivares) (“RNPC”) for 11 soybean varieties and 13 wheat varieties at the RNPC. We have also received the registration for 13 soybean varieties and five wheat varieties in Uruguay, two soybean variety in South Africa, three soybean varieties in Paraguay and two soybean varieties in Bolivia. We are currently seeking registration for one soybean variety in South Africa.
We seek to protect our non-patent intellectual property, such as know-how and regulatory data, through contracts and confidentiality agreements. Know-how generated by the activities of our companies is protected by specific services agreements or employment agreements. Employment agreements include undertakings regarding confidentiality and assignment of inventions and discoveries. Our regulatory data is protected by standard confidentiality and data protection mechanisms. We have over 1,334 trademarks and over 290 trademark applications worldwide.
We will continue to file and prosecute patents, PVP certificate and trademark applications in the United States and foreign jurisdictions, and maintain trade secrets, consistent with our business plan, to protect our intellectual property rights.
Government Regulation
We are subject to agriculture, health and environmental regulations in the countries in which we operate or in countries where final products containing our technologies (e.g., grains containing biotech traits) will be consumed. We must obtain and comply with various permits and licenses from government authorities and municipalities in the jurisdictions in which we operate before we can test and ultimately commercialize our products/technologies.
For all of our products, particularly our pesticidal products and HB4-traited seeds, compliance with the regulatory requirements of each country is one of our highest priorities. These regulations are multilayered and touch all steps in the research, development, approval and commercialization of our products. Regulators typically require extensive product performance, product characterization and quality control and product safety data for each product. On the regulations related exclusively to genetically modified organisms, we continue to conduct field tests under special permits in countries where our technologies are still not fully approved, while we continue to seek approvals, always complying with the local regulations.
The laws and regulations we are subject to will continue to evolve as there are advances in biotechnology and our other businesses. Our regulatory affairs team is responsible for generating the data necessary to secure product approvals and to oversee product stewardship programs to ensure our products are used safely, effectively and fully in compliance with all relevant regulations.
In Brazil, CTNBio, is the local regulatory agency for biosafety. Both HB4 soy and wheat have obtained approval from CTNBio for their consumption and cultivation. We further obtained regulatory approvals for consumption of the HB4 technology from many regulatory agencies around the world, including from the FDA and USDA in the United States. We continue to seek approvals on a global scale, always complying with the local regulations. See “Item 4. Information on the Company—B. Business Overview—Industry Overview—Sustainability-Driven Solutions—The HB4 technology” for the complete list of approvals and submissions to date.
In the United States, the EPA regulates the bio-based pest management products under the Federal Insecticide, Fungicide and Rodenticide Act (“FIFRA”), the Federal Food, Drug and Cosmetics Act (“FFDCA”) and the Food Quality Protection Act (“FQPA”). In addition, some of the plant health products are regulated as fertilizers, auxiliary plant substances, soil amendments and/or beneficial substances in each of the 50 states. In addition to EPA approval, we are required to obtain regulatory approval from the appropriate state regulatory authority in individual states and foreign regulatory authorities before we can market or sell any pest management product in those jurisdictions. We also generally pursue organic certification for our product portfolio, including USDA National Organic Program, Organic Materials Review Institute, EcoCert and ControlUnion.
Around the globe, the regulatory process for biostimulants and bionutrients (biofertilizers) is significantly accelerated compared to that for biopesticides. In the United States, if plant health products are not used to control pests or do not act as plant (growth) regulators, they currently fall outside the legal scope of FIFRA, FFDCA and FQPA and, therefore, we do not need to submit applications for EPA registrations for such products. However, we must still submit state registrations for some of our products. Products containing microbes of foreign origin may also need to be “deregulated” (or determined not to be a plant pest) under the Plant Protection Act by the USDA Animal and Plant Health Inspection Service prior to use in field trials or for large scale release.
Insurance
We maintain customary insurance policies that we consider to be in line with market practice and adequate for our business. Our principal insurance policies are personal injury (as mandated by Argentine labor law), worker’s compensation, all operational risk, civil liability, fire, theft, cars, transport, credit, work injury risk, cyber liability, cargo cyber link, cargo STP, ERISA bond, domestic property, boiler & machinery, general liability, business auto, foreign package, umbrella, and bond insurance entered into in connection with grants received. We maintain product liability insurance coverage in respect of Pro Farm Group’s products portfolio which is covered by our general liability insurance policy.
Legal Proceedings
From time to time, we may become party to litigation or other legal proceedings that we consider to be a part of the ordinary course of our business. We are not currently involved in any legal proceedings that could reasonably be expected to have a material adverse effect on our business, prospects, financial condition, or results of operations, other than the proceeding described in “Item 8. Financial Information—A. Consolidated Statements and other Financial Information—Legal Proceedings— An injunction in connection with the Rizobacter Acquisition may require us to surrender part of our interest in Rizobacter.” As of the date of this report, we are involved in one material legal proceeding, as referenced above, and we do not face any claims of possible intellectual property infringement. We may become involved in material legal proceedings in the future as part of the ordinary course of our business.
| C. | Organizational Structure |
The following diagram depicts our organizational structure as of June 30, 2024:
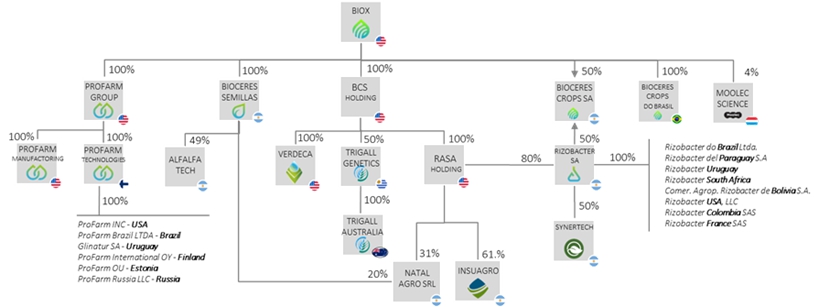
The following table identifies our main subsidiaries and joint ventures as of June 30, 2024:
| Country of | Ownership | Voting | ||||||||
| Name | Incorporation | Interest | Interest | |||||||
| Alfalfa Tehcnologies S.R.L. (1) | Argentina | 49 | % | 49 | % | |||||
| BCS Holding Inc. | USA | 100 | % | 100 | % | |||||
| Bioceres Crops do Brasil Ltda. | Brazil | 100 | % | 100 | % | |||||
| Bioceres Crops S.A. (2) | Argentina | 90 | % | 90 | % | |||||
| Bioceres Semillas S.A.U. | Argentina | 100 | % | 100 | % | |||||
| Comer. Agrop. Rizobacter de Bolivia S.A. (2) | Bolivia | 80 | % | 80 | % | |||||
| Glinatur S.A. | Uruguay | 100 | % | 100 | % | |||||
| Insumos Agroquímicos S.A. | Argentina | 61 | % | 61 | % | |||||
| Moolec Science SA(1) | Luxembourg | 4 | % | 4 | % | |||||
| Natal Agro S.R.L. | Argentina | 51 | % | 51 | % | |||||
| Pro Farm Group, Inc. | USA | 100 | % | 100 | % | |||||
| Pro Farm International, OÜ | Finland | 100 | % | 100 | % | |||||
| Pro Farm Michigan Manufacturing LLC | USA | 100 | % | 100 | % | |||||
| Pro Farm Russia, LLC | Russia | 100 | % | 100 | % | |||||
| Pro Farm Technologies Comércio de Insumo Agrícolas do Brasil Ltda. | Brazil | 99 | % | 99 | % | |||||
| Pro Farm Technologies, OÜ | Finland | 100 | % | 100 | % | |||||
| Pro Farm, Inc. | USA | 100 | % | 100 | % | |||||
| Rasa Holding LLC | USA | 100 | % | 100 | % | |||||
| Rizobacter Argentina S.A. | Argentina | 80 | % | 80 | % | |||||
| Rizobacter Colombia SAS (2) | Colombia | 80 | % | 80 | % | |||||
| Rizobacter del Paraguay S.A. (2) | Paraguay | 80 | % | 80 | % | |||||
| Rizobacter do Brasil Ltda. (2) | Brazil | 80 | % | 80 | % | |||||
| Rizobacter France SAS (2) | France | 80 | % | 80 | % | |||||
| Rizobacter South Africa (2) | South Africa | 80 | % | 80 | % | |||||
| Rizobacter Uruguay (2) | Uruguay | 80 | % | 80 | % | |||||
| Rizobacter USA, LLC (2) | United States | 80 | % | 80 | % | |||||
| Synertech Industrias S.A. (1) (2) | Argentina | 40 | % | 40 | % | |||||
| Trigall Australia Pty Ltd (1) (3) | Australia | 50 | % | 50 | % | |||||
| Trigall Genetics S.A. (1) | Uruguay | 50 | % | 50 | % | |||||
| Verdeca LLC | USA | 100 | % | 100 | % | |||||
Notes:—
| (1) | Joint ventures and unconsolidated entities. |
| (2) | Calculated considering the indirect interests held through Rizobacter. The indirect equity interest participation included in this table is 80% of the direct equity interest participation that Rasa Holding LLC owns in each entity. See “Risks Related to our Business and Strategy—Certain of the Rizobacter shares we own are subject to a judicial injunction that, if decided unfavorably to us, would require us to surrender part of our interest in Rizobacter thereby reducing our equity interest in Rizobacter.” |
| (3) | Calculated considering the indirect interests held through Trigall Genetics S.A. |
| D. | Property, Plant and Equipment |
Our main manufacturing and distribution facilities are located in Pergamino, Buenos Aires province, Argentina. Our manufacturing facilities include (i) the adjuvant formulation plant with 2.1 million gallons in annual production capacity, (ii) one biological production plant with an annual capacity of 1.25 million gallons, and another biological production plant, inaugurated after the fiscal year end, with an annual capacity of 0.62 million gallons, (iii) the insecticides and fungicides formulation plant with an annual production capacity of 1 million gallons, (iv) the micro-beaded fertilizer facility with an annual production capacity of 50,000, and (v) over 375,000 square feet of warehouse space for packaging and logistics. We test and conduct trial runs of our key technologies at our main field station located in Pergamino, Argentina, which also has processing capabilities for foundation seed.
In Londrina, in the state of Paraná, Brazil, where our main subsidiary is located, we recently completed the construction of a new high-tech adjuvant facility plant with an annual capacity of approximately 2.6 million gallons.
As a result of closing of the Pro Farm Merger, we incorporated a 11,400 square-foot manufacturing facility in Bangor, Michigan, where we ferment and formulate most of Pro Farm’s biopesticides, with an annual capacity of up to 0.6 million gallon, and a formulation plant of insecticides and fungicides with a production capacity of up to 0.8 million gallon per year. We test and conduct trial runs of our key technologies at our Laboratory and Research Centers in Helsinki, Finland and Davis, California, USA.
ITEM 4A. UNRESOLVED STAFF COMMENTS
None.
ITEM 5. OPERATING AND FINANCIAL REVIEW AND PROSPECTS
The following discussion of our financial condition and results of operations should be read in conjunction with our audited consolidated financial statements as of June 30, 2024 and 2023 and for the years ended June 30, 2024, 2023 and 2022, and the notes thereto, included elsewhere in this report.
The following discussion contains forward-looking statements that involve risks and uncertainties. Our actual results may differ materially from those discussed in the forward-looking statements as a result of various factors, including those set forth in “Cautionary Note Regarding Forward-Looking Statements” and “Item 3. Key Information—D. Risk Factors.”
| A. | Operating Results |
Factors affecting our results of operations
Our results of operations have been influenced and will continue to be influenced by the following factors:
Market demand for our products and services
Our sales and profitability are influenced by the demand for our crop productivity products in the particular markets in which we operate. Demand from distributors and end customers (farmers), is typically affected by fluctuations in agricultural commodities prices, operating and input costs and resulting crop profitability, weather conditions, farmer planting decisions and timing of these, technology adoption and general macroeconomic conditions including foreign exchange rates, interest rates, etc.
Seasonality and weather conditions
Our business is highly seasonal given the inherent cyclicality of crop planting and harvesting. Generally, our sales are concentrated in the third and fourth quarters of each calendar year (corresponding to our first and second fiscal quarters), when demand for our seed and integrated products, crop protection products and crop nutrition products increases as summer crop planting season begins in South America, and winter crop season occurs in the Northern hemisphere. Our portfolio of products is highly oriented towards crop planting. Our second calendar quarter (corresponding to our fourth fiscal quarter) is gaining increasing importance due to the summer planting season in the Northern Hemisphere and the growing proportion of our North American sales. This period is also strengthening relatively due to HB4 wheat sales in South America. The first calendar quarter (corresponding to our third fiscal quarter) remains our least active seasonal quarter.
In our seed and integrated products business, we enter into contracts with growers and seed suppliers based on our anticipated market demand. We generally store seeds during the harvest season and ship them from inventory throughout the year, with the objective of selling most of the inventory before the next year’s season. Our crop protection and our crop nutrition business follow a similar cycle to the seed cycle.
In addition to the structural cyclicality determined by planting seasons in each geography, there may be variations from year to year, as the timing of orders from distributors and customers may change in response to prevailing market prices or price expectations, and weather conditions in each particular year. Unpredictable weather conditions such as heavy rains, hail, floods, freezing conditions, windstorms, drought or fire, as well as other hazardous situations beyond our control, may cause our sales and operating results to fluctuate significantly. In addition, disruptions that cause delays in growers’ decisions relating to harvesting or planting can result in the movement of orders from one quarter to the next, which also causes fluctuations in our quarterly operating results. Finally, some of our customers and distributors place bulk orders only once or twice a year, which may further cause our revenues to fluctuate from period to period.
Fluctuations in commodity prices
Our results of operations, particularly the demand and price for our products, are affected by global agricultural commodities prices. Agricultural commodity prices vary in response to changes in global supply and demand conditions. Agricultural commodity prices are also significantly influenced by speculative actions and by currency exchange rates, volatility in credit markets and fluctuations in consumer and business confidence. Prices may also be affected by governmental programs and policies regarding agriculture, as well as general trade, fiscal and exchange control policies. Exogenous factors, such as drought, floods, general weather conditions, diseases and natural disasters may also affect agricultural commodities prices. Demand for agricultural commodities, such as wheat and soybeans, both for human consumption and as animal feed, has generally increased with worldwide economic growth and prosperity.
Macroeconomic conditions in Latin America
A significant portion of our revenue is generated by emerging markets, particularly Latin America. Therefore, our operating results and financial condition may be impacted by macroeconomic and fiscal conditions in these markets, including fluctuations in currency exchange rates, inflation and interest rates. The emerging markets where we operate, including mainly Argentina and Brazil, remain subject to such fluctuations and inflation-related risks. See “Item 3. Key Information—D. Risk Factors—Risks Related to Operating in Latin America— Inflation in Argentina and government controls may adversely affect the economy and our financial condition and results of operations.”
For the years ended June 30, 2022, our Argentine subsidiaries applied IAS 29 “Financial reporting in hyperinflationary economies,” which requires that the financial statements of an entity whose functional currency is the currency of a hyperinflationary economy be stated in terms of the current measuring unit at the closing date of the reporting period. For such purpose, the inflation occurred since the acquisition date or the revaluation date, as applicable, must be computed for non-monetary items. The standard details a series of factors to be considered for concluding whether an economy is hyperinflationary, including, but not limited to, a cumulative inflation rate over a three-year period that approaches or exceeds 100%. As of June 30, 2018, the cumulative inflation in Argentina exceeded 100%. Therefore, as of July 1, 2018, the Argentine economy was considered hyperinflationary, in accordance with IAS 29.
During an inflationary period, any entity that maintains an excess of monetary assets over monetary liabilities will lose purchasing power, and any entity that maintains an excess of monetary liabilities over monetary assets will gain purchasing power, provided that such items are not subject to an adjustment mechanism.
In summary, the restatement mechanism of IAS 29 establishes that monetary assets and liabilities will not be restated because they are already expressed in a current unit of measurement at the end of the reporting period. Assets and liabilities subject to adjustments based on specific agreements will be adjusted according to those agreements. Non-monetary items measured at their current values at the end of the reporting period, such as fair value or others, do not need to be restated. The remaining non-monetary assets and liabilities will be restated according to a general price index. The loss or gain for the net monetary position will be included in the net result of the reporting period, presented in a separate line item.
From July 1, 2022, our main Argentine subsidiaries changed their functional currency from the Argentine Peso to the U.S. dollar as a result of changes in events and conditions that are relevant to their business operations, which include a hyper inflationary macroeconomic context and the depreciation of the Argentine Peso, in addition to the effects on our business of certain business combination transactions on our business, as discussed below.
In recent years, Argentina’s macroeconomic scenario has featured a misalignment between inflation rates and the devaluation of the Argentine Peso, which became more pronounced during the first half of the year ended June 30, 2022. Notwithstanding such misalignment, our Argentine subsidiaries have been able to continue pricing their products in U.S. dollars as the costs of products and services are set in U.S. dollars. This has also been achievable as the demand for the type of products we commercialize is relatively inelastic when compared to non-essential goods and services. Further, Argentina’s significant economic volatility has caused materials, and other costs of providing goods that we acquire from the Argentine domestic market, to become increasingly indexed to the U.S. dollar (i.e., denominated in Argentine Pesos but indexed to the U.S. dollar exchange rate).
Following the merger with Pro Farm, which closed at the beginning of the fiscal year ended June 30, 2023, in addition to other business combination transactions, we established a global commercial strategy with a view to unifying pricing policies for the commercialization of our products.
In accordance with IAS 21 we have considered the following primary factors to determine the functional currency of our main Argentine subsidiaries: (i) the sales prices for goods and services, which are mainly influenced and determined by the U.S. dollar; and (ii) the increasing influence of transactions indexed to the U.S. dollar related to labor, materials, and other costs of providing goods.
Taking into account the analysis of the primary factors provided by IAS 21 in determining the functional currency of our main Argentine subsidiaries (in particular the increased influence of exchange rates on their costs of operations, which are indexed to the U.S. dollar), we identified that there is strong evidence that their functional currency had changed to the U.S. dollar.
As discussed above, we assessed primary indicators and determined that they were conclusive for the analyzed period; however, consideration was also given to secondary indicators. The result of such analysis also leads to the conclusion that the U.S. dollar is the relevant currency for cash generation from operating and financing activities of our main Argentine subsidiaries.
In accordance with IAS 21, the effects of the change in functional currency were recorded prospectively. Accordingly, from July 1, 2022, there are no longer significant effects of inflation adjustments in our financial statements.
Changes in import and export duties, and import or export controls may affect the business
Since 2002, the Argentine government has imposed duties on the exports of various primary and manufactured products. Since then, and with successive administrations, these duties have been changed on several occasions.
In October 2022, Argentina has also imposed stricter controls to the import of goods and services. In respect of imports of goods, Argentine companies had limited access to the FX Market in order to make payments abroad.
Also starting in 2022, exports of goods have been frequently subject to a differential higher FX rate conversion when entering and settling their export balances (called “dolar soja” or “dólar blend”) to incentivize the sale and export of agricultural commodities. Such FX rate derives from a blend of the official exchange rate (80%) and the actual FX rate that could be obtained by entering into blue-chip swap transactions (20%).
During 2022 and 2023, the BCRA modified foreign exchange regulations regarding foreign currency outflows. This amendment had a strong impact, mainly in the access to the FX Market, in the payment of services rendered by non-Argentine residents.
On December 13, 2023, as Javier Milei took office as the new President of the Argentine Republic, the BCRA through Communication “A” 7917, repealed the requirements for import of goods and services, respectively and prior BCRA’ approval to access the FX Market to make import payments of good that are not otherwise regulated to the extent that the other applicable regulatory requirements are met. At the end of December 2023, SIRA system was abrogated through the Joint General Resolution No. 5466/2023 (Secretary of Commerce & AFIP), which created a new regime for import declarations. The SEDI system requires that importers register a sworn statement with the relevant data beforehand. This application is compared with the information in the tax authorities’ records. Once these controls are passed, the application will be set to REGISTERED status. It is worth mentioning that the “Risk Profile” controls required under the prior regimes have been discontinued. To register a definitive import, it will be necessary to have a SEDI declaration in READY status. Once the status is READY, the SEDI declaration may be used within 360 calendar days. The SEDI regime does not require any prior sworn statements on payments of services abroad. Currently, importers are not facing difficulties to obtain quick approvals of their SEDI declarations and imports are flowing more swiftly.
As of June 30, 2024, the following crop exports were subject to the following export duties: soybean and soy products 31-33%, corn, wheat, barley, sunflower and sorghum 4.5-12%, corn and wheat flour 7% and sunflower oil 7%.
Since July 23, 2024, through Communication “A” 8074, the BCRA modified the previous schedule for payments of goods that are not otherwise regulated, allowing the payment of 50% of the value free on board after 30 and the remaining 50% after 60 days from the registration of entry to customs of the goods.
Regarding export duties, the Executive Branch has not had the authority to increase the applicable export duty rate as from January 1, 2022. In this sense, any export duty applied by the Federal Executive without the due delegation of faculties assigned by the legislature would be rendered unconstitutional by judicial courts. Although the Executive Branch does not have any delegated powers to change export duties, during 2024 there have been some sector (dairy, meat products, fruits) that have seen their export duties reduced by the Federal Executive to promote exports.
Stages of development of our products
Our results of operations will vary depending on the stage of development of our products and technologies. Some of our products are currently in the early stages of development and our historical operating results are not indicative of the operating results we expect to experience in later stages of product development. As we are able to advance such technologies and products through the development and regulatory phases to commercial launch, we expect our revenues and cash flows to increase.
Our costs are also impacted by the stage of development of our products and technologies, requiring, for example, expenditures in the research, development, and regulatory phases of a product without corresponding revenue generation until commercial launch. Product development expenses may fluctuate from period to period and may also increase if we choose to accelerate certain product development programs or any regulatory or commercialization process with respect to one or more of our crop productivity products in development stage.
Regulatory environment
Our results of operations will vary depending on the speed in which we are able to obtain regulatory approvals for our products and the cost associated with securing such approvals. The degree of regulation to which we are subject varies by jurisdiction and activity. Our ability to sell our technologies and products depends on our ability to obtain and maintain necessary authorizations, permits and regulatory approvals in the markets in which we operate. See “Risk Factors —Risks Related to our Business and Strategy—Our business and the commercialization of our products currently in development are subject to various government regulations and we or our collaborators may be unable to obtain, or may face delays in obtaining, necessary regulatory approvals. In addition, if we are unable to comply with applicable regulatory regimes, we may not be able to sell our products in certain jurisdictions.”
Results of operations
We have based the following discussion on our consolidated financial statements for the years ended June 2024, 2023 and 2022 included elsewhere in this report. You should read it along with these financial statements, and it is qualified in its entirety by reference to them.
We have elected to omit certain discussions relating to the earliest of the three years covered by the consolidated financial statements presented. See “Item 5. Operating and Financial Review and Prospects” in our annual report on Form 20-F for the year ended June 30, 2023, filed on November 14, 2023, for reference to such discussions for the fiscal year ended June 30, 2022, the earliest of the three fiscal years presented.
Comparison of the years ended June 30, 2024 and 2023
The table below illustrates our results of operations for the years ended June 30, 2024 and 2023.
| For the years ended June 30, |
||||||||
| 2024 | 2023 | |||||||
| (in millions of US$) | ||||||||
| Revenues from contracts with customers and initial recognition and changes in the fair value of biological assets at the point of harvest | 464.8 | 420.1 | ||||||
| Cost of sales | (278.2 | ) | (235.5 | ) | ||||
| Gross Profit | 186.6 | 184.6 | ||||||
| Research and development expenses | (17.2 | ) | (15.3 | ) | ||||
| Selling, general and administrative expenses | (123.7 | ) | (113.0 | ) | ||||
| Share of profit of joint ventures and associates | 4.0 | 1.2 | ||||||
| Changes in the net realizable value of agricultural products after harvest and other income or expenses, net | (4.9 | ) | (3.3 | ) | ||||
| Operating profit | 44.8 | 54.2 | ||||||
| Net financial costs | (34.8 | ) | (35.1 | ) | ||||
| Profit before income tax | 10.0 | 19.1 | ||||||
| Income tax | (3.8 | ) | 1.1 | |||||
| Profit (Loss) | 6.2 | 20.2 | ||||||
| Other comprehensive (loss) income | (0.8 | ) | (0.8 | ) | ||||
| Total comprehensive profit(1) | 5.4 | 19.3 | ||||||
| Non-IFRS measures(2) | ||||||||
| Adjusted EBITDA (unaudited) | 81.4 | 81.2 | ||||||
Notes:—
| (1) | Includes (i) exchange differences on translation of foreign operations from joint ventures, (ii) exchange differences on translation of foreign operations, (iii) revaluation of property, plant and equipment, net of tax from joint ventures and (iv) revaluation of property, plant and equipment, net of tax. |
| (2) | We define Adjusted EBITDA as profit/(loss) exclusive of financial income/(costs), income tax benefit/(expense), depreciation, amortization, share-based compensation, inventory purchase allocation and one-time transactional expenses. Adjusted EBITDA is a non-IFRS measures. For a complete presentation of the reconciliation, see the section entitled “—Non-IFRS Financial Measures.” |
Revenues from contracts with customers and initial recognition and changes in the fair value of biological assets at the point of harvest
Total revenue increased by US$44.7 million, or 10.6%, totaling US$464.8 million for the year ended June 30, 2024, compared to our total revenue of US$420.1 for the year ended June 30, 2023. Revenue from HB4 sales, adjuvants, and other crop protection products increased as a result of normalized weather conditions in the southern hemisphere and, to a lesser extent, an increase in bio stimulant sales in Europe.
Crop Protection. Total revenue increased by US$17.7 million, or 8.6%, to US$223.5 million for the year ended June 30, 2024, from US$205.8 million for the year ended June 30, 2023. This increase was due to a greater demand for crop protection products in key markets, such as Brazil and Argentina, as a result of heightened pest pressure - in this segment, adjuvants and seed protection products were the main growth drivers.
Crop Nutrition. Total revenue decreased by US$12.4 million, or 7.9%, to US$144.8 million for the year ended June 30, 2024, compared to US$157.3 million for the year ended June 30, 2023. The decrease was mainly due to a US$17.2 million decrease in the accrual of the Syngenta license payment in the amount of US$15.7 million in the year ended June 30, 2024, compared to US$32.9 million in the year ended June 30, 2023. In addition, softened micro-beaded fertilizers demand in the fourth quarter interrupted the momentum shown by this product category during the first half of the fiscal year, while bio stimulants were the best performers, increasing by more than 50%, mainly in Europe.
Seed and Integrated Products. Total revenue increased by US$39.7 million, or 70.0%, to US$96.4 million for the year ended June 30, 2024, compared to US$56.7 million for the year ended June 30, 2023, as a result of the largest year-on-year increase driven by HB4 sales.
Gross profit
Gross profit remained nearly flat compared to the year before, increasing by US$2.2 million, or 1.2%, to $186.6 million for the year ended June 30, 2024, from $184.6 million for the year ended June 30, 2023 primarily due to the lower contribution of the Syngenta compensatory payment.
Crop Nutrition. In addition, the Syngenta license payment entails a 100% gross margin, and the U$$17.2 million decline translates directly into gross profit, lowering Crop Nutrition segment’s gross profit and average gross margin, compared to last year.
Crop Protection. Crop Protection saw gross margin improvement on top of top line growth, with margin expansions led by the bio protection portfolio as well as a more focused approach to third-party products’ commercialization.
Seed and Integrated Products. In Seed and Integrated Products, HB4 downstream sales — with a lower gross margin than upstream sales – were higher in the year ended June 2024, as a result of grain inventories being drawn down to minimize working capital requirements and to develop commercial channels for fully traced grain inventories. As a result, gross profit for Seed and Integrated Products grew less than sales. Overall gross margin decreased 381 bps to 40% for the year ended June 30, 2024, from 44% in the year ended June 30, 2023.
Research and development expenses
Research and development expenses, which include ongoing efforts to maintain and continuously update our existing product portfolio, remained nearly flat at 4% of revenue in the year ended June 30, 2024, compared to the year ended June 30, 2024, totaling US$17.2 for the year ended June 30, 2024 compared to US$15.3 million for the year ended June 30, 2023.
When excluding depreciation and amortization and share-based incentives, research and development expenses remained nearly flat totaling US$10.1 million in the year ended June 30, 2024, compared to US$9.8 million in the year ended June 30, 2023.
Selling, general and administrative expenses
Selling, general and administrative expenses increased by US$10.7 million, or 9.5%, to US$123.7 million for the year ended June 30, 2024, from US$113.0 million for the year ended June 30, 2023. Total selling, general and administrative expenses as a percentage of revenues stood flat at 27% in the year ended June 30, 2023, compared to the year ended June 30, 2023.
When excluding depreciation and amortization, transaction expenses and share-based incentives fixed selling, general and administrative expenses remained nearly flat at nearly US$72.0 million as a result of deliberate cost management actions across multiple geographies, while variable expenses increased to US27.8 million in the year ended June 30 2024 from US$22.6 million in the year ended June 30, 2023, in connection with sales performance. Main increases were related to sale taxes in the amount of US$2.7 million and freight and haulage expenses in the amount of US$2.2 million.
Share of profit of joint ventures and associates
The profit resulting from our share in the profit of joint ventures and associates increased by US$2.8 million to US$4.0 million for the year ended June 30, 2024 from US$1.2 million in the year ended June 30, 2023 mainly as a result of an increase of the share profit in Synertech.
Changes in the net realizable value of agricultural products after harvest and other income or expenses, net
The changes in the net realizable value of agricultural products after harvest, along with other net income or expenses increased by US$1.6 million reaching a loss of US$4.9 million for the year ended June 30, 2024 compared to US$3.3 million for the year ended June 30, 2023. These results are presented together as they reflect changes in the fair value of agricultural products and their commercialization. The increase was primarily driven by higher volumes of grain sold and a decline in international prices during the period.
Financial results
Financial costs increased by US$3.1 million, or 13.0%, to US$26.9 million for the year ended June 30, 2024 from US$23.8 million for the year ended June 30, 2023 driven by interest expenses in the amount of US$2.9 million and financial commission in the amount of US$0.2 million.
Other financial results decreased by US$3.4 million to US$7.9 million for the year ended June 30, 2024, compared to a loss of US$11.3 million for the year ended June 30, 2023, mainly as a result of a gain in exchange differences in the amount of US$12.9 million and net gain of inflation effect on monetary items in the amount of US$1.3 million offset by changes in fair value of financial assets or liabilities and other financial results totaling US$10.8 million.
Income tax
Income tax changed to an expense of US$3.8 million for the year ended June 30, 2024, from a gain of US$1.1 million for the year ended June 30, 2023. The tax on the Group’s profit before tax differs from the theoretical amount that would arise using the weighted average tax rate applicable to profits of the consolidated entities due to share of profit or loss of subsidiaries, joint ventures and associates, share-based incentives charges, non-deductible expenses, tax inflation adjustment and result of inflation effect on monetary items, among other.
The theoretical amount that would arise using the weighted average tax rate applicable to profits of the consolidated entities changed from a gain of US$1.3 million for the year ended June 30, 2023, to an expense of US$2.5 million for the year ended June 30, 2024 primarily due to higher profitability in profit-making entities where the average tax rate ranged at nearly 34% of US$20.0 million, a lower gain of US$20.3 million in low or null taxation jurisdictions, offset by higher losses of US$8.1 million in loss-making entities where the average tax rate ranged from 23.3% for the year ended June 30, 2023 and 26.9% for the year ended June 30, 2024.
The income tax expense was calculated by applying the tax rate in force in the respective countries, as follows:
| Income tax for | ||||||||||||
| Earnings before |
Weighted average |
the year ended |
||||||||||
| income tax-rate |
applicable
tax rate |
June 30, 2024 |
||||||||||
| Tax Jurisdiction | ||||||||||||
| Low or null taxation jurisdictions | 9,431,930 | — | — | |||||||||
| Profit-making entities | 30,435,214 | 34.7 | % | 10,560,379 | ||||||||
| Loss-making entities | (29,831,873 | ) | 26.9 | % | (8,027,426 | ) | ||||||
| Total | 10,035,271 | 2,532,953 | ||||||||||
Profit for the year
As a result of the foregoing, profit for the year ended June 30, 2024 totaled US$6.3 million compared to US$20.2 million for the year ended June 30, 2023.
Other comprehensive loss
Other comprehensive loss stood flat at US$0.8 million for the year ended June 30, 2024. The loss for the year ended June 30, 2024, was entirely explained by foreign exchange differences on translation of foreign operations.
Total comprehensive income
As a result of the foregoing, we recorded a total comprehensive income of US$5.5 million for the year ended June 30, 2024, compared to US$19.3 million for the year ended June 30, 2023.
Comparison of the years ended June 30, 2023 and 2022
The table below illustrates our results of operations for the years ended June 30, 2023 and 2022.
| For the years ended June 30, |
||||||||
| 2023 | 2022(3) | |||||||
| (in millions of US$) | ||||||||
| Revenues from contracts with customers and initial recognition and changes in the fair value of biological assets at the point of harvest | 420.1 | 334.8 | ||||||
| Cost of sales | (235.5 | ) | (208.4 | ) | ||||
| Gross Profit | 184.6 | 126.4 | ||||||
| Research and development expenses | (15.3 | ) | (6.9 | ) | ||||
| Selling, general and administrative expenses | (113.0 | ) | (77.5 | ) | ||||
| Share of profit of joint ventures and associates | 1.2 | 1.1 | ||||||
| Changes in the net realizable value of agricultural products after harvest and other income or expenses, net | (3.3 | ) | (3.3 | ) | ||||
| Operating profit | 54.2 | 39.9 | ||||||
| Net financial costs | (35.1 | ) | (25.8 | ) | ||||
| Profit before income tax | 19.1 | 14.1 | ||||||
| Income tax | 1.1 | (18.0 | ) | |||||
| Profit (Loss) | 20.2 | (3.9 | ) | |||||
| Other comprehensive (loss) income | (0.8 | ) | 35.2 | |||||
| Total comprehensive profit(1) | 19.3 | 31.3 | ||||||
| Non-IFRS measures(2) | ||||||||
| Adjusted EBITDA (unaudited) | 81.2 | 51.5 | ||||||
Notes:—
| (1) | Includes (i) exchange differences on translation of foreign operations from joint ventures, (ii) exchange differences on translation of foreign operations, (iii) revaluation of property, plant and equipment, net of tax from joint ventures and (iv) revaluation of property, plant and equipment, net of tax. |
| (2) | We define Adjusted EBITDA as profit/(loss) exclusive of financial income/(costs), income tax benefit/(expense), depreciation, amortization, share-based compensation, inventory purchase allocation and one-time transactional expenses. Adjusted EBITDA is a non-IFRS measures. For a complete presentation of the reconciliation, see the section entitled “—Non-IFRS Financial Measures.” |
| (3) | Our results of operations for the year ended June 30, 2022 do not include the results of operations of Pro Farm, as the Pro Farm Merger closed on July 12, 2022. |
Revenues from contracts with customers and initial recognition and changes in the fair value of biological assets at the point of harvest
Total revenue increased by US$85.2 million, or 25.5%, to US$420.1 million in the year ended June 30, 2023, from US$334.8 million from the year ended June 30, 2022. Pro Farm revenue and the accrual of the upfront fee from the Syngenta Exclusive Global Distribution Agreement contributed US$41.0 million and US$32.9 million, respectively, of the increased revenue for the period. This increase in total revenue was achieved despite strong historical results for the year ended June 30, 2022, and a number of external factors that challenged growth, including a drought of historical magnitude in Argentina and negative industry dynamics in the U.S. and Brazil.
Crop Protection. Total revenue in the crop protection segment increased by US$31.4 million, or 18.0%, to US$205.8 million for the year ended June 30, 2023, from US$174.4 million for the year ended June 30, 2022. This increase includes US$31.1 million in revenue from Pro Farm’s bio-protection products. Excluding this Pro Farm revenue, crop protection revenue remained almost flat, as the segment faced significant headwinds from adverse weather conditions and high levels of channel inventories in several geographies. Adjuvant sales also remained almost flat at US$50.0 million despite a 17% reduction in sales volume.
Crop Nutrition. Total revenue in the crop nutrition segment increased by US$48.2 million, or 44.2%, to US$157.3 million for the year ended June 30, 2023, compared to US$109.1 million for the year ended June 30, 2022. Crop nutrition saw the largest yearly increase of all three segments driven by: (i) the US$32.9 million accrual of the upfront fee from the Syngenta Exclusive Global Distribution Agreement, (ii) an increase of US$10.0 million in micro-beaded fertilizer sales due to higher fertilizers prices (which more than offset the decrease in sales volume), and (iii) US$9.8 million in sales from Pro Farm’s bio-stimulants.
Seed and Integrated Products. Total revenue in the seed and integrated products segment increased by US$5.4 million, or 10.5%, to US$56.7 million for the year ended June 30, 2023, compared to US$51.3 million for the year ended June 30, 2022. The increase was mainly driven by a US$4.7 million increase in HB4 sales, resulting from greater sales volume when compared to the previous fiscal year, followed by increases of US$3.4 million and US$0.6 million in seed treatment packs and royalty payments, respectively. These revenue increases were partially offset by the initial recognition and changes in the fair value of biological assets.
Gross profit
Total gross profit increased by US$58.2 million, or 46.0%, to US$184.6 million for the year ended June 30, 2023, from US$126.4 million for the year ended June 30, 2022, which was mainly driven by the US$32.9 million upfront fee accrual under the Exclusive Global Distribution Agreement with Syngenta, US$24.9 million from the incorporation of Pro Farm products and US$1.2 million from the R&D Collaboration Agreement with Syngenta.
The crop nutrition segment achieved a 57.1% of gross margin compared to 43.1% in the previous year, mainly driven by positive results from the agreements with Syngenta for the global distribution of inoculants, as well as growth in micro-beaded fertilizers sales with higher prices. Gross profit in crop protection increased due to the inclusion of US$16.8 million from Pro Farm products. Excluding these items, gross profit for this segment was almost flat year over year, in line with sales performance. The incorporation of Pro Farm products into the portfolio increased the average margin for this segment from 28.6% to 34.2%. Finally, despite higher sales, gross profit contribution from seed & integrated Products decreased by 13.9%, heavily impacted by product mix.
Research and development expenses
Research and development expenses include ongoing efforts to maintain and continuously update our existing product portfolio. Research and development expenses increased by US$8.4 million, or 121.7%, to US$15.3 million for the year ended June 30, 2023, from US$6.9 million for the year ended June 30, 2022, primarily as a result of additional expenses with R&D at Pro Farm, which totaled of US$7.2 million.
Selling, general and administrative expenses
Selling, general and administrative expenses increased by US$35.5 million, or 45.8%, to US$113.0 million for the year ended June 30, 2023 from US$77.5 million for the year ended June 30, 2022 mainly as a result of additional selling, general and administrative expenses from Pro Farm totaling US$26.8 million.
When excluding depreciation and amortization, transaction expenses and share-based incentives, selling, general and administrative expenses for the year ended June 30, 2023, was US$94.4 million, an increase of US$28.8 million compared to US$65.6 million for the year ended June 30, 2022, of which US$20.1 was due to Pro Farm’s selling, general and administrative expenses. The remaining US$8.7 million was mainly due to an increase in employee benefits and social security expenses, professional fees, expenses, taxes, among others.
Share of profit of joint ventures and associates
The profit resulting from our share in the profit of joint ventures and associates remained almost flat in US$1.2 million, as operational results of our joint ventures were similar to those relating to the year ended June 30, 2022.
Changes in the net realizable value of agricultural products after harvest and other income or expenses, net
Changes in the net realizable value of agricultural products after harvest and other income or expenses, net remained flat in US$3.3 million in the year ended June 30, 2023 and 2022. These results are presented together as they are explained due to the changes in fair value of agricultural products and its commercialization.
Financial results
Financial costs increased by US$5.9 million, or 33.0%, to US$23.8 million for the year ended June 30, 2023 from US$17.9 million for the year ended June 30, 2022 driven by a higher debt position compared with to the year ended June 30, 2022. Interest expenses does not include a gain from translation effects on Argentine Peso denominated loans.
Other financial results increased by US$3.4 million, or 43.0%, to US$11.3 million for the year ended June 30, 2023, compared to a loss of US$7.9 million for the year ended June 30, 2022, mainly as a result of changes in fair value of financial assets or liabilities and other financial results.
Income tax
Income tax changed to a gain of US$1.1 million in the year ended June 30, 2023, from an expense of US$18.0 million for the year ended June 30, 2022. The tax on the Group’s profit before tax differs from the theoretical amount that would arise using the weighted average tax rate applicable to profits of the consolidated entities due to share of profit or loss of subsidiaries, joint ventures and associates, share-based incentives charges, non-deductible expenses, tax inflation adjustment and result of inflation effect on monetary items, among other.
The theoretical amount that would arise using the weighted average tax rate applicable to profits of the consolidated entities changed from a loss of US$9.2 million in the year ended June 30, 2022, to a gain of US$1.3 million in the year ended June 30, 2023. In the year ended June 30, 2023, our income tax was significantly impacted by the profitability of the Syngenta Agreement, after accounting for corporate finance and operational expenses, which were subject to a 0% tax rate. Further, our income tax was affected by the inclusion of new jurisdictions resulting from the closing of the business combinations during the fiscal year, in addition to low profitability in Latin American jurisdictions resulting from adverse weather conditions.
For the year ended June 30, 2022, our income tax was mainly influenced by profitability in Latin American jurisdictions where the average tax rate ranges from 30% to 35%. Profitability was mainly offset by losses in low or null taxation jurisdictions and by losses in jurisdictions where the average tax rate ranges from 21% to 30%.
The income tax expense was calculated by applying the tax rate in force in the respective countries, as follows:
| Income tax for | ||||||||||||
| Earnings before |
Weighted average |
the year ended |
||||||||||
| income tax-rate |
applicable tax rate |
June 30, 2023 |
||||||||||
| Tax Jurisdiction | ||||||||||||
| Low or null taxation jurisdictions | 29,696,082 | — | — | |||||||||
| Profit-making entities | 10,484,562 | 34.1 | % | 3,577,919 | ||||||||
| Loss-making entities | (21,074,697 | ) | 23.3 | % | (4,909,463 | ) | ||||||
| Total | 19,105,947 | (1,331,544 | ) | |||||||||
| Income tax for | ||||||||||||
| Earnings before |
Weighted average | the year ended |
||||||||||
| income tax-rate |
applicable tax rate |
June 30, 2022 |
||||||||||
| Tax Jurisdiction | ||||||||||||
| Low or null taxation jurisdictions | (10,954,972 | ) | — | — | ||||||||
| Profit-making entities | 33,448,094 | 34.7 | % | 11,591,173 | ||||||||
| Loss-making entities | (8,430,094 | ) | 28.9 | % | (2,425,147 | ) | ||||||
| Total | 14,063,630 | 9,166,026 | ||||||||||
Profit (Loss) for the year
As a result of the foregoing, loss for the year ended June 30, 2023 amounted to US$20.2 million compared to a loss of US$3.9 million for the year ended June 30, 2022.
Other comprehensive income (loss)
Other comprehensive loss totaled US$0.8 million for the year ended June 30, 2023 compared to a comprehensive income of US$35.2 million for the year ended June 30, 2022, primarily as a result of US$39.8 million reduction of the benefits of foreign differences on translation of foreign operations due to the change of functional currency in our main Argentine operational subsidiaries, which was offset by a decrease of the loss in revaluation of property, plant and equipment of US$3.8 million.
Total comprehensive income
As a result of the foregoing, we recorded a total comprehensive income of US$19.3 million for the year ended June 30, 2023 compared to a total comprehensive loss of US$31.3 million for the year ended June 30, 2022.
Non-IFRS Financial Measures
We supplement the use of IFRS financial measures in this report with non-IFRS financial measures, including Adjusted EBITDA.
These non-IFRS measures should not be considered in isolation or as a substitute for measures of performance prepared in accordance with IFRS and may be different from non-IFRS measures used by other companies. In addition, these non-IFRS measures are not based on any comprehensive set of accounting rules or principles. Non-IFRS measures have limitations in that they do not reflect all of the amounts associated with our results of operations as determined in accordance with IFRS. These non-IFRS financial measure should only be used to evaluate our results of operations in conjunction with the most comparable IFRS financial measures.
Adjusted EBITDA
We define Adjusted EBITDA as profit/(loss) exclusive of financial income/(costs), income tax benefit/(expense), depreciation, amortization, share-based compensation, inventory purchase allocation and one-time transactional expenses.
We believe that Adjusted EBITDA provides useful supplemental information to investors about us and our results. Adjusted EBITDA is among the measures used by our management team to evaluate our financial and operating performance and make day-to-day financial and operating decisions. In addition, similarly titled measures are frequently used by our competitors, rating agencies, securities analysts, investors and other parties to evaluate companies in our industry. We also believe that Adjusted EBITDA is helpful to investors because it provides additional information about trends in our core operating performance prior to considering the impact of capital structure, depreciation, amortization and taxation on our results. Adjusted EBITDA should not be considered in isolation or as a substitute for other measures of financial performance reported in accordance with IFRS. Adjusted EBITDA has limitations as an analytical tool, including:
| ● | Adjusted EBITDA does not reflect changes in, including cash requirements for, our working capital needs or contractual commitments; |
| ● | Adjusted EBITDA does not reflect our financial expenses, or the cash requirements to service interest or principal payments on our indebtedness, or interest income or other financial income; |
| ● | Adjusted EBITDA does not reflect our income tax expense or the cash requirements to pay our income taxes; |
| ● | although depreciation and amortization are non-cash charges, the assets being depreciated or amortized often will need to be replaced in the future, and Adjusted EBITDA does not reflect any cash requirements for the replacements; |
| ● | although share-based compensation is a non-cash charge, Adjusted EBITDA does not consider the potentially dilutive impact of share-based compensation; and |
| ● | other companies may calculate Adjusted EBITDA, and similarly titled measures differently, limiting its usefulness as a comparative measure. |
We compensate for the inherent limitations associated with using Adjusted EBITDA through disclosure of these limitations, presentation of our consolidated financial statements in accordance with IFRS and reconciliation of Adjusted EBITDA to income/(loss) for the period or year, which is the most directly comparable IFRS measure.
The table below provides a reconciliation of our income or loss for the period/year to Adjusted EBITDA:
| Year Ended June 30, | ||||||||||||
| 2024 | 2023 | 2022 | ||||||||||
| (in millions of US$) | ||||||||||||
| Reconciliation of Net Loss to Adjusted EBITDA: | ||||||||||||
| Profit (Loss) | 6.3 | 20.2 | (3.9 | ) | ||||||||
| Income tax | 3.8 | (1.1 | ) | 18.0 | ||||||||
| Financial results | 34.8 | 35.1 | 25.8 | |||||||||
| Depreciation of property, plant and equipment | 9.2 | 8.4 | 5.0 | |||||||||
| Amortization of intangible assets | 12.1 | 11.0 | 4.2 | |||||||||
| Share-based incentive and stock options | 14.1 | 3.4 | 1.4 | |||||||||
| Transactional expenses | 1.1 | 4.2 | 1.0 | |||||||||
| Adjusted EBITDA (unaudited) | 81.4 | 81.2 | 51.5 | |||||||||
| B. | Liquidity and Capital Resources |
Overview
Since our inception, we have funded our operations primarily with sales of our products and borrowings, including the issuance of notes and corporate bonds. Our principal use of cash is to fund our operations, investments in intangible assets, expenditures in property, plant and equipment, working capital requirements and repayment of debt obligations.
As of June 30, 2024, our total indebtedness was US$259.7 million, of which approximately 47% consisted of long-term obligations. Cash and cash equivalents, short-term deposits and other short-term investments represented approximately 41% of the current portion of debt. As of June 30, 2024, our cash and cash equivalents amounted to US$44.5 million, and we held other current financial assets that amounted to US$11.7 million.
We believe that our existing cash and cash equivalents, cash inflows from revenue and borrowings (including refinancing debt and credit lines) will be adequate to meet our anticipated cash needs for the next 12 months.
Our ability to generate cash is subject to our performance, general economic conditions, industry trends and other factors. To the extent that our existing cash and cash equivalents are insufficient to fund our future activities and requirements, we may need to raise additional funds through public or private equity or debt financing. If we issue equity or convertible securities in order to raise additional funds, our existing shareholders may experience substantial dilution. If we raise cash through the issuance of indebtedness, we may be subject to additional contractual restrictions on our business. We cannot assure the investor that we would be able to raise additional funds on favorable terms or at all.
Cash Flows
Set forth below is a comparative discussion of our cash flows, which includes cash flows from discontinued operations.
Statement of Cash Flows
The tables below illustrate our statement of cash flows for the years ended June 30, 2024 and 2023:
| Year Ended June 30, | ||||||||
| 2024 | 2023 | |||||||
| (in millions of US$) | ||||||||
| Statement of cash flows | ||||||||
| Net cash flows generated by operating activities | 41.7 | 2.6 | ||||||
| Net cash flows used in investing activities | (28.7 | ) | (25.7 | ) | ||||
| Net cash flows (used in) generated by financing activities | (10.1 | ) | 33.0 | |||||
| Net increase in cash and cash equivalents | 2.9 | 9.8 | ||||||
| Inflation effects on cash and cash equivalents | — | (0.1 | ) | |||||
| Effect of exchange rate changes on cash and equivalents | (6.6 | ) | 4.9 | |||||
We believe that funds from operations, the availability of liquid financial assets and our access to external borrowing through the financial markets will be sufficient to satisfy our working capital needs, to finance our planned capital spending program, to service our debt in the future twelve months and to address short-term changes in business conditions.
Net cash flows generated by operating activities
Cash generated by operating activities for the year ended June 30, 2024 amounted to US$41.7 million. Earning before financial results, income tax, depreciation and amortization, share-based incentives and transactional expenses amounted to US$81.4 million was offset by US$39.6 million of working capital outflow. The net cash flows used for working capital was manly driven by an increase in trade receivables of US$46.7 million and a reduction of deferred revenue and advances from customers of US$21.1 million that was offset by a decrease in inventories and an increase in trade and other payables for US$14.2 million.
While days of sale increased by 18% as of June 30, 2024, days of inventory outstanding has decreased by 24% as of June 30, 2024 all with respect to the year ended June 30, 2023. Days payables outstanding stood almost flat as of June 30, 2024 compared to the year ended June 30, 2023.
Cash generated by operating activities for the year ended June 30, 2023 amounted to US$2.6 million due to our incremental working capital outflow, although our earnings before interest, taxes and depreciation increased. This was mainly driven by an increase in trade receivables of US$56.9 million, recoverable income tax of US$16.2 million and other receivables of US$11.5 million.
The severe drought in Argentina negatively impacted our clients and, consequently, payment terms for trade receivables and other receivables. Days of sale and inventory outstanding increased by an average of 15%, while days payables outstanding remained almost flat in the year ended June 30, 2023 when compared to the year ended June 30, 2022.
Net cash flows used in investing activities
Cash used in investing activities for the year ended June 30, 2024 amounted to US$28.7 million. This was primarily attributable to net investments in property, plant and equipment of US$9.5 million and purchases and capitalized development expenditures relating to intangible assets of US$13.0 million and net investment in financial assets of US$6.3 million.
Cash used in investing activities for the year ended June 30, 2023 amounted to US$25.7 million and was primarily attributable to net investments in property, plant and equipment of US$11.2 million and purchases and capitalized development expenditures relating to intangible assets of US$11.2 million and net investment in financial assets of US$7.7 million which was partially offset by cash acquired in the Pro Farm Merger.
Net cash flows (used in) generated by financing activities
Cash used in financing activities for the year ended June 30, 2024 amounted to US$10.1 million and consisted mainly of net proceeds from borrowings and leased assets payments.
Cash provided by financing activities for the year ended June 30, 2023 amounted to US$33.0 million and consisted mainly of net proceeds from borrowings of US$40.3 million, partially offset by leased assets payments and the purchase of our shares pursuant to our Buy-Back Program for US$3.9 million and US$3.0 million, respectively.
Indebtedness
As of June 30, 2024, our total outstanding borrowings, including interest accrued, were US$178.8 million, which consists of US$136.7 million of current borrowings, including US$91.8 million of the short-term portion of long-term loans, US$42.0 million in corporate bonds and US$2.9 million in trust debt securities, US$42.1 million of non-current borrowing, which includes corporate bonds of US$25.1 million, borrowings of US$15.3 million and trust debt securities of US$1.7 million. In addition, as of June 30, 2024, we had US$80.8 million non-current debt from the Notes due 2026.
As of June 30, 2024, our indebtedness denominated in U.S. dollar totaled US$232.5 million, which bear a fixed weighted average interest rate of 5.2%. Our borrowings denominated in Argentine Pesos totaled US$14.8 million that bear a fixed weighted average interest rate of 35.5%. Our borrowings denominated in Brazilian reais totaled US$12.3 million and bear a fixed weighted average interest rate of 15.5%.
As of June 30, 2024, US$178.8 million (or 68.9%) of our total outstanding borrowings were unsecured and US$80.8 million (or 31.1%) were secured.
Issuance of Notes
See “Item 10. Additional Information—C. Material Contracts— Issuance of Notes due 2026.”
Public Corporate Bonds
Below is a summary of public corporate bonds outstanding as of June 30, 2024:
| Sector | US$million | Rate | Maturity | |||||||
| VI – Class B | 3.4 | 5.25 | % | September 7, 2024 | ||||||
| VII | 20.0 | 1.49 | % | December 28, 2024 | ||||||
| VIII – Class A | 21.5 | 1.5 | % | February 10, 2025 | ||||||
| VIII – Class B | 5.0 | 3.98 | % | February 10, 2026 | ||||||
| IX – Class A | 13.0 | 5.0 | % | June 28, 2026 | ||||||
| IX – Class B | 7.0 | 7.5 | % | June 28, 2026 | ||||||
Series VI
On August 31, 2021, we issued US$16.1 million Series VI corporate bonds in Argentina. The bonds were issued in two tranches: the Class A bonds matured in March 2023 and accrue interest at a rate of 3.75% and the Class B bonds mature in September 2024 and accrue interest at a rate of 5.25%.
Series VII
On December 23, 2021, we issued US$20.0 million Series VII corporate bonds in Argentina. The Series VII bonds mature in December 2024 and accrue interest at a rate of 1.49%.
Series VIII
On February 8, 2023, we issued US$26.5 million Series VIII corporate bonds in Argentina. The bonds were issued in two tranches: the Class A bonds mature in February 2025 and accrue interest at a rate of 1.5% and the Class B bonds mature in February 2026 and accrue interest at a rate of 3.98%.
Series IX
On July 1, 2024, we issued US$20.0 million Series IX corporate bonds in Argentina. The bonds were issued in two tranches: the Class A bonds mature in June 2026 and accrue interest at a rate of 5.0% and the Class B bonds mature in June 2026 and accrue interest at a rate of 7.5%.
Consideration of payment of acquisitions
Verdeca and other intangibles assets
On November 12, 2020, we acquired the remaining 50% ownership interest in Verdeca from Arcadia Biosciences, making it our wholly owned subsidiary. As part of this transaction, we gained full access and control of Verdeca’s vetted soybean library of gene-edited materials used to develop new quality and productivity, as well as exclusive rights to all Arcadia technologies that are applicable to soybean. In addition, through this transaction, we have also acquired rights to Arcadia’s quality wheat traits and the related Good Wheat™ brand for use in Latin America. In consideration for the acquisition, we paid Arcadia US$5.0 million in cash and US$15.0 million in equity consisting of 1,875,000 of our ordinary shares, US$1.0 million in reimbursement costs associated with the transaction and US$2 million upon Arcadia obtaining Chinese import clearance for HB4 soy royalty payments equivalent to (i) 6% of the net HB4 soy technology revenues realized by Verdeca, capped at an US$10.0 million aggregate amount, and (ii) 25% of the net wheat technology revenues resulting from in-licensed materials.
Insuagro
On April 9, 2021, as part of the reorganization process of our crop protection business segment, we acquired a controlling interest in Insuagro, an Argentine public company listed on Bolsas y Mercados Argentinos S.A. (“BYMA”). The interest acquired is represented by a total of 11,022,000 shares, distributed as follows: (i) 2,749,390 ordinary, registered shares of AR$0.10 nominal value each and five votes per share, denominated Class A; and (ii) 8,272,610 ordinary, registered shares of Pesos 0.10 nominal value each and one vote per share, denominated Class B, jointly representing 50.1% of equity interest and 55.05% of voting interest.
The consideration for the acquisition was US$0.282 per share, totaling an amount of US$3.1 million (the “Fixed Price”). At closing, we paid US$0.2 million, and the rest was payable in three installments due August 31, 2022, 2023 and 2024 for an amount of US$0.9 million, US$0.9 million and US$1.2 million, respectively. The amount payable accrued an annual interest of 5.5%. Furthermore, the Fixed Price may be increased up to 3.5x Adjusted EBITDA (as defined in the share exchange agreement) per share to be measured in each annual reporting period.
As we reached a controlling interest in Insuagro and pursuant to the Argentine Capital Market Law and the National Securities Commission rules, we filed a mandatory take-over tender offer (the “Insuagro Tender Offer”) of the Class B ordinary shares listed at BYMA. As a result of the Insuagro Tender Offer, we acquired 2,467,990 ordinary shares Class B, increasing our shareholding in Insuagro to 61.32% of the equity interest and 61.22% of the voting rights.
On August 31, 2022, the fixed price per share of the Insuagro Tender Offer increased by US$0.965 based on the Adjusted EBITDA (as defined in the share exchange agreement) for the year ended June 30, 2022
| C. | Research and Development, Patents and Licenses, etc. |
For a discussion of our research and development policy, see “Item 4. Information on the Company—B. Business Overview— In-House R&D, Technology Sourcing and Product Development Timeline and Process”. For a discussion of patent and licenses, see “Item 4. Information on the Company—B. Business Overview—Intellectual Property.”
| D. | Trend Information |
For a discussion of trend information, see “—A. Operating Results—Factors affecting our results of operations.”
| E. | Critical Accounting Estimates |
The preparation of our consolidated financial statements and related disclosures in accordance with IFRS requires our management to make certain judgments, estimates and assumptions regarding the future. Estimates and judgments are continually evaluated based on historical experience and other factors, including expectations of future events that are believed to be reasonable under the circumstances. In the future, actual experience may differ from these judgments, estimates and assumptions. The judgments, estimates and assumptions that have a significant risk of causing a material adjustment to the carrying amounts of assets and liabilities within the next financial year are discussed in our audited consolidated financial statements included elsewhere in this report.
In order to provide an understanding of the manner in which our management forms its judgments about future events, including the variables underlying our judgments, estimates and assumptions, we summarize our critical accounting policies in Note 4 to our audited consolidated financial statements included elsewhere in this report.
ITEM 6. DIRECTORS, SENIOR MANAGEMENT AND EMPLOYEES
| A. | Directors and Senior Management |
Directors
As of June 30, 2024, the following persons (with ages as of the date of this report) were the directors and executive officers of Bioceres Crop Solutions.
Our Executive Officers and Directors
| Name | Age | Position | Initial Appointment | |||
| Federico Trucco, Ph.D. | 47 | Chief Executive Officer and Executive Director | February 27, 2019 | |||
| Enrique Lopez Lecube | 42 | Chief Financial Officer and Executive Director | February 27, 2019 | |||
| Gloria Montaron Estrada | 53 | Non-Executive Director | March 14, 2019 | |||
| Natalia Zang | 48 | Non-Executive Director | February 27, 2019 | |||
| Ari Freisinger | 39 | Non-Executive Director | February 27, 2019 | |||
| Yogesh Mago | 43 | Non-Executive Director | July 12, 2022 | |||
| Keith McGovern | 59 | Non-Executive Director | July 12, 2022 |
Biographical information for each member of our board of directors and senior management is set forth below.
Federico Trucco. Federico Trucco, Ph.D., has served as chief executive officer of Bioceres Group PLC since June 2011 and our chief executive officer since our listing in February 2019. He was also appointed as a member of Bioceres S.A.’s board of directors in December 2014 and President of Bioceres LLC (formerly Bioceres Inc.) in February 2012. He previously served in various positions at INDEAR including as general manager from 2009 to 2011, director of product development from 2008 to 2009 and research team leader of the Amaranth project from 2005 to 2009. Dr. Trucco also serves as president of Rasa Holding LLC, director and president of BCS Holding Inc., manager of Verdeca, director of Trigall, director of Rizobacter Argentina, president of Bioceres Semillas, president of Bioceres Crops S.A. (formerly SEMYA), director of Synertech Industrias S.A., director of Heritas S.A. and director of Moolec Science Ltd. Dr. Trucco received a Ph.D. in crop sciences and a CBA from the University of Illinois, a Master of Science degree in plant pathology and weed science from the Colorado State University and a bachelor’s degree in biochemistry from the Louisiana State University. In 2018, Federico was recognized with the Konex Award for business innovation for 2008-18, one of Argentina’s most prestigious leadership prizes. He was also recognized with the EY Entrepreneur of the Year Award for Argentina in 2019. Mr. Trucco was appointed President of the Argentine Chamber of Biotechnology in 2020.
Enrique López Lecube. Enrique López Lecube has served as chief financial officer of Bioceres Group PLC since November 2017, and our chief financial officer since our listing in February 2019. Mr. Lopez Lecube serves as director of Bioceres Semillas S.A.U. and vice president of Bioceres Crops S.A. (formerly SEMYA). He has served as Manager for M&A and Corporate Finance at Lartirigoyen & Cia S.A. – a Glencore subsidiary – since 2016, where he has led transactions in the food, chemical and service industries and worked in the finance department to oversee 10 group entities. Previously, he worked as head trader from 2010 to 2016 at Lartirigoyen & Cia S.A. From 2008 to 2010, he worked at Cargill focusing on grains and oilseeds. Mr. López Lecube earned an MBA from Kellogg of School of Management of Northwestern University and a degree in industrial engineering from ITBA (Instituto Tecnológico de Buenos Aires).
Gloria Montaron Estrada. Gloria Montaron Estrada is the Legal and Intellectual Property Director of Bioceres Group PLC and manager of Bioceres LLC, our controlling shareholder. She has served as our non-executive director since March 2019. She previously served as an attorney at Marval, O’Farrell & Mairal in Buenos Aires for 16 years, where her practice as centered around intellectual property, corporate and banking matters. Ms. Montaron also serves as a director of Bioceres LLC (formerly Bioceres Inc.), BCS Holding Inc., Bioceres Tech Services LLC, BF Farming Technologies Ltd. and SF500 Trust. She received an LLM in intellectual property from the University of Palermo, Buenos Aires, a degree in Law from the University of Buenos Aires, Argentina, and she also graduated as Intellectual Property Agent in 2013. She has successfully completed two out of three programs in the HBS Corporate Director Certificate at Harvard Business School: Making Corporate Boards More Effective and Audit Committees. Ms. Montaron is an active international lecturer in law congresses and seminars on her field of practice, and she also teaches at various universities in the area of intellectual property. Bioceres’ legal team, led by Ms. Montaron, won the award of “Deal of the Year – Private Equity” in 2019. Ms. Montaron was included at the GC Powerlist of Legal500 in Argentina and at the IAM Strategy 300, the World’s Leading IP Strategist. Ms. Montaron is a member of the Bar Association of the City of Buenos Aires.
Natalia Zang. Ms. Zang serves as one of our non-executive directors. Ms. Zang is a business leader with more than 25 years of experience in private equity, venture capital and corporate finance in Latin America, Europe, the U.S. and Australia. Ms. Zang serves as our non-executive director and chair of our audit committee. She is currently advisor of Gameto, a female-led biotech company and independent board member and chair of the audit committee of Moolec. Previously, Ms. Zang held C-level positions in several industries, including biotech, retail and real estate. In late 2015, Ms. Zang joined President Macri’s administration in Argentina, initially as Undersecretary for the Chief of Staff and then as Secretary (General Coordinator of the G20). Ms. Zang is a sought-after lecturer on business and women’s leadership issues, and she is active in mentoring programs for students and women entrepreneurs. Ms. Zang received a master’s degree in finance from the Universidad del CEMA and a bachelor’s degree in Business Administration from the Universidad Torcuato Di Tella.
Ari Freisinger. Ari Freisinger has served as our non-executive director since March 2019. He was a Principal at Highfields Capital from 2010-2018. Prior to that, he served as an investment banker at Barclays Capital in the mergers & acquisitions group. Mr. Freisinger received a master’s degree in economics and social history from the University of Oxford and a bachelor’s degree in economics from Columbia University. He currently serves on the board of the Jewish Family Service of Metrowest, a philanthropic organization in the greater Boston area.
Yogesh Mago. Yogesh Mago has served as our non-executive director since July 12, 2022. He has been a senior advisor for Ospraie Ag Science LLC, following the closing of the Pro Farm Merger one of our shareholders, since October 2016 and has over 15 years of experience in investing across a variety of industries globally, including agriculture, travel, consumer, transportation, industrials and real estate. Mr. Mago is the president and co-founder of Operation Water Inc., a nonprofit organization that aims to deliver sustainable access to clean water in impoverished countries through the development of scalable infrastructure projects. In addition, he is on the Advisory Board of Girl Rising, the nonprofit organization behind the worldwide social action campaign for girls’ education and empowerment. Mr. Mago has a Bachelor’s degree in Finance and International Business from New York University.
Keith McGovern. Mr. McGovern has over 30 years of experience in the agriculture industry, specializing in leading commercial potato farming and potato processing operations. He is President of R.D. Offutt Farms, a division of R.D. Offutt Company, one of the largest farming and food processing concerns in the United States. Mr. McGovern joined R.D. Offutt Company in August 1988. Mr. McGovern serves on the Management Committee of Lamb-Weston/RDO Frozen, a joint venture frozen potato product processing plant. He also serves on the Board of Alliance for Potato Research and Education, on the Management Committee for Columbia River Technologies, a whey processor in partnership with Tillamook and Fonterra, and the Management Committee for Simplot RDO, a frozen vegetable plant in Pasco, Washington. Mr. McGovern is a graduate of Embry Riddle Aeronautical University with a degree in Aeronautical Science and is still an active pilot.
| B. | Compensation |
Remuneration of Directors and Senior Management
The aggregate compensation, including benefits in kind, accrued or paid to our senior management with respect to the year ended June 30, 2024, for services in all capacities was US$2.1 million. In addition, in the year ended June 30, 2024, the accrual expense related to share-based incentives to our directors and senior management amounted to US$8.1 million of our ordinary shares.
Annual Bonuses
The Annual Bonus is an annual cash incentive bonus awarded to certain employees and not contemplated in the Equity Compensation Plans, to tie a portion of their compensation to financial and operational objectives achievable within the applicable fiscal year according to a target. The objectives and other terms and conditions of the annual cash bonuses for all its employees are determined every year.
Equity Compensation Plans
2023 Omnibus Equity Incentive Plan
On May 12, 2023, our board of directors approved the 2023 Omnibus Equity Incentive Plan (the “Plan”), to attract and retain the best available personnel, provide additional incentives to employees, directors and consultants and to promote the success of our business. Under the Plan, the maximum aggregate number of ordinary shares that may be issued pursuant to all awards is 1,700,000 ordinary shares. The Plan allows us to establish the terms and conditions of the equity awards granted thereunder.
Our board of directors or our Compensation Committee shall determine the manner and timing of vesting, exercise and expiration of options granted under the Plan. Option periods shall not exceed ten years, unless the option period (other than in the case of an incentive share option) would expire at a time when trading in the Shares is prohibited by our securities trading policy or a self-imposed “blackout period,” in which case options period shall be extended automatically until the 30th day following the expiration of such prohibition (so long as such extension shall not violate Section 409A of the Internal Revenue Code of 1986). We may accelerate the vesting and/or exercisability of any option, which acceleration shall not affect any other terms and conditions of such option.
Amount set aside for pension, retirement or similar benefits
The total amounts set aside or accrued by us to provide pension, retirement or similar benefits was US$0.2 million for the fiscal year ended June 30, 2024.
Director Compensation
Our board of directors has established a compensation program for non-executive directors, which consists of an annual retainer, board fees in accordance with their attendance at board meetings and committee fees for their service as members of a committee. We also reimburse our independent directors for reasonable out-of-pocket expenses incurred in connection with the performance of their duties as directors, including, without limitation, travel expenses in connection with their attendance in-person at board and committee meetings. Executive Directors do not receive any compensation for their services as directors.
| C. | Board Practices |
Our articles of association (the “Articles”) provide that the board of directors must comprise at least one member. As of June 30, 2024, our board consisted of seven directors. Each of our directors will have a term that expires at our annual general meeting, or until their respective successors are duly appointed and qualified, or until their earlier resignation, removal or death. None of our directors have service contracts with us or any of our subsidiaries providing for benefits upon termination of employment.
At our annual general meeting held on October 24, 2024, six directors were appointed to serve on the board of directors of the Company through our annual general meeting to be held in 2025: (i) Federico Trucco, (ii) Gloria Montaron Estrada, (iii) Enrique Lopez Lecube, (iv) Natalia Zang, (v) Keith McGovern and (vi) Yogesh Mago. In addition, our consolidated financial statements for the year ended June 30, 2024 were approved and Price Waterhouse & Co. S.R.L. (“PwC”) was reappointed as our independent registered public accounting firm.
We have ceased to be a “controlled company” for purposes of the Nasdaq rules. As a result, the Nasdaq rules require that our board of directors, compensation and nominating and governance committees be independent. However, we rely on our home country practices, in lieu of these requirements, which do not require us to have a majority of our board of directors to be independent, permit our nominating and governance committee to be comprised of shareholder representatives and do not require us to hold regular executive sessions in which only independent directors shall be present.
Audit Committee
As of June 30, 2024, our audit committee consisted of Natalia Zang, Yogesh Mago and Ari Freisinger, with Natalia Zang serving as the chair of the audit committee. Each of Yogesh Mago, Ari Freisinger and Natalia Zang meets the applicable audit committee independence standards. Ari Freisinger qualifies as an “audit committee financial expert,” as such term is defined in applicable SEC rules.
Our audit committee will, among other matters, oversee (i) our financial reporting, auditing and internal control activities; (ii) the integrity and audits of our financial statements; (iii) our compliance with legal and regulatory requirements; (iv) the qualifications and independence of our independent auditors; (v) the performance of our internal audit function and independent auditors; and (vi) our overall risk exposure and management. Duties of the audit committee will also include the following:
| ● | annually review and assess the adequacy of the audit committee charter and the performance of the audit committee; |
| ● | be responsible for recommending the appointment, retention and termination of our independent auditors and determine the compensation of the independent auditors; |
| ● | review the plans and results of the audit engagement with the independent auditors; |
| ● | evaluate the qualifications, performance and independence of the independent auditors; |
| ● | have sole authority to approve in advance all audit and non-audit services by the independent auditors, the scope and terms thereof and the fees therefor; |
| ● | review the adequacy of our internal accounting controls; and |
| ● | meet at least quarterly with our executive officers, internal audit staff and independent auditors in separate executive sessions. |
Our board of directors adopted a written charter for the audit committee, which is available free of charge on our corporate website at biocerescrops.com. The information on our website is not part of this report.
Compensation Committee
As of June 30, 2024, our compensation committee consisted of Ari Freisinger, Enrique López Lecube and Yogesh Mago, with Ari Freisinger serving as the chair of the compensation committee.
The compensation committee has the sole authority to retain and terminate any compensation consultant, to assist in the evaluation of employee compensation and to approve consultants’ fees and the other terms and conditions of consultants’ retention. The compensation committee will also, among other matters:
| ● | assist the board of directors in developing and evaluating potential candidates for executive officer positions and oversee the development of executive succession plans; |
| ● | administer, review and make recommendations to our board of directors regarding our compensation plans; |
| ● | annually review and approve our corporate goals and objectives with respect to compensation for executive officers and, at least annually, evaluate each executive officer’s performance in light of such goals and objectives to set his or her annual compensation, including salary, bonus and any equity and non-equity incentive compensation, subject to approval by our board of directors; |
| ● | provide oversight of management’s decisions regarding the performance, evaluation and compensation of other officers; and |
| ● | review our incentive compensation arrangements to confirm that incentive pay does not encourage unnecessary risk-taking and review and discuss, at least annually, the relationship between risk management policies and practices, business strategy and executive officer compensation. |
Nominating and Governance Committee
As of June 30, 2024, our nominating and governance committee consisted of Gloria Montaron Estrada, Keith McGovern and Natalia Zang, with Gloria Montaron Estrada serving as the chair of the nominating and governance committee.
The nominating and governance committee will, among other matters:
| ● | evaluate the independence of directors and nominate individuals to serve as directors; |
| ● | review the committee structure of our board of directors and recommend directors to serve as members or chairs of each committee of our board of directors; |
| ● | review and recommend committee slates annually and recommend additional committee members to fill vacancies as needed; |
| ● | develop and recommend to our board of directors a set of corporate governance guidelines applicable to us and, at least annually, review such guidelines and recommend changes to our board of directors for approval as necessary; and |
| ● | oversee the annual self-evaluation of our board of directors. |
Code of Ethics
We have adopted a Code of Ethics applicable to our directors, executive officers and employees and to the board members, employees, and officers of our controlled companies. The Code of Ethics codifies the business and ethical principles that govern all aspects of our business. A copy of the Code of Ethics will be filed with the SEC and will be provided without charge upon written request to us in writing at investorelations@biocerescrops.com. We intend to disclose any amendments to or waivers of certain provisions of our Code of Ethics in a Current Report on Form 6-K (as required) or on our website.
Nasdaq Corporate Governance Exemptions
As a foreign private issuer incorporated in the Cayman Islands with our principal listing on the Nasdaq Global Market, we follow the laws of the Cayman Islands, our “home country” for corporate governance practices, in lieu of the provisions of the Nasdaq Stock Market’s Marketplace Rule 5600 series that apply to the constitution of a quorum for any meeting of shareholders, the composition and independence requirements of the board of directors, the Nominations Committee and the Compensation Committee and the requirement to have regularly scheduled meetings at which only independent directors are present. The Nasdaq Stock Market’s rules also provide for the involvement of independent directors in the selection of director nominees. However, we rely on our home country practices, in lieu of these requirements, which do not require us to have a majority of our board of directors to be independent, permit our nominating and governance committee to be comprised of shareholder representatives and do not require us to hold regular executive sessions in which only independent directors shall be present. See “Item 6. Directors, Senior Management and Employees—C. Board Practices—Nominating and Governance Committee.”
The Nasdaq Stock Market’s rules require each Compensation Committee member to be an independent director for purposes of the Nasdaq Stock Market’s Marketplace Rule 5605(d)(2). However, to preserve greater flexibility in who may be appointed to the Compensation Committee, we will be relying on our home country practices, in lieu of this requirement and corporate governance practice and requirements in the Cayman Islands. Although Nasdaq Stock Market’s rules require listed companies to have regularly scheduled meetings at which only independent directors are present, we follow our home country practices instead, which do not impose such a requirement.
| D. | Employees |
The table below shows our employees by role and location, as of the dates indicated, and does not include employees of our research collaborators or joint venture partners.
| As of June 30, | ||||||||||||
| 2024 | 2023 | 2022 | ||||||||||
| Management, administrative and manufacturing | 577 | 462 | 359 | |||||||||
| Sales | 291 | 222 | 179 | |||||||||
| Argentina | 178 | 114 | 96 | |||||||||
| Brazil | 54 | 51 | 55 | |||||||||
| Rest of Latin America | 24 | 16 | 17 | |||||||||
| North America, Europe and Asia | 35 | 41 | 11 | |||||||||
| Research and development services | 115 | 106 | 27 | |||||||||
| Total | 983 | 790 | 565 | |||||||||
Our management and administrative employees are mainly located in Argentina, while our research and development services employees are located mainly in Argentina and the United States.
| E. | Share Ownership |
The table below sets forth information regarding the beneficial ownership of our ordinary shares as of September 30, 2024, by our directors and senior management and major shareholders. For the purposes of this table, a person is deemed to have “beneficial ownership” of any ordinary shares on a given date in which such person has the right to acquire within the 60 days after such date. For the purpose of computing the percentage of outstanding ordinary shares held by each person, or group of persons, named below on a given date, any security which such person or persons have the right to acquire within 60 days after such date is deemed to be outstanding, but is not deemed to be outstanding for the purpose of computing the percentage ownership of any other person. Except as otherwise indicated, the holders listed below have sole voting and investment power with respect to all ordinary shares beneficially owned by them. They have the same voting rights as all other holders of ordinary shares.
| Beneficial owners | Number of shares |
% owned (1) | ||||||
| Federico Trucco | 337,352 | * | ||||||
| Enrique López Lecube | 261,804 | * | ||||||
| Gloria Montaron Estrada | 154,198 | * | ||||||
| Natalia Zang | — | — | ||||||
| Yogesh Mago | 55,399 | * | ||||||
| Keith McGovern | 24,080 | * | ||||||
| 5% Shareholders | ||||||||
| Bioceres LLC(2) | 18,588,021 | 29.6 | % | |||||
| Bioceres Group PLC(3) | 6,924,868 | 11.0 | % | |||||
| Solel Partners LP | 4,579,364 | 7.3 | % | |||||
| THEO I SCSp | 4,076,898 | 6.5 | % | |||||
Notes:—
| * | Less than 1%. |
| (1) | Percentages calculated based on 62,848,483 ordinary shares outstanding as of June 30, 2024. |
| (2) | Represents ordinary shares and the shared power to vote 3,196,917 ordinary shares pursuant to Rizobacter Shareholders’ Agreement, dated as of March 5, 2019, by and between Bioceres LLC, Pedro Enrique Mac Mullen, Maria Marta Mac Mullen and International Property Services Corp., held by Bioceres LLC, a limited liability company formed under the laws of Delaware, with its registered office at 1209 Orange Street, Wilmington 19801-1120, County of New Castle, and an affiliate of Bioceres Group PLC. |
| (3) | Bioceres Group PLC may be deemed to be the beneficial owner of Shares held by Bioceres LLC and THEO I SCSp as Bioceres LLC is an indirect wholly-owned subsidiary of Bioceres Group PLC, and Bioceres Group PLC owns 96.2% of the outstanding equity securities of THEO I SCSp. Accordingly, Bioceres Group PLC may be deemed to beneficially own. |
For more information on our ordinary shares and share options owned by individual Directors and by individual members of our Executive Committee see “Item 6. Directors, Senior Management and Employees—B. Compensation—Bioceres Crop Solutions Stock Option Plan.”
| F. | Disclosure of a Registrant’s Action to Recover Erroneously Awarded Compensation |
Not applicable.
ITEM 7. MAJOR SHAREHOLDERS AND RELATED PARTY TRANSACTIONS
| A. | Major Shareholders |
See “Item 6. Directors, Senior Management and Employees—E. Share Ownership.”
Changes in Ownership
The following information sets forth the beneficial ownership of our shares for each person known to us based on the information most recently available to us.
We were informed of the following significant changes in the percentage ownership held by our major shareholders during the past three years:
| ● | On September 20, 2024, Bioceres Group PLC, Bioceres LLC, an affiliate of Bioceres Group PLC, and THEO I SCSp filed a Schedule 13D/A. Bioceres Group PLC reported beneficial ownership of 29,589,787 ordinary shares, representing 47.1% of our share capital. Bioceres LLC reported beneficial ownership of 18,588,021 ordinary shares, representing 29.6% or our share capital. THEO I SCSp reported beneficial ownership of 4,076,898 ordinary shares, representing 6.5% or our share capital. |
| ● | On March 25, 2024, Bioceres Group PLC, Bioceres LLC, an affiliate of Bioceres Group PLC, and THEO I SCSp filed a Schedule 13D/A. Bioceres Group PLC reported beneficial ownership of 30,830,632 ordinary shares, representing 49.1% of our share capital. Bioceres LLC reported beneficial ownership of 23,903,241 ordinary shares, representing 38.1% or our share capital. THEO I SCSp reported beneficial ownership of 5,000,000 ordinary shares, representing 8.0% or our share capital. |
| ● | On February 14, 2024, Solel Partners LP filed a Schedule 13G/A reporting beneficial ownership of 4,579,364 ordinary shares, representing 7.3% of our share capital. |
| ● | On January 25, 2023, Ardsley Advisory Partners LP, Ardsley Advisory Partners GP LLC, Ardsley Partners I GP LLC, Philip J. Hempleman and Ardsley Partners Renewable Energy Fund, L.P. filed a Schedule 13G. Ardsley Advisory Partners LP, Ardsley Advisory Partners GP LLC, Ardsley Partners I GP LLC and Philip J. Hempleman reported beneficial ownership of 1,854,000 ordinary shares, representing 3.0% of our share capital. Ardsley Partners Renewable Energy Fund, L.P. reported beneficial ownership of 1,845,000, representing 2.9% of our share capital. |
| ● | On November 18, 2022, DRACO Capital Investment Management Company S.A. and Draco I Event Opportunity Segregated Portfolio filed a Schedule 13G/A reporting beneficial ownership of 215,000 ordinary shares, representing 0.3% of our share capital. |
| ● | On November 17, 2022, Bioceres S.A., Bioceres LLC and THEO I SCSp filed a Schedule 13D/A reporting beneficial ownership of 31,560,683 ordinary shares, representing 50.2% of our share capital. |
| ● | On August 4, 2022, DRACO Capital Investment Management Company S.A. and Draco I Event Opportunity Segregated Portfolio filed a Schedule 13G/A reporting beneficial ownership of 8,376,900 ordinary shares, representing 13.5% of our share capital. |
| ● | On July 25, 2022, Bioceres LLC, Bioceres S.A. and THEO I SCSp filed a Schedule 13D/A reporting beneficial ownership of 23,554,111 ordinary shares, representing 37.8% of our share capital. |
| ● | On July 15, 2022, Ospraie Ag Science LLC, Ospraie Management, LLC, Ospraie Holding I, LP, Ospraie Management, Inc., OAS MM, LLC and Dwight Anderson filed a Schedule 13G reporting beneficial ownership of 6,233,590 ordinary shares, representing 10.0% of our share capital. |
| ● | On April 5, 2022, Bioceres LLC, Bioceres S.A. and THEO I SCSp filed a Schedule 13D/A reporting a beneficial ownership of 23,487,020 ordinary shares, representing 51.2% of our share capital. |
| ● | On February 14, 2022, DRACO Capital Investment Management Company S.A. and Draco I Event Opportunity Segregated Portfolio filed a Schedule 13G/A reporting a beneficial ownership of 8,158,878 ordinary shares, representing 19.9% or our share capital. |
| ● | On October 15, 2021, Bioceres LLC, Bioceres S.A. and THEO I SCSp filed a Schedule 13D/A reporting a beneficial ownership of 23,572,333 ordinary shares, representing 57.4% of our share capital. |
| ● | On October 4, 2021, DRACO Capital Investment Management Company S.A. and 5D+ Draco I Latam Income Plus Segregated Portfolio filed a Schedule 13G/A reporting a beneficial ownership of 8,051,973 ordinary shares, representing 19.6% of our share capital. This 13G/A was also filed by Biotech Investment Holding Ltd. which ceased to be the beneficial owner of more than five percent of our ordinary shares. |
| ● | On August 6, 2021, Bioceres LLC and Bioceres S.A. filed a Schedule 13D/A reporting a beneficial ownership of 23,572,333 ordinary shares, representing 57.4% of our share capital, and 57.4% of our share capital, respectively. |
| ● | On August 5, 2021, DRACO Capital Investment Management Company S.A., 5D+ Draco I Latam Income Plus Segregated Portfolio and Biotech Investment Holding Ltd. filed a Schedule 13D/A reporting a beneficial ownership of 7,991,226 ordinary shares, representing 19.4% of our share capital. |
| ● | On July 2, 2021, filed a Schedule 13D/A DRACO Capital Investment Management Company S.A., 5D+ Draco I Latam Income Plus Segregated Portfolio and Biotech Investment Holding Ltd. filed a Schedule 13D/A reporting a beneficial ownership of 8,940,635 ordinary shares, representing 21.8% of our share capital. |
Difference in Voting Rights
All of our ordinary shares have the same voting rights and none of major shareholder has different voting rights.
Securities Held in the Host Country
As of June 30, 2024, we had 62,848,483 ordinary shares issued and outstanding, of which 29,862,017 ordinary shares, or 47.5%, were held by our 148 registered shareholders in the United States.
Arrangements for Change in Control
We are not aware of any arrangements that may, when in force, result in a change in control.
| B. | Related Party Transactions |
Relationship with Bioceres Group PLC
As of the date of this report, Bioceres Group PLC owns approximately 47.1% of our ordinary shares. In addition, pursuant to the Rizobacter Shareholders’ Agreement, dated as of March 5, 2019, by and between Bioceres LLC, an affiliate of Bioceres Group PLC, Pedro Enrique Mac Mullen, Maria Marta Mac Mullen and International Property Services Corp., who own approximately 5.0 % of our ordinary shares, respectively, have agreed to vote in agreement with Bioceres LLC.
Policy Concerning Related Party Transactions
Our board of directors has adopted a written policy (the “related person transaction approval policy”), for the review of any transaction, arrangement or relationship in which it is a participant, if the amount involved exceeds US$120,000 and one of our executive officers, directors, director nominees or beneficial holders of more than 5% of our total equity (or their immediate family members), each of whom we refer to as a related person, has a direct or indirect material interest.
A copy of the related person transaction approval policy is available on our website.
Note Purchase Agreement and HB4 Soy Supply Agreement with Moolec Science SA
See “—Key Agreements— Note Purchase Agreement and HB4 Soy Supply Agreement with Moolec Science SA.”
R&D Services Agreements
In connection with R&D services, Bioceres Semillas and Rizobacter typically enter into agreements with INDEAR.
Rizobacter
On July 1, 2021, Rizobacter entered into a one-year R&D service agreement with INDEAR. The agreement may be extended indefinitely in one-year increments, and it has been extended annually since its effective date. Rizobacter accrued US$0.1 million for the services provided by INDEAR during the initial term. Under the agreement, Rizobacter will gain ownership of any intellectual property rights arising from the services rendered, encompassing patents, trademarks, plant variety rights, trade secrets, and other related intellectual property. Further, the agreement includes a confidentiality clause requiring both parties to keep terms and conditions confidential for five years following its termination or expiration, subject to certain exceptions. Additionally, INDEAR agreed to indemnify Rizobacter for any liabilities arising from the performance of the R&D services.
Bioceres Semillas
On July 1, 2021, Bioceres Semillas entered into a R&D service agreement with INDEAR, which matured on June 30, 2024. Once the initial one-year term expires, the agreement may be extended indefinitely in one-year increments. Bioceres Semillas accrued US$1.1 million for the services provided by INDEAR during the initial term. Under the agreement, Bioceres Semillas will gain ownership of any intellectual property rights arising from the services rendered, encompassing patents, trademarks, plant variety rights, trade secrets, and other related intellectual property. Further, the agreement includes a confidentiality clause requiring both parties to keep terms and conditions confidential for five years following its termination or expiration, subject to certain exceptions. Additionally, INDEAR agreed to indemnify Bioceres Semillas for any liabilities arising from the performance of the R&D services.
Field Station Lease Agreement
INDEAR entered into a field station lease agreement with Rizobacter, pursuant to which Rizobacter Argentina S.A. leases its field station located in Pergamino.
Term. Two-year term from the date of effectiveness from July 1, 2024. Once the term expires, the parties can agree to extend the term of the agreement by written agreement.
Compensation. INDEAR shall pay an annual amount of US$40,000.
Indemnification. INDEAR has agreed to indemnify Rizobacter Argentina S.A. for any liability that arises during the term of the Lease Agreement.
Storage Agreement
Synertech Industrias S.A. entered into a deposit and storage services agreement with Rizobacter (the “Deposit Agreement”), pursuant to which Rizobacter stores certain Synertech products on July 1, 2024.
Term. Two-year term from the date of effectiveness. Once the term expires, the parties can agree the extension of the term.
Compensation. In return for the deposit and storage services provided by Rizobacter, Synertech Industrias S.A must pay a monthly amount of US$6,500.
Indemnification. Rizobacter has agreed to indemnify Synertech Industrias S.A. for any liability that arises during the term of the Deposit Agreement related to the storage of the products.
License Agreements
Trigall Genetics S.A.
License agreement dated December 19, 2013, between BCS Holding Inc and Trigall Genetics S.A. (the “Trigall License Agreement”), pursuant to which BCS Holding Inc. granted to Trigall Genetics S.A. the exclusive sub-license of HB4 technology in wheat for research and commercial use of wheat in Argentina, Paraguay, Brazil and Uruguay.
Term. The Trigall License Agreement will remain in full force and effect until the date of dissolution of Trigall Genetics S.A.
Reservation of Rights. BCS Holding Inc. reserved the rights to research, develop, make or use (but not to sell, offer to sell or otherwise commercially exploit) HB4 technology solely for research purposes, during the term of the Trigall License Agreement within the defined territory of Argentina, Paraguay, Brazil and Uruguay.
Service Agreements to Joint Ventures
Trigall Genetics S.A., FD Admiral SAS, BCS Holding Inc. and INDEAR.
The service agreement dated December 19, 2013, by and among Trigall Genetics S.A., FD Admiral SAS and its affiliate Florimond Desprez Veuve & Fils SAS, BCS Holding Inc., Bioceres S.A. and INDEAR (the “Trigall Service Agreement”), pursuant to which research and development services are provided by BCS Holding Inc. and Florimond Desprez Veuve & Fils SAS through its affiliates.
Term. The Trigall Service Agreement will remain in full force and effect until the date of the dissolution of Trigall Genetics S.A.
Compensation. Trigall Genetics S.A. will pay to BCS Holding Inc. and Florimond Desprez Veuve & Fils SAS for the services provided. The services and the budget for such services is approved, every calendar year, by the board of directors of Trigall in advance.
Intellectual Property. All rights, titles and interest in or to the results and/or the intellectual property related thereto will vest in and be owned by Trigall Genetics S.A. All rights, title and interest in or to the intellectual property furnished to Trigall Genetics S.A. by BCS Holding Inc. or its affiliates and Florimond Desprez Veuve & Fils SAS or its affiliates in the framework of the Trigall Service Agreement remains owned by each party.
Synertech Industrias S.A. and Rizobacter.
Service Agreement dated June 30, 2016, by and between Synertech Industrias S.A. and Rizobacter (the “Synertech Services Agreement”), detailing the services regarding the production, management services and maintenance of the industrial facility.
Term. Nine-year term from date of effectiveness of the Synertech Services Agreement and its extensions. Once the term expires, the parties can agree the extension of the term.
Compensation. Synertech Industrias S.A. must pay an amount of US$25,764 on monthly basis.
Other Related Party Transactions
The following are certain other transactions with our directors, executive officers and shareholders.
Collaboration Agreement by and between Rizobacter and Espartina S.A. controlled by Marcelo Carrique, President of Rizobacter
The collaboration agreement between Espartina S.A. and Rizobacter (the “Collaboration Agreement”), pursuant to which Espartina S.A. performs services related to planting and harvesting of multiple crops for the 2024-2025, 2023-2024, 2022-2023 and 2021-2022 seasons and Rizobacter or its affiliates provides agricultural supplies at a price on arms’ length terms, that is, at the price offered to third parties under the same conditions. The parties to the Collaboration Agreement will distribute the profits according to their contributions. Mr. Carrique served as president of Rizobacter through June 30, 2024.
Indemnification Agreements
We have entered into indemnification agreements with each of our directors and executive officers. These agreements provide that the director or officer will be indemnified by us to the fullest extent permitted by law against liability and against all expenses reasonably incurred or paid by him or her in connection with any claim, action, suit or proceeding which he or she becomes involved as a party or otherwise by virtue of his or her being or having been such a director or officer of and against amounts paid or incurred by him or her in the resolution thereof. The agreements are subject to certain exceptions, including, among other exceptions, that no indemnification will be provided to any director or officer against any liability to us or our shareholders (i) by reason of actual fraud, dishonesty, actual fraudulent conduct, or gross negligence on the part of the director or officer; (ii) by reason of payment made under an insurance policy or any third party that has no recourse against the indemnitee director or officer; or (iii) if contrary to applicable law.
Secured Convertible Guaranteed Notes due 2026 and Secured Convertible Guaranteed Notes due 2026 Registration Rights Agreement
Funds affiliated with Mr. Ari Freisinger, a member of our board of directors, purchased US$9 million Secured Convertible Guaranteed Notes, see “Item 5. Operating and Financial Review and Prospects—B. Liquidity and Capital Resources— Issuance of Notes”, “Item 10. Additional Information—C. Material Contracts—Issuance of Notes due 2026—Secured Guaranteed Notes due 2026” and “Item 10. Additional Information—C. Material Contracts—Issuance of Notes—Secured Convertible Guaranteed Notes due 2026 Registration Rights Agreement.”
Shareholders Agreement
See “Item 10. Additional Information—C. Material Contracts—Sponsors Shareholders’ Agreement.”
| C. | Interests of Experts and Counsel |
Not applicable.
| A. | Consolidated Statements and Other Financial Information |
Financial Statements
Our financial statements are set forth under “Item 18. Financial Statements.” The financial statements are attached to this Annual Report on Form 20-F. The audit report of Price Waterhouse & Co. S.R.L., independent registered public accounting firm, is included herein immediately preceding the consolidated financial statements.
Export Sales
For information on export sales, please see Note 14 to our audited consolidated financial statements included elsewhere in this report.
Legal Proceedings
From time to time, we may become party to litigation or other legal proceedings that we consider to be a part of the ordinary course of our business. Other than as discussed below, we are not currently involved in any legal proceedings that could reasonably be expected to have a material adverse effect on our business, prospects, financial condition or results of operations, other than the proceeding described below. As of the date of this report, we do not face any claims of possible intellectual property infringement. We may become involved in material legal proceedings in the future as part of the ordinary course of our business.
An injunction in connection with the Rizobacter Acquisition may require us to surrender part of our interest in Rizobacter
Concurrently with the closing of business combination, the Rizobacter Call Option was exercised and we acquired 80% of Rizobacter’s capital stock, which we hold through our subsidiary RASA Holding. An injunction relating to a disputed transfer of shares that occurred in 1995 affects 29% of the shares we hold, and affects 44% of the total share capital of Rizobacter. The injunction requires that 30% of the dividends distributed on such shares be paid into a judicially created escrow account. Although the Argentine Supreme Court ruled against certain of the litigating historical shareholders, such shareholders subsequently pursued other legal recourse — including the injunction and non-innovative measure (medida de no innovar) — to further dispute the original transfer of shares. The non-innovative measure was overturned by an Argentine court of appeals on April 17, 2018.
Should the court rule against the free transferability of the affected shares, we would be obligated to return certain shares, thereby reducing our equity interest in Rizobacter. See “Item 3. Key Information —D. Risk Factors—Risks Related to our Business and Strategy—Certain of the Rizobacter shares we own are subject to a judicial injunction that, if decided unfavorably to us, would require us to surrender part of our interest in Rizobacter thereby reducing our equity interest in Rizobacter” and “Item 4. Information on the Company—Key Agreements, Rizobacter Acquisition.”
Dividend Policy
We currently intend to retain any earnings for use in our business and do not intend, as of the date of this report, to pay cash dividends on our ordinary shares for the foreseeable future. Dividends, if any, on our outstanding ordinary shares will be proposed by our board of directors and subject to the approval of our shareholders. Even if our shareholders decide to distribute dividends, the form, frequency and amount of such dividends will depend upon our future operations and earnings, capital requirements and surplus, general financial condition, contractual restrictions and other factors that our board of directors and shareholders may deem relevant. Currently, due to contractual restrictions, we are not entitled to distribute dividends to our shareholders.
| B. | Significant Changes |
No significant changes have occurred since June 30, 2024.
| A. | Offer and Listing Details |
Not applicable.
| B. | Plan of Distribution |
Not applicable.
| C. | Markets |
The Nasdaq Global Select Market.
| D. | Selling Shareholders |
Not applicable.
| E. | Dilution |
Not applicable.
| F. | Expenses of the Issue |
Not applicable.
ITEM 10. ADDITIONAL INFORMATION
| A. | Share Capital |
As of June 30, 2024, we had (i) 100,000,000 ordinary shares of a US$0.0001 par value authorized, (ii) 62,848,483 ordinary shares issued and outstanding, (iii) 1,000,000 preference shares of a US$0.0001 par value authorized, (iv) no preference shares issued and outstanding, (v) 3,927,176 ordinary shares reserved for our equity compensation plans. Of the total issued shares, we have repurchased 2,258,016 shares of our own.
Holders of the ordinary shares are entitled to one vote for each ordinary share.
| B. | Memorandum and Articles of Association |
Registration Number
Our registration number with the Cayman Islands Registrar of Companies is 329214.
Objects
Our Articles state that the objects for which we are established are unrestricted and we shall have full power and authority to carry out any object not prohibited by the laws of the Cayman Islands.
Directors
Our Articles do not restrict our directors’ power to vote in respect of any contract or transaction in which they are interested (provided that the nature of the interest of any director in any such contract or transaction shall be disclosed by them at or prior to its consideration and any vote thereon), vote on compensation to themselves or any other members of their body in the absence of an independent quorum or exercise borrowing powers. There is no mandatory retirement age for our directors and our directors are not required to own our securities in order to serve as directors.
Ordinary Shares
Holders of ordinary shares are entitled to receive ratable dividends when and if declared by our board of directors out of funds legally available therefore, subject to any rights of any outstanding series of preference shares.
Upon our winding up, liquidation and dissolution and after payment in full of all amounts required to be paid to creditors and to the holders of preference shares having liquidation preferences, if any, holders of ordinary shares will be entitled to receive pro rata our remaining assets available for distribution.
The rights, powers and privileges of holders of our ordinary shares are subject to those of holders of any shares of our preference shares or any other series or class of shares we may authorize and issue in the future.
Our ordinary shares are not subject to any sinking fund. All of our issued ordinary shares are fully paid up and none of our shareholders are liable for further capital calls. There are no provisions in the Articles that discriminate against any existing or prospective holder of our ordinary shares as a result of such shareholder owning a substantial number of ordinary shares.
Preference Shares
Our Articles provide that preference shares may be issued from time to time in one or more series. Our board of directors will be authorized to fix the voting rights, if any, designations, powers, preferences, the relative, participating, optional or other special rights and any qualifications, limitations and restrictions thereof, applicable to the shares of each series. Our board of directors will be able, without shareholder approval, to issue preference shares with voting and other rights that could adversely affect the voting power and other rights of the holders of the ordinary shares and could have anti-takeover effects. The ability of the board to issue preference shares without shareholder approval could have the effect of delaying, deferring or preventing a change of control of us or the removal of existing management. We have no preference shares issued and outstanding at the date hereof. Although we do not currently intend to issue any preference shares, we cannot assure you that we will not do so in the future.
Share Buy-Back Program
On May 6, 2020, our board of directors approved a program to repurchase its own securities for an aggregate of up to US$10,000,000 to enhance the allocation of capital to certain equity-finance obligations. As of June 30, 2024, we have acquired 731,562 ordinary shares under the Buy-Back Program.
Voting and Appointment of Directors
Voting Power
Except as otherwise required by law or as otherwise provided in any certificate of designation for any series of preference shares, the holders of our ordinary shares will possess all voting power for the appointment of our directors and all other matters requiring shareholder action and will at all times vote together as one class on all matters submitted to a vote of our shareholders. Holders of our ordinary shares will be entitled to one vote for each share held of record on all matters on which shareholders are entitled to vote generally, including the appointment or removal of directors. Holders of our ordinary shares will not have cumulative voting rights in the appointment of directors.
Pre-emptive or Other Rights
There will be no sinking fund or redemption provisions applicable to our ordinary shares.
Appointment of Directors
Our board consists of six directors. Each of our directors will have a term that expires at our annual general meeting in 2025, or until their respective successors are duly appointed and qualified, or until their earlier resignation, removal or death. There will be no cumulative voting with respect to the appointment of directors, with the result that directors will be appointed by an ordinary resolution, being a majority of the votes cast at our annual general meeting.
General Meetings
At least five clear days’ notice are required to be given of any general meeting, which notice shall specify the place, the day and the hour of the meeting and the general nature of the business to be conducted at the general meeting. No business will be transacted at any general meeting unless a quorum is present. The holders of a majority of the shares being individuals present in person or by proxy or if a corporation or other non-natural person by its duly authorized representative or proxy shall be a quorum. If a quorum is not present within half an hour from the time appointed for the meeting to commence or if during such a meeting a quorum ceases to be present, the meeting, if convened upon a shareholders’ request, will be dissolved and in any other case it shall stand adjourned to the same day in the next week at the same time and/or place or to such other day, time and/or place as the directors may determine, and if at the adjourned meeting a quorum is not present within half an hour from the time appointed for the meeting to commence, the shareholders present will be a quorum.
Annual General Meetings
Any annual general meeting will be held at such time and place as the directors shall appoint and if no other time and place is prescribed by them, it shall be held at the Registered Office on the second Wednesday in October of each year at ten o’clock in the morning. At these meetings the report of the directors (if any) shall be presented. Shareholders seeking to bring business before the annual general meeting or to nominate candidates for appointment as directors at the annual general meeting must deliver notice to our principal executive offices not later than the close of business on the 90th day nor earlier than the close of business on the 120th day prior to the scheduled date of the annual general meeting.
Extraordinary General Meetings
All general meetings other than annual general meetings are extraordinary general meetings. Shareholders holding not less than 10% in par value of the issued ordinary shares with voting rights can request, and the directors shall convene, extraordinary general meetings. Such shareholders’ request must state the objects of the meeting and must be signed by the requesting shareholders and deposited at the Registered Office.
If there are no directors as at the date of the deposit of the shareholders’ request or if the directors do not within twenty-one days from the date of such request duly proceed to convene a general meeting to be held within a further twenty-one days, the requesting shareholders, or any of them representing more than 50% of the total voting rights of all of the requesting shareholders, may themselves convene a general meeting, but any meeting so convened shall be held no later than the day which falls three months after the expiration of the said twenty-one day period.
Our Articles do not contain any provisions that would have an effect of delaying, deferring or preventing a change in control of our Company. Our Articles provide we shall have the power to merge or consolidate with one or more other constituent companies (as defined in the Cayman Islands Companies Act (As Revised)) upon such terms as our directors may determine and (to the extent required by the Cayman Islands Companies Act (As Revised)) with the approval of a Special Resolution.
Our Articles do not contain any provisions governing the ownership threshold above which shareholder ownership must be disclosed.
Our Articles are not significantly different from the requirements of the Cayman Islands Companies Act (As Revised) and the conditions imposed by our Articles governing changes in capital are not more stringent than what is required by the Cayman Islands Companies Act (As Revised).
Amendment of Governing Documents
As permitted by the Companies Act, our amended and restated memorandum and articles of association may only be amended with a special resolution of our shareholders.
Rights of Non-Resident or Foreign Shareholders
There are no limitations imposed by our Articles of Association on the rights of non-resident or foreign shareholders to hold or exercise voting rights on our shares. In addition, there are no provisions in the Articles of Association governing the ownership threshold above which shareholder ownership must be disclosed.
| C. | Material Contracts |
Issuance of Notes due 2026
Secured Guaranteed Notes due 2026
On March 6, 2020, we issued US$42.5 million aggregate principal amount of secured guaranteed convertible notes due 2023 (the “Secured Convertible Guaranteed Notes due 2023”) pursuant to a note purchase agreement among us, the purchasers party thereto and Solel Partners LP, as collateral agent (the “2020 Note Purchase Agreement”). The Secured Convertible Guaranteed Notes due 2023 were guaranteed by certain of our subsidiaries and secured by: (i) an intercompany loan pledge agreement; (ii) a share pledge granted by RASA Holding LLC of 41.3% of its shares in Rizobacter Argentina S.A., representing 33% of the capital stock of Rizobacter Argentina S.A. and (iii) an account pledge agreement and fiduciary assignment agreement granted by Rizobacter do Brasil Ltda.
Pursuant to the 2020 Note Purchase Agreement, the holders of the Secured Convertible Guaranteed Notes due 2023 requested the conversion of approximately 75% of the outstanding Secured Convertible Guaranteed Notes due 2023 into our ordinary shares. Accordingly, in March 2022 we issued 4,617,281 ordinary shares to holders of the Secured Convertible Guaranteed Notes due 2023.
Pursuant to the 2020 Note Purchase Agreement and a side-letter dated August 5, 2022: (i) the balance of Secured Convertible Guaranteed Notes due 2023 were converted into 1,526,454 of our ordinary shares, (ii) we repurchased such ordinary shares for US$24.0 million and (iii) we financed such repurchase with the proceeds from the issuance of an aggregate principal amount of US$24.0 million Secured Guaranteed Notes due 2026 pursuant to a Note Purchase Agreement, by and among us, Solel-Bioceres SPV, L.P., the holders from time to time party thereto and Wilmington Savings Fund Society, FSB as collateral agent. The Secured Guaranteed Notes due 2026 are secured by substantially all of the assets located in the United States of the Pro Farm. In addition, the Secured Guaranteed Notes due 2026 are guaranteed by BCS Holding Inc., Bioceres Crops do Brasil Ltda., Bioceres Crops S.A., Bioceres Semillas S.A.U., Verdeca LLC, Rasa Holding LLC, Rizobacter Argentina S.A., Rizobacter del Paraguay S.A., Rizobacter do Brasil Ltda., Rizobacter South Africa, Rizobacter Uruguay, Rizobacter USA, LLC, Glinatur S.A., Pro Farm, Pro Farm Michigan Manufacturing LLC, Pro Farm Technologies Comércio de Insumo Agrícolas do Brasil Ltda. and Pro Farm, Inc. (the “Guarantors”).
The Secured Guaranteed Notes due 2026 mature 48 months after the issue date and bear interest at 9.0% from the issue date through 24 months after the issue date, 13.0% from 25 through 36 months after the issue date and 14.0% from 37 through 48 months after the issue date. Interest is payable semi-annually. The Secured Guaranteed Notes due 2026 have no conversion rights into our ordinary shares.
Secured Convertible Guaranteed Notes due 2026
On August 5, 2022, we issued an aggregate principal amount of US$55.0 million secured convertible guaranteed notes due 2026 (the “Secured Convertible Guaranteed Notes due 2026”) pursuant to a note purchase agreement among us, Jasper Lake Ventures One LLC, Redwood Enhanced Income Corp, Liminality Partners LP, the holders from time-to-time party thereto and Wilmington Savings Fund Society, FSB, as collateral agent. The Secured Convertible Guaranteed Notes due 2026 are secured by substantially all of the assets located in the United States of Pro Farm. In addition, the Secured Convertible Guaranteed Notes due 2026 are guaranteed by the Guarantors.
The Secured Convertible Guaranteed Notes due 2026 mature 48 months after the issue date, unless converted earlier, and bear interest at 5% in cash plus 4% in kind per year, payable quarterly.
Secured Convertible Guaranteed Notes due 2026 Registration Rights Agreement
On August 5, 2020, we and the initial purchasers under the JRL NPA entered into a Registration Rights Agreement, by means of which we and the JRL NPA initial purchasers agreed to enter into the agreement to provide the JRL NPA initial purchasers with certain registration rights with respect to our ordinary shares issuable upon conversion of the Secured Convertible Guaranteed Notes due 2026.
Sponsors Shareholders’ Agreement
In connection with the consummation of the business combination, we, Bioceres LLC, an affiliate of Bioceres Group PLC, and UAC’s initial shareholders prior to Union’s initial public offering and their affiliates entered into the agreement, pursuant to which, among other things, the initial shareholders will have the right to nominate one director to our board of directors following the consummation of the business combination at each of our annual general meetings, provided, that, they do not hold less than a certain percentage of our ordinary shares. Bioceres LLC will agree to vote for such director nominee proposed by the initial shareholders.
| D. | Exchange Controls |
Within the framework of the uncertain economic situation faced by the Argentine Republic, and for the purpose of “(…) strengthening the ordinary operation of the economy, contribute to a sound administration of the exchange market, reduce the volatility of financial variables, and contain the impact of any fluctuations of financial cash flows on real economy” on September 1, 2019, Argentina’s Executive Branch issued Decree No. 609/2019 whereby it was provided, among other measures, that Argentine residents must repatriate export proceeds into Argentina, and delegates to the Argentine Central Bank the power to regulate the access to the FX Market for the purchase of foreign currency with Pesos and its transfer abroad.
Since the Export Controls Decree, the BCRA has periodically issued several regulations to regulate the inflow and outflow of funds through the FX Market, which are all unified under the consolidated text of foreign exchange available at the BCRA’s website: http://www.bcra.gob.ar/Pdfs/Texord/t-excbio.pdf. The most recent and comprehensive communications issued by BCRA are Communications “A” (6844, 7272, 7422, 7516, 7746, 7914, and 7953).
Current foreign exchange controls in Argentina affects the ability of both Argentine and non-Argentine residents to access the FX Market at the official exchange rate to acquire and/or transfer foreign currency to and from Argentina. They affect all industries and cover a wide variety of matters, including, among others, trading activities, imports and exports of goods and services, financial indebtedness, payment of profits and dividends, and repatriation of investments of non-Argentine residents.
As a general rule, transfers of foreign currency to and from Argentina must be made through the FX Market and are subject to compliance with certain requirements and conditions established by the regulations issued by the Argentina Central Bank from time to time.
In this regard, the Argentine Central Bank is empowered to establish the cases in which access to the Foreign Exchange Market will require its prior authorization, the granting of which is discretionary and, in practice, rarely occurs.
Pursuant to the foreign exchange regulations currently in force, among others:
| (1) | The prior authorization of the Argentine Central Bank is required for the access to the FX Market for the purchase of foreign currency, for the following purposes, among others: |
| ● | for the payment of profits and dividends out of Argentina, except up to an amount equal to 30% of the value of all new capital contributions of foreign direct investments made to the Argentine resident since such date to the extent that (i) the proceeds of those capital contributions have been repatriated into Argentina and converted into Pesos through FX Market and they have been capitalized, (ii) the registration of such capitalization has been requested before the Public Registry of Commerce and (iii) ) access to the FX Market for the payment of profits and dividends must happen in a term of no less than 30 calendar days as of the conversion into Pesos through the FX Market. See “ — Item 3. Key Information — C. Risk Factors — Argentine exchange controls and restrictions limit access to the FX Market to make payments and distributions from our Argentine subsidiaries and receive the proceeds of any sale of our assets in Argentina”; |
| ● | for the pre-payment of principal and interest on foreign financial indebtedness with an anticipation of more than three business days in advance to the scheduled maturity dates, except under certain limited exceptions; |
| ● | subject to certain exemptions, until December 31, 2024, for the payment of principal under financial indebtedness to related parties; |
| ● | for the pre-payment of indebtedness for the import of goods and services; and |
| ● | until December 31, 2024, the prior consent from the Argentine Central Bank shall be required to have access to the FX Market to advance payments of imports of goods or repayment of the principal amount of debts originated in the import of goods, except if certain conditions or exceptions are met. The Argentine Central Bank shall grant access to make payments of imports of goods of 50% of the value free on board after 30 days and the remaining 50% after 60 days from the registration of entry to customs of the goods. |
In addition to all the foregoing, access to the FX Market for the purchase of foreign currency is subject to the filing by the client of an affidavit declaring that (a) on the day it requests access to the foreign exchange market and in the previous 90 calendar days, and committing to refrain from executing them in the subsequent 90 calendar days: (i) it has not entered into sales in Argentina of securities with settlement in foreign currency; (ii) it has not exchanged securities issued by residents for external assets; (iii) it has not transferred securities to foreign depositaries; (iv) it has not acquired in Argentina securities issued by non-residents with settlement in Pesos; (v) it has not acquired Argentine depositary receipts of foreign shares (“CEDEARS”); (vi) it has not acquired securities representing private debt issued in foreign jurisdictions; (vii) it has not delivered funds in local currency or other local assets (except funds in foreign currency deposited in local financial institutions) to any human or legal person, resident or non-resident, related or not, receiving as prior or subsequent consideration, directly or indirectly, by itself or through a related, controlled or controlling entity, foreign assets, crypto-assets or securities deposited abroad; (b) all its holdings of foreign currency in Argentina are deposited at local bank accounts; (c) does not hold liquid foreign assets (i.e. holdings of foreign currency) outside Argentina or CEDEARS in excess of US$100,000; (d) commits to settle through the FX Market, within the five business days from settlement, all amounts received outside Argentina from the payment of loans granted to third parties, withdraw or expiration of term deposits or sale of any assets, when the asset was acquired, the term deposit made or the loan granted, after May 28, 2020; and (e) stating that as of the date on which access to the FX Market is requested, and in the 180 preceding days, no funds in local currency or other liquid local assets were delivered in Argentina to any individual or legal entity exercising a ‘direct control’ relationship or to a legal entity of the same economic group, excluding transactions directly associated with the acquisition of goods and services in the regular course of business. If the client has delivered local currency or any local asset (issued by an Argentine resident) to the direct controlling shareholder or to a legal entity of the same economic group, client may still comply with the abovementioned obligation if it submits an affidavit of the direct controlling shareholder and the legal entities of the same economic group, stating that they have not carried out any Restricted Operation in the previous 180 calendar days, and undertake not to carry out any such transactions in the subsequent 180 calendar days.
| (2) | The access to the FX Market for the purchase of foreign currency for any of the payments described above is subject to the compliance with the foreign indebtedness information regime before the Argentine Central Bank. |
| (3) | The proceeds of the disbursements of foreign financial loans incurred since September 1, 2019 must be transferred into Argentina and converted into Pesos (the “Repatriation”) in order for the Argentine resident debtor to have access to the FX Market for the payment of principal and interests under such foreign financial loan on their scheduled maturity. Foreign currency proceeds disbursed by non-Argentine residents as of September 1, 2019, must be transferred to Argentina and sold for Pesos in the FX Market. As such, a prior BCRA approval is not required for Argentine residents. In addition, the transaction must have been declared under the Reporting Foreign Assets and Liabilities Regime. See “—Reporting of Foreign Assets and Liabilities Regime.” |
Prepayments of principal and interests within more than three business days prior to the scheduled maturity require prior approval by the Argentine Central Bank, subject to certain exceptions.
| (4) | Proceeds from exports of goods (the consideration (“contravalor”) in foreign currency) must be transferred to Argentina and sold for Pesos in the FX Market at the official exchange rate within a term ranging from 15 to 180 calendar days depending on the goods exported and the relationship with the importer. Regardless of the applicable term, upon collection of the export, the proceeds thereof must be repatriated no later than five business days from the date of collection. |
Amounts collected in foreign currency for insurance claims related to the exported goods must also be repatriated and settled in Pesos in the FX Market, up to the amount of the insured exported goods.
The exporter must appoint a financial entity to track each export transaction. The obligation of repatriation and settlement of foreign currency through the FX Market corresponding to a shipping permit will be considered satisfied when the entity designated for tracking purposes certifies that repatriation and settlement has taken place.
| (5) | The collections of foreign currency by Argentine residents out of Argentina for the export of services are subject to mandatory Repatriation within the 5 consecutive days computed from the date of payment or collection. |
| E. | Taxation |
The following is a summary of the material Cayman Islands and U.S. tax consequences of acquiring, owning and disposing of securities.
Material Cayman Islands Tax Considerations
The following is a discussion on certain Cayman Islands income tax consequences of an investment in our securities. The discussion is a general summary of present law, which is subject to prospective and retroactive change. It is not intended as tax advice, does not consider any investor’s particular circumstances, and does not consider tax consequences other than those arising under Cayman Islands law.
Payments of dividends and capital in respect of our securities will not be subject to taxation in the Cayman Islands and no withholding will be required on the payment of a dividend or capital to any holder of the securities, nor will gains derived from the disposal of the securities be subject to Cayman Islands income or corporate tax. The Cayman Islands currently has no income, corporate or capital gains tax and no estate duty, inheritance tax or gift tax.
No stamp duty is payable in respect of the issue of our securities or on an instrument of transfer in respect of our securities.
The Government of the Cayman Islands will not, under existing legislation, impose any income, corporate or capital gains tax, estate duty, inheritance tax, gift tax or withholding tax upon the Company or its shareholders. The Cayman Islands is not party to a double tax treaty with any country that is applicable to any payments made to or by the Company.
The Company has applied for, and received, an undertaking from the Financial Secretary of the Cayman Islands that, in accordance with section 6 of the Tax Concessions Act (As Revised) of the Cayman Islands, for a period of 20 years from the date of the undertaking, no law which is enacted in the Cayman Islands imposing any tax to be levied on profits, income, gains or appreciations shall apply to the Company or its operations and, in addition, that no tax to be levied on profits, income, gains or appreciations or which is in the nature of estate duty or inheritance tax shall be payable (i) on or in respect of the shares, debentures or other obligations of the Company or (ii) by way of the withholding in whole or in part of a payment of dividend or other distribution of income or capital by the Company to or its shareholders or a payment of principal or interest or other sums due under a debenture or other obligation of the Company.
Material U.S. Federal Income Tax Considerations
General
The following is a summary of certain U.S. federal income tax consequences for U.S. Holders and Non-U.S. Holders (each, as defined below) of ordinary shares of the Company that hold the ordinary shares as capital assets. The discussion does not cover all aspects of U.S. federal income taxation that may be relevant to, or the actual tax effect that any of the matters described herein will have on, the ownership or disposition of ordinary shares by particular investors (including consequences under the alternative minimum tax or net investment income tax), and does not address state, local, non-U.S. or other tax laws.
This summary also does not address tax considerations applicable to investors that own (directly, indirectly or by attribution) 5 per cent. or more of the ordinary shares of the Company by vote or value, nor does this summary discuss all of the tax considerations that may be relevant to certain types of investors subject to special treatment under the U.S. federal income tax laws, such as:
| ● | financial institutions, |
| ● | insurance companies, |
| ● | individual retirement accounts and other tax-deferred accounts, |
| ● | tax-exempt organizations, |
| ● | dealers in securities or currencies, |
| ● | investors that will hold the ordinary shares as part of straddles, hedging transactions or conversion transactions for U.S. federal income tax purposes, |
| ● | persons that have ceased to be U.S. citizens or lawful permanent residents of the United States or are U.S. expatriates, |
| ● | investors holding the ordinary shares in connection with a trade or business conducted outside of the United States, |
| ● | U.S. Holders whose functional currency is not the U.S. dollar, |
| ● | Non-U.S. Holders holding the ordinary shares in connection with a trade or business conducted within the United States, or |
| ● | Non-U.S. Holders who are individuals present in the United States for 183 days or more in the taxable year at disposition. |
As used herein, the term “U.S. Holder” means a beneficial owner of ordinary shares that is, for U.S. federal income tax purposes, (i) an individual citizen or resident of the United States, (ii) a corporation created or organized under the laws of the United States, any state thereof or the District of Columbia, (iii) an estate the income of which is subject to U.S. federal income tax without regard to its source or (iv) a trust if a court within the United States is able to exercise primary supervision over the administration of the trust and one or more U.S. persons have the authority to control all substantial decisions of the trust, or the trust has validly elected to be treated as a domestic trust for U.S. federal income tax purposes.
As used herein, the term “Non-U.S. Holder” means a beneficial owner of ordinary shares that is, for U.S. federal income tax purposes, (i) a nonresident alien, (ii) a foreign corporation, or (iii) an estate or trust that in either case is not subject to U.S. federal income tax on a net income basis on income or gain from ordinary shares.
The U.S. federal income tax treatment of a partner in an entity or arrangement treated as a partnership for U.S. federal income tax purposes that holds ordinary shares will depend on the status of the partner and the activities of the partnership. Investors that are entities or arrangements treated as partnerships for U.S. federal income tax purposes should consult their tax advisers concerning the U.S. federal income tax consequences to them and their partners of the acquisition, ownership and disposition of ordinary shares by the partnership.
This summary is based on the tax laws of the United States, including the Internal Revenue Code of 1986, as amended, its legislative history, existing and proposed regulations thereunder, published rulings and court decisions, all as of the date hereof and all subject to change at any time, possibly with retroactive effect.
THE SUMMARY OF U.S. FEDERAL INCOME TAX CONSEQUENCES SET OUT BELOW IS FOR GENERAL INFORMATION ONLY. INVESTORS SHOULD CONSULT THEIR TAX ADVISERS AS TO THE PARTICULAR TAX CONSEQUENCES TO THEM OF ACQUIRING, OWNING, AND DISPOSING OF THE ORDINARY SHARES, INCLUDING THE APPLICABILITY AND EFFECT OF STATE, LOCAL, NON-U.S. AND OTHER TAX LAWS AND POSSIBLE CHANGES IN TAX LAW.
U.S. Holders
Dividends
Subject to the PFIC rules discussed below, distributions paid by the Company out of current or accumulated earnings and profits (as determined for U.S. federal income tax purposes) generally will be taxable to a U.S. Holder as dividend income, and will not be eligible for the dividends received deduction allowed to corporations. Distributions in excess of current and accumulated earnings and profits will be treated as a nontaxable return of capital to the extent of the U.S. Holder’s basis in the ordinary shares, and thereafter as capital gain. However, the Company cannot provide any assurance that it will maintain calculations of its earnings and profits in accordance with U.S. federal income tax accounting principles. U.S. Holders should therefore assume that any distribution by the Company with respect to ordinary shares may be reported as ordinary dividend income. U.S. Holders should consult their own tax advisers with respect to the appropriate U.S. federal income tax treatment of any distribution received or treated as received from the Company.
Dividends paid by the Company generally will be taxable to a non-corporate U.S. Holder at the reduced rate normally applicable to long-term capital gains, provided that (i) the ordinary shares are readily tradable on an established securities market in the United States; (ii) certain holding period requirements are satisfied; and (3) the Company is not classified as a PFIC for its taxable year during which the dividend is paid or its immediately preceding taxable year. See “—Passive Foreign Investment Company Considerations” below.
Sale or Other Disposition
Subject to the PFIC rules discussed below, upon a sale or other disposition of ordinary shares (including as a result of receipt of cash pursuant to the exercise of a warrant), a U.S. Holder generally will recognize capital gain or loss for U.S. federal income tax purposes equal to the difference, if any, between the amount realized on the sale or other disposition and the U.S. Holder’s adjusted tax basis in the ordinary shares. This capital gain or loss will be long-term capital gain or loss if the U.S. Holder’s holding period in the ordinary shares exceeds one year. Any gain or loss generally will be U.S. source. The deductibility of capital losses is subject to limitations.
See “—Passive Foreign Investment Company Considerations” below for a discussion of more adverse rules that will apply to a sale or other disposition of ordinary shares if the Company is or has been a PFIC for U.S. federal income tax purposes.
Passive Foreign Investment Company Considerations
In general, a non-U.S. corporation will be a Passive Foreign Investment Company (“PFIC”) in any taxable year in which, after taking into account the income and assets of the corporation and certain subsidiaries pursuant to applicable “look-through rules,” either (i) at least 75 per cent. of its gross income is “passive income” or (ii) at least 50 per cent. of the average value of its assets is attributable to assets which produce passive income or are held for the production of passive income. Passive income generally includes interest, dividends, rents, royalties and gains from commodities transaction). Goodwill is treated as an active asset under the PFIC rules to the extent attributable to activities that produce active income. Cash is a passive asset.
The Company does not believe that it was a PFIC for its most recent taxable year and does not expect to be a PFIC for the current taxable year. However, a company’s PFIC status is an annual factual determination that can be made only after the end of each taxable year and the Company’s PFIC status for any taxable year will depend on the composition of its income and assets and the value of its assets from time to time (which may be determined, in part, by reference to the market price of its Shares, which could be volatile) and the manner in which it operates its projects. Furthermore, the Company owns, and may continue to own, minority stakes in entities or joint ventures. Any entities or joint ventures in which the Company owns a less than 25% minority stake will generally be treated as a passive asset for purposes of the PFIC rules. Accordingly, no assurance can be given that the Company will not be a PFIC for any taxable year. If the Company is a PFIC for any taxable year and any entity in which it owns or is deemed to own equity interests is also a PFIC (any such entity, a “Lower-tier PFIC”), a U.S. Holder will be deemed to own a proportionate amount (by value) of the shares of each such Lower-tier PFIC and will be subject to U.S. federal income tax according to the rules described in the next paragraph on (i) certain distributions by a Lower-tier PFIC, and (ii) dispositions of shares of Lower-tier PFICs, in each case as if such U.S. Holder held such shares directly, even though such U.S. Holder did not receive any proceeds of those distributions or dispositions.
If the Company is a PFIC in any year during which a U.S. Holder owns ordinary shares, and the U.S. Holder has not made a mark-to-market or qualified electing fund election (if available), the U.S. Holder generally will be subject to special rules with respect to (i) any “excess distribution” (generally, any distributions treated as received by the U.S. Holder on the ordinary shares in a taxable year that are greater than 125 per cent. of the average annual distributions treated as received by the U.S. Holder in the three preceding taxable years or, if shorter, the U.S. Holder’s holding period for the ordinary shares and (ii) any gain realized on the sale or other disposition of ordinary shares. Under these rules (a) the excess distribution or gain will be allocated ratably over the U.S. Holder’s holding period, (b) the amount allocated to the current taxable year and any taxable year prior to the first taxable year in which the Company is a PFIC will be taxed as ordinary income, and (c) the amount allocated to each of the other taxable years will be subject to tax at the highest rate of tax in effect for the applicable class of taxpayer for that year and an interest charge for the deemed deferral benefit will be imposed with respect to the resulting tax attributable to each such other taxable year. If the Company is a PFIC for any taxable year during which a U.S. Holder holds the Shares, the Company would generally continue to be treated as a PFIC with respect to such U.S. Holder for all succeeding years during which such holder owns the Shares even if the Company ceases to meet the threshold requirements for PFIC status. Dividends paid by the Company in any year for which it is a PFIC or any year following such year will not be eligible for the reduced rate of tax described above under “Dividends.”
A U.S. Holder who has made a qualified electing fund (“QEF”) election (on or before the due date of the U.S. Holder’s tax return for the first taxable year to which the QEF applies) or a mark-to-market election with respect to the ordinary shares will not be subject to the PFIC regime if the Company ceases to be a PFIC. If the Company becomes a PFIC in future years, any prior QEF or mark-to-market election made by a U.S. Holder would still be valid, and new elections would not have to be made. However, a mark-to-market election cannot be made for any Lower-tier PFICs. U.S. Holders should consult their tax advisers regarding the application of the PFIC rules to their indirect ownership of shares in any Lower-tier PFICs.
If the Company were a PFIC for a prior taxable year during the U.S. Holder’s holding period, but ceases to be a PFIC for a subsequent taxable year, a U.S. Holder may make an election (a “deemed sale election”) to be treated for U.S. federal income tax purposes as having sold its ordinary shares, as applicable, on the last day of the last taxable year of the Company during which it was a PFIC. A U.S. Holder that makes a deemed sale election will cease to be treated as owning stock in a PFIC. However, gain recognized by a U.S. Holder as a result of making the deemed sale election will be subject to the rules described above.
A U.S. Holder who owns, or who is treated as owning, PFIC stock during any taxable year for which the Company is classified as a PFIC may be required to file Internal Revenue Service (“IRS”) Form 8621. Prospective purchasers should consult their tax advisers regarding the requirement to file IRS Form 8621 and the potential application of the PFIC regime.
Foreign Financial Asset Reporting
U.S. taxpayers that own certain foreign financial assets, including equity of foreign entities, with an aggregate value in excess of US$50,000 at the end of the taxable year or US$75,000 at any time during the taxable year (or, for certain individuals living outside the United States and married individuals filing joint returns, certain higher thresholds) may be required to file an IRS Form 8938 with respect to such assets with their tax returns. The ordinary shares are expected to constitute foreign financial assets subject to these requirements unless the ordinary shares are held in an account at a financial institution (in which case the account may be reportable if maintained by a foreign financial institution). U.S. Holders should consult their tax advisers regarding the application of the rules relating to foreign financial asset reporting.
Non-U.S. Holders
Subject to the discussion below under “—Backup Withholding and Information Reporting,” any proceeds of a sale or other disposition of the ordinary shares, as well as dividends and other proceeds with respect to the ordinary shares, are not subject to U.S. federal income tax, including withholding taxes, if paid to a Non-U.S. Holder.
Backup Withholding and Information Reporting
Payments of dividends and other proceeds with respect to ordinary shares by a U.S. paying agent or other U.S. intermediary will be reported to the IRS and to a holder as may be required under applicable U.S. Treasury Regulations. Backup withholding may apply to these payments if the holder fails to provide an accurate taxpayer identification number or certification of exempt status or fails to comply with applicable certification requirements. Certain holders are not subject to backup withholding (including corporations and Non-U.S. Holders who provide certification of their exempt status). Holders should consult their tax advisers as to their qualification for exemption from backup withholding and the procedure for obtaining an exemption.
| F. | Dividends and Paying Agents |
Not applicable.
| G. | Statement by Experts |
Not applicable.
| H. | Documents on Display |
We are subject to the information requirements of the Exchange Act, except that as a foreign issuer, we will not be subject to the proxy rules or the short-swing profit disclosure rules of the Exchange Act. In accordance with these statutory requirements, we will file or furnish reports and other information with the SEC, which you may inspect and copy at the Public Reference Room at 100 F Street, N.E., Washington, D.C. 20549. Information on the operation of the Public Reference Room may be obtained by calling the SEC at 1-800-SEC-0330. In addition, the SEC maintains an Internet website that contains reports and other information about issuers, like us, that file electronically with the SEC. The address of that website is www.sec.gov.
| I. | Subsidiary Information |
See “Item 4. Information on the Company—C. Organizational Structure” and Exhibit 8.1.
| J. | Annual Report to Security Holders. |
If we are required to provide an annual report to security holders in response to the requirements of Form 6-K, we will submit the annual report to security holders in electronic format in accordance with the EDGAR Filer Manual.
ITEM 11. QUANTITATIVE AND QUALITATIVE DISCLOSURES ABOUT MARKET RISK
Our board of directors has overall responsibility for establishing and monitoring our risk management objectives and policies. While it retains ultimate responsibility for risk management, it has delegated the day-to-day monitoring to the executive management team to design and operate processes that ensure effective implementation of the risk management objectives and policies, and management periodically to the board of directors. Our audit committee will also review the risk management policies and processes, and report findings to the board of directors. The overall objective of the board of directors is to set policies that seek to reduce risk as far as possible without unduly affecting our competitiveness and flexibility.
The risks and methods for managing the risks are reviewed regularly, in order to reflect changes in market conditions and our activities. Through training, management standards and procedures, we aim to develop a disciplined and constructive control environment in which all our employees understand their roles and obligations.
For further information on our market risks, please see Note 15 to our audited consolidated financial statements included elsewhere in this report.
ITEM 12. DESCRIPTION OF SECURITIES OTHER THAN EQUITY SECURITIES
| A. | Debt Securities |
Not applicable.
| B. | Warrants and Rights |
Not applicable.
| C. | Other Securities |
Not applicable.
| D. | American Depositary Shares |
Not applicable.
ITEM 13. DEFAULTS, DIVIDEND ARREARAGES AND DELINQUENCIES
| A. | Defaults |
Not applicable.
| B. | Arrears and Delinquencies |
Not applicable.
ITEM 14. MATERIAL MODIFICATIONS TO THE RIGHTS OF SECURITY HOLDERS AND USE OF PROCEEDS
Not applicable.
ITEM 15. CONTROLS AND PROCEDURES
| A. | Disclosure Controls and Procedures |
Under the supervision and with the participation of our management, including our chief executive officer and chief financial officer, we conducted an evaluation of the effectiveness of the design and operation of our disclosure controls and procedures, as defined in Rules 13a-15(e) and 15d-15(e) under the Exchange Act, as of June 30, 2024. Based on this evaluation, our chief executive officer and chief financial officer concluded that our disclosure controls and procedures were effective as of June 30, 2024, the end of the period covered by this report, at a reasonable assurance level and, accordingly, provide reasonable assurance that the information required to be disclosed by us in reports filed under the Exchange Act is recorded, processed, summarized and reported within the time periods specified in the SEC’s rules and forms and that information required to be disclosed by us in the reports we file or submit under the Exchange Act is accumulated and communicated to our management, including our chief executive officer and chief financial officer, or persons performing similar functions, as appropriate to allow timely decisions regarding required disclosure.
There are inherent limitations to the effectiveness of any system of disclosure controls and procedures, including the possibility of human error and the circumvention or overriding of the controls and procedures. Accordingly, even effective disclosure controls and procedures can only provide reasonable assurance of achieving their control objectives.
| B. | Management’s Annual Report on Internal Control Over Financial Reporting |
Management, under the supervision and with the participation of our Chief Executive Officer and Chief Financial Officer, is responsible for establishing and maintaining adequate internal control over financial reporting. Internal control over financial reporting is defined in Rule 13a-15(f) and 15d-15(f) under the Exchange Act as a process designed to provide reasonable assurance regarding the reliability of financial reporting and the preparation of financial statements for external purposes in accordance with IFRS as adopted by the IASB and includes those policies and procedures that:
| ● | pertain to the maintenance of records that in reasonable detail accurately and fairly reflect the transaction and dispositions of our assets; |
| ● | provide reasonable assurance that transactions are recorded as necessary to permit preparation of financial statements in accordance with IFRS as adopted by the IASB, and that our receipts and expenditures are being made only in accordance with authorizations of our management and directors; and |
| ● | provide reasonable assurance regarding prevention or timely detection of unauthorized acquisition, use or disposition of our assets that could have a material effect on the financial statements. |
Because of its inherent limitations, internal control over financial reporting may not prevent or detect misstatements. Also, projections of any evaluation of effectiveness to future periods are subject to the risk that controls may become inadequate because of changes in conditions, or that the degree of compliance with the policies or procedures may deteriorate.
Management assessed the effectiveness of our internal control over financial reporting (as defined in Rules 13(a)-13(f) and 15(d)-15(f) under the U.S. Securities Exchange Act of 1934) as of June 30, 2024. In making this assessment, it used the criteria established in Internal Control—Integrated Framework (2013) issued by the Committee of Sponsoring Organizations of the Treadway Commission. Based on their assessment, subject to the exclusion below, management concluded that, as of June 30, 2024, our internal control over financial reporting is effective based on those criteria.
The effectiveness of our internal control over financial reporting as of June 30, 2024 has been audited by PwC, an independent registered public accounting firm, as stated in their report which appears herein.
| C. | Attestation Report of the Registered Public Accounting Firm |
The effectiveness of our internal control over financial reporting as of June 30, 2024 has been audited by PwC, an independent registered public accounting firm, as stated in their report which appears herein.
| D. | Changes in Internal Control Over Financial Reporting |
During the period covered by this annual report, there have not been any changes in our internal control over financial reporting that have materially affected or are reasonably likely to materially affect, our internal control over financial reporting.
| A. | Audit Committee Financial Expert |
Our board of directors has determined that Ari Freisinger is an “audit committee financial expert” as defined by the SEC item 16A of Form 20-F. All members of the audit committee are independent directors as defined in the Nasdaq Global Select Market corporate governance standards and Rule 10A-3 under the Exchange Act.
| B. | Code of Ethics |
We have adopted a Code of Ethics applicable to our directors, executive officers and employees and to all board members, employees and officers of our controlled companies. The Code of Ethics codifies the business and ethical principles that govern all aspects of our business. A copy of the Code of Ethics will be filed with the SEC and will be provided without charge upon written request to Bioceres Crop Solutions in writing at investorelations@biocerescrops.com. Bioceres Crop Solutions intends to disclose any amendments to or waivers of certain provisions of our Code of Ethics in a Current Report on Form 6-K (as required) or on our website.
| C. | Principal Accountant Fees and Services |
PwC have acted as our principal accountants for the years ended June 30, 2024, and 2023. The following is a summary of fees paid or to be paid to PwC for services rendered for each of the last two fiscal years.
Audit Fees
Audit fees consist of fees billed for standard audit work that needs to be performed each year in order to issue opinions on our consolidated financial statements and for services that are normally provided by PwC in connection with regulatory filings. The aggregate fees billed by PwC for professional services rendered for the audit of our annual consolidated financial statements and review of the financial information included in our required filings with the SEC for the year ended June 30, 2024 and 2023 totaled US$1.2 million and US$0.5 million, respectively.
Audit-Related Fees
Audit-related fees billed consist of fees for services such as auditing of non-recurring transactions, reviews of semi-annual financial results, consents and comfort letters and any other audit services required for SEC or other regulatory filings. PwC did not bill us for audit-related services for the year ended June 30, 2024. PwC did not bill us for audit-related services for the year ended June 30, 2023.
Tax Fees
Tax services relate to the aggregated fees for services on tax compliance. The aggregate fees by PwC for tax fees for the year ended June 30, 2024 and 2023 amounted to less than US$0.1 million each.
All Other Fees
We did not pay PwC for other services for the years ended June 30, 2024 and 2023.
Pre-approval Policies
Our audit committee approves all auditing services and permitted non-audit services performed for us by our independent auditor in advance of an engagement. All auditing services and permitted non-audit services (including the fees and terms thereof) to be performed for us by our independent auditor must be approved by the audit committee in advance, subject to the de minimis exceptions for non-audit services described in Section 10A(i)(1)(B) of the Exchange Act which are approved by the committee prior to the completion of the audit.
| D. | Exemptions from the Listing Standards for Audit Committees |
No exemptions from the listing standards for our audit committee.
| E. | Purchases of Equity Securities by the Issuer and Affiliated Purchasers |
See “Item 10 Additional Information—B. Memorandum and Articles of Association—Share Buy-Back Program.”.
| F. | Change in Registrant’s Certifying Accountant |
Not applicable.
| G. | Corporate Governance |
See “Item 6. Directors, Senior Management and Employees—C. Board Practices.”
| H. | Mine Safety Disclosure |
Not applicable.
| I. | Disclosure Regarding Foreign Jurisdictions that Prevent Inspections |
Not applicable.
| J. | Insider Trading Policies |
Our board of directors has adopted insider trading policies and procedures governing the purchase, sale, and other dispositions of our securities by directors, senior management, and employees that are reasonably designed to promote compliance with applicable insider trading laws, rules and regulations, and any listing standards applicable to us.
| K. | Cybersecurity |
Risk Management and Strategy
We have developed and implemented cybersecurity risk management measures intended to protect the confidentiality, integrity, and availability of our critical systems and information. Our cybersecurity risk management measures are integrated into our overall enterprise risk management program.
Our cybersecurity risk management measures set out the foundation of the process for assessing, identifying and managing material risks from cybersecurity threats and provide guidance for response plan when facing cybersecurity threats. We have not engaged assessors or other third parties in connection with such processes.
There can be no assurance that our cybersecurity risk management measures and processes will be fully implemented, complied with or effective in protecting our systems and information. As of the date of this Form 20-F, we have not experienced any material cybersecurity incidents or identified any material cybersecurity threats that have affected or are reasonably likely to materially affect us, including our business strategy, results of operations or financial condition.
Cybersecurity Risk Governance
Our senior vice - president of Information Technology (the “Senior Vice President of IT”), who is a certified internal auditor (CIA), and received a master’s degree in business administration from the University of Chile, is responsible for assessing and managing material risks from cybersecurity threats. Our Senior Vice - President of IT oversees our efforts to monitor the prevention, detection, mitigation, and remediation of cybersecurity incidents. The information technology department has a dedicated leadership team focused entirely on cybercrime prevention, supported by specialized third party to run tests on the effectiveness of our controls.
Our board has specific responsibility for overseeing cybersecurity risk management and evaluation and being informed on risks from cybersecurity threats. Our Senior Vice - President of IT reports to the board on cybersecurity risk management matters as needed. Any material cybersecurity incidents would be reported to the board by our Chief Financial Officer. In the case of a material cybersecurity incident, our board is responsible for ensuring that the proposed action and disclosure of the incident is adequate and that measures are put in place to prevent further incidents. See “Risk Factors” in this Annual Report.
We have responded to Item 18 in lieu of this item.
Financial Statements are filed as part of this report, see page F-1.
| * | Previously filed. |
SIGNATURES
The registrant hereby certifies that it meets all of the requirements for filing on Form 20-F and that it has duly caused and authorized the undersigned to sign this registration statement on its behalf.
| Date: October 30, 2024 | |||
| BIOCERES CROP SOLUTIONS CORP. | |||
| By: | /s/ Federico Trucco | ||
| Name: | Federico Trucco | ||
| Title: | Chief Executive Officer | ||

BIOCERES CROP SOLUTIONS CORP.
Consolidated financial statements as of June
30, 2024 and 2023
and for the years ended June 30, 2024, 2023 and 2022.

INDEX
Consolidated financial statements as of June 30, 2024 and 2023 and for the years ended June 30, 2024, 2023 and 2022.
F-

Report of Independent Registered Public Accounting Firm
To the board of directors and shareholders of Bioceres Crop Solutions Corp.
Opinions on the Financial Statements and Internal Control over Financial Reporting
We have audited the accompanying consolidated statements of financial position of Bioceres Crop Solutions Corp. and its subsidiaries (the “Company”) as of June 30, 2024 and 2023, and the related consolidated statements of comprehensive income, of changes in equity and of cash flows for each of the three years in the period ended June 30, 2024, including the related notes (collectively referred to as the “consolidated financial statements”). We also have audited the Company’s internal control over financial reporting as of June 30, 2024, based on criteria established in Internal Control - Integrated Framework (2013) issued by the Committee of Sponsoring Organizations of the Treadway Commission (COSO).
In our opinion, the consolidated financial statements referred to above present fairly, in all material respects, the financial position of the Company as of June 30, 2024 and 2023, and the results of its operations and its cash flows for each of the three years in the period ended June 30, 2024 in conformity with International Financial Reporting Standards as issued by the International Accounting Standards Board. Also in our opinion, the Company maintained, in all material respects, effective internal control over financial reporting as of June 30, 2024, based on criteria established in Internal Control - Integrated Framework (2013) issued by the COSO.
Basis for Opinions
The Company’s management is responsible for these consolidated financial statements, for maintaining effective internal control over financial reporting, and for its assessment of the effectiveness of internal control over financial reporting, included in Management’s Annual Report on Internal Control over Financial Reporting appearing under item 15B. Our responsibility is to express opinions on the Company’s consolidated financial statements and on the Company’s internal control over financial reporting based on our audits. We are a public accounting firm registered with the Public Company Accounting Oversight Board (United States) (PCAOB) and are required to be independent with respect to the Company in accordance with the U.S. federal securities laws and the applicable rules and regulations of the Securities and Exchange Commission and the PCAOB.
We conducted our audits in accordance with the standards of the PCAOB. Those standards require that we plan and perform the audits to obtain reasonable assurance about whether the consolidated financial statements are free of material misstatement, whether due to error or fraud, and whether effective internal control over financial reporting was maintained in all material respects.
Our audits of the consolidated financial statements included performing procedures to assess the risks of material misstatement of the consolidated financial statements, whether due to error or fraud, and performing procedures that respond to those risks. Such procedures included examining, on a test basis, evidence regarding the amounts and disclosures in the consolidated financial statements. Our audits also included evaluating the accounting principles used and significant estimates made by management, as well as evaluating the overall presentation of the consolidated financial statements. Our audit of internal control over financial reporting included obtaining an understanding of internal control over financial reporting, assessing the risk that a material weakness exists, and testing and evaluating the design and operating effectiveness of internal control based on the assessed risk. Our audits also included performing such other procedures as we considered necessary in the circumstances. We believe that our audits provide a reasonable basis for our opinions.
F-
Definition and Limitations of Internal Control over Financial Reporting
A company’s internal control over financial reporting is a process designed to provide reasonable assurance regarding the reliability of financial reporting and the preparation of financial statements for external purposes in accordance with generally accepted accounting principles. A company’s internal control over financial reporting includes those policies and procedures that (i) pertain to the maintenance of records that, in reasonable detail, accurately and fairly reflect the transactions and dispositions of the assets of the company; (ii) provide reasonable assurance that transactions are recorded as necessary to permit preparation of financial statements in accordance with generally accepted accounting principles, and that receipts and expenditures of the company are being made only in accordance with authorizations of management and directors of the company; and (iii) provide reasonable assurance regarding prevention or timely detection of unauthorized acquisition, use, or disposition of the company’s assets that could have a material effect on the financial statements.
Because of its inherent limitations, internal control over financial reporting may not prevent or detect misstatements. Also, projections of any evaluation of effectiveness to future periods are subject to the risk that controls may become inadequate because of changes in conditions, or that the degree of compliance with the policies or procedures may deteriorate.
Critical Audit Matters
The critical audit matter communicated below is a matter arising from the current period audit of the consolidated financial statements that was communicated or required to be communicated to the audit committee and that (i) relates to accounts or disclosures that are material to the consolidated financial statements and (ii) involved our especially challenging, subjective, or complex judgments. The communication of critical audit matters does not alter in any way our opinion on the consolidated financial statements, taken as a whole, and we are not, by communicating the critical audit matter below, providing a separate opinion on the critical audit matter or on the accounts or disclosures to which it relates.
Impairment Tests on Goodwill (Pro Farm Group, Inc., Rizobacter S.A. and Bioceres Crops S.A. Cash Generating Units) and Intangible Assets Not yet available for use or with indefinite useful lives.
As described in Notes 4.6, 7.8 and 7.9 to the consolidated financial statements, the Company’s goodwill associated with the Pro Farm Group, Inc. Rizobacter S.A. and Bioceres Crop S.A. cash generating units (“CGU”) and intangible assets not yet available for use or with indefinite useful lives amounted to $76.1 million, $28.1 million, $7,5 million and $23.3 million, respectively, as of June 30, 2024. Impairment tests on goodwill and intangible assets not yet available for use or with indefinite useful lives are undertaken annually at the end of the reporting period. Where the carrying value of an asset exceeds its recoverable amount (i.e. the higher of value in use and fair value less costs to sell), the asset is written down to its recoverable amount. In each case, management determined the recoverable amount based on value in use calculations prepared by management. The determination of the recoverable amount of the CGU’s and intangible assets not yet available for use or with indefinite useful lives includes significant and numerous judgments and assumptions that are subject to various risks and uncertainties. The principal assumptions used in management’s models consisted of (i) budgeted market shares of joint ventures and other customers, (ii) budgeted product prices, (iii) growth rates used to extrapolate future cash flow projections to the terminal period and (iv) discount rates.
The principal considerations for our determination that performing procedures relating to impairment tests on goodwill (Pro Farm Group, Inc., Rizobacter S.A. and Bioceres Crops S.A. cash generating units) and intangible assets not yet available for use or with indefinite useful lives is a critical audit matter are (i) the significant judgment by management when developing the recoverable amount of the CGUs and intangible assets not yet available for use or with indefinite useful lives; (ii) a high degree of auditor judgment, subjectivity and effort in performing procedures and evaluating management’s significant assumptions used in the models related to the (i) budgeted market shares of joint ventures and other customers, (ii) budgeted product prices, (iii) growth rates used to extrapolate future cash flow projections to the terminal period and (iv) discount rates; and (iii) the audit effort involved the use of professionals with specialized skill and knowledge.
F-
Addressing the matter involved performing procedures and evaluating audit evidence in connection with forming our overall opinion on the consolidated financial statements. These procedures included testing the effectiveness of controls relating to management’s impairment tests on goodwill and intangible assets not yet available for use or with indefinite useful lives, including controls over the determination of the recoverable amounts for the CGUs and intangible assets not yet available for use or with indefinite useful lives. These procedures also included, among others (i) testing management’s process for developing the recoverable amounts of CGUs and intangible assets not yet available for use or with indefinite useful lives; (ii) evaluating the appropriateness of the models used; (iii) testing the completeness and accuracy of underlying data used in the models; (iv) evaluating the reasonableness of the significant assumptions used by management in the models related to budgeted market shares of joint ventures and other customers, budgeted product prices, growth rates used to extrapolate future cash flow projections to the terminal period and discount rates. Evaluating management’s assumptions used in the models related to budgeted market shares of joint ventures and other customers, budgeted product prices, growth rates used to extrapolate future cash flow projections to the terminal period and discount rates involved evaluating whether the assumptions used by management were reasonable considering (i) the current and past performance of the CGUs and the Company’s business; (ii) the consistency with external market and industry data; and (iii) whether these assumptions were consistent with evidence obtained in other areas of the audit. Professionals with specialized skill and knowledge were used to assist in the evaluation of the Company’s discounted cash flow model and the discount rate assumptions.
/s/ Price Waterhouse & Co. S.R.L.
| /s/ Guillermo Miguel Bosio | |
| Guillermo Miguel Bosio | |
| Partner | |
| Rosario, Argentina | |
| October 30, 2024 |
We have served as the Company’s auditor since 2018.
F-
CONSOLIDATED STATEMENTS OF FINANCIAL POSITION
As of June 30, 2024 and 2023
(Amounts in US$)
| Notes | 06/30/2024 | 06/30/2023 | |||||||||
| ASSETS | |||||||||||
| CURRENT ASSETS | |||||||||||
| Cash and cash equivalents | 7.1 | 44,473,270 | 48,129,194 | ||||||||
| Other financial assets | 7.2 | 11,695,528 | 12,135,020 | ||||||||
| Trade receivables | 7.3 | 207,320,974 | 158,006,474 | ||||||||
| Other receivables | 7.4 | 18,298,672 | 28,824,998 | ||||||||
| Recoverable income tax | 655,691 | 9,444,898 | |||||||||
| Inventories | 7.5 | 125,929,768 | 140,426,975 | ||||||||
| Biological assets | 7.6 | 294,134 | 146,842 | ||||||||
| Total current assets | 408,668,037 | 397,114,401 | |||||||||
| NON-CURRENT ASSETS | |||||||||||
| Other financial assets | 7.2 | 634,553 | 444,909 | ||||||||
| Other receivables | 7.4 | 17,957,121 | 2,546,241 | ||||||||
| Recoverable income tax | 10,889 | 16,286 | |||||||||
| Deferred tax assets | 9 | 9,698,860 | 7,312,964 | ||||||||
| Investments in joint ventures and associates | 13 | 39,786,353 | 39,296,810 | ||||||||
| Investment properties | 7.10 | 560,783 | 3,589,749 | ||||||||
| Property, plant and equipment | 7.7 | 74,573,278 | 67,853,835 | ||||||||
| Intangible assets | 7.8 | 174,797,456 | 173,783,956 | ||||||||
| Goodwill | 7.9 | 112,339,265 | 112,163,432 | ||||||||
| Right of use asset | 16 | 11,601,752 | 13,936,575 | ||||||||
| Total non-current assets | 441,960,310 | 420,944,757 | |||||||||
| Total assets | 850,628,347 | 818,059,158 | |||||||||
The accompanying Notes are an integral part of these Consolidated financial statements. Related parties’ balances and transactions are disclosed in Note 17.
F-
CONSOLIDATED STATEMENTS OF FINANCIAL POSITION
As of June 30, 2024 and 2023
(Amounts in US$)
| Notes | 06/30/2024 | 06/30/2023 | |||||||||
| LIABILITIES | |||||||||||
| CURRENT LIABILITIES | |||||||||||
| Trade and other payables | 7.11 | 168,732,469 | 150,807,674 | ||||||||
| Borrowings | 7.12 | 136,747,198 | 107,639,659 | ||||||||
| Employee benefits and social security | 7.14 | 7,340,958 | 9,606,707 | ||||||||
| Deferred revenue and advances from customers | 7.15 | 3,923,140 | 24,875,662 | ||||||||
| Income tax payable | 4,825,271 | 509,034 | |||||||||
| Consideration for acquisition | 4,814,032 | 1,415,099 | |||||||||
| Lease liabilities | 16 | 3,122,778 | 3,858,699 | ||||||||
| Total current liabilities | 329,505,846 | 298,712,534 | |||||||||
| NON-CURRENT LIABILITIES | |||||||||||
| Borrowings | 7.12 | 42,104,882 | 60,670,946 | ||||||||
| Deferred revenue and advances from customers | 7.15 | 1,925,138 | 2,057,805 | ||||||||
| Joint ventures and associates | 13 | 296,455 | 622,823 | ||||||||
| Deferred tax liabilities | 9 | 34,500,445 | 35,785,347 | ||||||||
| Provisions | 1,255,702 | 891,769 | |||||||||
| Consideration for acquisition | 2,504,473 | 3,578,157 | |||||||||
| Secured notes | 7.13 | 80,809,686 | 75,213,146 | ||||||||
| Lease liabilities | 16 | 8,161,359 | 10,030,524 | ||||||||
| Total non-current liabilities | 171,558,140 | 188,850,517 | |||||||||
| Total liabilities | 501,063,986 | 487,563,051 | |||||||||
| EQUITY | |||||||||||
| Equity attributable to owners of the parent | 314,008,930 | 298,594,088 | |||||||||
| Non-controlling interest | 35,555,431 | 31,902,019 | |||||||||
| Total equity | 349,564,361 | 330,496,107 | |||||||||
| Total equity and liabilities | 850,628,347 | 818,059,158 | |||||||||
The accompanying Notes are an integral part of these Consolidated financial statements. Related parties’ balances and transactions are disclosed in Note 17.
F-
CONSOLIDATED STATEMENTS OF COMPREHENSIVE INCOME
For the years ended June 30, 2024, 2023 and 2022
(Amounts in US$)
| Notes | 06/30/2024 | 06/30/2023 | 06/30/2022 | ||||||||||||
| Revenues from contracts with customers | 8.1 | 464,828,548 | 419,446,439 | 328,455,588 | |||||||||||
| Initial recognition and changes in the fair value of biological assets at the point of harvest | (45,746 | ) | 610,554 | 6,388,030 | |||||||||||
| Cost of sales | 8.2 | (278,221,812 | ) | (235,457,053 | ) | (208,364,095 | ) | ||||||||
| Changes in the net realizable value of agricultural products after harvest | (2,385,069 | ) | (4,351,433 | ) | (42,523 | ) | |||||||||
| Research and development expenses | 8.3 | (17,183,041 | ) | (15,345,315 | ) | (6,947,460 | ) | ||||||||
| Selling, general and administrative expenses | 8.4 | (123,690,910 | ) | (113,002,747 | ) | (77,483,812 | ) | ||||||||
| Share of profit or loss of joint ventures and associates | 13 | 4,049,508 | 1,198,628 | 1,144,418 | |||||||||||
| Other income or expenses, net | 8.5 | (2,530,882 | ) | 1,084,892 | (3,280,220 | ) | |||||||||
| Operating profit | 44,820,596 | 54,183,965 | 39,869,926 | ||||||||||||
| Financial cost | 8.6 | (26,871,698 | ) | (23,788,085 | ) | (17,926,197 | ) | ||||||||
| Other financial results | 8.6 | (7,913,627 | ) | (11,289,933 | ) | (7,880,099 | ) | ||||||||
| Profit before income tax | 10,035,271 | 19,105,947 | 14,063,630 | ||||||||||||
| Income tax | 9 | (3,778,615 | ) | 1,068,652 | (17,972,534 | ) | |||||||||
| Profit/ (Loss) for the year | 6,256,656 | 20,174,599 | (3,908,904 | ) | |||||||||||
| Profit (Loss) for the year attributable to: | |||||||||||||||
| Equity holders of the parent | 3,243,361 | 18,779,876 | (7,199,618 | ) | |||||||||||
| Non-controlling interests | 3,013,295 | 1,394,723 | 3,290,714 | ||||||||||||
| 6,256,656 | 20,174,599 | (3,908,904 | ) | ||||||||||||
| Profit/ (Loss) per share | |||||||||||||||
| Basic profit/ (loss) attributable to ordinary equity holders of the parent | 10 | 0.0516 | 0.3022 | (0.1702 | ) | ||||||||||
| Diluted profit/ (loss) attributable to ordinary equity holders of the parent | 10 | 0.0511 | 0.2972 | (0.1702 | ) | ||||||||||
The accompanying Notes are an integral part of these consolidated financial statements. Related parties’ balances and transactions are disclosed in Note 17.
F-
CONSOLIDATED STATEMENTS OF COMPREHENSIVE INCOME
For the years ended June 30, 2024, 2023 and 2022
(Amounts in US$)
| 06/30/2024 | 06/30/2023 | 06/30/2022 | ||||||||||
| Profit/ (Loss) for the year | 6,256,656 | 20,174,599 | (3,908,904 | ) | ||||||||
| Other comprehensive (loss) income | (787,354 | ) | (835,849 | ) | 35,172,250 | |||||||
| Items that may be subsequently reclassified to profit and loss | (787,354 | ) | 631,500 | 40,480,860 | ||||||||
| Foreign exchange differences on translation of foreign operations from joint ventures | (238 | ) | (46,901 | ) | 7,845,756 | |||||||
| Foreign exchange differences on translation of foreign operations | (787,116 | ) | 678,401 | 32,635,104 | ||||||||
| Items that will not be subsequently reclassified to loss and profit | — | (1,467,349 | ) | (5,308,610 | ) | |||||||
| Revaluation of property, plant and equipment, net of tax, of joint ventures and associates 1 | — | (184,630 | ) | (586,268 | ) | |||||||
| Revaluation of property, plant and equipment, net of tax 2 | — | (1,282,719 | ) | (4,722,342 | ) | |||||||
| Total comprehensive profit | 5,469,302 | 19,338,750 | 31,263,346 | |||||||||
| Total comprehensive profit attributable to: | ||||||||||||
| Equity holders of the parent | 2,755,173 | 17,924,877 | 22,145,704 | |||||||||
| Non-controlling interests | 2,714,129 | 1,413,873 | 9,117,642 | |||||||||
| 5,469,302 | 19,338,750 | 31,263,346 | ||||||||||
| (1) | The tax effect of the revaluation of property, plant and equipment of joint ventures and associates was $99,415 for the year ended June 30, 2023 and $315,683 for the year ended June 30, 2022. |
| (2) | The tax effect of the revaluation of property, plant and equipment was $ 703,087 for the year ended June 30,2023 and $2,837,650 for the year ended June 30, 2022. |
The accompanying Notes are an integral part of these Consolidated financial statements. Related parties’ balances and transactions are disclosed in Note 17.
F-
CONSOLIDATED STATEMENTS OF CHANGES IN EQUITY
For the years ended June 30, 2024, 2023 and 2022
(Amounts in US$)
| Attributable to the equity holders of the parent | ||||||||||||||||||||||||||||||||||||||||||||||||||||
| Changes in non- |
Own shares | Stock options and |
Foreign currency |
Revaluation of PP&E and effect |
Equity / (deficit) attributable to |
Non- | ||||||||||||||||||||||||||||||||||||||||||||||
| Issued | Share | controlling | trading | share based | Convertible | Cost of own | Retained | translation | of tax rate | owners of the | controlling | Total | ||||||||||||||||||||||||||||||||||||||||
| Description | capital | premium | interests | premium | incentives | instruments | shares held | deficit | reserve | change | parent | Interests | equity | |||||||||||||||||||||||||||||||||||||||
| 06/30/2021 | 4,158 | 120,662,386 | — | (916,202 | ) | 3,672,768 | 702,981 | (3,530,926 | ) | (25,483,275 | ) | (32,622,808 | ) | 5,254,160 | 67,743,242 | 22,547,062 | 90,290,304 | |||||||||||||||||||||||||||||||||||
| Share-based incentives (Note 19) | 17 | 1,385,886 | — | — | 95,157 | — | — | — | — | — | 1,481,060 | — | 1,481,060 | |||||||||||||||||||||||||||||||||||||||
| Capitalization of convertible notes (Note 7.13) | 462 | 36,771,234 | — | — | — | (527,236 | ) | — | — | — | — | 36,244,460 | — | 36,244,460 | ||||||||||||||||||||||||||||||||||||||
| Changes in non-controlling interests | — | — | (255,893 | ) | — | — | — | — | — | — | — | (255,893 | ) | (724,429 | ) | (980,322 | ) | |||||||||||||||||||||||||||||||||||
| (Loss) Profit or the year | — | — | — | — | — | — | — | (7,199,618 | ) | — | — | (7,199,618 | ) | 3,290,714 | (3,908,904 | ) | ||||||||||||||||||||||||||||||||||||
| Other comprehensive income or (loss) | — | — | — | — | — | — | — | — | 33,592,210 | (4,246,888 | ) | 29,345,322 | 5,826,928 | 35,172,250 | ||||||||||||||||||||||||||||||||||||||
| 06/30/2022 | 4,637 | 158,819,506 | (255,893 | ) | (916,202 | ) | 3,767,925 | 175,745 | (3,530,926 | ) | (32,682,893 | ) | 969,402 | 1,007,272 | 127,358,573 | 30,940,275 | 158,298,848 | |||||||||||||||||||||||||||||||||||
| Share-based incentives (Note 19) | 63 | 2,640,004 | — | 135,361 | 1,257,377 | — | — | — | — | — | 4,032,805 | — | 4,032,805 | |||||||||||||||||||||||||||||||||||||||
| Business combination (Note 6) | 1,640 | 153,357,564 | — | — | 1,620,140 | — | — | — | — | — | 154,979,344 | — | 154,979,344 | |||||||||||||||||||||||||||||||||||||||
| Capitalization of convertible notes (Note 7.13) | 153 | 12,211,485 | — | — | — | — | — | — | — | — | 12,211,638 | — | 12,211,638 | |||||||||||||||||||||||||||||||||||||||
| Purchase of own shares | — | — | — | — | — | — | (27,022,665 | ) | — | — | — | (27,022,665 | ) | — | (27,022,665 | ) | ||||||||||||||||||||||||||||||||||||
| Issuance of convertible notes (Note 7.13) | — | — | — | — | — | 9,109,516 | — | — | — | — | 9,109,516 | — | 9,109,516 | |||||||||||||||||||||||||||||||||||||||
| Distribution of dividends by subsidiary | — | — | — | — | — | — | — | — | — | — | — | (452,129 | ) | (452,129 | ) | |||||||||||||||||||||||||||||||||||||
| Profit for the year | — | — | — | — | — | — | — | 18,779,876 | — | — | 18,779,876 | 1,394,723 | 20,174,599 | |||||||||||||||||||||||||||||||||||||||
| Other comprehensive income or (loss) | — | — | — | — | — | — | — | — | 312,975 | (1,167,974 | ) | (854,999 | ) | 19,150 | (835,849 | ) | ||||||||||||||||||||||||||||||||||||
| 06/30/2023 | 6,493 | 327,028,559 | (255,893 | ) | (780,841 | ) | 6,645,442 | 9,285,261 | (30,553,591 | ) | (13,903,017 | ) | 1,282,377 | (160,702 | ) | 298,594,088 | 31,902,019 | 330,496,107 | ||||||||||||||||||||||||||||||||||
| Share-based incentives (Note 19) | 7 | 612,117 | — | — | 12,781,933 | — | — | — | — | — | 13,394,057 | — | 13,394,057 | |||||||||||||||||||||||||||||||||||||||
| Purchase of own shares | — | — | — | — | — | — | (734,388 | ) | — | — | — | (734,388 | ) | — | (734,388 | ) | ||||||||||||||||||||||||||||||||||||
| Business combination (Note 6) | — | — | — | — | — | — | — | — | — | — | — | 1,114,083 | 1,114,083 | |||||||||||||||||||||||||||||||||||||||
| Distribution of dividends by subsidiary | — | — | — | — | — | — | — | — | — | — | — | (174,800 | ) | (174,800 | ) | |||||||||||||||||||||||||||||||||||||
| Profit for the year | — | — | — | — | — | — | — | 3,243,361 | — | — | 3,243,361 | 3,013,295 | 6,256,656 | |||||||||||||||||||||||||||||||||||||||
| Other comprehensive loss | — | — | — | — | — | — | — | — | (488,188 | ) | — | (488,188 | ) | (299,166 | ) | (787,354 | ) | |||||||||||||||||||||||||||||||||||
| 06/30/2024 | 6,500 | 327,640,676 | (255,893 | ) | (780,841 | ) | 19,427,375 | 9,285,261 | (31,287,979 | ) | (10,659,656 | ) | 794,189 | (160,702 | ) | 314,008,930 | 35,555,431 | 349,564,361 | ||||||||||||||||||||||||||||||||||
The accompanying Notes are an integral part of these consolidated financial statements. Related parties’ balances and transactions are disclosed in Note 17.
F-
CONSOLIDATED STATEMENTS OF CASH FLOWS
For the years ended June 30, 2024, 2023 and 2022
(Amounts in US$)
| Notes | 06/30/2024 | 06/30/2023 | 06/30/2022 | ||||||||||||
| OPERATING ACTIVITIES | |||||||||||||||
| Profit/ (Loss) for the year | 6,256,656 | 20,174,599 | (3,908,904 | ) | |||||||||||
| Adjustments to reconcile profit to net cash flows | |||||||||||||||
| Income tax | 9 | 3,778,615 | (1,068,652 | ) | 17,972,534 | ||||||||||
| Financial results | 34,785,325 | 35,078,018 | 25,806,296 | ||||||||||||
| Depreciation of property, plant and equipment | 7.7 | 5,763,249 | 4,833,274 | 3,769,005 | |||||||||||
| Amortization of intangible assets | 7.8 | 12,113,107 | 10,991,433 | 4,161,392 | |||||||||||
| Depreciation of leased assets | 16 | 3,418,956 | 3,565,894 | 1,257,538 | |||||||||||
| Transactional expenses | 1,119,525 | 4,183,916 | 971,539 | ||||||||||||
| Share-based incentive and stock options | 14,134,885 | 3,415,108 | 1,430,745 | ||||||||||||
| Share of profit or loss of joint ventures and associates | 13 | (4,049,508 | ) | (1,198,628 | ) | (1,144,418 | ) | ||||||||
| Loss of participation in joint ventures and associates | 13 | — | 133,079 | — | |||||||||||
| Provisions for contingencies | 367,126 | 221,008 | 292,732 | ||||||||||||
| Allowance for impairment of trade debtors | 753,428 | 1,327,385 | 1,598,042 | ||||||||||||
| Allowance for obsolescence | 586,515 | 1,066,777 | 849,641 | ||||||||||||
| Initial recognition and changes in the fair value of biological assets | 45,746 | (610,554 | ) | (6,388,030 | ) | ||||||||||
| Changes in the net realizable value of agricultural products after harvest | 2,385,069 | 4,351,433 | 42,523 | ||||||||||||
| Gain on sale of equipment and intangible assets | (125,464 | ) | (74,593 | ) | (1,944,308 | ) | |||||||||
| Working capital adjustments | |||||||||||||||
| Trade receivables | (46,681,153 | ) | (56,867,123 | ) | (24,971,064 | ) | |||||||||
| Other receivables | (4,967,150 | ) | (11,475,717 | ) | (7,298,822 | ) | |||||||||
| Income and minimum presumed income taxes | 4,782,508 | (16,154,083 | ) | 6,469,983 | |||||||||||
| Inventories and biological assets | 14,176,656 | (11,066,489 | ) | (55,311,365 | ) | ||||||||||
| Trade and other payables | 14,234,092 | (4,501,398 | ) | 53,477,330 | |||||||||||
| Employee benefits and social security | (2,289,095 | ) | 1,258,673 | 3,003,793 | |||||||||||
| Deferred revenue and advances from customers | (21,087,704 | ) | 13,322,769 | (373,584 | ) | ||||||||||
| Income taxes paid | (853,299 | ) | (4,072,347 | ) | (7,059,177 | ) | |||||||||
| Government grants | — | — | (784 | ) | |||||||||||
| Interest collected | 2,747,398 | 5,378,413 | 5,628,962 | ||||||||||||
| Inflation effects on working capital adjustments | 321,103 | 376,597 | (35,846,973 | ) | |||||||||||
| Net cash flows generated / (used) by operating activities | 41,716,586 | 2,588,792 | (17,515,374 | ) | |||||||||||
The accompanying Notes are an integral part of these consolidated financial statements. Related parties’ balances and transactions are disclosed in Note 17.
F-
CONSOLIDATED STATEMENTS OF CASH FLOWS
For the years ended June 30, 2024, 2023 and 2022
(Amounts in US$)
| Notes | 06/30/2024 | 06/30/2023 | 06/30/2022 | ||||||||||||
| INVESTMENT ACTIVITIES | |||||||||||||||
| Proceeds from sale of property, plant and equipment | 336,726 | 137,357 | 2,046,771 | ||||||||||||
| Net cash received from business combination | 37,508 | 4,373,265 | — | ||||||||||||
| Net loans granted to shareholders and other related parties | — | — | (421,691 | ) | |||||||||||
| Proceeds from financial assets | 888,140 | 1,316,980 | 12,331,390 | ||||||||||||
| Investment in financial assets | (7,208,218 | ) | (8,990,083 | ) | (2,055,878 | ) | |||||||||
| Purchase of property, plant and equipment | 7.7 | (9,789,574 | ) | (11,360,469 | ) | (3,458,790 | ) | ||||||||
| Capitalized development expenditures | 7.8 | (11,855,766 | ) | (10,753,047 | ) | (5,149,684 | ) | ||||||||
| Purchase of intangible assets | 7.8 | (1,137,071 | ) | (449,673 | ) | (389,039 | ) | ||||||||
| Net cash flows (used) /generated by investing activities | (28,728,255 | ) | (25,725,670 | ) | 2,903,079 | ||||||||||
| FINANCING ACTIVITIES | |||||||||||||||
| Proceeds from borrowings | 135,818,247 | 79,817,888 | 140,431,184 | ||||||||||||
| Repayment of borrowings and financed payments | (112,614,437 | ) | (16,744,956 | ) | (110,625,272 | ) | |||||||||
| Interest payments | (24,724,436 | ) | (18,046,961 | ) | (13,009,834 | ) | |||||||||
| Decrease in bank overdrafts and other short-term borrowings | — | — | (32,838 | ) | |||||||||||
| Other financial payments | (2,746,945 | ) | (4,767,378 | ) | (180,538 | ) | |||||||||
| Acquisition of non-controlling interest in subsidiaries | — | — | (724,429 | ) | |||||||||||
| Purchase of own shares | (734,388 | ) | (2,996,947 | ) | — | ||||||||||
| Leased assets payments | 16 | (4,879,108 | ) | (3,855,517 | ) | (1,034,764 | ) | ||||||||
| Cash dividend distributed by subsidiary | (174,800 | ) | (452,129 | ) | — | ||||||||||
| Net cash flows (used) /generated by financing activities | (10,055,867 | ) | 32,954,000 | 14,823,509 | |||||||||||
| Net increase in cash and cash equivalents | 2,932,464 | 9,817,122 | 211,214 | ||||||||||||
| Inflation effects on cash and cash equivalents | (31,918 | ) | (101,767 | ) | (9,624,750 | ) | |||||||||
| Cash and cash equivalents as of beginning of the year | 7.1 | 48,129,194 | 33,475,266 | 36,046,113 | |||||||||||
| Effect of exchange rate changes on cash and equivalents | (6,556,470 | ) | 4,938,573 | 6,842,689 | |||||||||||
| Cash and cash equivalents as of the end of the year | 7.1 | 44,473,270 | 48,129,194 | 33,475,266 | |||||||||||
The accompanying Notes are an integral part of these Consolidated financial statements. Related parties’ balances and transactions are disclosed in Note 17.
F-
NOTES TO THE CONSOLIDATED FINANCIAL STATEMENTS
As of June 30, 2024 and 2023 and for the years ended June 30, 2024, 2023 and 2022
(Amounts in US$, except otherwise indicated)
Index
| 1. | General information. |
| 2. | Accounting standards and basis of preparation. |
| 3. | New standards, amendments and interpretations issued by the IASB. |
| 4. | Summary of significant accounting policies. |
| 5. | Critical accounting judgments and estimates. |
| 6. | Acquisitions and other significant transactions. |
| 7. | Information about components of consolidated statement of financial position. |
| 8. | Information about components of consolidated statement of comprehensive income. |
| 9. | Taxation. |
| 10. | Earnings per share. |
| 11. | Information about components of equity. |
| 12. | Cash flow information. |
| 13. | Joint ventures and associates. |
| 14. | Segment information. |
| 15. | Financial instruments – Risk management. |
| 16. | Leases. |
| 17. | Shareholders and other related parties’ balances and transactions. |
| 18. | Key management personnel compensation. |
| 19. | Share-based payments. |
| 20. | Contingencies, commitments and restrictions on the distribution of profits. |
| 21. | Events occurring after the reporting period. |
F-
NOTES TO THE CONSOLIDATED FINANCIAL STATEMENTS
As of June 30, 2024 and 2023 and for the years ended June 30, 2024, 2023 and 2022
(Amounts in US$, except otherwise indicated)
| 1. | GENERAL INFORMATION |
Bioceres Crop Solutions Corp. (NASDAQ: BIOX) is a leader in the development and commercialization of productivity solutions designed to regenerate agricultural ecosystems while making crops more resilient to climate change. To do this, Bioceres’ products create economic incentives for farmers and other stakeholders to adopt environmentally friendly production practices. Bioceres has a unique biotech platform with high impact, patented technologies for seeds and microbial ag inputs, as well as next generation crop nutrition and protection solutions.
Bioceres is a global company with an extensive geographic footprint. The Group’s agricultural inputs are marketed across more than 45 countries, primarily in South America, the United States and Europe.
Unless the context otherwise requires, “we”, “us”, “our”, “Bioceres”, “BIOX”, “the Group”, and “Bioceres Crop Solutions” will refer to Bioceres Crop Solutions Corp. and its subsidiaries.
| 2. | ACCOUNTING STANDARDS AND BASIS OF PREPARATION |
Statement of compliance with IFRS as issued by IASB
The consolidated financial statements of the Group have been prepared in accordance with International Financial Reporting Standards (“IFRS”) as issued by International Accounting Standard Board (“IASB”) following the accounting policies as set forth and summarized in Note 4. All IFRS issued by the IASB, effective at the time of preparing these consolidated financial statements have been applied.
Authorization for the issue of the consolidated financial statements
These consolidated financial statements of the Group as of June 30, 2024 and 2023 and for the years ended June 30, 2024, 2023 and 2022 have been authorized by the Board of Directors of Bioceres Crop Solutions on September 27, 2024.
Basis of measurement
The consolidated financial statements of the Group have been prepared using:
| ● | Going concern basis of accounting, considering the conclusion of the assessment made by the Group’s Management about the ability of the Group and its subsidiaries to continue as a going concern, in accordance with the requirements of paragraph 25 of IAS 1, “Presentation of Financial Statements”. |
| ● | Accrual basis of accounting (except for cash flows information). Under this basis of accounting, the effects of transactions and other events are recognized as they occur, even when there are no cash flows. |
Functional currency and presentation currency
| a) | Functional currency |
Items included in the financial statements of each of the Group’s entities are measured using the currency of the primary economic market in which the entity operates (i.e., “the functional currency”).
For the years ended June 30, 2022, our Argentine subsidiaries applied IAS 29 “Financial reporting in hyperinflationary economies,” which requires that the financial statements of an entity whose functional currency is the currency of a hyperinflationary economy be stated in terms of the measuring unit current at the closing date of the reporting period. For such purpose, the inflation produced since the acquisition date or the revaluation date, as applicable, must be computed for non-monetary items. The standard details a series of factors to be considered for concluding whether an economy is hyperinflationary, including, but not limited to, a cumulative inflation rate over a three-year period that approaches or exceeds 100%. As of June 30, 2018, the cumulative inflation in Argentina exceeded 100%. Therefore, as of July 1, 2018, the Argentine economy was considered hyperinflationary, in accordance with IAS 29.
F-
NOTES TO THE CONSOLIDATED FINANCIAL STATEMENTS
As of June 30, 2024 and 2023 and for the years ended June 30, 2024, 2023 and 2022
(Amounts in US$, except otherwise indicated)
During an inflationary period, any entity that maintains an excess of monetary assets over monetary liabilities will lose purchasing power, and any entity that maintains an excess of monetary liabilities over monetary assets will gain purchasing power, provided that such items are not subject to an adjustment mechanism.
In short, the restatement mechanism of IAS 29 establishes that monetary assets and liabilities will not be restated because they are already expressed in a current unit of measurement at the end of the reporting period. Assets and liabilities subject to adjustments based on specific agreements will be adjusted according to those agreements. Non-monetary items measured at their current values at the end of the reporting period, such as fair value or others, do not need to be restated. The remaining non-monetary assets and liabilities will be restated according to a general price index. The loss or gain for the net monetary position will be included in the net result of the reporting period, presented in a separate line item.
From July 1, 2022, our main Argentine subsidiaries changed their functional currency from the Argentine Peso to the U.S. dollar as a result of changes in events and conditions that are relevant to their business operations, which include a hyper inflationary macroeconomic context and the depreciation of the Argentine Peso, in addition to the effects on our business of certain business combination transactions, as discussed below.
Macroeconomic context – in recent years Argentina’s macroeconomic scenario has featured a misalignment between inflation rates and the devaluation of the Argentine peso, which became more pronounced during the first half of the year ended June 30, 2022. Notwithstanding such misalignment, our Argentine subsidiaries have been able to continue pricing their products in U.S. dollars as the costs of products and services are set in U.S. dollars. This has also been achievable as the demand for the type of products we commercialize is relatively inelastic when compared to non-essential goods and services. Further, Argentina’s significant economic volatility has caused materials, and other costs of providing goods that we acquire from the Argentine domestic market, to become increasingly indexed to the U.S. dollar (i.e., denominated in Argentine Pesos but indexed to the U.S. dollar exchange rate).
Business effects – following the merger with Pro Farm (see Note 6), which closed at the beginning of the fiscal year ended June 30, 2023, in addition to other business combination transactions, we established a global commercial strategy with a view to unifying pricing policies for the commercialization of our products.
In accordance with IAS 21, we have considered the following primary factors to determine the functional currency of our main Argentine subsidiaries: (i) the sales prices for goods and services, which are mainly influenced and determined by the U.S. dollar; and (ii) the increasing influence of transactions indexed to the U.S. dollar related to labor, materials, and other costs of providing goods.
Taking into account the analysis of the primary factors provided by IAS 21 in determining the functional currency of our main Argentine subsidiaries (in particular the increased influence of exchange rates on their costs of operations, which are indexed to the U.S. dollar), we identified that there is strong evidence that their functional currency had changed to the U.S. dollar.
As discussed above, we assessed primary indicators and determined that they were conclusive for the analyzed period; however, consideration was also given to secondary indicators. The result of such analysis also leads to the conclusion that the U.S. dollar is the relevant currency for cash generation from operating and financing activities of our main Argentine subsidiaries.
In accordance with IAS 21, the effects of the change in functional currency were recorded prospectively. Accordingly, from July 1, 2022, there are no longer significant effects of inflation adjustments in our financial statements.
F-
NOTES TO THE CONSOLIDATED FINANCIAL STATEMENTS
As of June 30, 2024 and 2023 and for the years ended June 30, 2024, 2023 and 2022
(Amounts in US$, except otherwise indicated)
| b) | Presentation currency |
The consolidated financial statements of the Group are presented in US dollars.
| c) | Foreign currency |
Transactions entered into by Group entities in a currency other than their functional currency are recorded at the relevant exchange rates as of the date upon which such transactions occur. Foreign currency monetary assets and liabilities are translated at the prevailing exchanges rates as of the final day of each reporting period. Exchange differences arising from the retranslation of unsettled monetary assets and liabilities are recognized immediately in profit or loss, except for foreign currency borrowings qualifying as a hedge of a net investment in a foreign operation for which exchange differences are recognized in other comprehensive income and accumulated in the foreign exchange reserve along with the exchange differences arising from the retranslation of the foreign operation. Upon the disposal of a foreign operation, the cumulative exchange differences recognized in the foreign exchange reserve relating to such operation up to the date of disposal are transferred to the consolidated statement of profit or loss and other comprehensive income as part of the gain or loss recognized upon such disposal.
Subsidiaries
Where the Group holds a controlling interest in an entity, such entity is classified as a subsidiary. The Group exercises control over such an entity if all three of the following elements are present: (i) the Group has the power to direct or cause the direction of the management and policies of the entity; (ii) the Group is exposed to the variable returns of such entity; and (iii) the Group has power to affect the variability of such returns. Control is reassessed whenever facts and circumstances indicate that there may be a change in any of these elements of control.
De-facto control exists in situations where the Group has the practical ability to direct the relevant activities of an entity without holding the majority of the voting rights. In determining whether de facto control exists, the Group considers all relevant facts and circumstances, including:
| - | The relative share of the Group’s voting rights with respect both the size and dispersion of other parties who hold voting rights; |
| - | Substantive potential voting rights held by the Group and by other parties; |
| - | Other contractual arrangements; and |
| - | Historic patterns in voting attendance. |
F-
NOTES TO THE CONSOLIDATED FINANCIAL STATEMENTS
As of June 30, 2024 and 2023 and for the years ended June 30, 2024, 2023 and 2022
(Amounts in US$, except otherwise indicated)
The subsidiaries of the Group, all of which have been included in the consolidated financial statements of the Group, are as follows:
The Group holds a majority share of the voting rights in all of its subsidiaries.
| Country of | ||||||||||||||
| incorporation | ||||||||||||||
| and principal | ||||||||||||||
| place of | % Equity interest | |||||||||||||
| Name | Principal activities | business | Ref | 06/30/2024 | 06/30/2023 | |||||||||
| RASA Holding, LLC | Holding company | USA | 100 | % | 100 | % | ||||||||
| Rizobacter Argentina S.A. | Microbiology Business | Argentina | 80 | % | 80 | % | ||||||||
| Rizobacter do Brasil Ltda. | Microbiology Business | Brazil | a | 80 | % | 80 | % | |||||||
| Rizobacter del Paraguay S.A. | Microbiology Business | Paraguay | a | 80 | % | 80 | % | |||||||
| Rizobacter Uruguay | Microbiology Business | Uruguay | a | 80 | % | 80 | % | |||||||
| Rizobacter South Africa | Microbiology Business | South Africa | a | 76 | % | 76 | % | |||||||
| Comer. Agrop. Rizobacter de Bolivia S.A. | Microbiology Business | Bolivia | a | 80 | % | 80 | % | |||||||
| Rizobacter USA, LLC | Microbiology Business | USA | a | 80 | % | 80 | % | |||||||
| Rizobacter Colombia SAS | Microbiology Business | Colombia | a | 80 | % | 80 | % | |||||||
| Rizobacter France SAS | Microbiology Business | France | a | 80 | % | 80 | % | |||||||
| Bioceres Crops S.A. | Microbiology Business | Argentina | 90 | % | 90 | % | ||||||||
| BCS Holding Inc | Holding Company | USA | 100 | % | 100 | % | ||||||||
| Bioceres Semillas S.A.U. | Production and commercialization of seeds | Argentina | 100 | % | 100 | % | ||||||||
| Verdeca LLC | Research and development | USA | 100 | % | 100 | % | ||||||||
| Insumos Agroquímicos S.A. | Selling of agricultural inputs | Argentina | 61.32 | % | 61.32 | % | ||||||||
| Bioceres Crops Do Brasil Ltda. | Production and commercialization of seeds | Brazil | 100 | % | 100 | % | ||||||||
| Pro Farm Group Inc. | Development and sale of biological products | USA | b | 100 | % | 100 | % | |||||||
| Pro Farm International, OÜ | Development and sale of biological products | Finland | b | 100 | % | 100 | % | |||||||
| Pro Farm Michigan Manufacturing LLC | Development and sale of biological products | USA | b | 100 | % | 100 | % | |||||||
| Pro Farm Russia, LLC | Development and sale of biological products | Russia | b | 100 | % | 100 | % | |||||||
| Pro Farm Technologies Comércio de Insumo Agrícolas do Brasil Ltda | Development and sale of biological products | Brazil | b | 99 | % | 99 | % | |||||||
| Pro Farm Technologies, OÜ | Development and sale of biological products | Finland | b | 100 | % | 100 | % | |||||||
| Glinatur S.A. | Development and sale of biological products | Uruguay | b | 100 | % | 100 | % | |||||||
| Pro Farm, Inc. | Holding Company | USA | b | 100 | % | 100 | % | |||||||
| Natal Agro S.R.L. | Development and breeding of corn varieties | Argentina | c | 51 | % | — | ||||||||
| a) | Indirect interests held through Rizobacter. The indirect equity interest participation included in this table was the 80% of the direct equity interest participation that Rizobacter owns in each entity. |
| b) | On July 12, 2022 we acquired a controlling interest in Pro Farm Group Inc. (“Pro Farm”) and its subsidiaries. See Note 6. |
| c) | On June 10, 2024 we acquired a controlling interest in Natal Agro S.R.L (“Natal”). See Note 6 |
F-
NOTES TO THE CONSOLIDATED FINANCIAL STATEMENTS
As of June 30, 2024 and 2023 and for the years ended June 30, 2024, 2023 and 2022
(Amounts in US$, except otherwise indicated)
Special purpose and structured entities (“SPE”)
A structured entity is an entity that has been designed so that voting or similar rights are not the dominant factor in deciding who controls the entity and the relevant activities are directed by means of contractual arrangements. In these cases, we consider the purpose and design of the SPE, including a consideration of the risks the SPE was expected to be exposed to, the risks it was designed to pass on to the parties involved with the SPE and whether we are exposed to some or all of those risks or potential returns. One then considers which activities have a significant impact on the SPE’s returns and determines which parties have an ability to direct each of those activities.
The Group controls an SPE when is exposed, or has rights, to variable returns from its involvement with the SPE and has the ability to affect those returns through its power over the SPE.
| 3. | NEW STANDARDS, AMENDMENTS AND INTERPRETATIONS ISSUED BY THE IASB |
| a) | The following new standards became applicable for the current reporting period and adopted by the Group. |
| - | Amendment to IAS 12 –Deferred tax related to assets and liabilities arising from a single transaction. |
| - | International Tax Reform—Pillar Two Model Rules (Amendments to IAS 12) |
| - | Amendments to IAS 1 and IFRS Practice Statement 2- Disclosure of Accounting Policies |
| - | Amendments to IAS 8-Definition of Accounting Estimates |
These amendments did not have any material impact on the Group.
| b) | The following new standards are not yet adopted by the Group. |
| - | Amendments to IFRS 16 - Lease Liability in a Sale and Leaseback. The amendments are effective for annual reporting periods beginning on or after 1 January 2024. |
| - | Amendments to IAS1 - Non - current liabilities with covenants. The amendments are effective for annual reporting periods beginning on or after 1 January 2024. |
| - | Amendments to IAS 7 - Statement of Cash Flows & to IFRS 7 - Financial Instruments: Disclosures. The amendments are effective for annual reporting periods beginning on or after 1 January 2024. |
| - | Amendments to IAS 21 - The Effects of Changes in Foreign Exchange Rates titled Lack of Exchangeability. The amendments are effective for annual reporting periods beginning on or after 1 January 2025. |
| - | Amendment to IAS 7 and IFRS 7 - Supplier Financing. The amendments are effective for annual periods beginning on or after January 1, 2024. |
| - | IFRS 19 – Subsidiaries without Public Accountability. The standard is effective for annual periods beginning on or after January 1, 2027. |
F-
NOTES TO THE CONSOLIDATED FINANCIAL STATEMENTS
As of June 30, 2024 and 2023 and for the years ended June 30, 2024, 2023 and 2022
(Amounts in US$, except otherwise indicated)
The above new standards and amendments are not expected to have material impact on the Group.
| - | IFRS 18 – Presentation and Disclosure in Financial Statements. This standard sets out requirements for the presentation and disclosure of information in general purpose financial statements to help ensure they provide relevant information that faithfully represents an entity’s assets, liabilities, equity, income and expenses. It is effective for annual periods beginning on or after January 1, 2027. |
| - | Amendments to IFRS 9 and IFRS 7 - Amendments to the Classification and Measurement of Financial Instruments. The amendments are effective for reporting periods beginning on or after 1 January 2026. |
The Group is currently analyzing the potential impact of these new standard on our financial statements.
| 4. | SUMMARY OF SIGNIFICANT ACCOUNTING POLICIES |
4.1. Cash and cash equivalents
For the purposes of the statements of financial position and statements of cash flows, cash and cash equivalents include cash on hand and in banks and short-term highly liquid investments. Investments can be readily convertible to known amounts of cash and they are subject to insignificant risk of changes in value. In the consolidated statements of financial position, bank overdrafts are included in borrowings within current liabilities.
4.2. Inventories
Inventories are recognized at cost initially and subsequently at the lower of cost and net realizable value. Cost comprises all costs of purchase and conversion as well as other costs incurred in bringing the inventories to their present location and condition.
Weighted average cost is used to determine the cost of ordinarily interchangeable items.
Estimates
The Group assesses the recoverability of inventories considering their sale price, whether the inventories are damaged and whether they have become obsolete in whole or in part.
Net realizable value is the sale price estimated to be attained in the ordinary course of business, less costs of completion and other selling expenses.
The Group sets up an allowance for obsolescence or slow-moving inventories in relation to finished and in-process products. The allowance for obsolescence or slow-moving inventories is recognized for finished products and in-process products based on an analysis by Management of the aging of inventory stocks.
4.3. Biological assets
Within current assets, growing crops are included as biological assets from the moment of sowing until the moment of harvest (approximately 5 to 7 months depending on the crop). At harvest time the biological assets are transformed into agricultural products, including seed varieties for resale, and incorporated into the inventory.
Costs are capitalized as biological assets if, and only if, (a) it is probable that future economic benefits will flow to the entity, and (b) the cost can be measured reliably. The Group capitalizes costs such as: planting, harvesting, weeding, seedlings, irrigation, agrochemicals, fertilizers and a systematic allocation of fixed and variable production overheads that are directly attributable to the management of biological assets, among others.
F-
NOTES TO THE CONSOLIDATED FINANCIAL STATEMENTS
As of June 30, 2024 and 2023 and for the years ended June 30, 2024, 2023 and 2022
(Amounts in US$, except otherwise indicated)
Biological assets, both at initial recognition and at each subsequent reporting date, are measured at fair value less costs to sell, except where fair value cannot be reliably measured. Cost approximates fair value when little biological transformation has taken place since the costs were originally incurred or the impact of biological transformation on price is not expected to be material.
Gains and losses that arise from measuring biological assets at fair value less costs to sell and measuring agricultural produce at the point of harvest at fair value less costs to sell are recognized in the statement of income in the period in which they arise in the line item “Initial recognition and changes in fair value of biological assets”.
From the harvest time, agricultural products are valued at net realizable value because there is a market asset, and the risk of non-sale is non-significant.
Generally, the estimation of the fair value of biological assets is based on models or inputs that are not observable in the market and the use of unobservable inputs is significant to the overall valuation of the assets. Unobservable inputs are determined based on the best information available. Key assumptions include future market prices, estimated yields at the point of harvest, estimated production cycle, future cash flows, future costs of harvesting and other costs, and estimated discount rate.
Market prices are generally determined by reference to observable data in the principal market for the agricultural produce. Harvesting costs and other costs are estimated based on historical and statistical data. Yields are estimated based on several factors, including the location of the farmland and soil type, environmental conditions, infrastructure and other restrictions and growth at the time of measurement. Yields are subject to a high degree of uncertainty and may be affected by several factors out of the Group’s control including but not limited to extreme or unusual weather conditions, plagues and other crop diseases, among other factors.
4.4. Business combinations
The Group applies the acquisition method to account for business combinations. The acquisition cost is measured as the aggregate of the consideration transferred for the acquisition of a subsidiary, which is measured at fair value at the acquisition date, and the amount of any non-controlling interest in such subsidiary. The Group recognizes any non-controlling interest in a subsidiary at the non-controlling interest’s proportionate share of the recognized amounts of subsidiary’s identifiable net assets. The acquisition related costs are expensed as incurred.
Any contingent consideration to be transferred by the Group is recognized at fair value at the acquisition date. The contingent consideration is classified as an asset or liability that is a financial instrument under IFRS 9 is measured at fair value through profit or loss.
Goodwill is initially measured at cost, which is the excess of the aggregate of the consideration transferred and the amount of the non-controlling interest and any previous interest carried over the net identifiable assets acquired, and liabilities assumed.
After initial recognition, goodwill is measured at cost less any accumulated impairment losses. For impairment testing, goodwill acquired in a business combination is, as of the acquisition date, allocated to each of the cash-generating units of the Group that is expected to benefit from the synergies of the combination, without considering whether other assets or liabilities of the subsidiary are allocated to those units.
Any impairment in the carrying value is recognized in the consolidated statement of comprehensive income. In the case of acquisitions in stages, prior to the write-off of the previously held equity interest in the subsidiary, said interest is re-measured at fair value as of the date of acquisition of control over the subsidiary. The result of the re-measurement at fair value is recognized in profit or loss.
When a seller in a business combination has contractually agreed to indemnify the Group for the result of a contingency or uncertainty related to the entirety or a portion of an asset or liability, the Group recognizes an indemnification asset. The indemnification asset is measured on the same basis as the indemnification item. At the end of each period, the Group measures the indemnification assets recognized at the acquisition date on the same basis as the indemnified liability, subject to any contractual limitation on the amount and, for an indemnification asset that is not periodically measured at fair value, based on Management’s assessment of the recoverability of the indemnification asset. The Group derecognizes the indemnification asset when it collects or sells it, or when it loses the right over it.
F-
NOTES TO THE CONSOLIDATED FINANCIAL STATEMENTS
As of June 30, 2024 and 2023 and for the years ended June 30, 2024, 2023 and 2022
(Amounts in US$, except otherwise indicated)
4.5. Business combination under common control
Common control of business combination is excluded from the scope of IFRS 3. There is no other specific guidance on this topic elsewhere in IFRS. Therefore, management needs to use judgement to develop an accounting policy that provides relevant and reliable information in accordance with IAS 8. Management accounting police choice for business combination under common control is “Predecessor value method”. A Predecessor value method involves accounting for the assets and liabilities of the acquired business using existing carrying values. Differences between the carrying value and the amount payable should be accounted as an equity contribution.
Management’s accounting policy choice is to use a prospective presentation method.
4.6. Impairment of non-financial assets (excluding inventories and deferred tax assets)
Impairment tests on goodwill and intangible assets not yet available for use, or with indefinite useful lives, are undertaken annually at the end of the reporting period. Other non-financial assets are subject to impairment tests whenever events or changes in circumstances indicate that their carrying amount may not be recoverable. Where the carrying value of an asset exceeds its recoverable amount (i.e., the higher of value in use and fair value less costs to sell), the asset is written down accordingly.
Where it is not possible to estimate the recoverable amount of an individual asset, the impairment test is carried out on the smallest group of assets to which it belongs for which there are separately identifiable cash flows (its Cash Generating Unit or CGU). Goodwill is allocated on initial recognition to each of the Group’s CGUs that are expected to benefit from a business combination that gives rise to the goodwill.
Impairment charges are included in profit or loss, except to the extent they reverse gains previously recognized in other comprehensive income. An impairment loss recognized for goodwill is not reversed.
Estimate
Impairment testing of goodwill and intangible assets not yet available for use, or with indefinite useful lives, requires the use of significant assumptions for the estimation of future cash flows and the determination of discount rates. The significant assumptions and the determination of discount rates for the impairment testing of goodwill are further explained in Note 7.9.
4.7. Joint arrangements
An associate is an entity over which the Group exerts significant influence. Significant influence is the power to participate in financial and operating policy decision-making at such entity, but it does not involve control or joint control over those policies.
The Group is a party to a joint arrangement when there is a contractual arrangement that confers joint control over the relevant activities of the arrangement to the Group and at least one other party. Joint control is assessed under the same principles as control over subsidiaries.
The Group classifies its interests in joint arrangements as either:
| - | Joint ventures: where the group has rights to only the net assets of the joint arrangement. |
| - | Joint operations: where the group has both the rights to the assets and obligations for the liabilities of the joint arrangement. |
F-
NOTES TO THE CONSOLIDATED FINANCIAL STATEMENTS
As of June 30, 2024 and 2023 and for the years ended June 30, 2024, 2023 and 2022
(Amounts in US$, except otherwise indicated)
In assessing the classification of interests in joint arrangements, the Group considers:
| - | The structure of the joint arrangement; |
| - | The legal form of joint arrangements structured through a separate vehicle; |
| - | The contractual terms of the joint arrangement agreement; and |
| - | Any other facts and circumstances (including any other contractual arrangements). |
The Group accounts for its interests in joint ventures using the equity method, where the Group’s share of post-acquisition profits and losses and other comprehensive income is recognized in the Consolidated statement of profit and loss and other comprehensive income.
Losses in excess of the Group’s investment in the joint venture are recognized only to the extent that the Group has incurred legal or constructive obligations or made payments on behalf of the joint venture.
Profits and losses arising on transactions between the Group and its joint ventures are recognized only to the extent of unrelated investors’ interests in the joint venture. The Group’s share in a joint venture’s profits and losses resulting from a transaction is eliminated against the carrying amount of investment in the joint venture through the line “share of profit (or loss) of joint ventures” in the Consolidated statements of profit or loss and other comprehensive income.
Any premium paid for an investment in a joint venture above the fair value of the Group’s share of the identifiable assets, liabilities and contingent liabilities acquired is capitalized and included in the carrying amount of the investment in the joint venture. Where there is objective evidence that the investment in a joint venture has been impaired, the carrying amount of the investment is tested for impairment in the same way as other non-financial assets.
When the Group loses significant influence in an associate or joint control over a joint venture, it measures and recognizes any investment held at fair value. Any difference between the carrying amount of the associate or joint venture when losing significant influence or joint control and the fair value of the held investment and sale revenue are recognized in profit or loss.
The Group accounts for its interests in joint operations by recognizing its share of assets, liabilities, revenues and expenses in accordance with its contractually conferred rights and obligations.
For all joint arrangements structured in separate vehicles the Group must assess the substance of the joint arrangement in determining whether it is classified as a joint venture or joint operation. This assessment requires the Group to consider whether it has rights to the joint arrangement’s net assets (in which case it is classified as a joint venture), or rights to and obligations for specific assets, liabilities, expenses, and revenues (in which case it is classified as a joint operation).
Estimates
There is uncertainty regarding Management’s estimates of the Group’s ability to recover the carrying amounts of the investments in joint ventures, since such estimates depend on the joint ventures’ ability to generate sufficient funds to complete the development projects, the future outcome of the project deregulation process and the amounts and timing of the cash flows from projects, among other future events.
Management assesses whether there are impairment indicators and, if any, it performs a recoverability analysis.
Management estimates of the recoverability of these investments represent the best estimate based on available evidence, the existing facts and circumstances, using reasonable and provable assumptions in the cash flow projections.
Therefore, the consolidated financial statements do not include adjustments that would be required if the Group were unable to recover the carrying amount of the above-mentioned assets by generating sufficient economic benefits in the future.
F-
NOTES TO THE CONSOLIDATED FINANCIAL STATEMENTS
As of June 30, 2024 and 2023 and for the years ended June 30, 2024, 2023 and 2022
(Amounts in US$, except otherwise indicated)
4.8. Property, plant and equipment
Property, plant and equipment items are initially recognized at cost. In addition to the purchase price, cost also includes costs directly attributable to such property, plant and equipment items. There are no unavoidable costs with respect to dismantling and removing items. The cost of property, plant and equipment items acquired in a business combination is their fair value at the acquisition date.
Depreciation is calculated using the straight-line method to allocate the property, plant or equipment items’ cost or revalued amounts, net of their residual values, over their estimated useful lives or, in the case of leasehold improvements and certain leased plant and equipment, the shorter lease term as follows:
Research instruments: 3 to 10 years
Office equipment: 5 to 10 years
Vehicles: 5 years
Computer equipment and software: 3 years
Fixture and fittings: 10 years
Machinery and equipment: 5 to 10 years
Buildings: 50 years
Useful lives and depreciation methods are reviewed every year as required by IAS 16.
Assets under items Land and Buildings, are accounted for at fair value arising from the last revaluation performed, applying the revaluation model indicated by IAS 16.
Starting with the fiscal year ended on June 30, 2024, the Group modified its Property, Plant, and Equipment valuation policy by changing the revaluation frequency for items classified under Buildings and Land. The revaluation must never exceed five years between each occurrence, in compliance with the maximum periods established by accounting standards, or whenever there are indications that the carrying amount differs significantly from the amount that could be determined using fair value at the end of the reporting year.
To obtain fair values, the existence or not of an active market is considered for the assets in their current status. For those assets for which an active market in their current status exists, the fair values were determined based on their market values. For the remaining cases, the market values of comparable new assets are analyzed, applying a discount based on the status and wear of each asset and considering the characteristics of each of the revalued assets (for example, improvements made, maintenance status, level of productivity, use, etc.
Estimates
The Group carries certain classes of property, plant and equipment under the revaluation model under IAS 16. The revaluation model requires that the Group carry property, plant and equipment at revalued amounts, being fair value at the date of revaluation less any subsequent accumulated depreciation and any subsequent accumulated impairment losses. IAS 16 requires that the Group carry out these revaluations with sufficient regularity so that the carrying amounts of its property, plant and equipment do not differ materially from that which would be determined using fair value at the end of a reporting period. The determination of fair value at the date of revaluation requires judgments, estimates and assumptions based on market conditions prevailing at the time of any such revaluation. Changes to any of the Group’s judgments, estimates or assumptions or to the market conditions subsequent to a revaluation will result in changes to the fair value of property, plant and equipment.
The Group prepares the corresponding revaluations on a regular basis taking into account the work of independent appraisers. The Group uses different valuation techniques depending on the class of property being valued. Generally, the Group determines the fair value of its industrial buildings and warehouses based on a depreciated replacement cost approach. The Group determines the fair value of its land based on active market prices adjusted, if necessary, for differences in the nature, location or condition of the specific asset. If this information is not available, the Group may use alternative valuation methods, such as recent prices in less active markets.
F-
NOTES TO THE CONSOLIDATED FINANCIAL STATEMENTS
As of June 30, 2024 and 2023 and for the years ended June 30, 2024, 2023 and 2022
(Amounts in US$, except otherwise indicated)
Property valuation is a significant area of estimation uncertainty. Fair values are prepared regularly by Management, taking into account independent valuations. The determination of fair value for the different classes of property, plant and equipment is sensitive to the selection of various significant assumptions and estimates. Changes in those significant assumptions and estimates could materially affect the determination of the revalued amounts of property, plant and equipment. The Group utilizes historical experience, market information and other internal information to determine and/or review the appropriate revalued amounts.
The following are the most significant assumptions used in the preparation of the revalued amounts for its classes of property, plant and equipment:
| a) | Land: The Group generally uses the market price of a square meter of land for the same or similar location as the most significant assumption to determine the revalued amount. The Group typically uses comparable land sales in the same location to assess appropriateness of the value of its land. |
| b) | Industrial buildings and warehouses: The Group generally determines the construction cost of a new asset and then the Group adjusts it for normal wear and tear. Construction prices may include, but are not limited to, construction materials, labor costs, installation and assembly costs, site preparation, professional fees and applicable taxes. Construction costs may differ significantly from year to year and are subject to macroeconomic changes in the economy where the Group operates, such as the impact of inflation and foreign exchange rates. The construction cost of its industrial buildings and warehouses is determined on a US dollar per constructed square meter basis, while the construction cost of its mills, facilities and grain storage facilities is determined by reference to their total capacity measured in tons milled or stored, respectively. A 5% increase or decrease in the construction costs or the estimate of normal wear and tear relating to such assets could have an impact of $ 1.2 million on their revalued amounts. |
Increases in the carrying amounts arising on revaluation of land and buildings are recognized, net of tax, in other comprehensive income and accumulated in reserves in shareholders’ equity. To the extent that the increase reverses a decrease previously recognized in profit or loss, the increase is first recognized in profit or loss. Decreases that reverse previous increases of the same asset are first recognized in other comprehensive income to the extent of the remaining surplus attributable to the asset; all other decreases are charged to profit or loss.
4.9. Leases
Leases are recognized as a right-of-use asset and corresponding liability at the date of which the leased asset is available for use by the Group. Each lease payment is allocated between the liability and finance cost. The finance cost is charged to profit or loss over the lease period so as to produce a constant periodic rate of interest on the remaining balance of the liability for each period. The right-of-use asset is depreciated over the shorter of the asset’s useful life and the lease term on a straight-line basis.
In determining the lease term, we consider all facts and circumstances that create an economic incentive to exercise an extension option, or not exercise a termination option. Extension options (or periods after termination options) are only included in the lease term if the lease is reasonably certain to be extended (or not terminated).
Short term leases are recognized on a straight-line basis as an expense in the income statement.
At initial recognition, the right-of-use asset is measured considering the value of the initial measurement of the lease liability; any lease payments made at or before the commencement date, less any lease incentives; and any initial direct costs incurred by the lessee. After initial recognition, the right-of-use assets are measured at cost, less any accumulated depreciation and/or impairment losses, and adjusted for any re-measurement of the lease liability. Depreciation of the right-of-use asset is calculated using the straight-line method over the estimated duration of the lease contract.
F-
NOTES TO THE CONSOLIDATED FINANCIAL STATEMENTS
As of June 30, 2024 and 2023 and for the years ended June 30, 2024, 2023 and 2022
(Amounts in US$, except otherwise indicated)
The lease liability is initially measured at the present value of the lease payments that are not paid at such date, including variable lease payments that depend on an index or rate, initially measured using the index or rate as of the commencement date; amounts expected to be payable by the lessee under residual value guarantees; the exercise price of a purchase option if the lessee is reasonably certain to exercise that option; payments of penalties for terminating the lease, if the lease term reflects the lessee exercising an option to terminate the lease; and fixed payments, less any lease incentives receivable. After the commencement date, we measure the lease liability by increasing the carrying amount to reflect interest on the lease liability; reducing the carrying amount to reflect lease payments made; and re-measuring the carrying amount to reflect any reassessment or lease modifications.
The above-mentioned inputs for the valuation of the right of use assets and lease liabilities including the determination of the contracts within the scope of the standard, the contract term ant interest rate used in the discounted cash flow involved a management’s estimations.
4.10. Intangible assets
| a) | Externally acquired intangible assets |
Externally acquired intangible assets are initially recognized at acquisition date fair value (which is considered as their cost). After initial recognition, those assets are measured at cost less accumulated amortization and accumulated impairment losses.
Intangible assets acquired from third parties have an estimated useful life as follows (in years):
Software: 3 years
Trademarks and patents: 5 years
Certification ISO Standards: 3 years
Useful lives and amortization methods are reviewed every year as required by IAS 38.
Estimates
To value acquired intangible assets, valuation techniques generally accepted in the market are applied, based mainly on the revenue approach (such as excess earnings, relief from royalty, and with or without), considering the characteristics of the assets to be valued and available information to estimate their acquisition date fair value. Application of these valuation techniques requires the use of several assumptions related to future cash flows and the discount rate.
| b) | Internally generated intangible assets (development costs) |
Expenditure on internally developed products is capitalized if it can be demonstrated that:
| - | It is technically feasible to develop the product for it to be sold; |
| - | Adequate resources are available to complete the development; |
| - | There is an intention to complete and sell the product; |
| - | The Group is able to sell the product; |
| - | Sale of the product will generate future economic benefits; and |
| - | Expenditure on the project can be measured reliably. |
F-
NOTES TO THE CONSOLIDATED FINANCIAL STATEMENTS
As of June 30, 2024 and 2023 and for the years ended June 30, 2024, 2023 and 2022
(Amounts in US$, except otherwise indicated)
Development expenditure not satisfying the above criteria and expenditure on the research phase of internal projects are recognized in the consolidated statement of profit or loss and other comprehensive income as incurred.
Capitalized development costs are amortized using the straight-line method over the periods the Group expects to benefit from selling the products developed.
Useful lives and amortization methods are reviewed every year as required by IAS 38.
The research and development process can be divided into several discrete steps or phases, which generally begin with discovery, validation and development and end with regulatory approval and commercial launch. The process for developing seed traits is relatively similar for both GM and non-GM traits. However, the two differ significantly in later phases of development. For example, obtaining regulatory approval for GM seeds is a far more comprehensive and lengthy process than for non-GM seeds. Although breeding programs and industrial biotechnology solutions may have shorter or simpler phases than those described below, the Group has used the industry consensus for seed-trait development phases to characterize its technology portfolios, which is generally divided into the following six phases:
| i) | Discovery: The first phase in the technology development process is the discovery or identification of candidate genes or genetic systems, metabolites, or microorganisms potentially capable of enhancing specified plant characteristics or enabling an agro-industrial biotech solution. |
| ii) | Proof of concept: Upon successful validation of the technologies in model systems (in vitro or in vivo), promising technologies graduate from discovery and are advanced to the proof-of-concept phase. The goal of this phase is to validate a technology within the targeted organism before moving forward with technology escalation activities or extensive field validation. |
| iii) | Early development: In this phase, field tests commenced in the proof-of-concept phase are expanded to evaluate various permutations of a technology in multiple geographies and growing cycles, as well as other characteristics in order to optimize the technology’s performance in the targeted organisms. The goal of the early development phase is to identify the best mode of use of a technology to define its performance concept. |
| iv) | Advanced development and deregulation: In this phase, extensive field tests are used to demonstrate the effectiveness of the technology for its intended purpose. In the case of GM traits, the process of obtaining regulatory approvals from government authorities is also initiated during this phase, and tests are performed to evaluate the potential environmental impact of modified plants. For solutions involving microbial fermentation, industrial-scale runs are conducted. |
| v) | Pre-launch: This phase involves finalizing the regulatory approval process and preparing for the launch and commercialization of the technology. The range of activities in this phase includes seed increases, pre-commercial production, and product and solution testing with selected customers. Usually, a more detailed marketing strategy and preparation of marketing materials occur during this phase. |
| vi) | Product launch: In general, this phase, which is the last milestone of the research and development process, is carried out by the Group, the joint ventures and/or the Group’s technology licensees. When technology is commercialized through the joint ventures or technology licensees, a successful product launch will trigger royalty payments to the Group, which are generally calculated as a percentage of the net sales realized by the technology and captured upon commercialization. |
Demonstrability of technical feasibility generally occurs when the project reaches the “advanced development and deregulation” phase because at this stage success is considered to be probable.
F-
NOTES TO THE CONSOLIDATED FINANCIAL STATEMENTS
As of June 30, 2024 and 2023 and for the years ended June 30, 2024, 2023 and 2022
(Amounts in US$, except otherwise indicated)
| c) | Intangible assets acquired in a business combination |
Intangible assets acquired in a business combination and recognized separately from goodwill are initially recognized at acquisition date fair value (which is considered as their cost). After initial recognition, those assets are measured at cost less accumulated amortization and accumulated impairment losses in the same manner as intangible assets acquired separately.
Intangible assets acquired in a business combination have an estimated useful life as follows (in years):
Product development: 5 – 15 years
Trademarks: 20 years
Customer loyalty: 14 – 26 years
Estimates
To value intangible assets acquired from a business combination, valuation techniques generally accepted in the market were applied, based mainly on the revenue approach (such as excess earnings, relief from royalty, and with or without), considering the characteristics of the assets to be valued and available information to estimate their acquisition date fair value. Application of these valuation techniques requires the use of several assumptions related to future cash flows and the discount rate.
4.11. Investment properties
Investment properties shall be measured initially at its cost. The cost of a purchased investment property comprises its purchase price and any directly attributable expenditure. Directly attributable expenditure includes, for example, professional fees for legal services, property transfer taxes and other transaction costs.
In the measurement after initial recognition, the Group has chosen the cost model for all investment property.
4.12. Financial assets and liabilities
The Group measures its financial assets and liabilities at initial recognition at fair value and subsequently at amortized cost using the effective interest method.
The Group has not irrevocably designated a financial asset or liability as measured at fair value through profit or loss to eliminate or significantly reduce a measurement or recognition inconsistency.
Financial assets or liabilities at fair value through profit or loss are measured at fair value through profit and loss due to the business model used in their negotiation and/or the contractual characteristics of their cash flows.
Estimates
The Group makes estimates of collectability of its recorded receivables. Management analyzes trade account receivables in accordance with conventional criteria, adjusting the amount through a charge of an allowance for bad debts upon recognition of the inability of third parties to afford their financial obligations to the Group. Management specifically analyzes the accounts receivable, the historical bad debts, solvency of customers, current economic trends and the changes to the payment conditions of customers to assess the adequate allowance for bad debts.
Offsetting of financial assets with financial liabilities
Financial assets and liabilities are offset and presented for their net amount in the statements of financial position only when the Group has the right, legally enforceable, to compensate the recognized amounts and has the intention to liquidate for the net amount or to settle the asset and cancel the liability simultaneously.
F-
NOTES TO THE CONSOLIDATED FINANCIAL STATEMENTS
As of June 30, 2024 and 2023 and for the years ended June 30, 2024, 2023 and 2022
(Amounts in US$, except otherwise indicated)
4.13. Borrowings
The Group measures its borrowings at initial recognition at fair value and, subsequently, are measured at amortized cost using the effective interest rate method.
Borrowing costs, either generic or specific, attributable to the acquisition, construction or production of assets that necessarily take a substantial period of time to get ready for their intended use or sale (qualifying assets) are included in the cost of the assets until the moment that they are substantially ready for use or sale. Income earned on the temporary investments of funds generated in specific borrowings still pending use in the qualifying assets, are deducted from the total of financing costs potentially eligible for capitalization.
All other loan costs are recognized under financial costs, through profit and loss.
4.14. Convertible notes
The convertible notes were classified as compound instruments, a non-derivative financial instrument that contains both a liability and an equity component. The equity component was measured as the residual amount that results from deducting the fair value of the liability component from the initial carrying amount of the instrument. The fair value of the consideration of the liability component was measured first at the fair value of a similar liability (including any embedded non-equity derivative features, such as an issuer’s call option to redeem the bond early) that does not have any associated equity conversion option.
The Group considers that if the instrument meets the ‘fixed for fixed’ condition, as the strike price is pre-determined at inception and only varies over time, and it is therefore classified as equity. As regards to the mandatory conversion feature, as it is a contingent settlement provision, the Group decided to measure the liability component at initial recognition, based on its best estimate of the present value of the redemption amount and allocated the residual to the equity component.
4.15. Employee benefits
Employee benefits are expected to be settled wholly within 12 months after the end of the reporting period and are presented as current liabilities.
The accounting policies related to incentive payments based on shares are detailed in Note 4.21.
4.16. Provisions
The Group has recognized provisions for liabilities of uncertain timing or amount. The provision is measured at the best estimate of the expenditure required to settle the obligation at the end of the reporting period, discounted at a pre-tax rate reflecting current market assessments of the time value of money and risks specific to the liability.
4.17. Change in ownership interest in subsidiaries without change of control
Transactions with non-controlling interest that do not result in a loss of control are accounted for as equity transactions – i.e., as transactions with the owners in their capacity as owners. The recorded value corresponds to the difference between the fair value of the consideration paid and/or received and the relevant share acquired and/or transferred of the carrying value of the net assets of the subsidiary.
4.18. Revenue recognition
Revenue is recognized when control has been transferred to the buyer. Transfers of control vary depending on the individual terms of the sales contract. Revenues are recognized when control of the products has been transferred, which generally means that the products have been delivered to the customer and there is no unfulfilled obligation that could affect a customer’s acceptance of the products. Generally, acceptance occurs upon shipment or delivery, but ultimately depends on the terms of the underlying contracts. The customer is then invoiced at the agreed-upon price with the usual payment terms for each geographical region. Those payment terms do not contain a significant financing component.
F-
NOTES TO THE CONSOLIDATED FINANCIAL STATEMENTS
As of June 30, 2024 and 2023 and for the years ended June 30, 2024, 2023 and 2022
(Amounts in US$, except otherwise indicated)
The timing of performance sometimes differs from the timing that the associated consideration is received from the customer, thus resulting in the recognition of a contract asset or contract liability. We recognize a contract liability if the customer’s payment of consideration is received prior to completion of our related performance obligation.
As a part of our customary business practices, we offer a number of sales incentives to our customers, including volume discounts, retailer incentives, prepayment options and other product rebates. For all such contracts that include any variable consideration, we estimate the amount of variable consideration that should be included in the transaction price utilizing either the expected value method or the most likely amount method, depending on the nature of the variable consideration. Variable consideration is included in the transaction price if, in our judgment, it is probable that a significant future reversal of cumulative revenue under the contract will not occur. Although determining the transaction price for consideration requires significant judgment, we have meaningful historical experience with incentives provided to customers and estimate the expected consideration in view of historical patterns of incentive payouts. These estimates are reassessed each reporting period.
We also offer an assurance warranty, which gives customers a refund or exchange right in the case the delivered product does not conform to specifications. Replacement products are accounted for under the warranty guidance if the customer exchanges one product for another of the same type, quality, and price. We have significant experience with historical return patterns and use this experience to include returns in the estimate of transaction price.
With respect to services, we mainly provide R&D and seed treatment services. Revenue associated with services is recognized by reference to the stage of completion of the transaction at the end of the reporting period. Each of the services to be provided has a detailed work plan in which all activities to be rendered are listed. The stage of completion for services is determined in accordance with the execution of the performed tasks listed in the respective work plan. The level of execution of such services is provided by our technical experts, who provide information relating to the transfer of goods or services. We have no material revenue for services that cannot be reliably estimated.
Revenue for usage-based royalties relating to licensed intellectual property rights is recognized at the later of when the performance obligation is satisfied and when a sale or use occurs.
Typically, our average payment terms range from 130 to 160 days at a consolidated level. Longer terms may be granted in limited circumstances; however, the effects of such sales are not material to our consolidated financial statements. Those payment terms do not contain a significant financing component.
4.19. Current and deferred income tax
Deferred tax assets and liabilities are recognized where the carrying amount of an asset or liability in the Consolidated statement of financial position differs from its tax base, except for differences arising on:
| - | The initial recognition of goodwill; |
| - | The initial recognition of an asset or liability in a transaction which is not a business combination and at the time of the transaction affects neither accounting or taxable profit; and |
| - | Investments in subsidiaries and jointly controlled entities where the Group is able to control the timing of the reversal of the difference and it is probable that the difference will not reverse in the foreseeable future. |
Recognition of deferred tax assets is restricted to those instances where it is probable that taxable profit will be available against which the difference can be utilized.
The amount of the asset or liability is determined using tax rates that have been enacted or substantively enacted by the end of the reporting period and are expected to apply when the deferred tax liabilities / (assets) are settled / (recovered).
F-
NOTES TO THE CONSOLIDATED FINANCIAL STATEMENTS
As of June 30, 2024 and 2023 and for the years ended June 30, 2024, 2023 and 2022
(Amounts in US$, except otherwise indicated)
Deferred tax assets and liabilities are offset when the Group has a legally enforceable right to offset current tax assets and liabilities and the deferred tax assets and liabilities relate to taxes levied by the same tax authority on either:
| - | The same taxable entity within the Group, or |
| - | Different entities within the Group which intend either to settle current tax assets and liabilities on a net basis, or to realize the assets and settle the liabilities simultaneously, in each future period in which significant amounts of deferred tax assets or liabilities are expected to be settled or recovered. |
4.20. Share-based payments
Certain executives and directors of the Group were granted incentives in the form of shares and options to purchase Bioceres Crop Solutions shares as consideration for services.
The cost of these share-based transactions is determined based on their fair value at the date upon which such incentives are granted using a valuation model that is appropriate in the circumstances.
This cost is recognized as an expense together with an increase in equity throughout the period in which the service or performance conditions are satisfied (i.e., the vesting period). The accumulated expense recorded in connection with these transactions at the end of each year until the vesting date reflects the time elapsed between the vesting period and Management’s best estimate of the number of equity instruments that will vest. The charge to income/loss for the period represents the variation in the accumulated expense recorded between the beginning and the end of the year.
Non-market related service and performance conditions are not taken into account when determining the grant date fair value of the equity instruments, but the probability that the conditions are fulfilled is assessed as part of Management’s best estimate of the number of equity instruments that will vest. Market-related performance conditions are reflected in the grant date fair value. Any other conditions related to equity-settled share-based payment transactions but without a service requirement are considered as non-vesting conditions. Non-vesting conditions are reflected in the fair value of the equity instruments and are charged to income/loss immediately unless there are service and/or performance conditions as well.
No amount is recognized for transactions that will not vest because non-market related performance conditions and/or service conditions were not satisfied. When transactions include market-related conditions or non-vesting conditions, the transactions are considered to be vested, irrespective of whether a market-related condition or the non-vesting condition is satisfied, provided that all the other performance and/or service conditions are met.
When the terms and conditions of an equity-settled share-based payment transaction are modified, the minimum expense recognized is the grant date fair value, unmodified, provided that the original terms have been complied with. An additional expense, measured at the date of modification, is recognized for any modification that increases the total fair value of the share-based payment transaction, or is otherwise beneficial to the employee.
When the transaction is settled by the Bioceres Crop Solutions or by the counterparty, any remainder of the fair value is charged to income immediately.
The dilutive effect of current options is considered in the calculation of the diluted earnings per share.
Estimates
The estimate of the fair value of equity-settled share-based payment transactions requires a determination to be made of the most adequate option pricing model to apply depending on the terms and conditions of the arrangement. This estimate also requires a determination of those factors most appropriate to the pricing model, including the expected life of the option and the expected volatility of the share price upon the basis of which hypotheses are made. The Group measures the fair value of these transactions at the grant date applying the Black-Scholes formula adjusted to consider the possible dilutive effect of the future exercise of the share options granted on their estimated fair value at grant date, as established in paragraph B41 of IFRS 2.
F-
NOTES TO THE CONSOLIDATED FINANCIAL STATEMENTS
As of June 30, 2024 and 2023 and for the years ended June 30, 2024, 2023 and 2022
(Amounts in US$, except otherwise indicated)
| 5. | CRITICAL ACCOUNTING JUDGMENTS AND ESTIMATES |
The Group makes certain estimates and assumptions regarding the future. Estimates and judgments are continually evaluated based on historical experience and other factors, including expectations of future events that are believed to be reasonable under the circumstances. In the future, actual experience may differ from these estimates and assumptions. The estimates and assumptions that have a significant risk of causing a material adjustment to the carrying amounts of assets and liabilities within the next financial year are listed below.
Critical estimates
| - | Impairment testing of intangible assets not yet available for use (Note 4.7). |
| - | Impairment of goodwill (Notes 4.7). |
| - | Identification and fair value of identifiable intangible assets arising in acquisitions (Note 4.10 c). |
| 6. | ACQUISITIONS AND OTHER SIGNIFICANT TRANSACTIONS |
Pro Farm Group, Inc
On July 12, 2022, we announced the closing of the merger (the “Pro Farm Merger”) with Pro Farm Group, Inc. (formerly Marrone Bio Innovations Inc.), pursuant to the Agreement and Plan of Merger (the “Merger Agreement”) dated March 16, 2022, among us, BCS Merger Sub, Inc., a wholly owned subsidiary of Bioceres, and Pro Farm Group, Inc. Upon the closing of the Pro Farm Merger, Pro Farm Group, Inc. became a wholly owned subsidiary of Bioceres and each share of Pro Farm Group, Inc. common stock was exchanged for our ordinary shares at a fixed exchange ratio of 0.088.
Pro Farm Group, Inc. leads the movement to environmentally sustainable farming practices through the discovery, development and sale of innovative biological products for crop protection, crop health and crop nutrition. The company’s commercial products are sold globally and supported by more than 343 patents and patent applications. Pro Farm Group, Inc. develops novel, environmentally sound solutions for agriculture using proprietary technologies to isolate and screen naturally occurring microorganisms and plant extracts.
The combined company has a diverse customer base, product portfolio and geographic reach across a wide range of crops, positioned to serve the massive market opportunity emerging from the bio-reduction and replacement of chemical ag inputs. The merger combines our expertise in bionutrition and seed care products with Pro Farm Group’s leadership in the development of biological crop protection and plant health solutions, creating a global leader in the development and commercialization of sustainable agricultural solutions.
The consideration of payment was measured at fair value, which was calculated as the sum of the acquisition-date fair values of the assets transferred, and the liabilities incurred.
Consideration of payment (amounts in thousands of dollars):
| Shares issued | 154,795 | |||
| Assumed RSU & Stock options | 1,620 | |||
| Cash payment | 29 | |||
| Total consideration | 156,444 |
F-
NOTES TO THE CONSOLIDATED FINANCIAL STATEMENTS
As of June 30, 2024 and 2023 and for the years ended June 30, 2024, 2023 and 2022
(Amounts in US$, except otherwise indicated)
Assets acquired and liabilities assumed (amounts in thousands of dollars):
| Net assets incorporated | ||||
| Cash and cash equivalents | 4,402 | |||
| Trade receivables | 6,855 | |||
| Other receivables | 1,423 | |||
| Inventories | 11,183 | |||
| Property, plant and equipment | 12,607 | |||
| Right of use assets, net | 3,005 | |||
| Intangible assets | 17,766 | |||
| Restricted cash | 1,560 | |||
| Other assets | 683 | |||
| Trade and other payables | (22,653 | ) | ||
| Lease liabilities | (3,245 | ) | ||
| Borrowings | (25,586 | ) | ||
| Other liabilities | (857 | ) | ||
| Revaluation of existing assets | ||||
| Property, plant and equipment | 494 | |||
| Intangible assets | 79,053 | |||
| Deferred tax | (6,336 | ) | ||
| Total net assets identified | 80,354 | |||
| Goodwill | 76,090 | |||
| Total consideration | 156,444 | |||
Goodwill is not expected to be deductible for tax purposes.
The amounts of revenue and net profit of the acquiree since the merger date included in the consolidated statement of comprehensive income for the year ended June 30, 2023, were $42.3 million and $5.4 million, respectively.
The pro forma revenue and net profit of the combined entity for the year ended June 30, 2023 as though the date for the merger had been as of the beginning of the reporting period amount to $42.6 million and $3.1 million, respectively.
Syngenta Seedcare Agreement
On September 12, 2022, we entered into a ten-year Exclusive Global Distribution Agreement with Syngenta Crop Protection AG (“Syngenta”), pursuant to which Syngenta will be the exclusive global distributor of certain of our biological solutions for seed care applications (the “Agreement”). Products included within the scope of the Agreement include nitrogen-fixing Rhizobia seed treatment solutions (inoculants), and other biological seed and soil treatment solutions. We have retained global rights for the use of products for HB4® crops; and, in the United States, Syngenta rights are non-exclusive for upstream applications. Pro Farm’s biological solutions are not included within the scope of the Agreement. On October 6, 2022, Syngenta made an upfront payment of $50 million as consideration under the Agreement. Concurrently with the Agreement, we entered into an R&D Collaboration Agreement and a Supply Agreement with Syngenta, which are discussed below.
F-
NOTES TO THE CONSOLIDATED FINANCIAL STATEMENTS
As of June 30, 2024 and 2023 and for the years ended June 30, 2024, 2023 and 2022
(Amounts in US$, except otherwise indicated)
The exclusive commercial collaboration is applicable for all countries, except for Argentina where both parties will continue to work under the existing framework. The Agreement is effective as of January 1, 2023, but its implementation was staggered as we continued distributing our products in certain countries during calendar year 2023. Syngenta will cover all operating expenses incurred in connection with marketing and sales in the exclusive territory.
In addition, concurrently with the Agreement, we entered into a Supply Agreement with Syngenta, whereby we act as the exclusive supplier of the products under the Agreement. The manufactured products will be purchased by Syngenta at a price equivalent to the production cost plus a profit margin, to be agreed upon by the parties in compliance with applicable laws. Consequently, for purposes of complying with transfer pricing regulations, the price to be paid will be a price equivalent to market conditions for an exclusive supply agreement and Syngenta will determine the resale price for end-customers.
Further, we entered into an R&D Collaboration Agreement that establishes a joint R&D program to accelerate the global development and registration of our products pipeline and new solutions for seed treatment, foliar and other applications. Except for “late development products” (as defined in the Agreement) which will be funded by us, funding of the R&D program will be shared between Syngenta and us, with Syngenta contributing up to 70% of the investment. The R&D Collaboration Agreement falls within the provisions of IFRS 11, as a joint operation agreement, based on the contractual rights and obligations of each party. We recognize our direct right to and share of any jointly held or incurred: assets, liabilities, revenues and expenses. The R&D activities relating to “late development products,” the cost of which will be funded by us, are within the scope of IFRS 15.
In accordance with IFRS 15, we have determined three performance obligations which are distinct from each other: (i) licensing of intellectual property rights; (ii) manufacturing; and (iii) R&D services. The license, the manufacturing and R&D services are not inputs to a combined item and they are separately identifiable. Syngenta can benefit from the license together with readily available resources other than the manufacturing and R&D services. The manufacturing process used to produce the products and R&D services are not unique or specialized and several other entities can also manufacture the product and provide the services to Syngenta.
(i) Licensing of biological intellectual property rights
We identified a right to use license of intellectual property rights, which relates to biological products, such as patents, inventions, information, data (including registration data), know-how, among others. The license granted has significant independent functionality and it is not expected that we will undertake activities that significantly affect the intellectual property to which Syngenta has rights, and Syngenta will benefit from such intellectual property rights, as available, from the effective date.
To determine the suitable method for estimating the standalone selling price of the license, we considered that the license has no observable price. Therefore, we determined that the residual approach should be applied as the standalone selling price for the license is highly uncertain. We have not yet licensed such rights to other third parties and have not yet established a price for such license. The residual approach involves estimating a standalone selling price for the remaining goods or services by deducting from the total transaction price the sum of the estimated or observable standalone selling prices of other goods and services in the contract. The standalone selling price for the license was estimated based on the residual approach given that the remaining good and services in the Agreement are sold at estimated or observable standalone selling prices.
Furthermore, the intellectual property license, pursuant to which we have assigned the right of use intellectual property rights, has a variable consideration component, which is calculated as 30% to 50% (depending on the years and territories) of the gross margin (calculated as revenue that Syngenta obtains from the commercialization of biological products, less the cost of sale of such biological products).
The transaction price includes fixed and variable consideration components. The fixed consideration amounts to $48.6 million (from the upfront fee mentioned above) and relates to the stand-alone selling price of the license, and the variable consideration corresponds to 30% to 50% of the gross profits from the sale of licensed products.
F-
NOTES TO THE CONSOLIDATED FINANCIAL STATEMENTS
As of June 30, 2024 and 2023 and for the years ended June 30, 2024, 2023 and 2022
(Amounts in US$, except otherwise indicated)
As a right-of-use license, revenue is recognized when Syngenta has the right to use and benefit from such license. The amount of the upfront fee calculated in consideration for the transfer of the promised license was recognized according to the relevant territories. $32.9 million was recognized as revenue in January 2023 relating to the countries where Syngenta may use the license for existing products, and $15.7 million related to the remaining territories was recognized as revenue in January 2024. We estimated the split based on gross margin projections for the products in the relevant territories.
For the variable consideration component, we will apply the exception for sales-based royalties. Sales-based royalties are recognized when the sale occurs. We use information periodically provided by Syngenta for our estimates.
(ii) Manufacturing
This performance obligation is satisfied at a point in time when control of the products is transferred to Syngenta. This performance obligation includes the right to use the commercial name of the products and is remunerated as part of the sale of such products. Syngenta may only use our trademark when selling our products pursuant to the Exclusive Global Distribution Agreement.
(iii) R&D Services
We recognize revenue by reference to the stage of completion of R&D services at the end of the reporting period that is determined by our staff and is previously agreed with Syngenta. The stage of completion for services is determined according to the execution of the performed tasks listed in the respective service work plan. Each service has a detailed technical work plan which lists all activities and tasks to be performed.
The Agreement has a “Clawback” clause, pursuant to which we shall pay a penalty to Syngenta, in the event of certain breaches or events. The termination events that would trigger the payment of a penalty are under our control as they relate to our unilateral decision to terminate the Exclusive Global Distribution Agreement or a decision to sell our biological products business. Considering that there is no past event that would trigger the recognition of a liability, and that such decisions are under our control, no accounting impact has been recognized for such clauses.
Natal Agro S.R.L.
On June 10, 2024, we acquired a controlling interest in Natal, an Argentine company that breeds and develops corn varieties. The interest acquired is represented by a total of 116,225 shares of AR$ 10 nominal value each, representing 51% of equity and voting interest.
The consideration for the acquisition was $0.22 million in cash and the commitment to carrying out, at our own expense, the regulatory activities for HB4 corn to obtain authorization for its commercialization in Argentina, and the regulatory activities for HB4 corn in Brazil, once the commercialization strategy of HB4 corn in Brazil has been defined by the Company.
Fair value of the consideration of payment (amounts in thousands of dollars)
| Cash payment | 215 | |||
| Regulatory activities | 1,120 | |||
| Total consideration | 1,335 |
The consideration of payment was measured at fair value, which was calculated as the sum of cash paid and the acquisition-date fair values of the regulatory services to be provided. The fair values measured were based on discounting future cash flow using market discount rates. The difference between fair value and nominal value of consideration will be recognized as finance cost over the period the consideration will be paid.
F-
NOTES TO THE CONSOLIDATED FINANCIAL STATEMENTS
As of June 30, 2024 and 2023 and for the years ended June 30, 2024, 2023 and 2022
(Amounts in US$, except otherwise indicated)
Assets acquired, liabilities assumed, and non-controlling interest recognized (amounts in thousands of dollars)
| Net assets incorporated | ||||
| Cash and cash equivalents | 253 | |||
| Other financial assets | 74 | |||
| Trade receivables | 596 | |||
| Other receivables | 289 | |||
| Income and minimum presumed recoverable income taxes | 20 | |||
| Inventories | 4,031 | |||
| Property, plant and equipment | 817 | |||
| Intangible assets | 122 | |||
| Right of use asset | 169 | |||
| Trade and other payables | (2,303 | ) | ||
| Borrowings | (743 | ) | ||
| Employee benefits and social security | (23 | ) | ||
| Deferred revenue and advances from customers | (3 | ) | ||
| Provisions for contingencies | (356 | ) | ||
| Lease liabilities | (169 | ) | ||
| Deferred tax liabilities | (501 | ) | ||
| Total net assets identified | 2,273 | |||
| Non-controlling interest | (1,114 | ) | ||
| Goodwill | 176 | |||
| Total consideration | 1,335 | |||
Goodwill is not expected to be deductible for tax purposes.
Non-controlling interest was measured at the present ownership instruments’ proportionate share in the recognized amounts of the acquiree’s identifiable net assets.
Due to the acquisition closing at the end of the fiscal year and time constraints, as of the date these financial statements were authorized for issuance, the fair value determination of the acquired assets, mainly intangibles, and assumed liabilities of Natal has not been finalized. The figures above are provisional and may be subject to measurement period adjustment.
The amounts of revenue and profit or loss of the acquiree since the acquisition date included in the consolidated statement of comprehensive income for year ended June 30, 2024, were $0.75 million and $0.09 million, respectively. The revenue and profit or loss of the combined entity for year ended June 30, 2024 as though the acquisition date for the business combination had been as of the beginning of the annual reporting period amount to $3.05 million and $(0.26) million, respectively.
F-
NOTES TO THE CONSOLIDATED FINANCIAL STATEMENTS
As of June 30, 2024 and 2023 and for the years ended June 30, 2024, 2023 and 2022
(Amounts in US$, except otherwise indicated)
7. INFORMATION ABOUT COMPONENTS OF CONSOLIDATED STATEMENTS OF FINANCIAL POSITION
7.1. Cash and cash equivalents
| 06/30/2024 | 06/30/2023 | |||||||
| Cash at bank and on hand | 44,473,270 | 48,129,194 | ||||||
| 44,473,270 | 48,129,194 | |||||||
7.2. Other financial assets
| 06/30/2024 | 06/30/2023 | |||||||
| Current | ||||||||
| Restricted short-term deposits | — | 212,703 | ||||||
| US Treasury bills | 1,993,668 | 9,163,298 | ||||||
| Mutual funds | 6,658,805 | 1,596,539 | ||||||
| Shares of Moolec Science S.A. | 1,530,375 | — | ||||||
| Other investments | 1,512,680 | 1,162,480 | ||||||
| 11,695,528 | 12,135,020 | |||||||
| 06/30/2024 | 06/30/2023 | |||||||
| Non-current | ||||||||
| Shares of Bioceres S.A. | 444,473 | 444,635 | ||||||
| Other investments | 190,080 | 274 | ||||||
| 634,553 | 444,909 | |||||||
7.3. Trade receivables
| 06/30/2024 | 06/30/2023 | |||||||
| Current | ||||||||
| Trade debtors | 205,057,590 | 160,269,233 | ||||||
| Allowance for impairment of trade debtors | (7,050,280 | ) | (7,425,604 | ) | ||||
| Shareholders and other related parties (Note 17) | 141,224 | — | ||||||
| Allowance for credit notes to be issued | (2,905,624 | ) | (3,694,019 | ) | ||||
| Trade debtors - Joint ventures and associates (Note 17) | 782,142 | 865,627 | ||||||
| Deferred checks | 11,295,922 | 7,991,237 | ||||||
| 207,320,974 | 158,006,474 | |||||||
The book value is reasonably approximate to the fair value given its short-term nature.
Variations in the allowance for uncollectible trade receivables are reported in Note 7.17.
F-
NOTES TO THE CONSOLIDATED FINANCIAL STATEMENTS
As of June 30, 2024 and 2023 and for the years ended June 30, 2024, 2023 and 2022
(Amounts in US$, except otherwise indicated)
7.4. Other receivables
| 06/30/2024 | 06/30/2023 | |||||||
| Current | ||||||||
| Taxes | 5,019,659 | 6,113,764 | ||||||
| Receivables for PP&E sales | — | 156,423 | ||||||
| Shareholders and other related parties (Note 17) | — | 3,792,429 | ||||||
| Other receivables - Joint ventures and associates (Note 17) | 207,449 | 6,104,219 | ||||||
| Prepayments to suppliers | 10,242,075 | 10,956,831 | ||||||
| Reimbursements over exports | — | 10,558 | ||||||
| Prepaid expenses and other receivables | 1,594,152 | 1,302,221 | ||||||
| Miscellaneous | 1,235,337 | 388,553 | ||||||
| 18,298,672 | 28,824,998 | |||||||
| 06/30/2024 | 06/30/2023 | |||||||
| Non-current | ||||||||
| Taxes | 752,045 | 873,699 | ||||||
| Other receivables - Joint ventures and associates (Note 17) | 15,495,543 | — | ||||||
| Reimbursements over exports | 1,461,038 | 1,290,227 | ||||||
| Loans receivables | 230,000 | 230,000 | ||||||
| Miscellaneous | 18,495 | 152,315 | ||||||
| 17,957,121 | 2,546,241 | |||||||
The book value of financial instruments in this note is reasonable.
7.5. Inventories
| 06/30/2024 | 06/30/2023 | |||||||
| Seeds | 5,967,231 | 1,542,159 | ||||||
| Resale products | 53,788,333 | 58,544,931 | ||||||
| Manufactured products | 26,081,250 | 25,881,761 | ||||||
| Goods in transit | 5,618,540 | 3,620,606 | ||||||
| Supplies | 22,546,093 | 24,893,187 | ||||||
| Agricultural products | 15,015,884 | 28,436,830 | ||||||
| Allowance for obsolescence | (3,087,563 | ) | (2,492,499 | ) | ||||
| 125,929,768 | 140,426,975 | |||||||
| Net of agricultural products | 110,913,884 | 111,990,145 | ||||||
The roll-forward of allowance for obsolescence is in Note 7.17. Inventories recognized as an expense during the years ended June 30, 2024, 2023 and 2022 amounted to $255.6, $200.2 and $190.3 million, respectively. Those expenses were included in cost of sales.
F-
NOTES TO THE CONSOLIDATED FINANCIAL STATEMENTS
As of June 30, 2024 and 2023 and for the years ended June 30, 2024, 2023 and 2022
(Amounts in US$, except otherwise indicated)
7.6. Biological assets
Changes in Biological assets:
| Soybean | Corn | Wheat | Barley | Sunflower | Total | |||||||||||||||||||
| Beginning of the year | — | — | 87,785 | 59,057 | — | 146,842 | ||||||||||||||||||
| Initial recognition and changes in the fair value of biological assets at the point of harvest | (352,199 | ) | (32,674 | ) | 231,526 | 106,605 | 996 | (45,746 | ) | |||||||||||||||
| Costs incurred during the year | 1,423,732 | 792,235 | 220,679 | 73,452 | 137,680 | 2,647,778 | ||||||||||||||||||
| Decrease due to harvest/disposals | (1,071,533 | ) | (759,561 | ) | (319,308 | ) | (165,662 | ) | (138,676 | ) | (2,454,740 | ) | ||||||||||||
| Year ended June 30, 2024 | — | — | 220,682 | 73,452 | — | 294,134 | ||||||||||||||||||
| Soybean | Corn | Wheat | Barley | Sunflower | Total | |||||||||||||||||||
| Beginning of the year | — | — | 44,413 | 12,900 | — | 57,313 | ||||||||||||||||||
| Initial recognition and changes in the fair value of biological assets at the point of harvest | 147,553 | 55,348 | 191,481 | 159,996 | 56,176 | 610,554 | ||||||||||||||||||
| Costs incurred during the year | 986,505 | 721,294 | 477,102 | 185,360 | 83,651 | 2,453,912 | ||||||||||||||||||
| Decrease due to harvest/disposals | (1,134,058 | ) | (776,642 | ) | (625,211 | ) | (299,199 | ) | (139,827 | ) | (2,974,937 | ) | ||||||||||||
| Year ended June 30, 2023 | — | — | 87,785 | 59,057 | — | 146,842 | ||||||||||||||||||
7.7. Property, plant and equipment
Property, plant and equipment as of June 30, 2024 and 2023, included the following:
| Net carrying amount |
Additions from business |
Reclassification from Investment |
Depreciation | Foreign currency |
Net carrying amount |
|||||||||||||||||||||||||||
| Class | 06/30/2023 | Additions | combination | properties | Disposals | of the year | translation | 06/30/2024 | ||||||||||||||||||||||||
| Office equipment | 263,892 | 235,900 | 2,242 | — | — | (77,639 | ) | (14,057 | ) | 410,338 | ||||||||||||||||||||||
| Vehicles | 2,032,853 | 904,798 | 173,190 | — | (1,677 | ) | (908,040 | ) | (775 | ) | 2,200,349 | |||||||||||||||||||||
| Equipment and computer software | 174,399 | 702,842 | 462 | — | (8,184 | ) | (333,521 | ) | (28,529 | ) | 507,469 | |||||||||||||||||||||
| Fixtures and fittings | 2,862,949 | 703,027 | 28,672 | — | 6,295 | (812,810 | ) | (1,663 | ) | 2,786,470 | ||||||||||||||||||||||
| Machinery and equipment | 14,463,756 | 5,459,571 | 1,084 | — | (154,492 | ) | (2,649,074 | ) | (410,517 | ) | 16,710,328 | |||||||||||||||||||||
| Land and buildings | 36,144,792 | 1,835,054 | — | 3,222,044 | 53,217 | (982,165 | ) | (595,040 | ) | 39,677,902 | ||||||||||||||||||||||
| Buildings in progress | 11,911,194 | 72,480 | 610,926 | — | (106,421 | ) | — | (207,757 | ) | 12,280,422 | ||||||||||||||||||||||
| Total | 67,853,835 | 9,913,672 | 816,576 | 3,222,044 | (211,262 | ) | (5,763,249 | ) | (1,258,338 | ) | 74,573,278 | |||||||||||||||||||||
F-
NOTES TO THE CONSOLIDATED FINANCIAL STATEMENTS
As of June 30, 2024 and 2023 and for the years ended June 30, 2024, 2023 and 2022
(Amounts in US$, except otherwise indicated)
| Net carrying amount |
Additions from business |
Depreciation of | Foreign currency |
Net carrying amount |
||||||||||||||||||||||||||||
| Class | 06/30/2022 | Additions | combination | Disposals | the year | Revaluation | translation | 06/30/2023 | ||||||||||||||||||||||||
| Office equipment | 269,538 | 57,835 | — | (520 | ) | (67,711 | ) | — | 4,750 | 263,892 | ||||||||||||||||||||||
| Vehicles | 2,665,074 | 353,886 | — | (20,260 | ) | (959,879 | ) | — | (5,968 | ) | 2,032,853 | |||||||||||||||||||||
| Equipment and computer software | 231,676 | 90,055 | 12,469 | (20,347 | ) | (141,839 | ) | — | 2,385 | 174,399 | ||||||||||||||||||||||
| Fixtures and fittings | 3,546,919 | 47,444 | 5,379 | — | (737,816 | ) | — | 1,023 | 2,862,949 | |||||||||||||||||||||||
| Machinery and equipment | 5,811,960 | 3,534,130 | 7,047,496 | (21,637 | ) | (1,988,931 | ) | — | 80,738 | 14,463,756 | ||||||||||||||||||||||
| Land and buildings | 34,240,384 | 4,100 | 4,750,136 | — | (937,098 | ) | (1,985,806 | ) | 73,076 | 36,144,792 | ||||||||||||||||||||||
| Buildings in progress | 3,142,774 | 7,198,309 | 1,285,092 | — | — | — | 285,019 | 11,911,194 | ||||||||||||||||||||||||
| Total | 49,908,325 | 11,285,759 | 13,100,572 | (62,764 | ) | (4,833,274 | ) | (1,985,806 | ) | 441,023 | 67,853,835 | |||||||||||||||||||||
The depreciation charge is included in Notes 8.3 and 8.4. The Group has no commitments to purchase property, plant and equipment items.
A detail of restricted assets is provided in Note 20.
Revaluation of property, plant and equipment
The Group updates frequently their assessment of the fair value of its land and buildings taking into account the most recent independent valuations and market data. Last valuations were performed as of June 30, 2023. Management determined the property, plant and equipment’s value within a range of reasonable fair value estimates.
All resulting fair value estimates for properties are included in level 2 or 3 depending on the methodology used.
The following are the carrying amounts that would have been recognized if land and building were stated at cost.
| Class of property | 06/30/2024 | 06/30/2023 | ||||||
| Land and buildings | 27,876,636 | 21,161,294 | ||||||
F-
NOTES TO THE CONSOLIDATED FINANCIAL STATEMENTS
As of June 30, 2024 and 2023 and for the years ended June 30, 2024, 2023 and 2022
(Amounts in US$, except otherwise indicated)
7.8. Intangible assets
Intangible assets as of June 30, 2024 and 2023 included the following:
| Net carrying amount |
Additions from business |
Transfers/ | Amortization | Foreign currency |
Net carrying amount |
|||||||||||||||||||||||
| Class | 06/30/2023 | Additions | combination | Disposals | of the year | translation | 06/30/2024 | |||||||||||||||||||||
| Seed and integrated products | ||||||||||||||||||||||||||||
| HB4 soy and breeding program | 31,679,681 | 5,986,682 | — | — | (2,091,992 | ) | — | 35,574,371 | ||||||||||||||||||||
| Integrated seed products | 2,841,008 | — | — | — | (191,559 | ) | 32,377 | 2,681,826 | ||||||||||||||||||||
| Crop nutrition | ||||||||||||||||||||||||||||
| Microbiological products | 37,295,460 | — | — | 7,610,115 | (3,718,326 | ) | — | 41,187,249 | ||||||||||||||||||||
| Microbiological products in progress | 12,213,341 | 5,869,084 | — | (7,610,115 | ) | — | (19,449 | ) | 10,452,861 | |||||||||||||||||||
| Other intangible assets | ||||||||||||||||||||||||||||
| Trademarks and patents | 51,933,444 | 44,073 | 122,305 | — | (4,071,453 | ) | — | 48,028,369 | ||||||||||||||||||||
| Trademarks and patents with indefinite useful lives | 7,827,309 | — | — | — | — | — | 7,827,309 | |||||||||||||||||||||
| Software | 1,638,519 | 585,313 | — | 276,128 | (670,514 | ) | (1,463 | ) | 1,827,983 | |||||||||||||||||||
| Software in progress | 349,171 | 507,685 | — | (276,128 | ) | — | — | 580,728 | ||||||||||||||||||||
| Customer loyalty | 23,006,023 | — | — | — | (1,369,263 | ) | — | 21,636,760 | ||||||||||||||||||||
| RG/RS/OX Wheat in progress | 5,000,000 | — | — | — | — | — | 5,000,000 | |||||||||||||||||||||
| Total | 173,783,956 | 12,992,837 | 122,305 | — | (12,113,107 | ) | 11,465 | 174,797,456 | ||||||||||||||||||||
| Net carrying amount |
Additions from business |
Transfers/ | Amortization | Foreign currency |
Net carrying amount |
|||||||||||||||||||||||
| Class | 06/30/2022 | Additions | combination | Disposals | of the year | translation | 06/30/2023 | |||||||||||||||||||||
| Seed and integrated products | ||||||||||||||||||||||||||||
| HB4 soy and breeding program | 29,802,534 | 3,587,337 | — | — | (1,710,190 | ) | — | 31,679,681 | ||||||||||||||||||||
| Integrated seed products | 3,137,158 | — | — | — | (332,531 | ) | 36,381 | 2,841,008 | ||||||||||||||||||||
| Crop nutrition | ||||||||||||||||||||||||||||
| Microbiological products | 558,027 | 128,161 | 39,613,280 | 62,785 | (3,073,154 | ) | 6,361 | 37,295,460 | ||||||||||||||||||||
| Microbiological products in progress | 5,234,321 | 7,037,549 | — | (62,785 | ) | — | 4,256 | 12,213,341 | ||||||||||||||||||||
| Other intangible assets | ||||||||||||||||||||||||||||
| Trademarks and patents | 439,732 | 49,748 | 55,420,441 | — | (3,976,477 | ) | — | 51,933,444 | ||||||||||||||||||||
| Trademarks and patents with indefinite useful lives | 7,827,309 | — | — | — | — | — | 7,827,309 | |||||||||||||||||||||
| Software | 2,083,642 | 105,229 | — | 29,868 | (582,064 | ) | 1,844 | 1,638,519 | ||||||||||||||||||||
| Software in progress | 84,343 | 294,696 | — | (29,868 | ) | — | — | 349,171 | ||||||||||||||||||||
| Customer loyalty | 22,537,803 | — | 1,785,237 | — | (1,317,017 | ) | — | 23,006,023 | ||||||||||||||||||||
| RG/RS/OX Wheat in progress | 5,000,000 | — | — | — | — | — | 5,000,000 | |||||||||||||||||||||
| Total | 76,704,869 | 11,202,720 | 96,818,958 | — | (10,991,433 | ) | 48,842 | 173,783,956 | ||||||||||||||||||||
The amortization charge is included in Notes 8.3 and 8.4.
There are no intangibles assets whose use has been restricted or which have been delivered as a guarantee. The Group has not assumed any commitments to acquire new intangibles.
F-
NOTES TO THE CONSOLIDATED FINANCIAL STATEMENTS
As of June 30, 2024 and 2023 and for the years ended June 30, 2024, 2023 and 2022
(Amounts in US$, except otherwise indicated)
Estimates
There is an inherent material uncertainty related to management’s estimation of the ability of the Group to recover the carrying amounts of internally generated intangible assets related to biotechnology projects because it is dependent upon Group`s ability to raise sufficient funds to complete the projects development, the future outcome of the regulatory process, and the timing and amount of the future cash flows generated by the projects, among other future events.
Management’s estimations about the demonstrability of the recognition criteria for these assets and the subsequent recoverability represent the best estimate that can be made based on all the available evidence, existing facts and circumstances and using reasonable and supportable assumptions in cash flow projections. Therefore, the Consolidated financial statements do not include any adjustments that would result if the Group were unable to recover the carrying amount of the above-mentioned assets through the generation of enough future economic benefits.
7.9. Goodwill
| 06/30/2024 | 06/30/2023 | |||||||
| Rizobacter Argentina S.A. | 28,080,271 | 28,080,271 | ||||||
| Bioceres Crops S.A. | 7,523,322 | 7,523,322 | ||||||
| Pro farm Group, Inc. | 76,089,749 | 76,089,749 | ||||||
| Insumos Agroquímicos S.A. | 470,090 | 470,090 | ||||||
| Natal Agro S.R.L. | 175,833 | — | ||||||
| 112,339,265 | 112,163,432 | |||||||
The Group is required to test whether goodwill has suffered any impairment on an annual basis. The recoverable amount is determined based on value in use calculations. The use of this method requires the estimation of future cash flows and the determination of a discount rate in order to calculate the present value of the cash flows.
Rizobacter CGU. This CGU is composed of all revenues collected through Rizobacter from the production and sale of proprietary and third-party products, both in the domestic and international markets. Additionally, Rizobacter generates revenue from the formulation, fragmentation and resale of third-party products.
Bioceres Crops CGU. This CGU is composed of the expected revenues from the commercialization of intensive R&D products that previously were allocated on the equity participation.
Insuagro CGU. This CGU is composed of all revenues collected through Insuagro from the production and sale of proprietary and third-party products, in the domestic markets.
Pro Farm Group CGU. This CGU is composed of all revenues collected through Pro Farm from the production and sale of proprietary and third-party products, both in the domestic and international markets.
Natal Agro CGU. This CGU is composed of all revenues collected through Natal from the production and sale of proprietary and third - party products, both in the domestic and international markets.
F-
NOTES TO THE CONSOLIDATED FINANCIAL STATEMENTS
As of June 30, 2024 and 2023 and for the years ended June 30, 2024, 2023 and 2022
(Amounts in US$, except otherwise indicated)
Management has made the estimates considering the cash flow projections projected by the management and third-party valuation reports on the assets, intangible assets and liabilities assumed. The key assumptions utilized are the following:
| Key assumption | Management’s approach | |
| Discount rate | The discount rate used ranges was 15.30% for Rizobacter, Bioceres Crops, Natal and Insuagro, and 9.9% for Pro Farm. The weighted average cost of capital (“WACC”) rate has been estimated based on the market capital structure. For the cost of debt, the indebtedness cost of the CGUs was used. For the cost of equity, the discount rate is estimated based on the Capital Asset Pricing Model (CAPM). The value assigned is consistent with external sources of information. |
|
| Budgeted market share of joint ventures and other customers | The projected revenue from the products and services of the CGUs has been estimated by the management based on market penetration data for comparable products and technologies and on future expectations of foreseen economic and market conditions. The value assigned is consistent with external sources of information. |
|
| Budgeted product prices | The prices estimated in the revenue projections are based on current and projected market prices for the products and services of the CGUs. The value assigned is consistent with external sources of information. |
|
| Growth rate used to extrapolate future cash flow projections to terminal period | The growth rate used to extrapolate the future cash flow projections to terminal period is 2%. The value assigned is consistent with external sources of information. |
Management believes that any reasonably possible change in any of these key assumptions would not cause the aggregate carrying amount of the CGU to exceed its recoverable amount.
7.10. Investment properties
| 06/30/2024 | 06/30/2023 | |||||||
| Investment properties | 560,783 | 3,589,749 | ||||||
| 560,783 | 3,589,749 | |||||||
The decrease for the year is attributed to the reclassification of an investment property to Property, Plant, and Equipment for operational use.
The book value of the investment property does not differ significantly from its fair value.
F-
NOTES TO THE CONSOLIDATED FINANCIAL STATEMENTS
As of June 30, 2024 and 2023 and for the years ended June 30, 2024, 2023 and 2022
(Amounts in US$, except otherwise indicated)
7.11. Trade and other payables
| 06/30/2024 | 06/30/2023 | |||||||
| Trade creditors | 108,307,192 | 104,211,238 | ||||||
| Shareholders and other related parties (Note 17) | 37,985 | 35,292 | ||||||
| Trade creditors - Parent company (Note 17) | 729,171 | 644,191 | ||||||
| Trade creditors - Joint ventures and associates (Note 17) | 52,888,732 | 41,402,594 | ||||||
| Taxes | 5,647,550 | 3,561,058 | ||||||
| Miscellaneous | 1,121,839 | 953,301 | ||||||
| 168,732,469 | 150,807,674 | |||||||
The trade and other payables include debts with grain producers. These debts represent payment obligations contracted by purchase contracts, which give the producer the right to set the price at any time between the delivery date and a future date. Those debts that are not fixed at closing are valued at their fair value and debts with a price set by the producer at their amortized cost.
7.12. Borrowings
| 06/30/2024 | 06/30/2023 | |||||||
| Current | ||||||||
| Bank borrowings | 91,816,134 | 61,303,952 | ||||||
| Corporate bonds | 42,035,925 | 35,547,510 | ||||||
| Trust debt securities | 2,895,139 | 7,296,506 | ||||||
| Net loans payables- Parents companies and related parties to Parent (Note 17) | — | 3,491,691 | ||||||
| 136,747,198 | 107,639,659 | |||||||
| Non-current | ||||||||
| Bank borrowings | 15,316,612 | 10,663,266 | ||||||
| Corporate bonds | 25,071,823 | 50,007,680 | ||||||
| Trust debt securities | 1,716,447 | — | ||||||
| 42,104,882 | 60,670,946 | |||||||
The carrying value of some borrowings as of June 30, 2024 are measured at amortized cost differ from their fair value. The following fair values measured are based on discounted cash flows (Level 3) due to the use of unobservable inputs, including own credit risk.
| 06/30/2024 | 06/30/2023 | |||||||||||||||
| Amortized | Amortized | |||||||||||||||
| cost | Fair value | cost | Fair value | |||||||||||||
| Current | ||||||||||||||||
| Bank borrowings | 91,816,134 | 90,406,055 | 61,303,952 | 57,209,155 | ||||||||||||
| Corporate Bonds | 42,035,925 | 41,492,963 | 35,547,510 | 34,725,828 | ||||||||||||
| Non-current | ||||||||||||||||
| Bank borrowings | 15,316,612 | 10,490,347 | 10,663,266 | 10,374,646 | ||||||||||||
| Corporate Bonds | 25,071,823 | 23,845,583 | 50,007,680 | 47,014,542 | ||||||||||||
F-
NOTES TO THE CONSOLIDATED FINANCIAL STATEMENTS
As of June 30, 2024 and 2023 and for the years ended June 30, 2024, 2023 and 2022
(Amounts in US$, except otherwise indicated)
7.13. Secured Notes
Secured Guaranteed Notes
The Secured Guaranteed Notes due 2026 mature 48 months after the issue date and bear interest at 9.0% from the issue date through 24 months after the issue date, 13.0% from 25 through 36 months after the issue date and 14.0% from 37 through 48 months after the issue date. Interest is payable semi-annually. The Secured Guaranteed Notes due 2026 have no conversion rights into our ordinary shares.
The carrying value the Secured Guaranteed Notes as of June 30, 2024 are measured at amortized cost. Its fair value based on discounted cash flows, using a fair interest rate, would amount to $25.7 million.
Secured Convertible Guaranteed Notes
The Secured Guaranteed Convertible Notes were issued for a total principal amount of $55 million. The notes have a 4- year maturity and accrue interest at an annual interest rate of 9%, of which 5% is payable in cash and 4% in-kind. At any time up to maturity the note holders might opt to convert the outstanding principal amount into common shares of Bioceres at a strike price of $18 per share. The Company can repurchase the notes voluntarily 30 months after the issue date.
At inception, the fair value of the liability component of the Secured Convertible Guaranteed Notes was measured using a discount rate of 13.57%.
The carrying value the Secured Convertible Guaranteed Notes as of June 30, 2024 are measured at amortized cost. Its fair value based on discounted cash flows, using a fair interest rate, would amount to $53.4 million.
Under the terms of the Secured Convertible Guaranteed Notes, the Group is in compliance with covenants.
7.14. Employee benefits and social security
| 06/30/2024 | 06/30/2023 | |||||||
| Salaries, accrued incentives, vacations and social security | 7,192,492 | 9,388,639 | ||||||
| Key management personnel (Note 17) | 148,466 | 218,068 | ||||||
| 7,340,958 | 9,606,707 | |||||||
7.15. Deferred revenue and advances from customers
| 06/30/2024 | 06/30/2023 | |||||||
| Current | ||||||||
| Advances from customers | 3,335,740 | 9,216,032 | ||||||
| Deferred revenue | 587,400 | 15,659,630 | ||||||
| 3,923,140 | 24,875,662 | |||||||
| Non-current | ||||||||
| Advances from customers | 52,511 | 620,893 | ||||||
| Deferred revenue | 1,872,627 | 1,436,912 | ||||||
| 1,925,138 | 2,057,805 | |||||||
F-
NOTES TO THE CONSOLIDATED FINANCIAL STATEMENTS
As of June 30, 2024 and 2023 and for the years ended June 30, 2024, 2023 and 2022
(Amounts in US$, except otherwise indicated)
7.16. Provisions
| 06/30/2024 | 06/30/2023 | |||||||
| Provisions for contingencies | 1,255,702 | 891,769 | ||||||
| 1,255,702 | 891,769 | |||||||
The Group has recorded a provision for probable administrative, judicial and out-of-court proceedings that could arise in the ordinary course of business, based on a prudent criterion according to its professional advisors and on Management’s assessment of the best estimate of the amount of possible claims. These potential claims are not likely to have a material impact on the results of the Group’s operations, its cash flow or financial position.
Management considers that the objective evidence is not enough to determine the date of the eventual cash outflow due to a lack of experience in any similar cases. However, the provision was classified under current or non-current liabilities, applying the best prudent criterion based on Management’s estimates.
There are no expected reimbursements related to the provisions.
The roll forward of the provision is in Note 7.17.
In order to assess the need for provisions and disclosures in its consolidated financial statements, Management considers the following factors: (i) nature of the claim and potential level of damages in the jurisdiction in which the claim has been brought; (ii) the progress of the eventual case; (iii) the opinions or views of tax and legal advisers; (iv) experience in similar cases; and (v) any decision of the Group`s management as to how it will respond to the eventual claim.
7.17. Changes in allowances and provisions
| Additions from business |
Uses and | Currency conversion |
||||||||||||||||||||||
| Item | 06/30/2023 | Additions | combination | reversals | difference | 06/30/2024 | ||||||||||||||||||
| DEDUCTED FROM ASSETS | ||||||||||||||||||||||||
| Allowance for impairment of trade debtors | (7,425,604 | ) | (753,428 | ) | — | 777,558 | 351,194 | (7,050,280 | ) | |||||||||||||||
| Allowance for obsolescence | (2,492,499 | ) | (586,515 | ) | — | 69,582 | (78,131 | ) | (3,087,563 | ) | ||||||||||||||
| Total deducted from assets | (9,918,103 | ) | (1,339,943 | ) | — | 847,140 | 273,063 | (10,137,843 | ) | |||||||||||||||
| INCLUDED IN LIABILITIES | ||||||||||||||||||||||||
| Provisions for contingencies | (891,769 | ) | (367,126 | ) | (355,898 | ) | 393,073 | (33,982 | ) | (1,255,702 | ) | |||||||||||||
| Total included in liabilities | (891,769 | ) | (367,126 | ) | (355,898 | ) | 393,073 | (33,982 | ) | (1,255,702 | ) | |||||||||||||
| Total | (10,809,872 | ) | (1,707,069 | ) | (355,898 | ) | 1,240,213 | 239,081 | (11,393,545 | ) | ||||||||||||||
F-
NOTES TO THE CONSOLIDATED FINANCIAL STATEMENTS
As of June 30, 2024 and 2023 and for the years ended June 30, 2024, 2023 and 2022
(Amounts in US$, except otherwise indicated)
| Additions from business |
Uses and | Currency conversion |
||||||||||||||||||||||
| Item | 06/30/2022 | Additions | combination | reversals | difference | 06/30/2023 | ||||||||||||||||||
| DEDUCTED FROM ASSETS | ||||||||||||||||||||||||
| Allowance for impairment of trade debtors | (7,142,252 | ) | (1,327,385 | ) | — | 1,797,648 | (753,615 | ) | (7,425,604 | ) | ||||||||||||||
| Allowance for obsolescence | (1,104,750 | ) | (1,066,777 | ) | (531,232 | ) | 690,503 | (480,243 | ) | (2,492,499 | ) | |||||||||||||
| Total deducted from assets | (8,247,002 | ) | (2,394,162 | ) | (531,232 | ) | 2,488,151 | (1,233,858 | ) | (9,918,103 | ) | |||||||||||||
| INCLUDED IN LIABILITIES | ||||||||||||||||||||||||
| Provisions for contingencies | (603,022 | ) | (221,008 | ) | (393,073 | ) | — | 325,334 | (891,769 | ) | ||||||||||||||
| Total included in liabilities | (603,022 | ) | (221,008 | ) | (393,073 | ) | — | 325,334 | (891,769 | ) | ||||||||||||||
| Total | (8,850,024 | ) | (2,615,170 | ) | (924,305 | ) | 2,488,151 | (908,524 | ) | (10,809,872 | ) | |||||||||||||
8. INFORMATION ABOUT COMPONENTS OF CONSOLIDATED STATEMENTS OF COMPREHENSIVE INCOME
8.1. Revenue from contracts with customers
| 06/30/2024 | 06/30/2023 | 06/30/2022 | ||||||||||
| Sale of goods and services | 443,554,101 | 385,295,414 | 326,460,004 | |||||||||
| Royalties | 986,602 | 1,247,567 | 1,995,584 | |||||||||
| Right of use licenses | 20,287,845 | 32,903,458 | — | |||||||||
| 464,828,548 | 419,446,439 | 328,455,588 | ||||||||||
Transactions of sales of goods and services with joint ventures and with shareholders and other related parties are reported in Note 17.
8.2. Cost of sales
| Item | 06/30/2024 | 06/30/2023 | 06/30/2022 | |||||||||
| Inventories as of the beginning of the year | 111,990,145 | 78,759,610 | 39,052,925 | |||||||||
| Business combination | 4,031,412 | 11,182,602 | — | |||||||||
| Purchases of the year | 249,648,267 | 233,471,036 | 229,990,487 | |||||||||
| Production costs | 24,672,636 | 23,227,844 | 15,756,739 | |||||||||
| Foreign currency translation | (1,206,764 | ) | 806,106 | 2,323,554 | ||||||||
| Subtotal | 389,135,696 | 347,447,198 | 287,123,705 | |||||||||
| Inventories as of the end of the year (*) | (110,913,884 | ) | (111,990,145 | ) | (78,759,610 | ) | ||||||
| Cost of sales | 278,221,812 | 235,457,053 | 208,364,095 | |||||||||
| (*) | Net of agricultural products. |
F-
NOTES TO THE CONSOLIDATED FINANCIAL STATEMENTS
As of June 30, 2024 and 2023 and for the years ended June 30, 2024, 2023 and 2022
(Amounts in US$, except otherwise indicated)
8.3. R&D classified by nature
| Research | Research | Research | ||||||||||
| and | and | and | ||||||||||
| development | development | development | ||||||||||
| expenses | expenses | expenses | ||||||||||
| Item | 06/30/2024 | 06/30/2023 | 06/30/2022 | |||||||||
| Amortization of intangible assets | 5,923,389 | 4,804,768 | 2,348,778 | |||||||||
| Analysis and storage | 5,302 | 52,660 | — | |||||||||
| Commissions and royalties | — | 16,257 | 57,662 | |||||||||
| Import and export expenses | — | 855 | — | |||||||||
| Depreciation of property, plant and equipment | 618,627 | 577,785 | 438,010 | |||||||||
| Freight and haulage | 30,450 | 17,429 | — | |||||||||
| Employee benefits and social securities | 4,727,340 | 4,530,533 | 1,787,163 | |||||||||
| Maintenance | 314,721 | 452,449 | 87,707 | |||||||||
| Energy and fuel | 8,101 | 111,481 | 59,170 | |||||||||
| Supplies and materials | 2,256,748 | 2,924,994 | 1,533,211 | |||||||||
| Mobility and travel | 205,572 | 243,865 | 140,179 | |||||||||
| Share-based incentives | 510,162 | 136,754 | 48,934 | |||||||||
| Publicity and advertising | 23,383 | — | — | |||||||||
| Professional fees and outsourced services | 1,265,765 | 660,887 | 197,289 | |||||||||
| Professional fees related parties | 256,877 | 542,551 | 180,901 | |||||||||
| Office supplies | 688,969 | 93,623 | 4,254 | |||||||||
| Information technology expenses | 29,013 | 31,356 | 5,325 | |||||||||
| Insurance | 48,872 | 78,673 | 12,541 | |||||||||
| Depreciation of leased assets | — | 68,321 | 36,426 | |||||||||
| Miscellaneous | 269,750 | 74 | 9,910 | |||||||||
| Total | 17,183,041 | 15,345,315 | 6,947,460 | |||||||||
| 06/30/2024 | 06/30/2023 | 06/30/2022 | ||||||||||
| R&D capitalized (Note 7.8) | 11,855,766 | 10,753,047 | 5,149,684 | |||||||||
| R&D profit and loss | 17,183,041 | 15,345,315 | 6,947,460 | |||||||||
| Total | 29,038,807 | 26,098,362 | 12,097,144 | |||||||||
F-
NOTES TO THE CONSOLIDATED FINANCIAL STATEMENTS
As of June 30, 2024 and 2023 and for the years ended June 30, 2024, 2023 and 2022
(Amounts in US$, except otherwise indicated)
8.4. Expenses classified by nature and function
| Selling, | ||||||||||||
| general and | ||||||||||||
| administrative | Total | |||||||||||
| Item | Production costs |
expenses | 06/30/2024 | |||||||||
| Amortization of intangible assets | 239,545 | 5,950,173 | 6,189,718 | |||||||||
| Analysis and storage | 598 | 160,133 | 160,731 | |||||||||
| Commissions and royalties | 217,000 | 1,745,169 | 1,962,169 | |||||||||
| Import and export expenses | 147,392 | 734,026 | 881,418 | |||||||||
| Depreciation of property, plant and equipment | 3,018,014 | 2,126,608 | 5,144,622 | |||||||||
| Depreciation of leased assets | 1,312,849 | 2,106,107 | 3,418,956 | |||||||||
| Impairment of receivables | — | 753,428 | 753,428 | |||||||||
| Freight and haulage | 927,910 | 11,831,050 | 12,758,960 | |||||||||
| Employee benefits and social securities | 10,015,691 | 38,253,407 | 48,269,098 | |||||||||
| Maintenance | 2,134,116 | 2,558,352 | 4,692,468 | |||||||||
| Energy and fuel | 997,066 | 514,422 | 1,511,488 | |||||||||
| Supplies and materials | 1,031,386 | 3,520,386 | 4,551,772 | |||||||||
| Mobility and travel | 143,046 | 4,250,764 | 4,393,810 | |||||||||
| Publicity and advertising | 233 | 4,985,955 | 4,986,188 | |||||||||
| Contingencies | 66,682 | 300,444 | 367,126 | |||||||||
| Share-based incentives | 1,111,919 | 12,512,804 | 13,624,723 | |||||||||
| Professional fees and outsourced services | 1,960,315 | 8,759,807 | 10,720,122 | |||||||||
| Professional fees related parties | — | 225,950 | 225,950 | |||||||||
| Office supplies and registrations fees | 242,790 | 1,601,554 | 1,844,344 | |||||||||
| Insurance | 199,109 | 2,117,158 | 2,316,267 | |||||||||
| Information technology expenses | 35,526 | 3,692,227 | 3,727,753 | |||||||||
| Obsolescence | 581,804 | 4,711 | 586,515 | |||||||||
| Taxes | 285,791 | 14,184,503 | 14,470,294 | |||||||||
| Miscellaneous | 3,854 | 801,772 | 805,626 | |||||||||
| Total | 24,672,636 | 123,690,910 | 148,363,546 | |||||||||
F-
NOTES TO THE CONSOLIDATED FINANCIAL STATEMENTS
As of June 30, 2024 and 2023 and for the years ended June 30, 2024, 2023 and 2022
(Amounts in US$, except otherwise indicated)
| Selling, | ||||||||||||
| general and | ||||||||||||
| Production | administrative | Total | ||||||||||
| Item | costs | expenses | 06/30/2023 | |||||||||
| Amortization of intangible assets | 173,032 | 6,013,633 | 6,186,665 | |||||||||
| Analysis and storage | 4,496 | 700,671 | 705,167 | |||||||||
| Commissions and royalties | 127,771 | 1,396,750 | 1,524,521 | |||||||||
| Import and export expenses | 150,402 | 794,561 | 944,963 | |||||||||
| Depreciation of property, plant and equipment | 2,161,236 | 2,094,253 | 4,255,489 | |||||||||
| Depreciation of leased assets | 468,524 | 3,029,049 | 3,497,573 | |||||||||
| Impairment of receivables | — | 1,327,385 | 1,327,385 | |||||||||
| Freight and haulage | 2,427,296 | 9,645,962 | 12,073,258 | |||||||||
| Employee benefits and social securities | 9,973,301 | 38,030,033 | 48,003,334 | |||||||||
| Maintenance | 1,195,111 | 2,067,672 | 3,262,783 | |||||||||
| Energy and fuel | 967,412 | 397,305 | 1,364,717 | |||||||||
| Supplies and materials | 1,075,319 | 1,047,720 | 2,123,039 | |||||||||
| Mobility and travel | 90,848 | 4,140,153 | 4,231,001 | |||||||||
| Publicity and advertising | 2,528 | 5,668,569 | 5,671,097 | |||||||||
| Contingencies | — | 221,008 | 221,008 | |||||||||
| Share-based incentives | — | 3,278,354 | 3,278,354 | |||||||||
| Professional fees and outsourced services | 2,629,567 | 13,498,757 | 16,128,324 | |||||||||
| Professional fees related parties | — | 277,137 | 277,137 | |||||||||
| Office supplies and registrations fees | 229,500 | 833,430 | 1,062,930 | |||||||||
| Insurance | 230,388 | 3,006,387 | 3,236,775 | |||||||||
| Information technology expenses | 11,556 | 3,087,945 | 3,099,501 | |||||||||
| Obsolescence | 1,012,788 | 53,989 | 1,066,777 | |||||||||
| Taxes | 255,227 | 11,533,391 | 11,788,618 | |||||||||
| Miscellaneous | 41,542 | 858,633 | 900,175 | |||||||||
| Total | 23,227,844 | 113,002,747 | 136,230,591 | |||||||||
F-
NOTES TO THE CONSOLIDATED FINANCIAL STATEMENTS
As of June 30, 2024 and 2023 and for the years ended June 30, 2024, 2023 and 2022
(Amounts in US$, except otherwise indicated)
| Selling, | ||||||||||||
| general and | ||||||||||||
| Production | administrative | Total | ||||||||||
| Item | costs | expenses | 06/30/2022 | |||||||||
| Amortization of intangible assets | 177,782 | 1,634,832 | 1,812,614 | |||||||||
| Commissions and royalties | 165,013 | 1,661,984 | 1,826,997 | |||||||||
| Import and export expenses | 241,301 | 843,383 | 1,084,684 | |||||||||
| Depreciation of property, plant and equipment | 1,243,606 | 2,087,389 | 3,330,995 | |||||||||
| Depreciation of leased assets | 249,230 | 971,882 | 1,221,112 | |||||||||
| Impairment of receivables | — | 1,598,042 | 1,598,042 | |||||||||
| Freight and haulage | 931,592 | 9,528,553 | 10,460,145 | |||||||||
| Employee benefits and social securities | 7,750,363 | 22,980,983 | 30,731,346 | |||||||||
| Maintenance | 929,600 | 1,499,107 | 2,428,707 | |||||||||
| Energy and fuel | 555,066 | 53,146 | 608,212 | |||||||||
| Supplies and materials | 773,873 | 2,103,877 | 2,877,750 | |||||||||
| Mobility and travel | 60,326 | 2,399,260 | 2,459,586 | |||||||||
| Publicity and advertising | — | 4,840,864 | 4,840,864 | |||||||||
| Contingencies | — | 292,732 | 292,732 | |||||||||
| Share-based incentives | — | 1,381,811 | 1,381,811 | |||||||||
| Professional fees and outsourced services | 1,483,627 | 7,792,707 | 9,276,334 | |||||||||
| Professional fees related parties | — | 389,714 | 389,714 | |||||||||
| Office supplies and registrations fees | 197,033 | 776,542 | 973,575 | |||||||||
| Insurance | 99,001 | 1,620,959 | 1,719,960 | |||||||||
| Information technology expenses | 1,002 | 1,863,134 | 1,864,136 | |||||||||
| Obsolescence | 849,641 | — | 849,641 | |||||||||
| Taxes | 47,296 | 10,671,564 | 10,718,860 | |||||||||
| Miscellaneous | 1,387 | 491,347 | 492,734 | |||||||||
| Total | 15,756,739 | 77,483,812 | 93,240,551 | |||||||||
8.5. Other income or expenses, net
| 06/30/2024 | 06/30/2023 | 06/30/2022 | ||||||||||
| Net result from commercialization of agricultural products | (3,560,703 | ) | 174,122 | (5,536,561 | ) | |||||||
| Reimbursements for exports | — | — | 615,840 | |||||||||
| Expenses recovery | 336,815 | 79,274 | 616,975 | |||||||||
| Others | 693,006 | 831,496 | 1,023,526 | |||||||||
| (2,530,882 | ) | 1,084,892 | (3,280,220 | ) | ||||||||
F-
NOTES TO THE CONSOLIDATED FINANCIAL STATEMENTS
As of June 30, 2024 and 2023 and for the years ended June 30, 2024, 2023 and 2022
(Amounts in US$, except otherwise indicated)
8.6. Finance results
| 06/30/2024 | 06/30/2023 | 06/30/2022 | ||||||||||
| Financial costs | ||||||||||||
| Interest expenses with the Parent (Note 17) | (45,852 | ) | (462,575 | ) | (817,170 | ) | ||||||
| Interest expenses | (24,078,901 | ) | (20,767,168 | ) | (14,135,820 | ) | ||||||
| Financial commissions | (2,746,945 | ) | (2,558,342 | ) | (2,973,207 | ) | ||||||
| (26,871,698 | ) | (23,788,085 | ) | (17,926,197 | ) | |||||||
| Other financial results | ||||||||||||
| Exchange differences generated by assets | (15,750,105 | ) | (20,410,188 | ) | 33,661,590 | |||||||
| Exchange differences generated by liabilities | 19,166,100 | 10,890,789 | (46,154,598 | ) | ||||||||
| Changes in fair value of financial assets or liabilities and other financial results | (13,026,967 | ) | (2,209,036 | ) | 2,966,135 | |||||||
| Net gain of inflation effect on monetary items | 1,697,345 | 438,502 | 1,646,774 | |||||||||
| (7,913,627 | ) | (11,289,933 | ) | (7,880,099 | ) | |||||||
9. TAXATION
The balances of income tax and minimum presumed income tax recoverable and payable are as follows:
| 06/30/2024 | 06/30/2023 | |||||||
| Current assets | ||||||||
| Income tax | 655,691 | 9,444,898 | ||||||
| 655,691 | 9,444,898 | |||||||
| Non-current assets | ||||||||
| Income tax | 10,889 | 16,286 | ||||||
| 10,889 | 16,286 | |||||||
| 06/30/2024 | 06/30/2023 | |||||||
| Liabilities | ||||||||
| Income tax | 4,825,271 | 509,034 | ||||||
| 4,825,271 | 509,034 | |||||||
The roll forward of net deferred tax as of June 30, 2024 and 2023 is as follows:
| 06/30/2024 | 06/30/2023 | |||||||
| Beginning of the year deferred tax | (28,472,383 | ) | (24,994,569 | ) | ||||
| Additions for business combination | (501,478 | ) | (6,335,717 | ) | ||||
| Charge for the year | 5,115,586 | 2,380,157 | ||||||
| Charge to OCI | — | 712,458 | ||||||
| Conversion difference | (943,310 | ) | (234,712 | ) | ||||
| Total net deferred tax | (24,801,585 | ) | (28,472,383 | ) | ||||
F-
NOTES TO THE CONSOLIDATED FINANCIAL STATEMENTS
As of June 30, 2024 and 2023 and for the years ended June 30, 2024, 2023 and 2022
(Amounts in US$, except otherwise indicated)
The roll forward of deferred tax assets and liabilities as of June 30, 2024 and 2023 are as follows:
| Additions | Income | |||||||||||||||||||
| Balance | for business | tax | Conversion | Balance | ||||||||||||||||
| Deferred tax assets | 06/30/2023 | combination | provision | difference | 30/06/2024 | |||||||||||||||
| Tax Loss-Carry Forward | 16,701,783 | — | 5,655,758 | (775,137 | ) | 21,582,404 | ||||||||||||||
| Changes in fair value of financial assets or liabilities | 3,107 | — | — | (2,232 | ) | 875 | ||||||||||||||
| Trade receivables | 354,741 | — | 212,688 | (130,077 | ) | 437,352 | ||||||||||||||
| Allowances | 796,606 | — | (297,513 | ) | (51,567 | ) | 447,526 | |||||||||||||
| Royalties | 723,083 | — | 48,310 | (6,502 | ) | 764,891 | ||||||||||||||
| Others | 4,210,435 | 765,384 | (2,094,736 | ) | (130,148 | ) | 2,750,935 | |||||||||||||
| Total deferred tax assets | 22,789,755 | 765,384 | 3,524,507 | (1,095,663 | ) | 25,983,983 | ||||||||||||||
| Additions | Income | |||||||||||||||||||
| Balance | for business | tax | Conversion | Balance | ||||||||||||||||
| Deferred tax liabilities | 06/30/2023 | combination | provision | difference | 30/06/2024 | |||||||||||||||
| Intangible assets | (28,798,967 | ) | — | 867,747 | 113,763 | (27,817,457 | ) | |||||||||||||
| Property, plant and equipment depreciation | (13,620,151 | ) | (211,136 | ) | (784,369 | ) | 6,380 | (14,609,276 | ) | |||||||||||
| Inflation tax adjustment | (566,759 | ) | — | 386,486 | 17,358 | (162,915 | ) | |||||||||||||
| Inventories | (5,979,778 | ) | (940,231 | ) | (640,394 | ) | — | (7,560,403 | ) | |||||||||||
| Others financial assets | (2,150,406 | ) | — | 1,690,100 | — | (460,306 | ) | |||||||||||||
| Right-of-use leased asset | (120,440 | ) | (115,495 | ) | 30,997 | 14,852 | (190,086 | ) | ||||||||||||
| Others | (25,637 | ) | — | 40,512 | — | 14,875 | ||||||||||||||
| Total deferred tax liabilities | (51,262,138 | ) | (1,266,862 | ) | 1,591,079 | 152,353 | (50,785,568 | ) | ||||||||||||
| Net deferred tax | (28,472,383 | ) | (501,478 | ) | 5,115,586 | (943,310 | ) | (24,801,585 | ) | |||||||||||
| Additions | Income | |||||||||||||||||||||||
| Balance | for business | tax | Charge | Conversion | Balance | |||||||||||||||||||
| Deferred tax assets | 06/30/2022 | combination | provision | to OCI | difference | 30/06/2023 | ||||||||||||||||||
| Tax Loss-Carry Forward | 2,683,161 | 10,369,053 | 4,052,151 | — | (402,582 | ) | 16,701,783 | |||||||||||||||||
| Changes in fair value of financial assets or liabilities | 113,029 | — | (108,217 | ) | — | (1,705 | ) | 3,107 | ||||||||||||||||
| Trade receivables | 91,604 | — | 70,748 | — | 192,389 | 354,741 | ||||||||||||||||||
| Allowances | 654,260 | — | 175,692 | — | (33,346 | ) | 796,606 | |||||||||||||||||
| Royalties | 525,057 | — | 200,979 | — | (2,953 | ) | 723,083 | |||||||||||||||||
| Others | 2,500,218 | — | 1,713,497 | — | (3,280 | ) | 4,210,435 | |||||||||||||||||
| Total deferred tax assets | 6,567,329 | 10,369,053 | 6,104,850 | — | (251,477 | ) | 22,789,755 | |||||||||||||||||
F-
NOTES TO THE CONSOLIDATED FINANCIAL STATEMENTS
As of June 30, 2024 and 2023 and for the years ended June 30, 2024, 2023 and 2022
(Amounts in US$, except otherwise indicated)
| Additions | Income | |||||||||||||||||||||||
| Balance | for business | tax | Charge | Conversion | Balance | |||||||||||||||||||
| Deferred tax liabilities | 06/30/2022 | combination | provision | to OCI | difference | 30/06/2023 | ||||||||||||||||||
| Intangible assets | (13,664,699 | ) | (16,601,120 | ) | 1,399,616 | — | 67,236 | (28,798,967 | ) | |||||||||||||||
| Property, plant and equipment depreciation | (14,190,560 | ) | (103,650 | ) | 37,949 | 712,458 | (76,348 | ) | (13,620,151 | ) | ||||||||||||||
| Inflation tax adjustment | (1,607,912 | ) | — | 1,015,276 | — | 25,877 | (566,759 | ) | ||||||||||||||||
| Inventories | (1,538,310 | ) | — | (4,441,468 | ) | — | — | (5,979,778 | ) | |||||||||||||||
| Government grants | (2,215 | ) | — | 2,215 | — | — | — | |||||||||||||||||
| Others financial assets | (402,390 | ) | — | (1,748,016 | ) | — | — | (2,150,406 | ) | |||||||||||||||
| Right-of-use leased asset | (113,994 | ) | — | (6,446 | ) | — | — | (120,440 | ) | |||||||||||||||
| Others | (41,818 | ) | — | 16,181 | — | — | (25,637 | ) | ||||||||||||||||
| Total deferred tax liabilities | (31,561,898 | ) | (16,704,770 | ) | (3,724,693 | ) | 712,458 | 16,765 | (51,262,138 | ) | ||||||||||||||
| Net deferred tax | (24,994,569 | ) | (6,335,717 | ) | 2,380,157 | 712,458 | (234,712 | ) | (28,472,383 | ) | ||||||||||||||
Principal statutory taxes rates in the countries where the Group operates for all of the years presented are:
| 06/30/2024 | 06/30/2023 | 06/30/2022 | ||||||||||
| Current tax expense | (8,894,201 | ) | (1,311,505 | ) | (19,004,370 | ) | ||||||
| Deferred tax | 5,115,586 | 2,380,157 | 1,031,836 | |||||||||
| Total | (3,778,615 | ) | 1,068,652 | (17,972,534 | ) | |||||||
The tax on the Group’s profit before tax differs from the theoretical amount that would arise using the weighted average tax rate applicable to profits of the consolidated entities as follows:
| 06/30/2024 | 06/30/2023 | 06/30/2022 | ||||||||||
| Earning before income tax-rate | 10,035,271 | 19,105,947 | 14,063,630 | |||||||||
| Income tax expense by applying tax rate in force in the respective countries | (2,532,953 | ) | 1,331,544 | (9,166,026 | ) | |||||||
| Share of profit or loss of subsidiaries, joint ventures and associates | 1,371,636 | 241,301 | 440,944 | |||||||||
| Stock options charge | (1,351,831 | ) | (558,026 | ) | (50,163 | ) | ||||||
| Non-deductible expenses | (1,468,643 | ) | (371,316 | ) | (303,518 | ) | ||||||
| Tax inflation adjustment | 8,788,533 | 7,920,895 | 1,826,488 | |||||||||
| Result of inflation effect on monetary items and other finance results | (8,999,710 | ) | (8,120,822 | ) | (10,669,710 | ) | ||||||
| Foreign investment coverage | — | — | 510,487 | |||||||||
| Others | 414,353 | 625,076 | (561,036 | ) | ||||||||
| Income tax expenses | (3,778,615 | ) | 1,068,652 | (17,972,534 | ) | |||||||
The income tax expense was calculated by applying the tax rate in force in the respective countries, as follows:
| Earning | Weighted | Income tax | ||||||||||
| before | average | as of | ||||||||||
| income | applicable | June 30, | ||||||||||
| Tax jurisdiction | tax-rate | tax rate | 2024 | |||||||||
| Low or null taxation jurisdictions | 9,431,930 | 0.0 | % | — | ||||||||
| Profit-making entities | 30,435,214 | 34.7 | % | (10,560,379 | ) | |||||||
| Loss-making entities | (29,831,873 | ) | 26.9 | % | 8,027,426 | |||||||
| 10,035,271 | (2,532,953 | ) | ||||||||||
F-
NOTES TO THE CONSOLIDATED FINANCIAL STATEMENTS
As of June 30, 2024 and 2023 and for the years ended June 30, 2024, 2023 and 2022
(Amounts in US$, except otherwise indicated)
| Earning | Weighted | Income tax | ||||||||||
| before | average | as of | ||||||||||
| income | applicable | June 30, | ||||||||||
| Tax jurisdiction | tax-rate | tax rate | 2023 | |||||||||
| Low or null taxation jurisdictions | 29,696,082 | 0.0 | % | — | ||||||||
| Profit-making entities | 10,484,562 | 34.1 | % | (3,577,918 | ) | |||||||
| Loss-making entities | (21,074,697 | ) | 23.3 | % | 4,909,462 | |||||||
| 19,105,947 | 1,331,544 | |||||||||||
| Earning | Weighted | Income tax | ||||||||||
| before | average | as of | ||||||||||
| income | applicable | June 30, | ||||||||||
| Tax jurisdiction | tax-rate | tax rate | 2022 | |||||||||
| Low or null taxation jurisdictions | (10,954,972 | ) | 0.0 | % | — | |||||||
| Profit-making entities | 33,448,696 | 34.7 | % | (11,591,173 | ) | |||||||
| Loss-making entities | (8,430,094 | ) | 28.8 | % | 2,425,147 | |||||||
| 14,063,630 | (9,166,026 | ) | ||||||||||
The charge for income tax charged directly to profit or loss and the amount and expiry date of carry forward tax losses as of June 30, 2024 are as follows:
| Fiscal year | Loss Carry forward | Tax-Loss Carry forward |
Prescription | Tax jurisdiction | ||||||||
| 2020 | 268,445 | 67,926 | 2025 | Argentina | ||||||||
| 2020 | 223,999 | 47,040 | 2040 | United States of America | ||||||||
| 2021 | 490,645 | 145,190 | 2026 | Argentina | ||||||||
| 2021 | 511,839 | 107,486 | 2041 | United States of America | ||||||||
| 2022 | 450,151 | 121,717 | 2027 | Argentina | ||||||||
| 2022 | 1,072,159 | 225,154 | 2042 | United States of America | ||||||||
| 2023 | 899,709 | 261,473 | 2028 | Argentina | ||||||||
| 2023 | 51,574,868 | 10,830,722 | 2043 | United States of America | ||||||||
| 2023 | 3,598,124 | 1,223,362 | 2028 | Brasil | ||||||||
| 2024 | 3,200,142 | 880,349 | 2029 | Argentina | ||||||||
| 2024 | 21,898,887 | 4,598,766 | 2044 | United States of America | ||||||||
| 2024 | 803,432 | 200,858 | 2034 | France | ||||||||
| 2024 | 8,448,123 | 2,872,361 | 2029 | Brasil | ||||||||
| Total | 93,440,523 | 21,582,404 | ||||||||||
The amount of tax losses for the fiscal year ended on June 30, 2024 is an estimate of the amount to be presented in the tax return.
Estimates
There is an inherent material uncertainty related to management’s estimation of the ability of the Group to use the deferred tax assets (both carryforward of unused tax losses and deductible temporary differences) and the credit of minimum presumed income tax because their future utilization depends on the generation of enough future taxable income by the entities within the Group during the periods in which those temporary differences are deductible or when the unused tax losses can be used.
Based on the projections of future taxable income for the periods in which the deferred tax assets are deductible, the Group’s management estimates that, except for the part of deferred tax asset that were unrecognized, it is probable that the entities within the Group can utilize those deferred tax assets, which depends, among other factors, on the success of the current projects of agricultural biotechnology, the future market price of commodities and the market share of the entities within the Group.
The estimates of management about the demonstrability of the recognition criteria for these deferred tax assets and their subsequent recoverability represent the best estimate that can be made based on all the available evidence, existing facts and circumstances and the use of reasonable and supportable assumptions in the projections of future taxable income. Therefore, the Consolidated financial statements do not include adjustments that could result if the entities within the Group would not be able to recover the deferred tax assets through the generation of enough future taxable income.
F-
NOTES TO THE CONSOLIDATED FINANCIAL STATEMENTS
As of June 30, 2024 and 2023 and for the years ended June 30, 2024, 2023 and 2022
(Amounts in US$, except otherwise indicated)
10. EARNING PER SHARE
| 06/30/2024 | 06/30/2023 | 06/30/2022 | ||||||||||
| Numerator | ||||||||||||
| Profit/ (Loss) for the year (basic EPS) | 3,243,361 | 18,779,876 | (7,199,618 | ) | ||||||||
| Profit/ (Loss) for the year (diluted EPS) | 3,243,361 | 18,779,876 | (7,199,618 | ) | ||||||||
| Denominator | ||||||||||||
| Weighted average number of shares (basic EPS) | 62,840,129 | 62,146,082 | 42,302,318 | |||||||||
| Weighted average number of shares (diluted EPS) | 63,485,432 | 63,185,508 | 42,302,318 | |||||||||
| Basic profit/ (loss) attributable to ordinary equity holders of the parent | 0.0516 | 0.3022 | (0.1702 | ) | ||||||||
| Diluted profit/ (loss) attributable to ordinary equity holders of the parent | 0.0511 | 0.2972 | (0.1702 | ) | ||||||||
For the year ended June 30, 2024 and 2023, diluted earnings per share was calculated by adjusting the weighted average number of shares outstanding to assume conversion of all dilutive potential shares. The Group had two categories of dilutive potential shares, share-based incentives and the convertible notes.
The stock options were included in the diluted EPS calculation for the year ended June 30, 2024 and 2023 only for the tranches in which the average market price of ordinary shares during the periods was higher than the assumed proceeds per option.
Convertible notes outstanding were not included in the diluted EPS calculations for the year ended June 30, 2024 and 2023 because the interest (net of tax and other changes in income or expense) per ordinary share obtainable on conversion exceeds basic earnings per share.
11. INFORMATION ABOUT COMPONENTS OF EQUITY
Capital issued
As of June 30, 2024, we had, (i) 100,000,000 ordinary shares ($0.0001 par value) authorized, (ii) 62,848,483 ordinary shares issued and outstanding, (iii) 1,000,000 preference shares ($0.0001 par value) authorized, (iv) no preference shares issued and outstanding, (v) 3,927,176 ordinary shares reserved for our equity compensation plans. Of the total issued shares, we have repurchased 2,258,016 shares of our own.
Holders of the ordinary shares are entitled to one vote for each ordinary share.
Convertible notes
Convertibles notes were classified as compound instruments, a non-derivative financial instrument that contains both a liability and an equity component. The equity consideration was included in the “Convertible instruments” column. See Note 7.13.
F-
NOTES TO THE CONSOLIDATED FINANCIAL STATEMENTS
As of June 30, 2024 and 2023 and for the years ended June 30, 2024, 2023 and 2022
(Amounts in US$, except otherwise indicated)
Non-controlling interests
The subsidiaries whose non-controlling interest is significant as of June 30, 2024 and 2023 is:
| Name | 06/30/2024 | 06/30/2023 | ||||||
| Rizobacter Argentina S.A. | 20 | % | 20 | % | ||||
| Insumos Agroquimicos S.A. | 38.68 | % | 38.68 | % | ||||
Below is a detail of the summarized financial information of Rizobacter and Insuagro, prepared in accordance with IFRS, and modified due to fair value adjustments at the acquisition date and differences in accounting policies. The information is presented prior to eliminations between that subsidiary and other Group companies.
Rizobacter
Summary financial statements:
| 06/30/2024 | 06/30/2023 | |||||||
| Current assets | 345,561,483 | 335,866,177 | ||||||
| Non-current assets | 98,157,355 | 89,038,654 | ||||||
| Total assets | 443,718,838 | 424,904,831 | ||||||
| Current liabilities | 258,332,709 | 232,082,379 | ||||||
| Non-current liabilities | 69,831,217 | 93,498,026 | ||||||
| Total liabilities | 328,163,926 | 325,580,405 | ||||||
| Equity attributable to controlling interest | 115,554,674 | 99,323,049 | ||||||
| Equity attributable to non-controlling interest | 238 | 1,377 | ||||||
| Total equity | 115,554,912 | 99,324,426 | ||||||
| Total liabilities and equity | 443,718,838 | 424,904,831 | ||||||
F-
NOTES TO THE CONSOLIDATED FINANCIAL STATEMENTS
As of June 30, 2024 and 2023 and for the years ended June 30, 2024, 2023 and 2022
(Amounts in US$, except otherwise indicated)
Summary statements of comprehensive income or loss
| 06/30/2024 | 06/30/2023 | 06/30/2022 | ||||||||||
| Revenues | 303,870,411 | 288,880,411 | 280,625,028 | |||||||||
| Initial recognition and changes in the fair value of biological assets at the point of harvest | (2,468,693 | ) | (3,199,885 | ) | 3,973,780 | |||||||
| Cost of sales | (194,869,433 | ) | (178,970,954 | ) | (176,497,573 | ) | ||||||
| Gross margin | 106,532,285 | 106,709,572 | 108,101,235 | |||||||||
| Research and development expenses | (3,341,318 | ) | (3,851,144 | ) | (3,190,439 | ) | ||||||
| Selling, general and administrative expenses | (65,215,877 | ) | (68,580,834 | ) | (59,057,350 | ) | ||||||
| Share of profit or loss of joint ventures and associates | 716,168 | 222,364 | 611,989 | |||||||||
| Other income | (947,068 | ) | 361,639 | 113,378 | ||||||||
| Operating profit | 37,744,190 | 34,861,597 | 46,578,813 | |||||||||
| Financial results | (14,275,961 | ) | (25,356,667 | ) | (12,668,145 | ) | ||||||
| Profit before taxes | 23,468,229 | 9,504,930 | 33,910,668 | |||||||||
| Income tax expense | (8,216,712 | ) | (3,064,006 | ) | (16,788,853 | ) | ||||||
| Result for the year | 15,251,517 | 6,440,924 | 17,121,815 | |||||||||
| Foreign exchange differences on translation of foreign operations | (1,495,976 | ) | 1,075,805 | 1,824,666 | ||||||||
| Revaluation of property, plant and equipment, net of tax | — | (1,435,739 | ) | (5,308,610 | ) | |||||||
| Total comprehensive result | 13,755,541 | 6,080,990 | 13,637,871 | |||||||||
There were no dividends paid to Rizobacter non-controlling interest (NCI) in the years ended June 30, 2024, 2023 and 2022.
Insuagro
Summary financial statements:
| 06/30/2024 | 06/30/2023 | |||||||
| Current assets | 48,088,212 | 46,335,283 | ||||||
| Non-current assets | 5,253,148 | 2,056,730 | ||||||
| Total assets | 53,341,360 | 48,392,013 | ||||||
| Current liabilities | 45,049,873 | 39,442,599 | ||||||
| Non-current liabilities | 293,858 | 1,242,098 | ||||||
| Total liabilities | 45,343,731 | 40,684,697 | ||||||
| Total equity | 7,997,629 | 7,707,316 | ||||||
| Total liabilities and equity | 53,341,360 | 48,392,013 | ||||||
F-
NOTES TO THE CONSOLIDATED FINANCIAL STATEMENTS
As of June 30, 2024 and 2023 and for the years ended June 30, 2024, 2023 and 2022
(Amounts in US$, except otherwise indicated)
Summary statements of comprehensive income or loss
| 06/30/2024 | 06/30/2023 | 06/30/2022 | ||||||||||
| Revenues | 57,959,538 | 55,710,643 | 49,116,626 | |||||||||
| Cost of sales | (44,575,216 | ) | (42,765,656 | ) | (35,181,813 | ) | ||||||
| Gross margin | 13,384,322 | 12,944,987 | 13,934,813 | |||||||||
| Selling, general and administrative expenses | (9,360,140 | ) | (7,931,425 | ) | (7,894,444 | ) | ||||||
| Other income or expenses, net | (9,723 | ) | 9,833 | 159,794 | ||||||||
| Operating profit | 4,014,459 | 5,023,395 | 6,200,163 | |||||||||
| Financial results | (3,223,411 | ) | (2,403,656 | ) | (2,954,581 | ) | ||||||
| Profit/(loss) before tax | 791,048 | 2,619,739 | 3,245,582 | |||||||||
| Income tax | (85,586 | ) | (1,053,372 | ) | (1,421,973 | ) | ||||||
| Profit/(loss) for the year | 705,462 | 1,566,367 | 1,823,609 | |||||||||
| Exchange differences on translation of foreign operations | — | — | 733,029 | |||||||||
| Revaluation of property, plant and equipment, net of tax | — | (31,610 | ) | — | ||||||||
| Total comprehensive result | 705,462 | 1,534,757 | 2,556,638 | |||||||||
12. CASH FLOW INFORMATION
Significant non-cash transactions related to investing and financing activities are as follows:
| 06/30/2024 | 06/30/2023 | 06/30/2022 | ||||||||||
| Investment activities | ||||||||||||
| Net assets acquisition by business combination | 1,297,882 | 152,070,313 | — | |||||||||
| Investment in-kind in other related parties (Note 17) | 2,409,244 | 1,163,384 | 1,580,556 | |||||||||
| Capitalization of interest on buildings in progress | 124,098 | 74,710 | — | |||||||||
| Financed sale of property, plant and equipment | — | — | 1,734,281 | |||||||||
| Reclassification from Investment properties to property, plant and equipment | — | 3,589,749 | — | |||||||||
| Sale of Moolec Science S.A. equity investment | (900,000 | ) | (133,079 | ) | — | |||||||
| Non-monetary contributions in joint ventures and associates | — | — | 3,000 | |||||||||
| 2,931,224 | 156,765,077 | 3,317,837 | ||||||||||
| 06/30/2024 | 06/30/2023 | 06/30/2022 | ||||||||||
| Financing activities | ||||||||||||
| Capitalization of convertible notes (Note 7.13) | — | 12,211,638 | 36,244,460 | |||||||||
| Purchase of own shares | — | (24,025,718 | ) | — | ||||||||
| Acquisition of non-controlling interest in subsidiaries | — | — | 255,893 | |||||||||
| — | (11,814,080 | ) | 36,500,353 |
The Group has incorporated the assets and liabilities from Natal Agro S.R.L. and Pro Farm Group Inc mentioned in Note 6.
F-
NOTES TO THE CONSOLIDATED FINANCIAL STATEMENTS
As of June 30, 2024 and 2023 and for the years ended June 30, 2024, 2023 and 2022
(Amounts in US$, except otherwise indicated)
Disclosure of changes in liabilities arising from financing activities:
| Financing activities | ||||||||||||||||
| Consideration | Convertible | |||||||||||||||
| Borrowings | for acquisition | notes | Total | |||||||||||||
| As of June 30, 2022 | 145,478,637 | 12,902,790 | 12,559,071 | 170,940,498 | ||||||||||||
| Proceeds | 24,817,888 | — | 55,000,000 | 79,817,888 | ||||||||||||
| Payments | (13,596,339 | ) | (3,148,617 | ) | — | (16,744,956 | ) | |||||||||
| Conversion of Convertible Notes (Note 7.13) | — | — | (9,109,516 | ) | (9,109,516 | ) | ||||||||||
| Interest payment | (12,873,219 | ) | — | (5,173,742 | ) | (18,046,961 | ) | |||||||||
| Exchange differences, currency translation differences and other financial results | 24,483,638 | (4,760,917 | ) | 21,937,333 | 41,660,054 | |||||||||||
| As of June 30, 2023 | 168,310,605 | 4,993,256 | 75,213,146 | 248,517,007 | ||||||||||||
| Financing activities | ||||||||||||||||
| Consideration | Convertible | |||||||||||||||
| Borrowings | for acquisition | notes | Total | |||||||||||||
| As of June 30, 2023 | 168,310,605 | 4,993,256 | 75,213,146 | 248,517,007 | ||||||||||||
| Proceeds | 135,818,247 | — | — | 135,818,247 | ||||||||||||
| Payments | (109,702,266 | ) | (2,912,171 | ) | — | (112,614,437 | ) | |||||||||
| Financing for assets acquisitions | 743,279 | 1,119,975 | — | 1,863,254 | ||||||||||||
| Interest payment | (20,552,108 | ) | — | (4,172,328 | ) | (24,724,436 | ) | |||||||||
| Exchange differences, currency translation differences and other financial results | 4,234,323 | 4,117,445 | 9,768,868 | 18,120,636 | ||||||||||||
| As of June 30, 2024 | 178,852,080 | 7,318,505 | 80,809,686 | 266,980,271 | ||||||||||||
13. JOINT VENTURES AND ASSOCIATES
| 06/30/2024 | 06/30/2023 | |||||||
| Assets | ||||||||
| Synertech Industrias S.A. | 39,749,851 | 36,026,710 | ||||||
| Alfalfa Technologies S.R.L. | 36,502 | 36,502 | ||||||
| Moolec Science S.A. | — | 3,233,598 | ||||||
| 39,786,353 | 39,296,810 | |||||||
| 06/30/2024 | 06/30/2023 | |||||||
| Liabilities | ||||||||
| Trigall Genetics S.A. | 296,455 | 622,823 | ||||||
| 296,455 | 622,823 | |||||||
Moole Science S.A. ownership was reclassified as a marked-to-market asset (NASDAQ:MLEC). As of June 30, 2024, we own 1,391,250 ordinary shares, representing less than 4% of the company’s equity.
F-
NOTES TO THE CONSOLIDATED FINANCIAL STATEMENTS
As of June 30, 2024 and 2023 and for the years ended June 30, 2024, 2023 and 2022
(Amounts in US$, except otherwise indicated)
Changes in joint ventures investments and affiliates:
| 06/30/2024 | 06/30/2023 | |||||||
| As of the beginning of the year | 38,673,987 | 37,836,144 | ||||||
| Revaluation of property, plant and equipment | — | (184,630 | ) | |||||
| Share-based incentives | 65,470 | 3,825 | ||||||
| Sale of equity investment - Indrasa Biotecnología S.A. | — | (133,079 | ) | |||||
| Sale of equity investment - Moolec Science S.A. | (900,000 | ) | — | |||||
| Reclassification of Moolec Science S.A. | (2,398,829 | ) | — | |||||
| Foreign currency translation | (238 | ) | (46,901 | ) | ||||
| Share of profit or loss | 4,049,508 | 1,198,628 | ||||||
| As of the end of the year | 39,489,898 | 38,673,987 | ||||||
Share of profit or loss of joint ventures and affiliates:
| 06/30/2024 | 06/30/2023 | 06/30/2022 | ||||||||||
| Trigall Genetics S.A. | 326,368 | 103,703 | 670,065 | |||||||||
| Synertech Industrias S.A. | 3,723,140 | 564,598 | 856,006 | |||||||||
| Moolec Science Limited | — | — | (383,447 | ) | ||||||||
| Moolec Science S.A. | — | 467,714 | — | |||||||||
| Indrasa Biotecnología S.A. | — | 62,613 | 1,794 | |||||||||
| 4,049,508 | 1,198,628 | 1,144,418 | ||||||||||
There are no significant restrictions on the ability of the joint ventures and affiliates to transfer funds to the Group for cash dividends, or to repay loans or advances made by the Group, except for the Argentinian legal obligation to establish a legal reserve for 5% of the profit for the year until reaching 20% of the capital for Argentinian entities.
F-
NOTES TO THE CONSOLIDATED FINANCIAL STATEMENTS
As of June 30, 2024 and 2023 and for the years ended June 30, 2024, 2023 and 2022
(Amounts in US$, except otherwise indicated)
Summarized financial information prepared in accordance with International Financial Reporting Standards (“IFRS”) in relation to the joint ventures is presented below:
| Trigall Genetics | ||||||||
| Summarized balance sheet | 06/30/2024 | 06/30/2023 | ||||||
| Current assets | ||||||||
| Cash and cash equivalents | 450,687 | 39,085 | ||||||
| Other current assets | 6,429,065 | 4,824,095 | ||||||
| Total current assets | 6,879,752 | 4,863,180 | ||||||
| Non-current assets | ||||||||
| Intangible assets | 17,122,954 | 15,943,633 | ||||||
| Investments in joint ventures and associates | 3,623,325 | 3,027,061 | ||||||
| Total non-current assets | 20,746,279 | 18,970,694 | ||||||
| Current liabilities | ||||||||
| Other current liabilities | 1,832,719 | 2,696,046 | ||||||
| Total current liabilities | 1,832,719 | 2,696,046 | ||||||
| Non-current liabilities | ||||||||
| Financial liabilities | 22,318,949 | 18,498,360 | ||||||
| Other non- current liabilities | 653,604 | 471,444 | ||||||
| Total non-current liabilities | 22,972,553 | 18,969,804 | ||||||
| Net assets | 2,820,759 | 2,168,024 | ||||||
| Trigall Genetics | ||||||||||||
| Summarized statements of comprehensive income | 06/30/2024 | 06/30/2023 | 06/30/2022 | |||||||||
| Revenue | 2,525,061 | 2,010,229 | 2,205,849 | |||||||||
| Finance income | — | — | — | |||||||||
| Finance expense | (24,435 | ) | (718,388 | ) | (97,419 | ) | ||||||
| Depreciation and amortization | (507,860 | ) | (507,860 | ) | (234,190 | ) | ||||||
| Profit of the year | 674,059 | 207,410 | 1,340,129 | |||||||||
| Other comprehensive income | — | (17,156 | ) | — | ||||||||
| Total comprehensive income | 674,059 | 190,254 | 1,340,129 | |||||||||
F-
NOTES TO THE CONSOLIDATED FINANCIAL STATEMENTS
As of June 30, 2024 and 2023 and for the years ended June 30, 2024, 2023 and 2022
(Amounts in US$, except otherwise indicated)
| Synertech | ||||||||
| Summarized balance sheet | 06/30/2024 | 06/30/2023 | ||||||
| Current assets | ||||||||
| Cash and cash equivalents | 3,086 | 745,758 | ||||||
| Other current assets | 55,960,505 | 49,857,184 | ||||||
| Total current assets | 55,963,591 | 50,602,942 | ||||||
| Non-current assets | ||||||||
| Property, plan and equipment | 11,195,394 | 12,277,213 | ||||||
| Other non- current assets | — | 74,459 | ||||||
| Total non-current assets | 11,195,394 | 12,351,672 | ||||||
| Current liabilities | ||||||||
| Financial liabilities | 19,015,285 | 18,747,463 | ||||||
| Other current liabilities | 8,595,232 | 11,501,222 | ||||||
| Total current liabilities | 27,610,517 | 30,248,685 | ||||||
| Non-current liabilities | ||||||||
| Other non- current liabilities | 3,447,008 | 3,841,374 | ||||||
| Total non-current liabilities | 3,447,008 | 3,841,374 | ||||||
| Net assets | 36,101,460 | 28,864,555 | ||||||
| Synertech | ||||||||||||
| Summarized statements of comprehensive income | 06/30/2024 | 06/30/2023 | 06/30/2022 | |||||||||
| Revenue | 61,815,678 | 62,798,136 | 61,117,486 | |||||||||
| Finance income | 5,608,329 | 633,741 | 7,019,720 | |||||||||
| Finance expense | (7,385,028 | ) | (6,768,810 | ) | (8,644,475 | ) | ||||||
| Depreciation and amortization | (1,554,452 | ) | (2,032,809 | ) | (1,339,357 | ) | ||||||
| (Loss)/Profit of the year | 7,236,901 | 3,980,995 | (2,429,401 | ) | ||||||||
| Other comprehensive (loss)/income | — | (369,259 | ) | (1,172,537 | ) | |||||||
| Total comprehensive (loss)/income | 7,236,901 | 3,611,736 | (3,601,938 | ) | ||||||||
F-
NOTES TO THE CONSOLIDATED FINANCIAL STATEMENTS
As of June 30, 2024 and 2023 and for the years ended June 30, 2024, 2023 and 2022
(Amounts in US$, except otherwise indicated)
14. SEGMENT INFORMATION
The Group is organized into three main operating segments:
Seed and integrated products
The seed and integrated products segment focuses mainly on the development and commercialization of seed technologies and products that increase yield per hectare, with a focus on the provision of seed technologies integrated with crop protection and crop nutrition products designed to control weeds, insects or diseases, to increase their quality characteristics, to improve nutritional value and other benefits. The segment focuses on the commercialization of integrated products that combine three complementary components biotechnological events, germplasm and seed treatments—in order to increase crop productivity and create value for customers. While each component can increase yield independently, through an integrated technology strategy the segment offers products that complement and integrate with each other to generate higher yields in crops.
Currently the segment generates revenue from ordinary activities through the sale of seeds, integrated product packs, royalties and licenses charged to third parties, among others.
Crop protection
The crop protection segment mainly includes the development, production and marketing of high-tech adjuvants and a full range of pest control molecules and biocontrol products. Adjuvants are used in mixtures to facilitate the application and effectiveness of active ingredients, such as insecticides, leading to better performance, reduced usage rates and lower residue levels Insecticides and fungicides are applied to control pests and significantly reduce disease during the germination period.
The segment currently generates revenue from ordinary activities through the sale of adjuvants, insecticides, fungicides and baits, among others.
Crop nutrition
The crop nutrition segment focuses mainly on the development, production and commercialization of inoculants that allow the biological fixation of nitrogen in the crops, and of fertilizers including biofertilizers and microgranulated fertilizers that optimize the productivity and yield of the crops.
Currently the segment generates income from ordinary activities through the sale of inoculants, bio-inductors, biological fertilizers and microgranulated fertilizers, among others.
The measurement principles for the Group’s segment reporting structure are based on the IFRS principles adopted in the Consolidated financial statements. Revenue generated by products and services exchanged between segments and entities within the Group are calculated based on market prices.
F-
NOTES TO THE CONSOLIDATED FINANCIAL STATEMENTS
As of June 30, 2024 and 2023 and for the years ended June 30, 2024, 2023 and 2022
(Amounts in US$, except otherwise indicated)
The following tables present information with respect to the Group’s reporting segments:
| Seed and | ||||||||||||||||
| integrated | Crop | Crop | ||||||||||||||
| Year ended June 30, 2024 | products | protection | nutrition | Consolidated | ||||||||||||
| Revenues from contracts with customers | ||||||||||||||||
| Sale of goods and services | 94,457,404 | 223,538,317 | 125,558,380 | 443,554,101 | ||||||||||||
| Royalties | 986,602 | — | — | 986,602 | ||||||||||||
| Right of use licenses | 1,000,000 | — | 19,287,845 | 20,287,845 | ||||||||||||
| Others | ||||||||||||||||
| Initial recognition and changes in the fair value of biological assets at the point of harvest | (45,746 | ) | — | — | (45,746 | ) | ||||||||||
| Total | 96,398,260 | 223,538,317 | 144,846,225 | 464,782,802 | ||||||||||||
| Cost of sales | (66,306,974 | ) | (143,807,301 | ) | (68,107,537 | ) | (278,221,812 | ) | ||||||||
| Gross profit per segment | 30,091,286 | 79,731,016 | 76,738,688 | 186,560,990 | ||||||||||||
| % Gross margin | 31 | % | 36 | % | 53 | % | 40 | % | ||||||||
| Seed and | ||||||||||||||||
| integrated | Crop | Crop | ||||||||||||||
| Year ended June 30, 2023 | products | protection | nutrition | Consolidated | ||||||||||||
| Revenues from contracts with customers | ||||||||||||||||
| Sale of goods and services | 55,360,397 | 205,685,451 | 124,249,566 | 385,295,414 | ||||||||||||
| Royalties | 1,247,567 | — | — | 1,247,567 | ||||||||||||
| Right of use licenses | — | — | 32,903,458 | 32,903,458 | ||||||||||||
| Others | ||||||||||||||||
| Initial recognition and changes in the fair value of biological assets at the point of harvest | 319,428 | 153,460 | 137,666 | 610,554 | ||||||||||||
| Total | 56,927,392 | 205,838,911 | 157,290,690 | 420,056,993 | ||||||||||||
| Cost of sales | (31,012,687 | ) | (137,529,299 | ) | (66,915,067 | ) | (235,457,053 | ) | ||||||||
| Gross profit per segment | 25,914,705 | 68,309,612 | 90,375,623 | 184,599,940 | ||||||||||||
| % Gross margin | 46 | % | 33 | % | 57 | % | 44 | % | ||||||||
| Seed and | ||||||||||||||||
| integrated | Crop | Crop | ||||||||||||||
| Year ended June 30, 2022 | products | protection | nutrition | Consolidated | ||||||||||||
| Revenues from contracts with customers | ||||||||||||||||
| Sale of goods and services | 45,862,562 | 173,095,092 | 107,502,350 | 326,460,004 | ||||||||||||
| Royalties | 1,995,584 | — | — | 1,995,584 | ||||||||||||
| Others | ||||||||||||||||
| Initial recognition and changes in the fair value of biological assets at the point of harvest | 3,672,192 | 1,171,749 | 1,544,089 | 6,388,030 | ||||||||||||
| Total | 51,530,338 | 174,266,841 | 109,046,439 | 334,843,618 | ||||||||||||
| Cost of sales | (21,839,689 | ) | (124,489,307 | ) | (62,035,099 | ) | (208,364,095 | ) | ||||||||
| Gross profit per segment | 29,690,649 | 49,777,534 | 47,011,340 | 126,479,523 | ||||||||||||
| % Gross margin | 58 | % | 29 | % | 43 | % | 38 | % | ||||||||
As of the current period, changes in the net realizable value of agricultural products after harvest have been excluded from segment information since those results depend on market fluctuations which are beyond the Group’s operating control. The Group has recast the comparative figures accordingly.
F-
NOTES TO THE CONSOLIDATED FINANCIAL STATEMENTS
As of June 30, 2024 and 2023 and for the years ended June 30, 2024, 2023 and 2022
(Amounts in US$, except otherwise indicated)
Revenue by similar group of products or services
| 06/30/2024 | 06/30/2023 | 06/30/2022 | ||||||||||
| Seed and integrated products | 96,398,260 | 56,607,964 | 47,858,146 | |||||||||
| Seed Treatments Packs | 29,992,052 | 32,469,652 | 29,056,276 | |||||||||
| Seed & Royalties Payments | 5,587,594 | 7,004,400 | 6,384,927 | |||||||||
| HB4 Program | 60,818,614 | 17,133,912 | 12,416,943 | |||||||||
| Crop protection | 227,212,278 | 205,685,451 | 173,095,092 | |||||||||
| Adjuvants | 56,634,128 | 52,978,705 | 51,211,406 | |||||||||
| Seed CP Products and Services | 34,877,911 | 26,080,587 | 26,478,873 | |||||||||
| Other CP Products and Services | 106,766,415 | 94,123,984 | 95,404,813 | |||||||||
| Bioprotection | 28,933,824 | 32,502,175 | — | |||||||||
| Crop nutrition | 141,218,010 | 157,153,024 | 107,502,350 | |||||||||
| Inoculants & Biofertilizers | 18,315,253 | 23,621,534 | 23,621,552 | |||||||||
| Micro-beaded Fertilizers | 88,158,727 | 90,827,714 | 83,880,798 | |||||||||
| Biostimulants | 15,456,185 | 9,800,318 | — | |||||||||
| Syngenta license agreement | 19,287,845 | 32,903,458 | — | |||||||||
| Total revenues | 464,828,548 | 419,446,439 | 328,455,588 | |||||||||
Geographical information
| 06/30/2024 | 06/30/2023 | 06/30/2022 | ||||||||||
| Argentina | 346,794,376 | 288,228,267 | 261,624,779 | |||||||||
| Brazil | 24,175,116 | 23,690,028 | 33,049,005 | |||||||||
| LATAM | 21,952,339 | 21,044,547 | 15,340,382 | |||||||||
| North America | 27,370,220 | 30,372,912 | 5,086,007 | |||||||||
| EMEA | 21,320,535 | 22,014,855 | 12,920,323 | |||||||||
| ROW | 23,215,962 | 34,095,830 | 435,092 | |||||||||
| Total revenues | 464,828,548 | 419,446,439 | 328,455,588 | |||||||||
| 06/30/2024 | 06/30/2023 | |||||||
| Non-current assets | ||||||||
| Argentina | 137,325,749 | 124,612,208 | ||||||
| Brazil | 7,698,175 | 8,398,403 | ||||||
| LATAM | 1,162,654 | 1,064,290 | ||||||
| North America | 189,199,549 | 192,129,674 | ||||||
| EMEA | 44,141 | 61,526 | ||||||
| ROW | 26,279,731 | 27,535,122 | ||||||
| Total non-current assets | 361,709,999 | 353,801,223 | ||||||
| Property, plant and equipment | 74,573,278 | 67,853,835 | ||||||
| Intangible assets | 174,797,456 | 173,783,956 | ||||||
| Goodwill | 112,339,265 | 112,163,432 | ||||||
| Total reportable assets | 361,709,999 | 353,801,223 | ||||||
| Total non-reportable assets | 488,918,348 | 464,257,935 | ||||||
| Total assets | 850,628,347 | 818,059,158 | ||||||
As of the current period, geographical information is reported by main countries and regions. LATAM refers to Latin America countries, excluding Argentina and Brazil which are reported separately. North America includes United States of America and Canada. The EMEA region covers Europe, the Middle East and Africa. The Group has recast the comparative figures accordingly.
F-
NOTES TO THE CONSOLIDATED FINANCIAL STATEMENTS
As of June 30, 2024 and 2023 and for the years ended June 30, 2024, 2023 and 2022
(Amounts in US$, except otherwise indicated)
15. FINANCIAL INSTRUMENTS – RISK MANAGEMENT
The Group is exposed to a variety of financial risks that arise from its activities and from its use of financial instruments. This Note provides information on the Group’s exposure to certain main risks, the Group’s objectives, policies and processes regarding the measurement and management of each risk.
The Group does not use derivative financial instruments to hedge any of the above risks.
General objectives, policies and processes
The Board of Directors has overall responsibility for establishing and monitoring the Group’s risk management objectives and policies and, whilst retaining ultimate responsibility for them, it has delegated the function to design and operate processes that ensure the effective implementation of the objectives and policies to the management that periodically reports to the Board of Directors on the evolution of the risk management activities and results. The overall objective of the Board of Directors is to set policies that seek to reduce risk as much as possible without unduly affecting the Group’s competitiveness and flexibility.
The Group’s risk management policy is established to identify and analyze the risks facing the Group, to set appropriate risk limits and controls and to monitor risks and adherence to limits. The risks and methods for managing the risks are reviewed regularly in order to reflect changes in market conditions and the Group’s activities. The Group, through training and management standards and procedures, aims to develop a disciplined and constructive control environment in which all the employees understand their roles and obligations.
The Group seeks to use suitable means of financing to minimize the Group’s capital costs and to manage and control the Group’s financial risks effectively. There have been no substantive changes in the Group’s exposure to financial instrument risks, its objectives, policies and processes for managing those risks or the methods used to measure them from previous periods unless otherwise stated in this Note.
The Group adopted a code of ethics applicable to its principal executive, financial and accounting officers and all employees.
The principal risks and uncertainties facing the business, set out below, do not appear in any particular order of potential materiality or probability of occurrence.
Credit risk
Credit risk is the risk of financial loss to the Group if a customer or counterparty fails to meet its contractual obligations, which derives mainly from trade and other receivables, as well as from cash and deposits in financial institutions.
The credit risk to which the Group is exposed is mainly defined in the Group’s accounts receivable followed by cash and cash equivalents, with the logical importance of being able to satisfy the Group’s needs in the short term.
Trade and other receivables
Credit risk is the risk of financial loss to the Group if a customer or counterparty fails to meet its contractual obligations and derives mainly from trade receivables and other receivables generated by services and product sales. The Group is also exposed to political and economic risk events, which may cause nonpayment of local and foreign currency obligations to the Group owed by customers, partners, contractors and suppliers.
The Group sells its products to a diverse base of customers. Customers include multi-national and local agricultural companies, distributors, and farmers who purchase the Group’s products. Type and class of customers may differ depending on the Group’s business segments.
F-
NOTES TO THE CONSOLIDATED FINANCIAL STATEMENTS
As of June 30, 2024 and 2023 and for the years ended June 30, 2024, 2023 and 2022
(Amounts in US$, except otherwise indicated)
The Group’s management determines concentrations of credit risk by periodically monitoring the credit worthiness rating of existing customers and through a monthly review of the trade receivables’ aging analysis. In monitoring the customers’ credit risk, customers are grouped according to their credit characteristics.
The Group’s policy is to manage credit exposure to counterparties through a process of credit rating. The Group performs credit evaluations of existing and new customers, and every new customer is examined thoroughly regarding the quality of its credit before offering the customer transaction terms. The examination made by the Group includes outside credit rating information, if available. Additionally, and even if there is no independent outside rating, the Group assesses the credit quality of the customer taking into account its financial position, past experience, bank references and other factors. A credit limit is prescribed for each customer. These limits are examined periodically. Customers that do not meet the Group’s criteria for credit quality may do business with the Group on a prepayment basis or by furnishing collateral satisfactory to the Group. The Group may still seek collateral and guarantees as it may consider appropriate regardless the credit profile of any customer.
To cover trade receivables, the Group has a credit insurance for main subsidiaries, which periodically analyzes its customer portfolio.
The financial statements contain specific provisions for doubtful debts, which properly reflect, in Management’s estimate, the loss embedded in debts, the collection of which is doubtful. The maximum exposure to credit risk is represented by the carrying amount of each financial asset in the statement of financial position after deducting any impairment allowance.
On that basis, the loss allowance as of June 30, 2024 was determined as follows:
| Gross carrying |
Expected | |||||||||||
| amount-trade | Loss | Loss | ||||||||||
| receivables | rate | allowance | ||||||||||
| Current | 127,382,407 | 0.43 | % | 546,098 | ||||||||
| More than 15 days past due | 41,161,452 | 0.13 | % | 51,834 | ||||||||
| More than 30 days past due | 14,956,204 | 0.14 | % | 20,313 | ||||||||
| More than 60 days past due | 4,662,049 | 0.10 | % | 4,707 | ||||||||
| More than 90 days past due | 5,117,416 | 0.31 | % | 15,674 | ||||||||
| More than 120 days past due | 803,189 | 0.63 | % | 5,041 | ||||||||
| More than 180 days past due | 6,013,438 | 24.66 | % | 1,445,178 | ||||||||
| More than 365 days past due | 4,961,435 | 100.00 | % | 4,961,435 | ||||||||
| Total 06/30/2024 | 205,057,590 | 7,050,280 | ||||||||||
Cash and deposits in banks
The Group is exposed to counterparty credit risk on cash and cash equivalent balances. The Group holds cash on deposit with a number of financial institutions. The Group manages its credit risk exposure by limiting individual deposits to clearly defined limits. The Group only deposits with high quality banks and financial institutions.
The maximum exposure to credit risk is represented by the carrying amount of cash and cash equivalents in the statement of financial position.
F-
NOTES TO THE CONSOLIDATED FINANCIAL STATEMENTS
As of June 30, 2024 and 2023 and for the years ended June 30, 2024, 2023 and 2022
(Amounts in US$, except otherwise indicated)
Liquidity risk
Liquidity risk is the risk that the Group will encounter difficulty in meeting its financial obligations when they come due.
The Group’s approach to managing its liquidity risk is to manage the profile of debt maturities and funding sources, maintaining sufficient cash, and ensuring the availability of funding from an adequate amount of committed credit facilities. The Group’s ability to fund its existing and prospective debt requirements is managed by maintaining diversified funding sources with adequate committed funding lines from high quality lenders.
The cash flow forecast is determined at both an entity level and consolidated level. The forecasts are reviewed by the Board of Directors in advance, enabling the Group’s cash requirements to be anticipated. The Group examines the forecasts of its liquidity requirements in order to ascertain that there is sufficient cash for the operating needs, including the amounts required in order to settle financial liabilities.
The following table sets out the contractual maturities of financial liabilities:
| Between one | ||||||||||||
| Up to 3 | 3 to 12 | and three | ||||||||||
| As of June 30, 2024 | months | months | years | |||||||||
| Trade and other payables | 107,801,065 | 60,931,404 | — | |||||||||
| Borrowings | 73,706,045 | 63,041,153 | 42,104,882 | |||||||||
| Convertible notes | — | — | 80,809,686 | |||||||||
| Leasing liabilities | 738,561 | 2,384,217 | 8,161,359 | |||||||||
| Total | 182,245,671 | 126,356,774 | 131,075,927 | |||||||||
| Between one | ||||||||||||
| Up to 3 | 3 to 12 | and three | ||||||||||
| As of June 30, 2023 | months | months | years | |||||||||
| Trade and other payables | 60,086,911 | 71,780,831 | 3,048,515 | |||||||||
| Borrowings | 29,650,553 | 78,835,499 | 62,825,777 | |||||||||
| Convertible notes | — | — | 75,213,146 | |||||||||
| Leasing liabilities | 616,448 | 1,748,504 | 9,660,548 | |||||||||
| Total | 90,353,912 | 152,364,834 | 150,747,986 | |||||||||
As of June 30, 2024, and 2023 the Group had no exposure to derivative liabilities.
Currency risk
Foreign currency risk is the risk that the fair value or future cash flows of a financial instrument will fluctuate because of changes in foreign exchange rate. Currency on foreign exchange risk arises when the Group enters into transactions denominated in a currency other than its functional currency.
The table below sets forth our net exposure to currency risk as of June 30, 2024:
| Net foreign currency position | 06/30/2024 | |
| Amount expressed in US$ | (6,680,256) |
Considering only this net currency exposure as of June 30, 2024 if an US Dollar revaluation or depreciation in relation to other foreign currencies with the remaining variables remaining constant, would have a positive or a negative impact on comprehensive income as a result of foreign exchange gains or losses. We estimate that a devaluation or an appreciation of the US Dollar other currencies of 10% during the year ended June 30, 2024 would have resulted in a net pre-tax loss or gain of approximately $0.7 million.
F-
NOTES TO THE CONSOLIDATED FINANCIAL STATEMENTS
As of June 30, 2024 and 2023 and for the years ended June 30, 2024, 2023 and 2022
(Amounts in US$, except otherwise indicated)
Interest rate risk
The Group’s financing costs may be affected by interest rate volatility. Borrowings under the Group’s interest rate management policy may be fixed or floating rate. The Group maintains adequate committed borrowing facilities and holds most of its financial assets primarily in cash or checks collected from customers that are readily convertible into known amounts of cash.
The Group’s interest rate risk arises from long-term borrowings. Borrowings issued at floating rates expose the Group to cash flow interest rate risk. Borrowings issued at fixed rates expose the Group to fair value interest rate risk. The Group has not entered into derivative contracts to hedge this exposure.
The Group’s debt composition is set out below.
| 06/30/2024 | 06/30/2023 | |||||||
| Carrying | Carrying | |||||||
| amount | amount | |||||||
| Fixed-rate instruments | ||||||||
| Current financial liabilities | (140,060,223 | ) | (108,610,785 | ) | ||||
| Non-current financial liabilities | (125,419,041 | ) | (139,462,249 | ) | ||||
| Variable-rate instruments | ||||||||
| Current financial liabilities | (1,501,007 | ) | (443,973 | ) | ||||
Holding all other variables constant, including levels of our external indebtedness, as of June 30, 2024 a one percentage point increase in floating interest rates would increase interest payable by less than $ 0.01 million.
The Company does not use derivative financial instruments to hedge its interest rate risk exposure.
Capital risk
The Group’s objectives when managing capital are to safeguard the Group’s ability to continue as a going concern, in order to provide returns for shareholders and benefits for other stakeholders, and to maintain an optimal capital structure to reduce the cost of capital.
The Group manages its capital structure and makes adjustments to it in the light of changes in economic conditions and the risk characteristics of the underlying assets. In order to maintain or adjust the capital structure, the Group may adjust the amount of any dividends it could pay to shareholders, return capital to shareholders, issue new shares, or sell assets to reduce debt.
F-
NOTES TO THE CONSOLIDATED FINANCIAL STATEMENTS
As of June 30, 2024 and 2023 and for the years ended June 30, 2024, 2023 and 2022
(Amounts in US$, except otherwise indicated)
Financial instruments by category
The following tables show additional information required under IFRS 7 on the financial assets and liabilities recorded as of June 30, 2024, and 2023.
Financial assets by category
| Mandatorily measured at fair | ||||||||||||||||
| Amortized cost | value through profit or loss | |||||||||||||||
| Financial asset | 06/30/2024 | 06/30/2023 | 06/30/2024 | 06/30/2023 | ||||||||||||
| Cash and cash equivalents | 44,473,270 | 48,129,194 | — | — | ||||||||||||
| Other financial assets | 634,553 | 657,612 | 11,695,528 | 11,922,317 | ||||||||||||
| Trade receivables | 207,320,974 | 158,006,474 | — | — | ||||||||||||
| Other receivables (*) | 18,647,862 | 12,124,724 | — | — | ||||||||||||
| Total | 271,076,659 | 218,918,004 | 11,695,528 | 11,922,317 | ||||||||||||
| (*) | Advances expenses and tax balances are not included. |
Financial liabilities by category
| Mandatorily measured at fair | ||||||||||||||||
| Amortized cost | value through profit or loss | |||||||||||||||
| Financial liability | 06/30/2024 | 06/30/2023 | 06/30/2024 | 06/30/2023 | ||||||||||||
| Trade and other payables | 156,742,677 | 142,582,166 | 11,989,792 | 8,225,508 | ||||||||||||
| Borrowings | 178,852,080 | 168,310,605 | — | — | ||||||||||||
| Secured notes | 80,809,686 | 75,213,146 | — | — | ||||||||||||
| Lease liability | 11,284,137 | 13,889,223 | — | — | ||||||||||||
| Consideration for acquisition | 4,594,391 | 4,993,256 | 2,724,114 | — | ||||||||||||
| Total | 432,282,971 | 404,988,396 | 14,713,906 | 8,225,508 | ||||||||||||
Financial instruments measured at fair value
Fair value by hierarchy
According to the requirements of IFRS 7, the Group classifies each class of financial instrument valued at fair value into three levels, depending on the relevance of the judgment associated to the assumptions used for measuring the fair value.
Level 1 comprises financial assets and liabilities with fair values determined by reference to quoted prices (unadjusted) in active markets for identical assets or liabilities.
F-
NOTES TO THE CONSOLIDATED FINANCIAL STATEMENTS
As of June 30, 2024 and 2023 and for the years ended June 30, 2024, 2023 and 2022
(Amounts in US$, except otherwise indicated)
Level 2 comprises inputs other than quoted prices included within Level 1 that are observable for the asset or liability, either directly (i.e. as prices) or indirectly (i.e. derived from prices).
Level 3 comprises financial instruments with inputs for estimating fair value that are not based on observable market data.
| Measurement at fair value at 06/30/2024 | Level 1 | Level 2 | Level 3 | |||||||||
| Financial assets at fair value | ||||||||||||
| Mutual funds | 6,658,805 | — | — | |||||||||
| Moolec Science S.A. shares | 1,530,375 | — | — | |||||||||
| Other investments | 3,506,348 | — | — | |||||||||
| Financial liability at fair value | ||||||||||||
| Trade and other payables | — | 11,989,792 | — | |||||||||
| Consideration for acquisition | 2,724,114 | — | — | |||||||||
| Measurement at fair value at 06/30/2023 | Level 1 | Level 2 | Level 3 | |||||||||
| Financial assets at fair value | ||||||||||||
| US Treasury bills | 9,163,298 | — | — | |||||||||
| Mutual funds | 1,596,539 | — | — | |||||||||
| Other investments | 1,162,480 | — | — | |||||||||
| Financial liability at fair value | ||||||||||||
| Trade and other payables | — | 8,225,508 | — |
Estimation of fair value
The fair value of marketable securities, mutual funds, shares and US Treasury Bills is calculated using the market approach using quoted prices in active markets for identical assets. The quoted marked price used for financial assets held by the Group is the current bid price. These instruments are included in level 1.
The Group’s financial liabilities, which were not traded in an active market, were determined using valuation techniques that maximize the use of available market information, and thus rely as little as possible on specific estimates of the entity specific estimates. If all significant inputs required to fair value an instrument are observable, the instruments are included in level 2.
If one or more of the significant inputs is not based on observable market data, the instruments are included in level 3.
The Group’s policy is to recognize transfers between different categories of the fair value hierarchy at the time they occur or when there are changes in the circumstances that cause the transfer. There were no transfers between levels of the fair value hierarchy. There were no changes in economic or business circumstances affecting fair value.
Financial instruments not measured at fair value
The financial instruments not measured at fair value include cash and cash equivalents, trade accounts receivable, other accounts receivable, trade payables and other debts, borrowings, financed payments and convertible notes.
The carrying value of financial instruments not measured at fair value does not differ significantly from their fair value, except for borrowings (Note 7.12).
Management estimates that the carrying value of the financial instruments measured at amortized cost approximates their fair value.
F-
NOTES TO THE CONSOLIDATED FINANCIAL STATEMENTS
As of June 30, 2024 and 2023 and for the years ended June 30, 2024, 2023 and 2022
(Amounts in US$, except otherwise indicated)
16. LEASES
The right-of-use asset was initially measured at the amount of the lease liability plus initial direct costs incurred, adjusted by pre-payments made in relation to the lease. The right-of-use asset was measured at cost less accumulated depreciation and accumulated impairment.
The lease liability was initially measured at the present value of the lease payments payable over the lease term, discounted at the rate implicit in the lease if it can be readily determined. If that rate cannot be readily determined, the Group uses its incremental borrowing rate.
The information about the right-of-use and liabilities related with lease assets is as follows:
| Right-of-use leased asset | 06/30/2024 | 06/30/2023 | ||||||
| Book value at the beginning of the year | 21,163,192 | 15,828,032 | ||||||
| Additions of the year | 2,585,223 | 3,154,950 | ||||||
| Additions from business combination | 168,988 | 3,005,000 | ||||||
| Disposals | (1,284,975 | ) | (1,839,921 | ) | ||||
| Exchange differences | (1,652,831 | ) | 1,015,131 | |||||
| Book value at the end of the year | 20,979,597 | 21,163,192 | ||||||
| Depreciation | 06/30/2024 | 06/30/2023 | ||||||
| Book value at the beginning of the year | 7,226,617 | 3,684,006 | ||||||
| Depreciation of the year | 3,418,956 | 3,565,894 | ||||||
| Disposals | (1,092,167 | ) | (171,870 | ) | ||||
| Exchange differences | (175,561 | ) | 148,587 | |||||
| Accumulated depreciation at the end of the year | 9,377,845 | 7,226,617 | ||||||
| Total | 11,601,752 | 13,936,575 | ||||||
| Lease liability | 06/30/2024 | 06/30/2023 | ||||||
| Book value at the beginning of the year | 13,889,223 | 11,751,284 | ||||||
| Additions of the year | 2,585,223 | 3,154,950 | ||||||
| Additions from business combination | 168,988 | 3,245,000 | ||||||
| Interest expenses, exchange differences and inflation effects | (480,189 | ) | (406,494 | ) | ||||
| Payments of the year | (4,879,108 | ) | (3,855,517 | ) | ||||
| Total | 11,284,137 | 13,889,223 | ||||||
| Lease Liabilities | 06/30/2024 | 06/30/2023 | ||||||
| Non-current | 8,161,359 | 10,030,524 | ||||||
| Current | 3,122,778 | 3,858,699 | ||||||
| Total | 11,284,137 | 13,889,223 | ||||||
| 06/30/2024 | 06/30/2023 | |||||||
| Machinery and equipment | 3,655,741 | 3,655,741 | ||||||
| Vehicles | 1,272,071 | 1,475,581 | ||||||
| Equipment and computer software | 1,130,541 | 903,306 | ||||||
| Land and buildings | 14,921,244 | 15,128,564 | ||||||
| 20,979,597 | 21,163,192 |
| (1) | The incremental borrowing rate used was 2.78% in dollars and 12.74% in reais. |
F-
NOTES TO THE CONSOLIDATED FINANCIAL STATEMENTS
As of June 30, 2024 and 2023 and for the years ended June 30, 2024, 2023 and 2022
(Amounts in US$, except otherwise indicated)
17. SHAREHOLDERS AND OTHER RELATED PARTIES BALANCES AND TRANSACTIONS
During the year ended June 30, 2024, 2023 and 2022, the transactions between the Group and related parties, are as follows:
| Value of transactions for the year ended | ||||||||||||||
| Party | Transaction type | 06/30/2024 | 06/30/2023 | 06/30/2022 | ||||||||||
| Joint ventures and associates | Sales and services | 32,036,547 | 27,945,312 | 25,585,104 | ||||||||||
| Joint ventures and associates | Purchases of goods and services | (61,946,096 | ) | (60,847,857 | ) | (62,876,997 | ) | |||||||
| Joint ventures and associates | Equity contributions | — | — | 3,000 | ||||||||||
| Key management personnel | Salaries, social security benefits and other benefits | (10,209,376 | ) | (5,002,881 | ) | (4,042,348 | ) | |||||||
| Shareholders and other related parties | Sales of goods and services | 2,911,723 | 6,381,641 | 844,587 | ||||||||||
| Shareholders and other related parties | Purchases of goods and services | (1,998,349 | ) | (2,249,940 | ) | (2,904,956 | ) | |||||||
| Shareholders and other related parties | In-kind contributions | 2,409,244 | 1,163,384 | 1,580,556 | ||||||||||
| Shareholders and other related parties | Net loans granted | — | — | 421,691 | ||||||||||
| Shareholders and other related parties | Interest expenses | — | 5,753 | 42,813 | ||||||||||
| Parent company and related parties to Parent (Note 8.6) | Interest expenses | (45,852 | ) | (462,575 | ) | (817,170 | ) | |||||||
| Total | (36,842,159 | ) | (33,067,163 | ) | (42,163,720 | ) | ||||||||
The related balances owed by and to them as of June 30, 2024 and 2023 are as follows:
| Amounts receivable from related parties | ||||||||||
| Party | Transaction type | 06/30/2024 | 06/30/2023 | |||||||
| Shareholders and other related parties | Trade debtors | 141,224 | — | |||||||
| Shareholders and other related parties | Other receivables | — | 3,792,429 | |||||||
| Joint ventures and associates | Trade debtors | 782,142 | 865,627 | |||||||
| Joint ventures and associates | Other receivables | 15,702,992 | 6,104,219 | |||||||
| Total | 16,626,358 | 10,762,275 | ||||||||
| Amounts payable to related parties | ||||||||||
| Party | Transaction type | 06/30/2024 | 06/30/2023 | |||||||
| Parent company and related parties to Parent | Trade creditors | (729,171 | ) | (644,191 | ) | |||||
| Parent company and related parties to Parent | Net loans payables | — | (3,491,691 | ) | ||||||
| Key management personnel | Salaries, social security benefits and other benefits | (148,466 | ) | (218,068 | ) | |||||
| Shareholders and other related parties | Trade and other payables | (37,985 | ) | (35,292 | ) | |||||
| Joint ventures and associates | Trade creditors | (52,888,732 | ) | (41,402,594 | ) | |||||
| Total | (53,804,354 | ) | (45,791,836 | ) | ||||||
F-
NOTES TO THE CONSOLIDATED FINANCIAL STATEMENTS
As of June 30, 2024 and 2023 and for the years ended June 30, 2024, 2023 and 2022
(Amounts in US$, except otherwise indicated)
18. KEY MANAGEMENT PERSONNEL COMPENSATION
Key management personnel are those persons having authority and responsibility for planning, directing, and controlling the activities of the Group.
The compensation of directors and other members of key management personnel, including social contributions and other benefits, were as follows for the year ended June 30, 2024, 2023 and 2022.
| 06/30/2024 | 06/30/2023 | 06/30/2022 | ||||||||||
| Salaries, social security and other benefits | 2,092,122 | 1,587,773 | 2,611,603 | |||||||||
| Share-based incentives | 8,117,254 | 3,415,108 | 1,430,745 | |||||||||
| Total | 10,209,376 | 5,002,881 | 4,042,348 | |||||||||
The Company entered into indemnification agreements with each of its directors and executive officers. These agreements generally provide that the relevant director or officer will be indemnified by the Company to the fullest extent permitted by law against liability and against all expenses reasonably incurred or paid by him or her in connection with any claim, action, suit or proceeding which he or she becomes involved as a party or otherwise by virtue of his or her being or having been such a director or officer of the Company and against amounts paid or incurred by him or her in the settlement thereof.
The agreements are subject to certain exceptions, including that no indemnification will be provided to any director or officer against any liability to the Group or its shareholder (i) by reason of intentional fraudulent conduct, dishonesty, willful misconduct, or gross negligence on the part of the director or officer; or (ii) by reason of payment made under an insurance policy or any third party that has no recourse against the indemnitee director or officer.
The compensation of key executives is determined by the Compensation Committee based on the performance of individuals and market trends.
19. SHARE-BASED PAYMENT
2023 Omnibus Equity Incentive Plan
On May 12, 2023, the board of directors of the Company approved the 2023 Omnibus Equity Incentive Plan to attract and retain the best available personnel, provide additional incentives to employees, directors and consultants and to promote the success of our business. In addition to introducing new incentive plans, it comprehensively amends and restates in entirety (i) the Employee Stock Purchase Plan, (ii) the Equity Compensation Plan, (iii) the Stand Alone Stock Option Grant, and (iv) the Employee Stock Option Plan.
| - | Employee Stock Purchase Plan (“ESPP”): incentive plan for eligible employees with no stock compensation to purchase ordinary shares of the Company up to a maximum of 15% percent of such employee’s monthly compensation. The number of ordinary shares subject to the ESPP shall be 200,000 ordinary shares. The purchase price will be equal to 85% of the lower of the closing price of the Company’s ordinary shares on the first business day and the last business day of the relevant offering period. As of the date of these consolidated financial statements the ESSP is not yet implemented. |
F-
NOTES TO THE CONSOLIDATED FINANCIAL STATEMENTS
As of June 30, 2024 and 2023 and for the years ended June 30, 2024, 2023 and 2022
(Amounts in US$, except otherwise indicated)
| - | Equity Compensation Plan: annual incentive plan based on certain financial and operational targets defined by the Board of Directors upon approval of the annual budget. |
| - | Stand Alone Stock Option Grant: plan granted up to 1,200,000 underlying ordinary shares. The options have an exercise price of $4.55 and expire on October 31, 2029. Options can be exercised for a period of up to three years, with 1/3 vesting every 12 months, and on a cashless basis at their volume weighted average price (“VWAP”) of the ordinary shares during a twenty-day period to the date of exercise. |
| - | Employee Stock Option Plan: plan granted up to 100,000 underlying ordinary shares to certain key employees. The options have an exercise price of $5.55 and expire on October 23, 2030. Options can be exercised for a period of up to three years, with 1/3 vesting every 12 months, and on a cashless basis at their volume weighted average price (“VWAP”) of the ordinary shares during a twenty-day period to the date of exercise. |
| - | Past Share Option plan: immediately vested options with a strike price between $11.93 and $13.24. |
| - | Base Share Option plan: to vest and become exercisable in equal installments on June 30, 2023, June 30, 2024, and June 30, 2025, with a strike price between $10.47 and $10.79. |
| - | Performance Share Option plan: to vest and become exercisable if the Group’s fiscal year 2025 EBITDA reaches at least US$120 million, at 0% of the award, and linearly thereafter up to 100% of the awarded options when reaching at least US$150 million. These options have also a strike price of between $10.47 and $10.79. |
The fair value of the stock options at the grant date was estimated using the “Black-Scholes” model, considering the terms and conditions under which the options on shares were granted and adjusted to consider the possible dilutive effect of the future exercise of options.
| Stand Alone | Employee | Past Share | Base Share | Performance | ||||||||||||||||
| Stock Option | Stock Option | Option | Option | Share | ||||||||||||||||
| Factor | Grant | Plan | plan | plan | Option plan | |||||||||||||||
| Weighted average fair value of shares | $ | 5.42 | $ | 13.98 | $ | 11.45 | $ | 10.80 | $ | 10.79 | ||||||||||
| Weighted average exercise price | $ | 4.55 | $ | 5.55 | $ | 12.48 | $ | 10.52 | $ | 10.52 | ||||||||||
| Weighted average expected volatility | 29.69 | % | 42.18 | % | 48.73 | % | 54.73 | % | 54.73 | % | ||||||||||
| Dividend rate | 0 | % | 0 | % | 0 | % | 0 | % | 0 | % | ||||||||||
| Weighted average risk-free interest rate | 1.66 | % | 1.17 | % | 4.40 | % | 4.47 | % | 4.47 | % | ||||||||||
| Weighted average expected life | 9.89 years | 9.22 years | 4.89 years | 2.97 year | 2.97 year | |||||||||||||||
| Weighted average fair value of stock options at measurement date | $ | 2.47 | $ | 10.10 | $ | 5.01 | $ | 4.46 | $ | 4.45 | ||||||||||
There are no market-related performance conditions or non-vesting conditions that should be considered for determining the fair value of options.
The Group estimated that nearly 100% of the share options will be exercised, based on historical trends of executive retention and option exercise behavior. This estimate is reviewed at the end of each annual or interim period.
F-
NOTES TO THE CONSOLIDATED FINANCIAL STATEMENTS
As of June 30, 2024 and 2023 and for the years ended June 30, 2024, 2023 and 2022
(Amounts in US$, except otherwise indicated)
2013 Stock Incentive Plan
As part of the merger described in Note 6, we have assumed the outstanding “2013 Stock Incentive Plan” from Pro Farm Group. On the merger date the total equity awards outstanding was converted consistent with the terms of the merger agreement into an aggregate of 1,191,362 option and or restricted stock units which was fully registered with the Securities and Exchange Commission on July 26, 2022. All equity awards retained their original granted terms. The company has not granted any additional awards under this plan during the year.
The Company’s fair value of the grants was estimated utilizing a Black Scholes option pricing model based on the following range of assumptions which have determined consistent with the Company’s historical methodology for such assumptions:
| July 12, 2022 |
||||
| Exercise price | $ | 7.16 - 204.66 | ||
| Expected life (years) | 0.03 - 9.83 | |||
| Estimated volatility factor | 34.9% - 44.4 | % | ||
| Risk-free interest rate | 0.0 | % | ||
| Expected dividend yield | — | |||
The following table shows the evolution of stock option and weighted average exercise price for the years ended June 30, 2024 and 2023:
| 06/30/2024 | 06/30/2023 | |||||||||||||||
| W.A. | W.A. | |||||||||||||||
| Number of | Exercise | Number of | Exercise | |||||||||||||
| options | price | options | price | |||||||||||||
| At the beginning of the year | 1,791,000 | 15.79 | 1,047,801 | 4.63 | ||||||||||||
| Assumed for business combination | — | — | 1,046,774 | 25.65 | ||||||||||||
| Granted during the year | 5,631,894 | 10.55 | — | — | ||||||||||||
| Cancelled or expired during the year | (570 | ) | 10.07 | (36,244 | ) | 8.46 | ||||||||||
| Exercised during the year | (76,529 | ) | 10.73 | (267,331 | ) | 11.86 | ||||||||||
| Effective at the end of the year | 7,345,795 | 11.83 | 1,791,000 | 15.79 | ||||||||||||
F-
NOTES TO THE CONSOLIDATED FINANCIAL STATEMENTS
As of June 30, 2024 and 2023 and for the years ended June 30, 2024, 2023 and 2022
(Amounts in US$, except otherwise indicated)
20. CONTINGENCIES, COMMITMENTS AND RESTRICTIONS ON THE DISTRIBUTION OF PROFITS
The secured guaranteed notes and the convertibles notes referenced in Note 7.13 are secured by substantially all of the assets located in the United States of Pro Farm Group, Inc. and its U.S. subsidiaries and are guaranteed by BCS Holding Inc., Bioceres Crops do Brasil Ltda., Bioceres Crops S.A., Bioceres Semillas S.A.U., Verdeca LLC, Rasa Holding LLC, Rizobacter Argentina S.A., Rizobacter del Paraguay S.A., Rizobacter do Brasil Ltda., Rizobacter South Africa, Rizobacter Uruguay, Rizobacter USA, LLC, Pro Farm Group, Inc., Pro Farm Michigan Manufacturing LLC, Pro Farm, Inc., Pro Farm Technologies Comércio de Insumo Agrícolas do Brasil Ltda., Glinatur S.A. and Pro Farm OU.
21. EVENTS OCCURRING AFTER THE REPORTING PERIOD
Subsequent to June 30, 2024, there have been no other situations or circumstances that may require significant adjustments or further disclosure in these consolidated financial statements that were not mentioned above.
F-76
Exhibit 99.6

BIOCERES CROP SOLUTIONS CORP.
Unaudited interim condensed consolidated financial
statements
as of December 31, 2024 and June 30, 2024, and for the
three- and six-month periods ended December 31, 2024 and 2023.

INDEX
| Unaudited interim condensed consolidated financial statements as of December 31, 2024 and June 30, 2024, and for the three- and six-month periods ended December 31, 2024 and 2023. | ||
| Unaudited interim condensed consolidated statements of financial position as of December 31, 2024 and June 30, 2024 | F-3 | |
| Unaudited interim condensed consolidated statements of comprehensive income for the three- and six-month periods ended December 31, 2024 and 2023 | F-5 | |
| Unaudited interim condensed consolidated statements of changes in equity for the six-month periods ended December 31, 2024 and 2023 | F-6 | |
| Unaudited interim condensed consolidated statements of cash flows for the six-month periods ended December 31, 2024 and 2023 | F-7 | |
| Notes to the unaudited interim condensed consolidated financial statements | F-9 |
F-
UNAUDITED INTERIM CONDENSED CONSOLIDATED STATEMENTS OF FINANCIAL POSITION
As of December 31, 2024, and June 30, 2024
(Amounts in US$)
| Notes | 12/31/2024 | 06/30/2024 | ||||||||
| ASSETS | ||||||||||
| CURRENT ASSETS | ||||||||||
| Cash and cash equivalents | 5.1 | 29,176,741 | 44,473,270 | |||||||
| Other financial assets | 5.2 | 2,018,893 | 11,695,528 | |||||||
| Trade receivables | 5.3 | 226,458,428 | 207,320,974 | |||||||
| Other receivables | 5.4 | 17,204,097 | 18,298,672 | |||||||
| Recoverable income tax | 1,500,924 | 655,691 | ||||||||
| Inventories | 5.5 | 101,809,489 | 125,929,768 | |||||||
| Biological assets | 4,398,841 | 294,134 | ||||||||
| Total current assets | 382,567,413 | 408,668,037 | ||||||||
| NON-CURRENT ASSETS | ||||||||||
| Other financial assets | 5.2 | 817,544 | 634,553 | |||||||
| Other receivables | 5.4 | 18,248,572 | 17,957,121 | |||||||
| Recoverable income tax | 15,379 | 10,889 | ||||||||
| Deferred tax assets | 7 | 13,282,972 | 9,698,860 | |||||||
| Investments in joint ventures and associates | 11 | 40,013,004 | 39,786,353 | |||||||
| Investment properties | 560,783 | 560,783 | ||||||||
| Property, plant and equipment | 5.6 | 74,901,243 | 74,573,278 | |||||||
| Intangible assets | 5.7 | 176,292,048 | 176,893,136 | |||||||
| Goodwill | 112,163,432 | 112,163,432 | ||||||||
| Right of use asset | 14 | 16,335,484 | 11,601,752 | |||||||
| Total non-current assets | 452,630,461 | 443,880,157 | ||||||||
| Total assets | 835,197,874 | 852,548,194 | ||||||||
The accompanying Notes are an integral part of these unaudited interim condensed consolidated financial statements. Related parties’ balances and transactions are disclosed in Note 15.
F-
UNAUDITED INTERIM CONDENSED CONSOLIDATED STATEMENTS OF FINANCIAL POSITION
As of December 31, 2024, and June 30, 2024
(Amounts in US$)
| Notes | 12/31/2024 | 06/30/2024 | ||||||||
| LIABILITIES | ||||||||||
| CURRENT LIABILITIES | ||||||||||
| Trade and other payables | 5.8 | 144,026,138 | 168,732,469 | |||||||
| Borrowings | 5.9 | 119,191,968 | 136,747,198 | |||||||
| Employee benefits and social security | 5.10 | 8,230,370 | 7,340,958 | |||||||
| Deferred revenue and advances from customers | 5.11 | 2,929,540 | 3,923,140 | |||||||
| Income tax payable | 5,898,060 | 4,825,271 | ||||||||
| Consideration for acquisition | 3,211,075 | 4,617,281 | ||||||||
| Lease liabilities | 14 | 5,289,223 | 3,122,778 | |||||||
| Total current liabilities | 288,776,374 | 329,309,095 | ||||||||
| NON-CURRENT LIABILITIES | ||||||||||
| Borrowings | 5.9 | 66,913,633 | 42,104,882 | |||||||
| Deferred revenue and advances from customers | 5.11 | 1,879,736 | 1,925,138 | |||||||
| Joint ventures and associates | 11 | 749,269 | 296,455 | |||||||
| Deferred tax liabilities | 7 | 32,950,920 | 34,995,791 | |||||||
| Provisions | 1,114,593 | 1,255,702 | ||||||||
| Consideration for acquisition | 2,233,332 | 2,309,234 | ||||||||
| Secured notes | 83,400,171 | 80,809,686 | ||||||||
| Lease liabilities | 14 | 10,848,789 | 8,161,359 | |||||||
| Total non-current liabilities | 200,090,443 | 171,858,247 | ||||||||
| Total liabilities | 488,866,817 | 501,167,342 | ||||||||
| EQUITY | ||||||||||
| Equity attributable to owners of the parent | 309,552,310 | 315,041,257 | ||||||||
| Non-controlling interest | 36,778,747 | 36,339,595 | ||||||||
| Total equity | 346,331,057 | 351,380,852 | ||||||||
| Total equity and liabilities | 835,197,874 | 852,548,194 | ||||||||
The accompanying Notes are an integral part of these unaudited interim condensed consolidated financial statements. Related parties’ balances and transactions are disclosed in Note 15.
F-
UNAUDITED INTERIM CONDENSED CONSOLIDATED STATEMENTS OF COMPREHENSIVE INCOME
For the three- and six-month periods ended of December 31, 2024, and 2023
(Amounts in US$)
| Three-month period ended | Six-month period ended | |||||||||||||||||
| Notes | 12/31/2024 | 12/31/2023 | 12/31/2024 | 12/31/2023 | ||||||||||||||
| Revenues from contracts with customers | 6.1 | 106,759,111 | 140,293,827 | 199,380,189 | 256,476,632 | |||||||||||||
| Initial recognition and changes in the fair value of biological assets at the point of harvest | (78,122 | ) | (72,785 | ) | 588,053 | 338,128 | ||||||||||||
| Cost of sales | 6.2 | (61,550,407 | ) | (88,710,537 | ) | (117,346,452 | ) | (160,326,318 | ) | |||||||||
| Changes in the net realizable value of agricultural products after harvest | (768,055 | ) | (746,242 | ) | (204,910 | ) | (2,192,558 | ) | ||||||||||
| Research and development expenses | 6.3 | (4,192,836 | ) | (3,643,077 | ) | (8,604,115 | ) | (8,224,318 | ) | |||||||||
| Selling, general and administrative expenses | 6.4 | (33,161,078 | ) | (31,164,937 | ) | (63,325,204 | ) | (65,097,785 | ) | |||||||||
| Share of profit or loss of joint ventures and associates | 11 | 360,155 | 2,052,296 | (226,163 | ) | 3,560,967 | ||||||||||||
| Other income or expenses, net | 6.5 | 549,863 | (1,166,603 | ) | 25,840 | (2,398,238 | ) | |||||||||||
| Operating profit | 7,918,631 | 16,841,942 | 10,287,238 | 22,136,510 | ||||||||||||||
| Financial cost | 6.6 | (7,431,785 | ) | (3,815,993 | ) | (14,593,633 | ) | (11,477,850 | ) | |||||||||
| Other financial results | 6.6 | (80,697 | ) | (3,454,061 | ) | (2,751,918 | ) | (3,336,196 | ) | |||||||||
| Profit/ (Loss) before income tax | 406,149 | 9,571,888 | (7,058,313 | ) | 7,322,464 | |||||||||||||
| Income tax | 7 | 199,092 | (8,333,387 | ) | 1,465,501 | (8,762,427 | ) | |||||||||||
| Profit/ (Loss) for the period | 605,241 | 1,238,501 | (5,592,812 | ) | (1,439,963 | ) | ||||||||||||
| Profit (Loss) for the period attributable to: | ||||||||||||||||||
| Equity holders of the parent | 143,535 | 108,449 | (6,225,727 | ) | (4,483,185 | ) | ||||||||||||
| Non-controlling interests | 461,706 | 1,130,052 | 632,915 | 3,043,222 | ||||||||||||||
| 605,241 | 1,238,501 | (5,592,812 | ) | (1,439,963 | ) | |||||||||||||
| Profit/ (Loss) per share | ||||||||||||||||||
| Basic loss attributable to ordinary equity holders of the parent | 8 | 0.0023 | 0.0017 | (0.0991 | ) | (0.0713 | ) | |||||||||||
| Diluted loss attributable to ordinary equity holders of the parent | 8 | 0.0023 | 0.0017 | (0.0991 | ) | (0.0713 | ) | |||||||||||
| Profit/ (Loss) for the period | 605,241 | 1,238,501 | (5,592,812 | ) | (1,439,963 | ) | ||||||||||||
| Other comprehensive profit/ (loss) | 94,004 | 485,703 | 82,961 | (444,254 | ) | |||||||||||||
| Items that may be subsequently reclassified to profit/(loss) | 94,004 | 485,703 | 82,961 | (444,254 | ) | |||||||||||||
| Foreign exchange differences on translation of foreign operations from joint ventures | — | 897 | — | 897 | ||||||||||||||
| Foreign exchange differences on translation of foreign operations | 94,004 | 484,806 | 82,961 | (445,151 | ) | |||||||||||||
| Total comprehensive profit/ (loss) | 699,245 | 1,724,204 | (5,509,851 | ) | (1,884,217 | ) | ||||||||||||
| Total comprehensive profit/ (loss) attributable to: | ||||||||||||||||||
| Equity holders of the parent | 393,768 | 510,976 | (6,021,054 | ) | (4,853,354 | ) | ||||||||||||
| Non-controlling interests | 305,477 | 1,213,228 | 511,203 | 2,969,137 | ||||||||||||||
| 699,245 | 1,724,204 | (5,509,851 | ) | (1,884,217 | ) | |||||||||||||
The accompanying Notes are an integral part of these unaudited interim condensed consolidated financial statements. Related parties’ balances and transactions are disclosed in Note 15.
F-
UNAUDITED INTERIM CONDENSED CONSOLIDATED STATEMENTS OF CHANGES IN EQUITY
For the six-month periods ended of December 31, 2024, and 2023
(Amounts in US$)
| Attributable to the equity holders of the parent | ||||||||||||||||||||||||||||||||||||||||||||||||||||
| Equity / | ||||||||||||||||||||||||||||||||||||||||||||||||||||
| Stock | Revaluation | (deficit) | ||||||||||||||||||||||||||||||||||||||||||||||||||
| Changes | Own | options | Cost of | Foreign | of PP&E | attributable | ||||||||||||||||||||||||||||||||||||||||||||||
| in non- | shares | and share | own | currency | and effect | to owners | Non- | |||||||||||||||||||||||||||||||||||||||||||||
| Issued | Share | controlling | trading | based | Convertible | shares | Retained | translation | of tax rate | of the | controlling | Total | ||||||||||||||||||||||||||||||||||||||||
| Description | capital | premium | interests | premium | incentives | instruments | held | deficit | reserve | change | parent | Interests | equity | |||||||||||||||||||||||||||||||||||||||
| 06/30/2023 | 6,493 | 327,028,559 | (255,893 | ) | (780,841 | ) | 6,645,442 | 9,285,261 | (30,553,591 | ) | (13,903,017 | ) | 1,282,377 | (160,702 | ) | 298,594,088 | 31,902,019 | 330,496,107 | ||||||||||||||||||||||||||||||||||
| Share-based incentives | 4 | 526,017 | — | — | 7,009,405 | — | — | — | — | — | 7,535,426 | — | 7,535,426 | |||||||||||||||||||||||||||||||||||||||
| Purchase of own shares | — | — | — | — | — | — | (734,388 | ) | — | — | — | (734,388 | ) | — | (734,388 | ) | ||||||||||||||||||||||||||||||||||||
| Distribution of dividends by subsidiary | — | — | — | — | — | — | — | — | — | — | — | (151,612 | ) | (151,612 | ) | |||||||||||||||||||||||||||||||||||||
| (Loss) / profit for the period | — | — | — | — | — | — | — | (4,483,185 | ) | — | — | (4,483,185 | ) | 3,043,222 | (1,439,963 | ) | ||||||||||||||||||||||||||||||||||||
| Other comprehensive loss | — | — | — | — | — | — | — | — | (370,169 | ) | — | (370,169 | ) | (74,085 | ) | (444,254 | ) | |||||||||||||||||||||||||||||||||||
| 12/31/2023 | 6,497 | 327,554,576 | (255,893 | ) | (780,841 | ) | 13,654,847 | 9,285,261 | (31,287,979 | ) | (18,386,202 | ) | 912,208 | (160,702 | ) | 300,541,772 | 34,719,544 | 335,261,316 | ||||||||||||||||||||||||||||||||||
| 06/30/2024 | 6,500 | 327,640,676 | (255,893 | ) | (780,841 | ) | 19,427,375 | 9,285,261 | (31,287,979 | ) | (9,627,329 | ) | 794,189 | (160,702 | ) | 315,041,257 | 36,339,595 | 351,380,852 | ||||||||||||||||||||||||||||||||||
| Share-based incentives | — | 63,055 | — | — | 1,395,951 | — | — | — | — | — | 1,459,006 | — | 1,459,006 | |||||||||||||||||||||||||||||||||||||||
| Purchase of own shares | — | — | — | — | — | — | (926,899 | ) | — | — | — | (926,899 | ) | — | (926,899 | ) | ||||||||||||||||||||||||||||||||||||
| Distribution of dividends by subsidiary | — | — | — | — | — | — | — | — | — | — | — | (72,051 | ) | (72,051 | ) | |||||||||||||||||||||||||||||||||||||
| (Loss) / profit for the period | — | — | — | — | — | — | — | (6,225,727 | ) | — | — | (6,225,727 | ) | 632,915 | (5,592,812 | ) | ||||||||||||||||||||||||||||||||||||
| Other comprehensive (loss) / income | — | — | — | — | — | — | — | — | 204,673 | — | 204,673 | (121,712 | ) | 82,961 | ||||||||||||||||||||||||||||||||||||||
| 12/31/2024 | 6,500 | 327,703,731 | (255,893 | ) | (780,841 | ) | 20,823,326 | 9,285,261 | (32,214,878 | ) | (15,853,056 | ) | 998,862 | (160,702 | ) | 309,552,310 | 36,778,747 | 346,331,057 | ||||||||||||||||||||||||||||||||||
The accompanying Notes are an integral part of these unaudited interim condensed consolidated financial statements. Related parties’ balances and transactions are disclosed in Note 15.
F-
UNAUDITED INTERIM CONDENSED CONSOLIDATED STATEMENTS OF CASH FLOWS
For the six-month periods ended of December 31, 2024, and 2023
(Amounts in US$)
| Notes | 12/31/2024 | 12/31/2023 | ||||||||
| OPERATING ACTIVITIES | ||||||||||
| Loss for the period | (5,592,812 | ) | (1,439,963 | ) | ||||||
| Adjustments to reconcile profit to net cash flows | ||||||||||
| Income tax | 7 | (1,465,501 | ) | 8,762,427 | ||||||
| Financial results | 17,345,551 | 14,814,046 | ||||||||
| Depreciation of property, plant and equipment | 5.6 | 3,035,184 | 2,556,422 | |||||||
| Amortization of intangible assets | 5.7 | 5,944,246 | 5,474,971 | |||||||
| Depreciation of leased assets | 14 | 2,219,948 | 1,711,256 | |||||||
| Share-based incentive and stock options | 2,338,406 | 8,527,214 | ||||||||
| Share of profit or loss of joint ventures and associates | 11 | 226,163 | (3,560,967 | ) | ||||||
| Provisions for contingencies | 175,487 | 49,090 | ||||||||
| Allowance for impairment of trade debtors | 1,980,726 | 296,051 | ||||||||
| Allowance for obsolescence | 477,756 | 282,836 | ||||||||
| Initial recognition and changes in the fair value of biological assets | (588,053 | ) | (338,128 | ) | ||||||
| Changes in the net realizable value of agricultural products after harvest | 204,910 | 2,192,558 | ||||||||
| Gain on sale of equipment and intangible assets | (147,199 | ) | (33,521 | ) | ||||||
| Working capital adjustments | ||||||||||
| Trade receivables | (23,973,784 | ) | (38,431,478 | ) | ||||||
| Other receivables | 866,073 | 3,281,861 | ||||||||
| Income and minimum presumed income taxes | (4,640,270 | ) | 8,670,430 | |||||||
| Inventories and biological assets | 19,339,831 | 13,725,208 | ||||||||
| Trade and other payables | (21,442,963 | ) | 11,867,420 | |||||||
| Employee benefits and social security | 889,412 | (1,388,050 | ) | |||||||
| Deferred revenue and advances from customers | (1,039,002 | ) | (2,698,249 | ) | ||||||
| Interest collected | 3,579,162 | 1,204,931 | ||||||||
| Inflation effects on working capital adjustments | 66,366 | 323,421 | ||||||||
| Net cash flows (used) /generated by operating activities | (200,363 | ) | 35,849,786 | |||||||
The accompanying Notes are an integral part of these unaudited interim condensed consolidated financial statements. Related parties’ balances and transactions are disclosed in Note 15.
F-
UNAUDITED INTERIM CONDENSED CONSOLIDATED STATEMENTS OF CASH FLOWS
For the six-month periods ended of December 31, 2024, and 2023
(Amounts in US$)
| Notes | 12/31/2024 | 12/31/2023 | ||||||||
| INVESTMENT ACTIVITIES | ||||||||||
| Proceeds from sale of property, plant and equipment | 155,471 | 45,268 | ||||||||
| Proceeds from financial assets | 9,628,376 | — | ||||||||
| Investment in financial assets | (5,656,002 | ) | (16,363,130 | ) | ||||||
| Purchase of property, plant and equipment | 5.6 | (3,934,189 | ) | (6,070,237 | ) | |||||
| Capitalized development expenditures | 5.7 | (5,022,789 | ) | (4,454,893 | ) | |||||
| Purchase of intangible assets | 5.7 | (284,372 | ) | (219,829 | ) | |||||
| Net cash flows used by investing activities | (5,113,505 | ) | (27,062,821 | ) | ||||||
| FINANCING ACTIVITIES | ||||||||||
| Proceeds from borrowings | 84,101,646 | 69,810,628 | ||||||||
| Repayment of borrowings and financed payments | (78,069,806 | ) | (79,250,768 | ) | ||||||
| Interest payments | (12,598,035 | ) | (12,168,664 | ) | ||||||
| Other financial payments | (2,249,398 | ) | (1,288,813 | ) | ||||||
| Purchase of own shares | (926,899 | ) | (734,388 | ) | ||||||
| Leased assets payments | 14 | (2,497,966 | ) | (2,493,617 | ) | |||||
| Cash dividend distributed by subsidiary | (72,051 | ) | (151,612 | ) | ||||||
| Net cash flows used by financing activities | (12,312,509 | ) | (26,277,234 | ) | ||||||
| Net decrease in cash and cash equivalents | (17,626,377 | ) | (17,490,269 | ) | ||||||
| Inflation effects on cash and cash equivalents | 1,960 | (10,495 | ) | |||||||
| Cash and cash equivalents as of beginning of the period | 5.1 | 44,473,270 | 48,129,194 | |||||||
| Effect of exchange rate changes on cash and equivalents | 2,327,888 | (6,226,493 | ) | |||||||
| Cash and cash equivalents as of the end of the period | 5.1 | 29,176,741 | 24,401,937 | |||||||
The accompanying Notes are an integral part of these unaudited interim condensed consolidated financial statements. Related parties’ balances and transactions are disclosed in Note 15.
F-
NOTES TO THE UNAUDITED INTERIM CONDENSED CONSOLIDATED FINANCIAL STATEMENTS
(Amounts in US$, except otherwise indicated)
Index
| 1. | General information. |
| 2. | Accounting standards and basis of preparation. |
| 3. | New standards, amendments and interpretations issued by the IASB. |
| 4. | Acquisitions and other significant transactions. |
| 5. | Information about components of unaudited interim condensed consolidated statement of financial position. |
| 6. | Information about components of unaudited interim condensed consolidated statement of comprehensive income. |
| 7. | Taxation. |
| 8. | Earnings per share. |
| 9. | Equity information. |
| 10. | Cash flow information. |
| 11. | Joint ventures and associates. |
| 12. | Segment information. |
| 13. | Financial instruments – Risk management. |
| 14. | Leases. |
| 15. | Shareholders and other related parties’ balances and transactions. |
| 16. | Key management personnel compensation. |
| 17. | Contingencies, commitments and restrictions on the distribution of profits. |
| 18. | Events occurring after the reporting period. |
F-
NOTES TO THE UNAUDITED INTERIM CONDENSED CONSOLIDATED FINANCIAL STATEMENTS
(Amounts in US$, except otherwise indicated)
| 1. | GENERAL INFORMATION |
Bioceres Crop Solutions Corp. (NASDAQ:BIOX) is a leader in the development and commercialization of productivity solutions designed to regenerate agricultural ecosystems while making crops more resilient to climate change. To do this, Bioceres’ products create economic incentives for farmers and other stakeholders to adopt environmentally friendly production practices. Bioceres has a unique biotech platform with high impact, patented technologies for seeds and microbial ag inputs, as well as next generation crop nutrition and protection solutions.
Bioceres is a global company with an extensive geographic footprint. The Group’s agricultural inputs are marketed across more than 45 countries, primarily in South America, the United States and Europe.
Unless the context otherwise requires, “we”, “us”, “our”, “Bioceres”, “BIOX”, “the Group”, and “Bioceres Crop Solutions” will refer to Bioceres Crop Solutions Corp. and its subsidiaries.
| 2. | ACCOUNTING STANDARDS AND BASIS OF PREPARATION |
Statement of compliance with IFRS as issued by IASB
These unaudited interim condensed consolidated financial statements for the three- and six-month period ended December 31, 2024, have been prepared in accordance with Accounting Standard IAS 34 Interim Financial Reporting.
These unaudited interim condensed consolidated financial statements do not include all notes of the type normally included in an annual financial statement. Accordingly, these unaudited interim condensed consolidated financial statements are to be read in conjunction with the consolidated financial statements for the fiscal year ended June 30, 2024.
Authorization for the issue of the consolidated financial statements
These unaudited interim condensed consolidated financial statements of the Group as of December 31, 2024, and June 30, 2024 and for the three- and six-month periods ended December 31, 2024 and 2023 were authorized by the Board of Directors of Bioceres Crop Solutions Corp. on February 27, 2025.
Basis of measurement
The consolidated financial statements of the Group have been prepared using:
| ● | Going concern basis of accounting, considering the conclusion of the assessment made by the Group’s Management about the ability of the Group and its subsidiaries to continue as a going concern, in accordance with the requirements of paragraph 25 of IAS 1, “Presentation of Financial Statements”. |
| ● | Accrual basis of accounting (except for cash flows information). Under this basis of accounting, the effects of transactions and other events are recognized as they occur, even when there are no cash flows. |
Functional currency and presentation currency
| a) | Functional currency |
Items included in the financial statements of each of the Group’s entities are measured using the currency of the primary economic market in which the entity operates (i.e., “the functional currency”).
F-
NOTES TO THE UNAUDITED INTERIM CONDENSED CONSOLIDATED FINANCIAL STATEMENTS
(Amounts in US$, except otherwise indicated)
| b) | Presentation currency |
The consolidated financial statements of the Group are presented in US dollars.
| c) | Foreign currency |
Transactions entered into by Group entities in a currency other than their functional currency are recorded at the relevant exchange rates as of the date upon which such transactions occur. Foreign currency monetary assets and liabilities are translated at the prevailing exchanges rates as of the final day of each reporting period. Exchange differences arising from the retranslation of unsettled monetary assets and liabilities are recognized immediately in profit or loss, except for foreign currency borrowings qualifying as a hedge of a net investment in a foreign operation for which exchange differences are recognized in other comprehensive income and accumulated in the foreign exchange reserve along with the exchange differences arising from the retranslation of the foreign operation. Upon the disposal of a foreign operation, the cumulative exchange differences recognized in the foreign exchange reserve relating to such operation up to the date of disposal are transferred to the consolidated statement of profit or loss and other comprehensive income as part of the gain or loss recognized upon such disposal.
Changes in accounting policies
The accounting policies adopted in the preparation of these unaudited interim condensed consolidated financial statements are consistent with those adopted for the preparation of the consolidated financial statements as of June 30, 2024.
| 3. | NEW STANDARDS, AMENDMENTS AND INTERPRETATIONS ISSUED BY THE IASB |
| a) | The following new standards, amendments and interpretations became applicable for the current reporting period and adopted by the Group. |
| - | Amendments to IFRS 16 - Lease Liability in a Sale and Leaseback. |
| - | Amendments to IAS1 - Non-current liabilities with covenants. |
| - | Amendments to IAS 7- Statement of Cash Flows & to IFRS 7- Financial Instruments: Disclosures. |
| - | Amendment to IAS 7 and IFRS 7 - Supplier Financing. |
These new standards and amendments did not have any material impact on the Group.
| b) | The following new standards are not yet adopted by the Group. |
| - | Amendments to IAS 21- The Effects of Changes in Foreign Exchange Ratestitled Lack of Exchangeability. The amendments are effective for annual reporting periods beginning on or after 1 January 2025. |
| - | Amendment to IFRS 9 and IFRS 7 – Classification and measurement of financial instruments. The amendments are effective for annual periods beginning on or after January 1, 2026. |
| - | IFRS 19 - Subsidiaries without Public Accountability: Disclosures- The amendments are effective for annual periods beginning on or after January 1, 2027. |
| - | Annual Improvements to IFRS Accounting Standards—Volume 11. The amendments are effective for annual periods beginning on or after January 1, 2026. |
| - | Amendments to IFRS 9 and IFRS 7 – Contracts Referencing Nature-dependent Electricity. The amendments are effective for annual periods beginning on or after January 1, 2026. |
The above amendments are not expected to have material impact on the Group.
F-
NOTES TO THE UNAUDITED INTERIM CONDENSED CONSOLIDATED FINANCIAL STATEMENTS
(Amounts in US$, except otherwise indicated)
| - | IFRS 18 – Presentation and Disclosure in Financial Statements. This standard sets out requirements for the presentation and disclosure of information in general purpose financial statements to help ensure they provide relevant information that faithfully represents an entity’s assets, liabilities, equity, income and expenses. It is effective for annual periods beginning on or after January 1, 2027. |
The Group is analyzing the potential impact of this standard on our financial statements.
| 4. | ACQUISITIONS AND OTHER SIGNIFICANT TRANSACTIONS |
Natal Agro S.R.L.
On June 10, 2024, we acquired a controlling interest in Natal Agro S.R.L (“Natal”), an Argentine company that breeds and develops corn varieties. The interest acquired is represented by a total of 116,225 shares of AR$ 10 nominal value each, representing 51% of equity and voting interest.
The consideration for the acquisition was $0.22 million in cash and the commitment to carrying out, at our own expense, the regulatory activities for HB4 corn to obtain authorization for its commercialization in Argentina, and the regulatory activities for HB4 corn in Brazil, once the commercialization strategy of HB4 corn in Brazil has been defined by the Company.
Fair value of the consideration of payment
| Cash payment | 215,415 | |||
| Regulatory activities | 727,985 | |||
| Total consideration | 943,400 |
The consideration of payment was measured at fair value, which was calculated as the sum of cash paid and the acquisition-date fair values of the regulatory services to be provided. The fair values measured were based on discounting future cash flow using market discount rates. The difference between fair value and nominal value of consideration will be recognized as finance cost over the period the consideration will be paid.
F-
NOTES TO THE UNAUDITED INTERIM CONDENSED CONSOLIDATED FINANCIAL STATEMENTS
(Amounts in US$, except otherwise indicated)
Assets acquired, liabilities assumed, and non-controlling interest recognized
| Cash and cash equivalents | 252,923 | |||
| Other financial assets | 73,950 | |||
| Trade receivables | 596,463 | |||
| Other receivables | 288,861 | |||
| Income and minimum presumed recoverable income taxes | 19,998 | |||
| Inventories | 4,031,412 | |||
| Property, plant and equipment | 816,576 | |||
| Intangible assets | 2,217,985 | |||
| Right of use asset | 168,988 | |||
| Trade and other payables | (2,302,332 | ) | ||
| Borrowings | (743,279 | ) | ||
| Employee benefits and social security | (23,346 | ) | ||
| Deferred revenue and advances from customers | (2,515 | ) | ||
| Provisions | (355,898 | ) | ||
| Lease liabilities | (168,988 | ) | ||
| Deferred tax liabilities | (996,824 | ) | ||
| Total net assets identified | 3,873,974 | |||
| Non-controlling interest | (1,898,247 | ) | ||
| Gain from a bargain purchase | (1,032,327 | ) | ||
| Total consideration | 943,400 |
The business combination was executed in a context of financial setbacks faced by the acquired company. To address these, in addition to the initial cash payment, Bioceres has committed to providing a working capital loan of up to $3 million to help alleviate the financial strain.
Bioceres will also provide regulatory services related to its proprietary technologies, which will enable strategic business development for Natal and create a new product pipeline leveraging Bioceres’ technology. Specifically, Bioceres has agreed to grant Natal an exclusive license for certain technologies to be applied to corn, with Natal committing to pay 15% of the revenues generated from this technology.
Since the issuance of the annual financial statements for the period ending June 30, 2024, we have revisited the fair value of the services we committed to providing in exchange for payment and have made progress in identifying and valuing specific intangible assets.
As required by the standards, measurement period adjustments are incorporated into the business combination accounting. The effect of the adjustment corresponds to the identification of an intangible asset for an amount of $0.8 million (net of deferred income tax liability and non-controlling interest of $0.5 million and $0.8 million, respectively) and a change in the fair value of the consideration by $0.4 million, generating a bargain purchase gain of $1.0 million as opposed to the $0.2 million goodwill recognized as of June 30, 2024. Comparative prior period information in the financial statements has been updated to reflect these adjustments, as if the business combination had been fully accounted for on the acquisition date.
Non-controlling interest was measured at the present ownership instruments’ proportionate share in the recognized amounts of the acquiree’s identifiable net assets.
F-
NOTES TO THE UNAUDITED INTERIM CONDENSED CONSOLIDATED FINANCIAL STATEMENTS
(Amounts in US$, except otherwise indicated)
| 5. | INFORMATION ABOUT COMPONENTS OF CONSOLIDATED STATEMENTS OF FINANCIAL POSITION |
| 5.1. | Cash and cash equivalents |
| 12/31/2024 | 06/30/2024 | |||||||
| Cash at bank and on hand | 29,176,741 | 44,473,270 | ||||||
| 29,176,741 | 44,473,270 | |||||||
| 5.2. | Other financial assets |
| 12/31/2024 | 06/30/2024 | |||||||
| Current | ||||||||
| US Treasury bills | — | 1,993,668 | ||||||
| Mutual funds | 48,520 | 6,658,805 | ||||||
| Shares of Moolec Science S.A. | 1,113,000 | 1,530,375 | ||||||
| Other investments | 857,373 | 1,512,680 | ||||||
| 2,018,893 | 11,695,528 | |||||||
| 12/31/2024 | 06/30/2024 | |||||||
| Non-current | ||||||||
| Shares of Bioceres Group PLC. | 444,413 | 444,473 | ||||||
| Other investments | 373,131 | 190,080 | ||||||
| 817,544 | 634,553 | |||||||
| 5.3. | Trade receivables |
| 12/31/2024 | 06/30/2024 | |||||||
| Current | ||||||||
| Trade debtors | 228,727,937 | 205,057,590 | ||||||
| Allowance for impairment of trade debtors | (8,706,185 | ) | (7,050,280 | ) | ||||
| Shareholders and other related parties (Note 15) | 208,284 | 141,224 | ||||||
| Allowance for credit notes to be issued | — | (2,905,624 | ) | |||||
| Trade debtors - Joint ventures and associates (Note 15) | — | 782,142 | ||||||
| Deferred checks | 6,228,392 | 11,295,922 | ||||||
| 226,458,428 | 207,320,974 | |||||||
The book value is reasonably approximate to the fair value given its short-term nature.
F-
NOTES TO THE UNAUDITED INTERIM CONDENSED CONSOLIDATED FINANCIAL STATEMENTS
(Amounts in US$, except otherwise indicated)
| 5.4. | Other receivables |
| 12/31/2024 | 06/30/2024 | |||||||
| Current | ||||||||
| Taxes | 7,147,490 | 5,019,659 | ||||||
| Shareholders and other related parties (Note 15) | 89,447 | — | ||||||
| Other receivables - Joint ventures and associates (Note 15) | 318,451 | 207,449 | ||||||
| Prepayments to suppliers | 5,525,881 | 10,242,075 | ||||||
| Prepaid expenses and other receivables | 1,988,422 | 1,594,152 | ||||||
| Miscellaneous | 2,134,406 | 1,235,337 | ||||||
| 17,204,097 | 18,298,672 | |||||||
| 12/31/2024 | 06/30/2024 | |||||||
| Non-current | ||||||||
| Taxes | 574,602 | 752,045 | ||||||
| Other receivables - Joint ventures and associates (Note 15) | 16,184,334 | 15,495,543 | ||||||
| Reimbursements over exports | 1,248,507 | 1,461,038 | ||||||
| Loans receivables | 230,000 | 230,000 | ||||||
| Miscellaneous | 11,129 | 18,495 | ||||||
| 18,248,572 | 17,957,121 | |||||||
In September 2024, we entered into a note purchase agreement (the “Note Purchase Agreement”) and a HB4 soy supply agreement (the “HB4 Soy Supply Agreement”) with one of our associates, Moolec Science SA (“Moolec”). In June 2024, under the terms of the HB4 Soy Supply Agreement, we supplied to Moolec an amount of HB4 soy equivalent to $6.6 million. In exchange, Moolec Science issued convertible notes to us in an aggregate principal amount of $6.6 million (the “Moolec Convertible Notes”).
The Moolec Convertible Notes will mature 36 months after and include a “payment-in-kind” feature. If the trading price of Moolec’s ordinary shares exceeds the strike price of $6.00 per ordinary share for 10 trading days, we have the option to exercise the early conversion option pursuant to which the principal amount outstanding under the Moolec Convertible Notes may be converted into ordinary shares of Moolec at the strike price. At maturity, Moolec has the option to convert the principal amount outstanding under the Moolec Convertible Notes into ordinary shares. In connection with our early conversion option and Moolec’s optional conversion at maturity, Moolec may deliver ordinary shares, cash, or a combination of cash and ordinary shares.
| 5.5. | Inventories |
| 12/31/2024 | 06/30/2024 | |||||||
| Seeds | 6,146,855 | 5,967,231 | ||||||
| Resale products | 46,799,130 | 53,788,333 | ||||||
| Manufactured products | 18,846,502 | 26,081,250 | ||||||
| Goods in transit | 3,122,201 | 5,618,540 | ||||||
| Supplies | 20,773,539 | 22,546,093 | ||||||
| Agricultural products | 9,583,835 | 15,015,884 | ||||||
| Allowance for obsolescence | (3,462,573 | ) | (3,087,563 | ) | ||||
| 101,809,489 | 125,929,768 | |||||||
| Net of agricultural products | 92,225,654 | 110,913,884 | ||||||
F-
NOTES TO THE UNAUDITED INTERIM CONDENSED CONSOLIDATED FINANCIAL STATEMENTS
(Amounts in US$, except otherwise indicated)
| 5.6. | Property, plant and equipment |
Property, plant and equipment as of December 31, 2024 and 2023 included the following:
| Net | Net | |||||||||||||||||||||||||||
| carrying | Foreign | carrying | ||||||||||||||||||||||||||
| amount | Depreciation | currency | amount | |||||||||||||||||||||||||
| Class | 06/30/2024 | Additions | Transfers | Disposals | of the period | translation | 12/31/2024 | |||||||||||||||||||||
| Office equipment | 410,338 | 17,929 | — | — | (39,218 | ) | (15,717 | ) | 373,332 | |||||||||||||||||||
| Vehicles | 2,200,349 | 29,675 | — | (8,272 | ) | (447,262 | ) | (1,330 | ) | 1,773,160 | ||||||||||||||||||
| Equipment and computer software | 507,469 | 26,008 | — | — | (119,943 | ) | (28,600 | ) | 384,934 | |||||||||||||||||||
| Fixtures and fittings | 2,786,470 | 8,834 | — | — | (454,316 | ) | 59 | 2,341,047 | ||||||||||||||||||||
| Machinery and equipment | 16,710,328 | 474,971 | 73,221 | — | (1,464,721 | ) | (364,814 | ) | 15,428,985 | |||||||||||||||||||
| Land and buildings | 39,677,902 | — | 46,431 | — | (509,724 | ) | (260,985 | ) | 38,953,624 | |||||||||||||||||||
| Buildings in progress | 12,280,422 | 3,521,132 | (119,652 | ) | — | — | (35,741 | ) | 15,646,161 | |||||||||||||||||||
| Total | 74,573,278 | 4,078,549 | — | (8,272 | ) | (3,035,184 | ) | (707,128 | ) | 74,901,243 | ||||||||||||||||||
| Net | Net | |||||||||||||||||||||||
| carrying | Foreign | carrying | ||||||||||||||||||||||
| amount | Depreciation | currency | amount | |||||||||||||||||||||
| Class | 06/30/2023 | Additions | Disposals | of the period | translation | 12/31/2023 | ||||||||||||||||||
| Office equipment | 263,892 | 52,158 | — | (33,828 | ) | (2,114 | ) | 280,108 | ||||||||||||||||
| Vehicles | 2,032,853 | 556,237 | (9,013 | ) | (416,309 | ) | 13,917 | 2,177,685 | ||||||||||||||||
| Equipment and computer software | 174,399 | 101,224 | — | (83,364 | ) | (1,562 | ) | 190,697 | ||||||||||||||||
| Fixtures and fittings | 2,862,949 | 10,483 | (2,734 | ) | (394,798 | ) | (6,134 | ) | 2,469,766 | |||||||||||||||
| Machinery and equipment | 14,463,756 | 275,297 | — | (1,185,336 | ) | 2,496 | 13,556,213 | |||||||||||||||||
| Land and buildings | 36,144,792 | 10,351 | — | (442,787 | ) | 33,183 | 35,745,539 | |||||||||||||||||
| Buildings in progress | 11,911,194 | 5,112,029 | — | — | (55,102 | ) | 16,968,121 | |||||||||||||||||
| Total | 67,853,835 | 6,117,779 | (11,747 | ) | (2,556,422 | ) | (15,316 | ) | 71,388,129 | |||||||||||||||
The depreciation charge is included in Notes 6.3 and 6.4. The Group has no commitments to purchase property, plant and equipment items.
F-
NOTES TO THE UNAUDITED INTERIM CONDENSED CONSOLIDATED FINANCIAL STATEMENTS
(Amounts in US$, except otherwise indicated)
| 5.7. | Intangible assets |
Intangible assets as of December 31, 2024 and 2023 included the following:
| Net carrying | Foreign | Net carrying | ||||||||||||||||||||||
| amount | Amortization | currency | amount | |||||||||||||||||||||
| Class | 06/30/2024 | Additions | Transfers | of the period | translation | 12/31/2024 | ||||||||||||||||||
| Seed and integrated products | ||||||||||||||||||||||||
| HB4 technology and breeding program | 35,574,371 | 2,392,794 | — | (1,051,883 | ) | — | 36,915,282 | |||||||||||||||||
| Integrated seed products | 2,681,826 | — | — | (97,479 | ) | 47,642 | 2,631,989 | |||||||||||||||||
| Crop nutrition | ||||||||||||||||||||||||
| Microbiological products | 41,187,249 | — | — | (1,813,650 | ) | — | 39,373,599 | |||||||||||||||||
| Microbiological products in progress | 10,452,861 | 2,629,995 | — | — | (6,916 | ) | 13,075,940 | |||||||||||||||||
| Other intangible assets | ||||||||||||||||||||||||
| Trademarks and patents | 47,906,064 | 133,595 | — | (2,040,315 | ) | — | 45,999,344 | |||||||||||||||||
| Trademarks and patents with indefinite useful lives | 10,045,294 | — | — | — | (4,626 | ) | 10,040,668 | |||||||||||||||||
| Software | 1,827,983 | — | 137,598 | (255,684 | ) | (103 | ) | 1,709,794 | ||||||||||||||||
| Software in progress | 580,728 | 150,777 | (137,598 | ) | — | — | 593,907 | |||||||||||||||||
| Customer loyalty | 21,636,760 | — | — | (685,235 | ) | — | 20,951,525 | |||||||||||||||||
| RG/RS/OX Wheat in progress | 5,000,000 | — | — | — | — | 5,000,000 | ||||||||||||||||||
| Total | 176,893,136 | 5,307,161 | — | (5,944,246 | ) | 35,997 | 176,292,048 | |||||||||||||||||
| Net | Net | |||||||||||||||||||
| carrying | Foreign | carrying | ||||||||||||||||||
| amount | Amortization | currency | amount | |||||||||||||||||
| Class | 06/30/2023 | Additions | of the period | translation | 12/31/2023 | |||||||||||||||
| Seed and integrated products | ||||||||||||||||||||
| HB4 technology and breeding program | 31,679,681 | 1,729,439 | (855,094 | ) | — | 32,554,026 | ||||||||||||||
| Integrated seed products | 2,841,008 | — | (86,762 | ) | (238,121 | ) | 2,516,125 | |||||||||||||
| Crop nutrition | ||||||||||||||||||||
| Microbiological products | 37,295,460 | 1,002,180 | (1,402,972 | ) | (1,296 | ) | 36,893,372 | |||||||||||||
| Microbiological products in progress | 12,213,341 | 1,723,274 | — | (365 | ) | 13,936,250 | ||||||||||||||
| Other intangible assets | ||||||||||||||||||||
| Trademarks and patents | 51,933,444 | 1,288 | (2,332,908 | ) | — | 49,601,824 | ||||||||||||||
| Trademarks and patents with indefinite useful lives | 7,827,309 | — | — | — | 7,827,309 | |||||||||||||||
| Software | 1,638,519 | 218,541 | (282,764 | ) | (352 | ) | 1,573,944 | |||||||||||||
| Software in progress | 349,171 | — | — | (60 | ) | 349,111 | ||||||||||||||
| Customer loyalty | 23,006,023 | — | (514,471 | ) | — | 22,491,552 | ||||||||||||||
| RG/RS/OX Wheat in progress | 5,000,000 | — | — | — | 5,000,000 | |||||||||||||||
| Total | 173,783,956 | 4,674,722 | (5,474,971 | ) | (240,194 | ) | 172,743,513 | |||||||||||||
F-
NOTES TO THE UNAUDITED INTERIM CONDENSED CONSOLIDATED FINANCIAL STATEMENTS
(Amounts in US$, except otherwise indicated)
| 5.8. | Trade and other payables |
| 12/31/2024 | 06/30/2024 | |||||||
| Trade creditors | 91,328,172 | 108,307,192 | ||||||
| Shareholders and other related parties (Note 15) | 49,646 | 37,985 | ||||||
| Trade creditors - Parent company (Note 15) | 797,564 | 729,171 | ||||||
| Trade creditors - Joint ventures and associates (Note 15) | 44,694,720 | 52,888,732 | ||||||
| Taxes | 6,960,551 | 5,647,550 | ||||||
| Miscellaneous | 195,485 | 1,121,839 | ||||||
| 144,026,138 | 168,732,469 | |||||||
| 5.9. | Borrowings |
| 12/31/2024 | 06/30/2024 | |||||||
| Current | ||||||||
| Bank borrowings | 97,216,797 | 91,816,134 | ||||||
| Corporate bonds | 19,024,076 | 42,035,925 | ||||||
| Trust debt securities | 2,951,095 | 2,895,139 | ||||||
| 119,191,968 | 136,747,198 | |||||||
| Non-current | ||||||||
| Bank borrowings | 20,429,329 | 15,316,612 | ||||||
| Corporate bonds | 46,484,304 | 25,071,823 | ||||||
| Trust debt securities | — | 1,716,447 | ||||||
| 66,913,633 | 42,104,882 | |||||||
In November 2024, we completed a $25.9 million public offering of Series X corporate bonds in the Argentine market. The bonds were issued in two tranches: Class A: Approximately $2.4 million 7.0% p.a. bonds due November 2026; and Class B: Approximately $23.5 million 8.0% p.a. bonds due November 2027.
The carrying value of some borrowings as of December 31, 2024 are measured at amortized cost differ from their fair value. The following fair values measured are based on discounted cash flows (Level 3) due to the use of unobservable inputs, including own credit risk.
| 12/31/2024 | 06/30/2024 | |||||||||||||||
| Amortized cost | Fair value | Amortized cost | Fair value | |||||||||||||
| Current | ||||||||||||||||
| Bank borrowings | 97,216,797 | 97,367,516 | 91,816,134 | 89,874,010 | ||||||||||||
| Corporate Bonds | 19,024,076 | 18,783,131 | 42,035,925 | 41,492,963 | ||||||||||||
| Non-current | ||||||||||||||||
| Bank borrowings | 20,429,329 | 18,521,587 | 15,316,612 | 14,850,783 | ||||||||||||
| Corporate Bonds | 46,484,304 | 42,828,561 | 25,071,823 | 23,845,583 | ||||||||||||
F-
NOTES TO THE UNAUDITED INTERIM CONDENSED CONSOLIDATED FINANCIAL STATEMENTS
(Amounts in US$, except otherwise indicated)
| 5.10. | Employee benefits and social security |
| 12/31/2024 | 06/30/2024 | |||||||
| Salaries, accrued incentives, vacations and social security | 7,843,894 | 7,192,492 | ||||||
| Key management personnel (Note 15) | 386,476 | 148,466 | ||||||
| 8,230,370 | 7,340,958 | |||||||
| 5.11. | Deferred revenue and advances from customers |
| 12/31/2024 | 06/30/2024 | |||||||
| Current | ||||||||
| Advances from customers | 2,929,540 | 3,335,740 | ||||||
| Deferred revenue | — | 587,400 | ||||||
| 2,929,540 | 3,923,140 | |||||||
| Non-current | ||||||||
| Advances from customers | 41,237 | 52,511 | ||||||
| Deferred revenue | 1,838,499 | 1,872,627 | ||||||
| 1,879,736 | 1,925,138 | |||||||
| 6. | INFORMATION ABOUT COMPONENTS OF CONSOLIDATED STATEMENTS OF COMPREHENSIVE INCOME |
| 6.1. | Revenue from contracts with customers |
| Three-month period ended | Six-month period ended | |||||||||||||||
| 12/31/2024 | 12/31/2023 | 12/31/2024 | 12/31/2023 | |||||||||||||
| Sale of goods and services | 106,510,141 | 140,198,499 | 198,437,433 | 255,827,291 | ||||||||||||
| Royalties | 248,970 | 95,328 | 942,756 | 649,341 | ||||||||||||
| 106,759,111 | 140,293,827 | 199,380,189 | 256,476,632 | |||||||||||||
Transactions of sales of goods and services with joint ventures and with shareholders and other related parties are reported in Note 15.
| 6.2. | Cost of sales |
| Three-month period ended | Six-month period ended | |||||||||||||||
| Item | 12/31/2024 | 12/31/2023 | 12/31/2024 | 12/31/2023 | ||||||||||||
| Inventories as of the beginning of the period | 109,450,616 | 118,965,477 | 110,913,884 | 111,990,145 | ||||||||||||
| Purchases of the period | 39,733,111 | 73,304,984 | 87,376,569 | 144,999,639 | ||||||||||||
| Production costs | 5,339,587 | 5,858,417 | 11,843,478 | 12,981,672 | ||||||||||||
| Foreign currency translation | (747,253 | ) | 198,524 | (561,825 | ) | (28,273 | ) | |||||||||
| Subtotal | 153,776,061 | 198,327,402 | 209,572,106 | 269,943,183 | ||||||||||||
| Inventories as of the end of the period (*) | (92,225,654 | ) | (109,616,865 | ) | (92,225,654 | ) | (109,616,865 | ) | ||||||||
| Cost of sales | 61,550,407 | 88,710,537 | 117,346,452 | 160,326,318 | ||||||||||||
| (*) | Net of agricultural products. |
F-
NOTES TO THE UNAUDITED INTERIM CONDENSED CONSOLIDATED FINANCIAL STATEMENTS
(Amounts in US$, except otherwise indicated)
| 6.3. | R&D classified by nature |
| Three-month period ended | Six-month period ended | |||||||||||||||
| Research and | Research and | Research and | Research and | |||||||||||||
| development | development | development | development | |||||||||||||
| expenses | expenses | expenses | expenses | |||||||||||||
| Item | 12/31/2024 | 12/31/2023 | 12/31/2024 | 12/31/2023 | ||||||||||||
| Amortization of intangible assets | 1,386,583 | 1,288,218 | 2,748,884 | 2,453,158 | ||||||||||||
| Analysis and storage | — | 5,302 | — | 5,302 | ||||||||||||
| Commissions and royalties | 3,960 | — | 3,960 | — | ||||||||||||
| Depreciation of property, plant and equipment | 222,334 | 154,645 | 420,532 | 312,453 | ||||||||||||
| Freight and haulage | 8,260 | 10,361 | 10,481 | 14,278 | ||||||||||||
| Employee benefits and social securities | 1,445,494 | 904,781 | 2,979,027 | 2,211,907 | ||||||||||||
| Maintenance | 45,173 | (110,722 | ) | 147,700 | 96,056 | |||||||||||
| Energy and fuel | 1,918 | 1,599 | 4,352 | 5,227 | ||||||||||||
| Supplies and materials | 136,252 | 334,684 | 775,812 | 1,182,066 | ||||||||||||
| Mobility and travel | 62,236 | 75,703 | 108,665 | 89,474 | ||||||||||||
| Share-based incentives | 55,956 | (44,501 | ) | 91,097 | 143,749 | |||||||||||
| Publicity and advertising | (2,131 | ) | — | — | — | |||||||||||
| Professional fees and outsourced services | 939,162 | 502,410 | 1,040,121 | 994,197 | ||||||||||||
| Professional fees related parties | — | 216,792 | 16,373 | 216,792 | ||||||||||||
| Office supplies | 27,945 | 300,001 | 175,426 | 470,376 | ||||||||||||
| Information technology expenses | 1,085 | 5,265 | 20,777 | 9,640 | ||||||||||||
| Insurance | 10,722 | (1,463 | ) | 23,494 | 19,586 | |||||||||||
| Depreciation of leased assets | 20,916 | — | 37,252 | — | ||||||||||||
| Miscellaneous | (173,029 | ) | 2 | 162 | 57 | |||||||||||
| Total | 4,192,836 | 3,643,077 | 8,604,115 | 8,224,318 | ||||||||||||
| 12/31/2024 | 12/31/2023 | 12/31/2024 | 12/31/2023 | |||||||||||||
| R&D capitalized (Note 5.7) | 3,368,772 | 2,507,389 | 5,022,789 | 4,454,893 | ||||||||||||
| R&D profit and loss | 4,192,836 | 3,643,077 | 8,604,115 | 8,224,318 | ||||||||||||
| Total | 7,561,608 | 6,150,466 | 13,626,904 | 12,679,211 | ||||||||||||
F-
NOTES TO THE UNAUDITED INTERIM CONDENSED CONSOLIDATED FINANCIAL STATEMENTS
(Amounts in US$, except otherwise indicated)
| 6.4. | Expenses classified by nature and function |
| Three-month period ended | Six-month period ended | |||||||||||||||||||||||
| Selling, | Selling, | |||||||||||||||||||||||
| general and | general and | |||||||||||||||||||||||
| Production | administrative | Total | Production | administrative | Total | |||||||||||||||||||
| Item | costs | expenses | 12/31/2024 | costs | expenses | 12/31/2024 | ||||||||||||||||||
| Amortization of intangible assets | 55,985 | 1,475,275 | 1,531,260 | 156,124 | 3,039,238 | 3,195,362 | ||||||||||||||||||
| Analysis and storage | — | 80,241 | 80,241 | — | 83,155 | 83,155 | ||||||||||||||||||
| Commissions and royalties | 560,371 | 273,803 | 834,174 | 560,371 | 1,085,605 | 1,645,976 | ||||||||||||||||||
| Import and export expenses | (49,057 | ) | 234,658 | 185,601 | — | 655,178 | 655,178 | |||||||||||||||||
| Depreciation of property, plant and equipment | 670,405 | 618,075 | 1,288,480 | 1,378,837 | 1,235,815 | 2,614,652 | ||||||||||||||||||
| Depreciation of leased assets | 584,909 | 853,395 | 1,438,304 | 748,412 | 1,434,284 | 2,182,696 | ||||||||||||||||||
| Impairment of receivables | — | 1,795,847 | 1,795,847 | — | 1,980,726 | 1,980,726 | ||||||||||||||||||
| Freight and haulage | 507,769 | 2,797,830 | 3,305,599 | 1,215,352 | 5,321,153 | 6,536,505 | ||||||||||||||||||
| Employee benefits and social securities | 1,802,661 | 11,755,856 | 13,558,517 | 4,270,878 | 21,796,271 | 26,067,149 | ||||||||||||||||||
| Maintenance | 377,031 | 569,483 | 946,514 | 891,075 | 1,365,831 | 2,256,906 | ||||||||||||||||||
| Energy and fuel | 64,774 | 18,632 | 83,406 | 294,101 | 42,155 | 336,256 | ||||||||||||||||||
| Supplies and materials | 150,391 | 638,261 | 788,652 | 349,722 | 1,510,587 | 1,860,309 | ||||||||||||||||||
| Mobility and travel | 36,443 | 989,065 | 1,025,508 | 68,371 | 2,159,076 | 2,227,447 | ||||||||||||||||||
| Publicity and advertising | — | 852,145 | 852,145 | — | 2,233,428 | 2,233,428 | ||||||||||||||||||
| Contingencies | 55,521 | (177,193 | ) | (121,672 | ) | 55,521 | 119,966 | 175,487 | ||||||||||||||||
| Share-based incentives | 187,447 | 1,323,722 | 1,511,169 | 264,260 | 1,983,049 | 2,247,309 | ||||||||||||||||||
| Professional fees and outsourced services | 368,070 | 2,550,141 | 2,918,211 | 894,020 | 4,363,205 | 5,257,225 | ||||||||||||||||||
| Professional fees related parties | — | 226,041 | 226,041 | — | 270,679 | 270,679 | ||||||||||||||||||
| Office supplies and registrations fees | 7,568 | 215,138 | 222,706 | 51,865 | 563,052 | 614,917 | ||||||||||||||||||
| Insurance | 54,737 | 753,608 | 808,345 | 114,562 | 1,430,971 | 1,545,533 | ||||||||||||||||||
| Information technology expenses | 1,025 | 877,837 | 878,862 | 12,597 | 1,669,932 | 1,682,529 | ||||||||||||||||||
| Obsolescence | (148,656 | ) | 11,794 | (136,862 | ) | 401,812 | 75,944 | 477,756 | ||||||||||||||||
| Taxes | 55,530 | 4,031,663 | 4,087,193 | 102,660 | 8,509,982 | 8,612,642 | ||||||||||||||||||
| Miscellaneous | (3,337 | ) | 395,761 | 392,424 | 12,938 | 395,922 | 408,860 | |||||||||||||||||
| Total | 5,339,587 | 33,161,078 | 38,500,665 | 11,843,478 | 63,325,204 | 75,168,682 | ||||||||||||||||||
F-
NOTES TO THE UNAUDITED INTERIM CONDENSED CONSOLIDATED FINANCIAL STATEMENTS
(Amounts in US$, except otherwise indicated)
| Three-month period ended | Six-month period ended | |||||||||||||||||||||||
| Selling, | Selling, | |||||||||||||||||||||||
| general and | general and | |||||||||||||||||||||||
| Production | administrative | Total | Production | administrative | Total | |||||||||||||||||||
| Item | costs | expenses | 12/31/2023 | costs | expenses | 12/31/2023 | ||||||||||||||||||
| Amortization of intangible assets | 30,371 | 1,409,176 | 1,439,547 | 60,849 | 2,960,964 | 3,021,813 | ||||||||||||||||||
| Analysis and storage | — | (310 | ) | (310 | ) | 570 | 153,163 | 153,733 | ||||||||||||||||
| Commissions and royalties | 287,085 | 214,193 | 501,278 | 421,677 | 1,008,251 | 1,429,928 | ||||||||||||||||||
| Import and export expenses | (23,326 | ) | 198,134 | 174,808 | 43,902 | 318,479 | 362,381 | |||||||||||||||||
| Depreciation of property, plant and equipment | 665,585 | 492,789 | 1,158,374 | 1,308,591 | 935,378 | 2,243,969 | ||||||||||||||||||
| Depreciation of leased assets | 359,666 | 514,391 | 874,057 | 699,044 | 1,012,212 | 1,711,256 | ||||||||||||||||||
| Impairment of receivables | — | (56,869 | ) | (56,869 | ) | — | 296,051 | 296,051 | ||||||||||||||||
| Freight and haulage | (9,689 | ) | 3,889,270 | 3,879,581 | 634,188 | 6,878,364 | 7,512,552 | |||||||||||||||||
| Employee benefits and social securities | 3,128,563 | 11,270,171 | 14,398,734 | 5,935,502 | 21,509,102 | 27,444,604 | ||||||||||||||||||
| Maintenance | 584,638 | 584,177 | 1,168,815 | 1,007,395 | 1,152,332 | 2,159,727 | ||||||||||||||||||
| Energy and fuel | 337,536 | 256,150 | 593,686 | 500,658 | 272,547 | 773,205 | ||||||||||||||||||
| Supplies and materials | 107,343 | 859,700 | 967,043 | 367,386 | 1,691,154 | 2,058,540 | ||||||||||||||||||
| Mobility and travel | 61,069 | 800,142 | 861,211 | 94,476 | 2,148,705 | 2,243,181 | ||||||||||||||||||
| Publicity and advertising | 1,300 | 1,143,753 | 1,145,053 | 1,300 | 2,305,251 | 2,306,551 | ||||||||||||||||||
| Contingencies | 1,239 | 20,742 | 21,981 | 1,239 | 47,851 | 49,090 | ||||||||||||||||||
| Share-based incentives | 64,472 | 2,313,575 | 2,378,047 | 339,904 | 8,043,561 | 8,383,465 | ||||||||||||||||||
| Professional fees and outsourced services | 454,522 | 1,966,056 | 2,420,578 | 963,972 | 3,542,038 | 4,506,010 | ||||||||||||||||||
| Professional fees related parties | — | 66,618 | 66,618 | — | 66,618 | 66,618 | ||||||||||||||||||
| Office supplies and registrations fees | (69,652 | ) | 281,221 | 211,569 | 80,236 | 651,991 | 732,227 | |||||||||||||||||
| Insurance | 54,150 | 628,292 | 682,442 | 81,174 | 1,102,142 | 1,183,316 | ||||||||||||||||||
| Information technology expenses | 8,825 | 1,181,470 | 1,190,295 | 27,186 | 1,924,633 | 1,951,819 | ||||||||||||||||||
| Obsolescence | (222,449 | ) | — | (222,449 | ) | 282,836 | — | 282,836 | ||||||||||||||||
| Taxes | 56,941 | 3,252,941 | 3,309,882 | 127,760 | 7,019,360 | 7,147,120 | ||||||||||||||||||
| Miscellaneous | (19,772 | ) | (120,845 | ) | (140,617 | ) | 1,827 | 57,638 | 59,465 | |||||||||||||||
| Total | 5,858,417 | 31,164,937 | 37,023,354 | 12,981,672 | 65,097,785 | 78,079,457 | ||||||||||||||||||
| 6.5. | Other income or expenses, net |
| Three-month period ended | Six-month period ended | |||||||||||||||
| 12/31/2024 | 12/31/2023 | 12/31/2024 | 12/31/2023 | |||||||||||||
| Net result from commercialization of agricultural products | (205,348 | ) | (1,643,612 | ) | (1,033,714 | ) | (2,960,005 | ) | ||||||||
| Expenses recovery | 334,232 | 149,053 | 505,719 | 236,106 | ||||||||||||
| Others | 420,979 | 327,956 | 553,835 | 325,661 | ||||||||||||
| 549,863 | (1,166,603 | ) | 25,840 | (2,398,238 | ) | |||||||||||
F-
NOTES TO THE UNAUDITED INTERIM CONDENSED CONSOLIDATED FINANCIAL STATEMENTS
(Amounts in US$, except otherwise indicated)
| 6.6. | Finance results |
| Three-month period ended | Six-month period ended | |||||||||||||||
| 12/31/2024 | 12/31/2023 | 12/31/2024 | 12/31/2023 | |||||||||||||
| Financial costs | ||||||||||||||||
| Interest expenses with the Parent (Note 15) | — | (97,062 | ) | — | (194,125 | ) | ||||||||||
| Interest expenses | (6,285,004 | ) | (3,059,671 | ) | (12,344,235 | ) | (9,994,912 | ) | ||||||||
| Financial commissions | (1,146,781 | ) | (659,260 | ) | (2,249,398 | ) | (1,288,813 | ) | ||||||||
| (7,431,785 | ) | (3,815,993 | ) | (14,593,633 | ) | (11,477,850 | ) | |||||||||
| Other financial results | ||||||||||||||||
| Exchange differences generated by assets | 389,238 | (2,364,285 | ) | (2,297,054 | ) | (12,049,351 | ) | |||||||||
| Exchange differences generated by liabilities | (638,120 | ) | 11,339,308 | 256,636 | 21,674,845 | |||||||||||
| Changes in fair value of financial assets or liabilities and other financial results | 113,770 | (13,576,179 | ) | (758,646 | ) | (13,727,825 | ) | |||||||||
| Net gain of inflation effect on monetary items | 54,415 | 1,147,095 | 47,146 | 766,135 | ||||||||||||
| (80,697 | ) | (3,454,061 | ) | (2,751,918 | ) | (3,336,196 | ) | |||||||||
| 7. | TAXATION |
Taxes on income in the interim periods are accrued using the tax rate that would be applicable to expected total annual earnings.
| Three-month period ended | Six-month period ended | |||||||||||||||
| 12/31/2024 | 12/31/2023 | 12/31/2024 | 12/31/2023 | |||||||||||||
| Current tax expense | (3,700,970 | ) | 2,611,796 | (4,863,336 | ) | (3,845,338 | ) | |||||||||
| Deferred tax | 3,900,062 | (10,945,183 | ) | 6,328,837 | (4,917,089 | ) | ||||||||||
| Total | 199,092 | (8,333,387 | ) | 1,465,501 | (8,762,427 | ) | ||||||||||
| 12/31/2024 | 12/31/2023 | |||||||
| Beginning of the period deferred tax | (25,296,931 | ) | (28,472,383 | ) | ||||
| Charge for the period | 6,328,837 | (4,917,089 | ) | |||||
| Conversion difference | (699,854 | ) | (361,295 | ) | ||||
| Total net deferred tax | (19,667,948 | ) | (33,750,767 | ) | ||||
F-
NOTES TO THE UNAUDITED INTERIM CONDENSED CONSOLIDATED FINANCIAL STATEMENTS
(Amounts in US$, except otherwise indicated)
The tax on the Group’s profit before tax differs from the theoretical amount that would arise using the weighted average tax rate applicable to profits of the consolidated entities as follows:
| Three-month period ended | Six-month period ended | |||||||||||||||
| 12/31/2024 | 12/31/2023 | 12/31/2024 | 12/31/2023 | |||||||||||||
| Earning before income tax-rate | 406,149 | 9,571,888 | (7,058,313 | ) | 7,322,464 | |||||||||||
| Income tax expense by applying tax rate in force in the respective countries | 339,932 | (3,712,895 | ) | 2,382,343 | (5,434,748 | ) | ||||||||||
| Share of profit or loss of subsidiaries, joint ventures and associates | 80,501 | 688,853 | (15,763 | ) | 1,219,030 | |||||||||||
| Stock options charge | (64,915 | ) | (262,241 | ) | (133,846 | ) | (1,489,037 | ) | ||||||||
| Non-deductible expenses | (398,345 | ) | 266,854 | (942,346 | ) | (116,220 | ) | |||||||||
| Tax inflation adjustment | 708,130 | 2,634,025 | 1,500,823 | 7,460,048 | ||||||||||||
| Result of inflation effect on monetary items and other finance results | (466,211 | ) | (8,647,836 | ) | (1,325,710 | ) | (11,000,459 | ) | ||||||||
| Others | — | 699,853 | — | 598,959 | ||||||||||||
| Income tax expenses | 199,092 | (8,333,387 | ) | 1,465,501 | (8,762,427 | ) | ||||||||||
The income tax expense was calculated by applying the tax rate in force in the respective countries, as follows.
| Six-month period ended | ||||||||||||||||||||||||
| December 31, 2024 | December 31, 2023 | |||||||||||||||||||||||
| Earning | Weight average | Earning | Weight average | |||||||||||||||||||||
| before | applicable | before | applicable | |||||||||||||||||||||
| Tax jurisdiction | income tax-rate |
tax rate |
Income tax | income tax-rate |
tax rate |
Income tax | ||||||||||||||||||
| Low or null taxation jurisdictions | 6,695,356 | 0.0 | % | — | (5,056,118 | ) | 0.0 | % | — | |||||||||||||||
| Profit-making entities | 10,383,519 | 35.0 | % | (3,637,726 | ) | 26,813,257 | 33.6 | % | (9,007,794 | ) | ||||||||||||||
| Loss-making entities | (24,137,188 | ) | 24.9 | % | 6,020,069 | (14,434,675 | ) | 24.8 | % | 3,573,046 | ||||||||||||||
| (7,058,313 | ) | 2,382,343 | 7,322,464 | (5,434,748 | ) | |||||||||||||||||||
| Three-month period ended | ||||||||||||||||||||||||
| December 31, 2024 | December 31, 2023 | |||||||||||||||||||||||
| Earning | Weight average | Earning | Weight average | |||||||||||||||||||||
| before | applicable | before | applicable | |||||||||||||||||||||
| income tax-rate |
tax rate |
Income tax | income tax-rate |
tax rate |
Income tax | |||||||||||||||||||
| Low or null taxation jurisdictions | 5,481,793 | 0.0 | % | — | (1,132,446 | ) | 0.0 | % | — | |||||||||||||||
| Profit-making entities | 7,902,688 | 35.9 | % | (2,839,077 | ) | 14,168,259 | 33.0 | % | (4,679,136 | ) | ||||||||||||||
| Loss-making entities | (12,978,332 | ) | 24.5 | % | 3,179,009 | (3,463,925 | ) | 27.9 | % | 966,241 | ||||||||||||||
| 406,149 | 339,932 | 9,571,888 | (3,712,895 | ) | ||||||||||||||||||||
F-
NOTES TO THE UNAUDITED INTERIM CONDENSED CONSOLIDATED FINANCIAL STATEMENTS
(Amounts in US$, except otherwise indicated)
| 8. | EARNING PER SHARE |
The numerators and denominators used in the calculation of basic EPS and diluted EPS are presented below:
| Three-month period ended | Six-month period ended | |||||||||||||||
| 12/31/2024 | 12/31/2023 | 12/31/2024 | 12/31/2023 | |||||||||||||
| Numerator | ||||||||||||||||
| Profit/ (Loss) for the period (basic EPS) | 143,535 | 108,449 | (6,225,727 | ) | (4,483,185 | ) | ||||||||||
| Profit/ (Loss) for the period (diluted EPS) | 143,535 | 108,449 | (6,225,727 | ) | (4,483,185 | ) | ||||||||||
| Denominator | ||||||||||||||||
| Weighted average number of shares (basic EPS) | 62,822,158 | 62,839,961 | 62,822,158 | 62,839,961 | ||||||||||||
| Weighted average number of shares (diluted EPS) | 63,170,350 | 63,877,692 | 62,822,158 | 62,839,961 | ||||||||||||
| Basic profit/ (loss) attributable to ordinary equity holders of the parent | 0.0023 | 0.0017 | (0.0991 | ) | (0.0713 | ) | ||||||||||
| Diluted profit/ (loss) attributable to ordinary equity holders of the parent | 0.0023 | 0.0017 | (0.0991 | ) | (0.0713 | ) | ||||||||||
For the six-month periods ended December 31, 2024 and 2023, diluted EPS was the same as basic EPS, as the effect of potential ordinary shares would be antidilutive.
For the three-month period ended December 31, 2024 and 2023, diluted earnings per share was calculated by adjusting the weighted average number of shares outstanding to assume conversion of all dilutive potential shares. The Group had two categories of dilutive potential shares, share-based incentives and the convertible notes.
The stock options were included in the diluted EPS calculation for the three-month period ended December 31, 2024 and 2023, only for the tranches in which the average market price of ordinary shares during the periods was higher than the assumed proceeds per option.
Convertible notes outstanding were not included in the diluted EPS calculations for the three-month period ended December 31, 2024 and 2023, because the interest (net of tax and other changes in income or expense) per ordinary share obtainable on conversion exceeds basic earnings per share.
| 9. | EQUITY INFORMATION |
Capital issued
As of December 31, 2024, we had (i) 100,000,000 ordinary shares ($0.0001 par value) authorized, (ii) 62,710,847 ordinary shares issued and outstanding, (iii) 1,000,000 preferred shares ($0.0001 par value) authorized, (iv) no preferred shares issued and outstanding, (v) 3,920,136 ordinary shares reserved for our equity compensation plans. Of the total issued shares, we have repurchased 2,402,692 shares of our own.
Holders of the ordinary shares are entitled to one vote for each ordinary share.
F-
NOTES TO THE UNAUDITED INTERIM CONDENSED CONSOLIDATED FINANCIAL STATEMENTS
(Amounts in US$, except otherwise indicated)
| 10. | CASH FLOW INFORMATION |
Significant non-cash transactions related to investing and financing activities are as follows:
| 12/31/2024 | 12/31/2023 | |||||||
| Investment activities | ||||||||
| Investment in-kind in other related parties (Note 15) | 3,642,234 | — | ||||||
| Capitalization of interest on buildings in progress | 144,360 | 47,542 | ||||||
| 3,786,594 | 47,542 | |||||||
| 11. | JOINT VENTURES AND ASSOCIATES |
| 12/31/2024 | 06/30/2024 | |||||||
| Assets | ||||||||
| Synertech Industrias S.A. | 39,976,502 | 39,749,851 | ||||||
| Alfalfa Technologies S.R.L. | 36,502 | 36,502 | ||||||
| 40,013,004 | 39,786,353 | |||||||
| 12/31/2024 | 06/30/2024 | |||||||
| Liabilities | ||||||||
| Trigall Genetics S.A. | 749,269 | 296,455 | ||||||
| 749,269 | 296,455 | |||||||
Changes in joint ventures investments and affiliates:
| 12/31/2024 | 12/31/2023 | |||||||
| As of the beginning of the period | 39,489,898 | 38,673,987 | ||||||
| Share-based incentives | — | 50,383 | ||||||
| Foreign currency translation | — | 897 | ||||||
| Share of profit or loss | (226,163 | ) | 3,560,967 | |||||
| As of the end of the period | 39,263,735 | 42,286,234 | ||||||
Share of profit or loss of joint ventures and affiliates:
| Three-month period ended | Six-month period ended | |||||||||||||||
| 12/31/2024 | 12/31/2023 | 12/31/2024 | 12/31/2023 | |||||||||||||
| Trigall Genetics S.A. | 325,384 | 522,143 | (452,814 | ) | 506,840 | |||||||||||
| Synertech Industrias S.A. | 34,771 | 1,654,865 | 226,651 | 3,178,839 | ||||||||||||
| Moolec Science S.A. | — | (124,712 | ) | — | (124,712 | ) | ||||||||||
| 360,155 | 2,052,296 | (226,163 | ) | 3,560,967 | ||||||||||||
F-
NOTES TO THE UNAUDITED INTERIM CONDENSED CONSOLIDATED FINANCIAL STATEMENTS
(Amounts in US$, except otherwise indicated)
| 12. | SEGMENT INFORMATION |
The tables present information with respect to the Group´s reporting segments:
| Seed and | ||||||||||||||||
| integrated | Crop | Crop | ||||||||||||||
| Six-month period ended December 31, 2024 | products | protection | nutrition | Consolidated | ||||||||||||
| Revenues from contracts with customers | ||||||||||||||||
| Sale of goods and services | 42,959,645 | 100,406,986 | 55,070,802 | 198,437,433 | ||||||||||||
| Royalties | 942,756 | — | — | 942,756 | ||||||||||||
| Others | ||||||||||||||||
| Initial recognition and changes in the fair value of biological assets at the point of harvest | 588,053 | — | — | 588,053 | ||||||||||||
| Total | 44,490,454 | 100,406,986 | 55,070,802 | 199,968,242 | ||||||||||||
| Cost of sales | (27,868,376 | ) | (60,663,237 | ) | (28,814,839 | ) | (117,346,452 | ) | ||||||||
| Gross profit per segment | 16,622,078 | 39,743,749 | 26,255,963 | 82,621,790 | ||||||||||||
| % Gross margin | 37 | % | 40 | % | 48 | % | 41 | % | ||||||||
| Seed and | ||||||||||||||||
| integrated | Crop | Crop | ||||||||||||||
| Six-month period ended December 31, 2023 | products | protection | nutrition | Consolidated | ||||||||||||
| Revenues from contracts with customers | ||||||||||||||||
| Sale of goods and services | 53,777,458 | 127,029,466 | 75,020,367 | 255,827,291 | ||||||||||||
| Royalties | 649,341 | — | — | 649,341 | ||||||||||||
| Others | ||||||||||||||||
| Initial recognition and changes in the fair value of biological assets at the point of harvest | 77,353 | 141,457 | 119,318 | 338,128 | ||||||||||||
| Total | 54,504,152 | 127,170,923 | 75,139,685 | 256,814,760 | ||||||||||||
| Cost of sales | (36,216,288 | ) | (81,249,196 | ) | (42,860,834 | ) | (160,326,318 | ) | ||||||||
| Gross profit per segment | 18,287,864 | 45,921,727 | 32,278,851 | 96,488,442 | ||||||||||||
| % Gross margin | 34 | % | 36 | % | 43 | % | 38 | % | ||||||||
| Seed and | ||||||||||||||||
| integrated | Crop | Crop | ||||||||||||||
| Three-month period ended December 31, 2024 | products | protection | nutrition | Consolidated | ||||||||||||
| Revenues from contracts with customers | ||||||||||||||||
| Sale of goods and services | 24,457,718 | 52,667,290 | 29,385,133 | 106,510,141 | ||||||||||||
| Royalties | 248,970 | — | — | 248,970 | ||||||||||||
| Others | ||||||||||||||||
| Initial recognition and changes in the fair value of biological assets at the point of harvest | (78,122 | ) | — | — | (78,122 | ) | ||||||||||
| Total | 24,628,566 | 52,667,290 | 29,385,133 | 106,680,989 | ||||||||||||
| Cost of sales | (15,066,349 | ) | (31,637,560 | ) | (14,846,498 | ) | (61,550,407 | ) | ||||||||
| Gross profit per segment | 9,562,217 | 21,029,730 | 14,538,635 | 45,130,582 | ||||||||||||
| % Gross margin | 39 | % | 40 | % | 49 | % | 42 | % | ||||||||
F-
NOTES TO THE UNAUDITED INTERIM CONDENSED CONSOLIDATED FINANCIAL STATEMENTS
(Amounts in US$, except otherwise indicated)
| Seed and | ||||||||||||||||
| integrated | Crop | Crop | ||||||||||||||
| Three-month period ended December 31, 2023 | products | protection | nutrition | Consolidated | ||||||||||||
| Revenues from contracts with customers | ||||||||||||||||
| Sale of goods and services | 32,100,405 | 71,275,106 | 36,822,988 | 140,198,499 | ||||||||||||
| Royalties | 95,328 | — | — | 95,328 | ||||||||||||
| Others | ||||||||||||||||
| Initial recognition and changes in the fair value of biological assets at the point of harvest | (10,491 | ) | (30,661 | ) | (31,633 | ) | (72,785 | ) | ||||||||
| Total | 32,185,242 | 71,244,445 | 36,791,355 | 140,221,042 | ||||||||||||
| Cost of sales | (22,105,907 | ) | (45,065,404 | ) | (21,539,226 | ) | (88,710,537 | ) | ||||||||
| Gross profit per segment | 10,079,335 | 26,179,041 | 15,252,129 | 51,510,505 | ||||||||||||
| % Gross margin | 31 | % | 37 | % | 41 | % | 37 | % | ||||||||
| 13. | FINANCIAL INSTRUMENTS – RISK MANAGEMENT |
Financial instruments by category
The following tables show additional information required under IFRS 7 on the financial assets and liabilities recorded as of December 31, 2024, and June 30, 2024.
Financial assets by category
| Mandatorily measured at fair | ||||||||||||||||
| Amortized cost | value through profit or loss | |||||||||||||||
| Financial asset | 12/31/2024 | 06/30/2024 | 12/31/2024 | 06/30/2024 | ||||||||||||
| Cash and cash equivalents | 15,119,853 | 44,473,270 | 14,056,888 | — | ||||||||||||
| Other financial assets | 817,544 | 634,553 | 2,018,893 | 11,695,528 | ||||||||||||
| Trade receivables | 226,458,428 | 207,320,974 | — | — | ||||||||||||
| Other receivables (*) | 13,426,411 | 18,647,862 | 6,789,863 | — | ||||||||||||
| Total | 255,822,236 | 271,076,659 | 22,865,644 | 11,695,528 | ||||||||||||
| (*) | Advances expenses and tax balances are not included. |
Financial liabilities by category
| Mandatorily measured at fair | ||||||||||||||||
| Amortized cost | value through profit or loss | |||||||||||||||
| Financial liability | 12/31/2024 | 06/30/2024 | 12/31/2024 | 06/30/2024 | ||||||||||||
| Trade and other payables | 137,380,715 | 156,742,677 | 6,645,423 | 11,989,792 | ||||||||||||
| Borrowings | 186,105,601 | 178,852,080 | — | — | ||||||||||||
| Secured notes | 83,400,171 | 80,809,686 | — | — | ||||||||||||
| Lease liability | 16,138,012 | 11,284,137 | — | — | ||||||||||||
| Consideration for acquisition | 3,966,922 | 4,202,401 | 1,477,485 | 2,724,114 | ||||||||||||
| Total | 426,991,421 | 431,890,981 | 8,122,908 | 14,713,906 | ||||||||||||
F-
NOTES TO THE UNAUDITED INTERIM CONDENSED CONSOLIDATED FINANCIAL STATEMENTS
(Amounts in US$, except otherwise indicated)
Financial instruments measured at fair value
| Measurement at fair value at 12/31/2024 | Level 1 | Level 2 | Level 3 | |||||||||
| Financial assets at fair value | ||||||||||||
| Mutual funds | 48,520 | — | — | |||||||||
| Moolec Science S.A. shares | 1,113,000 | — | — | |||||||||
| Other investments | 857,373 | — | — | |||||||||
| Other receivables - Joint ventures and associates | — | 6,789,863 | — | |||||||||
| Financial liability at fair value | ||||||||||||
| Trade and other payables | — | 6,645,423 | — | |||||||||
| Consideration for acquisition | 1,477,485 | — | — | |||||||||
| Measurement at fair value at 06/30/2024 | Level 1 | Level 2 | Level 3 | |||||||||
| Financial assets at fair value | ||||||||||||
| Mutual funds | 6,658,805 | — | — | |||||||||
| US Treasury bills | 1,993,668 | — | — | |||||||||
| Moolec Science S.A. shares | 1,530,375 | — | — | |||||||||
| Other investments | 1,512,680 | — | — | |||||||||
| Financial liability at fair value | ||||||||||||
| Trade and other payables | — | 11,989,792 | — | |||||||||
| Consideration for acquisition | 2,724,114 | — | — | |||||||||
Estimation of fair value
The fair value of marketable securities, mutual funds and US Treasury Bills is calculated using the market approach using quoted prices in active markets for identical assets. The quoted marked price used for financial assets held by the Group is the current bid price. These instruments are included in level 1.
The Group’s financial liabilities, which were not traded in an active market, were determined using valuation techniques that maximize the use of available market information, and thus rely as little as possible on specific estimates of the entity specific estimates. If all significant inputs required to fair value an instrument are observable, the instruments are included in level 2.
If one or more of the significant inputs is not based on observable market data, the instruments are included in level 3.
The Group’s policy is to recognize transfers between different categories of the fair value hierarchy at the time they occur or when there are changes in the circumstances that cause the transfer. There were no transfers between levels of the fair value hierarchy. There were no changes in economic or business circumstances affecting fair value.
Financial instruments not measured at fair value
The financial instruments not measured at fair value include cash and cash equivalents, trade accounts receivable, other accounts receivable, trade payables and other debts, borrowings, financed payments and convertible notes.
The carrying value of financial instruments not measured at fair value does not differ significantly from their fair value, except for borrowings (Note 5.9).
Management estimates that the carrying value of the financial instruments measured at amortized cost approximates their fair value.
F-
NOTES TO THE UNAUDITED INTERIM CONDENSED CONSOLIDATED FINANCIAL STATEMENTS
(Amounts in US$, except otherwise indicated)
Currency risk
Foreign currency risk is the risk that the fair value or future cash flows of a financial instrument will fluctuate because of changes in foreign exchange rate. Currency on foreign exchange risk arises when the Group enters into transactions denominated in a currency other than its functional currency.
The table below sets forth our net exposure to currency risk as of December 31, 2024:
| Net foreign currency position | 12/31/2024 | |||
| Amount expressed in US$ | 619,984 | |||
Considering only this net currency exposure as of December 31, 2024 if an US Dollar revaluation or depreciation in relation to other foreign currencies with the remaining variables remaining constant, would have a positive or a negative impact on comprehensive income as a result of foreign exchange gains or losses. We estimate that a devaluation or an appreciation of the US Dollar other currencies of 10% during the period ended December 31, 2024 would have resulted in a net pre-tax loss or gain of approximately $0.06 million.
| 14. | LEASES |
| Right-of-use leased asset | 12/31/2024 | 06/30/2024 | ||||||
| Book value at the beginning of the period | 20,979,597 | 21,163,192 | ||||||
| Additions of the period | 7,872,230 | 2,585,223 | ||||||
| Additions from business combination | — | 168,988 | ||||||
| Disposals | (76,298 | ) | (1,284,975 | ) | ||||
| Exchange differences | (986,508 | ) | (1,652,831 | ) | ||||
| Book value at the end of the period | 27,789,021 | 20,979,597 | ||||||
| Depreciation | 12/31/2024 | 06/30/2024 | ||||||
| Book value at the beginning of the period | 9,377,845 | 7,226,617 | ||||||
| Depreciation of the period | 2,219,948 | 3,418,956 | ||||||
| Disposals | (76,298 | ) | (1,092,167 | ) | ||||
| Exchange differences | (67,958 | ) | (175,561 | ) | ||||
| Accumulated depreciation at the end of the period | 11,453,537 | 9,377,845 | ||||||
| Total | 16,335,484 | 11,601,752 |
| Lease liability | 12/31/2024 | 06/30/2024 | ||||||
| Book value at the beginning of the period | 11,284,137 | 13,889,223 | ||||||
| Additions of the period | 7,872,230 | 2,585,223 | ||||||
| Additions from business combination | — | 168,988 | ||||||
| Interest expenses, exchange differences and inflation effects | (520,389 | ) | (480,189 | ) | ||||
| Payments of the period | (2,497,966 | ) | (4,879,108 | ) | ||||
| Total | 16,138,012 | 11,284,137 | ||||||
| Lease Liabilities | 12/31/2024 | 06/30/2024 | ||||||
| Non-current | 10,848,789 | 8,161,359 | ||||||
| Current | 5,289,223 | 3,122,778 | ||||||
| Total | 16,138,012 | 11,284,137 | ||||||
F-
NOTES TO THE UNAUDITED INTERIM CONDENSED CONSOLIDATED FINANCIAL STATEMENTS
(Amounts in US$, except otherwise indicated)
The recognized right-of-use assets relate to the following types of assets:
| 12/31/2024 | 06/30/2024 | |||||||
| Machinery and equipment | 3,655,741 | 3,655,741 | ||||||
| Vehicles | 1,117,687 | 1,272,071 | ||||||
| Equipment and computer software | 1,234,475 | 1,130,541 | ||||||
| Land and buildings | 21,781,118 | 14,921,244 | ||||||
| 27,789,021 | 20,979,597 | |||||||
The incremental borrowing rate used was 3.81% in US$ and 13.64% in reais.
| 15. | SHAREHOLDERS AND OTHER RELATED PARTIES BALANCES AND TRANSACTIONS |
During the period ended December 31, 2024, and 2023, the transactions between the Group and related parties, and the related balances owed by and to them, are as follows:
| Value of transactions for the period ended | ||||||||||
| Party | Transaction type | 12/31/2024 | 12/31/2023 | |||||||
| Joint ventures and associates | Sales and services | 6,745,127 | 14,270,782 | |||||||
| Joint ventures and associates | Purchases of goods and services | (23,351,132 | ) | (20,696,699 | ) | |||||
| Key management personnel | Salaries, social security benefits and other benefits | (1,817,360 | ) | (9,667,629 | ) | |||||
| Key management personnel | Sales and services | 6,048 | — | |||||||
| Key management personnel | Purchases of goods and services | 821,959 | — | |||||||
| Shareholders and other related parties | Sales of goods and services | 6,463,117 | 1,643,269 | |||||||
| Shareholders and other related parties | Purchases of goods and services | (1,750,963 | ) | (2,178,877 | ) | |||||
| Shareholders and other related parties | In-kind contributions | 3,642,234 | — | |||||||
| Shareholders and other related parties | Interest expenses | — | (194,125 | ) | ||||||
| Total | (9,240,970 | ) | (16,823,279 | ) | ||||||
| Amounts receivable from related parties |
||||||||||
| Party | Transaction type | 12/31/2024 | 06/30/2024 | |||||||
| Shareholders and other related parties | Trade debtors | 208,284 | 141,224 | |||||||
| Shareholders and other related parties | Other receivables | 89,447 | — | |||||||
| Joint ventures and associates | Trade debtors | — | 782,142 | |||||||
| Joint ventures and associates | Other receivables | 16,502,785 | 15,702,992 | |||||||
| Total | 16,800,516 | 16,626,358 | ||||||||
| Amounts payable to related parties |
||||||||||
| Party | Transaction type | 12/31/2024 | 06/30/2024 | |||||||
| Parent company and related parties to Parent | Trade creditors | (797,564 | ) | (729,171 | ) | |||||
| Key management personnel | Salaries, social security benefits and other benefits | (386,476 | ) | (148,466 | ) | |||||
| Shareholders and other related parties | Trade and other payables | (49,646 | ) | (37,985 | ) | |||||
| Joint ventures and associates | Trade creditors | (44,694,720 | ) | (52,888,732 | ) | |||||
| Total | (45,928,406 | ) | (53,804,354 | ) | ||||||
F-
NOTES TO THE UNAUDITED INTERIM CONDENSED CONSOLIDATED FINANCIAL STATEMENTS
(Amounts in US$, except otherwise indicated)
| 16. | KEY MANAGEMENT PERSONNEL COMPENSATION |
The compensation of directors and other members of key management personnel, including social contributions and other benefits, were as follows for the period ended December 31, 2024, and 2023.
| 12/31/2024 | 12/31/2023 | |||||||
| Salaries, social security and other benefits | 1,356,493 | 1,140,415 | ||||||
| Share-based incentives | 480,450 | 8,527,214 | ||||||
| Total | 1,836,943 | 9,667,629 | ||||||
| 17. | CONTINGENCIES, COMMITMENTS AND RESTRICTIONS ON THE DISTRIBUTION OF PROFITS |
There were no other significant changes to the contingencies, commitments and restrictions on the distribution of profits from the disclosure made in the Consolidated financial statement as of June 30, 2024.
| 18. | EVENTS OCCURRING AFTER THE REPORTING PERIOD |
Within the context of a new strategy for our seed business, on February 6, 2025 we signed an agreement with GDM for the development of new soybean solutions with exclusive rights outside the drought tolerant space. Under this ten-year agreement, GDM will use Verdeca's patented platform to develop and market a new generation of soybean varieties with superior agronomic performance. This opportunity will leverage from the collaboration that has already started several years ago.
Subsequent to December 31, 2024, there have been no other situations or circumstances that may require significant adjustments or further disclosure in these consolidated financial statements that were not mentioned above.
F-
Exhibit 99.7
CONSENT OF INDEPENDENT REGISTERED PUBLIC ACCOUNTING FIRM
We hereby consent to the incorporation by reference in the Registration Statement on Form F-3 (No. 333-283113) and Form S-8 (Registration No. 333-282263) of Moolec Science SA of our report dated April 15, 2025 relating to the financial statements of Bioceres Group PLC., which appears in this Current Report on Form 6-K.
/s/ Price Waterhouse & Co. S.R.L.
/s/ Guillermo Miguel Bosio (Partner)
Rosario, Argentina
April 17, 2025
Exhibit 99.8
CONSENT OF INDEPENDENT REGISTERED PUBLIC ACCOUNTING FIRM
We hereby consent to the incorporation by reference in the Registration Statement on Form F-3 (No. 333-283113) and Form S-8 (Registration No. 333-282263) of Moolec Science SA of our report dated October 30, 2024 relating to the financial statements and the effectiveness of internal control over financial reporting of Bioceres Crops Solution Corp., which appears in this Current Report on Form 6-K.
/s/ Price Waterhouse & Co. S.R.L.
/s/ Guillermo Miguel Bosio (Partner)
Rosario, Argentina
April 17, 2025