UNITED STATES
SECURITIES AND EXCHANGE COMMISSION
Washington, D.C. 20549
FORM 8-K
Current Report
Pursuant to Section 13 OR 15(d) of The Securities Exchange Act of 1934
March 17, 2025
Date of Report (Date of earliest event reported)
Health In Tech, Inc.
(Exact name of registrant as specified in its charter)
| Nevada | 001-42449 | 87-3545722 | ||
| (State or other jurisdiction of incorporation) |
(Commission File Number) | (IRS Employer Identification No.) |
| 701 S. Colorado Ave, Suite 1 Stuart, FL |
34994 | |
| (Address of principal executive offices) | (Zip Code) |
Registrant’s telephone number, including area code: (888) 373-0333
N/A
(Former name or former address, if changed since last report)
Check the appropriate box below if the Form 8-K filing is intended to simultaneously satisfy the filing obligation of the registrant under any of the following provisions:
| ☐ | Written communications pursuant to Rule 425 under the Securities Act (17 CFR 230.425) |
| ☐ | Soliciting material pursuant to Rule 14a-12 under the Exchange Act (17 CFR 240.14a-12) |
| ☐ | Pre-commencement communications pursuant to Rule 14d-2(b) under the Exchange Act (17 CFR 240.14d-2(b)) |
| ☐ | Pre-commencement communications pursuant to Rule 13e-4(c) under the Exchange Act (17 CFR 240.13e-4(c)) |
Securities registered pursuant to Section 12(b) of the Act:
| Title of each class | Trading Symbol(s) | Name of each exchange on which registered | ||
| Class A Common Stock, $0.001 par value per share | HIT | The Nasdaq Stock Market LLC (Nasdaq Capital Market) |
Indicate by check mark whether the registrant is an emerging growth company as defined in Rule 405 of the Securities Act of 1933 (17 CFR §230.405) or Rule 12b-2 of the Securities Exchange Act of 1934 (17 CFR §240.12b-2).
Emerging growth company ☒
If an emerging growth company, indicate by check mark if the registrant has elected not to use the extended transition period for complying with any new or revised financial accounting standards provided pursuant to Section 13(a) of the Exchange Act. ☐
Item 7.01. Regulation FD Disclosure.
On March 17, 2025, Health In Tech, Inc., a Nevada corporation (the “Company”) prepared an investor presentation that officers and other representatives of the Company intend to present at conferences and meetings. A copy of the investor presentation is furnished as Exhibit 99.1 of this Current Report on Form 8-K. The information set forth in this Item 7.01 of this Current Report on Form 8-K and in the attached Exhibit 99.1 is deemed to be “furnished” and shall not be deemed to be “filed” for purposes of Section 18 of the Securities Exchange Act of 1934, as amended (the “Exchange Act”), or otherwise subject to the liabilities of that Section. The information set forth in Item 7.01 of this Current Report on Form 8-K, including Exhibit 99.1, shall not be deemed incorporated by reference into any filing under the Exchange Act or the Securities Act of 1933, as amended, regardless of any general incorporation language in such filing.
Forward-Looking Statements
Certain statements in this Current Report on Form 8-K are forward-looking statements for purposes of the safe harbor provisions under the U.S. Private Securities Litigation Reform Act of 1995. Forward-looking statements may include estimates or expectations about Health In Tech’s possible or assumed operational results, financial condition, business strategies and plans, market opportunities, competitive position, industry environment, and potential growth opportunities. In some cases, forward-looking statements can be identified by terms such as “may,” “will,” “should,” “design,” “target,” “aim,” “hope,” “expect,” “could,” “intend,” “plan,” “anticipate,” “estimate,” “believe,” “continue,” “predict,” “project,” “potential,” “goal,” or other words that convey the uncertainty of future events or outcomes. These statements relate to future events or to Health In Tech’s future financial performance, and involve known and unknown risks, uncertainties and other factors that may cause Health In Tech’s actual results, levels of activity, performance, or achievements to be different from any future results, levels of activity, performance or achievements expressed or implied by these forward-looking statements. You should not place undue reliance on forward-looking statements because they involve known and unknown risks, uncertainties and other factors which are, in some cases, beyond Health In Tech’s control and which could, and likely will, affect actual results, levels of activity, performance or achievements. Some of the risks and uncertainties, although not all risks and uncertainties, that could cause the Company’s actual results to differ materially from those presented in its forward-looking statements are set forth in the “Risk Factors” section in the Company’s Annual Report on Form 10-K, its Quarterly Reports on Form 10-Q, and all of its other filings with the U.S. Securities and Exchange Commission, as such risks, uncertainties and other important factors may be updated from time to time in the Company’s subsequent reports. Any forward-looking statement reflects Health In Tech’s current views with respect to future events and is subject to these and other risks, uncertainties and assumptions relating to Health In Tech’s operations, results of operations, growth strategy and liquidity.
Item 9.01. Financial Statements and Exhibits.
(d) Exhibits:
| Exhibit No. | Description | |
| 99.1 | Investor Presentation. | |
| 104 | Cover Page Interactive Data File (embedded within the Inline XBRL document) |
SIGNATURES
Pursuant to the requirements of the Securities Exchange Act of 1934, the registrant has duly caused this report to be signed on its behalf by the undersigned hereunto duly authorized.
| Dated: March 17, 2025 | ||
| HEALTH IN TECH, INC. | ||
| By: | /s/ Tim Johnson | |
| Name: | Tim Johnson | |
| Title: | Chief Executive Officer | |
Exhibit 99.1
This Presentation has been prepared by the Company solely for informational purposes . The information included herein in this presentation has not been independently verified . No representations, warranties or undertakings, express or implied, are made by the Company or any of it’ s affiliates, advisers or representatives or the underwriters as to, and no reliance should be placed upon, the accuracy, fairness, completeness or correctness of the information or opinions presented or contained in this presentation . By viewing or accessing the information contained in this presentation, you acknowledge and agree that none of the Company or any of its affiliates, advisers or representatives or the underwriters accept any responsibility whatsoever (in negligence or otherwise) for any loss howsoever arising from any information presented or contained in this presentation or otherwise arising in connection with the presentation . The information presented or contained in this presentation is subject to change without notice and its accuracy is not guaranteed . None of the Company or any of its affiliates, advisers or representatives or the underwriters make any undertaking to update any such information subsequent to the date hereof . This presentation should not be construed as legal, tax, investment or other advice . This presentation contains statements that reflect the Company’s intent, beliefs or current expectations about the future . These statements can be recognized by the use of words such as “expects,” “plans,” “will,” “estimates,” “projects,” “intends,” or words of similar meaning . These forward - looking statements are not guarantees of future performance and are based on a number of assumptions about the Company’s operations and other factors, many of which are beyond the Company’s control, and accordingly, actual results may differ materially from these forward - looking statements . Caution should be taken with respect to such statements, and you should not place undue reliance on any such forward looking statements . The Company or any of its affiliates, advisers or representatives or the underwriters has no obligation and does not undertake to revise forward looking statements to reflect newly available information, future events or circumstances . This presentation does not constitute an offer to sell or an invitation to purchase or subscribe for any securities of the Company for sale in the United States or anywhere else . No part of this presentation shall form the basis of or be relied upon in connection with any contract or commitment whatsoever . Specifically, these materials do not constitute a “prospectus” within the meaning of the U . S . Securities Act of 1933 , as amended, and the regulations enacted thereunder . This presentation does not contain all relevant information relating to the Company or its securities, particularly with respect to the risks and special considerations involved with an investment in the securities of the Company . In evaluating its business, the Company uses certain non - GAAP measures as supplemental measures to review and assess its operating and financial performance . These non - GAAP financial measures have limitations as analytical tools, and when assessing the Company’s operating and financial performances, investors should not consider them in isolation, or as a substitute for any consolidated statement of operations data prepared in accordance with U . S . GAAP . As participants of this presentation, you agree not to photograph, copy or otherwise reproduce this presentation in any form or pass on this presentation to any other person for any purpose . Disclaimer 2 Health In Tech is Changing Healthcare through Digital Innovation 3

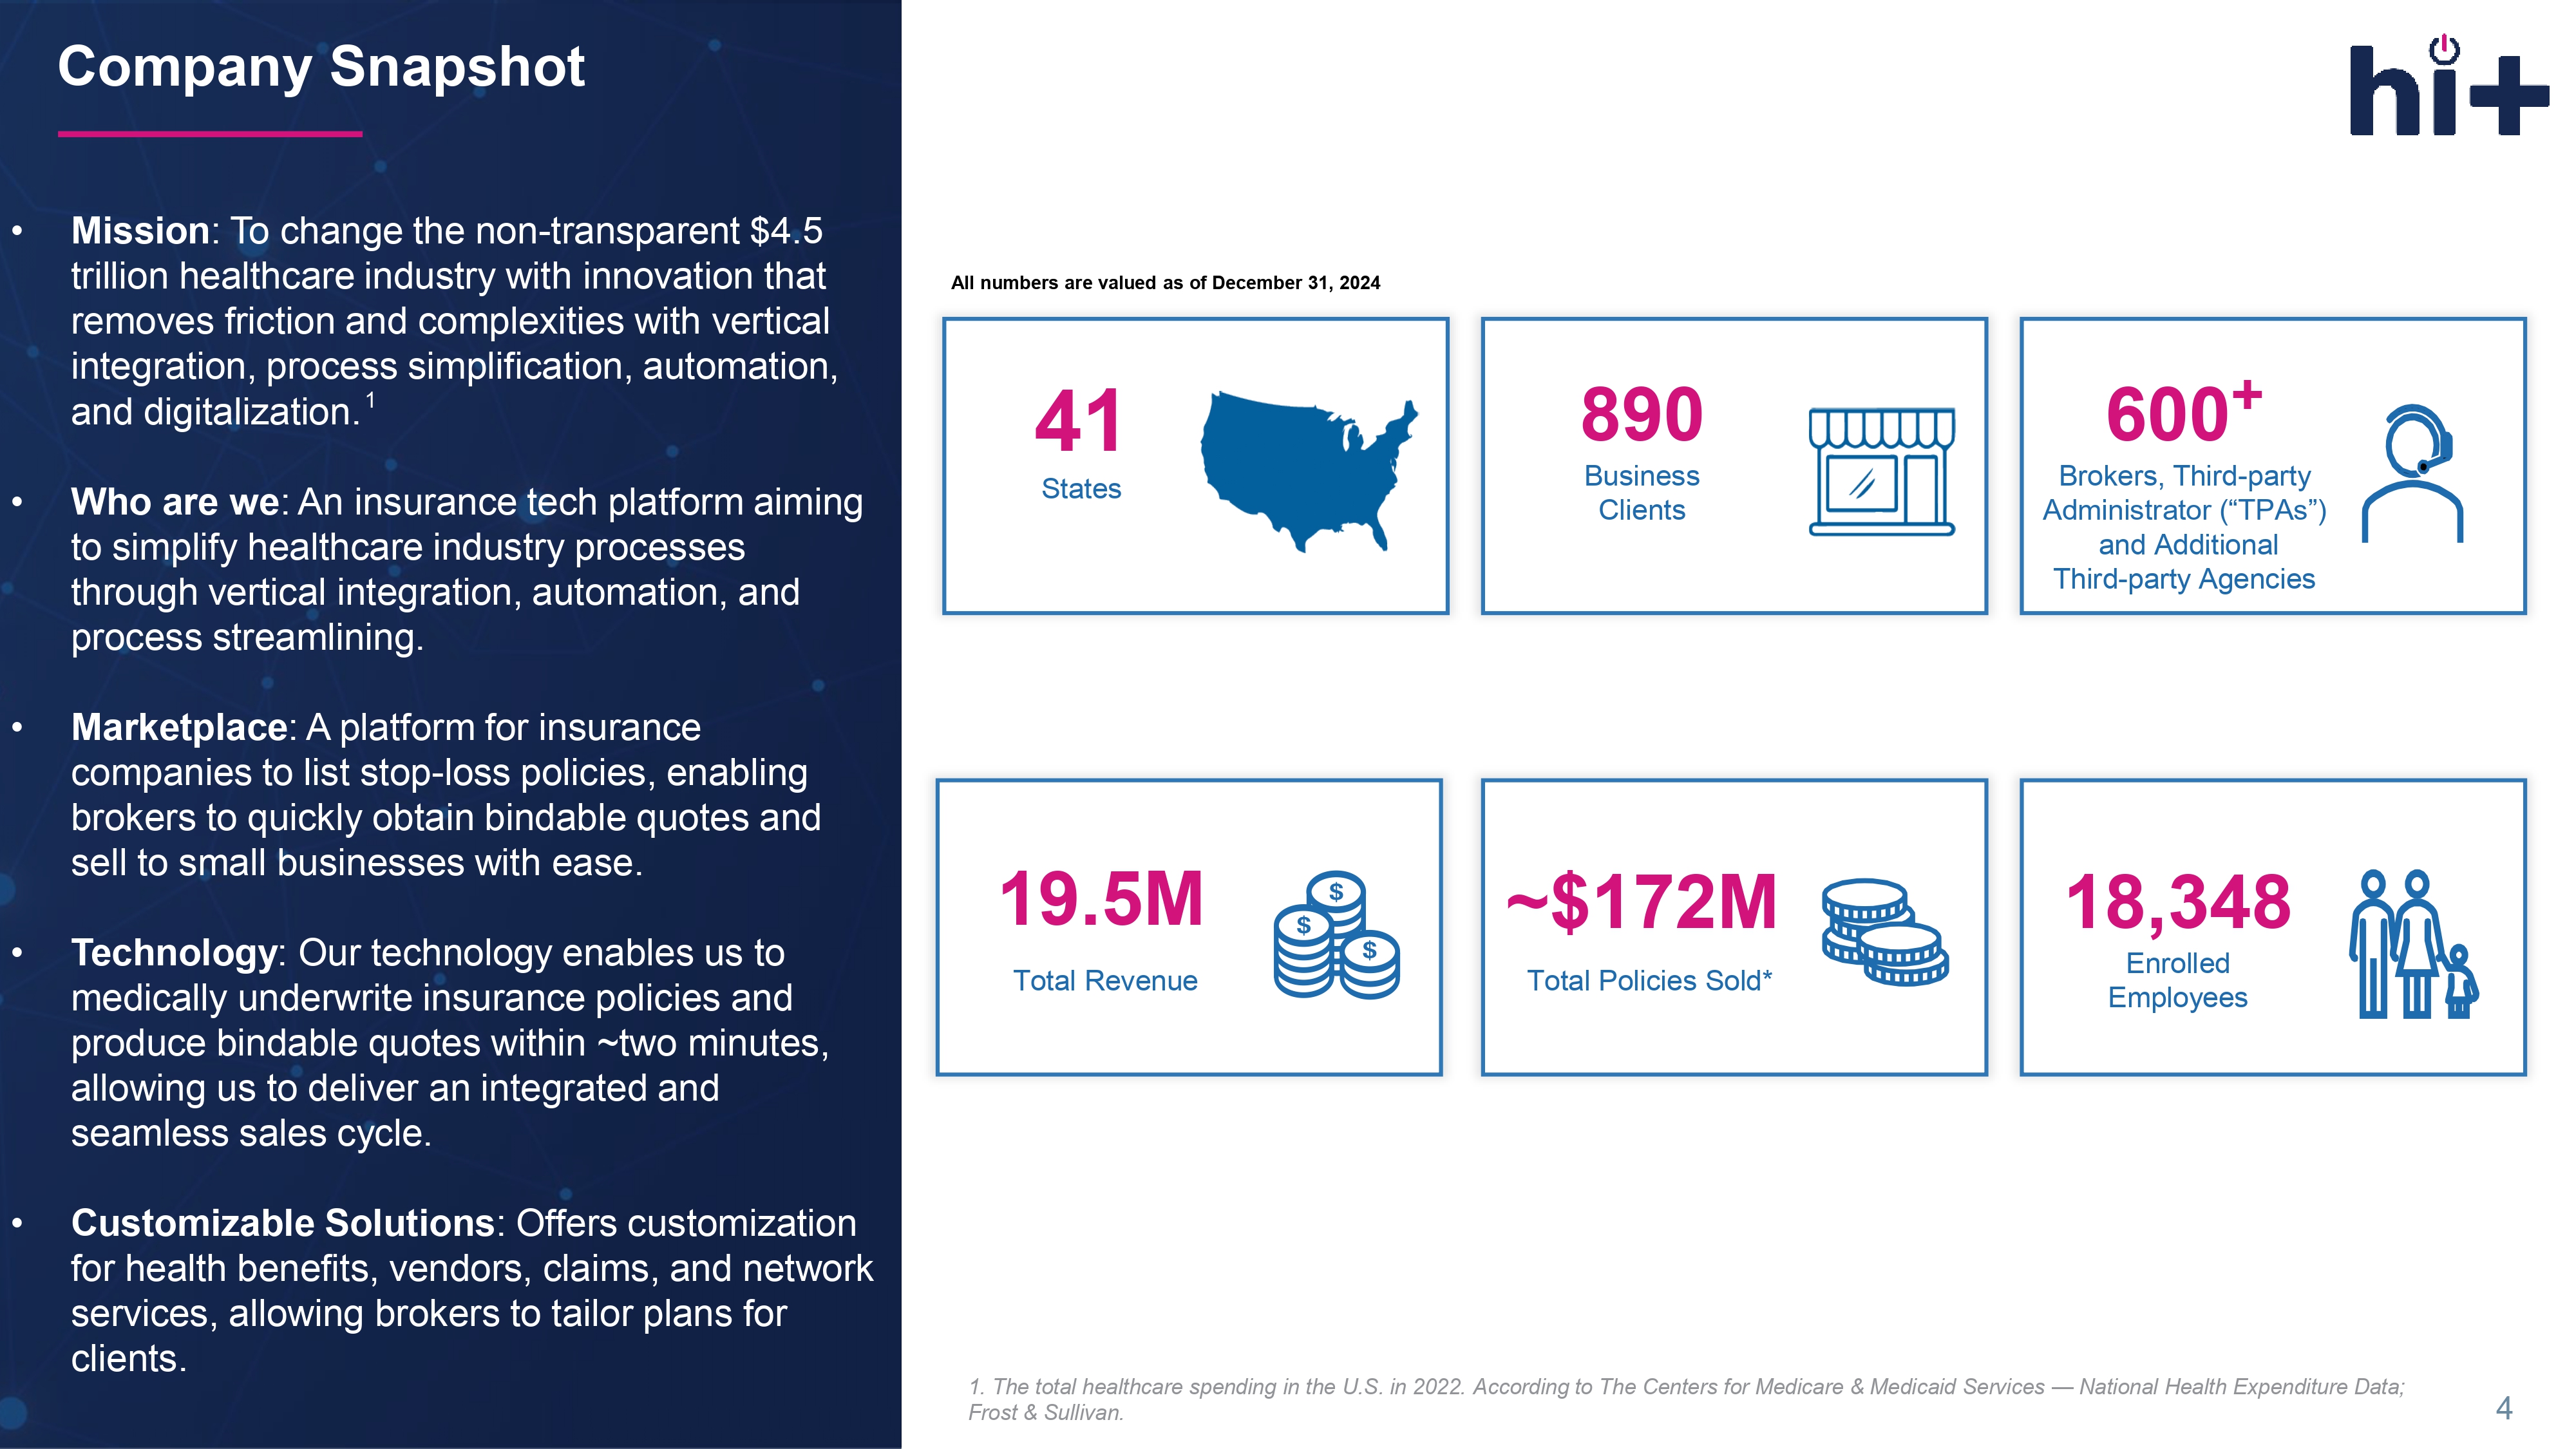
• Who are we : An insurance tech platform aiming to simplify healthcare industry processes through vertical integration, automation, and process streamlining. • Marketplace : A platform for insurance companies to list stop - loss policies, enabling brokers to quickly obtain bindable quotes and sell to small businesses with ease. • Technology : Our technology enables us to medically underwrite insurance policies and produce bindable quotes within ~two minutes, allowing us to deliver an integrated and seamless sales cycle. • Customizable Solutions : Offers customization for health benefits, vendors, claims, and network services, allowing brokers to tailor plans for clients. • Mission : To change the non - transparent $ 4 . 5 trillion healthcare industry with innovation that removes friction and complexities with vertical integration, process simplification, automation, and digitalization . 1 19.5M Total Revenue ~$172M Total Policies Sold* 18,348 Enrolled Employees 41 States 890 Business Clients 600 + Brokers, Third - party Administrator (“TPAs”) and Additional Third - party Agencies 4 1. The total healthcare spending in the U.S. in 2022. According to The Centers for Medicare & Medicaid Services — National Health Expenditure Data; Frost & Sullivan. All numbers are valued as of December 31, 2024 Company Snapshot INACCESSIBILITY COMPLICATED LACK OF TRANSPARENCY î Small business are under - represented due to a lack of insurance product solutions and lack of competition.
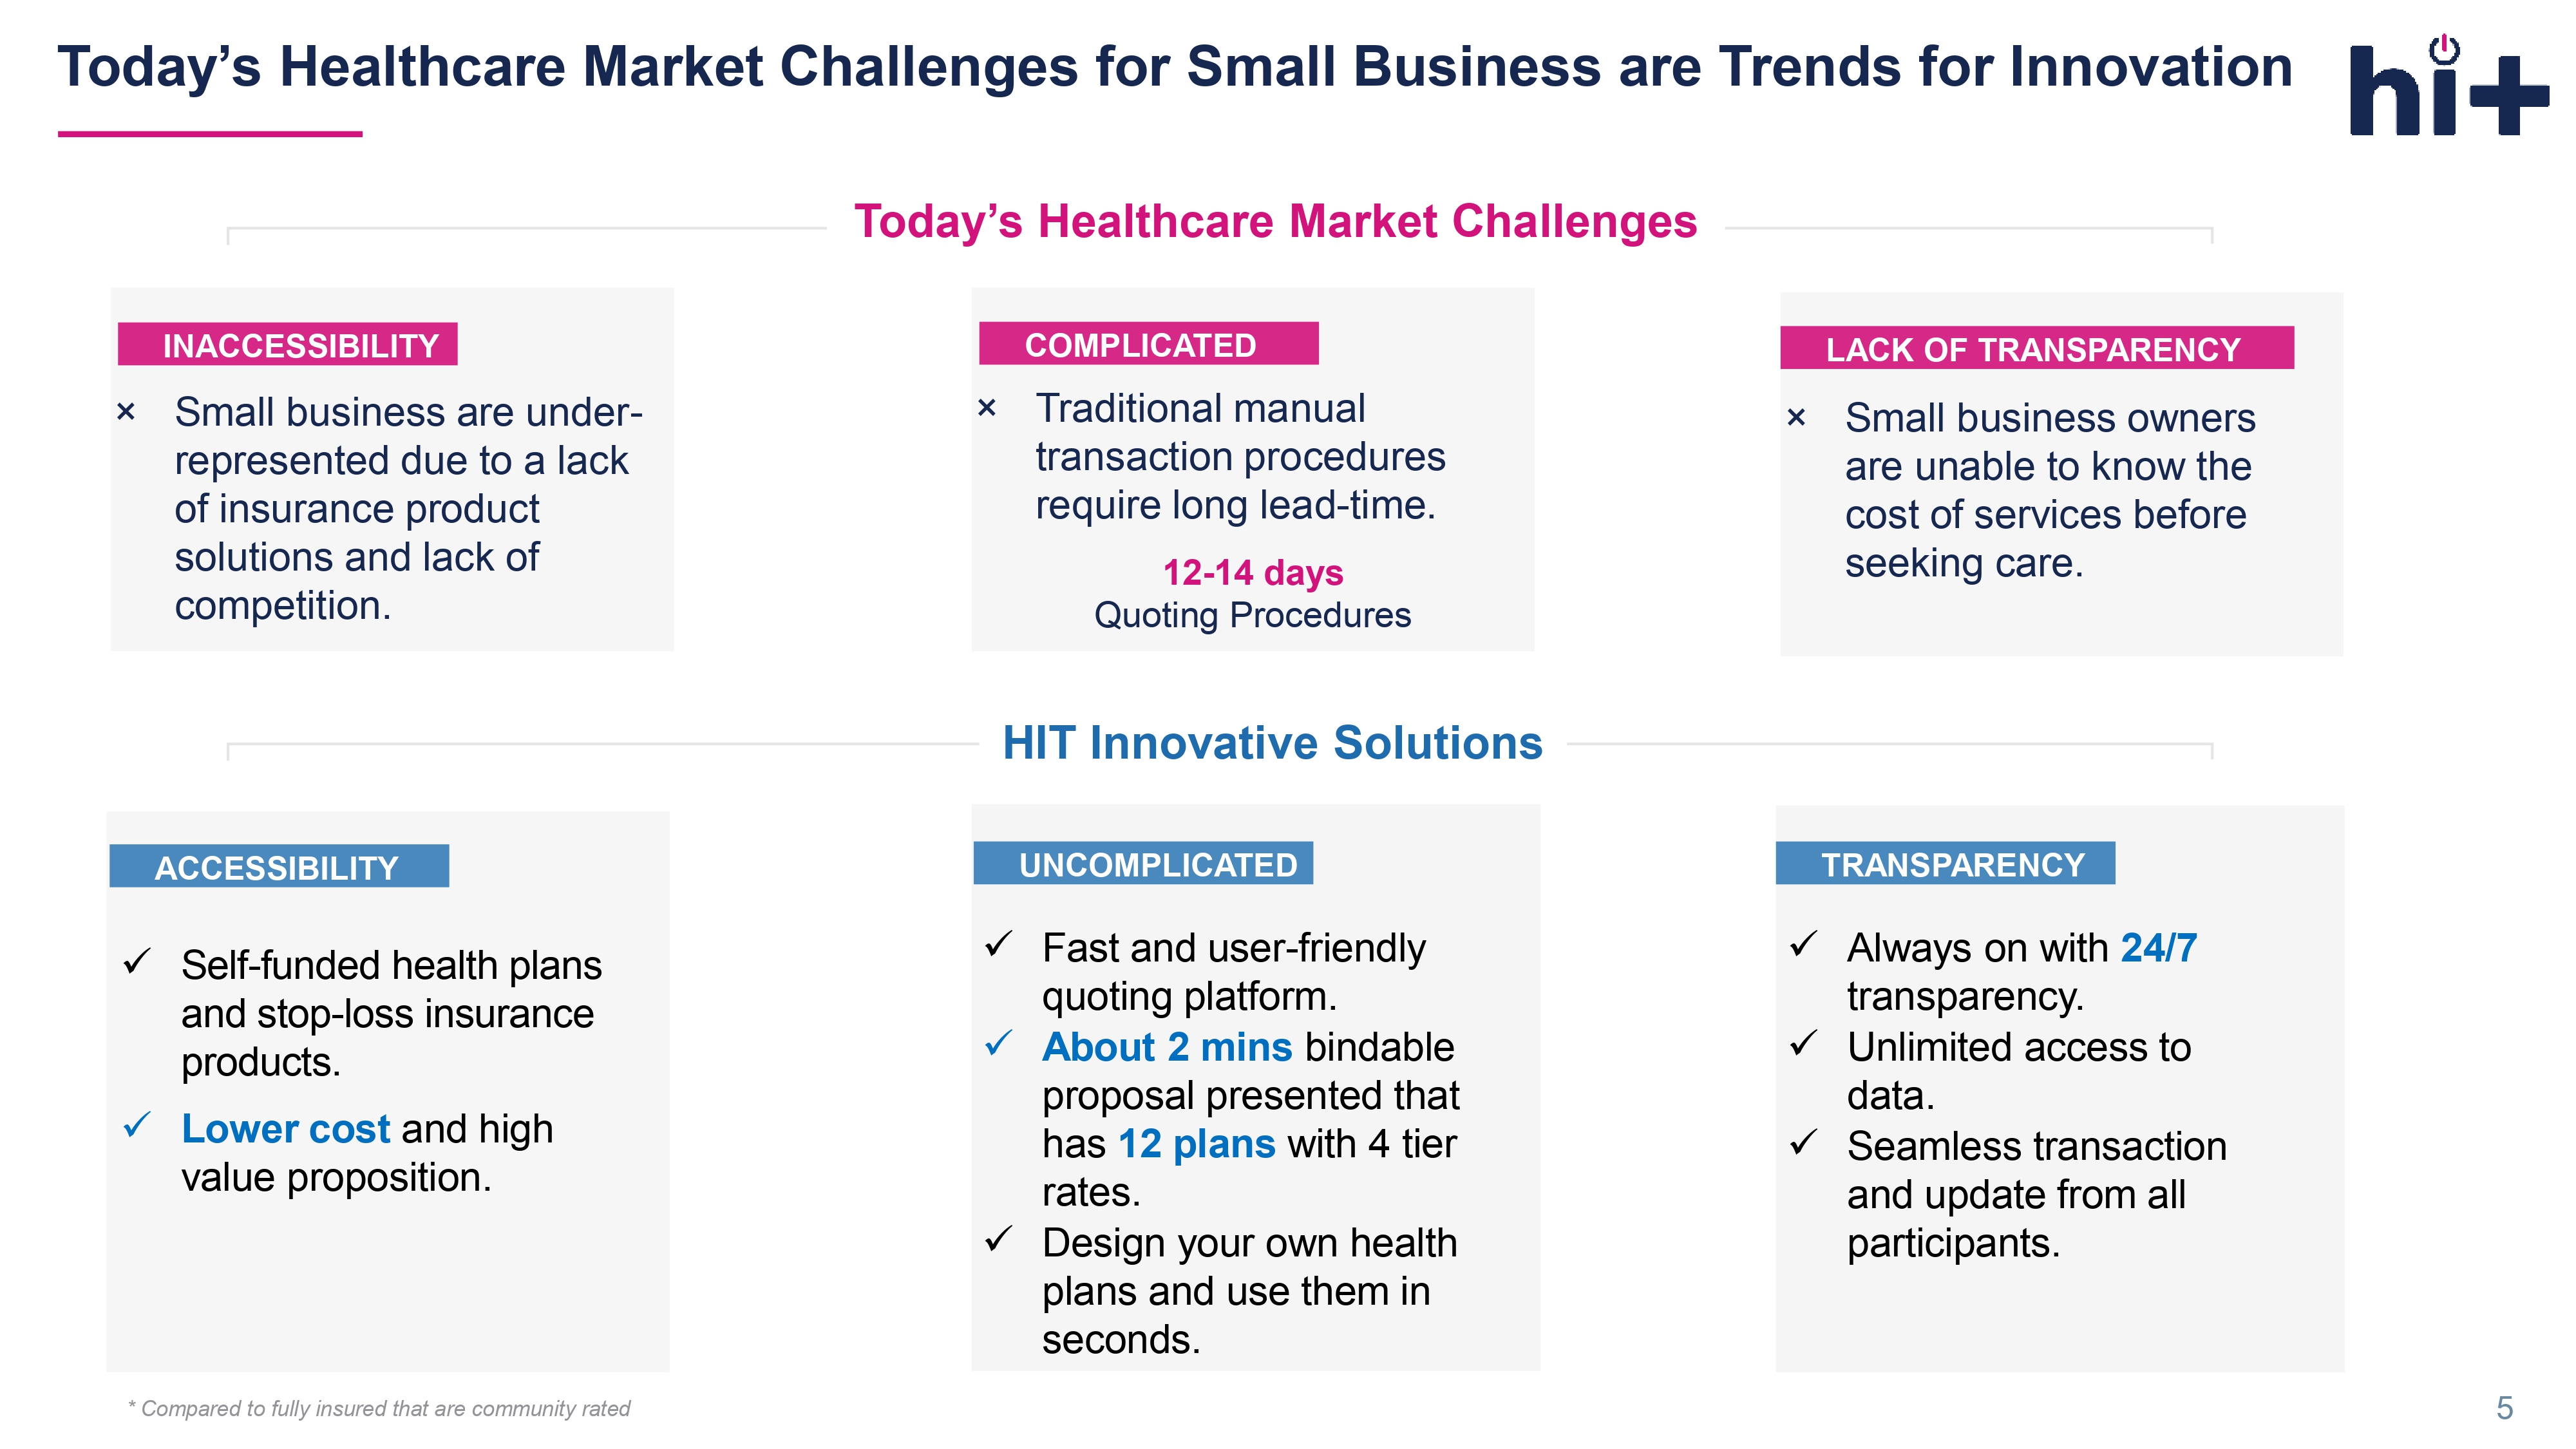
î Traditional manual transaction procedures require long lead - time. 12 - 14 days Quoting Procedures x Self - funded health plans and stop - loss insurance products . x Lower cost and high value proposition . x Fast and user - friendly quoting platform . x About 2 mins bindable proposal presented that has 12 plans with 4 tier rates . x Design your own health plans and use them in seconds. x Always on with 24/7 transparency. x Unlimited access to data. x Seamless transaction and update from all participants. HIT Innovative Solutions ACCESSIBILITY UNCOMPLICATED TRANSPARENCY Today’s Healthcare Market Challenges î Small business owners are unable to know the cost of services before seeking care .
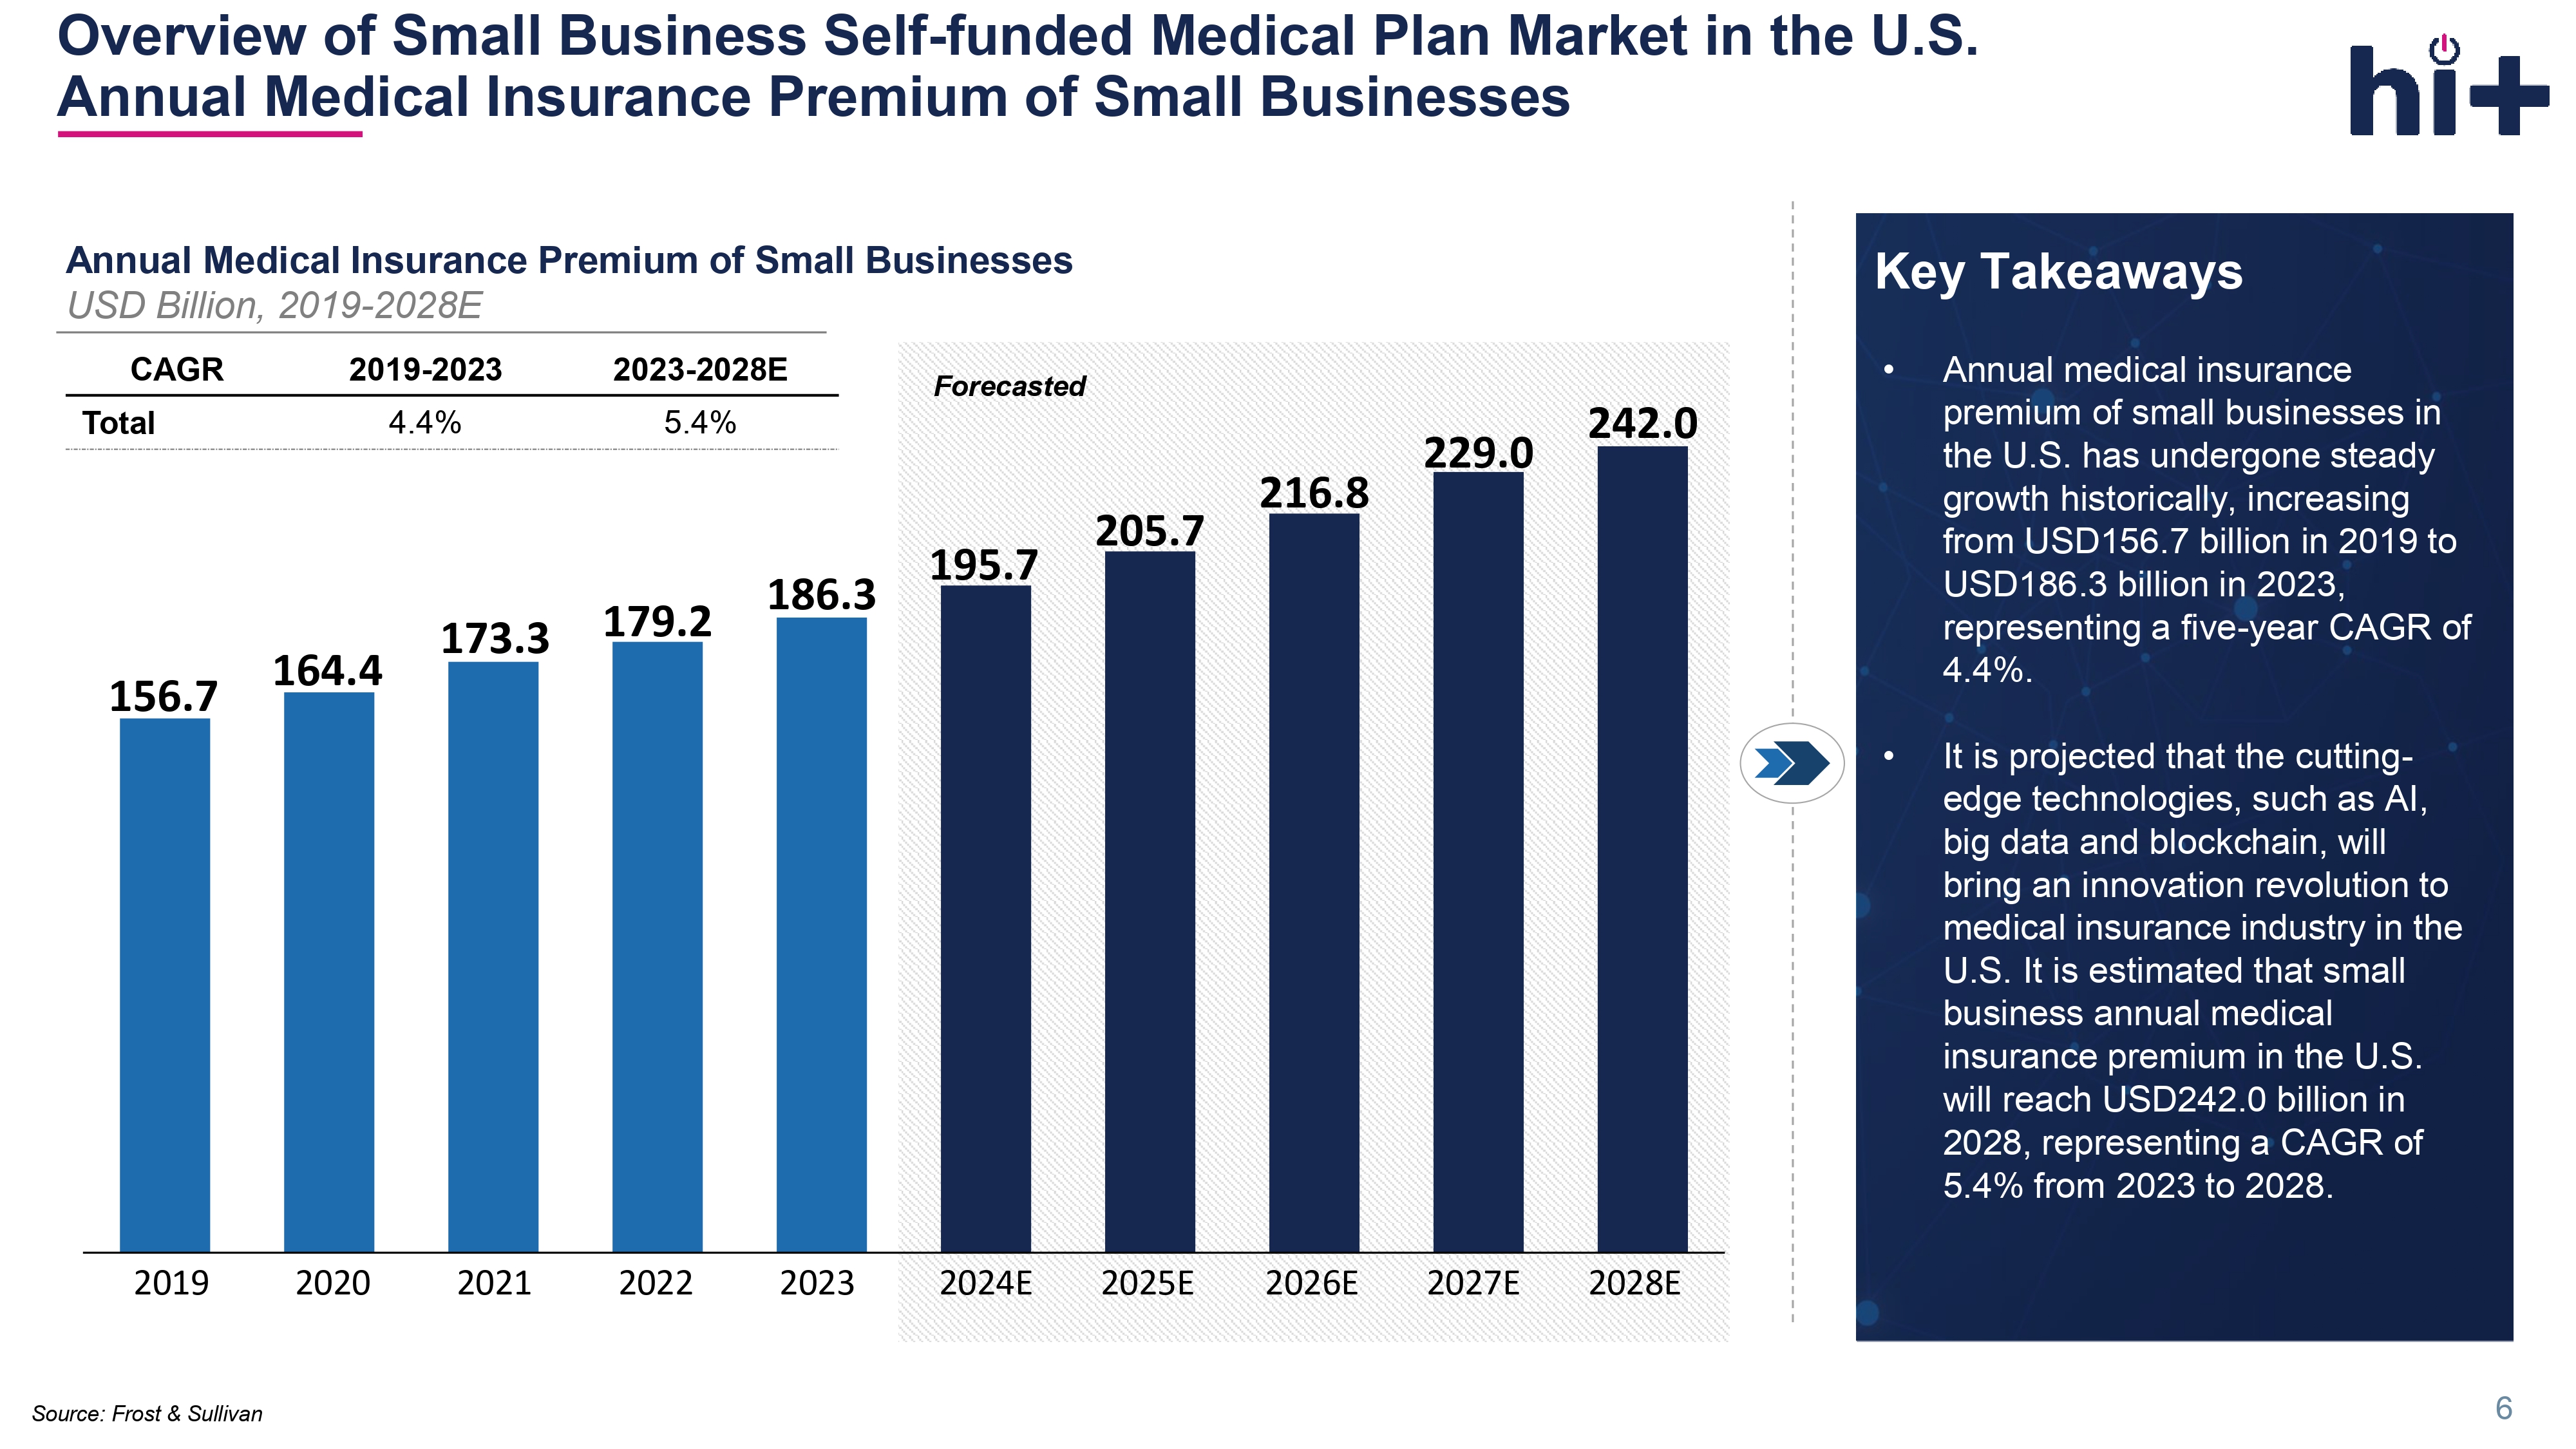
Today’s Healthcare Market Challenges for Small Business are Trends for Innovation 5 * Compared to fully insured that are community rated Forecasted 156.7 164.4 173.3 179.2 186.3 195.7 205.7 216.8 229.0 242.0 Annual Medical Insurance Premium of Small Businesses USD Billion, 2019 - 2028E 2019 2020 2021 2022 2023 2024E 2025E 2026E 2027E 2028E 2023 - 2028E 2019 - 2023 CAGR 5.4% 4.4% Total Key Takeaways • Annual medical insurance premium of small businesses in the U.S. has undergone steady growth historically, increasing from USD156.7 billion in 2019 to USD186.3 billion in 2023, representing a five - year CAGR of 4.4%. • It is projected that the cutting - edge technologies, such as AI, big data and blockchain, will bring an innovation revolution to medical insurance industry in the U.S. It is estimated that small business annual medical insurance premium in the U.S. will reach USD242.0 billion in 2028, representing a CAGR of 5.4% from 2023 to 2028. Overview of Small Business Self - funded Medical Plan Market in the U.S. Annual Medical Insurance Premium of Small Businesses 6 Source: Frost & Sullivan Brokers TPAs SMEs Carriers Brokers Patients Carriers Providers Providers TPAs SME/Patients • A primary exchange aimed to make healthcare plans competitive through direct contracts, eliminating intermediaries.
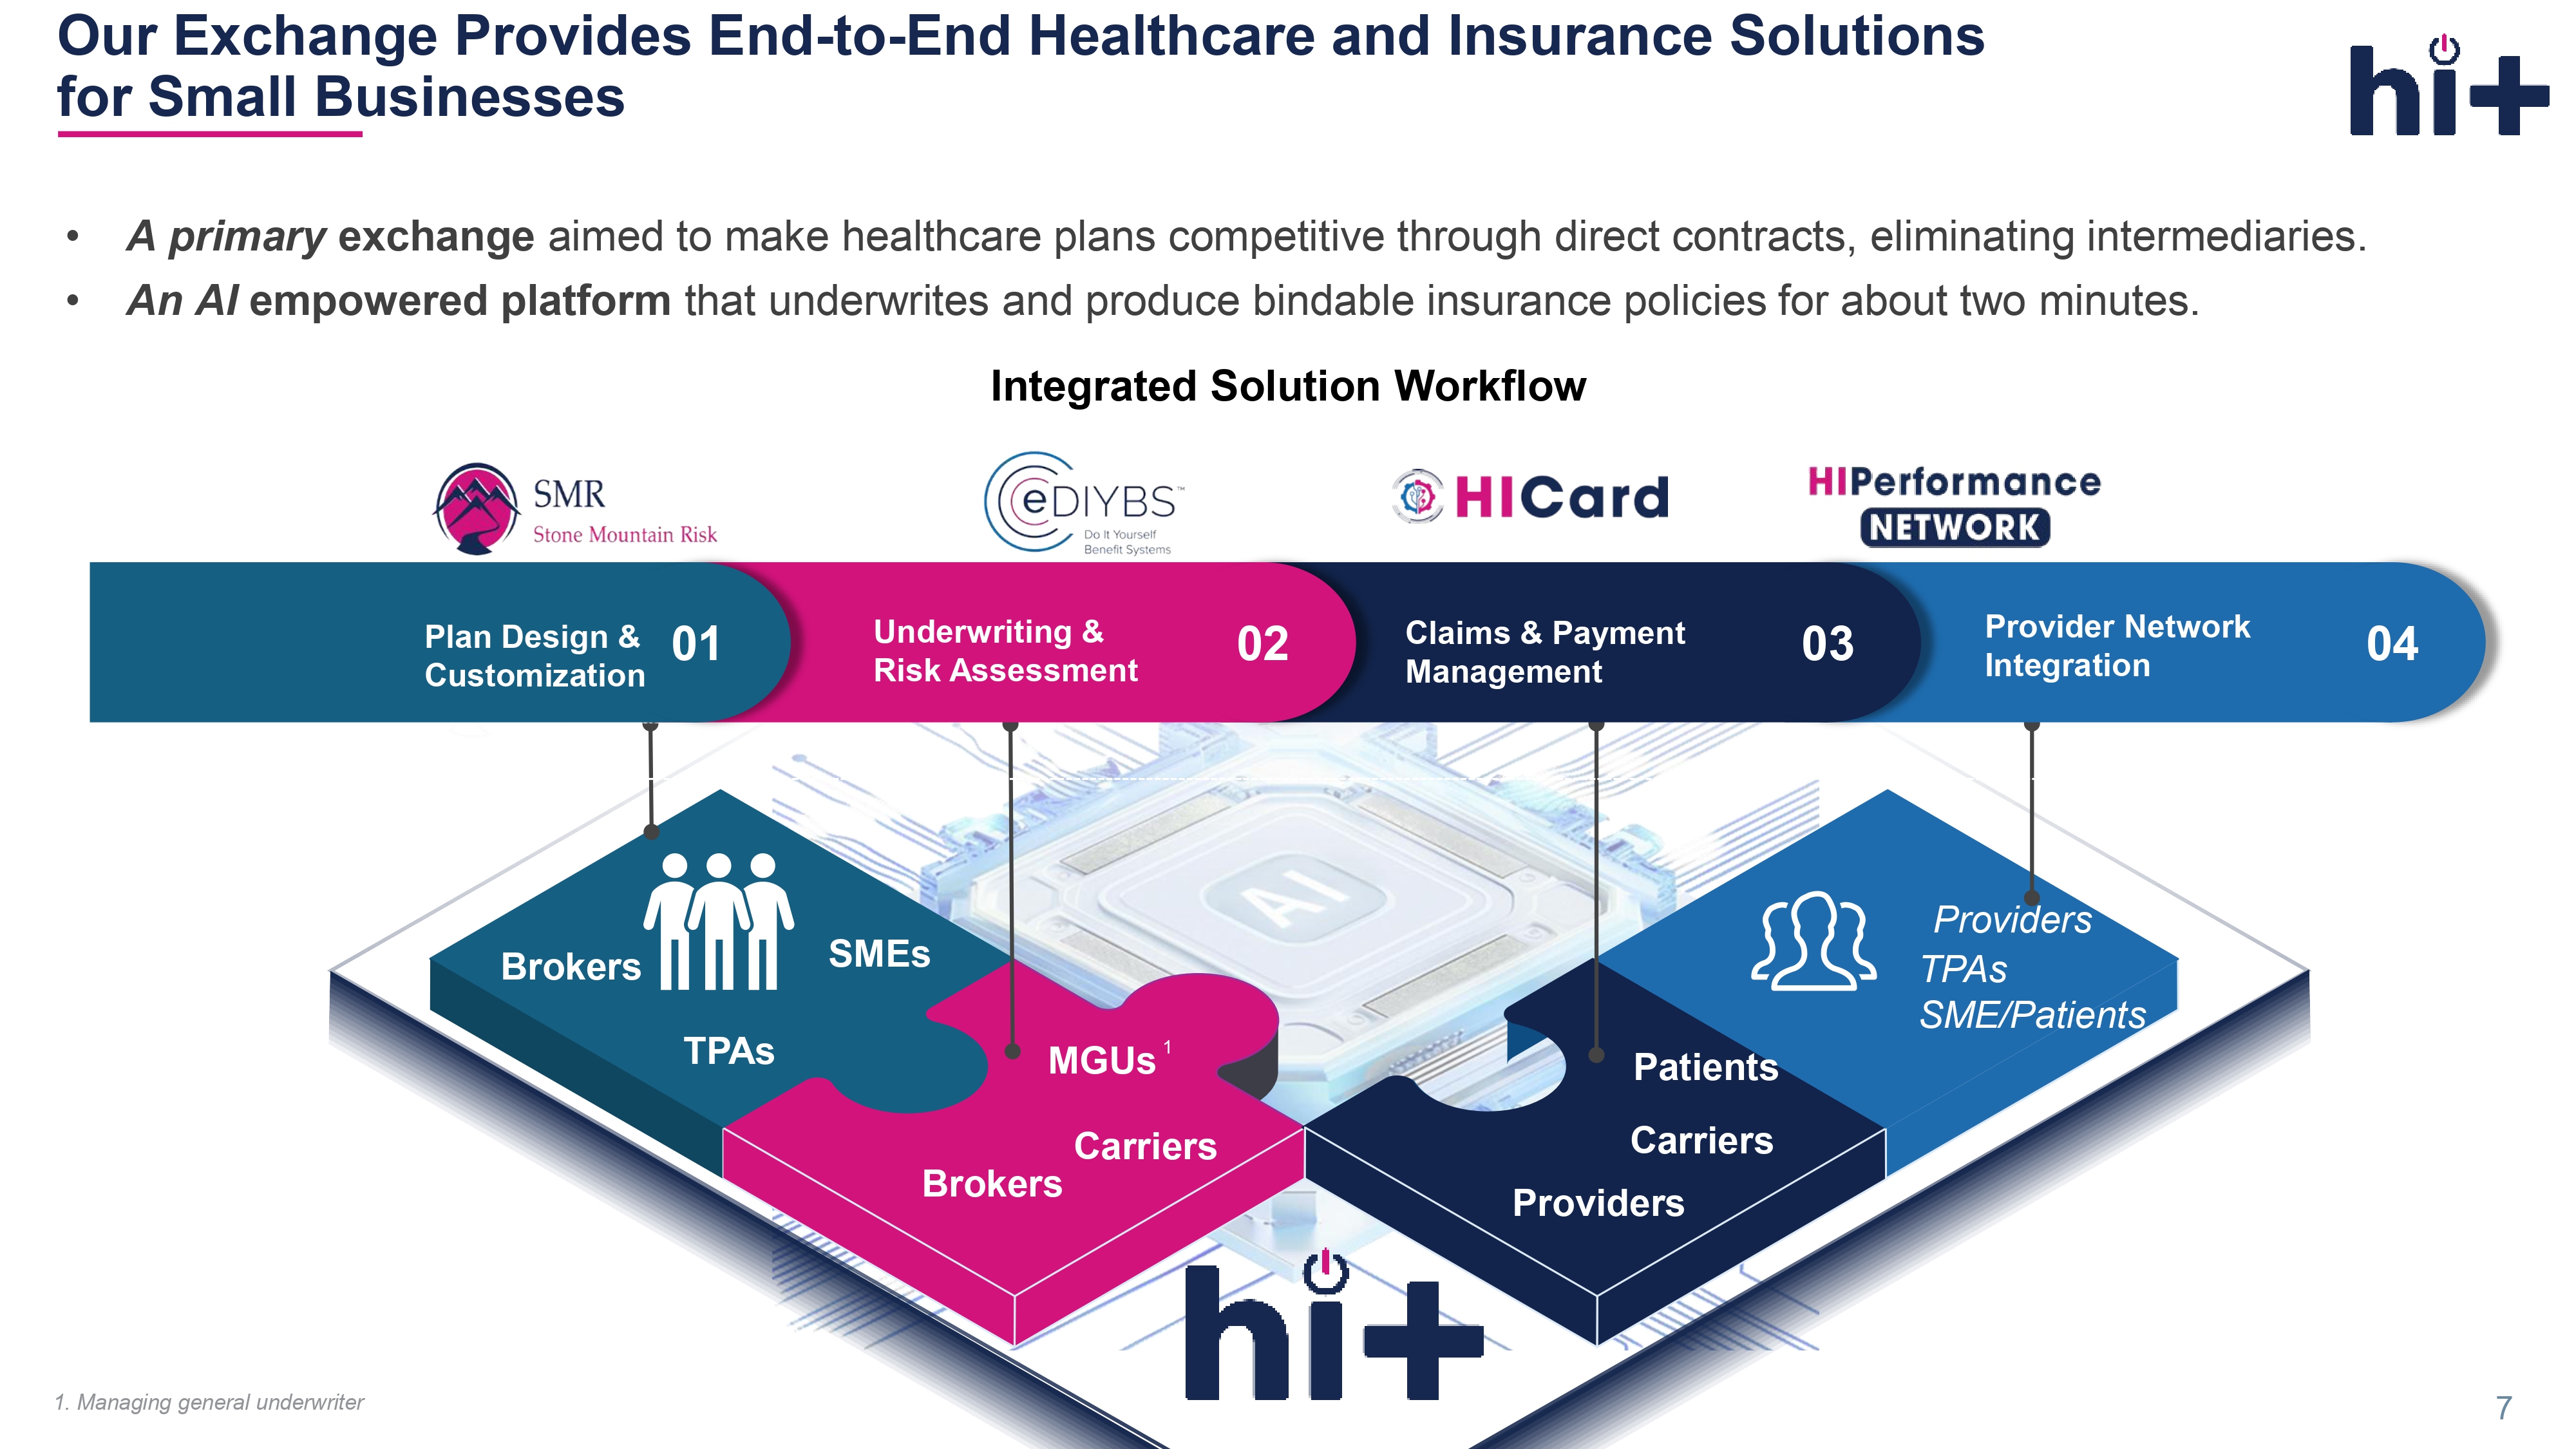
• An AI empowered platform that underwrites and produce bindable insurance policies for about two minutes. Integrated Solution Workflow 04 03 02 01 Plan Design & Customization Underwriting & Risk Assessment Claims & Payment Management Provider Network Integration MGUs 1 Our Exchange Provides End - to - End Healthcare and Insurance Solutions for Small Businesses 1. Managing general underwriter 7 AI - Powered Innovation » Automates medical underwriting & broker quoting with machine learning.
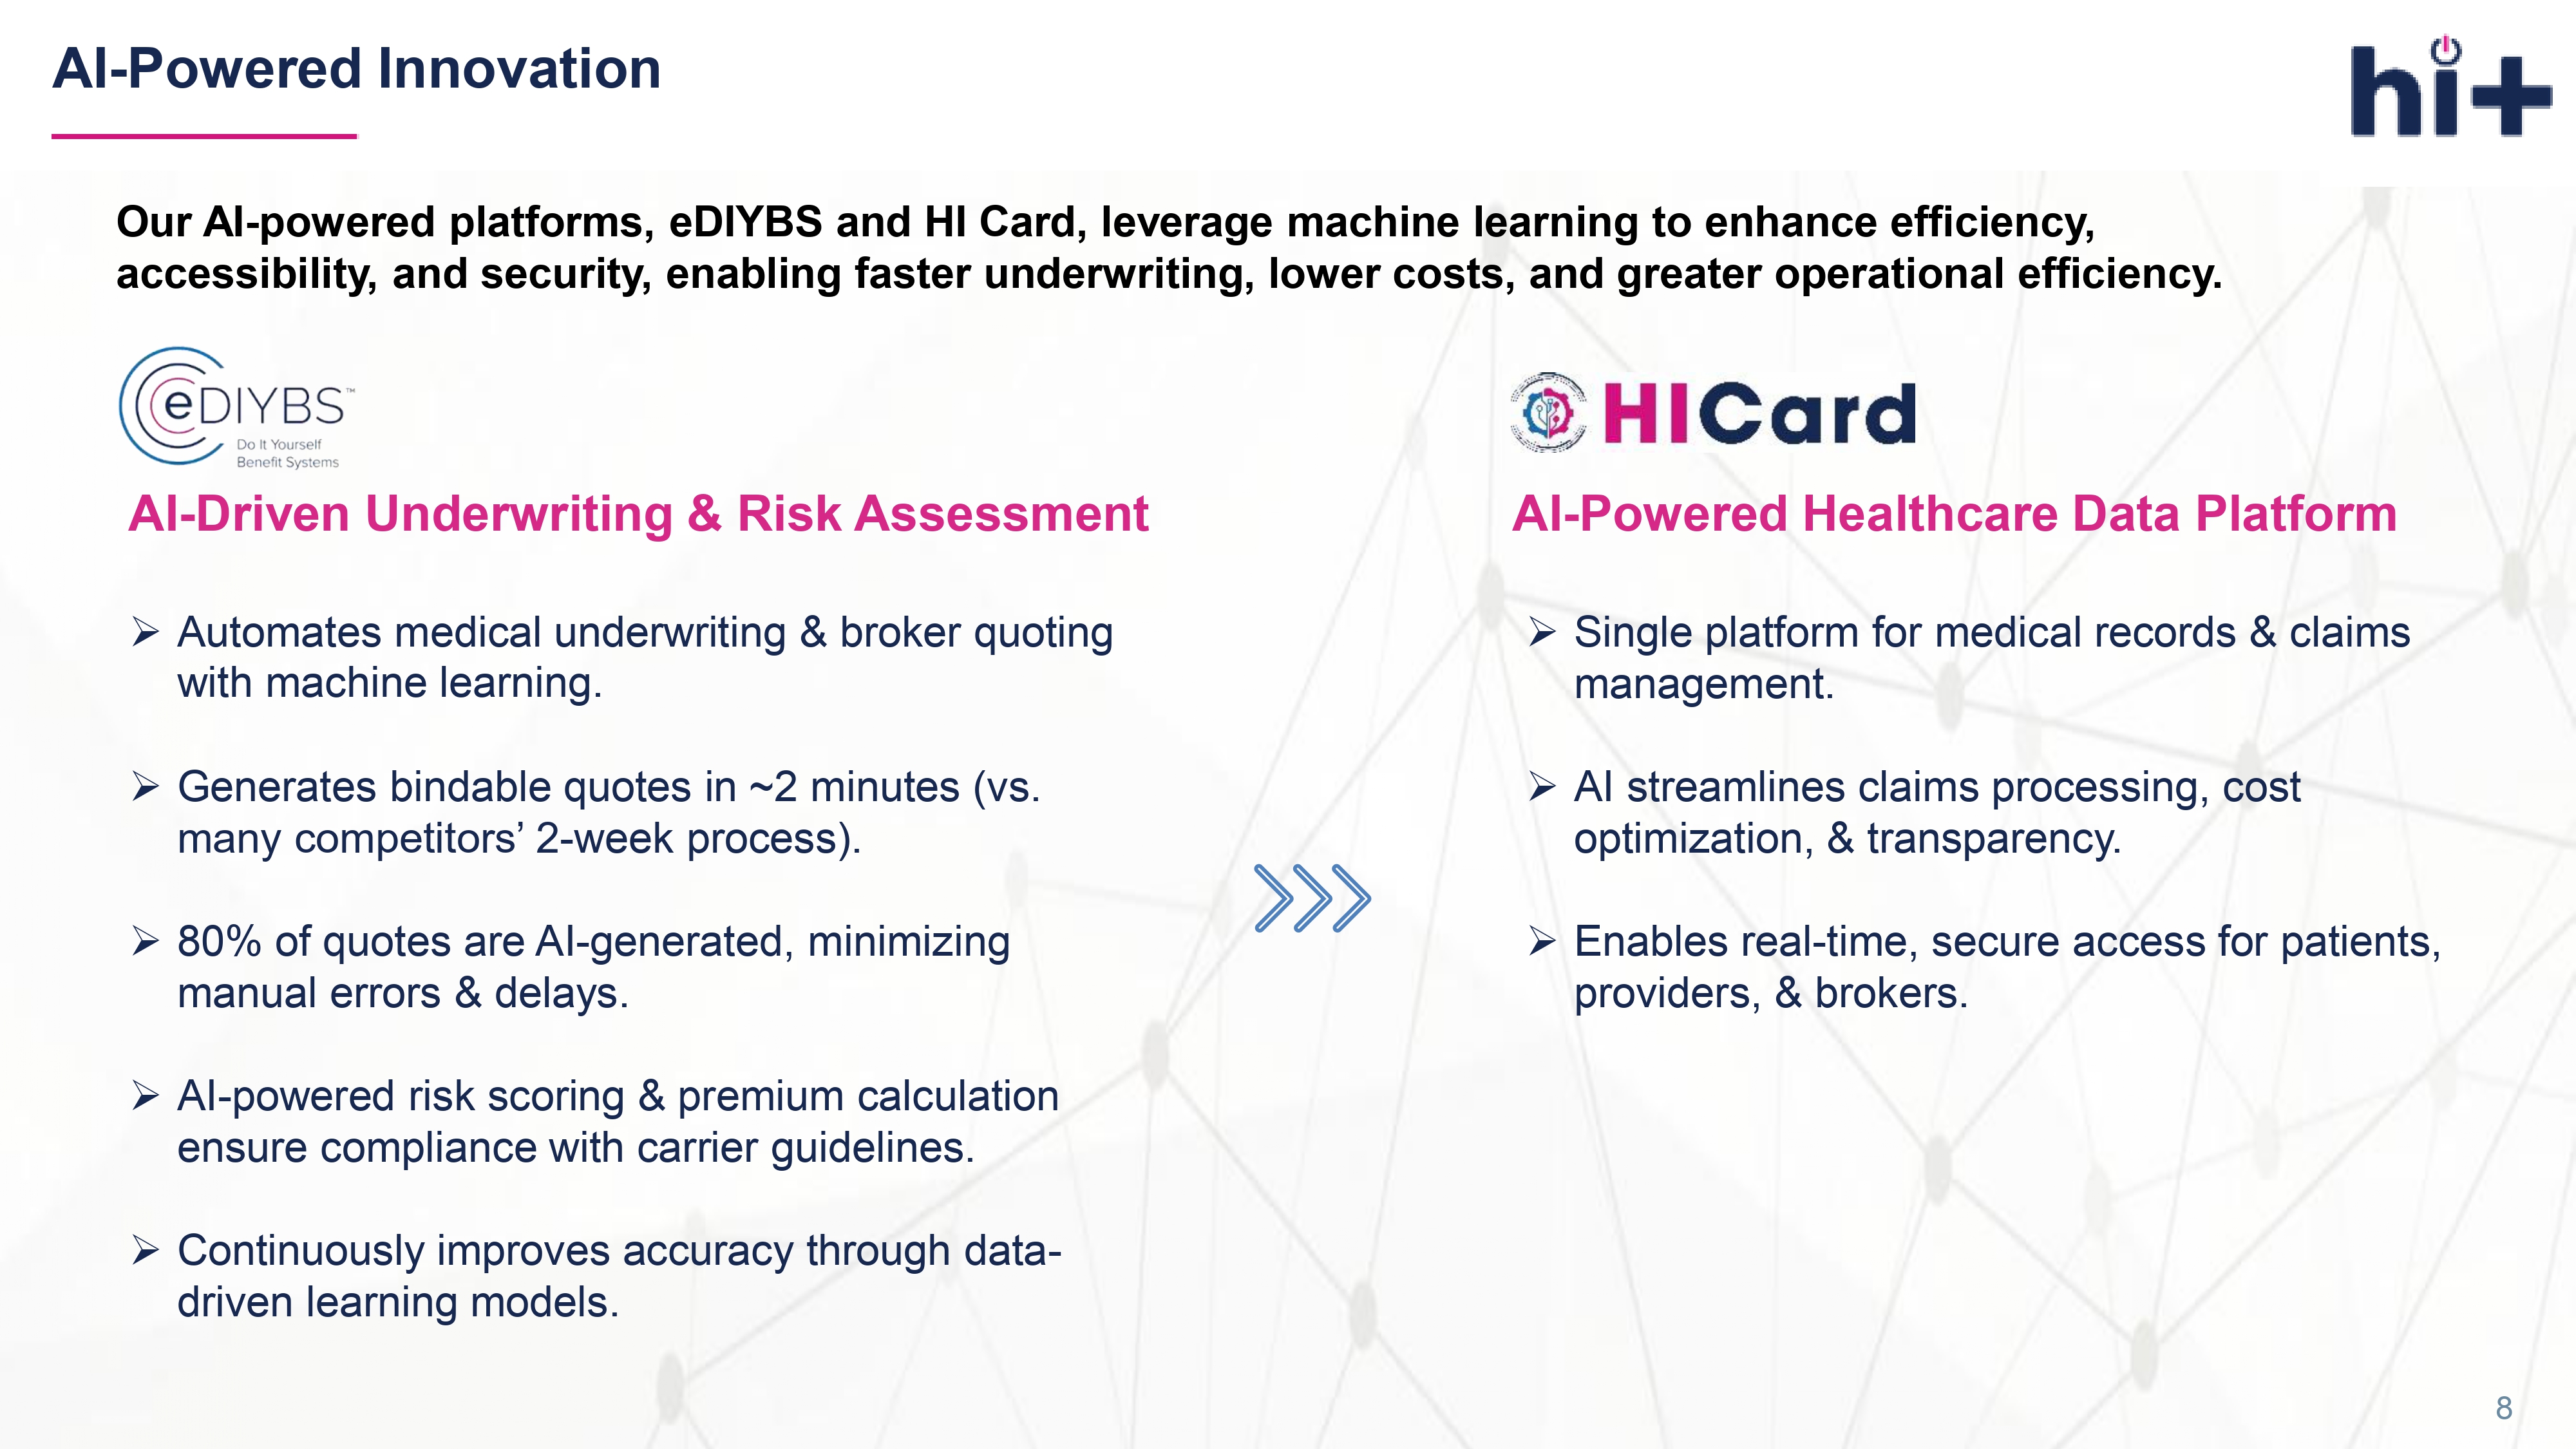
» Generates bindable quotes in ~2 minutes (vs. many competitors’ 2 - week process). » 80% of quotes are AI - generated, minimizing manual errors & delays. » AI - powered risk scoring & premium calculation ensure compliance with carrier guidelines. » Continuously improves accuracy through data - driven learning models. Our AI - powered platforms, eDIYBS and HI Card, leverage machine learning to enhance efficiency, accessibility, and security, enabling faster underwriting, lower costs, and greater operational efficiency. AI - Driven Underwriting & Risk Assessment AI - Powered Healthcare Data Platform » Single platform for medical records & claims management. 8 » AI streamlines claims processing, cost optimization, & transparency. » Enables real - time, secure access for patients, providers, & brokers.
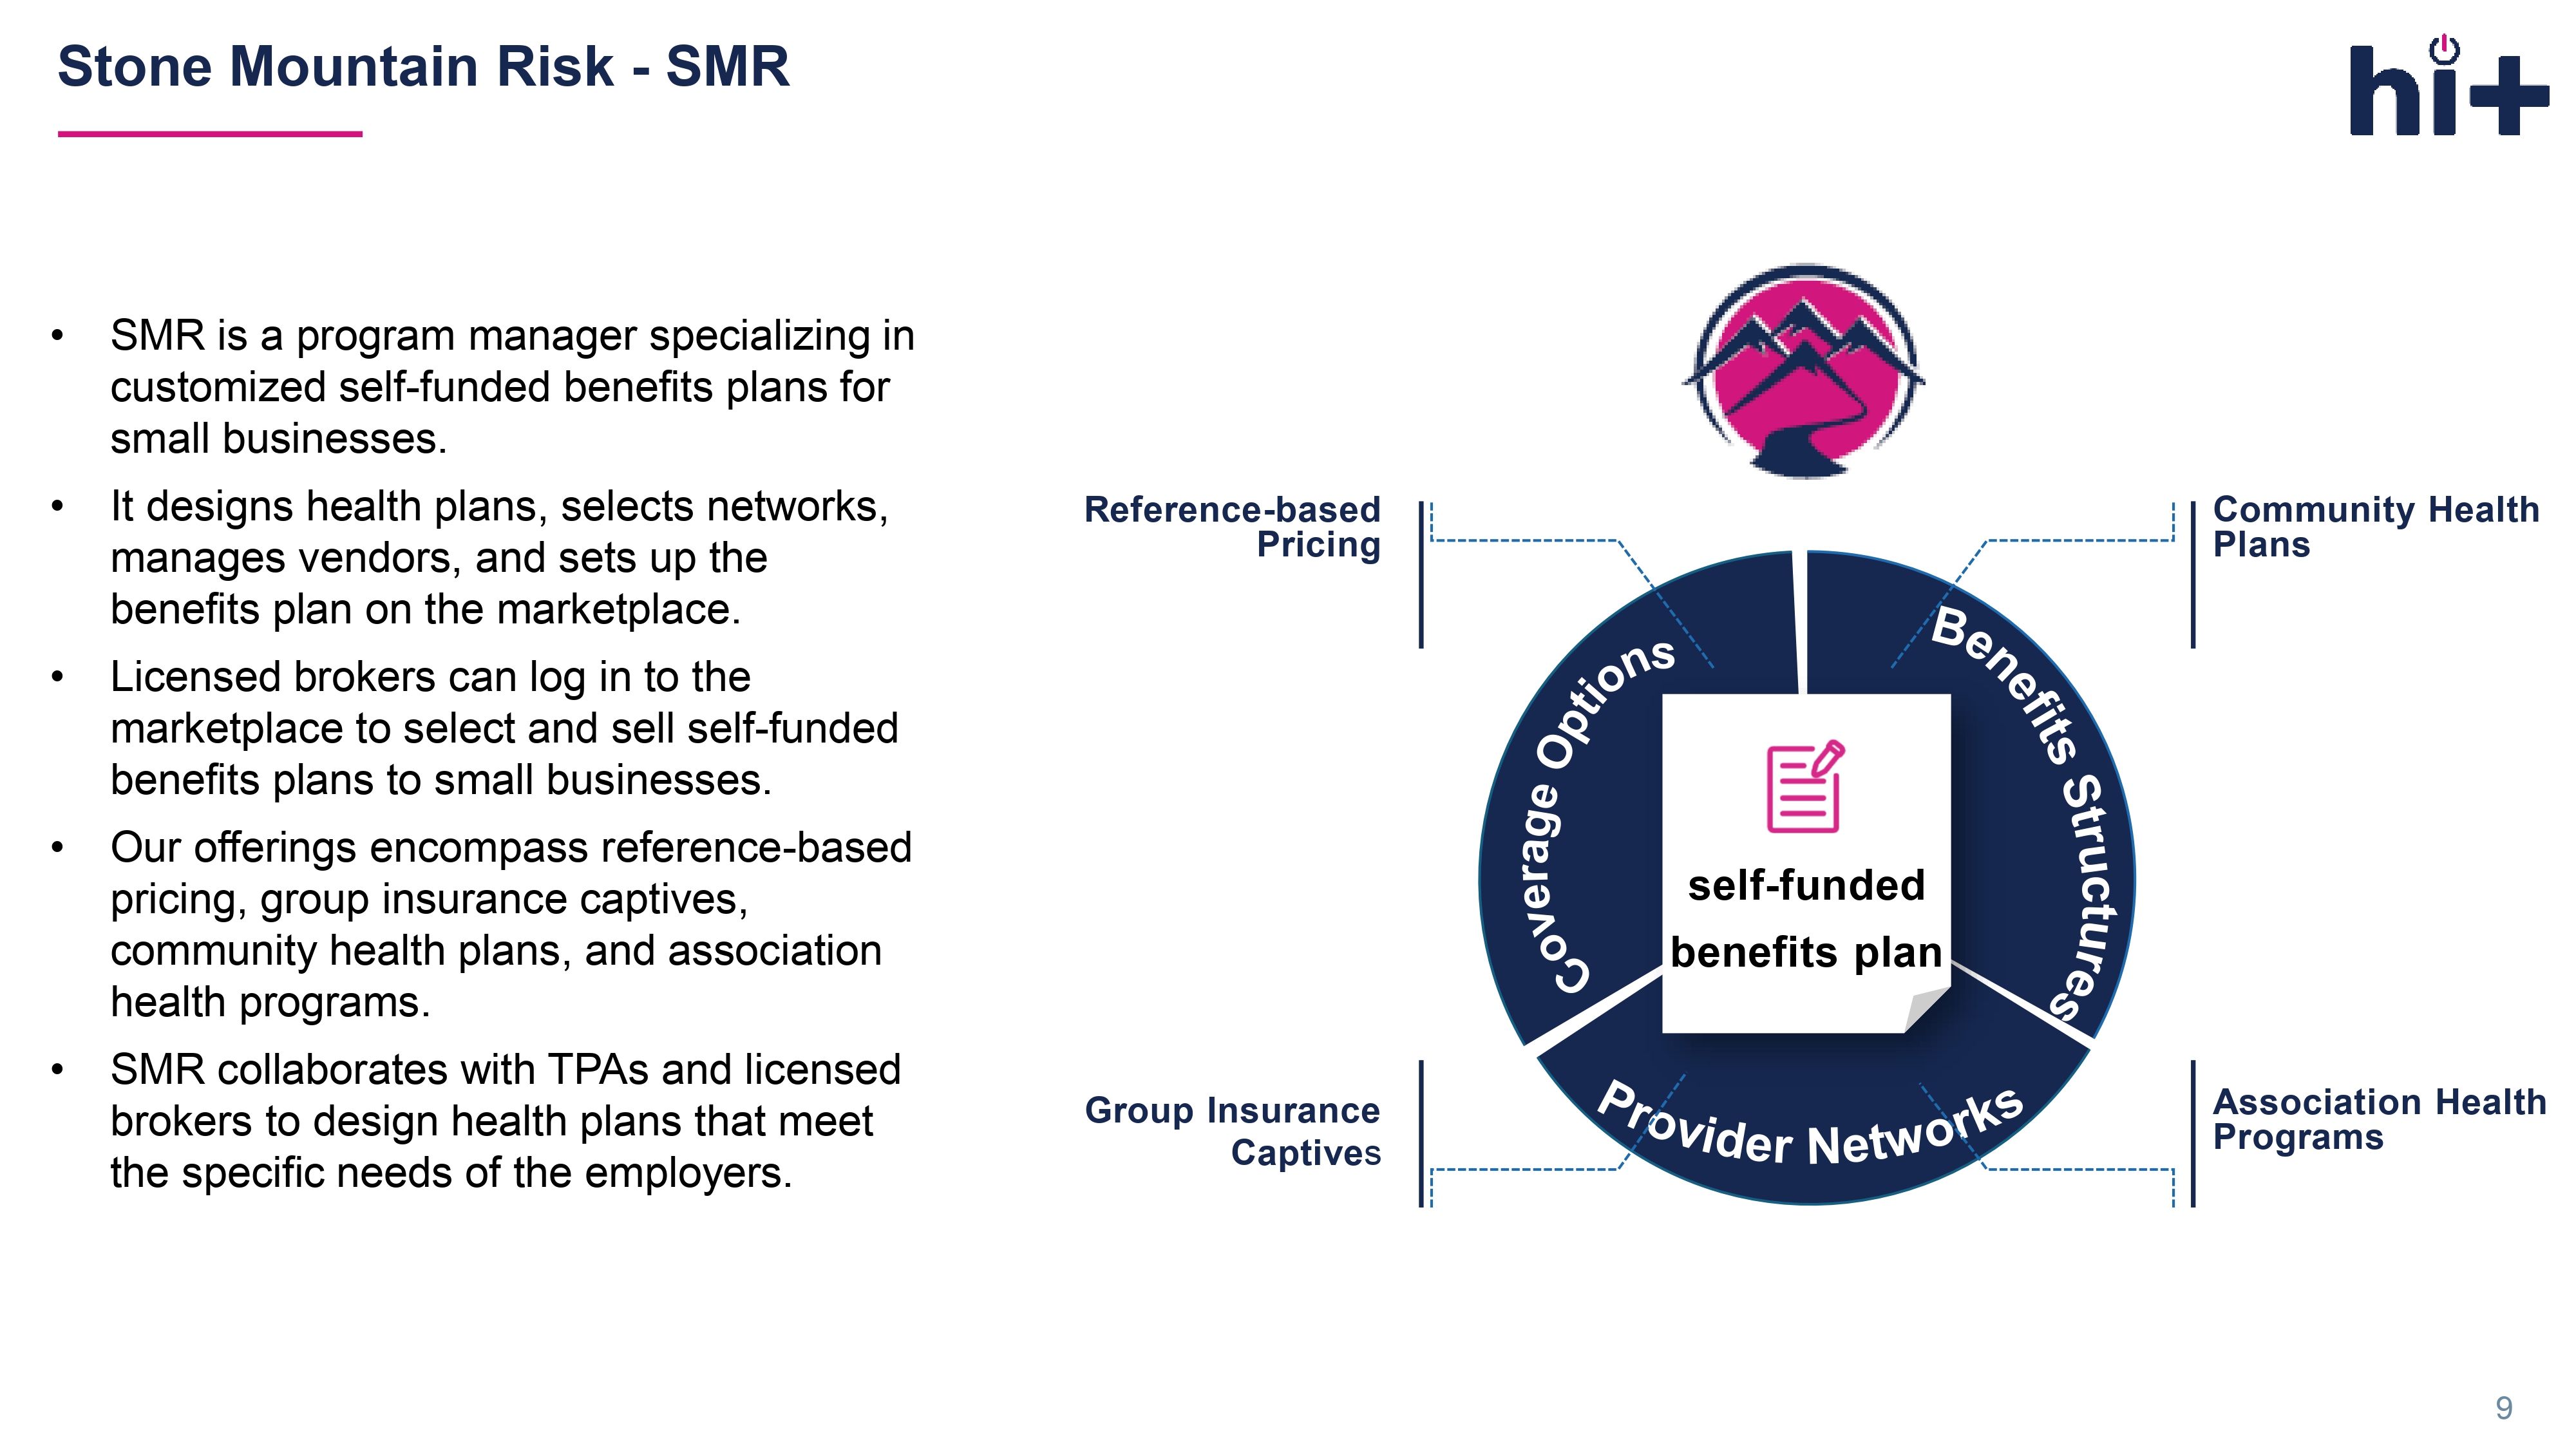
self - funded benefits plan Reference - based Pricing Group Insurance Captive s Community Health Plans Association Health Programs • SMR is a program manager specializing in customized self - funded benefits plans for small businesses. • It designs health plans, selects networks, manages vendors, and sets up the benefits plan on the marketplace. • Licensed brokers can log in to the marketplace to select and sell self - funded benefits plans to small businesses. • Our offerings encompass reference - based pricing, group insurance captives, community health plans, and association health programs. • SMR collaborates with TPAs and licensed brokers to design health plans that meet the specific needs of the employers. Stone Mountain Risk - SMR 9 Contractual Relationship Stop loss Carriers • Stop - loss carriers are companies that provide stop - loss coverage plans for employers who self - fund their health benefit plans.
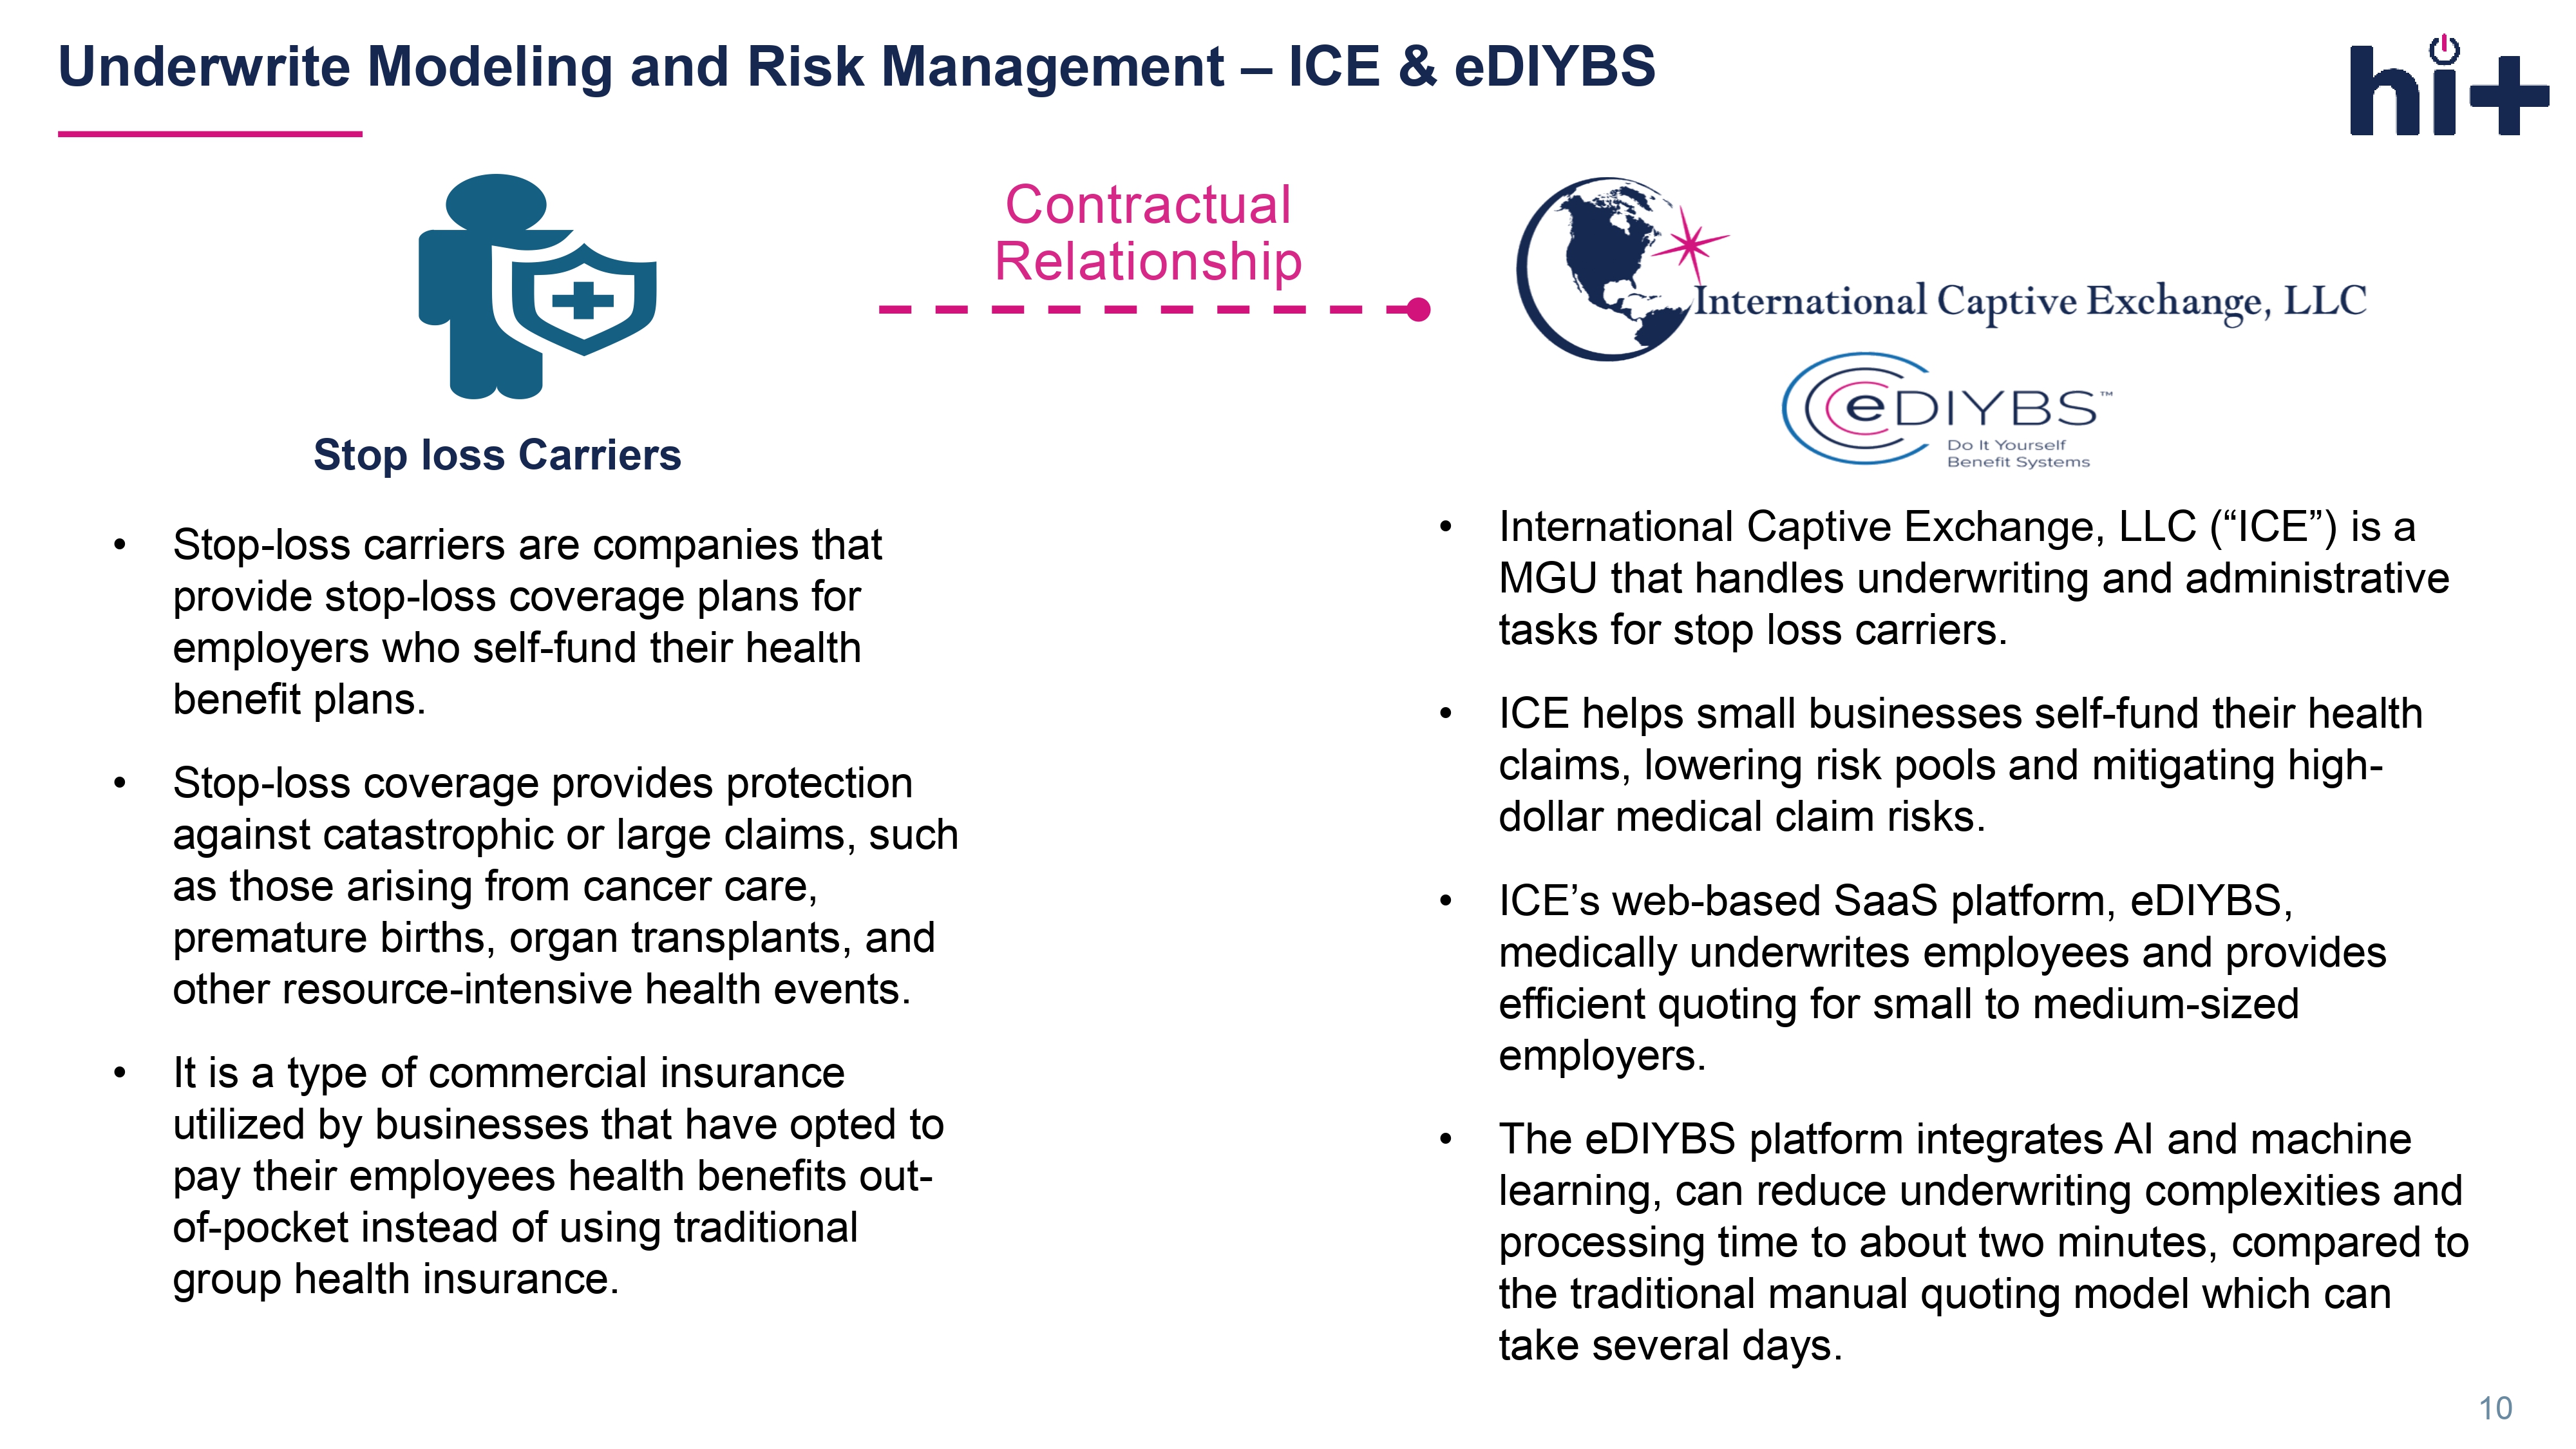
• Stop - loss coverage provides protection against catastrophic or large claims, such as those arising from cancer care, premature births, organ transplants, and other resource - intensive health events. • It is a type of commercial insurance utilized by businesses that have opted to pay their employees health benefits out - of - pocket instead of using traditional group health insurance. • International Captive Exchange, LLC (“ICE”) is a MGU that handles underwriting and administrative tasks for stop loss carriers. • ICE helps small businesses self - fund their health claims, lowering risk pools and mitigating high - dollar medical claim risks. • ICE’s web - based SaaS platform, eDIYBS, medically underwrites employees and provides efficient quoting for small to medium - sized employers. • The eDIYBS platform integrates AI and machine learning, can reduce underwriting complexities and processing time to about two minutes, compared to the traditional manual quoting model which can take several days. Underwrite Modeling and Risk Management – ICE & eDIYBS 10 12 days Typical Quoting Procedure Bindable Proposal Presented 2 Minutes 4 Tiers AI Backed Technology and Process Simplification 12 Plans 1.Brokers gather health application 2.Brokers create insurance package 3.Underwriters produce manual quotes 4.

Nurse reviews health applications 5. Underwriters finalize quote proposal 6. Brokers present bindable proposal Proprietary eDIYBS: Power on Efficiency 11 • HI Card simplifies healthcare management with a unified platform for medical records and claims, offering 24/7 access to patients, providers, brokers, and TPAs.

• By partnering with hospitals nationwide, HI Card reduces corporate health insurance premiums through automation and self - funding mechanisms, cutting administrative costs and enhancing benefits. • The platform provides secure, instant access to health data, plan details, claims, and directories, all with a single login. Patient seeks care Patient logs into HI Card Portal prior to their doctor visit Patient checks in with HI Card Patient’s plan and eligibility is accessed by providers and administrators Providers update patient’s records and billing within 24 hours onto HI Card and share all the data with insurance carrier Patient simply pays a co - pay and receives care Payers process claims and submits a copy for HI Card Health Intelligence Card (HI Card): Power on Integration 12 HI Card’s HI Performance Network offers Medicare - based reimbursement pricing, with direct Medicare contracts across 50 states, 10,489 hospitals, and over 1.3 million providers 50 States 10,489 Hospitals* 1,306,625 Provider Locations All numbers above are valued as of December 31, 2024.

Recent Development 14
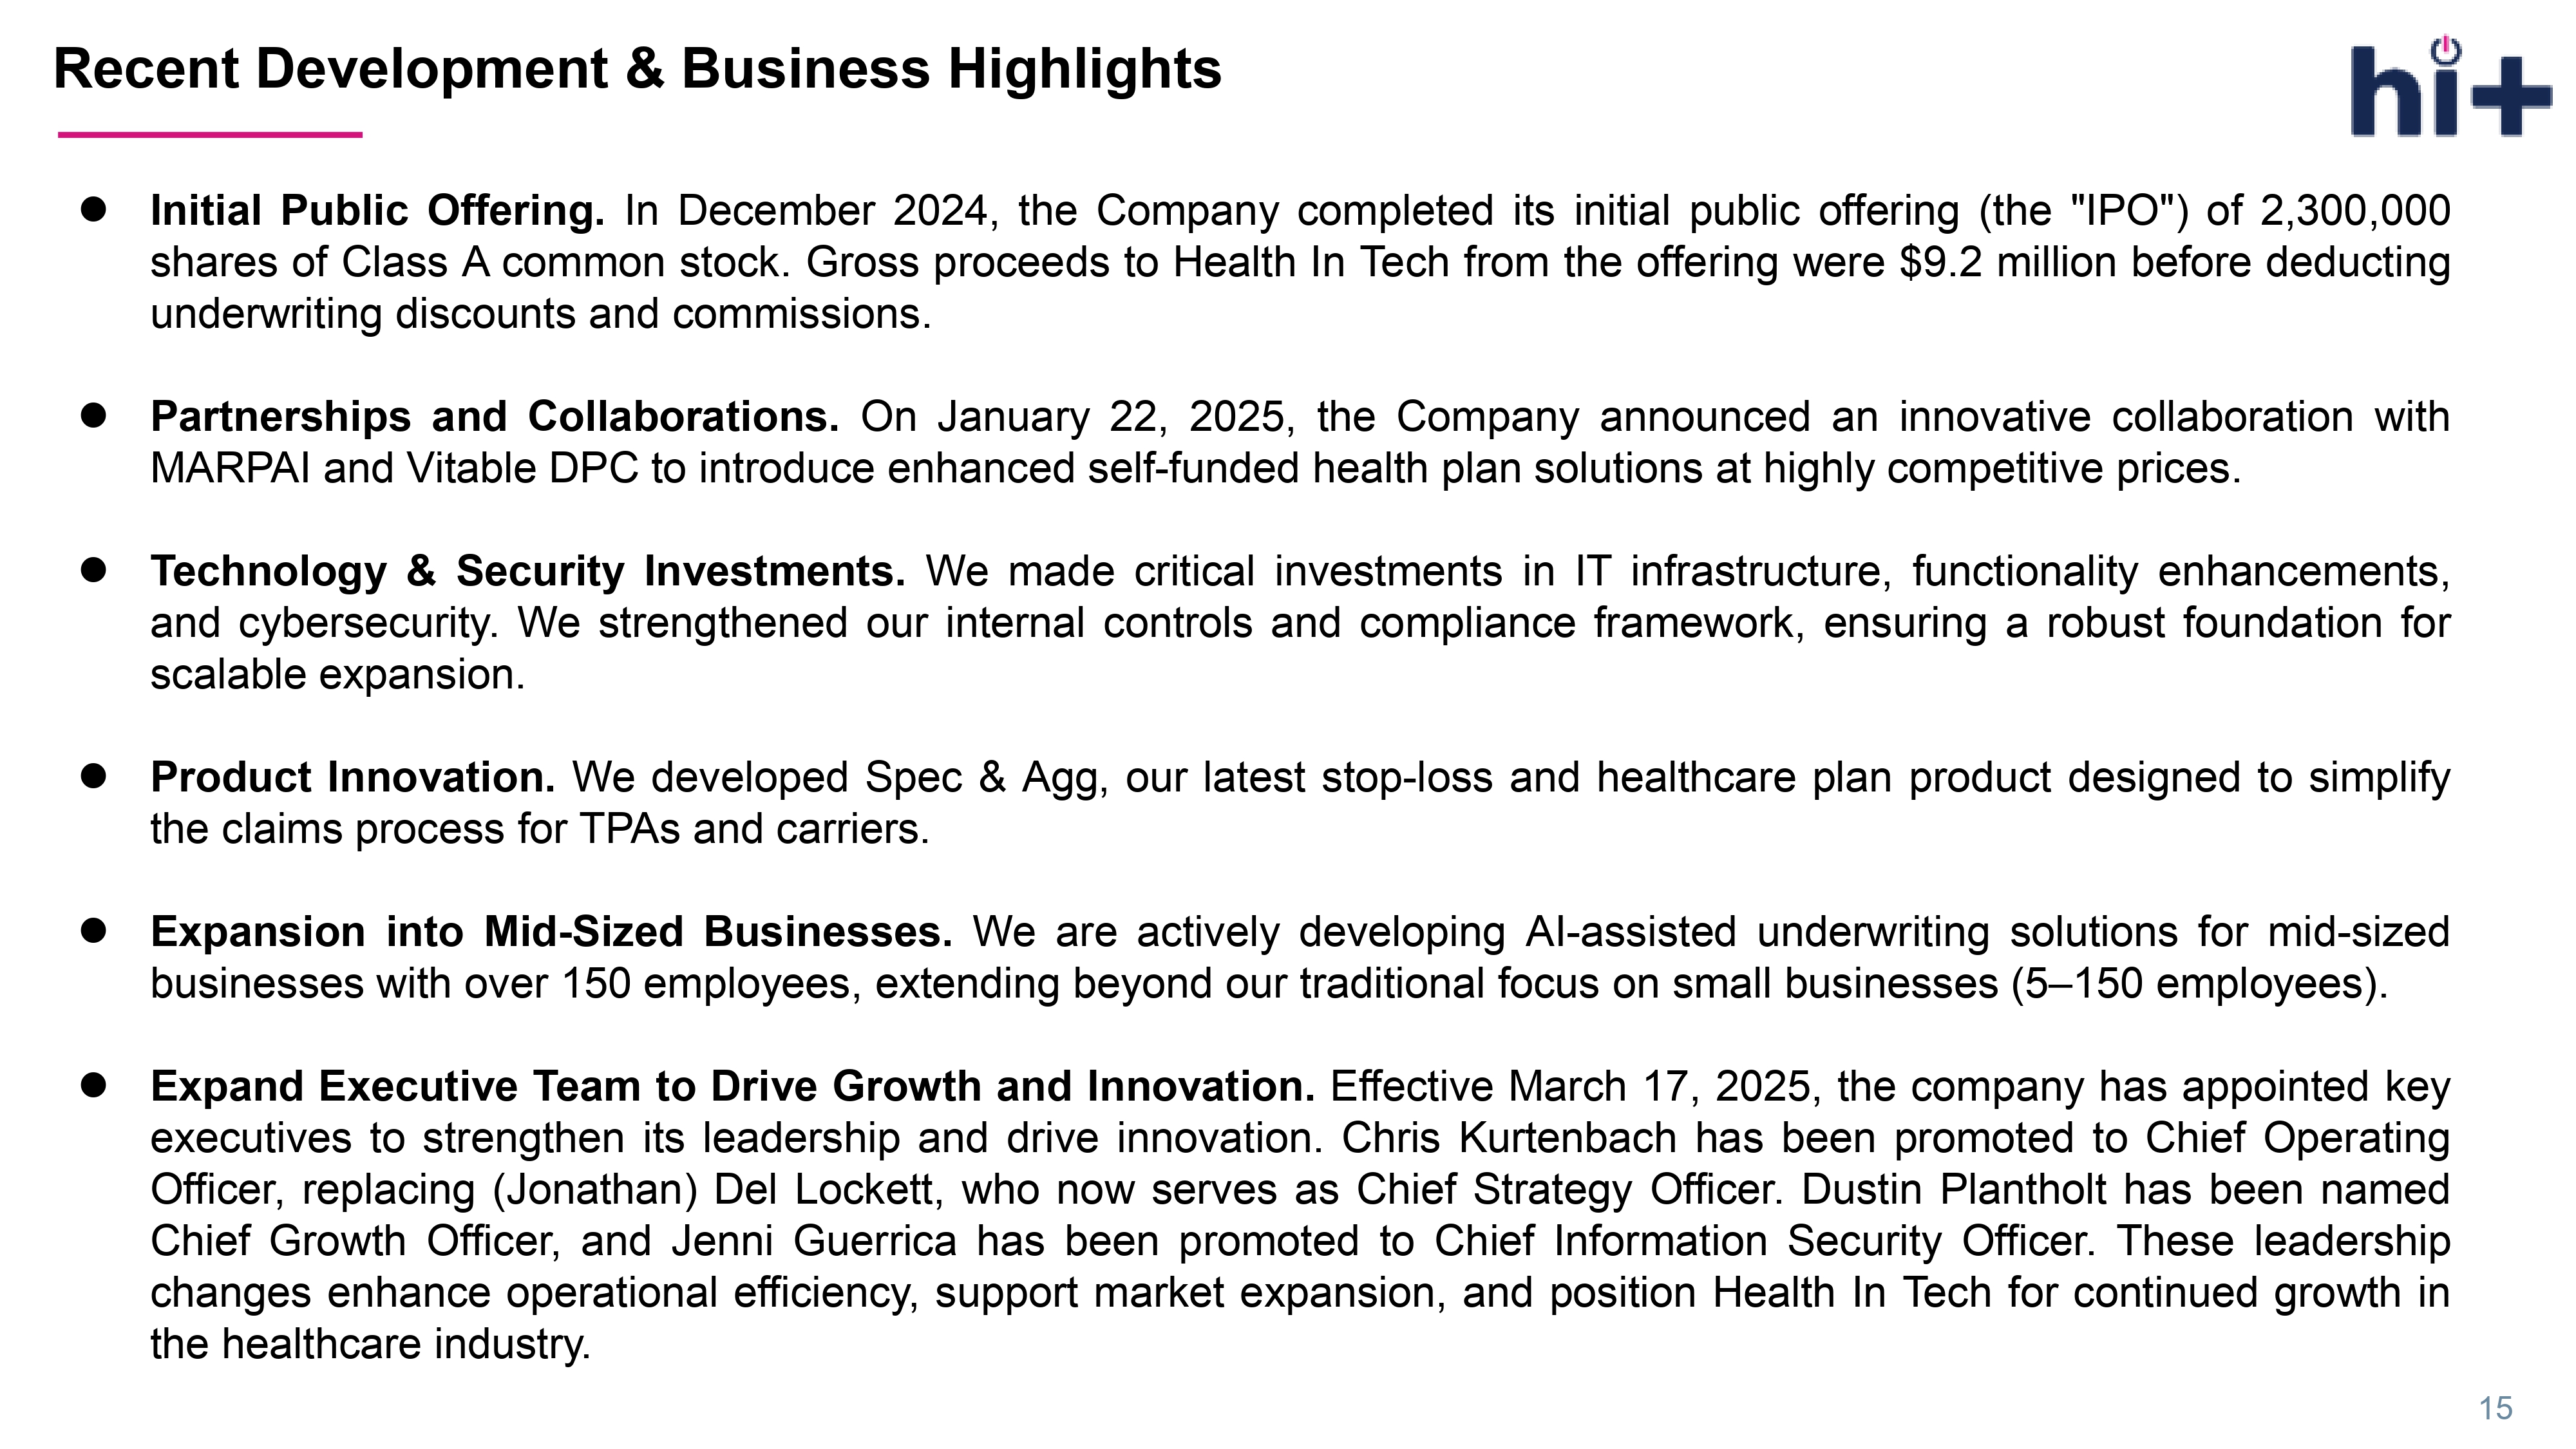
Hospital number includes multiple locations 13 HI - Performance Network: Power on Savings Recent Development & Business Highlights Initial Public Offering . In December 2024 , the Company completed its initial public offering (the "IPO") of 2 , 300 , 000 shares of Class A common stock . Gross proceeds to Health In Tech from the offering were $ 9 . 2 million before deducting underwriting discounts and commissions . Partnerships and Collaborations . On January 22 , 2025 , the Company announced an innovative collaboration with MARPAI and Vitable DPC to introduce enhanced self - funded health plan solutions at highly competitive prices . Technology & Security Investments . We made critical investments in IT infrastructure, functionality enhancements, and cybersecurity . We strengthened our internal controls and compliance framework, ensuring a robust foundation for scalable expansion . Product Innovation. We developed Spec & Agg, our latest stop - loss and healthcare plan product designed to simplify the claims process for TPAs and carriers. Expansion into Mid - Sized Businesses . We are actively developing AI - assisted underwriting solutions for mid - sized businesses with over 150 employees, extending beyond our traditional focus on small businesses ( 5 – 150 employees) . Expand Executive Team to Drive Growth and Innovation . Effective March 17 , 2025 , the company has appointed key executives to strengthen its leadership and drive innovation . Chris Kurtenbach has been promoted to Chief Operating Officer, replacing (Jonathan) Del Lockett, who now serves as Chief Strategy Officer . Dustin Plantholt has been named Chief Growth Officer, and Jenni Guerrica has been promoted to Chief Information Security Officer . These leadership changes enhance operational efficiency, support market expansion, and position Health In Tech for continued growth in the healthcare industry . 15 Revenue Composition Revenues from underwriting modelling Revenues from Program HI Card: A flat fee per employee per month (PEPM) SMR: A flat fee per employee per month (PEPM) ICE: Fee as % of premiums received as the carrier Key Growth Driver The number of enrolled employees from employers purchased healthcare plan with stoploss medical insurance Revenue Composition and Key Growth Driver 17

Financial Overview 16

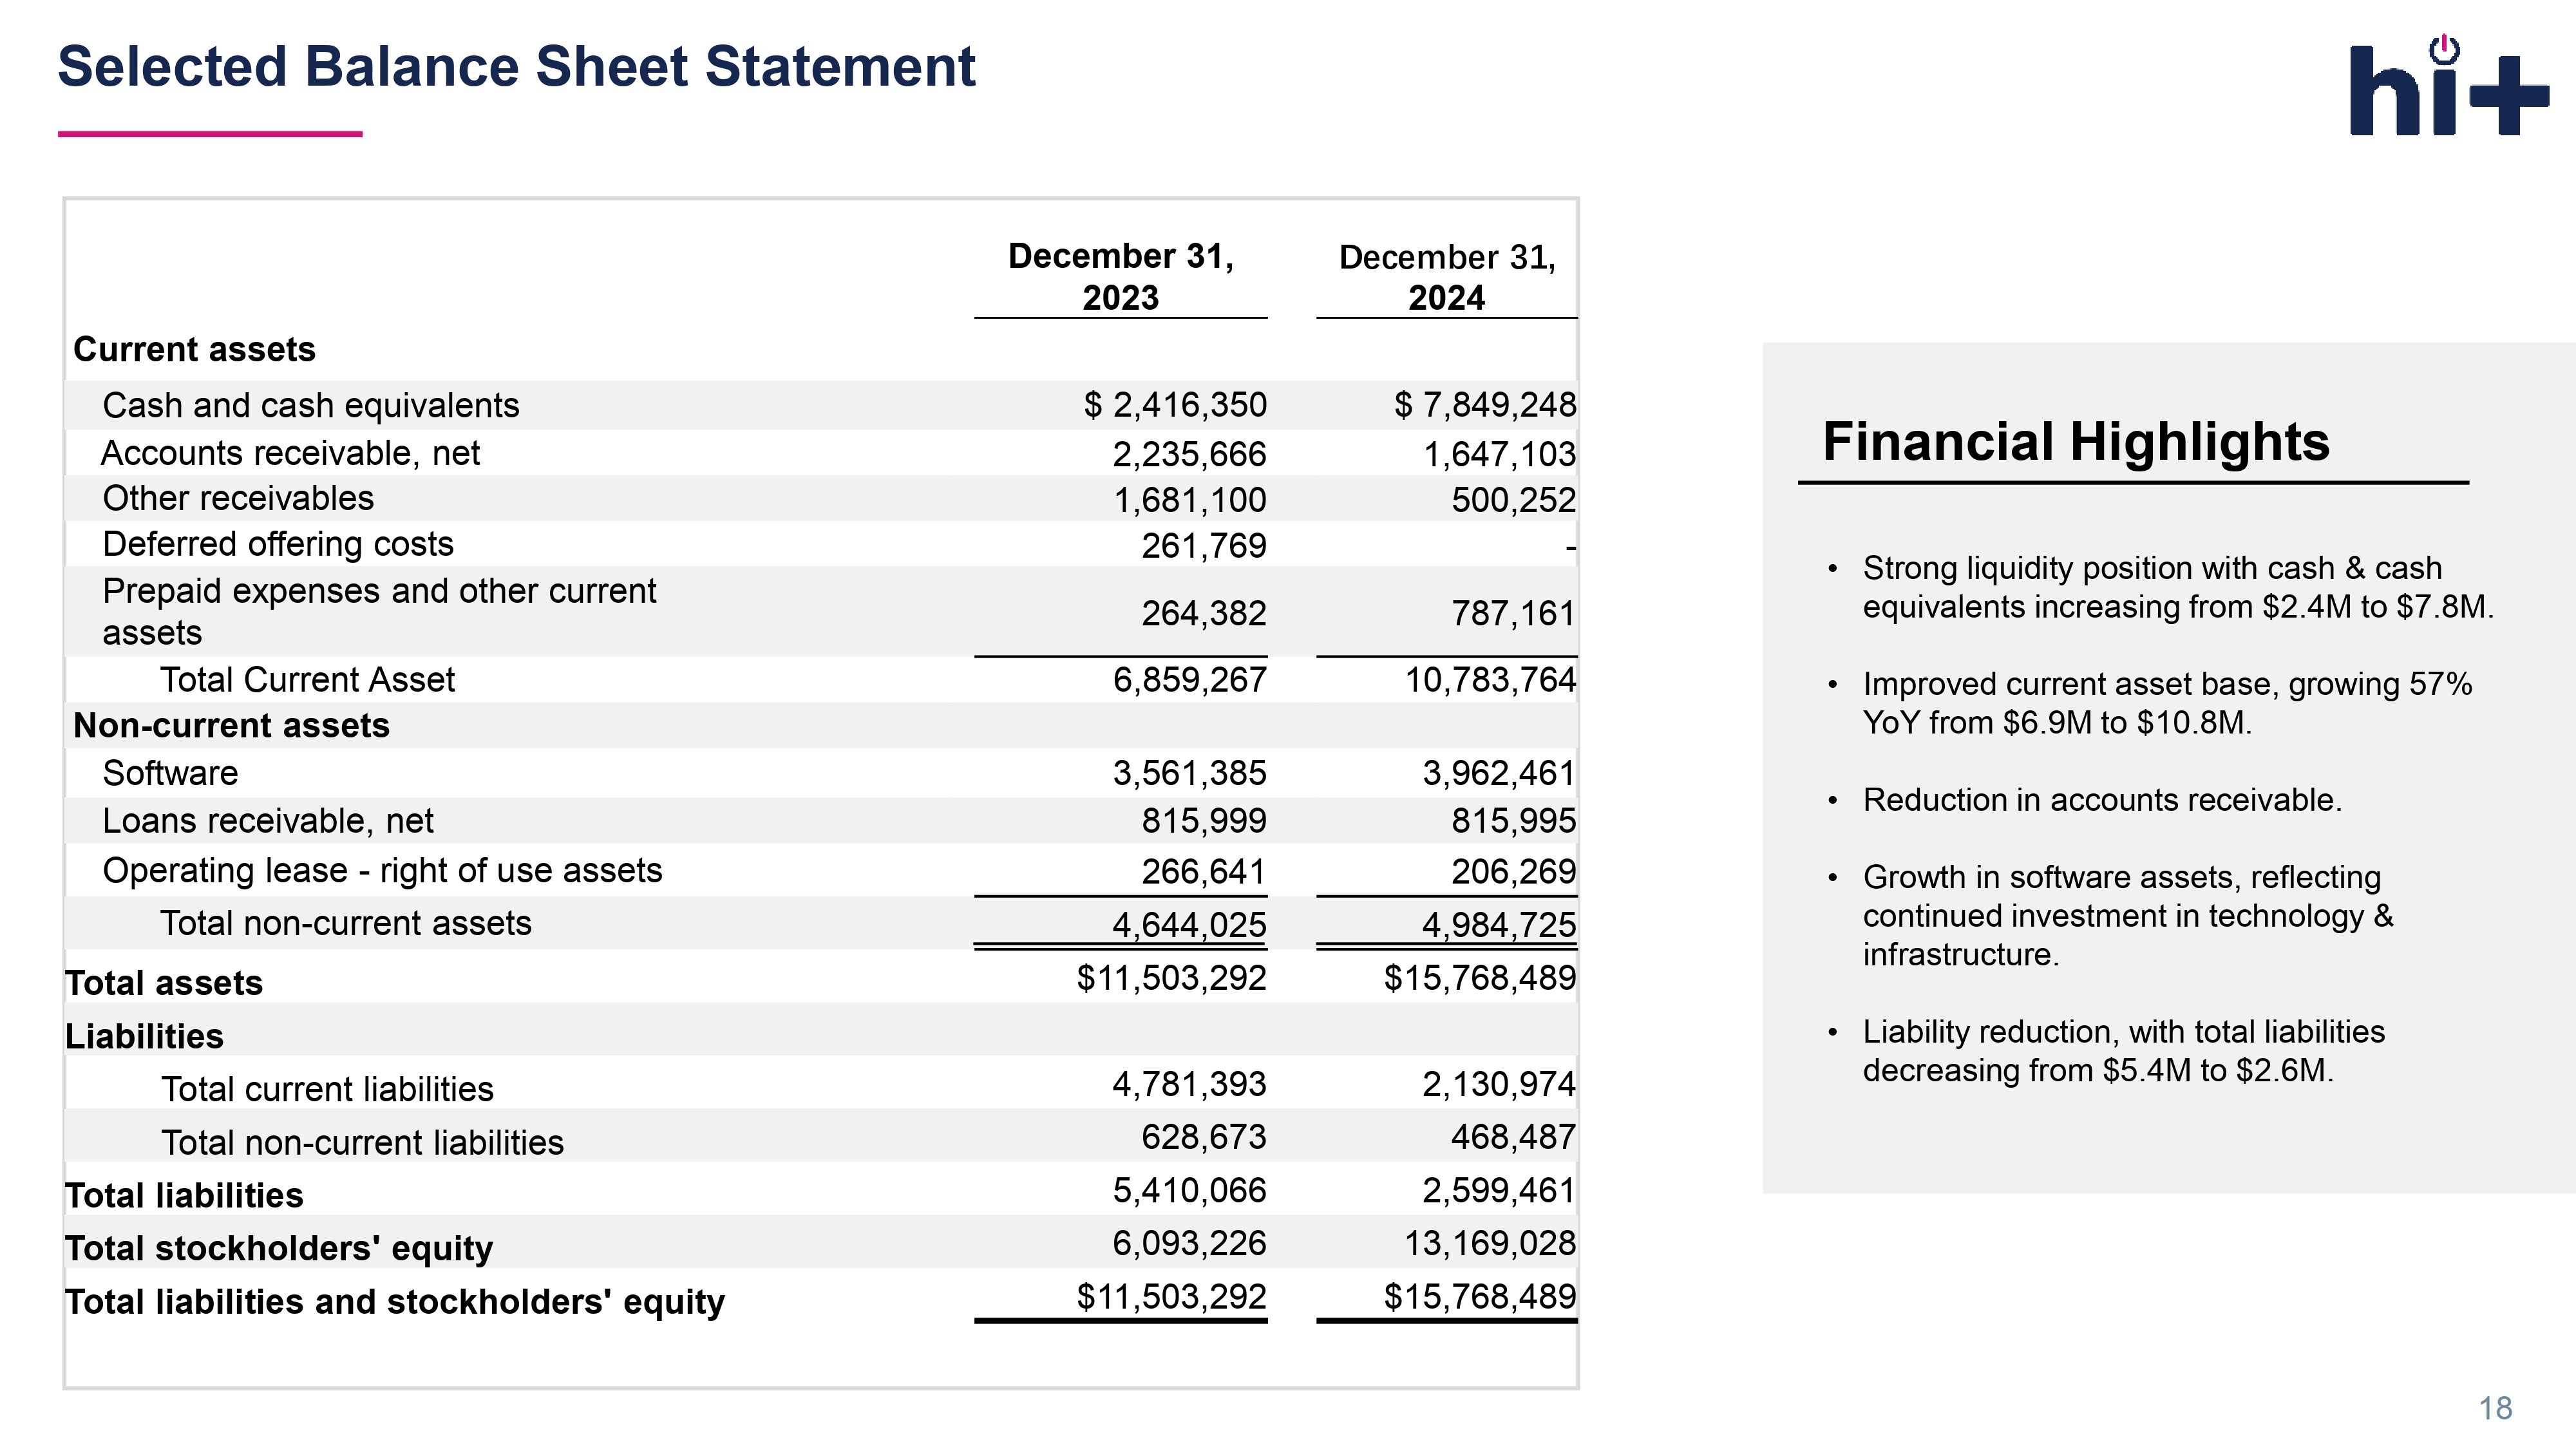
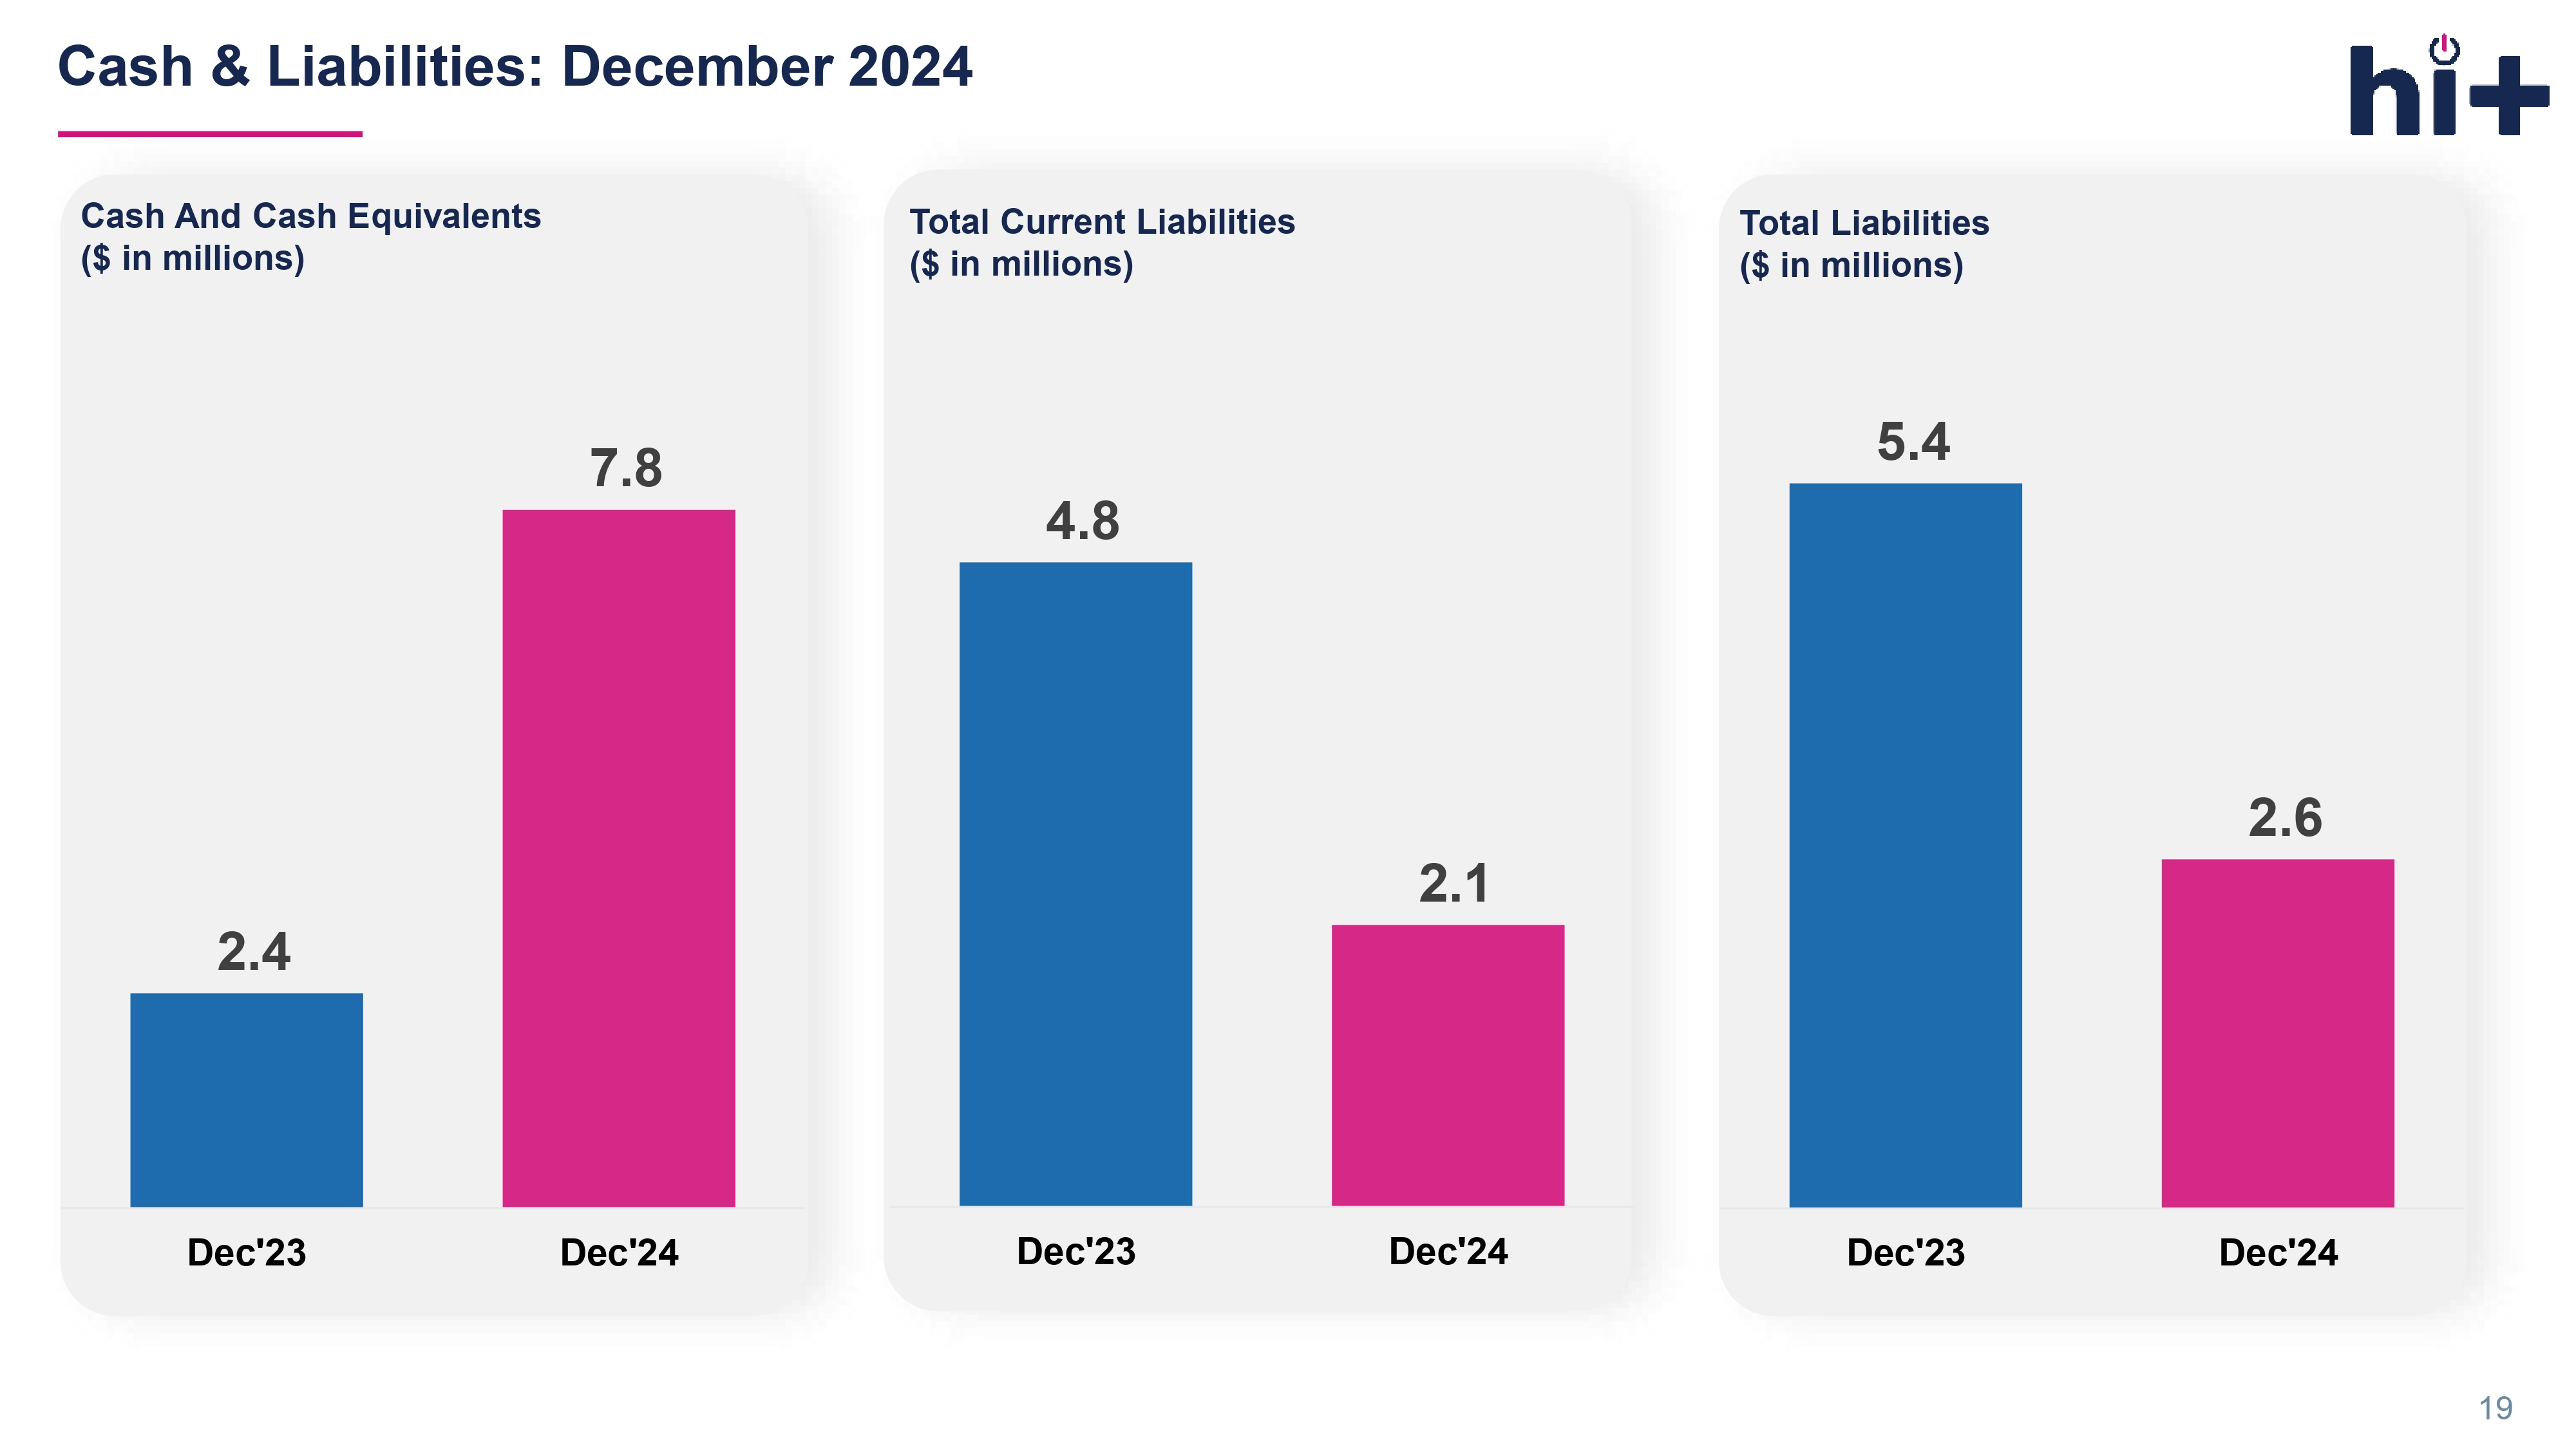
December 31, 2024 December 31, 2023 Current assets $ 7,849,248 $ 2,416,350 Cash and cash equivalents 1,647,103 2,235,666 Accounts receivable, net 500,252 1,681,100 Other receivables - 261,769 Deferred offering costs 787,161 264,382 Prepaid expenses and other current assets 10,783,764 6,859,267 Total Current Asset Non - current assets 3,962,461 3,561,385 Software 815,995 815,999 Loans receivable, net 206,269 266,641 Operating lease - right of use assets 4,984,725 4,644,025 Total non - current assets $15,768,489 $11,503,292 Total assets Liabilities 2,130,974 4,781,393 Total current liabilities 468,487 628,673 Total non - current liabilities 2,599,461 5,410,066 Total liabilities 13,169,028 6,093,226 Total stockholders' equity $15,768,489 $11,503,292 Total liabilities and stockholders' equity Selected Balance Sheet Statement Financial Highlights • Strong liquidity position with cash & cash equivalents increasing from $2.4M to $7.8M. • Improved current asset base, growing 57% YoY from $6.9M to $10.8M. • Reduction in accounts receivable. • Growth in software assets, reflecting continued investment in technology & infrastructure. • Liability reduction, with total liabilities decreasing from $5.4M to $2.6M. 18 2.4 7.8 Dec'23 Dec'24 Cash & Liabilities: December 2024 4.8 19 2.1 Dec'23 Dec'24 Cash And Cash Equivalents ($ in millions) Total Current Liabilities ($ in millions) 5.4 2.6 Dec'23 Dec'24 Total Liabilities ($ in millions)
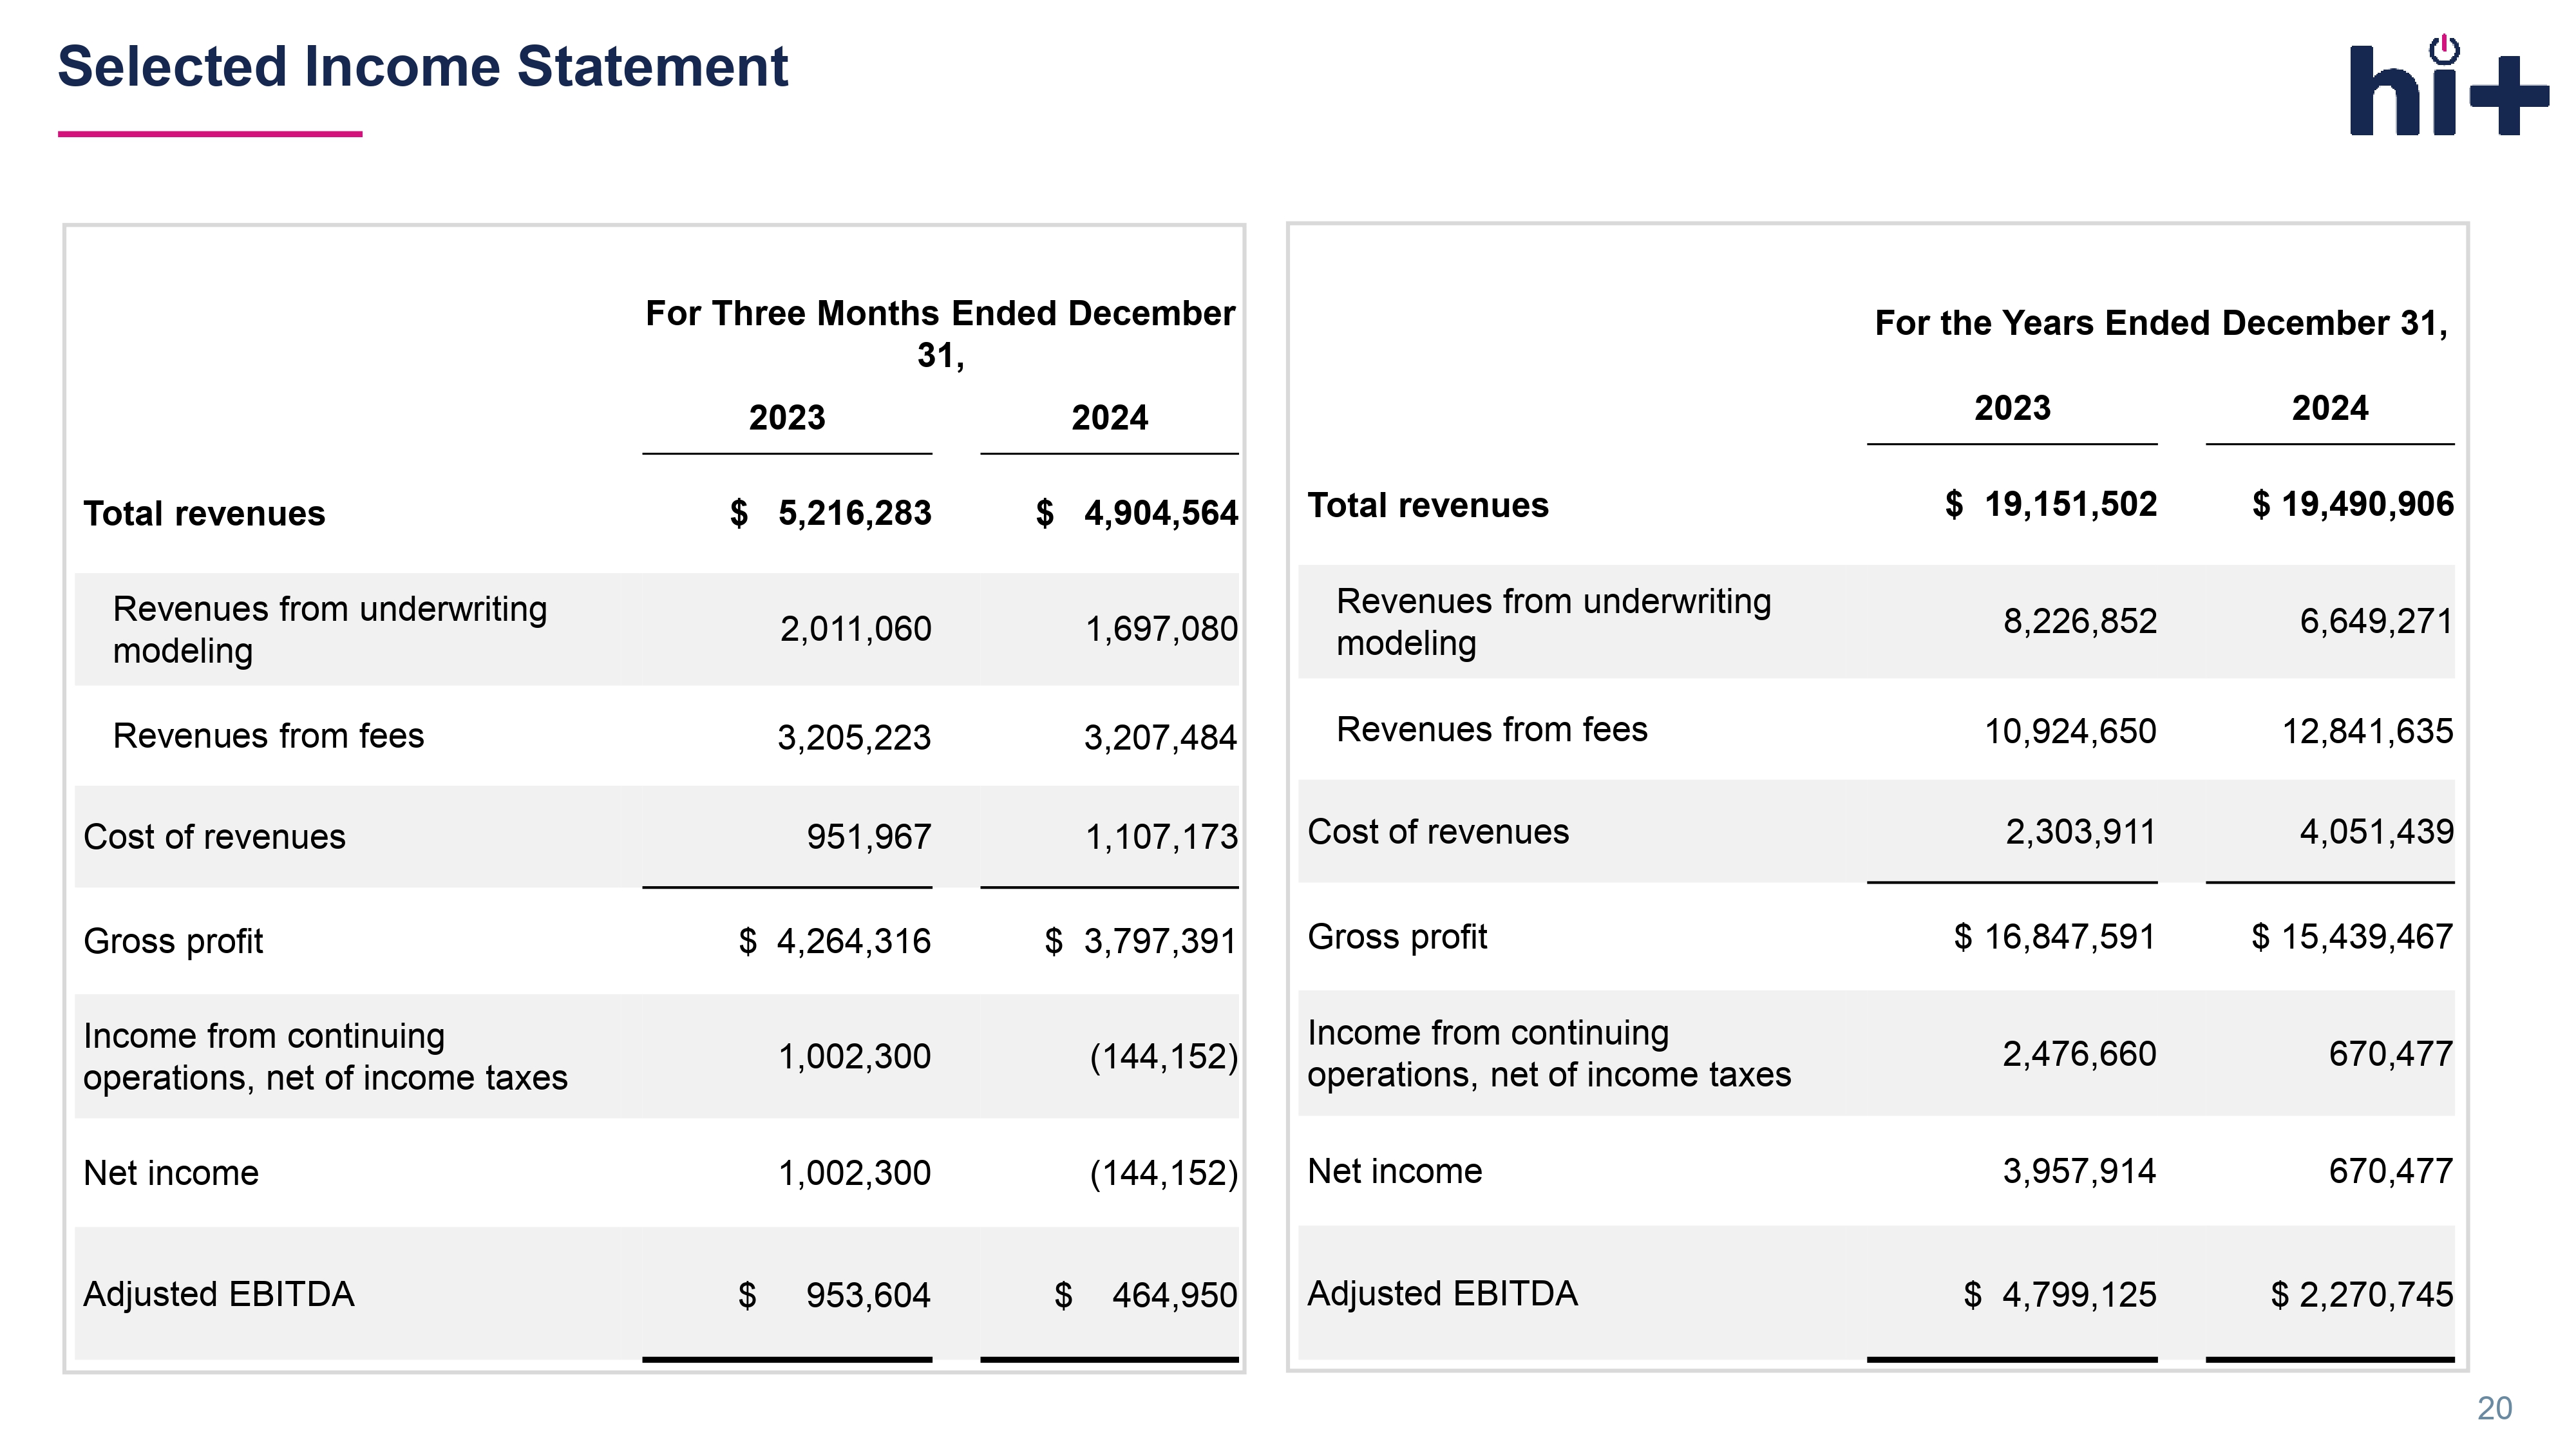
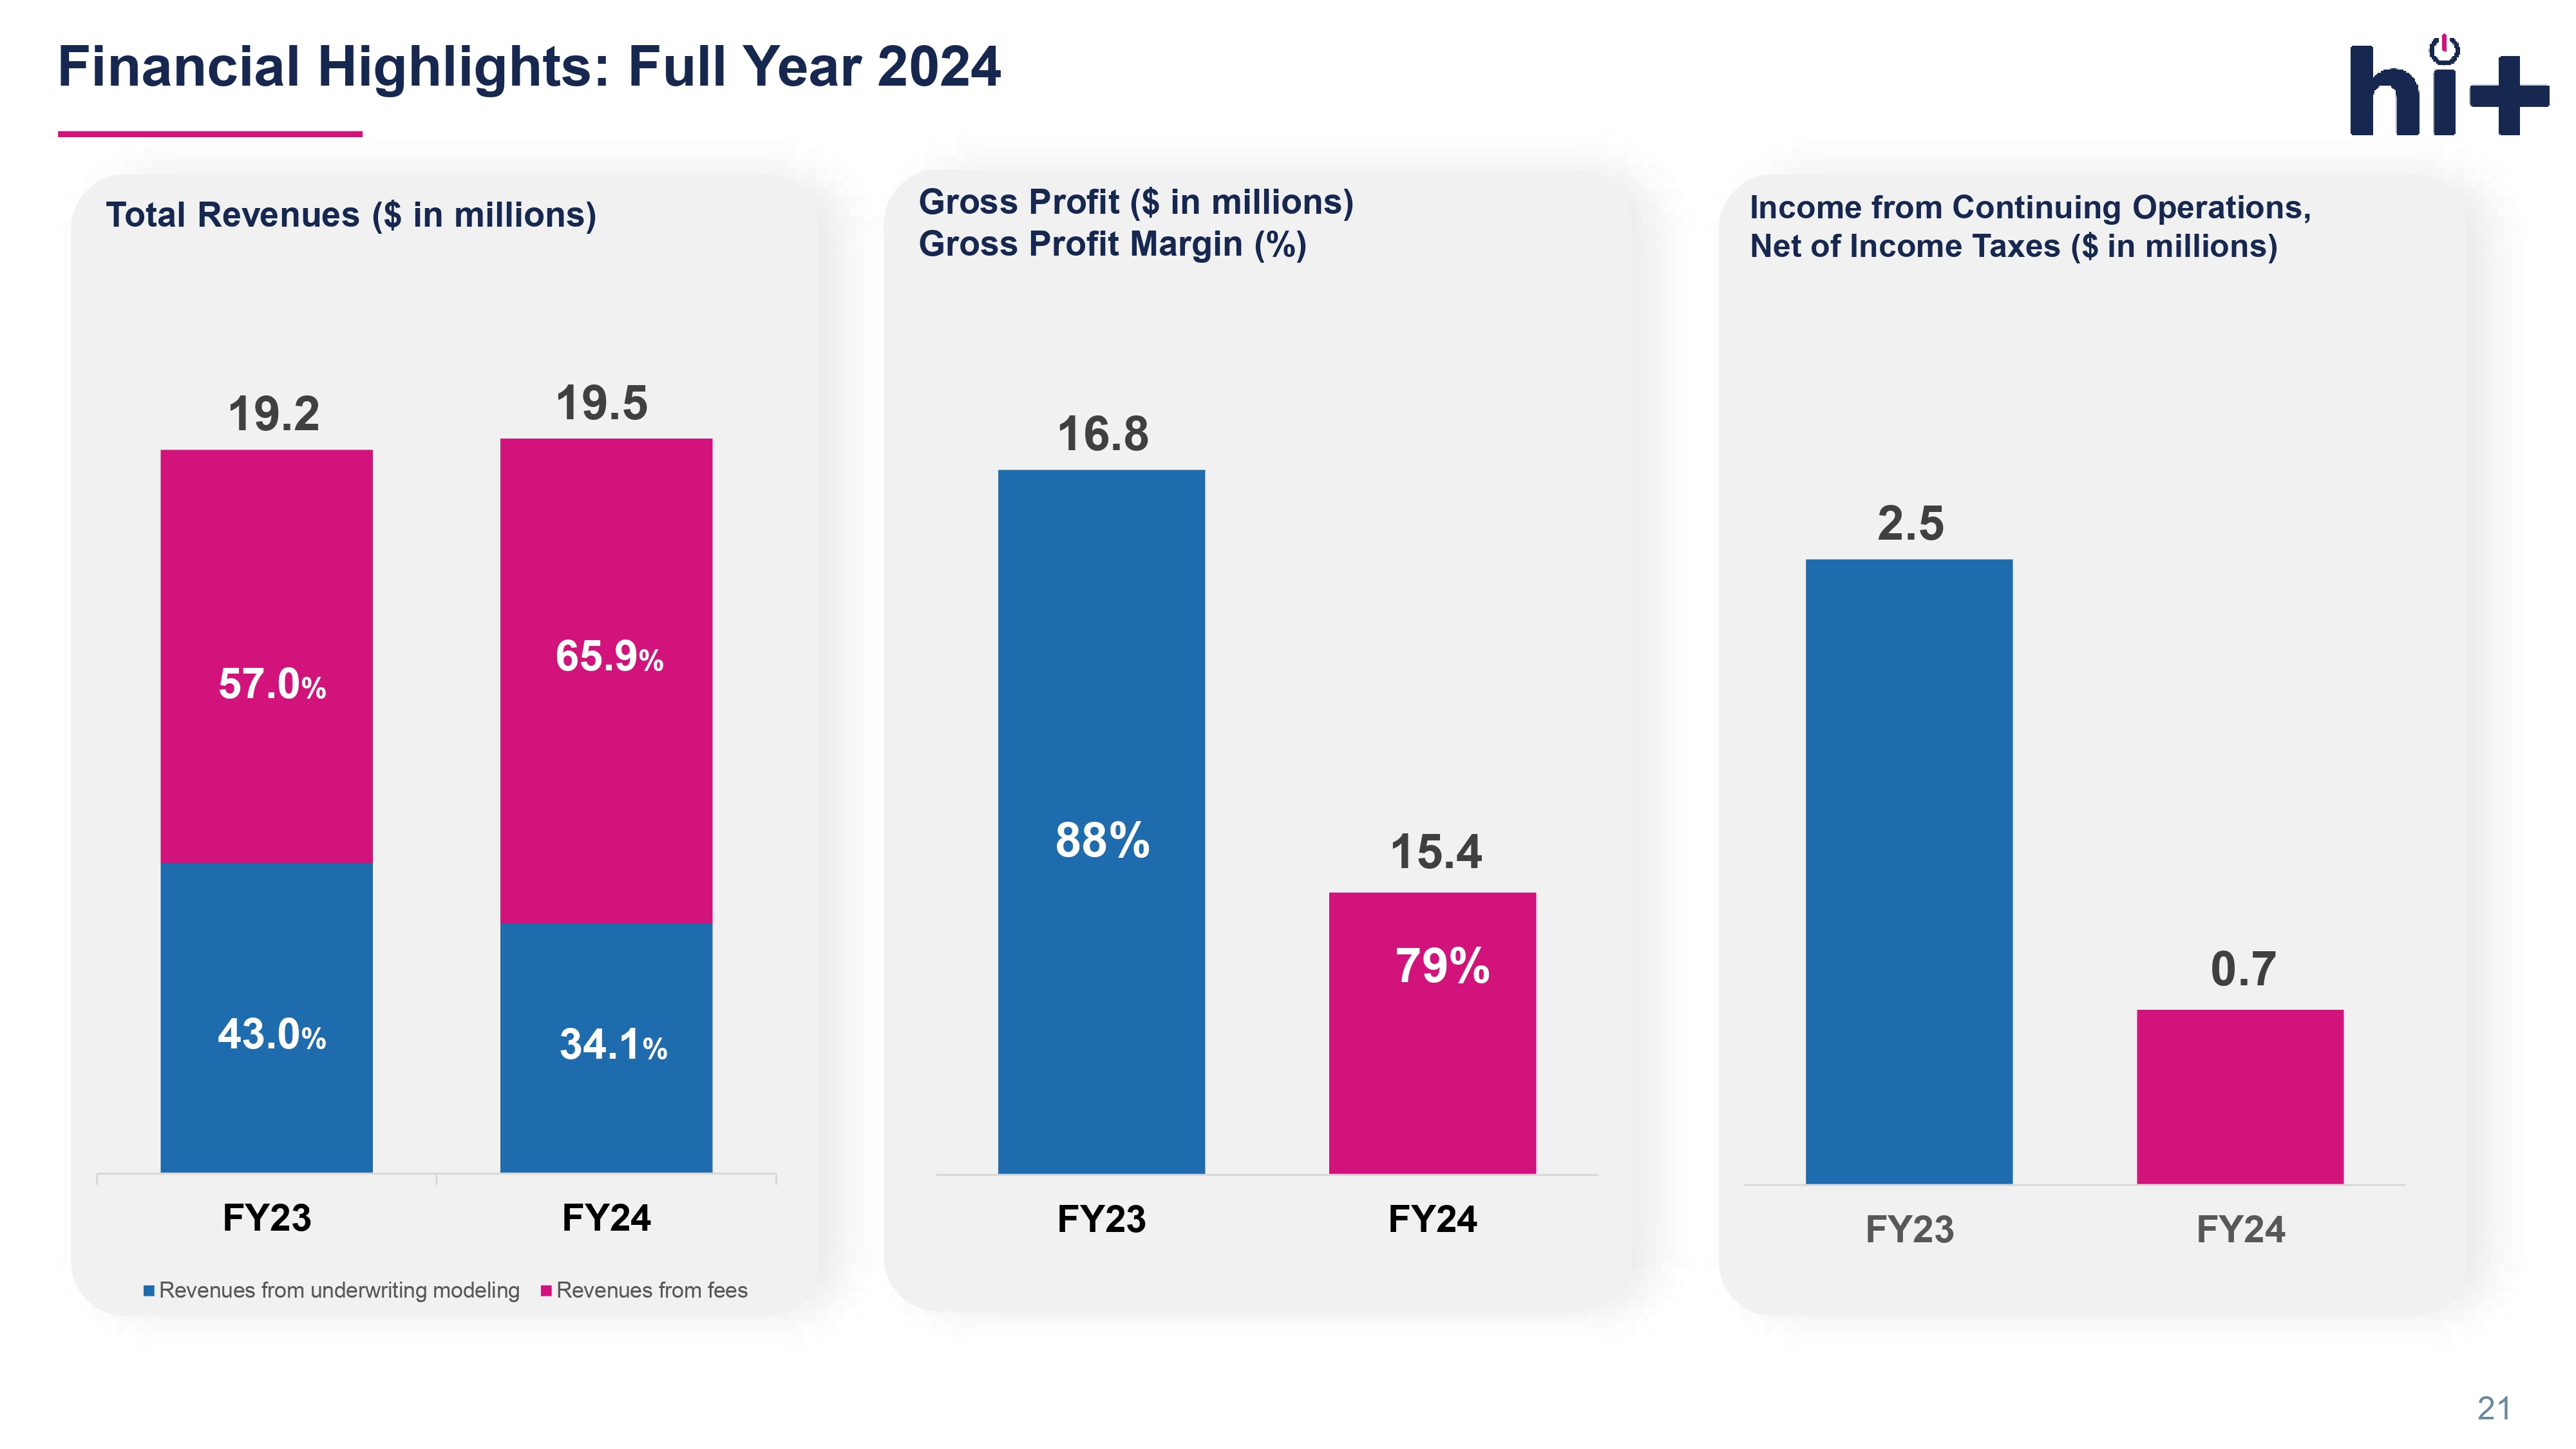
For Three Months Ended December 31, 2024 2023 $ 4,904,564 $ 5,216,283 Total revenues 1,697,080 2,011,060 Revenues from underwriting modeling 3,207,484 3,205,223 Revenues from fees 1,107,173 951,967 Cost of revenues $ 3,797,391 $ 4,264,316 Gross profit (144,152) 1,002,300 Income from continuing operations, net of income taxes (144,152) 1,002,300 Net income $ 464,950 $ 953,604 Adjusted EBITDA Selected Income Statement For the Years Ended December 31, 2024 2023 $ 19,490,906 $ 19,151,502 Total revenues 6,649,271 8,226,852 Revenues from underwriting modeling 12,841,635 10,924,650 Revenues from fees 4,051,439 2,303,911 Cost of revenues $ 15,439,467 $ 16,847,591 Gross profit 670,477 2,476,660 Income from continuing operations, net of income taxes 670,477 3,957,914 Net income $ 2,270,745 $ 4,799,125 Adjusted EBITDA 20 16.8 15.4 FY23 FY24 88% 79% 19.2 19.5 FY23 FY24 Revenues from underwriting modeling Revenues from fees 65.9 % 34.1 % Total Revenues ($ in millions) Gross Profit ($ in millions) Gross Profit Margin (%) Financial Highlights: Full Year 2024 Income from Continuing Operations, Net of Income Taxes ($ in millions) 43.0 % 57.0 % 2.5 21 0.7 FY23 FY24
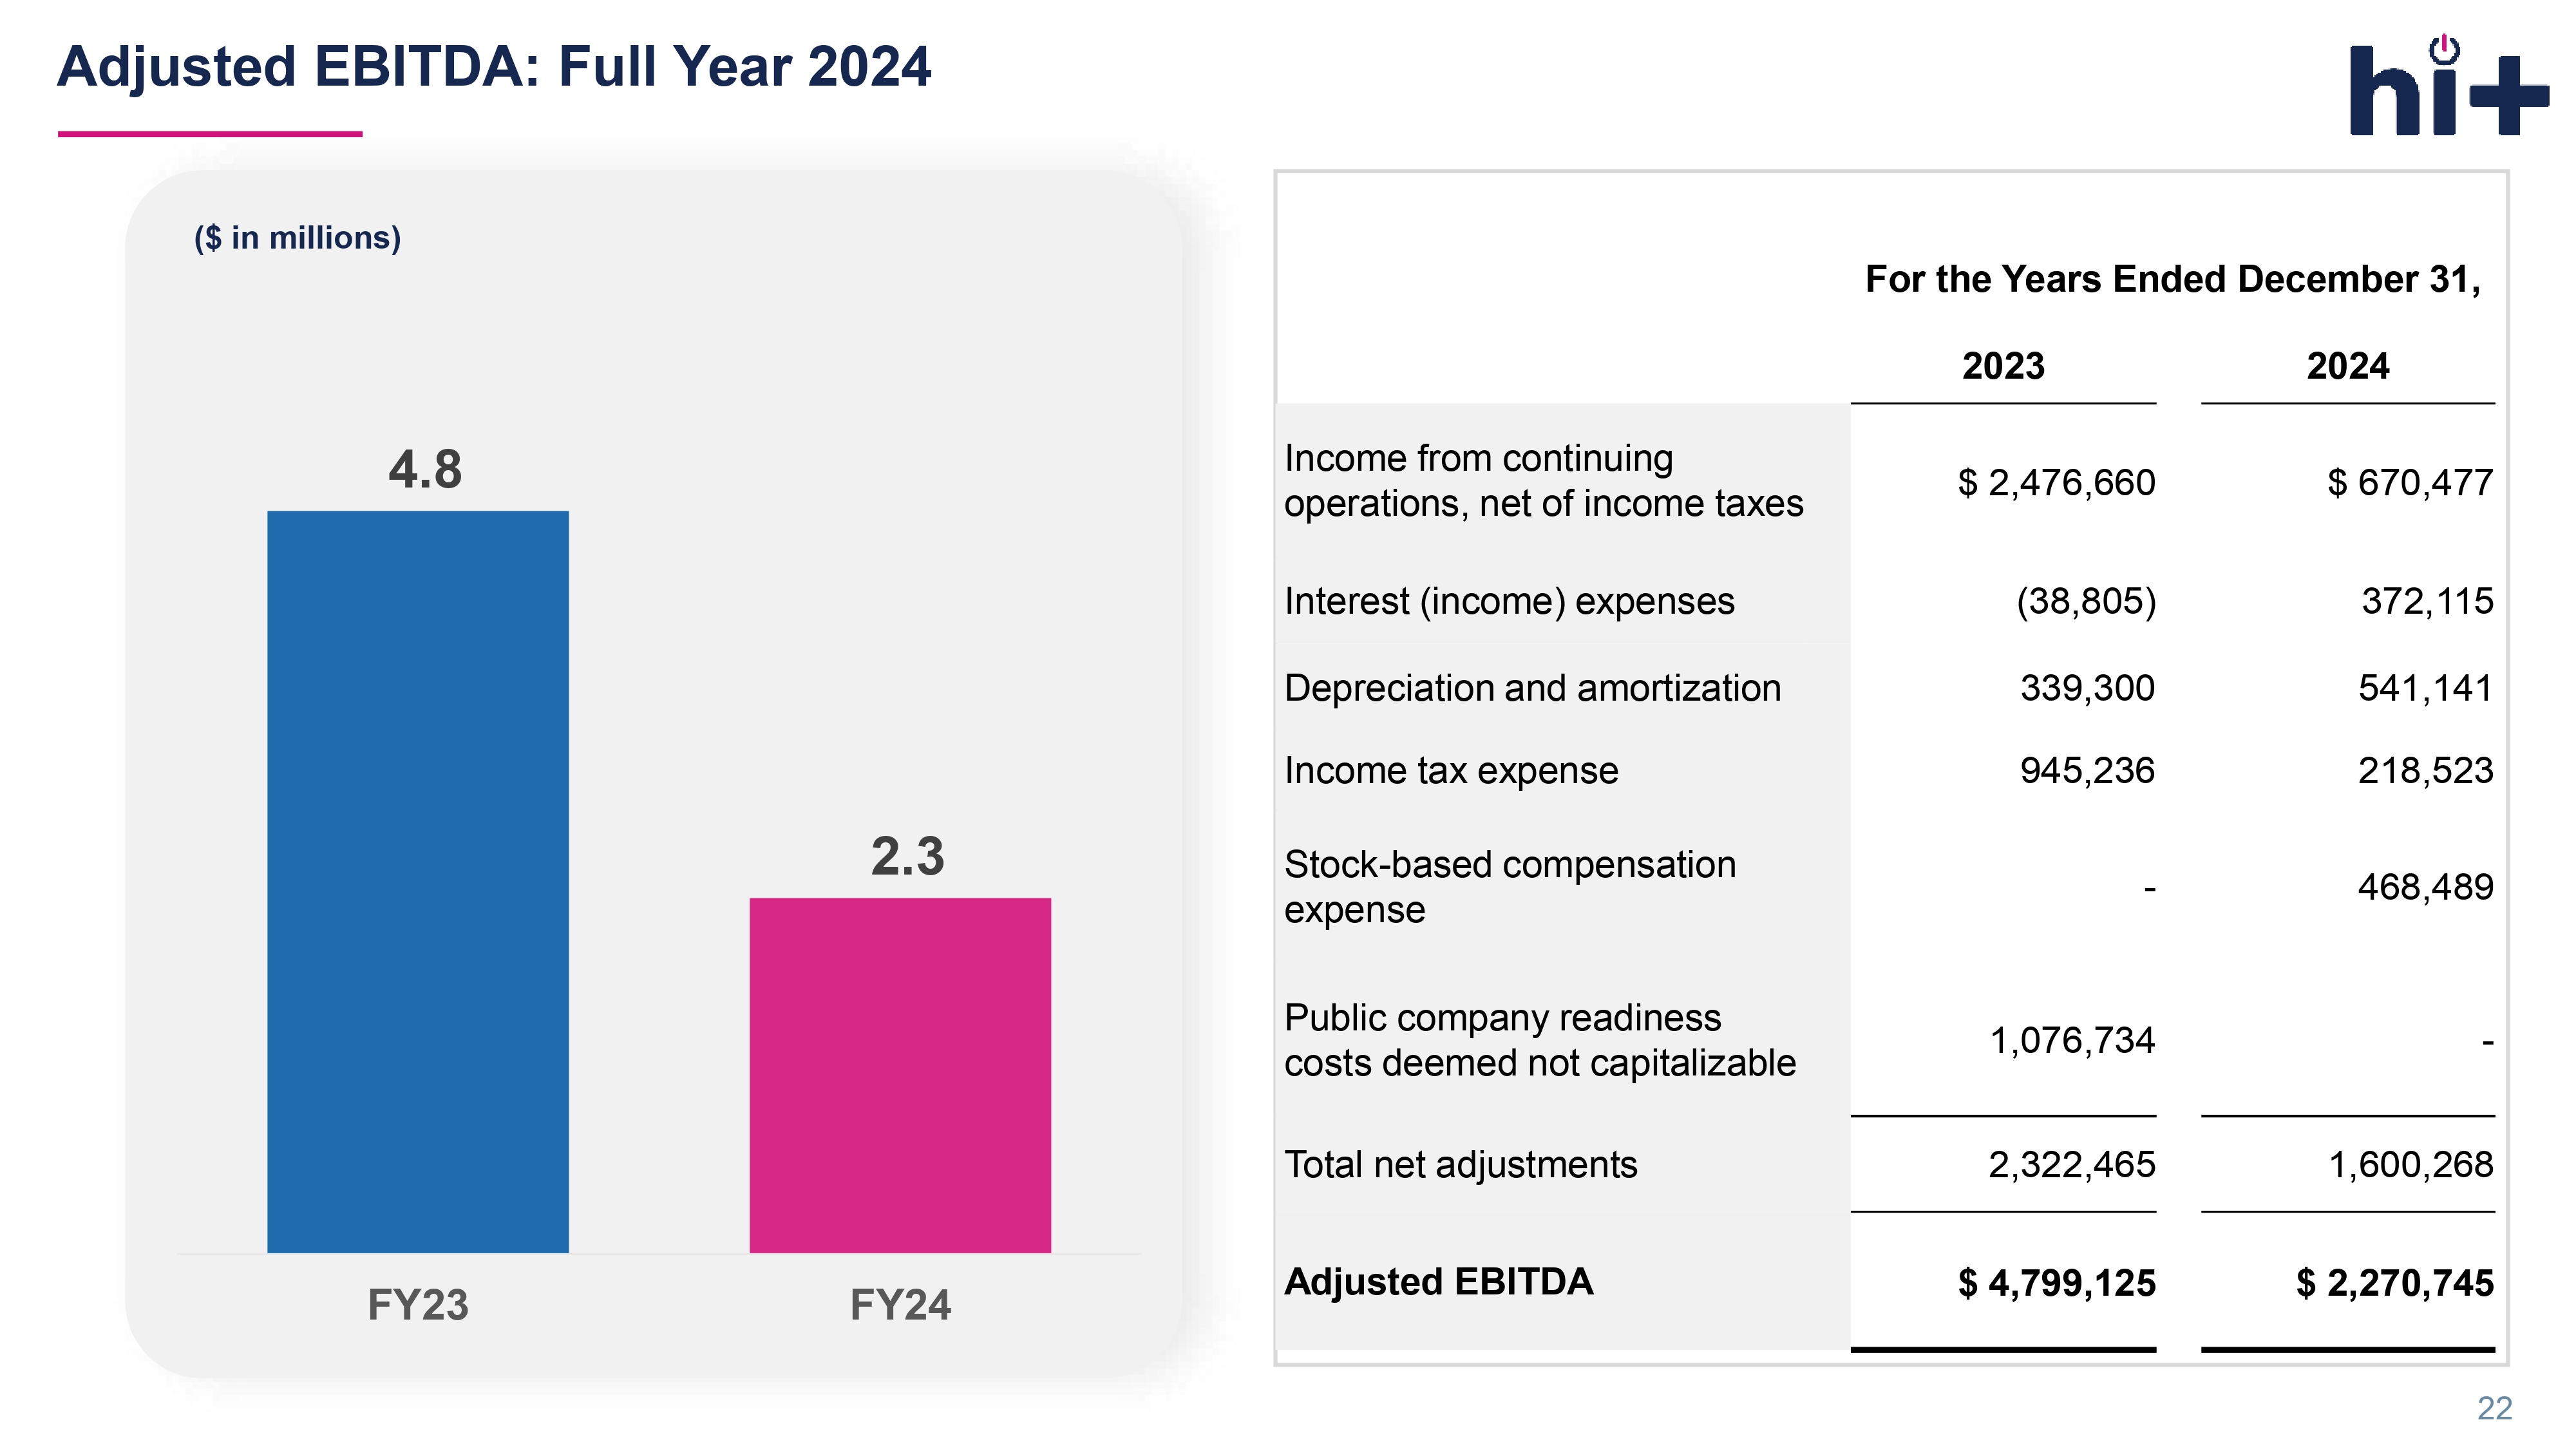
Adjusted EBITDA: Full Year 2024 ($ in millions) For the Years Ended December 31, 2024 2023 $ 670,477 $ 2,476,660 Income from continuing operations, net of income taxes 372,115 (38,805) Interest (income) expenses 541,141 339,300 Depreciation and amortization 218,523 945,236 Income tax expense 468,489 - Stock - based compensation expense - 1,076,734 Public company readiness costs deemed not capitalizable 1,600,268 2,322,465 Total net adjustments $ 2,270,745 $ 4,799,125 Adjusted EBITDA 4.8 2.3 FY23 FY24 22 4.3 3.8 Q4'23 Q4'24 Gross Profit ($ in millions) Gross Profit Margin (%) 5.2 4.9 Q4'23 Q4'24 Revenues from underwriting modeling Revenues from fees 65.4 % 34.6 % Total Revenues ($ in millions) 38.6 % 61.4 % Financial Highlights: Q4 2024 Income from Continuing Operations, Net of Income Taxes ($ in millions) 1.0 - 0.1 Q4'23 Q4'24 82% 23 77%

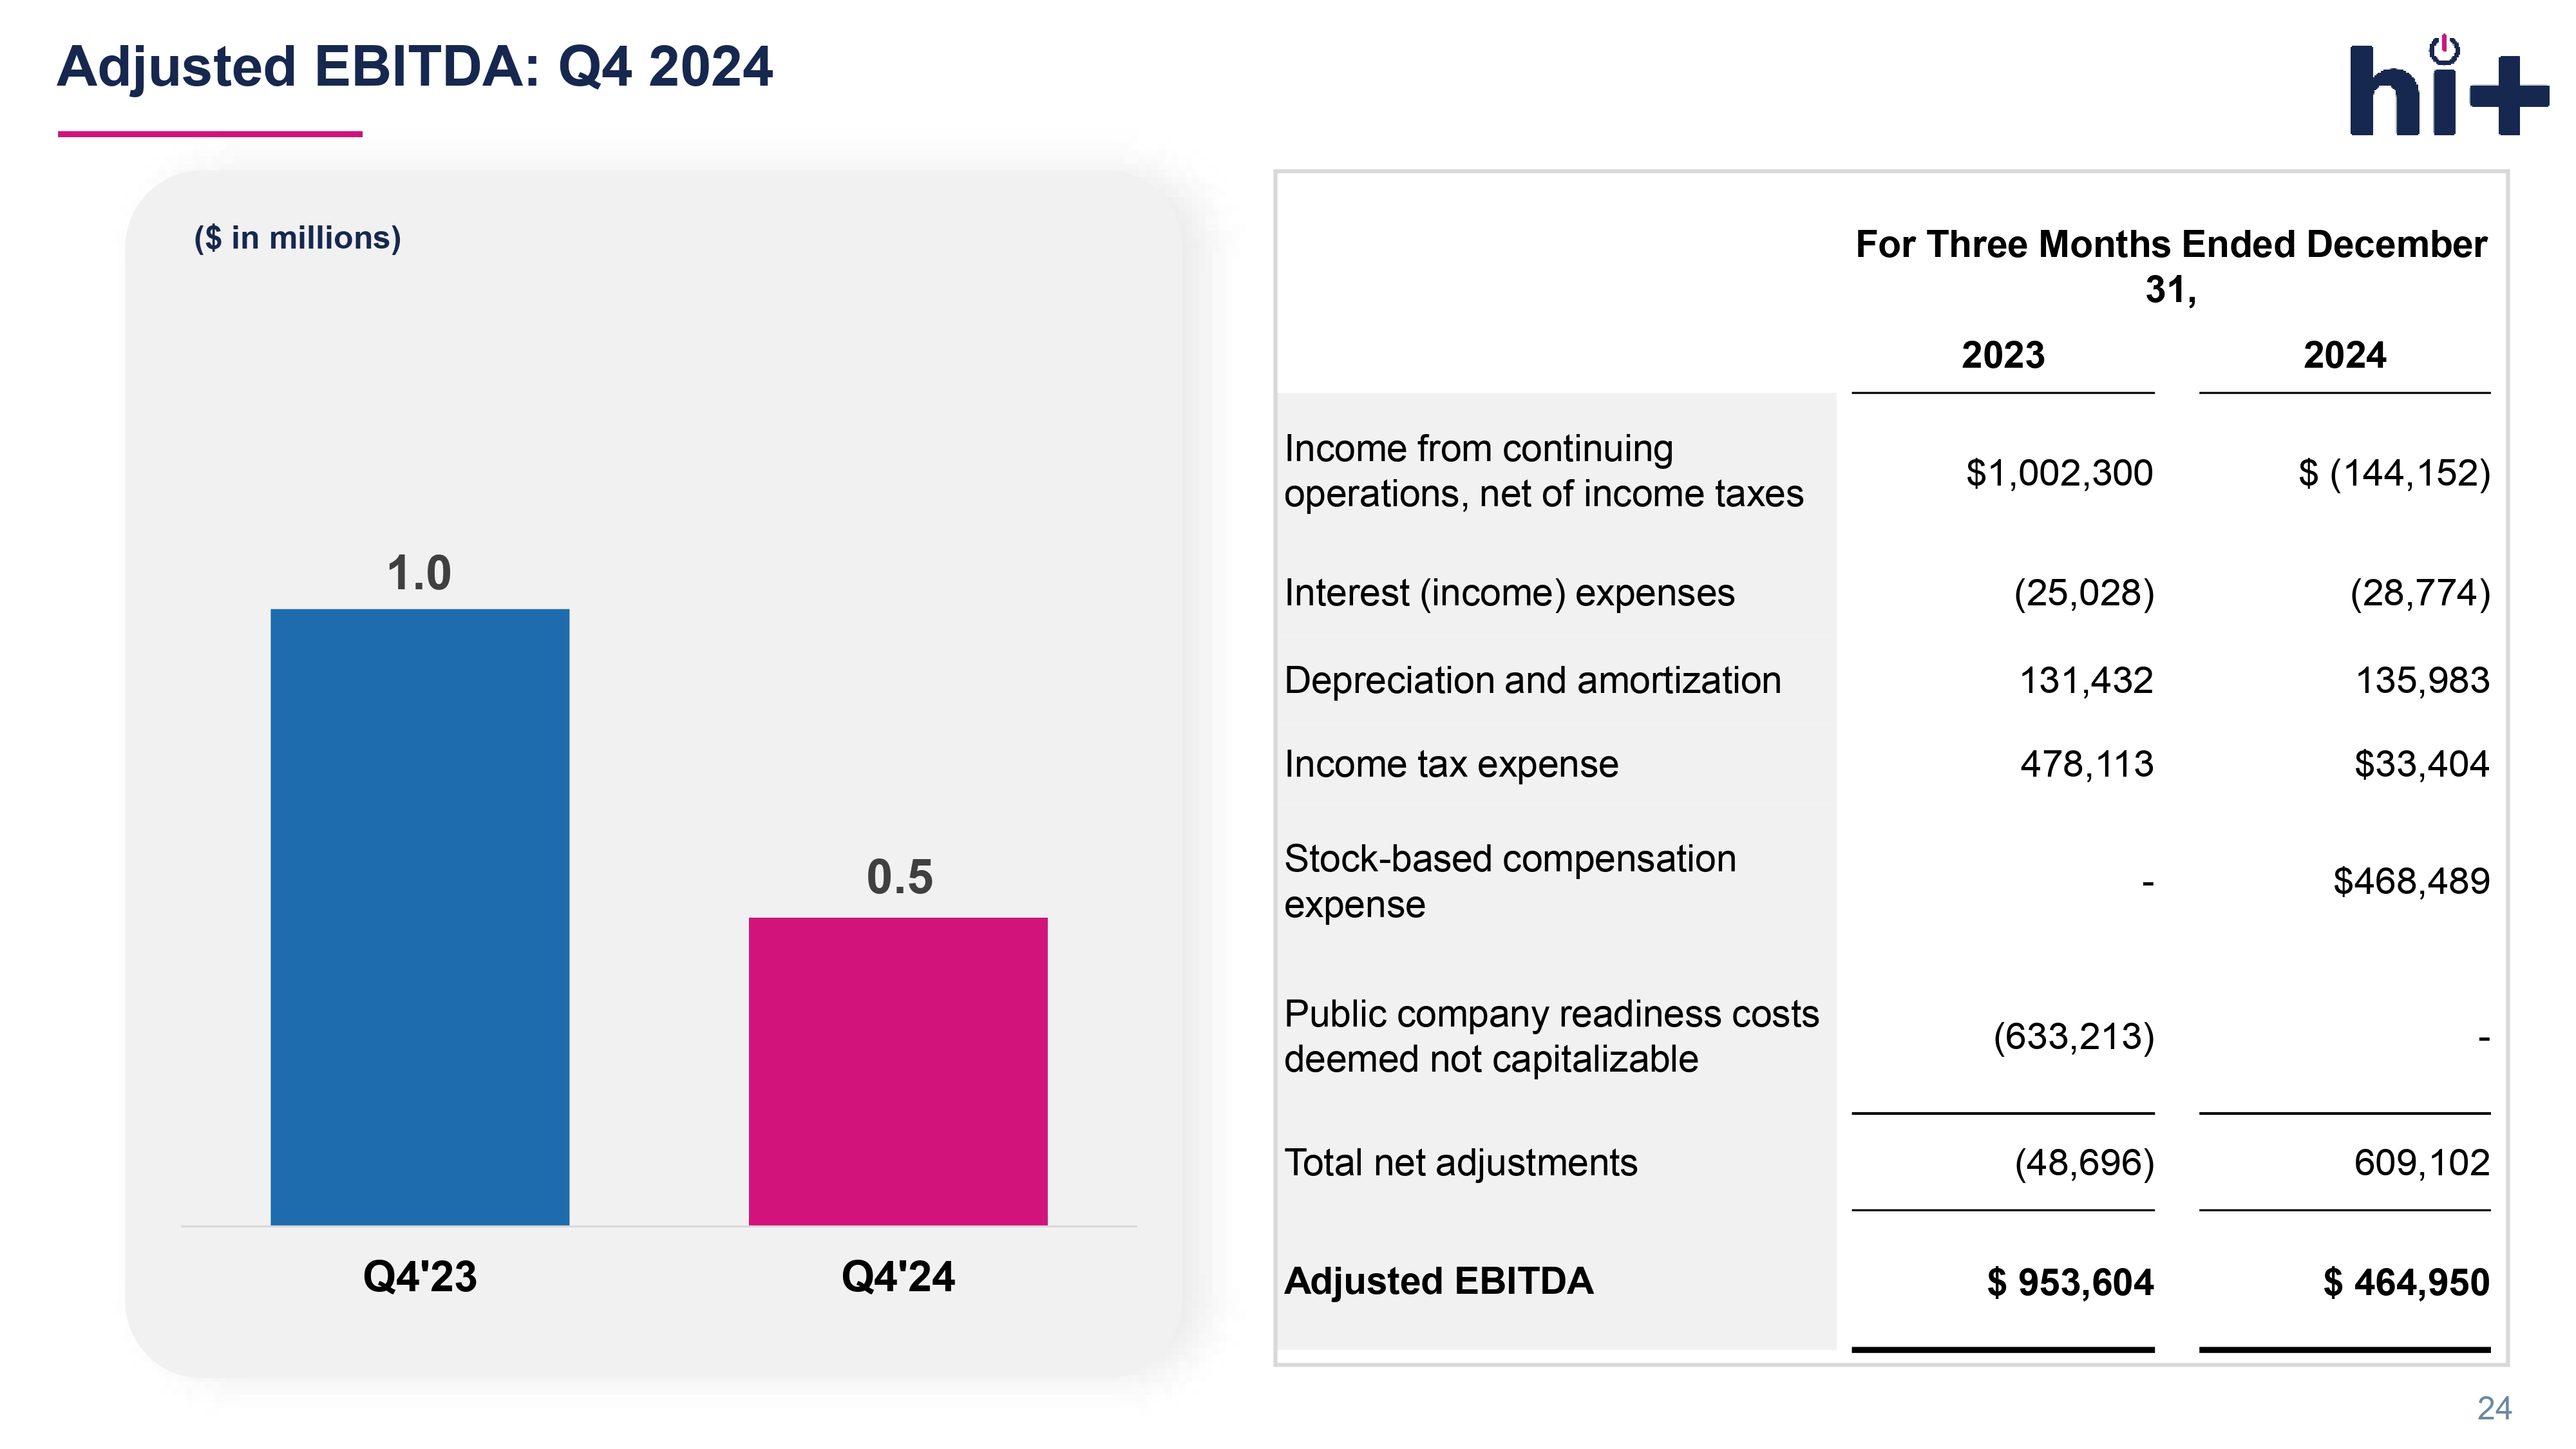
For Three Months Ended December 31, 2024 2023 $ (144,152) $1,002,300 Income from continuing operations, net of income taxes (28,774) (25,028) Interest (income) expenses 135,983 131,432 Depreciation and amortization $33,404 478,113 Income tax expense $468,489 - Stock - based compensation expense - (633,213) Public company readiness costs deemed not capitalizable 609,102 (48,696) Total net adjustments $ 464,950 $ 953,604 Adjusted EBITDA Adjusted EBITDA: Q4 2024 ($ in millions) 1.0 24 0.5 Q4'23 Q4'24 • “ Broker” or “insurance broker” is an intermediary who sells, solicits or negotiates insurance policies on behalf of a client for compensation.
A broker typically acts on behalf of a client by negotiating with multiple insurers • “Carrier” refers to an insurance company or insurer that provides stop loss insurance. • “eDIYBS” refers to our Enhanced Do It Yourself Benefits System. Licensed brokers log in to this online platform to select vendors, networks, and stop loss insurance programs. The broker can design and sell the self - funded benefits plan to small employers • “MGU” refers to Managing General Underwriter and is an entity that performs underwriting and administrative functions on behalf of an insurance company. International Captive Exchange, LLC, a wholly - owned subsidiary of the Company (“ICE”) is an MGU. ICE is granted the authority by insurance carriers to underwrite policies, meaning ICE can assess risks, set premiums, and determine coverage terms within the guidelines provided by the carrier. • “Self - funded benefits plan” or “self - insured group health plan” is an insurance plan in which the employer assumes the financial risk for providing health care benefits to its employees. In practical terms, self - insured employers pay for each out - of - pocket claim as they are incurred instead of paying a fixed premium to an insurance carrier, which is known as a fully - insured plan. Typically, a self - insured employer will set up a special trust fund to earmark money (corporate and employee contributions) to pay incurred claims. • “Stop - loss insurance ” (also known as excess insurance) is a product that provides protection for self - funded employers by serving as a reimbursement mechanism for catastrophic claims exceeding pre - determined levels. • “Third - party administrator (TPA)” is a company that manages claims and administrative tasks for an employer’s self - funded employee benefits plan. TPAs are often the primary point of contact for employees. • “Small employers” refer to the small businesses with total employees ranging from 5 to 150 employees. Certain Terms and Definitions 25