UNITED STATES
SECURITIES AND EXCHANGE COMMISSION
Washington, D.C. 20549
FORM 6-K
Report of Foreign Private Issuer
Pursuant to Rule 13a-16 or 15d-16
of the Securities Exchange Act of 1934
For the Month of March 2025
Commission File Number 001-35948
Kamada Ltd.
(Translation of registrant’s name into English)
2 Holzman Street
Science Park, P.O. Box 4081
Rehovot 7670402
Israel
(Address of principal executive offices)
Indicate by check mark whether the registrant files or will file annual reports under cover Form 20-F or Form 40-F.
Form 20-F ☒ Form 40-F ☐
This Form 6-K is being incorporated by reference into the Registrant’s Form S-8 Registration Statements, File Nos. 333-192720, 333-207933, 333-215983, 333-222891, 333-233267 and 333-265866.
The following exhibits are attached:
SIGNATURE
Pursuant to the requirements of the Securities Exchange Act of 1934, the registrant has duly caused this report to be signed on its behalf by the undersigned hereunto duly authorized.
| Date: March 5, 2025 | KAMADA LTD. | |
| By: | /s/ Nir Livneh | |
|
Nir Livneh Vice President General Counsel and |
||
EXHIBIT INDEX
3
Exhibit 99.1
Kamada Declares Special Cash Dividend of $0.20 Per Share
Company Reports Record Revenue and Profitability for Full-Year 2024
REHOVOT, Israel, and HOBOKEN, NJ – March 5, 2025 – Kamada Ltd. (NASDAQ: KMDA; TASE: KMDA.TA), a commercial stage global biopharmaceutical company with a portfolio of marketed products indicated for rare and serious conditions and a leader in the specialty plasma-derived field, today announced that its Board of Directors has declared a special cash dividend of $0.20 (approximately NIS 0.72) per share on the Company’s ordinary shares (totaling approximately $11.5 million). The special cash dividend will be payable on April 7, 2025, to shareholders of record at the close of business on March 17, 2025.
“Based on the Company’s strong financial results for 2024 and its solid cash position, we are pleased to announce a special cash dividend to be paid to our shareholders for the first time since Kamada’s establishment,” said Amir London, Kamada’s Chief Executive Officer. “We believe that we are well positioned to continue our growth, with ample liquidity to advance our four main growth pillars, which include organic commercial growth, execution of business development and M&A transactions, expansion of our plasma collection operations and further advancement of our lead product candidate, Inhaled AAT. The declaration of this dividend to our shareholders reinforces our confidence of the Company’s business prospects and demonstrates our commitment to generating shareholder value. I would like to thank our shareholders for their continued support and trust in Kamada.”
The Company will withhold tax on the dividend in accordance with Israeli tax law. The Company applied for a ruling from the Israel Tax Authority in connection with tax withholding to non-Israeli shareholders and will announce the main terms of such ruling once obtained.
About Kamada
Kamada Ltd. (the “Company”) is a global biopharmaceutical company with a portfolio of marketed products indicated for rare and serious conditions and a leader in the specialty plasma-derived therapies field. The Company’s strategy is focused on driving profitable growth through four primary growth pillars: First, organic growth from its commercial activities, including continued investment in the commercialization and life cycle management of its proprietary products, which include six FDA-approved specialty plasma-derived products: KEDRAB®, CYTOGAM®, GLASSIA®, WINRHO SDF®, VARIZIG® and HEPAGAM B®, as well as KAMRAB®, KAMRHO (D)® and two types of equine-based anti-snake venom products, and the products in the distribution segment portfolio, mainly through the launch of several biosimilar products in Israel. Second: the Company aims to secure significant new business development, in-licensing, collaboration and/or merger and acquisition opportunities, which are anticipated to enhance the Company’s marketed products portfolio and leverage its financial strength and existing commercial infrastructure to drive long-term growth. Third: the Company is expanding its plasma collection operations to support revenue growth through the sale of normal source plasma to other plasma-derived manufacturers, and to support its increasing demand for hyper-immune plasma. The Company currently owns two operating plasma collection centers in the United States, in Beaumont Texas and Houston Texas, and plans to open the third center in San Antonio, Texas, by the end of the first quarter of 2025. Lastly, the Company is leveraging its manufacturing, research and development expertise to advance the development and commercialization of additional product candidates, targeting areas of significant unmet medical need, with the lead product candidate Inhaled AAT, for which the Company is continuing to progress the InnovAATe clinical trial, a randomized, double-blind, placebo-controlled, pivotal Phase 3 trial. FIMI Opportunity Funds, the leading private equity firm in Israel, is the Company’s controlling shareholder, beneficially owning approximately 38% of the outstanding ordinary shares.
Cautionary Note Regarding Forward-Looking Statements
This release includes forward-looking statements within the meaning of Section 21E of the U.S. Securities Exchange Act of 1934, as amended, and the safe harbor provisions of the U.S. Private Securities Litigation Reform Act of 1995. Forward-looking statements are statements that are not historical facts, including statements regarding: 1) the payment of this special cash dividend, which is not an indication of any future dividends, 2) Kamada being well positioned to continue its growth, with ample liquidity to advance its four main growth pillars, which include organic commercial growth, execution of business development and M&A transactions, expansion of Kamada’s plasma collection operations and further advancement of its lead product candidate Inhaled AAT, and 3) confidence in Kamada’s business prospects and commitment to generating shareholder value. Forward-looking statements are based on Kamada’s current knowledge and its present beliefs and expectations regarding possible future events and are subject to risks, uncertainties and assumptions. Actual results and the timing of events could differ materially from those anticipated in these forward-looking statements as a result of several factors including, but not limited to the evolving nature of the conflicts in the Middle East and the impact of such conflicts in Israel, the Middle East and the rest of the world, the impact of these conflicts on market conditions and the general economic, industry and political conditions in Israel, the U.S. and globally, continuation of inbound and outbound international delivery routes, continued demand for Kamada’s products, financial conditions of the Company’s customer, suppliers and services providers, Kamada’s ability to leverage new business opportunities and integrate the new product portfolio into its current product portfolio, Kamada’s ability to grow the revenues of its new product portfolio, and leverage and expand its international distribution network, ability to reap the benefits of the acquisition of the plasma collection center, including the ability to open additional U.S. plasma centers, and acquisition of the FDA-approved plasma-derived hyperimmune commercial products, the ability to continue enrollment of the pivotal Phase 3 InnovAATe clinical trial, unexpected results of clinical studies, Kamada’s ability to manage operating expenses, additional competition in the markets that Kamada competes, regulatory delays, prevailing market conditions and the impact of general economic, industry or political conditions in the U.S., Israel or otherwise, and other risks detailed in Kamada’s filings with the U.S. Securities and Exchange Commission (the “SEC”) including those discussed in its most recent Annual Report on Form 20-F and in any subsequent reports on Form 6-K, each of which is on file or furnished with the SEC and available at the SEC’s website at www.sec.gov. The forward-looking statements made herein speak only as of the date of this announcement and Kamada undertakes no obligation to update publicly such forward-looking statements to reflect subsequent events or circumstances, except as otherwise required by law.
CONTACTS:
Chaime Orlev
Chief Financial Officer
IR@kamada.com
Brian Ritchie
LifeSci Advisors, LLC
212-915-2578
britchie@LifeSciAdvisors.com
Exhibit 99.2
Kamada Reports Record Top and Bottom Line 2024 Financial Results and Affirms 2025 Guidance Representing Double-Digit Profitable Growth
| ● | Record Year with Total 2024 Revenues of $161.0 Million, Representing a 13% Increase over Fiscal Year 2023 and Adjusted EBITDA of $34.1 Million, Up 42% Year-over-Year, and a 21% Margin of Revenues |
| ● | Cash Provided by Operating Activities of $47.6 Million During 2024 Resulted in a Year-End Strong Cash Balance of $78.4 Million; Solid Financial Position to Accelerate Inorganic Growth |
| ● | Net Income for the Year was $14.5 Million, or $0.25 per Diluted Share, Up 75% Year-over-Year |
| ● | Strong Performance Positions Company for Double Digit Profitable Growth in Fiscal Year 2025; Reiterates 2025 Full-Year Revenue Guidance of $178 Million to $182 Million and Adjusted EBITDA of $38 Million to $42 Million |
| ● | Declares Special Cash Dividend of $0.20 Per Share (Totaling Approximately $11.5 Million) |
| ● | Conference Call and Live Webcast Today at 8:00am ET |
REHOVOT, Israel, and HOBOKEN, NJ – March 5, 2025 -- Kamada Ltd. (NASDAQ: KMDA; TASE: KMDA.TA), a global biopharmaceutical company with a portfolio of marketed products indicated for rare and serious conditions and a leader in the specialty plasma-derived field, today announced financial results for the three months and year ended December 31, 2024.
“Our performance over the course of 2024 was excellent, leading to record annual top- and bottom-line financial results,” said Amir London, Kamada’s Chief Executive Officer. “We enter 2025 from a position of significant strength, continuing to benefit from growth across our entire portfolio, with anticipated 2025 guidance representing a year-over-year double digit growth of 12% in revenues and 17% in adjusted EBITDA, when comparing 2025 guidance mid-points to 2024 results, driven by our diverse commercial portfolio marketed in over 30 countries. We look forward to continuing to execute on our multi-year value generating strategy based on our four key growth pillars, comprising of organic commercial growth, the execution of business development and M&A transactions, our plasma collection operations, and the further advancement of our pivotal Phase 3 Inhaled AAT program.”
“Our organic growth will be driven by continued investment in the commercialization and life cycle management of our six FDA-approved specialty plasma-derived products, as well as the products in our Distribution segment portfolio, primarily through the continued launch of biosimilar products in Israel. During 2025, we aim to leverage our strong financial position to secure new business development, in-licensing, collaboration, and/or merger and acquisitions transactions. Such transactions are expected to generate operational and/or commercial synergies with our current commercial portfolio,” continued Mr. London.
“Moreover, we are expanding our plasma collection operations to support revenue growth through the sale of normal source plasma to third parties, and to support our increasing demand for specialty plasma. We currently have two operating U.S. plasma collection centers, and a third center in San Antonio, Texas, will be opened by the end of this month. Lastly, we continue to progress the InnovAATe clinical trial, a randomized, double-blind, placebo-controlled, pivotal Phase 3 trial of our Inhaled AAT product. Importantly, we recently announced FDA agreement to accept a proposed revision to our study statistical plan that resulted in reducing the number of study subjects to 180 patients, and our plan to conduct an interim futility analysis by the end of 2025,” concluded Mr. London.
Financial Highlights for Year Ended December 31, 2024
| ● | Total revenues for 2024 were $161.0 million, a 13% increase from the $142.5 million generated in 2023. The increase in revenues was primarily attributable to KEDRAB and CYTOGAM growth year-over-year. |
| ● | Gross profit and gross margins were $70.0 million and 43%, respectively, in the year ended December 31, 2024, compared to $55.5 million and 39%, respectively, in 2023. The increase in gross profit and gross margins year-over-year was primarily due to the increase in sales and improved product and territory sales mix. |
| ● | Operating expenses, including research and development (R&D), sales and marketing (S&M), general and administrative (G&A), and other expenses, totaled $49.9 million in the year ended December 31, 2024, as compared to $45.4 million in the prior year. The higher operating expenses were primarily attributable to an increase in S&M costs associated with marketing activities in the U.S., as well as increased R&D costs, primarily due to advancing the Inhaled AAT clinical trial. |
| ● | Net income for the year ended December 31, 2024, was $14.5 million, or $0.25 per diluted share, up 75% compared to a net income of $8.3 million, or $0.15 per diluted share, in the prior year. |
| ● | Adjusted EBITDA, as detailed in the tables below, was $34.1 million in the year ended December 31, 2024, a 42% increase as compared to $24.1 million in the prior year. |
| ● | Cash provided by operating activities was $47.6 million in the year ended December 31, 2024, as compared to $4.3 million in the prior year. The significant increase is correlated to the increase in profitability and improvement in the Company’s working capital. |
Financial Highlights for the Three Months Ended December 31, 2024
| ● | Total revenues were $39.0 million in the fourth quarter of 2024, a 7% increase compared to $36.4 million in the fourth quarter of 2023. |
| ● | Gross profit and gross margins were $17.0 million and 44%, respectively, in the fourth quarter of 2024, up 18% compared to $14.4 million and 40%, respectively, in the fourth quarter of 2023. |
| ● | Operating expenses, including R&D, S&M, G&A and other expenses, totaled $12.0 million in the fourth quarter of 2024, as compared to $11.6 million in the fourth quarter of 2023. |
| ● | Net income was $3.8 million, or $0.07 per diluted share, in the fourth quarter of 2024, as compared to $5.1 million, or $0.09 per diluted share, in the fourth quarter of 2023. The decrease in net income was mainly attributable to higher financial costs associated with reevaluation of long-term contingent liabilities. |
| ● | Adjusted EBITDA, as detailed in the tables below, was $8.8 million in the fourth quarter of 2024, up 38% compared to $6.4 million in the fourth quarter of 2023. |
| ● | Cash provided by operating activities was $10.4 million in the fourth quarter of 2024, as compared to cash provided by operating activities of $6.1 million in the fourth quarter of 2023. |
Balance Sheet Highlights
As of December 31, 2024, the Company had cash and cash equivalents of $78.4 million, as compared to $55.6 million as of December 31, 2023.
Recent Corporate Highlights
| ● | Announced the payment of a special cash dividend of $0.20 (approximately NIS 0.72) per share on the Company’s ordinary shares (totaling approximately $11.5 million) based on Kamada’s strong financial results for 2024 and solid cash position. The special cash dividend will be payable on April 7, 2025, to shareholders of record at the close of business on March 17, 2025. |
| ● | Obtained positive feedback from the U.S. FDA, confirming the Agency’s agreement with the Company’s previously proposed relaxed two-sided Type 1 error rate control of 10% (p-value of 0.1) for the inhaled AAT pivotal Phase 3 study, reducing the study sample size from 220 patients to approximately 180 patients, while maintaining the statistical power of the trial. |
| ● | Announced its plan to conduct an interim futility analysis for the inhaled AAT pivotal Phase 3 study by the end of 2025. |
| ● | Announced the award of a contract with an international organization for the supply of KAMRAB® and VARIZIG® in Latin America for 2025-2027. Total expected revenue under the three-year contract for both products is estimated to be approximately $25 million. The expected portion for the calendar year 2025 is included in Kamada’s 2025 revenue guidance. |
Fiscal 2025 Guidance
Kamada continues to expect to generate fiscal year 2025 total revenues in the range of $178 million to $182 million, and adjusted EBITDA in the range of $38 million to $42 million, representing a year-over-year increase of approximately 12% in revenues and 17% in adjusted EBITDA based on the mid-point of the 2025 guidance.
Conference Call Details
Kamada management will host an investment community conference call today at 8:00am Eastern Time to discuss these results and answer questions. Shareholders and other interested parties may participate in the call by dialing 1-877-413-7208 (from within the U.S.), 1-201-689-8555 (International), or 1-809-406-247 Investors (from Israel) using conference I.D. 13751522. The call will be webcast live on the internet at: https://viavid.webcasts.com/starthere.jsp?ei=1706625&tp_key=810bb27504
Non-IFRS financial measures
We present EBITDA and adjusted EBITDA because we use these non-IFRS financial measures to assess our operational performance, for financial and operational decision-making, and as a means to evaluate period-to-period comparisons on a consistent basis. Management believes these non-IFRS financial measures are useful to investors because: (1) they allow for greater transparency with respect to key metrics used by management in its financial and operational decision-making and provide investors with a meaningful perspective on the current underlying performance of the Company’s core ongoing operations; and (2) they exclude the impact of certain items that are not directly attributable to our core operating performance and that may obscure trends in the core operating performance of the business. Non-IFRS financial measures have limitations as an analytical tool and should not be considered in isolation from, or as a substitute for, our IFRS results. We expect to continue reporting non-IFRS financial measures, adjusting for the items described below, and we expect to continue to incur expenses similar to certain of the non-cash, non-IFRS adjustments described below. Accordingly, unless otherwise stated, the exclusion of these and other similar items in the presentation of non-IFRS financial measures should not be construed as an inference that these items are unusual, infrequent or non-recurring. EBITDA and adjusted EBITDA are not recognized terms under IFRS and do not purport to be an alternative to IFRS terms as an indicator of operating performance or any other IFRS measure. Moreover, because not all companies use identical measures and calculations, the presentation of EBITDA and adjusted EBITDA may not be comparable to other similarly titled measures of other companies. EBITDA is defined as net income (loss), plus income tax expense, plus or minus financial income or expenses, net, plus or minus income or expense in respect of securities measured at fair value, net, plus or minus income or expenses in respect of currency exchange differences and derivatives instruments, net, plus depreciation and amortization expense, whereas adjusted EBITDA is the EBITDA plus non-cash share-based compensation expenses and certain other costs.
For the projected 2025 adjusted EBITDA information presented herein, the Company is unable to provide a reconciliation of this forward measure to the most comparable IFRS financial measure because the information for these measures is dependent on future events, many of which are outside of the Company’s control. Additionally, estimating such forward-looking measures and providing a meaningful reconciliation consistent with the Company’s accounting policies for future periods is meaningfully difficult and requires a level of precision that is unavailable for these future periods and cannot be accomplished without unreasonable effort. Forward-looking non-IFRS measures are estimated in a manner consistent with the relevant definitions and assumptions noted in the Company’s adjusted EBITDA for historical periods.
About Kamada
Kamada Ltd. (the “Company”) is a global biopharmaceutical company with a portfolio of marketed products indicated for rare and serious conditions and a leader in the specialty plasma-derived therapies field. The Company’s strategy is focused on driving profitable growth through four primary growth pillars: First, organic growth from its commercial activities, including continued investment in the commercialization and life cycle management of its proprietary products, which include six FDA-approved specialty plasma-derived products: KEDRAB®, CYTOGAM®, GLASSIA®, WINRHO SDF®, VARIZIG® and HEPAGAM B®, as well as KAMRAB®, KAMRHO (D)® and two types of equine-based anti-snake venom products, and the products in the distribution segment portfolio, mainly through the launch of several biosimilar products in Israel. Second: the Company aims to secure significant new business development, in-licensing, collaboration and/or merger and acquisition opportunities, which are anticipated to enhance the Company’s marketed products portfolio and leverage its financial strength and existing commercial infrastructure to drive long-term growth. Third: the Company is expanding its plasma collection operations to support revenue growth through the sale of normal source plasma to other plasma-derived manufacturers, and to support its increasing demand for hyper-immune plasma. The Company currently owns two operating plasma collection centers in the United States, in Beaumont Texas and Houston Texas, and plans to open the third center in San Antonio, Texas, by the end of the first quarter of 2025. Lastly, the Company is leveraging its manufacturing, research and development expertise to advance the development and commercialization of additional product candidates, targeting areas of significant unmet medical need, with the lead product candidate Inhaled AAT, for which the Company is continuing to progress the InnovAATe clinical trial, a randomized, double-blind, placebo-controlled, pivotal Phase 3 trial. FIMI Opportunity Funds, the leading private equity firm in Israel, is the Company’s controlling shareholder, beneficially owning approximately 38% of the outstanding ordinary shares.
Cautionary Note Regarding Forward-Looking Statements
This release includes forward-looking statements within the meaning of Section 21E of the U.S. Securities Exchange Act of 1934, as amended, and the safe harbor provisions of the U.S. Private Securities Litigation Reform Act of 1995. Forward-looking statements are statements that are not historical facts, including statements regarding: 1) double digit profitable growth in fiscal year 2025, 2) reiteration of 2025 full-year revenue guidance of $178 million to $182 million and adjusted EBITDA of $38 million to $42 million, 3) expectation to continuing to execute the Company’s multi-year value generating strategy based on four key growth pillars, comprising of organic commercial growth, the execution of business development and M&A transactions, the Company’s plasma collection operations, and the further advancement of the Company’s pivotal Phase 3 Inhaled AAT program, 4) continued investment in the commercialization and life cycle management of the Company’s six FDA-approved specialty plasma-derived products, as well as the products in the Company’s Distribution segment portfolio, primarily through the continued launch of biosimilar products in Israel, 5) securing new business development, in-licensing, collaboration, and/or merger and acquisitions transactions and the success of such transactions, 6) expectation that new transactions will generate operational and/or commercial synergies with the current commercial portfolio, 7) expanding the Company’s plasma collection operations to support revenue growth through the sale of normal source plasma to third parties, and to support the Company’s increasing demand for specialty plasma, 8) opening a third plasma collection center in San Antonio, Texas, by the end of March, 2025, 9) continued progress of the InnovAATe clinical trial and conducting an interim futility analysis by the end of 2025, 10) expectation to supply KAMRAB and VARIZIG in Latin America for 2025-2027 and the expected revenue under the three-year contract for both products at approximately $25 million, and 11) the expected payment of a special cash dividend. Forward-looking statements are based on Kamada’s current knowledge and its present beliefs and expectations regarding possible future events and are subject to risks, uncertainties and assumptions. Actual results and the timing of events could differ materially from those anticipated in these forward-looking statements as a result of several factors including, but not limited to the evolving nature of the conflicts in the Middle East and the impact of such conflicts in Israel, the Middle East and the rest of the world, the impact of these conflicts on market conditions and the general economic, industry and political conditions in Israel, the U.S. and globally, continuation of inbound and outbound international delivery routes, continued demand for Kamada’s products, financial conditions of the Company’s customer, suppliers and services providers, Kamada’s ability to leverage new business opportunities and integrate the new product portfolio into its current product portfolio, Kamada’s ability to grow the revenues of its new product portfolio, and leverage and expand its international distribution network, ability to reap the benefits of the acquisition of the plasma collection center, including the ability to open additional U.S. plasma centers, and acquisition of the FDA-approved plasma-derived hyperimmune commercial products, the ability to continue enrollment of the pivotal Phase 3 InnovAATe clinical trial, unexpected results of clinical studies, Kamada’s ability to manage operating expenses, additional competition in the markets that Kamada competes, regulatory delays, prevailing market conditions and the impact of general economic, industry or political conditions in the U.S., Israel or otherwise, and other risks detailed in Kamada’s filings with the U.S. Securities and Exchange Commission (the “SEC”) including those discussed in its most recent Annual Report on Form 20-F and in any subsequent reports on Form 6-K, each of which is on file or furnished with the SEC and available at the SEC’s website at www.sec.gov. The forward-looking statements made herein speak only as of the date of this announcement and Kamada undertakes no obligation to update publicly such forward-looking statements to reflect subsequent events or circumstances, except as otherwise required by law.
CONTACTS:
Chaime Orlev
Chief Financial Officer
IR@kamada.com
Brian Ritchie
LifeSci Advisors, LLC
212-915-2578
britchie@LifeSciAdvisors.com
CONDENSED CONSOLIDATED STATEMENTS OF FINANCIAL POSITION
| As of December 31, | ||||||||
| 2024 | 2023 | |||||||
| U.S. Dollars in thousands | ||||||||
| Assets | ||||||||
| Current Assets | ||||||||
| Cash and cash equivalents | $ | 78,435 | $ | 55,641 | ||||
| Trade receivables, net | 21,547 | 19,877 | ||||||
| Other accounts receivables | 5,546 | 5,965 | ||||||
| Inventories | 78,819 | 88,479 | ||||||
| Total Current Assets | 184,347 | 169,962 | ||||||
| Non-Current Assets | ||||||||
| Property, plant and equipment, net | 36,245 | 28,224 | ||||||
| Right-of-use assets | 9,617 | 7,761 | ||||||
| Intangible assets and other long-term assets | 103,226 | 110,152 | ||||||
| Goodwill | 30,313 | 30,313 | ||||||
| Contract asset | 8,019 | 8,495 | ||||||
| Deferred taxes | 488 | - | ||||||
| Total Non-Current Assets | 187,908 | 184,945 | ||||||
| Total Assets | $ | 372,255 | $ | 354,907 | ||||
| Liabilities | ||||||||
| Current Liabilities | ||||||||
| Current maturities of lease liabilities | 1,631 | 1,384 | ||||||
| Current maturities of other long term liabilities | 10,181 | 14,996 | ||||||
| Trade payables | 27,735 | 24,804 | ||||||
| Other accounts payables | 9,671 | 8,261 | ||||||
| Deferred revenues | 171 | 148 | ||||||
| Total Current Liabilities | 49,389 | 49,593 | ||||||
| Non-Current Liabilities | ||||||||
| Lease liabilities | 9,431 | 7,438 | ||||||
| Contingent consideration | 20,646 | 18,855 | ||||||
| Other long-term liabilities | 32,816 | 34,379 | ||||||
| Employee benefit liabilities, net | 509 | 621 | ||||||
| Total Non-Current Liabilities | 63,402 | 61,293 | ||||||
| Shareholder’s Equity | ||||||||
| Ordinary shares | 15,028 | 15,021 | ||||||
| Additional paid in capital net | 266,933 | 265,848 | ||||||
| Capital reserve due to translation to presentation currency | (3,490 | ) | (3,490 | ) | ||||
| Capital reserve from hedges | 51 | 140 | ||||||
| Capital reserve from share-based payments | 6,316 | 6,427 | ||||||
| Capital reserve from employee benefits | 364 | 275 | ||||||
| Accumulated deficit | (25,738 | ) | (40,200 | ) | ||||
| Total Shareholder’s Equity | 259,464 | 244,021 | ||||||
| Total Liabilities and Shareholder’s Equity | $ | 372,255 | $ | 354,907 | ||||
CONDENSED CONSOLIDATED STATEMENTS OF PROFIT OR LOSS AND OTHER COMPREHENSIVE INCOME
| For the Year Ended December 31, |
For the Three Months Ended December 31, |
|||||||||||||||
| 2024 | 2023 | 2024 | 2023 | |||||||||||||
| U.S. Dollars in thousands, except for per share data |
U.S. Dollars in thousands, except for per share data |
|||||||||||||||
| Revenues from proprietary products | $ | 141,447 | $ | 115,458 | $ | 31,415 | $ | 29,021 | ||||||||
| Revenues from distribution | 19,506 | 27,061 | 7,590 | 7,411 | ||||||||||||
| Total revenues | 160,953 | 142,519 | 39,005 | 36,432 | ||||||||||||
| Cost of revenues from proprietary products | 73,708 | 63,342 | 14,501 | 15,479 | ||||||||||||
| Cost of revenues from distribution | 17,278 | 23,687 | 7,473 | 6,541 | ||||||||||||
| Total cost of revenues | 90,986 | 87,029 | 21,974 | 22,020 | ||||||||||||
| Gross profit | 69,967 | 55,490 | 17,031 | 14,412 | ||||||||||||
| Research and development expenses | 15,185 | 13,933 | 2,673 | 3,239 | ||||||||||||
| Selling and marketing expenses | 18,428 | 16,193 | 4,566 | 4,620 | ||||||||||||
| General and administrative expenses | 15,702 | 14,381 | 4,124 | 3,778 | ||||||||||||
| Other expense | 601 | 919 | 590 | (1 | ) | |||||||||||
| Operating income | 20,051 | 10,064 | 5,078 | 2,776 | ||||||||||||
| Financial income | 2,118 | 588 | 684 | 496 | ||||||||||||
| Income (expenses) in respect of currency exchange differences and derivatives instruments, net |
(94 | ) | 55 | (349 | ) | (671 | ) | |||||||||
| Revaluation of long-term liabilities | (8,081 | ) | (980 | ) | (2,765 | ) | 2,378 | |||||||||
| Financial expense | (660 | ) | (1,298 | ) | (189 | ) | 45 | |||||||||
| Income before tax on income | 13,334 | 8,429 | 2,459 | 5,024 | ||||||||||||
| Taxes on income | 1,128 | (145 | ) | 1,349 | 34 | |||||||||||
| Net Income | $ | 14,462 | $ | 8,284 | $ | 3,808 | $ | 5,058 | ||||||||
| Other Comprehensive Income: | ||||||||||||||||
| Amounts that will be or that have been reclassified to profit or loss when specific conditions are met, net of tax Gain (loss) on cash flow hedges |
(30 | ) | (186 | ) | 33 | 148 | ||||||||||
| Net amounts transferred to the statement of profit or loss for cash flow hedges | (59 | ) | 414 | 2 | 90 | |||||||||||
| Items that will not be reclassified to profit or loss in subsequent periods: | ||||||||||||||||
| Remeasurement gain (loss) from defined benefit plan | 89 | (73 | ) | 81 | (43 | ) | ||||||||||
| Total comprehensive income | $ | 14,462 | $ | 8,439 | $ | 3,924 | $ | 5,253 | ||||||||
| Earnings per share attributable to equity holders of the Company: | ||||||||||||||||
| Basic net earnings per share | $ | 0.25 | $ | 0.17 | $ | 0.07 | $ | 0.09 | ||||||||
| Diluted net earnings per share | $ | 0.25 | $ | 0.15 | $ | 0.07 | $ | 0.09 | ||||||||
CONDENSED CONSOLIDATED INTERIM STATEMENTS OF CASH FLOWS
| For the year ended | For the Three Months Ended | |||||||||||||||
| December 31, | December 31, | |||||||||||||||
| 2024 | 2023 | 2024 | 2023 | |||||||||||||
| U.S. Dollars in thousands | U.S. Dollars in thousands | |||||||||||||||
| Cash Flows from Operating Activities | ||||||||||||||||
| Net income | $ | 14,462 | $ | 8,284 | $ | 3,808 | $ | 5,058 | ||||||||
| Adjustments to reconcile net income to net cash provided by operating activities: | ||||||||||||||||
| Adjustments to the profit or loss items: | ||||||||||||||||
| Depreciation and amortization | 13,808 | 12,714 | 4,100 | 3,208 | ||||||||||||
| Financial expense, net | 6,717 | 1,635 | 2,619 | (2,248 | ) | |||||||||||
| Cost of share-based payment | 874 | 1,314 | 174 | 373 | ||||||||||||
| Taxes on income | (1,128 | ) | 145 | (1,349 | ) | (34 | ) | |||||||||
| Loss (gain) from sale of property and equipment | 11 | (5 | ) | - | - | |||||||||||
| Change in employee benefit liabilities, net | 52 | (125 | ) | 46 | 19 | |||||||||||
| 20,334 | 15,678 | 5,590 | 1,318 | |||||||||||||
| Changes in asset and liability items: | ||||||||||||||||
| Decrease (increase) in trade receivables, net | (1,977 | ) | 7,835 | (5,226 | ) | 5,757 | ||||||||||
| Decrease (increase) in other accounts receivables | 593 | (1,150 | ) | (859 | ) | (3,866 | ) | |||||||||
| Decrease (increase) in inventories | 9,659 | (19,694 | ) | (7,261 | ) | (14,683 | ) | |||||||||
| Decrease (increase) in contract asset | 476 | 2,814 | 140 | 51 | ||||||||||||
| Increase (decrease) in trade payables | 1,226 | (8,885 | ) | 11,973 | 11,432 | |||||||||||
| Increase in other accounts payables | 1,413 | 765 | 1,570 | 1,124 | ||||||||||||
| Increase (decrease) in deferred revenues | 23 | 113 | 130 | 133 | ||||||||||||
| 11,413 | (18,202 | ) | 467 | (52 | ) | |||||||||||
| Cash (paid) received during the year for: | ||||||||||||||||
| Interest paid | (594 | ) | (1,228 | ) | (170 | ) | (79 | ) | ||||||||
| Interest received | 2,118 | - | 684 | (92 | ) | |||||||||||
| Taxes paid | (139 | ) | (217 | ) | 19 | (43 | ) | |||||||||
| 1,385 | (1,445 | ) | 533 | (214 | ) | |||||||||||
| Net cash provided by operating activities | $ | 47,594 | $ | 4,315 | $ | 10,398 | $ | 6,110 | ||||||||
CONDENSED CONSOLIDATED INTERIM STATEMENTS OF CASH FLOWS (cont.)
| For the year ended December 31, |
For the Three Months Ended December 31, |
|||||||||||||||
| 2024 | 2023 | 2024 | 2023 | |||||||||||||
| U.S. Dollars in thousands | U.S. Dollars in thousands | |||||||||||||||
| Cash Flows from Investing Activities | ||||||||||||||||
| Purchase of property and equipment and intangible assets | $ | (10,740 | ) | $ | (5,850 | ) | $ | (2,924 | ) | $ | (1,974 | ) | ||||
| Proceeds from sale of property and equipment | 1 | 7 | - | 1 | ||||||||||||
| Net cash used in investing activities | (10,739 | ) | (5,843 | ) | (2,924 | ) | (1,973 | ) | ||||||||
| Cash Flows from Financing Activities | ||||||||||||||||
| Proceeds from exercise of share base payments | 7 | 4 | 4 | 1 | ||||||||||||
| Proceeds from issuance of ordinary shares, net | - | 58,231 | - | - | ||||||||||||
| Repayment of lease liabilities | (1,251 | ) | (850 | ) | (361 | ) | (82 | ) | ||||||||
| Repayment of long-term loans | - | (17,407 | ) | - | - | |||||||||||
| Repayment of other long-term liabilities | (12,667 | ) | (17,300 | ) | (351 | ) | (1,500 | ) | ||||||||
| Net cash provided by (used in) financing activities | (13,911 | ) | 22,678 | (708 | ) | (1,581 | ) | |||||||||
| Exchange differences on balances of cash and cash equivalent | (150 | ) | 233 | (332 | ) | 482 | ||||||||||
| Increase in cash and cash equivalents | 22,794 | 21,383 | 6,434 | 3,038 | ||||||||||||
| Cash and cash equivalents at the beginning of the year | 55,641 | 34,258 | 72,001 | 52,603 | ||||||||||||
| Cash and cash equivalents at the end of the year | $ | 78,435 | $ | 55,641 | $ | 78,435 | $ | 55,641 | ||||||||
| Significant non-cash transactions | ||||||||||||||||
| Right-of-use asset recognized with corresponding lease liability | $ | 3,304 | $ | 6,546 | $ | 141 | 2,666 | |||||||||
| Purchase of property and equipment in credit | $ | 1,955 | $ | 646 | $ | 1,955 | 646 | |||||||||
NON-IFRS MEASURES
| For the year ended December 31, |
For the Three Months Ended December 31, |
|||||||||||||||
| 2024 | 2023 | 2024 | 2023 | |||||||||||||
| U.S. Dollars in thousands | U.S. Dollars in thousands | |||||||||||||||
| Cash Flows from Investing Activities | ||||||||||||||||
| Net Income | $ | 14,462 | $ | 8,284 | $ | 3,808 | $ | 5,058 | ||||||||
| Taxes on income | (1,128 | ) | 145 | (1,349 | ) | (34 | ) | |||||||||
| Financial expenses (income), net | 6,717 | 1,635 | 2,619 | (2,248 | ) | |||||||||||
| Depreciation and amortization expense | 13,218 | 12,714 | 3,510 | 3,208 | ||||||||||||
| Non-cash share-based compensation expenses | 867 | 1,314 | 167 | 373 | ||||||||||||
| Adjusted EBITDA | $ | 34,136 | $ | 24,092 | $ | 8,755 | $ | 6,357 | ||||||||
9
Exhibit 99.3

March 2025 Fourth Quarter & Year Ended December 31, 2024 Investors Call FORWARD - LOOKING STATEMENT This presentation is not intended to provide investment or medical advice . It should be noted that some products under development described herein have not been found safe or effective by any regulatory agency and are not approved for any use outside of clinical trials . This presentation contains forward - looking statements, which express the current beliefs and expectations of Kamada’s management . Such statements include 2025 financial guidance ; growth strategy and plans for double digit growth ; progression of inhaled AAT clinical study, its benefits and advantages, potential market size, potential FDA's feedback, our plan to reduce the study sample to approximately 180 patients, and to conduct an interim futility analysis by the end of 2025 ; KedRab sales, growth prospects of Cytogam and growth prospects related to the Israeli distribution business segment and the U . S . plasma segment ; success in identifying and integrating M&A targets for growth and the payment of this cash dividend . These statements involve a number of known and unknown risks and uncertainties that could cause Kamada's future results, performance or achievements to differ significantly from the projected results, performances or achievements expressed or implied by such forward - looking statements . Important factors that could cause or contribute to such differences include, but are not limited to, risks relating to Kamada's ability to successfully develop and commercialize its products and product candidates, progress and results of any clinical trials, introduction of competing products, continued market acceptance of Kamada’s commercial products portfolio, impact of geo - political environment in the middle east, impact of any changes in regulation and legislation that could affect the pharmaceutical industry, difficulty in predicting, obtaining or maintaining U . S . Food and Drug Administration, European Medicines Agency and other regulatory authority approvals, restrains related to third parties’ IP rights and changes in the health policies and structures of various countries, success of M&A strategies, environmental risks, changes in the worldwide pharmaceutical industry and other factors that are discussed under the heading “Risk Factors” of Kamada’s 2024 Annual Report on Form 20 - F (filed on March 5 , 2025 ), as well as in Kamada’s recent Forms 6 - K filed with the U . S . Securities and Exchange Commission . This presentation includes certain non - IFRS financial information, which is not intended to be considered in isolation or as a substitute for, or superior to, the financial information prepared and presented in accordance with IFRS . The non - IFRS financial measures may be calculated differently from, and therefore may not be comparable to, similarly titled measures used by other companies . In accordance with the requirement of the SEC regulations a reconciliation of these non - IFRS financial measures to the comparable IFRS measures is included in an appendix to this presentation . Management uses these non - IFRS financial measures for financial and operational decision - making and as a means to evaluate period - to - period comparisons . Management believes that these non - IFRS financial measures provide meaningful supplemental information regarding Kamada’s performance and liquidity . Forward - looking statements speak only as of the date they are made, and Kamada undertakes no obligation to update any forward - looking statement to reflect the impact of circumstances or events that arise after the date the forward - looking statement was made, except as required by applicable law . 2 KEDRAB® CYTOGAM® HEPGAM B® VARIZIG® WINRHO® GLASSIA® KAMADA - A GLOBAL BIOPHARMACEUTICAL COMPANY 6 FDA - Approved Products 15 % CAGR (from 2021) $ 178 - 182M 2025 Revenues Guidance $ 38 - 42M 2025 Adj.

EBIDTA Guidance 4 Pillars of Growth A LEADER IN SPECIALTY PLASMA THERAPIES, WITH A PORTFOLIO OF MARKETED PRODUCTS INDICATED FOR RARE AND SERIOUS CONDITIONS $ 78.4 M Cash @ Dec 31 , 2024 3 Organic Growth M&A Transactions Inhaled AAT Pivotal Study Plasma Collection Centers DELIVERING ON OUR COMMITMENTS 4

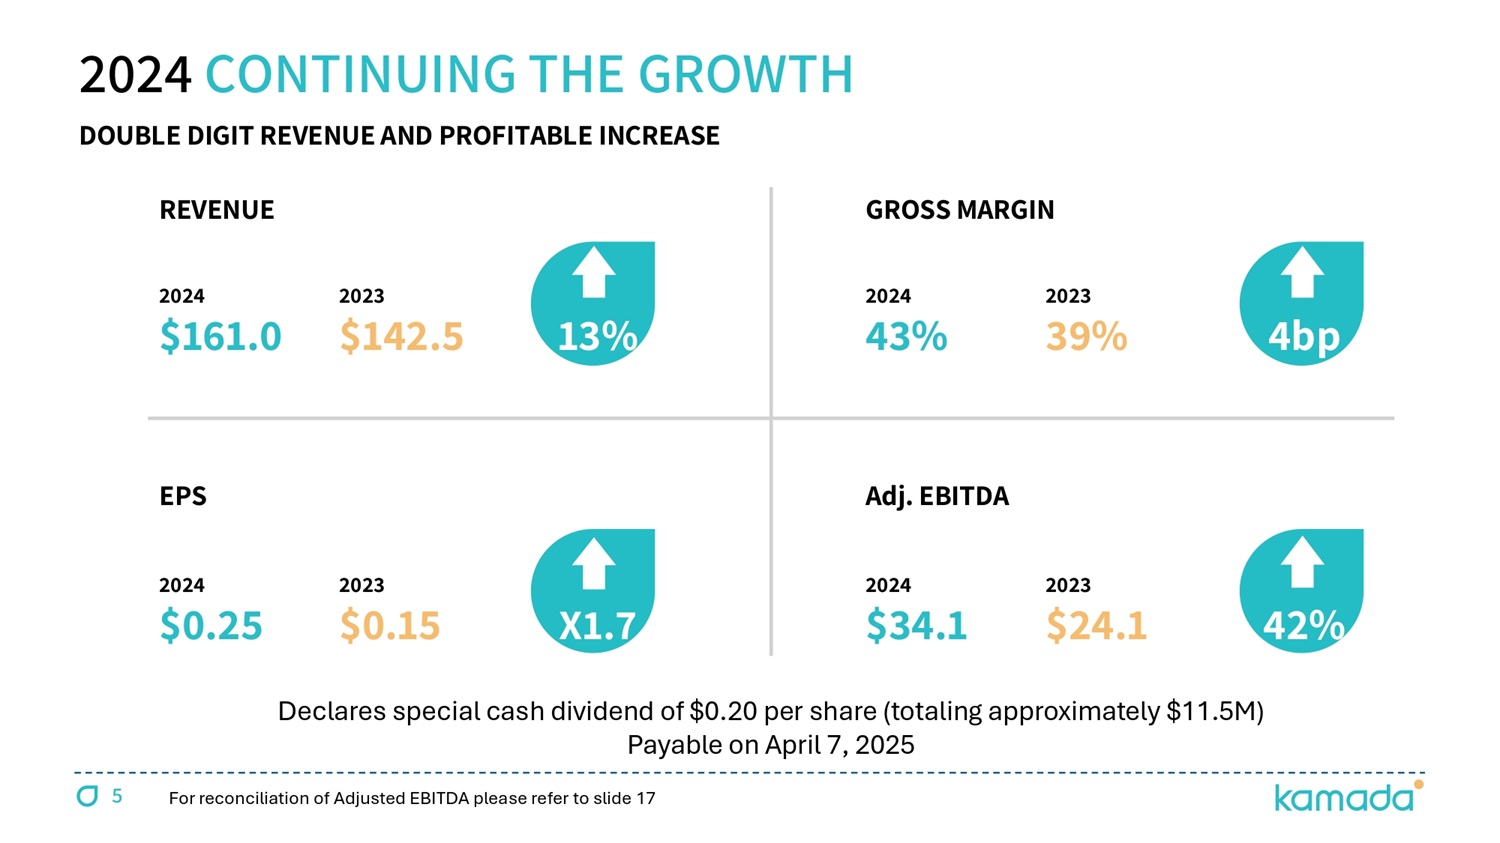
GROSS MARGIN REVENUE 4bp 2023 39% 2024 43 % 13% 2023 $142.5 2024 $ 161.0 Adj. EBITDA EPS 42% 2023 $24.1 2024 $ 34.1 X1.7 2023 $0.15 2024 $0.25 2024 CONTINUING THE GROWTH DOUBLE DIGIT REVENUE AND PROFITABLE INCREASE 5 For reconciliation of Adjusted EBITDA please refer to slide 17 Declares special cash dividend of $0.20 per share (totaling approximately $11.5M) Payable on April 7, 2025 6 18 24 34 38 - 42 2021 2022 2023 2024 2025 104 129 142 161 178 - 182 2021 2022 2023 2024 2025 ADJUSTED EBITDA US$M 61% CAGR 2025 represents annual guidance 2025 represents annual guidance ANNUAL DOUBLE - DIGIT GROWTH TRAJECTORY REVENUES US$M 15% CAGR 6 Cash Provided by Operating Activities of $47.6 Million During 2024 Resulted in a Year - End Strong Cash Position of $78.4 Million


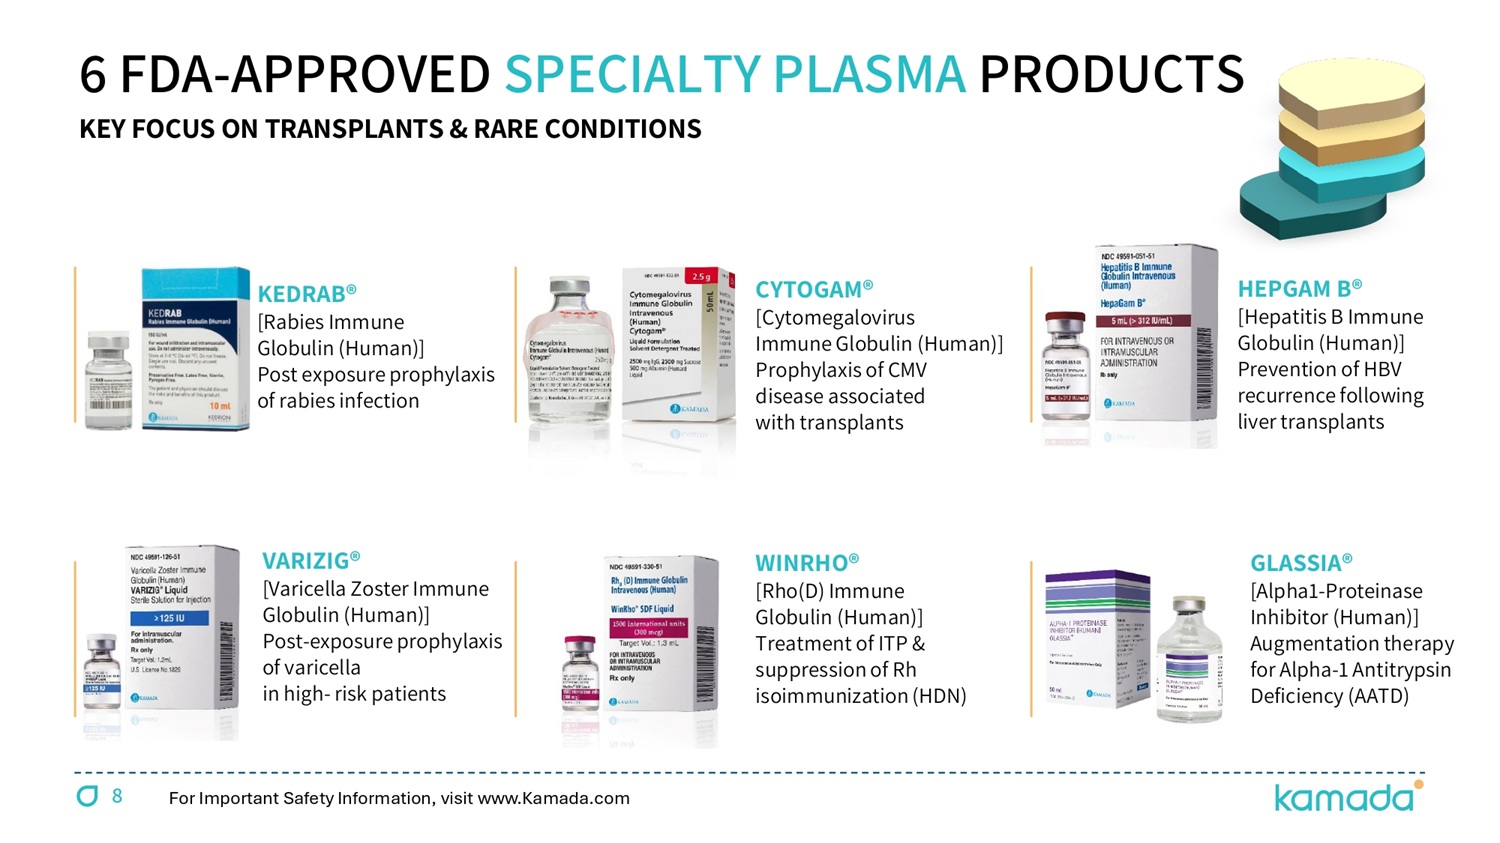
KAMADA ’ S ROADMAP FOR CONTINUED ANNUAL DOUBLE - DIGIT GROWTH 7 Organic Growth Portfolio of 6 FDA - approved products; Over 30 territories ; and Distribution portfolio in Israel M&A Transactions Support growth through M&A transactions Plasma Collection Centers Each new center expected to contribute annual revenues of $ 8 M - $ 10 M at peak capacity Inhaled AAT Phase III pivotal clinical study, targeting a market of over $2B 8 6 FDA - APPROVED SPECIALTY PLASMA PRODUCTS KEDRAB® [Rabies Immune Globulin (Human)] Post exposure prophylaxis of rabies infection CYTOGAM® [Cytomegalovirus Immune Globulin (Human)] Prophylaxis of CMV disease associated with transplants HEPGAM B® [Hepatitis B Immune Globulin (Human)] Prevention of HBV recurrence following liver transplants VARIZIG® [Varicella Zoster Immune Globulin (Human)] Post - exposure prophylaxis of varicella in high - risk patients WINRHO® [Rho(D) Immune Globulin (Human)] Treatment of ITP & suppression of Rh isoimmunization (HDN) KEY FOCUS ON TRANSPLANTS & RARE CONDITIONS For Important Safety Information, visit www.Kamada.com GLASSIA® [Alpha 1 - Proteinase Inhibitor (Human)] Augmentation therapy for Alpha - 1 Antitrypsin Deficiency (AATD)

$ 150 M Total U.S HRIG market size, KEDRAB presents double - digit growth YoY Only anti - Rabies IgG product with FDA approved label confirming safety and effectiveness in children KEDRAB /KAMRAB $ 50 M 2024 U.S. Revenues; $ 135 M Minimum sales in the U.S.
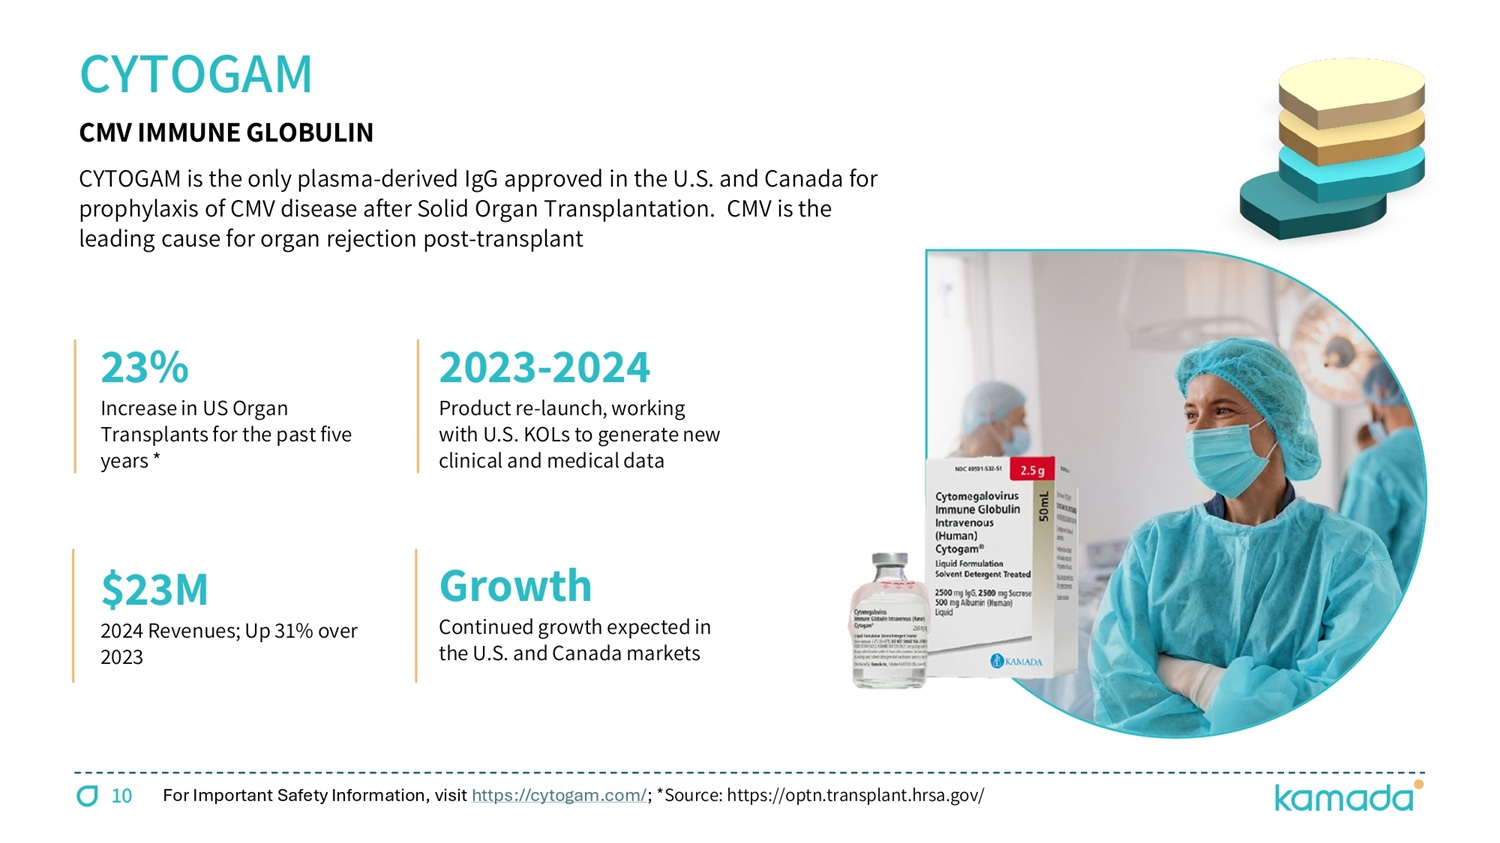
expected in 2025 - 2027 Only 2 FDA approved products Leading HRIG in Canada, Australia, Israel, Latin America and additional territories A GLOBAL LEADER IN ANTI - RABIES IMMUNE GLOBULIN (HRIG) For Important Safety Information, visit https://kedrab.com/ 9 CYTOGAM is the only plasma - derived IgG approved in the U.S. and Canada for prophylaxis of CMV disease after Solid Organ Transplantation. CMV is the leading cause for organ rejection post - transplant CYTOGAM ĎČĎď - 2024 Product re - launch, working with U.S. KOLs to generate new clinical and medical data 23 Ʊ Increase in US Organ Transplants for the past five years Ŀ $ 23 M 2024 Revenues; Up 31 % over 2023 CMV IMMUNE GLOBULIN Growth Continued growth expected in the U.S.
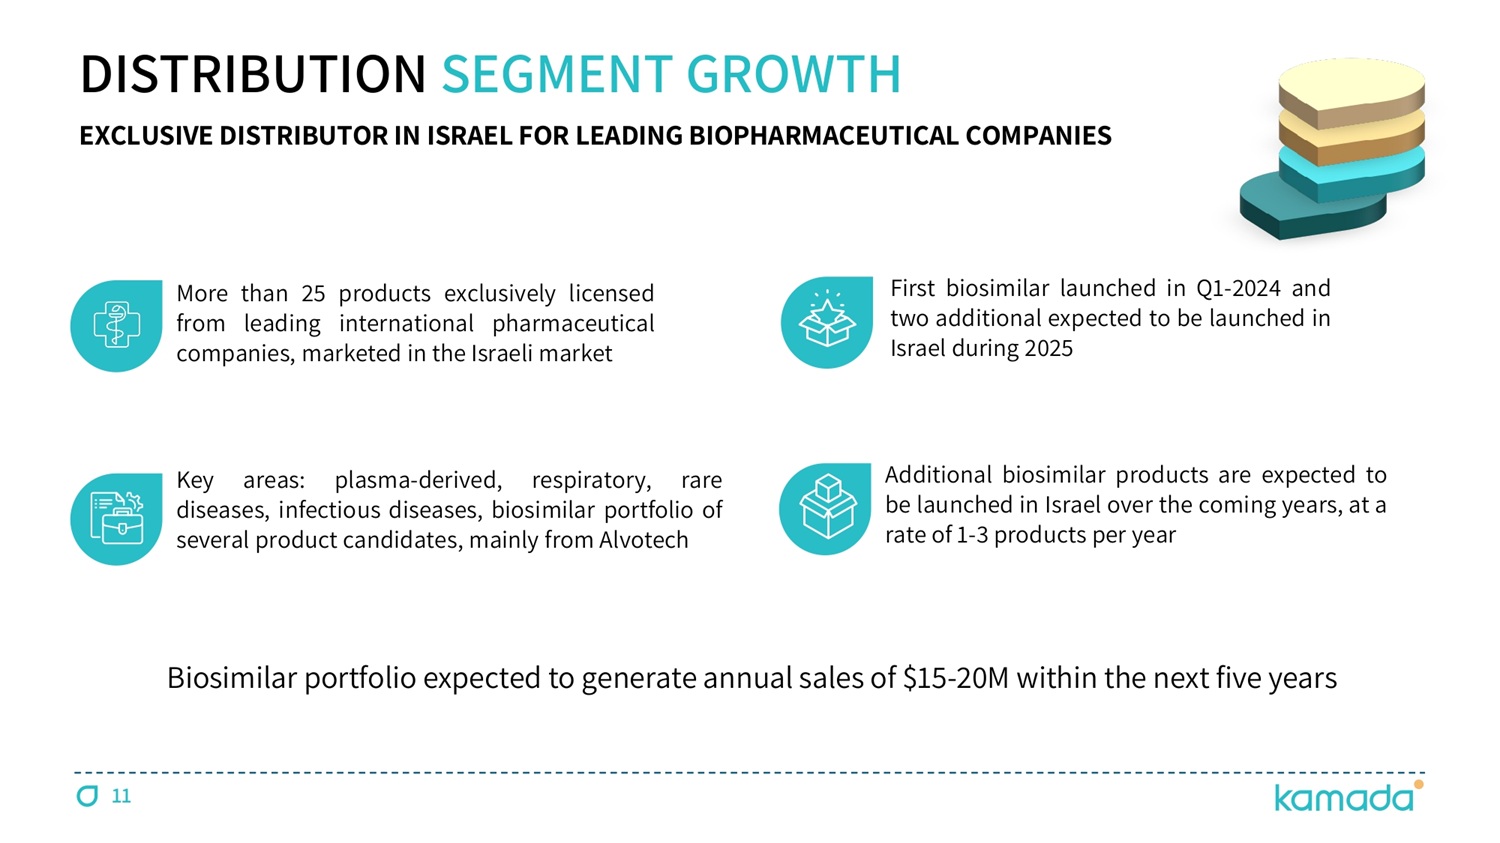
and Canada markets 10 For Important Safety Information, visit https://cytogam.com/ ; *Source: https://optn.transplant.hrsa.gov/ DISTRIBUTION SEGMENT GROWTH More than 25 products exclusively licensed from leading international pharmaceutical companies, marketed in the Israeli market EXCLUSIVE DISTRIBUTOR IN ISRAEL FOR LEADING BIOPHARMACEUTICAL COMPANIES Key areas : plasma - derived, respiratory, rare diseases, infectious diseases, biosimilar portfolio of several product candidates, mainly from Alvotech First biosimilar launched in Q 1 - 2024 and two additional expected to be launched in Israel during 2025 Additional biosimilar products are expected to be launched in Israel over the coming years, at a rate of 1 - 3 products per year Biosimilar portfolio expected to generate annual sales of $ 15 - 20 M within the next five years 11 12 M&A TRANSACTIONS AIMING TO SECURE NEW BUSINESS DEVELOPMENT AND M&A TRANSACTIONS DURING 2025 ; LEVERAGING OVERALL FINANCIAL STRENGTH AND COMMERCIAL INFRASTRUCTURE Exploring strategic business development opportunities to identify potential acquisition or in - licensing to accelerate long - term growth Focusing on products synergistic to our existing commercial and/or production activities Strong financial position, commercial infrastructure and proven successful M&A capabilities


13 KAMADA PLASMA EXPANDING VERTICAL INTEGRATION & REVENUE GROWTH Collecting hyper - immune plasma for our specialty IgG products and normal source plasma (NSP) to support revenue growth Recently opened a new plasma collection center in Houston, Texas ; planning to open another center in San Antonio, Texas (by the end of Q 1 - 25 ) At full collection capacity, each of the Houston and San Antonio centers is expected to generate annual revenues of $8M to $10M from sales of NSP $ 2 Billion A substantial market opportunity ( 2028 ) č Based on expected changes to the statistical analysis plan, intend to reduce the study sample size to approximately 180 patients , and conduct an interim futility analysis by the end of 2025 FDA recently reconfirmed overall study design, endorsed positive safety data to date, and confirmed its agreement with our proposed P - value of 0.1 in evaluating the trial’s efficacy primary endpoint INHALED AAT PHASE 3 PIVOTAL STUDY InnovAATe - a global, double - blind, randomized, placebo - controlled pivotal Phase 3 clinical trial testing the safety and efficacy of inhaled AAT in patients with AATD.
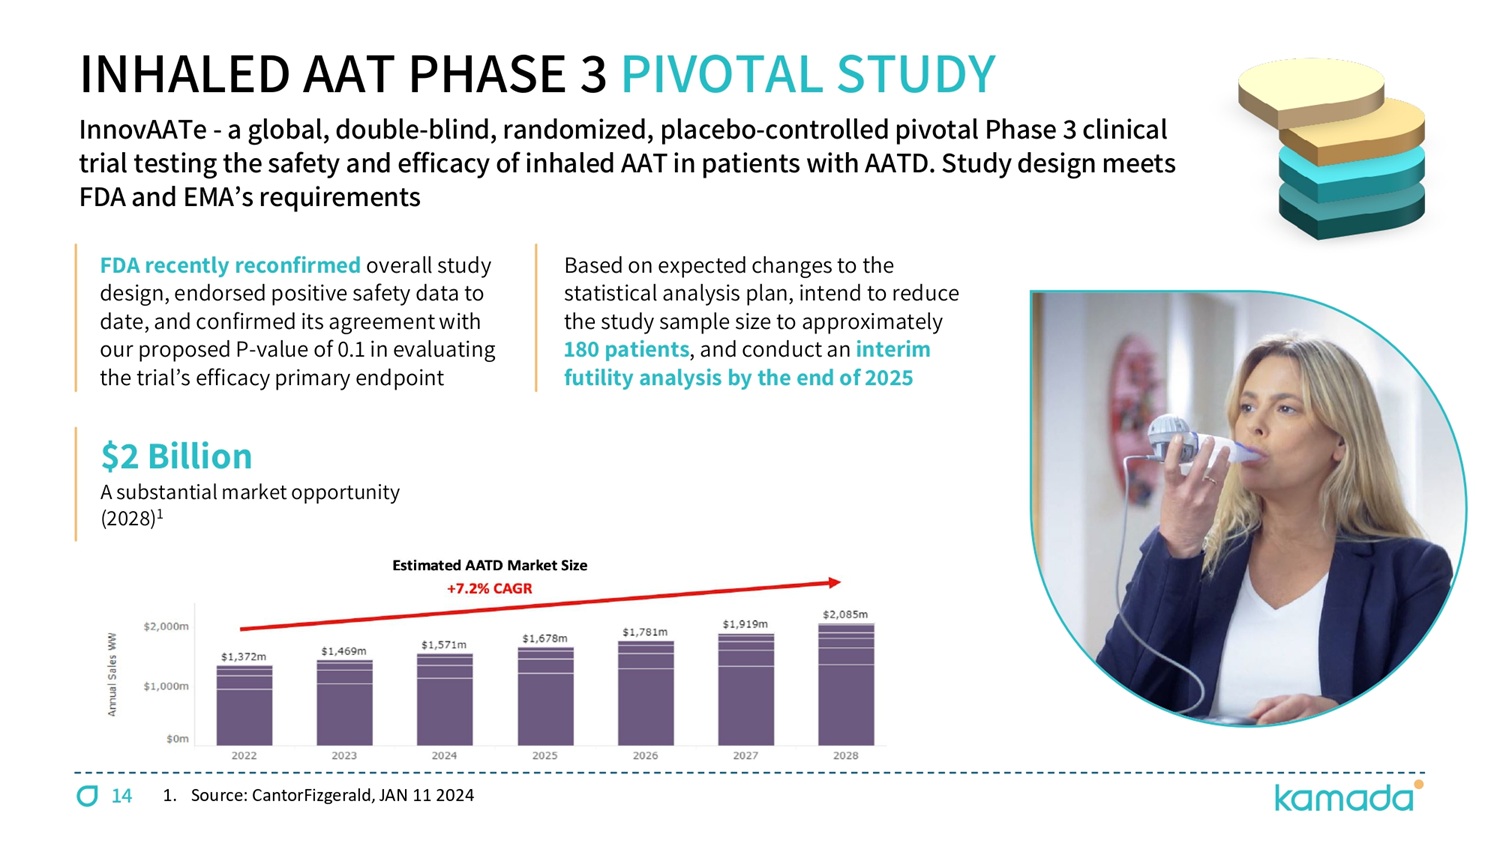
Study design meets FDA and EMA ’ s requirements 1. Source: CantorFizgerald, JAN 11 2024 14

INHALED AAT PHASE 3 PIVOTAL STUDY Non - Invasive, at - home treatment. Expected better ease of use and quality of life for AATD patients than current IV SOC Most effective mode of treatment for delivering therapeutic quantities of AAT directly into the airways Studied in more than 200 individuals to date, with an established safety profile Only 1/8th of the IV AAT dosing, more cost - effective; favorable market access landscape STUDY D ESIGN EXPECTED ADVANTAGES čŃč Ɗ randomization; 9 active sites; ~ 50 % 1 of patients enrolled to date; Open Label Extension (OLE) initiated Mid 2024 Inhaled AAT ĔČ mg Ɗ once Ɗ daily o r Ɗ placebo, Ɗ during Ɗ two Ɗ years of Ɗ treatment Primary Ɗ Endpoint: Lung Ɗ function - FEV č Secondary Ɗ Endpoints Ń Lung Ɗ density - CT Ɗ densitometry Ɗ and Ɗ other Ɗ disease Ɗ severity Ɗ parameters 15 POTENTIAL TRANSFORMATIVE TREATMENT IN AATD - RELATED LUNG DISEASE 1.

B a sed on reduced sample size of 180 patients, see previous slide 16 DETAILS Q4/23 Q4/24 FY 2023 FY 2024 US $ M Driven by two key growth drivers, KEDRAB® & CYTOGAM® 29.0 31.4 115.4 141.5 PROPRIETARY 7.4 7.6 27.1 19.5 DISTRIBUTION 13% YoY increase; over mid - point annual guidance 36.4 39.0 142.5 161.0 TOTAL REVENUES 14.4 17.0 55.5 70.0 GROSS PROFIT 4 basis point increase YoY 40% 44% 39% 43% GROSS MARGIN (11.6) (12.0) (45.4) (49.9) OPEX 5.1 3.8 8.3 14.5 NET PROFIT 42% YoY increase; over mid - point annual guidance 6.4 8.8 24.1 34.1 Adjusted EBITDA Generated $47.6M of operating cash flow during 2024 55.6 78.4 CASH Including acquisition related intangible assets ($129M @ December 24) 354.9 372.3 TOTAL ASSETS Increase associated with new plasma collection centers in the U.S.
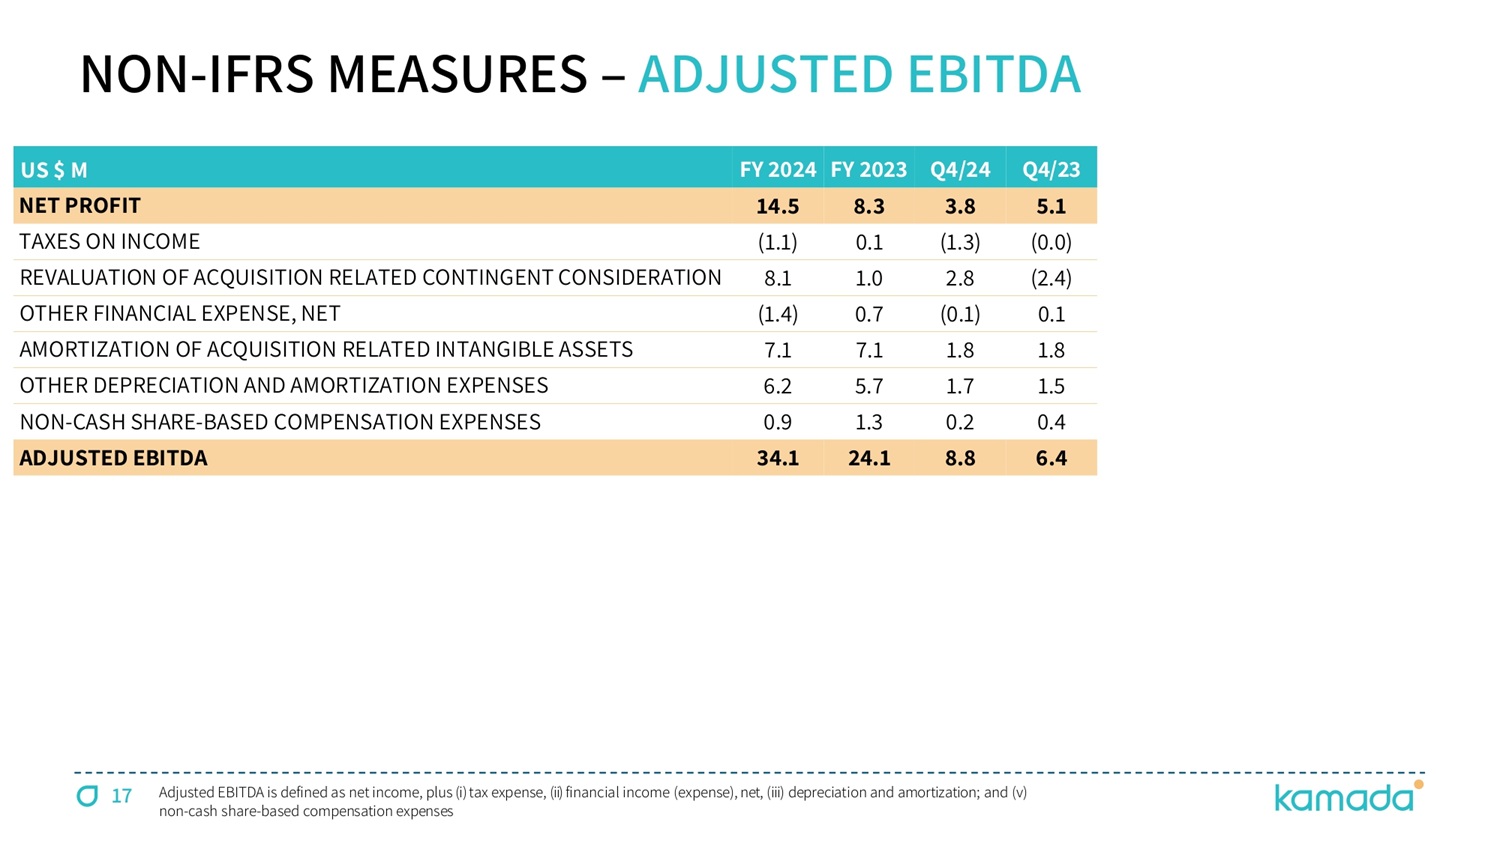
8.8 11.1 LEASE LIABILITIES Acquisition related contingent consideration 68.2 63.6 CONTINGENT LIABILITIES 244.0 259.5 EQUITY Available cash net of contingent and lease liabilities (21.4) 3.7 NET CASH (DEBT) Adjusted EBITDA is defined as net income, plus ( i ) tax expense, (ii) financial income (expense), net, (iii) depreciation and amortization ; and (v) non - cash share - based compensation expenses STRONG 2024 FINANCIAL RESULTS NL0 17 NON - IFRS MEASURES – ADJUSTED EBITDA Q4/23 Q4/24 FY 2023 FY 2024 US $ M 5.1 3.8 8.3 14.5 NET PROFIT (0.0) (1.3) 0.1 (1.1) TAXES ON INCOME (2.4) 2.8 1.0 8.1 REVALUATION OF ACQUISITION RELATED CONTINGENT CONSIDERATION 0.1 (0.1) 0.7 (1.4) OTHER FINANCIAL EXPENSE, NET 1.8 1.8 7.1 7.1 AMORTIZATION OF ACQUISITION RELATED INTANGIBLE ASSETS 1.5 1.7 5.7 6.2 OTHER DEPRECIATION AND AMORTIZATION EXPENSES 0.4 0.2 1.3 0.9 NON - CASH SHARE - BASED COMPENSATION EXPENSES 6.4 8.8 24.1 34.1 ADJUSTED EBITDA Adjusted EBITDA is defined as net income, plus ( i ) tax expense, (ii) financial income (expense), net, (iii) depreciation and amortization ; and (v) non - cash share - based compensation expenses KEDRAB® CYTOGAM® HEPGAM B® VARIZIG® WINRHO® GLASSIA® KAMADA - A GLOBAL BIOPHARMACEUTICAL COMPANY 6 FDA - Approved Products 15 % CAGR (from 2021) $ 178 - 182M 2025 Revenues Guidance $ 38 - 42M 2025 Adj.

EBIDTA Guidance 4 Pillars of Growth DELIVERING ON OUR COMMITMENTS 18 Organic Growth M&A Transactions Inhaled AAT Pivotal Study Plasma Collection Centers $ 78.4 M Cash @ Dec 31, 2024

THANK YOU www.kamada.com