UNITED STATES
SECURITIES AND EXCHANGE COMMISSION
Washington, D.C. 20549
FORM 6-K
REPORT OF FOREIGN ISSUER
PURSUANT TO RULE 13a-16 OR 15b-16 OF
THE SECURITIES EXCHANGE ACT OF 1934
For the month of February 2025
Commission File Number 001-35401
CEMENTOS PACASMAYO S.A.A.
(Exact name of registrant as specified in its charter)
PACASMAYO CEMENT CORPORATION
(Translation of registrant’s name into English)
Republic of Peru
(Jurisdiction of incorporation or organization)
Calle La Colonia 150, Urbanización El Vivero
Surco, Lima
Peru
(Address of principal executive office)
Indicate by check mark whether the registrant files or will file annual reports under cover Form 20-F or Form 40-F.
Form 20-F ☒ Form 40-F ☐
CEMENTOS PACASMAYO S.A.A.
The following exhibit is attached:
| EXHIBIT NO. | DESCRIPTION | |
| 99.1 | Cementos Pacasmayo S.A.A. Announces Consolidated Results for Fourth Quarter 2024 |
Signatures
Pursuant to the requirements of the Securities Exchange Act of 1934, the registrant has duly caused this report to be signed on its behalf by the undersigned, thereunto duly authorized.
CEMENTOS PACASMAYO S.A.A.
| By: | /s/ CARLOS JOSE MOLINELLI MATEO | |
| Name: | Carlos Jose Molinelli Mateo | |
| Title: | Stock Market Representative | |
| Date: | February 13, 2025 |
2
Exhibit 99.1
E-mail:cbustamante@cpsaa.com.pe
CEMENTOS PACASMAYO S.A.A. ANNOUNCES CONSOLIDATED RESULTS
FOR FOURTH QUARTER 2024
Lima, Peru, February 13, 2025 – Cementos Pacasmayo S.A.A. and subsidiaries (NYSE: CPAC; BVL: CPACASC1) (“the Company” or “Pacasmayo”) a leading cement company serving the Peruvian construction industry, announced today its consolidated results for the fourth quarter (“4Q24”) and for the year (“2024”) ended December 31, 2024. These results have been prepared in accordance with International Financial Reporting Standards (“IFRS”) and are stated in Soles (S/).
4Q24 FINANCIAL AND OPERATIONAL HIGHLIGHTS:
(All comparisons are to 4Q23, unless otherwise stated)
| ● | Sales volume of cement, concrete and precast increased by 2.6%, mainly due to an increase in bagged cement and public sector demand. |
| ● | Revenues increased by 3.0%, in line with increased sales volume. |
| ● | Consolidated EBITDA of S/142.5 million, an 8.7% decrease compared to adjusted EBITDA in 4Q23. |
| ● | Consolidated EBITDA margin of 27.1%, a 3.5 percentage point decrease compared to adjusted EBITDA margin in 4Q23. |
| ● | Net income of S/ 50.0 million, a 39.3% increase mainly due to the impairment loss of our vertical kilns included in the 2023 results. |
| ● | Sustainability achievements - We are honored to be included in the Yearbook by S&P, for the fifth consecutive year, and to achieve 9th place in the general ranking of the most responsible companies in terms of sustainability in the country according to Merco ESG. |
2024 FINANCIAL AND OPERATIONAL HIGHLIGHTS:
(All comparisons are to 2023, unless otherwise stated)
| ● | Sales volume of cement, concrete and precast decreased by 3.7%, mainly due to the decrease in cement demand. |
| ● | Revenues increased by 1.4%, mainly due to sales mix and higher prices. |
| ● | Consolidated EBITDA of S/ 549.3 million, a 6.0% increase compared to adjusted EBITDA in 2023, mainly due to operational efficiencies derived from our new kiln in Pacasmayo and more favorable costs of raw materials. |
| ● | Consolidated EBITDA margin of 27.8%, a 1.2 percentage point increase compared to adjusted EBITDA margin, mainly due to the above-mentioned operational efficiencies. |
| ● | Net income of S/ 198.9 million, a 17.8% increase, mainly due to an increase in operating profit as a result of increased revenues and operating efficiencies as described above. |

We invite you to review our historical results by clicking on the underlined titles:
| Financial and Operating Results | ||||||||||||||||||||||||
| 4Q24 | 4Q23 | % Var. | 2024 | 2023 | % Var. | |||||||||||||||||||
| Cement, concrete and precast shipments (MT) | 769.8 | 750.6 | 2.6 | % | 2,845.5 | 2,953.4 | -3.7 | % | ||||||||||||||||
| In millions of S/ | ||||||||||||||||||||||||
| Sales of goods | 526.7 | 511.4 | 3.0 | % | 1,978.1 | 1,950.1 | 1.4 | % | ||||||||||||||||
| Gross profit | 197.4 | 201.6 | -2.1 | % | 728.5 | 689.4 | 5.7 | % | ||||||||||||||||
| Operating profit | 99.1 | 80.6 | 23.0 | % | 391.0 | 337.5 | 15.9 | % | ||||||||||||||||
| Net income | 50.0 | 35.9 | 39.3 | % | 198.9 | 168.9 | 17.8 | % | ||||||||||||||||
| Consolidated EBITDA | 142.5 | 119.5 | 19.2 | % | 549.3 | 481.8 | 14.0 | % | ||||||||||||||||
| Adjusted EBITDA/1 | 142.5 | 156.1 | -8.7 | % | 549.3 | 518.3 | 6.0 | % | ||||||||||||||||
| Gross Margin | 37.5 | % | 39.4 | % | -1.9 | pp. | 36.8 | % | 35.4 | % | 1.4 | pp. | ||||||||||||
| Operating Margin | 18.8 | % | 15.8 | % | 3.0 | pp. | 19.8 | % | 17.3 | % | 2.5 | pp. | ||||||||||||
| Net income Margin | 9.5 | % | 7.0 | % | 2.5 | pp. | 10.1 | % | 8.7 | % | 1.4 | pp. | ||||||||||||
| Consolidated EBITDA Margin | 27.1 | % | 23.4 | % | 3.7 | pp. | 27.8 | % | 24.7 | % | 3.1 | pp. | ||||||||||||
| Adjusted EBITDA Margin | 27.1 | % | 30.5 | % | -3.4 | pp. | 27.8 | % | 26.6 | % | 1.2 | pp. | ||||||||||||
1/EBITDA has been adjusted to exclude the effect of the impairment of our vertical kilns.
|
|
|
|
MANAGEMENT COMMENTS
During 4Q24 we saw a reversal of the negative trend in sales volume, resulting in an increase of 2.6% year-over-year. This increase was mainly due to increased sales to the public sector, as well as a pick up in demand for bagged cement. For the whole year 2024, revenues increased 1.4%, despite a slight decrease in sales volumes, mainly due to sales mix and our dynamic pricing strategy. Moreover, consolidated EBIDTA reached a record S/ 549.3 million, with an EBITDA margin of 27.8%. These results, considering a challenging demand environment, are outstanding, and give us the confidence to believe that, taking into account a stronger demand scenario in 2025, we will be able to deliver even better results.
We would like to take this opportunity to look over this past year’s performance, taking a more strategic view of our medium and longer-term goals. As we have mentioned before, digital transformation is one of the most important pillars of our strategy. During 2024 we made significant progress in digital transformation and cybersecurity, aligning technology with the company’s strategic objectives. Initiatives such as our Cyberweek have raised awareness among our workers about digital security, while Demo Days have strengthened the culture of innovation through feedback and the presentation of disruptive projects. In this context, we have promoted the adoption of strategic initiatives such as Pacasmayo 4.0 (digitization of operations), Maverick (user-centered service), Kukla (AI for prospecting) and Gemini AI (process optimization with advanced algorithms). Additionally, in our supply chain, the integration of data in a Data Lake has allowed the implementation of tools such as spend analysis, inventory optimization and dynamic control dashboards, improving operational efficiency. Automation has also been key, highlighting the Service Acceptance project with Smartflow, which modernizes our logistics processes. Although the benefits of this level of automation are evident, it is also key to identify the risks that come with it. Cybersecurity is a matter we take very seriously and are constantly working on improving. This past year, we strengthened the protection of our operational technologies (OT), increasing the maturity of our industrial network. We also consolidated an Information Security Committee with representatives from various management positions. Since 2023, we have implemented IT protection programs that continue to evolve in 2024, ensuring a secure and reliable digital infrastructure aligned with our vision of innovation and technological transformation. As a result of these efforts, we became the first Peruvian cement company to achieve ISO 27001 certification, the international standard for safeguarding the confidentiality and integrity of information.
Now moving on to our medium and long term goals related to sustainability, we are very pleased to announce that we are the first Peruvian cement company to obtain the Environmental Product Declaration from the Global EPD program for three of its cements and plants: Fortimax (Piura, Pacasmayo plant), Extraforte and Type I (Piura, Pacasmayo and Rioja plant). This international certification, verified by AENOR, provides transparent information on the environmental impact of our products throughout their life cycle, which reaffirms our environmental commitment, as well as our leadership in sustainability in the construction sector.
Finally, we would like to focus on two recognitions that we received these past weeks. First, we are extremely pleased to be included, for the fifth consecutive year, in The Sustainability Yearbook by S&P. Along the same lines, for the ninth consecutive year, we were the industry leaders in the Merco Responsabilidad ESG ranking this year. This evaluation includes three types of criteria: environment (E), clients and society (S), ethics and corporate governance (G). Moreover, this year we entered the top 10, placing 9th in the general ranking of the most responsible companies in terms of sustainability in the country. These recognitions give us the confidence to continue moving forward with our sustainability strategy, embedding it at the heart of our business.
2024 has been a year of both challenges and transformation. While rising insecurity—particularly in the form of extortion—negatively impacted demand, we successfully delivered strong results in EBITDA and net income. This year also marked a significant milestone in our journey of innovation and growth, as we spun off our digital solutions company. With over 68 years of experience in the Peruvian market and an unwavering commitment to challenging the status quo, we are confident in our ability to navigate the future with resilience and optimism.
|
|
|
|
ECONOMIC OVERVIEW 4Q24:
During the fourth quarter of 2024, the Central Reserve Bank of Peru (BCRP for its Spanish abbreviation) projected growth of 3.2% for 2024, although with a higher-than-expected fiscal deficit. To better face this situation, the government announced the issuance of sovereign bonds in 2025 in order to finance its commitments. The northern region in particular has had a solid economic performance during 2024, leading the country’s economic growth with an expansion of 5.6%. This growth was mainly attributed to the increase in anchovy fishing, which recorded an increase of 184.0%, benefiting the fishmeal and fish oil industry.
The Peruvian construction sector showed notable dynamism this quarter. According to the Central Reserve Bank of Peru (BCRP), in October 2024, construction activity expanded by 4.9%, accumulating growth of 4.3% in the first ten months of the year. This growth was fueled by accelerated public and private projects, alongside a 3.2% increase in domestic cement consumption in October.
The Peruvian Chamber of Construction (Capeco) projected annual growth in the sector of 3.7% for 2024, exceeding the 7.8% contraction recorded in 2023. This rebound is due, in part, to the expansion of domestic cement consumption and the sustained progress of public works in recent months.
A significant milestone this quarter was the inauguration of the Chancay megaport in November 2024, a joint project between the Chinese state company Cosco Shipping and the Peruvian company Volcan. As South America’s first smart port, Chancay aims to position Peru as a key global trade hub and strengthen its ties with the Asian market.
Despite these advances, challenges remain in public investment execution. Capeco warned that only 68.0% of the allocated budget for public projects would be utilized by year-end, leaving approximately 22 billion soles unspent. This shortfall limits the full economic impact of infrastructure projects and raises concerns about the sector’s medium-term sustainability.
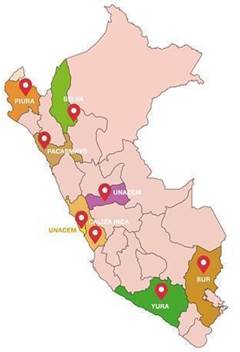
PERUVIAN CEMENT INDUSTRY OVERVIEW:
The demand for cement in Peru is covered mainly by Pacasmayo, UNACEM and Cementos Yura, and to a lesser extent by Caliza Inca, Holcim, imports and other small producers. Pacasmayo mainly covers the demand in the northern region of the country, while UNACEM covers the central region and Cementos Yura the southern region.
|
|
|
|
The northern region of Peru, according to the Instituto Nacional de Estadística e Informática (INEI) and Apoyo Consultoría, represents approximately 32.5% of the country’s population and 16.0% of national Gross Domestic Product (“GDP”). Despite the country’s sustained growth over the last 10 years, Peru continues to have a significant housing deficit, estimated at 1.9 million households throughout the country as per the Ministry of Housing, Construction and Sanitation (80% qualitative and 20% quantitative deficit).
In Peru, the majority of cement is sold to a highly fragmented consumer base of individuals that tend to gradually buy bags of cement to build or to improve their homes, a segment the industry refers to as “self-construction”.
Northern Region (thousands of metric tons)
| Plant | 2020 | 2021 | 2022 | 2023 | Nov-24 LTM |
% part | ||||||||||||||||||
| Pacasmayo Group | 2,576 | 3,626 | 3,437 | 2,951 | 2,817 | 22.7 | % | |||||||||||||||||
| Imports | 38 | 40 | 2 | - | - | 0.0 | % | |||||||||||||||||
| Total | 2,614 | 3,666 | 3,439 | 2,951 | 2,817 | 22.7 | % | |||||||||||||||||
Central Region (thousands of metric tons)
| Plant | 2020 | 2021 | 2022 | 2023 | Nov-24 LTM |
% part | ||||||||||||||||||
| UNACEM | 4,172 | 5,838 | 6,297 | 5,617 | 5,491 | 44.2 | % | |||||||||||||||||
| Caliza Inca | 382 | 492 | 515 | 585 | 743 | 6.0 | % | |||||||||||||||||
| Imports | 493 | 691 | 202 | 145 | 206 | 1.7 | % | |||||||||||||||||
| Total | 5,047 | 7,021 | 7,014 | 6,347 | 6,440 | 51.9 | % | |||||||||||||||||
Southern Region (thousands of metric tons)
| Plant | 2020 | 2021 | 2022 | 2023 | Nov-24 LTM |
% part | ||||||||||||||||||
| Grupo Yura | 2,019 | 2,904 | 3,047 | 2,581 | 2,544 | 20.5 | % | |||||||||||||||||
| Imports | 189 | 150 | 67 | 65 | 67 | 0.5 | % | |||||||||||||||||
| Total | 2,208 | 3,054 | 3,114 | 2,646 | 2,611 | 21.0 | % | |||||||||||||||||
| Others | 732 | 877 | 427 | 423 | 552 | 4.4 | % | |||||||||||||||||
| Total, All Region | 10,601 | 14,618 | 13,994 | 12,367 | 12,420 | 100.0 | % | |||||||||||||||||
|
* |
Import figures are sourced from Aduanet. They represent quantities of imported cement, not shipped cement. |
Source: INEI, Aduanet
|
|
|
|
OUR STRATEGIC PROGRESS
 |
 |
DJSI Members |
| Members since 2019, we are the only Peruvian cement company in the construction materials industry that is part of the Dow Jones MILA index, highlighting our commitment to sustainability. | ||

|
Our Contribution to Urban Development | 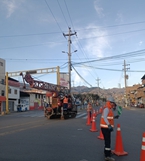 |
| As part of our contribution to Urban Development, we delivered two projects in the form of works for taxes: the improvement of urban mobility access in the city of Cajamarca and the improvement of the road service in the Campo Polo Human Settlement in Piura. | ||
 |
|
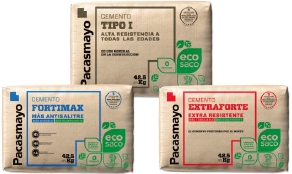
Eco-Efficient Products |
| We are the first Peruvian cement company to obtain the Environmental Product Declaration for three cements in our portfolio: Type I, Extraforte and Fortimax. | ||
 |
|
Leading the way in cybersecurity |
| We are the first Peruvian cement company to obtain ISO 27001, an international standard used to protect the confidentiality and integrity of information. | ||
 |
|
Inauguration of the I+D laboratory |
| We opened the applications laboratory, designed to optimize the performance of our cement through tests in its different applications. This space reinforces our commitment to innovation and quality in each project. | ||
|
|
|
|
OPERATING RESULTS:
Production:
Cement Production Volume
(thousands of metric tons)
| Production | ||||||||||||||||||||||||
| 4Q24 | 4Q23 | % Var. | 2024 | 2023 | % Var. | |||||||||||||||||||
| Pacasmayo Plant | 449.7 | 477.9 | -5.9 | % | 1,668.4 | 1,655.8 | 0.8 | % | ||||||||||||||||
| Rioja Plant | 83.7 | 46.9 | 78.5 | % | 320.3 | 258.5 | 23.9 | % | ||||||||||||||||
| Piura Plant | 233.4 | 239.5 | -2.5 | % | 843.3 | 1,031.9 | -18.3 | % | ||||||||||||||||
| Total | 766.8 | 764.3 | 0.3 | % | 2,832.0 | 2,946.2 | -3.9 | % | ||||||||||||||||
Cement production volume at the Pacasmayo plant decreased 5.9% in 4Q24 compared to 4Q23, mainly due to a slight decrease in cement demand in this area. During 2024, production increased 0.8% compared to 2023, mainly due to the transfer of production from the Piura to the Pacasmayo plant.
During this quarter, cement production volume at the Rioja plant increased 78.5% in 4Q24 and 23.9% in 2024 compared to 4Q23 and 2023 respectively, mainly due to increased cement demand in this area. Additionally, in 4Q23 there were electrical problems in the area that resulted in a halt in operations.
Cement production volume at the Piura Plant decreased 2.5% compared to 4Q23 and 18.3% in 2024 compared to 2023, mainly due to a slight decrease in demand, as well as some transfer of production to the Pacasmayo plant.
Total cement production volume increased 0.3% in 4Q24 compared to 4Q23. In 2024, total cement production volume decreased 3.9% in line with decreased cement demand.
Clinker Production Volume
(thousands of metric tons)
| Production | ||||||||||||||||||||||||
| 4Q24 | 4Q23 | % Var. | 2024 | 2023 | % Var. | |||||||||||||||||||
| Pacasmayo Plant | 341.8 | 334.0 | 2.3 | % | 1,272.6 | 1,097.9 | 15.9 | % | ||||||||||||||||
| Rioja Plant | 61.5 | 37.4 | 64.4 | % | 241.9 | 199.6 | 21.2 | % | ||||||||||||||||
| Piura Plant | 88.9 | 271.9 | -67.3 | % | 608.5 | 799.4 | -23.9 | % | ||||||||||||||||
| Total | 492.2 | 643.4 | -23.5 | % | 2,123.0 | 2,096.9 | 1.2 | % | ||||||||||||||||
Clinker production volume at the Pacasmayo plant during 4Q24 increased 2.3% and 15.9% during 2024, compared to 4Q23 and 2023 respectively, mainly due to increased production in our new kiln in Pacasmayo, which is more efficient.
Clinker production volume at the Rioja plant increased 64.4% in 4Q24 compared to 4Q23 and 21.2% in 2024, compared to 2023, mainly due to the increased cement production in this area, as well as the above-mentioned temporary halt in production in 4Q23.
Clinker production volume at the Piura plant during 4Q24 decreased 67.3% and 23.9% during 2024,compared to 2023, according to our annual production plan that aims to maximize the operational efficiency of our kilns.
Total clinker production volume decreased 23.5% in 4Q24, compared to 4Q23, mainly due to the decreased clinker production in the Piura Plant this quarter, as established by our annual production plan. During 2024, clinker production volume increased 1.2% compared to 2023.
|
|
|
|
Quicklime Production Volume
(thousands of metric tons)
| Production | ||||||||||||||||||||||||
| 4Q24 | 4Q23 | % Var. | 2024 | 2023 | % Var. | |||||||||||||||||||
| Pacasmayo Plant | 0.0 | 5.9 | N/R | 18.9 | 29.0 | -34.8 | % | |||||||||||||||||
There was no quicklime production in 4Q24. During 2024, quicklime production volume decreased 34.8% compared to 2023 respectively, mainly due to our annual production program in order to maximize productivity.
INSTALLED CAPACITY:
Installed Clinker and Cement Capacity
Full year installed cement capacity at the Pacasmayo, Piura and Rioja plants remained stable at 2.9 million MT, 1.6 million MT and 440,000 MT, respectively.
Full year installed clinker capacity at the Pacasmayo, Piura and Rioja plants remained stable at 1.8 million MT, 990,000 MT and 289,080 MT, respectively.
Full year installed quicklime capacity at the Pacasmayo plant remained stable at 240,000 MT.
UTILIZATION RATE1:
Pacasmayo Plant Utilization Rate
| Utilization Rate | ||||||||||||||||||||||||
| 4Q24 | 4Q23 | % Var. | 2024 | 2023 | % Var. | |||||||||||||||||||
| Cement | 62.0 | % | 65.9 | % | -3.9 | pp. | 57.5 | % | 57.1 | % | 0.4 | pp. | ||||||||||||
| Clinker | 76.0 | % | 69.9 | % | 6.0 | pp. | 70.7 | % | 62.0 | % | 8.7 | pp. | ||||||||||||
| Quicklime | 0.0 | % | 9.9 | % | -9.9 | pp. | 7.9 | % | 12.1 | % | -4.2 | pp. | ||||||||||||
Cement production utilization rate at the Pacasmayo plant decreased 3.9 percentage points in 4Q24 compared to 4Q23, mainly due to the decreased cement demand mentioned above. In 2024, cement production utilization rate increased 0.4 percentage points mainly due to a shift in production from the Piura plant.
Clinker production utilization rate in 4Q24 increased 6.0 percentage points compared to 4Q23 and 8.7 percentage points during 2024, compared to 2023, mainly due to the optimization of our capacity.
Quicklime production utilization rate decreased 9.9 percentage points in 4Q24 and 4.2 percentage points in 2024 compared to 4Q23 and 2023 respectively, mainly due to our annual production program mentioned above.
| 1 | The utilization rates are calculated by dividing production in a given period over installed capacity. The utilization rate implies annualized production, which is calculated by multiplying real production for each quarter by four. |
|
|
|
|
Rioja Plant Utilization Rate
| Utilization Rate | ||||||||||||||||||||||||
| 4Q24 | 4Q23 | % Var. | 2024 | 2023 | % Var. | |||||||||||||||||||
| Cement | 76.1 | % | 42.6 | % | 33.5 | pp. | 72.8 | % | 58.8 | % | 14.0 | pp. | ||||||||||||
| Clinker | 84.8 | % | 53.4 | % | 31.4 | pp. | 83.4 | % | 71.3 | % | 12.1 | pp. | ||||||||||||
The cement production utilization rate at the Rioja plant was 76.1% in 4Q24 and 72.8% in 2024; 33.5 and 14.0 percentage points higher than 4Q23 and 2023 respectively, in line with increased demand in this area and the temporary halt in production in 4Q23 mentioned above.
The clinker production utilization rate at the Rioja plant was 84.8% in 4Q24 and 83.4% in 2024; 31.4 and 12.1 percentage points higher than 4Q23 and 2023 respectively, mainly due to the above-mentioned reasons.
Piura Plant Utilization Rate
| Utilization Rate | ||||||||||||||||||||||||
| 4Q24 | 4Q23 | % Var. | 2024 | 2023 | % Var. | |||||||||||||||||||
| Cement | 58.4 | % | 59.9 | % | -1.5 | pp. | 52.7 | % | 64.5 | % | -11.8 | pp. | ||||||||||||
| Clinker | 27.1 | % | 100.0 | % | -72.8 | pp. | 61.5 | % | 79.9 | % | -18.5 | pp. | ||||||||||||
The cement production utilization rate at the Piura plant decreased 1.5 percentage points in 4Q24 and 11.8 percentage points compared to 4Q23 and 2023 respectively, mainly due to a shift in production to the Pacasmayo plant.
The clinker production utilization rate at the Piura plant decreased 72.8 percentage points in 4Q24 and 18.5 percentage points compared to 4Q23 and 2023 respectively, mainly due to our annual clinker production plan, which aims to maximize efficiencies as we utilize all of our capacity at certain periods during the year.
Consolidated Utilization Rate
| Utilization Rate | ||||||||||||||||||||||||
| 4Q24 | 4Q23 | % Var. | 2024 | 2023 | % Var. | |||||||||||||||||||
| Cement | 62.1 | % | 61.9 | % | 0.2 | pp. | 57.3 | % | 59.6 | % | -2.3 | pp. | ||||||||||||
| Clinker | 63.9 | % | 80.5 | % | -16.5 | pp. | 68.9 | % | 64.4 | % | 4.6 | pp. | ||||||||||||
The consolidated cement production utilization rate was 62.1% in 4Q24, remaining in line with 4Q23. In 2024, the consolidated cement production utilization rate was 57.3%, 2.3 percentage points lower than 2023, in line with decreased demand.
The consolidated clinker production utilization rate was 63.9% in 4Q24, 16.5 percentage points lower than 4Q23, mainly due to lower clinker production in our Piura plant this quarter following our annual production plan. In 2024, the consolidated clinker production utilization rate was 68.9%, 4.6 percentage points higher than 2023, mainly due to production for inventory purposes.
|
|
|
|
FINANCIAL RESULTS:
Income Statement:
The following table shows a summary of the Consolidated Financial Results:
Consolidated Financial Results
(in millions of Soles S/)
| Income Statement | ||||||||||||||||||||||||
| 4Q24 | 4Q23 | % Var. | 2024 | 2023 | % Var. | |||||||||||||||||||
| Sales of goods | 526.7 | 511.4 | 3.0 | % | 1,978.1 | 1,950.1 | 1.4 | % | ||||||||||||||||
| Gross Profit | 197.4 | 201.6 | -2.1 | % | 728.5 | 689.4 | 5.7 | % | ||||||||||||||||
| Total operating expenses, net | -98.3 | -121.0 | -18.8 | % | -337.5 | -351.9 | -4.1 | % | ||||||||||||||||
| Operating Profit | 99.1 | 80.6 | 23.0 | % | 391.0 | 337.5 | 15.9 | % | ||||||||||||||||
| Total other expenses, net | -21.9 | -25.0 | -12.4 | % | -94.8 | -91.8 | 3.3 | % | ||||||||||||||||
| Profit before income tax | 77.2 | 55.6 | 38.8 | % | 296.2 | 245.7 | 20.6 | % | ||||||||||||||||
| Income tax expense | -27.2 | -19.7 | 38.1 | % | -97.3 | -76.8 | 26.7 | % | ||||||||||||||||
| Profit for the period | 50.0 | 35.9 | 39.3 | % | 198.9 | 168.9 | 17.8 | % | ||||||||||||||||
During 4Q24, revenues increased 3.0% and 1.4% in 2024, compared to 4Q23 and 2023 respectively, mainly due to sales mix and pricing. In addition, operating profit during 4Q24 increased 23% and 15.9% in 2024, when compared to 4Q23 and 2023 respectively. This improvement was mainly due to operational efficiencies and lower cost of raw materials, mainly coal. Profit for the period increased 39.3% in 4Q24 and 17.8% in 2024 compared to 4Q23 and 2023 respectively, primarily due to increased operating profit, as well as to the impairment of our vertical kilns during 4Q23.
SALES OF GOODS
The following table shows the Sales of Goods and their respective margins by business segment:
Sales: cement, concrete and precast
(in millions of Soles S/)
| Cement, concrete and precast | ||||||||||||||||||||||||
| 4Q24 | 4Q23 | % Var. | 2024 | 2023 | % Var. | |||||||||||||||||||
| Sales of goods | 511.4 | 485.4 | 5.4 | % | 1,906.8 | 1,850.2 | 3.1 | % | ||||||||||||||||
| Cost of Sales | -313.8 | -284.1 | 10.5 | % | -1,178.0 | -1,162.5 | 1.3 | % | ||||||||||||||||
| Gross Profit | 197.6 | 201.3 | -1.8 | % | 728.8 | 687.7 | 6.0 | % | ||||||||||||||||
| Gross Margin | 38.6 | % | 41.5 | % | -2.8 | pp. | 38.2 | % | 37.2 | % | 1.1 | pp. | ||||||||||||
Sales of cement, concrete and precast increased 5.4% in 4Q24 and 3.1% in 2024, when compared to 4Q23 and 2023 respectively, mainly due to increased sales of bagged cement as well as concrete, mortar and pavement. Gross margin decreased 2.8 percentage points during 4Q24, mainly due to increased costs of pavement and concrete. Gross margin in 2024 increased 1.1 percentage points mainly due to the efficiencies derived from our new kiln in Pacasmayo, decreased use of imported clinker, as well as decreased costs of raw materials.
|
|
|
|
Sales: cement
(in millions of Soles S/)
Sales of cement represented 82.4% of cement, concrete, and precast sales during 4Q24.
| Cement | ||||||||||||||||||||||||
| 4Q24 | 4Q23 | % Var. | 2024 | 2023 | % Var. | |||||||||||||||||||
| Sales of goods | 421.6 | 414.2 | 1.8 | % | 1,605.5 | 1,642.4 | -2.2 | % | ||||||||||||||||
| Cost of Sales | -223.1 | -219.4 | 1.7 | % | -878.1 | -966.1 | -9.1 | % | ||||||||||||||||
| Gross Profit | 198.5 | 194.8 | 1.9 | % | 727.4 | 676.3 | 7.6 | % | ||||||||||||||||
| Gross Margin | 47.1 | % | 47.0 | % | 0.1 | pp. | 45.3 | % | 41.2 | % | 4.1 | pp. | ||||||||||||
Sales of cement increased 1.8% in 4Q24 compared to 4Q23 mainly due to an increase in sales volume of bagged cement this quarter. In 2024, sales of cement decreased 2.2% compared to 2023, mainly due to decreased demand. However, gross margin increased 0.1 percentage points during 4Q24 and 4.1 percentage points during 2024, when compared to 4Q23 and 2023 respectively, mainly due to cost optimization, derived from our new kiln in Pacasmayo, as well as lower costs of raw materials such as coal, as mentioned above.
Sales: concrete, pavement and mortar
(in millions of Soles S/)
Sales of concrete, pavement and mortar represented 15.7% of cement, concrete, and precast sales during 4Q24.
| Concrete, pavement and mortar | ||||||||||||||||||||||||
| 4Q24 | 4Q23 | % Var. | 2024 | 2023 | % Var. | |||||||||||||||||||
| Sales of goods | 80.5 | 61.5 | 30.9 | % | 271.3 | 182.3 | 48.8 | % | ||||||||||||||||
| Cost of Sales | -82.6 | -56.4 | 46.5 | % | -272.2 | -170.2 | 59.9 | % | ||||||||||||||||
| Gross Profit | -2.1 | 5.1 | N/R | -0.9 | 12.1 | N/R | ||||||||||||||||||
| Gross Margin | -2.6 | % | 8.3 | % | -10.9 | pp. | -0.3 | % | 6.6 | % | -7.0 | pp. | ||||||||||||
Sales of concrete, pavement and mortar increased 30.9% during 4Q24, when compared to 4Q23 and 48.8% in 2024 compared to 2023, mainly due to increased sales volume of pavement to supply the Piura airport runways improvement project. Gross margin decreased 10.9 percentage points in 4Q24 compared to 4Q23 and 7.0 percentage points in 2024 compared to 2023. This decrease was mainly due to the execution of the Piura airport project. There is a difference in exchange rate between the rate projected in the contract versus the real exchange rate, as well as increased costs related to the execution of the Piura airport project, as it extended over our planned execution period. However, this extension did not imply a breach of contract, as the agreed-upon deadline with the client was not exceeded. We remain confident that developing building solutions is the right path for our company, even if it entails some short-term learning curve additional costs.
|
|
|
|
Sales: precast
(in millions of Soles S/)
Sales of precast represented 1.8% of cement, concrete, and precast sales during 4Q24.
| Precast | ||||||||||||||||||||||||
| 4Q24 | 4Q23 | % Var. | 2024 | 2023 | % Var. | |||||||||||||||||||
| Sales of goods | 9.4 | 9.7 | -3.1 | % | 30.1 | 25.5 | 18.0 | % | ||||||||||||||||
| Cost of Sales | -8.0 | -8.2 | -2.4 | % | -27.7 | -26.2 | 5.7 | % | ||||||||||||||||
| Gross Profit | 1.4 | 1.5 | -6.7 | % | 2.4 | -0.7 | N/R | |||||||||||||||||
| Gross Margin | 14.9 | % | 15.5 | % | -0.6 | pp. | 8.0 | % | -2.7 | % | 10.7 | pp. | ||||||||||||
During 4Q24, precast sales decreased 3.1% compared to 4Q23 mainly due to decreased sales volume. In 2024, precast sales increased 18.0% compared to 2023, mainly due to demand from the public sector. Gross margin during 4Q24 remained in line with 4Q23. In 2024 gross margin increased 10.7 percentage points, when compared to 2023, mainly due to dilution of fixed costs because of higher volumes.
Sales: Quicklime
(in millions of Soles S/)
| Quicklime | ||||||||||||||||||||||||
| 4Q24 | 4Q23 | % Var. | 2024 | 2023 | % Var. | |||||||||||||||||||
| Sales of goods | 2.4 | 6.1 | -60.7 | % | 14.2 | 25.7 | -44.7 | % | ||||||||||||||||
| Cost of Sales | -3.2 | -6.2 | -48.4 | % | -16.4 | -24.2 | -32.2 | % | ||||||||||||||||
| Gross Profit | -0.8 | -0.1 | N/R | -2.2 | 1.5 | N/R | ||||||||||||||||||
| Gross Margin | -33.3 | % | -1.6 | % | -31.7 | pp. | -15.5 | % | 5.8 | % | -21.3 | pp. | ||||||||||||
During 4Q24, quicklime sales decreased 60.7%, when compared to 4Q23 and 44.7% in 2024 when compared to 2023 and gross margin decreased 31.7 percentage points in 4Q24 and 21.3 percentage points in 2024, compared to 4Q23 and 2023 respectively, mainly due to decreased sales volume and lower dilution of fixed costs. It is important to note that quicklime sales only represent less than 0.5% of our consolidated revenues.
Sales: Construction Supplies2
(in millions of Soles S/)
| Construction Supplies | ||||||||||||||||||||||||
| 4Q24 | 4Q23 | % Var. | 2024 | 2023 | % Var. | |||||||||||||||||||
| Sales of goods | 12.8 | 19.8 | -35.4 | % | 56.9 | 74.1 | -23.2 | % | ||||||||||||||||
| Cost of Sales | -12.3 | -19.4 | -36.6 | % | -54.9 | -73.4 | -25.2 | % | ||||||||||||||||
| Gross Profit | 0.5 | 0.4 | 25.0 | % | 2.0 | 0.7 | N/R | |||||||||||||||||
| Gross Margin | 3.9 | % | 2.0 | % | 1.9 | pp. | 3.5 | % | 0.9 | % | 2.6 | pp. | ||||||||||||
During 4Q24, construction supply sales decreased 35.4% compared to 4Q23 and 23.2% in 2024 compared to 2023, mainly due to decreased sales of steel rebars. Gross margin increased 1.9 percentage points in 4Q24 and 2.6 percentage points in 2024, compared to 4Q23 and 2023 respectively.
| 2 | Construction supplies include the following products: steel rebar, wires, nails, corrugated iron, electric conductors, plastic tubes and accessories, among others. |
|
|
|
|
OPERATING EXPENSES:
Administrative Expenses
(in millions of Soles S/)
| Administrative Expenses | ||||||||||||||||||||||||
| 4Q24 | 4Q23 | % Var. | 2024 | 2023 | % Var. | |||||||||||||||||||
| Personnel expenses | 41.6 | 35.4 | 17.5 | % | 136.8 | 125.1 | 9.4 | % | ||||||||||||||||
| Third-party services | 22.7 | 16.3 | 39.3 | % | 75.7 | 65.0 | 16.5 | % | ||||||||||||||||
| Board of Directors | 1.5 | 1.3 | 15.4 | % | 6.0 | 5.9 | 1.7 | % | ||||||||||||||||
| Depreciation and amortization | 5.1 | 4.4 | 15.9 | % | 17.5 | 15.3 | 14.4 | % | ||||||||||||||||
| Other | -0.2 | 3.4 | N/R | 17.4 | 20.7 | -15.9 | % | |||||||||||||||||
| Total | 70.7 | 60.8 | 16.3 | % | 253.4 | 232.0 | 9.2 | % | ||||||||||||||||
Administrative expenses increased 16.3% in 4Q24 compared to 4Q23 and 9.2% in 2024, compared to 4Q23 and 2023 respectively, mainly due to increased personnel expenses because of a larger workforce, as well as higher workers’ profit sharing, and third party services, related to renewal fees for mining concessions, software and licences, among others.
Selling Expenses
(in millions of Soles S/)
| Selling and distribution expenses | ||||||||||||||||||||||||
| 4Q24 | 4Q23 | % Var. | 2024 | 2023 | % Var. | |||||||||||||||||||
| Personnel expenses | 9.9 | 10.6 | -6.6 | % | 43.7 | 41.6 | 5.0 | % | ||||||||||||||||
| Advertising and promotion | 2.5 | 1.4 | 78.6 | % | 9.1 | 7.5 | 21.3 | % | ||||||||||||||||
| Third party services | 2.1 | 1.8 | 16.7 | % | 8.5 | 7.5 | 13.3 | % | ||||||||||||||||
| Information technology related services | 1.8 | 0.2 | N/R | 4.7 | 2.1 | N/R | ||||||||||||||||||
| Other | 8.9 | 4.7 | 89.4 | % | 15.4 | 10.9 | 41.3 | % | ||||||||||||||||
| Total | 25.2 | 18.7 | 34.8 | % | 81.4 | 69.6 | 17.0 | % | ||||||||||||||||
Selling expenses increased 34.8% in 4Q24 and 17.0% in 2024 compared to 4Q23 and 2023 respectively, mainly due to increased personnel expenses because of a larger workforce, as well as higher workers’ profit sharing, advertising and promotion, as well as software and licenses.
|
|
|
|
EBITDA RECONCILIATION:
Consolidated EBITDA
(in millions of Soles S/)
| Consolidated EBITDA | ||||||||||||||||||||||||
| 4Q24 | 4Q23 | % Var. | 2024 | 2023 | % Var. | |||||||||||||||||||
| Net Income | 50.0 | 35.9 | 39.3 | % | 198.9 | 168.9 | 17.8 | % | ||||||||||||||||
| + Income tax expense | 27.2 | 19.7 | 38.1 | % | 97.3 | 76.8 | 26.7 | % | ||||||||||||||||
| - Finance income | -2.1 | -2.9 | -27.6 | % | -6.3 | -7.2 | -12.5 | % | ||||||||||||||||
| + Financial expenses | 24.4 | 27.2 | -10.3 | % | 100.3 | 104.0 | -3.6 | % | ||||||||||||||||
| +/- Net loss from exchange rate | -0.4 | 0.8 | N/R | 0.9 | -4.9 | N/R | ||||||||||||||||||
| + Depreciation and amortization | 43.4 | 38.8 | 11.9 | % | 158.2 | 144.2 | 9.7 | % | ||||||||||||||||
| Consolidated EBITDA | 142.5 | 119.5 | 19.2 | % | 549.3 | 481.8 | 14.0 | % | ||||||||||||||||
| Impairment of vertical kilns | 0.0 | 36.6 | N/R | 0.0 | 36.6 | N/R | ||||||||||||||||||
| Adjusted EBITDA | 142.5 | 156.1 | -8.7 | % | 549.3 | 518.3 | 6.0 | % | ||||||||||||||||
EBITDA decreased 8.7% in 4Q24, when compared to adjusted EBITDA in 4Q23 mainly due to an increase in costs and expenses. In 2024, adjusted EBITDA increased 6.0% when compared to 2023, mainly due to lower raw material costs, a slight increase in revenues and the operational efficiency derived from our new kiln in Pacasmayo
Cash and Debt Position:
Consolidated Cash (in millions of Soles S/)
As of December 31, 2024, the cash balance was S/ 72.7 million (US $19.3 million). This balance includes certificates of deposit in the amount of S/ 24 million (US $6.4 million), distributed as follows:
Certificates of deposits in Soles
| Bank | Amount (S/) |
Interest Rate |
Initial Date | Maturity Date | ||||||
| BCP | S/ 10.0 | 4.40 | % | December 27, 2024 | January 13, 2025 | |||||
| BCP | S/ 1.5 | 4.36 | % | December 27, 2024 | January 2, 2025 | |||||
| BCP | S/ 12.5 | 4.36 | % | December 31, 2024 | January 2, 2025 | |||||
| S/ 24.0 | ||||||||||
The remaining balance of S/ 48.7 million (US$ 12.9 million) is held mainly in the Company’s bank accounts, of which US$ 6.7 million are denominated in US dollars and the balance in Soles.
|
|
|
|
DEBT POSITION:
Consolidated Debt
(in millions of Soles S/)
Certificates of deposits in Soles
Below are the contractual obligations with payment deadlines related to the Company’s debt, including interest.
| Payments due by period | ||||||||||||||||||||
| Less than 1 year | 1-3 Years | 3-5 Years | More than 5 Years | Total | ||||||||||||||||
| Indebtedness | 459.6 | 312.7 | 416.4 | 310.0 | 1,498.7 | |||||||||||||||
| Future interest payments | 79.1 | 115.5 | 74.2 | 47.7 | 316.5 | |||||||||||||||
| Total | 538.7 | 428.2 | 490.6 | 357.7 | 1,815.2 | |||||||||||||||
As of December 31, 2024, the Company’s total outstanding debt, as shown in the financial statements, reached S/ 1,493.2 million (US$ 396.07 million). This debt is primarily composed of the two issuances of the local bonds issued in January, 2019 and part of the club deal.
As of December 31, 2024, Debt/EBITDA ratio was 2.7 times.
Capex
(in millions of Soles S/)
As of December 31, 2024, the Company invested S/ 96.9 million (US$ 25.8 million), allocated to the following projects:
| Projects | 2024 | |||
| Pacasmayo Plant Projects | 30.1 | |||
| Concrete and aggregates equipment | 37.0 | |||
| Rioja Plant Projects | 6.6 | |||
| Piura Plant Projects | 15.8 | |||
| Others | 7.4 | |||
| Total | 96.9 | |||
|
|
|
|
ABOUT CEMENTOS PACASMAYO S.A.A.
Cementos Pacasmayo S.A.A. is a cement company, located in the Northern region of Peru. In February 2012, the Company’s shares were listed on The New York Stock Exchange - Euronext under the ticker symbol “CPAC”. With more than 65 years of operating history, the Company produces, distributes and sells cement and cement-related materials, such ready-mix concrete and precast materials. Pacasmayo’s products are primarily used in construction, which has been one of the fastest-growing segments of the Peruvian economy in recent years. The Company also produces and sells quicklime for use in mining operations.
For more information, please visit: http://www.cementospacasmayo.com.pe/
Note: The Company presented some figures converted from Soles to U.S. Dollars for comparison purposes. The exchange rate used to convert Soles to U.S. dollars was S/ 3.758 per US$ 1.00, which was the average exchange rate, reported as of December 31, 2024 by the Superintendencia de Banca, Seguros y AFP’s (SBS). The information presented in U.S. dollars is for the convenience of the reader only. Certain figures included in this report have been subject to rounding adjustments. Accordingly, figures shown as totals in certain tables may not be arithmetic aggregations of the figures presented in previous quarters.
This press release may contain forward-looking statements. These statements are statements that are not historical facts, and are based on management’s current view and estimates of future economic circumstances, industry conditions, Company performance and financial results. Also, certain reclassifications have been made to make figures comparable for the periods. The words “anticipates”, “believes”, “estimates”, “expects”, “plans” and similar expressions, as they relate to the Company, are intended to identify forward-looking statements. Statements regarding the declaration or payment of dividends, the implementation of principal operating and financing strategies and capital expenditure plans, the direction of future operations and the factors or trends affecting financial condition, liquidity or results of operations are examples of forward-looking statements. Such statements reflect the current views of management and are subject to a number of risks and uncertainties. There is no guarantee that the expected events, trends or results will actually occur. The statements are based on many assumptions and factors, including general economic and market conditions, industry conditions, and operating factors. Any changes in such assumptions or factors could cause actual results to differ materially from current expectations.
|
|
|
|
CONSOLIDATED STATEMENTS OF FINANCIAL POSITION
As of December 31, 2024 and December 31,2023 (both audited)
| As of Dec-24 |
As of Dec-23 |
|||||||
| S/ (000) | S/ (000) | |||||||
| Cash and cash equivalents | 72,723 | 90,193 | ||||||
| Trade and other receivables,net | 131,168 | 99,688 | ||||||
| Income tax prepayments | 7,736 | 4,485 | ||||||
| Inventories | 773,997 | 791,074 | ||||||
| Prepayments | 6,872 | 6,809 | ||||||
| Total current assets | 992,496 | 992,249 | ||||||
| Trade and other receivables, net | 43,224 | 43,397 | ||||||
| Financial instruments designated at fair value through OCI | 239 | 249 | ||||||
| Property, plant and equipment, net | 2,031,139 | 2,099,351 | ||||||
| Intangible assets, net | 63,596 | 62,920 | ||||||
| Goodwill | 4,459 | 4,459 | ||||||
| Deferred income tax assets | 21,816 | 11,428 | ||||||
| Right-of-use asset, net | 9,023 | 7,609 | ||||||
| Other assets | 51 | 73 | ||||||
| Total non-current assets | 2,173,547 | 2,229,486 | ||||||
| Total assets | 3,166,043 | 3,221,735 | ||||||
| Trade and other payables | 242,051 | 231,511 | ||||||
| Financial obligations | 458,346 | 383,146 | ||||||
| Lease liabilities | 2,958 | 3,999 | ||||||
| Income tax payable | 17,937 | 14,222 | ||||||
| Provisions | 44,263 | 56,510 | ||||||
| Total current liabilities | 765,555 | 689,388 | ||||||
| Financial obligations | 1,034,845 | 1,189,880 | ||||||
| Lease liabilities | 6,462 | 4,130 | ||||||
| Provisions | 28,146 | 27,453 | ||||||
| Deferred income tax liabilities | 117,937 | 120,876 | ||||||
| Total non-current liabilities | 1,187,390 | 1,342,339 | ||||||
| Total liabilities | 1,952,945 | 2,031,727 | ||||||
| Capital stock | 423,868 | 423,868 | ||||||
| Investment shares | 40,279 | 40,279 | ||||||
| Investment shares held in Treasury | (121,258 | ) | (121,258 | ) | ||||
| Additional paid-in capital | 432,779 | 432,779 | ||||||
| Legal reserve | 168,636 | 168,636 | ||||||
| Other accumulated comprehensive results (loss) | (16,551 | ) | (16,290 | ) | ||||
| Retained earnings | 285,345 | 261,994 | ||||||
| Total Equity | 1,213,098 | 1,190,008 | ||||||
| Total liability and equity | 3,166,043 | 3,221,735 | ||||||
|
|
|
|
INTERIM CONDENSED CONSOLIDATED UNAUDITED STATEMENTS OF PROFIT AND LOSS
For the three(unaudited) and twelve-month(audited) periods ended December 31, 2024 and 2023.
| 4Q24 | 4Q23 | 2024 | 2023 | |||||||||||||
| S/ (000) | S/ (000) | S/ (000) | S/ (000) | |||||||||||||
| Sales of goods | 526,672 | 508,162 | 1,978,071 | 1,950,075 | ||||||||||||
| Cost of sales | (329,322 | ) | (306,522 | ) | (1,249,545 | ) | (1,260,623 | ) | ||||||||
| Gross profit | 197,350 | 201,640 | 728,526 | 689,452 | ||||||||||||
| Operating income (expenses) | ||||||||||||||||
| Administrative expenses | (70,711 | ) | (60,812 | ) | (253,383 | ) | (231,967 | ) | ||||||||
| Selling and distribution expenses | (25,174 | ) | (18,672 | ) | (81,410 | ) | (69,569 | ) | ||||||||
| Other operating (expenses) income, net | (2,274 | ) | (4,996 | ) | (2,700 | ) | (13,810 | ) | ||||||||
| Assets Impairment | - | (36,551 | ) | - | (36,551 | ) | ||||||||||
| Total operating expenses, net | (98,159 | ) | (121,031 | ) | (337,493 | ) | (351,897 | ) | ||||||||
| Operating profit | 99,191 | 80,609 | 391,033 | 337,555 | ||||||||||||
| Other income (expenses) | ||||||||||||||||
| Finance income | 2,073 | 2,992 | 6,298 | 7,246 | ||||||||||||
| Financial costs | (24,418 | ) | (27,261 | ) | (100,308 | ) | (104,045 | ) | ||||||||
| Accumulated net loss due on settlement of derivative financial instruments | - | - | - | 19 | ||||||||||||
| Loss from exchange difference, net | 411 | (784 | ) | (836 | ) | 4,933 | ||||||||||
| Total other expenses, net | (21,934 | ) | (25,053 | ) | (94,846 | ) | (91,847 | ) | ||||||||
| Profit before income tax | 77,257 | 55,556 | 296,187 | 245,708 | ||||||||||||
| Income tax expense | (27,177 | ) | (19,697 | ) | (97,312 | ) | (76,808 | ) | ||||||||
| Profit for the period | 50,080 | 35,859 | 198,875 | 168,900 | ||||||||||||
| Earnings per share | ||||||||||||||||
| Basic and diluted earnings per year attributable to equity holders of common shares and investment in shares of Cementos Pacasmayo S.A.A. (S/ per share) | 0.12 | 0.08 | 0.46 | 0.39 |
|
|
|
|
CONSOLIDATED STATEMENTS OF CHANGES IN EQUITY
For the years ended December 31, 2024, 2023 (audited)
| Attributable to equity holders of the parent | ||||||||||||||||||||||||||||||||||||
| Capital | Investment Shares | Investments Shares hold in Treasury |
Additional paid-in capital | Legal reserve | Unrealized gain(loss) in financial instruments designated at fair value |
Unrealized gain(loss) on cash flow hedge |
Retained earnings | Total | ||||||||||||||||||||||||||||
| S/(000) | S/(000) | S/(000) | S/(000) | S/(000) | S/ (000) | S/ (000) | S/ (000) | S/ (000) | ||||||||||||||||||||||||||||
| Balance as of January 1, 2023 | 423,868 | 40,279 | (121,258 | ) | 432,779 | 168,636 | (16,267 | ) | (1,520 | ) | 268,618 | 1,195,135 | ||||||||||||||||||||||||
| Profit for the year | - | - | - | - | - | - | - | 168,900 | 168,900 | |||||||||||||||||||||||||||
| Other comprehensive loss | - | - | - | - | - | (18 | ) | 1,520 | - | 1,502 | ||||||||||||||||||||||||||
| Other | - | - | - | - | - | (5 | ) | - | - | (5 | ) | |||||||||||||||||||||||||
| Total comprehensive income | - | - | - | - | - | (23 | ) | 1,520 | 168,900 | 170,397 | ||||||||||||||||||||||||||
| Dividend Distribution | - | - | - | - | - | - | - | (175,524 | ) | (175,524 | ) | |||||||||||||||||||||||||
| Balance as of December 31, 2023 | 423,868 | 40,279 | (121,258 | ) | 432,779 | 168,636 | (16,290 | ) | - | 261,994 | 1,190,008 | |||||||||||||||||||||||||
| Balance as of January 1, 2024 | 423,868 | 40,279 | (121,258 | ) | 432,779 | 168,636 | (16,290 | ) | - | 261,994 | 1,190,008 | |||||||||||||||||||||||||
| Profit for the year | - | - | - | - | - | - | - | 198,875 | 198,875 | |||||||||||||||||||||||||||
| Other comprehensive loss | - | - | - | - | - | (261 | ) | - | - | (261 | ) | |||||||||||||||||||||||||
| Total comprehensive income | - | - | - | - | - | (261 | ) | - | 198,875 | 198,614 | ||||||||||||||||||||||||||
| Dividend Distribution | - | - | - | - | - | - | - | (175,524 | ) | (175,524 | ) | |||||||||||||||||||||||||
| Balance as of December 31, 2024 | 423,868 | 40,279 | (121,258 | ) | 432,779 | 168,636 | (16,551 | ) | - | 285,345 | 1,213,098 | |||||||||||||||||||||||||
19