UNITED STATES
SECURITIES AND EXCHANGE COMMISSION
Washington, D.C. 20549
FORM 6-K
REPORT OF FOREIGN PRIVATE ISSUER
PURSUANT TO RULE 13a-16 OR 15d-16 OF
THE SECURITIES EXCHANGE ACT OF 1934
For the month of February 2025
Commission File Number 001-36903
KORNIT DIGITAL LTD.
(Translation of Registrant’s name into English)
12 Ha’Amal Street
Park Afek
Rosh Ha’Ayin 4824096 Israel
(Address of Principal Executive Office)
Indicate by check mark whether the registrant files or will file annual reports under cover of Form 20-F or Form 40-F.
Form 20-F ☒ Form 40-F ☐
CONTENTS
Results of Operations and Financial Condition- Quarter and Year Ended December 31, 2024
On February 12, 2025, Kornit Digital Ltd. (“Kornit”) issued a press release entitled “Kornit Digital Reports Fourth Quarter and Full Year 2024 Results,” in which Kornit reported its results of operations for the fourth quarter and year ended December 31, 2024. A copy of that press release is furnished as Exhibit 99.1 hereto.
Kornit is holding a conference call on February 12, 2025 to discuss its results for the quarter and year ended December 31, 2024, and, in connection with that call, will make available to its investors a slide presentation to provide additional information regarding its business and its financial results. That slide presentation is attached as Exhibit 99.2 to this Report of Foreign Private Issuer on Form 6-K (this “Form 6-K”) and is incorporated herein by reference.
Exhibits
Incorporation by Reference
The U.S. GAAP financial information contained in the (i) consolidated balance sheets, (ii) consolidated statements of operations and (iii) consolidated statements of cash flows included in the press release attached as Exhibit 99.1 to this Report of Foreign Private Issuer on Form 6-K is hereby incorporated by reference into Kornit’s Registration Statements on Form S-8 (File No.’s 333-203970, 333-214015, 333-217039, 333-223794, 333-230567, 333-237346,333-254749, and 333-263975).
SIGNATURES
Pursuant to the requirements of the Securities Exchange Act of 1934, the registrant has duly caused this report to be signed on its behalf by the undersigned, thereunto duly authorized.
| KORNIT DIGITAL LTD. | ||
| Date: February 12, 2025 | By: | /s/ Lauri Hanover |
| Name: | Lauri Hanover | |
| Title: | Chief Financial Officer | |
2
Exhibit 99.1
Investor Contact:
Jared Maymon
Global Head of Investor Relations
Jared.Maymon@Kornit.com

Kornit Digital Reports Fourth Quarter and Full Year 2024 Results
| ● | Fourth quarter revenues of $60.7 million, in line with previous guidance |
| ● | Fourth quarter GAAP net income of $2.2 million; non-GAAP net income of $8.7 million |
| ● | Successfully delivered positive EBITDA and strong cash flow from operating activities in both Q4 and for the full year 2024 |
| ● | Breakthrough innovations and continued momentum across our markets set the stage for profitable growth in 2025 |
Rosh-Ha’Ayin, Israel – February 12, 2024 – Kornit Digital Ltd. (“Kornit” or the “Company”) (Nasdaq: KRNT), a global leader in sustainable, on-demand, digital fashion and textile production technologies, today reported its results for the fourth quarter and full year ended December 31, 2024.
“Our fourth quarter performance was fueled by a successful peak season and growing impressions across our key customers,” said Ronen Samuel, Kornit’s Chief Executive Officer. “One of the most exciting highlights of Q4 was the Apollo platform’s performance. Having delivered 15 Apollo systems throughout the year, with most becoming fully operational during this critical period, customer feedback has been excellent, reinforcing Apollo’s role as a key enabler of mass-scale digital production.”
Mr. Samuel continued that “at the beginning of 2024, we set clear objectives: return to positive EBITDA, generate meaningful cash flow, and establish a scalable, disciplined model that fuels long-term expansion. Thanks to the dedicated efforts of our teams, I am pleased to report that we not only delivered on these goals but also introduced game-changing innovations, strengthened our market position, and expanded into new strategic adjacencies.”.
Mr. Samuel concluded, “As we stated in our last call, 2025 is about execution—translating the strong foundation built in 2024 into scalable, profitable growth, strengthening our market leadership and driving the industry forward with our innovative solutions and business models.”
Fourth Quarter 2024 Results of Operations
| ● | Total revenue for the fourth quarter of 2024 was $60.7 million compared with $56.6 million in the prior year period, due primarily to growth in products revenue. |
| ● | GAAP gross profit margin for the fourth quarter of 2024 was 51.3% compared with 25.8% in the prior year period. On a non-GAAP basis, gross profit margin was 55.1% compared with 48.6% in the prior year period. |
| ● | GAAP operating expenses for the fourth quarter of 2024 were $32.3 million compared with $42.4 million in the prior year period. On a non-GAAP basis, operating expenses decreased by 6.9% to $28.0 million compared with the prior year period. |
| ● | GAAP net income for the fourth quarter of 2024 was $2.2 million, or $0.05 basic and diluted per share, compared with net loss of $22.9 million, or ($0.48) basic and diluted per share, for the fourth quarter of 2023. |
| ● | Non-GAAP net income for the fourth quarter of 2024 was $8.7 million, or $0.18 basic and diluted per share, compared with non-GAAP net income of $3.8 million, or $0.08 per basic share, for the fourth quarter of 2023. |
| ● | Adjusted EBITDA for the fourth quarter of 2024 was $8.4 million compared with adjusted EBITDA of $0.2 million for the fourth quarter of 2023. Adjusted EBITDA margin for the fourth quarter of 2024 was 13.8% compared with 0.3% for the fourth quarter of 2023. |
Full Year 2024 Results of Operations
| ● | Total revenue for the full year 2024 was $203.8 million compared with $219.8 million in the prior year, due primarily to lower systems revenue. |
| ● | GAAP gross profit margin for the full year 2024 was 45.0% compared with 30.5% in the prior year. On a non-GAAP basis, gross profit margin was 48.6% compared with 38.4% in the prior year. |
| ● | GAAP operating expenses for the full year 2024 were $129.1 million compared with $154.5 million in the prior year. On a non-GAAP basis, operating expenses decreased by 14.0% to $109.8 million compared with the prior year. |
| ● | GAAP net loss for the full year 2024 was $16.8 million, or ($0.35) basic and diluted per share, compared with net loss of $64.4 million, or ($1.31) basic and diluted per share, for the full year 2023. |
| ● | Non-GAAP net income for the full year 2024 was $10.1 million, or non-GAAP basic and diluted net income per share was $0.21 and $0.20, respectively, compared with non-GAAP net loss of $20.4 million, or ($0.42) basic and diluted per share, for the full year 2023. |
| ● | Adjusted EBITDA for the full year 2024 was $0.3 million compared with adjusted EBITDA loss of $30.9 million for the full year 2023. Adjusted EBITDA margin for the full year 2024 was 0.2% compared with –14.0% for the full year 2023. |
First Quarter 2025 Guidance
For the first quarter of 2025, the Company expects revenues to be in the range of $45.5 million to $49.5 million and adjusted EBITDA margin between –9% to –4% of revenue.
Fourth Quarter and Full Year 2024 Earnings Conference Call Information
The Company will host a conference call today at 8:30 a.m. ET, or 3:30 p.m. Israel time, to discuss the results, followed by a question-and-answer session with the investor community.
A live webcast of the call can be accessed at ir.kornit.com. To access the call, participants may dial toll-free at 1-877-407-0792 or 1-201-689-8263. The toll-free Israeli number is 1 809 406 247.
To listen to a replay of the conference call, dial toll-free 1-844-512-2921 or 1-412-317-6671 and enter confirmation code 13751316. The telephone replay will be available approximately three hours after the completion of the live call until 11:59 pm ET on February 26, 2025. The call will also be available for replay via the webcast link on Kornit’s Investor Relations website.
About Kornit Digital
Kornit Digital (NASDAQ: KRNT) is a worldwide market leader in sustainable, on-demand, digital fashion, and textile production technologies. The company offers end-to-end solutions including digital printing systems, inks, consumables, software, and fulfillment services through its global fulfillment network. Headquartered in Israel with offices in the USA, Europe, and Asia Pacific, Kornit Digital serves customers in more than 100 countries and states worldwide. To learn more about how Kornit Digital is boldly transforming the world of fashion and textiles, visit www.kornit.com.
Forward Looking Statements
Certain statements in this press release are “forward-looking statements” within the meaning of the Private Securities Litigation Reform Act of 1995 and other U.S. securities laws. Forward-looking statements are characterized by the use of forward-looking terminology such as “will,” “expects,” “anticipates,” “continue,” “believes,” “should,” “intended,” “guidance,” “preliminary,” “future,” “planned,” or other words. These forward-looking statements include, but are not limited to, statements relating to the Company’s objectives, plans and strategies, statements of preliminary or projected results of operations or of financial condition and all statements that address activities, events, or developments that the Company intends, expects, projects, believes or anticipates will or may occur in the future. Forward-looking statements are not guarantees of future performance and are subject to risks and uncertainties. The Company has based these forward-looking statements on assumptions and assessments made by its management in light of their experience and their perception of historical trends, current conditions, expected future developments and other factors they believe to be appropriate. Important factors that could cause actual results, developments and business decisions to differ materially from those anticipated in these forward-looking statements include, among other things: the duration and severity of adverse macro-economic headwinds that were caused by inflationary pressures and higher interest rates, which have impacted, and may continue to impact, in an adverse manner, the Company’s operations, financial position and cash flows, in part due to the adverse impact on the Company’s customers and suppliers; the Company’s degree of success in developing, introducing and selling new or improved products and product enhancements including specifically the Company’s Poly Pro and Presto products, and the Company’s Apollo direct-to-garment platform; the extent of the Company’s ability to consummate sales to large accounts with multi-system delivery plans; the degree of the Company’s ability to fill orders for its systems and consumables; the extent of the Company’s ability to increase sales of its systems, ink and consumables; the extent of the Company’s ability to leverage its global infrastructure build-out; the development of the market for digital textile printing; the availability of alternative ink; competition; sales concentration; changes to the Company’s relationships with suppliers; the extent of the Company’s success in marketing; and those additional factors referred to under “Risk Factors” in Item 3.D of the Company’s Annual Report on Form 20-F for the year ended December 31, 2023, filed with the SEC on March 28, 2024. Any forward-looking statements in this press release are made as of the date hereof, whether as a result of new information, future events or otherwise, except as required by law.
Non-GAAP Discussion Disclosure
The Company presents certain non-GAAP financial measures, in this press release and in the accompanying conference call to discuss the Company’s quarterly results. These non-GAAP financial measures reflect adjustments to corresponding GAAP financial measures in order to exclude the impact of the following: share-based compensation expenses; amortization of intangible assets; restructuring expenses; foreign exchange differences associated with ASC 842; and non-cash deferred tax income.
The Company defines “Adjusted EBITDA” as non-GAAP operating income (loss), which reflects the adjustments described in the preceding paragraph, as further adjusted to exclude depreciation expense.
The purpose of the foregoing non-GAAP financial measures is to convey the Company’s performance exclusive of non-cash charges and other items that are considered by management to be outside of the Company’s core operating results. These non-GAAP measures are among the primary factors management uses in planning for and forecasting future periods. Furthermore, the non-GAAP measures are regularly used internally to understand, manage, and evaluate the Company’s business and make operating decisions, and the Company believes that they are useful to investors as a consistent and comparable measure of the ongoing performance of the Company’s business. The Company’s non-GAAP financial measures are not meant to be considered in isolation or as a substitute for comparable GAAP measures and should be read only in conjunction with the Company’s consolidated financial statements prepared in accordance with GAAP. Additionally, these non-GAAP financial measures may differ materially from the non-GAAP financial measures used by other companies.
The reconciliation tables included below present a reconciliation of our non-GAAP financial measures to the most directly comparable GAAP financial measures.
KORNIT DIGITAL LTD.
AND ITS SUBSIDIARIES
CONSOLIDATED BALANCE SHEETS
(U.S. dollars in thousands)
| December 31, | December 31, | |||||||
| 2024 | 2023 | |||||||
| (Unaudited) | (Audited) | |||||||
| ASSETS | ||||||||
| CURRENT ASSETS: | ||||||||
| Cash and cash equivalents | $ | 35,003 | $ | 39,605 | ||||
| Short-term bank deposit | 205,934 | 235,600 | ||||||
| Marketable securities | 222,937 | 57,292 | ||||||
| Trade receivables, net | 65,459 | 93,632 | ||||||
| Inventory | 60,342 | 67,712 | ||||||
| Other accounts receivable and prepaid expenses | 25,714 | 28,546 | ||||||
| Total current assets | 615,389 | 522,387 | ||||||
| LONG-TERM ASSETS: | ||||||||
| Marketable securities | 48,086 | 223,203 | ||||||
| Deposits and other long-term assets | 10,542 | 8,209 | ||||||
| Severance pay fund | 306 | 283 | ||||||
| Property,plant and equipment, net | 45,342 | 50,905 | ||||||
| Equipment on lease, net | 13,880 | - | ||||||
| Operating lease right-of-use assets | 19,054 | 23,782 | ||||||
| Intangible assets, net | 5,721 | 7,647 | ||||||
| Goodwill | 29,164 | 29,164 | ||||||
| Total long-term assets | 172,095 | 343,193 | ||||||
| Total assets | 787,484 | 865,580 | ||||||
| LIABILITIES AND SHAREHOLDERS’ EQUITY | ||||||||
| CURRENT LIABILITIES: | ||||||||
| Trade payables | 9,019 | 6,936 | ||||||
| Employees and payroll accruals | 13,101 | 12,121 | ||||||
| Deferred revenues and advances from customers | 2,339 | 2,158 | ||||||
| Operating lease liabilities | 3,311 | 5,073 | ||||||
| Other payables and accrued expenses | 16,561 | 23,814 | ||||||
| Total current liabilities | 44,331 | 50,102 | ||||||
| LONG-TERM LIABILITIES: | ||||||||
| Accrued severance pay | 1,051 | 1,080 | ||||||
| Operating lease liabilities | 15,065 | 18,533 | ||||||
| Other long-term liabilities | 138 | 198 | ||||||
| Total long-term liabilities | 16,254 | 19,811 | ||||||
| SHAREHOLDERS’ EQUITY | 726,899 | 795,667 | ||||||
| Total liabilities and shareholders’ equity | $ | 787,484 | $ | 865,580 | ||||
KORNIT DIGITAL LTD.
AND ITS SUBSIDIARIES
CONSOLIDATED STATEMENTS OF OPERATIONS
(U.S. dollars in thousands, except share and per share data)
| Three Months Ended | Year Ended | |||||||||||||||
| December 31, | December 31, | |||||||||||||||
| 2024 | 2023 | 2024 | 2023 | |||||||||||||
| (Unaudited) | (Unaudited) | (Audited) | ||||||||||||||
| Revenues | ||||||||||||||||
| Products | $ | 47,711 | $ | 43,573 | $ | 148,086 | $ | 161,045 | ||||||||
| Services | 12,985 | 13,012 | 55,739 | 58,741 | ||||||||||||
| Total revenues | 60,696 | 56,585 | 203,825 | 219,786 | ||||||||||||
| Cost of revenues | ||||||||||||||||
| Products | 18,088 | 23,125 | 61,697 | 91,516 | ||||||||||||
| Services | 11,479 | 18,888 | 50,366 | 61,313 | ||||||||||||
| Total cost of revenues | 29,567 | 42,013 | 112,063 | 152,829 | ||||||||||||
| Gross profit | 31,129 | 14,572 | 91,762 | 66,957 | ||||||||||||
| Operating expenses: | ||||||||||||||||
| Research and development, net | 9,781 | 12,033 | 41,578 | 50,060 | ||||||||||||
| Sales and marketing | 15,200 | 17,909 | 58,413 | 66,836 | ||||||||||||
| General and administrative | 7,358 | 12,449 | 29,086 | 37,592 | ||||||||||||
| Total operating expenses | 32,339 | 42,391 | 129,077 | 154,488 | ||||||||||||
| Operating loss | (1,210 | ) | (27,819 | ) | (37,315 | ) | (87,531 | ) | ||||||||
| Financial income, net | 3,849 | 5,424 | 22,350 | 24,150 | ||||||||||||
| Income (loss) before taxes on income | 2,639 | (22,395 | ) | (14,965 | ) | (63,381 | ) | |||||||||
| Taxes on income | 423 | 539 | 1,835 | 970 | ||||||||||||
| Net income (loss) | $ | 2,216 | $ | (22,934 | ) | $ | (16,800 | ) | $ | (64,351 | ) | |||||
| Basic income (loss) per share | $ | 0.05 | $ | (0.48 | ) | $ | (0.35 | ) | $ | (1.31 | ) | |||||
| Weighted average number of shares used in computing basic net income (loss) per share | 47,180,390 | 48,231,916 | 47,482,820 | 49,160,266 | ||||||||||||
| Diluted income (loss) per share | $ | 0.05 | $ | (0.48 | ) | $ | (0.35 | ) | $ | (1.31 | ) | |||||
| Weighted average number of shares used in computing diluted net income (loss) per share | 48,222,449 | 48,231,916 | 47,482,820 | 49,160,266 | ||||||||||||
KORNIT DIGITAL LTD.
AND ITS SUBSIDIARIES
RECONCILIATION OF GAAP TO NON-GAAP CONSOLIDATED STATEMENTS OF OPERATIONS
(U.S. dollars in thousands, except share and per share data)
| Three Months Ended | Year Ended | |||||||||||||||
| December 31, | December 31, | |||||||||||||||
| 2024 | 2023 | 2024 | 2023 | |||||||||||||
| (Unaudited) | (Unaudited) | |||||||||||||||
| Revenues | $ | 60,696 | $ | 56,585 | $ | 203,825 | $ | 219,786 | ||||||||
| GAAP cost of revenues | $ | 29,567 | $ | 42,013 | $ | 112,063 | $ | 152,829 | ||||||||
| Cost of product recorded for share-based compensation (1) | (524 | ) | (545 | ) | (2,018 | ) | (2,356 | ) | ||||||||
| Cost of service recorded for share-based compensation (1) | (409 | ) | (447 | ) | (1,703 | ) | (1,758 | ) | ||||||||
| Intangible assets amortization on cost of product (2) | (176 | ) | (260 | ) | (936 | ) | (1,053 | ) | ||||||||
| Intangible assets amortization on cost of service (2) | (160 | ) | (160 | ) | (640 | ) | (640 | ) | ||||||||
| Restructuring expenses (3) | (1,067 | ) | (11,501 | ) | (1,981 | ) | (11,590 | ) | ||||||||
| Non-GAAP cost of revenues | $ | 27,231 | $ | 29,100 | $ | 104,785 | $ | 135,432 | ||||||||
| GAAP gross profit | $ | 31,129 | $ | 14,572 | $ | 91,762 | $ | 66,957 | ||||||||
| Gross profit adjustments | 2,336 | 12,913 | 7,278 | 17,397 | ||||||||||||
| Non-GAAP gross profit | $ | 33,465 | $ | 27,485 | $ | 99,040 | $ | 84,354 | ||||||||
| GAAP operating expenses | $ | 32,339 | $ | 42,391 | $ | 129,077 | $ | 154,488 | ||||||||
| Share-based compensation (1) | (4,151 | ) | (4,653 | ) | (18,035 | ) | (18,475 | ) | ||||||||
| Intangible assets amortization (2) | (88 | ) | (93 | ) | (350 | ) | (550 | ) | ||||||||
| Restructuring expenses (3) | (105 | ) | (7,579 | ) | (862 | ) | (7,785 | ) | ||||||||
| Non-GAAP operating expenses | $ | 27,995 | $ | 30,066 | $ | 109,830 | $ | 127,678 | ||||||||
| GAAP Financial income, net | $ | 3,849 | $ | 5,424 | $ | 22,350 | $ | 24,150 | ||||||||
| Foreign exchange losses associated with ASC 842 | (169 | ) | 1,579 | 388 | 378 | |||||||||||
| Non-GAAP Financial income , net | $ | 3,680 | $ | 7,003 | $ | 22,738 | $ | 24,528 | ||||||||
| GAAP Taxes on income | $ | 423 | $ | 539 | $ | 1,835 | $ | 970 | ||||||||
| Non-cash deferred tax income | - | 88 | - | 666 | ||||||||||||
| Non-GAAP Taxes on income | $ | 423 | $ | 627 | $ | 1,835 | $ | 1,636 | ||||||||
| GAAP Net income (loss) | $ | 2,216 | $ | (22,934 | ) | $ | (16,800 | ) | $ | (64,351 | ) | |||||
| Share-based compensation (1) | 5,084 | 5,645 | 21,756 | 22,589 | ||||||||||||
| Intangible assets amortization (2) | 424 | 513 | 1,926 | 2,243 | ||||||||||||
| Restructuring expenses (3) | 1,172 | 19,080 | 2,843 | 19,375 | ||||||||||||
| Foreign exchange losses associated with ASC 842 | (169 | ) | 1,579 | 388 | 378 | |||||||||||
| Non-cash deferred tax income | - | (88 | ) | - | (666 | ) | ||||||||||
| Non-GAAP net income (loss) | $ | 8,727 | $ | 3,795 | $ | 10,113 | $ | (20,432 | ) | |||||||
| GAAP diluted income (loss) per share | $ | 0.05 | $ | (0.48 | ) | $ | (0.35 | ) | $ | (1.31 | ) | |||||
| Non-GAAP diluted income (loss) per share | $ | 0.18 | $ | 0.08 | $ | 0.20 | $ | (0.42 | ) | |||||||
| Weighted average number of shares | ||||||||||||||||
| Shares used in computing GAAP diluted net income (loss) per share | 48,222,449 | 48,231,916 | 47,482,820 | 49,160,266 | ||||||||||||
| Shares used in computing Non-GAAP diluted net income (loss) per share | 49,868,143 | 50,094,714 | 49,341,794 | 49,160,266 | ||||||||||||
| (1) Share-based compensation | ||||||||||||||||
| Cost of product revenues | $ | 524 | $ | 545 | $ | 2,018 | $ | 2,356 | ||||||||
| Cost of service revenues | 409 | 447 | 1,703 | 1,758 | ||||||||||||
| Research and development | 1,255 | 1,329 | 5,310 | 5,759 | ||||||||||||
| Sales and marketing | 1,212 | 1,635 | 6,228 | 6,689 | ||||||||||||
| General and administrative | 1,684 | 1,689 | 6,497 | 6,027 | ||||||||||||
| $ | 5,084 | $ | 5,645 | $ | 21,756 | $ | 22,589 | |||||||||
| (2) Intangible assets amortization | ||||||||||||||||
| Cost of product revenues | $ | 176 | $ | 260 | $ | 936 | $ | 1,053 | ||||||||
| Cost of service revenues | 160 | 160 | 640 | 640 | ||||||||||||
| Sales and marketing | 88 | 93 | 350 | 550 | ||||||||||||
| $ | 424 | $ | 513 | $ | 1,926 | $ | 2,243 | |||||||||
| (3) Restructuring expenses | ||||||||||||||||
| Cost of product revenues | $ | 818 | $ | 5,569 | $ | 1,683 | $ | 5,658 | ||||||||
| Cost of service revenues | 249 | 5,932 | 298 | 5,932 | ||||||||||||
| Research and development | - | 860 | 235 | 880 | ||||||||||||
| Sales and marketing | - | 2,744 | 190 | 2,930 | ||||||||||||
| General and administrative | 105 | 3,975 | 437 | 3,975 | ||||||||||||
| $ | 1,172 | $ | 19,080 | $ | 2,843 | $ | 19,375 | |||||||||
KORNIT DIGITAL LTD.
AND ITS SUBSIDIARIES
CONSOLIDATED STATEMENTS OF CASH FLOWS
(U.S. dollars in thousands)
| Three Months Ended | Year Ended | |||||||||||||||
| December 31, | December 31, | |||||||||||||||
| 2024 | 2023 | 2024 | 2023 | |||||||||||||
| (Unaudited) | (Unaudited) | |||||||||||||||
| Cash flows from operating activities: | ||||||||||||||||
| Net income (loss) | $ | 2,216 | $ | (22,934 | ) | $ | (16,800 | ) | $ | (64,351 | ) | |||||
| Adjustments to reconcile net loss to net cash used in operating activities: | ||||||||||||||||
| Depreciation and amortization | 3,313 | 3,287 | 13,047 | 14,700 | ||||||||||||
| Restructuring and other charges | 1,172 | 19,080 | 1,172 | 19,080 | ||||||||||||
| Fair value of warrants deducted from revenues | - | 4,841 | 3,273 | 13,842 | ||||||||||||
| Share-based compensation | 5,084 | 5,645 | 21,756 | 22,589 | ||||||||||||
| Amortization of premium and accretion of discount on marketable securities, net | (230 | ) | 83 | (389 | ) | 756 | ||||||||||
| Realized loss on sale and redemption of marketable securities | (45 | ) | 93 | (164 | ) | 134 | ||||||||||
| Change in operating assets and liabilities: | ||||||||||||||||
| Trade receivables, net | 8,673 | 6,557 | 28,173 | (19,220 | ) | |||||||||||
| Other accounts receivables and prepaid expenses | 1,795 | (5,040 | ) | 2,832 | (6,492 | ) | ||||||||||
| Inventory | 2,875 | 4,521 | 3,005 | 11,028 | ||||||||||||
| Operating leases right-of-use assets and liabilities, net | (266 | ) | 1,544 | (502 | ) | (179 | ) | |||||||||
| Deposits and other long term assets | (674 | ) | (103 | ) | (2,333 | ) | (2,282 | ) | ||||||||
| Trade payables | 3,856 | (2,902 | ) | 2,150 | (6,491 | ) | ||||||||||
| Employees and payroll accruals | 1,020 | (2,294 | ) | 2,456 | (1,089 | ) | ||||||||||
| Deferred revenues and advances from customers | 798 | (1,339 | ) | 181 | (4,990 | ) | ||||||||||
| Other payables and accrued expenses | (2,950 | ) | (8,357 | ) | (9,020 | ) | (10,547 | ) | ||||||||
| Accrued severance pay, net | 6 | (14 | ) | (52 | ) | (152 | ) | |||||||||
| Other long - term liabilities | 20 | (74 | ) | (60 | ) | (1,018 | ) | |||||||||
| Net cash provided by (used in) operating activities | 26,663 | 2,594 | 48,725 | (34,682 | ) | |||||||||||
| Cash flows from investing activities: | ||||||||||||||||
| Purchase of property, plant and equipment | (897 | ) | (934 | ) | (4,394 | ) | (7,006 | ) | ||||||||
| Production of equipment for lease to customers | (1,023 | ) | - | (10,746 | ) | - | ||||||||||
| Proceeds from (investment in) short-term bank deposits, net | (36,533 | ) | (15,505 | ) | 29,666 | 39,433 | ||||||||||
| Proceeds from sales and redemption of marketable securities | 12,500 | - | 22,994 | 7,240 | ||||||||||||
| Proceeds from maturities of marketable securities | 12,012 | 6,300 | 56,641 | 20,522 | ||||||||||||
| Investment in marketable securities | (16,772 | ) | (9,526 | ) | (62,673 | ) | (33,977 | ) | ||||||||
| Net cash provided by (used in) investing activities | (30,713 | ) | (19,665 | ) | 31,488 | 26,212 | ||||||||||
| Cash flows from financing activities: | ||||||||||||||||
| Exercise of employee stock options | 594 | - | 716 | 293 | ||||||||||||
| Payments related to shares withheld for taxes | (402 | ) | (608 | ) | (1,476 | ) | (1,045 | ) | ||||||||
| Repurchase of ordinary shares | (75,000 | ) | (19,004 | ) | (84,055 | ) | (55,770 | ) | ||||||||
| Net cash used in financing activities | (74,808 | ) | (19,612 | ) | (84,815 | ) | (56,522 | ) | ||||||||
| Decrease in cash and cash equivalents | (78,858 | ) | (36,683 | ) | (4,602 | ) | (64,992 | ) | ||||||||
| Cash and cash equivalents at the beginning of the period | 113,861 | 76,288 | 39,605 | 104,597 | ||||||||||||
| Cash and cash equivalents at the end of the period | $ | 35,003 | $ | 39,605 | $ | 35,003 | $ | 39,605 | ||||||||
| Non-cash investing and financing activities: | ||||||||||||||||
| Purchase of property and equipment on credit | 247 | 314 | 247 | 314 | ||||||||||||
| Inventory transferred to be used as property and equipment and Equipment on lease | 3,156 | - | 4,732 | 531 | ||||||||||||
| Property, plant and equipment transferred to be used as inventory | 47 | 131 | 367 | 865 | ||||||||||||
| Lease liabilities arising from obtaining right-of-use assets | 623 | (2,875 | ) | (448 | ) | 2,934 | ||||||||||
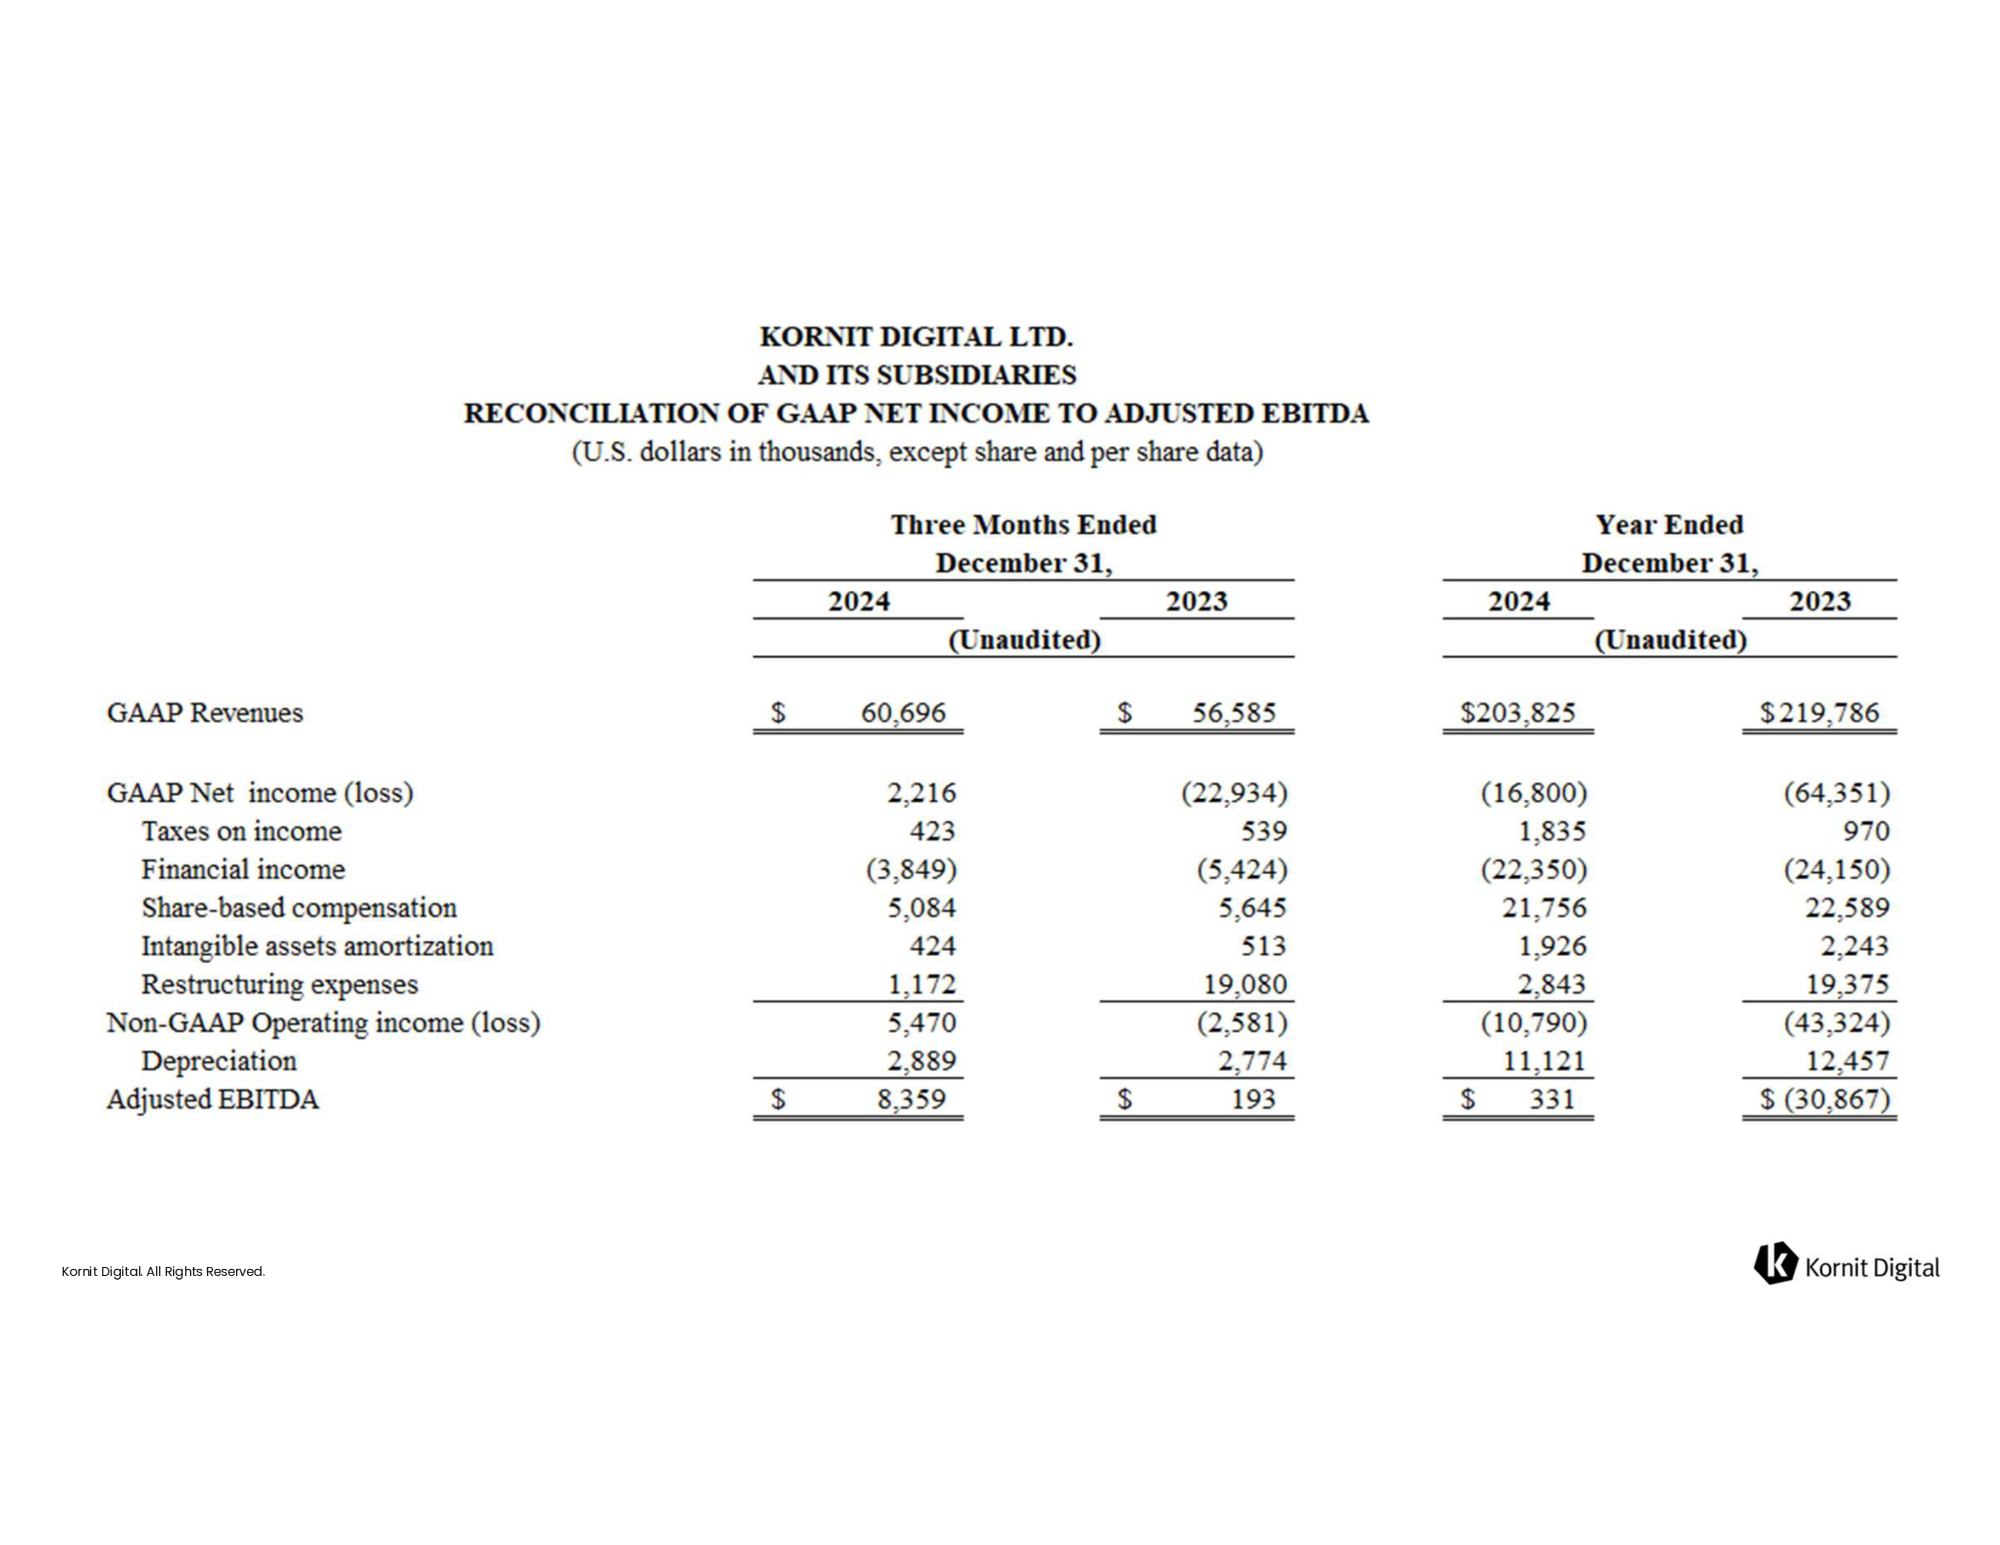
KORNIT DIGITAL LTD.
AND ITS SUBSIDIARIES
RECONCILIATION OF GAAP NET INCOME TO ADJUSTED EBITDA
(U.S. dollars in thousands, except share and per share data)
| Three Months Ended | Year Ended | |||||||||||||||
| December 31, | December 31, | |||||||||||||||
| 2024 | 2023 | 2024 | 2023 | |||||||||||||
| (Unaudited) | (Unaudited) | |||||||||||||||
| GAAP Revenues | $ | 60,696 | $ | 56,585 | $ | 203,825 | $ | 219,786 | ||||||||
| GAAP Net income (loss) | 2,216 | (22,934 | ) | (16,800 | ) | (64,351 | ) | |||||||||
| Taxes on income | 423 | 539 | 1,835 | 970 | ||||||||||||
| Financial income | (3,849 | ) | (5,424 | ) | (22,350 | ) | (24,150 | ) | ||||||||
| Share-based compensation | 5,084 | 5,645 | 21,756 | 22,589 | ||||||||||||
| Intangible assets amortization | 424 | 513 | 1,926 | 2,243 | ||||||||||||
| Restructuring expenses | 1,172 | 19,080 | 2,843 | 19,375 | ||||||||||||
| Non-GAAP Operating income (loss) | 5,470 | (2,581 | ) | (10,790 | ) | (43,324 | ) | |||||||||
| Depreciation | 2,889 | 2,774 | 11,121 | 12,457 | ||||||||||||
| Adjusted EBITDA | $ | 8,359 | $ | 193 | $ | 331 | $ | (30,867 | ) | |||||||
9
Exhibit 99.2
Kornit Digital. All Rights Reserved. Kornit Digital. All Rights Reserved. Kornit Digital (NASDAQ: KRNT) Fourth Quarter & Full Year 2024 Earnings Conference Call Supporting Slides February 12, 2025 Kornit Digital. All Rights Reserved.

Kornit Digital. All Rights Reserved. On Today’s Call Ronen Samuel CEO Lauri Hanover CFO Jared Maymon Investor Relations Kornit Digital.
All Rights Reserved. Safe Harbor This presentation contains “forward - looking statements” within the meaning of the Private Securities Litigation Reform Act of 1995 and other U . S . securities laws . Forward - looking statements are characterized by the use of forward - looking terminology such as “will,” “expects,” “anticipates,” “continue,” “believes,” “should,” “intended,” “guidance,” “preliminary,” “future,” “planned,” or other words . These forward - looking statements include, but are not limited to, statements relating to the Company’s objectives, plans and strategies, statements of preliminary or projected results of operations or of financial condition and all statements that address activities, events, or developments that the Company intends, expects, projects, believes or anticipates will or may occur in the future . Forward - looking statements are not guarantees of future performance and are subject to risks and uncertainties . The Company has based these forward - looking statements on assumptions and assessments made by its management in light of their experience and their perception of historical trends, current conditions, expected future developments and other factors they believe to be appropriate . Important factors that could cause actual results, developments and business decisions to differ materially from those anticipated in these forward - looking statements include, among other things : the duration and severity of adverse macro - economic headwinds that were caused by inflationary pressures and higher interest rates, which have impacted, and may continue to impact, in an adverse manner, the Company’s operations, financial position and cash flows, in part due to the adverse impact on the Company’s customers and suppliers ; the Company’s degree of success in developing, introducing and selling new or improved products and product enhancements including specifically the Company’s Poly Pro and Presto products, and the Company’s Apollo direct - to - garment platform ; the extent of the Company’s ability to consummate sales to large accounts with multi - system delivery plans ; the degree of the Company’s ability to fill orders for its systems and consumables ; the extent of the Company’s ability to increase sales of its systems, ink and consumables ; the extent of the Company’s ability to leverage its global infrastructure build - out ; the development of the market for digital textile printing ; the availability of alternative ink ; competition ; sales concentration ; changes to the Company’s relationships with suppliers ; the extent of the Company’s success in marketing ; and those additional factors referred to under “Risk Factors” in Item 3 . D of the Company’s Annual Report on Form 20 - F for the year ended December 31 , 2023 , filed with the SEC on March 28 , 2024 . Any forward - looking statements in this press release are made as of the date hereof, whether as a result of new information, future events or otherwise, except as required by law . In addition to U . S . GAAP financials, this presentation includes certain non - GAAP financial measures . These non - GAAP financial measures are in addition to, and not a substitute for or superior to, measures of financial performance prepared in accordance with U . S . GAAP . Please see the reconciliation table that appears among the financial tables in our earnings release being issued today, which earnings release is attached as Exhibit 99 . 1 to our report of foreign private issuer on Form 6 - K being furnished to the SEC today, which reconciliation table is incorporated by reference in this presentation . This presentation contains statistical data that we obtained from industry publications and reports generated by third parties . Although we believe that the publications and reports are reliable, we have not independently verified this statistical data . Kornit, Kornit Digital, the K logo, and NeoPigment are trademarks of Kornit Digital Ltd . All other trademarks are the property of their respective owners and are used for reference purposes only . Such use should not be construed as an endorsement of our products or services .

Kornit Digital. All Rights Reserved. Business Highlights Kornit Digital.

All Rights Reserved. Reflecting on Full - Year 2024 ― Successful execution of our strategy, return to profitability, and set the stage for acceleration and profitable growth ― At the beginning of 2024, we set the objectives to return to profitability, generate meaningful cash flow, and establish a scalable, disciplined model fueling long - term growth ― Delivered on these goals, and introduced game - changing innovations, strengthened our market position, and expanded into new strategic adjacencies Kornit Digital.
All Rights Reserved. Fourth Quarter of 2024 Recap ― Reported revenue of $60.7 million and adjusted EBITDA margin of 13.8% ― Generated $26.7 million of operating cash flow in the quarter ― Fourth quarter performance was fueled by a successful peak season and growing impressions across our key customers ― After delivering 15 Apollo systems throughout the year, with most becoming fully operational during the peak season, customer feedback has been excellent Kornit Digital.
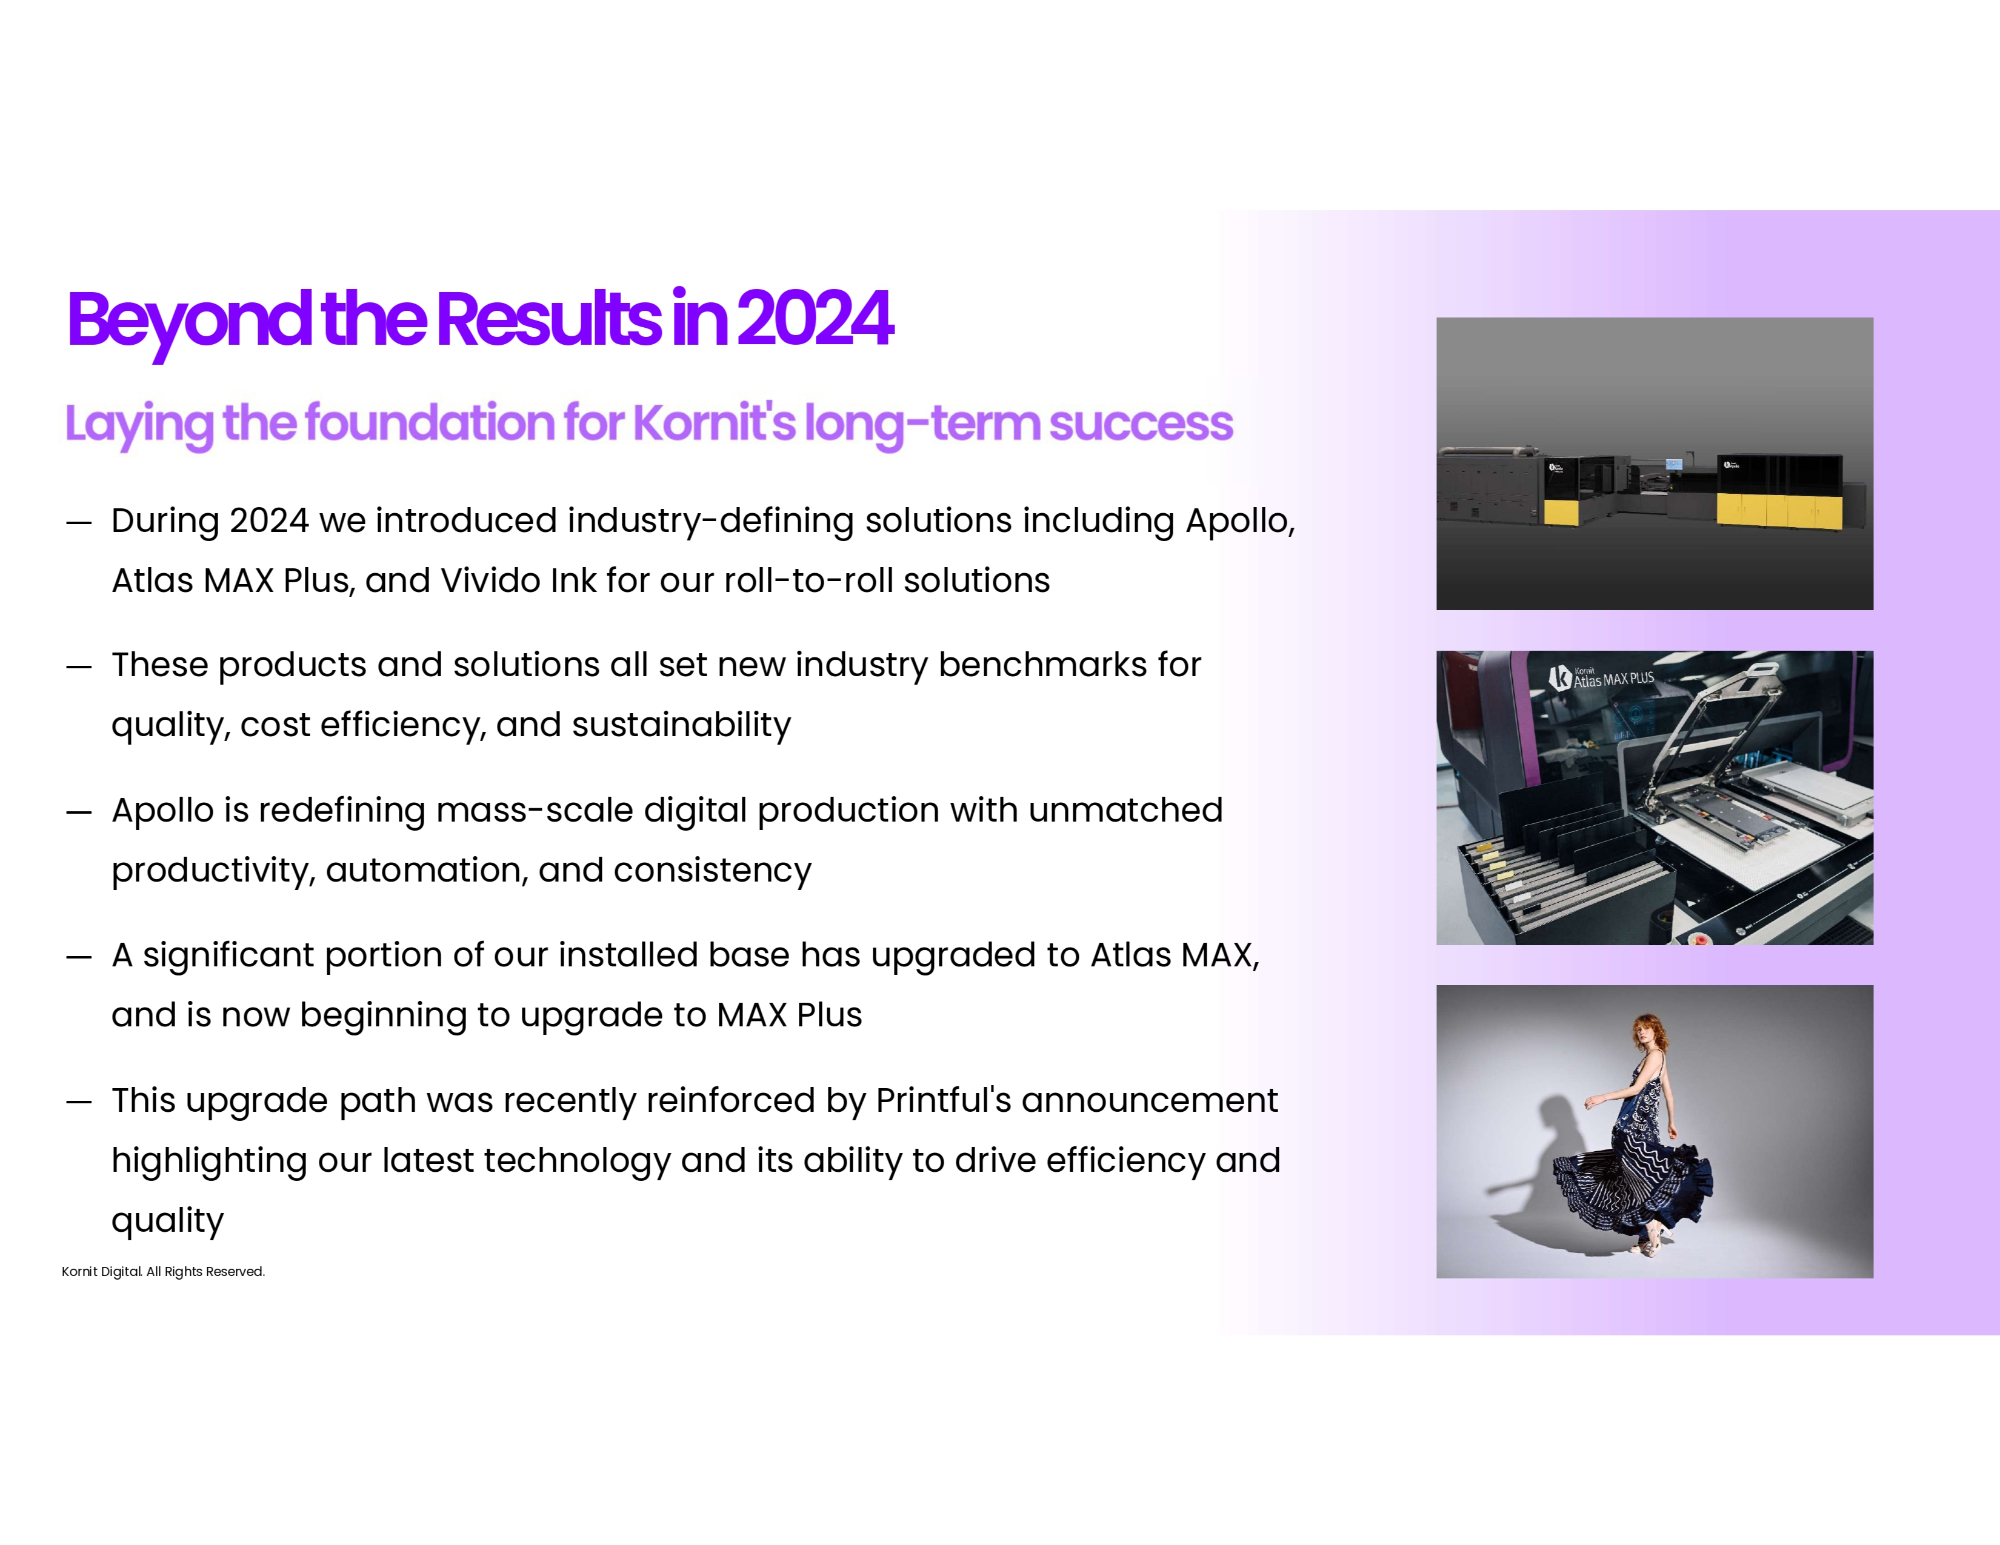
All Rights Reserved. Beyond the Results in 2024 ― During 2024 we introduced industry - defining solutions including Apollo, Atlas MAX Plus, and Vivido Ink for our roll - to - roll solutions ― These products and solutions all set new industry benchmarks for quality, cost efficiency, and sustainability ― Apollo is redefining mass - scale digital production with unmatched productivity, automation, and consistency ― A significant portion of our installed base has upgraded to Atlas MAX, and is now beginning to upgrade to MAX Plus ― This upgrade path was recently reinforced by Printful's announcement highlighting our latest technology and its ability to drive efficiency and quality Kornit Digital.
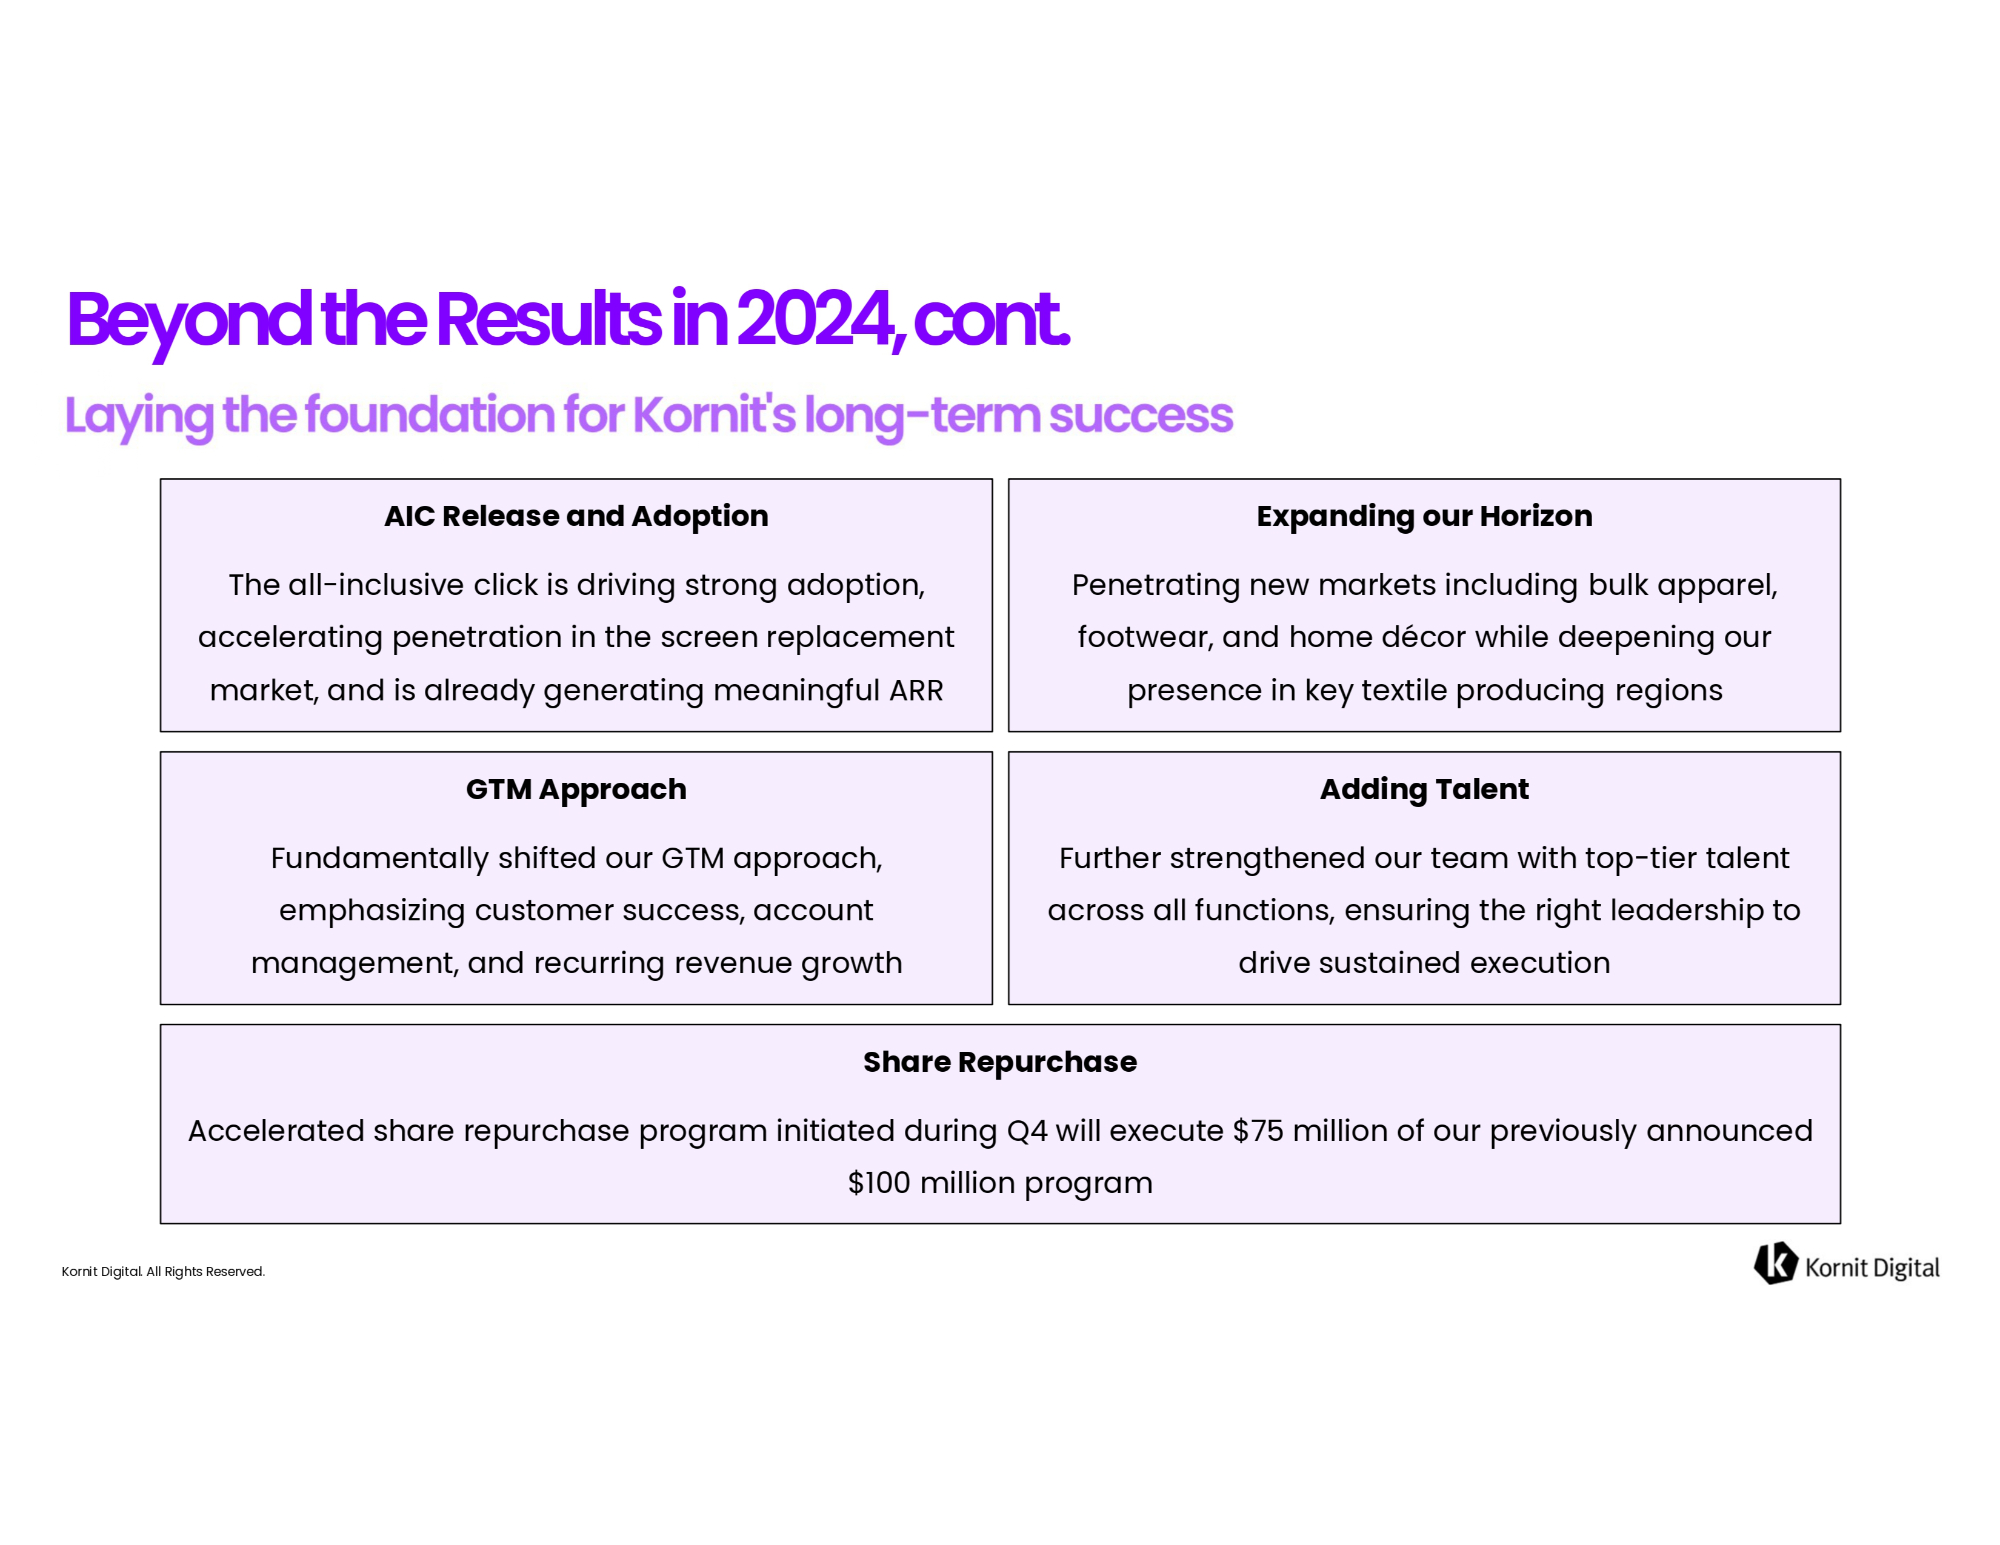
All Rights Reserved. Beyond the Results in 2024, cont. AIC Release and Adoption The all - inclusive click is driving strong adoption, accelerating penetration in the screen replacement market, and is already generating meaningful ARR Expanding our Horizon Penetrating new markets including bulk apparel, footwear, and home décor while deepening our presence in key textile producing regions GTM Approach Fundamentally shifted our GTM approach, emphasizing customer success, account management, and recurring revenue growth Adding Talent Further strengthened our team with top - tier talent across all functions, ensuring the right leadership to drive sustained execution Share Repurchase Accelerated share repurchase program initiated during Q 4 will execute $ 75 million of our previously announced $ 100 million program Kornit Digital.
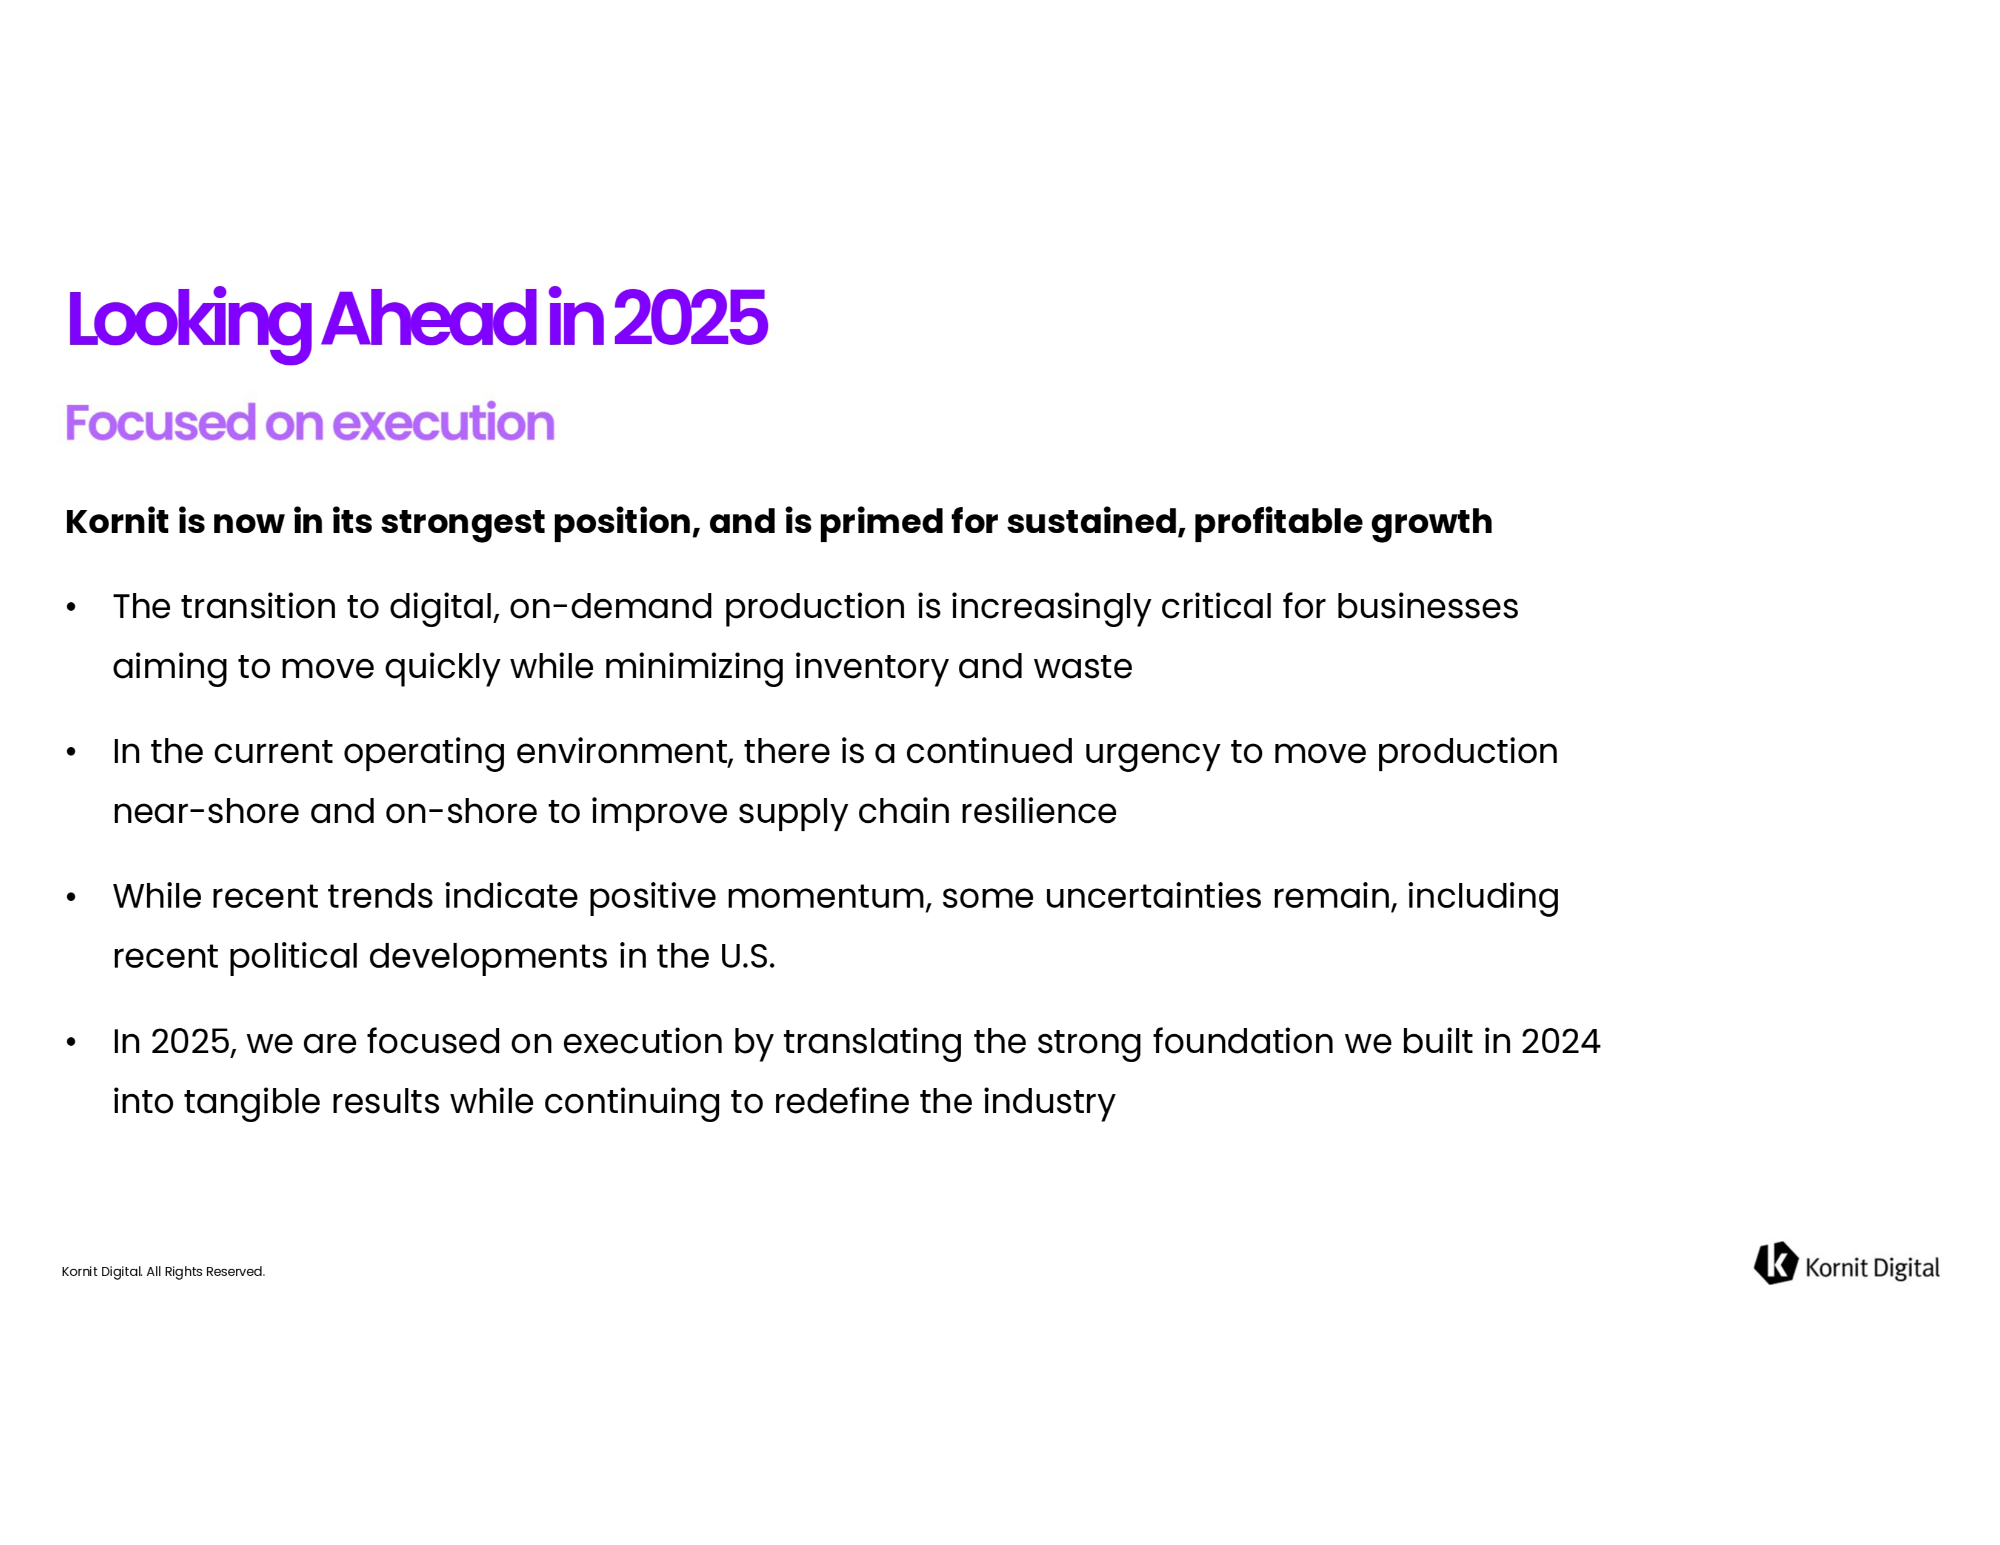
All Rights Reserved. Looking Ahead in 2025 Kornit is now in its strongest position, and is primed for sustained, profitable growth • The transition to digital, on - demand production is increasingly critical for businesses aiming to move quickly while minimizing inventory and waste • In the current operating environment, there is a continued urgency to move production near - shore and on - shore to improve supply chain resilience • While recent trends indicate positive momentum, some uncertainties remain, including recent political developments in the U.S. • In 2025, we are focused on execution by translating the strong foundation we built in 2024 into tangible results while continuing to redefine the industry Kornit Digital.

All Rights Reserved. Financial Highlights Kornit Digital.
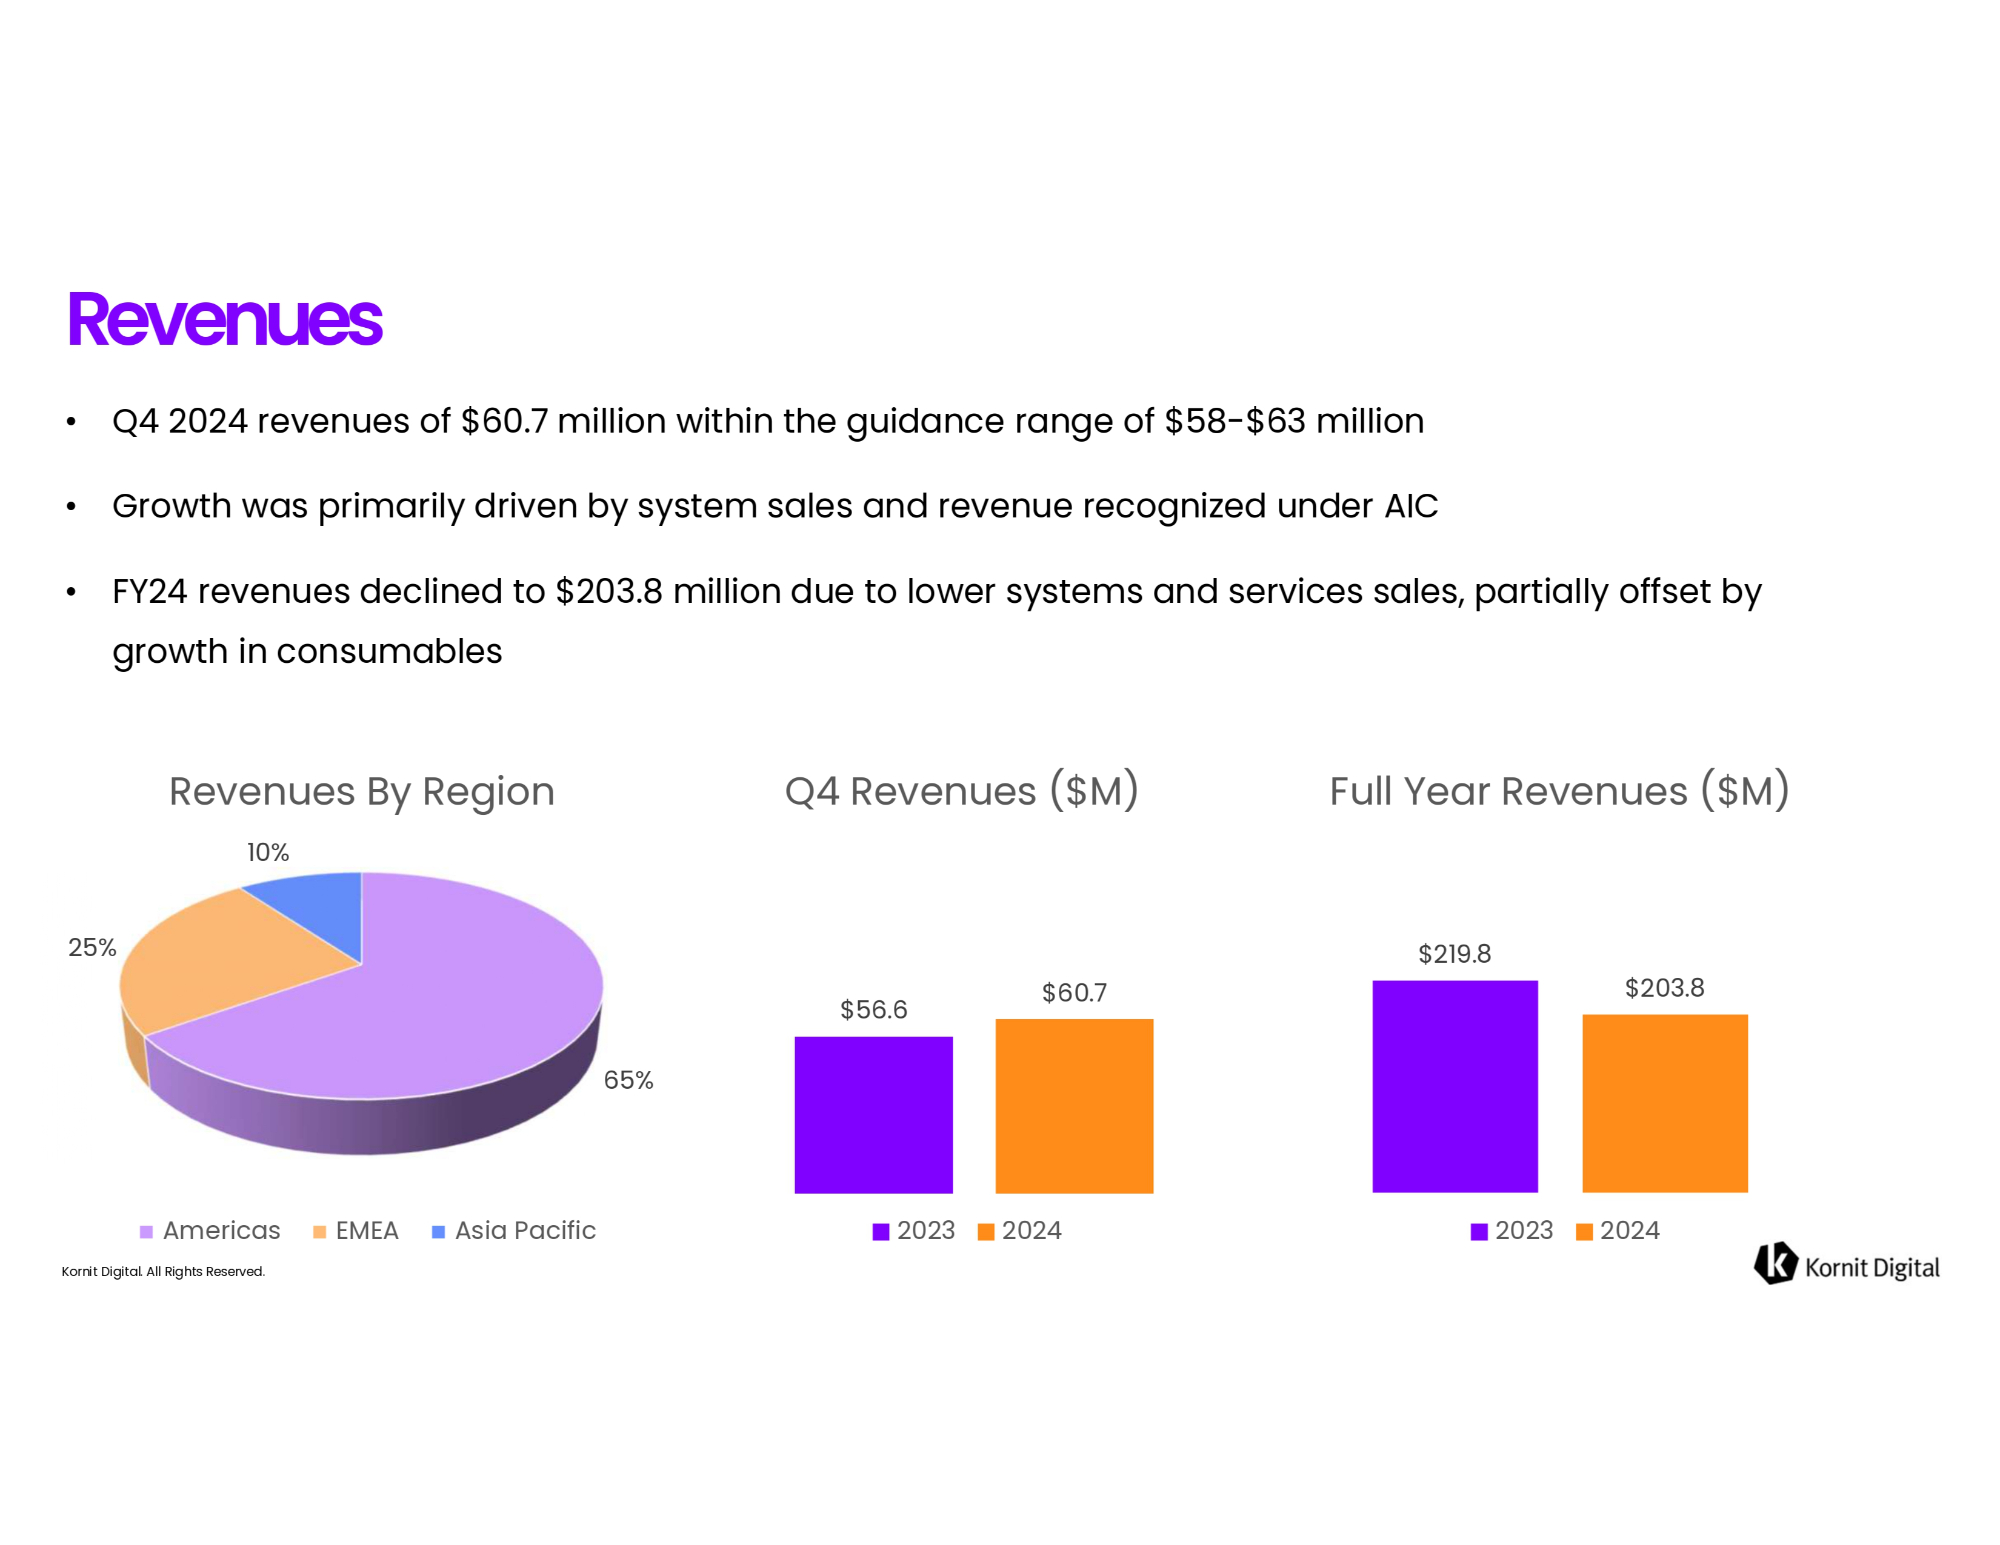
All Rights Reserved. • Q4 2024 revenues of $60.7 million within the guidance range of $58 - $63 million • Growth was primarily driven by system sales and revenue recognized under AIC • FY24 revenues declined to $203.8 million due to lower systems and services sales, partially offset by growth in consumables Revenues $56.6 $60.7 Q4 Revenues ($M) 2023 2024 $219.8 $ 203.8 Full Year Revenues ($M) 2023 2024 65% 25% 10% Revenues By Region Americas EMEA Asia Pacific Kornit Digital.
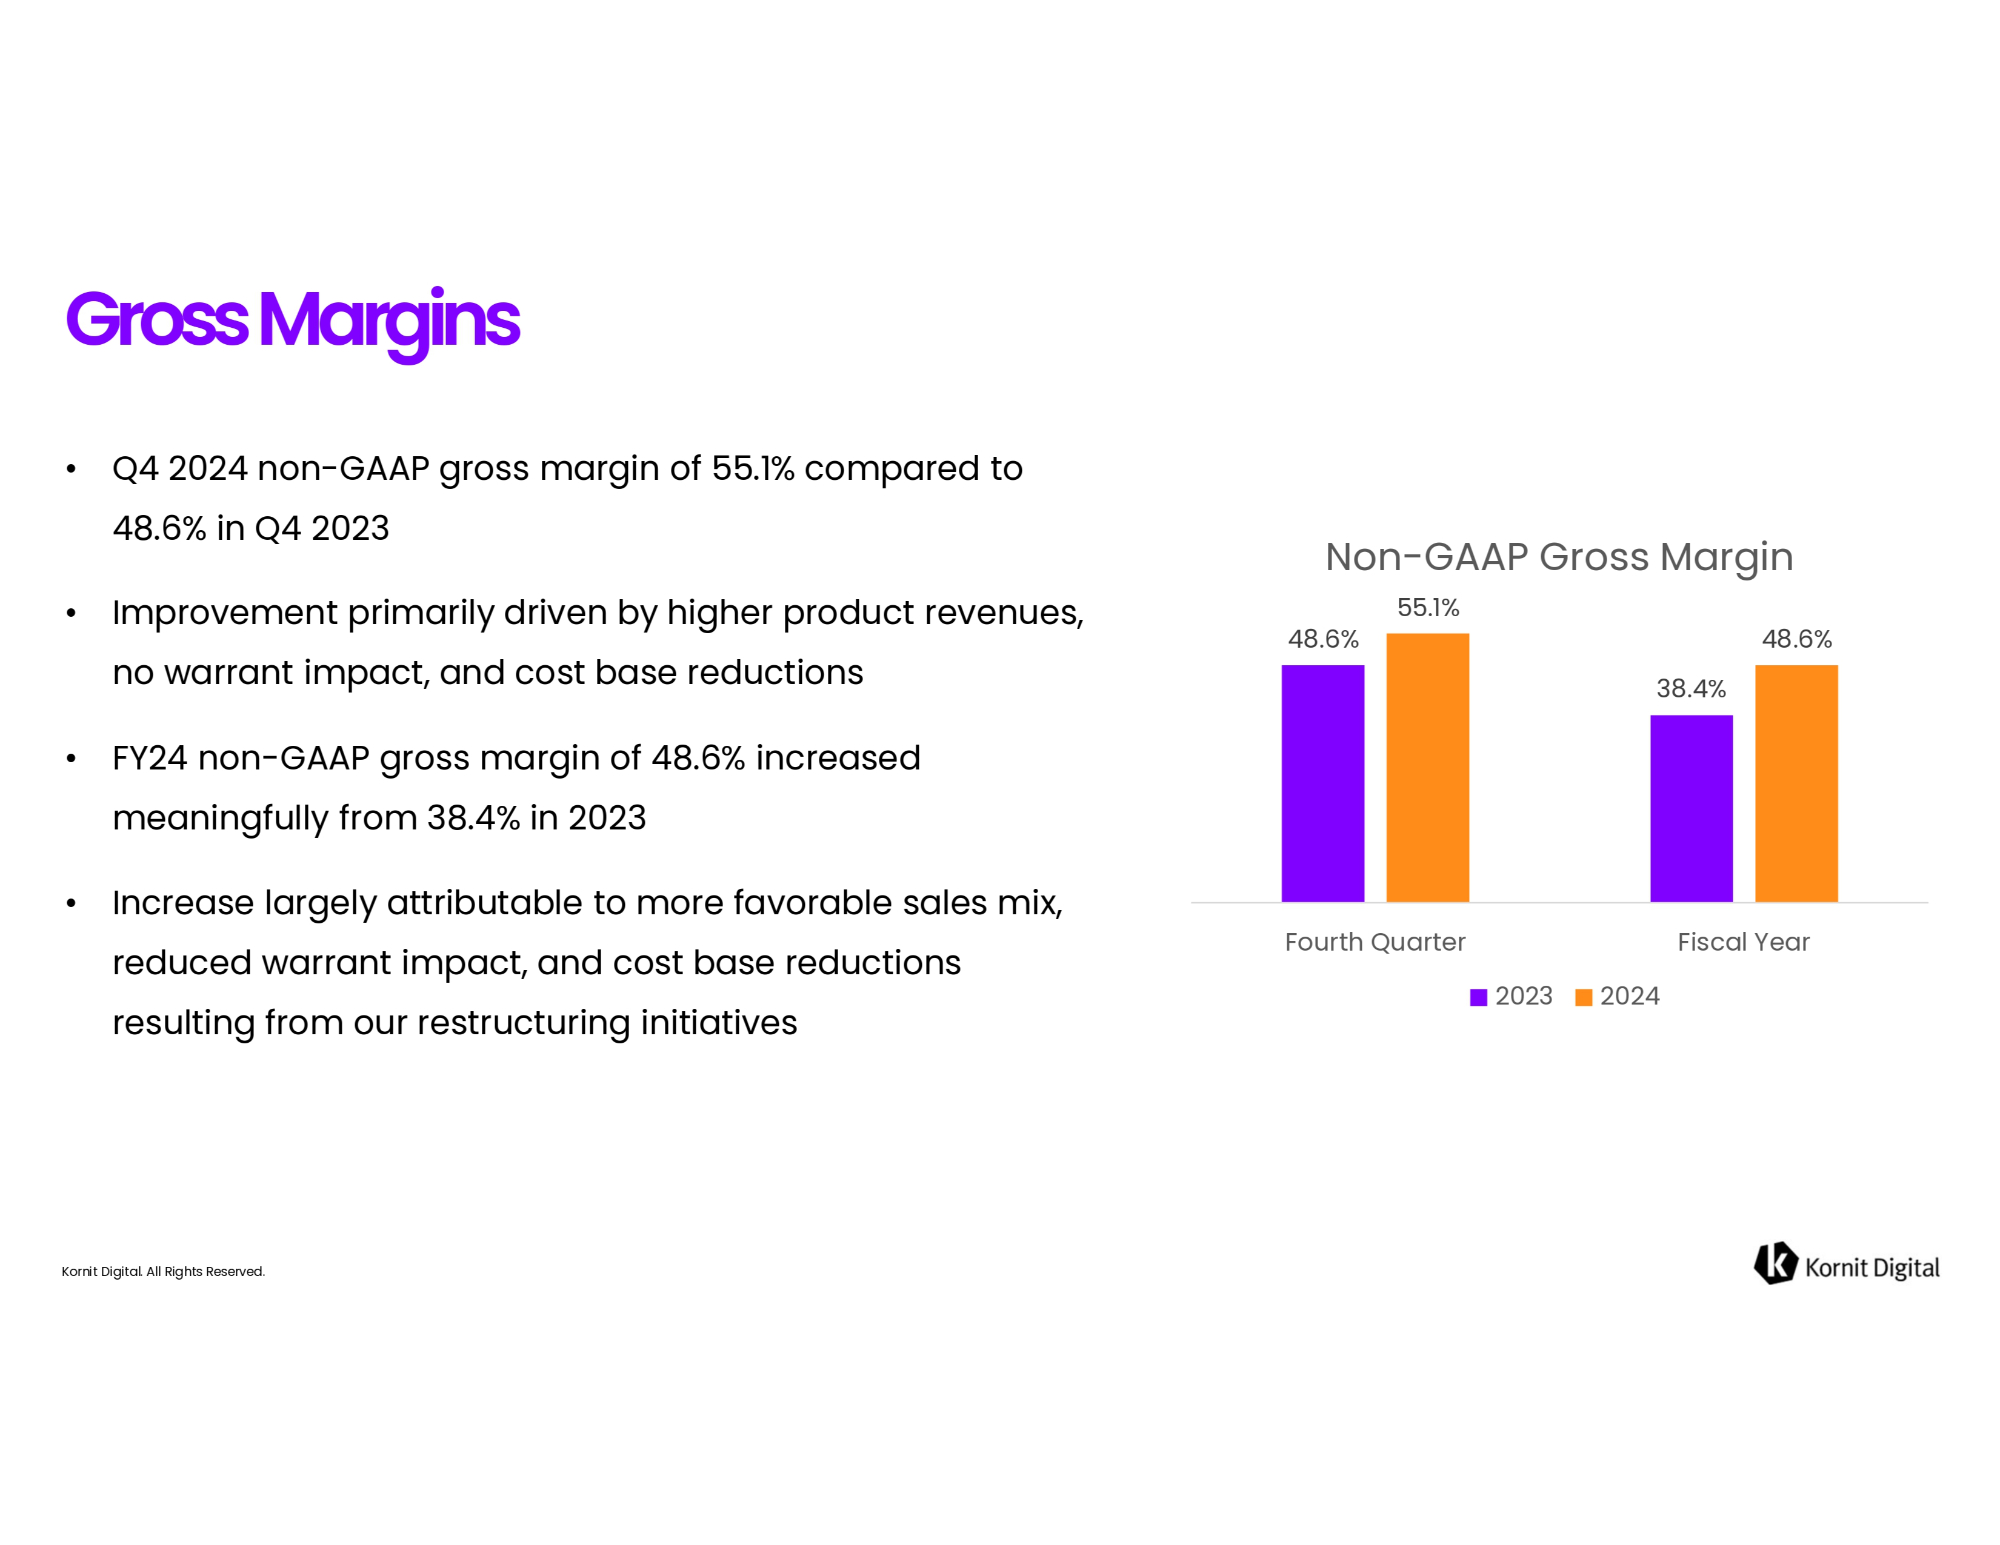
All Rights Reserved. • Q4 2024 non - GAAP gross margin of 55.1% compared to 48.6% in Q4 2023 • Improvement primarily driven by higher product revenues, no warrant impact, and cost base reductions • FY24 non - GAAP gross margin of 48.6% increased meaningfully from 38.4% in 2023 • Increase largely attributable to more favorable sales mix, reduced warrant impact, and cost base reductions resulting from our restructuring initiatives Gross Margins 48.6% 38.4% 55.1% 48.6% Fourth Quarter Fiscal Year Non - GAAP Gross Margin 2023 2024 Kornit Digital.
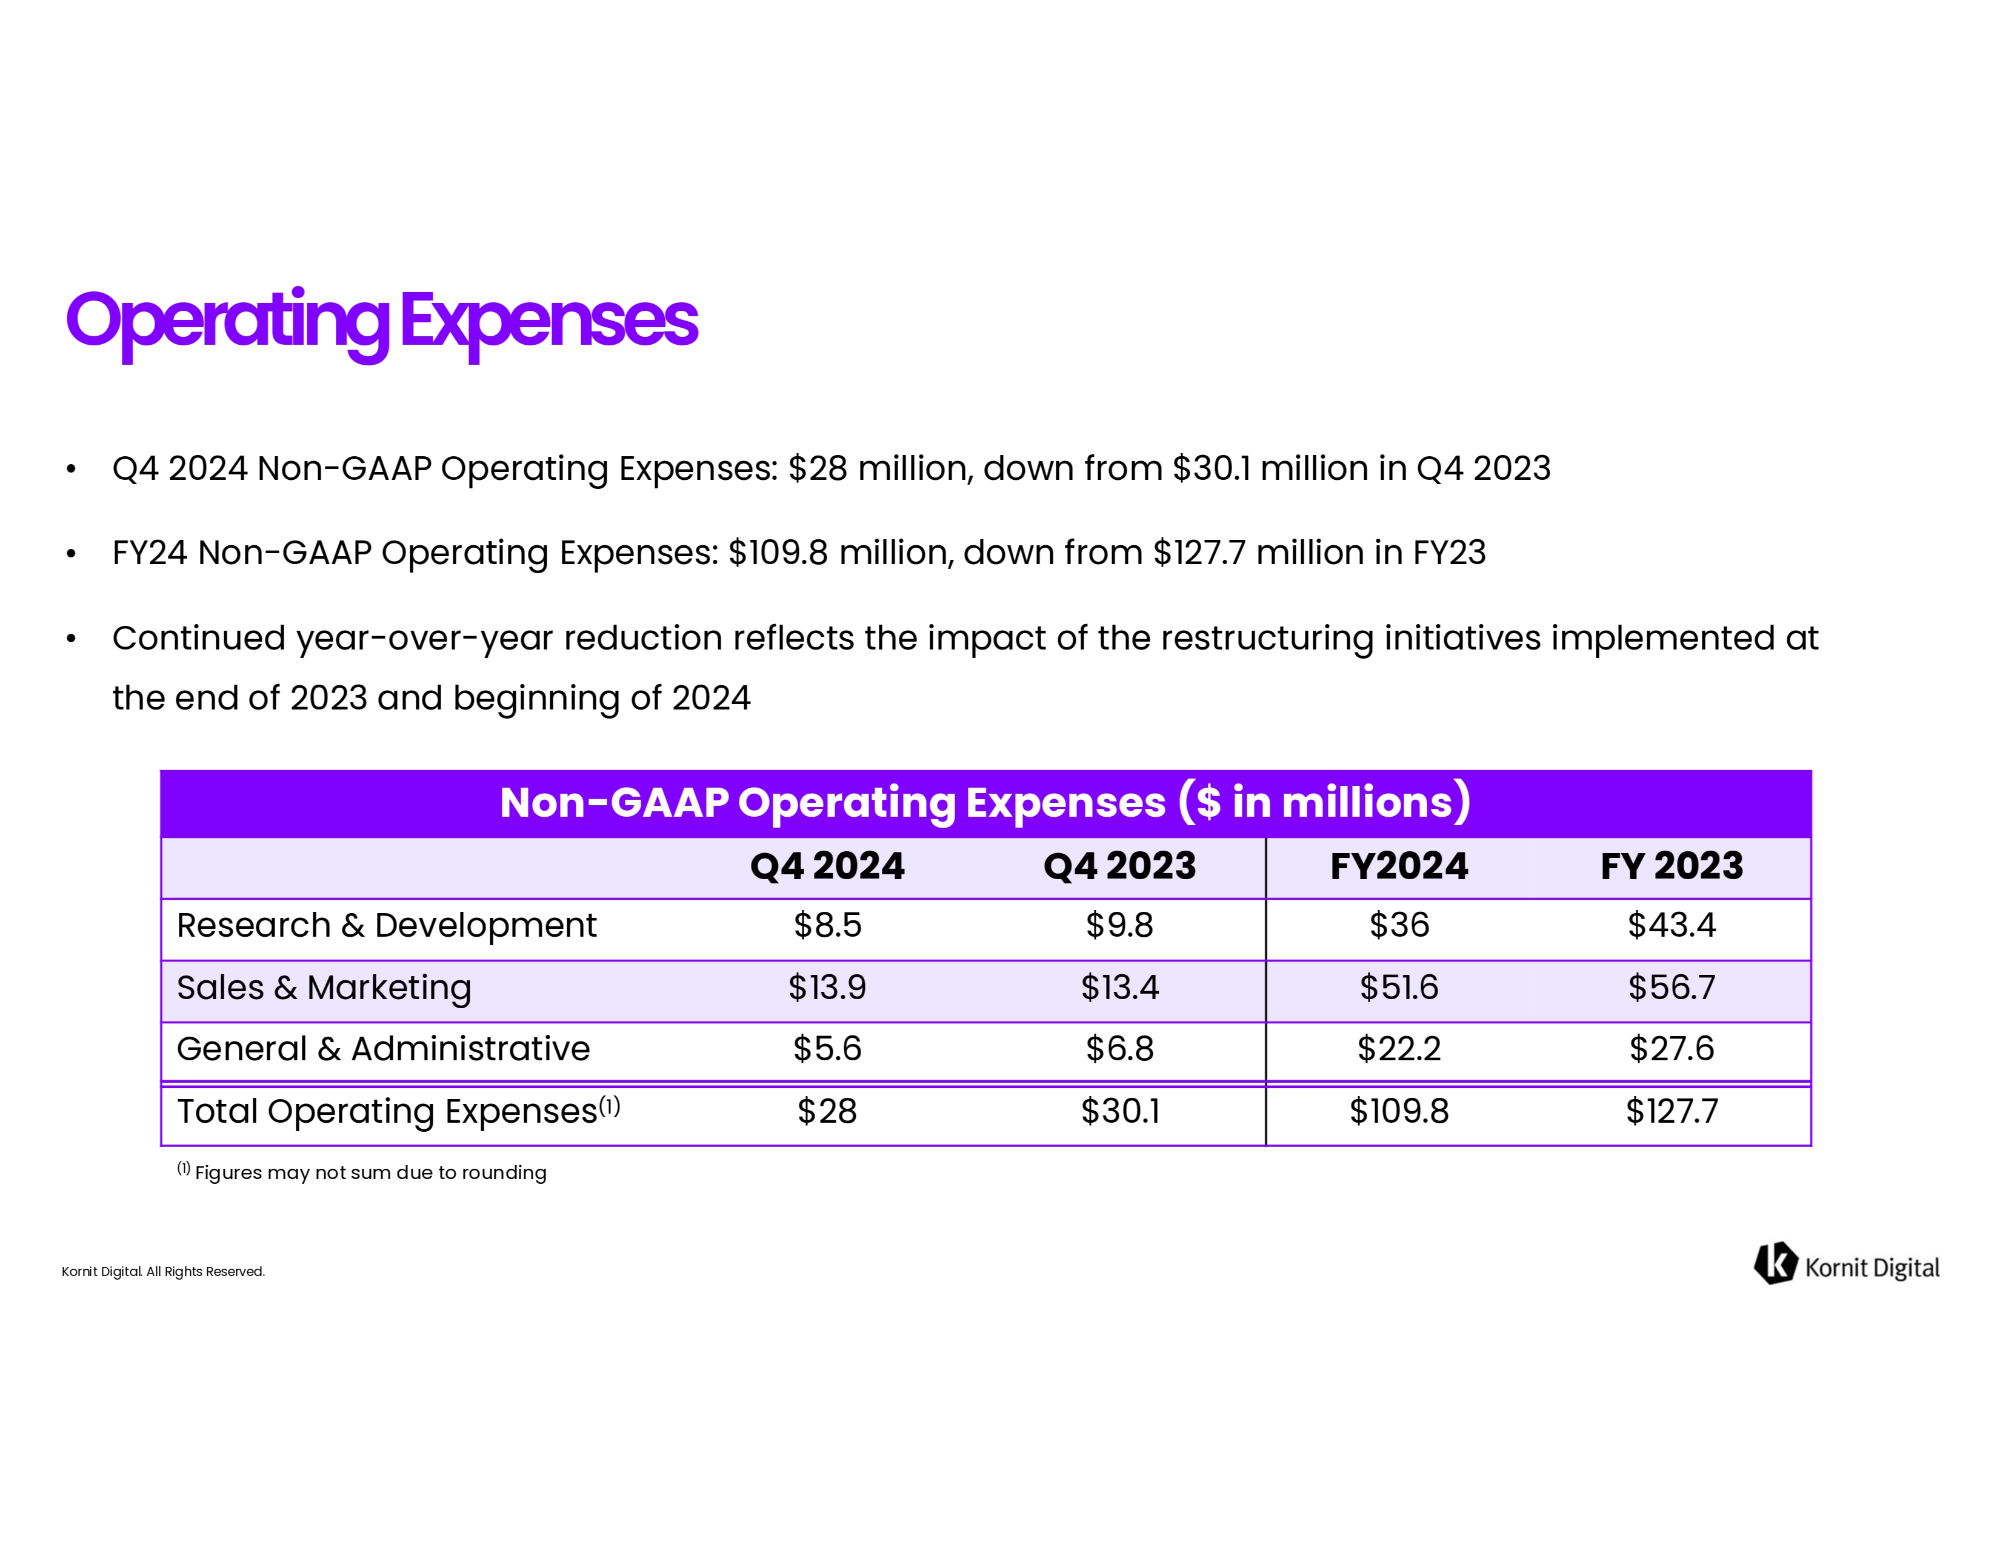
All Rights Reserved. • Q4 2024 Non - GAAP Operating Expenses: $28 million, down from $30.1 million in Q4 2023 • FY24 Non - GAAP Operating Expenses: $109.8 million, down from $127.7 million in FY23 • Continued year - over - year reduction reflects the impact of the restructuring initiatives implemented at the end of 2023 and beginning of 2024 Operating Expenses Non - GAAP Operating Expenses ($ in millions) FY 2023 FY2024 Q4 2023 Q4 2024 $43.4 $36 $9.8 $8.5 Research & Development $56.7 $51.6 $13.4 $13.9 Sales & Marketing $27.6 $22.2 $6.8 $5.6 General & Administrative $127.7 $109.8 $30.1 $28 Total Operating Expenses (1) (1) Figures may not sum due to rounding Kornit Digital.
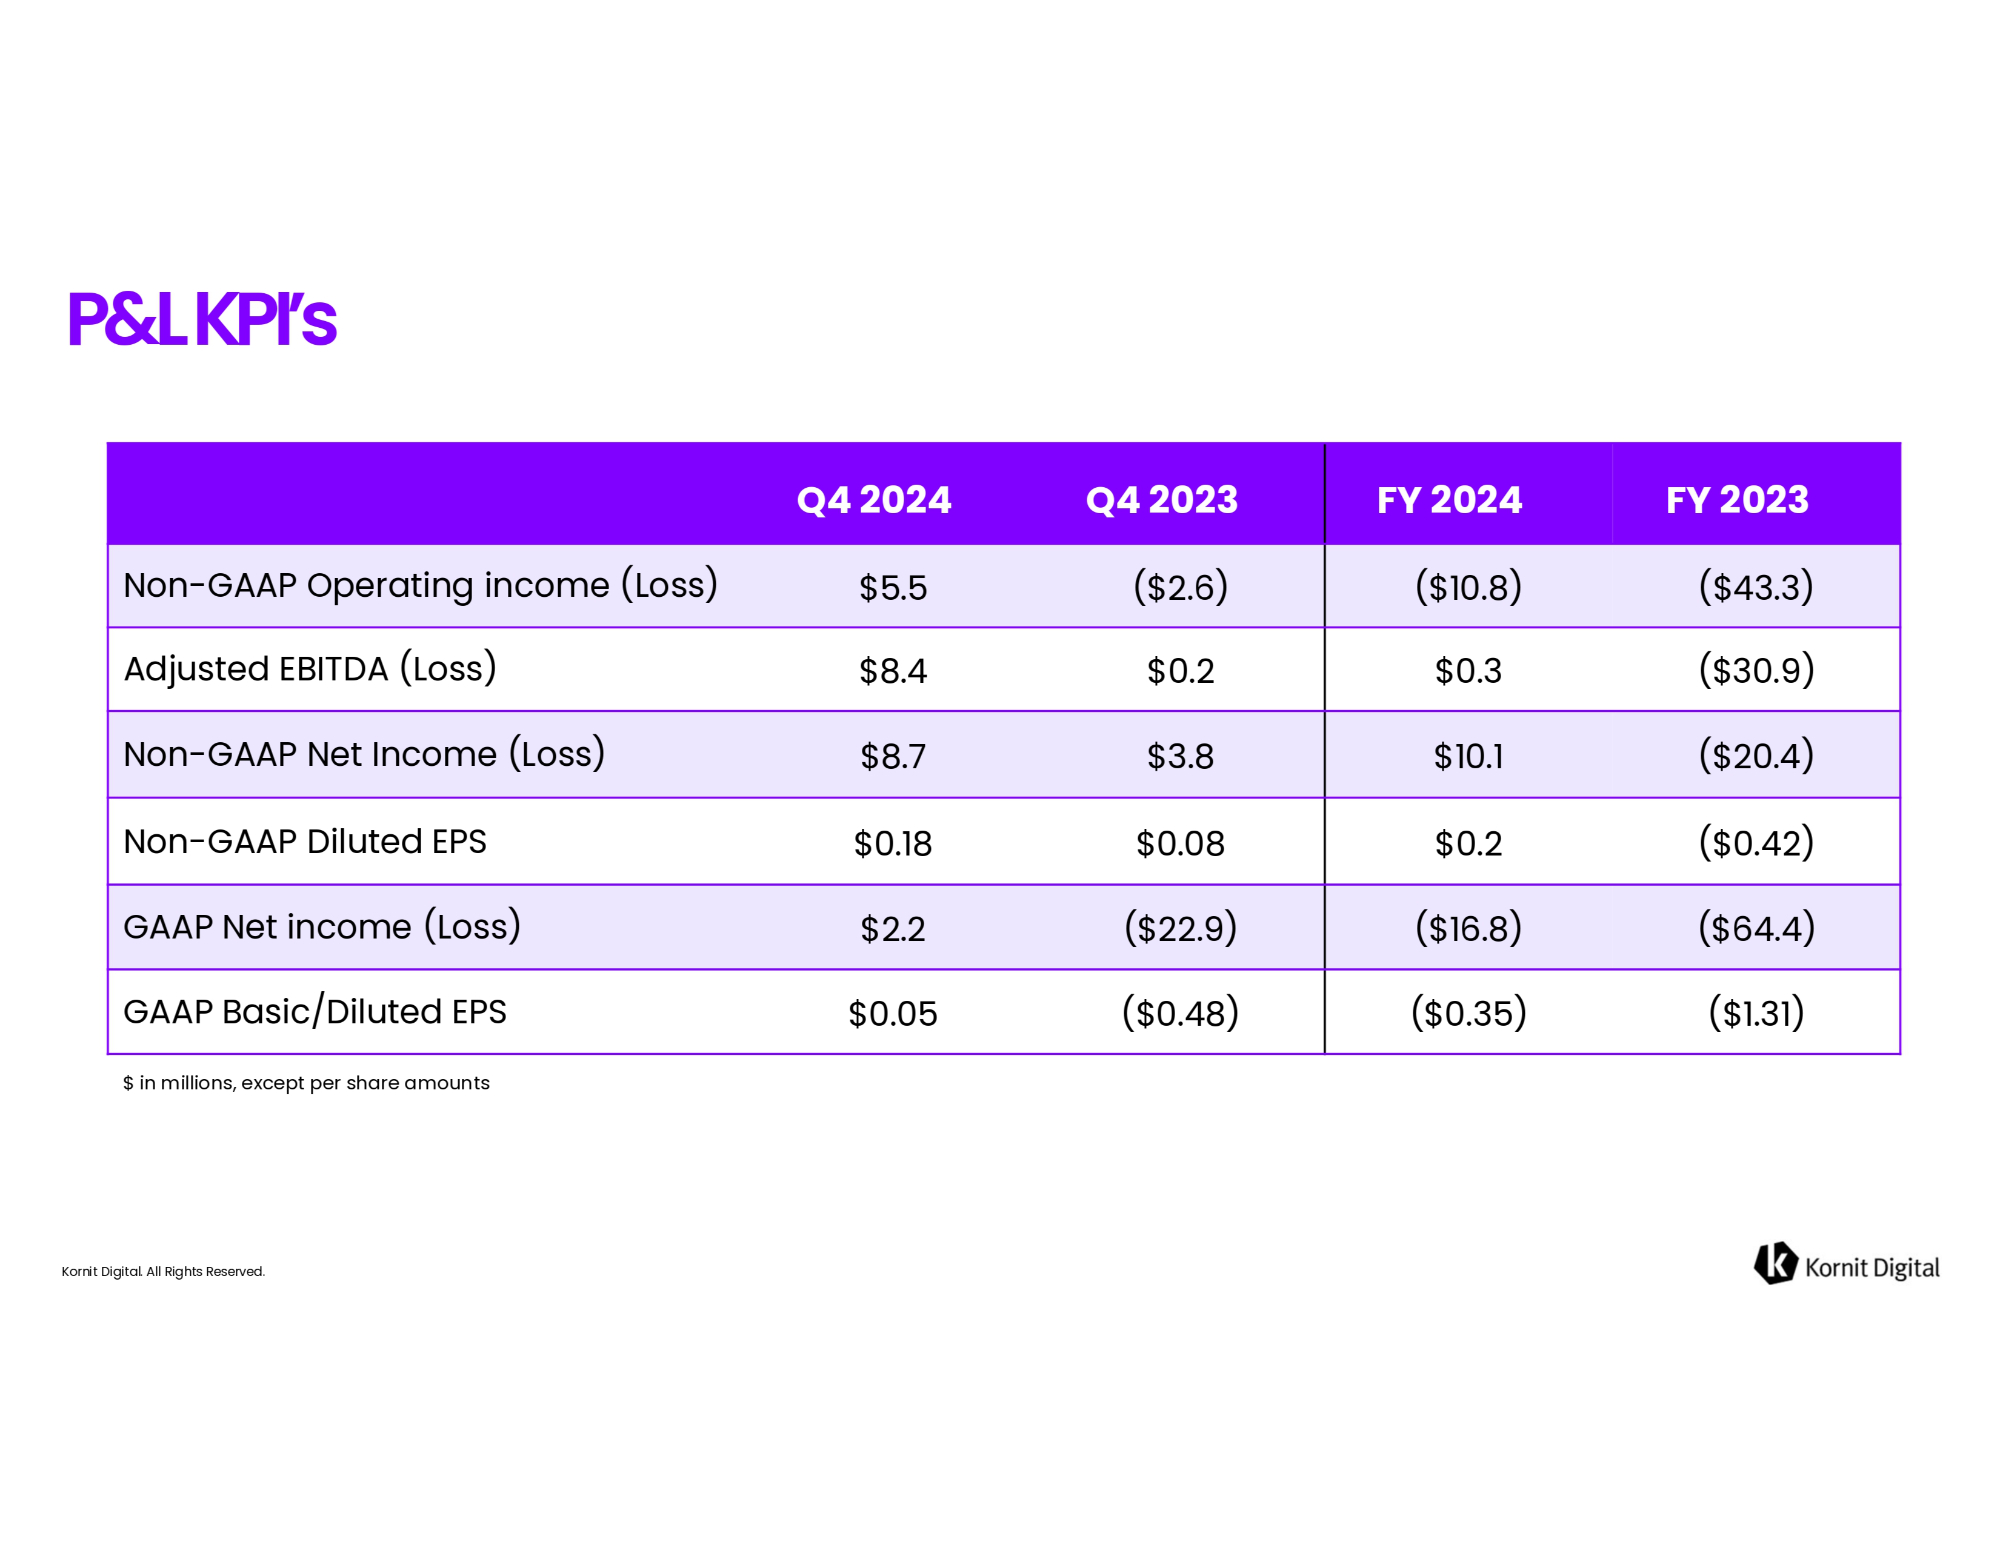
All Rights Reserved. P&L KPI’s FY 2023 FY 2024 Q4 2023 Q4 2024 ($43.3) ($10.8) ($2.6) $5.5 Non - GAAP Operating income (Loss) ($30.9) $0.3 $0.2 $8.4 Adjusted EBITDA (Loss) ($20.4) $10.1 $3.8 $8.7 Non - GAAP Net Income (Loss) ($0.42) $0.2 $0.08 $0.18 Non - GAAP Diluted EPS ($64.4) ($16.8) ($22.9) $2.2 GAAP Net income (Loss) ($1.31) ($0.35) ($0.48) $0.05 GAAP Basic/Diluted EPS $ in millions, except per share amounts Kornit Digital.
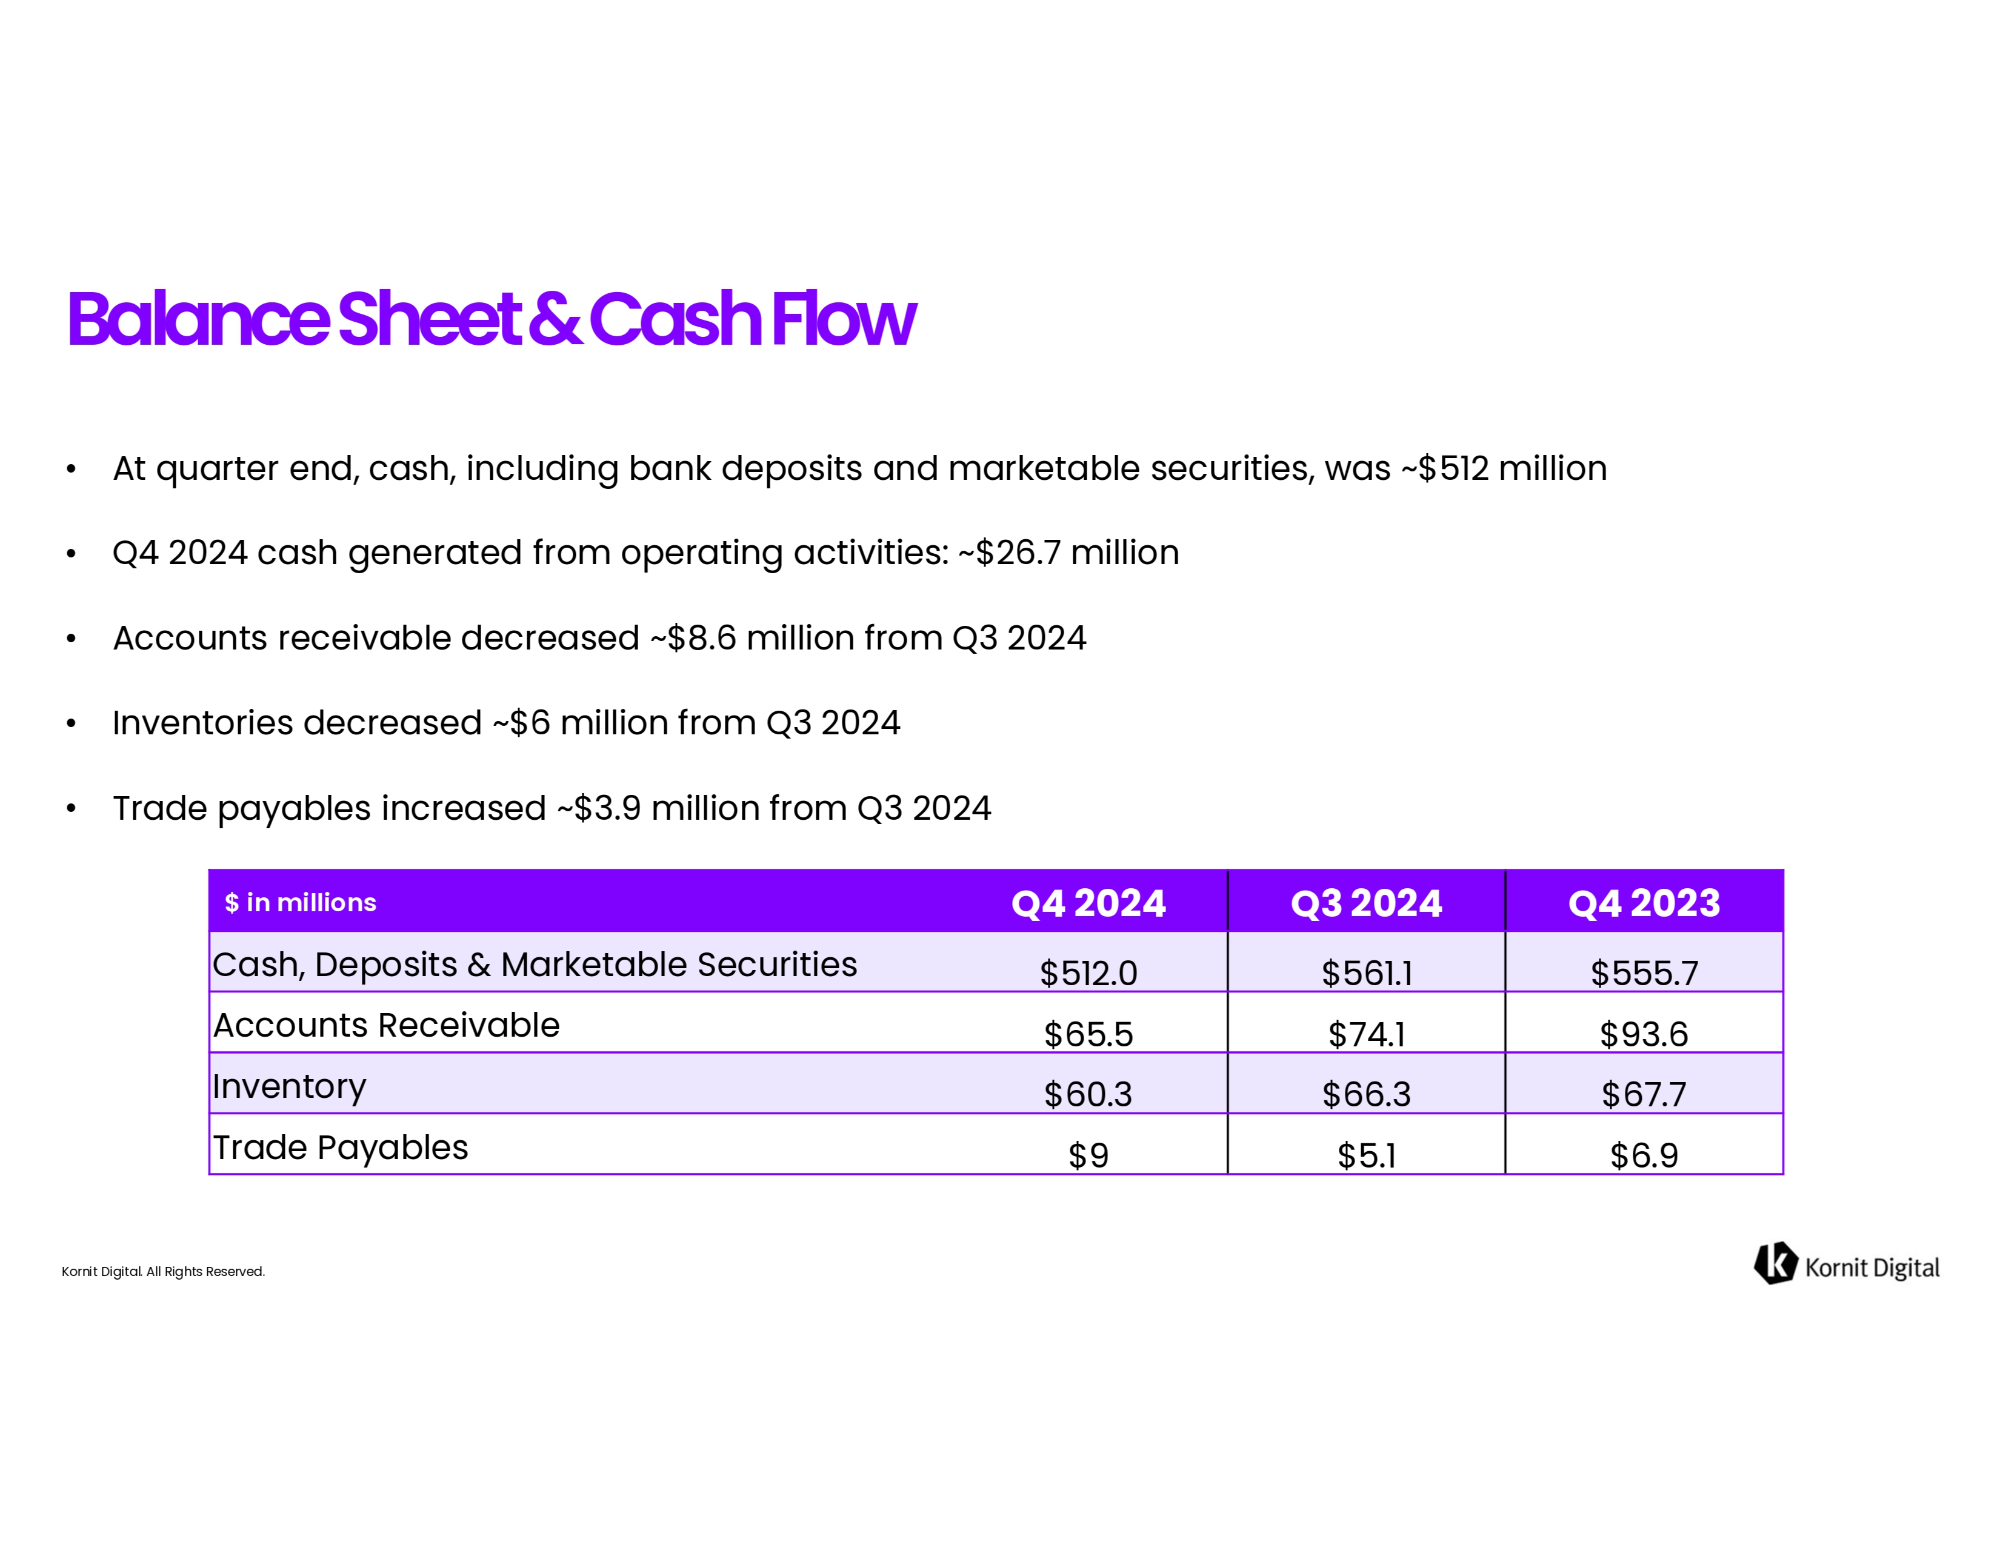
All Rights Reserved. • At quarter end, cash, including bank deposits and marketable securities, was ~$512 million • Q4 2024 cash generated from operating activities: ~$26.7 million • Accounts receivable decreased ~$8.6 million from Q3 2024 • Inventories decreased ~$6 million from Q3 2024 • Trade payables increased ~$3.9 million from Q3 2024 Balance Sheet & Cash Flow Q4 2023 Q3 2024 Q4 2024 $555.7 $561.1 $512.0 Cash, Deposits & Marketable Securities $93.6 $74.1 $65.5 Accounts Receivable $67.7 $66.3 $60.3 Inventory $6.9 $5.1 $9 Trade Payables $ in millions Kornit Digital.
All Rights Reserved. • Used $84.1 million on share repurchases during 2024 • Activity in 2024 brings the total gross amount used on repurchases to $121.6 million at an average execution price of $24.40 • During Q4, we entered an accelerated share repurchase under which we plan to repurchase ~$75 million of our ordinary shares • Under the terms of the ASR agreement, we received an initial delivery of ~1.8 million shares in exchange for a prepayment of $75 million • The final number of shares repurchased under the agreement is dependent on average daily VWAP through the end of the contract (expected to close in June) • Planning to execute on the remaining $25 million balance of our recently announced $100 million program through opportunistic repurchasing Share Repurchase Program Kornit Digital.
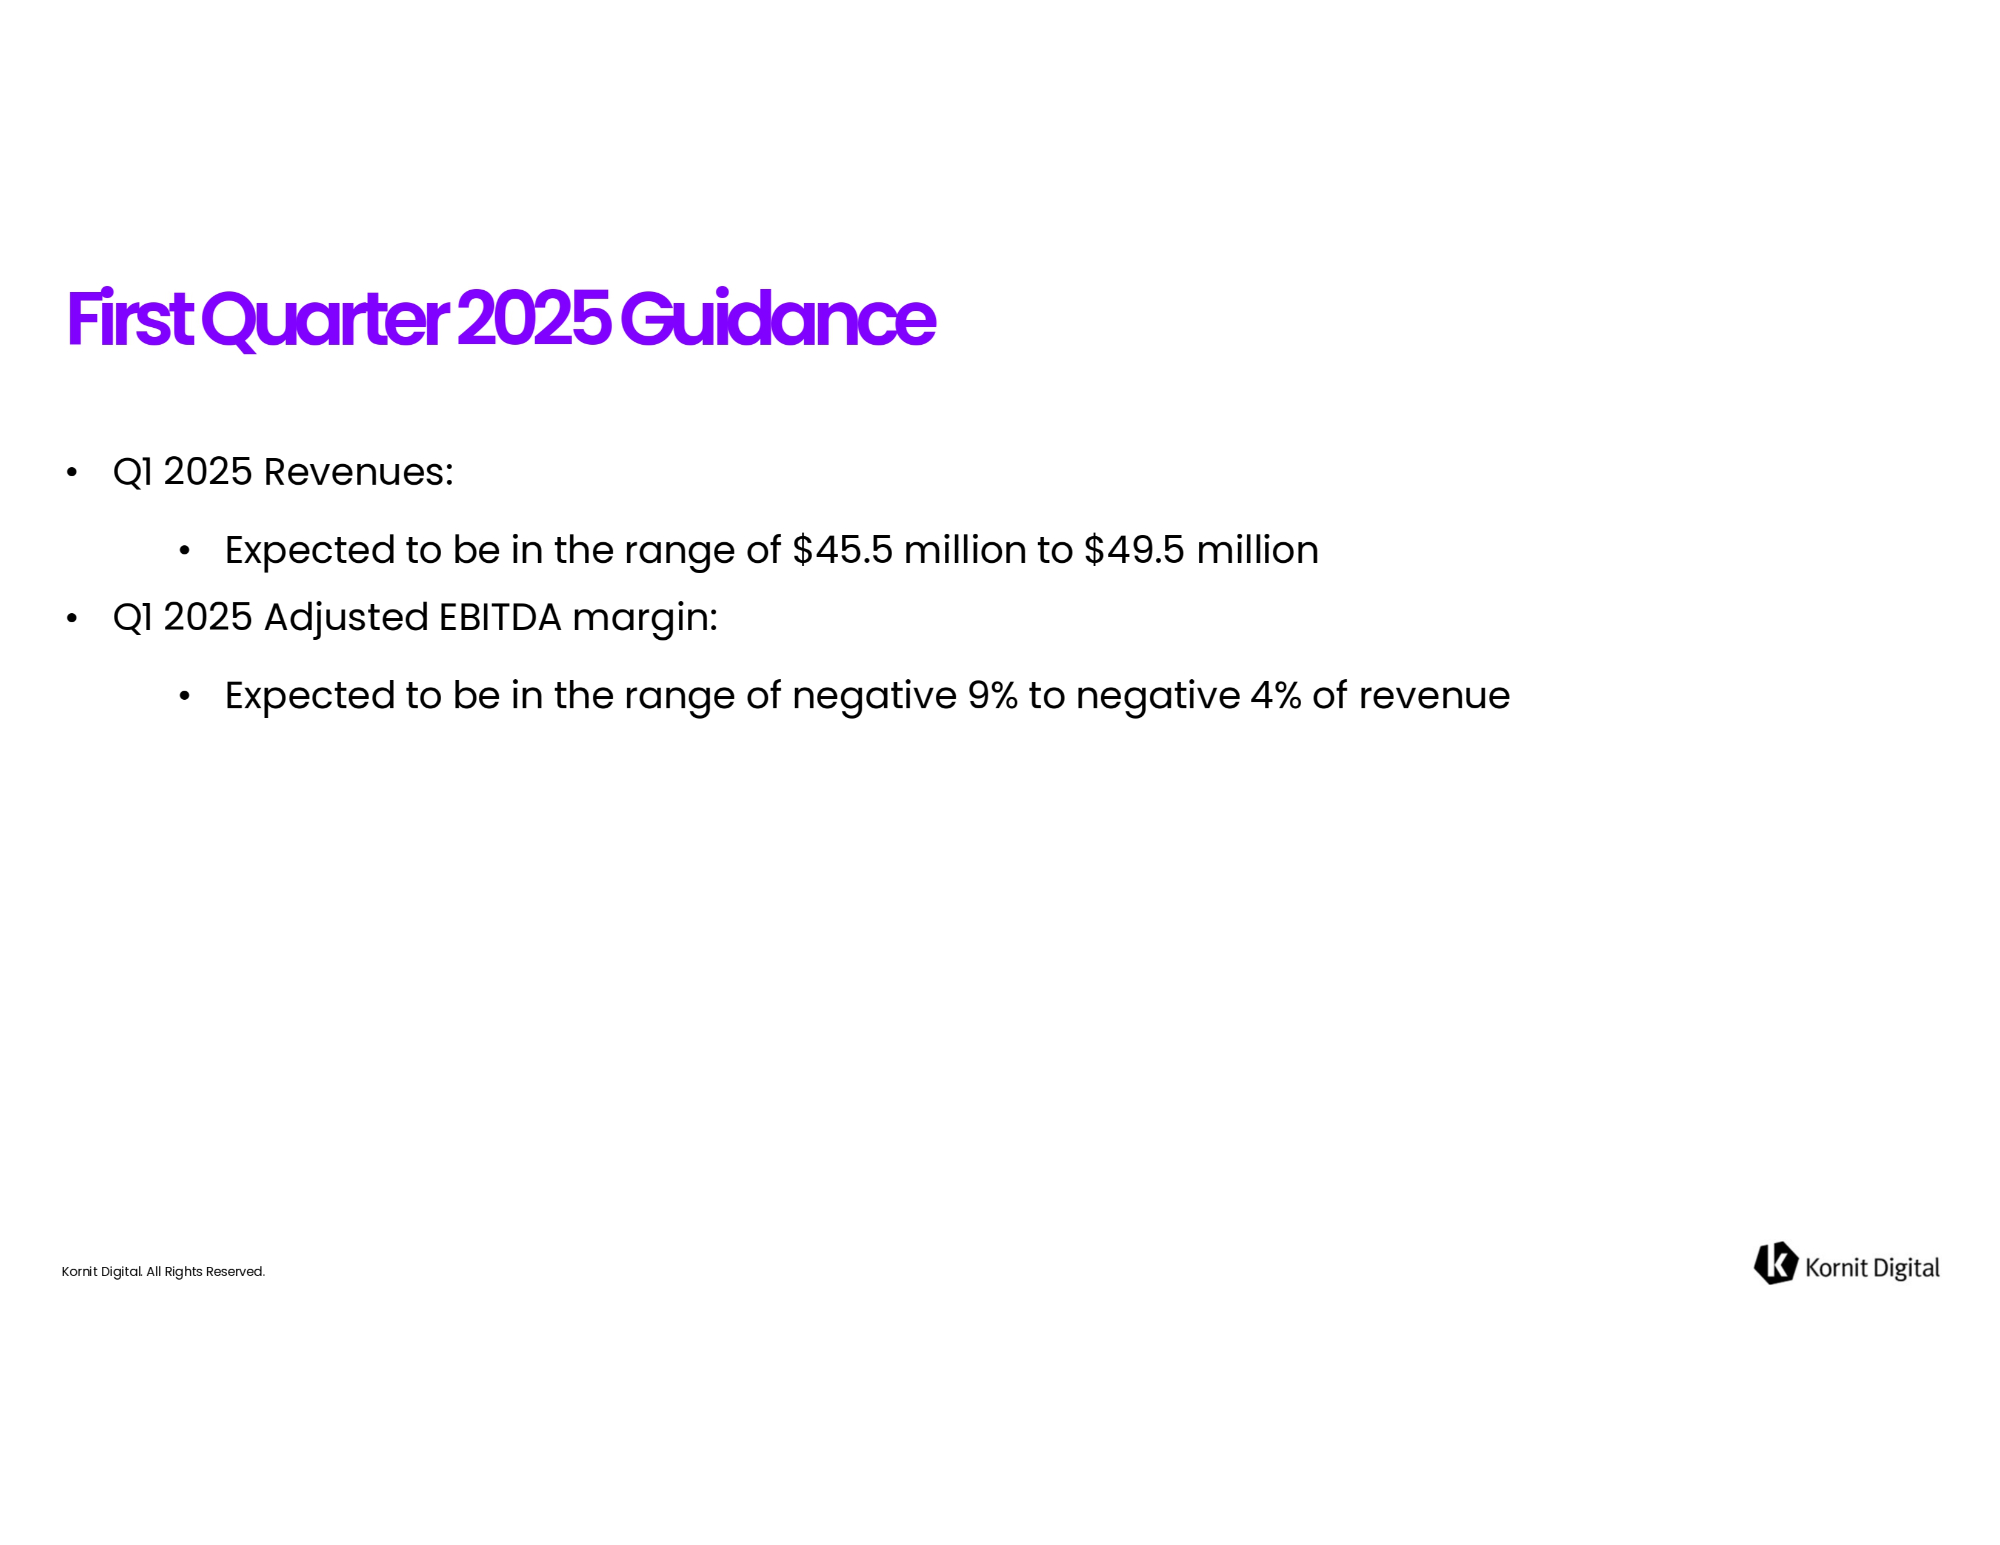
All Rights Reserved. • Q1 2025 Revenues: • Expected to be in the range of $45.5 million to $49.5 million • Q1 2025 Adjusted EBITDA margin: • Expected to be in the range of negative 9% to negative 4% of revenue First Quarter 2025 Guidance Kornit Digital.
All Rights Reserved.

Kornit Digital. All Rights Reserved. Thank You!