UNITED STATES
SECURITIES AND EXCHANGE COMMISSION
Washington, D.C. 20549
FORM 6-K
REPORT OF FOREIGN PRIVATE ISSUER
PURSUANT TO RULE 13a-16 OR 15d-16 UNDER
THE SECURITIES EXCHANGE ACT OF 1934
For the month of August 2024
Commission File Number: 001-42153
TOYO Co., Ltd
5F, Tennoz First Tower
2-2-4, Higashi-Shinagawa, Shinagawa-ku
Tokyo, Japan 140-0002
(Address of Principal Executive Offices)
Indicate by check mark whether the registrant files or will file annual reports under cover Form 20-F or Form 40-F.
Form 20-F ☒ Form 40-F ☐
EXPLANATORY NOTE
A copy of the investor presentation of TOYO Co., Ltd (“TOYO”), a Cayman Islands exempted company, at the conference call held by TOYO to discuss its first half 2024 results held on August 21, 2024, is being furnished as Exhibit 99.1 with this Report on Form 6-K.
EXHIBIT INDEX
| Exhibit No. | Description | |
| 99.1 | Investor Presentation dated August 21, 2024 |
SIGNATURE
Pursuant to the requirements of the Securities Exchange Act of 1934, the registrant has duly caused this report to be signed on its behalf by the undersigned, thereunto duly authorized.
| TOYO Co., Ltd | ||
| By: | /s/ Junsei Ryu | |
| Name: | Junsei Ryu | |
| Title: | Director and Chief Executive Officer | |
Date: August 23, 2024
2
Exhibit 99.1

August 2024 Investor Deck TOYO Co., Ltd (NASDAQ: TOYO)
Safe Harbor Forward - Looking Statements • This presentation includes “forward - looking statements” within the meaning of the “safe harbor” provisions of the United States Private Securities Litigation Reform Act of 1995 . Forward - looking statements may be identified by the use of words such as “estimate,” “plan,” “project,” “forecast,” “intend,” “will,” “expect,” “anticipate,” “believe,” “seek,” “target” or other similar expressions that predict or indicate future events or trends or that are not statements of historical matters . These forward - looking statements include, but are not limited to, statements regarding the expected growth of TOYO, the expected order delivery of TOYO, TOYO’s construction plan of manufactures and strategies of building up integrated value chain in the U . S . . These statements are based on various assumptions, whether or not identified in this presentation, and on the current expectations of TOYO’s management and are not predictions of actual performance . • These statements involve risks, uncertainties, and other factors that may cause actual results, levels of activity, performance, or achievements to be materially different from those expressed or implied by these forward - looking statements . Although TOYO believes that it has a reasonable basis for each forward - looking statement contained in this presentation, TOYO caution you that these statements are based on a combination of facts and factors currently known and projections of the future, which are inherently uncertain . In addition, there are risks and uncertainties described in the documents filed by TOYO from time to time with the SEC . These filings may identify and address other important risks and uncertainties that could cause actual events and results to differ materially from those contained in the forward - looking statements . • TOYO cannot assure you that the forward - looking statements in this presentation will prove to be accurate . These forward - looking statements are subject to several risks and uncertainties, including, among others, the outcome of any potential litigation, government or regulatory proceedings, the sales performance of TOYO, and other risks and uncertainties, including but not limited to those included under the heading “Risk Factors” of the filings of TOYO with the SEC . There may be additional risks that TOYO does not presently know or that TOYO currently believes are immaterial that could also cause actual results to differ from those contained in the forward - looking statements . In light of the significant uncertainties in these forward - looking statements, nothing in this presentation should be regarded as a representation by any person that the forward - looking statements set forth herein will be achieved or that any of the contemplated results of such forward - looking statements will be achieved . The forward - looking statements in this presentation represent the views of TOYO as of the date of this presentation . Subsequent events and developments may cause those views to change . However, while TOYO may update these forward - looking statements in the future, there is no current intention to do so except to the extent required by applicable law . You should, therefore, not rely on these forward - looking statements as representing the views of TOYO as of any date subsequent to the date of this presentation . Except as may be required by law, TOYO does not undertake any duty to update these forward - looking statements .

Powering the world with green, clean energy through high - quality solar solutions at a competitive scale and cost. 3 Trusted Japanese brand.
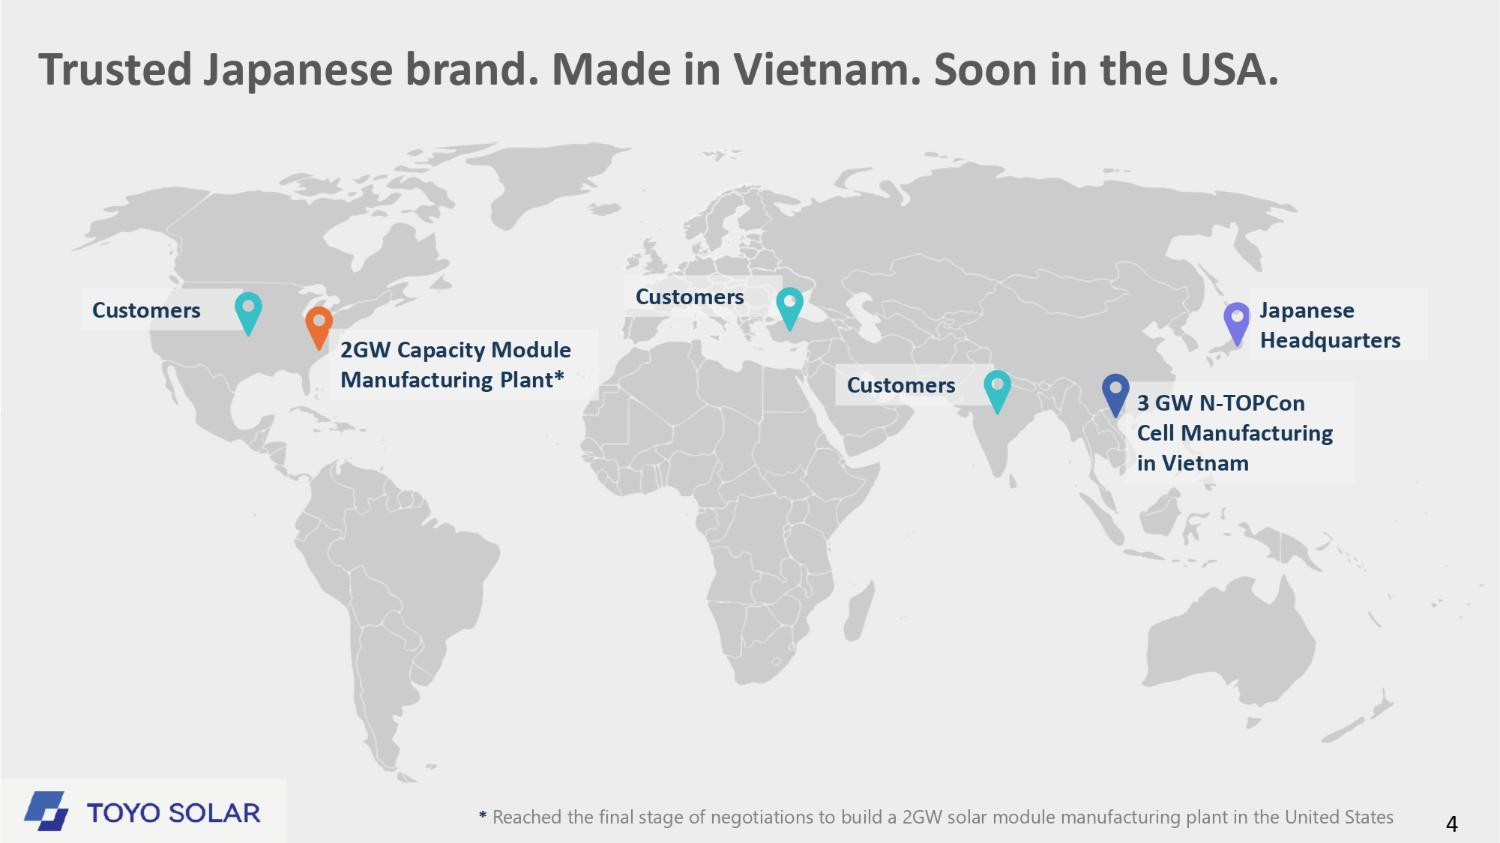
Made in Vietnam. Soon in the USA.

3 GW N - TOPCon Cell Manufacturing in Vietnam Japanese Headquarters Customers Customers Customers 2GW Capacity Module Manufacturing Plant* * Reached the final stage of negotiations to build a 2GW solar module manufacturing plant in the United States 4 Chief Executive Officer & Chairman Mr. Ryu has nearly 20 years of experience in the solar solution industry and has been the director, representative or joint representative of several affiliates including, Abalance Corporation, WWB Corporation, Vietnam Sunergy Joint Stock Company (“VSUN”), Fuji Solar Co., Ltd, VALORS Corporation, Birdy Fuel Cells LLC, and Japan Photocatalyst Center Corporation. Chief Financial Officer & Director Mr. Chung has over twenty years’ experience within the financial industry, encompassing roles in investment banking and equity sales. Serving as the vice president of asset finance for Nomura Securities from May 2007 to May 2016, Mr. Chung advised equity & debt financing for domestic and overseas clients on different type of structured transaction related to solar and wind power projects. Chief Technology Officer & Director Dr. Wang, Ph. D. has achieved over 30 years of solar innovation and is recognized as a top scientist and innovator in PV tech. She has served as the head of research and vice president at China Sunergy and as chief engineer at CEEG (Nanjing) PV - Tech Co. In Australia, she focused on PERL cells and associated technologies as a professional officer and scientist at the Photovoltaics Special Research Centre of the University of South Wales. Accomplished Leadership Team Junsei Ryu Taewoo Chung Dr. Aihua Wang, Ph.D. 5 Continuing efforts toward technology advancements driven by industrial scientists Proven operational and engineering expertise from largest non - China brand with TOPCon production Balanced production strategy to achieve organic economic merits for solar power 1 2 4 5 Fast Growing Solar Provider Ramping Solar Cell & photovoltaic (“PV”) Capacity 6 3 Fully automated, stringent management to ensure quality & low human resource requirement Affiliation with VSUN as a well recognized and established brand in the U.S

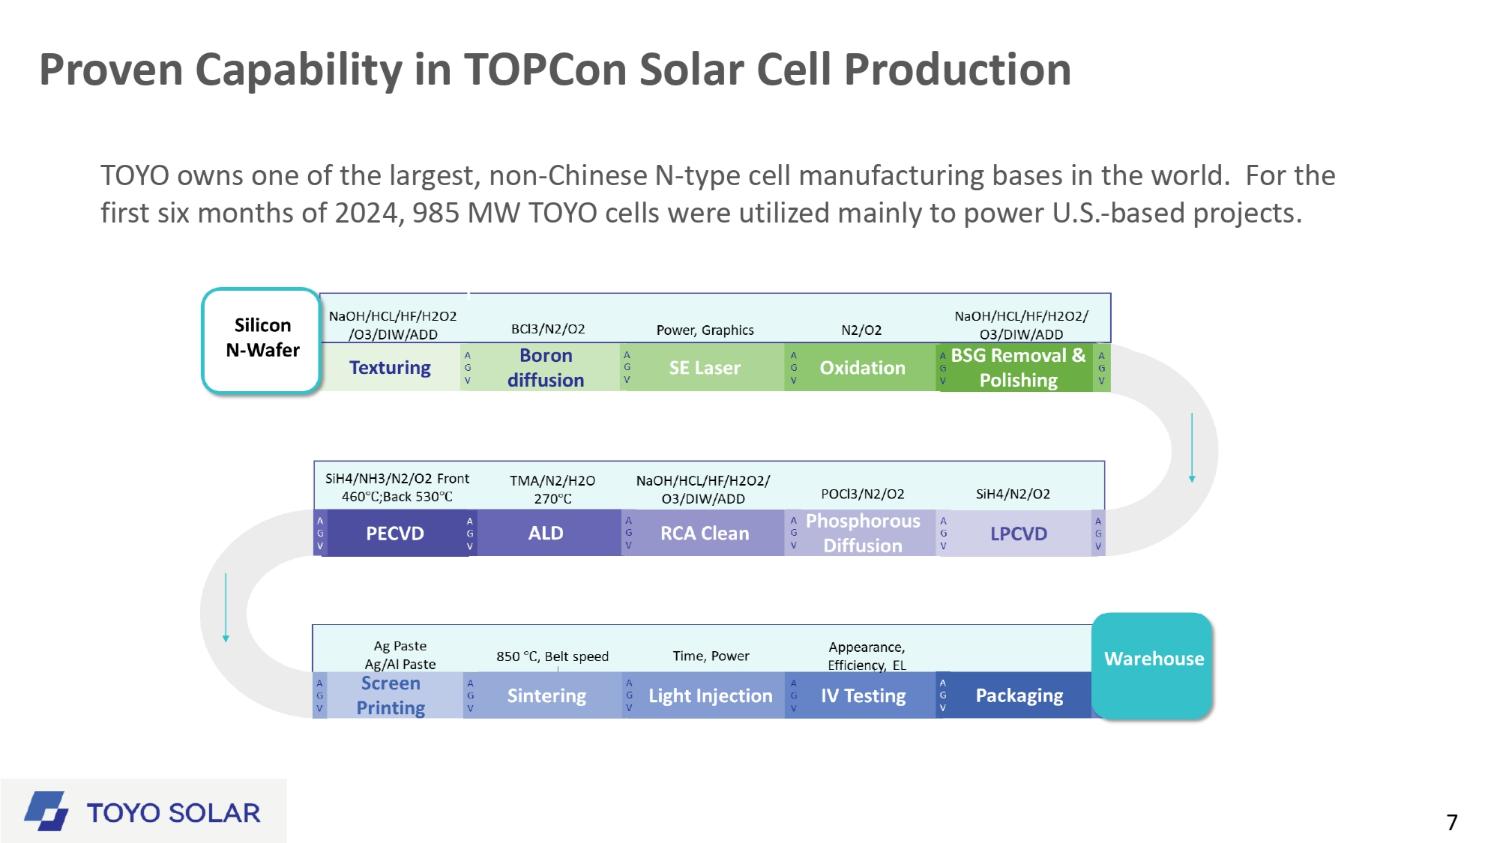
Proven Capability in TOPCon Solar Cell Production 7 TOYO owns one of the largest, non - Chinese N - type cell manufacturing bases in the world. For the first six months of 2024, 985 MW TOYO cells were utilized mainly to power U.S. - based projects.
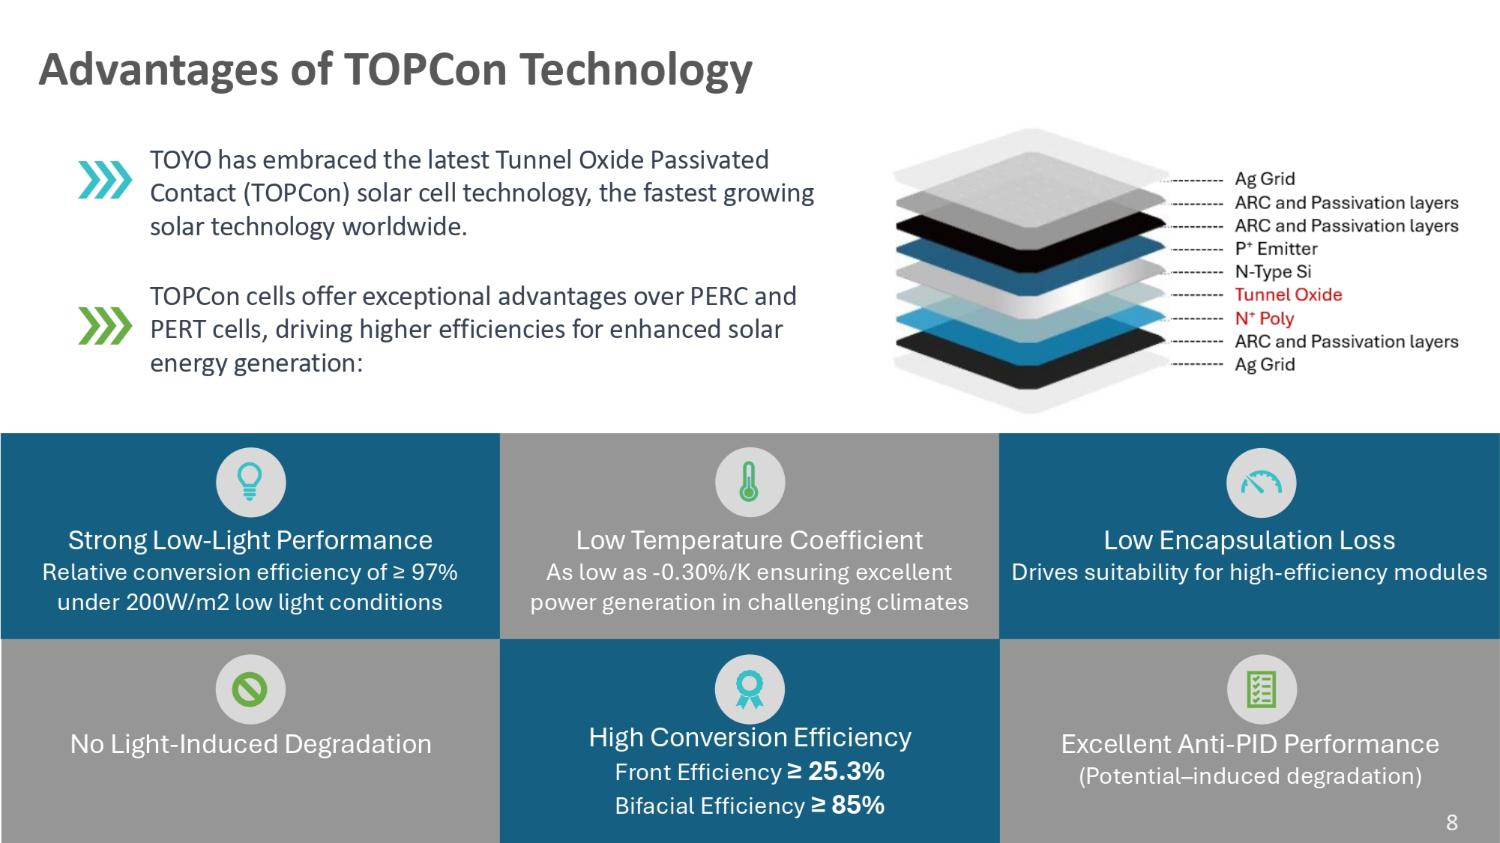
No Light - Induced Degradation High Conversion Efficiency Front Efficiency ≥ 25.3% Bifacial Efficiency ≥ 85% Excellent Anti - PID Performance (Potential – induced degradation) Strong Low - Light Performance Relative conversion efficiency of ≥ 97% under 200W/m2 low light conditions Low Temperature Coefficient As low as - 0.30%/K ensuring excellent power generation in challenging climates Low Encapsulation Loss Drives suitability for high - efficiency modules TOYO has embraced the latest Tunnel Oxide Passivated Contact (TOPCon) solar cell technology, the fastest growing solar technology worldwide. TOPCon cells offer exceptional advantages over PERC and PERT cells, driving higher efficiencies for enhanced solar energy generation: Advantages of TOPCon Technology 8 Manufacturing Excellence DCI Environmental Management System Certificate DCI Quality Management Certificate DCI Occupational Health & Safety Management Certificate ZRK Certificate of Conformity TOYO is dedicated to adhering to the highest standards of quality manufacturing and employee health and safety.
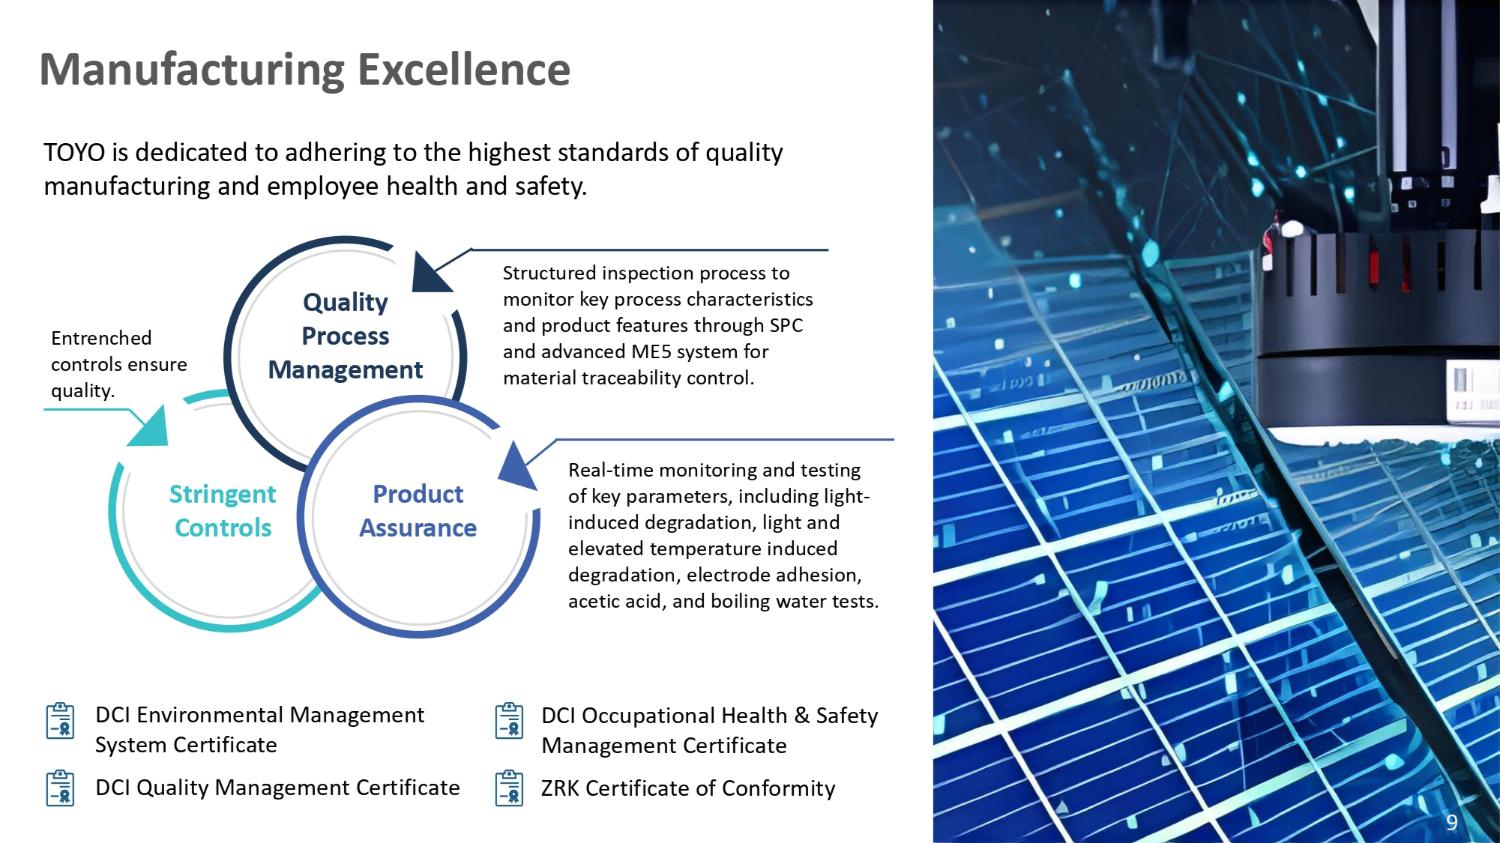
Stringent Controls Product Assurance Quality Process Management Entrenched controls ensure quality. Structured inspection process to monitor key process characteristics and product features through SPC and advanced ME5 system for material traceability control. Real - time monitoring and testing of key parameters, including light - induced degradation, light and elevated temperature induced degradation, electrode adhesion, acetic acid, and boiling water tests. 9 10 State - of - the - Art Automated Guided Vehicles Automated Guided Vehicles (AGVs) provided numerous benefits including a decreased cost of labor, allowing for faster expansion.


04 01 Improves workplace safety 02 03 05 06 Reduces utility costs Increases productivity Enhances consistency and reliability Reduces wage expenses Creates systems flexibility & adaptability 10 Accomplished engineers, Dr. Aihua Wang, Ph.D., the Chief Technical Officer, and Dr. Jianhua Zhao, Ph.D., as Chief Technical Advisor of TOYO, lead the research and development efforts at TOYO, overseeing a large team. Together, they’re dedicated to the research and development of higher efficiency and quality solar cells. Award Winning Research and Development 2023 Winners of the Queen Elizabeth Award for Engineering Professor Andrew Blakers; Dr. Jianhua Zhao, Ph.D.; Dr.
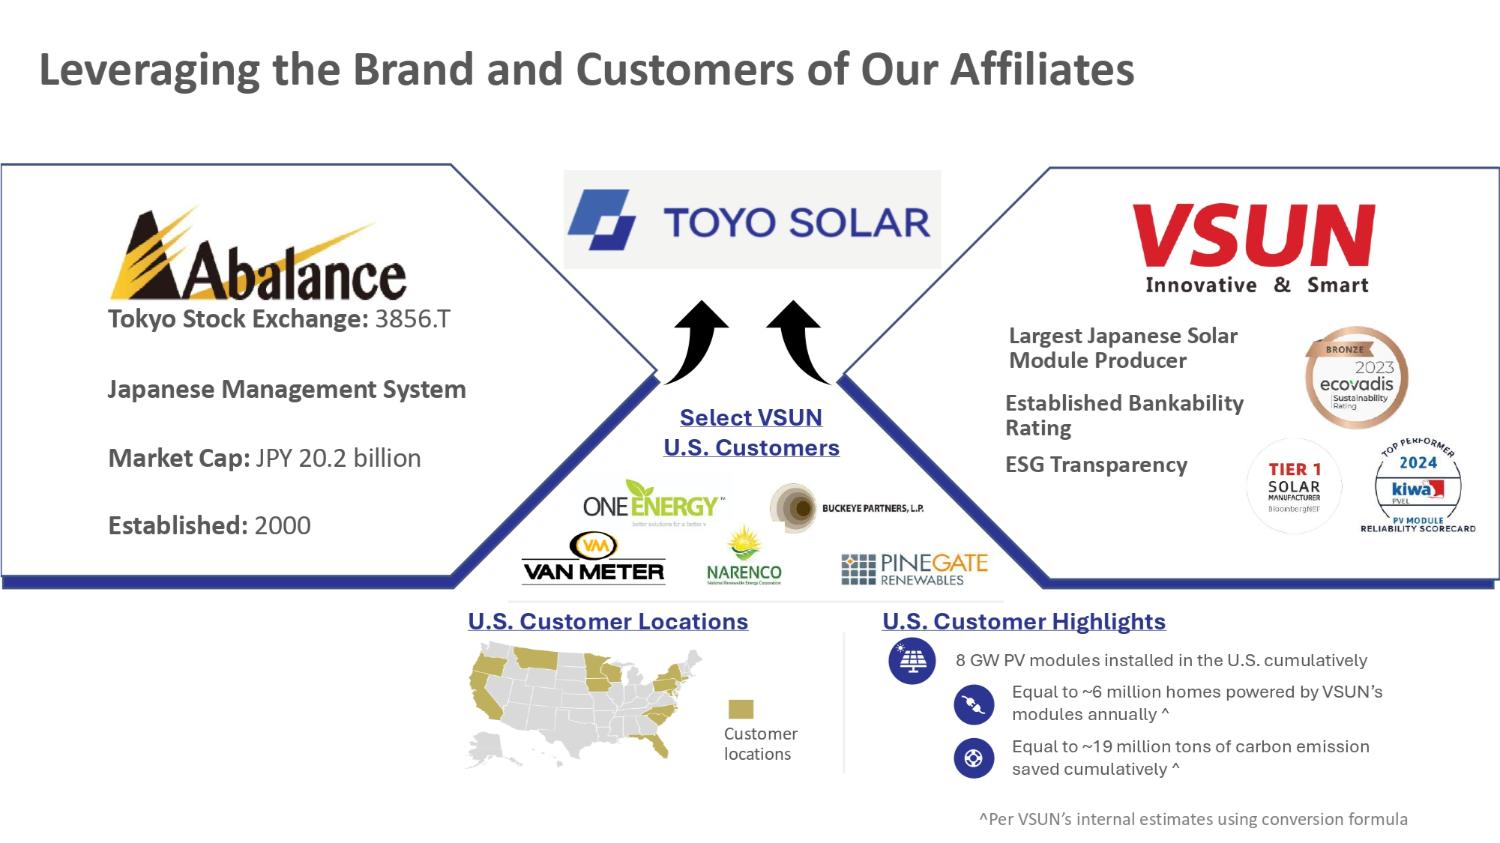
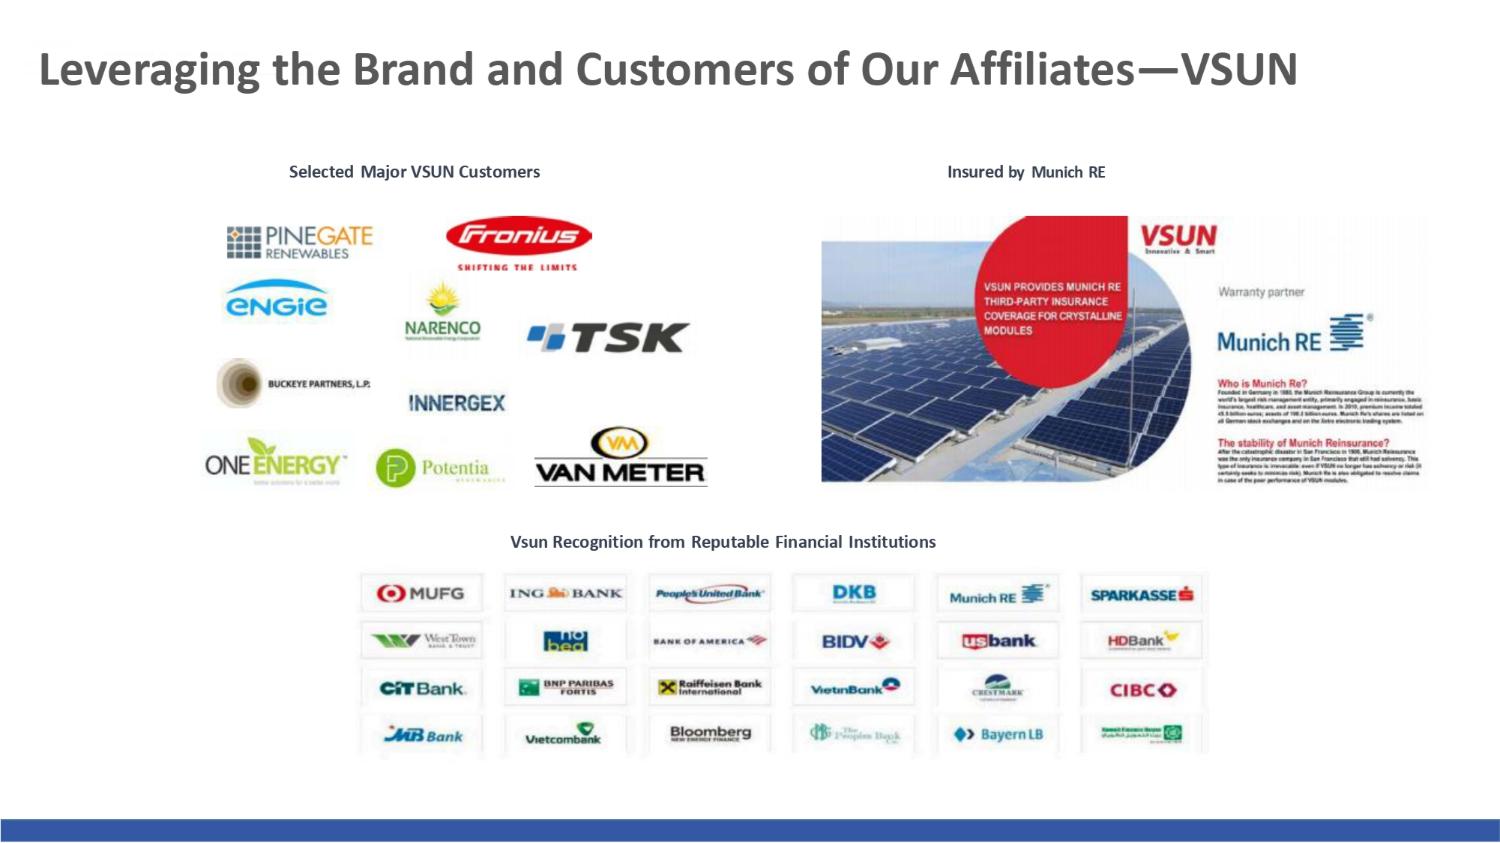
Aihua Wang, Ph.D.,; Professor Martin Green 11 Leveraging the Brand and Customers of Our Affiliates Largest Japanese Solar Module Producer Tokyo Stock Exchange: 3856.T Japanese Management System Market Cap: JPY 20.2 billion Established: 2000 Select VSUN U.S. Customers Customer locations U.S. Customer Locations Established Bankability Rating ESG Transparency U.S. Customer Highlights 8 GW PV modules installed in the U.S. cumulatively Equal to ~6 million homes powered by VSUN’s modules annually ^ Equal to ~19 million tons of carbon emission saved cumulatively ^ ^Per VSUN’s internal estimates using conversion formula Vsun Recognition from Reputable Financial Institutions Selected Major VSUN Customers Insured by Munich RE Leveraging the Brand and Customers of Our Affiliates — VSUN

Natural Gas Source: SEIA/Wood Mackenzie Solar Market Insight Report Q2 2024, U.S. Energy Information Administration • Projected solar installations for 2024 are just shy of 40 GW dc • Cumulative deployment by 2029 is expected to install more than 250 GW dc of capacity • The Inflation Reduction Act continues to drive demand for solar power and energy storage, accelerates transition to renewable energy Wafer manufacturing in the United States stopped in 2014 and is only now renewing production; cell production ended in 2020, and solar - grade polysilicon production dropped by 2/3, PV - assembled modules stagnated until 2018. In 2023, the United States produced approximately 7 GW of PV panels – only 17% of the total local demand. U.S. PV Installation Historical and Forecast by Segment: 2014 - 2029 The U.S. is the second largest solar consumer market globally Solar Wind Other 14 Storage Coal Residential Non - residential Utility New U.S. Electricity - Generation Capacity Additions: 2010 – Q1 2024 Meaningful U.S.
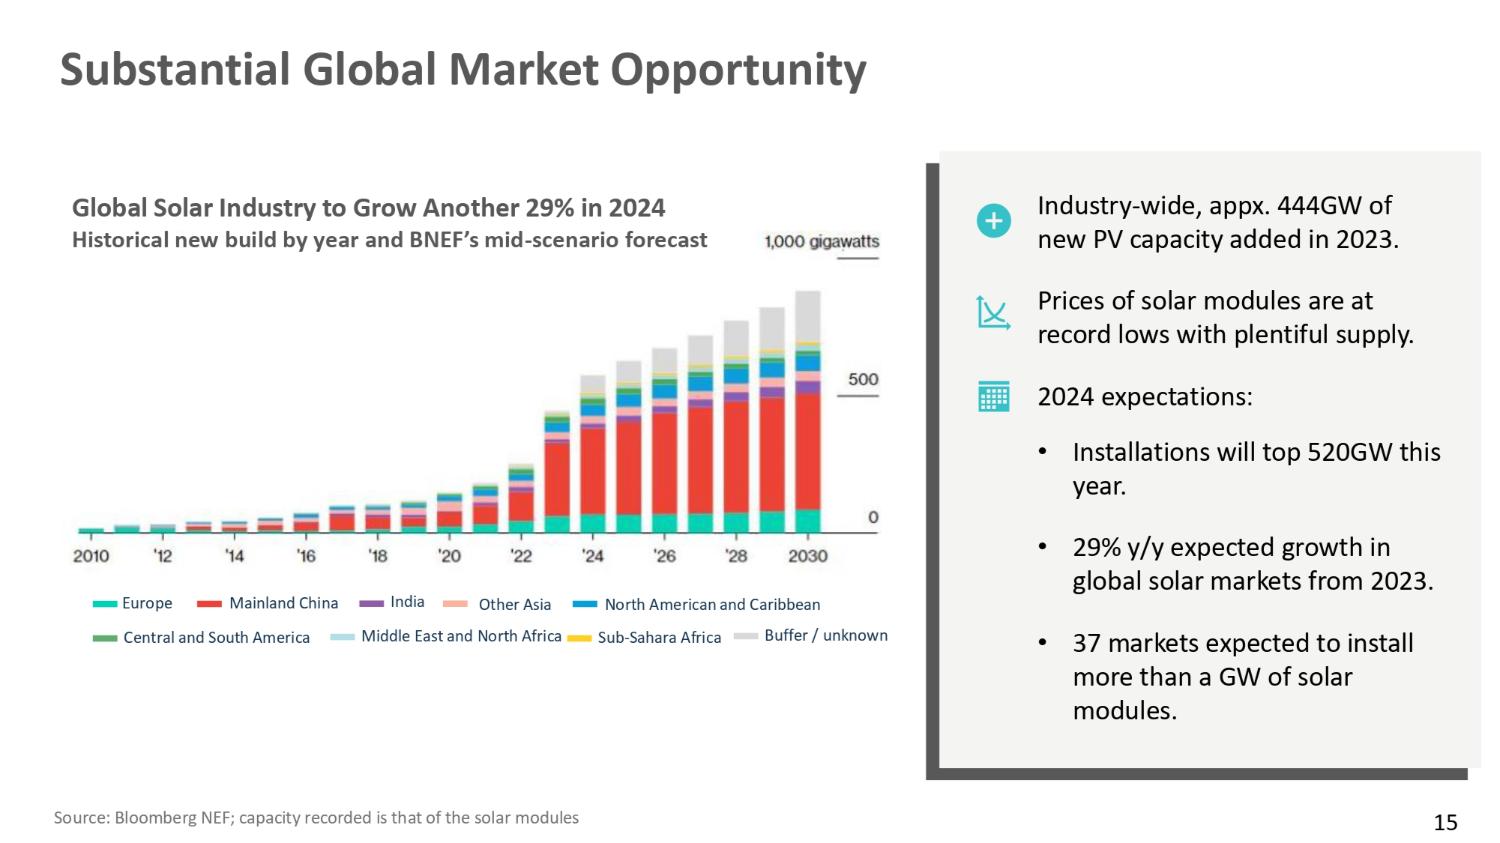
Solar Opportunity Substantial Global Market Opportunity Global Solar Industry to Grow Another 29% in 2024 Historical new build by year and BNEF’s mid - scenario forecast India Europe Mainland China Central and South America North American and Caribbean Other Asia Middle East and North Africa Sub - Sahara Africa Buffer / unknown Source: Bloomberg NEF; capacity recorded is that of the solar modules Industry - wide, appx. 444GW of new PV capacity added in 2023. Prices of solar modules are at record lows with plentiful supply. 2024 expectations: • Installations will top 520GW this year. • 29% y/y expected growth in global solar markets from 2023. • 37 markets expected to install more than a GW of solar modules. 15 Plans to raise $100 million to construct plant Outlay Policy Benefits Enable 70% Return in the First 12 Months after Pilot Production TOYO plans to raise $100 million to invest in its US 2GW PV Module plant, and due to the Inflation Reduction Act (IRA), it can quickly recoup its investment.
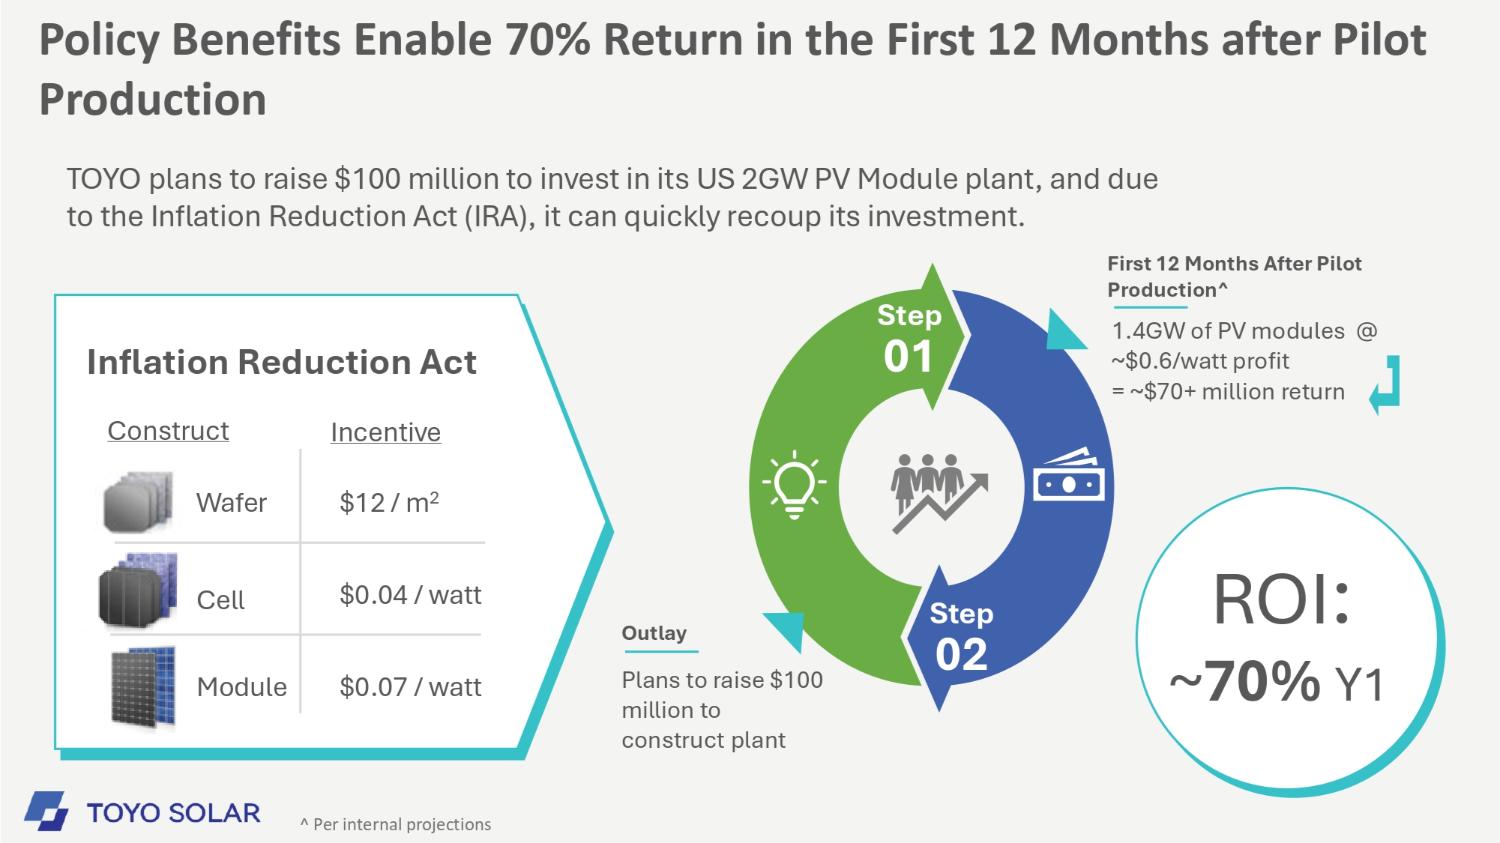
First 12 Months After Pilot Production^ 1.4GW of PV modules @ ~$0.6/watt profit = ~$70+ million return Step 01 Step 02 Inflation Reduction Act Construct Incentive $12 / m 2 Wafer $0.04 / watt Cell $0.07 / watt Module ROI : ~ 70% Y1 ^ Per internal projections Strategic Development Plan Enhancing operational efficiency through vertical integration We are working to integrate: • the upstream production of wafer slicing • midstream production of solar cells • downstream production of PV modules Streamlining processes, reducing costs, and improving efficiencies for our production.
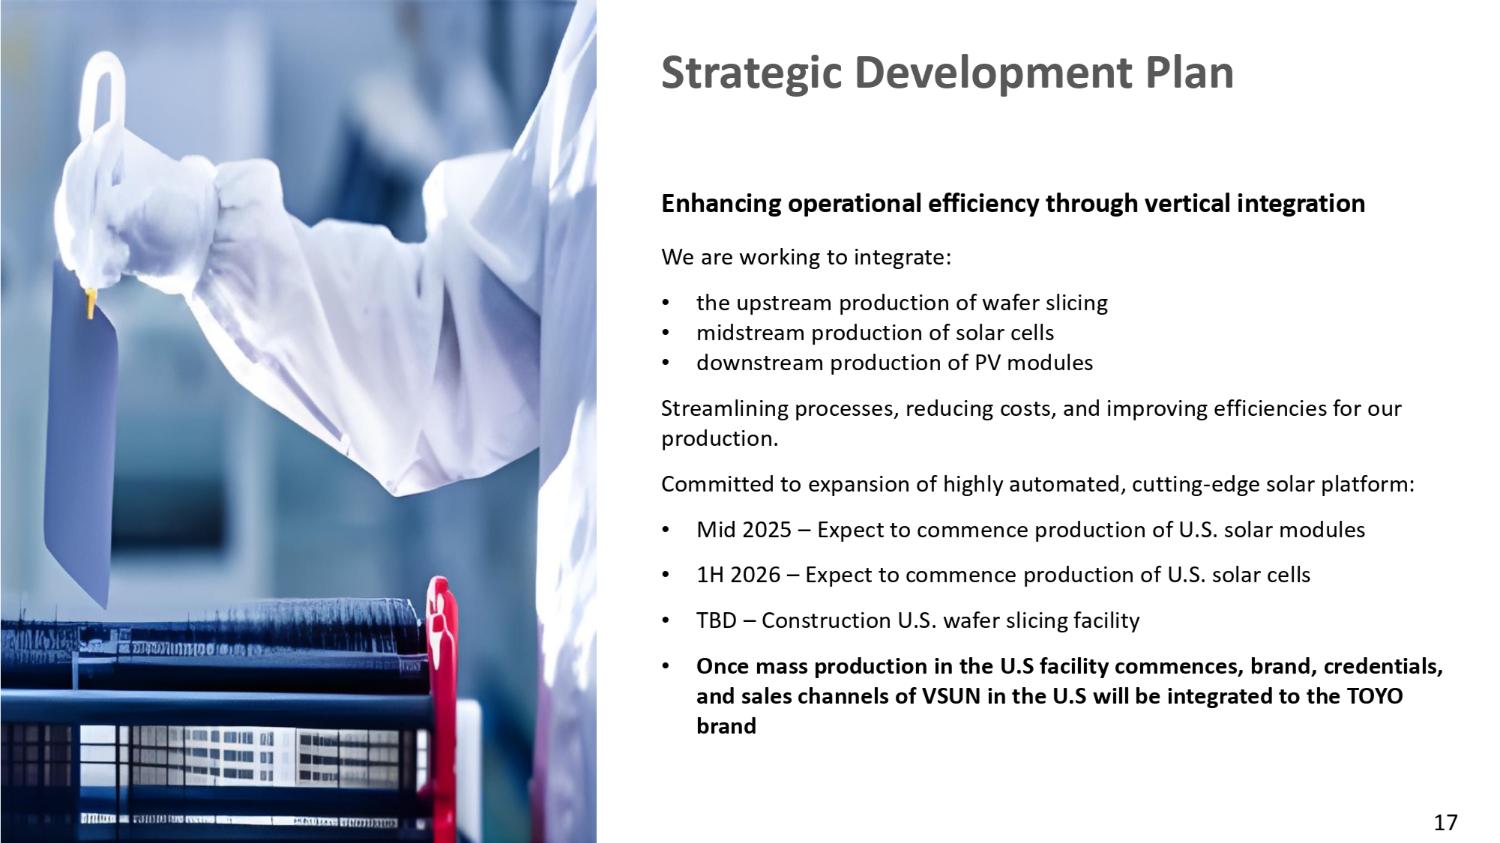
Committed to expansion of highly automated, cutting - edge solar platform: • Mid 2025 – Expect to commence production of U.S. solar modules • 1H 2026 – Expect to commence production of U.S. solar cells • TBD – Construction U.S. wafer slicing facility • Once mass production in the U.S facility commences, brand, credentials, and sales channels of VSUN in the U.S will be integrated to the TOYO brand 17 Committed to Environmental Stewardship TOYO is focused on further developing the clean energy industry, adhering to a responsible global supply chain strategy, and contributing to the sustainable development of human beings with more professional, efficient and cleaner products.

Social Responsibility 100% Material Traceability 18

Summary Strengthened by Affiliates Abalance & VSUN Addressable Market Offers Substantial Opportunity TOPCon Technology & Automated Guided Vehicles All Materials are 100% Traceable Inflation Reduction Act Incentives to Boost Results Rapid Revenue Growth & Strong Margins 19 First Half 2024 Financial Results TOYO Co., Ltd (NASDAQ: TOYO)


Key Metrics 3 GW Manufacturing Capacity First Six Months 2024 21 $138.1M Revenues 985 MW Solar cells shipped $19.6M Net Income First Six Months 2024 Financial Results (USD in millions, except per share amounts) 1H2023 1H 2024 - 138.1 Revenues - 26.6 Gross Profit - 19.3% Gross margin 1.8 4.2 Operating expenses (loss) (1.9) 19.6 Net income (loss) (0.05) 0.48 Net diluted income (loss) per share


Balance Sheet & Cash Flow Statement (USD in millions, except per share amounts) December 31, 2023 June 30, 2024 19.0 44.4 Cash and cash equivalents 108.7 124.9 Total debt 40.0 27.2 Inventories (12.5) 21.8 Cash flow from operations (114.2) (16.6) Net cash used in investing activities 146.1 21.5 Cash flow from financing activities Recent Developments Completed business combination with Blue World Acquisition Corp, and the ordinary shares of TOYO began trading on the Nasdaq stock market on July 2, 2024.
Signed global cooperation agreement with OCI, a major non - Chinese silicon material supplier to offer our customers trustworthy and verifiable photovoltaic products.
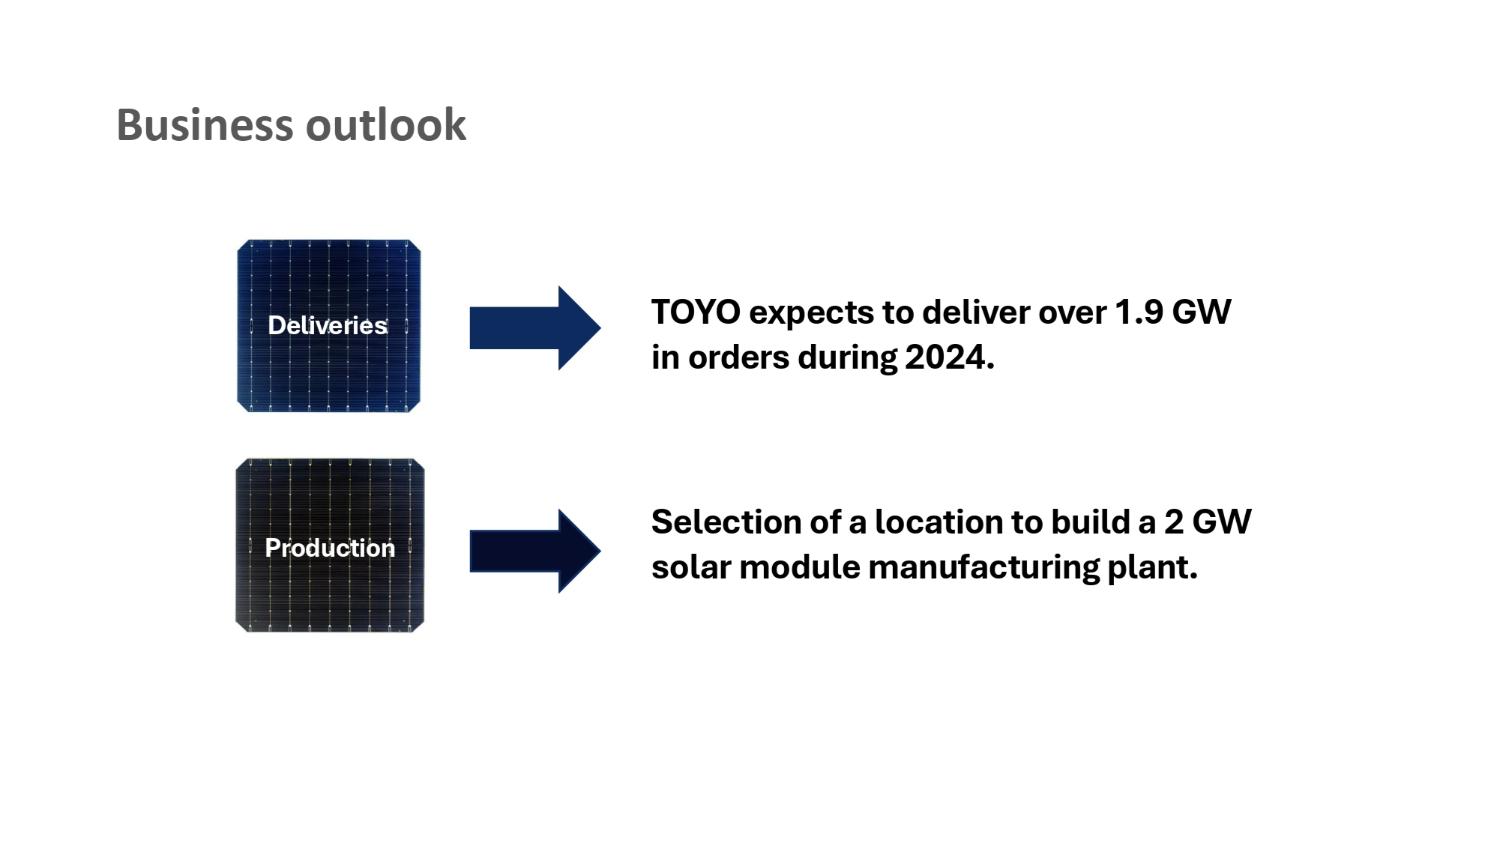
Business outlook Deliveries Production TOYO expects to deliver over 1.G GW in orders during 2024. Selection of a location to build a 2 GW solar module manufacturing plant.

26 Appendix

Unaudited Condensed Consolidated Balance Sheet(Expressed in U.S. dollars) December 31, 2023 June 30, 2024 (unaudited) ASSETS Current Assets $ 18,035,405 $ 41,669,523 Cash 82,195 129,635 Restricted cash — 121,118 Accounts receivable – a related party 149,304 229,992 Prepayments 24,400,798 27,048,348 Prepayments – a related party 39,999,992 27,190,797 Inventories, net 85,702 169,005 Other current assets 82,753,396 96,558,418 Total Current Assets Non - current Assets 879,893 2,587,665 Restricted cash, non - current 2,084,810 2,576,390 Deferred offering costs 7,757,193 7,311,709 Long - term prepaid expenses 1,466,878 1,364,798 Deposits for property and equipment 142,781,558 130,812,056 Property and equipment, net 537,032 233,357 Right of use assets 22,250 — Other non - current assets 155,529,614 144,885,975 Total Non - current Assets $ 238,283,010 $241,444,393 Total Assets LIABILITIES AND SHAREHOLDERS’ EQUITY Current Liabilities $ — $ 34,008,887 Short - term bank borrowings 37,221,124 25,018,771 Accounts payable 530,817 4,913,175 Contract liabilities 28,815,934 9,137,458 Contract liabilities – a related party 96,867,739 68,509,793 Due to related parties 5,606,763 3,771,701 Other payable and accrued expenses 151,260 32,901 Lease liabilities, current 169,193,637 145,392,686 Total Current Liabilities 372,725 228,240 Lease liabilities, non - current 11,819,527 22,412,628 Long - term bank borrowings 12,192,252 22,640,868 Total Non - current Liabilities 181,385,889 168,033,554 Total Liabilities Commitments and Contingencies (Note 14) Shareholders’ Equity 4,100 4,100 Ordinary shares (par value $0.0001 per share, 500,000,000 shares authorized, 41,000,000 and 41,000,000 shares issued and outstanding as of June 30, 2024 and December 31, 2023, respectively)* 49,995,900 50,005,900 Additional paid - in capital 9,702,316 29,252,764 Retained earnings (2,805,195) (5,851,925) Accumulated other comprehensive loss 56,897,121 73,410,839 Total Shareholders’ Equity $ 238,283,010 $241,444,393 Total Liabilities and Shareholders’ Equity The share information is presented on a retroactive basis to reflect the reorganization effected on February 27, 2024 Unaudited Condensed Consolidated Statement of Operations and Comprehensive Income (Loss) (Expressed in U.S Dollars) For the Six Months Ended June 30, 2023 2024 $ — $ 112,287,775 Revenues from related parties — 25,790,220 Revenues from third parties — 138,077,995 Revenues — (84,435,258) Cost of revenues – related parties — (26,995,841 ) Cost of revenues – third parties — (111,431,099) Cost of revenues — 26,646,896 Gross profit Operating expenses — (355,026) Selling and marketing expenses (1,756,468 ) (3,836,158 ) General and administrative expenses (1,756,468) (4,191,184) Total operating expenses (1,756,468) 22,455,712 Income (loss) from operations Other expenses, net (165,644) (1,767,661) Interest expenses, net (148) (1,137,603) Other expenses, net (165,792 ) (2,905,264 ) Total other expenses, net (1,922,260) 19,550,448 Income (loss) before income taxes — — Income tax expenses $ (1,922,260) $ 19,550,448 Net income (loss) Other comprehensive loss (1,632,089) (3,046,730) Foreign currency translation adjustment $ (3,554,349) $ 16,503,718 Comprehensive income (loss) 41,000,000 41,000,000 Weighted average number of ordinary share outstanding – basic and diluted* Earnings (loss) per share – basic and diluted* $ 0.48 $ (0.05) The share information is presented on a retroactive basis to reflect the reorganization effected on February 27, 2024

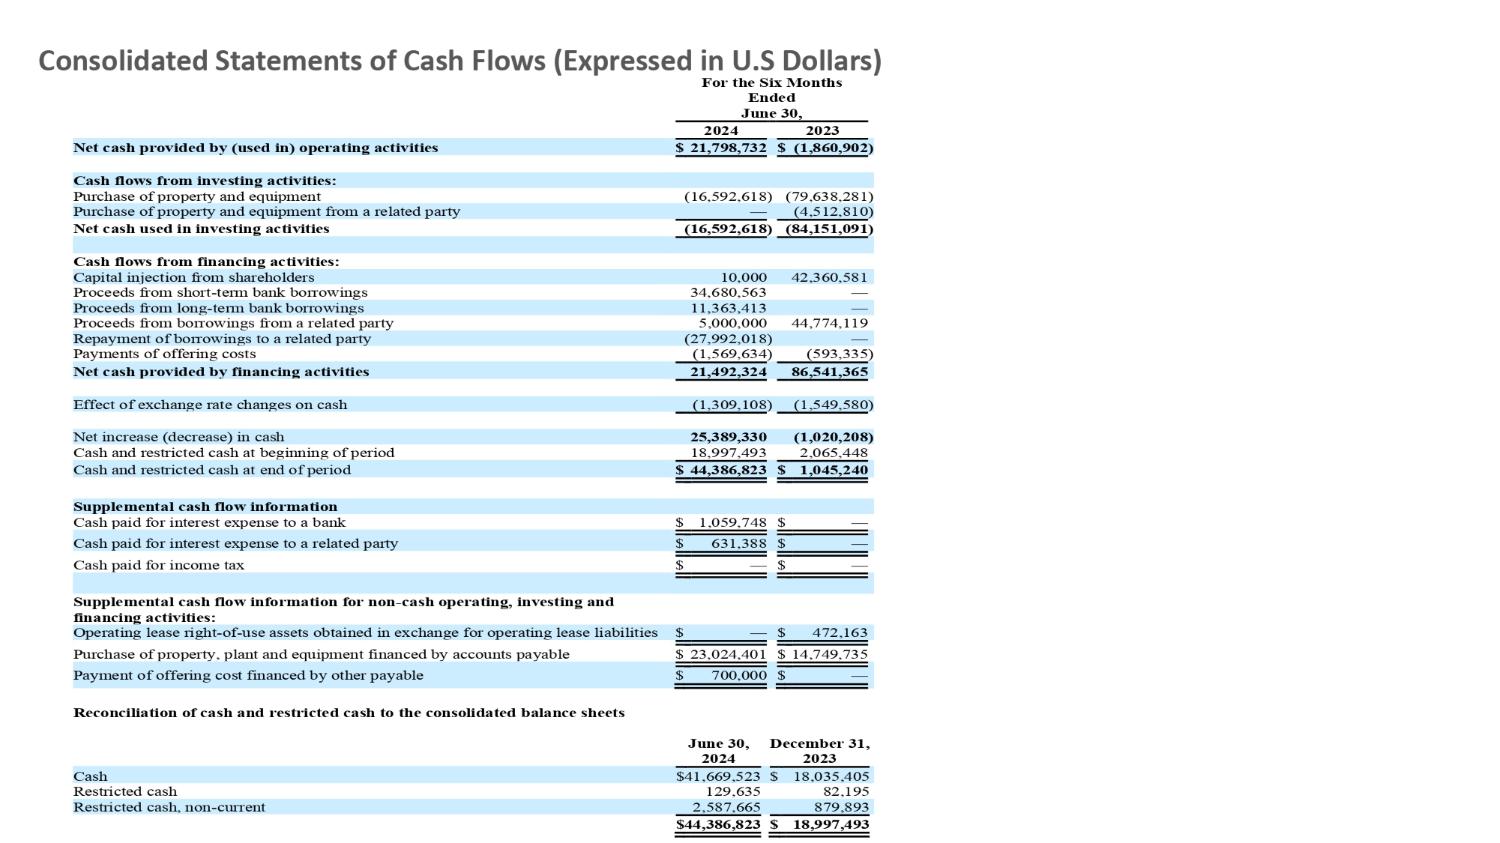
Consolidated Statements of Cash Flows (Expressed in U.S Dollars) For the Six Months Ended June 30, 2024 2023 Net cash provided by (used in) operating activities $ 21,798,732 $ (1,860,902) Cash flows from investing activities: Purchase of property and equipment Purchase of property and equipment from a related party Net cash used in investing activities (16,592,618) (79,638,281) — (4,512,810) (16,592,618 ) (84,151,091 ) Cash flows from financing activities: Capital injection from shareholders 10,000 42,360,581 Proceeds from short - term bank borrowings 34,680,563 — Proceeds from long - term bank borrowings 11,363,413 — Proceeds from borrowings from a related party 5,000,000 44,774,119 Repayment of borrowings to a related party (27,992,018) — Payments of offering costs (1,569,634 ) (593,335 ) Net cash provided by financing activities Effect of exchange rate changes on cash 21,492,324 86,541,365 (1,309,108) (1,549,580) Net increase (decrease) in cash Cash and restricted cash at beginning of period Cash and restricted cash at end of period 25,389,330 (1,020,208) 18,997,493 2,065,448 $ 44,386,823 $ 1,045,240 Supplemental cash flow information Cash paid for interest expense to a bank $ 1,059,748 $ — Cash paid for interest expense to a related party $ 631,388 $ — Cash paid for income tax $ — $ — Supplemental cash flow information for non - cash operating, investing and financing activities: Operating lease right - of - use assets obtained in exchange for operating lease liabilities Purchase of property, plant and equipment financed by accounts payable Payment of offering cost financed by other payable $ — $ 472,163 $ 23,024,401 $ 14,749,735 $ 700,000 $ — Reconciliation of cash and restricted cash to the consolidated balance sheets June 30, December 31, 2024 2023 Cash $41,669,523 $ 18,035,405 Restricted cash 129,635 82,195 Restricted cash, non - current 2,587,665 879,893 $44,386,823 $ 18,997,493