FORM
6-K
SECURITIES AND EXCHANGE COMMISSION
Washington, D.C. 20549
Report of Foreign Private Issuer
Pursuant to Rule
13a-16 or 15d-16
of the Securities Exchange Act of 1934
For the month of April, 2024
Commission File Number 001-15266
BANK
OF CHILE
(Translation of registrant’s name into English)
Ahumada
251
Santiago, Chile
(Address of principal executive offices)
Indicate by check mark whether the registrant files or will file annual reports under cover Form 20-F or Form 40-F.
Form 20-F ☒ Form 40-F ☐
Indicate
by check mark whether by furnishing the information contained in this Form, the
registrant is also thereby furnishing the information to the Commission pursuant to Rule
12g3-2(b) under the Securities Exchange Act of 1934.
Yes ☐ No ☒
If “Yes” is marked, indicate below the file number assigned to the registrant in connection with Rule 12g3-2(b): 82- ________ BANCO DE CHILE REPORT ON FORM 6-K
Attached is a Press Release issued by Banco de Chile (“the Bank”) on April 30, 2024, regarding its financial results for the First Quarter 2024.
SIGNATURE
Pursuant to the requirements of the Securities Exchange Act of 1934, the registrant has duly caused this report to be signed on its behalf by the undersigned, thereunto duly authorized.
Date: April 30, 2024
| Banco de Chile | ||
| By: | /S/ Eduardo Ebensperger O. | |
| Eduardo Ebensperger O. | ||
| CEO | ||
2
Exhibit 99.1

| 1 Financial Management Review 1Q24 | April 2024 130 years contributing to the development of the country and its people.
Quarterly Financial Report Table of Con t ents I. About Banco de Chile Our History 4 Financial Snapshot on Banco de Chile II. Corporate Governance Equity Composition and Ownership Structure 6 Board of Directors, Committees and Managerial Structure III. Business Strategy 9 Corporate Statements and Commitments Stakeholders Engagement Competitive Landscape, Business Trends and Regulation Strategy of Banco de Chile At a Glance Business Segments Description Snapshot on Strategic Advances IV. Economic and Business Environment 1 9 Economic Outlook Banking Industry Performance and Projections Competitive Position V. Management Discussion & Analysis 2 4 Income Statement Analysis Business Segments Performance Balance Sheet Analysis VI.

Risk & Capital Management 5 0 Risk Management Approach Funding Concentration and Liquidity Market Risk Operational Risk Capital Adequacy and Credit Ratings | 2 About this Report Basis for Presentation This financial report, which accompanies our quarterly financial statements, has been prepared as requested by the Chilean Financial Market Commission (CMF) in the Compendium of Accounting Standards for Banks while being elaborated in accordance with the IFRS Practice Statement 1 – Management Commentary as issued by the International Accounting Standards Board (IASB) . Figures included in this report “ Financial Management Review ” , for purposes of analysis, are based on both the financial statements and management information systems of Banco de Chile . Forward - Looking Information The information contained herein incorporates by reference statements which constitute “ forward - looking statements ” that include statements regarding the intent, belief or current expectations of our directors and officers with respect to our future operating performance . Such statements include any forecasts, projections and descriptions of anticipated cost savings or other synergies . You should be aware that any such forward - looking statements are not guarantees of future performance and may involve risks and uncertainties, and that actual results may differ from those set forth in the forward - looking statements as a result of various factors (including, without limitations, the actions of competitors, future global economic conditions, market conditions, foreign exchange rates, and operating and financial risks related to managing growth and integrating acquired businesses), many of which are beyond our control . The occurrence of any such factors not currently expected by us would significantly alter the results set forth in these statements . Factors that could cause actual results to differ materially and adversely include, but are not limited to : ⭬ changes in general economic, business or political or other conditions in Chile or changes in general economic or business conditions in Latin America; ⭬ changes in capital markets in general that may affect policies or attitudes toward lending to Chile or Chilean companies; ⭬ unexpected developments in certain existing litigation; ⭬ increased costs; ⭬ unanticipated increases in financing and other costs or the inability to obtain additional debt or equity financing on attractive terms; ⭬ natural disasters or pandemics; ⭬ the effect of tax laws or other kind of regulation on our business; ⭬ other risk factors as reported in our form 20F filed with the U.S. SEC. Undue reliance should not be placed on such statements, which speak only as of the date that they were made . Our independent public accountants have not examined or compiled the forward - looking statements and, accordingly, do not provide any assurance with respect to such statements . These cautionary statements should be considered in connection with any written or oral forward - looking statements that we may issue in the future . We do not undertake any obligation to release publicly any revisions to such forward - looking statements to reflect later events or circumstances or to reflect the occurrence of unanticipated events .

| 3 Contacts Pablo Mejia Head of Investor Relations Investor Relations | Banco de Chile pmejiar@bancochile.cl Daniel Galarce Head of Financial Control & Capital Financial Control & Capital Area | Banco de Chile dgalarce@bancochile.cl About de Chile Banco Our History Banco de Chile dates back to 1893 when the financial institution was formed following the merger of the Valparaíso, Agrícola and Nacional de Chile banks . We have played an important role in the economic history of Chile . Since the beginning, we have been a fundamental pillar for the development of the country and a financial and business reference, maintaining a leading position in the Chilean banking industry . Before the creation of the Central Bank in 1926 and prior to the enactment of the General Banking Act, we were the main stabilization agent of the Chilean banking system . Throughout our history we have developed a well - recognized brand name in Chile and expanded our operations in foreign markets, where we developed an extensive network of correspondent banks . In 1987 and 1988 , we established four subsidiaries to provide a full range of specialized financial products and services as permitted by the General Banking Act . In 1999 , we widened our sco pe of specialized financial services by creating our insurance brokerage and factoring subsidiaries . During the early 2000 s, the Chilean banking industry witnessed intense merger and acquisition activity . In 2002 , we merged wi th Banco de A . Edwards, which allowed us to expand our business to new customer segments . In 2008 , we merged our operations with Citibank Chile . As a result of these consolidations, we currently operate a distribution network that is composed of two brand names, namely, “Banco de Chile” (which operates throughout Chile) and “Banco Edwards - Citi” (which is primarily oriented to higher income segments) . Likewise, most of our subsidiaries operate under the brand name “Banchile” . Our legal name is Banco de Chile and we are organized as a banking corporation under the laws of Chile and were licensed by t he CMF to operate as a commercial bank on September 17 , 1996 . Our main executive offices are located at Paseo Ahumada 251 , Santiago, Chile, our telephone number is + 56 ( 2 ) 2637 - 1111 and our website is www . bancochile . cl . We are a full - service financial institution that provides, directly and indirectly through our subsidiaries, a wide variety of lending and non - lending products and services to all segments of the Chilean financial market, providing our customers with power ful, differentiated and comprehensive value offerings . In addition to our traditional banking operations, our subsidiaries and aff iliates permit us to offer a variety of non - banking but specialized financial services including securities brokerage, mutual funds management, investment banking, insurance brokerage and collection services . We are present in all Chilean regions through our nationwide branch network and we have one of the best digital and mobile ba nking platforms in Chile, which allow us to meet the needs of more than 2 million customers in timely and safe manner . From the int ernational perspective, our alliance with Citigroup provides our customers with access to a wide network of products and services abroad . We have outstanding competitive strengths, such as excellent brand recognition, a comprehensive remote and non - remote distribution network, a distinctive and large customer base, a competitive funding structure, a solid equity base and a high credit quality loan portfolio . This is reflected in outstanding credit risk ratings by international agencies, which position us as one of the most solid private banks in Latin America . | 4 About Banco de Chile Financial Snapshot 1Q24 (In Millions of Ch$) N e t Inc o me Ch$297,655 265,951 297,655 1Q23 1 Q 24 Annua l V ar.

+11.9% O p eratin g Re v e n u e s Ch$780,346 702,501 780,346 1 Q 23 1 Q 24 Annua l V ar. +11.1% E x p e c te d Cred i t Lo s s es Ch$113,168 105,508 113,168 1 Q 23 1 Q 24 Annua l V ar. +7.3% O p eratin g Ex p e n s es Ch$283,844 263,442 283,844 1 Q 23 1 Q 24 Annua l V ar.

+7.7% | 5 Corporate Governa n ce Equity Composition and Ownership Structure E qu i t y a n d S h a r e s Our equity is composed of 101 , 017 , 081 , 114 fully paid - in shares of common stock, without nominal (par) value . These shares are traded on the Santiago and Electronic Stock Exchanges in Chile under the ticker symbol “CHILE” . Also, since January 2 , 2002 Banco de Chile’s shares are traded on the New York Stock Exchange under the American Depositary Receipts (ADR) program in the form of A me r i c a n D epos i t a ry S ha r e s ( A D S ) u nde r t h e t i c ke r s y m bo l “ B C H ” . E ac h o f ou r A D S represents 200 shares of common stock without par value . JPMorgan Chase Bank is th e d e po s it a r y o f ou r A D S . A s o f Ma r c h 3 1 , 2 0 2 4 O w n e r s h i p S t r u c t u r e Our main shareholder is the LQIF group, w h i c h d i r e c t l y a n d i nd i r e c t l y o w n s 51 . 1 5 % o f o u r sha r e s . L Q I F i s a j o i n t a v en t u r e t ha t is equally owned by Quiñenco S . A . ( 50 % ) an d C i t i g r ou p I nc . ( 5 0 % e a c h o t he r ) . A s t r a t eg i c pa rt ne r sh i p a g r e em en t be t w e en Quiñenco and Citigroup gives control to Quiñenco over LQIF and the companies d i r ec t l y a n d i nd i r e c t l y c o n t r o l l e d b y L Q I F .

| 6 Corporate Governance Board of Directors, Committees and Managerial Structure B o a r d o f D i r e c t o r s Our Board of Directors (Board) is the main corporate governance body and its most important duties include establishing strategic guidelines ; approving policies, procedures and mechanisms designed to meet the objectives of the corporate governance system ; and appointing a Chief Executive Officer . The Board is composed of eleven directors and two alternate directors, in accordance with our bylaws . The board is voted every three years . In March 2023 , the most recent election date, our shareholders elected new directors, of which eleven were proposed by LQIF (nine directors and two alternate directors) and other two members were proposed by shareholders other than LQIF, including an independent director . Currently, our Board is composed of three women and ten men . Our Board meets twice a month, except in February, when it meets once . Extraordinary sessions ma y b e c o n v e n e d b y t h e C h a i r ma n o r b y r e q ue s t o f on e o r m o r e r egu l a r d i r ec t o r s . In the annual shareholders’ meeting held on March 28 , 2024 , Mr . Patricio Jottar was confirmed as Director of the board . B o a r d C o m m i t t ee s Our Board delegates certain functions and activities to our committees to control, evaluate and report to the board of directors regarding specific matters which may affect our businesses.
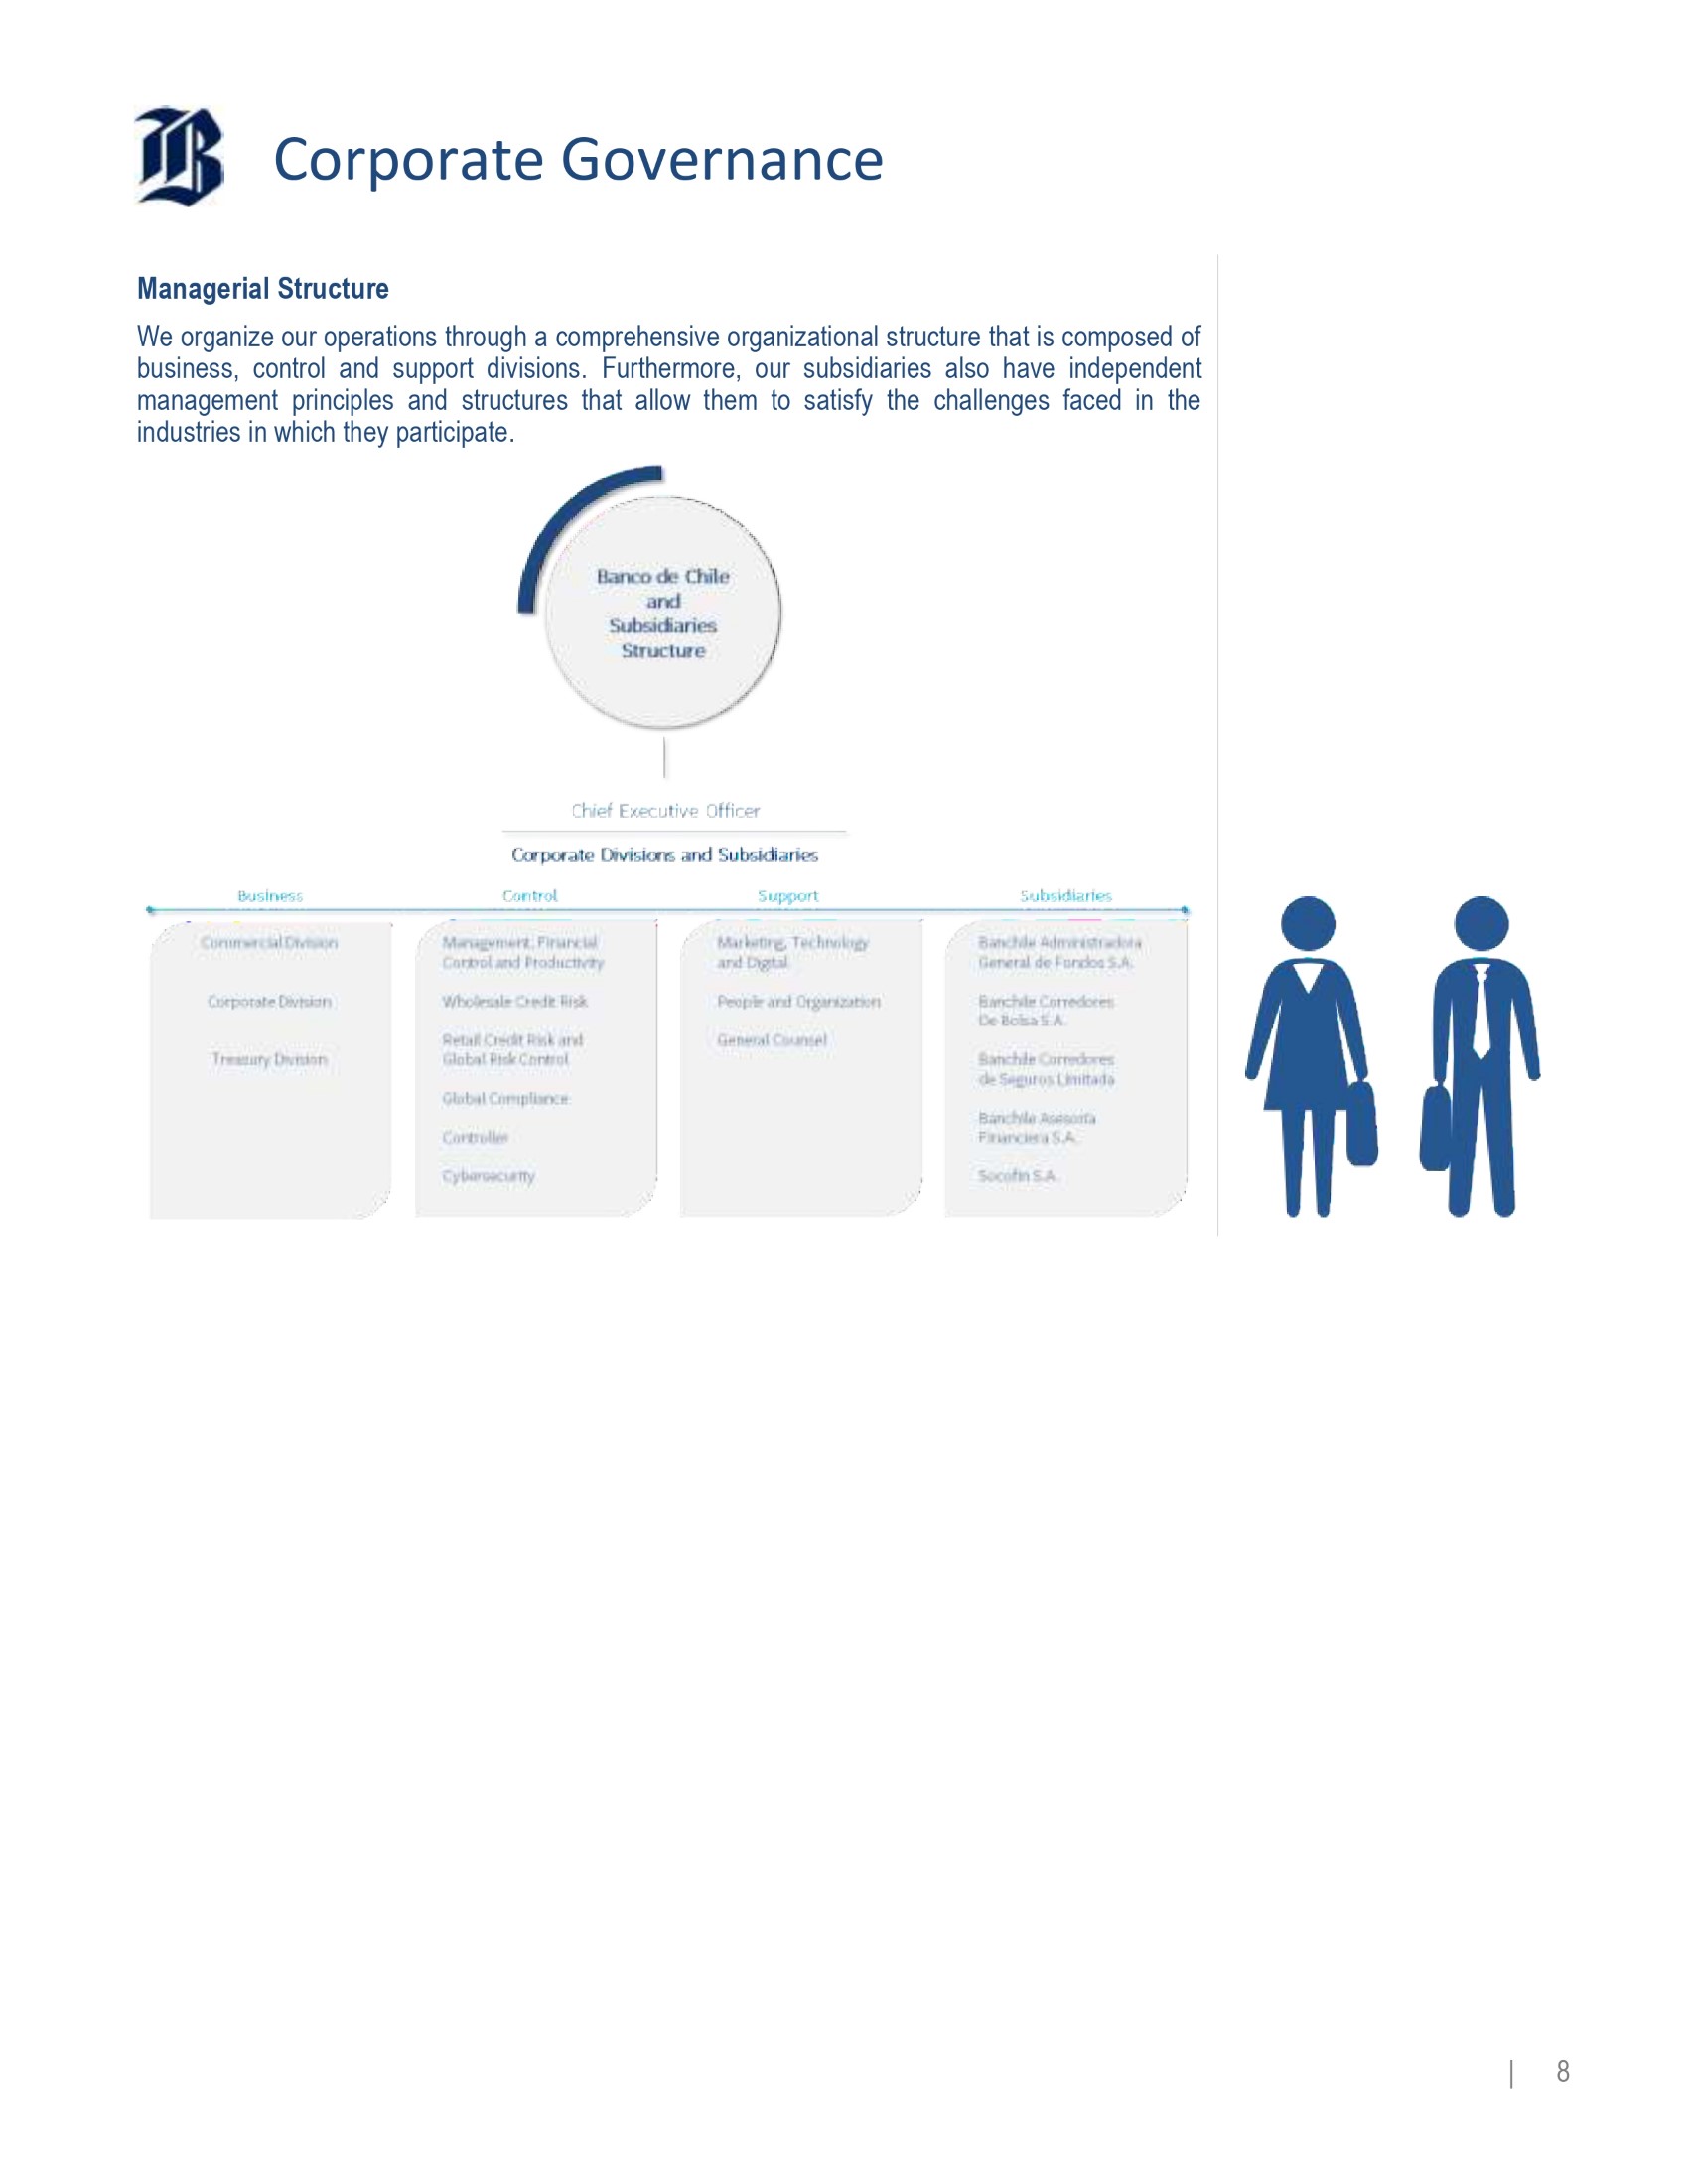
| 7 Corporate Governance Man ag e r i a l S t r u c t u r e We organize our operations through a comprehensive organizational structure that is composed of business, control and support divisions . Furthermore, our subsidiaries also have independent management principles and structures that allow them to satisfy the challenges faced in the industries in which they participate . | 8 Business Strategy Corporate Statements and Commitments P u r p o s e Mission To contribute to the development of the country and its people.

W e a re a l e a d in g , g lo b a l l y - c o nn e c t e d f i n a nc i a l co r p o r a t i on with a prestigious business tradition. We provide financial services of excellence to each customer segment, offering creative, agile and effective solutions and thus ensuring value creation for our shareholders, our employees and the c o m m u n i ty a t l a r g e . Vision Corporate Values In everything we do, we constantly strive to be the best bank for our customers, the best place to work, and the best investment for our shareholders. We do so in a way that de m o n s t r a t es o u r co m m i t m e n t t o t h e p e o p l e i n ou r organization and the community in general.

| 9 Business Strategy Commitments O u r C u s t o m e r s We pursue to be the bank with the best service quality, offering innovative, simple and secure products and services designed to meet the needs and aspirations of each segment, with timely, agile and proactive service in order to build trusted and long - term relationships . To achieve this we strive to continuously develop always - available service channels that allow fluid and timely communication, while counting on employees devoted to customer service that also have digital knowledge . O u r S t a ff We are certain that our team is a distinctive asset and a solid competitive advantage in the industry . This is based on their commitment, dedication and excellence . For this reason, we offer development and growth opportunities based on merit, providing competitive compensation and economic and welfare benefits . At the same time, we seek to promote a respectful, friendly and collaborative work environment in a place that has suitable technological tools and infrastructure . We build a homogeneous and distinctive culture, based on corporate commitments and values through the involvement in social activities, in order to become a Corporation distinguished as the best place to work and the best team in Chilean banking industry . O u r S ha r e ho l d e rs We honor our shareholders' confidence by maximizing the company's value, with r e s p o n s i b i li t y , p r ude n c e a n d a l on g - t e rm bus i nes s v i s i o n . We dep l o y o u r b u s i n e s s strategy based on appropriate risk management and a culture of operational excellence that allows us to project the sustainable leadership of the corporation . O u r C o m m un i t y We are convinced that our success is linked to the sustainable development of our country and the community . That is why in our daily actions we reflect our commitment to community by supporting diverse initiatives to overcome adversity, through the development of internal policies and being present in emblematic solidarity crusades . We are committed to respecting diversity and inclusion, entrepreneurship, en v i r o nm e n t a l c a re a n d e qua lit y an d gove r n an c e d i m en s i on s .

| 10 Business Strategy Stakeholder Engagement Banco de Chile keeps several communication channels open with our stakeholders in order to gather information to answer questions and manage concerns regarding different issues. We also actively participate in social media and count on specific channels dedicated to managing inquiries and requirements. Stakeholders Engagement Objectives Mechanisms and/or Channels of Communication F requency C us to mer s www.bancochile.c l Branches and ATMs Telephone banking service 600 637 37 37 Mobile applications https://cl.linkedin.com/company/banco - de - chile Twitter and Instagram:@bancodechile | @bancoedwards |@ayudaBancoChile Facebook: bancodechile | bancoedwards Ongoing Shareholders and Regulators Offer excellent service characterized by integrity, personalization, agility and proactivity in order to build long - term, trust - based relationships . Use permanently available service channels to keep customers informed in a timely and appropriate manner . Provide differentiated financial solutions featuring quality, innovative products and services for each customer segment . Be the best investment option, maintaining a leading position by value of shares traded Promote operational efficiency and productivity in order to encourage prudent risk management based on integrity and transparency . Comply with the regulatory requirements defined by the correspondent authority . Keep a corporate governance and internal control environment that allow to manage risk and capital adequately . Shareholders’ meeting Annual Report & Form 20 - F Financial reporting Investor Relations: ir@bancochile.c l Webcasts Website CMF Reports belonging to both the Information System and the Risk System Frameworks. Annual Q u a rt e r l y Monthly Ongoing E mp l o y e e s Offer merit - based development opportunities with competitive compensation and economic benefits. Promote a respectful, polite work environment in a location equipped with the appropriate technology and infrastructure. Intranet / Emails / SOY_DELCHILE App Competency Assessment Counseling Program (Programa Orienta) My Health Program (Programa Mi Salud) Quality of Life Program / Active Chile Program Point Bank / Team meetings Contact: comitedeetica@bancochile.c l apoyolaboral@bancochile.c l centroatencionpersonas@bancochile.c l Annual O n go ing Co m mun i t y Promote financial education. Facilitate a more equitable society that offers greater opportunities through inclusion of persons with disabilities. Manage the business in an environmentally respectful manner. Support SMEs and entrepreneurs in developing their businesses. Annual Report Contact: sostenibilidad@bancochile.c l www.bancochile.c l Ongoing Supp l i er s Build long - term collaborative supplier relationships based on transparency, competition, efficiency, respect and objectivity. Streamline and increase the effectiveness of processes for supplying goods and services. Ensure that services are hired and goods are acquired under market conditions. Ensure that the bank's obligations are paid in accordance with the terms and conditions agreed.

proveedores@bancochile.c l Ongoing | 11 Business Strategy Competitive Landscape, Business Trends and Regulation C h il e a n F i nan c i a l I n dus t r y The Chilean market for banking and other financial services is highly and increasingly competitive and consists of various market sectors . The most important sector is commercial banking with total loans (excluding operations of subsidiaries abroad) representing 82 % of the Chilean GDP as of December 31 , 2 0 2 3 . The Chilean banking industry consisted of 17 banks, 16 of which were private sector banks and one state - owned bank, name l y , B an c o E s t ado . We face significant and increasing competition in all market segments in which we operate . As a comprehensive commercial bank that offers a wide range of services to all types of enterprises and individual customers, we deal with a variety of competitors, ranging from large private sector commercial ban k s t o mo r e s p e c i a l i z e d en t i t i e s , su c h a s “ n i che ” bank s . In addition, we face competition from other types of lenders, such as non - banking leasing, crowdfunding, factoring and automobile financing companies, especially in credit products, mutual funds, pension funds and insurance companies within the market for savings products, as well as insurance c omp a n i e s i n t h e ma r ke t f o r m o r t g a g e l o an s . Likewise, other non - traditional providers of financial services have emerged over the last years, such as e - commerce, local and foreign fintech companies, Telecom companies, like internet and mobile phone providers, and more recently some marketplaces that may set and provide offerings, in the form of temporary financing, directly to their customers or providers . These new ways of doing business are based on the disintermediation of traditional banking service providers while not being subject to the same capital requirements that banks are . Therefore, these providers represent a challenge for the t r ad i t i on a l b a n k i n g i n du s t r y . Within the local banking industry, our primary competitors are the main private sector commercial banks in Chile, namely, Banco Santander - Chile, BCI, Scotiabank Chile, and Itaú . Nevertheless, we also face competition from Banco del Estado . In the retail market, we compete with other private sector Chilean banks, as well as with Banco del Estado . Among private sector banks, we believe our strongest competitors in t h i s ma r ke t a r e B an c o S a n t a nd e r — C h il e , S co t i aba n k C h il e a nd BCI, as these banks have developed diversified business strategies focused on both small and medium sized companies and lower to middle income segments of the Chilean population . In addition, we believe our strongest competitors in the high - income individual segment are Banco Santander — Chile, and Banco Bice, as these banks rely on specialized business models that provide wealth management and traditional ban k i n g se r v i c e s , a s w e d o . In the wholesale market, we believe our strongest competitors are also Banco Santander - Chile, BCI, Itaú and Scotiabank Chile . Similarly, we believe these banks are our most significant competitors in the small and medium sized c omp a n i es ’ b u s i n e s s seg m en t . We also compete, mainly through our subsidiaries, with c omp a n i e s t ha t o ff e r no n - ba n k i n g s p e c i a l i z e d f i na n c i a l s e r v i c es in the higher - income individuals segment and the middle market and corporate segment such as Larrain Vial, BTG Pactual, Moneda Asset and CrediCorp, whose core businesses are stock brokerage, financial advisory and wealth management services . Other Chilean commercial banks also compete in these markets of specialized financial services, but they are l e s s f oc u s e d o n su c h bu s i ne s se s . The Chilean banking industry has experienced increased levels o f c o mp e t i t i o n i n r e c e n t yea r s f r o m do m e s t i c a s w e l l a s f o r e i gn banks . This phenomenon has triggered a consolidation wave within the industry and the creation of more comprehensive banking entities that participate in most of our markets . Consequently, banks’ strategies have increasingly been focused on reducing costs and improving efficiency standards in order to compete effectively with the larger banks .

| 12 Business Strategy K e y T r e n d s i n t h e B a n k i n g B u s i ne s s S o c i a l a nd C u l t u r a l : | 13 N e w p o li t ic a l an d s oc i a l cyc l e . Several government - promoted reforms with potencial impact on the economic and business environment. Global and local economic uncertainty. Increasing competition and regulatory requirements. Generational and customer - worker behavioral changes. Digital transformation and adaptation to new technologies. C han g e i n t h e c o m pan y - c u s t o me r r e l a t i onsh i p . C li m a t e chan g e . B a n k i n g B u s i n e s s : C on s o l i d a t i o n o f d i g i t a l chan n e l s a s t h e p r i m a r y me a n s o f i n t e r a c t i n g w i t h c u s t o me rs a n d no n - cu s t o me r s . Mode r n i z a t i o n o f t h e bu s i ne s s mode l : Ta len t ma n ag e men t and IT strategies for adapting to the new environment. S u s t a ina b i li t y r e q u i r e me n t s . Optimization of cost base to mitigate competition and r egu l a t o ry c h ang e s . Innovations in banking operational solutions. E me r g enc e o f no n - t r a d i t i o na l co mpe t i t o rs . R e g u l a t o r y E nv i r o n me n t Th e C M F : The CMF must regulate, oversee, sanction and manage the operation, stability and development of the Chilean financial market by easing the participation of market agents while k eep i n g p ub l i c t r u s t . In o r de r to d o s o , t h e C M F m u s t hav e an overall and systemic vision by protecting interests of investors and insured agents . The CMF also can impose sanctions on the s upe r v i s e d e n t i t i e s . R ega r d i n g t h e s p e c i f i c po w e r s o f t h e C M F r e l a t e d t o bank i ng r egu l a t i o n , t h i s en t i t y a u t ho r i z e s t h e c r ea t i o n o f ne w b an k s a nd has broad powers to interpret and enforce legal and regulatory requirements applicable to banks and financial institutions . Furthermore, in cases of noncompliance with its legal and regulatory requirements, the CMF has the ability to impose sanctions . In extreme cases, it can appoint, with the prior approval of the board of directors of the Central Bank, a provisional administrator to manage banks . It also has the mandate to approve any amendment to banks’ bylaws . A bank’s financial statements as of December 31 of each year must be audited and submitted to the CMF together with the opinion of its independent auditors . Also, banks are required by the CMF to include in mid - year financial statements (as of June 30 of every fiscal year) an auditor’s limited review s t a t e men t i n a cc o r da n c e w i t h C h il e a n G AA P . In addition, banks are required to provide extensive information regarding their operations at various periodic intervals to the C M F b y m e an s o f s p e c i a l i z e d r epo r ts a s so c i a t e d w i t h bu s i nes s - related risk, products, debtors, transactions, distribution c han n e l s , am o n g o t he r s . Th e C e n t r a l B a n k : The Central Bank is an autonomous legal entity created under the framework of the Chilean Constitution . It is subject to its Ley Orgánica Constitucional (the “Organic Constitutional Law”) and the current Chilean Constitution . The Central Bank is directed and administered by a board of directors composed of five members appointed by the President of Chile, subject to S ena te a p p r ova l . The legal purpose of the Central Bank is to maintain the stability of the Chilean peso, control inflation and the orderly functioning of Chile’s internal and external payment systems . The Central Ban k ’ s p o w e rs i n c l u d e s e t t i n g r e s e r v e r equ i r e m en t s , r e gu l a t i ng t h e a m oun t o f m one y an d c re d i t i n c i r cu l a t i o n , e x e c u t i n g f o r e i gn exchange operations and establishing regulations and guidelines regarding foreign exchange, lending and monetary matters . Th e S E C : As we are listed on the New York Stock Exchange since January 1 st , 2002 through our ADR program, we are also subject to regulation and supervision of the Securities and Exchange Commission . We are required to file with SEC the form 20 F, including audited financial statements, as of December of each year in accordance with IFRS as issued by the International Accounting Standards Board .

Business Strategy Strategy of Banco de Chile At a Glance Competitive Strengt h s a n d Resourc e s Financial Sustained leadership in profitability R obus t cap i ta l bas e an d dem a nd depos i t s S t r on g c r e d i t an d ES G r i s k r at i n g s Hu m a n a n d Cult u r al T a l en t a tt r act i o n an d deve l o p m e n t capac i t y A co ll a bo r at i v e w o r k cu l t u r e Ri s k managem e n t l ead e r sh i p Organizational B r an d va l u e S ton g co r p o r at e g ove r n anc e Leade r i n d i g i ta l bank i n g Global presence through the strategic alliance with Citigroup Social Outstand i n g c o r p o r at e r epu t at i on B r oa d custom e r ba se S t r on g supp li e r r e l at i onsh i p C ont i nue d r e l at i onsh i p wi t h i nv e sto r s R ecogn i ze d p r omot e r o f i nc l us i o n an d en t r e p r ene u r sh i p S tr a t eg i c P i l la r s Cu s to m e r a t the Ce n t e r of o u r Decisi o ns E ffici e n c y a n d P r odu c tiv i ty S u s t ai n a b ili t y and Co m m it m en t to Chile “ Bes t Ba nk for o ur Custom e r s ” “ Quick , t im e ly , sec ure a n d di g ita l ” “ A n e ste em e d b a n k with a s o li d r e p ut atio n ” “A bank that supports entrepreneurship” Mid - t e r m O b j ec t i ve s Net Promoter Business (1) Efficiency Return on Average Corporate Scor e Comm e r cia l L o a ns Rati o Capita l an d R eserves ( 1 ) Reputation (2 ) Consum e r Loans Dem a nd Dep osits ≥ 73 % Top 1 ≤ 42 % Top 1 Top 3 (1) Among relevant peers. Demand deposits denominated in local currency. Excluding operations of subsidiaries abroad for market share. (2) B a s ed on Me rc o R a n k i ng .

| 14 Business Strategy Business Segments Description In line with our strategic pillar “Customer at the Center of our Decisions”, we pursue to offer the best value proposition in the banking industry by delivering excellent service quality, along with timely and effective solutions. Given the wide diversity of clients, ranging from individuals to private banking customers and from micro - entrepreneurs to corporations, we organize our operations and value propositions into four business segments: .

| 15 Business Strategy Retail Banking Segment This business unit provides universal financial solutions to students, employed workers, self – employed workers, retired people, individuals with medium to high incomes, as well as to and micro, small and medium - sized companies with annual s a l e s o f u p t o U F 70 , 0 00 . The value propositions are characterized by their differentiation, recognizing customers preferences in their way of interacting with the bank, whether on - site or remotely, according to their needs for the simplest to the most sophisticated p r od u c t s an d s e r v i c e s . The financial products and services offered by this segment include current accounts, debit cards, credit cards, lines of credit, mortgage loans, consumer loans, commercial loans, general purpose mortgage loans, finance leases, factoring services, mutual fund management and stock brokerage, foreign trade, payments and collections, insurance brokerage including life and general insurance, time deposits, savings instruments and foreign currency services, through a network of branches operating under the “Banco de Chile” and “Banco Edwards Citi” brands . Wholesale Banking Segment The Wholesale Banking unit provides products and services to companies with annual sales that exceed UF 70 , 000 , which include a large proportion of Chilean listed and unlisted companies, subsidiaries of multinational companies and conglomerates operating in Chile, in the financial, commercial, manufacturing, industrial, infrastructure, real estate and construction sectors, as well as projects, concessions, family offices and large companies . This unit provides a wide range of products that include short and long - term commercial loans, working capital loans, lines of credit, corporate credit cards, foreign trade and foreign currency brokerage, factoring services, leases and long - term syndicated loans . Investment banking services are provided by the subsidiary Banchile Asesoría Financiera S . A . , such as transaction structuring services for mergers and acquisitions and assistance with debt restructuring . It provides cash management services, which include paying payroll, suppliers, pensions and dividends, collection services, connections to international funds transfer networks, checking accounts and deposits, fund management, treasury and investment management, derivative contracts, insurance brokerage, and other tailored services .

| 16 Business Strategy Treasury Segment Our Treasury segment manages a wide range of financial services available to our customers, including currency intermediation, forward contracts, interest rate swaps, transactions under repurchase agreements and investment products ba s e d o n bon d s a n d d e po s i t s . Our Treasury manages currency, interest rate and term mismatches, ensures that our liquidity is sufficient, manages the investment portfolio and brokers fixed - income, foreign exchange and derivative instruments . It also manages mismatches with the aim of securing a suitable financing structure and diversifying i t s s o u r ce s o f f i n an c e . The Treasury segment is also responsible for : (i) the issuance of short - and long - term senior bonds, as well as long - term subordinated bonds, in Chile or abroad, (ii) monitoring compliance with regulatory deposit limits, technical reserves and maturity and rate matches/mismatches, (iii) monitoring our adherence to the security margins defined by regulatory limits, and risk limits for interest rate, currency and investment gaps . This segment continually monitors the Bank’s cost of funding by benchmarking with the rest of the local financial system and financing a l t e r n a t i ve s i n C h il e o r a b r o ad . Subsidiaries We have made several strategic long - term investments in financial services companies that are engaged in activities that complement our commercial banking activities . In making these investments our goal has been to develop a comprehensive financial group capable of meeting the diverse financial needs of our current and potential customers by offering traditional banking products and specialized financial services through our different subsidiaries . Our subsidiaries operate under Banchile brand name, with exception of Socofin .

Through them we offer the following financial services to Banco de Chile’s c u s t o me r s an d no n - c u s t o m e r s : Securities Brokerage and FX trading Mu t u a l Fu nd s an d I n v e s t m en t F und s Ma n ag e men t I n s u r an c e B r o k e r a g e Financial Advisory and Investment Banking C o ll e c t i o n S e r v i ce s | 17 Business Strategy Snapshot on Strategic Advances Str a tegi c Pi l l a r Key Perform a n c e In dic a tor As o f Marc h Mi d - T erm T a rg e t 2024 Compliance x 76.4% Net Promo t er Sc o re Custo m er at t h e Cen t er of our Decisio n s ― T o p 2 Com m erc i al Loans Market Shar e ( 1 ) in Business 3 ― T o p 2 Co n s u m e r L o a ns x T o p 1 D e m and D e po sits x 36.4% Cos t - to - I n c o m e Ratio Eff ici en c y and Pro d u ctivity x T o p 1 Return o n A v era g e Cap i t al and R e s erve s ( 1 ) Su st a i n ab ilit y a nd Com mitm ent to Ch il e x T o p 3 Corporate Re p ut a t i o n ( 2 ) Ma i n A ch i evem e n t s an d H ighlight s o f t h e perio d Improvement in face - to face - service times together with new functionalities in digital and self - services channels Launc h o f ne w “ FA N Ahor r o ” ac coun t w i t h 100 % digi t a l onbo a r d ing Successful renovation of the value proposition of investment products by simplifying and complementing the offer according to the investor s profile Significant advances in digital sale of consumer loans, insurance banking product and current accounts Improvement in loyalty program through new VIP lounges at Santiago International Airport Improvements in efficiency, functionality and reliability of process automation based on new RPA platform Kick - off of ERP update project for the automation and centralization of purchasing and payment activities for the Bank and subsidiaries, together with new processes for the optimization of infrastructure investment flow Roll - out of the first phase of technological modernization process of Banchile Administradora General de Fondos and beginning of the transformation project at Banchile Corredora de Bolsa Development of important activities within the framework of our commitment to sustainability: Support for families affected by wildfires in Valparaiso, waste - collection activities and launch of the “Women who inspire 2024” program (1) Based on market shares as of February 29, 2024 (latest available information). Among relevant peers. Demand deposits denominated in local currency. Excluding operations of subsidiaries abroad for market share. (2) B a s e d o n M e r c o R a n k i n g 20 23 .
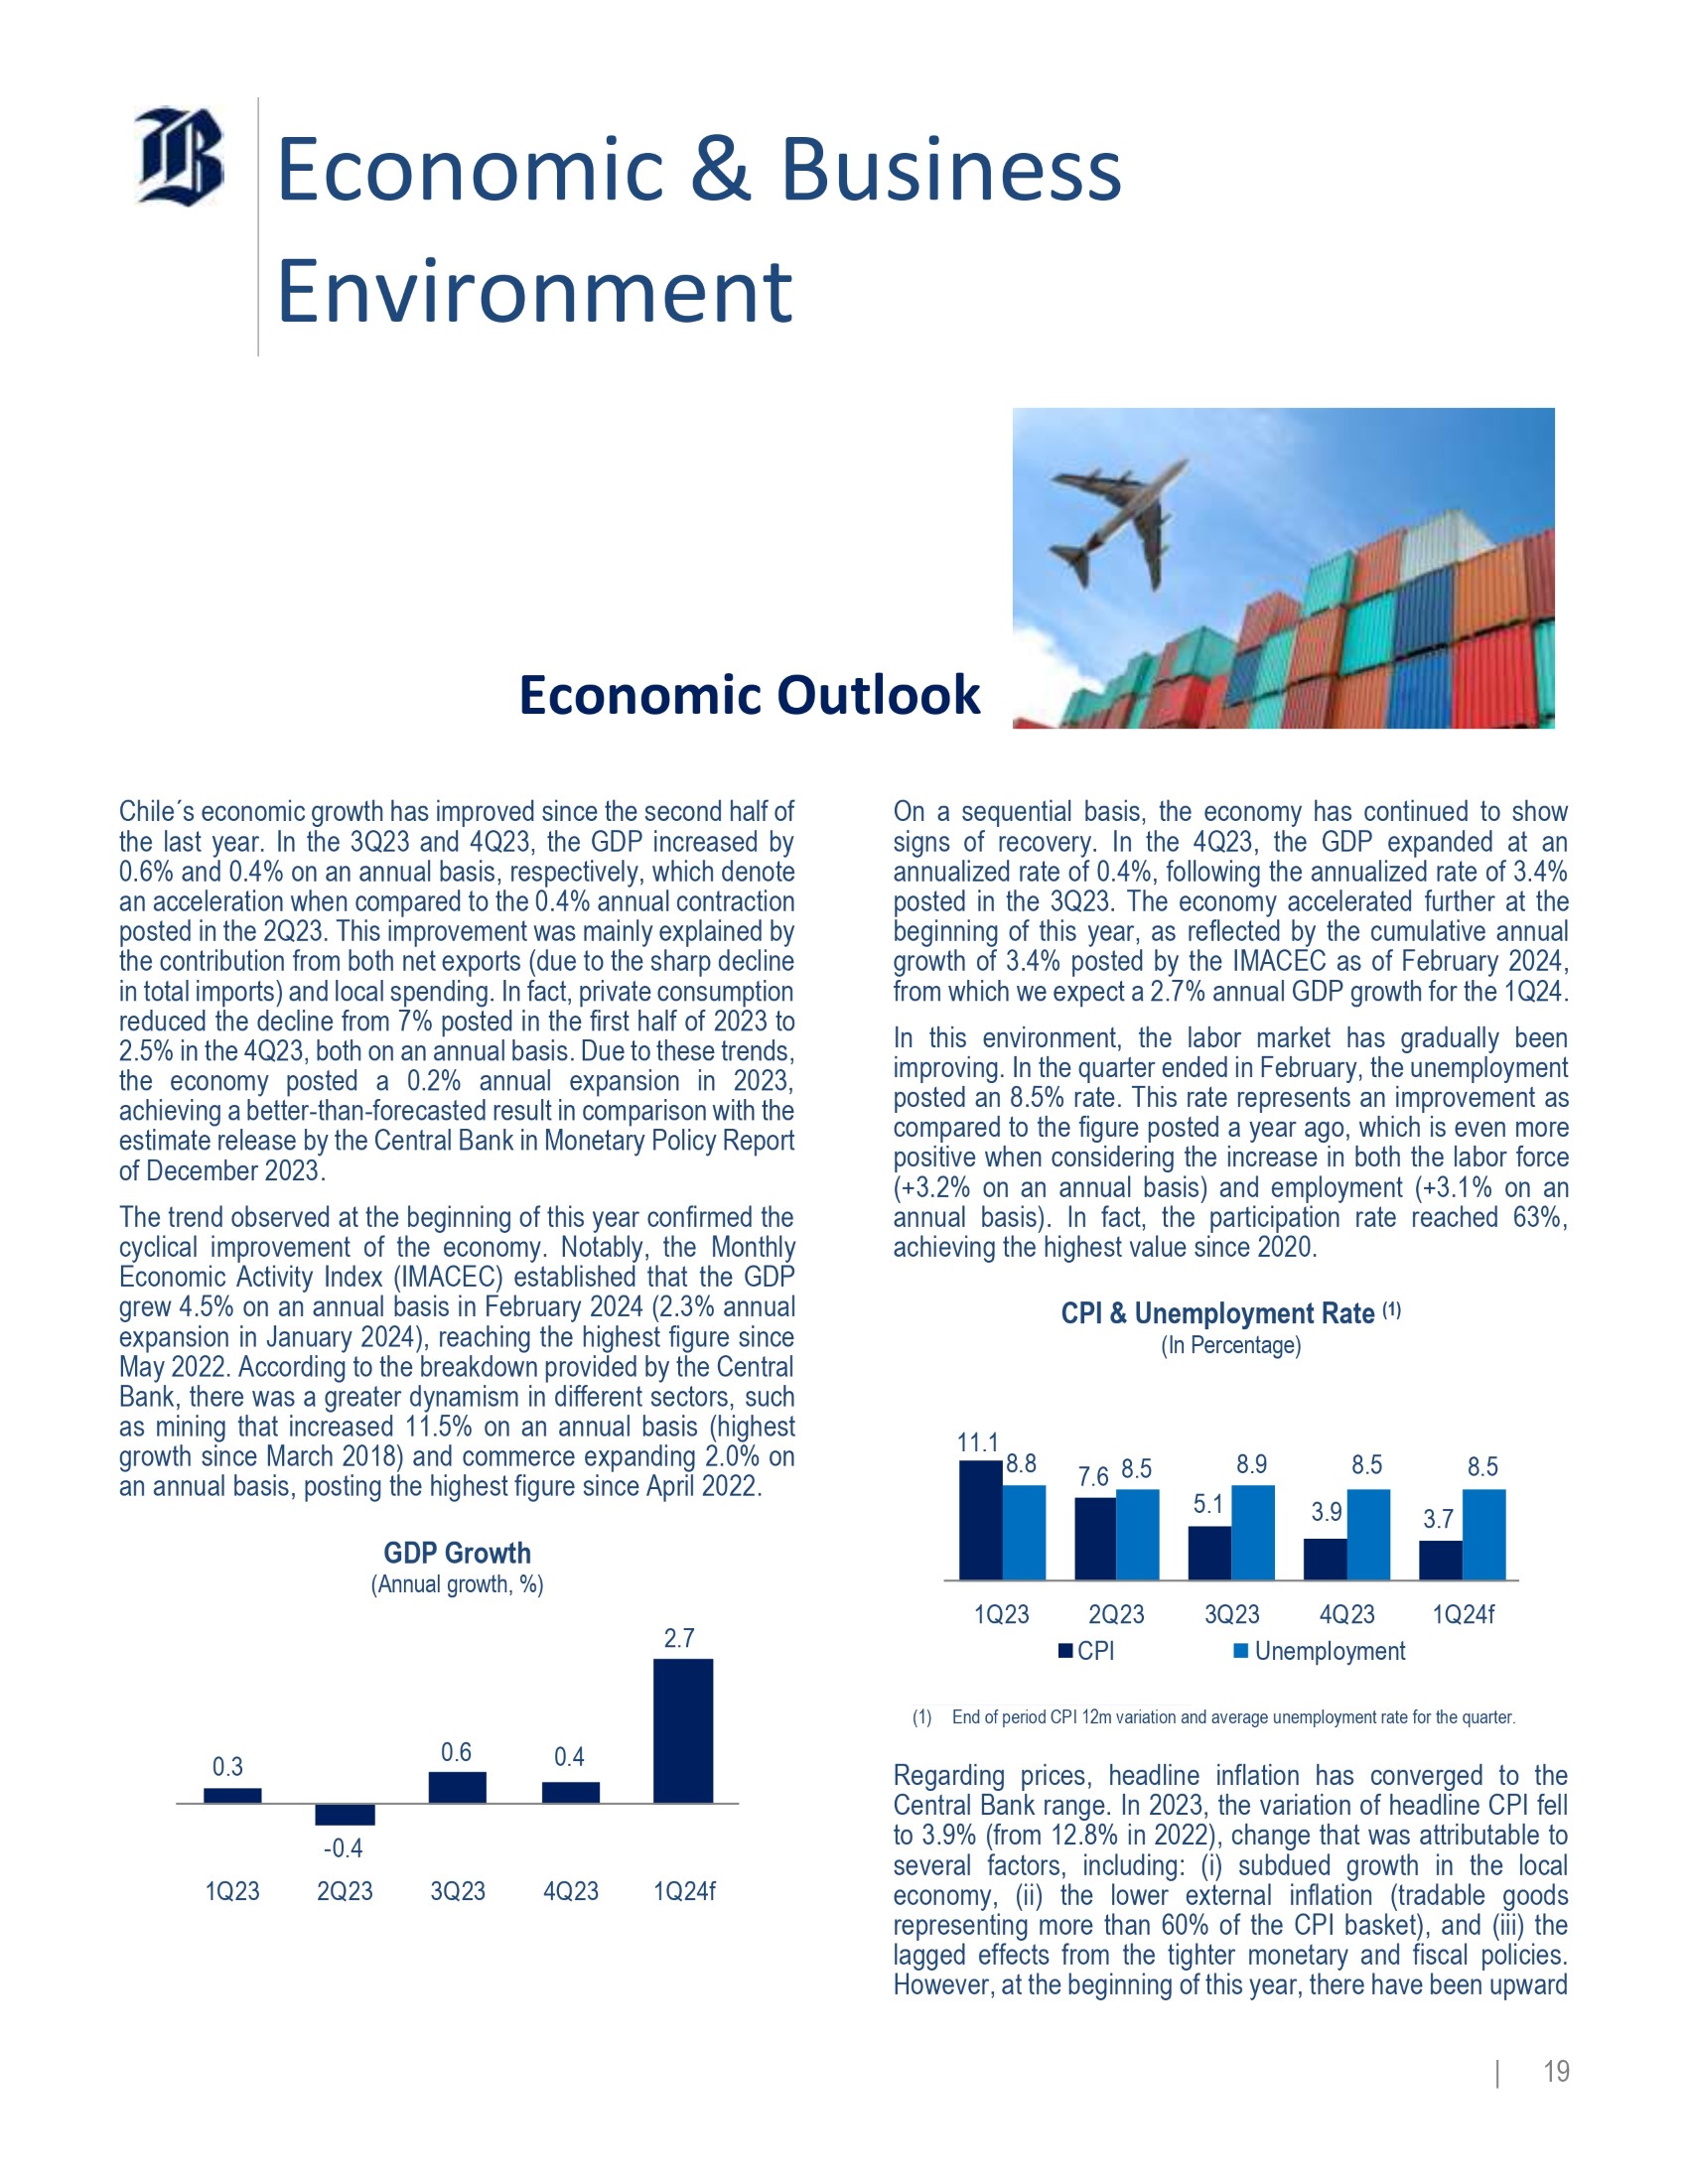
| 18 Economic & Business Environment Economic Outlook Chile s economic growth has improved since the second half of the last year . In the 3 Q 23 and 4 Q 23 , the GDP increased by 0 . 6 % and 0 . 4 % on an annual basis, respectively, which denote an acceleration when compared to the 0 . 4 % annual contraction posted in the 2 Q 23 . This improvement was mainly explained by the contribution from both net exports (due to the sharp decline in total imports) and local spending . In fact, private consumption reduced the decline from 7 % posted in the first half of 2023 to 2 . 5 % in the 4 Q 23 , both on an annual basis . Due to these trends, the economy posted a 0 . 2 % annual expansion in 2023 , achieving a better - than - forecasted result in comparison with the estimate release by the Central Bank in Monetary Policy Report o f D e c em b e r 202 3 . The trend observed at the beginning of this year confirmed the cyclical improvement of the economy . Notably, the Monthly Economic Activity Index (IMACEC) established that the GDP g r e w 4 . 5 % o n a n a nnu a l b a s i s i n F eb r u a r y 20 2 4 ( 2 . 3 % a n nua l expansion in January 2024 ), reaching the highest figure since May 2022 . According to the breakdown provided by the Central Bank, there was a greater dynamism in different sectors, such as mining that increased 11 . 5 % on an annual basis (highest growth since March 2018 ) and commerce expanding 2 . 0 % on an annual basis, posting the highest figure since April 2022 . GD P G r owth ( A n n ua l gr o w t h , %) 0.3 0.6 0 .4 - 0.4 2 Q 23 2 . 7 1 Q 23 3 Q 23 4 Q 23 1 Q 24 f On a sequential basis, the economy has continued to show signs of recovery . In the 4 Q 23 , the GDP expanded at an annualized rate of 0 . 4 % , following the annualized rate of 3 . 4 % posted in the 3 Q 23 . The economy accelerated further at the beginning of this year, as reflected by the cumulative annual growth of 3 . 4 % posted by the IMACEC as of February 2024 , from which we expect a 2 . 7 % annual GDP growth for the 1 Q 24 . In this environment, the labor market has gradually been improving . In the quarter ended in February, the unemployment po s t e d a n 8 . 5 % r a t e . T h i s r a t e r e p r e s e n t s a n i m p r o v e me n t as compared to the figure posted a year ago, which is even more po s i t i v e when c o n s i d e r i n g t h e i n c r e a s e i n b o t h t h e l ab o r f o r c e (+ 3 . 2 % on an annual basis) and employment (+ 3 . 1 % on an annual basis) . In fact, the participation rate reached 63 % , achieving the highest value since 2020 . C P I & U nemploy men t R at e ( 1 ) ( In P e r c e n t ag e ) 11 .1 5 .1 3 .9 3.7 8 .8 7.6 8.5 8 .9 8 .5 8.5 1 Q 23 2 Q 23 CPI 1 Q 24 f 3Q23 4Q23 U ne m p l o y m en t (1) End of period CPI 12m variation and average unemployment rate for the quarter. Regarding prices, headline inflation has converged to the Central Bank range . In 2023 , the variation of headline CPI fell to 3 . 9 % (from 12 . 8 % in 2022 ), change that was attributable to several factors, including : (i) subdued growth in the local economy, (ii) the lower external inflation (tradable goods representing more than 60 % of the CPI basket), and (iii) the lagged effects from the tighter monetary and fiscal policies .
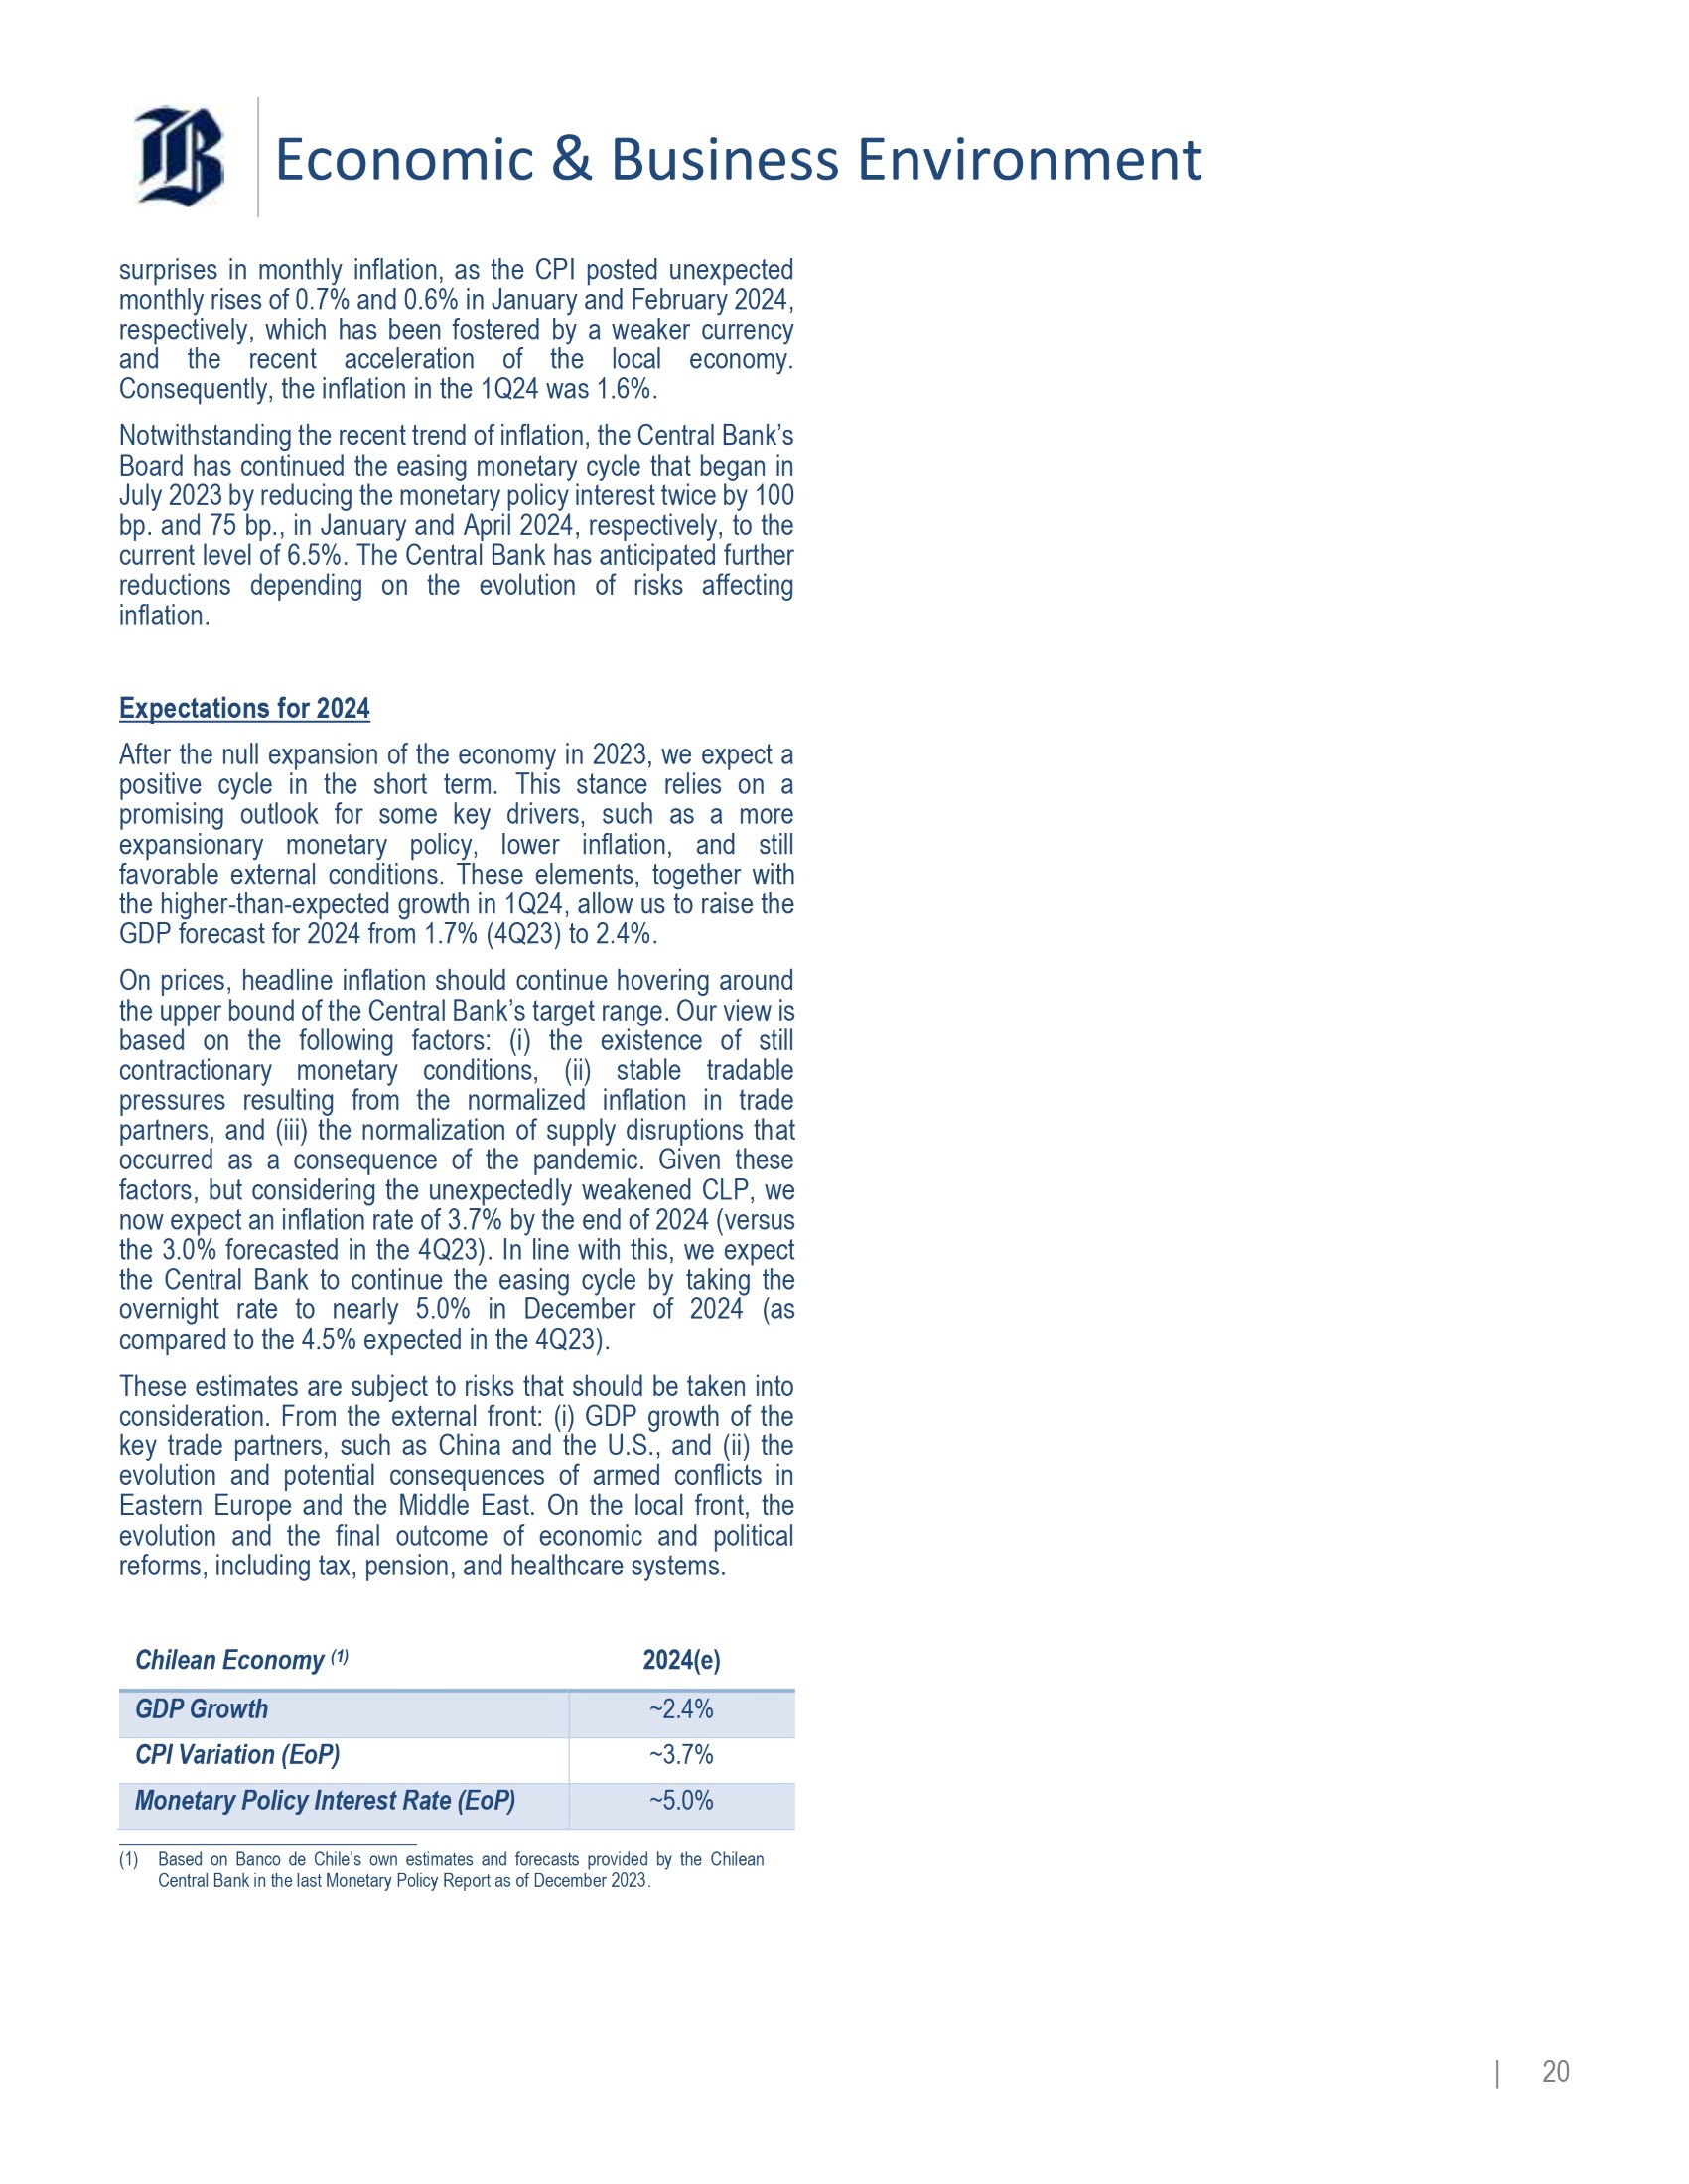
However, at the beginning of this year, there have been upward | 19 Economic & Business Environment surprises in monthly inflation, as the CPI posted unexpected mon t h l y r i se s o f 0 . 7 % a n d 0 . 6 % i n Janu a r y an d F eb r u a r y 2 02 4 , respectively, which has been fostered by a weaker currency and the recent acceleration of the local economy . Consequently, the inflation in the 1 Q 24 was 1 . 6 % . Notwithstanding the recent trend of inflation, the Central Bank’s Board has continued the easing monetary cycle that began in July 2023 by reducing the monetary policy interest twice by 100 bp . and 75 bp . , in January and April 2024 , respectively, to the current level of 6 . 5 % . The Central Bank has anticipated further reductions depending on the evolution of risks affecting inflation . E x p e c t a ti on s f o r 20 24 After the null expansion of the economy in 2023 , we expect a positive cycle in the short term . This stance relies on a promising outlook for some key drivers, such as a more expansionary monetary policy, lower inflation, and still favorable external conditions . These elements, together with the higher - than - expected growth in 1 Q 24 , allow us to raise the G D P f o r e c a s t f o r 202 4 f r o m 1 . 7 % ( 4 Q 23 ) t o 2 . 4 % . On prices, headline inflation should continue hovering around the upper bound of the Central Bank’s target range . Our view is based on the following factors : (i) the existence of still contractionary monetary conditions, (ii) stable tradable pressures resulting from the normalized inflation in trade partners, and (iii) the normalization of supply disruptions that occurred as a consequence of the pandemic . Given these factors, but considering the unexpectedly weakened CLP, we now expect an inflation rate of 3 . 7 % by the end of 2024 (versus the 3 . 0 % forecasted in the 4 Q 23 ) . In line with this, we expect the Central Bank to continue the easing cycle by taking the overnight rate to nearly 5 . 0 % in December of 2024 (as c omp a r e d t o t h e 4 . 5 % e x p e c t e d i n t h e 4 Q 23 ) . These estimates are subject to risks that should be taken into consideration . From the external front : (i) GDP growth of the key trade partners, such as China and the U . S . , and (ii) the evolution and potential consequences of armed conflicts in Eastern Europe and the Middle East . On the local front, the evolution and the final outcome of economic and political reforms, including tax, pension, and healthcare systems . Ch ile a n E co no m y ( 1 ) 2 0 2 4 ( e) ~2.4% GD P G r o w th ~3.7% C P I Va r ia t i o n ( E o P ) ~5.0% Mon e t a r y Policy I n t e r e st Rate (E o P ) (1) Based on Banco de Chile’s own estimates and forecasts provided by the Chilean Central Bank in the last Monetary Policy Report as of December 2023.
| 20 Economic & Business Environment Banking Industry Performance and Projections In the 1 Q 24 the lending activity has continued to be weakened, although showing a tempered recovery in real terms, particularly in light of more normalized inflation . Based on that, as of February 29 , 2024 (latest available information), the local banking industry shows basically nil 12 - month real growth . On a po s i t iv e t one , ho w e v e r, bo t h c om m e r c i a l a n d c o n s um e r l o ans continue wrestling the subdued economic activity by displaying an improving trend in relation to previous quarters, though staying in negative territory on an annual basis by the end of February 2024 . Mortgage loans, in turn, keep on advancing at a slower pace than prior years by reflecting the specific dynamics of the housing market . As in previous quarters, total loans growth continued to be highly influenced by the trajectory f o ll o w e d b y co m m e r c i a l l oan s . Loan G r owth ( 1 ) ( 1 2 m % cha n g e, i n r e a l t e r m s ) - 4 . 7 % - 2 . 7 % - 1 .5 % - 5 .8 % 1 . 3 % 1 . 7 % 2 .1 % 2 . 4 % 2 . 6 % 0 .3 % - 2 . 4 % - 2 . 5 % - 4 . 5 % - 3 .8 % - 1 . 6 % - 2.3% - 3 .7 % - 0 . 8 % - 1.2% M a r - 2 3 Sep - 23 - 8.5% J u n - 23 T o ta l L o an s R e s i den t i a l Loan s Dec - 23 Feb - 24 C o mm e r c i a l L o an s C on s u m e r L oan s (1) Figures do not include operations of subsidiaries abroad. On this backdrop, total loans managed by the local banking industry amounted to Ch $ 235 , 152 , 640 million, excluding operations of offshore subsidiaries, according to the latest CMF report as of February 29 , 2024 . This balance denotes nominal annual growth of 4 . 1 % , which corresponds to a tempered 12 - month real expansion of 0 . 3 % , when adjusting by inflation . This evolution has been fuelled by : (i) an annual real expansion of 2 . 6 % in residential mortgage loans, that continue to be the main engine of lending activity on the grounds of a stubborn demand for housing that, despite the current interest rate scenario, k eep s o n g r o w i n g , y e t a t s l o w e r pa c e , ( ii ) c o n s u me r l o an s t hat have continued to show a sort of recovery in real terms by reducing the 12 - month real contraction to 0 . 8 % , which has been c au s e d b y a nnu a l r e a l c on t r a ct i o n i n i n s t a l l m e n t l o an s t ha t has partly been offset by the more intensive use of credit cards, in line with lowered liquidity, and (iii) commercial loans that have continued to be the main source of slowdown by downsizing 1 . 2 % in real terms on the grounds of an overall business activity and private investment in particular that remains constrained . The evolution of the industry’s loan portfolio is in line with the evidence provided by the quarterly credit surveys conducted by the Central Bank . In the case of residential mortgage and consumer loans, there is some evidence of weakened demand in the margin in contrast with the 4 Q 23 while offer conditions seem to be constrained yet, which is in line with the evolution of some market drivers, such as unemployment and household disposable income, as well as more normalized asset quality, as reflected by the increase of total past - due indicators from 1 . 8 % in February 2023 to 2 . 3 % in February 2024 . Regarding commercial loans, although the economic activity has displayed a sort of recovery from the slowdown seen in 2023 , as evidenced by the Monthly Economic Activity Indicator (IMACEC) that showed an annual growth of 3 . 4 % as of February 2024 , the business sentiment does not appear to be taking off yet and, therefore, private investment remains sluggish . On the other hand, the pickup depicted by some sectors, such as commerce and services may give some breathing room to the SME segment . All in all, even though the Central Bank does not report more restrictive offer conditions, except for the Construction and Real Estate sector, the quarterly credit survey reveals some evidence of weakened dema n d f r o m bo t h l a r g e c o mp a n i e s a n d S M E s . From the liabilities point of view, Demand Deposits managed by the industry accounted for Ch $ 66 , 289 , 984 million as of February 29 , 2024 , which denotes a 3 . 6 % nominal growth when compared to February 2023 while representing a slight real contraction when adjusting by 12 - month inflation . The lower advance than total loans suggests that Demand Deposits should continue to converge to an average reciprocity rate ~ 26 - 27 % over total loans, which will depend on several factors, including disposable income, inflation and interest rates . As of the same date, Time Deposits amounted to Ch $ 108 , 966 , 736 million, which denotes a 3 . 6 % annual nominal growth . This is in line with the deceleration observed throughout 2023 .
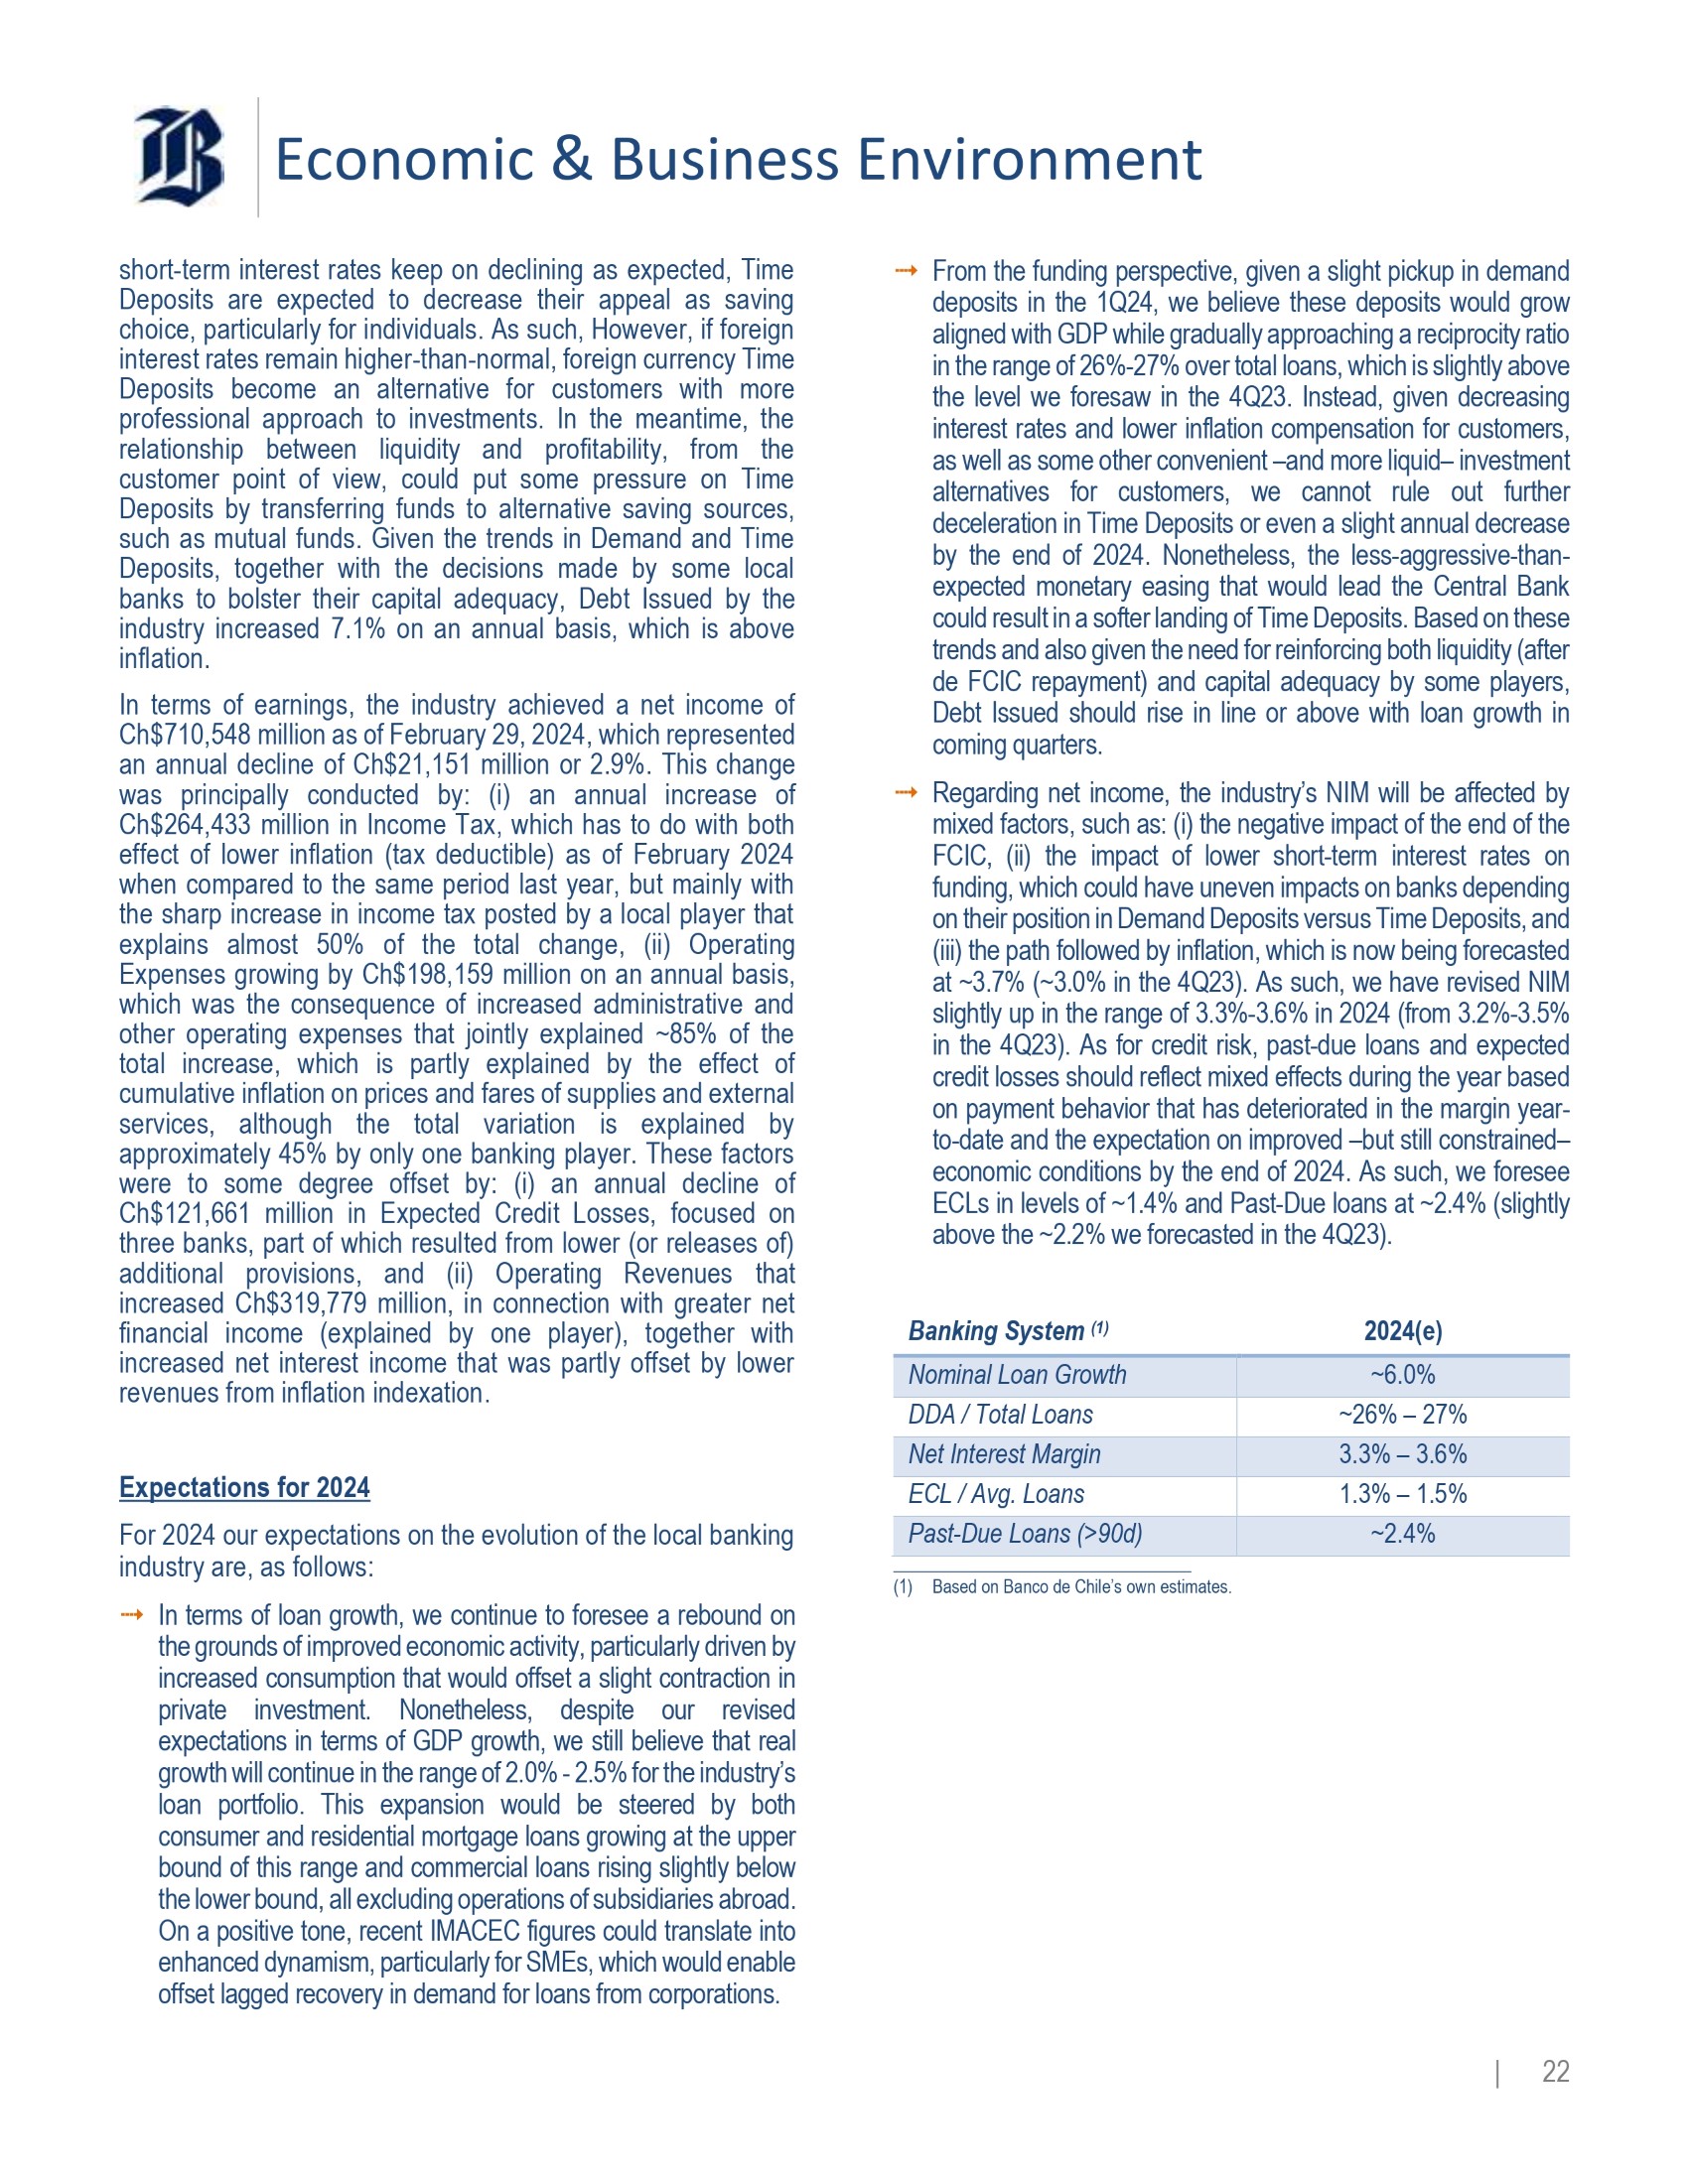
As long as | 21 Economic & Business Environment short - term interest rates keep on declining as expected, Time Deposits are expected to decrease their appeal as saving c ho i ce , p a r t i cu l a r l y f o r i n d i v i du a l s . As s uch , H o w e v e r, i f f o r e i gn interest rates remain higher - than - normal, foreign currency Time Deposits become an alternative for customers with more professional approach to investments . In the meantime, the relationship between liquidity and profitability, from the customer point of view, could put some pressure on Time Deposits by transferring funds to alternative saving sources, s u c h a s mu t u a l f u n d s . G i v e n t h e t r e n d s i n D e ma n d an d T i me Deposits, together with the decisions made by some local banks to bolster their capital adequacy, Debt Issued by the industry increased 7 . 1 % on an annual basis, which is above inflation . In terms of earnings, the industry achieved a net income of Ch $ 710 , 548 million as of February 29 , 2024 , which represented an annual decline of Ch $ 21 , 151 million or 2 . 9 % . This change was principally conducted by : (i) an annual increase of Ch $ 264 , 433 million in Income Tax, which has to do with both effect of lower inflation (tax deductible) as of February 2024 when compared to the same period last year, but mainly with the sharp increase in income tax posted by a local player that explains almost 50 % of the total change, (ii) Operating E x pe n s e s g r o w i n g b y C h $ 1 9 8 , 15 9 m i l li o n o n a n an n ua l b a s i s , which was the consequence of increased administrative and other operating expenses that jointly explained ~ 85 % of the total increase, which is partly explained by the effect of cumulative inflation on prices and fares of supplies and external services, although the total variation is explained by approximately 45 % by only one banking player . These factors were to some degree offset by : (i) an annual decline of Ch $ 121 , 661 million in Expected Credit Losses, focused on three banks, part of which resulted from lower (or releases of) additional provisions, and (ii) Operating Revenues that increased Ch $ 319 , 779 million, in connection with greater net financial income (explained by one player), together with increased net interest income that was partly offset by lower revenues from inflation indexation . E x p e c t a ti on s f o r 20 24 For 2024 our expectations on the evolution of the local banking i ndu s t r y a r e , a s f o ll o w s : ⭬ I n t e r m s o f l o a n g r o w t h , w e c o n t i nu e t o f o r e s e e a r e bo u n d o n the grounds of improved economic activity, particularly driven by i n c r ea s e d c on s um p t i o n t h a t w o u l d o ff s e t a s li g h t c o n t r a c t i o n in private investment . Nonetheless, despite our revised e x p e c t a t i o n s i n t e r m s o f G D P g r o w t h , w e s t il l be l i e v e t h a t r ea l g r o w t h w il l c o n t i n u e i n t h e r an g e o f 2 . 0 % - 2 . 5 % f o r t h e i n d u s tr y ’ s loan portfolio . This expansion would be steered by both c on s u m e r a n d r e s i d e n ti a l mo r t g a g e l oa n s g r o w i n g a t t h e u p pe r bound of this range and commercial loans rising slightly below the lower bound, all excluding operations of subsidiaries abroad . On a positive tone, recent IMACEC figures could translate into enhanced dynamism, particularly for SMEs, which would enable offset lagged recovery in demand for loans from corporations . Ban ki n g S y s t e m ( 1 ) ⭬ From the funding perspective, given a slight pickup in demand dep o s i t s i n t h e 1 Q 2 4 , w e be l i e v e t h e s e d e po s i t s w o u l d g r o w aligned with GDP while gradually approaching a reciprocity ratio in the range of 26 % - 27 % over total loans, which is slightly above the level we foresaw in the 4 Q 23 . Instead, given decreasing interest rates and lower inflation compensation for customers, as well as some other convenient – and more liquid – investment alternatives for customers, we cannot rule out further deceleration in Time Deposits or even a slight annual decrease by the end of 2024 . Nonetheless, the less - aggressive - than - expected monetary easing that would lead the Central Bank could result in a softer landing of Time Deposits . Based on these trends and also given the need for reinforcing both liquidity (after de FCIC repayment) and capital adequacy by some players, Debt Issued should rise in line or above with loan growth in c om i n g qu a r t e r s . ⭬ Regarding net income, the industry’s NIM will be affected by mixed factors, such as : (i) the negative impact of the end of the FCIC, (ii) the impact of lower short - term interest rates on funding, which could have uneven impacts on banks depending on their position in Demand Deposits versus Time Deposits, and (iii) the path followed by inflation, which is now being forecasted a t ~ 3 . 7 % ( ~ 3 . 0 % i n t h e 4 Q 23 ) . A s s u c h , w e ha v e r e v i s e d N I M slightly up in the range of 3 . 3 % - 3 . 6 % in 2024 (from 3 . 2 % - 3 . 5 % i n t h e 4 Q 2 3 ) . A s f o r c r e d i t r i sk , pa s t - d u e l oa n s a n d e x p e c t e d credit losses should reflect mixed effects during the year based o n pa y me n t be h a v i o r t h a t ha s d e t e r i o r a t e d i n t h e m a r g i n y e a r - to - date and the expectation on improved – but still constrained – economic conditions by the end of 2024 . As such, we foresee ECLs in levels of ~ 1 . 4 % and Past - Due loans at ~ 2 . 4 % (slightly abo v e t h e ~ 2 . 2 % w e f o r e c a s t e d i n t h e 4 Q 2 3 ) . 2024(e) ~6.0% Nom ina l L o an Gr owth ~2 6 % – 27% D D A / T ot al L o a ns 3.3% – 3. 6 % Net Inte r es t M a r gin 1. 3% – 1. 5 % E CL / A vg . L o a ns ~2.4% Pas t - Due L o a n s ( >9 0 d) ( 1 ) B a s e d o n B a n c o d e C h il e ’ s o w n e s t i m a t e s .
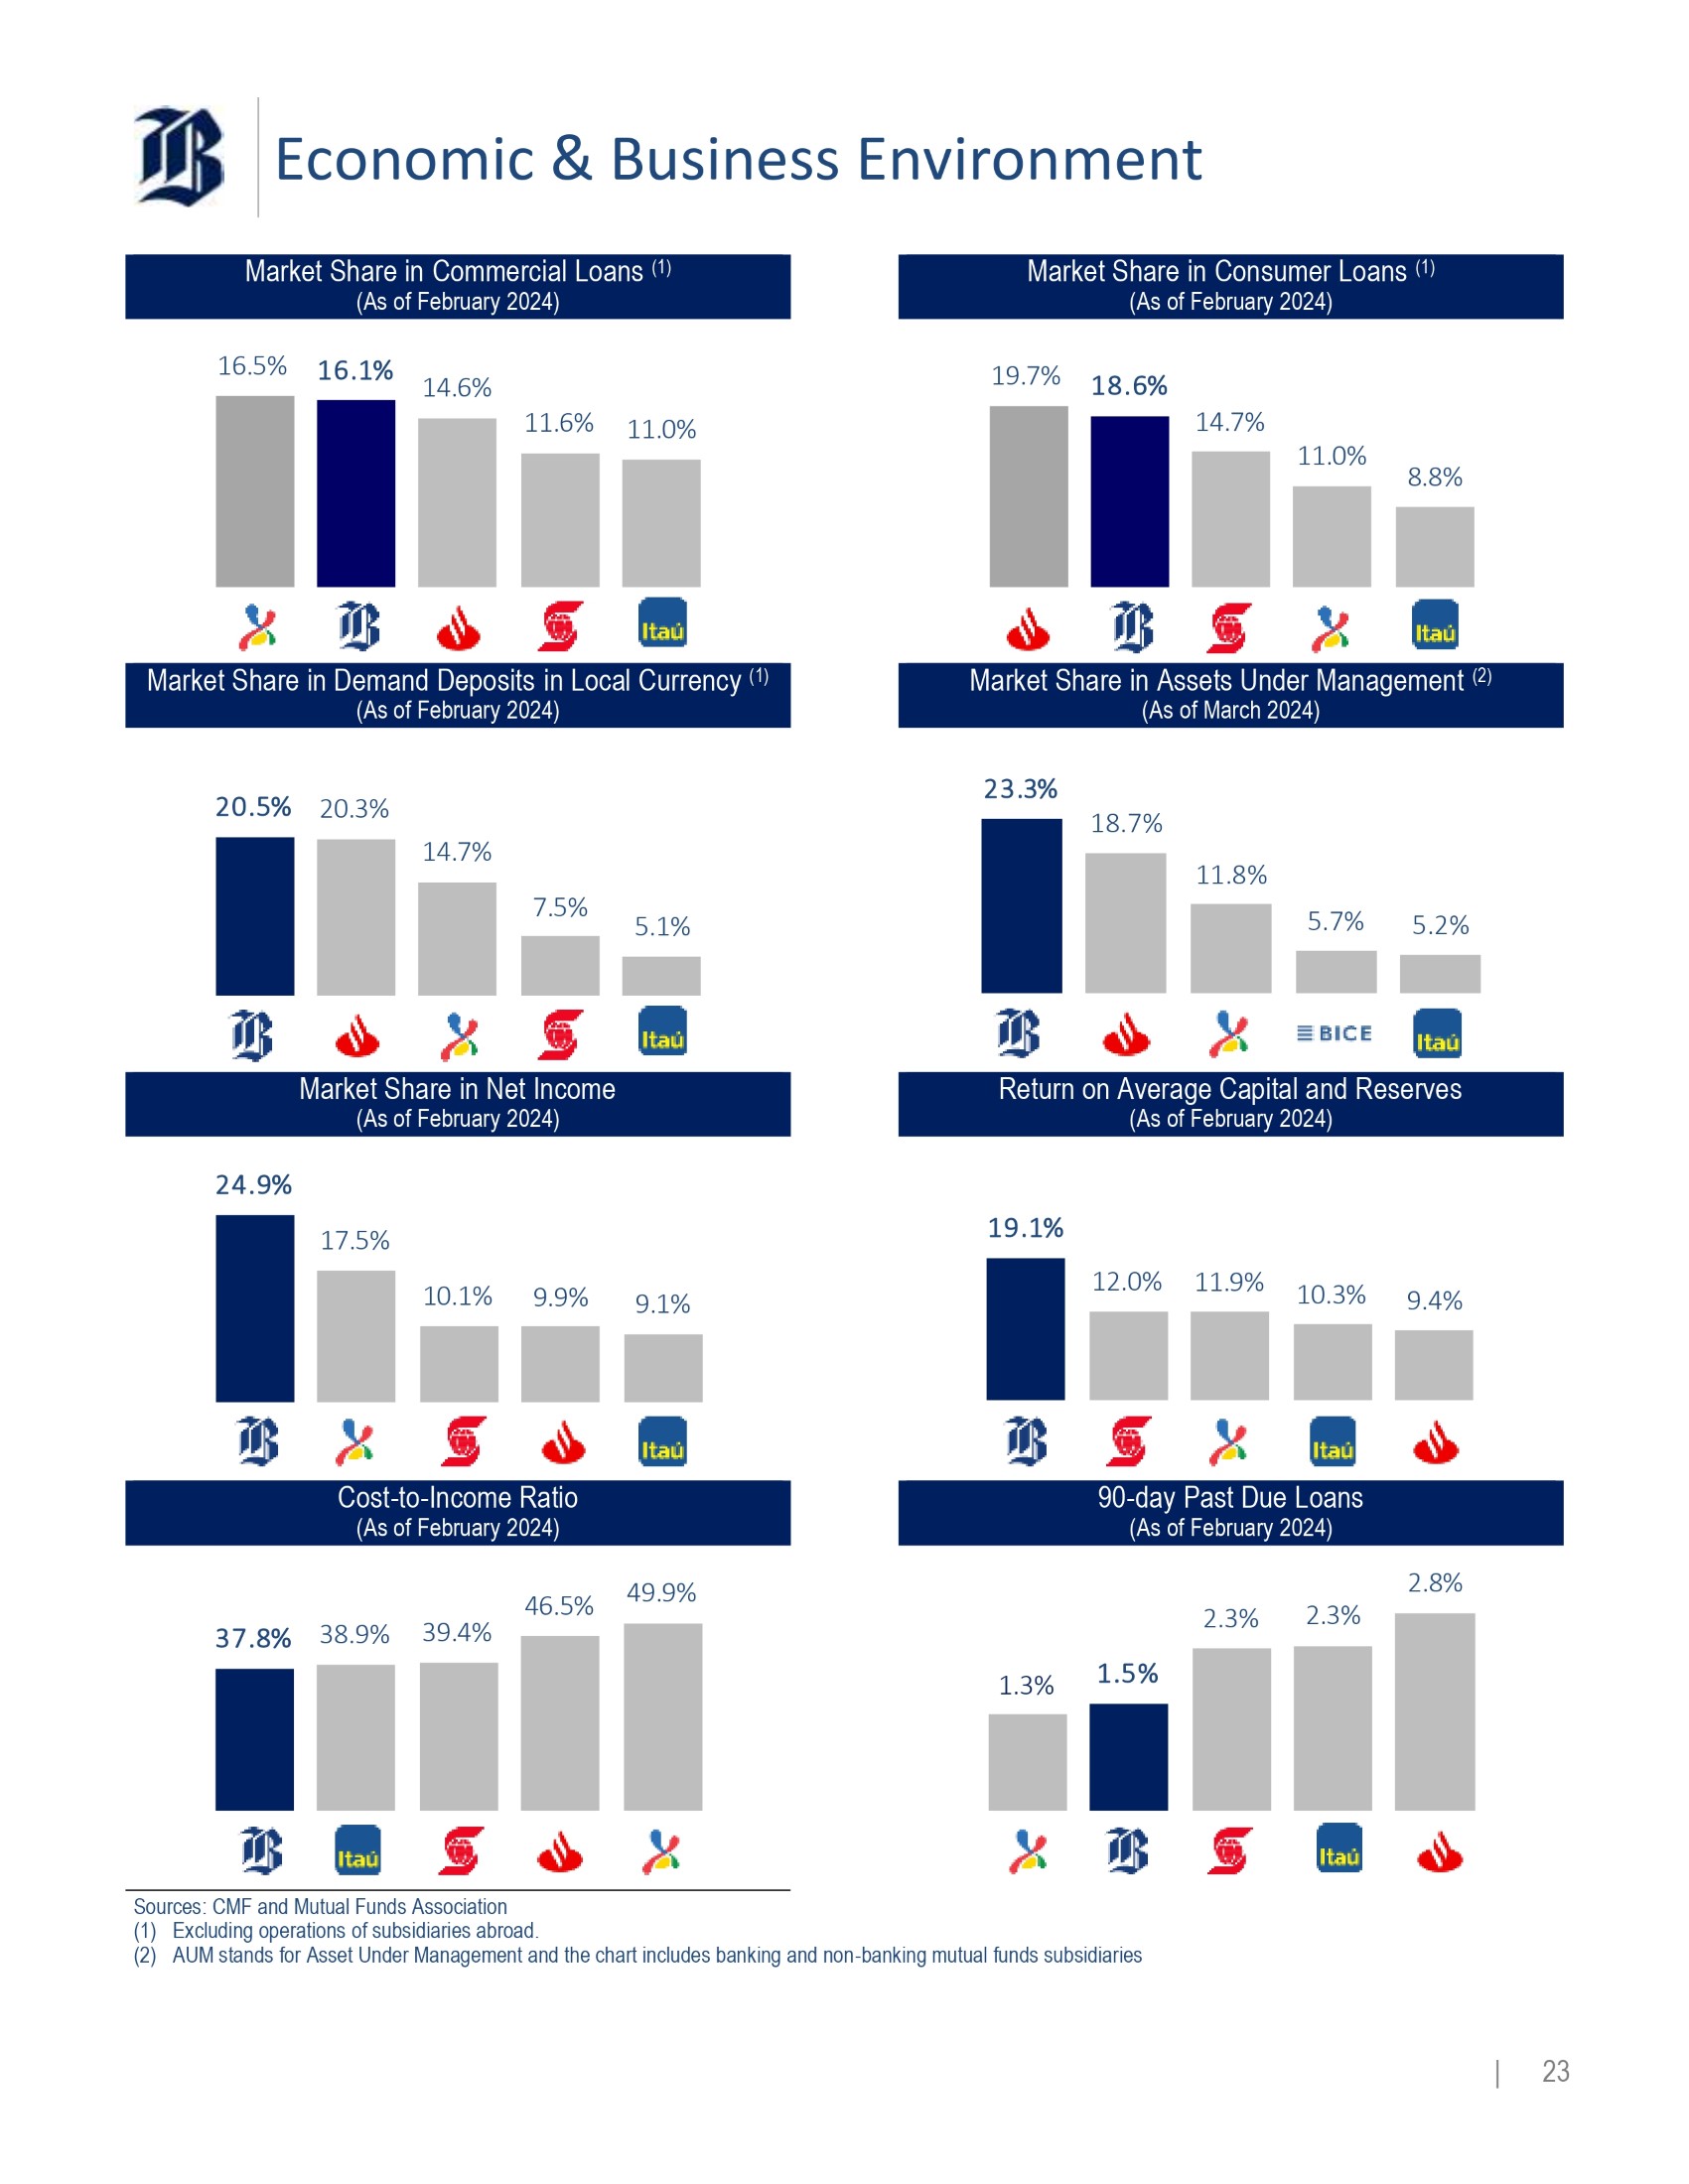
| 22 Economic & Business Environment Ma r ke t S ha re i n C o m m e r c i a l Loa n s ( 1 ) ( A s o f F e b r ua r y 20 2 4 ) Ma r ke t S ha re i n C o nsu m e r L oa n s ( 1 ) ( A s o f F e b r ua r y 2024 ) 16 . 5 % 16 . 1 % 14 . 6 % 11 . 6 % 11 . 0 % 19 . 7 % 18 . 6 % 14 . 7 % 11 . 0 % 8 . 8 % Market Share in Demand Deposits in Local Currency (1) ( A s o f F e b r ua r y 20 2 4 ) Ma r ke t S ha re i n A s se t s U n de r M a na g e m en t ( 2 ) ( A s o f M a r c h 202 4 ) 20 . 5 % 20 . 3 % 14 . 7 % 7 . 5 % 5 . 1 % 23 . 3 % 18 . 7 % 11 . 8 % 5 . 7 % 5 . 2 % Ma r ke t S ha re i n N e t I nc o m e ( A s o f F e b r ua r y 20 2 4 ) R e t u r n o n A ve r a g e C a p i t a l a n d R ese r ve s ( A s o f F e b r ua r y 2024 ) 24 . 9 % 17 . 5 % 10 . 1 % 9 . 9 % 9 . 1 % 19 . 1 % 12 . 0 % 11 . 9 % 10 . 3 % 9 . 4 % C o s t - to - I nc om e R a t i o ( A s o f F e b r ua r y 20 2 4 ) 90 - d ay P as t D u e L o a ns ( A s o f F e b r ua r y 2024 ) 37 . 8 % 38 . 9 % 39 . 4 % 46 . 5 % 49 . 9 % 1 . 3 % 1 . 5 % 2 . 3 % 2 . 3 % 2 . 8 % Sources: CMF and Mutual Funds Association (1) E xc l u d i n g op e r a t i on s o f s ub s i d i a r i e s a b r o ad .

(2) AUM stands for Asset Under Management and the chart includes banking and non - banking mutual funds subsidiaries | 23 Management Discussion & Analysis Income Statement Analysis 1Q24 (In Millions of Ch$) N e t I n c o me 1 Q 2 4 v s . 1 Q 2 3 Our net income amounted to Ch $ 297 , 655 million in the 1 Q 24 , which den o t e d a n a n nu a l i n c r em e n t o f 1 1 . 9 % w he n c o mp a r e d t o t h e fi gu r e r ea c he d i n t h e s am e p e r i o d o f 20 2 3 . Q ua r ter l y N e t Inco m e ( In m illi o n s o f C h $ ) In c o m e T ax Non - C u s t o m er Income C u s t o m er Income E x pe c t ed C r ed i t Losses O pe r a t i ng E x pen s es 11.9% This annual variation in net income was primarily sustained by an annual increase of Ch $ 77 , 845 million or 11 . 1 % in operating revenues, mainly underlain by an annual boost in customer income, that was in turn fostered by enhanced income from both loans and deposits . Thi s f a c t o r w a s t o s o m e de g r e e c oun t e r b a l a n c e d b y : ⭬ An annual rise of Ch $ 20 , 402 million or 7 . 7 % in operating e x p e n s e s , ma i n l y a t tr i b u t a b l e t o t h e e ff e c t o f i n f l a t i o n o n U F - indexed line items, mainly salaries, IT expenses fixed - assets ma i n t e n an c e a n d i n c r e a s e d r en t a l c o s t s . ⭬ An annual increase of Ch $ 18 , 079 or 26 . 7 % in income tax primarily due to an increase of 14 . 9 % in pre - tax income, in addition to lower inflation in the 1 Q 24 when compared to the 1 Q 23 , which is tax deductible under the Chilean tax law . ⭬ An annual increase of Ch $ 7 , 660 million or 7 . 3 % in Expected Credit Losses (ECLs), which was principally explained by loan growth, including cross border loans, specific cases in the Wholesale Banking segment, and higher impairments of financial assets on an annual basis . These impacts were partially compensated by a decrease in ECLs related to the Retail segment due to both stabilized delinquency rates in the 1 Q 24 , in comparison with increasing past - due in the 1 Q 23 , and a l o w e r u s e o f r e v o l v i n g l o a n s b y c u s t o m e r s . R e t u r n o n A ve r a g e E q u it y ( R O A E ) R etu r n on A verage E q uity (Annualized) 21 .6 % 22 . 6 % 1 Q 23 1 Q 24 R O A E Based on the net income earned as of March 31 , 2024 , we achieved a R O A E o f 22 . 6 % i n t h e 1 Q 2 4 , t ha t p o s i t i v e l y c o mp a r e s w i t h t h e 21 . 6 % r ea c h e d a y e a r e a r l i e r .
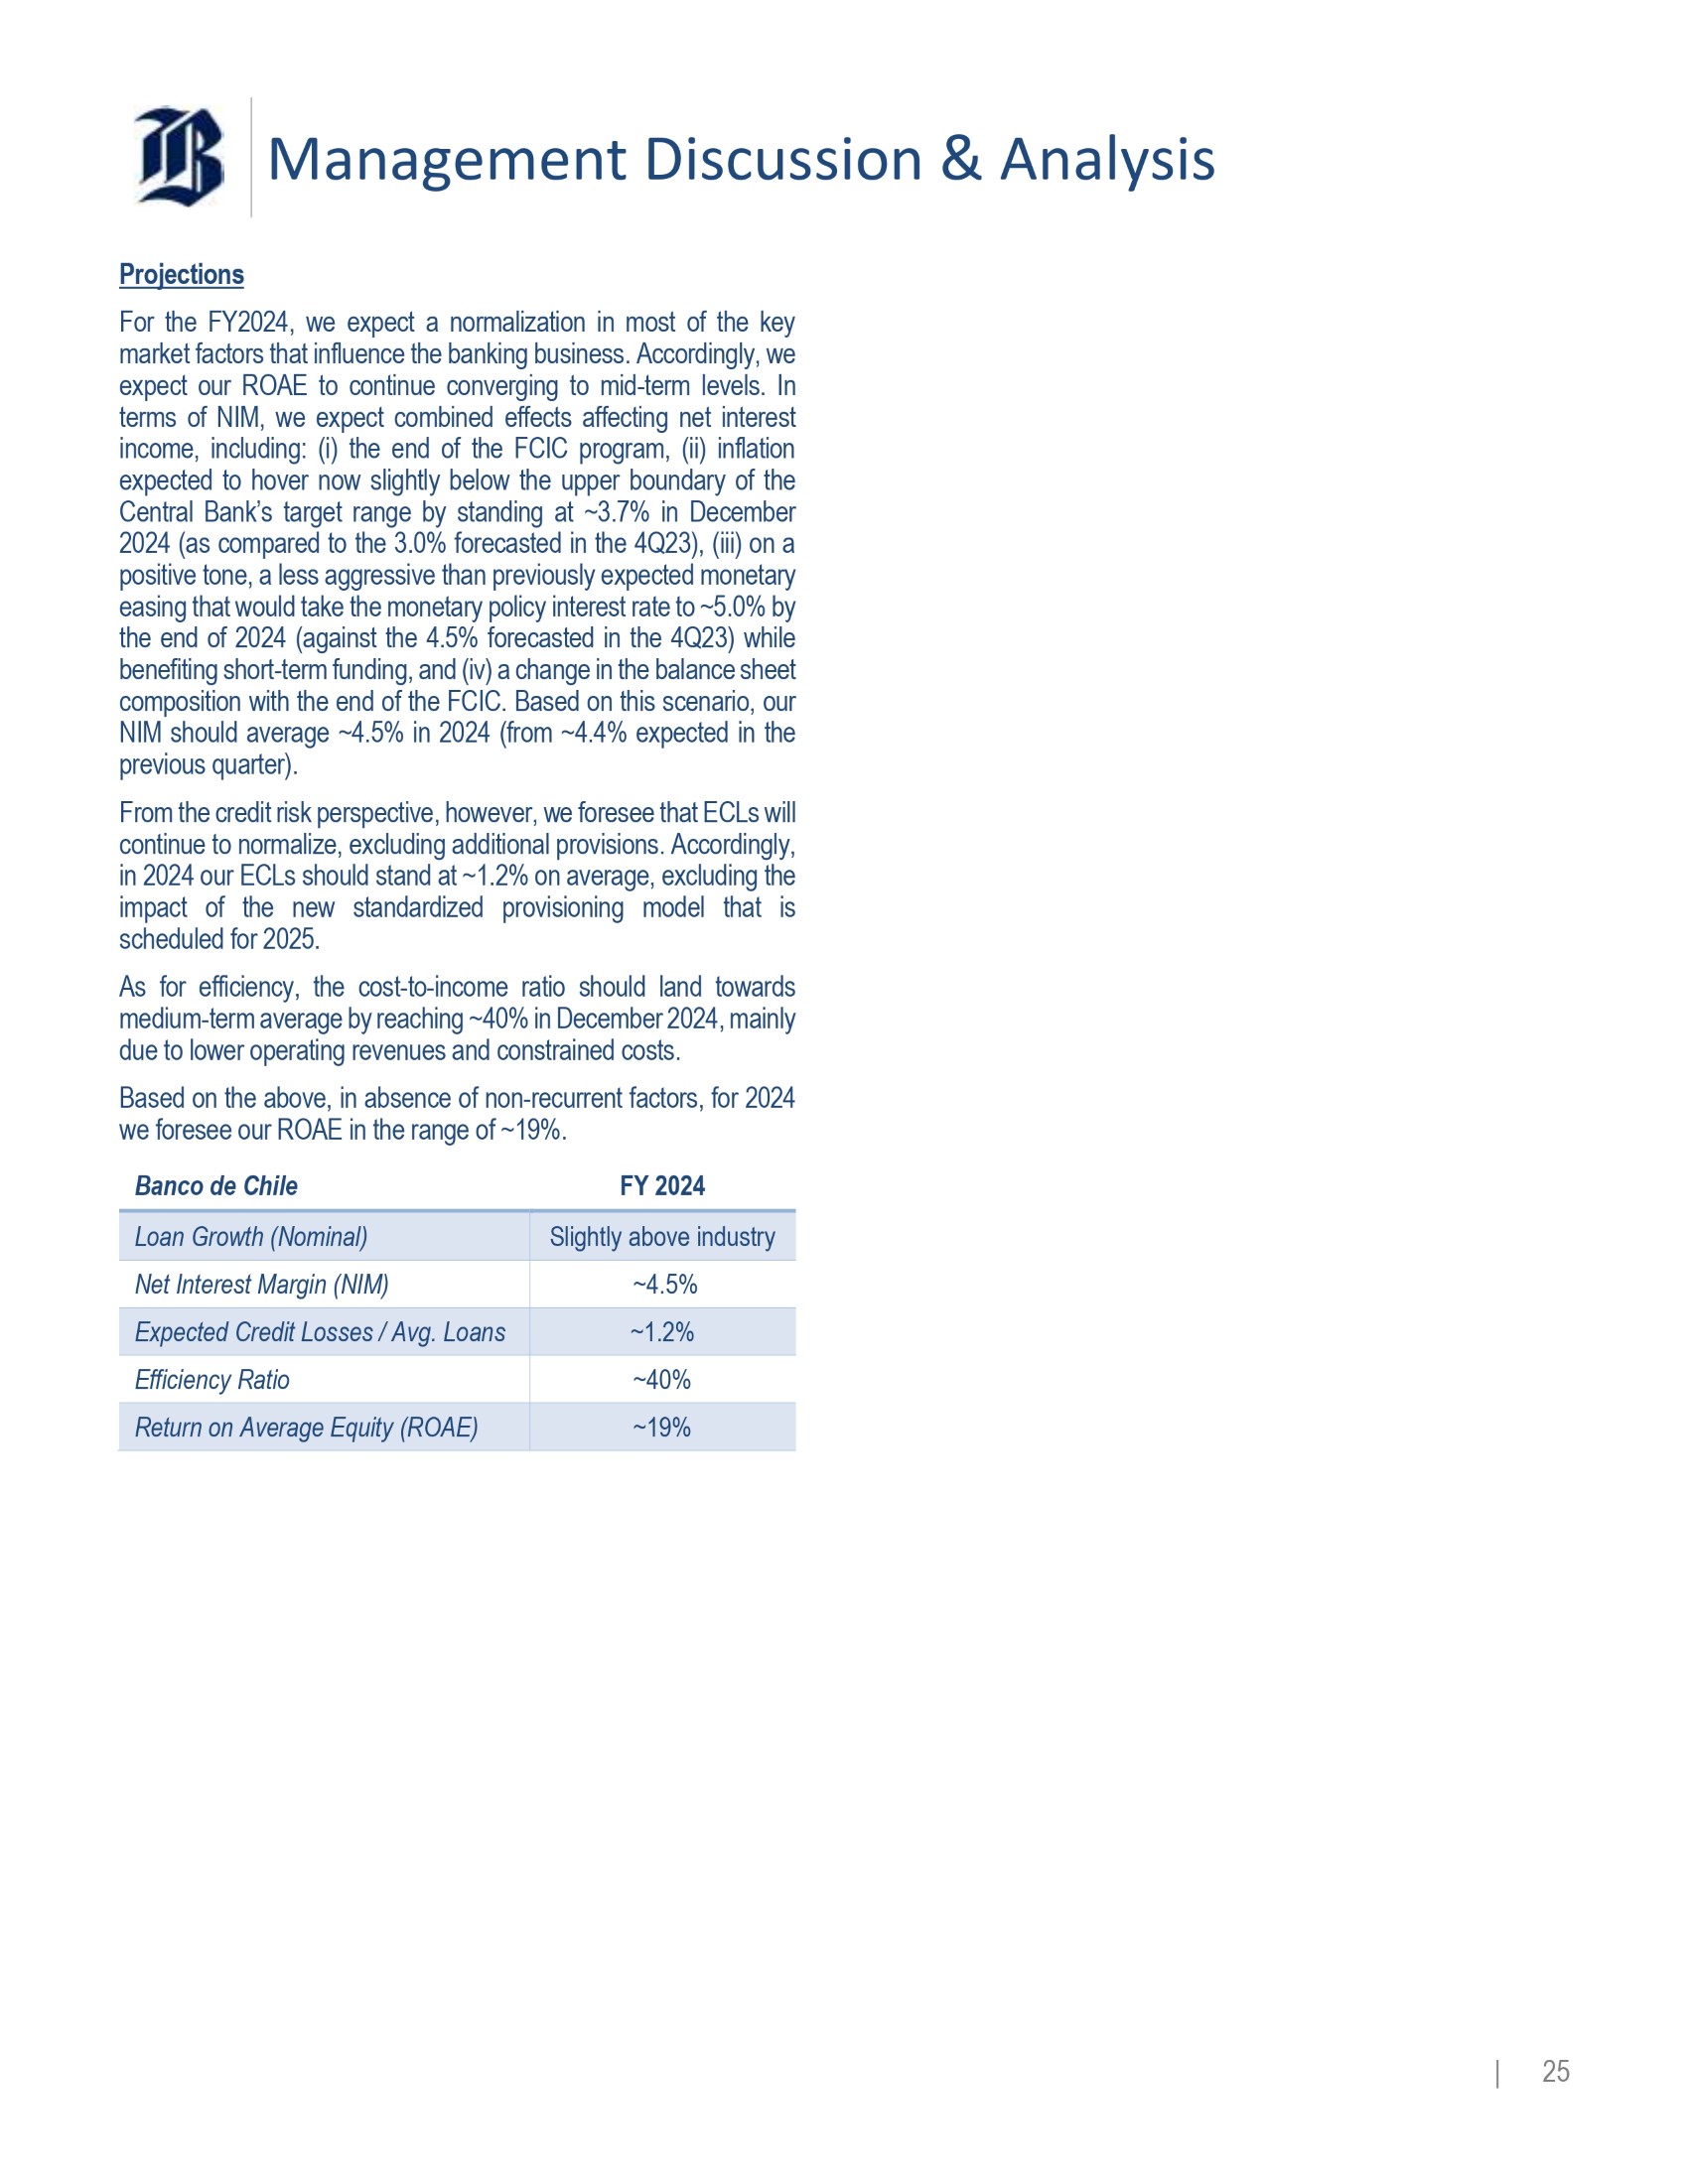
| 24 Management Discussion & Analysis Projections For the FY 2024 , we expect a normalization in most of the key market factors that influence the banking business . Accordingly, we expect our ROAE to continue converging to mid - term levels . In terms of NIM, we expect combined effects affecting net interest income, including : (i) the end of the FCIC program, (ii) inflation expected to hover now slightly below the upper boundary of the Central Bank’s target range by standing at ~ 3 . 7 % in December 202 4 ( a s c o mp a r e d t o t h e 3 . 0 % f o r e c a s t e d i n t h e 4 Q 23 ) , ( ii i ) o n a positive tone, a less aggressive than previously expected monetary easing that would take the monetary policy interest rate to ~ 5 . 0 % by the end of 2024 (against the 4 . 5 % forecasted in the 4 Q 23 ) while benefiting short - term funding, and (iv) a change in the balance sheet composition with the end of the FCIC . Based on this scenario, our NIM should average ~ 4 . 5 % in 2024 (from ~ 4 . 4 % expected in the p r e v i o u s q ua r t e r ) . From the credit risk perspective, however, we foresee that ECLs will continue to normalize, excluding additional provisions . Accordingly, in 2024 our ECLs should stand at ~ 1 . 2 % on average, excluding the impact of the new standardized provisioning model that is sc h e du l e d f o r 2 0 25 . As for efficiency, the cost - to - income ratio should land towards medium - term average by reaching ~ 40 % in December 2024 , mainly due to lower operating revenues and constrained costs . Based on the above, in absence of non - recurrent factors, for 2024 w e f o r e s e e o u r R O A E i n t h e r a ng e o f ~ 1 9 % . Ban c o d e C h ile F Y 2024 | 25 Slightl y a b o v e in d ust ry L o a n G r owt h (Nom inal) ~4.5% Net Inte r es t M a r gi n (NIM) ~1.2% Exp e cte d Cr e d i t L o s se s / A vg . L o a ns ~40% E fficien c y Ratio ~19% Retu r n on Aver a ge Equi t y (RO AE )

Management Discussion & Analysis O pe r atin g R eve n ues B r eak d own ( In m illi o n s o f C h $ ) Q u a r t e r C h a ng e 1 Q 24 /1 Q 23 % Ch$ Mar - 24 Mar - 23 % Ch$ 1Q24 1Q23 + 16.8 % 76,286 530,334 454,048 + 16.8 % 76,286 530,334 454,048 N et In t e r e s t In c o m e ( In t e r e s t and In f l a t i on) + 1.7 % 1,771 104,743 102,972 + 1.7 % 1,771 104,743 102,972 F i nan ci al R e s u l t s ( 1) + 14.0 % 78,057 635,077 557,020 + 14.0 % 78,057 635,077 557,020 N et F i n a n cial I n c o m e + 0.4 % 557 137,472 136,915 + 0.4 % 557 137,472 136,915 N et F ees a n d C o mm isi o n s + 7.5 % 603 8,592 7,989 + 7.5 % 603 8,592 7,989 O th er O p e r a t i n g I n c o m e (89.0)% - 1,760 218 1,978 (89.0)% - 1,760 218 1,978 I n c o m e a tt r i b ut a b le t o a ff ilia t es (27.7)% 388 - 1,013 - 1,401 (27.7)% 388 - 1,013 - 1,401 I n c o m e f r o m N on - C u rr e n t A sse t s H eld fo r S ale + 11.1 % 77,845 780,346 702,501 + 11.1 % 77,845 780,346 702,501 T ot al O p e r a t i n g R eve nu es bp. Mar - 24 Mar - 23 bp. 1Q24 1Q23 K ey R a t i o s 27 4.72% 4.45% 27 4.72% 4.45% N et In t e r e s t M a r g i n 44 5.14% 4.70% 44 5.14% 4.70% N et F i nan ci al M a r g i n - 4 1.45% 1.49% - 4 1.45% 1.49% F ees t o A v e r age Loans C h a ng e M a r - 24 / M a r - 23 I n M illi on s o f C h $ Year - to - Date (1) Include results from financial assets held for trading measured at fair value in P&L, financial assets measured at fair value through other comprehensive income, financial liabilities measured at fair value, trading derivatives, hedge accounting derivatives and foreign exchange transactions. N e t F i n a n c ial I n c o me 1 Q2 4 v s . 1 Q2 3 N e t Financial I n com e B r ea k down ( In M illi o n s o f C h $ ) 377,562 449,409 179,458 185,668 557,020 635,077 1Q23 1Q24 N on - C u s t o m e r F i nan c i a l I n c o m e C u s t o m e r F i nan c i a l I n c o m e | 26 Net financial income totalled Ch $ 635 , 077 million in the 1 Q 24 , increasing Ch $ 78 , 057 million when compared to the Ch $ 557 , 020 million reached a year earlier . This performance strongly relied on the overall improvement of our financial core revenues, as reflected by customer financial income growing Ch $ 71 , 847 million on an annual basis, from Ch $ 377 , 562 million in the 1 Q 23 to Ch $ 449 , 409 million in the 1 Q 24 . To a lesser extent, non - customer financial income rose from Ch $ 179 , 458 million in the 1 Q 23 to Ch $ 185 , 668 million in the 1 Q 24 , equivalent to a Ch $ 6 , 210 million YoY expansion . T h i s p e r f o r m an c e w a s t h e r e s u l t o f : ⭬ An annual advance of Ch $ 30 , 757 million in income from loans, from Ch $ 202 , 671 million in the 1 Q 23 to Ch $ 233 , 428 million in the 1 Q 24 . The overall performance of income from loans was largely influenced by an annual increase of Ch $ 30 , 331 million in income from consumer loans, associated with a sharp improvement on consumer lending margins and, to a lesser degree, with average balances increasing 5 . 1 % on an annual basis . Likewise, income from resi dent ia l m ortgag e l oan s g r e w C h $ 3 , 46 4 millio n i n lin e with the 7 . 4 % annual increase in average balances . Instead, income from commercial loans decreased Ch $ 3 , 038 million on an annual basis, on the grounds of more competitive lendin g s pre ads . ⭬ An annual rise of Ch $ 22 , 298 million in income from time deposits (TD) . As mentioned in previous quarterly reports, the trend followed by this product has been in connection with improved margins on TD resulting from more active pricing management that has leveraged on our digital transformation strategy . This effect coupled with average TD balances that incre ased 9 . 0 % o n a n annua l b asis . ⭬ An annual improvement of Ch $ 18 , 878 million in the contribution from demand deposits (DDA) to our funding cost, mostly associated with core deposits that have continued to gro w steadi l y o n the ground s o f ou r premiu m cus to m e r bas e, fo r CLP - deno m inated dem a n d d epo sits , i n parti c ula r .

Management Discussion & Analysis ⭬ An annual increase of Ch $ 8 , 203 million from the management of our balance sheet and financial positions, which may be summarized as follows : (i) an annual growth of Ch $ 12 , 714 million in revenues from the management of our De b t S ecur i ties an d Tra di n g d e sks , princip a ll y infl u enced b y positive marking - to - market on our on trading derivatives, as a result of favourable changes in shorter terms of the local yiel d curv es , w hic h i n t u r n was mildl y offs e t b y the effe c t of both lower inflation (measured as UF variation) on CLF - denominated securities in the 1 Q 24 when compared to the 1 Q 2 3 an d dec re a sed rev enu e s from the managem e n t o f our intraday FX position, and (ii) an annual advance of Ch $ 8 , 065 million in the contribution of our USD - denominated asset position that hedges expenses denominated in foreign currency (ECLs on cross border loans and provisions related to our loyalty program) due to the sharp depreciation of the Chilea n Pes o i n th e 1 Q 2 4 ( 1 2 . 3 % ) a s c o mpa red to the 6 . 6 % appreciation in the 1 Q 23 . These effects were partly offset by : (i) an annual decline of Ch $ 8 , 172 million in the contribution of the bank’s UF - indexed net asset exposure (structural and directional positions) resulting from the annual decrease in inflation, which – measured as UF variation – accounted for 0 . 8 % in the 1 Q 24 in relation to 1 . 3 % in the 1 Q 23 , that in turn was par tl y compen sat e d b y be t te r A L M res u lts , a s we hav e continue benefiting from on - balance sheet gaps, particularly those arising from CLP - denominated short - term assets funded by CLF - denominated liabilities, and (ii) an annual reduction of Ch $ 2 , 823 million in revenues Sales & Structuring, mostly influenced by a high comparison base, given specific derivative transactions carried out by corporate client s i n th e 1 Q 2 3 . N e t F i n a n c i a l M a r g i n ( N F M ) We reached a net financial margin of 5 . 14 % during the 1 Q 24 , which represents an annual improvement of 44 bp . when compared to the 4 . 70 % recorded in the 1 Q 23 . This annual change in NFM was mostly influenced by improved commercial margins on both loans and deposits, as well as solid contribution from ALM during the quarter, given the proactive management of financial gaps that seek to take advantage of trends in yield curves under the current macroeconomic environment . As a result, we were able to increase our NFM ratio despite the above - mentioned decline in inflation . All things being equal, we outperformed by 77 bp . the net financial margin of 4 . 37 % posted by the industry in the 1 Q 24 , as the negative effect of lower inflation and changes in interest rates do not necessarily affect the banking industry in the same fashion, due to t h e ba l an c e s he e t s t r u c t u r e o f e a c h b an k . 4 . 70 % N e t Financial Margi n ( 1 ) ( N et F i n a nci a l I n c o m e / A vg. I n t e r es t E a r ning Asse t s ) 5.14% 3 . 87 % 4 . 37 % 1 Q 23 1Q24 BCH Industry (1) Industry s ratios for the 1Q24 consider the three - month period ended on February 29, 2024. N e t F e e I n c o me 1 Q 2 4 v s . 1 Q 2 3 Our net fee income amounted to Ch $ 137 , 472 million in the 1 Q 24 , which denoted an annual increase of Ch $ 557 million or 0 . 4 % as compared to the Ch $ 136 , 915 million posted in the 1 Q 23 . N e t Fee Income ( In M illi o n s o f C h $ ) 2 , 47 6 15,656 10,327 2,203 13,309 16,879 28,395 32,396 28,663 28,190 54,018 41,875 136 , 9 15 137 , 4 72 O t h e rs S t o c k B r o k e r age C r ed i t s , c on t i ngen t l o an s and r epa y m e n ts M u t u a l F und s I n s u r an c e B r o k e r age Transactional Services 1Q23 1Q24 The annual growth in fee - based income was mainly supported by: ⭬ Higher fee - income from Mutual Funds that increased Ch $ 4 , 00 1 m i llio n o n a n an n ua l b asis , from Ch $ 28 , 39 5 millio n to Ch $ 32 , 396 million, due to a 37 . 4 % annual increment in average assets under management, in line with actual and | 27 Management Discussion & Analysis expected changes in interest rate trends and shifts in investo rs’ p ref e r enc es.
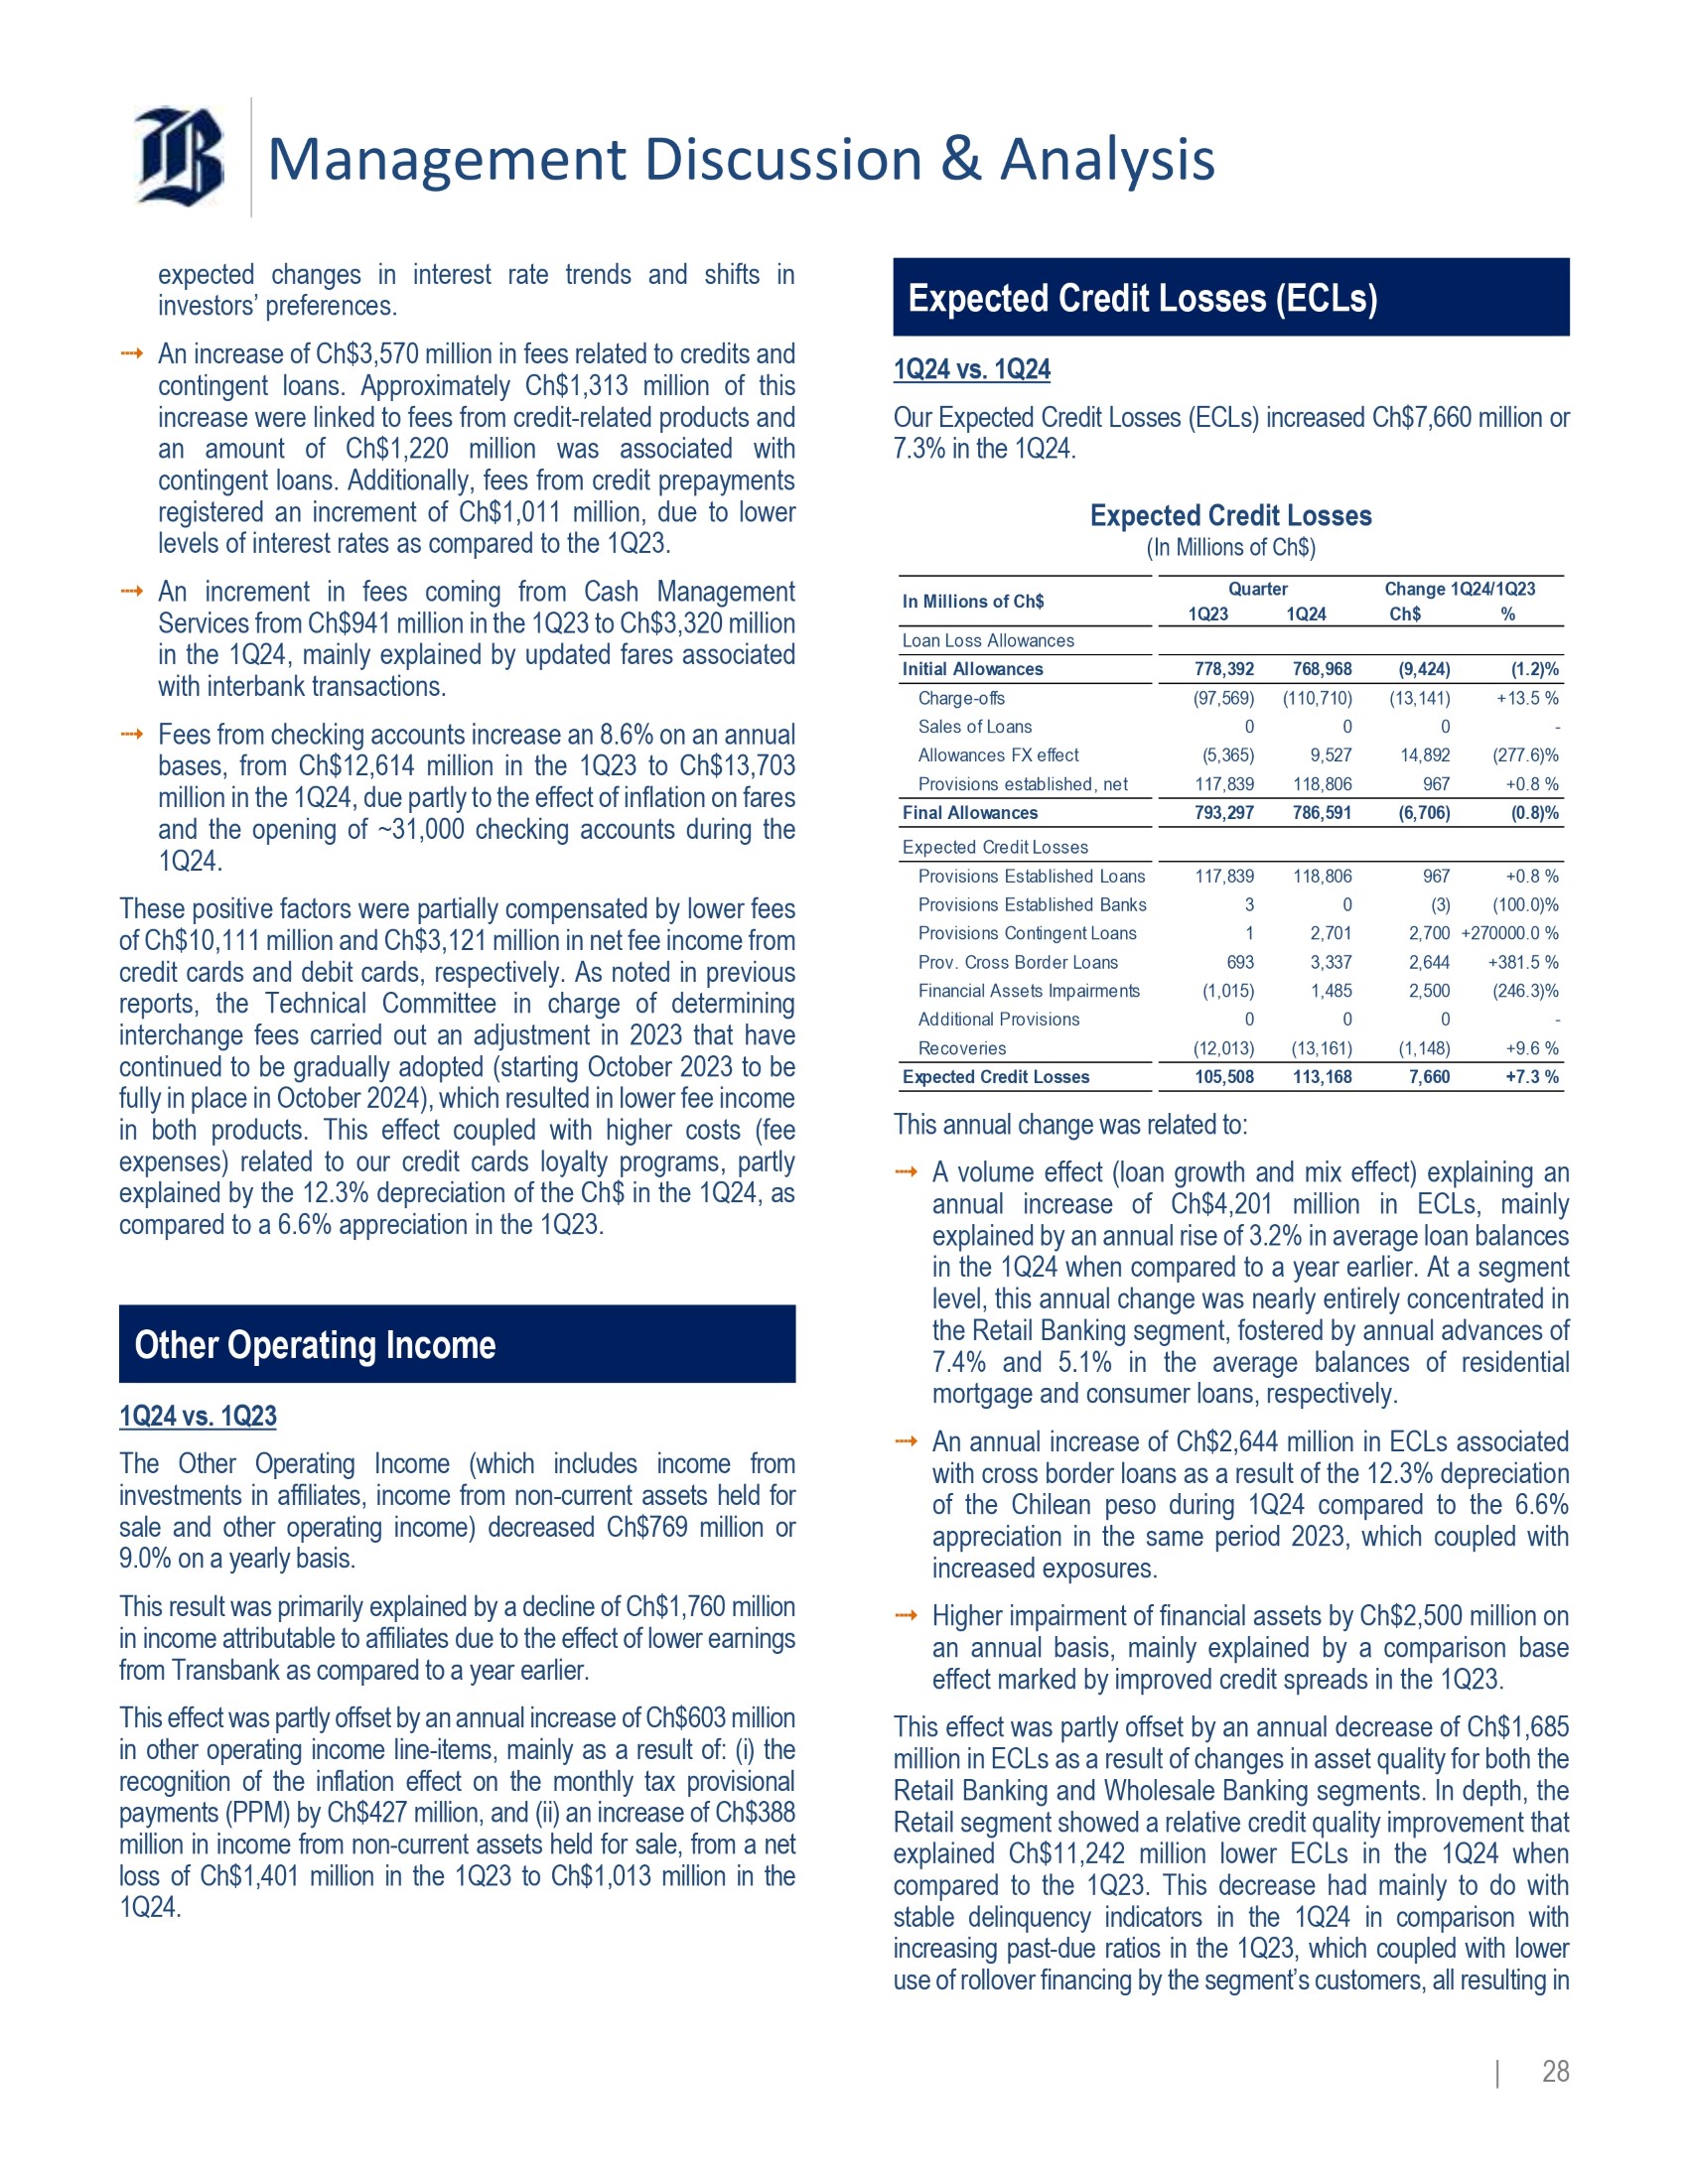
⭬ An increase of Ch $ 3 , 570 million in fees related to credits and contingent loans . Approximately Ch $ 1 , 313 million of this increase were linked to fees from credit - related products and an amount of Ch $ 1 , 220 million was associated with contingent loans . Additionally, fees from credit prepayments registered an increment of Ch $ 1 , 011 million, due to lower level s o f in ter e s t rat e s a s c o m p are d to the 1 Q 23 . ⭬ An increment in fees coming from Cash Management Services from Ch $ 941 million in the 1 Q 23 to Ch $ 3 , 320 million in the 1 Q 24 , mainly explained by updated fares associated wit h inte rb an k t r ans action s . ⭬ Fee s from ch e ckin g acc o unts i n crea s e a n 8 . 6 % o n a n an n ual bases, from Ch $ 12 , 614 million in the 1 Q 23 to Ch $ 13 , 703 millio n i n the 1 Q 24 , d u e par tl y t o the effe c t o f inflation o n f a res and the opening of ~ 31 , 000 checking accounts during the 1 Q 24 . These positive factors were partially compensated by lower fees of Ch $ 10 , 111 million and Ch $ 3 , 121 million in net fee income from credit cards and debit cards, respectively . As noted in previous reports, the Technical Committee in charge of determining interchange fees carried out an adjustment in 2023 that have continued to be gradually adopted (starting October 2023 to be fully in place in October 2024 ), which resulted in lower fee income in both products . This effect coupled with higher costs (fee expenses) related to our credit cards loyalty programs, partly explained by the 12 . 3 % depreciation of the Ch $ in the 1 Q 24 , as compare d t o a 6 . 6 % app rec i ati o n i n the 1 Q 23 . | 28 O th e r O p e r a t i ng I n c o me 1 Q 2 4 v s . 1 Q 2 3 The Other Operating Income (which includes income from investments in affiliates, income from non - current assets held for sale and other operating income) decreased Ch $ 769 million or 9 . 0 % o n a y e a r l y b a s i s . This result was primarily explained by a decline of Ch $ 1 , 760 million in income attributable to affiliates due to the effect of lower earnings f r o m T r a n s b a n k a s c o m pa r e d t o a y e a r ea r li e r . This effect was partly offset by an annual increase of Ch $ 603 million in other operating income line - items, mainly as a result of : (i) the recognition of the inflation effect on the monthly tax provisional pa y men t s ( P P M ) b y C h $ 4 2 7 m i l l i on , a n d ( i i ) a n i n c r e a s e o f C h $ 3 8 8 million in income from non - current assets held for sale, from a net loss of Ch $ 1 , 401 million in the 1 Q 23 to Ch $ 1 , 013 million in the 1 Q 24 . Expec ted C r e d i t Lo s s e s ( ECLs) 1 Q2 4 v s . 1 Q2 4 Our Expected Credit Losses (ECLs) increased Ch$7,660 million or 7.3 % i n t h e 1 Q2 4 . E xpecte d C r edi t L o s s es ( In M illi o n s o f C h $ ) 24/1Q23 % C h a n g e 1 Q Ch$ ter 1Q24 Q u a r 1Q23 I n M illi o n s of C h$ L o a n L o s s A ll o w an c e s (1.2)% (9,424) 768,968 778,392 I n i t i a l A ll o w a n c e s + 13 . 5 % (13,141) (110,710) (97,569) Charge - offs - 0 0 0 S a l e s o f L o an s (277.6)% 14,892 9,527 (5,365) A ll o w an c e s FX e ff e c t + 0 . 8 % 967 118,806 117,839 Provisions established, net (0.8)% (6,706) 786,591 793,297 F i n a l A ll o w a n c e s E x pe c t e d C r ed it L o ss e s + 0 . 8 % 967 118,806 117,839 Provisions Established Loans (100.0)% (3) 0 3 Provisions Established Banks 2 , 70 0 + 270000 . 0 % 2,701 1 P r o v i s i o n s C o n t i n ge n t L o an s + 381 . 5 % 2,644 3,337 693 P r o v . C r o s s B o r de r L o an s (246.3)% 2,500 1,485 (1,015) Fi nan c i a l A ss e t s I m p a i r m e n t s - 0 0 0 A dd i t i o na l P r o v i s i o n s + 9 . 6 % (1,148) (13,161) (12,013) Recoveries + 7 . 3 % 7,660 113,168 105,508 E x p e c t e d C r e d i t L o sse s T h i s a n nu a l c ha n g e w a s r e l a t e d t o : ⭬ A volume effe c t ( l oa n gro wth a n d mi x effect ) ex p lainin g an annual increase of Ch $ 4 , 201 million in ECLs, mainly explained by an annual rise of 3 . 2 % in average loan balances in the 1 Q 24 when compared to a year earlier . At a segment level, this annual change was nearly entirely concentrated in the Retail Banking segment, fostered by annual advances of 7 . 4 % and 5 . 1 % in the average balances of residential mortgage and consumer loans, respectively . ⭬ An annual increase of Ch $ 2 , 644 million in ECLs associated with cross border loans as a result of the 12 . 3 % depreciation of the Chilean peso during 1 Q 24 compared to the 6 . 6 % appreciation in the same period 2023 , which coupled with incre ased expo s u re s . ⭬ Higher impairment of financial assets by Ch $ 2 , 500 million on an annual basis, mainly explained by a comparison base effect marked by improved credit spreads in the 1 Q 23 . This effect was partly offset by an annual decrease of Ch $ 1 , 685 million in ECLs as a result of changes in asset quality for both the Re tai l B a nkin g an d Wh olesal e B a nkin g segments . I n depth , t h e Retail segment showed a relative credit quality improvement that explained Ch $ 11 , 242 million lower ECLs in the 1 Q 24 when compared to the 1 Q 23 .

This decrease had mainly to do with stable delinquency indicators in the 1 Q 24 in comparison with increasing past - due ratios in the 1 Q 23 , which coupled with lower use of rollover financing by the segment’s customers, all resulting in Management Discussion & Analysis 1 .1 5 % 1.20% lower ECLs coming from our provisioning models . Instead, credit quality in the Wholesale Banking segment showed an net deterioration that translated into higher ECLs by Ch $ 9 , 555 million in the 1 Q 24 when compared to the same period of 2023 . This increase was mainly explained by a rise in delinquency rates from 0 . 5 1 % i n th e 1 Q 2 3 t o 0 . 9 1 % i n th e 1 Q 2 4 , a s we l l a s a cou p l e o f specific wholesale customers belonging who experienced risk pro file det eriora t ion . In March 2024 the CMF published the final rules associated with a new standardized method for consumer loans provisioning, which will become effective in January 2025 . Based on the information we have as of the date of this quarterly report, the adoption of this new methodology is expected to have an adverse impact ranging from Ch $ 60 , 000 million to Ch $ 65 , 000 million on ou r res u lt s o f ope rati o n s unde r C hilea n GA A P , bef or e i ncom e ta x . In order to address this adverse impact, the Bank has resolved to reduce additional allowances for an equivalent amount at the time th e ne w method o log y i s im p le m ented . E x p e c t e d C r e d i t L o s s e s R a t i o Based on the above, our ECLs ratio (annualized ECLs over average loans) went slightly up by 5 bp . from 1 . 15 % in the 1 Q 23 to 1 . 20 % in the 1 Q 24 , which is highly consistent with long - term a v e r ag e l e v e l s f o r u s . E xpecte d C r edi t L o s s e s R at i o ( 1 ) ( Exp e ct ed C r e d i t L oss e s / Av er a g e L o a ns) 1.44% 1 .3 3 % 1 Q 24 1Q23 BCH Industry (1) Industry s ratios for the 1Q24, consider the three - month and the year - to - date periods e n d e d o n F eb r ua ry 2 9 , 2 0 2 4 . Based on our ECLs ratios, we continued to outperform the industry i n t e r m s o f r i s k e x pen s e s b y 1 3 bp . i n 1 Q 2 4 i f c on t r a s t e d w i t h t he 1 . 33 % posted by the industry in the same period . Going forward, w e e x pe c t t o m a in t a i n a s i m il a r E C L r a t i o o v e r t h e r e s t o f 2024 , although we cannot rule out specific peaks during the year . Pas t - D u e Lo a n s Regarding non - performing loans, our past - due ratio (loans overdue 90 days or more) amounted to 1 . 50 % in March 2024 , from the 1 . 22 % reached in the same period last year . The evolution of our past - due ratio reflects that credit risk metrics are gradually on road to normalization, on the grounds of lowered liquidity among customers, unemployment, and subdued economic activity . Pas t D ue R ati o ( 1 ) ( >9 0 d P a s t - D ue L o a n s / T o t a l L o a n s ) 1.22% 1 . 33 % 1 . 35 % 1 . 43 % 1 .5 0 % 1 . 85 % 1 .9 5 % 2 .0 4 % 2 . 15 % 2.28% Mar - 24 Dec - 23 J u n - 23 S ep - 23 Mar - 23 Industry BCH (1) Industry s ratio as of March 2024, consider the year - to - date period ended on Febuary 29, 2024. However, based on these figures, we continued to outreach the bankin g sys tem i n delinque nc y b y 7 8 bp . b y t h e e n d o f 1Q24. O p e r a t i ng Exp e n se s 1 Q 2 4 v s . 1 Q 2 3 Our operating expenses totaled Ch $ 283 , 844 million in the 1 Q 24 , which represented an annual expansion of Ch $ 20 , 402 million or 7 . 7 % when compared to the amount of Ch $ 263 , 442 million posted a y ea r ea r li e r . O pe r atin g E xpe n ses ( In M illi o n s o f C h $ ) 1 Q 2 3 1 Q 2 4 + 5 . 5 % 7,392 141,410 134,018 P e r s o nn e l e x pe n s e s + 10 . 3 % 10,232 109,223 98,991 Administrative expenses + 2 . 8 % 643 23,402 22,759 D ep r e c i a t i o n an d A m o r t . - 123 94 (29) Impairments + 26 . 1 % 2,012 9,715 7,703 O t h e r O pe r . E x pe n s e s + 7 . 7 % 20,402 283,844 263,442 To t a l O p e r at i ng E x p e n se s bp. / % 1Q24 1Q23 Additional Information (113)bp 36.4% 37.5% Op. Exp. / Op. Rev. +7bp 2.0% 1.9% Op. Exp. / Avg.
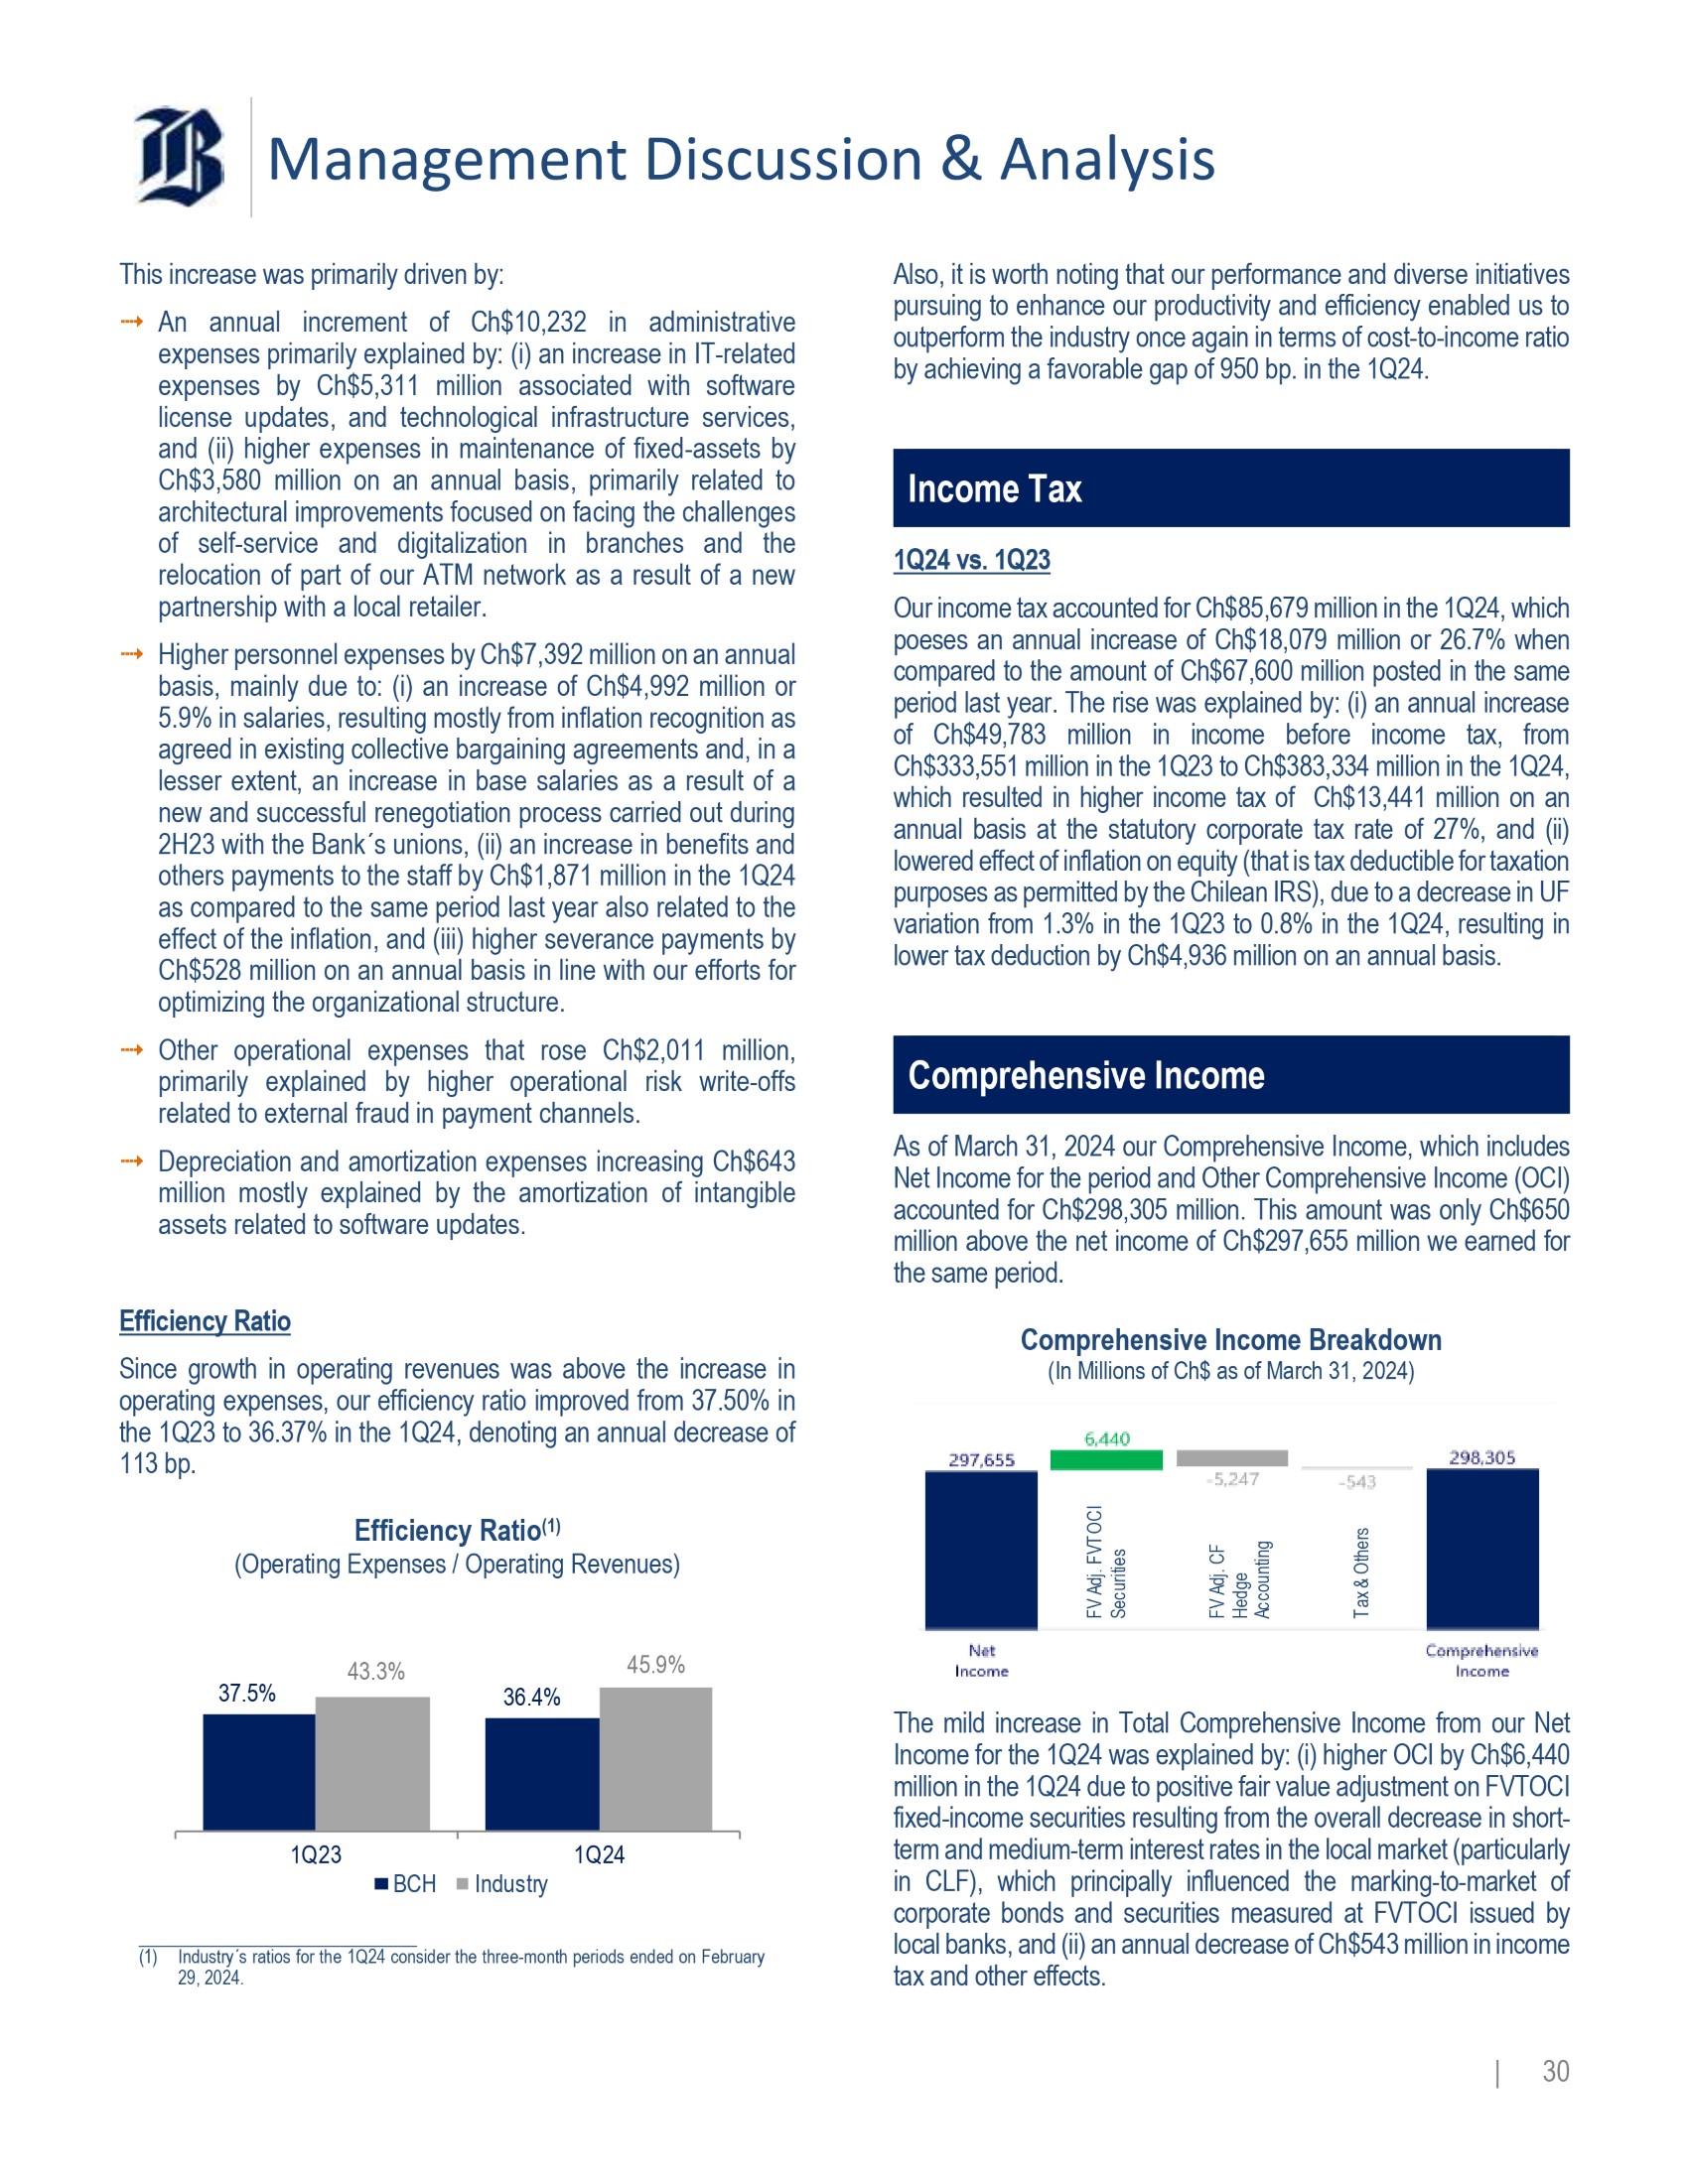
Assets (4.0)% 12,065 12,571 H e a d c o un t ( # ) - E O P (3.8)% 255 265 B ran c h e s ( # ) - E O P I n M illi ons of C h$ Quarter C h a nge 1 Q 24 / 1 Q 2 3 Ch$ % | 29 Management Discussion & Analysis Thi s increas e wa s prim a ril y dr iv e n by : ⭬ An annual increment of Ch $ 10 , 232 in administrative expenses primarily explained by : (i) an increase in IT - related expenses by Ch $ 5 , 311 million associated with software license updates, and technological infrastructure services, and (ii) higher expenses in maintenance of fixed - assets by Ch $ 3 , 580 million on an annual basis, primarily related to architectural improvements focused on facing the challenges of self - service and digitalization in branches and the rel o cat io n o f par t o f ou r ATM net work a s a res u l t o f a new par tn e rship with a l oca l ret a iler . ⭬ Higher personnel expenses by Ch $ 7 , 392 million on an annual bas is , main l y du e t o : (i) a n inc r ease o f C h $ 4 , 99 2 m illio n or 5 . 9 % in salaries, resulting mostly from inflation recognition as agreed in existing collective bargaining agreements and, in a lesser extent, an increase in base salaries as a result of a new and successful renegotiation process carried out during 2 H 2 3 with the B a nk s uni on s , (i i ) a n incre ase i n ben efit s and others payments to the staff by Ch $ 1 , 871 million in the 1 Q 24 as compared to the same period last year also related to the effect of the inflation, and (iii) higher severance payments by Ch $ 528 million on an annual basis in line with our efforts for optimizing the organizational structure . ⭬ Other operational expenses that rose Ch $ 2 , 011 million, primarily explained by higher operational risk write - offs related to external fraud in payment channels . ⭬ Depreciation and amortization expenses increasing Ch $ 643 million mostly explained by the amortization of intangible assets rela t e d t o softwa re u p da t es . E ffi c i e n c y R a ti o Since growth in operating revenues was above the increase in operating expenses, our efficiency ratio improved from 37 . 50 % in the 1 Q 23 to 36 . 37 % in the 1 Q 24 , denoting an annual decrease of 113 bp . E fficiency R ati o ( 1 ) (Operating Expenses / Operating Revenues) 37 .5 % 36 .4 % 43 . 3 % 45 .9 % 1 Q 24 1Q23 BCH Industry (1) Industry s ratios for the 1Q24 consider the three - month periods ended on February 29, 2024. Also, it is worth noting that our performance and diverse initiatives pursuing to enhance our productivity and efficiency enabled us to outperform the industry once again in terms of cost - to - income ratio b y a c h i e v i n g a f av o r ab l e ga p o f 95 0 bp . i n th e 1 Q 24 . I n c o me T a x 1 Q 2 4 v s . 1 Q 2 3 Our income tax accounted for Ch $ 85 , 679 million in the 1 Q 24 , which poe s e s a n a nn u a l i n c r e a s e o f C h $ 1 8 , 0 7 9 m i l li o n o r 2 6 . 7 % w h e n compared to the amount of Ch $ 67 , 600 million posted in the same period last year . The rise was explained by : (i) an annual increase of Ch $ 49 , 783 million in income before income tax, from Ch $ 333 , 551 million in the 1 Q 23 to Ch $ 383 , 334 million in the 1 Q 24 , which resulted in higher income tax of Ch $ 13 , 441 million on an annual basis at the statutory corporate tax rate of 27 % , and (ii) lowered effect of inflation on equity (that is tax deductible for taxation purposes as permitted by the Chilean IRS), due to a decrease in UF variation from 1 . 3 % in the 1 Q 23 to 0 . 8 % in the 1 Q 24 , resulting in lower tax deduction by Ch $ 4 , 936 million on an annual basis . Compr e h e n s ive I n c o me As of March 31 , 2024 our Comprehensive Income, which includes Net Income for the period and Other Comprehensive Income (OCI) a cc o un t e d f o r C h $ 2 9 8 , 3 0 5 m ill i o n . T h i s a m ou n t w a s on l y C h $ 6 5 0 million above the net income of Ch $ 297 , 655 million we earned for t h e s a m e p e r i od . C omp r ehensive In c ome B r e akdown ( In M illi o n s o f C h$ a s o f M ar c h 31 , 2 0 24 ) F V A d j . F V T O C I Securities | 30 F V A d j . C F Hedge A cc oun t i n g T a x & O t he r s T h e m i l d i n c r ea s e i n T o t a l C o m p r e h en s i v e I n c o m e fr o m o u r N e t Income for the 1 Q 24 was explained by : (i) higher OCI by Ch $ 6 , 440 million in the 1 Q 24 due to positive fair value adjustment on FVTOCI fixed - income securities resulting from the overall decrease in short - term and medium - term interest rates in the local market (particularly in CLF), which principally influenced the marking - to - market of corporate bonds and securities measured at FVTOCI issued by l o c a l b an k s , a n d ( i i ) a n a n nu a l d e c r ea s e o f C h $ 5 4 3 m il l i o n i n i n c o m e t a x an d o t he r e f f e c t s .

Management Discussion & Analysis These effects were almost entirely offset by a negative fair value adjustment in cash flows hedge accounting derivatives by Ch $ 5 , 247 million due to a slight overall decrease in long - term interest rates denominated in CLF that translated into negative fair value adjustments on liability legs of cross currency swaps, which more than offset the positive fair value adjustments in asset legs of our hedging swaps on the grounds of specific foreign interest rates .

| 31 Management Discussion & Analysis Business Segments Performance 1Q24 (In Millions of Ch$) Our pre - tax income totaled Ch $ 383 , 334 million in the 1 Q 24 , which denotes an annual increase of Ch $ 49 , 783 million when compared to the Ch $ 333 , 551 million reached in the 1 Q 23 . The main driver for this change was higher pre - tax income in the Retail Banking segment that increased Ch $ 50 , 508 million or 38 . 4 % on an annual basis, on the grounds of an improved top line and lower expected credit losses . On the other hand, the decrease in income before income tax in the Wholesale Banking was almost totally offset by greater pre - tax i n c o m e e a r n e d b y o u r T r e a s u r y a n d S ub s i d i a r i e s . In terms of composition, in the 1 Q 24 the main source of income before income tax was the Retail Banking segment that contributed with 47 . 5 % share of our total amount . In addition, the Wholesale Banking segment explained 42 . 3 % of our pre - tax income, followed by Subsidiaries and Treasury that contributed with 6 . 6 % and 3 . 6 % , respectively .

Q ua r ter l y P r e - Tax I n come by B usiness Se g ment ( In M illi o n s o f C h $ ) 383,334 333,551 25,395 162,215 24,085 172,950 181,911 13,813 131,403 5,113 1Q23 Treasury Wh o l e s a l e B a n k i n g 1Q24 R e t a i l B an k ing Subsidiaries | 32 Management Discussion & Analysis R etai l B ankin g Segm e nt The Retail Banking segment recorded pre - tax income of Ch $ 181 , 911 million in the 1 Q 24 , which denoted an annual increase of Ch $ 50 , 508 million when compared the Ch $ 131 , 403 million earned in the 1 Q 23 . This increment was the consequence of mixed factors . On a positive tone we may highlight : (i) an annual increase of Ch $ 59 , 548 million in operating revenues, from Ch $ 423 , 465 million in the 1 Q 23 to Ch $ 483 , 013 million in the 1 Q 24 , due mainly to the positive growth in income from loans, particularly fostered by consumer lending, and higher income associated with the increase in margins of demand and time deposits as a consequence of higher average interest rates and proactive pricing management, and (ii) an annual decrease of Ch $ 7 , 124 million in ECLs, from Ch $ 100 , 255 million in the 1 Q 23 to Ch $ 93 , 131 million in the 1 Q 24 , which was primarily supported by both stabilized delinquency rates in the 1 Q 24 , in comparison with increasing past - due in the previous year, and a lower use of revolving loans by customers . These effects were partly offset by an annual increase of Ch $ 16 , 164 million in operating expenses, from Ch $ 191 , 807 million in the 1 Q 23 to Ch $ 207 , 971 million in the 1 Q 24 , which – in turn – was associated with diverse factors, such as the recognition of cumulative inflation on salaries, greater IT - related expenses and higher expenses related to improvements in the infrastructure of some of our branches in order to be poised for the adoption of new market trends in digital banking and self - service tools . W h olesale B an k in g S egmen t The Wholesale Banking segment posted pre - tax income of Ch $ 162 , 215 million in the 1 Q 24 , which represented a decrease of Ch $ 10 , 735 million or 6 . 2 % when compared to the figure posted in the same period of 2023 . This performance was mainly the result of : (i) an increment of Ch $ 12 , 284 million in ECLs in the 1 Q 24 , from the Ch $ 6 , 268 million posted in the 1 Q 23 , which was mostly explained by a net credit quality deterioration in this segment, based on higher delinquency ratios as compared to the 1 Q 23 and also due to some specific cases of wholesale banking customers that presented a deteriorated financial condition, as mentioned earlier, (ii) higher operating expenses by Ch $ 1 , 667 million on an annual basis, equivalent to a 3 . 4 % annual increase, which was in line with the trend followed by inflation in the period . These effects were partly counterbalanced by an increment of Ch $ 3 , 216 million in operating revenues, from Ch $ 227 , 964 million in 1 Q 23 to Ch $ 231 , 180 million in 1 Q 24 , largely influenced by higher income from fees and commissions that, in turn, was mainly associated with increased fee - income from cash management services, given renegotiated fares for interbank transactions, as well as greater credit - related fees . Other components of revenues registered a slight decrease of 1 . 4 % on an annual basis .

| 33 Management Discussion & Analysis T r easury Se g ment Income before income tax from our Treasury segment amounted to Ch $ 13 , 813 million in the 1 Q 24 , which is equivalent to an annual advance of Ch $ 8 , 700 million or 170 . 2 % when compared to the Ch $ 5 , 113 million reached in the 1 Q 23 . This annual change was fostered by : (i) an annual increase of Ch $ 11 , 850 million from the management of the Trading desk on the grounds of favorable changes in interest rates, in particular for shorter terms of local yield curves (primarily on CLF - denominated interest rates) that increased the market value of our held - for - trading derivatives portfolio, and (ii) higher annual results by Ch $ 2 , 879 million from the management of the Debt Securities desk in light of changes in market factors, such as the above - mentioned evolution of short - term interest rates, that improved the funding cost for fixed - income securities measured at FVTOCI managed by this desk . These factors were partly offset by : (i) an annual surge of Ch $ 2 , 500 million in impairment of financial assets given a comparison base effect (improved credit spreads in the 1 Q 23 ), and (ii) greater valuation adjustments for derivatives by Ch $ 2 , 016 million on an annual basis, from a net gain of Ch $ 135 million in the 1 Q 23 to a net loss of Ch $ 1 , 881 million in the 1 Q 24 , primarily associated with increased Probabilities of Default (PD) of certain counterparties, given worsened credit risk profiles . Subsidiaries Overall, our Subsidiaries reached pre - tax income of Ch $ 25 , 395 million in the 1 Q 24 , amount that was Ch $ 1 , 310 million above the level posted in the same period of 2023 . This annual advance mainly relied on : (i) greater pre - tax income by Ch $ 2 , 116 million or 19 . 6 % from our Stock Brokerage subsidiary mostly as a result of higher revenues from the management of the securities portfolio handled by the company, given the decline in local nominal interest rates, particularly in shorter terms of the yield curve during the 1 Q 24 and, to a lesser degree, greater fee income from the core trading business, (ii) an annual increment of Ch $ 730 million or 7 . 7 % in income before income tax from our Mutual Funds subsidiary, which was primarily fostered by increased fee - income coming from a 37 . 4 % annual increase in average Assets Under Management that was – to some degree – offset by a decline in average margins, on the grounds of the change in portfolio mix from equity to short - term debt funds, in line with market expectations on the path that should be followed by the monetary policy interest rate, and (iii) an annual increase of Ch $ 266 million in the pre - tax income of our Collection Services subsidiary that was primarily supported by increased fee - income on the grounds of higher collection activity produced by the increment in past - due loans, which was in part compensated by higher operating expenses . These changes were to some extent offset by : (i) an annual decrease of Ch $ 1 , 158 million in pre - tax income from our Financial Investment business mainly explained by lower fee - income attributable to transactions in which the subsidiary participated in the 1 Q 23 in relation to no transactions carried out this year, and (ii) lower income before income tax generated by our Insurance Brokerage subsidiary by Ch $ 644 million on an annual basis, which is fully explained by higher personnel expenses arising from increased severance payments due to organizational restructuring carried out in this company during the quarter .
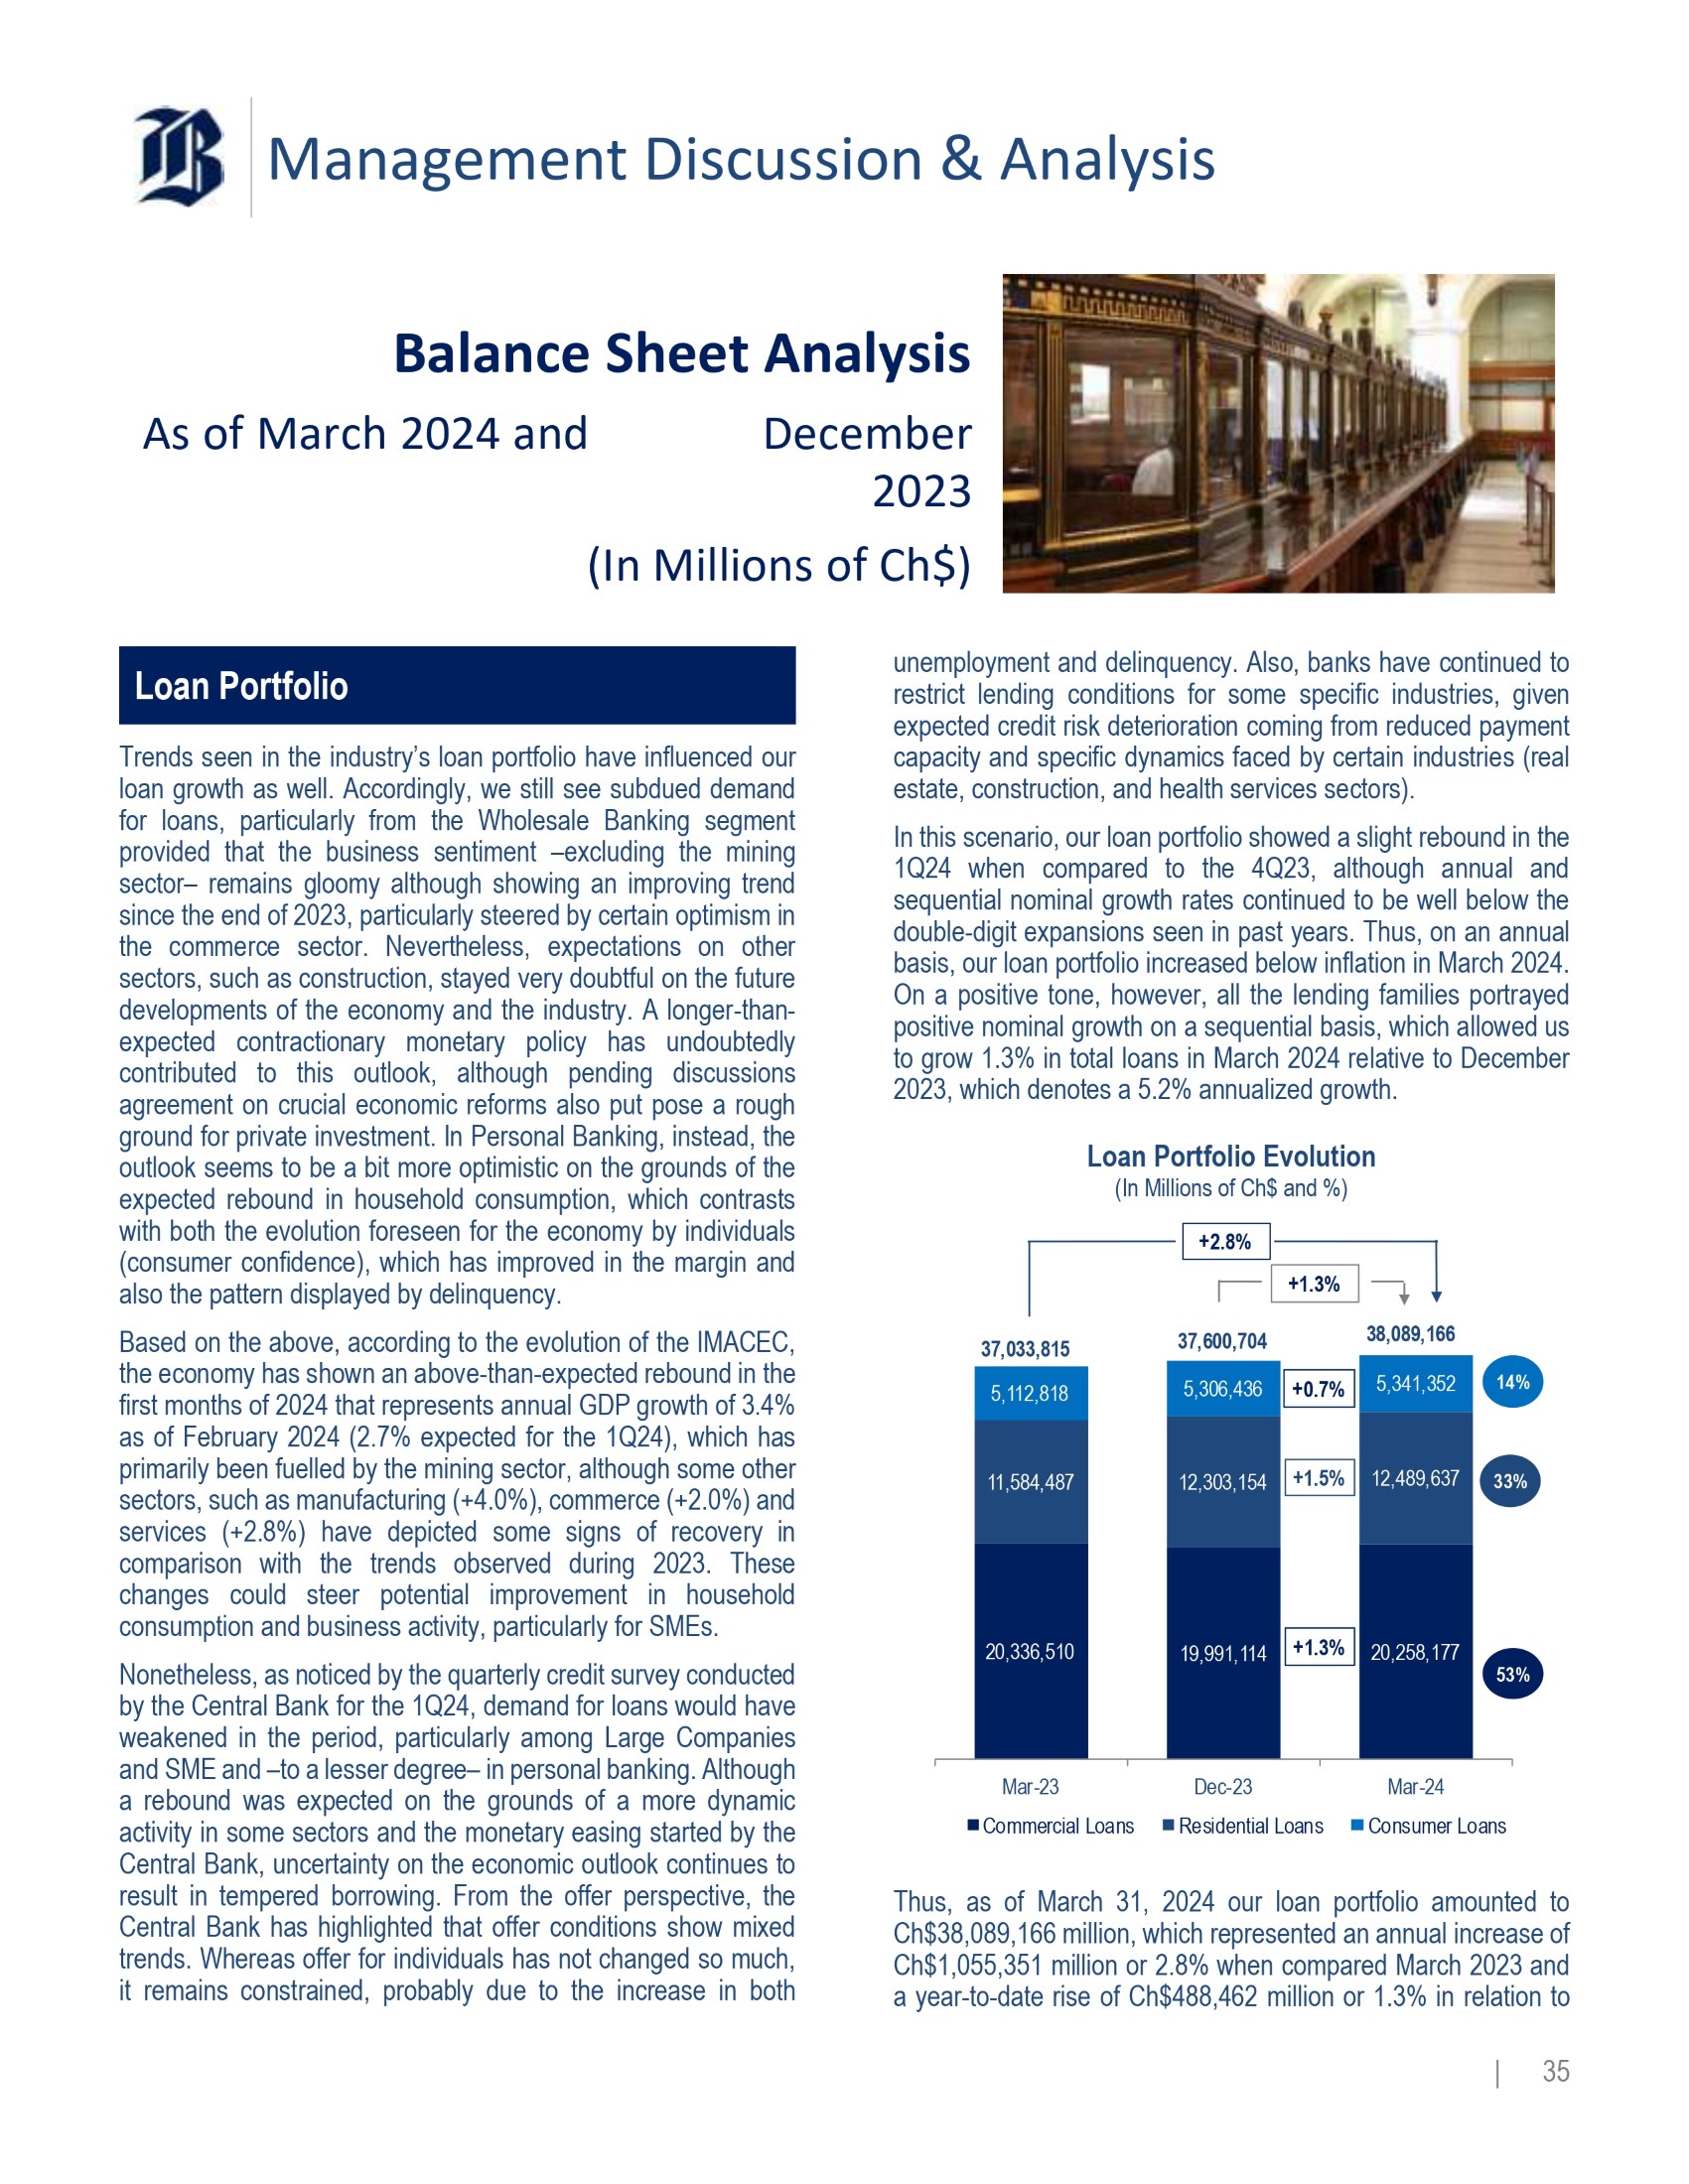
| 34 Management Discussion & Analysis Balance Sheet Analysis As of March 2024 and D e c e m b e r 2023 (In Millions of Ch$) Lo a n P o rtf o l i o Trends seen in the industry’s loan portfolio have influenced our loan growth as well . Accordingly, we still see subdued demand for loans, particularly from the Wholesale Banking segment provided that the business sentiment – excluding the mining sector – remains gloomy although showing an improving trend since the end of 2023 , particularly steered by certain optimism in the commerce sector . Nevertheless, expectations on other sectors, such as construction, stayed very doubtful on the future developments of the economy and the industry . A longer - than - expected contractionary monetary policy has undoubtedly contributed to this outlook, although pending discussions agreemen t o n c r ucia l econ o mi c ref o rms als o p u t pose a ro u g h ground for private investment . In Personal Banking, instead, the outlook seems to be a bit more optimistic on the grounds of the expected rebound in household consumption, which contrasts with both the evolution foreseen for the economy by individuals (co nsum e r con f i den ce) , wh i c h ha s impr oved i n t h e margi n an d als o the pat tern d i splaye d b y de linquen cy . Based on the above, according to the evolution of the IMACEC, the economy has shown an above - than - expected rebound in the first months of 2024 that represents annual GDP growth of 3 . 4 % as of February 2024 ( 2 . 7 % expected for the 1 Q 24 ), which has primarily been fuelled by the mining sector, although some other sectors, such as manufacturing (+ 4 . 0 % ), commerce (+ 2 . 0 % ) and services (+ 2 . 8 % ) have depicted some signs of recovery in comparison with the trends observed during 2023 . These changes could steer potential improvement in household consumptio n a n d busines s ac ti v ity , particularl y f o r SMEs . Nonetheless, as noticed by the quarterly credit survey conducted b y the Ce n tra l B an k fo r the 1 Q 24 , deman d fo r loa n s wo u l d hav e weakened in the period, particularly among Large Companies and SME and – to a lesser degree – in personal banking . Although a rebound was expected on the grounds of a more dynamic activit y i n som e sec tors an d the mon eta ry eas in g sta rted b y t he Central Bank, uncertainty on the economic outlook continues to result in tempered borrowing . From the offer perspective, the Central Bank has highlighted that offer conditions show mixed trends . Whereas offer for individuals has not changed so much, it remains constrained, probably due to the increase in both unemployment and delinquency . Also, banks have continued to restrict lending conditions for some specific industries, given expecte d cred i t ri sk deter i o rat i o n coming from re d uced paymen t capacity and specific dynamics faced by certain industries (real estate, construction, and health services sectors) . In this scenario, our loan portfolio showed a slight rebound in the 1 Q 24 when compared to the 4 Q 23 , although annual and sequential nominal growth rates continued to be well below the double - dig i t expans ion s seen i n pas t y ear s . Thu s , o n a n annu a l basis, our loan portfolio increased below inflation in March 2024 . On a positive tone, however, all the lending families portrayed positive nominal growth on a sequential basis, which allowed us to grow 1 . 3 % in total loans in March 2024 relative to December 2023 , w h ic h deno t e s a 5 . 2 % an nualize d growt h . Loan P o r tf o li o E volutio n ( In M illi o n s o f C h$ a nd % ) 20,336,510 19,991,114 20 , 258 , 17 7 11,584,487 12,303,154 12 , 489 , 63 7 5 , 1 12 , 81 8 5 , 306 , 43 6 5,341,352 37,033,815 37,600,704 38,089,166 Mar - 23 C o mm e r c i a l Lo a n s Dec - 23 R e s i d en t i a l Loa n s Mar - 24 C o n s u m e r L o an s + 1 . 3 % + 1 . 5 % +2.8% 53% 33% 14% + 0 . 7 % +1.3% Thus, as of March 31 , 2024 our loan portfolio amounted to Ch $ 38 , 089 , 166 million, which represented an annual increase of Ch $ 1 , 055 , 351 million or 2 . 8 % when compared March 2023 and a year - to - date rise of Ch $ 488 , 462 million or 1 .

3 % in relation to | 35 Management Discussion & Analysis December 2023 . This evolution represents a moderate annual real contraction when adjusting by 12 - month inflation, which is aligned with the trend seen for the industry . On a sequential basis, our loan book posted slight real growth (when adjusting by UF variation), which has been fostered by both personal banking and a wholesale banking that showed some positive signs of recovery, while SMEs remained contained . At a lending product level, the recent evolution of our loan book has primarily been supporte d by : ⭬ Residential mortgage loans that reached Ch $ 12 , 489 , 637 million in March 2024 , which resulted in an annual increase of Ch $ 905 , 150 million or 7 . 8 % when compared to March 2023 . On a sequential basis, our residential mortgage loans increased Ch $ 186 , 483 million or 1 . 5 % in comparison with December 2023 . The annual expansion poses real growth of ~ 3 . 4 % , which poses a slight recovery when compared to the 4 Q 23 . This has resulted in a minor increase in market share on both an annual and a year - to - date basis . As previously mentioned, residential mortgage loans continue to be decoupled from the fundamentals of the economic outlook . In this regard, despite the real estate and construction sector continue to show a marked slowdown in sales, the demand for housing keeps on increasing, yet at a slower pace . Amid this environment we have devoted efforts to design tailored offerings for our premium customer base, which have allowed u s t o gro w i n th i s pro duc t th a t a ls o pro duce custome r loyalty i n t h e lon g - ru n . Therefore, the annual expansion in residential mortgage loans has been fostered by : (i) an annual increment of 37 . 4 % in loan origination that passed from Ch $ 261 , 647 million in the 1 Q 2 3 t o Ch $ 359 , 5 8 4 millio n i n the 1 Q 24 , whi c h w a s main ly the result of improved risk intelligence that has bolstered the effectiveness of commercial campaigns targeting specific personal banking subsegments . Additionally, as most of residential mortgage loans are denominated in UF, the annual rise of 4 . 3 % in inflation, measured as UF variation, also contributed to explain a large portion of total nominal growth . ⭬ Consumer loans that amounted to Ch $ 5 , 341 , 352 million in March 2024 , which was Ch $ 228 , 534 million or 4 . 5 % and Ch $ 34 , 916 million or 0 . 7 % above the balances recorded in March 2023 and December 2023 , respectively . Alt houg h deman d fo r lo a n s ha s markedl y sof te ne d i n r ela tion to the last couple of years, we have managed to keep on growing by means of targeted campaigns and accurate business analytics that pursue to satisfy our customers’ needs . As such, we have maintained installment loan origination at pre - pandemic levels – in nominal terms – by achieving a total origination of Ch $ 524 , 367 million in the 1 Q 24 , which denotes an annual nominal growth of 7 . 3 % when compared to the Ch $ 488 , 789 million achieved in the 1 Q 23 . As a result, our installment loans grew Ch $ 85 , 238 millio n o r 2 . 7 % o n a n annua l b a sis . | 36 Also, as mentioned in previous reports, we have complemented our installment loans offering with our solid cred i t cards progr a m s th a t all o w cus to m e r s t o manag e t hei r month - by - month spending by accessing convenient lending conditions while benefiting from a well - recognized loyalty program . Accordingly, loans related with the use of credit cards have continued to increase, yet at lowered rates, by reaching Ch $ 1 , 851 , 892 million in March 2024 , which indicates an annual increment of Ch $ 138 , 603 million or 8 . 1 % when compared to March 2023 while in comparison with December 2023 the amount of credit - card - related loans remained all but flat in March 2024 . The expansion in the credit card business has resulted from promoting the use of credit cards among medium and upper - income targeted segment s o f custome r s b y del i v erin g appealin g ben efit s while improving segmentation to target income segments . These efforts have coupled with both reduced liquidity among customers after periods of extraordinary disposable income and significant progress we have made in our scoring and expected credit losses models, as well as customer knowledge, to adequately overcome the increase in credit car d lending . ⭬ Commercial loans that accounted for Ch $ 20 , 258 , 177 million, which denoted an annual downsize of Ch $ 78 , 333 million or 0 . 4 % and a year - to - date slight expansion of Ch $ 267 , 063 million or 1 . 3 % in comparison with the balances reached in March 2023 and December 2023 , respectively . Although this evo lutio n i s som ewh a t aligne d w it h the tre n d observe d b y the industry’s loan book, which has been primarily characterized by a subdued demand for loans, our performance in commercial loans has also to do with our emphasis on keeping a balanced risk - return relationship while precisely selecting – particularly in the Wholesale Banking segment – th e businesse s i n whic h w e en g age . I n term s o f lendin g products , t h e declin e i n com m ercia l l o ans in March 2024 was primarily fostered by a contraction in commercia l c r edits , wh i c h dec r eased Ch $ 404 , 1 2 6 millio n o r 2 . 6 % and Ch $ 83 , 554 million or 0 . 5 % in comparison with March 2023 and December 2023 , respectively . This trend was particularly concentrated in the Wholesale Banking segment, and to a lesser degree, in the SMEs . Whereas the former has principally been caused by the macroeconomic factors explained earlier, including private investment slump and business sentiment, the SME segment denotes a decline on the grounds of the end of the state - guaranteed loan programs, such as the “ FOGAPE Chile Apoya ”, which softene d th e effect s o f su b du e d borrowin g whil e finishin g in Decembe r 2023 .
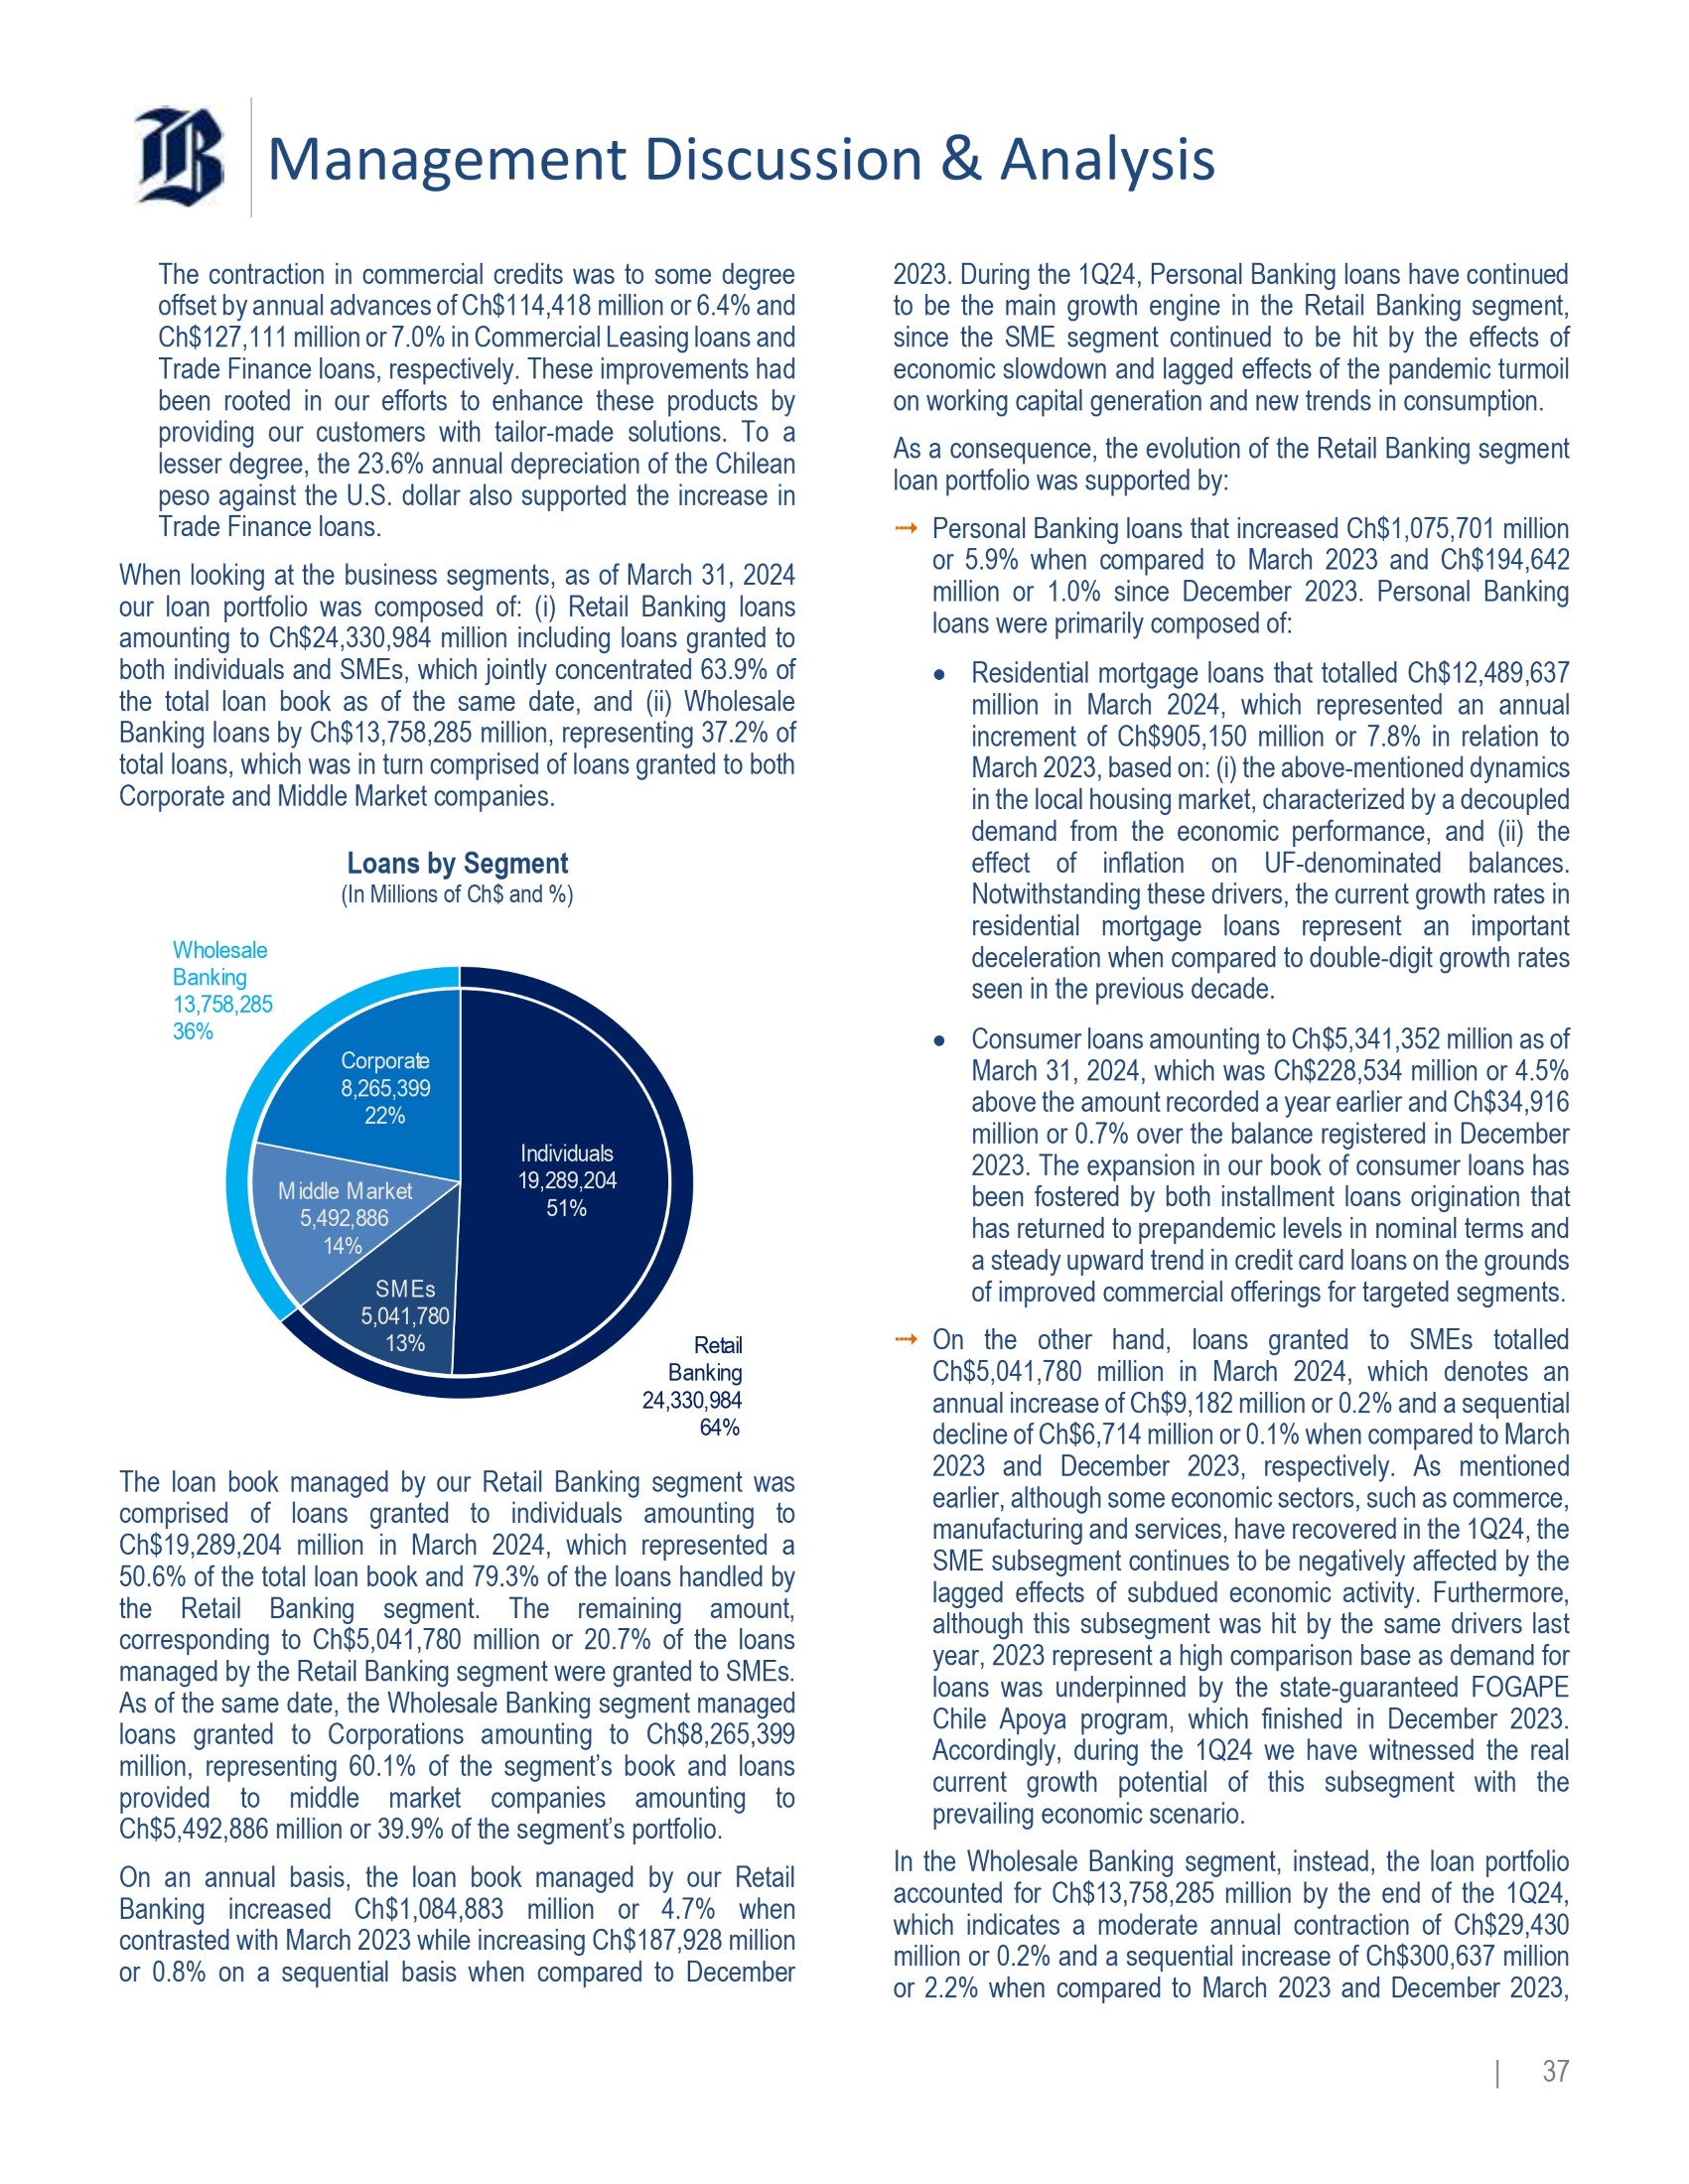
Management Discussion & Analysis R e t a i l Banking 24 , 330 , 98 4 64% Individuals 19,289,204 51% | 37 M i dd l e M a r k e t 5,492,886 14% SMEs 5,041,780 13% The contraction in commercial credits was to some degree offs e t b y annua l advance s o f C h $ 114 , 41 8 mi l lio n o r 6 . 4 % and Ch $ 127 , 11 1 millio n o r 7 . 0 % i n C ommercia l Leasi n g loa n s and Trade Finance loans, respectively . These improvements had been rooted in our efforts to enhance these products by providing our customers with tailor - made solutions . To a lesser degree, the 23 . 6 % annual depreciation of the Chilean peso against the U . S . dollar also supported the increase in Trad e Financ e l o ans . When looking at the business segments, as of March 31 , 2024 our loan portfolio was composed of : (i) Retail Banking loans amounting to Ch $ 24 , 330 , 984 million including loans granted to both individuals and SMEs, which jointly concentrated 63 . 9 % of the total loan book as of the same date, and (ii) Wholesale Banking loans by Ch $ 13 , 758 , 285 million, representing 37 . 2 % of tota l loans , w hic h wa s i n t ur n c o mpri sed o f loa n s grante d to b o th Corporate and Middle Market companies . Loans by S eg m ent ( In M illi o n s o f C h$ a nd % ) Wholesale Banking 13 , 758 , 28 5 36% Corporate 8,265,399 22% The loan book managed by our Retail Banking segment was comprised of loans granted to individuals amounting to Ch $ 19 , 289 , 204 million in March 2024 , which represented a 50 . 6 % of the total loan book and 79 . 3 % of the loans handled by the Retail Banking segment . The remaining amount, corresponding to Ch $ 5 , 041 , 780 million or 20 . 7 % of the loans managed by the Retail Banking segment were granted to SMEs . As of the same date, the Wholesale Banking segment managed loans granted to Corporations amounting to Ch $ 8 , 265 , 399 million, representing 60 . 1 % of the segment’s book and loans provided to middle market companies amounting to Ch $ 5 , 492 , 886 million or 39 . 9 % of the segment’s portfolio . On an annual basis, the loan book managed by our Retail Banking increased Ch $ 1 , 084 , 883 million or 4 . 7 % when contrasted with March 2023 while increasing Ch $ 187 , 928 million or 0 . 8 % on a sequential basis when compared to December 2023 . During the 1 Q 24 , Personal Banking loans have continued to be the main growth engine in the Retail Banking segment, since the SME segment continued to be hit by the effects of economic slowdown and lagged effects of the pandemic turmoil on working capital generation and new trends in consumption . As a consequence, the evolution of the Retail Banking segment loa n p ortf oli o w a s su ppo rted by : ⭬ Personal Banking loans that increased Ch $ 1 , 075 , 701 million or 5 . 9 % when compared to March 2023 and Ch $ 194 , 642 million or 1 . 0 % since December 2023 . Personal Banking loans were pr i mari l y co m posed of : Residential mortgage loans that totalled Ch $ 12 , 489 , 637 million in March 2024 , which represented an annual increment of Ch $ 905 , 150 million or 7 . 8 % in relation to March 2023 , based on : (i) the above - mentioned dynamics in the local housing market, characterized by a decoupled demand from the economic performance, and (ii) the effect of inflation on UF - denominated balances . Notwithstanding these drivers, the current growth rates in residential mortgage loans represent an important deceleration when compared to double - digit growth rates seen i n th e previ o u s decade . Consumer loans amounting to Ch $ 5 , 341 , 352 million as of Marc h 31 , 202 4 , whi c h was C h $ 228 , 53 4 millio n o r 4 . 5 % above the amount recorded a year earlier and Ch $ 34 , 916 millio n o r 0 . 7 % ove r the bal an c e re g iste red i n De c emb er 2023 . The expansion in our book of consumer loans has been fostered by both installment loans origination that ha s re t urne d to prepand e mi c l e vel s i n nomin a l t e rms a nd a ste ad y upw ar d tre n d i n cred i t c ar d loa n s o n the g r oun ds of improved commercial offerings for targeted segments . ⭬ On the other hand, loans granted to SMEs totalled Ch $ 5 , 041 , 780 million in March 2024 , which denotes an annual increase of Ch $ 9 , 182 million or 0 . 2 % and a sequential decline of Ch $ 6 , 714 million or 0 . 1 % when compared to March 2023 and December 2023 , respectively . As mentioned earlier, although some economic sectors, such as commerce, manufacturing and services, have recovered in the 1 Q 24 , the SME subsegment continues to be negatively affected by the lagged effects of subdued economic activity . Furthermore, although this subsegment was hit by the same drivers last year, 2023 represent a high comparison base as demand for loans was underpinned by the state - guaranteed FOGAPE Chile Apoya program, which finished in December 2023 . Accordingly, during the 1 Q 24 we have witnessed the real current growth potential of this subsegment with the prevailin g econ o mi c s cen a r io . In the Wholesale Banking segment, instead, the loan portfolio accounted for Ch $ 13 , 758 , 285 million by the end of the 1 Q 24 , which indicates a moderate annual contraction of Ch $ 29 , 430 million or 0 . 2 % and a sequential increase of Ch $ 300 , 637 million or 2 .

2 % when compared to March 2023 and December 2023 , Management Discussion & Analysis respectively . As we have pointed out in the last quarterly reports, the Wholesale Banking segment has likely been the most affected segment due to economic deceleration, as private investment has been – in turn – probably the key factor conducting th e evolutio n o f a g gregat e d em and . Furthermore, in a business landscape that is still marked by uncertainty and provided that some sectors are experiencing their own challenges on financial and sustainability matters, the deman d for loa n s ha s co n tin ue d t o b e we a k a n d we have kep t o n preserving our prudent approach to credit risk . These forces conditioned annual growth in this segment yet . However, the sequential change poses a more positive tone for the potential recovery if market conditions continue to consolidate . All in all, the evolution of the Wholesale Banking loan book was influenced by : ⭬ An annua l dec re a s e o f Ch $ 17 4 , 1 0 2 millio n o r 2 . 1 % i n t o tal loa n s mana g e d b y ou r C orpor a t e Divi sion . O n a sequen t i al basis, however, this banking unit posted an increment of Ch $ 196 , 340 million or 2 . 4 % from the level recorded in Decembe r 2023 , w h ic h seem s t o b e a n impo rta n t annual i z ed recovery . As mentioned in previous reports, this business unit has been battered by the effects of lowered capital expenditures and lengthy approval processes of large - scale projects . These factors caused an important decrease in the demand for commercial credits from corporate customers that went down by Ch $ 174 , 081 million or 2 . 1 % on an annual basis, which was to some degree offset by tempered expans io n i n bot h leasin g an d f act orin g lo an s . ⭬ Loans handled by our Large Companies Division (middle market companies) that posted an annual increase of Ch $ 144 , 672 million or 2 . 7 % and a year - to - date expansion of Ch $ 104 , 297 million or 1 . 9 % when compared to March 2023 and December 2023 , respectively . These changes seem to be particularly important, since this division was to some degree benefited in 2023 by the state - guaranteed FOGAPE Chile Apoya Program, which poses a high comparison base . In this regard, it is worth noting that the expansion in loans managed by this division has been boosted by the recovery in both leasing and trade finance loans, once again related to revised and enhanced value offerings we have developed for these products by leveraging on digital transformation and improve d busin e s s in telli ge n ce . As we have pointed out in previous reports, for 2024 we expect to recover momentum in loan growth . We firmly believe that if uncertainty fades away, and the Central Bank maintains a expansionary stance – as expected – the economy should take off at least towards potential growth . If that occurs, our loan book shoul d gro w sli g htl y above GD P i n commercia l loans . In personal banking, instead, we continue to expect growing somewhat faster than the industry in both consumer and residential mortgage loans, as the cost of credit is expected to decrease hand by hand with the path foreseen for the monetary policy interest rate and a housing market that would remain decoupled from economic factors . As a result, our whole loan portfolio should expand slightly above the industry by the end of 2024 . Marke t S ha r e i n L o an s ( 1 ) ( % a s o f t he e nd o f each p e r i o d ) 16 . 3 % 16 . 1% 16 . 2 % 18 . 1 % 18 . 6 % 18 . 5% 18 . 7 % 18 . 6 % 16 . 5% 16 . 1 % 16.0% 15 . 8 % 16 . 2 % 16.1% 16 . 1 % 15 . 2% 15 . 2 % 15 . 3 % 15 . 3 % 15 . 3 % Feb - 23 Jun - 23 Sep - 23 T o t al L o a n s C o mm e r c i a l L o a n s Dec - 23 Feb - 24 C o n s u m e r L o a n s R e s i d e n t i a l L o a n s | 38 ( 1 ) E xc l ud i n g op e r a t i on s o f s u b s i d i a r i e s a b r oa d . In terms of market positioning, as of February 29 , 2024 (latest available information released by the CMF), we held a 16 . 1 % market share in total loans, which was 10 bp . below the stake reached in February 2023 and 2 bp . beneath the stake achieved in December 2023 . The annual decline was driven by an a decrease in market share in commercial loans (from 16 . 5 % to 16 . 1 % ), given the factors mentioned earlier at a segment level, marked by both subdued demand and our prudent approach to credit risk . This effect was to some degree offset by : (i) a significant market share annual gain of 52 bp . in consumer loans (from 18 . 1 % to 18 . 6 % ), which has been based on the deployment o f r obu s t c omm e rcial stra te g ie s fo r tar gete d in c o m e segmen t s i n which we want to grow faster than relevant peers, and (ii) an annual market share increment of 11 bp . (from 15 . 2 % to 15 . 3 % ) in residential mortgage loans by growing slightly faster than the industry on the grounds of our competitive cost of funds for this typ e o f credit s . For 2024 , given our expectation to grow slightly above the industry, we aim to gain market presence in consumer and residential mortgage loans by the end of the year, while maintaining our market stake in commercial loans . Overall, we should recover market positioning in the margin in total loans whe n compare d t o Decem b e r 2 02 3 .

Management Discussion & Analysis D e b t Se c u r i ti e s P o rtf o l i o Our Debt Securities portfolio amounted to Ch $ 9 , 419 , 758 million as of March 31 , 2024 . As mentioned in the last quarterly reports, the portfolio composition has been characterized by both the landing process expected for interest rates, particularly in the local market, following normalized levels of inflation, and – more recently – by decisions made to ensure our liquidity adequacy while addressing collateral needs arising from the FCIC program . D eb t S ecur itie s P o r tf o li o by Type of I n st r ument ( 1 ) ( In M illi o n s o f C h$ a nd % ) Local Banks 1 , 8 32 , 7 34 19.5% C en t r a l B an k & G o v e r n m en t 7,027,614 74.6% Local C o r p o r at e Bonds 44,388 0.5% F oreign Issuers 23 4 , 160 2.5% Mutual F u n ds & Other 280 , 86 2 3.0% (1) Mututal Funds & Other instruments include minor positions in equity instruments held b y o u r S e c u r i t i e s Br o k e r a g e s u b s i d i a r y . | 39 Based on this view, securities issued by both the Chilean Central Bank and the Chilean Government continued to concentrate a significant part of our fixed - income portfolio by representing 74 . 6 % as of March 31 , 2024 . To a lesser degree, as of the same date, the rest of portfolio was composed of : (i) bonds and certificates of deposit (CDs hereafter) issued by local banks accounting for 19 . 5 % , (ii) long - term bonds issued by foreign banks and the U . S . Federal Reserve representing 2 . 5 % , (iii) mutual funds and other securities totalling 3 . 0 % mostly invested in fixed - income instruments issued by the Central Bank and the Chilean Government, and to much lesser extent by equity instruments held by our Securities Brokerage subsidiary and, (iv) bond s issu e d b y loca l compan i e s amo unt i n g to 0 . 5 % o f the to tal securitie s portfo l i o . As requested by the Chilean Central Bank, during 2023 we increased positions in liquid assets in order to be poised for the maturity of the FCIC program by replacing less liquid previously pledged collaterals . Moreover, since November 2023 we began to use the “Liquidity Deposit Program” (PDL hereafter), as provided by the Central Bank, which pursues to facilitate the FCIC payment process . As pointed out in previous quarterly reports, during the 1 Q 24 we continued to take PDL by investing proceeds coming from the maturity of other fixed - income instruments . Thus, as of March 31 , 2024 , we had taken PDL booked as financial instruments measured at amortized cost, which enabled us to cover the full amount of the FCIC that was repaid on April 1 st, 2024 (notional amount of Ch $ 3 , 110 , 600 million) . Over the next months, we will continue to ensure a high - liquid assets buffer in the form of Central Bank’s notes (“PDBC”), local banks’ certificates of deposit or overnight deposits in the Central Bank, the latter accounted under “Loans and Advances to Banks”, to be prepared for the second tranche of the FCIC . The important thing is that, as of the date of this report, we have no need to raise further funding in order to repay the second tranche of the FCIC . Similarly, the payment of the FCIC program will not translate in significant changes in our liquidity ratios from th e curren t le ve l s . From the inv e stmen t p u rp o s e p ersp ective , a s o f Marc h 31 , 20 2 4 our Debt Securities portfolio was comprised of : ⭬ Financial instruments measured at amortized cost amounting to Ch $ 4 , 071 , 555 million, representing 43 . 2 % of the total Debt S e curitie s p o rtf o lio . A s exp la i n e d earlier , PDL p r ovide d b y the Central Bank for the FCIC payment process gained significant share by amounting to Ch $ 3 , 148 , 356 million (including capital and interests) as of March 31 , 2024 that permitted us to fully repay the first tranche of the FCIC on April 1 st, 2024 . To a lesser degree, bonds issued by the Central Bank and the Chilean Government concentrate the remaining part of this portfolio as of the same date by totalling Ch $ 923 , 372 million . As of March 31 , 2024 approximately Ch $ 310 , 050 million of these positions (excluding the PDL) were pledged as collateral for the second tranche of the FCIC . ⭬ Fixed - income securities measured at fair value through other comprehensive income (FVTOCI hereafter) that represented Ch $ 3 , 196 , 366 million or 33 . 9 % of the debt securities portfolio as of March 31 , 2024 . Of this amount, approximately Ch $ 1 , 587 , 654 million or 49 . 7 % were concentrated in fixed - income securities issued by local banks, mostly associated with short - term CDs, and also in securities issued by the Chilean Central Bank and the Chilean Government jointly amounting to Ch $ 1 , 330 , 165 million and representing 41 . 6 % of these kinds of instruments . To a lesser extent, we continued to invest in fixed - income securities issued by foreign institutions (U . S . banks and the U . S . Federal Reserve) amounting to Ch $ 234 , 160 million or 7 . 3 % of the FVTOCI portfolio . These exposures to offshore securities continued to be motivated on our expectation on declining foreign interest rates and favorable adjustments in credit spreads , whic h h ave take n l o n g e r tha n expected . Als o , i t i s impo rta n t t o not e th a t a s o f Marc h 31 , 202 4 s o me of the FVTOCI positions in CDs issued by local banks amounting to approximately Ch $ 497 , 076 million were pledged as collateral of the second tranche of the FCIC obligation .

Management Discussion & Analysis ⭬ Debt securities held for Trading that reached Ch $ 1 , 870 , 975 million as of March 31 , 2024 , amount that was primarily composed of short - term notes issued by the Chilean Central Bank (PDBC hereafter) by approximately Ch $ 1 , 412 , 974 million, which are utilized by our Treasury to manage temporary cash surplus . As explained later, the proceeds coming from the maturity of PDBC were mostly invested in PDL for the first FCIC repayment . Also, PDBC have very short mat uritie s and , th e ref o re, positi o n s o n th e m d o no t expose us to significant price risk . The remaining amount of debt securities held - for - trading were primarily comprised of bonds issued by the Chilean Government . No positions held in the trading portfolio were pledged as collateral of the FCIC progra m a s o f Marc h 31 , 2 0 24 . ⭬ Other instruments, composed of Mutual Funds and minor equity positions that jointly amounted to Ch $ 280 , 862 million as of March 31 , 2024 . Mutual funds represented 98 . 0 % of this amount and were largely associated with holdings taken by our Treasury as part of our liquidity management practices . D eb t Secur itie s P o r tf o li o by P u r pose ( 1 ) ( In M illi o n s o f C h $ ) 3 ,3 63 ,6 24 2,641,507 1 , 8 70 , 9 75 5,070,987 3 , 7 86 , 5 25 3 ,1 96 ,3 66 904 , 64 3 1 ,4 31 ,0 83 4,071,555 4 , 30 2 8,621,439 8 , 9 90 , 5 60 409,328 9 , 4 19 , 7 58 280,862 Mar - 23 T r ad i ng S e c u r i t i e s A mo r t i z e d C o s t D e c - 23 Mar - 24 F a i r V a l ue T h r ou g h O C I O t he r I n s t r umen t s (1) Trading Securities include minor positions in equity instruments held by our Securities Brokerage subsidiary. Centra l Ban k fo r t h e FC I C repa yment , sinc e Novem b e r 2023, Ch$507,260 million in December 2023 to Ch$3,148,356 | 40 On an annual basis, our Debt Securities portfolio experienced an increase of Ch $ 798 , 319 million or 9 . 3 % when compared to March 31 , 2023 . This increase was caused by a combination of factors, a s foll o ws : ⭬ An annual increase of Ch $ 3 , 166 , 912 million or 350 . 1 % in fixed - income instruments measured at amortized cost . As we anticipated in former reports, this increase was largely associated with positions taken in the PDL provided by the amounting to Ch $ 3 , 148 , 356 million by the end of the 1 Q 24 (including capital and interest accrued) . The increase in these positions were primarily taken from the proceeds obtained as a result of the scheduled maturity of PDBC and bonds issued by the Central Bank and the Chilean Government booked as tradin g securitie s o r F V TOC I in s truments . O n th e othe r han d , former positions held at amortized cost increased Ch $ 18 , 730 million or 2 . 1 % when compared to March 2023 , which was mainly related to the effect of inflation on part of instruments that are denominated in UF . It is worth mentioning that on April 1 st, 2024 , PDL holdings were fully transferred to the Chilean Central Bank for the first repayment of the FCIC . This change in instruments measured at amortized cost was par tl y o ffs e t by : ⭬ An annual decrease of Ch $ 1 , 874 , 621 million or 37 . 0 % in financial instruments measured at FVTOCI in comparison with March 2023 . This change had mainly to do with lower positions in bonds issued by both the Chilean Central Bank and the Chilean Government by Ch $ 1 , 967 , 058 million on an annual basis . This decline was fostered by both scheduled expiration and specific – though minor – sales . As mentioned earlier, proceeds from these instruments was principally invested in PDL booked at amortized cost . To a lesser degree, this main trend was to some degree offset by an annual increase of Ch $ 70 , 781 million or 43 . 3 % in further positions taken in bonds issued by foreign banks, given our expectations on both foreign interest rates and credit spreads . ⭬ Lower positions in Trading securities by Ch $ 770 , 532 million or 29 . 2 % on an annual basis . This decline was mainly produced by an annual decrease of Ch $ 768 , 826 million or 32 . 1 % in securities issued by the Central Bank and the Chilean Government, which in turn was primarily conducted by maturity of former holdings on PDBC by Ch $ 709 , 923 million or 33 . 4 % on an annual basis . As previously mentioned, proceeds from the maturity of PDBC were reinvested in PDL for the first FCIC payment . To a lesser degree, positions in bonds issued by the Chilean Central Bank and the Chilean Government decreased Ch $ 58 , 903 million or 21 . 7 % on an annual basis, mainly due to the positions that were closed in the 1 Q 24 after benefiting from favorabl e c h ang e s i n interes t ra t e s durin g tha t pe riod . On a year - to - date basis, the Debt Securities portfolio evidenced an expansion of Ch $ 429 , 198 million or 4 . 8 % when contrasted with December 2023 . Once again, this evolution was the consequence o f mixed facto r s , i ncluding : ⭬ A year - to - date increase of Ch $ 2 , 640 , 472 million or 184 . 5 % , i n fin ancia l assets measu r e d a t amo rtiz e d cos t i n re l atio n to December 2023 . As in the case of annual figures, this incremen t was a lmos t tot a ll y at trib u ta b l e to gre at e r pos i tio n s ta k e n i n PDL i n orde r t o b e po i se d fo r the pa y men t o f t h e first tranche of FCIC .
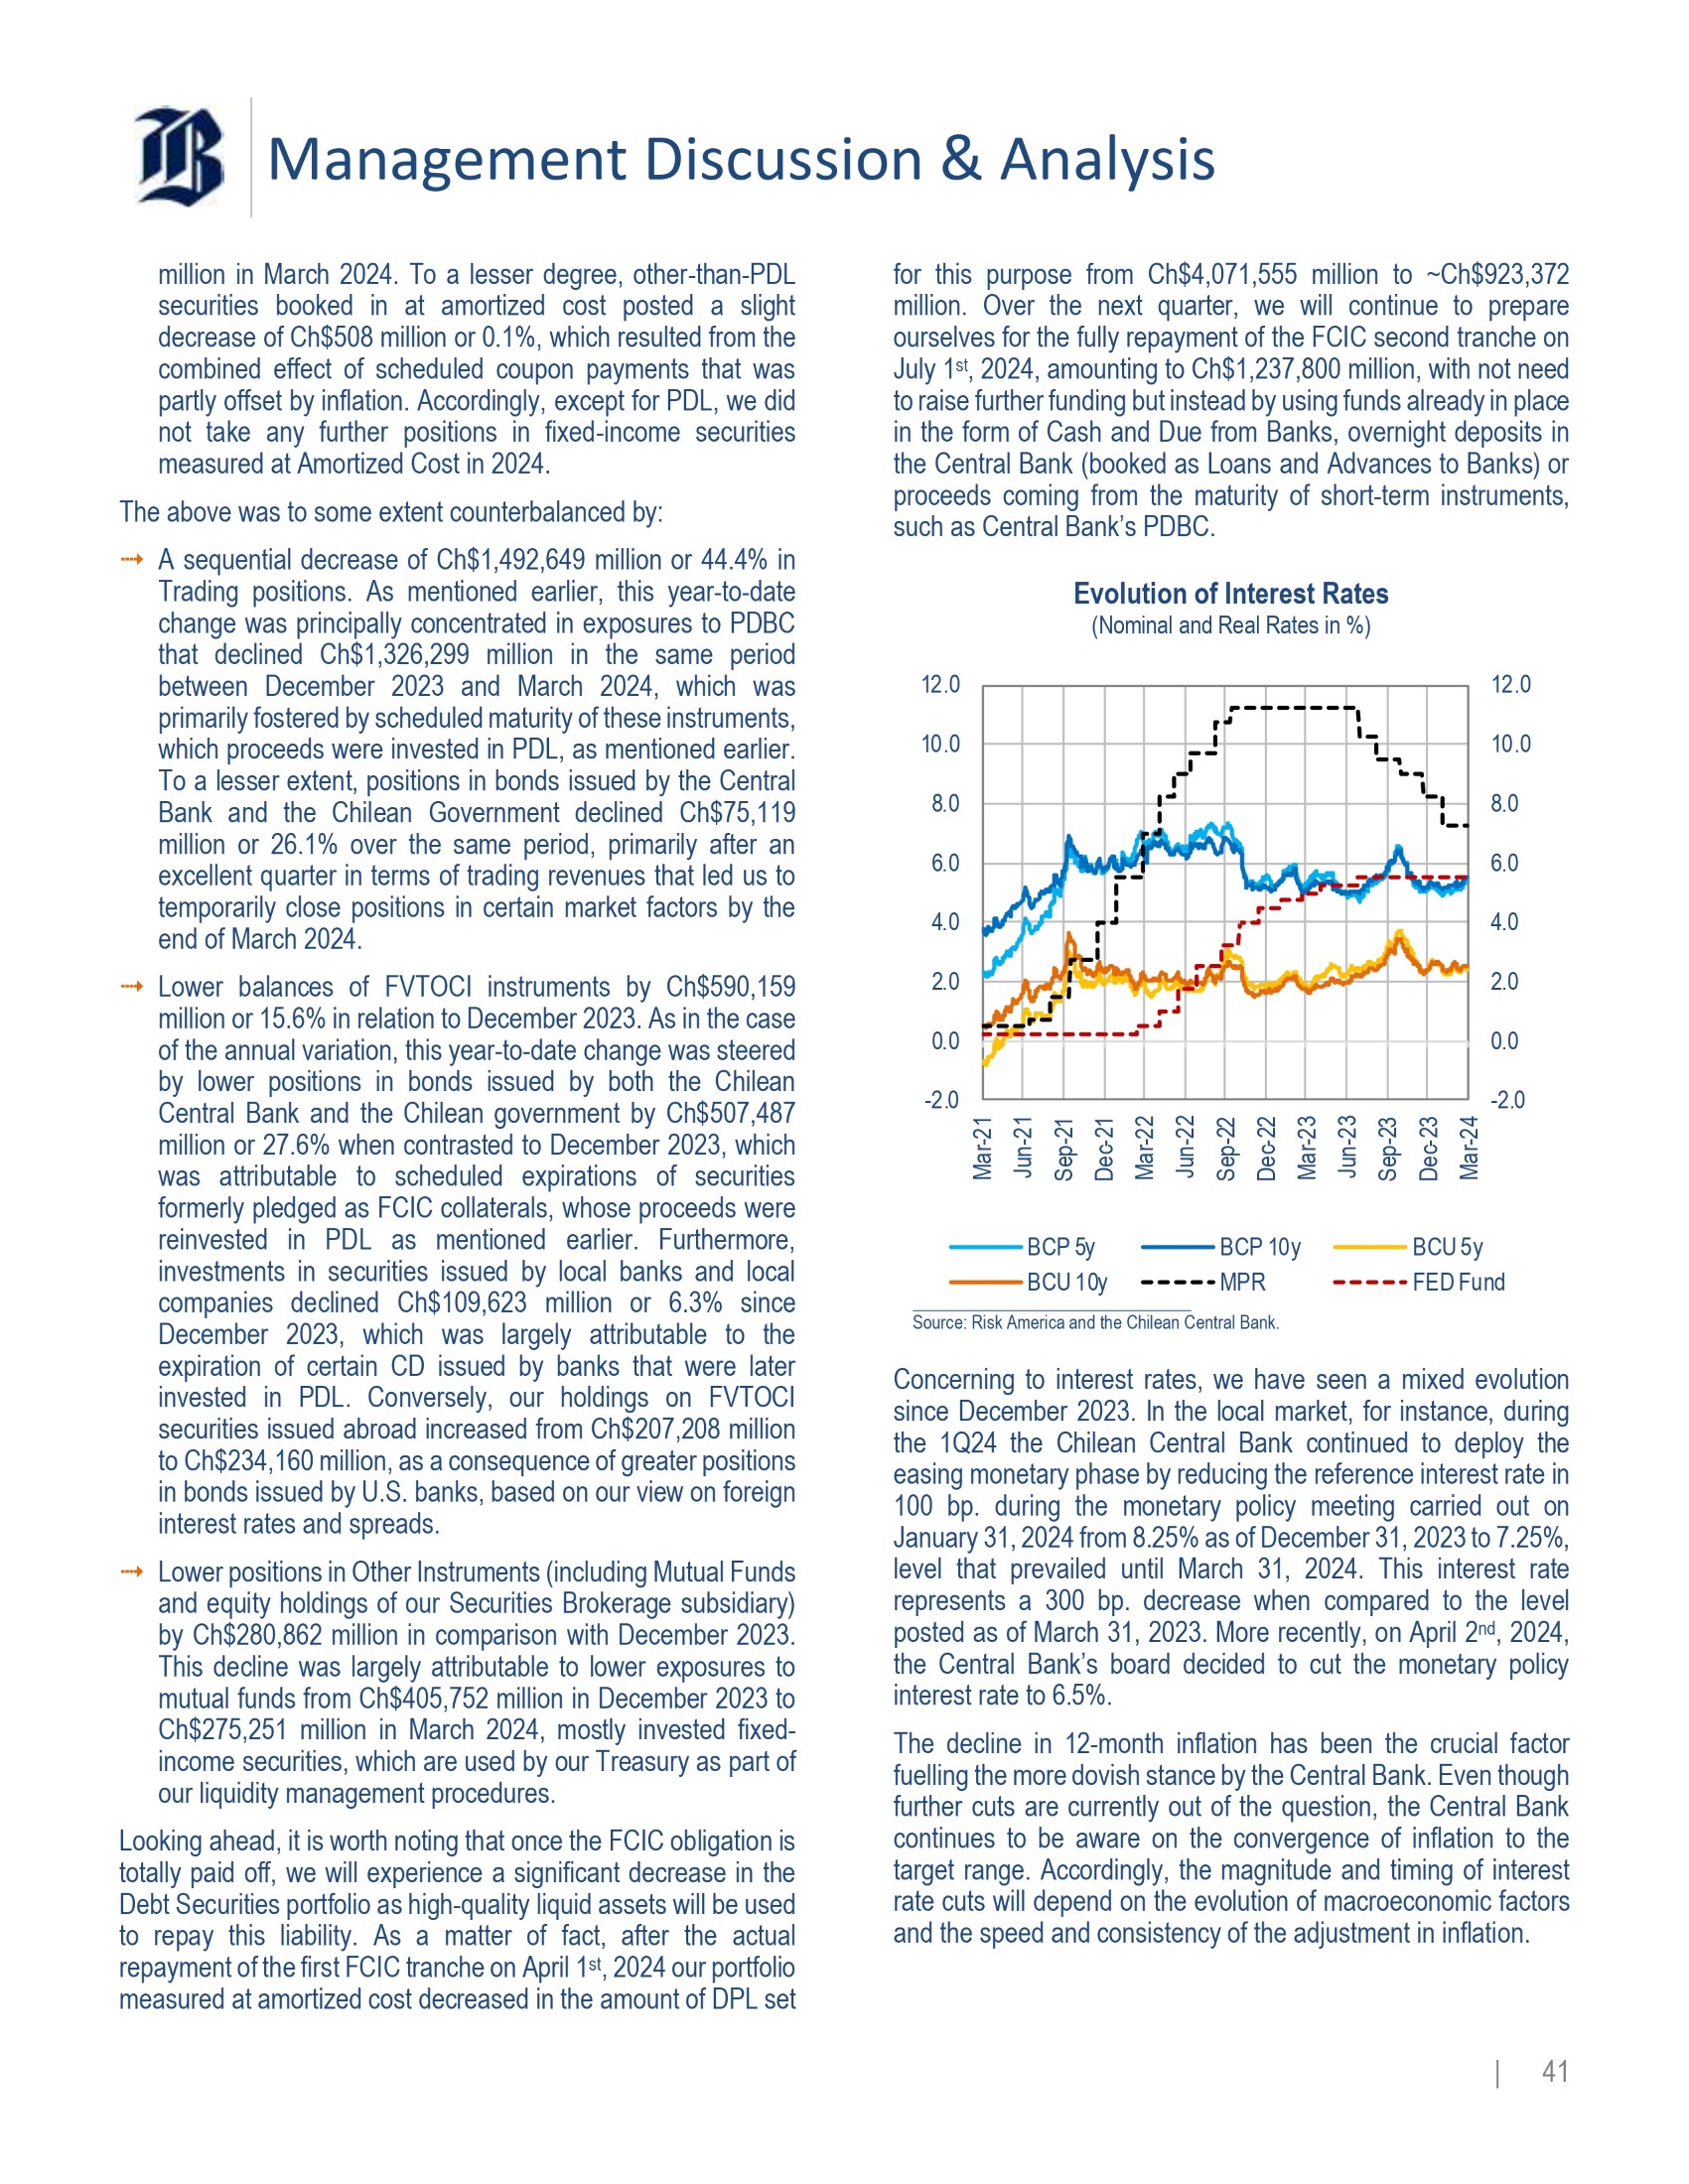
As a matter of fact, PDL increased from Management Discussion & Analysis million in March 2024 . To a lesser degree, other - than - PDL securities booked in at amortized cost posted a slight decrease of Ch $ 508 million or 0 . 1 % , which resulted from the combined effect of scheduled coupon payments that was par tl y offs e t b y infla tio n . A c cord i ngl y , excep t fo r PD L , we did not take any further positions in fixed - income securities measure d a t A mortize d C o s t i n 2024 . Th e above wa s t o s om e ext e n t counte rb alan ced b y : ⭬ A sequential decrease of Ch $ 1 , 492 , 649 million or 44 . 4 % in Trading positions . As mentioned earlier, this year - to - date chang e was pr i ncipall y c o nce n t rat e d i n expos u res t o P D BC that declined Ch $ 1 , 326 , 299 million in the same period between December 2023 and March 2024 , which was primarily fostered by scheduled maturity of these instruments, whic h pro ceed s we r e investe d i n PD L , a s men tio ne d ear l i er . To a lesser extent, positions in bonds issued by the Central Bank and the Chilean Government declined Ch $ 75 , 119 million or 26 . 1 % over the same period, primarily after an excellent quarter in terms of trading revenues that led us to temporarily close positions in certain market factors by the en d o f Ma r c h 20 2 4 . ⭬ Lower balances of FVTOCI instruments by Ch $ 590 , 159 million or 15 . 6 % in relation to December 2023 . As in the case of the annual variation, this year - to - date change was steered by lower positions in bonds issued by both the Chilean Central Bank and the Chilean government by Ch $ 507 , 487 million or 27 . 6 % when contrasted to December 2023 , which was attributable to scheduled expirations of securities formerly pledged as FCIC collaterals, whose proceeds were reinvested in PDL as mentioned earlier . Furthermore, investments in securities issued by local banks and local companies declined Ch $ 109 , 623 million or 6 . 3 % since December 2023 , which was largely attributable to the expiration of certain CD issued by banks that were later invested in PDL . Conversely, our holdings on FVTOCI securities issued abroad increased from Ch $ 207 , 208 million to Ch $ 234 , 160 million, as a consequence of greater positions in bonds issued by U . S . banks, based on our view on foreign interest rate s an d sp re a ds . ⭬ Lower positions in Other Instruments (including Mutual Funds and equity holdings of our Securities Brokerage subsidiary) by Ch $ 280 , 862 million in comparison with December 2023 . This decline was largely attributable to lower exposures to mutual funds from Ch $ 405 , 752 million in December 2023 to Ch $ 275 , 251 million in March 2024 , mostly invested fixed - income securities, which are used by our Treasury as part of ou r liqu idit y ma nagemen t p r oc e dur es . B C P 5 y Looking ahead, it is worth noting that once the FCIC obligation is totally paid off, we will experience a significant decrease in the Debt Securities portfolio as high - quality liquid assets will be used to repay this liability . As a matter of fact, after the actual repayment of the first FCIC tranche on April 1 st , 2024 our portfolio measured at amortized cost decreased in the amount of DPL set for this purpose from Ch $ 4 , 071 , 555 million to ~Ch $ 923 , 372 million . Over the next quarter, we will continue to prepare ourselves for the fully repayment of the FCIC second tranche on July 1 st , 2024 , amounting to Ch $ 1 , 237 , 800 million, with not need to raise further funding but instead by using funds already in place in the form of Cash and Due from Banks, overnight deposits in the Central Bank (booked as Loans and Advances to Banks) or proceeds coming from the maturity of short - term instruments, such a s Centra l Bank’ s P D BC . E volutio n of Inter es t R at e s ( N o m i n a l a nd R e a l R a t e s i n % ) - 2 . 0 0 . 0 2 . 0 4 . 0 6 . 0 8 . 0 1 0 . 0 1 2 . 0 - 2 . 0 0 . 0 2 . 0 4 . 0 6 . 0 8 . 0 1 0 . 0 1 2 . 0 M a r - 2 1 J u n - 2 1 S e p - 2 1 D e c - 2 1 M a r - 2 2 Jun - 22 S e p - 2 2 D e c - 2 2 M a r - 2 3 Jun - 23 S e p - B C P 1 0 y BCU 10y MPR B C U 5 y | 41 F E D F u n d Source: Risk America and the Chilean Central Bank. Concerning to interest rates, we have seen a mixed evolution since December 2023 . In the local market, for instance, during the 1 Q 24 the Chilean Central Bank continued to deploy the easing monetary phase by reducing the reference interest rate in 100 bp . during the monetary policy meeting carried out on January 31 , 2024 from 8 . 25 % as of December 31 , 2023 to 7 . 25 % , level that prevailed until March 31 , 2024 . This interest rate represents a 300 bp . decrease when compared to the level pos ted a s o f Marc h 31 , 2023 . Mor e rec e ntly , o n A p ril 2 nd , 202 4 , the Central Bank’s board decided to cut the monetary policy interest ra t e to 6 . 5 % . The decline in 12 - month inflation has been the crucial factor fuelling the more dovish stance by the Central Bank . Even though further cuts are currently out of the question, the Central Bank continues to be aware on the convergence of inflation to the target range . Accordingly, the magnitude and timing of interest rate cuts will depend on the evolution of macroeconomic factors and the speed and consistency of the adjustment in inflation .

Management Discussion & Analysis Given the actual and expected path of the monetary policy interest rate, short - term interest rates paid by local banks on time deposits have decreased consistently . However, at this point, nominal and real yield curves continued to be inverted . Amid this environment, medium - and long - term nominal and real interest rates showed uneven behaviors during the 1 Q 24 and some intra - quarter volatility . As a matter of fact, interest rates of five - year and ten - year nominal bonds issued by the Central Bank ended up the 1 Q 24 at levels of ~ 5 . 6 % after declining in the 4 Q 23 to levels of ~ 5 . 2 % . Real interest rates, instead, presented mixed trends, as demonstrated by UF - denominated five - year bonds issued by the Central Bank remained stable year - to - date at ~ 2 . 4 % in March 2024 . However, although UF - denominated ten - year bonds concluded the 1 Q 24 at ~ 2 . 4 % , which is similar to the level shown in December 2023 , presented some volatility during the period by peaking up to ~ 2 . 7 % by the end of February 2024 . The evolution of longer - term interest rates had primarily to do with doubts arising from unexpected monthly inflation figures in December 2023 as well as January and February 2024 , when CPI decreased 0 . 5 % and increased 0 . 7 % and 0 . 6 % , respectively, which resulted in adjustments on inflation expectations from the former market views as of December 2023 when 12 - month inflation appea red t o b e c ont r o l l ed . Regardin g foreig n interes t rat e s , th e U . S . Federa l R eserv e (F E D ) has highlighted the monetary policy rate would take longer - than - expecte d t o return t o neutra l le v el s a s inf l a tio n con t inue d t o b e a risk factor for the economy, particularly on the grounds of external factors , such a s arme d conflic t s i n th e Easter n Europe an d the Middle East . Accordingly, the FED Fund Rate (FFR) remained flat in the 1 Q 24 at 5 . 5 % . Although the market expects the FED fun d t o d ecrease , t h e timin g f o r cut s i s no t clea r yet . The divergent path followed by the local MPR and the FFR could bring about second - round effects on the Chilean economy due to the impact of the interest rate gap on the exchange rate that could produc e a pas s - t hroug h effe c t o n loca l price s while condit i oni n g monetar y a ction s t o b e take n b y th e C hilea n Centra l Ban k i f loc a l price s beha v e w ors e th a n exp e cted . Lookin g fo r war d , i n t h e loca l f r o nt , a s inflation ret u rns t o th e m i d - term target range, the Central Bank should continue implementing cuts to the MPR . Based on that we continue to expect the Central Bank to reduce the monetary policy rate during 2024 . However, we have revised our forecast from 4 . 5 % to 5 . 0 % in December 2024 , given recent CPI monthly variations that have beaten market expectations . Notwithstanding that, given the inflation figures seen in the 1 Q 24 , we cannot rule out a less aggressive monetary easing actions that those expected by the market and us . In the case of mid - and long - term local interest rates, we still see some room for downside correction for mid - term interest rates ( 5 - year bonds in CLP and CLF) to the extent the mid - term inflation expectations anchor within the Central Bank target range and, subsequently, the yield curve becomes positivel y sloped . O th e r A s se ts As of March 31 , 2024 our Other Assets totalled Ch $ 10 , 069 , 138 million, which represented an annual decrease of Ch $ 16 , 276 million or 0 . 2 % when compared to March 2023 and a year - to - date increase of Ch $ 98 , 882 million or 1 . 0 % in relation to December 31 , 2023 . O ther A ssets ( In M illi o n s o f C h $ ) 779,631 10,069,138 9,970,256 10,085,414 1,764,159 1,733,648 1,495,108 758,208 681,012 427,598 1,216,747 487,327 2,519,180 690,206 1,596,106 2,653,925 2,811,589 2,084,441 3,248,501 2,464,648 2,712,774 D e c - 2 3 Mar - 23 C a s h a n d D u e f r o m B a n k s L o a n s t o B a n k s D e f e rr e d & C u rr e n t T a x e s M a r - 2 4 Derivatives C a s h i n C olle c t io n & R EP O Other On an annual basis, the decrease in Other Assets when compared to March 2023 was primarily steered by: ⭬ An annual increase of Ch $ 379 , 359 million or 23 . 8 % in Loans an d A d vance s t o B a nks . Th i s d rop was main l y e xplaine d by lower balances in overnight deposits in the Central Bank (accruing the MPR less 25 bp . ) for an amount of Ch $ 499 , 931 million, as part of the liquidity actions carried out by our Treasury to manage short - term cash mismatches arising from schedule d obligatio n s o r purc h ase s o f financia l instru m ents . This factor was to some extent offset by greater balances borrowed by foreign banks, increasing Ch $ 120 , 765 million on a n annua l ba s is . ⭬ An annual decrease of Ch $ 262 , 608 million or 38 . 0 % in Cash in Process of Collection & REPO in contrast with March 2023 , which was primarily fostered by lower amounts of payments in course of collection of financial transactions (primarily der ivative s a n d fix ed - income s ecu ritie s ) a s we were n o t so active given our view on the path that should be followed by loca l ma rket f a c t ors . ⭬ An annual decline of Ch $ 157 , 664 million or 5 . 6 % in trading and hedge accounting derivatives with overall positive fair value adjustment .

As pointed out in the previous quarterly | 42 Management Discussion & Analysis report, the evolution in fair value of derivatives has been steered by both changes in positions on local interest rates and the path followed by these market factors for trading derivatives . On the other hand, exposures through hedge accounting derivatives have remained relatively flat by maintaining a short position in CLF and a long position in foreig n curren c y . The ref o r e , the downwa rd tr e n d ado pte d by local long - term interest rates, particularly in shorter terms of the yiel d curv e durin g the 1 Q 2 4 , res u l ted i n dec re a sin g fair value of trading derivatives, despite the 23 . 6 % depreciation o f th e C hilea n p e s o again s t t h e U . S . do l la r . These drivers were to some degree offset by an annual increment of Ch $ 535 , 727 million or 19 . 7 % in Cash and Due from Banks in March 2024 when compared to March 2023 . This annual change was mainly conducted by an increment in deposits in our current accoun t i n th e Ch i lea n Cen t ra l Bank , f r o m Ch $ 390 , 50 2 millio n i n March 2023 to Ch $ 1 , 150 , 682 million in March 2024 , primarily due to our ongoing liquidity management procedures to administer cash surplus . This was to some extent offset by an annual decrease in deposits in foreign banks for an amount of Ch $ 149 , 532 million, mainly attributable to lower requirements from derivatives contracts . To a lesser degree, other line - items of Other Assets posted an annual increase of Ch $ 269 , 051 million or 18 . 0 % , attributable to diverse accounts . On a year - to - date basis, our Other Assets posted an increase of Ch $ 98 , 882 million or 1 . 0 % when compared to December 2023 . As in the case of the annual change, this evolution had to do with mixed f acto rs, a s f o llows : ⭬ Lower balances of Loans and Advances to Banks from Ch $ 2 , 519 , 180 million in December 2023 to Ch $ 1 , 216 , 747 million as of March 31 , 2024 . This change was primarily fostered by a decrease in overnight deposits in the Central Bank, from Ch $ 2 , 100 , 933 million in December 2023 to Ch $ 800 , 467 million in March 2024 , proceeds that were mainly invested in the PDL program provided by the Central Bank to facilitate the repayment of the first tranche of the FCIC occurring on April 1 st, 2024 and, to a lesser degree, transferred to our current account held in the Central Bank (other - than - overnight - deposits) . ⭬ A year - to - date decrease of Ch $ 59 , 729 million or 12 . 3 % in Cash in Process of Collection & REPO, given the same drive rs m ent io n e d earlier . | 43 These factors were to some extent counterbalanced by ⭬ A year - to - date growth of Ch $ 783 , 853 million or 31 . 8 % in Cash and Due from Banks when compared to December 2023 . This change was attributable to both greater balances of deposits in our current account in the Central Bank by Ch $ 560 , 25 6 millio n o n a yea r - t o - dat e basi s an d dep osit s in foreign banks increasing by Ch $ 299 , 755 million within the same period as part of both the management of cash surplus (partly coming from lower overnight deposits in the Central Bank, as mentioned above) and increased fair value of derivatives transactions on a year - to - date basis, which res ulte d i n gre at e r collate ral re q uiremen ts . ⭬ An incremen t o f Ch $ 5 69 , 48 4 m i llio n o r 27 . 3 % i n tra d in g and hedge accounting derivative transactions with positive fair value adjustments in March 2024 when compared to December 2023 . This year - to - date change was fostered by the behavior of diverse market factors, including : (i) a 12 . 3 % year - to - date depreciation of the Chilean peso against the U . S . dollar as of March 31 , 2024 when compared to December 31 , 2023 , (ii) trading positions in derivatives that turned from liability positions into asset exposures to local interest rat e s , an d (iii) the do w nw ard tre n d i n CLP an d CLF interest rates, particularly in shorter buckets of the yield curve in the three - month period ranging from December 31 , 2023 t o Marc h 31 , 20 2 4 . Cur r e n t A c c o un ts & D e m a nd De p o s it s After periods of huge liquidity in the local market, current account s an d deman d deposit s seeme d t o have ret u r ne d t o more normalized levels in relation to Total Loans and Time Deposits . Divers e underlyin g fac t or s contr i bute d t o thi s behavior , including : (i) a significant decrease in 12 - month inflation that amounted to 3 . 7 % in March 2024 as compared to 11 . 1 % posted in March 2023 , measured as CPI variation, which reduced the loss of purchasin g powe r fo r c urre n t a ccount s ba l ances , (ii) t h e eas i n g monetary cycle started by the Chilean Central Bank in the 2 H 23 b y ta k in g the ref e re n c e int e rest ra t e from 11 . 25 % i n Marc h 20 2 3 and 8 . 25 % in December 2023 to 7 . 25 % in March 2024 , which means lower opportunity cost for this kind of savings, and (iii) more importantly, a liquidity excess in the economy that seems to definitely disappeared, particularly among individuals .

Management Discussion & Analysis Based on the above, our current accounts and demand deposits amounted to Ch $ 13 , 539 , 960 million as of March 31 , 2024 , which represented an annual increment of Ch $ 389 , 329 million or 3 . 0 % when compared to March 2023 and a year - to - date increment of Ch $ 218 , 300 million or 1 . 6 % in relation to December 2023 . To t a l D eman d D eposi t s ( In M illi o n s o f C h $ ) 13,539,960 13,321,660 13,150,631 5,952,505 5,860,996 5,793,520 7,587,455 7,460,664 7,357,111 Dec - 23 Mar - 23 R e ta i l B an k i ng Mar - 24 W ho l e s a l e B a n k i n g At a business segment level, DDA managed by the Retail and the Wholesale Banking segments behaved on a similar fashion, both conduction the tempered overall increase in DDA . In this regard, DDA administered by the Retail Banking segment posted an annual increase of Ch $ 230 , 344 million or 3 . 1 % by reaching Ch $ 7 , 587 , 455 million in March 2024 vis - à - vis the Ch $ 7 , 357 , 111 million posted a year earlier, while – on a year - to - date – basis Re tai l B a nk i n g D D A we n t u p b y Ch $ 126 , 79 1 millio n o r 1 . 7 % fr o m the Ch $ 7 , 460 , 664 million recorded in December 2023 . In the same line, the Wholesale Banking segment reached DDA by Ch $ 5 , 952 , 505 million in March 2024 , representing an annual increase of Ch $ 158 , 985 million or 2 . 7 % when compared to March 2023 and a year - to - date increment of Ch $ 91 , 509 million or 1 . 6 % whe n contraste d wit h Dec e mb e r 2023 . In our view, these trends reaffirm the return of DDA balances to a medium - term behaviour after periods of extraordinary liquidity, particularly among individuals . Also, the cumulative effect of past inflation on current prices and lagged recognition of that effect on overall salaries, which eroded the purchasing power, together with the impact of increased unemployment in the economy, has resulted in lower dynamism of DDA in the banking industry, from which we have taken advantage in the 1 Q 24 on the grounds of our premium customer base in comparison with our relevant peers . To t a l D eman d D eposi t s by C u r r ency ( In M illi o n s o f C h $ ) 13,539,960 13,321,660 13,150,631 1,949,983 1,961,638 2,105,464 11,589,977 11,360,022 11,045,167 D e c - 23 Mar - 24 F o r e i gn C u r r e n c y Mar - 23 Lo c a l C u r r e n c y In terms of the currency composition, as of March 31 , 2024 our DDA continued to be mainly composed of Ch $ - denominated DDA, which totalled Ch $ 11 , 589 , 977 million as of the same date, indicating an annual increase of Ch $ 544 , 810 million or 4 . 9 % when compared to March 2023 . When compared to December 2023 , DDA denominated in Chilean peso posted an increase of Ch $ 229 , 955 million or 2 . 0 % in March 2024 . As such, the evolution of total DDA has primarily been conducted by the trend followed by local currency demand deposits, given the drivers mentioned earlier, including : (i) the actual and the expected downward correction for short - term interest rates, which reduces the opportunity cost of funds, and (ii) declining 12 - month inflation that contributes to reduce the loss in purchasing power . As a res u lt, loca l curre nc y DDA con t inue d t o b e the main sou rce of DDA by representing 85 . 6 % of the total DDA balances as of March 2024 , in relation to the 84 . 0 % and the 85 . 3 % recorded a yea r an d a quart e r earlier , r es p ectively . Instead, DDA denominated in foreign currency decreased on bot h a n an n ua l an d a yea r - to - d at e bas is . As o f Marc h 31 , 20 2 4 foreign currency DDA amounted to Ch $ 1 , 949 , 983 million, which denotes an annual decline of Ch $ 155 , 481 million or 7 . 4 % when compared to March 2023 and a year - to - date slight decrease of Ch $ 11 , 655 million or 0 . 6 % if contrasted with December 2023 . More importantly, foreign currency DDA expressed in USD displayed a decline from USD 2 , 650 million in March 2023 to USD 2 , 244 million in December 2023 and USD 1 , 985 million, which makes the trend even clearer .
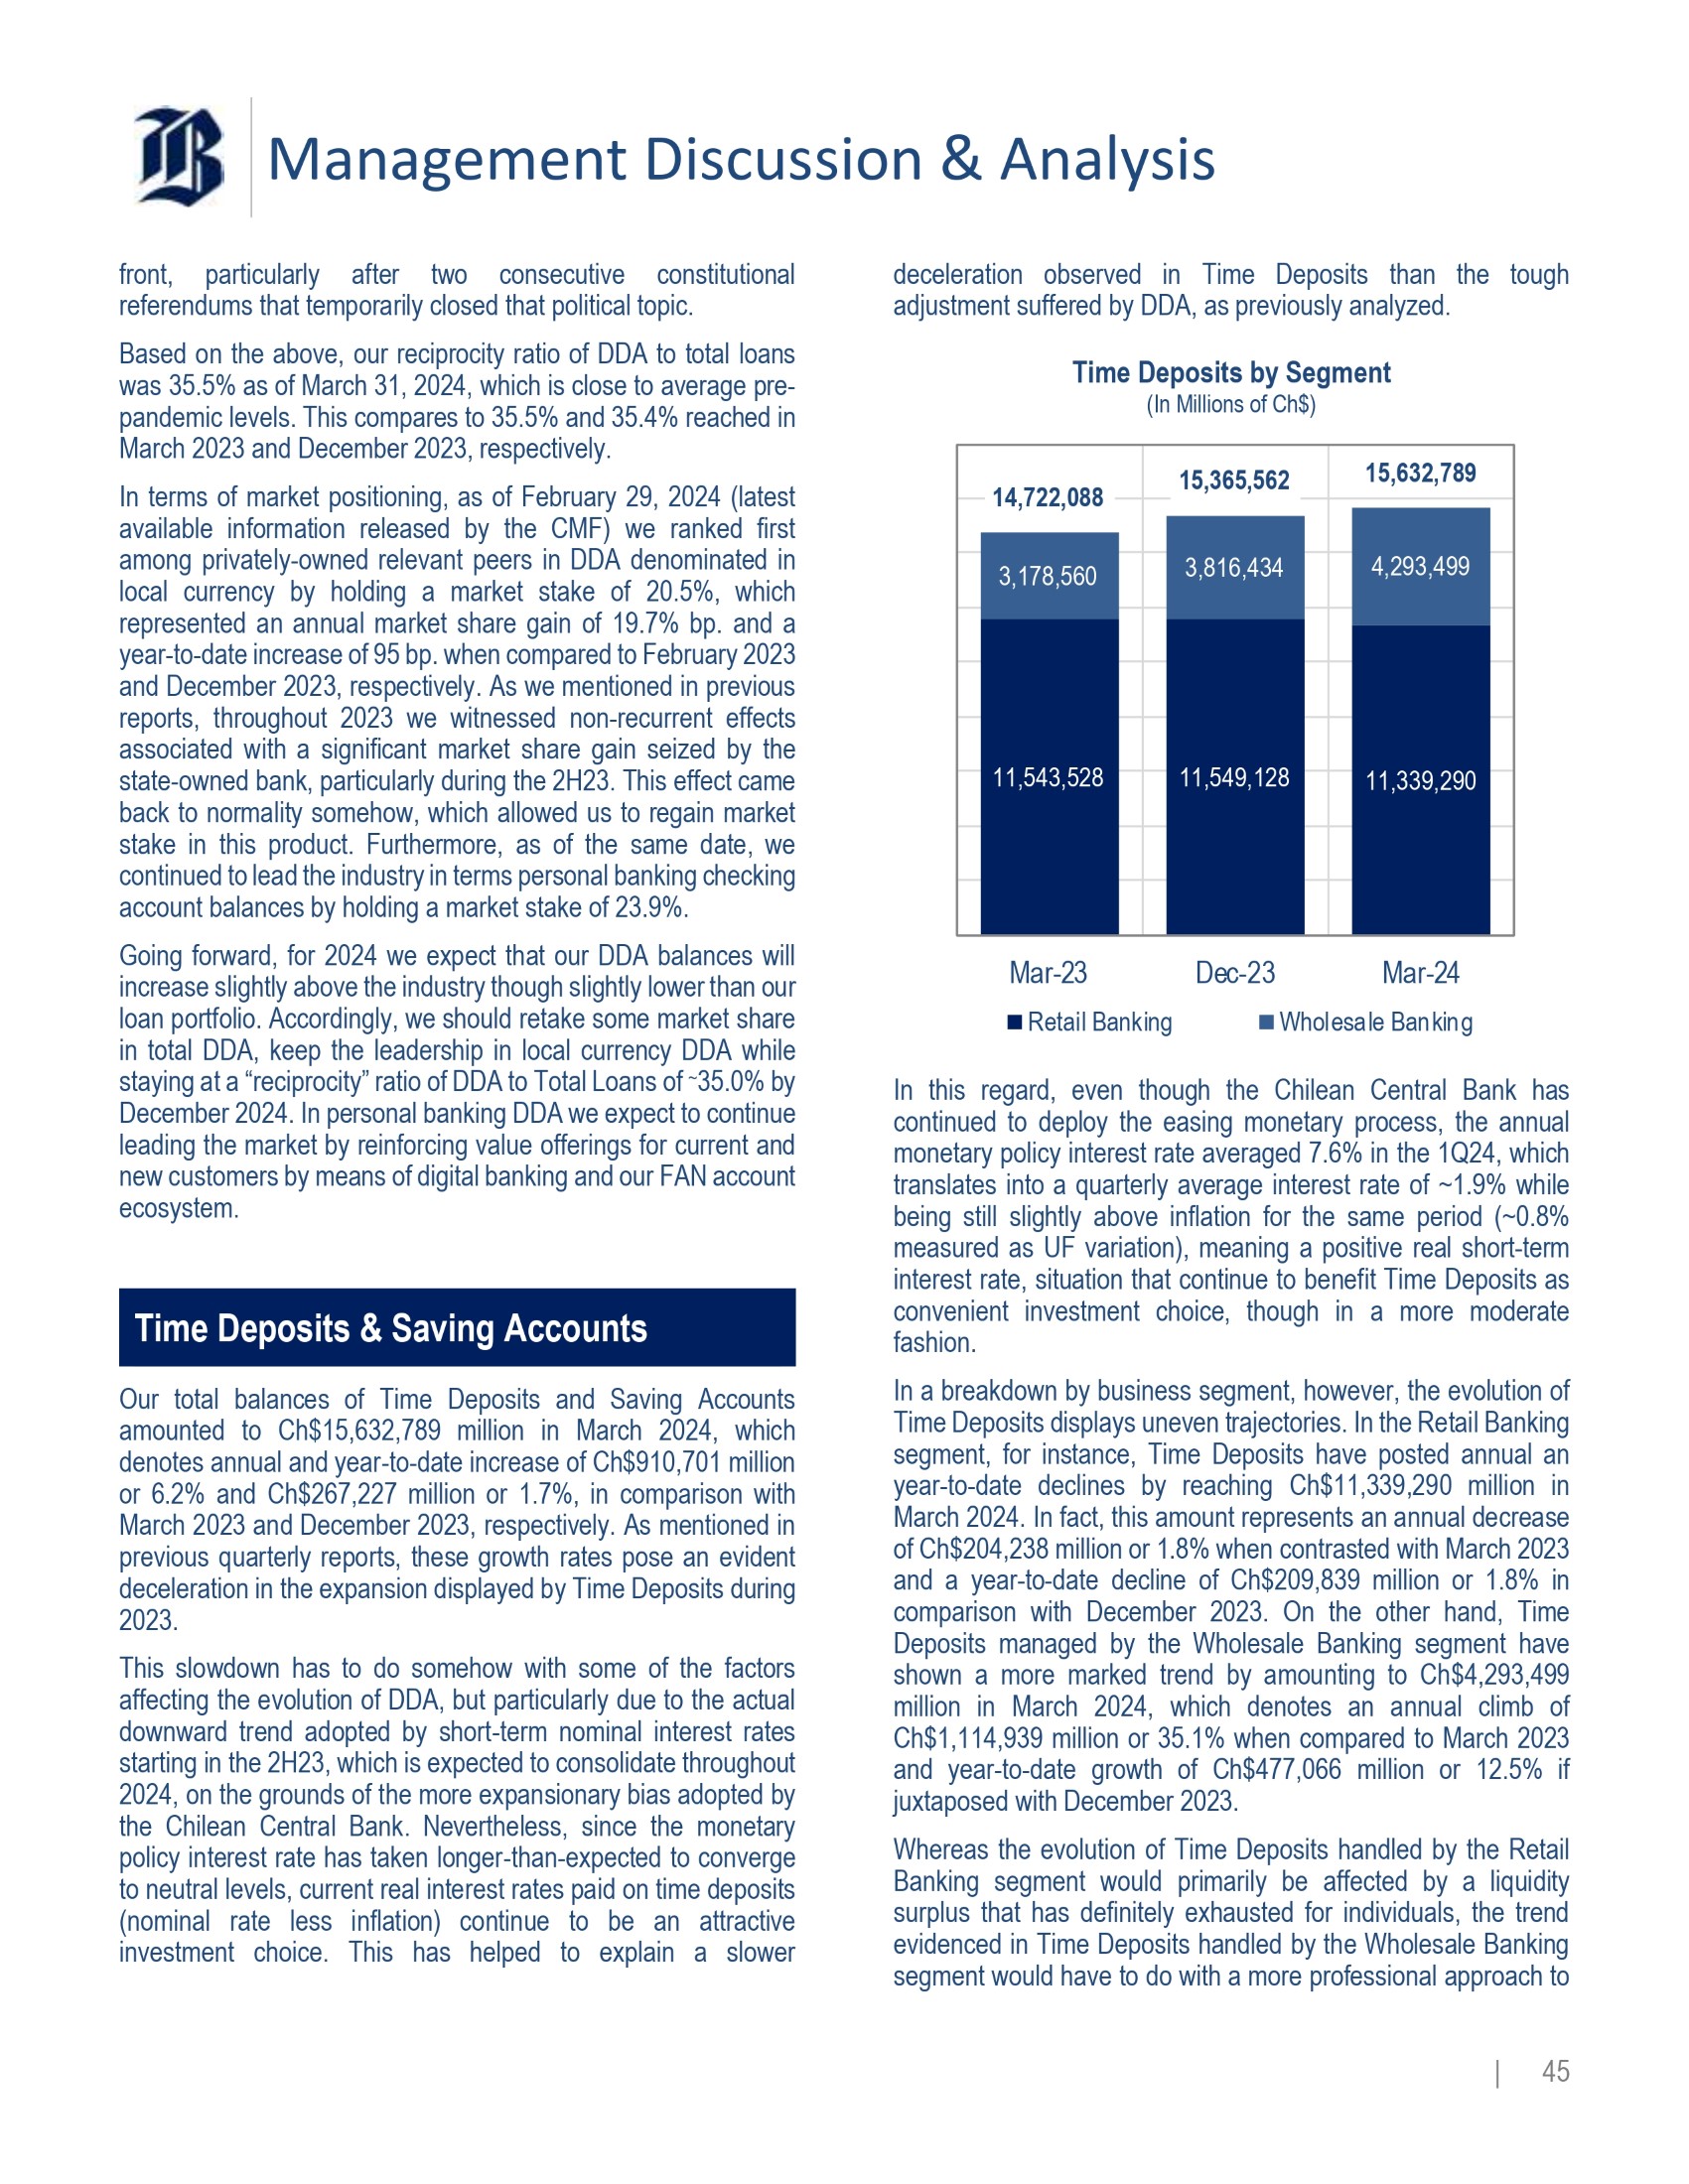
In our view, changes in foreign currency DDA had primarily to do with : (i) foreign interest rates that remain at higher - than - normal levels due to monetary contractionary cycles, which lifts the opportunity cost of funds saved in current accounts, and (ii) lowered uncertainty in the local | 44 Management Discussion & Analysis front, particularly after two consecutive constitutional referendums that temporarily closed that political topic . B a sed o n the a bov e , ou r reci p rocit y ratio o f DDA t o t ota l loa n s was 35 . 5 % as of March 31 , 2024 , which is close to average pre - pandemic levels . This compares to 35 . 5 % and 35 . 4 % reached in March 2023 and December 2023 , respectively . In terms of market positioning, as of February 29 , 2024 (latest available information released by the CMF) we ranked first among privately - owned relevant peers in DDA denominated in local currency by holding a market stake of 20 . 5 % , which represented an annual market share gain of 19 . 7 % bp . and a year - to - date increase of 95 bp . when compared to February 2023 an d De c emb e r 2 023 , res p ect i v e l y . As we men ti o ne d i n pre vi o us reports, throughout 2023 we witnessed non - recurrent effects associated with a significant market share gain seized by the state - owned bank, particularly during the 2 H 23 . This effect came back to normality somehow, which allowed us to regain market stake in this product . Furthermore, as of the same date, we continued to lead the industry in terms personal banking checking account balances by holding a market stake of 23 . 9 % . Going forward, for 2024 we expect that our DDA balances will increase slightly above the industry though slightly lower than our loan portfolio . Accordingly, we should retake some market share in total DDA, keep the leadership in local currency DDA while staying at a “reciprocity” ratio of DDA to Total Loans of ~ 35 . 0 % by December 2024 . In personal banking DDA we expect to continue leading the market by reinforcing value offerings for current and new customers by means of digital banking and our FAN account ecosystem . T im e D e p o s it s & Sa v i ng Acc o u n ts Our total balances of Time Deposits and Saving Accounts amounted to Ch $ 15 , 632 , 789 million in March 2024 , which denotes annual and year - to - date increase of Ch $ 910 , 701 million or 6 . 2 % and Ch $ 267 , 227 million or 1 . 7 % , in comparison with March 2023 and December 2023 , respectively . As mentioned in previous quarterly reports, these growth rates pose an evident deceleration in the expansion displayed by Time Deposits during 2023 . This slowdown has to do somehow with some of the factors affecting the evolution of DDA, but particularly due to the actual downward trend adopted by short - term nominal interest rates startin g i n th e 2 H 23 , wh i c h i s ex pecte d t o consolidat e through o u t 2024 , on the grounds of the more expansionary bias adopted by the Chilean Central Bank . Nevertheless, since the monetary policy interest rate has taken longer - than - expected to converge to neutral levels, current real interest rates paid on time deposits (nominal rate less inflation) continue to be an attractive investment choice . This has helped to explain a slower deceleration observed in Time Deposits than the tough adjust men t su ffe r e d b y D D A, a s pre viou sl y anal y zed . Time D eposit s b y Se g ment ( In M illi o n s o f C h $ ) 15,632,789 15,365,562 14,722,088 4,293,499 3,816,434 3,178,560 11,339,290 11,549,128 11,543,528 D e c - 2 3 Mar - 23 R e t a i l B an k i n g Mar - 24 W ho l e s a l e B a n k i n g In this regard, even though the Chilean Central Bank has continued to deploy the easing monetary process, the annual monetary policy interest rate averaged 7 . 6 % in the 1 Q 24 , which translates into a quarterly average interest rate of ~ 1 . 9 % while being still slightly above inflation for the same period (~ 0 . 8 % measured as UF variation), meaning a positive real short - term interest rate, situation that continue to benefit Time Deposits as convenient investment choice, though in a more moderate fashion . In a breakdown by business segment, however, the evolution of Time Deposits displays uneven trajectories . In the Retail Banking segment, for instance, Time Deposits have posted annual an year - to - date declines by reaching Ch $ 11 , 339 , 290 million in March 2024 . In fact, this amount represents an annual decrease o f Ch $ 204 , 23 8 millio n o r 1 . 8 % wh e n con tra s ted with Marc h 2 0 23 and a year - to - date decline of Ch $ 209 , 839 million or 1 . 8 % in comparison with December 2023 . On the other hand, Time Deposits managed by the Wholesale Banking segment have shown a more marked trend by amounting to Ch $ 4 , 293 , 499 million in March 2024 , which denotes an annual climb of Ch $ 1 , 114 , 939 million or 35 . 1 % when compared to March 2023 and year - to - date growth of Ch $ 477 , 066 million or 12 . 5 % if juxt apose d with Decembe r 20 2 3 .

Whereas the evolution of Time Deposits handled by the Retail Banking segment would primarily be affected by a liquidity surplus that has definitely exhausted for individuals, the trend evidence d i n T i m e D e pos it s h a ndle d b y the Wh olesal e B a nk in g segment would have to do with a more professional approach to | 45 Management Discussion & Analysis investment and specialized information that enabled these customers to continuously be looking for the best choice to optimize the profitability of their short - term cash surplus . This is also correlated with the increase evidenced by Time Deposits denominated in foreign currency, that posted increases of Ch $ 367 , 087 million or 23 . 9 % when compared to March 2023 and Ch $ 56 , 956 million or 3 . 1 % if contrasted with December 2023 , on the grounds of short - term interest rates in foreign currency that remain at higher - than - normal levels since global central banks have not even started to undertake expansionary monetary pro cesses , a s inflation c ont inu e s t o affe c t d e velope d economi e s . This also contributes to the depreciation of the Chilean Peso, since CLP - denominated interest rates are going down . Therefore, foreign - currency Time Deposits appear to be an attract iv e inve s t men t al ter n a tive for w h olesal e c u sto mers . Looking forward, we foresee Time Deposits 12 - month growth to continue decelerating in 2024 by converging to a long - term liability structure composition . However, in the end, the path to be followed by Time Deposits will depend on diverse factors including the evolution of DDA, liquidity trends in the local and the offshore bond markets and, more importantly, on the actual growth posted by our loan portfolio . From the demand side, as the interest rates paid on Time Deposits continue to decline, in close association with the monetary policy interest rate expected jou rn e y , th e re wo u l d b e les s in c entiv e t o ta k e this kin d o f dep osit s by customers . With the information handled at this point, by the end of 2024 we foresee Time Deposits to remain relatively flat in nominal terms when compared to the balances recorded in December 2023 . All in all, the reciprocity ratio of Time Deposits to Total Loans would hover below the 41 % observed in December 2023 , which is more or less the same level reached in Marc h 2024 . D e b t Is s u e d The Debt Issued totalled Ch $ 10 , 776 , 369 million on March 31 , 2024 , which denotes an annual increase of Ch $ 410 , 108 million or 4 . 0 % in comparison with March 2023 and a year - to - date growth of Ch $ 376 , 490 million or 3 . 6 % when contrasted with Decembe r 31 , 2 023 . Although inflation is partly responsible for the annual and the year - to - date evolution of debt issued, as bonds issued in the local market are mostly denominated in UF, during the 1 Q 24 we carried out diverse bond placements, particularly in the local market but also overseas, as part of our continuous search for funding alternatives that enable us to maintain our market - leading cost of funds . Also, we have issued new long - term debt with the aim of replacing scheduled amortization of older bonds and also based on the grounds of our expectation of moderate balance sheet growth . Thus, in the three - month period ended on March 31 , 202 4 w e plac e d bonds : ⭬ In the local market and fully denominated in UF for an amount of Ch $ 262 , 487 million with average maturity of 4 . 7 years and a n ave ra g e issu a n c e rate o f 3 . 5 % i n r ea l ter ms . T hi s a mou nt joined to the Ch $ 707 , 032 million issued since between March 31 , 2023 and December 31 , 2023 , also denominated in UF . ⭬ Overseas we placed a 10 - year bond in Hong - Kong amo unt in g t o Ch $ 5 2 , 3 8 5 milli o n bea ring a n ave ra g e inte rest rate of 4 . 2 % . This placement combined with bond issuances b y Ch $ 67 , 80 1 millio n i n Japan an d Mexico durin g the nin e - month period ranging from March 31 , 2023 and December 31 , 2023 . E volutio n of D eb t Iss u ed ( In M illi o n s o f C h $ ) 10,776,369 10,399,879 10,366,261 1,263 1,444 2,004 1,053,813 9,721,293 1,039,814 9,358,621 1,029,546 9,334,711 Mar - 23 S en i o r B ond s D e c - 23 Mar - 24 S ub o r d i na t e d B o n d s M o r t gage F i na n c e B o nd s On the other hand, neither over the last twelve months nor in the 1 Q 24 we have issued any tranche of subordinated bonds, despite the room we have to do so in order to bolster our capital adequacy . Accordingly, the annual growth of Ch $ 24 , 267 million or 2 . 4 % and the year - to - date increase of Ch $ 13 , 999 million or 1 . 3 % pos ted b y subo rdi n ate d b ond s was full y e xplaine d b y t h e effect of inflation on notional amounts denominated in UF . As subordinated bonds are a source of capital adequacy, future issuances will depend on both scheduled maturity for purposes of Tier 2 Capital computation, which is not an issue for 2024 , and potential initiatives to bolster our equity base, if required in the future .

| 46 Management Discussion & Analysis In terms of currency concentration, the annual and quarterly change in Debt Issued was mainly attributable to : (i) new placements of bonds denominated in local currency that incre ased Ch $ 242 , 35 0 milli o n o r 2 . 9 % o n a n annu a l bas i s a n d Ch $ 224 , 230 million or 2 . 7 % on a year - to - date basis, which was primarily supported by the previously mentioned placements that were partly offset by scheduled maturities, and (ii) greater balances of long - term debt denominated in foreign - currency by Ch $ 167 , 75 8 millio n o r 8 . 5 % o n a n annua l basi s a n d Ch $ 1 52 , 2 6 0 million or 7 . 7 % year - to - date, which was related to both the issuance of new bonds abroad, as mentioned earlier, but particularly due to the evolution of the exchange rate characterized by a Chilean peso that depreciated 23 . 6 % and 12 . 3 % in March 2024 when compared to March 2023 and Decembe r 2023 , respectiv e ly . D eb t Issue d by C u r r ency ( In M illi o n s o f C h$ a nd % ) Lo c a l C u rr en c y 8,640,346 80.2% F o r e i g n C u rr en c y 2,136,023 19.8% As for debt issued in foreign currency expressed in notional amounts passed from U . S . $ 2 , 478 million in March 2023 to U . S . $ 2 , 269 million in December 2023 and U . S . $ 2 , 175 million in March 2024 , mainly due to scheduled amortizations of formerly issued bonds . It is worth noting that, even though we aim to maintain our presence in overseas markets as a source of funding diversification, the main driver when issuing debt has to do with competitiveness . As such, the proportion of local vs foreign currency debt will finally depend on the cost of funding we ar e tra n sfe rring t o ou r cus t o m e rs . I n this re gard , deb t issu e d i n local currency (including subordinated bonds) passed from re p res e ntin g 81 . 0 % i n Marc h 2 0 2 3 an d 80 . 9 % i n De c emb e r 20 2 3 to 80 . 2 % in March 2024 as a percentage of total debt issued . Looking forward, we aim to continue assessing funding alternatives based on the evolution of DDA, liquidity in capital local and foreign capital markets, changes in both the yield curv e s an d cred i t sp r ead s , an d l oa n growt h . Ac c or d ing ly , fo r 20 2 4 we expect to grow faster than in the last three years in long - term debt in order to both finance the expected expansion in residential mortgage and commercial loans and addressed the scheduled maturity of the current stock of this type of funding . Therefore, if our expectations on loan growth, DDA and Time Deposits are achieved, long - term debt should grow above the loa n p ortf olio . O th e r L i ab i l ities Our Other Liabilities accounted for Ch $ 11 , 667 , 446 million by the end of the 1 Q 24 , which was Ch $ 338 , 154 million or 2 . 8 % below the level posted in March 2023 but surpassed by Ch $ 199 , 280 million or 1 . 7 % the figure reached in December 2023 . O ther Liabilit i es ( In M illi o n s o f C h $ ) 11,667,446 11,468,166 12,005,600 3,243,532 3,278,349 3,749,928 2,763,406 3,241,226 2,357,523 5,625,691 5,360,715 5,520,842 M a r - 2 3 Dec - 23 Ma r - 2 4 B o rr o w i ng f r om F .I. D e r i v a t i v e s P r o v i s i on s & O t h e r s The change in other liabilities has primarily been conducted by the evolution of derivatives, including both trading derivatives and hedge accounting derivatives, given the variation of market factors that resulted in fair value adjustments . On the other hand, Borrowings from Financial Institutions and Provisions & Other Liabilities presented moderate changes . On an annual basis, the main underlyin g fa c tors w e re, a s f o llows : ⭬ Derivatives with negative fair value adjustment decreasing Ch $ 477 , 820 million or 14 . 7 % in relation to March 2024 . The change in fair value had mainly to do with the reduced exposures in the 1 Q 24 when contrasted with the 1 Q 23 , particularly in CLF - denominated derivatives, mainly due to the more normalized inflation scenario in the 1 Q 24 in relation t o a yea r earlier , effe c t th a t was t o som e deg ree offs e t b y a 23 . 6 % depreciation of the Chilean peso against the U . S . dollar .
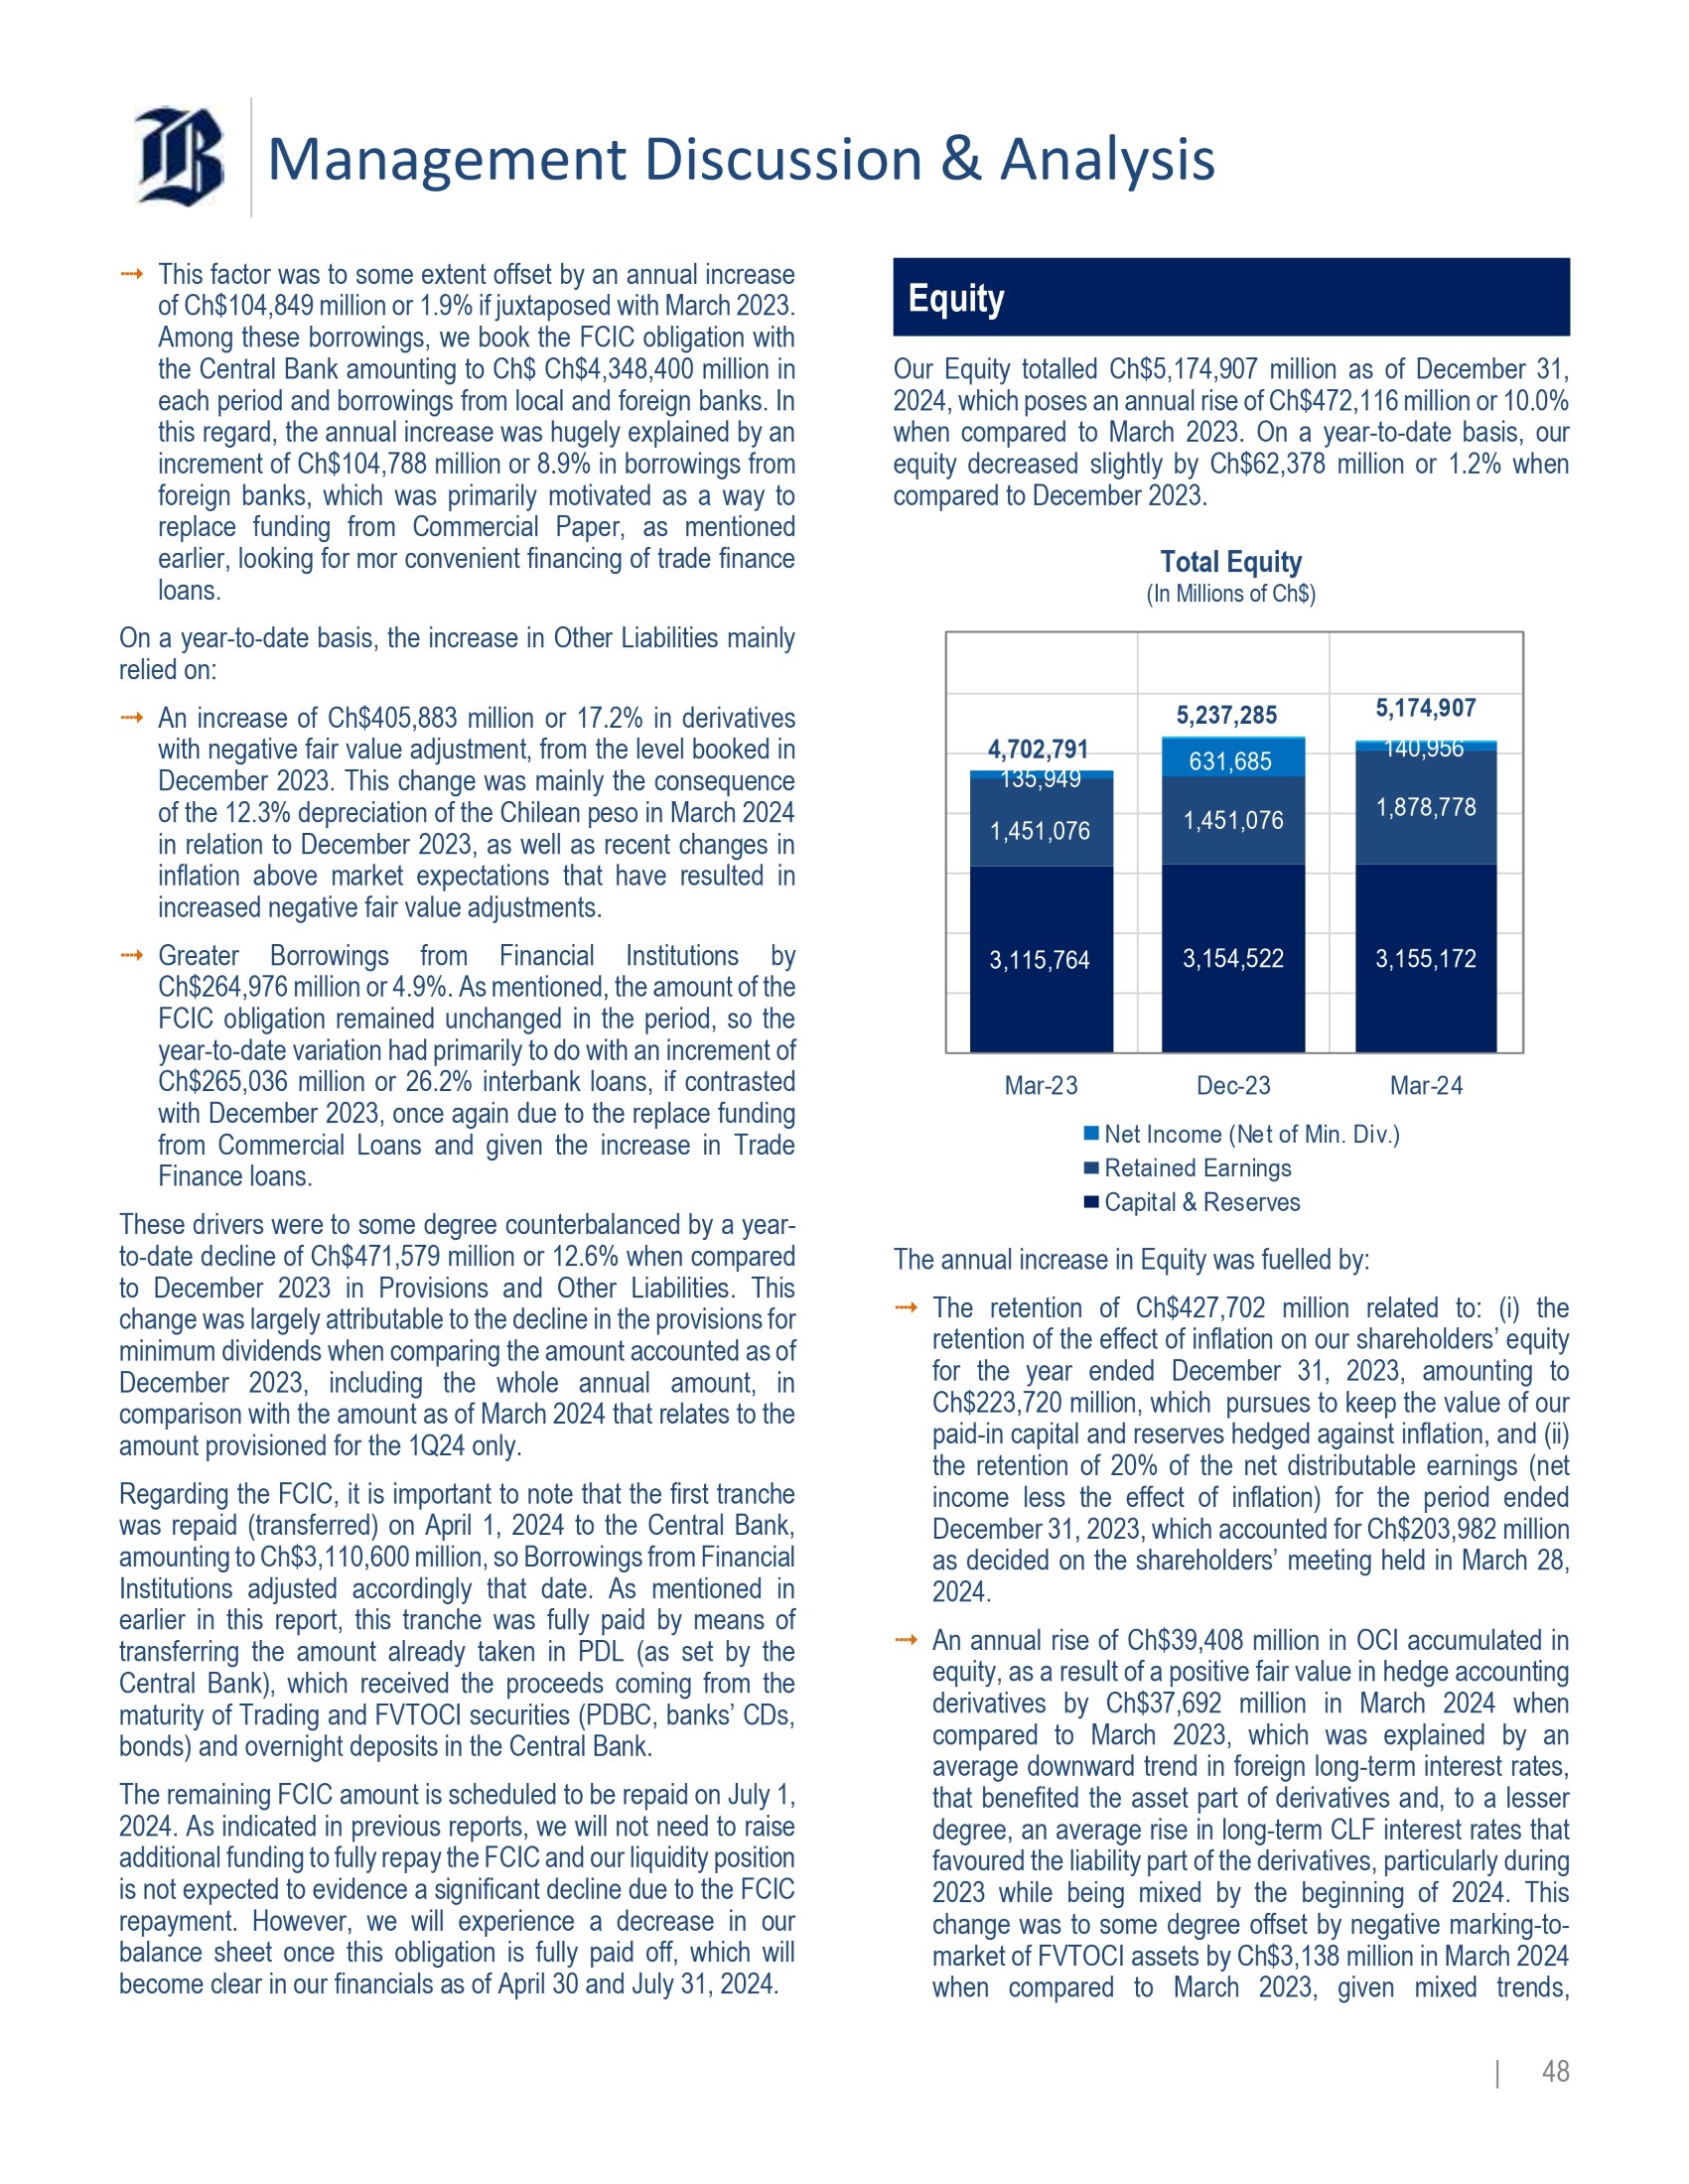
| 47 Management Discussion & Analysis ⭬ This factor was to some extent offset by an annual increase of Ch $ 104 , 849 million or 1 . 9 % if juxtaposed with March 2023 . Among these borrowings, we book the FCIC obligation with the Central Bank amounting to Ch $ Ch $ 4 , 348 , 400 million in each perio d an d bor rowi n g s fr o m loca l an d for eig n ban ks . In this regard, the annual increase was hugely explained by an increment of Ch $ 104 , 788 million or 8 . 9 % in borrowings from foreign banks, which was primarily motivated as a way to replace funding from Commercial Paper, as mentioned earlier , loo k i n g for mo r conven i en t fin ancin g o f tr a d e fin a n ce loans . O n a yea r - to - d at e bas is , the i n crea s e i n Oth e r Liabiliti e s main l y reli e d o n : ⭬ An increase of Ch $ 405 , 883 million or 17 . 2 % in derivatives with negative fair value adjustment, from the level booked in December 2023 . This change was mainly the consequence o f th e 12 . 3 % deprec i atio n o f th e Chi l ea n p eso i n Marc h 2024 in relation to December 2023 , as well as recent changes in inflation above market expectations that have resulted in increased negative fair value adjustments . ⭬ Greater Borrowings from Financial Institutions by Ch $ 264 , 976 million or 4 . 9 % . As mentioned, the amount of the FCIC obligation remained unchanged in the period, so the year - to - date variation had primarily to do with an increment of Ch $ 265 , 036 million or 26 . 2 % interbank loans, if contrasted with December 2023 , once again due to the replace funding from Commercial Loans and given the increase in Trade Financ e loans . These drivers were to some degree counterbalanced by a year - to - dat e dec l in e o f Ch $ 4 7 1 , 5 7 9 millio n o r 12 . 6 % wh e n co m par e d to December 2023 in Provisions and Other Liabilities . This change was largely attributable to the decline in the provisions for minimum dividends when comparing the amount accounted as of December 2023 , including the whole annual amount, in compariso n wit h t h e amou n t a s o f Marc h 202 4 t h a t rela t e s t o t h e amount provisioned for the 1 Q 24 only . Regarding the FCIC, it is important to note that the first tranche was repaid (transferred) on April 1 , 2024 to the Central Bank, amounting to Ch $ 3 , 110 , 600 million, so Borrowings from Financial Institutions adjusted accordingly that date . As mentioned in earlier in this report, this tranche was fully paid by means of transferring the amount already taken in PDL (as set by the Central Bank), which received the proceeds coming from the maturity of Trading and FVTOCI securities (PDBC, banks’ CDs, bonds) and overnight deposits in the Central Bank . The remaining FCIC amount is scheduled to be repaid on July 1 , 2024 . As indicated in previous reports, we will not need to raise additional funding to fully repay the FCIC and our liquidity position i s no t expe cte d to evidenc e a s i gni fic an t dec lin e d u e t o t h e F C I C repayment . However, we will experience a decrease in our balance sheet once this obligation is fully paid off, which will become clear in our financials as of April 30 and July 31 , 2024 . Equity Our Equity totalled Ch $ 5 , 174 , 907 million as of December 31 , 2024 , which poses an annual rise of Ch $ 472 , 116 million or 10 . 0 % when compared to March 2023 . On a year - to - date basis, our equity decreased slightly by Ch $ 62 , 378 million or 1 . 2 % when compare d t o D e cembe r 20 2 3 . To t a l E q uity ( In M illi o n s o f C h $ ) 4,702,791 5,174,907 140,956 5,237,285 1,878,778 631,685 1,451,076 135,949 1,451,076 3,155,172 3,154,522 3,115,764 Mar - 23 Dec - 23 Mar - 24 N e t I n c o m e ( N e t o f M i n . D i v .) R e t a i ned E a r n i ng s C ap i t a l & R e s e r v e s The annual increase in Equity was fuelled by : ⭬ The retention of Ch $ 427 , 702 million related to : (i) the retention of the effect of inflation on our shareholders’ equity for the year ended December 31 , 2023 , amounting to Ch $ 223 , 72 0 mill i o n , whic h pu r sue s t o keep th e valu e o f our paid - in capital and reserves hedged against inflation, and (ii) the retention of 20 % of the net distributable earnings (net income less the effect of inflation) for the period ended Decembe r 31 , 2023 , whic h acc o unte d fo r Ch $ 203 , 98 2 mill i on as decided on the shareholders’ meeting held in March 28 , 2024 . ⭬ An annual rise of Ch $ 39 , 408 million in OCI accumulated in equity, as a result of a positive fair value in hedge accounting derivatives by Ch $ 37 , 692 million in March 2024 when compared to March 2023 , which was explained by an average downward trend in foreign long - term interest rates, that benefited the asset part of derivatives and, to a lesser deg re e , a n ave ra g e rise i n lon g - term CLF interest r ates that favoured the liability part of the derivatives, particularly during 2023 while being mixed by the beginning of 2024 .

This chang e was t o som e de g ree o f fs e t b y neg ativ e marki n g - to - marke t o f F V TO C I as set s b y C h $ 3 , 13 8 millio n i n Marc h 202 4 when compared to March 2023 , given mixed trends, | 48 Management Discussion & Analysis particularly in local interest rates that resulted in negative fair value adjustments in the nine - month period ranging from March 31 , 2023 to December 31 , 2023 that were to some extent compensated by positive fair value adjustments in the three - mon t h perio d e n de d o n M arc h 31 , 2 0 24 , o n the gr o und s of the decline experienced by local nominal interest rates for shorte r term s o f th e yiel d c u rve . When compared to December 2023, the slight decrease in Equity ha d t o d o w ith: ⭬ A com par iso n base ef f ec t th a t res ulte d i n l o wer ne t income by Ch $ 490 , 729 million, once deducted provisions for minimum dividends, from Ch $ 631 , 685 million as of December 31 , 2023 to Ch $ 140 , 956 million in the first three months of 2024 . ⭬ This effect was almost totally offset by the retention of Ch $ 427 , 702 million, which is explained by the factors mentioned for annual variations, meaning the retention of both the inflation effect on equity with charge to the net income earned in 2023 and the retention of 20 % of the net dist rib u ta b l e ear n ing s f o r t h e s a m e yea r .
| 49 Risk & Capital Management Risk Management Approach Ris k M ana g ement P r inc ip l es Banco de Chile’s risk profile ensures that its business can sustainably grow and is aligned with its strategic objectives, in order to maximize value creation and guarantee its liquidity and solvency . Global risk management takes into consideration the business segments served by the bank and its subsidiaries, which is approached from an integrated and differentiated perspective . The bank's corporate governance relies on active participation by the board, in order to adequately manage risk, either directly or through committees composed of directors and senior management that have been described in the Corporate Governance section of this report . The board establishes the risk policies, the risk appetite framework, and the guidelines to develop, validate and monitor its models . It approves the provision models and annually issues an opinion on the adequacy of provisions . Management is responsible for establishing rules and procedures, and for controlling compliance with the board’s instructions . The bank has integrated its capital and liquidity planning process into its strategic planning, in line with the risks inherent to its business, the financial and competitive environment, its business strategy, corporate values, and its risk governance, management and control systems . Its capital planning process is aligned with the regulator’s requirements and incorporates Risk Weighted Asset calculations and stress tests for its credit, market and operational risks, and the integrated measuremen t o f it s f inancia l a n d non - financia l r i sks . The Wholesale Credit Risk Division, the Retail Credit Risk and Global Risk Control Division and the Cybersecurity Division jointly manage risk . They form the corporate risk governance structure, and their highly experienced and specialized teams, together with a robust regulatory framework, secure optimal and effective management of the matters they address . The first two divisions are responsible for credit risk during the loan origination, monitoring and recovery stages for these respective segments . The Wholesale Credit Risk Division has a Market Risk Area that is responsible for measuring, limiting, controlling and reporting on market risk, as well as defining valuation and management standards for the bank’s assets and liabilities .
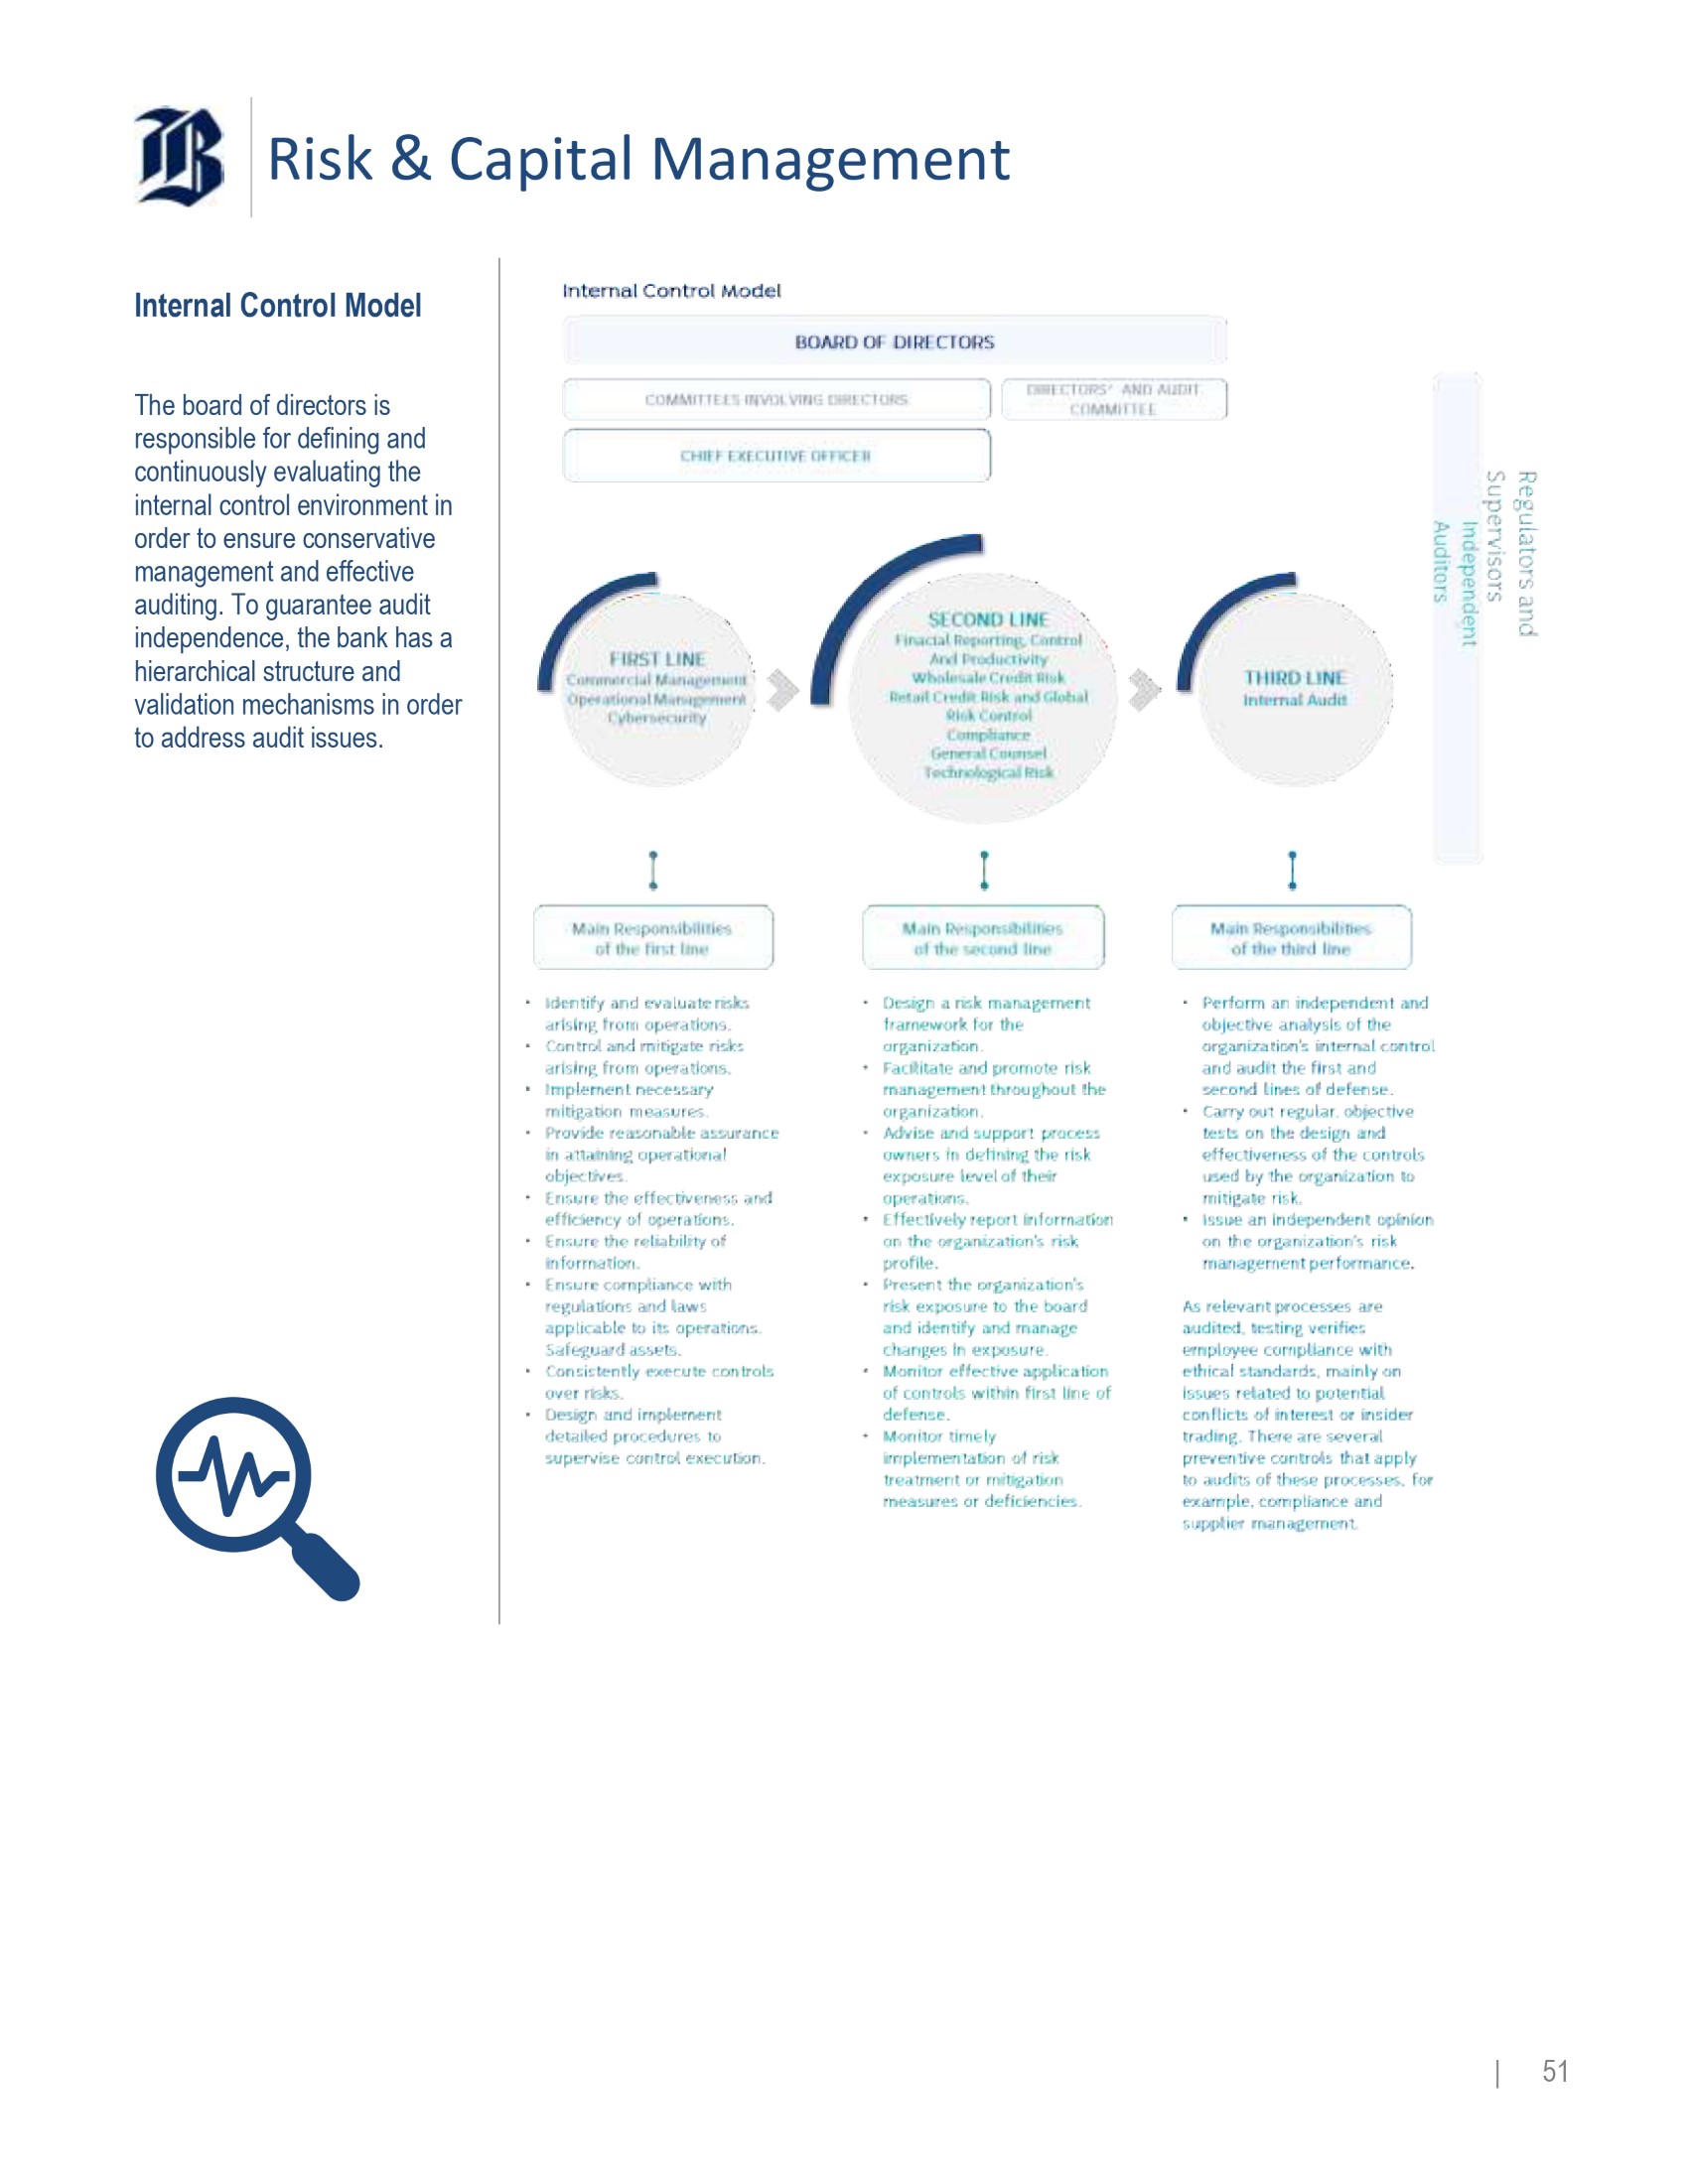
| 50 Risk & Capital Management Inter na l Co n trol M odel Th e boar d o f dir e ctor s is responsibl e for d efinin g an d continuousl y eva l uatin g the inte rn a l contro l e nvironme n t in orde r t o ensu re c onserva tive managemen t an d effective auditing . To gua r ant e e aud it independence , t h e ban k ha s a hierarchical structure and va lida tion mech a nism s i n o rd e r t o addres s audi t i ssues.

| 51 Risk & Capital Management Cre dit Ris k Credi t r i s k as s esse s the probab ilit y t ha t t h e c oun ter pa r ty i n a loa n t rans act i o n doe s n ot mee t it s contra c t ua l obliga ti o n because o f pay m en t in capaci t y o r financia l inso l vency , an d t h at lea d s t o a po te n tial loa n lo ss. The bank seeks an adequate risk - return and an appropriate risk balance, through careful credit risk management, which covers the loan origination, monitoring and recovery processes . It also continuously manages risk knowledge using an integral approach, in order to contribute to the business and anticipate threats that may damage its solvency or the quality of its loan portfolio, by developing a unique risk awareness culture throughout the corporation . This requires developing a risk management framework for the business segments served by the bank, responding to regulatory requirements and commercial dynamism, contributing to digital transformation, and contributing to the bank’s businesses from a risk management perspective . It adopts a portfolio perspective that efficiently and proactively manages, resolves and controls the business approval process . The bank integrates socio - environmental criteria into its evaluations for granting financing for domestic and regional projects that might generate such an impact, wherever executed . Projects must have all the permits, authorizations, licenses and studies required for their impacts in order to qualify for financing . For large customers, the bank also has specialized customer service units involved in the process of financing large - scale projects such as public works concessions that include building infrastructure and mining, power or real estate developments, all of which may have an environmental impact . Credit policies and processes are based on the following management principles, which use a specialized approach according to the characteristics of the bank’s markets and segments, and acknowledges their peculiarities : Perform a rigorous evaluation during the loan origination process Implement a continuous, robust portfolio monitoring process Develop credit risk modelling guidelines, covering regulatory and management aspects, for efficient decision making at each stage of the lending process. Implemen t a ti m ely , flexibl e , eff i cien t collection s structure Efficiently manage teams, tools and information availability Our two credit risk divisions use these management principles to contribute to the business and anticipate threats that may affect solvency and portfolio quality, based on a segmentation by business, as follows : Retai l Banki n g Segmen t Loan origination for these segments is mainly managed using risk evaluation scoring tools, supported by an appropriate credit attribution model, which is required to approve each transaction . These evaluations examine factors such as total borrowings, payment capacity and maximu m acc e pta bl e expo s ur e fo r the cu sto mer . Wholesal e B a nkin g Se g ment Origination management for this segment involves an individual assessment of the customer and if it belongs to a group of companies then this takes into consideration the bank’s relationship with the rest of the group . This individual assessment considers income - generating capacity, financial capacity with emphasis on solvency, exposure levels, industry variables, an evaluation of the partners and management and aspects particular to the transaction such as the financing structure, terms, products and any guarantees .

| 52 Risk & Capital Management Pri ce Ris k Price risk can b e define d a s t he risk o f l osse s i n t h e Tra din g an d / o r t h e B a nkin g B o ok , arising fro m advers e m ovemen t s i n marke t facto r s. The Bank separates this risk based on three types of market factors : spot prices, interest rates and option volatility . The Bank has a Market Risk Management policy, which is annually approved by the Board of Directors, where the types of internal limits and alerts are established, in addition to the regulatory ones, for the measurement of financial exposures and/or price risks . The measurement and control of the price risk, for management purposes, is carried out through various internal metrics and reports that differ from each other, depending on whether they are used for exposures in the Trading and Currency Book or for those belonging to the Accrual Book . Regarding the internal tools designed for the Trading and Currency Book, the price risk management is deployed through the calculation and reporting of financial exposures through their sensitivities or greeks and the risk of the entire portfolio by means of the VaR model . Additionally, the Bank has established internal metrics for the management of the price risk of the Accrual Book, defining limits and alerts for interest rate exposures . The Bank measures interest rate exposures through the Interest Rate Exposure (IRE) metric, and interest rate risk for the Accrual Boo k us i n g th e E a R 12 M ( E arn i ng s a t Risk 1 2 months ) me t ho d ology . In addition, internal policies establish the periodic carrying out of stress exercises on the positions of the Trading and Currency Book, and the Accrual Book, which are used to contrast them against the maximum price risk tolerance defined by the Board of Directors . Limit usage and alert status are regularly reported to the respective business units . Likewise, the Bank's Senior Management is immediately notified in the case of excess limits or activation of alerts, including the monitoring of corrective action plans, if necessary . This information is reported monthly to the Finance, International and Market Risk Committee and on a quarterly basis to the Board of Directors . Liquidity Ri s k Liquid it y ri s k can aris e eith e r d u e t o a redu ctio n i n t h e bank’s fundin g capacit y ( fundin g liqu i di t y risk) o r a re d uc t io n i n the t r ade d valu e o f it s assets tha t can be liquida ted o r it s marke t f act o rs fro m derivativ e s hel d i n its por tfo l io s (tra ns act io n o r tr a din g liqu idit y risk ) . The Bank has a Liquidity Risk Management Policy, reviewed and approved at least annually by the Board, which establishes the main guidelines for measuring, limiting, reporting and controlling liquidity risk . Funding liquidity is measured, reported and controlled by means of using internal metrics, including the Market Access Report (MAR) . MAR limits are established to ensure that funding can be obtained and / or renewed in professional markets under normal business conditions, in different time horizons and currencies . The Bank also sets a minimum amount of highly liquid assets (or liquidity buffer), and a limit of the cross - currency funding position . Concentration ratios and other complementary metrics are also periodically measured, reported and controlled against warning levels . In addition, the Bank reports standardized metrics to regulators in accordance with their guidelines, such as the Liquidity Coverage Ratio (LCR) and the Net Stable Financing Ratio (NSFR) . It also continuously monitors and tracks market variables and/or material events that could affect our liquidity position . In accordance with its Liquidity Risk Management Policy, the Bank performs regular stress testing in order to quantify its cash needs in the event of adverse scenarios of varying severity, which are contrasted against potentially available action plans detailed within the Liquidity Contingency Plan . These results are daily reported, monitored and controlled based on the maximum liquidity risk appetite defined by the Board . On the other hand, trading liquidity is assured by using limits with certain specific maturities based on the amounts that are normally traded in professional markets for interest rate exposure generated by debt instruments and derivatives . The same process is used to limit the Bank's overall exposure to each currency and to exchange rate volatility with varying maturities . These internal and regulatory metrics are regularly reported to the business units responsible for managing liquidity risk . Similarly, senior management is immediately notified if the limits are exceeded or triggers are breached, including, if necessary, monitoring of corrective action plans . Finally, the general status of liquidity risk is reported to the Asset and Liabilities Committee on a mon thly ba si s a n d to the B oa r d o n a quar terl y b a sis .

| 53 Risk & Capital Management Op e r a tio n a l R i sk Op era tio na l ri s k i s t h e ri s k o f l os s resulting from deficiencies or failure s i n inter n a l process e s, staf f o r systems , o r fro m e xter n al events . This defi n it i o n inc l ud e s lega l risks an d e xcludes str a te g i c an d re p uta tion ri s ks. Operational risk is inherent to all activities, products and systems, as well as strategic, business and support processes throughout the organization . All bank employees are appropriately responsible for the management and control of operational risks inherent to their duties, since these risks may result in direct or indirect financial losses . The bank controls and manages operational risk by developing a regulatory and governance framework adapted to the complexity of its business . The Operational Risk Policy defines a comprehensive management framework that includes identifying, evaluating, controlling, mitigating, monitoring and reporting these risks . This requires executing several processes as follows : Pr o ces s A sse s s men t S uppl ie r Manage men t Frau d Manag e ment Management of Operational Events and Operational Losses Operational Risk Assessment for Projects Contro l Testing Risk Appetit e P rofil e an d F ram e work S e lf - Assess m e n t Ma t rix Relations with External Entities and Corporate Training Plan Busi ness Con t inuity Differen t s i tuati o n s tha t could affec t th e bus i nes s cont i nuit y o f th e orga nizatio n o r th e count r y, whic h require s t o b e consta n tly prepare d t o k ee p ope rati n g t h e produc t s an d se r vice s t ha t a r e critica l t o i t s cu s tomers. Being prepared to face any emergency is key to providing exceptional services to our customers . Therefore, we have developed a robust, consistent Business Continuity Plan to safeguard the bank and its subsidiaries . The objective of the plan is to establish general guidelines for ensuring the safety of our employees, protecting the organization's capital from catastrophic events, maintaining and updating documentation, and conducting training and testing .
To comply with these guidelines, the bank has developed a strategy to meet this objective that covers the following areas : Documen t Ma n agement B u sine s s C ont i n uit y T e stin g Crisi s Manage ment Criti c a l Suppli e r Manage ment Managemen t o f Alternativ e Sit e s Relationshi p wi t h Subsidia rie s a n d Externa l Org a nizations Continuou s Im p rovement Training Informatio n Sec u rit y Office r (I S O) | 54 Risk & Capital Management Techn o logi c a l Ri s k , Cyb e r s e curity a nd Data Protection Society is increasingly digitalized, so customer privacy and cybersecurity risk management is a priority for Banco de Chile . Therefore, the bank has developed a Strategic Cybersecurity Plan, which is aligned with the bank's business strategy . The main objectives of this plan are to protect customer and employee data, safeguard the bank's data, manage technological, cybersecurity and data security risks, and strengthen the risk prevention culture . This plan complies with the appropriate regulations, which include the Personal Data Protection Law 21 , 096 , the Protection of Privacy Law 19 , 628 and the provisions published in the Updated Compilation of Rules (RAN) issued by the Financial Market Commission (CMF) . This plan has been approved by senior management, who regularly receive associated progress reports . Data security and cybersecurity policies at Banco de Chile establish guidelines regarding the responsibility for and protection of data and its associated risk management, based on both regulatory aspects and international standards . These policies are reviewed annually and apply to employees, outsourced personnel, as well as suppliers and contractors of services who access its facilities or have access to bank and subsidiary data . The controls that protect this information and IT assets are defined by regulations, processes and the bank’s internal procedures . Co n duct Ris k a nd An t i - M oney Laun d e ri ng Banco de Chile knows that sound ethical management is essential for its industry leading position . Therefore, the bank has diverse protocols, systems and models to ensure ethical behavior of all its employees . The Code of Conduct is the key guideline and essential component of the bank's corporate ethics . It contains the general principles and instructions that guide the ethical - professional conduct of the employees, directors and board advisors . The purpose of the code is to safeguard the fundamental values to properly conduct the bank's business, in accordance with the bank's corporate philosophy . The Ethics Committee is responsible for overseeing its implementation within the bank . Preventing corruption and the use of the bank and its subsidiaries to engage in unlawful practices has been a concern over the last few decades for Banco de Chile . Awareness - raising measures and controls have been intensified during the recent years, in order to prevent this kind of behavior . The bank has approved a Code of Conduct, a Prevention of Dishonest Practices Policy and a Handling Conflicts of Interest Policy, which describe the main roles and responsibilities to avoid that anything may be interpreted as a violation of ethical conduct or imply the risk of corruption or bribery . The Compliance Division by means of its Regulatory Compliance Area and the Ethics Committee are responsible for ensuring compliance with the conduct described in these policies . M odel Ri s k a nd Intern a l Control Its purpose is to manage the risks associated with models and their processes, so it relies on the model validation, model risk management and internal control functions . Model validation is responsible for performing an independent review of risk models, including risk - weighted assets and stress testing, during their construction and implementation stages . It validates compliance with board - approved guidelines and addresses aspects such as governance, data quality, modeling techniques, methodological and parametric implementation analysis and documentation . The results of these reviews are submitted to the respective committees . Model risk management is responsible for monitoring models and ensuring that they fulfill their life cycle status . The Model Risk Management Committee was created in July 2023 and is composed o f membe r s o f t h e Bank ’ se n io r management .

| 55 Risk & Capital Management Funding Concentration & Liquidity Position Our liquidity position has continued to be solid as depicted by both the Liquidity Coverage Ratio (LCR) and the Net Stable Funding Ratio (NSFR), which have remained well above the prevailing regulatory limits of 100 % and 80 % , respectively, as defined by the banking liquidity regulation . Liqui d it y R atios : L C R and N S FR (In percentage as of each date, based on CMF C49 report) 450% 400% 350% 300% 250% 200% 150% 100% 50% 0% 450% 400% 350% 300% 250% 200% 150% 100% 50% 0% Ma r - 2 3 Apr - 23 Ma y - 2 3 Jun - 23 Jul - 23 A ug - 23 S ep - 23 Oct - 23 N o v - 2 3 D e c - 2 3 Jan - 24 F eb - 2 4 Ma r - 2 4 LCR NSFR To achieve this position, we maintained high - quality liquid assets around an average of Ch $ 6 , 636 Bn . during the 1 Q 24 , which explains the positive gap shown by the LCR . These assets are primarily composed of fixed - income securities issued by both the Chilean Central Bank and the Chilean Government . In the case of the NSFR, given our balance sheet structure and solid management of liquidity gaps, the relationship between available and required funding has remained stable over time . From the funding concentration perspective, the deposit composition has been stable in the 2024 . In fact, Time Deposits as a percentage of our total liabilities (i . e . excluding equity accounts) slightly decreased from 30 . 4 % in December 2023 to 30 . 3 % in March 2024 , while demand deposits reduced their share from 26 . 4 % to 26 . 2 % within the same period . Furthermore, given the current and persistent position in liquid assets, we have required lower funding from professional counterparties . In this regard, our liabilities structure continued to be well balanced, as reflected by a 43 % share of financial counterparties, a 43 % share of retail counterparties and a 14 % composed of wholesale non - financial counterparties . Liability C oncen t r atio n by C ou n ter pa r ty ( As p er c e n t age o f Tot a l L i a b ili ti es) 43% 43% 14% F i na n c i a l C o u n t e r p a r t i e s R e t a i l C o u n t e r p a r t i e s Wholesale Non - Financial Counterparties Worth mentioning is that approximately 69 % of the liabilities with financia l count e rpartie s a r e co n centrate d i n l o n g - term b ond s a n d the FCIC program set by the Central Bank, both representing a 30 % of our total liabilities (excluding equity), as of March 31 , 2024 . The first tranche of the FCIC amounting to Ch $ 3 , 110 , 600 millio n w a s re p ai d o n A p ril 1 , 2 0 24 .
| 56 Risk & Capital Management Price Risk We continue to manage our trading portfolio prudently by focusing on providing competitive prices to our financial and corporate counterparties within the market - making activity and in order to keep trading price risk at bounded levels . V alu e - a t - R is k T r adin g B ook (1 - day impact) ( 9 9 % con fi dence l eve l / I n div i d ua l Basi s ) e % C h a n g Ch$ Date 2024 Year - to - 2023 I n Milli on s o f C h $ 8.3% 121 1,576 1,456 Average - 12.6% - 376 2,605 2,982 Maximum 12.4% 99 894 796 Minimum The Value - at - Risk (VaR) of our Trading Book averaged Ch $ 1 , 576 million in 2024 , which represented a 8 . 3 % increase when compared to the average of Ch $ 1 , 456 million VaR recorded in 2023 . This was the consequence of greater long positions in both fixed - income securities and derivatives exposed to CLP and CLF, particularly at the beginning of the 1 Q 24 . Regardless of the relative annual increase in positions and the use of internal threshold s se t fo r th e Va R me tric , th e pric e ris k i n thi s portf o l i o remain s low . On the other hand, the interest rate risk in the Banking Book, measured as the 12 - month Earnings - at - Risk (EaR) metric, decreased from an average of Ch $ 245 , 081 million in the 1 Q 23 to Ch $ 222 , 886 million in the 1 Q 24 , which denoted a 9 . 1 % annual decline . I n M illion s o f C h $ 2023 2024 C h $ % Average M a x i m um Minimum 245,081 252,659 235,747 222,886 253,124 175,971 - 22,195 464 - 59,776 - 9.1% 0.2% - 25.4% E ar nings - a t - R is k B ankin g B ook (12 - mon t h i mpact) (99% confidence level / 3 - month defeasance period / Individual Basis) Year - to - Date Change In comparison with the same quarter last year, the 12 - month EaR has decreased, mostly due to changes in the gaps of the CLP balance sheet and the lower expected level of interest rates and inflation . Nonetheless, by the end of the 1 Q 24 the use of this metric has risen due to higher volatility in the market - implied inflation and nominal rates for the three - year sample ended on Marc h 31 , 2024 . As for our exposure to inflation, the net asset exposure to UF in the Banking Book reached Ch $ 8 , 051 Bn . in March 2024 . The increase in the UF gap has been based on our view of inflation pressures in the economy in the short - term, while maintaining a balanced risk - return relationship . It is worth mentioning that this position is composed of both, our structural gap that covers our shareholders’ equity from the effect of inflation in the long - run and directional positions taken by our Treasury in order to profit from short - ter m cha n ge s o n ma r ke t e xpectation s . Inflati on - Index e d P osition in the B ankin g B ook ( In Billi o n s o f C h $ , E nd o f P er i o d ) 7 ,5 33 7 ,8 02 8 , 02 0 6,759 6 , 84 3 6 , 77 4 7 , 29 3 7,685 8 , 0 74 8,051 Mar - 22 Jun - 22 S e p - 2 2 D e c - 2 2 Mar - 23 Jun - 23 A u g - 2 3 S e p - 2 3 D e c - 2 3 M a r - 2 4 Based on the income we have accrued from inflation variation over the last quarters, we believe our strategy has more than compensated the risk involved . Nevertheless, as mentioned in previous reports, we are continually assessing the expected track fo r inflatio n t o ch a ng e ou r ex p os ur e i f necessary .

| 57 Risk & Capital Management Operational Risk Regarding Operational Risk, we aim to keep a reasonable level of losses, by means of monitoring and controlling the proper functioning of our processes, personnel and internal systems whil e als o cons i derin g exte r na l i ssues . In order to achieve this goal, we operate through a Comprehensive Risk Management Framework, as well as a governance structure that addresses the complexity of our bus ine s s mode l . As of March 31 , 2024 , net operational losses accounted for Ch $ 6 , 809 million, which was primarily composed of : (i) losses associated with external fraud representing 69 . 9 % , (ii) losses related to execution, delivery and process management concentrating 16 . 6 % , and (iii) other effects jointly representing 13 . 5 % , comprised of losses related to business disruption and syst e m f ail u r e , i n additio n t o los s e s from cus to m e r s , pro d uct s a n d business practices, as well as damage in fixed - assets . N e t Operation a l L o sse s b y T ype ( In M illi o n s o f C h$ / N et of R ecover i e s ) 0 A s o f M a rc h 3 1 , 2 0 2 3 2 , 0 0 0 4 , 0 0 0 6 , 0 0 0 Labor Practices and Labor Security E x e c u t io n , D e li v ery and P r o c e s s M a n a g e m e n t E x t e r n a l F r a ud Bu s ine s s I n t e r ru m p t ion a n d S y s t em F a ilu re D a m a g e i n F i x e d - A s s e t s C u s t o m e r s , P r o d u c t s a n d B u s in e s s P r a c t ic es I n t e r n al F r a ud As o f M a rc h 3 1 , 2 0 2 4 The amount of net operational losses recorded as of March 31 , 2024 represented an annual increase of Ch $ 1 , 635 million or 31 . 6 % when compared to the Ch $ 5 , 174 million registered in 2023 . This change was aligned with the trend observed over the last quarters while being explained by specific factors arising this year . Thus, the main reasons underlying this annual change had to do with : ⭬ An annual increase of Ch $ 1 , 335 million or 39 . 0 % in net losses associated with the external fraud category, from the Ch $ 3 , 422 million incurred last year . This change is mainly associated with a rise in losses from electronic fraud, which represents an 88 . 8 % of the net losses in the category, including fraudulent transactions through credit and debit cards and electronic money transfers . This trend is affecting the industry as a whole given recent changes introduced to frau d la w wit h t h ese kind s o f p aymen t me thods . ⭬ An incre ase o f Ch $ 46 5 millio n i n ne t lo s se s as sociate d with the execution, delivery and management of processes category, mainly due to errors in the execution of operational processes . To mitigate the effects mentioned above, we have implemented various measures to reinforce controls, which should allow us to reduce the impact and/or the avoidance of future losses .

| 58 Risk & Capital Management Capital Adequacy and Risk Ratings C a pit a l A d e q u ac y Our Total Capital Ratio reached 16 . 9 % as of March 2024 , representing a decrease of 10 bp . when compared to the ratio reached in March 2023 , which is explained by both the end of the recognition of additional provisions as AT 1 Capital and the decline higher than provisioned dividend distribution in March 2024 , from a provision of 60 % to an actual distribution of 80 % of the net distributable earnings . For the same reason, the Tier 1 Capital ratio posted 13 . 3 % , which was 2 bp . below the ratio achieved in March 2023 . In addition, our CET 1 ratio was 13 . 3 % in March 2024 , which denoted annual improvement of 48 bp . on the grounds of the net income earned during 2024 , which more tha n offs e t th e adv ers e impac t s mention e d abov e . 8. 4 % 12 . 8 % 13 . 3 % 17 . 0 % 8. 8 % 13 . 3 % 13 . 3 % 16 . 9 % +43 bp C apita l A dequacy R ati o s ( As p er c e n t age a s o f each da t e) + 4 8 b p ( 2 ) b p (10) bp Common Common Equity Tier 1 Equity Tier 1 Total Assets RWA T i e r 1 C a p i t a l RWA Total C a p i t a l RWA Mar - 23 Mar - 24 Based on these figures in 1 Q 24 we complied with all mandatory limits of 3 . 0 % for the leverage ratio, 7 . 0 % for the CET 1 ratio, 8 . 5 % for the Tier 1 ratio and 10 . 5 % for the Total Capital ratio . Likewise, our current capital position enables us to be poised to address the completion of the Basel III implementation, including: (i) the 0.5% counter - cyclical buffer defined by the Central Bank in May 2023 (to be fulfilled in May 2024), (ii) the 0.5% Pilar 2 charge set by CMF for Banco de Chile on January 16 , 2024 (to be fulfilled in four - year period starting June 30 , 2024 , and (iii) the 1 . 25 % systemic c a pita l c h arg e c o nfi r me d b y CM F fo r u s a t t h e s a me leve l o f prio r ye a rs, o n A p ril 1 , 2 024 . C r e dit Ri s k Ra t ings Our credit ratings determine the cost and the terms upon which we are able to obtain funding . Rating agencies evaluate us by taking into account diverse factors, including the financial strength, the business environment and the economic backdrop . Inter natio n a l C r edi t R atings MOODY’S Short - Term P - 1 Foreig n Curre n cy Outlook Long - Term A2 Stable ST A ND A R D & P O O R’S Long - Term Short - Term Foreig n Curre n cy Outlook A A - 1 Negative Local C r edi t R atings HUMPHREYS Long - Term Short - Term Deposits Outlook AA A Nive l 1+ Stable FELLE R R A TE Short - Term Nive l 1+ Deposits Outlook Long - Term AAA Stable Although no rating actions have been undertaken for international nor local banks, we cannot rule out that further actions on Chile’s rating or sovereign debt will not result in adjustments to the outlook or ratings of local banks, including us .

| 59 Co n solidate d Statement o f I ncome Chilean GAAP - In millions of Chilean pesos (MCh$) and US dollars (MUS$) Year - to - Date Quarter % C hang e Mar - 24/Mar - 23 Mar - 24 MUS$ Mar - 24 MCh$ Mar - 23 MCh$ % C hang e 1Q24/1Q23 1Q24 MUS$ 1Q24 MCh$ 4Q23 MCh$ 1Q23 MCh$ 3 .6 % 815.3 800,766 773,145 3 .6 % 815.3 800,766 813,781 773,145 I n t e r e s t r e v enu e ( 16 . 8 ) % (343.4) (337,325) (405,228) ( 16 . 8 ) % (343.4) (337,325) (379,510) (405,228) I n t e r e s t e x pen se 26 .0 % 471.9 463,441 367,917 26 .0 % 471.9 463,441 434,271 367,917 N e t I n t e r es t I n c o m e ( 32 . 0 ) % 157.5 154,693 227,418 ( 32 . 0 ) % 157.5 154,693 297,456 227,418 I nde x a t i o n r e v enu e f r o m U F ( 37 . 9 ) % (89.4) (87,800) (141,287) ( 37 . 9 ) % (89.4) (87,800) (170,204) (141,287) I nde x a t i o n e x pen s e s f r o m U F ( 22 . 3 ) % 68.1 66,893 86,131 ( 22 . 3 ) % 68.1 66,893 127,252 86,131 N e t I n c o m e f r o m U F I nd exa t i o n 4 .9 % 183.2 179,937 171,602 4 .9 % 183.2 179,937 183,880 171,602 I n c o m e f r o m f ee s an d c o mm is s i on s 22 .4 % (43.2) (42,465) (34,687) 22 .4 % (43.2) (42,465) (44,072) (34,687) E x pen s e s f r o m f ee s an d c o mm is s i on s 0 .4 % 140.0 137,472 136,915 0 .4 % 140.0 137,472 139,808 136,915 N e t F ee s a n d C o mm i s i on s - (4.3) (4,243) 133,785 - (4.3) (4,243) 111,054 133,785 R e s u l t s f r o m A s s e t s /L i ab ili t i e s he l d f o r T r ad i n g - 2.6 2,539 (117) - 2.6 2,539 (3,916) (117) R e s u l t s f r o m F V T O C I A s s e t s an d A s s e t / L i ab ili t i e s a t A - 108.3 106,447 (30,696) - 108.3 106,447 9,821 (30,696) R e s u l t s f o r m F o r e i g n E x c hang e T r an s a c t i on s 1 .7 % 106.6 104,743 102,972 1 .7 % 106.6 104,743 116,959 102,972 F i n a n c i a l R es u l t s ( 89 . 0 ) % 0.2 218 1,978 ( 89 . 0 ) % 0.2 218 5,075 1,978 I n c o m e a tt r i bu t a b le t o a ff ili a t e s ( 27 . 7 ) % (1.0) (1,013) (1,401) ( 27 . 7 ) % (1.0) (1,013) 937 (1,401) I n c o m e f r o m N on - C u rr e n t A sse t s H e ld f o r S a le 7 .5 % 8.7 8,592 7,989 7 .5 % 8.7 8,592 38,736 7,989 Other operating income 11 .1 % 794.6 780,346 702,501 11 .1 % 794.5 780,346 863,038 702,501 To t a l O p e r a t i n g R eve nu e s 5 .5 % (144.0) (141,410) (134,018) 5 .5 % (144.0) (141,410) (177,049) (134,018) P e r s onne l E x pen s e s 10 .3 % (111.2) (109,223) (98,991) 10 .3 % (111.2) (109,223) (103,875) (98,991) A d m i n is t r a t iv e E x pen s e s 2 .8 % (23.8) (23,402) (22,759) 2 .8 % (23.8) (23,402) (23,520) (22,759) D ep r e ci a t i o n an d A m o r t iz a t i o n - (0.1) (94) 29 ( 424 . 1 ) % (0.1) (94) (1,650) 29 Impairments 26 .1 % (9.9) (9,715) (7,703) 26 .1 % (9.9) (9,715) (12,783) (7,703) O t he r Ope r a t i n g E x pen s e s 7 .7 % (289.0) (283,844) (263,442) 7 .7 % (289.0) (283,844) (318,877) (263,442) To t a l O p e r a t i n g E x p e n se s 0 .8 % (121.1) (118,806) (117,842) 0 .8 % (121.1) (118,806) (142,034) (117,842) P r o visi on s f o r Loan s a t A m o r t iz e d C o st 770 .0 % (6.1) (6,038) (694) 770 .0 % (6.1) (6,038) (3,287) (694) S pe ci a l P r o visi on s f o r C r ed i t Risk 9 .6 % 13.4 13,161 12,013 9 .6 % 13.4 13,161 17,724 12,013 R e c o v e r y o f w r i tt en - o f f l oan s - (1.5) (1,485) 1,015 - (1.5) (1,485) (303) 1,015 F i nan ci a l A s s e t s I m pa i r m en t s 7 .3 % (115.2) (113,168) (105,508) 7 .3 % (115.2) (113,168) (127,900) (105,508) E x p ec t e d C r e d it Lo sse s ( E C L s ) 14 .9 % 390.2 383,334 333,551 14 .9 % 390.2 383,334 416,261 333,551 O p e r a t i n g R es u lt 26 .7 % (87.2) (85,679) (67,600) 26 .7 % (87.2) (85,679) (30,717) (67,600) I n c o m e t a x 11 .9 % 303.0 297,655 265,951 11 .9 % 303.0 297,655 385,544 265,951 N e t I n c o m e f o r t h e P e r i o d - - - - - - - 1 - N on - C on t r o lli n g i n t e r e st 11 .9 % 303.0 297,655 265,951 11 .9 % 303.0 297,655 385,543 265,951 Net Income for the Period attributable to Equity Hol ( 61 . 6 ) % 6.6 6,440 16,791 ( 61 . 6 ) % 6.6 6,440 2,434 16,791 F a i r V a l u e A d j . S e c u r i t i e s FT V O C I ( 109 . 3 ) % (5.3) (5,247) 56,304 - (5.3) (5,247) 56,879 56,304 F a il r V a l u e A d j . H edg e A c c oun t i n g ( 97 . 0 ) % (0.6) (543) (17,809) ( 97 . 0 ) % (0.6) (543) (29,596) (17,809) I n c o m e T a x & O t he r e ff e c t s ( 7 . 1 ) % 303.7 298,305 321,237 ( 7 . 1 ) % 303.7 298,305 415,262 321,237 C o m p r e h e n s i v e I n c o m e | 60 These results have been prepared in accordance with Chilean GAAP on an unaudited, consolidated basis . All figures are expressed in nominal Chilean pesos (historical pesos), unless otherwise stated . All figures expressed in US dollars (except earnings per ADR) were converted using the exchange rate of Ch $ 982 . 21 per US $ 1 . 00 as of March 31 , 2024 . Earnings per ADR were calculated considering the nominal net income, the exchange rate and the number of shares outstanding at the end of each period . Banco de Chile files its consolidated financial statements, together with those of its subsidiaries, with the Financial Market Commission, on a monthly basis . In addition, Banco de Chile files its quarterly financial statements (notes included) with the SEC in form 6 K, simultaneously or previously to file this quarterly earnings report . Such documentation is equally available at Banco de Chile’s website both in Spanish and English .

Co n solidate d B a l a n c e Sh e e t Chilean GAAP - In millions of Chilean pesos (MCh$) and US dollars (MUS$) % C han g e M a r - 24 / M a r - 2 3 M a r - 2 4 M U S $ M a r - 2 4 MCh$ D e c - 2 3 MCh$ M a r - 2 3 MCh$ ASSETS 19 . 7 % 3,307.3 3,248,501 2,464,648 2,712,774 C as h a n d du e f r o m b a n k s ( 42 . 4 ) % 377.8 371,068 415,505 644,311 T r a n sac t i on s in t h e c ou r s e o f c o ll ec t i o n ( 14 . 2 ) % 4,763.3 4,678,580 5,808,328 5,453,487 Financial Assets for Trading at Fair Value through P&L ( 10 . 0 ) % 2,572.5 2,526,743 2,035,376 2,807,678 D e r iv a te i n s t r u m en ts ( 29 . 2 ) % 1,904.9 1,870,975 3,363,624 2,641,507 D eb t S e c ur i t i e s 6 , 428 . 6 % 285.9 280,862 409,328 4,302 Other ( 37 . 0 ) % 3,254.3 3,196,366 3,786,525 5,070,987 F i n a n c i a l A sse t s a t F a ir V a l u e Th r oug h O C I ( 37 . 0 ) % 3,254.3 3,196,366 3,786,525 5,070,987 D eb t S e c ur i t i e s 3 , 151 . 9 % 129.5 127,182 49,065 3,911 Derivative Intruments for Hedge Accounting 10 . 0 % 43,420.0 42,647,407 40,853,821 38,787,162 F i n a n c i a l A ss t e s a t A m o r t i z e d C o s t 23 . 2 % 57.6 56,530 71,822 45,895 Receivables from repurchase agreements and security borrowings 350 . 1 % 4,145.3 4,071,555 1,431,083 904,643 D eb t S e c ur i t i e s ( 23 . 8 ) % 1,238.8 1,216,747 2,519,180 1,596,106 Loan s an d ad v a n c e s to B an ks ( 0 . 4 ) % 20,625.1 20,258,177 19,991,114 20,336,510 C o mm e r ci a l l oan s 7 . 8 % 12,715.9 12,489,637 12,303,154 11,584,487 R e si den t i a l m o r t gag e l oan s 4 . 5 % 5,438.1 5,341,352 5,306,436 5,112,818 C on s u m e r l oan s ( 0 . 8 ) % (800.8) (786,591) (768,968) (793,297) A ll o w an c e s f o r l oa n l o s s e s 20 . 8 % 79.1 77,703 76,994 64,314 I n ves t m e n t s in o t h e r c o m p a n i e s 30 . 9 % 146.9 144,238 137,204 110,158 I n t a ng i b le asse t s ( 5 . 1 ) % 201.5 197,908 201,657 208,646 P r op e r t y a n d E qu i p m e n t 5 . 9 % 105.6 103,737 108,889 97,941 L ease d asse t s ( 3 . 2 ) % 244.5 240,148 141,194 248,155 C u rr e n t t a x asse t s ( 2 . 5 ) % 527.4 518,060 539,818 531,476 D e f e rr e d t a x asse t s 22 . 3 % 1,263.0 1,240,573 1,208,904 1,014,049 Others 3 . 4 % 57,820.2 56,791,471 55,792,552 54,947,371 To t a l A sse t s | 61 % C han g e M a r - 24 / M a r - 2 3 M a r - 2 4 M U S $ M a r - 2 4 MCh$ D e c - 2 3 MCh$ M a r - 2 3 MCh$ L I AB I L I T I E S & E Q U I T Y Liabilities T r a n sac t i on s in t h e c ou r s e o f p ay m e n t Financial Liabilities for Trading at Fair Value through P&L D e r iv a te i n s t r u m en ts Other Derivative Intruments for Hedge Accounting Financial Liabilities at Amortized Cost C u rr en t a c c oun ts an d o t he r de m an d depo si ts S a vi n g a c c oun ts an d t i m e depo si ts P a y a b l e s f r o m r epu r c h a s e ag r ee m en ts an d s e c ur i ty l end i n g B o rr o wi ng s f r o m f i nan ci a l i n s t i t u t i on s D eb t I s s ue d O t he r f i nan ci a l ob li ga t i on s L eas e li a b ili t i e s Instruments Issued for Regulatory Capital Provisions C u rr e n t t a x li a b ili t i e s Deferred tax liabilities Other liabilities ( 46 . 2 ) % ( 8 . 6 ) % ( 8 . 7 ) % 40 . 0 % ( 73 . 9 ) % 4 . 4 % 3 . 0 % 6 . 2 % 72 . 7 % 1 . 9 % 4 . 1 % 5 . 4 % 4 . 6 % 2 . 4 % 5 . 3 % ( 48 . 2 ) % 2 , 293 . 6 % 11 . 4 % 302.1 2,737.2 2,733.4 3.8 80.1 45,794.8 13,785.2 15,915.9 188.4 5,727.6 9,898.7 279.0 98.2 1,072.9 1,104.3 0.5 1.9 1,359.5 296,700 2,688,497 2,684,732 3,765 78,674 44,980,113 13,539,960 15,632,789 185,126 5,625,691 9,722,556 273,991 96,404 1,053,813 1,084,658 524 1,867 1,335,314 356,871 2,199,226 2,196,921 2,305 160,602 43,904,480 13,321,660 15,365,562 157,173 5,360,715 9,360,065 339,305 101,480 1,039,814 1,573,248 808 - 1 , 218 , 73 8 551,880 2,942,400 2,939,711 2,689 301,515 43,097,374 13,150,631 14,722,088 107,189 5,520,842 9,336,715 259,909 92,193 1,029,546 1,029,694 1,012 78 1,198,888 2 . 7 % 52,551.5 51,616,564 50,555,267 50,244,580 To t a l li a b ili t i e s 0 . 0 % 0 . 0 % ( 271 . 5 ) % 29 . 5 % 11 . 9 % 20 . 5 % ( 50 . 0 ) % 2,464.4 722.6 25.3 1,912.8 303.0 (159.5) 0 2,420,538 709,742 24,892 1,878,778 297,655 (156,699) 1 2,420,538 709,742 24,242 1,451,076 1,243,634 (611,949) 2 2,420,538 709,742 (14,516) 1,451,076 265,951 (130,002) 2 E qu i t y o f t h e B a n k ' s o w n e r s Capital R e s er v e s O t he r c o m p r ehen siv e i n c o m e Retained earnings from previous periods I n c o m e f o r t h e pe r i o d P r o visi on s f o r m i n i m u m d ivi dend s N on - C on t r o lli n g I n t e r es t 10 . 0 % 5,268.7 5,174,907 5,237,285 4,702,791 To t a l e qu i t y 3 . 4 % 57,820.2 56,791,471 55,792,552 54,947,371 To t a l L i a b ili t i e s & E qu i t y These results have been prepared in accordance with Chilean GAAP on an unaudited, consolidated basis . All figures are expressed in nominal Chilean pesos (historical pesos), unless otherwise stated . All figures expressed in US dollars (except earnings per ADR) were converted using the exchange rate of Ch $ 982 . 21 per US $ 1 . 00 as of March 31 , 2024 . Earnings per ADR were calculated considering the nominal net income, the exchange rate and the number of shares outstanding at the end of each period . Banco de Chile files its consolidated financial statements, together with those of its subsidiaries, with the Financial Market Commission, on a monthly basis . In addition, Banco de Chile files its quarterly financial statements (notes included) with the SEC in form 6 K, simultaneously or previously to file this quarterly earnings report . Such documentation is equally available at Banco de Chile’s website both in Spanish and English .
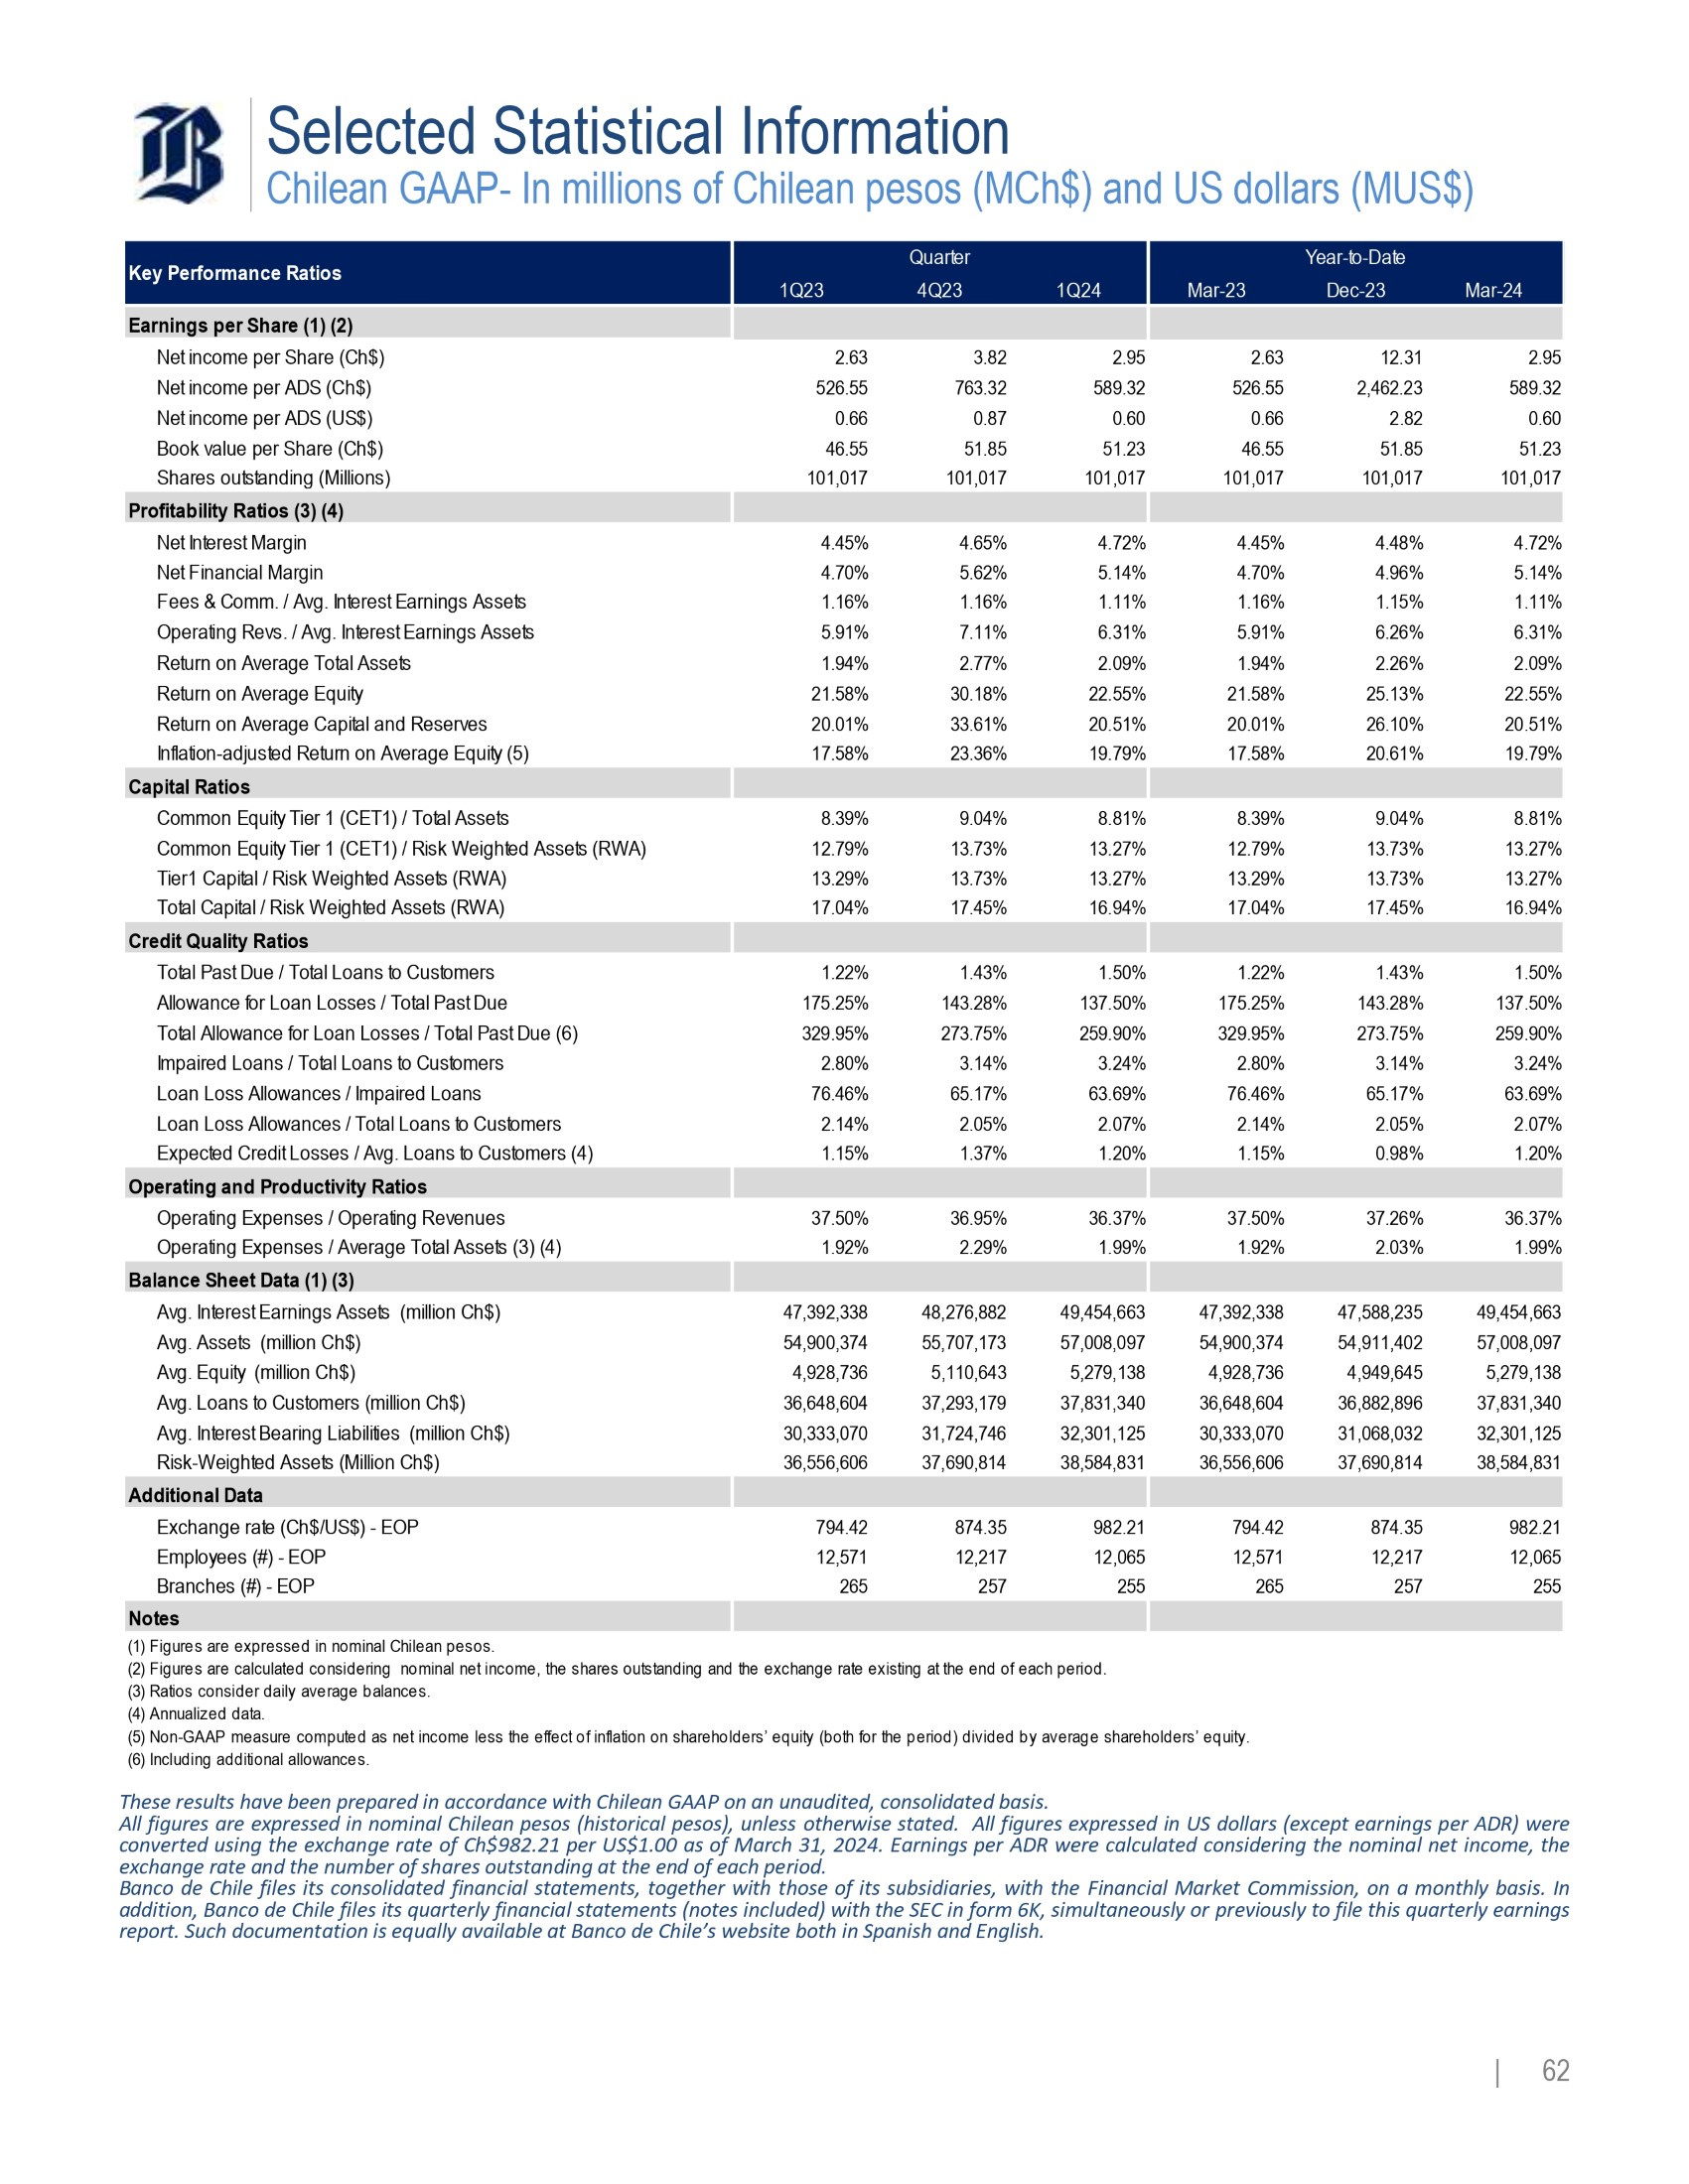
S e l e cte d Sta t i stica l I nfor m a t i o n Chilean GAAP - In millions of Chilean pesos (MCh$) and US dollars (MUS$) Mar - 24 Year - to - Date Dec - 23 Mar - 23 1Q24 Quarter 4Q23 1Q23 K e y P e r f o r m a n c e R a t i o s E a r n i ng s p e r S h a r e ( 1 ) ( 2 ) 2.95 12.31 2.63 2.95 3.82 2.63 N e t i n c o m e pe r S ha r e ( C h$ ) 589.32 2,462.23 526.55 589.32 763.32 526.55 N e t i n c o m e pe r A D S ( C h$ ) 0.60 2.82 0.66 0.60 0.87 0.66 N e t i n c o m e pe r A D S ( U S $ ) 51.23 51.85 46.55 51.23 51.85 46.55 B oo k v a l u e pe r S ha r e ( C h$ ) 101,017 101,017 101,017 101,017 101,017 101,017 S ha r e s ou t s t and i n g ( M illi on s ) P r o f i t a b ili t y R a t i o s ( 3 ) ( 4 ) 4.72% 4.48% 4.45% 4.72% 4.65% 4.45% N e t I n t e r e s t M a r g i n 5.14% 4.96% 4.70% 5.14% 5.62% 4.70% N e t F i nan c i a l M a r g i n 1.11% 1.15% 1.16% 1.11% 1.16% 1.16% F ee s & C o mm . / A v g . I n t e r e s t E a r n i ng s A ss e t s 6.31% 6.26% 5.91% 6.31% 7.11% 5.91% O pe r a t i n g R e v s . / A v g . I n t e r e s t E a r n i ng s A ss e t s 2.09% 2.26% 1.94% 2.09% 2.77% 1.94% R e t u r n o n A v e r ag e T o t a l A ss e t s 22.55% 25.13% 21.58% 22.55% 30.18% 21.58% R e t u r n o n A v e r ag e E qu i t y 20.51% 26.10% 20.01% 20.51% 33.61% 20.01% R e t u r n o n A v e r ag e C ap i t a l an d R e s e r v e s 19.79% 20.61% 17.58% 19.79% 23.36% 17.58% I n f l a t i on - ad j u s t e d R e t u r n o n A v e r ag e E qu i t y ( 5 ) C a p i t a l R a t i o s 8.81% 9.04% 8.39% 8.81% 9.04% 8.39% C o mm o n E qu i t y T i e r 1 ( C E T 1 ) / T o t a l A ss e t s 13.27% 13.73% 12.79% 13.27% 13.73% 12.79% C o mm o n E qu i t y T i e r 1 ( C E T 1 ) / R i s k We i gh t e d A ss e t s ( R W A ) 13.27% 13.73% 13.29% 13.27% 13.73% 13.29% T i e r 1 C ap i t a l / R i s k We i gh t e d A ss e t s ( R W A ) 16.94% 17.45% 17.04% 16.94% 17.45% 17.04% T o t a l C ap i t a l / R i s k We i gh t e d A ss e t s ( R W A ) C r e d i t Q u a li t y R a t i o s 1.50% 1.43% 1.22% 1.50% 1.43% 1.22% T o t a l P a s t D u e / T o t a l Loan s t o C u s t o m e r s 137.50% 143.28% 175.25% 137.50% 143.28% 175.25% All o w an c e f o r Loa n Lo ss e s / T o t a l P a s t D u e 259.90% 273.75% 329.95% 259.90% 273.75% 329.95% T o t a l All o w an c e f o r Loa n Lo ss e s / T o t a l P a s t D u e ( 6 ) 3.24% 3.14% 2.80% 3.24% 3.14% 2.80% I m pa i r e d Loan s / T o t a l Loan s t o C u s t o m e r s 63.69% 65.17% 76.46% 63.69% 65.17% 76.46% Loa n Lo s s All o w an c e s / I m pa i r e d Loan s 2.07% 2.05% 2.14% 2.07% 2.05% 2.14% Loa n Lo s s All o w an c e s / T o t a l Loan s t o C u s t o m e r s 1.20% 0.98% 1.15% 1.20% 1.37% 1.15% E x pe c t e d C r ed i t Lo ss e s / A v g . Loan s t o C u s t o m e r s ( 4 ) O p e r a t i n g a n d P r odu c t i v i t y R a t i o s 36.37% 37.26% 37.50% 36.37% 36.95% 37.50% O pe r a t i n g E x pen s e s / O pe r a t i n g R e v enue s 1.99% 2.03% 1.92% 1.99% 2.29% 1.92% Operating Expenses / Average Total Assets (3) (4) B a l a n c e S h ee t D a t a ( 1 ) ( 3 ) 49,454,663 47,588,235 47,392,338 49,454,663 48,276,882 47,392,338 A v g . I n t e r e s t E a r n i ng s A ss e t s ( m illi o n C h$ ) 57,008,097 54,911,402 54,900,374 57,008,097 55,707,173 54,900,374 A v g . A ss e t s ( m illi o n C h$ ) 5,279,138 4,949,645 4,928,736 5,279,138 5,110,643 4,928,736 A v g . E qu i t y ( m illi o n C h$ ) 37,831,340 36,882,896 36,648,604 37,831,340 37,293,179 36,648,604 A v g . Loan s t o C u s t o m e r s ( m illi o n C h$ ) 32,301,125 31,068,032 30,333,070 32,301,125 31,724,746 30,333,070 Avg. Interest Bearing Liabilities (million Ch$) 38,584,831 37,690,814 36,556,606 38,584,831 37,690,814 36,556,606 R i sk - We i gh t e d A ss e t s ( M illi o n C h$ ) A dd i t i on a l D a t a 982.21 874.35 794.42 982.21 874.35 794.42 E xc hang e r a t e ( C h$ /U S $ ) - E O P 12,065 12,217 12,571 12,065 12,217 12,571 E m p l o y ee s ( # ) - E O P 255 257 265 255 257 265 B r an c he s ( # ) - E O P Notes ( 1 ) Fi g u r e s a r e e x p r e ss e d in n o mi na l C h il e a n pe s o s . (2) Figures are calculated considering nominal net income, the shares outstanding and the exchange rate existing at the end of each period. (3) Ratios consider daily average balances. (4) Annualized data. (5) Non - GAAP measure computed as net income less the effect of inflation on shareholders’ equity (both for the period) divided by average shareholders’ equity. (6) Including additional allowances. | 62 These results have been prepared in accordance with Chilean GAAP on an unaudited, consolidated basis . All figures are expressed in nominal Chilean pesos (historical pesos), unless otherwise stated . All figures expressed in US dollars (except earnings per ADR) were converted using the exchange rate of Ch $ 982 . 21 per US $ 1 . 00 as of March 31 , 2024 . Earnings per ADR were calculated considering the nominal net income, the exchange rate and the number of shares outstanding at the end of each period . Banco de Chile files its consolidated financial statements, together with those of its subsidiaries, with the Financial Market Commission, on a monthly basis . In addition, Banco de Chile files its quarterly financial statements (notes included) with the SEC in form 6 K, simultaneously or previously to file this quarterly earnings report . Such documentation is equally available at Banco de Chile’s website both in Spanish and English .