UNITED STATES
SECURITIES AND EXCHANGE COMMISSION
Washington, D.C. 20549
FORM 8-K
CURRENT REPORT
Pursuant to Section 13 OR 15(d) of The Securities Exchange Act of 1934
Date of Report (Date of earliest event reported) April 17, 2024 (April 17, 2024)
SB FINANCIAL GROUP, INC
(Exact name of registrant as specified in its charter)
| Ohio | 0-13507 | 34-1395608 | ||
| (State or other jurisdiction of incorporation) |
(Commission File Number) |
(IRS Employer Identification No.) |
| 401 Clinton Street, Defiance, OH | 43512 | |
| (Address of principal executive offices) | (Zip Code) |
Registrant’s telephone number, including area code (419) 783-8950
Not Applicable
(Former name or former address, if changed since last report.)
Check the appropriate box below if the Form 8-K filing is intended to simultaneously satisfy the filing obligation of the registrant under any of the following provisions (see General Instruction A.2. below):
| ☐ | Written communications pursuant to Rule 425 under the Securities Act (17 CFR 230.425) |
| ☐ | Soliciting material pursuant to Rule 1 4a- 12 under the Exchange Act (17 CFR 240.1 4a- 12) |
| ☐ | Pre-commencement communications pursuant to Rule 1 4d-2(b) under the Exchange Act (17 CFR 240.1 4d-2(b)) |
| ☐ | Pre-commencement communications pursuant to Rule 1 3e-4(c) under the Exchange Act (17 CFR 240.1 3e-4(c)) |
Securities registered pursuant to Section 12(b) of the Act:
| Title of each class | Trading symbol(s) | Name of each exchange on which registered | ||
|
Common Shares, No Par Value 6,766,494 Outstanding at April 17, 2024 |
SBFG |
The NASDAQ Stock Market, LLC |
Indicate by check mark whether the registrant is an emerging growth company as defined in Rule 405 of the Securities Act of 1933 (§230.405 of this chapter) or Rule 12b-2 of the Securities Exchange Act of 1934 (§240.12b-2 of this chapter).
Emerging growth company ☐
If an emerging growth company, indicate by check mark if the registrant has elected not to use the extended transition period for complying with any new or revised financial accounting standards provided pursuant to Section 13(a) of the Exchange Act. ☐
Item 7.01. Regulation FD Disclosure.
The management of SB Financial Group, Inc. (the “Company”) will make a presentation at the Company’s Annual Meeting of Shareholders on April 17, 2024. The slides that will accompany the presentation are furnished in this Current Report on Form 8-K, pursuant to this Item 7.01, as Exhibit 99.1, and are incorporated herein by reference.
The information in this Item 7.01, including Exhibit 99.1 furnished herewith, is being furnished and shall not be deemed to be “filed” for purposes of Section 18 of the Exchange Act or otherwise subject to the liabilities of that Section, nor shall such information be deemed to be incorporated by reference in any registration statement or other document filed under the Securities Act or the Exchange Act, except as otherwise stated in such filing.
Item 9.01. Financial Statements and Exhibits.
(a) Not Applicable
(b) Not Applicable
(c) Not Applicable
(d) Exhibits
| Exhibit No. | Description | |
| 99.1 | Slide presentation for the Annual Meeting of Shareholders of SB Financial Group, Inc. on April 17, 2024 (furnished pursuant to Item 7.01 hereof) | |
| 104 | Cover Page Interactive Data File (embedded within the Inline XBRL document) |
-
SIGNATURE
Pursuant to the requirements of the Securities Exchange Act of 1934, the registrant has duly caused this report to be signed on its behalf by the undersigned hereunto duly authorized.
| SB FINANCIAL GROUP, INC. | ||
| Dated: April 17, 2024 | By: | /s/ Anthony V. Cosentino |
| Anthony V. Cosentino | ||
| Executive Vice President and Chief Financial Officer | ||
-
INDEX TO EXHIBITS
Current Report on Form 8-K
Dated April 17, 2024
SB Financial Group, Inc.
| Exhibit No. | Description | |
| 99.1 | Slide presentation for the Annual Meeting of Shareholders of SB Financial Group, Inc. on April 17, 2024 (furnished pursuant to Item 7.01 hereof) | |
| 104 | Cover Page Interactive Data File (embedded within the Inline XBRL document) |
-3-
Exhibit 99.1
2024 ANNUAL SHAREHOLDER MEETING SB FINANCIAL GROUP, INC.
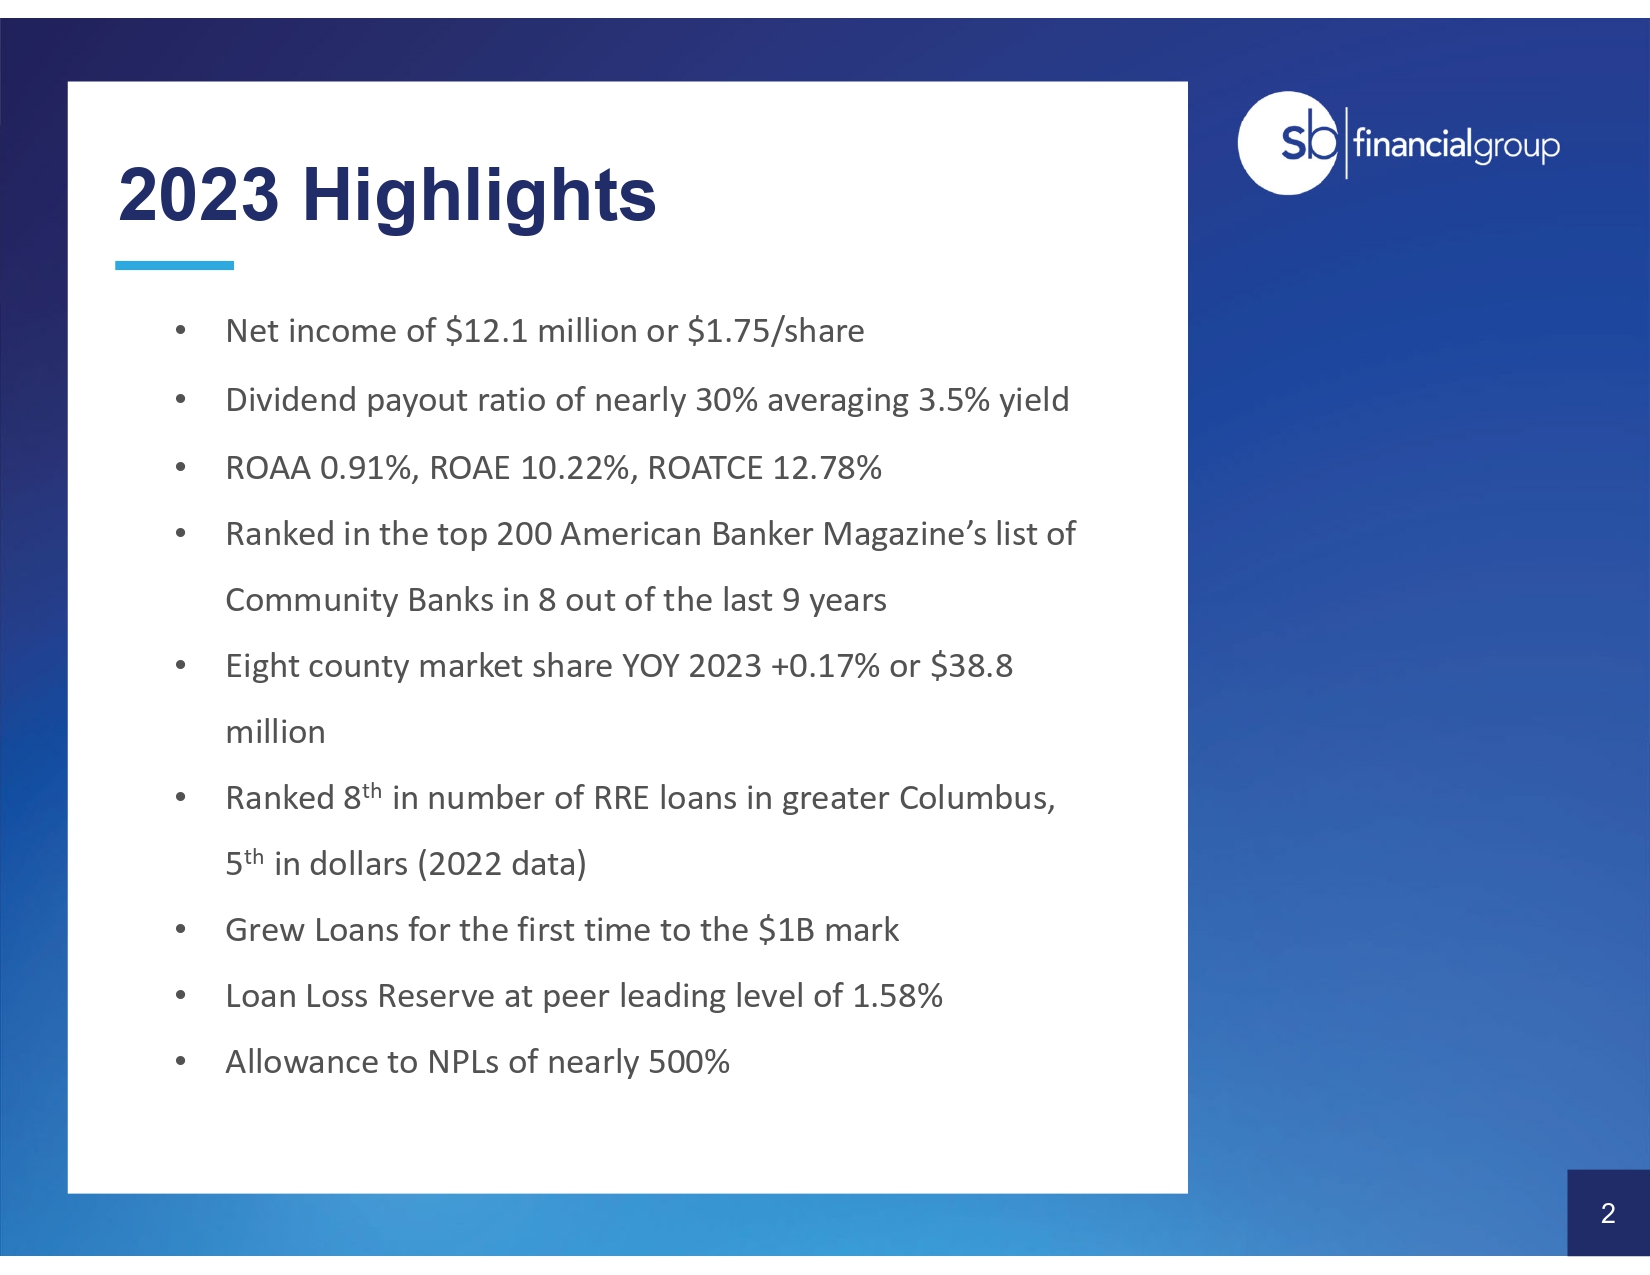
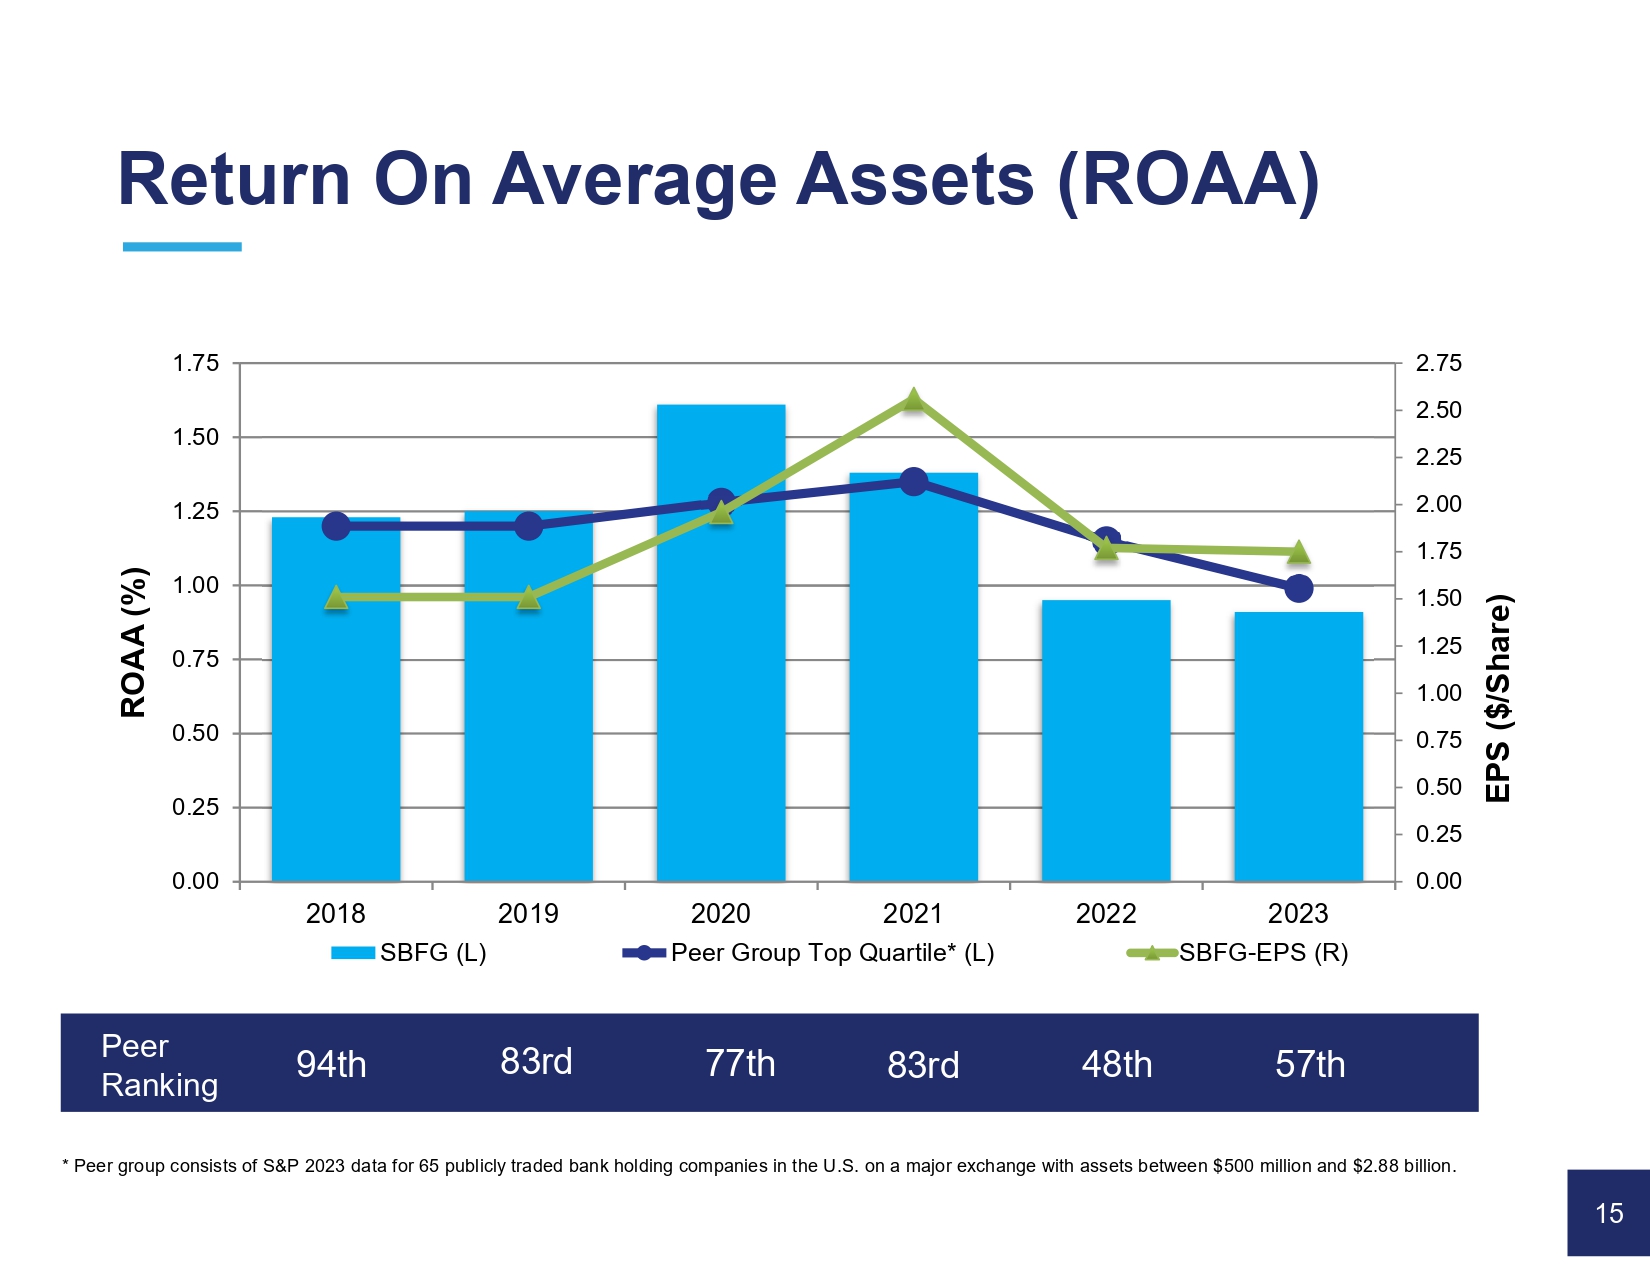
Building on Resilience and Innovation to Drive Growth • Net income of $12.1 million or $1.75/share • Dividend payout ratio of nearly 30% averaging 3.5% yield • ROAA 0.91%, ROAE 10.22%, ROATCE 12.78% • Ranked in the top 200 American Banker Magazine’s list of Community Banks in 8 out of the last 9 years • Eight county market share YOY 2023 +0.17% or $38.8 million • Rank ed 8 th in number of RRE loans in greater Columbus, 5 th in dollars (2022 data) • Grew Loans for the first time to the $1B mark • Loan Loss Reserve at peer leading level of 1.58% • Allowance to NPLs of nearly 500% 2023 Highlights 2 0.00 0.25 0.50 0.75 1.00 1.25 1.50 1.75 2.00 2.25 2.50 2.75 0.00 0.25 0.50 0.75 1.00 1.25 1.50 1.75 2018 2019 2020 2021 2022 2023 EPS ($/Share) ROAA (%) SBFG (L) Peer Group Top Quartile* (L) SBFG-EPS (R) * Peer group consists of S &P 20 23 data for 65 publicly traded bank holding companies in the U.S. on a major exchange with assets between $5 00 million and $ 2.88 billion. Peer Ranking 94th 83rd 77th Return On Average Assets (ROAA) 15 83rd 48th 57th

3
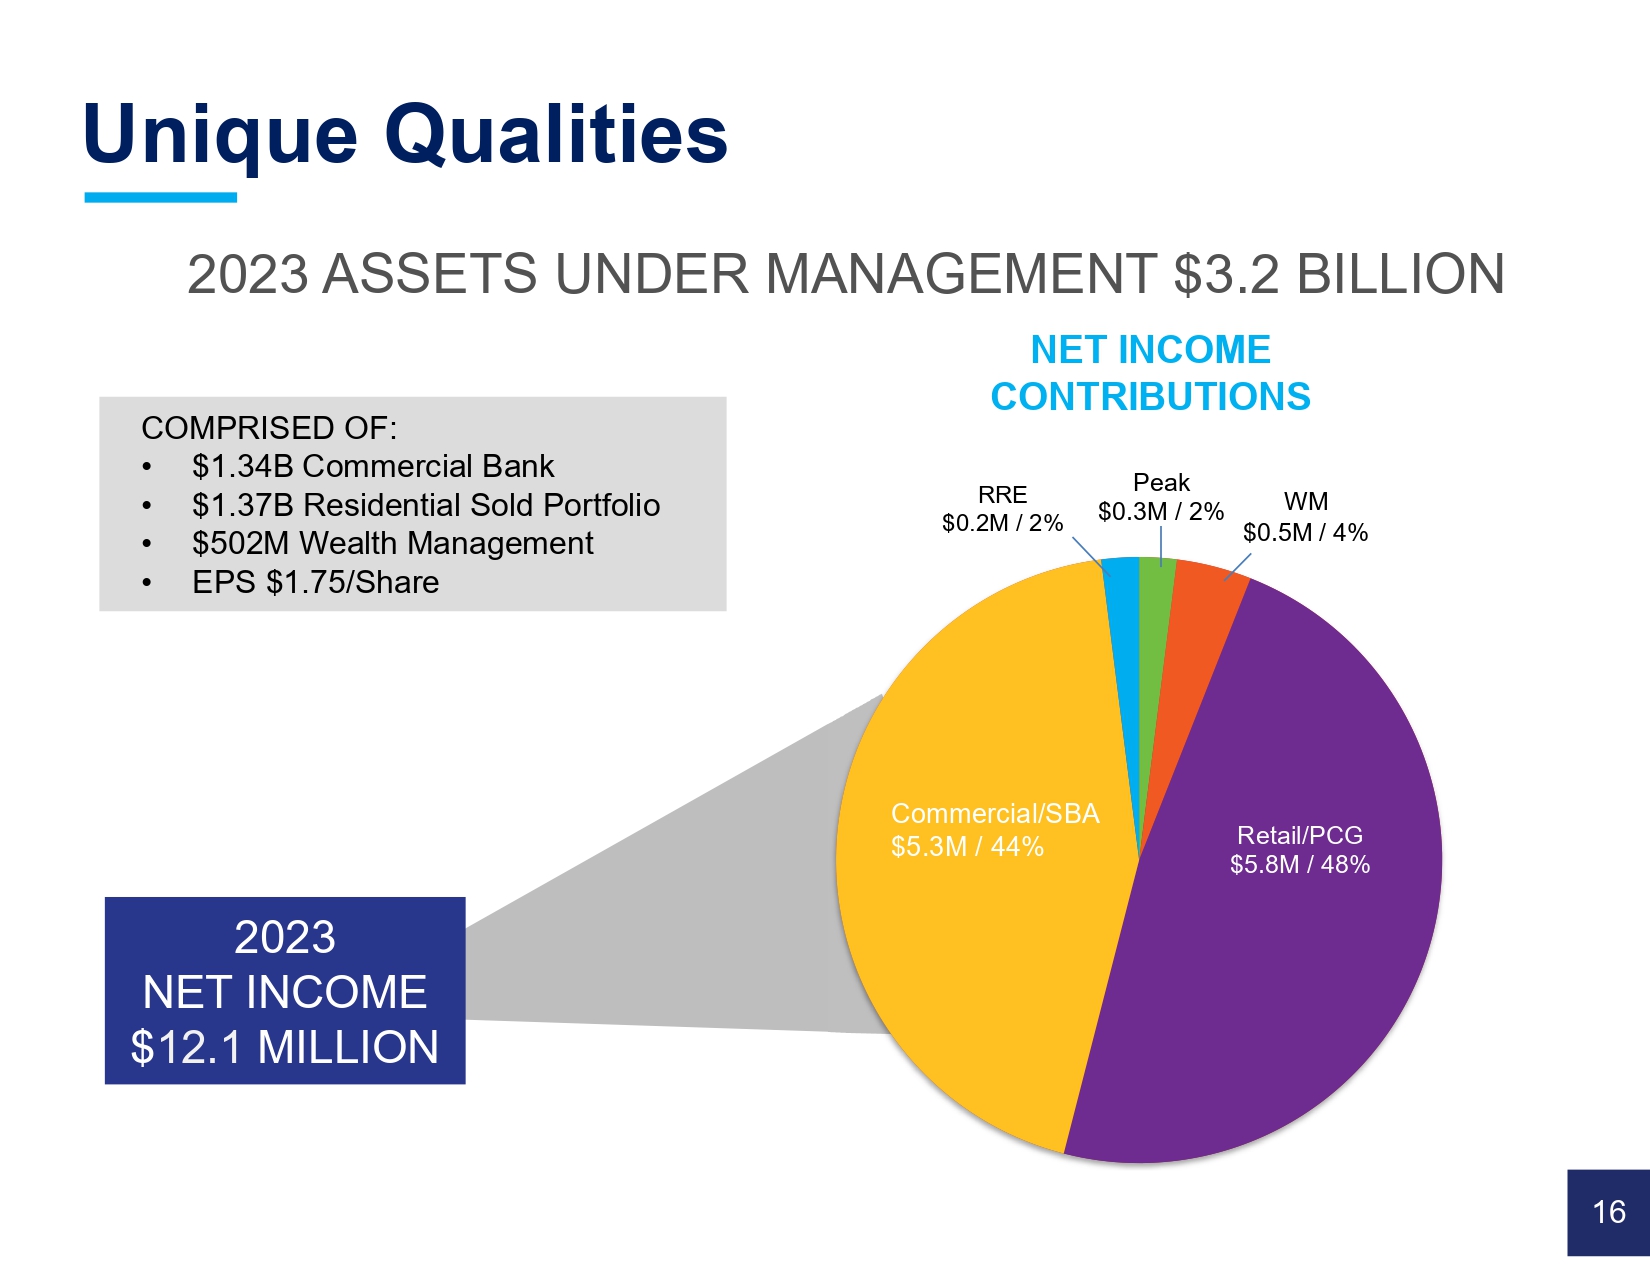
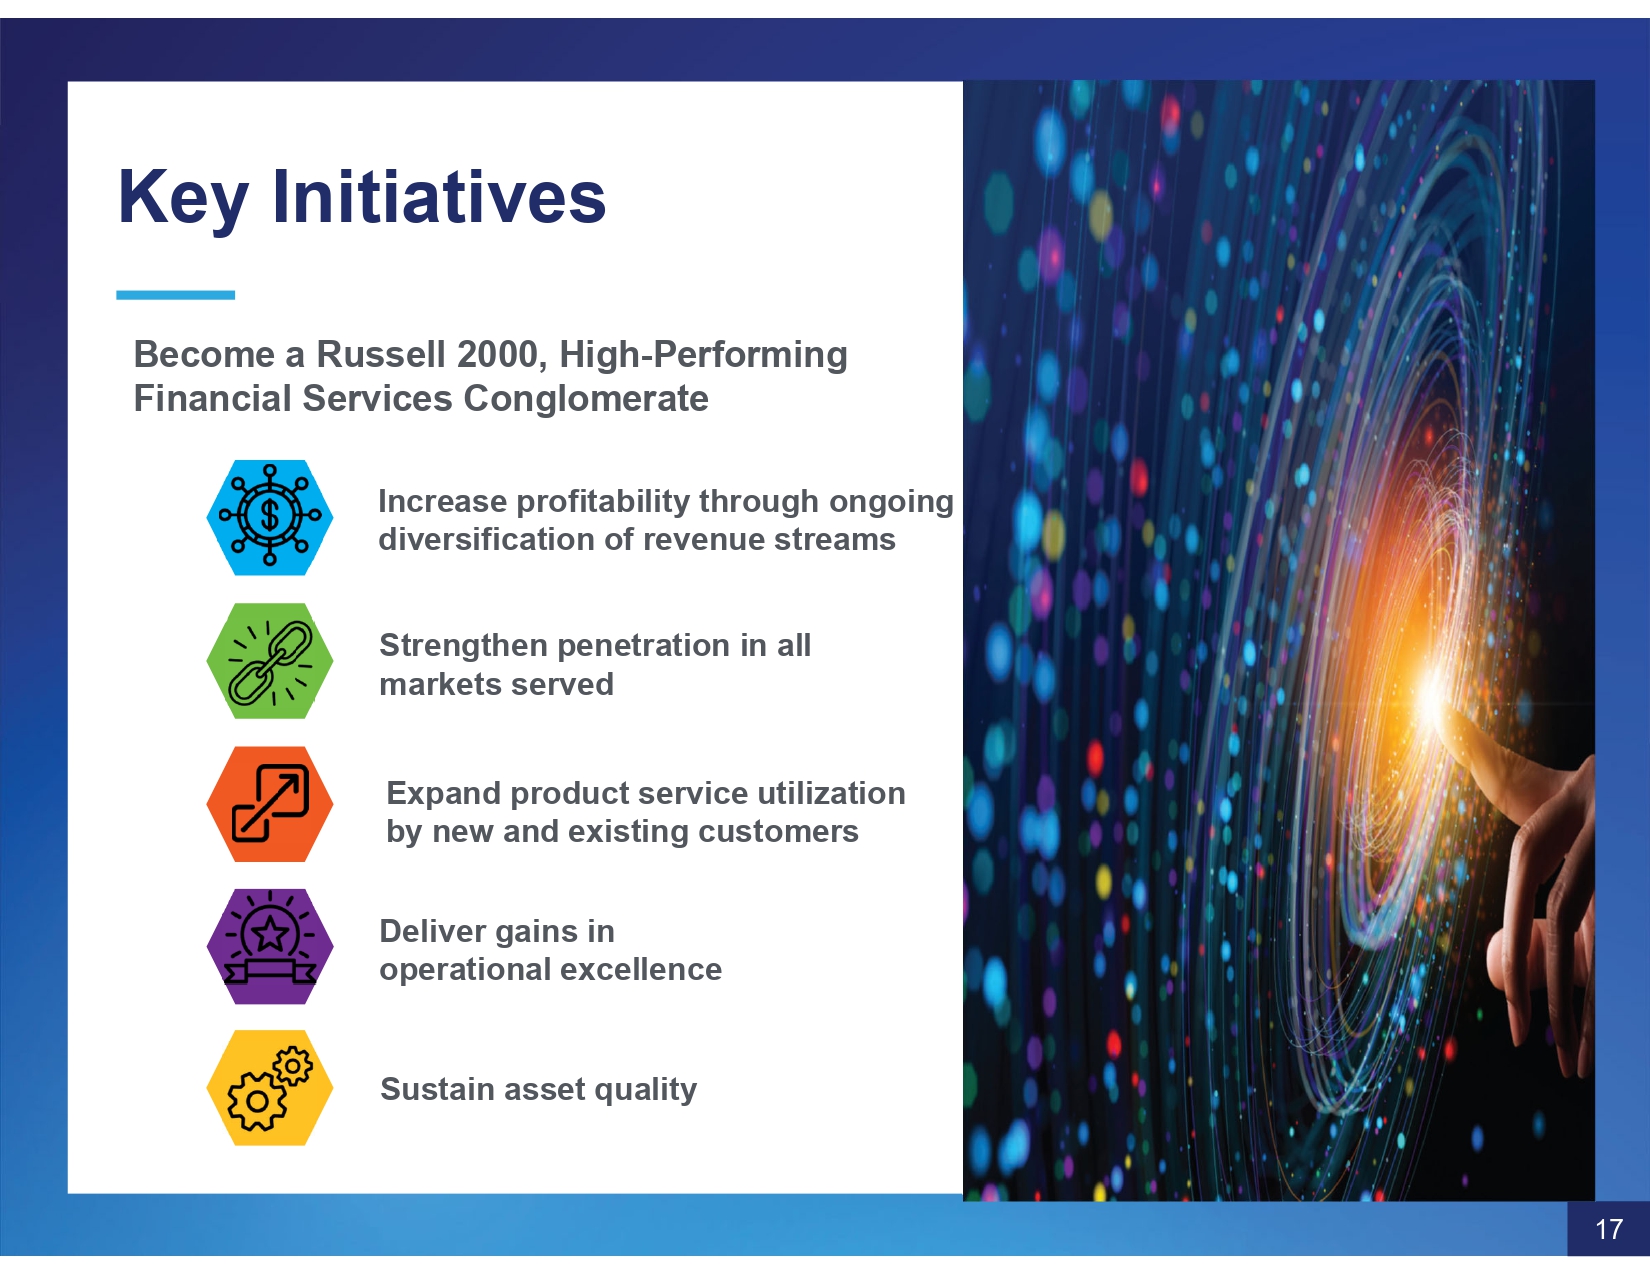
RRE $0.2M / 2% Retail/PCG $5.8M / 48% Peak $0.3M / 2% Commercial/SBA $5.3M / 44% WM $0.5M / 4% NET INCOME CONTRIBUTIONS 20 23 NET INCOME $ 12.1 MILLION 20 23 ASSETS UNDER MANAGEMENT $ 3.2 BILLION COMPRISED OF: • $1.34B Commercial Bank • $1.37B Residential Sold Portfolio • $502M Wealth Management • EPS $1.75/Share Unique Qualities 16 Key Initiatives Become a Russell 2000, High - Performing Financial Services Conglomerate Increase profitability through ongoing diversification of revenue streams Strengthen penetration in all markets served Expand product service utilization by new and existing customers Deliver gains in operational excellence Sustain asset quality 1 7
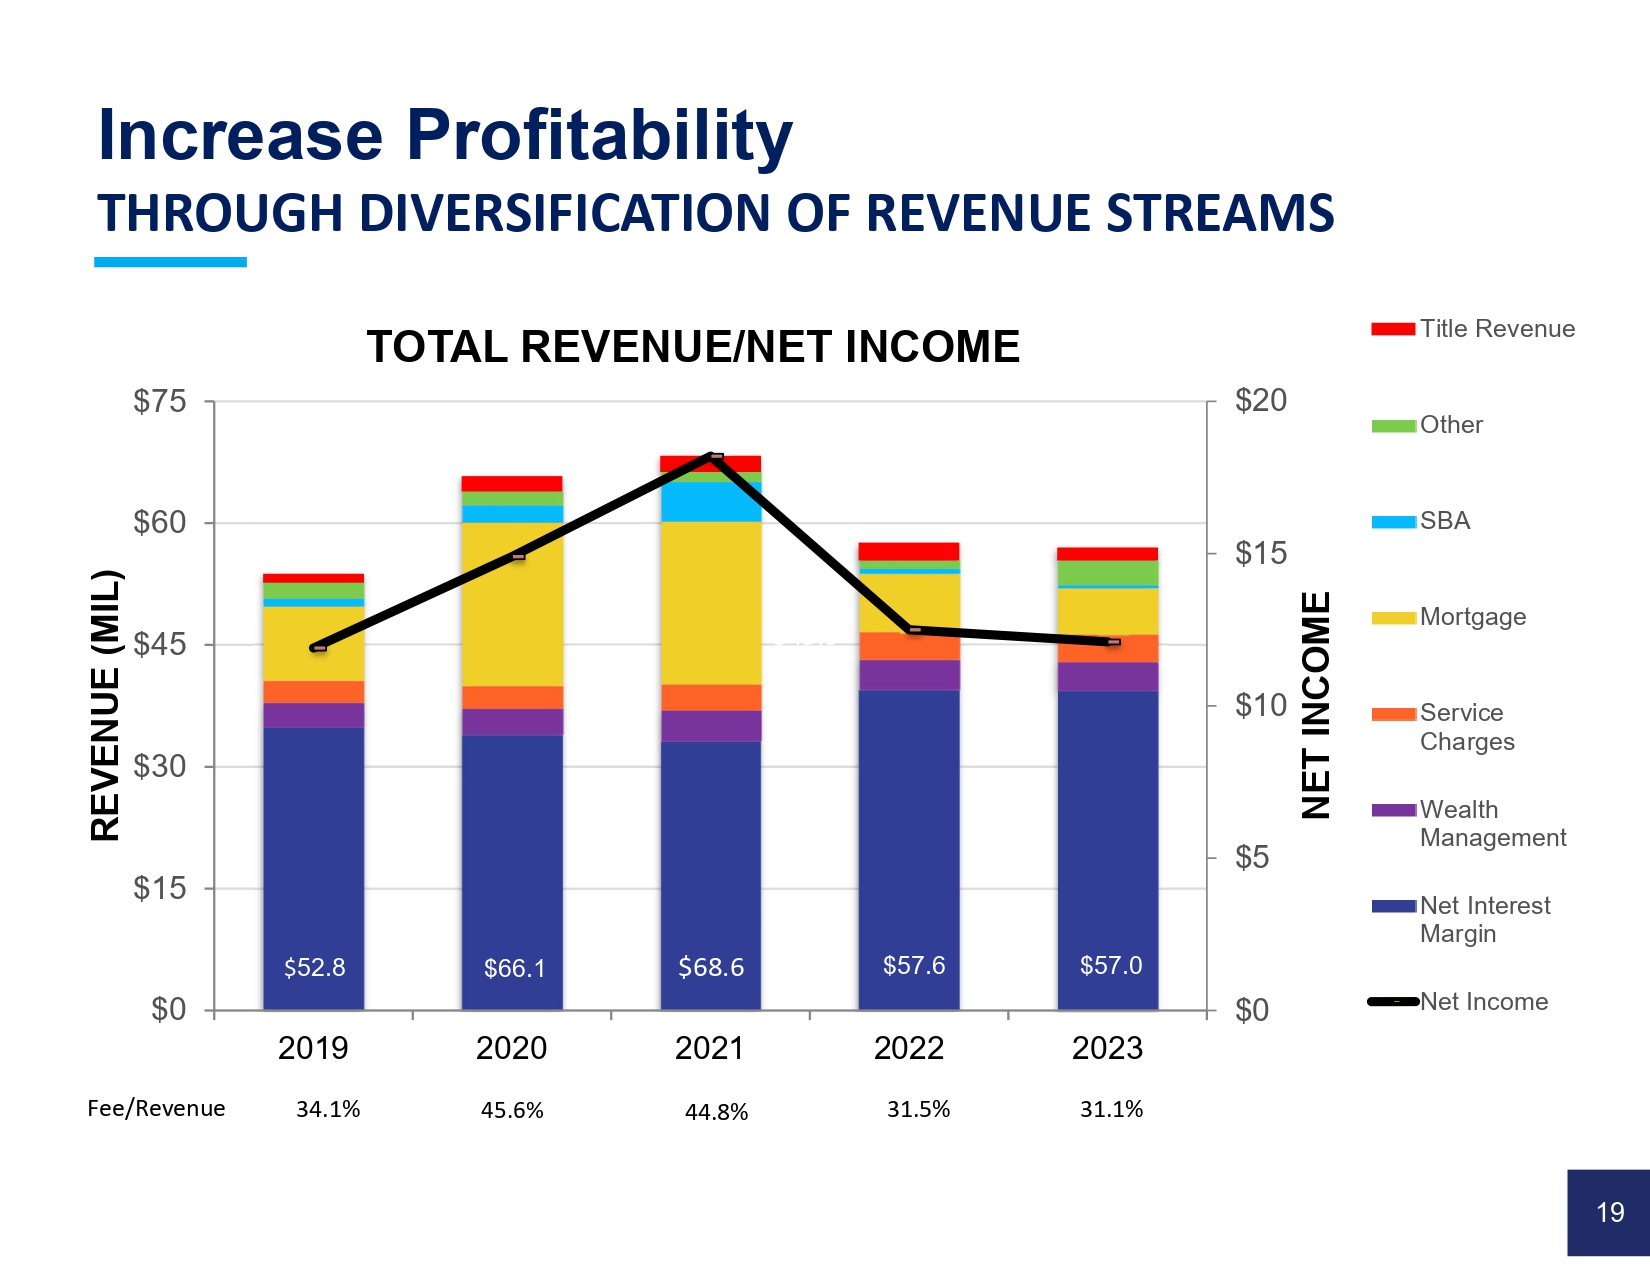
Key Initiatives Become a Russell 2000, High - Performing Financial Services Conglomerate Increase profitability through ongoing diversification of revenue streams Strengthen penetration in all markets served Expand product service utilization by new and existing customers Deliver gains in operational excellence Sustain asset quality 18 Increase Profitability THROUGH DIVERSIFICATION OF REVENUE STREAMS $0 $5 $10 $15 $20 $0 $15 $30 $45 $60 $75 2019 2020 2021 2022 2023 NET INCOME REVENUE (MIL) TOTAL REVENUE/NET INCOME Title Revenue Other SBA Mortgage Service Charges Wealth Management Net Interest Margin Net Income $ 52.8 45.6 % $66.1 Fee/Revenue 44.8% 31.5% 34.1% 19 $49.9 $68.6 $57.6 31.1% $57.0
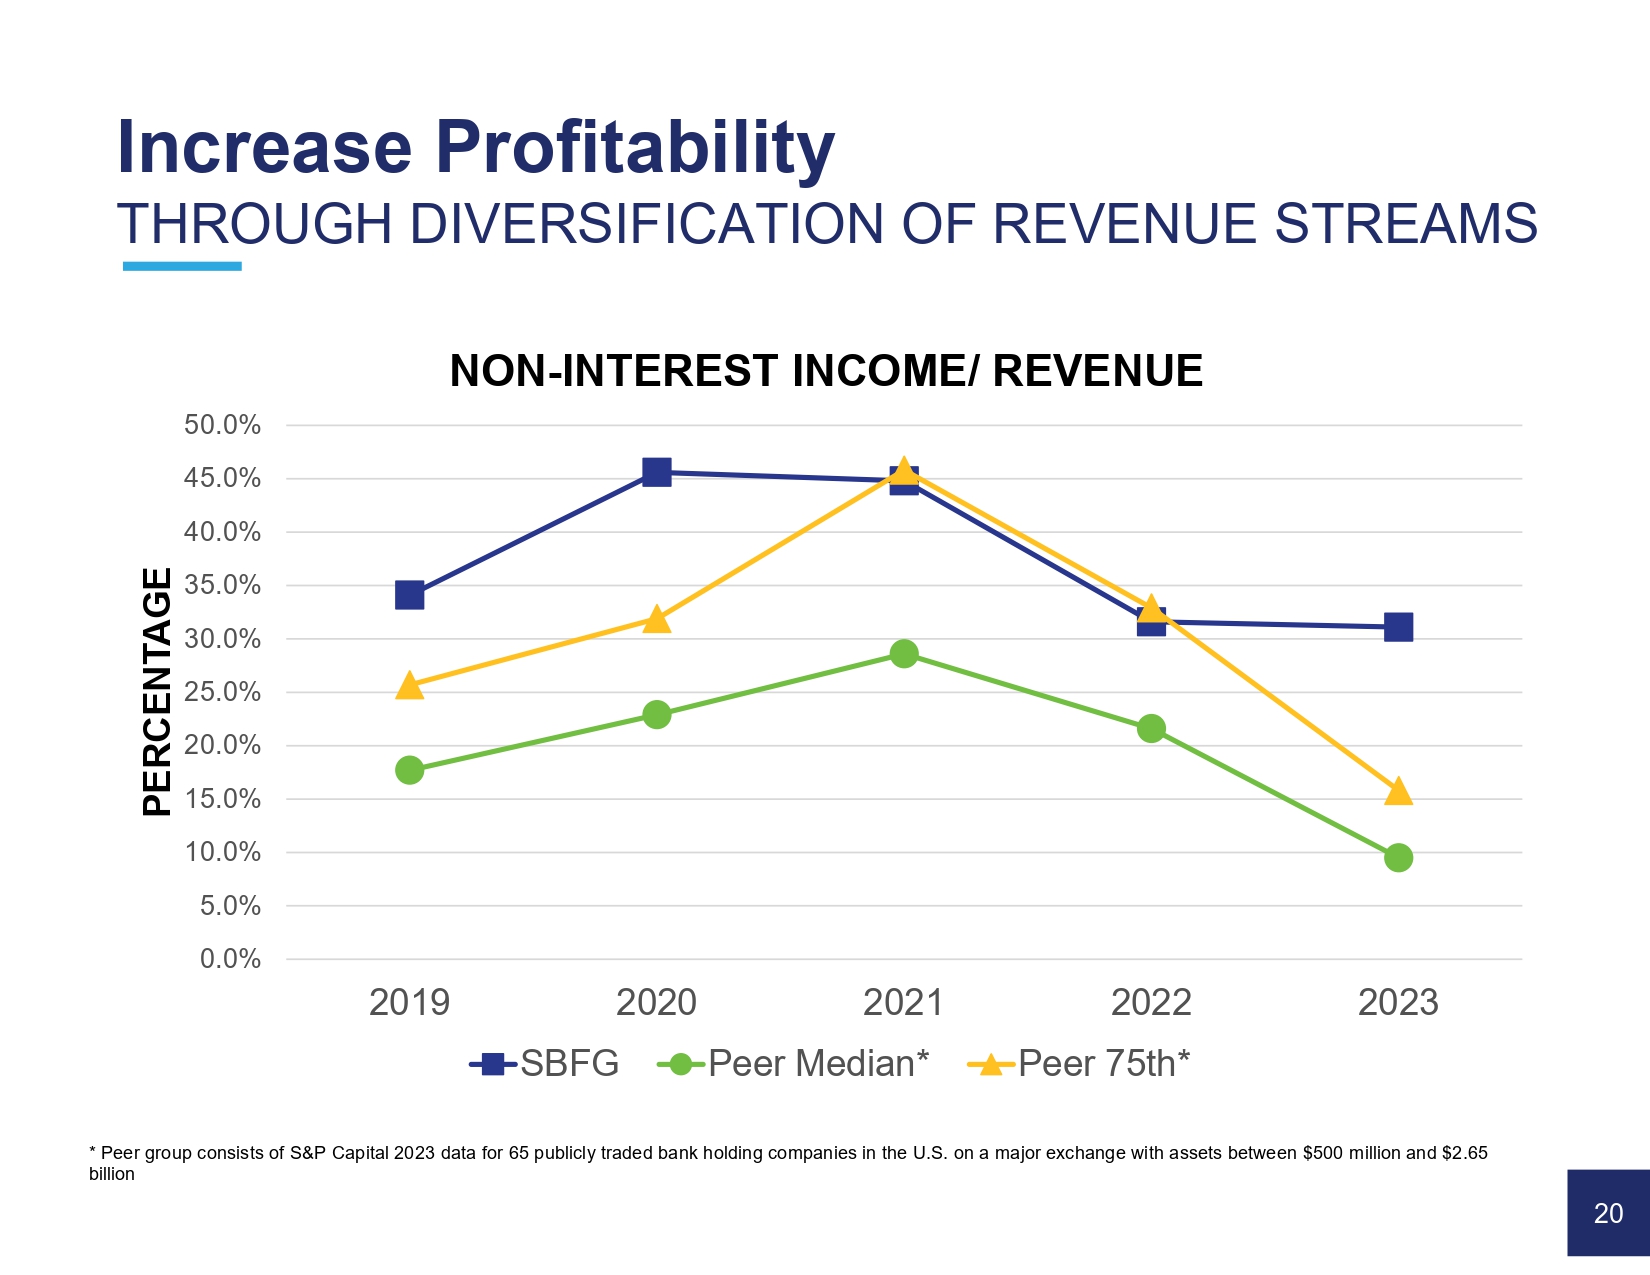
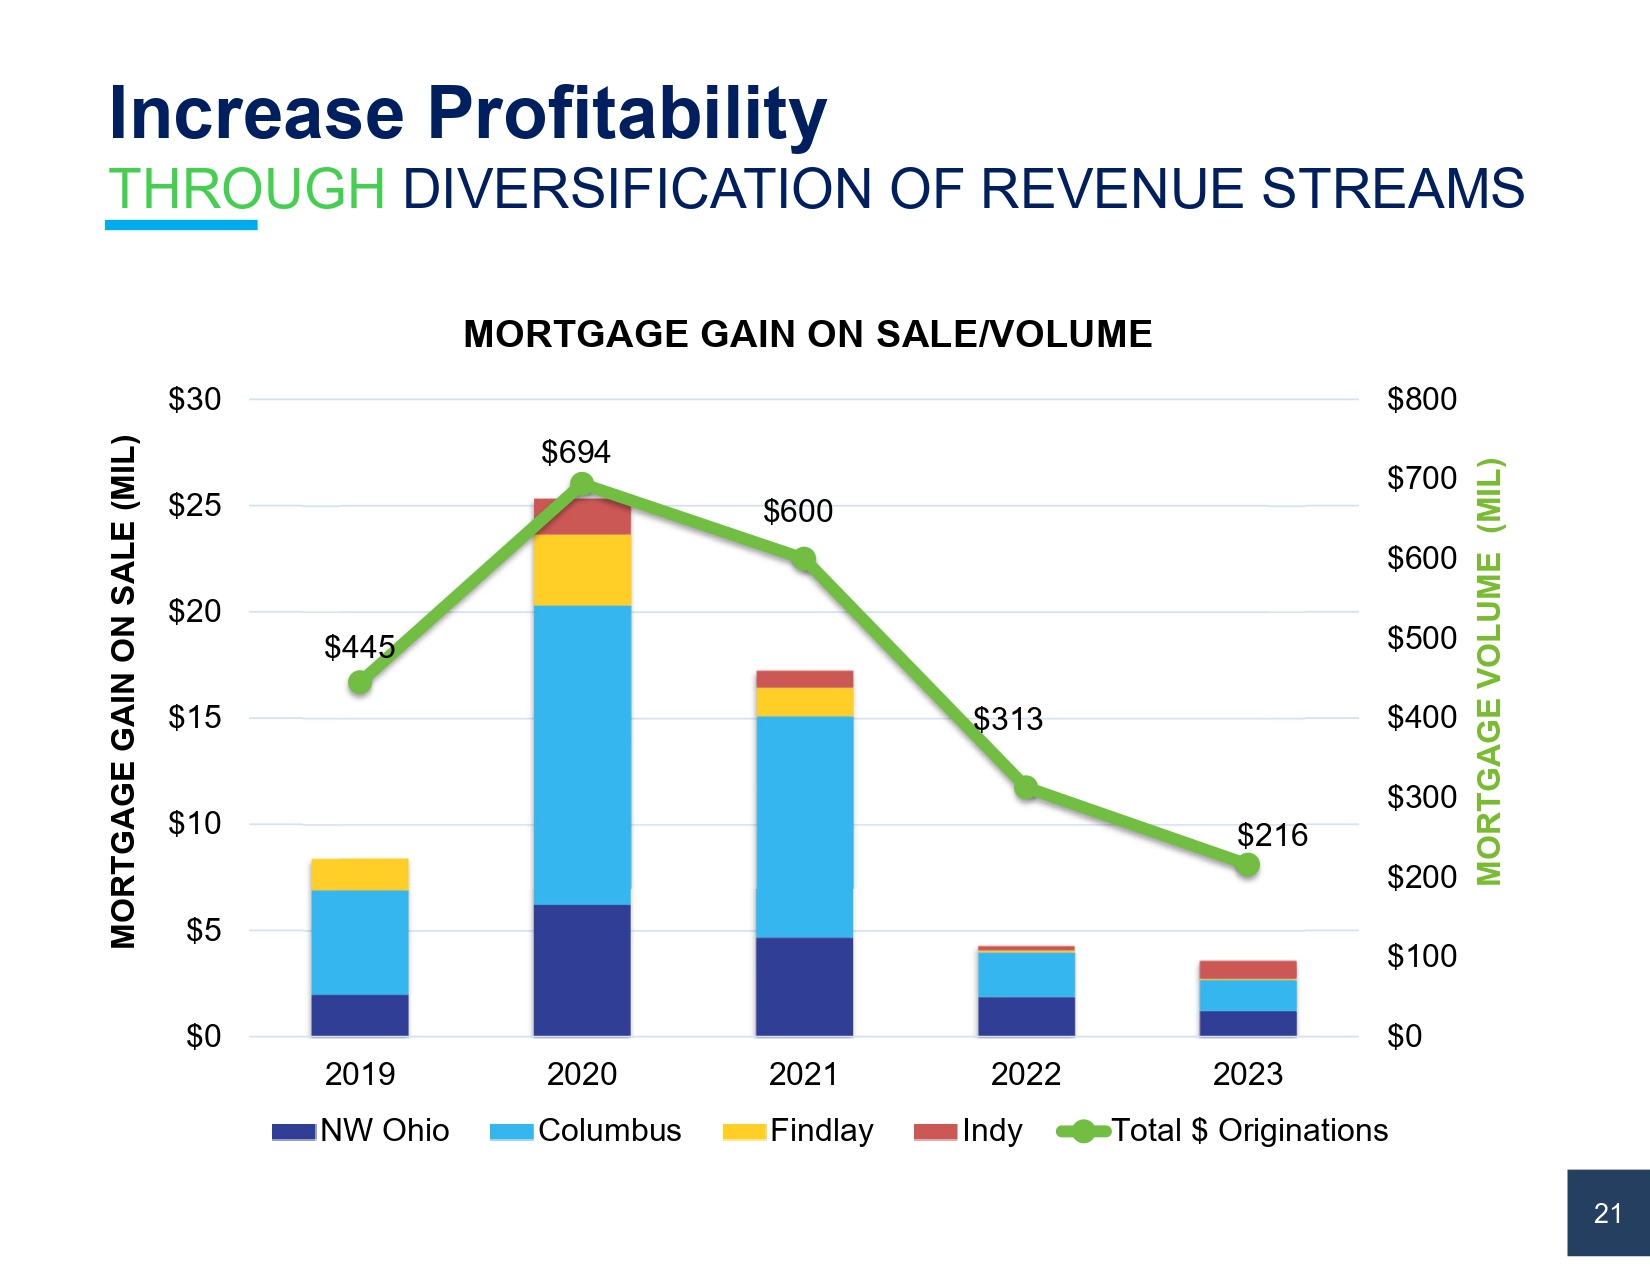
* Peer group consists of S &P Capital 20 23 data for 65 publicly traded bank holding companies in the U.S. on a major exchange with assets between $500 million and $ 2.65 billion 0.0% 5.0% 10.0% 15.0% 20.0% 25.0% 30.0% 35.0% 40.0% 45.0% 50.0% 2019 2020 2021 2022 2023 PERCENTAGE NON - INTEREST INCOME/ REVENUE SBFG Peer Median* Peer 75th* Increase Profitability THROUGH DIVERSIFICATION OF REVENUE STREAMS 20 $445 $694 $600 $313 $216 $0 $100 $200 $300 $400 $500 $600 $700 $800 $0 $5 $10 $15 $20 $25 $30 2019 2020 2021 2022 2023 MORTGAGE VOLUME (MIL) MORTGAGE GAIN ON SALE (MIL) MORTGAGE GAIN ON SALE/VOLUME NW Ohio Columbus Findlay Indy Total $ Originations Increase Profitability THROUGH DIVERSIFICATION OF REVENUE STREAMS 26 21
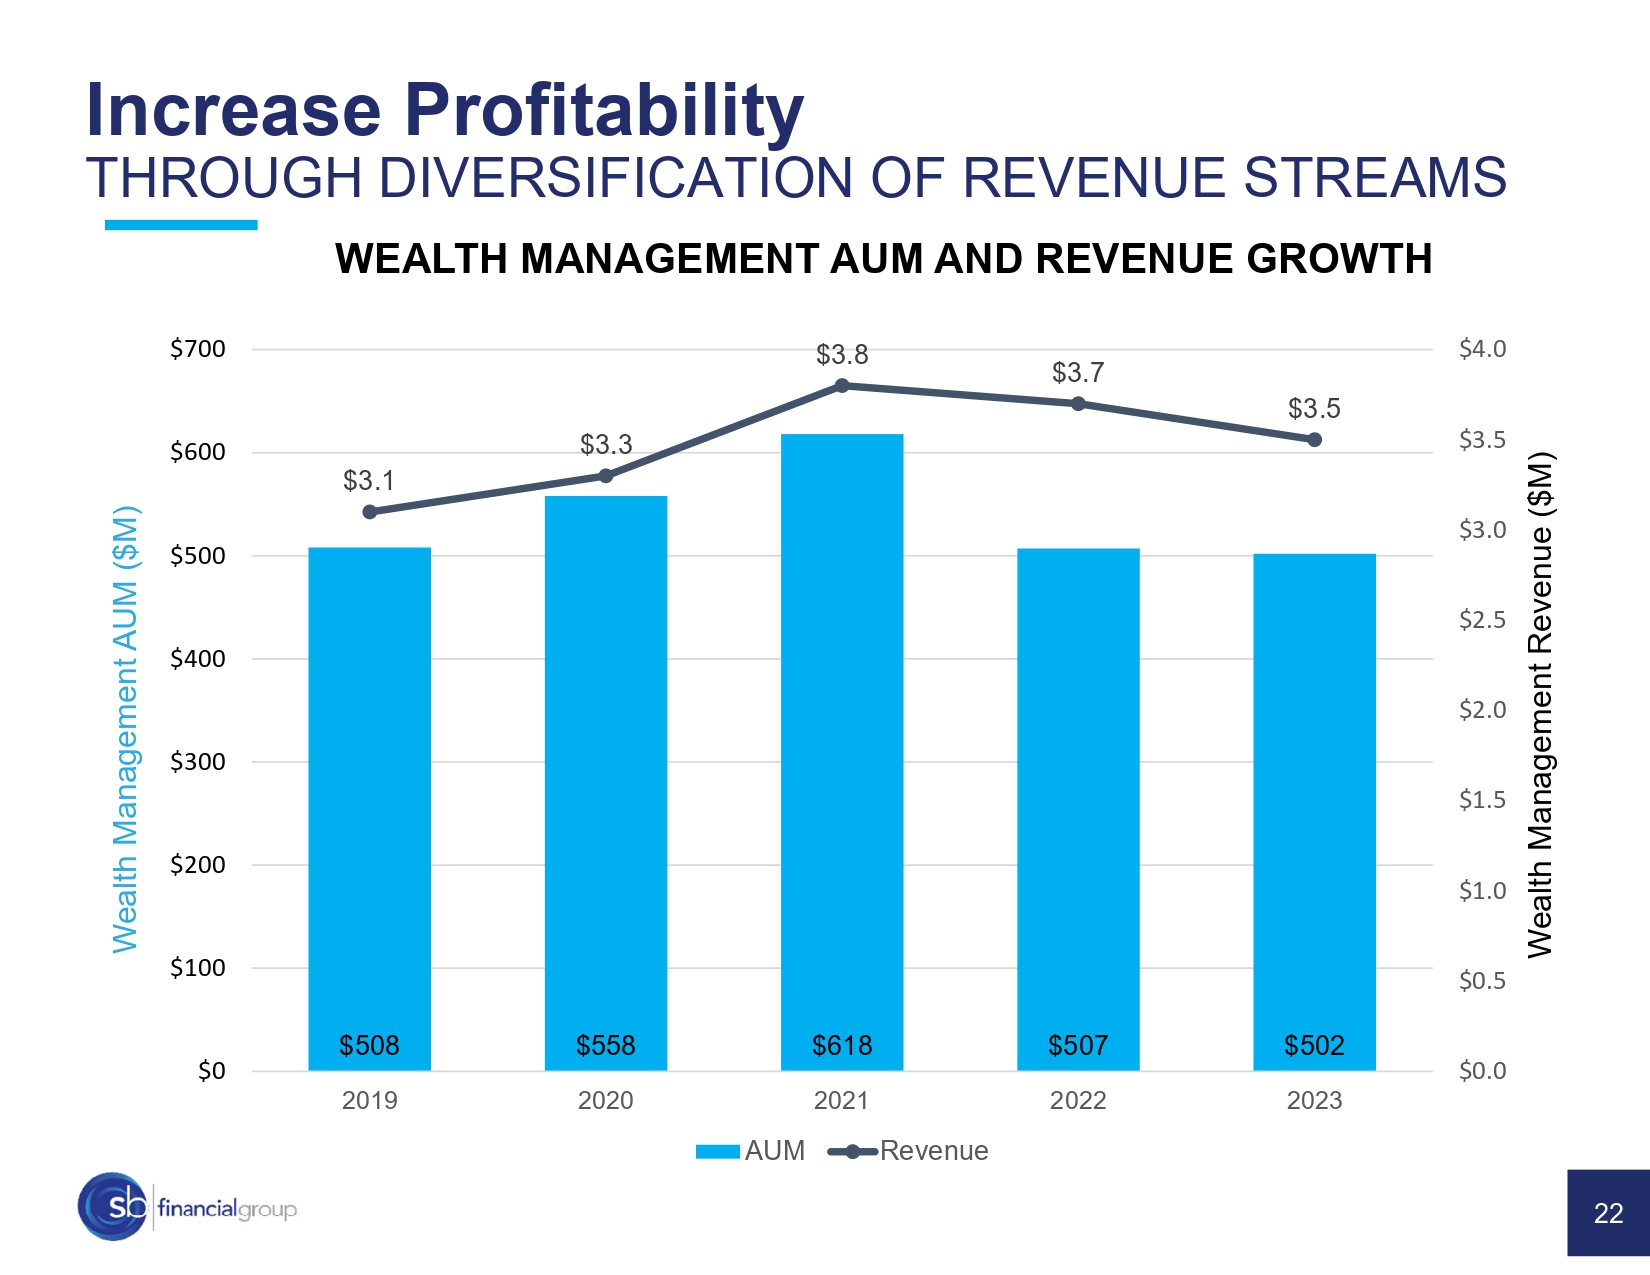
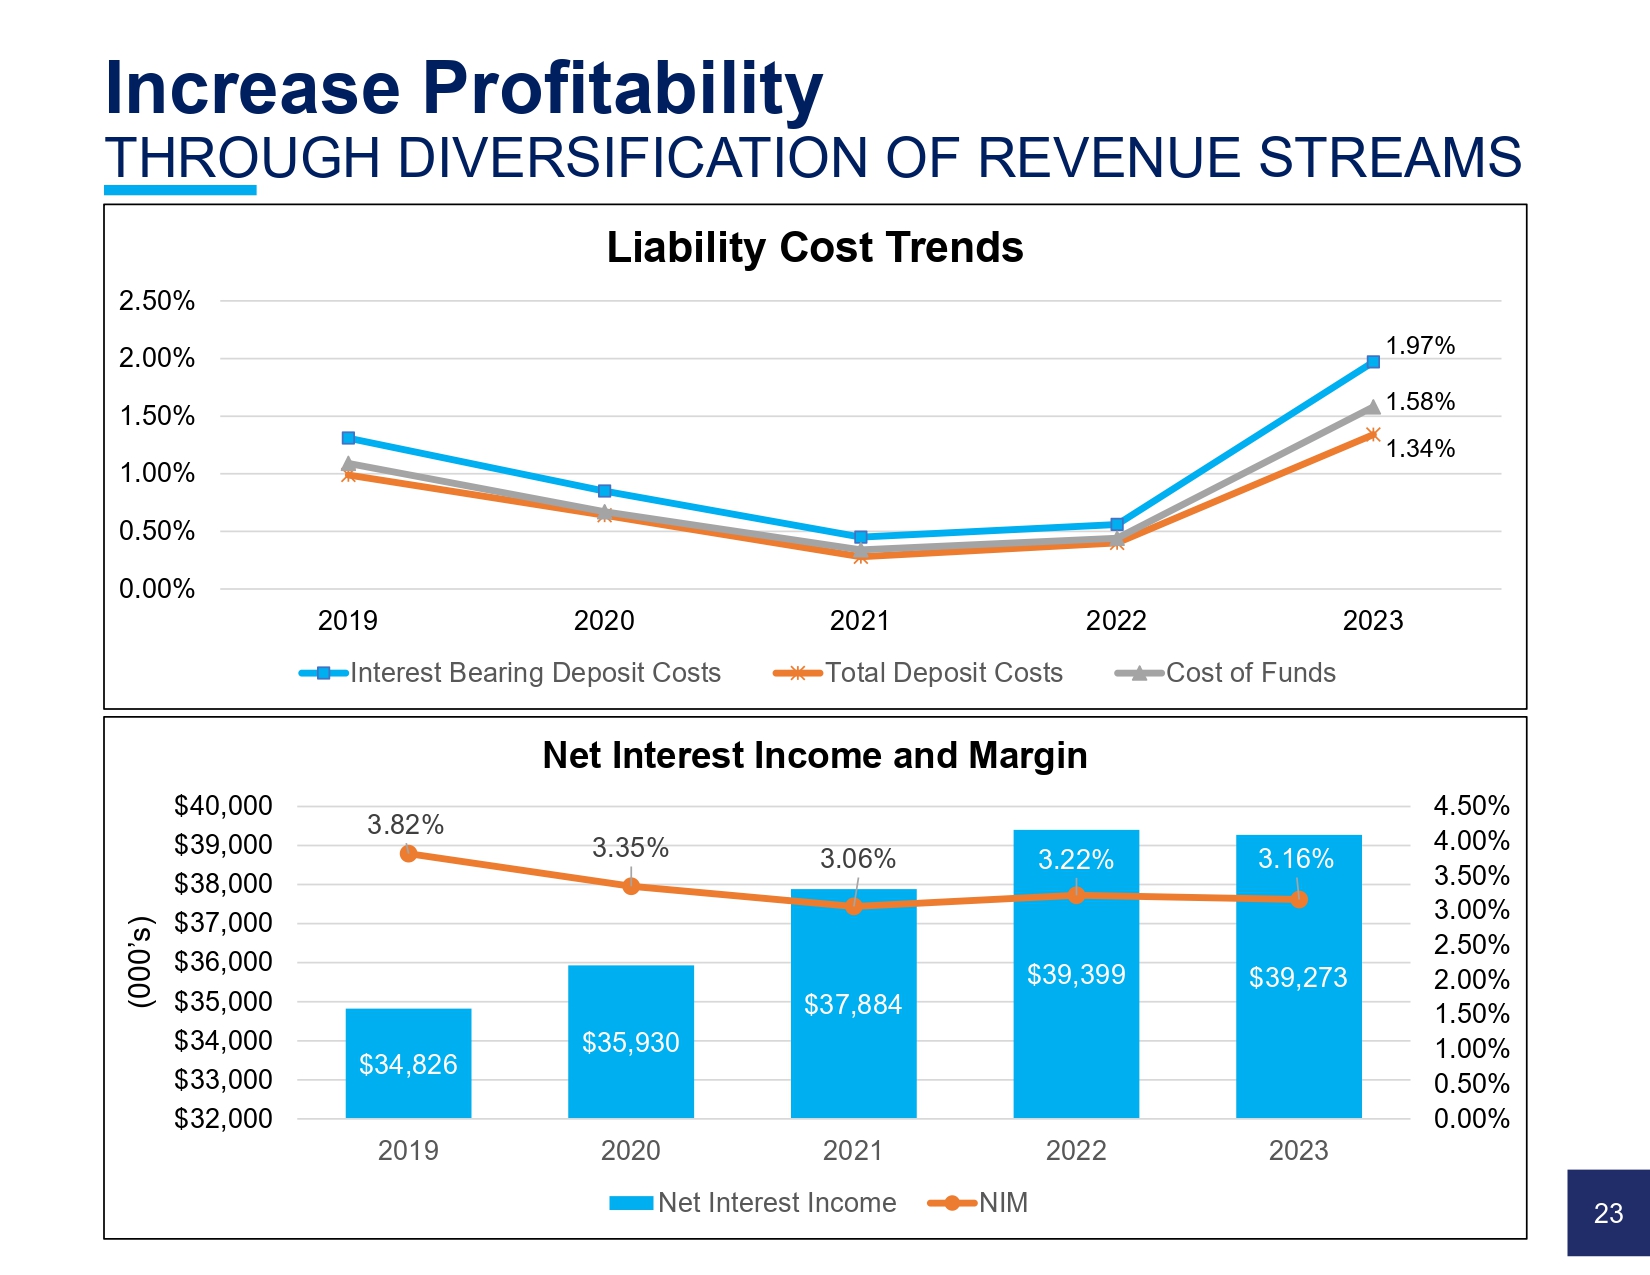
Increase Profitability THROUGH DIVERSIFICATION OF REVENUE STREAMS $508 $558 $618 $507 $502 $3.1 $3.3 $3.8 $3.7 $3.5 $0.0 $0.5 $1.0 $1.5 $2.0 $2.5 $3.0 $3.5 $4.0 $0 $100 $200 $300 $400 $500 $600 $700 2019 2020 2021 2022 2023 Wealth Management Revenue ($M) Wealth Management AUM ($M) AUM Revenue WEALTH MANAGEMENT AUM AND REVENUE GROWTH 22 Increase Profitability THROUGH DIVERSIFICATION OF REVENUE STREAMS $34,826 $35,930 $37,884 $39,399 $39,273 3.82% 3.35% 3.06% 3.22% 3.16% 0.00% 0.50% 1.00% 1.50% 2.00% 2.50% 3.00% 3.50% 4.00% 4.50% $32,000 $33,000 $34,000 $35,000 $36,000 $37,000 $38,000 $39,000 $40,000 2019 2020 2021 2022 2023 (000’s) Net Interest Income and Margin Net Interest Income NIM 0.00% 0.50% 1.00% 1.50% 2.00% 2.50% 2019 2020 2021 2022 2023 Liability Cost Trends Interest Bearing Deposit Costs Total Deposit Costs Cost of Funds 1.97% 1.58% 1.34% 23

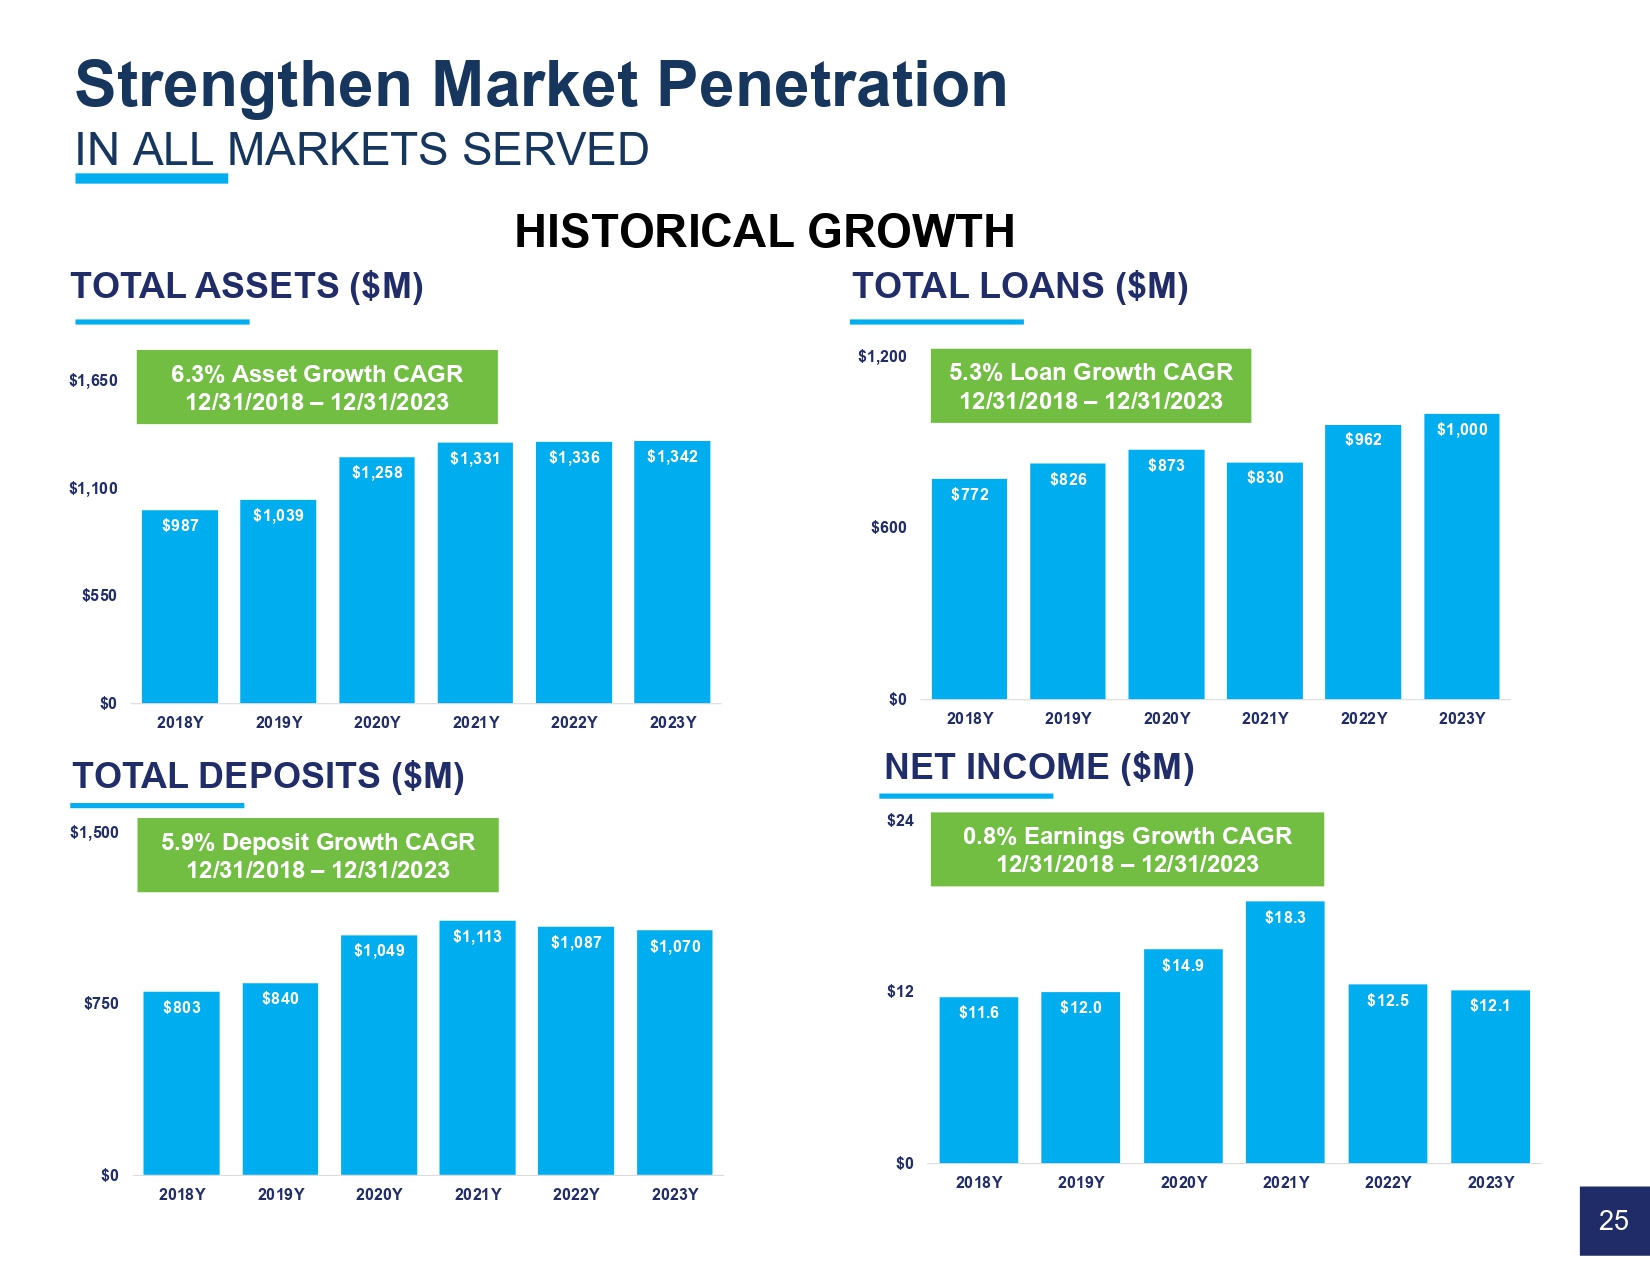
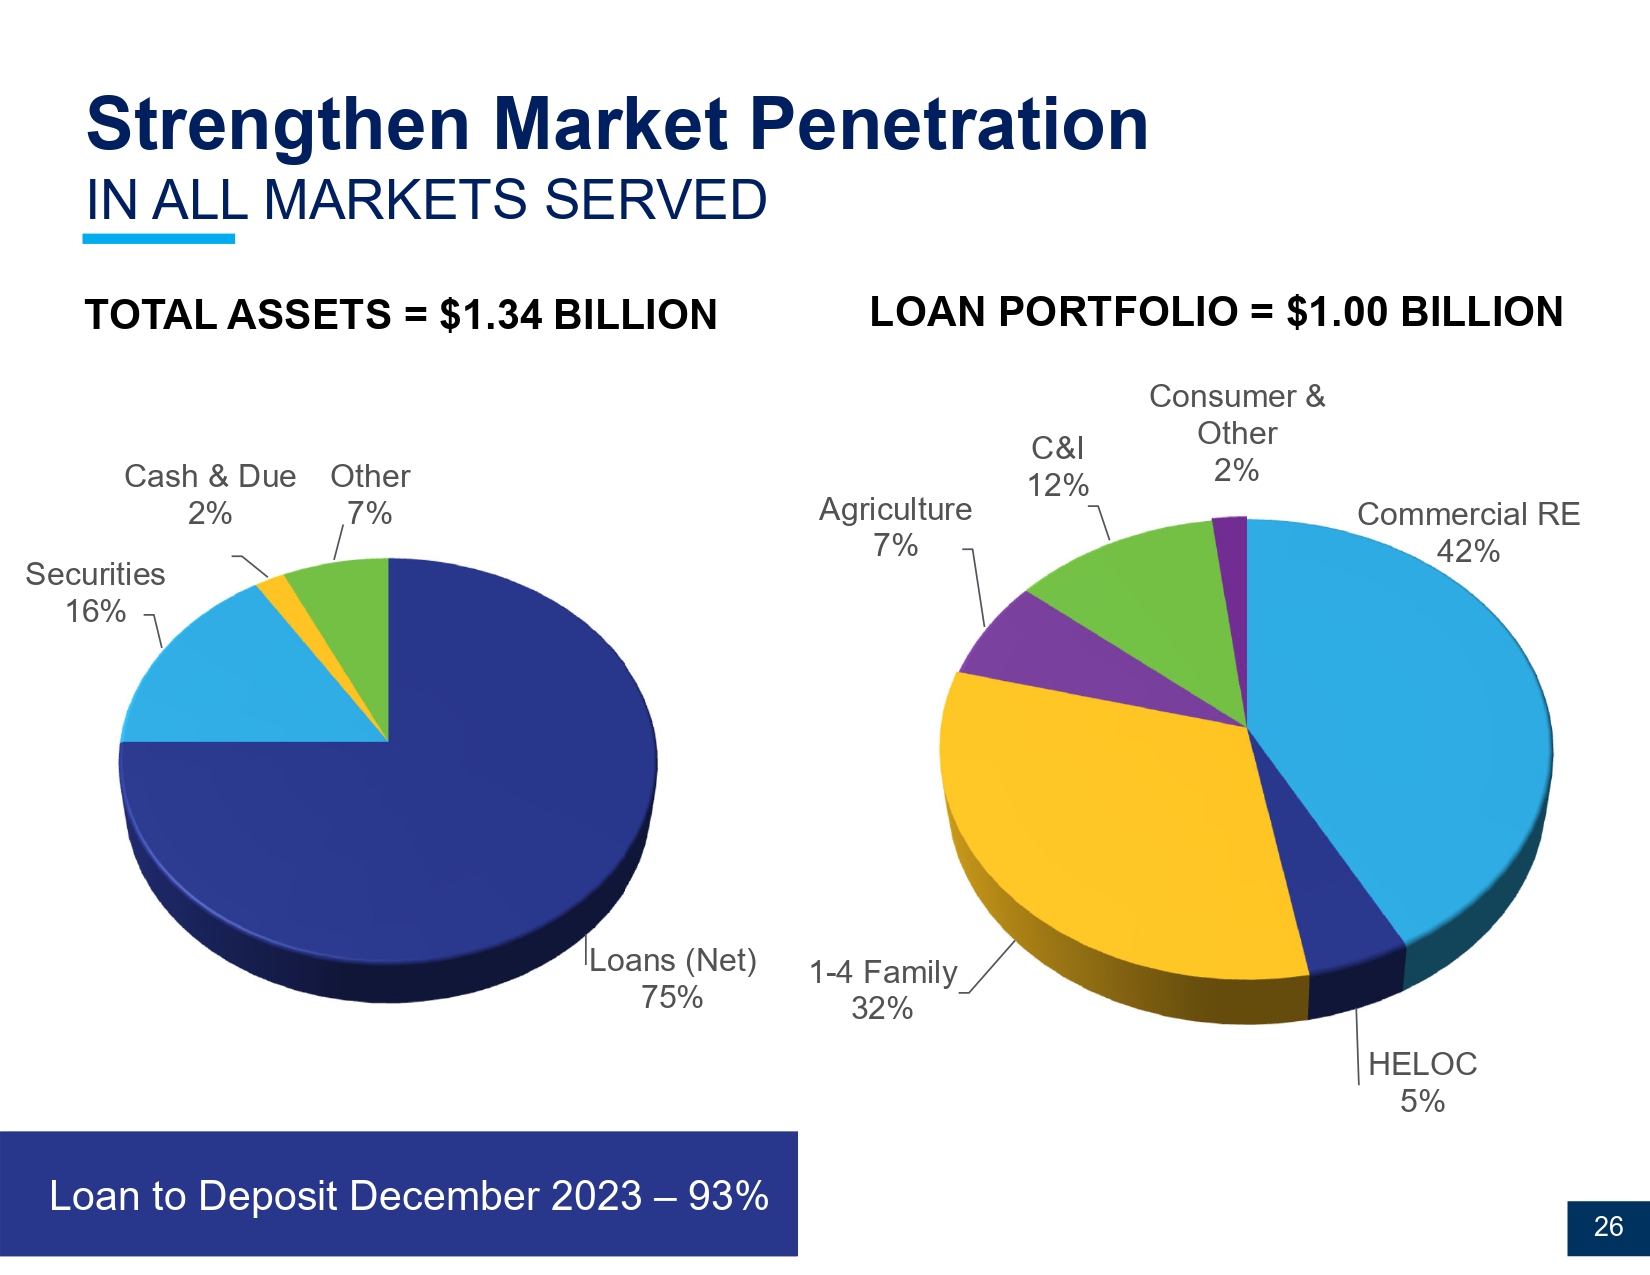
Key Initiatives Become a Russell 2000, High - Performing Financial Services Conglomerate Increase profitability through ongoing diversification of revenue streams Strengthen penetration in all markets served Expand product service utilization by new and existing customers Deliver gains in operational excellence Sustain asset quality 24 TOTAL ASSETS ($M) $11.6 $12.0 $14.9 $18.3 $12.5 $12.1 $0 $12 $24 2018Y 2019Y 2020Y 2021Y 2022Y 2023Y $803 $840 $1,049 $1,113 $1,087 $1,070 $0 $750 $1,500 2018Y 2019Y 2020Y 2021Y 2022Y 2023Y $987 $1,039 $1,258 $1,331 $1,336 $1,342 $0 $550 $1,100 $1,650 2018Y 2019Y 2020Y 2021Y 2022Y 2023Y Strengthen Market Penetration IN ALL MARKETS SERVED $772 $826 $873 $830 $962 $1,000 $0 $600 $1,200 2018Y 2019Y 2020Y 2021Y 2022Y 2023Y TOTAL LOANS ($M) TOTAL DEPOSITS ($M) NET INCOME ($M) 6.3% Asset Growth CAGR 12/31/2018 – 12/31/2023 5.3% Loan Growth CAGR 12/31/2018 – 12/31/2023 5.9% Deposit Growth CAGR 12/31/2018 – 12/31/2023 0.8% Earnings Growth CAGR 12/31/2018 – 12/31/2023 25 HISTORICAL GROWTH Loans (Net) 75% Securities 16% Cash & Due 2% Other 7% Commercial RE 42% HELOC 5% 1 - 4 Family 32% Agriculture 7% C&I 12% Consumer & Other 2% LOAN PORTFOLIO = $ 1.00 BILLION Strengthen Market Penetration IN ALL MARKETS SERVED Loan to Deposit December 2023 – 93% TOTAL ASSETS = $1.34 BILLION 26
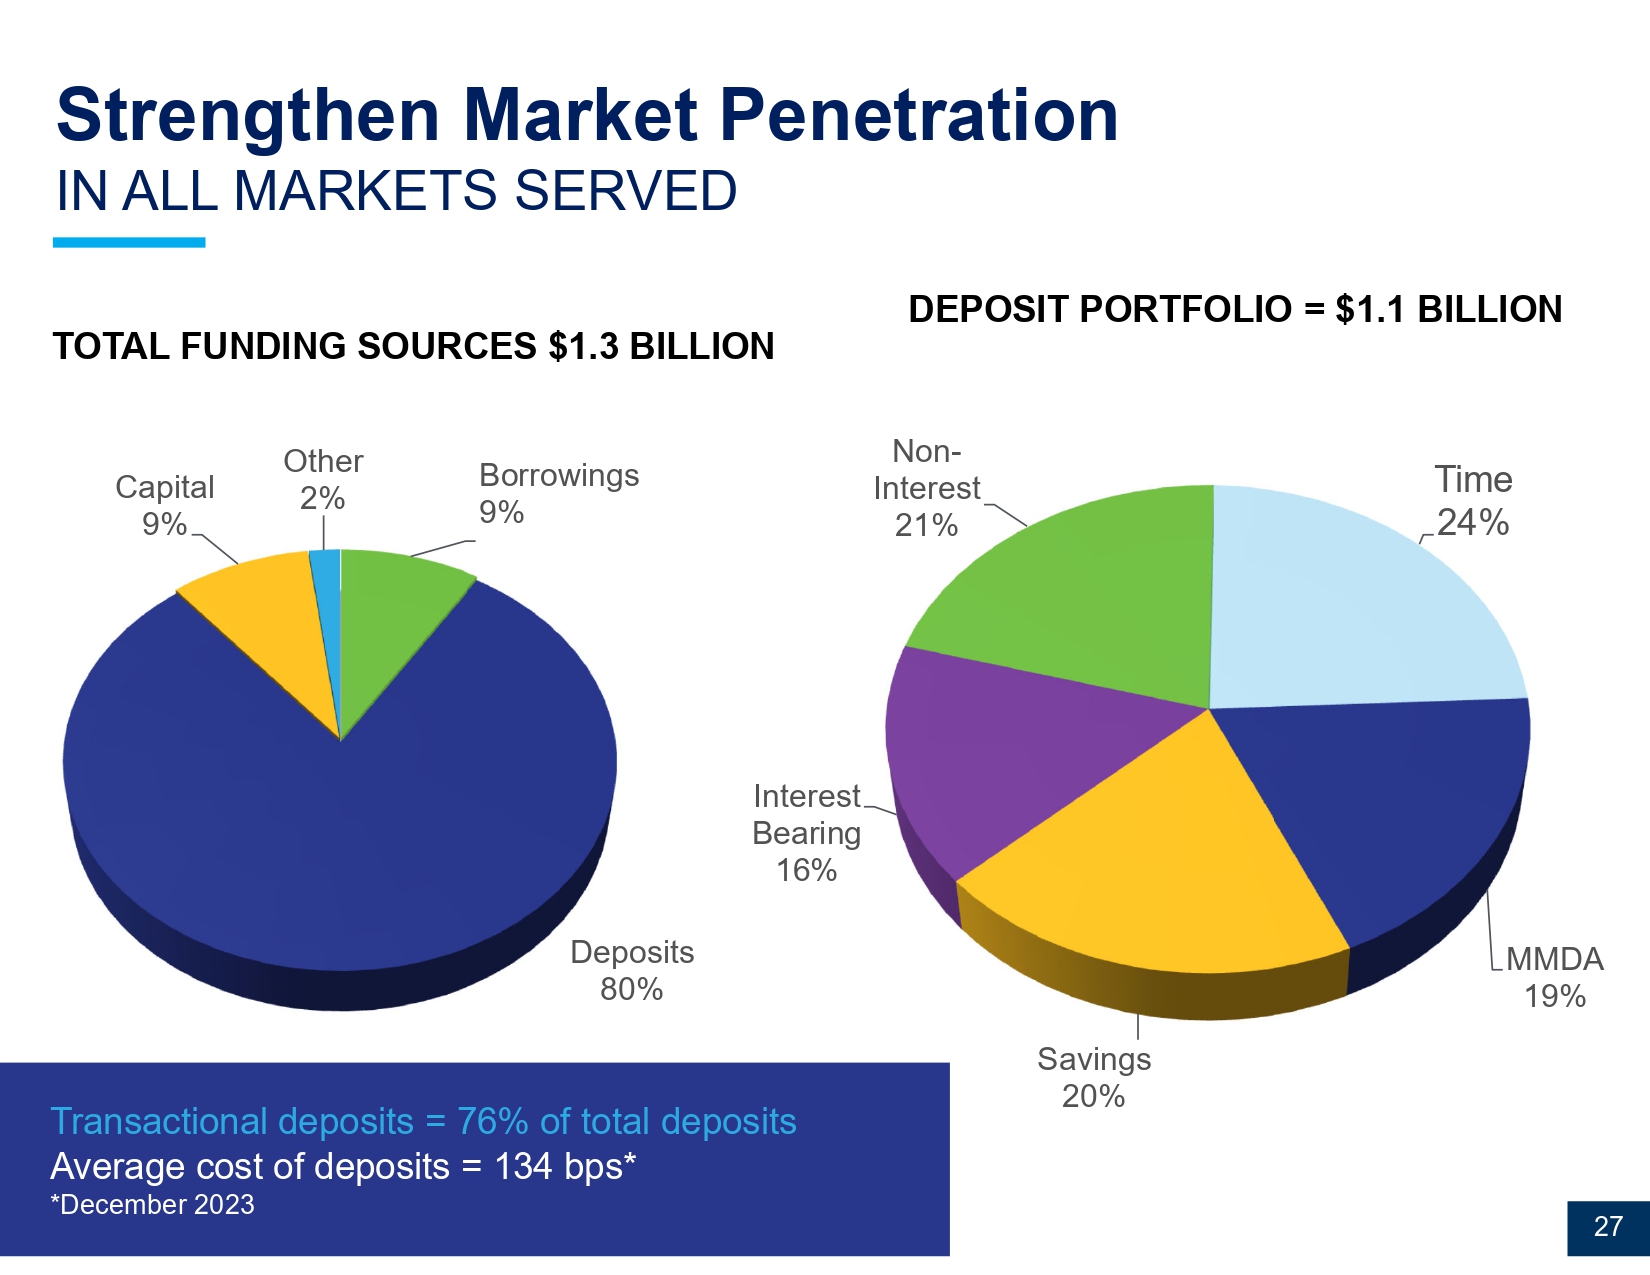
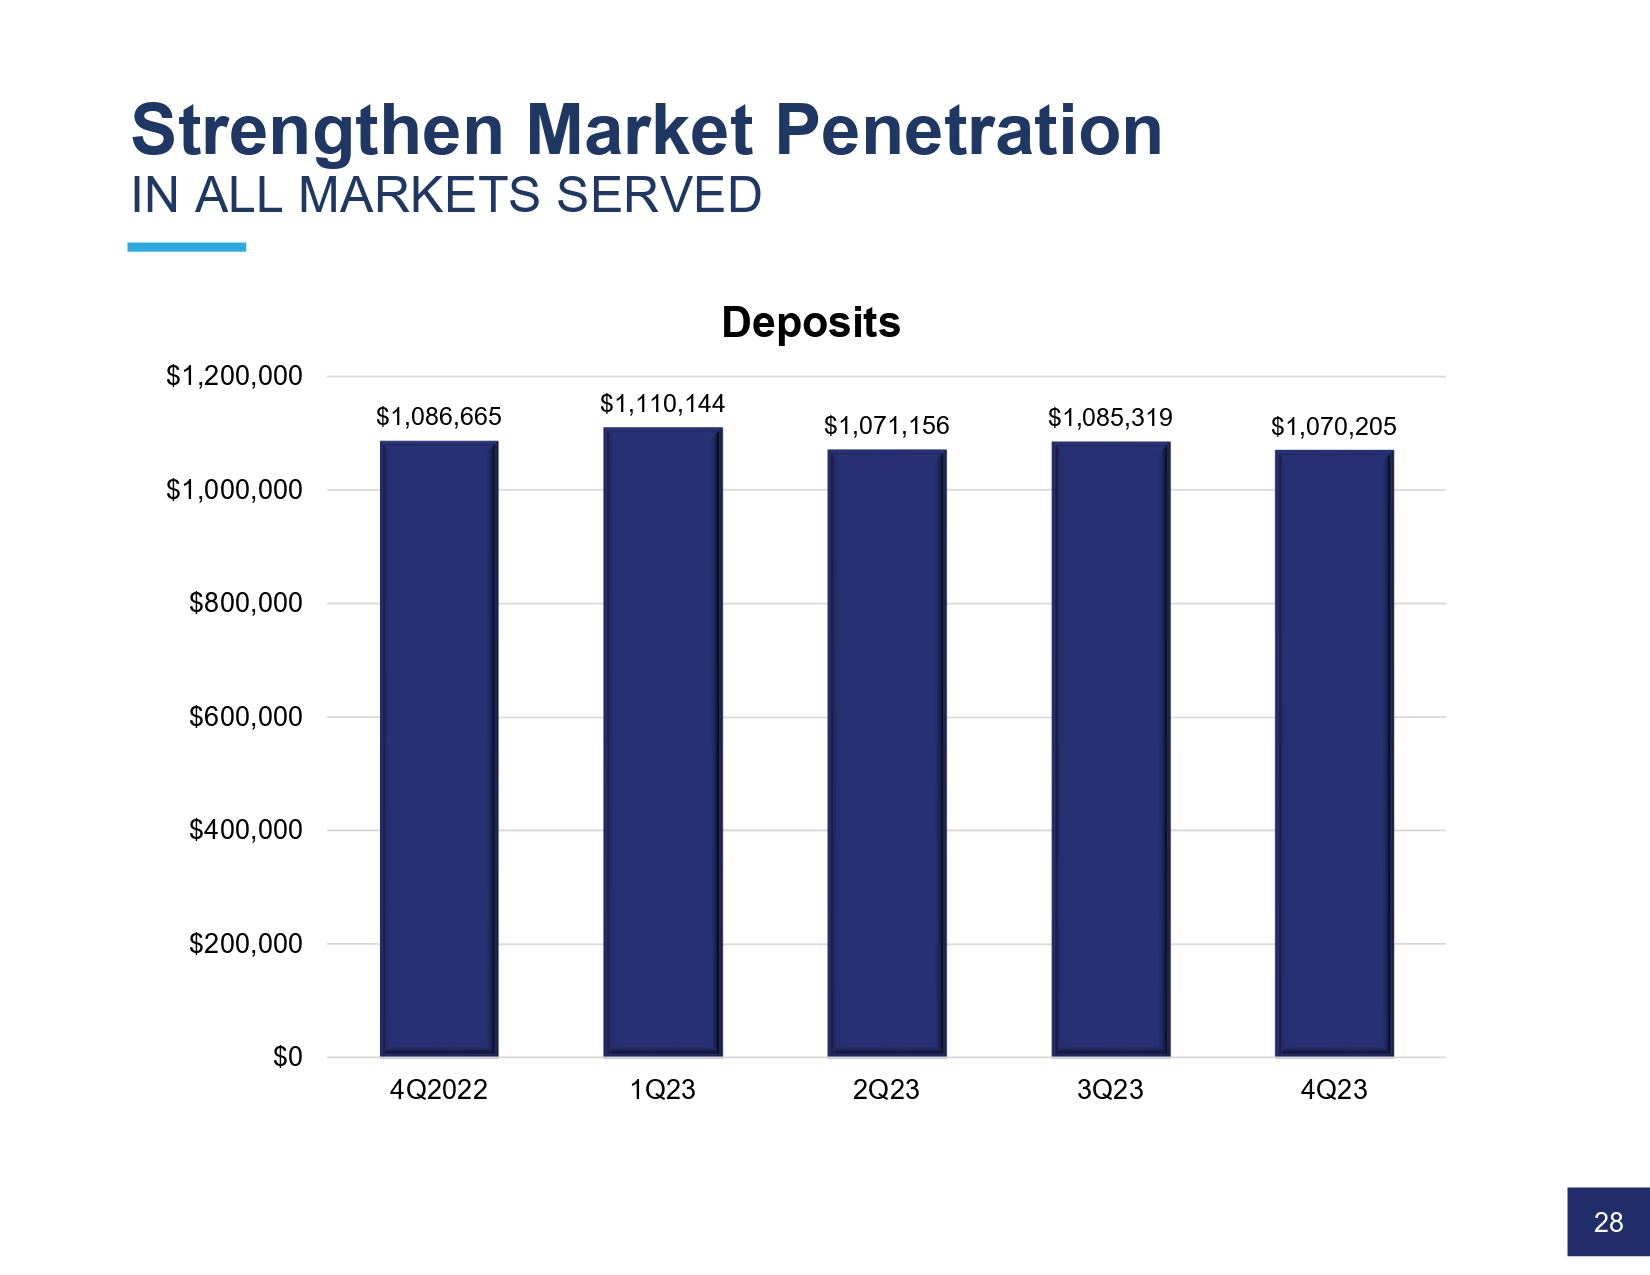
Borrowings 9% Deposits 80% Capital 9% Other 2% Time 24% MMDA 19% Savings 20% Interest Bearing 16% Non - Interest 21% D EPOSIT PORTFOLIO = $1.1 BILLION Strengthen Market Penetration IN ALL MARKETS SERVED Transactional deposits = 76% of total deposits Average cost of deposits = 134 bps* *December 2023 TOTAL FUNDING SOURCES $1.3 BILLION 27 Strengthen Market Penetration IN ALL MARKETS SERVED $1,086,665 $1,110,144 $1,071,156 $1,085,319 $1,070,205 $0 $200,000 $400,000 $600,000 $800,000 $1,000,000 $1,200,000 4Q2022 1Q23 2Q23 3Q23 4Q23 Deposits 28
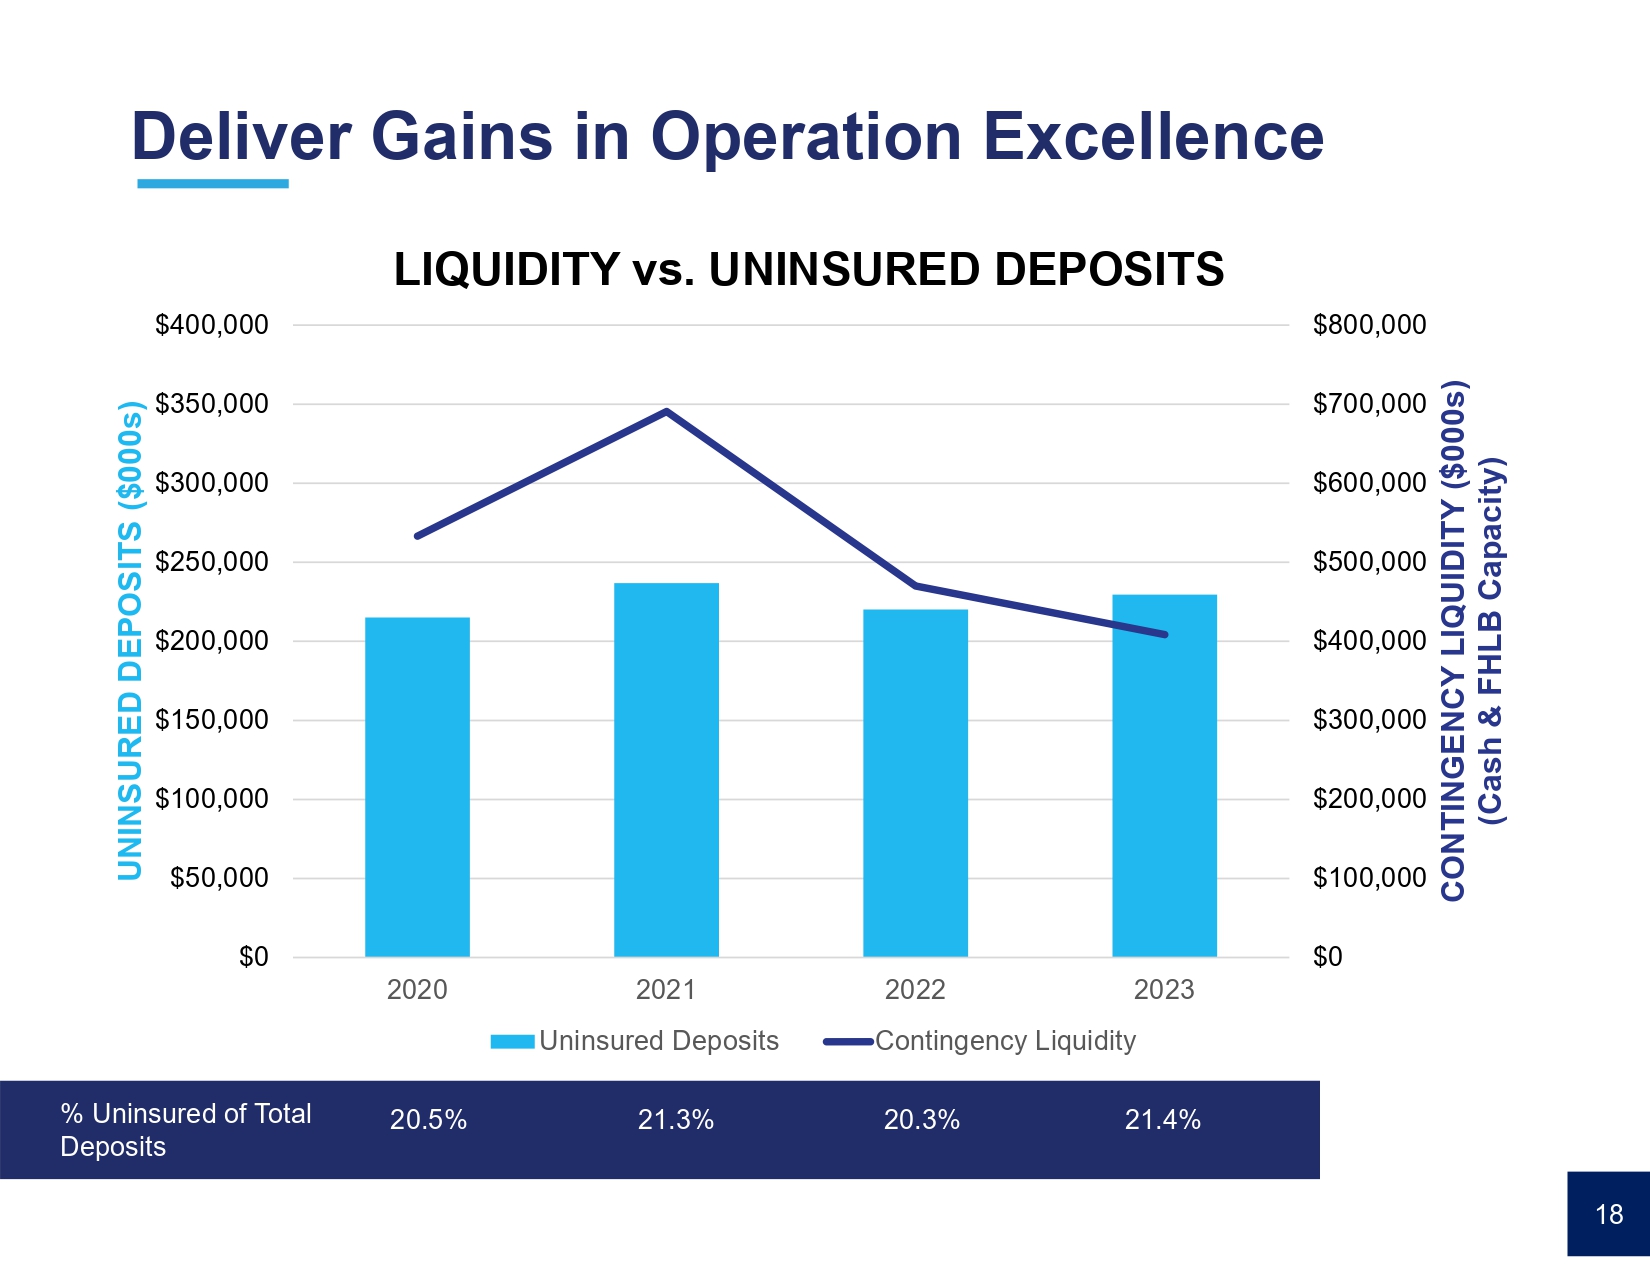
$0 $100,000 $200,000 $300,000 $400,000 $500,000 $600,000 $700,000 $800,000 $0 $50,000 $100,000 $150,000 $200,000 $250,000 $300,000 $350,000 $400,000 2020 2021 2022 2023 CONTINGENCY LIQUIDITY ($000s) (Cash & FHLB Capacity) UNINSURED DEPOSITS ($000s) LIQUIDITY vs. UNINSURED DEPOSITS Uninsured Deposits Contingency Liquidity Deliver Gains in Operation Excellence % Uninsured of Total Deposits 20.5% 21.3% 20.3% 18 21.4% Key Initiatives Become a Russell 2000, High - Performing Financial Services Conglomerate Increase profitability through ongoing diversification of revenue streams Strengthen penetration in all markets served Expand product service utilization by new and existing customers Deliver gains in operational excellence Sustain asset quality 30

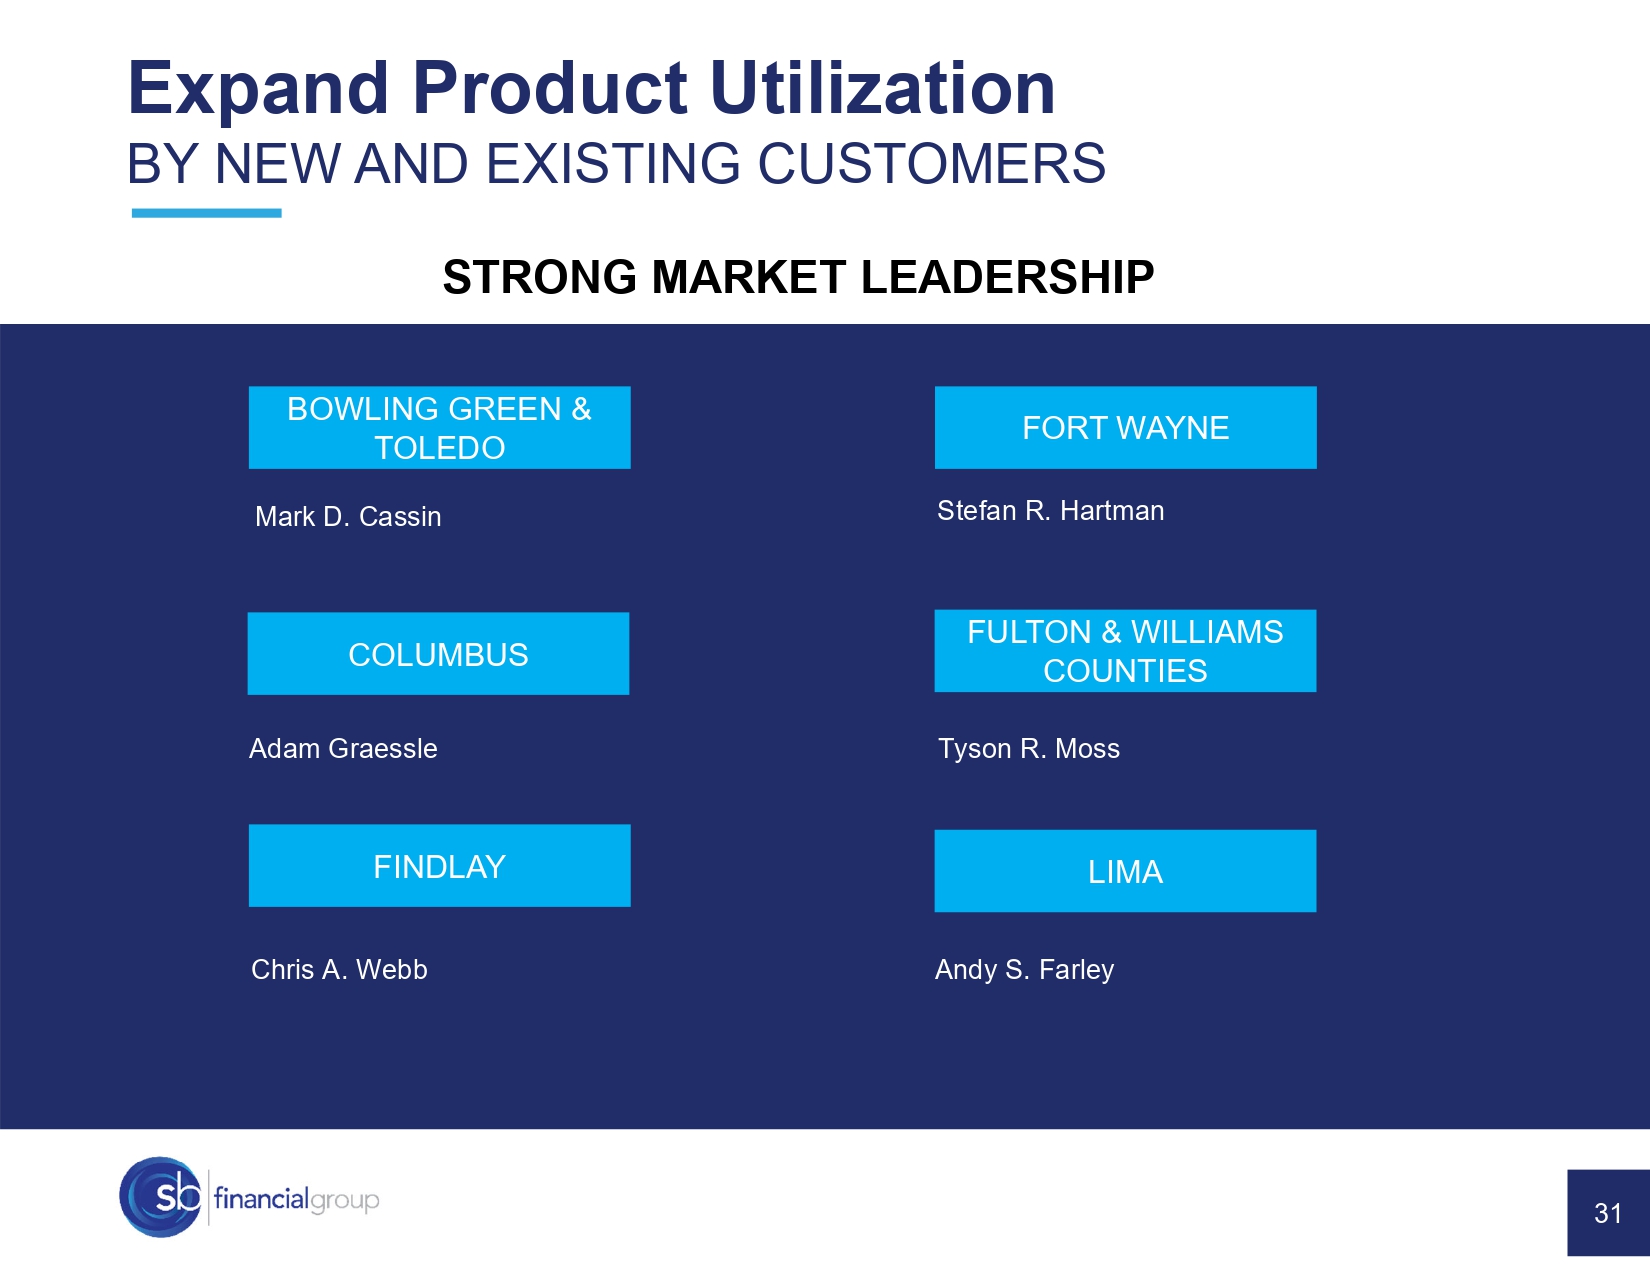
STRONG MARKET LEADERSHIP BOWLING GREEN & TOLEDO FULTON & WILLIAMS COUNTIES Mark D. Cassin Tyson R. Moss Chris A. Webb LIMA FINDLAY Andy S. Farley Stefan R. Hartman FORT WAYNE COLUMBUS Adam Graessle 31 Expand Product Utilization BY NEW AND EXISTING CUSTOMERS 0 5,000 10,000 15,000 20,000 25,000 30,000 35,000 40,000 0 10,000 20,000 30,000 40,000 50,000 60,000 70,000 80,000 90,000 100,000 110,000 2015 2017 2019 2021 2023 Products & Services/Household Products/Services Households Expand Product Utilization BY NEW AND EXISTING CUSTOMERS 32

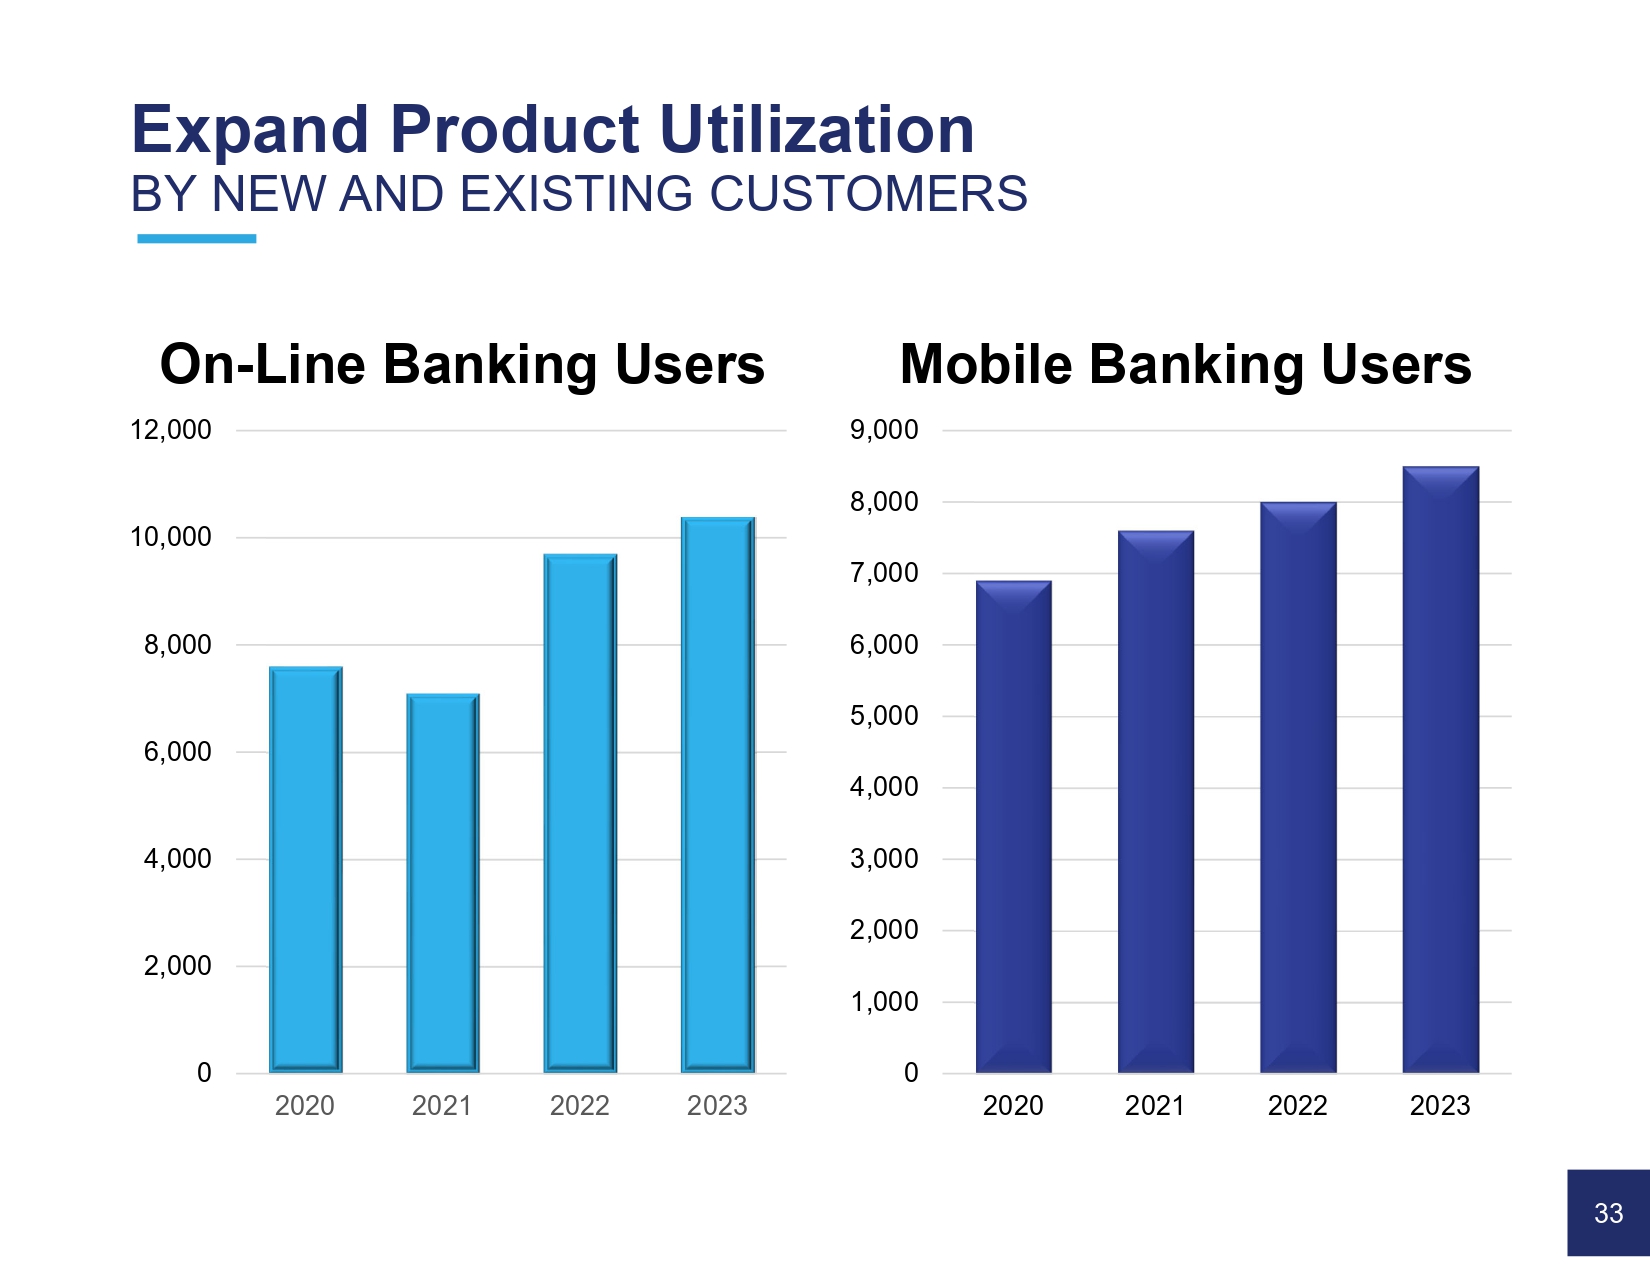
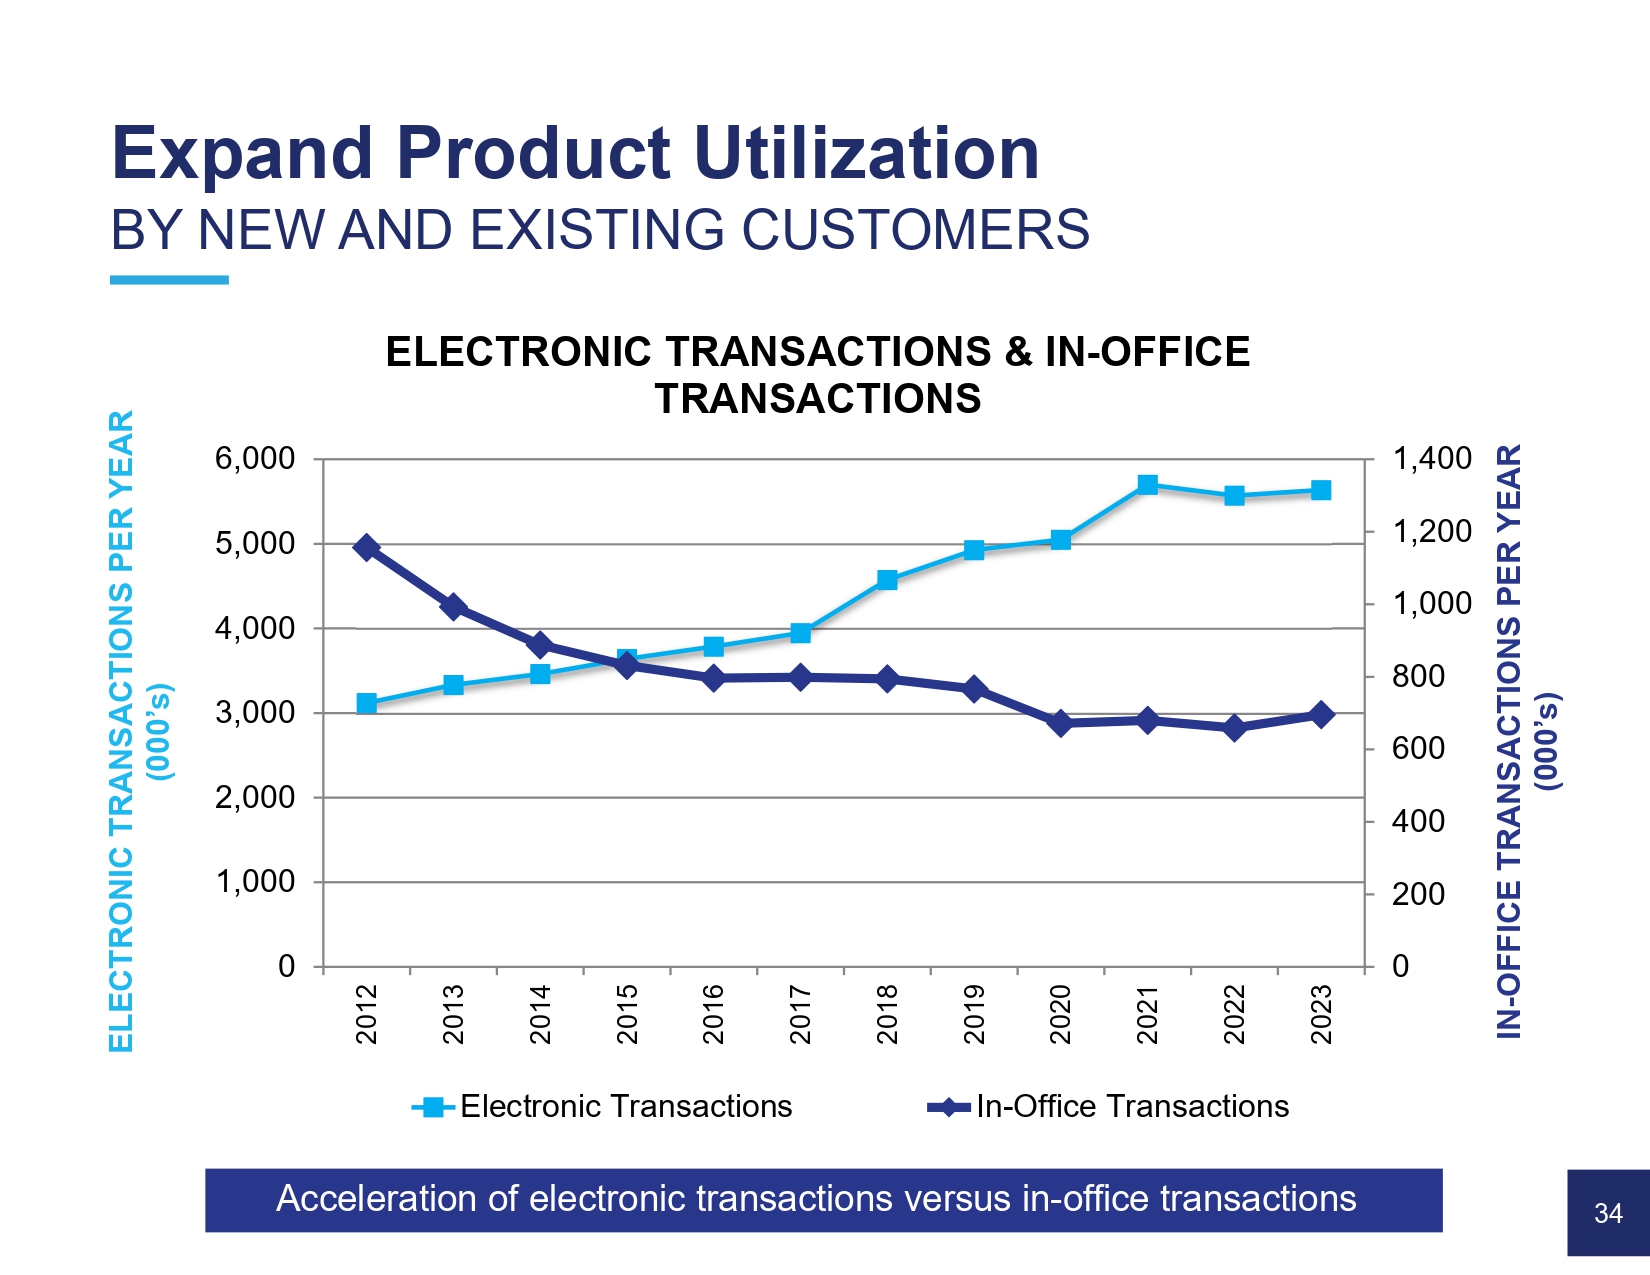
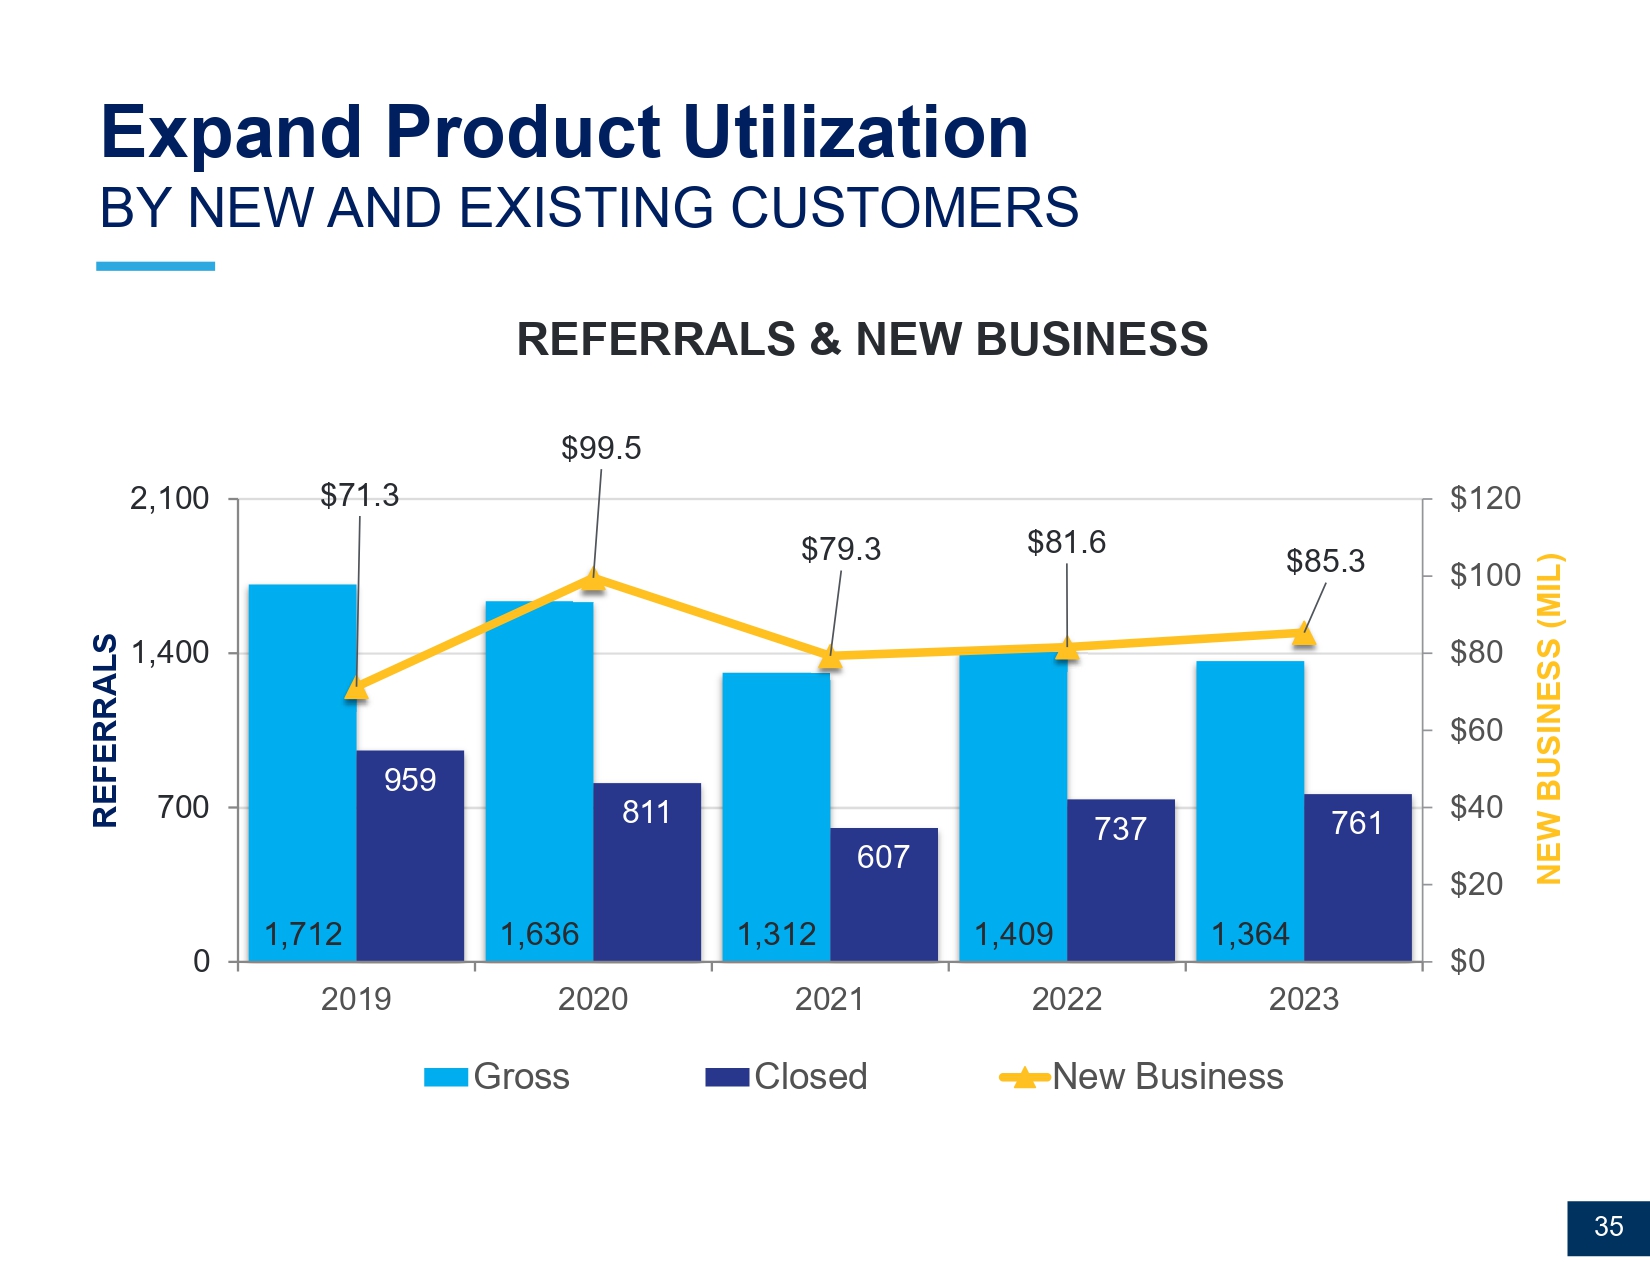
On - Line Banking Users 0 2,000 4,000 6,000 8,000 10,000 12,000 2020 2021 2022 2023 Mobile Banking Users 0 1,000 2,000 3,000 4,000 5,000 6,000 7,000 8,000 9,000 2020 2021 2022 2023 Expand Product Utilization BY NEW AND EXISTING CUSTOMERS 33 0 200 400 600 800 1,000 1,200 1,400 0 1,000 2,000 3,000 4,000 5,000 6,000 2012 2013 2014 2015 2016 2017 2018 2019 2020 2021 2022 2023 IN - OFFICE TRANSACTIONS PER YEAR (000’s) ELECTRONIC TRANSACTIONS PER YEAR (000’s) ELECTRONIC TRANSACTIONS & IN - OFFICE TRANSACTIONS Electronic Transactions In-Office Transactions Acceleration of electronic transactions versus in - office transactions Expand Product Utilization BY NEW AND EXISTING CUSTOMERS 34 1,712 1,636 1,312 1,409 1,364 959 811 607 737 761 $71.3 $99.5 $79.3 $81.6 $85.3 $0 $20 $40 $60 $80 $100 $120 0 700 1,400 2,100 2019 2020 2021 2022 2023 NEW BUSINESS (MIL) REFERRALS REFERRALS & NEW BUSINESS Gross Closed New Business Expand Product Utilization BY NEW AND EXISTING CUSTOMERS 35

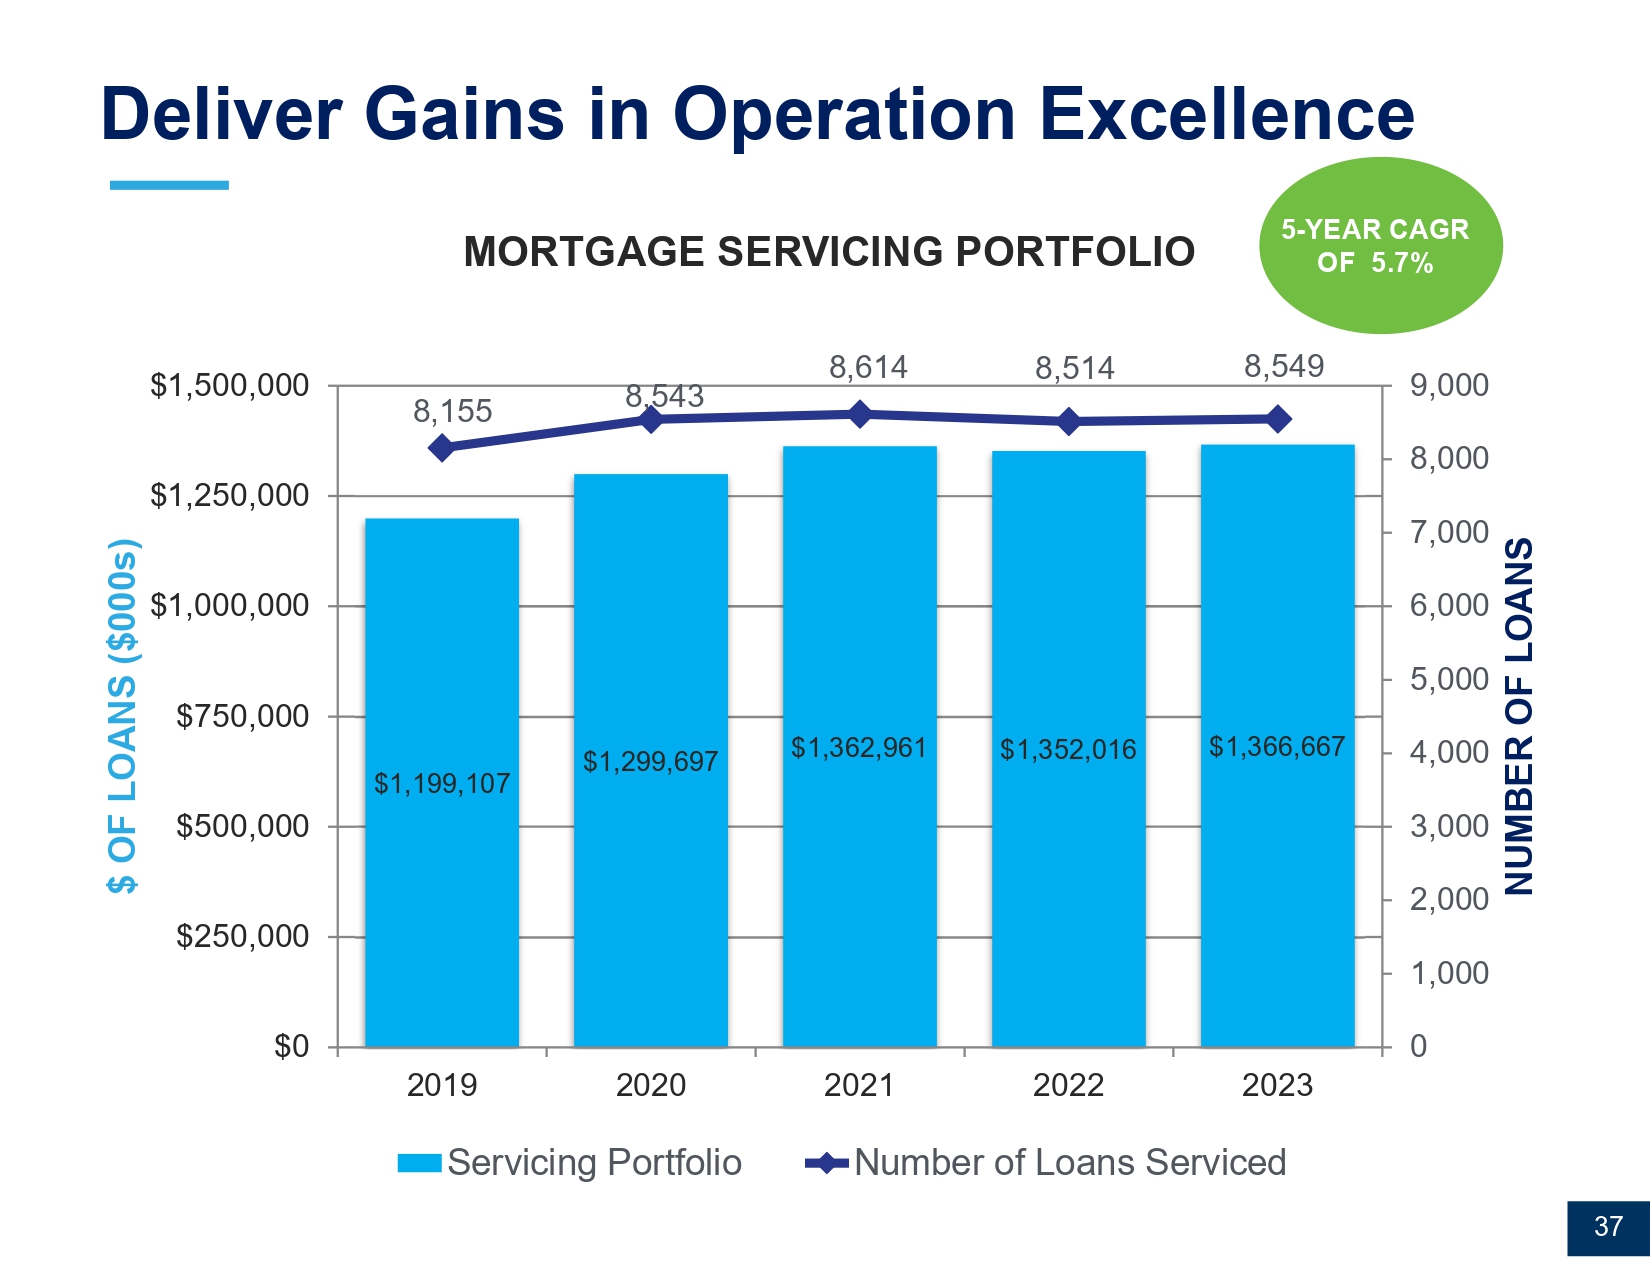
Key Initiatives Become a Russell 2000, High - Performing Financial Services Conglomerate Increase profitability through ongoing diversification of revenue streams Strengthen penetration in all markets served Expand product service utilization by new and existing customers Deliver gains in operational excellence Sustain asset quality 36 Deliver Gains in Operation Excellence $1,199,107 $1,299,697 $1,362,961 $1,352,016 $1,366,667 8,155 8,543 8,614 8,514 8,549 0 1,000 2,000 3,000 4,000 5,000 6,000 7,000 8,000 9,000 $0 $250,000 $500,000 $750,000 $1,000,000 $1,250,000 $1,500,000 2019 2020 2021 2022 2023 NUMBER OF LOANS $ OF LOANS ($000s) Servicing Portfolio Number of Loans Serviced 5 - YEAR CAGR OF 5 .7 % 37 MORTGAGE SERVICING PORTFOLIO


Deliver Gains in Operation Excellence 13.4 14.2 15.2 14.7 14.7 0.0 3.0 6.0 9.0 12.0 15.0 18.0 2019 2020 2021 2022 2023 RATIO (%) TOTAL RISK BASED CAPITAL Total Risk Based Capital Well Capitalized 38 $7.98 $9.24 $10.39 $11.59 $13.27 $15.39 $15.23 $16.30 $17.60 $17.95 $19.42 $1.07 $1.06 $1.19 $1.38 $1.74 $1.51 $1.51 $1.96 $2.56 $1.77 $1.75 $0.00 $0.50 $1.00 $1.50 $2.00 $2.50 $3.00 $0.00 $2.00 $4.00 $6.00 $8.00 $10.00 $12.00 $14.00 $16.00 $18.00 $20.00 2013 2014 2015 2016 2017 2018 2019 2020 2021 2022 2023 Earnings Per Share Tangible Book Value TBV* EPS Deliver Gains in Operation Excellence Tax Change 3 39 *Adjusted for AOCI (2023/2024) TBV AND EPS PERFORMANCE Deliver Gains in Operation Excellence Dividend Payout Ratio 23.84 20.41 17.19 27.12 29.71 0.00 5.00 10.00 15.00 20.00 25.00 30.00 35.00 2019 2020 2021 2022 2023 Percent Payout Ratio Average Annual Dividend 0.00 0.10 0.20 0.30 0.40 0.50 0.60 Dollars 40 10 YEAR CAGR OF 16.4%

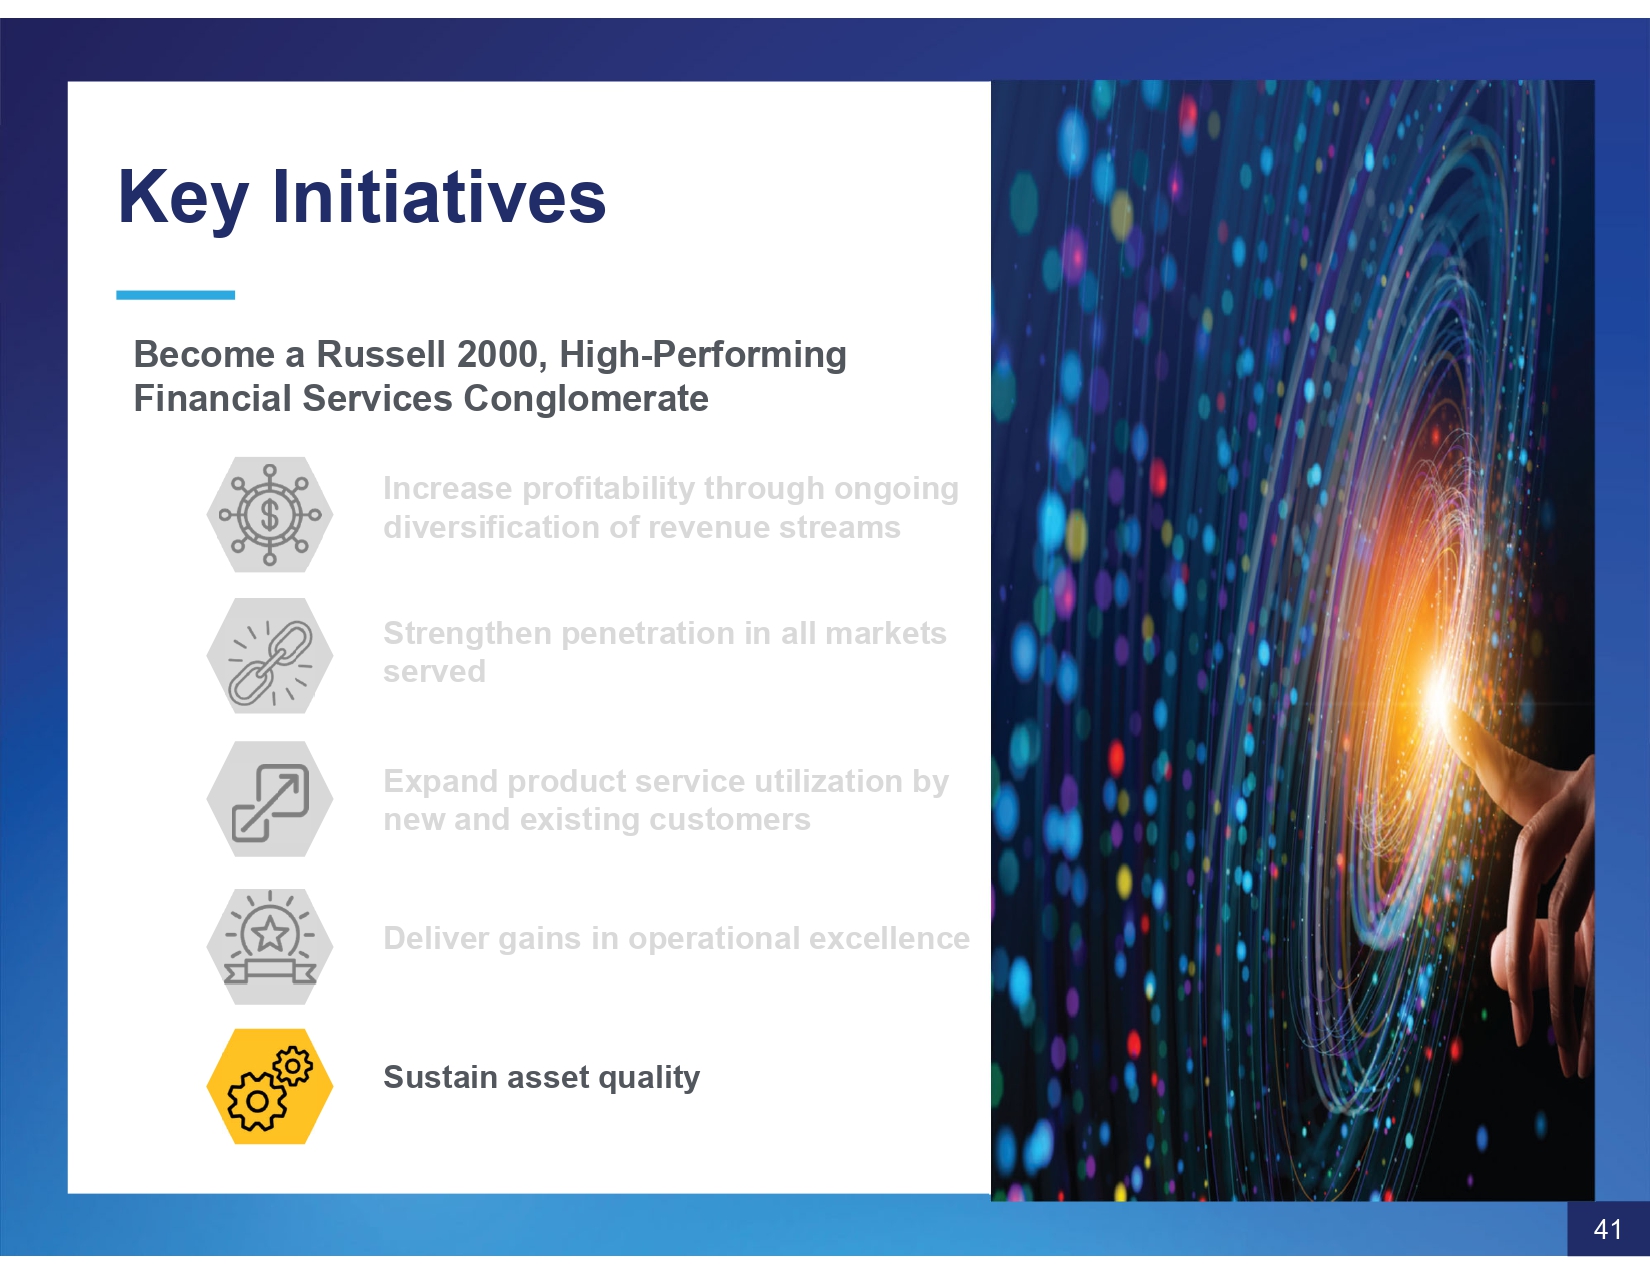
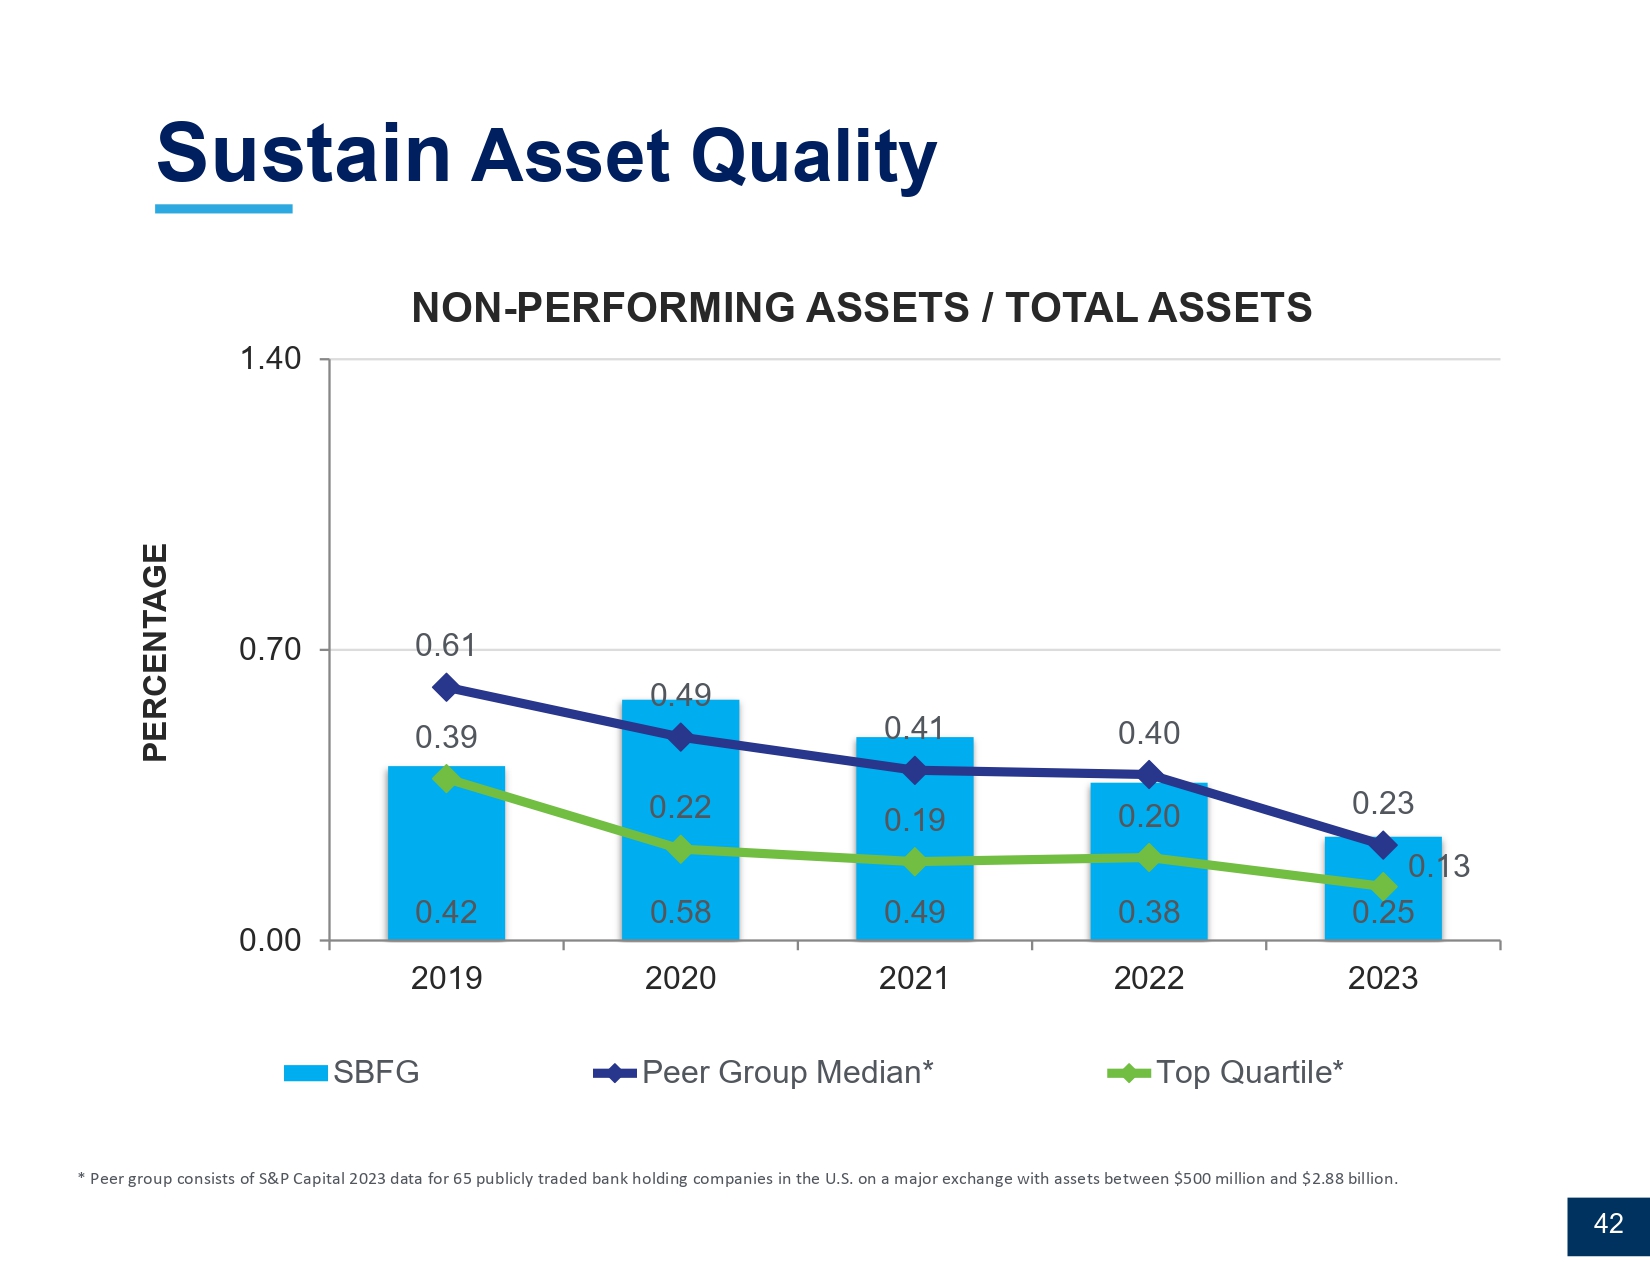
Key Initiatives Become a Russell 2000, High - Performing Financial Services Conglomerate Increase profitability through ongoing diversification of revenue streams Strengthen penetration in all markets served Expand product service utilization by new and existing customers Deliver gains in operational excellence Sustain asset quality 41 Sustain Asset Quality * Peer group consists of S&P Capital 20 23 data for 65 publicly traded bank holding companies in the U.S. on a major exchange with assets between $500 million and $ 2.88 billion. 0.42 0.58 0.49 0.38 0.25 0.61 0.49 0.41 0.40 0.23 0.39 0.22 0.19 0.20 0.13 0.00 0.70 1.40 2019 2020 2021 2022 2023 PERCENTAGE NON - PERFORMING ASSETS / TOTAL ASSETS SBFG Peer Group Median* Top Quartile* 42

Sustain Asset Quality * Peer group consists of S&P Capital 20 23 data for 65 publicly traded bank holding companies in the U.S. on a major exchange with assets between $500 million and $ 2.88 billion.
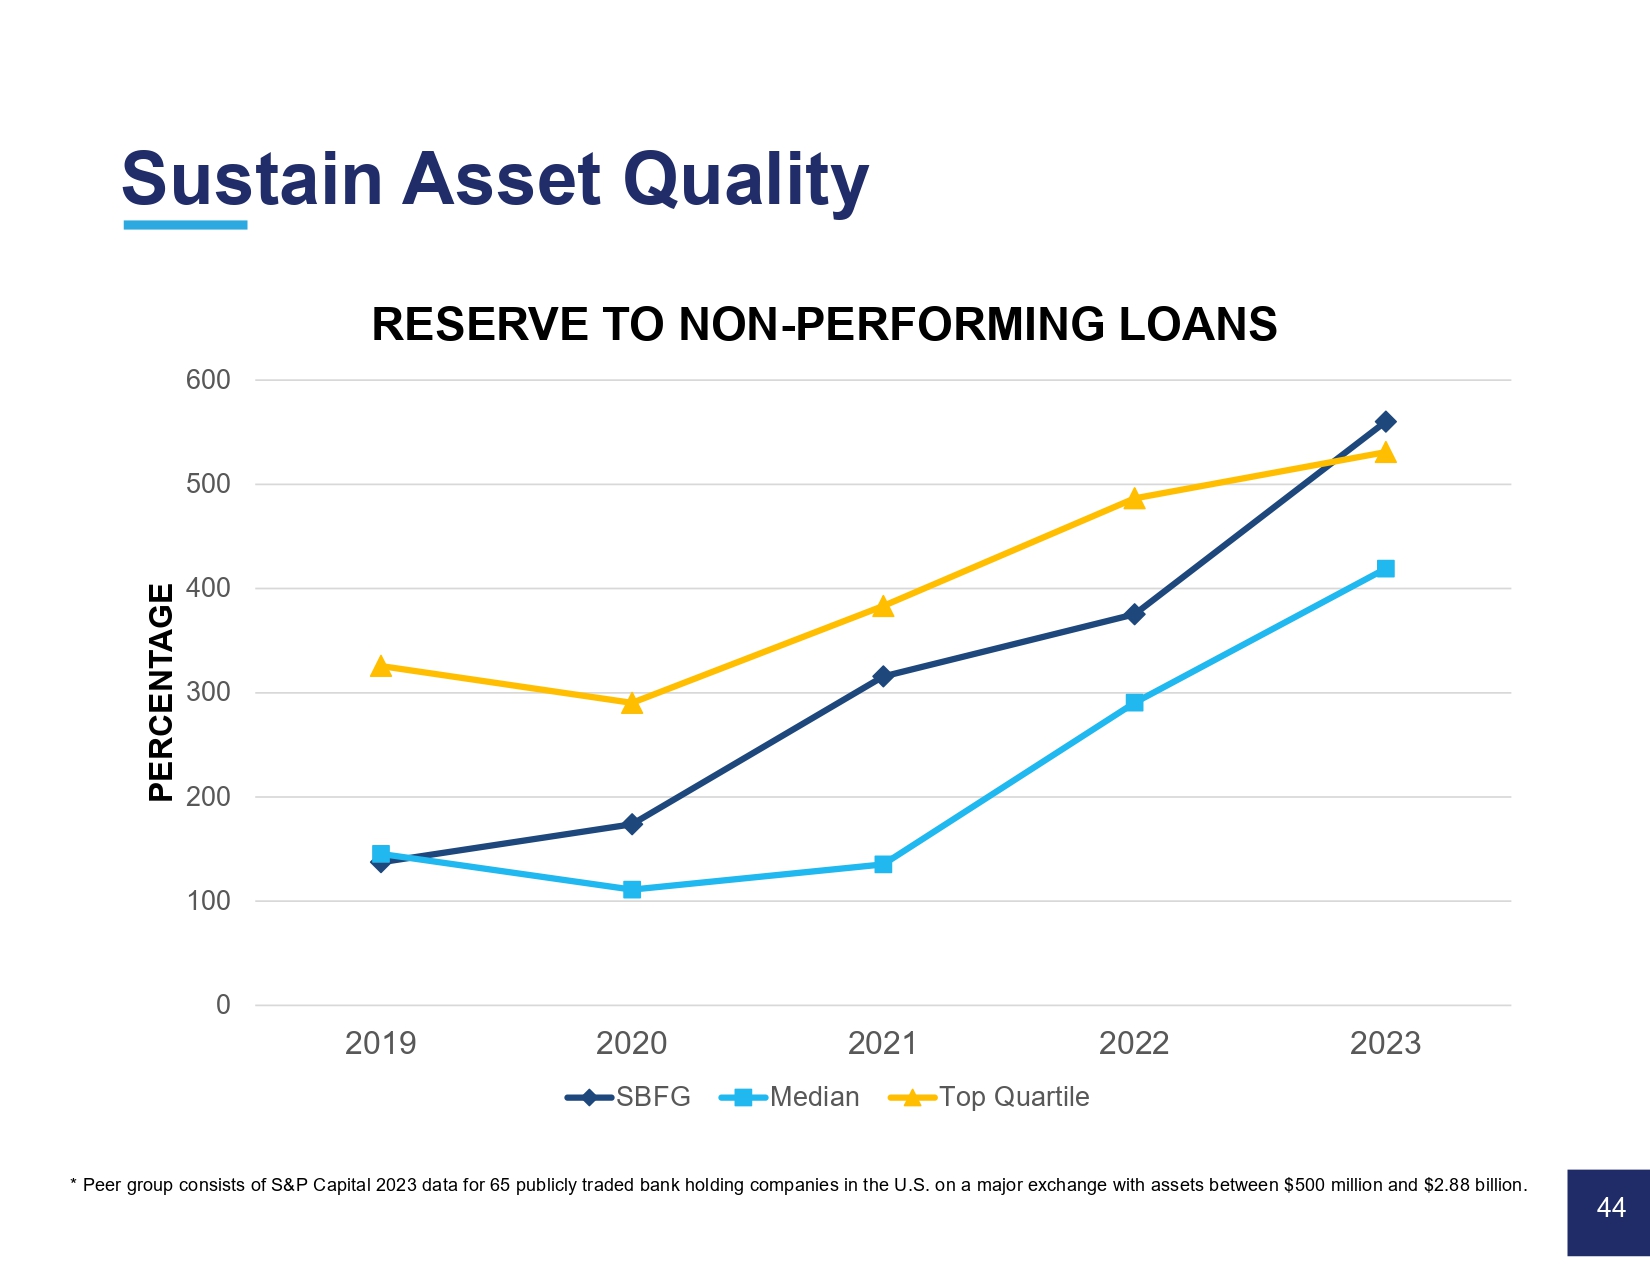
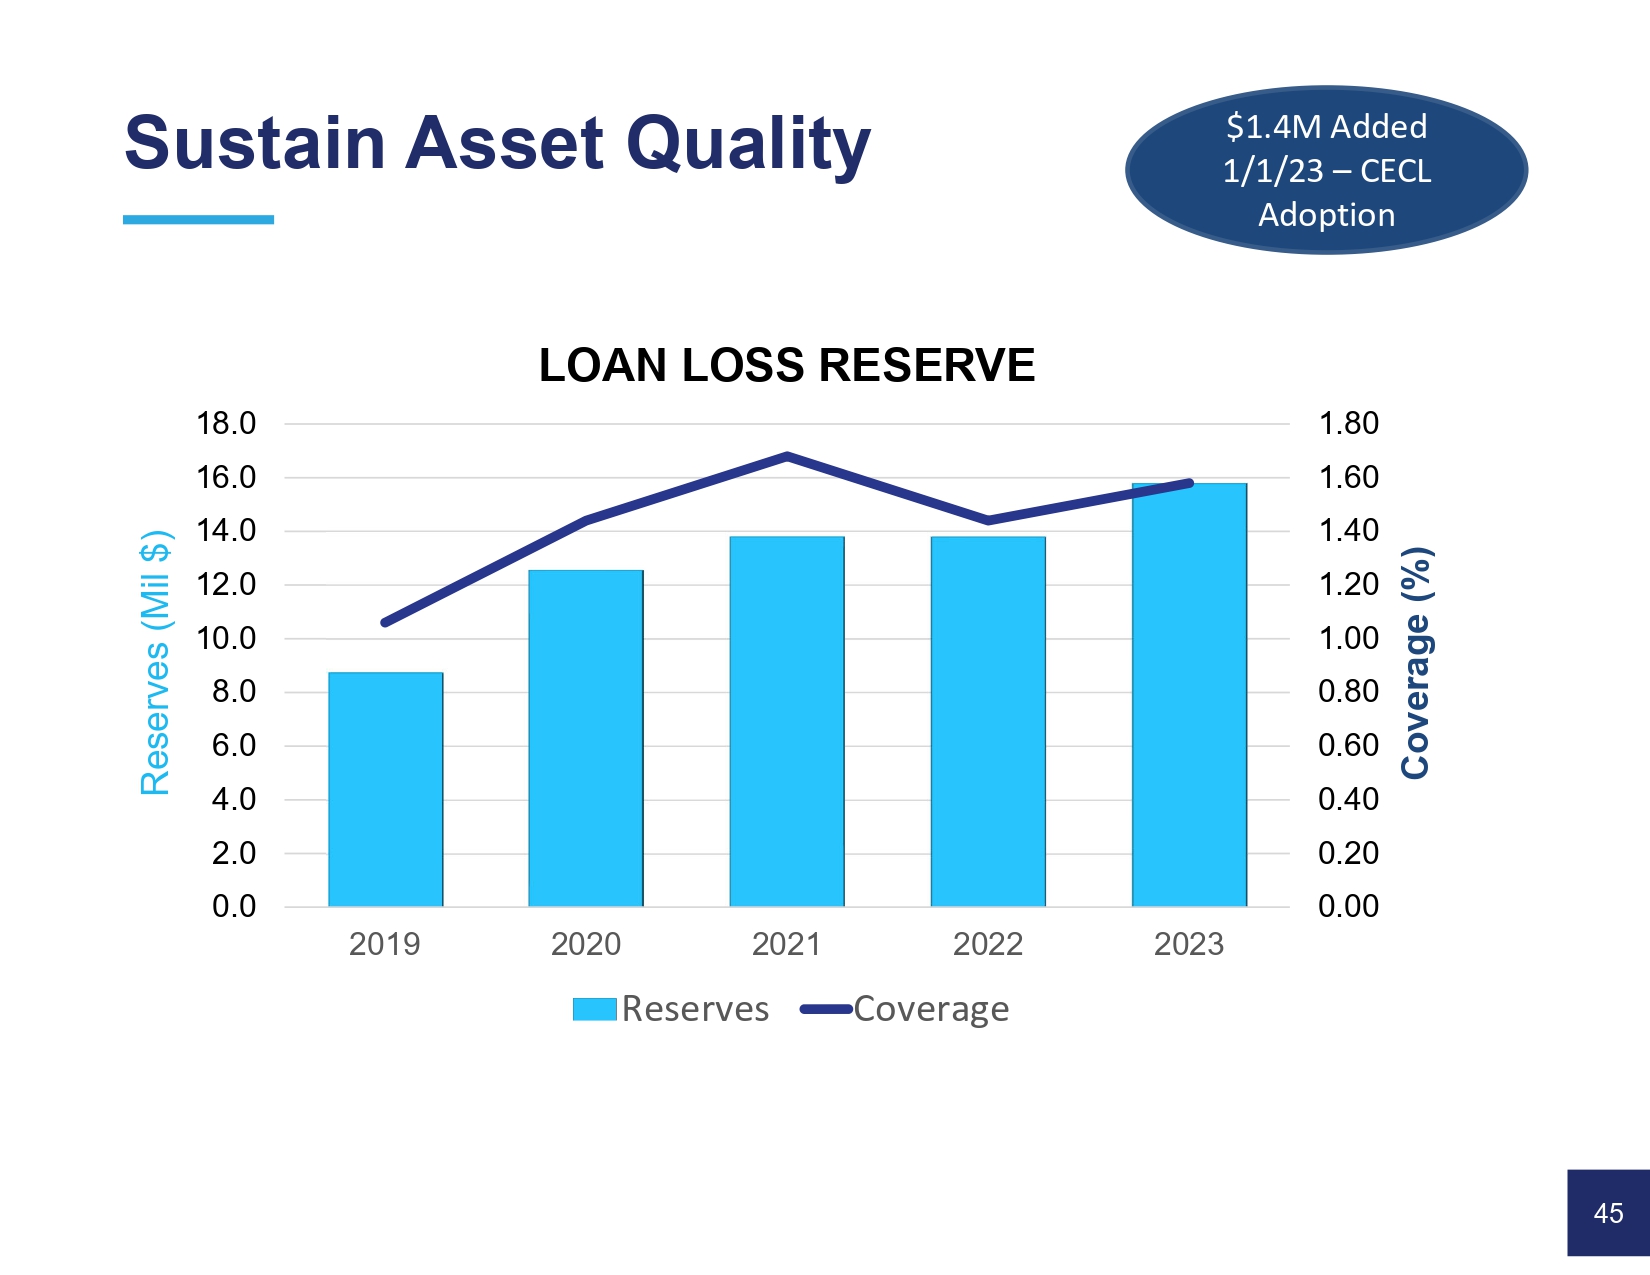
-0.05% 0.00% 0.05% 0.10% 2019 2020 2021 2022 2023 NCO’s/ AVERAGE LOANS SBFG Peer Median* Top Quartile* PERCENTAGE 43 0 100 200 300 400 500 600 2019 2020 2021 2022 2023 PERCENTAGE RESERVE TO NON - PERFORMING LOANS SBFG Median Top Quartile Sustain Asset Quality * Peer group consists of S &P Capital 20 23 data for 65 publicly traded bank holding companies in the U.S. on a major exchange with assets between $500 million and $ 2.88 billion. 44 Sustain Asset Quality 45 0.00 0.20 0.40 0.60 0.80 1.00 1.20 1.40 1.60 1.80 0.0 2.0 4.0 6.0 8.0 10.0 12.0 14.0 16.0 18.0 2019 2020 2021 2022 2023 Coverage (%) Reserves (Mil $) LOAN LOSS RESERVE Reserves Coverage $1.4M Added 1/1/23 – CECL Adoption
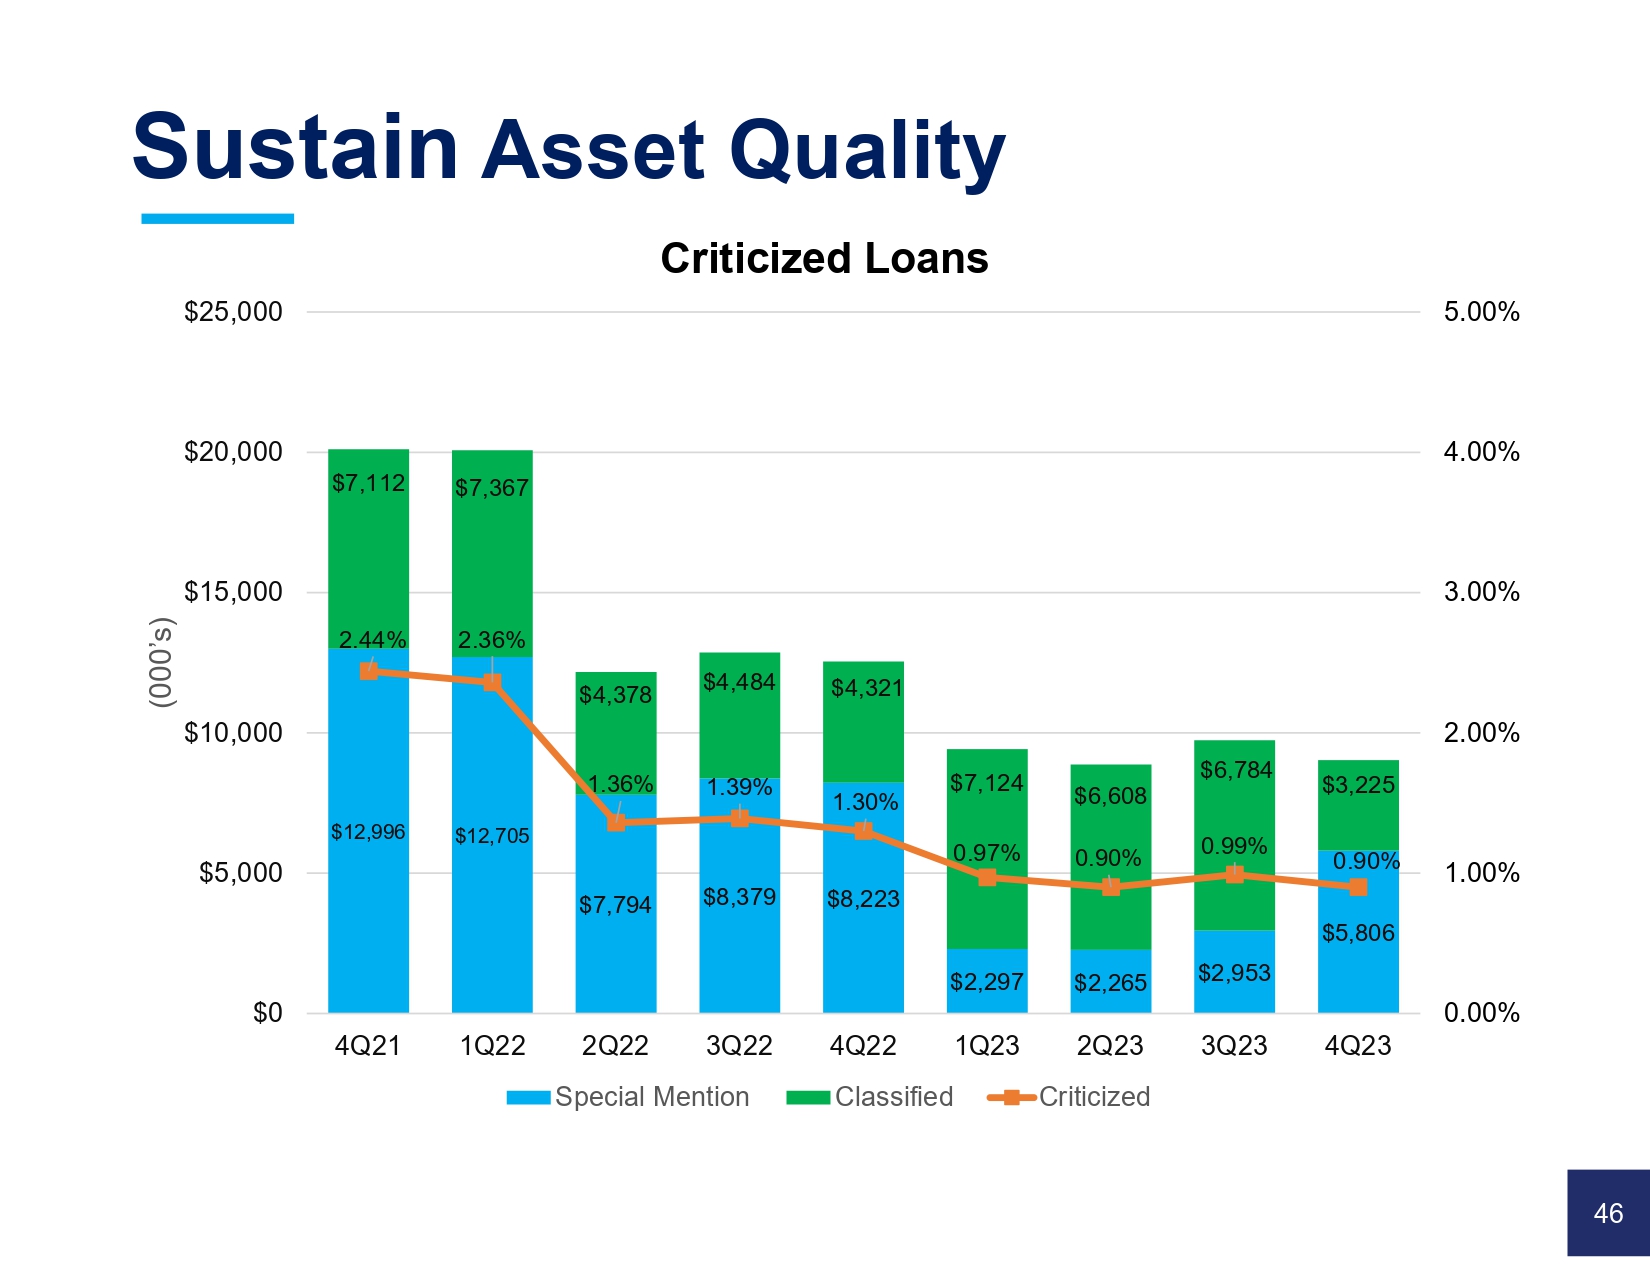
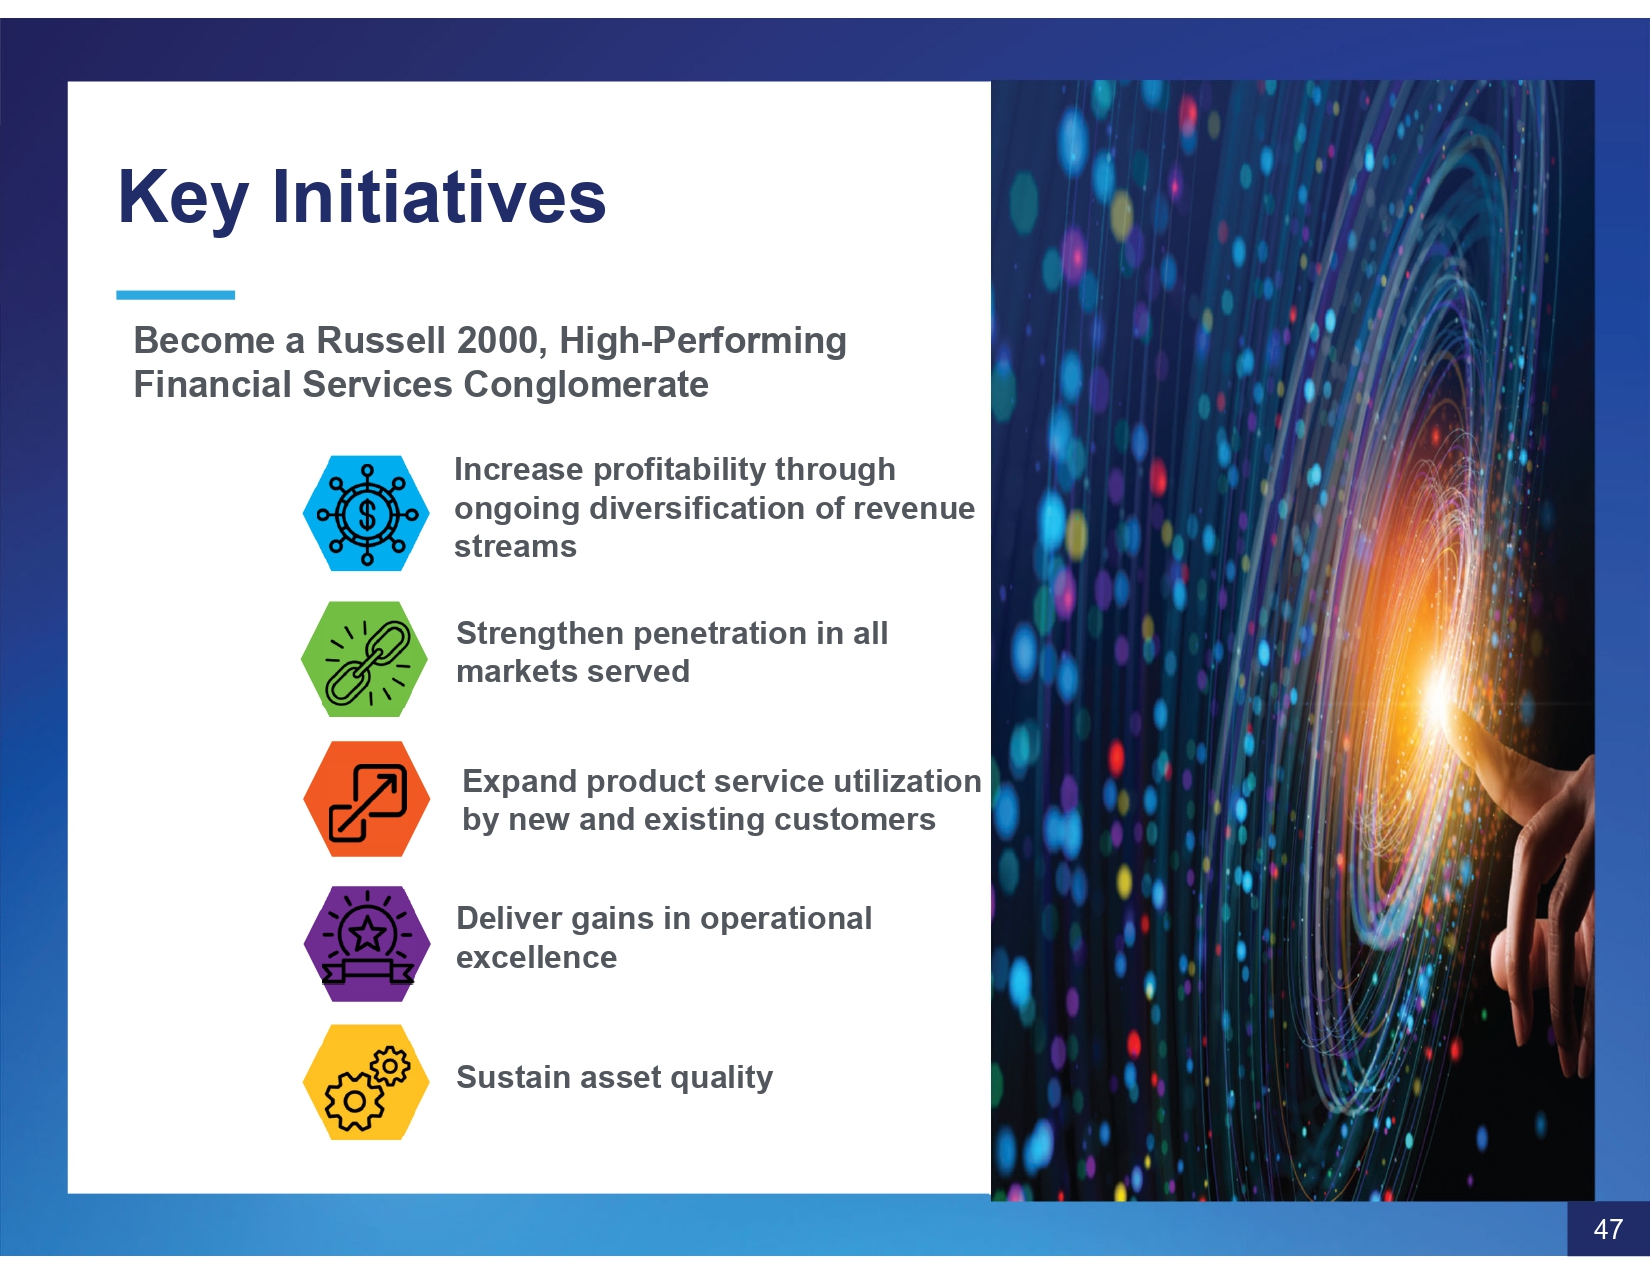
Sustain Asset Quality $12,996 $12,705 $7,794 $8,379 $8,223 $2,297 $2,265 $2,953 $5,806 $7,112 $7,367 $4,378 $4,484 $4,321 $7,124 $6,608 $6,784 $3,225 2.44% 2.36% 1.36% 1.39% 1.30% 0.97% 0.90% 0.99% 0.90% 0.00% 1.00% 2.00% 3.00% 4.00% 5.00% $0 $5,000 $10,000 $15,000 $20,000 $25,000 4Q21 1Q22 2Q22 3Q22 4Q22 1Q23 2Q23 3Q23 4Q23 (000’s) Criticized Loans Special Mention Classified Criticized 46 Key Initiatives Become a Russell 2000, High - Performing Financial Services Conglomerate Increase profitability through ongoing diversification of revenue streams Strengthen penetration in all markets served Expand product service utilization by new and existing customers Deliver gains in operational excellence Sustain asset quality 47

49 Thank you for joining us today! Board and Management