UNITED STATES
SECURITIES AND EXCHANGE COMMISSION
Washington, D.C. 20549
Form 6-K
Report of Foreign Private Issuer
Pursuant to Rule 13a-16 or 15d-16
under the Securities Exchange Act of 1934
For the month of: March 2024
Commission file number: 001-38610
ALARUM TECHNOLOGIES LTD.
(Translation of registrant’s name into English)
30 Haarba’a Street Tel-Aviv (P.O. Box 174)
Tel-Aviv, 6473926 Israel
(Address of principal executive offices)
Indicate by check mark whether the registrant files or will file annual reports under cover of Form 20-F or Form 40-F.
Form 20-F ☒ Form 40-F ☐
CONTENTS
Attached hereto as Exhibit 99.1 and incorporated by reference herein is Alarum Technologies Ltd.’s (the “Registrant”) press release issued on March 14, 2024, titled “Alarum Announces Record of $1.7 Million Net Profit and $2.2 Million Adjusted EBITDA in the Fourth Quarter of 2023”, announcing the Registrant’s financial results for the fourth quarter and year ended December 31, 2023. Also attached hereto as Exhibit 99.2 and incorporated by reference herein is a corporate presentation of the Registrant (the “Corporate Presentation”). The Corporate Presentation is also available on the Registrant’s website, here: www.alarum.io.
The first paragraph, the six bullet points under the section titled “Key highlights for the three months and year ended December 31, 2023”, the five bullet points under the section titled “Recent Business Developments”, the sections titled “Financial Results from Continuing Operations for the Three Months Ended December 31, 2023”, “Financial Results from continuing operations for the year Ended December 31, 2023”, “Balance Sheet Highlights”, “Use of Non-IFRS Financial Results”, “Forward-Looking Statements” and the IFRS financial statements in the press release attached as Exhibit 99.1 incorporated by reference into the registration statements on Form S-8 (File Nos. 333-233510, 333-239249, 333-250138, 333-258744, 333-267586 and 333-274585) and Form F-3 (File Nos. 333-233724, 333-235368, 333-236030, 333-233976, 333-237629, 333-253983, 333-267580 and 333-274604) of the Registrant, filed with the Securities and Exchange Commission, to be a part thereof from the date on which this report is submitted, to the extent not superseded by documents or reports subsequently filed or furnished.
SIGNATURES
Pursuant to the requirements of the Securities Exchange Act of 1934, the registrant has duly caused this report to be signed on its behalf by the undersigned, thereunto duly authorized.
| Alarum Technologies Ltd. (Registrant) |
||
| Date: March 14, 2024 | By | /s/ Hagit Gal |
| Name: | Hagit Gal | |
| Title: | Corporate Legal Counsel | |
2
Exhibit 99.1

Alarum Announces Record of $1.7 Million Net Profit and $2.2 Million Adjusted EBITDA in the Fourth Quarter of 2023
Revenue Continues to Set Records; $7.1 million in the fourth quarter and over $26.5 million for full year 2023
NetNut’s revenues surged 150% both for the fourth quarter of 2023 and the entire year compared to the equivalent periods in 2022 – the annual revenue amounted to more than $21 million
TEL AVIV, Israel, March 14, 2024 – Alarum Technologies Ltd. (Nasdaq, TASE: ALAR) (“Alarum” or the “Company”), a global provider of internet access and data collection solutions, today announced record financial results for the three months and full year periods, ended December 31, 2023.
Key highlights for the three months and year ended December 31, 2023:
| ● | Net Retention Rates (NRR)1- Starting from 2024, the Company plans to update on a quarterly basis its customer retention (NRR). NetNut Ltd.’s (“NetNut”) NRRs were 153% as of December 31, 2023, and 144% as of September 30, 2023. NRR greater than 100% indicates that the company experiences revenue growth from its existing customer base in the specific period even after accounting for lost revenue due to customers’ churn. Conversely, an NRR lower than 100% suggests that the company loses revenue from existing customers in the specific period due to churn which is higher than revenue gain through up-sells or cross-sells. |
| ● | IFRS net profit from continuing operations reached $1.7 million in the fourth quarter of 2023, compared to an IFRS net loss from continuing operations of $3.0 million in the fourth quarter of 2022. |
| ● | Adjusted EBITDA for the fourth quarter of 2023 continued to grow, reaching $2.2 million, compared to Adjusted EBITDA loss of $2.0 million in the fourth quarter of 2022. |
| ● | Revenues from continuing operations for the three months ended December 31, 2023, reached a record high of $7.1 million, an increase of approximately 39% compared to the three months ended December 31, 2022. |
| ● | Revenues from continuing operations for the full year of 2023 totaled $26.5 million, an increase of approximately 43% compared to $18.6 million in 2022. |
| ● | NetNut’s 2023 full year revenue amounted to $21.3 million, reflecting growth of over 150% year-over-year, compared to $8.5 million in revenues for 2022. |
“I am proud to share the most successful quarter in the Company’s history, as revenue, net profit and Adjusted EBITDA, all meaningfully exceeded results from the previous quarter. We delivered efficient operational execution following our decision, in the second quarter of 2023, to scale down other activities and focus on NetNut’s operations,” said Shachar Daniel, Alarum’s Chief Executive Officer.
| 1 | NRR represent the average growth rates for preceding four quarters compared to the equivalent period a year earlier, of current customers only, without the revenues generated from new customers, but including up-sales and cross-sales on one hand and churn on the other hand. |
Recent Business Developments:
| ● | In October 2023, NetNut launched its first data collection product – the SERP Scraper API, which won its first customers. |
| ● | In late January 2024, NetNut introduced its new and innovative Website Unblocker, the second product of the data collection product line. |
| ● | In February 2024, NetNut announced the launch of its revolutionary AI data collector product line. |
| ● | During the fourth quarter of 2023 and recent months, NetNut won new customers in the AI-powered sales intelligence market and the Fintech market. |
| ● | NetNut was granted a U.S. patent. |
“We began 2024 on a high note, by setting new monthly revenue records,” Mr. Daniel added. “Looking ahead, our strategy for 2024 involves expanding our cutting-edge product line, with a special emphasis on our advanced AI data collector series. The AI and data collection sectors complement each other significantly; it is imperative that AI platforms have access to large volumes of data. Furthermore, we aim to grow our presence in the IP proxy network (IPPN) sector by entering new markets, enhancing our network infrastructure, and partnering with more top-tier customers globally.”
Chen Katz, chairman of the board of directors of Alarum, commented, “The ongoing demonstration of financial stability, growth and operating performance supported the record financial results for the quarter and entire year. We successfully crystalized and executed our business strategy, transforming into a high-growth, profitable company, which we believe will create value for our shareholders.”
Financial Results from Continuing Operations for the Three Months Ended December 31, 2023:
| ● | Revenues amounted to $7.1 million (Q4.2022: $5.1 million). The increase is attributed to the organic growth in the enterprise access business revenues, despite a reduction in the consumer access business revenues. |
| ● | Cost of revenues totaled $1.8 million (Q4.2022: $2.3 million). The reduction stems mainly from CyberKick’s traffic acquisition costs stoppage in July 2023 and clearing fees decrease, due to the Company’s updated scale down strategy for its CyberKick operations. The reduction was offset by an increase in enterprise internet access business costs of addresses and networks and servers used for the generation of the additional enterprise access business revenues. |
| ● | Research and development expenses totaled $0.8 million (Q4.2022: $1.0 million). Reduced expenses in the consumer internet access business due to the operations scale down and a decrease in subcontractor costs in the enterprise internet access business were offset by an increase in payroll and related expenses in the enterprise business. |
| ● | Sales and marketing expenses totaled $1.6 million (Q4.2022: $3.5 million). The decrease resulted mainly from the stoppage of media acquisition costs in July 2023 due to CyberKick’s operations scale down strategy. This reduction was slightly offset by higher payroll and related expenses in the enterprise internet access business. |
| ● | General and administrative expenses totaled $1.2 million (Q4.2022: $1.4 million). The decrease is mainly due to lower salary costs as a result of CyberKick’s operations scale down strategy and lower professional fees. |
| ● | Finance expenses reached $0.05 million (Q4.2022: $0.08 million). |
| ● | Tax benefit totaled $0.02 million (Q4.2022: $0.1 million). |
| ● | As a result, IFRS net profit from continuing operations reached $1.7 million, or $0.03 basic profit per ordinary share (Q4.2022: IFRS net loss from continuing operations of $3.0 million, or $0.09 basic loss per ordinary share). |
| ● | Adjusted EBITDA was $2.2 million (Q4.2022: Adjusted EBITDA loss of $2.0 million). |
Financial Results from continuing operations for the year Ended December 31, 2023:
| ● | Total revenues amounted to $26.5 million (2022: $18.6 million). The increase is attributed to the organic growth in the enterprise access business revenues, which was offset by a reduction of revenues in the consumer internet access business. |
| ● | Cost of revenues totaled $7.7 million (2022: $8.4 million). The decrease is mainly a result of the decrease in the traffic acquisition costs stoppage in July 2023 and reduced clearing fees due to CyberKick’s operations scale down strategy in the consumer internet access business. This decrease was offset by an increase in the core enterprise internet access business costs of addresses and networks and servers and intangibles impairment that resulted from the consumer business scale down. |
| ● | Research and development expenses totaled $3.6 million (2022: $3.8 million). The decrease is due to lower subcontractors’ costs and lower salary and share-based compensation related to the consumer internet access business, partially offset mainly by higher payroll and related expenses in the enterprise internet access business. |
| ● | Sales and marketing expenses totaled $10.0 million (2022: $11.8 million). The decrease resulted mainly from lower media costs and payroll and related expenses in the consumer internet access business, partially offset by intangible assets impairment loss related to CyberKick as well as an increase in payroll and related expenses in the enterprise internet access business. |
| ● | General and administrative expenses totaled $4.4 million (2022: $6.7 million). The decrease is largely due to reduced professional fees, particularly legal fees related to resolved patent proceedings in May 2022. |
| ● | Goodwill impairment loss was $6.3 million (2022: $0.6 million). The Company recorded a goodwill impairment loss related to the CyberKick cash-generating-unit of $6.3 million due to the decrease in its forecasted operating results, compared to a goodwill impairment loss during 2022 related to the NetNut Networks cash-generating-unit (NetNut’s subsidiary) of $0.6 million. |
| ● | Financial expenses reached $0.6 million (2022: $0.1 million). The increase is mainly due to an increase in finance expenses resulting from the O.R.B. Spring Ltd. agreement as well as interest expenses related to the short-term bank loans, and the September 2023 private placement. |
| ● | Tax benefit totaled $0.5 million (2022: $0.3 million). The increase is mainly due to the recognition of deferred tax assets in NetNut as well as a reduction in deferred taxes liabilities as a result of the intangible assets impairment related to CyberKick. |
| ● | IFRS net loss from continuing operations totaled $5.6 million, or $0.14 basic loss per ordinary share (2022: IFRS net loss from continuing operations of $12.4 million, or $0.39 basic loss per ordinary share). |
| ● | Adjusted EBITDA was $5.2 million (2022: Adjusted EBITDA loss of $8.5 million). |
The Company defines EBITDA (EBITDA loss) as net profit (loss) from continuing operations before depreciation, amortization and impairment of intangible assets, interest and tax, and defines Adjusted EBITDA (Adjusted EBITDA loss) as EBITDA (EBITDA loss) as further adjusted to remove the impact of (i) impairment of goodwill (if any); and (ii) share-based compensation expense.
The following table presents the reconciled effect of the above on the Company’s Adjusted EBITDA or Adjusted EBITDA loss from continuing operations for the three and full year ended December 31, 2023 and 2022:
| For the year Ended December 31, |
For the Three-Month Period Ended December 31, |
|||||||||||||||
| (millions of U.S. dollars) | 2023 | 2022 | 2023 | 2022 | ||||||||||||
| Net profit (loss) from continuing operations | (5.6 | ) | (12.4 | ) | 1.7 | (3.0 | ) | |||||||||
| Adjustments: | ||||||||||||||||
| Depreciation, amortization and impairment of intangible assets | 3.5 | 2.0 | 0.1 | 0.8 | ||||||||||||
| Finance expense, net | 0.6 | * | 0.1 | * | ||||||||||||
| Tax benefit | (0.5 | ) | (0.3 | ) | * | (0.1 | ) | |||||||||
| EBITDA (EBITDA loss) | (2.0 | ) | (10.7 | ) | 1.9 | (2.3 | ) | |||||||||
| Adjustments: | ||||||||||||||||
| Impairment of goodwill | 6.3 | 0.6 | - | - | ||||||||||||
| Share-based compensation | 0.9 | 1.6 | 0.3 | 0.3 | ||||||||||||
| Adjusted EBITDA (Adjusted EBITDA loss) | 5.2 | (8.5 | ) | 2.2 | (2.0 | ) | ||||||||||
| * | Less than $0.1 million |
Balance Sheet Highlights:
| ● | As of December 31, 2023, shareholders’ equity totaled $13.2 million, or approximately $2.20 per outstanding American Depositary Share, compared to shareholders’ equity of $13.3 million as of December 31, 2022. The reduction is due mainly to the goodwill and intangible assets impairment recorded in the second quarter of 2023, offset by the September 2023 private placement. |
| ● | As of December 31, 2023, the Company’s cash and cash equivalents balance totaled $10.9 million, compared to $3.3 million as of December 31, 2022. |
Use of Non-IFRS Financial Results
In addition to disclosing financial results calculated in accordance with International Financial Reporting Standards (IFRS), as issued by the International Accounting Standards Board, this press release contains non-IFRS financial measures of EBITDA, EBITDA loss, Adjusted EBITDA and Adjusted EBITDA loss for the periods presented that exclude depreciation, amortization and impairment of intangible assets, interest and tax, as further adjusted for the effect of impairment of goodwill and share-based compensation expenses. The Company’s management believes the non-IFRS financial information provided in this release is useful to investors’ understanding and assessment of the Company’s ongoing operations. Management also uses both IFRS and non-IFRS information in evaluating and operating its business internally, and as such deemed it important to provide this information to investors. The non-IFRS financial measures disclosed by the Company should not be considered in isolation, or as a substitute for, or superior to, financial measures calculated in accordance with IFRS, and the financial results calculated in accordance with IFRS and reconciliations to those financial statements should be carefully evaluated. Investors are encouraged to review the reconciliations of these non-IFRS measures to their most directly comparable IFRS financial measures provided in the financial statement tables herein.
Full Year 2023 Financial Results Conference Call
Mr. Shachar Daniel, Chief Executive Officer of Alarum, and Mr. Shai Avnit, Chief Financial Officer of Alarum, will host a conference call on March 14, 2024, at 8:30 a.m. ET, to discuss the fourth quarter and full year 2023 financial results, followed by a Q&A session.
To attend the conference call, please dial one of the following teleconferencing numbers. Please begin by placing your call five minutes before the conference call commences. If you are unable to connect using the toll-free number, please try the international dial-in number:
| Date: | Thursday, March 14, 2024 | |
| Time: | 8:30 a.m. Eastern time, 5:30 a.m. Pacific time | |
| Toll-free dial-in number: | 1-877-407-0789 or 1-201-689-8562 | |
| Israel Toll Free: | 1 809 406 247 |
Participants will be required to state their name and company upon entering the call. If you have any difficulty connecting with the conference call, please contact Michal Efraty on behalf of Alarum at +972-(0)-52-3044404.
The conference call will be broadcast live and available for replay here: https://viavid.webcasts.com/starthere.jsp?ei=1659997&tp_key=a21faf2a1e
A replay of the conference call will be available after 11:30 a.m. Eastern time March 14, 2024, through April 10, 2024:
| Toll-free replay number: | 1-844-512-2921 or 1-412-317-6671 | |
| Replay ID: | 13744883 |
About Alarum Technologies Ltd.
Alarum Technologies Ltd. (Nasdaq, TASE: ALAR) is a global provider of internet access and web data collection solutions.
The solutions by NetNut, our enterprise internet access and data collection arm, are based on our world’s fastest and most advanced and secured hybrid proxy network, enabling our customers to collect data anonymously at any scale from any public sources over the web. Our network comprises both exit points based on our proprietary reflection technology and hundreds of servers located at our ISP partners around the world. The infrastructure is optimally designed to guarantee privacy, quality, stability, and the speed of the service.
For more information about Alarum and its internet access solutions, please visit www.alarum.io.
Follow us on Twitter
Subscribe to our YouTube channel
Forward-Looking Statements
This press release contains forward-looking statements within the meaning of the “safe harbor” Words such as “expects,” “anticipates,” “intends,” “plans,” “believes,” “seeks,” “estimates” and similar expressions or variations of such words are intended to identify forward-looking statements. Alarum is using forward-looking statements in this press release when it discusses its preliminary unaudited revenues for February 2024, the Company’s ability to continue and drive revenue growth, expand its product line, enter new markets, maintain operational efficiency, execute its business strategy, grow profitability, and create value for shareholders. Because such statements deal with future events and are based on Alarum’s current expectations, they are subject to various risks and uncertainties and actual results, performance or achievements of Alarum could differ materially from those described in or implied by the statements in this press release. The forward-looking statements contained or implied in this press release are subject to other risks and uncertainties, including those discussed under the heading “Risk Factors” in Alarum’s annual report on Form 20-F filed with the Securities and Exchange Commission (“SEC”) on March 14, 2024, and in any subsequent filings with the SEC. Except as otherwise required by law, Alarum undertakes no obligation to publicly release any revisions to these forward-looking statements to reflect events or circumstances after the date hereof or to reflect the occurrence of unanticipated events. References and links to websites have been provided as a convenience, and the information contained on such websites is not incorporated by reference into this press release. Alarum is not responsible for the contents of third-party websites.
The Company is providing a February 2024 revenue estimate in this press release, rather than final amounts, primarily because the financial closing process and review are not yet complete and, as a result, the Company’s results upon completion of its closing process and review may vary from this preliminary estimate.
Investor Relations Contacts:
Michal Efraty
+972-(0)52-3044404
investors@alarum.io
Consolidated Statements of Financial Position
(In thousands of USD)
| December 31, | ||||||||
| 2023 | 2022 | |||||||
| (Audited) | ||||||||
| Assets | ||||||||
| Current assets: | ||||||||
| Cash and cash equivalents | 10,872 | 3,290 | ||||||
| Short-term restricted deposits | - | 560 | ||||||
| Trade receivables, net | 1,994 | 1,790 | ||||||
| Other receivables | 399 | 760 | ||||||
| 13,265 | 6,400 | |||||||
| Non-current assets: | ||||||||
| Long-term restricted deposits | 3 | 127 | ||||||
| Long-term deposit | 104 | 21 | ||||||
| Other non-current assets | 142 | 228 | ||||||
| Property and equipment, net | 88 | 92 | ||||||
| Right of use assets | 779 | 190 | ||||||
| Deferred tax asset | 181 | - | ||||||
| Goodwill | 4,118 | 10,429 | ||||||
| Intangible assets, net | 1,386 | 4,884 | ||||||
| Total non-current assets | 6,801 | 15,971 | ||||||
| Total assets | 20,066 | 22,371 | ||||||
| Liabilities and equity | ||||||||
| Current liabilities: | ||||||||
| Trade payables | 369 | 2,167 | ||||||
| Other payables | 2,439 | 2,350 | ||||||
| Current maturities of long-term loan | 290 | 617 | ||||||
| Short-term bank loans | - | 1,606 | ||||||
| Contract liabilities | 1,983 | 1,170 | ||||||
| Derivative financial instruments | 109 | 26 | ||||||
| Short-term lease liabilities | 370 | 204 | ||||||
| Total current liabilities | 5,560 | 8,140 | ||||||
| Non-current liabilities: | ||||||||
| Long-term loans | 802 | 606 | ||||||
| Long-term lease liabilities | 523 | 13 | ||||||
| Deferred tax liabilities | - | 301 | ||||||
| Total non-current liabilities | 1,325 | 920 | ||||||
| Total liabilities | 6,885 | 9,060 | ||||||
| Equity: | ||||||||
| Ordinary shares | - | - | ||||||
| Share premium | 100,576 | 95,077 | ||||||
| Other equity reserves | 14,938 | 15,042 | ||||||
| Accumulated deficit | (102,333 | ) | (96,808 | ) | ||||
| Total equity | 13,181 | 13,311 | ||||||
| Total liabilities and equity | 20,066 | 22,371 | ||||||
Consolidated Statements of Profit or Loss
(In thousands of USD, except per share amounts)
| For the Year Ended December 31, |
For the Three Months Ended December 31, |
|||||||||||||||
| 2023 | 2022 | 2023 | 2022 | |||||||||||||
| (Audited) | (Audited) | (Unaudited) | (Unaudited) | |||||||||||||
| Revenues | 26,521 | 18,550 | 7,107 | 5,126 | ||||||||||||
| Cost of revenues | 7,711 | 8,402 | 1,778 | 2,299 | ||||||||||||
| Gross profit | 18,810 | 10,148 | 5,329 | 2,827 | ||||||||||||
| Research and development expenses | 3,557 | 3,824 | 795 | 1,019 | ||||||||||||
| Sales and marketing expenses | 10,035 | 11,823 | 1,579 | 3,499 | ||||||||||||
| General and administrative expenses | 4,406 | 6,661 | 1,207 | 1,374 | ||||||||||||
| Impairment of goodwill | 6,311 | 569 | - | - | ||||||||||||
| Operating expenses | 24,309 | 22,877 | 3,581 | 5,892 | ||||||||||||
| Operating profit (loss) | (5,499 | ) | (12,729 | ) | 1,748 | (3,065 | ) | |||||||||
| Finance expense, net | (590 | ) | (54 | ) | (54 | ) | (79 | ) | ||||||||
| Tax benefit (expense) | 482 | 327 | (22 | ) | 112 | |||||||||||
| Profit (loss) from continuing operations, net of tax | (5,607 | ) | (12,456 | ) | 1,672 | (3,032 | ) | |||||||||
| Profit (loss) from discontinued operations, net of tax | 82 | (695 | ) | - | 136 | |||||||||||
| Net profit (loss) | (5,525 | ) | (13,151 | ) | 1,672 | (2,896 | ) | |||||||||
| Basic and diluted profit (loss) per share | ||||||||||||||||
| Continuing operations | (0.14 | ) | (0.39 | ) | 0.03 | (0.09 | ) | |||||||||
| Discontinued operations | 0.00 | (0.03 | ) | - | 0.00 | |||||||||||
| (0.14 | ) | (0.42 | ) | 0.03 | (0.09 | ) | ||||||||||
8
Exhibit 99.2
© 2024 Alarum Technologies Ltd. All Rights Reserved.
Corporate Presentation March 2024 NASDAQ / TASE: ALAR NASDAQ / TASE : ALAR Disclaimer & Forward - Looking Statements This presentation was by prepared Alarum Technologies Ltd . (the "Company“ or “Alarum”) . This presentation does not constitute an offer to purchase or sell securities of the Company or an invitation to receive such offers, nor does it constitute a recommendation or opinion with respect to the Company's securities and is intended for informational purposes only . The information presented in the presentation with respect to the Company's operations is concise and presented for convenience purposes only and does not provide all of the information on the Company and its subsidiaries and its business, nor is it a substitute for inspection of the Company’s periodic reports . This presentation may contain copyrighted material the use of which has not always been specifically authorized by the copyright owner . We are making such material available in our efforts to advance understanding of issues related to our solutions . This presentation may also contain links or reference to other third - party websites . Such links or references are only for the convenience of the reader, user or browser ; Alarum and its members do not recommend or endorse the contents of the third - party sites . This presentation contains “forward - looking statements” within the meaning of the Private Securities Litigation Reform Act and other securities laws . Words such as “expects,” “anticipates,” “intends,” “plans,” “believes,” “seeks,” “estimates” and similar expressions or variations of such words are intended to identify forward - looking statements . For example, the Company is using forward - looking statements when it discusses its estimated revenue, annual run - rate, the potential of its products, its strategy and growth drivers, the execution of its business strategy, the future value for shareholders and customers, its high retention rate, market potential for its products and future market growth . Forward - looking statements are not historical facts, and are based upon management’s current expectations, beliefs and projections, many of which, by their nature, are inherently uncertain . Such expectations, beliefs and projections are expressed in good faith . However, there can be no assurance that management’s expectations, beliefs and projections will be achieved, and actual results may differ materially from what is expressed in or indicated by the forward - looking statements . Forward - looking statements are subject to risks and uncertainties that could cause actual performance or results to differ materially from those expressed in the forward - looking statements . For a more detailed description of the risks and uncertainties affecting the Company, reference is made to the Company’s reports filed from time to time with the Securities and Exchange Commission (“SEC”), including, but not limited to, the risks detailed in the Company’s annual report on Form 20 - F filed with the SEC on March 14 , 2024 , and in any subsequent filings with the SEC . Forward - looking statements speak only as of the date the statements are made . The Company assumes no obligation to update forward - looking statements to reflect actual results, subsequent events or circumstances, changes in assumptions or changes in other factors affecting forward - looking information except to the extent required by applicable securities laws . If the Company does update one or more forward - looking statements, no inference should be drawn that the Company will make additional updates with respect thereto or with respect to other forward - looking statements . 2 Alarum Technologies A publicly traded company Dual listed on Nasdaq and TASE.

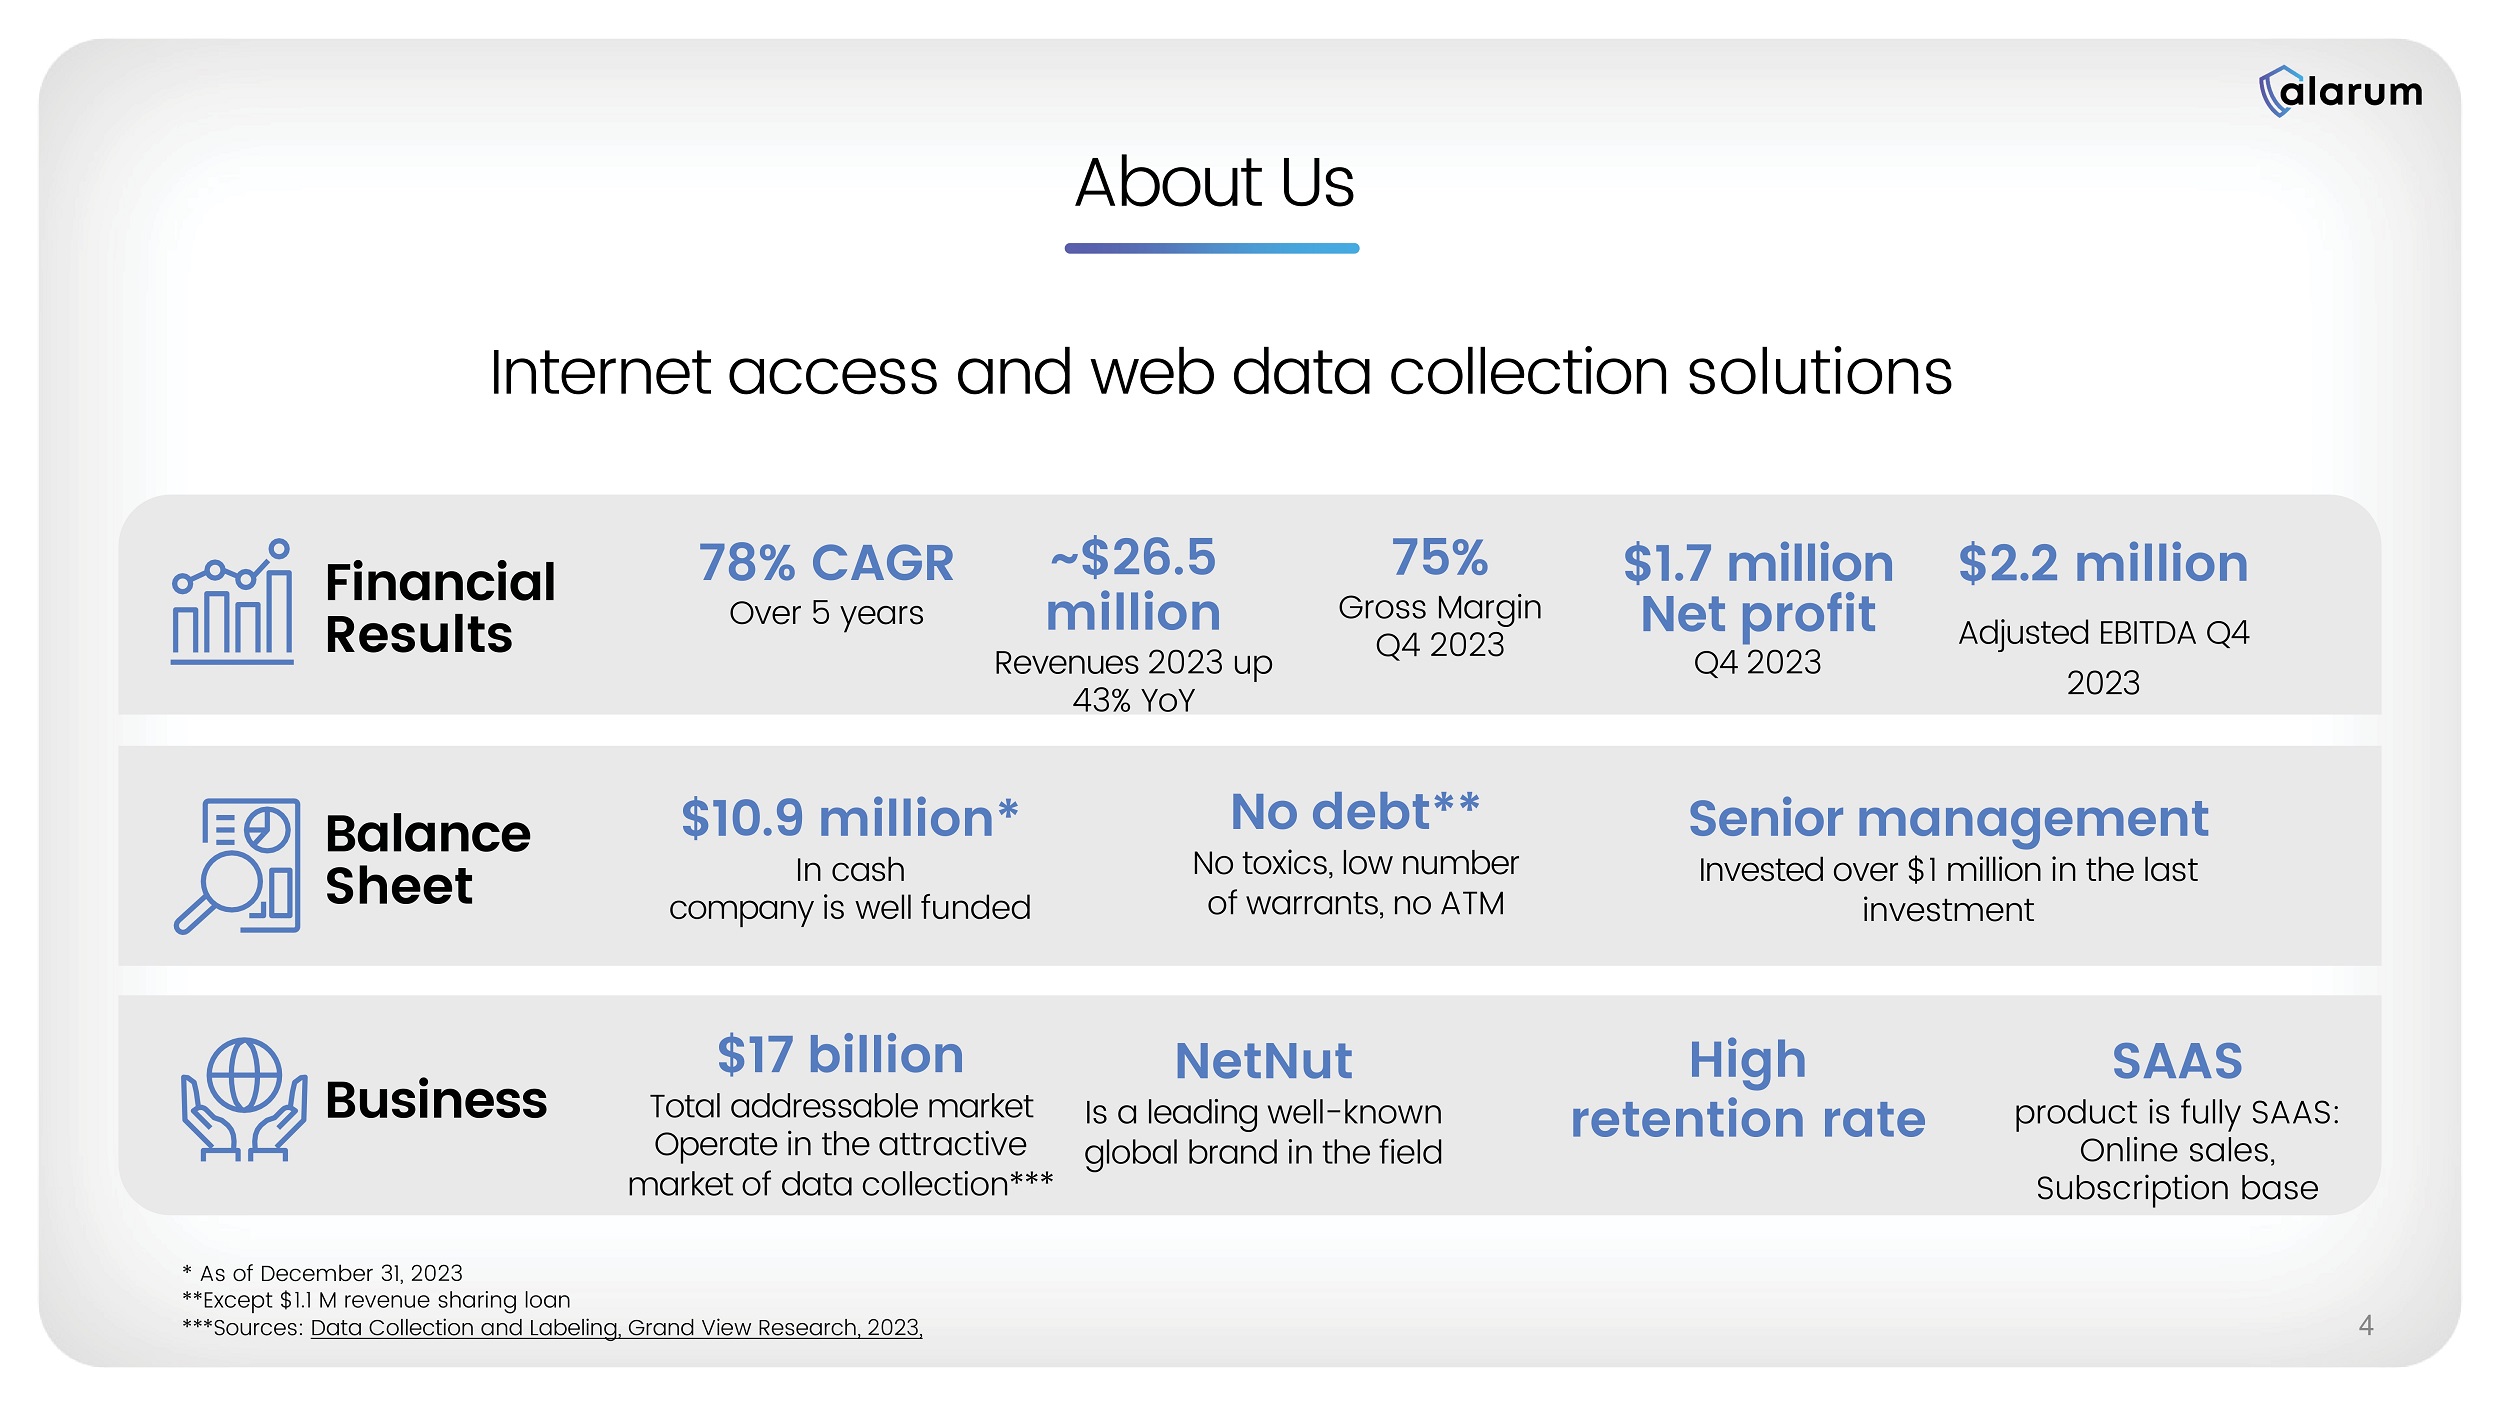
Holds 100% of NetNut, a global provider of internet access and web data collection solutions. Providing data collection solutions Offer enterprises with advanced tools to gather, analyze and extract data from the web anonymously without getting misled, manipulated or blocked. Innovation, stability & competitive edge Our innovative data collection solutions support enterprises worldwide in expanding and growing their business by maintaining competitive advantage, leading the market and improve financial outcomes. Lead the data collection market with innovative in house developed products, using advanced AI technologies , collaboration with elite teams, building on our robust well - established network. 3 About Us Internet access and web data collection solutions Financial Results Balance Sheet Business $10.9 million* In cash company is well funded $17 billion Total addressable market Operate in the attractive market of data collection*** 78% CAGR Over 5 years No debt** No toxics, low number of warrants, no ATM Senior management Invested over $1 million in the last investment NetNut Is a leading well - known global brand in the field ~$26.5 million Revenues 2023 up 43% YoY $2.2 million Adjusted EBITDA Q4 2023 SAAS product is fully SAAS: Online sales, Subscription base * As of December 31, 2023 **Except $1.1 M revenue sharing loan ***Sources: Data Collection and Labeling, Grand View Research, 2023, 4 75% Gross Margin Q4 2023 High retention rate $1.7 million Net profit Q4 2023

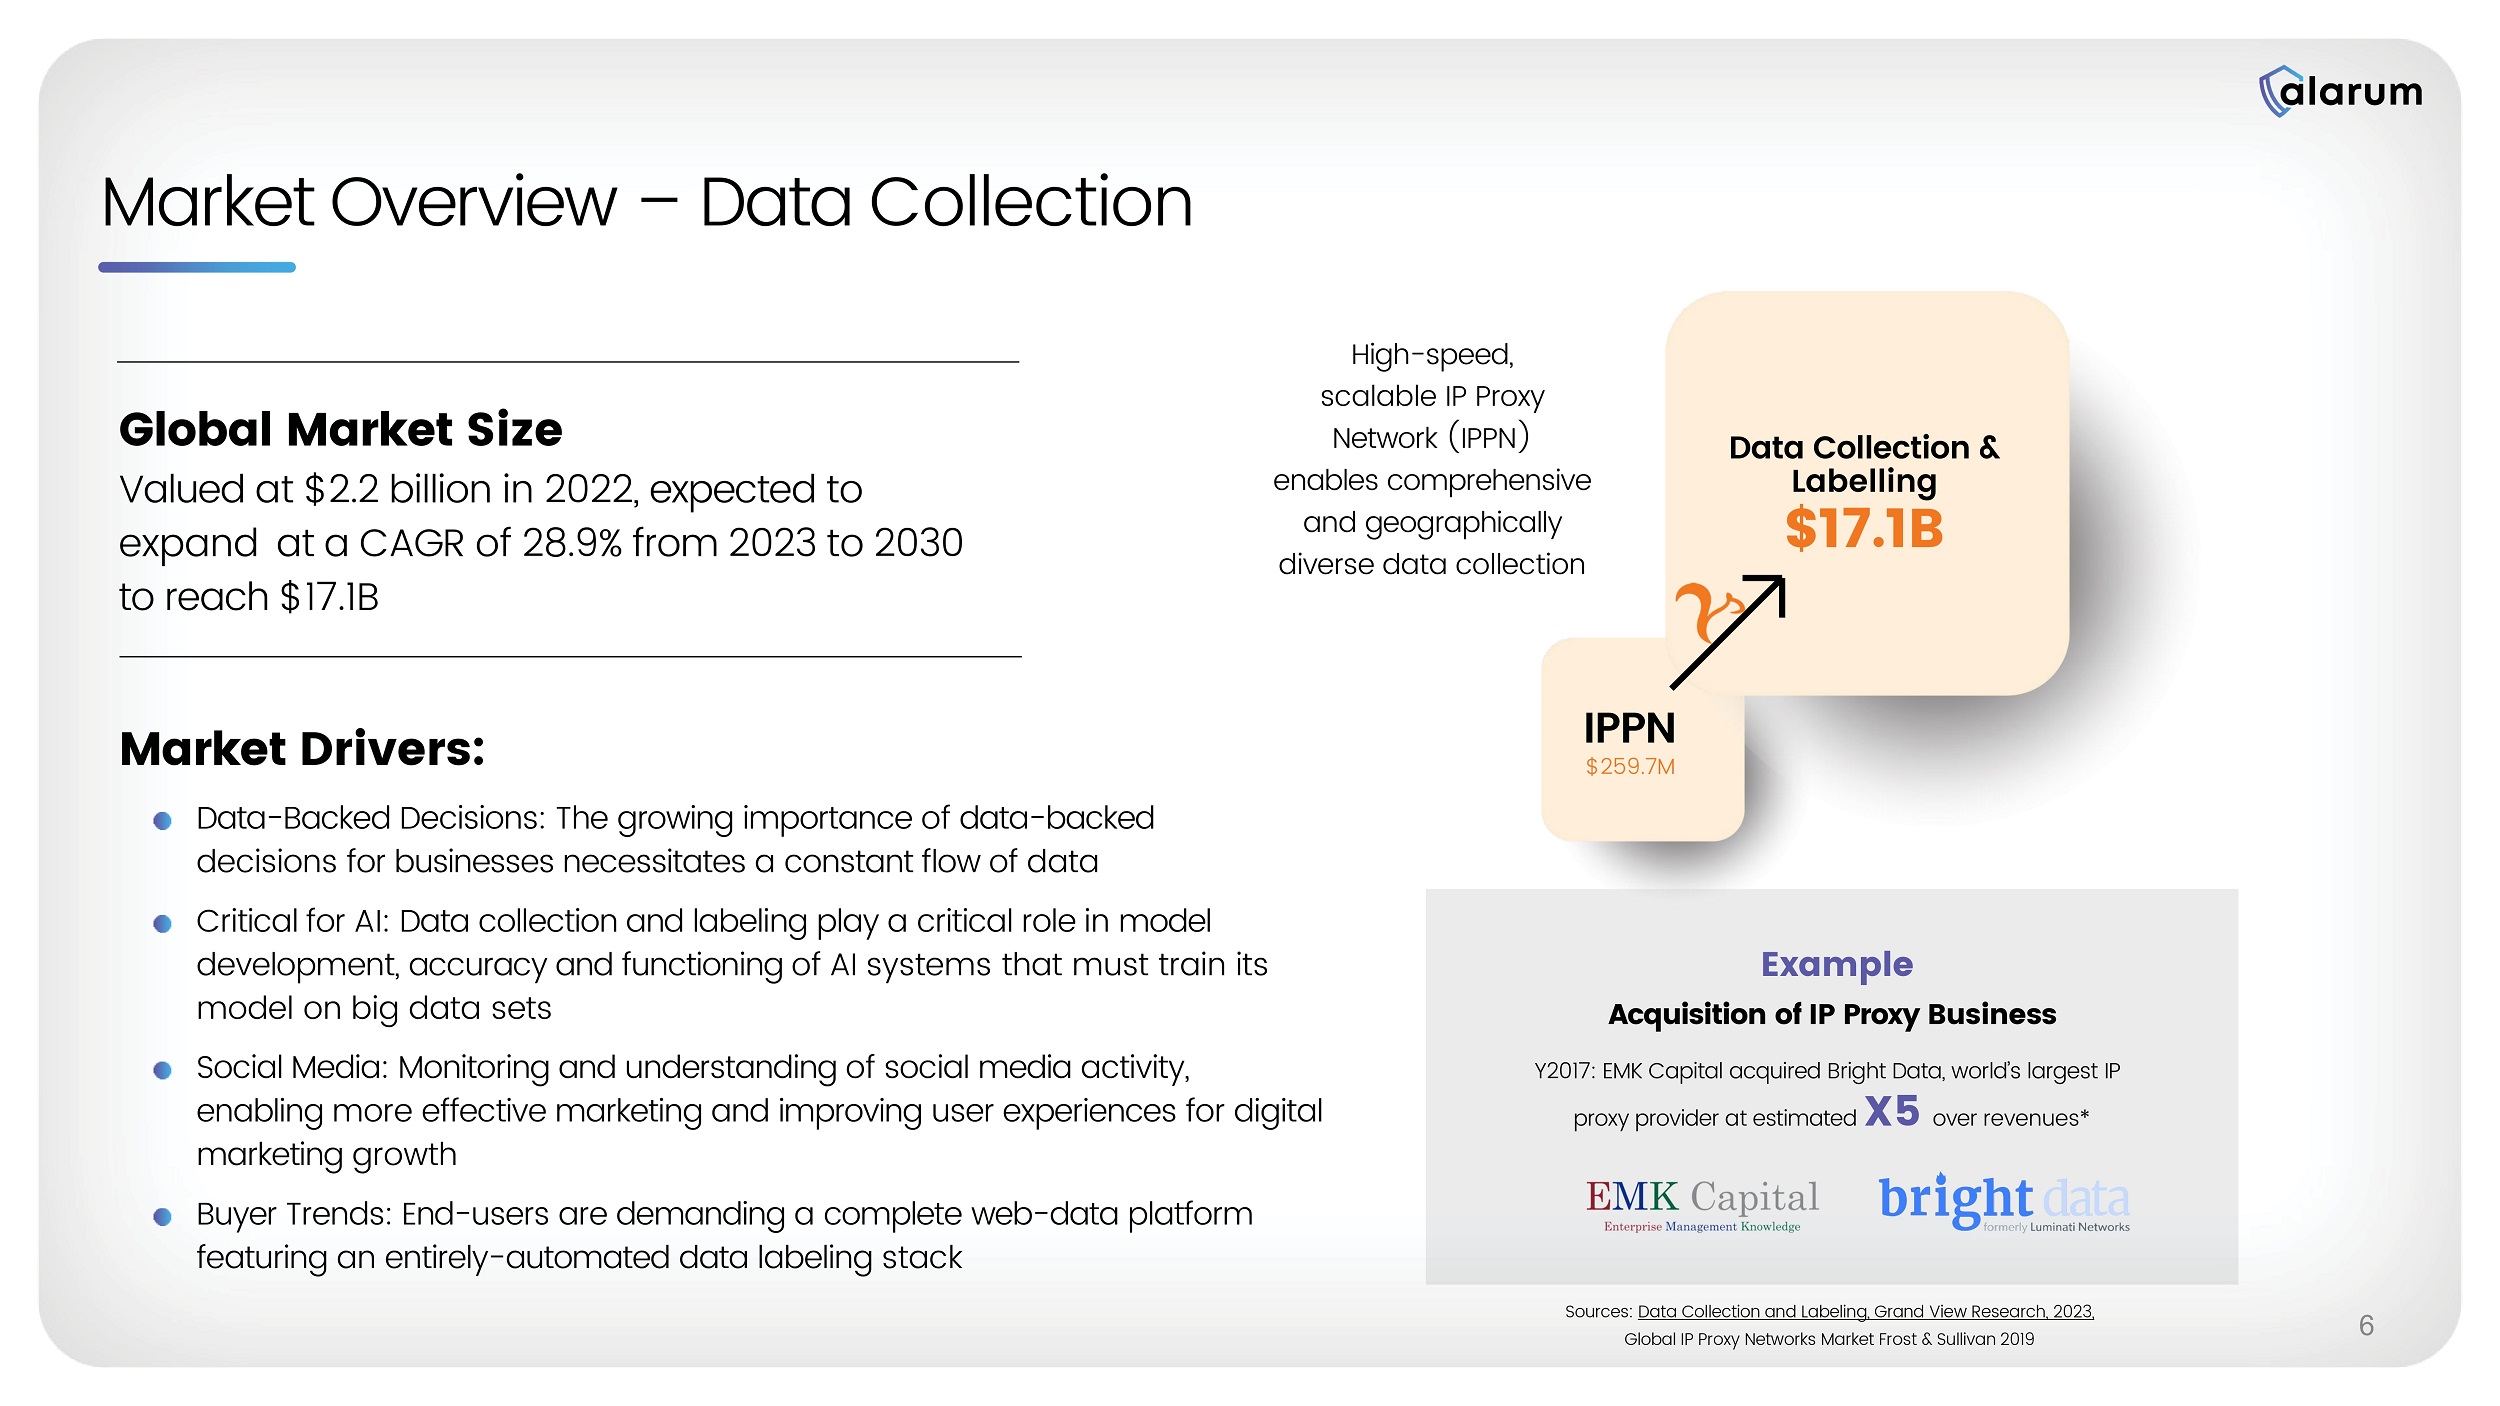
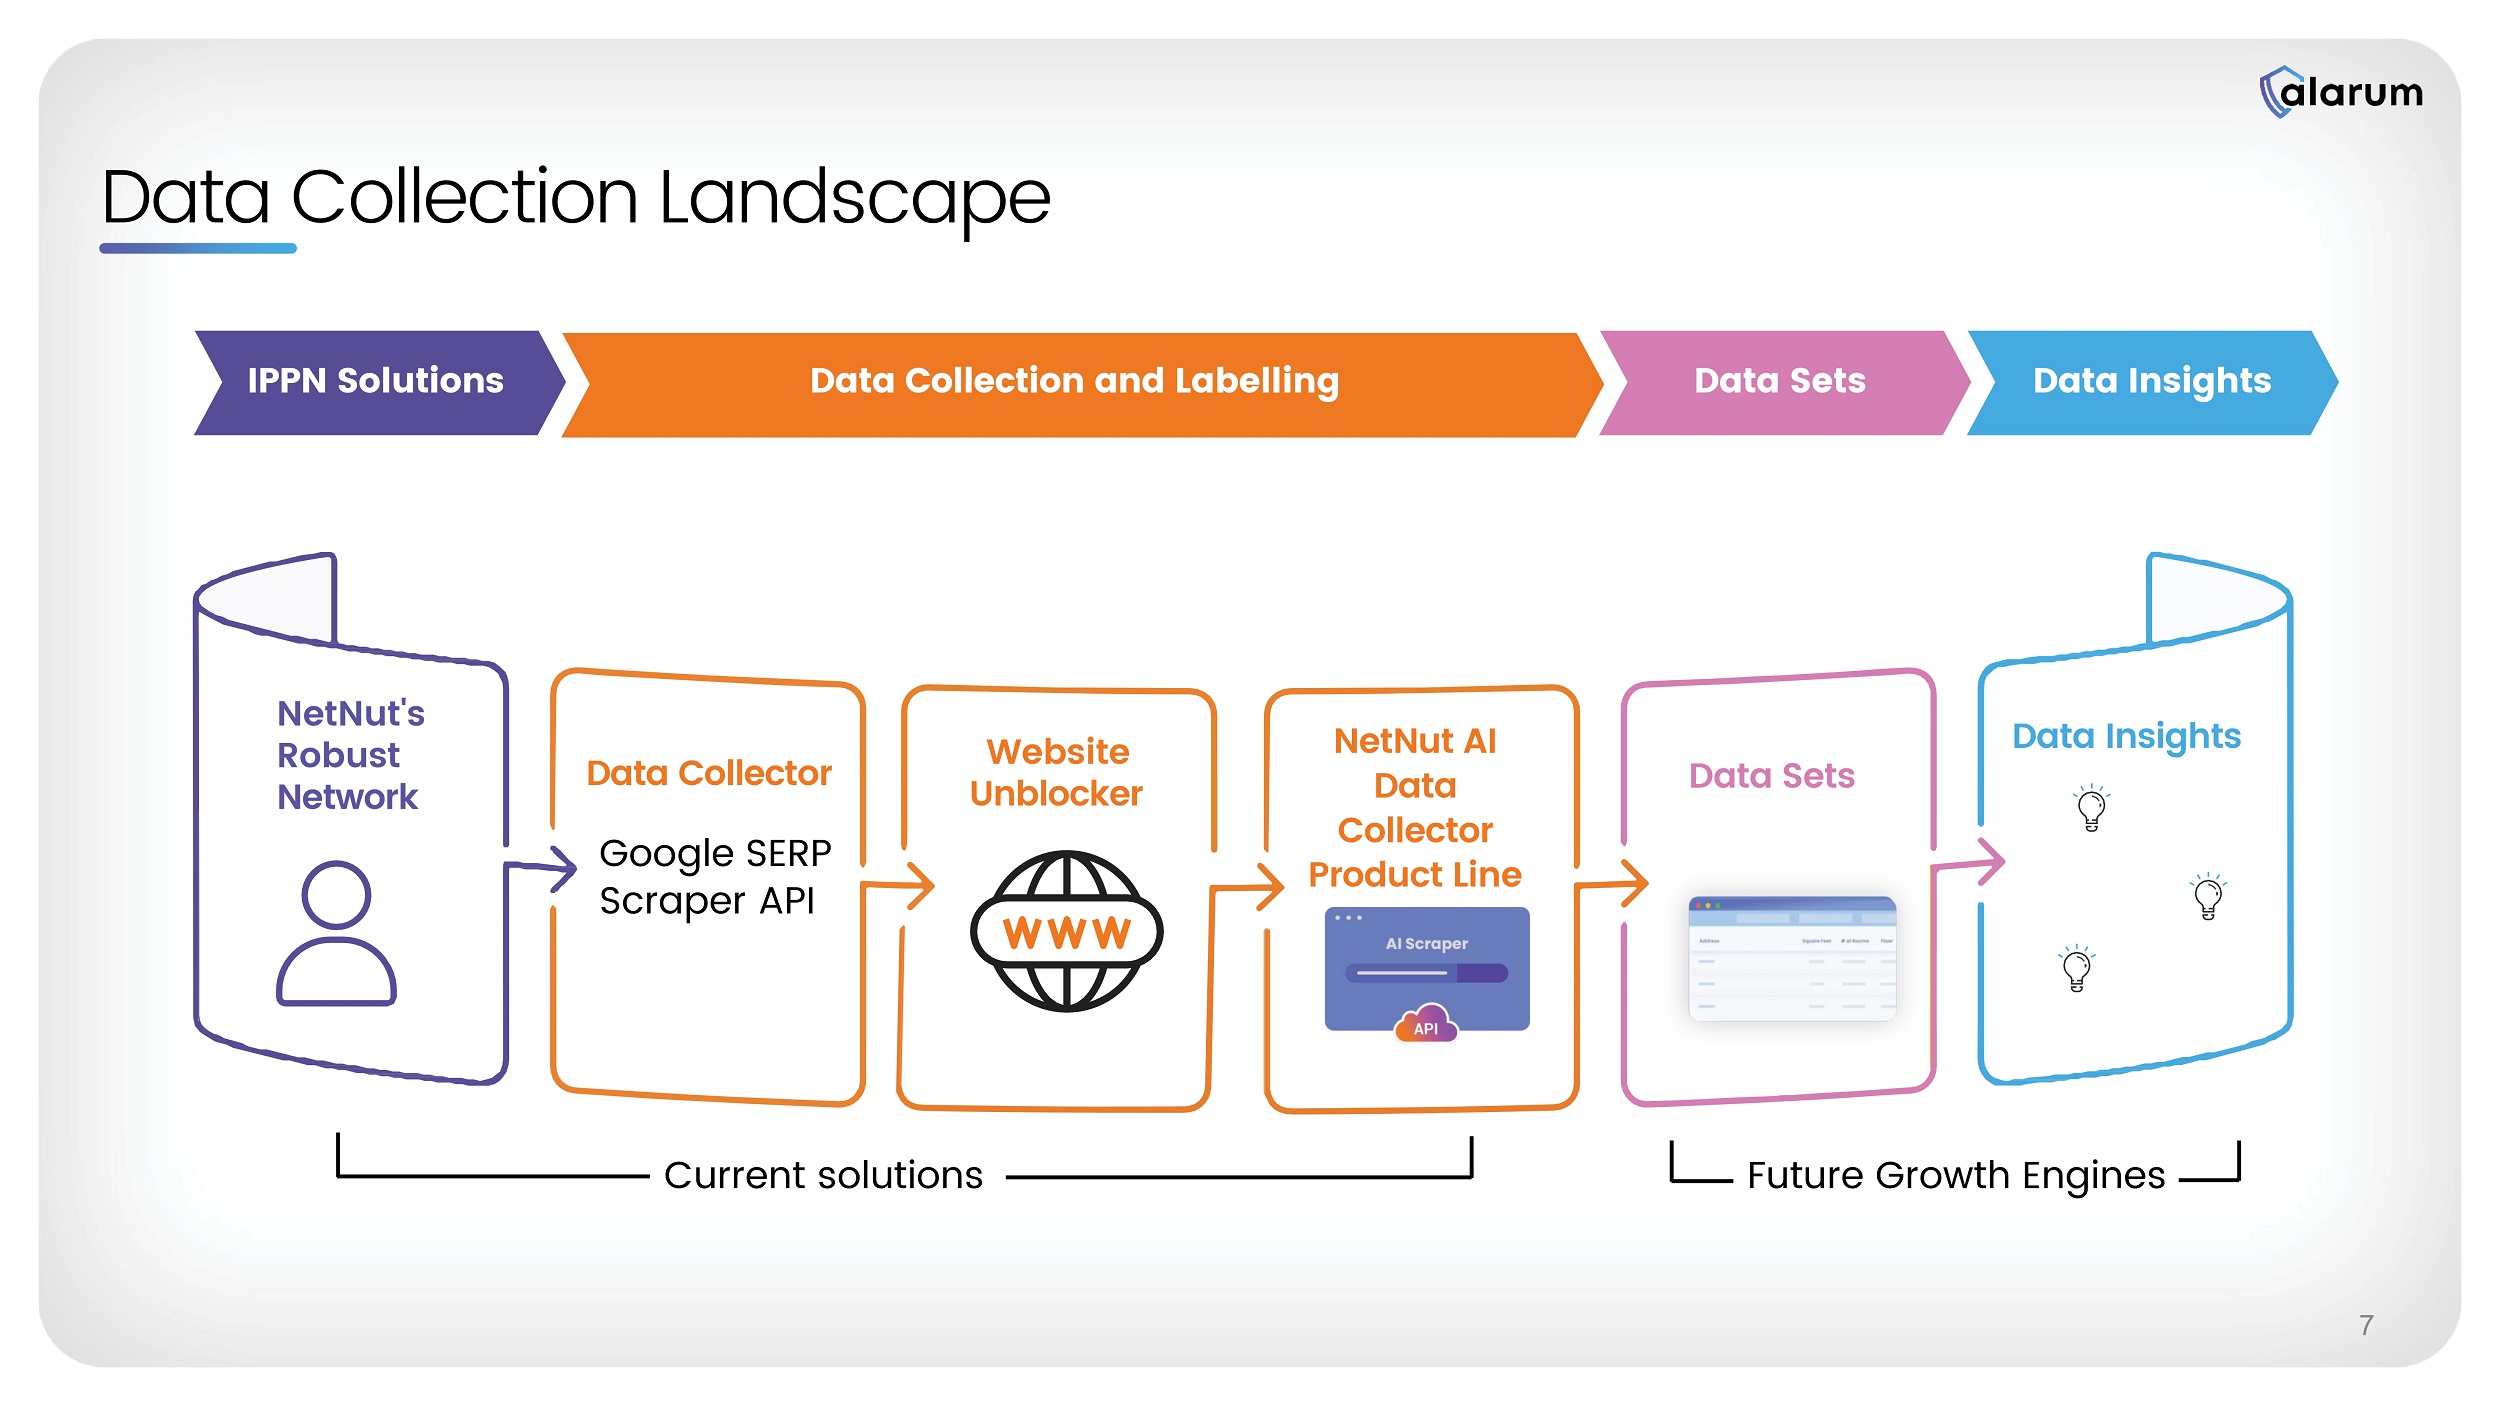
Business Timeline 2013 - 2019 Focus on cybersecurity solutions for enterprises 2019 - 2021 Strategic shift to M&A Acquired NetNut 2022 Started our path to profitability 2023 Focus on NetNut: • Sold our enterprises cybersecurity activity • Scaled down consumer activity As of H2 2023, Alarum is focused only on its data collection solutions 5 Q4 2023 Achieved record revenue and net profit of $1.7 million Market Overview – Data Collection Global Market Size Valued at $2.2 billion in 2022, expected to expand at a CAGR of 28.9% from 2023 to 2030 to reach $17.1B Market Drivers: Data - Backed Decisions: The growing importance of data - backed decisions for businesses necessitates a constant flow of data Critical for AI: Data collection and labeling play a critical role in model development, accuracy and functioning of AI systems that must train its model on big data sets Social Media: Monitoring and understanding of social media activity, enabling more effective marketing and improving user experiences for digital marketing growth Buyer Trends: End - users are demanding a complete web - data platform featuring an entirely - automated data labeling stack Sources: Data Collection and Labeling, Grand View Research, 2023 , Global IP Proxy Networks Market Frost & Sullivan 2019 High - speed, scalable IP Proxy Network (IPPN) enables comprehensive and geographically diverse data collection IPPN $259.7M Data Collection & Labelling $17.1B Example Acquisition of IP Proxy Business Y2017: EMK Capital acquired Bright Data, world’s largest IP proxy provider at estimated X5 over revenues* 6 Data Co lection Landscape NetNut's Robust Network IPPN Solutions NetNut AI Data Collector Product Line Data Collector Data Collection and Labelling Data Sets Data Insights Data Insights Data Sets Website Unblocker Google SERP Scraper API Future Growth Engines Current solutions 7
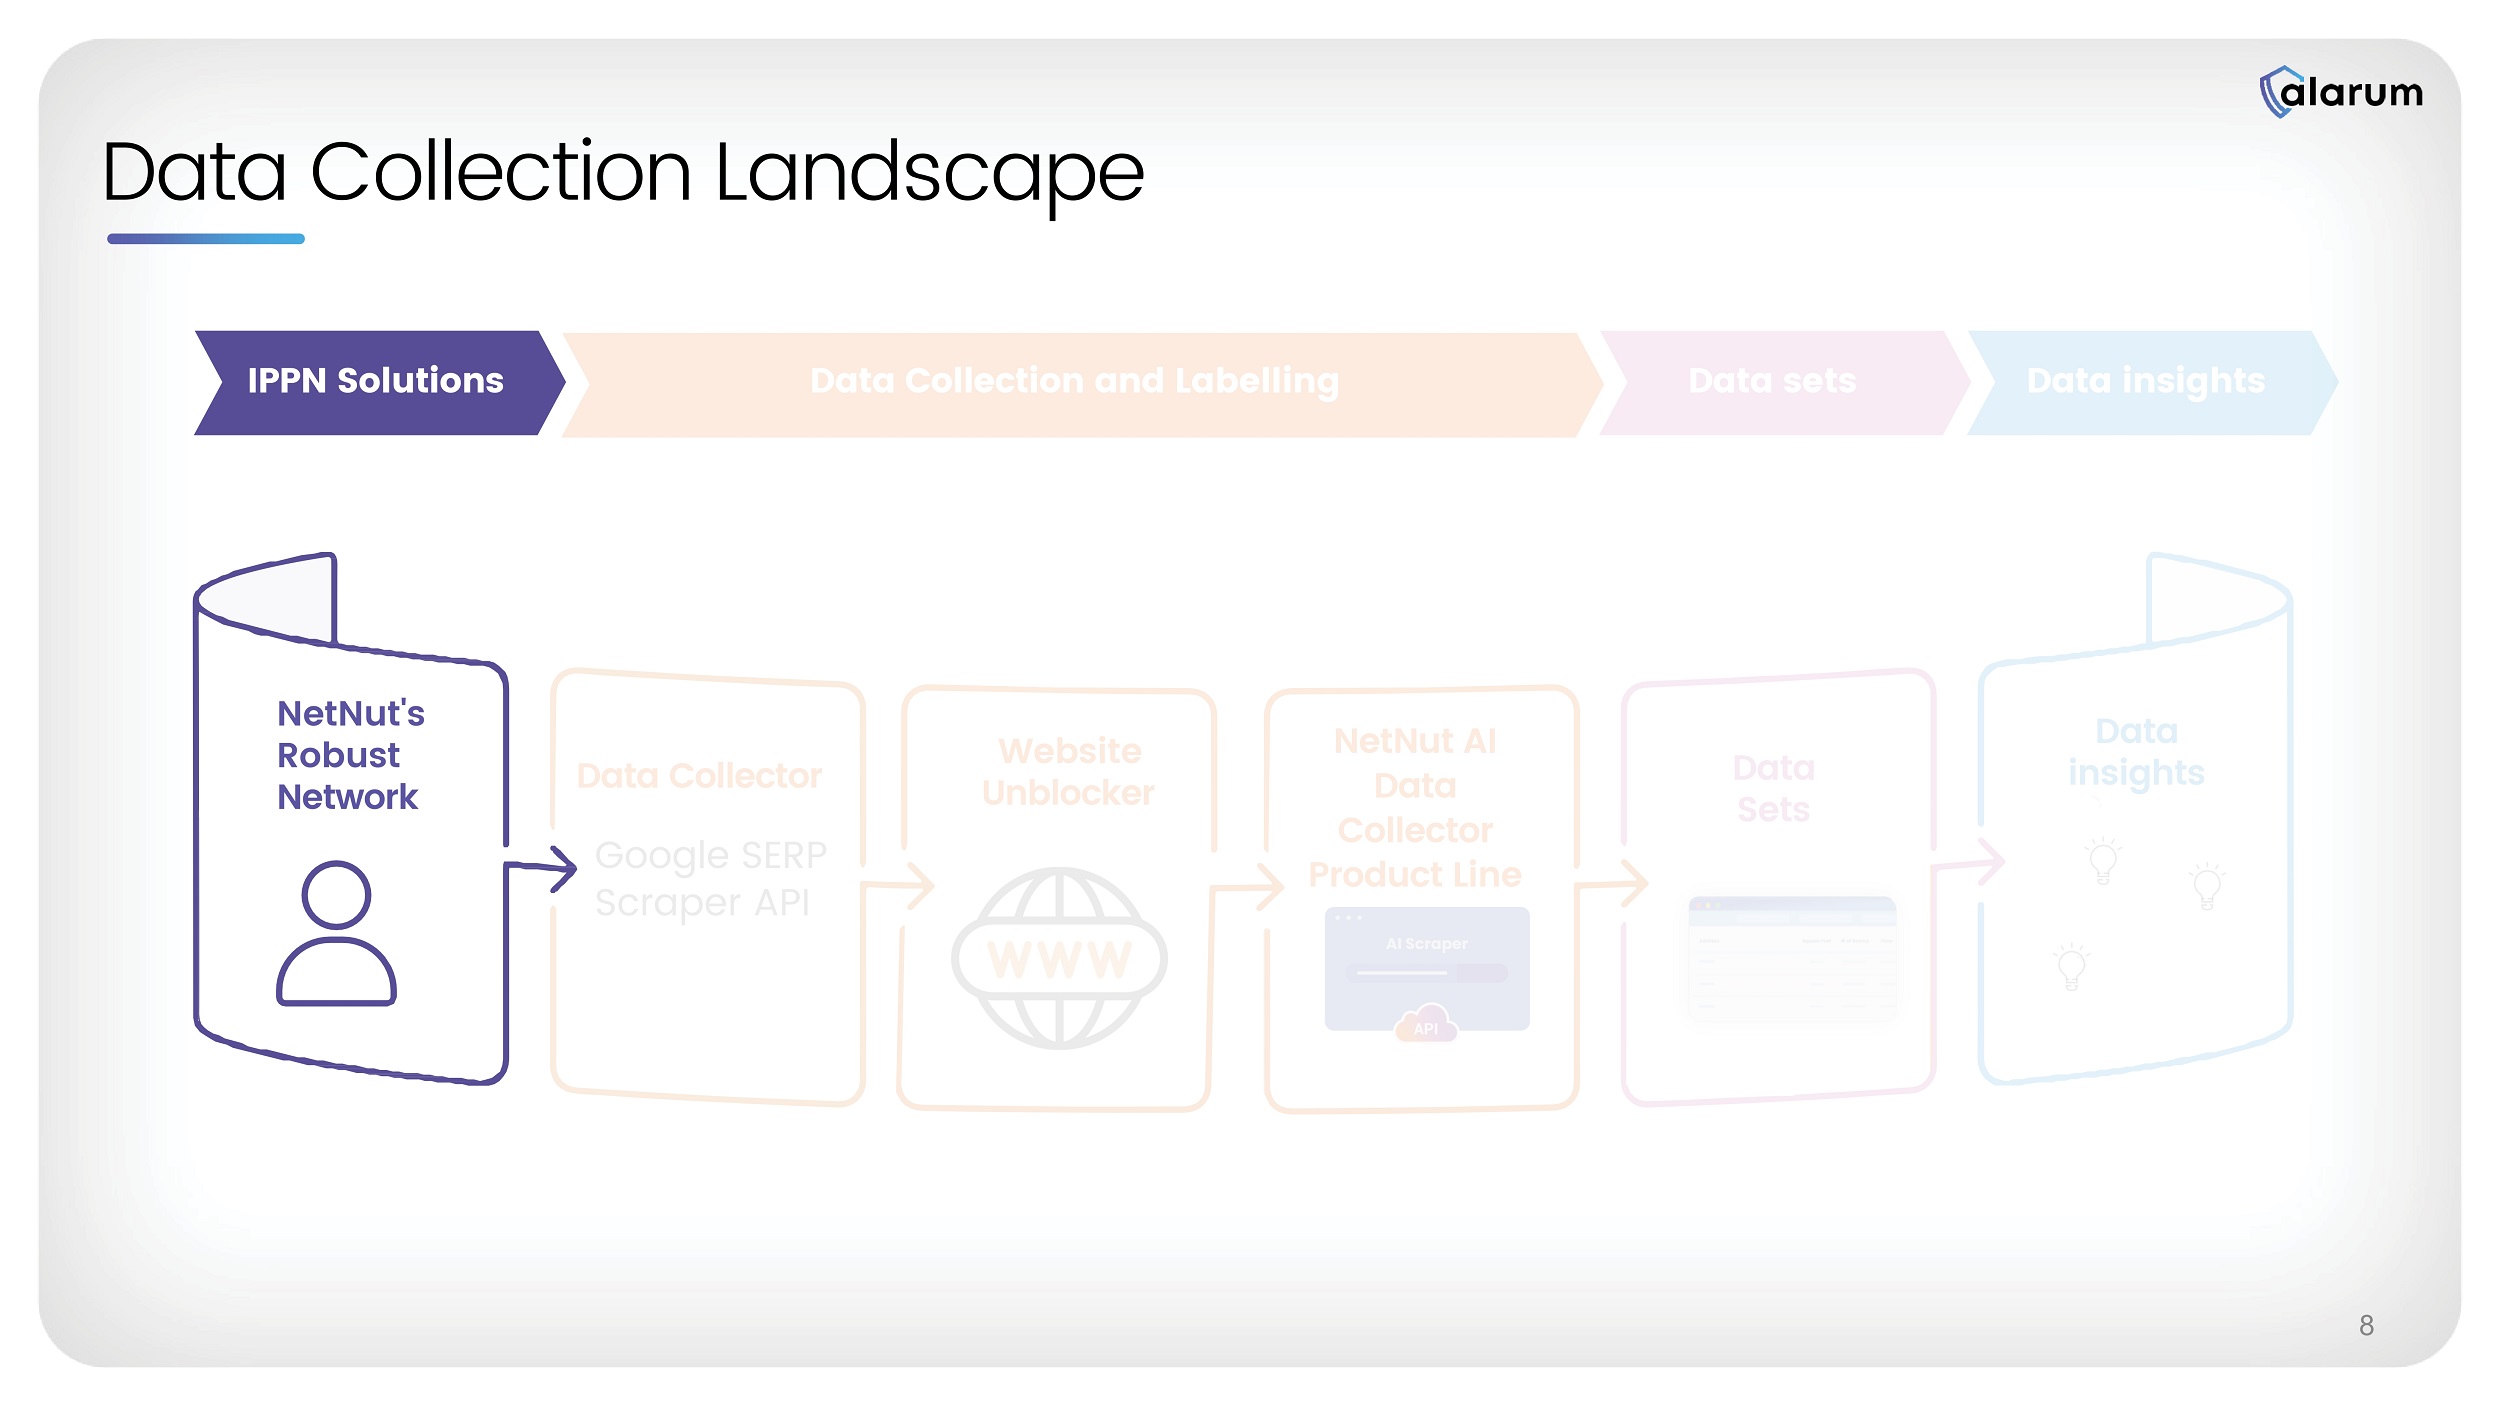
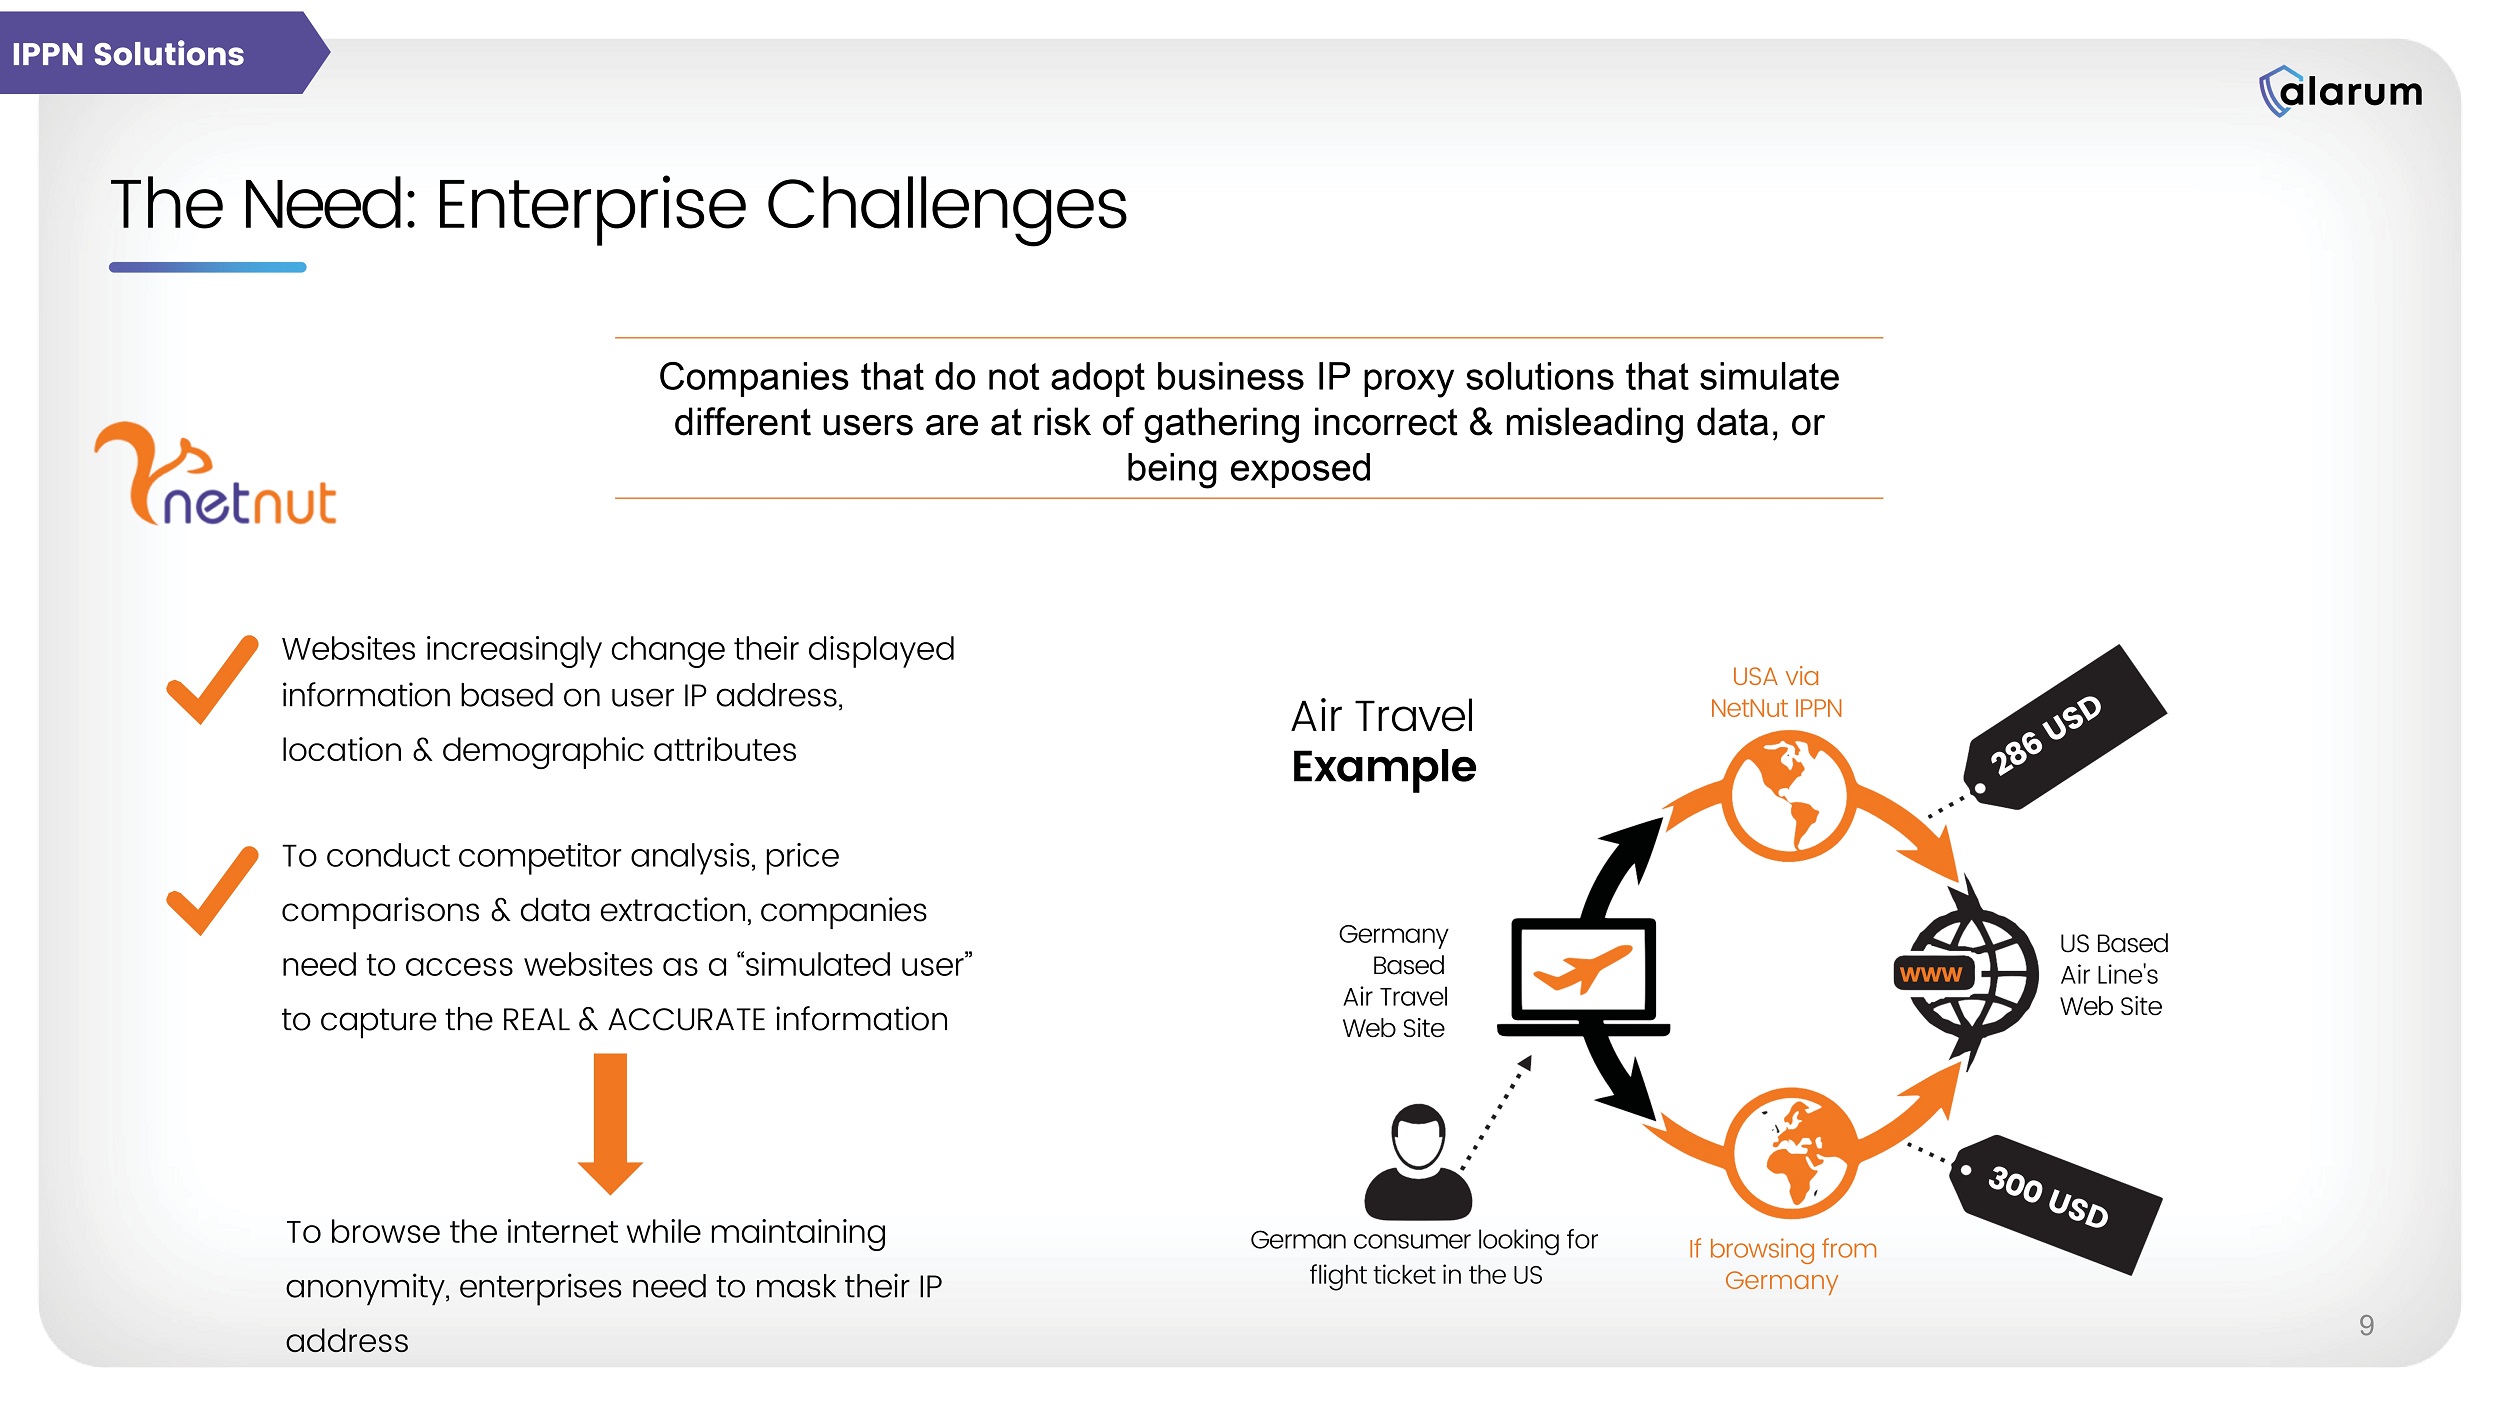
Google SERP Scraper API Data Collection Landscape NetNut AI Data Collector Product Line Data Collector Website Unblocker Data Sets Data insights IPPN Solutions Data Collection and Labelling Data insights 8 Data sets NetNut's Robust Network The Need: Enterprise Cha lenges Websites increasingly change their displayed information based on user IP address, location & demographic attributes To conduct competitor analysis, price comparisons & data extraction, companies need to access websites as a “simulated user” to capture the REAL & ACCURATE information To browse the internet while maintaining anonymity, enterprises need to mask their IP address Air Travel Example USA via NetNut IPPN If browsing from Germany US Based Air Line's Web Site Germany Based Air Travel Web Site German consumer looking for flight ticket in the US WWW 9 Companies that do not adopt business IP proxy solutions that simulate different users are at risk of gathering incorrect & misleading data, or being exposed IPPN Solutions Our customers seamlessly collect accurate, transparent & in scale data from any public online sources NetNut's platform is based on our proprietary reflection technology.
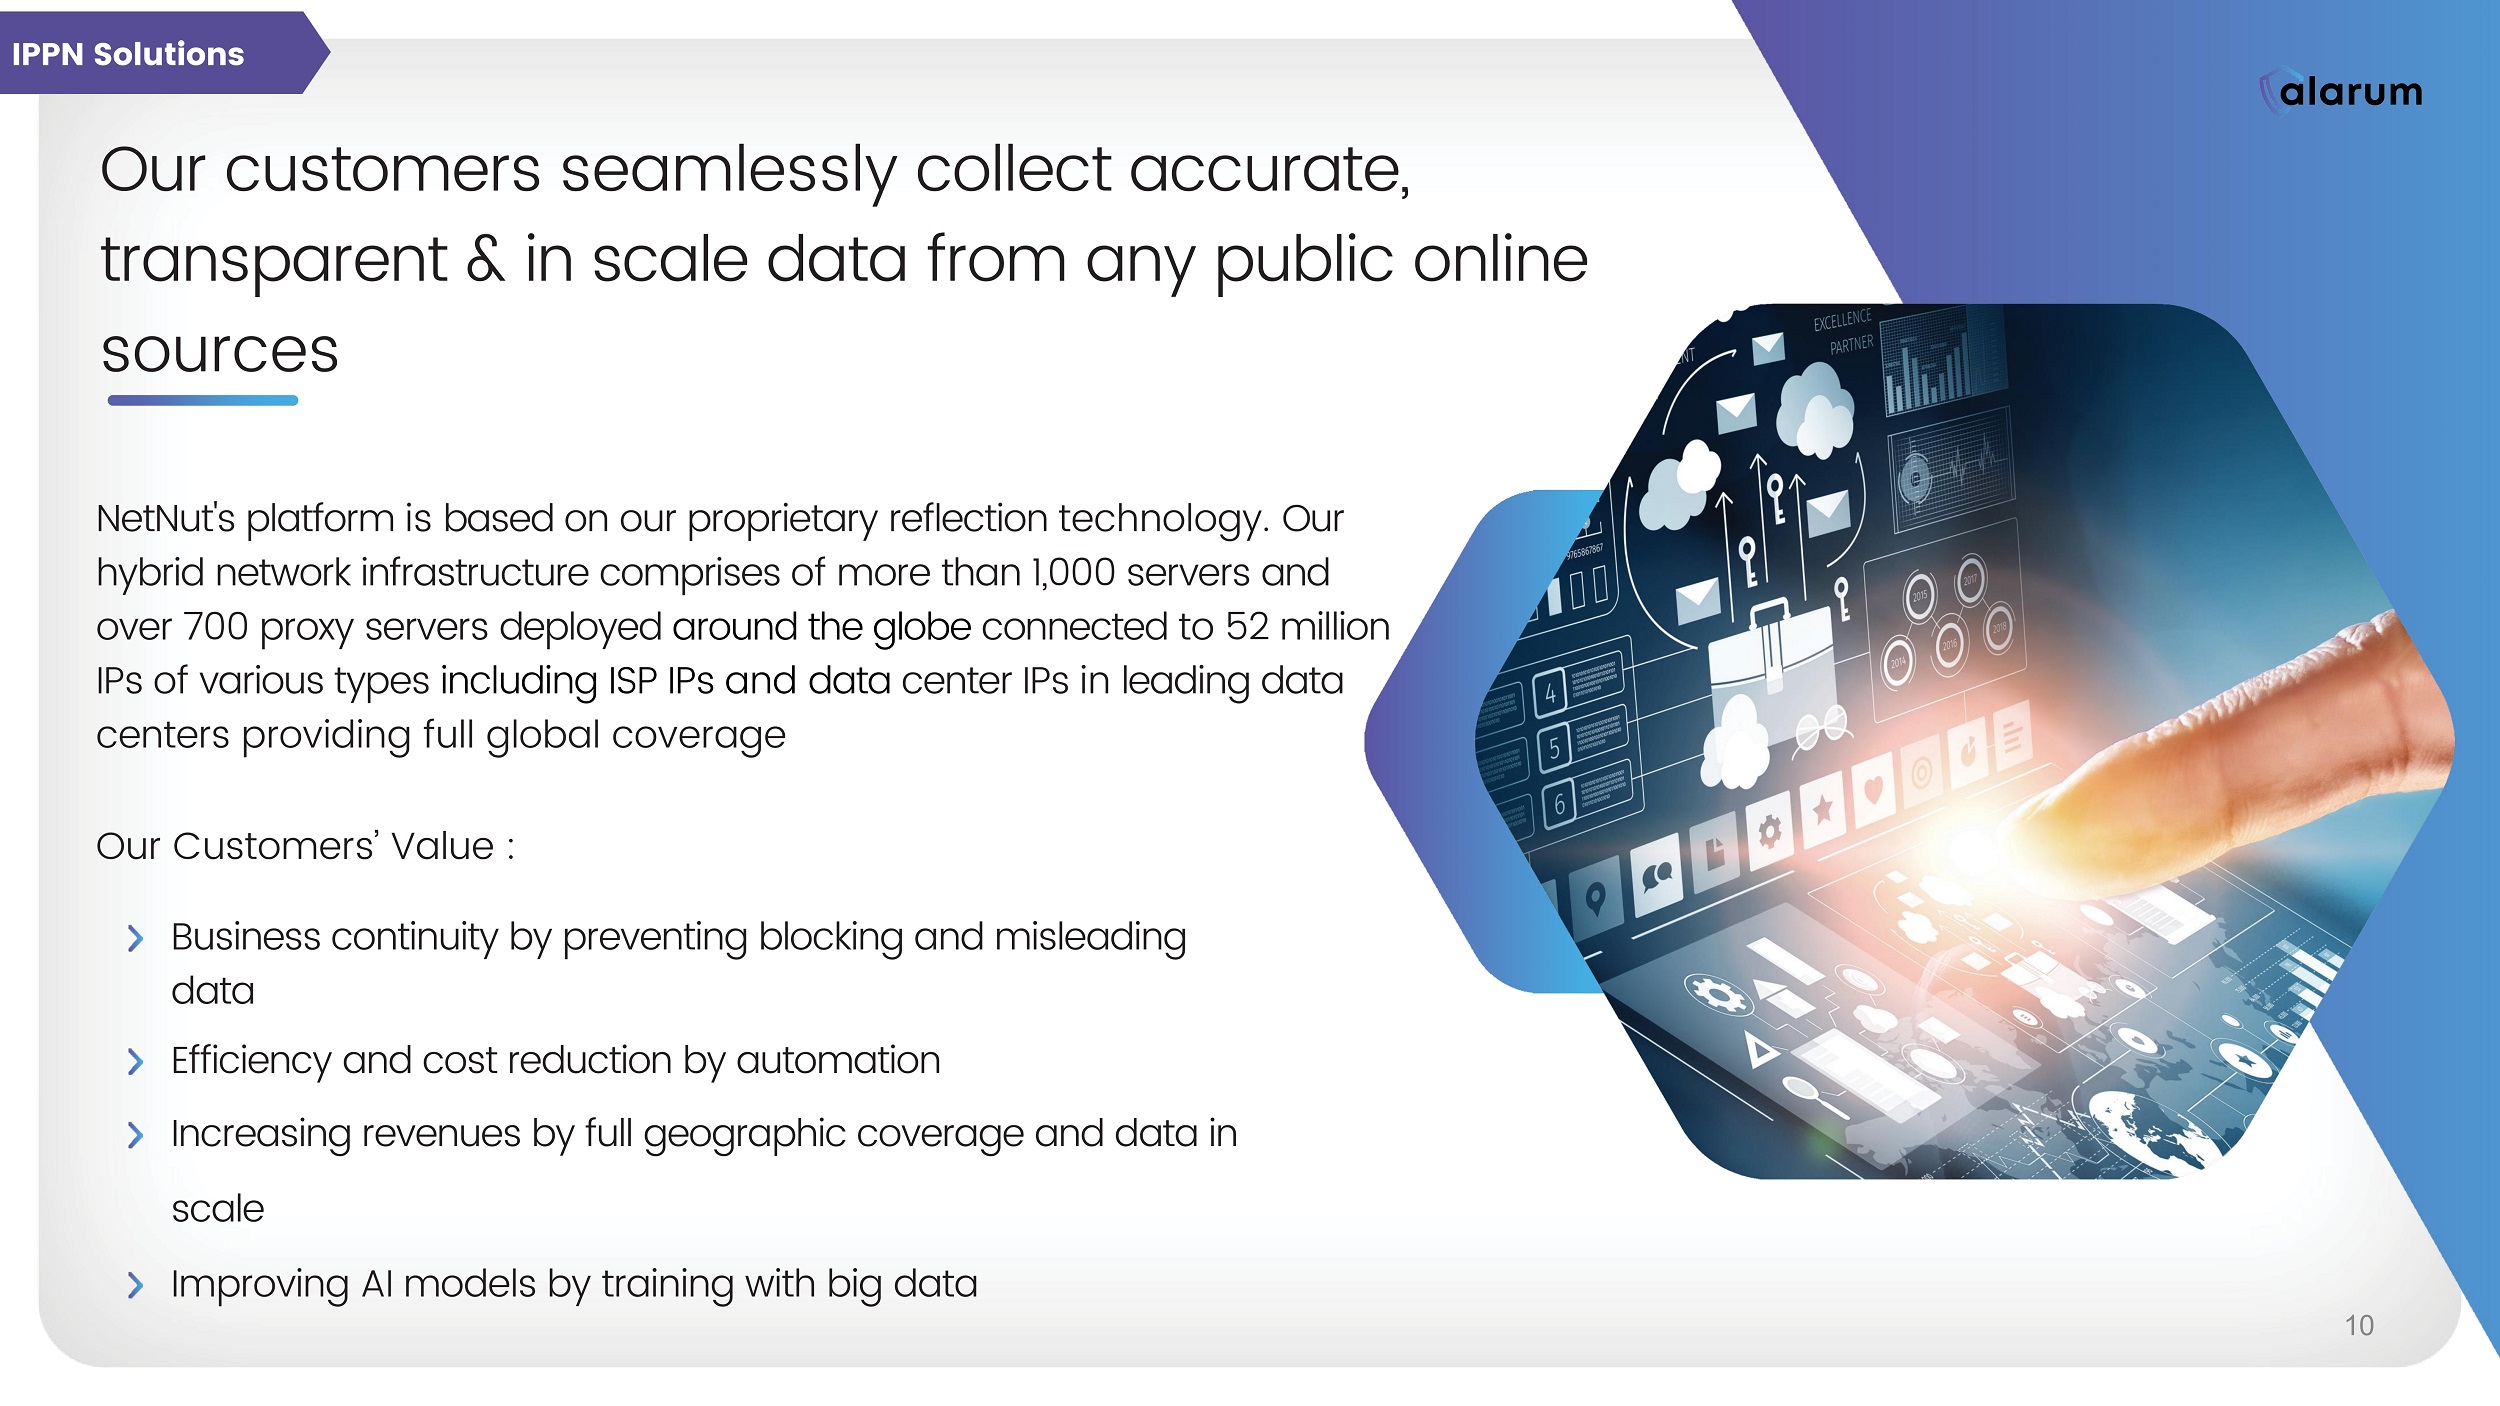
Our hybrid network infrastructure comprises of more than 1,000 servers and over 700 proxy servers deployed around the globe connected to 52 million IPs of various types including ISP IPs and data center IPs in leading data centers providing full global coverage Our Customers’ Value : Business continuity by preventing blocking and misleading data Efficiency and cost reduction by automation Increasing revenues by full geographic coverage and data in scale Improving AI models by training with big data IPPN Solutions 10 Selected Use Cases Ad verification Our ad network customers view their advertisers' landing pages to ensure they don't contain malware or improper ads.
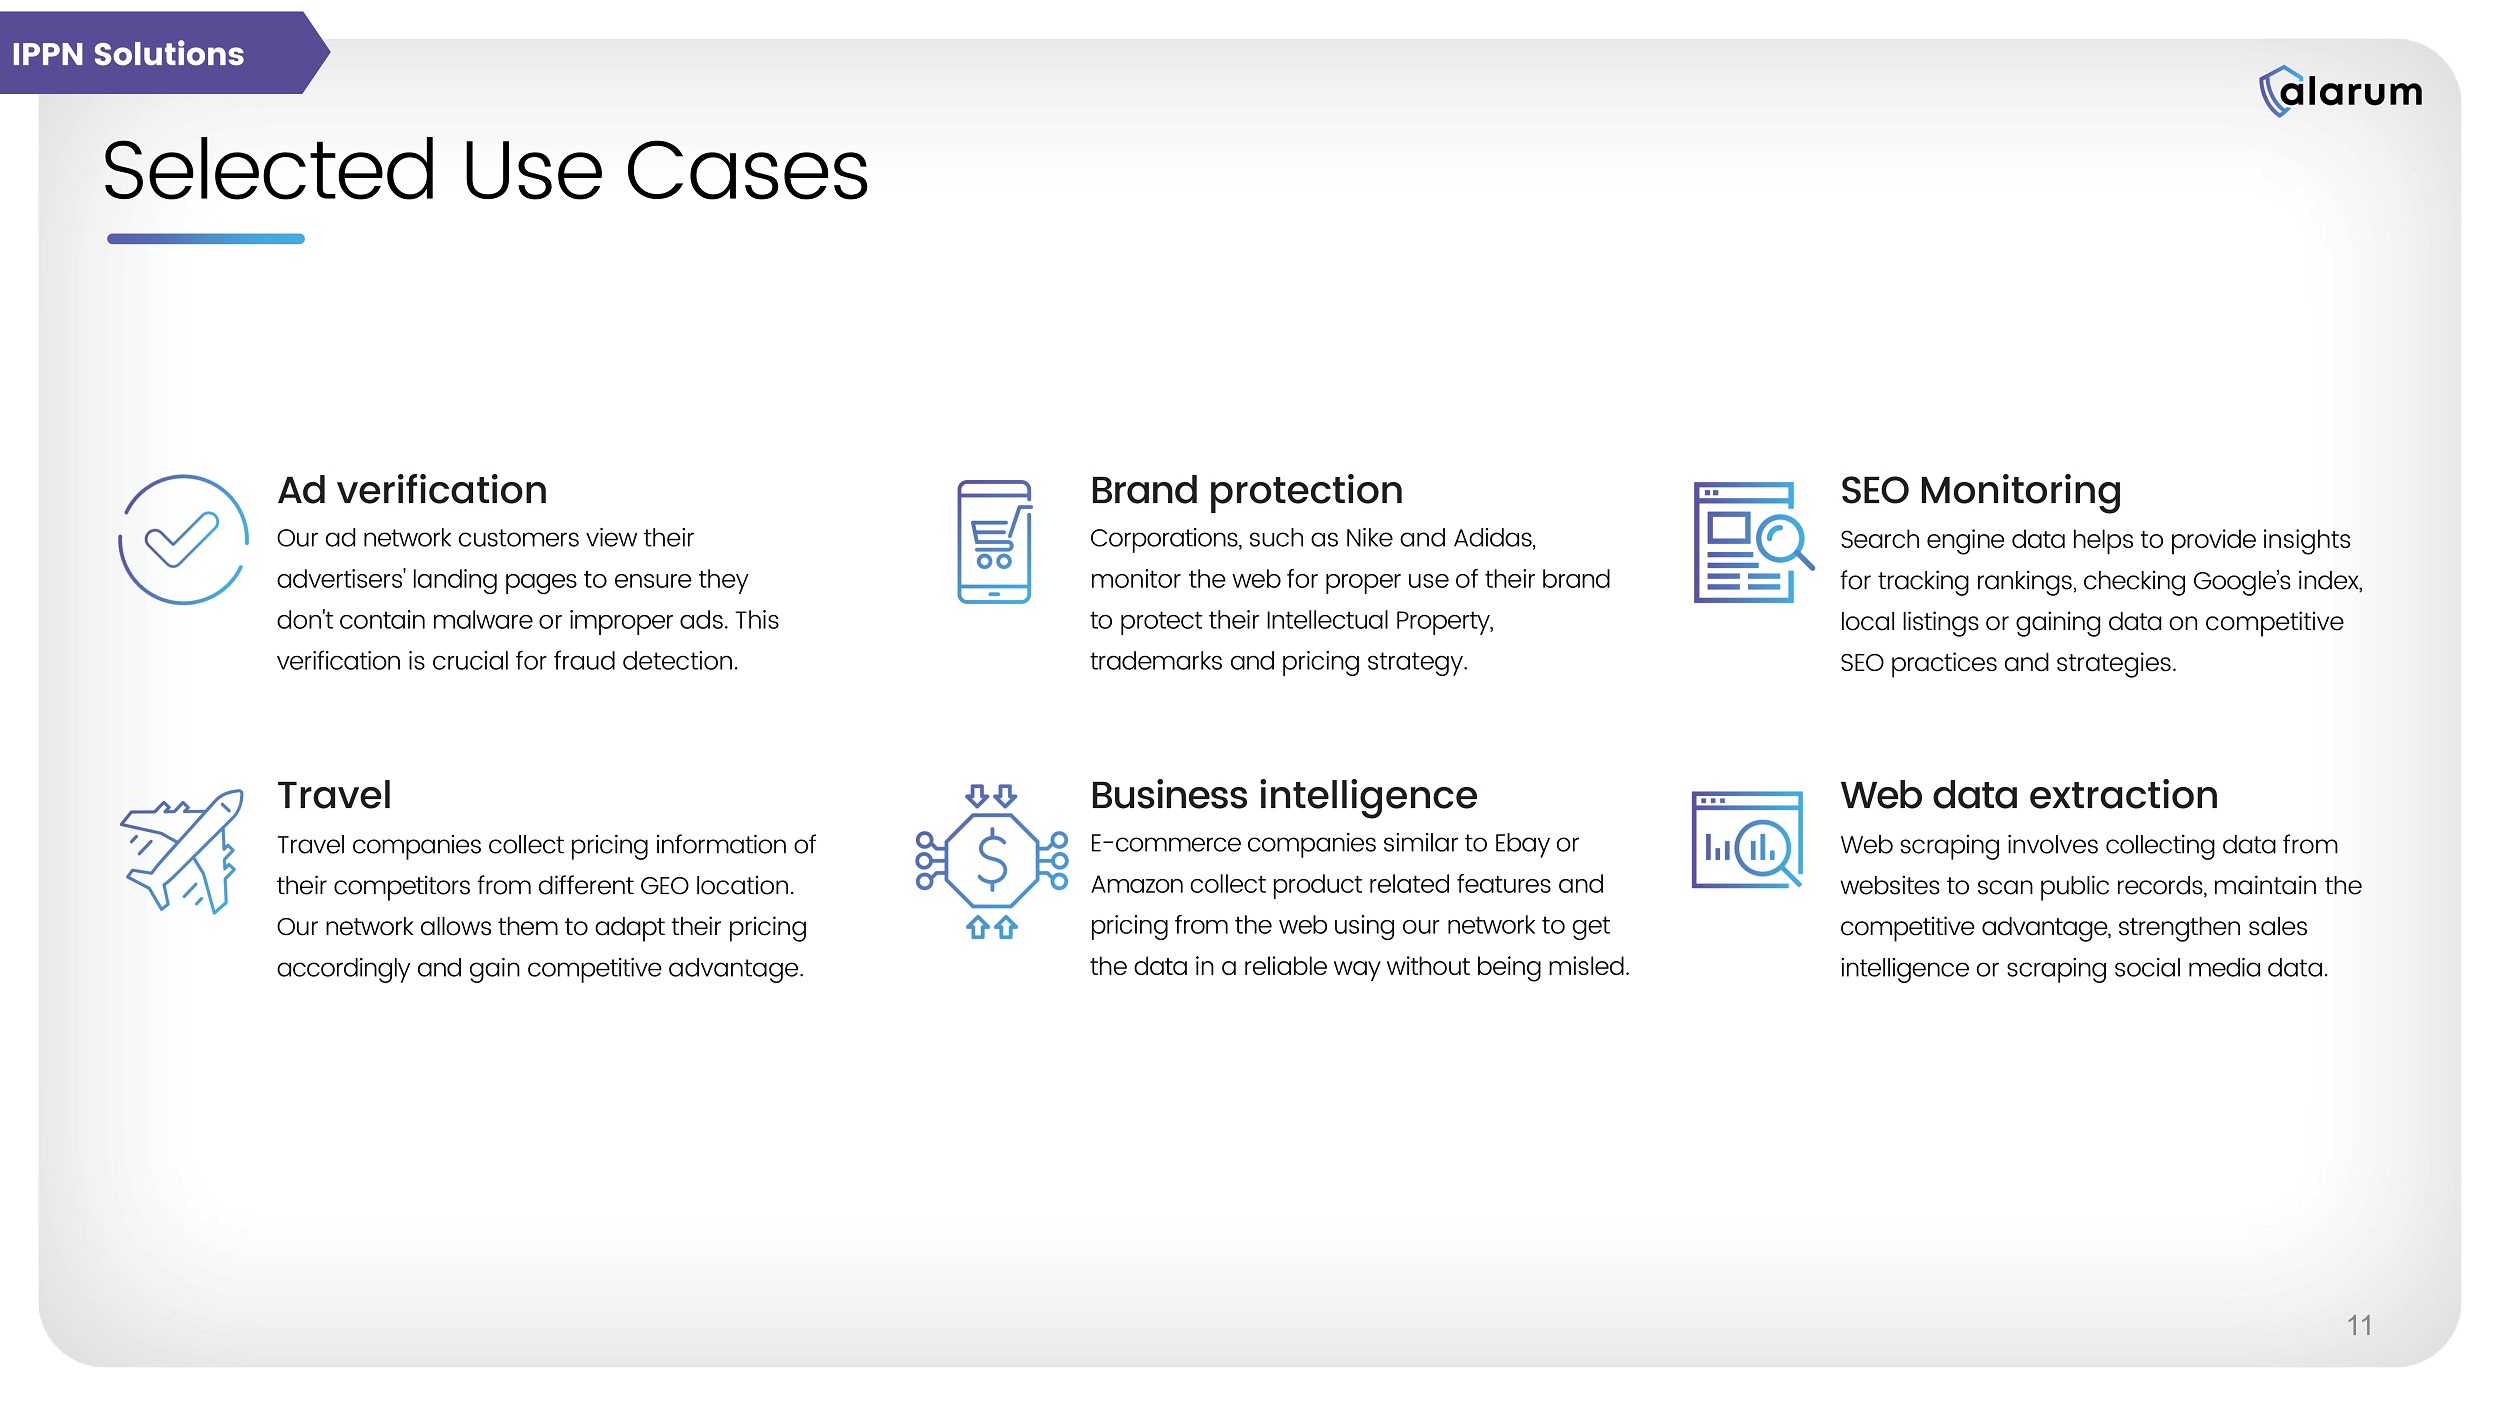
This verification is crucial for fraud detection. Travel Travel companies collect pricing information of their competitors from different GEO location. Our network allows them to adapt their pricing accordingly and gain competitive advantage. Brand protection Corporations, such as Nike and Adidas, monitor the web for proper use of their brand to protect their Intellectual Property, trademarks and pricing strategy. Business intelligence E - commerce companies similar to Ebay or Amazon collect product related features and pricing from the web using our network to get the data in a reliable way without being misled. SEO Monitoring Search engine data helps to provide insights for tracking rankings, checking Google’s index, local listings or gaining data on competitive SEO practices and strategies. Web data extraction Web scraping involve s collecting data from websites to scan public records, maintain the competitive advantage, strengthen sales intelligence or scraping social media data.

IPPN Solutions 11 Customer Case Study: Dynamic Pricing Company Success with NetNut’s Network Challenges Our Value By leveraging NetNut's advanced proxy solutions, the Dynamic Pricing Company achieved remarkable improvements in its web data collection processes. These enhancements have directly contributed to the company's ability to provide more efficient and effective dynamic pricing services to its clients. Solutions Provided by NetNut Customer a nd Industry Profile The company experienced significant difficulties in collecting vast amounts of data from various sites in real - time. Ensuring the localization of data was also a critical concern. Due to the extensive scale of the data collection effort, issues with reliability and challenges in circumventing blocking mechanisms were common. NetNut delivered a comprehensive solution to the company, seamlessly integrating both rotating residential and data center proxies. This fusion of offerings allowed the company to customize its web data collection strategies for each target site, ensuring the use of the most appropriate IP product. Concurrently, this approach facilitated cost - saving measures without sacrificing quality. 12B requests/month 1,020T of data collection 99% success rates on average Using 52M+ IPs from various countries worldwide IPPN Solutions Based in the USA, the Dynamic Pricing Company has a global team spread across 15 countries and customers in 100+ countries spread across all six continents. The company offers an innovative data driven solution which dynamically manage pricing and rates based on real - time: help vacation rentals increase revenues and save them hours in the process. 12 Data Collection Landscape NetNut's Robust Network NetNut AI Data Collector Product Line Data Sets Data insights Website Unblocker Google SERP Scraper API IPPN Solutions Data Collection and Labelling Data insights Data sets Data Collector 13

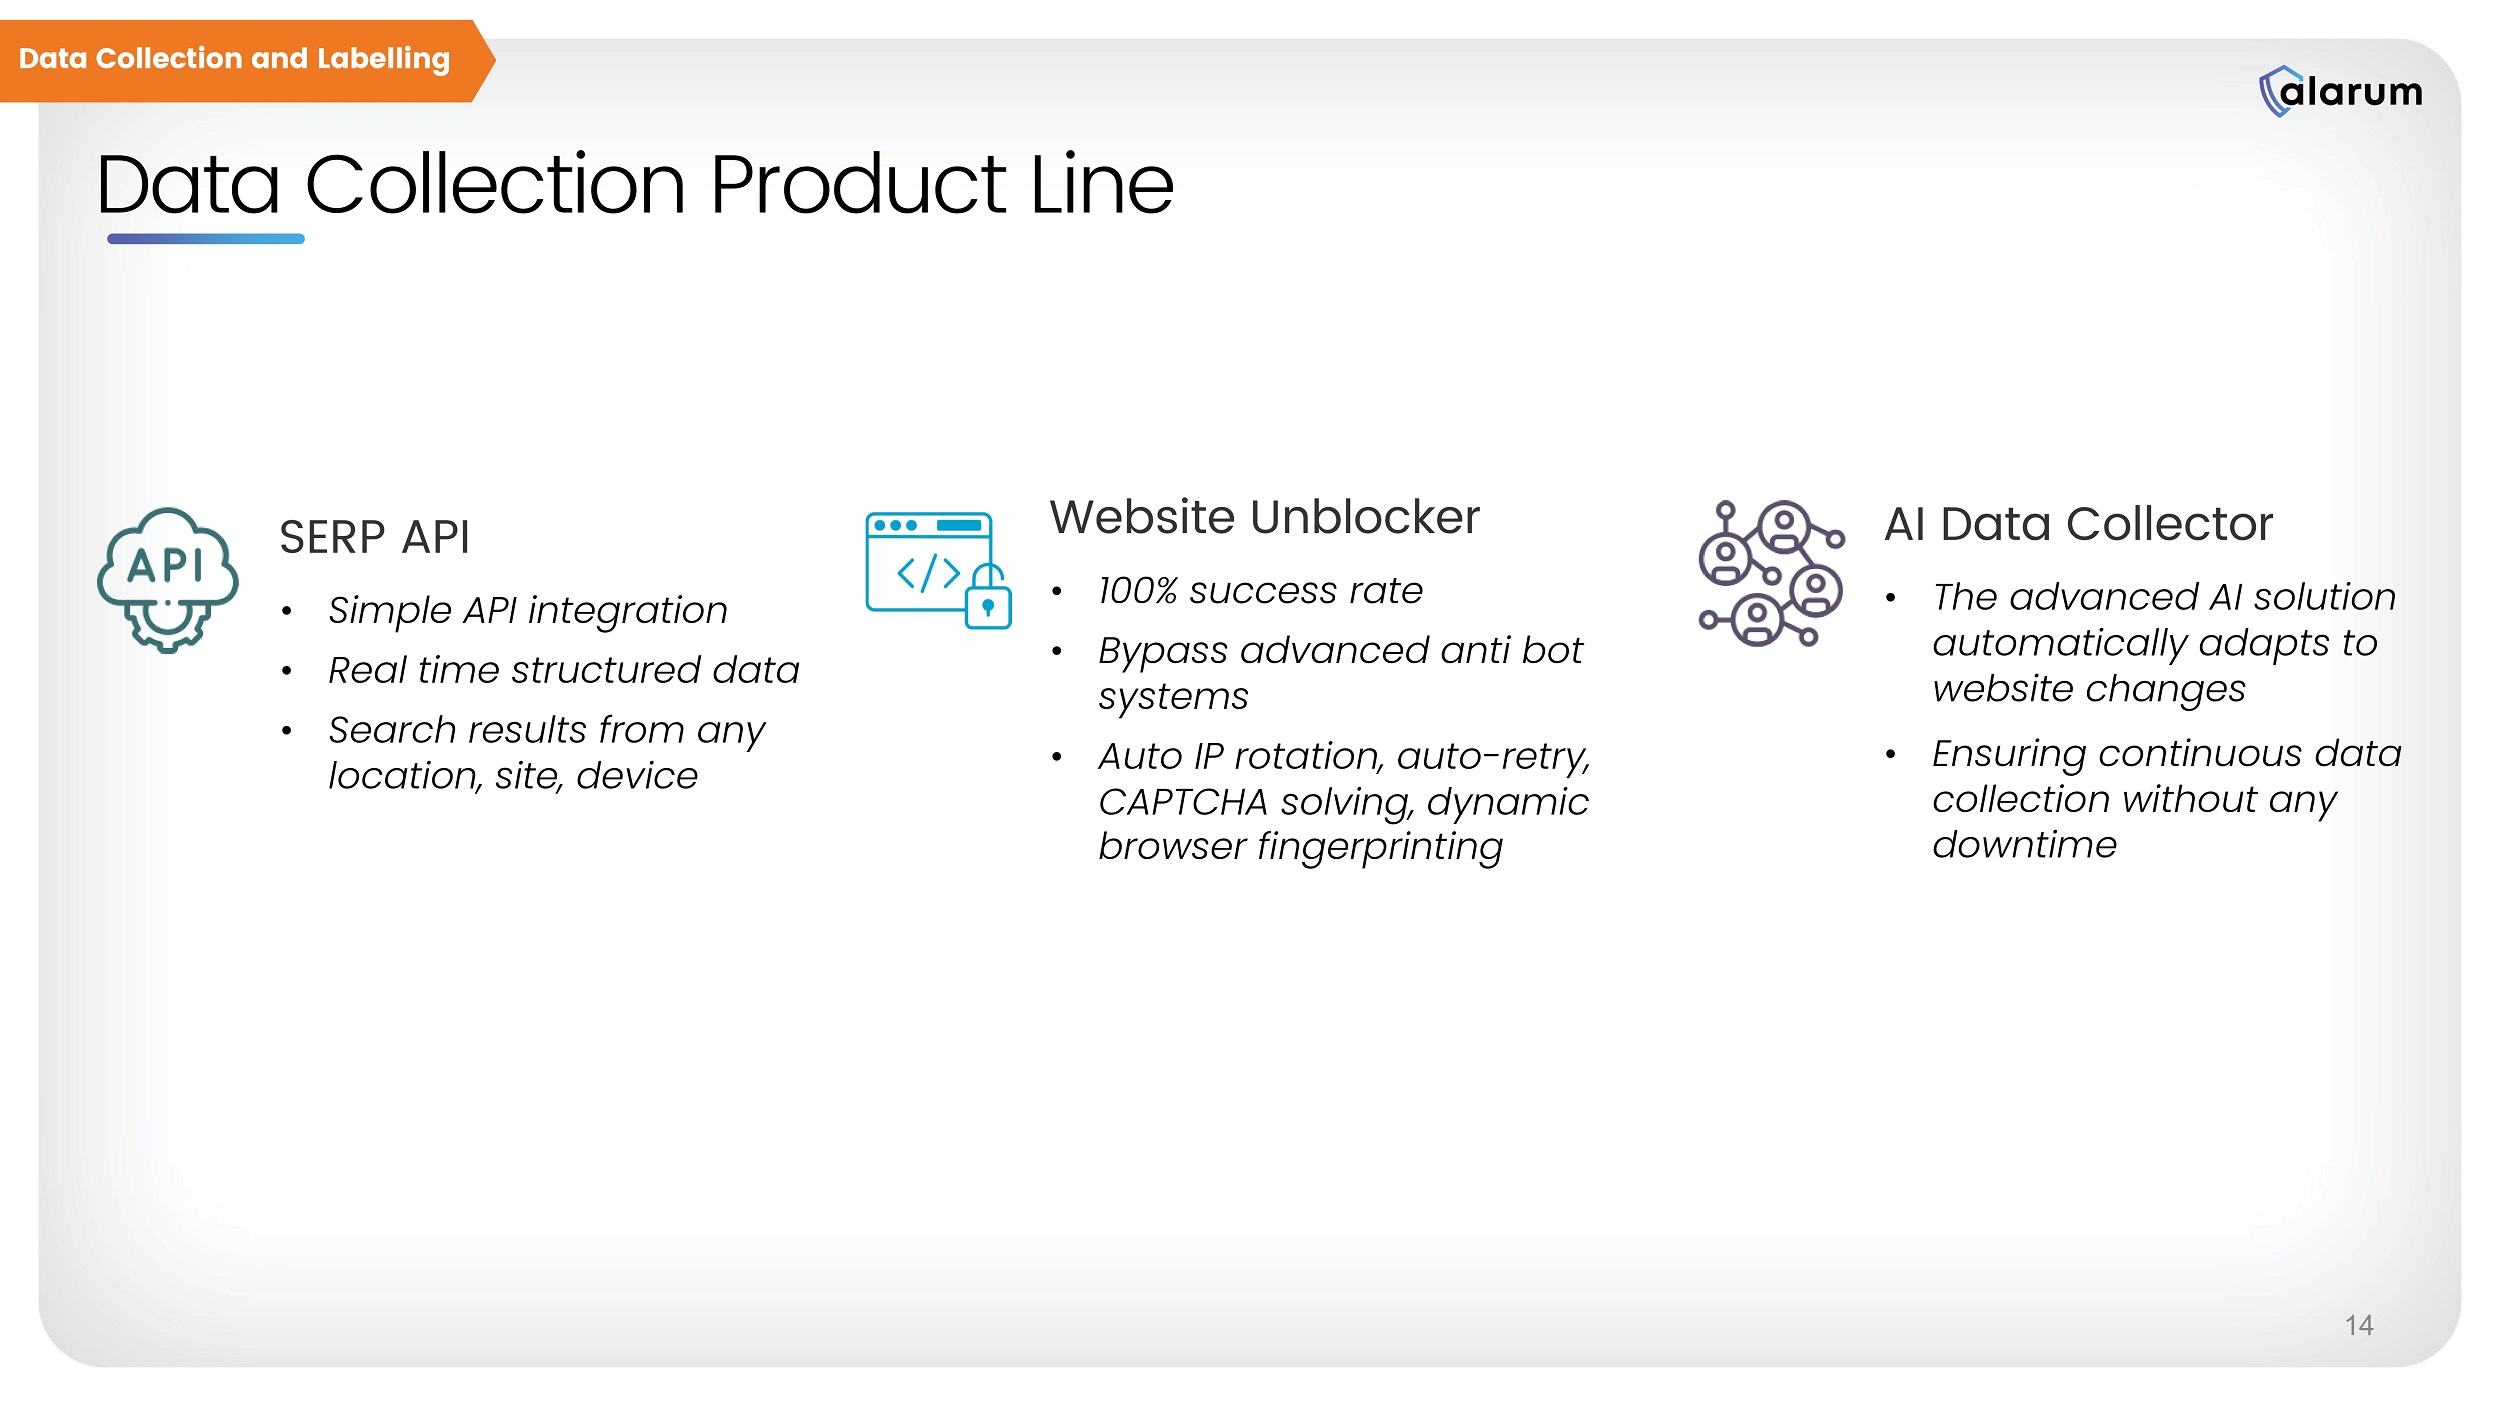
Website Unblocker • 100 % success rate • Bypass advanced anti bot systems • Auto IP rotation, auto - retry, CAPTCHA solving, dynamic browser fingerprinting AI Data Collector • The advanced AI solution automatically adapts to website changes • Ensuring continuous data collection without any downtime SERP API • Simple API integration • Real time structured data • Search results from any location, site, device Data Collection Product Line Data Collection and Labelling 14 In Launch: AI Data Collector Enables enterprises to effortlessly generate a data collector within minutes, thanks to its intuitive, no - code interface.
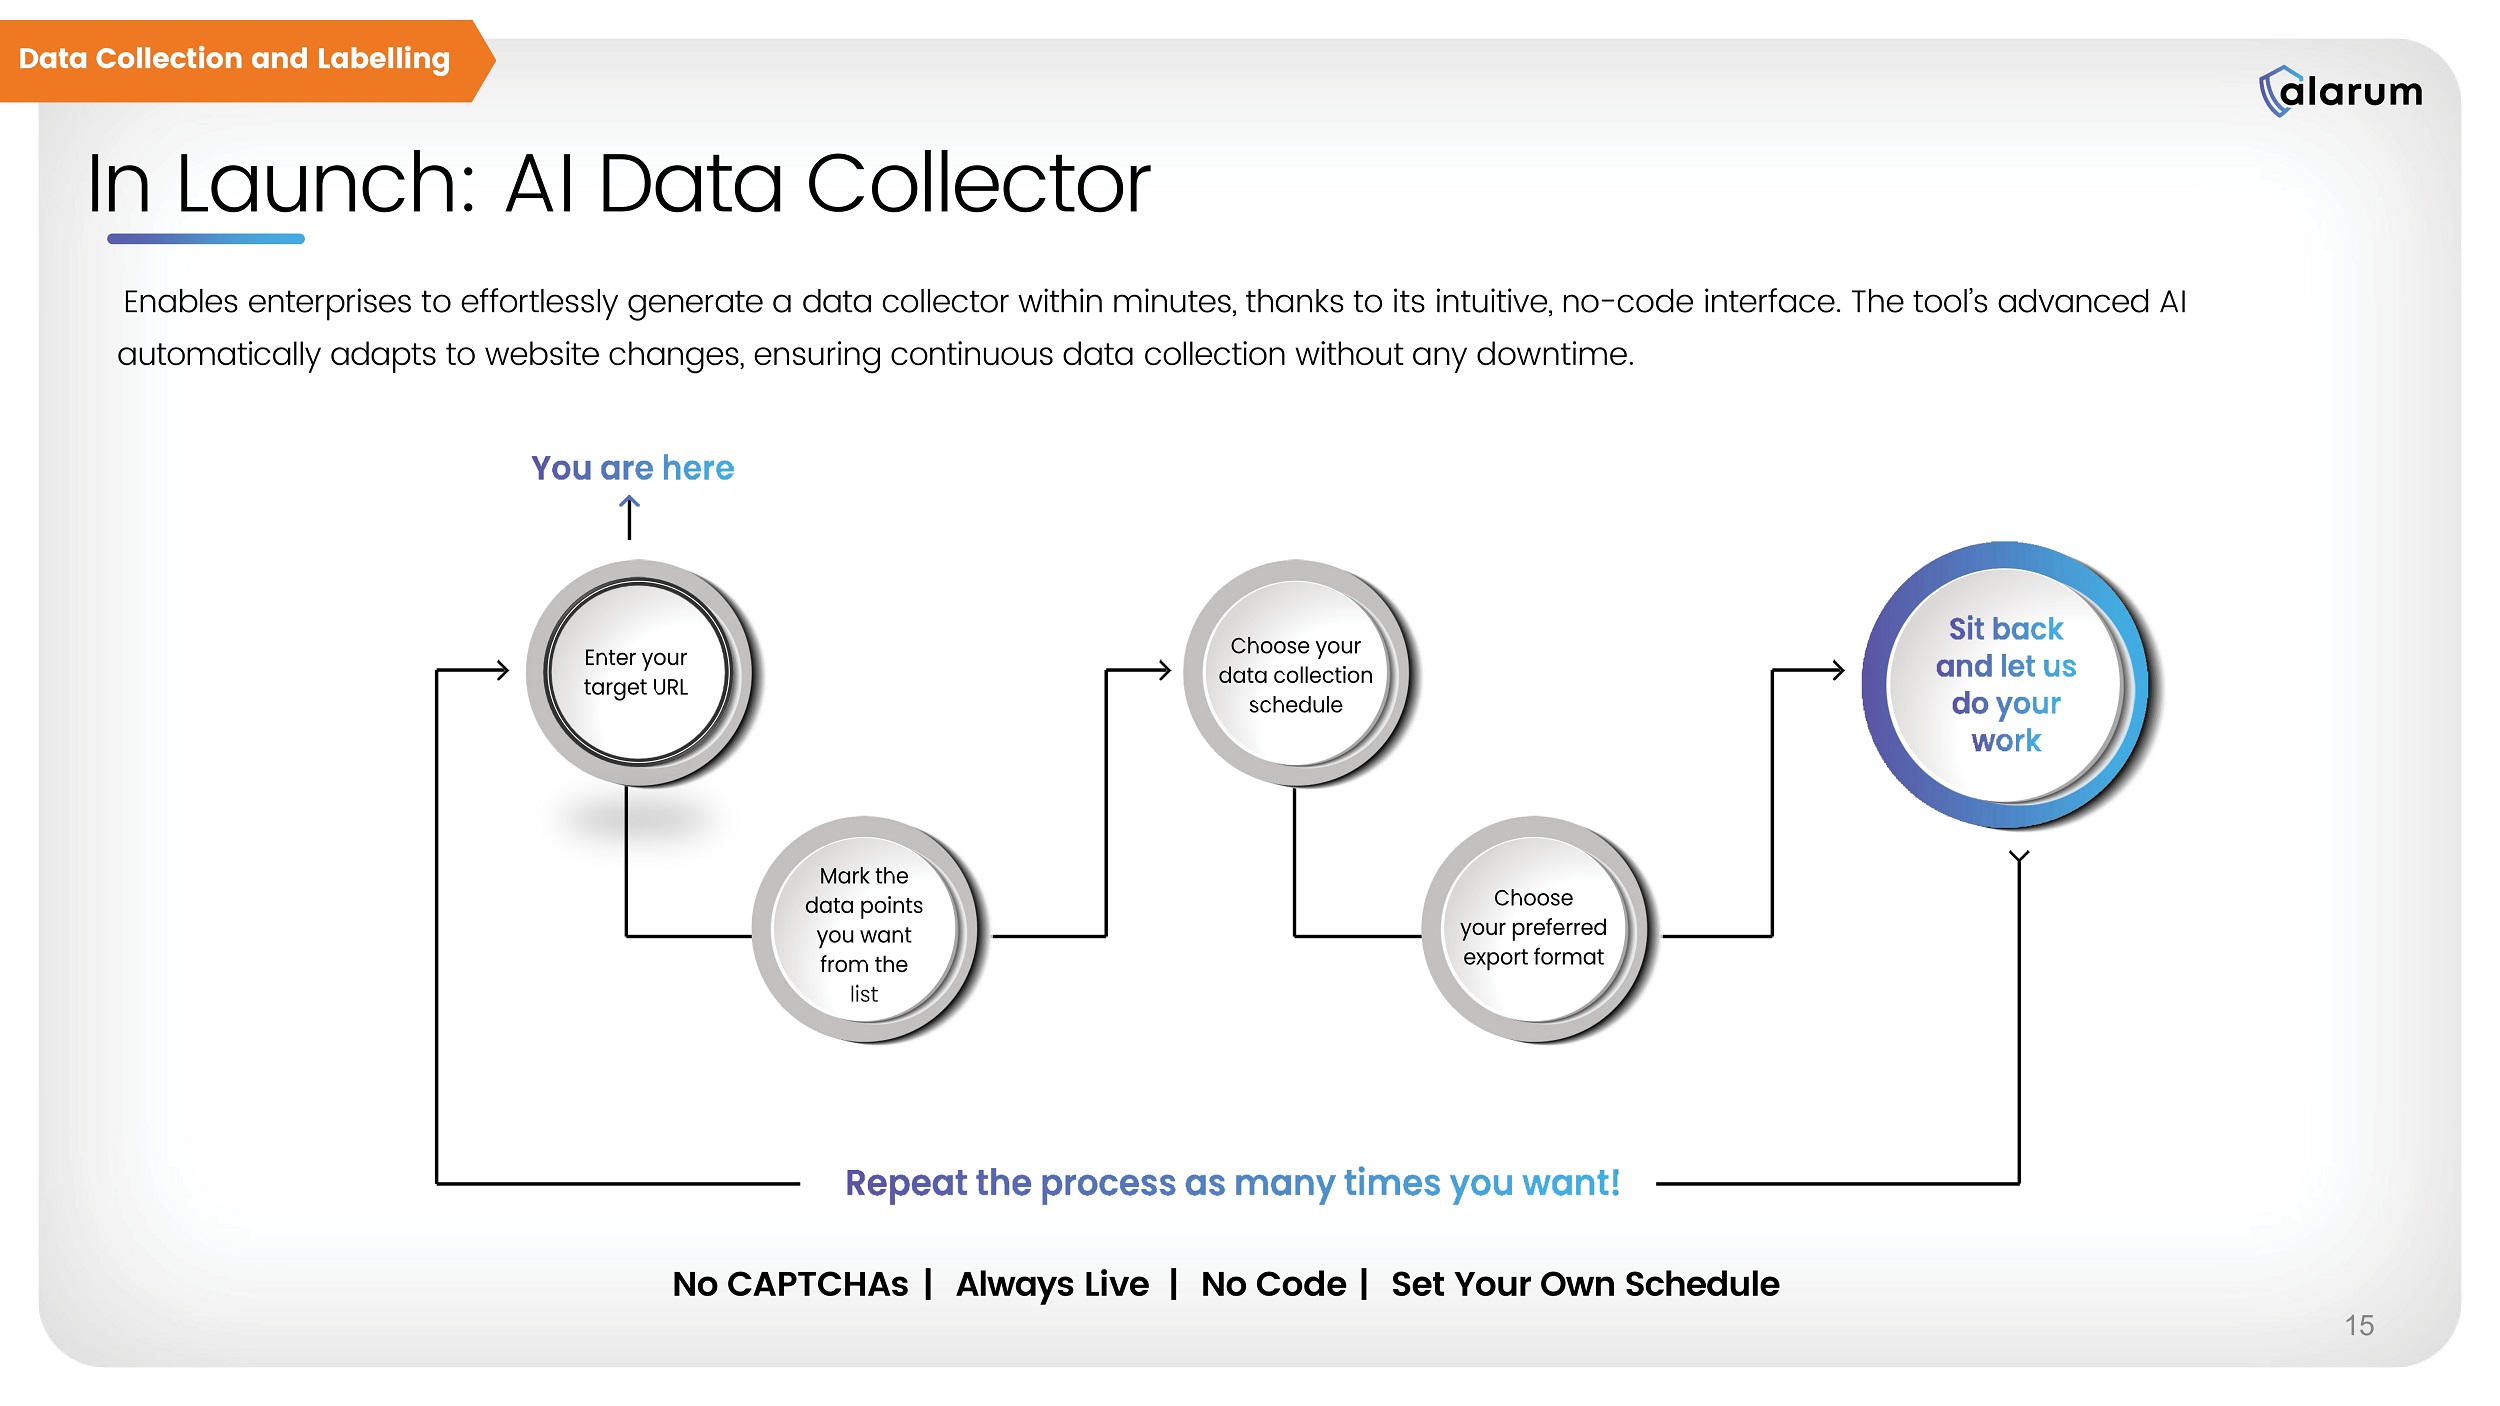
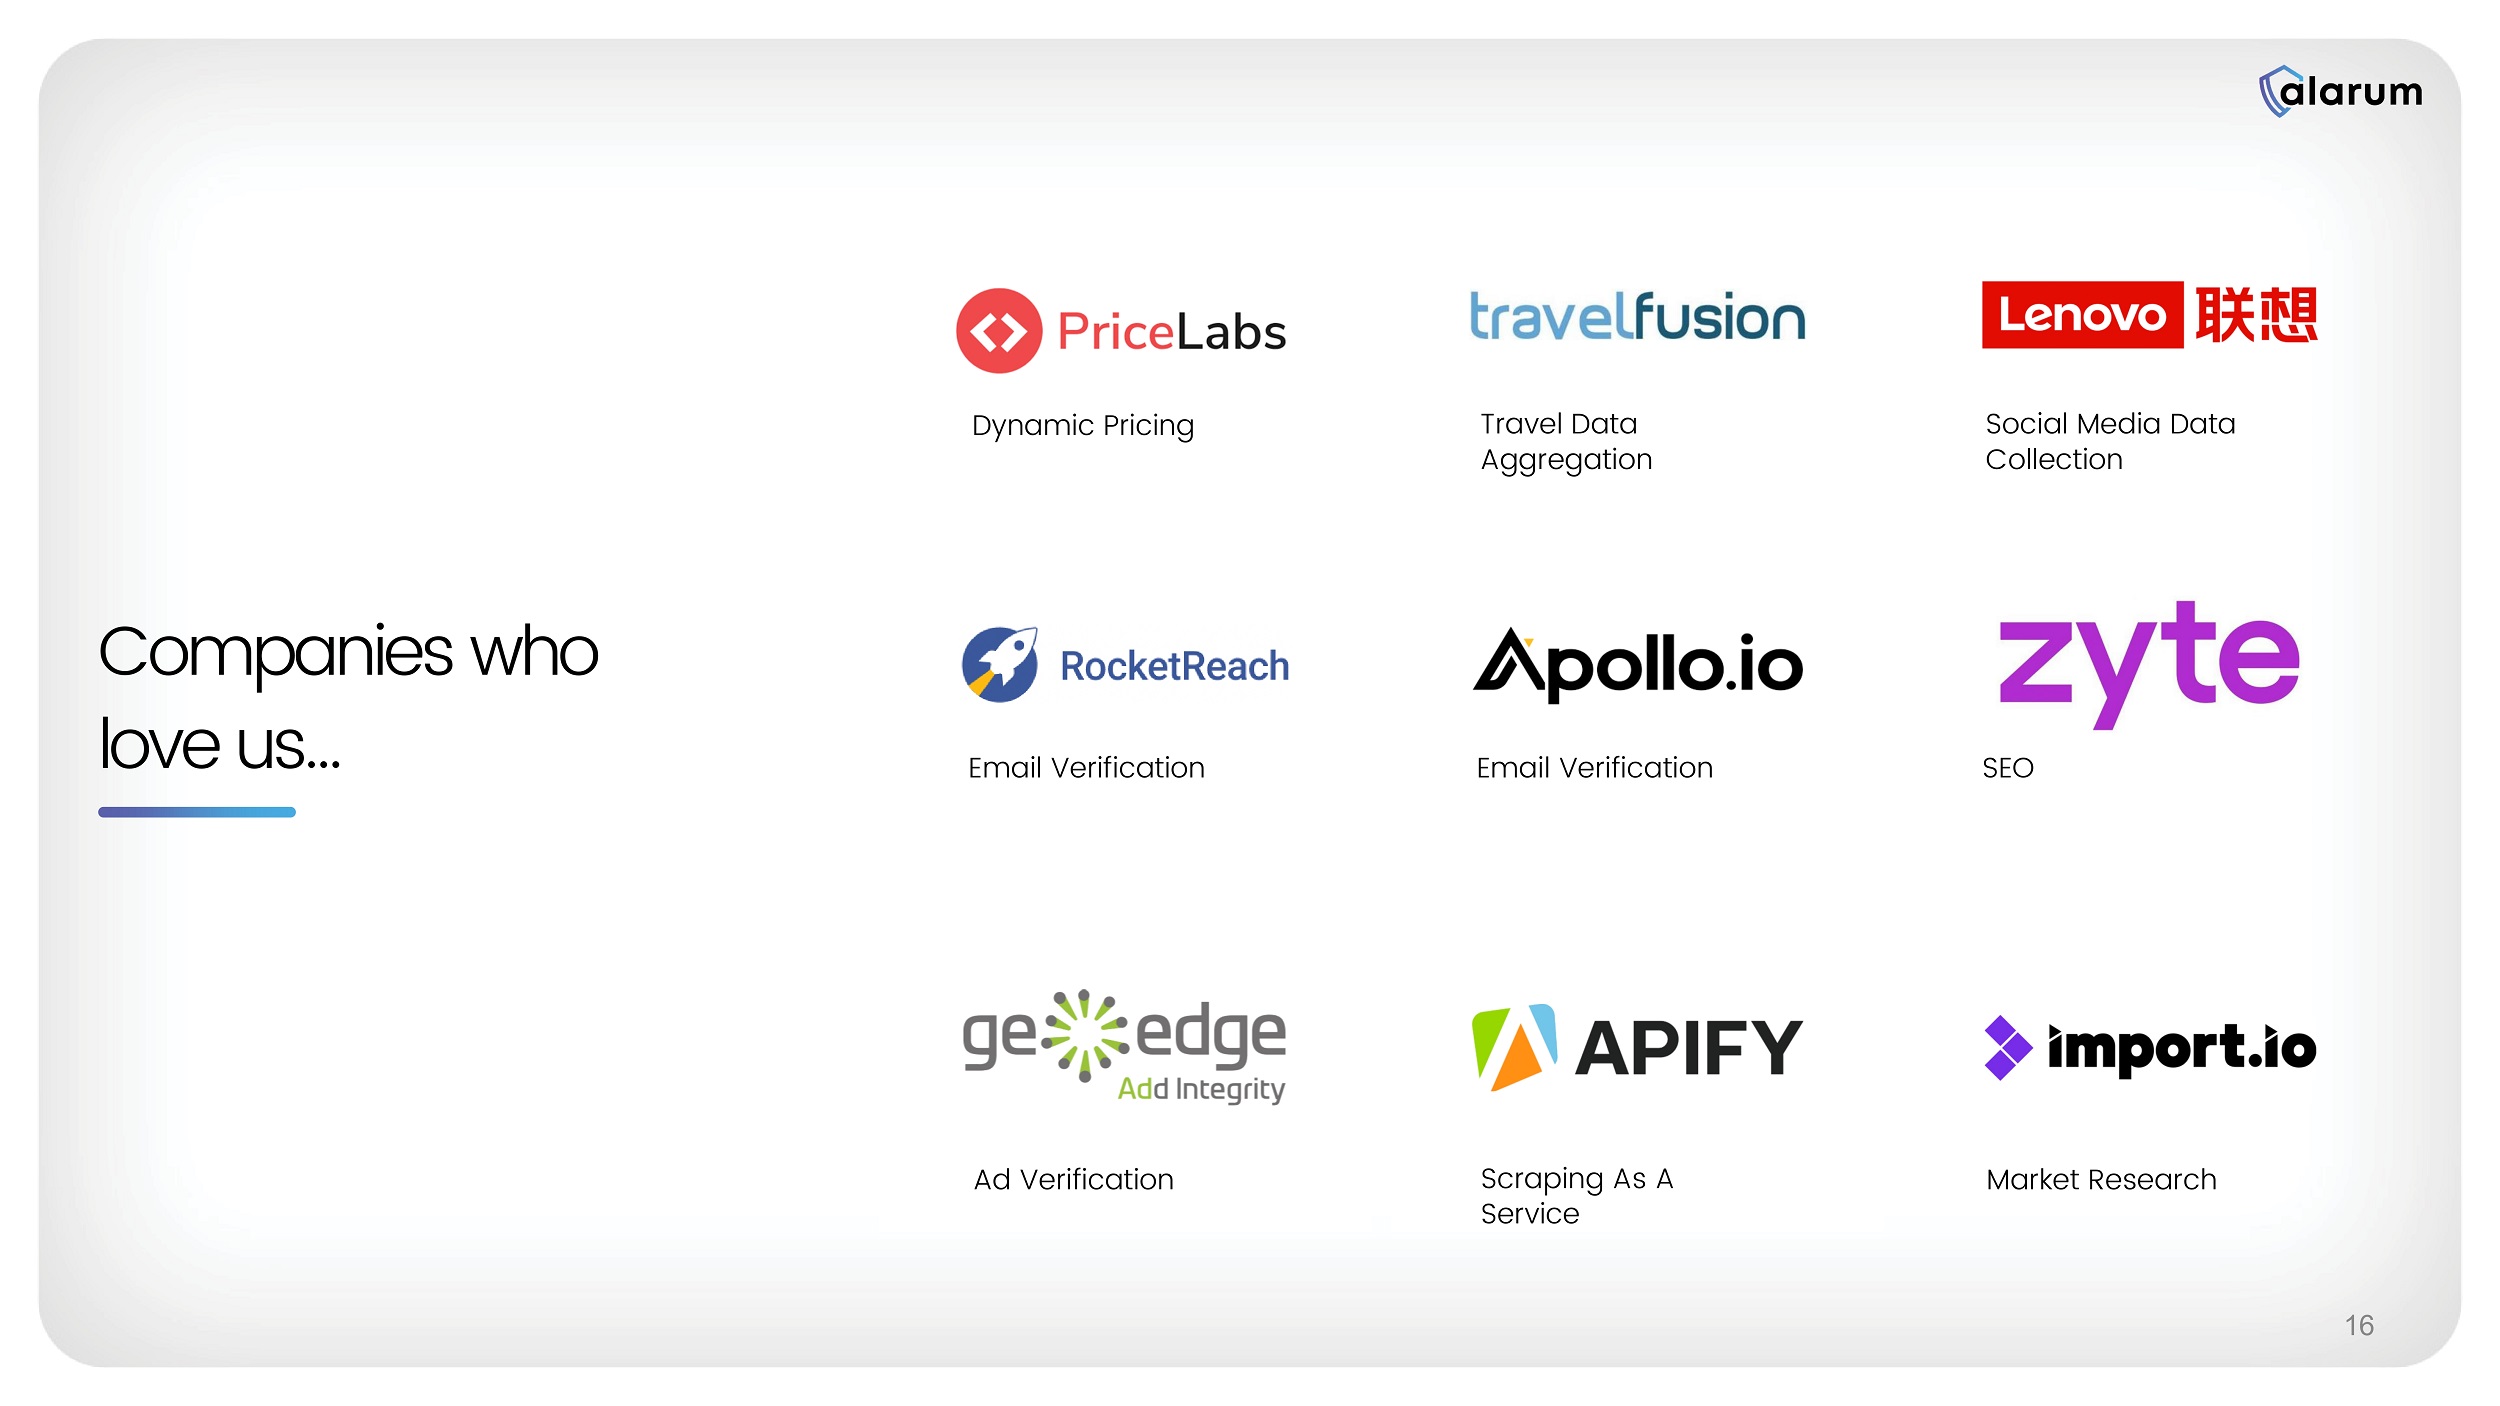
The tool’s advanced AI automatically adapts to website changes, ensuring continuous data collection without any downtime. No CAPTCHAs | Always Live | No Code | Set Your Own Schedule Data Collection and Labelling 15 Companies who love us… Dynamic Pricing 16 Email Verification Ad Verification Travel Data Aggregation Email Verification Scraping As A Service Social Media Data Collection SEO Market Research


Alarum - Exceptional Annual Revenue Growth Revenue increased 1700% (x18) Over five years $4.9 M $3.3 M $1.4 M $10.3 M $18.8 M $26.5 M 2023 2018 2019 2020 2021 2022 17 Customer Breakdown 2023 Travel Digital Marketing SEO Google People Data Brand Protection Sneakers Market Research eCommerce Automated Data Collection Ad verification Social Media Ticketing Sales Intelligence Re - Seller VPN X> $1,000,000 $5.8 million $9.9 million $4.7 million $0.8 million $0.1 million $100,000 <X< $1,000,000 $10,000 <X< $100,000 $1,000 <X< $10,000 0 <X< $1,000 85 48 43 19 17 14 3 34 131 196 591 20 18 17 NetNut: Revenue Growth and Operating Profit 2$M H1 2021 $3 M H2 2021 $2.2 M H1 2022 $0.1 M H2 2022 $2.2M H1 2023 Revenues Increased 350% Operating Profit (Loss) H1 2021 H1 2022 H1 2023 H2 2021 H2 2022 $3.5 M $2.8 M $3.7 M $4.8 M $8.4 M H2 2023 $12.9M $4.2M H2 2023 19


Customer S uccess NetNut’s Net Retention Rates We calculate our NRR as of a period end by starting with the Annual Recurring Revenues (ARR) from the cohort of all customers as of 12 months prior to such period - end, or the Prior Period ARR . We then calculate the ARR from these same customers as of the current period - end, or the Current Period ARR . Current Period ARR includes any expansion and is net of contraction or attrition over the last 12 months but excludes ARR from new customers in the current period . We then divide the Current Period ARR by the Prior Period ARR to arrive at the point - in - time NRR . We then calculate the average of the trailing four quarter point - in - time NRR to arrive at the NRR . 31.12.23 30.09.23 1.44 1.53 Net Retention Rates (NRR) represent the average growth rates of current customers only, without the revenues generated from new customers, but including up - sales and cross - sales on one hand and churn on the other hand. NRR greater than 100% indicates that the company experiences revenue growth from its existing customer base in the specific period even after accounting for lost revenue due to customers’ churn. Conversely, an NRR lower than 100% suggests that the company loses revenue from existing customers in the specific period due to churn which is higher than revenue gain through up - sells or cross - sells.
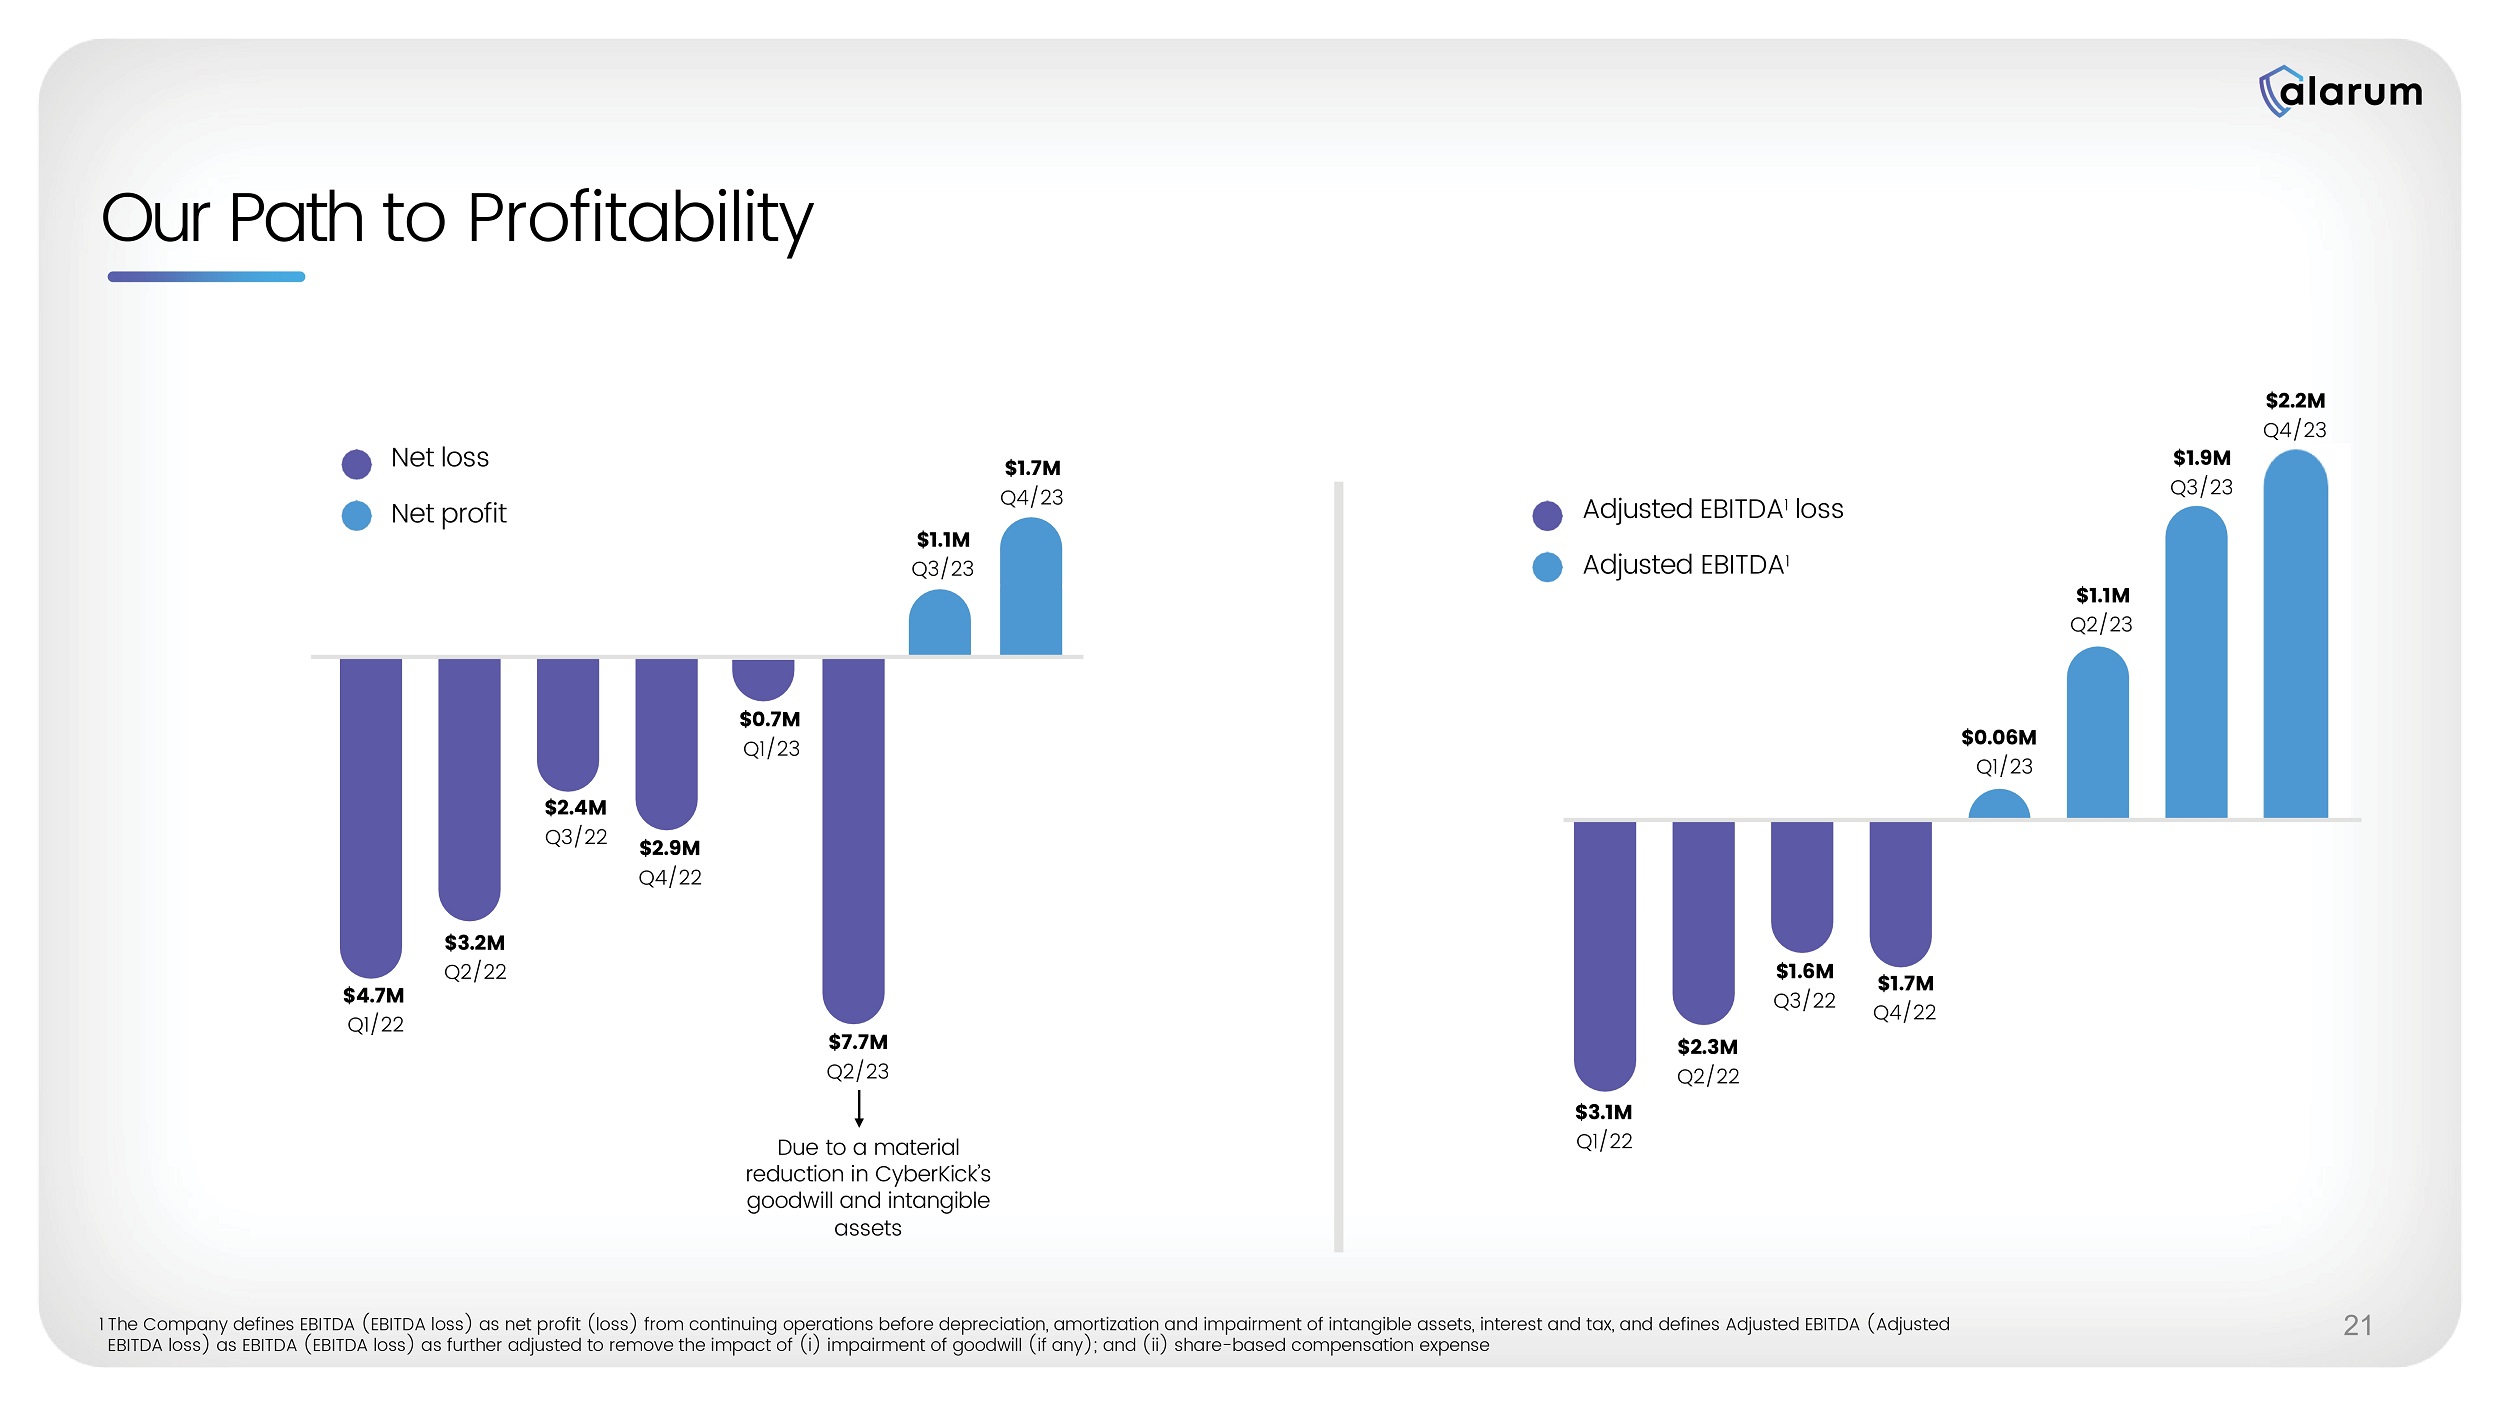
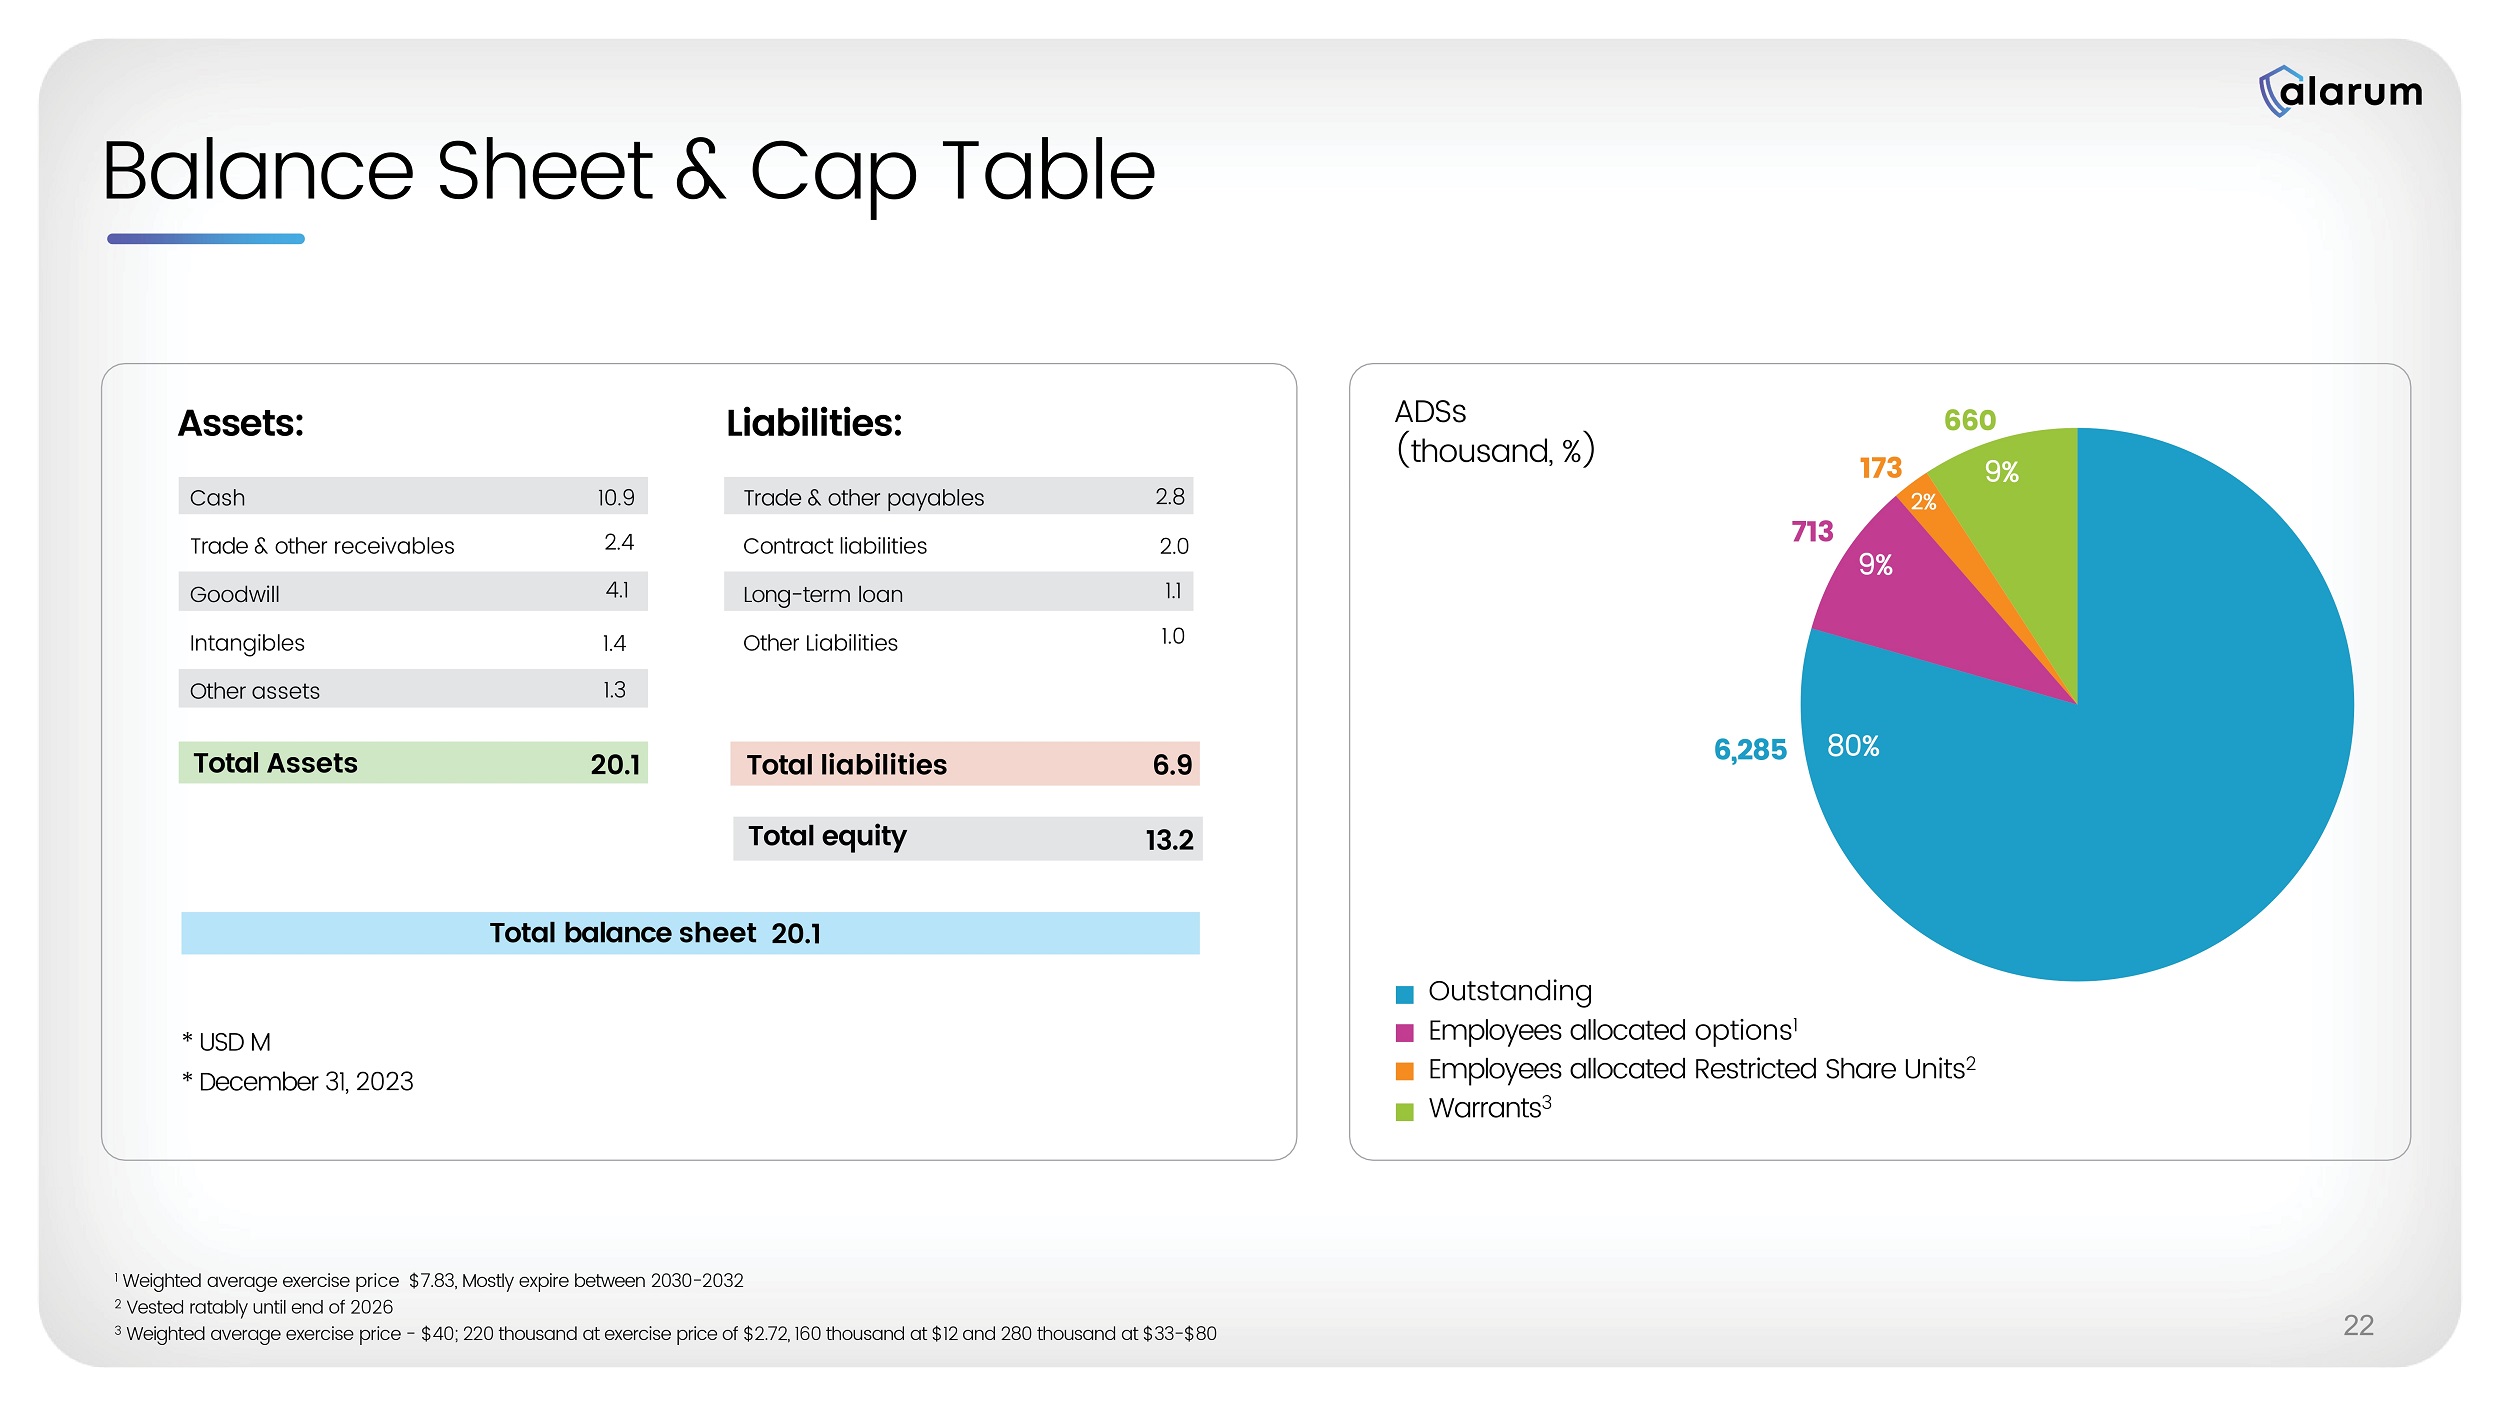
In NetNut we have high NRR in 2023 - one of the reasons for the 2023 rapid revenue growth 20 Our Path to Profitability 1 The Company defines EBITDA (EBITDA loss) as net profit (loss) from continuing operations before depreciation, amortization and impairment of intangible assets, interest and tax, and defines Adjusted EBITDA (Adjusted EBITDA loss) as EBITDA (EBITDA loss) as further adjusted to remove the impact of (i) impairment of goodwill (if any); and (ii) share - based compensation expense 21 $3.1M Q1/22 $2.3M Q2/22 $1.6M Q3/22 $1.7M Q4/22 $0.06M Q1/23 $1.1M Q2/23 $1.9M Q3/23 Adjusted EBITDA 1 loss Adjusted EBITDA 1 $2.2M Q4/23 Net loss Net profit $4.7M Q1/22 $3.2M Q2/22 $2.4M Q3/22 $2.9M Q4/22 $0.7M Q1/23 $7.7M Q2/23 $1.1M Q3/23 Due to a material reduction in CyberKick’s goodwill and intangible assets $1.7M Q4/23 Balance Sheet & Cap Table Assets: * USD M * December 31, 2023 Trade & other receivables Goodwill Total Assets 20.1 Liabilities: Total equity 13.2 Long - term loan Other Liabilities Total balance sheet 20.1 173 713 6,285 Outstanding Employees allocated options 1 Employees allocated Restricted Share Units 2 Warrants 3 ADSs (thousand, %) 1 Weighted average exercise price $7.83, Mostly expire between 2030 - 2032 2 Vested ratably until end of 2026 3 Weighted average exercise price - $40; 220 thousand at exercise price of $2.72, 160 thousand at $12 and 280 thousand at $33 - $80 22 80% 9% 660 9% 2% Trade & other payables 2.8 Contract liabilities 2.0 1.1 1.0 Total liabilities 6.9 Cash 10.9 2.4 4.1 Intangibles 1.4 Other assets 1.3

Penetrate new territories Increase Network infrastructure, Geo coverage and end points Add AI and analysis capabilities to our data product to deliver end to end solution for end customers Engagement with Fortune 500 customers Web unblocker distribution AI Scraper 23 Leadership Chen Katz Chairman of the Board Shachar Daniel Chief Executive Officer, Co - Founder, Director Shai Avnit Chief Financial Officer Ezra Muallem Chief Operating Officer Moshe Kramer Senior V.P. R&D Jeffy Binhas Chief Revenue Officer Tomer Cohen Chief Technology Officer David Matrikin V.P. Product Strategy Eitan Bremler V.P. Product Dafna Lipowicz V.P. People Omer Weiss Corporate Legal Counsel 24


Achieved record net profit of $1.7 million and record Adjusted EBITDA of $2.2 million in Q4 2023 Record revenue for 2023 - $26.5 million Highly - scalable business model - 75%+ gross margins Innovation at the attractive growing market of data collection Record revenue and all time high operating cashflow for the fourth quarter of 2023 Key Takeaways 25 Thank You Investor Relations Michal Efraty Direct: +972 - 523044404 investors@alarum.io Alarum Technologies Ltd. Alarum Technologies Ltd. P.O. Box 174 30 Haarba'a Street Tel Aviv 6473925 Israel www.alarum.io NASDAQ / TASE : ALAR 26
