
2023 SB Financial Group, Inc. 10-K
UNITED STATES
SECURITIES AND EXCHANGE COMMISSION
Washington, D.C. 20549
FORM 10-K
(Mark One)
☒ ANNUAL REPORT PURSUANT TO SECTION 13 OR 15(d) OF THE SECURITIES EXCHANGE ACT OF 1934
For the fiscal year ended December 31, 2023
OR
☐ TRANSITION REPORT PURSUANT TO SECTION 13 OR 15(d) OF THE SECURITIES EXCHANGE ACT OF 1934
For the transition period from ___________ to ____________
Commission File Number 001-36785
SB FINANCIAL GROUP, INC.
(Exact name of Registrant as specified in its charter)
| Ohio | 34-1395608 | |
| (State or other jurisdiction of | (I.R.S. Employer | |
| incorporation or organization) | Identification No.) | |
| 401 Clinton Street, Defiance, Ohio | 43512 | |
| (Address of principal executive offices) | (Zip Code) | |
| Registrant’s telephone number, including area code: | (419) 783-8950 | |
|
Securities registered pursuant to Section 12(b) of the Act: |
||
| Title of each class | Trading Symbol(s) | Name of each exchange on which | ||
| Common Shares, No Par Value | SBFG |
The NASDAQ Stock Market, LLC (NASDAQ Capital Market) |
Securities registered pursuant to Section 12(g) of the Act:
Not Applicable
Indicate by check mark if the registrant is a well-known seasoned issuer, as defined in Rule 405 of the Securities Act. Yes ☐ No ☒
Indicate by check mark if the registrant is not required to file reports pursuant to Section 13 or Section 15(d) of the Act. Yes ☐ No ☒
Indicate by check mark whether the registrant (1) has filed all reports required to be filed by Section 13 or 15(d) of the Securities Exchange Act of 1934 during the preceding 12 months (or for such shorter period that the registrant was required to file such reports), and (2) has been subject to such filing requirements for the past 90 days. Yes ☒ No ☐
Indicate by check mark whether the registrant has submitted electronically every Interactive Data File required to be submitted pursuant to Rule 405 of Regulation S-T (§ 232.405 of this chapter) during the preceding 12 months (or for such shorter period that the registrant was required to submit such files). Yes ☒ No ☐
Indicate by check mark whether the registrant is a large accelerated filer, an accelerated filer, a non-accelerated filer, a smaller reporting company, or an emerging growth company. Non-Accelerated Filer ☒ Smaller Reporting Company ☒
If an emerging growth company, indicate by check mark if the registrant has elected not to use the extended transition period for complying with any new or revised financial accounting standards provided pursuant to Section 13(a) of the Exchange Act. ☐
Indicate by check mark whether the registrant has filed a report on and attestation to its management’s assessment of the effectiveness of its internal control over financial reporting under Section 404(b) of the Sarbanes-Oxley Act (15 U.S.C. 7262(b)) by the registered public accounting firm that prepared or issued its audit report. Yes ☐ No ☒
If securities are registered pursuant to Section 12(b) of the Act, indicate by check mark whether the financial statements of the registrant included in the filing reflect the correction of an error to previously issued financial statements. ☐
Indicate by check mark whether any of those error corrections are restatements that required a recovery analysis of incentive-based compensation received by any of the registrant’s executive officers during the relevant recovery period pursuant to §240.10D-1(b). ☐
Indicate by check mark whether the registrant is a shell company (as defined in Rule 12b-2 of the Exchange Act). Yes ☐ No ☒
The aggregate market value of the common shares of the registrant held by non-affiliates computed by reference to the closing price of the common shares as reported on the NASDAQ Capital Market as of June 30, 2023 (the last business day of the registrant’s most recently completed second fiscal quarter) was $85.9 million. For this purpose, executive officers and directors of the registrant are considered affiliates.
The number of common shares of the registrant outstanding at February 23, 2024 was 6,787,451.
DOCUMENTS INCORPORATED BY REFERENCE
Portions of the Registrant’s definitive Proxy Statement for its Annual Meeting of Shareholders to be held on April 17, 2024 are incorporated by reference into Part III of this Annual Report on Form 10-K.
SB FINANCIAL GROUP, INC.
2023 ANNUAL REPORT ON FORM 10-K
TABLE OF CONTENTS
PART I
Item 1. Business.
Certain statements contained in this Annual Report on Form 10-K which are not statements of historical fact constitute forward-looking statements within the meaning of the Private Securities Litigation Reform Act of 1995. See “Cautionary Statement Regarding Forward-Looking Information” under Item 1A. Risk Factors on page 14 of this Annual Report on Form 10-K.
General
SB Financial Group, Inc., an Ohio corporation (the “SB Financial”), is a financial holding company subject to regulation under the Bank Holding Company Act of 1956, as amended, and to inspection, examination and supervision by the Board of Governors of the Federal Reserve System (the “Federal Reserve Board” or the “FRB”). SB Financial was organized in 1983. The executive offices of the SB Financial are located at 401 Clinton Street, Defiance, Ohio 43512.
Through its direct and indirect subsidiaries, the SB Financial is engaged in a variety of financial activities, including commercial banking, and wealth management services, as explained in more detail below.
As used in this Annual Report on Form 10-K, the “Company” refers to SB Financial and its consolidated subsidiaries collectively, except where the context indicates the reference relates solely to the registrant, SB Financial.
State Bank and Trust Company
The State Bank and Trust Company (“State Bank”) is an Ohio state-chartered bank and wholly owned subsidiary of the Company. State Bank offers a full range of commercial banking services, including checking accounts, savings accounts, money market accounts and time certificates of deposit; automatic teller machines (“ATMs”); commercial, consumer, agricultural and residential mortgage loans; personal and corporate trust services; commercial leasing; bank credit card services; safe deposit box rentals; internet banking; private client group services; and other personalized banking services. The trust and financial services division of State Bank offers various trust and financial services, including asset management services for individuals and corporate employee benefit plans, as well as brokerage services through Cetera Investment Services, an unaffiliated company. State Bank presently operates 22 banking centers, located within the Ohio counties of Allen, Defiance, Franklin, Fulton, Hancock, Lucas, Paulding, Williams and Wood, and one banking center located in Allen County, Indiana. State Bank also presently operates six loan production offices, located in Franklin and Lucas Counties, Ohio, Boone, Hamilton and Steuben Counties, Indiana, and Monroe County, Michigan. At December 31, 2023, State Bank had 243 full-time equivalent employees.
SBFG Title, LLC
SBFG Title, LLC dba Peak Title Agency (“SBFG Title”) was formed as an Ohio limited liability company in January 2019 and purchased all of the assets and real estate of an Ohio-based title agency effective March 15, 2019. SBFG Title is a wholly owned subsidiary of the Company. SBFG Title provides title insurance and operates three locations located within the Ohio Counties of Franklin and Williams. At December 31, 2023, SBFG Title had 8 full-time equivalent employees.
RFCBC
RFCBC, Inc. (“RFCBC”) is an Ohio corporation and wholly owned subsidiary of the Company that was incorporated in August 2004. RFCBC operates as a loan subsidiary in servicing and working out problem loans and is presently inactive. At December 31, 2023, RFCBC had no employees.
Rurbanc Data Services
Rurbanc Data Services, Inc. dba RDSI Banking Systems (“RDSI”) was formed in 1964 and became an Ohio corporation in June 1976. In September 2006, RDSI acquired Diverse Computer Marketers, Inc. (“DCM”), which was merged into RDSI effective December 31, 2007. Effective January 1, 2018, the Company completed the sale of the customer contracts and certain other assets of RDSI’s remaining check and statement processing business operated through the DCM division. As a result of the sale, RDSI is presently inactive and had no employees at December 31, 2023.
Rurban Mortgage Company
Rurban Mortgage Company (“RMC”) is an Ohio corporation and wholly owned subsidiary of State Bank. RMC is a mortgage company and is presently inactive. At December 31, 2023, RMC had no employees.
SBT Insurance
SBT Insurance, LLC (“SBI”) is an Ohio corporation and wholly owned subsidiary of State Bank. SBI is an insurance company that engages in the sale of insurance products to retail and commercial customers of State Bank. At December 31, 2023, SBI had no employees.
SB Captive
SB Captive, Inc. (“SB Captive”) is a Nevada corporation and wholly owned subsidiary of SB Financial. SB Captive is a self-insurance company that provides coverage to State Bank and SB Financial. The purpose of the SB Captive is to mitigate insurance risk by participating in a pool with other banks. At December 31, 2023, SB Captive had no employees.
Rurban Statutory Trust II
Rurban Statutory Trust II (“RST II”) is a trust that was organized in August 2005. In September 2005, RST II closed a pooled private offering of 10,000 Capital Securities with a liquidation amount of $1,000 per security. The proceeds of the offering were loaned to the Company in exchange for junior subordinated debentures with terms similar to the Capital Securities. The sole assets of RST II are the junior subordinated debentures and the back-up obligations, which in the aggregate, constitute a full and unconditional guarantee by the Company of the obligations of RST II under the Capital Securities.
SBFG Mortgage, LLC
SBFG Mortgage, LLC was formed as an Ohio limited liability company in December 2019. SBFG Mortgage, LLC is a mortgage company and is presently inactive. At December 31, 2023, SBFG Mortgage, LLC had no employees.
Competition
The Company experiences significant competition in attracting depositors and borrowers. Competition in lending activities comes principally from other commercial banks in the lending areas of State Bank, and to a lesser extent, from savings associations, insurance companies, governmental agencies, credit unions, securities brokerage firms, finance companies, financial technology companies (“fintechs”) and pension funds. The primary factors in competing for loans are interest rates and overall banking services.
State Bank’s competition for deposits comes from other commercial banks, savings associations, money market funds and credit unions as well as from insurance companies, securities brokerage firms, and fintechs. The primary factors in competing for deposits are interest rates paid on deposits and convenience of office location. State Bank operates in the highly competitive wealth management services field and its competition consists primarily of other bank wealth management departments.
Supervision and Regulation
The following is a summary discussion of the significant statutes and regulations applicable to the Company and its subsidiaries. This discussion is qualified in its entirety by reference to the full text of the statutes, regulations and policies that are described. Also, such statutes, regulations and policies are continually under review by the U.S. Congress and state legislatures and federal and state regulatory agencies. A change in statutes, regulations or regulatory policies applicable to the Company or its subsidiaries could have a material effect on our business.
Regulation of Bank Holding Companies and Their Subsidiaries in General
SB Financial is a financial holding company and, as such, is subject to regulation under the Bank Holding Company Act of 1956, as amended (the “Bank Holding Company Act”). SB Financial is subject to the reporting requirements of, and examination and regulation by, the FRB. The FRB has extensive enforcement authority over bank holding companies, including, without limitation, the ability to assess civil money penalties, issue cease and desist or removal orders, and require that a bank holding company divest subsidiaries, including its subsidiary banks. In general, the FRB may initiate enforcement actions for violations of laws and regulations and for unsafe or unsound practices. A bank holding company and its subsidiaries are prohibited from engaging in certain tying arrangements in connection with extensions of credit and/or the provision of other property or services to a customer by the bank holding company or its subsidiaries.
The Bank Holding Company Act requires the prior approval of the FRB before a financial or bank holding company may acquire direct or indirect ownership or control of more than 5 percent of the voting shares of any bank (unless the bank is already majority owned by the bank holding company), acquire all or substantially all of the assets of another bank or another financial or bank holding company, or merge or consolidate with any other bank holding company. Subject to certain exceptions, the Bank Holding Company Act also prohibits a financial or bank holding company from acquiring 5 percent or more of the voting shares of any company that is not a bank and from engaging in any business other than banking or managing or controlling banks. The primary exception to this prohibition allows a bank holding company to own shares in any company the activities of which the FRB had determined, as of November 19, 1999, to be so closely related to banking as to be a proper incident thereto.
In April 2020, the FRB adopted a final rule to revise its regulations related to determinations of whether a company has the ability to exercise a controlling influence over another company for purposes of the Bank Holding Company Act. The final rule expands and codifies the presumptions for use in such determinations. By codifying the presumptions, the final rule provides greater transparency on the types of relationships that the FRB generally views as supporting a facts-and-circumstances determination that one company controls another company. The FRB’s final rule applies to questions of control under the Bank Holding Company Act but does not extend to the Change in Bank Control Act.
As a result of the Gramm-Leach-Bliley Act of 1999, also known as the Financial Services Modernization Act of 1999, which amended the Bank Holding Company Act, bank holding companies that are financial holding companies may engage in any activity, or acquire and retain the shares of a company engaged in any activity, that is either (1) financial in nature or incidental to such financial activity (as determined by the FRB in consultation with the Secretary of the Treasury), or (2) complementary to a financial activity, and that does not pose a substantial risk to the safety and soundness of depository institutions or the financial system generally. Activities that are financial in nature include securities underwriting dealing and market-making, insurance underwriting and agency, and merchant banking activities. On January 2, 2019, SB Financial elected, and received approval from the FRB, to become a financial holding company.
Various requirements and restrictions under the laws of the United States and the State of Ohio affect the operations of State Bank, including requirements to maintain reserves against deposits, restrictions on the nature and amount of loans that may be made and the interest that may be charged thereon, restrictions relating to investments and other activities, limitations on credit exposure to correspondent banks, limitations on activities based on capital and surplus, limitations on payment of dividends, and limitations on branching.
Various consumer laws and regulations also affect the operations of State Bank. The Dodd-Frank Wall Street Reform and Consumer Protection Act of 2010 (the “Dodd-Frank Act”) established the Consumer Financial Protection Bureau (the “CFPB”), which regulates consumer financial products and services and certain financial services providers. The CFPB is authorized to prevent unfair, deceptive or abusive acts or practices and ensures consistent enforcement of laws so that consumers have access to fair, transparent and competitive markets for consumer financial products and services. Since it was established, the CFPB has exercised extensively its rulemaking and interpretative authority.
The Federal Home Loan Bank (the “FHLB”) provide credit to their members in the form of advances. As a member of the FHLB of Cincinnati, State Bank must maintain certain minimum investments in the capital stock of the FHLB of Cincinnati. State Bank was in compliance with these requirements at December 31, 2023.
Federal Reserve System
The FRB requires all depository institutions to maintain reserves at specified levels against their transaction accounts, primarily checking accounts. In response to the COVID-19 pandemic, the FRB reduced reserve requirement ratios to 0 percent effective on March 26, 2020, to support lending to households and businesses. The reserve requirement ratio remained at 0 percent as of December 31, 2023.
Economic Growth, Regulatory Relief and Consumer Protection Act
On May 25, 2018, the Economic Growth, Regulatory Relief and Consumer Protection Act (the “Regulatory Relief Act”) was enacted, which repealed or modified certain provisions of the Dodd-Frank Act and eased restrictions on all but the largest banks (those with consolidated assets in excess of $250 billion). Bank holding companies with consolidated assets of less than $100 billion, including the Company, are no longer subject to enhanced prudential standards. The Regulatory Relief Act also relieves bank holding companies and banks with consolidated assets of less than $100 billion, including the Company, from certain record-keeping, reporting and disclosure requirements. Certain other regulatory requirements applied only to banks with consolidated assets in excess of $50 billion and so did not apply to the Company even before the enactment of the Regulatory Relief Act.
Restrictions on Dividends
There can be no assurance as to the amount of dividends which may be declared in future periods with respect to the common shares of the Company, since such dividends are subject to the discretion of the Company’s Board of Directors, cash needs, and general business conditions, dividends from the Company’s subsidiaries and applicable governmental regulations and policies.
The ability of the Company to obtain funds for the payment of dividends and for other cash requirements is largely dependent on the amount of dividends that may be declared by State Bank and the Company’s other subsidiaries. State Bank may not pay dividends to the Company if, after paying such dividends, it would fail to meet the required minimum levels under the risk-based capital guidelines and the minimum leverage ratio requirements. In addition, State Bank must obtain the approval of the FRB and the Ohio Division of Financial Institutions (the “ODFI”) if a dividend in any year would cause the total dividends for that year to exceed the sum of the current year’s net profits and the retained net profits for the preceding two years, less required transfers to surplus. At December 31, 2023, State Bank had $30.3 million of excess earnings over the preceding three years.
Payment of dividends by State Bank may be restricted at any time at the discretion of the regulatory authorities, if they deem such dividends to constitute an unsafe and/or unsound banking practice. Moreover, the FRB expects the Company to serve as a source of strength to its subsidiary banks, which may require it to retain capital for further investment in the subsidiary, rather than for dividends to shareholders of the Company.
The Company’s ability to pay dividends on its shares is also conditioned upon the payment, on a current basis, of quarterly interest payments on the subordinated debentures underlying the Company’s trust preferred securities. In addition, under the terms of the Company’s fixed-to-floating rate subordinated debt, the Company’s ability to pay dividends on its shares is conditioned upon the Company continuing to make required principal and interest payments, and not incurring an event of default, with respect to the subordinated debt.
Transactions with Affiliates and Insiders
The Company and State Bank are separate and distinct legal entities. The FRB’s Regulation W and various other legal limitations restrict State Bank from lending funds to, or engaging in other “covered transactions” with, the Company (or any other affiliate), generally limiting such covered transactions with any one affiliate to 10 percent of State Bank’s capital and surplus and limiting all such covered transactions with all affiliates to 20 percent of State Bank’s capital and surplus. Covered transactions, including extensions of credit, sales of securities or assets and provision of services, also must be on terms and conditions consistent with safe and sound banking practices, including credit standards, that are substantially the same or at least as favorable to State Bank as those prevailing at the time for transactions with unaffiliated companies.
A bank’s authority to extend credit to executive officers, directors and greater than 10 percent shareholders, as well as entities such persons control, is subject to Sections 22(g) and 22(h) of the Federal Reserve Act and Regulation O promulgated thereunder by the FRB. Among other things, these loans must be made on terms (including interest rates charged and collateral required) that are substantially the same as those offered to unaffiliated individuals or be made as part of a benefit or compensation program and on terms widely available to employees, and must not involve a greater than normal risk of repayment. In addition, the amount of loans a bank may make to these persons is based, in part, on the bank’s capital position, and certain approval procedures must be followed in making loans which exceed specified amounts.
Federally insured banks are subject, with certain exceptions, to certain additional restrictions (including collateralization) on extensions of credit to their parent holding companies or other affiliates, on investments in the stock or other securities of affiliates and on the taking of such stock or securities as collateral from any borrower. In addition, such banks are prohibited from engaging in certain tying arrangements in connection with any extension of credit or the providing of any property or service.
COVID-19 Legislation and Initiatives
In response to the novel COVID-19 pandemic (“COVID-19”), the Coronavirus Aid, Relief, and Economic Security Act of 2020, as amended (the “CARES Act”), was signed into law on March 27, 2020, to provide national emergency economic relief measures. Many of the CARES Act’s programs were dependent upon the direct involvement of U.S. financial institutions, such as the Company and State Bank, were implemented through rules and guidance adopted by federal departments and agencies, including the U.S. Department of Treasury, the FRB and other federal banking agencies, including those with direct supervisory jurisdiction over the Company and State Bank.
The CARES Act amended the loan program of the Small Business Administration (the “SBA”), in which State Bank participates, to create a guaranteed, unsecured loan program, the Paycheck Protection Program (“PPP”), to fund operational costs of eligible businesses, organizations and self-employed persons during COVID-19. These loans are eligible to be forgiven if certain conditions are satisfied and are fully guaranteed by the SBA. In June 2020, the Paycheck Protection Program Flexibility Act was enacted, which, among other things, gave borrowers additional time and flexibility to use PPP loan proceeds. After previously being extended by Congress, the application deadline for PPP loans expired on May 31, 2021. No collateral or personal guarantees were required for PPP loans. In addition, neither the government nor lenders have been permitted to charge the recipients of PPP loans any fees. On December 27, 2020, the President signed into law the Consolidated Appropriations Act, 2021 (the “CAA”), which included the Economic Aid to Hard-Hit Small Businesses, Nonprofits, and Venues Act (the “HHSB Act”). Among other things, the HHSB Act renewed the PPP, allocating $284.45 billion for both new first-time PPP loans under the existing PPP and the expansion of existing PPP loans for certain qualified, existing PPP borrowers. In addition to extending and amending the PPP, the HHSB Act also created a new grant program for “shuttered venue operators”.
On December 2, 2020, the federal bank regulatory agencies issued an interim final rule that provided temporary relief for specified community banking organizations related to certain regulations and reporting requirements as a result, in large part, of their growth in size from the response to COVID-19. Community banking organizations are subject to different rules and requirements based on their risk profile and asset size. Due to their involvement in federal COVID-19 response programs (such as the PPP) and other lending that supports the U.S. economy, many community banking organizations experienced rapid and unexpected increases in their sizes, which were generally expected to be temporary. The temporary increase in size could have subjected community banking organizations to new regulations or reporting requirements. However, community banking organizations with assets approaching the $10.0 billion asset threshold and that would otherwise have become subject to additional regulatory requirements upon crossing such threshold, including requirements related to capital adequacy standards, debit card interchange fees and routing, and management official interlocks, had until January 1, 2022 to either reduce their size or to prepare for the new regulatory and reporting standards.
Regulatory Capital
The risk-based capital guidelines adopted by the federal banking agencies are based on the “International Convergence of Capital Measurement and Capital Standard” (Basel I), published by the Basel Committee on Banking Supervision (the “Basel Committee”). In July 2013, the United States banking regulators issued new capital rules applicable to smaller banking organizations which also implement certain of the provisions of the Dodd-Frank Act (the “Basel III Capital Rules”). Community banking organizations, including the Company and State Bank, began transitioning to the new rules on January 1, 2015. The new minimum capital requirements became effective on January 1, 2015, whereas a new capital conservation buffer and deductions from common equity capital phased in from January 1, 2016 through January 1, 2019, and most deductions from common equity tier 1 capital phased in from January 1, 2015 through January 1, 2019.
The Basel III Capital Rules include (a) a minimum common equity tier 1 capital ratio of 4.5%, (b) a minimum Tier 1 capital ratio of 6.0%, (c) a minimum total capital ratio of 8.0%, and (d) a minimum leverage ratio of 4.0%.
Common equity for the common equity tier 1 capital ratio generally includes common stock (plus related surplus), retained earnings, accumulated other comprehensive income (unless an institution elects to exclude such income from regulatory capital), and limited amounts of minority interests in the form of common stock, subject to applicable regulatory adjustments and deductions.
Tier 1 capital generally includes common equity as defined for the common equity tier 1 capital ratio, plus certain non-cumulative preferred stock and related surplus, cumulative preferred stock and related surplus, trust preferred securities that have been grandfathered (but which are not permitted going forward), and limited amounts of minority interests in the form of additional Tier 1 capital instruments, less certain deductions.
Tier 2 capital, which can be included in the total capital ratio, generally consists of other preferred stock and subordinated debt meeting certain conditions plus limited amounts of the allowance for credit losses (“ACL”), subject to specified eligibility criteria, less applicable deductions.
The deductions from common equity tier 1 capital include goodwill and other intangibles, certain deferred tax assets, mortgage-servicing assets above certain levels, gains on sale in connection with a securitization, investments in a banking organization’s own capital instruments and investments in the capital of unconsolidated financial institutions (above certain levels).
Under the guidelines, capital is compared to the relative risk related to the balance sheet. To derive the risk included in the balance sheet, one of several risk weights is applied to different balance sheet and off-balance sheet assets, primarily based on the relative credit risk of the counterparty. The capital amounts and classification are also subject to qualitative judgments by the regulators about components, risk weightings and other factors.
The Basel III Capital Rules also place restrictions on the payment of capital distributions, including dividends, and certain discretionary bonus payments to executive officers if the banking organization does not hold a capital conservation buffer of greater than 2.5 percent composed of common equity tier 1 capital above its minimum risk-based capital requirements, or if its eligible retained income is negative in that quarter and its capital conservation buffer ratio was less than 2.5 percent at the beginning of the quarter.
In September 2019, the FRB, along with other federal bank regulatory agencies, issued a final rule, effective January 1, 2020, that gave community banks, including State Bank, the option to calculate a simple leverage ratio to measure capital adequacy if the community banks met certain requirements. Under the rule, a community bank was eligible to elect the Community Bank Leverage Ratio (“CBLR”) framework if it had less than $10 billion in total consolidated assets, limited amounts of certain assets and off-balance sheet exposures, and a leverage ratio greater than 9.0%. Qualifying institutions that elected to use the CBLR framework (each, a “CBLR Bank”) and that maintain a leverage ratio of greater than 9.0% will be considered to have satisfied the risk-based and leverage capital requirements in the regulatory agencies’ generally applicable capital rules and to have met the well-capitalized ratio requirements. No CBLR Bank was required to calculate or report risk-based capital, and each CBLR Bank could opt out of the framework at any time, without restriction, by reverting to the generally applicable risk-based capital rule. Pursuant to the CARES Act, on August 26, 2020, the federal banking agencies adopted a final rule that temporarily lowered the CBLR threshold and provided a gradual transition back to the prior level. Specifically, the CBLR threshold was reduced to 8.0% for the remainder of 2020, increased to 8.5% for 2021, and returned to 9.0% on January 1, 2022. This final rule became effective on October 1, 2020. The Company did not utilize the CBLR in assessing capital adequacy and continued to follow existing capital rules.
In December 2018, the federal banking agencies issued a final rule to address regulatory capital treatment of credit loss allowances under the current expected credit loss (“CECL”) model (accounting standard). The rule revised the federal banking agencies’ regulatory capital rules to identify which credit loss allowances under the CECL model are eligible for inclusion in regulatory capital and to provide banking organizations the option to phase in over three years the day-one adverse effects on regulatory capital that may result from the adoption of the CECL model. Upon the Company’s adoption of CECL effective January 1, 2023, the Company recognized a one-time cumulative effect adjustment (increase) to the ACL of $1.4 million and did not elect to utilize the three-year phase in. The Company’s risk-based capital ratios remained in excess of “well-capitalized” levels after the impact of the one-time cumulative effect adjustment.
At December 31, 2023, State Bank was in compliance with all of the regulatory capital requirements to which it was subject. For State Bank’s capital ratios, see Note 16 to the Consolidated Financial Statements under Item 8 of this Report on Form 10-K (the “Consolidated Financial Statements”).
The FRB has adopted regulations governing prompt corrective action to resolve the problems of capital deficient and otherwise troubled state-chartered member banks. At each successively lower defined capital category, a bank is subject to more restrictive and numerous mandatory or discretionary regulatory actions or limits, and the FRB has less flexibility in determining how to resolve the problems of the institution. In addition, the FRB generally can downgrade a bank’s capital category, notwithstanding its capital level, if, after notice and opportunity for hearings, the bank is deemed to be engaged in an unsafe or unsound practice, because it has not corrected deficiencies that resulted in it receiving a less than satisfactory examination rating on matters other than capital or it is deemed to be in an unsafe or unsound condition. State Bank’s capital at December 31, 2023, met the standards for the highest capital category, a “well-capitalized” bank.
In April 2015, the FRB issued a final rule which increased the size limitation for qualifying bank holding companies under the FRB’s Small Bank Holding Company Policy Statement from $500 million to $1 billion of total consolidated assets. In August 2018, the FRB issued an interim final rule, as required by the Regulatory Relief Act, to further increase size limitations under the Small Bank Holding Company Policy Statement to $3 billion of total consolidated assets. The Company continues to qualify under the Small Bank Holding Company Policy Statement for exemption from the FRB’s consolidated risk-based capital and leverage rules at the holding company level.
Federal Deposit Insurance Corporation
The Federal Deposit Insurance Corporation (the “FDIC”) is an independent federal agency, which insures the deposits of federally insured banks and savings associations up to certain prescribed limits and safeguards the safety and soundness of financial institutions. The general insurance limit is $250,000 per separately insured depositor. This insurance is backed by the full faith and credit of the United States government.
As insurer, the FDIC is authorized to conduct examinations of and to require reporting by insured institutions, including State Bank, to prohibit any insured institution from engaging in any activity the FDIC determines to pose a threat to the Deposit Insurance Fund (the “DIF”), and to take enforcement actions against insured institutions. The FDIC may terminate insurance of deposits of any institution if the FDIC finds that the institution has engaged in unsafe and unsound practices, is in an unsafe or unsound condition or has violated any applicable law, regulation, rule, order or condition imposed by the FDIC or other regulatory agency.
The FDIC assesses a quarterly deposit insurance premium on each insured institution based on risk characteristics of the insured institution to the DIF, with institutions deemed less risky paying lower rates. Currently, assessments for institutions with less than $10 billion of total assets are based on financial measures and supervisory ratings derived from statistical models that estimate the probability of failure within three years. The FDIC may increase or decrease the range of assessments uniformly, except that no adjustments can deviate more than two basis points from the base assessment without notice and comment rule making. The FDIC may also impose special assessments in emergency situations, which fund the DIF. The FDIC has established 2 percent as the Designated Reserve Ratio (“DRR”), which is the amount in the DIF as a percentage of all DIF insured deposits. In March 2016, the FDIC adopted final rules designed to meet the statutory minimum DRR of 1.35 percent by September 30, 2020, the deadline imposed by the Dodd-Frank Act. The Dodd-Frank Act required the FDIC to offset the effect on insured institutions with assets of less than $10 billion of the increase in the statutory minimum DRR to 1.35% from the former statutory minimum of 1.15%. Although the FDIC’s rules reduced assessment rates on all banks, they imposed a surcharge on banks with assets of $10 billion or more to be paid until the DRR reached 1.35%. The DRR met the statutory minimum of 1.35% on September 30, 2018. As a result, the previous surcharge imposed on banks with assets of $10 billion or more was lifted. In addition, preliminary assessment credits have been determined by the FDIC for banks with assets of less than $10 billion, which had previously contributed to the increase of the DRR to 1.35%.
On June 30, 2019, the DRR reached 1.40%, and the FDIC applied credits for banks with assets of less than $10 billion (“small bank credits”) beginning September 30, 2019. As of June 30, 2020, the DRR fell below the minimum DRR to 1.30%. As a result, the FDIC adopted a restoration plan requiring the restoration of the DRR to 1.35% within eight years (September 30, 2028). The FDIC rules further changed the method of determining risk-based assessment rates for established banks with less than $10 billion in assets to better ensure that banks taking on greater risks pay more for deposit insurance than banks that take on less risk. As of September 30, 2022, the DRR was 1.26%. Because the DRR remained below the statutory minimum, the FDIC adopted a final rule in October 2022 increasing the assessment rate from three basis points to five basis points beginning with the first quarterly assessment period of 2023. In the FDIC’s most recent semiannual update for the Amended Restoration Plan in November 2023, the FDIC noted that increased loss provisions associated with the failures of Silicon Valley Bank, Signature Bank and First Republic Bank in 2023 that reduced the DIF balance, coupled with strong growth in insured deposits, resulted in the reserve ratio declining 15 basis points from 1.25% as of December 2022 to 1.10% as of June 30, 2023. Despite the decline in the reserve ratio, the FDIC staff projected that the reserve ratio remains on track to reach the statutory minimum of 1.35% ahead of the deadline of September 30, 2028. As a result, the FDIC staff recommended no changes to the Amended Restoration Plan and all scheduled assessment rates were maintained.
On November 16, 2023, the FDIC adopted a final rule implementing a special assessment to recover the loss to the DIF arising from the protection of uninsured depositors following the failures of Silicon Valley Bank and Signature Bank. The assessment base for the special assessment is equal to an insured depository institution’s estimated uninsured deposits reported for the quarter ended December 31, 2022, adjusted to exclude the first $5 billion in estimated uninsured deposits. The FDIC will collect the special assessment at an annual rate of approximately 13.4 basis points, over eight quarterly assessment periods, beginning with the first quarter of 2024. Because State Bank’s uninsured deposits were less than $5 billion for the quarter ended December 31, 2022, State Bank will not be subject to this special assessment.
The FDIC is authorized to prohibit any insured institution from engaging in any activity that poses a serious threat to the insurance fund and may initiate enforcement actions against a bank, after first giving the institution’s primary regulatory authority an opportunity to take such action. The FDIC may also terminate the deposit insurance of any institution that has engaged in or is engaging in unsafe or unsound practices, is in an unsafe or unsound condition to continue operations or has violated any applicable law, order or condition imposed by the FDIC.
Community Reinvestment Act
The Community Reinvestment Act (the “CRA”) requires State Bank’s primary federal regulatory agency, the FRB, to assess State Bank’s record in meeting the credit needs of the communities served by State Bank. The FRB assigns one of four ratings: outstanding, satisfactory; needs to improve or substantial noncompliance. The rating assigned to a financial institution is considered in connection with various applications submitted by the financial institution or its holding company to its banking regulators, including applications to acquire another financial institution or to open or close a branch office. In addition, all subsidiary banks of a financial holding company must maintain a satisfactory or outstanding rating in order for the financial holding company to avoid limitations on its activities. State Bank received a satisfactory rating in its most recent CRA examination.
On October 24, 2023, the federal banking agencies, including the FRB, issued a final rule designed to strengthen and modernize the regulations implementing the CRA. The changes are designed to encourage banks to expand access to credit, investment and banking services in low- and moderate-income communities, adapt to changes in the banking industry, including mobile and internet banking, provide greater clarity and consistency in the application of the CRA regulations, and tailor CRA evaluations and data collection to bank size and type. The applicability date for the majority of the changes to the CRA regulations is January 1, 2026, and additional requirements will be applicable on January 1, 2027. The Company cannot predict the impact the changes to the CRA will have on its operations at this time.
SEC and NASDAQ Regulation
The Company is subject to the jurisdiction of the Securities and Exchange Commission (the “SEC”) and certain state securities authorities relating to the offering and sale of its securities. The Company is subject to the registration, reporting and other regulatory requirements of the Securities Act of 1933, as amended (the “Securities Act”), and the Securities Exchange Act of 1934, as amended (the “Exchange Act”), and the rules adopted by the SEC under those acts. The Company’s common shares are listed on The NASDAQ Capital Market (“NASDAQ”) under the symbol “SBFG”. As a result, the Company is subject to NASDAQ rules and regulations applicable to listed companies.
The SEC has adopted rules and regulations governing, among other matters, corporate governance, auditing and accounting, executive compensation, and enhanced and timely disclosure of corporate information. The SEC has also approved corporate governance rules promulgated by NASDAQ. The Company has adopted and implemented a Code of Conduct and Ethics and a copy of that policy can be found on the Company’s website at www.YourSBFinancial.com by first clicking “Corporate Overview” and then “Governance Documents”. The Company has also adopted charters of the Audit and Risk Management Committee, the Compensation Committee and the Governance and Nominating Committee, which charters are available on the Company’s website at www.YourSBFinancial.com by first clicking “Corporate Overview” and then “Governance Documents”.
USA Patriot Act and Anti-Money Laundering Act
The Uniting and Strengthening of America by Providing Appropriate Tools Required to Intercept and Obstruct Terrorism Act of 2001 (the “Patriot Act”) gives the United States government powers to address terrorist threats through enhanced domestic security measures, expanded surveillance powers, increased information sharing and broadened anti-money laundering requirements. Title III of the Patriot Act encourages information sharing among bank regulatory agencies and law enforcement bodies. Further, certain provisions of Title III impose affirmative obligations on a broad range of financial institutions. Among other requirements, Title III and related regulations require regulated financial institutions to establish a program specifying procedures for obtaining identifying information from customers seeking to open new accounts and establish enhanced due diligence policies, procedures and controls designed to detect and report suspicious activity. State Bank has established policies and procedures that State Bank believes comply with the requirements of the Patriot Act.
The Anti-Money Laundering Act of 2020 (the “AMLA”), which amends the Bank Secrecy Act of 1970 (the “BSA”), was enacted in January 2021. The AMLA is intended to be a comprehensive reform and modernization to U.S. bank secrecy and anti-money laundering laws. Among other things, it codifies a risk-based approach to anti-money laundering compliance for financial institutions; requires the development of standards for evaluating technology and internal processes for BSA compliance; expands enforcement-related and investigation-related authority, including increasing available sanctions for certain BSA violations and instituting BSA whistleblower initiatives and protections.
Office of Foreign Assets Control Regulation
The U.S. Treasury Department’s Office of Foreign Assets Control (“OFAC”) administers and enforces economic and trade sanctions against targeted foreign countries and regimes, under authority of various laws, including designated foreign countries, nationals and others. OFAC publishes lists of specially designated targets and countries. State Bank is responsible for, among other things, blocking accounts of, and transactions with, such targets and countries, prohibiting unlicensed trade and financial transactions with them and reporting blocked transactions after their occurrence. Failure to comply with these sanctions could have serious financial, legal and reputational consequences, including causing applicable bank regulatory authorities not to approve merger or acquisition transactions when regulatory approval is required or to prohibit such transactions even if approval is not required. Regulatory authorities have imposed cease and desist orders and civil money penalties against institutions found to be violating these obligations.
Executive and Incentive Compensation
The Dodd-Frank Act requires that the federal banking agencies, including the FRB and the FDIC, issue a rule related to incentive-based compensation. No final rule implementing this provision of the Dodd-Frank Act has, as of the date of the filing of this Annual Report on Form 10-K, been adopted, but a proposed rule was published in 2016 that expanded upon a prior proposed rule published in 2011. The proposed rule is intended to: (i) prohibit incentive-based payment arrangements that the banking agencies determine could encourage certain financial institutions to take inappropriate risks by providing excessive compensation or that could lead to material financial loss; (ii) require the board of directors of those financial institutions to take certain oversight actions related to incentive-based compensation; and (iii) require those financial institutions to disclose information concerning incentive-based compensation arrangements to the appropriate federal regulator. Although a final rule has not been issued, the Company has undertaken efforts to ensure that the Company’s incentive compensation plans do not encourage inappropriate risks, consistent with the principles identified above.
In June 2010, the FRB, the Office of the Comptroller of the Currency (the “OCC”) and the FDIC issued comprehensive final guidance on incentive compensation policies intended to ensure that the incentive compensation policies of banking organizations do not undermine the safety and soundness of such organizations by encouraging excessive risk-taking. The guidance, which covers all employees that have the ability to materially affect the risk profile of an organization, either individually or as part of a group, is based upon the key principles that a banking organization’s incentive compensation arrangements should (i) provide incentives that do not encourage risk-taking beyond the organization’s ability to effectively identify and manage risks, (ii) be compatible with effective internal controls and risk management and (iii) be supported by strong corporate governance, including active and effective oversight by the organization’s board of directors. These three principles are incorporated into the proposed joint compensation regulations under the Dodd-Frank Act, described above.
The FRB and the OCC review, as part of their respective regular, risk-focused examination process, the incentive compensation arrangements of banking organizations, such as the Company and State Bank, that are not “large, complex banking organizations.” These reviews are tailored to each organization based on the scope and complexity of the organization’s activities and the prevalence of incentive compensation arrangements. Deficiencies will be incorporated into the organization’s supervisory ratings, which can affect the organization’s ability to make acquisitions and take other actions. Enforcement actions may be taken against a banking organization if its incentive compensation arrangements, or related risk-management control or governance processes, pose a risk to the organization’s safety and soundness and the organization is not taking prompt and effective measures to correct the deficiencies.
Public company compensation committee members must meet heightened independence requirements and consider the independence of compensation consultants, legal counsel and other advisors to the compensation committee. A compensation committee must have the authority to hire advisors and to have the public company fund reasonable compensation of such advisors.
SEC regulations require public companies to provide various disclosures about executive compensation in annual reports and proxy statements and to present to their shareholders a non-binding vote on the approval of executive compensation.
Following the adoption of additional listing requirements in 2023 to comply with the Dodd-Frank Act and rules adopted by the SEC in October 2022, public companies are now required, to adopt and implement “clawback” policies for incentive compensation payments and to disclose the details of the procedures which allow recovery of incentive compensation that was paid on the basis of erroneous financial information necessitating a restatement due to material noncompliance with financial reporting requirements. This clawback policy is intended to apply to compensation paid within the three completed fiscal years immediately preceding the date the issuer is required to prepare a restatement and would cover all executives who received incentive awards. The Company’s clawback policy adopted in accordance with these listing standards is included as Exhibit 97.
Consumer Protection Laws and Regulations
Banks are subject to regular examination to ensure compliance with federal consumer protection statutes and regulations, including, but not limited to, the following:
| ● | The Equal Credit Opportunity Act (prohibiting discrimination in any credit transaction on the basis of any of various criteria); |
| ● | The Truth in Lending Act (requiring that credit terms are disclosed in a manner that permits a consumer to understand and compare credit terms more readily and knowledgeably); |
| ● | The Fair Housing Act (making it unlawful for a lender to discriminate in housing-related lending activities against any person on the basis of certain criteria); |
| ● | The Home Mortgage Disclosure Act (requiring financial institutions to collect data that enables regulatory agencies to determine whether financial institutions are serving the housing credit needs of the communities in which they are located); |
| ● | The Real Estate Settlement Procedures Act (requiring that lenders provide borrowers with disclosures regarding the nature and cost of real estate settlements and prohibits abusive practices that increase borrowers’ costs); and |
| ● | Privacy provisions of the Gramm-Leach-Bliley Act (requiring financial institutions to establish policies and procedures to restrict the sharing of non-public customer data with non-affiliated parties and to protect customer information from unauthorized access). |
The banking regulators also use their authority under the Federal Trade Commission Act to take supervisory or enforcement action with respect to unfair or deceptive acts or practices by banks that may not necessarily fall within the scope of a specific banking or consumer finance law.
Financial Privacy Provisions
Federal and state regulations limit the ability of banks and other financial institutions to disclose non-public information about consumers to non-affiliated third parties. These limitations require disclosure of privacy policies to consumers and, in some circumstances, allow consumers to prevent disclosure of certain personal information to a non-affiliated third party. These regulations affect how consumer information is transmitted through diversified financial companies and conveyed to outside vendors.
State Bank is also subject to regulatory guidelines establishing standards for safeguarding customer information. These guidelines describe the federal bank regulatory agencies’ expectations for the creation, implementation and maintenance of an information security program, which would include administrative, technical and physical safeguards appropriate to the size and complexity of the institution and the nature and scope of its activities. The standards set forth in the guidelines are intended to ensure the security and confidentiality of customer records and information, protect against any anticipated threats or hazards to the security or integrity of such records and protect against unauthorized access to or use of such records or information that could result in substantial harm or inconvenience to any customer.
Cybersecurity
In March 2015, federal regulators issued two related statements regarding cybersecurity. One statement indicates that financial institutions should design multiple layers of security controls to establish several lines of defense and to ensure that their risk management processes also address the risk posed by compromised customer credentials, including security measures to reliably authenticate customers accessing Internet-based services of the financial institution. The other statement indicates that a financial institution’s management is expected to maintain sufficient business continuity planning processes to ensure the rapid recovery, resumption and maintenance of the financial institution’s operations after a cyber-attack involving destructive malware. A financial institution is also expected to develop appropriate processes to enable recovery of data and business operations and address rebuilding network capabilities and restoring data if the financial institution or its critical service providers fall victim to this type of cyber-attack. If State Bank fails to observe the regulatory guidance, it could be subject to various regulatory sanctions, including financial penalties.
In November 2021, the OCC, the FRB and the FDIC issued a final rule, which became effective in May 2022, requiring banking organizations that experience a computer-security incident to notify certain entities. A computer-security incident occurs when actual or potential harm to the confidentiality, integrity, or availability of an information system or the information occurs, or there is a violation or imminent threat of a violation to banking security policies and procedures. The affected bank must notify its respective federal regulator of the computer-security incident as soon as possible and no later than 36 hours after the bank determines a computer-security incident that rises to the level of a notification incident has occurred. These notifications are intended to promote early awareness of threats to banking organizations and will help banks react to those threats before they manifest into larger incidents. This rule also requires bank service providers to notify their bank organization customers of a computer-security incident that has caused, or is reasonably likely to cause, a material service disruption or degradation for four or more hours.
Furthermore, the Cyber Incident Reporting for Critical Infrastructure Act, enacted in March 2022, will require, once administrative rules are adopted, certain covered entities, including those in the financial services industry, to report a covered cyber incident to the U.S. Department of Homeland Security’s Cybersecurity & Infrastructure Security Agency (“CISA”) within 72 hours after a covered entity reasonably believes an incident has occurred. Separate reporting to CISA will also be required within 24 hours if a ransom payment is made as a result of a ransomware attack.
State regulators have also been increasingly active in implementing privacy and cybersecurity standards and regulations. Recently, several states have adopted regulations requiring certain financial institutions to implement cybersecurity programs and providing detailed requirements with respect to these programs, including data encryption requirements. Many states have also recently implemented or modified their data breach notification and data privacy requirements. The Company expects this trend of state-level activity in those areas to continue and is continually monitoring developments in the states in which our customers are located.
On July 26, 2023, the SEC adopted final rules that require public companies to promptly disclose material cybersecurity incidents in Current Reports on Form 8-K and detailed information regarding their cybersecurity risk management, strategy, and governance on an annual basis in their Annual Reports on Form 10-K. See ITEM 1C. CYBERSECURITY. Effective on or after December 18, 2023 (except for smaller reporting companies, such as the Company, which are provided a 180-day deferral), public companies are required to report on Form 8-K any cybersecurity incident they determine to be material within four business days of making that determination. These SEC rules, and any other regulatory guidance, are in addition to notification and disclosure requirements under state and federal banking laws and regulations.
In the ordinary course of business, the Company relies on electronic communications and information systems to conduct its operations and to store sensitive data. The Company employs an in-depth, layered, defensive approach that leverages people, processes and technology to manage and maintain cybersecurity controls. The Company employs a variety of preventative and detective tools to monitor, block, and provide alerts regarding suspicious activity, as well as to report on any suspected advanced persistent threats. The Company also regularly invests in new products and technology to further enhance these tools and mechanisms. Notwithstanding the strength of the Company’s defensive measures, the threat from cyber-attacks is severe, attacks are sophisticated and increasing in volume, and attackers respond rapidly to changes in defensive measures. While to date, the Company has not detected a significant compromise, significant data loss or any material financial losses related to cybersecurity attacks, the Company’s systems and those of its customers and third-party service providers are under constant threat and it is possible that the Company could experience a significant event in the future. Risks and exposures related to cybersecurity attacks are expected to remain high for the foreseeable future due to the rapidly evolving nature and sophistication of these threats, as well as due to the expanding use of Internet banking, mobile banking and other technology-based products and services by us and our customers.
Effect of Environmental Regulation
Compliance with federal, state and local provisions regulating the discharge of materials into the environment, or otherwise relating to the protection of the environment, has not had a material effect upon the capital expenditures, earnings or competitive position of the Company and its subsidiaries. The Company believes that the nature of the operations of its subsidiaries has little, if any, environmental impact. The Company, therefore, anticipates no material capital expenditures for environmental control facilities for its current fiscal year or for the near future. The Company’s subsidiaries may be required to make capital expenditures for environmental control facilities related to properties which they may acquire through foreclosure proceedings in the future; however, the amount of such capital expenditures, if any, is not currently determinable.
Effects of Government Monetary Policy
The earnings of the Company are affected by general and local economic conditions and by the policies of various governmental regulatory authorities. In particular, the FRB regulates money and credit conditions and interest rates to influence general economic conditions, primarily through open market acquisitions or dispositions of United States Government securities, varying the discount rate on member bank borrowings and setting reserve requirements against member and nonmember bank deposits. FRB monetary policies have had a significant effect on the interest income and interest expense of commercial banks, including State Bank, and are expected to continue to do so in the future.
Human Capital Resources
Our employees are vital to our success in the financial services industry. As a human-capital intensive business, the long-term success of our company depends on our people. Our goal is to ensure that we have the right talent, in the right place, at the right time. We do that through our commitment to attracting, developing and retaining our employees.
We strive to attract individuals who are people-focused and share our values. We have a comprehensive program dedicated to selecting new talent and enhancing the skills of our employees. In our recruiting efforts, we strive to have a diverse group of candidates to consider for our roles.
We have designed a compensation structure that we believe is attractive to our current and prospective employees. We also offer our employees the opportunity to participate in a variety of professional and leadership development programs. Our programs include a variety of industry, product, technical, professional, business development, leadership and regulatory topics. These programs are available online and in-person. In addition, we encourage all employees to be involved in the communities we serve through various volunteer activities.
We seek to retain our employees by using their feedback to create and continually enhance programs that support their needs. We use company-wide surveys to solicit feedback from our employees. We have a formal annual goal setting and performance review process for our employees. We promote a values-based culture, an important factor in retaining our employees. Our training, to share and communicate our culture to all employees, plays an important part in this process. We are committed to having a diverse workforce, and an inclusive work environment is a natural extension of our culture. We are committed to ensuring that all our employees feel welcomed, valued, respected and heard so that they can fully contribute their unique talents for the benefit of our customers, their careers, our company and our communities.
We monitor and evaluate various turnover and attrition metrics throughout our organization. Our annualized voluntary turnover is relatively low, as is the case for turnover of our top performers, a record which we attribute to our strong values-based culture, commitment to career development, and attractive compensation and benefit programs.
At December 31, 2023, the Company employed approximately 251 full-time equivalent employees to whom a variety of benefits are provided. Management considers its relationship with its employees to be good.
| Item 1A. | Risk Factors. |
Cautionary Statement Regarding Forward-Looking Information
Certain statements contained in this Annual Report on Form 10-K, and in other statements that we make from time to time in filings by the Company with the SEC, in press releases, and in oral and written statements made by or with the approval of the Company which are not statements of historical fact constitute forward-looking statements within the meaning of Section 27A of the Securities Act, Section 21E of the Exchange Act, and the Private Securities Litigation Reform Act of 1995. Examples of forward-looking statements include: (a) projections of income or expense, earnings per share, the payment or non-payment of dividends, capital structure and other financial items; (b) statements of plans and objectives of the Company or our Board of Directors or management, including those relating to products and services; (c) statements of future economic performance; (d) statements of future customer attraction or retention; and (e) statements of assumptions underlying these statements. Forward-looking statements reflect our expectations, estimates or projections concerning future results or events. These statements are generally identified by the use of forward-looking words or phrases such as “anticipates”, “believes”, “estimates”, “expects”, “intends”, “may”, “plans”, “projects”, “should”, “will allow”, “will continue”, “will likely result”, “will remain”, “would be”, or similar expressions.
The Private Securities Litigation Reform Act of 1995 provides a “safe harbor” for forward-looking statements to encourage companies to provide prospective information so long as those statements are identified as forward-looking and are accompanied by meaningful cautionary statements identifying important factors that could cause actual results to differ materially from those discussed in the forward-looking statements. We desire to take advantage of the “safe harbor” provisions of the Act.
Forward-looking statements involve risks and uncertainties. Actual results may differ materially from those predicted by the forward-looking statements because of various factors and possible events, including those factors discussed in the Risk Factors below. There is also the risk that the Company’s management or Board of Directors incorrectly analyzes these risks and forces, or that the strategies the Company develops to address them are unsuccessful.
Forward-looking statements speak only as of that date on which they are made. Except as may be required by law, the Company undertakes no obligation to update any forward-looking statement to reflect events or circumstances after the date on which the statement is made. All forward-looking statements attributable to the Company or any person acting on our behalf are qualified in their entirety by the following cautionary statements.
Risk Factors
The following sets forth certain risk factors that we are believe are relevant to the Company and its business. These risk factors are not presented in any particular order and do not constitute all of the risks that may affect our business. Additional risks that are not presently known or that we currently deem to be immaterial could also have a material adverse impact on our business, financial condition, or results of operations.
Economic, Market and Political Risks:
Changes in economic and political conditions could adversely affect our earnings through declines in deposits, loan demand, the ability of our customers to repay loans and the value of collateral securing our loans.
Our success depends to a large extent upon local and national economic conditions, as well as governmental fiscal and monetary policies. Conditions such as inflation, recession, unemployment, changes in interest rates, fiscal and monetary policy, an increasing federal government budget deficit, the failure of the federal government to raise the federal debt ceiling and/or possible future U.S. government shutdowns over budget disagreements, slowing gross domestic product, tariffs, a U.S. withdrawal from or significant renegotiation of trade agreements, trade wars, and other factors beyond our control may adversely affect our deposit levels and composition, the quality of investment securities available for purchase, demand for loans, the ability of our borrowers to repay their loans, and the value of the collateral securing loans made by us. Disruptions in U.S. and global financial markets, and changes in oil production in the Middle East also affect the economy and stock prices in the U.S., which can affect our earnings capital, as well as the ability of our customers to repay loans. Because we have a significant amount of real estate loans, decreases in real estate values could adversely affect the value of property used as collateral and our ability to sell the collateral upon foreclosure. Adverse changes in the economy may also have a negative effect on the ability of our borrowers to make timely repayments of their loans, which would have an adverse impact on our earnings and cash flows. In addition, our lending and deposit gathering activities are concentrated primarily in Northwest Ohio. As a result, our success depends in large part on the general economic conditions of these areas, particularly given that a significant portion of our lending relates to real estate located in this region. Therefore, adverse changes in the economic conditions in these areas could adversely impact our earnings and cash flows.
Instability in global economic conditions and geopolitical matters, as well as volatility in financial markets, could have a material adverse effect on our results of operations and financial condition.
The macroeconomic environment in the U.S. is susceptible to global events and volatility in financial markets. In addition, trade negotiations between the U.S. and other nations remain uncertain and could adversely impact economic and market conditions for the Company and our clients and counterparties. Instability in global economic conditions and geopolitical matters, such as military conflicts in Ukraine and the Middle East, as well as volatility in financial markets, could have a material adverse effect on our results of operations and financial condition. For example, on February 24, 2022, Russian military forces invaded Ukraine, and sustained conflict and disruption in the region have occurred and remains likely to continue. In addition, the October 7, 2023, attack by Hamas in Israel has resulted in prolonged conflict and disruption in the Middle East. Although the length, impact and outcome of the ongoing war in Ukraine and the conflict in the Middle East are highly unpredictable, these conflicts have resulted, and could continue to result, in significant market and other disruptions, including significant volatility in commodity prices and supply of energy resources, instability in financial markets, supply chain interruptions, political and social instability, changes in consumer or purchaser preferences, as well as increases in cyberattacks and espionage. The extent and duration of the military action, sanctions and resulting market disruptions could be significant and could potentially have substantial impact on the global economy and the Company’s business for an unknown period of time. Any of the above-mentioned events or disruptions could affect our business, financial condition and operating results, and may also magnify the impact of other risks described in this Form 10-K.
We may be unable to manage interest rate risks, which could reduce our net interest income.
Our results of operations are affected principally by net interest income, which is the difference between interest earned on loans and investments and interest expense paid on deposits and other borrowings. The spread between the yield on our interest-earning assets and our overall cost of funds may be compressed, and our net interest income may continue to be adversely impacted by changing rates. We cannot predict or control changes in interest rates. National, regional and local economic conditions and the policies of regulatory authorities, including monetary policies of the FRB, affect the movement of interest rates and our interest income and interest expense. If the interest rates paid on deposits and other borrowed funds increase at a faster rate than the interest rates received on loans and other investments, our net interest income, and therefore earnings, could be adversely affected. Earnings could also be adversely affected in a declining rate environment if the interest paid for deposits decrease more slowly than the interest rates received on loans and other investments.
In addition, certain assets and liabilities may react in different degrees to changes in market interest rates. For example, interest rates on some types of assets and liabilities may fluctuate prior to changes in broader market interest rates, while interest rates on other types may lag behind. While the bulk of our variable rate commercial assets have interest rate floors, some of our assets, such as adjustable rate mortgages, have features that restrict changes in their interest rates, including rate caps.
We believe that the impact on our cost of funds will depend on a number of factors, including but not limited to, the competitive environment in the banking sector for deposit pricing, opportunities for clients to invest in other markets such as fixed income and equity markets, and the propensity of customers to invest in their businesses. The effect on our net interest income from a change in interest rates will ultimately depend on the extent to which the aggregate impact of loan re-pricings exceeds the impact of increases in our cost of funds.
Changes in interest rates may affect the level of voluntary prepayments on our loans and may also affect the level of financing or refinancing by customers. Changes in interest rates may also negatively affect the ability of the Company’s borrowers to repay their loans, particularly as interest rates rise and adjustable rate loans become more expensive.
Interest rates are highly sensitive to many factors that are beyond our control. Some of these factors include: inflation, recession, unemployment, money supply, international disorders, and instability in domestic and foreign financial markets. The Company’s management uses various measures to monitor interest rate risk and believes it has implemented effective asset and liability management strategies to reduce the potential adverse effects of changes in interest rates on the Company’s financial condition and results of operations. Management also periodically adjusts the mix of assets and liabilities to manage interest rate risk. However, any significant, unexpected, prolonged change in market interest rates could have a material adverse effect on our financial condition and results of operations.
Risks Related to Our Business Operations:
If our actual credit losses exceed our allowance for credit losses, our net income will decrease.
Our loan customers may not repay their loans according to their terms, and the collateral securing the payment of these loans may be insufficient to pay any remaining loan balance. We may experience significant credit losses, which could have a material adverse effect on our operating results. In accordance with accounting principles generally accepted in the United States, we maintain an ACL to provide for loan defaults and non-performance, which when combined, we refer to as the ACL. Our ACL may not be adequate to cover actual credit losses, and future provisions for credit losses could have a material adverse effect on our operating results. Our ACL is based on prior experience, as well as an evaluation of the risks in the current portfolio. The amount of future losses is susceptible to changes in economic, operating and other conditions, including changes in interest rates that may be beyond our control, and these losses may exceed current estimates. Federal regulatory agencies, as an integral part of their examination process, review our loans and ACL. We cannot guarantee that we will not further increase the ACL or that regulators will not require us to increase this allowance. Either of these occurrences could have a material adverse effect on our financial condition and results of operations.
Moreover, the Financial Accounting Standards Board (the “FASB”) has changed its requirements for establishing the ACL. On June 16, 2016, the FASB issued Accounting Standard Update (“ASU”) 2016-13 “Financial Instruments - Credit Losses”, which replaces the incurred loss model with an expected loss model and is referred to as the CECL model. Under the incurred loss model, loans are recognized as impaired when there is no longer an assumption that future cash flows will be collected in full under the originally contracted terms. Under the CECL model, financial institutions are required to use historical information, current conditions and reasonable forecasts to estimate the expected loss over the life of the loan. The transition to the CECL model requires significantly greater data requirements and changes to methodologies to accurately account for expected losses under the new parameters. If the methodologies and assumptions that we use in the CECL model are proven to be incorrect or inadequate, the ACL may not be sufficient, resulting in the need for additional ACL to be established, which could have a material adverse impact on our financial condition and results of operations.
The new CECL accounting guidance is effective for annual reporting periods and interim reporting periods within those annual periods, beginning after December 15, 2019. However, the FASB deferred the effective date for this ASU for smaller reporting companies, such as the Company, to annual reporting periods and interim reporting periods within those annual periods, beginning after December 15, 2022. The Company recognized a one-time cumulative effect adjustment (increase) to the ACL of $1.4 million upon adoption as of January 1, 2023. In addition, the Company established a related reserve for unfunded commitments of $1.1 million as of January 1, 2023.
If real estate markets or the economy in general deteriorate, State Bank may experience increased delinquencies and credit losses. The ACL may not be sufficient to cover actual loan-related losses. Additionally, banking regulators may require State Bank to increase its ACL in the future, which could have a negative effect on the Company’s financial condition and results of operations. Additions to the ACL will result in a decrease in net earnings and capital and could hinder our ability to grow our assets.
Any significant increase in our ACL or loan charge offs, including increases required by applicable regulatory authorities, might have a material adverse effect on the Company’s financial condition and results of operations.
Our success depends upon our ability to attract and retain key personnel.
Our success depends upon the continued service of our senior management team and upon our ability to attract and retain qualified financial services personnel. Competition for qualified employees is intense. We cannot guarantee that we will be able to retain our existing key personnel or attract additional qualified personnel. If we lose the services of our key personnel, or are unable to attract additional qualified personnel, our business, financial condition and results of operations could be adversely affected.
We depend upon the accuracy and completeness of information about customers.
In deciding whether to extend credit or enter into other transactions with customers, we may rely on information provided to us by customers, including financial statements and other financial information. We may also rely on representations of customers as to the accuracy and completeness of that information and, with respect to financial statements, on reports of independent auditors. For example, in deciding whether to extend credit to a business, we may assume that the customer’s audited financial statements conform to generally accepted accounting principles and present fairly, in all material respects, the financial condition, results of operations and cash flows of the customer, and we may also rely on the audit report covering those financial statements. Our financial condition and results of operations could be negatively impacted to the extent we rely on financial statements that do not comply with generally accepted accounting principles or that are materially misleading.
We may not be able to grow, and if we do, we may have difficulty managing that growth.
Our business strategy is to continue to grow our assets and expand our operations, including through potential strategic acquisitions. Our ability to grow depends, in part, upon our ability to expand our market share, successfully attract core deposits, and to identify loan and investment opportunities as well as opportunities to generate fee-based income. We can provide no assurance that we will be successful in increasing the volume of our loans and deposits at acceptable levels and upon terms acceptable to us. We also can provide no assurance that we will be successful in expanding our operations organically or through strategic acquisitions while managing the costs and implementation risks associated with this growth strategy.
We expect to continue to experience growth in the number of our employees and customers and the scope of our operations, but we may not be able to sustain our historical rate of growth or continue to grow our business at all. Our success will depend upon the ability of our officers and key employees to continue to implement and improve our operational and other systems, to manage multiple, concurrent customer relationships, and to hire, train and manage our employees. In the event that we are unable to perform all these tasks and meet these challenges effectively, including continuing to attract core deposits, our operations, and consequently our earnings, could be adversely impacted.
Future acquisitions or other expansion may adversely impact our financial condition and results of operations.
In the future, we may acquire other financial institutions or branches or assets of other financial institutions. We may also open new branches, enter into new lines of business, or offer new products or services. Any such acquisition or expansion of our business will involve a number of expenses and risks, which may include some or all of the following:
| ● | the time and expense associated with identifying and evaluating potential acquisitions or expansions; |
| ● | the potential inaccuracy of estimates and judgments used to evaluate credit, operations, management and market risk with respect to target institutions; |
| ● | the time and costs of evaluating new markets, hiring local management and opening new offices, and the delay between commencing these activities and the generation of profits from the expansion; |
| ● | any financing required in connection with an acquisition or expansion; |
| ● | the diversion of management’s attention to the negotiation of a transaction and the integration of the operations and personnel of the combining businesses; |
| ● | entry into unfamiliar markets and the introduction of new products and services into our existing business; |
| ● | the possible impairment of goodwill associated with an acquisition and possible adverse short-term effects on our results of operations; and |
| ● | the risk of loss of key employees and customers. |
We may incur substantial costs to expand, and we can give no assurance that such expansion will result in the levels of profits we expect. Neither can we assure that integration efforts for any future acquisitions will be successful. We may issue equity securities in connection with acquisitions, which could dilute the economic and voting interests of our existing shareholders.
We are exposed to a number of operational risks.
We are exposed to many types of operational risk, including reputational risk, legal and compliance risk, cybersecurity risk, the risk of fraud or theft by employees or outsiders, unauthorized transactions by employees or operational errors, including clerical or record-keeping errors or those resulting from faulty or disabled computer or telecommunications systems.
We rely heavily on communications and information systems to conduct our business. Any failure, interruption or breach in security of these systems could result in failures or disruptions in our customer relationship management, general ledger, deposit, loan and other systems.
Given the volume of transactions we process, certain errors may be repeated or compounded before they are discovered and successfully rectified. Our necessary dependence upon automated systems to record and process our transaction volume may further increase the risk that technical system flaws or employee tampering or manipulation of those systems will result in losses that are difficult to detect. We may also be subject to disruptions of our operating systems arising from events that are wholly or partially beyond our control (for example, cyberattacks or electrical or telecommunications outages), which may give rise to disruption of service to customers and to financial loss or liability. We are further exposed to the risk that our external vendors may be unable to fulfill their contractual obligations (or will be subject to the same risk of fraud or operational errors by their respective employees as we are) and to the risk that our (or our vendors’) consumer compliance, business continuity and data security systems prove to be inadequate.
Negative public opinion can result from our actual or alleged conduct in any number of activities, including lending practices, corporate governance, acquisitions, social media and other marketing activities, and the implementation of environmental, social and governance (“ESG”) practices, and from actions taken by governmental regulators and community organizations in response to any of the foregoing activities. Negative public opinion could adversely affect our ability to attract and keep customers, could expose us to potential litigation and regulatory action, and could have a material adverse effect on the price of our common shares or result in heightened volatility of our stock price.
Recent and future bank failures may adversely affect the Company’s business, earnings and financial condition.
The failure of other banks can have significant impacts on the national, regional and local banking industry and the business environment in which the Company operates. The recent bank failures of Silicon Valley Bank in California, Signature Bank in New York, and First Republic Bank in California during the first and second quarters of 2023 have caused a degree of panic and uncertainty in the investor community and among bank customers generally. While the Company does not believe that the circumstances of these three bank failures are indicators of broader issues with the banking system, these and any future bank failures may reduce customer confidence, affect sources of funding and liquidity (for example, by increasing the withdrawal or transfer of deposits by customers), increase regulatory requirements and costs, adversely affect financial markets and/or have a negative reputational ramification for the banking industry as a whole. The Company will continue to monitor the ongoing events concerning these three banks, as well as any future potential bank failures and/or volatility within the banking industry in general, along with any responsive measures taken by the banking regulators to mitigate or manage potential turmoil in the banking industry.
We could experience an unexpected inability to obtain needed liquidity which could adversely affect our business, profitability, and viability a going concern.
Liquidity measures the ability to meet current and future cash flow needs as they become due. The liquidity of a financial institution reflects its ability to meet loan requests, to accommodate possible outflows in deposits, and to take advantage of interest rate market opportunities and is essential to a financial institution’s business. The ability of a financial institution to meet its current financial obligations is a function of its balance sheet structure, its ability to liquidate assets, and its access to alternative sources of funds. The bank failures in 2023 exemplify the potential serious results of the unexpected inability of insured depository institutions to obtain needed liquidity to satisfy deposit withdrawal requests, including how quickly such requests can accelerate once uninsured depositors lose confidence in an institution’s ability to satisfy its obligations to depositors. We seek to ensure our funding needs are met by maintaining a level of liquidity through asset and liability management. If we become unable to obtain funds when needed, it could have a material adverse effect on our business, financial condition, and results of operations.
Our information systems may experience an interruption or security breach.
We rely heavily on communications and information systems to conduct our business. Any failure, interruption or breach in security of these systems could result in failures or disruptions in our customer relationship management, general ledger, deposit, loan and other systems. While we have policies and procedures designed to prevent or limit the effect of the possible failure, interruption or security breach of our information systems, there can be no assurance that any such failure, interruption or security breach will not occur or, if they do occur, that they will be adequately addressed. The occurrence of any failure, interruption or security breach of our information systems could damage our reputation, result in a loss of customer business, subject us to additional regulatory scrutiny, or expose us to civil litigation and possible financial liability.
Unauthorized disclosure of sensitive or confidential client information, or breaches in security of our systems, could severely harm our business.
We collect, process and store sensitive consumer data by utilizing computer systems and telecommunications networks operated by both third-party service providers and us. State Bank’s necessary dependence upon automated systems to record and process State Bank’s transactions poses the risk that technical system flaws, employee errors, tampering or manipulation of those systems, or attacks by third parties will result in losses and may be difficult to detect. We have security and backup and recovery systems in place, as well as a business continuity plan, to ensure the computer systems will not be inoperable, to the extent possible. We also routinely review documentation of such controls and backups related to third party service providers. Our inability to use or access these information systems at critical points in time could unfavorably impact the timeliness and efficiency of our business operations. In recent years, some banks have experienced cyberattacks with the goal and effect of disrupting the ability of the bank to process transactions. Other businesses have been victims of ransomware attacks in which the business becomes unable to access its own information and is presented with a demand to pay a ransom in order to once again have access to its information.
We could be adversely affected if one of our employees or a third-party service provider causes a significant operational breakdown or failure, either as a result of human error or where an individual purposefully sabotages or fraudulently manipulates our operations or systems. State Bank is further exposed to the risk that the third-party service providers may be unable to fulfill their contractual obligations (or will be subject to the same risks as we are). These disruptions may interfere with service to our customers, cause additional regulatory scrutiny and result in a financial loss or liability. We are also at risk of the impact of natural disasters, terrorism and international hostilities on our systems or for the effects of outages or other failures involving power or communications systems operated by others.
Misconduct by employees could include fraudulent, improper or unauthorized activities on behalf of clients or improper use of confidential information. We may not be able to prevent employee errors or misconduct, and the precautions we take to detect this type of activity might not be effective in all cases. Employee errors or misconduct could subject us to civil claims for negligence or regulatory enforcement actions, including fines and restrictions on our business.
In addition, there have been instances where financial institutions have been victims of fraudulent activity in which criminals pose as customers to initiate wire and automated clearinghouse transactions out of customer accounts. Although we have policies and procedures in place to verify the authenticity of our customers, we cannot assure that such policies and procedures will prevent all fraudulent transfers.
We have implemented security controls to prevent unauthorized access to our computer systems, and we require that our third-party service providers maintain similar controls. However, the Company’s management cannot be certain that these measures will be successful. A security breach of the computer systems and loss of confidential information, such as customer account numbers and related information, could result in a loss of customers’ confidence and, thus, loss of business. We could also lose revenue if competitors gain access to confidential information about our business operations and use it to compete with us. While we maintain specific “cyber” insurance coverage, which would apply in the event of various breach scenarios, the amount of coverage may not be adequate in any particular case. Furthermore, because cyber threat scenarios are inherently difficult to predict and can take many forms, some breaches may not be covered under our cyber insurance coverage.
Further, we may be affected by data breaches at retailers and other third parties who participate in data interchanges with us and our customers that involve the theft of customer credit and debit card data, which may include the theft of our debit card PIN numbers and commercial card information used to make purchases at such retailers and other third parties. Such data breaches could result in us incurring significant expenses to reissue debit cards and cover losses, which could result in a material adverse effect on our results of operations.
There can be no assurance that we will not suffer such cyber-attacks or other information security breaches (or attempted breaches) or incur resulting losses in the future. Our risk and exposure to these matters remains heightened because of, among other things, the evolving nature of these threats, and our plans to continue to implement internet and mobile banking capabilities to meet customer demand. As cyber and other data security threats continue to evolve, we may be required to expend significant additional resources to continue to modify and enhance protective measures or to investigate and remediate any security vulnerabilities.
All of the types of cybersecurity incidents discussed above could result in damage to the Company’s reputation, loss of customer business, litigation, increased regulatory scrutiny and potential enforcement actions, repairs of system damage, increased investments in cybersecurity (such as obtaining additional technology, making organizational changes, deploying additional personnel, training personnel and engaging consultants), increased insurance premiums, and loss of investor confidence and a reduction in the price of our common shares, all of which could result in financial loss and material adverse effects on the Company’s results of operations and financial condition.
Our business could be adversely affected through third parties who perform significant operational services on our behalf.
The third parties performing operational services for the Company are subject to risks similar to those faced by the Company relating to cybersecurity, breakdowns or failures of their own systems, or misconduct of their employees. Like many other community banks, State Bank also relies, in significant part, on a single vendor for the systems which allow State Bank to provide banking services to State Bank’s customers.
One or more of the third parties utilized by us may experience a cybersecurity event or operational disruption and, if any such event does occur, it may not be adequately addressed, either operationally or financially, by such third party. Certain of these third parties may have limited indemnification obligations to us in the event of a cybersecurity event or operational disruption or may not have the financial capacity to satisfy their indemnification obligations.
Financial or operational difficulties of a third-party provider could also impair our operations if those difficulties interfere with such third party’s ability to serve the Company. If a critical third-party provider is unable to meet the needs of the Company in a timely manner, or if the services or products provided by such third party are terminated or otherwise delayed and if the Company is not able to develop alternative sources for these services and products quickly and cost-effectively, our business could be materially adversely affected.
Additionally, regulatory guidance adopted by federal banking regulators addressing how banks select, engage and manage their third-party relationships, affects the circumstances and conditions under which we work with third parties and the cost of managing such relationships.
Strong competition within our market area may reduce our ability to attract and retain deposits and originate loans.
We face competition both in originating loans and in attracting deposits within our market area. We compete for clients by offering personal service and competitive rates on our loans and deposit products. The type of institutions we compete with include large regional financial institutions, community banks, thrifts and credit unions operating within our market areas. Nontraditional sources of competition for loan and deposit dollars come from captive auto finance companies, mortgage banking companies, internet banks, brokerage companies, insurance companies, fintechs and direct mutual funds. As a result of their size and ability to achieve economies of scale, certain of our competitors offer a broader range of products and services than we offer. We expect competition to remain intense in the future due to legislative, regulatory and technological changes and the continuing trend of consolidation in the financial services industry. In addition, to stay competitive in our markets we may need to adjust the interest rates on our products to match the rates offered by our competitors, which could adversely affect our net interest margin. As a result, our profitability depends upon our continued ability to successfully compete in our market areas while achieving our investment objectives.
We may be required to repurchase loans we have sold or indemnify loan purchasers under the terms of the sale agreements, which could adversely affect our liquidity, results of operations and financial statements.
When State Bank sells a mortgage loan, it agrees to repurchase or substitute a mortgage loan if it is later found to have breached any representation or warranty State Bank made about the loan or if the borrower is later found to have committed fraud in connection with the origination of the loan. While we have underwriting policies and procedures designed to avoid breaches of representations and warranties as well as borrower fraud, there can be no assurance that no breach or fraud will ever occur. Required repurchases, substitutions or indemnifications could have an adverse impact on our liquidity, results of operations and financial statements.
We are subject to environmental liability risk associated with lending activities.
A significant portion of our loan portfolio is secured by real property. During the ordinary course of business, we foreclose on and take title to properties securing certain loans. In doing so, there is a risk that hazardous or toxic substances could be found on these properties. If hazardous or toxic substances are found, we may be liable for remediation costs, as well as for personal injury and property damage. Environmental laws and evolving regulation may require us to incur substantial expenses and may materially reduce the affected property’s value or limit our ability to use or sell the affected property. In addition, future laws and regulations or more stringent interpretations or enforcement policies with respect to existing laws or regulations may increase our exposure to environmental liability. Environmental reviews of real property before initiating foreclosure actions may not be sufficient to detect all potential environmental hazards. The remediation costs and any other financial liabilities associated with an environmental hazard could have a material adverse effect on our business, financial condition and results of operations.
Legislative, Legal and Regulatory Risks:
FDIC insurance premiums may increase materially, which could negatively affect our profitability.
The FDIC insures deposits at FDIC insured financial institutions, including State Bank. The FDIC charges the insured financial institutions premiums to maintain the DIF at a certain level. During 2008 and 2009, there were higher levels of bank failures which dramatically increased resolution costs of the FDIC and depleted the deposit insurance fund. The FDIC collected a special assessment in 2009 to replenish the DIF and also required a prepayment of an estimated amount of future deposit insurance premiums. In October 2022, the FDIC adopted a final rule increasing the assessment rate from three basis points to five basis points beginning with the first quarterly assessment period of 2023. The FDIC recently adopted rules revising the assessments in a manner benefiting banks with assets totaling less than $10 billion. There can be no assurance, however, that assessments will not be changed in the future.
We operate in a highly regulated industry, and the laws and regulations that govern our operations, corporate governance, executive compensation and financial accounting, or reporting, including changes in, or failure to comply with the same, may adversely affect the Company.
The banking industry is highly regulated. We are subject to supervision, regulation and examination by various federal and state regulators, including the FRB, the SEC, the CFPB, the FDIC, Financial Industry Regulatory Authority, Inc. (“FINRA”), and various state regulatory agencies. The statutory and regulatory framework that governs the Company is generally designed to protect depositors and customers, the DIF, the U.S. banking and financial system, and financial markets as a whole and not to protect shareholders. These laws and regulations, among other matters, prescribe minimum capital requirements, impose limitations on our business activities (including foreclosure and collection practices), limit the dividends or distributions that we can pay, and impose certain specific accounting requirements that may be more restrictive and may result in greater or earlier charges to earnings or reductions in capital than would otherwise be required under generally accepted accounting principles in the United States of America. Compliance with laws and regulations can be difficult and costly, and changes to laws and regulations often impose additional compliance costs. Both the scope of the laws and regulations and the intensity of the supervision to which we are subject have increased in recent years in response to the perceived state of the financial services industry, as well as other factors such as technological and market changes. Such regulation and supervision may increase our costs and limit our ability to pursue business opportunities. Further, our failure to comply with these laws and regulations, even if the failure was inadvertent or reflects a difference in interpretation, could subject the Company to restrictions on business activities, fines, and other penalties, any of which could adversely affect results of operations, the capital base, and the price of our common shares. Further, any new laws, rules, or regulations could make compliance more difficult or expensive or otherwise adversely affect our business and financial condition.
Legislative or regulatory changes or actions could adversely impact our business.
The financial services industry is extensively regulated. We are subject to extensive state and federal regulation, supervision and legislation that govern almost all aspects of our operations. Laws and regulations may change from time to time and are primarily intended for the protection of consumers, depositors, borrowers, the DIF and the banking system as a whole, and not to benefit our shareholders.
Regulations affecting banks and financial services businesses are undergoing continuous change, and management cannot predict the effect of these changes. While such changes are generally intended to lessen the regulatory burden on financial institutions, the impact of any changes to laws and regulations or other actions by regulatory agencies may negatively impact us or our ability to increase the value of our business. Regulatory authorities have extensive discretion in connection with their supervisory and enforcement activities, including the imposition of restrictions on the operation of a financial institution, the classification of assets held by a financial institution, the adequacy of a financial institution’s ACL and the ability to complete acquisitions. Additionally, actions by regulatory agencies against us could cause us to devote significant time and resources to defending our business and may lead to penalties that materially affect us and our shareholders. Even the reduction of regulatory restrictions could have an adverse effect on us and our shareholders if such lessening of restrictions increases competition within our industry or our market area.
Changes in accounting standards could influence our results of operations.
The accounting standard setters, including the FASB, the SEC and other regulatory bodies, periodically change the financial accounting and reporting standards that govern the preparation of our consolidated financial statements. These changes can be difficult to predict and can materially affect how we record and report our financial condition and results of operations. In some cases, we could be required to apply a new or revised standard retroactively, which would result in the restatement of our financial statements for prior periods.
The preparation of consolidated financial statements in conformity with U.S. Generally Accepted Accounting Principles (“GAAP”) requires management to make significant estimates that affect the financial statements. Due to the inherent nature of these estimates, actual results may vary materially from management’s estimates.
Noncompliance with the Bank Secrecy Act (BSA) and other anti-money laundering statutes and regulations could cause a material financial loss.
The BSA and the Patriot Act contain anti-money laundering and financial transparency provisions intended to detect and prevent the use of the U.S. financial system for money laundering and terrorist financing activities. The BSA, as amended by the Patriot Act, requires depository institutions and their holding companies to undertake activities including maintaining an anti-money laundering program, verifying the identity of clients, monitoring for and reporting suspicious transactions, reporting on cash transactions exceeding specified thresholds, and responding to requests for information by regulatory authorities and law enforcement agencies. The Financial Crimes Enforcement Network (“FinCEN”), a unit of the U.S. Department of the Treasury that administers the BSA, is authorized to impose significant civil money penalties for violations of those requirements and has recently engaged in coordinated enforcement efforts with the federal bank regulatory agencies, as well as the U.S. Department of Justice, Drug Enforcement Administration, and Internal Revenue Service. The AMLA is intended to be a comprehensive reform and modernization to U.S. bank secrecy and anti-money laundering laws, which includes a codified risk-based approach to anti-money laundering compliance for financial institutions; requires the development of standards for evaluating technology and internal processes for BSA compliance; expands enforcement-related and investigation-related authority, including increasing available sanctions for certain BSA violations and instituting BSA whistleblower incentives and protections.
There is also increased scrutiny of compliance with the rules enforced by the Office of Foreign Assets Control (“OFAC”). If the Company’s policies, procedures, and systems are deemed deficient, or if the policies, procedures, and systems of the financial institutions that the Company has already acquired or may acquire in the future are deficient, the Company may be subject to liability, including fines and regulatory actions such as restrictions on State Bank’s ability to pay dividends and the necessity to obtain regulatory approvals to proceed with certain planned business activities, including acquisition plans, which could negatively impact our business, financial condition, and results of operations. Failure to maintain and implement adequate programs to combat money laundering and terrorist financing could also have serious reputational consequences for the Company.
We may be the subject of litigation, which could result in legal liability and damage to our business and reputation.
From time to time, we may be subject to claims or legal action from customers, employees or others. Financial institutions like the Company and State Bank are facing a growing number of significant class actions, including those based on the manner of calculation of interest on loans and the assessment of overdraft fees. Future litigation could include claims for substantial compensatory and/or punitive damages or claims for indeterminate amounts of damages. We are also involved from time to time in other reviews, investigations and proceedings (both formal and informal) by governmental and other agencies regarding our business. These matters also could result in adverse judgments, settlements, fines, penalties, injunctions or other relief. Like other large financial institutions, we are also subject to risk from potential employee misconduct, including non-compliance with policies and improper use or disclosure of confidential information.
Our insurance may not cover all claims that may be asserted against us, and any claims asserted against us, regardless of merit or eventual outcome, may harm our reputation. Should the ultimate judgments or settlements in any litigation exceed our insurance coverage, they could have a material adverse effect on our financial condition and results of operations. In addition, we may not be able to obtain appropriate types or levels of insurance in the future, nor may we be able to obtain adequate replacement policies with acceptable terms, if at all.
We could face legal and regulatory risk arising out of our residential mortgage business.
Numerous federal and state governmental, legislative and regulatory authorities are investigating practices in the business of mortgage and home equity lending and servicing and in the mortgage-related insurance and reinsurance industries. We could face the risk of class actions, other litigation and claims from: the owners of or purchasers of such loans originated or serviced by us, homeowners involved in foreclosure proceedings or various mortgage-related insurance programs, downstream purchasers of homes sold after foreclosure, title insurers, and other potential claimants. Included among these claims are claims from purchasers of mortgage and home equity loans seeking the repurchase of loans where the loans allegedly breached origination covenants, representations, and warranties made to the purchasers in the purchase and sale agreements. The CFPB has issued new rules for mortgage origination and mortgage servicing. Both the origination and servicing rules create new private rights of action for consumers against lenders and servicers in the event of certain violations.
Risks Related to Our Capital and Common Shares:
Our ability to pay cash dividends is limited, and we may be unable to pay cash dividends in the future even if we elect to do so.
We are dependent primarily upon the earnings of our operating subsidiaries for funds to pay dividends on our common shares. The payment of dividends by us is also subject to regulatory restrictions. As a result, any payment of dividends in the future will be dependent, in large part, on our ability to satisfy these regulatory restrictions and our subsidiaries’ earnings, capital requirements, financial condition and other factors. There can be no assurance as to if or when the Company may pay dividends or as to the amount of any dividends which may be declared and paid to shareholders in future periods. Failure to pay dividends on our shares could have a material adverse effect on the market price of our shares.
A limited trading market exists for our common shares, which could lead to price volatility.
The ability to sell our common shares depends upon the existence of an active trading market for those shares. While our shares are listed for trading on the NASDAQ Capital Market, there is moderate trading volume in these shares. As a result, shareholders may be unable to sell our shares at the volume, price and time desired. The limited trading market for our shares may cause fluctuations in the market value of our shares to be exaggerated, leading to price volatility in excess of that which would occur in a more active trading market. In addition, even if a more active market of our shares should develop, we cannot guarantee that such a market will continue.
The market price of our common shares may be subject to fluctuations and volatility.
The market price of our common shares may fluctuate significantly due to, among other things, changes in market sentiment regarding our operations, financial results or business prospects, the banking industry generally or the macroeconomic outlook. Certain events or changes in the market or banking industry generally are beyond our control. In addition to the other risk factors contained or incorporated by reference herein, factors that could affect our trading price:
| ● | our actual or anticipated operating and financial results, including how those results vary from the expectations of management, securities analysts and investors; |
| ● | changes in financial estimates or publications of research reports and recommendations by financial analysts or actions taken by rating agencies with respect to us or other financial institution; |
| ● | failure to declare dividends on our common shares from time to time; |
| ● | reports in the press or investment community generally or relating to our reputation or the financial services industry; |
| ● | developments in our business or operations or in the financial sector generally; |
| ● | any future offerings by us of our common shares; |
| ● | any future offerings by us of debt or preferred shares, which would be senior to our common shares upon liquidation and for purposes of dividend distributions; |
| ● | legislative or regulatory changes affecting our industry generally or our business and operations specifically; |
| ● | the operating and share price performance of companies that investors consider to be comparable to us; |
| ● | announcements of strategic developments, acquisitions, restructurings, dispositions, financings and other material events by us or our competitors; |
| ● | actions by our current shareholders, including future sales of common shares by existing shareholders, including our directors and executive officers; |
| ● | proposed or final regulatory changes or developments; |
| ● | anticipated or pending regulatory investigations, proceedings, or litigation that may involve or affect us; and |
| ● | other changes in U.S. or global financial markets, global economies and general market conditions, such as interest or foreign exchange rates, stock, commodity, credit or asset valuations or volatility. |
Equity markets in general and our shares have experienced volatility over the past few years. The market price of our shares may continue to be subject to volatility unrelated to our operating performance or business prospects, which could result in a decline in the market price of our shares.
Investors could become subject to regulatory restrictions upon ownership of our common shares.
Under the Federal Change in Bank Control Act, a person may be required to obtain prior approval from the Federal Reserve Board before acquiring 10 percent or more of our common shares or the power to directly or indirectly control our management, operations, or policies.
We have implemented anti-takeover devices that could make it more difficult for another company to purchase us, even though such a purchase may increase shareholder value.
In many cases, shareholders may receive a premium for their shares if we were purchased by another company. Ohio law and our Amended Articles of Incorporation, as amended (“Articles”), and Amended and Restated Regulations, as amended (“Regulations”), make it difficult for anyone to purchase us without the approval of our Board of Directors. Consequently, a takeover attempt may prove difficult, and shareholders may not realize the highest possible price for their securities.
We may be compelled to seek additional capital in the future, but capital may not be available when needed.
We are required by federal and state regulatory authorities to maintain adequate levels of capital to support our operations. In addition, federal banking agencies have proposed extensive changes to their capital requirements; including raising required amounts and eliminating the inclusion of certain instruments from the calculation of capital. In addition, we may elect to raise additional capital to support our business or to finance acquisitions, if any, or we may otherwise elect to raise additional capital. Our ability to raise additional capital, if needed, will depend on conditions in the capital markets, economic conditions and a number of other factors, many of which are outside our control, and on our financial performance. Accordingly, we cannot be assured of our ability to raise additional capital if needed or on terms acceptable to us. If we cannot raise additional capital when needed, it may have a material adverse effect on our financial condition, results of operations and prospects.
General Risk Factors:
Our earnings are significantly affected by the fiscal and monetary policies of the federal government and its agencies.
The policies of the FRB impact us significantly. The FRB regulates the supply of money and credit in the United States. Its policies directly and indirectly influence the rate of interest earned on loans and paid on borrowings and interest-bearing deposits and can also affect the value of financial instruments we hold. Those policies determine to a significant extent our cost of funds for lending and investing. Changes in those policies are beyond our control and are difficult to predict. FRB policies can also affect our borrowers, potentially increasing the risk that they may fail to repay their loans. For example, a tightening of the money supply by the FRB could reduce the demand for a borrower’s products and services. This could adversely affect the borrower’s earnings and ability to repay its loan, which could have a material adverse effect on our financial condition and results of operations.
Changes in tax laws could adversely affect our performance.
We are subject to extensive federal, state and local taxes, including income, excise, sales/use, payroll, franchise, withholding and ad valorem taxes. Changes to tax laws could have a material adverse effect on our results of operations; fair values of net deferred tax assets and obligations of state and political subdivisions held in our investment securities portfolio. In addition, our customers are subject to a wide variety of federal, state and local taxes. Changes in taxes paid by our customers may adversely affect their ability to purchase homes or consumer products, which could adversely affect their demand for our loans and deposit products. In addition, such negative effects on our customers could result in defaults on the loans we have made.
The preparation of our financial statements requires the use of estimates that may vary from actual results.
The preparation of consolidated financial statements in conformity with accounting principles generally accepted in the U.S. requires management to make significant estimates that affect the financial statements. Two of our most critical estimates are the level of the ACL and the accounting for goodwill and other intangibles. Because of the inherent nature of these estimates, we cannot provide complete assurance that we will not be required to adjust earnings for significant unexpected loan losses, nor that we will not recognize a material provision for impairment of our goodwill. For additional information regarding these critical estimates, see Item 7. Management’s Discussion and Analysis of Financial Condition and Results of Operations beginning on page 32 of this Annual Report on Form 10-K.
We may experience increasing scrutiny and evolving expectations from customers, regulators, investors, and other stakeholders with respect to the Company’s environmental, social and governance practices.
Financial institutions are facing increasing scrutiny from customers, regulators, investors, and other stakeholders related to their ESG practices and disclosure. Investor advocacy groups, investment funds, and influential investors are also increasingly focused on these practices, especially as they relate to the environment, health and safety, diversity, labor conditions, and human rights. Increased ESG-related compliance costs for the Company as well as among our suppliers, vendors and various other parties within our supply chain could result in increases to our overall operational costs. Failure to adapt to or comply with regulatory requirements or investor or stakeholder expectations and standards could negatively impact our reputation, ability to do business with certain partners, access to capital, and the price of our common shares. New government regulations could also result in new or more stringent forms of ESG oversight and expanding mandatory and voluntary reporting, diligence, and disclosure.
We need to constantly update our technology in order to compete and meet customer demands.
The financial services market, including banking services, is undergoing rapid technological changes with frequent introductions of new technology-driven products and services. In addition to better serving customers, the effective use of technology increases efficiency and may enable us to reduce costs. Our future success will depend, in part, on our ability to use technology to provide products and services that provide convenience to customers and to create additional efficiencies in our operations. Some of our competitors have substantially greater resources to invest in technological improvements. We may not be able to effectively implement new technology-driven products and services or be successful in marketing these products and services to our customers. Failure to successfully keep pace with technological changes affecting the financial services industry could negatively affect our growth, revenue and profit.
Climate change, severe weather, natural disasters, acts of war or terrorism and other external events could significantly impact our business.
Natural disasters, including severe weather events of increasing strength and frequency due to climate change, acts of war or terrorism, and other adverse external events could have a significant impact on our ability to conduct business or upon third parties who perform operational services for us or our customers. Such events could affect the stability of our deposit base, impair the ability of borrowers to repay outstanding loans, impair the value of collateral securing loans, cause significant property damage, result in lost revenue or cause us to incur additional expenses.
Item 1B. Unresolved Staff Comments
None.
Item 1C. Cybersecurity
The Company regularly assesses risks from cybersecurity threats, monitors its information systems for potential vulnerabilities, and tests those systems pursuant to the Company’s cybersecurity policies, standards, processes, and practices, which are integrated into the Company’s overall risk management program. We have adopted aspects of the NIST cybersecurity framework, to which risk management in relation to our information systems is aligned. We categorize our information systems as either Tier 1 (critical) or Tier 2 or Tier 3 (essential), depending on business value and/or risk of financial or compliance impact of cybersecurity incidents. Our information security team uses a multifaceted approach to monitor, assess, identify, and manage material risks to the Company from cybersecurity threats, including testing of the effectiveness of our cybersecurity incident prevention and response systems; conducting routine vulnerability scanning of information systems assets; network/endpoint detection and response coupled with advanced identification-enhanced logging capabilities powered by artificial intelligence software; discovery through collaboration with the Company’s internal audit team; monitoring of threat intelligence feeds provided by industry associations/groups, service providers, and federal/state authorities; and professional service engagements, such as retaining the services of an external 24/7 security operations center and partnering with third parties in testing our information systems for vulnerabilities from external, internal, and social engineering perspectives and assessing the effectiveness of our cybersecurity controls.
The Company partners with third-party service providers and employs processes to assess, identify, and manage material risks from cybersecurity threats arising from the use of such third-party service providers. Our latest assessment attempted to identify vulnerabilities in our network and systems from external, internal, and social engineering perspectives. Our cybersecurity practices (including with respect to third-party service providers) have been assessed to represent a level of maturity consistent with industry best practices.
Risks from cybersecurity threats, including as a result of any previous cybersecurity incidents, have not materially affected the Company, including its business strategy, results of operations, and financial condition. For more information about these and other risks, see ITEM 1A. RISK FACTORS.
Our board of directors oversees the Company’s risk management process, including cybersecurity risks, directly and through its committees. The Audit & Risk Management Committee and the Board provides structured oversight of the Company’s risk management program, which focuses on the most significant short, intermediate, and long-term risks the Company faces. The Company has an Information Security Council (the “Council”) that is responsible for overseeing the development and upkeep of written policies and procedures aimed at safeguarding the Company’s information systems and the nonpublic information stored within them. In addition, the Council plays a crucial role in the governance of the cybersecurity risk management process. This involves collaborating with third-party industry experts and the Company’s internal audit team to conduct risk assessments of the Company’s information security program (the “Program”). The assessments encompass an evaluation of the Company’s adherence to the Program, including the elements of the Program that are dictated by relevant laws, regulations, and the Company’s information security policy and procedures. Reports of the Council are shared regularly throughout the year with the board of directors. Furthermore, the Company conducts periodic cybersecurity assessments and preparedness analyses, supervised by our designated Chief Technology & Innovation Officer (“CTIO”).
The Company routinely engages third-party industry experts to perform risk assessments of the Program. At least annually, our internal audit team conducts a formal risk assessment and develops an audit plan that identifies, assesses, and prioritizes risks that include cybersecurity. The results of the risk assessment and the proposed audit plan are communicated to various leaders within the Company as well as the Audit & Risk Management Committee for input. The audit plan is reassessed throughout the year, and the plan is subject to modification by our internal audit team, e.g., based on such considerations as changes to resources, business operations, or internal or external risk factors.
Item 2. Properties.
The Company’s principal executive offices are located at 401 Clinton Street, Defiance, Ohio. State Bank owns this facility, with a portion of the facility utilized as a retail banking center. In addition, State Bank owns the land and buildings occupied by 21 of its banking centers and leases two other properties used as banking centers. The Company also occupies office space from various parties for loan production and other business purposes on varying lease terms. There is no outstanding mortgage debt on any of the properties which are owned by State Bank.
Listed below are the banking centers, loan production offices and service facilities of the Company and their addresses, all of which are located in Allen, Defiance, Delaware, Franklin, Fulton, Hancock, Lucas, Paulding, Williams and Wood counties of Ohio; Allen, Boone, Hamilton and Steuben counties of Indiana; and Monroe county of Michigan:
SB Financial Group, Inc. Property List as of December 31, 2023
| ($ in thousands) | Description/Address | Leased/ Owned |
Total Deposits 12/31/23 |
|||||
| Main Banking Center & Corporate Office | ||||||||
| 401 | Clinton Street, Defiance, OH | Owned | $ | 254,499 | ||||
| Banking Centers/Drive-Thru’s | ||||||||
| 1419 | West High Street, Bryan, OH | Owned | 56,400 | |||||
| 510 | Third Street, Defiance, OH (Drive-thru) | Owned | N/A | |||||
| 1600 | North Clinton Street, Defiance, OH | Leased | 38,898 | |||||
| 312 | Main Street, Delta, OH | Owned | 20,504 | |||||
| 4080 | West Dublin Granville Road, Dublin, OH | Owned | 79,995 | |||||
| 104 | North Michigan Avenue, Edgerton, OH | Owned | 12,508 | |||||
| 201 | East Lincoln Street, Findlay, OH | Owned | 21,823 | |||||
| 408 | South Main Street Suite A, Findlay, OH | Leased | 103 | |||||
| 12832 | Coldwater Road, Fort Wayne, IN | Owned | 29,364 | |||||
| 1232 | North Main Street, Bowling Green, OH | Owned | 22,454 | |||||
| 235 | Main Street, Luckey, OH | Owned | 29,324 | |||||
| 133 | East Morenci Street, Lyons, OH | Owned | 23,672 | |||||
| 930 | West Market Street, Lima, OH | Owned | 58,987 | |||||
| 1201 | East Main Street, Montpelier, OH | Owned | 42,167 | |||||
| 218 | North First Street, Oakwood, OH | Owned | 24,413 | |||||
| 220 | North Main Street, Paulding, OH | Owned | 70,841 | |||||
| 610 | East South Boundary Street, Perrysburg, OH | Owned | 14,232 | |||||
| 119 | South State Street, Pioneer, OH | Owned | 38,644 | |||||
| 6401 | Monroe Street, Sylvania, OH | Owned | 57,552 | |||||
| 311 | Main Street, Walbridge, OH | Owned | 30,982 | |||||
| 101 | North Michigan Street, Edon, OH | Owned | 59,472 | |||||
| 1379 | North Shoop Avenue, Wauseon, OH | Owned | 83,371 | |||||
| Loan Production Offices | ||||||||
| 307 | North Wayne Street, Angola, IN | Owned | N/A | |||||
| 10100 | Lantern Road, Suite 240, Fishers, IN | Leased | N/A | |||||
| 94 | Granville Street, Gahanna, OH | Owned | N/A | |||||
| 8204 | Secor Road, Lambertville, MI | Leased | N/A | |||||
| 1900 | Monroe Street, Suite 108, Toledo, OH | Leased | N/A | |||||
| 100 | South Main Street, Suite 102, Zionsville, IN | Leased | N/A | |||||
| Service Facilities (SBT/ SBFG Title) | ||||||||
| 105 | East Holland Street, Archbold, OH | Leased | N/A | |||||
| 125 | West Butler Street, Bryan OH | Owned | N/A | |||||
| 9101 | Antares Avenue, Columbus, OH | Owned | N/A | |||||
| 1911 | Baltimore Road, Defiance, OH | Leased | N/A | |||||
| Total deposits | $ | 1,070,205 | ||||||
SB Captive operates from office space located at 101 Convention Center Dr., Suite 850, Las Vegas, NV 89109.
The Company’s subsidiaries have several noncancellable leases for business use that expire over the next five years. Aggregate rental expense for these leases was $0.20 million and $0.19 million for the years ended December 31, 2023 and 2022, respectively.
Future minimum lease payments under operating leases are:
| ($ in thousands) | ||||
| 2024 | $ | 241 | ||
| 2025 | 156 | |||
| 2026 | 140 | |||
| 2027 | 117 | |||
| 2028 | 80 | |||
| Thereafter | 567 | |||
| Total minimum lease payments | $ | 1,301 | ||
Item 3. Legal Proceedings.
In the ordinary course of our business, the Company and its subsidiaries are parties to various legal actions, which we believe are incidental to the operation of our business. Although the ultimate outcome and amount of liability, if any, with respect to these legal actions cannot presently be ascertained with certainty, in the opinion of management, based upon information currently available to us, any resulting liability is not likely to have a material adverse effect on the Company’s consolidated financial position, results of operations or cash flows.
Item 4. Mine Safety Disclosures.
Not Applicable
Supplemental Item: Information about our Executive Officers
The following table lists the names and ages of the executive officers of the Company as of February 24, 2024, the positions presently held by each executive officer, and the principal occupation(s) and business experience of each executive officer during the past five years. Unless otherwise indicated, each person has held his or her principal occupation(s) for more than five years.
|
Name |
Age |
Position(s) Held with the Company and its Subsidiaries and Principal Occupation(s) | ||
| Mark A. Klein | 69 | Chairman of the Company since April 2015; Director of the Company since February 2010; President and Chief Executive Officer of the Company since January 2010 and of State Bank since January 2006; Director of State Bank since 2006; President of RDSI since October 2011; Member of State Bank Trust Investment Review Committee since March 2007. | ||
| Anthony V. Cosentino | 62 | Executive Vice President and Chief Financial Officer of the Company and State Bank since March 2010; Chief Financial Officer of RDSI since October 2011; Member of State Bank Trust Investment Review Committee since June 2010. | ||
| Ernesto Gaytan | 52 | Executive Vice President and Chief Technology Innovation Officer of the Company and State Bank since November 2017. | ||
| Steven R. Walz | 53 | Executive Vice President and Chief Lending Officer of State Bank since December 2021; Senior Vice President and Chief Lending Officer of State Bank from September 2021 through December 2021; Senior Vice President and Chief Credit Officer of State Bank from November 2017 through November 2019; Vice President and Senior Credit Analyst of State Bank from September 2012 through November 2017; Assistant Vice President and Commercial Services Officer of State Bank from September 2011 to September 2012; Assistant Vice President and Credit Analyst of State Bank from January 2010 through September 2012; Began working for State Bank in October 2007 as a Credit Analyst; Mr. Walz left State Bank in November 2019 to work as President for K&P Medical Transport, LLC. prior to rejoining State Bank in September 2021. | ||
| Keeta J. Diller | 67 | Executive Vice President of the Company since July 2019; Executive Vice President and Chief Operations Officer of State Bank since August 2023; Executive Vice President and Chief Risk Officer from July 2019 to August 2023; Senior Vice President and Chief Enterprise Risk Management Officer of State Bank from August 2018 through July 2019; Senior Vice President and Audit Coordinator and Director of Operations of State Bank from December 2011 through August 2018; Vice President and Internal Auditor of State Bank from January 2010 through December 2011; Corporate Secretary for the Company since 1996; Began working for State Bank in February 1990 as the Accounting Supervisor. | ||
| David A. Homoelle | 56 | Columbus Regional President and Residential Real Estate Executive of State Bank since May 2021; Columbus Regional President of State Bank from November 2007 through May 2021; Began working for State Bank in November 2007 as a Columbus Regional President. |
PART II
Item 5. Market for Registrant’s Common Equity, Related Stockholder Matters and Issuer Purchases of Equity Securities.
Market Information
Our common shares are traded on the NASDAQ Capital Market under the symbol “SBFG”. There were 6,719,676 common shares outstanding as of December 31, 2023, which were held by approximately 1,162 record holders.
The Company paid quarterly dividends on its common shares in the aggregate amounts of $0.52 per share and $0.48 per share in 2023 and 2022, respectively. The Company presently anticipates continuing to pay quarterly dividends in the future at similar levels. However, there is no guarantee that dividends on our common shares will continue in the future.
The ability of the Company to obtain funds for the payment of dividends and for other cash requirements is largely dependent on the amount of dividends that may be declared by State Bank and the Company’s other subsidiaries. Payment of dividends by State Bank may be restricted at any time at the discretion of the regulatory authorities, if they deem such dividends to constitute an unsafe and/or unsound banking practice. These provisions could have the effect of limiting the Company’s ability to pay dividends on its outstanding shares. Moreover, the Federal Reserve Board expects the Company to serve as a source of strength to its subsidiary banks, which may require it to retain capital for further investment in State Bank, rather than for dividends to shareholders of the Company. The Company’s ability to pay dividends on its shares is also conditioned upon the payment, on a current basis, of quarterly interest payments on the subordinated debentures underlying the Company’s trust preferred securities. In addition, under the terms of the Company’s fixed-to-floating rate subordinated debt, the Company’s ability to pay dividends on its shares is conditioned upon the Company continuing to make required principal and interest payments, and not incurring an event of default, with respect to the subordinated debt.
Performance Graph
The following performance graph compares the five-year total shareholder return of the Company’s common shares, based on an initial investment on December 31, 2018, and assuming reinvestment of dividends, against two indices – the NASDAQ Composite Index and the KBW NASDAQ Bank Index. This Performance Graph shall not be deemed to be “soliciting material” or to be “filed” with the SEC, nor shall such information be deemed to be incorporated by reference into any future filing under the Securities Act or the Exchange Act, except to the extent that the Company specifically incorporates this Performance Graph by reference into such filing.
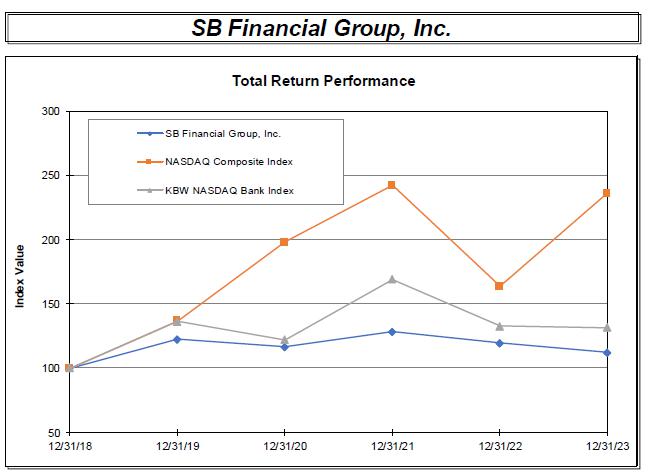
| Period Ending | ||||||||||||||||||||||||
| Index | 12/31/18 | 12/31/19 | 12/31/20 | 12/31/21 | 12/31/22 | 12/31/23 | ||||||||||||||||||
| SB Financial Group, Inc. | 100.00 | 122.20 | 116.41 | 128.29 | 119.26 | 112.17 | ||||||||||||||||||
| NASDAQ Composite Index | 100.00 | 136.69 | 198.10 | 242.03 | 163.28 | 236.17 | ||||||||||||||||||
| KBW NASDAQ Bank Index | 100.00 | 136.13 | 122.09 | 168.88 | 132.75 | 131.57 | ||||||||||||||||||
Source: S&P Global Market Intelligence
© 2024
Issuer Purchases of Equity Securities
The table below reflects the common shares repurchased by the Company during the three months ended December 31, 2023. As of December 31, 2023, the Company had 236,357 shares remaining of the 500,000 approved under the Company’s existing share repurchase program which was authorized by the Company’s Board of Directors on December 21, 2022 and expires December 31, 2024.
| (a) | (b) | (c) | (d) | |||||||||||||
| Period | Total Number of Shares Purchased |
Weighted Average Price Paid per Share |
Total Number of Shares Purchased as Part of Publicly Announced Plans or Programs |
Maximum Number of Shares that May Yet be Purchased Under the Plans or Programs |
||||||||||||
| 10/01/23 - 10/31/23 | 17,752 | $ | 13.14 | 17,752 | 272,056 | |||||||||||
| 11/01/23 - 11/30/23 | 13,988 | 13.59 | 13,988 | 258,068 | ||||||||||||
| 12/01/23 - 12/31/23 | 21,711 | 14.76 | 21,711 | 236,357 | ||||||||||||
| Total | 53,451 | $ | 13.92 | 53,451 | 236,357 | |||||||||||
Item 6. [Reserved].
Item 7. Management’s Discussion and Analysis of Financial Condition and Results of Operations.
SB Financial Group, Inc. (“SB Financial”), is a financial holding company registered with the Federal Reserve Board and subject to regulation under the Bank Holding Company Act of 1956, as amended. Through its direct and indirect subsidiaries, including The State Bank and Trust Company (“State Bank”), SB Financial is engaged in commercial and retail banking, wealth management and private client financial services.
The following discussion provides a review of the consolidated financial condition and results of operations of SB Financial and its subsidiaries (collectively, the “Company”). This discussion should be read in conjunction with the Company’s Consolidated Financial Statements and related Notes as of and for the years ended December 31, 2023 and 2022 included in this Annual Report on Form 10-K.
Strategic Discussion
The focus and strategic goal of the Company is to grow into and remain a top decile (>90th percentile) independent financial services company. The Company intends to achieve and maintain that goal by executing our five key initiatives.
Increase profitability through ongoing diversification of revenue streams: For the twelve months ended December 31, 2023, the Company generated $17.7 million in noninterest income, or 31.1 percent of total operating revenue, from fee-based products. These revenue sources include fees generated from saleable residential mortgage loans, retail deposit products, wealth management services, saleable business-based loans (small business and farm service) and title agency revenue. For the twelve months ended December 31, 2022, the Company generated $18.2 million in noninterest income, or 31.6 percent of total operating revenue from fee-based products.
Strengthen our penetration in all markets served: Over our 119-year history of continuous operation in Northwest Ohio, we have established a significant presence in our traditional markets in Defiance, Fulton, Paulding and Williams counties in Ohio. In our newer markets of Bowling Green, Columbus, Findlay, Toledo (Ohio) and Ft. Wayne (Indiana), our current market penetration is minimal but we believe our potential for growth is significant. Over the past few years, we have expanded and committed additional resources to our presence in the Findlay and Edgerton markets in particular; however, we continue to seek to expand the presence and penetration in all of our markets.
Expand product utilization by new and existing customers: As of December 31, 2023, we operated in 14 counties in Northwest Ohio, Central Ohio and Northeast Indiana with 23 full service offices, 23 ATM’s and six loan production offices. Combined in the 14 counties of operation, we command 4.4 percent of the deposit market share, which has steadily grown.
Deliver gains in operational excellence: Our management team believes that becoming and remaining a high-performance financial services company will depend upon seamlessly and consistently delivering operational excellence, as demonstrated by the Company’s leadership in the origination and servicing of residential mortgage loans. As of December 31, 2023, the Company serviced 8,549 residential mortgage loans with an aggregate principal balance of $1.37 billion. As of December 31, 2022, the Company serviced 8,514 loans with an aggregate principal balance of $1.35 billion.
Sustain asset quality: As of December 31, 2023, the Company’s asset quality metrics remained strong. Specifically, total nonperforming assets were $3.3 million, or 0.25 percent of total assets. Total delinquent loans at December 31, 2023 were 0.15 percent of total loans. As of December 31, 2022, the Company had total nonperforming assets of $5.1 million, or 0.38 percent of total assets. Total delinquent loans at December 31, 2022 were 0.27 percent of total loans.
The successful execution of these five strategies have enabled the Company to improve financial performance across a broad series of metrics. These metrics over the last five years are outlined in the following table. Specifically, the Company has increased total assets by $303.8 million, or 29.3 percent. The growth has been on both sides of the balance sheet over the five year period, with loans growing $174.7 million or 21.2 percent and deposits growing $230.0 million or 27.4 percent.
During the prior five-year period, the Company has raised capital through the issuance of debt securities to the market, which has improved capital significantly and expanded liquidity for potential strategic expansion. Strategic expansion has also occurred during the period with the acquisition of a small community bank (The Edon State Bank of Edon, Ohio) in 2020, the opening of three branch offices and the acquisition of two full service title agencies.
Financial Highlights
Year Ended December 31,
| ($ in thousands, except per share data) | ||||||||||||||||||||
| 2023 | 2022 | 2021 | 2020 | 2019 | ||||||||||||||||
| Earnings | ||||||||||||||||||||
| Interest income | $ | 58,152 | $ | 44,569 | $ | 41,904 | $ | 42,635 | $ | 44,400 | ||||||||||
| Interest expense | 18,879 | 5,170 | 4,020 | 6,705 | 9,574 | |||||||||||||||
| Net interest income | 39,273 | 39,399 | 37,884 | 35,930 | 34,826 | |||||||||||||||
| Provision for loan losses | 315 | - | 1,050 | 4,500 | 800 | |||||||||||||||
| Noninterest income | 17,721 | 18,231 | 30,697 | 30,096 | 18,016 | |||||||||||||||
| Noninterest expense | 41,962 | 42,314 | 44,808 | 43,087 | 37,410 | |||||||||||||||
| Provision for income taxes | 2,622 | 2,795 | 4,446 | 3,495 | 2,659 | |||||||||||||||
| Net income | 12,095 | 12,521 | 18,277 | 14,944 | 11,973 | |||||||||||||||
| Preferred stock dividends | - | - | - | - | 950 | |||||||||||||||
| Net income available to common shareholders | 12,095 | 12,521 | 18,277 | 14,944 | 11,023 | |||||||||||||||
| Per Common Share Data | ||||||||||||||||||||
| Basic earnings | $ | 1.77 | $ | 1.79 | $ | 2.58 | $ | 1.96 | $ | 1.71 | ||||||||||
| Diluted earnings | 1.75 | 1.77 | 2.56 | 1.96 | 1.51 | |||||||||||||||
| Cash dividends declared | 0.52 | 0.48 | 0.44 | 0.40 | 0.36 | |||||||||||||||
| Total equity per share | 18.50 | 17.08 | 21.05 | 19.39 | 17.53 | |||||||||||||||
| Average Balances | ||||||||||||||||||||
| Average total assets | $ | 1,334,644 | $ | 1,318,781 | $ | 1,322,253 | $ | 1,161,396 | $ | 1,027,932 | ||||||||||
| Average equity | 118,315 | 126,963 | 144,223 | 139,197 | 133,190 | |||||||||||||||
| Ratios | ||||||||||||||||||||
| Return on average total assets | 0.91 | % | 0.95 | % | 1.38 | % | 1.29 | % | 1.16 | % | ||||||||||
| Return on average equity | 10.22 | 9.86 | 12.67 | 10.74 | 8.99 | |||||||||||||||
| Cash dividend payout ratio1 | 29.62 | 27.25 | 17.18 | 20.54 | 23.84 | |||||||||||||||
| Average equity to average assets | 8.86 | 9.63 | 10.91 | 11.99 | 12.96 | |||||||||||||||
| Period End Totals | ||||||||||||||||||||
| Total assets | $ | 1,342,387 | $ | 1,335,633 | $ | 1,330,854 | $ | 1,257,839 | $ | 1,038,577 | ||||||||||
| Available-for-sale securities | 219,708 | 238,780 | 263,259 | 149,406 | 100,948 | |||||||||||||||
| Loans held for sale | 2,525 | 2,073 | 7,472 | 7,234 | 7,258 | |||||||||||||||
| Total loans & leases | 1,000,212 | 962,075 | 822,714 | 872,723 | 825,510 | |||||||||||||||
| Allowance for credit losses | 15,786 | 13,818 | 13,805 | 12,574 | 8,755 | |||||||||||||||
| Total deposits | 1,070,205 | 1,086,665 | 1,113,045 | 1,049,011 | 840,219 | |||||||||||||||
| Advances from FHLB | 83,600 | 60,000 | 5,500 | 8,000 | 16,000 | |||||||||||||||
| Trust preferred securities | 10,310 | 10,310 | 10,310 | 10,310 | 10,310 | |||||||||||||||
| Subordinated debt, net | 19,642 | 19,594 | 19,546 | - | - | |||||||||||||||
| Total equity | 124,342 | 118,428 | 144,929 | 142,923 | 136,094 | |||||||||||||||
| 1 | Cash dividends on common shares divided by net income available to common. |
Critical Accounting Policies and Estimates
The accounting and reporting policies of the Company are in accordance with generally accepted accounting principles in the United States and conform to general practices within the banking industry. The Company’s significant accounting policies are described in detail in the Notes to the Company’s Consolidated Financial Statements for the years ended December 31, 2023 and 2022. The preparation of financial statements in conformity with generally accepted accounting principles requires management to make estimates and assumptions. The Company’s financial position and results of operations can be affected by these estimates and assumptions and are integral to the understanding of reported results. Critical accounting policies are those policies that management believes are the most important to the portrayal of the Company’s financial condition and results, and they require management to make estimates that are difficult, subjective or complex.
Allowance for Credit Losses: The Company believes the determination of the ACL involves a higher degree of judgment and complexity than its other significant accounting policies. The ACL is calculated with the objective of maintaining a reserve level believed by management to be sufficient to absorb estimated credit losses over the life of an asset or an off-balance sheet credit exposure. Management’s determination of the adequacy of the ACL is based on periodic evaluations of past events, including historical credit loss experience on financial assets with similar risk characteristics, current conditions, and reasonable and supportable forecasts that affect the collectability of the remaining cash flows over the contractual term of the financial assets. However, this evaluation has subjective components requiring material estimates, including expected default probabilities, the expected loss given default, the amounts and timing of expected future cash flows on individually evaluated loans, and estimated losses based on historical loss experience and forecasted economic conditions. All of these factors may be susceptible to significant change. To the extent that actual results differ from management estimates, additional provisions for credit losses may be required that would adversely impact earnings in future periods.
Goodwill and Other Intangibles: The Company records all assets and liabilities acquired in purchase acquisitions, including goodwill and other intangibles, at fair value as required. Goodwill is subject, at a minimum, to annual tests for impairment. Other intangible assets are amortized over their estimated useful lives using straight-line and accelerated methods, and are subject to impairment if events or circumstances indicate a possible inability to realize the carrying amount. The initial goodwill and other intangibles recorded and subsequent impairment analysis requires management to make subjective judgments concerning estimates of how the acquired asset will perform in the future. Events and factors that may significantly affect the estimates include, among others, customer attrition, changes in revenue growth trends, specific industry conditions and changes in competition.
Income Taxes: Income tax expense is the total of the current year income tax due or refundable and the change in deferred tax assets and liabilities. Deferred tax assets and liabilities are the expected future tax amounts for the temporary differences between carrying amounts and tax bases of assets and liabilities, computed using enacted tax rates. A valuation allowance, if needed, reduces deferred tax assets to the amount expected to be realized. Realization of deferred tax assets is dependent upon the generation of a sufficient level of future taxable income and recoverable taxes paid in prior years. Although realization is not assured, management believes it is more likely than not that all of the deferred tax assets will be realized. The Company recognizes interest and/or penalties related to income tax matters in income tax expense.
An effective tax rate of 21% is used to determine after-tax components of other comprehensive income (loss) included in the statements of shareholders’ equity.
A tax position is recognized as a benefit only if it is “more likely than not” that the tax position would be sustained in a tax examination, with a tax examination being presumed to occur. The amount recognized is the largest amount of tax benefit that is greater than 50% likely of being realized on examination. For tax positions not meeting the “more likely than not” test, no tax benefit is recorded.
Changes in Financial Condition
Total assets at December 31, 2023, were $1.343 billion, compared to $1.335 billion at December 31, 2022. Loans (excluding loans held for sale) were $1.000 billion at December 31, 2023, compared to $962.1 million at December 31, 2022. Total deposits were $1.070 billion at December 31, 2023, compared to $1.087 billion at December 31, 2022. As client balance sheets and liquidity was utilized in the economy, deposit levels moderated and assets were reallocated from cash and securities into loans.
The following are the condensed average balance sheets of the Company for the years ending December 31 and includes the interest earned or paid, and the average interest rate, on each asset and liability:
| 2023 | 2022 | 2021 | ||||||||||||||||||||||||||||||||||
| ($ in thousands) | Average | Average | Average | Average | Average | Average | ||||||||||||||||||||||||||||||
| Balance | Interest | Rate | Balance | Interest | Rate | Balance | Interest | Rate | ||||||||||||||||||||||||||||
| Assets | ||||||||||||||||||||||||||||||||||||
| Taxable securities/cash | $ | 254,133 | $ | 6,092 | 2.40 | % | $ | 330,549 | $ | 5,798 | 1.75 | % | $ | 380,770 | $ | 3,386 | 0.89 | % | ||||||||||||||||||
| Non-taxable securities | 7,181 | 170 | 2.37 | % | 8,106 | 198 | 2.44 | % | 7,802 | 353 | 4.52 | % | ||||||||||||||||||||||||
| Loans, net1 | 985,217 | 51,890 | 5.27 | % | 888,116 | 38,573 | 4.34 | % | 854,521 | 38,165 | 4.47 | % | ||||||||||||||||||||||||
| Total earning assets | 1,246,531 | 58,152 | 4.67 | % | 1,226,771 | 44,569 | 3.63 | % | 1,243,093 | 41,904 | 3.37 | % | ||||||||||||||||||||||||
| Cash and due from banks | 4,035 | 7,296 | 7,290 | |||||||||||||||||||||||||||||||||
| Allowance for credit losses | (15,478 | ) | (13,808 | ) | (13,422 | ) | ||||||||||||||||||||||||||||||
| Premises and equipment | 22,990 | 24,137 | 24,710 | |||||||||||||||||||||||||||||||||
| Other assets | 76,566 | 74,385 | 60,582 | |||||||||||||||||||||||||||||||||
| Total assets | $ | 1,334,644 | $ | 1,318,781 | $ | 1,322,253 | ||||||||||||||||||||||||||||||
| Liabilities | ||||||||||||||||||||||||||||||||||||
| Savings and interest-bearing demand deposits | $ | 619,906 | $ | 7,599 | 1.23 | % | $ | 693,271 | $ | 2,258 | 0.33 | % | $ | 672,296 | $ | 1,813 | 0.27 | % | ||||||||||||||||||
| Time deposits | 236,665 | 7,109 | 3.00 | % | 159,401 | 1,219 | 0.76 | % | 177,918 | 1,316 | 0.74 | % | ||||||||||||||||||||||||
| Repurchase agreements & other | 15,765 | 74 | 0.47 | % | 20,481 | 39 | 0.19 | % | 22,821 | 42 | 0.18 | % | ||||||||||||||||||||||||
| Advances from FHLB | 55,044 | 2,603 | 4.73 | % | 16,420 | 515 | 3.14 | % | 6,507 | 188 | 2.89 | % | ||||||||||||||||||||||||
| Trust preferred securities | 10,310 | 716 | 6.94 | % | 10,310 | 361 | 3.50 | % | 10,310 | 199 | 1.93 | % | ||||||||||||||||||||||||
| Subordianted debt | 19,616 | 778 | 3.97 | % | 19,570 | 778 | 3.98 | % | 12,057 | 462 | 3.83 | % | ||||||||||||||||||||||||
| Total interest-bearing liabilities | 957,306 | 18,879 | 1.97 | % | 919,453 | 5,170 | 0.56 | % | 901,909 | 4,020 | 0.45 | % | ||||||||||||||||||||||||
| Demand deposits | 237,976 | 252,899 | 255,908 | |||||||||||||||||||||||||||||||||
| Other liabilities | 21,047 | 19,466 | 20,213 | |||||||||||||||||||||||||||||||||
| Total liabilities | 1,216,329 | 1,191,818 | 1,178,030 | |||||||||||||||||||||||||||||||||
| Shareholders’ equity | 118,315 | 126,963 | 144,223 | |||||||||||||||||||||||||||||||||
| Total liabilities and shareholders’ equity | $ | 1,334,644 | $ | 1,318,781 | $ | 1,322,253 | ||||||||||||||||||||||||||||||
| Net interest income (tax equivalent basis) | $ | 39,273 | $ | 39,399 | $ | 37,884 | ||||||||||||||||||||||||||||||
| Net interest income as a percent of average interest-earning assets - GAAP measure | 3.15 | % | 3.21 | % | 3.05 | % | ||||||||||||||||||||||||||||||
| Net interest income as a percent of average interest-earning assets - Non-GAAP measure 2 | 3.16 | % | 3.22 | % | 3.06 | % | ||||||||||||||||||||||||||||||
| -- Computed on a fully tax equivalent basis (FTE) | ||||||||||||||||||||||||||||||||||||
| 1 | Nonaccruing loans and loans held for sale are included in the average balances. |
| 2 | Interest on tax exempt securities and loans is computed on a tax equivalent basis using a 21 percent statutory tax rate, and added to the net interest income. The tax equivalent adjustment was $0.14, $0.11 and $0.15 million in 2023, 2022 and 2021, respectively. |
The following tables set forth the effect of volume and rate changes on interest income and expense for the periods indicated. For purposes of these tables, changes in interest due to volume and rate were determined as follows:
| ● | Volume variance - change in volume multiplied by the previous year’s rate. |
| ● | Rate variance - change in rate multiplied by the previous year’s volume. |
| ● | Rate/volume variance - change in volume multiplied by the change in rate. This variance allocates the volume variance and rate variance in proportion to the relationship of the absolute dollar amount of the change in each. |
| Total | ||||||||||||
| Variance | Variance Attributable To | |||||||||||
| ($ in thousands) | 2023/2022 | Volume | Rate | |||||||||
| Interest income | ||||||||||||
| Taxable securities | $ | 294 | $ | (1,340 | ) | $ | 1,634 | |||||
| Non-taxable securities1 | (28 | ) | (23 | ) | (5 | ) | ||||||
| Loans, net of unearned income and deferred fees1 | 13,317 | 4,217 | 9,100 | |||||||||
| Total interest income | 13,583 | 2,853 | 10,730 | |||||||||
| Interest expense | ||||||||||||
| Savings and interest-bearing demand deposits | 5,341 | (239 | ) | 5,580 | ||||||||
| Time deposits | 5,890 | 591 | 5,299 | |||||||||
| Repurchase agreements & other | 35 | (9 | ) | 44 | ||||||||
| Advances from FHLB | 2,088 | 1,211 | 877 | |||||||||
| Trust preferred securities | 355 | - | 355 | |||||||||
| Subordinated debt | - | - | - | |||||||||
| Total interest expense | 13,709 | 1,554 | 12,155 | |||||||||
| Net interest income | $ | (126 | ) | $ | 1,299 | $ | (1,425 | ) | ||||
| 1 | Interest on non-taxable securities and loans has been adjusted to fully tax equivalent |
The maturity distribution and weighted-average interest rates of debt securities available-for-sale at December 31, 2023, are set forth in the table below. The weighted-average interest rates are based on coupon rates for securities purchased at par value and on effective interest rates considering amortization or accretion if the securities were purchased at a premium or discount:
| Maturing | ||||||||||||||||||||||||||||||||||||||||
|
($ in thousands) |
Within
1 Year |
Weighted
Average Yield |
1-5 Years | Weighted
Average Yield |
5-10 Years | Weighted
Average Yield |
After
10 Years |
Weighted
Average Yield |
Total | Weighted
Average Yield |
||||||||||||||||||||||||||||||
| Available-for-sale: | ||||||||||||||||||||||||||||||||||||||||
| U.S. Treasury and Government agencies | $ | 539 | 3.79 | % | $ | 1,559 | 3.33 | % | $ | 4,419 | 1.46 | % | $ | 6,517 | 1.84 | % | ||||||||||||||||||||||||
| Mortgage-backed securities | - | 18,028 | 1.48 | % | 10,411 | 2.01 | % | 160,428 | 1.90 | % | 188,867 | 1.87 | % | |||||||||||||||||||||||||||
| State and political subdivisions | 261 | 2.92 | % | 280 | 2.61 | % | 1,987 | 3.89 | % | 7,370 | 2.57 | % | 9,898 | 2.83 | % | |||||||||||||||||||||||||
| Other corporate securities | - | - | 14,426 | 3.69 | % | - | 14,426 | 3.69 | % | |||||||||||||||||||||||||||||||
| Total securities by maturity | $ | 800 | 3.51 | % | $ | 19,867 | 1.64 | % | $ | 31,243 | 2.83 | % | $ | 167,798 | 1.93 | % | $ | 219,708 | 2.03 | % | ||||||||||||||||||||
| ($ in thousands) | Years Ended December 31, | |||||||||||
| Total loans | 2023 | 2022 | % Change | |||||||||
| Commercial business & agriculture | $ | 191,932 | $ | 192,478 | -0.3 | % | ||||||
| Commercial real estate | 424,041 | 412,635 | 2.8 | % | ||||||||
| Residential real estate | 318,123 | 291,512 | 9.1 | % | ||||||||
| Consumer & other | 65,673 | 65,005 | 1.0 | % | ||||||||
| Total loans | 999,769 | 961,630 | 4.0 | % | ||||||||
| Net deferred costs (fees) | 443 | 445 | -0.4 | % | ||||||||
| Total loans, net deferred costs (fees) | 1,000,212 | 962,075 | 4.0 | % | ||||||||
| Loans held for sale | $ | 2,525 | $ | 2,073 | 21.8 | % | ||||||
| Total deposits | 2023 | 2022 | % Change | |||||||||
| Noninterest bearing demand | $ | 228,713 | $ | 256,799 | -10.9 | % | ||||||
| Interest-bearing demand | 166,413 | 191,719 | -13.2 | % | ||||||||
| Savings & money market | 419,570 | 447,267 | -6.2 | % | ||||||||
| Time deposits | 255,509 | 190,880 | 33.9 | % | ||||||||
| Total deposits | 1,070,205 | 1,086,665 | -1.5 | % | ||||||||
| Total shareholders’ equity | $ | 124,342 | $ | 118,428 | 5.0 | % | ||||||
Loans held for investment (“HFI”) increased $38.1 million, or 4.0 percent, to $1.0 billion at December 31, 2023, which was due to an increase in residential and commercial real estate lending during 2023. The Company booked a much higher portion of residential real estate production on the balance sheet as increases in rates moved customers to variable rate mortgage products.
Concentrations of Credit Risk: The Company makes commercial, real estate and installment loans to customers located mainly in the Tri-State region of Ohio, Indiana and Michigan. Commercial loans include loans collateralized by commercial real estate, business assets and, in the case of agricultural loans, crops and farm equipment and the loans are expected to be repaid from cash flow from operations of businesses. As of December 31, 2023, commercial business and agricultural loans made up approximately 19.2 percent of the HFI loan portfolio while commercial real estate loans accounted for approximately 42.4 percent of the HFI loan portfolio. As of December 31, 2023, residential first mortgage loans, which are secured by first mortgages on residential real estate, made up approximately 31.8 percent of the HFI portfolio, while consumer loans to individuals, which are primarily secured by consumer assets, made up approximately 6.6 percent of the HFI loan portfolio.
Maturities and Sensitivities of Loans to Changes in Interest Rates: The following table shows the maturity distribution of loans outstanding as of December 31, 2023. The amounts have been categorized between loans with a fixed or floating interest rate (floating rate loans have an adjustable interest rate that changes in accordance to a rate index).
Maturities and Sensitivities of Loans to Changes in Interest Rates
As of December 31, 2023
| ($ in thousands) | Within one year |
After one, but within five years |
After five, but within fifteen years |
After fifteen years |
Total | |||||||||||||||
| Loans with fixed interest rates: | ||||||||||||||||||||
| Commercial & industrial | $ | 1,255 | $ | 30,703 | $ | 18,994 | $ | 18 | $ | 50,970 | ||||||||||
| Commercial real estate - owner occupied | 1,532 | 5,370 | 7,838 | 99 | 14,839 | |||||||||||||||
| Commercial real estate - nonowner occupied | 4,508 | 25,358 | 12,929 | 124 | 42,919 | |||||||||||||||
| Agricultural | 217 | 4,367 | 8,556 | 2,232 | 15,372 | |||||||||||||||
| Residential real estate | 1 | 979 | 16,430 | 29,500 | 46,910 | |||||||||||||||
| HELOC | - | - | - | - | - | |||||||||||||||
| Consumer | 3,615 | 9,271 | 1,393 | - | 14,279 | |||||||||||||||
| Total | $ | 11,128 | $ | 76,048 | $ | 66,140 | $ | 31,973 | $ | 185,289 | ||||||||||
| Loans with floating interest rates: | ||||||||||||||||||||
| Commercial & industrial | $ | 30,311 | $ | 11,101 | $ | 33,638 | $ | 696 | $ | 75,746 | ||||||||||
| Commercial real estate - owner occupied | 2,498 | 10,904 | 43,427 | 55,049 | 111,878 | |||||||||||||||
| Commercial real estate - nonowner occupied | 7,035 | 37,860 | 87,968 | 121,541 | 254,404 | |||||||||||||||
| Agricultural | 773 | 4,410 | 20,140 | 24,964 | 50,287 | |||||||||||||||
| Residential real estate | 3,757 | 417 | 12,206 | 254,833 | 271,213 | |||||||||||||||
| HELOC | 32 | 260 | 33,859 | 13,694 | 47,845 | |||||||||||||||
| Consumer | 717 | 2,833 | - | - | 3,550 | |||||||||||||||
| Total | $ | 45,123 | $ | 67,785 | $ | 231,238 | $ | 470,777 | $ | 814,923 | ||||||||||
| Total loans: | ||||||||||||||||||||
| Commercial & industrial | $ | 31,566 | $ | 41,804 | $ | 52,632 | $ | 714 | $ | 126,716 | ||||||||||
| Commercial real estate - owner occupied | 4,030 | 16,274 | 51,265 | 55,148 | 126,717 | |||||||||||||||
| Commercial real estate - nonowner occupied | 11,543 | 63,218 | 100,897 | 121,665 | 297,323 | |||||||||||||||
| Agricultural | 990 | 8,777 | 28,696 | 27,196 | 65,659 | |||||||||||||||
| Residential real estate | 3,758 | 1,396 | 28,636 | 284,333 | 318,123 | |||||||||||||||
| HELOC | 32 | 260 | 33,859 | 13,694 | 47,845 | |||||||||||||||
| Consumer | 4,332 | 12,104 | 1,393 | - | 17,829 | |||||||||||||||
| Total loans | $ | 56,251 | $ | 143,833 | $ | 297,378 | $ | 502,750 | $ | 1,000,212 | ||||||||||
Deposits decreased $16.5 million, or 1.5 percent, to $1.07 billion at December 31, 2023. Increased inflation and interest rates resulted in clients seeking higher returns on their deposit accounts. As a result, during 2023, we experienced a shift in the mix of our deposit balances as more of our clients moved balances to long-term time deposit accounts. Specifically, during 2023, time deposits increased $64.6 million, or 34 percent, while other deposits decreased $81.1 million, or 6 percent.
The average amount of deposits and weighted-average rates paid are summarized as follows for the years ended December 31:
| 2023 | 2022 | 2021 | ||||||||||||||||||||||
| Average | Average | Average | Average | Average | Average | |||||||||||||||||||
| ($ in thousands) | Amount | Rate | Amount | Rate | Amount | Rate | ||||||||||||||||||
| Savings and interest bearing demand deposits | $ | 619,906 | 1.23 | % | $ | 693,271 | 0.33 | % | $ | 672,296 | 0.27 | % | ||||||||||||
| Time deposits | 236,665 | 3.00 | % | 159,401 | 0.76 | % | 177,918 | 0.74 | % | |||||||||||||||
| Non interest bearing demand deposits | 237,976 | - | 252,899 | - | 255,908 | - | ||||||||||||||||||
| Totals | $ | 1,094,547 | 1.35 | % | $ | 1,105,571 | 0.31 | % | $ | 1,106,122 | 0.28 | % | ||||||||||||
Time deposits that exceeded the FDIC insurance limit of $250,000 are summarized as follows:
| ($ in thousands) | 2023 | 2022 | ||||||
| Three months or less | $ | 6,637 | $ | 6,992 | ||||
| Over three months through six months | 1,599 | 102 | ||||||
| Over six months and through twelve months | 5,209 | 1,330 | ||||||
| Over twelve months | 8,935 | 6,949 | ||||||
| Total | $ | 22,380 | $ | 15,373 | ||||
Shareholders’ equity at December 31, 2023, was $124.3 million, or 9.3 percent of total assets compared to $118.4 million or 8.9 percent of total assets at December 31, 2022. Retained earnings increased during the year due to earnings of $12.1 million less dividends paid to common shareholders of $3.6 million and repurchases of Company common shares of $3.5 million. The fair market value of the bond portfolio improved slightly during 2023 due to the valuation adjustment on the portfolio, which resulted in accumulated other comprehensive income (“AOCI”) falling to $29.8 million from $32.1 million.
The Company continued to repurchase its own common shares during the year under the Company’s repurchase program authorized by the Board of Directors on December 21, 2022. Specifically, the Company repurchased 244,325 shares during 2023 at an average price of $13.98 per share. As of December 31, 2023, the Company had 255,675 shares remaining of the 500,000 shares authorized for repurchase under the Company’s existing share repurchase program, which expires December 31, 2024.
| Asset Quality | Years Ended December 31, | |||||||||||
| ($ in thousands) | 2023 | 2022 | % Change | |||||||||
| Nonaccruing loans | $ | 2,818 | $ | 3,682 | -23.5 | % | ||||||
| Foreclosed assets and other assets held for sale, net | 511 | 777 | -34.2 | % | ||||||||
| Nonperforming assets | 3,329 | 4,459 | -25.3 | % | ||||||||
| Net charge-offs/(recoveries) | 92 | (13 | ) | -807.7 | % | |||||||
| Provision for credit losses | 315 | - | N/M | |||||||||
| Allowance for credit losses | 15,786 | 13,818 | 14.2 | % | ||||||||
| Nonaccruing loans/total loans | 0.28 | % | 0.38 | % | -26.4 | % | ||||||
| Allowance/nonaccruing loans | 560.18 | % | 375.29 | % | 49.3 | % | ||||||
| Nonperforming assets/total assets | 0.25 | % | 0.33 | % | -25.7 | % | ||||||
| Net charge offs/average loans | 0.01 | % | 0.00 | % | -1100.0 | % | ||||||
| Allowance/loans | 1.58 | % | 1.44 | % | 9.9 | % | ||||||
| Allowance/nonperforming loans | 560.18 | % | 375.29 | % | 49.3 | % | ||||||
Nonperforming assets totaled $3.3 million, or 0.25 percent of total assets at December 31, 2023, a decrease of $1.1 million, or 25.3 percent from 2022. The Company had total net charge-offs on loans of $92,000 in 2023, as compared to net recoveries of $13,000 in 2022. The Company’s ACL at December 31, 2023, now covers nonperforming loans at 560 percent, up from 319 percent at December 31, 2022.
The following schedule presents an analysis of the ACL, average loan data and related ratios at December 31 for the years indicated:
| ($ in thousands) | Provision for Credit Losses | Net (Chargeoffs) Recoveries | Average Loans | Ratio of annualized net (chargeoffs) recoveries to average loans | ||||||||||||
| December 31, 2023 | ||||||||||||||||
| Commercial & industrial | $ | 110 | $ | - | $ | 124,435 | 0.00 | % | ||||||||
| Commercial real estate - owner occupied | 202 | - | 118,583 | 0.00 | % | |||||||||||
| Commercial real estate - nonowner occupied | 119 | - | 301,072 | 0.00 | % | |||||||||||
| Agricultural | 23 | - | 59,720 | 0.00 | % | |||||||||||
| Residential real estate | 190 | (52 | ) | 313,034 | -0.02 | % | ||||||||||
| HELOC | 39 | - | 46,576 | 0.00 | % | |||||||||||
| Consumer | 5 | (40 | ) | 15,470 | -0.26 | % | ||||||||||
| Total | $ | 688 | $ | (92 | ) | $ | 978,890 | -0.01 | % | |||||||
| December 31, 2022 | ||||||||||||||||
| Commercial & industrial | $ | (227 | ) | $ | - | $ | 126,496 | 0.00 | % | |||||||
| Commercial real estate - owner occupied | (868 | ) | - | 122,031 | 0.00 | % | ||||||||||
| Commercial real estate - nonowner occupied | 367 | - | 276,805 | 0.00 | % | |||||||||||
| Agricultural | 12 | - | 58,745 | 0.00 | % | |||||||||||
| Residential real estate | 923 | - | 239,162 | 0.00 | % | |||||||||||
| HELOC | (45 | ) | 13 | 43,210 | 0.03 | % | ||||||||||
| Consumer | (162 | ) | - | 14,039 | 0.00 | % | ||||||||||
| Total | $ | - | $ | 13 | $ | 880,488 | 0.00 | % | ||||||||
| December 31, 2021 | ||||||||||||||||
| Commercial & industrial | $ | (1,411 | ) | $ | 227 | $ | 160,267 | 0.14 | % | |||||||
| Commercial real estate - owner occupied | 505 | - | 118,713 | 0.00 | % | |||||||||||
| Commercial real estate - nonowner occupied | 825 | - | 264,980 | 0.00 | % | |||||||||||
| Agricultural | 103 | - | 53,122 | 0.00 | % | |||||||||||
| Residential real estate | 975 | 6 | 195,277 | 0.00 | % | |||||||||||
| HELOC | (16 | ) | - | 43,488 | 0.00 | % | ||||||||||
| Consumer | 69 | (52 | ) | 11,546 | -0.45 | % | ||||||||||
| Total | $ | 1,050 | $ | 181 | $ | 847,393 | 0.02 | % | ||||||||
The ACL balance and the provision for credit losses are determined by management based upon periodic reviews of the loan portfolio. In addition, management considers the level of charge offs on loans, as well as the fluctuations of charge offs and recoveries on loans, in the factors which caused these changes. Estimating the risk of loss and the amount of loss is necessarily subjective. Accordingly, the allowance is maintained by management at a level considered adequate to cover losses that are currently anticipated based on past loss experience, economic conditions, information about specific borrower situations, including their financial position and collateral values, and other factors and estimates which are subject to change over time.
The Company has substantially increased its reserve level over the last several years. Specifically, the Company’s ACL balance has increased from $8.8 million at December 31, 2019 to $15.8 million at December 31, 2023, which reflects an increase of $7.0 million, or 80 percent. This increase was the result of $6.7 million in provision expense during the period and minimal charge-offs, which were just $0.8 million over the four-year period. The reserve increased during 2023 due to the one-time CECL adjustment of $1.4 million taken in January of 2023 upon the Company’s adoption of the CECL methodology.
The following schedule provides a breakdown of the ACL allocated by type of loan and related ratios at December 31 for the years indicated:
| Allowance Amount | Percentage of Loans In Each Category to Total Loans | Allowance Amount | Percentage of Loans In Each Category to Total Loans | Allowance Amount | Percentage of Loans In Each Category to Total Loans | |||||||||||||||||||
| ($ in thousands) | 2023 | 2022 | 2021 | |||||||||||||||||||||
| Commercial & industrial | $ | 2,003 | 12.7 | % | $ | 1,663 | 12.0 | % | $ | 1,890 | 14.9 | % | ||||||||||||
| Commercial real estate - owner occupied | 1,952 | 12.4 | % | 1,696 | 12.3 | % | 2,564 | 14.5 | % | |||||||||||||||
| Commercial real estate - nonowner occupied | 5,718 | 36.2 | % | 4,584 | 33.2 | % | 4,217 | 31.9 | % | |||||||||||||||
| Agricultural | 440 | 2.8 | % | 611 | 4.4 | % | 599 | 7.0 | % | |||||||||||||||
| Residential real estate | 4,936 | 31.3 | % | 4,438 | 32.1 | % | 3,515 | 25.1 | % | |||||||||||||||
| HELOC | 510 | 3.2 | % | 547 | 4.0 | % | 579 | 5.1 | % | |||||||||||||||
| Consumer | 227 | 1.4 | % | 279 | 2.0 | % | 441 | 1.6 | % | |||||||||||||||
| $ | 15,786 | 100.0 | % | $ | 13,818 | 100.0 | % | $ | 13,805 | 100.0 | % | |||||||||||||
As further detailed in ITEM 1A. RISK FACTORS, the CARES Act provided for significant consumer and small business relief due to the impact of the COVID-19 pandemic. The Company provided payment relief to a number of consumer and small business customers throughout 2020 and 2021, which we believe was successful and enabled our clients to weather the pandemic effectively. All such COVID-related payment deferrals had expired or been removed by December 31, 2021 and all clients were back to contractual terms at such date.
Regulatory capital reporting is required for State Bank only, as the Company is currently exempt from quarterly regulatory capital level measurement pursuant to the Small Bank Holding Company Policy Statement. As of December 31, 2023, State Bank met all regulatory capital levels required to be considered well-capitalized (see Note 16 to the Consolidated Financial Statements).
On May 27, 2021, the Company issued and sold $20.0 million in aggregate principal amount of its 3.65% Fixed to Floating Rate Subordinated Notes due 2031 in a private placement exempt from the registration requirements under the Securities Act. The Subordinated Notes bear interest at a fixed rate of 3.65% through May 31, 2026. From June 1, 2026 to the maturity date or earlier redemption of the Subordinated Notes, the interest rate will reset quarterly to an interest rate per annum, equal to the then-current-three-month Secured Overnight Financing Rate (“SOFR”) provided by the Federal Reserve Bank of New York plus 296 basis points. The Subordinated Notes have a maturity of 10 years.
Earnings Summary – 2023 vs. 2022
Net income for 2023 was $12.1 million, or $1.75 per diluted share, compared with net income of $12.5 million, or $1.77 per diluted share, for 2022. State Bank reported net income for 2023 of $13.3 million, which was down slightly from the $13.4 million of net income in 2022. SBFG Title reported net income for 2023 of $0.24 million, which was down from net income of $0.39 million for 2022.
Positive results for 2023 included loan growth of $38.1 million, while deposits were slightly lower by $16.5 million. The Company completed the final forgiveness in January of 2023 from the nearly 1,200 PPP loans processed during 2020 and 2021. The mortgage banking business line was impacted by the rapidly rising rates, which contributed to the reduction in both balance growth and gains on sale. For the full year of 2023, residential real estate loan production was $215.5 million, with $3.6 million of revenue from gains on sale. The level of mortgage origination was down from the $313.0 million in 2022. The Company’s loans serviced for others ended the year at $1.367 billion, up slightly from $1.352 billion at December 31, 2022.
Operating revenue decreased just slightly by $0.6 million, or 1.1 percent, from $57.6 million in 2022 to $57.0 million in 2023 due to decreased originated mortgage servicing rights (“OMSR”) recapture, significantly lower mortgage gain revenue offset by a $1.4 million gain on the sale of equity securities. SBFG Title revenue decreased by $0.6 million to $1.6 million for 2023.
Operating expense decreased by $0.35 million, or 0.8 percent, from $42.3 million in 2022 to $42.0 million in 2023, due to lower incentive and commission levels, which were partially offset by higher medical costs and increased spending on technology.
Results of Operations
| Years Ended December 31, | ||||||||||||
| ($ in thousands, except per share data) | 2023 | 2022 | % Change | |||||||||
| Total assets | $ | 1,343,249 | $ | 1,335,633 | 0.6 | % | ||||||
| Total investments | 219,708 | 238,780 | -8.0 | % | ||||||||
| Loans held for sale | 2,525 | 2,073 | 21.8 | % | ||||||||
| Loans, net of unearned income | 1,000,212 | 962,075 | 4.0 | % | ||||||||
| Allowance for credit losses | 15,786 | 13,818 | 14.2 | % | ||||||||
| Total deposits | 1,070,205 | 1,086,665 | -1.5 | % | ||||||||
| Total operating revenue1 | $ | 56,994 | $ | 57,630 | -1.1 | % | ||||||
| Net interest income | 39,273 | 39,399 | -0.3 | % | ||||||||
| Loan loss provision | 315 | - | N/M | |||||||||
| Noninterest income | 17,721 | 18,231 | -2.8 | % | ||||||||
| Noninterest expense | 41,962 | 42,314 | -0.8 | % | ||||||||
| Net income | 12,095 | 12,521 | -3.4 | % | ||||||||
| Diluted earnings per share | 1.75 | 1.77 | -1.1 | % | ||||||||
| 1 | Operating revenue equals net interest income plus noninterest income. |
Net interest income was $39.3 million for 2023 and decreased slightly from net income of $39.4 million for 2022. Average earning assets increased slightly to $1.25 billion in 2023, compared to $1.23 billion in 2022, primarily due to the increase in our loan portfolio, partially offset by lower cash and securities. The consolidated 2023 full year net interest margin on an fully-taxable equivalent (“FTE”) basis decreased 6 basis points to 3.16 percent compared to 3.22 percent for the full year of 2022.
Provision for credit losses was taken in 2023 in the amount of $0.32 million compared to zero provision taken during 2022. For 2023, net charge-offs totaled $0.1 million or 0.01 percent of average loans, compared to net recoveries of $0.01 million or (0.00) percent of average loans, for 2022.
| Noninterest Income | Years Ended December 31, | |||||||||||
| ($ in thousands) | 2023 | 2022 | % Change | |||||||||
| Wealth management fees | $ | 3,532 | $ | 3,728 | -5.3 | % | ||||||
| Customer service fees | 3,403 | 3,378 | 0.7 | % | ||||||||
| Gains on sale of residential loans & OMSR’s | 3,609 | 4,298 | -16.0 | % | ||||||||
| Mortgage loan servicing fees, net | 2,101 | 2,964 | 29.1 | % | ||||||||
| Gain on sale of non-mortgage loans | 429 | 566 | -24.2 | % | ||||||||
| Title insurance income | 1,635 | 2,229 | -26.6 | % | ||||||||
| Other | 3,012 | 1,068 | 182.0 | % | ||||||||
| Total noninterest income | $ | 17,721 | $ | 18,231 | -2.8 | % | ||||||
Total noninterest income was $17.7 million for 2023 compared to $18.2 million for 2022, representing a decrease of $0.5 million, or 2.8 percent, year-over-year. Gains on sale of residential mortgage loans was down from 2022 by $0.7 million, or 16.0 percent. The Company sold $161.2 million of originated mortgages into the secondary market in 2023, which due to being slightly more than the amortization on the serviced portfolio, increased the size of our serviced loan portfolio to $1.367 billion at December 31, 2023 from $1.352 billion at December 31, 2022. Sales of non-mortgage loans (small business and farm credits) in 2023 was the same as in 2022 at $4.2 million. The Company saw its wealth management assets under management decline by $5.3 million to $501.8 million at December 31, 2023, with total wealth management fees declining $0.2 million to $3.5 million.
| Noninterest Expense | Years Ended December 31, | |||||||||||
| ($ in thousands) | 2023 | 2022 | % Change | |||||||||
| Salaries & employee benefits | $ | 22,777 | $ | 24,142 | -5.7 | % | ||||||
| Net occupancy expense | 3,096 | 2,993 | 3.4 | % | ||||||||
| Equipment expense | 4,078 | 3,616 | 12.8 | % | ||||||||
| Data processing fees | 2,659 | 2,510 | 5.9 | % | ||||||||
| Professional fees | 3,024 | 3,214 | -5.9 | % | ||||||||
| Marketing expense | 782 | 911 | -14.2 | % | ||||||||
| Telephone and communications | 501 | 474 | 5.7 | % | ||||||||
| Postage and delivery expense | 432 | 422 | 2.4 | % | ||||||||
| State, local and other taxes | 949 | 1,082 | -12.3 | % | ||||||||
| Employee expense | 631 | 613 | 2.9 | % | ||||||||
| Other expense | 3,033 | 2,337 | 29.8 | % | ||||||||
| Total noninterest expense | $ | 41,962 | $ | 42,314 | -0.8 | % | ||||||
Total noninterest expense was $42.0 million for 2023 compared to $42.3 million for 2022, representing a $0.3 million, or 0.8 percent, decrease year-over-year. Total full-time equivalent employees ended 2023 at 251, which was down 17 from year end 2022.
Earnings Summary – 2022 vs. 2021
Net income for 2022 was $12.5 million, or $1.77 per diluted share, compared with net income of $18.3 million, or $2.56 per diluted share, for 2021. State Bank reported net income for 2022 of $13.4 million, which was down from the $18.6 million in net income in 2021. SBFG Title reported net income for 2022 of $0.4 million, which was down from net income of $0.5 million in 2021.
Positive results for 2022 included loan growth of $135.9 million when excluding the impact of the PPP initiative, while total deposits declined in 2022 by $23.5 million. The mortgage banking business line contributed gain on sale revenues of $4.3 million, with residential real estate loan production of $312.6 million and sales of loans of $184.8 million for the year. The level of mortgage origination declined in 2022 to $313.0 million from the $600.0 million in 2021.
Operating revenue decreased by $11.0 million, or 16.0 percent, from $68.6 million in 2021 to $57.6 million in 2022 due to decreased PPP fees, OMSR recapture and lower mortgage gain revenue. SBFG Title increased revenue by $0.2 million to $2.3 million for 2022.
Operating expense decreased by $2.5 million, or 5.6 percent, from $44.8 million in 2021 to $42.3 million in 2022, due to compensation and fringe benefit cost decreases partially offset by higher spend on technology/digital initiatives.
Goodwill, Intangibles and Capital Purchases
The Company completed its most recent annual goodwill impairment review as of December 31, 2023. Due to declines in the Company’s share price, a quantitative evaluation of goodwill was completed as of September 30, 2023, which revealed that impairment was not warranted. No events have occurred since that assessment, which would warrant impairment. At December 31, 2023, the Company concluded that it was more likely than not that the fair value of the reporting unit exceeded its carrying value, resulting in no impairment. The Company’s goodwill is further discussed in Note 6 to the Consolidated Financial Statements.
Management plans to continue from time to time to purchase additional premises and equipment and improve current facilities to meet the current and future needs of the Company’s customers. These purchases will include buildings, leasehold improvements, furniture and equipment. Management expects that cash on hand and cash generated from current operations will fund these capital expenditures and purchases.
Liquidity
Liquidity relates primarily to the Company’s ability to fund loan demand, meet deposit customers’ withdrawal requirements and provide for operating expenses. Sources used to satisfy these needs consist of cash and due from banks, interest-bearing deposits in other financial institutions, securities available-for-sale, loans held for sale and borrowings from various sources. These assets, excluding the borrowings, are commonly referred to as liquid assets. Liquid assets were $246.7 million at December 31, 2023, which included pledged available-for-sale securities of $102.3 million, compared to liquid assets of $270.8 million at December 31, 2022.
The Company does not have material cash requirements for capital expenditures over the next year. Any cash needs for capital requirements would be funded by cash existing at the Company. It is not anticipated that the Company will be required to initiate external borrowings in order to fund ongoing operations.
The Company’s commercial real estate, first mortgage residential, agricultural and multi-family mortgage portfolio of $807.8 million at December 31, 2023, can and is readily used to collateralize borrowings, which is an additional source of liquidity. Management believes the Company’s current liquidity level, without these borrowings, is sufficient to meet its current and anticipated liquidity needs. At December 31, 2023, all eligible commercial real estate, residential first, multi-family mortgage and agricultural loans were pledged under a FHLB blanket lien.
Significant additional off balance-sheet liquidity is available in the form of FHLB advances, unused federal funds lines from correspondent banks and the national certificate of deposit market. Management expects the risk of changes in off-balance-sheet arrangements to be immaterial to earnings. Based on the current collateralization requirements of the FHLB, approximately $81.9 million of additional borrowing capacity existed at December 31, 2023.
At December 31, 2023 and 2022, the Company had $41.0 million and $56.0 million in federal funds lines available. The Company also had $105.5 million in unpledged securities at December 31, 2023 available for additional borrowings.
The cash flow statements for the periods presented provide an indication of the Company’s sources and uses of cash as well as an indication of the ability of the Company to maintain an adequate level of liquidity. A discussion of the cash flow statements for 2023 and 2022 follows:
The Company experienced positive cash flows from operating activities in 2023 and 2022. Net cash from operating activities was $14.0 million and $25.6 million for the years ended December 31, 2023 and 2022, respectively. Significant operating items for 2023 included gain on sale of loans of $4.0 million and net income of $12.1 million. Cash provided by the sale of loans held for sale were $161.2 million. Cash used in the origination of loans held for sale were $159.3 million.
The Company experienced negative cash flows from investing activities in 2023 and 2022. Net cash used in investing activities was $17.4 million and $165.7 million for the years ended December 31, 2023 and 2022, respectively. A net increase in loans of $38.7 million was the primary change in 2023. The changes for 2022 include the purchase of available-for-sale securities of $50.6 million and net increase in loans of $139.7 million. The Company had proceeds from repayments, maturities, sales and calls of securities of $22.2 million and $35.9 million in 2023 and 2022, respectively.
The Company experienced negative cash flows from financing activities in 2023 and positive cash flows in 2022. Net cash used in financing activities was $1.5 million and net cash provided by financing activities was $18.4 million for the years ended December 31, 2023 and 2022, respectively. Negative cash flows of $16.5 million and $26.4 million are attributable to the change in deposits for 2023 and 2022, respectively.
The Company uses an Economic Value of Equity (“EVE”) analysis to measure risk in the balance sheet incorporating all cash flows over the estimated remaining life of all balance sheet positions. The EVE analysis calculates the net present value of the Company’s assets and liabilities in rate shock environments that range from -400 basis points to +400 basis points. The results of this analysis are reflected in the following table, which reflects the Company’s neutral balance sheet that directionally is trending to a liability sensitive position:
Economic Value of Equity
December 31, 2023
($ in thousands)
| Change in rates | $ Amount | $ Change | % Change | |||||||||
| +400 basis points | $ | 206,660 | $ | (9,716 | ) | -4.49 | % | |||||
| +300 basis points | 211,240 | (5,136 | ) | -2.37 | % | |||||||
| +200 basis points | 211,639 | (4,737 | ) | -2.19 | % | |||||||
| +100 basis points | 213,900 | (2,476 | ) | -1.14 | % | |||||||
| Base Case | 216,376 | - | - | |||||||||
| -100 basis points | 213,526 | (2,850 | ) | -1.32 | % | |||||||
| -200 basis points | 206,761 | (9,616 | ) | -4.44 | % | |||||||
| -300 basis points | 195,925 | (20,452 | ) | -9.45 | % | |||||||
| -400 basis points | 196,802 | (19,574 | ) | -9.05 | % | |||||||
Economic Value of Equity
December 31, 2022
($ in thousands)
| Change in rates | $ Amount | $ Change | % Change | |||||||||
| +400 basis points | $ | 264,361 | $ | (61,360 | ) | -18.84 | % | |||||
| +300 basis points | 284,602 | (41,120 | ) | -12.62 | % | |||||||
| +200 basis points | 303,265 | (22,457 | ) | -6.89 | % | |||||||
| +100 basis points | 319,473 | (6,249 | ) | -1.92 | % | |||||||
| Base Case | 325,722 | - | - | |||||||||
| -100 basis points | 321,550 | (4,172 | ) | -1.28 | % | |||||||
| -200 basis points | 305,242 | (20,480 | ) | -6.29 | % | |||||||
| -300 basis points | 293,718 | (32,004 | ) | -9.83 | % | |||||||
| -400 basis points | 271,404 | (54,318 | ) | -16.68 | % | |||||||
Item 7A. Quantitative and Qualitative Disclosures about Market Risk.
Asset liability management involves developing, executing and monitoring strategies to maintain appropriate liquidity, maximize net interest income and minimize the impact that significant fluctuations in market interest rates would have on current and future earnings. The business of the Company and the composition of its balance sheet consist of investments in interest-earning assets (primarily loans, mortgage-backed securities, and securities available-for-sale) which are primarily funded by interest-bearing liabilities (deposits and borrowings). With the exception of specific loans which are originated and held for sale, all of the financial instruments of the Company are for other than trading purposes. All of the Company’s transactions are denominated in U.S. dollars with no specific foreign exchange exposure. In addition, the Company has limited exposure to commodity prices related to agricultural loans. The impact of changes in foreign exchange rates and commodity prices on interest rates are assumed to be insignificant. The Company’s financial instruments have varying levels of sensitivity to changes in market interest rates resulting in market risk. Interest rate risk is the Company’s primary market risk exposure; to a lesser extent, liquidity risk also impacts market risk exposure.
Interest rate risk is the exposure of a banking institution’s financial condition and results to adverse movements in interest rates. Accepting this risk can be an important source of profitability and shareholder value; however, excessive levels of interest rate risk could pose a significant threat to the Company’s earnings and capital base. Accordingly, effective risk management that maintains interest rate risks at prudent levels is essential to the Company’s safety and soundness.
Evaluating a financial institution’s exposure to changes in interest rates includes assessing both the adequacy of the management process used to control interest rate risk and the organization’s quantitative level of exposure. When assessing the interest rate risk management process, the Company seeks to ensure that appropriate policies, procedures, management information systems and internal controls are in place to maintain interest rate risks at prudent levels of consistency and continuity. Evaluating the quantitative level of interest rate risk exposure requires the Company to assess the existing and potential future effects of changes in interest rates on its consolidated financial condition, including capital adequacy, earnings, liquidity and asset quality (when appropriate).
The FRB together with the OCC and the FDIC adopted a Joint Agency Policy Statement on interest rate risk effective June 26, 1996. The policy statement provides guidance to examiners and bankers on sound practices for managing interest rate risk, which will form the basis for ongoing evaluation of the adequacy of interest rate risk management at supervised institutions. The policy statement also outlines fundamental elements of sound management that have been identified in prior Federal Reserve guidance and discusses the importance of these elements in the context of managing interest rate risk. Specifically, the guidance emphasizes the need for active board of director and senior management oversight and a comprehensive risk management process that effectively identifies, measures and controls interest rate risk.
Financial institutions derive their income primarily from the excess of interest collected over interest paid. The rates of interest an institution earns on its assets and owes on its liabilities generally are established contractually for a period of time. Since market interest rates change over time, an institution is exposed to lower profit margins (or losses) if it cannot adapt to interest rate changes. For example, assume that an institution’s assets carry intermediate or long-term fixed rates and that those assets are funded with short-term liabilities. If market interest rates rise by the time the short-term liabilities must be refinanced, the increase in the institution’s interest expense on its liabilities may not be sufficiently offset if assets continue to earn at the long-term fixed rates. Accordingly, an institution’s profits could decrease on existing assets because the institution will either have lower net interest income or possibly, net interest expense. Similar risks exist when assets are subject to contractual interest rate ceilings, or rate-sensitive assets are funded by longer-term, fixed-rate liabilities in a declining rate environment.
There are several ways an institution can manage interest rate risk including: 1) matching repricing periods for new assets and liabilities, for example, by shortening or lengthening terms of new loans, investments, or liabilities; 2) selling existing assets or repaying certain liabilities; and 3) hedging existing assets, liabilities, or anticipated transactions. An institution might also invest in more complex financial instruments intended to hedge or otherwise change interest rate risk. Interest rate swaps, futures contracts, options on futures contracts, and other such derivative financial instruments can be used for this purpose. Because these instruments are sensitive to interest rate changes, they require management’s expertise to be effective. The Company has not purchased derivative financial instruments in the past, but during 2023 and 2022 the Company entered into interest rate swap agreements as an accommodation to certain loan customers (see Note 8 to the Consolidated Financial Statements). The Company may purchase such instruments in the future if market conditions are favorable.
The Company manages its interest rate risk by the employment of strategies to assure that desired levels of both interest-earning assets and interest-bearing liabilities mature or reprice with similar time frames. Such strategies include: 1) loans receivable which are renewed (and repriced) annually, 2) variable rate loans, 3) certificates of deposit with terms from one month to six years, 4) securities available-for-sale which mature at various times primarily from one through ten years, 5) federal funds borrowings with terms of one day to 90 days, and 6) FHLB borrowings with terms of one day to ten years.
Management believes the most significant impact on financial results is the Company’s ability to react to changes in interest rates. Management seeks to maintain an essentially balanced position between interest sensitive assets and liabilities and actively manages loan, security, and liability maturities in order to protect against the effects of wide interest rate fluctuations on net income and shareholders’ equity.
For additional quantitative and qualitative information regarding the Company’s interest rate risk, refer to the section captioned “Liquidity” under Item 7. Management’s Discussion and Analysis of Financial Condition and Results of Operations in this Form 10-K, which is incorporated herein by reference.
Item 8. Financial Statements and Supplementary Data.
Our Consolidated Financial Statements and Notes thereto and other supplementary data follow.
Index to Consolidated Financial Statements
F-
SB Financial Group, Inc.
Consolidated Balance Sheets
at December 31,
| ($ in thousands) | 2023 | 2022 | ||||||
| Assets | ||||||||
| Cash and due from banks | $ | 22,965 | $ | 27,817 | ||||
| Interest bearing time deposits | 1,535 | 2,131 | ||||||
| Available-for-sale securities | 219,708 | 238,780 | ||||||
| Loans held for sale | 2,525 | 2,073 | ||||||
| Loans, net of unearned income | 1,000,212 | 962,075 | ||||||
| Allowance for credit losses | (15,786 | ) | (13,818 | ) | ||||
| Premises and equipment, net | 21,378 | 22,829 | ||||||
| Federal Reserve and Federal Home Loan Bank Stock, at cost | 7,279 | 6,326 | ||||||
| Foreclosed assets and other assets held for sale, net | 511 | 777 | ||||||
| Interest receivable | 4,657 | 4,091 | ||||||
| Goodwill | 23,239 | 23,239 | ||||||
| Cash value of life insurance | 29,121 | 28,870 | ||||||
| Mortgage servicing rights | 13,906 | 13,503 | ||||||
| Other assets | 11,999 | 16,940 | ||||||
| Total assets | $ | 1,343,249 | $ | 1,335,633 | ||||
| Liabilities and shareholders’ equity | ||||||||
| Liabilities | ||||||||
| Deposits | ||||||||
| Non interest bearing demand | $ | 228,713 | $ | 256,799 | ||||
| Interest bearing demand | 166,413 | 191,719 | ||||||
| Savings | 216,965 | 191,272 | ||||||
| Money market | 202,605 | 255,995 | ||||||
| Time deposits | 255,509 | 190,880 | ||||||
| Total deposits | 1,070,205 | 1,086,665 | ||||||
| Repurchase agreements | 13,387 | 14,923 | ||||||
| Federal Home Loan Bank advances | 83,600 | 60,000 | ||||||
| Trust preferred securities | 10,310 | 10,310 | ||||||
| Subordinated debt net of issuance costs | 19,642 | 19,594 | ||||||
| Interest payable | 2,443 | 769 | ||||||
| Other liabilities | 19,320 | 24,944 | ||||||
| Total liabilities | 1,218,907 | 1,217,205 | ||||||
| Commitments & Contingent Liabilities | ||||||||
| Shareholders’ Equity | ||||||||
| Preferred stock, no par value; authorized 200,000 shares; 2023 - 0 shares outstanding, 2022 - 0 shares outstanding | ||||||||
| Common stock, no par value; 2023 - 10,500,000 shares authorized, 8,525,375 shares issued; 2022 - 10,500,000 shares authorized, 8,525,375 shares issued | 61,319 | 61,319 | ||||||
| Additional paid-in capital | 15,124 | 15,087 | ||||||
| Retained earnings | 108,486 | 101,966 | ||||||
| Accumulated other comprehensive loss | (29,831 | ) | (32,120 | ) | ||||
| Treasury stock, at cost; (2023 - 1,756,733 common shares; 2022 - 1,589,913 common shares) | (30,756 | ) | (27,824 | ) | ||||
| Total shareholders’ equity | 124,342 | 118,428 | ||||||
| Total liabilities and shareholders’ equity | $ | 1,343,249 | $ | 1,335,633 | ||||
See Notes to Consolidated Financial Statements
F-
SB Financial Group, Inc.
Consolidated Statements of Income
Years Ended December 31,
| ($ in thousands, except per share data) | 2023 | 2022 | ||||||
| Interest Income | ||||||||
| Loans | ||||||||
| Taxable | $ | 51,407 | $ | 38,238 | ||||
| Tax exempt | 483 | 335 | ||||||
| Securities | ||||||||
| Taxable | 5,245 | 5,174 | ||||||
| Tax exempt | 170 | 198 | ||||||
| Other interest income | 847 | 624 | ||||||
| Total interest income | 58,152 | 44,569 | ||||||
| Interest Expense | ||||||||
| Deposits | 14,708 | 3,477 | ||||||
| Repurchase agreements & other | 74 | 39 | ||||||
| Federal Home Loan Bank advance expense | 2,603 | 515 | ||||||
| Trust preferred securities expense | 716 | 361 | ||||||
| Subordinated debt expense | 778 | 778 | ||||||
| Total interest expense | 18,879 | 5,170 | ||||||
| Net Interest Income | 39,273 | 39,399 | ||||||
| Provision for credit losses - loans | 688 | |||||||
| Provision for unfunded commitments | (373 | ) | ||||||
| Total provision for credit losses | 315 | |||||||
| Net interest income after provision for loan losses | 38,958 | 39,399 | ||||||
| Noninterest Income | ||||||||
| Wealth management fees | 3,532 | 3,728 | ||||||
| Customer service fees | 3,403 | 3,378 | ||||||
| Gain on sale of mortgage loans & OMSR | 3,609 | 4,298 | ||||||
| Mortgage loan servicing fees, net | 2,101 | 2,964 | ||||||
| Gain on sale of non-mortgage loans | 429 | 566 | ||||||
| Title insurance income | 1,635 | 2,229 | ||||||
| Net gain on sale of securities | 1,453 | |||||||
| Other income | 1,559 | 1,068 | ||||||
| Total noninterest income | 17,721 | 18,231 | ||||||
| Noninterest Expense | ||||||||
| Salaries and employee benefits | 22,777 | 24,142 | ||||||
| Net occupancy expense | 3,096 | 2,993 | ||||||
| Equipment expense | 4,078 | 3,616 | ||||||
| Data processing fees | 2,659 | 2,510 | ||||||
| Professional fees | 3,024 | 3,214 | ||||||
| Marketing expense | 782 | 911 | ||||||
| Telephone and communications | 501 | 474 | ||||||
| Postage and delivery expense | 432 | 422 | ||||||
| State, local and other taxes | 949 | 1,082 | ||||||
| Employee expense | 631 | 613 | ||||||
| Other expense | 3,033 | 2,337 | ||||||
| Total noninterest expense | 41,962 | 42,314 | ||||||
| Income before income tax | 14,717 | 15,316 | ||||||
| Provision for income taxes | 2,622 | 2,795 | ||||||
| Net Income | $ | 12,095 | $ | 12,521 | ||||
| Basic earnings per common share | $ | 1.77 | $ | 1.79 | ||||
| Diluted earnings per common share | $ | 1.75 | $ | 1.77 | ||||
See Notes to Consolidated Financial Statements
F-
SB Financial Group, Inc.
Consolidated Statements of Comprehensive Income (Loss)
Years Ended December 31,
| ($ in thousands) | 2023 | 2022 | ||||||
| Net income | $ | 12,095 | $ | 12,521 | ||||
| Other comprehensive income (loss) | ||||||||
| Available for sale investment securities: | ||||||||
| Gross unrealized holding gain (loss) arising in the period | 2,897 | (38,323 | ) | |||||
| Related tax benefit | (608 | ) | 8,048 | |||||
| Net effect on other comprehensive income (loss) | 2,289 | (30,275 | ) | |||||
| Total comprehensive income (loss) | $ | 14,384 | $ | (17,754 | ) | |||
See Notes to Consolidated Financial Statements
F-
SB Financial Group, Inc.
Consolidated Statements of Shareholders’ Equity
Years Ended December 31,
| Common | Additional Paid-in |
Retained | Accumulated Other Comprehensive |
Treasury | ||||||||||||||||||||
| ($ in thousands, except per share data) | Stock | Capital | Earnings | Income (Loss) | Stock | Total | ||||||||||||||||||
| January 1, 2023 | $ | 61,319 | $ | 15,087 | $ | 101,966 | $ | (32,120 | ) | $ | (27,824 | ) | $ | 118,428 | ||||||||||
| Net income | 12,095 | 12,095 | ||||||||||||||||||||||
| Other comprehensive income | 2,289 | 2,289 | ||||||||||||||||||||||
| CECL initial adjustment | (1,991 | ) | (1,991 | ) | ||||||||||||||||||||
| Dividends on common, $0.52 per share | (3,584 | ) | (3,584 | ) | ||||||||||||||||||||
| Restricted stock vesting | (539 | ) | 539 | |||||||||||||||||||||
| Repurchased stock (244,325 shares) | (3,471 | ) | (3,471 | ) | ||||||||||||||||||||
| Stock based compensation expense | 576 | 576 | ||||||||||||||||||||||
| December 31, 2023 | $ | 61,319 | $ | 15,124 | $ | 108,486 | $ | (29,831 | ) | $ | (30,756 | ) | $ | 124,342 | ||||||||||
| Common | Additional Paid-in |
Retained | Accumulated Other Comprehensive |
Treasury | ||||||||||||||||||||
| ($ in thousands, except per share data) | Stock | Capital | Earnings | Income (Loss) | Stock | Total | ||||||||||||||||||
| January 1, 2022 | $ | 54,463 | $ | 14,944 | $ | 99,716 | $ | (1,845 | ) | $ | (22,349 | ) | $ | 144,929 | ||||||||||
| Net income | 12,521 | 12,521 | ||||||||||||||||||||||
| Other comprehensive loss | (30,275 | ) | (30,275 | ) | ||||||||||||||||||||
| Stock dividends on common (344,663 shares) | 6,856 | (6,864 | ) | (8 | ) | |||||||||||||||||||
| Dividends on common, $0.48 per share | (3,407 | ) | (3,407 | ) | ||||||||||||||||||||
| Restricted stock vesting | (425 | ) | 425 | |||||||||||||||||||||
| Repurchased stock (317,356 shares) | (5,900 | ) | (5,900 | ) | ||||||||||||||||||||
| Stock based compensation expense | 568 | 568 | ||||||||||||||||||||||
| December 31, 2022 | $ | 61,319 | $ | 15,087 | $ | 101,966 | $ | (32,120 | ) | $ | (27,824 | ) | $ | 118,428 | ||||||||||
See Notes to Consolidated Financial Statements
F-
SB Financial Group, Inc.
Consolidated Statements of Cash Flows
Years Ended December 31,
| ($ in thousands) | ||||||||
| 2023 | 2022 | |||||||
| Operating Activities | ||||||||
| Net Income | $ | 12,095 | $ | 12,521 | ||||
| Items not requiring (providing) cash | ||||||||
| Depreciation and amortization | 2,235 | 2,196 | ||||||
| Provision for credit losses | 315 | |||||||
| Expense of share-based compensation plan | 576 | 568 | ||||||
| Amortization of premiums and discounts on securities | 522 | 897 | ||||||
| Amortization of intangible assets | 90 | 69 | ||||||
| Amortization of originated mortgage servicing rights | 1,242 | 1,749 | ||||||
| Impairment (recovery) of mortgage servicing rights | 50 | (1,279 | ) | |||||
| Deferred income taxes | 1,878 | 2,709 | ||||||
| Proceeds from sale of loans held for sale | 161,183 | 189,515 | ||||||
| Originations of loans held for sale | (159,292 | ) | (181,192 | ) | ||||
| Gain from sale of loans | (4,038 | ) | (4,864 | ) | ||||
| Net gains on sales of securities | (1,453 | ) | ||||||
| Changes in | ||||||||
| Interest receivable | (566 | ) | (1,171 | ) | ||||
| Other assets | 3,876 | (2,014 | ) | |||||
| Interest payable & other liabilities | (4,724 | ) | 5,865 | |||||
| Net cash provided by operating activities | 13,989 | 25,569 | ||||||
| Investing Activities | ||||||||
| Purchases of available-for-sale securities | (723 | ) | (50,618 | ) | ||||
| Proceeds from maturities of interest bearing time deposits | 596 | 512 | ||||||
| Proceeds from maturities of available-for-sale securities | 22,170 | 35,878 | ||||||
| Net change in loans | (38,736 | ) | (139,670 | ) | ||||
| Purchase of premises, equipment | (958 | ) | (1,896 | ) | ||||
| Proceeds from bank owned life insurance | 398 | |||||||
| Purchase of bank owned life insurance | (10,500 | ) | ||||||
| Purchase of Federal Reserve and Federal Home Loan Bank Stock | (953 | ) | (1,023 | ) | ||||
| Proceeds from sale of foreclosed assets | 816 | 1,646 | ||||||
| Net cash used in investing activities | (17,390 | ) | (165,671 | ) | ||||
| Financing Activities | ||||||||
| Net decrease in demand deposits, money market, interest checking & savings accounts | (81,089 | ) | (60,756 | ) | ||||
| Net increase in time deposits | 64,629 | 34,376 | ||||||
| Net decrease in securities sold under agreements to repurchase | (1,536 | ) | (397 | ) | ||||
| Proceeds from Federal Home Loan Bank advances | 810,500 | 232,000 | ||||||
| Repayment of Federal Home Loan Bank advances | (786,900 | ) | (177,500 | ) | ||||
| Stock repurchase plan | (3,471 | ) | (5,900 | ) | ||||
| Dividends on common shares | (3,584 | ) | (3,415 | ) | ||||
| Net cash provided by (used in) financing activities | (1,451 | ) | 18,408 | |||||
| Increase in cash and cash equivalents | (4,852 | ) | (121,694 | ) | ||||
| Cash and cash equivalents, beginning of year | 27,817 | 149,511 | ||||||
| Cash and cash equivalents, end of year | $ | 22,965 | $ | 27,817 | ||||
| Supplemental cash flow information | ||||||||
| Interest paid | $ | 17,205 | $ | 4,700 | ||||
| Supplemental non-cash disclosure | ||||||||
| Transfer of loans to foreclosed assets | $ | 507 | $ | 322 | ||||
| Stock dividends declared and paid | $ | $ | 6,856 | |||||
See Notes to Consolidated Financial Statements
F-
SB Financial Group, Inc.
Notes to Consolidated Financial Statements
Years Ended December 31, 2023 and 2022
Note 1: Organization and Summary of Significant Accounting Policies
Organization and Nature of Operations
SB Financial Group, Inc. (“SB Financial”) is a financial holding company whose principal activity is the ownership and management of its wholly-owned subsidiaries, The State Bank and Trust Company (“State Bank”), SBFG Title, LLC dba Peak Title Agency (“SBFG Title”), SB Captive, Inc. (“SB Captive”), RFCBC, Inc. (“RFCBC”), Rurbanc Data Services, Inc. dba RDSI Banking Systems (“RDSI”), Rurban Statutory Trust II (“RST II”), and SBFG Mortgage, LLC. State Bank owns all the outstanding stock of Rurban Mortgage Company (“RMC”) and State Bank Insurance, LLC (“SBI”). The “Company” refers to SB Financial and its consolidated subsidiaries collectively, except where the context indicates the reference relates solely to the registrant, SB Financial.
The Company is primarily engaged in providing a full range of banking and wealth management services to individual and corporate customers primarily located in Ohio, Indiana, and Michigan. The Company is subject to competition from other financial institutions in its market areas. The Company is regulated by certain federal and state agencies and undergoes periodic examinations by those regulatory authorities.
Principles of Consolidation
The Consolidated Financial Statements include the accounts of the Company, State Bank, SBFG Title, SB Captive, RFCBC, RDSI, RMC, RST II, SBFG Mortgage, LLC, and SBI. All significant intercompany accounts and transactions were eliminated in consolidation.
Use of Estimates
The preparation of financial statements in conformity with accounting principles generally accepted in the United States of America requires management to make estimates and assumptions that affect the reported amounts of assets and liabilities and disclosure of contingent assets and liabilities at the date of the financial statements and the reported amounts of revenues and expenses during the reporting period. Actual results could differ from those estimates. Material estimates that are particularly susceptible to significant change relate to the determination of the ACL, loan servicing rights, and fair value of financial instruments.
Significant Accounting Policies
Cash Equivalents
The Company considers all liquid investments with original maturities of three months or less to be cash equivalents. At December 31, 2023 and 2022, cash equivalents consisted primarily of interest-bearing and noninterest bearing demand deposit balances held by correspondent banks.
At December 31, 2023, the Company’s correspondent cash accounts exceeded federally insured limits by $.4 million. Additionally, the Company had approximately $5.9 million of cash held by the Federal Reserve Bank (“FRB”) and the Federal Home Loan Bank (“FHLB”), which is not federally insured.
Securities
Available-for-sale securities, which include any debt security for which the Company has no immediate plan to sell but which may be sold in the future, are carried at fair value. Unrealized gains and losses are recorded, net of related income tax effects, in other comprehensive income.
F-
Amortization of premiums and accretion of discounts are recorded as interest income from securities. Realized gains and losses are recorded as net security gains (losses). Gains and losses on sales of securities are determined on the specific-identification method.
The Company has made a policy election to exclude accrued interest from the amortized cost basis of securities and report accrued interest separately in other assets on the consolidated balance sheets. A security is placed on nonaccrual status at the time any principal or interest payments become more than 90 days delinquent or if full collection of interest or principal becomes uncertain. Accrued interest for a security placed on nonaccrual is reversed against interest income. There was no accrued interest related to securities reversed against interest income for the years ended December 31, 2023 or 2022.
Allowance for Credit Losses – Available-for-Sale Securities
For available-for-sale securities in an unrealized loss position, the Company first assesses whether it intends to sell, or it is more likely than not that it will be required to sell the security before recovery of its amortized cost basis. If either of the criteria regarding intent or requirement to sell is met, the security’s amortized cost basis is written down to fair value through income as a provision for credit losses. For available-for-sale securities that do not meet the aforementioned criteria, the Company evaluates whether the decline in fair value has resulted from credit losses or other factors. In making this assessment, management considers the extent to which fair value is less than amortized cost, any changes to the rating of the security by a rating agency, and adverse conditions specifically related to the security, among other factors. If this assessment indicates that a credit loss exists, the present value of cash flows expected to be collected from the security are compared to the amortized cost basis of the security. If the present value of cash flows expected to be collected is less than the amortized cost basis, a credit loss exists and an ACL is recorded for the credit loss, limited by the amount that the fair value is less than the amortized cost basis.
Changes in the ACL are recorded as provision for (or reversal of) credit losses. Available-for-sale securities are charged-off against the allowance or, in the absence of any allowance, written down through income when deemed uncollectible by management or when either of the aforementioned criteria regarding intent or requirement to sell is met. At December 31, 2023, no ACL on available-for-sale securities was recorded.
Management has made the accounting policy election to exclude accrued interest receivable on available-for-sale securities from the estimate of credit losses. Accrued interest receivable on available-for-sale debt securities totaled $0.7 million at December 31, 2023. Should the decline in fair value be the result of credit losses or other factors, the security would be moved into a nonaccrual status and all accrued interest be reversed.
Mortgage Loans Held for Sale
Mortgage loans originated and intended for sale in the secondary market are carried at the lower of cost or fair value in the aggregate. Net unrealized losses, if any, are recognized through a valuation allowance by charges to noninterest income. Gains and losses on loan sales are recorded in noninterest income. The Company utilizes third-party hedges to minimize the impact of interest rate risk fluctuations, and their impact is realized through noninterest income.
Loans
Loans that management has the intent and ability to hold for the foreseeable future, or until maturity or payoffs, are reported at their outstanding principal balances adjusted for any charge offs, the ACL, any deferred fees or costs on originated loans and unamortized premiums or discounts on purchased loans. Interest income is reported on the interest method and includes amortization of net deferred loan fees and costs over the loan term. Generally, loans are placed on nonaccrual status not later than 90 days past due. Past due status is based on the contractual terms of the loan. All interest accrued, but not collected for loans that are placed on nonaccrual or charged off, is reversed against interest income. The interest on these loans is accounted for on the cash-basis or cost-recovery method, until qualifying for return to accrual. Loans are returned to accrual status when all the principal and interest amounts contractually due are brought current and future payments are reasonably assured.
F-
Allowance for Credit Losses - Loans
The ACL is a valuation account that is deducted from the loans’ amortized cost basis to present the net amount expected to be collected on the loans. Loans are charged off against the allowance when management believes that the uncollectability of a loan balance is confirmed. Expected recoveries do not exceed the aggregate of amounts previously charged-off and expected to be charged-off.
Management estimates the ACL using relevant available information, from internal and external sources, relating to past events, current conditions, and reasonable and supportable forecasts. Historical credit loss experience provides the basis for the estimation of expected credit losses. Adjustments to historical loss information are made for differences in current loan-specific risk characteristics such as differences in underwriting standards, portfolio mix, delinquency level, or term as well as changes in environmental conditions, such as changes in unemployment rates, property values, or other relevant factors.
The Company measures expected credit losses for loans on a pooled basis when similar risk characteristics exist. The Company has identified the following portfolio segments:
| ● | Commercial & Industrial - Commercial & industrial loans consist of loans or lines of credit to finance accounts receivable, inventory or other general business needs, and lease financing agreements for equipment, vehicles, or other assets. The primary risk associated with commercial & industrial loans and lease financing agreements is the ability of borrowers to achieve business results consistent with those projected at origination. Failure to achieve these projections presents risk the borrower will be unable to service the debt consistent with the contractual terms of the loan or lease. |
| ● | Commercial Real Estate - Owner Occupied - Owner occupied commercial real estate loans consist of loans to purchase or re-finance owner occupied nonresidential properties. This includes office buildings and other commercial facilities. Commercial mortgages secured by owner occupied properties are primarily dependent on the ability of borrowers to achieve business results consistent with those projected at loan origination. While these loans are collateralized by real property in an effort to mitigate risk, it is possible the liquidation of collateral will not fully satisfy the obligation as the commercial real estate collateral may be more adversely affected by conditions in the real estate markets or in the general economy. |
| ● | Commercial Real Estate – Nonowner Occupied - Nonowner occupied commercial real estate loans consist of loans to purchase, construct, or refinance investment nonresidential properties. This includes office buildings and other facilities rented or leased to unrelated parties, as well as multifamily properties. The primary risk associated with nonowner occupied commercial real estate loans is the ability of the income-producing property that collateralizes the loan to produce adequate cash flow to service the debt. While these loans are collateralized by real property in an effort to mitigate risk, it is possible the liquidation of collateral will not fully satisfy the obligation as the commercial real estate collateral may be more adversely affected by conditions in the real estate markets or in the general economy. |
| ● | Agricultural - Agricultural loans consist of loans or lines of credit to finance farmland, equipment, and general business needs or other assets. The primary risk associated with agricultural loans is the ability of borrowers to achieve business results consistent with those projected at origination. Failure to achieve these projections presents risk the borrower will be unable to service the debt consistent with the contractual terms of the loan. |
| ● | Residential Real Estate – Residential real estate mortgage loans consist of loans to purchase or refinance the borrower’s primary dwelling, second residence or vacation home and are often secured by 1-4 family residential property. Significant and rapid declines in real estate values can result in borrowers having debt levels in excess of the current market value of the collateral. |
| ● | Home Equity Line of Credit (HELOCs) - Home equity loans consist of HELOCs and other lines of credit secured by first or second liens on the borrower’s primary residence. These loans are secured by both senior and junior liens on the residential real estate and are particularly susceptible to declining collateral values. This risk is elevated for loans secured by junior liens as a substantial decline in value could render the junior lien position effectively unsecured. |
F-
| ● | Consumer - Consumer loans consist of loans to finance unsecured home improvements, personal assets, such as automobiles or recreational vehicles, and revolving lines of credit that can be secured or unsecured. Repayment of these loans is primarily dependent on the personal income of the borrowers, which can be impacted by economic conditions in their market areas. The value of the underlying collateral within this class is at risk of potential rapid depreciation which could result in unpaid balances in excess of the collateral. |
The Company utilizes a Discounted Cash Flow (“DCF”) method to estimate the quantitative portion of the ACL for all loan pools evaluated on a collective pooled basis, with the exception of the credit card portfolio, which was estimated using the Remaining Life Method. For each segment, a Loss Driver Analysis (“LDA”) was performed in order to identify appropriate loss drivers and create a regression model for use in forecasting cash flows. The LDA utilized the Company’s own Federal Financial Institutions Examination Council’s (“FFIEC”) Call Report data, as well as peer institution data.
In creating the DCF model, the Company has established a one-year reasonable and supportable forecast period with a one-year straight line reversion to the long-term historical average. The Company’s own loan-level loss data contained within the model is being supplemented with peer data in most loan pools as there was not sufficient loan-level detail from prior cycles reflecting similar economic conditions as the forecasted loss drivers to result in a sound calculation.
Key inputs into the DCF model include loan-level detail, including the amortized cost basis of individual loans, payment structure, loss history, and forecasted loss drivers. The Company utilizes data from Federal Reserve Economic Data (“FRED”) to provide economic forecasts under various scenarios, which are applied to loan pools to reflect credit risk in the current economic environment.
Additional key assumptions in the DCF model include the probability of default (“PD”), loss given default (“LGD”), and prepayment/curtailment rates. When possible, the Company utilizes its own PDs for the reasonable and supportable forecast period. When it is not possible to use the Company’s own PDs, the LDA is utilized to determine PDs based on the forecasted economic factors. When possible, the Company utilizes its own LGDs for the reasonable and supportable forecast period. When it is not possible to use the Company’s own LGDs, the LGD is derived using a method referred to as Frye Jacobs. The Frye Jacobs method is a mathematical formula that traces the relationship between LGD and PD over time and projects the LGD based on the level of PD forecasted. In all cases, the Frye Jacobs method is utilized to calculate LGDs during the reversion period and long-term historical average. Benchmark prepayment and curtailment rates were used in the ACL estimate.
Management also considers further adjustments to historical loss information for current conditions and reasonable and supportable forecasts that differ from the conditions that exist for the period over which historical information is evaluated as well as other changes in qualitative factors not inherently considered in the quantitative analyses. A number of factors are considered including economic forecast uncertainty, credit quality trends, valuation trends, concentration risk, quality of loan review, changes in personnel, impact of rising interest rates, external factors and other considerations. The resulting qualitative adjustments are applied to the relevant collectively evaluated loan pools. The qualitative analysis increases or decreases the allowance allocation for each loan pool based on the assessment of factors described above. During each reporting period, management also considers the need to adjust the baseline lifetime loss rates for factors that may cause expected losses to differ from those experienced in the historical loss periods.
Loans that do not share risk characteristics are evaluated on an individual basis. When management determines that foreclosure is probable and the borrower is experiencing financial difficulty, the expected credit losses are based on the fair value of collateral at the reporting dated adjusted for selling costs as appropriate.
The Company is also required to consider expected credit losses associated with loan commitments over the contractual period in which it is exposed to credit risk on the underlying commitments. Any allowance for off-balance sheet credit exposures is reported in Other liabilities on the Company’s consolidated balance sheet and is increased or decreased through a provision for credit loss expense on the Company’s consolidated statement of income. The calculation includes consideration of the likelihood that funding will occur and forecasted credit losses on commitments expected to be funded over their estimated lives. The allowance is calculated using the same methodology, inputs and assumptions as the funded portion of loans at the segment level applied to the amount of commitments expected to be funded.
F-
While the Company’s policies and procedures used to estimate the ACL, as well as the resultant provision for credit losses charged to income, are considered adequate by management and are reviewed periodically by regulators, model validators and internal audit, they are necessarily approximate and imprecise. There are factors beyond the Company’s control, such as changes in projected economic conditions, real estate markets or particular industry conditions, which may materially impact asset quality and the adequacy of the ACL and thus the resulting provision for credit losses.
Premises and Equipment
Depreciable assets are stated at cost less accumulated depreciation. Depreciation is charged to expense using the straight-line method for buildings and equipment over the estimated useful lives of the assets. Leasehold improvements are capitalized and depreciated using the straight-line method over the terms of the respective leases.
Long-lived Asset Impairment
The Company evaluates the recoverability of the carrying value of long-lived assets whenever events or circumstances indicate the carrying amount may not be recoverable. If a long-lived asset is tested for recoverability and the undiscounted estimated future cash flows expected to result from the use and eventual disposition of the asset is less than the carrying amount of the asset, the asset’s cost is adjusted to fair value and an impairment loss is recognized as the amount by which the carrying amount of a long-lived asset exceeds its fair value.
Federal Reserve Bank (FRB) and Federal Home Loan Bank (FHLB) Stock
FRB and FHLB stock are required investments for institutions that are members of the FRB and FHLB systems. The required investment in the common stock is based on a predetermined formula, carried at cost and evaluated for impairment.
Foreclosed Assets and Other Assets Held for Sale
Assets acquired through, or in lieu of, loan foreclosure are held for sale and are initially recorded at fair value less costs to sell at the date of foreclosure, establishing a new cost basis. Subsequent to foreclosure, valuations are periodically performed by management and the assets are carried at the lower of the carrying amount or the fair value less cost to sell. Revenue and expenses from operations related to foreclosed assets and changes in the valuation allowance are included in net income or expense from foreclosed assets.
Goodwill
Goodwill is tested for impairment annually or upon a triggering event. If the implied fair value of goodwill is lower than its carrying amount, goodwill impairment is indicated and goodwill is written down to its implied fair value.
Core Deposits and Other Intangibles
Intangible assets are being amortized on a straight-line basis over weighted-average periods ranging from one to eight years. Such assets are periodically evaluated as to the recoverability of their carrying value. Purchased software is being amortized using the straight-line method over periods ranging from one to three years.
Derivatives
The Company enters into forward contracts for the future delivery of mortgage loans to third-party investors and enters into interest rate lock commitments (“IRLCs”) with potential borrowers to fund specific mortgage loans that will be sold into the secondary market. The forward contracts are entered into in order to economically hedge the effect of changes in interest rates resulting from the Company’s commitment to fund the loans.
F-
The IRLCs and forward contracts are not designated as accounting hedges and are recorded at fair value with the changes in fair value reflected in noninterest income on the consolidated statements of income. The fair value of derivative instruments with a positive fair value are reported in accrued income and other assets in the consolidated balance sheets, while the derivative instruments with a negative fair value are reported in accrued expenses and other liabilities in the consolidated balance sheets.
For exchange-traded contracts, fair value is based on quoted market prices. For non-exchange traded contracts, fair value is based on dealer quotes, pricing models, discounted cash flow methodologies or similar techniques for which the determination of fair value may require significant management judgment or estimation.
Mortgage Servicing Rights
Mortgage servicing assets are recognized separately when rights are acquired through purchase or through sale of financial assets. Under the servicing assets and liabilities accounting guidance (Accounting Standards Codification “ASC” 806-50), servicing rights from the sale or securitization of loans originated by the Company are initially measured at fair value at the date of transfer. The Company subsequently measures each class of servicing asset using the amortization method. Under the amortization method, servicing rights are amortized in proportion to and over the period of estimated net servicing income. The amortized assets are assessed for impairment based on fair value at each reporting date.
Fair value is based on market prices for comparable mortgage servicing contracts, when available, or alternatively, is based on a valuation model that calculates the present value of estimated future net servicing income. The valuation model incorporates assumptions that market participants would use in estimating future net servicing income, such as the cost of service, the discount rate, the custodial earning rate, an inflation rate, ancillary income, prepayment speeds and default rates and losses. These variables change from quarter to quarter as market conditions and projected interest rates change, and may have an adverse impact on the value of the mortgage servicing right and may result in a reduction to noninterest income.
Each class of separately recognized servicing assets subsequently measured using the amortization method is evaluated and measured for impairment. Impairment is determined by stratifying rights into tranches based on predominant characteristics, such as interest rate, loan type and investor type. Impairment is recognized through a valuation allowance for an individual tranche, to the extent that fair value is less than the carrying amount of the servicing assets for that tranche. The valuation allowance is adjusted to reflect changes in the measurement of impairment after the initial measurement of impairment. Changes in valuation allowances are reported with “Mortgage loan servicing fees, net” in the income statement. Fair value in excess of the carrying amount of servicing assets for that stratum is not recognized.
Servicing fee income is recorded for fees earned for servicing loans. The fees are based on a contractual percentage of the outstanding principal or a fixed amount per loan and are recorded as income when earned. The amortization of mortgage servicing rights is netted against loan servicing fee income.
Share-Based Employee Compensation Plan
At December 31, 2023 and 2022, the Company had a share-based employee compensation plan (see Note 18 to the Consolidated Financial Statements).
Transfers of Financial Assets
Transfers of financial assets are accounted for as sales, when control over the assets has been surrendered. Control over transferred assets is deemed to be surrendered when (1) the assets have been isolated from the Company – put presumptively beyond the reach of the transferor and its creditors, even in bankruptcy or other receivership, (2) the transferee obtains the right (free of conditions that constrain it from taking advantage of that right) to pledge or exchange the transferred assets and (3) the Company does not maintain effective control over the transferred assets through an agreement to repurchase them before the maturity or the ability to unilaterally cause the holder to return specific assets.
F-
Income Taxes
The Company accounts for income taxes in accordance with income tax accounting guidance (ASC 740). The income tax accounting guidance results in two components of income tax expense: current and deferred. Current income tax expense reflects taxes to be paid or refunded for the current period by applying the provisions of the enacted tax law to the taxable income or excess of deductions over revenues. The Company determines deferred income taxes using the liability (or balance sheet) method. Under this method, the net deferred tax asset or liability is based on the tax effects of the differences between the book and tax bases of assets and liabilities, and enacted changes in tax rates and laws are recognized in the period in which they occur. Deferred income tax expense results from changes in deferred tax assets and liabilities between periods. Deferred tax assets are reduced by a valuation allowance if, based on the weight of evidence available, it is more likely than not that some portion or all of a deferred tax asset will not be realized.
Uncertain tax positions are recognized if it is more likely than not, based on the technical merits, that the tax position will be realized or sustained upon examination. The term more likely than not means a likelihood of more than 50 percent; the term “upon examination” also includes resolution of the related appeals or litigation processes, if any. A tax position that meets the more-likely-than-not recognition threshold is initially and subsequently measured as the largest amount of tax benefit that has a greater than 50 percent likelihood of being realized upon settlement with a taxing authority that has full knowledge of all relevant information. The determination of whether or not a tax position has met the more-likely-than-not recognition threshold considers the facts, circumstances and information available at the reporting date and is subject to management’s judgment.
The Company recognizes interest and penalties on income taxes as a component of income tax expense.
The Company files consolidated income tax returns with its subsidiaries. With a few exceptions, the Company is no longer subject to U.S. Federal, State and Local examinations by tax authorities for the years before 2020. As of December 31, 2023, the Company had no uncertain income tax positions.
Treasury Shares
Treasury stock is stated at cost. Cost is determined by the weighted-average cost method.
Earnings Per Share
Earnings per share (“EPS”) is computed using the two-class method. Basic EPS represent income available to common shareholders divided by the weighted-average number of common shares outstanding during each period. Diluted EPS reflect additional potential common shares that may be issued by the Company related solely to outstanding stock options or awards which are determined using the treasury stock method. Treasury stock shares are not deemed outstanding for EPS calculations.
Comprehensive Income (Loss)
Comprehensive income (loss) consists of net income (loss) and other comprehensive income (loss), net of applicable income taxes. Other comprehensive income (loss) includes unrealized appreciation (depreciation) on available-for-sale securities. AOCI consists solely of the cumulative unrealized gains and losses on available-for-sale securities net of income tax.
Subordinated Debt
At December 31, 2023, the Company had subordinated debt obligations of $20.0 million related to its 3.65% Fixed to Floating Rate Subordinated Notes due 2031, which were issued and sold by the Company on May 27, 2021. The Subordinated Notes were issued in order to provide additional funds for various corporate obligations of the Company, including share buybacks, acquisition costs and organic asset growth (see Note 13 to the Consolidated Financial Statements).
F-
Revenue Recognition
The Company recognizes revenues as they are earned based on contractual terms, as transactions occur, or services are provided and collectability is reasonably assured. The Company’s principal source of revenue is interest income from loans and leases and investment securities. The Company also earns noninterest income from various banking and financial services offered through State Bank.
Interest income is the largest source of revenue for the Company and is primarily recognized on an accrual basis.
Noninterest income is earned through a variety of financial and transaction services provided to corporate and consumer clients such as trust and wealth advisory, deposit account, debit card, mortgage banking and title insurance.
Adoption of New Accounting Standards:
ASU No. 2016-13: Financial Instruments – Credit Losses (Topic 326) Measurement of Credit Losses on Financial Instruments
On January 1, 2023, the Company adopted ASU 2016-13 - Financial Instruments - Credit Losses (Topic 326): Measurement of Credit Losses on Financial Instruments (“ASU 2016-13”) (“ASC 326”) as amended. The new accounting guidance in this ASU replaces the incurred loss methodology with an expected loss methodology, which is referred to as the current expected credit loss (“CECL”) methodology. The CECL methodology is applicable to the measurement of credit losses on financial assets measured at amortized cost, including loan receivables and held-to-maturity (“HTM”) debt securities. It also applies to off-balance sheet credit exposures not accounted for as insurance (loan commitments, standby letters of credit, financial guarantees, and other similar instruments that are noncancellable), and net investments in leases recognized by a lessor. The CECL methodology requires an entity to estimate credit losses over the life of an asset or off-balance sheet credit exposure.
In addition, CECL made changes to the accounting for available-for-sale debt securities. One such change is to require credit losses to be presented as an allowance rather than as a write-down on available-for-sale debt securities if management determines that the Company does not intend to sell and it is more likely than not, that the Company will not be required to sell the securities.
The Company adopted ASC 326 using the modified retrospective method for all financial assets measured at amortized cost and off-balance sheet credit exposures. Results for reporting periods beginning on or after January 1, 2023 are presented under ASC 326 while prior period amounts continue to be reported in accordance with previously applicable GAAP. The transition adjustment of the CECL adoption included an increase in the ACL of $1.4 million and an increase of $1.1 million to establish a reserve for unfunded commitments, with a $2.0 million decrease to retained earnings, and $0.5 million of deferred tax being recorded as part of the deferred tax asset in the Company’s consolidated balance sheet.
F-
The following table details the impact of the adoption of ASC 326:
| January 1, 2023 | ||||||||||||||||
| ($ in thousands) | Pre-ASC 326 adoption | Impact of ASC 326 adoption |
As reported under ASC 326 |
Cummulative Effect on Retained Earnings | ||||||||||||
| Allowance for credit loss on loans | ||||||||||||||||
| Commercial & industrial | $ | 1,663 | $ | 230 | $ | 1,893 | $ | 182 | ||||||||
| Commercial real estate - owner occupied | 1,696 | 54 | 1,750 | 43 | ||||||||||||
| Commercial real estate - nonowner occupied | 4,584 | 1,015 | 5,599 | 801 | ||||||||||||
| Agricultural | 611 | (194 | ) | 417 | (153 | ) | ||||||||||
| Residential real estate | 4,438 | 360 | 4,798 | 284 | ||||||||||||
| Home equity line of credit (HELOC) | 547 | (76 | ) | 471 | (60 | ) | ||||||||||
| Consumer | 279 | (17 | ) | 262 | (13 | ) | ||||||||||
| Total ACL on loans | $ | 13,818 | $ | 1,372 | $ | 15,190 | $ | 1,084 | ||||||||
| ACL on off-balance sheet commitments | $ | $ | 1,149 | $ | 1,149 | $ | 907 | |||||||||
ASU No. 2022-02: Financial Instruments – Credit Losses (Topic 326) Troubled Debt Restructurings and Vintage Disclosures
On January 1, 2023, the Company adopted ASU 2022-02 Financial Instruments - Credit Losses (Topic 326) Troubled Debt Restructurings and Vintage Disclosures, which removed the existing measurement and disclosure requirements for loans considered to be Troubled Debt Restructurings (“TDRs”) and added additional disclosure requirements related to modifications provided to borrowers experiencing financial difficulty. Prior to adoption of ASU 2022-02, a change in contractual terms of a loan where a borrower was experiencing financial difficulty and received a concession not available through other sources was required to be disclosed as a TDR, whereas now a borrower that is experiencing financial difficulty and receives a modification in the form of principal forgiveness, interest rate reduction, an other-than-insignificant payment delay or a term extension in the current period needs to be disclosed. The amendment was adopted prospectively and had no impact on the Company’s consolidated financial statements aside from additional and revised financial statement disclosures (See Note 4 to the Consolidated Financial Statements).
ASU No. 2020-04: Reference Rate Reform – Facilitation of the Effects of Reference Rate Reform on Financial Reporting (Topic 848)
This guidance provides temporary options to ease the potential burden in accounting for reference rate reform. It is intended to help stakeholders during the global market-wide reference rate transition period. The guidance is effective as of March 12, 2020 through December 31, 2022. However, a deferral of the implementation of the Reference Rate Reform was issued in December of 2022, which extends the implementation to December 31, 2024. The Company has implemented a replacement for the reference rate and has determined that the changes did not have a material impact on the Company’s consolidated financial statements.
ASU No. 2023-02: Accounting for Investments in Tax Credit Structures Using the Proportional Amortization Method (ASU 2023-02).
This ASU permits reporting entities to elect to account for their tax equity investments, regardless of the tax credit program from which the income tax credits are received, using the proportional amortization if certain conditions are met. A reporting entity makes an accounting policy election to apply the proportional amortization method on a tax-credit-by-tax-credit-program basis rather than electing to apply the proportional amortization method at the reporting entity level or to individual investments. The Company adopted the standard using a modified retrospective transition approach to the amendments related to our low income housing tax credit (“LIHTC”) investments that are eligible to apply proportional amortization. The adoption of this standard did not have a material effect on the Company’s operating results or financial condition.
Accounting Standards not yet adopted:
ASU No. 2023-09: Income Taxes (Topic 740): Improvements to Income Tax Disclosures
In December 2023, the FASB issued ASU 2023-09, “Income Taxes (Topic 740): Improvements to Income Tax Disclosures.” The amendments in this update address investor requests for more transparency about income tax information through improvements to income tax disclosures, primarily related to effective tax rate reconciliation and information related to income taxes paid, among certain other amendments to improve the effectiveness of such disclosures. The amendments of this ASU are effective for fiscal years beginning after December 15, 2024 and are to be applied on a prospective basis. Adoption of this ASU is not expected to have a material impact on the Company’s Consolidated Financial Statements.
F-
Note 2: Earnings Per Share
EPS is computed using the two-class method. Basic EPS is computed by dividing net income available to common shareholders by the weighted-average number of common shares outstanding during the applicable period, excluding participating securities. Participating securities include non-vested restricted stock awards. Non-vested restricted stock awards are considered participating securities to the extent the holders of these securities receive non-forfeitable dividends at the same rate as holders of common shares. Diluted EPS is computed using the weighted-average number of shares determined for the basic EPS plus the dilutive effect of stock compensation using the treasury stock method. EPS for the years ended December 31, 2023 and 2022 is computed as follows:
| Twelve Months Ended December 31, |
||||||||
| ($ and outstanding shares in thousands - except per share data) | 2023 | 2022 | ||||||
| Distributed earnings allocated to common shares | $ | 3,584 | $ | 3,412 | ||||
| Undistributed earnings allocated to common shares | 8,482 | 9,082 | ||||||
| Net earnings allocated to common shares | 12,066 | 12,494 | ||||||
| Net earnings allocated to participating securities | 29 | 27 | ||||||
| Net Income allocated to common shares and participating securities | $ | 12,095 | $ | 12,521 | ||||
| Weighted average shares outstanding for basic earnings per share | 6,829 | 7,005 | ||||||
| Dilutive effect of stock compensation | 88 | 73 | ||||||
| Weighted average shares outstanding for diluted earnings per share | 6,917 | 7,078 | ||||||
| Basic earnings per common share | $ | 1.77 | $ | 1.79 | ||||
| Diluted earnings per common share | $ | 1.75 | $ | 1.77 | ||||
There were no anti-dilutive shares in 2023 or 2022.
On January 10, 2022, the Company announced that its board of directors had declared a 5 percent common stock dividend payable on February 4, 2022, to shareholders of record as of January 21, 2022. Holders of the Company’s common shares as of the record date received one additional common share for every twenty common shares held on the record date. No fractional shares were issued, and shareholders received cash for such fractional interests based on the closing price of $19.89 of the Company’s common shares on the record date.
F-
Note 3: Available-for-Sale Securities
The amortized cost and appropriate fair values, together with gross unrealized gains and losses, of available-for-sale securities are as follows:
| Gross | Gross | |||||||||||||||
| Amortized | Unrealized | Unrealized | ||||||||||||||
| ($ in thousands) | Cost | Gains | Losses | Fair Value | ||||||||||||
| December 31, 2023 | ||||||||||||||||
| U.S. Treasury and Government agencies | $ | 7,339 | $ | 1 | $ | (823 | ) | $ | 6,517 | |||||||
| Mortgage-backed securities | 221,717 | 3 | (32,853 | ) | 188,867 | |||||||||||
| State and political subdivisions | 11,212 | 8 | (1,322 | ) | 9,898 | |||||||||||
| Other corporate securities | 17,200 | (2,774 | ) | 14,426 | ||||||||||||
| Totals | $ | 257,468 | $ | 12 | $ | (37,772 | ) | $ | 219,708 | |||||||
| Gross | Gross | |||||||||||||||
| Amortized | Unrealized | Unrealized | ||||||||||||||
| Cost | Gains | Losses | Fair Value | |||||||||||||
| December 31, 2022 | ||||||||||||||||
| U.S. Treasury and Government agencies | $ | 7,636 | $ | $ | (872 | ) | $ | 6,764 | ||||||||
| Mortgage-backed securities | 241,741 | 4 | (35,910 | ) | 205,835 | |||||||||||
| State and political subdivisions | 12,862 | 10 | (1,769 | ) | 11,103 | |||||||||||
| Other corporate securities | 17,200 | (2,122 | ) | 15,078 | ||||||||||||
| Totals | $ | 279,439 | $ | 14 | $ | (40,673 | ) | $ | 238,780 | |||||||
The amortized cost and fair value of securities available-for-sale at December 31, 2023, by contractual maturity, are shown below. Expected maturities differ from contractual maturities because issuers may have the right to call or prepay obligations with or without call or prepayment penalties.
| Amortized | Fair | |||||||
| ($ in thousands) | Cost | Value | ||||||
| Within one year | $ | 809 | $ | 800 | ||||
| Due after one year through five years | 1,903 | 1,839 | ||||||
| Due after five years through ten years | 24,483 | 20,824 | ||||||
| Due after ten years | 8,556 | 7,378 | ||||||
| 35,751 | 30,841 | |||||||
| Mortgage-backed securities | 221,717 | 188,867 | ||||||
| Totals | $ | 257,468 | $ | 219,708 | ||||
The fair value of securities pledged as collateral, to secure public deposits and for other purposes, was $89.7 million at December 31, 2023, and $53.9 million at December 31, 2022. Securities delivered for repurchase agreements (not included above) were $19.7 million at December 31, 2023 and $17.8 million at December 31, 2022.
During the 4th quarter of 2023, the Company sold all of the equity shares it owned in Visa Class “B” shares. As a result of this sale, the Company no longer owns any Visa Class B shares. The carrying value of the Visa Class B shares on the Company’s balance sheet was nominal as the Company had a historical cost basis of $0.01 per share. After transaction costs, the Company realized a pre-tax gain on the sale of $1.45 million.
F-
Certain investments in debt securities are reported in the financial statements at an amount less than their historical cost. There were 139 securities and 144 securities reported with amounts less than their historical value at December 31, 2023 and 2022, respectively. Total fair value of these investments was $217.0 million and $235.5 million at December 31, 2023 and 2022, respectively, which was approximately 99 percent and 99 percent, respectively, of the Company’s available-for-sale investment portfolio.
The following tables present securities with unrealized losses at December 31, 2023 and 2022:
| ($ in thousands) | Less than 12 Months | 12 Months or Longer | Total | |||||||||||||||||||||
| Fair Value | Unrealized Losses | Fair Value | Unrealized Losses | Fair Value | Unrealized Losses | |||||||||||||||||||
| December 31, 2023 | ||||||||||||||||||||||||
| U.S. Treasury and Government agencies | $ | $ | $ | 6,022 | $ | (823 | ) | $ | 6,022 | $ | (823 | ) | ||||||||||||
| Mortgage-backed securities | 188,508 | (32,853 | ) | 188,508 | (32,853 | ) | ||||||||||||||||||
| State and political subdivisions | 8,541 | (1,322 | ) | 8,541 | (1,322 | ) | ||||||||||||||||||
| Other corporate securities | 13,926 | (2,774 | ) | 13,926 | (2,774 | ) | ||||||||||||||||||
| Totals | $ | $ | $ | 216,997 | $ | (37,772 | ) | $ | 216,997 | $ | (37,772 | ) | ||||||||||||
| Less than 12 Months | 12 Months or Longer | Total | ||||||||||||||||||||||
| Fair Value | Unrealized Losses | Fair Value | Unrealized Losses | Fair Value | Unrealized Losses | |||||||||||||||||||
| December 31, 2022 | ||||||||||||||||||||||||
| U.S. Treasury and Government agencies | $ | 3,788 | $ | (452 | ) | $ | 2,974 | $ | (420 | ) | $ | 6,762 | $ | (872 | ) | |||||||||
| Mortgage-backed securities | 52,351 | (5,234 | ) | 153,055 | (30,676 | ) | 205,406 | (35,910 | ) | |||||||||||||||
| State and political subdivisions | 7,461 | (1,370 | ) | 1,268 | (399 | ) | 8,729 | (1,769 | ) | |||||||||||||||
| Other corporate securities | 12,015 | (1,736 | ) | 2,564 | (386 | ) | 14,579 | (2,122 | ) | |||||||||||||||
| Totals | $ | 75,615 | $ | (8,792 | ) | $ | 159,861 | $ | (31,881 | ) | $ | 235,476 | $ | (40,673 | ) | |||||||||
Based on evaluation of available evidence, including recent changes in market interest rates, credit rating information and information obtained from regulatory filings, management believes the declines in fair value for these securities are temporary. Management reviews these securities on a quarterly basis and evaluates if any security has a fair value less than its amortized cost. Once these securities are identified, management determines whether a decline in fair value resulted from a credit loss or other factors. In making the assessment, the Company may consider various factors including the extent to which fair value is less than amortized cost, performance on any underlying collateral, downgrades in the ratings of the security by a rating agency, the failure of the issuer to make scheduled interest or principal payments and adverse conditions specifically related to the security. If the assessment indicates that a credit loss exists, a provision is recorded to the ACL.
F-
Note 4: Loans and Allowance for Credit Losses
The following tables present the categories of loans at December 31, 2023 and 2022:
| Total Loans | ||||||||
| ($ in thousands) | 2023 | 2022 | ||||||
| Commercial & industrial | $ | 126,716 | $ | 128,393 | ||||
| Commercial real estate - owner occupied | 126,717 | 110,929 | ||||||
| Commercial real estate - nonowner occupied | 297,323 | 301,880 | ||||||
| Agricultural | 65,659 | 64,505 | ||||||
| Residential real estate | 318,123 | 291,368 | ||||||
| Home equity line of credit (HELOC) | 47,845 | 45,056 | ||||||
| Consumer | 17,829 | 19,944 | ||||||
| Total loans | 1,000,212 | 962,075 | ||||||
| Allowance for credit losses | (15,786 | ) | (13,818 | ) | ||||
| Loans, net | $ | 984,426 | $ | 948,257 | ||||
The Company makes commercial, agri-business, consumer and residential loans to customers throughout its defined market area. Commitments to extend credit are agreements to lend to a customer as long as there is no violation of any condition established in the contract. Commitments generally have fixed expiration dates or other termination clauses and may require payment of a fee. Since a portion of the commitments may expire without being drawn upon, the total commitment amounts do not necessarily represent future cash requirements. Each customer’s creditworthiness is evaluated on a case-by-case basis. The amount of collateral obtained, if deemed necessary, is based on management’s credit evaluation of the customer. Collateral held varies, but may include accounts receivable, inventory, property, plant and equipment, commercial real estate and residential real estate.
Standby letters of credit are conditional commitments issued by the Company to guarantee the performance of a customer to a third party. Those guarantees are primarily issued to support public and private borrowing arrangements, including commercial paper, bond financing and similar transactions. The credit risk involved in issuing letters of credit is essentially the same as that involved in extending loans to customers.
Listed below is a summary of loan commitments, unused lines of credit, and standby letters of credit as of December 31, 2023 and 2022.
| ($ in thousands) | 2023 | 2022 | ||||||
| Loan commitments and unused lines of credit | $ | 201,605 | $ | 221,668 | ||||
| Standby letters of credit | 1,184 | 1,336 | ||||||
| Totals | $ | 202,789 | $ | 223,004 | ||||
The risk characteristics of each loan portfolio segment are as follows:
Commercial & Industrial and Agricultural
Commercial & industrial and agricultural loans are primarily based on the identified cash flows of the borrower and secondarily on the underlying collateral provided by the borrower. The cash flows of borrowers, however, may not be as expected and the collateral securing these loans may fluctuate in value. Most commercial loans are secured by the assets being financed or other business assets, such as accounts receivable or inventory, and may include a personal guarantee. Short-term loans may be made on an unsecured basis. In the case of loans secured by accounts receivable, the availability of funds for the repayment of these loans may be substantially dependent on the ability of the borrower to collect amounts due from its customers.
F-
Commercial Real Estate (Owner and Nonowner Occupied)
Commercial real estate loans are viewed primarily as cash flow loans and secondarily as loans secured by real estate. Commercial real estate lending typically involves higher loan principal amounts and the repayment of these loans is generally dependent on the successful operation of the property securing the loan or the business conducted on the property securing the loan. Commercial real estate loans may be more adversely affected by conditions in the real estate markets or in the general economy. The characteristics of properties securing the Company’s commercial real estate portfolio are diverse, but with geographic location almost entirely in the Company’s market area. Management monitors and evaluates commercial real estate loans based on collateral, geography and risk grade criteria. In general, the Company avoids financing single purpose projects unless other underwriting factors are present to help mitigate risk. In addition, management tracks the level of owner-occupied commercial real estate versus non-owner-occupied loans.
Construction loans are underwritten utilizing feasibility studies, independent appraisal reviews and financial analysis of the developers and property owners. Construction loans are generally based on estimates of costs and value associated with the completed project. These estimates may be inaccurate. Construction loans often involve the disbursement of substantial funds with repayment substantially dependent on the success of the ultimate project. Sources of repayment for these types of loans may be pre-committed permanent loans from approved long-term lenders, sales of developed property or an interim loan commitment from the Company until permanent financing is obtained. These loans are closely monitored by on-site inspections and are considered to have higher risks than other real estate loans due to their ultimate repayment being sensitive to interest rate changes, governmental regulation of real property, general economic conditions and the availability of long-term financing.
Residential Real Estate, Home Equity Line of Credit (“HELOC”) and Consumer
Residential and consumer loans consist of two segments – residential mortgage loans and personal loans. Residential mortgage loans are secured by 1-4 family residences and are generally owner-occupied, and the Company generally establishes a maximum loan-to-value ratio and requires private mortgage insurance if that ratio is exceeded. HELOCs are typically secured by a subordinate interest in 1-4 family residences, and consumer personal loans are secured by consumer personal assets, such as automobiles or recreational vehicles. Some consumer personal loans are unsecured, such as small installment loans and certain lines of credit. Repayment of these loans is primarily dependent on the personal income of the borrowers, which can be impacted by economic conditions in their market areas, such as unemployment levels. Repayment can also be impacted by changes in property values on residential properties. Risk is mitigated by the fact that these loans are of smaller individual amounts and spread over a large number of borrowers.
Allowance for Credit Losses (ACL)
The ACL is an estimate of the expected credit losses on financial assets measured at amortized cost, which is measured using relevant information about past events, including historical credit loss experience on financial assets with similar risk characteristics, current conditions, and reasonable and supportable forecasts that affect the collectability of the remaining cash flows over the contractual term of the financial assets. A provision for credit losses is charged to operations based on management’s periodic evaluation of these and other pertinent factors.
F-
As a result of the adoption of ASC 326, the Company recorded a $1.4 million increase to the ACL as a cumulative-effect adjustment on January 1, 2023. The following table summarizes the activity related to the ACL for the twelve months ended December 31, 2023 under the CECL methodology.
| ($ in thousands) For the twelve months ended December 31, 2023 |
Balance, beginning of period |
Impact of Adopting ASC 326 |
Chargeoffs | Recoveries | Provision for Credit Losses |
Balance, end of period |
||||||||||||||||||
| Commercial & industrial | $ | 1,663 | $ | 230 | $ | $ | $ | 110 | $ | 2,003 | ||||||||||||||
| Commercial real estate - owner occupied | 1,696 | 54 | 202 | 1,952 | ||||||||||||||||||||
| Commercial real estate - nonowner occupied | 4,584 | 1,015 | 119 | 5,718 | ||||||||||||||||||||
| Agricultural | 611 | (194 | ) | 23 | 440 | |||||||||||||||||||
| Residential real estate | 4,438 | 360 | (53 | ) | 1 | 190 | 4,936 | |||||||||||||||||
| HELOC | 547 | (76 | ) | 39 | 510 | |||||||||||||||||||
| Consumer | 279 | (17 | ) | (65 | ) | 25 | 5 | 227 | ||||||||||||||||
| Total | $ | 13,818 | $ | 1,372 | $ | (118 | ) | $ | 26 | $ | 688 | $ | 15,786 | |||||||||||
Prior to the adoption of ASC 326 on January 1, 2023, the Company calculated the ACL under the incurred loss methodology. The following table contains disclosures related to the ACL for the year ended December 31, 2022 under this methodology.
| ($ in thousands) For the twelve months ended December 31, 2022 |
Balance, beginning of period |
Impact of Adopting ASC 326 |
Chargeoffs | Recoveries | Provision for Credit Losses |
Balance, end of period |
||||||||||||||||||
| Commercial & industrial | $ | 1,890 | $ | $ | $ | $ | (227 | ) | $ | 1,663 | ||||||||||||||
| Commercial real estate - owner occupied | 2,564 | (868 | ) | 1,696 | ||||||||||||||||||||
| Commercial real estate - nonowner occupied | 4,217 | 367 | 4,584 | |||||||||||||||||||||
| Agricultural | 599 | 12 | 611 | |||||||||||||||||||||
| Residential real estate | 3,515 | 923 | 4,438 | |||||||||||||||||||||
| HELOC | 579 | (34 | ) | 47 | (45 | ) | 547 | |||||||||||||||||
| Consumer | 441 | (162 | ) | 279 | ||||||||||||||||||||
| Total | $ | 13,805 | $ | $ | (34 | ) | $ | 47 | $ | $ | 13,818 | |||||||||||||
The following table presents gross chargeoffs for the year ended December 31, 2023 by loan category and origination year.
| ($ in thousands) | Term Loans by Year of Origination | Revolving | ||||||||||||||||||||||||||||||
| December 31, 2023 | 2023 | 2022 | 2021 | 2020 | 2019 | Prior | Loans | Total | ||||||||||||||||||||||||
| Commercial & industrial | $ | $ | $ | $ | $ | $ | $ | $ | ||||||||||||||||||||||||
| Commercial real estate - owner occupied | ||||||||||||||||||||||||||||||||
| Commercial real estate - nonowner occupied | ||||||||||||||||||||||||||||||||
| Agricultural | ||||||||||||||||||||||||||||||||
| Residential real estate | 32 | 21 | 53 | |||||||||||||||||||||||||||||
| Home equity line of credit (HELOC) | ||||||||||||||||||||||||||||||||
| Consumer | 12 | 8 | 11 | 34 | 65 | |||||||||||||||||||||||||||
| $ | $ | 12 | $ | 40 | $ | 32 | $ | $ | $ | 34 | $ | 118 | ||||||||||||||||||||
Collateral dependent loans are loans for which the repayment is expected to be provided substantially through the operation or sale of the collateral and the borrower is experiencing financial difficulty. The Company reviews individually evaluated loans for designation as collateral dependent loans, as well as other loans that management of the Company designates as having higher risk. These loans do not share common risk characteristics and are not included within the collectively evaluated loans for determining the ACL.
F-
The following table presents an analysis of collateral-dependent loans of the Company as of December 31, 2023.
| ($ in thousands) | Collateral Type | Allocated | ||||||||||||||
| December 31, 2023 | Real Estate | Other | Total | Allowance | ||||||||||||
| Commercial & industrial | $ | 604 | $ | - | $ | 604 | $ | 97 | ||||||||
| Commercial real estate - owner occupied | - | - | - | - | ||||||||||||
| Commercial real estate - nonowner occupied | 284 | - | 284 | 40 | ||||||||||||
| Agricultural | - | - | - | - | ||||||||||||
| Residential real estate | 1,023 | - | 1,023 | 18 | ||||||||||||
| HELOC | - | - | - | - | ||||||||||||
| Consumer | - | - | - | - | ||||||||||||
| Total | $ | 1,911 | $ | - | $ | 1,911 | $ | 155 | ||||||||
Under CECL, for collateral dependent loans, the Company has adopted the practical expedient to measure the ACL based on the fair value of collateral. The ACL is calculated on an individual loan basis based on the shortfall between the fair value of the loan’s collateral, which is adjusted for liquidation costs/discounts, and amortized cost. If the fair value of the collateral exceeds the amortized cost, no allowance is required.
The following table disaggregates the allowance for loan losses and recorded investment in loans by impairment methodology under the incurred loss methodology as of December 31, 2022.
| December 31, 2022 | Commercial & industrial | Commercial real estate | Agricultural | Residential real estate | Consumer | Total | ||||||||||||||||||
| Allowance for loan losses: | ||||||||||||||||||||||||
| Ending allowance attributable to loans: | ||||||||||||||||||||||||
| Individually evaluated for impairment | $ | $ | $ | $ | 138 | $ | 2 | $ | 140 | |||||||||||||||
| Collectively evaluated for impairment | $ | 1,663 | $ | 6,280 | $ | 611 | $ | 4,300 | $ | 824 | $ | 13,678 | ||||||||||||
| Totals | $ | 1,663 | $ | 6,280 | $ | 611 | $ | 4,438 | $ | 826 | $ | 13,818 | ||||||||||||
| Loans: | ||||||||||||||||||||||||
| Individually evaluated for impairment | $ | 204 | $ | 347 | $ | $ | 2,863 | $ | 114 | $ | 3,528 | |||||||||||||
| Collectively evaluated for impairment | $ | 128,189 | $ | 412,462 | $ | 64,505 | $ | 288,505 | $ | 64,886 | $ | 958,547 | ||||||||||||
| Totals | $ | 128,393 | $ | 412,809 | $ | 64,505 | $ | 291,368 | $ | 65,000 | $ | 962,075 | ||||||||||||
F-
Credit Risk Profile
The Company categorizes loans into risk categories (loan grades) based on relevant information about the ability of borrowers to service their debt such as current financial information, historical payment experience, credit documentation, public information and current economic trends, among other factors. The Company analyzes loans individually by classifying the loans as to credit risk. This analysis includes loans with an outstanding balance greater than $100,000 and non-homogeneous loans, such as commercial and commercial real estate loans. This analysis is performed on a quarterly basis. The Company uses the following definitions for risk ratings:
Pass (grades 1 – 4): Loans which management has determined to be performing as expected and in agreement with the terms established at the time of loan origination.
Special Mention (grade 5): Assets have potential weaknesses that deserve management’s close attention. If left uncorrected, these potential weaknesses may result in deterioration of the repayment prospects for the asset or in the Company’s credit position at some future date. Special mention assets are not adversely classified and do not expose the Company to sufficient risk to warrant adverse classification. Ordinarily, special mention credits have characteristics which corrective management action would remedy.
Substandard (grade 6): Loans are inadequately protected by the current sound worth and paying capacity of the obligor or of the collateral pledged, if any. Loans so classified must have a well-defined weakness or weaknesses that jeopardized the liquidation of the debt. They are characterized by the distinct possibility that the Company will sustain some loss if the deficiencies are not corrected.
Doubtful (grade 7): Loans classified as doubtful have all the weaknesses inherent in those classified Substandard with the added characteristic that the weaknesses make collection or liquidation in full, on the basis of current known facts, conditions and values, highly questionable and improbable.
Loss (grade 8): Loans are considered uncollectable and of such little value that continuing to carry them as assets on the Company’s financial statement is not feasible. Loans will be classified as loss when it is neither practical nor desirable to defer writing off or reserving all or a portion of a basically worthless asset, even though partial recovery may be possible at some time in the future.
F-
The Company evaluates the loan risk grading system definitions and allowance for credit loss methodology on an ongoing basis. The following table presents loan balances by credit quality indicators by year of origination as of December 31, 2023.
| ($ in thousands) | Term Loans by Year of Origination | Revolving | Revolving Loans Converted | |||||||||||||||||||||||||||||||||
| December 31, 2023 | 2023 | 2022 | 2021 | 2020 | 2019 | Prior | Loans | to Term | Total | |||||||||||||||||||||||||||
| Commercial & industrial | ||||||||||||||||||||||||||||||||||||
| Pass (1 - 4) | $ | 17,239 | $ | 18,076 | $ | 19,143 | $ | 10,573 | $ | 7,449 | $ | 5,965 | $ | 45,831 | $ | 444 | $ | 124,720 | ||||||||||||||||||
| Special Mention (5) | - | 731 | - | 64 | - | 140 | 201 | - | 1,136 | |||||||||||||||||||||||||||
| Substandard (6) | - | 41 | - | - | 25 | 137 | - | 80 | 283 | |||||||||||||||||||||||||||
| Doubtful (7) | 195 | - | 226 | - | 1 | 100 | 50 | 5 | 577 | |||||||||||||||||||||||||||
| Loss (8) | - | - | - | - | - | - | - | - | - | |||||||||||||||||||||||||||
| Total | $ | 17,434 | $ | 18,848 | $ | 19,369 | $ | 10,637 | $ | 7,475 | $ | 6,342 | $ | 46,082 | $ | 529 | $ | 126,716 | ||||||||||||||||||
| Commercial real estate - owner occupied | ||||||||||||||||||||||||||||||||||||
| Pass (1 - 4) | $ | 29,253 | $ | 21,427 | $ | 26,808 | $ | 12,931 | $ | 12,881 | $ | 20,409 | $ | 112 | $ | 173 | $ | 123,994 | ||||||||||||||||||
| Special Mention (5) | - | - | - | 2,338 | 358 | - | - | - | 2,696 | |||||||||||||||||||||||||||
| Substandard (6) | - | - | - | - | - | - | - | - | - | |||||||||||||||||||||||||||
| Doubtful (7) | - | - | 26 | - | 1 | - | - | - | 27 | |||||||||||||||||||||||||||
| Loss (8) | - | - | - | - | - | - | - | - | - | |||||||||||||||||||||||||||
| Total | $ | 29,253 | $ | 21,427 | $ | 26,834 | $ | 15,269 | $ | 13,240 | $ | 20,409 | $ | 112 | $ | 173 | $ | 126,717 | ||||||||||||||||||
| Commercial real estate - nonowner occupied | ||||||||||||||||||||||||||||||||||||
| Pass (1 - 4) | $ | 52,915 | $ | 67,285 | $ | 47,658 | $ | 46,364 | $ | 30,561 | $ | 47,895 | $ | 2,377 | $ | - | $ | 295,055 | ||||||||||||||||||
| Special Mention (5) | - | - | - | - | 838 | 1,134 | - | - | 1,972 | |||||||||||||||||||||||||||
| Substandard (6) | - | - | - | - | - | 154 | 18 | - | 172 | |||||||||||||||||||||||||||
| Doubtful (7) | - | - | - | - | - | 124 | - | - | 124 | |||||||||||||||||||||||||||
| Loss (8) | - | - | - | - | - | - | - | - | - | |||||||||||||||||||||||||||
| Total | $ | 52,915 | $ | 67,285 | $ | 47,658 | $ | 46,364 | $ | 31,399 | $ | 49,307 | $ | 2,395 | $ | - | $ | 297,323 | ||||||||||||||||||
| Agricultural | ||||||||||||||||||||||||||||||||||||
| Pass (1 - 4) | $ | 9,496 | $ | 16,131 | $ | 12,940 | $ | 3,029 | $ | 1,859 | $ | 9,801 | $ | 12,403 | $ | - | $ | 65,659 | ||||||||||||||||||
| Special Mention (5) | - | - | - | - | - | - | - | - | - | |||||||||||||||||||||||||||
| Substandard (6) | - | - | - | - | - | - | - | - | - | |||||||||||||||||||||||||||
| Doubtful (7) | - | - | - | - | - | - | - | - | - | |||||||||||||||||||||||||||
| Loss (8) | - | - | - | - | - | - | - | - | - | |||||||||||||||||||||||||||
| Total | $ | 9,496 | $ | 16,131 | $ | 12,940 | $ | 3,029 | $ | 1,859 | $ | 9,801 | $ | 12,403 | $ | - | $ | 65,659 | ||||||||||||||||||
| Residential real estate | ||||||||||||||||||||||||||||||||||||
| Pass (1 - 4) | $ | 53,013 | $ | 110,531 | $ | 85,075 | $ | 31,558 | $ | 10,425 | $ | 22,564 | $ | 1,816 | $ | 1,300 | $ | 316,282 | ||||||||||||||||||
| Special Mention (5) | - | - | - | - | - | - | - | - | - | |||||||||||||||||||||||||||
| Substandard (6) | - | - | 361 | 54 | 485 | 920 | - | - | 1,820 | |||||||||||||||||||||||||||
| Doubtful (7) | - | - | - | - | - | 21 | - | - | 21 | |||||||||||||||||||||||||||
| Loss (8) | - | - | - | - | - | - | - | - | - | |||||||||||||||||||||||||||
| Total | $ | 53,013 | $ | 110,531 | $ | 85,436 | $ | 31,612 | $ | 10,910 | $ | 23,505 | $ | 1,816 | $ | 1,300 | $ | 318,123 | ||||||||||||||||||
| Home equity line of credit (HELOC) | ||||||||||||||||||||||||||||||||||||
| Pass (1 - 4) | $ | - | $ | - | $ | 46 | $ | 18 | $ | 85 | $ | 94 | $ | 40,932 | $ | 6,492 | $ | 47,667 | ||||||||||||||||||
| Special Mention (5) | - | - | - | - | - | 59 | 20 | 99 | 178 | |||||||||||||||||||||||||||
| Substandard (6) | - | - | - | - | - | - | - | - | - | |||||||||||||||||||||||||||
| Doubtful (7) | - | - | - | - | - | - | - | - | - | |||||||||||||||||||||||||||
| Loss (8) | - | - | - | - | - | - | - | - | - | |||||||||||||||||||||||||||
| Total | $ | - | $ | - | $ | 46 | $ | 18 | $ | 85 | $ | 153 | $ | 40,952 | $ | 6,591 | $ | 47,845 | ||||||||||||||||||
| Consumer | ||||||||||||||||||||||||||||||||||||
| Pass (1 - 4) | $ | 3,296 | $ | 5,142 | $ | 1,429 | $ | 740 | $ | 221 | $ | 128 | $ | 6,863 | $ | - | $ | 17,819 | ||||||||||||||||||
| Special Mention (5) | - | - | - | 1 | - | - | - | - | 1 | |||||||||||||||||||||||||||
| Substandard (6) | - | 9 | - | - | - | - | - | - | 9 | |||||||||||||||||||||||||||
| Doubtful (7) | - | - | - | - | - | - | - | - | - | |||||||||||||||||||||||||||
| Loss (8) | - | - | - | - | - | - | - | - | - | |||||||||||||||||||||||||||
| Total | $ | 3,296 | $ | 5,151 | $ | 1,429 | $ | 741 | $ | 221 | $ | 128 | $ | 6,863 | $ | - | $ | 17,829 | ||||||||||||||||||
| Total Loans | ||||||||||||||||||||||||||||||||||||
| Pass (1 - 4) | $ | 165,212 | $ | 238,592 | $ | 193,099 | $ | 105,213 | $ | 63,481 | $ | 106,856 | $ | 110,334 | $ | 8,409 | $ | 991,196 | ||||||||||||||||||
| Special Mention (5) | - | 731 | - | 2,403 | 1,196 | 1,333 | 221 | 99 | 5,983 | |||||||||||||||||||||||||||
| Substandard (6) | - | 50 | 361 | 54 | 510 | 1,211 | 18 | 80 | 2,284 | |||||||||||||||||||||||||||
| Doubtful (7) | 195 | - | 252 | - | 2 | 245 | 50 | 5 | 749 | |||||||||||||||||||||||||||
| Loss (8) | - | - | - | - | - | - | - | - | - | |||||||||||||||||||||||||||
| Total Loans | $ | 165,407 | $ | 239,373 | $ | 193,712 | $ | 107,670 | $ | 65,189 | $ | 109,645 | $ | 110,623 | $ | 8,593 | $ | 1,000,212 | ||||||||||||||||||
F-
The following table presents loan balances by credit quality indicators and loan categories as of December 31, 2022.
| ($ in thousands) December 31, 2022 |
Commercial & industrial |
Commercial real estate - owner occupied |
Commercial real estate - nonowner occupied |
Agricultural | Residential real estate |
HELOC | Consumer | Total | ||||||||||||||||||||||||
| Pass (1 - 4) | $ | 127,727 | $ | 107,999 | $ | 296,611 | $ | 64,505 | $ | 288,028 | $ | 44,746 | $ | 19,915 | $ | 949,531 | ||||||||||||||||
| Special Mention (5) | 394 | 2,930 | 4,899 | 8,223 | ||||||||||||||||||||||||||||
| Substandard (6) | 158 | 160 | 3,316 | 310 | 29 | 3,973 | ||||||||||||||||||||||||||
| Doubtful (7) | 114 | 210 | 24 | 348 | ||||||||||||||||||||||||||||
| Loss (8) | ||||||||||||||||||||||||||||||||
| Total Loans | $ | 128,393 | $ | 110,929 | $ | 301,880 | $ | 64,505 | $ | 291,368 | $ | 45,056 | $ | 19,944 | $ | 962,075 | ||||||||||||||||
The following tables present the Company’s loan portfolio aging analysis as of December 31, 2023 and 2022:
| ($ in thousands) | 30-59 Days | 60-89 Days | Greater Than 90 Days |
Total Past |
||||||||||||||||||||
| December 31, 2023 | Past Due | Past Due | Past Due | Due | Current | Total Loans | ||||||||||||||||||
| Commercial & industrial | $ | 26 | $ | $ | 658 | $ | 684 | $ | 126,032 | $ | 126,716 | |||||||||||||
| Commercial real estate - owner occupied | 126,717 | 126,717 | ||||||||||||||||||||||
| Commercial real estate - nonowner occupied | 29 | 29 | 297,294 | 297,323 | ||||||||||||||||||||
| Agricultural | 65,659 | 65,659 | ||||||||||||||||||||||
| Residential real estate | 222 | 395 | 617 | 317,506 | 318,123 | |||||||||||||||||||
| HELOC | 8 | 67 | 75 | 47,770 | 47,845 | |||||||||||||||||||
| Consumer | 88 | 33 | 1 | 122 | 17,707 | 17,829 | ||||||||||||||||||
| Total Loans | $ | 114 | $ | 263 | $ | 1,150 | $ | 1,527 | $ | 998,685 | $ | 1,000,212 | ||||||||||||
| 30-59 Days | 60-89 Days | Greater Than 90 Days |
Total Past |
|||||||||||||||||||||
| December 31, 2022 | Past Due | Past Due | Past Due | Due | Current | Total Loans | ||||||||||||||||||
| Commercial & industrial | $ | 23 | $ | 108 | $ | 114 | $ | 245 | $ | 128,148 | $ | 128,393 | ||||||||||||
| Commercial real estate - owner occupied | 110,929 | 110,929 | ||||||||||||||||||||||
| Commercial real estate - nonowner occupied | 114 | 32 | 146 | 301,734 | 301,880 | |||||||||||||||||||
| Agricultural | 64,505 | 64,505 | ||||||||||||||||||||||
| Residential real estate | 98 | 411 | 1,287 | 1,796 | 289,572 | 291,368 | ||||||||||||||||||
| HELOC | 98 | 24 | 138 | 260 | 44,796 | 45,056 | ||||||||||||||||||
| Consumer | 61 | 26 | 22 | 109 | 19,835 | 19,944 | ||||||||||||||||||
| Total Loans | $ | 394 | $ | 569 | $ | 1,593 | $ | 2,556 | $ | 959,519 | $ | 962,075 | ||||||||||||
All loans past due 90 days are systematically placed on nonaccrual status.
When a loan is moved to nonaccrual status, total unpaid interest accrued to date is reversed from income. Subsequent payments are applied to the outstanding principal balance with the interest portion of the payment recorded on the balance sheet as a contra-loan. Interest received on nonaccrual loans may be realized once all contractual principal amounts are received or when a borrower establishes a history of six consecutive timely principal and interest payments. It is at the discretion of management to determine when a loan is placed back on accrual status upon receipt of six consecutive timely payments.
F-
The categories of nonaccrual loans as of December 31, 2023 and December 31, 2022 are presented in the following table.
| 2023 | 2022 | |||||||||||||||
| ($ in thousands) | Nonaccrual loans with no allowance | Nonaccrual loans with an allowance | Total nonaccrual loans | Total nonaccrual loans | ||||||||||||
| Commercial & industrial | $ | 651 | $ | 97 | $ | 748 | $ | 114 | ||||||||
| Commercial real estate - owner occupied | 26 | 26 | ||||||||||||||
| Commercial real estate - nonowner occupied | 141 | 141 | 210 | |||||||||||||
| Agricultural | ||||||||||||||||
| Residential real estate | 1,694 | 18 | 1,712 | 3,020 | ||||||||||||
| Home equity line of credit (HELOC) | 180 | 180 | 310 | |||||||||||||
| Consumer | 11 | 11 | 28 | |||||||||||||
| Total loans | $ | 2,703 | $ | 115 | $ | 2,818 | $ | 3,682 | ||||||||
Impaired Loans (Prior to the Adoption of ASC 326)
Prior to the adoption of ASU 2016-13, a loan was considered impaired when, based on current information and events, it was probable that the Company would be unable to collect the scheduled payments of principal or interest when due according to the contractual terms of the loan agreement. Factors considered by management in determining impairment included payment status, collateral value and the probability of collecting scheduled principal and interest payments when due. Loans that experienced insignificant payment delays and payment shortfalls generally were not classified as impaired. Management determined the significance of payment delays and payment shortfalls on a case-by-case basis, taking into consideration each of the circumstances surrounding the loan and the borrower, including the length of the delay, the reasons for the delay, the borrower’s prior payment record and the amount of the shortfall in relation to the principal and interest owed. Impairment was measured on a loan-by-loan basis for commercial, agricultural, and construction loans by either the present value of expected future cash flows discounted at the loan’s effective interest rate, the loan’s obtainable market price or the fair value of the collateral if the loan is collateral dependent.
Large groups of smaller balance homogenous loans were collectively evaluated for impairment. Accordingly, the Company did not separately identify individual consumer and residential loans for impairment measurements, unless such loans were the subject of a restructuring agreement due to financial difficulties of the borrower. Impaired loans less than $100,000 were included in groups of homogenous loans. These loans were evaluated based on delinquency status. Interest payments on impaired loans were typically applied to principal unless collectability of the principal amount was reasonably assured, in which case interest was recognized on a cash basis.
F-
The following table presents impaired loan activity for the twelve months ended December 31, 2022:
| ($ in thousands) | Recorded | Unpaid Principal | Related | Average Recorded | Interest Income | |||||||||||||||
| Twelve Months Ended December 31, 2022 | Investment | Balance | Allowance | Investment | Recognized | |||||||||||||||
| With no related allowance recorded: | ||||||||||||||||||||
| Commercial & industrial | $ | 204 | $ | 627 | $ | $ | 650 | $ | 34 | |||||||||||
| Commercial real estate - owner occupied | ||||||||||||||||||||
| Commercial real estate - nonowner occupied | 347 | 825 | 1,350 | 94 | ||||||||||||||||
| Agricultural | ||||||||||||||||||||
| Residential real estate | 1,491 | 1,558 | 1,793 | 65 | ||||||||||||||||
| HELOC | 68 | 68 | 85 | 4 | ||||||||||||||||
| Consumer | ||||||||||||||||||||
| With a specific allowance recorded: | ||||||||||||||||||||
| Commercial & industrial | ||||||||||||||||||||
| Commercial real estate - owner occupied | ||||||||||||||||||||
| Commercial real estate - nonowner occupied | ||||||||||||||||||||
| Agricultural | ||||||||||||||||||||
| Residential real estate | 1,372 | 1,372 | 138 | 1,424 | 43 | |||||||||||||||
| HELOC | 46 | 46 | 2 | 51 | 2 | |||||||||||||||
| Consumer | ||||||||||||||||||||
| Totals: | ||||||||||||||||||||
| Commercial & industrial | $ | 204 | $ | 627 | $ | $ | 650 | $ | 34 | |||||||||||
| Commercial real estate - owner occupied | $ | $ | $ | $ | $ | |||||||||||||||
| Commercial real estate - nonowner occupied | $ | 347 | $ | 825 | $ | $ | 1,350 | $ | 94 | |||||||||||
| Agricultural | $ | $ | $ | $ | $ | |||||||||||||||
| Residential real estate | $ | 2,863 | $ | 2,930 | $ | 138 | $ | 3,217 | $ | 108 | ||||||||||
| HELOC | $ | 114 | $ | 114 | $ | 2 | $ | 136 | $ | 6 | ||||||||||
| Consumer | $ | $ | $ | $ | $ | |||||||||||||||
Modifications made to Borrowers Experiencing Financial Difficulty
In the normal course of business, the Company may execute loan modifications with borrowers. These modifications are analyzed to determine whether the modification is considered concessionary, long term and made to a borrower experiencing financial difficulty. The Company’s modifications generally include interest rate adjustments, principal reductions, and amortization and maturity date extensions. These modifications provide the borrowers with short-term cash relief to allow them to improve their financial condition. If a loan modification is determined to be made to a borrower experiencing financial difficulty, the loan is considered collateral dependent and evaluated as part of the ACL as described above in the Allowance for Credit Losses section of this Note.
For the twelve months ended December 31, 2023, the Company did not modify any loans made to borrowers experiencing financial difficulty. The Company had no commitments to lend to borrowers experiencing financial difficulty for which the Company had modified an existing loan as of December 31, 2023.
Prior to the adoption of ASU 2022-02, the Company reported Troubled Debt Restructured loans (“TDRs”). TDRs are modified loans where a concession was provided to a borrower experiencing financial difficulties. Loan modifications are considered TDRs when the concessions provided are not available to the borrower through either normal channels or other sources. There were no new TDRs during the period ended December 31, 2022.
F-
The Company monitors loan payments on an on-going basis to determine if a loan is considered to have a payment default. Determination of payment default involves analyzing the economic conditions that exist for each customer and its ability to generate positive cash flows during the loan term. For the twelve-month period ended December 31, 2023, the Company had no loan modifications made to borrowers experiencing financial difficulty for which there was a payment default within the 12 months following the modification date.
Unfunded Loan Commitments
The Company maintains an allowance for off-balance sheet credit exposures such as unfunded balances for existing lines of credit, commitments to extend future credit, as well as both standby and commercial letters of credit when there is a contractual obligation to extend credit and when this extension of credit is not unconditionally cancellable (i.e. commitment cannot be canceled at any time). The allowance for off-balance sheet credit exposures is adjusted as a provision for credit loss expense. The estimate includes consideration of the likelihood that funding will occur, which is based on a historical funding study derived from internal information, and an estimate of expected credit losses on commitments expected to be funded over its estimated life, which are the same loss rates that are used in computing the ACL for loans. The ACL for unfunded loan commitments is classified on the balance sheet within Other liabilities.
The following table presents the balance and activity in the ACL for unfunded loan commitments for the twelve months ended December 31, 2023 and 2022.
| ($ in thousands) | 2023 | 2022 | ||||||
| Balance, beginning of period | $ | $ | ||||||
| Adjustment for adoption of ASU 2016-13 | 1,149 | |||||||
| Provision for unfunded commitments | (373 | ) | ||||||
| Balance, end of period | $ | 776 | $ | |||||
Related Party Loans
Loans to directors and their related interests, including loans to companies for which directors are principal owners and executive officers are presented in the following table at December 31:
| ($ in thousands) | 2023 | 2022 | ||||||
| Balance at beginning of period | $ | 521 | $ | 521 | ||||
| Effect of change in compostioin of directors and executive officers | 112 | |||||||
| New Term Loans | ||||||||
| Repayment of term loans | (144 | ) | (53 | ) | ||||
| Changes in balances of revolving lines of credit | 58 | (59 | ) | |||||
| Balance at end of period | $ | 435 | $ | 521 | ||||
F-
Note 5: Premises and Equipment
Major classifications of premises and equipment stated at cost were as follows at December 31:
| ($ in thousands) | 2023 | 2022 | ||||||
| Land | $ | 3,563 | $ | 3,563 | ||||
| Buildings and improvements | 27,663 | 27,699 | ||||||
| Equipment | 15,842 | 14,315 | ||||||
| Construction in process | 167 | 879 | ||||||
| 47,235 | 46,456 | |||||||
| Less accumulated depreciation | (25,857 | ) | (23,627 | ) | ||||
| Net premises and equipment | $ | 21,378 | $ | 22,829 | ||||
Note 6: Goodwill and Intangibles
The balance of goodwill was $23.2 million for the twelve months ended December 31, 2023 and December 31, 2022.
| 2023 | 2022 | |||||||
| ($ in thousands) | Carrying Amount | Carrying Amount | ||||||
| Beginning balance | $ | 23,239 | $ | 23,191 | ||||
| Measurement period adjustments | 48 | |||||||
| Ending balance | $ | 23,239 | $ | 23,239 | ||||
Impairment exists when a reporting unit’s carrying value of goodwill exceeds its fair value. Goodwill is tested on the last day of the last quarter of each calendar year. The Company performed a quantitative analysis of goodwill as of September 30, 2023, and determined that no impairment was required. At December 31, 2023, the Company determined that no events had occurred to change the assessment from the quantitative analysis and it was more likely than not that the fair value of the reporting unit exceeded its carrying value, including goodwill. The qualitative assessment indicated that it was more likely than not that the fair value of the reporting unit exceeded its carrying value, resulting in no impairment.
Carrying basis and accumulated amortization of intangible assets were as follows at December 31:
| 2023 | 2022 | |||||||||||||||
| Gross Carrying | Accumulated | Gross Carrying | Accumulated | |||||||||||||
| ($ in thousands) | Amount | Amortization | Amount | Amortization | ||||||||||||
| Core deposits intangible | $ | 660 | $ | (236 | ) | $ | 660 | $ | (170 | ) | ||||||
| Customer relationship intangible | 200 | (200 | ) | 200 | (176 | ) | ||||||||||
| Banking intangibles | $ | 860 | $ | (436 | ) | $ | 860 | $ | (346 | ) | ||||||
Amortization expense for intangibles for the years ended December 31, 2023 and 2022 was $0.09 million and $0.07 million, respectively. Estimated amortization expense for each of the following five years is immaterial.
F-
Note 7: Mortgage Banking and Servicing Rights
Mortgage loans serviced for others are not included in the accompanying consolidated balance sheets. The unpaid principal balance of mortgage loans serviced for others approximated $1.4 billion at both December 31, 2023 and 2022. Contractually specified servicing fees of approximately $3.4 million and $3.2 million were included in mortgage loan servicing fees in the consolidated income statement for the years ended December 31, 2023 and 2022, respectively.
The following table summarizes mortgage servicing rights capitalized and related amortization, along with activity in the related valuation allowance at December 31:
| ($ in thousands) | 2023 | 2022 | ||||||
| Carrying amount, beginning of year | $ | 13,503 | $ | 12,034 | ||||
| Mortgage servicing rights capitalized during the year | 1,695 | 1,939 | ||||||
| Mortgage servicing rights amortization during the year | (1,242 | ) | (1,749 | ) | ||||
| Net change in valuation allowance | (50 | ) | 1,279 | |||||
| Carrying amount, end of year | $ | 13,906 | $ | 13,503 | ||||
| Valuation allowance: | ||||||||
| Beginning of year | $ | 177 | $ | 1,456 | ||||
| Increase (reduction) | 50 | (1,279 | ) | |||||
| End of year | $ | 227 | $ | 177 | ||||
| Fair value, beginning of period | $ | 15,754 | $ | 12,629 | ||||
| Fair value, end of period | $ | 17,125 | $ | 15,754 | ||||
Note 8: Derivative Financial Instruments
The Company is exposed to certain risks arising from both its business operations and economic conditions. The Company manages its exposures to a wide variety of business and operational risks primarily through management of its core business activities. The Company manages economic risks, including interest rate, liquidity and credit risk, primarily by managing the amount, sources and duration of its assets and liabilities and through the use of derivative financial instruments. Specifically, the Company enters into derivative financial instruments to manage exposures that arise from business activities that result in the receipt or payment of future known and uncertain cash amounts, the value of which are determined by interest rates. The Company’s derivative financial instruments are used to manage differences in the amount, timing and duration of the Company’s known or expected cash payments principally related to certain variable-rate assets.
The Company does not use derivatives for trading or speculative purposes. Derivatives not designated as hedges are not speculative and result from a service the Company provides to certain customers. The Company executes interest rate swaps with commercial banking customers to facilitate their respective risk management strategies. Those interest rate swaps are simultaneously hedged by offsetting interest rate swaps that the Company executes with a third party, such that the Company minimizes its net risk exposure resulting from such transactions. As the interest rate swaps associated with this program do not meet the strict hedge accounting requirements, changes in the fair value of both the customer swaps and the offsetting swaps are recognized directly in earnings.
Additionally, the Company enters into forward contracts for the future delivery of mortgage loans to third-party investors and enters into IRLCs with potential borrowers to fund specific mortgage loans that will be sold into the secondary market. The forward contracts that are entered into, economically hedge the effect of changes in interest rates resulting from the Company’s commitment to fund the loans. The IRLCs and forward contracts are not designated as accounting hedges and are recorded at fair value with changes in fair value reflected in noninterest income on the consolidated statements of income. The fair value of derivative instruments with a positive fair value are reported in accrued income and other assets in the consolidated balance sheets, while derivative instruments with a negative fair value are reported in accrued expenses and other liabilities in the consolidated balance sheets.
F-
The table below presents the notional amount and fair value of the Company’s interest rate swaps, IRLCs and forward contracts utilized at December 31:
| 2023 | 2022 | |||||||||||||||
| Notional | Fair | Notional | Fair | |||||||||||||
| ($ in thousands) | Amount | Value | Amount | Value | ||||||||||||
| Asset Derivatives | ||||||||||||||||
| Derivatives not designated as hedging instruments | ||||||||||||||||
| Interest rate swaps associated with loans | $ | 68,381 | $ | 3,638 | $ | 66,477 | $ | 5,538 | ||||||||
| IRLCs | 7,466 | 45 | ||||||||||||||
| Forward contracts | 5,500 | 26 | ||||||||||||||
| Total contracts | $ | 75,847 | $ | 3,683 | $ | 71,977 | $ | 5,564 | ||||||||
| Liability Derivatives | ||||||||||||||||
| Derivatives not designated as hedging instruments | ||||||||||||||||
| Interest rate swaps associated with loans | $ | 68,381 | $ | (3,638 | ) | $ | 66,477 | $ | (5,538 | ) | ||||||
| IRLCs | 3,268 | (20 | ) | |||||||||||||
| Forward contracts | 10,750 | (37 | ) | |||||||||||||
| Total contracts | $ | 79,131 | $ | (3,675 | ) | $ | 69,745 | $ | (5,558 | ) | ||||||
The fair value of interest rate swaps were estimated using a discounted cash flow method that incorporates current market interest rates as of the balance sheet date. Fair values of IRLCs and forward contracts were estimated using changes in mortgage interest rates from the date the Company entered into the IRLC and the balance sheet date.
The following table presents the amounts included in the consolidated statements of income for non-hedging derivative financial instruments for the twelve months ended December 31, 2023 and 2022.
| Amount of gain (loss) | ||||||||||
| ($ in thousands) | Statement of income classification | 2023 | 2022 | |||||||
| Interest rate swap contracts | Other income | $ | 132 | $ | 19 | |||||
| IRLCs | Gain on sale of mortgage loans & OMSR | 65 | (42 | ) | ||||||
| Forward contracts | Gain on sale of mortgage loans & OMSR | (63 | ) | 57 | ||||||
The following table shows the offsetting of financial assets and derivative assets at December 31, 2023 and 2022.
| Gross amounts of |
Gross amounts offset in the |
Net amounts of assets presented in the |
Gross amounts not offset in the consolidated balance sheet |
|||||||||||||||||||||
| ($ in thousands) | recognized assets |
consolidated balance sheet |
consolidated balance sheet |
Financial instruments |
Cash collateral received |
Net amount |
||||||||||||||||||
| December 31, 2023 | ||||||||||||||||||||||||
| Interest rate swaps | $ | 3,957 | $ | 319 | $ | 3,638 | $ | $ | 2,900 | $ | 738 | |||||||||||||
| December 31, 2022 | ||||||||||||||||||||||||
| Interest rate swaps | $ | 5,540 | $ | 2 | $ | 5,538 | $ | $ | 4,480 | $ | 1,058 | |||||||||||||
F-
The following table shows the offsetting of financial liabilities and derivative liabilities at December 31, 2023 and 2022.
| Gross amounts of |
Gross amounts offset in the |
Net amounts of liabilities presented in the |
Gross amounts not offset in the consolidated balance sheet |
|||||||||||||||||||||
| ($ in thousands) | recognized liabilities |
consolidated balance sheet |
consolidated balance sheet |
Financial instruments |
Cash collateral pledged |
Net amount |
||||||||||||||||||
| December 31, 2023 | ||||||||||||||||||||||||
| Interest rate swaps | $ | 3,957 | $ | 319 | $ | 3,638 | $ | $ | - | $ | 3,638 | |||||||||||||
| December 31, 2022 | ||||||||||||||||||||||||
| Interest rate swaps | $ | 5,540 | $ | 2 | $ | 5,538 | $ | $ | $ | 5,538 | ||||||||||||||
Note 9: Interest-Bearing Deposits
Interest-bearing time deposits in denominations of $250,000 or more totaled $54.1 million on December 31, 2023 and $23.4 million on December 31, 2022. There were no certificates of deposits from brokers as of December 31, 2023 and $7.0 million as of December 31, 2022.
At December 31, 2023, the scheduled maturities of time deposits were as follows:
| ($ in thousands) | ||||
| 2024 | $ | 197,374 | ||
| 2025 | 41,190 | |||
| 2026 | 14,459 | |||
| 2027 | 1,958 | |||
| 2028 | 528 | |||
| Thereafter | ||||
| Total | $ | 255,509 | ||
Included in time deposits at December 31, 2023 and 2022 were $56.5 million and $58.0 million, respectively, of deposits which were obtained through the Certificate of Deposit Account Registry Service (“CDARS”). This service allows deposit customers to maintain fully insured balances in excess of the $250,000 FDIC limit without the inconvenience of having multi-banking relationships. Under the reciprocal program that the Company is currently participating in, customers agree to allow their deposits to be placed with other participating banks in the CDARS program in insurable amounts under $250,000. In exchange, other banks in the program agree to place their deposits with the Company also in insurable amounts under $250,000.
Deposits of directors and their associates, including deposits of companies for which directors are principal owners and executive officers, totaled $5.2 million and $7.0 million at December 31, 2023 and 2022, respectively.
Note 10: Short-Term Borrowings
| ($ in thousands) | 2023 | 2022 | ||||||
| Securities Sold Under Repurchase Agreements | $ | 13,387 | $ | 14,923 | ||||
The Company has retail repurchase agreements to facilitate cash management transactions with commercial customers. These obligations were secured by agency securities of $4.5 million and $5.4 million as of December 31, 2023 and 2022, respectively, and mortgage-backed securities of $15.2 million and $12.4 million for 2023 and 2022, respectively. The collateral is held at the FHLB and has maturities from 2025 through 2051. At December 31, 2023, these repurchase agreements totaled $13.4 million. The maximum amount of outstanding agreements at any month end during 2023 and 2022 totaled $24.6 million and $30.9 million, respectively, and the monthly average of such agreements totaled $15.8 million and $20.3 million during 2023 and 2022, respectively. The repurchase agreements mature within one month.
F-
The Company has borrowing capabilities at the Federal Reserve Discount Window (“Discount Window”) and the Bank Term Funding Program (“BTFP”) by pledging either securities or loans as collateral. As of December 31, 2023, there was $20.1 million of collateral pledged, but no borrowings drawn at either borrowing facilities.
At December 31, 2023 and 2022, the Company had $41.0 million in federal funds lines, of which none were drawn.
Note 11: Federal Home Loan Bank (FHLB) Advances
The FHLB advances were secured by $272.1 million in mortgage loans at December 31, 2023. Advances consisted of fixed and variable interest rates from 3.75 to 5.47 percent. Fixed rate advances are subject to restrictions or penalties in the event of prepayment. Aggregate annual maturities of FHLB advances at December 31, 2023, were:
| ($ in thousands) | Debt | |||
| 2024 | 61,100 | |||
| 2026 | 5,000 | |||
| 2028 | 17,500 | |||
| Total | $ | 83,600 | ||
Note 12: Trust Preferred Securities
On September 15, 2005, RST II, a wholly-owned subsidiary of the Company, closed a pooled private offering of 10,000 Capital Securities with a liquidation amount of $1,000 per security. The proceeds of the offering were loaned to the Company in exchange for junior subordinated debentures with terms similar to the Capital Securities. Distributions on the Capital Securities are payable quarterly at a variable rate that is currently based upon the 3-month CME Group Benchmark Administration (“CME”) Term Secured Overnight Financing Rate (“SOFR”) as adjusted by the relevant spread adjustment plus 1.80 percent and are included in interest expense in the Consolidated Financial Statements. These securities may be included in Tier 1 capital and may be prepaid at any time without penalty (with certain limitations applicable) under current regulatory guidelines and interpretations. The balance of the Capital Securities as of December 31, 2023 and 2022 was $10.3 million, with a maturity date of September 15, 2035.
Note 13: Subordinated Debt
On May 27, 2021, the Company entered into Subordinated Note Purchase Agreements with qualified institutional buyers and accredited investors pursuant to which the Company issued and sold $20.0 million in aggregate principal amount of its 3.65% Fixed to Floating Rate Subordinated Notes due 2031 (the “Notes”). The Notes were sold by the Company in a private placement exempt from the registration requirements under the Securities Act of 1933, as amended.
The Notes mature on June 1, 2031 and bear interest at a fixed rate of 3.65% through May 31, 2026. From June 1, 2026 to the maturity date or earlier redemption of the Notes, the interest rate will reset quarterly to an interest rate per annum, equal to the then-current-three-month SOFR provided by the Federal Reserve Bank of New York plus 296 basis points. The Company may redeem the Notes at any time after May 31, 2026, and at any time in whole, but not in part, upon the occurrence of certain events. Any redemption of the Notes will be subject to prior regulatory approval. The Company incurred debt issuance costs for placement fees, legal and other out-of-pocket expenses of approximately $0.5 million, which are being amortized over the life of the Notes.
Note 14: Income Taxes
The provision for income taxes includes these components:
| For The Year Ended December 31, |
||||||||
| ($ in thousands) | 2023 | 2022 | ||||||
| Taxes currently payable | $ | 744 | $ | 86 | ||||
| Deferred provision | 1,878 | 2,709 | ||||||
| Income tax expense | $ | 2,622 | $ | 2,795 | ||||
F-
A reconciliation of income tax expense at the statutory rate to the Company’s actual income tax expense is shown below:
| For The Year Ended December 31, |
||||||||
| ($ in thousands) | 2023 | 2022 | ||||||
| Computed at the statutory rate (21%) | $ | 3,091 | $ | 3,216 | ||||
| Increase (decrease) resulting from | ||||||||
| Tax exempt interest | (117 | ) | (111 | ) | ||||
| BOLI income | (187 | ) | (106 | ) | ||||
| Sec. 831(b) election | (198 | ) | (199 | ) | ||||
| Other | 33 | (5 | ) | |||||
| Actual tax expense | $ | 2,622 | $ | 2,795 | ||||
The tax effects of temporary differences related to deferred taxes shown on the balance sheets are:
| For The Year Ended December 31, |
||||||||
| ($ in thousands) | 2023 | 2022 | ||||||
| Deferred tax assets | ||||||||
| Allowance for credit losses | $ | 3,315 | $ | 2,902 | ||||
| Unrealized losses on available-for-sale securities | 7,929 | 8,538 | ||||||
| Capitalized research and development costs | 90 | 117 | ||||||
| Accrued bonus | 124 | 142 | ||||||
| Net operating loss | 2,758 | 5,410 | ||||||
| Other | 819 | 854 | ||||||
| 15,035 | 17,963 | |||||||
| Deferred tax liabilities | ||||||||
| Depreciation | (983 | ) | (1,117 | ) | ||||
| Mortgage servicing rights | (2,920 | ) | (2,836 | ) | ||||
| Purchase accounting adjustments | (1,488 | ) | (1,598 | ) | ||||
| Prepaids | (475 | ) | (527 | ) | ||||
| Net deferred loan costs | (93 | ) | (93 | ) | ||||
| Section 475 MTM | (7,929 | ) | (8,538 | ) | ||||
| FHLB stock dividends | (122 | ) | (271 | ) | ||||
| (14,010 | ) | (14,980 | ) | |||||
| Net deferred tax asset | $ | 1,025 | $ | 2,983 | ||||
As of December 31, 2023 the Company had $13.1 million in net operating losses. No valuation allowance is recorded as these are expected to be fully utilized and have no expiration.
Note 15: Accumulated Other Comprehensive Income (Loss)
Accumulated other comprehensive income (loss) represents reclassifications out of unrealized gains and losses on available-for-sale securities net of income tax. There were no reclassifications for the years ending December 31, 2023 and 2022.
Note 16: Regulatory Matters
As of December 31, 2023, based on its call report computations, State Bank was classified as well capitalized under the regulatory framework for prompt corrective action. To be categorized as well capitalized, State Bank must maintain capital ratios as set forth in the table below. There are no conditions or events since December 31, 2023 that management believes have changed State Bank’s capital classification.
F-
State Bank’s actual capital amounts and ratios are presented in the following table. Capital levels are presented for State Bank only as the Company is exempt from quarterly reporting at the holding company level:
| For Capital Adequacy | To Be Well Capitalized Under Prompt Corrective | |||||||||||||||||||||||
| Actual | Purposes | Action Procedures | ||||||||||||||||||||||
| ($ in thousands) | Amount | Ratio | Amount | Ratio | Amount | Ratio | ||||||||||||||||||
| As of December 31, 2023 | ||||||||||||||||||||||||
| Tier I Capital to average assets | $ | 148,049 | 10.93 | % | $ | 54,185 | 4.0 | % | $ | 67,732 | 5.0 | % | ||||||||||||
| Tier I Common equity capital to risk-weighted assets | $ | 148,049 | 13.42 | % | $ | 49,640 | 4.5 | % | $ | 71,702 | 6.5 | % | ||||||||||||
| Tier I Capital to risk-weighted assets | $ | 148,049 | 13.42 | % | $ | 66,186 | 6.0 | % | $ | 88,249 | 8.0 | % | ||||||||||||
| Total Risk-based capital to risk-weighted assets | $ | 161,872 | 14.67 | % | $ | 88,249 | 8.0 | % | $ | 110,311 | 10.0 | % | ||||||||||||
| As of December 31, 2022 | ||||||||||||||||||||||||
| Tier I Capital to average assets | $ | 146,678 | 11.06 | % | $ | 53,069 | 4.0 | % | $ | 66,336 | 5.0 | % | ||||||||||||
| Tier I Common equity capital to risk-weighted assets | $ | 146,678 | 13.42 | % | $ | 49,200 | 4.5 | % | $ | 71,067 | 6.5 | % | ||||||||||||
| Tier I Capital to risk-weighted assets | $ | 146,678 | 13.42 | % | $ | 65,600 | 6.0 | % | $ | 87,466 | 8.0 | % | ||||||||||||
| Total Risk-based capital to risk-weighted assets | $ | 160,346 | 14.67 | % | $ | 87,466 | 8.0 | % | $ | 109,333 | 10.0 | % | ||||||||||||
The above minimum capital requirements exclude the capital conservation buffer required to avoid limitations on capital distributions, including dividend payments and certain discretionary bonus payments to executive officers. The capital conservation buffer was 2.50 percent at December 31, 2023 and the Company still would have met the minimum capital requirements when the capital buffer is considered. The net unrealized gain or loss on available-for-sale securities is not included in computing regulatory capital. Management believes that State Bank met all capital adequacy requirements to which State Bank was subject as of December 31, 2023.
Note 17: Employee Benefits
The Company has a share-based incentive compensation plan that permits the grant of stock options, restricted stock and other share-based awards to employees, directors and advisory board members of the Company and its subsidiaries. In addition, the Company has instituted a long-term incentive program, with the objective of rewarding senior management through grants of restricted common shares of the Company (see Note 18 to the Consolidated Financial Statements).
The Company has a retirement savings 401(k) plan covering substantially all employees. The Company provides a safe harbor matching contribution equal to 100% of an employees’ salary deferral amounts up to 4% of the employees’ eligible compensation. Employees are immediately vested in their voluntary contributions and in any Company safe harbor matching contributions. Any discretionary contribution made by the Company is fully vested after three years of credited service. Employer contributions charged to expense for 2023 and 2022 were $0.6 million and $0.7 million, respectively.
Also, the Company has Supplemental Executive Retirement Plan (“SERP”) Agreements with certain active and retired officers. The agreements provide monthly payments for up to 15 years that equal 15 percent to 25 percent of average compensation prior to retirement or death. The charges to expense for the current agreements were $0.2 million and $0.2 million for 2023 and 2022, respectively.
F-
Additional life insurance is provided to certain officers through bank-owned life insurance (“BOLI”) policies. By way of a separate split-dollar agreement, each policy’s interests are divided between the Company and the insured’s beneficiary. The Company owns the policy’s cash value and a portion of the policy net death benefit, over and above the cash value assigned to the insured’s beneficiary. In May 2022, an additional $10.5 million in BOLI policies were purchased. The cash surrender value of all life insurance policies totaled $29.1 million and $28.9 million at December 31, 2023 and 2022, respectively.
The Company has a noncontributory employee stock ownership plan (“ESOP”) covering substantially all employees of the Company and its subsidiaries. Voluntary contributions are made by the Company to the plan. Each eligible employee is vested based upon years of service, including prior years of service. The Company’s contributions to the account of each employee become fully vested after three years of service. Benefit expense for the value of the stock purchased is recorded equal to the fair market value of the stock when contributions, which are determined annually by the Board of Directors of the Company, are made to the ESOP. Allocated shares in the ESOP at December 31, 2023 and 2022, were 328,187 and 370,876, respectively.
Dividends on allocated shares in the ESOP are recorded as dividends and charged to retained earnings. Compensation expense is recorded equal to the fair market value of the stock when contributions, which are determined annually by the Board of Directors of the Company, are made to the ESOP. ESOP expense for the years ended December 31, 2023 and 2022 was $0.1 million and $0.0 million, respectively.
Note 18: Share-Based Compensation Plan
In April 2017, the shareholders approved a new share-based incentive compensation plan, the SB Financial Group, Inc. 2017 Stock Incentive Plan (the “2017 Plan”). This plan permits the grant or award of incentive stock options, nonqualified stock options, stock appreciation rights (“SAR’s”), restricted stock, and restricted stock units (“RSU’s”) for up to 500,000 common shares of the Company.
The 2017 Plan is intended to advance the interests of the Company and its shareholders by offering employees, directors and advisory board members of the Company and its subsidiaries an opportunity to acquire or increase their ownership interest in the Company through grants of equity-based awards. The 2017 Plan permits equity-based awards to be used to attract, motivate, reward and retain highly competent individuals upon whose judgment, initiative, leadership and efforts are key to the success of the Company by encouraging those individuals to become shareholders of the Company.
Option awards are granted with an exercise price equal to the market price of the Company’s common shares at the date of grant and those option awards vest based on five years of continuous service and have 10-year contractual terms. The fair value of each option award is estimated on the date of grant using the Black-Scholes valuation model. There were no options granted in 2023 or 2022. There were no stock options outstanding, and no compensation expense charged against income with respect to option awards under the Plan, as of December 31, 2023 or 2022.
As of December 31, 2023, there was no unrecognized compensation cost related to incentive option share-based compensation arrangements granted under the 2017 Plan.
Pursuant to the Long Term Incentive (“LTI”) Plan, the Company awards restricted common shares of the Company to certain key executives under the 2017 Plan. These restricted stock awards vest over a four-year period and are intended to assist the Company in retention of key executives. During 2023 and 2022, the Company met certain performance targets and restricted stock awards were approved by the Board. The compensation cost charged against income for the LTI Plan was $0.6 million and $0.6 million for 2023 and 2022, respectively. The total income tax benefit recognized in the income statement for share-based compensation arrangements was $0.1 million and $0.1 million for 2023 and 2022, respectively.
F-
A summary of restricted stock activity under the Company’s LTI Plan as of December 31, 2023 and changes during the year ended is presented below:
| Shares | Weighted- Average Value per Share |
|||||||
| Nonvested, January 1, 2023 | 52,919 | $ | 19.23 | |||||
| Granted | 28,664 | 16.53 | ||||||
| Vested | (31,810 | ) | 17.96 | |||||
| Forfeited | (807 | ) | 18.27 | |||||
| Nonvested, December 31, 2023 | 48,966 | $ | 18.49 | |||||
As of December 31, 2023, there was $0.6 million of total unrecognized compensation cost related to non-vested share-based compensation arrangements related to the restricted stock awards under the 2017 Plan which were granted in accordance with the LTI Plan. That cost is expected to be recognized over a weighted-average period of 1.62 years.
Note 19: Disclosures About Fair Value of Assets and Liabilities
Pursuant to ASC 820, fair value is defined as the price that would be received to sell an asset or paid to transfer a liability in an orderly transaction between market participants at the measurement date. A three level hierarchy exists in ASC 820 for fair value measurements based upon the inputs to the valuation of an asset or liability:
Level 1: Quoted prices in active markets for identical assets or liabilities
Level 2: Observable inputs other than Level 1 prices, such as quoted prices for similar assets or liabilities; quoted prices in markets that are not active; or other inputs that are observable or can be corroborated by observable market data for substantially the full term of the assets or liabilities.
Level 3: Unobservable inputs that are supported by little or no market activity and that are significant to the fair value of the assets or liabilities
Following is a description of the valuation methodologies and inputs used for assets measured at fair value on a recurring basis, recognized in the accompanying balance sheets, as well as the general classification of such assets pursuant to the valuation hierarchy.
Available-for-sale securities
The fair value of available-for-sale securities are determined by various valuation methodologies. Level 2 securities include obligations of U.S. government agencies, mortgage-backed securities, obligations of political and state subdivisions, and corporate securities. Level 2 inputs do not include quoted prices for individual securities in active markets; however, they do include inputs that are either directly or indirectly observable for the individual security being valued. Such observable inputs include interest rates and yield curves at commonly quoted intervals, volatilities, prepayment speeds, credit risks and default rates. Also included are inputs derived principally from or corroborated by observable market data by correlation or other means.
Interest rate contracts
The fair values of interest rate contracts are based upon the estimated amount the Company would receive or pay to terminate the contracts or agreements, taking into account underlying interest rates, creditworthiness of underlying customers for credit derivatives and, when appropriate, the creditworthiness of the counterparties.
F-
Forward contracts
The fair values of forward contracts on to-be-announced securities are determined using quoted prices in active markets, or benchmarked thereto (Level 1).
Interest Rate Lock Commitments (IRLCs)
The fair value of IRLCs are determined using the projected sale price of individual loans based on changes in the market interest rates, projected pull-through rates (the probability that an IRLC will ultimately result in an originated loan), the reduction in the value of the applicant’s option due to the passage of time, and the remaining origination costs to be incurred based on management’s estimate of market costs (Level 3).
The following table presents the fair value measurements of securities measured at fair value on a recurring basis and the level within the fair value hierarchy in which the fair value measurements fell at December 31, 2023 and 2022:
| ($ in thousands) | Fair value at December 31, 2023 |
(Level 1) | (Level 2) | (Level 3) | ||||||||||||
| U.S. Treasury and Government Agencies | $ | 6,517 | $ | $ | 6,517 | $ | ||||||||||
| Mortgage-backed securities | 188,867 | 188,867 | ||||||||||||||
| State and political subdivisions | 9,898 | 9,898 | ||||||||||||||
| Other corporate securities | 14,426 | 14,426 | ||||||||||||||
| Interest rate contracts - assets | 3,638 | 3,638 | ||||||||||||||
| Interest rate contracts - liabilities | (3,638 | ) | (3,638 | ) | ||||||||||||
| Forward contracts | (37 | ) | (37 | ) | ||||||||||||
| IRLCs | 45 | 45 | ||||||||||||||
| ($ in thousands) | Fair value at December 31, 2022 |
(Level 1) | (Level 2) | (Level 3) | ||||||||||||
| U.S. Treasury and Government Agencies | $ | 6,764 | $ | $ | 6,764 | $ | ||||||||||
| Mortgage-backed securities | 205,835 | 205,835 | ||||||||||||||
| State and political subdivisions | 11,103 | 11,103 | ||||||||||||||
| Other corporate securities | 15,078 | 15,078 | ||||||||||||||
| Interest rate contracts - assets | 5,538 | 5,538 | ||||||||||||||
| Interest rate contracts - liabilities | (5,538 | ) | (5,538 | ) | ||||||||||||
| Forward contracts | 26 | 26 | ||||||||||||||
| IRLCs | (20 | ) | (20 | ) | ||||||||||||
Level 1 - quoted prices in active markets for identical assets
Level 2 - significant other observable inputs
Level 3 - significant unobservable inputs
The following table reconciles the beginning and ending balances of recurring fair value measurements recognized in the accompanying consolidated balance sheets using significant unobservable (Level 3) inputs for the years ended December 31, 2023 and 2022.
| for the Twelve Months Ended December 31, |
||||||||
| ($ in thousands) | 2023 | 2022 | ||||||
| Interest rate lock commitments | ||||||||
| Balance at beginning of period | $ | (20 | ) | $ | 22 | |||
| Change in fair value | 65 | (42 | ) | |||||
| Balance at end of period | $ | 45 | $ | (20 | ) | |||
F-
The following is a description of the valuation methodologies and inputs used for assets measured at fair value on a nonrecurring basis and recognized in the accompanying balance sheets, as well as the general classification of such assets pursuant to the valuation hierarchy.
Collateral-dependent Individually Evaluated Loans, Net of ACL
Loans for which it is probable the Company will not collect all principal and interest due according to contractual terms are measured for collateral dependency. The estimated fair value of collateral-dependent loans is based on the appraised value of the collateral, less estimated cost to sell. Collateral-dependent loans are classified within Level 3 of the fair value hierarchy. This method requires obtaining independent appraisals of the collateral from a list of preapproved appraisers, which are reviewed for accuracy and consistency by the Company. The appraised values are reduced by applying a discount factor to the value based on the Company’s loan review policy. All individually evaluated loans held by the Company were collateral dependent at December 31, 2023 and 2022.
Mortgage Servicing Rights
Mortgage servicing rights do not trade in an active, open market with readily observable prices. Accordingly, fair value is estimated using discounted cash flow models associated with the servicing rights and discounting the cash flows using discount market rates, prepayment speeds and default rates. The servicing portfolio has been valued using all relevant positive and negative cash flows including servicing fees, miscellaneous income and float; marginal costs of servicing; the cost of carry of advances; and foreclosure losses; and applying certain prevailing assumptions used in the marketplace. Due to the nature of the valuation inputs, mortgage servicing rights are classified within Level 3 of the hierarchy. These mortgage servicing rights are tested for impairment on a quarterly basis.
The following table presents the fair value measurements of assets measured at fair value on a non-recurring basis and the level within the fair value hierarchy in which the fair value measurements fell at December 31, 2023 and 2022:
| ($ in thousands) | Fair value at December 31, 2023 |
(Level 1) | (Level 2) | (Level 3) | ||||||||||||
| Collateral-dependent Individually evaluated loans | $ | 864 | $ | $ | $ | 864 | ||||||||||
| Mortgage servicing rights | 1,896 | 1,896 | ||||||||||||||
| ($ in thousands) | Fair value at December 31, 2022 |
(Level 1) | (Level 2) | (Level 3) | ||||||||||||
| Collateral-dependent impaired loans | $ | 1,028 | $ | $ | $ | 1,028 | ||||||||||
| Mortgage servicing rights | 1,448 | 1,448 | ||||||||||||||
Level 1 - quoted prices in active markets for identical assets
Level 2 - significant other observable inputs
Level 3 - significant unobservable inputs
F-
Unobservable (Level 3) Inputs
The following tables present quantitative information about unobservable inputs used in recurring and nonrecurring Level 3 fair value measurements at December 31, 2023 and 2022:
| ($ in thousands) | Fair value at December 31, 2023 |
Valuation technique |
Unobservable inputs | Range (weighted- average) |
||||||||
| Collateral-dependent individually evaluated loans | $ | 864 | Market comparable properties | Comparability adjustments (%) | 2 - 100% (25 | %) | ||||||
| Mortgage servicing rights | 1,896 | Discounted cash flow | Discount rate | 11.01 | % | |||||||
| Constant prepayment rate | 7.16 | % | ||||||||||
| P&I earnings credit | 5.33 | % | ||||||||||
| T&I earnings credit | 5.13 | % | ||||||||||
| Inflation for cost of servicing | 3.50 | % | ||||||||||
| IRLCs | 45 | Discounted cash flow | Loan closing rates | 27% - 91 | % | |||||||
| ($ in thousands) | Fair value at December 31, 2022 |
Valuation technique |
Unobservable inputs | Range (weighted- average) |
||||||||
| Collateral-dependent impaired loans | $ | 1,028 | Market comparable properties | Comparability adjustments (%) | 8 - 21% (12 | %) | ||||||
| Mortgage servicing rights | 1,448 | Discounted cash flow | Discount rate | 11.39 | % | |||||||
| Constant prepayment rate | 7.52 | % | ||||||||||
| P&I earnings credit | 4.35 | % | ||||||||||
| T&I earnings credit | 4.58 | % | ||||||||||
| Inflation for cost of servicing | 3.50 | % | ||||||||||
| IRLCs | (20 | ) | Discounted cash flow | Loan closing rates | 41% - 99 | % | ||||||
The mortgage servicing rights portfolio is measured for fair value by an independent third party. The valuation of the portfolio hinges on a number of quantitative factors. These factors include, but are not limited to, a discount rate applied to the cash flows, and an assumption of future principal prepayments. The prepayment assumptions are based upon the historical performance of the Company’s portfolio as well as market metrics. The servicing rights have had a decrease in prepayments and the 3.42 percent decrease in the constant prepayment rate reflects the change in market rates. In addition, the earnings credit rate decreased and the discount rate increased.
The following methods were used to estimate the fair value of all other financial instruments recognized in the accompanying balance sheets at amounts other than fair value.
Cash and Due From Banks, Interest Bearing Time Deposits, FRB and FHLB Stock and Interest Receivable and Payable
Fair value is determined to be the carrying amount for these items (which include cash on hand, due from banks, and federal funds sold) because they represent cash or mature in 90 days or less, and do not represent unanticipated credit concerns.
Loans Held for Sale
The fair value of loans held for sale is based upon quoted market prices, where available, or is determined by discounting estimated cash flows using interest rates approximating the Company’s current origination rates for similar loans and adjusted to reflect the inherent credit risk.
F-
Loans
The estimated fair value of loans follows the guidance in ASU 2016-01, which prescribes an “exit price” approach in estimating and disclosing fair value of financial instruments. The fair value calculation at that date discounted estimated future cash flows using rates that incorporated discounts for credit, liquidity, and marketability factors.
Deposits, Repurchase Agreements & FHLB Advances
Deposits include demand deposits, savings accounts and certain money market deposits. The carrying amount approximates the fair value. The estimated fair value for fixed-maturity time deposits, as well as borrowings, is based on estimates of the rate the Company could pay on similar instruments with similar terms and maturities at December 31, 2023 and 2022.
Loan Commitments
The fair value of commitments is estimated using the fees currently charged to enter into similar agreements, taking into account the remaining terms of the agreements and the present creditworthiness of the counterparties. The estimated fair values for other financial instruments and off-balance-sheet loan commitments approximate cost at December 31, 2023 and 2022 and are not considered significant to this presentation.
Trust Preferred Securities
The fair value for Trust Preferred Securities is estimated by discounting the cash flows using an appropriate discount rate.
Subordinated Debt
The fair value for Subordinated Debt is estimated by discounting the cash flows using an appropriate discount rate.
The following table presents estimated fair values of the Company’s financial instruments. The fair values of certain instruments were calculated by discounting expected cash flows, which involves significant judgments by management and uncertainties. Fair value is the estimated amount at which financial assets or liabilities could be exchanged in a current transaction between willing parties, other than in a forced or liquidation sale. Because no market exists for these financial instruments, and because management does not intend to sell these financial instruments, the Company does not know whether the fair values shown below represent values at which the respective financial instruments could be sold individually or in the aggregate.
| ($ in thousands) | Carrying | Fair | Fair value measurements using | |||||||||||||||||
| December 31,2023 | amount | value | (Level 1) | (Level 2) | (Level 3) | |||||||||||||||
| Financial assets | ||||||||||||||||||||
| Cash and due from banks | $ | 22,965 | $ | 22,965 | $ | 22,965 | $ | $ | ||||||||||||
| Interest bearing time deposits | 1,535 | 1,535 | 1,535 | |||||||||||||||||
| Loans held for sale | 2,525 | 2,565 | 2,565 | |||||||||||||||||
| Loans, net of allowance for credit losses | 984,426 | 964,216 | 964,216 | |||||||||||||||||
| Federal Reserve and FHLB Bank stock, at cost | 7,279 | 7,279 | 7,279 | |||||||||||||||||
| Interest receivable | 4,657 | 4,657 | 4,657 | |||||||||||||||||
| Financial liabilities | ||||||||||||||||||||
| Deposits | $ | 1,070,205 | $ | 1,078,028 | $ | 814,696 | $ | 263,332 | $ | |||||||||||
| Short-term borrowings | 13,387 | 13,387 | 13,387 | |||||||||||||||||
| FHLB advances | 83,600 | 83,368 | 83,368 | |||||||||||||||||
| Trust preferred securities | 10,310 | 9,759 | 9,759 | |||||||||||||||||
| Subordinated debt, net of issuance costs | 19,642 | 19,435 | 19,435 | |||||||||||||||||
| Interest payable | 2,443 | 2,443 | 2,443 | |||||||||||||||||
F-
| ($ in thousands) | Carrying | Fair | Fair value measurements using | |||||||||||||||||
| December 31, 2022 | amount | value | (Level 1) | (Level 2) | (Level 3) | |||||||||||||||
| Financial assets | ||||||||||||||||||||
| Cash and due from banks | $ | 27,817 | $ | 27,817 | $ | 27,817 | $ | $ | ||||||||||||
| Interest bearing time deposits | 2,131 | 2,131 | 2,131 | |||||||||||||||||
| Loans held for sale | 2,073 | 2,100 | 2,100 | |||||||||||||||||
| Loans, net of allowance for loan losses | 948,257 | 945,699 | - | 945,699 | ||||||||||||||||
| Federal Reserve and FHLB Bank stock, at cost | 6,326 | 6,326 | 6,326 | |||||||||||||||||
| Interest receivable | 4,091 | 4,091 | 4,091 | |||||||||||||||||
| Financial liabilities | ||||||||||||||||||||
| Deposits | $ | 1,086,665 | $ | 1,090,718 | $ | 895,785 | $ | 194,933 | $ | |||||||||||
| Short-term borrowings | 14,923 | 14,923 | 14,923 | |||||||||||||||||
| FHLB advances | 60,000 | 59,886 | 59,886 | |||||||||||||||||
| Trust preferred securities | 10,310 | 9,674 | 9,674 | |||||||||||||||||
| Subordinated debt, net of issuance costs | 19,594 | 18,959 | 18,959 | |||||||||||||||||
| Interest payable | 769 | 769 | 769 | |||||||||||||||||
Note 20: Parent Company Financial Information
Presented below is condensed financial information of the parent company only:
Condensed Balance Sheets
| ($ in thousands) | 2023 | 2022 | ||||||
| Assets | ||||||||
| Cash & cash equivalents | $ | 6,468 | $ | 4,655 | ||||
| Investment in banking subsidiaries | 139,502 | 135,923 | ||||||
| Investment in nonbanking subsidiaries | 6,279 | 6,587 | ||||||
| Other assets | 2,726 | 2,076 | ||||||
| Total assets | $ | 154,975 | $ | 149,241 | ||||
| Liabilities | ||||||||
| Trust preferred securities | $ | 10,000 | $ | 10,000 | ||||
| Sub debt net of issuance cost | 19,642 | 19,594 | ||||||
| Borrowings from nonbanking subsidiaries | 310 | 310 | ||||||
| Other liabilities & accrued interest payable | 681 | 909 | ||||||
| Total liabilities | 30,633 | 30,813 | ||||||
| Shareholders’ equity | 124,342 | 118,428 | ||||||
| Total liabilities and shareholders’ equity | $ | 154,975 | $ | 149,241 | ||||
F-
Condensed Statements of Income
| ($ in thousands) | 2023 | 2022 | ||||||
| Dividends from subsidiaries: | ||||||||
| Banking subsidiaries | $ | 10,000 | $ | |||||
| Nonbanking subsidiaries | 700 | 750 | ||||||
| Total income | 10,700 | 750 | ||||||
| Expenses | ||||||||
| Interest expense | 1,494 | 1,139 | ||||||
| Other expense | 1,616 | 1,747 | ||||||
| Total expenses | 3,110 | 2,886 | ||||||
| Income before income tax | 7,590 | (2,136 | ) | |||||
| Income tax benefit | (652 | ) | (613 | ) | ||||
| Income (loss) before equity in undistributed income of subsidiaries | 8,242 | (1,523 | ) | |||||
| Equity in undistributed income of subsidiaries | ||||||||
| Banking subsidiaries | 3,290 | 13,426 | ||||||
| Nonbanking subsidiaries | 563 | 618 | ||||||
| Total | 3,853 | 14,044 | ||||||
| Net income | $ | 12,095 | $ | 12,521 | ||||
Condensed Statements of Comprehensive Income (Loss)
| ($ in thousands) | 2023 | 2022 | ||||||
| Net income | $ | 12,095 | $ | 12,521 | ||||
| Other comprehensive income (loss): | ||||||||
| Available-for-sale investment securities: | ||||||||
| Gross unrealized holding gain (loss) arising in the period | 2,897 | (38,323 | ) | |||||
| Related tax (expense) benefit | (608 | ) | 8,048 | |||||
| Net effect on other comprehensive income (loss) | 2,289 | (30,275 | ) | |||||
| Total comprehensive income (loss) | $ | 14,384 | $ | (17,754 | ) | |||
F-
Condensed Statements of Cash Flows
| ($ in thousands) | 2023 | 2022 | ||||||
| Operating activities | ||||||||
| Net income | $ | 12,095 | $ | 12,521 | ||||
| Items not requiring (providing) cash | ||||||||
| Equity in undistributed net income of subsidiaries | (3,853 | ) | (14,044 | ) | ||||
| Stock compensation expense | 576 | 568 | ||||||
| Other assets | 230 | 973 | ||||||
| Other liabilities | (228 | ) | (502 | ) | ||||
| Net cash provided by (used in) operating activities | 8,820 | (484 | ) | |||||
| Financing activities | ||||||||
| Dividends on common shares | (3,584 | ) | (3,407 | ) | ||||
| Stock dividends on common shares | (8 | ) | ||||||
| Repurchase of common shares | (3,471 | ) | (5,900 | ) | ||||
| Other financing activities | 48 | 48 | ||||||
| Net cash used in financing activities | (7,007 | ) | (9,267 | ) | ||||
| Net change in cash and cash equivalents | 1,813 | (9,751 | ) | |||||
| Cash and cash equivalents at beginning of year | 4,655 | 14,406 | ||||||
| Cash and cash equivalents at end of year | $ | 6,468 | $ | 4,655 | ||||
Note 21: Quarterly Financial Information (unaudited)
Quarterly Financial Information (unaudited)
Years ended December 31,
| ($ in thousands, except per share data) | ||||||||||||||||
| 2023 | December | September | June | March | ||||||||||||
| Interest income | $ | 15,126 | $ | 14,796 | $ | 14,406 | $ | 13,824 | ||||||||
| Interest expense | 5,542 | 5,260 | 4,577 | 3,500 | ||||||||||||
| Net interest income | 9,584 | 9,536 | 9,829 | 10,324 | ||||||||||||
| Provision for loan losses | (74 | ) | (6 | ) | 145 | 250 | ||||||||||
| Noninterest income | 5,531 | 4,163 | 4,361 | 3,666 | ||||||||||||
| Noninterest expense | 10,369 | 10,481 | 10,339 | 10,773 | ||||||||||||
| Income tax expense | 937 | 537 | 631 | 517 | ||||||||||||
| Net income | $ | 3,883 | $ | 2,687 | $ | 3,075 | $ | 2,450 | ||||||||
| Basic earnings per common share | $ | 0.58 | $ | 0.39 | $ | 0.45 | $ | 0.35 | ||||||||
| Diluted earnings per common share | $ | 0.56 | $ | 0.39 | $ | 0.45 | $ | 0.35 | ||||||||
| Dividends per share | $ | 0.135 | $ | 0.130 | $ | 0.130 | $ | 0.125 | ||||||||
| 2022 | December | September | June | March | ||||||||||||
| Interest income | $ | 12,936 | $ | 11,764 | $ | 10,474 | $ | 9,395 | ||||||||
| Interest expense | 2,037 | 1,334 | 881 | 918 | ||||||||||||
| Net interest income | 10,899 | 10,430 | 9,593 | 8,477 | ||||||||||||
| Provision for loan losses | ||||||||||||||||
| Noninterest income | 3,713 | 4,043 | 4,673 | 5,802 | ||||||||||||
| Noninterest expense | 10,268 | 10,385 | 10,802 | 10,859 | ||||||||||||
| Income tax expense | 812 | 746 | 630 | 607 | ||||||||||||
| Net income | $ | 3,532 | $ | 3,342 | $ | 2,834 | $ | 2,813 | ||||||||
| Basic earnings per common share | $ | 0.51 | $ | 0.48 | $ | 0.40 | $ | 0.40 | ||||||||
| Diluted earnings per common share | $ | 0.50 | $ | 0.47 | $ | 0.40 | $ | 0.40 | ||||||||
| Dividends per share | $ | 0.125 | $ | 0.120 | $ | 0.120 | $ | 0.115 | ||||||||
F-
Report of Independent Registered Public Accounting Firm
To the Shareholders, Board of Directors, and Audit Committee
SB Financial Group, Inc.
Defiance, Ohio
Opinion on the Consolidated Financial Statements
We have audited the accompanying consolidated balance sheets of SB Financial Group, Inc. (the “Company”) as of December 31, 2023 and 2022, the related consolidated statements of income, comprehensive income (loss), shareholders’ equity, and cash flows for each of the years ended December 31, 2023 and 2022, and the related notes (collectively referred to as the “financial statements”). In our opinion, the consolidated financial statements referred to above present fairly, in all material respects, the financial position of the Company as of December 31, 2023 and 2022, and the results of its operations and its cash flows for each of the years then ended, in conformity with accounting principles generally accepted in the United States of America.
Change in Accounting Principle
As discussed in Note 1 to the financial statements, the Company changed its method of accounting for credit losses effective January 1, 2023 due to the adoption of Accounting Standards Topic 326: Financial Instruments – Credit Losses. The adoption of the new credit loss standard and its subsequent application is also communicated as a critical audit matter.
Basis for Opinion
These financial statements are the responsibility of the Company’s management. Our responsibility is to express an opinion on the Company’s financial statements based on our audits.
We are a public accounting firm registered with the Public Company Accounting Oversight Board (United States) (“PCAOB”) and are required to be independent with respect to the Company in accordance with the U.S. federal securities laws and the applicable rules and regulations of the Securities and Exchange Commission and the PCAOB.
We conducted our audits in accordance with the standards of the PCAOB. Those standards require that we plan and perform the audit to obtain reasonable assurance about whether the financial statements are free of material misstatement, whether due to error or fraud. The Company is not required to have, nor were we engaged to perform, an audit of its internal control over financial reporting. As part of our audits, we are required to obtain an understanding of internal control over financial reporting but not for the purpose of expressing an opinion on the effectiveness of the Company’s internal control over financial reporting. Accordingly, we express no such opinion.
Our audits included performing procedures to assess the risks of material misstatement of the financial statements, whether due to error or fraud, and performing procedures that respond to those risks. Such procedures include examining, on a test basis, evidence regarding the amounts and disclosures in the financial statements. Our audits also included evaluating the accounting principles used and significant estimates made by management, as well as evaluating the overall presentation of the financial statements. We believe that our audits provide a reasonable basis for our opinion.
F-
Critical Audit Matter
The critical audit matter communicated below is a matter arising from the current-period audit of the financial statements that was communicated or required to be communicated to the audit committee and that: (1) relates to accounts or disclosures that are material to the financial statements and (2) involved our especially challenging, subjective, or complex judgments. The communication of a critical audit matter does not alter in any way our opinion on the consolidated financial statements, taken as a whole, and we are not, by communicating the critical audit matter below, providing a separate opinion on the critical audit matter or on the accounts or disclosures to which it relates.
Allowances for Credit Losses
As discussed in Note 1 to the consolidated financial statements, the Company changed its method of accounting for credit losses effective January 1, 2023, due to the adoption of Accounting Standards Topic 326: Financial Instruments – Credit Losses. The Company’s loan portfolio totaled $1.0 billion as of December 31, 2023, and the associated allowance for credit losses (“ACL”) on loans was $15.8 million. As discussed in Notes 1 and 4 to the consolidated financial statements, the Company measures expected credit losses for loans on a pooled basis when similar risk characteristics exist using relevant available information, from internal and external sources, relating to past events, current conditions, reasonable and supportable forecasts. Historical credit loss experience provides the basis for the estimation of expected credit losses. Management also considers further adjustments to historical loss information for current conditions and reasonable and supportable forecasts that differ from the conditions that exist for the period over which historical information is evaluated as well as other changes in qualitative factors not inherently considered in the quantitative analyses. The resulting qualitative adjustments are applied to the relevant collectively evaluated loan pools.
We have identified the ACL, and more specifically the qualitative adjustments applied in the ACL, as a critical audit matter. The principal consideration for our determination is the high degree of judgment and subjectivity in auditing the assumptions utilized by management in calculating the qualitative reserve component. This required a high degree of judgement due to the nature and extent of audit evidence and effort required to address this matter.
The primary procedures we performed related to this critical audit matter included:
| ● | Obtained an understanding of the Company’s process and internal controls for establishing the ACL, including the selection, application and related adjustments of the qualitative factor components of the ACL. |
| ● | Evaluated the relevancy and reliability of the underlying data used to derive the qualitative factors, including comparison to internal, external and/or peer data to ensure movement in a directionally consistent manner. |
| ● | Assessed the appropriateness and reasonableness of the qualitative factor adjustments, including evaluating management’s judgments as to which factors and relevant assessed risks impacted the qualitative adjustments for each loan pool. |
| ● | Evaluated the reasonableness of the assumptions utilized by management in calculating the qualitative reserve component. |
| ● | Tested the accuracy of the mathematical application of the qualitative factors to adjust the historical loss experience. |
/s/ FORVIS, LLP
We have served as the Company’s auditor since 2002.
Indianapolis, Indiana
March 8, 2024
F-
Item 9. Changes in and Disagreements With Accountants on Accounting and Financial Disclosure.
Not Applicable.
Item 9A. Controls and Procedures.
Evaluation of Disclosure Controls and Procedures
With the participation of the Chief Executive Officer (the principal executive officer) and the Chief Financial Officer (the principal financial officer) of the Company, the Company’s management has evaluated the effectiveness of the Company’s disclosure controls and procedures (as defined in Rule 13a-15(e) under the Exchange Act) as of the end of the fiscal year covered by this Annual Report on Form 10-K. Based on that evaluation, the Company’s Chief Executive Officer and the Company’s Chief Financial Officer have concluded that:
| ● | Information required to be disclosed by the Company in this Annual Report on Form 10-K and other reports which the Company files or submits under the Exchange Act would be accumulated and communicated to the Company’s management, including its principal executive officer and principal financial officer, as appropriate to allow timely decisions regarding required disclosure; |
| ● | Information required to be disclosed by the Company in this Annual Report on Form 10-K and other reports which the Company files or submits under the Exchange Act would be recorded, processed, summarized and reported within the time periods specified in the SEC’s rules and forms; and |
| ● | The Company’s disclosure controls and procedures were effective as of the end of the fiscal year covered by this Annual Report on Form 10-K. |
Management’s Report on Internal Control Over Financial Reporting
The Management of the Company is responsible for establishing and maintaining adequate internal control over financial reporting as defined in Rules 13a-15(f) and 15d-15(f) under the Exchange Act. The Company’s internal control over financial reporting is designed to provide reasonable assurance regarding the reliability of financial reporting and the preparation of financial statements for external purposes in conformity with U.S. generally accepted accounting principles. The Company’s internal control over financial reporting includes those policies and procedures that:
| ● | Pertain to the maintenance of records that, in reasonable detail, accurately and fairly reflect the transactions and dispositions of the assets of the Company and its consolidated subsidiaries; |
| ● | Provide reasonable assurance that transactions are recorded as necessary to permit preparation of financial statements in conformity with U.S. generally accepted accounting principles, and that receipts and expenditures of the Company and its consolidated subsidiaries are being made only in accordance with authorizations of management and directors of the Company; and |
| ● | Provide reasonable assurance regarding prevention of timely detection of unauthorized acquisition, use or disposition of the assets of the Company and its consolidated subsidiaries that could have a material effect on the financial statements. |
With the supervision and participation of our Chief Executive Officer and our Chief Financial Officer, management assessed the effectiveness of the Company’s internal controls over financial reporting as of December, 31, 2023, based on the criteria established in Internal Control – Integrated Framework (2013) issued by the Committee of Sponsoring Organizations of the Treadway Commission. Based on our assessment and those criteria, management concluded that, as of December 31, 2023, the Company’s internal control over financial reporting is effective.
This Annual Report does not include an attestation report of the Company’s registered public accounting firm regarding internal control over financial reporting. Management’s report was not subject to attestation by the Company’s registered public accounting firm pursuant to rules of the SEC that permit the Company to provide only management’s report in this Annual Report on Form 10-K.
Changes in Internal Controls Over Financial Reporting
There were no changes in the Company’s internal control over financial reporting (as defined in Rule 13a-15(f) under the Exchange Act) that occurred during the Company’s fiscal quarter ended December 31, 2023, that have materially affected, or are reasonably likely to materially affect, the Company’s internal control over financial reporting.
Item 9B. Other Information.
| (a) | None. |
| (b) | During the quarter ended December 31, 2023, no director or 16 officer (as defined under Rule 16a-1 of the Exchange Act) adopted or terminated any Rule 10b5-1 trading arrangements or any non-Rule 10b5-1 trading arrangements (in each case, as defined in Item 408(a) of Regulation S-K). |
Item 9C. Disclosure Regarding Foreign Jurisdictions that Prevent Inspections.
Not Applicable.
PART III
Item 10. Directors, Executive Officers and Corporate Governance.
Directors and Executive Officers
The information required by Item 401 of SEC Regulation S-K concerning the directors of the Company and the nominees for election as directors of the Company at the Annual Meeting of Shareholders to be held on April 19, 2024 (the “2024 Annual Meeting”), is incorporated herein by reference from the disclosure included in the Company’s definitive Proxy Statement relating to the 2024 Annual Meeting (the “2024 Proxy Statement”), under the caption “PROPOSAL NO. 1 – ELECTION OF DIRECTORS”. The information concerning the executive officers of the Company required by Item 401 of SEC Regulation S-K is set forth in the portion of Part I of this Annual Report on Form 10-K entitled “Supplemental Item: Information about our Executive Officers.”
Compliance with Section 16(a) of the Exchange Act
The information required by Item 405 of SEC Regulation S-K is incorporated herein by reference from the disclosure included in the Company’s 2024 Proxy Statement under the caption “SECTION 16(a) REPORTS.”
Committee Charters and Code of Conduct and Ethics
The Company’s Board of Directors has adopted charters for each of the Audit and Risk Management Committee, the Compensation Committee and the Governance and Nominating Committee. Copies of these charters are available on the Company’s Internet website at www.YourSBFinancial.com by first clicking “Corporate Overview” and then “Governance Documents”. The Company has adopted a Code of Conduct and Ethics that applies to the Company’s directors, officers and employees. A copy of the Code of Conduct and Ethics is available on the Company’s Internet website at www.YourSBFinancial.com by first clicking “Corporate Overview” and then “Governance Documents”. Interested persons may also obtain copies of the Code of Conduct and Ethics, the Audit and Risk Management Committee charter, the Compensation Committee charter and the Governance and Nominating Committee charter, without charge, by writing to SB Financial Group, Inc., Attn: Keeta J. Diller, 401 Clinton Street, Defiance, OH 43512.
Audit and Risk Management Committee
The information required by Items 407(d)(4) and 407(d)(5) of SEC Regulation S-K is incorporated herein by reference from the disclosure included under the caption “MEETINGS AND COMMITTEES OF THE BOARD – Audit & Risk Management Committee” in the Company’s 2024 Proxy Statement.
Nominating Committee
The procedures by which shareholders of the Company may recommend nominees to the Company’s Board of Directors are described under the caption “CORPORATE GOVERNANCE – Nominations of Directors” in the Company’s 2024 Proxy Statement. The procedures by which shareholders of the Company many recommend nominees to the Company’s Board of Directors have not materially changed from those described in the Company’s definitive Proxy Statement for the 2023 Annual Meeting of Shareholders held on April 20, 2023.
Item 11. Executive Compensation.
The executive compensation information required by this item is incorporated herein by reference to the information contained in the Company’s 2024 Proxy Statement under the captions “COMPENSATION OF EXECUTIVE OFFICERS”, “EQUITY INCENTIVE PLAN INFORMATION”, “DIRECTOR COMPENSATION”, and “COMPENSATION COMMITTEE INTERLOCKS AND INSIDER PARTICIPATION”.
Item 12. Security Ownership of Certain Beneficial Owners and Management and Related Stockholder Matters.
The information required by Item 403 of SEC Regulation S-K is incorporated herein by reference from the disclosure included in the Company’s 2024 Proxy Statement under the caption “SECURITY OWNERSHIP OF CERTAIN BENEFICIAL OWNERS AND MANAGEMENT”.
Equity Compensation Plan Information
The SB Financial Group, Inc. 2017 Stock Incentive Plan (the “2017 Plan”) was approved by the shareholders of the Company at the 2017 Annual Meeting of Shareholders.
The following table shows, as of December 31, 2023, the number of common shares issuable upon exercise of outstanding stock options, the weighted-average exercise price of those stock options, and the number of common shares remaining for future issuance under the Company’s equity compensation plans (excluding common shares issuable upon exercise of outstanding stock options):
| Equity compensation plans approved by security holders | ||||||
| ($ in thousands, except per share data) | 2017 Plan | |||||
| a) | Number of securities to be issued upon exercise of outstanding options, warrants and rights | - | ||||
| b) | Weighted-average exercise price of outstanding options, warrants and rights | $ | - | |||
| c) | Number of securities remaining available for future issuance under equity compensation plans (excluding securities reflected in row a) | 343,179 | ||||
Item 13. Certain Relationships and Related Transactions, and Director Independence.
The information required by Item 404 of SEC Regulation S-K is incorporated herein by reference from the disclosure contained in the Company’s 2024 Proxy Statement under the caption “TRANSACTIONS WITH RELATED PERSONS”.
The information required by Item 407(a) of SEC Regulation S-K is incorporated herein by reference from the disclosure contained in the Company’s 2024 Proxy Statement under the caption “CORPORATE GOVERNANCE – Director Independence”.
Item 14. Principal Accountant Fees and Services.
The information required to be disclosed in this Item 14 is incorporated herein by reference from the disclosure contained in the Company’s 2024 Proxy Statement under the caption “AUDIT & RISK MANAGEMENT COMMITTEE DISCLOSURE”.
PART IV
Item 15. Exhibits and Financial Statement Schedules.
(a)(1) Financial Statements
The following consolidated financial statements are incorporated by reference from Item 8 hereof:
| ● | Consolidated Balance Sheets as of December 31, 2023 and 2022 |
| ● | Consolidated Statements of Income for the Years ended December 31, 2023 and 2022 |
| ● | Consolidated Statements of Comprehensive Income (Loss) for the Years ended December 31, 2023 and 2022 |
| ● | Consolidated Statements of Shareholders’ Equity for the Years ended December 31, 2023 and 2022 |
| ● | Consolidated Statements of Cash Flows for Years ended December 31, 2023 and 2022 |
| ● | Notes to Consolidated Financial Statements |
| ● | Report of Independent Registered Public Accounting Firm (FORVIS, LLP) |
(a)(2) Financial Statement Schedules
All schedules for which provision is made in the applicable accounting regulations of the SEC are not required under the related instructions or are inapplicable and, therefore, have been omitted.
(a)(3) Exhibits
The documents listed in the Index to Exhibits that immediately precedes the signature page of this Form 10-K are filed/furnished with this Form 10-K as exhibits or incorporated into this Form 10-K by reference as noted. Each management contract or compensatory plan or arrangement required to be filed as an exhibit to this Form 10-K is identified as such in the Index to Exhibits.
(b) Exhibits
The documents listed in the Index to Exhibits that immediately precedes the signature page of this Form 10-K are filed/furnished with this Form 10-K as exhibits or incorporated into this Form 10-K by reference as noted.
(c) Financial Statement Schedules
None.
Item 16. Form 10-K Summary.
Not Applicable.
Exhibits
|
Exhibit No. |
Description |
Location | ||
| 3.1 | Amended Articles of the Company | Incorporated herein by reference to Exhibit 3.1 to the Company’s Annual Report on Form 10-K for the fiscal year ended December 31, 2022 (File No. 31-36785). | ||
| 3.2 | Certificate of Amendment to the Amended Articles of the Company as filed with the Ohio Secretary of State on April 27, 1993 | Incorporated herein by reference to Exhibit 3.2 to the Company’s Annual Report on Form 10-K for the fiscal year ended December 31, 2018 (File No. 31-36785). | ||
| 3.3 | Certificate of Amendment to the Amended Articles of the Company as filed with the Ohio Secretary of State on April 30, 1997 | Incorporated herein by reference to Exhibit 3(c) to the Company’s Annual Report on Form 10-K for the fiscal year ended December 31, 1997 (File No. 0-13507). | ||
| 3.4 | Certificate of Amendment to the Amended Articles of the Company as filed with the Ohio Secretary of State on May 27, 2011 | Incorporated herein by reference to Exhibit 3.1 to the Company’s Current Report on Form 8-K filed June 1, 2011 (File No. 0-13507). | ||
| 3.5 | Certificate of Amendment to the Amended Articles of the Company as filed with the Ohio Secretary of State on April 12, 2013 | Incorporated herein by reference to Exhibit 3.1 to the Company’s Current Report on Form 8-K filed April 18, 2013 (File No. 0-13507). | ||
| 3.6 | Certificate of Amendment by Directors or Incorporators to Articles filed with the Secretary of State of the State of Ohio on November 6, 2014 | Incorporated herein by reference to Exhibit 3.1 to the Company’s Current Report on Form 8-K filed November 12, 2014 (File No. 0-13507). | ||
| 3.7 | Certificate of Amendment to the Amended Articles of the Company as filed with the Ohio Secretary of State on January 25, 2022 | Incorporated herein by reference to Exhibit 3.1 to the Company’s Current Report on Form 8-K filed January 27, 2022 (File No. 0-13507). | ||
| 3.8 | Amended Articles of the Company, as amended (reflecting amendments through January 25, 2022) [for SEC reporting compliance purposes only – not filed with the Ohio Secretary of State] | Incorporated herein by reference to Exhibit 3.8 to the Company’s Annual Report on Form 10-K for the fiscal year ended December 31, 2022 (File No. 31-36785). | ||
| 3.9 | Amended and Restated Regulations of the Company | Incorporated herein by reference to Exhibit 3.5 to the Company’s Annual Report on Form 10-K for the fiscal year ended December 31, 2005 (File No. 0-13507). | ||
| 3.10 | Certificate Regarding Adoption of Amendment to Section 2.01 of the Amended and Restated Regulations of the Company by the Shareholders on April 16, 2009 | Incorporate herein by reference to Exhibit 3.1 to the Company’s Current Report on Form 8-K filed April 22, 2009 (File No. 0-13507). | ||
| 4.1 | Form of 3.65% Fixed-to-Floating Rate Subordinated Note due 2031 | Incorporated herein by reference to Exhibit 4.1 to the Company’s Current Report on Form 8-K filed May 28, 2021 (File No. 0-13507). |
|
Exhibit No. |
Description |
Location | ||
| 4.2 | Form of Subordinated Note Purchase Agreement by and between the Company and the several Purchasers | Incorporated herein by reference to Exhibit 10.1 to the Company’s Current Report on Form 8-K filed May 28, 2021 (File No. 0-13507). | ||
| 4.3 | Indenture, dated as of September 15, 2005, by and between the Company and Wilmington Trust Company, as Debenture Trustee, relating to Floating Rate Junior Subordinated Deferrable Interest Debentures | Incorporated herein by reference to Exhibit 4.1 to the Company’s Quarterly Report on Form 10-Q for the quarterly period ended September 30, 2005 (File No. 0-13507). | ||
| 4.4 | Amended and Restated Declaration of Trust of Rurban Statutory Trust II, dated as of September 15, 2005 | Incorporated herein by reference to Exhibit 4.2 to the Company’s Quarterly Report on Form 10-Q for the quarterly period ended September 30, 2005 (File No. 0-13507). | ||
| 4.5 | Guarantee Agreement, dated as of September 15, 2005, by and between the Company and Wilmington Trust Company, as Guarantee Trustee | Incorporated herein by reference to Exhibit 4.3 to the Company’s Quarterly Report on Form 10-Q for the quarterly period ended September 30, 2005 (File No. 0-13507). | ||
| 4.6 | Agreement to furnish instruments and agreements defining rights of holders of long-term debt | Filed herewith. | ||
| 4.7 | Description of Common Shares of the Company | Incorporated herein by reference to Exhibit 4.7 to the Company’s Annual Report on Form 10-K for the fiscal year ended December 31, 2021 (File No. 31-36785). | ||
| 10.1* | The Company’s Plan to Allow Directors to Elect to Defer Compensation | Incorporated herein by reference to Exhibit 10(v) to the Company’s Annual Report on Form 10-K for the fiscal year ended December 31, 1996 (File No. 0-13507). | ||
| 10.2* | Employees’ Stock Ownership and Savings Plan of the Company | Incorporated herein by reference to Exhibit 10(y) to the Company’s Annual Report on Form 10-K for the fiscal year ended December 31, 1999 (File No. 0-13507). | ||
| 10.3* | Employee Stock Purchase Plan of the Company | Incorporated herein by reference to Exhibit 10(z) to the Company’s Annual Report on Form 10-K for the fiscal year ended December 31, 2002 (File No. 0-13507). | ||
| 10.4* | Amended and Restated Employment Agreement, dated January 22, 2018, between the Company and Mark A. Klein | Incorporated herein by reference to Exhibit 10.1 to the Company’s Current Report on Form 8-K filed January 26, 2018 (File No. 01-36785). | ||
| 10.5* | Amended and Restated Change of Control Agreement, dated January 22, 2018, between the Company and Mark A. Klein | Incorporated herein by reference to Exhibit 10.2(a) to the Company’s Current Report on Form 8-K filed January 26, 2018 (File No. 01-36785). |
|
Exhibit No. |
Description |
Location | ||
| 10.6* |
Incorporated herein by reference to Exhibit 10.2(b) to the Company’s Current Report on Form 8-K filed January 26, 2018 (File No. 01-36785). |
|||
| 10.7* | Amended and Restated Change of Control Agreement, dated January 22, 2018, between the Company and David A. Homoelle | Incorporated herein by reference to Exhibit 10.7 to the Company’s Annual Report on Form 10-K for the fiscal year ended December 31, 2021 (File No. 31-36785). | ||
| 10.8* | Amended Supplemental Executive Retirement Plan Agreement, dated as of January 22, 2018 by and between the Company and Mark A. Klein | Incorporated by reference to Exhibit 10.3(a) to the Company’s Current Report on Form 8-K filed January 26, 2018 (File No 01-36785). | ||
| 10.9* | Amended Supplemental Executive Retirement Plan Agreement, dated as of January 22, 2018 by and between the Company and Anthony V. Cosentino | Incorporated by reference to Exhibit 10.3(b) to the Company’s Current Report on Form 8-K filed January 26, 2018 (File No 01-36785). | ||
| 10.10* | Supplemental Executive Retirement Plan Agreement, dated as of January 22, 2018 by and between the Company and David A. Homoelle | Incorporated herein by reference to Exhibit 10.10 to the Company’s Annual Report on Form 10-K for the fiscal year ended December 31, 2021 (File No. 31-36785). | ||
| 10.11* | 2017 Split Dollar Agreement and Endorsement, dated as of January 22, 2018, between and The State Bank and Trust Company and Mark A. Klein | Incorporated by reference to Exhibit 10.4(a) to the Company’s Current Report on Form 8-K filed January 26, 2018 (File No 01-36785). | ||
| 10.12* | 2017 Split Dollar Agreement and Endorsement, dated as of January 22, 2018, between and The State Bank and Trust Company and Anthony V. Cosentino | Incorporated by reference to Exhibit 10.4(b) to the Company’s Current Report on Form 8-K filed January 26, 2018 (File No 01-36785). | ||
| 10.13* | 2017 Split Dollar Agreement and Endorsement, dated as of January 22, 2018, between and The State Bank and Trust Company and David A. Homoelle | Incorporated herein by reference to Exhibit 10.13 to the Company’s Annual Report on Form 10-K for the fiscal year ended December 31, 2021 (File No. 31-36785). | ||
| 10.14* | Non-Qualified Deferred Compensation Plan of the Company effective as of January 1, 2007 |
Incorporated herein by reference to Exhibit 10.20 to the Company’s Annual Report on Form 10-K for the fiscal year ended December 31, 2006 (File No. 0-13507). |
||
| 10.15* | Long-Term Incentive Compensation Plan for the Company and Affiliates |
Incorporated by reference to Exhibit 10.1 to the Company’s Current Report on Form 8-K filed August 20, 2012 (File No. 0-13507). |
||
| 10.16* | SB Financial Group 2017 Stock Incentive Plan | Incorporated herein by reference to Exhibit 10.16 to the Company’s Annual Report on Form 10-K for the fiscal year ended December 31, 2021 (File No. 31-36785). |
|
Exhibit No. |
Description |
Location | ||
| 10.17* | Form of Restricted Stock Award Agreement (For Employees) under the Company’s 2017 Stock Incentive Plan | Filed herewith. | ||
| 13 |
2023 Annual Report of Registrant (not deemed filed except for portions thereof which are specifically incorporated by reference in this Annual Report on Form 10-K) |
Specified portions filed herewith. | ||
| 21 | Filed herewith. | |||
| 23 | Filed herewith. | |||
| 24 | Power of Attorney of Directors and Executive Officers |
Included on signature page of this Annual Report on Form 10-K. |
||
| 31.1 |
Rule 13a-14(a)/15d-14(a) Certification – Principal Executive Officer |
Filed herewith. | ||
| 31.2 | Rule 13a-14(a)/15d-14(a) Certification – Principal Financial Officer | Filed herewith. | ||
| 32.1 | Section 1350 Certification – Principal Executive Officer and Principal Financial Officer |
Filed herewith. |
||
| 97 | Clawback Policy | Filed herewith. | ||
| 101 | The following materials from SB Financial Group Inc.’s 2023 Annual Report and incorporated therefrom in SB Financial Group, Inc.’s Annual Report on Form 10-K for the fiscal year ended December 31, 2023, formatted in XBRL (extensible business reporting language) pursuant to Rule 405 of Regulation S-T: (i) the Consolidated Balance Sheets as of December 31, 2023 and 2022; (ii) the Consolidated Statements of Income for the years ended December 31, 2023 and 2022; (iii) the Consolidated Statements of Comprehensive Income for the years ended December 31, 2023 and 2022; (iv) the Consolidated Statements of Changes in Shareholders’ Equity for the years ended December 31, 2023 and 2022; (v) the Consolidated Statements of Cash Flows for the years ended December 31, 2023 and 2022; and (vi) the Notes to Consolidated Financial Statements (electronically submitted herewith). | |||
| 104 | Cover Page Interactive Data File (formatted as Inline XBRL and contained in Exhibit 101) | |||
| * | Management contract or compensatory plan or arrangement. |
SIGNATURES
Pursuant to the requirements of Section 13 or 15(d) of the Securities Exchange Act of 1934, the Registrant has duly caused this Report to be signed on its behalf by the undersigned, thereunto duly authorized.
| SB FINANCIAL GROUP, INC. | ||
| By: | /s/ Anthony V. Cosentino | |
| Date: March 8, 2024 | Anthony V. Cosentino, Executive Vice President and Chief Financial Officer | |
Power of Attorney
KNOW ALL MEN BY THESE PRESENTS, that each undersigned officer and/or director of SB Financial Group, Inc., an Ohio corporation (the “Company”), which is about to file with the Securities and Exchange Commission, Washington, D.C., under the provisions of the Securities Exchange Act of 1934, as amended, the Annual Report of the Company on Form 10-K for the fiscal year ended December 31, 2023, hereby constitutes and appoints Mark A. Klein and Anthony V. Cosentino, and each of them, as his true and lawful attorneys-in-fact and agents, with full power of substitution and re-substitution, for him and in his name, place and stead, in any and all capacities, to sign both the Annual Report on Form 10-K and any and all amendments and documents related thereto, and to file the same, and any and all exhibits, financial statements and schedules related thereto, and other documents in connection therewith, with the Securities and Exchange Commission and the NASDAQ Stock Market, granting unto said attorneys-in-fact and agents, and substitute or substitutes, full power and authority to do and perform each and every act and thing requisite and necessary to be done in and about the premises, as fully to all intents and purposes as he might or could do in person, hereby ratifying and confirming all things that each of said attorneys-in-fact and agents, or either of them or his or their substitute or substitutes, may lawfully do or cause to be done by virtue hereof.
Pursuant to the requirements of the Securities Exchange Act of 1934, this Report has been signed below by the following persons on behalf of the Registrant and in the capacities and on the dates indicated.
| Name | Date | Capacity | ||
| /s/ Mark A. Klein | March 8, 2024 | Chairman, President and Chief Executive Officer | ||
| Mark A. Klein | ||||
| /s/ Anthony V. Cosentino | March 8, 2024 | Executive Vice President and Chief Financial Officer | ||
| Anthony V. Cosentino | ||||
| /s/ George W. Carter | March 8, 2024 | Director | ||
| George W. Carter | ||||
| /s/ Gaylyn J. Finn | March 8, 2024 | Director | ||
| Gaylyn J. Finn | ||||
| /s/ Richard L. Hardgrove | March 8, 2024 | Director | ||
| Richard L. Hardgrove | ||||
| /s/ Tom R. Helberg | March 8, 2024 | Director | ||
| Tom R. Helberg | ||||
| /s/ Rita A. Kissner | March 8, 2024 | Director | ||
| Rita A. Kissner | ||||
| /s/ Mark A. Klein | March 8, 2024 | Director | ||
| Mark A. Klein | ||||
| /s/ William G. Martin | March 8, 2024 | Director | ||
| William G. Martin | ||||
| /s/ Timothy J. Stolly | March 8, 2024 | Director | ||
| Timothy J. Stolly | ||||
| /s/ Timothy L. Claxton | March 8, 2024 | Director | ||
| Timothy L. Claxton | ||||
| Date: March 8, 2024 |
| Officers List | ||||
| SB Financial Group, Inc. | NICHOLE T. WICHMAN | STEFAN R. HARTMAN | ||
| Senior Vice President | Senior Vice President | |||
| MARK A. KLEIN | Chief Marketing Officer | Fort Wayne Market Executive | ||
| Chairman, President and | ||||
| Chief Executive Officer | MICHAEL R. DULLE | TYSON R. MOSS | ||
| Vice President | Senior Vice President | |||
| ANTHONY V. COSENTINO | Corporate HR Strategic Manager | Fulton/Williams County | ||
| Executive Vice President | Market Executive | |||
| Chief Financial Officer | RONDA M. HERKO | |||
| Vice President | CHRISTOPHER A. WEBB | |||
| KEETA J. DILLER | Human Resources Manager | Senior Vice President | ||
| Executive Vice President | Findlay Market Executive | |||
| Corporate Secretary | RONALD E. SPANGLER | |||
| Vice President | Commercial Banking | |||
| The State Bank and Trust Company | Loan Review Officer | |||
| PAUL C. ERWIN | ||||
| Administration | BLAKE A. WILLIAMS | Senior Vice President | ||
| Vice President | Commercial Services Officer III | |||
| MARK A. KLEIN | Corporate Sales Champion | |||
| Chairman, President and | TIMOTHY P. MOSER | |||
| Chief Executive Officer | THERESA M. GINEMAN | Senior Vice President | ||
| Assistant Vice President | Ag Lending Manager | |||
| ANTHONY V. COSENTINO | Loan Review Officer | |||
| Executive Vice President | ROLLAND C. (COREY) DEMING | |||
| Chief Financial Officer | SEAN M. GORMAN | Vice President | ||
| Assistant Vice President | Commercial Services Officer III | |||
| KEETA J. DILLER | Asset Liability Manager | |||
| Executive Vice President | ROBERT D. EGGLETON | |||
| Chief Operations Officer | DAWN M. HUTCHESON | Vice President | ||
| Assistant Vice President | Commercial Services Officer III | |||
| ERNESTO GAYTAN | Accountant III | |||
| Executive Vice President | ANDREW J. KIESS | |||
| Chief Technology Innovation Officer | CODI L. KING | Vice President | ||
| Assistant Vice President | Commercial Services Officer I | |||
| STEVEN A. WALZ | Risk Management Specialist, BSA Officer | |||
| Executive Vice President | SHAUN N. MACK | |||
| Chief Lending Officer | CATHERINE E. PERRY | Vice President | ||
| Assistant Vice President | Commercial Services Officer I | |||
| CAROL M. ROBBINS | Quality Control Manager | |||
| Senior Vice President | STEPHANIE L. PARIS | |||
| Controller | SARAH S. MEKUS | Vice President | ||
| Officer, Executive Assistant | Commercial Services Officer I | |||
| DAVID A. HOMOELLE | Corporate Secretary | |||
| Senior Vice President | JACOB M. SCHUMM | |||
| Residential Real Estate Executive | Regional Executives | Vice President | ||
| Commercial Services Officer III | ||||
| JENNIFER A. SWIECH | MARK D. CASSIN | |||
| Senior Vice President | Senior Vice President | |||
| Chief Risk Officer, Director of Legal | Bowling Green & Toledo Market Executive | |||
| ABAGALE M. WATERS | ANDREW S. FARLEY | |||
| Senior Vice President | Senior Vice President | |||
| Director of Human Resources | Lima Market Executive |
| Credit Administration | AMANDA D. VOGELSONG | ROBERT W. WARNER | ||
| Assistant Vice President | Vice President | |||
| MICHAEL D. EBBESKOTTE | Process Engineer - Deposits | Outside Mortgage Sales Loan Originator | ||
| Senior Vice President | ||||
| Credit Administration Manager | SUSAN A. LONG | JACQUELON C. WILSON | ||
| Officer | Vice President | |||
| AMY M. HOFFMAN | Quality Control Analyst - Deposits | Community Development Mortgage | ||
| Senior Vice President | Loan Originator | |||
| Chief Credit Officer | Mortgage Lending | |||
| RHONDA S. CLARK | ||||
| ERICA R. BARE | RICHARD A. SMITH | Assistant Vice President | ||
| Vice President | Senior Vice President | Outside Mortgage Sales Loan Originator | ||
| Senior Credit Analyst | Residential Real Estate Sales | |||
| Manager - Indianapolis Region | PARKER H. EVANS | |||
| ANDREW M. RICKENBERG | Assistant Vice President | |||
| Vice President | STEVEN J. WATSON | Secondary Market Manager | ||
| Collections and Resource Recovery | Senior Vice President | |||
| Administrator | Residential Real Estate Sales | ADRIANNE M. FLEEMAN | ||
| Manager - Columbus, Defiance, Findlay | Assistant Vice President | |||
| RONALD J. SWISHER | Senior RRE Underwriter | |||
| Officer | DENISE S. DAVENPORT | |||
| Commercial Credit Analyst | Vice President | RYAN G. SIBLEY | ||
| Outside Mortgage Sales Loan Originator | Assistant Vice President | |||
| Information Technology and | Outside Mortgage Sales Loan Originator | |||
| Operations | KIMBERLY W. DONOVAN | |||
| Vice President | TAMARA D. TRENKAMP | |||
| MELINDA L. CLINE | Senior RRE Underwriter | Assistant Vice President | ||
| Senior Vice President | Community Development Mortgage | |||
| Director of Lending Operations | SUSAN A. ERHART | Loan Originator | ||
| Vice President | ||||
| KATIE S. CLEMENS | Senior RRE Underwriter | ZACHARY M. WILLIAMS | ||
| Assistant Vice President | Assistant Vice President | |||
| Deposit Operations Manager | JOYCE A. FERGUSON | Community Development Officer | ||
| Vice President | Outside Mortgage Sales Loan Originator | |||
| ANN M. FISHPAW | Outside Mortgage Sales Loan Originator | |||
| Assistant Vice President | ||||
| Deposit Services Supervisor | ANDREW C. PATTON | |||
| Vice President | ||||
| TADD J. BROOKET | Residential Construction Manager | |||
| Senior Vice President | ||||
| Director of IT Infrastructure | JARED M. PEREZ | |||
| Vice President | ||||
| JEREMY M. DOTSON | Outside Mortgage Sales Loan Originator | |||
| Vice President | ||||
| Cybersecurity & IT Governance Leader | SUZANNE M. REICHARD | |||
| Vice President | ||||
| GARY A. SAXMAN | Outside Mortgage Sales Loan Originator | |||
| Vice President | ||||
| Data Processing Engineer | BRIAN E. SMITH | |||
| Vice President | ||||
| STEVEN E. STRUBLE | Encompass Administrator | |||
| Vice President | ||||
| IT Leader, Fiserv Platform | KAREN A. VARNER | |||
| Vice President | ||||
| JEFF A. EITZMAN | Outside Mortgage Sales Loan Originator | |||
| Assistant Vice President | ||||
| Systems Administrator- Operations |
| Private Banking | SBA/ Small Business Lending | KATIE N. CLEMENTZ | ||
| Vice President | ||||
| RACHEL R. COPELAND | BRANDON S. GERKEN | Trust Operations Services Manager | ||
| Vice President | Senior Vice President | |||
| PCG Private Banker | SBA/Small Business | MARK G. FROELICH | ||
| Lending Manager | Vice President | |||
| KASEY A. SCHWARTZ | Wealth Management Advisor | |||
| Vice President | KYLE A. FRISCH | |||
| Director of Private Banking | Assistant Vice President | CORINA KEMPE | ||
| Small Business Lender | Vice President | |||
| SUSAN F. WEST | WM Advisor/Director of Brokerage Services | |||
| Vice President | Treasury Management | |||
| PCG Private Banker | MAUREEN G. KILLION | |||
| CLINTON B. BEASLEY | Officer | |||
| BRIANNE M. FROBOSE | Vice President | Operations Manager, Brokerage | ||
| Assistant Vice President | Treasury Management Officer | |||
| PCG Private Banker | SBFG Title, LLC | |||
| SEAN L. LAFONTAINE | ||||
| JASON S. MAY | Vice President | DAWN E. VAN HORN | ||
| Assistant Vice President | Director of Treasury Management | Senior Vice President | ||
| PCG Private Banker | Regional Licensed Title Manager | |||
| BROOKE C. FRAZEE | ||||
| Retail Banking | Assistant Vice President | LORI L. LAPE | ||
| Treasury Management Officer | Assistant Vice President | |||
| NANCY E. RANKIN | Licensed Title Manager | |||
| Vice President | Wealth Management | |||
| Head of Retail Banking | ||||
| DAVID A. BELL | ||||
| JESSICA D. BABCOCK | Executive Vice President | |||
| Assistant Vice President | Retirement Services Manager | |||
| Banking Center Sales Manager II | ||||
| KELLY W. CLEVELAND | ||||
| ANDREA P. JELLISON | Senior Vice President | |||
| Assistant Vice President | Chief Investment Officer | |||
| Community Sales & Lending Manager | ||||
| JENNIFER L. MASON | ||||
| JAMES R. STATES | Senior Vice President | |||
| Assistant Vice President | Chief Walth Management Officer | |||
| Banking Center Sales Manager |
60
Exhibit 4.6

March 8, 2024
Securities and Exchange Commission
100 F Street, NE
Washington, D.C. 20549
RE: SB Financial Group, Inc. – Annual Report on Form 10-K for the fiscal year ended December 31, 2023
Ladies and Gentlemen:
SB Financial Group, Inc., an Ohio corporation (“SB Financial”), is today filing with the Securities and Exchange Commission (the “SEC”) the Annual Report on Form 10-K of SB Financial for the fiscal year ended December 31, 2023 (“SB Financial’s 2023 Form 10-K”).
Pursuant to the instructions relating to the Exhibits in Item 601 (b)(4)(iii) of Regulation S-K, SB Financial hereby agrees to furnish to the SEC, upon request, copies of instruments and agreements defining the rights of holders of long-term debt and of the long-term debt of its consolidated subsidiaries, which are not being filed as exhibits to SB Financial’s 2023 Form 10-K. None of such long-term debt exceeds 10 percent of the total assets of SB Financial and its subsidiaries on a consolidated basis.
Very truly yours,
| SB FINANCIAL GROUP, INC. | |
| /s/ Anthony V. Cosentino | |
| Anthony V. Cosentino | |
| Executive Vice President and | |
| Chief Financial Officer |
| 401 Clinton Street | Defiance, OH 43512 | |
| P 419.783.8950 | F 419.782.6393 | |
| YourSBFinancial.com |
Exhibit 10.17
SB FINANCIAL GROUP, INC.
2017 STOCK INCENTIVE PLAN
RESTRICTED STOCK AWARD AGREEMENT
For ________________________________
In recognition of your services to SB Financial Group, Inc. and its current and future Subsidiaries (the “Company”), the Compensation Committee (the “Committee”) of the Board of Directors of the Company has granted to you (the “Grantee”) restricted common shares, without par value, of the Company (“Restricted Stock”), subject to the terms and conditions described in the SB Financial Group, Inc. 2017 Stock Incentive Plan (the “Plan”) and this Restricted Stock Award Agreement (this “Award Agreement”).
To ensure you fully understand the terms and conditions of your Restricted Stock, you should read the Plan and this Award Agreement carefully. Capitalized terms that are not defined in this Award Agreement have the same meanings as in the Plan.
You should return a signed copy of this Award Agreement to:
Keeta J. Diller
Executive Vice President and Corporate Secretary
SB Financial Group, Inc.
401 Clinton Street
Defiance, Ohio 43512
1. Summary of Your Restricted Stock
Grant Date: _________________
Number of Shares of Restricted Stock: ______ Shares
2. Transfer Restrictions and Restriction Periods
(a) Transfer Restrictions. Your Restricted Stock will be subject to a risk of forfeiture and the Company will hold the shares in escrow until the shares of Restricted Stock vest as provided below (the “Restriction Periods”) and the Restriction Periods lapse. Except as described below, you may not sell, transfer, pledge, assign, alienate or hypothecate your shares of Restricted Stock. After the Restriction Periods lapse, your Restricted Stock will be distributed to you or forfeited, depending on whether or not you satisfy the terms and conditions described in this Award Agreement.
(b) Restriction Periods.
(i) Subject to the provisions of the Plan and this Award Agreement (including Section 3), provided that you are continuously employed by the Company, continuously serve as a member of the Advisory Board of the Company (“Advisory Board Member”), or continuously serve as a member of the Board of Directors of the Company (“Director”), as applicable, the restrictions on your Restricted Stock will lapse and the Restricted Stock will become fully vested according to the following schedule:
| (A) | __ Shares on _____________; |
| (B) | __ Shares on _____________; |
| (C) | __ Shares on _____________; and |
| (D) | __ Shares on _____________. |
(ii) Notwithstanding the foregoing and unless otherwise specified in a separate change in control agreement (or similar written agreement) between you and the Company, the Restriction Periods will lapse and the Restricted Stock will become fully vested if an Applicable Event occurs.
3. Effect of Retirement or Other Termination on Restricted Stock
(a) Retirement. If before all shares of Restricted Stock granted hereunder have vested you voluntarily terminate your service as an Employee or as an Advisory Board Member and, if applicable, as a Director of the Company after (i) attaining the age of 62 and (ii) completing five years of service to the Company (“Normal Retirement”), the Restricted Stock shall continue to vest under this Award Agreement only if after the Grant Date you do not accept employment with or perform any services for any bank or bank affiliated entity that competes with any line of business of the Company and that has operations in any of the Company’s counties of operation (currently Allen, Cuyahoga, Defiance, Delaware, Fulton, Franklin, Hancock, Lucas, Paulding, Seneca, Williams and Wood counties of Ohio; Allen, Hamilton and Steuben counties of Indiana, and Monroe county of Michigan) and any additional counties in any states that may arise from Company expansion, mergers and acquisitions, or corporate reorganizations after the Grant Date (the “Non-Competition Restriction”). You acknowledge that the time period, geographic scope, and scope of services covered by this restriction are reasonable in light of the confidential and proprietary information to which you had access to while employed by the Company or served as an Advisory Board Member and, if applicable, served as a Director of the Company.
(b) Death or Disability. If your service as an Employee or Advisory Board Member and, if applicable, as a Director of the Company terminates due to your death or Disability, the Restriction Periods will lapse and the Restricted Stock will become fully vested on the date of your termination.
(c) Termination for Any Other Reason. Except as provided in Section 2(b)(ii), if your service as an Employee or Advisory Board Member and, if applicable, a Director of the Company terminates for any reason other than death, Disability or Normal Retirement, any unvested shares of Restricted Stock will be forfeited on the date of your termination.
4. Settling Your Restricted Stock
Your Restricted Stock will be released from escrow and distributed to you as soon as practicable after all terms, restrictions and conditions described in the Plan and this Award Agreement have been satisfied. Any fractional share of Restricted Stock will be forfeited.
5. Non-Disclosure and Non-Solicitation Covenants
(a) Incorporation of Non-Disclosure and Non-Solicitation Agreement. Either simultaneously with or previous to the date of this Award Agreement, you entered into that certain Non-Disclosure and Non-Solicitation Agreement with the Company dated ___________________________ (the “ND/NS Agreement”), which agreement is incorporated herein by reference. You acknowledge and agree that the ND/NS Agreement (and the covenants set forth therein) is a valid and enforceable agreement and constitutes an essential element of this grant of Restricted Stock, without which the Company would not have entered into this Award Agreement.
(b) Breach of ND/NS Agreement or Section 3(a). In the event you breach any covenant set forth in the ND/NS Agreement or in Section 3(a) of this Award Agreement, as applicable, in addition to any and all remedies to which the Company is entitled under the ND/NS Agreement, you will be required to reimburse the Company an amount equal to the Fair Market Value of any Restricted Stock that vested in the four years prior to the breach (regardless of the reason for such vesting), with the Fair Market Value as to each amount of shares vesting as provided in Section 2 based on the value of such shares, at the election of the Company in its sole discretion, either on the Grant Date, the date of vesting, or the date of termination of your employment, service as an Advisory Board Member or service as a Director of the Company (the “Clawback Amount”). The Clawback Amount will be payable within 30 days after demand, either in cash or, with the consent of the Company, by returning to the Company a number of shares of Stock with a Fair Market Value at the date of such return equal to the Clawback Amount.
(c) Breach Following Normal Retirement. If your service terminates because of a Normal Retirement and you violate the terms of the ND/NS Agreement or Section 3(a) of this Award Agreement, as applicable, in addition to any all remedies to which the Company is entitled under the ND/NS Agreement, continued vesting of the your Restricted Stock shall immediately cease and the Company shall be entitled to the Clawback Amount under Section 5(b) hereof.
6. Other Rules Affecting Your Restricted Stock
(a) Rights During the Restriction Periods. During the Restriction Periods (and even though the shares of Restricted Stock are held in escrow until they are settled), you (i) may exercise full voting rights associated with the shares of Restricted Stock and (ii) will be entitled to receive all dividends and other distributions paid with respect to that Restricted Stock; provided, however, that if any dividends or other distributions are paid in shares of Stock, those shares will be subject to the same provisions and restrictions on transfer and forfeiture as the shares of Restricted Stock with respect to which they were issued under this Award Agreement.
(b) Beneficiary Designation. You may name a beneficiary or beneficiaries to receive Restricted Stock that has vested but has not been settled at the time of your death by completing and filing with the Committee a written beneficiary designation on a form prescribed by the Committee. If you have not completed a beneficiary designation form or if you wish to change your beneficiary, you may complete the beneficiary designation form attached to this Award Agreement as Exhibit A. You do not need to designate a beneficiary now and no designation is required to be completed as a condition of receiving your Restricted Stock. Upon your death, the Company will deliver any shares underlying your Restricted Stock to your beneficiary upon receipt by the Company of proof of identity and the existence of a validly designated beneficiary at the time of your death. However, if you die without designating a beneficiary or if you do not complete the form correctly, the Company will deliver any shares underlying your Restricted Stock to the executor or administrator of your estate, or if no such executor or administrator has been appointed to the knowledge of the Company, the Company may, in its sole discretion, deliver such Stock to your spouse or to any one or more of your dependents as the Company may designate.
(c) Tax Withholding. The Company will have the right and is hereby authorized to deduct or withhold an amount sufficient to satisfy federal, state and local taxes required by law to be withheld with respect to the grant of your Restricted Stock. At the sole discretion of the Committee, you may be permitted to satisfy the foregoing withholding liability by paying to the Company the withholding amount in cash, through the delivery or attestation of shares of Stock you have owned for at least the previous six months (or such other period acceptable under generally accepted accounting principles) with a Fair Market Value equal to the statutory minimum withholding liability or by having the Company withhold shares of Stock that would otherwise be issued to you when your Restricted Stock is settled with a Fair Market Value equal to the statutory minimum withholding liability.
(d) Transferring Your Restricted Stock. During the Restriction Periods, your Restricted Stock may not be sold, transferred, pledged, assigned or otherwise alienated or hypothecated, except by will or the laws of descent and distribution. However, as described in Section 6(b), you may designate a beneficiary who may receive any Restricted Stock that is settled after your death. Also, with the Committee’s consent, you may be allowed to transfer your Restricted Stock to an immediate family member, a partnership consisting solely of immediate family members or trusts for the benefit of immediate family members. Contact us at the address given on the first page of this Award Agreement if you are interested in transferring your Restricted Stock to such a transferee.
(e) Adjustments to Your Restricted Stock. If there is a Stock dividend, Stock split, recapitalization (including payment of an extraordinary dividend), merger, consolidation, combination, spin-off, distribution of assets to shareholders, exchange of shares or other similar corporate change affecting the Stock, the Committee will appropriately adjust the number of shares of Restricted Stock and any other factors, limits or terms affecting your Restricted Stock. Notwithstanding the foregoing, an adjustment will be made only to the extent such adjustment complies with Section 409A of the Code, to the extent applicable.
(f) Restrictions on Transfer of Stock. Shares of Stock tendered under this Award Agreement may be subject to any stock transfer orders and other restrictions that the Committee believes to be advisable under the rules, regulations and other requirements of the Securities and Exchange Commission, any exchange, market or other quotation system on or through which the Company’s securities are then traded, or any applicable federal or state securities law. The Committee may cause a legend or legends to be placed on any certificates issued under this Award Agreement to make appropriate reference to any restrictions.
(g) Tenure. Nothing in the Plan or this Award Agreement shall confer upon you the right to continue as an Employee, Advisory Board Member or Director, as applicable, of the Company or any Subsidiary or to otherwise modify the at will nature of your employment or service.
7. Miscellaneous Provisions
(a) Governing Law; Exclusive Jurisdiction. This Award Agreement will be construed in accordance with and governed by the laws (other than laws governing conflicts of laws) of the State of Ohio. Except as provided in this Section, any dispute arising out of or in connection with this Award Agreement shall be subject to the exclusive jurisdiction of the Court of Common Pleas of Defiance County, Ohio, or the United States District Court for the Northern District of Ohio, and you expressly consent to the personal jurisdiction and venue of such courts. Notwithstanding the foregoing, (i) the Company, and only the Company, in its sole discretion, may seek injunctive relief or other equitable remedies to enforce the terms of this Award Agreement in any court of competent jurisdiction, and (ii) this Award Agreement shall not foreclose the jurisdiction of any Financial Industry Regulatory Authority, Inc. (“FINRA”) mandated arbitration nor prohibit or restrict any registered representatives and employees of registered investment advisors from requesting arbitration of a dispute in the FINRA arbitration forum as specified in FINRA Rules, provided that nothing in this Award Agreement shall prevent the Company from seeking injunctive relief in any court of competent jurisdiction.
(b) Reasonableness of Restrictions. You agree that during the course of employment or service, you will acquire Confidential Information (as defined in the ND/NS Agreement) about the business of the Company, its customers and prospective customers and other Confidential Information of the Company, and that such Confidential Information if disclosed or used by you or used by others would provide an unfair advantage in competing with the Company. Based upon the foregoing, Employee, Advisory Board Member, or Director acknowledges that the covenants and restrictions contained in Sections 3, 5, and 6 of this Award Agreement (i) are reasonable and necessary for the protection of the Company, (ii) do not impose undue hardship on the you and (iii) are not injurious to the public. It is the desire and intent of the parties that the restrictions shall be enforced to the fullest extent permitted by law.
(c) Covenants and Restrictions Independent of Other Provisions. You acknowledge and agree that the covenants and restrictions in Sections 3, 5, and 6 of this Award Agreement are essential elements of this Award Agreement and shall be construed as independent of any other provision of this Award Agreement, and the existence of any claim or cause of action by you against the Company, whether predicated on this Award Agreement or otherwise, shall not constitute a defense to the enforcement by the Company of any of these covenants or restrictions. You acknowledge and agree that if you breach any of these covenants or restrictions, the Company will suffer irreparable harm and will have no adequate remedy at law.
(d) Severability. If the scope of any restriction contained in this Award Agreement is too broad to permit enforcement of such restriction to its fullest extent, then such restriction will be enforced to the maximum extent permitted by law. You hereby consent and agree that such scope may be judicially modified accordingly in any proceeding brought to enforce such restriction, including by modifying its scope, deleting any or all of the offending provisions, adding additional language to this Award Agreement, or by making any other modifications deemed necessary to carry out the intent an agreement of the parties as expressed to the maximum extent permitted by law. You and the Company agree that any modification made by a court will become part of the Agreement and treated as though originally set forth herein. If any portion of this Award Agreement is held as unenforceable and stricken, such a holding will not affect the validity of the remainder of this Award Agreement, the balance of which will continue to be binding on you and the Company.
(e) Remedies for Breach. You agree that any breach of this Award Agreement will result in irreparable harm to the Company for which monetary damages are insufficient. In addition to any other legal or equitable rights the Company has, it will be entitled to restrain you from breaching your obligations through temporary, preliminary or permanent injunctive relief and to recover the Company’s attorneys’ fees and costs incurred in pursuing its rights.
(f) Amendment of Award Agreement. This Award Agreement may be amended by a written agreement signed by both parties to this Award Agreement; provided, however, that the Company may amend this Award Agreement to the extent necessary to comply with applicable law without your consent or any additional consideration, even if those amendments eliminate, restrict or reduce your rights under this Award Agreement.
(g) Other Terms and Conditions. Your Restricted Stock is subject to the terms and conditions described in this Award Agreement and the Plan, which is incorporated by reference into and made a part of this Award Agreement. You acknowledge that you have read the Plan carefully, that you have had an opportunity to ask questions of the Company’s Executive Vice President and Secretary about this Award Agreement and the Plan, and that you fully understand all the terms and conditions of your Restricted Stock under this Award Agreement. In the event of a conflict between the terms of the Plan and the terms of this Award Agreement, the terms of the Plan will govern. The Committee has the sole responsibility of interpreting the Plan and this Award Agreement, and its determination of the meaning of any provision in the Plan or this Award Agreement shall be binding on you.
(h) Other Agreements. Your Restricted Stock will be subject to the terms of any other written agreements between you and the Company, including the ND/NS Agreement, to the extent that those other agreements do not directly conflict with the terms of the Plan or this Award Agreement.
(i) Representations Regarding Agreements with Other Parties. You represent and warrant to the Company that you are not subject to any agreement with any third party, that could restrict the performance of your employment or service obligations to the Company, to include your obligations under this Award Agreement, whether characterized as an agreement or agreements relating to non-competition, non-solicitation, confidentiality, assignment of inventions, or trade secret license, and agree not to enter into any such agreements with third parties while you are employed by or serving the Company. You agree to defend, indemnify and hold the Company harmless for any damages and legal expenses incurred in the event that this representation is breached.
(j) Signature in Counterparts. This Award Agreement may be signed in counterparts, each of which will be deemed an original, but all of which will constitute one and the same instrument.
[SIGNATURE PAGE FOLLOWS]
* * * * *
Your Acknowledgement
By signing below as the “Participant,” you acknowledge and agree that:
| ● | A copy of the Plan has been made available to you; |
| ● | You have read the Plan carefully; and |
| ● | You understand and accept the terms and conditions placed on your Restricted Stock. |
| PARTICIPANT | SB FINANCIAL GROUP, INC. |
| Print Name: | Print Name: | |||
| Title: | ||||
| Date: | Date: | |||
EXHIBIT A
SB FINANCIAL GROUP, INC.
2017 STOCK INCENTIVE PLAN
BENEFICIARY DESIGNATION FORM
Primary Beneficiary Designation. I designate the following person(s) as my primary beneficiary or beneficiaries, in the proportion specified, to receive or to exercise any vested Awards under the SB Financial Group, Inc. 20__ Stock Incentive Plan (the “Plan”) that are unpaid or unexercised at my death:
| ______% to | |||||
| (Name) | (Relationship) | ||||
| Address: | |||||
| ______% to | |||||
| (Name) | (Relationship) | ||||
| Address: | |||||
| ______% to | |||||
| (Name) | (Relationship) | ||||
| Address: | |||||
| ______% to | |||||
| (Name) | (Relationship) | ||||
| Address: |
Note: You are not required to name more than one primary beneficiary but, if you do, the sum of these percentages may not be greater than 100 percent.
Contingent Beneficiary Designation. If one or more of my primary beneficiaries dies before I die, I direct that any vested Awards under the Plan that are unpaid or unexercised at my death and that might otherwise have been paid to that beneficiary be:
_____ Allocated to my other named primary beneficiaries in proportion to the allocation given above (ignoring the interest allocated to the deceased primary beneficiary); or
_____ Allocated, in the proportion specified, among the following contingent beneficiaries:
| ______% to | |||||
| (Name) | (Relationship) | ||||
| Address: | |||||
| ______% to | |||||
| (Name) | (Relationship) | ||||
| Address: | |||||
| ______% to | |||||
| (Name) | (Relationship) | ||||
| Address: | |||||
| ______% to | |||||
| (Name) | (Relationship) | ||||
| Address: |
Note: You are not required to name more than one contingent beneficiary but, if you do, the sum of these percentages may not be greater than 100 percent.
| (Signature) | (Date) | |
| (Print Name) |
Please return an executed copy of this form to the following: Keeta J. Diller, Executive Vice President and Corporate Secretary, SB Financial Group, Inc., 401 Clinton Street, Defiance, Ohio 43512
Exhibit 21
List of Subsidiaries
| Name | State of Incorporation | |
| The State Bank and Trust Company | Ohio | |
| SBFG Title, LLC | Ohio | |
| SBFG Mortgage, LLC | Ohio | |
| RFCBC, Inc. | Ohio | |
| SB Captive, Inc. | Nevada | |
| Rurban Mortgage Company | Ohio | |
| SBT Insurance, LLC | Ohio | |
| Rurbanc Data Services, Inc. | Ohio | |
| Rurban Statutory Trust II | Declaration of Trust – State of Delaware | |
| NC Merger Corp.* | Ohio |
| * | NC Merger Corp. is a wholly-owned subsidiary of Rurbanc Data Services, Inc. NC Merger Corp. has no assets or liabilities and is inactive. |
Exhibit 23
Consent of Independent Registered Public Accounting Firm
We consent to the incorporation by reference in the Registration Statements on Forms S-8 (File Nos. 333-220075 and 333-150911) and Forms S-3 (File Nos. 333-248406, 333-217206 and 333-191192) of SB Financial Group, Inc. (the “Company”) of our report dated March 8, 2024, on our audits of the consolidated financial statements of the Company as of December 31, 2023 and 2022 and for each of the years then ended, which report is included (or incorporated by reference) in this Annual Report on Form 10-K.
FORVIS, LLP
Indianapolis, Indiana
March 8, 2024
Exhibit 31.1
CERTIFICATION
I, Mark A. Klein, certify that:
| 1. | I have reviewed this Annual Report on Form 10-K of SB Financial Group, Inc.; |
| 2. | Based on my knowledge, this report does not contain any untrue statement of a material fact or omit to state a material fact necessary to make the statements made, in light of the circumstances under which such statements were made, not misleading with respect to the period covered by this report; |
| 3. | Based on my knowledge, the financial statements, and other financial information included in this report, fairly present in all material respects the financial condition, results of operations and cash flows of the registrant as of, and for, the periods presented in this report; |
| 4. | The registrant’s other certifying officer and I are responsible for establishing and maintaining disclosure controls and procedures (as defined in Exchange Act Rules 13a-15(e) and 15d-15(e)) and internal control over financial reporting (as defined in Exchange Act Rules 13a-15(f) and 15d-15(f)) for the registrant and have: |
| a. | designed such disclosure controls and procedures, or caused such disclosure controls and procedures to be designed under our supervision, to ensure that material information relating to the registrant, including its consolidated subsidiaries, is made known to us by others within those entities, particularly during the period in which this report is being prepared; |
| b. | designed such internal control over financial reporting, or caused such internal control over financial reporting to be designed under our supervision, to provide reasonable assurance regarding the reliability of financial reporting and the preparation of the financial statements for external purposes in accordance with generally accepted accounting principles; |
| c. | evaluated the effectiveness of the registrant’s disclosure controls and procedures and presented in this report our conclusions about the effectiveness of the disclosure controls and procedures, as of the end of the period covered by this report based upon such evaluation; and |
| d. | disclosed in this report any change in the registrant’s internal control over financial reporting that occurred during the registrant’s fourth fiscal quarter that has materially affected, or is reasonably likely to materially affect, the registrant’s internal control over financial reporting; and |
| 5. | The registrant’s other certifying officer and I have disclosed, based on our most recent evaluation of internal control over financial reporting, to the registrant’s auditors and the audit committee of registrant’s board of directors (or persons performing the equivalent functions): |
| a. | all significant deficiencies and material weaknesses in the design or operation of internal control over financial reporting which are reasonably likely to adversely affect the registrant’s ability to record, process, summarize and report financial information; and |
| b. | any fraud, whether or not material, that involves management or other employees who have a significant role in the registrant’s internal control over financial reporting. |
| Dated: March 8, 2024 | By: | /s/ Mark A. Klein |
| Mark A. Klein | ||
| Chairman, President and Chief Executive Officer |
Exhibit 31.2
CERTIFICATION
I, Anthony V. Cosentino, certify that:
| 1. | I have reviewed this Annual Report on Form 10-K of SB Financial Group, Inc.; |
| 2. | Based on my knowledge, this report does not contain any untrue statement of a material fact or omit to state a material fact necessary to make the statements made, in light of the circumstances under which such statements were made, not misleading with respect to the period covered by this report; |
| 3. | Based on my knowledge, the financial statements, and other financial information included in this report, fairly present in all material respects the financial condition, results of operations and cash flows of the registrant as of, and for, the periods presented in this report; |
| 4. | The registrant’s other certifying officer and I are responsible for establishing and maintaining disclosure controls and procedures (as defined in Exchange Act Rules 13a-15(e) and 15d-15(e)) and internal control over financial reporting (as defined in Exchange Act Rules 13a-15(f) and 15d-15(f)) for the registrant and have: |
| a. | designed such disclosure controls and procedures, or caused such disclosure controls and procedures to be designed under our supervision, to ensure that material information relating to the registrant, including its consolidated subsidiaries, is made known to us by others within those entities, particularly during the period in which this report is being prepared; |
| b. | designed such internal control over financial reporting, or caused such internal control over financial reporting to be designed under our supervision, to provide reasonable assurance regarding the reliability of financial reporting and the preparation of the financial statements for external purposes in accordance with generally accepted accounting principles; |
| c. | evaluated the effectiveness of the registrant’s disclosure controls and procedures and presented in this report our conclusions about the effectiveness of the disclosure controls and procedures, as of the end of the period covered by this report based upon such evaluation; and |
| d. | disclosed in this report any change in the registrant’s internal control over financial reporting that occurred during the registrant’s fourth fiscal quarter that has materially affected, or is reasonably likely to materially affect, the registrant’s internal control over financial reporting; and |
| 5. | The registrant’s other certifying officer and I have disclosed, based on our most recent evaluation of internal control over financial reporting, to the registrant’s auditors and the audit committee of registrant’s board of directors (or persons performing the equivalent functions): |
| a. | all significant deficiencies and material weaknesses in the design or operation of internal control over financial reporting which are reasonably likely to adversely affect the registrant’s ability to record, process, summarize and report financial information; and |
| b. | any fraud, whether or not material, that involves management or other employees who have a significant role in the registrant’s internal control over financial reporting. |
| Dated: March 8, 2024 | By: | /s/ Anthony V. Cosentino |
| Anthony V. Cosentino | ||
| Executive Vice President and Chief Financial Officer |
Exhibit 32.1
Section 1350 Certification*
In connection with the Annual Report of SB Financial Group, Inc. (the “Company”) on Form 10-K for the fiscal year ended December 31, 2023, as filed with the Securities and Exchange Commission on the date hereof (the “Report”), the undersigned Mark A. Klein, Chairman, President and Chief Executive Officer of the Company, and Anthony V. Cosentino, Executive Vice President and Chief Financial Officer of the Company, each certify, pursuant to Section 1350 of Chapter 63 of Title 18 of the United States Code, as adopted pursuant to Section 906 of the Sarbanes-Oxley Act of 2002, that:
| (1) | The Report fully complies with the requirements of Section 13(a) or 15(d) of the Securities Exchange Act of 1934, as amended; and |
| (2) | The information contained in the Report fairly presents, in all material respects, the consolidated financial condition and results of operations of the Company and its subsidiaries. |
| /s/ Mark A. Klein | /s/ Anthony V. Cosentino | |
| Mark A. Klein, | Anthony V. Cosentino | |
| Chairman, President and Chief Executive Officer | Executive Vice President and Chief Financial Officer | |
| Dated: March 8, 2024 | Dated: March 8, 2024 |
| * | This certification is being furnished as required by Rule 13a-14(b) under the Securities Exchange Act of 1934, as amended (the “Exchange Act”), and Section 1350 of Chapter 63 of Title 18 of the United States Code, and shall not be deemed “filed” for purposes of Section 18 of the Exchange Act or otherwise subject to the liability of that Section. This certification shall not be deemed to be incorporated by reference into any filing under the Securities Act of 1933, as amended, or the Exchange Act, except to the extent the Company specifically incorporates it by reference in such filing. |
Exhibit 97
Executive Officer Clawback Policy
This Policy has been adopted by the Board as of the Effective Date. This Policy provides for the recovery of Erroneously Awarded Compensation from Executive Officers in the event of an Accounting Restatement. This Policy is intended to comply with, and shall be interpreted to be consistent with, Section 10D of the Exchange Act, Rule 10D-1 and the Listing Rule. Capitalized terms used in this Policy have the respective meanings given to them in Section 1 below.
| 1. | Definitions. For purposes of this Policy, the following capitalized terms have the meanings set forth below. |
| A. | “Accounting Restatement” means an accounting restatement of the Company’s financial statements due to the material noncompliance of the Company with any financial reporting requirement under the securities laws, including any required accounting restatement to correct an error in previously issued financial statements that is material to the previously issued financial statements, or that would result in a material misstatement if the error were corrected in the current period or left uncorrected in the current period. |
| B. | “Accounting Restatement Date” means the earlier to occur of: (i) the date the Board, a committee of the Board, or the officer or officers of the Company authorized to take such action if Board action is not required, concludes, or reasonably should have concluded, that the Company is required to prepare an Accounting Restatement; and (ii) the date a court, regulator, or other legally authorized body directs the Company to prepare an Accounting Restatement. |
| C. | “Board” means the Board of Directors of the Company. |
| D. | “Clawback Period” means, with respect to any Accounting Restatement, the three completed fiscal years of the Company immediately preceding the Accounting Restatement Date and any transition period (that results from a change in the Company’s fiscal year) of less than nine months within or immediately following those three completed fiscal years. |
| E. | “Code” means the Internal Revenue Code of 1986, as amended. |
| F. | “Committee” means the Compensation Committee of the Board. |
| G. | “Company” means SB Financial Group, Inc. |
| H. | “Effective Date” means November 15, 2023. |
| I. | “Erroneously Awarded Compensation” means, in the event of an Accounting Restatement, the amount of Incentive-Based Compensation received by an Executive Officer during the Clawback Period that exceeds the amount of Incentive-Based Compensation that otherwise would have been received by such Executive Officer had the Incentive-Based Compensation been determined based on the restated amounts in such Accounting Restatement. The amount of Erroneously Awarded Compensation shall be computed without regard to any taxes paid by the relevant Executive Officer (including any taxes withheld by the Company from the Incentive-Based Compensation paid to such Executive Officer). For Incentive-Based Compensation based on (or derived from) stock price or total stockholder return, where the amount of Erroneously Awarded Compensation is not subject to mathematical recalculation directly from the information in an Accounting Restatement: (i) the Committee must determine the amount of Erroneously Awarded Compensation related to such Incentive-Based Compensation by making a reasonable estimate of the effect of the Accounting Restatement on the stock price or total stockholder return upon which the Incentive-Based Compensation was received; and (ii) the Company must maintain documentation of the determination of that reasonable estimate and provide such documentation to Nasdaq. |
| J. | “Exchange Act” means the Securities Exchange Act of 1934, as amended. |
| K. | “Executive Officer” means the Company’s current and former president, principal financial officer, principal accounting officer (or if there is not such accounting officer, the controller), any vice president in charge of a principal business unit, division or function (such as sales, administration or finance), any other officer who performs a policy-making function, or any other person who performs similar policy-making functions for the Company. Executive Officers of the Company’s parents or subsidiaries are deemed Executive Officers of the Company if they perform such policy-making functions for the Company. Policy-making function is not intended to include policy-making functions that are not significant. Identification of an Executive Officer for purposes of this Policy include individuals deemed to be Executive Officers by the Board and/or the Committee and those executive officers identified by the Company pursuant to 17 CFR 229.401(b). |
| L. | “Financial Reporting Measure” means any measure that is determined and presented in accordance with the accounting principles used in preparing the Company’s financial statements, and any measure that is derived wholly or in part from such measure. A Financial Reporting Measure is not required to be presented within the Company’s financial statements or included in a filing with the SEC to qualify as a Financial Reporting Measure. For purposes of this Policy, Financial Reporting Measure includes, but is not limited to, stock price and total stockholder return. |
| M. | “Incentive-Based Compensation” means any compensation that is granted, earned, or vested based wholly or in part upon the attainment of a Financial Reporting Measure. |
| N. | “Listing Rule” means Nasdaq Rule 5608. |
| O. | “Nasdaq” means The Nasdaq Stock Market. |
| P. | “Policy” means this Executive Officer Clawback Policy, as the same may be amended pursuant to the terms hereof. |
| Q. | “Rule 10D-1” means Rule 10D-1 promulgated under the Exchange Act. |
| R. | “SEC” means the U.S. Securities and Exchange Commission. |
| 2. | Policy Administration. This Policy will be administered and interpreted by the Committee. The Committee is authorized to make all determinations under this Policy to the extent permitted by the Listing Rule and in compliance with Section 409A of the Code. All determinations made by the Committee pursuant to this Policy will be final and binding on all persons, including the Company and its affiliates, shareholders, and Executive Officers, and need not be uniform with respect to each individual subject to the Policy. |
| 3. | Policy Application. This Policy applies to all Incentive-Based Compensation received by a person: (a) after beginning service as an Executive Officer; (b) who served as an Executive Officer at any time during the performance period for such Incentive-Based Compensation; (c) while the Company had a class of securities listed on a national securities exchange or a national securities association; and (d) during the Clawback Period. For purposes of this Policy, Incentive-Based Compensation is considered “received” in the Company’s fiscal period during which the relevant Financial Reporting Measure specified in the Incentive-Based Compensation award is attained, even if the payment or grant of such Incentive-Based Compensation occurs after the end of that period. For the avoidance of doubt, the terms of this Policy apply to any Incentive-Based Compensation received by Executive Officers on or after the Effective Date even if such Incentive-Based Compensation was approved, awarded, granted or paid to Executive Officers before the Effective Date. |
| 4. | Recovery of Erroneously Awarded Compensation. In the event of an Accounting Restatement, the Company shall reasonably determine and recover the amount of any Erroneously Awarded Compensation received by any Executive Officer, as determined pursuant to this Policy. The Committee shall determine, in its sole and absolute discretion, the timing and method for recovering Erroneously Awarded Compensation, to the extent permitted under the Listing Rule and in compliance with (or pursuant to an exemption from the application of) Section 409A of the Code, which may include without limitation (a) seeking reimbursement of all or part of any cash or equity-based award, (b) cancelling prior cash or equity-based awards, (c) canceling or offsetting against any future payable or planned compensation (including, without limitation, base salary or cash or equity-based awards), (d) forfeiture of deferred compensation and (e) any other method authorized by applicable law or contract. |
| A. | The Company’s recovery obligation pursuant to this Section 4 shall not apply if any of the following conditions are met and the Committee determines that such recovery would be impracticable: |
| i. | The direct expense paid to a third party to assist in enforcing this Policy would exceed the amount to be recovered. Before concluding that it would be impracticable to recover any amount of Erroneously Awarded Compensation based on expense of enforcement, the Company must make a reasonable attempt to recover such Erroneously Awarded Compensation, document such reasonable attempt(s) to recover, and provide that documentation to Nasdaq; |
| ii. | Recovery would violate home country law where that law was adopted prior to November 28, 2022. Before concluding that it would be impracticable to recover any amount of Erroneously Awarded Compensation based on violation of home country law, the Company must obtain an opinion of home country counsel, acceptable to Nasdaq, that recovery would result in such a violation, and provide a copy of the opinion to Nasdaq; or |
| iii. | Recovery would likely cause an otherwise tax-qualified retirement plan, under which benefits are broadly available to employees of the registrant, to fail to meet the requirements of Section 401(a)(13) or Section 411(a) of the Code and regulations thereunder. |
| 5. | Indemnification Prohibition. The Company is prohibited from (a) indemnifying any Executive Officer against the loss of any Erroneously Awarded Compensation and (b) paying, or reimbursing any Executive Officer for, the cost of any insurance to cover any such loss. |
| 6. | Reporting and Disclosure. The Company shall file all disclosures with respect to this Policy in accordance with the requirements of the federal securities laws, including disclosures required by applicable SEC filings. |
| 7. | Amendment; Termination. The Board may amend this Policy from time to time in its sole and absolute discretion and shall amend this Policy as it deems necessary to comply with applicable laws, rules or regulations, including SEC rules or the rules of any national securities exchange or a national securities association on which the Company’s securities are listed. The Board may terminate this Policy at any time. [Notwithstanding anything to the contrary, no amendment or termination of this Policy shall adversely affect [in any material way] any Incentive-Based Compensation approved, granted, awarded, earned or paid to an Executive Officer prior to the effective date of such amendment or termination, except solely to the extent such amendment or termination is required by applicable laws, rules, or regulations, including SEC rules or the rules of any national securities exchange or a national securities association on which the Company’s securities are listed.] |
| 8. | Other Recoupment Rights. The Committee intends that this Policy will be applied to the fullest extent of the law. The Committee may, as a condition to the grant of any benefit and employment with the Company or its subsidiaries, require an Executive Officer to acknowledge and agree that any employment agreement, award agreement or other agreement entered into or provided to such Executive Officer shall be subject to the terms of this Policy; provided, however, that the Committee’s failure to do so shall not serve as a waiver of the Company’s rights or such Executive Officer’s obligations under this Policy with respect to any such employment agreement, award agreement or other agreement. Any right of recoupment under this Policy is in addition to, and not in lieu of, any other remedies or rights of recoupment that may be available to the Company under applicable law, rule or regulation or pursuant to the terms of any similar policy in any employment agreement, award agreement or similar agreement and any other legal remedies available to the Company. Nothing contained in this Policy, and no recoupment or recovery as contemplated by this Policy, shall limit any claims, damages or other legal remedies the Company or any of its affiliates may have against an Executive Officer arising out of or resulting from any actions or omissions by the Executive Officer. |
| 9. | Acknowledgement. Each Executive Officer shall sign and return to the Company, within 14 calendar days following the later of (i) the Effective Date or (ii) the date the individual becomes an Executive Officer, the acknowledgement attached hereto as Exhibit A, pursuant to which the Executive Officer agrees to be bound by, and to comply with, the terms and conditions of this Policy. |
| 10. | Successors. This Policy is binding and enforceable against all Executive Officers and their beneficiaries, heirs, executors, administrators, or other legal representatives. |
| 11. | Governing Law; Venue. This Policy and all rights and obligations hereunder are governed by and construed in accordance with the internal laws of the State of Ohio, excluding any choice of law rules or principles that may direct the application of the laws of another jurisdiction. All actions arising out of or relating to this Policy shall be heard and determined exclusively in the courts of the State of Ohio, County of Defiance, or, if it has or can acquire jurisdiction, in the United States District Court for the Northern District of Ohio. |
Exhibit A
Executive Officer Clawback Policy
Acknowledgement
Pursuant to the Executive Officer Clawback Policy (as may be amended pursuant to the terms thereof, the “Policy”), the undersigned acknowledges, agrees and confirms that he or she has (i) received and reviewed the Policy and (ii) been identified by the Board and/or Committee as an Executive Officer of the Company. Capitalized terms used but not defined in this Acknowledgement shall have the respective meanings ascribed to them in the Policy.
To the extent of any inconsistency between the Policy and the terms of any employment agreement or other compensation plan, program, arrangement, or agreement under which any compensation has been or will be approved, granted, awarded, earned or paid to the undersigned, the terms of the Policy will prevail.
By signing this Acknowledgement, the undersigned acknowledges and agrees that the undersigned is and will continue to be subject to the Policy and that the Policy will apply both during and after the undersigned’s employment with the Company or its subsidiaries. In addition, by signing below, the undersigned agrees to be bound by, and to comply with, the terms of the Policy, including, without limitation, by returning any Erroneously Awarded Compensation to the Company to the extent required by, and in a manner consistent with, the Policy.
| EXECUTIVE OFFICER | ||
| By: | ||
| Name: | ||
| Date: | ||
A-1