UNITED STATES
SECURITIES AND EXCHANGE COMMISSION
WASHINGTON, D.C. 20549
FORM 6-K
Report of Foreign Private Issuer
Pursuant to Rule 13a-16 or 15d-16
under the Securities Exchange Act of 1934
For the month of November 2023
Commission File Number 001-35751
STRATASYS LTD.
(Translation of registrant’s name into English)
| c/o Stratasys, Inc. 7665 Commerce Way Eden Prairie, Minnesota 55344 |
1 Holtzman Street, Science Park P.O. Box 2496 Rehovot, Israel 76124 |
|
| (Addresses of principal executive offices) | ||
Indicate by check mark whether the registrant files or will file annual reports under cover of Form 20-F or Form 40-F:
Form 20-F ☒ Form 40-F ☐
CONTENTS
Quarterly Results of Operations
On November 16, 2023, Stratasys Ltd. (“Stratasys”, “we” or “us”) announced our financial results for the third quarter and nine months ended September 30, 2023. A copy of our press release announcing our results is furnished as Exhibit 99.1 to this Report of Foreign Private Issuer on Form 6-K (this “Form 6-K”) and is incorporated herein by reference.
In conjunction with the conference call being held on November 16, 2023 to discuss our results, we are furnishing a copy of the slide presentation that provides supplemental information regarding our business and our financial results, and which will be referenced on that conference call. We have attached that presentation to this Form 6-K as Exhibit 99.2, which exhibit is incorporated herein by reference.
Changes to Board of Directors
On November 16, 2023, we announced that we have appointed Aris Kekedjian as a new, independent member of our board of directors, effective immediately. Mr. Kekedjian has replaced Ziva Patir, who has decided to step down from the board following ten years of service as a director.
Additional information concerning Mr. Kekedjian, including biographical information, is contained in the press release attached as Exhibit 99.3 to this Form 6-K.
Incorporation by Reference
The information under the heading “Changes to Board of Directors” above, along with the contents of Exhibit 99.3 to this Form 6-K (other than any quotations contained therein), are incorporated by reference into Stratasys’ registration statements on Form S-8, SEC file numbers 333-190963, 333-236880, 333-253694, 333-262951, 333-262952, and 333-270249, filed by Stratasys with the SEC on September 3, 2013, March 4, 2020, March 1, 2021, February 24, 2022, February 24, 2022 and March 3, 2023 respectively, and Form F-3, SEC file numbers 333-251938 and 333-253780, filed by Stratasys with the SEC on January 7, 2021 and March 2, 2021, respectively, as amended, and shall be a part thereof from the date on which this Form 6-K is furnished, to the extent not superseded by documents or reports subsequently filed or furnished.
The information under the heading “Quarterly Results of Operations”, along with the contents of Exhibits 99.1 and 99.2, shall not be deemed to be “filed” for the purposes of Section 18 of the Securities Exchange Act of 1934, as amended, and shall not be incorporated by reference into any filing under the Securities Act of 1933, as amended, except as shall be expressly set forth by specific reference in such filing.
Exhibits
The following exhibits are furnished as part of this Form 6-K:
SIGNATURES
Pursuant to the requirements of the Securities Exchange Act of 1934, the registrant has duly caused this report to be signed on its behalf by the undersigned, thereunto duly authorized.
| STRATASYS LTD. | ||
| Dated: November 16, 2023 | By: | /s/ Eitan Zamir |
| Name: | Eitan Zamir | |
| Title: | Chief Financial Officer | |
2
Exhibit 99.1

Stratasys Releases Third Quarter 2023 Financial Results
| ● | Revenue of $162.1 million, essentially flat with third quarter 2022, up 3.3% at constant currency excluding MakerBot and Stratasys Direct divestments |
| ● | Record-level recurring revenue for consumables reflects strong printer utilization |
| ● | GAAP net loss of $47.3 million, or $0.68 per diluted share, and non-GAAP net income of $2.4 million, or $0.04 per diluted share |
| ● | Ninth straight quarter of adjusted profitability |
| ● | Updating 2023 outlook |
MINNEAPOLIS & REHOVOT, Israel - (BUSINESS WIRE) - November 16, 2023 - Stratasys Ltd. (Nasdaq: SSYS) (“Stratasys” or the “Company”), a leader in polymer 3D printing solutions, today announced financial results for the third quarter 2023.
Third Quarter 2023 Financial Results Compared to Third Quarter 2022:
| ● | Revenue of $162.1 million compared to $162.2 million. |
| ● | GAAP gross margin of 40.5%, compared to 43.6%. |
| ● | Non-GAAP gross margin of 48.3%, compared to 48.5%. |
| ● | GAAP operating loss of $42.8 million, which includes $17.3 million of costs related to merger and acquisition activities, defense against hostile tender offer, proxy contest and related professional fees, compared to an operating loss of $15.6 million. |
| ● | Non-GAAP operating income of $4.1 million, compared to $4.5 million. |
| ● | GAAP net loss of $47.3 million, or $0.68 per diluted share, compared to net income of $18.7 million, or $0.28 per diluted share, which net income in Q3 2022 included a one-time $39.1M gain from the MakerBot deconsolidation. |
| ● | Non-GAAP net income of $2.4 million, or $0.04 per diluted share, compared to $3.3 million, or $0.05 per diluted share. |
| ● | Adjusted EBITDA of $9.8 million, compared to $9.9 million. |
| ● | Cash used in operations of $12.7 million, compared to $18.4 million in the year-ago quarter, due to the costs related to mergers and acquisitions activities, defense against a hostile tender offer, a proxy contest and related professional fees. Excluding these one-time payments, operating cash flow for the third quarter of 2023 would have been positive. |
Dr. Yoav Zeif, Stratasys’ Chief Executive Officer stated, “During the third quarter, Stratasys delivered solid operating and financial results, highlighted by record recurring revenues from consumables, reflecting solid printer utilization. Our relentless focus on execution allowed us to deliver comparable results to the year-ago quarter for revenues, non-GAAP margins and adjusted EBITDA, as well as our ninth consecutive quarter of positive adjusted earnings per share.”
Dr. Zeif continued, “We want to acknowledge the tremendous support we have received from partners, customers, investors and our industry since the tragic events in Israel. We especially want to thank our employees who have performed in an exemplary fashion during these challenging times. Our operations have been fully functional, allowing us to continue delivering industry-leading results. We have streamlined and focused our business, while simultaneously rolling out new and exciting innovations that will expand our leadership position across systems, materials, software and customer service. Our recently introduced F3300 is the latest step in that continued evolution to unlock manufacturing benefits for our customers. Our maturity as a company, financial discipline and resilient business model position us well to deliver exceptional value for many years to come.”
2023 Financial Outlook:
Based on the divestitures in Stratasys Direct, as well as macroeconomic uncertainty in its end markets, the Company is updating its revenue guidance and its outlook for the remainder of 2023 as follows:
| ● | Full year revenue of $620 million to $630 million. |
| ● | Full year non-GAAP gross margins of 48.0% to 49.0%. |
| ● | Full year non-GAAP operating expenses in a range of $288 million to $290 million. |
| ● | Full year non-GAAP operating margins in a range of 2.0% to 2.5%. |
| ● | GAAP net loss of $117 million to $104 million, or ($1.70) to ($1.51) per diluted share. |
| o | Includes one-time extraordinary costs associated with defense of tender offer and proxy contest, and merger-related activities. |
| ● | Non-GAAP net income of $6 million to $9 million, or $0.10 to $0.14 per diluted share. |
| ● | Adjusted EBITDA of $35 million to $38 million. |
| ● | Capital expenditures of $15 million to $20 million. |
2023 non-GAAP earnings guidance excludes $112 million to $121 million of expenses attributable to projected amortization of intangible assets, share-based compensation expense, and reorganization and other expenses (including the one-time extraordinary costs referenced above). 2023 non-GAAP guidance includes tax adjustments of $2 million to $3 million on the above non-GAAP items.
Appropriate reconciliations between GAAP and non-GAAP financial measures are provided in a table at the end of our press release and slide presentation, with itemized detail concerning the non-GAAP financial measures.
Stratasys Ltd. Third Quarter 2023 Webcast and Conference Call Details
The Company plans to webcast its conference call to discuss its third quarter 2023 financial results on Thursday, November 16, 2023, at 10:00 a.m. (ET).
The investor conference call will be available via live webcast on the Stratasys Web site at investors.stratasys.com, or directly at the following web address:
https://event.choruscall.com/mediaframe/webcast.html?webcastid=bSk6aoYV
To participate by telephone, the U.S. toll-free number is 877-407-0619 and the international dial-in is +1-412-902-1012. Investors are advised to dial into the call at least ten minutes prior to the call to register. The webcast will be available for six months at investors.stratasys.com, or by accessing the above-provided web address.
Stratasys is leading the global shift to additive manufacturing with innovative 3D printing solutions for industries such as aerospace, automotive, consumer products, healthcare, fashion and education. Through smart and connected 3D printers, polymer materials, a software ecosystem, and parts on demand, Stratasys solutions deliver competitive advantages at every stage in the product value chain. The world’s leading organizations turn to Stratasys to transform product design, bring agility to manufacturing and supply chains, and improve patient care.
To learn more about Stratasys, visit www.stratasys.com, the Stratasys blog, X.com (formerly Twitter), LinkedIn, or Facebook. Stratasys reserves the right to utilize any of the foregoing social media platforms, including the Company’s websites, to share material, non-public information pursuant to the SEC’s Regulation FD. To the extent necessary and mandated by applicable law, Stratasys will also include such information in its public disclosure filings.
Stratasys is a registered trademark and the Stratasys signet is a trademark of Stratasys Ltd. and/or its subsidiaries or affiliates. All other trademarks are the property of their respective owners.
Cautionary Statement Regarding Forward-Looking Statements
The statements in this press release regarding Stratasys’ strategy, and the statements regarding its projected future financial performance, including the financial guidance concerning its expected results for 2023 and beyond, are forward-looking statements reflecting management’s current expectations and beliefs. These forward-looking statements are based on current information that is, by its nature, subject to rapid and even abrupt change. Due to risks and uncertainties associated with Stratasys’ business, actual results could differ materially from those projected or implied by these forward-looking statements. These risks and uncertainties include, but are not limited to: the degree of our success at introducing new or improved products and solutions that gain market share; the degree of growth of the 3D printing market generally; the impact of potential shifts in the prices or margins of the products that we sell or services that we provide, including due to a shift towards lower margin products or services; the impact of competition and new technologies; the outcome of our board’s comprehensive process to explore strategic alternatives for our company; the degree to which our company’s operations remain resistant to potential adverse effects of Israel’s war against the terrorist organization Hamas; potential further charges against earnings that we could be required to take due to impairment of additional goodwill or other intangible assets; the extent of our success at successfully consummating and integrating into our existing business acquisitions or investments in new businesses, technologies, products or services; the global macro-economic environment, including headwinds caused by inflation, high interest rates, unfavorable currency exchange rates and potential recessionary conditions; potential changes in our management and board of directors; global market, political and economic conditions, and in the countries in which we operate in particular; costs and potential liability relating to litigation and regulatory proceedings; risks related to infringement of our intellectual property rights by others or infringement of others’ intellectual property rights by us; the extent of our success at maintaining our liquidity and financing our operations and capital needs; the impact of tax regulations on our results of operations and financial condition; and those additional factors referred to in Item 3.D “Key Information - Risk Factors”, Item 4, “Information on the Company”, Item 5, “Operating and Financial Review and Prospects,” and all other parts of our Annual Report on Form 20-F for the year ended December 31, 2022, which we filed with the U.S. Securities and Exchange Commission, or SEC, on March 3, 2023 (the “2022 Annual Report”). Readers are urged to carefully review and consider the various disclosures made throughout our 2022 Annual Report and the Report of Foreign Private Issuer on Form 6-K that attaches Stratasys’ unaudited, condensed consolidated financial statements and its review of its results of operations and financial condition for the third quarter and first nine months of 2023, which will be furnished to the SEC on or about the date hereof, and our other reports filed with or furnished to the SEC, which are designed to advise interested parties of the risks and factors that may affect our business, financial condition, results of operations and prospects. Any guidance provided, and other forward-looking statements made, in this press release are provided or made (as applicable) as of the date hereof, and Stratasys undertakes no obligation to publicly update or revise any forward-looking statements, whether as a result of new information, future events or otherwise, except as required by law.
Use of Non-GAAP Financial Measures
The non-GAAP data included herein, which excludes certain items as described below, are non-GAAP financial measures. Our management believes that these non-GAAP financial measures are useful information for investors and shareholders of our company in gauging our results of operations (i) on an ongoing basis after excluding mergers, acquisitions and divestments related expense or gains and reorganization-related charges or gains, and legal provisions and (ii) excluding non-cash items such as stock-based compensation expenses, acquired intangible assets amortization, including intangible assets amortization related to equity method investments, impairment of long-lived assets and goodwill, revaluation of our investments and the corresponding tax effect of those items. These non-GAAP adjustments either do not reflect actual cash outlays that impact our liquidity and our financial condition or have a non-recurring impact on the statement of operations, as assessed by management. These non-GAAP financial measures are presented to permit investors to more fully understand how management assesses our performance for internal planning and forecasting purposes. The limitations of using these non-GAAP financial measures as performance measures are that they provide a view of our results of operations without including all items indicated above during a period, which may not provide a comparable view of our performance to other companies in our industry. Investors and other readers should consider non-GAAP measures only as supplements to, not as substitutes for or as superior measures to, the measures of financial performance prepared in accordance with GAAP. Reconciliation between results on a GAAP and non-GAAP basis is provided in a table below.
Yonah Lloyd
CCO & VP Investor Relations (in thousands, except share data)
Yonah.Lloyd@stratasys.com
Source: Stratasys Ltd.
Stratasys Ltd.
Consolidated Balance Sheets
(Unaudited)
| September 30, | December 31, | |||||||
| 2023 | 2022 | |||||||
| ASSETS | ||||||||
| Current assets | ||||||||
| Cash and cash equivalents | $ | 104,563 | $ | 150,470 | ||||
| Short-term deposits | 80,000 | 177,367 | ||||||
| Accounts receivable, net of allowance for credit losses of $1.4 million and $0.9 million as of September 30, 2023 and December 31, 2022, respectively | 164,075 | 144,739 | ||||||
| Inventories | 197,420 | 194,054 | ||||||
| Prepaid expenses | 9,732 | 5,767 | ||||||
| Other current assets | 27,534 | 27,823 | ||||||
| Total current assets | 583,324 | 700,220 | ||||||
| Non-current assets | ||||||||
| Property, plant and equipment, net | 198,272 | 195,063 | ||||||
| Goodwill | 90,187 | 64,953 | ||||||
| Other intangible assets, net | 141,201 | 121,402 | ||||||
| Operating lease right-of-use assets | 19,533 | 18,122 | ||||||
| Long-term investments | 129,738 | 141,610 | ||||||
| Other non-current assets | 19,510 | 18,420 | ||||||
| Total non-current assets | 598,441 | 559,570 | ||||||
| Total assets | $ | 1,181,765 | $ | 1,259,790 | ||||
| LIABILITIES AND EQUITY | ||||||||
| Current liabilities | ||||||||
| Accounts payable | $ | 60,845 | $ | 72,921 | ||||
| Accrued expenses and other current liabilities | 49,817 | 45,912 | ||||||
| Accrued compensation and related benefits | 31,502 | 34,432 | ||||||
| Deferred revenues - short term | 51,751 | 50,220 | ||||||
| Operating lease liabilities - short term | 6,511 | 7,169 | ||||||
| Total current liabilities | 200,426 | 210,654 | ||||||
| Non-current liabilities | ||||||||
| Deferred revenues - long term | 28,559 | 25,214 | ||||||
| Deferred income taxes - long term | 6,889 | 5,638 | ||||||
| Operating lease liabilities - long term | 12,692 | 10,670 | ||||||
| Contingent consideration | 25,884 | 23,707 | ||||||
| Other non-current liabilities | 24,172 | 24,475 | ||||||
| Total non-current liabilities | 98,196 | 89,704 | ||||||
| Total liabilities | 298,622 | 300,358 | ||||||
| Equity | ||||||||
| Ordinary shares, NIS 0.01 nominal value, authorized 180,000 thousands shares; 69,165 shares and 67,086 shares issued and outstanding at September 30, 2023 and December 31, 2022, respectively | 194 | 187 | ||||||
| Additional paid-in capital | 3,080,877 | 3,048,915 | ||||||
| Accumulated other comprehensive loss | (12,958 | ) | (12,818 | ) | ||||
| Accumulated deficit | (2,184,970 | ) | (2,076,852 | ) | ||||
| Total equity | 883,143 | 959,432 | ||||||
| Total liabilities and equity | $ | 1,181,765 | $ | 1,259,790 | ||||
Stratasys Ltd.
Consolidated Statements of Operations
(in thousands, except per share data)
| Three Months Ended September 30, | Nine Months Ended September 30, | |||||||||||||||
| 2023 | 2022 | 2023 | 2022 | |||||||||||||
| (unaudited) | (unaudited) | (unaudited) | (unaudited) | |||||||||||||
| Net sales | ||||||||||||||||
| Products | $ | 113,270 | $ | 112,133 | $ | 323,353 | $ | 340,927 | ||||||||
| Services | 48,863 | 50,059 | 147,908 | 151,297 | ||||||||||||
| 162,133 | 162,192 | 471,261 | 492,224 | |||||||||||||
| Cost of sales | ||||||||||||||||
| Products | 59,546 | 55,916 | 168,235 | 176,421 | ||||||||||||
| Services | 36,938 | 35,527 | 105,760 | 107,984 | ||||||||||||
| 96,484 | 91,443 | 273,995 | 284,405 | |||||||||||||
| Gross profit | 65,649 | 70,749 | 197,266 | 207,819 | ||||||||||||
| Operating expenses | ||||||||||||||||
| Research and development, net | 23,567 | 23,145 | 69,347 | 71,489 | ||||||||||||
| Selling, general and administrative | 84,880 | 63,230 | 221,173 | 195,085 | ||||||||||||
| 108,447 | 86,375 | 290,520 | 266,574 | |||||||||||||
| Operating loss | (42,798 | ) | (15,626 | ) | (93,254 | ) | (58,755 | ) | ||||||||
| Gain from deconsolidation of subsidiary | - | 39,136 | - | 39,136 | ||||||||||||
| Financial income (expenses), net | 687 | 452 | 2,147 | (2,080 | ) | |||||||||||
| Income (loss) before income taxes | (42,111 | ) | 23,962 | (91,107 | ) | (21,699 | ) | |||||||||
| Income tax expenses | (645 | ) | (3,298 | ) | (5,145 | ) | (2,796 | ) | ||||||||
| Share in losses of associated companies | (4,523 | ) | (1,915 | ) | (11,866 | ) | (2,089 | ) | ||||||||
| Net income (loss) | $ | (47,279 | ) | $ | 18,749 | $ | (108,118 | ) | $ | (26,584 | ) | |||||
| Net income (loss) per share | ||||||||||||||||
| Basic | $ | (0.68 | ) | $ | 0.28 | $ | (1.58 | ) | $ | (0.40 | ) | |||||
| Diluted | $ | (0.68 | ) | $ | 0.28 | $ | (1.58 | ) | $ | (0.40 | ) | |||||
| Weighted average ordinary shares outstanding | ||||||||||||||||
| Basic | 69,093 | 66,772 | 68,432 | 66,356 | ||||||||||||
| Diluted | 69,093 | 67,038 | 68,432 | 66,356 | ||||||||||||
| Three Months Ended September 30, | ||||||||||||||||||||||||||
| 2023 | Non-GAAP | 2023 | 2022 | Non-GAAP | 2022 | |||||||||||||||||||||
| GAAP | Adjustments | Non-GAAP | GAAP | Adjustments | Non-GAAP | |||||||||||||||||||||
| U.S. dollars and shares in thousands (except per share amounts) | ||||||||||||||||||||||||||
| Gross profit (1) | $ | 65,649 | $ | 12,617 | $ | 78,266 | $ | 70,749 | $ | 7,990 | $ | 78,739 | ||||||||||||||
| Operating income (loss) (1,2) | (42,798 | ) | 46,885 | $ | 4,087 | (15,626 | ) | 20,149 | 4,523 | |||||||||||||||||
| Net income (loss) (1,2,3) | (47,279 | ) | 49,725 | $ | 2,446 | 18,749 | (15,423 | ) | 3,326 | |||||||||||||||||
| Net income (loss) per diluted share (4) | $ | (0.68 | ) | $ | 0.72 | $ | 0.04 | $ | 0.28 | $ | (0.23 | ) | $ | 0.05 | ||||||||||||
| (1) | Acquired intangible assets amortization expense | 5,142 | 6,941 | |||||||||||||||||||||||
| Non-cash stock-based compensation expense | 891 | 1,061 | ||||||||||||||||||||||||
| Restructuring and other related costs | 6,584 | (12 | ) | |||||||||||||||||||||||
| 12,617 | 7,990 | |||||||||||||||||||||||||
| (2) | Acquired intangible assets amortization expense | 2,599 | 2,138 | |||||||||||||||||||||||
| Non-cash stock-based compensation expense | 6,588 | 6,330 | ||||||||||||||||||||||||
| Restructuring and other related costs | 2,360 | 1,309 | ||||||||||||||||||||||||
| Revaluation of investments | 4,300 | 901 | ||||||||||||||||||||||||
| Contingent consideration | 265 | 394 | ||||||||||||||||||||||||
| Legal, consulting and other expenses | 18,156 | 1,087 | ||||||||||||||||||||||||
| 34,269 | 12,159 | |||||||||||||||||||||||||
| 46,885 | 20,149 | |||||||||||||||||||||||||
| (3) | Corresponding tax effect | 153 | 2,993 | |||||||||||||||||||||||
| Finance expenses | 162 | - | ||||||||||||||||||||||||
| Equity method related amortization and other | 2,525 | 571 | ||||||||||||||||||||||||
| Gain from deconsolidation of Subsidiary | (39,136 | ) | ||||||||||||||||||||||||
| $ | 49,725 | $ | (15,423 | ) | ||||||||||||||||||||||
| (4) | Weighted average number of ordinary shares outstanding- Diluted | 69,093 | 69,815 | 67,038 | 67,038 | |||||||||||||||||||||
| Nine Months Ended September 30, | ||||||||||||||||||||||||||
| 2023 | Non-GAAP | 2023 | 2022 | Non-GAAP | 2022 | |||||||||||||||||||||
| GAAP | Adjustments | Non-GAAP | GAAP | Adjustments | Non-GAAP | |||||||||||||||||||||
| U.S. dollars and shares in thousands (except per share amounts) | ||||||||||||||||||||||||||
| Gross profit (1) | $ | 197,266 | $ | 29,199 | $ | 226,465 | $ | 207,819 | $ | 27,593 | $ | 235,412 | ||||||||||||||
| Operating income (loss) (1,2) | (93,254 | ) | 103,866 | $ | 10,612 | (58,755 | ) | 67,235 | $ | 8,480 | ||||||||||||||||
| Net income (loss) (1,2,3) | (108,118 | ) | 114,179 | $ | 6,061 | (26,584 | ) | 32,295 | $ | 5,711 | ||||||||||||||||
| Net income (loss) per diluted share (4) | $ | (1.58 | ) | $ | 1.67 | $ | 0.09 | $ | (0.40 | ) | $ | 0.49 | $ | 0.09 | ||||||||||||
| (1) | Acquired intangible assets amortization expense | 14,157 | 20,861 | |||||||||||||||||||||||
| Non-cash stock-based compensation expense | 2,822 | 3,041 | ||||||||||||||||||||||||
| Restructuring and other related costs | 12,220 | 3,691 | ||||||||||||||||||||||||
| 29,199 | 27,593 | |||||||||||||||||||||||||
| (2) | Acquired intangible assets amortization expense | 7,479 | 6,581 | |||||||||||||||||||||||
| Non-cash stock-based compensation expense | 20,920 | 21,714 | ||||||||||||||||||||||||
| Restructuring and other related costs | 6,626 | 1,864 | ||||||||||||||||||||||||
| Revaluation of investments | 4,880 | 3,217 | ||||||||||||||||||||||||
| Contingent consideration | 877 | 1,197 | ||||||||||||||||||||||||
| Legal, consulting and other expenses | 33,885 | 5,069 | ||||||||||||||||||||||||
| 74,667 | 39,642 | |||||||||||||||||||||||||
| 103,866 | 67,235 | |||||||||||||||||||||||||
| (3) | Corresponding tax effect | 3,404 | 3,219 | |||||||||||||||||||||||
| Finance expenses | 1,827 | 571 | ||||||||||||||||||||||||
| Equity method related amortization and other | 5,081 | 406 | ||||||||||||||||||||||||
| Gain from deconsolidation of Subsidiary | - | (39,136 | ) | |||||||||||||||||||||||
| $ | 114,179 | $ | 32,295 | |||||||||||||||||||||||
| (4) | Weighted average number of ordinary shares outstanding- Diluted | 68,432 | 69,046 | 66,356 | 67,007 | |||||||||||||||||||||
8
Exhibit 99.2
Q3 2023 Results Speakers Dr. Yoav Zeif, CEO Eitan Zamir, CFO Yonah Lloyd, CCO & VP IR November 16, 2023 Conference Call and Webcast Details US Toll - Free Dial - In 1 - 877 - 407 - 0619 International Dial - In 1 - 412 - 902 - 1012 Live Webcast and Replay https://event.choruscall.com/mediaframe/webcast.htm l?webcastid=bSk6aoYV 2 2


Forward - Looking Statements Cautionary Statement Regarding Forward - Looking Statements The statements in this slide presentation regarding Stratasys' strategy, and the statements regarding its projected future financial performance, including the financial guidance concerning its expected results for 2023, are forward - looking statements reflecting management's current expectations and beliefs. These forward - looking statements are based on current information that is, by its nature, subject to rapid and even abrupt change. Due to risks and uncertainties associated with Stratasys' business, actual results could differ materially from those projected or implied by these forward - looking statements. These risks and uncertainties include, but are not limited to: the degree of our success at introducing new or improved products and solutions that gain market share; the extent of growth of the 3D printing market generally; the duration and severity of headwinds caused by current macro - economic trends that have been adversely affecting, and may continue to adversely affect, our results, including unfavorable currency exchange rates, inflationary pressures and higher interest rates; the impact of potential shifts in the prices or margins of the products that we sell or services that we provide, including due to a shift towards lower margin products or services; the impact of competition and new technologies; the outcome and degree of success of our board’s comprehensive process to explore strategic alternatives for our company; the degree of impact of I srael’s war against the terrorist organization Hamas, given our Israeli headquarters, factories and significant operations; the extent of our success at successfully integrating into our existing business, or making additional, acquisitions or investments in new businesses, technologies, products or services; potential changes in our management and board of directors; global market, political and economic conditions, and in the countries in which we operate in particular (including risks stemming from Russia’s invasion of Ukraine); potential further charges against earnings that we could be required to take due to impairment of additional goodwill or other intangible assets that we have recently acquired or may acquire in the future; costs and potential liability relating to litigation and regulatory proceedings; risks related to infringement of our intellectual property rights by others or infringement of others' intellectual property rights by us; the extent of our success at maintaining our liquidity and financing our operations and capital needs; the impact of tax regulations on our results of operations and financial condition; and those additional factors referred to in Item 3.D “Key Information - Risk Factors”, Item 4, “Information on the Company”, Item 5, “Operating and Financial Review and Prospects,” and all other parts of our Annual Report on Form 20 - F for the year ended December 31, 2022, filed with the SEC on March 3, 2023 (the “2022 Annual Report”). Readers are urged to carefully review and consider the various disclosures made throughout our 2022 Annual Report and the Reports of Foreign Private Issuer on Form 6 - K that attach Stratasys’ unaudited, condensed consolidated financial statements and its review of its results of operations and financial condition, for the third quarter of 2023, which Stratasys is furnishing to the SEC today, and our other reports filed with or furnished to the SEC, which are designed to advise interested parties of the risks and factors that may affect our business, financial condition, results of operations and prospects. Any guidance provided, and other forward - looking statements made, in this slide presentation are made as of the date hereof, and Stratasys undertakes no obligation to publicly update or revise any forward - looking statements, whether as a result of new information, future events or otherwise, except as required by law.
Use of Non - GAAP Financial Information Use of Non - GAAP Financial Measures The non - GAAP data included herein, which excludes certain items as described below, are non - GAAP financial measures. Our management believes that these non - GAAP financial measures are useful information for investors and shareholders of our Company in gauging our results of operations (i) on an ongoing basis after excluding mergers, acquisitions and divestments related expense or gains and reorganization - related charges or gains, legal provisions, and (ii) excluding non - cash items such as stock - based compensation expenses, acquired intangible assets amortization, including intangible assets amortization related to equity method investments, impairment of long - lived assets and goodwill, revaluation of our investments and the corresponding tax effect of those items. The items eliminated via these non - GAAP adjustments either do not reflect actual cash outlays that impact our liquidity and our financial condition or have a non - recurring impact on the statement of operations, as assessed by management. These non - GAAP financial measures are presented to permit investors to more fully understand how management assesses our performance for internal planning and forecasting purposes. The limitations of using these non - GAAP financial measures as performance measures are that they provide a view of our results of operations without including all items indicated above during a period, which may not provide a comparable view of our performance to other companies in our industry. Investors and other readers should consider non - GAAP measures only as supplements to, not as substitutes for or as superior measures to, the measures of financial performance prepared in accordance with GAAP. Reconciliation between results on a GAAP and non - GAAP basis is provided in a table later in this slide presentation.

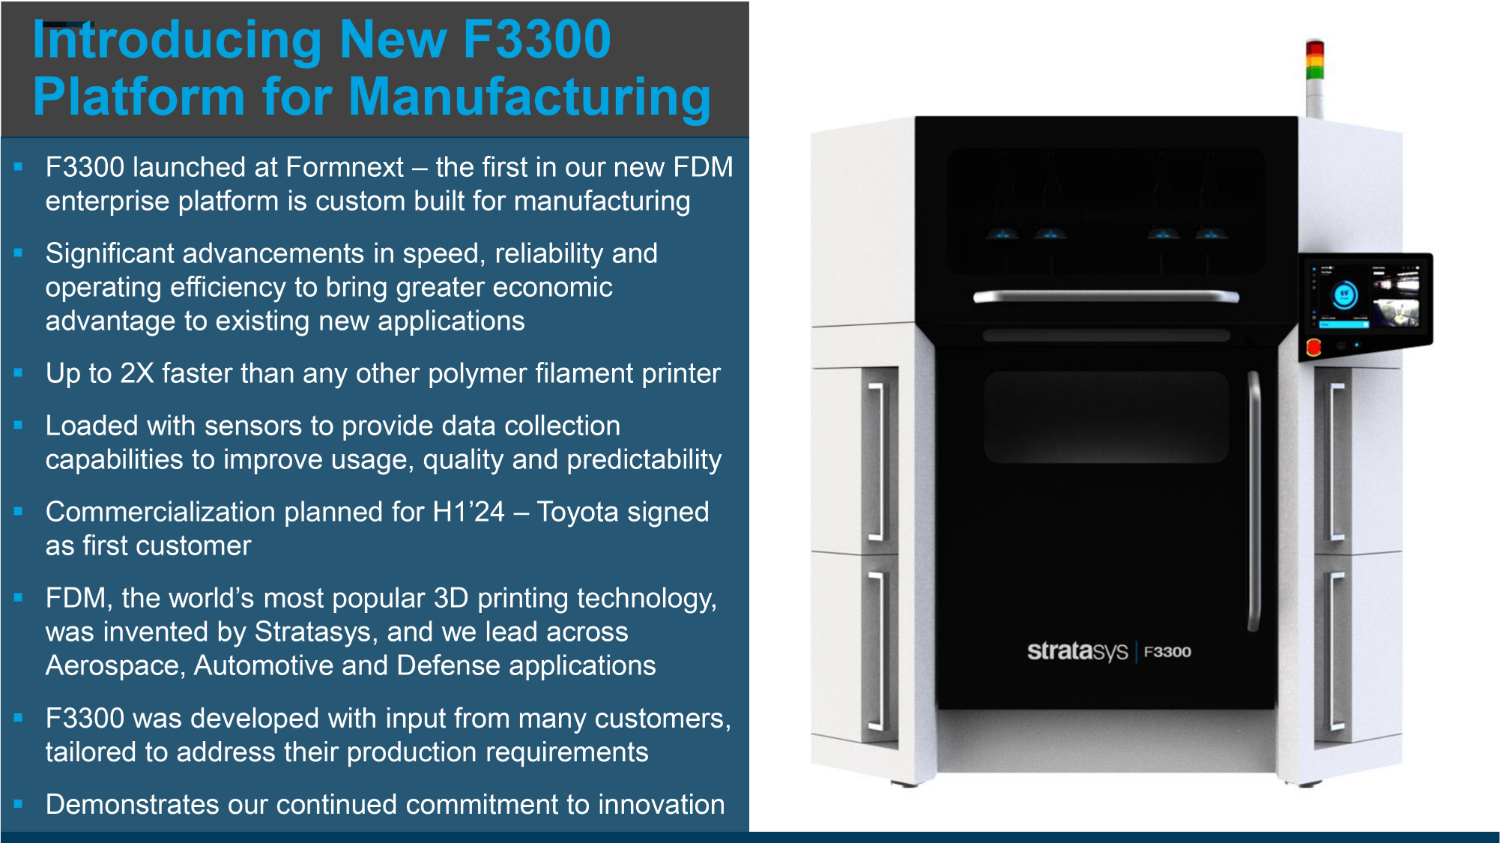
CEO Dr. Yoav Zeif ▪ Fully operational during the situation in Israel and proud of our employee’s dedication and spirit ▪ Appointed seasoned executive Aris Kekedjian to our board of directors; Thanking Ziva Patir for her commitment and contributions over 10 years of service ▪ Delivered record - high recurring consumables revenue despite challenging macro backdrop – reflects solid printer utilization ▪ Customers recognize our unique portfolio - demand and engagement stronger than ever ▪ Ninth consecutive adjusted profitable quarter ▪ Strong balance sheet with $185M cash, equivalents, short - term deposits and no debt supports our vision to lead the additive manufacturing industry Introducing New F3300 Platform for Manufacturing ▪ F3300 launched at Formnext – the first in our new FDM enterprise platform is custom built for manufacturing ▪ Significant advancements in speed, reliability and operating efficiency to bring greater economic advantage to existing new applications ▪ Up to 2X faster than any other polymer filament printer ▪ Loaded with sensors to provide data collection capabilities to improve usage, quality and predictability ▪ Commercialization planned for H1’24 – Toyota signed as first customer ▪ FDM, the world’s most popular 3D printing technology, was invented by Stratasys, and we lead across Aerospace, Automotive and Defense applications ▪ F3300 was developed with input from many customers, tailored to address their production requirements ▪ Demonstrates our continued commitment to innovation
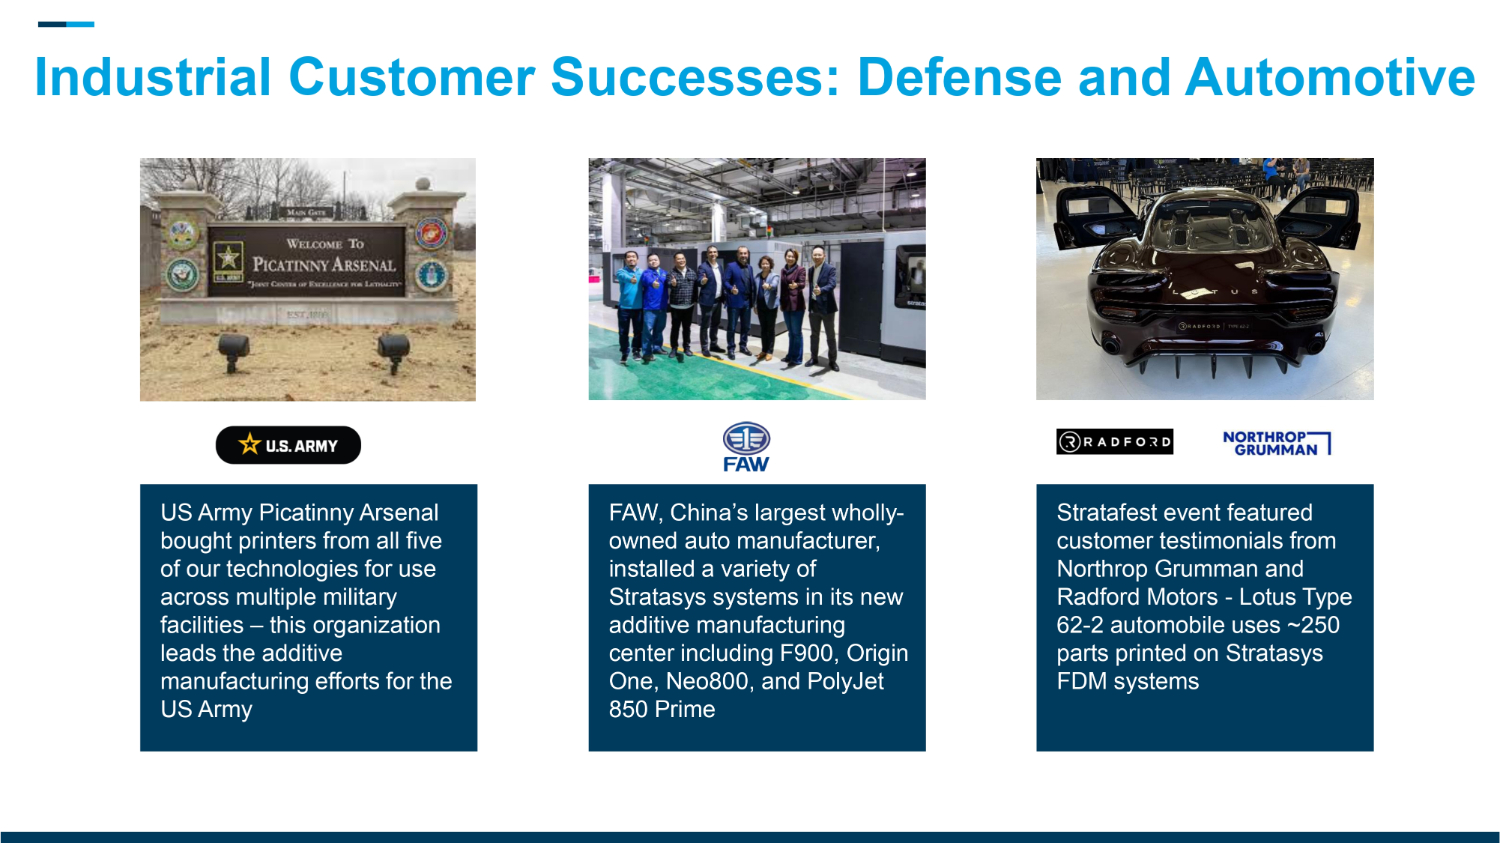
FAW, China’s largest wholly - owned auto manufacturer, installed a variety of Stratasys systems in its new additive manufacturing center including F900, Origin One, Neo800, and PolyJet 850 Prime Stratafest event featured customer testimonials from Northrop Grumman and Radford Motors - Lotus Type 62 - 2 automobile uses ~250 parts printed on Stratasys FDM systems US Army Picatinny Arsenal bought printers from all five of our technologies for use across multiple military facilities – this organization leads the additive manufacturing efforts for the US Army Industrial Customer Successes: Defense and Automotive Partnerships Drive New Opportunities ▪ Encee Medical in Germany to deliver Stratasys healthcare solutions - strategic decision to expand our network through medical specialty partners ▪ GO Orthotics produces custom orthotics with SAF printers to save time, achieve higher throughput and superior fit and comfort than traditional manufacturing.
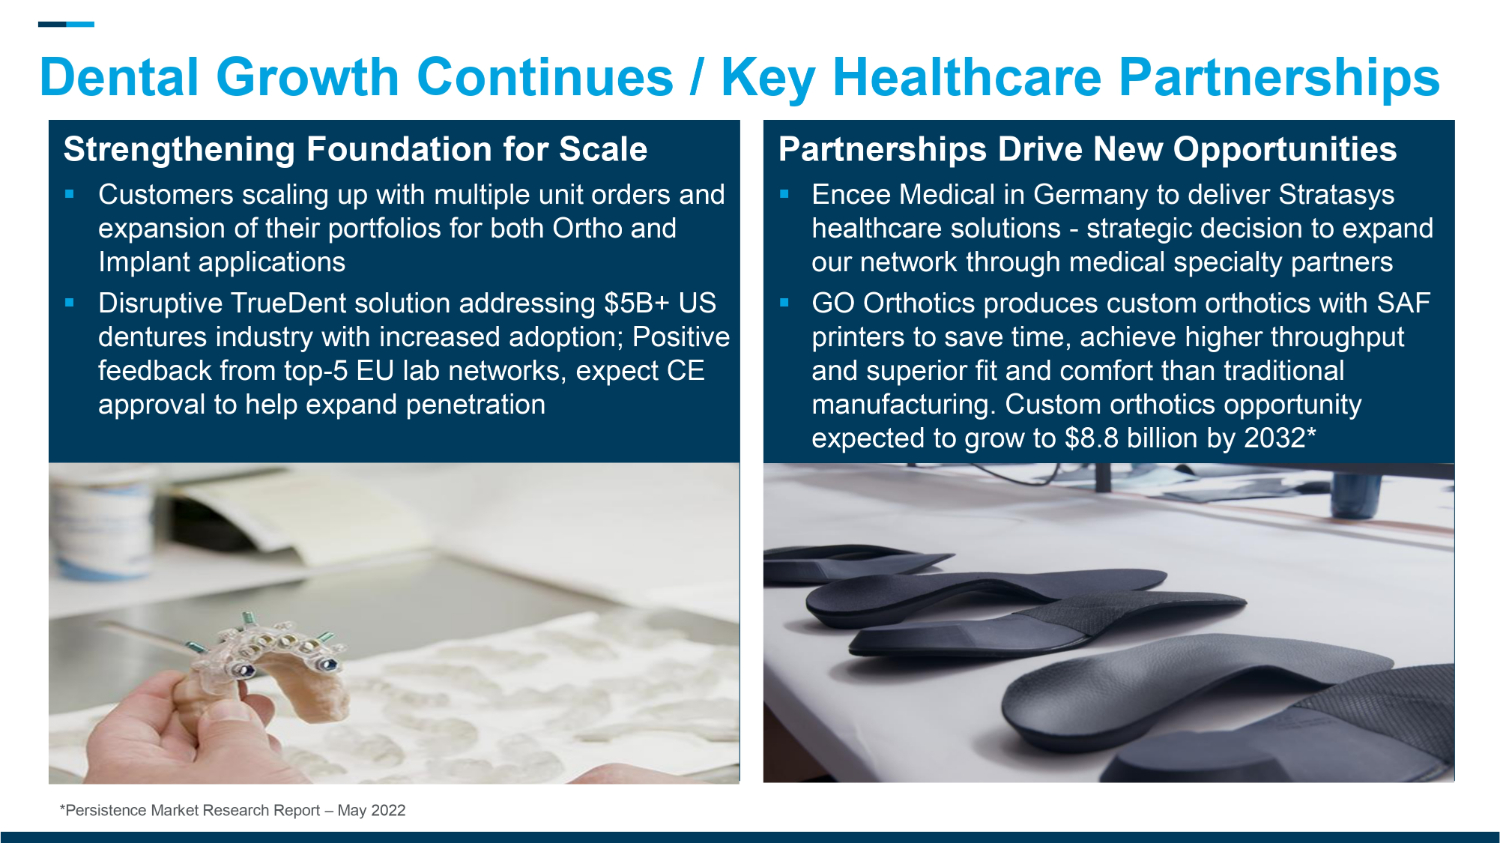
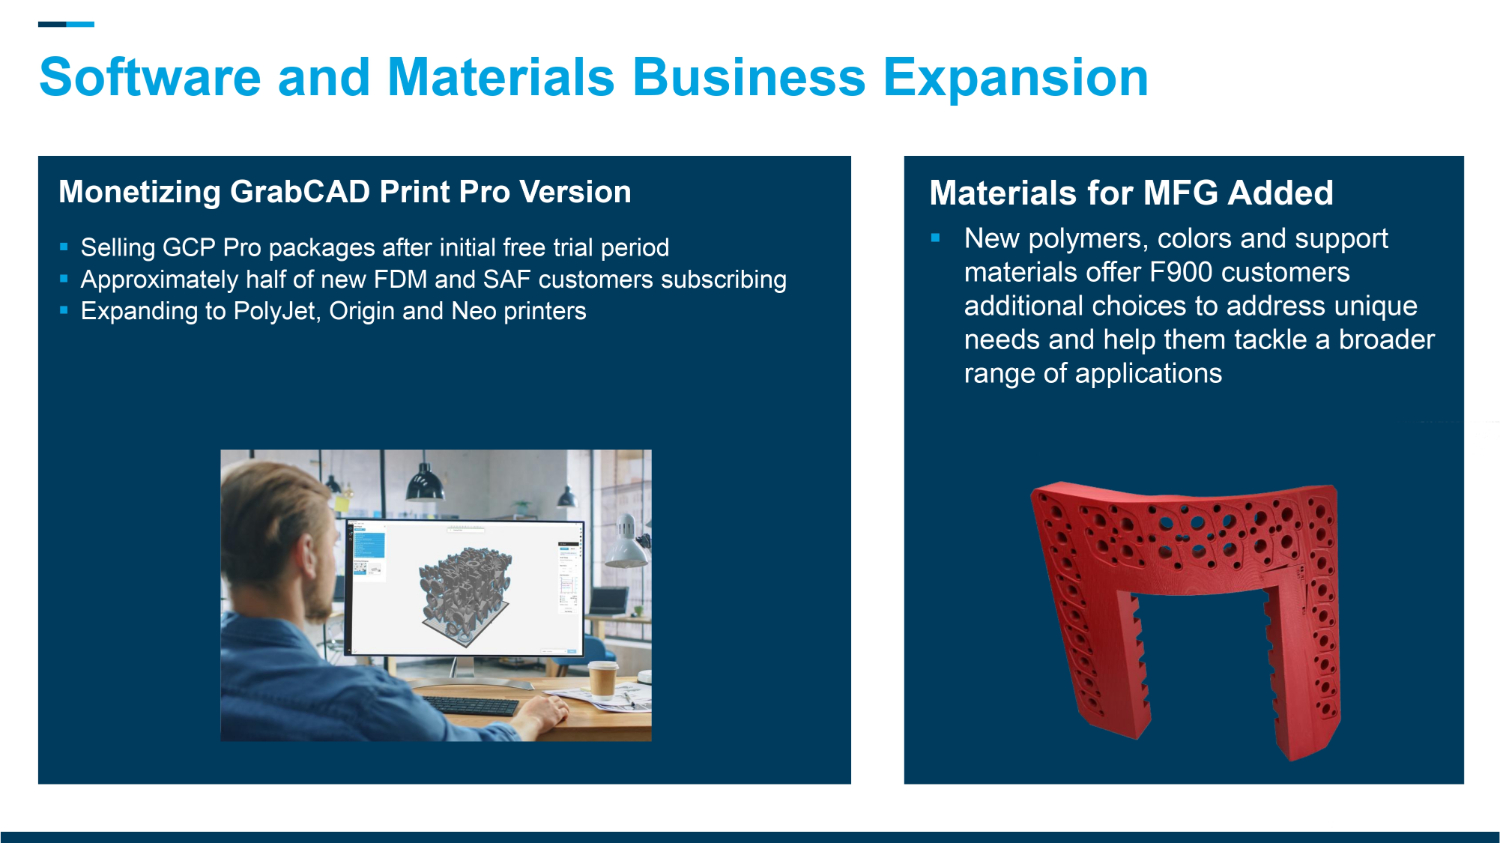
Custom orthotics opportunity expected to grow to $8.8 billion by 2032* Dental Growth Continues / Key Healthcare Partnerships *Persistence Market Research Report – May 2022 Strengthening Foundation for Scale ▪ Customers scaling up with multiple unit orders and expansion of their portfolios for both Ortho and Implant applications ▪ Disruptive TrueDent solution addressing $5B+ US dentures industry with increased adoption; Positive feedback from top - 5 EU lab networks, expect CE approval to help expand penetration Software and Materials Business Expansion Monetizing GrabCAD Print Pro Version ▪ Selling GCP Pro packages after initial free trial period ▪ Approximately half of new FDM and SAF customers subscribing ▪ Expanding to PolyJet, Origin and Neo printers Materials for MFG Added ▪ New polymers, colors and support materials offer F900 customers additional choices to address unique needs and help them tackle a broader range of applications
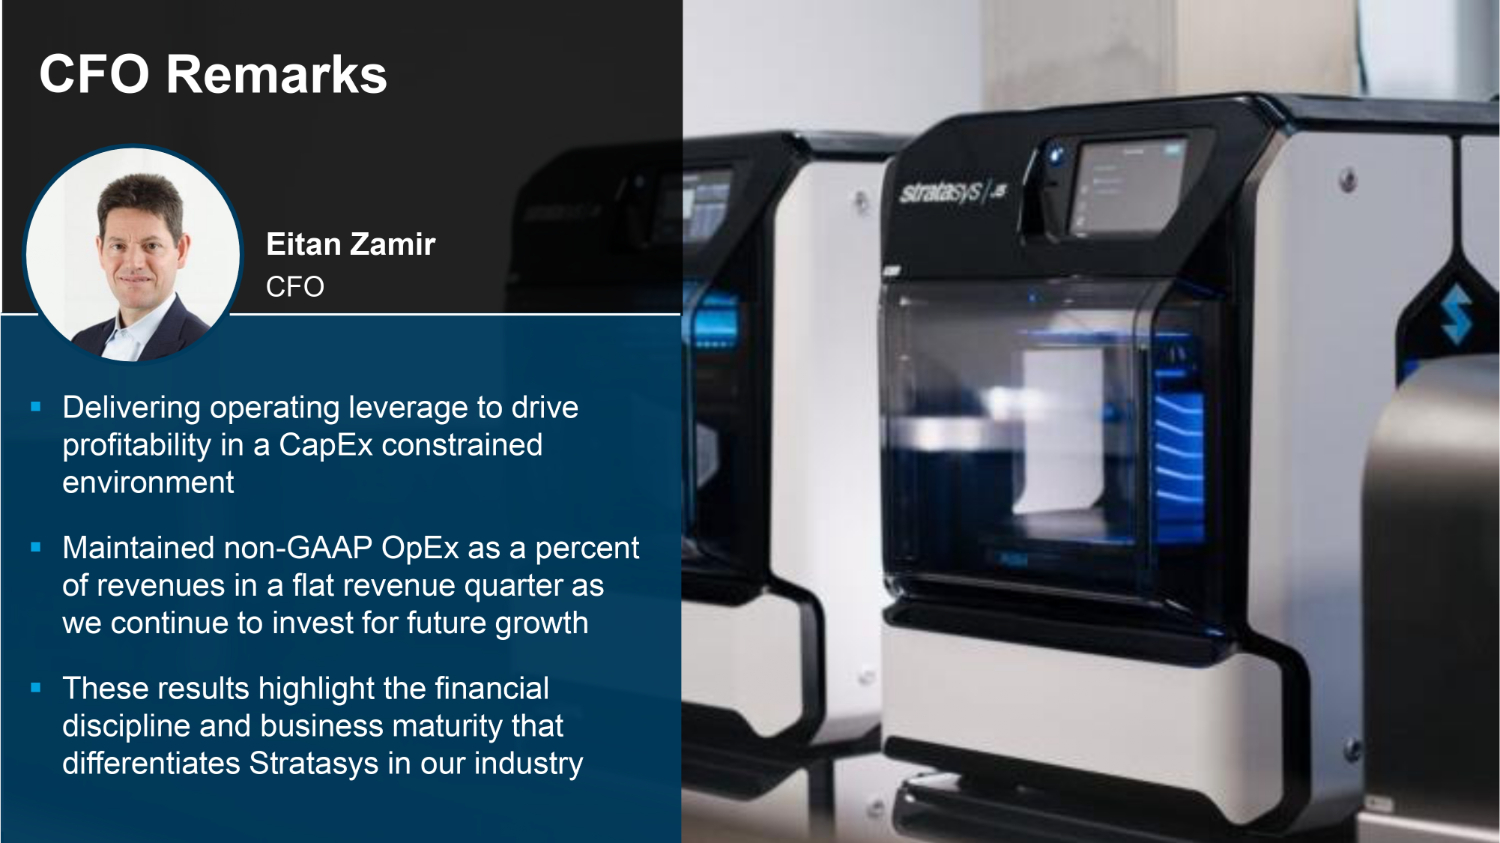
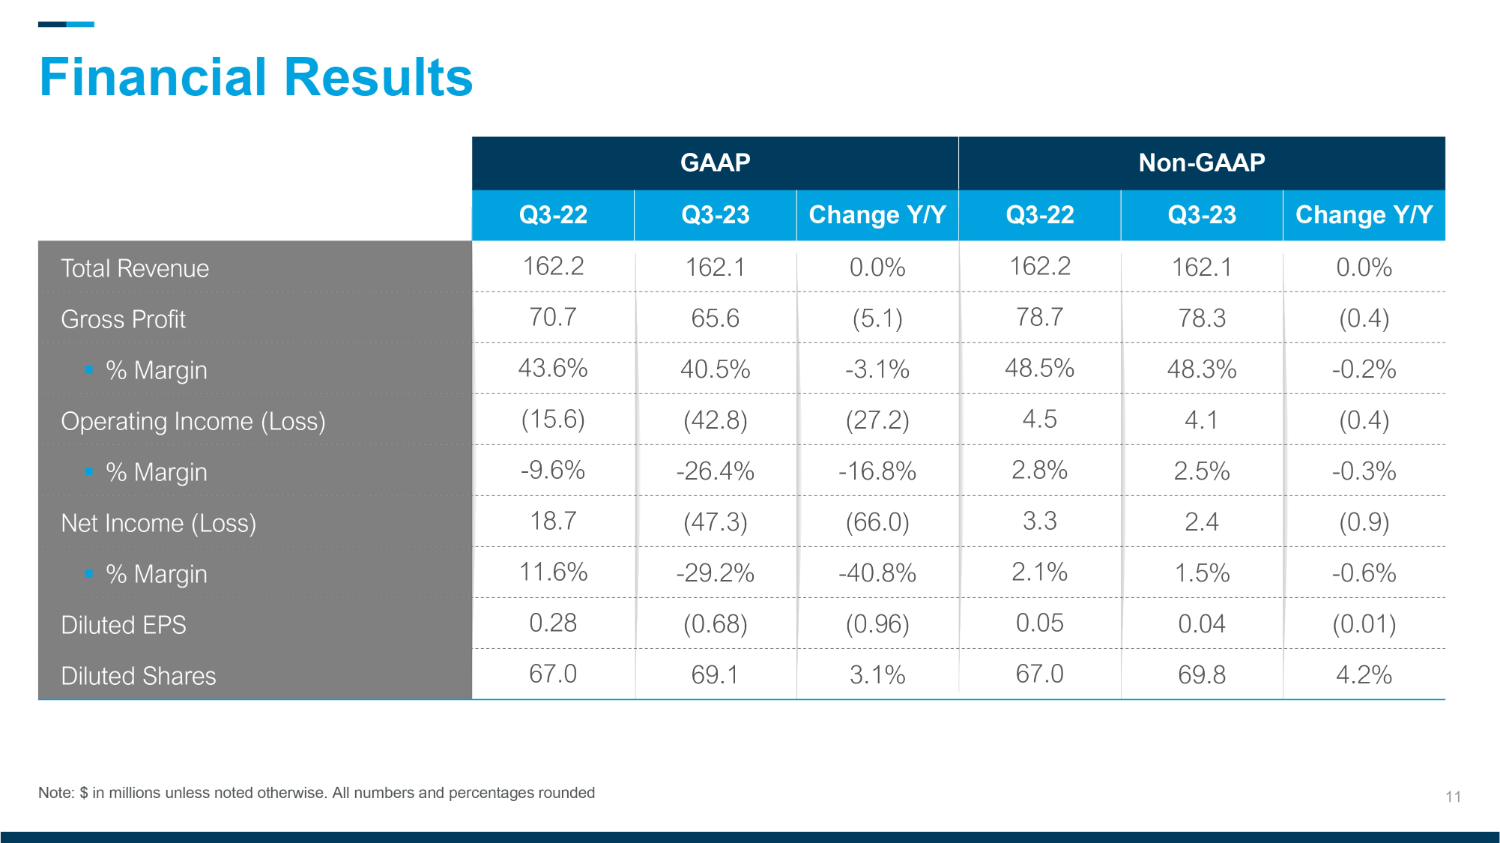
▪ Delivering operating leverage to drive profitability in a CapEx constrained environment ▪ Maintained non - GAAP OpEx as a percent of revenues in a flat revenue quarter as we continue to invest for future growth ▪ These results highlight the financial discipline and business maturity that differentiates Stratasys in our industry CFO Eitan Zamir CFO Remarks 11 Non - GAAP GAAP Change Y/Y Q3 - 23 Q3 - 22 Change Y/Y Q3 - 23 Q3 - 22 0.0% 162.1 162.2 0.0% 162.1 162.2 Total Revenue (0.4) 78.3 78.7 (5.1) 65.6 70.7 Gross Profit - 0.2% 48.3% 48.5% - 3.1% 40.5% 43.6% ▪ % Margin (0.4) 4.1 4.5 (27.2) (42.8) (15.6) Operating Income (Loss) - 0.3% 2.5% 2.8% - 16.8% - 26.4% - 9.6% ▪ % Margin (0.9) 2.4 3.3 (66.0) (47.3) 18.7 Net Income (Loss) - 0.6% 1.5% 2.1% - 40.8% - 29.2% 11.6% ▪ % Margin (0.01) 0.04 0.05 (0.96) (0.68) 0.28 Diluted EPS 4.2% 69.8 67.0 3.1% 69.1 6 7.0 Diluted Shares Note: $ in millions unless noted otherwise. All numbers and percentages rounded Financial Results * Reflects only 2 months of MakerBot revenue which was divested August 31, 2022 Note: $ in millions unless noted otherwise.
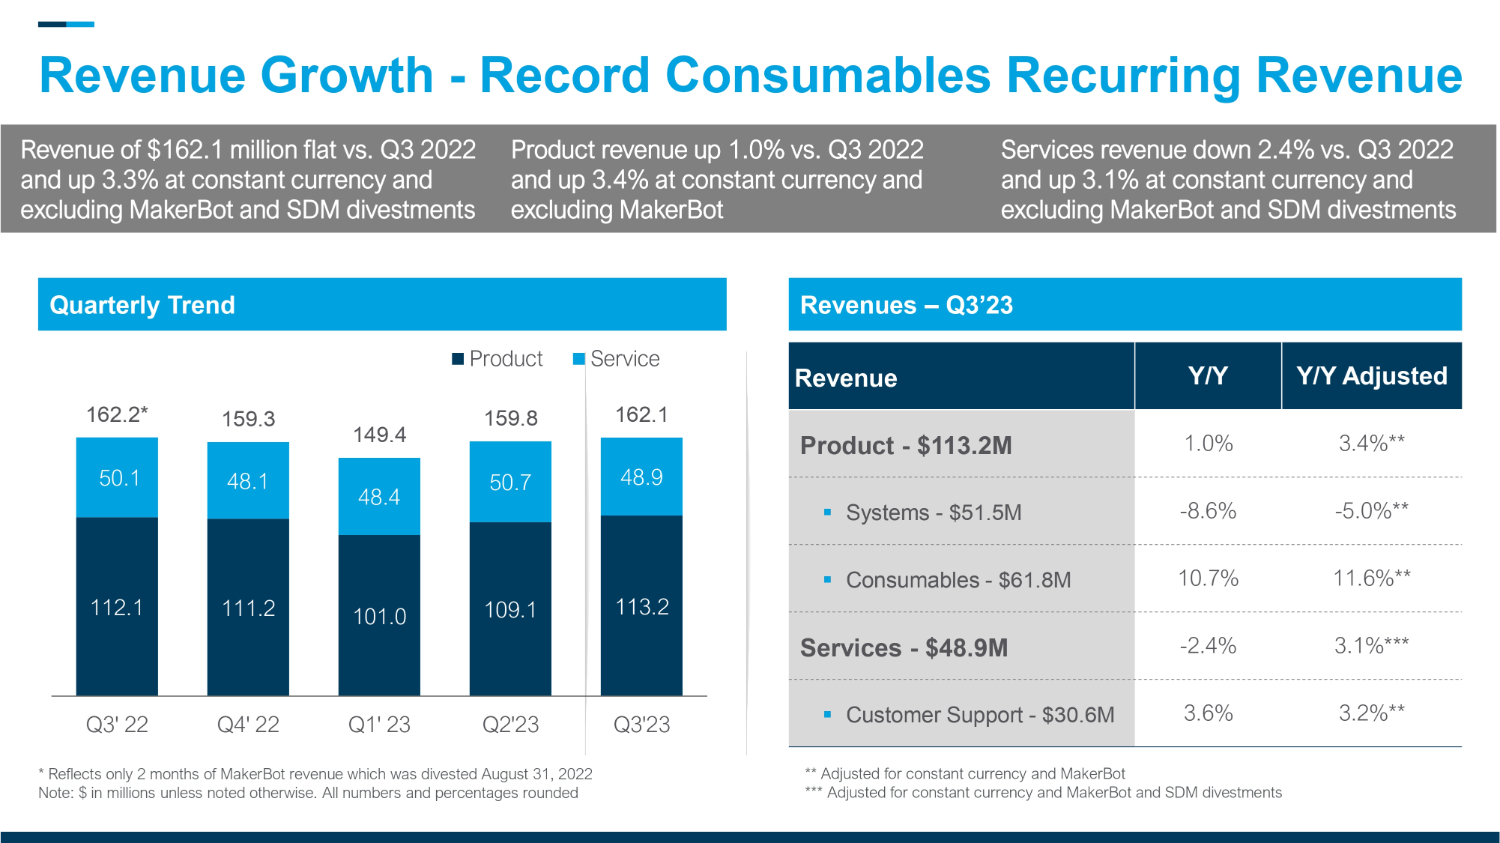
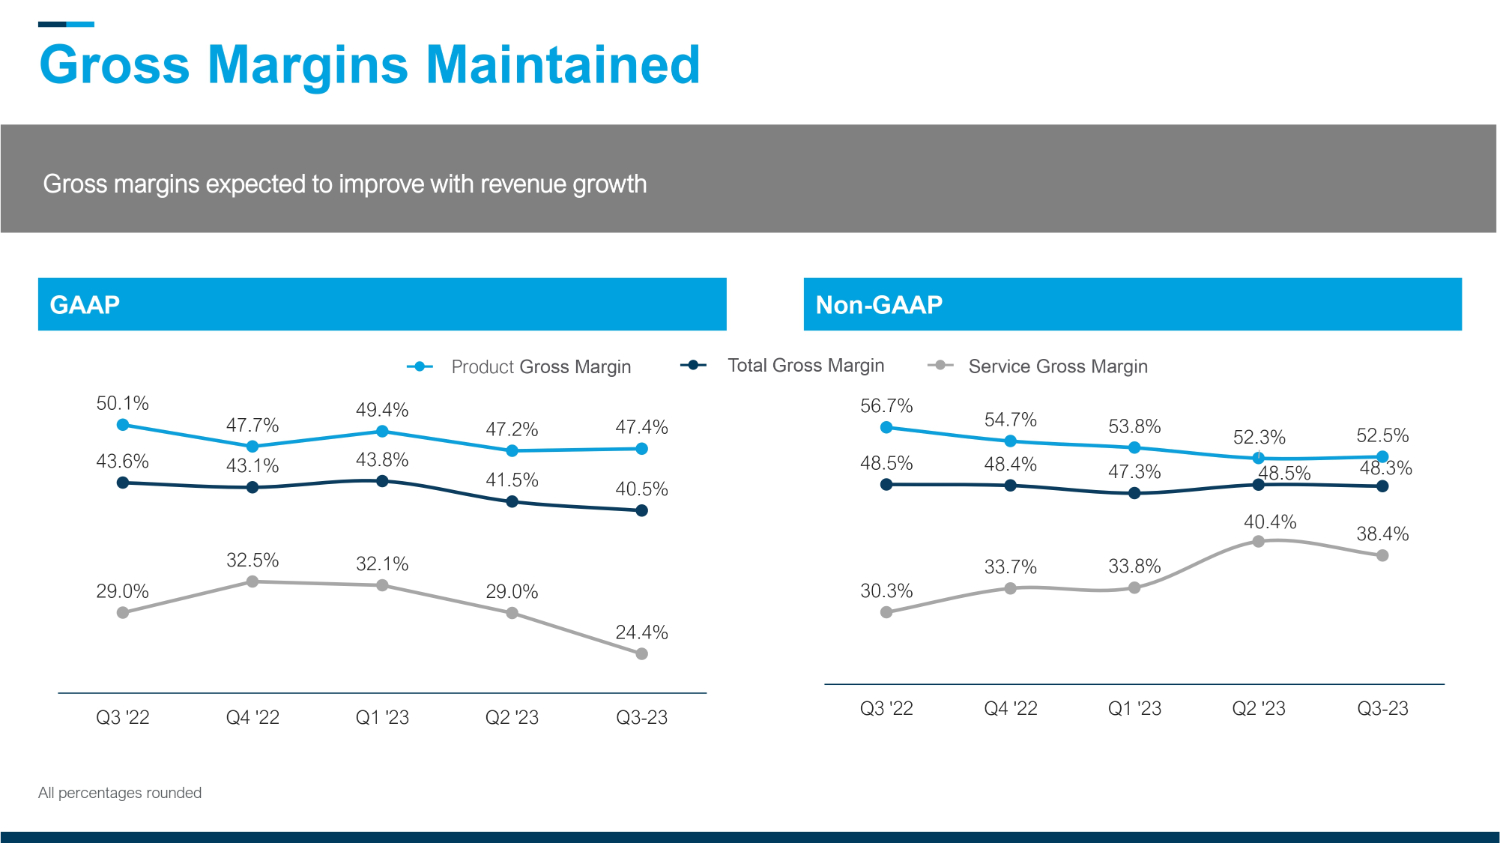
All numbers and percentages rounded Quarterly Trend Revenues – Q 3 ’ 2 112.1 111.2 101.0 109.1 113.2 50.1 48.1 48.4 50.7 48.9 162.2* 159.3 149.4 159.8 162.1 Q3' 22 Q4' 22 Q1' 23 Q2'23 Q3'23 Product Service Y/Y Adjusted Y/Y Revenue 3.4 % ** 1.0 % Product - $113.2M - 5.0 % ** - 8.6 % ▪ Systems - $51.5M 11.6%** 10.7% ▪ Consumables - $61.8M 3.1%*** - 2.4% Services - $48.9M 3.2%** 3.6% ▪ Customer Support - $30.6M Revenue of $ 162.1 million flat vs. Q 3 2022 and up 3.3 % at constant currency and excluding MakerBot and SDM divestments Product revenue up 1.0 % vs. Q 3 2022 and up 3.4 % at constant currency and excluding MakerBot Services revenue down 2.4 % vs. Q 3 2022 and up 3.1 % at constant currency and excluding MakerBot and SDM divestments Revenue Growth - Record Consumables Recurring Revenue ** Adjusted for constant currency and MakerBot *** Adjusted for constant currency and MakerBot and SDM divestments Gross Margins Maintained GAAP Non - GAAP 43.6% 43.1% 43.8% 41.5 % 40.5% 50.1% 47.7% 49.4% 47.2% 47.4% 29.0% 32.5 % 32.1% 29.0% 24.4% Q3 '22 Q4 '22 Q1 '23 Q2 '23 Q3-23 48.5% 48.4% 47.3% 48.5% 48.3 % 56.7% 54.7% 53.8% 52.3% 52.5% 30.3% 33.7% 33.8 % 40.4% 38.4% Q3 '22 Q4 '22 Q1 '23 Q2 '23 Q3-23 Service Gross Margin Product Gross Margin Total Gross Margin All percentages rounded Gross margins expected to improve with revenue growth
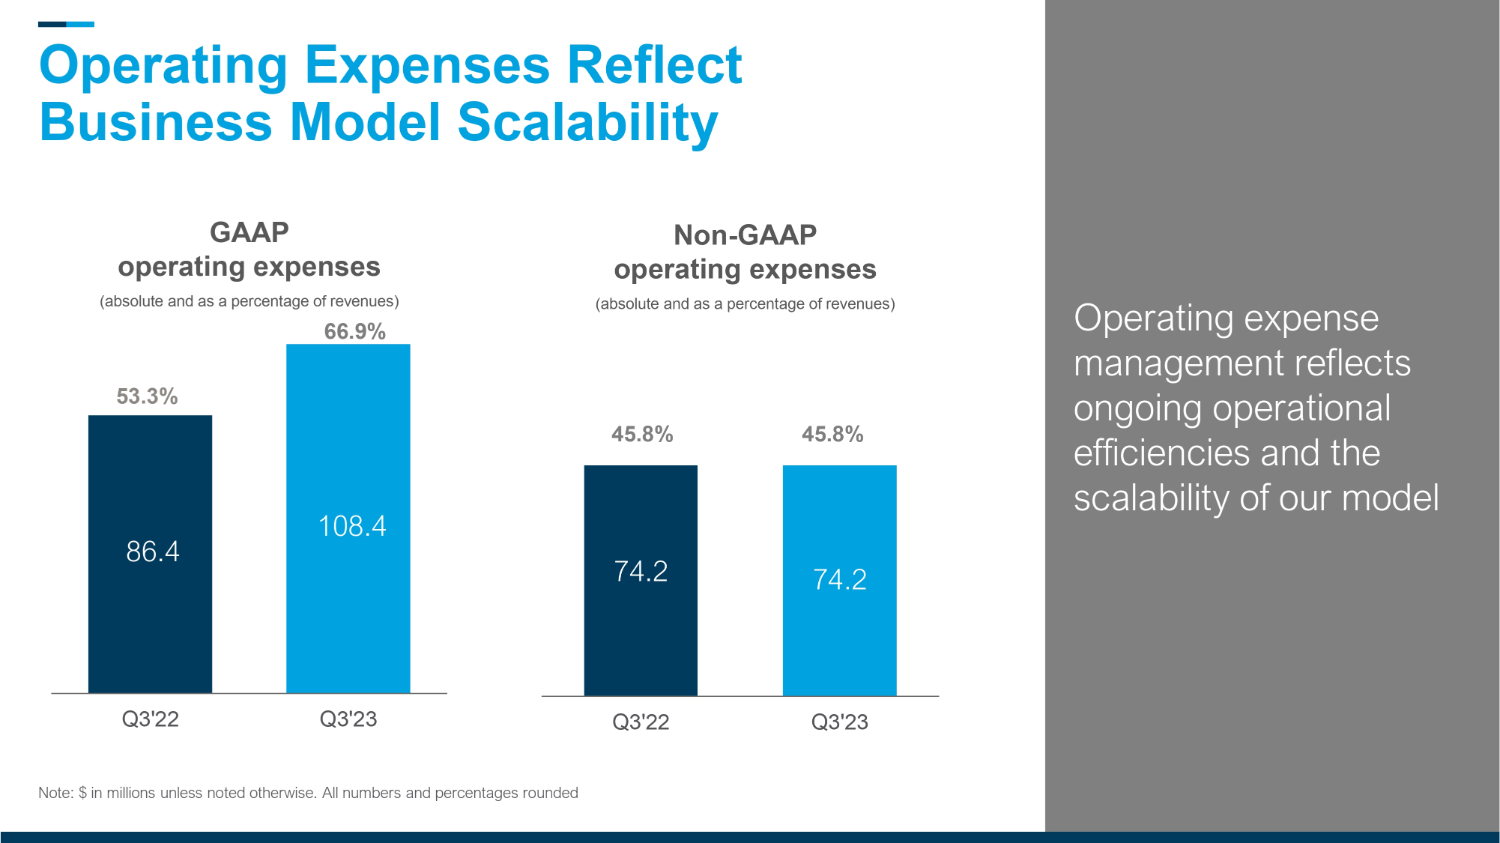
Operating Expenses Reflect Business Model Scalability GAAP operating expenses (absolute and as a percentage of revenues) Non - GAAP operating expenses (absolute and as a percentage of revenues) 86.4 108.4 Q3'22 Q3'23 66.9% 74.2 74.2 Q3'22 Q3'23 45.8% Note: $ in millions unless noted otherwise. All numbers and percentages rounded 53.3% 45.8% Operating expense management reflects ongoing operational efficiencies and the scalability of our model 18.7 (47.3) (15.6) (42.8) Ninth Straight Quarter of Positive Adjusted EPS Non - GAAP operating income (2.8% in Q3’22 vs 2.5% in Q3’23 out of total revenue) GAAP operating loss Non - GAAP net income GAAP net gain ( loss) Note: $ in millions unless noted otherwise.
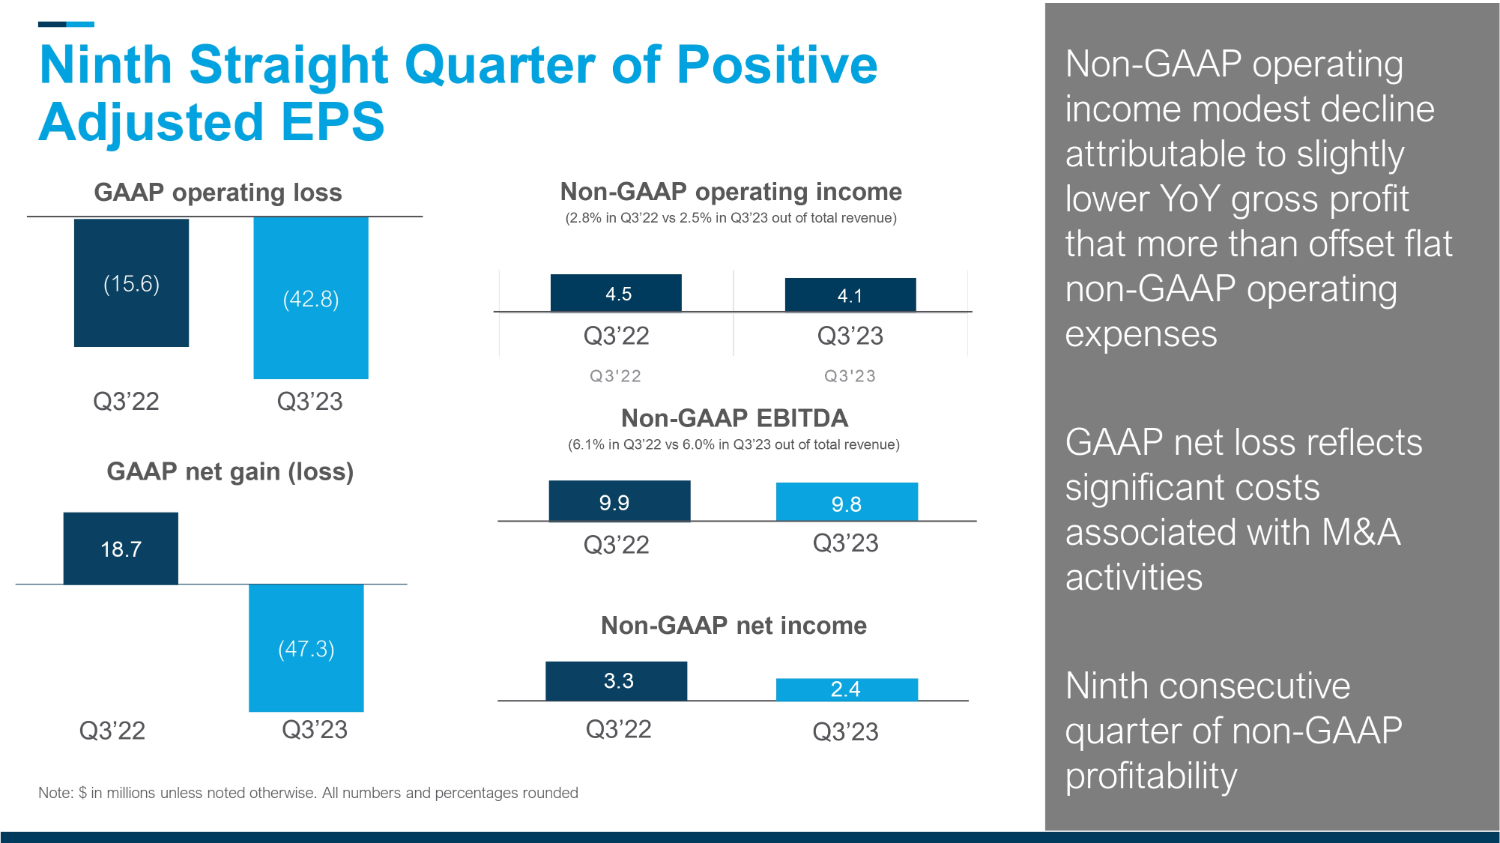
All numbers and percentages rounded 4.5 4.1 Q 3 ' 22 Q3'23 Q3’22 Q3’23 Q3’22 Q3’23 Q3’22 Q3’23 Q 3 ’ 22 Q3’23 Q3’22 Q3’23 Non - GAAP operating income modest decline attributable to slightly lower YoY gross profit that more than offset flat non - GAAP operating expenses GAAP net loss reflects significant costs associated with M&A activities Ninth consecutive quarter of non - GAAP profitability 9.8 9.9 3.3 2.4 Non - GAAP EBITDA ( 6.1 % in Q 3 ’ 22 vs 0 % in Q 3 ’ 23 out of total revenue)
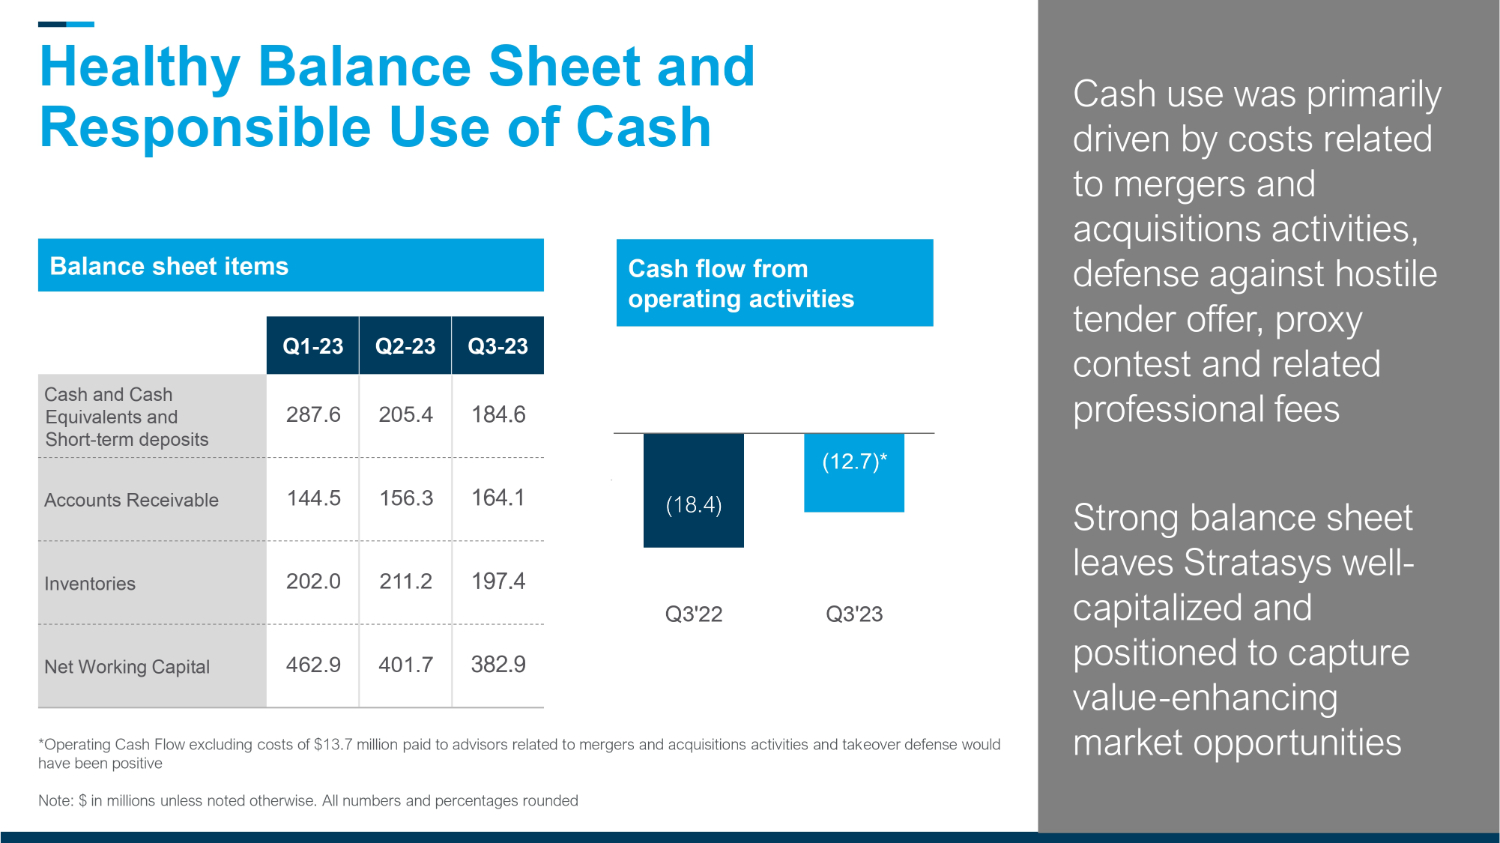
Healthy Balance Sheet and Responsible Use of Cash Balance sheet items (18.4) (12.7)* Q3'22 Q3'23 Cash flow from operating activities Q3 - 23 Q2 - 23 Q - 2 184.6 Cash and Cash Equivalents and Short - term deposits 164.1 Accounts Receivable 197.4 Inventories 382.9 ; Net Working Capital 16 Cash use was primarily driven by costs related to mergers and acquisitions activities, defense against hostile tender offer, proxy contest and related professional fees Strong balance sheet leaves Stratasys well - capitalized and positioned to capture value - enhancing market opportunities *Operating Cash Flow excluding costs of $13.7 million paid to advisors related to mergers and acquisitions activities and tak eov er defense would have been positive Note: $ in millions unless noted otherwise.
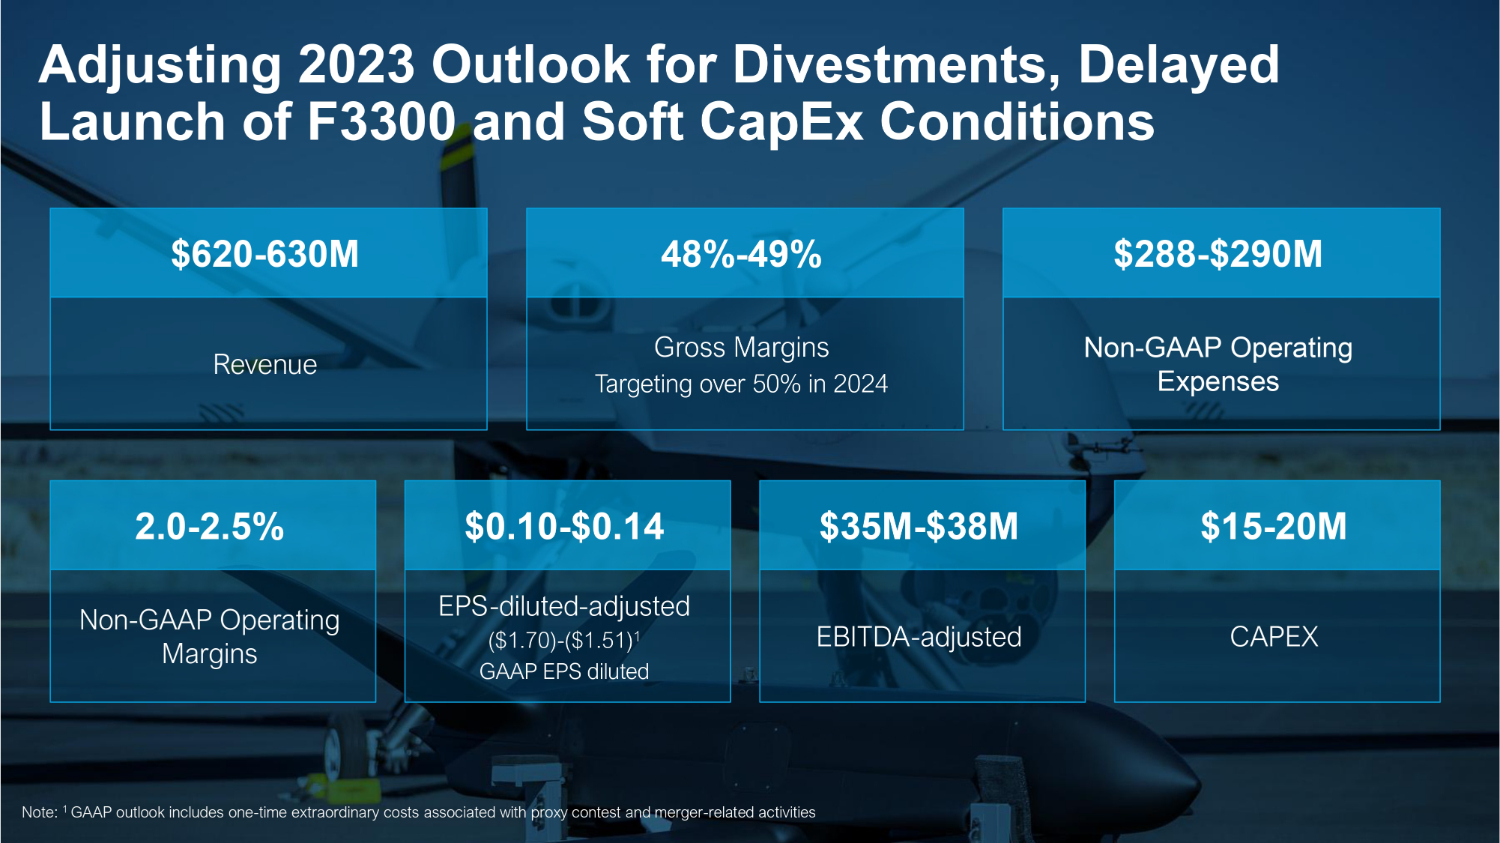
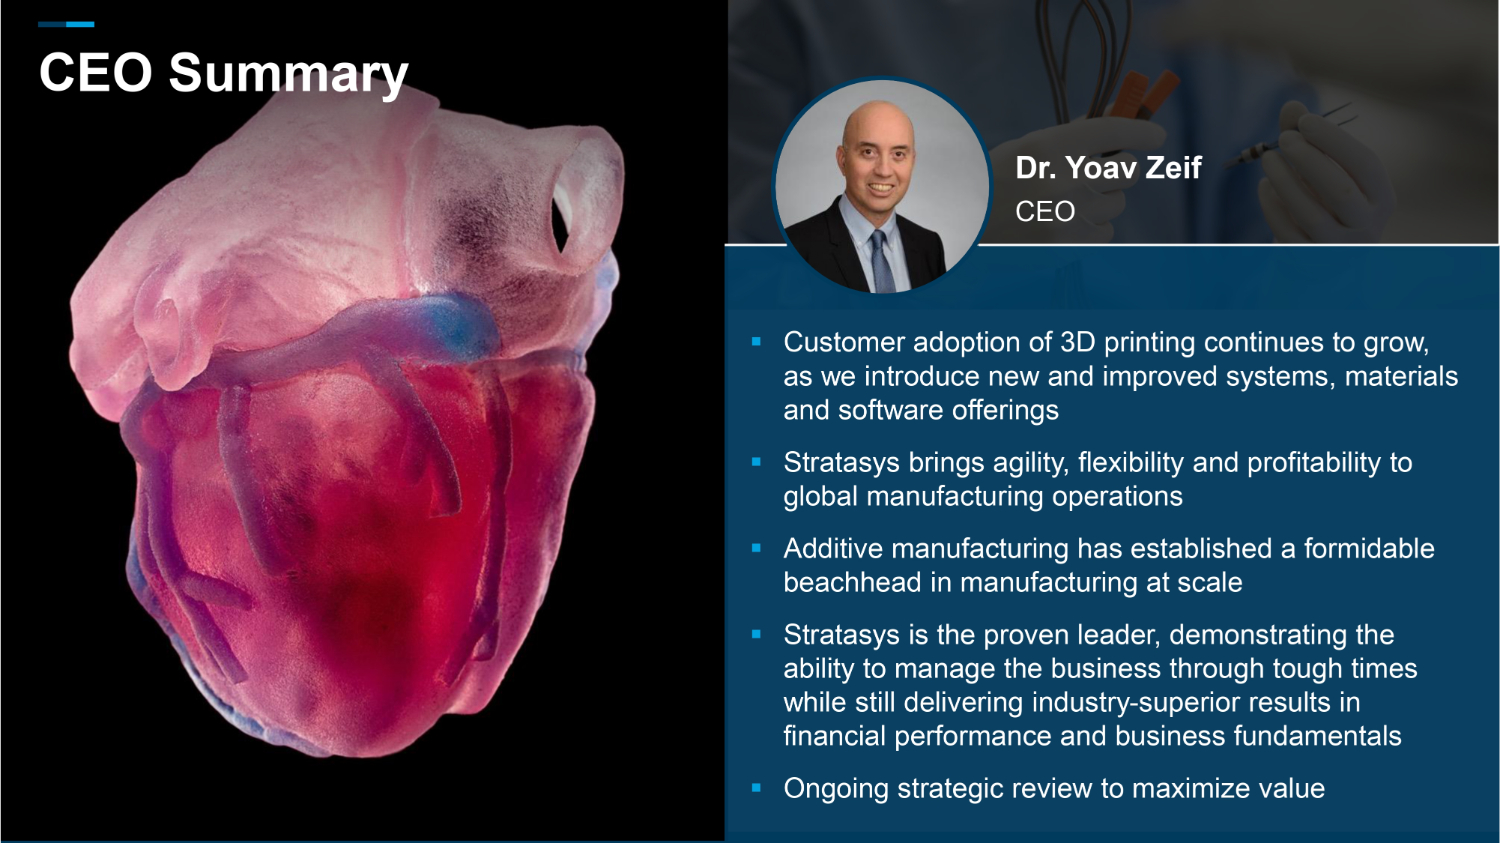
All numbers and percentages rounded Revenue Gross Margins Targeting over 50% in 2024 Non - GAAP Operating Expenses Non - GAAP Operating Margins EPS - diluted - adjusted ($1.70) - ($1.51) 1 GAAP EPS diluted CAPEX EBITDA - adjusted Adjusting 2023 Outlook for Divestments, Delayed Launch of F3300 and Soft CapEx Conditions Note: 1 GAAP outlook includes one - time extraordinary costs associated with proxy contest and merger - related activities $620 - 630M 48% - 49% $288 - $290M 2.0 - 2.5% $ 0.10 - $ 0.14 $ 15 - 20 M $35M - $38M CEO Summary CEO Dr. Yoav Zeif ▪ Customer adoption of 3D printing continues to grow, as we introduce new and improved systems, materials and software offerings ▪ Stratasys brings agility, flexibility and profitability to global manufacturing operations ▪ Additive manufacturing has established a formidable beachhead in manufacturing at scale ▪ Stratasys is the proven leader, demonstrating the ability to manage the business through tough times while still delivering industry - superior results in financial performance and business fundamentals ▪ Ongoing strategic review to maximize value

Thank You
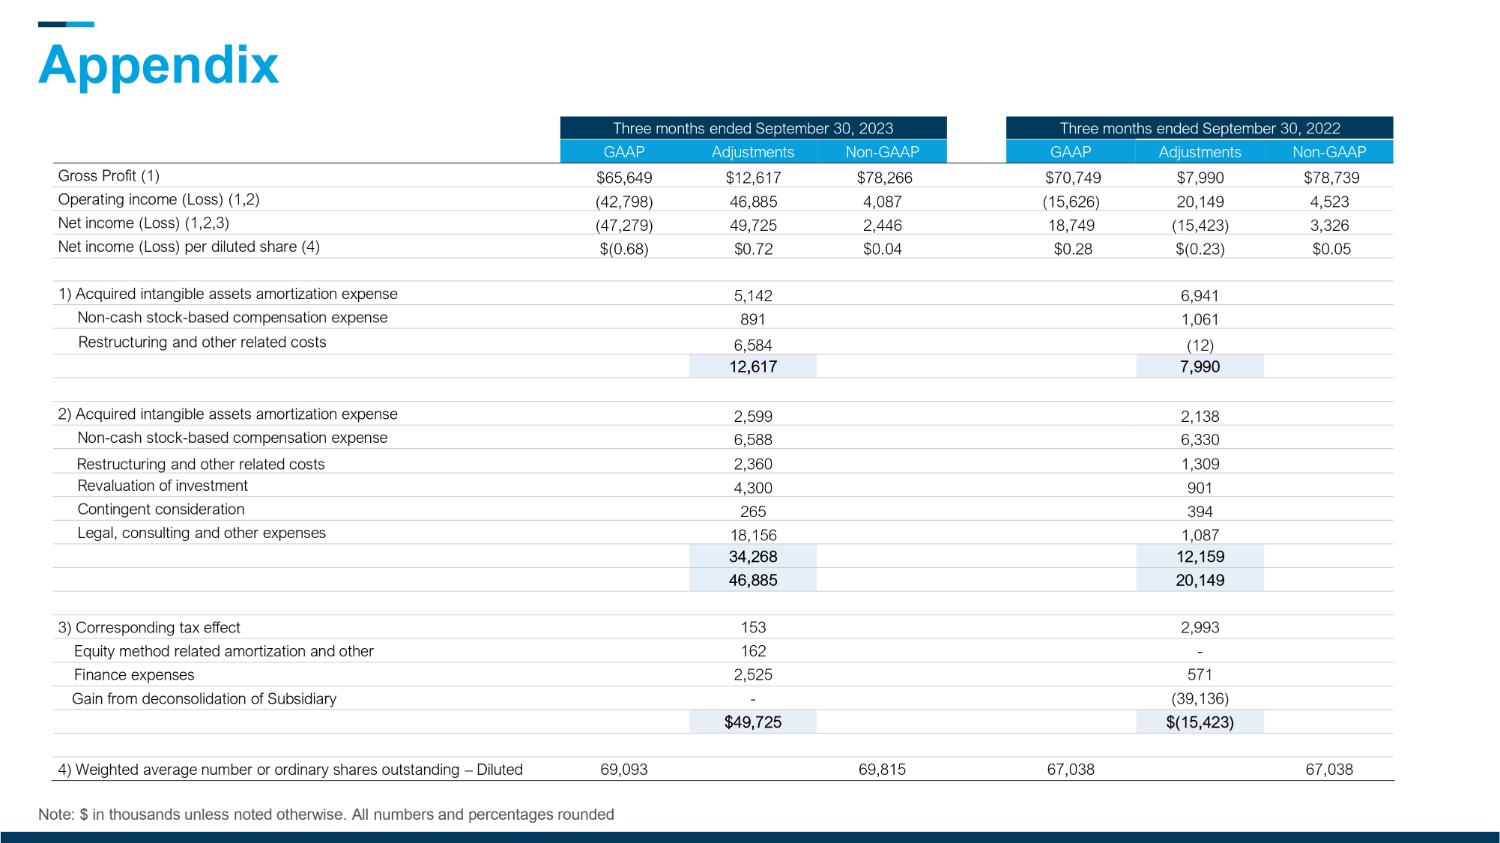
Appendix Note: $ in thousands unless noted otherwise. All numbers and percentages rounded Three months ended September 30 , 2022 Three months ended September 30 , 2023 Non - GAAP Adjustments GAAP Non - GAAP Adjustments GAAP $78,739 $7,990 $70,749 $78,266 $12,617 $65,649 Gross Profit (1) 4,523 20,149 (15,626) 4,087 46,885 (42,798) Operating income (Loss) (1,2) 3,326 (15,423) 18,749 2,446 49,725 (47,279) Net income (Loss) (1,2,3) $0.05 $(0.23) $ 0.28 $0.04 $0.72 $(0.68) Net income (Loss) per diluted share ( 4) 6,941 5,142 1) Acquired intangible assets amortization expense 1,061 891 Non - cash stock - based compensation expense (12) 6,584 Restructuring and other related costs 7,990 12,617 2,138 2,599 2) Acquired intangible assets amortization expense 6,330 6,588 Non - cash stock - based compensation expense 1,309 2,360 Restructuring and other related costs 901 4,300 Revaluation of investment 394 265 Contingent consideration 1,087 18,156 Legal, consulting and other expenses 12,159 34,268 20,149 46,885 2,993 153 3) Corresponding tax effect - 162 Equity method related amortization and other 571 2,525 Finance expenses (39,136) - Gain from deconsolidation of Subsidiary $(15,423) $49,725 67,038 67,038 69,815 69,093 4) Weighted average number or ordinary shares outstanding – Diluted
Exhibit 99.3
Stratasys Announces Changes to Board of Directors
MINNEAPOLIS & REHOVOT, Israel – November 16, 2023 – Stratasys Ltd. (Nasdaq: SSYS) (“Stratasys” or the “Company”), a leader in polymer 3D printing solutions, today announced that it has appointed Aris Kekedjian as an independent member of the Company’s Board of Directors, effective immediately. Mr. Kekedjian replaces Ziva Patir, who has decided to step down from the Company’s Board following ten years of service as a director. With this appointment, the Board will continue to comprise eight directors, seven of whom are independent.
Mr. Kekedjian is an established executive who brings more than 30 years of leadership expertise across business development, M&A and operations of complex cross-border businesses at scale. He currently serves as Chairman and Chief Executive Officer of Trinity Biotech, a publicly-traded healthcare diagnostics platform focused on the development, manufacture and marketing of clinical diagnostic products. Prior to Trinity, he spent three decades at General Electric and GE Capital in various leadership roles, most recently serving as Head of Business Development and Chief Investment Officer.
“Ongoing refreshment is a priority for our Board, and we are pleased to welcome Aris to the Stratasys Board,” said Dov Ofer, Stratasys’ Chairman of the Board of Directors. “With Aris’ global business experience, financial expertise and proven ability to deliver transformation of business, we are confident that Stratasys will benefit from his input and guidance as we continue to advance on our strategic initiatives and review opportunities to further enhance shareholder value.”
“I have long-admired Stratasys’ innovation and leadership in additive manufacturing, and I am honored to join Stratasys at such an important time for the Company,” said Mr. Kekedjian. “I look forward to working collaboratively with the Board and management team to drive the Company’s success and deliver value for shareholders.”
Ofer added, “On behalf of the Board, we thank Ziva for her outstanding service and many contributions to the Stratasys Board over the past ten years. Ziva was instrumental in enhancing Stratasys’ ongoing ESG programs, which are some of the first and most advanced in our industry. We wish her all the best.”
“It has been an honor to serve on the Stratasys Board for the past decade,” said Ms. Patir. “I am confident that the Company is well-positioned for continued growth under the oversight of this talented Board, and I look forward to watching the Company’s future successes.”
About Aris Kekedjian
Aris Kekedjian currently serves as Chairman and Chief Executive Officer of Trinity Biotech. Prior to joining Trinity Biotech in October 2022, he served as President and Chief Executive Officer of Icahn Enterprises from April 2021 to January 2022. Prior to that, Mr. Kekedjian held various roles of increasing responsibility at General Electric and GE Capital from 1989 to 2019, including Head of Corporate Development and Chief Investment Officer of GE; Managing Director and Global Head, Business Development of GE Capital; and Managing Director, Global Corporate Development and CEO of GE Capital in the MEA region. During his tenure at GE and GE Capital, Mr. Kekedjian guided the company through multiple phases of growth and transformation, including through the 2008 financial crisis and a series of multibillion-dollar mergers that helped reposition disparate assets into leading businesses. In addition, he previously served as a director of Xerox Holdings Corporation and XPO Logistics. Mr. Kekedjian holds a Bachelor of Commerce degree in Finance and International Business from Concordia University in Montreal, Canada.
About Stratasys
Stratasys is leading the global shift to additive manufacturing with innovative 3D printing solutions for industries such as aerospace, automotive, consumer products, healthcare, fashion and education. Through smart and connected 3D printers, polymer materials, a software ecosystem, and parts on demand, Stratasys solutions deliver competitive advantages at every stage in the product value chain. The world’s leading organizations turn to Stratasys to transform product design, bring agility to manufacturing and supply chains, and improve patient care.
To learn more about Stratasys, visit www.stratasys.com, the Stratasys blog, Twitter, LinkedIn, or Facebook. Stratasys reserves the right to utilize any of the foregoing social media platforms, including the Company’s websites, to share material, non-public information pursuant to the SEC’s Regulation FD. To the extent necessary and mandated by applicable law, Stratasys will also include such information in its public disclosure filings.
Stratasys is a registered trademark and the Stratasys signet is a trademark of Stratasys Ltd. and/or its subsidiaries or affiliates. All other trademarks are the property of their respective owners.
Cautionary Note Regarding Forward-Looking Statements
The statements in this press release regarding Stratasys’ strategic initiatives for enhancing shareholder value, and Mr. Kekedjian’s prospective contributions to those initiatives and to the Stratasys Board generally, are forward-looking statements reflecting Stratasys’ Board’s and management’s current expectations and beliefs. These forward-looking statements are based on current information that is, by its nature, subject to rapid and even abrupt change. Due to risks and uncertainties associated with Stratasys’ business, actual results could differ materially from those projected or implied by these forward-looking statements. These risks and uncertainties include, but are not limited to: the degree of our success at introducing new or improved products and solutions that gain market share; the degree of growth of the 3D printing market generally; the impact of potential shifts in the prices or margins of the products that we sell or services that we provide, including due to a shift towards lower margin products or services; the impact of competition and new technologies; the outcome of our board’s comprehensive process to explore strategic alternatives for our company; the degree to which our company’s operations remain resistant to potential adverse effects of Israel’s war against the terrorist organization Hamas; potential further charges against earnings that we could be required to take due to impairment of additional goodwill or other intangible assets; the extent of our success at successfully consummating and integrating into our existing business acquisitions or investments in new businesses, technologies, products or services; the global macro-economic environment, including headwinds caused by inflation, high interest rates, unfavorable currency exchange rates and potential recessionary conditions; potential changes in our management and board of directors; global market, political and economic conditions, and in the countries in which we operate in particular; costs and potential liability relating to litigation and regulatory proceedings; risks related to infringement of our intellectual property rights by others or infringement of others’ intellectual property rights by us; the extent of our success at maintaining our liquidity and financing our operations and capital needs; the impact of tax regulations on our results of operations and financial condition; and those additional factors referred to in Item 3.D “Key Information - Risk Factors”, Item 4, “Information on the Company”, Item 5, “Operating and Financial Review and Prospects,” and all other parts of our Annual Report on Form 20-F for the year ended December 31, 2022, which we filed with the U.S. Securities and Exchange Commission, or SEC, on March 3, 2023 (the “2022 Annual Report”). Readers are urged to carefully review and consider the various disclosures made throughout our 2022 Annual Report and the Report of Foreign Private Issuer on Form 6-K that attaches Stratasys’ unaudited, condensed consolidated financial statements and its review of its results of operations and financial condition for the third quarter and first nine months of 2023, which will be furnished to the SEC on or about the date hereof, and our other reports filed with or furnished to the SEC, which are designed to advise interested parties of the risks and factors that may affect our business, financial condition, results of operations and prospects. Any forward-looking statements made in this press release are provided or made (as applicable) as of the date hereof, and Stratasys undertakes no obligation to publicly update or revise any forward-looking statements, whether as a result of new information, future events or otherwise, except as required by law.
Investor and Media Contacts:
Stratasys Corporate &
North America
Chris Reese
chris.reese@stratasys.com
+1 651-357-0877
Investor Relations
Yonah Lloyd
yonah.lloyd@stratasys.com
+972-74-745-4919
Europe, Middle East, & Africa
Jonathan Wake / Samantha White,
Incus Media
stratasys@incus-media.com
+44 1737 215200
Brazil, Central America and South America
Erica Massini
erica.massini@stratasys.com
+55 (11) 2626-9229
Israel
Erik Snider
erik.snider@stratasys.com
+ 972 74 745 6053
Asia
Kalyani Dwivedi
kalyani.dwivedi@stratasys.com
+91 80 6746 2606
3