UNITED STATES
SECURITIES AND EXCHANGE COMMISSION
WASHINGTON, D.C. 20549
FORM 6-K
Report of Foreign Private Issuer
Pursuant to Rule 13a-16 or 15d-16
under the Securities Exchange Act of 1934
For the month of August 2023
Commission File Number 001-35751
STRATASYS LTD.
(Translation of registrant’s name into English)
| c/o Stratasys, Inc. 7665 Commerce Way Eden Prairie, Minnesota 55344 |
1 Holtzman Street, Science Park P.O. Box 2496 Rehovot, Israel 76124 |
(Addresses of principal executive offices)
Indicate by check mark whether the registrant files or will file annual reports under cover of Form 20-F or Form 40-F:
Form 20-F ☒ Form 40-F ☐
CONTENTS
Quarterly Results of Operations
On August 9, 2023, Stratasys Ltd. (“we” or “us”) announced our financial results for the second quarter and six months ended June 30, 2023. A copy of our press release announcing our results is furnished as Exhibit 99.1 to this Report of Foreign Private Issuer on Form 6-K (this “Form 6-K”) and is incorporated herein by reference.
In conjunction with the conference call being held on August 9, 2023 to discuss our results, we are furnishing a copy of the slide presentation that provides supplemental information regarding our business and our financial results, and which will be referenced on that conference call. We have attached that presentation to this Form 6-K as Exhibit 99.2, which exhibit is incorporated herein by reference.
The information in this Form 6-K, including Exhibits 99.1 and 99.2, shall not be deemed to be “filed” for the purposes of Section 18 of the Securities Exchange Act of 1934, as amended, and shall not be incorporated by reference into any filing under the Securities Act of 1933, as amended, except as shall be expressly set forth by specific reference in such filing.
Exhibits
The following exhibits are furnished as part of this Form 6-K:
SIGNATURES
Pursuant to the requirements of the Securities Exchange Act of 1934, the registrant has duly caused this report to be signed on its behalf by the undersigned, thereunto duly authorized.
| STRATASYS LTD. | ||
| Dated: August 9, 2023 | By: | /s/ Eitan Zamir |
| Name: | Eitan Zamir | |
| Title: | Chief Financial Officer | |
Exhibit 99.1

Stratasys Releases Second Quarter 2023 Financial Results
| ● | Revenue of $159.8 million 1.6% higher than second quarter 2022 excluding MakerBot (2.0% higher at constant currency) |
| ● | Highest-ever recurring revenue in Consumables and Customer Service |
| ● | GAAP net loss of $38.6 million, or $0.56 per diluted share which includes one-time extraordinary costs, and non-GAAP net income of $2.5 million, or $0.04 per diluted share |
| ● | Adjusted EBITDA grew 43% to $10.6 million year-over-year |
| ● | Eighth straight quarter of adjusted profitability |
| ● | Reiterating 2023 and medium-term revenue outlook |
MINNEAPOLIS & REHOVOT, Israel - (BUSINESS WIRE) - August 9, 2023 - Stratasys Ltd. (Nasdaq: SSYS) (“Stratasys” or the “Company”), a leader in polymer 3D printing solutions, today announced financial results for the second quarter 2023.
Second Quarter 2023 Financial Results Compared to Second Quarter 2022:
| ● | Revenue of $159.8 million compared to $166.6 million in second quarter 2022. |
| ● | GAAP gross margin of 41.5%, compared to 40.5%. |
| ● | Non-GAAP gross margin of 48.5%, compared to 47.6%. |
| ● | GAAP operating loss of $33.7 million, which includes one-time extraordinary costs related to prospective and potential mergers and acquisitions, defense against hostile tender offer, proxy contest and related professional fees, compared to an operating loss of $23.5 million. |
| ● | Non-GAAP operating income of $5.0 million, compared to non-GAAP operating income of $1.9 million. |
| ● | GAAP net loss of $38.6 million, or $0.56 per diluted share which includes the one-time costs noted above, compared to a net loss of $24.4 million, or $0.37 per diluted share. |
| ● | Non-GAAP net income of $2.5 million, or $0.04 per diluted share, compared to non-GAAP net income of $1.2 million, or $0.02 per diluted share. |
| ● | Adjusted EBITDA of $10.6 million, compared to $7.4 million. |
| ● | Cash used in operations of $23.2 million, compared to cash used in operations of $22.8 million in the year-ago quarter, due to the timing of annual incentive payments, increases in accounts receivable, costs related to prospective and potential mergers and acquisitions, defense against hostile tender offer, proxy contest and related professional fees. |
Dr. Yoav Zeif, Stratasys’ Chief Executive Officer stated, “Leveraging our position in polymer additive manufacturing, resilient business model and strong financial profile, Stratasys once again delivered solid operating and financial results despite persistent macroeconomic headwinds. For the second consecutive quarter we delivered record revenues from both consumables and customer service, demonstrating the growth in utilization of our systems even as customer capital budgets remain constrained. Our relentless focus on execution continued to drive meaningful improvements in adjusted gross margins both sequentially and year over year, as we delivered our eighth consecutive quarter of positive adjusted earnings per share.”
Dr. Zeif continued, “I would like to thank our employees who have continued to maintain their focus, furthering the execution of our strategy with excellence and helping to make Stratasys the healthiest and strongest-growing business in our industry. Despite the various M&A scenarios emerging in the industry, customers across all of our technologies remain highly engaged and confident in Stratasys as we continue to look for ways to expand our innovation and suite of offerings. The addition of Covestro’s Additive Manufacturing business has yielded immediate results, and our expected combination with Desktop Metal will create comprehensive offerings across the industrial landscape. Additive manufacturing is on the edge of tremendous growth as customers accelerate the use of our technologies at production scale. Together with our fortress balance sheet and resilient business model, we are well-positioned to drive profitable growth as we continue to create shareholder value.”
2023 Financial Outlook:
Based on current market conditions and assuming that the impacts of global inflationary pressures, interest rate hikes and supply chain costs do not impede economic activity further, the Company is reiterating its revenue guidance and the remainder of its outlook for 2023, other than GAAP earnings, as follows:
| ● | Full year revenue of $630 million to $670 million. |
| ● | Sequential quarterly revenue growth, notably higher in the second half. |
| ● | Based on current logistics and materials costs, full year non-GAAP gross margins of 48.0% to 49.0%, with a majority of the year-over-year improvement in the second half of 2023. |
| ● | Full year non-GAAP operating expenses in the range of $290 million to $300 million. |
| ● | Full year non-GAAP operating margins in a range of 2.5% to 3.5%, with improving profitable margins as the year progresses. |
| ● | GAAP net loss of $115 million to $96 million, or ($1.66) to ($1.39) per diluted share, which includes one-time extraordinary costs associated with the proxy contest and merger-related activities. |
| ● | Non-GAAP net income of $9 million to $17 million, or $0.12 to $0.24 per diluted share. |
| ● | Adjusted EBITDA of $35 million to $50 million. |
| ● | Capital expenditures of $20 million to $25 million. |
2023 non-GAAP earnings guidance excludes $30 million to $32 million of projected amortization of intangible assets, $28 million to $30 million of share-based compensation expense, and reorganization, one-time extraordinary costs associated with the proxy contest and merger-related activities and other expenses of $53 million to $59 million. 2023 non-GAAP guidance includes tax adjustments of $2 million to $3 million on the above non-GAAP items.
Medium Term Financial Forecast:
In addition, the Company is reiterating its forecast for key annual financial metrics:
| ● | 2024 gross margin above 50% and positive free cash flow. |
| ● | 2026 revenues to grow organically to greater than $1 billion, with adjusted EBITDA margin of 15% or greater. |
Appropriate reconciliations between GAAP and non-GAAP financial measures are provided in a table at the end of our press release and slide presentation, with itemized detail concerning the non-GAAP financial measures.
Stratasys Ltd. Second Quarter 2023 Webcast and Conference Call Details
The Company plans to webcast its conference call to discuss its second quarter 2023 financial results on Wednesday, August 9, 2023, at 10:00 a.m. (ET).
The investor conference call will be available via live webcast on the Stratasys Web site at investors.stratasys.com, or directly at the following web address:
https://event.choruscall.com/mediaframe/webcast.html?webcastid=B8jlZNVs
To participate by telephone, the U.S. toll-free number is 877-407-0619 and the international dial-in is +1-412-902-1012. Investors are advised to dial into the call at least ten minutes prior to the call to register. The webcast will be available for six months at investors.stratasys.com, or by accessing the above-provided web address.
Stratasys is leading the global shift to additive manufacturing with innovative 3D printing solutions for industries such as aerospace, automotive, consumer products, healthcare, fashion and education. Through smart and connected 3D printers, polymer materials, a software ecosystem, and parts on demand, Stratasys solutions deliver competitive advantages at every stage in the product value chain. The world’s leading organizations turn to Stratasys to transform product design, bring agility to manufacturing and supply chains, and improve patient care.
To learn more about Stratasys, visit www.stratasys.com, the Stratasys blog, X.com (formerly Twitter), LinkedIn, or Facebook. Stratasys reserves the right to utilize any of the foregoing social media platforms, including the Company’s websites, to share material, non-public information pursuant to the SEC’s Regulation FD. To the extent necessary and mandated by applicable law, Stratasys will also include such information in its public disclosure filings.
Stratasys is a registered trademark and the Stratasys signet is a trademark of Stratasys Ltd. and/or its subsidiaries or affiliates. All other trademarks are the property of their respective owners.
Cautionary Statement Regarding Forward-Looking Statements
The statements in this press release regarding Stratasys’ strategy, and the statements regarding its projected future financial performance, including the financial guidance concerning its expected results for 2023 and beyond, are forward-looking statements reflecting management’s current expectations and beliefs. These forward-looking statements are based on current information that is, by its nature, subject to rapid and even abrupt change. Due to risks and uncertainties associated with Stratasys’ business, actual results could differ materially from those projected or implied by these forward-looking statements. These risks and uncertainties include, but are not limited to: the degree of our success at introducing new or improved products and solutions that gain market share; the degree of growth of the 3D printing market generally; the impact of potential shifts in the prices or margins of the products that we sell or services that we provide, including due to a shift towards lower margin products or services; the impact of competition and new technologies; potential further charges against earnings that we could be required to take due to impairment of additional goodwill or other intangible assets; the extent of our success at successfully consummating and integrating into our existing business acquisitions or investments in new businesses, technologies, products or services; the global macro-economic environment, including headwinds caused by inflation, rising interest rates, unfavorable currency exchange rates and potential recessionary conditions, potential changes in our management and board of directors; global market, political and economic conditions, and in the countries in which we operate in particular; costs and potential liability relating to litigation and regulatory proceedings; risks related to infringement of our intellectual property rights by others or infringement of others’ intellectual property rights by us; the extent of our success at maintaining our liquidity and financing our operations and capital needs; the impact of tax regulations on our results of operations and financial condition; and those additional factors referred to in Item 3.D “Key Information - Risk Factors”, Item 4, “Information on the Company”, Item 5, “Operating and Financial Review and Prospects,” and all other parts of our Annual Report on Form 20-F for the year ended December 31, 2022, which we filed with the U.S. Securities and Exchange Commission, or SEC, on March 3, 2023 (the “2022 Annual Report”). Readers are urged to carefully review and consider the various disclosures made throughout our 2022 Annual Report and the Reports of Foreign Private Issuer on Form 6-K that attach Stratasys’ unaudited, condensed consolidated financial statements and its review of its results of operations and financial condition, for the quarterly periods throughout 2023, which will be furnished to the SEC throughout 2023, and our other reports filed with or furnished to the SEC, which are designed to advise interested parties of the risks and factors that may affect our business, financial condition, results of operations and prospects. Any guidance provided, and other forward-looking statements made, in this press release are provided or made (as applicable) as of the date hereof, and Stratasys undertakes no obligation to publicly update or revise any forward-looking statements, whether as a result of new information, future events or otherwise, except as required by law.
Use of Non-GAAP Financial Measures
The non-GAAP data included herein, which excludes certain items as described below, are non-GAAP financial measures. Our management believes that these non-GAAP financial measures are useful information for investors and shareholders of our company in gauging our results of operations (i) on an ongoing basis after excluding mergers, acquisitions and divestments related expense or gains and reorganization-related charges or gains, and legal provisions and (ii) excluding non-cash items such as stock-based compensation expenses, acquired intangible assets amortization, including intangible assets amortization related to equity method investments, impairment of long-lived assets and goodwill, revaluation of our investments and the corresponding tax effect of those items. These non-GAAP adjustments either do not reflect actual cash outlays that impact our liquidity and our financial condition or have a non-recurring impact on the statement of operations, as assessed by management. These non-GAAP financial measures are presented to permit investors to more fully understand how management assesses our performance for internal planning and forecasting purposes. The limitations of using these non-GAAP financial measures as performance measures are that they provide a view of our results of operations without including all items indicated above during a period, which may not provide a comparable view of our performance to other companies in our industry. Investors and other readers should consider non-GAAP measures only as supplements to, not as substitutes for or as superior measures to, the measures of financial performance prepared in accordance with GAAP. Reconciliation between results on a GAAP and non-GAAP basis is provided in a table below.
Important Additional Information Concerning the Proposed Merger with Desktop Metal
In connection with the proposed merger transaction between Stratasys and Desktop Metal, Inc. (“Desktop Metal”), Stratasys filed with the SEC a registration statement on Form F-4 that includes a joint proxy statement of Stratasys and Desktop Metal and that also constitutes a prospectus of Stratasys. Each of Stratasys and Desktop Metal may also file other relevant documents with the SEC regarding the proposed transaction. The registration statement has not yet become effective. After the registration statement is effective, the definitive joint proxy statement/prospectus will be mailed to shareholders of Stratasys and Desktop Metal. INVESTORS AND SECURITY HOLDERS ARE URGED TO READ THE REGISTRATION STATEMENT, THE JOINT PROXY STATEMENT/PROSPECTUS AND ANY OTHER RELEVANT DOCUMENTS THAT MAY BE FILED WITH THE SEC, AS WELL AS ANY AMENDMENTS OR SUPPLEMENTS TO THESE DOCUMENTS, CAREFULLY AND IN THEIR ENTIRETY IF AND WHEN THEY BECOME AVAILABLE BECAUSE THEY CONTAIN OR WILL CONTAIN IMPORTANT INFORMATION ABOUT THE PROPOSED TRANSACTION. Investors and security holders will be able to obtain free copies of the registration statement and definitive joint proxy statement/prospectus and other documents containing important information about Stratasys, Desktop Metal and the proposed transaction, once such documents are filed with the SEC through the website maintained by the SEC at http://www.sec.gov. Copies of the documents filed with, or furnished, to the SEC by Stratasys will be available free of charge on Stratasys’ website at https://investors.stratasys.com/sec-filings. Copies of the documents filed with the SEC by Desktop Metal will be available free of charge on Desktop Metal’s website at https://ir.desktopmetal.com/sec-filings/all-sec-filings.
Yonah Lloyd
CCO & VP Investor Relations (in thousands, except share data)
Yonah.Lloyd@stratasys.com
Source: Stratasys Ltd.
Stratasys Ltd.
Consolidated Balance Sheets
(Unaudited)
| June 30, | December 31, | |||||||
| 2023 | 2022 | |||||||
| ASSETS | ||||||||
| Current assets | ||||||||
| Cash and cash equivalents | $ | 144,366 | $ | 150,470 | ||||
| Short-term deposits | 61,000 | 177,367 | ||||||
| Accounts receivable, net of allowance for credit losses of $0.8 million and $0.9 million as of June 30, 2023 and December 31, 2022 | 156,264 | 144,739 | ||||||
| Inventories | 211,186 | 194,054 | ||||||
| Prepaid expenses | 10,187 | 5,767 | ||||||
| Other current assets | 27,463 | 27,823 | ||||||
| Total current assets | 610,466 | 700,220 | ||||||
| Non-current assets | ||||||||
| Property, plant and equipment, net | 200,994 | 195,063 | ||||||
| Goodwill | 92,946 | 64,953 | ||||||
| Other intangible assets, net | 148,613 | 121,402 | ||||||
| Operating lease right-of-use assets | 20,513 | 18,122 | ||||||
| Long-term investments | 138,624 | 141,610 | ||||||
| Other non-current assets | 18,269 | 18,420 | ||||||
| Total non-current assets | 619,959 | 559,570 | ||||||
| Total assets | $ | 1,230,425 | $ | 1,259,790 | ||||
| LIABILITIES AND EQUITY | ||||||||
| Current liabilities | ||||||||
| Accounts payable | $ | 69,793 | $ | 72,921 | ||||
| Accrued expenses and other current liabilities | 50,763 | 45,912 | ||||||
| Accrued compensation and related benefits | 29,534 | 34,432 | ||||||
| Deferred revenues - short term | 51,865 | 50,220 | ||||||
| Operating lease liabilities - short term | 6,842 | 7,169 | ||||||
| Total current liabilities | 208,797 | 210,654 | ||||||
| Non-current liabilities | ||||||||
| Deferred revenues - long term | 27,399 | 25,214 | ||||||
| Deferred income taxes - long term | 6,995 | 5,638 | ||||||
| Operating lease liabilities - long term | 13,346 | 10,670 | ||||||
| Contingent consideration | 26,151 | 23,707 | ||||||
| Other non-current liabilities | 24,510 | 24,475 | ||||||
| Total non-current liabilities | 98,401 | 89,704 | ||||||
| Total liabilities | 307,198 | 300,358 | ||||||
| Equity | ||||||||
| Ordinary shares, NIS 0.01 nominal value, authorized 180,000 thousands shares; 68,942 thousands shares and 67,086 thousands shares issued and outstanding at June 30, 2023 and December 31, 2022, respectively | 193 | 187 | ||||||
| Additional paid-in capital | 3,073,396 | 3,048,915 | ||||||
| Accumulated other comprehensive loss | (12,671 | ) | (12,818 | ) | ||||
| Accumulated deficit | (2,137,691 | ) | (2,076,852 | ) | ||||
| 923,227 | 959,432 | |||||||
| Total liabilities and equity | $ | 1,230,425 | $ | 1,259,790 | ||||
Stratasys Ltd.
Consolidated Statements of Operations
(in thousands, except per share data)
| Three Months Ended June 30, | Six Months Ended June 30, | |||||||||||||||
| 2023 | 2022 | 2023 | 2022 | |||||||||||||
| (unaudited) | (unaudited) | (unaudited) | (unaudited) | |||||||||||||
| Net sales | ||||||||||||||||
| Products | $ | 109,112 | $ | 115,721 | $ | 210,083 | $ | 228,794 | ||||||||
| Services | 50,639 | 50,882 | 99,045 | 101,238 | ||||||||||||
| 159,751 | 166,603 | 309,128 | 330,032 | |||||||||||||
| Cost of sales | ||||||||||||||||
| Products | 57,576 | 61,132 | 108,689 | 120,505 | ||||||||||||
| Services | 35,953 | 38,078 | 68,822 | 72,457 | ||||||||||||
| 93,529 | 99,210 | 177,511 | 192,962 | |||||||||||||
| Gross profit | 66,222 | 67,393 | 131,617 | 137,070 | ||||||||||||
| Operating expenses | ||||||||||||||||
| Research and development, net | 24,305 | 24,346 | 45,780 | 48,344 | ||||||||||||
| Selling, general and administrative | 75,576 | 66,592 | 136,293 | 131,855 | ||||||||||||
| 99,881 | 90,938 | 182,073 | 180,199 | |||||||||||||
| Operating loss | (33,659 | ) | (23,545 | ) | (50,456 | ) | (43,129 | ) | ||||||||
| Financial income (expenses), net | 687 | (1,170 | ) | 1,460 | (2,532 | ) | ||||||||||
| Loss before income taxes | (32,972 | ) | (24,715 | ) | (48,996 | ) | (45,661 | ) | ||||||||
| Income tax benefit (expenses) | (725 | ) | 429 | (4,500 | ) | 502 | ||||||||||
| Share in losses of associated companies | (4,918 | ) | (99 | ) | (7,343 | ) | (174 | ) | ||||||||
| Net loss | $ | (38,615 | ) | $ | (24,385 | ) | $ | (60,839 | ) | $ | (45,333 | ) | ||||
| Net loss per share | ||||||||||||||||
| Basic | $ | (0.56 | ) | $ | (0.37 | ) | $ | (0.89 | ) | $ | (0.69 | ) | ||||
| Diluted | $ | (0.56 | ) | $ | (0.37 | ) | $ | (0.89 | ) | $ | (0.69 | ) | ||||
| Weighted average ordinary shares outstanding | ||||||||||||||||
| Basic | 68,648 | 66,568 | 68,107 | 66,151 | ||||||||||||
| Diluted | 68,648 | 66,568 | 68,107 | 66,151 | ||||||||||||
| Three Months Ended June 30, | |||||||||||||||||||||||||
| 2023 | Non-GAAP | 2023 | 2022 | Non-GAAP | 2022 | ||||||||||||||||||||
| GAAP | Adjustments | Non-GAAP | GAAP | Adjustments | Non-GAAP | ||||||||||||||||||||
| U.S. dollars and shares in thousands (except per share amounts) | |||||||||||||||||||||||||
| Gross profit (1) | $ | 66,222 | $ | 11,283 | $ | 77,505 | $ | 67,393 | $ | 11,914 | $ | 79,307 | |||||||||||||
| Operating income (loss) (1,2) | (33,659 | ) | 38,666 | $ | 5,007 | (23,545 | ) | 25,479 | $ | 1,934 | |||||||||||||||
| Net income (loss) (1,2,3) | (38,615 | ) | 41,148 | $ | 2,533 | (24,385 | ) | 25,560 | $ | 1,175 | |||||||||||||||
| Net income (loss) per diluted (4) | $ | (0.56 | ) | $ | 0.60 | $ | 0.04 | $ | (0.37 | ) | $ | 0.39 | $ | 0.02 | |||||||||||
| (1) | Acquired intangible assets amortization expense | 5,014 | 6,954 | ||||||||||||||||||||||
| Non-cash stock-based compensation expense | 999 | 1,080 | |||||||||||||||||||||||
| Restructuring and other related costs | 3,378 | 15 | |||||||||||||||||||||||
| Impairment charges and write off | 1,892 | 3,865 | |||||||||||||||||||||||
| 11,283 | 11,914 | ||||||||||||||||||||||||
| (2) | Acquired intangible assets amortization expense | 2,686 | 2,218 | ||||||||||||||||||||||
| Non-cash stock-based compensation expense | 7,024 | 7,751 | |||||||||||||||||||||||
| Restructuring and other related costs | 2,468 | - | |||||||||||||||||||||||
| Revaluation of investments | - | 1,255 | |||||||||||||||||||||||
| Contingent consideration | 347 | 596 | |||||||||||||||||||||||
| Legal, consulting and other expenses | 14,858 | 1,745 | |||||||||||||||||||||||
| 27,383 | 13,565 | ||||||||||||||||||||||||
| 38,666 | 25,479 | ||||||||||||||||||||||||
| (3) | Corresponding tax effect | 213 | 81 | ||||||||||||||||||||||
| Finance expenses | 175 | - | |||||||||||||||||||||||
| Equity method related amortization and other | 2,094 | - | |||||||||||||||||||||||
| $ | 41,148 | $ | 25,560 | ||||||||||||||||||||||
| (4) | Weighted average number of ordinary shares outstanding- Diluted | 68,648 | 69,272 | 66,568 | 67,070 | ||||||||||||||||||||
| Six Months Ended June 30, | |||||||||||||||||||||||||||
| 2023 | Non-GAAP | 2023 | 2022 | Non-GAAP | 2022 | ||||||||||||||||||||||
| GAAP | Adjustments | Non-GAAP | GAAP | Adjustments | Non-GAAP | ||||||||||||||||||||||
| U.S. dollars and shares in thousands (except per share amounts) | |||||||||||||||||||||||||||
| Gross profit (1) | $ | 131,617 | $ | 16,582 | $ | 148,199 | $ | 137,070 | $ | 19,603 | $ | 156,673 | |||||||||||||||
| Operating income (loss) (1,2) | (50,456 | ) | 56,981 | $ | 6,525 | (43,129 | ) | 47,086 | $ | 3,957 | |||||||||||||||||
| Net income (loss) (1,2,3) | (60,839 | ) | 64,454 | $ | 3,615 | (45,333 | ) | 47,718 | $ | 2,385 | |||||||||||||||||
| Net income (loss) (4) | $ | (0.89 | ) | $ | 0.95 | $ | 0.05 | $ | (0.69 | ) | $ | 0.73 | $ | 0.04 | |||||||||||||
| (1) | Acquired intangible assets amortization expense | 9,015 | 13,920 | ||||||||||||||||||||||||
| Non-cash stock-based compensation expense | 1,931 | 1,980 | |||||||||||||||||||||||||
| Restructuring and other related costs | 3,744 | (162 | ) | ||||||||||||||||||||||||
| Impairment charges and write off | 1,892 | 3,865 | |||||||||||||||||||||||||
| 16,582 | 19,603 | ||||||||||||||||||||||||||
| (2) | Acquired intangible assets amortization expense | 4,880 | 4,443 | ||||||||||||||||||||||||
| Non-cash stock-based compensation expense | 14,332 | 15,384 | |||||||||||||||||||||||||
| Restructuring and other related costs | 4,266 | 555 | |||||||||||||||||||||||||
| Revaluation of investments | 580 | 2,316 | |||||||||||||||||||||||||
| Contingent consideration | 612 | 803 | |||||||||||||||||||||||||
| Legal, consulting and other expenses | 15,729 | 3,982 | |||||||||||||||||||||||||
| 40,399 | 27,483 | ||||||||||||||||||||||||||
| 56,981 | 47,086 | ||||||||||||||||||||||||||
| (3) | Corresponding tax effect | 3,251 | - | ||||||||||||||||||||||||
| Finance expenses | 638 | 226 | |||||||||||||||||||||||||
| Equity method related amortization and other | 3,584 | 406 | |||||||||||||||||||||||||
| $ | 64,454 | $ | 47,718 | ||||||||||||||||||||||||
| (4) | Weighted average number of ordinary shares outstanding- Diluted | 68,107 | 68,683 | 66,151 | 67,071 | ||||||||||||||||||||||
Exhibit 99.2
Q2 2023 Results Speakers Dr. Yoav Zeif, CEO Eitan Zamir, CFO Yonah Lloyd, CCO & VP IR August 9, 2023

Conference Call and Webcast Details US Toll - Free Dial - In 1 - 877 - 407 - 0619 International Dial - In 1 - 412 - 902 - 1012 Live Webcast and Replay https://event.choruscall.com/mediaframe/webcast. html?webcastid=B8jlZNVs 2 2

Forward - Looking Statements Cautionary Statement Regarding Forward - Looking Statements The statements in this slide presentation regarding Stratasys' strategy, and the statements regarding its projected future financial performance, including the financial guidance concerning its expected results for 2023, are forward - looking statements reflecting management's current expectations and beliefs. These forward - looking statements are based on current information that is, by its nature, subject to rapid and even abrupt change. Due to risks and uncertainties associated with Stratasys' business, actual results could differ materially from those projected or implied by these forward - looking statements. These risks and uncertainties include, but are not limited to: the degree of our success at introducing new or improved products and solutions that gain market share; the extent of growth of the 3D printing market generally; the duration and severity of headwinds caused by current macro - economic trends that have been adversely affecting, and may continue to adversely affect, our results, including unfavorable currency exchange rates, supply - chain delays, inflationary pressures and rising interest rates; the impact of potential shifts in the prices or margins of the products that we sell or services that we provide, including due to a shift towards lower margin products or services; the impact of competition and new technologies; the extent of our success at successfully integrating into our existing business, or making additional, acquisitions or investments in new businesses, technologies, products or services; potential changes in our management and board of directors; global market, political and economic conditions, and in the countries in which we operate in particular (including risks stemming from Russia’s invasion of Ukraine); potential further charges against earnings that we could be required to take due to impairment of additional goodwill or other intangible assets that we have recently acquired or may acquire in the future; costs and potential liability relating to litigation and regulatory proceedings; risks related to infringement of our intellectual property rights by others or infringement of others' intellectual property rights by us; the extent of our success at maintaining our liquidity and financing our operations and capital needs; the impact of tax regulations on our results of operations and financial condition; and those additional factors referred to in Item 3.D “Key Information - Risk Factors”, Item 4, “Information on the Company”, Item 5, “Operating and Financial Review and Prospects,” and all other parts of our Annual Report on Form 20 - F for the year ended December 31, 2022, to be filed with the SEC on or about March 3, 2023 (the “2022 Annual Report”). Readers are urged to carefully review and consider the various disclosures made throughout our 2022 Annual Report and the Reports of Foreign Private Issuer on Form 6 - K that attach Stratasys’ unaudited, condensed consolidated financial statements and its review of its results of operations and financial condition, for the quarterly periods throughout 2023, which Stratasys will be furnishing to the SEC over the course of 2023, and our other reports filed with or furnished to the SEC, which are designed to advise interested parties of the risks and factors that may affect our business, financial condition, results of operations and prospects. Any guidance provided, and other forward - looking statements made, in this slide presentation are made as of the date hereof, and Stratasys undertakes no obligation to publicly update or revise any forward - looking statements, whether as a result of new information, future events or otherwise, except as required by law. Industrial designer John Mauriello designed high - end sunglasses inspired by the themes of wind, fire, water, and shown here, earth, using full - color J55 Prime 3D printers.
Use of Non - GAAP Financial Information Use of Non - GAAP Financial Measures The non - GAAP data included herein, which excludes certain items as described below, are non - GAAP financial measures. Our management believes that these non - GAAP financial measures are useful information for investors and shareholders of our Company in gauging our results of operations (i) on an ongoing basis after excluding mergers, acquisitions and divestments related expense or gains and reorganization - related charges or gains, legal provisions, and (ii) excluding non - cash items such as stock - based compensation expenses, acquired intangible assets amortization, including intangible assets amortization related to equity method investments, impairment of long - lived assets and goodwill, revaluation of our investments and the corresponding tax effect of those items. The items eliminated via these non - GAAP adjustments either do not reflect actual cash outlays that impact our liquidity and our financial condition or have a non - recurring impact on the statement of operations, as assessed by management. These non - GAAP financial measures are presented to permit investors to more fully understand how management assesses our performance for internal planning and forecasting purposes. The limitations of using these non - GAAP financial measures as performance measures are that they provide a view of our results of operations without including all items indicated above during a period, which may not provide a comparable view of our performance to other companies in our industry. Investors and other readers should consider non - GAAP measures only as supplements to, not as substitutes for or as superior measures to, the measures of financial performance prepared in accordance with GAAP. Reconciliation between results on a GAAP and non - GAAP basis is provided in a table later in this slide presentation. 4 The color capabilities of J850 Prime 3D printers enable Microsoft to better match colors of product components, such as the Surface Laptop metal chassis and Alcantara keyboard deck.

▪ Working closely with 3D Systems during due diligence ▪ Strong Q2 results with record recurring consumables and customer service revenue ▪ Winning strategy on track for $1 billion revenue by 2026 with substantial profitability; Merger with Desktop Metal bolsters this expectation further ▪ Customer demand and engagement stronger than ever despite macro conditions ▪ Continuing to grow sales, particularly in MFG ▪ Eighth consecutive adjusted profitable quarter ▪ Strong balance sheet with over $200M cash and equivalents and no debt CEO Dr. Yoav Zeif

New Dental Solutions Seeing Rapid Adoption Top 5 US denture producers committed or likely to buy new TrueDent solution ▪ Only FDA - cleared full color monolithic 3D printed dentures solution on the market ▪ On track for European market availability next year / engaged with top 10 European dentures producers ▪ Dentures is a $5B+ opportunity with only 5% coming from additive manufacturing today Strong US and EMEA market response for new J3 DentaJet 3D printer for mixed trays of dental parts
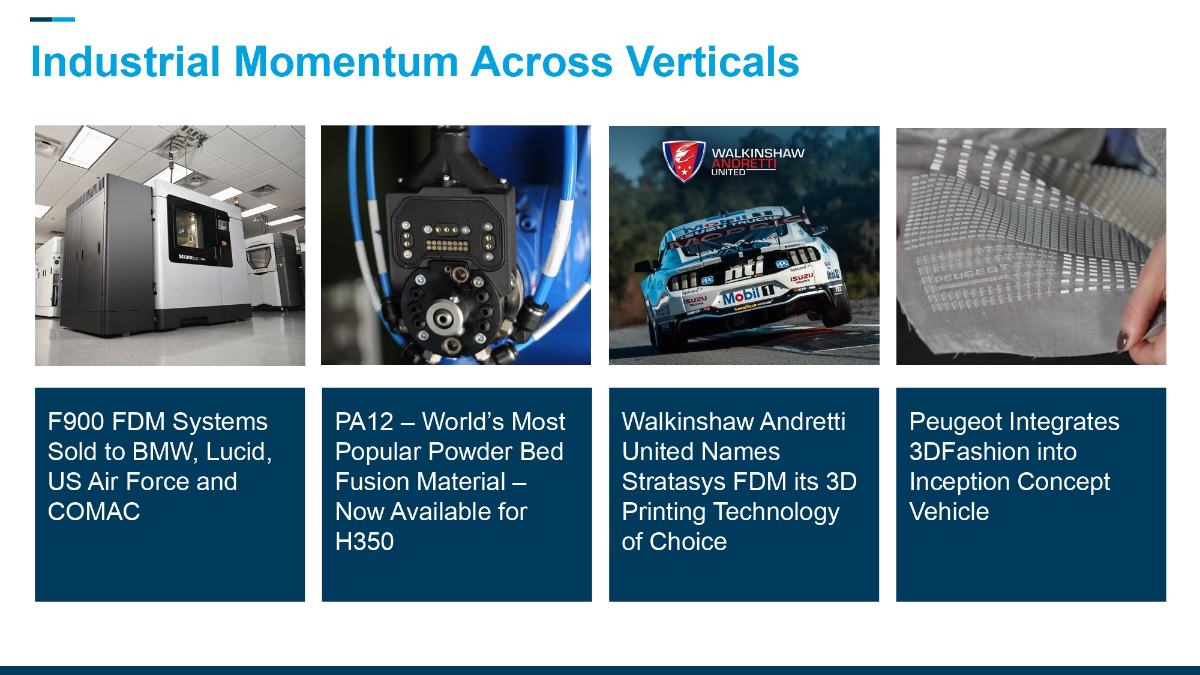
Walkinshaw Andretti United Names Stratasys FDM its 3D Printing Technology of Choice Peugeot Integrates 3DFashion into Inception Concept Vehicle PA12 – World’s Most Popular Powder Bed Fusion Material – Now Available for H350 F900 FDM Systems Sold to BMW, Lucid, US Air Force and COMAC Industrial Momentum Across Verticals
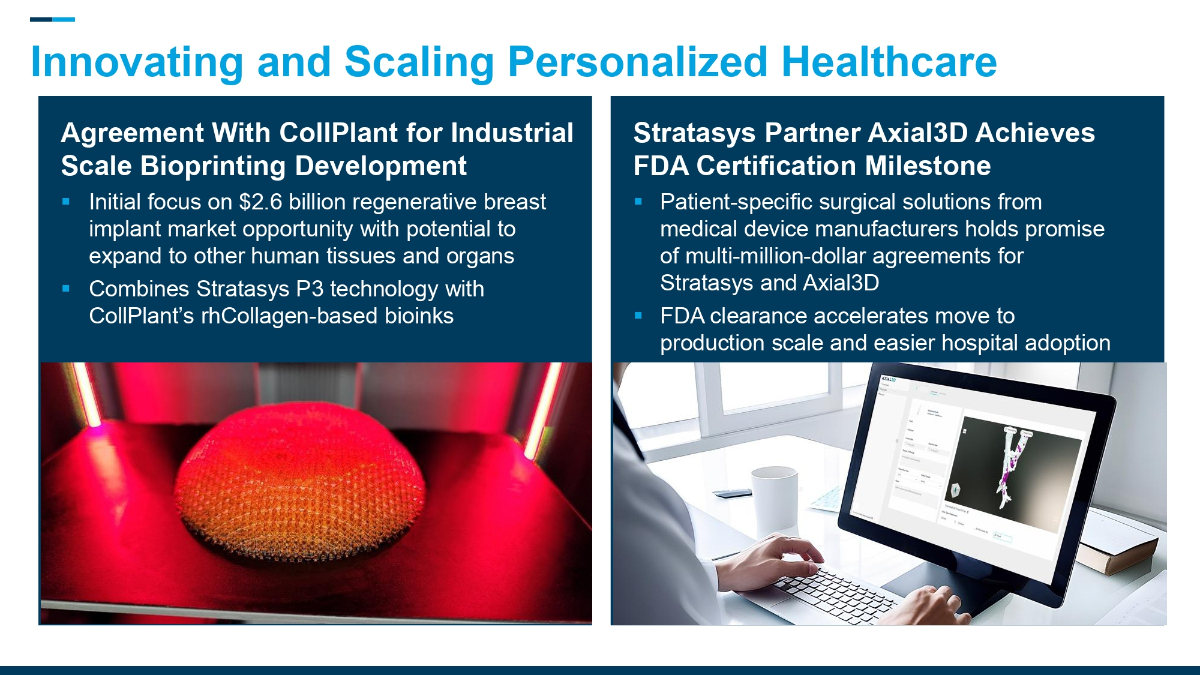
Innovating and Scaling Personalized Healthcare Stratasys Partner Axial3D Achieves FDA Certification Milestone ▪ Patient - specific surgical solutions from medical device manufacturers holds promise of multi - million - dollar agreements for Stratasys and Axial3D ▪ FDA clearance accelerates move to production scale and easier hospital adoption Agreement With CollPlant for Industrial Scale Bioprinting Development ▪ Initial focus on $2.6 billion regenerative breast implant market opportunity with potential to expand to other human tissues and organs ▪ Combines Stratasys P3 technology with CollPlant’s rhCollagen - based bioinks
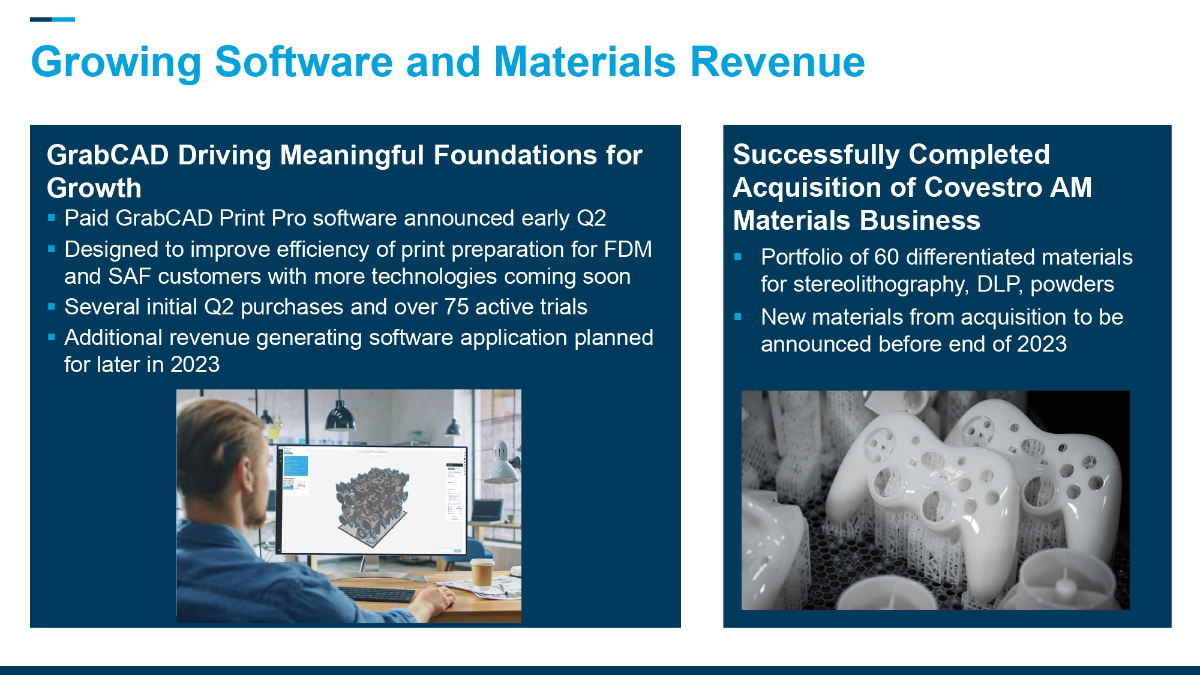
Growing Software and Materials Revenue GrabCAD Driving Meaningful Foundations for Growth ▪ Paid GrabCAD Print Pro software announced early Q2 ▪ Designed to improve efficiency of print preparation for FDM and SAF customers with more technologies coming soon ▪ Several initial Q2 purchases and over 75 active trials ▪ Additional revenue generating software application planned for later in 2023 Successfully Completed Acquisition of Covestro AM Materials Business ▪ Portfolio of 60 differentiated materials for stereolithography, DLP, powders ▪ New materials from acquisition to be announced before end of 2023
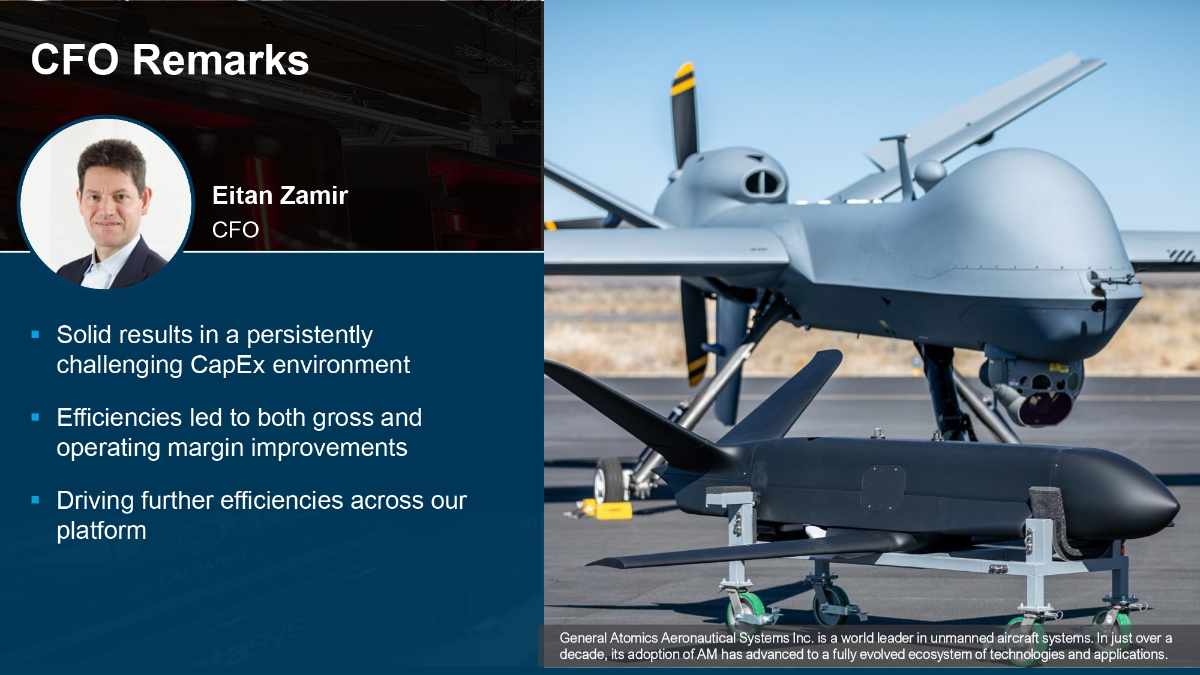
▪ Solid results in a persistently challenging CapEx environment ▪ Efficiencies led to both gross and operating margin improvements ▪ Driving further efficiencies across our platform CFO Eitan Zamir CFO Remarks Suggest more innovation - focused / modern image on this slide General Atomics Aeronautical Systems Inc. is a world leader in unmanned aircraft systems. In just over a decade, its adoption of AM has advanced to a fully evolved ecosystem of technologies and applications.
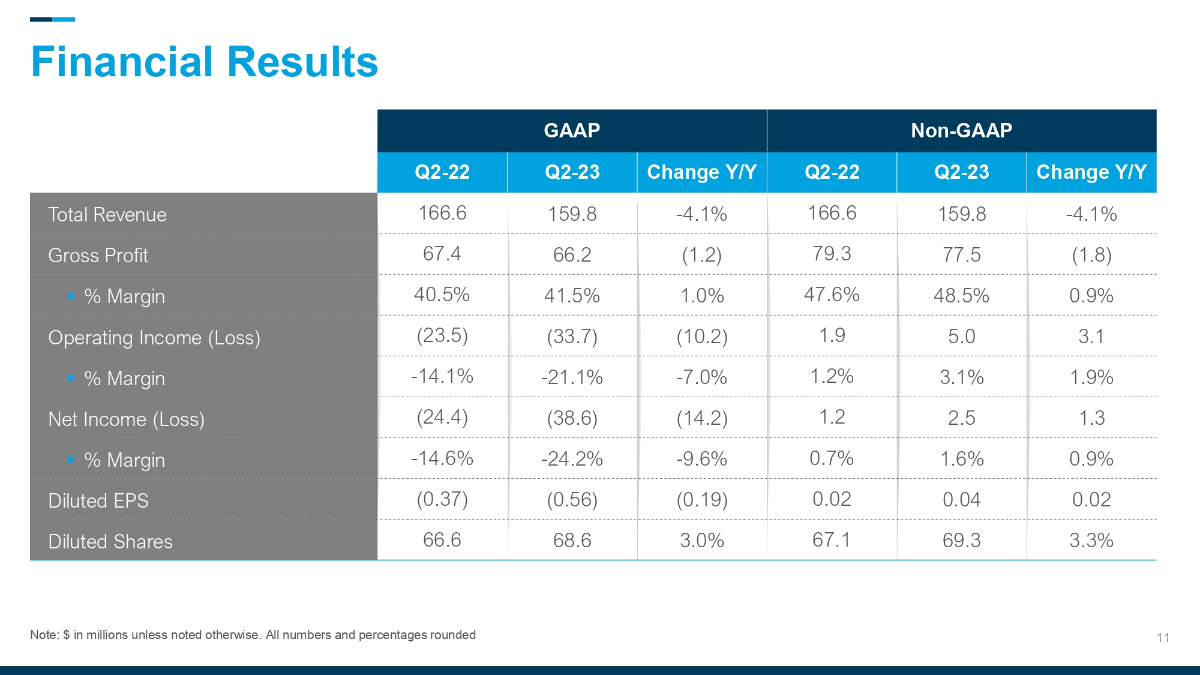
11 GAAP Non - GAAP Q2 - 22 Q2 - 23 Change Y/Y Q2 - 22 Q2 - 23 Change Y/Y Total Revenue 166.6 159.8 - 4.1% 166.6 159.8 - 4.1% Gross Profit 67.4 66.2 (1.2) 79.3 77.5 (1.8) ▪ % Margin 40.5% 41.5% 1.0% 47.6% 48.5% 0.9% Operating Income (Loss) (23.5) (33.7) (10.2) 1.9 5.0 3.1 ▪ % Margin - 14.1% - 21.1% - 7.0% 1.2% 3.1% 1.9% Net Income (Loss) (24.4) (38.6) (14.2) 1.2 2.5 1.3 ▪ % Margin - 14.6% - 24.2% - 9.6% 0.7% 1.6% 0.9% Diluted EPS (0.37) (0.56) (0.19) 0.02 0.04 0.02 Diluted Shares 6 6.6 68.6 3.0% 67.1 69.3 3.3% Note: $ in millions unless noted otherwise. All numbers and percentages rounded Financial Results
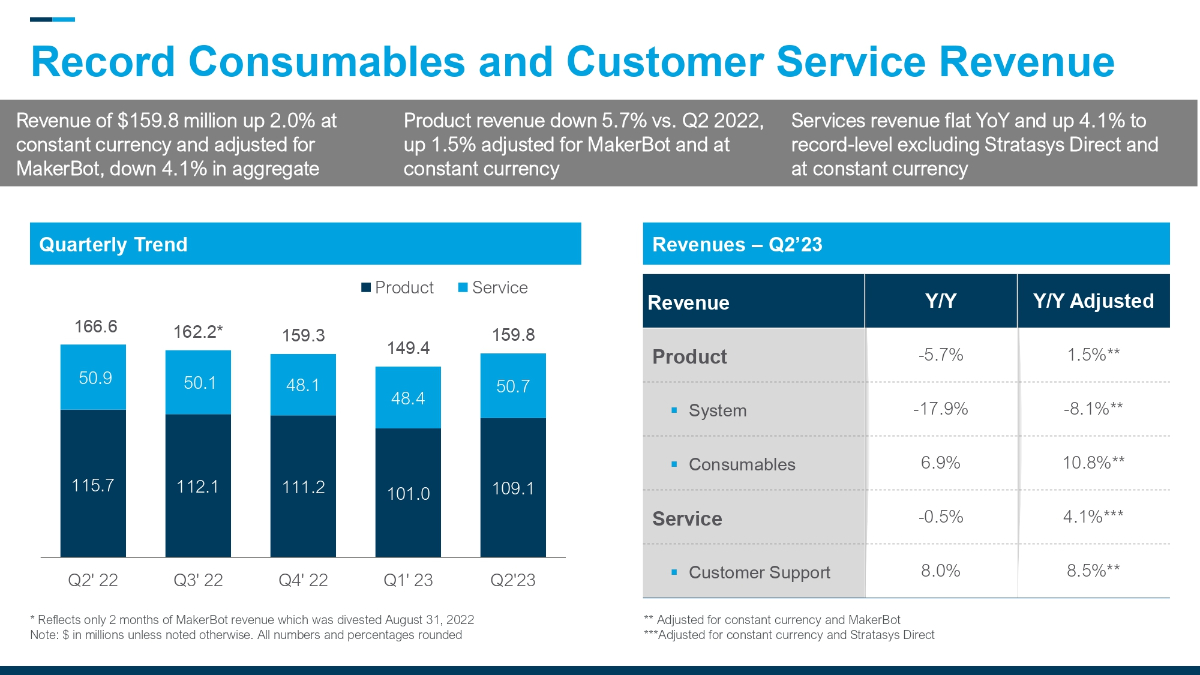
* Reflects only 2 months of MakerBot revenue which was divested August 31, 2022 Note: $ in millions unless noted otherwise. All numbers and percentages rounded Quarterly Trend Revenues – Q 2 ’ 2 115.7 112.1 111.2 101.0 109.1 50.9 50.1 48.1 48.4 50.7 166.6 162.2* 159.3 149.4 159.8 Q2' 22 Q3' 22 Q4' 22 Q1' 23 Q2'23 Product Service Revenue Y/Y Y/Y Adjusted Product - 5.7 % 1.5 % ** ▪ System - 17.9 % - 8.1 % ** ▪ Consumables 6.9% 10.8%** Service - 0.5% 4.1%*** ▪ Customer Support 8.0% 8.5%** Revenue of $ 159.8 million up 2.0 % at constant currency and adjusted for MakerBot, down 4.1 % in aggregate Product revenue down 5.7 % vs. Q 2 2022 , up 1.5 % adjusted for MakerBot and at constant currency Services revenue flat YoY and up 4.1 % to record - level excluding Stratasys Direct and at constant currency Record Consumables and Customer Service Revenue ** Adjusted for constant currency and MakerBot ***Adjusted for constant currency and Stratasys Direct
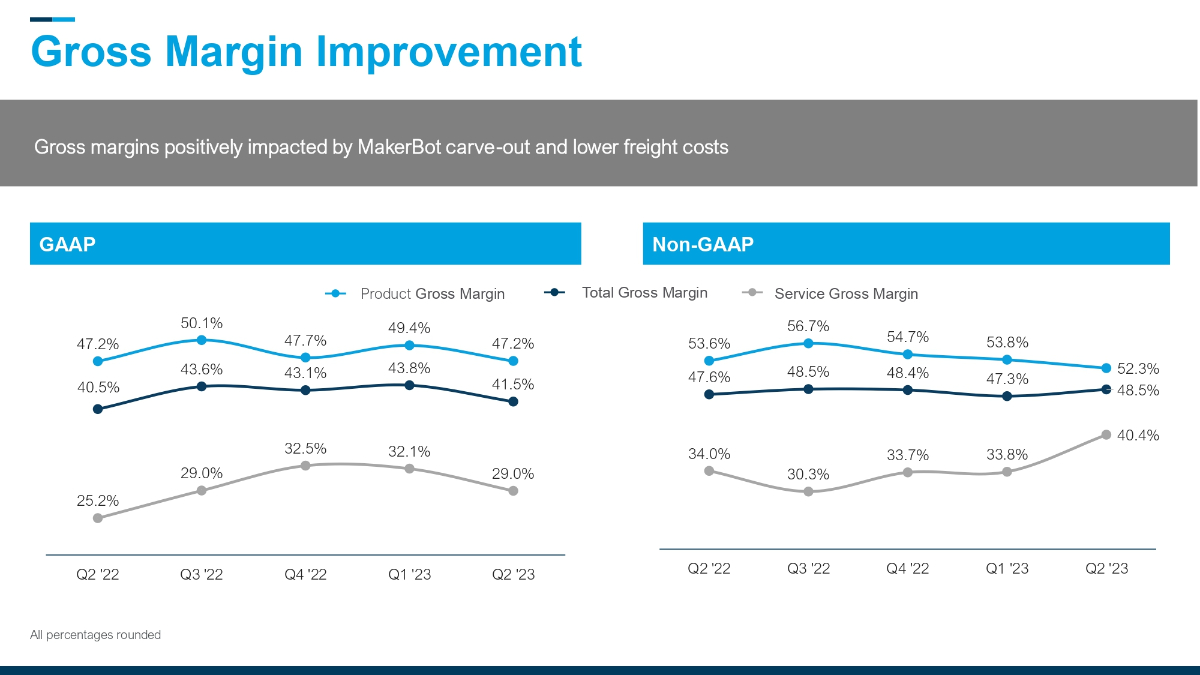
Gross Margin Improvement GAAP Non - GAAP 40.5% 43.6% 43.1 % 43.8% 41.5% 47.2% 50.1% 47.7% 49.4% 47.2% 25.2 % 29.0% 32.5% 32.1% 29.0% Q2 '22 Q3 '22 Q4 '22 Q1 '23 Q2 '23 47.6% 48.5% 48.4% 47.3 % 48.5% 53.6% 56.7% 54.7% 53.8% 52.3% 34.0% 30.3 % 33.7% 33.8% 40.4% Q2 '22 Q3 '22 Q4 '22 Q1 '23 Q2 '23 Service Gross Margin Product Gross Margin Total Gross Margin All percentages rounded Gross margins positively impacted by MakerBot carve - out and lower freight costs
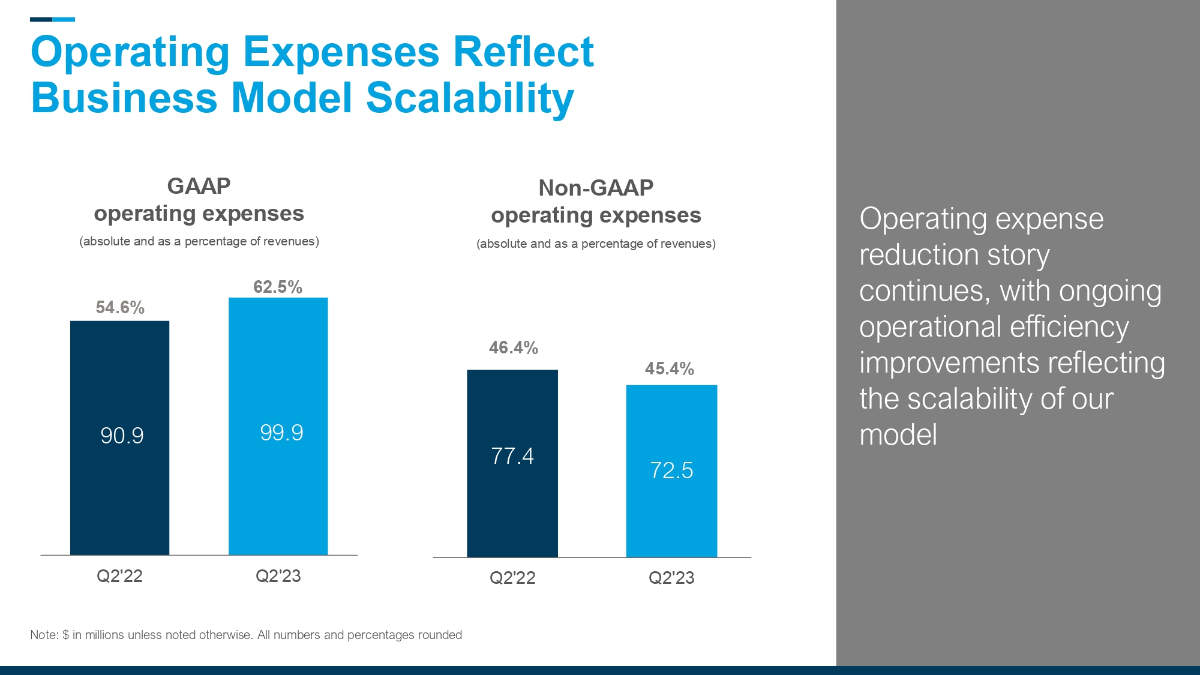
Operating Expenses Reflect Business Model Scalability GAAP operating expenses (absolute and as a percentage of revenues) Non - GAAP operating expenses (absolute and as a percentage of revenues) 90.9 99.9 Q2'22 Q2'23 62.5 % 77.4 72.5 Q2'22 Q2'23 45.4% Note: $ in millions unless noted otherwise. All numbers and percentages rounded 54.6% 46.4% Operating expense reduction story continues, with ongoing operational efficiency improvements reflecting the scalability of our model
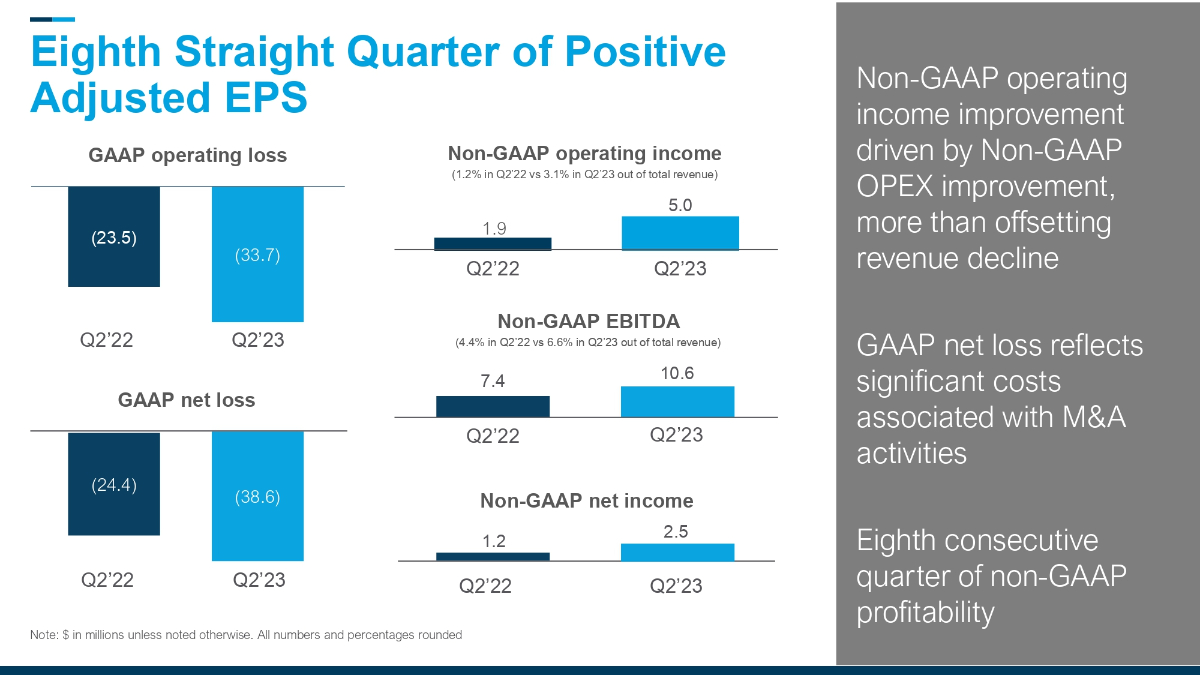
(23.5) (33.7) (24.4) (38.6) Eighth Straight Quarter of Positive Adjusted EPS Non - GAAP operating income (1.2% in Q2’22 vs 3.1% in Q2’23 out of total revenue) GAAP operating loss Non - GAAP net income GAAP net loss Note: $ in millions unless noted otherwise. All numbers and percentages rounded 1.9 Q2’22 Q2’23 Q2’22 Q2’23 Q ’ 22 Q ’ 23 Q2’22 Q2’23 Q2’22 Q2’23 Non - GAAP operating income improvement driven by Non - GAAP OPEX improvement, more than offsetting revenue decline GAAP net loss reflects significant costs associated with M&A activities Eighth consecutive quarter of non - GAAP profitability 5.0 10.6 7.4 1.2 2.5 Non - GAAP EBITDA ( 4. % in Q 2 ’ 22 vs % in Q 2 ’ 23 out of total revenue)
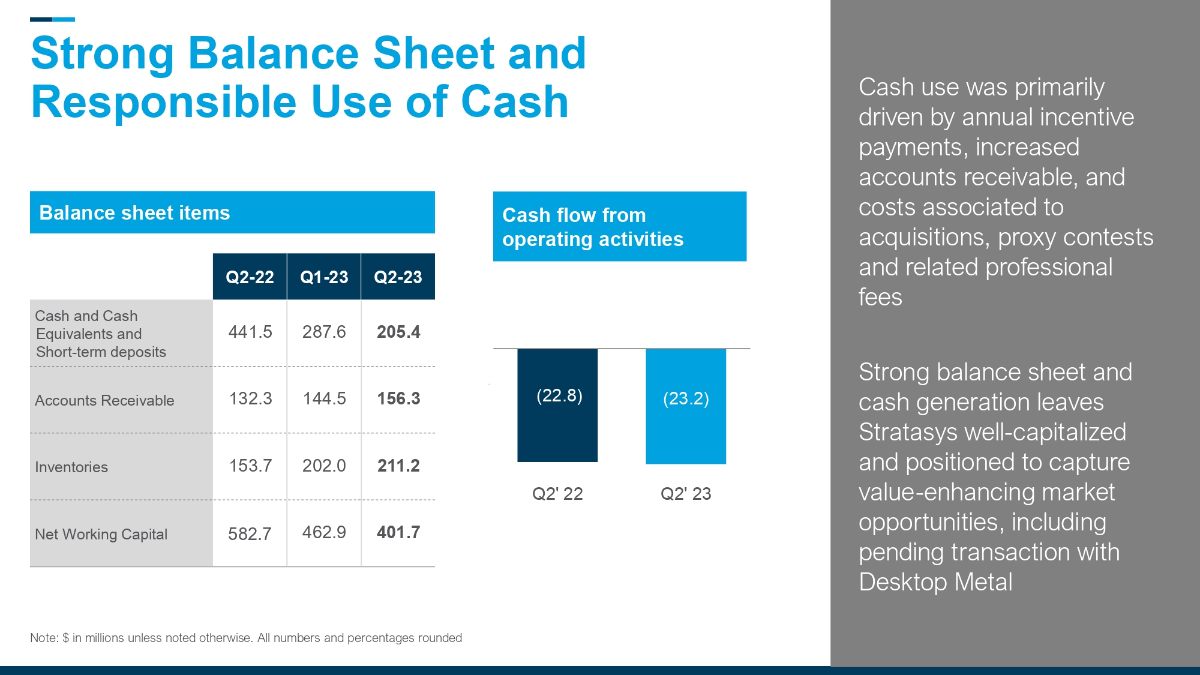
Strong Balance Sheet and Responsible Use of Cash Note: $ in millions unless noted otherwise. All numbers and percentages rounded Balance sheet items (22.8) (23.2) Q2' 22 Q2' 23 Cash flow from operating activities Q - 22 Q - 2 Q2 - 23 Cash and Cash Equivalents and Short - term deposits Accounts Receivable Inventories Net Working Capital 16 Cash use was primarily driven by annual incentive payments, increased accounts receivable, and costs associated to acquisitions, proxy contests and related professional fees Strong balance sheet and cash generation leaves Stratasys well - capitalized and positioned to capture value - enhancing market opportunities, including pending transaction with Desktop Metal
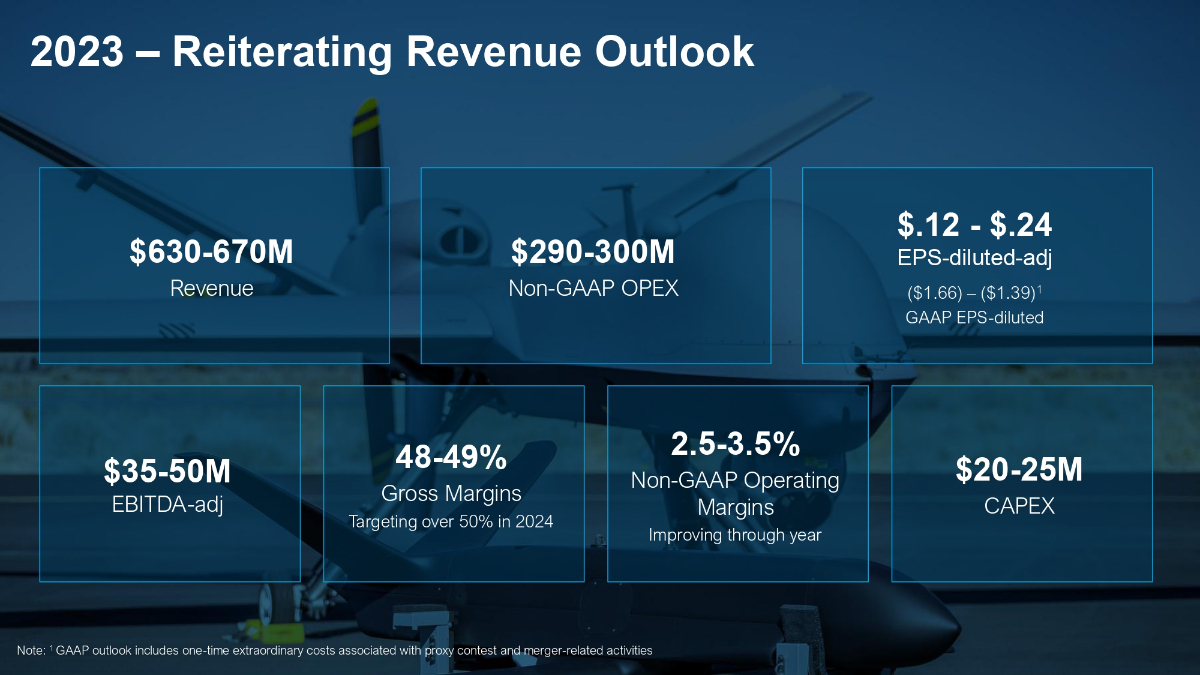
$ 630 - 670 M Revenue $ 290 - 300 M Non - GAAP OPEX $.12 - $.24 EPS - diluted - adj ($1.66) – ($1.39) 1 GAAP EPS - diluted $35 - 50M EBITDA - adj 48 - 49% Gross Margins Targeting over 50% in 2024 $20 - 25M CAPEX 2.5 - 3.5 % Non - GAAP Operating Margins Improving through year 2023 – Reiterating Revenue Outlook Note: 1 GAAP outlook includes one - time extraordinary costs associated with proxy contest and merger - related activities
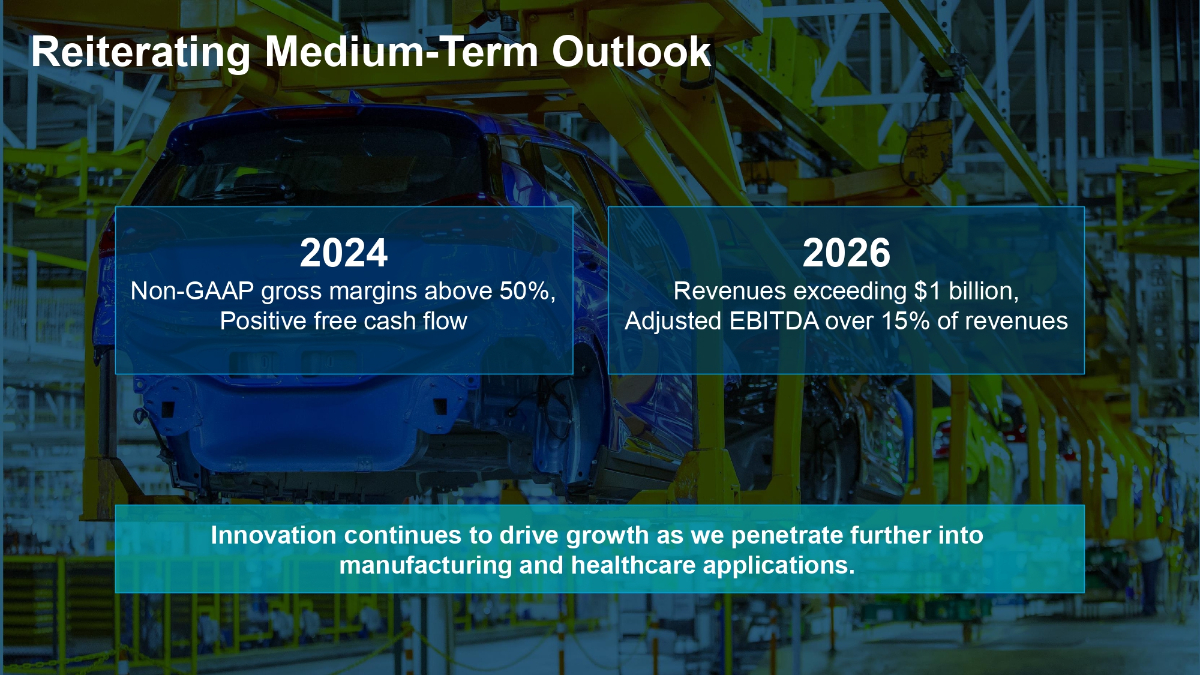
2024 Non - GAAP gross margins above 50%, Positive free cash flow 2026 Revenues exceeding $1 billion, Adjusted EBITDA over 15% of revenues Innovation continues to drive growth as we penetrate further into manufacturing and healthcare applications. Reiterating Medium - Term Outlook
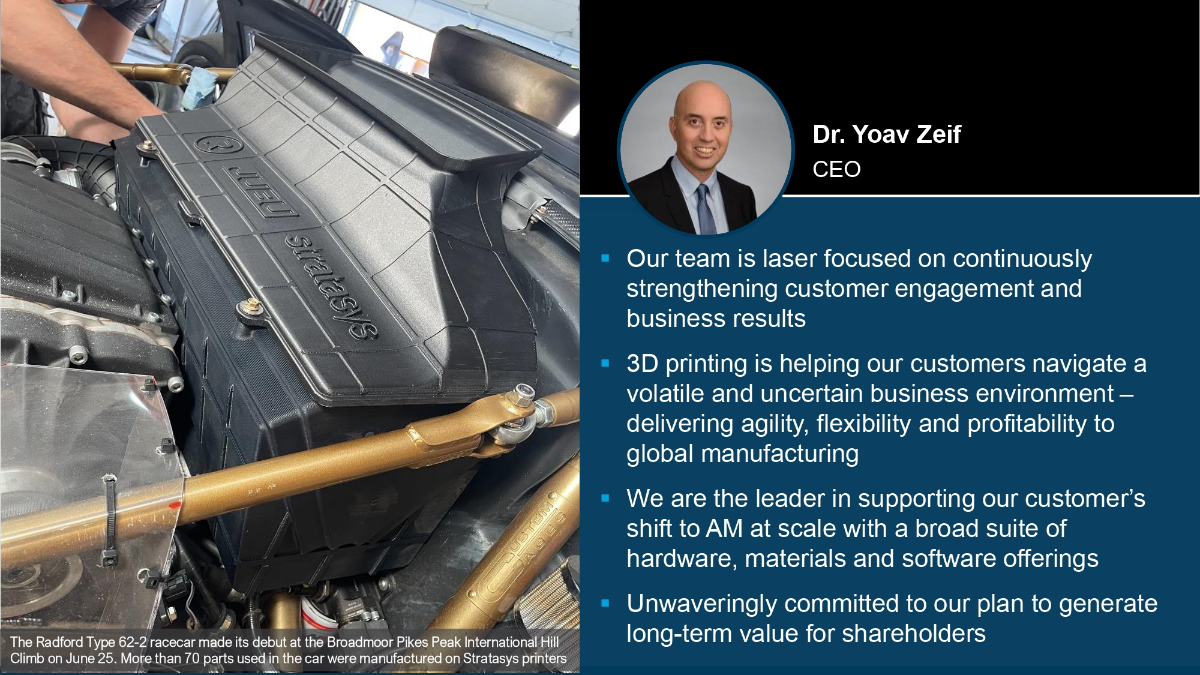
▪ Our team is laser focused on continuously strengthening customer engagement and business results ▪ 3D printing is helping our customers navigate a volatile and uncertain business environment – delivering agility, flexibility and profitability to global manufacturing ▪ We are the leader in supporting our customer’s shift to AM at scale with a broad suite of hardware, materials and software offerings ▪ Unwaveringly committed to our plan to generate long - term value for shareholders CEO Summary CEO Dr. Yoav Zeif The Radford Type 62 - 2 racecar made its debut at the Broadmoor Pikes Peak International Hill Climb on June 25. More than 70 parts used in the car were manufactured on Stratasys printers

Thank You!
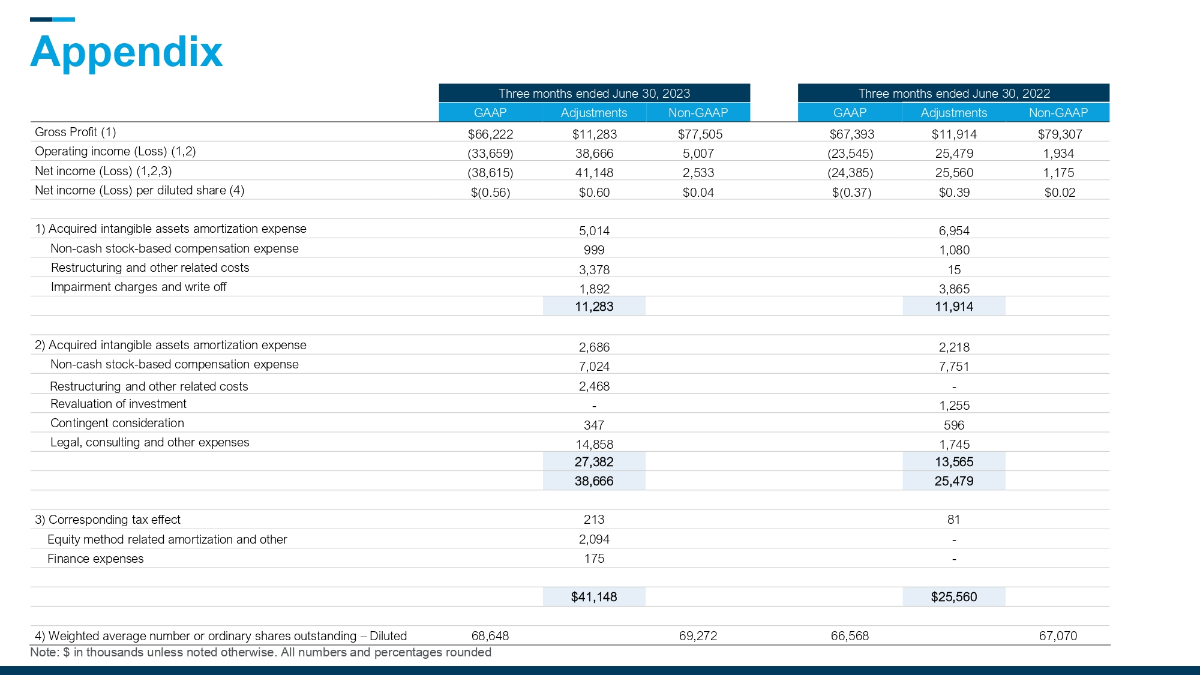
Appendix Note: $ in thousands unless noted otherwise. All numbers and percentages rounded Three months ended June 30 , 2023 Three months ended June 30, 2022 GAAP Adjustments Non - GAAP GAAP Adjustments Non - GAAP Gross Profit (1) $66,222 $11,283 $77,505 $67,393 $11,914 $79,307 Operating income (Loss) (1,2) (33,659) 38,666 5,007 (23,545) 25,479 1,934 Net income (Loss) (1,2,3) (38,615) 41,148 2,533 (24,385) 25,560 1,175 Net income (Loss) per diluted share ( 4) $(0.56) $0.60 $0.04 $(0.37) $0.39 $0.02 1) Acquired intangible assets amortization expense 5,014 6,954 Non - cash stock - based compensation expense 999 1,080 Restructuring and other related costs 3,378 15 Impairment charges and write off 1,892 3,865 11,283 11,914 2) Acquired intangible assets amortization expense 2,686 2,218 Non - cash stock - based compensation expense 7,024 7,751 Restructuring and other related costs 2,468 - Revaluation of investment - 1,255 Contingent consideration 347 596 Legal, consulting and other expenses 14,858 1,745 27,382 13,565 38,666 25,479 3) Corresponding tax effect 213 81 Equity method related amortization and other 2,094 - Finance expenses 175 - $41,148 $25,560 4) Weighted average number or ordinary shares outstanding – Diluted 68,648 69,272 66,568 67,070