UNITED STATES
SECURITIES AND EXCHANGE COMMISSION
Washington, D.C. 20549
FORM 6-K
REPORT OF FOREIGN PRIVATE ISSUER
PURSUANT TO RULE 13a-16 OR 15d-16
UNDER THE SECURITIES EXCHANGE ACT OF 1934
For the month of August 2023
Commission File Number: 001-41362
Ostin Technology Group Co., Ltd.
(Translation of registrant’s name into English)
Building 2, 101/201
1 Kechuang Road
Qixia District, Nanjing
Jiangsu Province, China 210046
(Address of principal executive offices)
Indicate by check mark whether the registrant files or will file annual reports under cover Form 20-F or Form 40-F.
Form 20-F ☒ Form 40-F ☐
INFORMATION CONTAINED IN THIS FORM 6-K REPORT
Ostin Technology Group Co., Ltd. (the “Company”) is filing its unaudited financial results for the six months ended March 31, 2023 and to discuss its recent corporate developments. Attached as exhibits to this Report on Form 6-K are:
| ● | the management’s discussion and analysis of financial condition and results of operations as Exhibit 99.1; |
| ● | the unaudited interim condensed consolidated financial statements and related notes as Exhibit 99.2; and |
| ● | interactive data file disclosure as Exhibit 101 in accordance with Rule 405 of Regulation S-T. |
CAUTIONARY STATEMENT REGARDING FORWARD-LOOKING STATEMENTS
This report on Form 6-K and the exhibits hereto contain “forward-looking statements” for purposes of the safe harbor provisions of the Private Securities Litigation Reform Act of 1995 that represent the Company’s beliefs, projections and predictions about future events. All statements other than statements of historical fact are “forward-looking statements,” including any projections of earnings, revenue or other financial items, any statements of the plans, strategies and objectives of management for future operations, any statements concerning proposed new projects or other developments, any statements regarding future economic conditions or performance, any statements of management’s beliefs, goals, strategies, intentions and objectives, and any statements of assumptions underlying any of the foregoing. Words such as “may”, “will”, “should”, “could”, “would”, “predicts”, “potential”, “continue”, “expects”, “anticipates”, “future”, “intends”, “plans”, “believes”, “estimates” and similar expressions, as well as statements in the future tense, identify forward-looking statements.
These statements are necessarily subjective and involve known and unknown risks, uncertainties and other important factors that could cause the Company’s actual results, performance or achievements, or industry results, to differ materially from any future results, performance or achievements described in or implied by such statements. Actual results may differ materially from expected results described in the Company’s forward-looking statements, including with respect to correct measurement and identification of factors affecting the Company’s business or the extent of their likely impact, and the accuracy and completeness of the publicly available information with respect to the factors upon which the Company’s business strategy is based or the success of the Company’s business.
Forward-looking statements should not be read as a guarantee of future performance or results, and will not necessarily be accurate indications of whether, or the times by which, the Company’s performance or results may be achieved. Forward-looking statements are based on information available at the time those statements are made and management’s belief as of that time with respect to future events, and are subject to risks and uncertainties that could cause actual performance or results to differ materially from those expressed in or suggested by the forward-looking statements. Important factors that could cause such differences include, but are not limited to, those factors discussed more fully under the caption “Risk Factors” as well as other risks and factors identified from time to time in the Company’s SEC filings.
Exhibit Index
| Exhibit No. | Description | |
| 99.1 | Management’s Discussion and Analysis of Financial Condition and Results of Operations for the Six Months Ended March 31, 2023 and 2022 | |
| 99.2 | Unaudited Interim Condensed Consolidated Financial Statements for the Six Months Ended March 31, 2023 and 2022 | |
| 101.INS | Inline XBRL Instance Document (the instance document does not appear in the Interactive Data File because its XBRL tags are embedded within the Inline XBRL document) | |
| 101.SCH | Inline XBRL Taxonomy Extension Schema Document | |
| 101.CAL | Inline XBRL Taxonomy Extension Calculation Linkbase Document | |
| 101.DEF | Inline XBRL Taxonomy Extension Definition Linkbase Document | |
| 101.LAB | Inline XBRL Taxonomy Extension Labels Linkbase Document | |
| 101.PRE | Inline XBRL Taxonomy Extension Presentation Linkbase Document | |
| 104 | Cover Page Interactive Data File (formatted as inline XBRL and contained in Exhibit 101) |
SIGNATURES
Pursuant to the requirements of the Securities Exchange Act of 1934, the registrant has duly caused this report to be signed on its behalf by the undersigned, thereunto duly authorized.
| Ostin Technology Group Co., Ltd. | ||
| By: | /s/ Tao Ling | |
| Name: | Tao Ling | |
| Title: | Chief Executive Officer | |
Date: August 3, 2023
3
Exhibit 99.1
MANAGEMENT’S DISCUSSION AND ANALYSIS OF FINANCIAL CONDITION AND RESULTS OF OPERATIONS
The following discussion and analysis of our financial condition and results of operations should be read in conjunction with our unaudited consolidated financial statements and related notes as set forth in Exhibit 99.2 entitled “Unaudited Interim Condensed Consolidated Financial Statements for the Six Months Ended March 31, 2023 and 2022.” In addition to historical unaudited consolidated financial information, the following discussion contains forward-looking statements that reflect our plans, estimates, and beliefs. Our actual results could differ materially from those discussed in the forward-looking statements. Factors that could cause or contribute to these differences include those discussed below and “Risk Factors” as more fully disclosed in our Annual Report on Form 20-F for the fiscal year ended September 30, 2022, as with the U.S. Securities and Exchange Commission (the “SEC”) on February 16, 2023. All amounts included herein with respect to the six months ended March 31, 2023 and 2022 are derived from our unaudited consolidated financial statements included elsewhere in Exhibit 99.2. Our financial statements have been prepared in accordance with U.S. Generally Accepted Accounting Principles, or U.S. GAAP. Unless the context indicates otherwise, references to “Ostin” are to Ostin Technology Group Co., Ltd., a Cayman Islands exempted company and references to “we,” “us,” “our,” “our company,” the “Company” or similar terms used in this Exhibit 99.1 are to Ostin and/or its consolidated subsidiaries.
Overview
We are a supplier of display modules and polarizers in China. We design, develop and manufacture TFT-LCD modules in a wide range of sizes and customized sizes according to the specifications of our customers. Our display modules are mainly used in consumer electronics, commercial LCD displays and automotive displays. We also manufacture polarizers used in the TFT-LCD display modules and are in the process of developing polarizers for the OLED display panel.
We were formed in 2010 by a group of individuals with industry expertise and have been operating our business, primarily through our wholly owned subsidiary, Jiangsu Austin Optronics Technology Co., Ltd. (“Jiangsu Austin”) and its subsidiaries. We currently operate one headquarter and three manufacturing facilities in China with an aggregate of 54,759 square meters - the headquarter is located in Jiangsu Province, one factory is located in Jiangsu Province for the manufacture of display modules, one in Chengdu, Sichuan Province for the manufacture of TFT-LCD polarizers and one in Luzhou, Sichuan Province, for manufacture of display modules which are primarily used in display devices for education, healthcare, transportation, businesses and offices.
We seek to build our market position based on our close collaborative customer relationships and a focus on the development of high-end display products and new display materials. Our customers include many of the leading manufacturers of computers, automotive electronics and LCD displays in China and worldwide. We have also successfully introduced our polarizers to many companies in China, and extended our product lines to include polarizers to be used for both vertical alignment (VA) panels and in-plane switching (IPS) panels in 2020.
Recent Developments
During the six months ended March 31, 2023, we continued our efforts to develop new products and aim to introduce a protection film to our customers. The production film is designed to be attached to the surface of products, such as OLED panels and wafers, to prevent damage from dust and scratch and will be manufactured through the production facilities we used for polarizers. The protection film is currently undergoing technical improvements. It is expected to pass customer testing in the third quarter of 2023 and is expected to be put into production from the fourth quarter of 2023.
In an effort to increase our profits as well as utilizing our extensive resources and expertise in the display panel industry, we have diversified our production and sales of display products to end users such as commercial display and consumer electronics, which generally have a higher profit margin than our display module products. We have also independently developed new technologies that are used in our proprietary products, such as the all-in-one intelligent conference system and Pintura wireless photo transmission system. Our sales of Pintura wireless photo transmission system in China started since October 2022. Based on our market evaluation, we are upgrading the current Pintura model and developing a new generation of product, which are expected to officially launch in the United States in late 2023. To boost our marketing efforts for these products, we have strengthened our sales force by hiring more sales representatives, providing end-user-focused sales training, attending electronics exhibitions and increasing expenditures on advertisements.
To further diversify our source of revenue, we have leveraged our strong research and development (“R&D”) capabilities and accumulated expertise in the display module field and developed customized solutions for our clients. However, throughout the six months ended March 31, 2023, our R&D team suspended the external service to put its main efforts into our independent product development.
Key Factors Affecting Our Results
Our results are primarily derived from the sales of display modules and polarizers to display manufacturers, end-brand customers or their system integrators in China, Hong Kong, Taiwan and Southeast Asia. The historical performance and outlook for our business is influenced by numerous factors, including the following:
| ● | Fluctuations in Prices of Electronic Component, Polarizer Materials, Other Costs - Fluctuations in the prices of raw materials can lead to volatility in the pricing of our products, which influences the buying patterns of our customers. Because the raw material cost represents over half of our total cost of sales, higher or lower raw material cost affects our gross margins. Increases in the market price of raw materials typically enable us to raise our selling prices. To a lesser extent, our gross margins and selling prices can also be impacted by the costs of transportation and labor. |
| ● | Price Fluctuations Due to Cyclical Market Condition - The display panel industry in general is characterized by cyclical market conditions. From time to time, the industry has been subject to imbalances between excess supply and a slowdown in demand, and in certain periods, resulting in declines in selling prices. In addition, capacity expansion anticipated in the display panel industry may lead to excess capacity. Capacity expansion in the display panel industry may be due to scheduled ramp-up of new manufacturing facilities, and any large increases in capacity as a result of such expansion could further drive down the selling prices of our products, which would affect our results of operations. We cannot assure you that any continuing or further decrease in selling prices or future downturns resulting from excess capacity or other factors affecting the industry will not be severe or that any such continuation, decrease or downturn would not seriously harm our business, financial condition and results of operations. | |
| ● | General Competition - Several of our products have historically faced significant competition both in China and some foreign markets, and we have successfully competed against our competitors with excellent customer service, high quality products and rapid fulfilment of customer orders. However, our business could be adversely affected by competitors who reduce prices, improve on-time delivery and take other competitive actions, which may reduce our customers’ purchases of products from us. |
Impact of the Covid-19 Pandemic
During the six months ended March 31, 2023, the COVID-19 pandemic continues to spread in China and other parts of the world, and COVID-19 restrictions and controls in China have not been relaxed until the end of 2022. Although the Chinese government has now lifted the restrictions, the COVID-19 pandemic still has negatively impacted, and may continue to negatively impact, the global economy and disrupt normal business activity, which may have an adverse effect on our results of operations.
The impacts of the COVID-19 pandemic on our business, financial condition, and results of operations include, but are not limited to, the following:
| ● | The demand for consumer electronics including TVs, monitors, and entertainment devices has been reduced due to market saturation after Chinese government lifted controls, as a result of consumers’ demand shifting to spending on outdoor activities, such as tourism. This has resulted in a decline in our sales and price of display modules during the six months ended March 31, 2023, compared to the same period in previous year. |
| ● | Our credit policy typically requires payment within 30 to 120 days, and payments on the vast majority of our sales have been collected within 45 days. Our average accounts receivable turnover periods were approximately 58 days and 62 days for the six months ended March 31, 2023 and 2022, respectively. The slight decrease in the accounts receivable turnover days is due to the company’s optimized sales process, improved efficiency in order processing, and active collection efforts, which have led to faster collection of sales revenue. |
| ● | For the six months ended March 31, 2023, we were able to repay all our debt and other obligations without taking advantage of any available payment deferral or forbearance term. | |
| ● | Our workforce remained stable for the six months ended March 31, 2023. We did not receive government subsidy or take advantage of any government assistance program in relation to the pandemic. We have complied with the various safety measures required by the local government and provided our employees with protective gears and regularly monitor and trace the health condition of our employees. However, we do not believe those safety measures have materially impacted our operation. |
In the longer-term, the adverse effects of the COVID-19 pandemic on the economies and financial markets of many countries are expected to persist, and may lead to an economic downturn or recession. This could adversely affect demand for some of our products and those of our customers, such as display modules used for automotive display, which may, in turn negatively impact our results of operations.
The degree to which the pandemic ultimately impacts our business and results of operations will depend on future developments beyond our control, including the severity of the pandemic, the actions to contain or treat the virus, how quickly and to what extent the economic and operating conditions can resume, and the severity and duration of the global economic downturn as a result of the pandemic.
Results of Operations
For the Six Months Ended March 31, 2023 and 2022
The following table summarizes the results of our operations for the six months ended March 31, 2023 and 2022, respectively, and provides information regarding the dollar and percentage increase or (decrease) during such periods.
(All amounts, other than percentages, are in U.S. dollars)
| For the Six Months | ||||||||||||||||
| Ended March 31, | Variance | |||||||||||||||
| 2023 | 2022 | Amount | Percentage | |||||||||||||
| Sales | $ | 34,295,114 | $ | 60,094,661 | $ | (25,799,547 | ) | (43 | )% | |||||||
| Cost of sales | 33,603,125 | 51,460,589 | (17,857,464 | ) | (35 | )% | ||||||||||
| Gross profit | $ | 691,989 | 8,634,072 | (7,942,083 | ) | (92 | )% | |||||||||
| Operating expenses: | ||||||||||||||||
| Selling and marketing expenses | 1,325,919 | 1,419,660 | (93,741 | ) | (7 | )% | ||||||||||
| General and administrative expenses | 3,175,731 | 3,550,877 | (375,146 | ) | (11 | )% | ||||||||||
| Research and development costs | 1,430,401 | 2,028,038 | (597,637 | ) | (29 | )% | ||||||||||
| Loss (Gain)from disposal of property, plant and equipment | (160,288 | ) | 1,242 | (161,530 | ) | (13,006 | )% | |||||||||
| Total operating expenses | $ | 5,771,763 | 6,999,817 | (1,228,054 | ) | (18 | )% | |||||||||
| Operating income | $ | (5,079,774 | ) | $ | 1,634,255 | $ | (6,928,065 | ) | (411 | )% | ||||||
| Other income (expenses): | ||||||||||||||||
| Interest expense, net | (544,923 | ) | (741,667 | ) | 196,744 | (27 | )% | |||||||||
| Other income (expenses), net | 499,982 | 615,587 | (115,605 | ) | (19 | )% | ||||||||||
| Total other income (expenses), net | (44,941 | ) | (126,080 | ) | 81,139 | (64 | )% | |||||||||
| Income before income taxes | $ | (5,124,715 | ) | $ | 1,508,175 | $ | (6,846,926 | ) | (440 | )% | ||||||
| Income tax provision | 108,189 | (306,515 | ) | 414,704 | (135 | )% | ||||||||||
| Net income | $ | (5,016,526 | ) | $ | 1,201,660 | $ | (6,432,222 | ) | (517 | )% | ||||||
Revenues
The following table presents revenue by major product and service categories for the six months ended March 31, 2023 and 2022, respectively.
| March 31, 2023 | March 31, 2022 | |||||||||||||||
| Revenues Amount | As % of | Revenues Amount | As % of | |||||||||||||
| Revenue Category | (In USD) | Revenues | (In USD) | Revenues | ||||||||||||
| Display modules | $ | 15,137,071 | 44 | % | $ | 27,961,103 | 47 | % | ||||||||
| Polarizers | 16,974,322 | 49 | % | 23,750,420 | 40 | % | ||||||||||
| Research and development services | - | - | 4,957,518 | 8 | % | |||||||||||
| Others (repair services) | 2,183,721 | 6 | % | 3,425,620 | 5 | % | ||||||||||
| Total | $ | 34,295,114 | 100 | % | $ | 60,094,661 | 100 | % | ||||||||
Revenues decreased by approximately $25.80 million or 43%, to approximately $34.30 million for the six months ended March 31, 2023 from approximately $60.09 million for the six months ended March 31, 2022. The significant decrease in revenues was primarily due to the decrease in sales from both display modules and polarizers resulted from the large-scale outbreak of coronavirus infections in mainland China in the fourth quarter of 2022 as more fully discussed below.
Revenue from sales of display modules decreased by approximately $12.82 million or 46%, to approximated $15.14 million for the six months ended March 31, 2023 from approximately $27.96 million for the six months ended March 31, 2022. Based on seasonality in our business and cyclical nature of our industry, we believe that the market demand will gradually recover in the second half of 2023 and give a steady boost to our sales of display modules in the next 12 to 18 months. We have also improved our research and development capabilities based on accumulated experience and expertise of new products research and development catering to our major end-brand clients and expanded certain product lines from trial production to mass production. For the six months ended March 31, 2023 and 2022, revenue generated from sales of the display modules accounted for 38% and 47% of our total revenues, respectively.
In 2018, we made a strategic decision to launch our new business segment - polarizers and our Chengdu manufacturing facility commenced mass production of polarizers in April 2019. Polarizer is an essential part of TFT-LCD display panel and has been in high demand in China due to limited domestic production capacity and concentration of supply in oversea suppliers. By adding polarizers in our product offering portfolio, we effectively expanded our business horizon, extended customer outreach, and strengthened our competitiveness. To facilitate mass production of polarizers, we invested substantial amounts of capital and human resources to construct and operate our Chengdu manufacturing facility during the six months ended March 31, 2023 and closed other low-margin product lines of display modules. For the six months ended March 31, 2023 and 2022, revenue generated from the polarizers were approximately $16.97 million and $23.75 million, respectively, representing a decrease of approximately $6.78 million or 29%. The prolonged COVID-19 pandemic has had a negative impact on the economy and thereby lowered the expectations of income, which has subsequently affected the demand for electronic consumer goods. Such decreased demand in the six months ended March 31, 2023 resulted decrease in the sales of our polarizers. For the six months ended March 31, 2023 and 2022, revenue generated from sales of polarizers accounted for 49% and 40% of our total revenues, respectively.
In addition to revenue from sales of display modules and polarizers, we also provide display panel repair services to our customers at extra charges, which involves sales of our products as replacement of certain parts of the display panels. The repair services were originally offered to a limited number of customers at their request and represent only a small portion of our revenues. As a result of our extending repair services customer base to those who did not purchase our display panel products, our revenues from repair services decreased by approximately $1.24 million, or 36%, to approximately $2.18 million for the six months ended March 31, 2023 from approximately $3.43 million for the six months ended March 31, 2022.
For the six months ended March 31, 2023, revenue generated from our new products R&D services was nil, representing significant decrease as compared to approximately $4.96 million for the six months ended March 31, 2022. This was primarily due to the fact that our R&D team suspended the external service to put its main efforts into our independent product development.
The following table shows our revenues by geographic region for the six months ended March 31, 2023 and March 31, 2022. To mitigate impact of the fluctuation of exchange rates and supply chain disruption caused by the COVID-19 pandemic, we focused more on domestic markets instead of overseas markets, and therefore, our sales to Hong Kong and Taiwan decreased significantly during the six months ended March 31, 2023 as compared to the same period last year.
| March 31, 2023 | March 31, 2022 | |||||||||||||||
| Revenues Amount |
As % of | Revenues Amount |
As % of | |||||||||||||
| Country/Region | (In USD) | Revenues | (In USD) | Revenues | ||||||||||||
| Mainland China | $ | 33,524,738 | 98 | % | $ | 55,034,541 | 92 | % | ||||||||
| Hong Kong and Taiwan | 761,136 | 2 | % | 5,060,120 | 8 | % | ||||||||||
| Southeast Asia | 9,240 | - | - | - | ||||||||||||
| Total | $ | 3,4974,469 | 100 | % | $ | 60,094,661 | 100 | % | ||||||||
Cost of sales
The following table presents cost of sales by categories for the six months ended March 31, 2023 and 2022, respectively.
| For the Six Months Ended March 31, |
||||||||
| 2023 | 2022 | |||||||
| Product Category | ||||||||
| Display modules | $ | 13,986,161 | $ | 26,117,379 | ||||
| Polarizers | 16,226,347 | 21,386,213 | ||||||
| Research and development services | 1,434,771 | 1,629,328 | ||||||
| Others | 1,955,845 | 2,327,669 | ||||||
| Total | $ | 33,603,125 | $ | 51,460,589 | ||||
| Gross Margin | ||||||||
| Display modules | 8 | % | 7 | % | ||||
| Polarizers | 4 | % | 10 | % | ||||
| Research and development services | / | 67 | % | |||||
| Others | 10 | % | 32 | % | ||||
| Total Gross Margin | 2 | % | 14 | % | ||||
Cost of sales decreased by approximately $17.86 million or 35%, to approximately $33.60 million for the six months ended March 31, 2023 from approximately $51.46 million for the six months ended March 31, 2022. The decrease in cost of sales was in line with the decrease in our revenue.
Our gross profit decreased by approximately $7.94 million, or 92%, to approximately $0.69 million for the six months ended March 31, 2023 from approximately $8.63 million for the six months ended March 31, 2022. Overall gross profit margin was 2% for the six months ended March 31, 2023, as compared to 14% for the six months ended March 31, 2022. The decrease in gross profit is due to we reduced unit sales price in an effort to clear lower-end products inventory.
The decrease in gross profit margin of display modules and polarizers was primarily attributable from high costs relating to the procurement of raw materials and decline in the market demand, resulting in a decrease in our products’ unit sale price and sales volume.
The decrease in gross profit for R&D services was due to the fact that our R&D team suspended the external service to put its main efforts into our independent product development.
Selling and marketing expenses
Selling and marketing expenses decreased by approximately $0.09 million, or 7%, to approximately $1.33 million for the six months ended March 31, 2023 as compared to approximately $1.42 million for the six months ended March 31, 2022. The decrease in selling and marketing expenses was mainly due to the reduction in market development activities.
General and administrative expenses
General and administrative (“G&A”) expenses decreased by approximately $0.38 million, or 11%, to approximately $3.18 million for the six months ended March 31, 2023 as compared to approximately $3.55 million for the six months ended March 31, 2022. The decrease in G&A expenses was due to the reduction of professional service fees upon the completion of our initial public offering.
Research and development expenses
Our research and development expenses decreased by approximately $0.6 million to $1.43 million for the six months ended March 31, 2023 from approximately $2.03 million for the same period in 2022. The decrease was mainly attributable to the outbreaks of the COVID-19 pandemic in the fourth quarter of 2022 in mainland China. Such outbreaks caused some of our employees, including R&D personnel, to contract the virus and became unable to work. As a result, we decided to halt some of our R&D projects, leading to a reduction in our R&D expenses.
Other income (expenses)
Other income (expenses) was approximately $0.50 million for the six months ended March 31, 2023, which primarily consisted of other non-business income of $0.52 million and other non-business expenses of $0.02 million. Other non-business income was mainly government subsidiaries of $0.52 million.
Other income (expenses) was approximately $0.62 million for the six months ended March 31, 2022, which primarily consisted of other non-business income of $0.63 million and other non-business expenses of $0.01 million. Other non-business income was mainly government subsidiaries of $0.56 million.
Net income (loss)
As a result of the foregoing, we recorded net loss of $5.02 million and net income of $1.20 million for the six months ended March 31, 2023 and 2022, respectively.
Liquidity and Capital Resources
| For the Six Months Ended March 31, |
||||||||
| 2023 | 2022 | |||||||
| Net cash provided by (used in) operating activities | $ | 574,718 | $ | 8,014,001 | ||||
| Net cash used in investing activities | (4,894,435 | ) | (1,444,310 | ) | ||||
| Net cash provided by (used in) financing activities | 4,546,954 | (3,780,988 | ) | |||||
| Effect of exchange rate changes on cash and cash equivalents | 1,091,956 | 59,099 | ||||||
| Net increase in cash and cash equivalents | $ | 864,719 | $ | 2,847,802 | ||||
| Cash and cash equivalents, beginning of period | 3,806,920 | 684,335 | ||||||
| Cash and cash equivalents, end of period | $ | 2,942,201 | $ | 3,532,137 | ||||
Operating Activities:
Net cash provided by operating activities for the six months ended March 31, 2023 was approximately $0.57 million, which was primarily attributable to a net loss of approximately $5.02 million, adjusted for non-cash items of approximately $2.03 million and adjustments for changes in working capital of approximately $3.56 million. The adjustments for changes in working capital mainly included:
| (i) | decrease in accounts receivable of approximately $1.77 million – our accounts receivable balance decreased significantly due to the collection of receivables from our major customers during the six months ended March 31, 2023; | |
| (ii) | increase in inventory of approximately $0.43 million – our inventory increased significantly due to the higher quantity of specific products in response to market changes. |
| (iii) | decrease in advances to suppliers of approximately $2.99 million – from time to time we are required to make advance payments to our suppliers for purchase of raw materials. Due to the decreased demand for raw materials resulted from the decreased sales and the effort to enhance the efficiency of our cash flows, we made lower advance payments to our suppliers during the six months ended March 31, 2023; |
| (iv) | increase in accounts payable of approximately $0.45 million due to an increase in the purchase of raw materials; and |
| (v) | increase in advance from customers of approximately $0.22 million due to a change in our credit policy, where we require advance payments from certain new customers. |
Net cash provided by operating activities for the six months ended March 31, 2022 was approximately $8.01 million, which was primarily attributable to a net profit of approximately $1.20 million, adjusted for non-cash items of approximately $1.10 million and adjustments for changes in working capital of approximately $5.72 million. The adjustments for changes in working capital mainly included:
| (i) | decrease in accounts receivable of approximately $10.36 million – our accounts receivable balance decreased significantly due to the collection of receivables from our major customers during the six months ended March 31, 2022; |
| (ii) | Increase in inventory of approximately $0.85 million – our inventory increased significantly due to increase in raw material inventory in transit as of March 31, 2022 resulting from the increase in transportation and delivery time caused by the COVID-19 pandemic; |
| (iii) | decrease in advances to suppliers of approximately $3.80 million – from time to time we are required to make advance payments to our suppliers for purchase of raw materials. Due to the decreased demand for raw materials resulted from the decreased sales and the effort to enhance the efficiency of our cash flows, we made lower advance payments to our suppliers during the six months ended March 31, 2022; |
| (iv) | decrease in accounts payable of approximately $6.36 million due to the payment to our suppliers; and |
| (v) | decrease in advance from customers of approximately $1.04 million due to the decreased sales of our products. |
Investing Activities:
Net cash used in investing activities was approximately $4.89 million for the six months ended March 31, 2023, mainly attributable to the addition of fixed assets of $4.93 million for production needs during the period. Additionally, the addition of intangible assets of $0.33 million during the same period. Furthermore, there was a gain of $0.37 million from the disposal of fixed assets and construction in progress.
Net cash used in investing activities was approximately $1.44 million for the six months ended March 31, 2022, mainly attributable to the addition of fixed assets of $1.39 million for production needs during the period.
Financing Activities:
Net cash provided by financing activities was approximately $4.55 million for the six months ended March 31, 2023, primarily attributable to repayment of related party loans of approximately $2.73 million, repayment of third-party loans of approximately $0.06 million, partially offset by net proceeds from bank loans of approximately $2.73 million.
Net cash used in financing activities was approximately $3.78 million for the six months ended March 31, 2022, primarily attributable to repayment of related party loans of approximately $1.92 million, repayment of third-party loans of approximately $3.29 million, partially offset by net proceeds from bank loans of approximately $1.92 million.
Primary Sources of Liquidity
Our primary sources of liquidity consist of existing cash balances, cash flows from our operating activities and availability under our loan arrangements with banks and certain third-party individuals. Our ability to generate sufficient cash flows from our operating activities is primarily dependent on our sales of display modules and polarizers to our customers at margins sufficient to cover fixed and variable expenses.
As of March 31, 2023 and September 30, 2022, we had cash and cash equivalents of $2,942,201 and $3,806,920, respectively. We believe that our current cash, cash to be generated from our operations and access to funds under our loan arrangements with banks will be sufficient to meet our working capital needs for at least the next twelve months.
We finance our operations through short-term loans provided by a syndicate of banks in China, as listed in Note 12 Short-term Borrowings of our unaudited consolidated financial statements. As of March 31, 2023, we had a total of 19 outstanding short-term loans provided by banks, with an aggregate principal amount of RMB122,000,000, or approximately $17.76 million. As of September 30, 2022, we had a total of 18 outstanding short-term loans provided by banks, with an aggregate principal amount of RMB102,930,000, or approximately $14.47 million. Each of these loans has a term of six months to one year and, pursuant to our agreements with these banks, all of the loans can be renewed and funds can be accessed immediately when the outstanding principal and interest are repaid in full. All of these loans have a fixed interest rate. The average interest rates were 4.60% and 4.78% for the outstanding bank loans as of March 31, 2023 and September 30, 2022, respectively.
We do not have any amounts committed to be provided by our related parties. However, we plan to expand our business by investing in new technologies either through acquisition or research and development and construction of facilities and purchase of equipment for production of new products. In April 2022, we received net proceeds of approximately $13.6 million after deducting underwriting discounts and commissions and offering expenses from our initial public offering. In the future, we may need to raise more capital through financing, including private and public offering, to fund our business development and further strengthen our position in the market.
Substantially all of our operations are conducted in China and a majority portion of our revenues, expense, cash and cash equivalents are denominated in RMB. RMB is subject to the exchange control regulation in China, and, as a result, we may have difficulty distributing any dividends outside of China due to PRC exchange control regulations that restrict our ability to convert RMB into U.S. dollars.
Capital Expenditures
Our capital expenditures consist primarily of expenditures for the purchase of fixed assets as a result of our business expansion in China mainland and overseas markets, and the construction and launch of, and the continuous investment in, the manufacturing facility of polarizers. Our capital expenditures amounted to $4.89 million for the six months ended March 31, 2023 and $1.44 million for the six months ended March 31, 2022.
Contractual Obligations
There were no significant contractual obligations and commercial commitments, other than our bank borrowings as disclosed in herein as of March 31, 2023 and September 30, 2022.
Off-balance Sheet Commitments and Arrangements
There were no off-balance sheet arrangements for the six months ended March 31, 2023 and 2022 that have or that in the opinion of management are likely to have, a current or future material effect on our consolidated financial condition or results of operations.
Impact of Inflation
We do not believe the impact of inflation on us is material. Our operations are in China and China’s inflation rates have been relatively stable in the last three years: 2.0% for 2022, 2.3% for 2021, 2.5% for 2020.
Holding Company Structure
We are a holding company with no material operations of our own. We conduct our operations primarily through Jiangsu Austin and its subsidiaries in China. As a result, our ability to pay dividends and to finance any debt we may incur depends upon dividends paid by our subsidiaries. Our PRC subsidiaries may purchase foreign exchange from relevant banks and make distributions to offshore companies after completing relevant foreign exchange registration with the SAFE. Our offshore companies may inject capital into or provide loans to our PRC subsidiaries through capital contributions or foreign debts, subject to applicable PRC regulations. If our subsidiaries or any newly formed subsidiaries incur debt on their own behalf in the future, the instruments governing their debt may restrict their ability to pay dividends to us. In addition, our PRC subsidiaries are permitted to pay dividends to us only out of their retained earnings, if any, as determined in accordance with PRC accounting standards and regulations.
Under PRC law, each of our affiliates in China is required to set aside at least 10% of its after-tax profits each year, if any, to fund a statutory reserve until such reserve reached 50% of its registered capital, after which any mandatory appropriation stops. Although the statutory reserves can be used, among other ways, to increase the registered capital and eliminate future losses in excess of retained earnings of the respective companies, the reserve funds are not distributable as cash dividends except in the event of liquidation of the companies. The reserved amounts as determined pursuant to PRC statutory laws totaled $1,497,537 and $1,496,314 as of March 31, 2023 and September 30, 2022, respectively.
Research and Development
The display panel industry is subject to rapid technological changes. We believe that effective research and development is essential to maintaining our competitive position in the market.
We conduct research and development primarily internally and through collaborations with various universities. We spend approximately 3-4% of revenue each year on our research and development activities. We have developed a research and development management system that encourages our engineers to make new project proposals and implement strict evaluation standards for each stage of a project development. New projects are selected primarily based on their feasibility and consistency with our overall research and development strategy, and are reviewed on a quarterly basis. As of March 31, 2023, our research and development department had a total of 60 employees, of which 10% have a master’s degree or higher.
The following are examples of products and technologies that have been developed through our research and development activities in recent years:
To strengthen our technology leadership and improve our competitiveness, we have focused on diversifying the use of our products to new industries, such as automotive, outdoor media, public education, and IoT terminals. In our research and development, we have aimed at upgrading the display technology of our products to cater for different application scenarios.
We have also expanded our research and development efforts to upstream raw materials. Through our cooperation with Inabata & Co., Ltd. in Japan, our polarizer manufacturing facilities in Chengdu started production in January 2019. We worked with Inabata & Co., Ltd. to jointly develop new polarizers to meet the technical specifications of customers in China. We will continue to invest in the research and development of polarizers for LCD and OLED display panels.
To enhance competitiveness in the end product market, our research and development team has been developing innovative products with a unique market positioning. We have started to independently develop new technologies, such as face recognition, simultaneous language translation, wireless charging, and synchronous projection, which are being applied to our own products, such as the all-in-one intelligent conference system and wireless photo transmission system.
Furthermore, with the expansion of the use of display panels, an increasing number of customers who are unable to independently develop their own control systems, are searching for one-stop display, control and transmission solutions that meet their needs. Since 2017, we have strengthened our technological capabilities to offer client-centric, one-stop solutions and services that cover product design, research and development as well as production and sales.
Trend Information
After the significant increase in customer demand resulting from the COVID-19 pandemic since 2019, the market demand keep declining during the six months ended March 31, 2023. Although the Chinese government has gradually relaxed control over the Covid-19 pandemic by the end of 2022, demand for IT products has not recovered, but rebounded in the direction of services, including tourism and catering. The costs of sales, production and raw materials also declined sharply following the decrease in market demand. By arranging the production plan based on sales orders, we avoided the backlog problem caused by the oversupply situation in the overall market. Based on seasonality in our business and the cyclical nature of our industry, and there is a delay in recovery from reduced demand caused by the pandemic, we believe that the market demand will gradually recover in the second half of 2023 and will boost our sales of display modules and polarizers in the next 12 to 18 months. However, we cannot predict future supply chain disruption and other sudden changes to the market demand including uncertainties from policies, international relationship or epidemics, which may adversely affect our results of operations and financial conditions.
Critical Accounting Estimates
The preparation of the unaudited consolidated financial statements in conformity with U.S. GAAP requires management to make estimates and assumptions that affect the amounts reported and disclosed in the unaudited consolidated financial statements and the accompanying notes. Such estimates include, but are not limited to, allowances for doubtful accounts, inventory valuation, useful lives of property, plant and equipment, intangible assets, and income taxes related to realization of deferred tax assets and uncertain tax position. Actual results could differ from those estimates.
11
Exhibit 99.2
OSTIN TECHNOLOGY GROUP CO., LTD.
CONDENSED CONSOLIDATED FINANCIAL STATEMENTS
FOR THE SIX MONTHS ENDED MARCH 31, 2023 AND 2022
(UNAUDITED)
F-
OSTIN TECHNOLOGY GROUP CO., LTD.
INDEX TO UNAUDITED CONDENSED CONSOLIDATED FINANCIAL STATEMENTS
Condensed Consolidated Financial Statements
F-
OSTIN TECHNOLOGY GROUP CO., LTD.
UNAUDITED CONDENSED CONSOLIDATED BALANCE SHEETS
AS OF MARCH 31, 2023 AND SEPTEMBER 30, 2022
(IN U.S. DOLLARS, EXCEPT FOR NUMBER OF SHARES DATA)
| March 31, 2023 |
September 30, |
|||||||
| ASSETS | (Unaudited) | |||||||
| Current Assets | ||||||||
| Cash and cash equivalents | $ | 2,620,400 | $ | 3,655,947 | ||||
| Restricted cash | 321,801 | 150,973 | ||||||
| Accounts receivable, net of allowance for doubtful accounts of $86,719 and $33,184, respectively | 4,648,700 | 6,270,505 | ||||||
| Notes receivable | 2,968 | |||||||
| Inventories, net | 16,192,184 | 15,432,712 | ||||||
| Advances to suppliers, net | 3,126,045 | 6,097,833 | ||||||
| Tax receivables | 776,641 | 92,749 | ||||||
| Prepaid expenses and other receivables | 611,951 | 207,584 | ||||||
| Total Current Assets | 28,300,690 | 31,908,303 | ||||||
| Property, plant and equipment, net | 23,443,592 | 19,415,829 | ||||||
| Land use rights, net | 1,621,238 | 1,284,591 | ||||||
| Intangible assets, net | 2,789,303 | 2,968,745 | ||||||
| Deferred tax assets, net | 558,870 | 566,404 | ||||||
| Long-term investment | 218,417 | 210,867 | ||||||
| Right-of-use lease assets | 5,571 | |||||||
| Other long-term receivables | 744,467 | 823,116 | ||||||
| TOTAL ASSETS | $ | 57,676,577 | $ | 57,183,426 | ||||
| LIABILITIES AND SHAREHOLDERS’ EQUITY | ||||||||
| Current Liabilities | ||||||||
| Accounts payable | $ | 6,964,460 | $ | 6,279,484 | ||||
| Accrued expenses and other current liabilities | 1,531,169 | 1,950,122 | ||||||
| Advances from customers | 1,690,464 | 1,415,175 | ||||||
| Due to related parties | 2,104,083 | 477,964 | ||||||
| Short-term borrowings | 24,773,938 | 21,292,963 | ||||||
| Operating lease liabilities – current | 87,367 | 89,917 | ||||||
| Total Current Liabilities | 37,151,481 | 31,505,625 | ||||||
| Long-term borrowings | 291,223 | |||||||
| Other long-term payables | 47,280 | 52,590 | ||||||
| TOTAL LIABILITIES | $ | 37,489,984 | $ | 31,558,215 | ||||
| COMMITMENTS AND CONTINGENCIES | ||||||||
| SHAREHOLDERS’ EQUITY | ||||||||
| Ordinary share, $0.0001 par value, 500,000,000 shares authorized, 14,006,250 and 14,006,250 shares issued and outstanding as of March 31, 2023 and September 30, 2022 |
1,401 | 1,401 | ||||||
| Additional paid-in capital | 23,256,219 | 23,256,219 | ||||||
| Statutory reserves | 1,497,537 | 1,496,314 | ||||||
| (Accumulated deficit) / Retained earnings | (2,506,040 | ) | 2,484,385 | |||||
| Accumulated other comprehensive loss | (2,301,399 | ) | (1,902,108 | ) | ||||
| Total Equity Attributable to Ostin Technology Group Co., Ltd. | 19,947,718 | 25,336,211 | ||||||
| Equity attributable to non-controlling interests | 238,875 | 289,000 | ||||||
| Total Shareholders’ Equity | 20,186,593 | 25,625,211 | ||||||
| TOTAL LIABILITIES AND SHAREHOLDERS’ EQUITY | $ | 57,676,577 | $ | 57,183,426 | ||||
The accompanying notes are an integral part of these consolidated financial statements.
F-
OSTIN TECHNOLOGY GROUP CO., LTD.
UNAUDITED
CONDENSED CONSOLIDATED STATEMENTS OF INCOME (LOSS) AND
COMPREHENSIVE INCOME (LOSS)
FOR THE SIX MONTHS ENDED MARCH 31, 2023 AND 2022
(IN U.S. DOLLARS, EXCEPT SHARES DATA)
| For the six months ended | ||||||||
| March 31, | ||||||||
| 2023 | 2022 | |||||||
| Sales | $ | 34,295,114 | $ | 60,094,661 | ||||
| Cost of sales | (33,603,125 | ) | (51,460,589 | ) | ||||
| Gross profit | 691,989 | 8,634,072 | ||||||
| Operating expenses: | ||||||||
| Selling and marketing expenses | (1,325,919 | ) | (1,419,660 | ) | ||||
| General and administrative expenses | (3,175,731 | ) | (3,550,877 | ) | ||||
| Research and development costs | (1,430,401 | ) | (2,028,038 | ) | ||||
| Gain from disposal of property, plant and equipment | 160,288 | (1,242 | ) | |||||
| Total operating expenses | (5,771,763 | ) | (6,999,817 | ) | ||||
| Operating income (loss) | (5,079,774 | ) | 1,911,951 | |||||
| Other income (expenses): | ||||||||
| Interest income (expense), net | (544,923 | ) | (741,667 | ) | ||||
| Other income (expenses), net | 499,982 | 615,587 | ||||||
| Total other income (expenses), net | (44,941 | ) | (126,080 | ) | ||||
| (Loss) Income before income taxes | (5,124,715 | ) | 1,508,175 | |||||
| Income tax benefit / (provision) | 108,189 | (306,515 | ) | |||||
| Net income | (5,016,526 | ) | 1,201,660 | |||||
| Net income (loss) attributable to non-controlling interests | (27,324 | ) | 1,759 | |||||
| Net income attributable to Ostin Technology Group Co., Ltd. | (4,989,202 | ) | 1,199,901 | |||||
| Net (loss) income | (5,016,526 | ) | 1,201,660 | |||||
| Other comprehensive income (loss): | ||||||||
| Foreign currency translation adjustment | (422,092 | ) | 279,564 | |||||
| Comprehensive (loss) income | (5,438,618 | ) | 1,481,224 | |||||
| Comprehensive (loss) income attributable to non-controlling interests | (50,125 | ) | 23,049 | |||||
| Comprehensive (loss) income attributable to Ostin Technology Group Co., Ltd. | (5,388,493 | ) | 1,458,175 | |||||
| Earnings per ordinary share | ||||||||
| $ | (0.36 | ) | $ | 0.12 | ||||
| Weighted average number of ordinary shares outstanding | ||||||||
| 14,006,250 | 10,125,000 | |||||||
The accompanying notes are an integral part of these consolidated financial statements.
F-
OSTIN TECHNOLOGY GROUP CO., LTD.
UNAUDITED CONDENSED CONSOLIDATED STATEMENTS OF CHANGES IN SHAREHOLDERS’ EQUITY
FOR THE SIX MONTHS ENDED MARCH 31, 2023 AND 2022
(IN U.S. DOLLARS, EXCEPT SHARES DATA)
| Shares | Amount | Additional paid-in capital |
Statutory reserves |
Retained Earnings/ (Accumulated deficit) |
Accumulated other comprehensive income (loss) |
Non- controlling interests |
Total shareholders’ equity |
|||||||||||||||||||||||||
| Balance at September 30, 2022 | 14,006,250 | $ | 1,401 | $ | 23,256,219 | $ | 1,496,314 | $ | 2,484,385 | $ | (1,902,108 | ) | $ | 289,000 | $ | 25,625,211 | ||||||||||||||||
| Foreign currency translation loss | - | - | - | - | - | (399,291 | ) | (22,801 | ) | (422,092 | ) | |||||||||||||||||||||
| Net loss | - | - | - | 1,223 | (4,990,425 | ) | - | (27,324 | ) | (5,016,526 | ) | |||||||||||||||||||||
| Balance at March 31, 2023 | 14,006,250 | $ | 1,401 | $ | 23,256,219 | $ | 1,497,537 | $ | (2,506,040 | ) | $ | (2,301,399 | ) | $ | 238,875 | $ | 20,186,593 | |||||||||||||||
OSTIN TECHNOLOGY GROUP CO., LTD.
UNAUDITED CONDENSED CONSOLIDATED STATEMENTS OF CHANGES IN SHAREHOLDERS’ EQUITY
FOR THE SIX MONTHS ENDED MARCH 31, 2022
(IN U.S. DOLLARS, EXCEPT SHARES DATA)
| Shares | Amount | Additional paid-in capital |
Statutory reserves |
Retained Earnings |
Accumulated other comprehensive income (loss) |
Non- controlling interests |
Total shareholders’ equity |
|||||||||||||||||||||||||
| Balance at September 30, 2021 | 10,125,000 | $ | 1,013 | $ | 10,856,169 | $ | 1,033,653 | $ | 2,748,068 | $ | (316,017 | ) | $ | 878,969 | $ | 15,201,855 | ||||||||||||||||
| Foreign currency translation gain | - | - | - | - | - | 258,274 | 21,290 | 279,564 | ||||||||||||||||||||||||
| Net income | - | - | - | 311,501 | 888,400 | - | 1,759 | 1,201,660 | ||||||||||||||||||||||||
| Balance at March 31, 2022 | 10,125,000 | $ | 1,013 | $ | 10,856,169 | $ | 1,345,154 | $ | 3,636,468 | $ | (57,743 | ) | $ | 902,018 | $ | 16,683,079 | ||||||||||||||||
The accompanying notes are an integral part of these consolidated financial statements.
F-
OSTIN TECHNOLOGY GROUP CO., LTD.
UNAUDITED CONDENSED CONSOLIDATED STATEMENTS OF CASH FLOWS
FOR THE SIX MONTHS ENDED MARCH 31, 2023 AND 2022
(IN U.S. DOLLARS)
| For the six months ended March 31, | ||||||||
| 2023 | 2022 | |||||||
| Cash Flows from Operating Activities: | ||||||||
| Net (loss) income | $ | (5,016,526 | ) | $ | 1,201,660 | |||
| Adjustments to reconcile net income to net cash (used in) provided by operating activities: | ||||||||
| Depreciation expense | 1,177,801 | 1,033,422 | ||||||
| Amortization expense of land use rights | 44,917 | 40,600 | ||||||
| Amortization expense of intangible assets | 213,300 | 96,747 | ||||||
| Amortization expense of right-of-use assets | 55,175 | |||||||
| Bad debt expense for accounts receivable | 53,535 | |||||||
| Bad debt expense for advances to suppliers | 150,547 | 8,929 | ||||||
| Inventory provision | 224,461 | (278,113 | ) | |||||
| Deferred tax assets, net | 7,534 | 137,297 | ||||||
| Gain from disposal of property, plant and equipment | 160,288 | 1,242 | ||||||
| Changes in operating assets and liabilities: | ||||||||
| Accounts receivable | 1,766,078 | 10,355,021 | ||||||
| Notes receivable | (2,922 | ) | 102,539 | |||||
| Inventories | (428,134 | ) | (853,457 | ) | ||||
| Advances to suppliers | 2,992,304 | 3,799,633 | ||||||
| Prepaid expenses and other receivables | (390,761 | ) | (564,954 | ) | ||||
| Other long-term receivables | 106,439 | |||||||
| Accounts payable | 452,977 | (6,356,916 | ) | |||||
| Accrued expenses and other current liabilities | (481,177 | ) | 377,896 | |||||
| Advances from customers | 221,124 | (1,039,026 | ) | |||||
| Income tax payable | (669,986 | ) | (1,419 | ) | ||||
| Operating lease liabilities | (102,275 | ) | ||||||
| Other long-term payables | (7,081 | ) | ||||||
| Net cash provided by operating activities | 574,718 | 8,014,001 | ||||||
| Cash Flows from Investing Activities: | ||||||||
| Purchases of property, plant and equipment | (4,934,633 | ) | (1,388,888 | ) | ||||
| Disposal of property, plant and equipment | 366,216 | |||||||
| Purchases of intangible assets | (326,018 | ) | (55,422 | ) | ||||
| Net cash used in investing activities | (4,894,435 | ) | (1,444,310 | ) | ||||
| Cash Flows from Financing Activities: | ||||||||
| Proceeds from (Repayments to) long-term liability | 286,694 | (501,136 | ) | |||||
| Proceeds from short-term bank borrowings | 13,354,166 | 7,245,544 | ||||||
| Repayments on short-term bank borrowings | (10,620,547 | ) | (5,322,322 | ) | ||||
| Proceeds from short-term borrowings from third party individuals | 157,681 | 888,624 | ||||||
| Repayments on short-term borrowings from third party individuals | (215,020 | ) | (4,176,289 | ) | ||||
| Proceeds from/(Repayments to) related parties | 1,583,980 | (1,915,409 | ) | |||||
| Net cash provided by (used in) financing activities | 4,546,954 | (3,780,988 | ) | |||||
| Effect of changes in currency exchange rates | (1,091,956 | ) | 59,099 | |||||
| Net (decrease) increase in cash and cash equivalents | (864,719 | ) | 2,847,802 | |||||
| Cash, cash equivalents and restricted cash at the beginning of period | 3,806,920 | 684,335 | ||||||
| Cash and cash equivalents and restricted cash at the end of period | $ | 2,942,201 | $ | 3,532,137 | ||||
| Reconciliation of cash, cash equivalents and restricted cash to the Consolidated Balance Sheets | ||||||||
| Cash and cash equivalents | $ | 2,620,400 | $ | 2,847,802 | ||||
| Restricted cash | 321,801 | 684,335 | ||||||
| Total cash, cash equivalents and restricted cash | $ | 2,942,201 | $ | 3,532,137 | ||||
| Supplemental disclosures of cash flows information: | ||||||||
| Cash paid for income taxes | $ | 100,880 | $ | 29,468 | ||||
| Cash paid for interest | $ | 566,254 | $ | 418,108 | ||||
The accompanying notes are an integral part of these consolidated financial statements.
F-
OSTIN TECHNOLOGY GROUP CO., LTD.
NOTES TO UNAUDITED CONDENSED CONSOLIDATED FINANCIAL STATEMENTS
NOTE 1 – ORGANIZATION AND NATURE OF OPERATIONS
Ostin Technology Group Co., Ltd. (“Ostin”) is a holding company incorporated on September 26, 2019 under the laws of the Cayman Islands. Ostin and its subsidiaries are collectively referred to as the “Company”. The Company engages in the business of designing, developing and manufacturing TFT-LCD modules and polarizers in a wide range of sizes and customized size according to the specifications of the customers utilizing automated production technique. The company currently operates one headquarter and three manufacturing facilities in China with an aggregate of 54,759 square meters – one factory is located in Jiangsu Province for the manufacture of display modules, one facility is in Sichuan Province for the manufacture of polarizers. The third manufacturing facilities is in Luzhou, Sichuan Province, for manufacture of display modules primarily to be used in devices in the education sector and commenced production in August 2020. The Company’s principal executive offices are located in Jiangsu Province, the People’s Republic of China (the “PRC” or “China”).
Reorganization
A reorganization of the Company’s legal structure was completed in June 2020. The reorganization involved (i) the incorporation of Ostin, a Cayman Islands company; Ostin Technology Holdings Limited (“Ostin BVI”), a British Virgin Islands company and a wholly owned subsidiary of Ostin; Ostin Technology Limited (“Ostin HK”), a Hong Kong company and a wholly owned subsidiary of Ostin BVI; and Nanjing Aosa Technology Development Co., Ltd. (“Nanjing Aosa”), a PRC limited liability company and a wholly owned subsidiary of Ostin HK; and (ii) the entry into a series of contractual arrangements (the “VIE Agreements”) by and between Nanjing Aosa and certain shareholders of Jiangsu Austin Optronics Technology Co., Ltd. (“Jiangsu Austin”) which was a PRC company limited by shares formed in December 2010 and has been the primary operating company of the Company in China. Ostin, Ostin BVI, Ostin HK, and Nanjing Aosa are all holding companies and have not commenced operations.
Prior to the reorganization, Mr. Tao Ling, Mr. Xiaohong Yin and 54 other shareholders (collectively and excluding Suhong Yuanda (as defined below), the “VIE Shareholders”) collectively owned 87.88% of the outstanding shares of Jiangsu Austin and Mr. Tao Ling, through Beijing Suhongyuanda Science and Technology Co., Ltd. (“Suhong Yuanda”) of which he was the sole shareholder, controlled 9.97% of the outstanding shares of Jiangsu Austin. On June 29, 2020, Mr. Tao Ling transferred his 100% equity interests in Suhong Yuanda to Nanjing Aosa. In June 2020, Nanjing Aosa entered into the VIE Agreements with the VIE Shareholders. After the reorganization, Ostin, through its subsidiary and the VIE arrangement, controls an aggregate of 97.85% of the outstanding shares of Jiangsu Austin. The VIE Shareholders collectively own 100% of the outstanding ordinary shares of Ostin, of which 39.99% and 9.51%, respectively, is owned by Mr. Tao Ling and Mr. Xiaohong Yin through their wholly owned holding companies.
Termination of the VIE Arrangements
In August 2021, shareholders of Jiangsu Austin entered into shares transfer agreements with the Company. Pursuant to the agreement, they agreed to transfer an aggregate of 39.97% of shares of Jiangsu Austin, which resulted in Nanjing Aosa, the Company’s WFOE, holding an aggregate of 97.85% of the shares of Jiangsu Austin following the completion of the share transfers. In February 2022, the Company fully terminated the VIE Arrangements and completed the reorganization of its corporate structure. As a result, the Company holds 97.85% of the issued and outstanding shares of Jiangsu Austin. Termination of the VIE agreement does not have impact on the Company’s consolidated financial position, results of operations and cash flows.
During the years presented in these consolidated financial statements, the control of the entities has never changed (always under the control of the Company). Accordingly, the combination has been treated as a corporate restructuring (“Reorganization”) of entities under common control and thus the current capital structure has been retroactively presented in prior periods as if such structure existed at that time and in accordance with ASC 805-50-45-5, the entities under common control are presented on a combined basis for all periods to which such entities were under common control. The consolidation of Ostin and its subsidiaries has been accounted for at historical cost and prepared on the basis as if the aforementioned transactions had become effective as of the beginning of the first period presented in the accompanying consolidated financial statements.
F-
Acquisition of non-controlling interest in Jiangsu Austin
In June 2022, the Company’s PRC subsidiary, Nanjing Aosa Technology Development Co., Ltd. (“Nanjing Aosa”) entered into an equity transfer agreement to acquire the remaining 2.15% equity interests of Jiangsu Austin in consideration of $338,652 (RMB 2,409,000). The transaction to acquire the remaining 2.15% equity interests of Jiangsu Austin was closed in June 2022 and after the acquisition, Nanjing Aosa owns 100% of the equity interest of Jiangsu Austin.
| In USD | ||||
| Purchase consideration | 338,652 | |||
| Noncontrolling interests | 330,068 | |||
| Additional paid-in capital | 8,584 | |||
| 338,652 | ||||
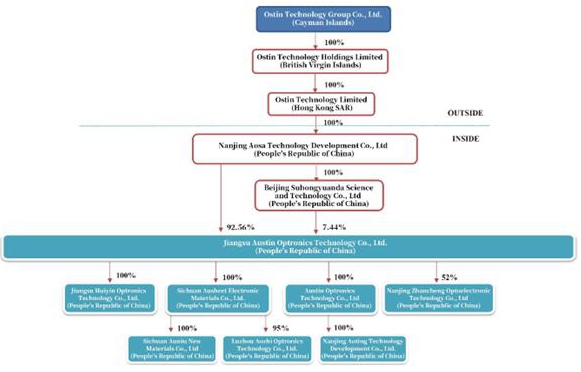
The following diagram illustrates the Company’s corporate structure, including its subsidiaries as of the date of issuance of the consolidated financial statements:
F-
NOTE 2 – SIGNIFICANT ACCOUNTING POLICIES
Basis of presentation and principles of consolidation
The accompanying condensed consolidated financial statements and related notes have been prepared in accordance with generally accepted accounting principles in the United Stated of America (“U.S. GAAP”) and have been consistently applied. The unaudited condensed consolidated financial statements include the financial statements of the Company and its subsidiaries. All significant inter-company transactions and balances have been eliminated upon consolidation.
A subsidiary is an entity in which the Company, directly or indirectly, controls more than one half of the voting power, has the power to appoint or remove the majority of the members of the board of directors, to cast a majority of votes at the meeting of the board of directors or to govern the financial and operating policies of the investee under a statute or agreement among the shareholders or equity holders.
Going Concern
As of March 31, 2023, the company had current assets and current liabilities of $28,300,690 and $37,151,481, respectively. This condition raises substantial doubt about the Company’s ability to continue as a going concern. Therefore, the Company may be unable to realize its assets and discharge its liabilities in normal course of business.
The Company meets its day-to-day working capital requirements through its bank facilities. Most of the bank borrowings as of March 31, 2023 that are repayable within the next 12 months are subject to renewal and the management is confident that these borrowings can be renewed upon expiration based on the Company’s past experience and credit history.
In order to strengthen the Company’s liquidity in the foreseeable future, the Company has taken the following measures: (i) Negotiating with banks in advance for renewal and obtaining new banking facilities; (ii) Taking various cost control measures to tighten the costs of operations; and (iii) Implementing various strategies to enhance sales and profitability.
The management has a reasonable expectation that the Company has adequate resources to continue in operational existence for the foreseeable future.
Use of estimates
The preparation of the unaudited consolidated financial statements in conformity with U.S. GAAP requires management to make estimates and assumptions that affect the amounts reported and disclosed in the consolidated financial statements and the accompanying notes. Such estimates include, but are not limited to, allowances for doubtful accounts, inventory valuation, useful lives of property, plant and equipment, intangible assets, and income taxes related to realization of deferred tax assets and uncertain tax position. Actual results could differ from those estimates.
F-
Foreign currency translation
The financial records of the Company’s subsidiaries in China are maintained in their local currencies which are Chinese Yuan (“RMB”). Monetary assets and liabilities denominated in currencies other than their local currencies are translated into local currencies at the rates of exchange in effect at the consolidated balance sheet dates. Transactions denominated in currencies other than their local currencies during the year are converted into local currencies at the applicable rates of exchange prevailing when the transactions occur. Transaction gains and losses are recorded in other income, net in the consolidated statements of income and comprehensive income.
The Company and its subsidiaries in British Virgin Islands and Hong Kong maintained their financial record using the United States dollar (“USD”) as the functional currency, while the subsidiaries of the Company in mainland China maintained their financial records using RMB as the functional currency. The reporting currency of the Company is USD. When translating local financial reports of the Company’s subsidiaries into USD, assets and liabilities are translated at the exchange rates at the consolidated balance sheet date, equity accounts are translated at historical exchange rates and revenue, expenses, gains and losses are translated at the average rate for the period. Translation adjustments are reported as cumulative translation adjustments and are shown as a separate component of other comprehensive income in the consolidated statements of income and comprehensive income.
The relevant exchange rates are listed below:
| March 31, 2023 |
September 30, 2022 |
March 31, 2022 |
||||||||||
| Period ended RMB: USD exchange rate | 6.8676 | 7.1135 | 6.3694 | |||||||||
| Period average RMB: USD exchange rate | 6.9761 | 6.5532 | 6.3393 | |||||||||
Cash and cash equivalents
The Company considers all highly liquid investment instruments with an original maturity of three months or less from the date of purchase to be cash equivalents. The Company maintains most of the bank accounts in the PRC. Cash balances in bank accounts in PRC are not insured by the Federal Deposit Insurance Corporation or other programs.
Restricted cash
As of September 30, 2022, restricted cash is cash held as collateral for the letters of credit the Company issued for its international transactions. As of March 31, 2023, restricted cash is pledged with fixed deposits.
Accounts receivable and allowance for doubtful accounts
Accounts receivable are recognized and carried at original invoiced amount less an estimated allowance for uncollectible accounts. The Company usually determines the adequacy of reserves for doubtful accounts based on individual account analysis and historical collection trends. The Company establishes a provision for doubtful receivables when there is objective evidence that the Company may not be able to collect amounts due. The allowance is based on management’s best estimates of specific losses on individual exposures, as well as a provision on historical trends of collections. Based on management of customers’ credit and ongoing relationship, management makes conclusions whether any balances outstanding at the end of the period will be deemed uncollectible on an individual basis and on an aging analysis basis. The provision is recorded against accounts receivable balances, with a corresponding charge recorded in the consolidated statements of income and comprehensive income. Delinquent account balances are written-off against the allowance for doubtful accounts after management has determined that the likelihood of collection is not probable.
Inventories
Inventories are stated at the lower of cost or net realizable value. Cost is principally determined using the weighted-average method. The Company records adjustments to inventory for excess quantities, obsolescence or impairment when appropriate to reflect inventory at net realizable value. These adjustments are based upon a combination of factors including current sales volume, market conditions, lower of cost or market analysis and expected realizable value of the inventory.
F-
Advances to suppliers
Advances to suppliers refer to advances for purchase of materials or other services, which are applied against accounts payable when the materials or services are received.
The Company reviews a supplier’s credit history and background information before advancing a payment. If the financial condition of its suppliers were to deteriorate, resulting in an impairment of their ability to deliver goods or provide services, the Company would write off such amount in the period when it is considered as impaired. The allowance for advances to suppliers recognized for the six months ended March 31, 2023 and 2022 were $150,547 and $8,929, respectively. The allowances for advances to suppliers balances as of March 31, 2023 and September 30, 2022 were $684,067 and $533,520, respectively.
Advances from customers
Advances from customers refer to advances received from customers regarding product sales, for which revenue is recognized upon delivery.
Property, plant and equipment, net
Property, plant, and equipment are recorded at cost less accumulated depreciation. Depreciation commences upon placing the asset in usage and is recognized on a straight-line basis over the estimated useful lives of the assets with 5% of residual value, as follows:
| Useful Lives |
||||
| Buildings | 20 years | |||
| Machinery and equipment | 5-10 years | |||
| Transportation vehicles | 4-5 years | |||
| Office equipment | 3-5 years | |||
| Electronic equipment | 3 years |
Expenditures for maintenance and repairs, which do not materially extend the useful lives of the assets, are charged to expense as incurred. Expenditures for major renewals and betterments which substantially extend the useful life of assets are capitalized. The cost and related accumulated depreciation of assets retired or sold are removed from the respective accounts, and any gain or loss is recognized in the consolidated statements of income and other comprehensive income in other income or expenses.
Leasehold Improvement
Leasehold improvement projects refer to the renovation, refurbishment, or decoration of leased premises or assets with the aim of enhancing efficiency and value. Leasehold improvement assets are initially measured at cost upon acquisition and are amortized over their estimated useful lives, typically the lease term. Amortization expense is recognized using the straight-line method.
Construction in progress
Construction in progress refers to ongoing or partially completed projects that the company is engaged in, including land development, new building construction, remodeling and renovation projects, among others. Construction in progress is measured using the cost model. The cost of construction in progress includes direct labor costs, material costs, subcontractor expenses, and interest expenses directly related to the project. The cost model is based on actual incurred expenses and is continuously updated.
Upon completion of the construction in progress, the company will apply the applicable accounting standards and policies to amortize the asset based on its estimated useful life and estimated fair value. The method of amortization will be determined based on the nature of the project and the company’s accounting policies.
F-
Land use rights, net
Under the PRC law, all land in the PRC is owned by the government and cannot be sold to an individual or company. The government grants individuals and companies the right to use parcels of land for specified periods of time. These land use rights are sometimes referred to informally as “ownership.” Land use rights are stated at cost less accumulated amortization.
| Rental period | ||
| Land use rights | 20-50 years |
Intangible assets, net
Intangible assets consist of software and patent purchased from other companies and capitalized software developed by the Company, which are recorded at cost less accumulated amortization. Intangible assets are amortized using the straight-line method with the following estimated useful lives:
| Useful lives | ||
| Software | 3 years | |
| Patent | 10 years |
Capitalized software represents software that is developed or purchased by an entity that will be sold, leased, or marketed as a stand-alone product as well as a software that will be sold as part of another product or process. All costs of developing software prior to establishing its technological feasibility are research and development costs and are expensed as incurred. Technological feasibility is achieved when an entity has completed all planning, designing, coding, and testing activities necessary to establish that the software product can be produced to meet its design specifications, including functions, features, and technical performance requirements. As described in ASC 985-20-25-1, this can be achieved through the use of either (1) a detail program design, or (2) the combination of a product design and working model, which have been confirmed for completeness by testing. Costs of developing software after establishing technological feasibility are recorded capitalized software.
The capitalized costs of developing software that will be sold, leased, or marketed will be amortized separately for each software product. An entity will begin amortizing the capitalized costs of the software when the product first becomes available for general release to customers.
For the six months ended March 31, 2023, the Company purchased intangible assets from third parties.
Right of use lease assets
The Company has two operating leases for manufacturing facilities and offices with no option to renew and the Company’s lease agreements do not contain any material residual value guarantees or material restrictive covenants. Effective October 1, 2019, the Company adopted the new lease accounting standard using a modified retrospective transition method which allowed the Company not to recast comparative periods presented in its consolidated financial statements. In addition, the Company elected the package of practical expedients, which allowed the Company to not reassess whether any existing contracts contain a lease, to not reassess historical lease classification as operating or finance leases, and to not reassess initial direct costs. The Company has not elected the practical expedient to use hindsight to determine the lease term for its leases at transition. The Company combines the lease and non-lease components in determining the ROU assets and related lease obligation. Adoption of this standard resulted in the recording of operating lease ROU assets and corresponding operating lease liabilities as disclosed in financial statements and had no impact on accumulated deficit as of March 31, 2023. ROU assets and related lease obligations are recognized at commencement date based on the present value of remaining lease payments over the lease term.
Long-term investment
Company’s long-term investment consists of equity investments without a readily determinable fair value. Under ASC Topic 321, Accounting for Equity Securities and Equity Investment, a measurement alternative is allowed for equity securities without a readily determinable fair value. Under the measurement alternative, the investment is measured at cost minus impairment, if any, plus or minus changes results from observable price changes in orderly transactions for the identical or a similar investment of the same issuer.
F-
Long-term liability
The Company has four transactions with two third-party for manufacturing facilities where the Company sold certain machinery located in China and subsequently leased the machinery back for 24 months. In these arrangements, the Company has no obligation to transferring the underlying asset to an unaffiliated third party or has a bargain purchase option at a price of RMB 1 to buyback the underlying asset by the end of the lease term. All these machineries are currently being used by the Company for its production purpose. The Company determined that in these transactions, the control of the asset is not transferred for the following reasons: (1) under the circumstances of not paying the financial liabilities, the buyer-lessor has no call option on the asset; and (2) the seller-lessee has a call option on the asset, and a.) the option is exercisable at something other than fair value as of the exercise date, b.) no alternative assets are available that are substantially the same as the asset transferred.
The Company concluded these transactions were not qualified as sale-leaseback accounting and shall account as normal borrowings from third parties. For accounting purposes, the Company did not derecognize the transferred asset and accounts for any amounts received as a financial liability measured at amortized cost subsequent to initial recognition. The balances with these third-party lenders as of March 31, 2023 and 2022 are as follows:
| March 31, | September 30, | |||||||
| 2023 | 2022 | |||||||
| (Unaudited) | ||||||||
| Total loan payable | $ | 41,307 | $ | 165,144 | ||||
| Current portion of loan payable (included in accrued and other current liabilities | (41,307 | ) | (165,144 | ) | ||||
| Long-term liability | $ | $ | ||||||
For the six months ended March 31, 2023 and 2022, the Company recognized interest expense of $5,992 and $47,925 on these loan payables, respectively.
Impairment of long-lived assets
The Company’s management reviews the carrying values of long-lived assets whenever events and circumstances, such as a significant decline in the asset’s market value, obsolescence or physical damage affecting the asset, significant adverse changes in the assets use, deterioration in the expected level of the assets performance, cash flows for maintaining the asset are higher than forecast, indicate that the net book value of an asset may not be recovered through expected future cash flows from its use and eventual disposition. If the estimated cash flows from the use of the asset and its eventual disposition are below the asset’s carrying value, then the asset is deemed to be impaired and written down to its fair value.
There was no impairment charge recognized for long-lived assets for March 31, 2023 and 2022.
Fair value measurement
Fair value measurements and disclosures requires disclosure of the fair value of financial instruments held by the Company. Fair value is defined as the price that would be received to sell an asset or paid to transfer a liability in an orderly transaction between market participants at the measurement date. A three-level fair value hierarchy prioritizes the inputs used to measure fair value. The hierarchy requires entities to maximize the use of observable inputs and minimize the use of unobservable inputs. The three levels of inputs used to measure fair value are as follows:
| ● | Level 1 inputs to the valuation methodology are quoted prices for identical assets or liabilities in active markets. | |
| ● | Level 2 inputs to the valuation methodology include quoted prices for similar assets and liabilities in active markets, quoted prices for identical or similar assets in inactive markets, and inputs that are observable for the asset or liability, either directly or indirectly, for substantially the full term of the financial instrument. | |
| ● | Level 3 inputs to the valuation methodology use one or more unobservable inputs which are significant to the fair value measurement. This includes certain pricing models, discounted cash flow methodologies and similar techniques that use significant unobservable inputs. |
F-
For the Company’s financial instruments, including cash and cash equivalents, accounts receivable, other receivables, accounts payable, due to related parties, notes receivable, notes payable, and short-term borrowing, the carrying amounts approximate their fair values due to their short maturities as of March 31, 2023 and 2022.
Value-added tax (“VAT”)
Sales revenue represents the invoiced value of goods, net of VAT. All of the Company’s products sold in the PRC are subject to a VAT on the gross sales price. The Company is subject a VAT rate of 13% effective on April 1, 2019. The VAT may be offset by VAT paid by the Company on raw materials and other materials included in the cost of producing or acquiring its finished products.
Revenue recognition
The Company generates its revenues mainly from sales of display modules and polarizers to third-party customers, who are mainly display manufacturers and end-brand customers. The Company follows Financial Accounting Standards Board (FASB) ASC 606 and accounting standards updates (“ASU”) 2014-09 for revenue recognition. On October 1, 2017, the Company has early adopted ASU 2014-09, which is a comprehensive new revenue recognition model that requires revenue to be recognized in a manner to depict the transfer of goods or services to a customer at an amount that reflects the consideration expected to be received in exchange for those goods or services. The Company considers revenue realized or realizable and earned when all the five following criteria are met: (1) identify the contract with a customer, (2) identify the performance obligations in the contract, (3) determine the transaction price, (4) allocate the transaction price to the performance obligations in the contract, and (5) recognize revenue when (or as) the entity satisfies a performance obligation.
The Company considers customer purchase orders to be the contracts with a customer. As part of its consideration of the contract, the Company evaluates certain factors including the customer’s ability to pay (or credit risk). For each contract, the Company considers the promise to transfer products, each of which is distinct, to be the identified performance obligations. The Company considers whether the nature of its promise is a performance obligation to provide the specified goods or services itself (that is, the entity is a principal) or to arrange for the other party to provide those goods or services (that is, the entity is an agent).
In determining the transaction price, the Company evaluates whether the price is subject to refund or adjustment to determine the net consideration to which the Company expects to be entitled. The Company offers customer warranty of six months to five years for defective products that is beyond contemplated defective rate mutually agreed in contract with customers. The Company analyzed historical refund claims for defective products and concluded that they have been immaterial.
Revenues are reported net of all VAT. As the Company’s standard payment terms are less than one year, the Company has elected the practical expedient under ASC 606-10-32-18 to not assess whether a contract has a significant financing component. The Company allocates the transaction price to each distinct product based on their relative standalone selling price.
Revenue is recognized when control of the product is transferred to the customer (i.e., when the Company’s performance obligation is satisfied at a point in time), which typically occurs at delivery. For international sales, the Company sells its products primarily under the free onboard (“FOB”) shipping point term. For sales under the FOB shipping point term, the Company recognizes revenues when products are delivered from Company to the designated shipping point. Prices are determined based on negotiations with the Company’s customers and are not subject to adjustment.
The Company also generates revenues from providing repair services. Revenues from repair service agreements are recognized at a point in time once the service is rendered to the customer. The Company considers whether the nature of its promise is a performance obligation to provide the specified goods or services itself (that is, the entity is a principal) or to arrange for the other party to provide those goods or services (that is, the entity is an agent).
The Company also generates revenues from providing research and development services. Revenues from research and development are mainly generated from video conferencing system development service. When the contract is awarded, the Company will develop the video conferencing system significantly customized to the needs of the customer. The duration of contracts ranges from nine months to twelve months. The Company develops the customized video conferencing system, which is combined output, to the customers. Therefore, each development contract is a single performance obligation under ASC 606-10-25-21. The Company considers whether the nature of its promise is a performance obligation to provide the specified goods or services itself (that is, the entity is a principal) or to arrange for the other party to provide those goods or services (that is, the entity is an agent).
F-
The Company is not able to sell the research and development services to another customer due to the individual customization of each contract and the Company has an enforceable right to payment for performance completed to date, which meets the criteria of the performance obligation over time under ASC 606-10-25-29. For performance obligations satisfied over time, the Company recognizes revenue over time by using the output method to measure the progress toward complete satisfaction of a performance obligation. The Company used the milestones reached method specified in each contract to determine the extent of progress toward completion.
Government subsidies
Government subsidies are recognized when received and all the conditions for their receipt have been met. Government subsidies as the compensation for expenses or losses already incurred or for the purpose of giving immediate financial support to the Company with no future related cost are recognized in profit or loss in the period in which they become receivable.
For the six months ended March 31, 2023 and 2022, the Company received government subsidies of $479,152 and $559,028, respectively. The grants were recorded as other income in the consolidated financial statements.
Research and development costs
Research and development activities are directed toward the development of new products as well as improvements in existing processes. These costs, which primarily include salaries, contract services and supplies, are expensed as incurred.
Shipping and handling costs
Shipping and handling costs are expensed when incurred and are included in selling and marketing expense. Shipping and handling costs were $288,767 and $224,567 for the six months ended March 31, 2023 and 2022, respectively.
Income taxes
The Company accounts for income taxes using the asset and liability method whereby it calculates deferred tax assets or liabilities for temporary differences between the tax basis of assets and liabilities and their reported amounts in the unaudited consolidated financial statements, net operating loss carry forwards and credits by applying enacted tax rates applicable to the fiscal years in which those temporary differences are expected to be reversed or settled. Deferred tax assets are reduced by a valuation allowance when, in the opinion of management, it is more likely than not that some portion or all of the deferred tax assets will not be realized. Current income taxes are provided for in accordance with the laws of the relevant taxing authorities. The components of the deferred tax assets and liabilities are individually classified as non-current amounts.
The Company records uncertain tax positions in accordance with ASC 740 on the basis of a two-step process whereby (1) the Company determines whether it is more likely than not that the tax positions will be sustained on the basis of the technical merits of the position and (2) for those tax positions that meet the more-likely-than-not recognition threshold, the Company recognizes the largest amount of tax benefit that is more than 50 percent likely to be realized upon ultimate settlement with the related tax authority.
To the extent applicable, the Company records interest and penalties as other expense. All of the tax returns of the Company’s PRC subsidiaries remain subject to examination by PRC tax authorities for five years from the date of filing. The fiscal year for tax purpose in PRC is December 31.
The Company is not subject to U.S. tax laws and local state tax laws. The Company’s income and that of its related entities must be computed in accordance with Chinese and foreign tax laws, as applicable, and all of which may be changed in a manner that could adversely affect the amount of distributions to shareholders. There can be no assurance that Income Tax Laws of PRC will not be changed in a manner that adversely affects shareholders. In particular, any such change could increase the amount of tax payable by the Company, reducing the amount available to pay dividends to the holders of the Company’s ordinary shares.
Earnings per share
Earnings per share is calculated in accordance with ASC 260 Earnings per Share. Basic earnings (loss) per share is computed by dividing the net income attributable to shareholders of the Company by the weighted average number of ordinary shares outstanding during the year. Diluted earnings per share is computed in accordance with the treasury stock method and based on the weighted average number of ordinary shares and dilutive ordinary share equivalents. Dilutive ordinary share equivalents are excluded from the computation of diluted earnings per share if their effects would be anti-dilutive. There were no dilutive ordinary share equivalents outstanding during the six months ended March 31, 2023 and 2022.
F-
Significant risks and uncertainties
Exchange Rate Risks
The Company operates in PRC, which may give rise to significant foreign currency risks mainly from fluctuations and the degree of volatility of foreign exchange rates between the USD and the RMB.
Currency Convertibility Risks
Substantially all of the Company’s operating activities are transacted in RMB, which is not freely convertible into foreign currencies. All foreign exchange transactions take place either through the People’s Bank of China or other banks authorized to buy and sell foreign currencies at the exchange rates quoted by the People’s Bank of China. Approval of foreign currency payments by the People’s Bank of China or other regulatory institutions requires submitting a payment application form together with other information such as suppliers’ invoices, shipping documents and signed contracts.
Concentration of Credit Risks
Financial instruments that potentially subject the Company to concentration of credit risks consist primarily of cash and cash equivalents, restricted cash, accounts receivables, and notes receivable. The Company places its cash and cash equivalents, restricted cash, and note receivable in good credit quality financial institutions in Hong Kong and PRC. Concentration of credit risks with respect to accounts receivables is linked to the concentration of revenue. To manage credit risk, the Company performs ongoing credit evaluations of customers’ financial condition.
Interest Rate Risks
The Company is subject to interest rate risk. Although the Company’s interest-bearing loans carry fixed interest rates within the reporting period, the Company is still subject to the risk of adverse changes in the interest rates charged by the banks if and when these loans are refinanced.
Risks and Uncertainties
The operations of the Company are located in the PRC. Accordingly, the Company’s business, financial condition, and results of operations may be influenced by political, economic, and legal environments in the PRC, as well as by the general state of the PRC economy. The Company’s results may be adversely affected by changes in the political, regulatory and social conditions in the PRC. Although the Company has not experienced losses from these situations and believes that it is in compliance with existing laws and regulations including its organization and structure disclosed in Note 1, this may not be indicative of future results.
Recent Accounting Pronouncements
The Company considers the applicability and impact of all accounting standards updates. Management periodically reviews new accounting standards that are issued.
In June 2016, the FASB issued ASU No. 2016-13, “Financial Instruments-Credit Losses (Topic 326): Measurement of Credit Losses on Financial Instruments”. This amends guidelines on reporting credit losses for assets held at amortized cost basis and available-for-sale debt securities. For assets held at amortized cost basis, Topic 326 eliminates the probable initial recognition threshold in current U.S. GAAP and, instead, requires an entity to reflect its current estimate of all expected credit losses. The allowance for credit losses is a valuation account that is deducted from the amortized cost basis of the financial assets to present the net amount expected to be collected. For available-for-sale debt securities, credit losses should be measured in a manner similar to current U.S. GAAP, however Topic 326 will require that credit losses be presented as an allowance rather than as a write-down. ASU 2016-13 affects entities holding financial assets and net investment in leases that are not accounted for at fair value through net income. The amendments affect loans, debt securities, trade receivables, net investments in leases, off balance sheet credit exposures, reinsurance receivables, and any other financial assets not excluded from the scope that have the contractual right to receive cash. The amendments in this ASU will be effective for fiscal years beginning after December 15, 2019, including interim periods within those fiscal years. In November 2019, the FASB issued ASU No. 2019-10, Financial Instruments—Credit Losses (Topic 326), Derivatives and Hedging (Topic 815), and Leases (Topic 842): Effective Dates, which amended the effective date of ASU 2016-13. The amendments in these ASUs are effective for the Company’s fiscal years, and interim periods within those fiscal years beginning April 1, 2022. The Company has adopted this guidance for the Company’s consolidated financial statements. The adoption of this policy has no material impact.
F-
In December 2019, the FASB issued ASU 2019-12, Simplifying the Accounting for Income Taxes, as part of its Simplification Initiative to reduce the cost and complexity in accounting for income taxes. This standard removes certain exceptions related to the approach for intra period tax allocation, the methodology for calculating income taxes in an interim period and the recognition of deferred tax liabilities for outside basis differences. It also amends other aspects of the guidance to help simplify and promote consistent application of GAAP. The amendments in these ASUs are effective for the Company’s fiscal years, and interim periods within those fiscal years beginning October 1, 2022. The Company has adopted this guidance for the Company’s consolidated financial statements. The adoption of this guidance has no impact on the calculation of the Company’s income taxes.
Other accounting standards that have been issued by the FASB or other standards-setting bodies are not expected to have a material effect on the Company’s financial position, result of operations or cash flows.
NOTE 3 – ACCOUNTS RECEIVABLE
Accounts receivable as of March 31, 2023 and September 30, 2021 consisted of the following:
| March 31, | September 30, | |||||||
| 2023 | 2022 | |||||||
| (Unaudited) | ||||||||
| Accounts receivable, gross | $ | 4,735,419 | $ | 6,303,689 | ||||
| Less: allowance for doubtful accounts | (86,719 | ) | (33,184 | ) | ||||
| Accounts receivable, net | $ | 4,648,700 | $ | 6,270,505 | ||||
The Company’s customers are, for the most part, end-brand customers or their system integrators and display panel manufacturers. The Company’s credit policy typically requires payment within 30 to 120 days, and payments on the vast majority of its sales have been collected within 60 days. The average accounts receivable turnover period was approximately 58 days and 55 days for the six months ended March 31, 2023 and the fiscal years ended September 30, 2022 respectively.
Below is an aged analysis of accounts receivables as of March 31, 2023, respectively.
| As of March 31, 2023 | ||||||||||||
| Accounts | Allowance | Accounts | ||||||||||
| receivable, | for doubtful | receivable, | ||||||||||
| Gross | accounts | Net | ||||||||||
| (Unaudited) | (Unaudited) | (Unaudited) | ||||||||||
| Within 90 days | $ | 3,708,339 | $ | $ | 3,708,339 | |||||||
| 91-180 days | 636,974 | 636,974 | ||||||||||
| 181-365 days | 150,616 | (7,531 | ) | 143,085 | ||||||||
| Greater than 1 year | 239,490 | (79,188 | ) | 160,302 | ||||||||
| Accounts receivable, net | $ | 4,735,419 | $ | (86,719 | ) | $ | 4,648,700 | |||||
Changes of allowance for doubtful accounts for the six months ended March 31, 2023 and September 30, 2022 are as follows:
| As of | As of | |||||||
| March 31, | September 30, | |||||||
| 2023 | 2022 | |||||||
| (Unaudited) | ||||||||
| Beginning balance | $ | 33,184 | $ | 94,166 | ||||
| Additional reserve through bad debt expense | 53,535 | |||||||
| Bad debt write-off | (60,982 | ) | ||||||
| Ending balance | $ | 86,719 | $ | 33,184 | ||||
Bad debt expense for doubtful accounts receivables recorded by the Company for the six months ended March 31, 2023 and September 30, 2022 were $53,535 and $0 respectively.
F-
NOTE 4 – NOTES RECEIVABLE
Notes receivable consisted of banker’s acceptance of $2,968 and nil received from the Company’s customers as of March 31, 2023 and September 30, 2022, respectively. This bank acceptance was transferred to the Company through endorsement by its customer.
NOTE 5 – INVENTORIES
Inventories as of March 31, 2023 and September 30, 2022 consisted of the following:
| March 31, | September 30, | |||||||
| 2023 | 2022 | |||||||
| (Unaudited) | ||||||||
| Raw materials | $ | 8,477,197 | $ | 6,401,458 | ||||
| Work in process | 13,648 | 7,830 | ||||||
| Finished goods | 6,484,813 | 7,117,789 | ||||||
| Goods in transit | 2,540,901 | 3,005,549 | ||||||
| Inventory provision | (1,324,375 | ) | (1,099,914 | ) | ||||
| Total inventories, net | $ | 16,192,184 | $ | 15,432,712 | ||||
Goods in transit of $2,540,901 and $3,005,549 as of March 31, 2023 and September 30, 2022 refer to the inventory items that have been shipped out from the Company but yet to be received by the Company’s customers or the designated shipping points. For sales from domestic customers, control of the product is transferred to the customer upon delivery. For sales from international customers, the Company sells its products primarily under FOB shipping point term and control of the product is transferred upon delivery to the designated shipping point.
For the six months ended March 31, 2023 and 2022, the Company recorded an inventory provision of $224,461 and wrote off an inventory of $278,113, respectively, presented in cost of sales in the Company’s statement of income and comprehensive income.
NOTE 6 – PROPERTY, PLANT AND EQUIPMENT, NET
Property, plant and equipment as of March 31, 2023 and September 30, 2022 consisted of the following:
| March 31, | September 30, | |||||||
| 2023 | 2022 | |||||||
| (Unaudited) | ||||||||
| Buildings | $ | 11,242,355 | $ | 10,384,017 | ||||
| Machinery and equipment | 7,984,596 | 7,632,069 | ||||||
| Electronic equipment | 2,278,607 | 1,876,114 | ||||||
| Transportation vehicles | 339,942 | 219,449 | ||||||
| Office equipment | 299,795 | 280,455 | ||||||
| Leasehold improvement | 546,037 | 793,929 | ||||||
| Construction in progress | 7,661,744 | 3,826,690 | ||||||
| Total property plant and equipment, at cost | 30,353,076 | 25,012,723 | ||||||
| Less: accumulated depreciation | (6,909,484 | ) | (5,596,894 | ) | ||||
| Property, plant and equipment, net | $ | 23,443,592 | $ | 19,415,829 | ||||
Depreciation expense was $1,177,801 and $1,033,422 for the six months ended March 31, 2023 and 2022, respectively. For the six months ended March 31, 2023 and 2022, the Company recorded no impairment of property, plant and equipment.
For the six months ended March 31, 2023 and 2022, the Company purchased new property plant and equipment of $1,294,113 and $1,388,888, respectively. For the six months ended March 31, 2023 and 2022, the Company also spent approximately $3,640,520 and $0 for the construction in progress regarding building and equipment, respectively.
F-
For the six months ended March 31, 2023, the Company disposed machinery, equipment and transportation vehicles with a net book value of $205,928 (cost of $290,302, accumulated depreciation of $84,374) and received cash from disposal of $366,216, causing a net disposal income of $160,288 included in operating income. For the six months ended March 31, 2022, the Company disposed machinery, equipment and transportation vehicles with a net book value of $1,242 (cost of $2,638, accumulated depreciation of $1,396) and received cash from disposal of $0, causing a net disposal loss of $1,242 included in operating income. The disposal was related to cutting maintenance cost of idle machinery, equipment, and transportation, and thus improving the production efficiency after the disposal.
For the six months ended March 31,2023 and 2022, the construction in progress assets were related to construction of manufacturing facilities for the Company.
As of March 31, 2023 and September 30, 2022, the Company pledged buildings to secure banking facilities granted to the Company. The carrying values of the pledged buildings to secure bank borrowings by the Company are shown in Note 12.
NOTE 7 – LAND USE RIGHTS, NET
Land use rights as of March 31, 2023 and September 30,2022 consisted of the following:
| March 31, | September 30, | |||||||
| 2023 | 2022 | |||||||
| (Unaudited) | ||||||||
| Land use rights, at cost | $ | 1,842,540 | $ | 1,454,194 | ||||
| Less: accumulated amortization | (221,302 | ) | (169,603 | ) | ||||
| Total land use rights, net | $ | 1,621,238 | $ | 1,284,591 | ||||
Amortization expense for land use rights were $44,917 and $40,600 for the six months ended March 31,2023 and 2022 respectively. For the six months ended March 31, 2023 and 2022, the Company recorded no impairment for land use rights, nor pledged land use rights to secure bank loans.
Estimated future amortization expense for land use rights is as follows as of March 31, 2023:
| 12 months ended March 31, | Amortization expense | |||
| 2024 | $ | 91,254 | ||
| 2025 | 91,254 | |||
| 2026 | 91,254 | |||
| 2027 | 91,254 | |||
| 2028 | 91,254 | |||
| Thereafter | 1,164,968 | |||
| Total | $ | 1,621,238 | ||
NOTE 8 – INTANGIBLE ASSETS, NET
Intangible assets, net as of March 31, 2023 and September 30, 2022 consisted of the following:
| March 31, | September 30, | |||||||
| 2023 | 2022 | |||||||
| (Unaudited) | ||||||||
| Purchased software, cost | $ | 1,012,235 | $ | 955,266 | ||||
| Purchased patent, cost | 1,100,000 | 1,100,000 | ||||||
| Capitalized software, cost | 1,909,581 | 1,843,571 | ||||||
| Total intangible assets, at cost | 4,021,816 | 3,898,837 | ||||||
| Less: accumulated amortization | (1,232,513 | ) | (930,092 | ) | ||||
| Intangible assets, net | $ | 2,789,303 | $ | 2,968,745 | ||||
F-
For the six months ended March 31,2023, the Company purchased software of $326,018, but did not purchase any patent rights from third-party supplier or developed any new capitalized software. The increase in the amount of capitalized software compared to September 30, 2022, is due to the impact of exchange rate fluctuations.
Amortization expense for intangible assets were $213,300 and $96,747 for the he six months ended March 31,2023 and 2022, respectively. The increase in the amortization amount of intangible assets in the current period is due to the capitalization of a software as of September 30, 2022. For the he six months ended March 31,2023 and September 30, 2022, the Company recorded no impairment of intangible asset, nor pledged intangible asset to secure bank loans.
Estimated future amortization expense for intangible assets is as follows as of March 31, 2023:
| 12 months ended March 31, | Amortization expense |
|||
| 2024 | $ | 673,430 | ||
| 2025 | 673,430 | |||
| 2026 | 601,916 | |||
| 2027 | 601,916 | |||
| 2028 | 238,611 | |||
| Total | $ | 2,789,303 | ||
NOTE 9 – LONG-TERM INVESTMENT
In July 2022, the Company made an investment in Nanjing Baituo Visual Technology Co., Ltd (“Nanjing Baituo”) by RMB 1,500,000 with equity percentage of 15%. The Company has no significant influence in Nanjing Baituo’s operation as the Company does not dedicate any members on the Board of Directors of Nanjing Baituo or participate in its management and daily operation. As of March 31, 2023, the Company carried the investment at its cost in the amount of $218,417. Nanjing Baituo is principally engaged in the operation of software development in artificial intelligence and virtual reality and manufacturing in wearable smart devices.
NOTE 10 – OTHER LONG-TERM RECEIVABLE
Other long-term receivable as of March 31,2023 and September 30, 2022 consisted of the following:
| March 31, | September 30, | |||||||
| 2023 | 2022 | |||||||
| (Unaudited) | ||||||||
| Escrow deposits for IPO proceeds | $ | 400,000 | $ | 400,000 | ||||
| Long- term deposits for contracts performance | 324,119 | 313,986 | ||||||
| Other long-term receivables | 20,348 | 109,130 | ||||||
| Total | $ | 744,467 | $ | 823,116 | ||||
The escrow deposits for IPO proceeds, have been released and returned to the company in May 2023.
NOTE 11 – ACCRUED EXPENSES AND OTHER CURRENT LIABILITIES
Accrued expenses and other current liabilities as of March 31, 2023 and September 30, 2022 consisted of the following:
| March 31, | September 30, | |||||||
| 2023 | 2022 | |||||||
| (Unaudited) | ||||||||
| Deferred government subsidies | $ | 1,004,367 | $ | 999,685 | ||||
| Current portion of long-term payable | 41,307 | 165,144 | ||||||
| Notes payable | 150,973 | |||||||
| Tax payable | 39,142 | 250,718 | ||||||
| Wages Payable | 103,071 | 91,409 | ||||||
| Interest payable | 149,625 | 281,165 | ||||||
| Other payables and accruals | 193,657 | 11,028 | ||||||
| Total | $ | 1,531,169 | $ | 1,950,122 | ||||
Deferred government subsidies were government subsidies the Company received from the local governments related to certain assets that will be amortized in the depreciated periods of the assets.
F-
NOTE 12 – SHORT-TERM BORROWINGS
Short-term borrowings as of March 31, 2023 and September 30, 2022 consisted of the following:
| March 31, | September 30, | |||||||
| 2023 | 2022 | |||||||
| (Unaudited) | ||||||||
| Short-term bank loans | $ | 17,764,576 | $ | 14,469,670 | ||||
| Short-term loans from third-party individuals and entities | 7,009,362 | 6,823,293 | ||||||
| Total | $ | 24,773,938 | $ | 21,292,963 | ||||
Short-term bank loans as of March 31, 2023 consisted of the following:
| Bank Name | Amount - RMB | Amount - USD | Issuance Date |
Expiration Date | Interest | |||||||||||
| Bank of Communications | 2,000,000 | 291,223 | 7/26/2022 | 7/25/2023 | 3.70 | % | ||||||||||
| Bank of Communications | 3,000,000 | 436,834 | 8/4/2022 | 8/2/2023 | 3.70 | % | ||||||||||
| Bank of Communications | 3,000,000 | 436,834 | 9/19/2022 | 9/15/2023 | 4.35 | % | ||||||||||
| Bank of Nanjing* | 9,000,000 | 1,310,500 | 4/4/2023 | 10/3/2023 | 3.70 | % | ||||||||||
| Bank of Nanjing*** | 6,900,000 | 1,004,718 | 10/18/2022 | 10/10/2023 | 3.70 | % | ||||||||||
| Bank of Nanjing* | 6,100,000 | 888,229 | 7/5/2022 | 7/3/2023 | 3.70 | % | ||||||||||
| Bank of China* | 10,000,000 | 1,456,113 | 8/10/2022 | 8/3/2023 | 3.70 | % | ||||||||||
| Bank of Ningbo | 10,000,000 | 1,456,113 | 6/23/2022 | 6/20/2023 | 4.20 | % | ||||||||||
| Zijin Rural Commercial Bank | 4,750,000 | 691,654 | 3/3/2023 | 3/3/2025 | 4.20 | % | ||||||||||
| Zijin Rural Commercial Bank | 5,250,000 | 764,459 | 1/31/2023 | 1/20/2025 | 4.35 | % | ||||||||||
| Bank of Jiangsu | 5,000,000 | 728,056 | 8/11/2022 | 8/10/2023 | 4.35 | % | ||||||||||
| Agricultural Bank of China | 10,000,000 | 1,456,113 | 11/9/2022 | 11/1/2023 | 3.65 | % | ||||||||||
| Bank of Nanjing* | 5,000,000 | 728,056 | 5/30/2022 | 5/19/2023 | 3.80 | % | ||||||||||
| Bank of Communications | 7,800,000 | 1,135,768 | 4/24/2022 | 4/23/2023 | 3.70 | % | ||||||||||
| Bank of Communications | 2,200,000 | 320,345 | 4/25/2022 | 4/25/2023 | 3.70 | % | ||||||||||
| Agricultural Bank of China | 10,000,000 | 1,456,113 | 1/1/2023 | 1/1/2024 | 3.65 | % | ||||||||||
| Bank of Chengdu | 7,000,000 | 1,019,279 | 5/20/2022 | 5/19/2023 | 4.55 | % | ||||||||||
| Bank of Chengdu | 5,000,000 | 728,056 | 3/22/2023 | 8/21/2023 | 8.50 | % | ||||||||||
| Bank of Chengdu | 10,000,000 | 1,456,113 | 8/19/2022 | 8/19/2023 | 3.90 | % | ||||||||||
| Total | 122,000,000 | $ | 17,764,576 | |||||||||||||
| * | As of March 31, 2023 a total of $5,387,616 bank loans were guaranteed by, or pledged by the personal assets owned by the Company’s major shareholder, Mr. Tao Ling and his immediate family members. No guarantee-fee was charged by Mr. Tao Ling and his immediate family members for the guarantees for the six months ended March 31, 2023. |
| ** | These short-term borrowings were repaid and renewed upon maturity. |
F-
Short-term bank loans as of September 30, 2022 consisted of the following:
| Bank Name | Amount - RMB | Amount - USD | Issuance Date |
Expiration Date | Interest | |||||||||||
| Bank of Nanjing* | 10,000,000 | 1,405,778 | 7/5/2022 | 7/3/2023 | 3.70 | % | ||||||||||
| Bank of Nanjing*** | 6,900,000 | 969,987 | 10/13/2021 | 10/12/2022 | 4.35 | % | ||||||||||
| Bank of Nanjing* | 5,000,000 | 702,889 | 5/24/2022 | 5/19/2023 | 3.80 | % | ||||||||||
| Bank of Communications | 6,100,000 | 857,524 | 7/26/2022 | 7/25/2023 | 3.70 | % | ||||||||||
| Bank of Communications | 2,000,000 | 281,156 | 8/4/2022 | 8/2/2023 | 3.70 | % | ||||||||||
| Bank of Communications | 4,180,000 | 587,614 | 9/19/2022 | 9/15/2023 | 3.65 | % | ||||||||||
| Bank of Communications | 3,000,000 | 421,733 | 9/19/2022 | 9/15/2023 | 3.65 | % | ||||||||||
| Bank of Communications | 2,200,000 | 309,271 | 4/25/2022 | 4/23/2023 | 3.70 | % | ||||||||||
| Bank of Communications | 7,800,000 | 1,096,507 | 4/24/2022 | 4/21/2023 | 3.70 | % | ||||||||||
| Bank of Chengdu | 7,000,000 | 984,044 | 5/20/2022 | 5/19/2023 | 4.55 | % | ||||||||||
| Bank of Chengdu | 5,000,000 | 702,889 | 3/24/2022 | 3/23/2023 | 4.55 | % | ||||||||||
| Zijin Rural Commercial Bank | 2,000,000 | 281,156 | 3/17/2022 | 3/16/2023 | 4.45 | % | ||||||||||
| Bank of China* | 3,000,000 | 421,733 | 8/10/2022 | 8/3/2023 | 3.70 | % | ||||||||||
| Bank of China* | 10,000,000 | 1,405,778 | 8/19/2022 | 8/19/2023 | 3.90 | % | ||||||||||
| Bank of Jiangsu | 10,000,000 | 1,405,778 | 8/11/2022 | 8/10/2023 | 4.36 | % | ||||||||||
| Bank of Ningbo | 9,000,000 | 1,265,200 | 6/23/2022 | 6/20/2023 | 4.20 | % | ||||||||||
| Bank of Yongfeng** | 4,750,000 | 667,744 | 4/1/2022 | 9/16/2022 | 4.90 | % | ||||||||||
| Bank of Yongfeng | 5,000,000 | 702,889 | 8/25/2022 | 2/24/2023 | 4.20 | % | ||||||||||
| Total | 102,930,000 | $ | 14,469,670 | |||||||||||||
| * | As of September 30, 2022, a total of $5,215,436 bank loans were guaranteed by, or pledged by the personal assets owned by, the Company’s major shareholder, Mr. Tao Ling and his immediate family members. No guarantee-fee was charged by Mr. Tao Ling and his immediate family members for the guarantees for the fiscal year ended September 30, 2022. |
| ** | These short-term borrowings were repaid and renewed upon maturity. |
Short-term borrowings also include loans from various individuals that are unsecured, due on demand, and bear interest of 4.42%. The Company recorded interest expense of $121,498 and $327,257 for the six months ended March 31, 2023 and 2022, respectively.
The Company’s bank loans are guaranteed by the Company’s major shareholder, Mr. Tao Ling and his immediate family members, third-party individuals, and third-party companies. See Note 14 – Related Party Transactions for more information on guaranty provided by Mr. Tao Ling and his immediate family members. Certain Company’s assets were also pledged to secure the banks loans. The details of the pledges of assets are as follows:
| March 31, | September 30, | |||||||
| 2023 | 2022 | |||||||
| (Unaudited) | ||||||||
| Buildings, net | $ | 1,032,078 | $ | 659,777 | ||||
| Bank deposit | 316,796 | 321,980 | ||||||
| Total | $ | 1,348,874 | $ | 981,757 | ||||
For the six months ended March 31, 2023 and 2022, interest expense on all short-term borrowings amounted to $687,752 and $747,351, respectively.
F-
NOTE 13 – CUSTOMER AND SUPPLIER CONCENTRATIONS
Significant customers and suppliers are those that account for greater than 10% of the Company’s revenues and purchases, respectively.
For the six months ended March 31, 2023, the Company had two significant customers which accounted for 45.6% and 23.1% of the Company’s total revenue, respectively. As of March 31, 2023, the Company had accounts receivable balances from one customer which accounted for 48.2% of the Company’s total accounts receivable balance.
For the six months ended March 31, 2022, the Company had two significant customers which accounted for 39.5% and 20.6% of total revenue, respectively. As of March 31, 2022, the Company had accounts receivable balance from one customer which accounted for 67.7% of the Company’s total accounts receivable.
The loss of any of the Company’s significant customer or the failure to attract new customers could have a material adverse effect on the Company’s business, consolidated results of operations and financial condition.
For the six months ended March 31, 2023, two suppliers accounted for 42.2% and 12.2% of the Company’s total purchase of raw materials, respectively. As of March 31, 2023, the Company had accounts payable balance to one supplier which accounted for 80.5% of the Company’s total accounts payable balance.
For the six months ended March 31, 2022, two suppliers accounted for 43.4% and 11.2% of the Company’s total purchase of raw materials, respectively. As of March 31, 2022, the Company had accounts payable balances to one supplier which accounted for 31.3% of the Company’s total accounts payable.
The loss of any of the Company’s significant supplier or the failure to purchase key raw material could have a material adverse effect on our business, consolidated results of operations and financial condition.
NOTE 14 – RELATED PARTY TRANSACTIONS
| 1) | Nature of relationships with related parties: |
| Name | Relationship with the Company | |
| Tao Ling | Principal shareholder, Chief Executive Officer and Chairman of the Company | |
| Xiaohong Yin | Principal shareholder and director of the Company | |
| Bozhen Gong | Immediate family member of Tao Ling | |
| Yun Tan | Immediate family member of Tao Ling | |
| Luzhou Nachuan Investment Limited | An entity which owns 5% equity interest of Luzhou Aozhi |
| 2) | Related party transactions |
For the six months ended March 31, 2023, the Company’s related parties provided working capital to support the Company’s operations when needed. The borrowings were unsecured, due on demand, and interest free. The following table summarizes borrowing transactions with the Company’s related parties:
| Borrowing/ | Payment/ | |||||||
| Collecting | Lending | |||||||
| Name of Related Parties | Amount | Amount | ||||||
| Tao Ling | $ | 394,203 | $ | 143,347 | ||||
| Xiaohong Yin | 1,799,173 | 236,694 | ||||||
| Bozhen Gong | 71,673 | 301,028 | ||||||
| Total | $ | 2,265,049 | $ | 681,069 | ||||
For the six months ended March 31, 2023, a total of $5,387,616 bank loans were guaranteed by, or pledged by the personal assets owned by, the Company’s major shareholder, Mr. Tao Ling and his immediate family members. No guarantee fee was charged by Mr. Tao Ling and his immediate family members for the guarantees for the six months ended March 31, 2023.
F-
For the six months ended March 31, 2022 the Company’s related parties provided working capital to support the Company’s operations when needed. The borrowings were unsecured, due on demand, and interest free. The following table summarizes borrowing transactions with the Company’s related parties:
| Name of related parties | Borrowing/ Collecting Amount | Payment/ Lending Amount | ||||||
| Xiaohong Yin | $ | 2,355,010 | $ | 4,270,419 | ||||
| Bozhen Gong | 314,001 | 314,001 | ||||||
| Total | $ | 2,669,011 | $ | 4,584,420 | ||||
As of March 31, 2022, a total of $7,500,826 bank loans were guaranteed by, or pledged by the personal assets owned by, the Company’s major shareholder, Mr. Tao Ling and his immediate family members. No guarantee-fee was charged by Mr. Tao Ling and his immediate family members for the guarantees for the six months ended March 31, 2022.
| 3) | Related party balances |
Net outstanding balances with related parties consisted of the following as of March 31,2022 and September 30, 2022:
| Accounts | Name of Related Parties |
March 31, 2023 |
September 30, 2022 |
|||||||
| (Unaudited) | ||||||||||
| Due to related parties | Tao Ling | $ | 254,820 | $ | - | |||||
| Due to related parties | Xiaohong Yin | 1,587,162 | - | |||||||
| Due to related parties | Bozhen Gong | 72,806 | 295,213 | |||||||
| Due to related parties | Yun Tan | 189,295 | 182,751 | |||||||
| Total due to related parties | $ | 2,104,083 | $ | 477,964 | ||||||
NOTE 15 – STOCKHOLDERS’ EQUITY
Ordinary Shares
The Company is authorized to issue 500,000,000 ordinary shares of a single class, par value $0.0001 per ordinary share. There are currently 14,006,250 issued and outstanding ordinary shares, of which Mr. Tao Ling and Mr. Xiaohong Yin, respectively, owns 28.91% and 6.78% through their wholly owned holding companies.
Share Surrender
In December 2020, an aggregate of 27,175,000 ordinary shares were surrendered by all our shareholders for no consideration and were then cancelled which in nature is a stock reverse split. As a result, the number of issued and outstanding ordinary shares decreased from 37,300,000 shares to 10,125,000 shares. All share information included in the consolidated financial statements and notes thereto have been retroactively adjusted as if such share surrender occurred on the first day of the first period presented.
Initial Public Offering
On April 29, 2022, the Company consummated its initial public offering of 3,881,250 ordinary shares, par value $0.0001 per share (the “Ordinary Shares”), including 506,250 additional Ordinary Shares issued pursuant to the full exercise of the underwriters’ over-allotment option, at a price of $4.00 per share, generating gross proceeds to the Company of $15,525,000 before deducting underwriting discounts and commissions and offering expenses. The offering was conducted on a firm commitment basis. After deducting underwriting discounts, commissions and expenses related to the offering, the Company recorded $12,409,022 (with $388 in par value and $12,408,634 in additional paid-in capital) net proceeds from its initial public offering.
F-
Dividends
Dividends declared by the Company are based on the distributable profits as reported in its statutory financial statements reported in accordance with PRC GAAP, which may differ from the results of operations reflected in the consolidated financial statements prepared in accordance with US GAAP. The Company’s ability to pay dividends is primarily from cash received from its operating activities in the PRC. No dividends were declared or paid by the Company for the six months ended March 31, 2023 and 2022.
Statutory Reserve
The Company is required to make appropriations to certain reserve funds, comprising the statutory reserve and the discretionary reserve, based on after-tax net income determined in accordance with generally accepted accounting principles of the PRC (“PRC GAAP”). Appropriations to the statutory reserve are required to be at least 10% of the after-tax net income determined in accordance with PRC GAAP until the reserve is equal to 50% of the entity’s registered capital. Appropriations to the discretionary reserve are made at the discretion of the Board of Directors of each of the Company PRC subsidiaries. The reserved amounts as determined pursuant to PRC statutory laws totaled $1,497,537 and $1,496,314 as of March 31, 2023 and September 30, 2022, respectively.
Under PRC laws and regulations, paid-in capital and statutory reserves are restricted to set-off against losses, expansion of production and operation and increasing registered capital of the respective company, and are not distributable other than upon liquidation. The reserves are not allowed to be transferred to the Company in terms of cash dividends, loans or advances, nor allowed for distribution except under liquidation.
Non-controlling Interests
Non-controlling interests represent the interest of non-controlling shareholders in the Company’s subsidiaries based on their proportionate interests in the equity of that company adjusted for its proportionate share of income or losses from operations. The non-controlling interests were $238,875 and $289,000 as of March 31, 2023 and September 30, 2022, respectively.
NOTE 16 – OTHER INCOME (EXPENSES), NET
Other income (expenses), net for the six months ended March 31, 2023 and March 31, 2022 consisted of the following:
| For the six months | ||||||||
| March 31, | ||||||||
| 2023 | 2022 | |||||||
| (Unaudited) | (Unaudited) | |||||||
| Government subsidies* | $ | 479,152 | $ | 559,028 | ||||
| Other miscellaneous non-business income (loss) | 20,830 | 56,559 | ||||||
| Total other income (expenses), net | $ | 499,982 | $ | 615,587 | ||||
| * | Government subsidies as the compensation for expenses or losses already incurred or for the purpose of giving immediate financial support to the Company with no future related cost are recognized in profit or loss in the period in which they become receivable. Government subsidies as the support for certain assets were recorded in deferred government subsidies and are amortized in the future periods. For six months ended March 31,2023 and 2022, the Company recorded government subsidies of $479,152 and $559,028 respectively. |
F-
NOTE 17 – INCOME TAXES
Enterprise Income Taxes (“EIT”)
The Company is incorporated in Cayman Island as an offshore holding company and is not subject to tax on income or capital gain under the laws of Cayman Island.
Ostin BVI is incorporated in BVI as an offshore holding company and is not subject to tax on income or capital gain under the laws of BVI.
Ostin HK and Austin Optronics are established in Hong Kong and are subject to statutory income tax rate at 16.5%.
The PRC subsidiaries of the Company are subject to statutory income tax rate at 25%.
The Company’s main operating subsidiary in PRC was certified as a High and New Technology Enterprise (“HNTE”) and enjoys a preferential tax rate of 15% since 2013, and the HNTE certificate needs to be renewed every three years. The subsidiary was eligible for a 15% preferential tax rate for the six months ended march 31, 2023 and 2022, and the Company has renewed its HNTE certificate in November 2019 and thus its validity extends to November 2022. The company has once again passed the high-tech enterprise qualification review in December 2022 and has been granted a high-tech enterprise certificate that will be valid for the years 2023, 2024, and 2025. This entitles the company to enjoy a preferential tax rate of 15% during the certificate’s validity period.
The Company evaluates each uncertain tax position (including the potential application of interest and penalties) based on the technical merits, and measure the unrecognized benefits associated with the tax positions. As of March 31, 2023 and 2022, the Company did not have any significant unrecognized uncertain tax positions. The Company did not incur any interest and penalties related to potential underpaid income tax expenses for the six months ended March 31, 2023 and 2022, respectively, and also does not anticipate any significant increases or decreases in unrecognized tax benefits in the next 12 months from March 31, 2023.
Per the consolidated statements of income and comprehensive income, the income tax expenses for the Company can be reconciled to the income before income taxes for the six months ended March 31, 20223 and 2022 as follows:
| For the six months ended | ||||||||
| March 31, | ||||||||
| 2023 | 2022 | |||||||
| (Unaudited) | (Unaudited) | |||||||
| Income before taxes excluded the amounts of loss incurring entities | $ | 12,877 | $ | 3,295,471 | ||||
| PRC EIT tax rates | 25%,15 | % | 25%,15 | % | ||||
| Tax at the PRC EIT tax rates | $ | 1,062 | $ | 495,614 | ||||
| Tax effect of R&D expenses deduction | (165,682 | ) | (355,512 | ) | ||||
| Tax effect of deferred tax recognized | 7,534 | 137,297 | ||||||
| Tax effect of non-deductible expenses | 48,896 | 29,132 | ||||||
| Income tax (benefit) provision | $ | (108,189 | ) | $ | 306,515 | |||
Income taxes for the six months ended March 31, 2023 and 2022 are attributed to the Company’s continuing operations in China and consisted of:
| For the six months ended | ||||||||
| March 31, | ||||||||
| 2023 | 2022 | |||||||
| (Unaudited) | (Unaudited) | |||||||
| Current income tax | $ | (115,723 | ) | $ | 169,711 | |||
| Deferred income tax | (7,534 | ) | 137,297 | |||||
| Total income tax (benefit) provision | $ | (108,189 | ) | $ | 306,515 | |||
F-
The tax effects of temporary differences that give rise to significant portions of the deferred tax assets and deferred tax liabilities as of March 31, 2023 and September 30,2022 are presented below:
| March 31, | September 30, | |||||||
| 2023 | 2022 | |||||||
| (Unaudited) | ||||||||
| Deferred tax assets: | ||||||||
| Bad debt allowance | $ | 115,618 | $ | 85,006 | ||||
| Inventory impairment provision | 198,656 | 164,987 | ||||||
| Other deductible temporary difference | (229,158 | ) | (55,232 | ) | ||||
| Net operating loss carry-forward | 473,754 | 371,643 | ||||||
| Total | $ | 558,870 | $ | 566,404 | ||||
There was no valuation allowance for the deferred tax assets as of March 31, 2023 and September 30, 2022. In assessing the realizability of deferred tax assets, management considers whether it is more likely than not that some portion or all the deferred tax assets will not be realized. The ultimate realization of deferred tax assets is dependent upon the generation of future taxable income during the periods in which those temporary differences become deductible. Management considers the scheduled reversal of deferred tax liabilities, projected future taxable income, and tax planning strategies in making this assessment. Based upon the level of historical taxable income, projections for future taxable income over the periods in which the deferred tax assets are deductible, and the scheduled reversal of deferred tax liabilities, management believes it is more likely than not the company will realize the benefits of those deductible differences as of March 31, 2023 and September 30, 2022.
NOTE 18 – COMMITMENT AND CONTINGENCIES
As of March 31, 2023, the Company had the following capital commitments under non-cancelable agreements related to construction in progress:
| Future payments | Capital commitments |
|||
| April 2023 to September 2023 | $ | 680,163 | ||
| October 2023 to September 2024 | 3,554,064 | |||
| October 2024 to September 2025 | ||||
| October 2025 to September 2026 | ||||
| October 2026 to September 2027 | ||||
| Thereafter | ||||
| Total | $ | 4,234,227 | ||
From time to time, the Company is involved in various legal proceedings, claims and other disputes arising from commercial operations, employees, and other matters which, in general, are subject to uncertainties and in which the outcomes are not predictable. The Company determines whether an estimated loss from a contingency should be accrued by assessing whether a loss is deemed probable and can be reasonably estimated. Although the Company can give no assurances about the resolution of pending claims, litigation or other disputes and the effect such outcomes may have on the Company, the Company believes that any ultimate liability resulting from the outcome of such proceedings to the extent not otherwise provided or covered by insurance, will not have a material adverse effect on our consolidated financial position or results of operations or liquidity. As of March 31, 2023 and September 30, 2022, the Company had no pending legal proceedings outstanding.
NOTE 19 – DISAGGREGATED REVENUE
The following table presents revenue by major product categories for the six months ended March 31, 2023 and 2022, respectively:
| March 31, 2023 | March 31, 2022 | |||||||||||||||
| Revenues Amount |
As % of Revenues |
Revenues Amount |
As % of Revenues |
|||||||||||||
| (In USD) | (In USD) | |||||||||||||||
| Revenue Category | (Unaudited) | (Unaudited) | (Unaudited) | (Unaudited) | ||||||||||||
| Display modules | $ | 15,137,071 | 44 | % | $ | 27,961,103 | 47 | % | ||||||||
| Polarizers | 16,974,322 | 49 | % | 23,750,420 | 40 | % | ||||||||||
| Research and development services | - | - | 4,957,518 | 8 | % | |||||||||||
| Others (repair services) | 2,183,721 | 6 | % | 3,425,620 | 5 | % | ||||||||||
| Total | $ | 34,295,114 | 100 | % | $ | 60,094,661 | 100 | % | ||||||||
The revenue under category of others, are mostly from repairing services and mold product sales that have not become significant portion of the revenue for the six months ended March 31, 2023 and 2022.
F-
NOTE 20 – SEGMENT REPORTING
ASC 280, “Segment Reporting”, establishes standards for reporting information about operating segments on a basis consistent with the Company’s internal organizational structure as well as information about geographical areas, business segments and major customers in financial statements for details on the Company’s business segments. The Company uses the “management approach” in determining reportable operating segments. The management approach considers the internal organization and reporting used by the Company’s chief operating decision maker for making operating decisions and assessing performance as the source for determining the Company’s reportable segments. All of the Company’s operating facilities and long-lived assets are in China, although the Company sells its products across different geographic regions. Based on management’s assessment, the Company has determined that it has only one operating segment as defined by ASC 280.
The following table presents revenues by geographic areas for the six months ended March 31, 2023 and 2022, respectively.
| March 31, 2023 | March 31, 2022 | |||||||||||||||
| Revenues Amount |
As % of Revenues |
Revenues Amount |
As % of Revenues |
|||||||||||||
| (In USD) | (In USD) | |||||||||||||||
| Country/Region | (Unaudited) | (Unaudited) | (Unaudited) | (Unaudited) | ||||||||||||
| Mainland China | $ | 33,524,738 | 98 | % | $ | 55,034,541 | 92 | % | ||||||||
| Hong Kong and Taiwan | 761,136 | 2 | % | 5,060,120 | 8 | % | ||||||||||
| Southeast Asia | 9,240 | |||||||||||||||
| Total | $ | 34,295,114 | 100 | % | $ | 60,094,661 | 100 | % | ||||||||
NOTE 21 – IMPACT OF COVID-19
The COVID-19 pandemic continues to spread in China and other parts of the world, and COVID-19 restrictions and controls in China have not been relaxed until the end of 2022. Although the Chinese government has now lifted the restrictions related to COVID-19, the COVID-19 pandemic still has negatively impacted, and may continue to negatively impact, the global economy and disrupt normal business activity, which may have an adverse effect on our results of operations.
The impacts of COVID-19 on our business, financial condition, and results of operations include, but are not limited to, the following:
| ● | The demand for consumer electronics including TVs, monitors, and entertainment devices has been reduced due to market saturation during the early stages of the pandemic. After Chinese government lifted controls, the situation didn’t get better for a while, as demand shifted to spending on outdoor activities, such as tourism. This has resulted in a decline in our sales and price of display modules during the six months ended March 31, 2023, compared to the same period in previous year. | |
| ● | Our credit policy typically requires payment within 30 to 120 days, and payments on the vast majority of our sales have been collected within 45 days. Our average accounts receivable turnover periods were approximately 58 days and 55 days for the six months ended March 31, 2023 and the fiscal years ended September 30 2022, respectively. The slight decrease in the accounts receivable turnover days may be due to the company’s optimized sales process, improved efficiency in order processing, and active collection efforts, which have led to faster collection of sales revenue. |
| ● | For the six months ended March 31, 2023, we were able to repay all our debt and other obligations without taking advantage of any available payment deferral or forbearance term. | |
| ● | Our workforce remained stable for the six months ended March 31, 2023. We did not receive government subsidy or take advantage of any government assistance program in relation to the pandemic. We have complied with the various safety measures required by the local government and provided our employees with protective gears and regularly monitor and trace the health condition of our employees. However, we do not believe those safety measures have materially impacted our operation. |
NOTE 22 – SUBSEQUENT EVENTS
The Company evaluated all events and transactions that occurred after March 31, 2023 up through the date of the issuance of consolidated financial statements on August 3, 2023 and concluded that no other material subsequent events except for the disclosed above.
F-
NOTE 23 – CONDENSED FINANCIAL INFORMATION OF THE PARENT COMPANY
The following is the condensed financial information of the Company on a parent company only basis.
OSTIN TECHNOLOGY GROUP CO., LTD.
PARENT COMPANY BALANCE SHEETS (IN U.S. DOLLARS)
| As of | As of | |||||||
| March 31, | September 30, | |||||||
| 2023 | 2022 | |||||||
| (Unaudited) | ||||||||
| ASSETS | ||||||||
| Cash and cash equivalents | $ | 12,742 | $ | 17673 | ||||
| Prepayments, deposits and other current assets | 8,828,142 | 8828142 | ||||||
| Investment in subsidiaries | 13,015,887 | 13,340,885 | ||||||
| Total assets | $ | 21,856,771 | $ | 22,186,700 | ||||
| LIABILITIES AND SHAREHOLDERS’ EQUITY | ||||||||
| Total liabilities | $ | $ | ||||||
| SHAREHOLDERS’ EQUITY | ||||||||
| Ordinary share, $0.0001 par value, 500,000,000 shares authorized, 14,006,250 and 14,006,250 shares issued and outstanding as of March 31, 2023 and 2022 | 1,401 | 1,401 | ||||||
| Additional paid-in capital | 23,256,219 | 23,256,219 | ||||||
| Retained earnings | (1,400,851 | ) | (1,070,920 | ) | ||||
| Accumulated other comprehensive loss | ||||||||
| Total equity of the Company’s shareholders | 21,856,771 | 22,186,700 | ||||||
| TOTAL LIABILITIES AND SHAREHOLDERS’ EQUITY | $ | 21,856,771 | $ | 22,186,700 | ||||
F-
OSTIN TECHNOLOGY GROUP CO., LTD.
UNAUDITED PARENT COMPANY STATEMENTS OF OPERATIONS
AND
OTHER COMPREHENSIVE INCOME
(IN U.S. DOLLARS)
| For the six months ended | ||||||||
| March 31, | ||||||||
| 2023 | 2022 | |||||||
| (Unaudited) | (Unaudited) | |||||||
| Operating expenses: | ||||||||
| General and administrative expenses | $ | (329,931 | ) | $ | ||||
| Total operating expenses | (329,931 | ) | ||||||
| Net loss | $ | (329,931 | ) | $ | ||||
| Other comprehensive loss: | ||||||||
| Foreign currency translation adjustment, net of nil tax | $ | (329,931 | ) | $ | - | |||
| Total comprehensive loss | $ | (329,931 | ) | $ | - | |||
F-
OSTIN TECHNOLOGY GROUP CO., LTD.
UNAUDITED PARENT COMPANY STATEMENTS OF CASH FLOWS
(IN U.S. DOLLARS)
| For the six months ended | ||||||||
| March 31, | ||||||||
| 2023 | 2022 | |||||||
| (Unaudited) | (Unaudited) | |||||||
| Cash Flows from Operating Activities: | ||||||||
| Net loss | $ | (329,931 | ) | $ | ||||
| Changes in operating assets and liabilities: | ||||||||
| Prepaid expenses and other receivables | 325,000 | |||||||
| Net cash used in operating activities | (4,931 | ) | ||||||
| Cash Flows from Investing Activities: | ||||||||
| Long-term investment | ||||||||
| Net cash used in investing activities | ||||||||
| Cash Flows from Financing Activities: | ||||||||
| Proceeds received from stock issuance | ||||||||
| Payments to related parties | ||||||||
| Net cash provided by financing activities | ||||||||
| Effect of changes in currency exchange rates | ||||||||
| Net (decrease) increase in cash and cash equivalents | (4,931 | ) | ||||||
| Cash, cash equivalents and restricted cash at the beginning of year | 17,673 | |||||||
| Cash and cash equivalents and restricted cash at the end of year | $ | 12,742 | $ | |||||
(a) Basis of Presentation
Condensed financial information is used for the presentation of the Company, or the parent company. The condensed financial information of the parent company has been prepared using the same accounting policies as set out in the Company’s consolidated financial statements except that the parent company used the cost method to account for investment in its subsidiaries.
The parent company’s condensed financial statements should be read in conjunction with the Company’s consolidated financial statements.
(b) Shareholders’ Equity
The Company is authorized to issue 500,000,000 ordinary shares of a single class, par value $0.0001 per ordinary share. There are currently 14,006,250 issued and outstanding ordinary shares, of which Mr. Tao Ling and Mr. Xiaohong Yin, respectively, owns 28.91% and 6.78% through their wholly owned holding companies.
Share Surrender
In December 2020, an aggregate of 27,175,000 ordinary shares were surrendered by all our shareholders for no consideration and were then cancelled which in nature is a stock reverse split. As a result, the number of issued and outstanding ordinary shares decreased from 37,300,000 shares to 10,125,000 shares. All share information included in the consolidated financial statements and notes thereto have been retroactively adjusted as if such share surrender occurred on the first day of the first period presented.
Initial Public Offering
On April 29, 2022, the Company consummated its initial public offering of 3,881,250 ordinary shares, par value $0.0001 per share, including 506,250 additional ordinary shares issued pursuant to the full exercise of the underwriters’ over-allotment option, at a price of $4.00 per share, generating gross proceeds to the Company of $15,525,000 before deducting underwriting discounts and commissions and offering expenses. The offering was conducted on a firm commitment basis. After deducting underwriting discounts, commissions and expenses related to the offering, the Company recorded $12,409,022 (with $388 in par value and $12,408,634 in additional paid-in capital) net proceeds from its initial public offering.
F-31