UNITED STATES
SECURITIES AND EXCHANGE COMMISSION
Washington, D.C. 20549
FORM 6-K
REPORT OF FOREIGN ISSUER
PURSUANT TO RULE 13a-16 OR 15b-16 OF
THE SECURITIES EXCHANGE ACT OF 1934
For the month of July 2023
Commission File Number 001-35401
CEMENTOS PACASMAYO S.A.A.
(Exact name of registrant as specified in its charter)
PACASMAYO CEMENT CORPORATION
(Translation of registrant’s name into English)
Republic of Peru
(Jurisdiction of incorporation or organization)
Calle La Colonia 150, Urbanización El
Vivero
Surco, Lima
Peru
(Address of principal executive office)
Indicate by check mark whether the registrant files or will file annual reports under cover Form 20-F or Form 40-F.
Form 20-F ☒ Form 40-F ☐
CEMENTOS PACASMAYO S.A.A.
The following exhibit is attached:
| EXHIBIT NO. | DESCRIPTION | |
| 99.1 | Consolidated Results for the First Quarter |
Signatures
Pursuant to the requirements of the Securities Exchange Act of 1934, the registrant has duly caused this report to be signed on its behalf by the undersigned, thereunto duly authorized.
| CEMENTOS PACASMAYO S.A.A. | ||
| By: | /s/ CARLOS JOSE MOLINELLI MATEO | |
| Name: | Carlos Jose Molinelli Mateo | |
| Title: | Stock Market Representative | |
| Date: | July 20, 2023 | |
2
Exhibit 99.1

E-mail: cbustamante@cpsaa.com.pe
CEMENTOS PACASMAYO S.A.A. ANNOUNCES CONSOLIDATED RESULTS
FOR SECOND QUARTER 2023
Lima, Peru, July 20, 2023 – Cementos Pacasmayo S.A.A. and subsidiaries (NYSE: CPAC; BVL: CPACASC1) (“the Company” or “Pacasmayo”) a leading cement company serving the Peruvian construction industry, announced today its consolidated results for the second quarter (“2Q23”) and the first six months of the year (“6M23”). These results have been prepared in accordance with International Financial Reporting Standards (“IFRS”) and are stated in nominal Peruvian Soles (S/).
2Q23 FINANCIAL AND OPERATIONAL HIGHLIGHTS:
(All comparisons are to 2Q22, unless otherwise stated)
| ● | Revenues decreased by 12.1%, mainly due to decreased contraction in demand, particularly in April, in the aftermath of severe rainfall in our area of influence, which affected the self-construction segment, as well as a stagnation in public investment. |
| ● | Sales volume of cement, concrete and precast decreased by 17.9%, mainly due to the above-mentioned reasons. |
| ● | Consolidated EBITDA of S/112.6 million, a 6.6% decrease, mainly due to decreased revenues, partially offset by lower costs. |
| ● | Consolidated EBITDA margin of 25.5%, a 1.5 percentage point increase, mainly due to decreased costs as we stopped using imported clinker. |
| ● | Net income of S/ 43.5 million, a 9.4% decrease mainly due to decreased revenues as mentioned above. |
6M23 FINANCIAL AND OPERATIONAL HIGHLIGHTS:
(All comparisons are to 6M22, unless otherwise stated)
| ● | Revenues decreased by 10.3%, mainly due to the impact of cyclone Yaku, causing severe rainfall in our area of influence, as well as low levels of public investment as new regional authorities are still settling in. The negative impact of roadblocks, as a result of social conflict, as well as the low levels of private investment also affected our revenues. |
| ● | Sales volume of cement, concrete and precast decreased by 17.1%, mainly due to the above-mentioned reasons. |
| ● | Consolidated EBITDA of S/233.3 million, a 5.9% decrease, mainly due to decreased revenues. |
| ● | Consolidated EBITDA margin of 25.3%, a 1.2 percentage point increase, mainly due to decreased costs as mentioned above. |
| ● | Net income of S/ 87.0 million, a 7.2% decrease, in line with lower revenues as mentioned above. |
| Financial and Operating Results | ||||||||||||||||||||||||
| 2Q23 | 2Q22 | % Var. | 6M23 | 6M22 | % Var. | |||||||||||||||||||
| Financial and Operating Results | 682.7 | 831.3 | -17.9 | % | 1,421.3 | 1,715.2 | -17.1 | % | ||||||||||||||||
| In millions of S/ | ||||||||||||||||||||||||
| Sales of goods | 442.0 | 502.9 | -12.1 | % | 922.0 | 1,028.3 | -10.3 | % | ||||||||||||||||
| Gross profit | 152.6 | 158.1 | -3.5 | % | 313.2 | 323.0 | -3.0 | % | ||||||||||||||||
| Operating profit | 78.7 | 85.9 | -8.4 | % | 165.4 | 179.5 | -7.9 | % | ||||||||||||||||
| Net income | 43.5 | 48.0 | -9.4 | % | 87.0 | 93.7 | -7.2 | % | ||||||||||||||||
| Consolidated EBITDA | 112.6 | 120.5 | -6.6 | % | 233.3 | 248.0 | -5.9 | % | ||||||||||||||||
| Gross Margin | 34.5 | % | 31.4 | % | 3.1 pp. | 34.0 | % | 31.4 | % | 2.6 pp. | ||||||||||||||
| Operating Margin | 17.8 | % | 17.1 | % | 0.7 pp. | 17.9 | % | 17.5 | % | 0.5 pp. | ||||||||||||||
| Net income Margin | 9.8 | % | 9.5 | % | 0.3 pp. | 9.4 | % | 9.1 | % | 0.3 pp. | ||||||||||||||
| Consolidated EBITDA Margin | 25.5 | % | 24.0 | % | 1.5 pp. | 25.3 | % | 24.1 | % | 1.2 pp. | ||||||||||||||

MANAGEMENT COMMENTS
During this quarter some demand-side challenges remained in the aftermath of cyclone Yaku and heavy rains mainly in April. Although revenues decreased 12.1% this quarter compared to the same period of 2022, EBITDA margin reached 25.5%, a 1.5 percentage point increase year-over-year. This is a clear indicator of how we are maximizing profitability by striving for efficiencies in a lower demand environment. We are confident that these measures will continue to help us navigate these difficult times successfully.
We would like to highlight two very significant events that, although they took place during this quarter, are really the result of long-term efforts. First, we are extremely proud to announce that the EcoSaco innovation obtained the “Gran Effie”, as well as a Gold Effie that was awarded in the “Innovation in product marketing” category and a Silver Effie in the “Positive change in the environment” category. The Effie awards are a symbol of outstanding achievement, recognized worldwide, that honor all types of effective marketing. It is remarkable that a regional cement company, such as Pacasmayo, obtained the greatest prize, since it is usually awarded to companies with a national presence and in the mass consumption segments. We are proud of this outstanding achievement, especially because the product truly represents our DNA. The EcoSaco is an eco-efficient packaging that completely disintegrates in the concrete mix, generating zero waste and contributing positively to the environment.
The EcoSaco is our latest innovation, but eco-efficiency has been in our corporate mindset for more than 25 years. During this time we have consistently worked on producing cement with a lower carbon footprint, mainly through decreased clinker factor. We know that there is still a long way to go; however, we are very proud of the results achieved so far. Pacasmayo’s portfolio is mostly made up of blended cements, which have a lower impact on the environment, since they use less clinker in their production. Currently, more than 85% of our cement sales come from blended cements, which have an average of 22% less clinker than traditional Portland cements, achieving significant savings in CO2 emissions during production.
Finally, we would like to mention that, for the fifth consecutive year, we are the top ranked cement company in MERCO talent indicator. Moreover, we have improved 11 positions in the overall ranking, reaching 11th place. This demonstrates once again our commitment, as we are convinced that the ability to recruit the best talent will be the most important competitive advantage in the future.
To sum up, this quarter we have seen results derived from our long-term strategy. The awards and ranking improvements are the best indicator that our client-centric vision and incorporation of innovation, sustainability and digital transformation as a common thread in our corporate actions are taking us on the right track. However, none of this success would be possible without our people, who are the driving force behind our company. It is thanks to their talent, commitment and determination that we can continue building the future you dream of.
ECONOMIC OVERVIEW 2Q23:
During the first half of the year, the downward trend in GDP growth continued, mainly due to the negative impact of roadblocks and the halt in activities, as a result of social conflicts, and due to excessive rainfall, including the effect from Cyclone Yaku in March. The most affected activities were construction, manufacturing and services. The construction sector was affected by the social conflicts and the rains, but a recovery is expected during the second half of the year. For 2024, growth of 3.2% is expected, driven by the recovery of public and private investment.
On July 6, Congress approved the creation of the National Infrastructure Authority (ANI for its Spanish acronym), whose objective is to provide the conditions to materialize a strategic vision of public investment through long-term plans and better multi-sector coordination.
Likewise, on July 4, the World Meteorological Organization (WMO) officially announced the start of the El Niño Phenomenon, after confirming that the conditions that could cause an increase in temperatures and meteorological alterations during the last months of the year were detected in the Pacific Ocean. In the case of Peru, it is expected that from October or November, when the rainy season begins, heavier rainfall will occur, due to the global El Niño Phenomenon and the coastal El Niño. At the moment, the occurrence of rains is expected to be moderate on the northern coast and highlands of Peru, but it is not ruled out that the intensity may change as the ocean temperature evolves.
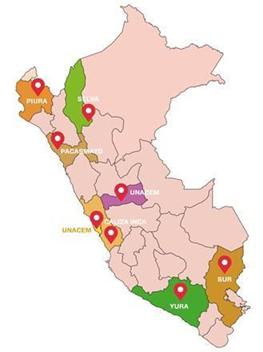
PERUVIAN CEMENT INDUSTRY OVERVIEW:
The demand for cement in Peru is covered mainly by Pacasmayo, UNACEM and Cementos Yura, and to a lesser extent by Caliza Inca, imports and other small producers. Pacasmayo mainly covers the demand in the northern region of the country, while UNACEM covers the central region and Cementos Yura the southern region.
The northern region of Peru, according to the Instituto Nacional de Estadística e Informática (INEI) and Apoyo Consultoría, represents approximately 32.5% of the country’s population and 16.0% of national Gross Domestic Product (“GDP”). Despite the country’s sustained growth over the last 10 years, Peru continues to have a significant housing deficit, estimated at 1.9 million households throughout the country as per the Ministry of Housing, Construction and Sanitation.
In Peru, the majority of cement is sold to a highly fragmented consumer base of individuals that tend to gradually buy bags of cement to build or to improve their homes, a segment the industry refers to as “self-construction”.
| Northern Region (thousands of metric tons) | ||||||||||||||||||||||||
| Plant | 2019 | 2020 | 2021 | 2022 | Apr-23-LTM | % part | ||||||||||||||||||
| Pacasmayo Group | 2,615 | 2,576 | 3,625 | 3,437 | 3,235 | 23.6 | % | |||||||||||||||||
| Imports | 13 | 38 | 62 | 2 | - | 0.0 | % | |||||||||||||||||
| Total | 2,628 | 2,614 | 3,687 | 3,439 | 3,235 | 23.6 | % | |||||||||||||||||
| Central Region (thousands of metric tons) | ||||||||||||||||||||||||
| Plant | 2019 | 2020 | 2021 | 2022 | Apr-23-LTM | % part | ||||||||||||||||||
| UNACEM | 5,316 | 4,172 | 5,838 | 6,297 | 6,146 | 44.9 | % | |||||||||||||||||
| Caliza Inca | 513 | 382 | 518 | 515 | 522 | 3.8 | % | |||||||||||||||||
| Imports | 663 | 493 | 630 | 202 | 80 | 0.6 | % | |||||||||||||||||
| Total | 6,492 | 5,047 | 6,986 | 7,014 | 6,748 | 49.3 | % | |||||||||||||||||
| Southern Region (thousands of metric tons) | ||||||||||||||||||||||||
| Plant | 2019 | 2020 | 2021 | 2022 | Apr-23-LTM | % part | ||||||||||||||||||
| Grupo Yura | 2,584 | 2,019 | 2,895 | 3,047 | 2,811 | 20.5 | % | |||||||||||||||||
| Imports | 98 | 189 | 181 | 67 | 69 | 0.5 | % | |||||||||||||||||
| Total | 2,682 | 2,208 | 3,076 | 3,114 | 2,880 | 21.0 | % | |||||||||||||||||
| Others | 769 | 732 | 877 | 840 | 840 | 6.1 | % | |||||||||||||||||
| Total, All Regions | 12,571 | 10,601 | 14,626 | 14,407 | 13,703 | 100.0 | % | |||||||||||||||||
| * | Import figures are sourced from Aduanet. They represent quantities of imported cement, not shipped cement. |
Source: INEI, Aduanet
OUR STRATEGIC PROGRESS


OPERATING RESULTS:
Production:
Cement Production Volume
(thousands of metric tons)
| Production | ||||||||||||||||||||||||
| 2Q23 | 2Q22 | % Var. | 6M23 | 6M22 | % Var. | |||||||||||||||||||
| Pacasmayo Plant | 353.6 | 426.4 | -17.1 | % | 705.7 | 876.1 | -19.4 | % | ||||||||||||||||
| Rioja Plant | 57.7 | 73.1 | -21.1 | % | 134.7 | 151.5 | -11.1 | % | ||||||||||||||||
| Piura Plant | 274.5 | 315.6 | -13.0 | % | 568.9 | 669.0 | -15.0 | % | ||||||||||||||||
| Total | 685.8 | 815.1 | -15.9 | % | 1,409.3 | 1,696.6 | -16.9 | % | ||||||||||||||||
Cement production volume at the Pacasmayo plant decreased 17.1% in 2Q23 compared to 2Q22 and 19.4% in 6M23 compared to 6M22, as severe rainfall significantly reduced consumption during March and April. Demand started to slowly pick up during May and June.
In 2Q23, cement production volume at the Rioja plant decreased by 21.1% and 11.1% in 6M23, compared to 2Q22 and 6M22 respectively, mainly due to a moderation in demand.
Cement production volume at the Piura Plant decreased 13.0% in 2Q23 and 15.0% in 6M23 compared to 2Q22 and 6M22 respectively, mainly due to the moderation in demand mentioned above.
Total cement production volume decreased 15.9% in 2Q23 compared to 2Q22 and 16.9% in 6M23 compared to 6M22, in line with the decrease in cement sales volume, as well as some inventory consumption.
Clinker Production Volume
(thousands of metric tons)
| Production | ||||||||||||||||||||||||
| 2Q23 | 2Q22 | % Var. | 6M23 | 6M22 | % Var. | |||||||||||||||||||
| Pacasmayo Plant | 205.4 | 238.6 | -13.9 | % | 435.4 | 470.4 | -7.4 | % | ||||||||||||||||
| Rioja Plant | 48.0 | 61.5 | -22.0 | % | 112.0 | 122.6 | -8.7 | % | ||||||||||||||||
| Piura Plant | 269.8 | 266.5 | 1.3 | % | 527.5 | 541.5 | -2.6 | % | ||||||||||||||||
| Total | 523.2 | 566.6 | -7.7 | % | 1,074.9 | 1,134.5 | -5.3 | % | ||||||||||||||||
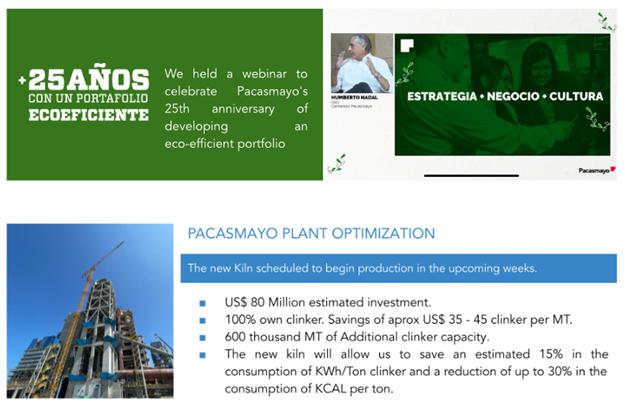
Clinker production volume at the Pacasmayo plant during 2Q23 decreased by 13.9%, mainly due to the temporary halt in production of our equipment, in preparation for the start of our new kiln. It is important to mention that this halt did not have an effect on the availability of clinker to produce cement.
Clinker production volume at the Rioja plant decreased 22.0% in 2Q23 compared to 2Q22 and 8.7% in 6M23 compared to 6M22, in line with decreased cement demand.
Clinker production volume at the Piura plant increased 1.3% in 2Q23 compared to 2Q22, as we continue to need all of our capacity to satisfy demand and inventory according to our annual production plan that aims to maximize the operational efficiency of our kilns. During 6M23, clinker production decreased slightly.
Total clinker production volume decreased 7.6% in 2Q23 and 5.3% in 6M23, compared to 2Q22 and 6M22 respectively, mainly due to the above mentioned reasons.
Quicklime Production Volume
(thousands of metric tons)
| Production | ||||||||||||||||||||||||
| 2Q23 | 2Q22 | % Var. | 6M23 | 6M22 | % Var. | |||||||||||||||||||
| Pacasmayo Plant | 8.1 | 6.1 | 32.8 | % | 18.3 | 24.7 | -25.9 | % | ||||||||||||||||
Quicklime production volume in 2Q23 increased 32.8% when compared to 2Q22 and decreased 25.9% in 6M23 when compared to 6M22, mainly due to our annual production program in order to maximize productivity.
INSTALLED CAPACITY:
Installed Clinker and Cement Capacity
Full year installed cement capacity at the Pacasmayo, Piura and Rioja plants remained stable at 2.9 million MT, 1.6 million MT and 440,000 MT, respectively.
Full year installed clinker capacity at the Pacasmayo, Piura and Rioja plants remained stable at 1.5 million MT, 1.0 million MT and 280,000 MT, respectively.
Full year installed quicklime capacity at the Pacasmayo plant remained stable at 240,000 MT.
UTILIZATION RATE1:
Pacasmayo Plant Utilization Rate
| Utilization Rate | ||||||||||||||||||||||||
| 2Q23 | 2Q22 | % Var. | 6M23 | 6M22 | % Var. | |||||||||||||||||||
| Cement | 48.8 | % | 58.8 | % | -10.0 pp. | 48.7 | % | 60.4 | % | -11.8 pp. | ||||||||||||||
| Clinker | 54.8 | % | 63.6 | % | -8.9 pp. | 58.1 | % | 62.7 | % | -4.7 pp. | ||||||||||||||
| Quicklime | 13.5 | % | 10.2 | % | 3.3 pp. | 15.3 | % | 20.6 | % | -5.3 pp. | ||||||||||||||
Cement production utilization rate at the Pacasmayo plant decreased 10.0 percentage points in 2Q23 and 11.8 percentage points when compared to 2Q22 and 6M22 respectively, mainly due to decreased cement demand as mentioned above.
Clinker production utilization rate in 2Q23 decreased 8.9 percentage points compared to 2Q22 and 4.7 percentage points in 6M23 compared to 6M22 , mainly due to the temporary halt in production in preparation for the new kiln.
| 1 | The utilization rates are calculated by dividing production in a given period over installed capacity. The utilization rate implies annualized production, which is calculated by multiplying real production for each quarter by four. |
Quicklime production utilization rate in 2Q23 increased 3.3 percentage points and decreased 5.3 percentage points in 6M23 compared to 2Q22 and 6M22 respectively, as mentioned above.
Rioja Plant Utilization Rate
| Utilization Rate | ||||||||||||||||||||||||
| 2Q23 | 2Q22 | % Var. | 6M23 | 6M22 | % Var. | |||||||||||||||||||
| Cement | 52.5 | % | 66.4 | % | -13.9 pp. | 61.2 | % | 68.9 | % | -7.6 pp. | ||||||||||||||
| Clinker | 68.6 | % | 87.9 | % | -19.3 pp. | 80.0 | % | 87.6 | % | -7.6 pp. | ||||||||||||||
The cement production utilization rate at the Rioja plant was 52.5% in 2Q23 and 61.2% in 6M23; 13.9 percentage points lower than 2Q22 and 7.6 percentage points lower than 6M22 respectively, in line with decreased cement demand.
The clinker production utilization rate at the Rioja plant was 68.6% in 2Q23 and 80.0% in 6M23; 19.3 and 7.6 percentage points lower than 2Q22 and 6M22 respectively.
Piura Plant Utilization Rate
| Utilization Rate | ||||||||||||||||||||||||
| 2Q23 | 2Q22 | % Var. | 6M23 | 6M22 | % Var. | |||||||||||||||||||
| Cement | 68.6 | % | 78.9 | % | -10.3 pp. | 71.1 | % | 83.6 | % | -12.5 pp. | ||||||||||||||
| Clinker | 100.0 | % | 100.0 | % | - p.p. | 100.0 | % | 100.0 | % | - p.p. | ||||||||||||||
The cement production utilization rate at the Piura plant was 68.6% in 2Q23 and 71.1% in 6M23, a 10.3 and 12.5 percentage point decrease when compared to 2Q22 and 6M22 respectively, mainly due to a temporary slowdown in demand due to heavy rainfall.
The clinker production utilization rate at the Piura plant was over 100% in 2Q23 and 6M23, as we continue to require our full capacity to satisfy demand and inventory requirements established in our annual production plan as mentioned above.
Consolidated Utilization Rate
| Utilization Rate | ||||||||||||||||||||||||
| 2Q23 | 2Q22 | % Var. | 6M23 | 6M22 | % Var. | |||||||||||||||||||
| Cement | 55.5 | % | 66.0 | % | -10.5 pp. | 57.1 | % | 68.7 | % | -11.6 pp. | ||||||||||||||
| Clinker | 75.3 | % | 81.5 | % | -6.2 pp. | 77.3 | % | 81.6 | % | -4.3 pp. | ||||||||||||||
The consolidated cement production utilization rate was 55.5% in 2Q23 and 57.1% in 6M23, 10.5 and 11.6 percentage points lower than 2Q22 and 6M22 respectively, in line with a market downturn.
The consolidated clinker production utilization rate was 75.3% in 2Q23 and 77.3% in 6M23, 6.2 and 4.3 percentage points lower than in 2Q22 and 6M22 respectively, mainly due to the above mentioned reasons.
FINANCIAL RESULTS:
Income Statement:
The following table shows a summary of the Consolidated Financial Results:
Consolidated Financial Results
(in millions of Soles S/)
| Income Statement | ||||||||||||||||||||||||
| 2Q23 | 2Q22 | % Var. | 6M23 | 6M22 | % Var. | |||||||||||||||||||
| Sales of goods | 442.0 | 502.9 | -12.1 | % | 922.0 | 1,028.3 | -10.3 | % | ||||||||||||||||
| Gross Profit | 152.6 | 158.1 | -3.5 | % | 313.2 | 323 | -3.0 | % | ||||||||||||||||
| Total operating expenses, net | -73.9 | -72.2 | 2.4 | % | -147.8 | -143.6 | 2.9 | % | ||||||||||||||||
| Operating Profit | 78.7 | 85.9 | -8.4 | % | 165.4 | 179.4 | -7.8 | % | ||||||||||||||||
| Total other expenses, net | -18.8 | -15.9 | 18.2 | % | -42.3 | -44.7 | -5.4 | % | ||||||||||||||||
| Profit before income tax | 59.9 | 70.0 | -14.4 | % | 123.1 | 134.7 | -8.6 | % | ||||||||||||||||
| Income tax expense | -16.4 | -22.0 | -25.5 | % | -36.1 | -41 | -12.0 | % | ||||||||||||||||
| Profit for the period | 43.5 | 48.0 | -9.4 | % | 87.0 | 93.7 | -7.2 | % | ||||||||||||||||
During 2Q23, revenues decreased by 12.1% and 10.3% in 6M23, compared to 2Q22 and 6M22, mainly due to decreased sales volumes. Gross profit decreased by 3.5% in 2Q23 and 3.0% in 6M23, compared to 2Q22 and 6M22 respectively, mainly due to the decrease in revenues, partially offset by lower costs as we decreased the amount of imported clinker used. Profit for the period decreased by 9.4% in 2Q23 as compared to 2Q22 and 7.2% in 6M23 when compared to 6M22, primarily due to decreased sales, partially offset by cost reductions.
SALES OF GOODS
The following table shows the Sales of Goods and their respective margins by business segment:
Sales: cement, concrete and precast
(in millions of Soles S/)
| Cement, concrete and precasts | ||||||||||||||||||||||||
| 2Q23 | 2Q22 | % Var. | 6M23 | 6M22 | % Var. | |||||||||||||||||||
| Sales of goods | 420.7 | 469.4 | -10.4 | % | 867.8 | 947.0 | -8.4 | % | ||||||||||||||||
| Cost of Sales | -268.0 | -309.6 | -13.4 | % | -556.0 | -625.6 | -11.1 | % | ||||||||||||||||
| Gross Profit | 152.7 | 159.8 | -4.4 | % | 311.8 | 321.5 | -3.0 | % | ||||||||||||||||
| Gross Margin | 36.3 | % | 34.0 | % | 2.3 pp. | 35.9 | % | 33.9 | % | 2.0 pp. | ||||||||||||||
Sales of cement, concrete and precast decreased 10.4% in 2Q23 and 8.4% in 6M23, when compared to 2Q22 and 6M22 respectively, mainly due to decreased volume of bagged cement and concrete due to the decrease in both self-construction and public and private works, as new regional authorities took office in January and are still settling in. Gross margin increased 2.3 percentage points during 2Q23 and 2.0 percentage points during 6M23, when compared to 2Q22 and 6M22 respectively, mainly due to the decreased use of imported clinker because of lower volumes as well as optimization of our current capacity to achieve higher production levels.
Sales: cement
(in millions of Soles S/)
Sales of cement represented 91.2% of cement, concrete and precast sales during 2Q23.
| Cement | ||||||||||||||||||||||||
| 2Q23 | 2Q22 | % Var. | 6M23 | 6M22 | % Var. | |||||||||||||||||||
| Sales of goods | 383.5 | 414.1 | -7.4 | % | 789.3 | 837.8 | -5.8 | % | ||||||||||||||||
| Cost of Sales | -230.7 | -258.9 | -10.9 | % | -479.3 | -523.1 | -8.4 | % | ||||||||||||||||
| Gross Profit | 152.8 | 155.2 | -1.5 | % | 310.0 | 314.7 | -1.5 | % | ||||||||||||||||
| Gross Margin | 39.8 | % | 37.5 | % | 2.3 pp. | 39.3 | % | 37.6 | % | 1.7 pp. | ||||||||||||||
Sales of cement decreased 7.4% in 2Q23 compared to 2Q22 and 5.8% in 6M23 compared to 6M22, mainly due to decreased demand. However, gross margin increased 2.3 percentage points, mainly due to cost optimization, as we minimized the use of imported clinker and benefitted from lower coal costs.
Sales: concrete, pavement and mortar
(in millions of Soles S/)
Sales of concrete, pavement and mortar represented 7.8% of cement, concrete, and precast sales during 2Q23.
| Concrete, pavement and mortar | ||||||||||||||||||||||||
| 2Q23 | 2Q22 | % Var. | 6M23 | 6M22 | % Var. | |||||||||||||||||||
| Sales of goods | 32.7 | 47.1 | -30.6 | % | 69.3 | 94.3 | -26.5 | % | ||||||||||||||||
| Cost of Sales | -32.2 | -41.9 | -23.2 | % | -66.2 | -84.9 | -22.0 | % | ||||||||||||||||
| Gross Profit | 0.5 | 5.2 | -90.4 | % | 3.1 | 9.4 | -67.0 | % | ||||||||||||||||
| Gross Margin | 1.5 | % | 11.0 | % | -9.5 pp. | 4.5 | % | 10.0 | % | -5.5 pp. | ||||||||||||||
Sales of concrete, pavement and mortar decreased 30.6% during 2Q22 and 26.5% in 6M22 compared to 2Q22 and 6M22 respectively, mainly due to decreased public and private investment as new authorities took office recently as mentioned above. However, we have already started seeing signs that the demand from the public segment should pick up during the second half of the year. Gross margin decreased 9.5 percentage points in 2Q23 compared to 2Q22 and 5.5 percentage points in 6M23 compared to 6M22, mainly due to lower dilution of fixed costs.
Sales: precast
(in millions of Soles S/)
Sales of precast represented 1.0% of cement, concrete, and precast sales during 2Q23.
| Precast | ||||||||||||||||||||||||
| 2Q23 | 2Q22 | % Var. | 6M23 | 6M22 | % Var. | |||||||||||||||||||
| Sales of goods | 4.4 | 8.2 | -46.3 | % | 9.1 | 14.9 | -38.9 | % | ||||||||||||||||
| Cost of Sales | -5.1 | -8.8 | -42.0 | % | -10.5 | -17.6 | -40.3 | % | ||||||||||||||||
| Gross Profit | -0.7 | -0.6 | 16.7 | % | -1.4 | -2.7 | -48.1 | % | ||||||||||||||||
| Gross Margin | -15.9 | % | -7.3 | % | -8.6 pp. | -15.4 | % | -18.1 | % | 2.7 pp. | ||||||||||||||
During 2Q23, precast sales decreased 46.3% compared to 2Q22 and 38.9% in 6M23 compared to 6M22, mainly due to decreased public and private investment. Gross margin was negative, mainly due to market contraction and the consequent lower dilution of fixed costs.
Sales: Quicklime
(in millions of Soles S/)
| Quicklime | ||||||||||||||||||||||||
| 2Q23 | 2Q22 | % Var. | 6M23 | 6M22 | % Var. | |||||||||||||||||||
| Sales of goods | 5.2 | 7.4 | -29.7 | % | 16.3 | 21.8 | -25.2 | % | ||||||||||||||||
| Cost of Sales | -5.0 | -9.0 | -44.4 | % | -14.5 | -22.3 | -35.0 | % | ||||||||||||||||
| Gross Profit | 0.2 | -1.6 | -112.5 | % | 1.8 | -0.5 | -460.0 | % | ||||||||||||||||
| Gross Margin | 3.8 | % | -21.6 | % | 25.5 pp. | 11.0 | % | -2.3 | % | 13.3 pp. | ||||||||||||||
During 2Q23, quicklime sales decreased 29.7%, when compared to 2Q22 and 25.2% in 6M23 when compared to the same period of the previous year, mainly due to decreased sales. However, gross margin increased 25.5 percentage points in 2Q23 and 13.3 percentage points in 6M23 when compared to 2Q22 and 6M22 respectively, mainly due to our focus on higher margin products, as well as the moderation in coal prices.
Sales: Construction Supplies2
(in millions of Soles S/)
| Construction Supplies | ||||||||||||||||||||||||
| 2Q23 | 2Q22 | % Var. | 6M23 | 6M22 | % Var. | |||||||||||||||||||
| Sales of goods | 16.1 | 26.0 | -38.1 | % | 37.9 | 59.4 | -36.2 | % | ||||||||||||||||
| Cost of Sales | -16.0 | -25.9 | -38.2 | % | -37.9 | -57.0 | -33.5 | % | ||||||||||||||||
| Gross Profit | 0.1 | 0.1 | - | - | 2.4 | -N/R | ||||||||||||||||||
| Gross Margin | 0.6 | % | 0.4 | % | 0.2 pp. | - | 4.0 | % | -4.0 pp. | |||||||||||||||
| 2 | Construction supplies include the following products: steel rebar, wires, nails, corrugated iron, electric conductors, plastic tubes and accessories, among others. |
During 2Q23, construction supply sales decreased 38.1% compared to 2Q22 and 36.2% in 6M23 compared to 6M22, mainly due to the contraction in demand from the construction segment. Gross margin was flat in 2Q23 when compared to 2Q22. During the first 6M23, gross margin decreased 4.0 percentage points compared to 6M22, mainly due to higher costs.
OPERATING EXPENSES:
Administrative Expenses
(in millions of Soles S/)
Administrative expenses increased 6.2% in 2Q23 compared to 2Q22 and 7.2% in 6M23 compared to 6M22, mainly due to increase in personnel expenses mainly due to increased wages in line with inflation, as well as increased donations as a result of cyclone Yaku.
| Administrative expenses | ||||||||||||||||||||||||
| 2Q23 | 2Q22 | % Var. | 6M23 | 6M22 | % Var. | |||||||||||||||||||
| Personnel expenses | 29.2 | 28.8 | 1.4 | % | 60.9 | 55.6 | 9.5 | % | ||||||||||||||||
| Third-party services | 14.3 | 16.2 | -11.7 | % | 32.5 | 33.0 | -1.5 | % | ||||||||||||||||
| Board of directors | 1.4 | 1.6 | -12.5 | % | 2.9 | 3.1 | -6.5 | % | ||||||||||||||||
| Depreciation and amortization | 3.0 | 4.1 | -26.8 | % | 7.3 | 7.9 | -7.6 | % | ||||||||||||||||
| Other | 10.4 | 4.2 | N/R | 12.5 | 8.7 | 43.7 | % | |||||||||||||||||
| Total | 58.3 | 54.9 | 6.2 | % | 116.1 | 108.3 | 7.2 | % | ||||||||||||||||
Selling Expenses
(in millions of Soles S/)
Selling expenses decreased 7.6% in 2Q23 and 2.4% in 6M23, compared to 2Q22 and 6M22 respectively, mainly due to decreases in personnel expenses, mainly variable salaries in line with decreased sales, as well as decreased advertising and promotion expenses.
| Selling and distribution expenses | ||||||||||||||||||||||||
| 2Q23 | 2Q22 | % Var. | 6M23 | 6M22 | % Var. | |||||||||||||||||||
| Personnel expenses | 9.5 | 10.9 | -12.8 | % | 19.7 | 21.3 | -7.5 | % | ||||||||||||||||
| Advertising and promotion | 2.0 | 2.2 | -9.1 | % | 4.1 | 4.2 | -2.4 | % | ||||||||||||||||
| Third party services | 2.2 | 1.9 | 15.8 | % | 3.7 | 3.6 | 2.8 | % | ||||||||||||||||
| Other | 2.0 | 2.0 | - | 5.7 | 4.9 | 16.3 | % | |||||||||||||||||
| Total | 15.7 | 17.0 | -7.6 | % | 33.2 | 34.0 | -2.4 | % | ||||||||||||||||
EBITDA RECONCILIATION:
Consolidated EBITDA
(in millions of Soles S/)
| Consolidated EBITDA | ||||||||||||||||||||||||
| 2Q23 | 2Q22 | % Var. | 6M23 | 6M22 | % Var. | |||||||||||||||||||
| Net Income | 43.5 | 48.0 | -9.4 | % | 87.0 | 93.7 | -7.2 | % | ||||||||||||||||
| + Income tax expense | 16.4 | 22.0 | -25.5 | % | 36.1 | 41 | -12.0 | % | ||||||||||||||||
| - Finance income | -0.9 | -1.0 | -10.0 | % | -2.2 | -1.6 | 37.5 | % | ||||||||||||||||
| + Finance costs | 24.2 | 23.8 | 1.7 | % | 49.9 | 46.6 | 7.1 | % | ||||||||||||||||
| +/- Net loss on the valuation of trading derivative financial instruments | 0.0 | 0.0 | N/R | 0.0 | 0.1 | N/R | ||||||||||||||||||
| +/- Net loss from exchange rate | -4.5 | -6.9 | -34.8 | % | -5.3 | -0.4 | N/R | |||||||||||||||||
| + Depreciation and amortization | 33.9 | 34.6 | -2.0 | % | 67.8 | 68.6 | -1.2 | % | ||||||||||||||||
| Consolidated EBITDA | 112.6 | 120.5 | -6.6 | % | 233.3 | 248.0 | -5.9 | % | ||||||||||||||||
Consolidated EBITDA decreased 6.6% in 2Q23 and 5.9% in 6M23, when compared to 2Q22 and 6M22 respectively, mainly due to the temporary decrease in demand, due to the negative effects of heavy rainfall during March and April. However, it is important to mention that this decline was partially offset by a better cost structure, mainly due to lower coal costs and the reduction of imported clinker.
Cash and Debt Position:
Consolidated Cash (in millions of Soles S/)
As of June 30, 2023, the cash balance was S/75.7 million (US$ 20.9 million). This balance includes certificates of deposit in the amount of S/ 41.0 million (US$ 11.3 million), distributed as follows:
| Bank | Amount (S/) | Interest Rate | Initial Date | Maturity Date | ||||||
| Banco de Crédito del Perú | S/ 4.5 | 7.50 | % | June 30, 2023 | July 6, 2023 | |||||
| Banco de Crédito del Perú | S/ 3.0 | 7.50 | % | June 30, 2023 | July 4, 2023 | |||||
| Banco de Crédito del Perú | S/ 3.0 | 7.50 | % | June 30, 2023 | July 6, 2023 | |||||
| Banco de Crédito del Perú | S/ 3.0 | 7.58 | % | June 13, 2023 | August 29, 2023 | |||||
| Banco de Crédito del Perú | S/ 3.0 | 7.78 | % | June 23, 2023 | August 29, 2023 | |||||
| Banco de Crédito del Perú | S/ 3.0 | 7.76 | % | June 30, 2023 | August 29, 2023 | |||||
| Banco de Crédito del Perú | S/ 2.0 | 7.92 | % | April 28, 2023 | August 29, 2023 | |||||
| Banco de Crédito del Perú | S/ 2.0 | 7.80 | % | May 5, 2023 | August 29, 2023 | |||||
| Banco de Crédito del Perú | S/ 2.0 | 7.80 | % | May 12, 2023 | August 29, 2023 | |||||
| Banco de Crédito del Perú | S/ 2.0 | 7.80 | % | May 19, 2023 | August 29, 2023 | |||||
| Banco de Crédito del Perú | S/ 2.0 | 7.80 | % | May 26, 2023 | August 29, 2023 | |||||
| Banco de Crédito del Perú | S/ 2.0 | 7.88 | % | May 31, 2023 | August 29, 2023 | |||||
| Banco de Crédito del Perú | S/ 2.0 | 7.88 | % | June 8, 2023 | August 29, 2023 | |||||
| Banco de Crédito del Perú | S/ 1.5 | 7.18 | % | June 30, 2023 | July 6, 2023 | |||||
| Scotiabank Perú | S/ 2.0 | 8.45 | % | June 23, 2023 | 1 September, 2023 | |||||
| Scotiabank Perú | S/ 2.0 | 8.40 | % | June 13, 2023 | July 31, 2023 | |||||
| Scotiabank Perú | S/ 2.0 | 8.35 | % | June 30, 2023 | July 31, 2023 | |||||
| S/ 41.0 | ||||||||||
The remaining balance of S/ 34.7 million (US$ 9.6 million) is held mainly in the Company’s bank accounts, of which US$ 5.2 million are denominated in US dollars and the balance in Soles.
DEBT POSITION:
Consolidated Debt
(in millions of Soles S/)
Certificates of deposits in Soles
Below are the contractual obligations with payment deadlines related to the Company’s debt, including interest.
| Payments due by period | ||||||||||||||||||||
| Less
than 1 year |
1-3 Years | 3-5 Years | More
than 5 Years |
Total | ||||||||||||||||
| Indebtedness | 346.40 | 312.7 | 312.70 | 648.2 | 1,620.0 | |||||||||||||||
| Future interest payments | 94.7 | 142.0 | 107.40 | 98.7 | 442.8 | |||||||||||||||
| Total | 441.1 | 454.7 | 420.1 | 746.9 | 2,062.8 | |||||||||||||||
As of June 30, 2023, the Company’s total outstanding debt, as shown in the financial statements, reached S/ 1,612.5 million (US$ 443.9 million). This debt is primarily composed of the two issuance of the local bond issued in January, 2019 and the club deal obtained last year.
As of June 30, 2023, Debt/EBITDA ratio was 3.3 times.
Capex
(in millions of Soles S/)
As of June 30, 2023 the Company invested S/ 161.8 million (US$ 44.5 million), allocated to the following projects:
| Projects | 6M23 | |||
| Pacasmayo Plant Projects | 144.8 | |||
| Concrete and aggregates equipment | 7.6 | |||
| Rioja Plant Projects | 5.3 | |||
| Piura Plant Projects | 2.3 | |||
| Others | 1.8 | |||
| Total | 161.8 | |||
ABOUT CEMENTOS PACASMAYO S.A.A.
Cementos Pacasmayo S.A.A. is a cement company, located in the Northern region of Peru. In February 2012, the Company’s shares were listed on The New York Stock Exchange - Euronext under the ticker symbol “CPAC”. With more than 65 years of operating history, the Company produces, distributes and sells cement and cement-related materials, such ready-mix concrete and precast materials. Pacasmayo’s products are primarily used in construction, which has been one of the fastest-growing segments of the Peruvian economy in recent years. The Company also produces and sells quicklime for use in mining operations.
For more information, please visit: http://www.cementospacasmayo.com.pe/
Note: The Company presented some figures converted from Soles to U.S. Dollars for comparison purposes. The exchange rate used to convert Soles to U.S. dollars was S/ 3.633 per US$ 1.00, which was the average exchange rate, reported as of June 30, 2023 by the Superintendencia de Banca, Seguros y AFP’s (SBS). The information presented in U.S. dollars is for the convenience of the reader only. Certain figures included in this report have been subject to rounding adjustments. Accordingly, figures shown as totals in certain tables may not be arithmetic aggregations of the figures presented in previous quarters.
This press release may contain forward-looking statements. These statements are statements that are not historical facts, and are based on management’s current view and estimates of future economic circumstances, industry conditions, Company performance and financial results. Also, certain reclassifications have been made to make figures comparable for the periods. The words “anticipates”, “believes”, “estimates”, “expects”, “plans” and similar expressions, as they relate to the Company, are intended to identify forward-looking statements. Statements regarding the declaration or payment of dividends, the implementation of principal operating and financing strategies and capital expenditure plans, the direction of future operations and the factors or trends affecting financial condition, liquidity or results of operations are examples of forward-looking statements. Such statements reflect the current views of management and are subject to a number of risks and uncertainties. There is no guarantee that the expected events, trends or results will actually occur. The statements are based on many assumptions and factors, including general economic and market conditions, industry conditions, and operating factors. Any changes in such assumptions or factors could cause actual results to differ materially from current expectations.
CONSOLIDATED STATEMENTS OF FINANCIAL POSITION
As of June 30, 2023 (unaudited) and December 31, 2022 (audited)
| As
of Jun-23 |
As
of Dec-22 |
|||||||
| S/ (000) | S/ (000) | |||||||
| Assets | ||||||||
| Current Assets | ||||||||
| Cash and cash equivalents | 65,660 | 81,773 | ||||||
| Term deposits with maturity greater than ninety days | 10,000 | - | ||||||
| Other financial instruments | - | 86,893 | ||||||
| Trade and other receivables,net | 92,072 | 101,491 | ||||||
| Income tax prepayments | 7,450 | 8,268 | ||||||
| Inventories | 929,918 | 884969 | ||||||
| Payments | 26,375 | 25,059 | ||||||
| Total current assets | 1,131,475 | 1,188,453 | ||||||
| As
of Jun-23 |
As
of Dec-22 |
|||||||
| S/ (000) | S/ (000) | |||||||
| Non-current assets | ||||||||
| Trade and other receivables, net | 44,076 | 43,543 | ||||||
| Financial instruments designated at fair value through OCI | 274 | 274 | ||||||
| Property, plant and equipment, net | 2,090,370 | 2,007,838 | ||||||
| Intangible assets, net | 59,681 | 56,861 | ||||||
| Goodwill | 4,459 | 4,459 | ||||||
| Deferred income tax assets | 10,873 | 9,005 | ||||||
| Right-of-use assets | 7,199 | 3,639 | ||||||
| Other assets | 81 | 89 | ||||||
| Total non-current assets | 2,217,013 | 2,125,708 | ||||||
| Total assets | 3,348,488 | 3,314,161 | ||||||
| As
of Jun-23 |
As
of Dec-22 |
|||||||
| S/ (000) | S/ (000) | |||||||
| Liabilities and equity | ||||||||
| Current liabilities | ||||||||
| Trade and other payables | 234,958 | 284,554 | ||||||
| Financial obligations | 345,146 | 618,907 | ||||||
| Lease liabilities | 3,052 | 2,005 | ||||||
| Income tax payable | 11,773 | 16,340 | ||||||
| Provisiones | 48,510 | 31,333 | ||||||
| Total current liabilities | 643,439 | 953,139 | ||||||
| As
of Jun-23 |
As
of Dec-22 |
|||||||
| S/ (000) | S/ (000) | |||||||
| Non-current liabilities | ||||||||
| Financial obligations | 1,267,393 | 974,264 | ||||||
| Lease liabilities | 4,585 | 2,350 | ||||||
| Provisions | 17,860 | 47,638 | ||||||
| Deferred income tax liabilities | 131,635 | 141,635 | ||||||
| Total non-current liabilities | 1,421,473 | 1,165,887 | ||||||
| Total liabilities | 2,064,912 | 2,119,026 | ||||||
| As
of Jun-23 |
As
of Dec-22 |
|||||||
| S/ (000) | S/ (000) | |||||||
| Equity | ||||||||
| Capital stock | 423,868 | 423,868 | ||||||
| Investment shares | 40,279 | 40,279 | ||||||
| Investment shares holds in Treasury shares | -121,258 | -121,258 | ||||||
| Additional paid-in capital | 432,779 | 432,779 | ||||||
| Legal reserve | 168,636 | 168,636 | ||||||
| Other accumulated comprehensive results (loss) | -16,272 | -17,787 | ||||||
| Retained earnings | 355,544 | 268,618 | ||||||
| Total Equity | 1,283,576 | 1,195,135 | ||||||
| Total liability and equity | 3,348,488 | 3,314,161 | ||||||
INTERIM CONDENSED CONSOLIDATED UNAUDITED STATEMENTS OF PROFIT AND LOSS
For the three-month and six-month periods ended June 30, 2023 and 2022 (both unaudited)
| 2Q23 | 2Q22 | 2023 | 2022 | |||||||||||||
| S/ (000) | S/ (000) | S/ (000) | S/ (000) | |||||||||||||
| Sales of goods | 442,039 | 502,886 | 922,034 | 1,028,295 | ||||||||||||
| Cost of sales | (289,461 | ) | (344,804 | ) | (608,861 | ) | (705,248 | ) | ||||||||
| Gross Profit | 152,578 | 158,082 | 313,173 | 323,047 | ||||||||||||
| Operating income (expenses) | ||||||||||||||||
| Administrative expenses | (58,327 | ) | (54,861 | ) | (116,056 | ) | (108,250 | ) | ||||||||
| Selling and distribution expenses | (15,674 | ) | (17,025 | ) | (33,208 | ) | (33,995 | ) | ||||||||
| Other operating (expenses) income, net | 73 | (311 | ) | 1,476 | (1,335 | ) | ||||||||||
| Total operating expenses , net | (73,928 | ) | (72,197 | ) | (147,788 | ) | (143,580 | ) | ||||||||
| Operating profit | 78,650 | 85,885 | 165,385 | 179,467 | ||||||||||||
| Other income (expenses) | ||||||||||||||||
| Finance income | 836 | 1,012 | 2,191 | 1,570 | ||||||||||||
| Financial costs | (24,156 | ) | (23,813 | ) | (49,877 | ) | (46,608 | ) | ||||||||
| Accumulated net loss due on settlement of derivative financial instruments | - | 45 | 19 | (64 | ) | |||||||||||
| Loss from exchange difference, net | 4,518 | 6,865 | 5,341 | 351 | ||||||||||||
| Total other expenses, net | (18,802 | ) | (15,891 | ) | (42,326 | ) | (44,751 | ) | ||||||||
| Profit before income tax | 59,848 | 69,994 | 123,059 | 134,716 | ||||||||||||
| Income tax expense | (16,414 | ) | (22,015 | ) | (36,133 | ) | (41,012 | ) | ||||||||
| Profit for the period | 43,434 | 47,979 | 86,926 | 93,704 | ||||||||||||
| Earnings per share | ||||||||||||||||
| Basic and diluted earnings per year attributable to equity holders of common shares and investment in shares of Cementos Pacasmayo S.A.A. (S/ per share) | 0.10 | 0.11 | 0.20 | 0.22 | ||||||||||||
CONSOLIDATED STATEMENTS OF CHANGES IN EQUITY
For the six-month periods ended June 30, 2023, 2022 (unaudited)
| Attributable to equity holders of the parent | ||||||||||||||||||||||||||||||||||||
| Capital Stock |
Investment shares |
Investments shares hold in treasury |
Additional paid-in capital |
Legal reserve |
Unrealized gain (loss) on financial instruments designated at fair value |
Unrealized gain (loss) on cash flow hedge |
Retained earning |
Total equity |
||||||||||||||||||||||||||||
| S/ (000) | S/ (000) | S/ (000) | S/ (000) | S/ (000) | S/ (000) | S/ (000) | S/ (000) | S/ (000) | ||||||||||||||||||||||||||||
| Balance as of January 1, 2022 | 423,868 | 40,279 | (121,258 | ) | 432,779 | 168,636 | (15,869 | ) | (4,225 | ) | 271,595 | 1,195,805 | ||||||||||||||||||||||||
| Profit for the year | - | - | - | - | - | - | - | 93,704 | 93,704 | |||||||||||||||||||||||||||
| Other comprehensive loss | - | - | - | - | - | 275 | - | 275 | ||||||||||||||||||||||||||||
| Total comprehensive income | - | - | 275 | 93,704 | 93,979 | |||||||||||||||||||||||||||||||
| Balance as of June 30, 2022 | 423,868 | 40,279 | (121,258 | ) | 432,779 | 168,636 | (15,869 | ) | (3,950 | ) | 365,299 | 1,289,784 | ||||||||||||||||||||||||
| Balance as of December 31, 2022 | 423,868 | 40,279 | (121,258 | ) | 432,779 | 168,636 | (16,267 | ) | (1,520 | ) | 268,618 | 1,195,135 | ||||||||||||||||||||||||
| Profit for the year | - | - | - | - | - | - | - | 86,926 | 86,926 | |||||||||||||||||||||||||||
| Other comprehensive loss | - | - | - | - | - | - | 1,520 | - | 1,520 | |||||||||||||||||||||||||||
| Other comprehensive loss | - | - | - | - | - | (5 | ) | - | - | (5 | ) | |||||||||||||||||||||||||
| Total comprehensive income | - | - | - | - | - | (5 | ) | 1,520 | 86,926 | 88,441 | ||||||||||||||||||||||||||
| Balance as of June 30, 2023 | 423,868 | 40,279 | -121,258 | 432,779 | 168,636 | (16,272 | ) | - | 355,544 | 1,283,576 | ||||||||||||||||||||||||||
21