UNITED STATES
SECURITIES AND EXCHANGE COMMISSION
Washington, DC 20549
FORM 10-K
☒ ANNUAL REPORT PURSUANT TO SECTION 13 OR 15(d) OF THE SECURITIES AND EXCHANGE ACT OF 1934
for the fiscal year ended April 1, 2023
☐ TRANSITION REPORT PURSUANT TO SECTION 13 OR 15(d) OF THE SECURITIES EXCHANGE ACT OF 1934
for the transition period from __________to _________
Commission file number 001-40840
RBC BEARINGS INCORPORATED
(Exact name of registrant as specified in its charter)
| Delaware | 95-4372080 | |
(State or other jurisdiction of | (I.R.S. Employer |
| One Tribology Center, Oxford, CT | 06478 | |
| (Address of principal executive offices) | (Zip Code) | |
|
(203) 267-7001 (Registrant’s telephone number, including area code) |
||
Securities registered pursuant to Section 12(b) of the Act:
|
Title of Each Class |
Trading Symbol | Name of Each Exchange on Which Registered |
||
| Common Stock, par value $0.01 per share | RBC | The New York Stock Exchange | ||
| 5.00% Series A Mandatory Convertible Preferred Stock, par value $0.01 per share | RBCP | The New York Stock Exchange |
Securities registered pursuant to Section 12(g) of the Act: None
Indicate by check mark if the registrant is a well-known seasoned issuer, as defined in Rule 405 of the Securities Act. Yes ☒ No ☐
Indicate by check mark if the registrant is not required to file reports pursuant to Section 13 or Section 15(d) of the Act. Yes ☐ No ☒
Indicate by check mark whether the registrant: (1) has filed all reports required to be filed by Section 13 or Section 15(d) of the Securities Exchange Act of 1934 during the preceding 12 months (or for such shorter period that the registrant was required to file such reports), and (2) has been subject to such filing requirements for the past 90 days. Yes ☒ No ☐
Indicate by check mark whether the registrant has submitted electronically every Interactive Data File required to be submitted and posted pursuant to Rule 405 of Regulation S-T (§ 232.405 of this chapter) during the preceding 12 months (or for such shorter period that the registrant was required to submit such files). Yes ☒ No ☐
Indicate by check mark whether the registrant is a large accelerated filer, an accelerated filer, a non-accelerated filer or a smaller reporting company, or emerging growth company. See the definitions of “large accelerated filer,” “accelerated filer,” “smaller reporting company” and “emerging growth company” in Rule 12b-2 of the Exchange Act. (Check one):
| Large accelerated filer | ☒ | Accelerated filer | ☐ | Non-accelerated filer | ☐ | |
| Smaller reporting company | ☐ | Emerging growth company | ☐ |
If an emerging growth company, indicate by check mark if the registrant has elected not to use the extended transition period for complying with any new or revised financial accounting standards provided pursuant to Section 13(a) of the Exchange Act. ☐
Indicate by check mark whether the registrant has filed a report on and attestation to its management’s assessment of the effectiveness of its internal control over financial reporting under Section 404(b) of the Sarbanes-Oxley Act (15 U.S.C. 7262(b)) by the registered public accounting firm that prepared or issued its audit report. ☐
Indicate by check mark whether the registrant is a shell company (as defined in Rule 12b-2 of the Exchange Act). Yes ☐ No ☒
The aggregate market value of the registrant’s Common Stock held by non-affiliates of the registrant on October 1, 2022 (based on the September 30, 2022 closing sales price of $207.81 of the registrant’s Common Stock, as reported by the New York Stock Exchange) was approximately $6,030,035,239.
As of May 12, 2023, RBC Bearings Incorporated had 29,025,177 shares of Common Stock and 4,600,000 shares of Preferred Stock outstanding.
Documents Incorporated by Reference:
Portions of the registrant’s proxy statement to be filed within 120 days of the close of the registrant’s fiscal year in connection with the registrant’s Annual Meeting of Shareholders to be held September 7, 2023, are incorporated by reference into Part III of this Form 10-K.
Auditor Firm ID: 00042 Auditor Name: Ernst & Young LLP Auditor Location: Stamford, CT
TABLE OF CONTENTS
PART I
ITEM 1. BUSINESS
RBC Bearings Incorporated
RBC Bearings Incorporated, together with its subsidiaries, is an international manufacturer and marketer of highly engineered precision bearings, components and essential systems for the industrial, defense and aerospace industries. Our precision solutions are integral to the manufacture and operation of most machines and mechanical systems, to reduce wear to moving parts, facilitate proper power transmission, reduce damage and energy loss caused by friction, and control pressure and flow. The terms “we,” “us,” “our,” “RBC” and the “Company” mean RBC Bearings Incorporated and its subsidiaries, unless the context indicates another meaning. While we manufacture products in all major categories, we focus primarily on the higher end of the bearing, gearing and engineered component markets where we believe our value-added engineering and manufacturing capabilities, and application expertise enable us to differentiate ourselves from our competitors and enhance profitability. We believe our expertise has enabled us to garner leading positions in many of the product markets in which we primarily compete. With 52 facilities in 10 countries, of which 37 are manufacturing facilities, we have been able to significantly broaden our end markets, products, customer base and geographic reach.
All quantitative data contained in this Annual Report on Form 10-K (the “Annual Report”) is stated in millions, except for share and per-share data, number of facilities, square footage, and headcount.
The Bearing, Gearing and Engineered Component Industry
The bearing, gearing and engineered component industry is a fragmented multi-billion-dollar market. Purchasers of bearings, gearings and engineered components include producers of commercial and military aircraft, submarine and vehicle equipment, energy equipment, machinery manufacturers, industrial equipment and machinery manufacturers, construction machinery manufacturers, rail and train equipment manufacturers, packaging and canning machinery manufacturers, agriculture and mining equipment manufacturers, and specialized equipment manufacturers, as well as distributors who service the aftermarket for these products.
Demand for bearings, gearing and precision components in the diversified industrial market is influenced by growth factors in industrial machinery and equipment shipments, and construction, mining, energy, food and beverage, packaging and canning, semiconductor, and general industrial activity. In addition, usage of existing machinery will impact aftermarket demand for replacement products. In the aerospace market, new aircraft build rates along with carrier traffic volume worldwide determines demand for our solutions. Activity in the defense market is influenced by modernization programs necessitating spending on new equipment, as well as continued utilization of deployed equipment supporting aftermarket demand for replacement bearings, gearing and engineered components.
Customers and Markets
We serve a broad range of end markets where we can add value with our specialty precision bearings, essential systems and engineered components. We classify our customers into two principal categories: industrial and aerospace/defense. These principal end markets utilize a large number of both commercial and specialized bearings, gearings and engineered components. Although we provide a relatively small percentage of total bearings, gearings and engineered components supplied to each of our principal markets, we believe we have leading market positions in many of the specialized product markets in which we primarily compete. Financial information regarding geographic areas is set forth in Part II, Item 8, Note 20 of this Annual Report on Form 10-K.
Industrial Market (71% of net sales for the fiscal year ended April 1, 2023)
We manufacture bearings, gearing and engineered components for a wide range of diversified industrial markets, including construction and mining, oil and natural resource extraction, heavy truck, aggregates, rail and train, food and beverage, packaging and canning, material handling semiconductor machinery, wind, and the general industrial markets. Our products target market applications in which our engineering and manufacturing capabilities provide us with a competitive advantage in the marketplace.
Our largest industrial customers include Caterpillar, Komatsu and Kurt Manufacturing and various aftermarket distributors including Motion Industries, Applied Industrial, McMaster-Carr, BDI, Kaman and Purvis Industries. We believe that the diversification of our sales among the various segments of the industrial markets and channels reduces our exposure to downturns in any individual segment. We believe opportunities exist for growth and margin improvement in this market as a result of the introduction of new products, the expansion of aftermarket sales, and continued manufacturing process improvements.
Aerospace/Defense Market (29% of net sales for the fiscal year ended April 1, 2023)
We supply bearings and engineered components for use in commercial, private and military aircraft and aircraft engines, guided weaponry, space and satellites and vision and optical systems, and military marine and ground applications.
We supply precision products for many of the commercial aircraft currently operating worldwide and are the primary bearing supplier for many of the aircraft OEMs’ product lines. Commercial aerospace customers generally require precision products, often of special materials, made to unique designs and specifications. Many of our aerospace bearings and engineered component products are designed and certified during the original development of the aircraft being served, which often makes us the primary bearing supplier for the life of that aircraft.
We manufacture bearings and engineered components used by the U.S. Department of Defense (the “DOD”) and certain foreign governments for use in fighter jets, troop transports, naval vessels, helicopters, gas turbine engines, armored vehicles, guided weaponry, spaceflight and satellites. We manufacture an extensive line of standard products that conform to many domestic military application requirements, as well as customized products designed for unique applications. Our bearings and engineered components are manufactured to conform to U.S. military specifications and are typically custom-designed during the original product design phase, which often makes us the sole or primary supplier for the life of that product. Product approval for use on military equipment is often a lengthy process ranging from six months to six years.
Our largest aerospace and defense customers include the U.S. Department of Defense, Boeing, Airbus, Newport News Shipbuilding, Lockheed Martin, Northrop Grumman, Raytheon and various aftermarket distributors including National Precision Bearing, Jamaica Bearings, Wencor, and Wesco Aircraft. We believe our strong relationships with OEMs help drive our aftermarket sales since a portion of OEM sales are ultimately intended for use as replacement parts. We believe that growth and margin expansion in this market will be driven primarily by expanding our international presence, new commercial aircraft introductions, new products, share gains, and the refurbishment and maintenance of existing commercial and military aircraft.
In fiscal 2023, approximately 2% of our net sales were made directly, and we estimate that approximately an additional 8% of our net sales were made indirectly, to the U.S. government. The contracts or subcontracts for these sales may be subject to renegotiation of profit or termination at the election of the U.S. government. Based on experience, we believe that no material renegotiations or refunds will be required. See Part I, Item 1A. “Risk Factors – Future reductions or changes in U.S. government spending could negatively affect our business” of this Annual Report on Form 10-K.
Our two reportable business segments are aligned with the end-markets for our products. Operating results for the segments are evaluated regularly by our chief operating decision maker in determining resource allocation and assessing performance. The following table provides a summary of our two reportable business segments:
| Net Sales and Percent of Sales for the Fiscal Year Ended (dollars in millions) |
||||||||||||||
| Segment | April 1, 2023 |
April 2, 2022 |
April 3, 2021 |
Representative Applications | ||||||||||
| Industrial | $ | 1,039.0 | $ | 561.4 | $ | 212.8 | ● Mining, energy, aggregates, construction, wind | |||||||
| 71 | % | 60 | % | 35 | % | equipment and material handling | ||||||||
| ● Packaging and canning machinery | ||||||||||||||
| ● Semiconductor equipment | ||||||||||||||
| ● Industrial gears, components and collets | ||||||||||||||
| Aerospace/Defense | $ | 430.3 | $ | 381.5 | $ | 396.2 | ● Airframe control and actuation | |||||||
| 29 | % | 40 | % | 65 | % | ● Aircraft engine controls and landing gear | ||||||||
| ● Missile launchers | ||||||||||||||
| ● Radar and night vision systems | ||||||||||||||
| ● Hydraulics and valves | ||||||||||||||
| ● Space applications | ||||||||||||||
Products
Bearings, gearing and engineered components are employed to perform several functions including reduction of friction, transfer of motion, carriage of loads, and control of pressure and flows. We design, manufacture and market a broad portfolio of bearings, gearing and engineered components.
Plain Bearings. Plain bearings are primarily used to rectify inevitable misalignments in various mechanical components, such as aircraft controls, helicopter rotors, or heavy mining and construction equipment. Such misalignments are either due to machining inaccuracies or result when components change position relative to each other. Plain bearings are produced with either self-lubricating or metal-to-metal designs and consist of several sub-classes, including rod end bearings, spherical plain bearings and journal bearings.
Roller Bearings. Roller bearings are anti-friction products that utilize cylindrical rolling elements. We produce three main designs: tapered roller bearings, needle roller bearings and needle bearing track rollers, and cam followers. We offer several needle roller bearing designs that are used in both industrial applications and certain U.S. military aircraft platforms where there are high loads and the design is constrained by space considerations. A significant portion of our sales of needle roller bearings is to the aftermarket rather than to OEMs. Needle bearing track rollers and cam followers have wide and diversified use in the industrial market and are often prescribed as a primary component in articulated aircraft wings.
Ball Bearings. Ball bearings are devices that utilize high precision ball elements to reduce friction in high-speed applications. We specialize in four main types of ball bearings: high precision aerospace, airframe control, thin section, and industrial ball bearings. High precision aerospace bearings are primarily sold to customers in the defense industry that require more technically sophisticated bearing products providing a high degree of fault tolerance given the criticality of the applications in which they are used. Airframe control ball bearings are precision ball bearings that are plated to resist corrosion and are qualified under a military specification. Thin section ball bearings are specialized bearings that use extremely thin cross sections and give specialized machinery manufacturers many advantages. We produce a general line of industrial ball bearings sold primarily to the aftermarket.
Mounted Bearings. Mounted bearings are fully assembled bearings with a wide range of shaft attachment methods, rolling elements, housing materials and configurations offering a variety of sealing solutions. Mounted bearing products include mounted ball bearings, mounted roller bearings and mounted plain bearings, and are used in light to heavy loads, and in clean, corrosive or harsh environments. Mounted roller bearings are pre-machined to allow field installation of the Dodge bearing sensor, adding remote monitoring capability in difficult to access applications and unsafe environments. Applications include unit and bulk material handling, industrial air handling, large rotor fans, food processing, roll-out tables, and forest pulp and paper processing equipment.
Enclosed Gearing. We provide a broad range of enclosed gearing product lines including Quantis Gearmotor (helical style gearing with modular configurations and a variety of mounting methods), Torque Arm (shaft-mount gearing with helical style gearing and v-belt input for first stage reduction), Tigear (single reduction, right angle gear reducers with worm style gearing), MagnaGear & Maxum (parallel reducers with helical and planetary style gearing) and Controlled Start Transmission (planetary style gearing with hydraulic clutch package used for soft starting large conveyors). Applications include unit and bulk handling, food processing, roll-out tables, and forest pulp and paper processing equipment.
Motion Control Components. Power transmission components are of three types: mechanical drive components (offering V belt sheaves, synchronous sprockets, bushings and belts) used to change rotational speed between two pieces of equipment; couplings used to transmit torque between two rotating pieces of equipment, such as a motor and a gearbox; and conveyor components, which transfer torque from the mechanical drive equipment to the conveyor belt in bulk material handling applications. Applications include unit and bulk material handling, industrial air handling, large rotor fans, food processing, roll-out tables, and forest pulp and paper processing equipment.
Engineered Components. Engineered components include highly engineered hydraulics and valves, fasteners, precision mechanical components and machine tool collets. Engineered hydraulics and valves are used in aircraft and submarine applications and aerospace and defense aftermarket services. Precision mechanical components are used in all general industrial applications where some form of movement is required. Machine tool collets are cone-shaped metal sleeves used for holding circular or rod-like pieces in a lathe or other machine that provide effective part holding and accurate part location during machining operations.
Product Design and Development
We produce specialized bearings and engineered components that are often tailored to the specifications of a customer or application. Our sales professionals are highly experienced engineers who collaborate with our customers to develop bearing and engineered component solutions. The product development cycle can follow many paths, which are dependent on the end market or sales channel. The process normally takes between three and six years from concept to sale depending upon the application and the market. A typical process for a major OEM project begins when our design engineers meet with the customer at the machine design conceptualization stage and work with them through the conclusion of the product development.
Often, at the early stage, a bearing or engineered component design is produced that addresses the expected demands of the application including load, stress, heat, thermal gradients, vibration, lubricant supply, pressure and flows, and corrosion resistance, with one or two of these environmental constraints being predominant in the design consideration. A bearing or engineered component design must perform reliably for the period of time required by the customer’s product objectives.
Once a bearing or engineered component is designed, a mathematical simulation is created to replicate the expected application environment and thereby allow optimization with respect to these design variables. Upon conclusion of the design and simulation phase, samples are produced and laboratory testing commences at one of our test laboratories. The purpose of this testing phase is not only to verify the design and the simulation model but also to allow further design improvement where needed. The last phase is field testing by the customer, after which the product is ready for sale.
For many of our Aerospace/Defense products, the culmination of this lengthy process is the receipt of a product approval or certification, generally obtained from either the OEM, the DOD or the Federal Aviation Administration (“FAA”), which allows us to supply the product to the OEM customer and to the aftermarket. We currently have a significant number of such approvals, which often gives us a competitive advantage, and in many of these instances we are the only approved supplier of a given bearing or engineered component.
Manufacturing and Operations
Our manufacturing strategies are focused on product reliability, quality, safety and service. Custom and standard products are produced according to manufacturing schedules that ensure maximum availability of popular items for immediate sale while carefully considering the economies of lot production and special products. Capital programs and manufacturing methods development are focused on quality improvement, production costs, safety and service. A monthly review of product line production performance assures an environment of continuous attainment of profitability and quality goals.
Capacity. Our plants currently run on a full first shift with second and third shifts at select locations to meet the demands of our customers. We believe that current capacity levels and future annual estimated capital expenditures on equipment up to approximately 3.0% to 3.5% of net sales should permit us to effectively meet demand levels for the foreseeable future.
Inventory Management. We operate an inventory management program designed to balance customer delivery requirements with economically optimal inventory levels. In this program, each product is categorized based on characteristics including order frequency, number of customers and sales volume. Using this classification system, our primary goal is to maintain a sufficient supply of standard items while minimizing costs. In addition, production cost savings are achieved by optimizing plant scheduling around inventory levels and customer delivery requirements. This leads to more efficient utilization of manufacturing facilities and minimizes plant production changes while maintaining sufficient inventories to service customer needs.
Sales, Marketing and Distribution
Our marketing strategy is aimed at increasing sales within our two primary markets, targeting specific applications in which we can exploit our competitive strengths. To affect this strategy, we seek to expand into geographic areas not previously served by us and we continue to capitalize on new markets and industries for existing and new products. We employ a technically proficient sales force and utilize marketing managers, product managers, customer service representatives and product application engineers in our selling efforts.
We have developed our sales force through the hiring of sales personnel with prior industry experience, complemented by an in-house training program. We intend to continue to hire and develop expert sales professionals and strategically locate them to implement our expansion strategy. Today, our direct sales force is located to service North America, Europe, Asia and Latin America and is responsible for selling all of our products. This selling model leverages our relationship with key customers and provides opportunities to market multiple product lines to both established and potential customers. We also sell our products through a well-established, global network of industrial and aerospace distributors. This channel primarily provides our products to smaller OEM customers, aftermarket customers and the end users of bearings and engineered components that require local inventory and service. We intend to continue to focus on building distributor sales volume.
The Company has a joint venture in North America focused on joint logistics and e-business services. This joint venture, CoLinx, LLC (“CoLinx”), includes five equity members: Timken, SKF Group, Schaeffler Group, RBC Bearings Incorporated and Gates Industrial Corp. The e-business service focuses on information and business services for authorized distributors in the Industrial segment.
The Company also utilizes the RBC e-shop e-commerce platform to sell precision products and high quality mechanical components to customers.
The sale of our products is supported by a well-trained and experienced customer service organization, which provides customers with instant access to key information regarding their purchases. We also provide customers with updated information through our website, and we have developed on-line integration with specific customers, enabling more efficient ordering and timely order fulfillment for those customers.
We store product inventory in warehouses located in the Midwest, Southwest and on the East and West coasts of the U.S. as well as in Australia, Canada, France, India, Mexico, the People’s Republic of China and Switzerland. The inventory is located in these locations based on analysis of customer demand to provide superior service and product availability.
Competition
Our principal competitors include SKF, New Hampshire Ball Bearings, Regal Rexnord, Precision Castparts and Timken, although we compete with different companies for each of our product lines. We believe that for the majority of our products, the principal competitive factors affecting our business are product qualifications, product line breadth, service, quality and price. Although some of our current and potential competitors may have greater financial, marketing, personnel and other resources than us, we believe that we are well-positioned to compete with regard to each of these factors in each of the markets in which we operate.
Product Qualifications. Many of the products we produce are qualified for the application by the OEM, the DOD, the FAA, the user or a combination of these. These credentials have been achieved for thousands of distinct items after years of design, testing and improvement. Applicable Dodge products are compliant as required with related communications, safety, and Ex certifications for use in North America, Mexico, the EU, as well as other select international locations. This includes, but is not limited to, ATEX, IECEx, NYCE NOM, and C/US declarations of conformity. Several of our products are protected by patents, and we believe that in many cases we have strong brand identity or we are the sole source for products for a particular application.
Product Line Breadth. Our products encompass a broad range of designs which often create a critical mass of complementary bearings, essential systems and engineered components for our markets. This position provides many of our industrial and aerospace customers with a single manufacturer to provide the engineering service and product breadth needed to achieve a series of OEM design objectives and/or aftermarket requirements. This enhances our value to the OEM considerably while strengthening our overall market position.
Service. Product design, performance, reliability, availability, quality, and technical and administrative support are elements that define the service standard for this business. Our customers are sophisticated and demanding, as our products are fundamental and enabling components to the manufacturing or operation of their machinery. We maintain inventory levels of our most popular items for immediate sale and service. Our customers have high expectations regarding product availability and quality, and the primary emphasis of our service efforts is to provide the widest possible range of available products delivered on a timely basis.
Price. We believe our products are priced competitively in the markets we serve and we continually evaluate our manufacturing and other operations to maximize efficiencies in order to maintain competitive prices while maximizing our profit margins. We invest considerable effort to develop our price-to-value algorithms and we price to market levels where required by competitive pressures.
Joint Ventures
Investments in affiliated companies accounted for under the equity method at April 1, 2023 and April 2, 2022 were $0.6 and $0.7, respectively, and were reported within other noncurrent assets on the consolidated balance sheets.
Suppliers and Raw Materials
We obtain raw materials, component parts and supplies from a variety of sources and generally from more than one supplier. Our principal raw materials are steel and cast iron. Our suppliers and sources of raw materials are based in the U.S., Europe and Asia. We purchase steel at market prices, which fluctuate as a result of supply and demand driven by economic conditions in the marketplace. For further discussion of the possible effects of changes in the cost of raw materials on our business, see Part I, Item 1A. “Risk Factors” of this Annual Report on Form 10-K.
Backlog
As of April 1, 2023, we had order backlog of $663.8 compared to a backlog of $603.1 as of April 2, 2022. Orders included in our backlog are subject to cancellation, delay or modifications by our customers prior to fulfillment. We sell many of our products pursuant to contractual agreements, single-source relationships or long-term purchase orders, each of which may permit early termination by the customer. However, we believe that the unique nature of many of our products prevents other suppliers from being able to satisfy customer orders on a timely or cost-effective basis, thereby making it impracticable for our customers to shift their purchase of these products to other suppliers.
Human Capital
RBC employs 3,670 people at our 34 U.S. facilities, approximately 3% of whom are exempt and 97% are non-exempt. In addition, we employ 1,422 people at our 18 facilities located in Canada, Mexico, France, Switzerland, Germany, Poland, India, Australia and China. The majority of our personnel are RBC employees rather than independent contractors, temporaries or third-party labor provider personnel.
Our human capital objective is to attract and retain high-performing people who can work in a culture that fosters innovation and continuous improvement. To achieve that objective, we maintain an aggressive talent recruitment program, a fair and competitive compensation program, an on-going training and development program, and an ethical and safe work environment.
Talent Recruitment. Critical to our success is that we have a deep and talented pool of engineers who oversee the production of our current products to the highest standards, work directly with customers on applications, and direct the research and development for new products. To maintain that talent pool, we actively recruit engineers from over 40 colleges and universities around the U.S. In addition, we have developed deep collaborative relationships with a select group of schools, including internship and trainee programs with several of these schools.
Compensation. We offer fair and competitive compensation to our employees. Our employee benefits package includes medical, dental and vision coverage, life insurance, supplemental disability coverage, and 401(k) and supplemental employee retirement plans. In addition, participation in our long-term equity incentive plan goes very deep in our organization, providing employees with equity compensation/awards that they might not receive if they worked for one of our competitors.
Training. An important part of achieving our human capital objective is our in-house training programs – RBC University, Materials University, Mechanical Engineering Training and the Dodge Customer, Application, Product Training (CAPT) Program. These programs provide our employees with a uniform foundation regarding how we do business, expand their subject matter expertise, and develop the various leadership positions across our organization, including plant management and general management. We also offer a tuition reimbursement program for many employees wishing to further their classroom education in their chosen field.
Ethics. We expect our personnel to conduct the business of RBC in a legal and ethical manner. To ensure that they do that, our people are required to comply at all times with our corporate Code of Conduct, which among other things requires them to:
| ● | deal fairly with their coworkers and RBC’s customers, suppliers and competitors, |
| ● | comply with all applicable laws, |
| ● | protect RBC’s proprietary information and other assets, and | |
| ● | avoid conflicts of interest with RBC. |
Workplace Safety. Safety is of paramount importance to RBC and so we go to great lengths in striving for a zero-incident workplace that is consistent with our mandate to produce the highest quality, highly engineered components for our customers. Our general managers and operations managers are charged with creating and maintaining the highest standards of safety for employees, visitors and the local community through the use of industry best practices at their facilities. Monthly, each of our facilities reports to senior leadership on key safety metrics and we maintain a proactive approach in assessing and mitigating risk through root cause analysis, communication, training and teamwork.
Intellectual Property
We own U.S. and foreign patents and trademark registrations and U.S. copyright registrations and have U.S. trademark and patent applications pending. We file patent applications and maintain patents to protect certain technology, inventions and improvements that are important to the development of our business, and we file trademark applications and maintain trademark registrations to protect product names that have achieved brand-name recognition among our customers. We also rely upon trade secrets, know-how and continuing technological innovation to develop and maintain our competitive position. Many of our brands are well recognized by our customers and are considered valuable assets of our business. We do not believe, however, that any individual item of intellectual property is material to our business.
Regulation
Product Approvals. Essential to servicing the aerospace and defense markets is the ability to obtain product approvals. We have a substantial number of product approvals in the form of OEM approvals or Parts Manufacturer Approvals, or “PMAs,” from the FAA. We also have a number of active PMA applications in process. These approvals enable us to provide products used in virtually all domestic aircraft platforms presently in production or operation.
We are subject to various other federal laws, regulations and standards. New laws, regulations or standards or changes to existing laws, regulations or standards could subject us to significant additional costs of compliance or liabilities, and could result in material reductions to our results of operations, cash flow or revenues.
Environmental Matters
We are subject to federal, state and local environmental laws and regulations, including those governing discharges of pollutants into the air and water, the storage, handling and disposal of wastes and the health and safety of employees. We also may be liable under the Comprehensive Environmental Response, Compensation, and Liability Act or similar state laws for the costs of investigation and clean-up of contamination at facilities currently or formerly owned or operated by us, or at other facilities at which we have disposed of hazardous substances. In connection with such contamination, we may also be liable for natural resource damages, U.S. government penalties and claims by third parties for personal injury and property damage. Agencies responsible for enforcing these laws have authority to impose significant civil or criminal penalties for non-compliance. We believe we are currently in material compliance with all applicable requirements of environmental laws. We do not anticipate material capital expenditures for environmental compliance in fiscal year 2024.
Available Information
We file our annual, quarterly and current reports, proxy statements, and other documents with the Securities Exchange Commission (“SEC”) under the Securities Exchange Act of 1934. The public may read and copy any materials filed with the SEC at the SEC’s Office of Investor Education and Advocacy at 100F Street, NE, Washington, D.C. 20549. The public may obtain information on the operation of the Office of Investor Education and Advocacy by calling the SEC at 1–800–SEC–0330. Also, the SEC maintains an Internet website that contains reports, proxy and information statements, and other information regarding issuers that file electronically with the SEC. The public can obtain any documents that are filed by us at http://www.sec.gov.
In addition, this Annual Report on Form 10-K, as well as our quarterly reports on Form 10-Q, current reports on Form 8-K, any amendments to any of the foregoing reports, and our governance documents, are made available free of charge on our website (http://www.rbcbearings.com) as soon as reasonably practicable after such reports are electronically filed with or furnished to the SEC. Copies of the above reports and documents will also be provided free of charge upon written request to us.
ITEM 1A. RISK FACTORS
Cautionary Statement as to Forward-Looking Information
This report includes “forward-looking statements” within the meaning of the safe harbor provisions of the U.S. Private Securities Litigation Reform Act of 1995. All statements other than statements of historical fact are “forward-looking statements” for purposes of federal and state securities laws, including: projections of earnings, cash flows, revenue or other financial items; statements of the plans, strategies and objectives of management for future operations; statements concerning proposed new services or developments; statements regarding future economic conditions or performance or future growth rates in the markets we serve; statements regarding future raw material costs or supply; statements of belief; and statements of assumptions underlying any of the foregoing. Forward-looking statements may include the words “may,” “could,” “estimate,” “intend,” “plan,” “continue,” “believe,” “expect,” “anticipate” or other comparable terminology, or the negative of such terms.
Although we believe that the expectations and assumptions reflected in any of our forward-looking statements are reasonable, actual results could differ materially from those projected or assumed in any of our forward-looking statements. Our future financial condition, results of operations, and cash flows, as well as any forward-looking statements, are subject to change and to inherent risks and uncertainties, such as those disclosed in this Annual Report on Form 10-K. Factors that could cause our actual results, performance and achievements or industry results to differ materially from estimates or projections contained in forward-looking statements include, among others, the following:
| ● | The Company’s failure to maintain effective disclosure controls and procedures and internal control over financial reporting; |
| ● | Weaknesses or cyclicality in any of the industries in which our customers operate; |
| ● | Changes in marketing, product pricing and sales strategies, or development of new products by us or our competitors; |
| ● | Future reductions in U.S. governmental spending or changes in governmental programs, particularly military equipment procurement programs; |
| ● | Conditions that adversely affect the business of any of our significant customers; |
| ● | Our ability to obtain and retain product approvals; |
| ● | Supply and costs of raw materials (particularly steel) and energy resources, the imposition of import tariffs, and our ability to pass through these costs on a timely basis; |
| ● | Our ability to acquire and integrate complementary businesses; |
| ● | Unanticipated liabilities of acquired businesses; |
| ● | Unexpected equipment failures or catastrophic events; |
| ● | Our ability to attract and retain our management team and other highly skilled personnel; |
| ● | Work stoppages and other labor problems affecting us or our customers or suppliers; |
| ● | Changes in trade agreements or treaties and the imposition of tariffs on our goods exported to other countries; |
| ● | Regulatory changes or developments in the U.S. or in foreign countries where we produce or sell products; |
| ● | Developments or disputes concerning patents or other proprietary rights; |
| ● | Risks associated with utilizing information technology systems; |
| ● | Risks associated with operating internationally, including currency translation risks; |
| ● | Investors’ perceptions of us and our industry; |
| ● | Risks associated with the Dodge acquisition including the possible failure to realize the anticipated benefits from the acquisition and problems with the integration of Dodge with our legacy business; |
| ● | Risks associated with the substantial amount of debt we incurred to finance the Dodge acquisition; and |
| ● | Other risks and uncertainties including but not limited to those described from time to time in our current and quarterly reports filed with the SEC. |
These and additional factors that could cause actual results to differ materially from our forward-looking statements are set forth in this Annual Report on Form 10-K under Part I, Item 1. “Business,” Part I, Item 1A. “Risk Factors,” Part II, Item 7. “Management’s Discussion and Analysis of Financial Condition and Results of Operations,” and Part II, Item 8. “Financial Statements and Supplementary Data.” All forward-looking statements contained in this report and any subsequently filed reports are expressly qualified in their entirety by these cautionary statements.
We have no duty to update any forward-looking statements after the date of this report to conform such statements to actual results or to changes in our expectations. You are advised, however, to review any disclosures we make on related subjects in our future periodic filings with the SEC.
Risk Factors Relating to Our Company
Our business, operating results, cash flows or financial condition could be materially adversely affected by any of the following risks. The trading price of our common stock or preferred stock could decline due to any of these risks, and you could lose all or part of your investment. You should carefully consider these risks before investing in shares of our common stock or preferred stock.
The Company’s failure to maintain effective disclosure controls and procedures and internal control over financial reporting could result in material misstatements in our financial statements and a failure to meet our reporting and financial obligations, each of which could have a material adverse effect on the Company’s financial condition and the trading price of our common stock.
A material weakness in a company’s internal control over financial reporting is a deficiency, or a combination of deficiencies, in internal control over financial reporting such that there is a reasonable possibility that a material misstatement of that company’s annual or interim financial statements will not be prevented or detected on a timely basis.
During the first quarter of fiscal year 2023, the Company’s management identified a material weakness in internal control over financial reporting related to the design of our control to consider all relevant terms within executive employment agreements and the related application of relevant authoritative accounting guidance for stock-based compensation, a non-cash item. Management then re-evaluated its assessment of the effectiveness of internal control over financial reporting and its disclosure controls and procedures and concluded that they were not effective as of April 2, 2022, making it necessary for the Company to restate the financial statements for fiscal years 2022, 2021 and 2020. Although we have remediated this material weakness (see Part II, Item 9A of this Annual Report), there can be no assurance that additional material weaknesses will not occur in the future.
If the Company is unable to maintain effective internal control over financial reporting in the future, our ability to record, process and report financial information timely and accurately could be adversely affected, which could subject the Company to litigation or investigations, require management resources, increase costs, negatively affect investor confidence and adversely impact our stock price.
The bearings, engineered components and essential systems industries are highly competitive, and competition could reduce our profitability or limit our ability to grow.
The global bearings, engineered components and essential systems industries are highly competitive, and we compete with many U.S. and non-U.S. companies, some of which benefit from lower labor costs and fewer regulatory burdens than us. We compete primarily based on product qualifications, product line breadth, service and price. Certain competitors may be better able to manage costs than us or may have greater financial resources than we have. Due to the competitiveness in the bearings, engineered components and essential systems industries we may not be able to increase prices for our products to cover increases in our costs, and we may face pressure to reduce prices, which could materially reduce our revenues, cash flows and profitability. Competitive factors, including changes in market penetration, increased price competition and the introduction of new products and technology by existing and new competitors, could result in a material reduction in our revenues, cash flows and profitability.
The loss of a major customer, or a material adverse change in a major customer’s business, could result in a material reduction in our revenues, cash flows and profitability.
Our top ten customers collectively accounted for approximately 41%, 36% and 36% of our net sales during fiscal 2023, 2022 and 2021, respectively. Accordingly, the loss of one or more of those customers or a substantial decrease in those customers’ purchases from us could result in a material reduction in our revenues, cash flows and profitability. If one of our major customers were to experience an adverse change in its business, that customer could reduce its purchases from us.
The consolidation and combination of manufacturers could eliminate customers and/or put downward pricing pressures on sales of component parts. For example, the consolidation that has occurred in the defense industry in recent years has reduced the overall number of defense contractors. In addition, if one of our customers is acquired or merged with another entity, the new entity may discontinue using us as a supplier because of an existing business relationship between one of our competitors and the acquiring company, or because it may be more efficient to consolidate certain suppliers within the newly formed enterprise. The significance of the impact that such consolidations could have on our business is difficult to predict because we do not know when or if one or more of our customers will engage in merger or acquisition activity. However, if such activity involved our material customers it could materially impact our revenues, cash flows and profitability.
Weakness in any of the industries in which our customers operate, as well as the cyclical nature of our customers’ businesses generally, could materially reduce our revenues, cash flows and profitability.
The commercial aerospace, mining and construction equipment and other diversified industrial industries to which we sell our products are, to varying degrees, cyclical and tend to decline in response to overall declines in industrial production. Margins in those industries are highly sensitive to demand cycles, and our customers (or our customers’ customers) in those industries historically have tended to delay large capital purchases and projects, including expensive maintenance and upgrades, during economic downturns. As a result, our business is also cyclical, and the demand for our products by these customers depends, in part, on overall levels of industrial production, general economic conditions, and business confidence levels. Many of our customers have historically experienced periodic downturns, which often have had a negative effect on demand for our products. Future downward economic cycles or customer downturns could reduce sales of our products resulting in reductions in our revenues, cash flows and profitability.
Future reductions or changes in U.S. government spending could negatively affect our business.
In fiscal 2023, approximately 2% of our net sales were made directly, and we estimate that approximately an additional 8% of our net sales were made indirectly, to the U.S. government to support military or other government projects. Our failure (or the failure of our customers that are prime contractors to the government) to obtain new government contracts, the cancellation of government contracts relating to our products, or reductions in federal budget appropriations for programs in which our products are used could materially reduce our revenues, cash flows and profitability. A reduction in federal budget appropriations relating to our products could result from a shift in government defense spending to other programs in which we are not involved or a reduction in U.S. government defense spending generally (due to budget reduction initiatives or a shift in government spending priorities).
Fluctuating supply and costs of subcomponents, raw materials and energy resources, or the imposition of import tariffs, could materially reduce our revenues, cash flows and profitability.
Our business is dependent on the availability and costs of subcomponents, raw materials, particularly steel (generally in the form of stainless and chrome steel, which are commodity steel products), and energy resources. The availability and prices of subcomponents, raw materials and energy resources may be subject to change due to, among other things, new laws or regulations, economic inflation, suppliers’ allocations to other purchasers, interruptions in production or deliveries by suppliers and changes in exchange rates and supplier costs and profit expectations. The United States has imposed tariffs on steel and aluminum imports, and could impose tariffs on other items that we import, which could increase the cost of raw materials and decrease the available supply. Although we currently maintain alternative supply sources, our business is subject to the risk of price fluctuations and periodic delays in the delivery of certain subcomponents or raw materials. Disruptions in the supply of subcomponents, raw materials or energy resources could temporarily impair our ability to manufacture our products for our customers or require us to pay higher prices in order to obtain these items from other sources, which could thereby affect our net sales and profitability.
Where our customer contracts permit us to do so, we seek to pass through a significant portion of our additional costs to our customers through steel surcharges or price increases. However, many of our contracts are fixed-price contracts under which we are not able to pass these additional costs on to our customers. Even where we are able to pass these steel surcharges or price increases to our customers, there may be a lag of several months between the time we experience a cost increase and the time we are able to implement surcharges or price increases, particularly for orders already in our backlog. Competitive pressures and the terms of certain of our long-term contracts may require us to absorb at least part of these cost increases. As a result, our gross margin percentage could decline. We cannot provide assurances that we will be able to continue to pass these additional costs on to our customers at all or on a timely basis or that our customers will not seek alternative sources of supply if there are significant or prolonged increases in the price of subcomponents or other raw materials or energy resources.
Our results could be impacted by governmental trade policies and tariffs relating to our supplies imported from foreign vendors or our finished goods exported to other countries.
From time to time, the U.S. government has imposed tariffs on the importation of various products that we use to produce our finished goods, and various foreign countries, including the People’s Republic of China, have or could impose retaliatory tariffs on our products exported to those countries. While this situation has not had a material adverse effect on our business in the past, future tariffs on our foreign-sourced supplies and/or our finished goods exported to other countries could adversely impact our operating costs or demand for our products.
Some of our products and operations are subject to certain approvals and government regulations and the loss of such approvals, or our failure to comply with such regulations, could materially reduce our revenues, cash flows and profitability.
Essential to servicing the aerospace market is the ability to obtain product approvals. We have a substantial number of product approvals, which enable us to provide products used in virtually all domestic aircraft platforms presently in production or operation. Product approvals are typically issued by the FAA to designated OEMs who are Production Approval Holders of FAA-approved aircraft. These Production Approval Holders provide quality control oversight and generally limit the number of suppliers directly servicing the commercial aerospace market. Regulations enacted by the FAA provide for an independent process (the PMA process) that enables suppliers who currently sell their products to the Production Approval Holders to also sell products to the aftermarket. Our foreign sales may be subject to similar approvals or U.S. export control restrictions. We cannot assure you that we will not lose approvals for our aerospace products in the future. The loss or suspension of product approvals could result in lost sales and materially reduce our revenues, cash flows and profitability.
The repair and overhaul of aircraft parts and accessories throughout the world is highly regulated by government agencies, including the FAA. Our repair and overhaul operations are subject to certification pursuant to regulations established by the FAA and foreign government agencies, with regulations varying from country to country, although compliance with FAA requirements generally satisfies regulatory requirements in other countries. Our failure to comply with these regulations, or our compliance with new and more stringent government regulations, if enacted, could have an adverse effect on our business, financial condition and results of operations.
As a U.S. government contractor, we are subject to various procurement and other laws, regulations and contract terms applicable to our industry, including the FAR, the DFARS, the Truth in Negotiations Act, the False Claims Act, the Procurement Integrity Act, the International Traffic in Arms Regulations promulgated under the Arms Export Control Act, the Close the Contractor Fraud Loophole Act, the Foreign Corrupt Practices Act, and CAS, and we could be adversely affected by any negative finding by the U.S. government as to our compliance with them, including suspension or debarment from future government contracting.
The retirement of commercial aircraft could reduce our revenues, cash flows and profitability.
We sell replacement parts used in the repair and overhaul of jet engine and aircraft components, as well as provide such repair and overhaul services ourselves. As aircraft or engines for which we offer replacement parts or repair and overhaul services are retired, demand for these parts and services could decline and could reduce our revenue, cash flows and profitability.
Risks associated with utilizing information technology systems could adversely affect our operations.
We rely upon our information technology (“IT”) systems to process, transmit and store electronic information to manage and operate our business. Further, in the ordinary course of business we store sensitive data, including intellectual property, on our networks. The secure maintenance and transmission of this information is critical to our business operations.
We may face cyber events and other IT security threats, including malware, ransomware, phishing and other intrusions, to our IT infrastructure, attempts to gain unauthorized access to proprietary, classified or confidential information, and threats to the physical security of our IT systems. As a U.S. government contractor, our risk of cyber events may be greater than the risk faced by other companies that are not government contractors. In addition to security threats, our IT systems may also be subject to network, software or hardware failures. The unavailability of our IT systems, the failure of these systems to perform as anticipated, or any significant breach of data security could cause loss of data, disrupt our operations, require significant management attention and resources, subject us to liability to third parties, regulatory actions, or contract termination, and negatively impact our reputation among our customers and the public, which could have a negative impact on our financial and competitive position, results of operations and liquidity. In addition, our business with our customers and vendors could be impacted by cyber events on their IT systems.
To address the risk to our IT systems and data, we maintain an IT security program designed to resist cyber events and to mitigate the damage from successful events. A cyber event occurred in February 2021 that disrupted our IT systems. We took immediate steps to address the incident, including engaging two IT security and forensics experts to assess the impact to any affected data and to correct the security weakness that was exploited in the event. Based upon the forensic review, there was no evidence of data access or exfiltration and no material impact to the operations of the Company. Since the cyber event the Company has implemented a variety of measures to enhance and modernize our systems to guard against similar incidents in the future, and is also enhancing the Company’s recovery capabilities in the event of future incidents. We continue to evaluate the need to upgrade and/or replace our systems and network infrastructure to protect our IT environment, improve the effectiveness of our systems, and strengthen our cybersecurity program. However, these upgrades and replacements may not result in the protection or improvements anticipated.
Work stoppages and other labor problems could materially reduce our ability to operate our business.
We currently have three collective bargaining agreements covering employees at our Plymouth, Indiana, Fairfield, Connecticut and West Trenton, New Jersey facilities, representing approximately 9% of our U.S.-based hourly employees as of April 1, 2023. While we believe our relations with our employees are satisfactory, the inability to satisfactorily negotiate and enter into new collective bargaining agreements upon expiration, or a lengthy strike or other work stoppage at any of our facilities, particularly at some of our larger facilities, could materially reduce our ability to operate our business. In addition, any attempt by our employees not currently represented by a union to join a union could result in additional expenses, including with respect to wages, benefits and pension obligations.
In addition, work stoppages at one or more of our customers or suppliers (including suppliers of transportation services), many of which have large unionized workforces, could also cause disruptions to our business that we cannot control, and these disruptions could materially reduce our revenues, cash flows and profitability.
Unexpected equipment failures or catastrophic events could increase our costs and reduce our sales due to production curtailments or shutdowns.
Our manufacturing processes are dependent upon critical pieces of turning, milling, grinding, and electrical equipment, and this equipment could, on occasion, be out of service as a result of unanticipated failures. In addition to equipment failures, our facilities are also subject to the risk of catastrophic loss due to unanticipated events such as fires, explosions, earthquakes or violent weather conditions. In the future, we could experience material plant shutdowns or periods of reduced production as a result of these types of equipment failures or catastrophes. Interruptions in production capabilities would inevitably increase our production costs and reduce revenues, cash flows and profitability for the affected period.
We may not be able to continue to make the acquisitions necessary for us to realize our growth strategy.
The acquisition of businesses that complement or expand our operations is an important element of our business strategy. We frequently engage in evaluations of potential acquisitions and negotiations for possible acquisitions, some of which, if consummated, could be significant to us. We cannot assure you that we will be successful in identifying attractive acquisition candidates or completing acquisitions on favorable terms in the future. Our inability to acquire businesses, or to operate them profitably once acquired, could have a material adverse effect on our business, financial position, cash flow and growth.
Our ability to realize anticipated benefits and synergies from our acquisitions could be affected by a number of factors, including: the need for greater than expected cash or other financial resources or management time in order to implement or integrate acquisitions; increases in other expenses related to an acquisition, including restructuring and other exit costs; the timing and impact of purchase accounting adjustments; difficulties in employee or management integration, including labor disruptions or disputes; and unanticipated liabilities associated with acquired businesses.
Any potential cost-saving opportunities may take several quarters following an acquisition to implement, and any results of these actions may not be realized for several quarters thereafter, if at all.
Businesses that we acquire may have liabilities for which we are liable.
In order to complete an acquisition, it may be necessary for us to assume the liabilities of the acquired business, which was the case in the Dodge acquisition. These liabilities may be known at the time of the acquisition, but could be underestimated by us, or they may not be known to us until after the acquisition. In the case of an acquisition in which we do not assume all the liabilities of the acquired business, we obtain indemnification from the seller against the unassumed liabilities, although no assurance can be given that such indemnification will be sufficient in amount, scope or duration to fully offset the risk of the unassumed liabilities. Liabilities of acquired businesses that ultimately are borne by us (either because we assume them or our indemnification right proves to be insufficient or unenforceable) could have a material adverse effect on our business, financial condition or results of operations. In addition, after we complete an acquisition we may learn of other matters that adversely affect us, such as issues relating to the acquired business’s compliance with applicable laws, or issues relating to its supply chain, customer relationships or order demand.
Goodwill and indefinite-lived intangibles comprise a significant portion of our total assets, and if we determine that goodwill and indefinite-lived intangibles have become impaired in the future, our results of operations and financial condition in such years may be materially and adversely affected.
Goodwill represents the excess of cost over the fair market value of net assets acquired in business combinations. Indefinite-lived intangibles represent repair station certifications obtained in business combinations and assumed to have indefinite lives. As of April 1, 2023, we had $1,869.8 of goodwill and $24.3 of indefinite-lived intangibles, representing approximately 40% of our total assets. We review goodwill and indefinite-lived intangibles at least annually for impairment and any excess in carrying value over the estimated fair value is charged to the results of operations. Our estimates of fair value are based on assumptions about the future operating cash flows, growth rates, discount rates applied to these cash flows, and current market estimates of value. If we are required to record a charge to earnings because of an impairment of goodwill or indefinite-lived intangibles, our results of operations and financial condition could be materially and adversely affected.
We depend heavily on our senior management and other key personnel, the loss of whom could materially affect our financial performance and prospects.
Our business is managed by a number of key personnel, including our CEO Dr. Michael J. Hartnett. Our future success will depend on, among other things, our ability to retain the services of these personnel and to hire their successors and other highly qualified employees at all levels.
Our international operations are subject to risks inherent in such activities.
We have operations in Australia, Canada, France, Germany, India, Mexico, the Peoples Republic of China, Poland and Switzerland. Of our 52 facilities in 10 countries, 18 are located outside the U.S., including 10 manufacturing facilities in four countries.
In fiscal 2023, approximately 12% of our net sales were generated by our international operations. We expect that this proportion is likely to increase as we seek to increase our penetration of foreign markets, including through acquisitions such as Dodge, which included operations in Australia, Canada, India, Mexico and China. Our foreign operations are subject to the risks inherent in such activities such as: currency devaluations, logistical and communication challenges, costs of complying with a variety of foreign laws and regulations, greater difficulties in protecting and maintaining our rights to intellectual property, difficulty in staffing and managing geographically diverse operations, acts of terrorism or war or other acts that may cause social disruption which are difficult to quantify or predict, and general economic conditions in these foreign markets. Our international operations may be negatively impacted by changes in government policies, such as changes in laws and regulations, restrictions on imports and exports, sources of supply, duties or tariffs, the introduction of measures to control inflation, and changes in the rate or method of taxation. To date we have not experienced significant difficulties with the foregoing risks associated with our international operations.
Currency translation risks may have a material impact on our results of operations.
The majority of our foreign operations utilize the local currency as their functional currency. Foreign currency transaction gains and losses are included in earnings. Foreign currency transaction exposure arises primarily from the transfer of foreign currency from one subsidiary to another within the group and to foreign currency-denominated trade receivables. Unrealized currency translation gains and losses are recorded on the balance sheet upon translation of the foreign operations’ functional currency to the reporting currency. Because our financial statements are denominated in U.S. dollars, changes in currency exchange rates between the U.S. dollar and the currencies used by our international operations have had, and will continue to have, an impact on our earnings. We periodically enter into derivative financial instruments such as forward exchange contracts to reduce the effect of fluctuations in exchange rates on certain third-party sales transactions denominated in non-functional currencies. Currency fluctuations may affect our financial performance in the future and we cannot predict the impact of future exchange rate fluctuations on our results of operations. See Part II, Item 7A. “Quantitative and Qualitative Disclosures about Market Risk—Foreign Currency Exchange Rates” of this Annual Report on Form 10-K.
We may incur material losses for product liability and recall-related claims.
We are subject to a risk of product and recall-related liability in the event that the failure, use or misuse of any of our products results in personal injury, death or property damage or our products do not conform to our customers’ specifications. In particular, our products are installed in a number of types of vehicle fleets, including airplanes, trains, automobiles, heavy trucks and farm equipment, many of which may be subject to government-ordered recalls as well as voluntary recalls by the manufacturer. If one of our products is found to be defective, causes a fleet to be disabled or otherwise results in a product recall, significant claims may be brought against us. We currently maintain insurance coverage for product liability claims but not for recall-related claims. We cannot assure you that product liability claims, if made, would be covered by our insurance or would not exceed our insurance coverage limits. Claims that are not covered by insurance, or that exceed insurance coverage limits, could result in material losses. Claims that are covered by insurance could result in increased future insurance costs.
Our intellectual property and proprietary information are valuable, and any inability to protect them could adversely affect our business and results of operations; in addition, we may be subject to infringement claims by third parties.
Our ability to compete effectively is dependent upon our ability to protect and preserve the intellectual property and proprietary information owned, licensed or otherwise used by us. We have numerous U.S. and foreign trademark registrations and patents. We also have U.S. and foreign trademark and patent applications pending. We cannot assure you that our pending trademark and patent applications will result in trademark registrations and issued patents, and our failure to secure rights under these applications may limit our ability to protect the intellectual property rights that these applications were intended to cover. Although we have attempted to protect our intellectual property and proprietary information both in the United States and in foreign countries through a combination of patent, trademark, copyright and trade secret protection, and non-disclosure agreements, these steps may be insufficient to prevent unauthorized use of our intellectual property and proprietary information, particularly in foreign countries where the protection available for such intellectual property and proprietary information may be limited. We cannot assure you that any of our intellectual property rights will not be infringed upon or that our trade secrets will not be misappropriated or otherwise become known to or independently developed by competitors. We may not have adequate remedies available for any such infringement or other unauthorized use. We cannot assure you that any infringement claims asserted by us will not result in our intellectual property being challenged or invalidated, that our intellectual property will be held to be of adequate scope to protect our business, or that we will be able to deter current and former employees, contractors or other parties from breaching confidentiality obligations and misappropriating trade secrets.
We could become subject to litigation claiming that our intellectual property or proprietary information infringes the rights of a third party. In that event, we could incur substantial defense costs and, if such litigation is successful, we could be required to pay the claimant damages for our past use of such intellectual property or proprietary information, and we could either be required to pay royalties for our use of it in the future or be prohibited from using it in the future. Our inability to use our intellectual property and proprietary information on a cost-effective basis in the future could have a material adverse effect on our revenue, cash flow and profitability. See Part I, Item 1. “Business—Intellectual Property” of this Annual Report on Form 10-K.
Cancellation of orders in our backlog could negatively impact our revenues, cash flows and profitability.
As of April 1, 2023, we had an order backlog of $663.8. However, orders included in our backlog may be subject to cancellation, delay or other modifications by our customers and we cannot assure you that these orders will ultimately be fulfilled.
Quarterly performance can be affected by the timing of government product inspections and approvals.
A portion of our revenue is associated with contracts with the U.S. government that require onsite inspection and approval of the products by government personnel before we may ship the products, and we have no control over the timing of those inspections and approvals. If products scheduled for delivery in one quarter are not inspected or approved until the following quarter, the delay would adversely affect our sales and profitability for the quarter in which the shipments were scheduled.
We may fail to realize some of the anticipated benefits of the Dodge acquisition or those benefits may take longer to realize than expected.
Since our acquisition of our Dodge business in November 2021, we have realized certain benefits and synergies through leveraging the products, scale and combined enterprise customer bases of our legacy business and the Dodge business, and we believe that there are additional benefits and synergies that can be realized in the future. However, no assurance can be given that these additional benefits and synergies will be realized or that they will be realized in a timely manner. Failure to achieve these could adversely affect our results of operations or cash flows.
We incurred substantial debt in order to complete the Dodge acquisition, which could constrain our business and exposes us to the risk of defaults under our debt instruments.
As of November 1, 2021, we had approximately $1,800.0 of total debt as a result of the completion of the Dodge acquisition. As of April 1, 2023, our total debt was $1,395.0. This debt could or will have important consequences, including, but not limited to:
| ● | this debt requires us to make significant interest and principal payments in the future; |
| ● | a substantial portion of our cash flow from operations will be used to repay the principal and interest on our debt, thereby reducing the funds available to us for other purposes including for strategic acquisitions, working capital, capital expenditures, and general corporate purposes; |
| ● | our flexibility in planning for and reacting to changes in our business, the competitive landscape and the markets in which we operate may be limited; and |
| ● | we may be placed at a competitive disadvantage relative to other companies in our industry with less debt or comparable debt on more favorable terms. |
Our ability to make scheduled payments on and to refinance our indebtedness depends on and is subject to our financial and operating performance and no assurance can be given that our business will generate sufficient cash flow to service our debt.
Additionally, our ability to comply with the financial and other covenants contained in our debt instruments could be affected by, among other things, changes in our results of operations, the incurrence of additional indebtedness, the pricing of our products, our success at implementing cost reduction initiatives, our ability to successfully implement our overall business strategy, or changes in industry-specific or general economic conditions which are beyond our control. The breach of any of these covenants could result in a default or event of default under our debt instruments, which, if not cured or waived, could result in our being required to repay these borrowings before their due date. If we are forced to refinance these borrowings on less favorable terms or cannot refinance these borrowings, our prospects, business, financial condition, results of operations and cash flows could be materially and adversely affected and could cause us to become bankrupt or otherwise insolvent. In addition, these covenants may restrict our ability to engage in transactions that we believe would otherwise be in the best interests of our business and stockholders.
Increases in interest rates would increase the cost of servicing our term loan and could reduce our profitability.
As of April 1, 2023, $600.0 of our term loan was subject to a fixed-rate interest swap but the remaining $300.0 balance of the term loan bears interest at a variable rate. Future increases in interest rates would increase the cost of servicing the portion of the term loan not subject to a swap, which could materially reduce our profitability and cash flows.
Risk Factors Related to our Capital Stock
Provisions in our charter documents may prevent or hinder efforts to acquire a controlling interest in us.
Provisions of our certificate of incorporation and bylaws may discourage, delay or prevent a merger, acquisition or other change in control that stockholders may consider favorable, including transactions that might benefit our stockholders or in which our stockholders might otherwise receive a premium for their shares. These provisions may also prevent or frustrate attempts by our stockholders to replace or remove our management.
Pursuant to our charter documents, our Board of Directors (the “Board”) consists of eight members serving staggered three-year terms and divided into three classes. As a result, two annual meetings are required to change a majority of the Board members.
Our certificate of incorporation authorizes the issuance of 10,000,000 shares of preferred stock, with such designations, rights and preferences as may be determined from time to time by the Board, without stockholder approval. We utilized this authorization to issue 4,600,000 shares of 5.00% Series A Mandatory Convertible Preferred Stock (“MCPS”) in fiscal 2022. Certain terms of the MCPS could make an attempt to acquire RBC more difficult or expensive. In the future the Board could authorize the issuance of additional preferred stock with rights, preferences and privileges that rank equally with the MCPS, or that could have the effect of discouraging, delaying or preventing a change in control of us, or that could impede our stockholders’ ability to approve a transaction they consider in their best interests. Although we have no present intention to issue any additional preferred stock, no assurance can be given that we will not do so in the future. Holders of our common stock do not have preemptive rights to subscribe for a pro rata portion of preferred stock or any other capital stock that we may issue in the future.
We do not expect to pay cash dividends on our common stock in the foreseeable future and our ability to pay dividends on the MCPS is subject to various limitations.
Except for a $2.00 per common share special dividend paid in 2014, we have not paid any cash dividends on our common stock and we do not expect to pay cash dividends on the common stock in the foreseeable future. Instead, we plan to apply earnings and excess cash, if any, to the service of our debt, the payment of quarterly dividends on the MCPS, and the expansion and development of our business. Thus, any return on an investment in our common stock would depend solely on an increase, if any, in the market value of the common stock.
Our ability to pay dividends on the MCPS depends on several factors including:
| ● | The amount of cash we have on hand and cash generated by our business; |
| ● | Our anticipated financing needs, including our debt service obligations; |
| ● | The ability of our subsidiaries to distribute cash to our parent company, which issued the MCPS; |
| ● | Regulatory restrictions on our ability to pay dividends, including those under the Delaware General Corporation Law; and |
| ● | Contractual restrictions on our ability to pay dividends, including under our bank credit agreement with Wells Fargo. |
ITEM 1B. UNRESOLVED STAFF COMMENTS
None
ITEM 2. PROPERTIES
Our principal executive office consists of approximately 70,000 square feet located at One Tribology Center, Oxford, Connecticut, which we own, and our Dodge Industrial subsidiary has approximately 75,000 square feet of office space in Simpsonville, South Carolina, which we lease.
Our Industrial business segment maintains approximately 1,725,000 square feet of manufacturing space across 14 facilities in California, Connecticut, Indiana, New Jersey, North Carolina, Ohio, Oklahoma, South Carolina and Tennessee, some of which we own and some of which we lease. This manufacturing space includes approximately 460,000 square feet in two owned facilities in North Carolina and South Carolina, and approximately 650,000 square feet in three leased facilities in North Carolina, South Carolina and Tennessee, all of which are used by Dodge Industrial. The Industrial business segment also maintains approximately 467,000 square feet of manufacturing space across six leased facilities in China, Mexico and Switzerland and two owned facilities in Poland and Switzerland.
Our Aerospace/Defense business segment maintain approximately 840,000 square feet of manufacturing space across 13 facilities in Arizona, California, Connecticut, Georgia Indiana and South Carolina, some of which we own and some of which we lease. This manufacturing space includes 163,000 square feet in one owned facility in Arizona. The Aerospace/Defense business segment also maintains approximately 108,000 square feet of manufacturing space across two leased facilities in Mexico.
We own or lease approximately 239,000 square feet in three distribution centers located in California, South Carolina, and Tennessee, and we also lease several sales offices in various locations in the United States, Canada, France, China, Germany India and Australia. We also utilize third party logistics’ firms located strategically around the world to supplement distribution of our products.
We believe that as the term for each of our leased facilities expires we will be able to either secure a renewal or enter into a lease for an alternate location on market terms.
We believe that our existing facilities and equipment are generally in good condition, are well maintained and adequate to carry on our current operations. We also believe that our existing manufacturing facilities have sufficient capacity to meet increased customer demand.
ITEM 3. LEGAL PROCEEDINGS
On March 9, 2022 and March 21, 2023, the Company received civil investigative demands from the United States Department of Justice pursuant to the False Claims Act, 31 U.S.C. § 3733 (the “FCA”). The investigation concerns allegations that the Company submitted false claims in connection with (i) certifying that the Company’s employees were eligible for unemployment insurance benefits and pandemic relief and worked reduced hours and (ii) received grant proceeds in violation of the FCA. The Company is cooperating with the investigation. As the investigation is in its early stages, it is not possible to determine whether the investigation will have a material adverse effect, if any, on the Company.
Besides the matter described in the previous paragraph, from time to time we are involved in litigation that arises in the ordinary course of business, but we do not believe that any such litigation in which we are currently involved, either individually or in the aggregate, is likely to have a material adverse effect on our business, financial condition, operating results, cash flow or prospects.
ITEM 4. MINE SAFETY DISCLOSURES
Not applicable.
ITEM 4A. EXECUTIVE OFFICERS OF THE REGISTRANT
Our executive officers are appointed by the Board normally for a term of one year and/or until the appointment of their successors. All executive officers have been employed by the Company at their current positions during the past five-year period except as noted below. Our executive officers as of May 19, 2023 are as follows:
| Name | Age | Year Appointed |
Current Position and Previous Positions During Last Five Years | |||
| Michael J. Hartnett | 77 | 1992 | Chairman, President and Chief Executive Officer. | |||
| Daniel A. Bergeron | 63 | 2017 | Director, Vice President and Chief Operating Officer. | |||
| Patrick S. Bannon | 58 | 2017 | Vice President and General Manager. | |||
| Richard J. Edwards | 67 | 1996 | Vice President and General Manager. | |||
| John J. Feeney | 54 | 2020 | Vice President, General Counsel and Secretary. Served as Assistant General Counsel from 2014 to 2020. | |||
| Robert M. Sullivan | 39 | 2020 | Vice President and Chief Financial Officer. Served as Corporate Controller from 2017 to 2020. |
PART II
ITEM 5. MARKET FOR REGISTRANT’S COMMON EQUITY, RELATED STOCKHOLDER MATTERS AND ISSUER PURCHASES OF EQUITY SECURITIES
Price range of our Common Stock and Preferred Stock
Our common stock is quoted on the New York Stock Exchange under the symbol “RBC.” As of May 12, 2023, there was one holder of record of our common stock.
The following table shows the high and low sales prices of our common stock during the periods indicated:
| Fiscal 2023 | Fiscal 2022 | |||||||||||||||
| High | Low | High | Low | |||||||||||||
| First Quarter | $ | 202.73 | $ | 152.90 | $ | 208.11 | $ | 185.00 | ||||||||
| Second Quarter | 264.94 | 179.21 | 250.52 | 179.60 | ||||||||||||
| Third Quarter | 256.29 | 202.13 | 242.74 | 188.51 | ||||||||||||
| Fourth Quarter | 254.50 | 204.67 | 214.80 | 165.99 | ||||||||||||
The last reported sale price of our common stock on the New York Stock Exchange on May 12, 2023 was $217.99 per share.
Our preferred stock is quoted on the New York Stock Exchange under the symbol “RBCP.” As of May 12, 2023, there was one holder of record of our preferred stock.
The following table shows the high and low sales prices of our preferred stock during the periods indicated:
| Fiscal 2023 | Fiscal 2022 | |||||||||||||||
| High | Low | High | Low | |||||||||||||
| First Quarter | $ | 102.93 | $ | 81.01 | $ | — | $ | — | ||||||||
| Second Quarter | 127.19 | 92.95 | 126.88 | 101.00 | ||||||||||||
| Third Quarter | 123.15 | 101.39 | 122.74 | 101.17 | ||||||||||||
| Fourth Quarter | 121.21 | 101.57 | 109.76 | 91.35 | ||||||||||||
The last reported sale price of our preferred stock on the New York Stock Exchange on May 12, 2023 was $107.33 per share.
Issuer Purchases of Equity Securities
In 2019, our Board of Directors authorized us to repurchase up to $100.0 of our common stock from time to time on the open market, in block trade transactions, and through privately negotiated transactions, in compliance with SEC Rule 10b-18 depending on market conditions, alternative uses of capital, and other relevant factors. Purchases may be commenced, suspended, or discontinued at any time without prior notice.
Total share repurchases under the 2019 plan for the three months ended April 1, 2023 are as follows:
| Period | Total |
Average |
Number
of purchased
|
Approximate |
||||||||||||
| 01/01/2023 – 01/28/2023 | 10 | $ | 206.82 | 10 | $ | 72.5 | ||||||||||
| 01/29/2023 – 02/25/2023 | 5,014 | 239.72 | 5,014 | 71.3 | ||||||||||||
| 02/26/2023 – 04/01/2023 | - | - | - | $ | 71.3 | |||||||||||
| Total | 5,024 | $ | 239.65 | 5,024 | ||||||||||||
During the fourth quarter of fiscal 2023, we did not issue any common stock that was not registered under the Securities Act of 1933.
Equity Compensation Plans
Information regarding equity compensation plans required to be disclosed pursuant to this Item is included in Part II, Item 8, Note 17 of this Annual Report on Form 10-K.
Performance Graph
The following graph shows the total return to our stockholders compared to the Russell 3000 Index, the Nasdaq Composite Index and the S&P 400 Industrials (Sector) (TR) over the period from March 31, 2018 to April 1, 2023. Because of the diversity of our markets and products, we do not believe that a combination of peer issuers can be selected on an industry or line-of-business basis to provide a meaningful basis for comparing shareholder return. Accordingly, the Russell 3000 Index, which is comprised of issuers with generally similar market capitalizations to that of the Company, is included in the graph as permitted by applicable regulations. Each line on the graph assumes that $100 was invested in our common stock or in the respective indices on March 31, 2018 based on the closing price on that date. The graph then presents the value of these investments, assuming reinvestment of dividends, through the close of trading on April 1, 2023.
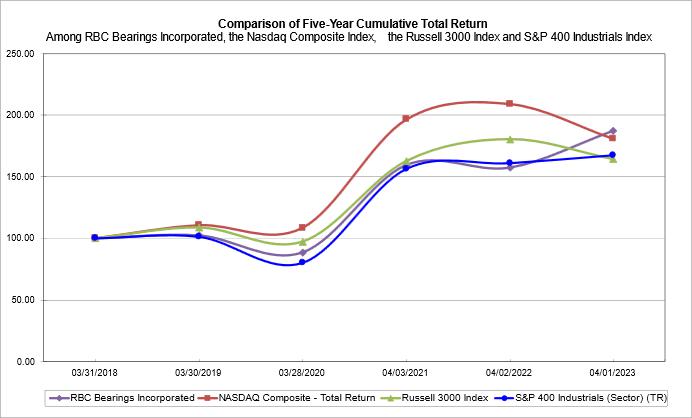
| March 31, 2018 |
March 30, 2019 |
March 28, 2020 |
April 3, 2021 |
April 2, 2022 |
April 1, 2023 |
|||||||||||||||||||
| RBC Bearings Incorporated | $ | 100.00 | $ | 102.39 | $ | 88.57 | $ | 159.53 | $ | 157.45 | $ | 187.36 | ||||||||||||
| Nasdaq Composite Index | 100.00 | 110.63 | 108.51 | 196.56 | 209.32 | 181.00 | ||||||||||||||||||
| Russell 3000 Index | 100.00 | 108.77 | 97.27 | 162.70 | 180.59 | 164.37 | ||||||||||||||||||
| S&P 400 Industrials (Sector) (TR) | 100.00 | 101.24 | 79.96 | 156.48 | 161.22 | 167.69 | ||||||||||||||||||
The cumulative total return shown on the stock performance graph indicates historical results only and may not be indicative of future results.
ITEM 6. [RESERVED]
Not applicable.
ITEM 7. MANAGEMENT’S DISCUSSION AND ANALYSIS OF FINANCIAL CONDITION AND RESULTS OF OPERATIONS
The financial and business analysis below provides information which we believe is relevant to an assessment and understanding of our consolidated financial position, results of operations and cash flows. This financial and business analysis should be read in conjunction with the consolidated financial statements and related notes. All references to “Notes” in this Item 7 refer to the “Notes to Consolidated Financial Statements” included in Item 8 of this Annual Report on Form 10-K.
The following discussion contains statements reflecting our views about our future performance that constitute “forward-looking statements” within the meaning of the safe harbor provisions of the U.S. Private Securities Litigation Reform Act of 1995. See the information provided in Part I, Item 1A. “Risk Factors” of this Annual Report on Form 10-K under the heading “Cautionary Statement as to Forward-Looking Information.”
General
We are a well-known international manufacturer of highly engineered precision bearings, components and essential systems for the industrial, defense and aerospace industries. Our precision solutions are integral to the manufacture and operation of most machines and mechanical systems, reduce wear to moving parts, facilitate proper power transmission, and reduce damage and energy loss caused by friction. While we manufacture products in all major bearing categories, we focus primarily on the higher end of the bearing market where we believe our value-added manufacturing and engineering capabilities enable us to differentiate ourselves from our competitors and enhance profitability. We believe our unique expertise has enabled us to garner leading positions in many of the product markets in which we primarily compete. With 52 facilities in 10 countries, of which 37 are manufacturing facilities, we have been able to significantly broaden our end markets, products, customer base and geographic reach. We have a fiscal year consisting of 52 or 53 weeks, ending on the Saturday closest to March 31. Based on this policy, fiscal year 2023 had 52 weeks and fiscal year 2022 had 52 weeks. We currently operate under two reportable business segments – Aerospace/Defense and Industrial:
| ● | Aerospace/Defense. This segment represents the end markets for the Company’s highly engineered bearings and precision components used in commercial aerospace, defense aerospace, and marine and ground defense applications. |
| ● | Industrial. This segment represents the end markets for the Company’s highly engineered bearings, gearings and precision components used in various industrial applications including: power transmission; construction, mining, energy and specialized equipment manufacturing; semiconductor production equipment manufacturing; agricultural machinery, commercial truck and automotive manufacturing; and tool holding. |
The markets for our products are cyclical, and we have endeavored to mitigate this cyclicality by entering into single and sole-source relationships and long-term purchase agreements, through diversification across multiple market segments within the Aerospace/Defense and Industrial segments, by increasing sales to the aftermarket, and by focusing on developing highly customized solutions.
Currently, our strategy is built around maintaining our role as a leading manufacturer of highly engineered bearings and precision components through the following efforts:
| ● | Developing innovative solutions. By leveraging our design and manufacturing expertise and our extensive customer relationships, we continue to develop new products for markets in which there are substantial growth opportunities. |
| ● | Expanding customer base and penetrating end markets. We continually seek opportunities to access new customers, geographic locations and bearing platforms with existing products or profitable new product opportunities. |
| ● | Increasing aftermarket sales. We believe that increasing our aftermarket sales of replacement parts will further enhance the continuity and predictability of our revenues and enhance our profitability. Such sales include sales to third party distributors, and sales to OEMs for replacement products and aftermarket services. The acquisition of Dodge has had a profound impact on our sales volumes to distributors and other aftermarket customers. We will further increase the percentage of our revenues derived from the replacement market by continuing to implement several initiatives. |
| ● | Pursuing selective acquisitions. The acquisition of businesses that complement or expand our operations has been and continues to be an important element of our business strategy. We believe that there will continue to be consolidation within the industry that may present us with acquisition opportunities. |
We have demonstrated expertise in acquiring and integrating bearing and precision engineered component manufacturers that have complementary products or distribution channels and have provided significant margin enhancement. We have consistently increased the profitability of acquired businesses through a process of methods and systems improvement coupled with the introduction of complementary and proprietary new products. Since 1992 we have completed 27 acquisitions, which have broadened our end markets, products, customer base and geographic reach.
Outlook
Our net sales increased 55.8% year over year due to an increase of 85.0% in Industrial segment sales and an increase of 12.8% in Aerospace and Defense segment sales. Approximately $743.1 of the Industrial segment sales were from the Dodge business. Excluding those sales, Industrial segment sales increased 9.8% year over year, reflecting sustained growth across many different areas, including in the semiconductor, energy, mining, and the general industrial markets.
Aerospace and Defense segment sales increased 12.8% year over year. Commercial aerospace increased 25.4%, reliably demonstrating the continued recovery and early stages of a growth cycle that we anticipate to continue into the next fiscal year. Defense sales, which represent approximately 31.8% of segment sales during the year, were down more than 7.0% for the year. Defense sales were negatively impacted by the timing of shipments associated with our marine business. This is not expected to continue, as our backlog in this end market is significant and deliveries are expected to accelerate in the coming years.
For the fiscal year ended April 1, 2023, approximately 70.7% of our net sales were attributable to the Industrial segment while the Aerospace/Defense segment contributed approximately 29.3% of our net sales. For the fourth quarter of fiscal 2023, approximately 69.1% of our net sales were attributable to the Industrial segment compared to approximately 30.9% for the Aerospace/Defense segment. Approximately 68.1% of Industrial segment sales in the fourth quarter were to distribution and aftermarket while approximately 31.9% were made directly to OEMs. Approximately 28.3% of our Aerospace/Defense segment sales were to the defense market in the fourth quarter of fiscal 2023. The Company expects net sales to be approximately $380.0 to $390.0 in the first quarter of fiscal 2024, compared to $354.1 in the first quarter of fiscal 2023, which represents a growth rate of 7.3% to 10.1%.
We ended fiscal 2023 with a backlog of $663.8 compared to $603.1 for the same period last year, representing a 10.1% increase year over year. This increase reflects the continued growth in all of our end markets, especially in our commercial aerospace and marine defense end markets.
We experienced solid operating cash flow generation during fiscal 2023 (as discussed in the section “Liquidity and Capital Resources” below). We believe that operating cash flows and available credit under the Revolving Credit Facility and New Foreign Revolver will provide adequate resources to fund internal growth initiatives for the foreseeable future, including at least the next 12 months. For further discussion regarding the funding of the Dodge acquisition, refer to Part II, Item 8 – Notes 9, 12 and 17. As of April 1, 2023, we had cash and cash equivalents of $65.4, of which, approximately $34.0 was cash held by our foreign operations.
Sources of Revenue
A contract with a customer exists when there is commitment and approval from both parties involved, the rights of the parties are identified, payment terms are defined, the contract has commercial substance and collectability of consideration is probable. The Company has determined that the contract with the customer is established when the customer purchase order is accepted or acknowledged. Long-term agreements (LTAs) are used by the Company and certain of its customers to reduce their supply uncertainty for a period of time, typically multiple years. While these LTAs define commercial terms including pricing, termination rights and other contractual requirements, they do not represent the contract with the customer for revenue recognition purposes.
Approximately 98% and 97% of the Company’s revenue was generated from the sale of products to customers in the industrial and aerospace/defense markets for each of the years ended April 1, 2023 and April 2, 2022, respectively. During fiscal 2023, approximately 2% of the Company’s revenue was derived from services performed for customers, which included repair and refurbishment work performed on customer-controlled assets as well as design and test work, compared to approximately 3% for fiscal 2022.
Refer to Note 2 – “Summary of Significant Accounting Policies” for further discussion regarding the Company’s revenue policy.
Cost of Sales
Cost of sales includes employee compensation and benefits, raw materials, outside processing, depreciation of manufacturing machinery and equipment, supplies and manufacturing overhead.
Less than half of our factory costs, depending on product mix, are attributable to raw materials, purchased components and outside processing. When we experience raw material inflation, we attempt to offset these cost increases by changing our buying patterns, expanding our vendor network and passing through price increases when possible. Although we experienced cost inflation on raw material for this fiscal year, we were able to mitigate it through pricing and strategic sourcing efforts.
We monitor gross margin performance through a process of monthly operation reviews with all our divisions. We develop new products to target certain markets allied to our strategies by first understanding volume levels and product pricing and then constructing manufacturing strategies to achieve defined margin objectives. We only pursue product lines where we believe that the developed manufacturing process will yield the targeted margins. Management monitors gross margins of all product lines on a monthly basis to determine which manufacturing processes or prices should be adjusted.
Fiscal 2023 Compared to Fiscal 2022
Results of Operations
(dollars in millions)
| FY23 | FY22 | $ Change | % Change | |||||||||||||
| Net sales | $ | 1,469.3 | $ | 942.9 | $ | 526.4 | 55.8 | % | ||||||||
| Net income attributable to common stockholders | $ | 143.8 | $ | 42.7 | $ | 101.1 | 236.6 | % | ||||||||
| Net income per common share attributable to common stockholders: Diluted | $ | 4.94 | $ | 1.56 | ||||||||||||
| Weighted average common shares attributable to common stockholders: Diluted | 29,072,429 | 27,311,029 | ||||||||||||||
Net sales for the fiscal year ended April 1, 2023 increased $526.4, or 55.8%, for fiscal 2023 compared to fiscal 2022. This increase in net sales was the result of an 85.0% increase in our Industrial segment, while sales in our Aerospace/Defense segment increased 12.8% year over year. Included in the increase in our Industrial segment was the impact of the Dodge acquisition, which contributed $743.1 of sales during the year. Excluding the impact of Dodge, total net sales increased 11.5%, and Industrial sales increased 9.8% year over year. The increase in Industrial segment sales reflects a pattern of sustained growth during the year, led by results in semiconductor, mining, energy, and general industrial markets. Within Aerospace/Defense, total commercial aerospace increased 25.4% and defense decreased 7.1% year over year. The commercial aerospace increase reflects the recovery in the market over the last year, and the start of a growth cycle as aircraft build rates at large OEMs escalate in coming years.
Net income attributable to common stockholders increased by $101.1 to $143.8 for fiscal 2023 compared to fiscal 2022. The net income attributable to common stockholders of $143.8 in fiscal 2023 was impacted by $8.8 of transition service agreement (TSA) costs associated with the Dodge acquisition, $2.7 of restructuring and consolidation charges incurred at some of our plants located in South Carolina, $76.7 of interest expense, $22.9 of preferred stock dividends and $43.0 of income tax expense. The net income attributable to common stockholders of $42.7 in fiscal 2022 was impacted by $13.8 of inventory purchase accounting adjustments associated with the Dodge acquisition, $30.6 of other costs associated with the Dodge acquisition, $41.5 of interest expense, $12.0 of preferred stock dividends and $24.0 of income tax expense.
Gross Margin
| FY23 | FY22 | $ Change | % Change | |||||||||||||
| Gross Margin | $ | 604.8 | $ | 357.1 | $ | 247.7 | 69.4 | % | ||||||||
| Gross Margin % | 41.2 | % | 37.9 | % | ||||||||||||
Gross margin was 41.2% of sales for fiscal 2023 compared to 37.9% for the same period last year. Gross margin during fiscal 2023 included $0.2 of inventory rationalization costs associated with consolidation efforts at one of our facilities located in South Carolina. Gross margin in fiscal 2022 included the unfavorable impact of $13.8 of purchase accounting adjustments associated with the Dodge acquisition and $0.9 of other inventory rationalization costs associated with consolidation efforts at one of our facilities. The expansion in margin during fiscal 2023 reflects the combination of continued cost efficiencies achieved through integration, product mix, pricing and the ability to maintain appropriate pricing levels while facing an inflationary environment both as it relates to manufacturing costs and human capital.
Selling, General and Administrative
| FY23 | FY22 | $ Change | % Change | |||||||||||||
| SG&A | $ | 229.7 | $ | 167.6 | $ | 62.1 | 37.0 | % | ||||||||
| % of net sales | 15.6 | % | 17.8 | % | ||||||||||||
SG&A expenses increased by $62.1 to $229.7 for fiscal 2023 compared to fiscal 2022. Included in the fiscal 2023 result is $97.9 of costs from the Dodge business, while fiscal 2022 only included five months of costs. As a percentage of sales, SG&A decreased more than 200 basis points, which was driven by efficiencies achieved through the integration of Dodge as well as a decrease of $18.9 of stock-based compensation year over year.
Other, Net
| FY23 | FY22 | $ Change | % Change | |||||||||||||
| Other, net | $ | 82.1 | $ | 68.4 | $ | 13.7 | 20.0 | % | ||||||||
| % of net sales | 5.6 | % | 7.3 | % | ||||||||||||
Other operating expenses for fiscal 2023 totaled $82.1 compared to $68.4 for fiscal 2022. For fiscal 2023, other operating expenses were comprised of $8.9 of TSA costs and other costs associated with the Dodge acquisition, $69.1 of amortization expense, $2.5 of plant consolidation and restructuring costs, $0.8 of bad debt expense, $0.3 of asset impairments, $0.3 of losses on disposal of assets, and $0.2 of other items. For fiscal 2022, other operating expenses were comprised of $30.6 of costs associated with the Dodge acquisition, $34.7 of amortization expense, $1.1 of plant consolidation and restructuring costs, $0.5 of bad debt expense, $0.3 of losses on disposal of assets, and $1.2 of other items.
Interest Expense, Net
| FY23 | FY22 | $ Change | % Change | |||||||||||||
| Interest expense | $ | 76.7 | $ | 41.5 | $ | 35.2 | 84.8 | % | ||||||||
| % of net sales | 5.2 | % | 4.4 | % | ||||||||||||
Interest expense, net, generally consists of interest charged on our debt and amortization of debt issuance costs offset by interest income (see “Liquidity and Capital Resources – Liquidity” below). Interest expense, net was $76.7 for fiscal 2023 compared to $41.5 for fiscal 2022. This included amortization of debt issuance costs of $7.2 for fiscal 2023 and $18.9 for fiscal 2022. Included in the debt issuance cost amortization in fiscal 2022 was $16.6 associated with the fees for a $2,800.0 bridge commitment obtained in connection with the Dodge acquisition. The increase in interest expense is primarily attributable to the Company now having a full twelve months of interest expense associated with the financing secured to acquire Dodge on November 1, 2021 as well as the impact of rising interest rates over the last twelve months.
Other Non-Operating Expense
| FY23 | FY22 | $ Change | % Change | |||||||||||||
| Other non-operating expense | $ | 6.6 | $ | 0.9 | $ | 5.7 | 692.6 | % | ||||||||
| % of net sales | 0.4 | % | 0.1 | % | ||||||||||||
Other non-operating expense for fiscal 2023 totaled $6.6, consisting primarily of costs associated with post-retirement benefit plans led by a $4.3 settlement loss related to the derecognition of $15.6 of pension liabilities and $15.6 of pension assets resulting from an annuity contract executed in March 2023. Refer to Part II, Item 8, Note 15 for further details of this transaction.
Income Taxes
| FY23 | FY22 | |||||||
| Income tax expense | $ | 43.0 | $ | 24.0 | ||||
| Effective tax rate with discrete items | 20.5 | % | 30.5 | % | ||||
| Effective tax rate without discrete items | 22.9 | % | 32.4 | % | ||||
Income tax expense for fiscal 2023 was $43.0 compared to $24.0 for fiscal 2022. Our effective income tax rate for fiscal 2023 was 20.5% compared to 30.5% for fiscal 2022. The effective income tax rates are different from the U.S. statutory rate due to the U.S. credits for increasing research activities and foreign-derived intangible income provision which decrease the rate and differences in foreign and state income taxes which increase the rate. Further, in fiscal 2022, the effective tax rate was negatively impacted by tax impacts associated with acquisition costs and increases in tax reserves associated with Section 162(m) of the Internal Revenue Code. The effective income tax rate for fiscal 2023 of 20.5% included discrete items of $5.1 of benefit comprised substantially of a benefit associated with stock-based compensation and a reduction in unrecognized tax benefits partially due to the expiration of the statute of limitations. The effective income tax rate for fiscal 2023 without these discrete items would have been 22.9%. The effective income tax rate for fiscal 2022 of 30.5% included discrete items of $1.5 benefit which are comprised substantially of a benefit associated with stock-based compensation and unrecognized tax benefits associated with the expiration of statutes of limitations, partially offset by tax expense arising from an increase in the valuation allowance on a capital loss carryforward. The effective income tax rate for fiscal 2022 without these discrete items would have been 32.4%.
Segment Information
We report our financial results under two operating segments: Aerospace/Defense and Industrial. We use gross margin as the primary measurement to assess the financial performance of each reportable segment.
Aerospace/Defense Segment:
| FY23 | FY22 | $ Change | % Change | |||||||||||||
| Net sales | $ | 430.3 | $ | 381.5 | $ | 48.8 | 12.8 | % | ||||||||
| Gross margin | $ | 171.0 | $ | 155.1 | $ | 15.9 | 10.2 | % | ||||||||
| Gross margin % | 39.7 | % | 40.7 | % | ||||||||||||
| SG&A | $ | 31.1 | $ | 29.0 | $ | 2.1 | 7.1 | % | ||||||||
| % of segment net sales | 7.2 | % | 7.6 | % | ||||||||||||
Net sales increased $48.8, or 12.8%, for fiscal 2023 compared to fiscal 2022. Commercial aerospace increased 25.4% year over year. Commercial aerospace OEM sales increased 25.2% while commercial distribution and aftermarket increased approximately 26.0% year over year. During the year, we saw improvement in the sales and orders to our commercial aerospace customers as aircraft build rates continued to grow. Our backlog and recent results reflect the early stages of this process which we expect to continue to see in upcoming quarters. Our defense markets, which represented about 31.8% of sales, decreased by approximately 7.1% during the period. Orders in the defense end market have been steady, however, the timing of shipments on orders for some of our marine customers has shifted into future quarters which negatively impacted our sales for fiscal 2023. Overall distribution and aftermarket sales, which represent 18.3% of segment sales, were up 16.4% year over year.
Gross margin was $171.0, or 39.7% of sales, in fiscal 2023 compared to $155.1, or 40.7% of sales, for the same period in fiscal 2022. Gross margin for fiscal 2022 was impacted by approximately $0.9 of inventory rationalization costs associated with consolidation efforts at one of our facilities. We anticipate margin expansion in the next year as the increasing orders on commercial products add volume through our plants driving cost efficiencies.
Industrial Segment:
| FY23 | FY22 | $ Change | % Change | |||||||||||||
| Net sales | $ | 1,039.0 | $ | 561.4 | $ | 477.6 | 85.0 | % | ||||||||
| Gross margin | $ | 433.8 | $ | 202.0 | $ | 231.8 | 114.8 | % | ||||||||
| Gross margin % | 41.8 | % | 36.0 | % | ||||||||||||
| SG&A | $ | 122.5 | $ | 58.6 | $ | 63.9 | 109.1 | % | ||||||||
| % of segment net sales | 11.8 | % | 10.4 | % | ||||||||||||
Net sales increased $477.6, or 85.0%, during fiscal 2023 compared to the same period last year. The increase was primarily due to the inclusion of a full twelve months of Dodge sales in fiscal 2023 and continued strong performance across the majority of our industrial markets. Excluding Dodge sales of $743.1, net sales increased by $26.3, or 9.8%, period over period. This increase was driven by performance in semiconductor, energy, mining, and the general industrial markets. Sales to distribution and the aftermarket reflected more than 66.0% of our industrial sales during the year. These distribution and aftermarket sales increased 113.9% compared to the same period in the prior year, and 4.5% on an organic basis.
Gross margin was $433.8, or 41.8% of sales, in fiscal 2023 compared to $202.0, or 36.0% of sales, for the same period in fiscal 2022. The gross margin for the fiscal 2023 included the unfavorable impact of $0.2 associated with inventory rationalization costs at one of our plants in South Carolina. The gross margin for the fiscal 2022 included the unfavorable impact of $13.8 of inventory purchase accounting adjustments associated with the Dodge acquisition. The expansion in margin year over year was led by cost efficiencies achieved through integration, product mix, pricing and the ability to maintain appropriate pricing levels while facing an inflationary environment both as it relates to manufacturing costs and human capital.
Corporate:
| FY23 | FY22 | $ Change | % Change | |||||||||||||
| SG&A | $ | 76.1 | $ | 80.0 | $ | (3.9 | ) | (4.9 | )% | |||||||
| % of total net sales | 5.2 | % | 8.5 | % | ||||||||||||
Corporate SG&A decreased $3.9 or 4.9% for fiscal 2023 compared to fiscal 2022 due to decreases in stock-based compensation partially offset by increases in personnel-related costs.
Liquidity and Capital Resources
Our business is capital-intensive. Our capital requirements include manufacturing equipment and materials. In addition, we have historically fueled our growth, in part, through acquisitions, including the Dodge acquisition completed on November 1, 2021. We have historically met our working capital, capital expenditure requirements and acquisition funding needs through our net cash flows provided by operations, various debt arrangements and sale of equity to investors. We believe that operating cash flows and available credit under the Revolving Credit Facility and New Foreign Revolver will provide adequate resources to fund internal growth initiatives for the foreseeable future. For further discussion regarding the funding of the Dodge acquisition, refer to Part II, Item 8 – Notes 9, 12 and 17.
Our ability to meet future working capital, capital expenditures and debt service requirements will depend on our future financial performance, which will be affected by a range of economic, competitive and business factors, particularly interest rates, cyclical changes in our end markets and prices for steel and our ability to pass through price increases on a timely basis, many of which are outside of our control. In addition, future acquisitions could have a significant impact on our liquidity position and our need for additional funds.
From time to time, we evaluate our existing facilities and operations and their strategic importance to us. If we determine that a given facility or operation does not have future strategic importance, we may sell, relocate, consolidate or otherwise dispose of those operations. Although we believe our operations would not be materially impaired by such dispositions, relocations or consolidations, we could incur significant cash or non-cash charges in connection with them.
Liquidity
As of April 1, 2023, we had cash and cash equivalents of $65.4, of which, approximately $34.0 was cash held by our foreign operations. We expect that our undistributed foreign earnings will be re-invested indefinitely for working capital, internal growth and acquisitions for and by our foreign subsidiaries. As discussed in further detail below, we also have the ability to borrow money from our existing credit facilities.
Domestic Credit Facility
On November 1, 2021, RBC Bearings Incorporated, our top holding company, and our Roller Bearing Company of America, Inc. subsidiary (“RBCA”) entered into a Credit Agreement (the “New Credit Agreement”) with Wells Fargo Bank, National Association (“Wells Fargo”), as Administrative Agent, Collateral Agent, Swingline Lender and Letter of Credit Issuer and the other lenders party thereto, and terminated the Company’s prior Credit Agreement, which was entered into with Wells Fargo in 2015 (the “2015 Credit Agreement”). The New Credit Agreement provides the Company with (a) a $1,300.0 term loan facility (the “Term Loan Facility”), which was used to fund a portion of the cash purchase price for the acquisition of Dodge and to pay related fees and expenses, and (b) a $500.0 revolving credit facility (the “Revolving Credit Facility” and together with the Term Loan Facility, the “Facilities”). Debt issuance costs associated with the New Credit Agreement totaled $14.9 and are being amortized over the life of the New Credit Agreement. When the 2015 Credit Agreement was terminated the Company wrote off $0.9 of previously unamortized debt issuance costs.
Prior to December 2022, amounts outstanding under the Facilities generally bear interest at either, at the Company’s option, (a) a base rate determined by reference to the higher of (i) Wells Fargo’s prime lending rate, (ii) the federal funds effective rate plus 1/2 of 1.00% and (iii) the one-month LIBOR rate plus 1.00% or (b) the LIBOR rate plus a specified margin, depending on the type of borrowing being made. The applicable margin is based on the Company’s consolidated ratio of total net debt to consolidated EBITDA (as defined within the New Credit Agreement) from time to time. In December 2022 the New Credit Agreement was amended to replace LIBOR with the secured overnight financing rate administered by the Federal Reserve Bank of New York (“SOFR”) so that borrowings under the Facilities denominated in U.S. dollars bear interest at a rate per annum equal to Term SOFR (as defined in the New Credit Agreement) plus a credit spread adjustment of 0.10% plus a margin ranging from 0.75% to 2.00% depending on the Company’s consolidated ratio of total net debt to consolidated EBITDA. The Facilities are subject to a SOFR floor of 0.00%. As of April 1, 2023, the Company’s margin was 1.25% for SOFR loans; and the commitment fee rate was 0.20% and the letter of credit fee rate was 1.25%. A portion of the Term Loan Facility is subject to a fixed- rate interest swap as discussed below under “Interest Rate Swap.”
The Term Loan Facility will mature in November 2026 and amortizes in quarterly installments with the balance payable on the maturity date. The Company can elect to prepay some or all of the outstanding balance from time to time without penalty, which will offset future quarterly amortization installments. Due to prepayments previously made, the required future principal payments on the Term Loan Facility are $0 for fiscal 2024, $0 for fiscal 2025, $0 for fiscal 2026, and approximately $900.0 for fiscal 2027. The Revolving Credit Facility will expire in November 2026, at which time all amounts outstanding under the Revolving Credit Facility will be payable.
The New Credit Agreement requires the Company to comply with various covenants, including the following financial covenants: (a) a maximum Total Net Leverage Ratio (as defined within the New Credit Agreement) of 5.50:1.00, which maximum Total Net Leverage Ratio shall decrease during certain subsequent test periods as set forth in the New Credit Agreement (provided that, no more than once during the term of the Facilities, such maximum ratio applicable at such time may be increased by the Company by 0.50:1.00 for a period of twelve (12) months after the consummation of a material acquisition), and (b) a minimum Interest Coverage Ratio of 2.00:1.00. As of April 1, 2023, the Company was in compliance with all debt covenants.
The New Credit Agreement allows the Company to, among other things, make distributions to shareholders, repurchase its stock, incur other debt or liens, or acquire or dispose of assets provided that the Company complies with certain requirements and limitations of the New Credit Agreement.
The Company’s domestic subsidiaries have guaranteed the Company’s obligations under the New Credit Agreement, and the Company’s obligations and the domestic subsidiaries’ guaranty are secured by a pledge of substantially all of the domestic assets of the Company and its domestic subsidiaries.
As of April 1, 2023, $900.0 was outstanding under the Term Loan Facility and approximately $3.7 of the Revolving Credit Facility was being utilized to provide letters of credit to secure the Company’s obligations relating to certain insurance programs, and the Company had the ability to borrow up to an additional $496.3 under the Revolving Credit Facility.
Senior Notes
On October 7, 2021, RBCA issued $500.0 aggregate principal amount of 4.375% Senior Notes due 2029 (the “Senior Notes”). The net proceeds from the issuance of the Senior Notes were approximately $492.0 after deducting initial purchasers’ discounts and commissions and offering expenses. On November 1, 2021, the Company used the proceeds to fund a portion of the cash purchase price for the acquisition of Dodge.
The Senior Notes were issued pursuant to an indenture with Wilmington Trust, National Association, as trustee (the “Indenture”). The Indenture contains covenants limiting the ability of the Company to (i) incur additional indebtedness or guarantee indebtedness, (ii) declare or pay dividends, redeem stock or make other distributions to stockholders, (iii) make investments, (iv) create liens or use assets as security in other transactions, (v) merge or consolidate, or sell, transfer, lease or dispose of substantially all of its assets, (vi) enter into transactions with affiliates, and (vii) sell or transfer certain assets. These covenants contain various exceptions, limitations and qualifications. At any time that the Senior Notes are rated investment grade, certain of these covenants will be suspended.
The Senior Notes are guaranteed jointly and severally on a senior unsecured basis by RBC Bearings and certain of RBCA’s existing and future wholly-owned domestic subsidiaries that also guarantee the New Credit Agreement.
Interest on the Senior Notes accrues at a rate of 4.375% and is payable semi–annually in cash in arrears on April 15 and October 15 of each year.
The Senior Notes will mature on October 15, 2029. The Company may redeem some or all of the Senior Notes at any time on or after October 15, 2024 at the redemption prices set forth in the Indenture, plus accrued and unpaid interest, if any, to, but excluding, the redemption date. The Company may also redeem up to 40% of the Senior Notes using the proceeds of certain equity offerings completed before October 15, 2024, at a redemption price equal to 104.375% of the principal amount thereof, plus accrued and unpaid interest, if any, to, but excluding, the redemption date. In addition, at any time prior to October 15, 2024, the Company may redeem some or all of the Senior Notes at a price equal to 100% of the principal amount, plus a “make–whole” premium, plus accrued and unpaid interest, if any, to, but excluding, the redemption date. If the Company sells certain of its assets or experiences specific kinds of changes in control, the Company must offer to purchase the Senior Notes.
Foreign Borrowing Arrangements
One of our foreign subsidiaries, Schaublin SA (“Schaublin”), entered into two separate credit agreements in 2019 with Credit Suisse (Switzerland) Ltd. (the “Foreign Credit Agreements”) to (i) finance the acquisition of our Swiss Tool business unit, and (ii) provide future working capital. The Foreign Credit Agreements provided Schaublin with a CHF 15.0 (approximately $15.4) term loan, which was extinguished in February 2022, and a CHF 15.0 (approximately $15.4) revolving credit facility, which was terminated in October 2022. Schaublin now has a separate CHF 5.0 (approximately $5.4 USD) revolving credit facility (the “New Foreign Revolver”) with Credit Suisse to provide future working capital, if necessary. As of April 1, 2023, $0.1 had been borrowed from the New Foreign Revolver. Fees associated with the New Foreign Revolver are nominal.
Interest Rate Swap
On October 28, 2022, the Company entered into a three-year USD-denominated interest rate swap (“the Swap”) from a third-party financial counterparty under the New Credit Agreement. The Swap was executed to protect the Company from interest rate volatility on our variable-rate Term Loan Facility. The Swap became effective December 30, 2022 and is comprised of a $600.0 notional with a maturity of three years. We receive a variable rate based on one-month Term SOFR and pay a fixed rate of 4.455%. As of April 1, 2023, approximately 78.5% of our debt bears interest at a fixed rate. The notional on the Swap will amortize as follows:
Year 1: $600.0
Year 2: $400.0
Year 3: $100.0
The Swap has been designated as a cash flow hedge of the variability of the first unhedged interest payments (the hedged transactions) paid over the hedging relationship’s specified time period of three years attributable to the borrowing’s contractually specified interest index on the hedged principal of its general borrowing program or replacement or refinancing thereof.
Cash Flows
Fiscal 2023 Compared to Fiscal 2022
The following table summarizes our cash flow activities:
| FY23 | FY22 | $ Change |
||||||||||
| Net cash provided by (used in): | ||||||||||||
| Operating activities | $ | 220.6 | $ | 180.3 | $ | 40.3 | ||||||
| Investing activities | (14.0 | ) | (2,847.5 | ) | 2,833.5 | |||||||
| Financing activities | (322.8 | ) | 2,698.5 | (3,021.3 | ) | |||||||
| Effect of exchange rate changes on cash | (1.3 | ) | 0.5 | (1.8 | ) | |||||||
| (Decrease)/increase in cash and cash equivalents | $ | (117.5 | ) | $ | 31.8 | $ | (149.3 | ) | ||||
During fiscal 2023 we generated cash of $220.6 from operating activities compared to $180.3 for fiscal 2022. The increase of $40.3 for fiscal 2023 was mainly the result of a $112.0 increase in net income, partially offset by a $2.0 decrease in non-cash activity and a net unfavorable change in operating assets and liabilities of $69.7. The unfavorable change in operating assets and liabilities is detailed in the table below. The change in non-cash activity was primarily driven by $49.9 more depreciation and amortization and $1.4 more noncash operating lease expense, partially offset by $18.9 less stock-based compensation, $21.6 less in deferred taxes, $11.7 less amortization of deferred financing costs, $1.0 less in debt extinguishment costs, and $0.1 decrease in consolidation and restructuring charges.
The following chart summarizes the unfavorable change in operating assets and liabilities of $69.7 for fiscal 2023 versus fiscal 2022 and the favorable change of $1.4 for fiscal 2022 versus fiscal 2021.
| FY23 | FY22 | |||||||
| Cash provided by (used in): | ||||||||
| Accounts receivable | $ | 61.3 | $ | (72.5 | ) | |||
| Inventory | (55.5 | ) | (17.1 | ) | ||||
| Prepaid expenses and other current assets | (4.0 | ) | (1.4 | ) | ||||
| Other noncurrent assets | 7.4 | 8.5 | ||||||
| Accounts payable | (63.5 | ) | 67.2 | |||||
| Accrued expenses and other current liabilities | (16.1 | ) | 19.5 | |||||
| Other noncurrent liabilities | 0.7 | (2.8 | ) | |||||
| Total change in operating assets and liabilities | $ | (69.7 | ) | $ | 1.4 | |||
During fiscal 2023, we used $14.0 for investing activities as compared to $2,847.5 for fiscal 2022. This decrease in cash used was attributable to $2,935.7 less cash used for acquisitions, $30.0 less purchases of marketable securities and $0.5 more proceeds from the sale of assets, partially offset by a $12.2 increase in capital expenditures and $120.5 less in proceeds from the sale of marketable securities.
During fiscal 2023, we used cash of $322.8 for financing activities compared to $2,698.5 cash generated in fiscal 2022. This decrease from cash generated to cash used was primarily attributable to proceeds received during fiscal 2022 of $605.5 from the issuance of common stock, $445.3 from the issuance of preferred stock, $1,285.8 from the Term Loan Facility, and $494.2 from the Senior Notes. During fiscal 2023 there were $187.0 more payments made on outstanding debt, $15.8 more cash dividends paid on preferred stock, $6.4 fewer exercises of stock-based awards, and $1.6 more in principal payments made on finance lease obligations, partially offset by $19.4 less in finance fees paid in connection with credit facilities and senior notes and $0.9 fewer repurchases of common stock.
Capital Expenditures
Our capital expenditures in fiscal 2023 were $42.0 compared to $29.8 in fiscal 2022. We expect to make capital expenditures of approximately 3.0% to 3.5% of net sales during fiscal 2024 in connection with our existing business. We funded our fiscal 2023 capital expenditures, and expect to fund fiscal 2024 capital expenditures, principally through existing cash and internally generated funds. We may also make substantial additional capital expenditures in connection with acquisitions.
Quarterly Results of Operations
Quarter Ended(2) |
||||||||||||||||||||||||||||||||
Apr. 1, 2023 |
Dec. 31, 2022 |
Oct. 1, 2022 |
Jul. 2, 2022 |
Apr. 2, 2022 |
Jan. 1, 2022 |
Oct. 2, 2021 |
Jul. 3, 2021 |
|||||||||||||||||||||||||
|
(Unaudited) (dollars in millions, except per share data)
|
||||||||||||||||||||||||||||||||
| Net sales | $ | 394.4 | $ | 351.6 | $ | 369.2 | $ | 354.1 | $ | 358.9 | $ | 266.9 | $ | 160.9 | $ | 156.2 | ||||||||||||||||
| Gross margin | 166.5 | 146.0 | 151.1 | 141.2 | 137.5 | 93.3 | 62.5 | 63.8 | ||||||||||||||||||||||||
| Operating income | 86.1 | 70.4 | 72.0 | 64.5 | 59.3 | 15.9 | 16.6 | 29.3 | ||||||||||||||||||||||||
| Net income/(loss) attributable to common stockholders | $ | 43.4 | $ | 30.6 | $ | 38.1 | $ | 31.7 | $ | 25.7 | $ | (5.2 | ) | $ | (1.8 | ) | $ | 24.0 | ||||||||||||||
| Net income/(loss) per common share attributable to common stockholders: | ||||||||||||||||||||||||||||||||
| Basic(1) | $ | 1.51 | $ | 1.06 | $ | 1.32 | $ | 1.11 | $ | 0.90 | $ | (0.18 | ) | $ | (0.07 | ) | $ | 0.96 | ||||||||||||||
| Diluted(1) | $ | 1.49 | $ | 1.05 | $ | 1.31 | $ | 1.09 | $ | 0.89 | $ | (0.18 | ) | $ | (0.07 | ) | $ | 0.95 | ||||||||||||||
| (1) | Net income per common share is computed independently for each of the quarters presented. Therefore, the sum of the quarterly earnings per share may not necessarily equal the total for the year. |
| (2) | Dodge was acquired on November 1, 2021 and is included within the quarters ended January 1, 2022 through April 1, 2023. |
Critical Accounting Policies and Estimates
Our discussion and analysis of our financial condition and results of operations are based upon our consolidated financial statements, which have been prepared in accordance with U.S. generally accepted accounting principles. The preparation of these financial statements requires us to make estimates and judgments that affect the reported amounts of assets, liabilities, revenues and expenses and related disclosure of contingent assets and liabilities. We evaluate our estimates on an on-going basis. Estimates are used for, but not limited to, the accounting for the allowance for doubtful accounts, valuation of inventories, goodwill and intangible assets, depreciation and amortization, income taxes and tax reserves, the valuation of options and the valuation of business combinations. We base our estimates on historical experience and on various other assumptions that are believed to be reasonable under the circumstances, the results of which form the basis for making judgments about the carrying values of assets and liabilities that are not readily apparent from other sources. We believe our judgments related to these accounting estimates are appropriate. Actual results may differ from these estimates under different assumptions or conditions.
Revenue Recognition. The performance obligations for the majority of RBC’s product sales are satisfied at the point in time in which the products are shipped. The Company has determined that the customer obtains control upon shipment of the product based on the shipping terms (i.e. when it ships from RBC’s dock or when the product arrives at the customer’s dock) and recognizes revenue when control has transferred to the customer. Once a customer has obtained control, the customer is able to direct the use of, and obtain substantially all of the remaining benefits from, the asset. Approximately 98% of the Company’s revenue was recognized in this manner based on sales for the year ended April 1, 2023 compared to approximately 97% for the year ended April 2, 2022.
The Company has determined performance obligations are satisfied over time for customer contracts where RBC provides services to customers and also for a limited number of product sales. RBC has determined revenue recognition over time is appropriate for our service revenue contracts as they create or enhance an asset that the customer controls throughout the duration of the contract. Approximately 2% of the Company’s revenue was recognized in this manner based on sales for the year ended April 1, 2023 compared to approximately 3% for the year ended April 2, 2022. Revenue recognition over time is appropriate for customer contracts with product sales in which the product sold has no alternative use to RBC without significant economic loss and an enforceable right to payment exists, including a normal profit margin from the customer, in the event of contract termination. These types of contracts comprised less than 1% of total sales for the year ended April 1, 2023 and the year ended April 2, 2022. For both of these types of contracts, revenue is recognized over time based on the extent of progress towards completion of the performance obligation. The Company utilizes the cost-to-cost measure of progress for over-time revenue recognition contracts as we believe this measure best depicts the transfer of control to the customer, which occurs as we incur costs on contracts. Revenues, including profits, are recorded proportionally as costs are incurred. Costs to fulfill include labor, materials, subcontractors’ costs, and other direct and indirect costs.
Pursuant to the over-time revenue recognition model, revenue may be recognized prior to the customer being invoiced. An unbilled receivable is recorded to reflect revenue that is recognized when (1) the cost-to-cost method is applied and (2) such revenue exceeds the amount invoiced to the customer. Contract assets are included within prepaid expenses and other current assets or other noncurrent assets on the consolidated balance sheets.
Inventory. Inventory is stated at the lower of cost or net realizable value. Cost is determined by the first-in, first-out method. We account for inventory under a full absorption method. We record adjustments to the value of inventory based upon past sales history and forecasted plans to sell our inventories. The physical condition, including age and quality, of the inventories is also considered in establishing its valuation. These adjustments are estimates, which could vary significantly, either favorably or unfavorably, from actual requirements if future economic conditions, customer inventory levels or competitive conditions differ from our expectations.
Goodwill and Indefinite-Lived Intangible Assets. Goodwill (representing the excess of the amount paid to acquire a company over the estimated fair value of the net assets acquired) and indefinite lived intangible assets are not amortized but instead are tested for impairment annually, or when events or circumstances indicate that the carrying value of such asset may not be recoverable. Separate tests are performed for goodwill and indefinite lived intangible assets. We completed a quantitative test of impairment on the indefinite lived intangible assets with no impairment noted in the current year. The determination of any goodwill impairment is made at the reporting unit level. The Company determines the fair value of a reporting unit and compares it to its carrying amount. If the carrying amount of the reporting unit exceeds its fair value, an impairment loss is recognized for any amount by which the carrying amount exceeds the reporting unit’s fair value. The Company applies the income approach (discounted cash flow method) in testing goodwill for impairment. The key assumptions used in the discounted cash flow method used to estimate fair value include discount rates, revenue growth rates, terminal growth rates and cash flow projections. Discount rates, revenue growth rates and cash flow projections are the most sensitive and susceptible to change as they require significant management judgment. Discount rates are determined by using a weighted average cost of capital (“WACC”). The WACC considers market and industry data as well as Company-specific risk factors for each reporting unit in determining the appropriate discount rate to be used. The discount rate utilized for each reporting unit for our fiscal 2023 test was 10.0% and is indicative of the return an investor would expect to receive for investing in such a business. Terminal growth rate determination follows common methodology of capturing the present value of perpetual cash flow estimates beyond the last projected period assuming a constant WACC and long-term growth rates. The terminal growth rate used for our fiscal 2023 test was 2.5%. The Company has determined that, to date, no impairment of goodwill exists and the aggregate fair value of the reporting units exceeded the carrying value in total by approximately 42.5%. The fair value of the reporting units exceeds the carrying value by a minimum of 13.1% at each of the two reporting units. A decrease of 1.0% in our terminal growth rate would not result in impairment of goodwill for any of our reporting units. An increase of 1.0% in our discount rate would not result in impairment of goodwill for any of our reporting units. The Company performs the annual impairment testing during the fourth quarter of each fiscal year. Although no changes are expected, if the actual results of the Company are less favorable than the assumptions the Company makes regarding estimated cash flows, the Company may be required to record an impairment charge in the future.
Valuation of Business Combinations. We allocate the amounts we pay for each acquisition to the assets we acquire and liabilities we assume based on their estimated fair values at the date of acquisition, including identifiable intangible assets, which either arise from a contractual or legal right or are separable from goodwill. We base the fair value of identifiable intangible assets acquired in a business combination on detailed valuations which are prepared with the assistance of a specialist and consider our best estimates of inputs and assumptions that a market participant would use. We utilize a specialist for these valuations due to the complexity and estimation uncertainty involved in determining the fair value given the significant assumptions involved. Significant assumptions utilized in the valuation models include discount rates, revenue growth rates and cash flow projections. We allocate to goodwill any excess purchase price over the fair value of the net tangible and identifiable intangible assets acquired. Transaction costs associated with these acquisitions are expensed as incurred through other, net on the consolidated statements of operations.
Income Taxes. As part of the process of preparing the consolidated financial statements, we are required to estimate the income taxes in each jurisdiction in which we operate. This process involves estimating the actual current tax liabilities together with assessing temporary differences resulting from the differing treatment of items for tax and financial reporting purposes. These differences result in deferred tax assets and liabilities, which are included in the consolidated balance sheets. We must then assess the likelihood that the deferred tax assets will be recovered, and to the extent that we believe that recovery is not more than likely, we are required to establish a valuation allowance. If a valuation allowance is established or increased during any period, we are required to include this amount as an expense within the tax provision in the consolidated statements of operations. Significant judgment is required in determining our provision for income taxes, deferred tax assets and liabilities, accrual for uncertain tax positions and any valuation allowance recognized against net deferred tax assets.
Recent Accounting Pronouncements
For a discussion of recent accounting pronouncements, see Note 2 – “Summary of Significant Accounting Policies – Recent Accounting Pronouncements.”
Impact of Inflation and Changes in Prices of Raw Materials
In fiscal 2023, the economy experienced inflation. We purchase steel at market prices, which fluctuate as a result of supply and demand in the marketplace. To date, we have managed price increases by changing our buying patterns, expanding our vendor network, and passing increases on to our customers through price increases on our products, the assessment of steel surcharges on our customers, or entry into long-term agreements with our customers containing escalator provisions tied to our invoiced price of steel. However, even if we are able to pass these steel surcharges or price increases to our customers, there may be a time lag of several months between the time a price increase goes into effect and our ability to implement surcharges or price increases, particularly for orders already in our backlog. As a result, our gross margin percentage may decline.
Competitive pressures and the terms of certain of our long-term contracts may require us to absorb at least part of these cost increases, particularly during periods of high inflation. Our principal raw materials are stainless and 52100 wire and rod steel (types of high alloy steel), which have historically been readily available. We have never experienced a work stoppage due to a supply shortage. We maintain multiple sources for raw materials including steel and have various supplier agreements. Through sole-source arrangements, supplier agreements and pricing, we have been able to minimize our exposure to fluctuations in raw material prices.
Our suppliers and sources of raw materials are based in the U.S., Europe and Asia. We believe that our sources are adequate for our needs in the foreseeable future, that there exist alternative suppliers for our raw materials and that in most cases readily available alternative materials can be used for most of our raw materials.
Off-Balance Sheet Arrangements
The Company has $3.7 of outstanding standby letters of credit, all of which are under the Revolving Credit Facility. We also have a contractual obligation for licenses related to the implementation and upgrade of an enterprise resource planning (“ERP”) system for Dodge. These license costs of $10.5 will be incurred over a five-year period.
Other than the items noted above, we had no significant off-balance sheet arrangements as of April 1, 2023.
ITEM 7A. QUANTITATIVE AND QUALITATIVE DISCLOSURES ABOUT MARKET RISK
We are exposed to market risks, which arise during the normal course of business from changes in interest rates and foreign currency exchange rates.
Interest Rates. We currently have variable rate debt outstanding under the Term Loan Facility. We regularly evaluate the impact of interest rate changes on our net income and cash flow and take action to limit our exposure when appropriate. As discussed in “Liquidity and Capital Resources” in Item 7 of this Annual Report, we entered into the Swap on October 28, 2022, which became effective on December 30, 2022. As of April 1, 2023, approximately 78.5% of our debt bears interest at a fixed rate.
Foreign Currency Exchange Rates. Our operations in the following countries utilize the following currencies as their functional currency:
| ● | Australia – Australian dollar | ● | India – rupee | ||
| ● | Canada – Canadian dollar | ● | Mexico – peso | ||
| ● | China – Chinese yuan | ● | Poland – zloty | ||
| ● | France – euro | ● | Switzerland – Swiss franc | ||
| ● | Germany – euro |
As a result, we are exposed to risk associated with fluctuating currency exchange rates between the U.S. dollar and these currencies. Foreign currency transaction gains and losses are included in earnings. Approximately 12% of our net sales were impacted by foreign currency fluctuations in fiscal 2023 compared to approximately 11% of our net sales in fiscal 2022. We expect that this proportion is likely to increase as we seek to increase our penetration of foreign markets, particularly within the aerospace and defense markets. Foreign currency transaction exposure arises primarily from the transfer of foreign currency from one subsidiary to another within the group, and to foreign-currency-denominated trade receivables. Unrealized currency translation gains and losses are recorded on the balance sheet upon translation of the foreign operations’ functional currency to the reporting currency. Because our financial statements are denominated in U.S. dollars, changes in currency exchange rates between the U.S. dollar and other currencies have had, and will continue to have, an impact on our earnings. We periodically enter into derivative financial instruments in the form of forward exchange contracts to reduce the effect of fluctuations in exchange rates on certain third-party sales transactions denominated in non-functional currencies. Based on the accounting guidance related to derivatives and hedging activities, we record derivative financial instruments at fair value. For derivative financial instruments designated and qualifying as cash flow hedges, the effective portion of the gain or loss on these hedges is reported as a component of accumulated other comprehensive income, and is reclassified into earnings when the hedged transaction affects earnings. As of April 1, 2023, the Company had no forward exchange contracts.
ITEM 8. FINANCIAL STATEMENTS AND SUPPLEMENTARY DATA
Report of Independent Registered Public Accounting Firm
To the Stockholders and the Board of Directors of RBC Bearings Incorporated
Opinion on the Financial Statements
We have audited the accompanying consolidated balance sheets of RBC Bearings Incorporated (the Company) as of April 1, 2023 and April 2, 2022, the related consolidated statements of operations, comprehensive income, stockholders’ equity and cash flows for each of the three years in the period ended April 1, 2023, and the related notes (collectively referred to as the “consolidated financial statements”). In our opinion, the consolidated financial statements present fairly, in all material respects, the financial position of the Company at April 1, 2023 and April 2, 2022, and the results of its operations and its cash flows for each of the three years in the period ended April 1, 2023, in conformity with U.S. generally accepted accounting principles.
We also have audited, in accordance with the standards of the Public Company Accounting Oversight Board (United States) (PCAOB), the Company’s internal control over financial reporting as of April 1, 2023, based on criteria established in Internal Control-Integrated Framework issued by the Committee of Sponsoring Organizations of the Treadway Commission (2013 framework) and our report dated May 19, 2023 expressed an unqualified opinion thereon.
Basis for Opinion
These financial statements are the responsibility of the Company’s management. Our responsibility is to express an opinion on the Company’s financial statements based on our audits. We are a public accounting firm registered with the PCAOB and are required to be independent with respect to the Company in accordance with the U.S. federal securities laws and the applicable rules and regulations of the Securities and Exchange Commission and the PCAOB.
We conducted our audits in accordance with the standards of the PCAOB. Those standards require that we plan and perform the audit to obtain reasonable assurance about whether the financial statements are free of material misstatement, whether due to error or fraud. Our audits included performing procedures to assess the risks of material misstatement of the financial statements, whether due to error or fraud, and performing procedures that respond to those risks. Such procedures included examining, on a test basis, evidence regarding the amounts and disclosures in the financial statements. Our audits also included evaluating the accounting principles used and significant estimates made by management, as well as evaluating the overall presentation of the financial statements. We believe that our audits provide a reasonable basis for our opinion.
Critical Audit Matter
The critical audit matter communicated below is a matter arising from the current period audit of the financial statements that was communicated or required to be communicated to the audit committee and that: (1) relates to accounts or disclosures that are material to the financial statements and (2) involved our especially challenging, subjective or complex judgments. The communication of the critical audit matter does not alter in any way our opinion on the consolidated financial statements, taken as a whole, and we are not, by communicating the critical audit matter below, providing a separate opinion on the critical audit matter or on the account or disclosures to which it relates.
| Valuation of Goodwill – Annual impairment evaluation | ||
| Description of the Matter |
At April 1, 2023, the Company’s goodwill was $1.9 billion. As discussed in Notes 2 and 10 of the consolidated financial statements, goodwill is tested for impairment at the reporting unit level annually, or when events or circumstances indicate that the carrying value of such asset may not be recoverable. The Company estimates the fair value of its reporting units using an income approach, specifically a discounted cash flow analysis.
Auditing management’s annual goodwill impairment test was complex and highly judgmental due to the significant estimation required to determine the fair value of the reporting units. The fair value estimates were sensitive to changes in significant assumptions such as the discount rates, revenue growth rates and cash flow projections which are affected by expectations about future market or economic conditions.
|
|
| How We Addressed the Matter in Our Audit |
We obtained an understanding, evaluated the design and tested the operating effectiveness of controls over the Company’s goodwill impairment review process, including controls over management’s review of the significant assumptions described above.
To test the estimated fair value of the Company’s reporting units, we performed audit procedures, with the assistance of our valuation specialists, that included, among others, assessing the methodologies utilized and testing the significant assumptions discussed above and the underlying data used by the Company in its analysis. We compared the significant assumptions used by management to current industry and economic trends. We assessed the historical accuracy of management’s estimates and performed sensitivity analyses of significant assumptions to evaluate the changes in the fair value of the reporting units that would result from changes in the underlying assumptions. In addition, we evaluated the reconciliation of the fair value of the reporting units to the market capitalization of the Company. |
/s/ Ernst & Young LLP
We have served as the Company’s auditor since 2002.
Stamford, Connecticut
May 19, 2023
RBC Bearings Incorporated
Consolidated Balance Sheets
(dollars in millions, except share and per share data)
| April 1, 2023 |
April 2, 2022 |
|||||||
| ASSETS | ||||||||
| Current assets: | ||||||||
| Cash and cash equivalents | $ | 65.4 | $ | 182.9 | ||||
| Accounts receivable, net of allowance for doubtful accounts of $3.7 at April 1, 2023 and $2.7 at April 2, 2022 | 239.6 | 247.5 | ||||||
| Inventory | 587.2 | 516.1 | ||||||
| Prepaid expenses and other current assets | 21.1 | 15.7 | ||||||
| Total current assets | 913.3 | 962.2 | ||||||
| Property, plant and equipment, net | 375.3 | 386.7 | ||||||
| Operating lease assets, net | 41.4 | 44.5 | ||||||
| Goodwill | 1,869.8 | 1,902.1 | ||||||
| Intangible assets, net | 1,452.9 | 1,511.5 | ||||||
| Other noncurrent assets | 37.7 | 38.4 | ||||||
| Total assets | $ | 4,690.4 | $ | 4,845.4 | ||||
| LIABILITIES AND STOCKHOLDERS’ EQUITY | ||||||||
| Current liabilities: | ||||||||
| Accounts payable | $ | 146.8 | $ | 158.6 | ||||
| Accrued expenses and other current liabilities | 153.4 | 145.3 | ||||||
| Current operating lease liabilities | 7.6 | 8.1 | ||||||
| Current portion of long-term debt | 1.5 | 1.5 | ||||||
| Total current liabilities | 309.3 | 313.5 | ||||||
| Long-term debt, less current portion | 1,393.5 | 1,686.8 | ||||||
| Noncurrent operating lease liabilities | 33.9 | 36.7 | ||||||
| Deferred income taxes | 295.1 | 315.5 | ||||||
| Other noncurrent liabilities | 122.7 | 120.4 | ||||||
| Total liabilities | 2,154.5 | 2,472.9 | ||||||
| Commitments and contingencies (Note 18) | ||||||||
| Stockholders’ equity: | ||||||||
| Preferred stock, $.01 par value; authorized shares: 10,000,000 as of April 1, 2023 and April 2, 2022, respectively; issued shares: 4,600,000 as of April 1, 2023 and April 2, 2022, respectively | 0.0 | 0.0 | ||||||
| Common stock, $.01 par value; authorized shares: 60,000,000 at April 1, 2023 and April 2, 2022, respectively; issued shares: 29,989,948 and 29,807,208 at April 1, 2023 and April 2, 2022, respectively | 0.3 | 0.3 | ||||||
| Additional paid-in capital | 1,589.9 | 1,564.3 | ||||||
| Accumulated other comprehensive income loss | (4.1 | ) | (5.8 | ) | ||||
| Retained earnings | 1,029.9 | 886.1 | ||||||
| Treasury stock, at cost, 966,398 shares and 928,322 shares at April 1, 2023 and April 2, 2022, respectively | (80.1 | ) | (72.4 | ) | ||||
| Total stockholders’ equity | 2,535.9 | 2,372.5 | ||||||
| Total liabilities and stockholders’ equity | $ | 4,690.4 | $ | 4,845.4 | ||||
See accompanying notes.
RBC Bearings Incorporated
Consolidated Statements of Operations
(dollars in millions, except share and per share data)
| Fiscal Year Ended | ||||||||||||
| April 1, 2023 |
April 2, 2022 |
April 3, 2021 |
||||||||||
| Net sales | $ | 1,469.3 | $ | 942.9 | $ | 609.0 | ||||||
| Cost of sales | 864.5 | 585.8 | 374.9 | |||||||||
| Gross margin | 604.8 | 357.1 | 234.1 | |||||||||
| Operating expenses: | ||||||||||||
| Selling, general and administrative | 229.7 | 167.6 | 102.8 | |||||||||
| Other, net | 82.1 | 68.4 | 16.7 | |||||||||
| Total operating expenses | 311.8 | 236.0 | 119.5 | |||||||||
| Operating income | 293.0 | 121.1 | 114.6 | |||||||||
| Interest expense, net | 76.7 | 41.5 | 1.4 | |||||||||
| Other non-operating expense/(income) | 6.6 | 0.9 | (0.0 | ) | ||||||||
| Income before income taxes | 209.7 | 78.7 | 113.2 | |||||||||
| Provision for income taxes | 43.0 | 24.0 | 23.1 | |||||||||
| Net income | $ | 166.7 | $ | 54.7 | $ | 90.1 | ||||||
| Preferred stock dividends | 22.9 | 12.0 | ||||||||||
| Net income attributable to common stockholders | $ | 143.8 | $ | 42.7 | $ | 90.1 | ||||||
| Net income per common share attributable to common stockholders: | ||||||||||||
| Basic | $ | 5.00 | $ | 1.58 | $ | 3.63 | ||||||
| Diluted | $ | 4.94 | $ | 1.56 | $ | 3.58 | ||||||
| Weighted average common shares: | ||||||||||||
| Basic | 28,764,092 | 26,946,355 | 24,851,344 | |||||||||
| Diluted | 29,072,429 | 27,311,029 | 25,149,405 | |||||||||
See accompanying notes.
RBC Bearings Incorporated
Consolidated Statements of Comprehensive Income
(dollars in millions)
| Fiscal Year Ended | ||||||||||||
| April 1, 2023 |
April 2, 2022 |
April 3, 2021 |
||||||||||
| Net income | $ | 166.7 | $ | 54.7 | $ | 90.1 | ||||||
| Pension and postretirement liability adjustments, net of taxes (1) | 9.4 | 4.2 | (4.5 | ) | ||||||||
| Change in fair value of derivatives (2) | (2.2 | ) | ||||||||||
| Foreign currency translation adjustments | (5.5 | ) | 0.4 | 1.0 | ||||||||
| Total comprehensive income | $ | 168.4 | $ | 59.3 | $ | 86.6 | ||||||
| (1) | These adjustments were net of tax expense of $2.0, tax expense of $1.1 and tax benefit of $0.9 in fiscal 2023, 2022 and 2021, respectively. |
| (2) | This adjustment was net of a tax benefit of $0.6 in fiscal 2023. |
See accompanying notes.
RBC Bearings Incorporated
Consolidated Statements of Stockholders’ Equity
(dollars in millions)
| Common Stock | Preferred Stock | Additional Paid-in |
Accumulated Other Comprehensive |
Retained | Treasury Stock | Total Stockholders’ |
||||||||||||||||||||||||||||||||||
| Shares | Amount | Shares | Amount | Capital | Income/(Loss) | Earnings | Shares | Amount | Equity | |||||||||||||||||||||||||||||||
| Balance at March 28, 2020 | 25,881,415 | $ | 0.3 | — | $ | — | $ | 433.2 | $ | (6.9 | ) | $ | 753.3 | (838,982 | ) | $ | (57.0 | ) | $ | 1,122.9 | ||||||||||||||||||||
| Net income | — | — | — | — | — | — | 90.1 | — | — | 90.1 | ||||||||||||||||||||||||||||||
| Stock-based compensation | — | — | — | — | 18.1 | — | — | — | — | 18.1 | ||||||||||||||||||||||||||||||
| Repurchase of common stock | — | — | — | — | — | — | — | (45,719 | ) | (6.8 | ) | (6.8 | ) | |||||||||||||||||||||||||||
| Exercise of equity awards | 141,767 | 0.0 | — | — | 11.3 | — | — | — | — | 11.3 | ||||||||||||||||||||||||||||||
| Change in pension and post-retirement plan benefit adjustments , net of tax benefit of $0.9 | — | — | — | — | — | (4.5 | ) | — | — | — | (4.5 | ) | ||||||||||||||||||||||||||||
| Issuance of restricted stock, net of forfeitures | 87,138 | — | — | — | — | — | — | — | — | — | ||||||||||||||||||||||||||||||
| Currency translation adjustments | — | — | — | — | — | 1.0 | — | — | — | 1.0 | ||||||||||||||||||||||||||||||
| Balance at April 3, 2021 | 26,110,320 | $ | 0.3 | — | $ | — | $ | 462.6 | $ | (10.4 | ) | $ | 843.4 | (884,701 | ) | $ | (63.8 | ) | $ | 1,232.1 | ||||||||||||||||||||
| Net income | — | — | — | — | — | — | 54.7 | — | — | 54.7 | ||||||||||||||||||||||||||||||
| Stock-based compensation | — | — | — | — | 32.9 | — | — | — | — | 32.9 | ||||||||||||||||||||||||||||||
| Preferred stock dividends | — | — | — | — | — | — | (12.0 | ) | — | — | (12.0 | ) | ||||||||||||||||||||||||||||
| Repurchase of common stock | — | — | — | — | — | — | — | (43,621 | ) | (8.6 | ) | (8.6 | ) | |||||||||||||||||||||||||||
| Exercise of equity awards | 149,896 | 0.0 | — | — | 18.0 | — | — | — | — | 18.0 | ||||||||||||||||||||||||||||||
| Change in pension and post-retirement plan benefit adjustments, net of tax expense of $1.1 | — | — | — | — | — | 4.2 | — | — | — | 4.2 | ||||||||||||||||||||||||||||||
| Issuance of restricted stock, net of forfeitures | 96,992 | — | — | — | — | — | — | — | — | — | ||||||||||||||||||||||||||||||
| Preferred stock issuance, net of issuance costs | — | — | 4,600,000 | 0.0 | 445.3 | — | — | — | — | 445.3 | ||||||||||||||||||||||||||||||
| Common stock issuance, net of issuance costs | 3,450,000 | 0.0 | — | — | 605.5 | — | — | — | — | 605.5 | ||||||||||||||||||||||||||||||
| Currency translation adjustments | — | — | — | — | — | 0.4 | — | — | — | 0.4 | ||||||||||||||||||||||||||||||
| Balance at April 2, 2022 | 29,807,208 | $ | 0.3 | 4,600,000 | $ | 0.0 | $ | 1,564.3 | $ | (5.8 | ) | $ | 886.1 | (928,322 | ) | $ | (72.4 | ) | $ | 2,372.5 | ||||||||||||||||||||
| Net income | — | — | — | — | — | — | 166.7 | — | — | 166.7 | ||||||||||||||||||||||||||||||
| Stock-based compensation | — | — | — | — | 14.0 | — | — | — | — | 14.0 | ||||||||||||||||||||||||||||||
| Preferred stock dividends | — | — | — | — | — | — | (22.9 | ) | — | — | (22.9 | ) | ||||||||||||||||||||||||||||
| Repurchase of common stock | — | — | — | — | — | — | — | (38,076 | ) | (7.7 | ) | (7.7 | ) | |||||||||||||||||||||||||||
| Exercise of equity awards | 116,563 | 0.0 | — | — | 11.6 | — | — | — | — | 11.6 | ||||||||||||||||||||||||||||||
| Change in pension and post-retirement plan benefit adjustments, net of tax expense of $2.0 | — | — | — | — | — | 9.4 | — | — | — | 9.4 | ||||||||||||||||||||||||||||||
| Issuance of restricted stock, net of forfeitures | 66,177 | — | — | — | — | — | — | — | — | — | ||||||||||||||||||||||||||||||
| Change in fair value of derivatives, net of tax benefit of $0.6 | — | — | — | — | — | (2.2 | ) | — | — | — | (2.2 | ) | ||||||||||||||||||||||||||||
| Currency translation adjustments | — | — | — | — | — | (5.5 | ) | — | — | — | (5.5 | ) | ||||||||||||||||||||||||||||
| Balance at April 1, 2023 | 29,989,948 | $ | 0.3 | 4,600,000 | $ | 0.0 | $ | 1,589.9 | $ | (4.1 | ) | $ | 1,029.9 | (966,398 | ) | $ | (80.1 | ) | $ | 2,535.9 | ||||||||||||||||||||
See accompanying notes.
RBC Bearings Incorporated
Consolidated Statements of Cash Flows
(dollars in millions)
| Fiscal Year Ended | ||||||||||||
April
1, |
April
2, |
April
3, |
||||||||||
| Cash flows from operating activities: | ||||||||||||
| Net income | $ | 166.7 | $ | 54.7 | $ | 90.1 | ||||||
| Adjustments to reconcile net income to net cash provided by operating activities: | ||||||||||||
| Depreciation and amortization | 115.4 | 65.5 | 32.7 | |||||||||
| Deferred income taxes | (21.4 | ) | 0.2 | 4.2 | ||||||||
| Amortization of deferred financing costs | 7.2 | 18.9 | 0.5 | |||||||||
| Consolidation and restructuring and other non-cash charges | 2.3 | 2.4 | 2.5 | |||||||||
| Noncash operating lease expense | 7.2 | 5.8 | 5.4 | |||||||||
| Loss on extinguishment of debt | 1.0 | |||||||||||
| Stock-based compensation | 14.0 | 32.9 | 18.1 | |||||||||
| Loss on disposition of assets | 0.3 | 0.3 | 1.3 | |||||||||
| Changes in operating assets and liabilities, net of acquisitions: | ||||||||||||
| Accounts receivable | 7.8 | (53.5 | ) | 19.0 | ||||||||
| Inventory | (71.7 | ) | (16.2 | ) | 0.9 | |||||||
| Prepaid expenses and other current assets | (5.8 | ) | (1.8 | ) | (0.4 | ) | ||||||
| Other noncurrent assets | (0.8 | ) | (8.2 | ) | (16.3 | ) | ||||||
| Accounts payable | (11.1 | ) | 52.4 | (14.8 | ) | |||||||
| Accrued expenses and other current liabilities | 6.0 | 22.1 | 2.6 | |||||||||
| Other noncurrent liabilities | 4.5 | 3.8 | 6.6 | |||||||||
| Net cash provided by operating activities | 220.6 | 180.3 | 152.4 | |||||||||
| Cash flows from investing activities: | ||||||||||||
| Capital expenditures | (42.0 | ) | (29.8 | ) | (11.8 | ) | ||||||
| Acquisition of businesses and related purchase price adjustments | 27.5 | (2,908.2 | ) | 0.3 | ||||||||
| Purchase of marketable securities | (30.0 | ) | (100.1 | ) | ||||||||
| Proceeds from sale of marketable securities | 120.5 | 10.0 | ||||||||||
| Proceeds from sale of assets | 0.5 | 0.0 | 0.1 | |||||||||
| Net cash used in investing activities | (14.0 | ) | (2,847.5 | ) | (101.5 | ) | ||||||
| Cash flows from financing activities: | ||||||||||||
| Proceeds from issuance of common stock, net of issuance costs | 605.5 | |||||||||||
| Proceeds from issuance of preferred stock, net of issuance costs | 445.3 | |||||||||||
| Proceeds from term loans, net of financing costs | 1,285.8 | |||||||||||
| Proceeds from senior notes, net of financing costs | 494.2 | |||||||||||
| Finance fees paid in connection with credit facilities and senior notes | (0.1 | ) | (19.5 | ) | ||||||||
| Repayments of revolving credit facilities | (3.0 | ) | ||||||||||
| Repayments of term loans | (300.0 | ) | (113.0 | ) | (4.4 | ) | ||||||
| Repayments of notes payable | (0.5 | ) | (0.5 | ) | (0.5 | ) | ||||||
| Principal payments on finance lease obligations | (3.2 | ) | (1.6 | ) | ||||||||
| Preferred stock dividends paid | (22.9 | ) | (7.1 | ) | ||||||||
| Repurchase of common stock | (7.7 | ) | (8.6 | ) | (6.8 | ) | ||||||
| Exercise of equity awards | 11.6 | 18.0 | 11.3 | |||||||||
| Net cash provided by/(used in) financing activities | (322.8 | ) | 2,698.5 | (3.4 | ) | |||||||
| Effect of exchange rate changes on cash | (1.3 | ) | 0.5 | 0.3 | ||||||||
| Cash and cash equivalents: | ||||||||||||
| (Decrease)/increase during the year | (117.5 | ) | 31.8 | 47.8 | ||||||||
| Cash and cash equivalents, at beginning of year | 182.9 | 151.1 | 103.3 | |||||||||
| Cash and cash equivalents, at end of year | $ | 65.4 | $ | 182.9 | $ | 151.1 | ||||||
| Supplemental disclosures of cash flow information: | ||||||||||||
| Cash paid for: | ||||||||||||
| Income taxes | $ | 60.4 | $ | 17.1 | $ | 16.7 | ||||||
| Interest | 69.9 | 11.6 | 1.1 | |||||||||
See accompanying notes.
RBC Bearings Incorporated
Notes to Consolidated Financial Statements
(dollars in millions, except share and per share data)
1. Organization and Business
RBC Bearings Incorporated, together with its subsidiaries, is an international manufacturer and marketer of highly engineered precision bearings, components and essential systems for the industrial, defense and aerospace industries, which are integral to the manufacture and operation of most machines, aircraft and mechanical systems, to reduce wear to moving parts, facilitate proper power transmission, reduce damage and energy loss caused by friction and control pressure and flow. The terms “we,” “us,” “our,” “RBC” and the “Company” mean RBC Bearings Incorporated and its subsidiaries, unless the context indicates another meaning. While we manufacture products in all major categories, we focus primarily on highly technical or regulated bearing products and engineered products for specialized markets that require sophisticated design, testing and manufacturing capabilities. We believe our unique expertise has enabled us to garner leading positions in many of the product markets in which we primarily compete. Over the past 18 years, we have broadened our end markets, products, customer base and geographic reach. We currently have 52 facilities in 10 countries, of which 37 are manufacturing facilities.
The Company operates in two reportable business segments—aerospace/defense and industrial—in which it manufactures roller bearing components and assembled parts and designs and manufactures high-precision roller and ball bearings. The Company sells to a wide variety of original equipment manufacturers (“OEMs”) and distributors who are widely dispersed geographically. No one customer accounted for more than 16% of the Company’s net sales in fiscal 2023, 11% of net sales in fiscal 2022 and 7% of net sales in fiscal 2021. The Company’s segments are further discussed in Note 20 “Reportable Segments.”
2. Summary of Significant Accounting Policies
General
The consolidated financial statements include the accounts of RBC Bearings Incorporated and its wholly-owned subsidiaries. All intercompany balances and transactions have been eliminated in consolidation.
The Company has a fiscal year consisting of 52 or 53 weeks, ending on the Saturday closest to March 31. Based on this policy, fiscal year 2023 contained 52 weeks, fiscal year 2022 contained 52 weeks and fiscal year 2021 contained 53 weeks.
Use of Estimates
The preparation of financial statements in conformity with generally accepted accounting principles requires management to make estimates and assumptions that affect the reported amounts of assets and liabilities, and disclosure of contingent assets and liabilities, at the date of the financial statements, and the reported amounts of revenues and expenses during the reporting period. Actual results could differ from those estimates. Estimates are used for, but not limited to, the accounting for the allowance for doubtful accounts, valuation of inventories, goodwill and intangible assets, depreciation and amortization, income taxes and tax reserves, purchase price allocation for acquired assets and liabilities, and the valuation of options.
Revenue Recognition
A contract with a customer exists when there is commitment and approval from both parties involved, the rights of the parties are identified, payment terms are defined, the contract has commercial substance, and collectability of consideration is probable. The Company has determined that the contract with the customer is established when the customer purchase order is accepted or acknowledged. Long-term agreements (LTAs) are used by the Company and certain of its customers to reduce their supply uncertainty for a period of time, typically multiple years. While these LTAs define commercial terms including pricing, termination rights and other contractual requirements, they do not represent the contract with the customer for revenue recognition purposes.
When the Company accepts or acknowledges the customer purchase order, the type of good or service is defined on a line-by-line basis. Individual performance obligations are established by virtue of the individual line items identified on the sales order acknowledgment at the time of issuance. The majority of the Company’s revenue relates to the sale of goods and contains a single performance obligation for each distinct good. The remainder of the Company’s revenue from customers is generated from services performed. These services include repair and refurbishment work performed on customer-controlled assets as well as design and test work. The performance obligations for these services are also identified on the sales order acknowledgement at the time of issuance on a line-by-line basis.
Transaction price reflects the amount of consideration that the Company expects to be entitled to in exchange for transferred goods or services. A contract’s transaction price is allocated to each distinct performance obligation and revenue is recognized as the performance obligation is satisfied. For all of our contracts, the Company either provides distinct goods or services. Where both distinct goods and services are provided, we separate the contract into more than one performance obligation (i.e., a good or service is individually listed in a contract or sold individually to a customer). The Company generally sells products and services with observable standalone selling prices.
The performance obligations for the majority of RBC’s product sales are satisfied at the point in time in which the products are shipped. The Company has determined that the customer obtains control upon shipment of the product based on the shipping terms (i.e. when it ships from RBC’s dock or when the product arrives at the customer’s dock) and recognizes revenue when control has transferred to the customer. Once a customer has obtained control, the customer is able to direct the use of, and obtain substantially all of the remaining benefits from, the asset.
The Company has determined performance obligations are satisfied over time for customer contracts where RBC provides services to customers and also for a limited number of product sales. RBC has determined revenue recognition over time is appropriate for our service revenue contracts as they create or enhance an asset that the customer controls throughout the duration of the contract. Revenue recognition over time is appropriate for customer contracts with product sales in which the product sold has no alternative use to RBC without significant economic loss and an enforceable right to payment exists, including a normal profit margin from the customer, in the event of contract termination. These types of contracts comprised less than 1% of total sales for the years ended April 1, 2023, April 2, 2022 and April 3, 2021, respectively. For both of these types of contracts, revenue is recognized over time based on the extent of progress towards completion of the performance obligation. The Company utilizes the cost-to-cost measure of progress for over-time revenue recognition contracts as we believe this measure best depicts the transfer of control to the customer, which occurs as we incur costs on contracts. Revenues, including profits, are recorded proportionally as costs are incurred. Costs to fulfill include labor, materials, subcontractors’ costs, and other direct and indirect costs.
Contract costs are the incremental costs of obtaining and fulfilling a contract (i.e., costs that would not have been incurred if the contract had not been obtained) to provide goods and services to customers. Contract costs largely consist of design and development costs for molds, dies and other tools that RBC will own and that will be used in producing the products under the supply arrangements. These contract costs are amortized to expense on a systematic and rational basis over a period consistent with the transfer to the customer of the goods or services to which the asset relates and are recorded in cost of sales. Costs incurred to obtain a contract are primarily related to sales commissions and are expensed as incurred as they are generally not tied to specific customer contracts. These costs are included within selling, general and administrative costs on the consolidated statements of operations.
In certain contracts, the Company facilitates shipping and handling activities after control has transferred to the customer. The Company has elected to record all shipping and handling activities as costs to fulfill a contract. In situations where the shipping and handling costs have not been incurred at the time revenue is recognized, the estimated shipping and handling costs are accrued.
Government Assistance
Like other companies involved in the aerospace industry that were impacted by the COVID-19 pandemic, the Company took part in the Aviation Manufacturing Jobs Protection (“AMJP”) program. The AMJP program provided funding to eligible businesses to pay a portion of their compensation costs for certain categories of employees for a period of time as part of a U.S. Department of Transportation program designed to maintain jobs in the aviation industry. During the 12-month periods ended April 1, 2023, April 2, 2022 and April 3, 2021, the Company recorded grant revenue of $3.1, $4.4 and $0, respectively, all of which was recorded within costs of sales on the consolidated statements of operations. The Company does not expect to receive any future grant revenue associated with the AMJP program. The Company is not currently receiving grant revenue from any other sources and does not anticipate doing so in future periods.
Cash and Cash Equivalents
The Company considers all highly liquid investments purchased with an original maturity of three months or less to be cash equivalents. The Company maintains its cash accounts with various banks and has not experienced any losses in such accounts.
Accounts Receivable, Net and Concentration of Credit Risk
Accounts receivable include amounts billed and currently due from customers. The amounts due are stated at their estimated net realizable value. The Company maintains an allowance for doubtful accounts for estimated losses resulting from the inability of its customers to make required payments. The Company uses an expected credit loss model to estimate the credit losses expected over the life of an exposure (or pool of exposures). The estimate of expected credit losses considers historical information, current information and reasonable and supportable forecasts, including estimates of prepayments. Financial instruments with similar risk characteristics are grouped together when estimating expected credit losses. The Company will write off accounts receivable after reasonable collection efforts have been made and the accounts are deemed uncollectible.
The Company sells to a large number of OEMs and distributors who service the aftermarket. The Company’s credit risk associated with accounts receivable is minimized due to its customer base and wide geographic dispersion. The Company performs ongoing credit evaluations of its customers’ financial condition and generally does not require collateral or charge interest on outstanding amounts. The Company had no concentrations of credit risk with any one customer greater than approximately 15% of accounts receivables at both April 1, 2023 and April 2, 2022.
Inventory
Inventory is stated at the lower of cost or net realizable value. Cost is determined by the first-in, first-out method. The Company accounts for inventory under a full absorption method, and records adjustments to the value of inventory based upon past sales history and forecasted plans to sell our inventories. The physical condition, including age and quality, of the inventories is also considered in establishing its valuation. These adjustments are estimates, which could vary significantly, either favorably or unfavorably, from actual requirements if future economic conditions, customer inventory levels or competitive conditions differ from our expectations.
Contract Assets (Unbilled Receivables)
Pursuant to the over-time revenue recognition model, revenue may be recognized prior to the customer being invoiced. An unbilled receivable is recorded to reflect revenue that is recognized when (1) the cost-to-cost method is applied and (2) such revenue exceeds the amount invoiced to the customer. Contract assets are included within prepaid expenses and other current assets or other noncurrent assets on the consolidated balance sheets.
Property, Plant and Equipment
Property, plant and equipment are recorded at cost. Depreciation and amortization of property, plant and equipment, is recorded using the straight-line method over the estimated useful lives of the respective assets. Depreciation of assets is reported within depreciation and amortization. Expenditures for normal maintenance and repairs are charged to expense as incurred.
The estimated useful lives of the Company’s property, plant and equipment are as follows:
| Buildings and improvements | 20-30 years |
| Machinery and equipment | 3-15 years |
| Leasehold improvements | Shorter of the term of lease or estimated useful life |
Leases
The Company determines if an arrangement is a lease at contract inception. For leases where the Company is the lessee, it recognizes lease assets and related lease liabilities at the lease commencement date based on the present value of lease payments over the lease term. The lease term is the noncancellable period for which a lessee has the right to use an underlying asset, including periods covered by an option to extend the lease if the lessee is reasonably certain to exercise that option and periods covered by an option to terminate the lease if the lessee is reasonably certain not to exercise that option. For renewal options, the Company performs an assessment at commencement if it is reasonably likely to exercise the option. The assessment is based on the Company’s intentions, past practices, estimates and factors that create an economic incentive for the Company. Generally, the Company is not reasonably certain to exercise the renewal option in a lease contract, with the exception of some of our leased manufacturing facilities. While some of the Company’s leases include options allowing early termination of the lease, the Company historically has not terminated its lease agreements early unless there is an economic, financial or business reason to do so; therefore, the Company does not typically consider the termination option in its lease term at commencement.
The Company must classify each lease as a finance lease or an operating lease. The Company’s finance leases are included in property, plant and equipment, net. Amortization of these assets is included in depreciation and amortization expense. The Company’s operating leases consist of rent commitments under various leases for office space, warehouses, land and buildings.
Most of the Company’s leases do not provide an implicit interest rate. As a result, the Company uses its incremental borrowing rate based on the information available at the commencement date in determining the present value of lease payments.
Subsequent to the initial measurement, the lease liability continues to be measured at the present value of unpaid lease payments throughout the lease term. The lease liability is remeasured if the lease is modified and the modification is not accounted for as a separate contract, there is a change in the assessment of the lease term, the assessment of a purchase option exercise or the amount probable of being owed under a residual value guarantee, or a contingency is resolved resulting in some or all of the variable lease payments becoming fixed payments. Subsequent to the initial measurement, the right-of-use asset for a finance lease is equivalent to the initial measurement less accumulated amortization and any accumulated impairment losses. Generally, amortization of finance leases is recorded to cost of sales on a straight-line basis over the lease term. Subsequent to initial measurement, the right-of-use asset for an operating lease is equivalent to initial measurement less accumulated amortization (the difference between the straight-line lease cost for the period and the accretion of the lease liability using the effective interest method).
Goodwill and Indefinite-Lived Intangible Assets
Goodwill (representing the excess of the amount paid to acquire a company over the estimated fair value of the net assets acquired) and indefinite-lived intangible assets are not amortized but instead are tested for impairment annually, or when events or circumstances indicate that the carrying value of such asset may not be recoverable. Separate tests are performed for goodwill and indefinite lived intangible assets. We completed a quantitative test of impairment on the indefinite lived intangible assets with no impairment noted in the current year. The determination of any goodwill impairment is made at the reporting unit level. The Company determines the fair value of a reporting unit and compares it to its carrying amount. If the carrying amount of the reporting unit exceeds its fair value, an impairment loss is recognized for any amount by which the carrying amount exceeds the reporting unit’s fair value. The Company applies the income approach (discounted cash flow method) in testing goodwill for impairment. The key assumptions used in the discounted cash flow method used to estimate fair value include discount rates, revenue growth rates, terminal growth rates and cash flow projections. Discount rates, revenue growth rates and cash flow projections are the most sensitive and susceptible to change as they require significant management judgment. Discount rates are determined by using a weighted average cost of capital (“WACC”). The WACC considers market and industry data as well as Company-specific risk factors for each reporting unit in determining the appropriate discount rate to be used. The discount rate utilized for each reporting unit for our fiscal 2023 test was 10.0% and is indicative of the return an investor would expect to receive for investing in such a business. Terminal growth rate determination follows common methodology of capturing the present value of perpetual cash flow estimates beyond the last projected period assuming a constant WACC and long-term growth rates. The terminal growth rate used for our fiscal 2023 test was 2.5%. The Company has determined that, to date, no impairment of goodwill exists and fair value of the reporting units exceeded the carrying value in total by approximately 42.5%. The fair value of the reporting units exceeds the carrying value by a minimum of 13.1% at each of the two reporting units.
Contract Liabilities (Deferred Revenue)
The Company may receive a customer advance or deposit prior to revenue being recognized. Since the performance obligations related to such advances may not have been satisfied, a contract liability is established. Contract liabilities are included within accrued expenses and other current liabilities or other noncurrent liabilities on the consolidated balance sheets until the respective revenue is recognized. Advance payments are not considered a significant financing component as the timing of the transfer of the related goods or services is at the discretion of the customer.
Income Taxes
The Company accounts for income taxes using the liability method, which requires it to recognize a current tax liability or asset for current taxes payable or refundable and a deferred tax liability or asset for the estimated future tax effects of temporary differences between the financial statement and tax reporting bases of assets and liabilities to the extent that they are realizable. Deferred tax expense (benefit) results from the net change in deferred tax assets and liabilities during the year. A valuation allowance is recorded to reduce deferred tax assets to the amount that is more likely than not to be realized. The Company is exposed to certain tax contingencies in the ordinary course of business and records those tax liabilities in accordance with the guidance for accounting for uncertain tax positions.
Temporary differences relate primarily to the timing of deductions for depreciation, stock-based compensation, goodwill amortization relating to the acquisition of operating divisions, basis differences arising from acquisition accounting, pension and retirement benefits, and various accrued and prepaid expenses. Deferred tax assets and liabilities are recorded at the rates expected to be in effect when the temporary differences are expected to reverse.
Net Income Per Share Attributable to Common Stockholders
Basic net income per share attributable to common stockholders is computed by dividing net income attributable to common stockholders by the weighted-average number of common shares outstanding.
Diluted net income per share attributable to common stockholders is computed by dividing net income attributable to common stockholders by the sum of the weighted-average number of common shares and dilutive common share equivalents then outstanding using the treasury stock method. Common share equivalents consist of the incremental common shares issuable upon the exercise of stock options and the conversion of MCPS to common shares.
We exclude outstanding stock options, stock awards and the MCPS from the calculations if the effect would be anti-dilutive. The dilutive effect of the MCPS is calculated using the if-converted method. The if-converted method assumes that these securities were converted to shares of common stock at the later of the September 24, 2021 issuance date or the beginning of the reporting period to the extent that the effect is dilutive. If the effect is anti-dilutive, we calculate net income per share attributable to common stockholders by adjusting net income in the numerator for the effect of the cumulative MCPS dividends for the respective period.
For the fiscal years ended April 1, 2023 and April 2, 2022, the effect of assuming the conversion of the 4,600,000 shares of MCPS into shares of common stock was anti-dilutive, and therefore excluded from the calculation of diluted earnings per share attributable to common stockholders. Accordingly, net income was reduced by cumulative MCPS dividends, as presented in our consolidated statement of operations, for purposes of calculating net income attributable to common stockholders.
For the fiscal year ended April 1, 2023, 110,368 employee stock options and 1,185 restricted shares were excluded from the calculation of diluted earnings per share attributable to common stockholders. For the fiscal year ended April 2, 2022, 179,289 employee stock options and 325 restricted shares have been excluded from the calculation of diluted earnings per share attributable to common stockholders. At April 3, 2021, 176,432 employee stock options and 35,780 restricted shares have been excluded from the calculation of diluted earnings per share attributable to common stockholders. The inclusion of these employee stock options and restricted shares would have been anti-dilutive.
The table below reflects the calculation of weighted-average shares outstanding for each period presented as well as the computation of basic and diluted net income per share attributable to common stockholders.
| Fiscal Year Ended | ||||||||||||
April
1, |
April
2, |
April
3, |
||||||||||
| Net income | $ | 166.7 | $ | 54.7 | $ | 90.1 | ||||||
| Preferred stock dividends | 22.9 | 12.0 | ||||||||||
| Net income attributable to common stockholders | $ | 143.8 | $ | 42.7 | $ | 90.1 | ||||||
| Denominator: | ||||||||||||
| Denominator for basic net income per share attributable to common stockholders — weighted-average shares outstanding | 28,764,092 | 26,946,355 | 24,851,344 | |||||||||
| Effect of dilution due to employee stock awards | 308,337 | 364,674 | 298,061 | |||||||||
| Denominator for diluted net income per share attributable to common stockholders — weighted-average shares outstanding | 29,072,429 | 27,311,029 | 25,149,405 | |||||||||
| Basic net income per share attributable to common stockholders | $ | 5.00 | $ | 1.58 | $ | 3.63 | ||||||
| Diluted net income per share attributable to common stockholders | $ | 4.94 | $ | 1.56 | $ | 3.58 | ||||||
Impairment of Long-Lived Assets
The Company assesses the net realizable value of its long-lived assets and evaluates such assets for impairment whenever indicators of impairment are present. For amortizable long-lived assets to be held and used, if indicators of impairment are present, management determines whether the sum of the estimated undiscounted future cash flows is less than the carrying amount. The amount of asset impairment, if any, is based on the excess of the carrying amount over its fair value, which is estimated based on projected discounted future operating cash flows using a discount rate reflecting the Company’s average cost of funds. During fiscal year 2023, impairment charges totaling $2.0 were recorded, of which, $1.7 was associated with consolidation and restructuring efforts at some of our plants located in South Carolina.
Long-lived assets to be disposed of by sale or other means are reported at the lower of carrying amount or fair value, less costs to sell.
Foreign Currency Translation and Transactions
Assets and liabilities of the Company’s foreign operations are translated into U.S. dollars using the exchange rate in effect at the balance sheet date. Results of operations are translated using the average exchange rate prevailing throughout the period. The effects of exchange rate fluctuations on translating foreign currency assets and liabilities from their functional currencies to the reporting currency are included in accumulated other comprehensive income (loss), while gains and losses resulting from foreign currency transactions are included in other non-operating expense (income).
Fair Value Measurements
Fair value is the price that would be received to sell an asset or paid to transfer a liability in an orderly transaction between market participants at the measurement date (exit price). Inputs used to measure fair value are within a hierarchy consisting of three levels. Level 1 inputs represent unadjusted quoted prices in active markets for identical assets or liabilities. Level 2 inputs represent unadjusted quoted prices in active markets for similar assets or liabilities, or unadjusted quoted prices for identical or similar assets or liabilities in markets that are not active, or inputs other than quoted prices that are observable for the asset or liability. Level 3 inputs represent unobservable inputs for the asset or liability. Financial assets and liabilities are classified in their entirety based on the lowest level of input that is significant to the fair value measurement.
The carrying amounts reported in the balance sheet for cash and cash equivalents, accounts receivable, prepaid expenses and other current assets, and accounts payable and accruals, and other current liabilities approximate their fair value due to their short-term nature.
The carrying amounts of the Company’s borrowings under the Facilities approximate fair value, as these obligations have interest rates which vary in conjunction with current market conditions and have been classified as Level 2 in the valuation hierarchy. The Senior Notes are reported at carrying value on the consolidated balance sheets. The fair value of the Senior Notes as of April 1, 2023 was $450.0 and was computed based on quoted market prices (observable inputs) and classified as Level 1 of the fair value hierarchy. The fair value of the interest rate swap was $2.8 at April 1, 2023, measured using Level 2 inputs. This amount is included in other noncurrent liabilities on the Company consolidated balance sheets. The interest rate swap, net of taxes, is $2.2 and is included in accumulated other comprehensive income on the Company’s consolidated balance sheets, and in the Company’s consolidated statements of comprehensive income.
Accumulated Other Comprehensive Income (Loss)
The components of comprehensive income (loss) that relate to the Company are net income, foreign currency translation adjustments and pension plan and postretirement benefits, all of which are presented in the consolidated statements of stockholders’ equity and comprehensive income (loss).
The following summarizes the activity within each component of accumulated other comprehensive income (loss), net of taxes:
| Currency Translation | Change in Fair Value of Derivatives | Pension and Postretirement Liability |
Total | |||||||||||||
| Balance at April 2, 2022 | $ | 0.9 | $ | $ | (6.7 | ) | $ | (5.8 | ) | |||||||
| Other comprehensive income before reclassifications | (5.5 | ) | (5.5 | ) | ||||||||||||
| Amounts recorded in/ reclassified from accumulated other comprehensive loss | (2.2 | ) | 9.4 | 7.2 | ||||||||||||
| Net current period other comprehensive income | (5.5 | ) | (2.2 | ) | 9.4 | 1.7 | ||||||||||
| Balance at April 1, 2023 | $ | (4.6 | ) | $ | (2.2 | ) | $ | 2.7 | $ | (4.1 | ) | |||||
Stock-Based Compensation
The Company recognizes stock-based compensation cost relating to all stock-based payment transactions in the financial statements based upon the grant-date fair value of the instruments issued over the requisite service period. The fair value of each option grant was estimated on the date of grant using the Black-Scholes pricing model. The Company estimates expected forfeitures at the grant date and recognizes stock-based compensation costs, accordingly.
Recent Accounting Pronouncements
Recent Accounting Standards Adopted
In March 2020, the Financial Accounting Standards Board (“FASB”) issued Accounting Standards Update (“ASU”) 2020-04, Reference Rate Reform (Topic 848) - Facilitation of the Effects of Reference Rate Reform on Financial Reporting. The objective of the standard is to address operational challenges likely to arise in accounting for contract modifications and hedge accounting due to reference rate reform. The amendments in this ASU provide optional expedients and exceptions for applying GAAP to contracts, hedging relationships and other transactions that reference LIBOR or another reference rate expected to be discontinued because of reference rate reform. The standard update is effective for all entities as of March 12, 2020 through December 31, 2022. This guidance is available immediately and may be implemented in any period prior to the guidance expiration on December 31, 2022. In December 2022, the FASB issued ASU No. 2022-06 Reference Rate Reform (Topic 848): Deferral of the Sunset Date of Topic 848, which deferred the sunset date of Topic 848 from December 31, 2022 to December 31, 2024. The Company adopted this ASU during the third quarter of fiscal year 2023 and elected to apply the practical expedient which allows us to account for the modification of the New Credit Agreement discussed in Note 12 to the financial statements as if the modification was not substantial. The impact of the adoption of this standard update did not have a material impact on the Company’s consolidated financial statements.
In November 2021, the FASB issued ASU 2021-10, Government Assistance (Topic 832). ASU 2021-10 is intended to increase transparency of government assistance by requiring entities to disclose the types of government assistance, the entity’s accounting for government assistance, and the effect of the government assistance on an entity’s financial statements. This new guidance is effective for all entities for annual reporting periods beginning after December 15, 2021. The Company has made the required disclosures associated with this ASU in Note 2 of this Annual Report.
Recent Accounting Standards Yet to Be Adopted
Other new pronouncements issued but not effective until after April 1, 2023 are not expected to have a material impact on our financial position, results of operations or liquidity.
3. Revenue from Contracts with Customers
Disaggregation of Revenue
The following table disaggregates total revenue by end market which is how we view our reportable segments (see Note 20):
| Fiscal Year Ended | ||||||||||||
| April 1, 2023 |
April 2, 2022 |
April 3, 2021 |
||||||||||
| Aerospace/Defense | $ | 430.3 | $ | 381.5 | $ | 396.2 | ||||||
| Industrial | 1,039.0 | 561.4 | 212.8 | |||||||||
| $ | 1,469.3 | $ | 942.9 | $ | 609.0 | |||||||
The following table disaggregates total revenue by geographic origin:
| Fiscal Year Ended | ||||||||||||
| April 1, 2023 |
April 2, 2022 |
April 3, 2021 |
||||||||||
| United States | $ | 1,292.9 | $ | 833.4 | $ | 546.0 | ||||||
| International | 176.4 | 109.5 | 63.0 | |||||||||
| $ | 1,469.3 | $ | 942.9 | $ | 609.0 | |||||||
The following table illustrates the approximate percentage of revenue recognized for performance obligations satisfied over time versus the amount of revenue recognized for performance obligations satisfied at a point in time:
| Fiscal Year Ended | ||||||||||||
| April 1, 2023 |
April 2, 2022 |
April 3, 2021 |
||||||||||
| Point-in-time | 98 | % | 97 | % | 96 | % | ||||||
| Over time | 2 | % | 3 | % | 4 | % | ||||||
| 100 | % | 100 | % | 100 | % | |||||||
Remaining Performance Obligations
Remaining performance obligations represent the transaction price of orders meeting the definition of a contract in the new revenue standard for which work has not been performed or has been partially performed and excludes unexercised contract options. The duration of the majority of our contracts, as defined by ASC Topic 606, is less than one year. The Company has elected to apply the practical expedient, which allows companies to exclude remaining performance obligations with an original expected duration of one year or less. The aggregate amount of the transaction price allocated to remaining performance obligations for such contracts with a duration of more than one year was approximately $391.5 at April 1, 2023. The Company expects to recognize revenue on approximately 65% and 90% of the remaining performance obligations over the next 12 and 24 months, respectively, with the remainder recognized thereafter.
Contract Balances
The timing of revenue recognition, invoicing and cash collections affect accounts receivable, unbilled receivables (contract assets) and customer advances and deposits (contract liabilities) on the consolidated balance sheets. These assets and liabilities are reported on the consolidated balance sheets on an individual contract basis at the end of each reporting period.
Contract Assets (Unbilled Receivables) - Pursuant to the over-time revenue recognition model, revenue may be recognized prior to the customer being invoiced. An unbilled receivable is recorded to reflect revenue that is recognized when (1) the cost-to-cost method is applied and (2) such revenue exceeds the amount invoiced to the customer.
As of April 1, 2023 and April 2, 2022, current contract assets were $4.5 and $3.9, respectively, and included within prepaid expenses and other current assets on the consolidated balance sheets. The increase in contract assets was primarily due to the recognition of revenue related to the satisfaction or partial satisfaction of performance obligations prior to billing partially offset by amounts billed to customers during the period. As of April 1, 2023 and April 2, 2022, the Company did not have any contract assets classified as noncurrent on the consolidated balance sheets.
Contract Liabilities (Deferred Revenue) - The Company may receive a customer advance or deposit, or have an unconditional right to receive a customer advance, prior to revenue being recognized. Since the performance obligations related to such advances may not have been satisfied, a contract liability is established. Advance payments are not considered a significant financing component as the timing of the transfer of the related goods or services is at the discretion of the customer.
As of April 1, 2023 and April 2, 2022, current contract liabilities were $20.6 and $19.6, respectively, and included within accrued expenses and other current liabilities on the consolidated balance sheets. The increase in current contract liabilities was primarily due to advance payments received and the reclassification of a portion of advance payments received from the noncurrent portion of contract liabilities partially offset by revenue recognized on customer contracts. For the year ended April 1, 2023, the Company recognized revenues of $13.1 that were included in the contract liability balance as of April 2, 2022. For the year ended April 2, 2022, the Company recognized revenues of $13.6 that were included in the contract liability balance at April 3, 2021.
As of April 1, 2023 and April 2, 2022, noncurrent contract liabilities were $19.8 and $10.4, respectively, and included within other noncurrent liabilities on the consolidated balance sheets. The increase in noncurrent contract liabilities was primarily due to advance payments received partially offset by the reclassification of a portion of advance payments received to the current portion of contract liabilities.
Variable Consideration
The amount of consideration to which the Company expects to be entitled in exchange for the goods and services is not generally subject to significant variations. However, the Company does offer certain customers rebates, prompt payment discounts, end-user discounts, the right to return eligible products, and/or other forms of variable consideration. The Company estimates this variable consideration using the expected value amount, which is based on historical experience. The Company includes estimated amounts in the transaction price to the extent it is probable that a significant reversal of cumulative revenue recognized will not occur when the uncertainty associated with the variable consideration is resolved. The Company adjusts the estimate of revenue at the earlier of when the amount of consideration the Company expects to receive changes or when the consideration becomes fixed. Accrued customer rebates were $39.6 and $35.2 at April 1, 2023 and April 2, 2022, respectively, and are included within accrued expenses and other current liabilities on the consolidated balance sheets.
4. Fair Value
Fair value is defined as the price that would be expected to be received to sell an asset or paid to transfer a liability in an orderly transaction between market participants at the measurement date (exit price). The FASB provides accounting rules that classify the inputs used to measure fair value into the following hierarchy:
Level 1 – Unadjusted quoted prices in active markets for identical assets or liabilities.
Level 2 – Unadjusted quoted prices in active markets for similar assets or liabilities, or unadjusted quoted prices for identical or similar assets or liabilities in markets that are not active, or inputs other than quoted prices that are observable for the asset or liability.
Level 3 – Unobservable inputs for the asset or liability.
Financial assets and liabilities are classified in their entirety based on the lowest level of input that is significant to the fair value measurement.
As a result of the occurrence of triggering events such as purchase accounting for acquisitions, the Company measures certain assets and liabilities based on Level 3 inputs.
Recurring Fair Value Measurements
The Company’s financial instruments consist primarily of cash and cash equivalents, accounts receivable, trade accounts payable, short-term borrowings, long-term debt, and a derivative in the form of an interest rate swap. Due to their short-term nature, the carrying value of cash and cash equivalents, accounts receivable, trade accounts payable, accrued expenses and short-term borrowings are a reasonable estimate of their fair value. Long-term assets held on our balance sheets related to benefit plan obligations are measured at fair value. The fair value of the Company’s long-term fixed-rate debt, based on quoted market prices, was $450.0 and $463.8 at April 1, 2023 and April 2, 2022, respectively. The carrying value of this debt was $493.3 at April 1, 2023 and $492.4 at April 2, 2022. The fair value of long-term fixed-rate debt was measured using Level 1 inputs. Due to the nature of fair value calculations for variable-rate debt, the carrying value of the Company’s long-term variable-rate debt is a reasonable estimate of its fair value. The fair value of the interest rate swap was $2.8 at April 1, 2023, measured using Level 2 inputs. This amount is included in other noncurrent liabilities on the Company’s consolidated balance sheets. The interest rate swap, net of taxes, is $2.2 and is included in accumulated other comprehensive income on the Company’s consolidated balance sheets, and in the Company’s consolidated statements of comprehensive income.
The Company does not believe it has significant concentrations of risk associated with the counterparties to its financial instruments.
5. Allowance for Doubtful Accounts
The activity in the allowance for doubtful accounts consists of the following:
| Fiscal Year Ended | Balance at Beginning of Year |
Additions | Other* | Write-offs | Balance at End of Year |
|||||||||||||||
| April 1, 2023 | $ | 2.7 | $ | 0.8 | $ | 0.4 | $ | (0.2 | ) | $ | 3.7 | |||||||||
| April 2, 2022 | 1.8 | 1.4 | (0.1 | ) | (0.4 | ) | 2.7 | |||||||||||||
| April 3, 2021 | 1.6 | 0.5 | (0.1 | ) | (0.2 | ) | 1.8 | |||||||||||||
| * | Foreign currency, price discrepancies, customer returns, disposition and acquisition transactions. |
6. Inventory
Inventories are summarized below:
| April 1, 2023 |
April 2, 2022 |
|||||||
| Raw materials | $ | 132.4 | $ | 112.6 | ||||
| Work in process | 132.5 | 123.0 | ||||||
| Finished goods | 322.3 | 280.5 | ||||||
| $ | 587.2 | $ | 516.1 | |||||
7. Property, Plant and Equipment
Property, plant and equipment consist of the following:
| April 1, 2023 |
April 2, 2022 |
|||||||
| Land | $ | 25.2 | $ | 24.2 | ||||
| Buildings and improvements | 174.3 | 170.1 | ||||||
| Machinery and equipment | 472.8 | 444.7 | ||||||
| 672.3 | 639.0 | |||||||
| Less: accumulated depreciation | (297.0 | ) | (252.3 | ) | ||||
| $ | 375.3 | $ | 386.7 | |||||
Depreciation expense was $46.2, $30.8 and $22.5 for the fiscal years ended April 1, 2023, April 2, 2022 and April 3, 2021, respectively.
Finance Leases
For the year ended April 1, 2023, $51.5 of assets included in buildings and improvements and $6.5 of assets included in machinery and equipment were accounted for as finance leases. For the year ended April 2, 2022, $50.4 of assets included in buildings and improvements and $1.2 of assets included in machinery and equipment were accounted for as finance leases. At April 1, 2023 and April 2, 2022, the Company had accumulated amortization of $5.8 and $1.3 associated with these assets, respectively. Amortization expense associated with these finance leases was $4.5 and $1.3 for the years ended April 1, 2023 and April 2, 2022, respectively, and is included within depreciation expense as mentioned above.
8. Leases
The Company enters into leases for manufacturing facilities, warehouses, sales offices, information technology equipment, plant equipment, vehicles and certain other equipment with varying end dates from April 2023 to March 2043, including renewal options.
The following table represents the impact of leasing on the consolidated balance sheets:
| Balance Sheet Classification | April 1, 2023 |
April 2, 2022 |
||||||||
| Assets: | ||||||||||
| Operating lease assets, net | Operating lease assets, net | $ | 41.4 | $ | 44.5 | |||||
| Finance lease right of use assets, net | Property, plant and equipment, net | 52.2 | 51.6 | |||||||
| Total leased assets, net | $ | 93.6 | $ | 96.1 | ||||||
| Liabilities: | ||||||||||
| Current operating lease liabilities | Current operating lease liabilities | 7.6 | 8.1 | |||||||
| Current finance lease liabilities | Accrued expenses and other current liabilities | 5.2 | 3.9 | |||||||
| Noncurrent operating lease liabilities | Noncurrent operating lease liabilities | 33.9 | 36.7 | |||||||
| Noncurrent finance lease liabilities | Other noncurrent liabilities | 48.5 | 48.0 | |||||||
| Total lease liabilities | $ | 95.2 | $ | 96.7 | ||||||
Cash paid included in the measurement of operating lease liabilities was $8.5 and $7.8 for the fiscal years ended April 1, 2023 and April 2, 2022, respectively, all of which were included within the operating cash flow section of the consolidated statements of cash flows. Lease assets obtained in exchange for new operating lease liabilities were $2.0 and $11.6 for the fiscal years ended April 1, 2023 and April 2, 2022, respectively. Of the $11.6 of operating lease assets obtained for new operating lease liabilities during fiscal 2022, $9.8 were obtained on November 1, 2021 as part of the Dodge acquisition. Lease modifications which resulted in newly obtained lease assets in exchange for new operating lease liabilities were $3.1 and $3.3 for the fiscal years ended April 1, 2023 and April 2, 2022, respectively.
Cash paid included in the measurement of finance lease liabilities was $5.0 and $1.6 for the fiscal years ended April 1, 2023 and April 2, 2022, respectively. Of these amounts, $3.2 and $1.6 were included within the financing cash flow section of the consolidated statements of cash flows for the fiscal years ended April 1, 2023 and April 2, 2022, respectively. $1.8 was included within the operating cash flow section of the consolidated statements of cash flows for the fiscal year ended April 1, 2023. Lease assets obtained in exchange for new finance lease liabilities were $4.0 and $52.9 for the fiscal years ended April 1, 2023 and April 2, 2022, respectively. Of the $52.9 of finance lease assets obtained for new operating lease liabilities during fiscal 2022, $39.0 were obtained on November 1, 2021 as part of the Dodge acquisition. Lease modifications which resulted in reductions of lease assets in exchange for reductions of finance lease liabilities were $0.1 and $0.0 for the fiscal years ended April 1, 2023 and April 2, 2022, respectively.
Total operating lease expense was $9.9, $8.3 and $7.6 for the fiscal years ended April 1, 2023, April 2, 2022 and April 3, 2021, respectively. Short-term and variable lease expense were immaterial.
Total finance lease expense was $6.4 for the fiscal years ended April 1, 2023, of which, $4.5 was related to amortization expense of finance lease assets and $1.9 was related to interest expense. Total finance lease expense was $2.0 for the fiscal years ended April 2, 2022, of which, $1.3 was related to amortization expense of finance lease assets and $0.7 was related to interest expense. Variable lease expense was immaterial.
Future undiscounted lease payments for the remaining lease terms as of April 1, 2023, including renewal options reasonably certain of being exercised, are as follows:
| Operating Leases |
||||
| Within one year | $ | 7.2 | ||
| One to two years | 5.7 | |||
| Two to three years | 5.0 | |||
| Three to four years | 5.1 | |||
| Four to five years | 3.6 | |||
| Thereafter | 25.6 | |||
| Total future undiscounted lease payments | 52.2 | |||
| Less: imputed interest | (10.7 | ) | ||
| Total operating lease liabilities | $ | 41.5 | ||
| Finance Leases |
||||
| Within one year | $ | 5.1 | ||
| One to two years | 5.2 | |||
| Two to three years | 5.1 | |||
| Three to four years | 4.5 | |||
| Four to five years | 4.0 | |||
| Thereafter | 45.5 | |||
| Total future undiscounted lease payments | 69.4 | |||
| Less: imputed interest | (15.7 | ) | ||
| Total finance lease liabilities | $ | 53.7 | ||
The weighted-average remaining lease term on April 1, 2023 for our operating leases is 10.9 years. The weighted-average discount rate on April 1, 2023 for our operating leases is 4.4%.
The weighted-average remaining lease term on April 1, 2023 for our finance leases is 15.3 years. The weighted-average discount rate on April 1, 2023 for our finance leases is 3.4%.
9. Dodge Acquisition
On November 1, 2021, the Company completed the acquisition of Dodge for approximately $2,908.2, net of cash acquired and subject to certain adjustments. The purchase price was paid with (i) $1,285.8 of borrowing under the Term Loan Facility, net of issuance costs, (ii) $1,050.8 of net proceeds from the common stock and MCPS offerings, (iii) $494.2 of net proceeds from the Senior Notes offering, and (iv) approximately $77.4 of cash on hand. Since the close of the transaction, adjustments totaling $28.7 have been recorded as a reduction of the purchase price.
In the acquisition, the Company purchased 100% of the capital stock of certain entities, including Dodge Mechanical Power Transmission Company Inc. (now known as Dodge Industrial, Inc.), and certain other assets relating to ABB Asea Brown Boveri Ltd’s mechanical power transmission business.
With offices in Simpsonville, South Carolina, Dodge is a leading manufacturer of mounted bearings, gearings and mechanical products with market-leading brand recognition. Dodge manufactures a complete line of mounted bearings, enclosed gearing and power transmission components across a diverse set of industrial end markets. Dodge primarily operates across the construction and mining aftermarket, and the food & beverage, warehousing and general machinery verticals, with sales predominately in the Americas.
Acquisition costs incurred for the fiscal year ended April 2, 2022 totaled $22.6 and were recorded as period expenses and included within other, net within the consolidated statements of operations. Remaining acquisition-related costs incurred for the fiscal year ended April 1, 2023 were immaterial. This acquisition was accounted for as a purchase transaction. The purchase price allocation was completed during the third quarter of fiscal 2023. The assets acquired and liabilities assumed were recorded based on their fair values at the date of acquisition as follows:
| November 1, 2021 |
||||
| Cash and cash equivalents | $ | 81.9 | ||
| Accounts receivable | 83.5 | |||
| Inventory | 136.1 | |||
| Prepaid expenses and other current assets | 1.3 | |||
| Property, plant and equipment | 165.1 | |||
| Operating lease assets | 9.8 | |||
| Goodwill | 1,596.1 | |||
| Other intangible assets | 1,385.1 | |||
| Other noncurrent assets | 3.7 | |||
| Accounts payable | (69.3 | ) | ||
| Accrued rebates | (30.2 | ) | ||
| Accrued expenses and other current liabilities | (44.8 | ) | ||
| Deferred tax liabilities | (298.6 | ) | ||
| Other noncurrent liabilities | (57.0 | ) | ||
| Net assets acquired | 2,962.7 | |||
| Less cash received | 81.9 | |||
| Net consideration | $ | 2,880.8 | ||
The goodwill associated with this acquisition is the result of expected synergies from combining the operations of the acquired business with the Company’s operations and intangible assets that do not qualify for separate recognition, such as an assembled workforce. $45.0 of the acquired goodwill is deductible for tax purposes.
The fair value of the identifiable intangible assets of $1,385.1, consisting primarily of customer relationships and trade names, was determined using the income approach. Specifically, a multi-period, excess earnings method was utilized for the customer relationships and the relief-from-royalty method was utilized for the trade name. The fair value of the customer relationships, $1,185.0, is being amortized based on the economic pattern of benefit over a period of 24 years; the fair value of the trade name, $200.0, is being amortized on a straight-line basis over a 26-year term. These amortization periods represent the estimated useful lives of the assets.
The results of operations for Dodge have been included in the Company’s financial statements for the period subsequent to the completion of the acquisition on November 1, 2021. Dodge contributed $743.1 of revenue and $148.1 of operating income for the fiscal year ended April 1, 2023. Dodge contributed $291.9 of revenue and $29.3 of operating income for the fiscal year ended April 2, 2022.
The following table reflects the unaudited pro forma operating results of the Company for the fiscal years ended April 2, 2022 and April 3, 2021, which gives effect to the acquisition of Dodge as if the Company had been acquired on March 31, 2019. The pro forma results are based on assumptions that the Company believes are reasonable under the circumstances. The pro forma results are not necessarily indicative of the operating results that would have occurred had the acquisitions been effective March 31, 2019, nor are they intended to be indicative of results that may occur in the future. The underlying pro forma information includes the historical financial results of the Company and the acquired business adjusted for certain items such as amortization of acquired intangible assets and acquisition costs incurred. The pro forma information does not include the effects of any synergies, cost reduction initiatives or anticipated integration costs related to the acquisitions.
| Fiscal Year Ended | ||||||||
| April 2, 2022 |
April 3, 2021 |
|||||||
| Net sales | $ | 1,327.6 | $ | 1,182.0 | ||||
| Net income | $ | 113.1 | $ | 99.9 | ||||
Upon closing, the Company entered into a transition services agreement (the “Dodge TSA”) with ABB, pursuant to which ABB agreed to support the information technology, human resources and benefits, finance, tax and treasury functions of the Dodge business for six to twelve months. Substantially all services under the Dodge TSA terminated on November 1, 2022. Costs associated with the Dodge TSA were $8.8 for the fiscal year ended April 1, 2023 and are included in other, net on the Company’s consolidated statement of operations. Since the purchase of the Dodge business on November 1, 2021, costs associated with the Dodge TSA were $16.8.
10. Goodwill and Intangible Assets
Goodwill
Goodwill balances, by segment, consist of the following:
| Plain | Roller | Ball | Engineered Products |
Aerospace/ Defense |
Industrial | Total | ||||||||||||||||||||||
| April 3, 2021 | $ | 79.6 | $ | 16.0 | $ | 5.6 | $ | 176.3 | $ | 277.5 | ||||||||||||||||||
| Allocation in the third quarter of fiscal 2022 (1) | (79.6 | ) | (16.0 | ) | (5.6 | ) | (176.3 | ) | 194.1 | 83.4 | ||||||||||||||||||
| Acquisition (2) | 1,624.8 | 1,624.8 | ||||||||||||||||||||||||||
| Translation adjustments | (0.2 | ) | (0.2 | ) | ||||||||||||||||||||||||
| April 2, 2022 | $ | 194.1 | $ | 1,708.0 | $ | 1,902.1 | ||||||||||||||||||||||
| Acquisition (2) | (28.7 | ) | (28.7 | ) | ||||||||||||||||||||||||
| Translation adjustments | (3.6 | ) | (3.6 | ) | ||||||||||||||||||||||||
| April 1, 2023 | $ | 194.1 | $ | 1,675.7 | $ | 1,869.8 | ||||||||||||||||||||||
| (1) | Represents reallocation of goodwill as a result of our change in segments in the third quarter of fiscal 2022. See Note 20 for further details. |
| (2) | Goodwill associated with the acquisition of Dodge discussed further in Note 9. |
Intangible Assets
| April 1, 2023 | April 2, 2022 | |||||||||||||||||||
| Weighted Average Useful Lives |
Gross Carrying Amount |
Accumulated Amortization |
Gross Carrying Amount |
Accumulated Amortization |
||||||||||||||||
| Product approvals | 24 | $ | 50.7 | $ | 18.4 | $ | 50.9 | $ | 16.7 | |||||||||||
| Customer relationships and lists | 24 | 1,293.7 | 106.5 | 1,294.6 | 53.4 | |||||||||||||||
| Trade names | 25 | 215.4 | 23.3 | 216.4 | 15.0 | |||||||||||||||
| Distributor agreements | 0.7 | 0.7 | ||||||||||||||||||
| Patents and trademarks | 16 | 13.4 | 7.2 | 12.3 | 6.6 | |||||||||||||||
| Domain names | 10 | 0.4 | 0.4 | 0.4 | 0.4 | |||||||||||||||
| Internal-use software | 4 | 15.2 | 4.4 | 8.6 | 3.9 | |||||||||||||||
| Other | 5 | 1.1 | 1.1 | 1.1 | 1.1 | |||||||||||||||
| 1,589.9 | 161.3 | 1,585.0 | 97.8 | |||||||||||||||||
| Non-amortizable repair station certifications | n/a | 24.3 | 24.3 | |||||||||||||||||
| Total | 24 | $ | 1,614.2 | $ | 161.3 | $ | 1,609.3 | $ | 97.8 | |||||||||||
Amortization expense for definite-lived intangible assets during fiscal years 2023, 2022 and 2021 was $69.1, $34.7 and $10.2, respectively. Estimated amortization expense for the five succeeding fiscal years and thereafter is as follows:
| 2024 | $ | 70.0 | ||
| 2025 | 70.0 | |||
| 2026 | 68.0 | |||
| 2027 | 66.1 | |||
| 2028 | 63.6 | |||
| 2029 and thereafter | 1,090.9 |
11. Accrued Expenses and Other Current Liabilities
The significant components of accrued expenses and other current liabilities are as follows:
| April 1, 2023 |
April 2, 2022 |
|||||||
| Employee compensation and related benefits | $ | 34.7 | $ | 34.7 | ||||
| Taxes | 17.5 | 11.7 | ||||||
| Contract liabilities | 20.6 | 19.6 | ||||||
| Accrued rebates | 39.6 | 35.2 | ||||||
| Workers compensation and insurance | 0.8 | 1.1 | ||||||
| Acquisition costs | 0.6 | 4.6 | ||||||
| Current finance lease liabilities | 5.2 | 3.9 | ||||||
| Accrued preferred stock dividends | 4.9 | 4.9 | ||||||
| Interest | 10.6 | 11.0 | ||||||
| Audit fees | 0.3 | 0.6 | ||||||
| Legal | 1.6 | 0.5 | ||||||
| Returns and warranties | 7.5 | 7.7 | ||||||
| Other | 9.5 | 9.8 | ||||||
| $ | 153.4 | $ | 145.3 | |||||
12. Debt
Domestic Credit Facility
On November 1, 2021, RBC Bearings Incorporated, our top holding company, and our Roller Bearing Company of America, Inc. subsidiary (“RBCA”) entered into a Credit Agreement (the “New Credit Agreement”) with Wells Fargo Bank, National Association (“Wells Fargo”), as Administrative Agent, Collateral Agent, Swingline Lender and Letter of Credit Issuer and the other lenders party thereto, and terminated the Company’s prior Credit Agreement, which was entered into with Wells Fargo in 2015 (the “2015 Credit Agreement”). The New Credit Agreement provides the Company with (a) a $1,300.0 term loan facility (the “Term Loan Facility”), which was used to fund a portion of the cash purchase price for the acquisition of Dodge and to pay related fees and expenses, and (b) a $500.0 revolving credit facility (the “Revolving Credit Facility” and together with the Term Loan Facility, the “Facilities”). Debt issuance costs associated with the New Credit Agreement totaled $14.9 and are being amortized over the life of the New Credit Agreement. When the 2015 Credit Agreement was terminated the Company wrote off $0.9 of previously unamortized debt issuance costs.
Prior to December 2022, amounts outstanding under the Facilities generally bore interest at either, at the Company’s option, (a) a base rate determined by reference to the higher of (i) Wells Fargo’s prime lending rate, (ii) the federal funds effective rate plus 1/2 of 1.00% and (iii) the one-month LIBOR rate plus 1.00% or (b) the LIBOR rate plus a specified margin, depending on the type of borrowing being made. The applicable margin was based on the Company’s consolidated ratio of total net debt to consolidated EBITDA (as defined within the New Credit Agreement) from time to time. In December 2022 the New Credit Agreement was amended to replace LIBOR with the secured overnight financing rate administered by the Federal Reserve Bank of New York (“SOFR”) so that borrowings under the Facilities denominated in U.S. dollars bear interest at a rate per annum equal to Term SOFR (as defined in the New Credit Agreement) plus a credit spread adjustment of 0.10% plus a margin ranging from 0.75% to 2.00% depending on the Company’s consolidated ratio of total net debt to consolidated EBITDA. The Facilities are subject to a SOFR floor of 0.00%. As of April 1, 2023, the Company’s margin was 1.25% for SOFR loans; and the commitment fee rate was 0.20% and the letter of credit fee rate was 1.25%. A portion of the Term Loan Facility is subject to a fixed- rate interest swap as discussed in Note 13, Derivative Financial Instruments.
The Term Loan Facility will mature in November 2026 and amortizes in quarterly installments with the balance payable on the maturity date. The Company can elect to prepay some or all of the outstanding balance from time to time without penalty, which will offset future quarterly amortization installments. Due to prepayments previously made, the required future principal payments on the Term Loan Facility are $0 for fiscal 2024, $0 for fiscal 2025, $0 for fiscal 2026, and approximately $900.0 for fiscal 2027. The Revolving Credit Facility will expire in November 2026, at which time all amounts outstanding under the Revolving Credit Facility will be payable.
The New Credit Agreement requires the Company to comply with various covenants, including the following financial covenants: (a) a maximum Total Net Leverage Ratio (as defined within the New Credit Agreement) of 5.50:1.00, which maximum Total Net Leverage Ratio shall decrease during certain subsequent test periods as set forth in the New Credit Agreement (provided that, no more than once during the term of the Facilities, such maximum ratio applicable at such time may be increased by the Company by 0.50:1.00 for a period of twelve (12) months after the consummation of a material acquisition), and (b) a minimum Interest Coverage Ratio of 2.00:1.00. As of April 1, 2023, the Company was in compliance with all debt covenants.
The New Credit Agreement allows the Company to, among other things, make distributions to shareholders, repurchase its stock, incur other debt or liens, or acquire or dispose of assets provided that the Company complies with certain requirements and limitations of the New Credit Agreement.
The Company’s domestic subsidiaries have guaranteed the Company’s obligations under the New Credit Agreement, and the Company’s obligations and the domestic subsidiaries’ guaranty are secured by a pledge of substantially all of the domestic assets of the Company and its domestic subsidiaries.
As of April 1, 2023, $900.0 was outstanding under the Term Loan Facility and approximately $3.7 of the Revolving Credit Facility was being utilized to provide letters of credit to secure the Company’s obligations relating to certain insurance programs, and the Company had the ability to borrow up to an additional $496.3 under the Revolving Credit Facility.
Senior Notes
On October 7, 2021, RBCA issued $500.0 aggregate principal amount of 4.375% Senior Notes due 2029 (the “Senior Notes”). The net proceeds from the issuance of the Senior Notes were approximately $492.0 after deducting initial purchasers’ discounts and commissions and offering expenses. On November 1, 2021, the Company used the proceeds to fund a portion of the cash purchase price for the acquisition of Dodge.
The Senior Notes were issued pursuant to an indenture with Wilmington Trust, National Association, as trustee (the “Indenture”). The Indenture contains covenants limiting the ability of the Company to (i) incur additional indebtedness or guarantee indebtedness, (ii) declare or pay dividends, redeem stock or make other distributions to stockholders, (iii) make investments, (iv) create liens or use assets as security in other transactions, (v) merge or consolidate, or sell, transfer, lease or dispose of substantially all of its assets, (vi) enter into transactions with affiliates, and (vii) sell or transfer certain assets. These covenants contain various exceptions, limitations and qualifications. At any time that the Senior Notes are rated investment grade, certain of these covenants will be suspended.
The Senior Notes are guaranteed jointly and severally on a senior unsecured basis by RBC Bearings and certain of RBCA’s existing and future wholly-owned domestic subsidiaries that also guarantee the New Credit Agreement.
Interest on the Senior Notes accrues at a rate of 4.375% and is payable semi–annually in cash in arrears on April 15 and October 15 of each year.
The Senior Notes will mature on October 15, 2029. The Company may redeem some or all of the Senior Notes at any time on or after October 15, 2024 at the redemption prices set forth in the Indenture, plus accrued and unpaid interest, if any, to, but excluding, the redemption date. The Company may also redeem up to 40% of the Senior Notes using the proceeds of certain equity offerings completed before October 15, 2024, at a redemption price equal to 104.375% of the principal amount thereof, plus accrued and unpaid interest, if any, to, but excluding, the redemption date. In addition, at any time prior to October 15, 2024, the Company may redeem some or all of the Senior Notes at a price equal to 100% of the principal amount, plus a “make–whole” premium, plus accrued and unpaid interest, if any, to, but excluding, the redemption date. If the Company sells certain of its assets or experiences specific kinds of changes in control, the Company must offer to purchase the Senior Notes.
Foreign Borrowing Arrangements
One of our foreign subsidiaries, Schaublin SA (“Schaublin”), entered into two separate credit agreements in 2019 with Credit Suisse (Switzerland) Ltd. (the “Foreign Credit Agreements”) to (i) finance the acquisition of our Swiss Tool business unit, and (ii) provide future working capital. The Foreign Credit Agreements provided Schaublin with a CHF 15.0 (approximately $15.4 USD) term loan, which was extinguished in February 2022, and a CHF 15.0 (approximately $15.4 USD) revolving credit facility, which was terminated in October 2022. Schaublin now has a separate CHF 5.0 (approximately $5.4 USD) revolving credit facility (the “New Foreign Revolver”) with Credit Suisse to provide future working capital, if necessary. As of April 1, 2023, $0.1 had been borrowed from the New Foreign Revolver. Fees associated with the New Foreign Revolver are nominal.
The balances payable under all borrowing facilities are as follows:
| April 1, 2023 |
April 2, 2022 |
|||||||
| Revolver and term loan facilities | $ | 900.0 | $ | 1,200.0 | ||||
| Senior notes | 500.0 | 500.0 | ||||||
| Debt issuance cost | (13.7 | ) | (20.9 | ) | ||||
| Other | 8.7 | 9.2 | ||||||
| Total debt | 1,395.0 | 1,688.3 | ||||||
| Less: current portion | 1.5 | 1.5 | ||||||
| Long-term debt | $ | 1,393.5 | $ | 1,686.8 | ||||
13. Derivative Financial Instruments
The Company is exposed to certain risks relating to its ongoing business operations, including market risks relating to fluctuations in interest rates. Derivative financial instruments are recognized on the consolidated balance sheets as either assets or liabilities and are measured at fair value. Changes in the fair values of derivatives are recorded each period in earnings or accumulated other comprehensive income, depending on whether a derivative is effective as part of a hedged transaction. Gains and losses on derivative instruments reported in accumulated other comprehensive income (loss) are subsequently included in earnings in the periods in which earnings are affected by the hedged item. The Company does not use derivative instruments for speculative purposes.
On October 28, 2022, the Company entered into a three-year USD-denominated interest rate swap (the “Swap”) with a third-party financial counterparty under the New Credit Agreement (see Note 12). The Swap was executed to protect the Company from interest rate volatility on our variable-rate Term Loan Facility. The Swap became effective December 30, 2022 and is comprised of a $600.0 notional with a maturity of three years. We receive a variable rate based on one-month Term SOFR and pay a fixed rate of 4.455%. As of April 1, 2023, approximately 78.5% of our debt bears interest at a fixed rate. The notional on the Swap will amortize as follows:
Year 1: $600.0
Year 2: $400.0
Year 3: $100.0
The Swap has been designated as a cash flow hedge of the variability of the first unhedged interest payments (the hedged transactions) paid over the hedging relationship’s specified time period of three years attributable to the borrowing’s contractually specified interest index on the hedged principal of its general borrowing program or replacement or refinancing thereof. The fair value of the Swap has been disclosed in Note 4. The accumulated other comprehensive income derivative component balance was a $2.2 loss at April 1, 2023, net of taxes. The gain/loss reclassified from accumulated other comprehensive income into earnings will be recorded as interest income/expense on the Swap and will be included in the operating section of the Company’s consolidated statements of cash flows.
14. Other Noncurrent Liabilities
The significant components of other noncurrent liabilities consist of:
| April 1, 2023 |
April 2, 2022 |
|||||||
| Other postretirement benefits | $ | 10.0 | $ | 16.3 | ||||
| Noncurrent income tax liability | 14.6 | 18.1 | ||||||
| Deferred compensation | 25.7 | 26.4 | ||||||
| Contract liabilities | 19.8 | 10.4 | ||||||
| Noncurrent finance lease liabilities | 48.5 | 48.0 | ||||||
| Other | 4.1 | 1.2 | ||||||
| $ | 122.7 | $ | 120.4 | |||||
15. Employee Benefit Plans
Noncontributory Defined Benefit Pension Plan
At April 1, 2023, the Company has one consolidated noncontributory defined benefit pension plan (the “Plan”) covering union employees in its Heim division plant in Fairfield, Connecticut, its Plymouth subsidiary plant in Plymouth, Indiana and former union employees of the Tyson subsidiary in Glasgow, Kentucky and the Nice subsidiary in Kulpsville, Pennsylvania.
Plan assets are comprised primarily of equity and fixed income investments. As of April 1, 2023 and April 2, 2022, Plan assets were $8.7 and $26.0, respectively.
The fair value of the above investments was determined using quoted market prices of identical instruments. Therefore, the valuation inputs within the fair value hierarchy established by ASC 820 were classified as Level 1 of the valuation hierarchy.
Benefits under the Plan are not a function of employees’ salaries; thus, the accumulated benefit obligation equals the projected benefit obligation. At April 1, 2023 and April 2, 2022, the projected benefit obligation was $3.8 and $22.8, respectively.
The discount rates used in determining the funded status of the Plan as of April 1, 2023 and April 2, 2022 were 4.70% and 3.30%, respectively.
The funded status of the Plan and the amount recognized in the balance sheet at April 1, 2023 and April 2, 2022 were $4.9 and $3.2, respectively. These overfunded amounts are included within noncurrent assets on the consolidated balance sheets.
Net periodic benefit cost of the Plan for fiscal years 2023, 2022 and 2021 was $0.2, $0.0 and $0.5, respectively. The discount rate used to determine net periodic benefit cost for fiscal years 2023, 2022 and 2021 was 3.30%, 2.70% and 2.80%, respectively.
On March 30, 2023, the Company was able to significantly reduce its liabilities associated with the Plan by executing a non-participating Single Group Premium Annuity Contract (“the Annuity Contract”) with American United Life Insurance Company (“AUL”), a OneAmerica Company. The Contract transfers the burden of making future benefit payments for transferring annuitants to AUL in return for a fixed one-time premium. The annuitants were primarily comprised of retirees and vested participants who had been terminated. As a result of this pension settlement, Plan assets decreased by $15.6, the projected benefit obligation decreased by $15.6, and the Company recognized a settlement loss of $4.3, included in other non-operating expense/(income). The $4.3 settlement loss was previously included within accumulated other comprehensive income/loss on the consolidated balance sheets.
Foreign Pension Plans
Two of the Company’s foreign operations, Schaublin and Swiss Tool, sponsor pension plans for their approximately 149 and 29 employees, respectively, in conformance with Swiss pension law. The Schaublin plan is funded with an independent semi-autonomous collective provident foundation whereas the Swiss Tool plan is funded with a reputable Swiss insurer. The unfunded liabilities of these plans at April 1, 2023 were $1.5. For fiscal years 2023, 2022 and 2021, net periodic benefit cost for these plans was $1.8, $1.7 and $1.1, respectively.
401(k) Plans
The Company has defined contribution plans under Section 401(k) of the Internal Revenue Code for all of its employees not covered by a collective bargaining agreement. Employer contributions under this plan, ranging from 10%-100% of eligible amounts contributed by employees, amounted to $8.6, $4.6 and $2.2 in fiscal 2023, 2022 and 2021, respectively.
Supplemental Executive Retirement Plan
The Company maintains a non-qualified Supplemental Executive Retirement Plan (“SERP”) for a select group of senior management employees. The SERP allows eligible employees to elect to defer up to 75% of their current salary and up to 100% of bonus compensation. The SERP also includes employees of the Dodge division. As of April 1, 2023 and April 2, 2022, the SERP assets were $28.6 and $30.5, respectively, and are included within other noncurrent assets on the consolidated balance sheets. As of April 1, 2023 and April 2, 2022, the SERP liabilities were $25.7 and $26.4, respectively, and are included within accrued expenses and other current liabilities and other noncurrent liabilities on the balance sheets.
Defined Benefit Health Care Plans
The Company, for the benefit of employees at its Heim, West Trenton, Plymouth and PIC facilities and former union employees of its Tyson and Nice subsidiaries, sponsors contributory defined benefit health care plans that provide postretirement medical and life insurance benefits to union employees who have attained certain age and/or service requirements while employed by the Company. The plans are unfunded and costs are paid as incurred. Postretirement benefit obligations were $2.4 and $2.3 at April 1, 2023 and April 2, 2022, respectively. Of these amounts, $0.2 are considered current and are included within accrued expenses and other current liabilities on the consolidated balance sheets as of both April 1, 2023 and April 2, 2022. The remainder of the balances are included in other noncurrent liabilities in the consolidated balance sheets. The Company also maintains a frozen defined benefit heath care plan for employees of the Dodge division with postretirement benefit obligations of $6.3 and $10.0 at April 1, 2023 and April 2, 2022, respectively. Of these amounts, $0.8 and $1.2 are considered current at April 1, 2023 and April 2, 2022, respectively. The amounts are included within the same balance sheet line items as other postretirement health care plans maintained by the Company.
16. Income Taxes
Income before income taxes for the Company’s domestic and foreign operations is as follows:
| Fiscal Year Ended | ||||||||||||
| April 1, 2023 |
April 2, 2022 |
April 3, 2021 |
||||||||||
| Domestic | $ | 191.0 | $ | 68.8 | $ | 108.6 | ||||||
| Foreign | 18.7 | 9.9 | 4.6 | |||||||||
| Total income before income taxes | $ | 209.7 | $ | 78.7 | $ | 113.2 | ||||||
The provision for income taxes consists of the following:
| Fiscal Year Ended | ||||||||||||
April
1, |
April
2, |
April
3, |
||||||||||
| Current tax expense: | ||||||||||||
| Federal | $ | 53.0 | $ | 18.3 | $ | 15.2 | ||||||
| State | 7.5 | 2.6 | 1.1 | |||||||||
| Foreign | 3.9 | 2.9 | 2.6 | |||||||||
| 64.4 | 23.8 | 18.9 | ||||||||||
| Deferred tax expense: | ||||||||||||
| Federal | (20.0 | ) | (0.5 | ) | 2.7 | |||||||
| State | (2.6 | ) | (0.3 | ) | 1.5 | |||||||
| Foreign | 1.2 | 1.0 | (0.0 | ) | ||||||||
| (21.4 | ) | 0.2 | 4.2 | |||||||||
| Total income taxes | $ | 43.0 | $ | 24.0 | $ | 23.1 | ||||||
An analysis of the difference between the provision for income taxes and the amount computed by applying the U.S. statutory income tax rate to pre-tax income follows:
| Fiscal Year Ended | ||||||||||||
April 1, 2023 |
April 2, 2022 |
April 3, 2021 |
||||||||||
| Income taxes using U.S. federal statutory rate | $ | 44.0 | $ | 16.5 | $ | 23.8 | ||||||
| State income taxes, net of federal benefit | 3.9 | 1.9 | 2.3 | |||||||||
| Stock-based compensation | (1.6 | ) | (2.6 | ) | (2.6 | ) | ||||||
| Foreign rate differential | 1.1 | 1.6 | 1.6 | |||||||||
| Research and development credits | (2.4 | ) | (1.5 | ) | (1.3 | ) | ||||||
| Company-owned life insurance | 0.3 | (0.0 | ) | (1.2 | ) | |||||||
| Foreign derived intangible income (FDII) | (2.7 | ) | (1.5 | ) | (1.1 | ) | ||||||
| U.S. unrecognized tax positions | (1.9 | ) | 5.4 | 1.8 | ||||||||
| Acquisition costs | 0.0 | 1.7 | ||||||||||
| Valuation allowance | 0.0 | 2.3 | 0.2 | |||||||||
| Other - net | 2.3 | 0.2 | (0.4 | ) | ||||||||
| $ | 43.0 | $ | 24.0 | $ | 23.1 | |||||||
Net deferred tax assets (liabilities) are comprised of the following:
April 1, 2023 |
April 2, 2022 |
|||||||
| Deferred tax assets: | ||||||||
| Pension and postretirement benefits | $ | 1.8 | $ | 2.7 | ||||
| Employee compensation accruals | 10.9 | 8.2 | ||||||
| Inventory | 15.8 | 14.1 | ||||||
| Operating lease liabilities | 7.8 | 8.8 | ||||||
| Finance lease liabilities | 0.0 | 7.7 | ||||||
| Stock compensation | 3.4 | 4.2 | ||||||
| Tax loss and credit carryforwards | 12.5 | 12.1 | ||||||
| State tax | 1.3 | 1.4 | ||||||
| Other accrued liabilities | 8.9 | 11.4 | ||||||
| Other | 13.9 | 2.4 | ||||||
| Total gross deferred tax assets | 76.3 | 73.0 | ||||||
| Valuation allowance | (8.5 | ) | (8.6 | ) | ||||
| Total deferred tax assets | $ | 67.8 | $ | 64.4 | ||||
| Deferred tax liabilities: | ||||||||
| Property, plant and equipment | $ | (33.5 | ) | $ | (42.7 | ) | ||
| Operating lease assets | (7.7 | ) | (8.9 | ) | ||||
| Other | (3.3 | ) | (2.9 | ) | ||||
| Intangible assets | (317.4 | ) | (324.4 | ) | ||||
| Total deferred tax liabilities | $ | (361.9 | ) | $ | (378.9 | ) | ||
| Total net deferred liabilities | $ | (294.1 | ) | $ | (314.5 | ) | ||
The Company evaluates deferred tax assets to ensure that the estimated future taxable income will be sufficient in character (i.e. capital versus ordinary income treatment), amount and timing to result in their recovery. After considering the positive and negative evidence, a valuation allowance has been recorded on foreign tax credits and on certain state and foreign credits and net operating losses as it is more likely than not (i.e. greater than a 50% likelihood) that these items will not be utilized. For the Company’s fiscal year ended April 1, 2023 the valuation allowance decreased by less than $0.2. For the Company’s fiscal year ended April 2, 2022 the valuation allowance increased by $2.4, which primarily pertained to a capital loss carryforward and an increase of U.S. federal and state credits. These valuation allowances are required because management has determined, based on financial projections and available tax strategies, that it is unlikely the net operating losses and credits will be utilized before they expire. If events or circumstances change, valuation allowances are adjusted at that time resulting in an income tax benefit or charge.
At April 1, 2023, the Company had state net operating loss carryovers in different jurisdictions at varying amounts up to $7.2, which expire at various dates through 2036. At April 1, 2023, the Company had foreign net operating loss carryovers in different jurisdictions at varying amounts that sum up to $2.3 which will expire at various dates through fiscal 2028. At April 1, 2023, the Company had U.S. federal and state credits in different jurisdictions at varying amounts up to $10 which principally expire at various dates through 2038. At April 1, 2023, the Company had Canadian investment tax credits up to $0.2 which will expire at various dates through 2037.
Under accounting standards (ASC 740) a deferred tax liability is not recorded for the excess of the tax basis over the financial reporting (book) basis of an investment in a foreign subsidiary if the indefinite reinvestment criteria is met. The Tax Cuts and Jobs Act (TCJA) required a mandatory deemed repatriation of certain undistributed earnings of the Company’s foreign subsidiaries as of December 31, 2017, and income taxes were accrued accordingly. If these deemed repatriated earnings were distributed in the form of cash dividends, the Company would not be subject to additional U.S. income taxes, other than tax arising from the movement of foreign exchange rates on previously taxed earnings, but could be subject to foreign income and withholding taxes. A provision has not been made for additional U.S. and foreign taxes at April 1, 2023 on approximately $63.1 of undistributed earnings of foreign subsidiaries or for any additional tax on the deemed repatriated earnings because the Company intends to reinvest these funds indefinitely to support foreign growth opportunities. Due to the inherent complexity of the multinational tax environment in which the company operates, it is not practicable to estimate the unrecognized deferred tax liability on these undistributed earnings. These earnings could become subject to additional tax under certain circumstances including, but not limited to, loans to the Company, or upon sale or pledging of the foreign subsidiary’s stock.
Uncertain Tax Positions
Unrecognized income tax benefits represent income tax positions taken on income tax returns but not yet recognized in the consolidated financial statements. If recognized, substantially all of the unrecognized tax benefits for the Company’s fiscal years ended April 1, 2023 and April 2, 2022 would affect the effective income tax rate.
A reconciliation of the beginning and ending amount of unrecognized tax benefits is as follows:
April 1, 2023 |
April 2, 2022 |
April 3, 2021 |
||||||||||
| Balance, beginning of year | $ | 22.8 | $ | 16.6 | $ | 14.2 | ||||||
| Gross increases (decreases) – tax positions taken during a prior period | (8.9 | ) | 0.4 | (0.2 | ) | |||||||
| Gross increases – tax positions taken during the current period | 1.7 | 7.6 | 4.0 | |||||||||
| Reductions due to lapse of the applicable statute of limitations | (2.5 | ) | (1.8 | ) | (1.4 | ) | ||||||
| Balance, end of year | $ | 13.1 | $ | 22.8 | $ | 16.6 | ||||||
The Company recognizes the interest and penalties accrued related to unrecognized tax benefits in income tax expense. The Company recognized expense of $0.1, $0.1 and $0.1 of interest and penalties on its statement of operations for the fiscal years ended April 1, 2023, April 2, 2022 and April 3, 2021, respectively. The Company had approximately $1.5 and $1.4 of accrued interest and penalties at April 1, 2023 and April 2, 2022, respectively.
The Company believes it is reasonably possible that some of its unrecognized tax positions may be effectively settled by the end of the Company’s fiscal year ending April 1, 2024, due to the closing of audits and the statute of limitations expiring in various jurisdictions. The decrease, pertaining primarily to federal and state credits and state tax, is estimated to be $2.1.
The Company files income tax returns in numerous U.S. and foreign jurisdictions, with returns subject to examination for varying periods, but generally back to and including the year ending March 28, 2020, although certain tax credits generated in earlier years are open under statute from April 1, 2006. The Company is no longer subject to U.S. federal tax examination by the Internal Revenue Service for years ending before March 28, 2020.
17. Stockholders’ Equity
Preferred Stock
We are authorized to issue 10,000,000 shares of preferred stock, $0.01 par value per share, in one or more series and to fix the powers, designations, preferences and relative participating, option or other rights thereof, including dividend rights, conversion rights, voting rights, redemption terms, liquidation preferences and the number of shares constituting any series, without any further vote or action by our stockholders.
On September 24, 2021, we completed an offering of 4,600,000 shares of 5.00% Series A Mandatory Convertible Preferred Stock (“MCPS”) in a public offering registered under the Securities Act of 1933, as amended (the “Securities Act”), including 600,000 shares issued pursuant to the full exercise of the option granted to the underwriters of the MCPS offering to purchase additional shares solely to cover over-allotments. The trading symbol for the MCPS is “RBCP.” The net proceeds from the offering were approximately $445.3 after deducting underwriting discounts and commissions and offering expenses. On November 1, 2021, the Company used the proceeds to fund a portion of the purchase price for the acquisition of Dodge.
Holders of MCPS are entitled to receive, when, as and if declared by our Board of Directors, or an authorized committee thereof, out of funds legally available for payment, cumulative dividends at the annual rate of 5.00% of the liquidation preference of $100 per share, payable in cash or, subject to certain limitations, by delivery of shares of common stock or any combination of cash and shares of common stock, at our election; provided, however, that any unpaid dividends on the MCPS will continue to accumulate as described in the Certificate of Designations that sets forth the rights, preferences and privileges of the MCPS. The Company made dividend payments of $5.8 on April 15, 2022, $5.7 on July 15, 2022, $5.7 on October 17, 2022, and $5.7 on January 17, 2023. The Company also had accrued $4.9 as of April 1, 2023 for dividends that were to be paid on April 17, 2023.
The MCPS has a liquidation preference of $100 per share plus accrued and unpaid dividends. As of April 1, 2023, the MCPS had an aggregate liquidation preference of $464.9.
Subject to certain exceptions, no dividend or distribution will be declared or paid on shares of our common stock, and no common stock will be purchased, redeemed or otherwise acquired for consideration by us or any of our subsidiaries unless, in each case, all accumulated and unpaid dividends for all preceding dividend periods have been declared and paid, or a sufficient amount of cash or number of shares of common stock has been set apart for the payment of such dividends, on all outstanding shares of MCPS. In the event of our voluntary or involuntary liquidation, winding-up or dissolution, no distribution of our assets may be made to holders of our common stock until we have paid holders of MCPS, each of which will be entitled to receive a liquidation preference in the amount of $100 per share plus accumulated and unpaid dividends.
Unless earlier converted or redeemed, each share of MCPS will automatically convert, for settlement on or about October 15, 2024, into between 0.4413 and 0.5405 shares of common stock, subject to customary anti-dilution adjustments. The conversion rate that will apply to mandatory conversions will be determined based on the average of the daily volume-weighted average prices over the 20 consecutive trading days beginning on, and including, the 21st scheduled trading day immediately before October 15, 2024. The conversion rate applicable to mandatory conversions may in certain circumstances be increased to compensate holders of the MCPS for certain unpaid accumulated dividends.
Common Stock
We are authorized to issue 60,000,000 shares of common stock, $0.01 par value per share. Holders of common stock are entitled to one vote per share. Holders of common stock are entitled to receive dividends, if and when declared by our Board of Directors, and to share ratably in our assets legally available for distribution to our stockholders in the event of liquidation after giving effect to any liquidation preference for the benefit of the MCPS or any other preferred stock then outstanding. Holders of common stock have no preemptive, subscription, redemption, or conversion rights. The holders of common stock do not have cumulative voting rights. The holders of a majority of the shares of common stock can elect all of the directors and can control our management and affairs.
On September 24, 2021, we completed an offering of 3,450,000 shares of common stock in a public offering registered under the Securities Act at an offering price of $185 per share, including 450,000 shares issued pursuant to the full exercise of the option granted to the underwriters of the offering to purchase additional shares. The net proceeds from the offering were approximately $605.5 after deducting underwriting discounts and commissions and offering expenses. On November 1, 2021, the Company used the proceeds to fund a portion of the cash purchase price for the acquisition of Dodge.
Long-Term Equity Incentive Plans
2013 Long-Term Incentive Plan. The 2013 Long-Term Incentive Plan provided for grants of stock options, stock appreciation rights, restricted stock and performance awards. The purpose of the Plan was to provide our directors, officers and other employees and persons who engage in services for us with incentives to maximize stockholder value and otherwise contribute to our success and to enable us to attract, retain and reward the best available persons for positions of responsibility. 1,500,000 shares of common stock were authorized for issuance under the Plan. The Company’s Compensation Committee administers the Plan. The Company’s Board also has the authority to administer the Plan and to take all actions that the Compensation Committee is otherwise authorized to take under the Plan. The terms and conditions of each award made under the Plan, including vesting requirements, is set forth consistent with the Plan in a written agreement with the grantee.
2017 Long-Term Incentive Plan. The 2017 Long-Term Incentive Plan provides for grants of stock options, stock appreciation rights, restricted stock and performance awards. Directors, officers and other employees and persons who engage in services for the Company are eligible for grants under the Plan. The purpose of the Plan is to provide these individuals with incentives to maximize stockholder value and otherwise contribute to the Company’s success and to enable the Company to attract, retain and reward the best available persons for positions of responsibility. 1,500,000 shares of common stock were authorized for issuance under the Plan, subject to adjustment in the event of a reorganization, stock split, merger or similar change in the Company’s corporate structure or in the outstanding shares of common stock. The Company may grant shares of restricted stock to its employees and directors in the future under the Plan. The Company’s Compensation Committee administers the Plan. The Company’s Board also has the authority to administer the Plan and to take all actions that the Compensation Committee is otherwise authorized to take under the Plan. The terms and conditions of each award made under the Plan, including vesting requirements, is set forth consistent with the Plan in a written agreement with the grantee.
2021 Long-Term Incentive Plan. The 2021 Long-Term Incentive Plan provides for grants of stock options, stock appreciation rights, restricted stock and performance awards. Directors, officers and other employees and persons who engage in services for the Company are eligible for grants under the Plan. The purpose of the Plan is to provide these individuals with incentives to maximize stockholder value and otherwise contribute to the Company’s success and to enable the Company to attract, retain and reward the best available persons for positions of responsibility. 1,500,000 shares of common stock were authorized for issuance under the Plan, subject to adjustment in the event of a reorganization, stock split, merger or similar change in the Company’s corporate structure or in the outstanding shares of common stock. The Company may grant shares of restricted stock to its employees and directors in the future under the Plan. The Company’s Compensation Committee administers the Plan. The Company’s Board also has the authority to administer the Plan and to take all actions that the Compensation Committee is otherwise authorized to take under the Plan. The terms and conditions of each award made under the Plan, including vesting requirements, is set forth consistent with the Plan in a written agreement with the grantee.
Stock Options. Under the Plans, the Compensation Committee or the Board may approve the award of grants of incentive stock options and other non-qualified stock options. The Compensation Committee also has the authority to approve the grant of options that will become fully vested and exercisable automatically upon a change in control. The Compensation Committee may not, however, approve an award to any one person in any calendar year for options to purchase common stock equal to more than 10% of the total number of shares authorized under the relevant Plan, and it may not approve an award of incentive options first exercisable in any calendar year whose underlying shares have a fair market value greater than $0.1 determined at the time of grant. The Compensation Committee will approve the exercise price and term of any option in its discretion; however, the exercise price may not be less than 100% of the fair market value of a share of common stock on the date of grant. Under the Plans, any incentive stock option must be exercised within seven years of the date of grant. Under the Plans, the exercise price of an incentive option awarded to a person who owns stock constituting more than 10% of the Company’s voting power may not be less than 110% of such fair market value on such date and the option must be exercised within five years of the date of grant. As of April 1, 2023, there were 92,736 outstanding options to purchase shares of common stock granted under the 2013 Long-Term Incentive Plan, 92,336 of which were exercisable. As of April 1, 2023, there were 530,899 outstanding options to purchase shares of common stock granted under the 2017 Long-Term Incentive Plan, 184,437 of which were exercisable. As of April 1, 2023, there were no outstanding options to purchase shares of common stock granted under the 2021 Long-Term Incentive Plan.
Restricted Stock. Under the Plans, the Compensation Committee may approve the award of restricted stock subject to the conditions and restrictions, and for the duration that it determines in its discretion. Under the 2017 and 2021 Long-Term Incentive Plans, the number of shares that may be used for restricted stock or restricted unit grants under the Plan may not exceed 50% of the total authorized number of shares under the Plan. As of April 1, 2023, there were 2,000, 190,124 and zero shares of restricted stock outstanding under the 2013, 2017 and 2021 Long-Term Incentive Plans, respectively.
Performance Awards. The Compensation Committee may approve the grant of performance awards contingent upon achievement by the grantee or by the Company, of set goals and objectives regarding specified performance criteria, over a specified performance cycle. Awards may include specific dollar-value target awards, performance units, the value of which is established at the time of grant, and/or performance shares, the value of which is equal to the fair market value of a share of common stock on the date of grant. The value of a performance award may be fixed or fluctuate on the basis of specified performance criteria. A performance award may be paid out in cash and/or shares of common stock or other securities. Certain senior executive officers receive performance awards in the form of stock options and restricted stock, as described in the preceding paragraphs.
Stock Appreciation Rights. The Compensation Committee may approve the grant of stock appreciation rights, or SARs, subject to the terms and conditions contained in the Plans. The exercise price of a SAR must equal the fair market value of a share of the Company’s common stock on the date the SAR was granted. Upon exercise of a SAR, the grantee will receive an amount in shares of our common stock equal to the difference between the fair market value of a share of common stock on the date of exercise and the exercise price of the SAR, multiplied by the number of shares as to which the SAR is exercised. There were no SARs issued or outstanding under the Plans as of April 1, 2023.
Amendment and Termination of the Plans. Except as otherwise provided in an award agreement, the Board of Directors, without approval of the stockholders, may amend or terminate the Plans, except that no amendment will become effective without prior approval of the stockholders of the Company if stockholder approval would be required by applicable law or regulations, including if required (i) under the provisions of Section 409A or any successor thereto, (ii) under the provisions of Section 422 of the Code or any successor thereto, or (iii) by any listing requirement of the principal stock exchange on which the common stock is then listed. Subject to the provisions of an award agreement, which may be more restrictive, no termination of the Plans shall materially and adversely affect any of the rights or obligations of any person, without his or her written consent, under any grant of options or other incentives previous granted under the Plans.
A summary of the status of the Company’s stock options outstanding as of April 1, 2023 and changes during the year then ended is presented below. All cashless exercises of options are handled through an independent broker.
| Number Of Common Stock Options |
Weighted Average Exercise Price |
Weighted Average Contractual Life (Years) |
Intrinsic Value ($ in millions) |
|||||||||||||
| Outstanding, April 2, 2022 | 695,887 | $ | 141.36 | 4.1 | $ | 38.3 | ||||||||||
| Awarded | 46,985 | 207.06 | ||||||||||||||
| Exercised | (116,563 | ) | 99.89 | |||||||||||||
| Forfeitures | (2,332 | ) | 172.27 | |||||||||||||
| Expirations | (342 | ) | 133.67 | |||||||||||||
| Outstanding, April 1, 2023 | 623,635 | $ | 153.95 | 3.7 | $ | 49.2 | ||||||||||
| Exercisable, April 1, 2023 | 276,773 | $ | 132.86 | 2.7 | $ | 27.6 | ||||||||||
The fair value for the Company’s options was estimated at the date of grant using the Black-Scholes option pricing model with the following weighted-average assumptions, which are updated to reflect current expectations of the dividend yield, expected life, risk-free interest rate and using historical volatility to project expected volatility:
| Fiscal Year Ended | ||||||||||||
| April 1, 2023 |
April 2, 2022 |
April 3, 2021 |
||||||||||
| Dividend yield | 0.00 | % | 0.00 | % | 0.00 | % | ||||||
| Expected weighted-average life (yrs.) | 5.0 | 5.0 | 5.0 | |||||||||
| Risk-free interest rate | 3.05 | % | 0.95 | % | 0.35 | % | ||||||
| Expected volatility | 45.57 | % | 43.43 | % | 41.35 | % | ||||||
The weighted average fair value per share of options granted was $90.39 in fiscal 2023, $76.65 in fiscal 2022 and $52.78 in fiscal 2021.
The Company recorded $2.4 (net of taxes of $0.7) in compensation in fiscal 2023 related to option awards. As of April 1, 2023, there was $8.2 of unrecognized compensation costs related to options which is expected to be recognized over a weighted average period of 3.5 years. The total intrinsic value of options exercised in fiscal 2023, 2022 and 2021 was $16.9, $11.9 and $12.7, respectively.
Of the total awards outstanding at April 1, 2023, 620,981 were either fully vested or are expected to vest. These shares have a weighted average exercise price of $153.80, an intrinsic value of $49.0 and a weighted average contractual term of 3.7 years.
A summary of the status of the Company’s restricted stock outstanding as of April 1, 2023 and the changes during the year then ended is presented below.
| Number Of Restricted Stock Shares |
Weighted- Average Grant Date Fair Value |
|||||||
| Non-vested, April 2, 2022 | 228,649 | $ | 169.69 | |||||
| Granted | 69,004 | 201.60 | ||||||
| Vested | (102,772 | ) | 159.71 | |||||
| Forfeitures | (2,757 | ) | 158.23 | |||||
| Non-vested, April 1, 2023 | 192,124 | $ | 186.67 | |||||
The weighted average fair value per share of restricted stock awards granted was $201.60 in fiscal 2023, $198.04 in fiscal 2022 and $153.70 in fiscal 2021.
The Company recorded $8.4 (net of taxes of $2.5) in compensation in fiscal 2023 related to restricted stock awards. These awards were valued at the fair market value of the Company’s common stock on the date of issuance and are being amortized as expense over the applicable vesting period. The total fair value of restricted stock awards that vested during fiscal 2023, 2022, and 2021 was $21.2, $22.1 and $19.5 , respectively. Unrecognized expense for restricted stock was $16.3 at April 1, 2023. This cost is expected to be recognized over a weighted average period of approximately 2.8 years.
18. Commitments and Contingencies
As of April 1, 2023, approximately 6% of the Company’s hourly employees in the U.S. and abroad were represented by labor unions.
The Company enters into U.S. government contracts and subcontracts that are subject to audit by the U.S. government. In the opinion of the Company’s management, the results of such audits, if any, are not expected to have a material impact on the cash flows, financial condition or results of operations of the Company.
For fiscal 2023, 2022 and 2021, there were no audits by the U.S. government, the results of which, in the opinion of the Company’s management, had a material impact on the cash flows, financial condition or results of operations of the Company.
The Company is subject to federal, state and local environmental laws and regulations, including those governing discharges of pollutants into the air and water, the storage, handling and disposal of wastes and the health and safety of employees. The Company also may be liable under the Comprehensive Environmental Response, Compensation, and Liability Act or similar state laws for the costs of investigation and cleanup of contamination at facilities currently or formerly owned or operated by the Company, or at other facilities at which the Company may have disposed of hazardous substances. In connection with such contamination, the Company may also be liable for natural resource damages, U.S. government penalties and claims by third parties for personal injury and property damage. Agencies responsible for enforcing these laws have authority to impose significant civil or criminal penalties for non-compliance. The Company believes it is currently in material compliance with all applicable requirements of environmental laws. The Company does not anticipate material capital expenditures for environmental compliance in fiscal years 2024 or 2025.
Investigation and remediation of contamination is ongoing at some of the Company’s sites. In particular, state agencies have been overseeing groundwater monitoring activities at the Company’s facility in Hartsville, South Carolina. At Hartsville, the Company is monitoring low levels of contaminants in the groundwater caused by former operations. Plans are currently underway to conclude remediation and monitoring activities. In connection with the purchase of the Fairfield, Connecticut facility in 1996, the Company agreed to assume responsibility for completing clean-up efforts previously initiated by the prior owner. The Company submitted data to the state that the Company believes demonstrates that no further remedial action is necessary, although the state may require additional clean-up or monitoring.
On March 9, 2022 and March 21, 2023, the Company received civil investigative demands from the United States Department of Justice pursuant to the False Claims Act, 31 U.S.C. § 3733 (the “FCA”). The investigation concerns allegations that the Company submitted false claims in connection with (i) certifying that the Company’s employees were eligible for unemployment insurance benefits and pandemic relief and worked reduced hours and (ii) received grant proceeds in violation of the FCA. The Company is cooperating with the investigation. As the investigation is in its early stages, it is not possible to determine whether the investigation will have a material adverse effect, if any, on the Company.
Besides the matter described in the previous paragraph, from time to time we are involved in litigation that arises in the ordinary course of business, but we do not believe that any such litigation in which we are currently involved, either individually or in the aggregate, is likely to have a material adverse effect on our business, financial condition, operating results, cash flow or prospects.
The Company has $3.7 of outstanding standby letters of credit, all of which are under the Revolving Credit Facility. We also have a contractual obligation for licenses related to the implementation and upgrade of an enterprise resource planning (“ERP”) system for Dodge. These ERP license costs of $10.5 will be incurred over a five-year period.
19. Other, Net
Other, net is comprised of the following:
| Fiscal Year Ended | ||||||||||||
| April 1, 2023 |
April 2, 2022 |
April 3, 2021 |
||||||||||
| Plant consolidation and restructuring costs | $ | 2.5 | $ | 1.1 | $ | 2.9 | ||||||
| Acquisition costs and transition services | 8.9 | 30.6 | ||||||||||
| Provision for doubtful accounts | 0.8 | 0.5 | 0.5 | |||||||||
| Amortization of intangibles | 69.1 | 34.7 | 10.2 | |||||||||
| Loss on disposal of assets | 0.3 | 0.3 | 1.3 | |||||||||
| Other expense | 0.5 | 1.2 | 1.8 | |||||||||
| $ | 82.1 | $ | 68.4 | $ | 16.7 | |||||||
20. Reportable Segments
The Company operates through operating segments and reports its financial results based on how its chief operating decision maker makes operating decisions, assesses the performance of the business, and allocates resources. Our operating segments are our reportable segments. These reportable segments are Aerospace/Defense and Industrial and are described below.
Aerospace/Defense. This segment represents the end markets for the Company’s highly engineered bearings and precision components used in commercial aerospace, defense aerospace, and sea and ground defense applications.
Industrial. This segment represents the end markets for the Company’s highly engineered bearings and precision components used in various industrial applications including: power transmission; construction, mining, energy and specialized equipment manufacturing; semiconductor production equipment manufacturing; agricultural machinery, commercial truck and automotive manufacturing; and tool holding.
The accounting policies of the reportable segments are the same as those described in Note 2 “Summary of Significant Accounting Policies.” Segment performance is evaluated based on segment net sales and gross margin. Items not allocated to segment operating income include corporate administrative expenses and certain other amounts. Identifiable assets by reportable segment consist of those directly identified with the segment’s operations.
| Fiscal Year Ended | ||||||||||||
| April 1, 2023 |
April 2, 2022 |
April 3, 2021 |
||||||||||
| Net External Sales | ||||||||||||
| Aerospace/Defense | $ | 430.3 | $ | 381.5 | $ | 396.2 | ||||||
| Industrial | 1,039.0 | 561.4 | 212.8 | |||||||||
| $ | 1,469.3 | $ | 942.9 | $ | 609.0 | |||||||
| Gross Margin | ||||||||||||
| Aerospace/Defense | $ | 171.0 | $ | 155.1 | $ | 161.2 | ||||||
| Industrial | 433.8 | 202.0 | 72.9 | |||||||||
| $ | 604.8 | $ | 357.1 | $ | 234.1 | |||||||
| Selling, General and Administrative Expenses | ||||||||||||
| Aerospace/Defense | $ | 31.1 | $ | 29.0 | $ | 29.1 | ||||||
| Industrial | 122.5 | 58.6 | 18.0 | |||||||||
| Corporate | 76.1 | 80.0 | 55.7 | |||||||||
| $ | 229.7 | $ | 167.6 | $ | 102.8 | |||||||
| Operating Income | ||||||||||||
| Aerospace/Defense | $ | 132.7 | $ | 117.8 | $ | 122.4 | ||||||
| Industrial | 236.5 | 107.5 | 52.9 | |||||||||
| Corporate | (76.2 | ) | (104.2 | ) | (60.7 | ) | ||||||
| $ | 293.0 | $ | 121.1 | $ | 114.6 | |||||||
| Total Assets | ||||||||||||
| Aerospace/Defense | $ | 749.8 | $ | 776.5 | $ | 792.3 | ||||||
| Industrial | 3,845.7 | 3,920.9 | 357.4 | |||||||||
| Corporate | 94.9 | 148.0 | 284.6 | |||||||||
| $ | 4,690.4 | $ | 4,845.4 | $ | 1,434.3 | |||||||
| Capital Expenditures | ||||||||||||
| Aerospace/Defense | $ | 9.5 | $ | 7.5 | $ | 8.7 | ||||||
| Industrial | 29.1 | 19.3 | 3.0 | |||||||||
| Corporate | 3.4 | 3.0 | 0.1 | |||||||||
| $ | 42.0 | $ | 29.8 | $ | 11.8 | |||||||
| Depreciation & Amortization | ||||||||||||
| Aerospace/Defense | $ | 18.6 | $ | 19.1 | $ | 19.9 | ||||||
| Industrial | 93.4 | 43.1 | 9.6 | |||||||||
| Corporate | 3.4 | 3.3 | 3.2 | |||||||||
| $ | 115.4 | $ | 65.5 | $ | 32.7 | |||||||
| Geographic External Sales | ||||||||||||
| Domestic | $ | 1,292.9 | $ | 833.4 | $ | 546.0 | ||||||
| Foreign | 176.4 | 109.5 | 63.0 | |||||||||
| $ | 1,469.3 | $ | 942.9 | $ | 609.0 | |||||||
| Geographic Long-Lived Assets | ||||||||||||
| Domestic | $ | 360.7 | $ | 373.0 | $ | 188.4 | ||||||
| Foreign | 56.0 | 58.2 | 55.5 | |||||||||
| $ | 416.7 | $ | 431.2 | $ | 243.9 | |||||||
21. Related Party Transactions
Equity Method Investee
The Company has a joint venture in North America focused on joint logistics and e-business services. This joint venture, CoLinx, LLC (“CoLinx”), includes five equity members: Timken, SKF Group, Schaeffler Group, RBC Bearings Incorporated and Gates Industrial Corp. The e-business service focuses on information and business services for authorized distributors in the Industrial segment. RBC Bearings Incorporated became a part of this joint venture as a result of the acquisition of Dodge on November 1, 2021. Total purchases from CoLinx for the fiscal years ended April 1, 2023 and April 2, 2022 were $18.4 and $7.2, respectively, and were included within selling, general and administrative costs on the consolidated statements of operations. Amounts outstanding in respect of these transactions were payables of $1.8 and $2.5 as of April 1, 2023 and April 2, 2022, respectively, and were included within accounts payable on the consolidated balance sheets. No dividends were received from CoLinx during the periods presented. The Company does not have any other equity method investees. The Company does not have any other significant related party transactions.
ITEM 9. CHANGES IN AND DISAGREEMENTS WITH ACCOUNTANTS ON ACCOUNTING AND FINANCIAL DISCLOSURE
None.
ITEM 9A. CONTROLS AND PROCEDURES
Evaluation of Disclosure Controls and Procedures
The Company’s management is responsible for establishing and maintaining effective disclosure controls and procedures, as defined under Rule 13a-15(e) of the Securities Exchange Act of 1934. As of the end of the period covered by this report, the Company performed an evaluation, under the supervision and with the participation of the Company’s management, including its Chief Executive Officer and Chief Financial Officer, of the effectiveness of the Company’s disclosure controls and procedures. In making its assessment, management has utilized the criteria set forth by the Committee of Sponsoring Organizations (COSO) of the Treadway Commission in Internal Control — Integrated Framework (2013 Framework). Based upon that evaluation, the Company’s Chief Executive Officer and Chief Financial Officer concluded that the Company’s disclosure controls and procedures provide reasonable assurance that the material information required to be disclosed by the Company in the reports that it files or submits to the Securities and Exchange Commission under the Securities Exchange Act of 1934 is recorded, processed, summarized and reported within the time periods specified in the Commission’s rules and forms. The Company’s management believes that its disclosure controls and procedures were effective as of April 1, 2023.
Remediation of Previously Reported Material Weaknesses
To address the previously reported material weaknesses in internal control over financial reporting described in Part II, Item 9A of the Company’s Form 10-K/A filed with the SEC on August 5, 2022, the Company enhanced and revised the design of existing controls and procedures to properly consider all relevant terms within executive employment agreements and account for them, accordingly. During the fourth quarter of fiscal 2023, the Company successfully completed the testing necessary to conclude that the material weakness had been remediated.
Changes in Internal Control Over Financial Reporting
No changes were made to the Company’s internal control over financial reporting (as defined in Rule 13a-15(f) under the Securities Exchange Act of 1934) during the last fiscal quarter that materially affected, or are reasonably likely to materially affect, the Company’s internal control over financial reporting.
Management’s Report on Internal Control Over Financial Reporting
Management of RBC Bearings Incorporated is responsible for establishing and maintaining adequate internal control over financial reporting, as such term is defined in Securities Exchange Act of 1934.
The Company’s internal control over financial reporting is supported by written policies and procedures that (i) pertain to the maintenance of records that, in reasonable detail, accurately and fairly reflect the transactions and dispositions of the Company’s assets; (ii) provide reasonable assurance that transactions are recorded as necessary to permit preparation of financial statements in accordance with generally accepted accounting principles, and that receipts and expenditures of the Company are being made only in accordance with authorizations of the Company’s management and directors; and (iii) provide reasonable assurance regarding prevention or timely detection of unauthorized acquisition, use or disposition of the Company’s assets that could have a material effect on the financial statements.
Because of its inherent limitations, internal control over financial reporting may not prevent or detect misstatements. Projections of any evaluation of effectiveness to future periods are subject to the risk that controls may become inadequate because of changes in conditions, or that the degree of compliance with the policies or procedures may deteriorate.
Under the supervision and with the participation of our management, including our principal executive officer and principal financial officer, we conducted an evaluation of the effectiveness of the Company’s internal control over financial reporting as of April 1, 2023 as required by Securities Exchange Act of 1934. In making this assessment, we used the criteria set forth in the framework in Internal Control-Integrated Framework (2013 Framework) issued by the Committee of Sponsoring Organizations of the Treadway Commission. Based on our evaluation under the framework in Internal Control-Integrated Framework, our management concluded that our internal control over financial reporting was effective as of April 1, 2023.
The effectiveness of our internal control over financial reporting as of April 1, 2023 has been audited by Ernst & Young LLP, an independent registered public accounting firm, as stated in their report which appears on the following page.
/s/ RBC Bearings Incorporated
Oxford, Connecticut
May 19, 2023
Report of Independent Registered Public Accounting Firm
To the Stockholders and the Board of Directors of RBC Bearings Incorporated
Opinion on Internal Control Over Financial Reporting
We have audited RBC Bearings Incorporated’s internal control over financial reporting as of April 1, 2023, based on criteria established in Internal Control—Integrated Framework issued by the Committee of Sponsoring Organizations of the Treadway Commission (2013 framework), (the COSO criteria). In our opinion, RBC Bearings Incorporated (the Company) maintained, in all material respects, effective internal control over financial reporting as of April 1, 2023, based on the COSO criteria.
We also have audited, in accordance with the standards of the Public Company Accounting Oversight Board (United States) (PCAOB), the consolidated balance sheets of the Company as of April 1, 2023 and April 2, 2022, the related consolidated statements of operations, comprehensive income, stockholders’ equity and cash flows for each of the three years in the period ended April 1, 2023 and the related notes and our report dated May 19, 2023 expressed an unqualified opinion thereon.
Basis for Opinion
The Company’s management is responsible for maintaining effective internal control over financial reporting and for its assessment of the effectiveness of internal control over financial reporting included in the accompanying Management’s Report on Internal Control Over Financial Reporting. Our responsibility is to express an opinion on the Company’s internal control over financial reporting based on our audit. We are a public accounting firm registered with the PCAOB and are required to be independent with respect to the Company in accordance with the U.S. federal securities laws and the applicable rules and regulations of the Securities and Exchange Commission and the PCAOB.
We conducted our audit in accordance with the standards of the PCAOB. Those standards require that we plan and perform the audit to obtain reasonable assurance about whether effective internal control over financial reporting was maintained in all material respects.
Our audit included obtaining an understanding of internal control over financial reporting, assessing the risk that a material weakness exists, testing and evaluating the design and operating effectiveness of internal control based on the assessed risk, and performing such other procedures as we considered necessary in the circumstances. We believe that our audit provides a reasonable basis for our opinion.
Definition and Limitations of Internal Control Over Financial Reporting
A company’s internal control over financial reporting is a process designed to provide reasonable assurance regarding the reliability of financial reporting and the preparation of financial statements for external purposes in accordance with generally accepted accounting principles. A company’s internal control over financial reporting includes those policies and procedures that (1) pertain to the maintenance of records that, in reasonable detail, accurately and fairly reflect the transactions and dispositions of the assets of the company; (2) provide reasonable assurance that transactions are recorded as necessary to permit preparation of financial statements in accordance with generally accepted accounting principles, and that receipts and expenditures of the company are being made only in accordance with authorizations of management and directors of the company; and (3) provide reasonable assurance regarding prevention or timely detection of unauthorized acquisition, use, or disposition of the company’s assets that could have a material effect on the financial statements.
Because of its inherent limitations, internal control over financial reporting may not prevent or detect misstatements. Also, projections of any evaluation of effectiveness to future periods are subject to the risk that controls may become inadequate because of changes in conditions, or that the degree of compliance with the policies or procedures may deteriorate.
/s/ Ernst & Young LLP
Stamford, Connecticut
May 19, 2023
ITEM 9B. OTHER INFORMATION
Board Committee Assignments
Audit Committee *
Edward D. Stewart, Chairman
Michael H. Ambrose
Richard R. Crowell
Compensation Committee
Dolores J. Ennico, Chairman
Dr. Steven H. Kaplan
Dr. Amir Faghri
Nominating and Governance Committee
Edward D. Stewart
Dr. Steven H. Kaplan
| * | At least one member of the Audit Committee qualifies as an “audit committee financial expert” as defined by applicable SEC rules. |
ITEM 9C.
Not applicable.
PART III
DISCLOSURE REGARDING FOREIGN JURISDICTIONS THAT PREVENTS INSPECTIONS The information called for by Part III, Items 10, 11, 12, 13 and 14 of Form 10-K, will be included in the Company’s Proxy Statement for its 2023 Annual Meeting of Shareholders, which the Company intends to file within 120 days after the close of its fiscal year ended April 1, 2023 and which is incorporated herein by reference.
PART IV
ITEM 15. EXHIBITS AND FINANCIAL STATEMENT SCHEDULES
(a) (1) The following Consolidated Financial Statements and Supplementary Data of the Company are included in Item 8, “Financial Statements and Supplementary Data” of this Annual Report on Form 10-K:
| ● | Report of Independent Registered Public Accounting Firm; | |
| ● | Consolidated Balance Sheets at April 1, 2023 and April 2, 2022; | |
| ● | Consolidated Statements of Operations for the fiscal years ended April 1, 2023, April 2, 2022 and April 3, 2021; | |
| ● | Consolidated Statements of Comprehensive Income for the fiscal years ended April 1, 2023, April 2, 2022 and April 3, 2021; | |
| ● | Consolidated Statements of Stockholders’ Equity for the fiscal years ended April 1, 2023, April 2, 2022 and April 3, 2021; | |
| ● | Consolidated Statements of Cash Flows for the fiscal years ended April 1, 2023, April 2, 2022 and April 3, 2021; and | |
| ● | Notes to Consolidated Financial Statements. |
(2) For a list of the Company’s Financial Statement Schedules, see Item 15(c) of this Annual Report on Form 10-K.
(3) For a list of the exhibits required by Regulation S-K, see Item 15(b) of this Annual Report on Form 10-K.
(b) The Exhibits required by Item 601 of Regulation S-K are filed as exhibits to this Annual Report on Form 10-K and indexed below immediately following Item 15(c), which index is incorporated herein by reference.
(c) All Financial Statement Schedules are included in the Financial Statements and Supplementary Data under Item 15(a)(1) of this Annual Report on Form 10-K and incorporated herein by reference.
Exhibit Index
The following exhibits are filed as part of this Annual Report on Form 10-K. The exhibits that are indicated below as having been previously filed by RBC Bearings Incorporated with the SEC are incorporated herein by reference. Our Commission file number is 001-40840.
| * | This certification is not deemed filed with the SEC and is not to be incorporated by reference into any of our filings under the Securities Act of 1933 or the Securities Exchange Act of 1934 (whether made before or after the date of this Annual Report on Form 10-K) irrespective of any general incorporation language contained in such filing. |
SIGNATURES
Pursuant to the requirements of Section 13 or 15(d) of the Securities Exchange Act of 1934, the Registrant has duly caused this Report to be signed on its behalf by the undersigned, thereunto duly authorized.
| RBC Bearings Incorporated | |||
| (Registrant) | |||
| By: | /s/ Michael J. Hartnett | ||
| Name: | Michael J. Hartnett | ||
| Title: | Chief Executive Officer | ||
| Date: | Date: May 19, 2023 | ||
Pursuant to the requirements of the Securities Exchange Act of 1934, this Report has been signed by the following persons on behalf of the Registrant and in the capacities and on the dates indicated.
| Signature | Title | |
| /s/ Michael J. Hartnett | Chairman, President and Chief Executive Officer | |
| Michael J. Hartnett | (principal executive officer and chairman) | |
| Date: May 19, 2023 | ||
| /s/ Daniel A. Bergeron | Chief Operating Officer | |
| Daniel A. Bergeron | ||
| Date: May 19, 2023 | ||
| /s/ Robert M. Sullivan | Chief Financial Officer | |
| Robert M. Sullivan | (principal financial officer) | |
| Date: May 19, 2023 | ||
| /s/ Matthew J. Tift | Corporate Controller | |
| Matthew J. Tift | ||
| Date: May 19, 2023 | ||
| /s/ Richard R. Crowell | Director | |
| Richard R. Crowell | ||
| Date: May 19, 2023 | ||
| /s/ Dolores J. Ennico | Director | |
| Dolores J. Ennico | ||
| Date: May 19, 2023 | ||
| /s/ Edward D. Stewart | Director | |
| Edward D. Stewart | ||
| Date: May 19, 2023 | ||
| /s/ Dr. Steven H. Kaplan | Director | |
| Dr. Steven H. Kaplan | ||
| Date: May 19, 2023 | ||
| /s/ Michael H. Ambrose | Director | |
| Michael H. Ambrose | ||
| Date: May 19, 2023 | ||
| /s/ Dr. Amir Faghri | Director | |
| Dr. Amir Faghri | ||
| Date: May 19, 2023 |
77
Exhibit 21
Subsidiaries of the Registrant*
Airtomic LLC – Delaware
All Power de Mexico, S. de R.L. de C.V. – Mexico
All Power Manufacturing Co. – California
Bär und Mettler AG – Switzerland
Beck Bühler Mutschler Capital AG – Switzerland
Climax Metal Products Company – Ohio
Dodge Industrial Australia Pty Ltd – Australia
Dodge Industrial Canada Inc. – Canada
Dodge Industrial, Inc. – Delaware
Dodge Industrial India Private Limited – India
Dodge Industrial (Shanghai) Company Limited – Hong Kong
Dodge Mechanical Power Transmission Mexico, S. de R.L. de C.V. – Mexico
Dodge (Shanghai) Mechanical Power Transmission Ltd. – People’s Republic of China
Industrial Tectonics Bearings Corporation – Delaware
RBC Aerostructures LLC – South Carolina
RBC Aircraft Products, Inc. – Delaware
RBC Bearings Polska sp. z o.o. – Poland
RBC de Mexico, S. de R.L. de C.V. – Mexico
RBC France SAS – France
RBC Lubron Bearing Systems, Inc. – Delaware
RBC Nice Bearings, Inc. – Delaware
RBC Oklahoma, Inc. – Delaware
RBC Precision Products, Inc. – Delaware
RBC Southwest Products, Inc. – Delaware
RBC Turbine Components LLC – Delaware
Roller Bearing Company of America, Inc. – Delaware
Sargent Aerospace and Defense LLC – Delaware
Schaublin GmbH – Germany
Schaublin Holding SA – Switzerland
Schaublin SA – Switzerland
Shanghai representative office of Roller Bearing Company of America, Inc. – People’s Republic of China
Sonic Industries, Inc. – California
Swiss Tool Systems AG - Switzerland
Vianel Holding AG – Switzerland
Western Precision Aero LLC – California
| * | All of which are, directly or indirectly, wholly-owned by the registrant. |
Exhibit 23
Consent of Independent Registered Public Accounting Firm
We consent to the incorporation by reference in the following Registration Statements:
| (1) | Registration Statement (Form S-8 No. 333-192164) pertaining to the RBC Bearings Incorporated 2013 Long-Term Equity Incentive Plan, |
| (2) | Registration Statement (Form S-8 No. 333-221329) pertaining to the RBC Bearings Incorporated 2017 Long-Term Equity Incentive Plan, |
| (3) | Registration Statement (Form S-3 No. 333-259669) pertaining to the RBC Bearings Incorporated Common Stock and Preferred Stock, and |
| (4) | Registration Statement (Form S-8 No. 333-265490) pertaining to the RBC Bearings Incorporated 2021 Long-Term Equity Incentive Plan; |
of our reports dated May 19, 2023, with respect to the consolidated financial statements of RBC Bearings Incorporated and the effectiveness of internal control over financial reporting of RBC Bearings Incorporated included in this Annual Report (Form 10-K) of RBC Bearings Incorporated for the year ended April 1, 2023.
| /s/ Ernst & Young LLP | |
| Stamford, Connecticut | |
| May 19, 2023 |
Exhibit 31.1
CERTIFICATION OF CHIEF EXECUTIVE OFFICER
PURSUANT TO SECTION 302 OF THE SARBANES-OXLEY ACT OF 2002
I, Dr. Michael J. Hartnett, certify that:
| 1. | I have reviewed this Report on Form 10-K of RBC Bearings Incorporated; |
| 2. | Based on my knowledge, this Report does not contain any untrue statement of a material fact or omit to state a material fact necessary to make the statements made, in light of the circumstances under which such statements were made, not misleading with respect to the period covered by this Report; |
| 3. | Based on my knowledge, the financial statements, and other financial information included in this Report, fairly present in all material respects the financial condition, results of operations and cash flows of the registrant as of, and for, the periods presented in this Report; |
| 4. | The registrant’s other certifying officer and I are responsible for establishing and maintaining disclosure controls and procedures (as defined in Exchange Act Rules 13a-15(e) and 15d-15(e)) and internal control over financial reporting (as defined in Exchange Act Rules 13a-15(f) and 15d-15(f)) for the registrant and have: |
| a) | designed such disclosure controls and procedures, or caused such disclosure controls and procedures to be designed under our supervision, to ensure that material information relating to the registrant, including any consolidated subsidiaries, is made known to us by others within those entities, particularly during the period in which this Report is being prepared; |
| b) | designed such internal control over financial reporting, or caused such internal control over financial reporting to be designed under our supervision, to provide reasonable assurance regarding the reliability of financial reporting and the preparation of financial statements for external purposes in accordance with generally accepted accounting principles; and |
| c) | evaluated the effectiveness of the registrant’s disclosure controls and procedures and presented in this report our conclusions about the effectiveness of the disclosure controls and procedures, as of the end of the period covered by this Report based on such evaluation; and |
| d) | disclosed in this Report any change in the registrant’s internal control over financial reporting that occurred during the registrant’s most recent fiscal quarter that has materially affected, or is reasonably likely to materially affect, the registrant’s internal control over financial reporting; and |
| 5. | The registrant’s other certifying officer and I have disclosed, based on our most recent evaluation of internal control over financial reporting, to the registrant’s auditors and the audit committee of the registrant’s board of directors (or persons performing the equivalent functions): |
| a) | all significant deficiencies and material weaknesses in the design or operation of internal control over financial reporting which are reasonably likely to adversely affect the registrant’s ability to record, process, summarize and report financial information; and |
| b) | any fraud, whether or not material, that involves management or other employees who have a significant role in the registrant’s internal control over financial reporting. |
| Date: May 19, 2023 | By: | /s/ Michael J. Hartnett |
| Michael J. Hartnett | ||
| President and Chief Executive Officer |
Exhibit 31.2
CERTIFICATION OF CHIEF FINANCIAL OFFICER
PURSUANT TO SECTION 302 OF THE SARBANES-OXLEY ACT OF 2002
I, Robert M. Sullivan, certify that:
| 1. | I have reviewed this Report on Form 10-K of RBC Bearings Incorporated; |
| 2. | Based on my knowledge, this Report does not contain any untrue statement of a material fact or omit to state a material fact necessary to make the statements made, in light of the circumstances under which such statements were made, not misleading with respect to the period covered by this Report; |
| 3. | Based on my knowledge, the financial statements, and other financial information included in this Report, fairly present in all material respects the financial condition, results of operations and cash flows of the registrant as of, and for, the periods presented in this Report; |
| 4. | The registrant’s other certifying officer and I are responsible for establishing and maintaining disclosure controls and procedures (as defined in Exchange Act Rules 13a-15(e) and 15d-15(e)) and internal control over financial reporting (as defined in Exchange Act Rules 13a-15(f) and 15d-15(f)) for the registrant and have: |
| a) | designed such disclosure controls and procedures, or caused such disclosure controls and procedures to be designed under our supervision, to ensure that material information relating to the registrant, including any consolidated subsidiaries, is made known to us by others within those entities, particularly during the period in which this Report is being prepared; |
| b) | designed such internal control over financial reporting, or caused such internal control over financial reporting to be designed under our supervision, to provide reasonable assurance regarding the reliability of financial reporting and the preparation of financial statements for external purposes in accordance with generally accepted accounting principles; and |
| c) | evaluated the effectiveness of the registrant’s disclosure controls and procedures and presented in this report our conclusions about the effectiveness of the disclosure controls and procedures, as of the end of the period covered by this Report based on such evaluation; and |
| d) | disclosed in this Report any change in the registrant’s internal control over financial reporting that occurred during the registrant’s most recent fiscal quarter that has materially affected, or is reasonably likely to materially affect, the registrant’s internal control over financial reporting; and |
| 5. | The registrant’s other certifying officer and I have disclosed, based on our most recent evaluation of internal control over financial reporting, to the registrant’s auditors and the audit committee of the registrant’s board of directors (or persons performing the equivalent functions): |
| a) | all significant deficiencies and material weaknesses in the design or operation of internal control over financial reporting which are reasonably likely to adversely affect the registrant’s ability to record, process, summarize and report financial information; and |
| b) | any fraud, whether or not material, that involves management or other employees who have a significant role in the registrant’s internal control over financial reporting. |
| Date: May 19, 2023 | By: | /s/ Robert M. Sullivan |
| Robert M. Sullivan | ||
| Vice President and Chief Financial Officer |
Exhibit 32.1
CERTIFICATION OF CHIEF EXECUTIVE OFFICER
PURSUANT TO
18 U.S.C SECTION 1350
In connection with the Annual Report of RBC Bearings Incorporated (the “Company”) Form 10-K for the year ended April 1, 2023, as filed with the Securities and Exchange Commission on the date hereof (the “Report”), the undersigned, Dr. Michael J. Hartnett, the President and Chief Executive Officer of the Company, pursuant to 18 U.S.C. §1350, as adopted pursuant to section 906 of the Sarbanes-Oxley Act of 2002, hereby certifies to the best of his knowledge that:
| (i) | the Report fully complies with the requirements of Section 13(a) or 15(d) of the Securities Exchange Act of 1934; and |
| (ii) | the information contained in the Report fairly presents, in all material respects, the financial condition and results of operations of the Company. |
Dated: May 19, 2023
| /s/ Michael J. Hartnett | |
| Michael J. Hartnett | |
| President and Chief Executive Officer |
Exhibit 32.2
CERTIFICATION OF CHIEF FINANCIAL OFFICER
PURSUANT TO
18 U.S.C. SECTION 1350
In connection with the Annual Report of RBC Bearings Incorporated (the “Company”) Form 10-K for the year ended April 1, 2023, as filed with the Securities and Exchange Commission on the date hereof (the “Report”), the undersigned, Robert M. Sullivan, Chief Financial Officer, of the Company, pursuant to 18 U.S.C. §1350, as adopted pursuant to section 906 of the Sarbanes-Oxley Act of 2002, hereby certifies to the best of his knowledge that:
| (i) | the Report fully complies with the requirements of Section 13(a) or 15(d) of the Securities Exchange Act of 1934; and |
| (ii) | the information contained in the Report fairly presents, in all material respects, the financial condition and results of operations of the Company. |
Dated: May 19, 2023
| /s/ Robert M. Sullivan | |
| Robert M. Sullivan | |
| Vice President and Chief Financial Officer |