UNITED STATES
SECURITIES AND EXCHANGE COMMISSION
WASHINGTON, D.C. 20549
FORM 6-K
Report of Foreign Private Issuer
Pursuant to Rule 13a-16 or 15d-16
under the Securities Exchange Act of 1934
For the month of May 2023
Commission File Number 001-35751
STRATASYS LTD.
(Translation of registrant’s name into English)
| c/o Stratasys, Inc. 7665 Commerce Way Eden Prairie, Minnesota 55344 |
1 Holtzman Street, Science Park P.O. Box 2496 Rehovot, Israel 76124 |
|
| (Addresses of principal executive offices) | ||
Indicate by check mark whether the registrant files or will file annual reports under cover of Form 20-F or Form 40-F:
Form 20-F ☒ Form 40-F ☐
Indicate by check mark if the registrant is submitting the Form 6-K in paper as permitted by Regulation S-T Rule 101(b)(1): ☐
Indicate by check mark if the registrant is submitting the Form 6-K in paper as permitted by Regulation S-T Rule 101(b)(7): ☐
CONTENTS
Quarterly Results of Operations
On May 16, 2023, Stratasys Ltd. (“we” or “us”) announced our financial results for the first quarter ended March 31, 2023. A copy of our press release announcing our results is furnished as Exhibit 99.1 to this Report of Foreign Private Issuer on Form 6-K (this “Form 6-K”) and is incorporated herein by reference.
In conjunction with the conference call being held on May 16, 2023 to discuss our results, we are furnishing a copy of the slide presentation that provides supplemental information regarding our business and our financial results, and which will be referenced on that conference call. We have attached that presentation to this Form 6-K as Exhibit 99.2, which exhibit is incorporated herein by reference.
The information in this Form 6-K, including Exhibits 99.1 and 99.2, shall not be deemed to be “filed” for the purposes of Section 18 of the Securities Exchange Act of 1934, as amended, and shall not be incorporated by reference into any filing under the Securities Act of 1933, as amended, except as shall be expressly set forth by specific reference in such filing.
SIGNATURES
Pursuant to the requirements of the Securities Exchange Act of 1934, the registrant has duly caused this report to be signed on its behalf by the undersigned, thereunto duly authorized.
| STRATASYS LTD. | ||
| Dated: May 16, 2023 | By: | /s/ Eitan Zamir |
| Name: | Eitan Zamir | |
| Title: | Chief Financial Officer | |
EXHIBIT INDEX
The following exhibits are furnished as part of this Form 6-K:
3
Exhibit 99.1

Stratasys Releases First Quarter 2023 Financial Results
| ● | Revenue of $149.4 million, 2.6% lower versus first quarter 2022 at constant currency and adjusted for divestitures |
| ● | Highest consumables quarter in Company’s history, grew 7.8% over prior year quarter at constant currency and adjusted for divestitures |
| ● | GAAP net loss of $22.2 million, or $0.33 per diluted share, and non-GAAP net income of $1.1 million, or $0.02 per diluted share |
| ● | Seventh straight quarter of adjusted profitability |
| ● | Increasing 2023 revenue outlook and reiterating operational cash flow generation |
| ● | Introducing medium-term expectations |
MINNEAPOLIS & REHOVOT, Israel - (BUSINESS WIRE) - May 16, 2023 - Stratasys Ltd. (Nasdaq: SSYS), a leader in polymer 3D printing solutions, today announced financial results for the first quarter 2023.
First Quarter 2023 Financial Results Compared to First Quarter 2022:
| ● | Revenue of $149.4 million, 8.6% lower versus first quarter 2022. |
| ● | GAAP gross margin of 43.8%, compared to 42.6%. |
| ● | Non-GAAP gross margin of 47.3%, compared to 47.3%. |
| ● | GAAP operating loss of $16.8 million, compared to an operating loss of $19.6 million. |
| ● | Non-GAAP operating income of $1.5 million, compared to non-GAAP operating income of $2.0 million. |
| ● | GAAP net loss of $22.2 million, or $0.33 per diluted share, compared to a net loss of $20.9 million, or $0.32 per diluted share. |
| ● | Non-GAAP net income of $1.1 million, or $0.02 per diluted share, compared to non-GAAP net income of $1.2 million, or $0.02 per diluted share. |
| ● | Adjusted EBITDA of $7.0 million, compared to $8.1 million. |
| ● | Planned inventory spending resulted in cash used in operations of $17.9 million, compared to cash used in operations of $16.1 million in the year-ago quarter. |
Dr. Yoav Zeif, Stratasys’ Chief Executive Officer stated, “Stratasys continues to execute our winning strategy, driven by our broad, global, diverse set of systems, materials, and software solutions. Utilization of our systems is growing, resulting in our highest ever quarter for recurring revenues from both consumables and customer service, even as clients’ capital budgets remain constrained. Our margin profile remains strong, and we delivered our seventh consecutive quarter of positive adjusted earnings per share, demonstrating the resiliency of our business model.”
Dr. Zeif continued, “Engagement with our customers across our entire suite of existing and new technologies remains robust, and we were excited to introduce transformative new dental hardware and materials offerings that will stimulate meaningful future growth. We expect the recently closed addition of Covestro’s Additive Manufacturing business to expand our leading position in higher-margin consumables offerings and significantly increase our recurring stream of revenue. Supported by our strong balance sheet, we continue to make the investments to drive disruptive innovation, such as our partnership with CollPlant to transform regenerative medicine. We expect to deliver outsized growth and industry share gains when macroeconomic headwinds subside and the additive manufacturing industry expands.”
2023 Financial Outlook:
Based on current market conditions and assuming that the impacts of global inflationary pressures, interest rate hikes and supply chain costs do not impede economic activity further, the Company is raising its revenue guidance and reiterating the remainder of its outlook for 2023:
| ● | Full year revenue of $630 million to $670 million. |
| ● | Sequential quarterly revenue growth, notably higher in the second half. |
| ● | Based on current logistics and materials costs, full year gross margins of 48.0% to 49.0%, with a majority of the year-over-year improvement in the second half of 2023. |
| ● | Full year-operating expenses in the range of $290 million to $300 million. |
| ● | Full year non-GAAP operating margins in a range of 2.5% to 3.5%, with improving profitable contribution through the year. |
| ● | GAAP net loss of $78 million to $57 million, or ($1.12) to ($0.83) per diluted share. |
| ● | Non-GAAP net income of $9 million to $17 million, or $0.12 to $0.24 per diluted share. |
| ● | Adjusted EBITDA of $35 million to $50 million. |
| ● | Capital expenditures of $20 million to $25 million. |
2023 non-GAAP earnings guidance excludes $30 million to $32 million of projected amortization of intangible assets, $28 million to $30 million of share-based compensation expense, and reorganization and other expenses of $15 million to $22 million. 2023 non-GAAP guidance includes tax adjustments of $2 million to $3 million on the above non-GAAP items.
Medium Term Financial Forecast:
In addition, the Company is providing the following forecast for key annual financial metrics:
| ● | 2024 gross margin above 50% and positive free cash flow. |
| ● | 2026 revenues to grow organically to greater than $1 billion, with adjusted EBITDA margin over 15%. |
Appropriate reconciliations between GAAP and non-GAAP financial measures are provided in a table at the end of our press release and slide presentation, with itemized detail concerning the non-GAAP financial measures.
Stratasys Ltd. First Quarter 2023 Webcast and Conference Call Details
The Company plans to webcast its conference call to discuss its first quarter 2023 financial results on Tuesday, May 16, 2023, at 8:30 a.m. (ET).
The investor conference call will be available via live webcast on the Stratasys Web site at investors.stratasys.com, or directly at the following web address:
https://event.choruscall.com/mediaframe/webcast.html?webcastid=f4rFQOPp
To participate by telephone, the U.S. toll-free number is 877-407-0619 and the international dial-in is +1-412-902-1012. Investors are advised to dial into the call at least ten minutes prior to the call to register. The webcast will be available for six months at investors.stratasys.com, or by accessing the above-provided web address.
Stratasys is leading the global shift to additive manufacturing with innovative 3D printing solutions for industries such as aerospace, automotive, consumer products, healthcare, fashion and education. Through smart and connected 3D printers, polymer materials, a software ecosystem, and parts on demand, Stratasys solutions deliver competitive advantages at every stage in the product value chain. The world’s leading organizations turn to Stratasys to transform product design, bring agility to manufacturing and supply chains, and improve patient care.
To learn more about Stratasys, visit www.stratasys.com, the Stratasys blog, Twitter, LinkedIn, or Facebook. Stratasys reserves the right to utilize any of the foregoing social media platforms, including the Company’s websites, to share material, non-public information pursuant to the SEC’s Regulation FD. To the extent necessary and mandated by applicable law, Stratasys will also include such information in its public disclosure filings.
Stratasys is a registered trademark and the Stratasys signet is a trademark of Stratasys Ltd. and/or its subsidiaries or affiliates. All other trademarks are the property of their respective owners.
Cautionary Statement Regarding Forward-Looking Statements
The statements in this press release regarding Stratasys’ strategy, and the statements regarding its projected future financial performance, including the financial guidance concerning its expected results for 2023 and beyond, are forward-looking statements reflecting management’s current expectations and beliefs. These forward-looking statements are based on current information that is, by its nature, subject to rapid and even abrupt change. Due to risks and uncertainties associated with Stratasys’ business, actual results could differ materially from those projected or implied by these forward-looking statements. These risks and uncertainties include, but are not limited to: the degree of our success at introducing new or improved products and solutions that gain market share; the degree of growth of the 3D printing market generally; the impact of potential shifts in the prices or margins of the products that we sell or services that we provide, including due to a shift towards lower margin products or services; the impact of competition and new technologies; potential further charges against earnings that we could be required to take due to impairment of additional goodwill or other intangible assets; the extent of our success at successfully consummating and integrating into our existing business acquisitions or investments in new businesses, technologies, products or services; the global macro-economic environment, including headwinds caused by inflation, rising interest rates, unfavorable currency exchange rates and potential recessionary conditions, potential changes in our management and board of directors; global market, political and economic conditions, and in the countries in which we operate in particular; costs and potential liability relating to litigation and regulatory proceedings; risks related to infringement of our intellectual property rights by others or infringement of others’ intellectual property rights by us; the extent of our success at maintaining our liquidity and financing our operations and capital needs; the impact of tax regulations on our results of operations and financial condition; and those additional factors referred to in Item 3.D “Key Information - Risk Factors”, Item 4, “Information on the Company”, Item 5, “Operating and Financial Review and Prospects,” and all other parts of our Annual Report on Form 20-F for the year ended December 31, 2022, which we filed with the U.S. Securities and Exchange Commission, or SEC, on March 3, 2023 (the “2022 Annual Report”). Readers are urged to carefully review and consider the various disclosures made throughout our 2022 Annual Report and the Reports of Foreign Private Issuer on Form 6-K that attach Stratasys’ unaudited, condensed consolidated financial statements and its review of its results of operations and financial condition, for the quarterly periods throughout 2023, which will be furnished to the SEC throughout 2023, and our other reports filed with or furnished to the SEC, which are designed to advise interested parties of the risks and factors that may affect our business, financial condition, results of operations and prospects. Any guidance provided, and other forward-looking statements made, in this press release are provided or made (as applicable) as of the date hereof, and Stratasys undertakes no obligation to publicly update or revise any forward-looking statements, whether as a result of new information, future events or otherwise, except as required by law.
Use of Non-GAAP Financial Measures
The non-GAAP data included herein, which excludes certain items as described below, are non-GAAP financial measures. Our management believes that these non-GAAP financial measures are useful information for investors and shareholders of our company in gauging our results of operations (i) on an ongoing basis after excluding mergers, acquisitions and divestments related expense or gains and reorganization-related charges or gains, and legal provisions and (ii) excluding non-cash items such as stock-based compensation expenses, acquired intangible assets amortization, including intangible assets amortization related to equity method investments, impairment of long-lived assets and goodwill, revaluation of our investments and the corresponding tax effect of those items. These non-GAAP adjustments either do not reflect actual cash outlays that impact our liquidity and our financial condition or have a non-recurring impact on the statement of operations, as assessed by management. These non-GAAP financial measures are presented to permit investors to more fully understand how management assesses our performance for internal planning and forecasting purposes. The limitations of using these non-GAAP financial measures as performance measures are that they provide a view of our results of operations without including all items indicated above during a period, which may not provide a comparable view of our performance to other companies in our industry. Investors and other readers should consider non-GAAP measures only as supplements to, not as substitutes for or as superior measures to, the measures of financial performance prepared in accordance with GAAP. Reconciliation between results on a GAAP and non-GAAP basis is provided in a table below.
Yonah Lloyd
CCO, VP Investor Relations
Yonah.Lloyd@stratasys.com
Source: Stratasys Ltd.
Stratasys Ltd.
Consolidated Balance Sheets
(Unaudited)
(in thousands, except share data)
| March 31, | December 31, | |||||||
| 2023 | 2022 | |||||||
| ASSETS | ||||||||
| Current assets | ||||||||
| Cash and cash equivalents | $ | 209,139 | $ | 150,470 | ||||
| Short-term deposits | 78,448 | 177,367 | ||||||
| Accounts receivable, net of allowance for credit losses of $0.8 million and $0.9 million as of March 31, 2023 and December 31, 2022 | 144,519 | 144,739 | ||||||
| Inventories | 201,997 | 194,054 | ||||||
| Prepaid expenses | 8,466 | 5,767 | ||||||
| Other current assets | 22,468 | 27,823 | ||||||
| Total current assets | 665,037 | 700,220 | ||||||
| Non-current assets | ||||||||
| Property, plant and equipment, net | 196,986 | 195,063 | ||||||
| Goodwill | 69,735 | 64,953 | ||||||
| Other intangible assets, net | 129,756 | 121,402 | ||||||
| Operating lease right-of-use assets | 16,884 | 18,122 | ||||||
| Long-term investments | 140,621 | 141,610 | ||||||
| Other non-current assets | 18,076 | 18,420 | ||||||
| Total non-current assets | 572,058 | 559,570 | ||||||
| Total assets | $ | 1,237,095 | $ | 1,259,790 | ||||
| LIABILITIES AND EQUITY | ||||||||
| Current liabilities | ||||||||
| Accounts payable | $ | 54,834 | $ | 72,921 | ||||
| Accrued expenses and other current liabilities | 49,554 | 45,912 | ||||||
| Accrued compensation and related benefits | 37,261 | 34,432 | ||||||
| Deferred revenues - short term | 53,774 | 50,220 | ||||||
| Operating lease liabilities - short term | 6,724 | 7,169 | ||||||
| Total current liabilities | 202,147 | 210,654 | ||||||
| Non-current liabilities | ||||||||
| Deferred revenues - long term | 25,439 | 25,214 | ||||||
| Deferred income taxes - long term | 7,075 | 5,638 | ||||||
| Operating lease liabilities - long term | 9,880 | 10,670 | ||||||
| Contingent consideration - long term | 24,222 | 23,707 | ||||||
| Other non-current liabilities | 23,869 | 24,475 | ||||||
| Total non-current liabilities | 90,485 | 89,704 | ||||||
| Total liabilities | 292,632 | 300,358 | ||||||
| Equity | ||||||||
| Ordinary shares, NIS 0.01 nominal value, authorized 180,000 thousands shares; 68,103 thousands shares and 67,086 thousands shares issued and outstanding at March 31, 2023 and December 31, 2022, respectively | 190 | 187 | ||||||
| Additional paid-in capital | 3,057,157 | 3,048,915 | ||||||
| Accumulated other comprehensive loss | (13,808 | ) | (12,818 | ) | ||||
| Accumulated deficit | (2,099,076 | ) | (2,076,852 | ) | ||||
| 944,463 | 959,432 | |||||||
| Total liabilities and equity | $ | 1,237,095 | $ | 1,259,790 | ||||
Stratasys Ltd.
Consolidated Statements of Operations
(in thousands, except per share data)
| Three Months Ended March 31, |
||||||||
| 2023 | 2022 | |||||||
| (unaudited) | (unaudited) | |||||||
| Net sales | ||||||||
| Products | $ | 100,971 | $ | 113,073 | ||||
| Services | 48,406 | 50,356 | ||||||
| 149,377 | 163,429 | |||||||
| Cost of revenues | ||||||||
| Products | 51,113 | 59,373 | ||||||
| Services | 32,869 | 34,379 | ||||||
| 83,982 | 93,752 | |||||||
| Gross profit | 65,395 | 69,677 | ||||||
| Operating expenses | ||||||||
| Research and development, net | 21,475 | 23,998 | ||||||
| Selling, general and administrative | 60,717 | 65,263 | ||||||
| 82,192 | 89,261 | |||||||
| Operating loss | (16,797 | ) | (19,584 | ) | ||||
| Financial income (expenses), net | 773 | (1,362 | ) | |||||
| Loss before income taxes | (16,024 | ) | (20,946 | ) | ||||
| Income tax benefit (expenses) | (3,775 | ) | 73 | |||||
| Share in losses of associated companies | (2,425 | ) | (75 | ) | ||||
| Net loss | $ | (22,224 | ) | $ | (20,948 | ) | ||
| Net loss per share | ||||||||
| Basic | $ | (0.33 | ) | $ | (0.32 | ) | ||
| Diluted | $ | (0.33 | ) | $ | (0.32 | ) | ||
| Weighted average ordinary shares outstanding | ||||||||
| Basic | 67,583 | 65,721 | ||||||
| Diluted | 67,583 | 65,721 | ||||||
| Three Months Ended March 31, | ||||||||||||||||||||||||
| 2023 | Non-GAAP | 2023 | 2022 | Non-GAAP | 2022 | |||||||||||||||||||
| GAAP | Adjustments | Non-GAAP | GAAP | Adjustments | Non-GAAP | |||||||||||||||||||
| U.S. dollars and shares in thousands (except per share amounts) | ||||||||||||||||||||||||
| Gross profit (1) | $ | 65,395 | $ | 5,299 | $ | 70,694 | $ | 69,677 | $ | 7,689 | $ | 77,366 | ||||||||||||
| Operating income (loss) (1,2) | (16,797 | ) | 18,315 | 1,518 | (19,584 | ) | 21,607 | $ | 2,023 | |||||||||||||||
| Net income (loss) attributable to Stratasys Ltd. (1,2,3) | (22,224 | ) | 23,306 | 1,082 | (20,948 | ) | 22,158 | $ | 1,210 | |||||||||||||||
| Net income (loss) per diluted share (4) | $ | (0.33 | ) | $ | 0.35 | $ | 0.02 | $ | (0.32 | ) | $ | 0.34 | $ | 0.02 | ||||||||||
| (1) | Acquired intangible assets amortization expense | 4,001 | 6,966 | |||||||||||||||||||||||
| Non-cash stock-based compensation expense | 932 | 900 | ||||||||||||||||||||||||
| Restructuring and other related costs | 366 | (177 | ) | |||||||||||||||||||||||
| 5,299 | 7,689 | |||||||||||||||||||||||||
| (2) | Acquired intangible assets amortization expense | 2,194 | 2,225 | |||||||||||||||||||||||
| Non-cash stock-based compensation expense | 7,308 | 7,633 | ||||||||||||||||||||||||
| Restructuring and other related costs | 1,798 | 555 | ||||||||||||||||||||||||
| Revaluation of investments | 580 | 1,061 | ||||||||||||||||||||||||
| Contingent consideration | 265 | 207 | ||||||||||||||||||||||||
| Other expenses | 871 | 2,237 | ||||||||||||||||||||||||
| 13,016 | 13,918 | |||||||||||||||||||||||||
| 18,315 | 21,607 | |||||||||||||||||||||||||
| (3) | Corresponding tax effect | 3,038 | 145 | |||||||||||||||||||||||
| Equity method related amortization | 1,490 | - | ||||||||||||||||||||||||
| Finance expenses | 463 | 406 | ||||||||||||||||||||||||
| 4,991 | 551 | |||||||||||||||||||||||||
| $ | 23,306 | $ | 22,158 | |||||||||||||||||||||||
| (4) | Weighted average number of ordinary shares outstanding- Diluted | 67,583 | 68,080 | 65,721 | 67,060 |
7
Exhibit 99.2
Q1 2023 Results Speakers Dr. Yoav Zeif, CEO Eitan Zamir, CFO Yonah Lloyd, CCO & VP IR May 16, 2023

Conference Call and Webcast Details US Toll - Free Dial - In 1 - 877 - 407 - 0619 International Dial - In 1 - 412 - 902 - 1012 Live Webcast and Replay https://event.choruscall.com/mediaframe/webcast.

html?webcastid=f4rFQOPp 2 2 Forward - Looking Statements Cautionary Statement Regarding Forward - Looking Statements 3 3 The statements in this slide presentation regarding Stratasys' strategy, and the statements regarding its projected future financial performance, including the financial guidance concerning its expected results for 2023, are forward - looking statements reflecting management's current expectations and beliefs. These forward - looking statements are based on current information that is, by its nature, subject to rapid and even abrupt change. Due to risks and uncertainties associated with Stratasys' business, actual results could differ materially from those projected or implied by these forward - looking statements. These risks and uncertainties include, but are not limited to: the degree of our success at introducing new or improved products and solutions that gain market share; the extent of growth of the 3D printing market generally; the duration and severity of headwinds caused by current macro - economic trends that have been adversely affecting, and may continue to adversely affect, our results, including unfavorable currency exchange rates, supply - chain delays, inflationary pressures and rising interest rates; the impact of potential shifts in the prices or margins of the products that we sell or services that we provide, including due to a shift towards lower margin products or services; the impact of competition and new technologies; the extent of our success at successfully integrating into our existing business, or making additional, acquisitions or investments in new businesses, technologies, products or services; potential changes in our management and board of directors; global market, political and economic conditions, and in the countries in which we operate in particular (including risks stemming from Russia’s invasion of Ukraine); potential further charges against earnings that we could be required to take due to impairment of additional goodwill or other intangible assets that we have recently acquired or may acquire in the future; costs and potential liability relating to litigation and regulatory proceedings; risks related to infringement of our intellectual property rights by others or infringement of others' intellectual property rights by us; the extent of our success at maintaining our liquidity and financing our operations and capital needs; the impact of tax regulations on our results of operations and financial condition; and those additional factors referred to in Item 3.D “Key Information - Risk Factors”, Item 4, “Information on the Company”, Item 5, “Operating and Financial Review and Prospects,” and all other parts of our Annual Report on Form 20 - F for the year ended December 31, 2022, to be filed with the SEC on or about March 2, 2023 (the “2022 Annual Report”). Readers are urged to carefully review and consider the various disclosures made throughout our 2022 Annual Report and the Reports of Foreign Private Issuer on Form 6 - K that attach Stratasys’ unaudited, condensed consolidated financial statements and its review of its results of operations and financial condition, for the quarterly periods throughout 2023, which Stratasys will be furnishing to the SEC over the course of 2023, and our other reports filed with or furnished to the SEC, which are designed to advise interested parties of the risks and factors that may affect our business, financial condition, results of operations and prospects. Any guidance provided, and other forward - looking statements made, in this slide presentation are made as of the date hereof, and Stratasys undertakes no obligation to publicly update or revise any forward - looking statements, whether as a result of new information, future events or otherwise, except as required by law.
Use of Non - GAAP Financial Information Use of Non - GAAP Financial Measures The non - GAAP data included herein, which excludes certain items as described below, are non - GAAP financial measures. Our management believes that these non - GAAP financial measures are useful information for investors and shareholders of our Company in gauging our results of operations (i) on an ongoing basis after excluding mergers, acquisitions and divestments related expense or gains and reorganization - related charges or gains, legal provisions, and (ii) excluding non - cash items such as stock - based compensation expenses, acquired intangible assets amortization, including intangible assets amortization related to equity method investments, impairment of long - lived assets and goodwill, revaluation of our investments and the corresponding tax effect of those items. The items eliminated via these non - GAAP adjustments either do not reflect actual cash outlays that impact our liquidity and our financial condition or have a non - recurring impact on the statement of operations, as assessed by management. These non - GAAP financial measures are presented to permit investors to more fully understand how management assesses our performance for internal planning and forecasting purposes. The limitations of using these non - GAAP financial measures as performance measures are that they provide a view of our results of operations without including all items indicated above during a period, which may not provide a comparable view of our performance to other companies in our industry. Investors and other readers should consider non - GAAP measures only as supplements to, not as substitutes for or as superior measures to, the measures of financial performance prepared in accordance with GAAP. Reconciliation between results on a GAAP and non - GAAP basis is provided in a table later in this slide presentation. 4 Nano Dimension Update ▪ Stratasys’ Board received three unsolicited proposals to acquire Stratasys for $18.00, $19.55, and $20.05 per share in cash.
▪ After careful review, the Board unanimously rejected each proposal because they substantially undervalue Stratasys in light of the Company’s standalone prospects. ▪ Nano is in midst of multiple lawsuits with its shareholders involving the control and governance of their company and, as a result, serious questions remain about the legitimacy of the Nano offer. ▪ We are committed to enhancing shareholder value and executing on Stratasys’ growth strategy. We are making strong progress towards becoming a highly profitable, $1 billion revenue company. As part of its fiduciary duties, the Board will review any bona fide proposal for the company and weigh it against our standalone plan.
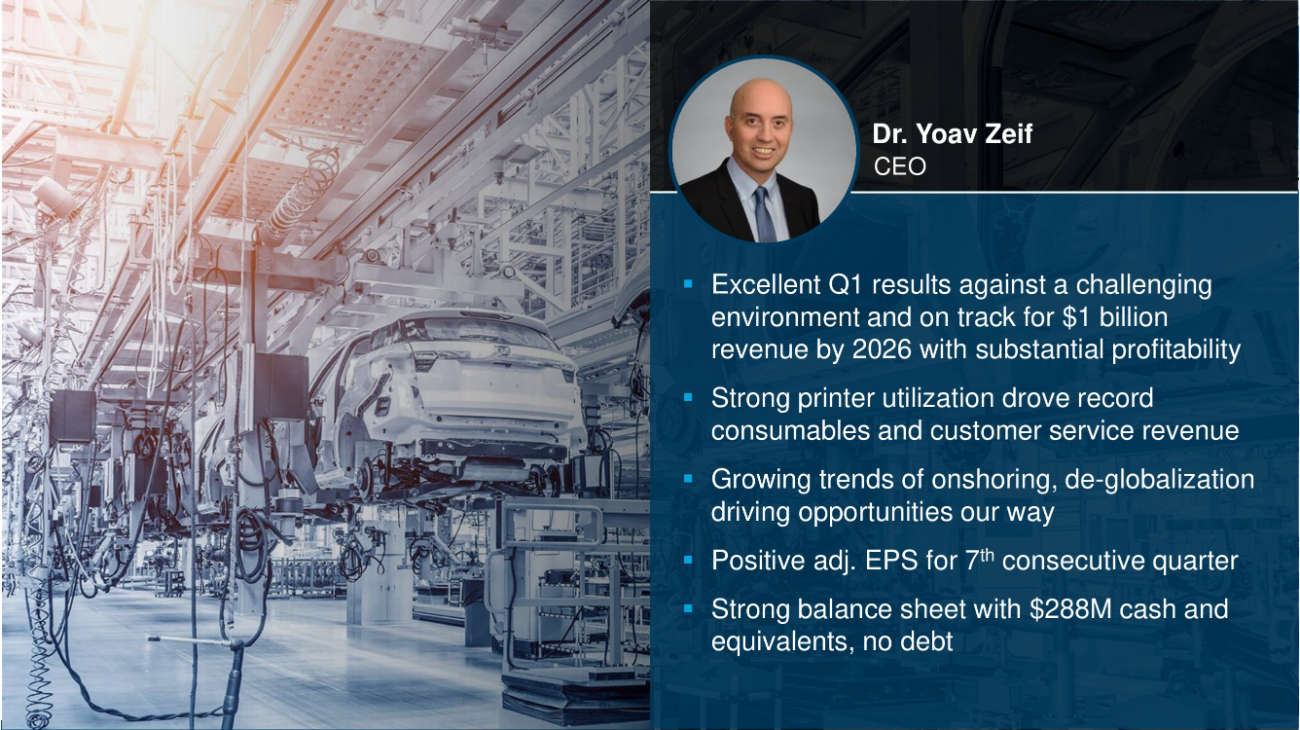
▪ Excellent Q1 results against a challenging environment and on track for $1 billion revenue by 2026 with substantial profitability ▪ Strong printer utilization drove record consumables and customer service revenue ▪ Growing trends of onshoring , de - globalization driving opportunities our way ▪ Positive adj. EPS for 7 th consecutive quarter ▪ Strong balance sheet with $288M cash and equivalents, no debt CEO Dr.
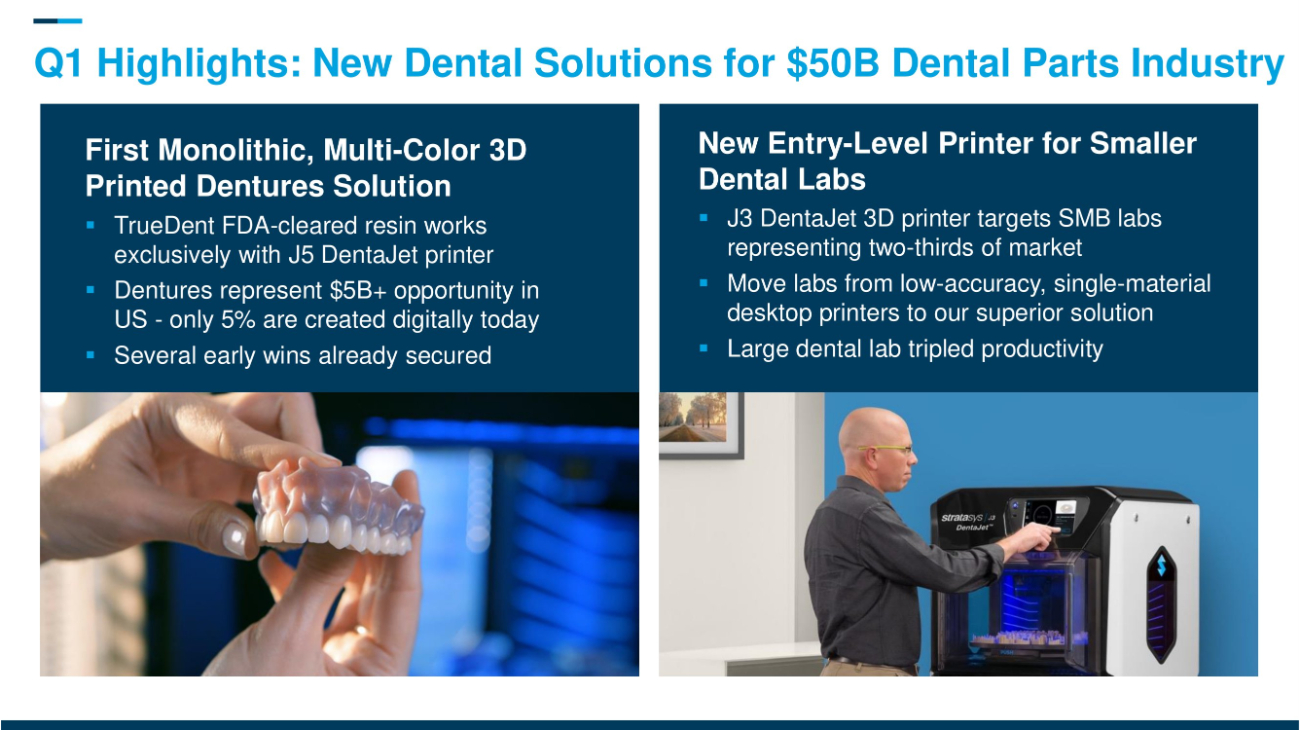
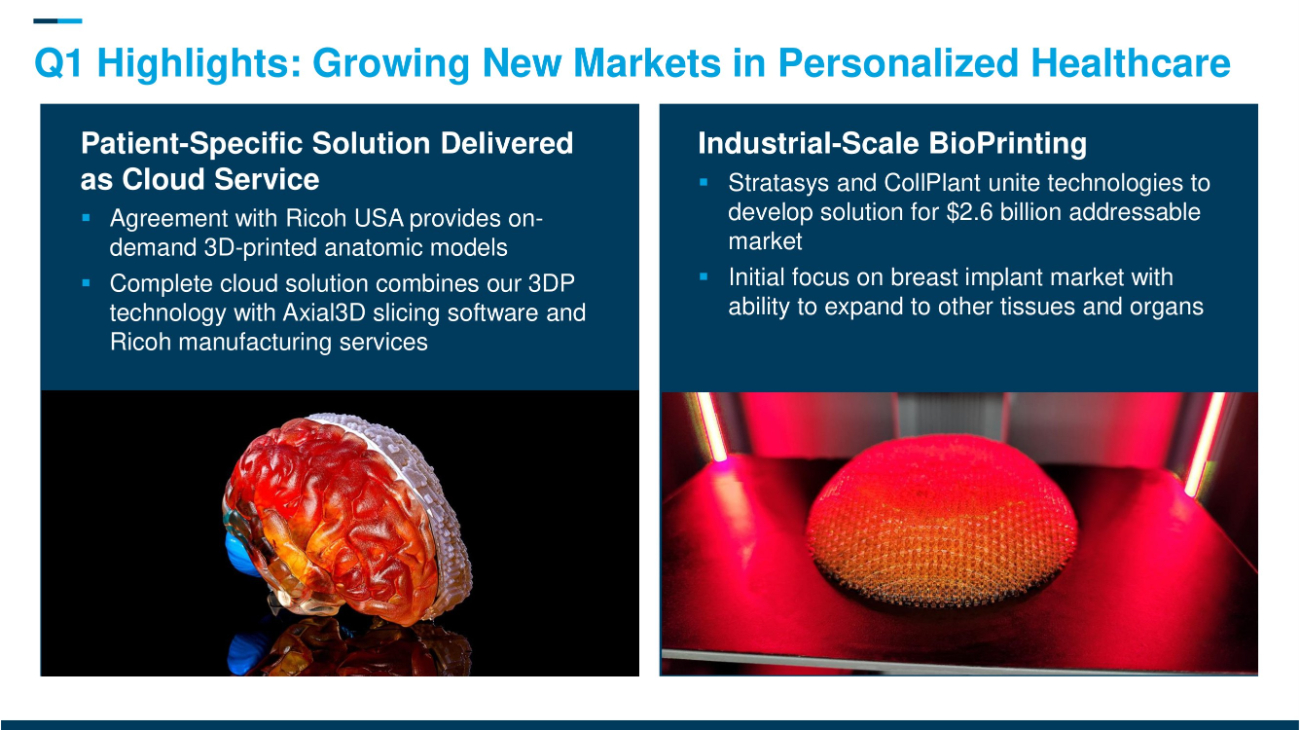
Yoav Zeif Q1 Highlights: New Dental Solutions for $50B Dental Parts Industry First Monolithic, Multi - Color 3D Printed Dentures Solution ▪ TrueDent FDA - cleared resin works exclusively with J5 DentaJet printer ▪ Dentures represent $5B+ opportunity in US - only 5% are created digitally today ▪ Several early wins already secured New Entry - Level Printer for Smaller Dental Labs ▪ J3 DentaJet 3D printer targets SMB labs representing two - thirds of market ▪ Move labs from low - accuracy, single - material desktop printers to our superior solution ▪ Large dental lab tripled productivity Q1 Highlights: Growing New Markets in Personalized Healthcare Patient - Specific Solution Delivered as Cloud Service ▪ Agreement with Ricoh USA provides on - demand 3D - printed anatomic models ▪ Complete cloud solution combines our 3DP technology with Axial3D slicing software and Ricoh manufacturing services Industrial - Scale BioPrinting ▪ Stratasys and CollPlant unite technologies to develop solution for $2.6 billion addressable market ▪ Initial focus on breast implant market with ability to expand to other tissues and organs
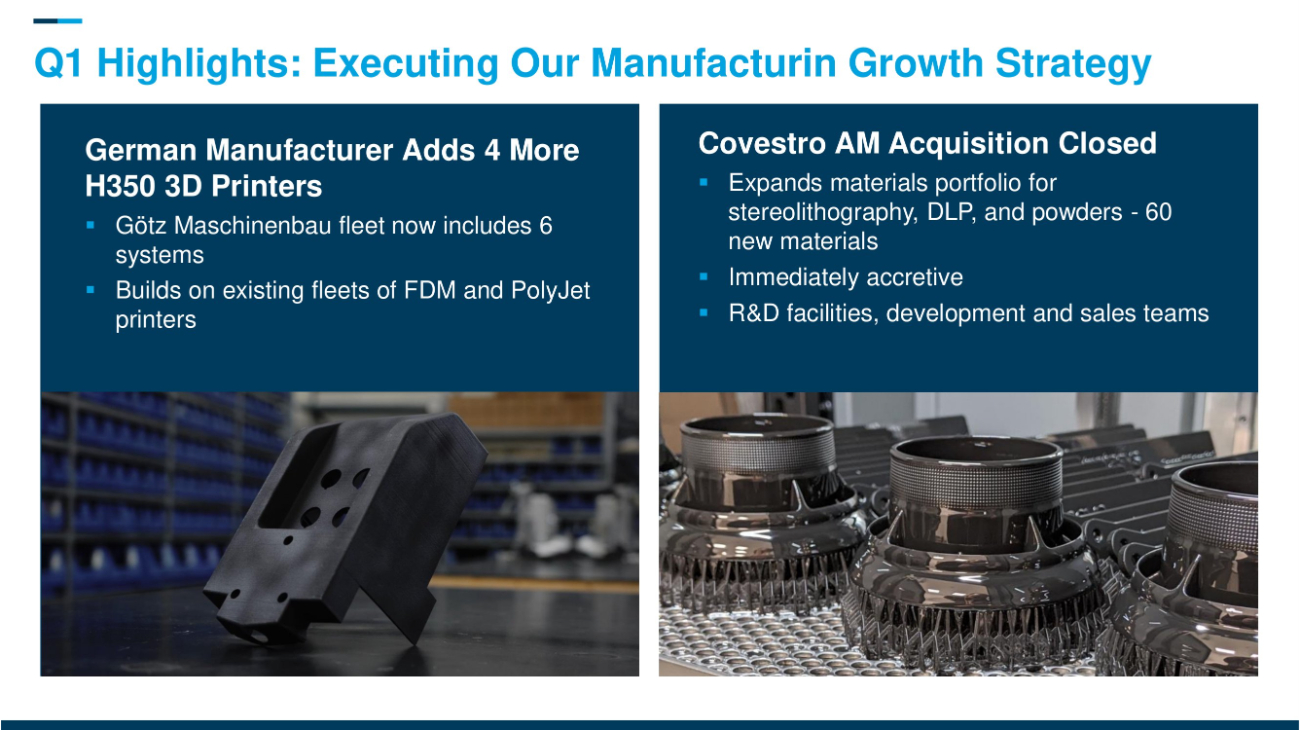
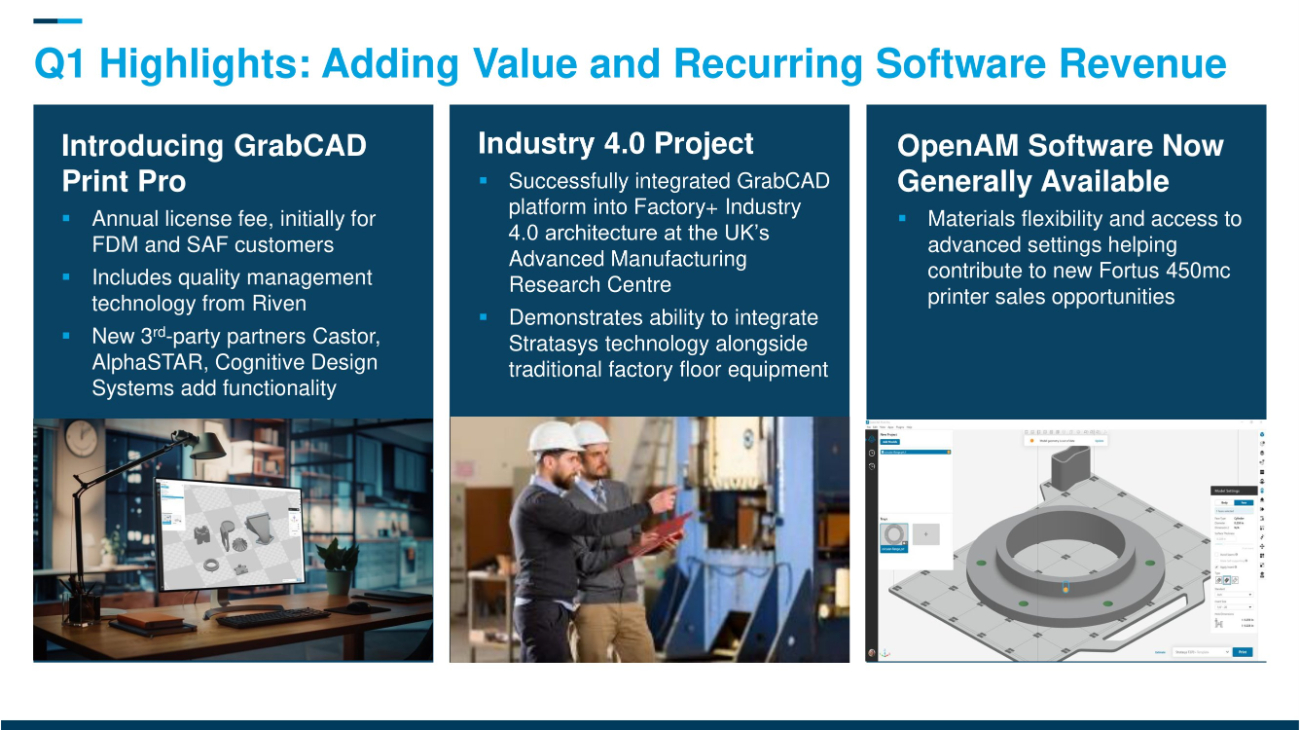
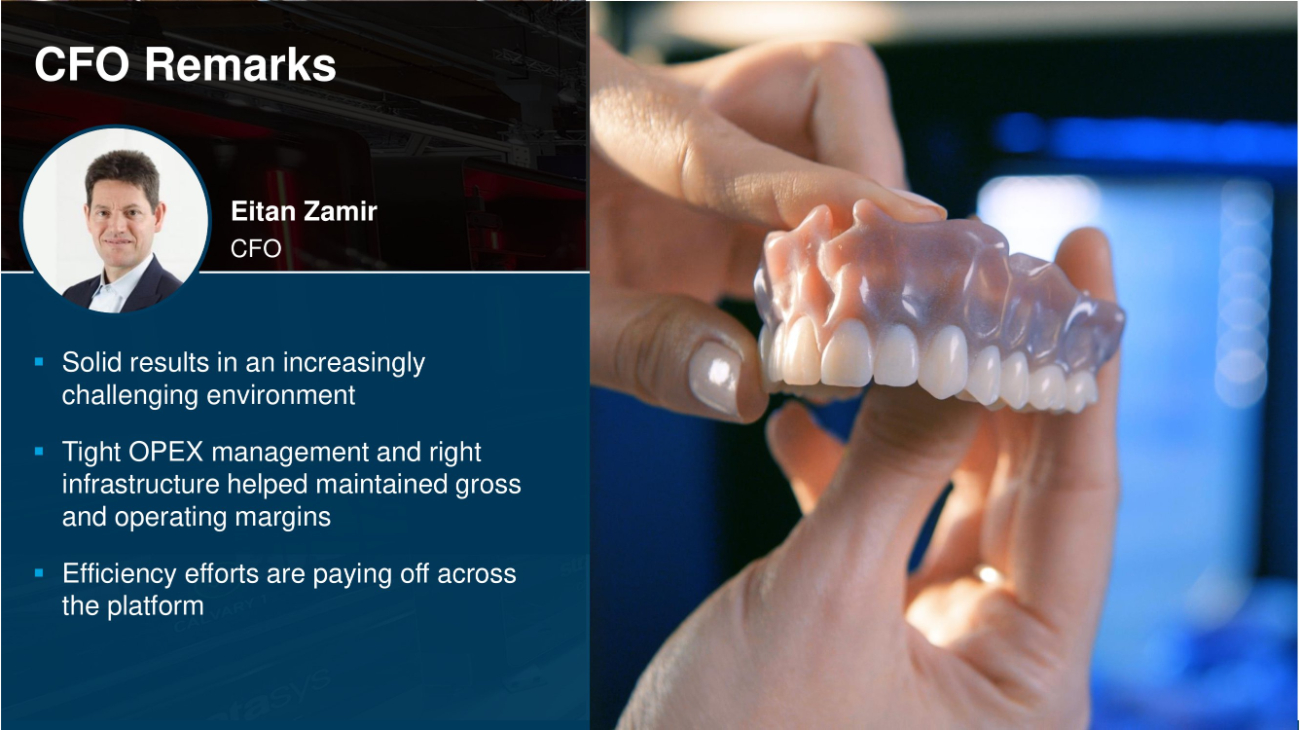
Q1 Highlights: Executing Our Manufacturin Growth Strategy German Manufacturer Adds 4 More H350 3D Printers ▪ Götz Maschinenbau fleet now includes 6 systems ▪ Builds on existing fleets of FDM and PolyJet printers Covestro AM Acquisition Closed ▪ Expands materials portfolio for stereolithography, DLP, and powders - 60 new materials ▪ Immediately accretive ▪ R&D facilities, development and sales teams Q1 Highlights: Adding Value and Recurring Software Revenue Introducing GrabCAD Print Pro ▪ Annual license fee, initially for FDM and SAF customers ▪ Includes quality management technology from Riven ▪ New 3 rd - party partners Castor, AlphaSTAR , Cognitive Design Systems add functionality Industry 4.0 Project ▪ Successfully integrated GrabCAD platform into Factory+ Industry 4.0 architecture at the UK’s Advanced Manufacturing Research Centre ▪ Demonstrates ability to integrate Stratasys technology alongside traditional factory floor equipment OpenAM Software Now Generally Available ▪ Materials flexibility and access to advanced settings helping contribute to new Fortus 450mc printer sales opportunities ▪ Solid results in an increasingly challenging environment ▪ Tight OPEX management and right infrastructure helped maintained gross and operating margins ▪ Efficiency efforts are paying off across the platform CFO Eitan Zamir CFO Remarks
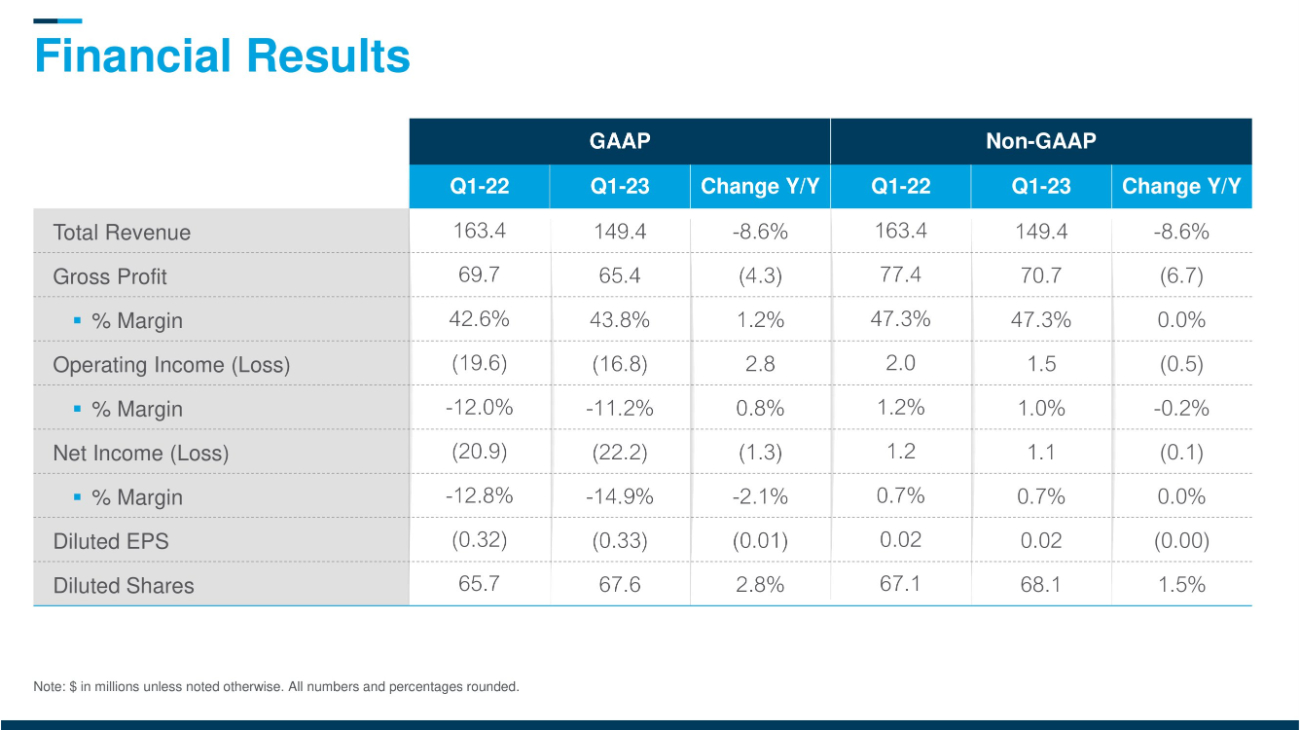
Financial Results Non - GAAP GAAP Change Y/Y Q1 - 23 Q1 - 22 Change Y/Y Q1 - 23 Q1 - 22 - 8.6% 149.4 163.4 - 8.6% 149.4 163 4 Total Revenue (6.7) 70.7 77.4 (4.3) 65.4 69 . 7 Gross Profit 0.0% 47.3% 47.3% 1.2% 43.8% 42.6% ▪ % Margin (0.5) 1.5 2.0 2.8 (16.8) (19.6) Operating Income (Loss) - 0.2% 1.0% 1.2% 0.8% - 11.2% - 12.0% ▪ % Margin (0.1) 1.1 1.2 (1.3) (22.2) (20.9) Net Income (Loss) 0.0% 0.7% 0.7% - 2.1% - 14.9% - 12.8% ▪ % Margin (0.00) 0.02 0.02 (0.01) (0.33) (0.32) Diluted EPS 1.5% 68.1 67.1 2.8% 67.6 6 5 . 7 Diluted Shares Note: $ in millions unless noted otherwise. All numbers and percentages rounded.
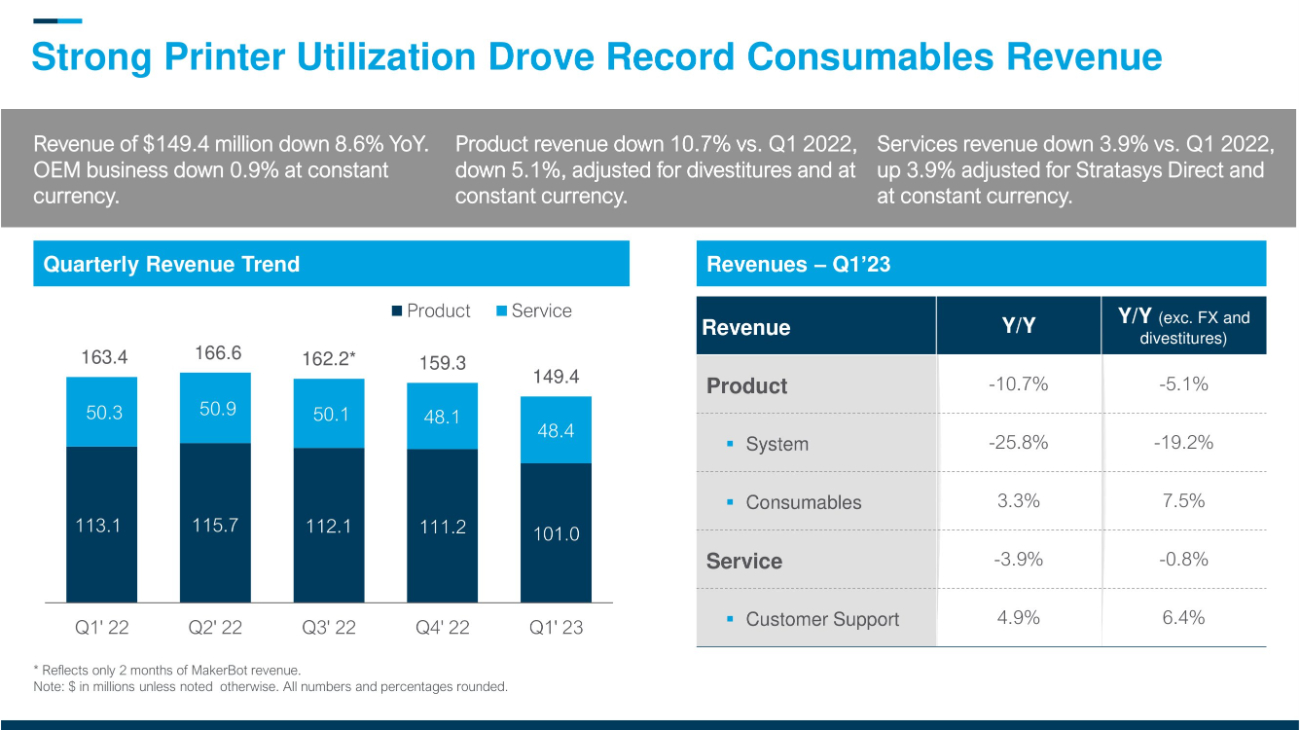
Strong Printer Utilization Drove Record Consumables Revenue * Reflects only 2 months of MakerBot revenue. Note: $ in millions unless noted otherwise. All numbers and percentages rounded. Quarterly Revenue Trend Revenues – Q 1 ’ 2 113.1 115.7 112.1 111.2 101.0 50.3 50.9 50.1 48.1 48.4 163.4 166.6 162.2* 159.3 149.4 Q1' 22 Q2' 22 Q3' 22 Q4' 22 Q1' 23 Product Service Y/Y (exc. FX and divestitures) Y/Y Revenue - 5 . 1 % - 10 . 7 % Product - 19 . 2 % - 25 . 8 % ▪ System 7.5% 3.3% ▪ Consumables - 0.8% - 3.9% Service 6.4% 4.9% ▪ Customer Support Revenue of $ 149.4 million down 8 .6 % YoY. OEM business down 0.9 % at constant currency. Product revenue down 10.7 % vs. Q 1 2022 , down 5.1 %, adjusted for divestitures and at constant currency. Services revenue down 3.9 % vs. Q 1 2022 , up 3.9 % adjusted for Stratasys Direct and at constant currency.
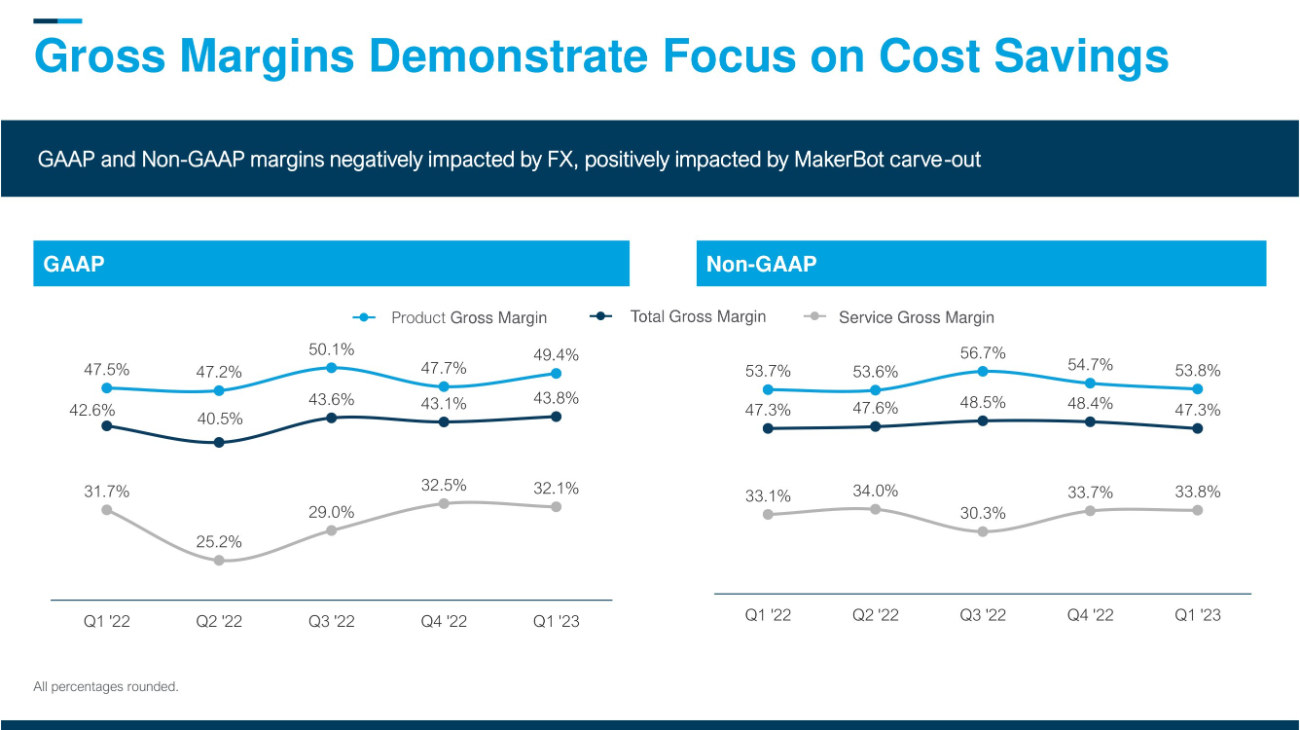
Gross Margins Demonstrate Focus on Cost Savings GAAP Non - GAAP 42.6% 40.5% 43.6% 43.1% 43.8 % 47.5% 47.2% 50.1% 47.7% 49.4% 31.7% 25.2% 29.0 % 32.5% 32.1% Q1 '22 Q2 '22 Q3 '22 Q4 '22 Q1 '23 47.3% 47.6% 48.5% 48.4% 47.3% 53.7 % 53.6% 56.7% 54.7% 53.8% 33.1% 34.0% 30.3% 33.7 % 33.8% Q1 '22 Q2 '22 Q3 '22 Q4 '22 Q1 '23 Service Gross Margin Product Gross Margin Total Gross Margin All percentages rounded. GAAP and Non - GAAP margins negatively impacted by FX, positively impacted by MakerBot carve - out Operating Expenses Reflects Effective Scalability GAAP expenses operating (absolute and as a percentage of revenues) Non - GAAP operating expenses (absolute and as a percentage of revenues) 89.3 82.2 Q1'22 Q1'23 55.0% 75.3 69.2 Q1'22 Q1'23 46.3% Note: $ in millions unless noted otherwise.
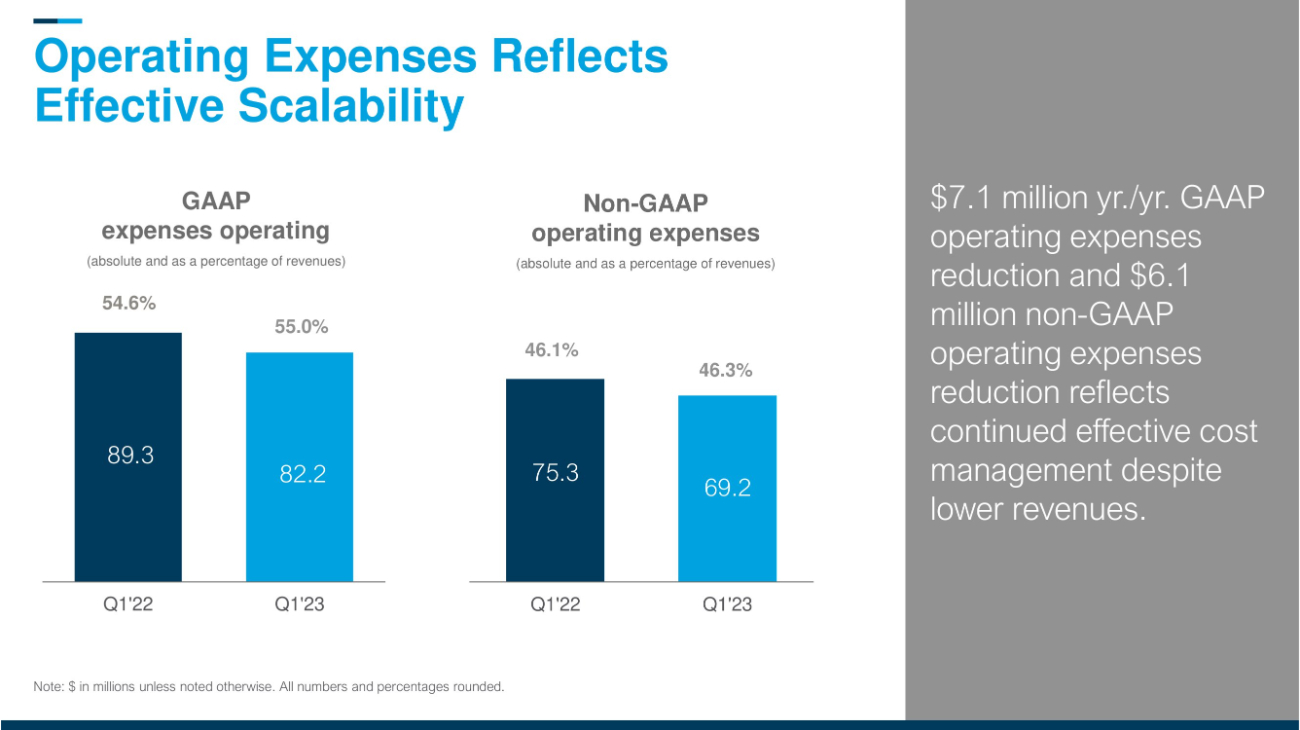
All numbers and percentages rounded. 54.6% 46.1% $ 7.1 million yr./yr. GAAP operating expenses reduction and $ 6.1 million non - GAAP operating expenses reduction reflects continued effective cost management despite lower revenues.
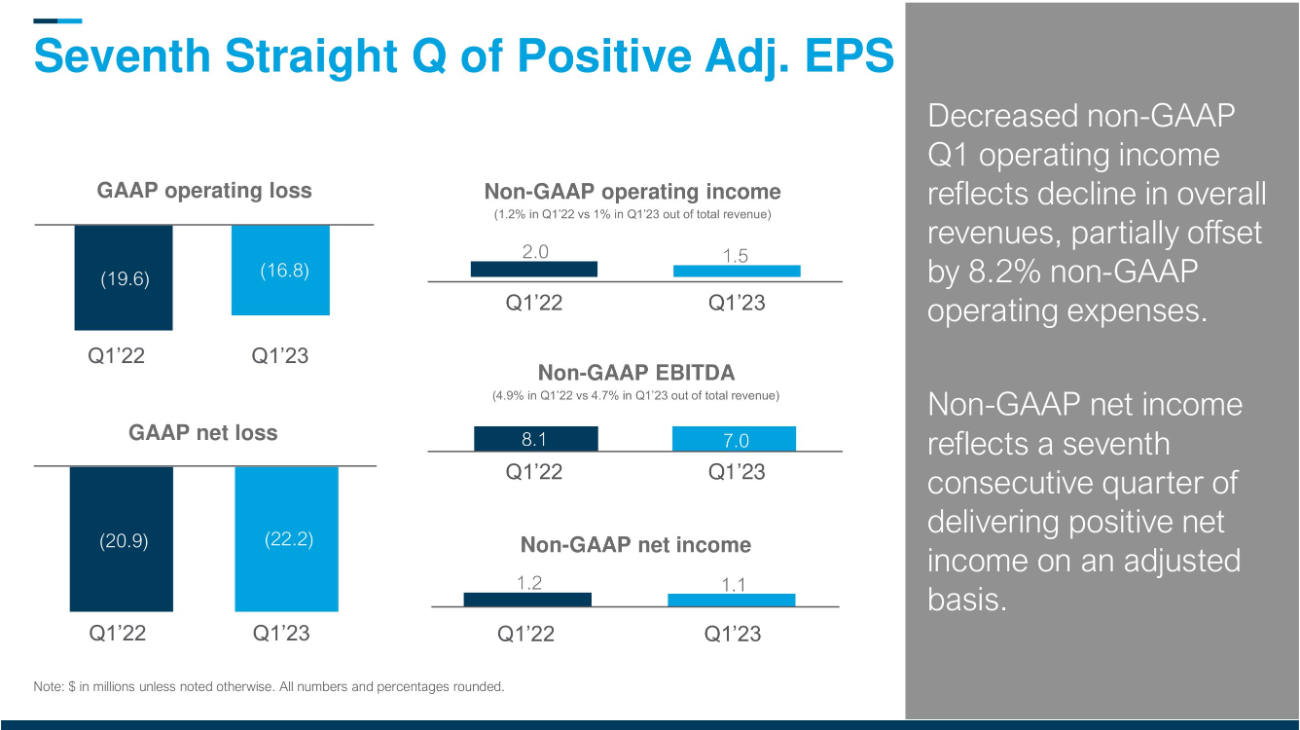
1.2 1.1 Seventh Straight Q of Positive Adj. EPS (19.6) (16.8) ( 20.9 ) (22.2) 8.1 7.0 Non - GAAP operating income (1.2% in Q1’22 vs 1% in Q1’23 out of total revenue) GAAP operating loss Non - GAAP net income GAAP net loss Note: $ in millions unless noted otherwise. All numbers and percentages rounded. Non - GAAP EBITDA (4.9% in Q1’22 vs 4.7% in Q1’23 out of total revenue) 2.0 1.5 Decreased non - GAAP Q1 operating income reflects decline in overall revenues, partially offset by 8.2% non - GAAP operating expenses. Non - GAAP net income reflects a seventh consecutive quarter of delivering positive net income on an adjusted basis. Q1’22 Q1’23 Q1’22 Q 1 ’ 23 Q1’22 Q1’23 Q1’22 Q1’23 Q1’22 Q1’23 Fortified Balance Sheet and Responsible Use of Cash Note: $ in millions unless noted otherwise.
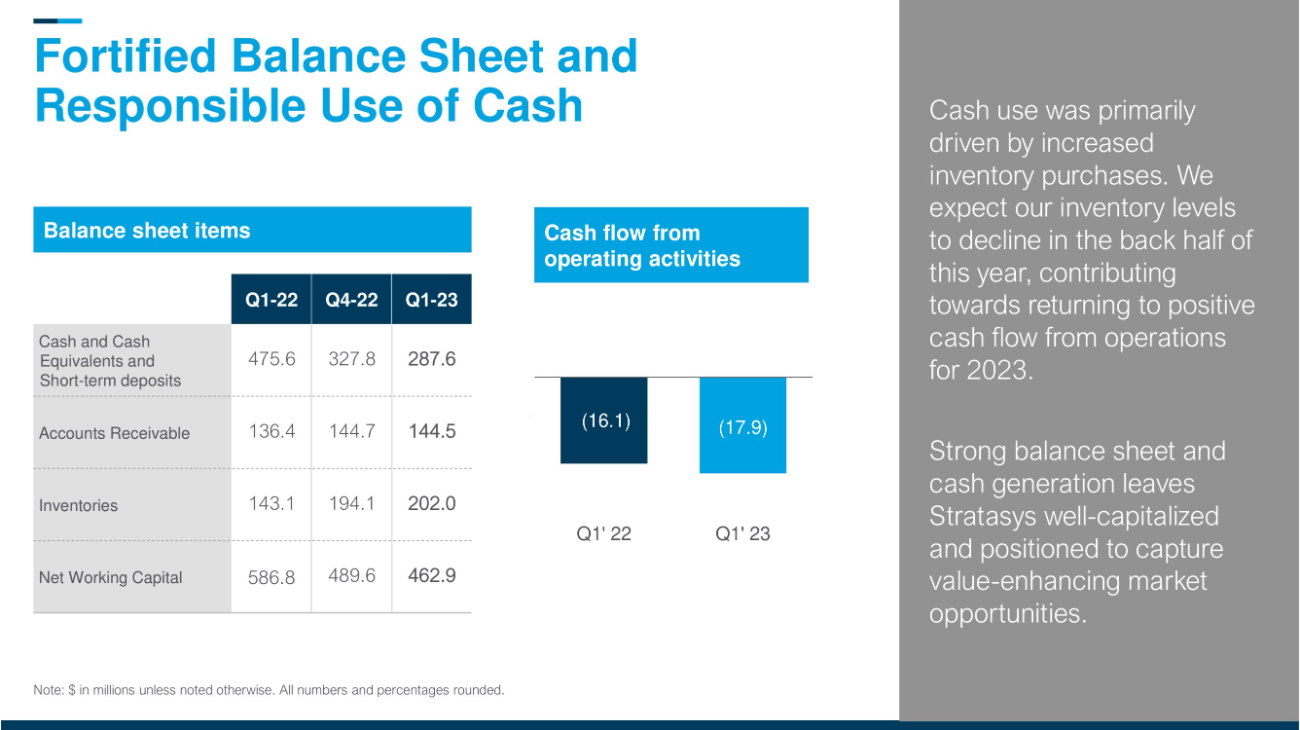
All numbers and percentages rounded. Balance sheet items (16.1) ( 17.9 ) Q1' 22 Q1' 23 Cash flow from operating activities Q - 23 Q4 - 22 Q1 - 22 287.6 327.8 475.6 Cash and Cash Equivalents and Short - term deposits 144.5 144.7 136.4 Accounts Receivable 202.0 194.1 143.1 Inventories 462.9 489.6 586.8 Net Working Capital Cash use was primarily driven by increased inventory purchases. We expect our inventory levels to decline in the back half of this year, contributing towards returning to positive cash flow from operations for 2023. Strong balance sheet and cash generation leaves Stratasys well - capitalized and positioned to capture value - enhancing market opportunities.
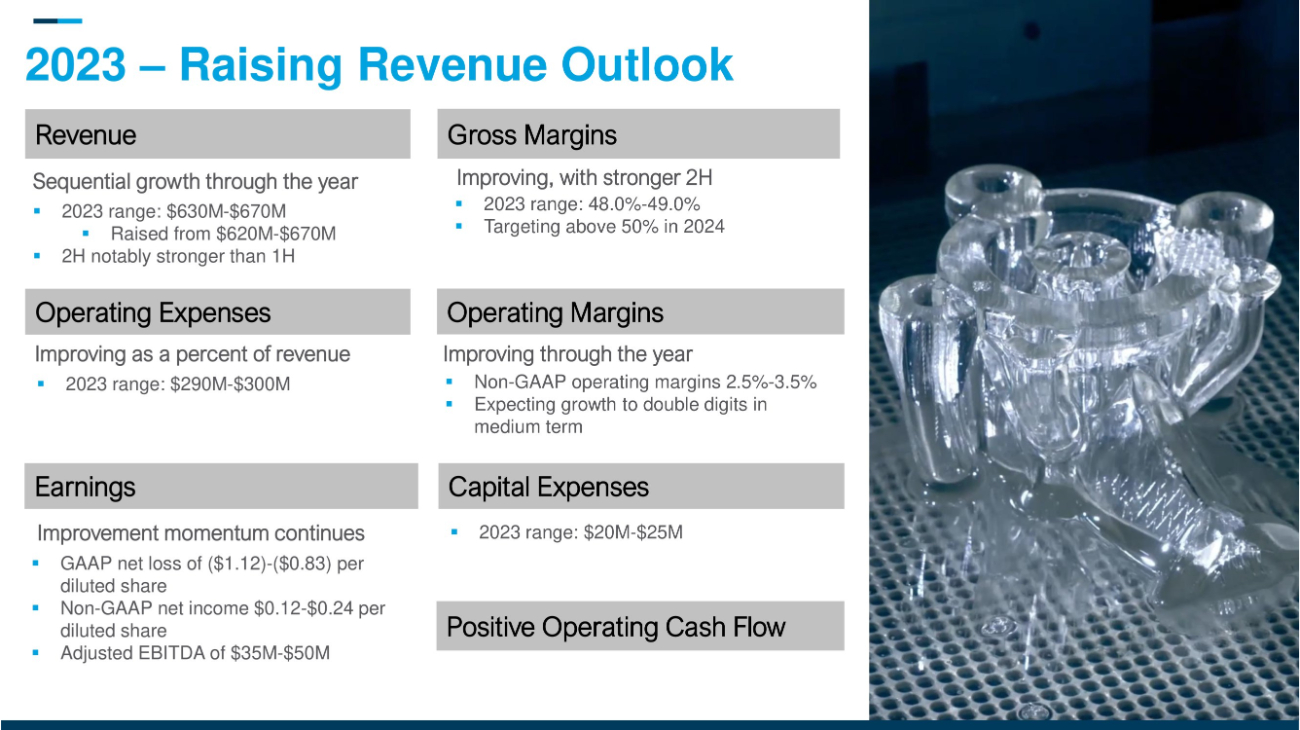
2023 – Raising Revenue Outlook ▪ 2023 range: $290M - $300M Operating Expe nses Gross Margins ▪ 2023 range: 48.0% - 49.0% ▪ Targeting above 50% in 2024 ▪ GAAP net loss of ($ 1.12 ) - ($ 0.83 ) per d iluted share ▪ Non - GAAP net income $ 0.12 - $ 0.24 per diluted share ▪ Adjusted EBITDA of $ 35 M - $ 50 M Earnings ▪ 2023 range: $630M - $670M ▪ Raised from $620M - $670M ▪ 2H notably stronger than 1H Revenue Operating Margins ▪ Non - GAAP operating margins 2 .5% - 3.5% ▪ Expecting growth to double digits in medium term 1 8 Capital Expenses Positive Operating Cash Flow Sequential growth through the year Improving, with stronger 2H Improving as a percent of revenue I mproving through the year ▪ 2023 range: $20M - $25M Improvement momentum continues Medium Term Outlook ▪ Revenues exceeding $ 1 billion ▪ Adjusted EBITDA over 15 % of revenues 2026 1 9 2024 ▪ Non - GAAP gross margins above 50% ▪ Positive free cash flow

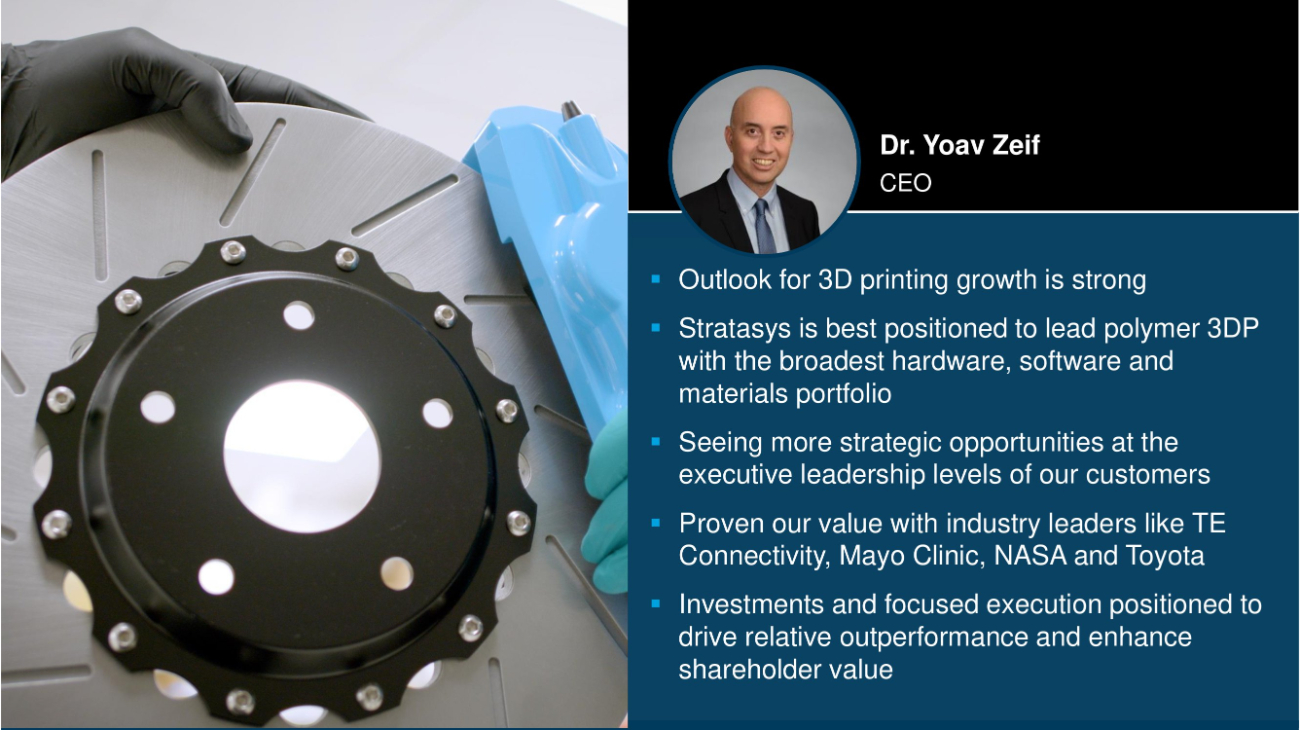
▪ Outlook for 3D printing growth is strong ▪ Stratasys is best positioned to lead polymer 3DP with the broadest hardware, software and materials portfolio ▪ Seeing more strategic opportunities at the executive leadership levels of our customers ▪ Proven our value with industry leaders like TE Connectivity, Mayo Clinic, NASA and Toyota ▪ Investments and focused execution positioned to drive relative outperformance and enhance shareholder value CEO Summary CEO Dr. Yoav Zeif Appendix Note: $ in thousands unless noted otherwise.

Thank You
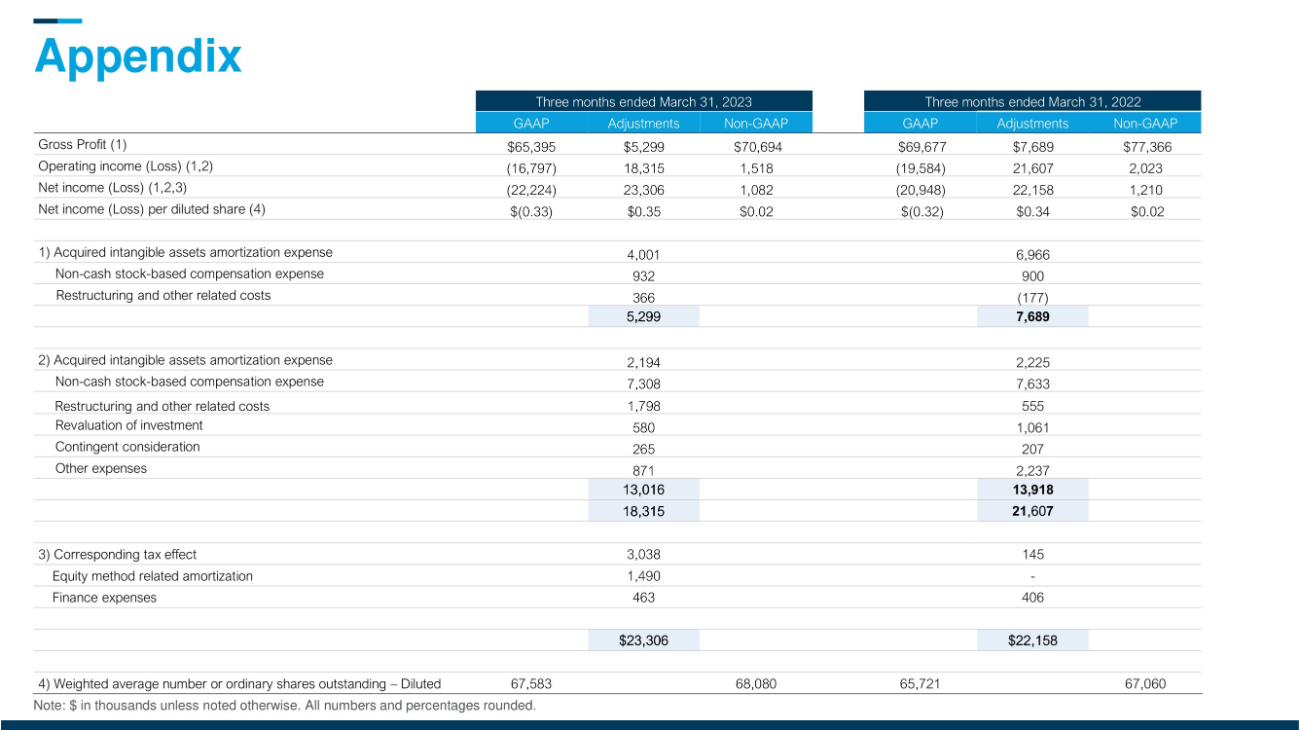
All numbers and percentages rounded. Three months ended March 31, 2022 Three months ended March 31, 2023 Non - GAAP Adjustments GAAP Non - GAAP Adjustments GAAP $77,366 $7,689 $69,677 $70,694 $5,299 $65,395 Gross Profit (1) 2,023 21,607 ( 19,584 ) 1,518 18,315 (16,797) Operating income (Loss) (1,2) 1,210 22,158 (20,948) 1,082 23,306 (22,224) Net income (Loss) (1,2,3) $0.02 $0.34 $(0.32) $0.02 $0.35 $(0.33) Net income (Loss) per diluted share ( 4) 6,966 4,001 1) Acquired intangible assets amortization expense 900 932 Non - cash stock - based compensation expense (177) 366 Restructuring and other related costs 5 299 2,225 2,194 2) Acquired intangible assets amortization expense 7,633 7,308 Non - cash stock - based compensation expense 555 1,798 Restructuring and other related costs 1,061 580 Revaluation of investment 207 265 Contingent consideration 2,237 871 Other expenses 13,016 ,60 18,315 145 3,038 3) Corresponding tax effect - 1,490 Equity method related amortization 406 463 Finance expenses $22,158 $23,306 67,060 65,721 68,080 67,583 4) Weighted average number or ordinary shares outstanding – Diluted