UNITED STATES
SECURITIES AND EXCHANGE COMMISSION
Washington, D.C. 20549
FORM 8-K
CURRENT REPORT
Pursuant to Section 13 or 15(d) of the Securities Exchange Act of 1934
Date of Report (Date of earliest event reported) November 15, 2023
| Transcat, Inc. |
| (Exact name of registrant as specified in its charter) |
| Ohio | 000-03905 | 16-0874418 |
| (State or other jurisdiction | (Commission | (IRS Employer |
| of incorporation) | File Number) | Identification No.) |
| 35 Vantage Point Drive, Rochester, New York | 14624 |
| (Address of principal executive offices) | (Zip Code) |
Registrant's telephone number, including area code (585) 352-7777
| (Former name or former address, if changed since last report) |
Check the appropriate box below if the Form 8-K filing is intended to simultaneously satisfy the filing obligation of the registrant under any of the following provisions:
| ☐ | Written communications pursuant to Rule 425 under the Securities Act (17 CFR 230.425) |
| ☐ | Soliciting material pursuant to Rule 14a-12 under the Exchange Act (17 CFR 240.14a-12) |
| ☐ | Pre-commencement communications pursuant to Rule 14d-2(b) under the Exchange Act (17 CFR 240.14d-2(b)) |
| ☐ | Pre-commencement communications pursuant to Rule 13e-4(c) under the Exchange Act (17 CFR 240.13e-4(c)) |
Securities registered pursuant to Section 12(b) of the Act:
| Title of each class | Trading Symbol(s) | Name of each exchange on which registered |
| Common Stock, $0.50 par value | TRNS | Nasdaq Global Market |
Indicate by check mark whether the registrant is an emerging growth company as defined in Rule 405 of the Securities Act of 1933 (§ 230.405 of this chapter) or Rule 12b-2 of the Securities Exchange Act of 1934 (§ 240.12b-2 of this chapter).
Emerging growth company ☐
If an emerging growth company, indicate by check mark if the registrant has elected not to use the extended transition period for complying with any new or revised financial accounting standards provided pursuant to Section 13(a) of the Exchange Act. ☐
| Item 7.01 | Regulation FD Disclosure. |
On November 15, 2023, Transcat, Inc. (the “Company”) will participate in the ROTH MKM New York Technology Conference using the presentation furnished as Exhibit 99.1 to this report. The presentation will also be posted on the Company’s website.
The information furnished pursuant to this Item 7.01, including Exhibit 99.1, shall not be deemed “filed” for purposes of Section 18 of the Securities Exchange Act of 1934, as amended (the “Exchange Act”), or otherwise subject to the liabilities under such section and shall not be deemed to be incorporated by reference into any filing of the Company under the Securities Act of 1933, as amended, or the Exchange Act.
| Item 9.01 | Financial Statements and Exhibits. |
(d) Exhibits.
| Exhibit No. | Description | |
| 99.1 | Transcat, Inc. Presentation dated November 15, 2023 | |
| 104 | Cover Page Interactive Data File (embedded within the Inline XBRL document) |
SIGNATURES
Pursuant to the requirements of the Securities Exchange Act of 1934, the registrant has duly caused this report to be signed on its behalf by the undersigned hereunto duly authorized.
| TRANSCAT, INC. | ||
| Dated: November 15, 2023 | By: | /s/ James M. Jenkins |
| James M. Jenkins | ||
| Chief Legal and Corporate Development Officer |
Exhibit 99.1

INVESTOR PRESENTATION November 2023

This presentation contains forward - looking statements within the meaning of Section 21 E of the Securities Exchange Act of 1934 . All statements other than historical fact are forward - looking statements . Forward - looking statements are not statements of historical fact and thus are subject to risks, uncertainties and assumptions . Forward - looking statements are identified by words such as “will,” “expects,” “estimates,” “projects,” “anticipates,” “believes,” “could,” “plans,” “target,” “aims” and other similar expressions or variations thereof . All statements addressing operating performance, events or developments that Transcat expects or anticipates will occur in the future, including but not limited to statements relating to anticipated revenue, profit margins, the commercialization of software projects, sales operations, capital expenditures, cash flows, operating income, growth strategy, segment growth, potential acquisitions, integration of acquired businesses, market position, customer preferences, outlook and changes in market conditions in the industries in which Transcat operates are forward - looking statements . Forward - looking statements should be evaluated in light of important risk factors and uncertainties . These risk factors and uncertainties include those more fully described in Transcat’s Annual Report and Quarterly Reports filed with the Securities and Exchange Commission, including under the heading entitled “Risk Factors . ” Should one or more of these risks or uncertainties materialize, or should any of the Company’s underlying assumptions prove incorrect, actual results may vary materially from those currently anticipated . In addition, undue reliance should not be placed on the Company’s forward - looking statements, which speak only as of the date they are made . Except as required by law, the Company disclaims any obligation to update, correct or publicly announce any revisions to any of the forward - looking statements contained in this news release, whether as the result of new information, future events or otherwise . This presentation is not an offer to sell, nor a solicitation of an offer to buy, any securities . Non - GAAP Disclaimer : This presentation includes some non - GAAP financial measures, which the Company believes are useful in evaluating our performance . You should not consider the presentation of this additional information in isolation or as a substitute for results compared in accordance with GAAP . Further discussion regarding our use of Non - GAAP financial measures, as well as the most directly comparable GAAP (accounting principles generally accepted in the United States) financial measures and information reconciling these Non - GAAP financial measures to our financial results prepared in accordance with GAAP, are included at the end of this presentation . These non - GAAP measures are presented as supplemental information and reconciled to the appropriate GAAP measures at the end of this presentation . The non - GAAP financial measures presented may be determined or calculated differently by other companies . The non - GAAP financial information presented should not be unduly relied upon .
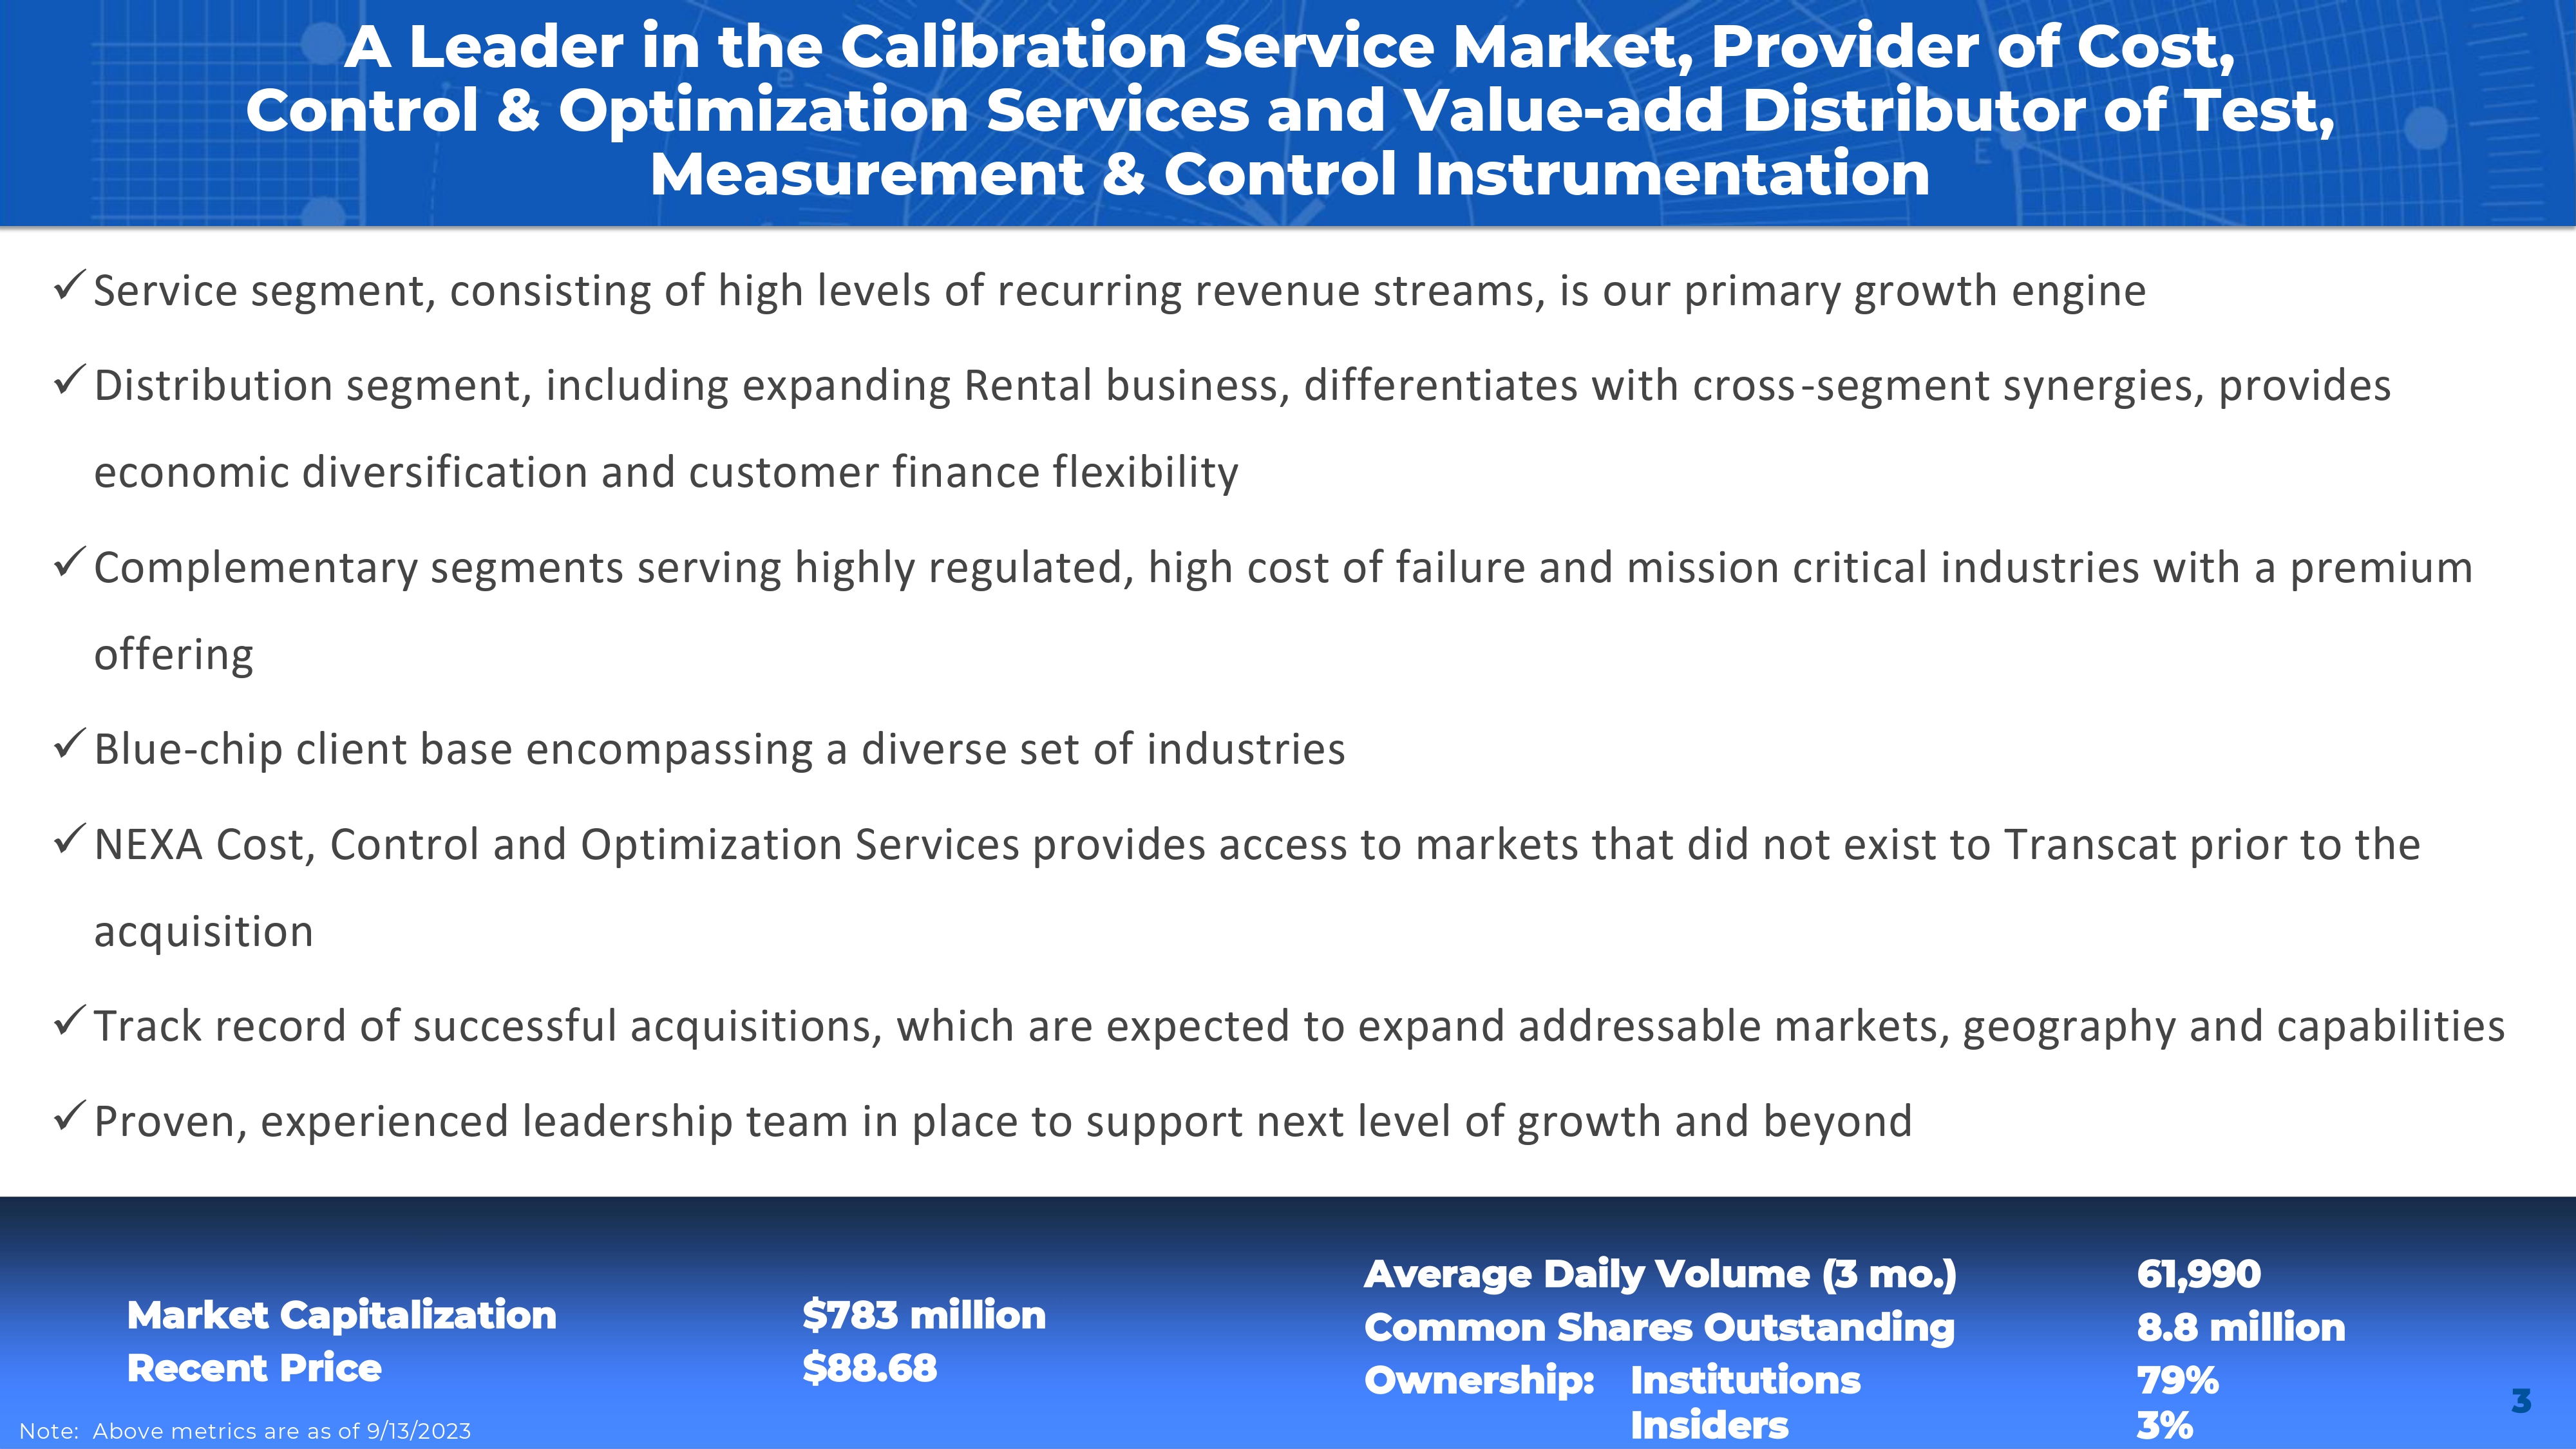

Safe Harbor Statement 3 A Leader in the Calibration Service Market, Provider of Cost, Control & Optimization Services and Value - add Distributor of Test, Measurement & Control Instrumentation Market Capitalization $783 million Recent Price $88.68 Average Daily Volume (3 mo.) 61,990 Common Shares Outstanding 8.8 million Ownership: Institutions 79% Insiders 3% Note: Above metrics are as of 9/13/2023 3 x Service segment, consisting of high levels of recurring revenue streams, is our primary growth engine x Distribution segment, including expanding Rental business, differentiates with cross - segment synergies, provides economic diversification and customer finance flexibility x Complementary segments serving highly regulated, high cost of failure and mission critical industries with a premium offering x Blue - chip client base encompassing a diverse set of industries x NEXA Cost, Control and Optimization Services provides access to markets that did not exist to Transcat prior to the acquisition x Track record of successful acquisitions, which are expected to expand addressable markets, geography and capabilities x Proven, experienced leadership team in place to support next level of growth and beyond 4 Seasoned Executive Management Team Michael W. West Senior Vice President of Business Operations ▪ 15+ years of experience in B2B distribution marketing and consulting ▪ Previously, VP of Distribution & Marketing at Transcat and principal owner of QuestCom Inc., a marketing and advertising firm QuestCom Inc. Mark Doheny Chief Operating Officer ▪ 22+ years of experience in industrial and distribution services, as well as financial management ▪ Previously, CFO and Treasurer at Transcat and CFO at Wheelabrator Technologies, Tunnel Hill Partners and Vallen Distribution Thomas Barbato Chief Financial Officer & Treasurer ▪ 20+ years of corporate finance experience in electronics and manufacturing services companies ▪ Previously, CFO of IEC Electronics Corp. and held various positions at Xerox, most recently VP of Finance Marcy Bosley Vice President of Sales ▪ 19+ years of experience in the calibration industry ▪ Previously, Senior Director of Sales at Transcat and VP of Sales at SIMCO Electronics, prior to leaving in 2019 Theresa A. Conroy Senior Vice President of Human Resources ▪ 25+ years of experience in labor, employment and human resources law ▪ Previously, Partner at Harter Secrest & Emery LLP James M. Jenkins General Counsel, VP of Corporate Development and Corporate Secretary ▪ 30+ years of experience in commercial, corporate and securities law, as well as M&A & business development ▪ Chairman of the Board at Lakeland Industries Inc ▪ Previously , Partner at Harter Secrest & Emery LLP John Cummins Vice President, NEXA Enterprise Asset Management ▪ 18+ years of experience in pharmaceutical and medical device engineering programs; Certified Pharmaceutical Industry Professional ▪ Previously, President and CEO at NEXA | EAM before its acquisition by Transcat Lee D. Rudow President & Chief Executive Officer and Director ▪ 33+ years of experience in calibration, distribution and software services ▪ Demonstrated ability to accelerate growth at companies ▪ Previously, VP at SIMCO Electronics and President and CEO at Davis Calibration, Inc.
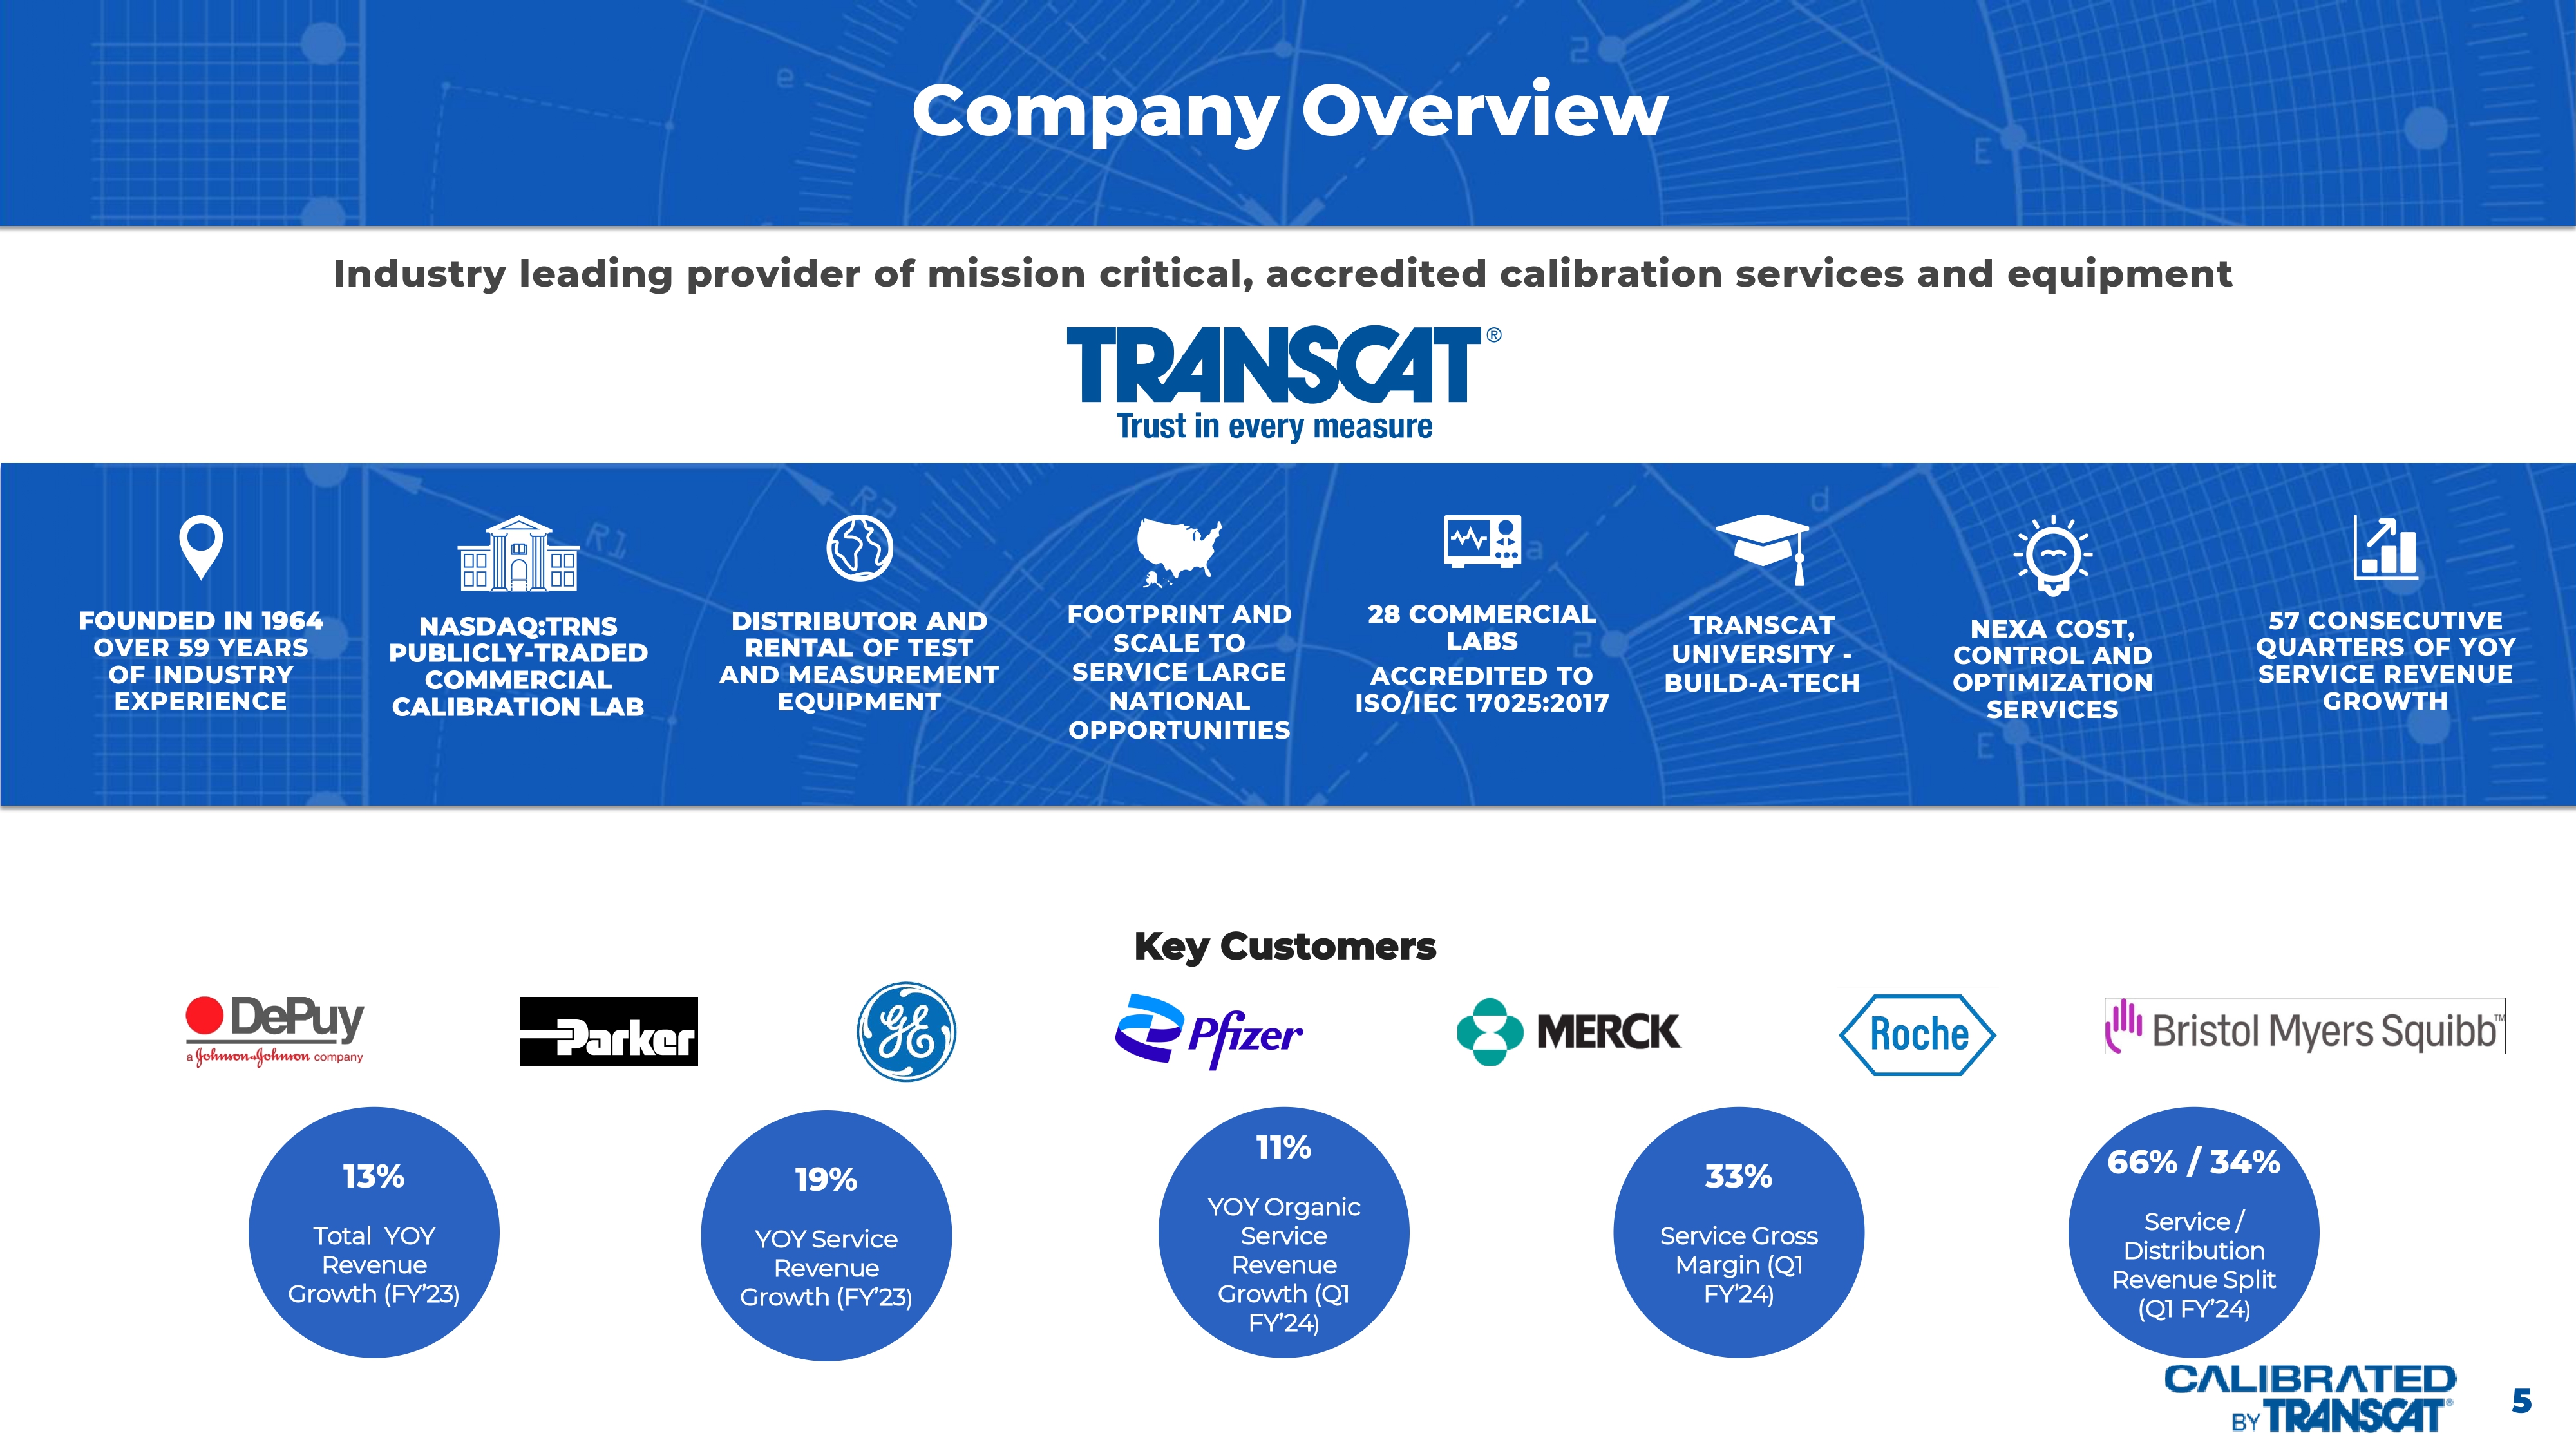
and Davis Inotek Corp Today’s Speakers 5 Company Overview Industry leading provider of mission critical, accredited calibration services and equipment FOUNDED IN 1964 OVER 59 YEARS OF INDUSTRY EXPERIENCE NASDAQ:TRNS PUBLICLY - TRADED COMMERCIAL CALIBRATION LAB 57 CONSECUTIVE QUARTERS OF YOY SERVICE REVENUE GROWTH NEXA COST, CONTROL AND OPTIMIZATION SERVICES DISTRIBUTOR AND RENTAL OF TEST AND MEASUREMENT EQUIPMENT 28 COMMERCIAL LABS ACCREDITED TO ISO/IEC 17025:2017 FOOTPRINT AND SCALE TO SERVICE LARGE NATIONAL OPPORTUNITIES TRANSCAT UNIVERSITY - BUILD - A - TECH Key Customers 19% YOY Service Revenue Growth (FY’23 ) 11% YOY Organic Service Revenue Growth (Q1 FY’24 ) 13% Total YOY Revenue Growth (FY’23 ) 33% Service Gross Margin (Q1 FY’24 ) 66% / 34% Service / Distribution Revenue Split (Q1 FY’24 )

6 History 57 Consecutive Quarters of YOY Service Revenue Growth 25,000 75,000 125,000 175,000 225,000 275,000 2012 2013 2014 2015 2016 2017 2018 2019 2020 2021 2022 2023 Service Revenue Total Revenue Total GM Service GM GM% 35% 20% Lee Rudow Joins Transcat w/ Service Focus Heavily Regulated Industry Focus NEXA Cost, Control and Optimization Transcat Rentals 1964 - 1982 Manufacturing 1982 - 2005 Distribution 2005 - Present Services 2021 - Present Cost, Control & Optimization Services Building a Services Engine Axiom Accelerating Rental Growth 7 Service Segment: Consistent Performance and Growth 2012 2013 2014 2015 2016 2017 2018 2019 2020 2021 2022 2023 Service Revenue 36.4$ 40.7$ 48.2$ 51.8$ 59.2$ 71.1$ 77.4$ 84.0$ 93.0$ 101.3$ 122.0$ 144.9$ Service GM% 23.7% 25.3% 26.6% 27.2% 26.3% 26.8% 25.7% 24.9% 25.3% 30.3% 31.9% 32.2% Service Op Income (0.2)$ 1.3$ 2.4$ 3.7$ 4.2$ 4.8$ 5.2$ 5.2$ 5.7$ 10.4$ 10.8$ 11.4$ Service Adjusted EBITDA 2.0$ 22.6$ Fiscal Year Service Adjusted EBITDA is a non - GAAP financial measure.
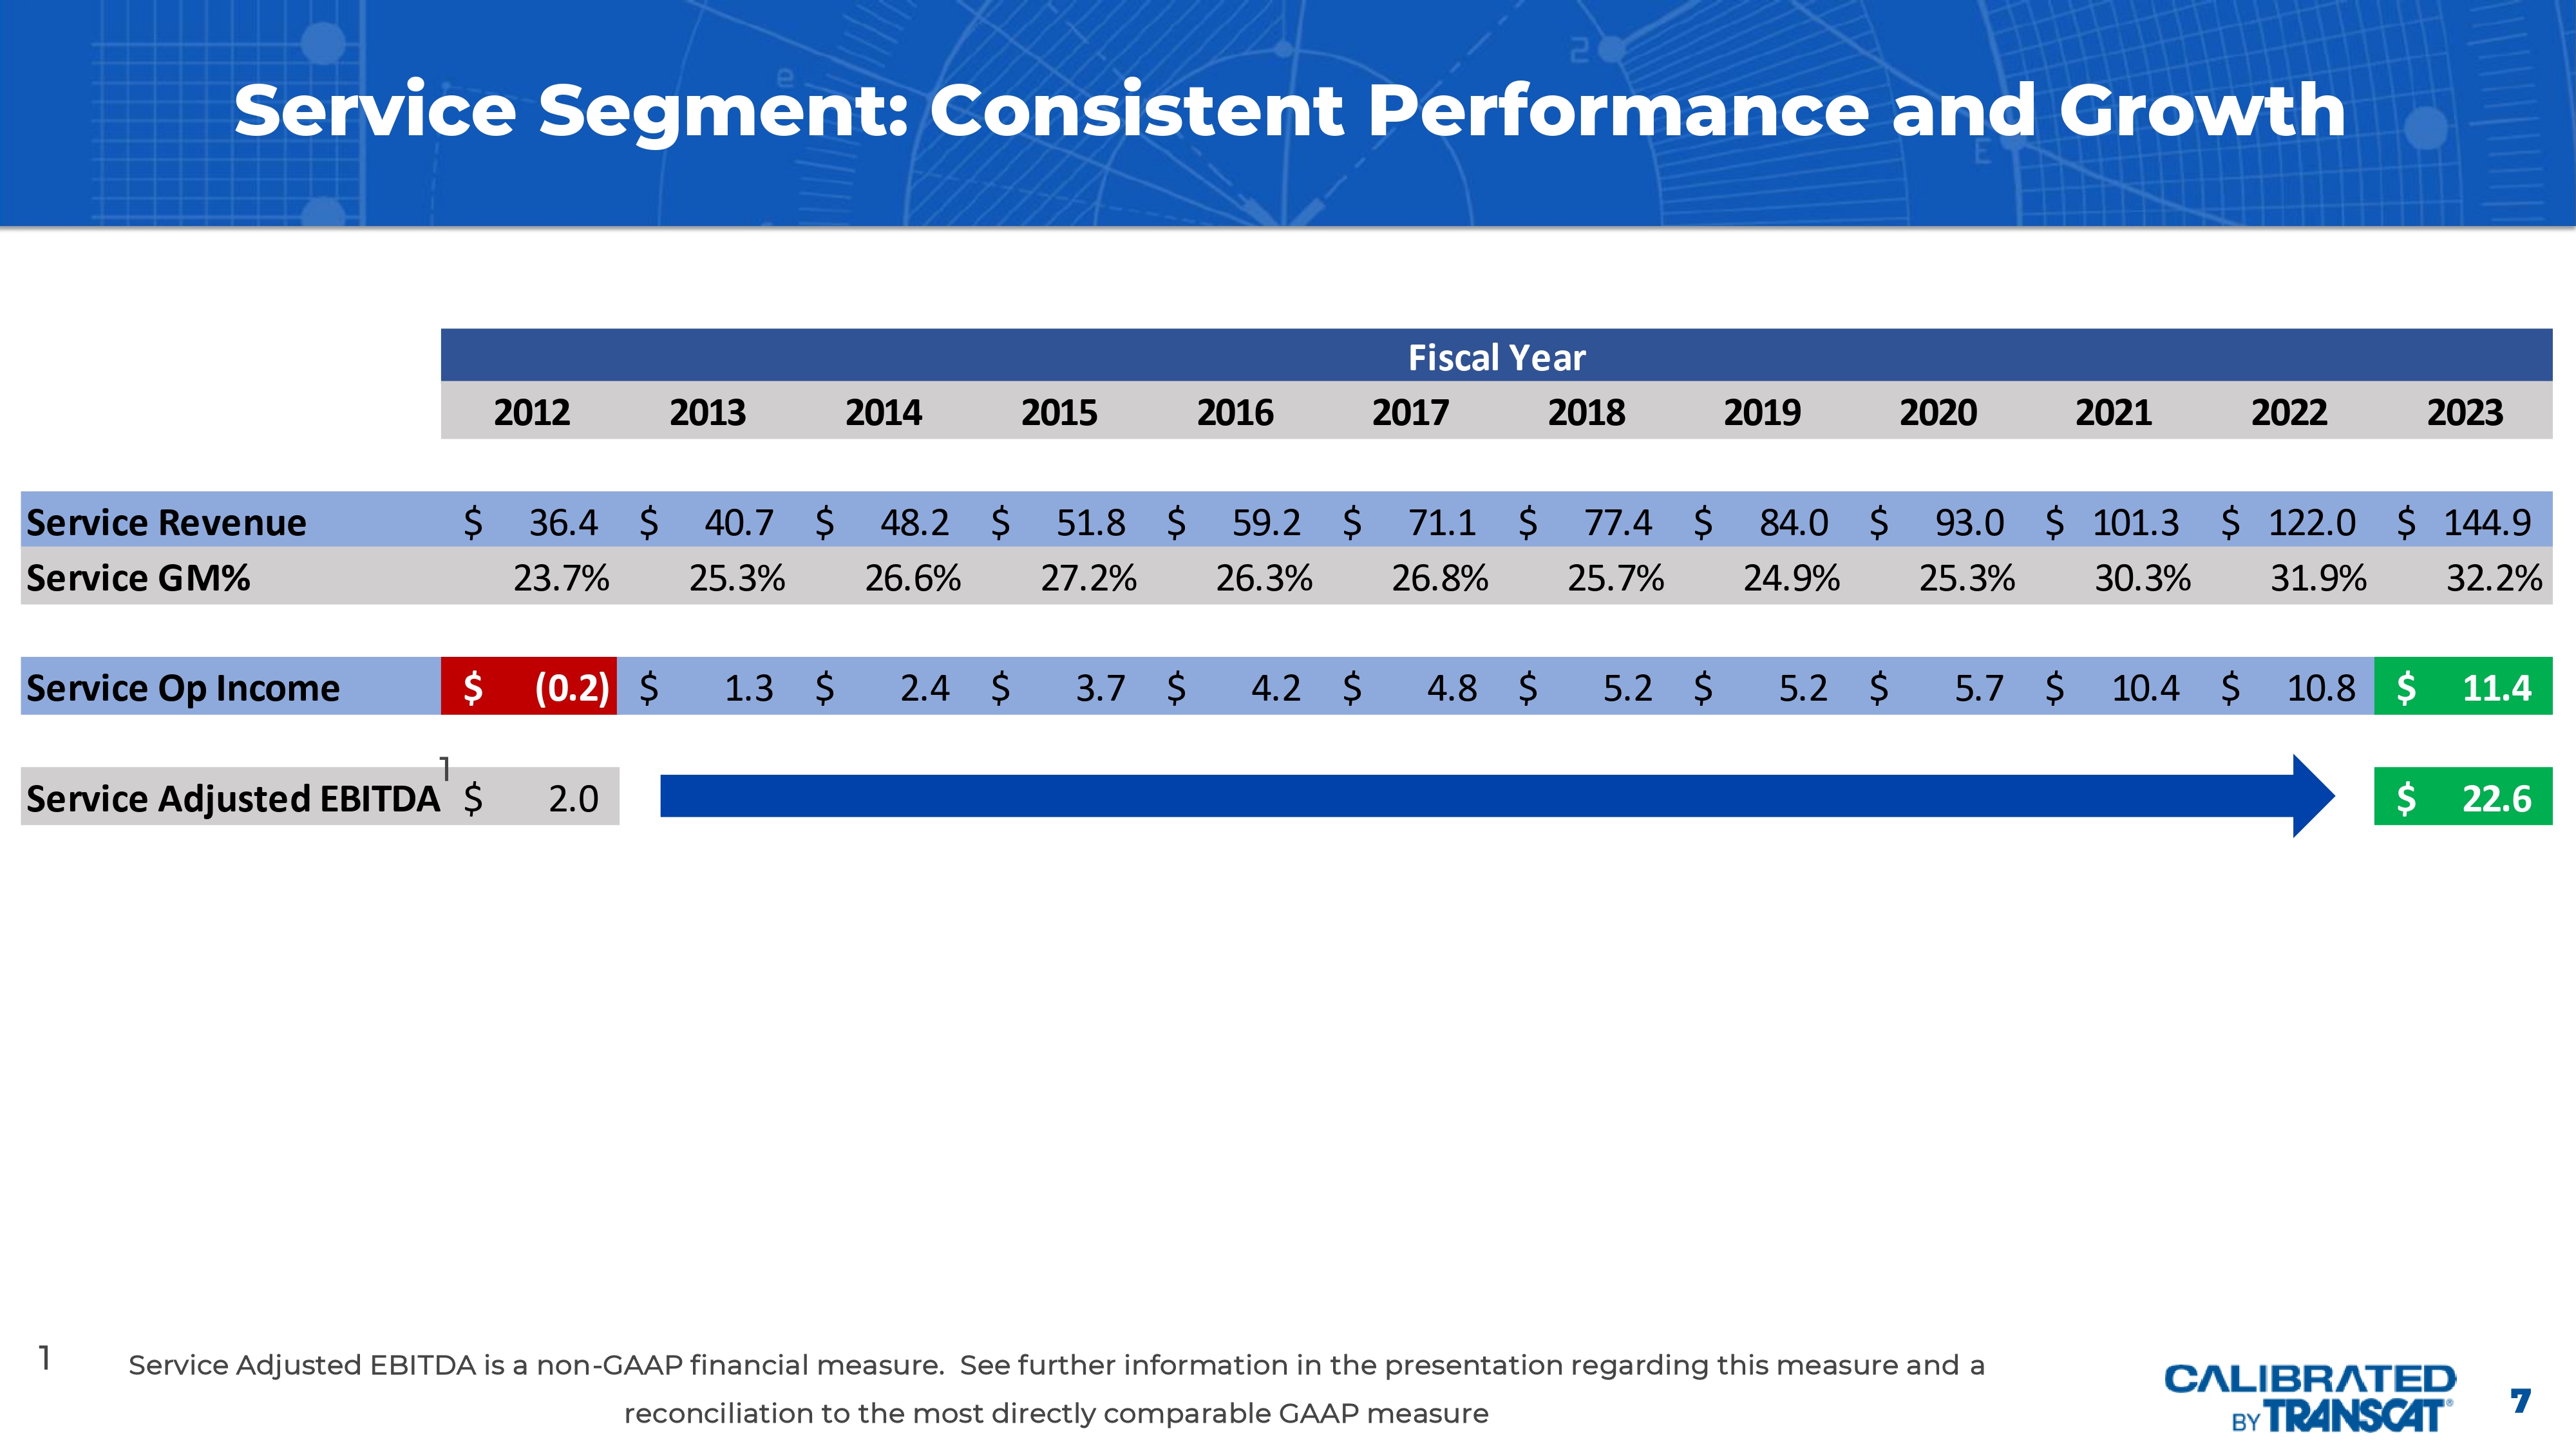
See further information in the presentation regarding this measure and a reconciliation to the most directly comparable GAAP measure 1 1 8 1.

As of Q1 FY 2024 TTM Revenue Ended June 24, 2023. Complementary Business Segments x Approx. 18% service revenue growth, approx. 11% organic growth x Driven by regulation and high cost of failure, life sciences focus x Strong operating leverage x Flat revenue growth with improving gross margins x Focused growth in higher margin rental business x Generates calibration services leads Calibration Services 66% of Revenue 1 Distribution / Rental 34% of Revenue 1 OPPORTUNITY FOR ACCELERATED GROWTH AND MARGIN EXPANSION x Unique value proposition x Synergies between segments Quality Lead Gen Strong cross - selling opportunities from distribution to calibration services 1. As of Q1 FY 2024, Revenue Ended June 24, 2023. Approx.

20% customer overlap across segments 9 Competitive Landscape and Differentiators Industry Attributes Recurring Service Revenue Streams Growing Service Market Driven by Regulation and High Cost of Failure Differentiators = Premium Priced Service Distribution and Rental a Source of Service Leads and Cash Flow NEXA Cost, Control and Optimization Services Highly Regulated Life Science Target Market Acquisitions to Expand Addressable Markets, Geography and Capabilities Footprint and scale to Service Large National Opportunities Transcat University - Build - A - Tech Calibration Industry – Competitive Landscape 5 National Players Transcat Trescal Tektronics Simco Electronics Applied Technical Services (ATS) Numerous Regional Players ($5m to $30m in Annual Revenue) Hundreds of Other Players (Highly Fragmented ($500K to $5M)
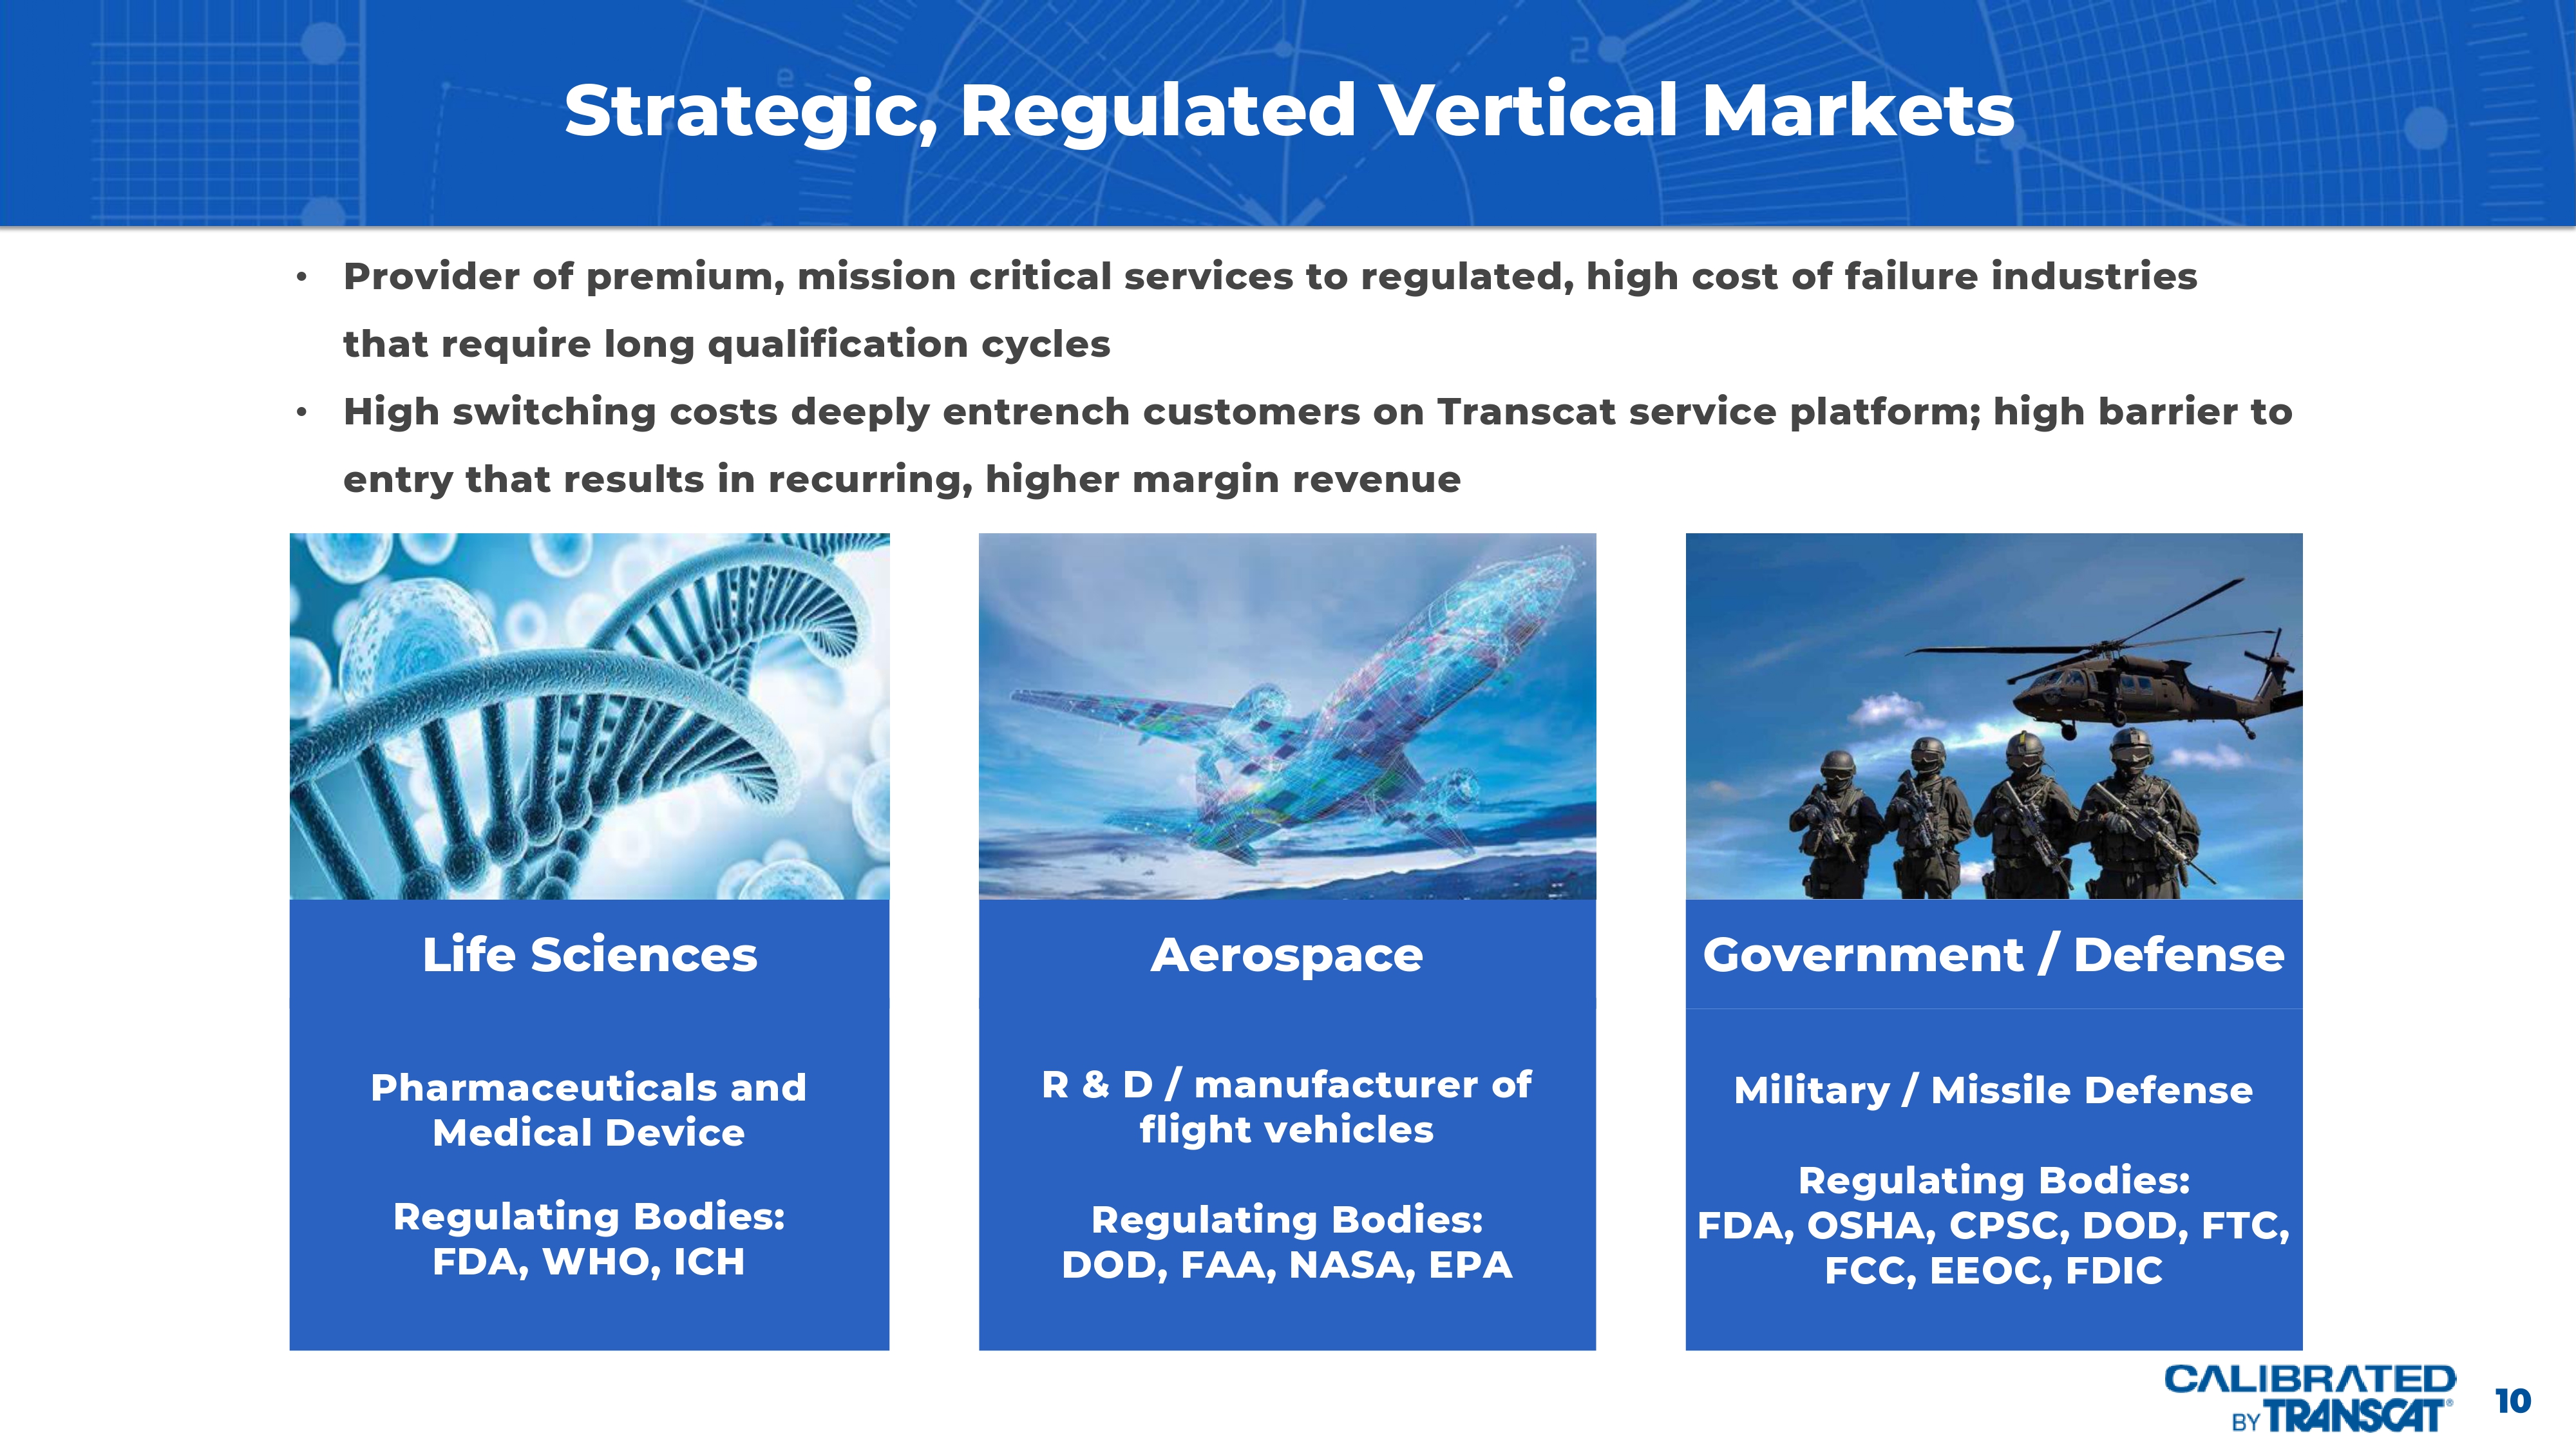
10 Strategic, Regulated Vertical Markets • Provider of premium, mission critical services to regulated, high cost of failure industries that require long qualification cycles • High switching costs deeply entrench customers on Transcat service platform; high barrier to entry that results in recurring, higher margin revenue Pharmaceuticals and Medical Device Regulating Bodies: FDA, WHO, ICH R & D / manufacturer of flight vehicles Regulating Bodies: DOD, FAA, NASA, EPA Military / Missile Defense Regulating Bodies: FDA, OSHA, CPSC, DOD, FTC, FCC, EEOC, FDIC Life Sciences Aerospace Government / Defense 11 Double - Digit Service Growth Drivers Acquisitions Expand Geographic Footprint, Capabilities, Markets (Leverage NEXA) (Leverage NEXA)


12 © 2022 Transcat Inc. San Juan Map Legend Transcat Headquarters Transcat Calibration Labs Transcat Client - Based Lab (CBL) Montreal Bosto n Harrisburg Philadelphia Pittsburgh Rochester Toronto Ottawa Milwaukee Indianapolis Dayton Charlotte St. Louis Denver Houston Phoenix San Diego Los Angeles Portland Testing Labs Pharma Pharma Aerospace Aerospace & Defense Aerospace & Defense Pharma Aerospace Pharma Pharma / Pharma Pharma Medical Device Medical Device Animal Health Medical Device Flexible Service Delivery Options: x Client - based lab x Periodic on - site x Mobile x In - house x Pickup & Delivery 50 Locations Serving the U.S., Canada, Ireland and Puerto Rico Milford Richmond Chesapeake Huntsville Medical Device Palm Beach Cincinnati Energy Aerospace & Defense Medical Device Testing Labs Little Island, Cork, Ireland Testing Labs Pharma Automotiv e Pharma 2023 Transcat, Inc.
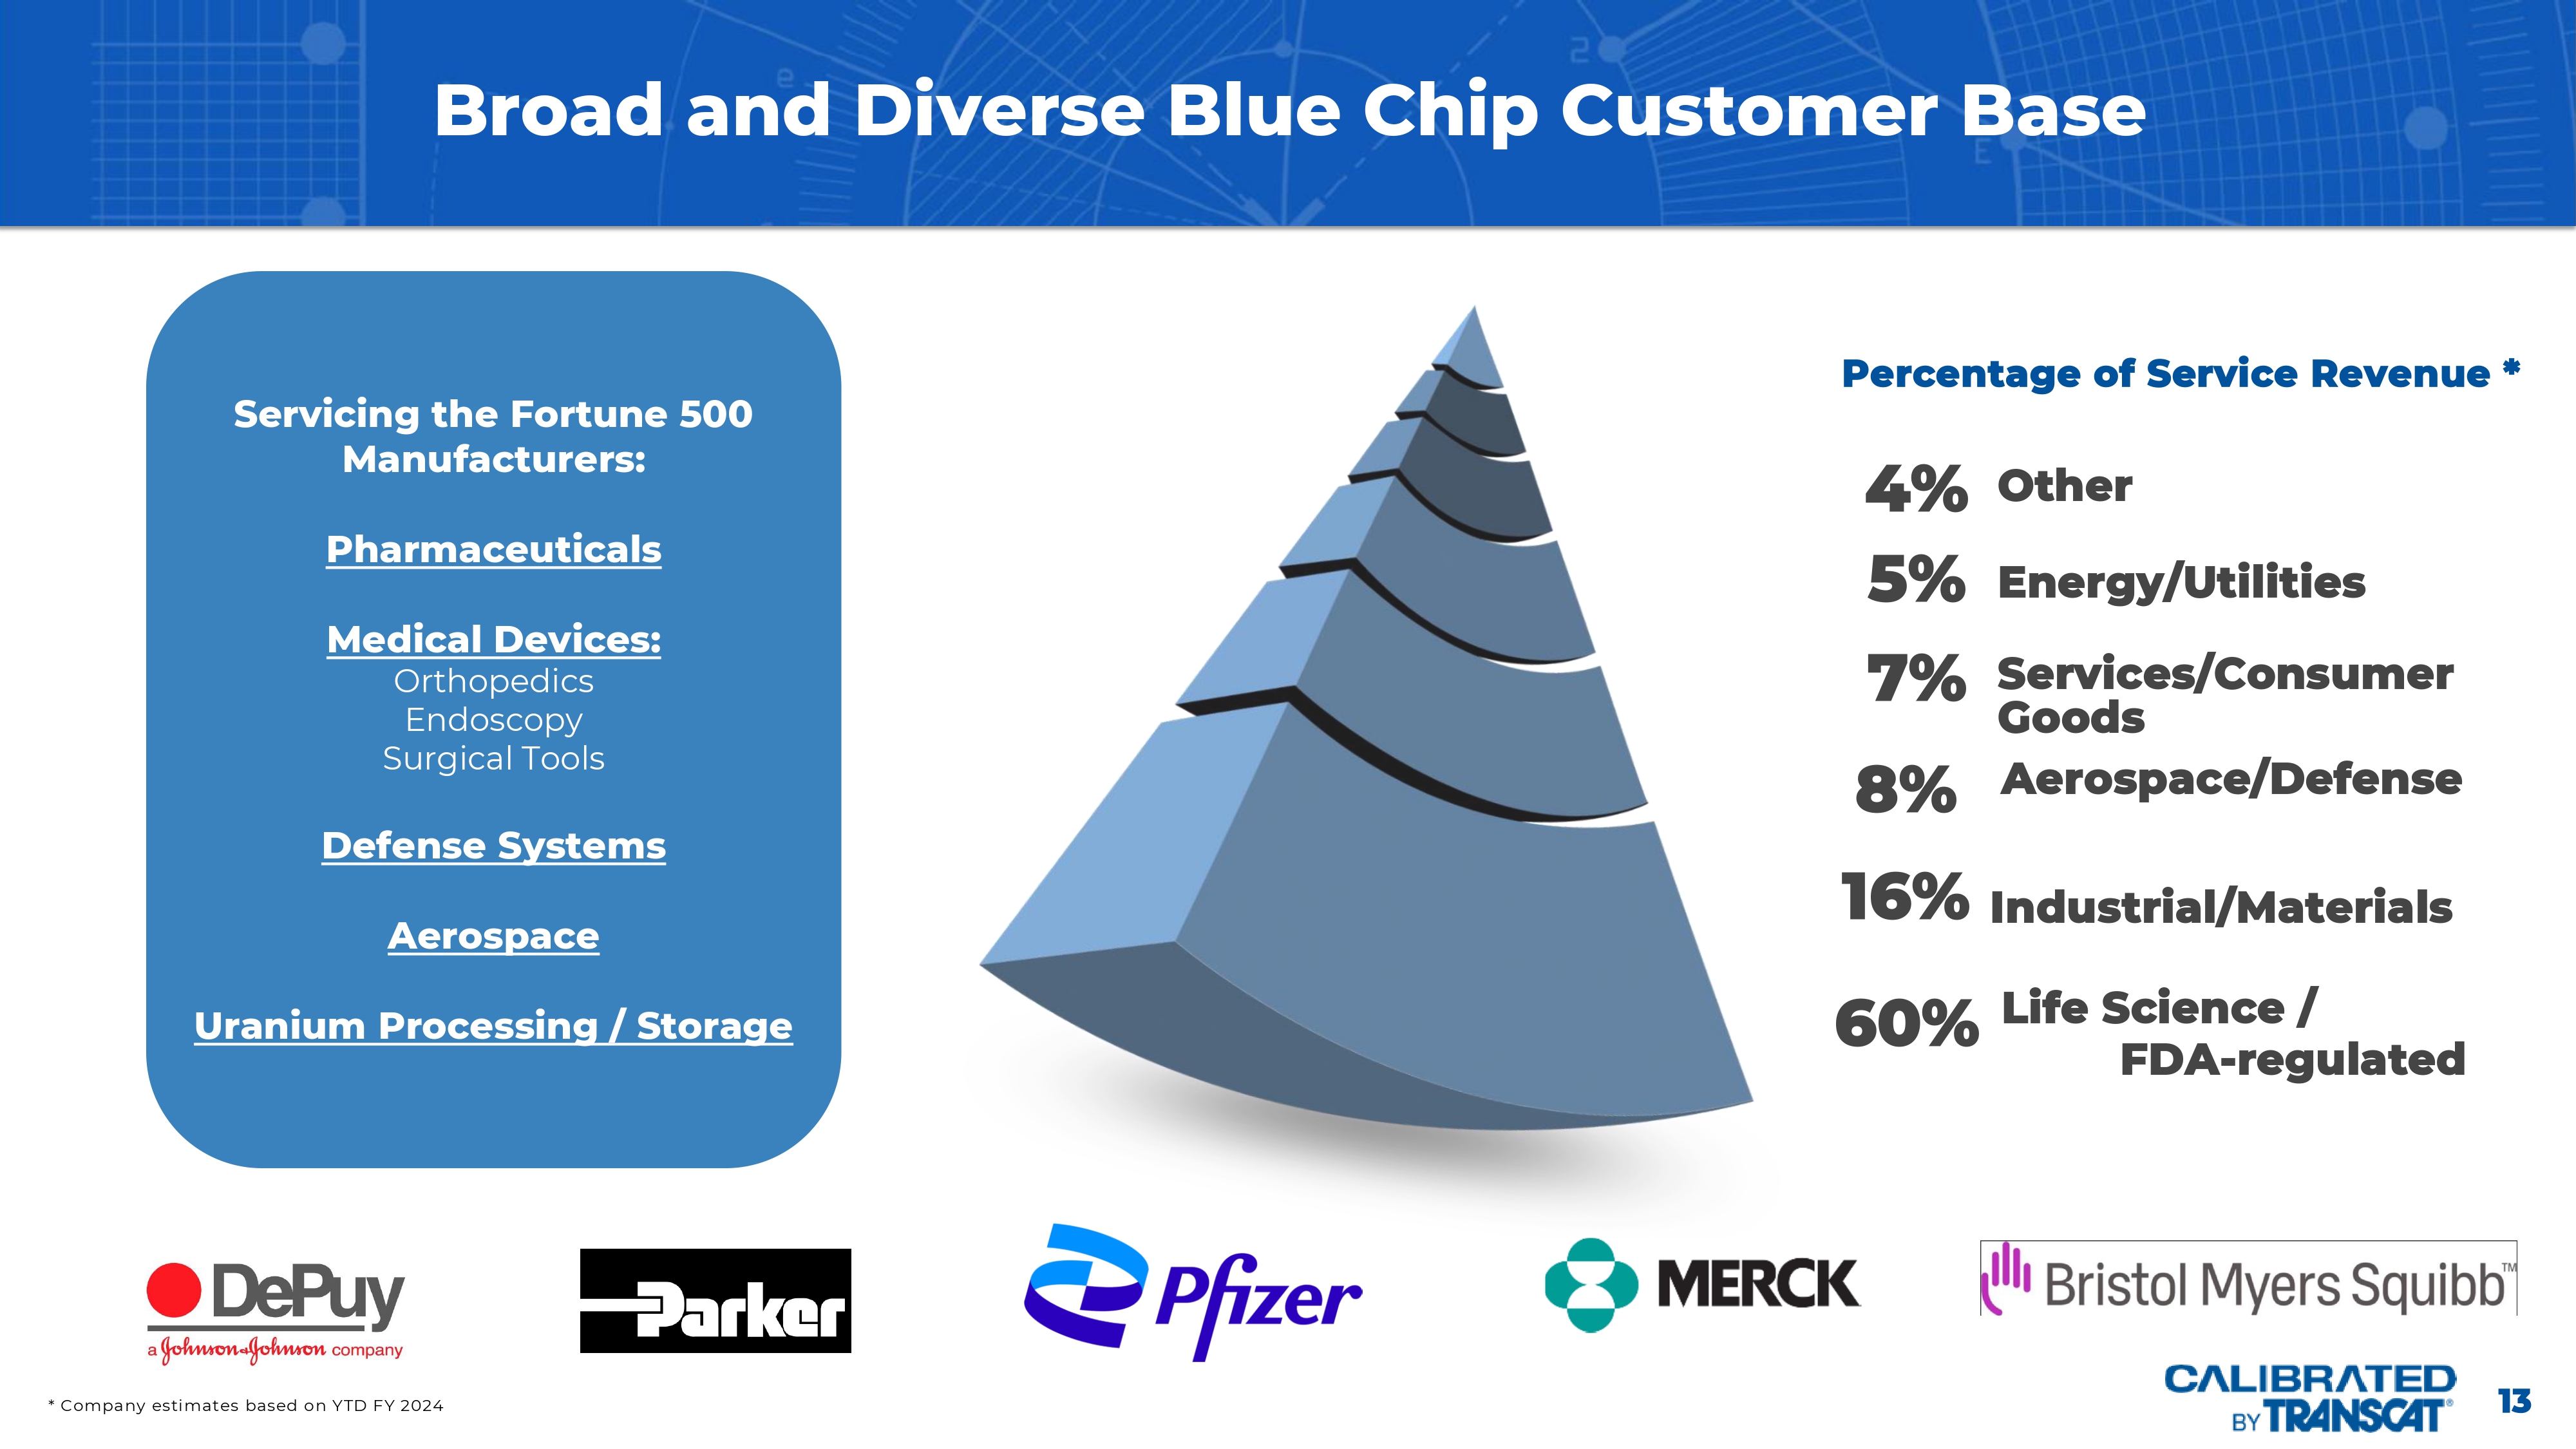
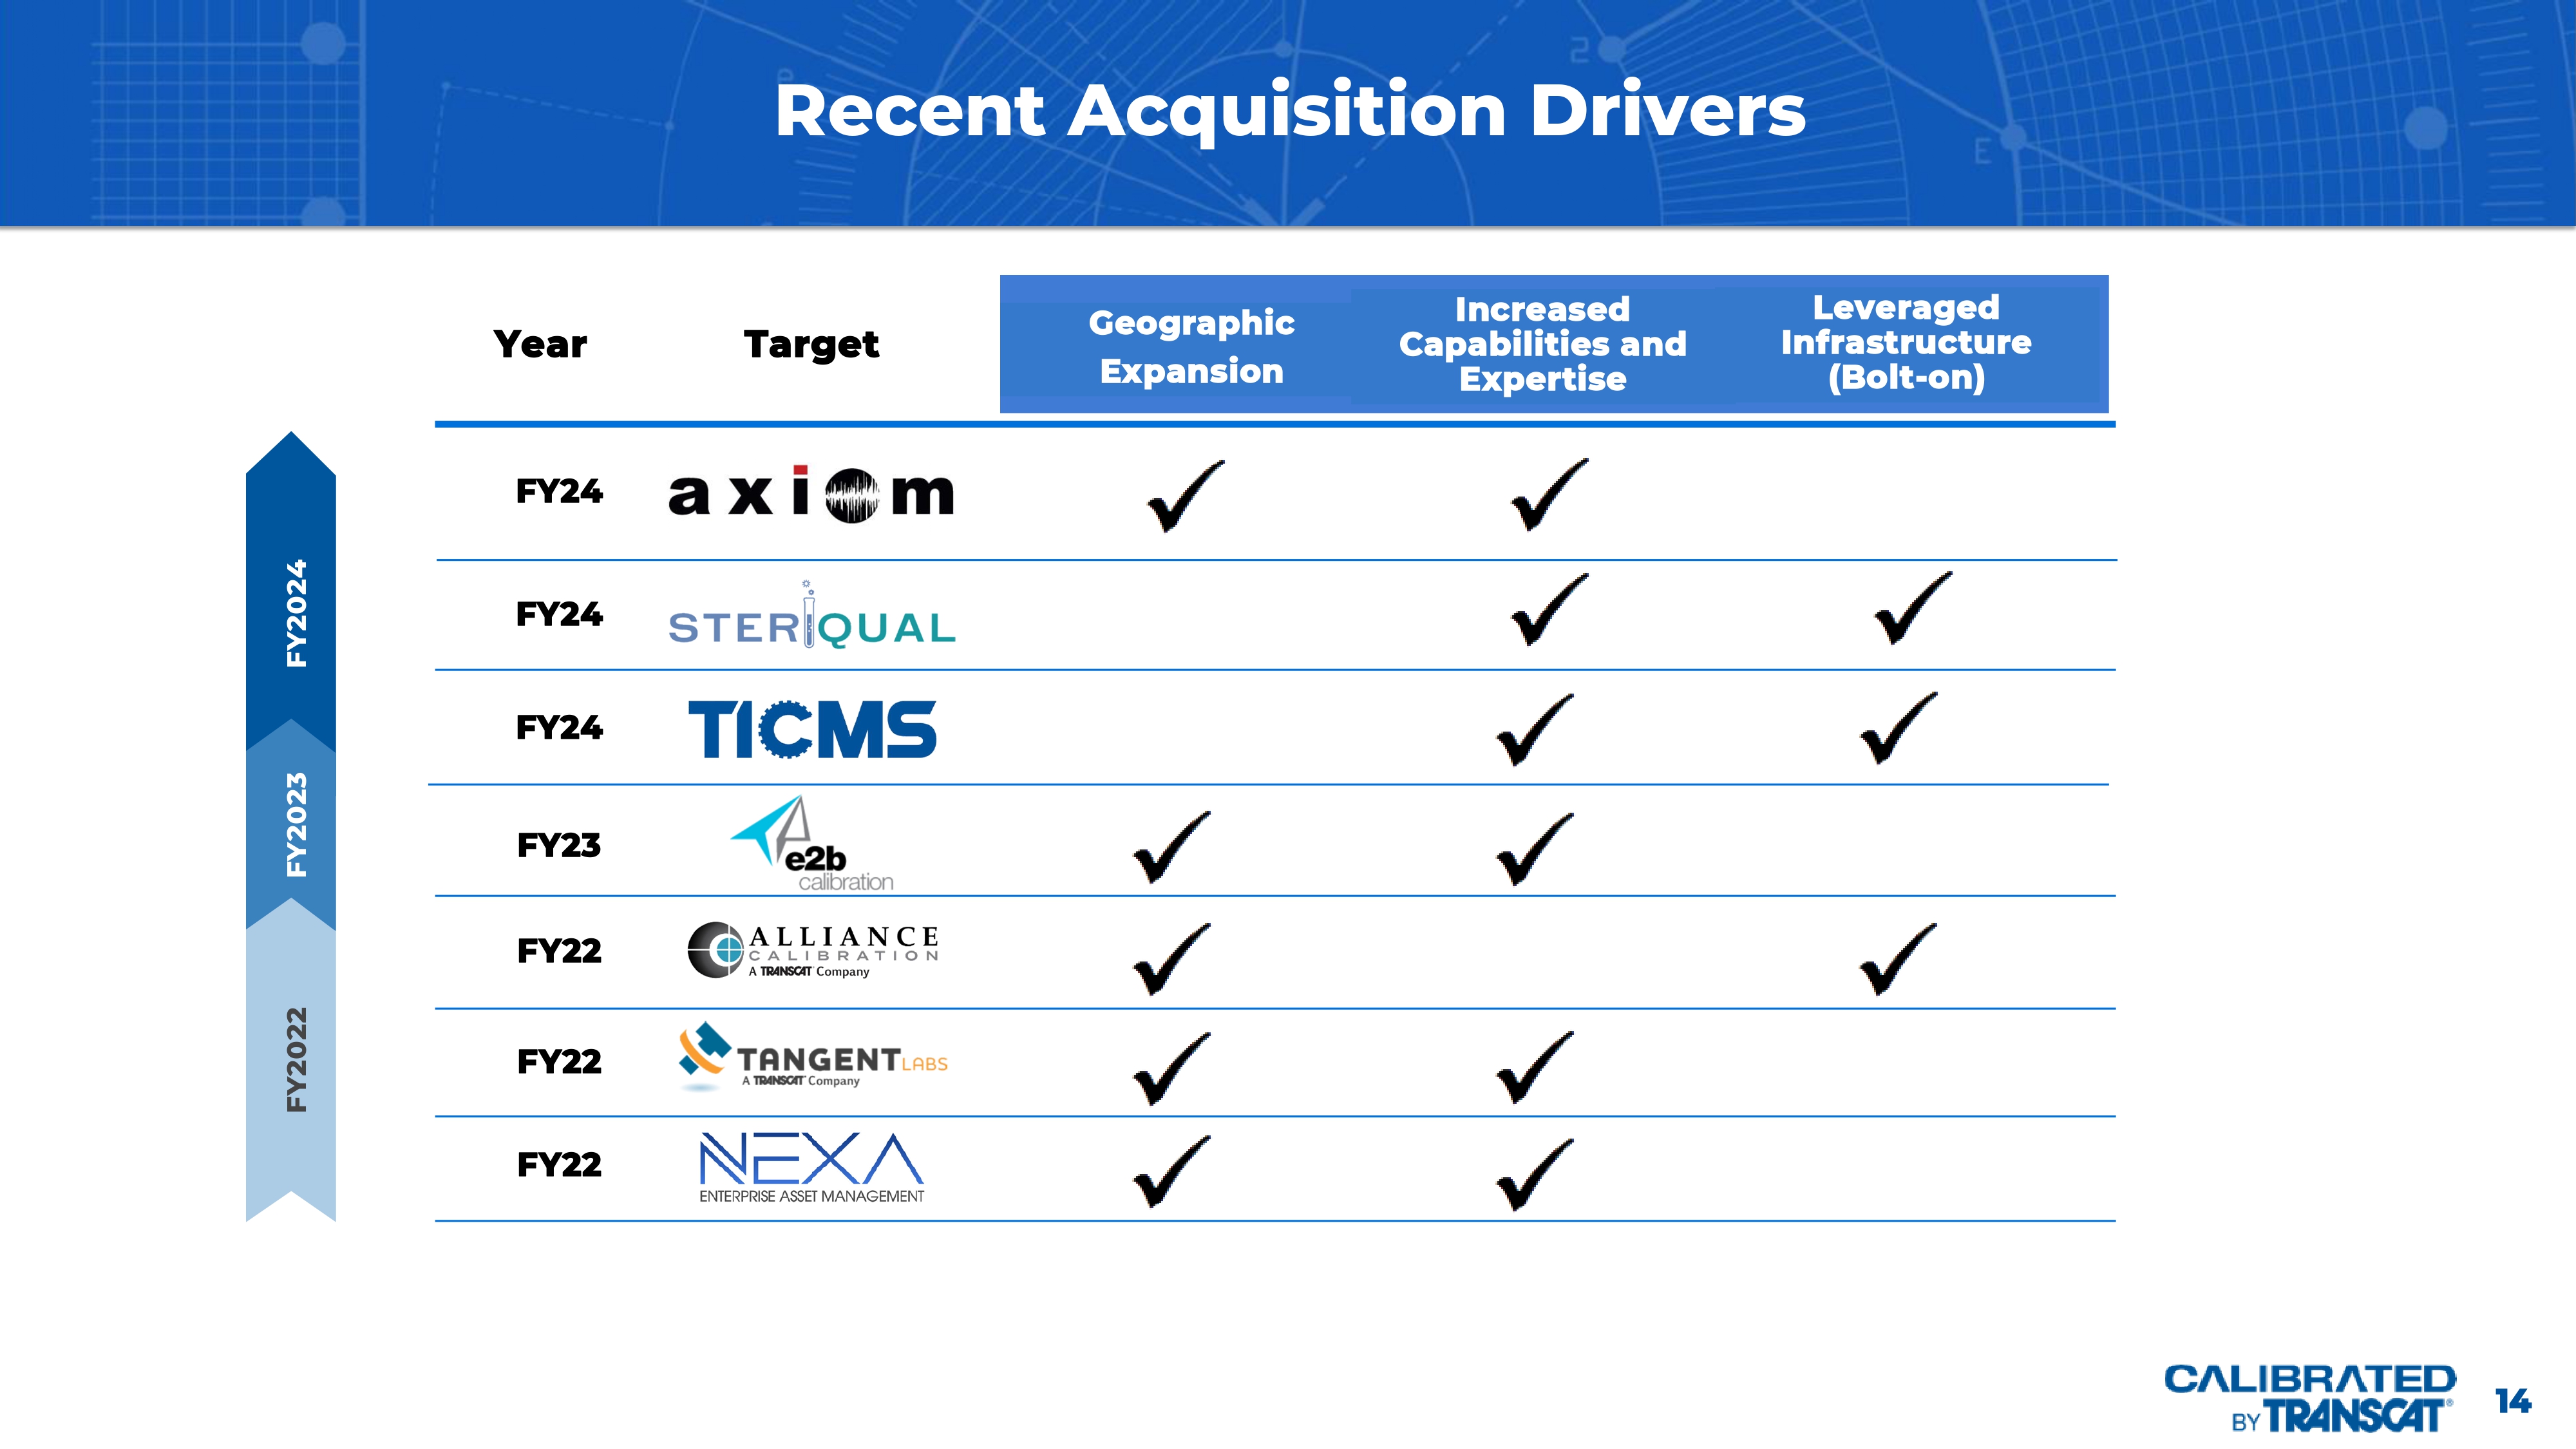
13 * Company estimates based on YTD FY 2024 Broad and Diverse Blue Chip Customer Base Percentage of Service Revenue * Servicing the Fortune 500 Manufacturers: Pharmaceuticals Medical Devices: Orthopedics Endoscopy Surgical Tools Defense Systems Aerospace Uranium Processing / Storage Industrial/Materials 60% Life Science / FDA - regulated 16% Other 4% Energy/Utilities 5% Services/Consumer Goods 7% 8% Aerospace/Defense 14 Recent Acquisition Drivers Geographic Expansion Leveraged Infrastructure (Bolt - on) FY22 FY22 FY22 FY23 FY24 FY24 FY24 FY2024 FY2023 FY2022 Year Target Increased Capabilities and Expertise
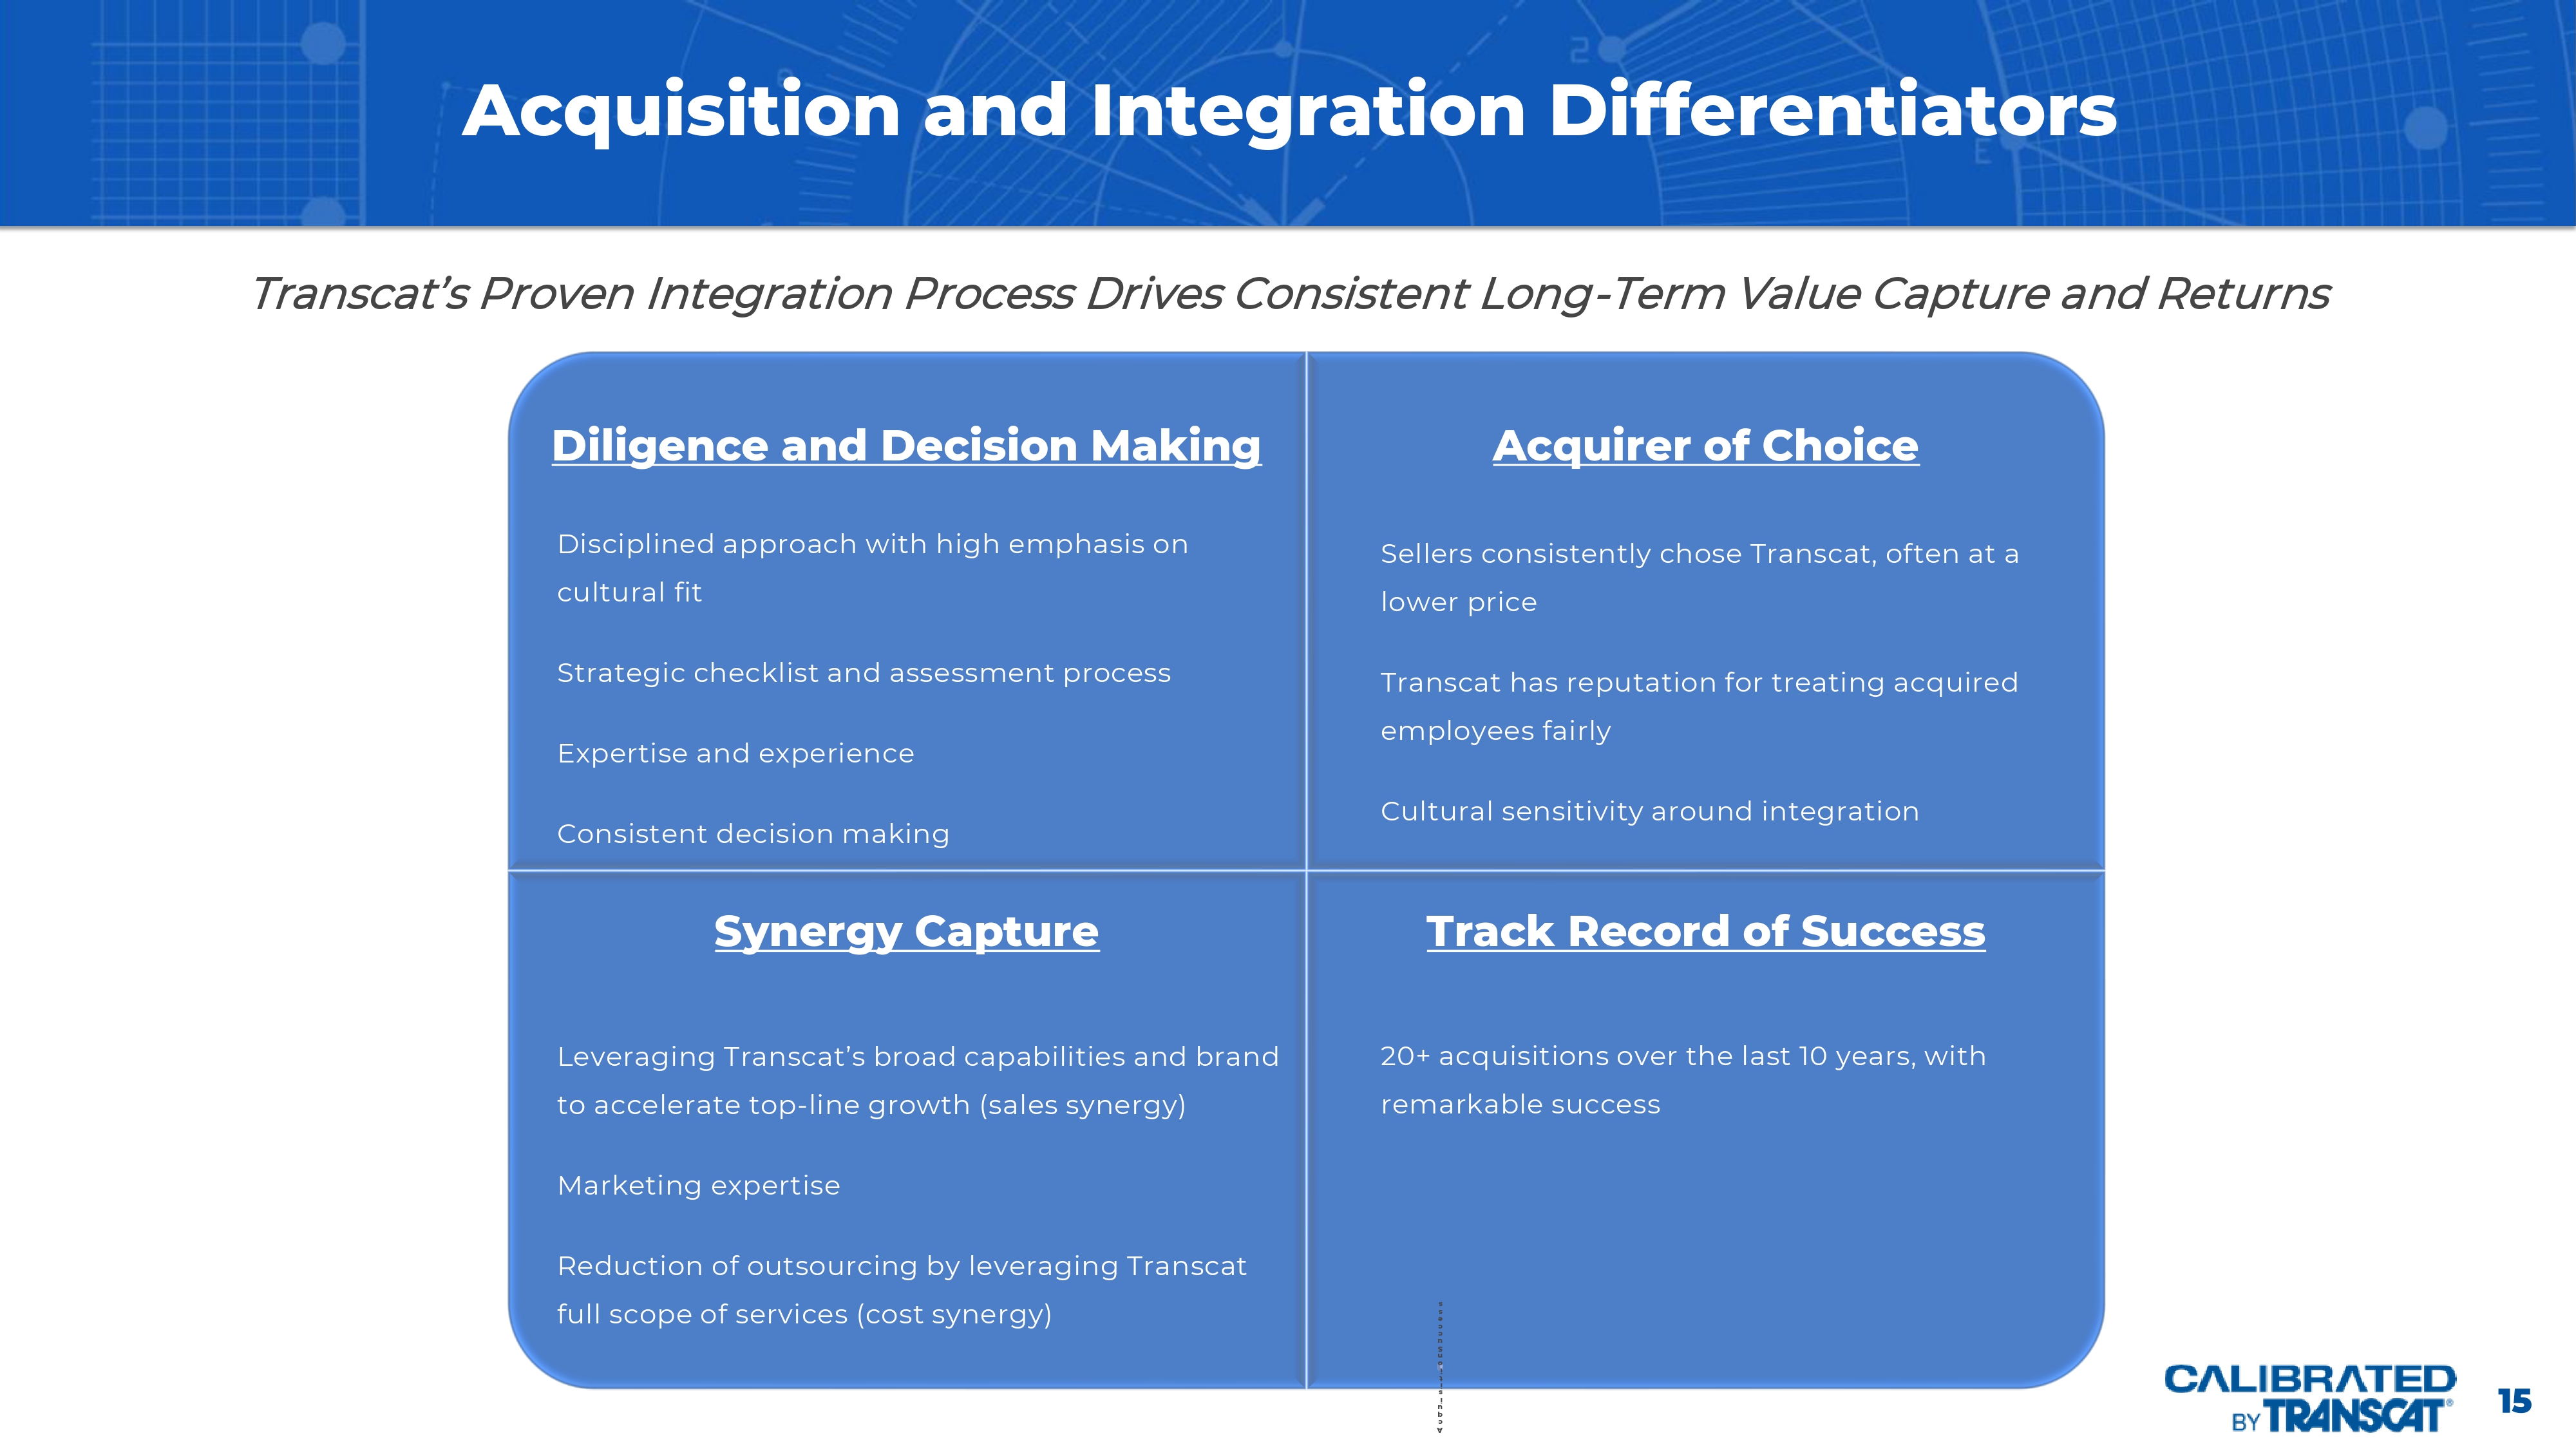
15 Acquisition and Integration Differentiators Diligence and Decision Making Acquirer of Choice Synergy Capture Track Record of Success A c q u i s i t i o n S u c c e s s Disciplined approach with high emphasis on cultural fit Strategic checklist and assessment process Expertise and experience Consistent decision making Transcat’s Proven Integration Process Drives Consistent Long - Term Value Capture and Returns Sellers consistently chose Transcat, often at a lower price Transcat has reputation for treating acquired employees fairly Cultural sensitivity around integration Leveraging Transcat’s broad capabilities and brand to accelerate top - line growth (sales synergy) Marketing expertise Reduction of outsourcing by leveraging Transcat full scope of services (cost synergy) 20+ acquisitions over the last 10 years, with remarkable success 16 Brand Extension and Expanded Addressable Markets – Portfolio of Service Companies Strong brand recognition and strategic acquisitions have expanded capabilities and synergies Immediate cross selling potential with complete "family" of services – in both Technical Services (Transcat Traditional Labs, CBLs, Pipettes, Biomedical) and Professional Services (NEXA, Validation, SteriQual) NEXA name retention for professional services "group" will help to separate these service offerings (i.e.

Transcat may lose a bid, but the client still engages with NEXA) SteriQual expected to roll up to the NEXA name (after brand recognition for CQV delivery)
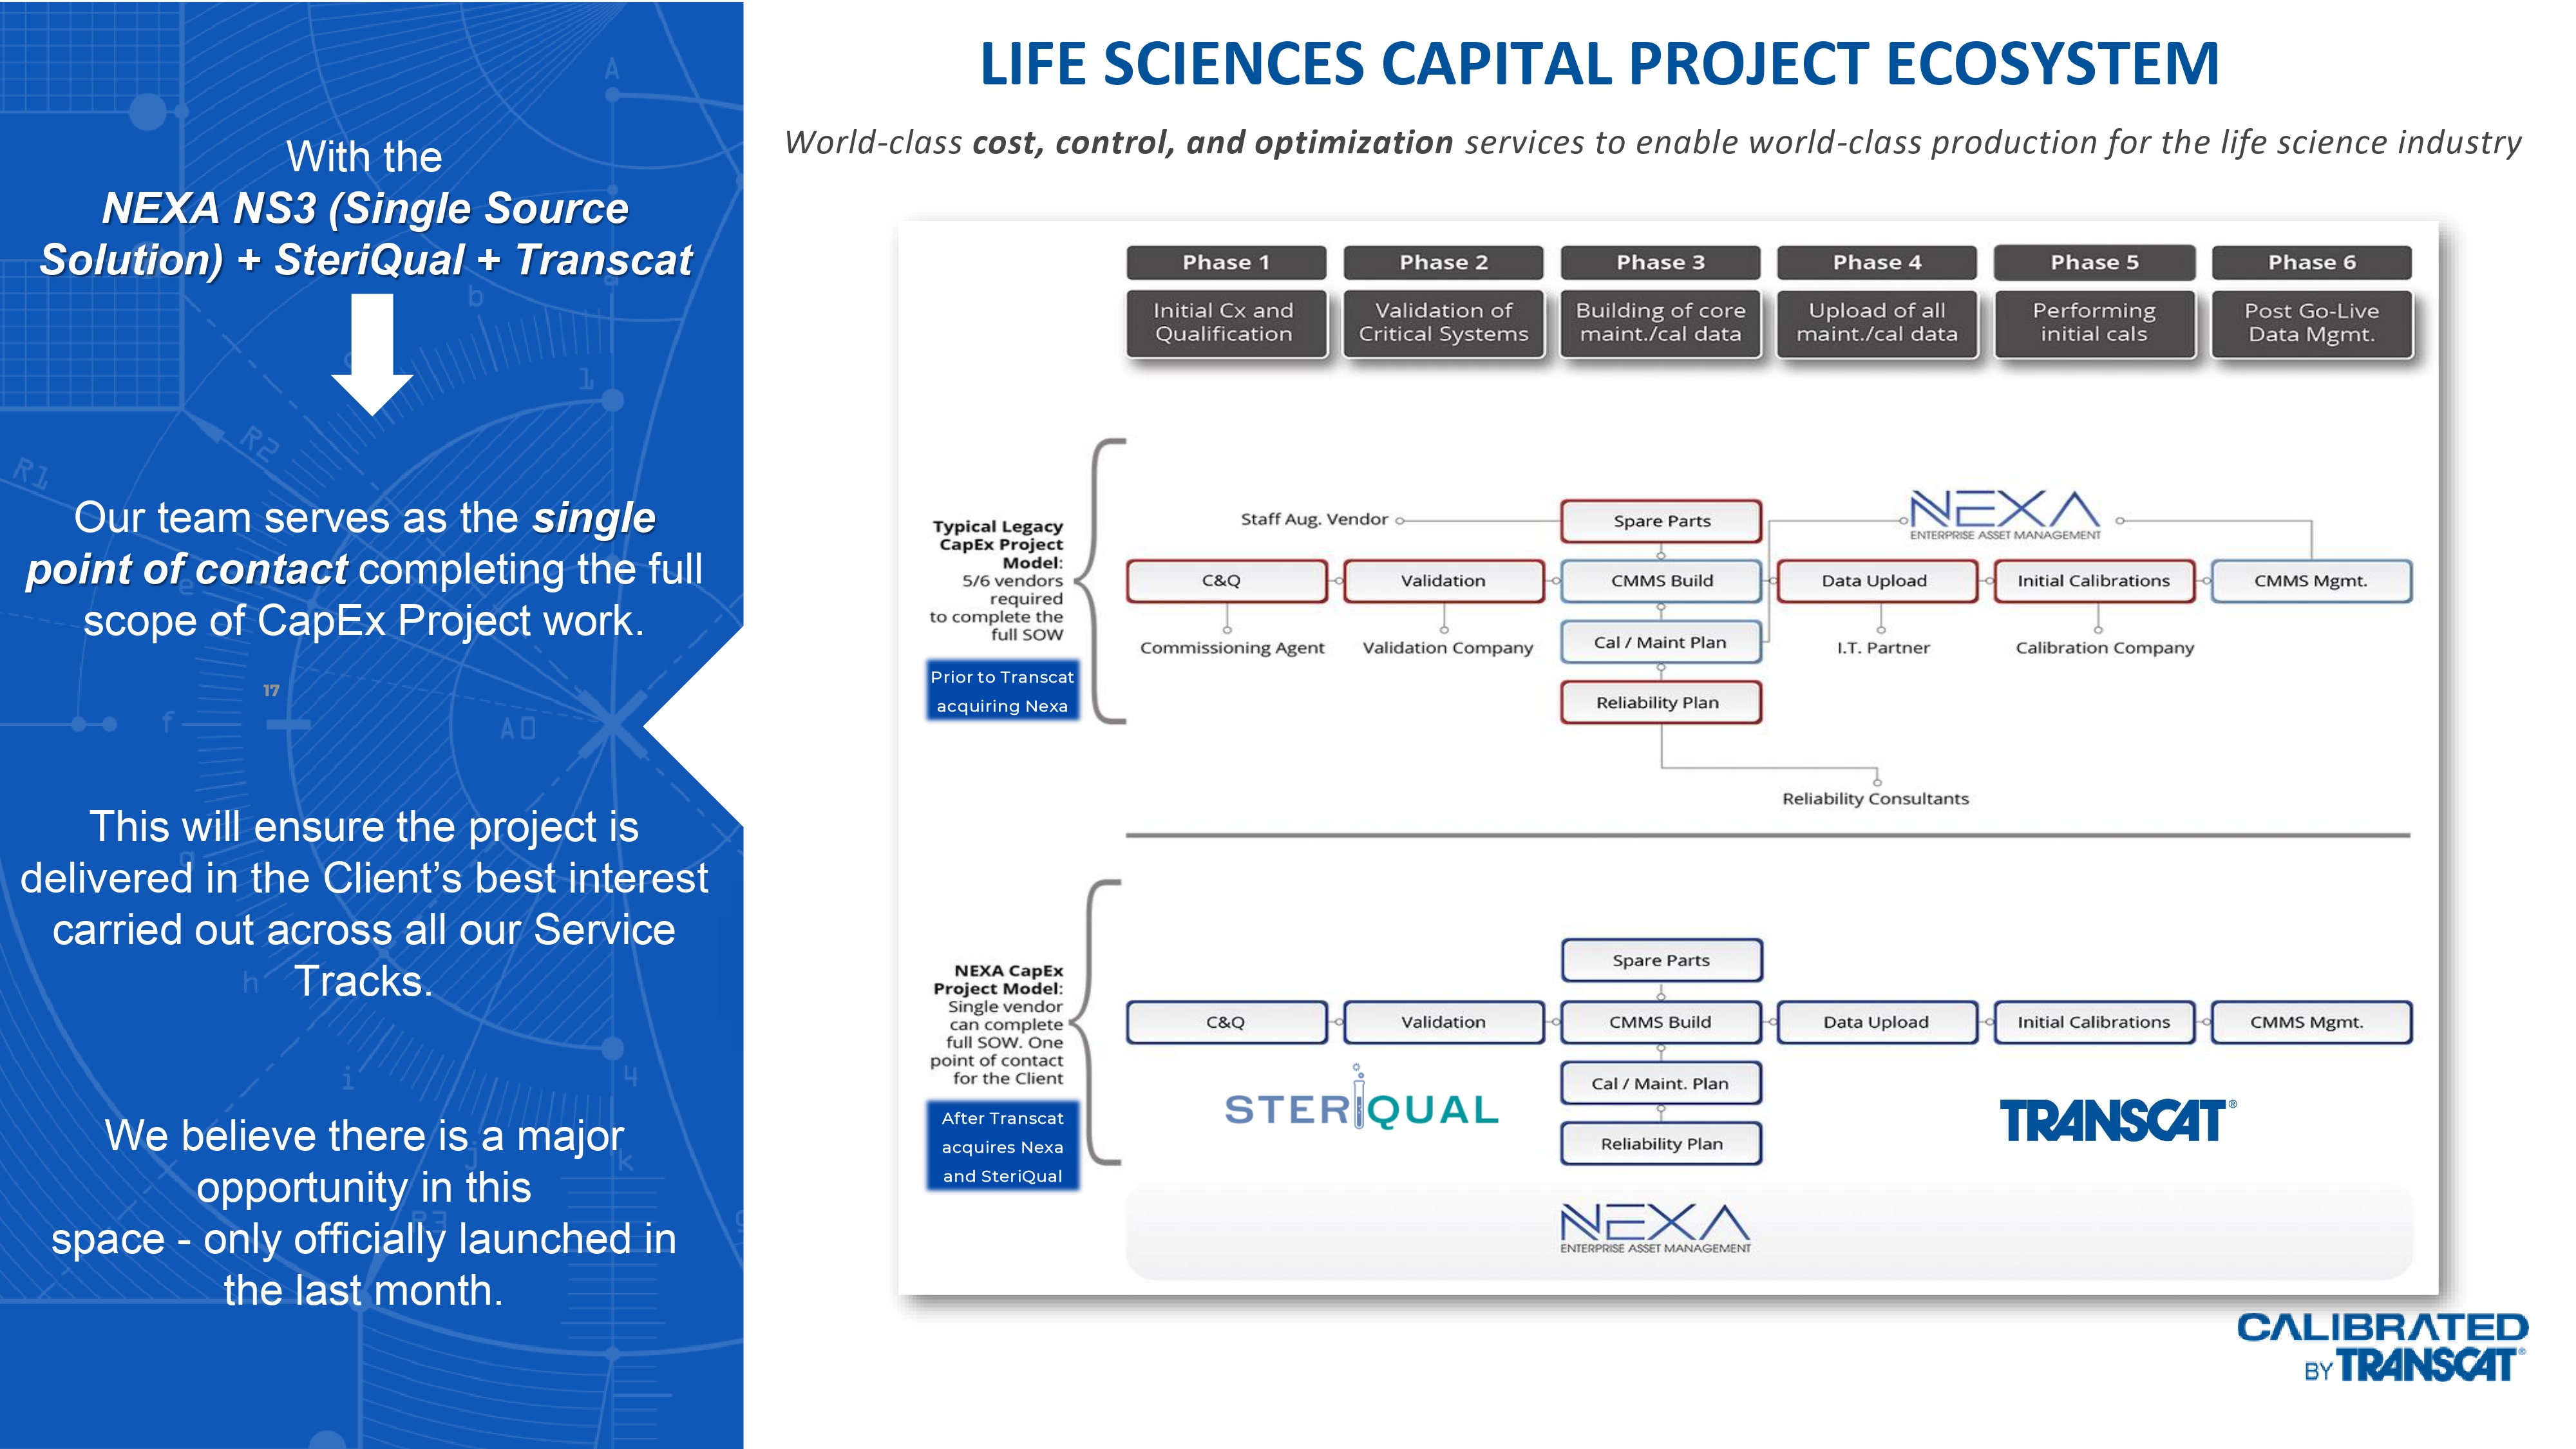
LIFE SCIENCES CAPITAL PROJECT ECOSYSTEM 17 With the NEXA NS3 (Single Source Solution) + SteriQual + Transcat Our team serves as the single point of contact completing the full scope of CapEx Project work. This will ensure the project is delivered in the Client’s best interest carried out across all our Service Tracks. We believe there is a major opportunity in this space - only officially launched in the last month.

World - class cost, control, and optimization services to enable world - class production for the life science industry Prior to Transcat acquiring Nexa After Transcat acquires Nexa and SteriQual 18 Axiom – Rental Business Accelerating Growth x $38 million purchase price; $28 million in Company stock and $10 million in cash x Existing leadership and staff retained, with Josh Shilts, current Axiom President, continuing to lead the organization x Little overlap in Rental Asset pools, which we believe presents a compelling cross - selling opportunity x Distribution and Rentals expected to generate high quality leads for Calibration Services Distribution/Rental Test and Rental Equipment Repair and Calibration Sell / Trade Equipment FINANCIAL OVERVIEW Note: Amounts shown in the graphs that follow may be rounded.

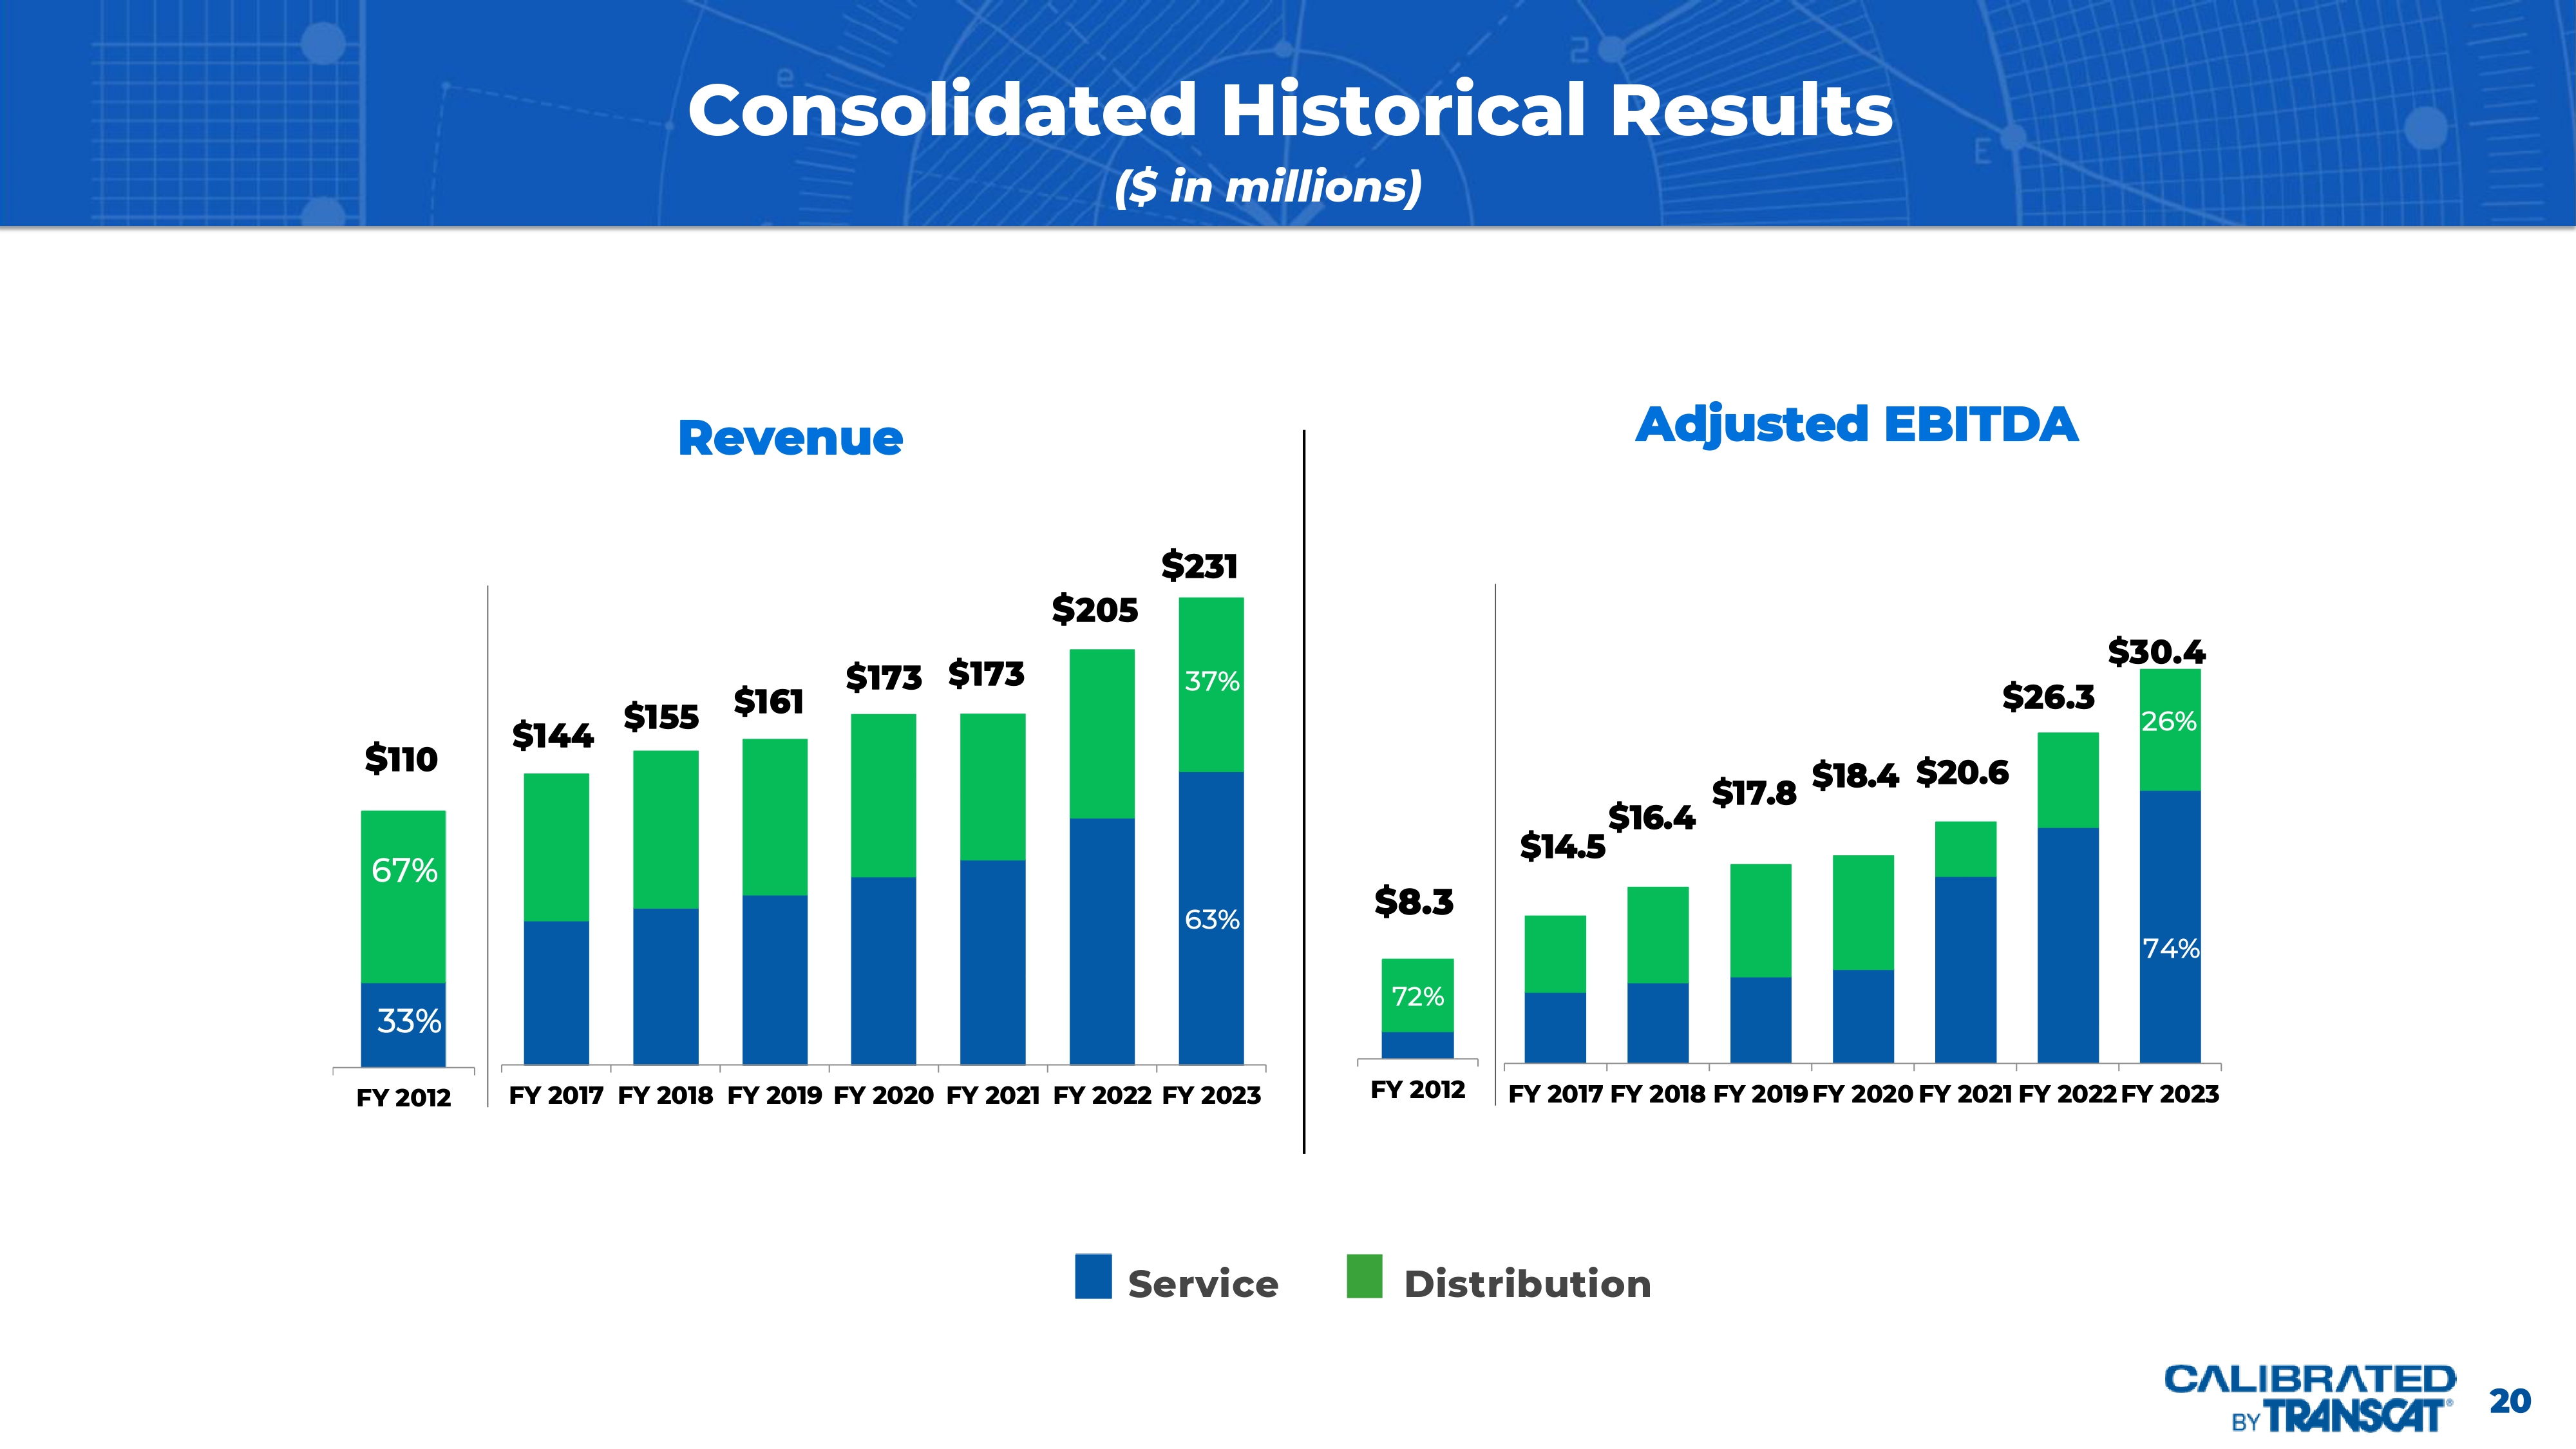
Therefore, totals shown in the graphs may not be equal to the sum of the segments 20 Consolidated Historical Results Distribution FY 2017 FY 2018 FY 2019 FY 2020 FY 2021 FY 2022 FY 2023 Revenue $173 $173 $155 FY 2017 FY 2018 FY 2019 FY 2020 FY 2021 FY 2022 FY 2023 Adjusted EBITDA $14.5 $16.4 $20.6 $18.4 $17.8 $144 $161 $ 205 $26.3 63% 37% FY 2012 $ 110 33% 67% FY 2012 Service $8.3 $ 231 $30.4 74% 26% 72% ($ in millions)

21 Service Segment Driving Strong Results $77.4 $84.0 $93.0 $101.3 $122.0 $144.9 FY 2018 FY 2019 FY 2020 FY 2021 FY 2022 FY 2023 Service Revenue 25.7% 24.9% 25.3% 30.3% 31.9% 32.2% FY 2018 FY 2019 FY 2020 FY 2021 FY 2022 FY 2023 Service Gross Margin % • Capturing share in highly regulated end markets, including life sciences and Aerospace & Defense • NEXA enterprise asset management acquired on August 31, 2021 • Recurring revenue nature of service segment provides for a high degree of visibility into future earnings • Enhanced gross margin profile: • Driven by operating leverage on organic growth and improved technician productivity • Operational focus on calibration automation and continuous process improvement ($ in millions)
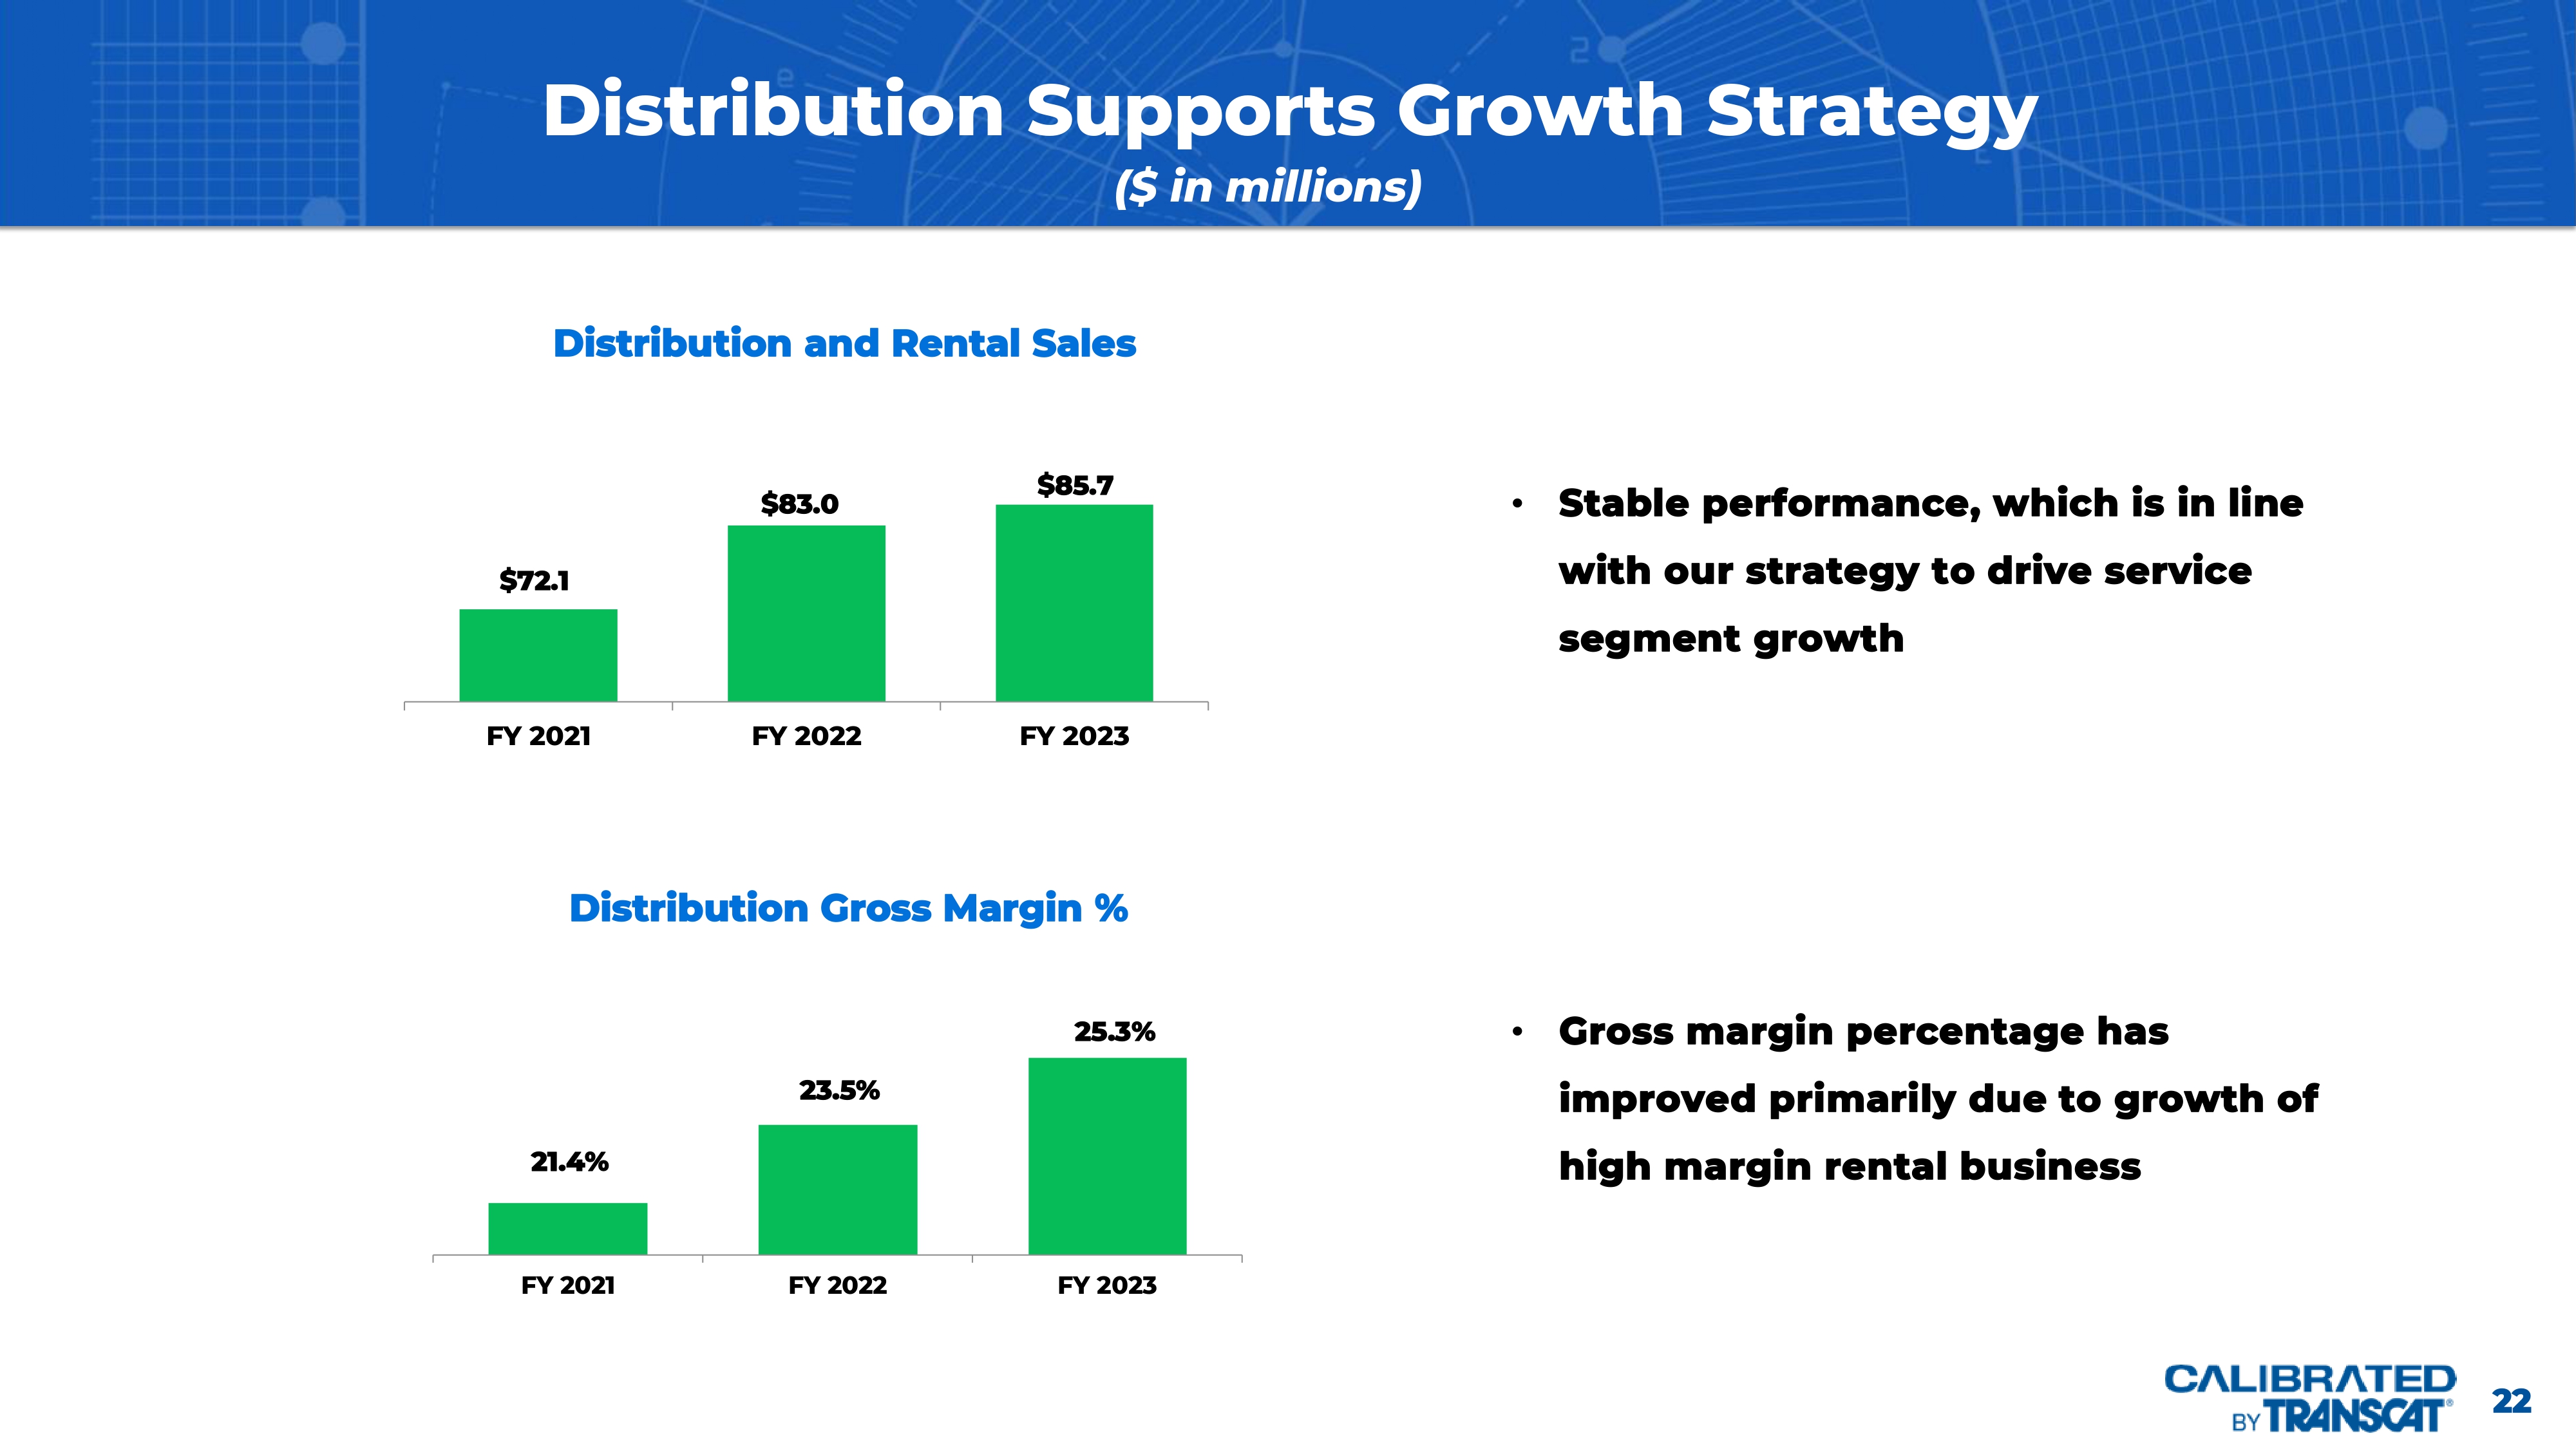
22 Distribution Supports Growth Strategy $72.1 $83.0 $85.7 FY 2021 FY 2022 FY 2023 Distribution and Rental Sales 5.0% 6.5% 0.9% 4.4% 6.5% 3.0% 21.4% 23.5% 25.3% FY 2021 FY 2022 FY 2023 Distribution Gross Margin % • Stable performance, which is in line with our strategy to drive service segment growth • Gross margin percentage has improved primarily due to growth of high margin rental business ($ in millions)

23 Fiscal 2024 Q2 Financial Details Fiscal 2024 Q2 Gross Profit and Margin Fiscal 2024 Q2 Adjusted EBITDA • Q2 Consolidated revenue up 11% on strong Service segment performance • Service revenue growth of 17%, with double - digit organic growth of 10% • Q2 Distribution revenue grew 1% versus prior year • Q2 Consolidated gross margin of 32.0% expanded 230 bps • Service gross margin of 34.0% expanded 140 basis points primarily due to improved productivity and Service organic revenue growth • Distribution gross margin expanded 340 bps due to a larger mix of Rental revenue • Consolidated adjusted EBITDA up 24 % driven by strong performance from both segments • Service segment adjusted EBITDA up 23 % • Distribution adjusted EBITDA up 28% Fiscal 2024 Q2 Revenue ($ in millions) Adjusted EBITDA is a non - GAAP financial measure.

See further information in the presentation regarding this measures and a reco nciliation to the most directly comparable GAAP measure 1 1 $35.3 $41.4 Q2 FY23 Q2 FY24 Service Segment $21.2 $21.4 Q2 FY23 Q2 FY24 Distribution Segment $56.4 $62.8 Q2 FY23 Q2 FY24 Consolidated 32.6% 34.0% $11.5 $14.1 Q2 FY23 Q2 FY24 Service Segment 24.9% 28.3% $5.3 $6.0 Q2 FY23 Q2 FY24 Distribution Segment 29.7% 32.0% $16.8 $20.1 Q2 FY23 Q2 FY24 Consolidated $5.5 $6.8 Q2 FY23 Q2 FY24 Service Segment $2.0 $2.5 Q2 FY23 Q2 FY24 Distribution Segment $7.5 $9.3 Q2 FY23 Q2 FY24 Consolidated +17% +1% +11% +23% +14% +20% +23% +28% +24% 24 ** In addition to reporting net cash provided by operations, a U.S. generally accepted accounting principle (“GAAP”) measure, we present operating free cash flow (net cash provided by operations less capital expenditures), which is a non - GAAP measure. We believe operating fr ee cash flow is an important liquidity measure that reflects the cash generated by the business, after the purchases of technology, capabilities an d assets, that can then be used for, among other things, strategic acquisitions, investments in the business, and funding ongoing operations. Op era ting free cash flow is not a measure of financial performance under GAAP and is not calculated through the application of GAAP. As such, it shoul d n ot be considered as a substitute or alternative for the GAAP measure of net cash provided by operations and, therefore, should not be used in iso lat ion of, rather in conjunction with, the GAAP measure. Operating free cash flow, as presented, may produce results that vary from the GAAP measu re and may not be comparable to a similarly defined non - GAAP measure used by other companies. Operating Free Cash Flow and Cap Table Six Months Ended September 24, 2022 September 23, 2023 Note: Components may not add to totals due to rounding $5.2 $16.0 Net cash provided by operations ($4.8) ($5.4) Capital expenditures (CapEx) $0.5 $10.5 Operating free cash flow (FCF)** • Cash Flow has improved versus prior year • Capital expenditures primarily focused on technology, service capabilities/expansion and rental pool assets; in line with expectations Operating Free Cash Flow Capitalization Supports Growth Strategy Capitalization September 23, 2023 Note: Components may not add to totals due to rounding $1.2 Cash and Cash Equivalents 53.3 Total Debt $52.0 Total Net Debt 138.3 Shareholders’ Equity $191.5 Total Capitalization 27.8% Debt / Total Capitalization 27.2% Net Debt / Total Capitalization *Pro forma for the contemplated transaction. • 1.37x leverage ratio at quarter - end (Total debt to TTM Adjusted EBITDA) • $32.0 M available from credit facility at quarter - end • Credit facility paid off subsequent to quarter end with the proceeds from Secondary Offering ($ in millions)

Questions & Answers

26 ($ in thousands) Adjusted EBITDA Reconciliation In addition to reporting net income, a U.S. generally accepted accounting principle (“GAAP”) measure, we present Adjusted EBI TDA (earnings before interest, income taxes, depreciation and amortization, non - cash stock compensation expense, restructuring expense and non - cash loss on sale of building), which is a non - GAAP measure. We believe Adju sted EBITDA is an important measure of our operating performance because it allows management, investors and others to evaluate and compare the performance of our core operations from period to period by remo vin g the impact of the capital structure (interest), tangible and intangible asset base (depreciation and amortization), taxes, stock - based compensation expense and other items, which is not always commensurate with the reporting period in which it is included. As such, we use Adjusted EBITDA as a measure of performance when evaluating our business segments and as a basis for planning and forecasting. Adjusted EBITDA is not a m eas ure of financial performance under GAAP and is not calculated through the application of GAAP. As such, it should not be considered as a substitute or alternative for the GAAP measure of net income and, therefore, sho uld not be used in isolation of, rather in conjunction with, the GAAP measure. Adjusted EBITDA, as presented, may produce results that vary from the GAAP measure and may not be comparable to a similarly defined non - GAAP meas ure used by other companies.

FY 2017 FY 2018 FY 2019 FY 2020 FY 2021 FY 2022 FY 2023 Net Income 4,522$ 5,922$ 7,145$ 8,067$ 7,791$ 11,380$ 10,688$ +Interest Expense 719 1,018 903 934 850 810 2,417 +Other (Expense) / Income 51 60 91 186 241 143 344 +Tax Provision 2,642 2,026 2,090 1,663 2,191 1,810 2,799 Operating Income 7,934$ 9,026$ 10,229$ 10,850$ 11,073$ 14,143$ 16,248$ +Depreciation & Amortization 6,184 5,991 6,361 6,658 7,580 9,077 10,955 +Restructuring Expense - - - - 650 - - +Acquisition Related Add-Back - - - - - 902 185 +Other (Expense) / Income (51) (60) (91) 15 (241) (143) (344) +Noncash Stock Compensation 453 1,411 1,327 884 1,513 2,328 3,377 Adjusted EBITDA 14,520$ 16,368$ 17,826$ 18,407$ 20,575$ 26,307$ 30,421$ 27 FY 2012 FY 2023 Service Operating Income (175)$ 11,422$ + Depreciation & Amortization 1,959$ 8,800$ + Transaction Expense 185$ + Other (Expense) / Income (37)$ (247)$ + Noncash Stock Compensation 263$ 2,463$ Service Adjusted EBITDA 2,010$ 22,623$ Distribution Operating Income $5,603 $4,826 + Depreciation & Amortization 937 2,155 + Transaction Expense - + Other (Expense) / Income (11) (97) + Noncash Stock Compensation 290 914 Distribution Adjusted EBITDA $6,819 $7,798 Service Adjusted EBITDA $2,010 $22,623 Distribution Adjusted EBITDA $6,819 $7,798 Total Adjusted EBITDA $8,829 $30,421 ($ in thousands) Segment Adjusted EBITDA Reconciliation In addition to reporting net income, a U.S. generally accepted accounting principle (“GAAP”) measure, we present Adjusted EBI TDA (earnings before interest, income taxes, depreciation and amortization, non - cash stock compensation expense, restructuring expense and non - cash loss on sale of building), which is a non - GAAP measure. We believe Adju sted EBITDA is an important measure of our operating performance because it allows management, investors and others to evaluate and compare the performance of our core operations from period to period by remo vin g the impact of the capital structure (interest), tangible and intangible asset base (depreciation and amortization), taxes, stock - based compensation expense and other items, which is not always commensurate with the reporting period in which it is included. As such, we use Adjusted EBITDA as a measure of performance when evaluating our business segments and as a basis for planning and forecasting. Adjusted EBITDA is not a m eas ure of financial performance under GAAP and is not calculated through the application of GAAP. As such, it should not be considered as a substitute or alternative for the GAAP measure of net income and, therefore, sho uld not be used in isolation of, rather in conjunction with, the GAAP measure. Adjusted EBITDA, as presented, may produce results that vary from the GAAP measure and may not be comparable to a similarly defined non - GAAP meas ure used by other companies.
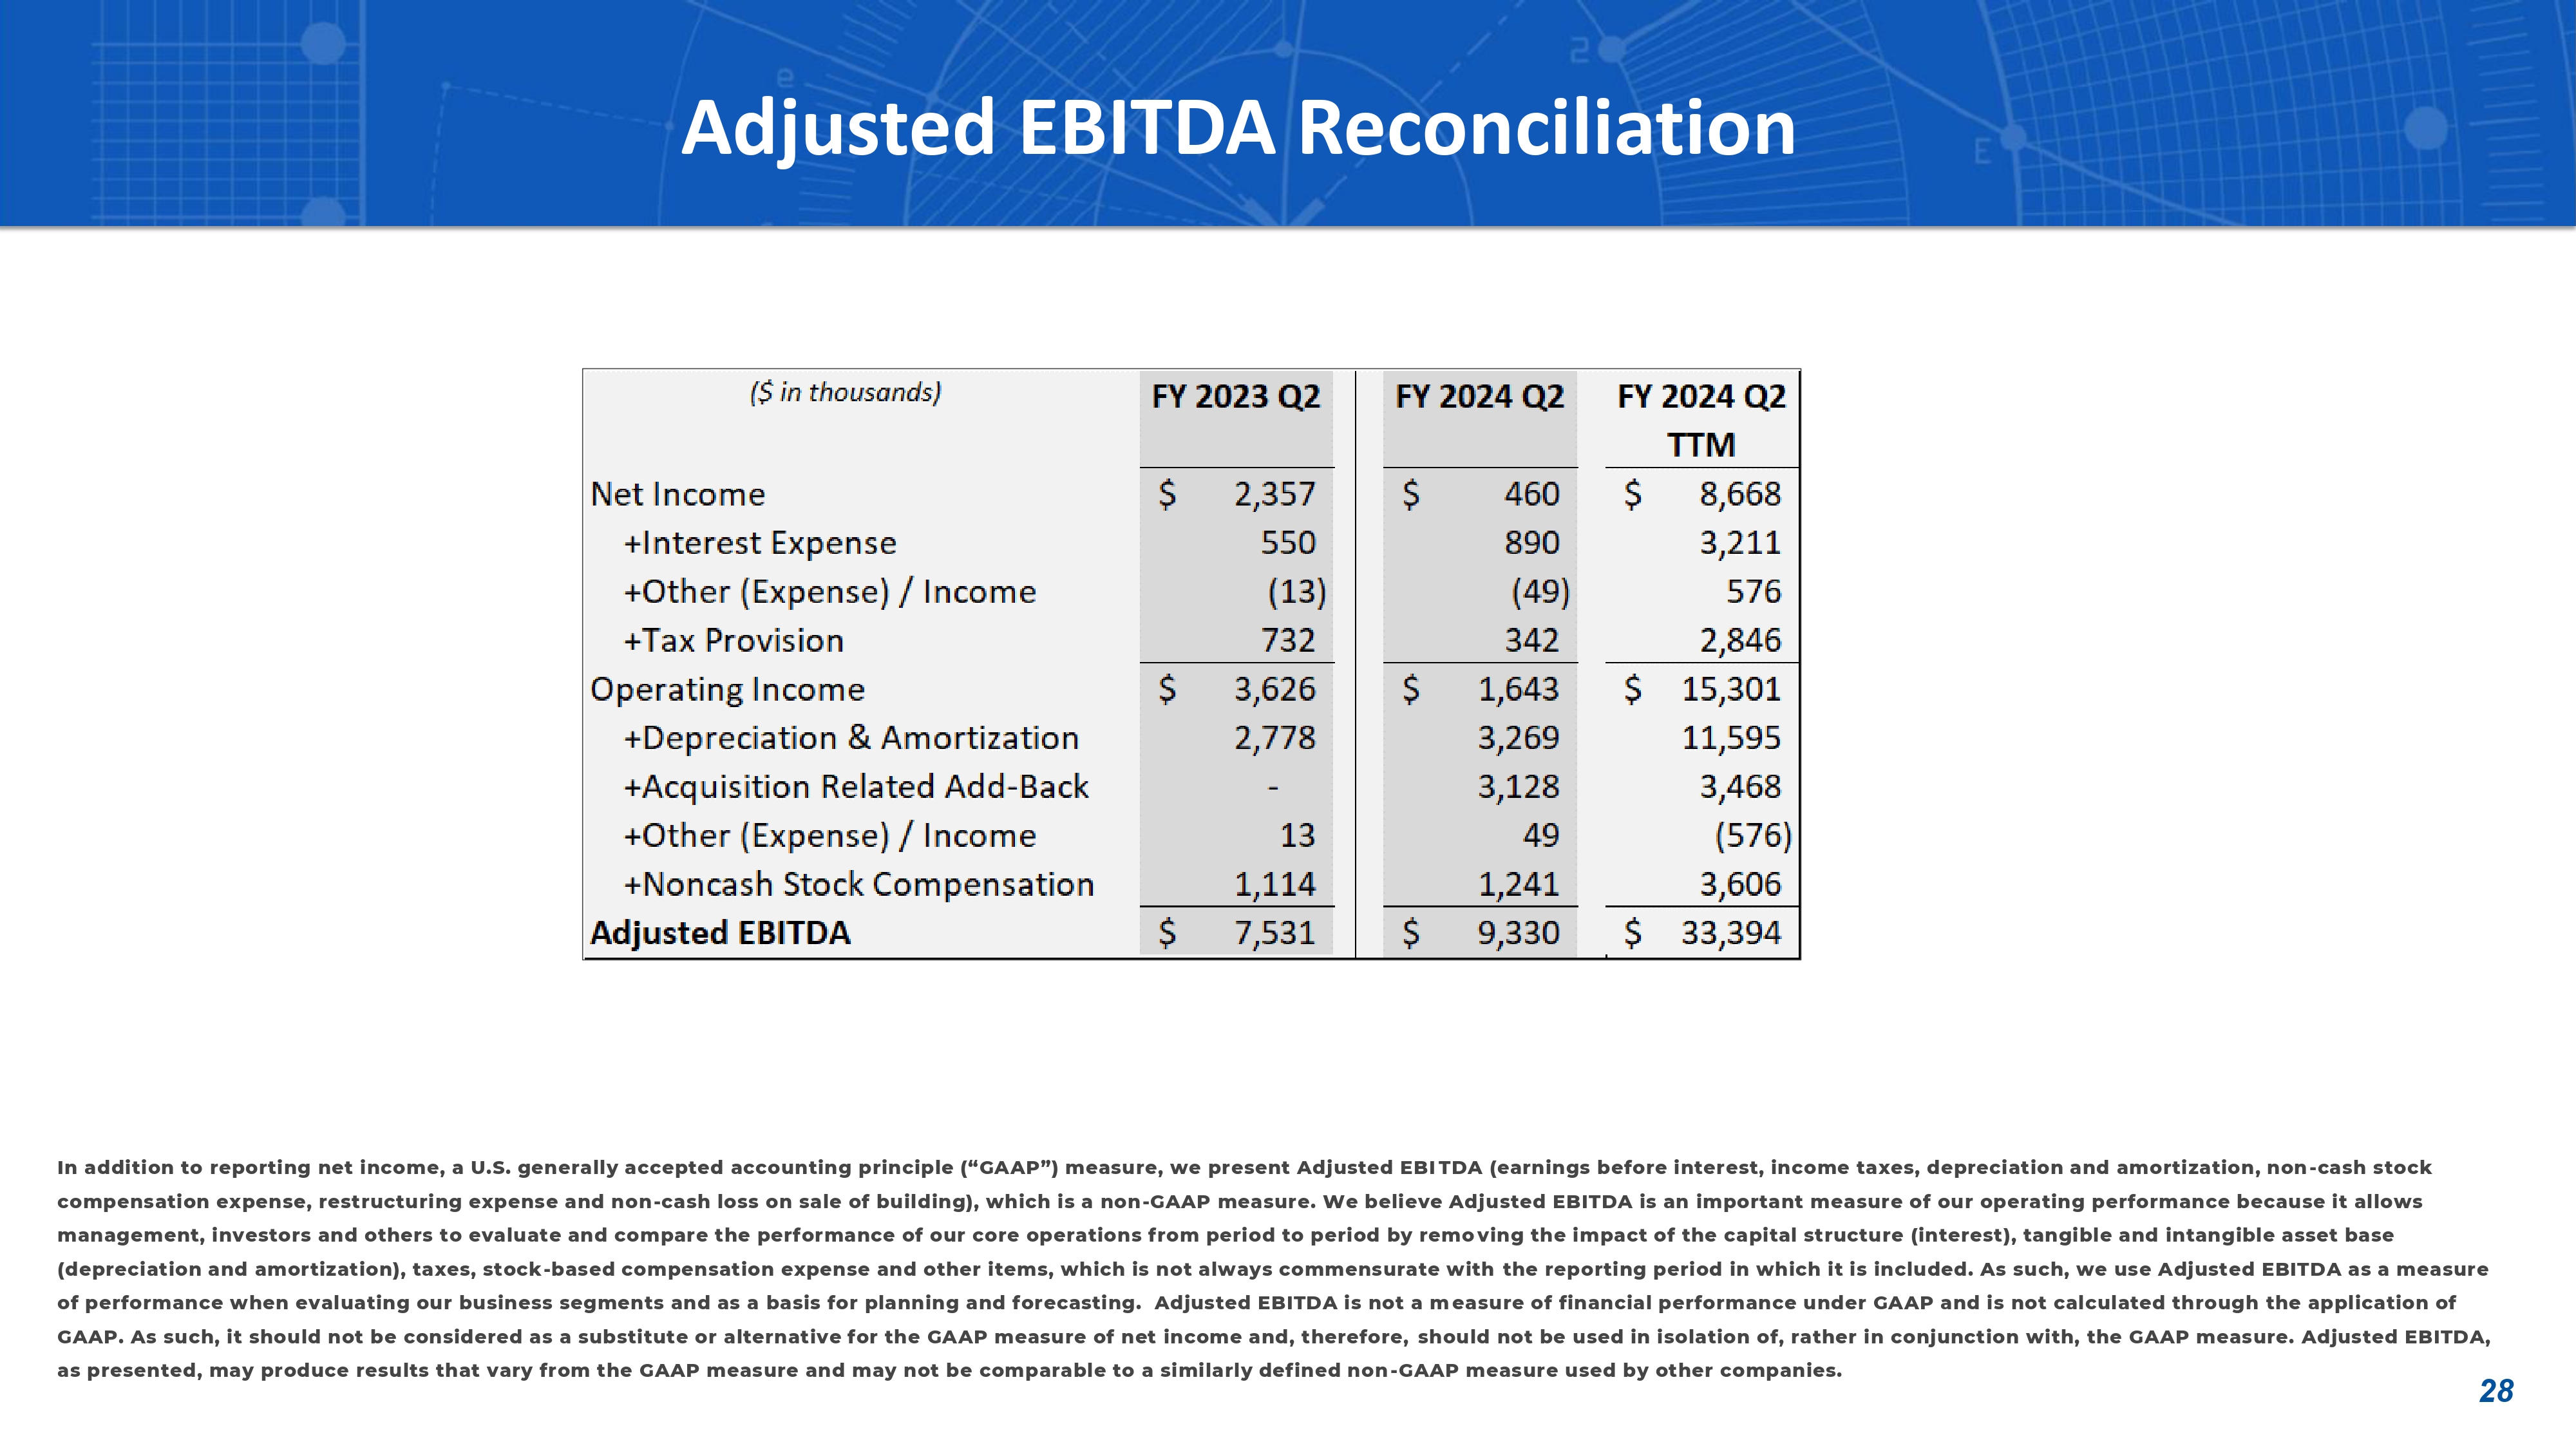
28 Adjusted EBITDA Reconciliation In addition to reporting net income, a U.S. generally accepted accounting principle (“GAAP”) measure, we present Adjusted EBI TDA (earnings before interest, income taxes, depreciation and amortization, non - cash stock compensation expense, restructuring expense and non - cash loss on sale of building), which is a non - GAAP measure. We believe Adju sted EBITDA is an important measure of our operating performance because it allows management, investors and others to evaluate and compare the performance of our core operations from period to period by remo vin g the impact of the capital structure (interest), tangible and intangible asset base (depreciation and amortization), taxes, stock - based compensation expense and other items, which is not always commensurate with the reporting period in which it is included. As such, we use Adjusted EBITDA as a measure of performance when evaluating our business segments and as a basis for planning and forecasting. Adjusted EBITDA is not a m eas ure of financial performance under GAAP and is not calculated through the application of GAAP. As such, it should not be considered as a substitute or alternative for the GAAP measure of net income and, therefore, sho uld not be used in isolation of, rather in conjunction with, the GAAP measure. Adjusted EBITDA, as presented, may produce results that vary from the GAAP measure and may not be comparable to a similarly defined non - GAAP meas ure used by other companies.

29 Segment Adjusted EBITDA Reconciliation In addition to reporting net income, a U.S. generally accepted accounting principle (“GAAP”) measure, we present Adjusted EBI TDA (earnings before interest, income taxes, depreciation and amortization, non - cash stock compensation expense, restructuring expense and non - cash loss on sale of building), which is a non - GAAP measure. We believe Adju sted EBITDA is an important measure of our operating performance because it allows management, investors and others to evaluate and compare the performance of our core operations from period to period by remo vin g the impact of the capital structure (interest), tangible and intangible asset base (depreciation and amortization), taxes, stock - based compensation expense and other items, which is not always commensurate with the reporting period in which it is included. As such, we use Adjusted EBITDA as a measure of performance when evaluating our business segments and as a basis for planning and forecasting. Adjusted EBITDA is not a m eas ure of financial performance under GAAP and is not calculated through the application of GAAP. As such, it should not be considered as a substitute or alternative for the GAAP measure of net income and, therefore, sho uld not be used in isolation of, rather in conjunction with, the GAAP measure. Adjusted EBITDA, as presented, may produce results that vary from the GAAP measure and may not be comparable to a similarly defined non - GAAP meas ure used by other companies.