株探米国株
エドガーで原本を確認する
0000029002false00000290022026-08-052026-08-05


UNITED STATES
SECURITIES AND EXCHANGE COMMISSION
WASHINGTON, D.C. 20549


FORM 8-K


CURRENT REPORT

Pursuant to Section 13 or 15(d) of the Securities Exchange Act of 1934

Date of Report (Date of earliest event reported): August 05, 2026


DIODES INCORPORATED

(Exact name of Registrant as Specified in Its Charter)


Delaware

002-25577

95-2039518

(State or Other Jurisdiction
of Incorporation)

(Commission File Number)

(IRS Employer
Identification No.)


4949 Hedgcoxe Road, Suite 200


Plano, Texas


75024

(Address of Principal Executive Offices)


(Zip Code)


Registrant’s Telephone Number, Including Area Code: 972 987-3900


(Former Name or Former Address, if Changed Since Last Report)


Check the appropriate box below if the Form 8-K filing is intended to simultaneously satisfy the filing obligation of the registrant under any of the following provisions:

Written communications pursuant to Rule 425 under the Securities Act (17 CFR 230.425)
Soliciting material pursuant to Rule 14a-12 under the Exchange Act (17 CFR 240.14a-12)
Pre-commencement communications pursuant to Rule 14d-2(b) under the Exchange Act (17 CFR 240.14d-2(b))
Pre-commencement communications pursuant to Rule 13e-4(c) under the Exchange Act (17 CFR 240.13e-4(c))

Securities registered pursuant to Section 12(b) of the Act:


Title of each class


Trading
Symbol(s)


Name of each exchange on which registered

Common Stock, Par Value $0.66 2/3


DIOD


The Nasdaq Stock Market LLC

Indicate by check mark whether the registrant is an emerging growth company as defined in Rule 405 of the Securities Act of 1933 (§ 230.405 of this chapter) or Rule 12b-2 of the Securities Exchange Act of 1934 (§ 240.12b-2 of this chapter).

Emerging growth company

If an emerging growth company, indicate by check mark if the registrant has elected not to use the extended transition period for complying with any new or revised financial accounting standards provided pursuant to Section 13(a) of the Exchange Act.


Item 2.02 Results of Operations and Financial Condition.

On August 5, 2026, Diodes Incorporated (the “Company”) issued a press release announcing its financial results for the second quarter ended June 30, 2026. A copy of the press release is furnished as Exhibit 99.1 to this Report.

In the press release, the Company utilizes financial measures and terms not calculated in accordance with generally accepted accounting principles in the United States (“GAAP”) in order to provide investors with an alternative method for assessing the Company’s operating results in a manner that enables investors to more thoroughly evaluate its current performance as compared to past performance. The Company also believes these non-GAAP measures provide investors with a more informed baseline for modeling the Company’s future financial performance. Management uses these non-GAAP measures for the same purpose. The Company believes that investors should have access to the same set of tools that management uses in analyzing results. These non-GAAP measures should be considered in addition to results prepared in accordance with GAAP, but should not be considered a substitute for or superior to GAAP results and may differ from similar measures used by other companies. See Exhibit 99.1 for a description and reconciliation with GAAP of the non-GAAP measures used.

The information furnished in this Item 2.02, including the exhibit referenced in this Item 2.02, will not be treated as “filed” for the purposes of Section 18 of the Securities Exchange Act of 1934, as amended (the “Exchange Act”), or otherwise subject to the liabilities of that section. This information will not be deemed incorporated by reference into any filing under the Securities Act of 1933, as amended (the “Securities Act”), or into another filing under the Exchange Act, unless that filing expressly refers to specific information in this Report.

Item 7.01 Regulation FD Disclosure.

From time to time, the Company may give corporate presentations to its customers, suppliers, investors and other interested parties. Copies of the Company’s corporate presentation slides, updated on August 5, 2026, are attached herewith as Exhibit 99.2 and Exhibit 99.3. Exhibit 99.2 provides an update focused on the Company’s second quarter 2026 financial results and Exhibit 99.3 is used in the Company’s investor relations presentations.

The information furnished in this Item 7.01, including the exhibits referenced in this Item 7.01, will not be treated as “filed” for the purposes of Section 18 of the Exchange Act, or otherwise subject to the liabilities of that section. This information will not be deemed incorporated by reference into any filing under the Securities Act, or into another filing under the Exchange Act, unless that filing expressly refers to specific information in this Report.

Forward-Looking Statements

Statements in this Current Report on Form 8-K (including in the documents attached as Exhibit 99.1, Exhibit 99.2 and Exhibit 99.3) contain forward-looking statements that involve future risks and uncertainties as contemplated by the safe harbor provided by the Private Securities Litigation Reform Act of 1995. All statements, other than statements of historical facts, included in this Current Report on Form 8-K (including the documents attached as Exhibit 99.1, Exhibit 99.2 and Exhibit 99.3) should be regarded as forward-looking statements and Exhibit 99.1, Exhibit 99.2 and Exhibit 99.3 contain a more detailed listing of the risks and uncertainties associated with those forward-looking statements. The Company undertakes no obligation to update publicly any forward-looking statements, whether as a result of new information, future events or otherwise, except as required by applicable law.

Item 9.01 Financial Statements and Exhibits.

(d) Exhibits.

Exhibit Number

Description

99.1

Press release dated August 5, 2026.

99.2

Second Quarter 2026 Financial Results.

99.3

Corporate slides for investor relations presentation.

104

Cover Page Interactive Data File (embedded within the Inline XBRL document).


SIGNATURES

Pursuant to the requirements of the Securities Exchange Act of 1934, the registrant has duly caused this report to be signed on its behalf by the undersigned thereunto duly authorized.


DIODES INCORPORATED


Date:

August 5, 2026

By:

/s/Brett R. Whitmire


Brett R. Whitmire
Chief Financial Officer


EX-99.1 2 diod-ex99_1.htm EX-99.1 EX-99.1

Exhibit 99.1

img74335243_0.jpg


Diodes Incorporated Reports Second Quarter 2026 Financial Results


Extends Growth Momentum in 2Q with Revenue Increasing over 20% and non-GAAP EPS Up over 100% YoY


Plano, Texas – August 5, 2026 -- Diodes Incorporated (Diodes) (Nasdaq: DIOD) today reported its financial results for the second quarter ended June 30, 2026.


Second Quarter Highlights

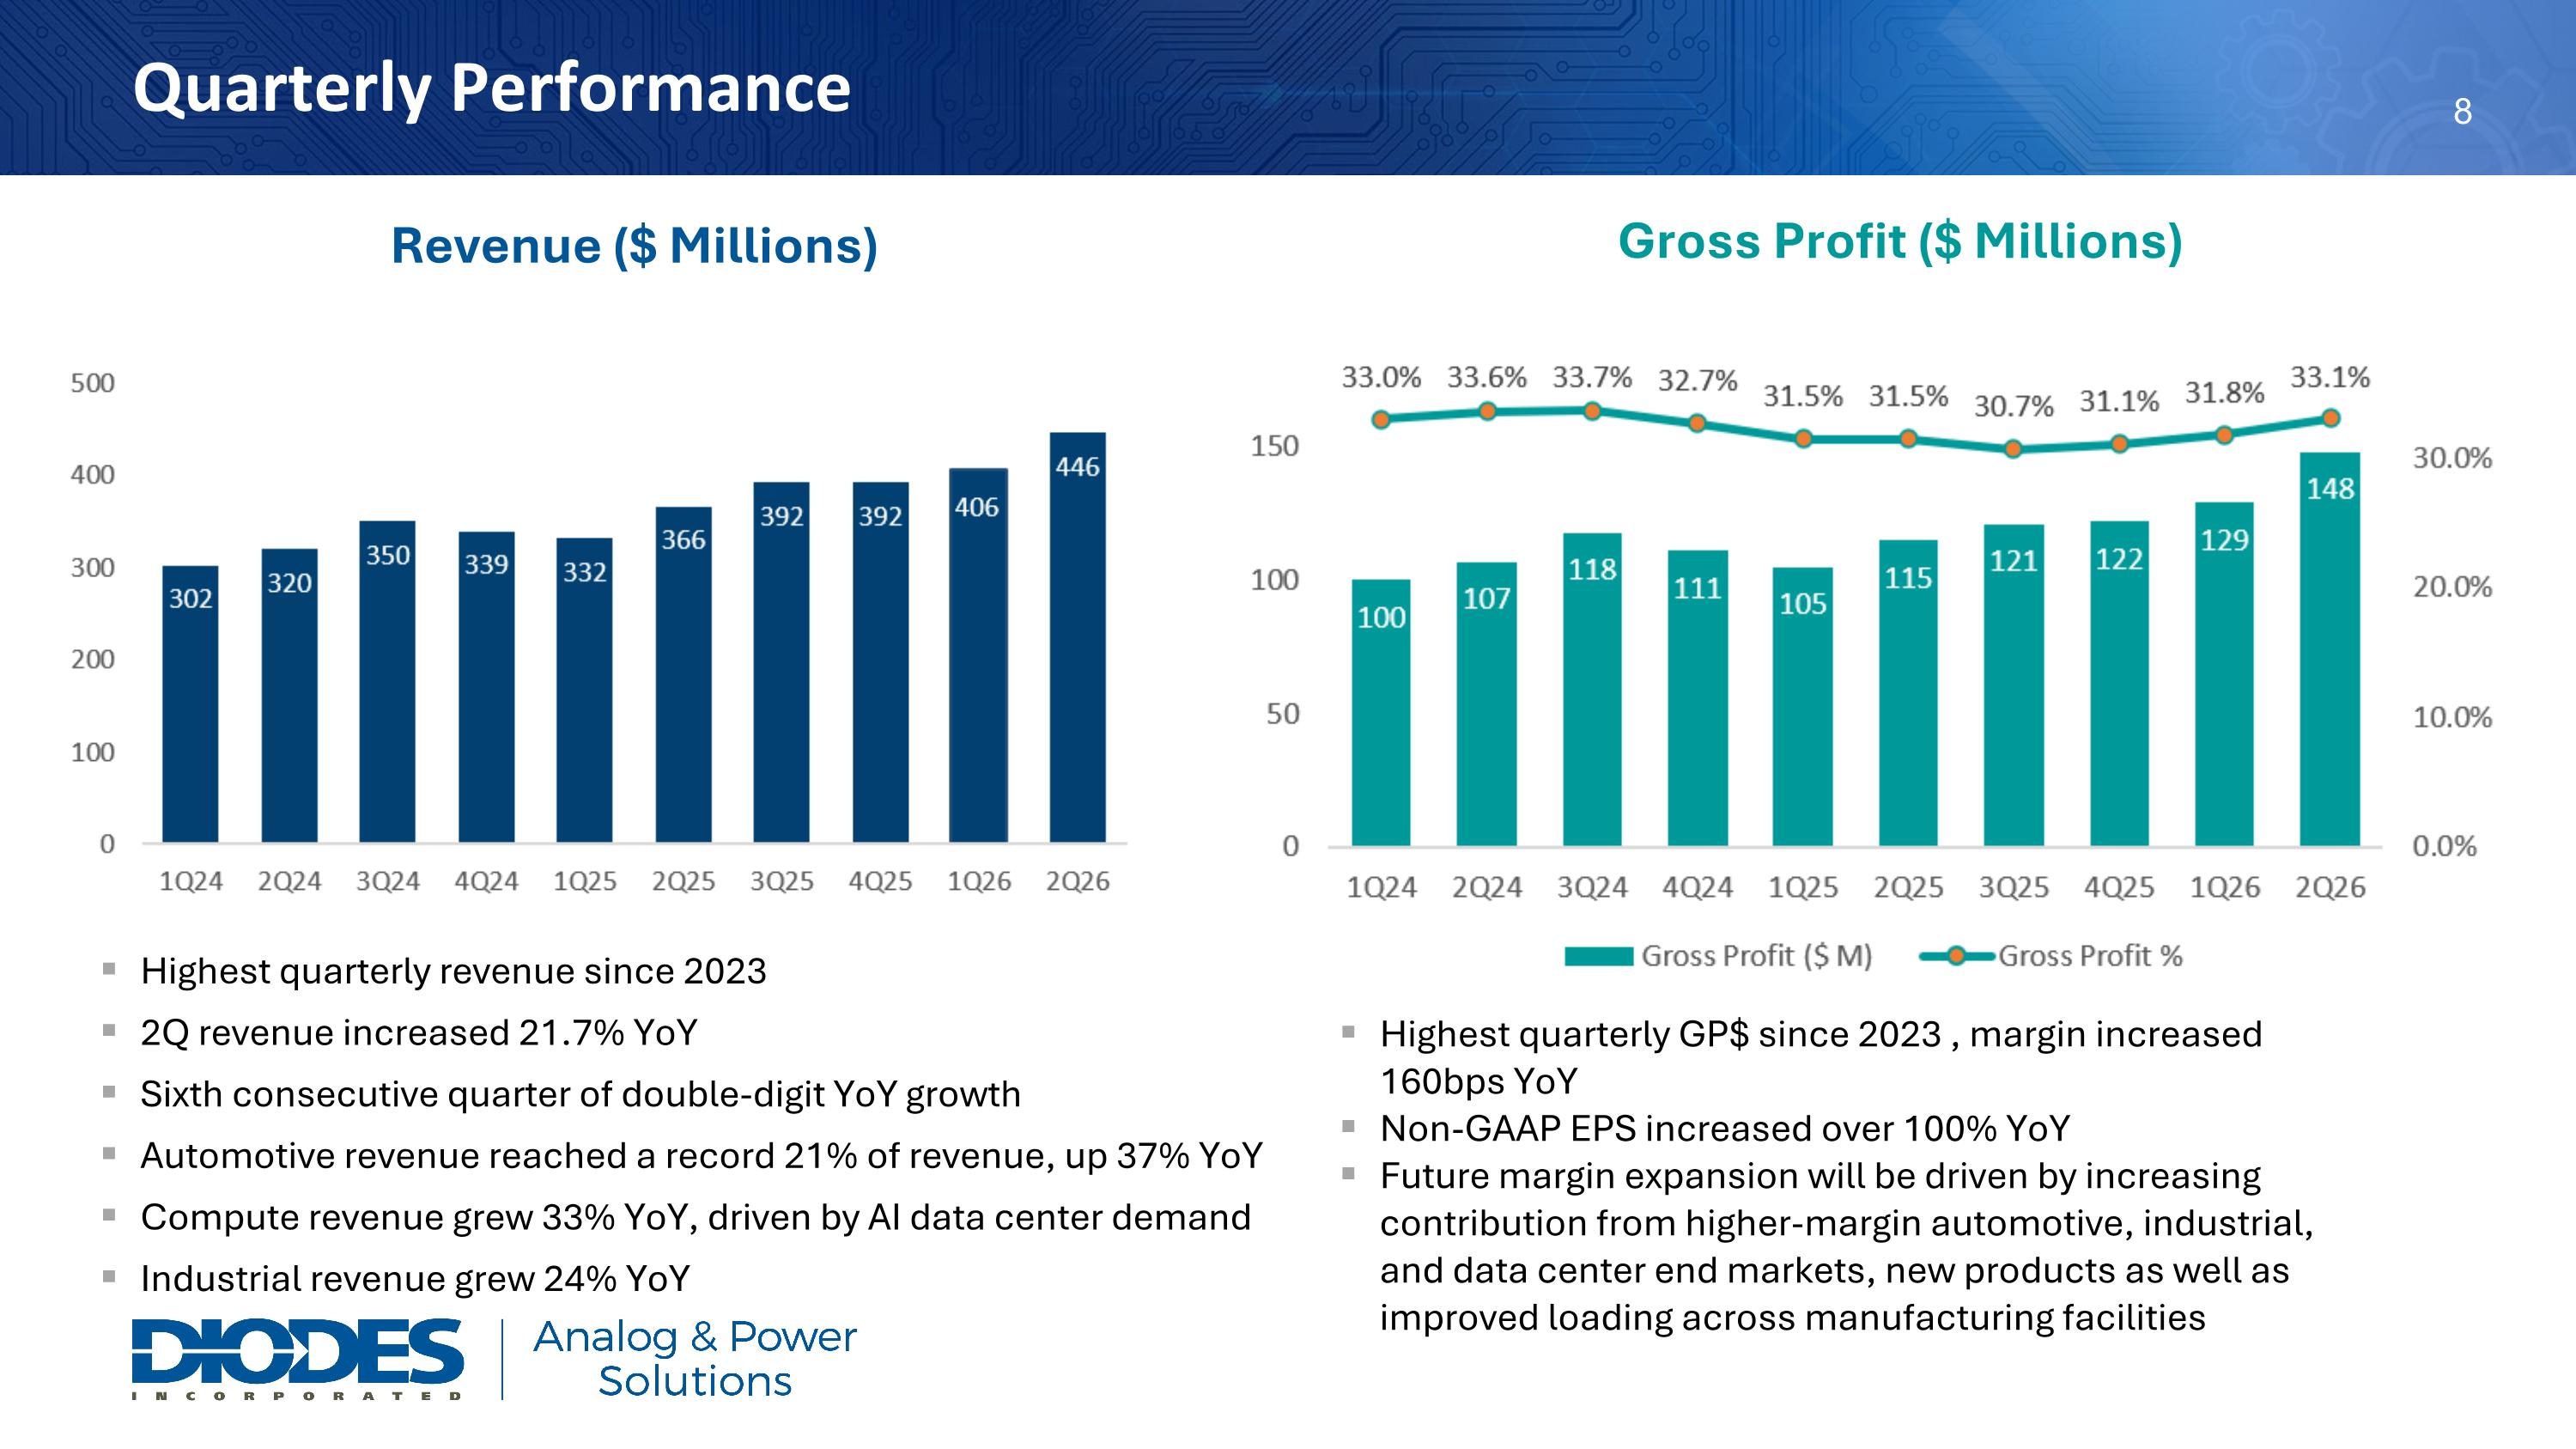
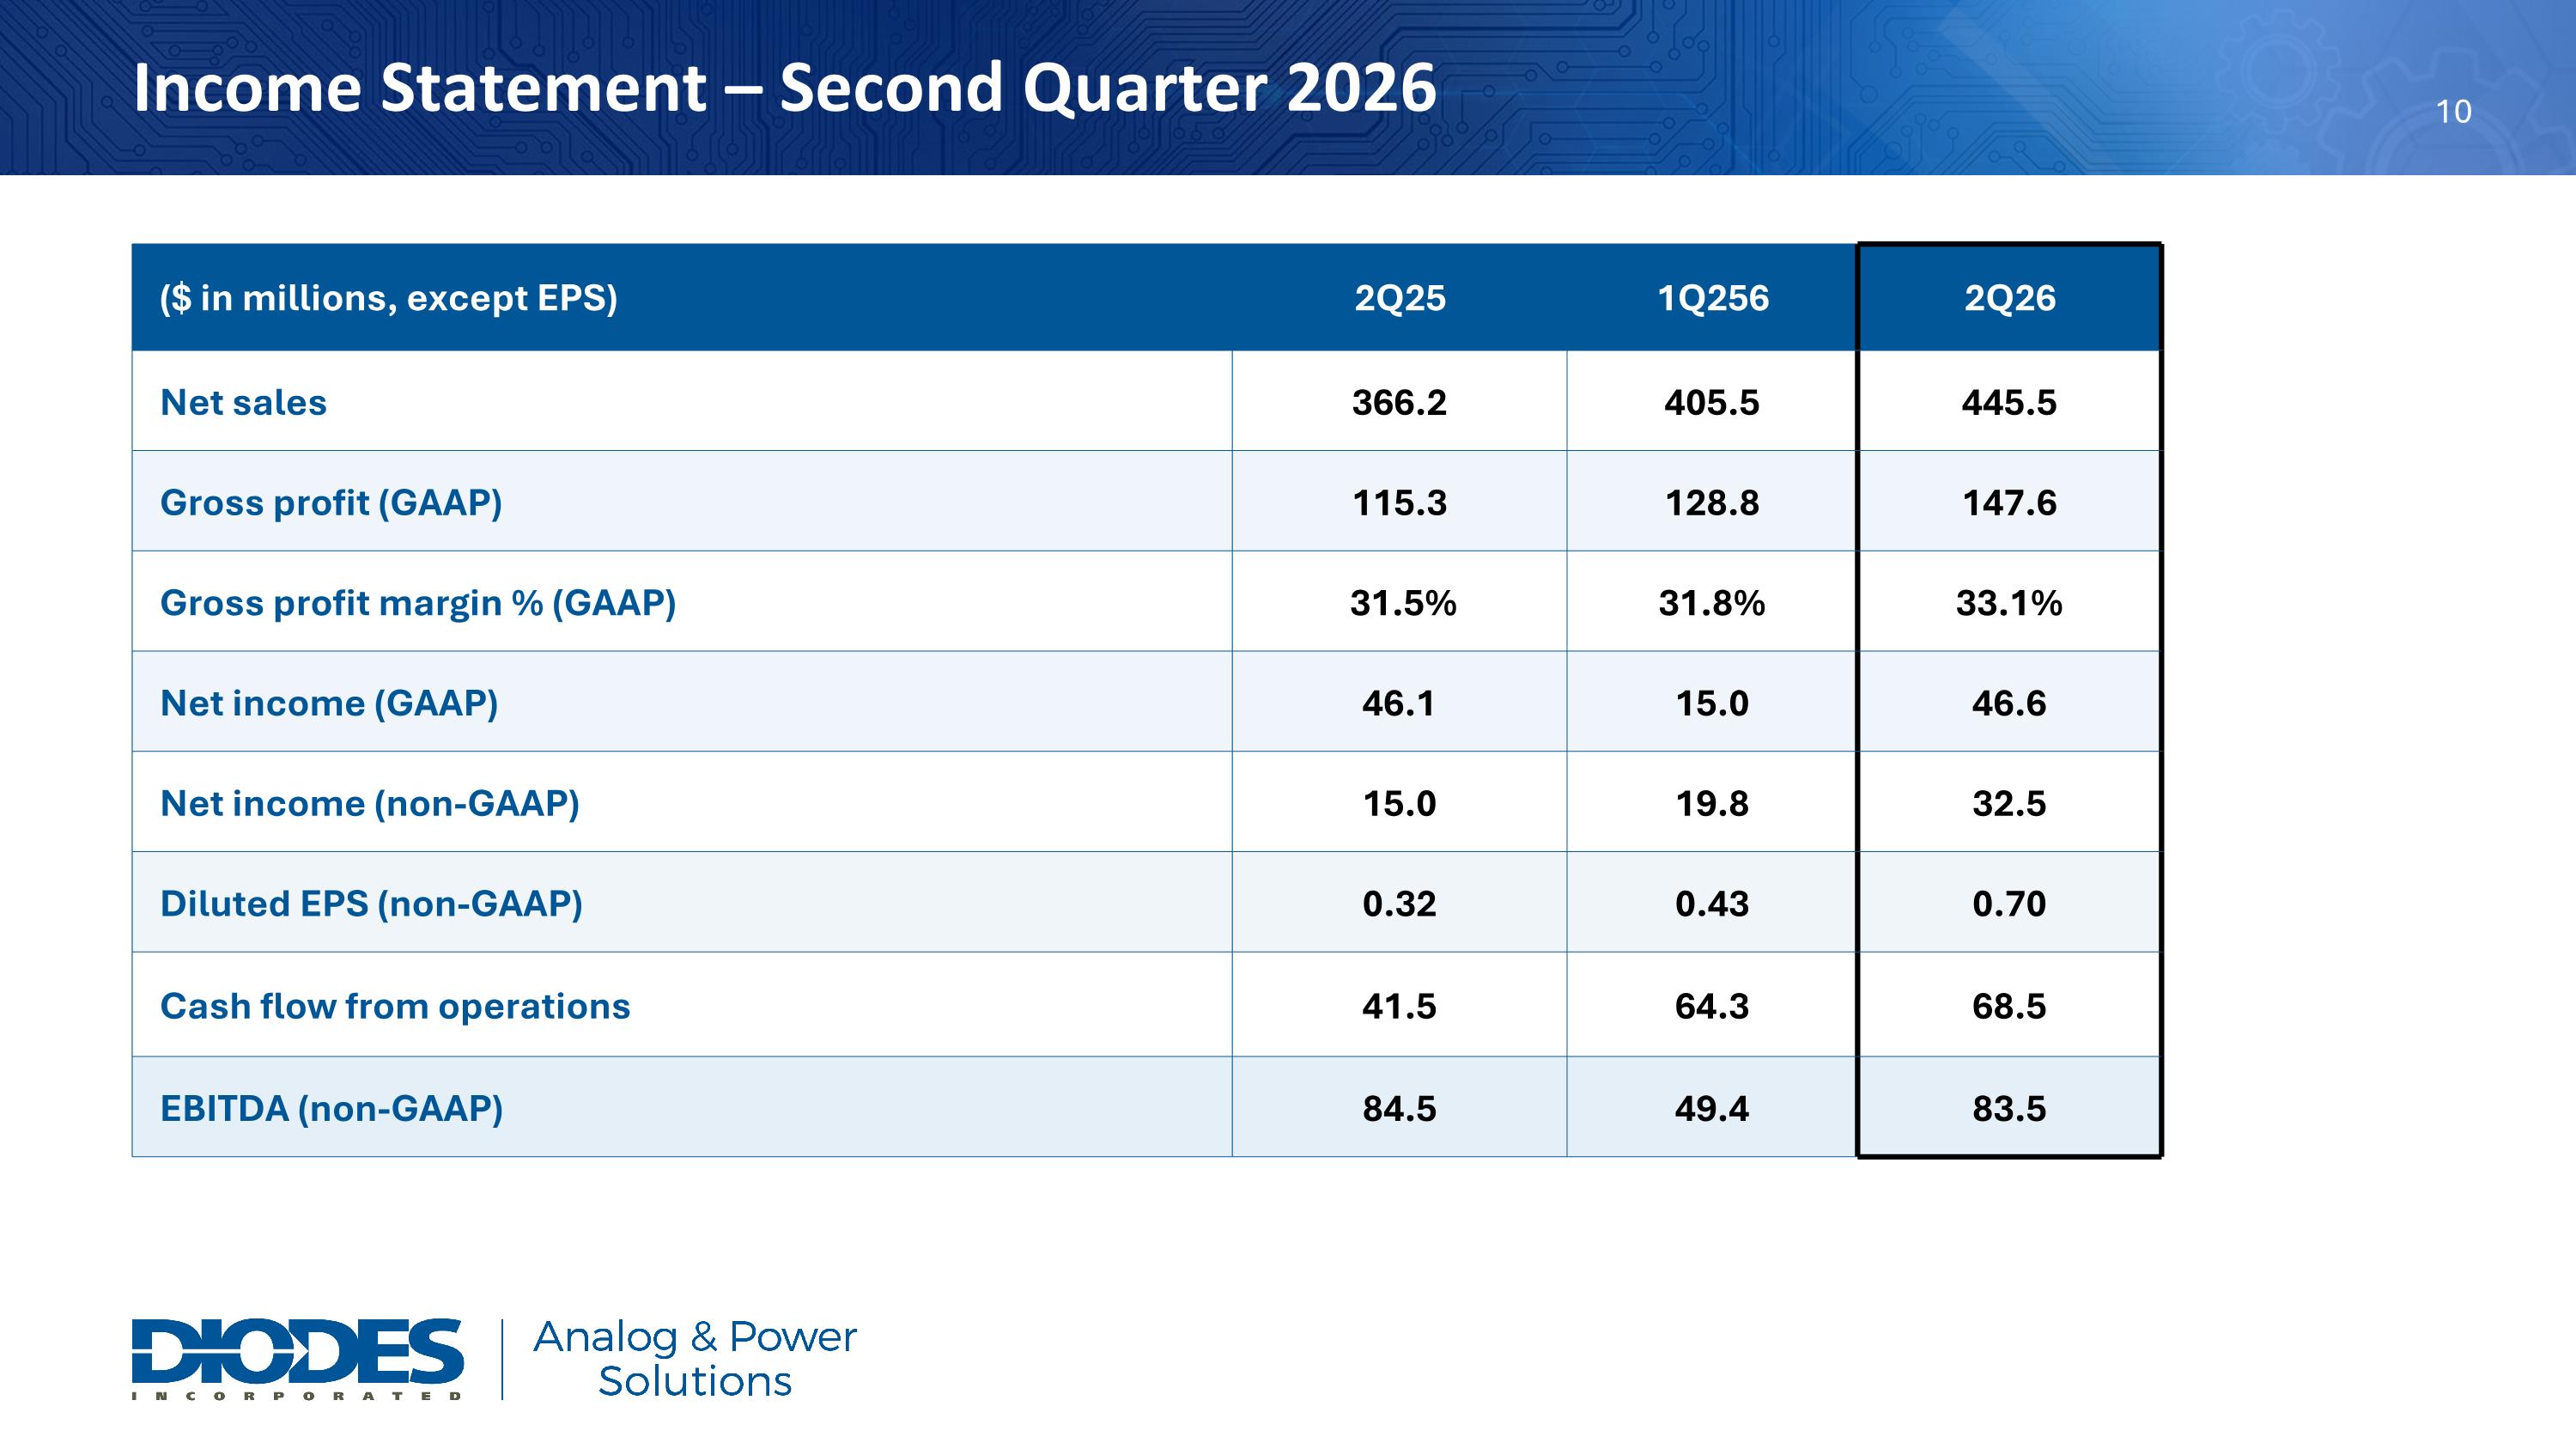
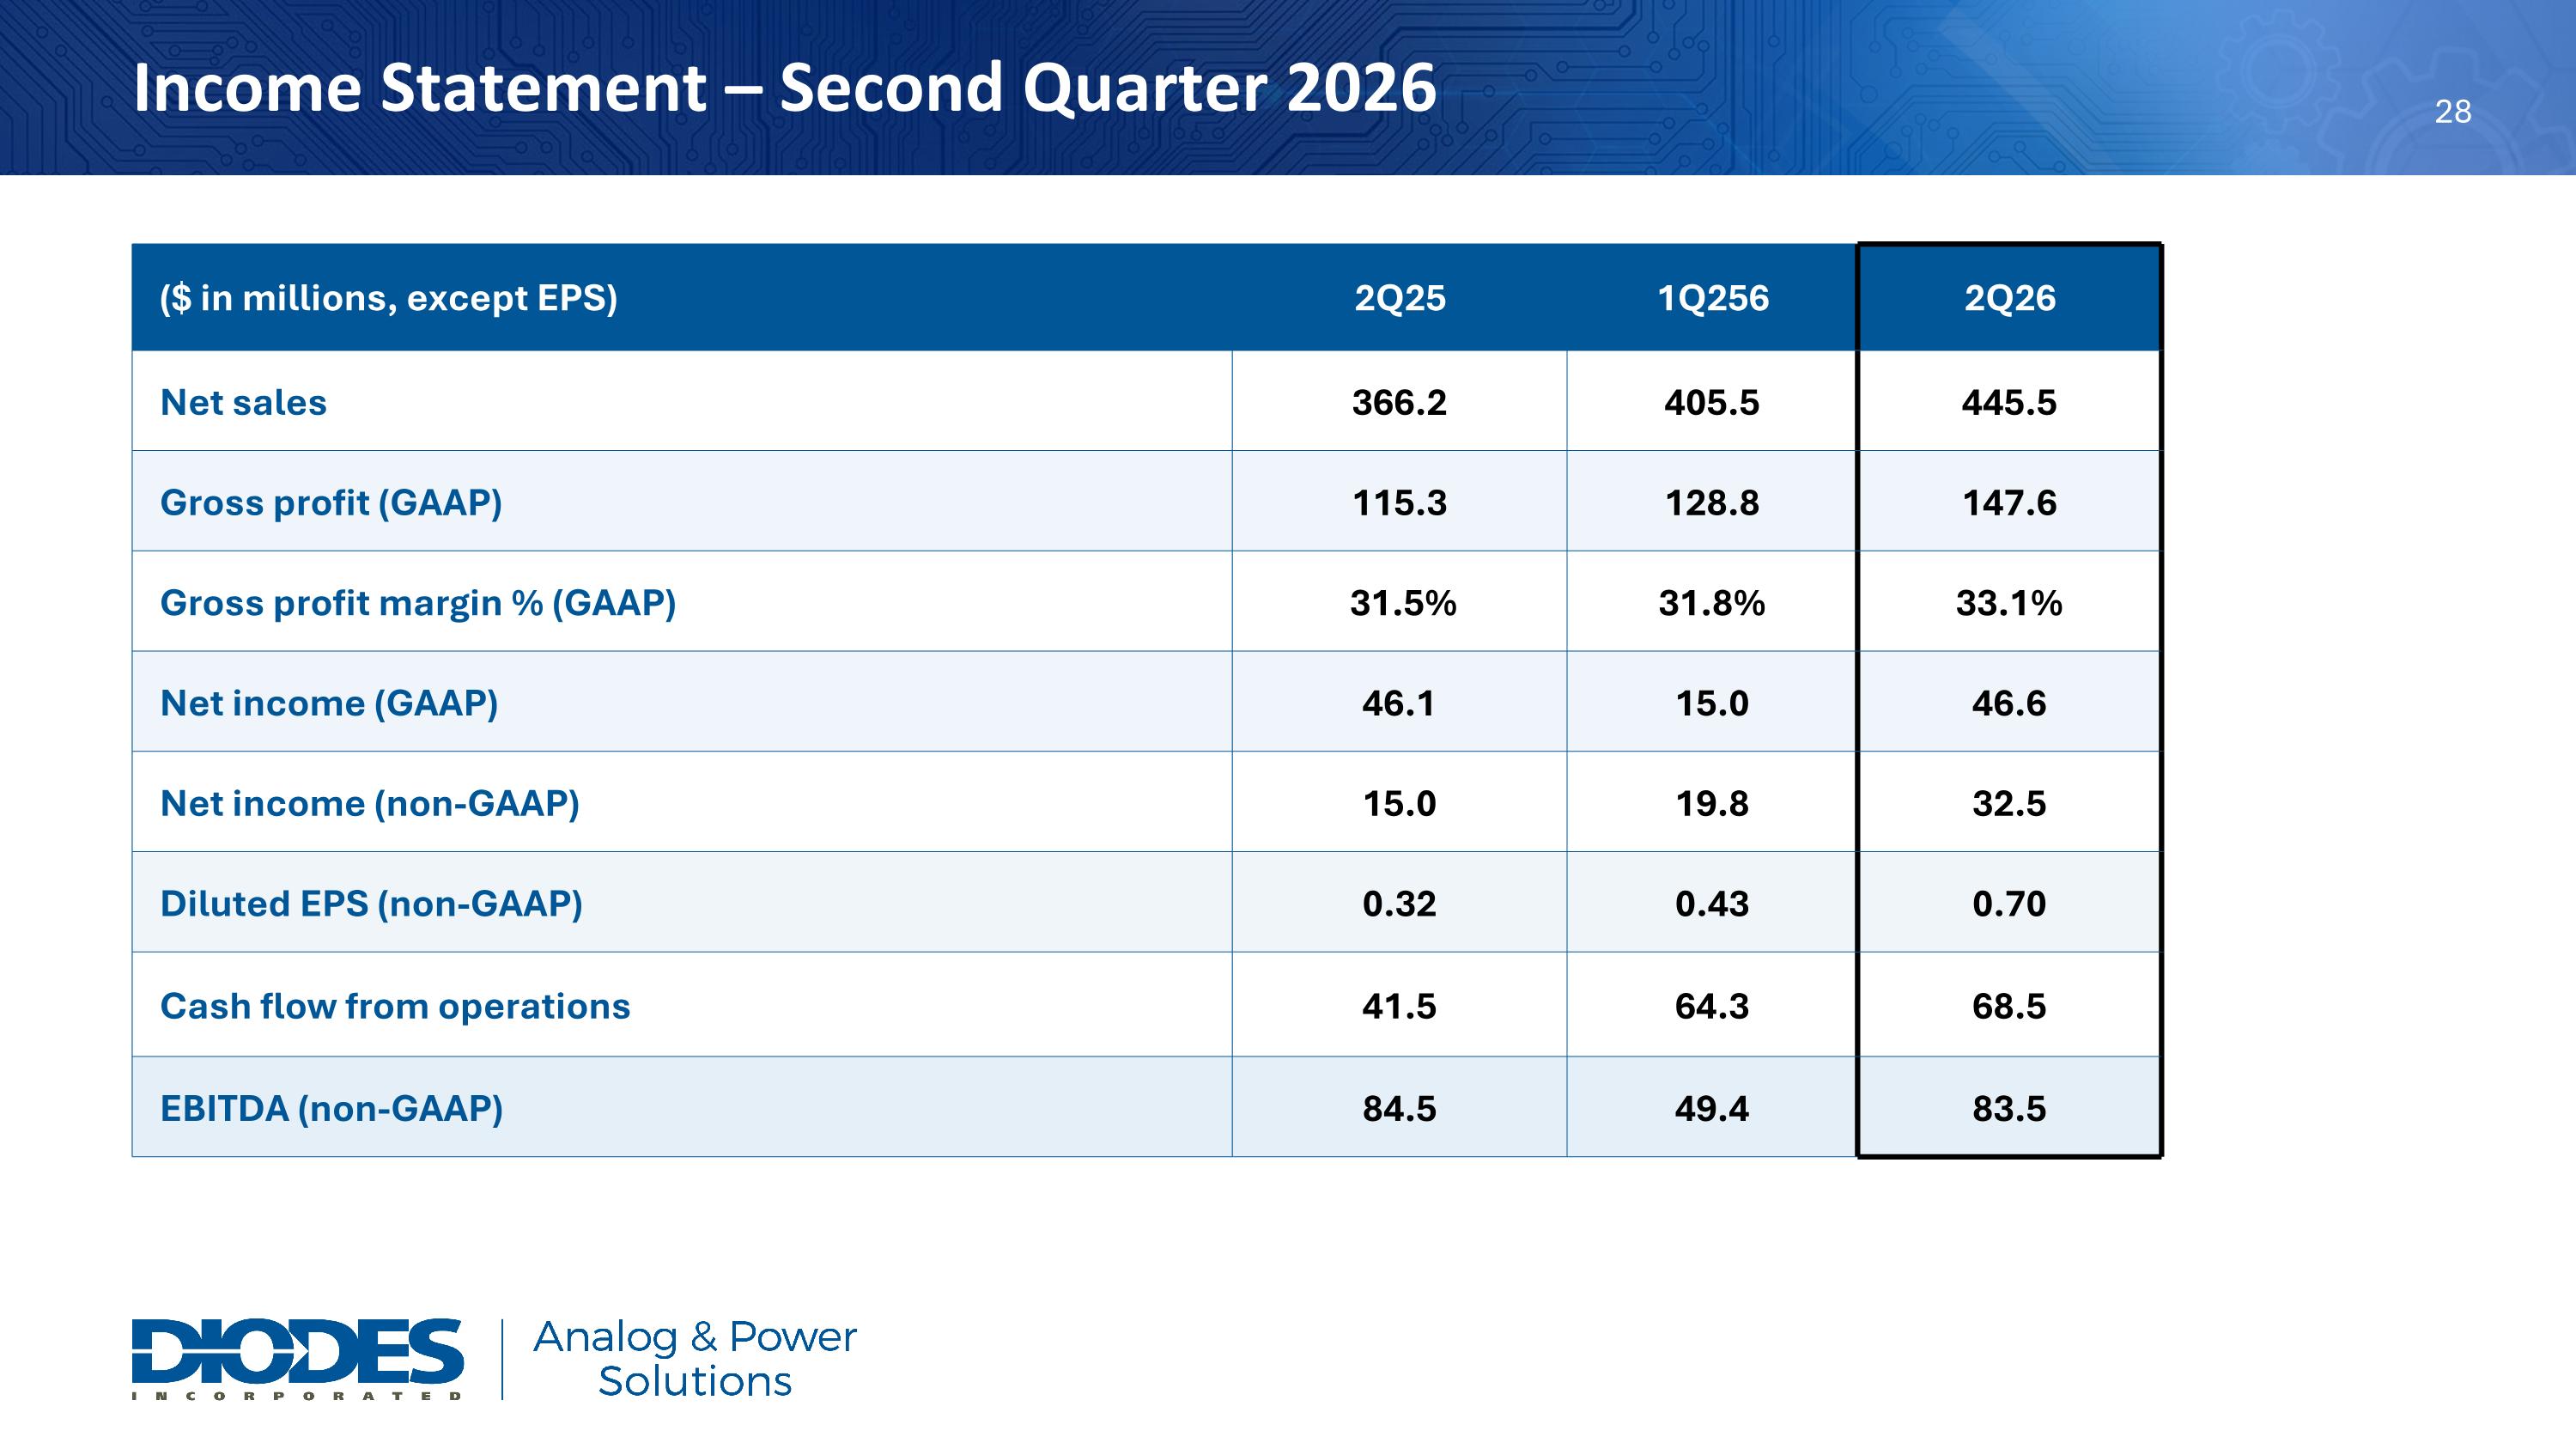
Revenue was $445.5 million, compared to $366.2 million in the second quarter 2025 and $405.5 million in the prior quarter;
GAAP gross profit was $147.6 million, compared to $115.3 million in the second quarter 2025 and $128.8 million in the prior quarter;
GAAP gross profit margin was 33.1 percent, compared to 31.5 percent in the second quarter 2025 and 31.8 percent in the prior quarter;
GAAP net income was $46.6 million, compared to GAAP net income of $46.1 million in the second quarter 2025 and GAAP net income of $15.0 million in the prior quarter;
Non-GAAP adjusted net income was $32.5 million, compared to $15.0 million in the second quarter 2025 and $19.8 million in the prior quarter;
GAAP EPS was $1.00 per diluted share, compared to GAAP EPS of $0.99 per diluted share in the same quarter a year ago and GAAP EPS of $0.32 per diluted share in the prior quarter;
Non-GAAP EPS was $0.70 per diluted share, compared to $0.32 per diluted share in the second quarter 2025 and $0.43 per diluted share in the prior quarter;
Excluding $8.9 million, net of tax, non-cash share-based compensation expense, both GAAP net income and non-GAAP adjusted net income would have increased by $0.19 per diluted share;
EBITDA was $83.5 million, or 18.7 percent of revenue, compared to $84.5 million, or 23.1 percent of revenue in the same quarter a year ago and $49.4 million, or 12.2 percent of revenue in the prior quarter;
Achieved $68.5 million cash flow from operations and $34.8 million of free cash flow, including $33.6 million of capital expenditures. Net cash flow was a positive $32.9 million, which includes $10.0 million for the stock buyback program.


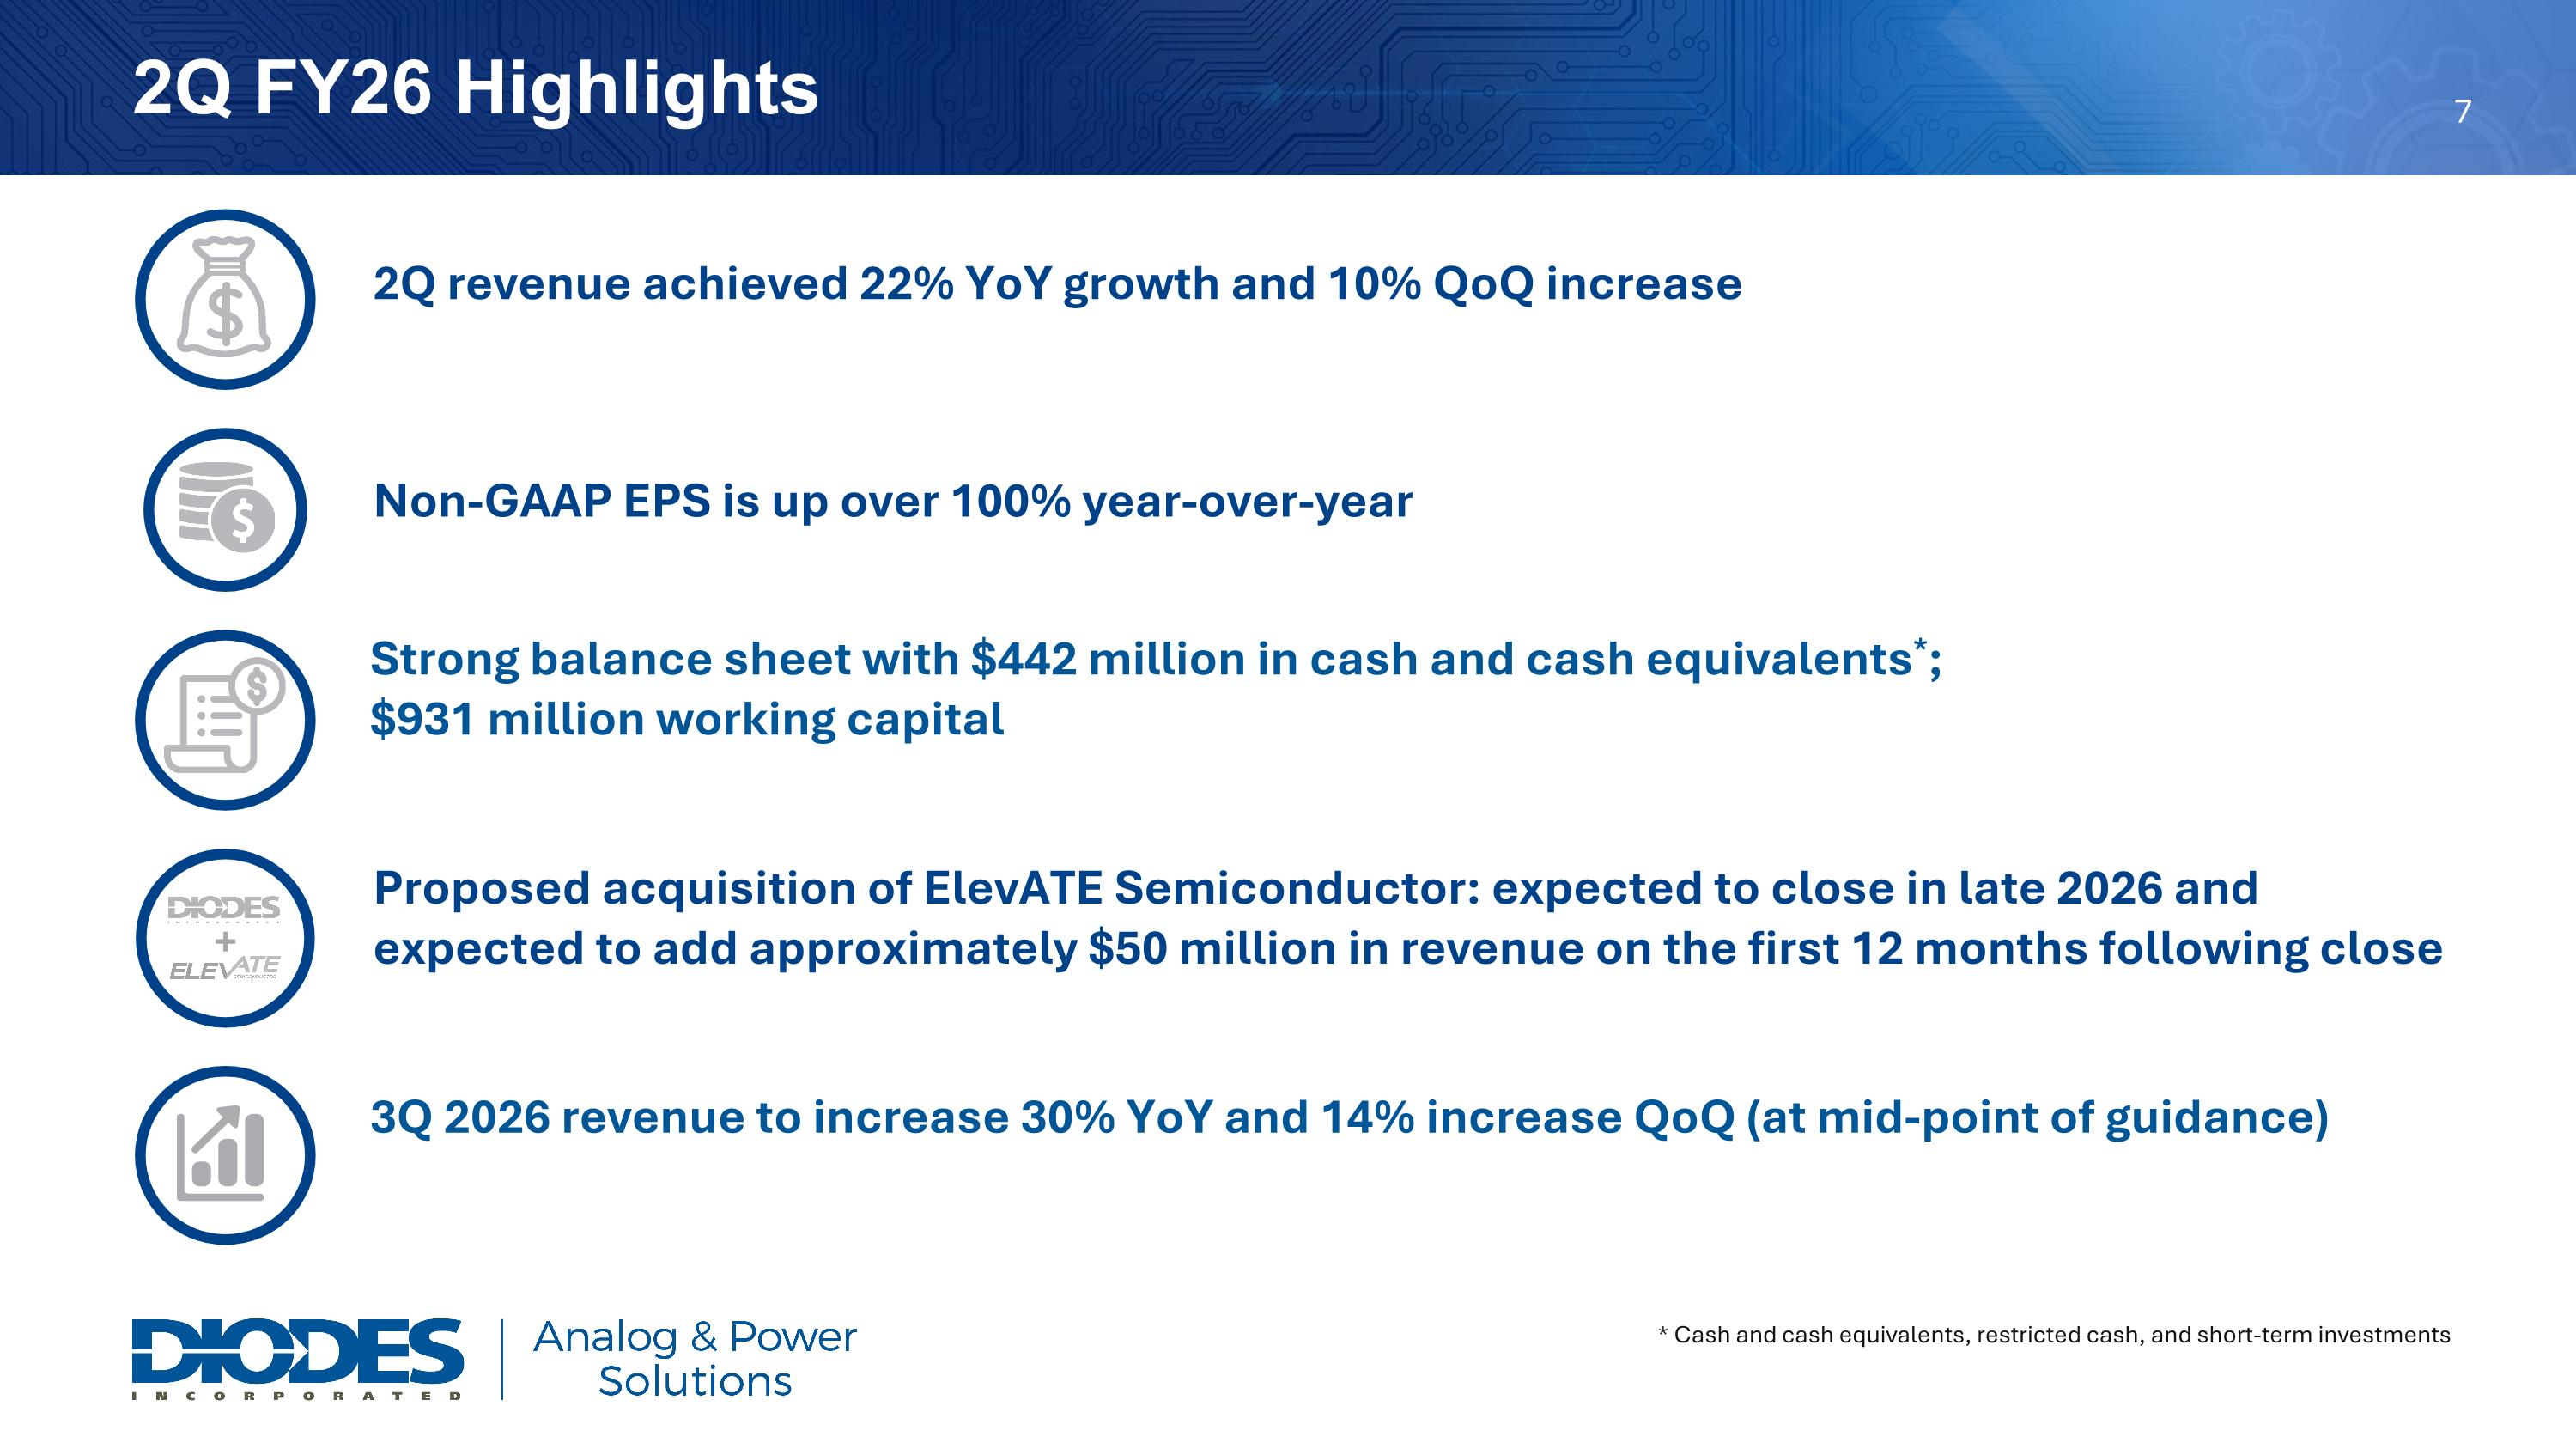
Commenting on the results, Gary Yu, President and CEO of Diodes, stated, “We extended our momentum in the second quarter with revenue again increasing more than 20% year-over-year, driven by growth across all regions. Revenue also increased 10% sequentially coupled with record global POS. As the sixth consecutive quarter of double-digit year-over-year growth, this quarter serves as further confirmation of strengthening demand in the overall market combined with Diodes expanding content across our analog and power solutions in our key focus areas of automotive, industrial and AI server-related applications.


“Additionally, the cost and operating initiatives we previously implemented during the market slowdown are producing measurable benefits to gross margin and our bottom line, with margin increasing 160 basis points year-over-year and non-GAAP earnings increasing by more than 100% again this quarter. These actions have also contributed to increased cash flow that has enabled us to reinvest in our growth and innovation, while also looking for inorganic


opportunities to expand our technology portfolio, such as the recent proposed acquisition of ElevATE Semiconductor.


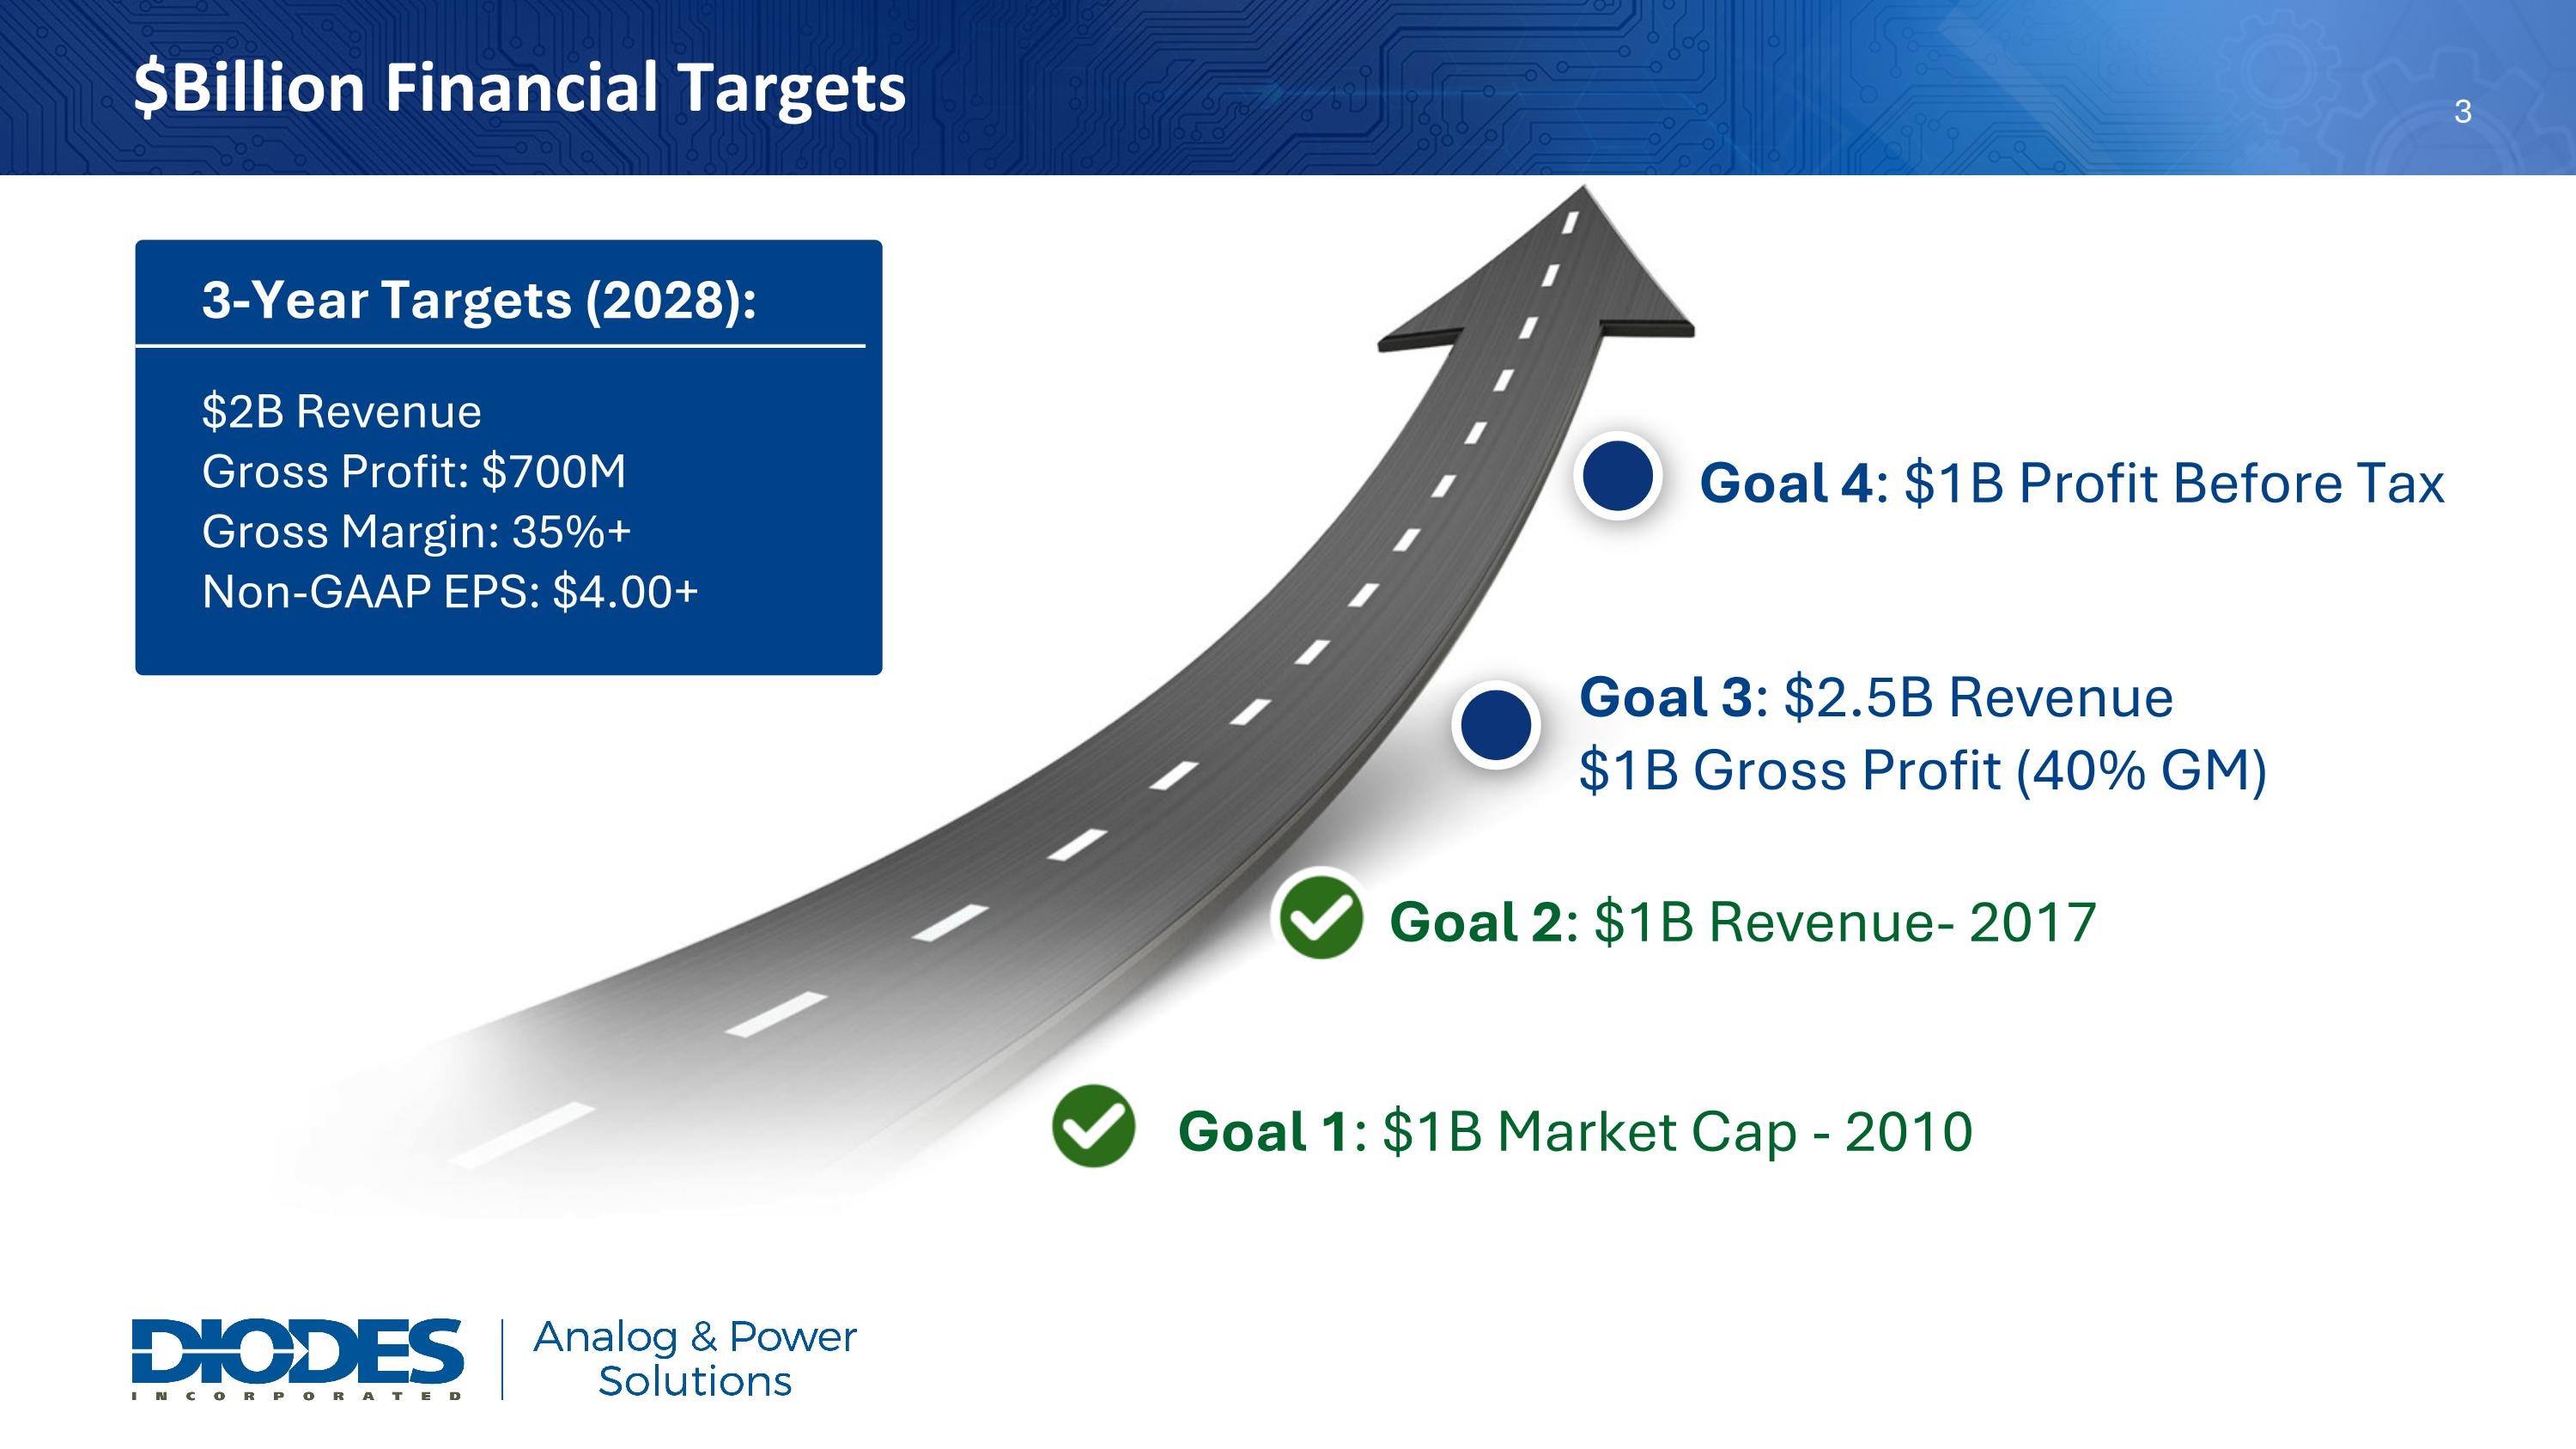
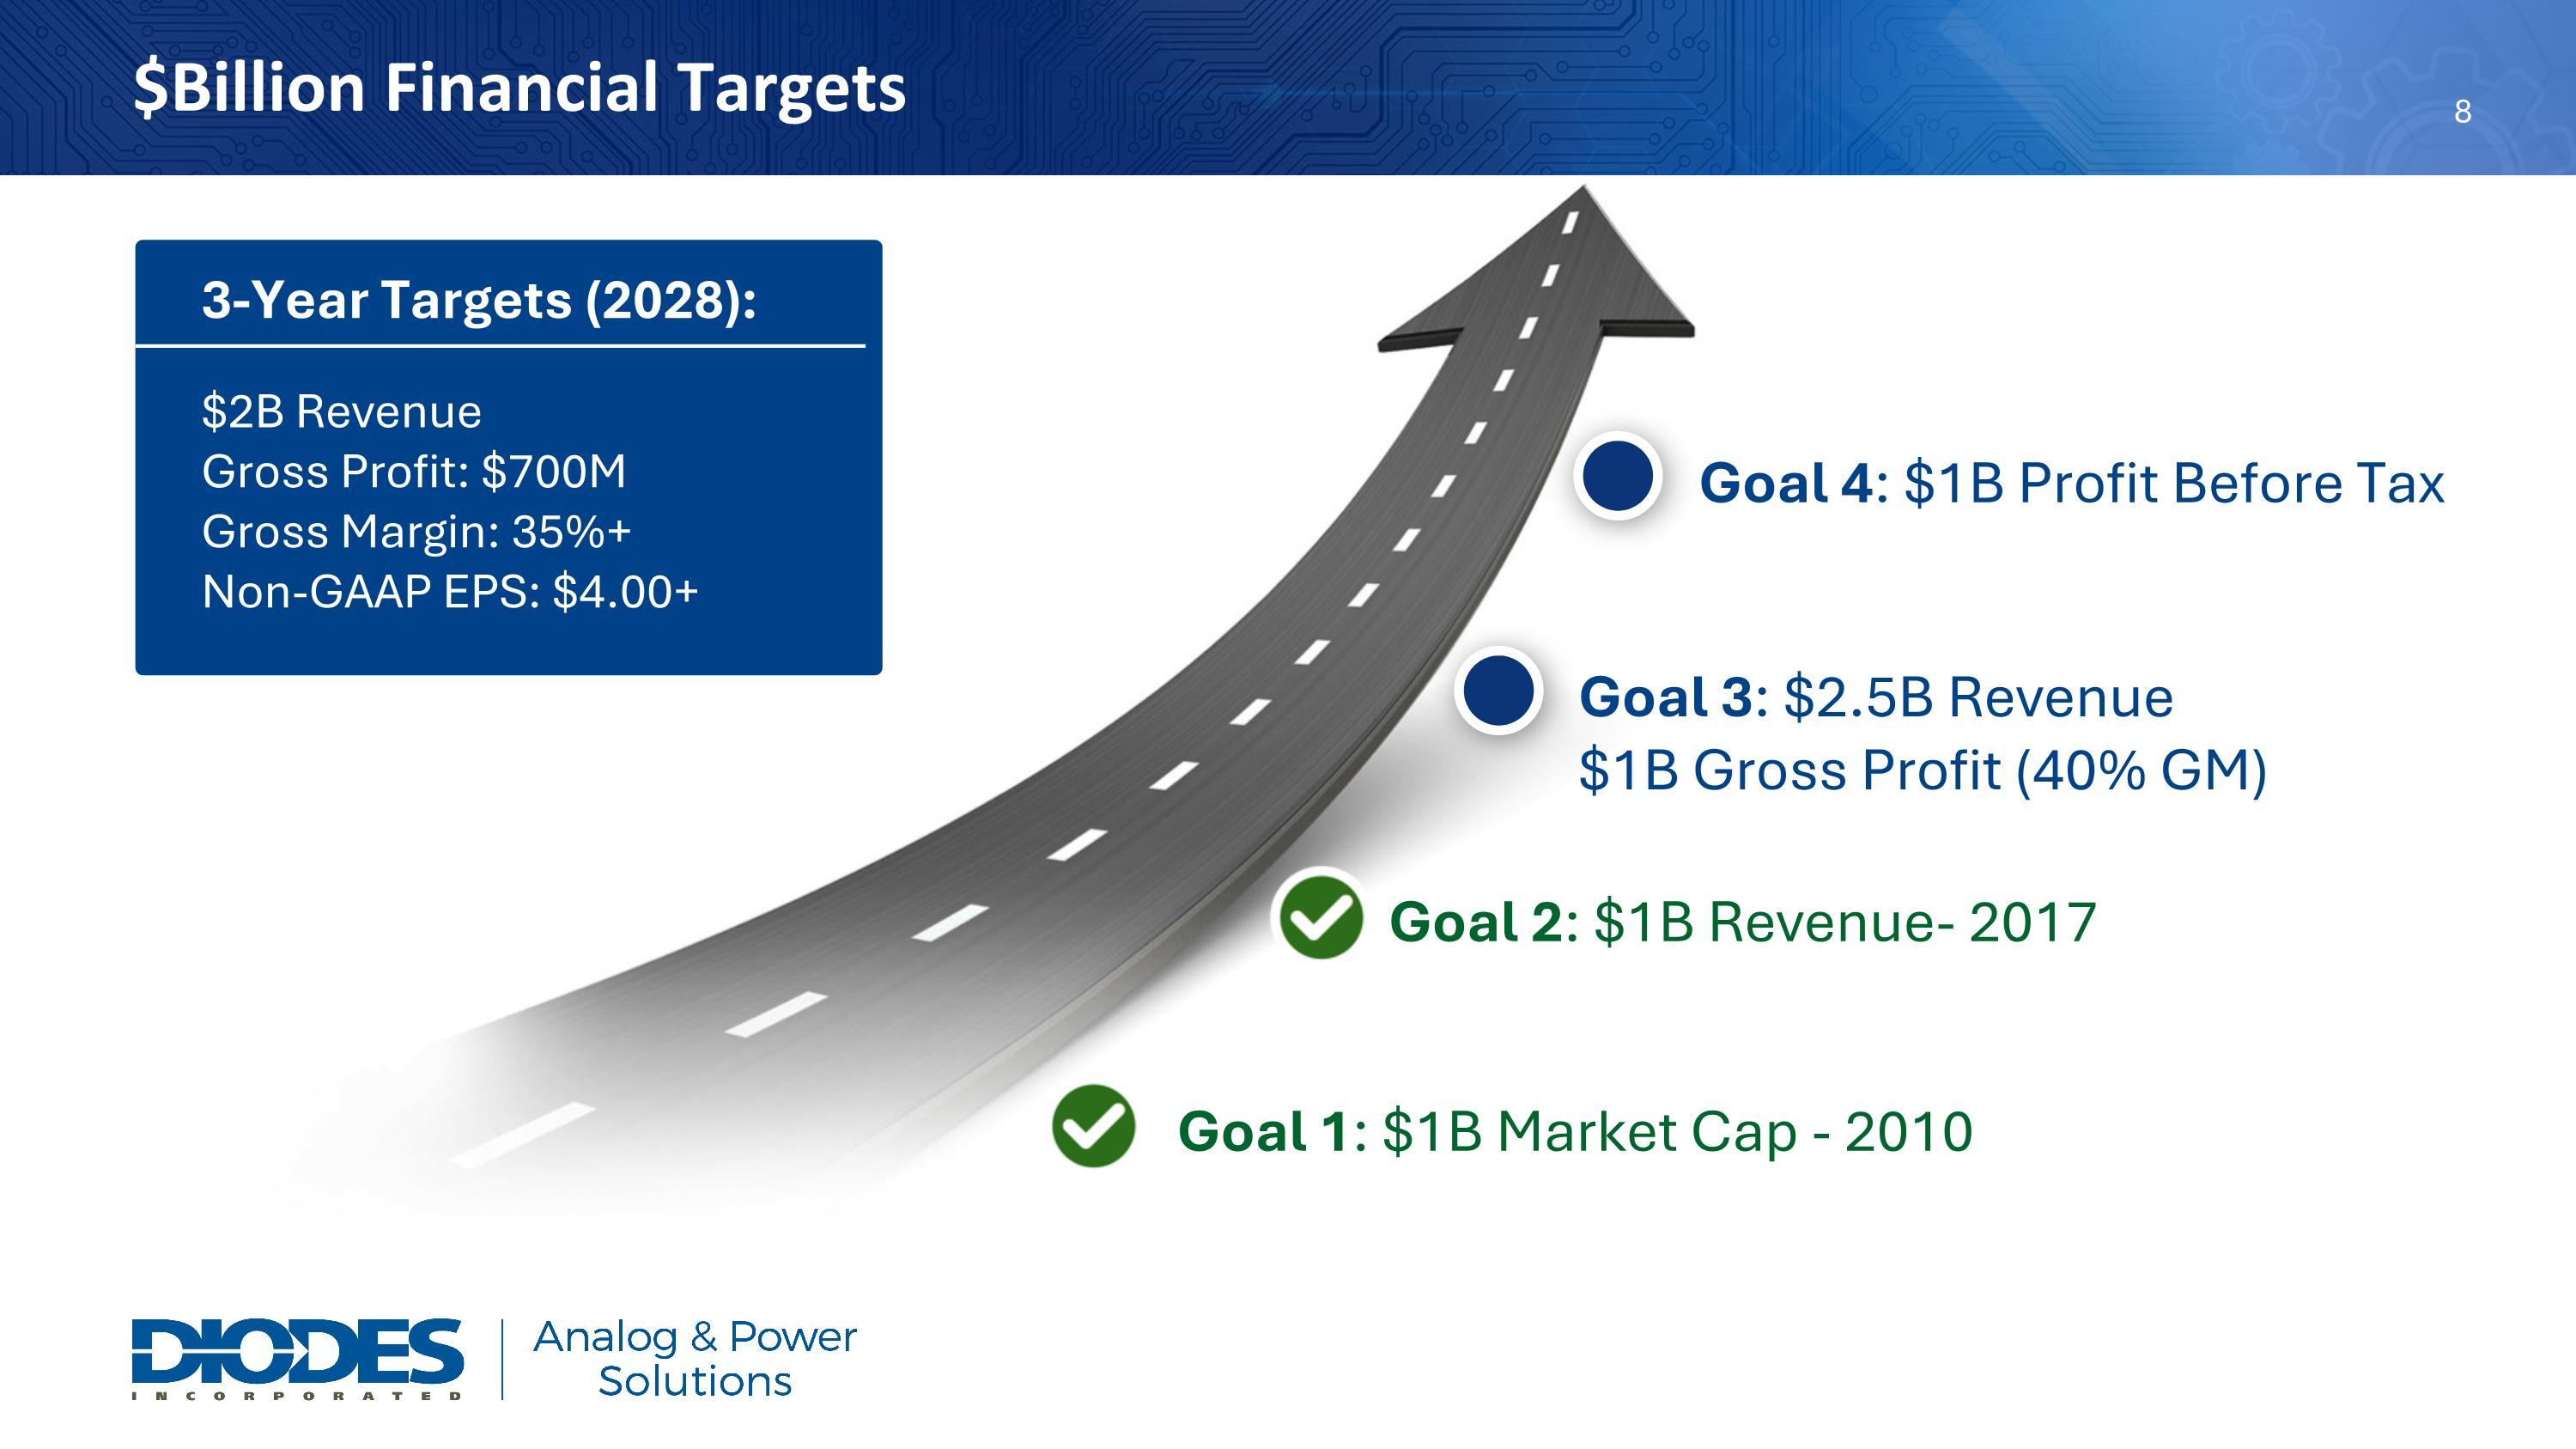
“As we look to the third quarter, we expect to extend our accelerating traction with revenue anticipated to increase 30% year-over-year and 14% sequentially at the mid-point. We also expect to deliver another 190-basis point sequential improvement in gross margin as our utilization continues to improve, combined with a 2.8 times year-over-year improvement in non-GAAP earnings. These expected results drive us closer toward our 3-year financial goals of $2 billion in annual revenue and over $4.00 in non-GAAP EPS.”


Second Quarter 2026

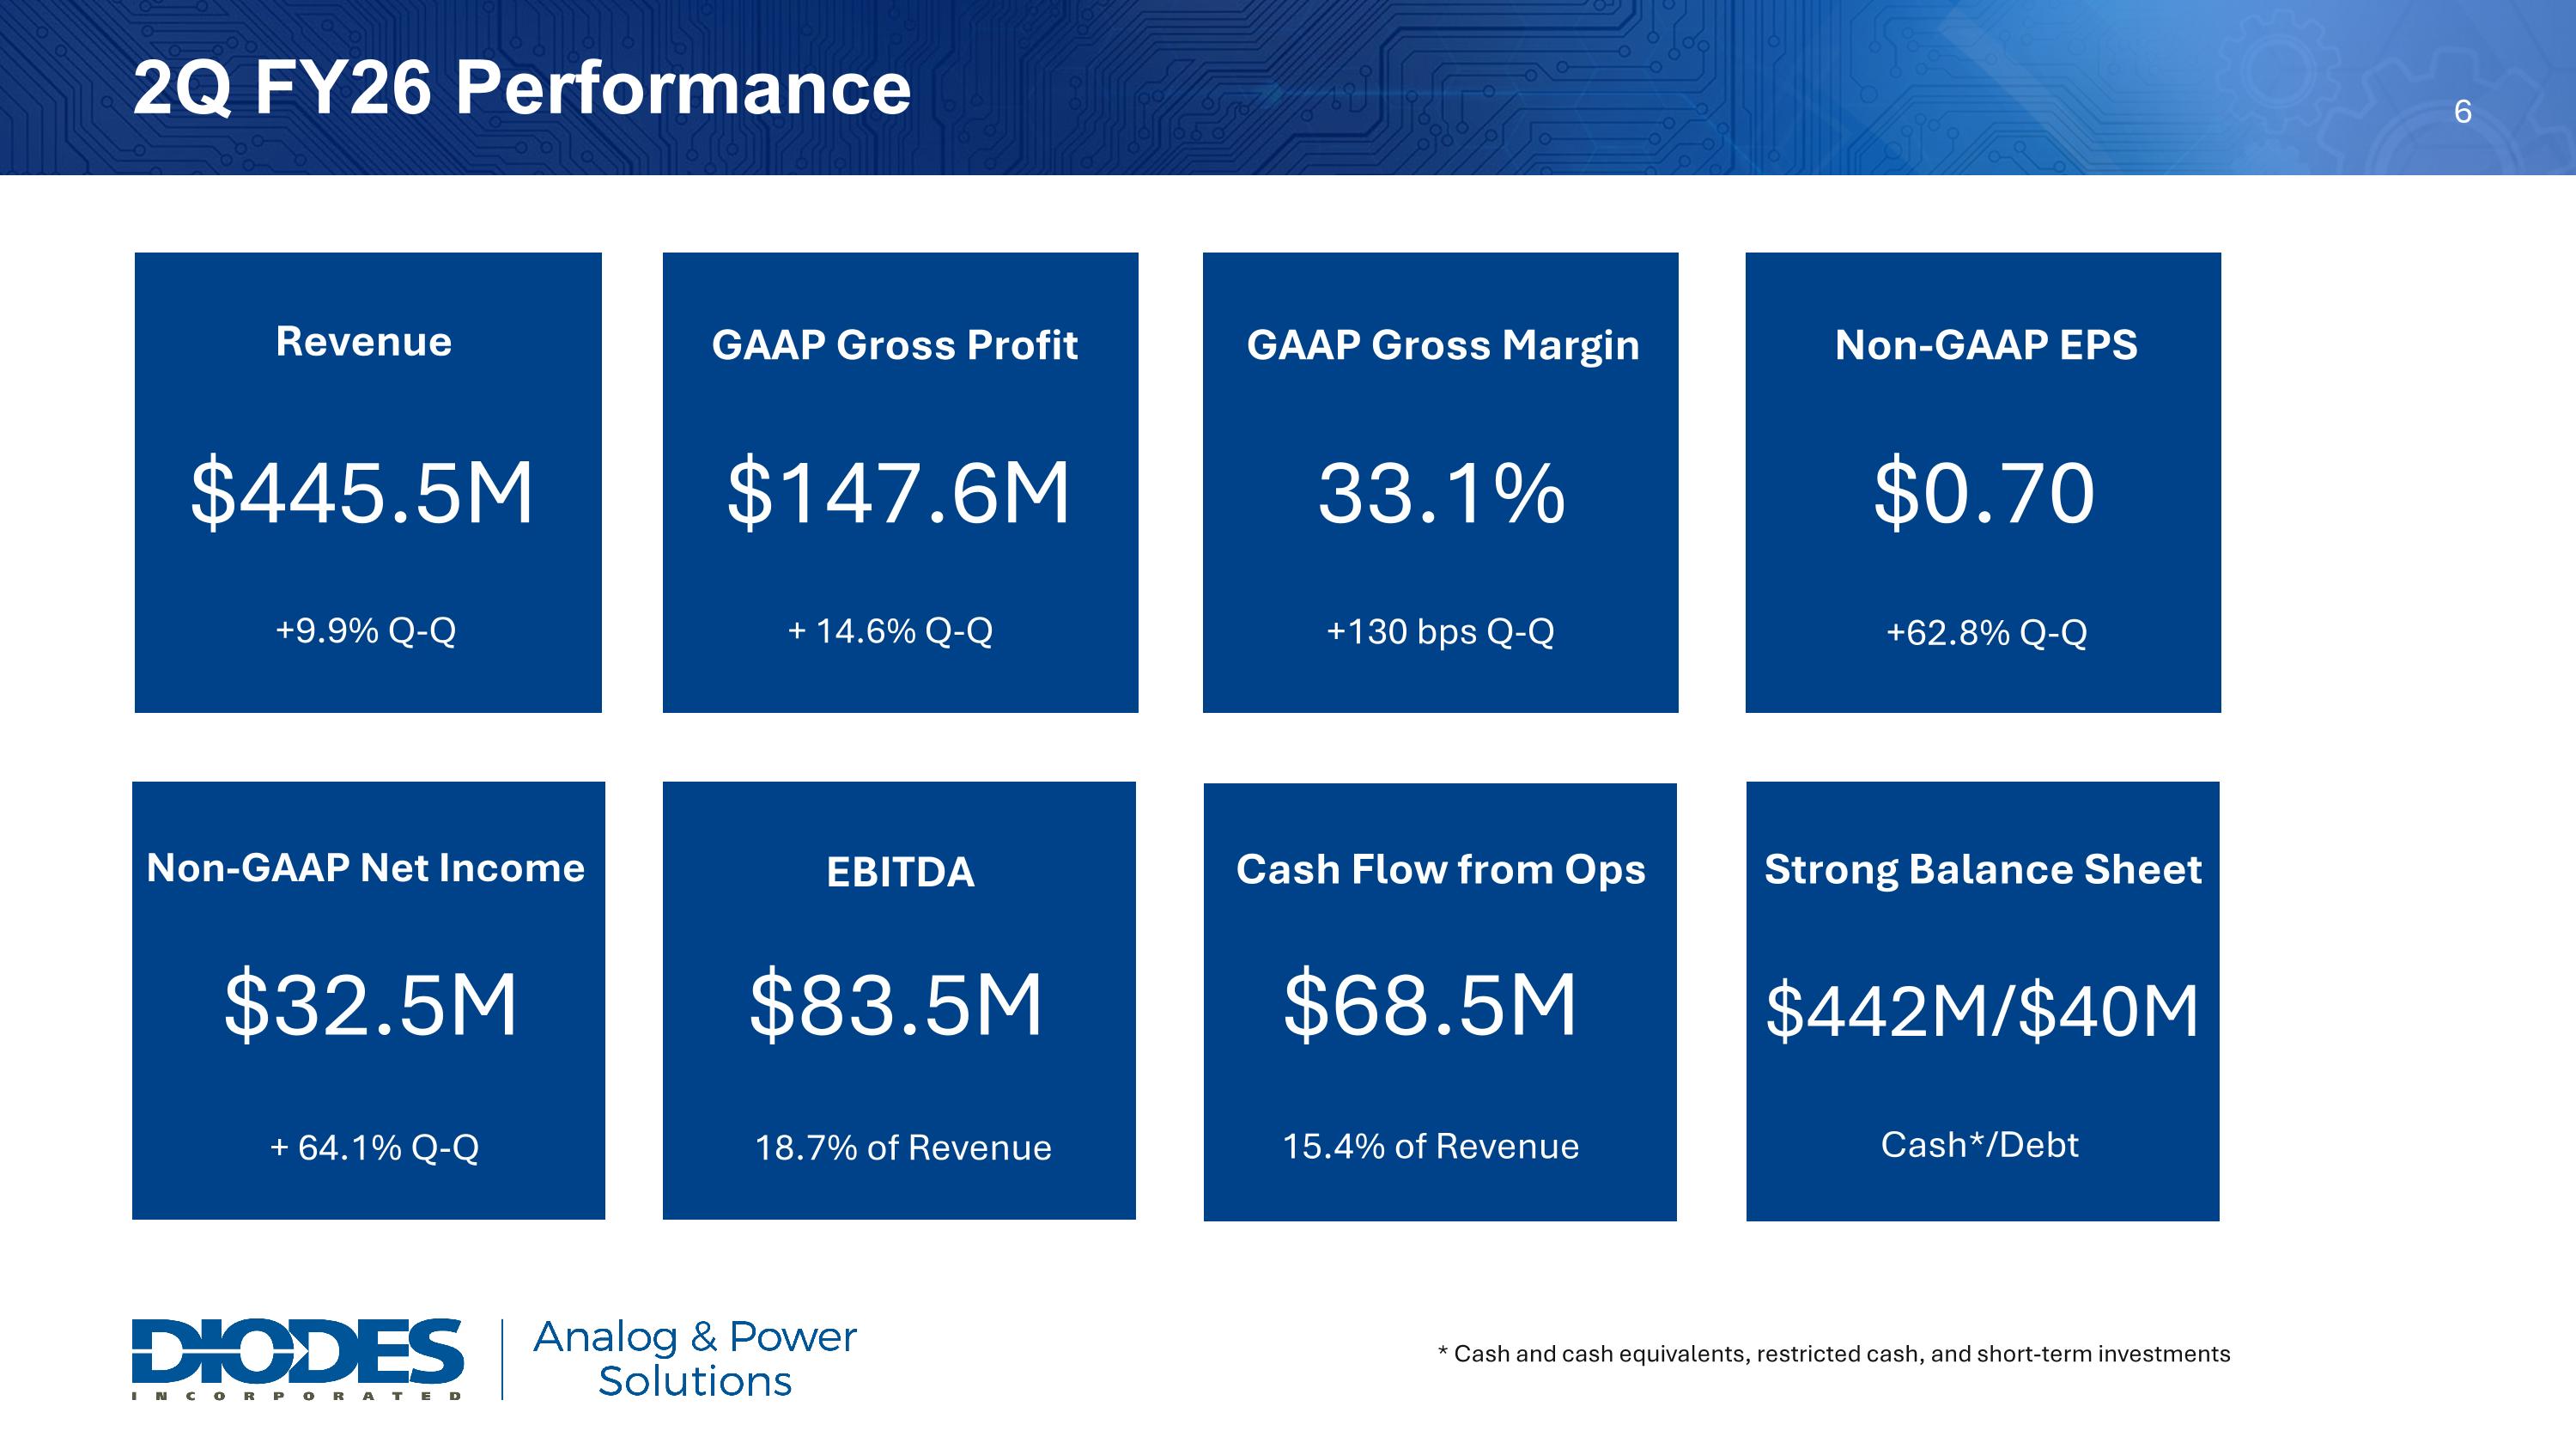
Revenue for second quarter 2026 was $445.5 million, compared to $366.2 million in the second quarter 2025 and $405.5 million in the prior quarter.


GAAP gross profit for the second quarter 2026 was $147.6 million, or 33.1 percent of revenue, compared to $115.3 million, or 31.5 percent of revenue, in the second quarter 2025 and $128.8 million, or 31.8 percent of revenue, in the prior quarter.


GAAP operating expenses for second quarter 2026 were $114.3 million, or 25.6 percent of revenue, and on a non-GAAP basis were $108.6 million, or 24.4 percent of revenue, which excludes $3.9 million acquisition-related intangible asset cost, $1.5 million of board/officer retirement expense and $0.3 million of acquisition-related costs. GAAP operating expenses in the second quarter 2025 were $105.9 million, or 28.9 percent of revenue and $109.0 million, or 26.9 percent of revenue, in the first quarter 2026.


Second quarter 2026 GAAP net income was $46.6 million, or $1.00 per diluted share, compared to GAAP net income in the second quarter 2025 of $46.1 million, or $0.99 per diluted share, and GAAP net income in the prior quarter of $15.0 million, or $0.32 per diluted share.


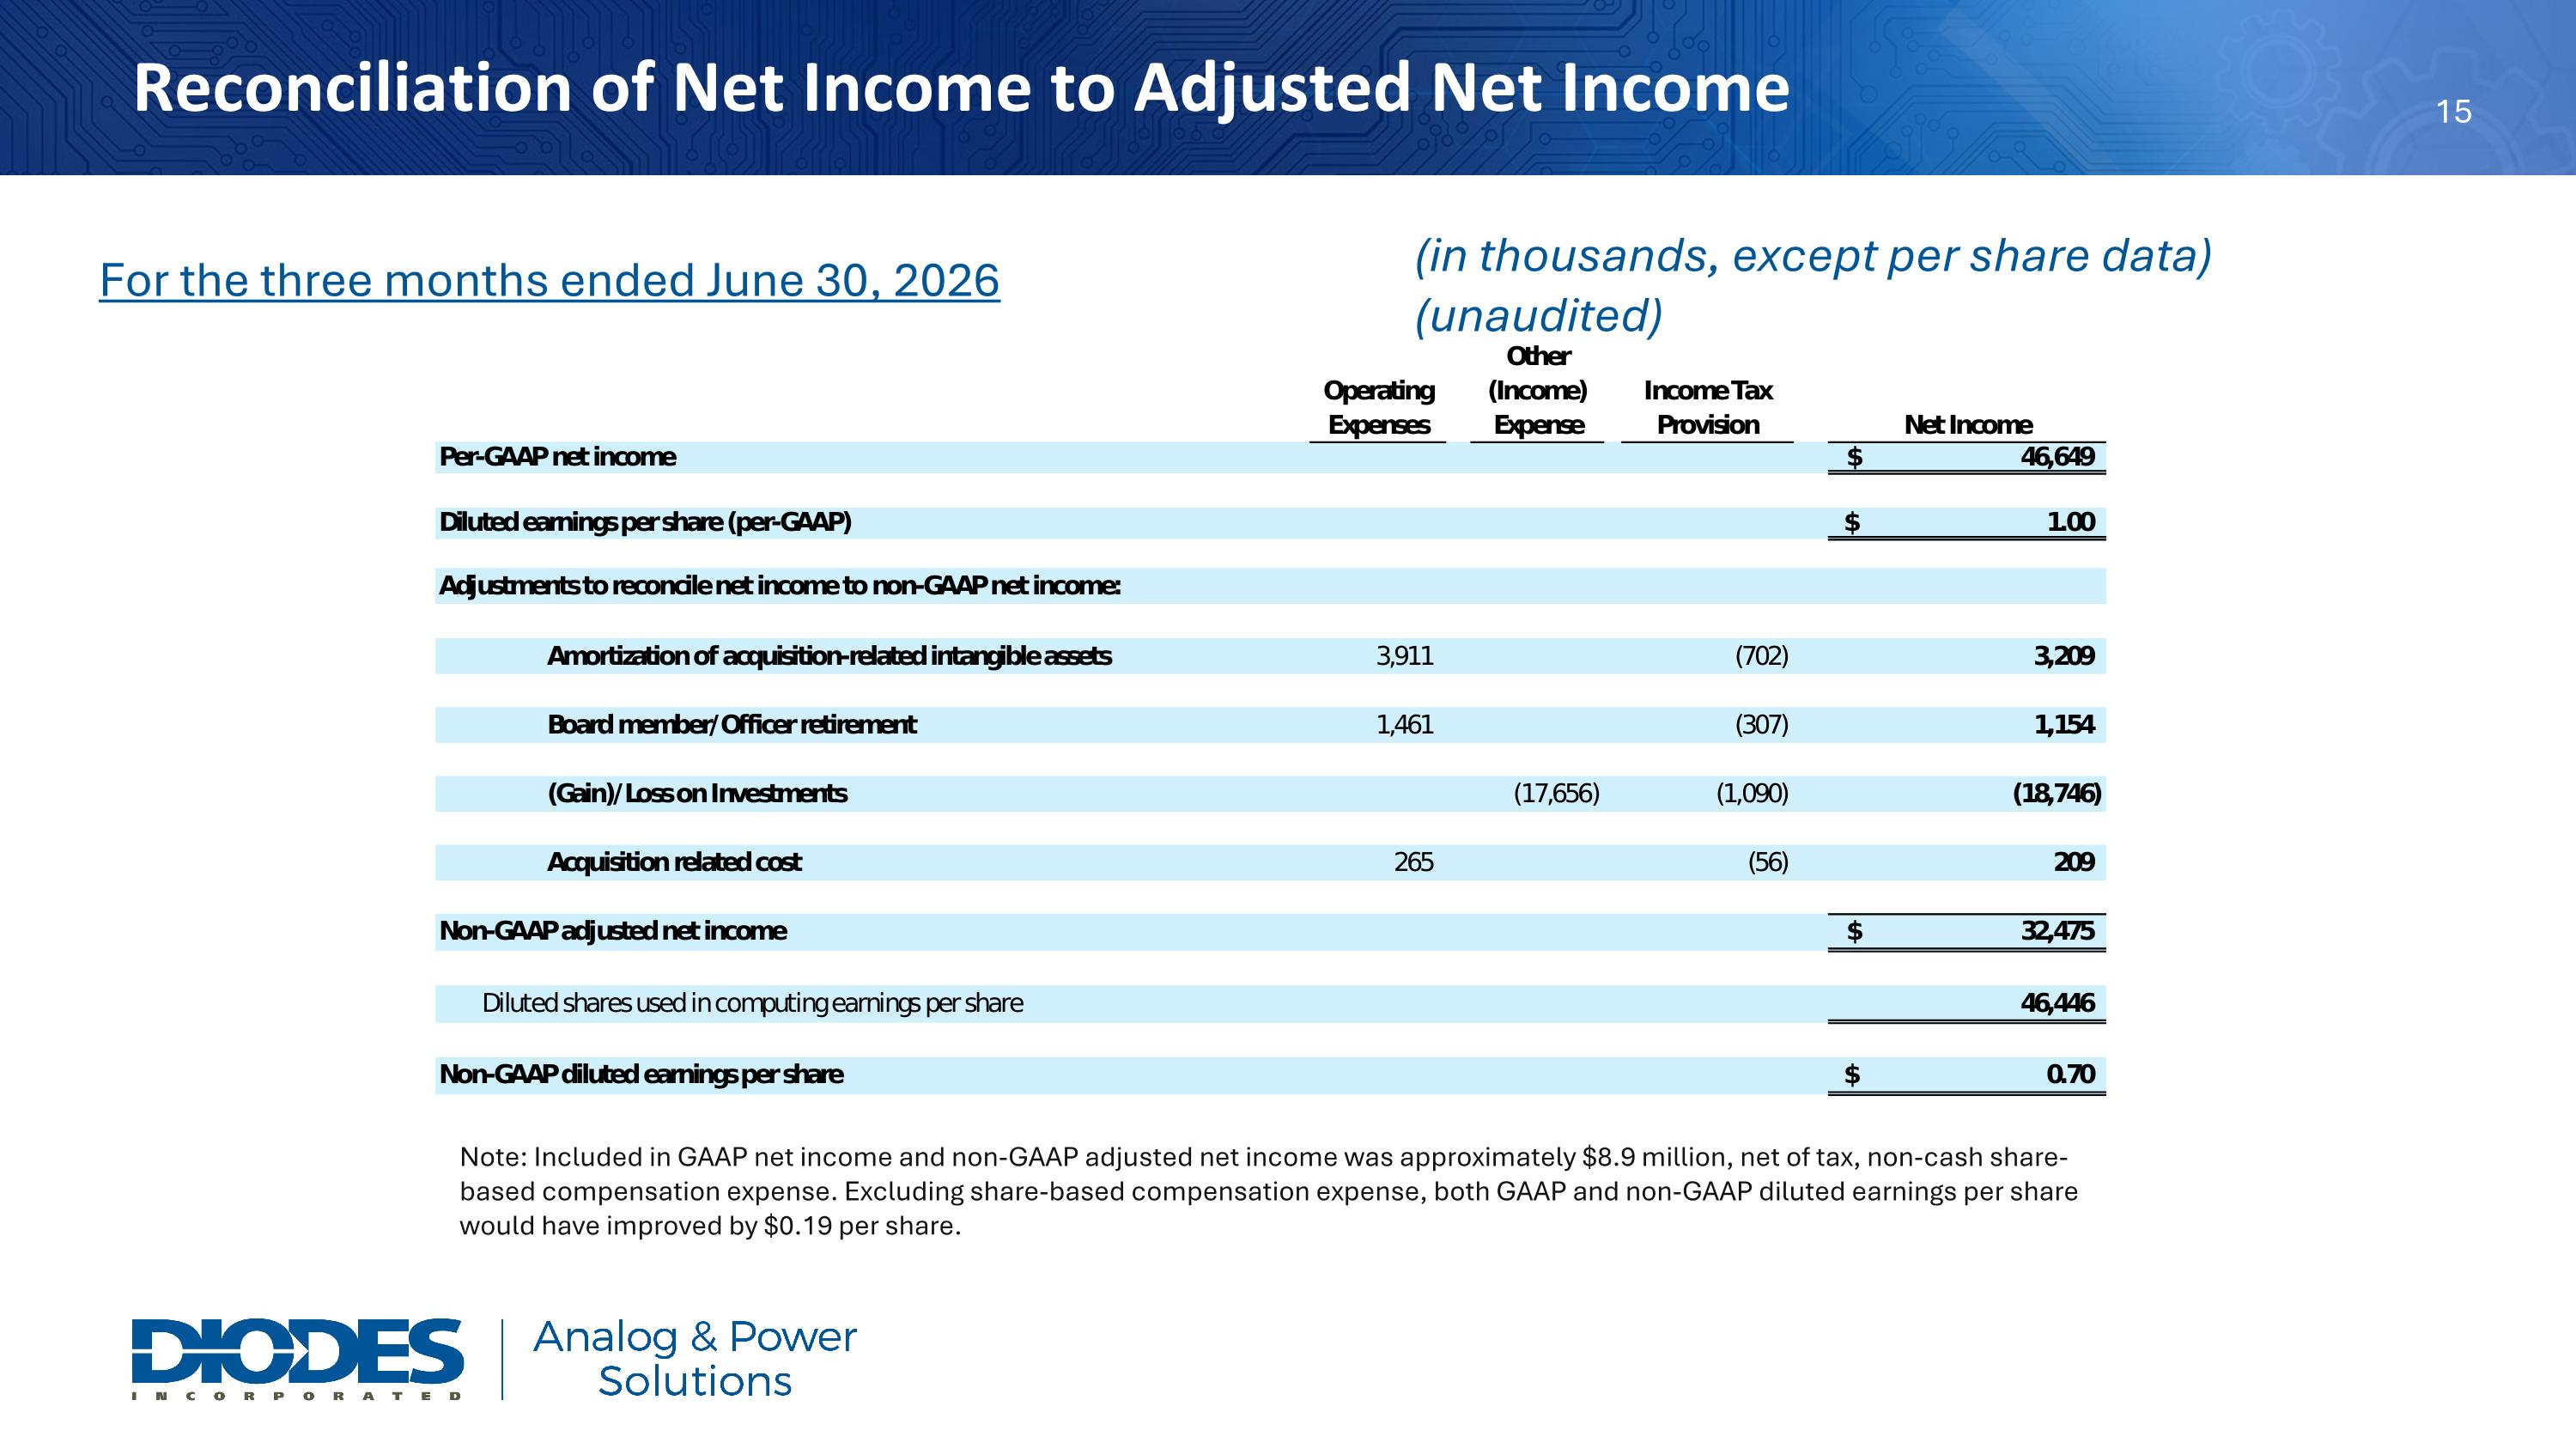
Second quarter 2026 non-GAAP adjusted net income was $32.5 million, or $0.70 per diluted share, which excluded, net of tax, an $18.7 million gain on investments, $3.2 million of acquisition-related intangible asset amortization cost, $1.2 million of board/officer retirement expense, and $0.2 million of acquisition-related costs. This compares to non-GAAP adjusted net income of $15.0 million, or $0.32 per diluted share, in the second quarter 2025 and $19.8 million, or $0.43 per diluted share, in the prior quarter.


The following is an unaudited summary reconciliation of GAAP net income to non-GAAP adjusted net income and per share data, net of tax (in thousands, except per share data):

Note: Throughout this release, we refer to “net income/loss attributable to common stockholders” as “net income/loss.”


Three Months Ended


June 30, 2026


Per-GAAP net income


$

46,649


Diluted earnings per share (per-GAAP)


$

1.00


Adjustments to reconcile net income to non-GAAP net income:


Amortization of acquisition-related intangible assets


3,209


Board member/Officer retirement


1,154


(Gain)/Loss on Investments


(18,746

)


Acquisition related cost


209


Non-GAAP adjusted net income


$

32,475


Non-GAAP diluted earnings per share


$

0.70


(See the reconciliation tables of GAAP net income to non-GAAP adjusted net income near the end of this release for further details.)


Included in second quarter 2026 GAAP and non-GAAP adjusted net income was approximately $8.9 million, net of tax, non-cash share-based compensation expense. Excluding share-based compensation expense, GAAP earnings per share (“EPS”) and non-GAAP adjusted EPS would have increased by $0.19 per share for the second quarter 2026, compared to $0.10 for the second quarter 2025 and $0.13 per share in the prior quarter.


EBITDA (a non-GAAP measure), which represents earnings before net interest expense, income tax, depreciation and amortization, in the second quarter 2026 was $83.5 million, or 18.7 percent of revenue, compared to $84.5 million, or 23.1 percent of revenue, in the second quarter 2025 and $49.4 million, or 12.2 percent of revenue, in the prior quarter. For a reconciliation of GAAP net income to EBITDA, see the table near the end of this release for further details.


For the second quarter 2026, net cash provided by operating activities was $68.5 million. Net cash flow was positive $32.9 million, which includes $10.0 million for the stock buyback program. Free cash flow (a non-GAAP measure) was $34.8 million, which includes $33.6 million of capital expenditures.


Balance Sheet

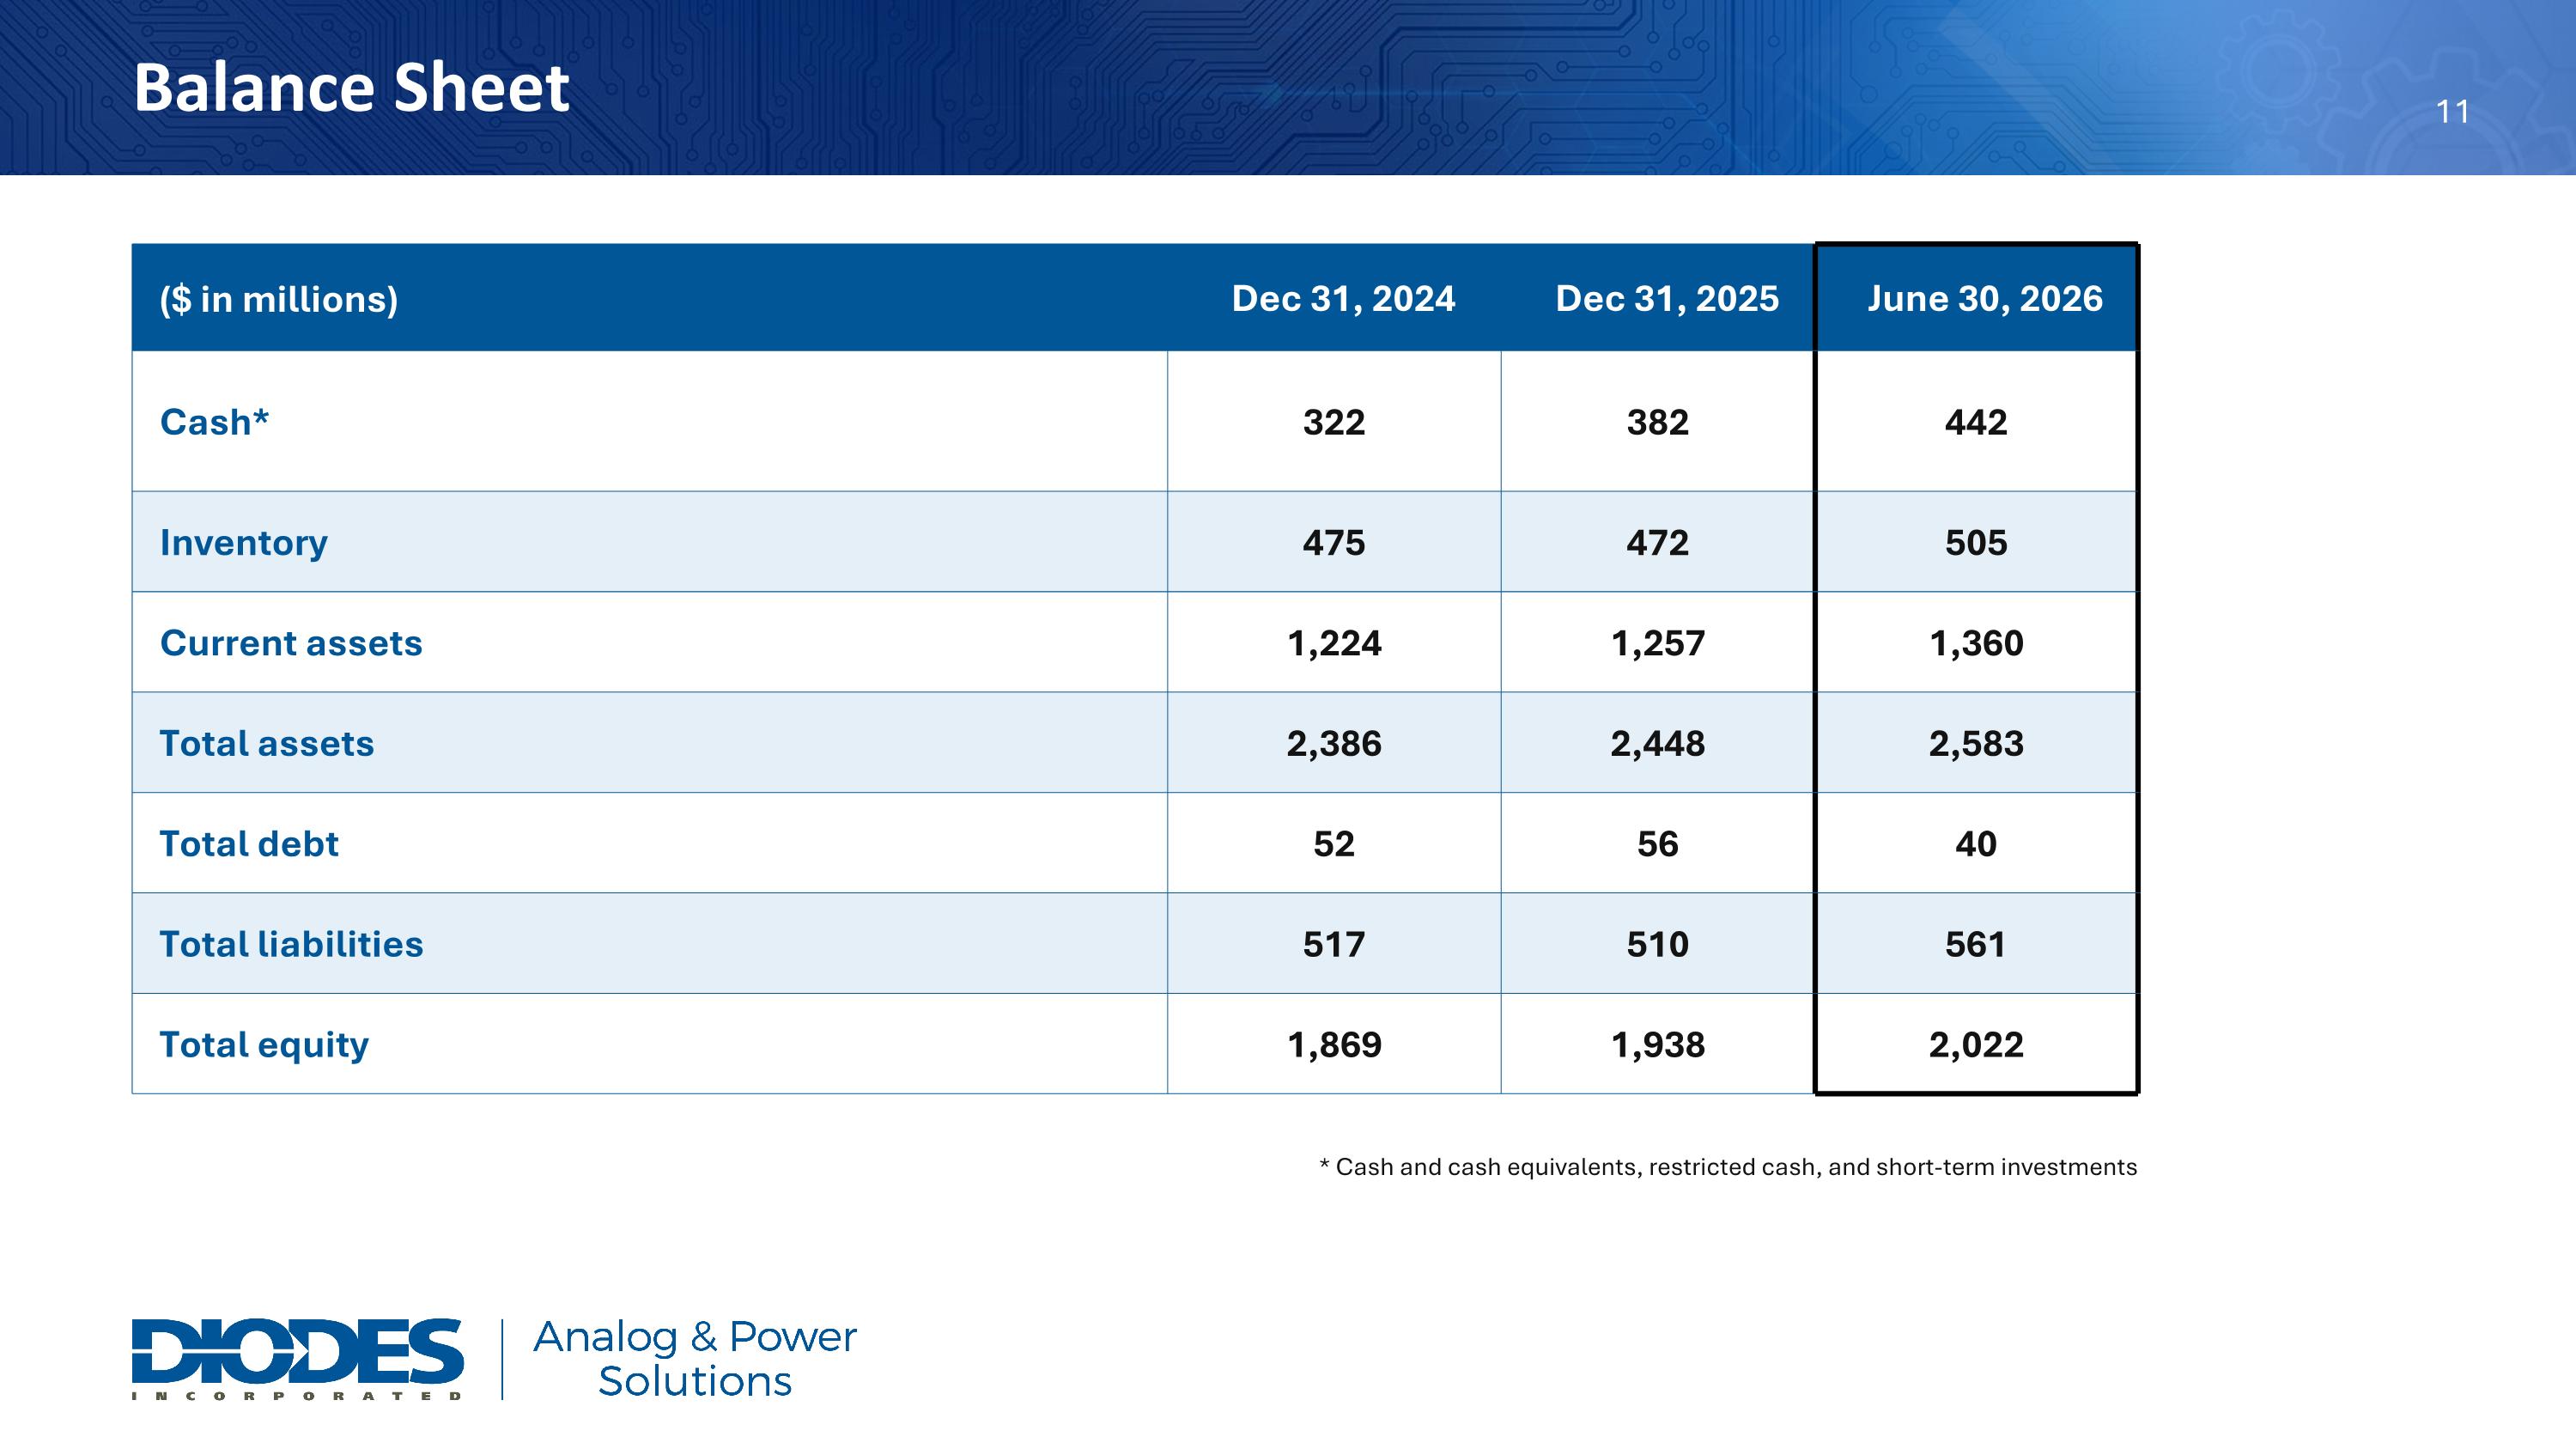
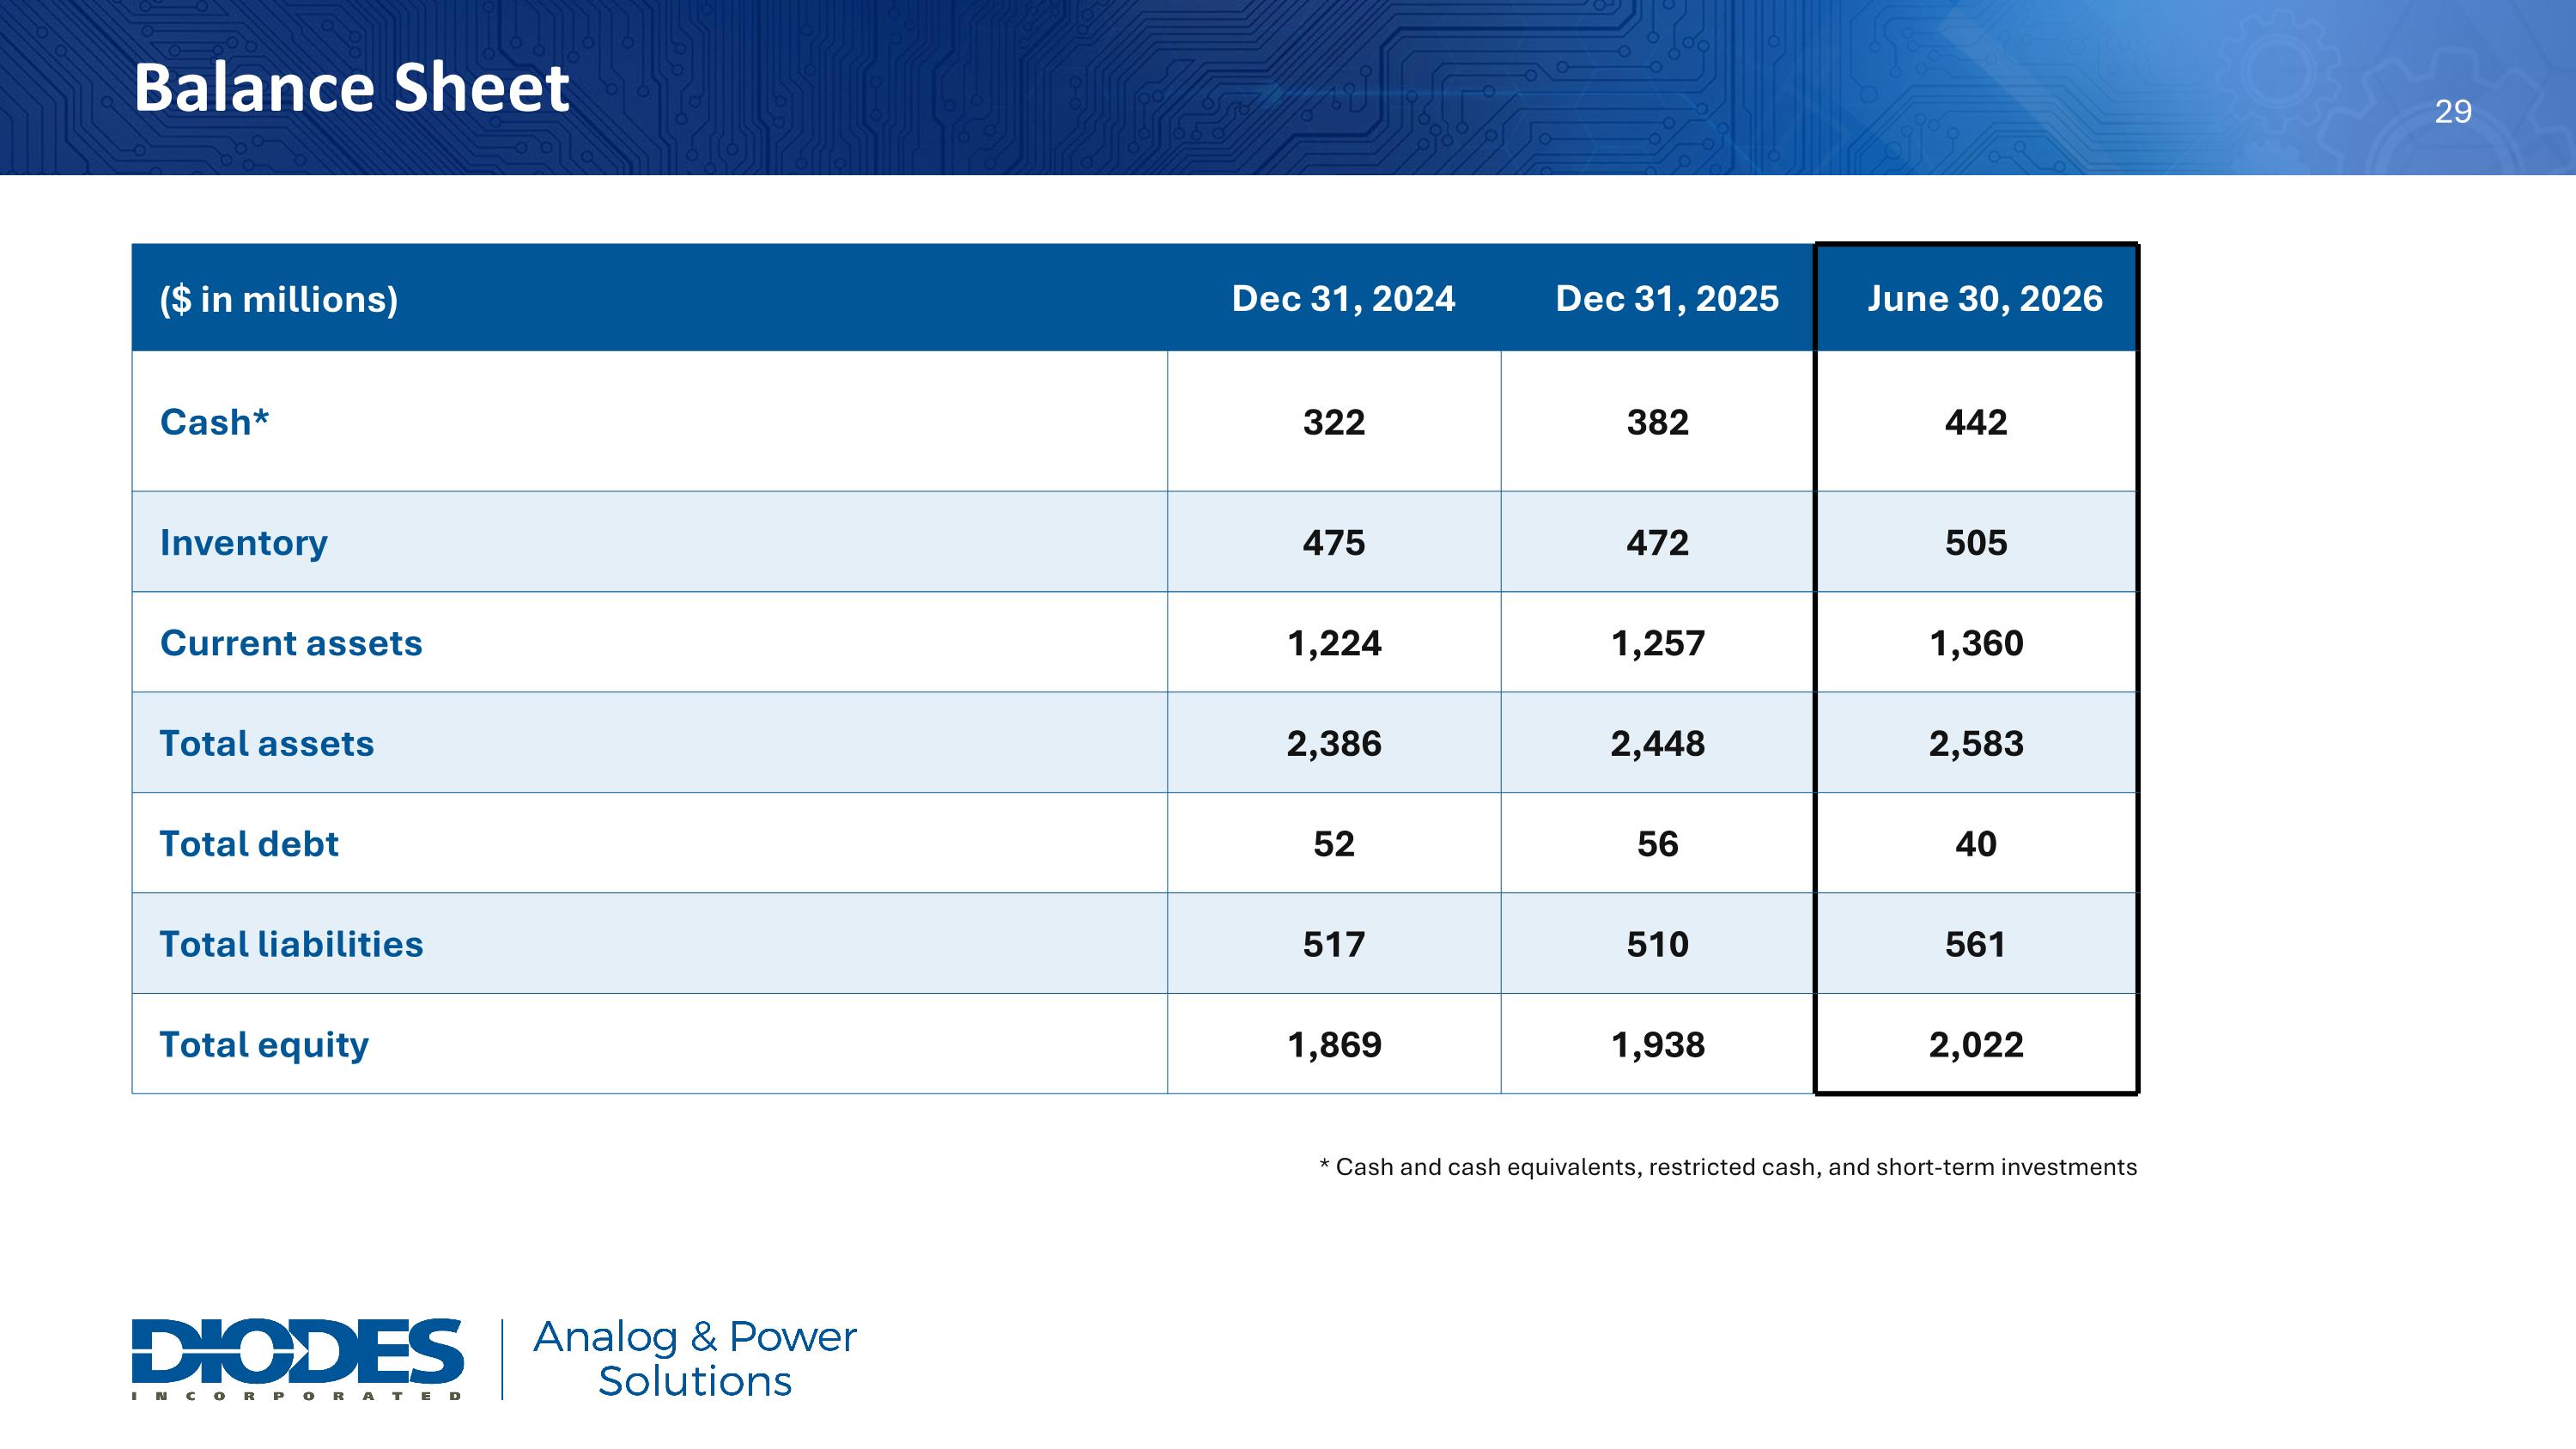
As of June 30, 2026, the Company had approximately $442 million in cash and cash equivalents, restricted cash, and short-term investments. Total debt (including long-term and short-term) amounted to approximately $40 million and working capital was approximately $931 million.


The results announced today are preliminary and unaudited, as they are subject to the Company finalizing its closing procedures and completion of the quarterly review by its independent registered public accounting firm. As such, these results are subject to revision until the Company files its Form 10-Q for the quarter ending June 30, 2026.


Business Outlook

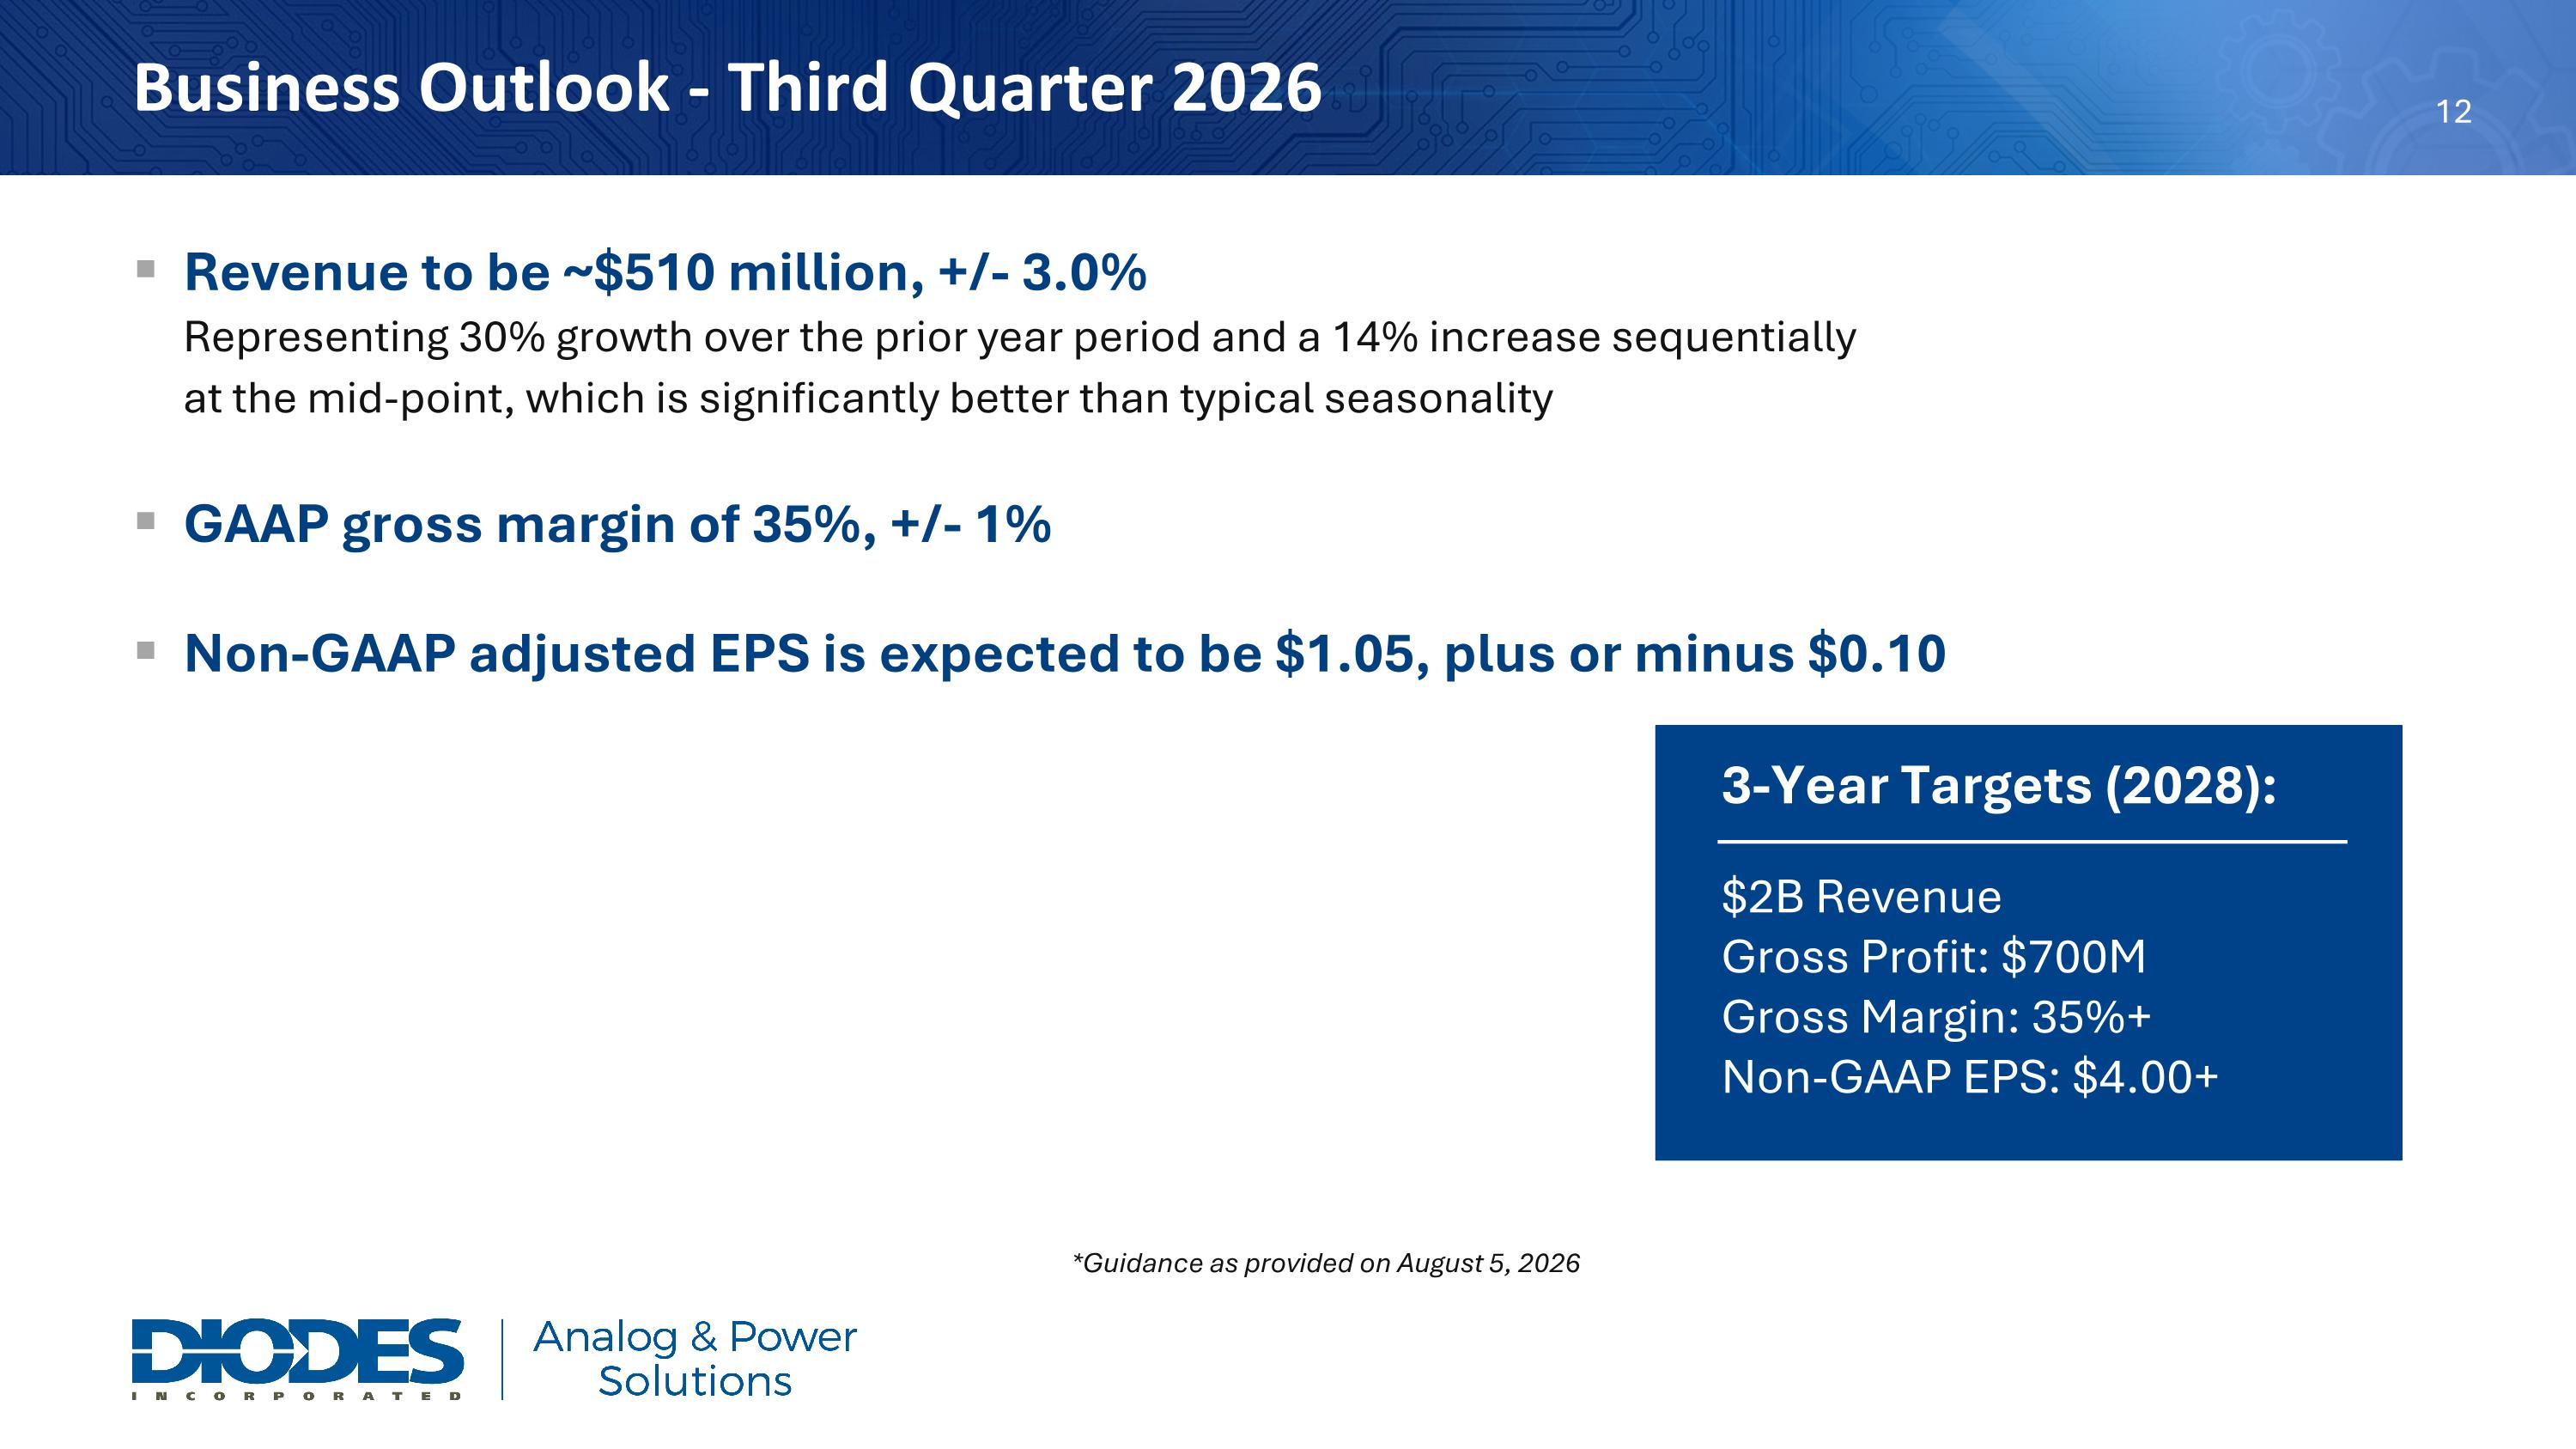
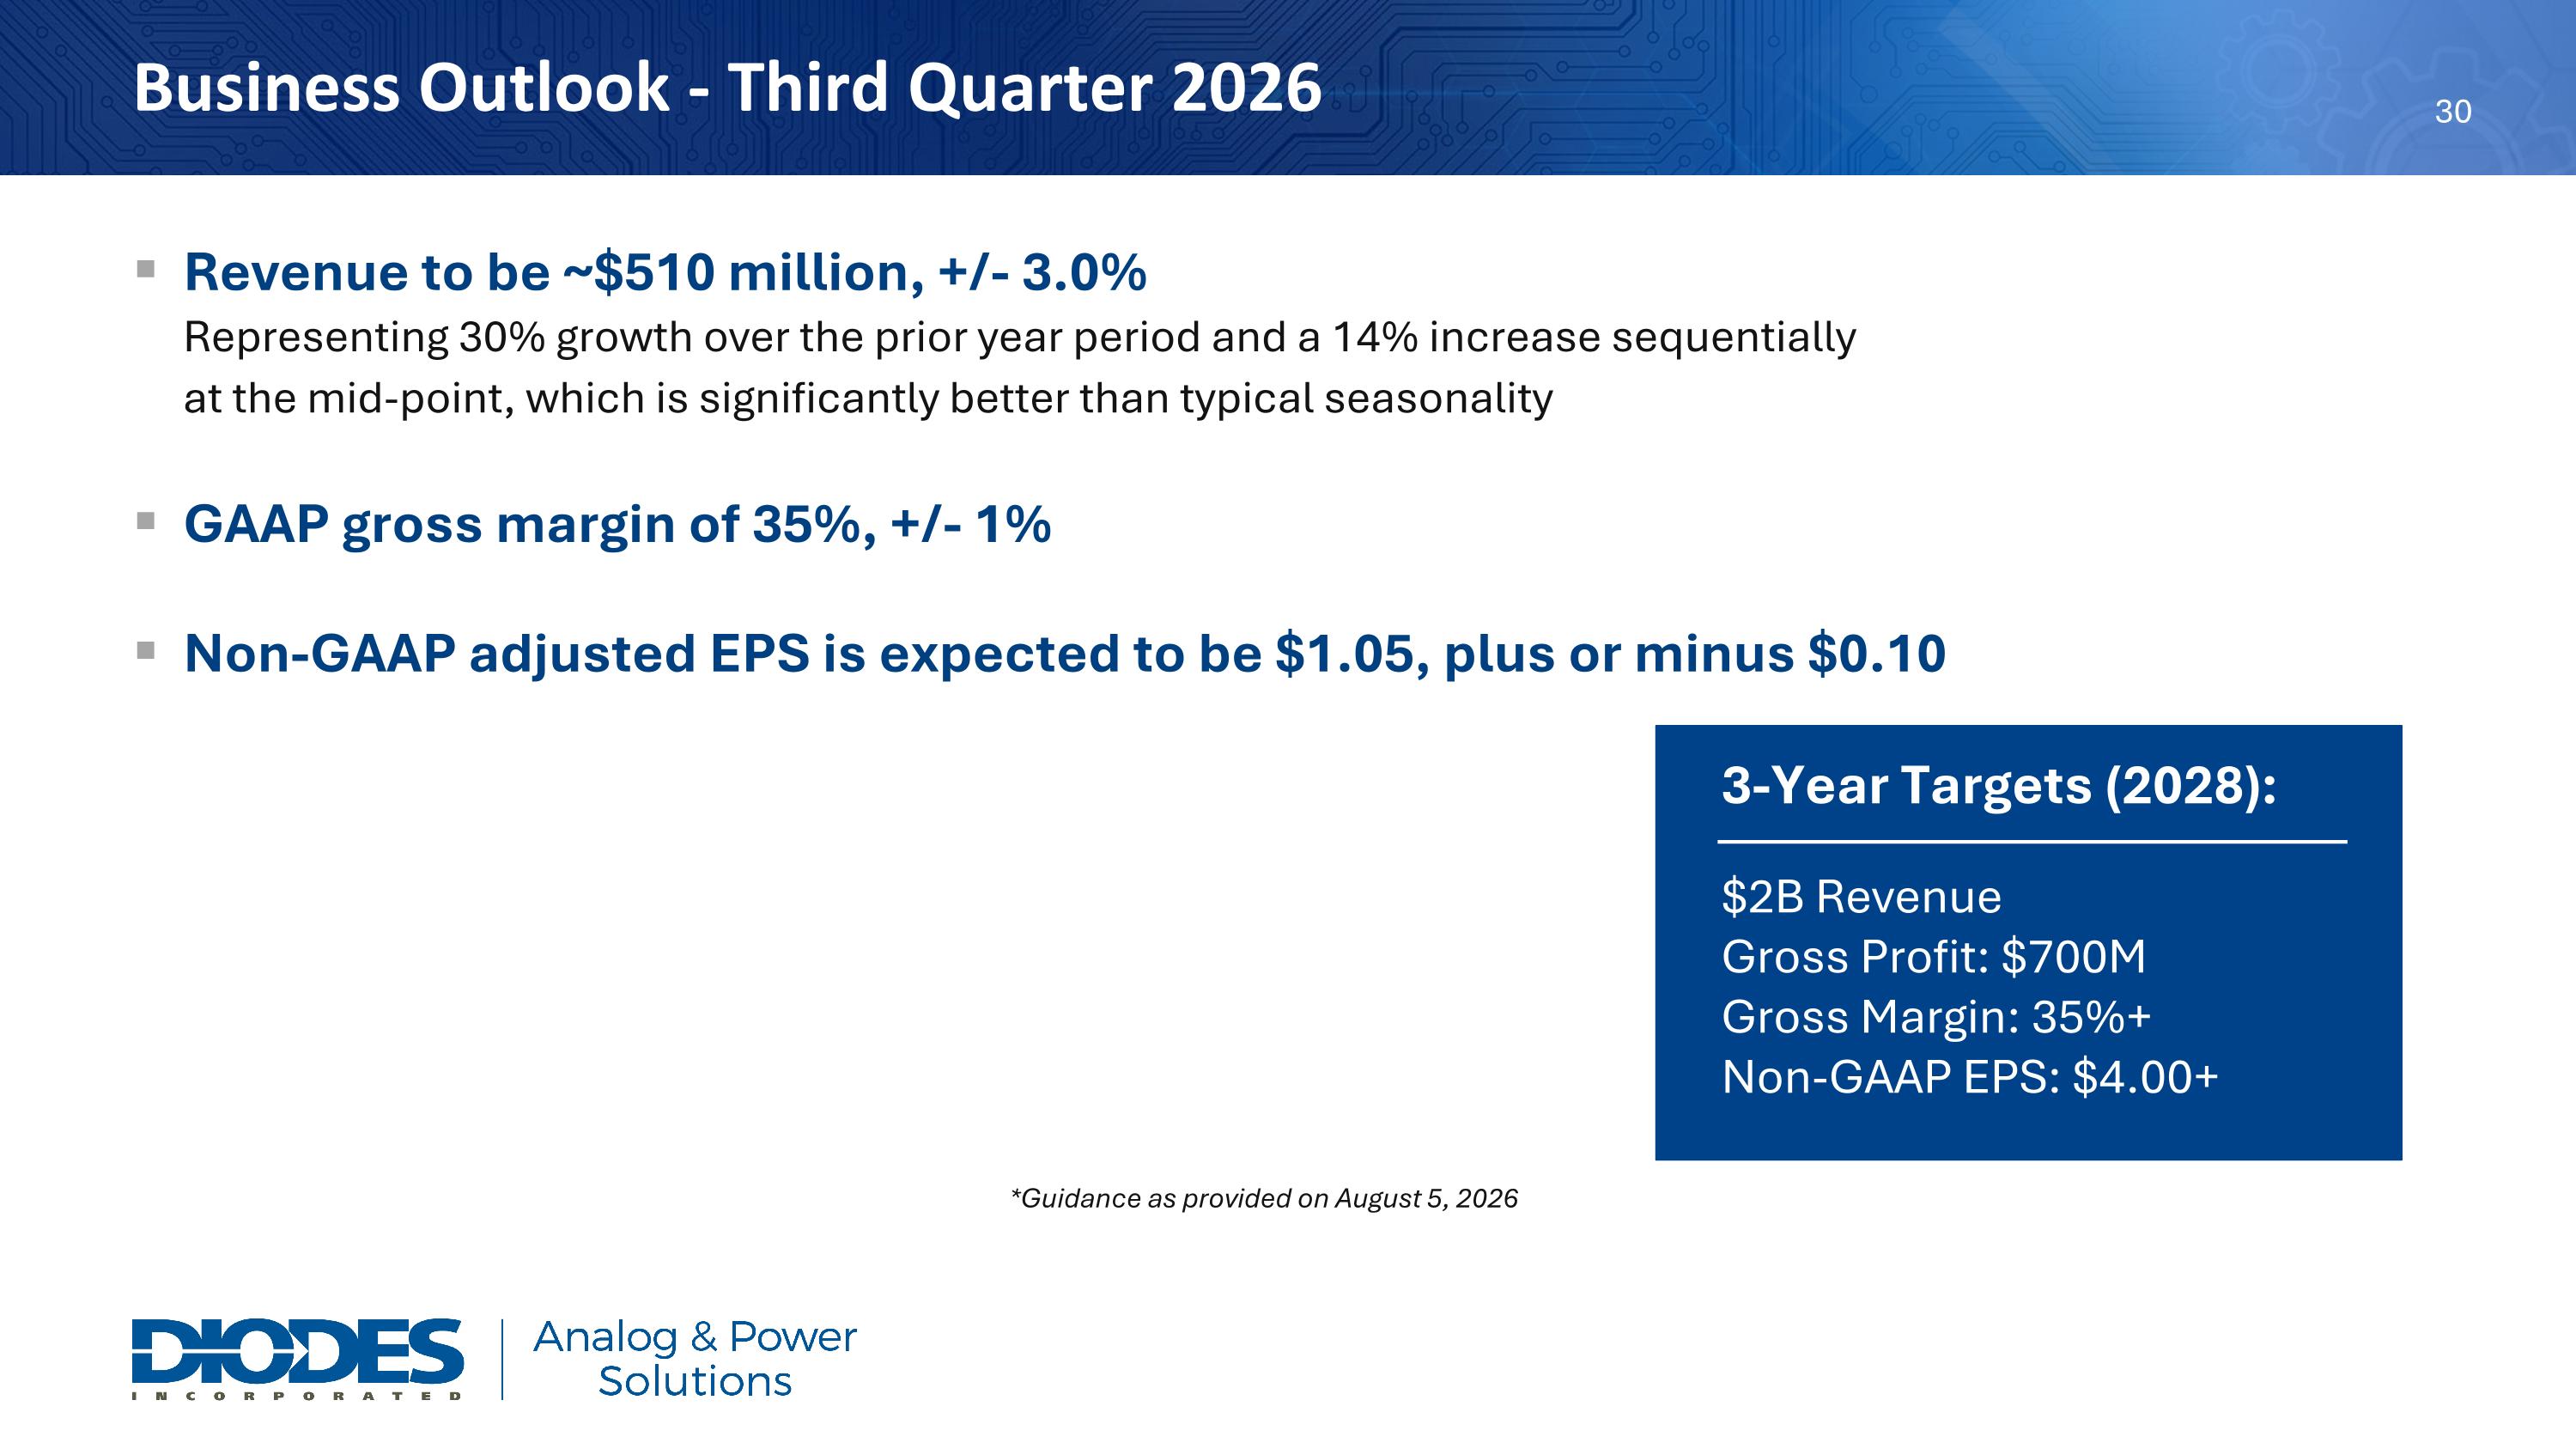
Gary Yu further commented, “For the third quarter of 2026, we expect revenue to increase to approximately $510 million, plus or minus 3 percent, representing a 30 percent increase year-over-year and a 14 percent increase sequentially at the mid-point. GAAP gross margin is expected to expand to 35.0 percent, plus or minus 1 percent. Non-GAAP adjusted EPS is expected to be $1.05, plus or minus $0.10.”


A reconciliation of our forward-looking non-GAAP EPS to the most directly comparable GAAP measures is not provided because such items cannot be reasonably calculated without unreasonable efforts due to the unpredictability of the amounts and timing of events affecting the items we exclude, including acquisition-related intangible asset costs, board member/officer retirements, acquisition-related costs, restructuring costs, gain/loss on investment, non-cash mark-to-market investment adjustments, impairment of equity investment, and other charges.


Conference Call

Diodes will host a conference call on Wednesday August 5, 2026 at 4:00 p.m. Central Time (5:00 p.m. Eastern Time) to discuss its second quarter financial results. Investors and analysts may join the conference call by dialing 1-800-715-9871 (international callers should dial +1-646-307-1963) and then enter passcode 5168100. A telephone replay of the call will be made available approximately two hours after the call and will remain available until August 12, 2026 at midnight Central Time. The replay number is 1-855-669-9658 with an access code of 1081985 followed by the # key. International callers should dial +1-412-317-0088 and enter the same access code at the prompt followed by the # key.

Additionally, this conference call will be broadcast live over the Internet and can be accessed by all interested parties on the Investor Relations section of the Company’s website. To listen to the live call, please go to the investors’ section of Diodes’ website and click on the conference call link at least 15 minutes prior to the start of the call to register, download and install any necessary audio software. For those unable to participate during the live broadcast, a replay will be available shortly after the call on Diodes' website for approximately 90 days.

About Diodes Incorporated

Diodes Incorporated (Nasdaq: DIOD), delivers high-quality semiconductor products to the world’s leading companies in the automotive, industrial, computing, consumer electronics, and communications markets. We leverage our expanded product portfolio of analog and power solutions combined with a flexible hybrid manufacturing model to meet customers’ needs. Our broad range of application-specific products, delivered through a total solutions sales approach and supported by global operations including engineering, testing, manufacturing, and customer service, enable us to be a premier provider for high-growth markets. For more information, visit www.diodes.com.


Safe Harbor Statement Under the Private Securities Litigation Reform Act of 1995: Any statements set forth above that are not historical facts are forward-looking statements that involve risks and uncertainties that could cause actual results to differ materially from those in the forward-looking statements. Such statements include statements containing forward-looking words such as “expect,” “anticipate,” “aim,” “estimate,” and variations thereof, including without limitation statements, whether direct or implied, regarding expectations of that for the third quarter of 2026, we expect revenue to be approximately $510 million plus or minus 3 percent; we expect GAAP gross margin to be 35.0 percent, plus or minus 1 percent; and non-GAAP adjusted EPS to be $1.05, plus or minus $0.10. Potential risks and uncertainties include, but are not limited to, such factors as: the risk that such expectations may not be met; the risk that the expected benefits of acquisitions may not be realized or that integration of acquired businesses may not continue as rapidly as we anticipate; the risk that we may not be able to maintain our current growth strategy or continue to maintain our current performance, costs, and loadings in our manufacturing facilities; the risk that we may not be able to increase our automotive, industrial, or other revenue and market share; risks of domestic and foreign operations, including excessive operating costs, labor shortages, higher tax rates, and our joint venture prospects; the risks of cyclical downturns in the semiconductor industry and of changes in end-market demand or product mix that may affect gross margin or render inventory obsolete; the risk of unfavorable currency exchange rates; the risk that our future outlook or guidance may be incorrect; the risks of global economic weakness or instability in global financial markets; the risks of trade restrictions, tariffs, or embargoes; the risk of breaches of our information technology systems; and other


information, including the “Risk Factors” detailed from time to time in Diodes’ filings with the United States Securities and Exchange Commission.


The Diodes logo is a registered trademark of Diodes Incorporated in the United States and other countries. © 2026 Diodes Incorporated. All Rights Reserved.


Company Contact:


Investor Relations Contact:

Diodes Incorporated


Shelton Group

Gurmeet Dhaliwal


Leanne Sievers

Vice President, Corporate Marketing & IR


President, Investor Relations

P: 408-232-9003


P: 949-224-3874

E: Gurmeet_Dhaliwal@diodes.com


E: lsievers@sheltongroup.com


DIODES INCORPORATED AND SUBSIDIARIES

CONSOLIDATED CONDENSED STATEMENTS OF OPERATIONS

(in thousands, except per share data)

(unaudited)


Three Months Ended


Six Months Ended


June 30,


June 30,


2026


2025


2026


2025


Net sales

$

445,529


$

366,212


$

850,996


$

698,325


Cost of goods sold


297,963


250,888


574,638


478,307


Gross profit


147,566


115,324


276,358


220,018


Operating expenses


Selling, general, and administrative


69,782


59,470


134,087


118,169


Research and development


40,651


40,537


81,266


79,164


Amortization of acquisition related intangible assets


3,911


5,839


7,855


11,663


(Gain) loss on disposal of fixed assets


(63

)


19


80


1


Other operating (income) expense


(5

)


70


15


336


Total operating expense


114,276


105,935


223,303


209,333


Income from operations


33,290


9,389


53,055


10,685


Other income (expense)


Interest income


5,548


7,024


10,993


12,837


Interest expense


(334

)


(506

)


(1,016

)


(973

)

Foreign currency (loss), net


(1,017

)


(6,432

)


(4,394

)


(6,615

)

Unrealized gain on investments


20,018


29,645


22,468


25,613


Impairment of equity investments


-


-


(1,249

)


(5,817

)

Gain on disposal of subsidiary


-


13,730


-


13,730


Other income


470


362


561


979


Total other income


24,685


43,823


27,363


39,754


Income before income taxes, equity in net earnings of equity investments, and noncontrolling interest


57,975


53,212


80,418


50,439


Income tax provision


6,847


9,063


10,847


9,083


Equity in net earnings of equity investments


(2,362

)


11


(4,703

)


17


Net income


48,766


44,160


64,868


41,373


Less net income attributable to noncontrolling interest


(2,117

)


1,938


(3,258

)


288


Net income attributable to common stockholders

$

46,649


$

46,098


$

61,610


$

41,661


Earnings per share attributable to common stockholders:


Basic

$

1.02


$

0.99


$

1.34


$

0.90


Diluted

$

1.00


$

0.99


1.33


$

0.90


Number of shares used in earnings per share computation:


Basic


45,921


46,398


45,920


46,385


Diluted


46,446


46,462


46,344


46,452


Note: Throughout this release, we refer to “net income attributable to common stockholders” as “net income.”


DIODES INCORPORATED AND SUBSIDIARIES

RECONCILIATION OF NET INCOME TO ADJUSTED NET INCOME

(in thousands, except per share data)

(unaudited)


For the three months ended June 30, 2026:


Operating Expenses


Other (Income) Expense


Income Tax Provision


Net Income


Per-GAAP net income


$

46,649


Diluted earnings per share (per-GAAP)


$

1.00


Adjustments to reconcile net income to non-GAAP net income:


Amortization of acquisition-related intangible assets


3,911


(702

)


3,209


Board member/Officer retirement


1,461


(307

)


1,154


(Gain)/Loss on Investments


(17,656

)


(1,090

)


(18,746

)


Acquisition related cost


265


(56

)


209


Non-GAAP adjusted net income


$

32,475


Diluted shares used in computing earnings per share


46,446


Non-GAAP diluted earnings per share


$

0.70


Note: Included in GAAP net income and non-GAAP adjusted net income was approximately $8.9 million, net of tax, non-cash share-based compensation expense. Excluding share-based compensation expense, both GAAP and non-GAAP diluted earnings per share would have improved by $0.19 per share.


DIODES INCORPORATED AND SUBSIDIARIES

CONSOLIDATED RECONCILIATION OF NET INCOME TO ADJUSTED NET INCOME – Cont.

(in thousands, except per share data)

(unaudited)


For the three months ended June 30, 2025:


Operating Expenses


Other (Income) Expense


Income Tax Provision


Net Income


Per-GAAP net income


$

46,098


Diluted earnings per share (per-GAAP)


$

0.99


Adjustments to reconcile net income to non-GAAP net income:


Amortization of acquisition-related intangible assets


5,839


(1,034

)


4,805


Acquisition related cost


77


(16

)


61


Restructuring charge


68


(14

)


54


Gain on disposal of subsidiary


(13,681

)


988


(12,693

)


(Gain)/Loss on Investments


(29,645

)


6,262


(23,383

)


Board member/Officer retirement


117


(25

)


92


Non-GAAP adjusted net income


$

15,034


Diluted shares used in computing earnings per share


46,462


Non-GAAP diluted earnings per share


$

0.32


Note: Included in GAAP net income and non-GAAP adjusted net income was approximately $4.6 million, net of tax, non-cash share-based compensation expense. Excluding share-based compensation expense, both GAAP and non-GAAP diluted earnings per share would have improved by $0.10 per share.


DIODES INCORPORATED AND SUBSIDIARIES

CONSOLIDATED RECONCILIATION OF NET INCOME TO ADJUSTED NET INCOME – Cont.

(in thousands, except per share data)

(unaudited)


For the six months ended June 30, 2026:


Operating Expenses


Other (Income) Expense


Income Tax Provision


Net Income


Per-GAAP net income


$

61,610


Diluted earnings per share (per-GAAP)


$

1.33


Adjustments to reconcile net income to non-GAAP net income:


Amortization of acquisition-related intangible assets


7,855


(1,411

)


6,444


Board member/Officer retirement


2,610


(594

)


2,016


(Gain)/Loss on Investments


(16,516

)


(1,497

)


(18,013

)


Acquisition related cost


265


(56

)


209


Non-GAAP adjusted net income


$

52,266


Diluted shares used in computing earnings per share


46,344


Non-GAAP diluted earnings per share


$

1.13


Note: Included in GAAP net income and non-GAAP adjusted net income was approximately $14.9 million, net of tax, non-cash share-based compensation expense. Excluding share-based compensation expense, both GAAP and non-GAAP diluted earnings per share would have improved by $0.32 per share.


DIODES INCORPORATED AND SUBSIDIARIES

CONSOLIDATED RECONCILIATION OF NET INCOME TO ADJUSTED NET INCOME – Cont.

(in thousands, except per share data)

(unaudited)


For the six months ended June 30, 2025:


Operating Expenses


Other (Income) Expense


Income Tax Provision


Net Income


Per-GAAP net income


$

41,661


Diluted earnings per share (per-GAAP)


$

0.90


Adjustments to reconcile net income to non-GAAP net income:


Amortization of acquisition-related intangible assets


11,663


(2,065

)


9,598


Acquisition related cost


248


(52

)


196


Restructuring charge


334


(54

)


280


Gain on disposal of subsidiary


(13,681

)


988


(12,693

)


(Gain)/Loss on Investments


(19,796

)


4,488


(15,308

)


Board member/Officer retirement


117


(25

)


92


Non-GAAP adjusted net income


$

23,826


Diluted shares used in computing earnings per share


46,452


Non-GAAP diluted earnings per share


$

0.51


Note: Included in GAAP net income and non-GAAP adjusted net income was approximately $9.6 million, net of tax, non-cash share-based compensation expense. Excluding share-based compensation expense, both GAAP and non-GAAP diluted earnings per share would have improved by $0.21 per share.


ADJUSTED NET INCOME AND ADJUSTED EARNINGS PER SHARE

The Company’s financial statements present net income and earnings per share that are calculated using accounting principles generally accepted in the United States (“GAAP”). The Company’s management makes adjustments to the GAAP measures that it feels are necessary to allow investors and other readers of the Company’s financial releases to view the Company’s operating results as viewed by the Company’s management, board of directors and research analysts in the semiconductor industry. These non-GAAP measures are not prepared in accordance with, and should not be considered alternatives or necessarily superior to, GAAP financial data and may be different from non-GAAP measures used by other companies. Because non-GAAP financial measures are not standardized, it may not be possible to compare these financial measures with other companies’ non-GAAP financial measures, even if they have similar names. The explanation of the adjustments made in the table above, are set forth below:

Detail of non-GAAP adjustments

Amortization of acquisition-related intangible assetsThe Company excluded this item, including amortization of developed technologies and customer relationships. The fair value of the acquisition-related intangible assets is amortized using straight-line methods which approximate the proportion of future cash flows estimated to be generated each period over the estimated useful life of the applicable assets. The Company believes that exclusion of this item is appropriate because a significant portion of the purchase price for its acquisitions was allocated to the intangible assets that have short lives and exclusion of the amortization expense allows comparisons of operating results that are consistent over time for both the Company’s newly acquired and long-held businesses. In addition, the Company excluded this item because there is significant variability and unpredictability among companies with respect to this expense.

Board member/Officer retirement – The Company excluded costs related to (1) the retirement of a board member, these costs represent cash payments and the accelerated vesting of previously issued stock awards, (2) the retirement of an officer, these costs represent cash payments and the accelerated vesting of previously issued stock awards. The Company feels it is appropriate to exclude these costs since they don’t represent ongoing operating expenses and will present investors with a more accurate indication of our continuing operations.

(Gain) Loss on Investment – The Company excluded gains and losses on various investments, as well as impairment and mark-to-market adjustments on equity investments. The Company believes these amounts are not reflective on the ongoing operations of the Company and exclusion of these items, provides investors an enhanced view of the Company’s operating results.

Acquisition related costs The Company excluded expenses associated with previous acquisitions of that typically consist of advisory, legal and other professional and consulting fees. These costs were expensed as they were incurred and as services were received, and in which the corresponding tax adjustments were made for the non-deductible portions of these expenses. The Company believes the exclusion of the acquisition-related costs provides investors with a more accurate reflection of costs likely to be incurred in the absence of an unusual event such as an acquisition and facilitates comparisons with the results of other periods that may not reflect such costs.

Restructuring charge – The Company recorded restructuring charges related to various locations. These restructuring charges are excluded from management’s assessment of the Company’s operating performance. The Company believes the exclusion of the restructuring charges provides investors an enhanced view of the cost structure of the Company’s operations and facilitates comparisons with the results of other periods that may not reflect such charges or may reflect different levels of such charges.

Gain on disposal of subsidiary – The Company excluded the gain on the disposal of a subsidiary. The Company believes this is not reflective of the ongoing operations and exclusion of this item provides investors an enhanced view of the Company’s operating results.

CASH FLOW ITEMS

Free cash flow (FCF) (Non-GAAP)

FCF for the second quarter of 2026 is a non-GAAP financial measure, which is calculated by subtracting capital expenditures from cash flow from operations. For the second quarter of 2026, FCF was $34.8 million, which represents the cash and cash equivalents that we are able to generate after taking into account cash outlays required to maintain or expand property, plant and equipment. FCF is important because it allows us to pursue opportunities to develop new products, make acquisitions and reduce debt.


CONSOLIDATED RECONCILIATION OF NET INCOME TO EBITDA

EBITDA represents earnings before net interest expense, income tax provision, depreciation and amortization. Management believes EBITDA is useful to investors because it is frequently used by securities analysts, investors and other interested parties, such as financial institutions in extending credit, in evaluating companies in our industry and provides further clarity on our profitability. In addition, management uses EBITDA, along with other GAAP and non-GAAP measures, in evaluating our operating performance compared to that of other companies in our industry. The calculation of EBITDA generally eliminates the effects of financing, operating in different income tax jurisdictions, and accounting effects of capital spending, including the impact of our asset base, which can differ depending on the book value of assets and the accounting methods used to compute depreciation and amortization expense. EBITDA is not a recognized measurement under GAAP, and when analyzing our operating performance, investors should use EBITDA in addition to, and not as an alternative for, income from operations and net income, each as determined in accordance with GAAP. Because not all companies use identical calculations, our presentation of EBITDA may not be comparable to similarly titled measures used by other companies. For example, our EBITDA takes into account all net interest expense, income tax provision, depreciation and amortization without taking into account any amounts attributable to noncontrolling interest. Furthermore, EBITDA is not intended to be a measure of free cash flow for management’s discretionary use, as it does not consider certain cash requirements such as tax and debt service payments.

The following table provides a reconciliation of net income to EBITDA (in thousands, unaudited):


Three Months Ended


Six Months Ended


June 30,


June 30,


2026


2025


2026


2025


Net income (per-GAAP)


$

46,649


$

46,098


$

61,610


$

41,661


Plus:


Interest expense, net


(5,214

)


(6,518

)


(9,977

)


(11,864

)

Income tax provision


6,847


9,063


10,847


9,083


Depreciation and amortization


35,233


35,895


70,445


71,813


EBITDA (non-GAAP)


$

83,515


$

84,538


$

132,925


$

110,693


DIODES INCORPORATED AND SUBSIDIARIES

CONSOLIDATED CONDENSED BALANCE SHEETS

(In thousands, except per share data)

(Unaudited)


June 30,


December 31,


2026


2025


Assets


Current assets:


Cash and cash equivalents


$

430,447


$

367,212


Restricted cash


1,634


5,134


Short-term investments


9,528


9,817


Accounts receivable, net of allowances of $4,205 and $4,095, respectively


310,279


307,055


Inventories


504,565


471,546


Prepaid expenses and other


103,606


96,198


Total current assets


1,360,059


1,256,962


Property, plant, and equipment, net


661,271


649,605


Deferred tax assets


60,842


59,297


Goodwill


182,514


183,437


Intangible assets, net


37,539


45,455


Equity investments


172,564


156,272


Operating lease assets


47,462


38,740


Other long-term assets


61,114


58,332


Total assets


$

2,583,365


$

2,448,100


Liabilities


Current liabilities:


Line of credit


$

18,560


$

30,264


Accounts payable


183,545


149,376


Operating lease liabilities, current


11,849


10,666


Accrued liabilities and other


191,098


170,256


Income tax payable


22,738


16,336


Current portion of long-term debt


1,611


1,442


Total current liabilities


429,401


378,340


Long-term debt, net of current portion


20,298


24,224


Deferred tax liabilities


5,102


6,145


Unrecognized tax benefits


23,844


23,454


Operating lease liabilities


36,687


28,890


Other long-term liabilities


45,724


48,638


Total liabilities


561,056


509,691


Stockholders' equity


Preferred stock - par value $1.00 per share; 1,000 shares authorized; no shares issued or outstanding


-


-


Common stock - par value $0.66 2/3 per share; 70,000 shares authorized; 55,977 and 55,883 issued; 45,869 and 45,875 outstanding, respectively


37,321


37,259


Additional paid-in capital


569,091


538,087


Retained earnings


1,847,049


1,785,439


Treasury stock, at cost, 10,108 and 10,008 shares, respectively


(382,143

)


(371,914

)

Accumulated other comprehensive loss


(119,017

)


(110,747

)

Stockholders' equity


1,952,301


1,878,124


Noncontrolling interest


70,008


60,285


Total equity


2,022,309


1,938,409


Total liabilities and stockholders' equity


$

2,583,365


$

2,448,100


EX-99.2 3 diod-ex99_2.htm EX-99.2

Slide 1

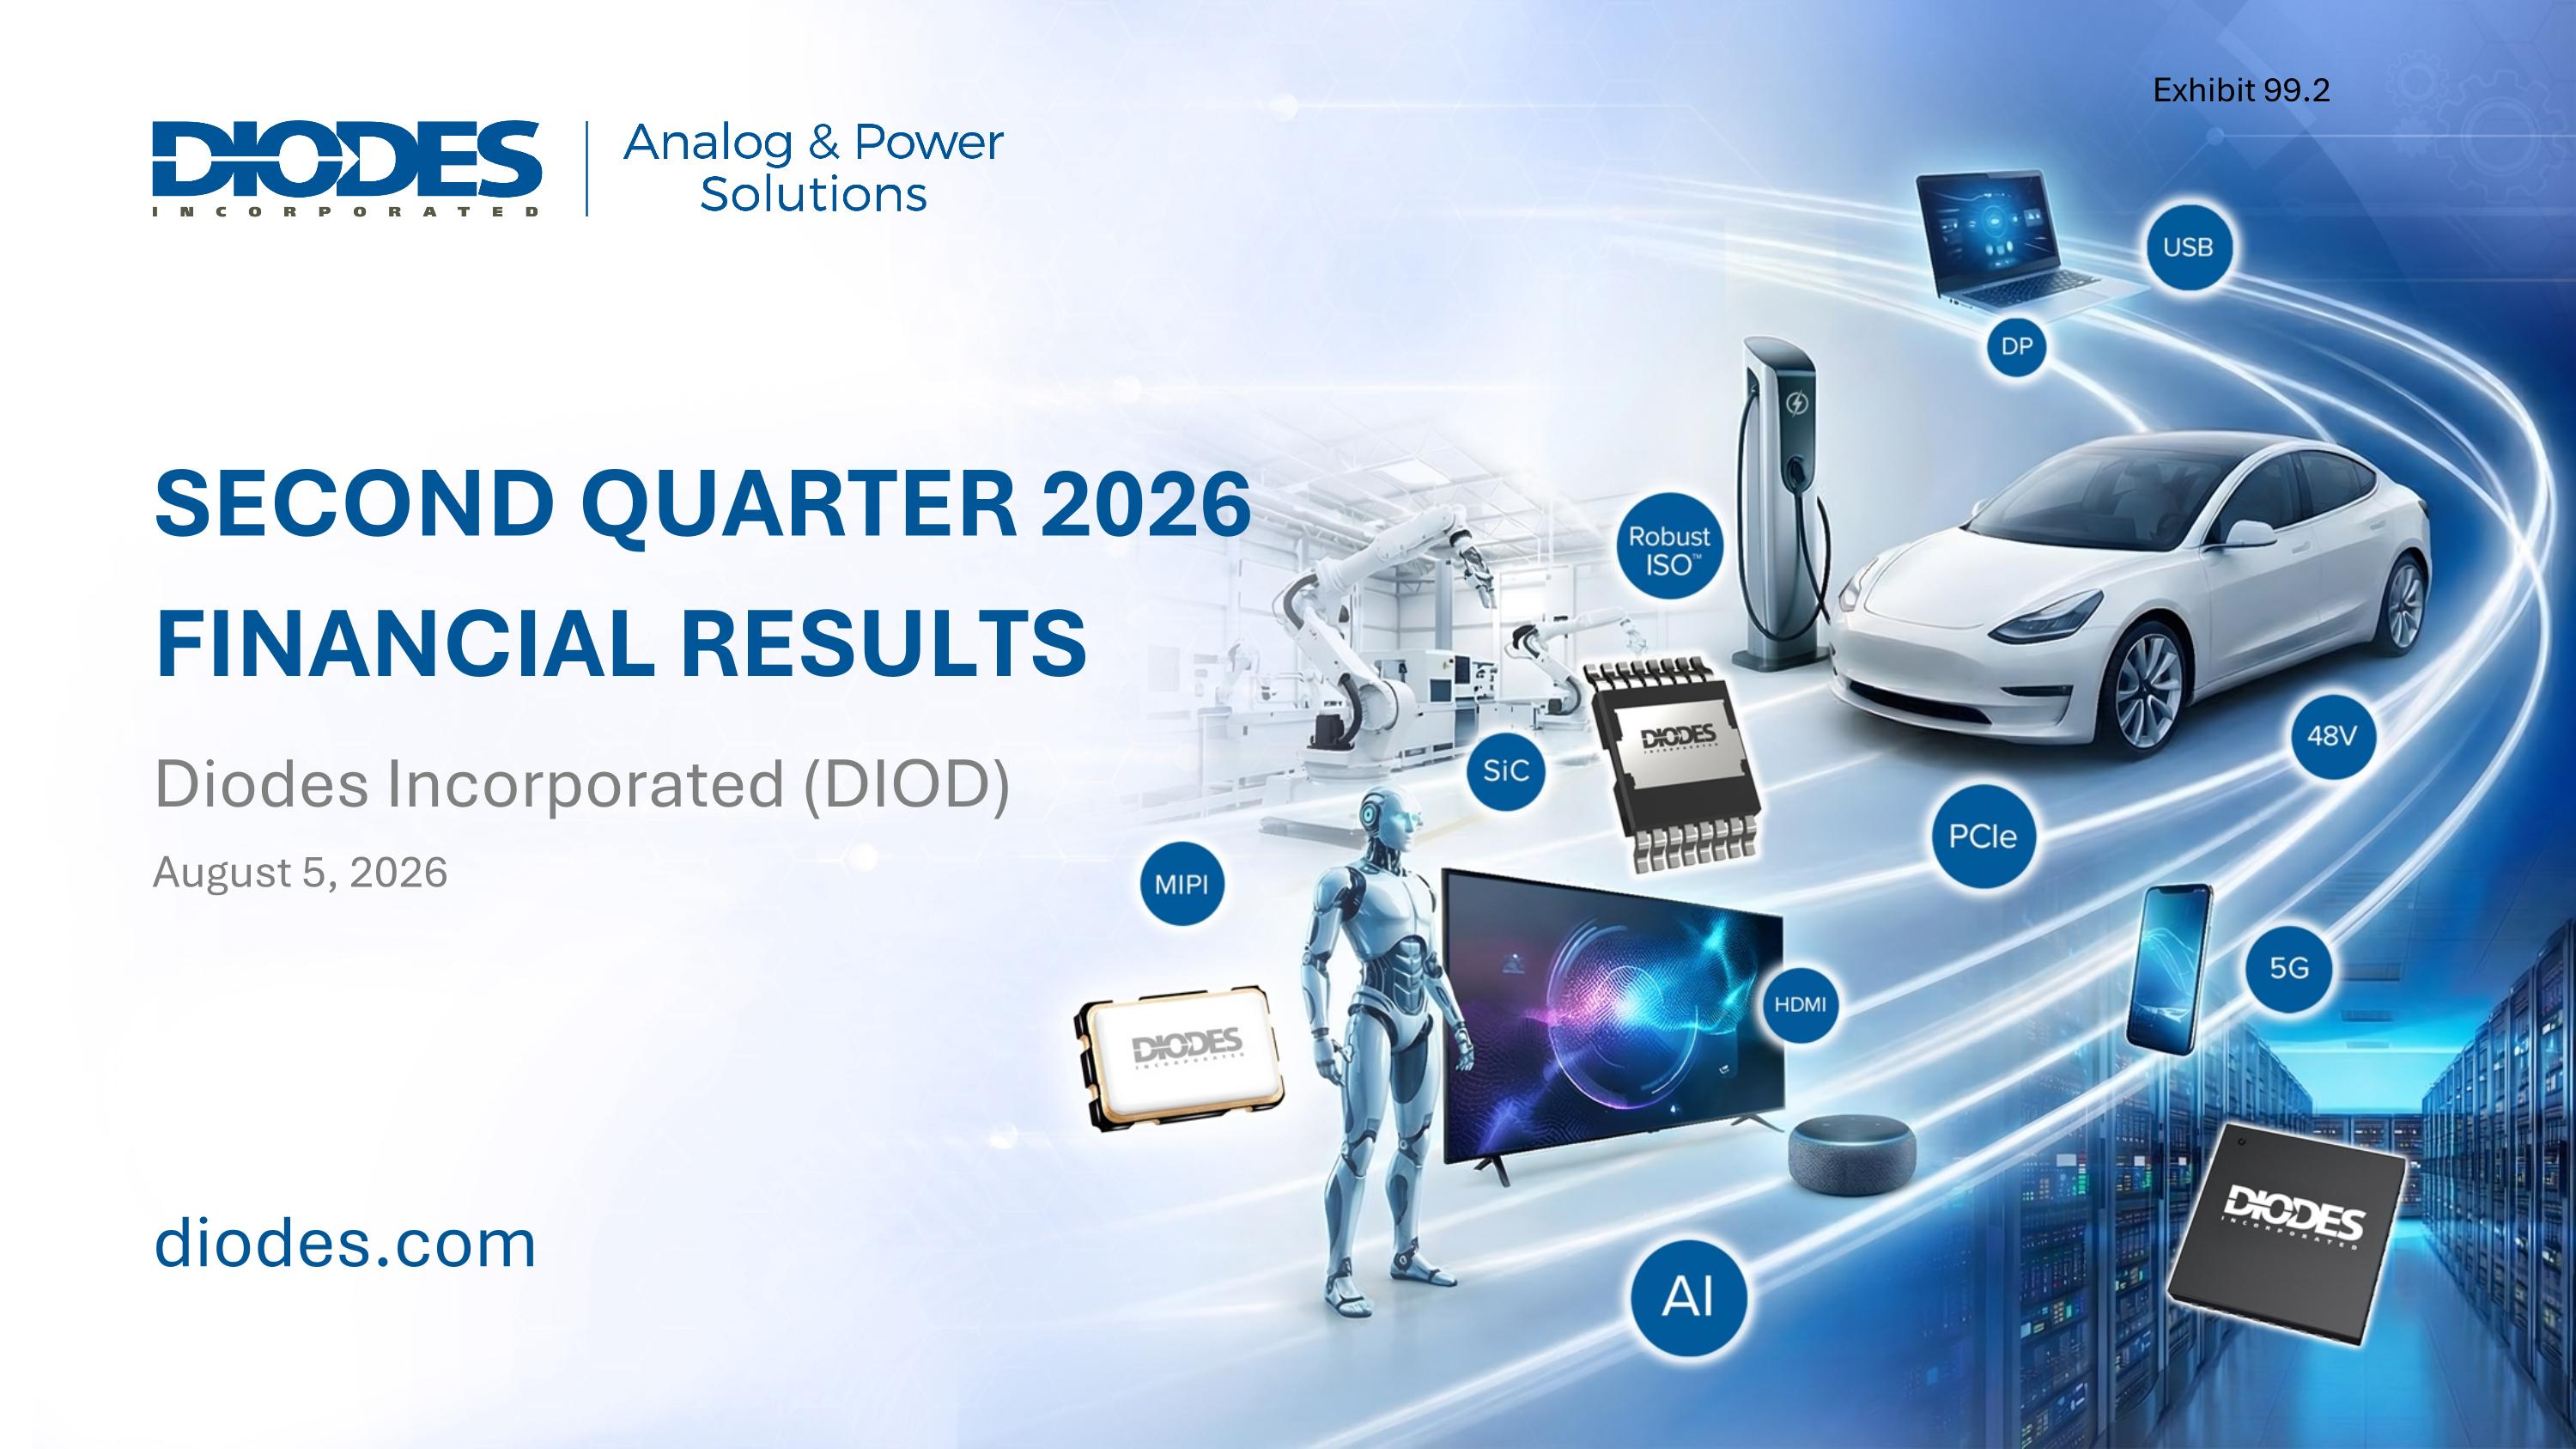
Diodes Incorporated (DIOD) SECOND QUARTER 2026 FINANCIAL RESULTS August 5, 2026 Exhibit 99.2


Slide 2

Safe Harbor Statement Safe Harbor Statement Under the Private Securities Litigation Reform Act of 1995: Any statements set forth above that are not historical facts are forward-looking statements that involve risks and uncertainties that could cause actual results to differ materially from those in the forward-looking statements. Such statements include statements containing forward-looking words such as “expect,” “anticipate,” “aim,” “estimate,” and variations thereof, including without limitation statements, whether direct or implied, regarding expectations of that for the third quarter of 2026, we expect revenue to be approximately $510 million plus or minus 3 percent; we expect GAAP gross margin to be 35.0 percent, plus or minus 1 percent; and non-GAAP adjusted EPS to be $1.05, plus or minus $0.10. Potential risks and uncertainties include, but are not limited to, such factors as: the risk that such expectations may not be met; the risk that the expected benefits of acquisitions may not be realized or that integration of acquired businesses may not continue as rapidly as we anticipate; the risk that we may not be able to maintain our current growth strategy or continue to maintain our current performance, costs, and loadings in our manufacturing facilities; the risk that we may not be able to increase our automotive, industrial, or other revenue and market share; risks of domestic and foreign operations, including excessive operating costs, labor shortages, higher tax rates, and our joint venture prospects; the risks of cyclical downturns in the semiconductor industry and of changes in end-market demand or product mix that may affect gross margin or render inventory obsolete; the risk of unfavorable currency exchange rates; the risk that our future outlook or guidance may be incorrect; the risks of global economic weakness or instability in global financial markets; the risks of trade restrictions, tariffs, or embargoes; the risk of breaches of our information technology systems; and other information, including the “Risk Factors” detailed from time to time in Diodes’ filings with the United States Securities and Exchange Commission. This presentation also contains non-GAAP measures. See the Company’s press release on August 5, 2026, titled, “Diodes Incorporated Reports Second Quarter 2026 Financial Results” for detailed information related to the Company’s non-GAAP measures and a reconciliation of GAAP net income to non-GAAP net income.


Slide 3

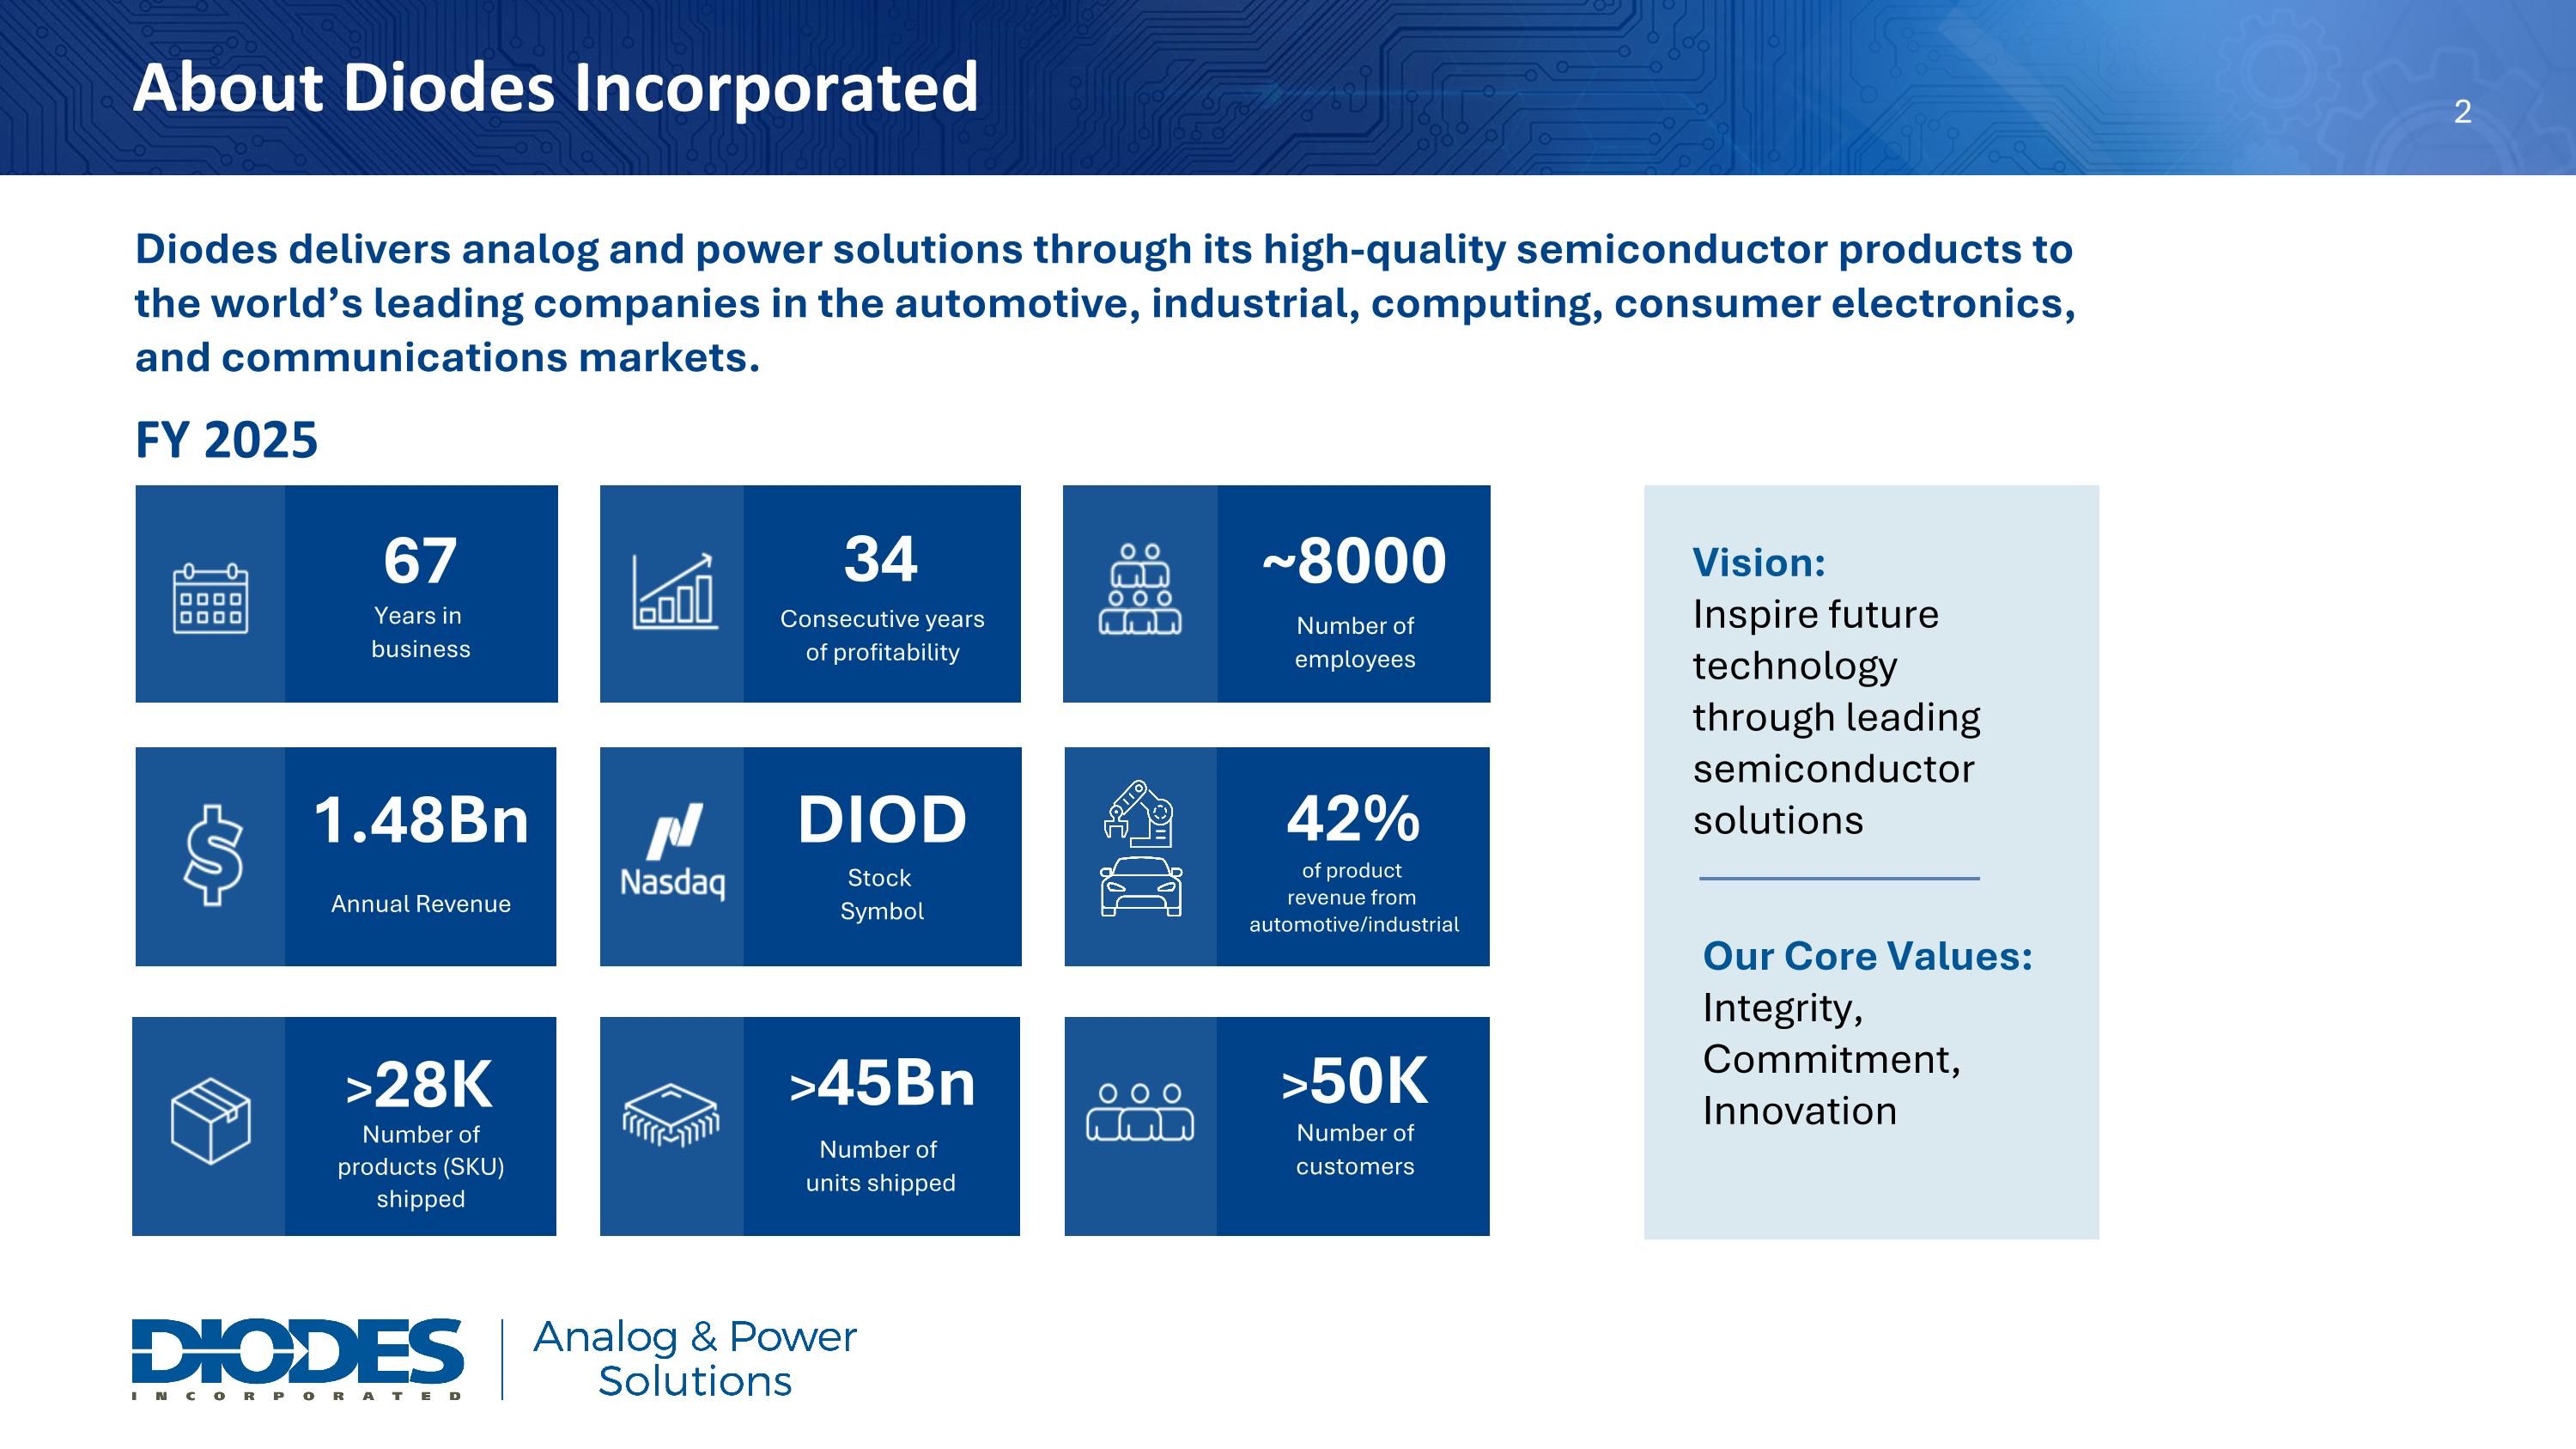
About Diodes Incorporated Diodes delivers analog and power solutions through its high-quality semiconductor products to the world’s leading companies in the automotive, industrial, computing, consumer electronics, and communications markets. Vision: Inspire future technology through leading semiconductor solutions Our Core Values:Integrity,Commitment,Innovation 67 Years in business 34 Consecutive yearsof profitability ~8000 Number ofemployees 1.48Bn Annual Revenue >45Bn >28K Number ofproducts (SKU)shipped >50K Number ofcustomers 42% of product revenue from automotive/industrial Stock Symbol Number of units shipped DIOD FY 2025


Slide 4

$Billion Financial Targets Goal 1: $1B Market Cap - 2010 Goal 2: $1B Revenue- 2017 Goal 3: $2.5B Revenue $1B Gross Profit (40% GM) Goal 4: $1B Profit Before Tax 3-Year Targets (2028): $2B Revenue Gross Profit: $700M Gross Margin: 35%+ Non-GAAP EPS: $4.00+


Slide 5

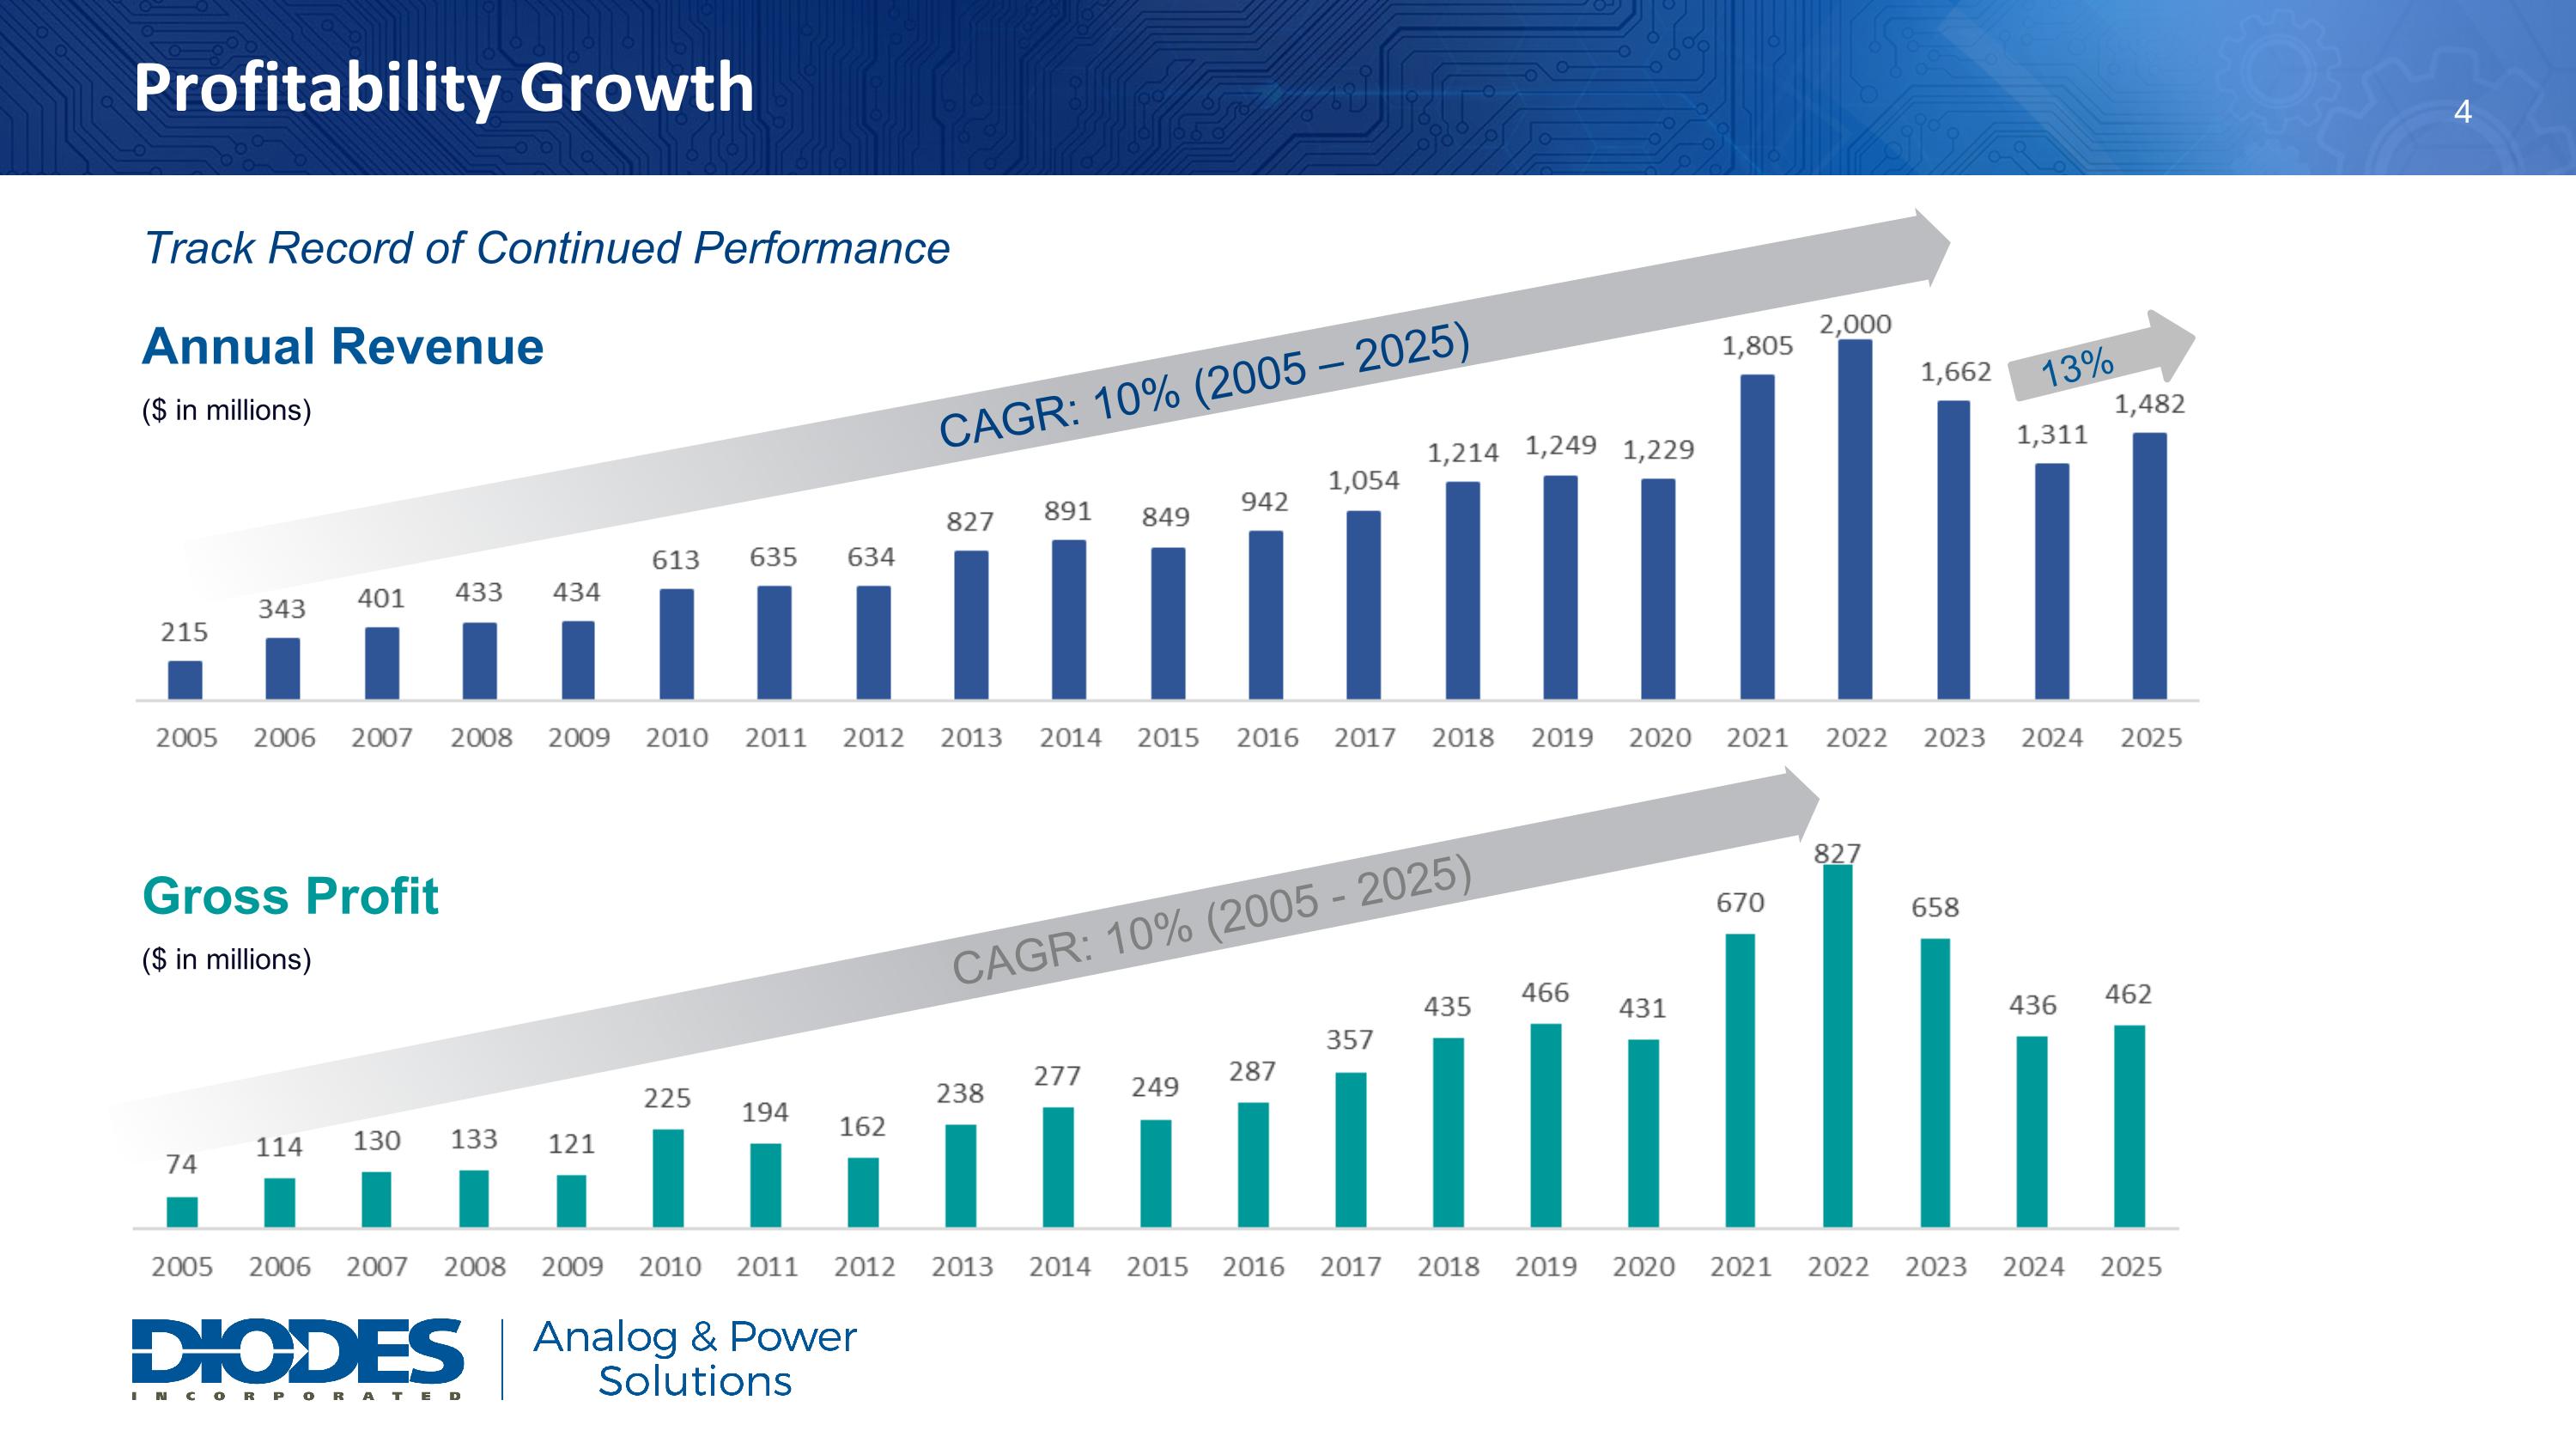
Profitability Growth Track Record of Continued Performance Gross Profit ($ in millions) ($ in millions) CAGR: 10% (2005 – 2025) CAGR: 10% (2005 - 2025) 13% Annual Revenue


Slide 6

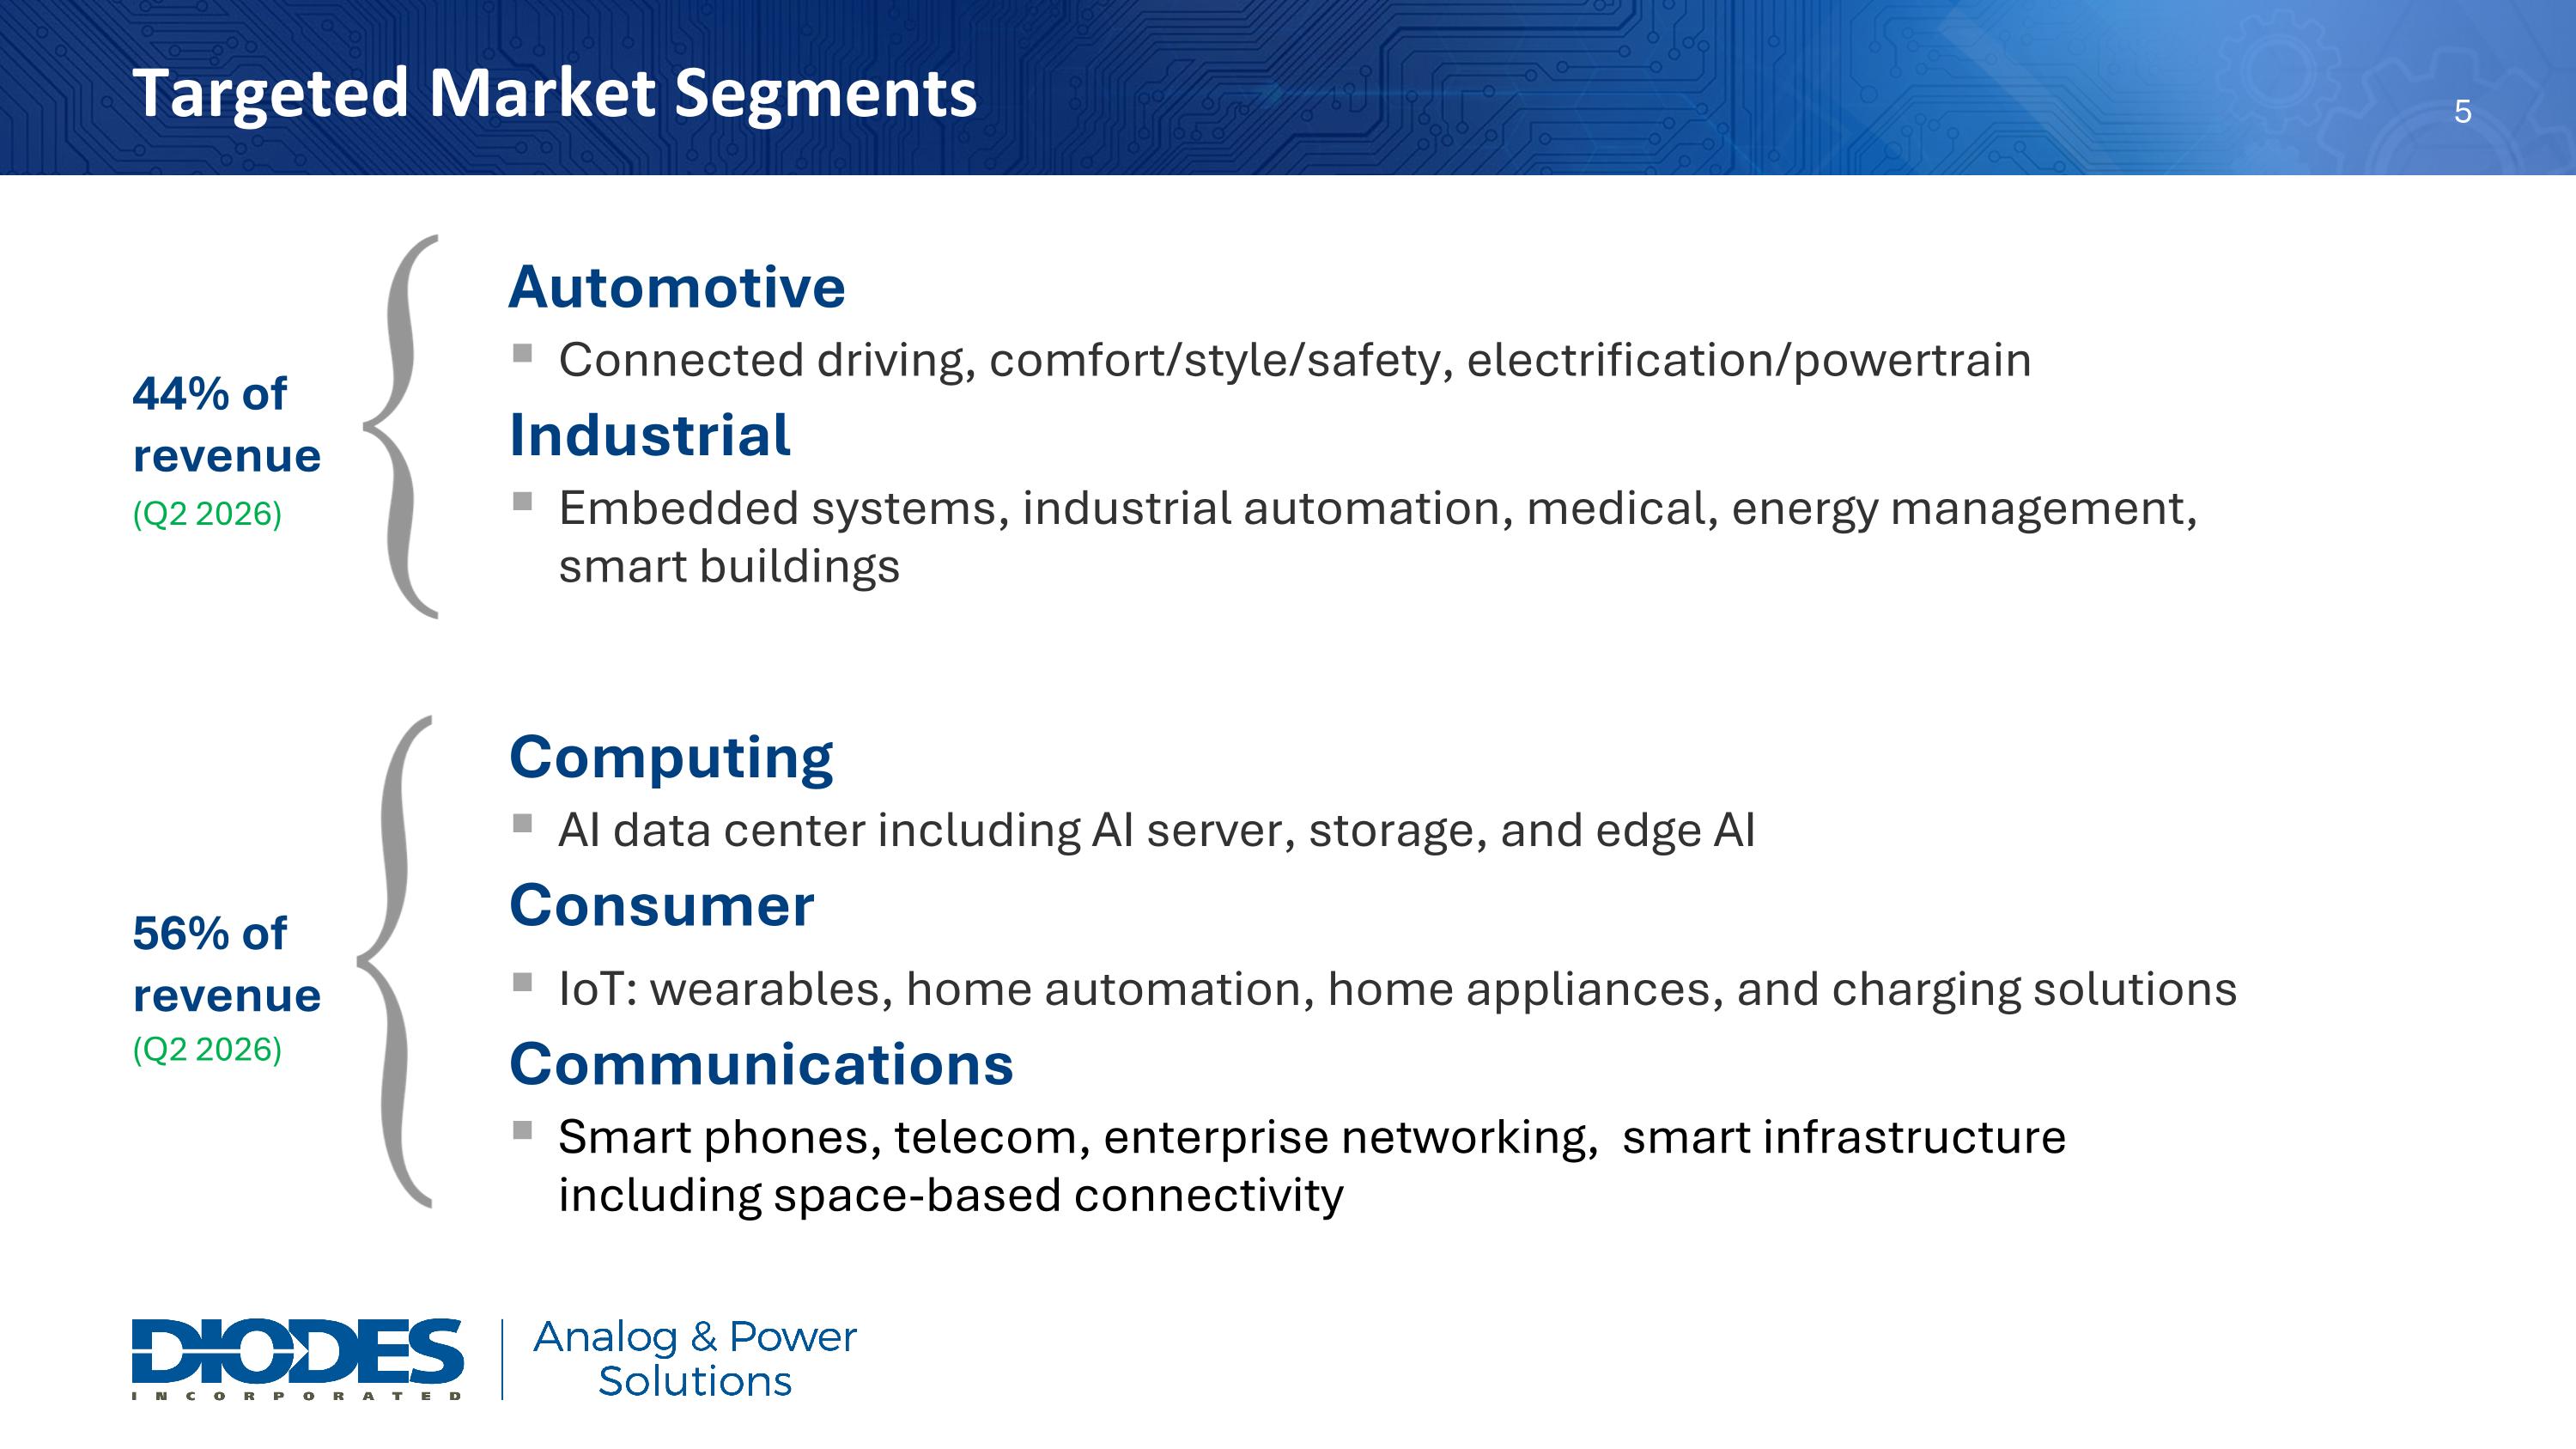
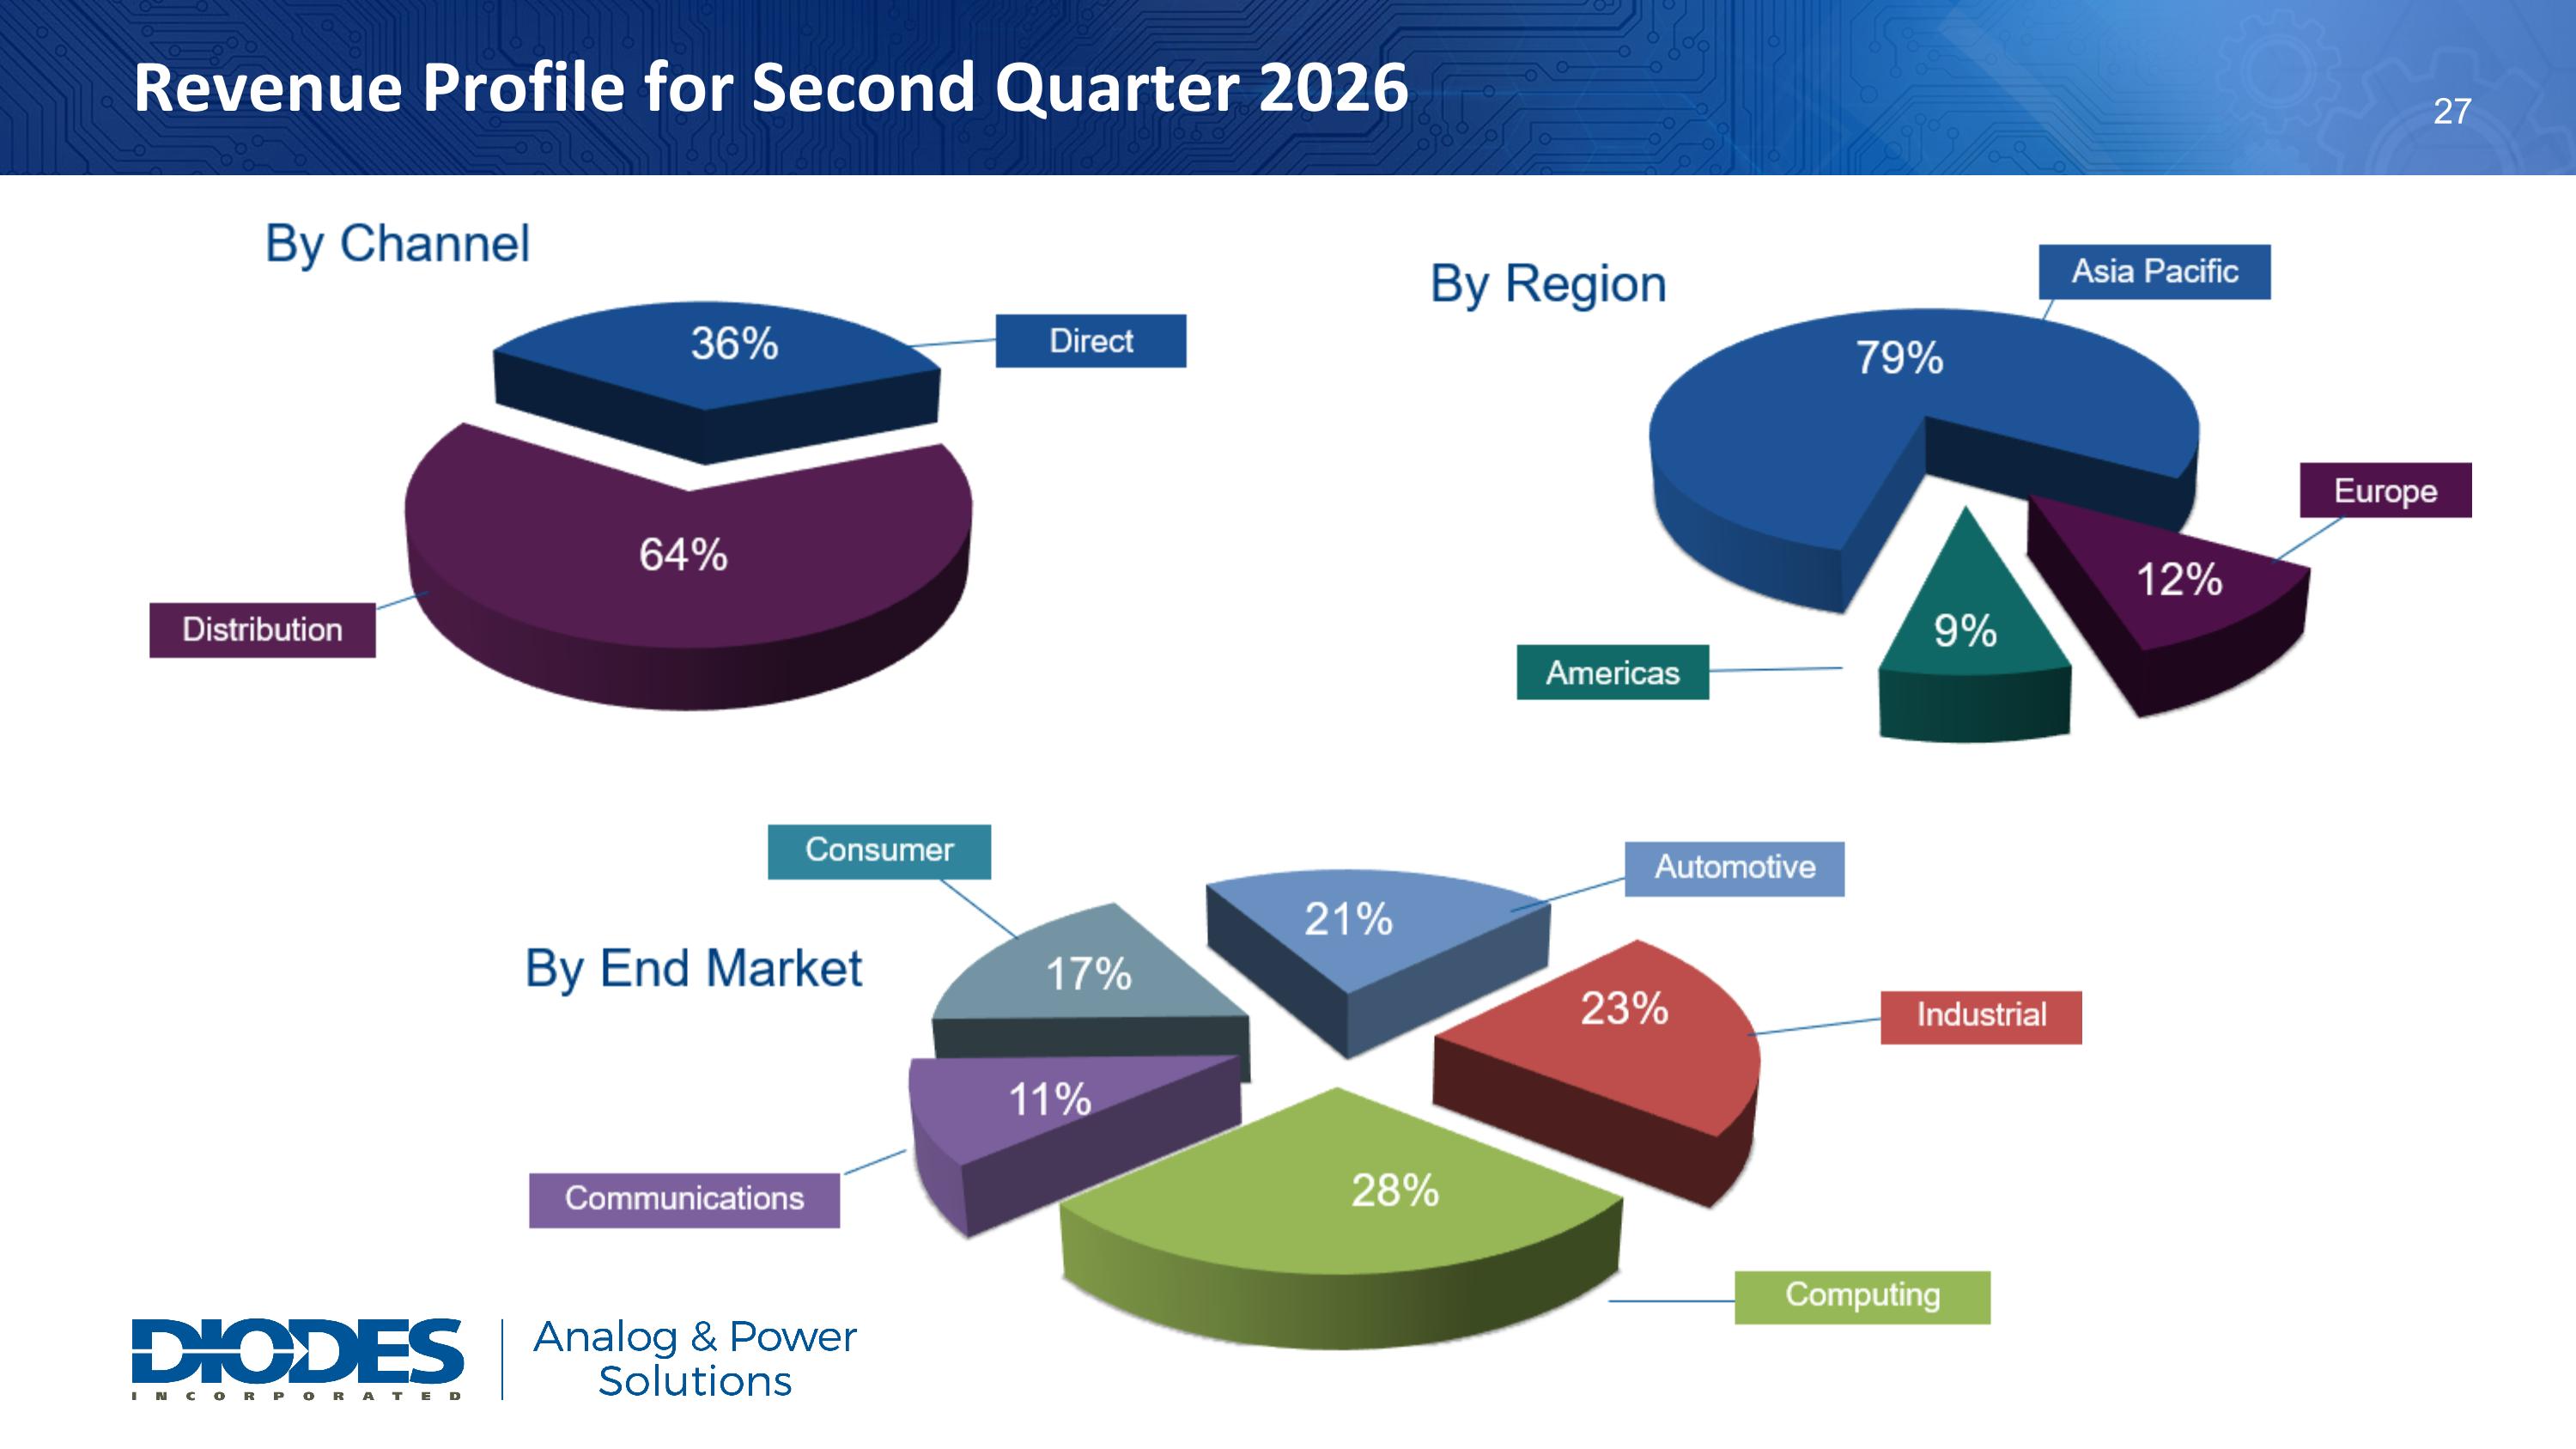
Automotive Connected driving, comfort/style/safety, electrification/powertrain Industrial Embedded systems, industrial automation, medical, energy management, smart buildings Computing AI data center including AI server, storage, and edge AI Consumer IoT: wearables, home automation, home appliances, and charging solutions Communications Smart phones, telecom, enterprise networking, smart infrastructure including space-based connectivity 56% of revenue 44% of revenue (Q2 2026) (Q2 2026) Targeted Market Segments


Slide 7

2Q FY26 Performance * Cash and cash equivalents, restricted cash, and short-term investments $445.5M +9.9% Q-Q Revenue $147.6M 33.1% +130 bps Q-Q GAAP Gross Margin $0.70 +62.8% Q-Q Non-GAAP EPS $32.5M + 64.1% Q-Q Non-GAAP Net Income $83.5M EBITDA 18.7% of Revenue Cash Flow from Ops 15.4% of Revenue Strong Balance Sheet $442M/$40M Cash*/Debt $68.5M + 14.6% Q-Q GAAP Gross Profit


Slide 8

2Q FY26 Highlights 2Q revenue achieved 22% YoY growth and 10% QoQ increase Strong balance sheet with $442 million in cash and cash equivalents*; $931 million working capital 3Q 2026 revenue to increase 30% YoY and 14% increase QoQ (at mid-point of guidance) Non-GAAP EPS is up over 100% year-over-year * Cash and cash equivalents, restricted cash, and short-term investments Proposed acquisition of ElevATE Semiconductor: expected to close in late 2026 and expected to add approximately $50 million in revenue on the first 12 months following close +


Slide 9

Quarterly Performance Gross Profit ($ Millions) Revenue ($ Millions) Highest quarterly revenue since 2023 2Q revenue increased 21.7% YoY Sixth consecutive quarter of double-digit YoY growth Automotive revenue reached a record 21% of revenue, up 37% YoY Compute revenue grew 33% YoY, driven by AI data center demand Industrial revenue grew 24% YoY Highest quarterly GP$ since 2023 , margin increased 160bps YoY Non-GAAP EPS increased over 100% YoY Future margin expansion will be driven by increasing contribution from higher-margin automotive, industrial, and data center end markets, new products as well as improved loading across manufacturing facilities


Slide 10

Revenue Profile for Second Quarter 2026


Slide 11

Income Statement – Second Quarter 2026 ($ in millions, except EPS) 2Q25 1Q256 2Q26 Net sales 366.2 405.5 445.5 Gross profit (GAAP) 115.3 128.8 147.6 Gross profit margin % (GAAP) 31.5% 31.8% 33.1% Net income (GAAP) 46.1 15.0 46.6 Net income (non-GAAP) 15.0 19.8 32.5 Diluted EPS (non-GAAP) 0.32 0.43 0.70 Cash flow from operations 41.5 64.3 68.5 EBITDA (non-GAAP) 84.5 49.4 83.5


Slide 12

Balance Sheet ($ in millions) Dec 31, 2024 Dec 31, 2025 June 30, 2026 Cash* 322 382 442 Inventory 475 472 505 Current assets 1,224 1,257 1,360 Total assets 2,386 2,448 2,583 Total debt 52 56 40 Total liabilities 517 510 561 Total equity 1,869 1,938 2,022 * Cash and cash equivalents, restricted cash, and short-term investments


Slide 13

Business Outlook - Third Quarter 2026 Revenue to be ~$510 million, +/- 3.0% Representing 30% growth over the prior year period and a 14% increase sequentially at the mid-point, which is significantly better than typical seasonality GAAP gross margin of 35%, +/- 1% Non-GAAP adjusted EPS is expected to be $1.05, plus or minus $0.10 *Guidance as provided on August 5, 2026 3-Year Targets (2028): $2B Revenue Gross Profit: $700M Gross Margin: 35%+ Non-GAAP EPS: $4.00+


Slide 14

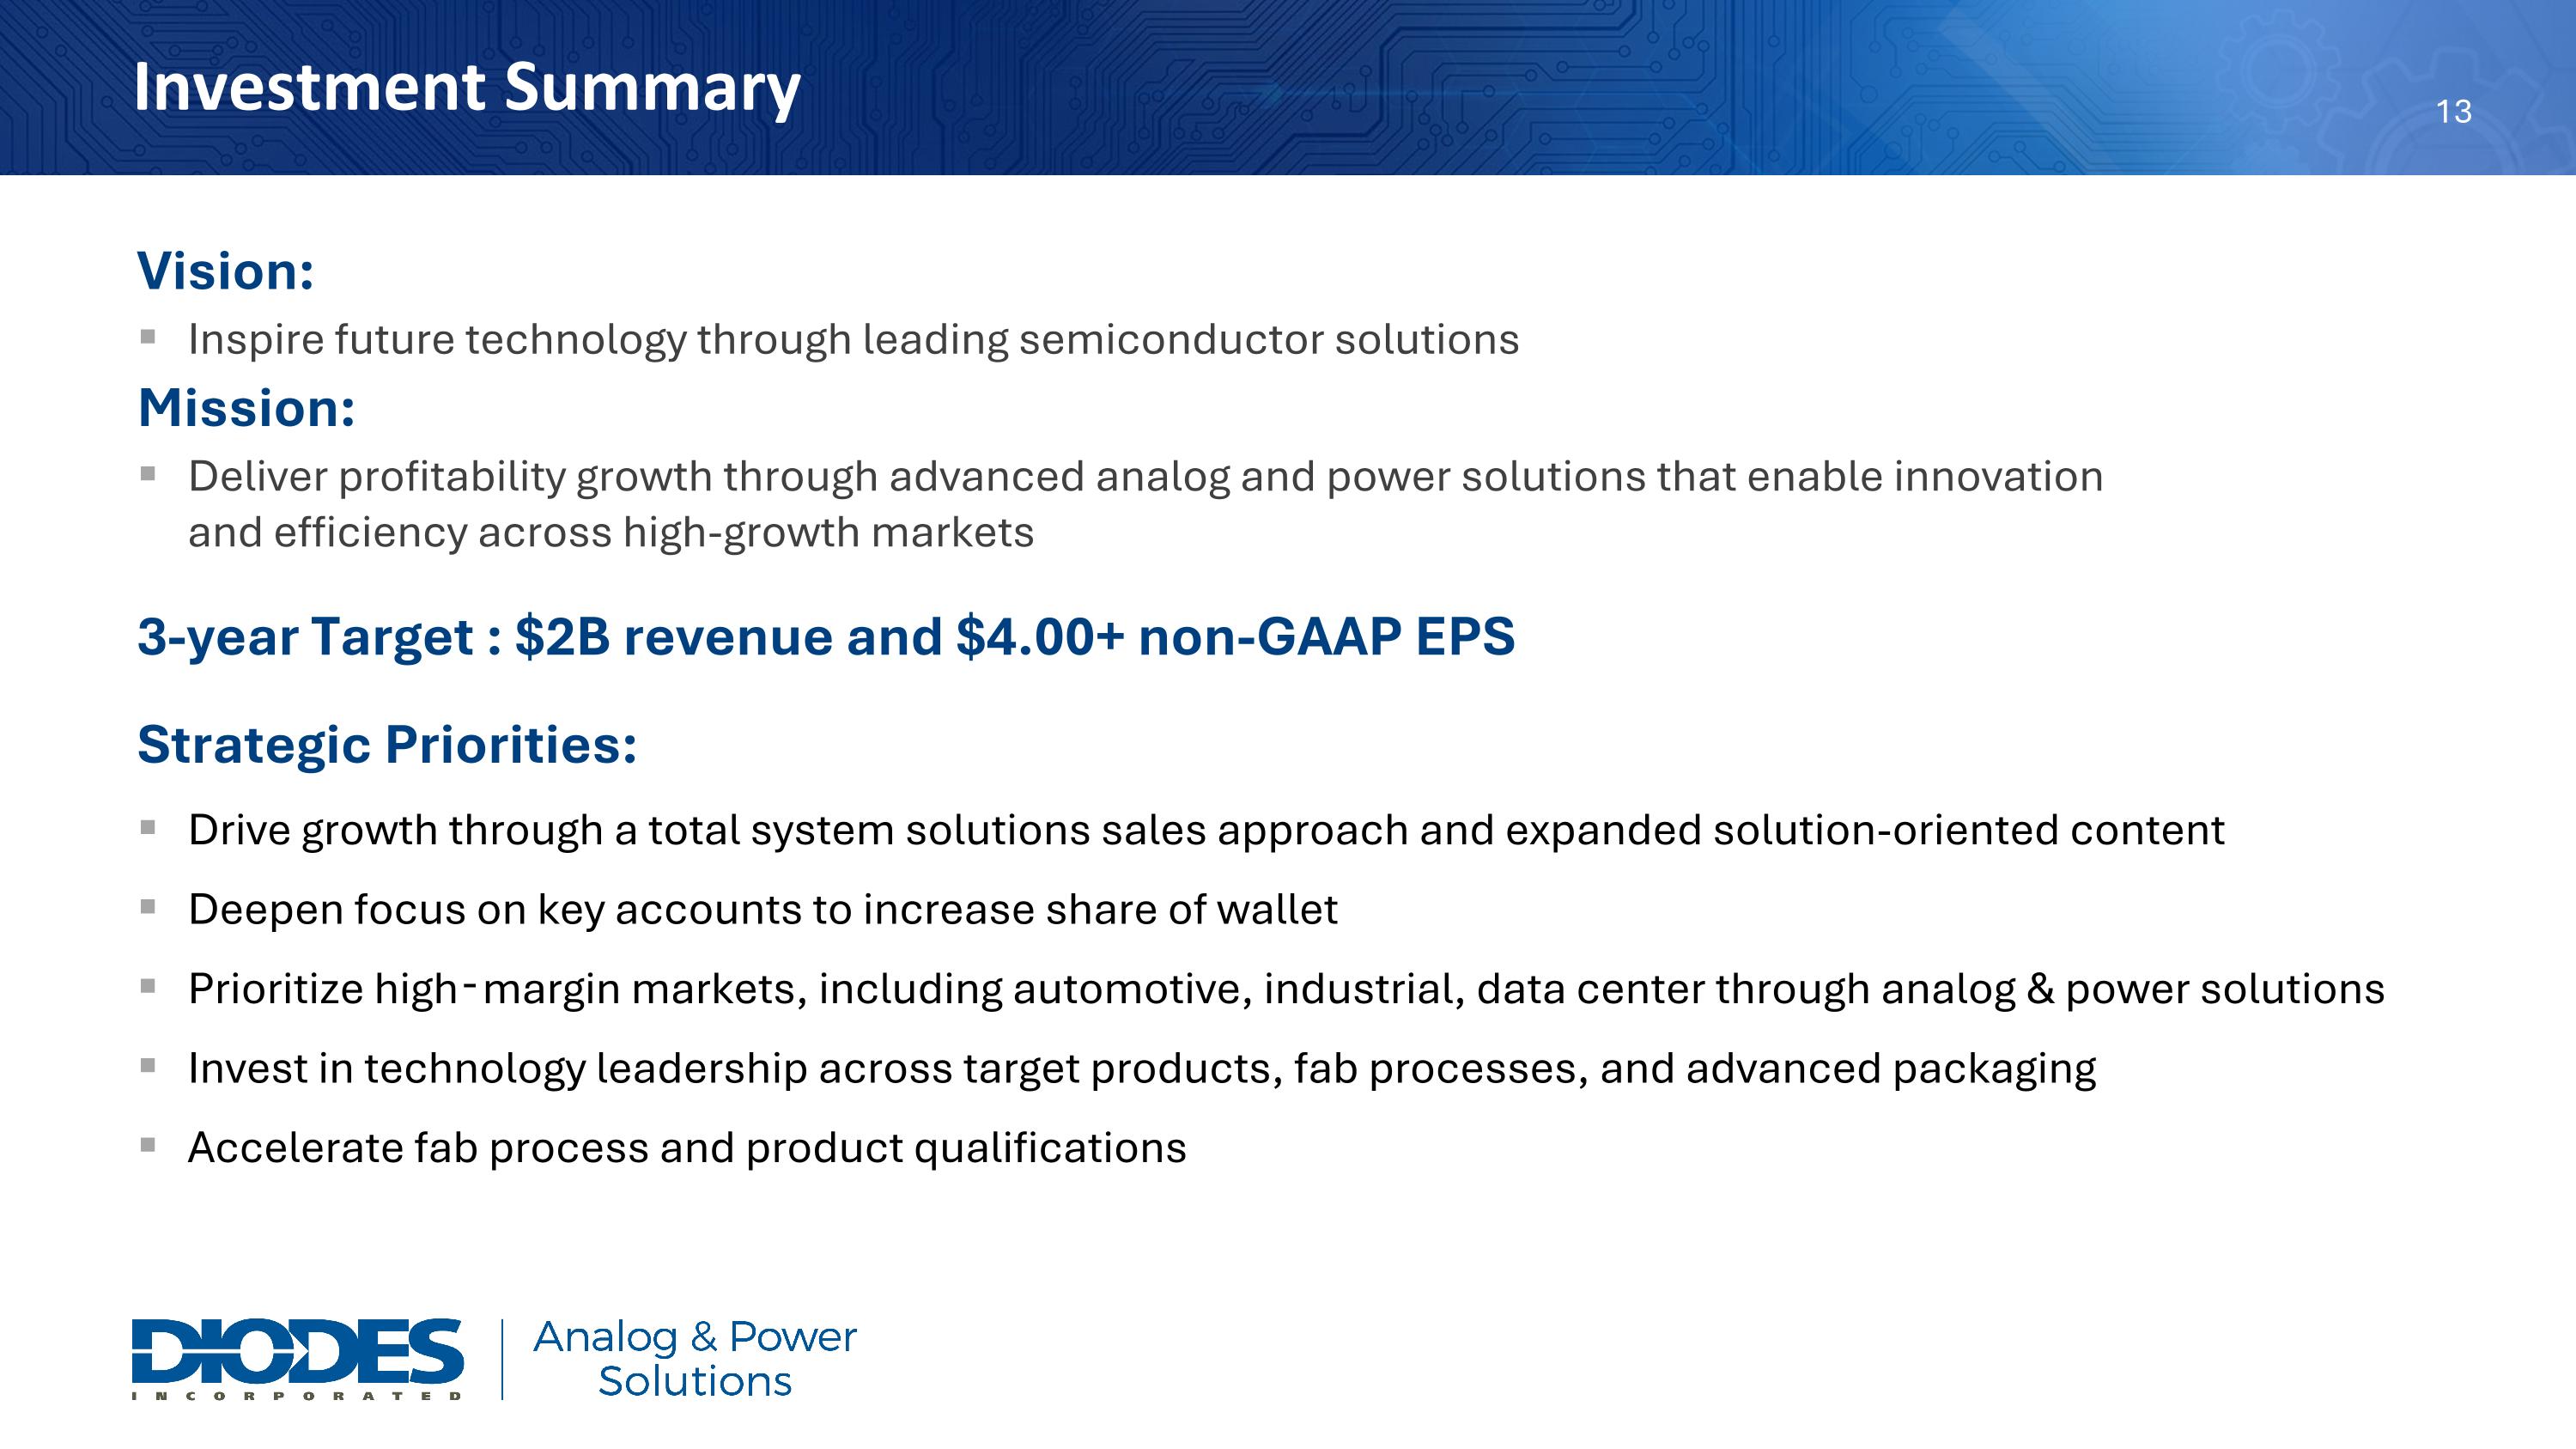
Investment Summary Vision: Inspire future technology through leading semiconductor solutions Mission: Deliver profitability growth through advanced analog and power solutions that enable innovation and efficiency across high-growth markets 3-year Target : $2B revenue and $4.00+ non-GAAP EPS Strategic Priorities: Drive growth through a total system solutions sales approach and expanded solution-oriented content Deepen focus on key accounts to increase share of wallet Prioritize high‑margin markets, including automotive, industrial, data center through analog & power solutions Invest in technology leadership across target products, fab processes, and advanced packaging Accelerate fab process and product qualifications


Slide 15


Slide 16

Reconciliation of Net Income to Adjusted Net Income (in thousands, except per share data) (unaudited) Note: Included in GAAP net income and non-GAAP adjusted net income was approximately $8.9 million, net of tax, non-cash share-based compensation expense. Excluding share-based compensation expense, both GAAP and non-GAAP diluted earnings per share would have improved by $0.19 per share. For the three months ended June 30, 2026


Slide 17

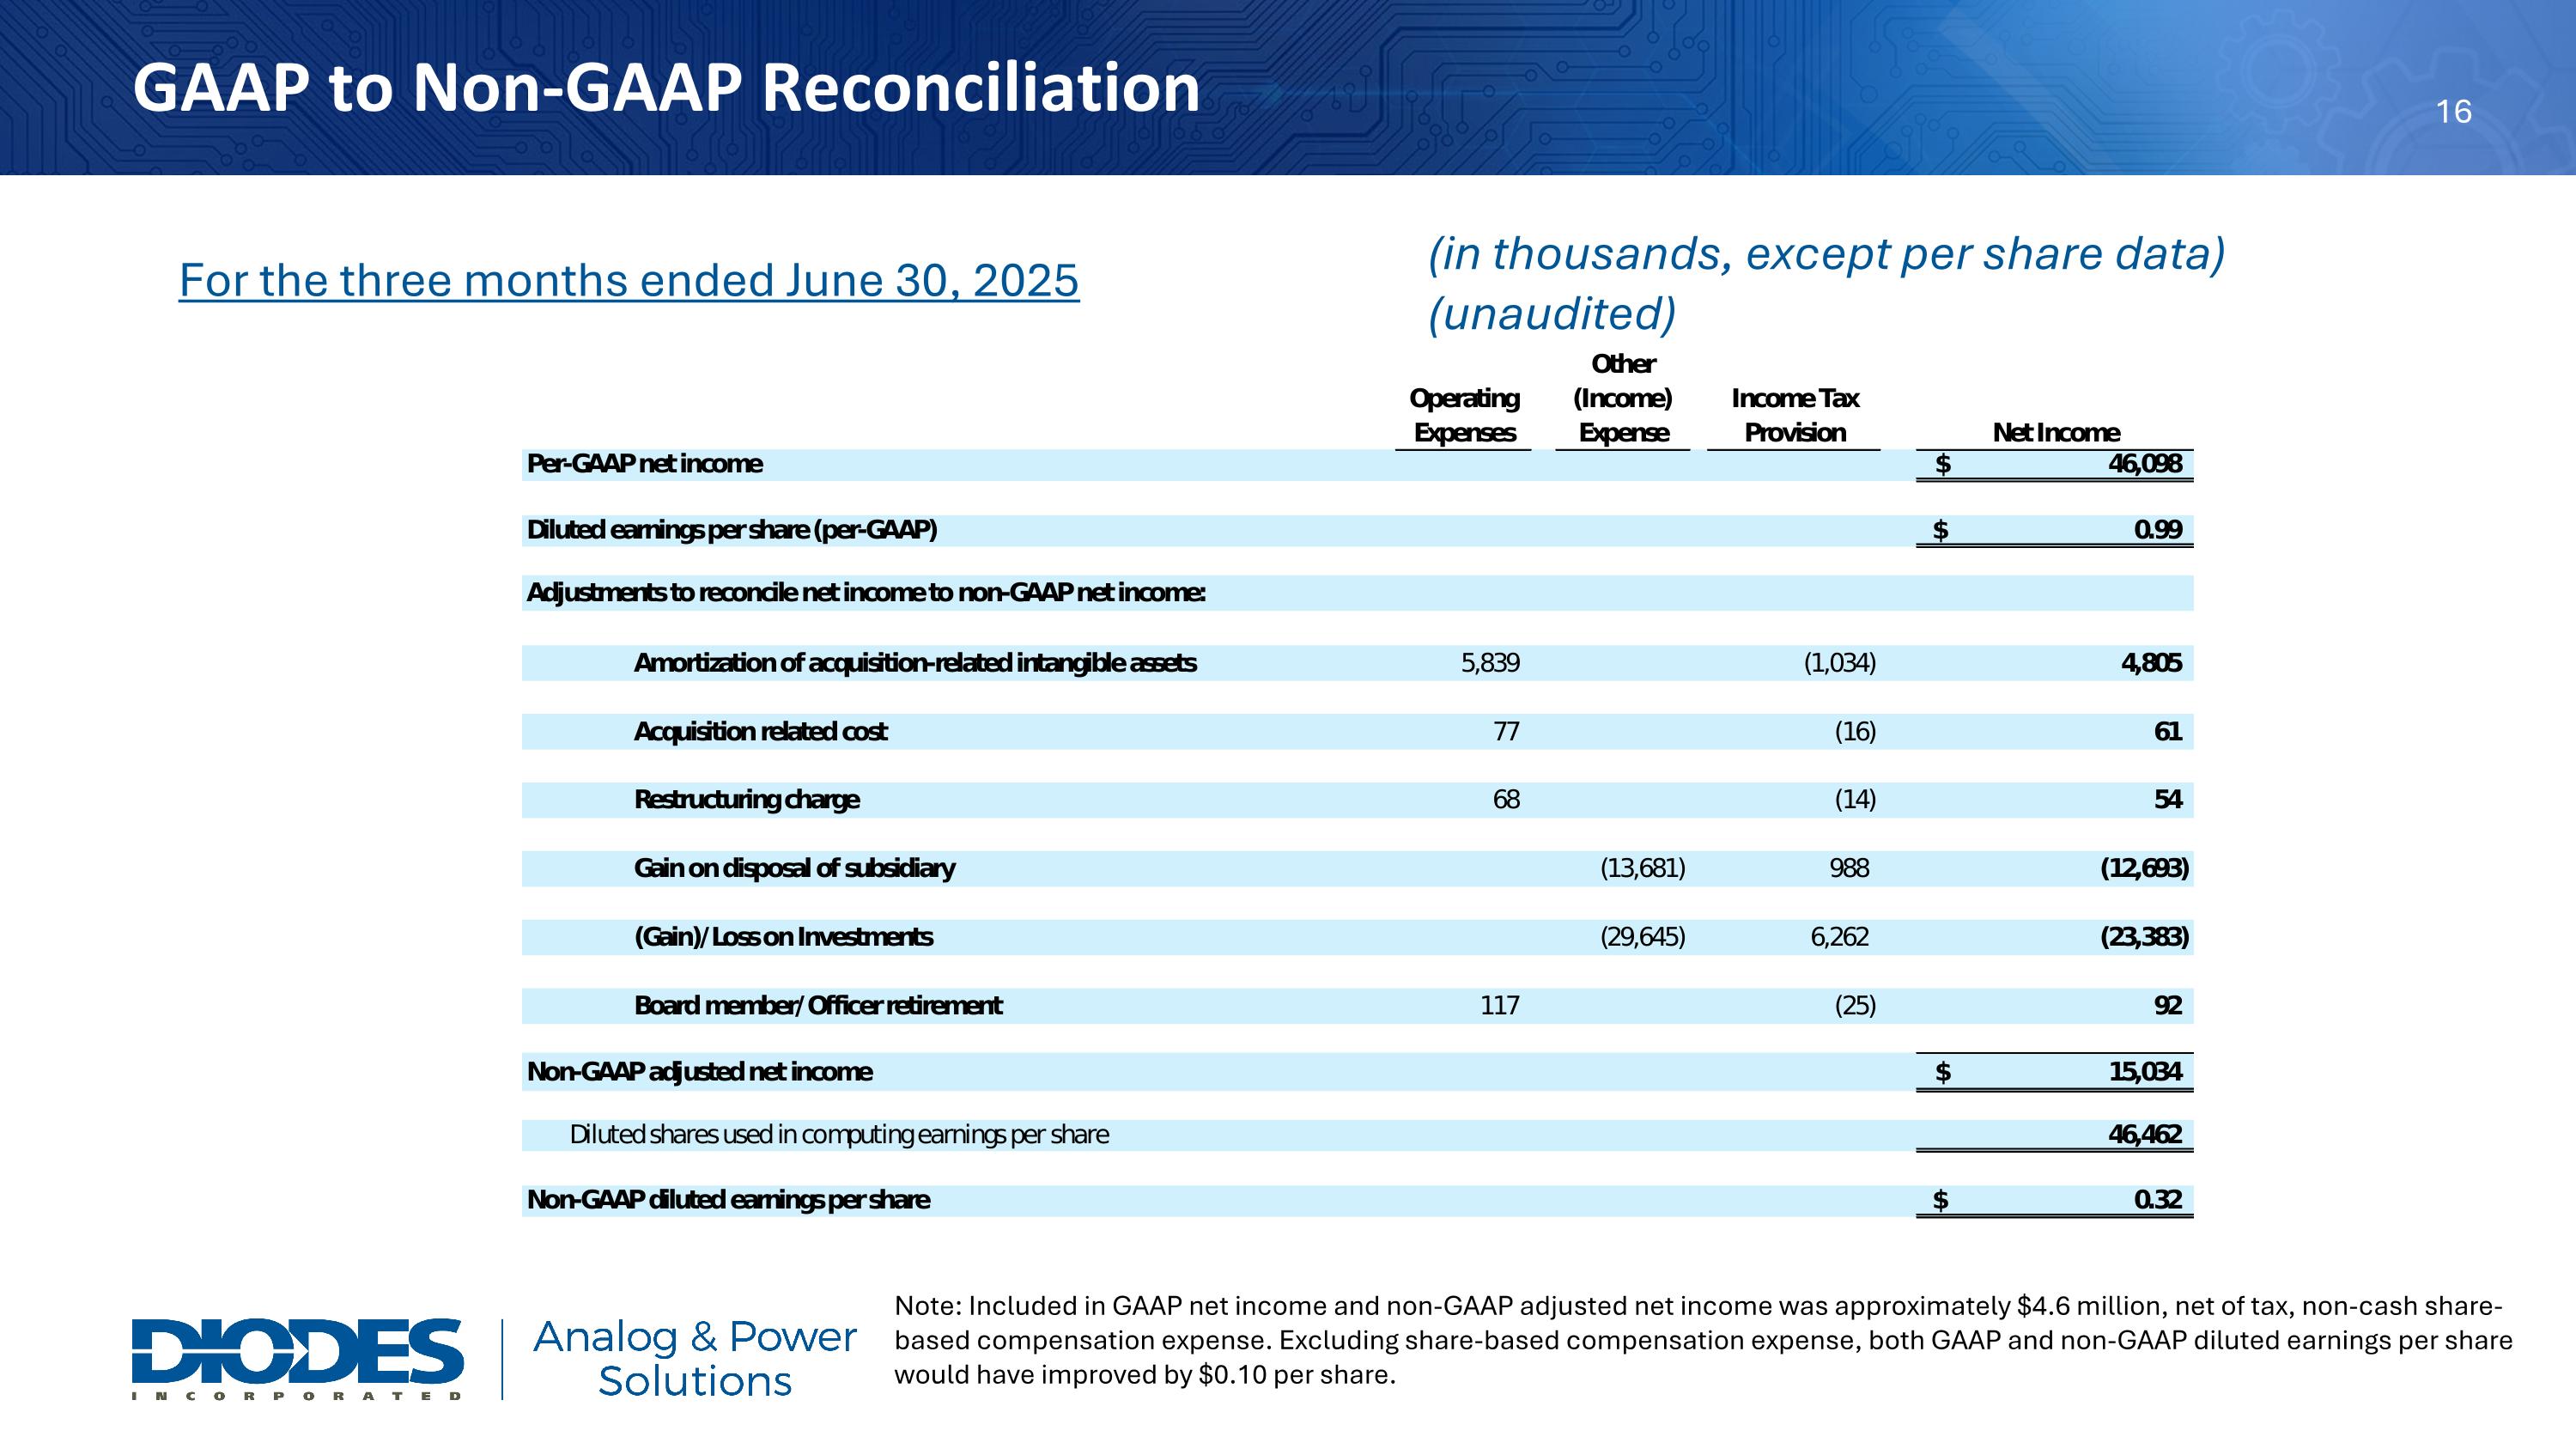
GAAP to Non-GAAP Reconciliation Note: Included in GAAP net income and non-GAAP adjusted net income was approximately $4.6 million, net of tax, non-cash share-based compensation expense. Excluding share-based compensation expense, both GAAP and non-GAAP diluted earnings per share would have improved by $0.10 per share. (in thousands, except per share data) (unaudited) For the three months ended June 30, 2025

EX-99.3 4 diod-ex99_3.htm EX-99.3

Slide 1

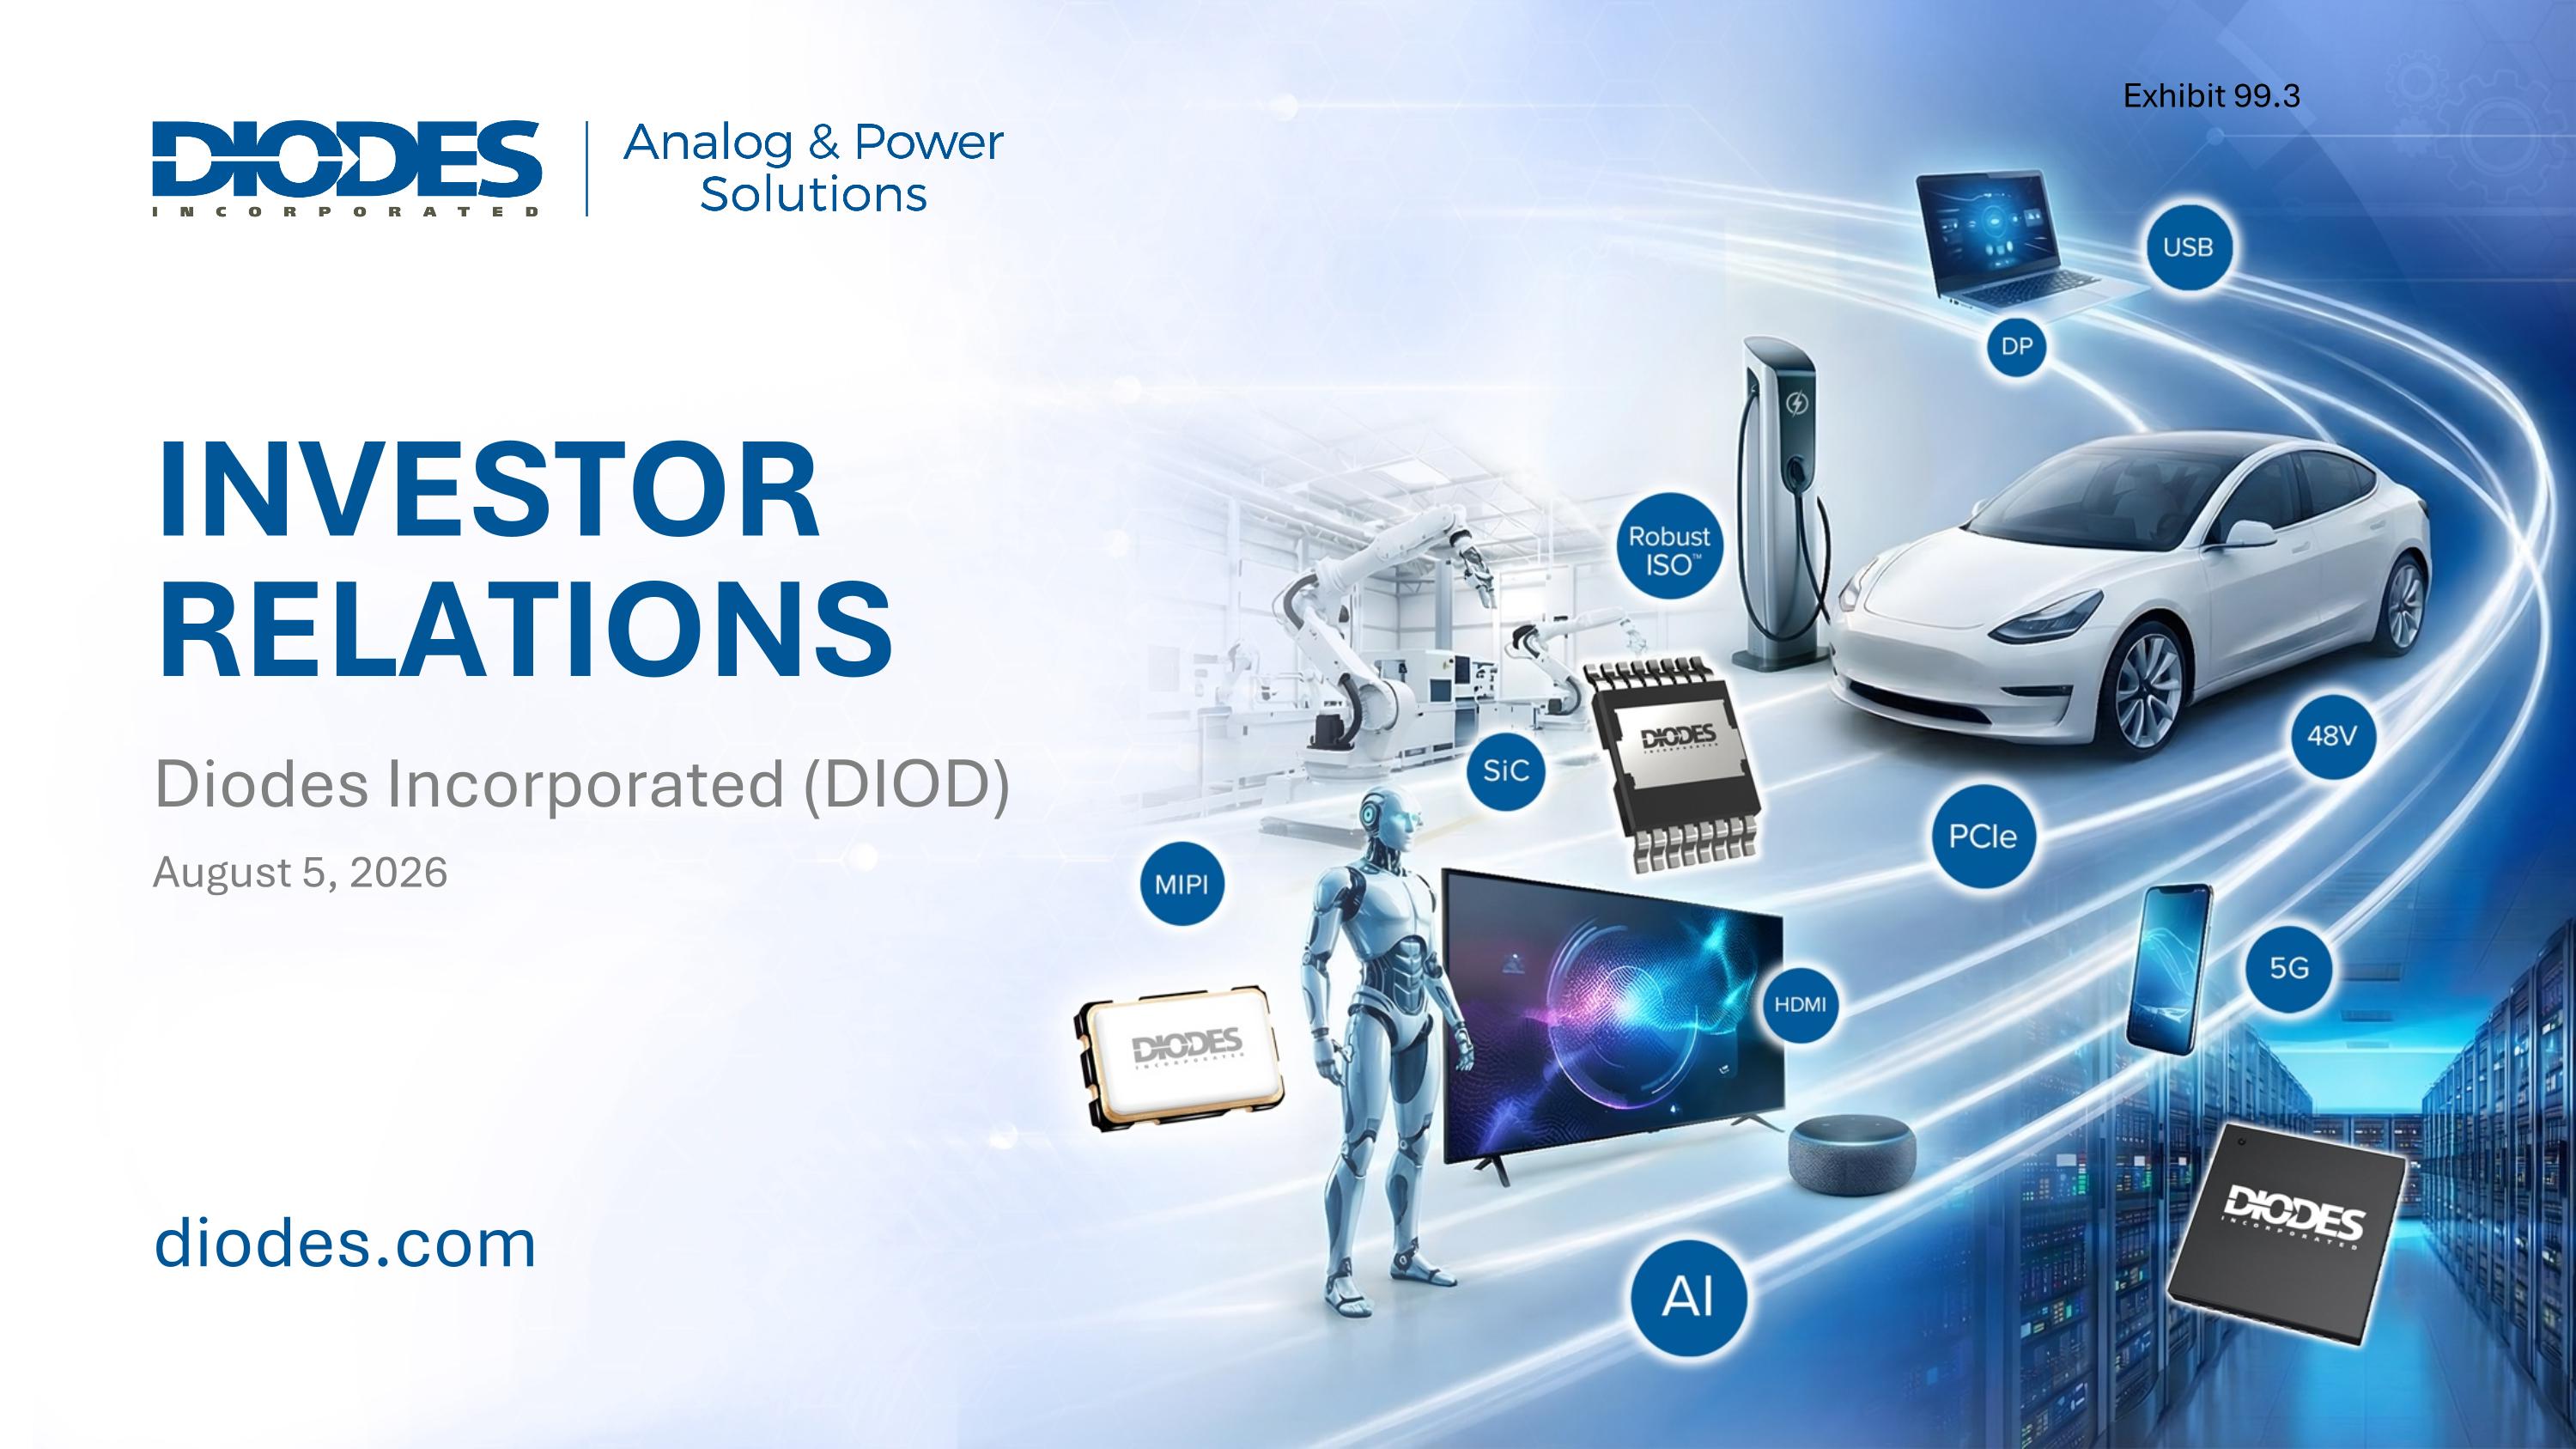
Diodes Incorporated (DIOD) INVESTOR RELATIONS August 5, 2026 Exhibit 99.3

Slide 2

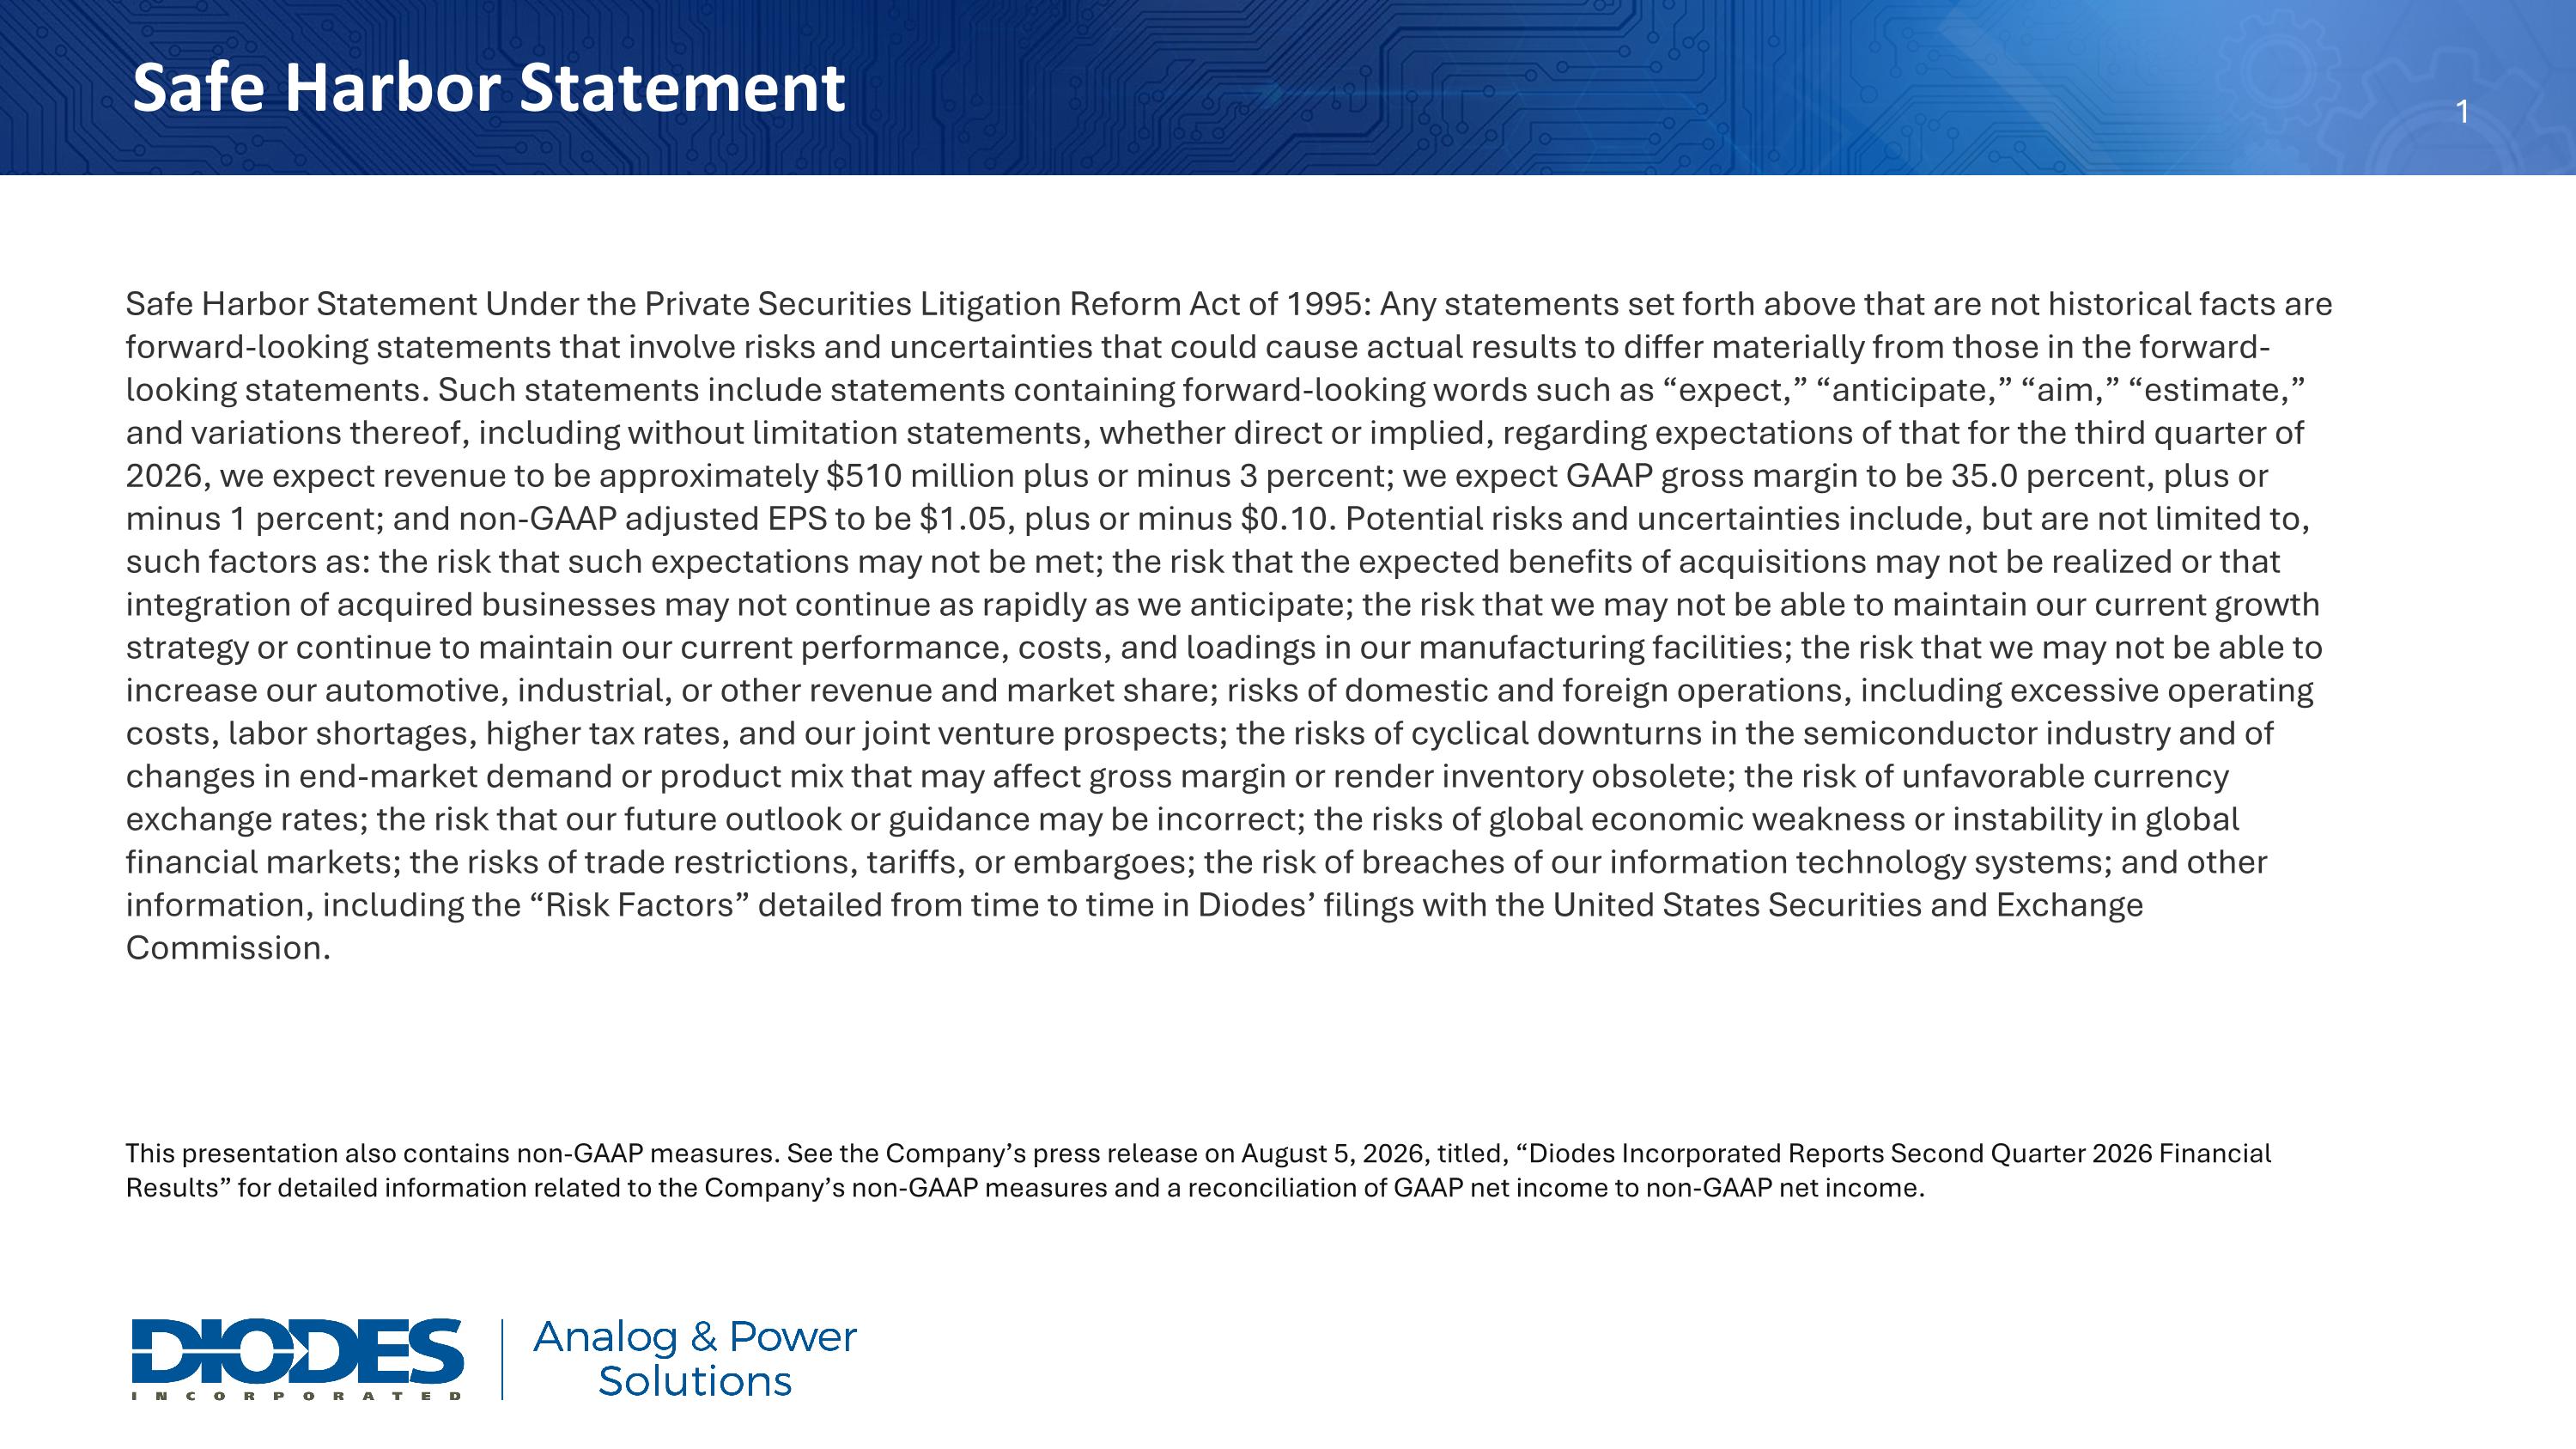
Safe Harbor Statement Safe Harbor Statement Under the Private Securities Litigation Reform Act of 1995: Any statements set forth above that are not historical facts are forward-looking statements that involve risks and uncertainties that could cause actual results to differ materially from those in the forward-looking statements. Such statements include statements containing forward-looking words such as “expect,” “anticipate,” “aim,” “estimate,” and variations thereof, including without limitation statements, whether direct or implied, regarding expectations of that for the third quarter of 2026, we expect revenue to be approximately $510 million plus or minus 3 percent; we expect GAAP gross margin to be 35.0 percent, plus or minus 1 percent; and non-GAAP adjusted EPS to be $1.05, plus or minus $0.10. Potential risks and uncertainties include, but are not limited to, such factors as: the risk that such expectations may not be met; the risk that the expected benefits of acquisitions may not be realized or that integration of acquired businesses may not continue as rapidly as we anticipate; the risk that we may not be able to maintain our current growth strategy or continue to maintain our current performance, costs, and loadings in our manufacturing facilities; the risk that we may not be able to increase our automotive, industrial, or other revenue and market share; risks of domestic and foreign operations, including excessive operating costs, labor shortages, higher tax rates, and our joint venture prospects; the risks of cyclical downturns in the semiconductor industry and of changes in end-market demand or product mix that may affect gross margin or render inventory obsolete; the risk of unfavorable currency exchange rates; the risk that our future outlook or guidance may be incorrect; the risks of global economic weakness or instability in global financial markets; the risks of trade restrictions, tariffs, or embargoes; the risk of breaches of our information technology systems; and other information, including the “Risk Factors” detailed from time to time in Diodes’ filings with the United States Securities and Exchange Commission. This presentation also contains non-GAAP measures. See the Company’s press release on August 5, 2026, titled, “Diodes Incorporated Reports Second Quarter 2026 Financial Results” for detailed information related to the Company’s non-GAAP measures and a reconciliation of GAAP net income to non-GAAP net income.

Slide 3

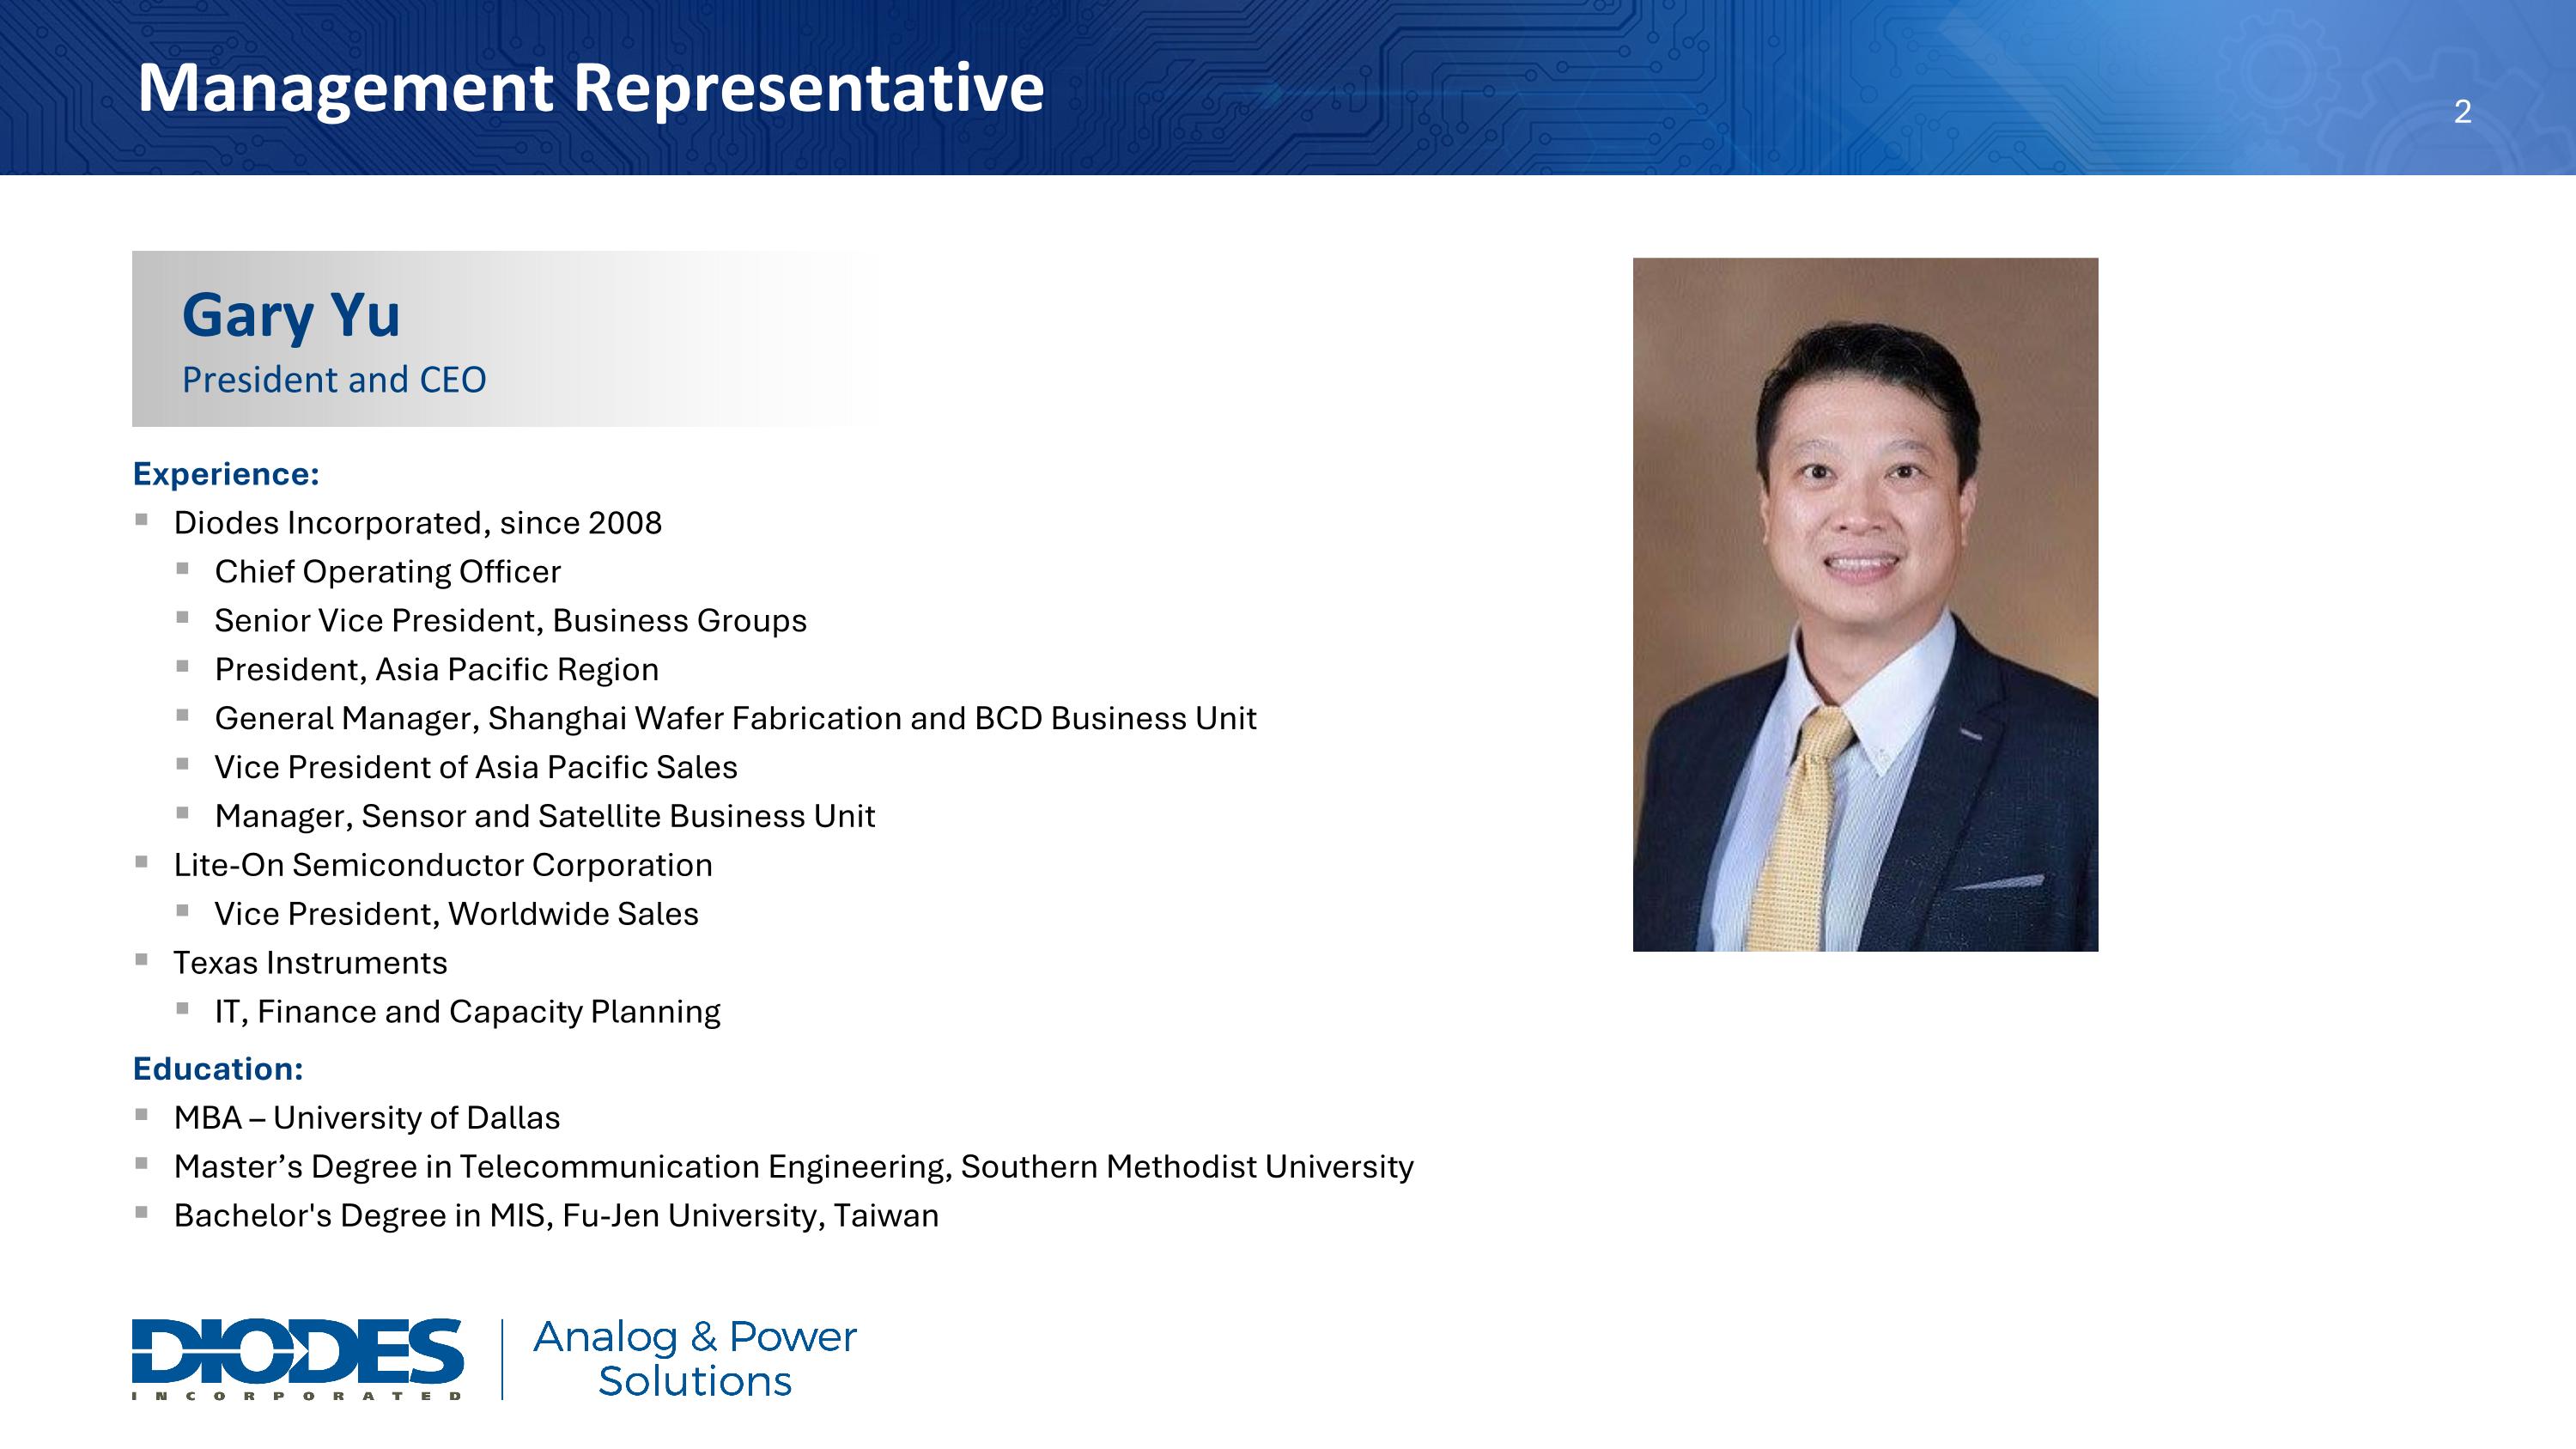
Gary Yu President and CEO Experience: Diodes Incorporated, since 2008 Chief Operating Officer Senior Vice President, Business Groups President, Asia Pacific Region General Manager, Shanghai Wafer Fabrication and BCD Business Unit Vice President of Asia Pacific Sales Manager, Sensor and Satellite Business Unit Lite-On Semiconductor Corporation Vice President, Worldwide Sales Texas Instruments IT, Finance and Capacity Planning Education: MBA – University of Dallas Master’s Degree in Telecommunication Engineering, Southern Methodist University Bachelor's Degree in MIS, Fu-Jen University, Taiwan Management Representative

Slide 4

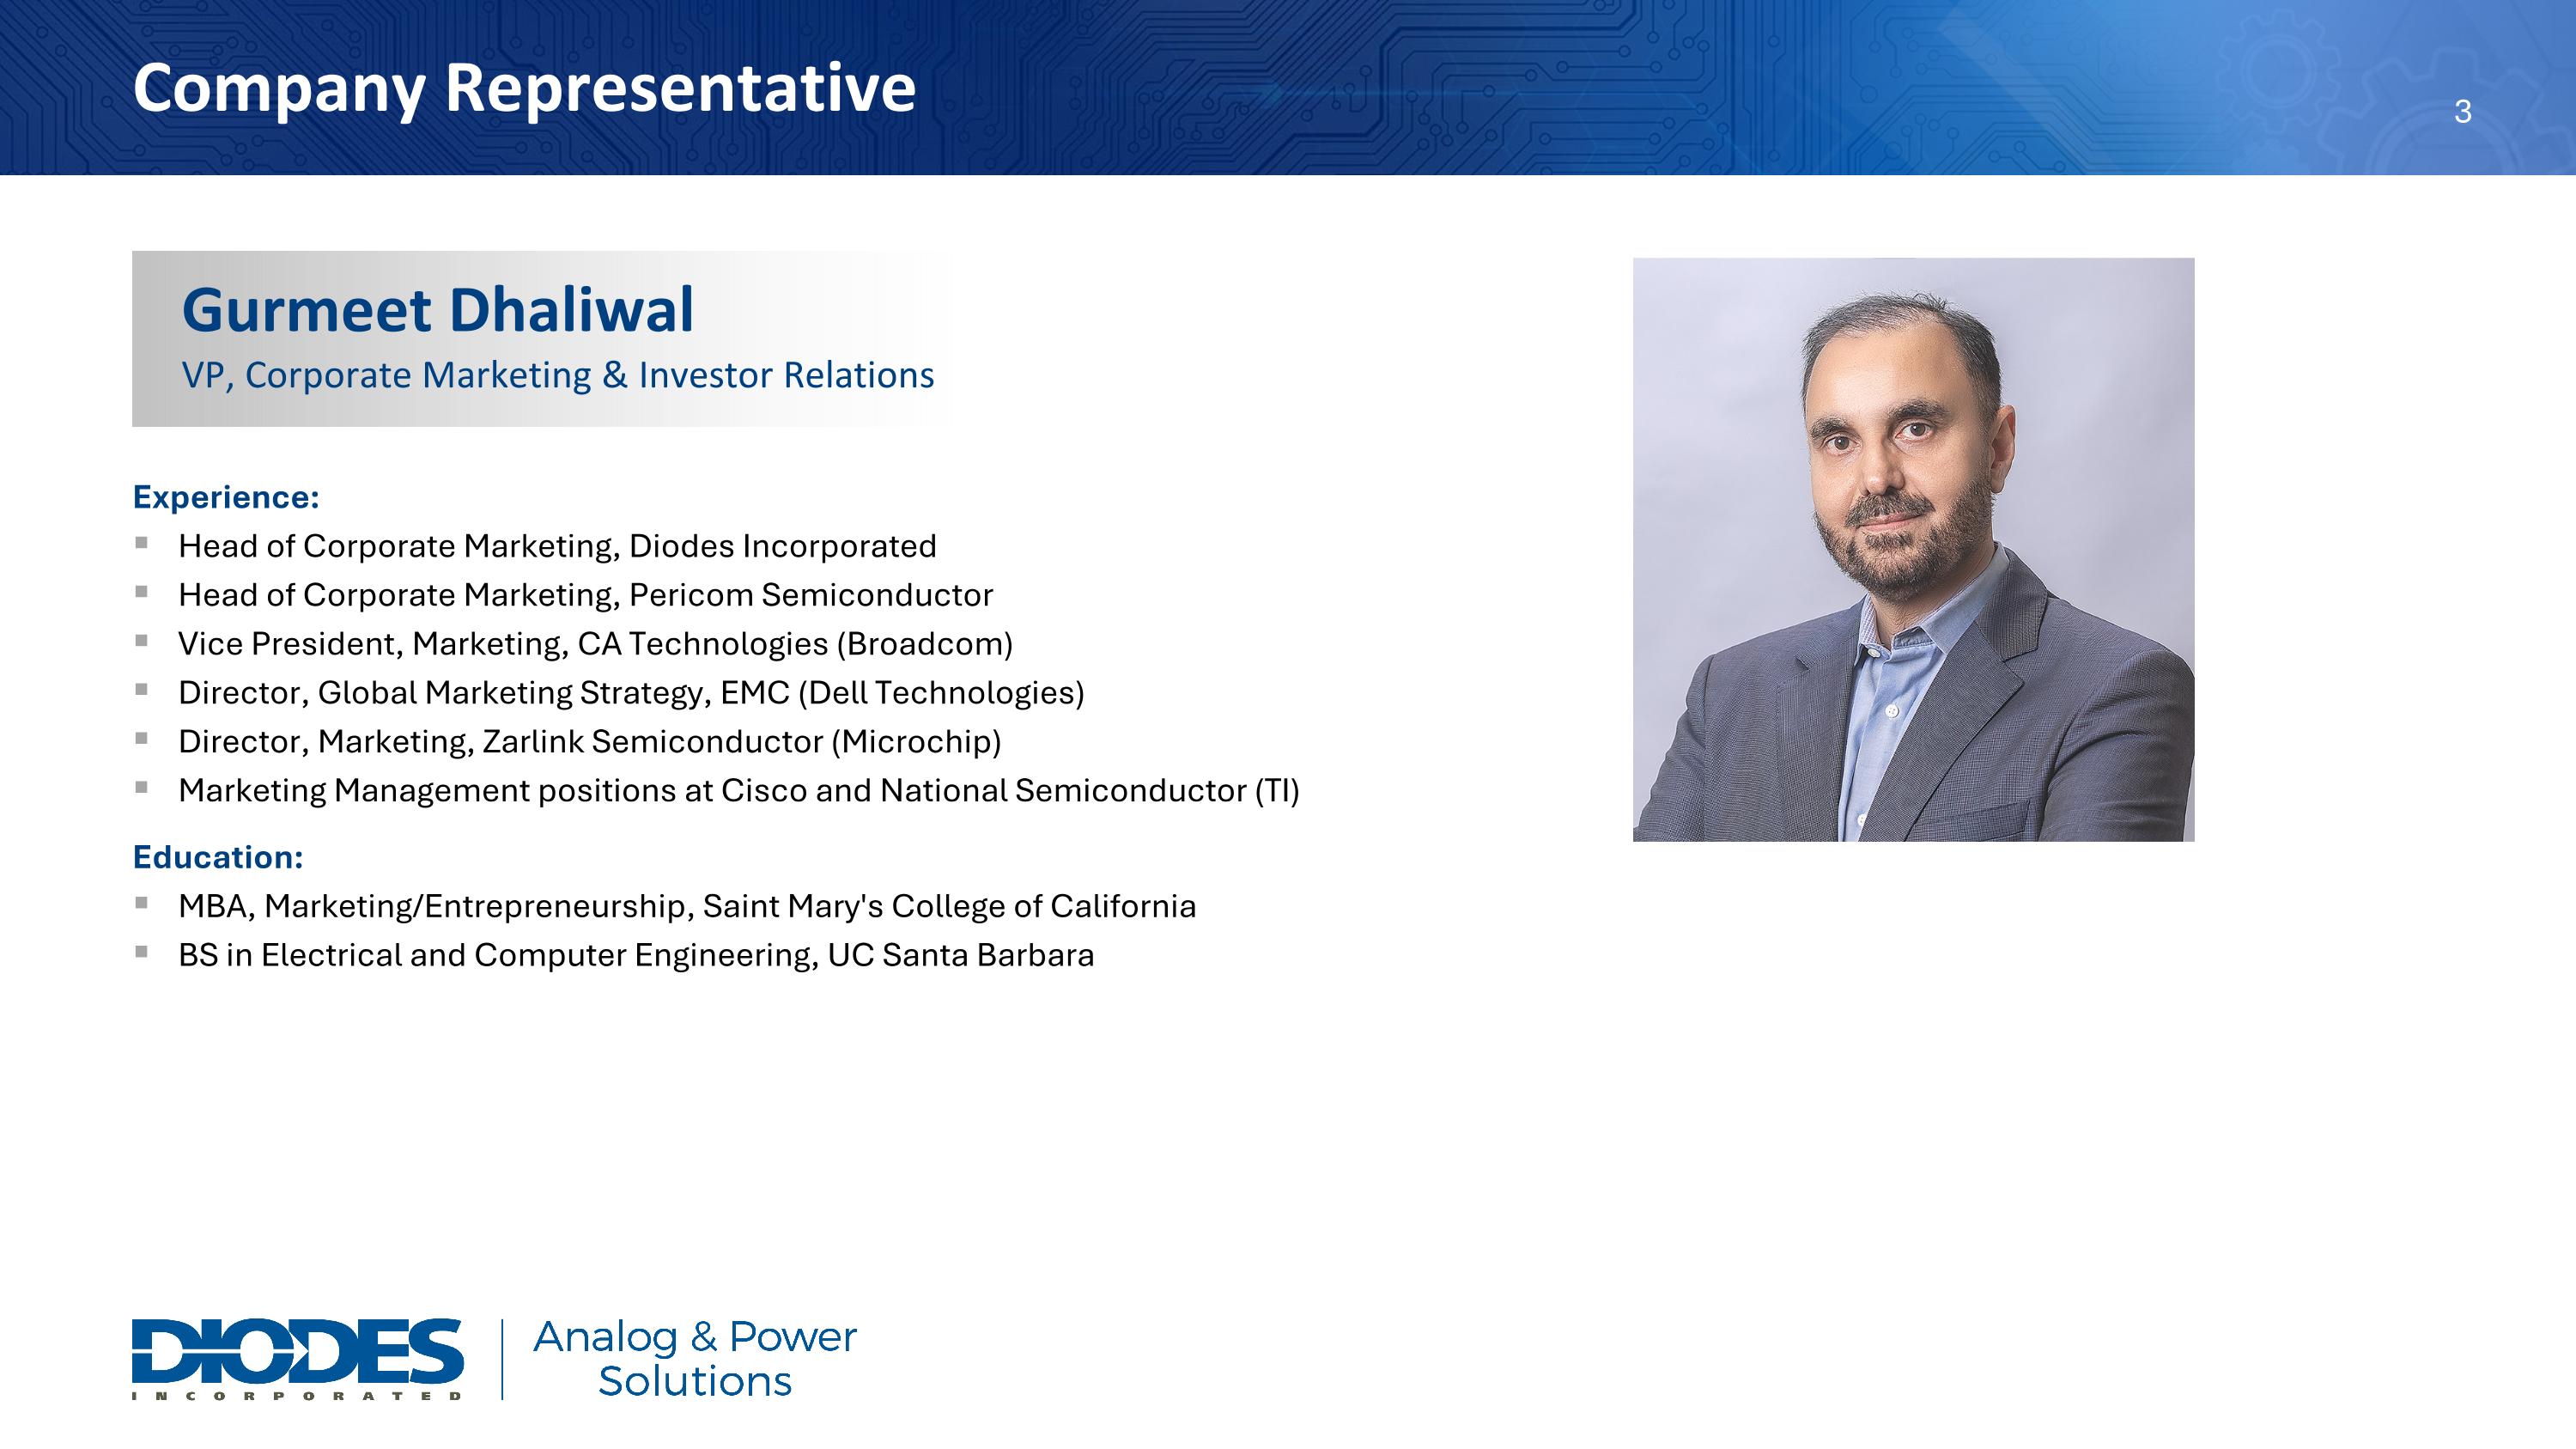
Company Representative Experience: Head of Corporate Marketing, Diodes Incorporated Head of Corporate Marketing, Pericom Semiconductor Vice President, Marketing, CA Technologies (Broadcom) Director, Global Marketing Strategy, EMC (Dell Technologies) Director, Marketing, Zarlink Semiconductor (Microchip) Marketing Management positions at Cisco and National Semiconductor (TI) Education: MBA, Marketing/Entrepreneurship, Saint Mary's College of California BS in Electrical and Computer Engineering, UC Santa Barbara Gurmeet Dhaliwal VP, Corporate Marketing & Investor Relations

Slide 5

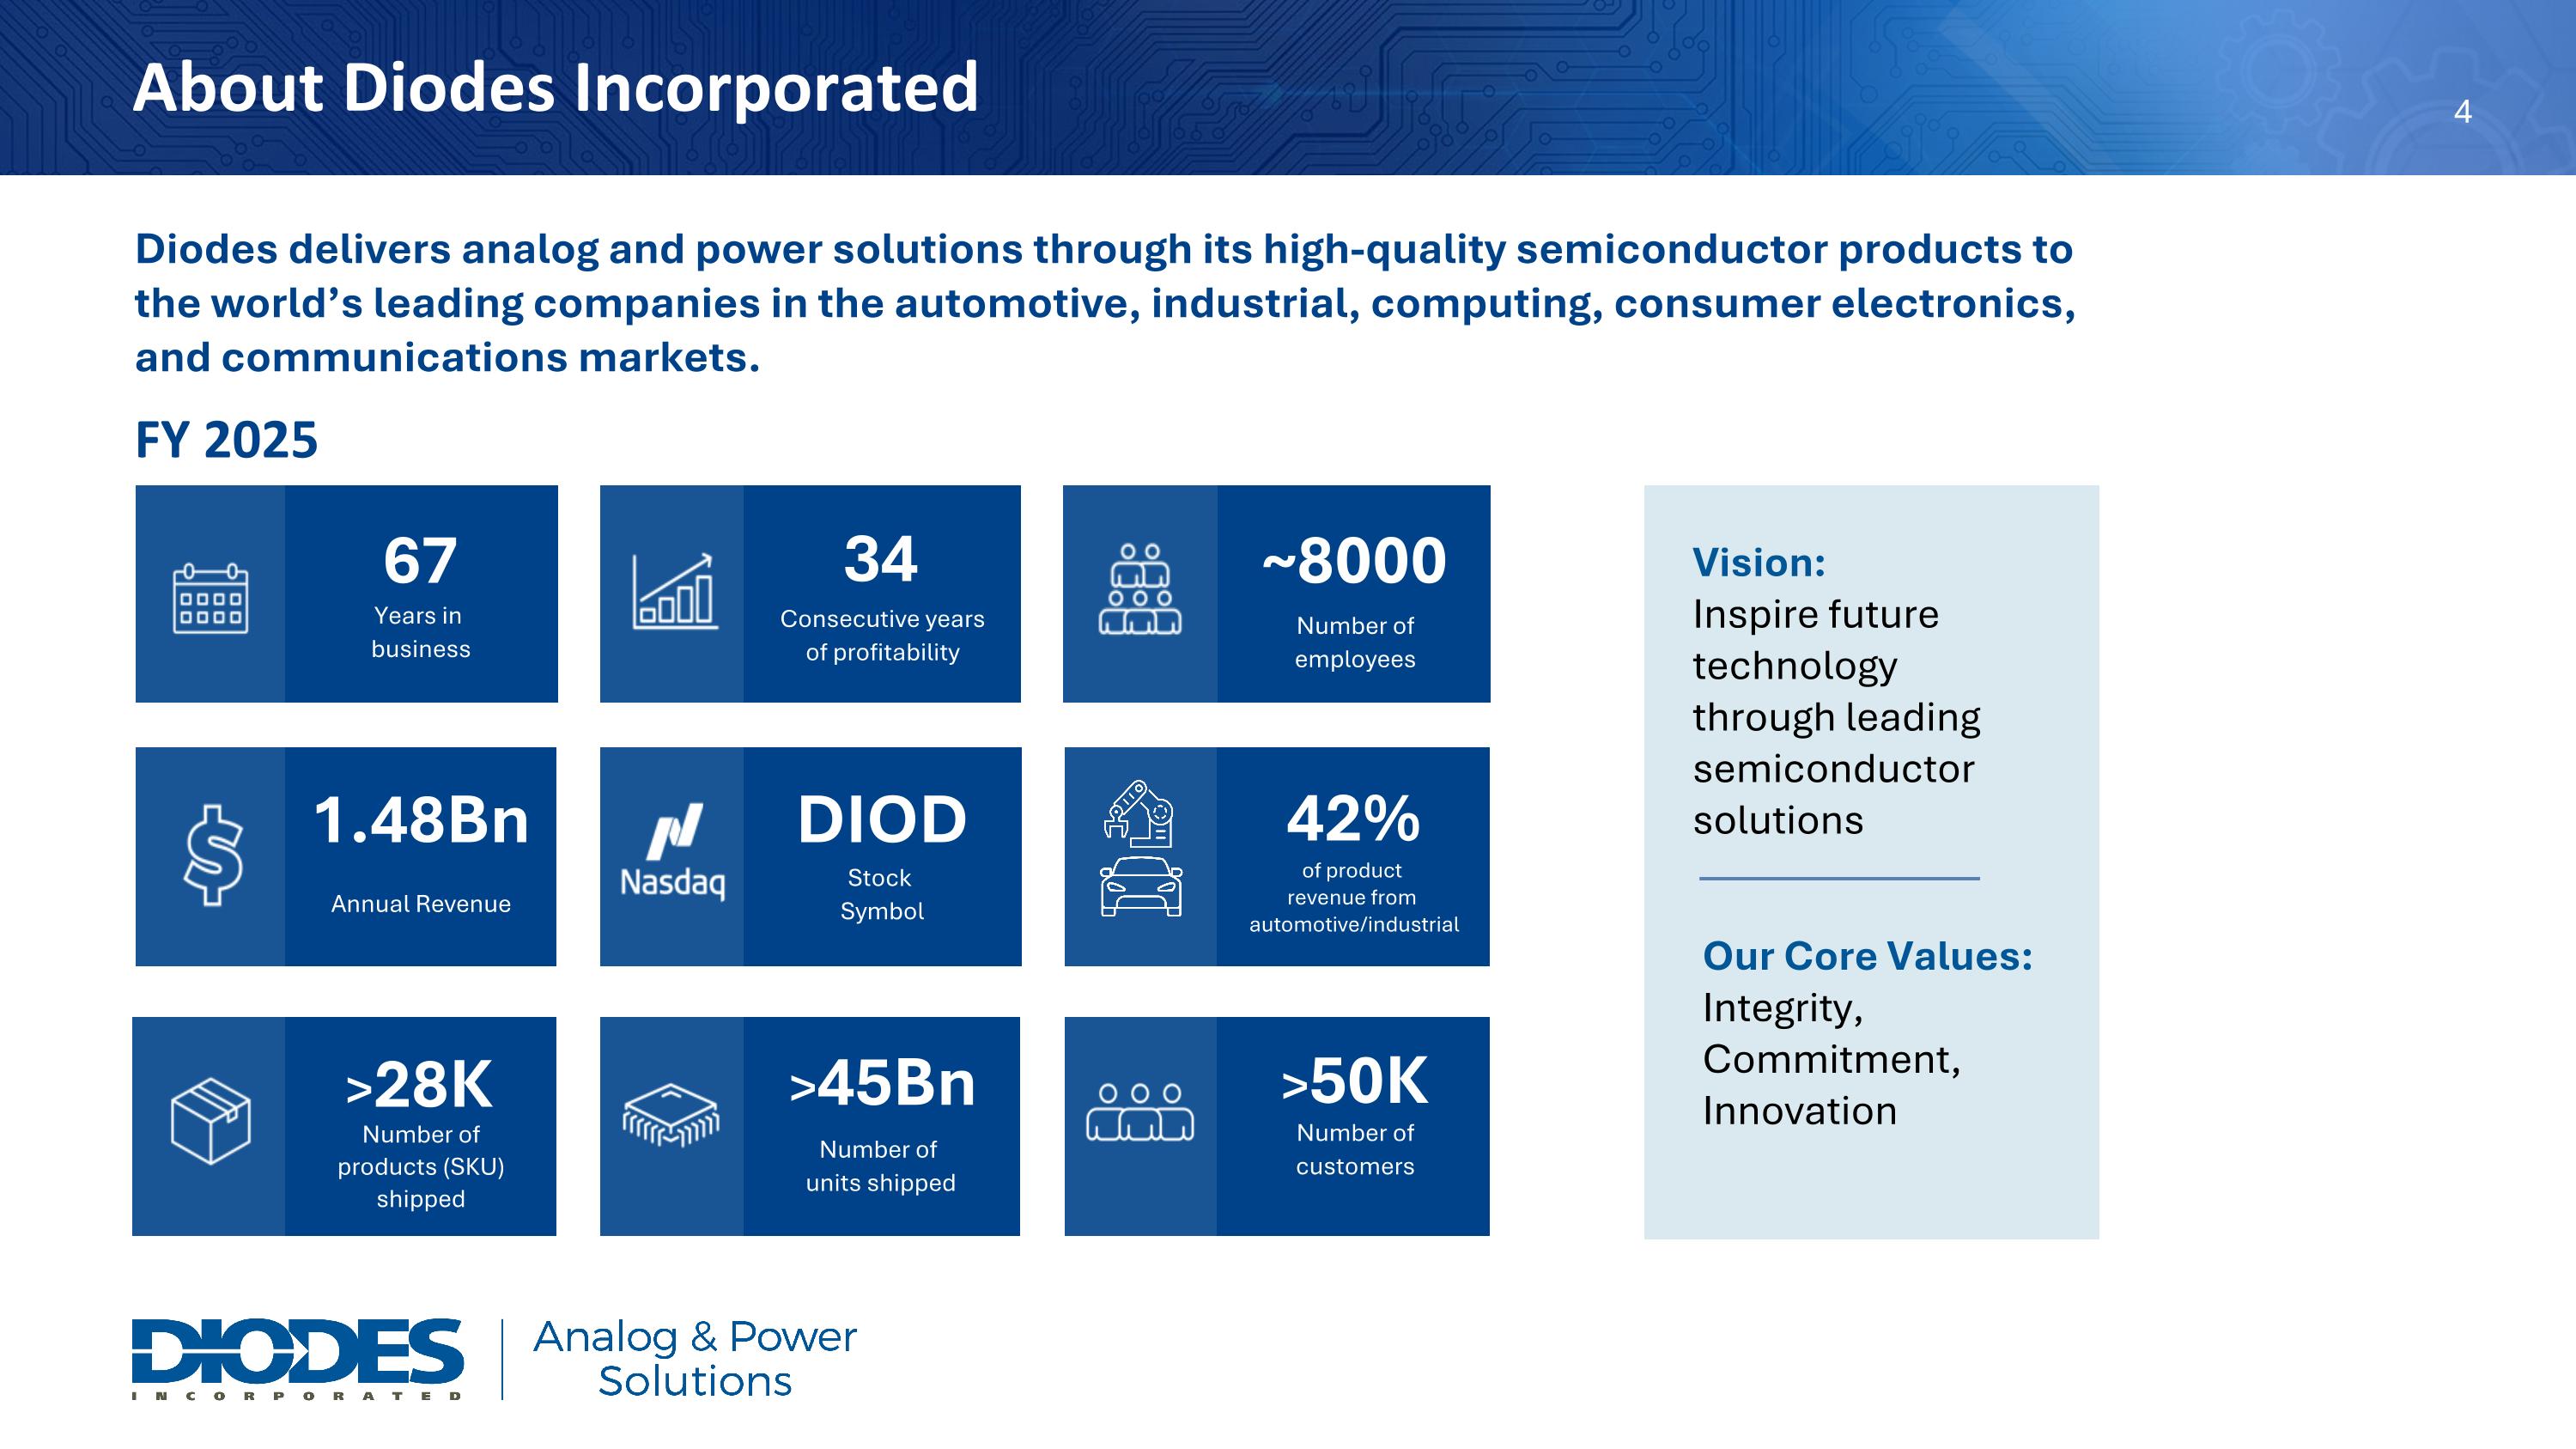
About Diodes Incorporated Diodes delivers analog and power solutions through its high-quality semiconductor products to the world’s leading companies in the automotive, industrial, computing, consumer electronics, and communications markets. Vision: Inspire future technology through leading semiconductor solutions Our Core Values:Integrity,Commitment,Innovation 67 Years in business 34 Consecutive yearsof profitability ~8000 Number ofemployees 1.48Bn Annual Revenue >45Bn >28K Number ofproducts (SKU)shipped >50K Number ofcustomers 42% of product revenue from automotive/industrial Stock Symbol Number of units shipped DIOD FY 2025

Slide 6

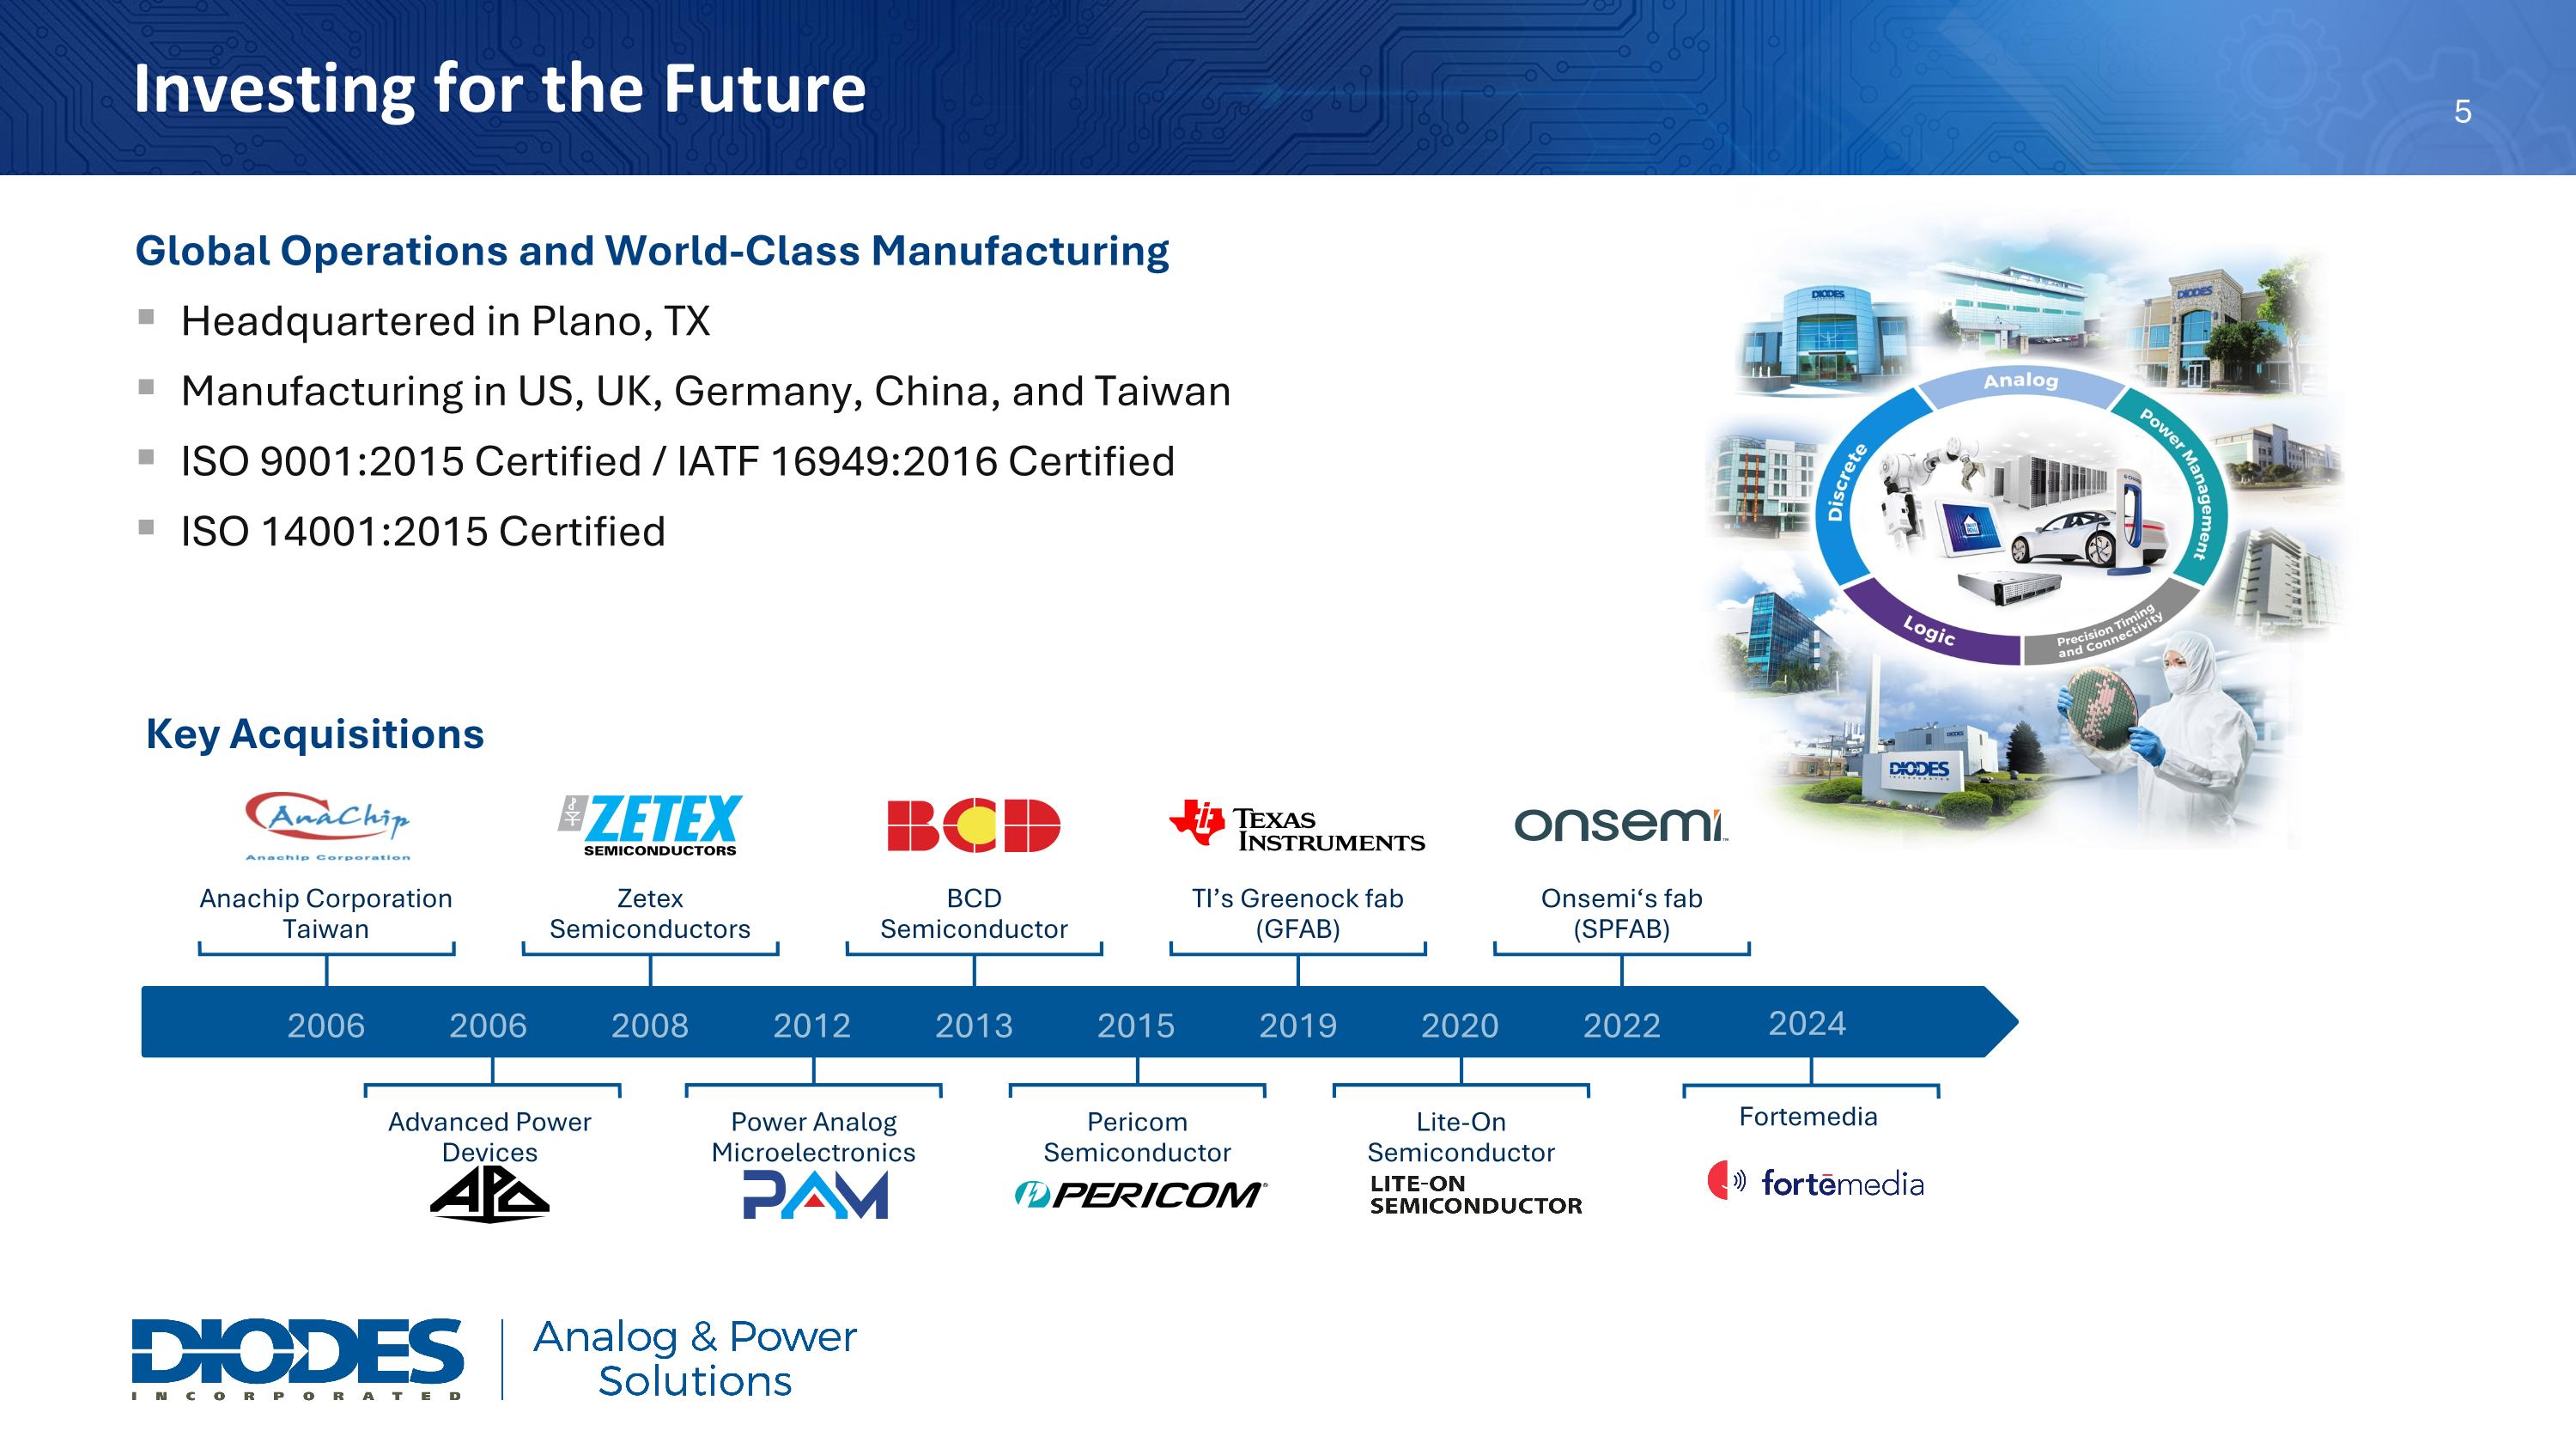
Global Operations and World-Class Manufacturing Headquartered in Plano, TX Manufacturing in US, UK, Germany, China, and Taiwan ISO 9001:2015 Certified / IATF 16949:2016 Certified ISO 14001:2015 Certified Key Acquisitions 2006 2006 2012 2015 2008 2013 2019 2020 2022 Anachip Corporation Taiwan Advanced Power Devices ZetexSemiconductors Power Analog Microelectronics BCDSemiconductor Pericom Semiconductor TI’s Greenock fab (GFAB) Lite-OnSemiconductor Onsemi‘s fab (SPFAB) 2024 Fortemedia Investing for the Future

Slide 7

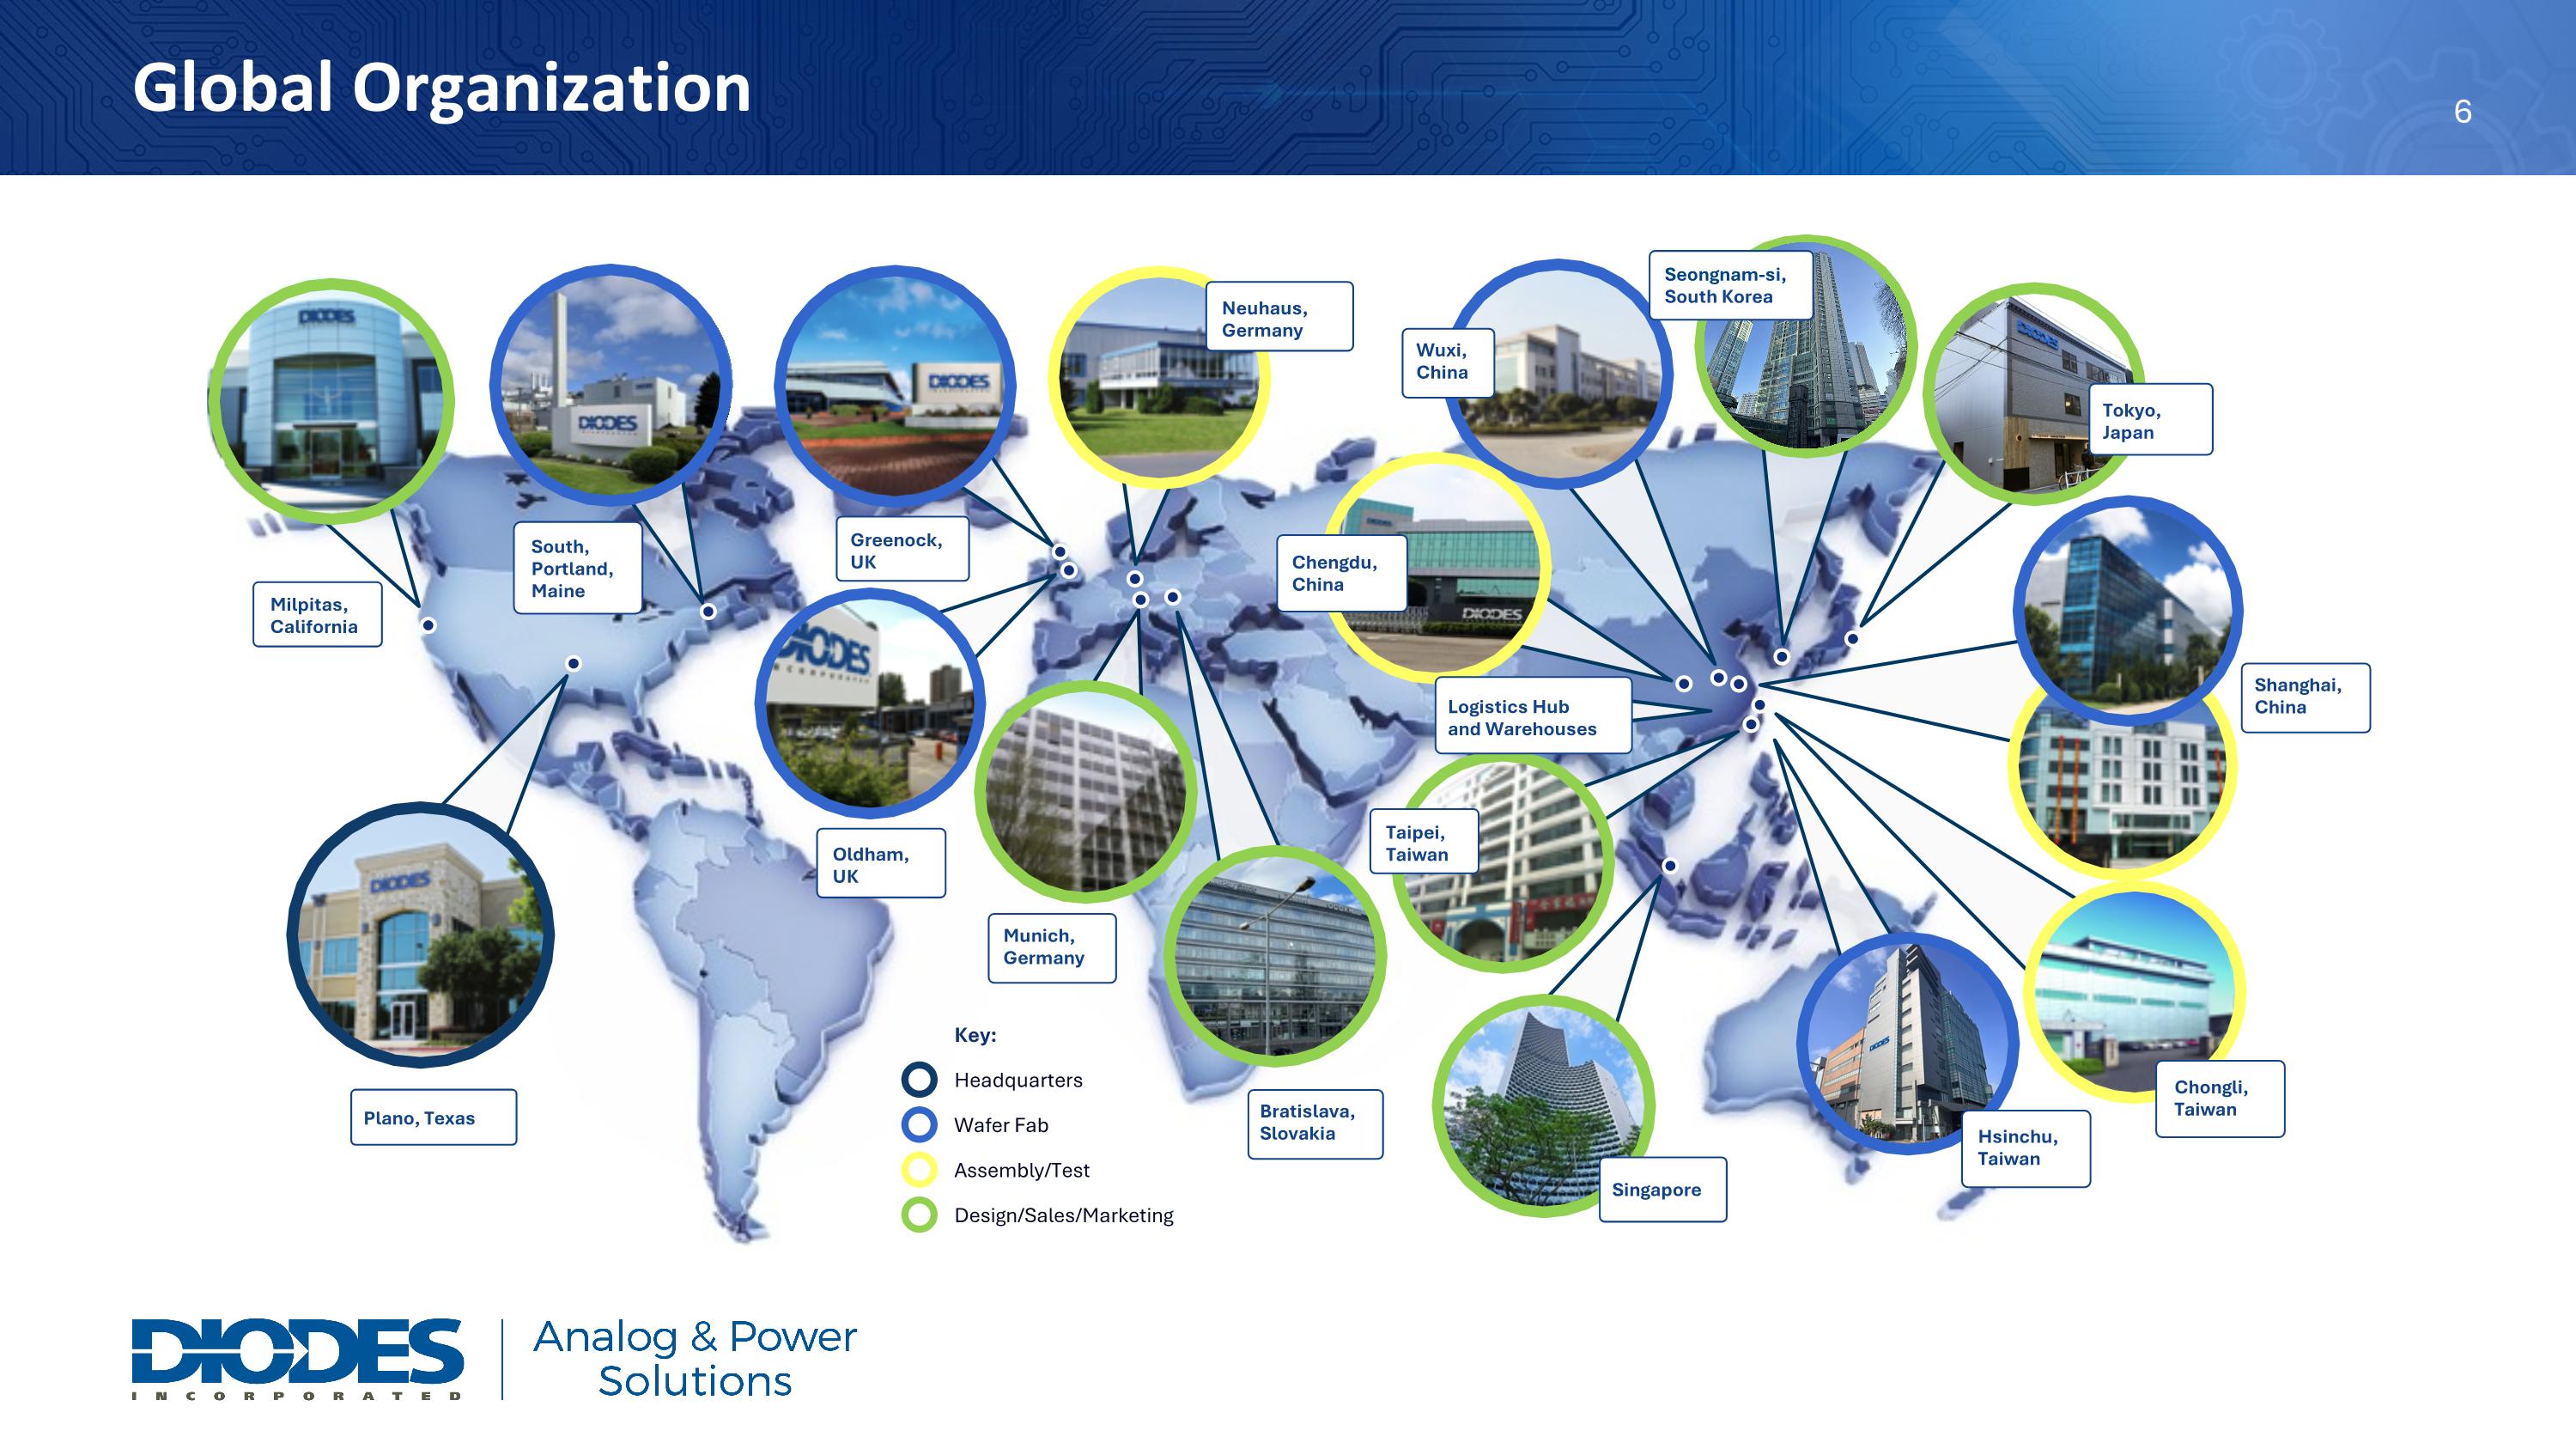
Global Organization Wuxi, China Shanghai,China Chongli,Taiwan Hsinchu,Taiwan Taipei,Taiwan Munich,Germany Neuhaus,Germany Plano, Texas Milpitas,California Greenock,UK Chengdu,China Logistics Hub and Warehouses Oldham,UK Key: Headquarters Wafer Fab Assembly/Test Design/Sales/Marketing South,Portland,Maine Tokyo,Japan Seongnam-si,South Korea Bratislava, Slovakia Singapore

Slide 8

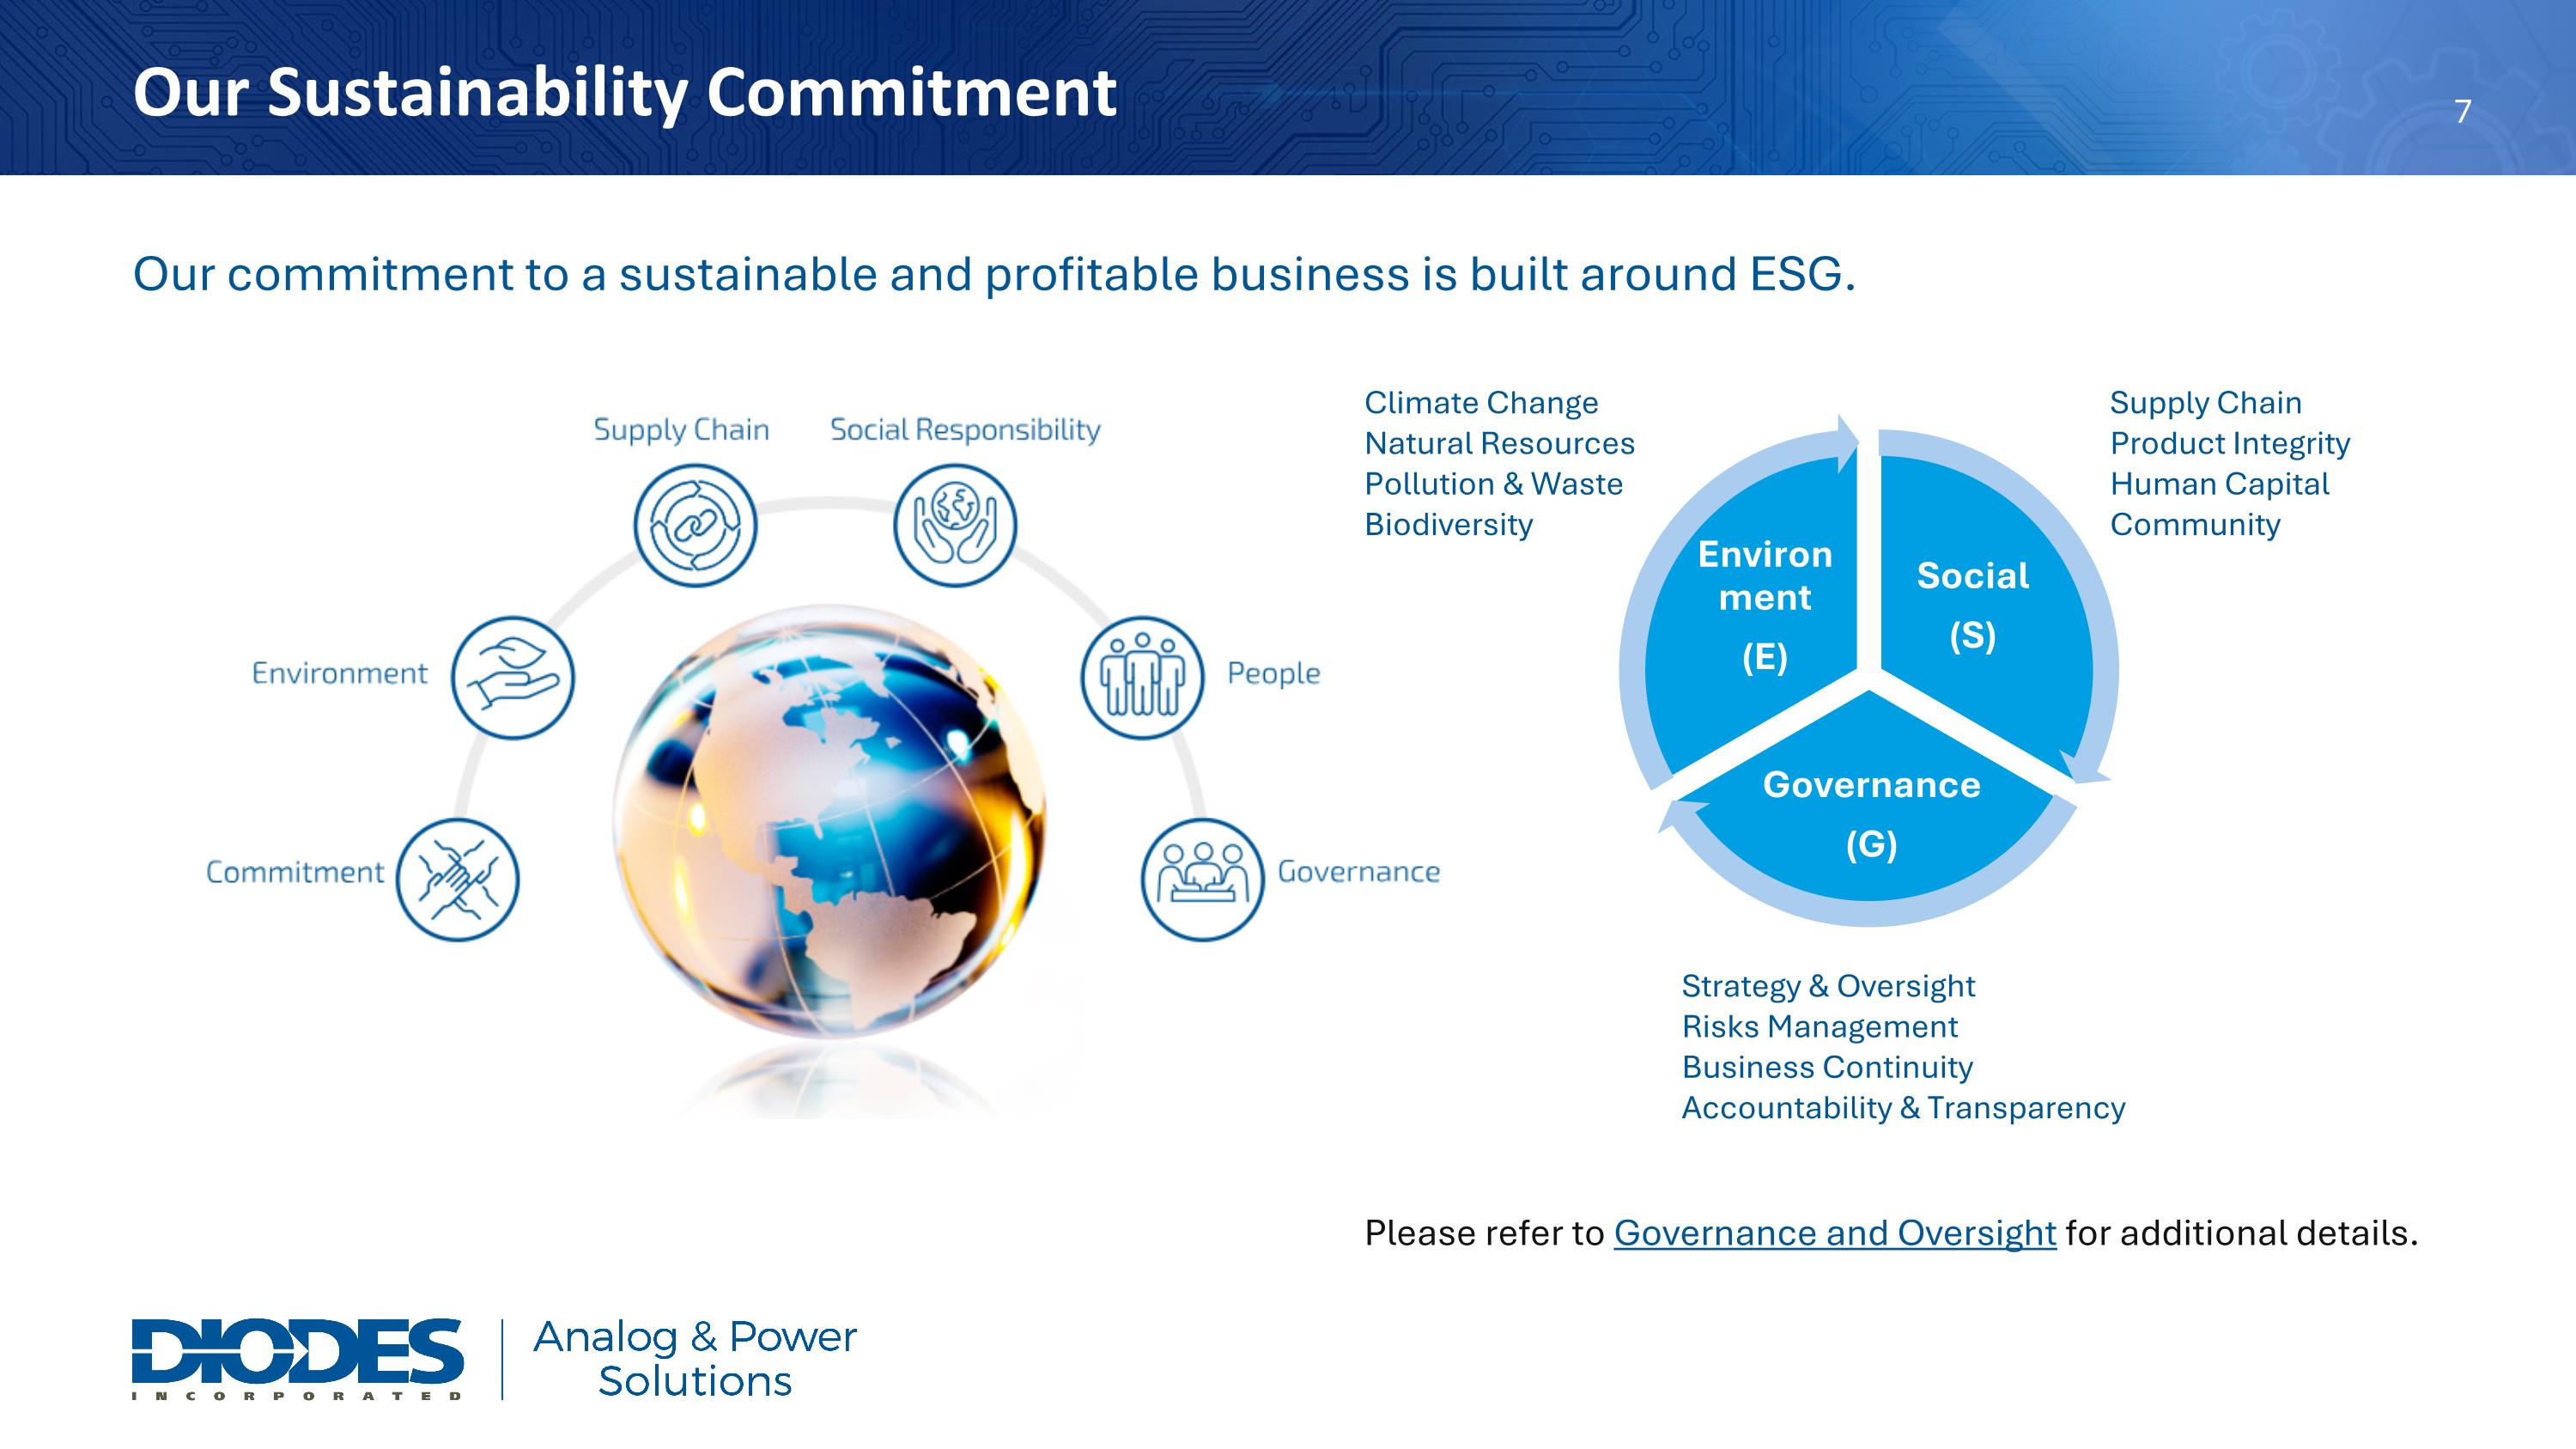
Our commitment to a sustainable and profitable business is built around ESG. Please refer to Governance and Oversight for additional details.  Social (S) Governance (G) Environment (E) Climate Change Natural Resources Pollution & Waste Biodiversity Strategy & Oversight Risks Management Business Continuity Accountability & Transparency Supply Chain Product Integrity Human Capital Community Our Sustainability Commitment

Slide 9

$Billion Financial Targets Goal 1: $1B Market Cap - 2010 Goal 2: $1B Revenue- 2017 Goal 3: $2.5B Revenue $1B Gross Profit (40% GM) Goal 4: $1B Profit Before Tax 3-Year Targets (2028): $2B Revenue Gross Profit: $700M Gross Margin: 35%+ Non-GAAP EPS: $4.00+

Slide 10

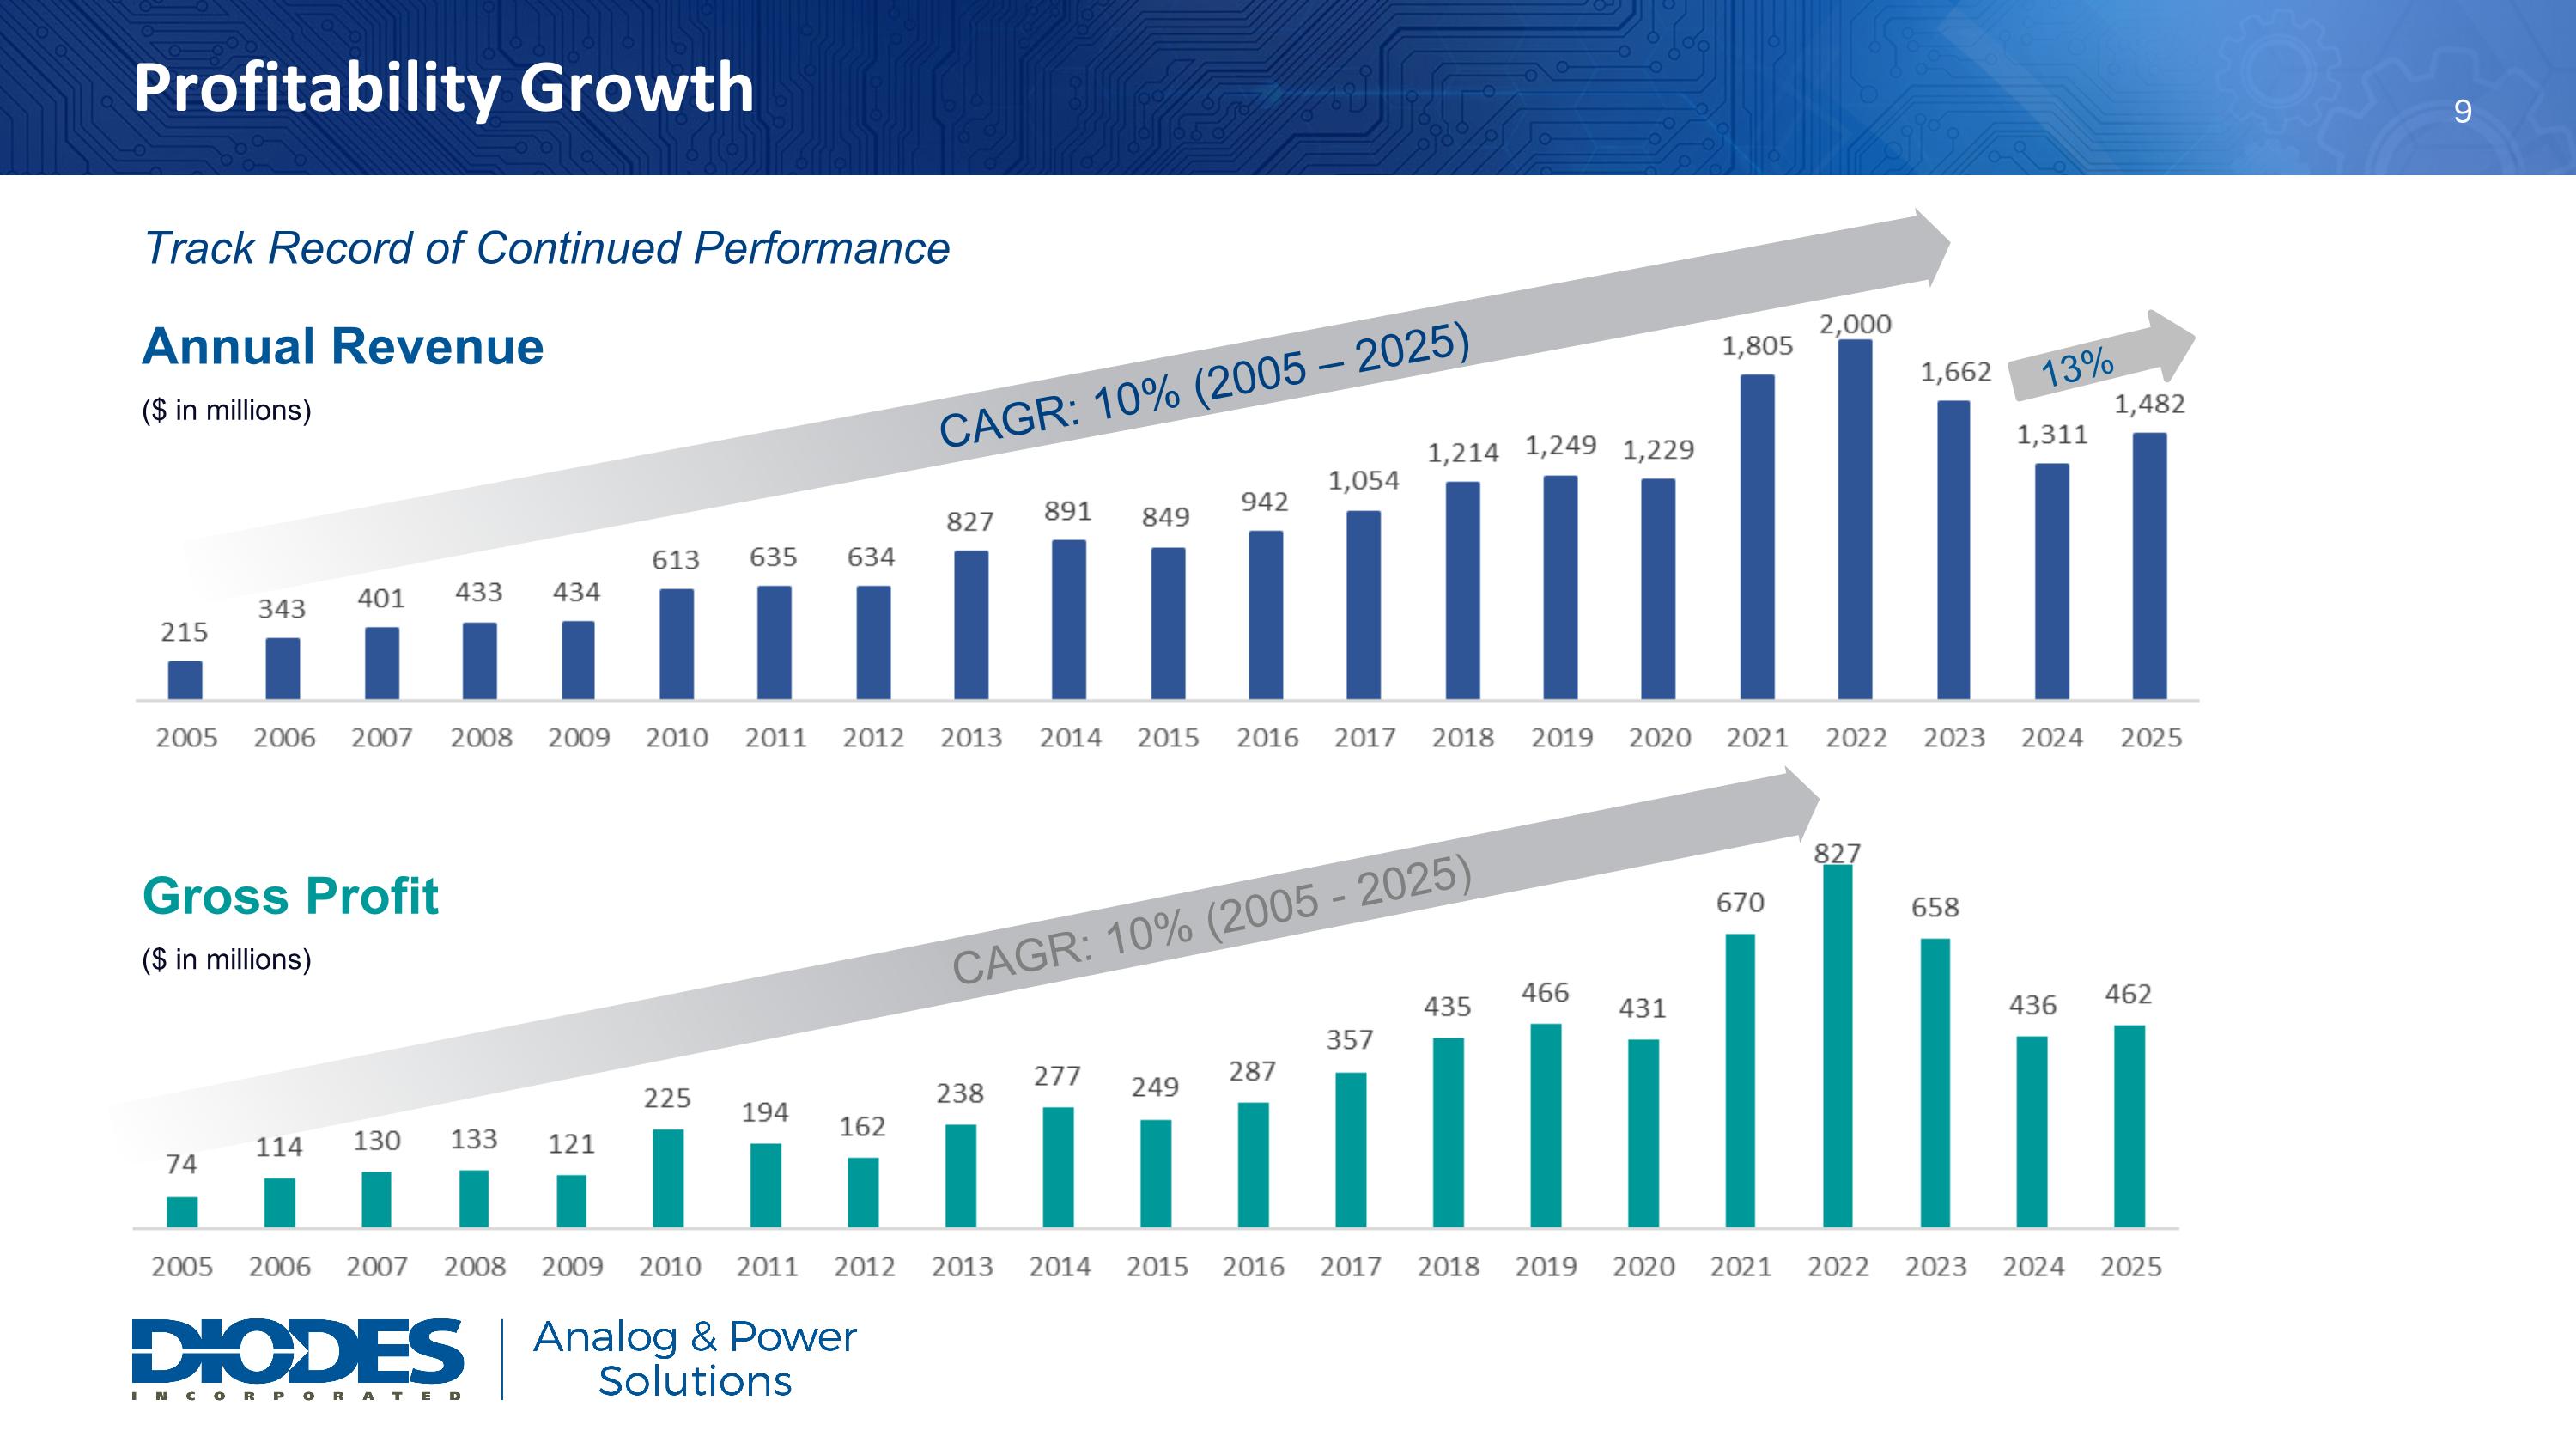
Profitability Growth Track Record of Continued Performance Gross Profit ($ in millions) ($ in millions) CAGR: 10% (2005 – 2025) CAGR: 10% (2005 - 2025) 13% Annual Revenue

Slide 11

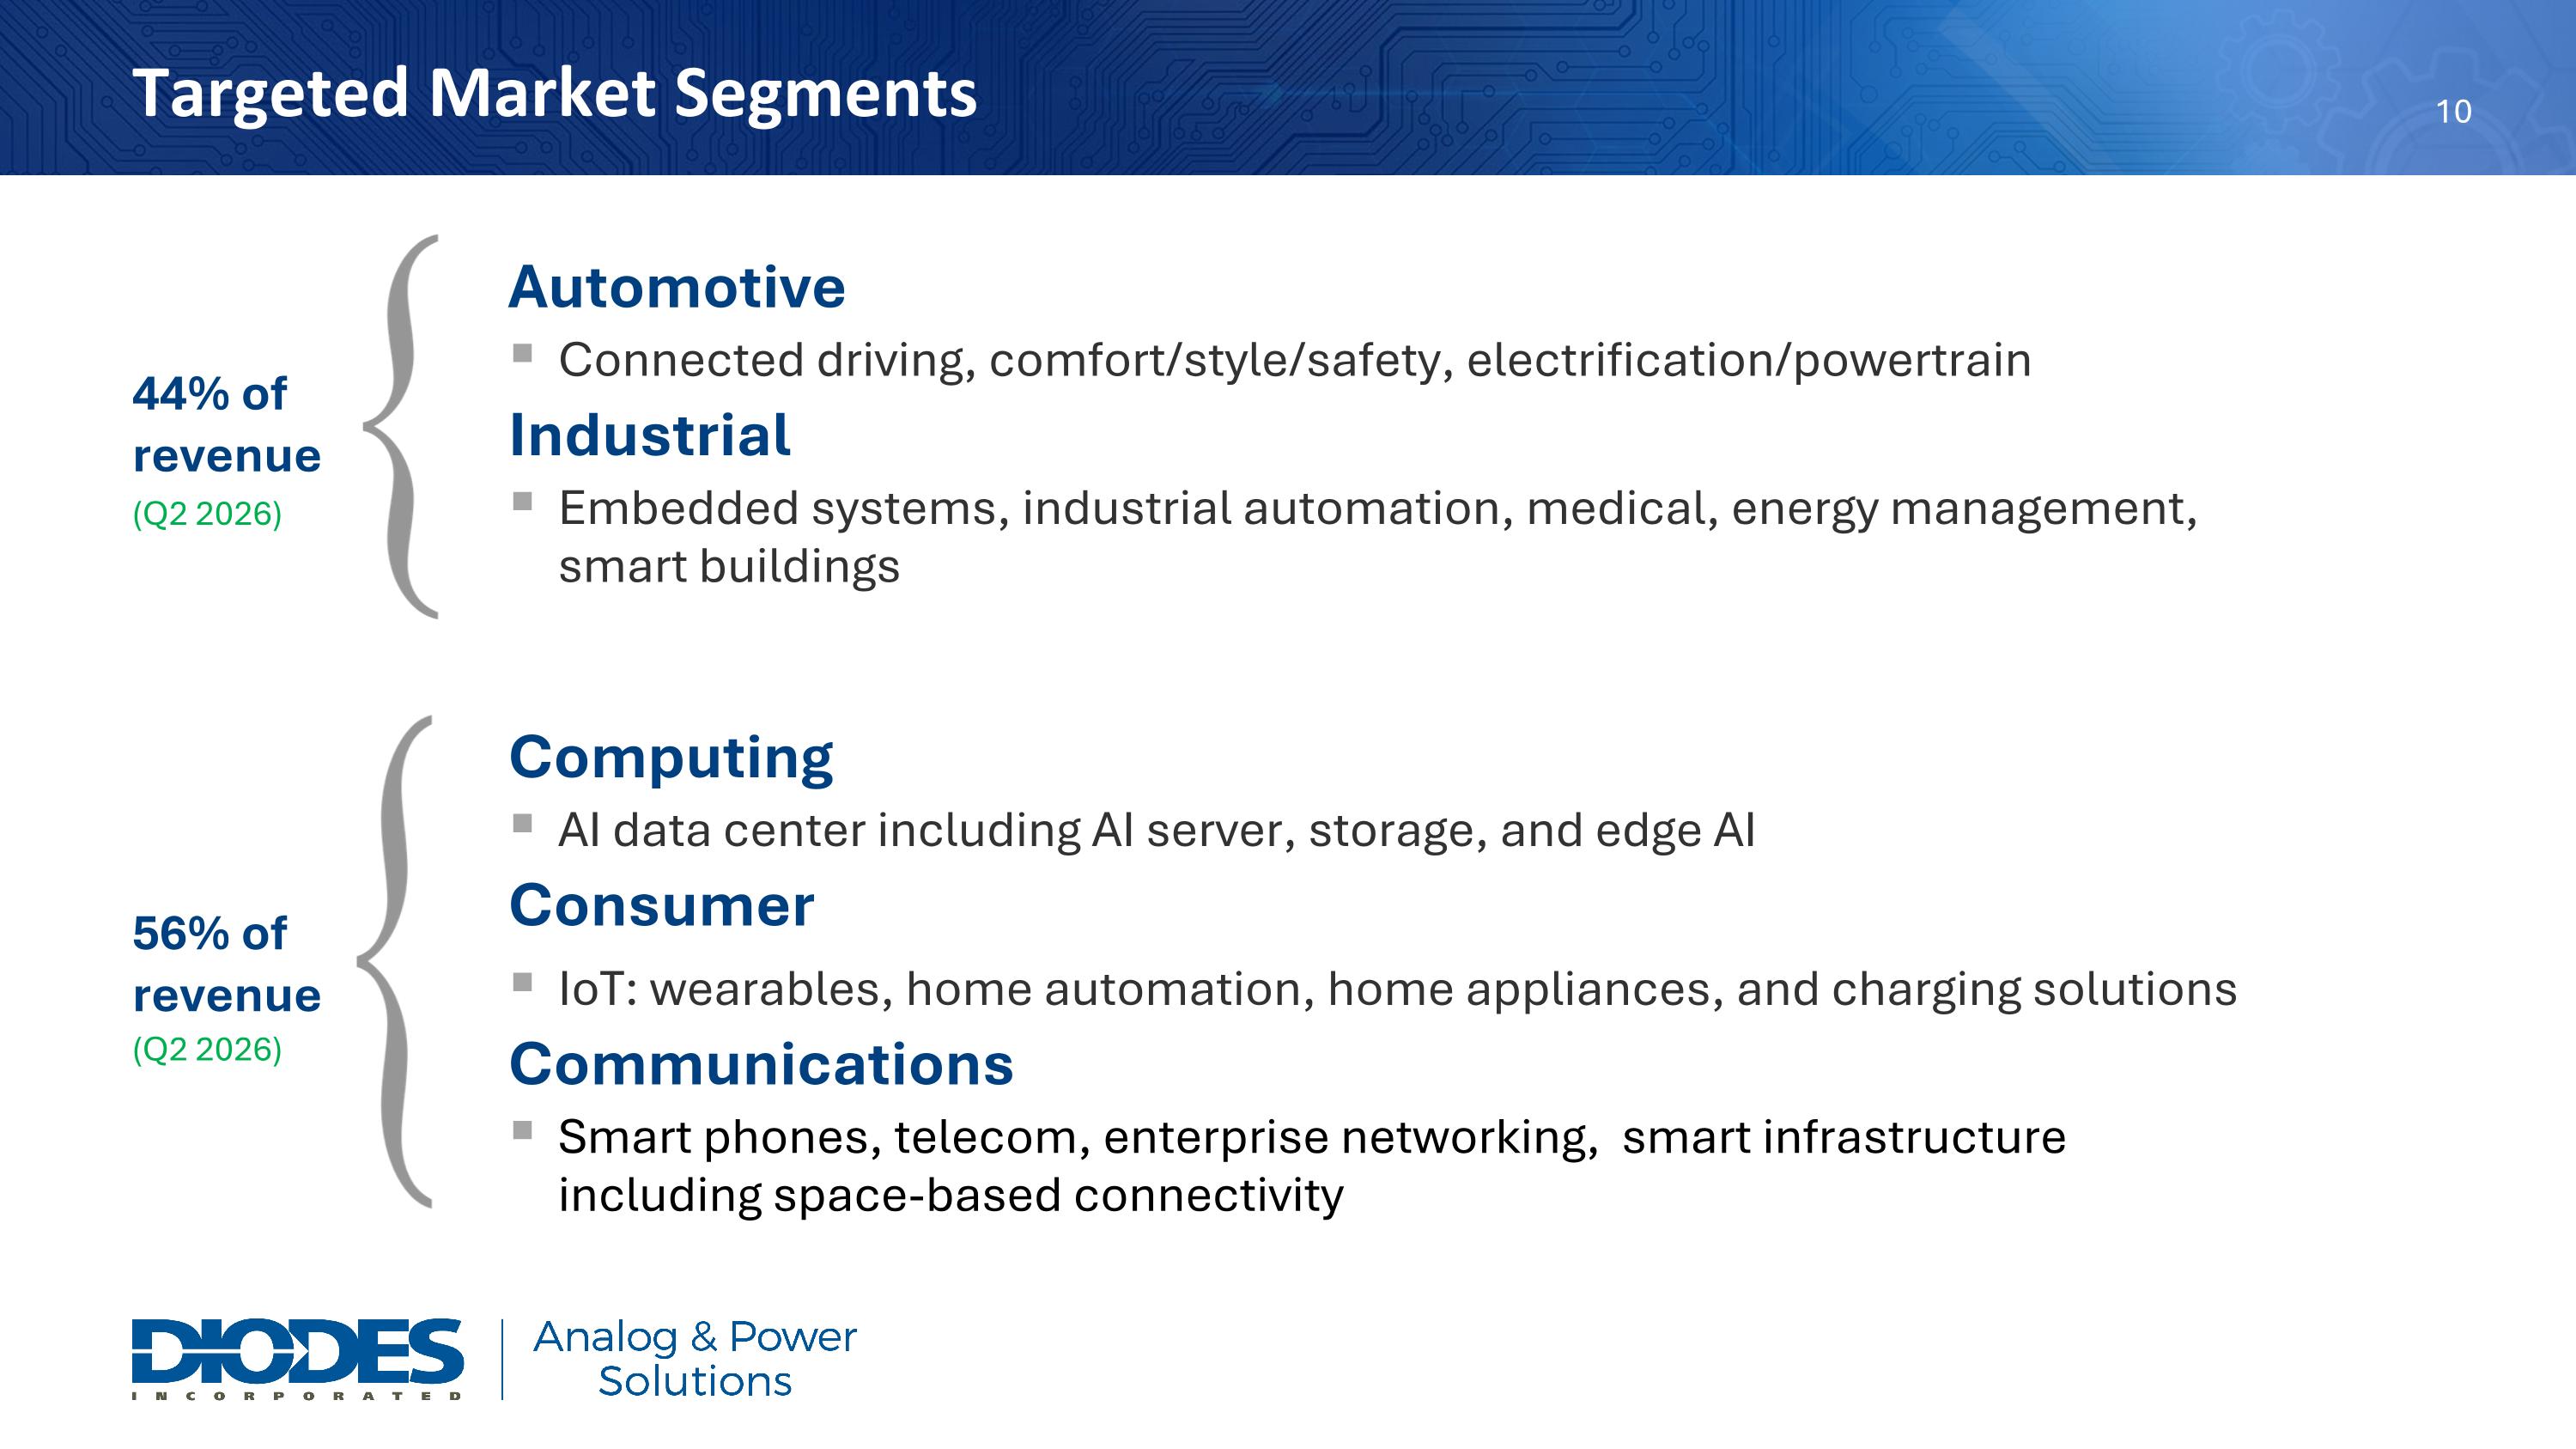
Automotive Connected driving, comfort/style/safety, electrification/powertrain Industrial Embedded systems, industrial automation, medical, energy management, smart buildings Computing AI data center including AI server, storage, and edge AI Consumer IoT: wearables, home automation, home appliances, and charging solutions Communications Smart phones, telecom, enterprise networking, smart infrastructure including space-based connectivity 56% of revenue 44% of revenue (Q2 2026) (Q2 2026) Targeted Market Segments

Slide 12

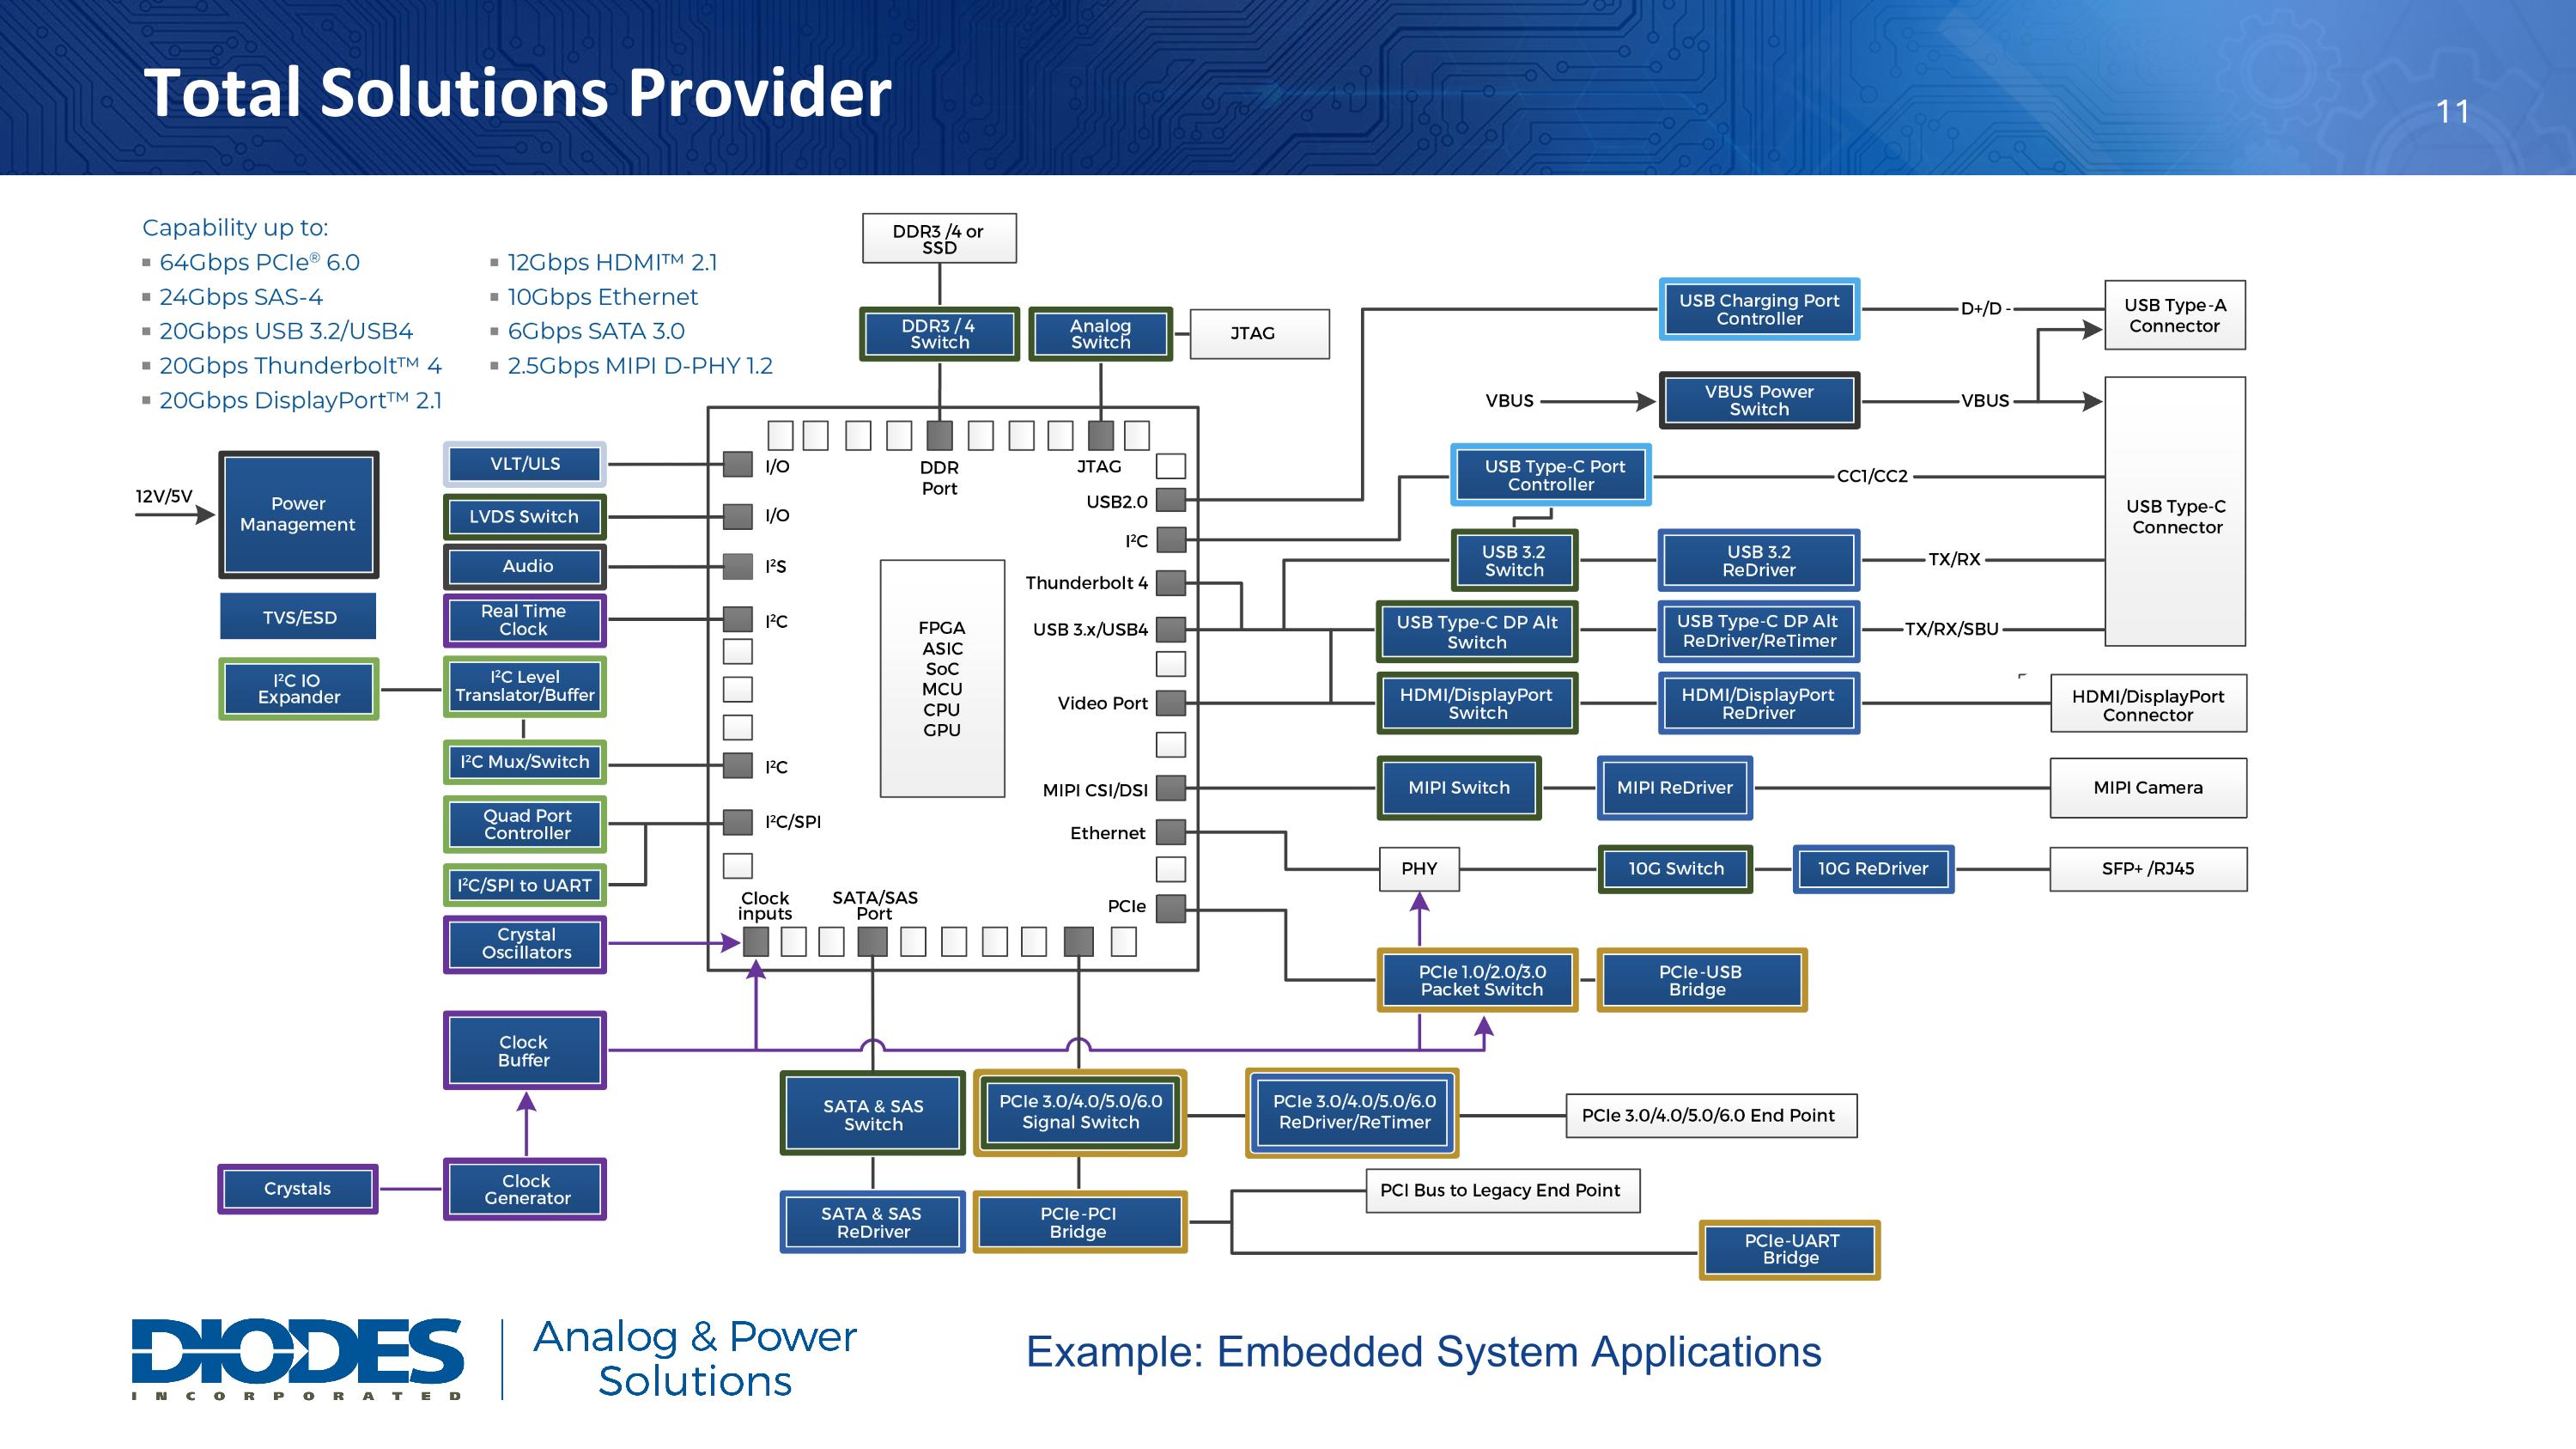
Example: Embedded System Applications Total Solutions Provider

Slide 13

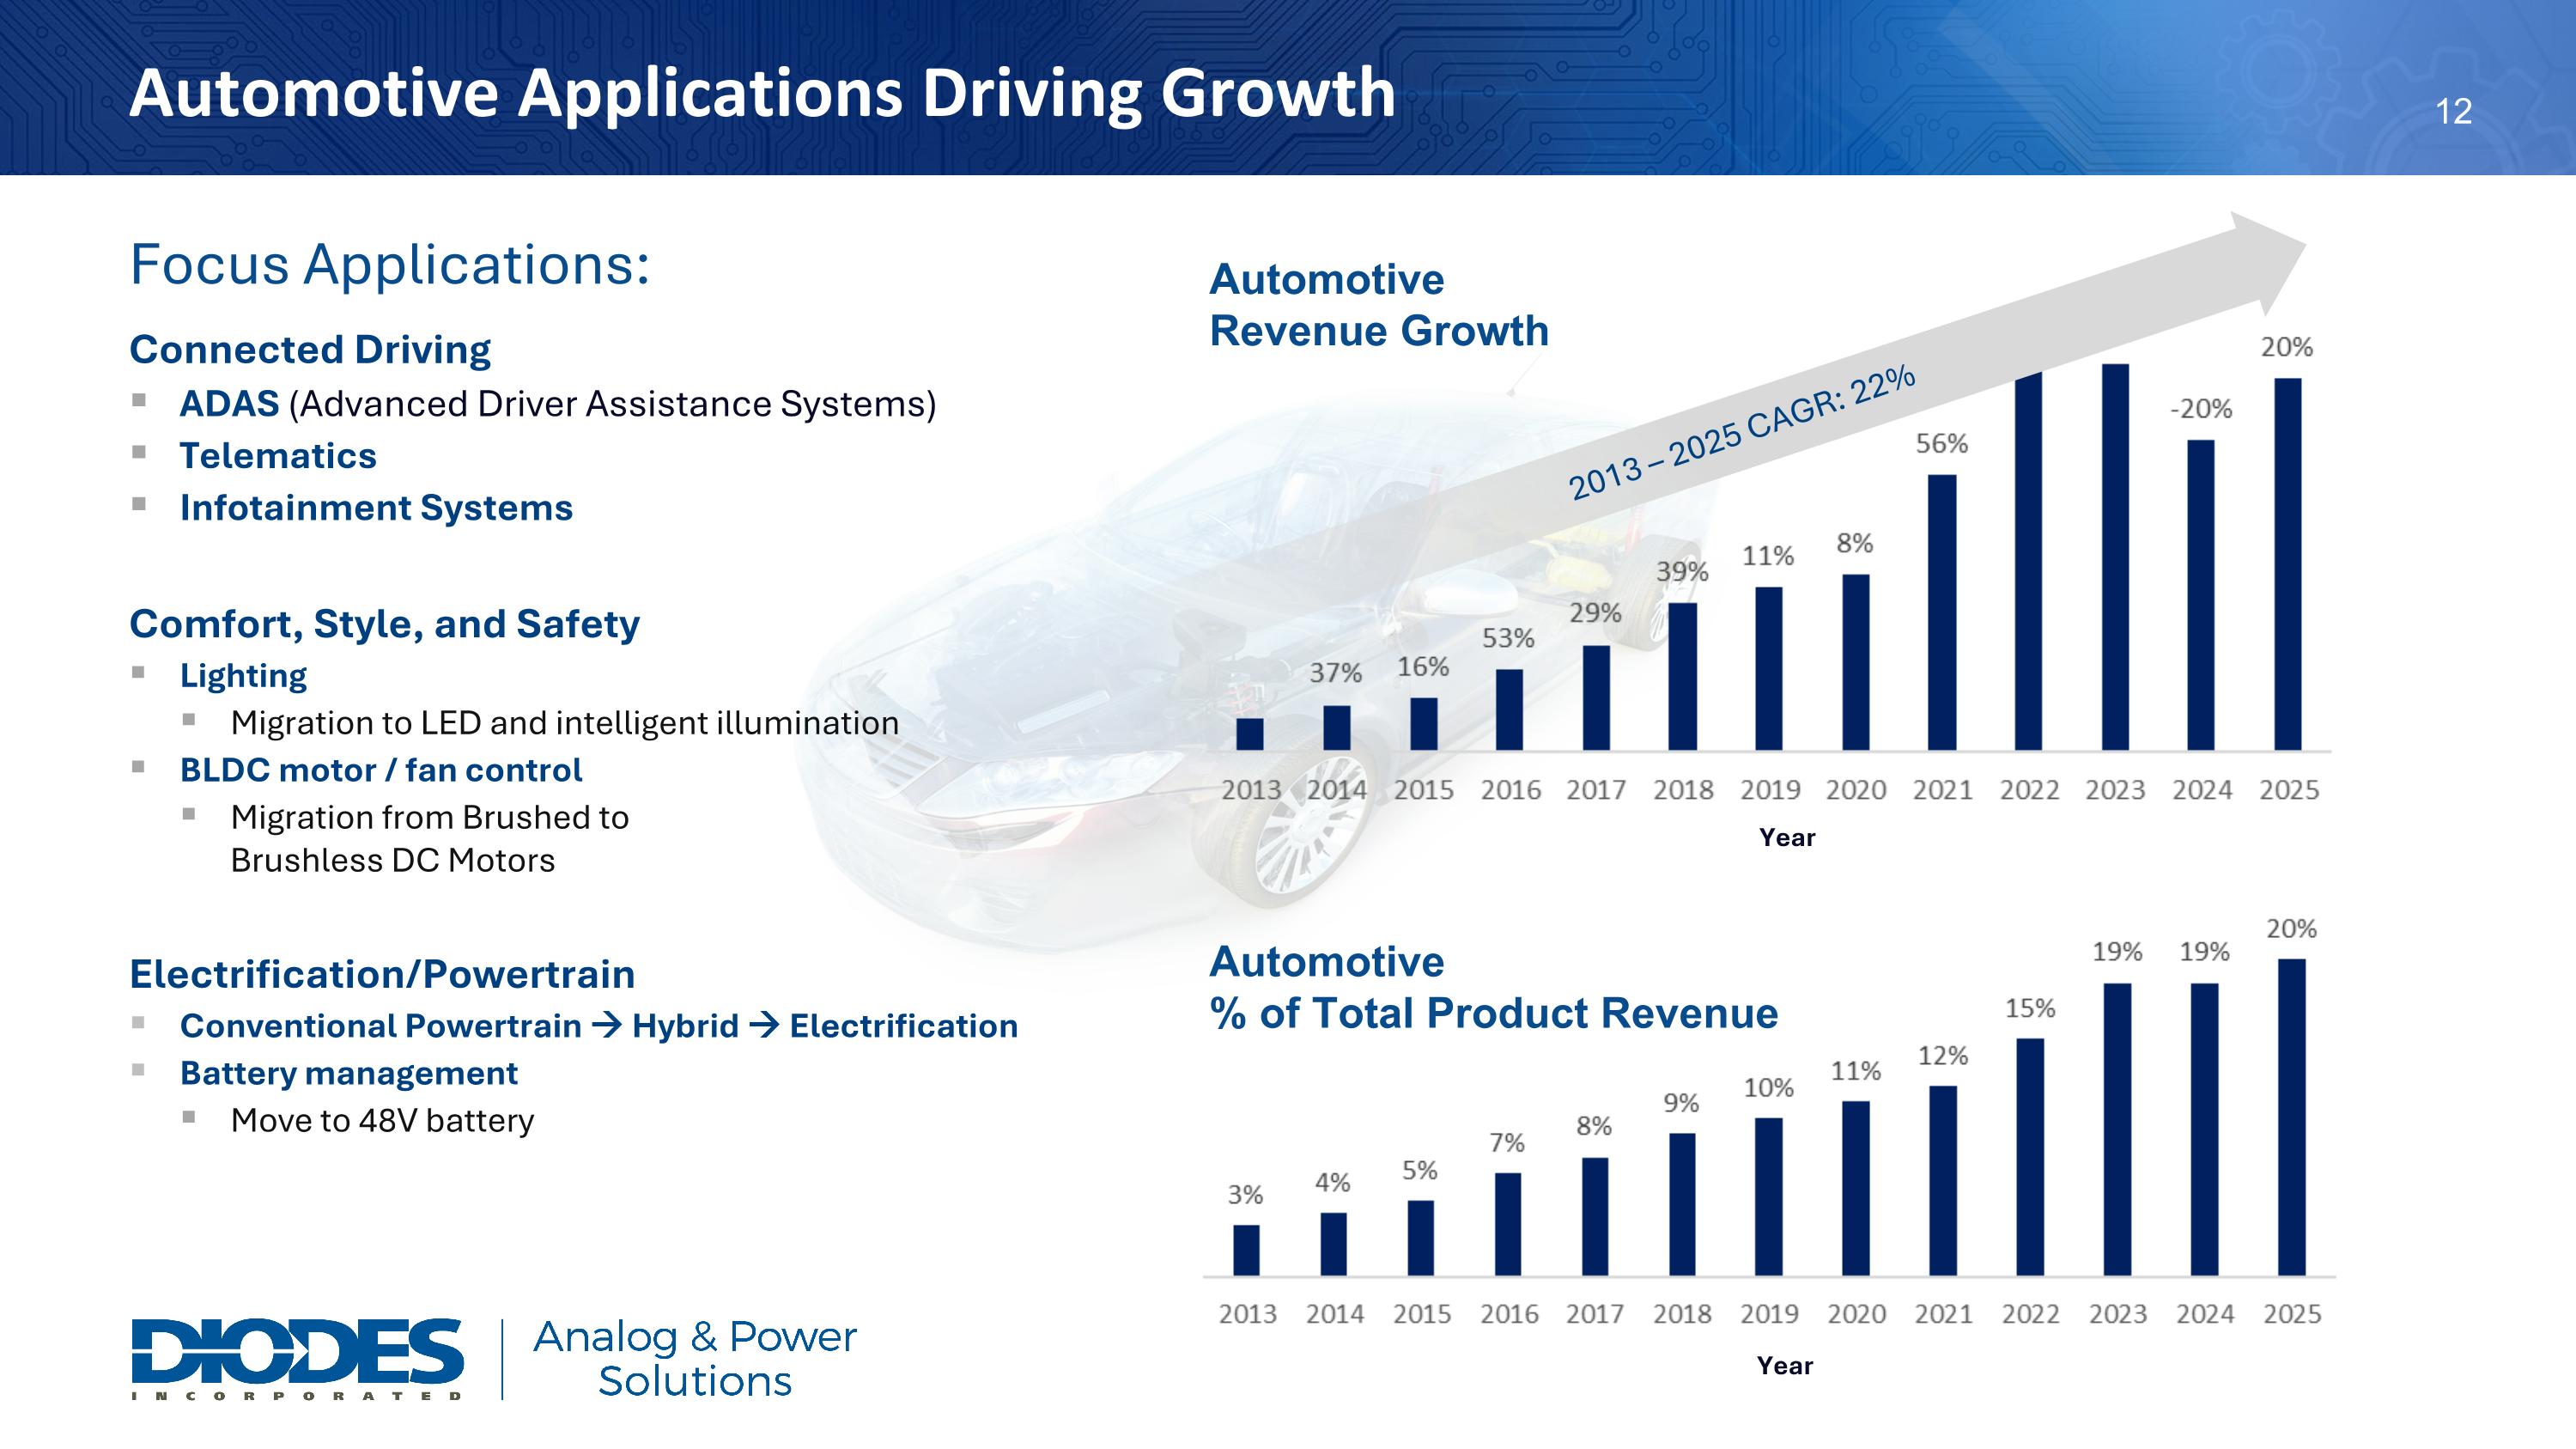
Connected Driving ADAS (Advanced Driver Assistance Systems) Telematics Infotainment Systems Comfort, Style, and Safety Lighting Migration to LED and intelligent illumination BLDC motor / fan control Migration from Brushed to Brushless DC Motors Electrification/Powertrain Conventional Powertrain  Hybrid  Electrification Battery management Move to 48V battery Focus Applications: Automotive Revenue Growth Year 2013 – 2025 CAGR: 22% Year Automotive % of Total Product Revenue Automotive Applications Driving Growth

Slide 14

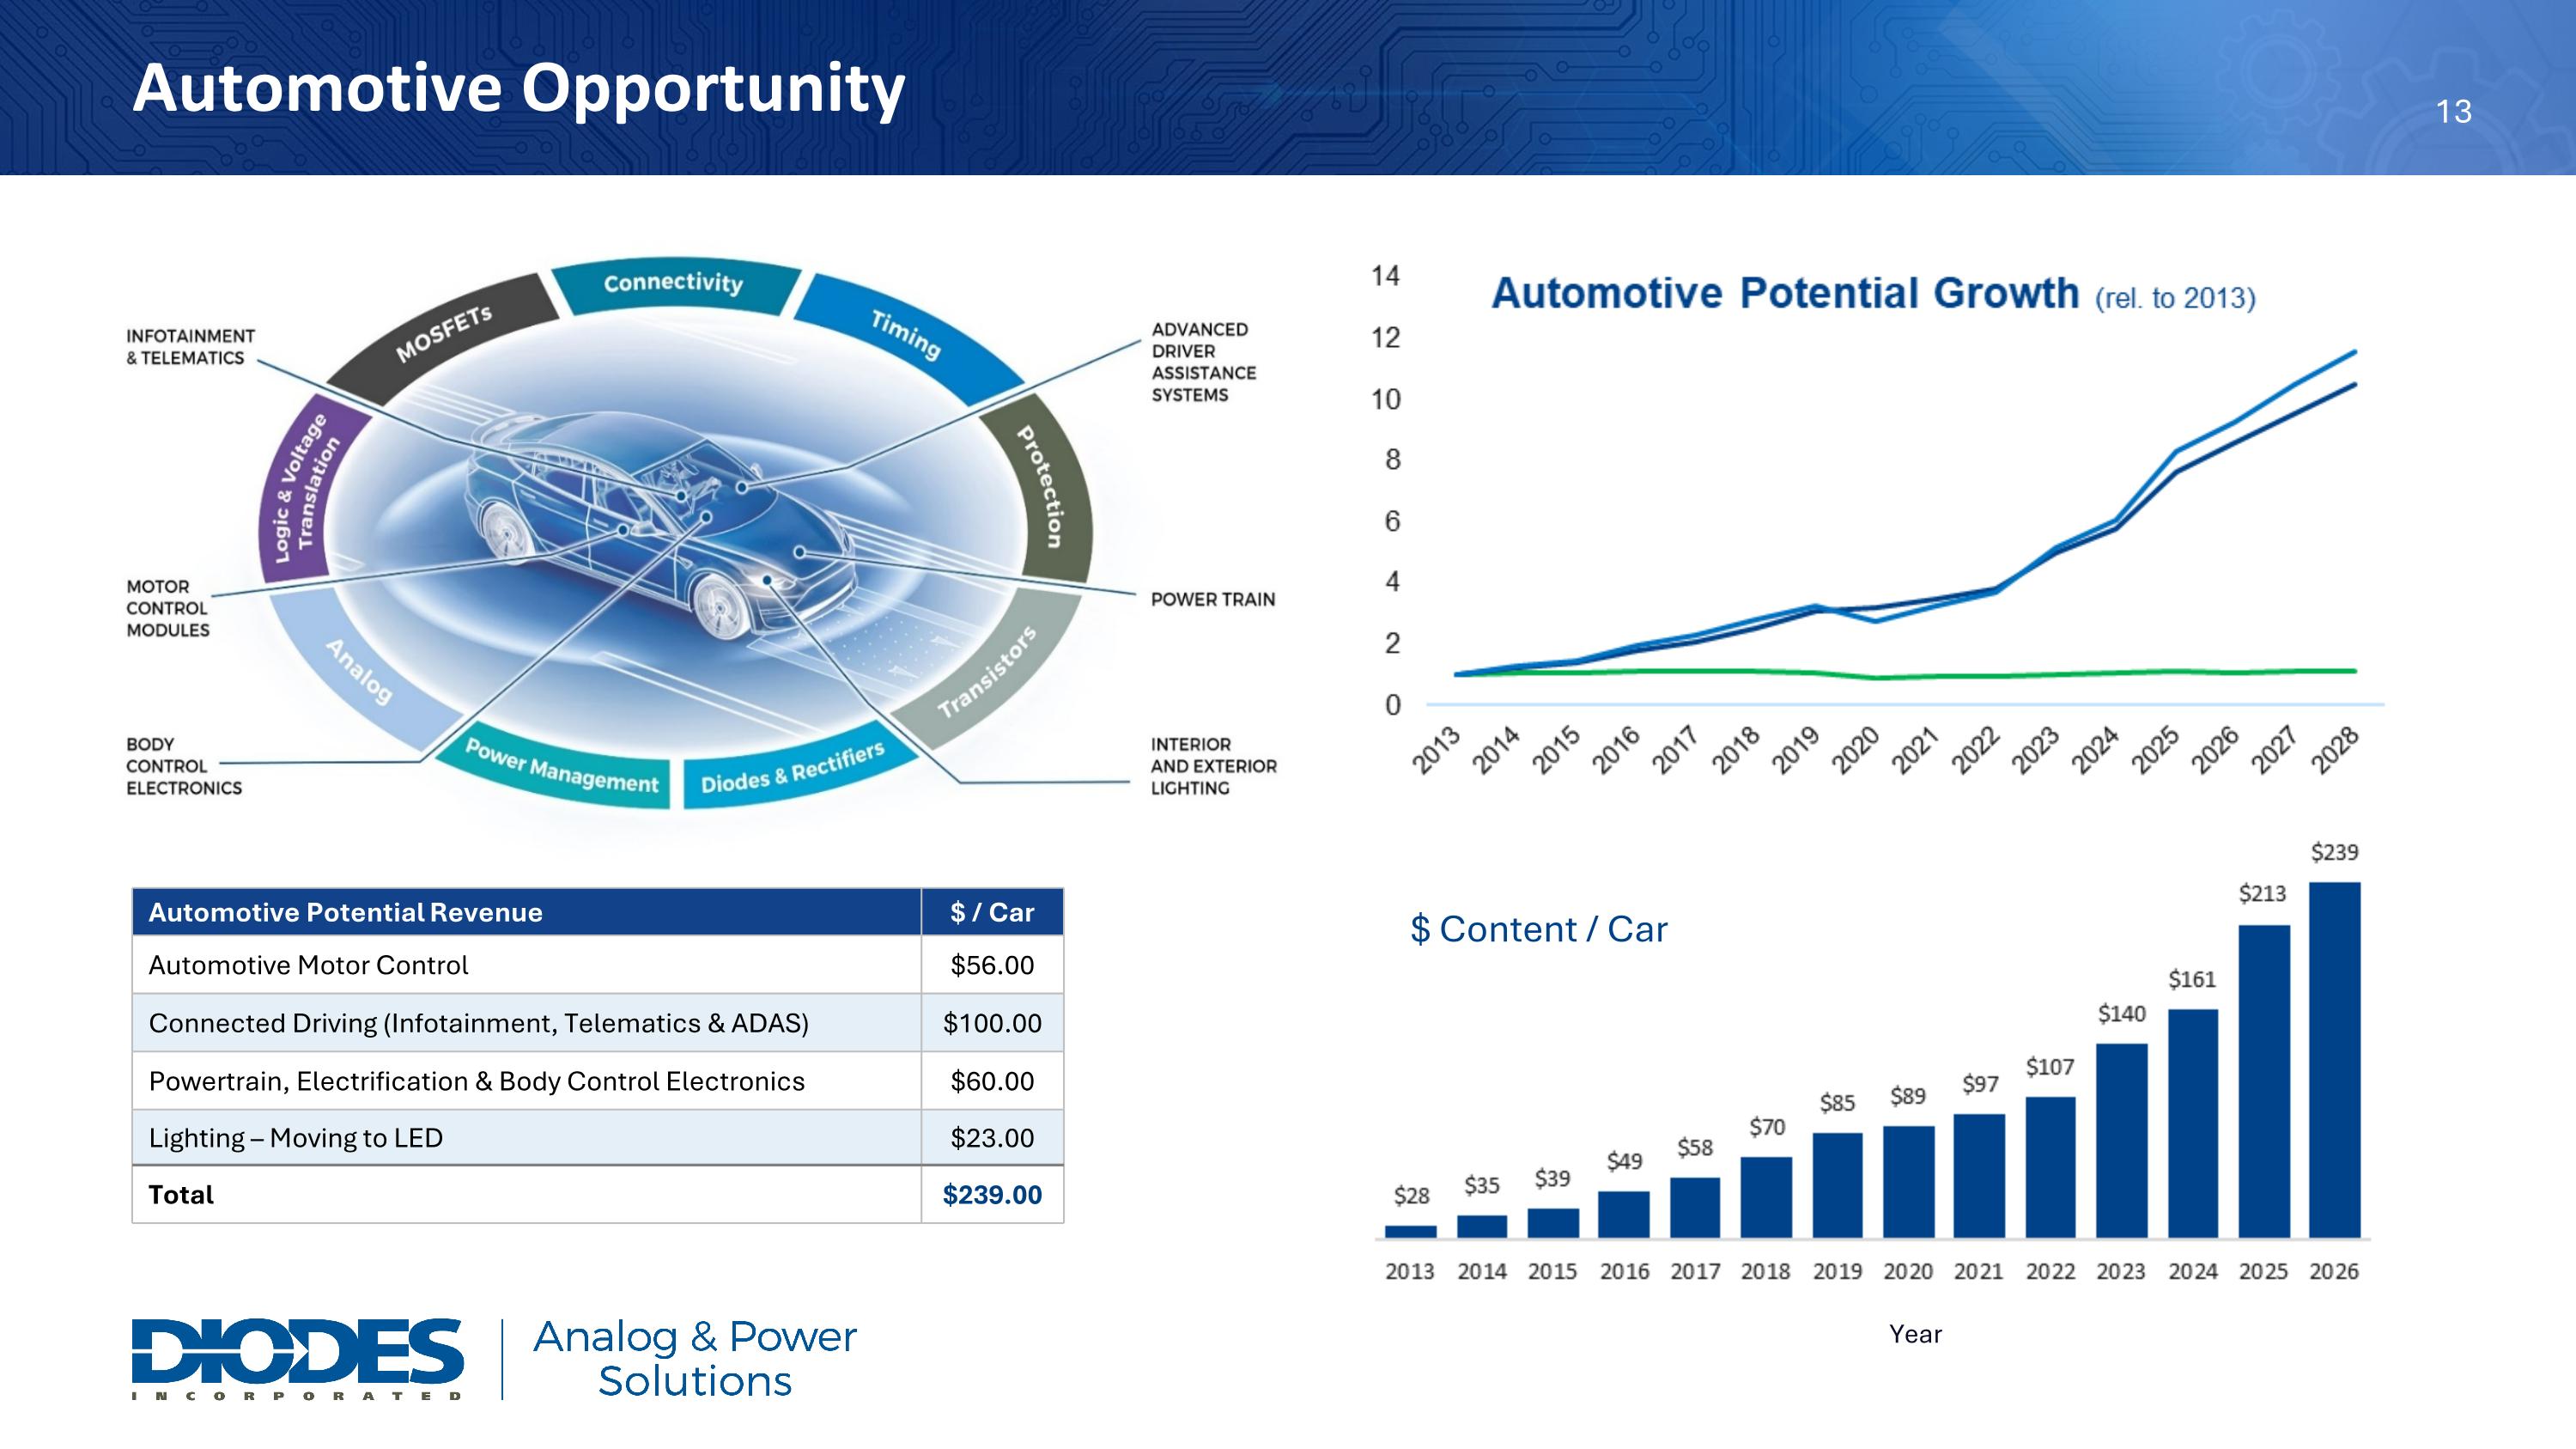
Automotive Potential Revenue $ / Car Automotive Motor Control $56.00 Connected Driving (Infotainment, Telematics & ADAS) $100.00 Powertrain, Electrification & Body Control Electronics $60.00 Lighting – Moving to LED $23.00 Total $239.00 $ Content / Car Year Automotive Opportunity

Slide 15

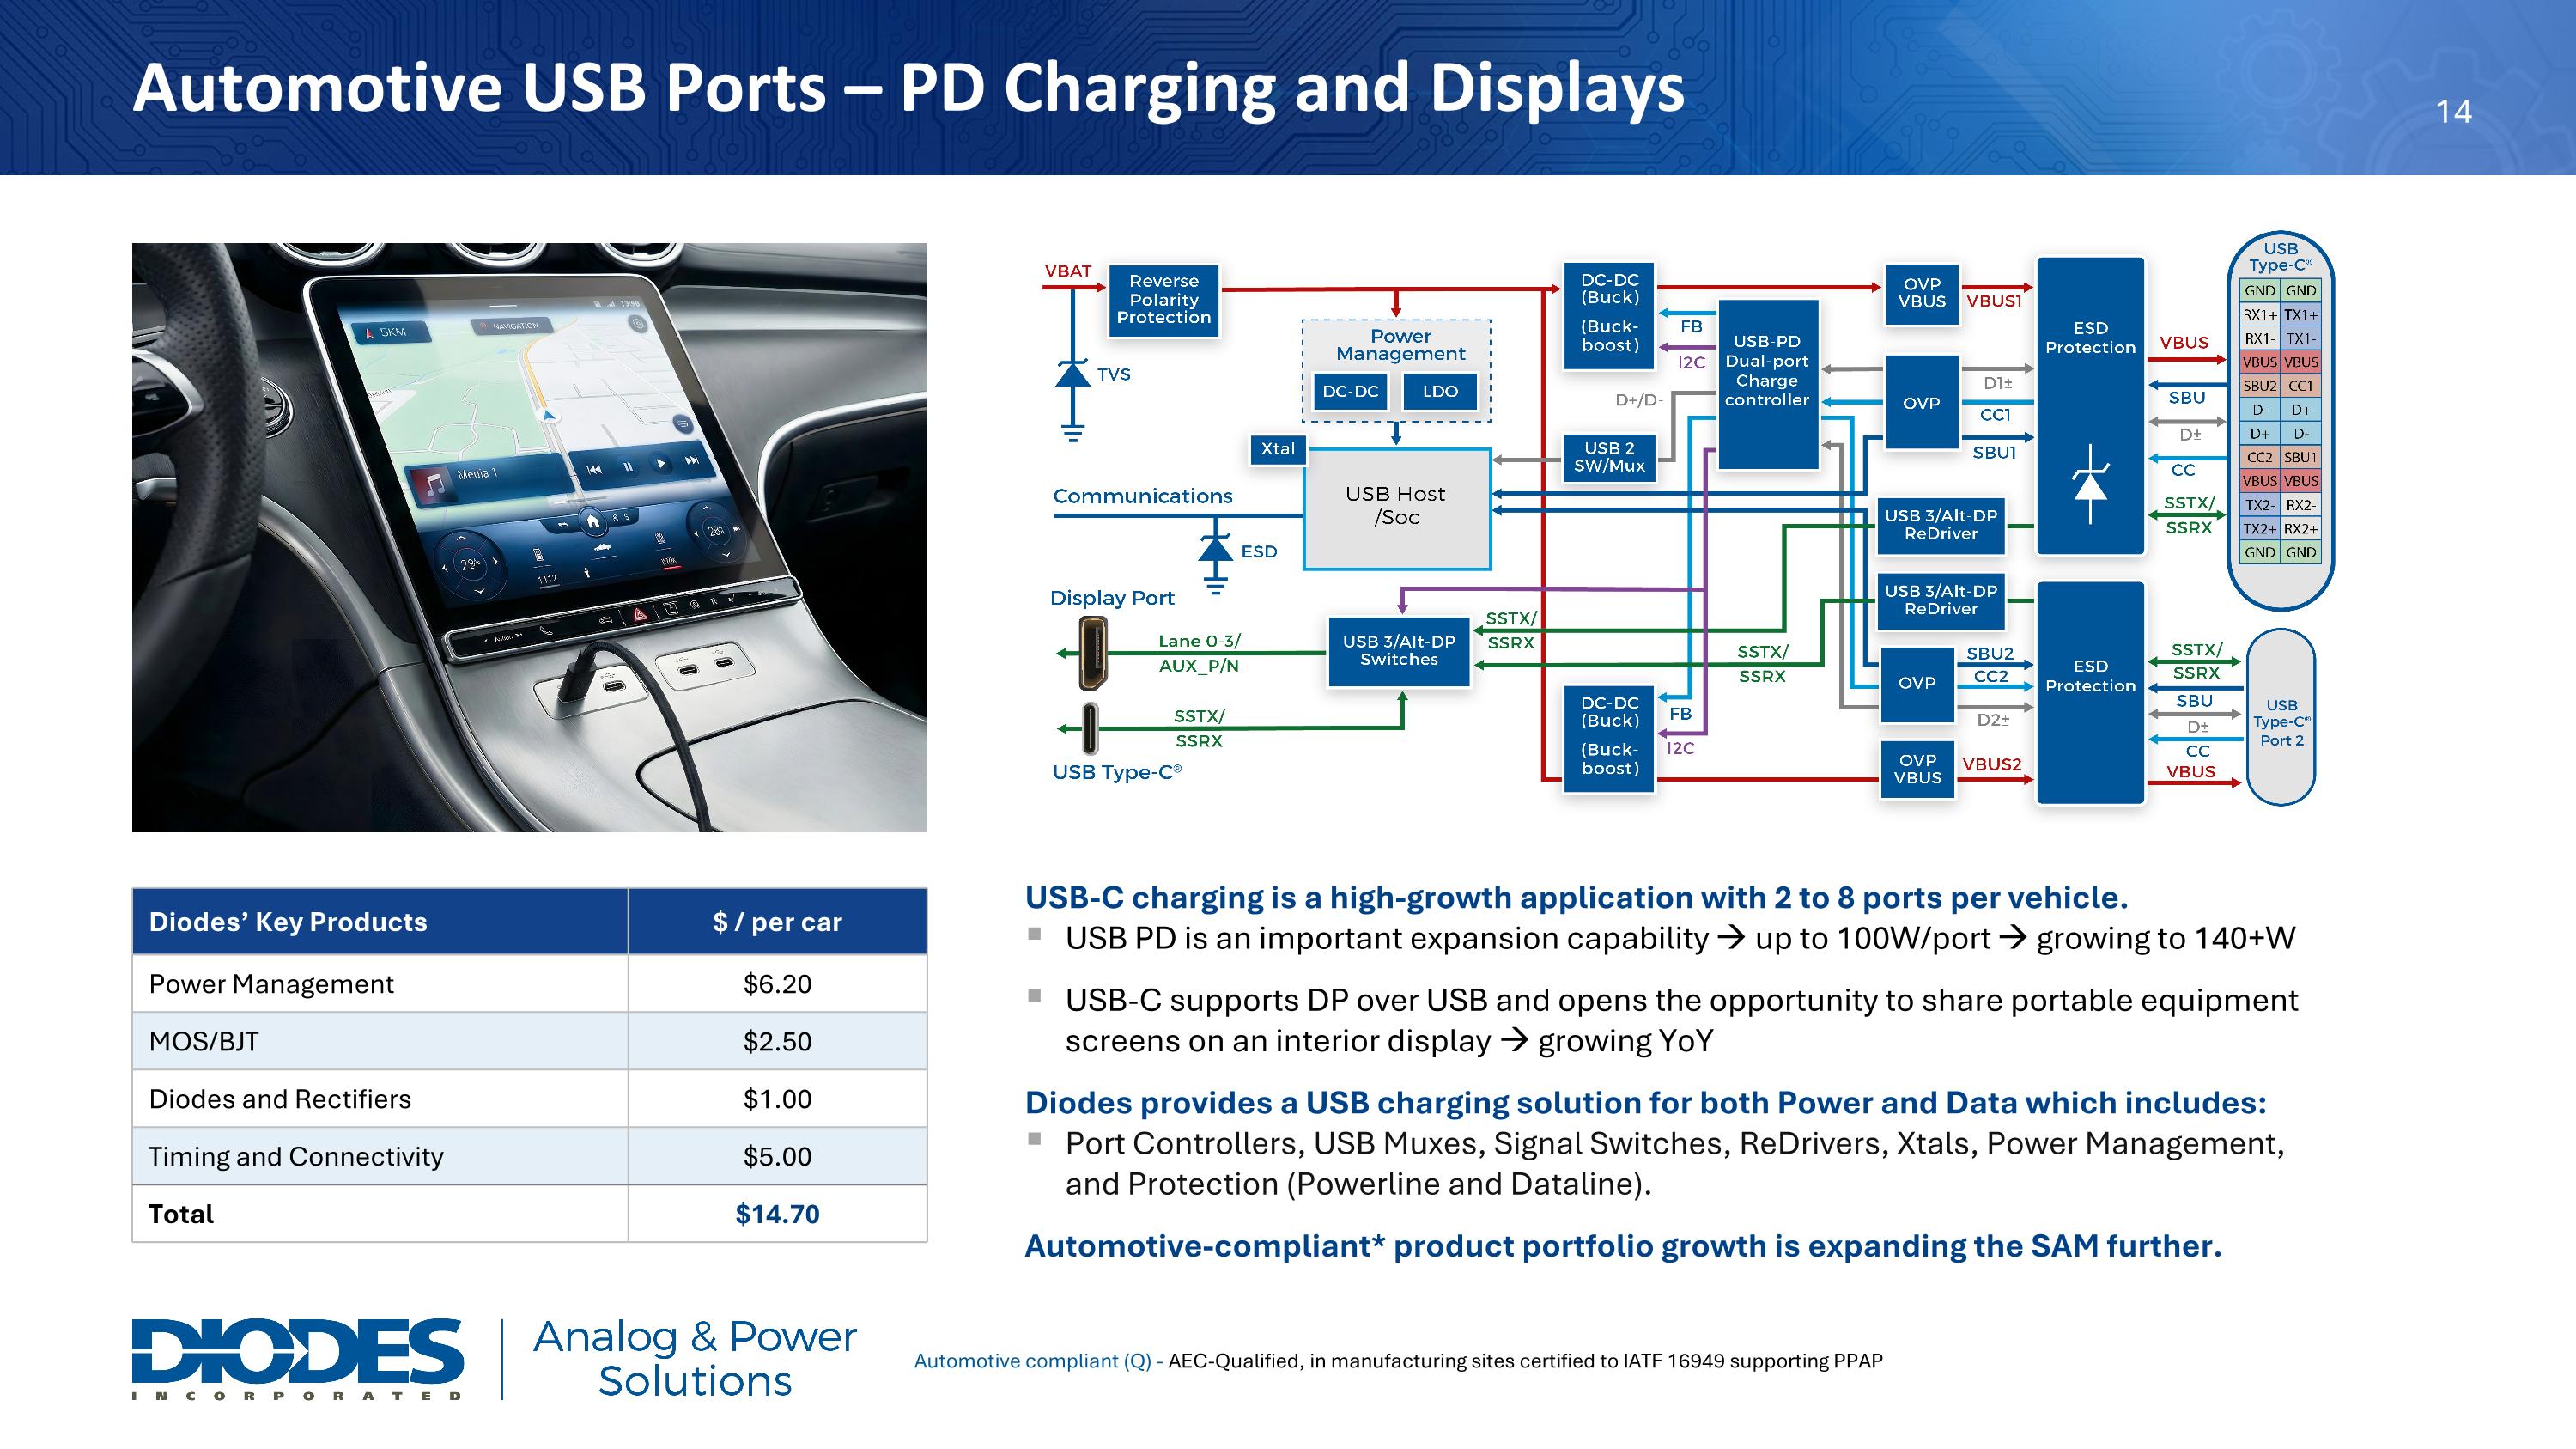
Automotive USB Ports – PD Charging and Displays Diodes’ Key Products $ / per car Power Management $6.20 MOS/BJT $2.50 Diodes and Rectifiers $1.00 Timing and Connectivity $5.00 Total $14.70 USB-C charging is a high-growth application with 2 to 8 ports per vehicle. USB PD is an important expansion capability  up to 100W/port  growing to 140+W USB-C supports DP over USB and opens the opportunity to share portable equipment screens on an interior display  growing YoY Diodes provides a USB charging solution for both Power and Data which includes: Port Controllers, USB Muxes, Signal Switches, ReDrivers, Xtals, Power Management, and Protection (Powerline and Dataline). Automotive-compliant* product portfolio growth is expanding the SAM further. Automotive compliant (Q) - AEC-Qualified, in manufacturing sites certified to IATF 16949 supporting PPAP

Slide 16

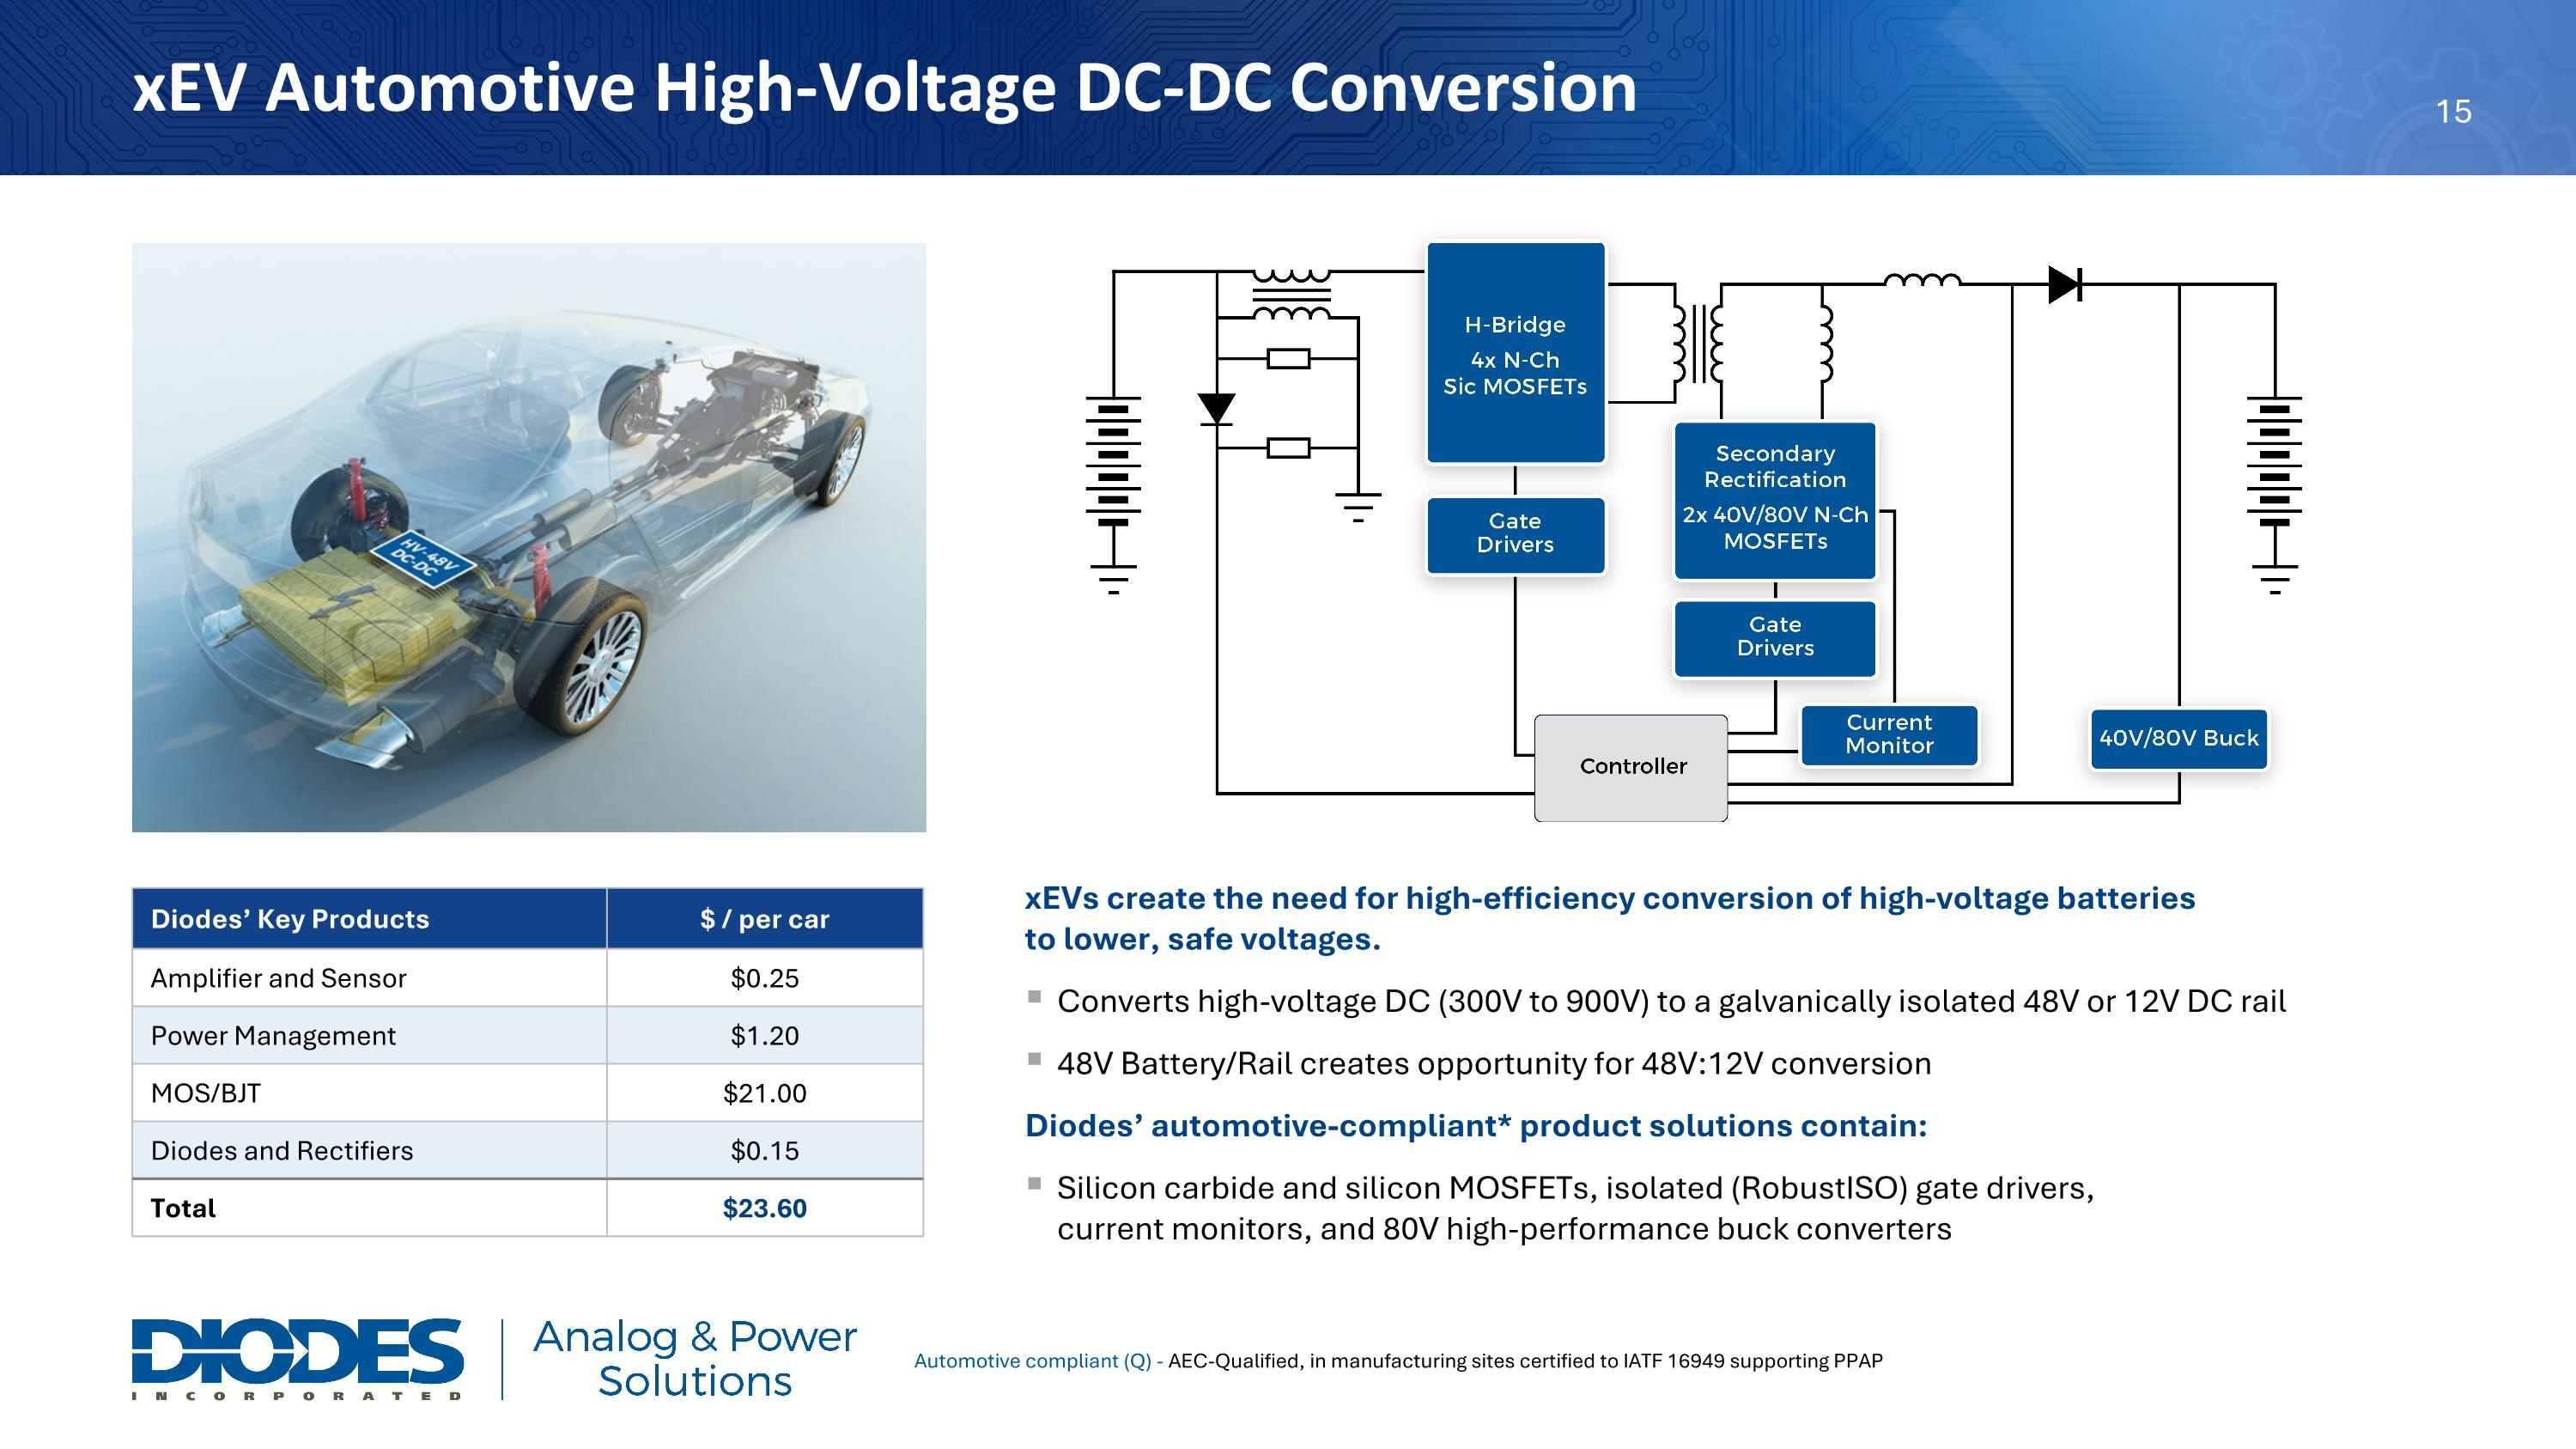
xEV Automotive High-Voltage DC-DC Conversion xEVs create the need for high-efficiency conversion of high-voltage batteries to lower, safe voltages. Converts high-voltage DC (300V to 900V) to a galvanically isolated 48V or 12V DC rail 48V Battery/Rail creates opportunity for 48V:12V conversion Diodes’ automotive-compliant* product solutions contain: Silicon carbide and silicon MOSFETs, isolated (RobustISO) gate drivers, current monitors, and 80V high-performance buck converters Diodes’ Key Products $ / per car Amplifier and Sensor $0.25 Power Management $1.20 MOS/BJT $21.00 Diodes and Rectifiers $0.15 Total $23.60 Automotive compliant (Q) - AEC-Qualified, in manufacturing sites certified to IATF 16949 supporting PPAP

Slide 17

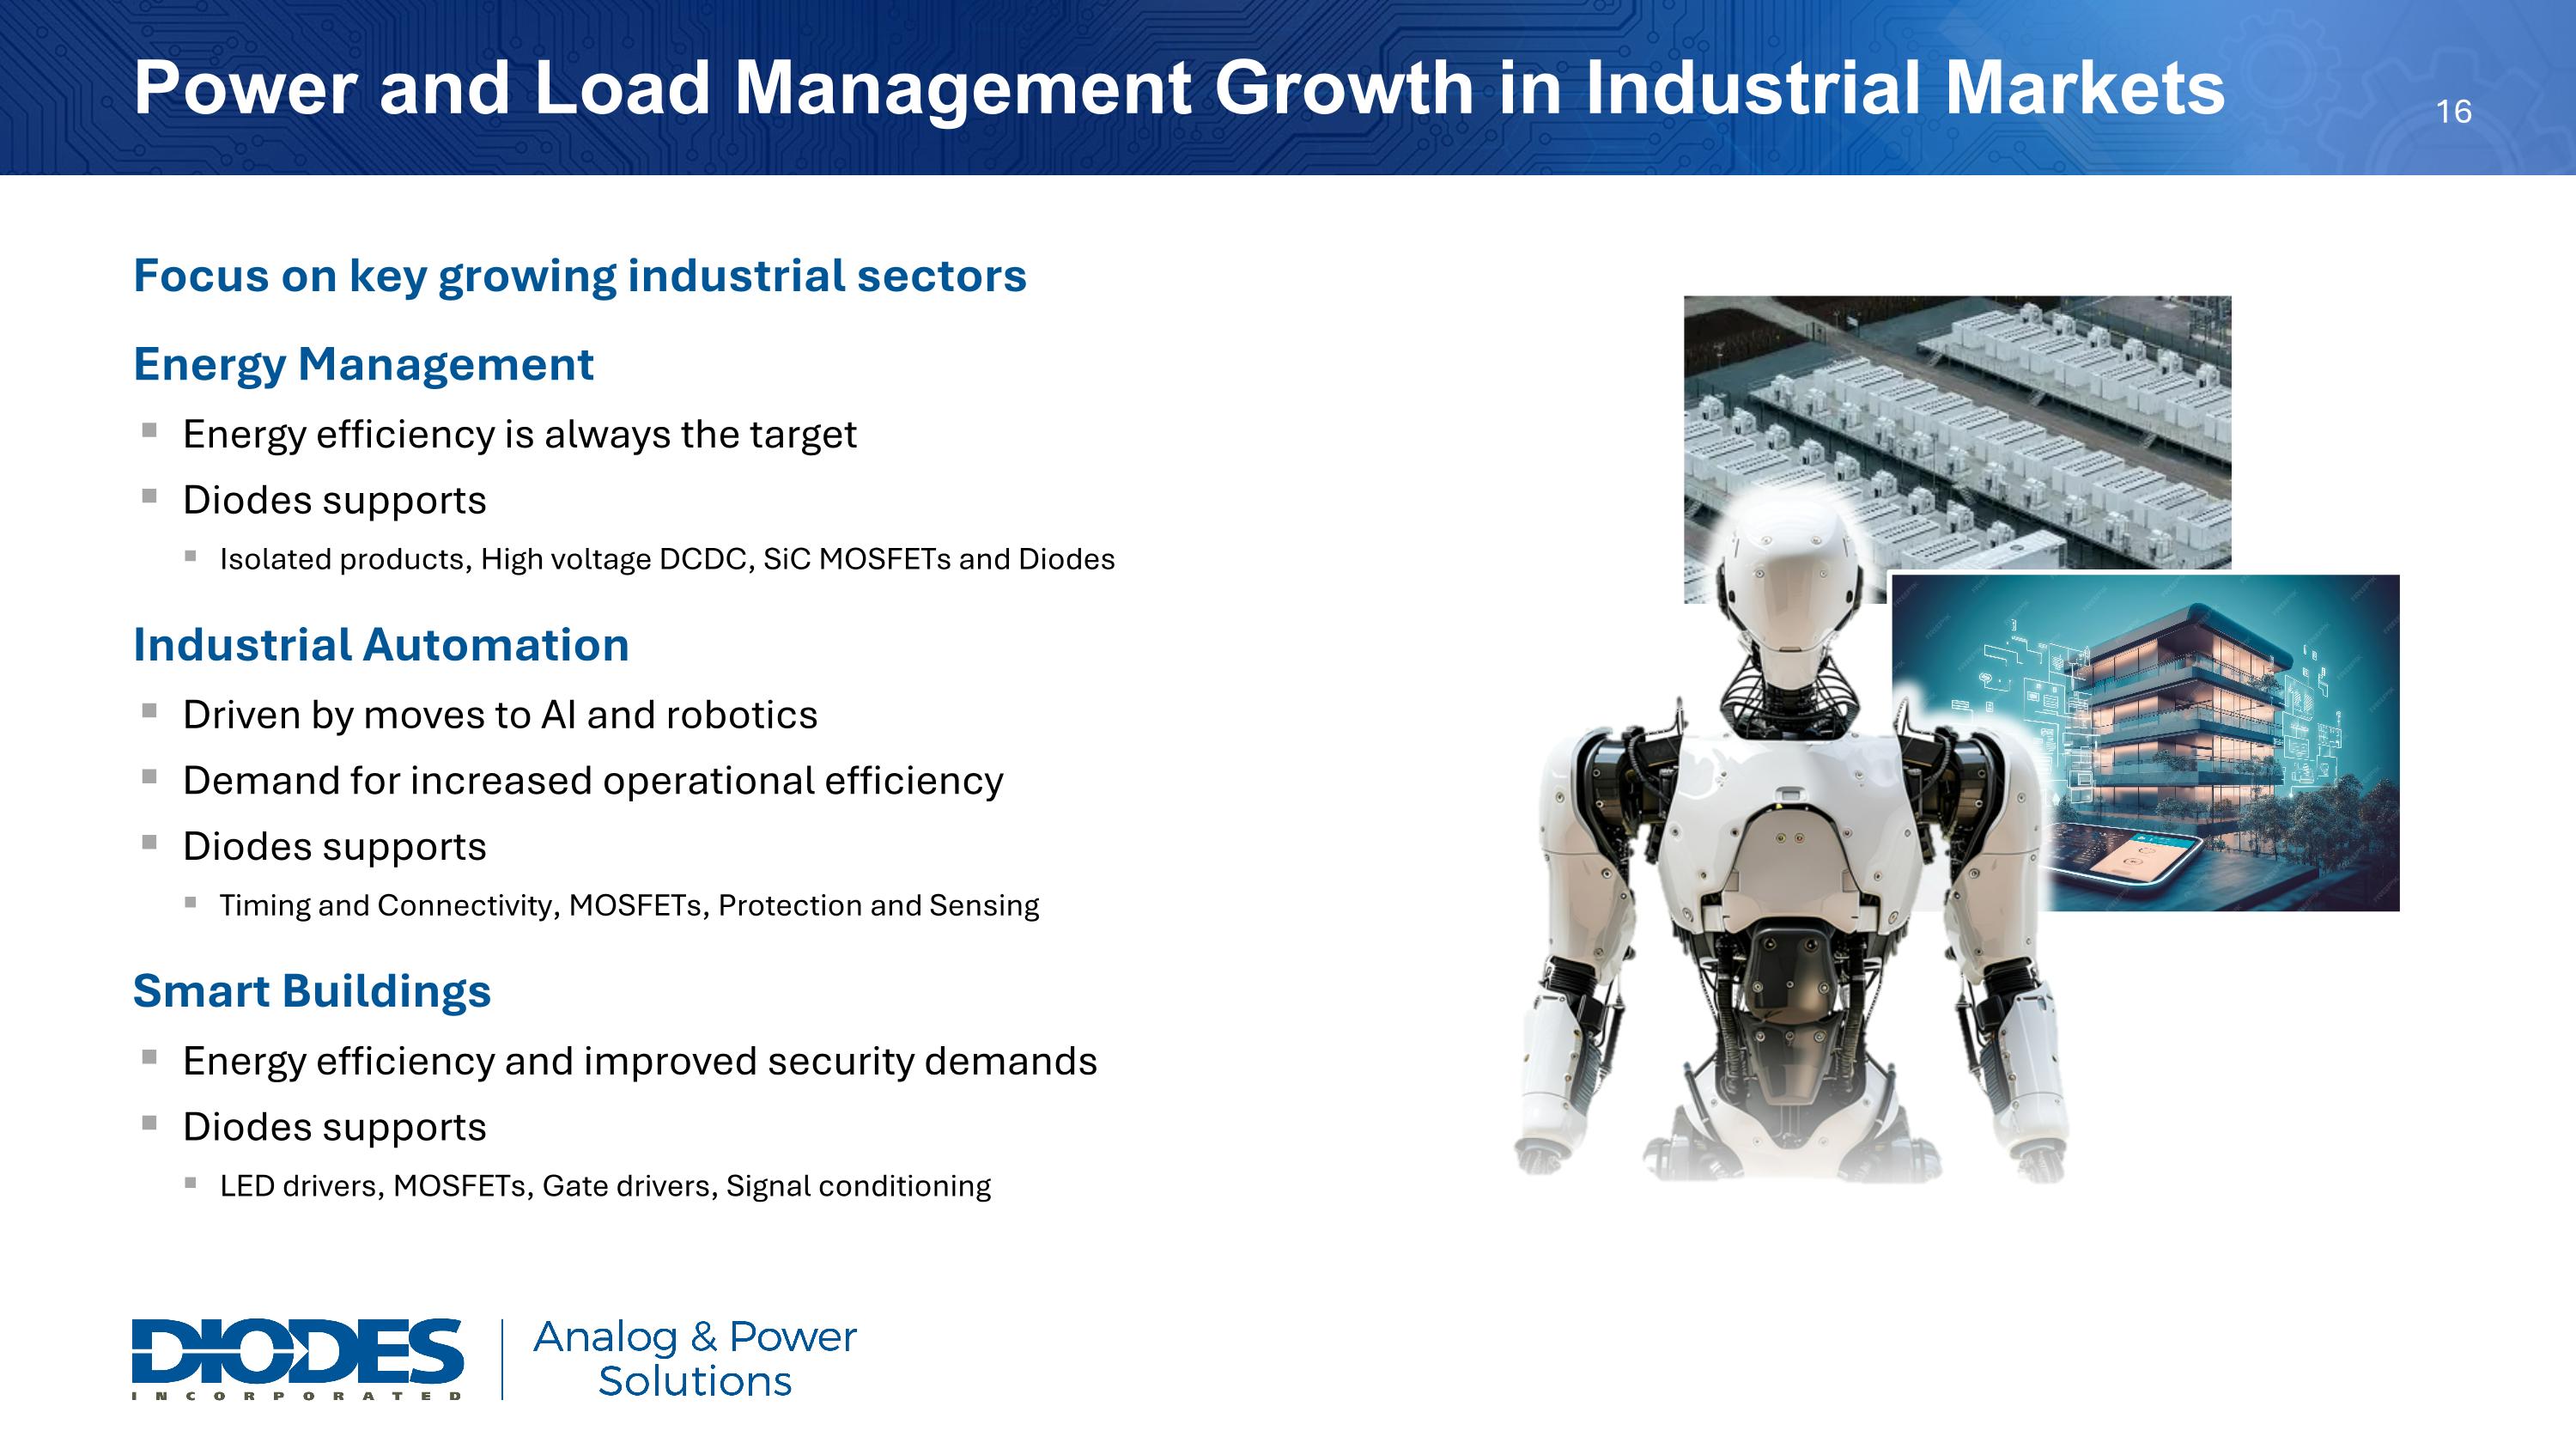
Power and Load Management Growth in Industrial Markets Focus on key growing industrial sectors Energy Management Energy efficiency is always the target Diodes supports Isolated products, High voltage DCDC, SiC MOSFETs and Diodes Industrial Automation Driven by moves to AI and robotics Demand for increased operational efficiency Diodes supports Timing and Connectivity, MOSFETs, Protection and Sensing Smart Buildings Energy efficiency and improved security demands Diodes supports LED drivers, MOSFETs, Gate drivers, Signal conditioning

Slide 18

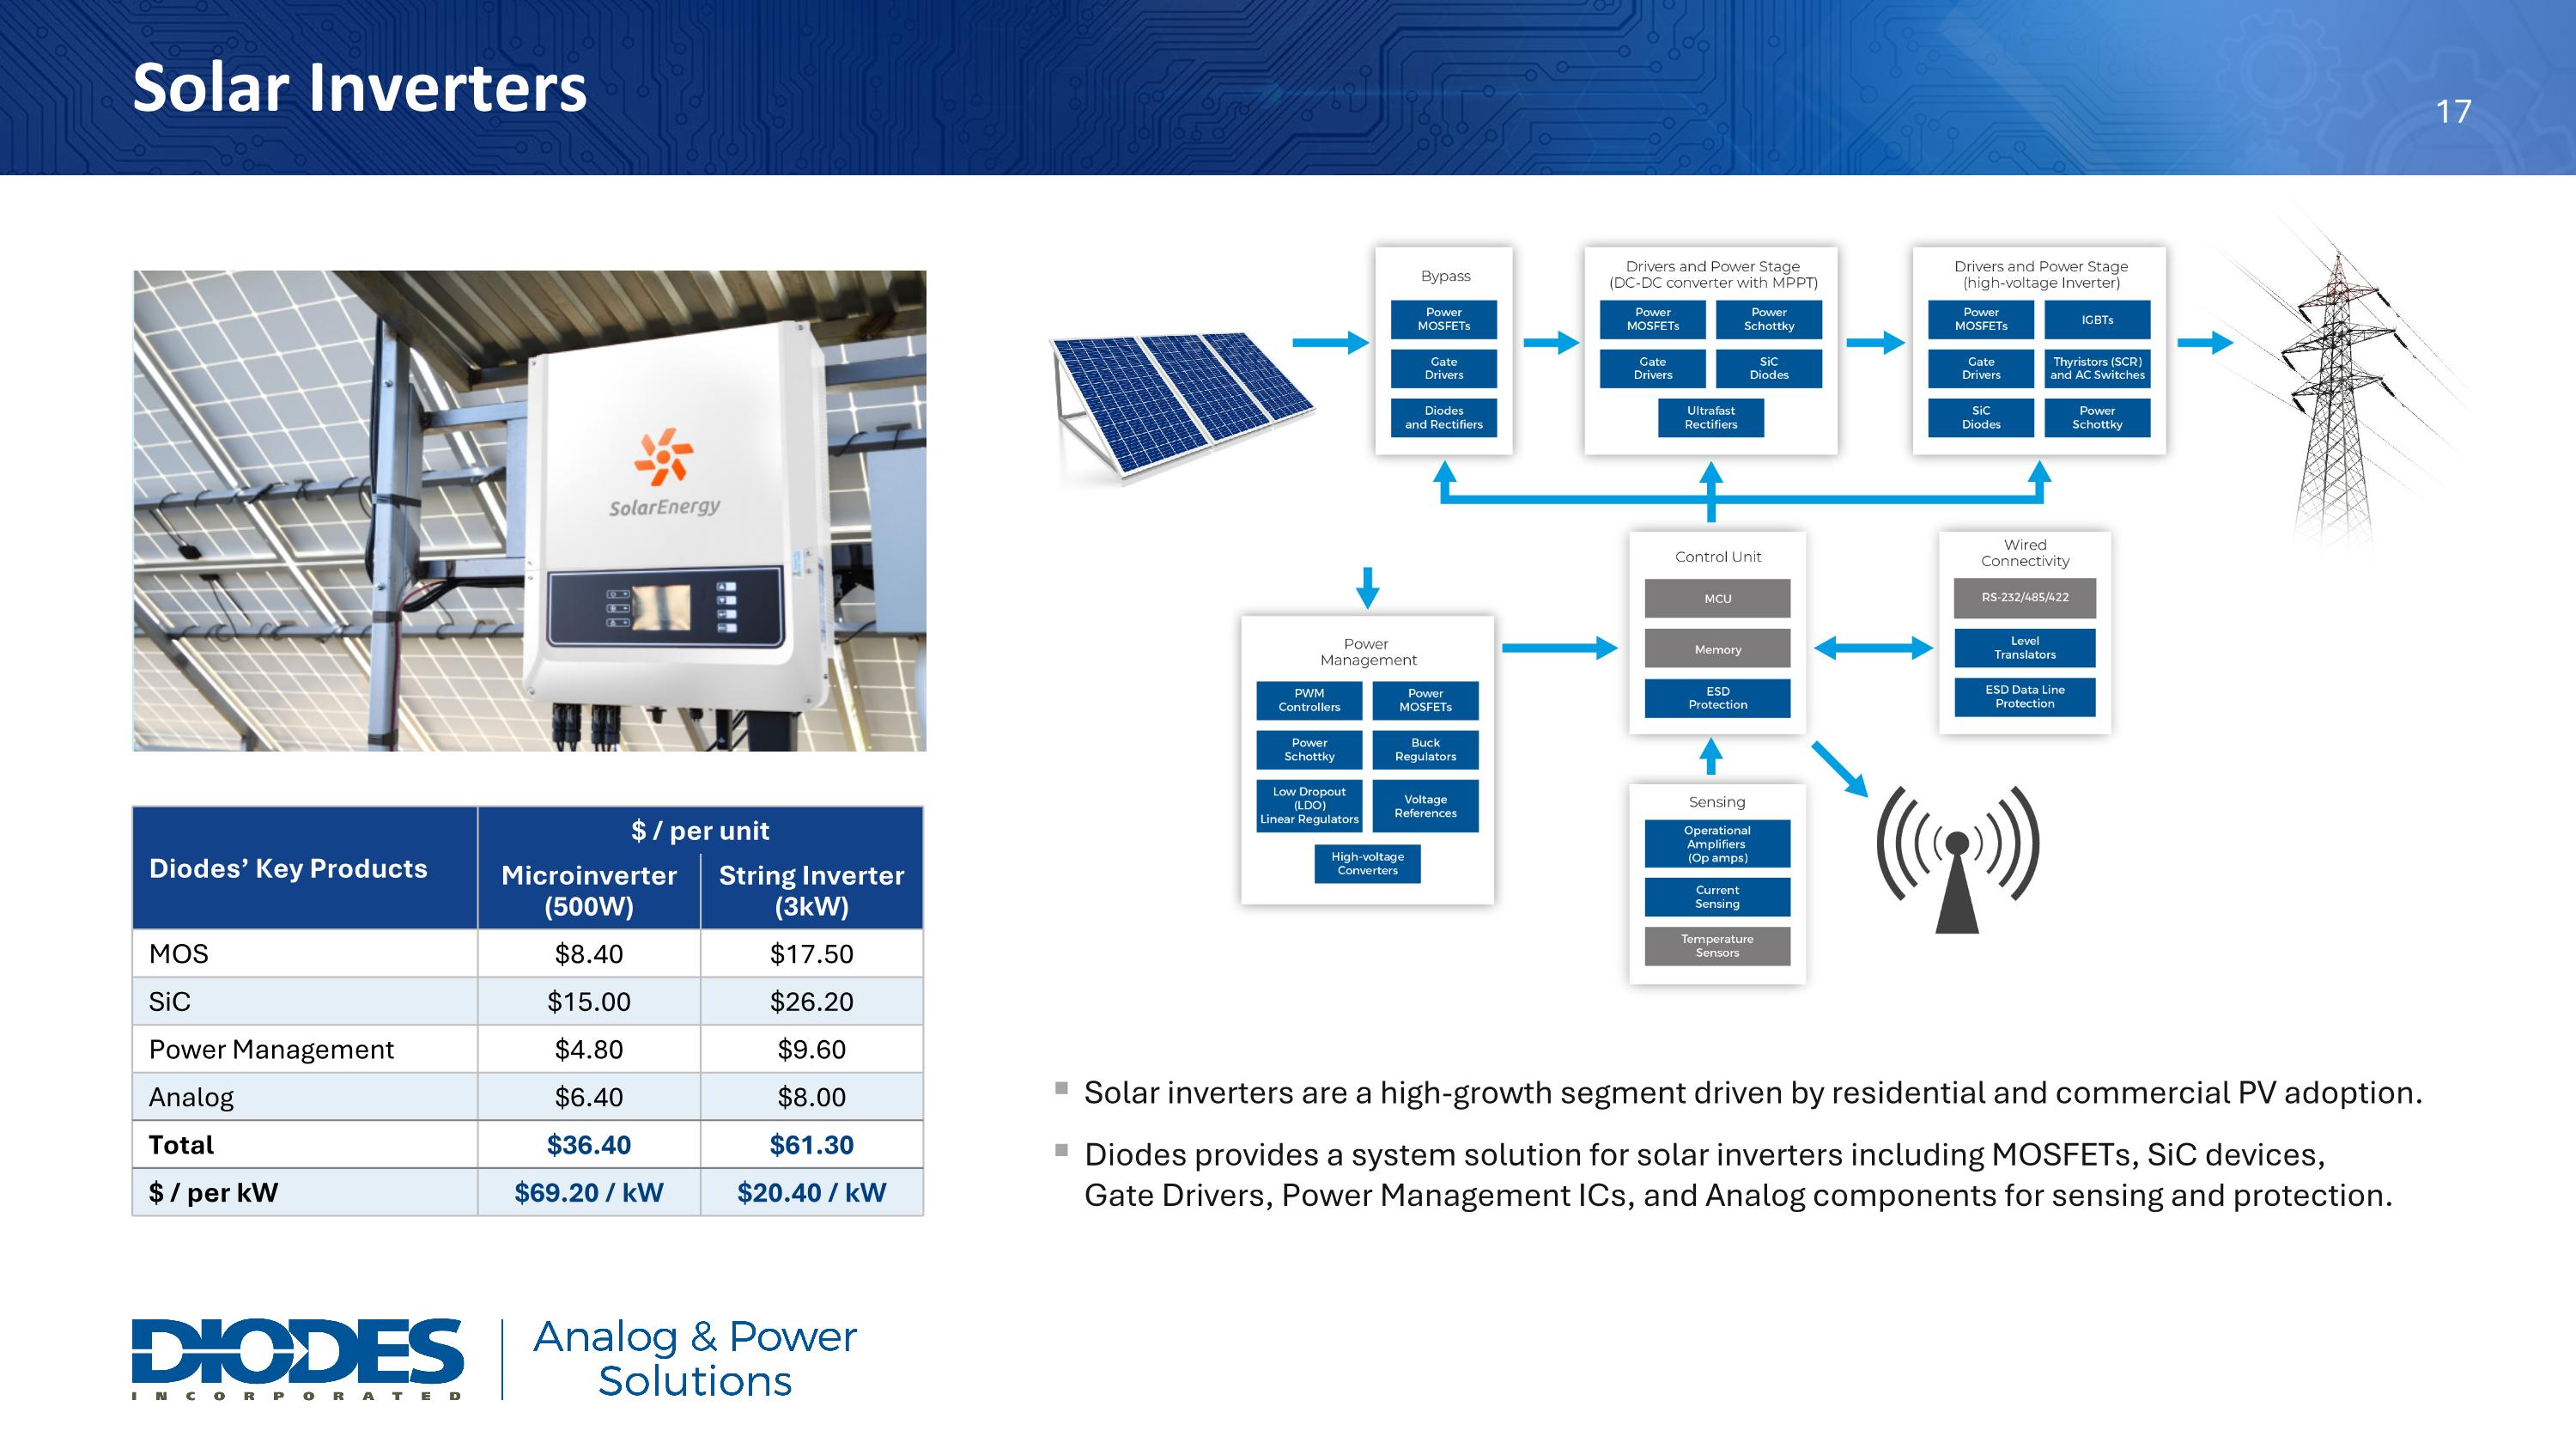
Diodes’ Key Products $ / per unit Microinverter (500W) String Inverter (3kW) MOS $8.40 $17.50 SiC $15.00 $26.20 Power Management $4.80 $9.60 Analog $6.40 $8.00 Total $36.40 $61.30 $ / per kW $69.20 / kW $20.40 / kW Solar inverters are a high-growth segment driven by residential and commercial PV adoption. Diodes provides a system solution for solar inverters including MOSFETs, SiC devices, Gate Drivers, Power Management ICs, and Analog components for sensing and protection. Solar Inverters

Slide 19

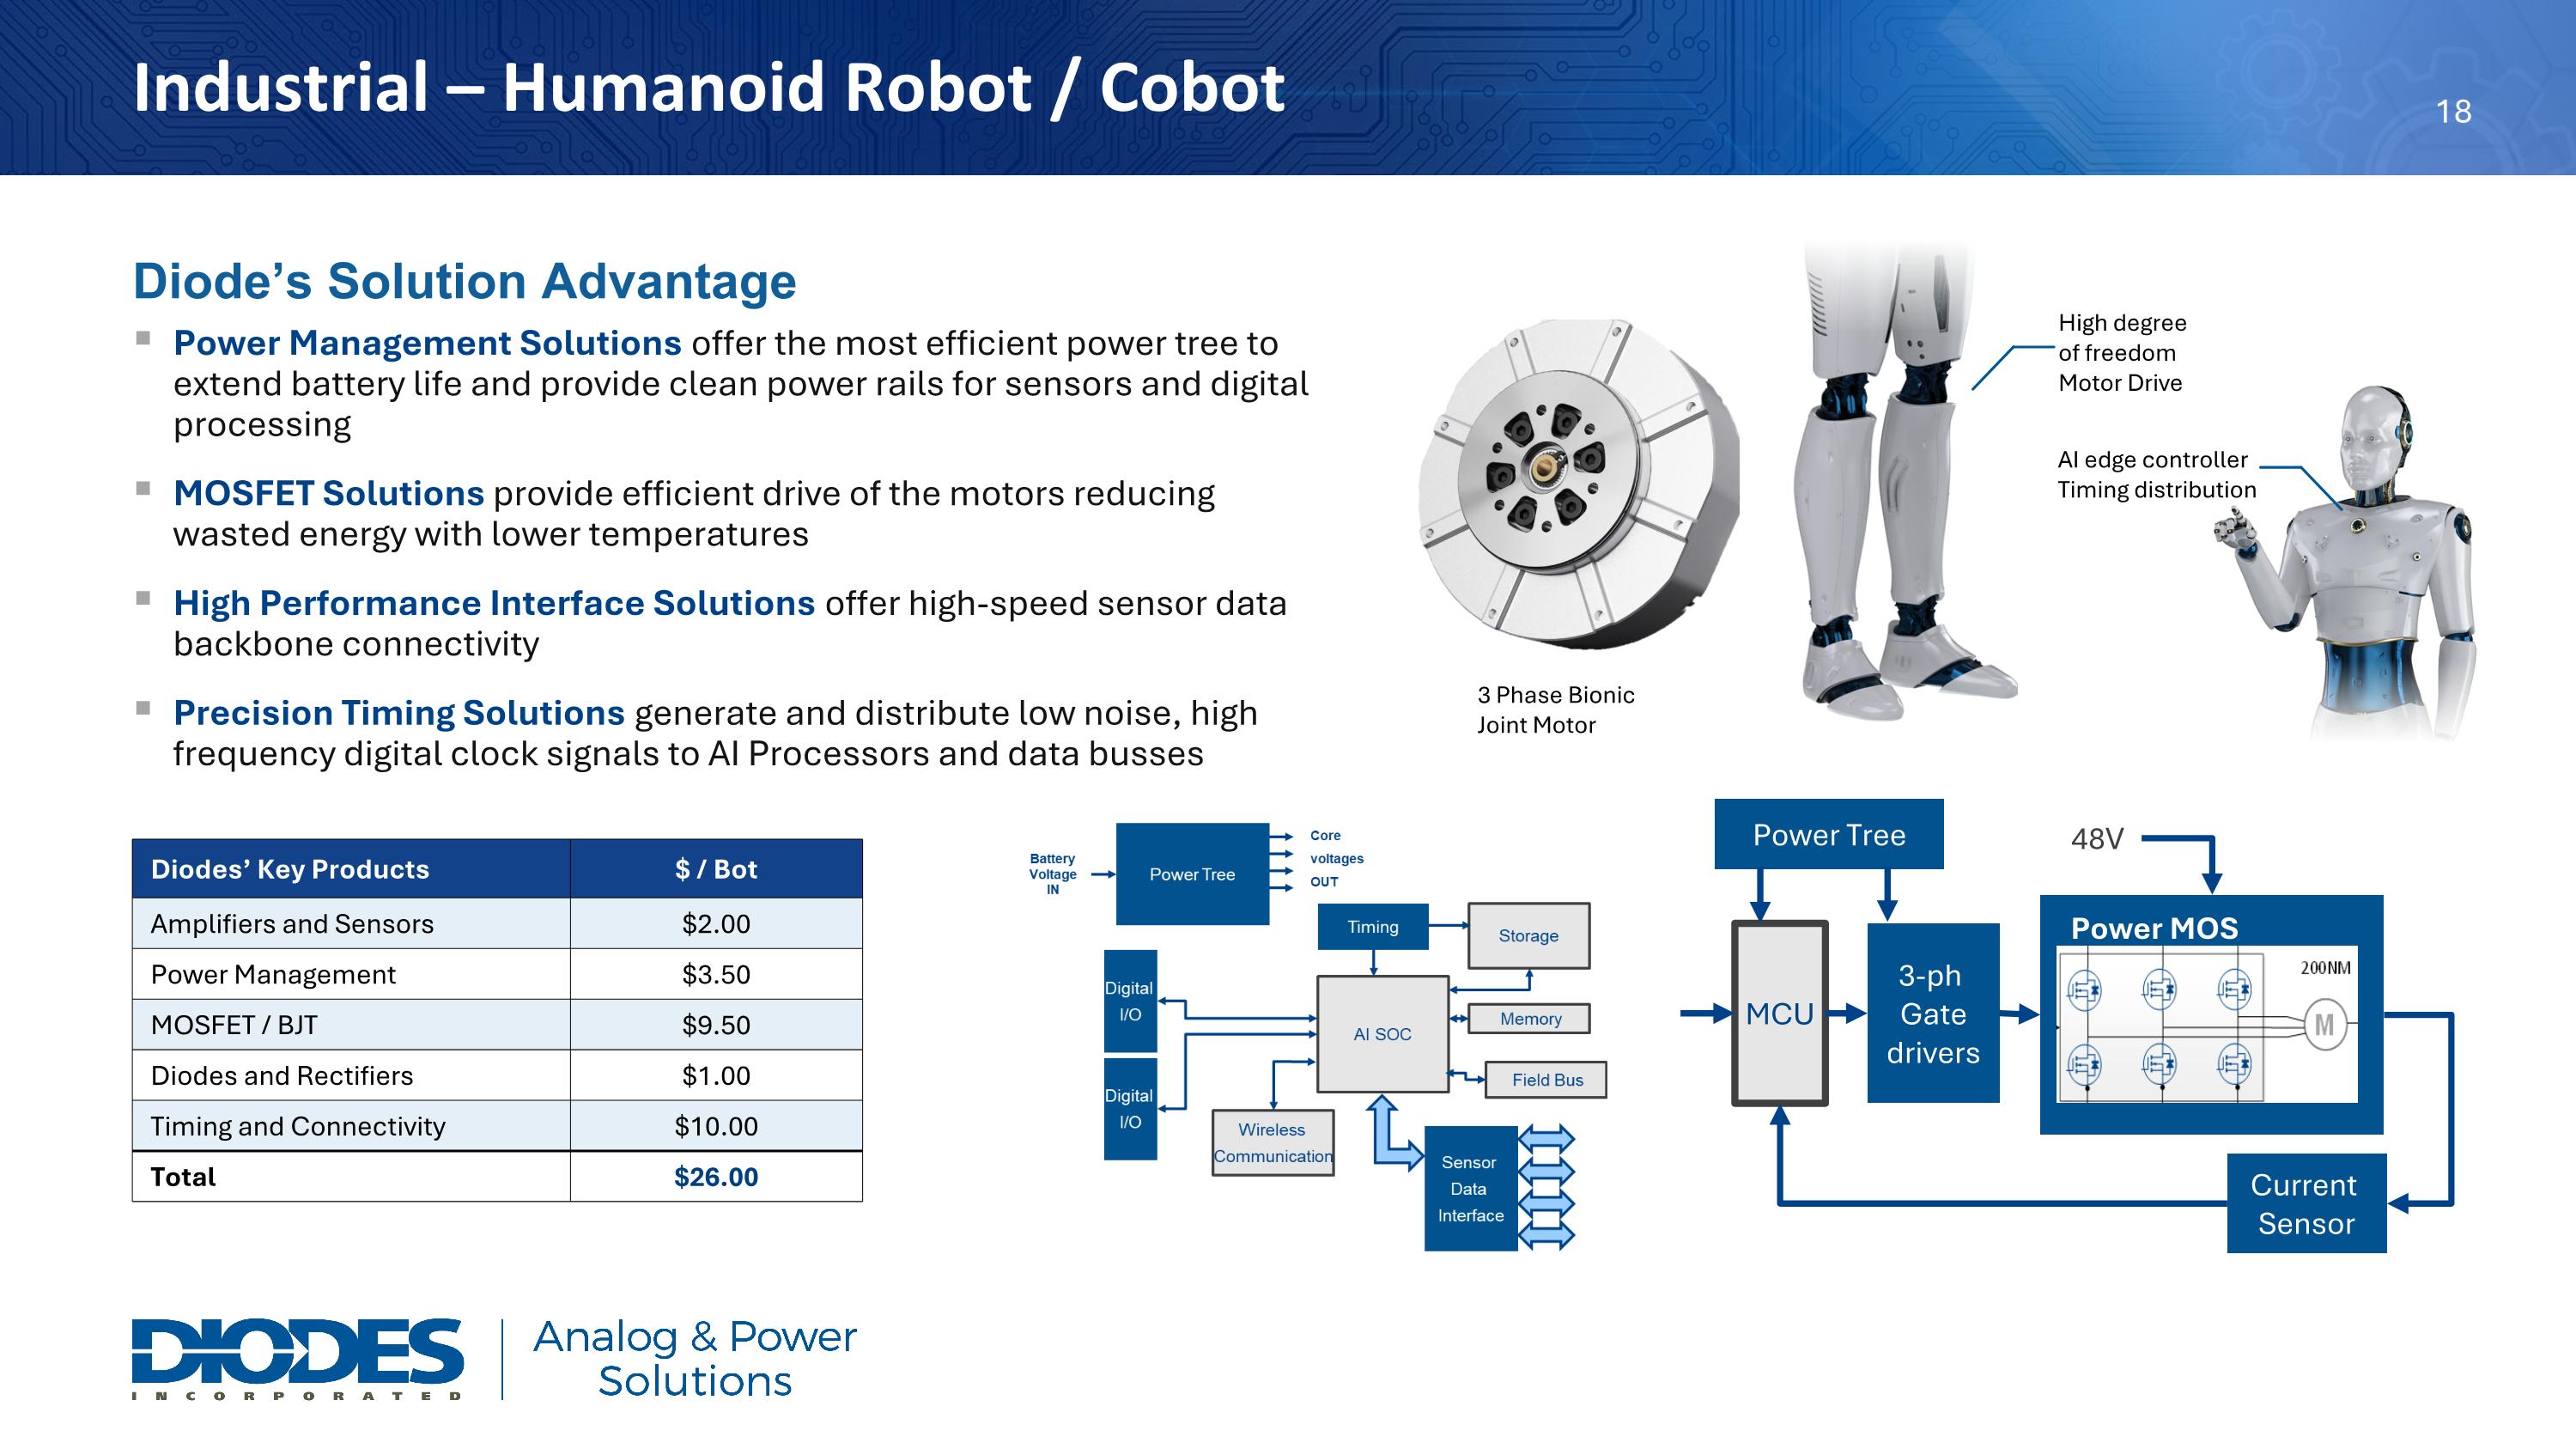
Diode’s Solution Advantage Power Management Solutions offer the most efficient power tree to extend battery life and provide clean power rails for sensors and digital processing MOSFET Solutions provide efficient drive of the motors reducing wasted energy with lower temperatures High Performance Interface Solutions offer high-speed sensor data backbone connectivity Precision Timing Solutions generate and distribute low noise, high frequency digital clock signals to AI Processors and data busses Diodes’ Key Products $ / Bot Amplifiers and Sensors $2.00 Power Management $3.50 MOSFET / BJT $9.50 Diodes and Rectifiers $1.00 Timing and Connectivity $10.00 Total $26.00 3 Phase Bionic Joint Motor Industrial – Humanoid Robot / Cobot High degree of freedom Motor Drive AI edge controllerTiming distribution MCU 3-ph Gate drivers Power Tree Current Sensor 48V Power MOS

Slide 20

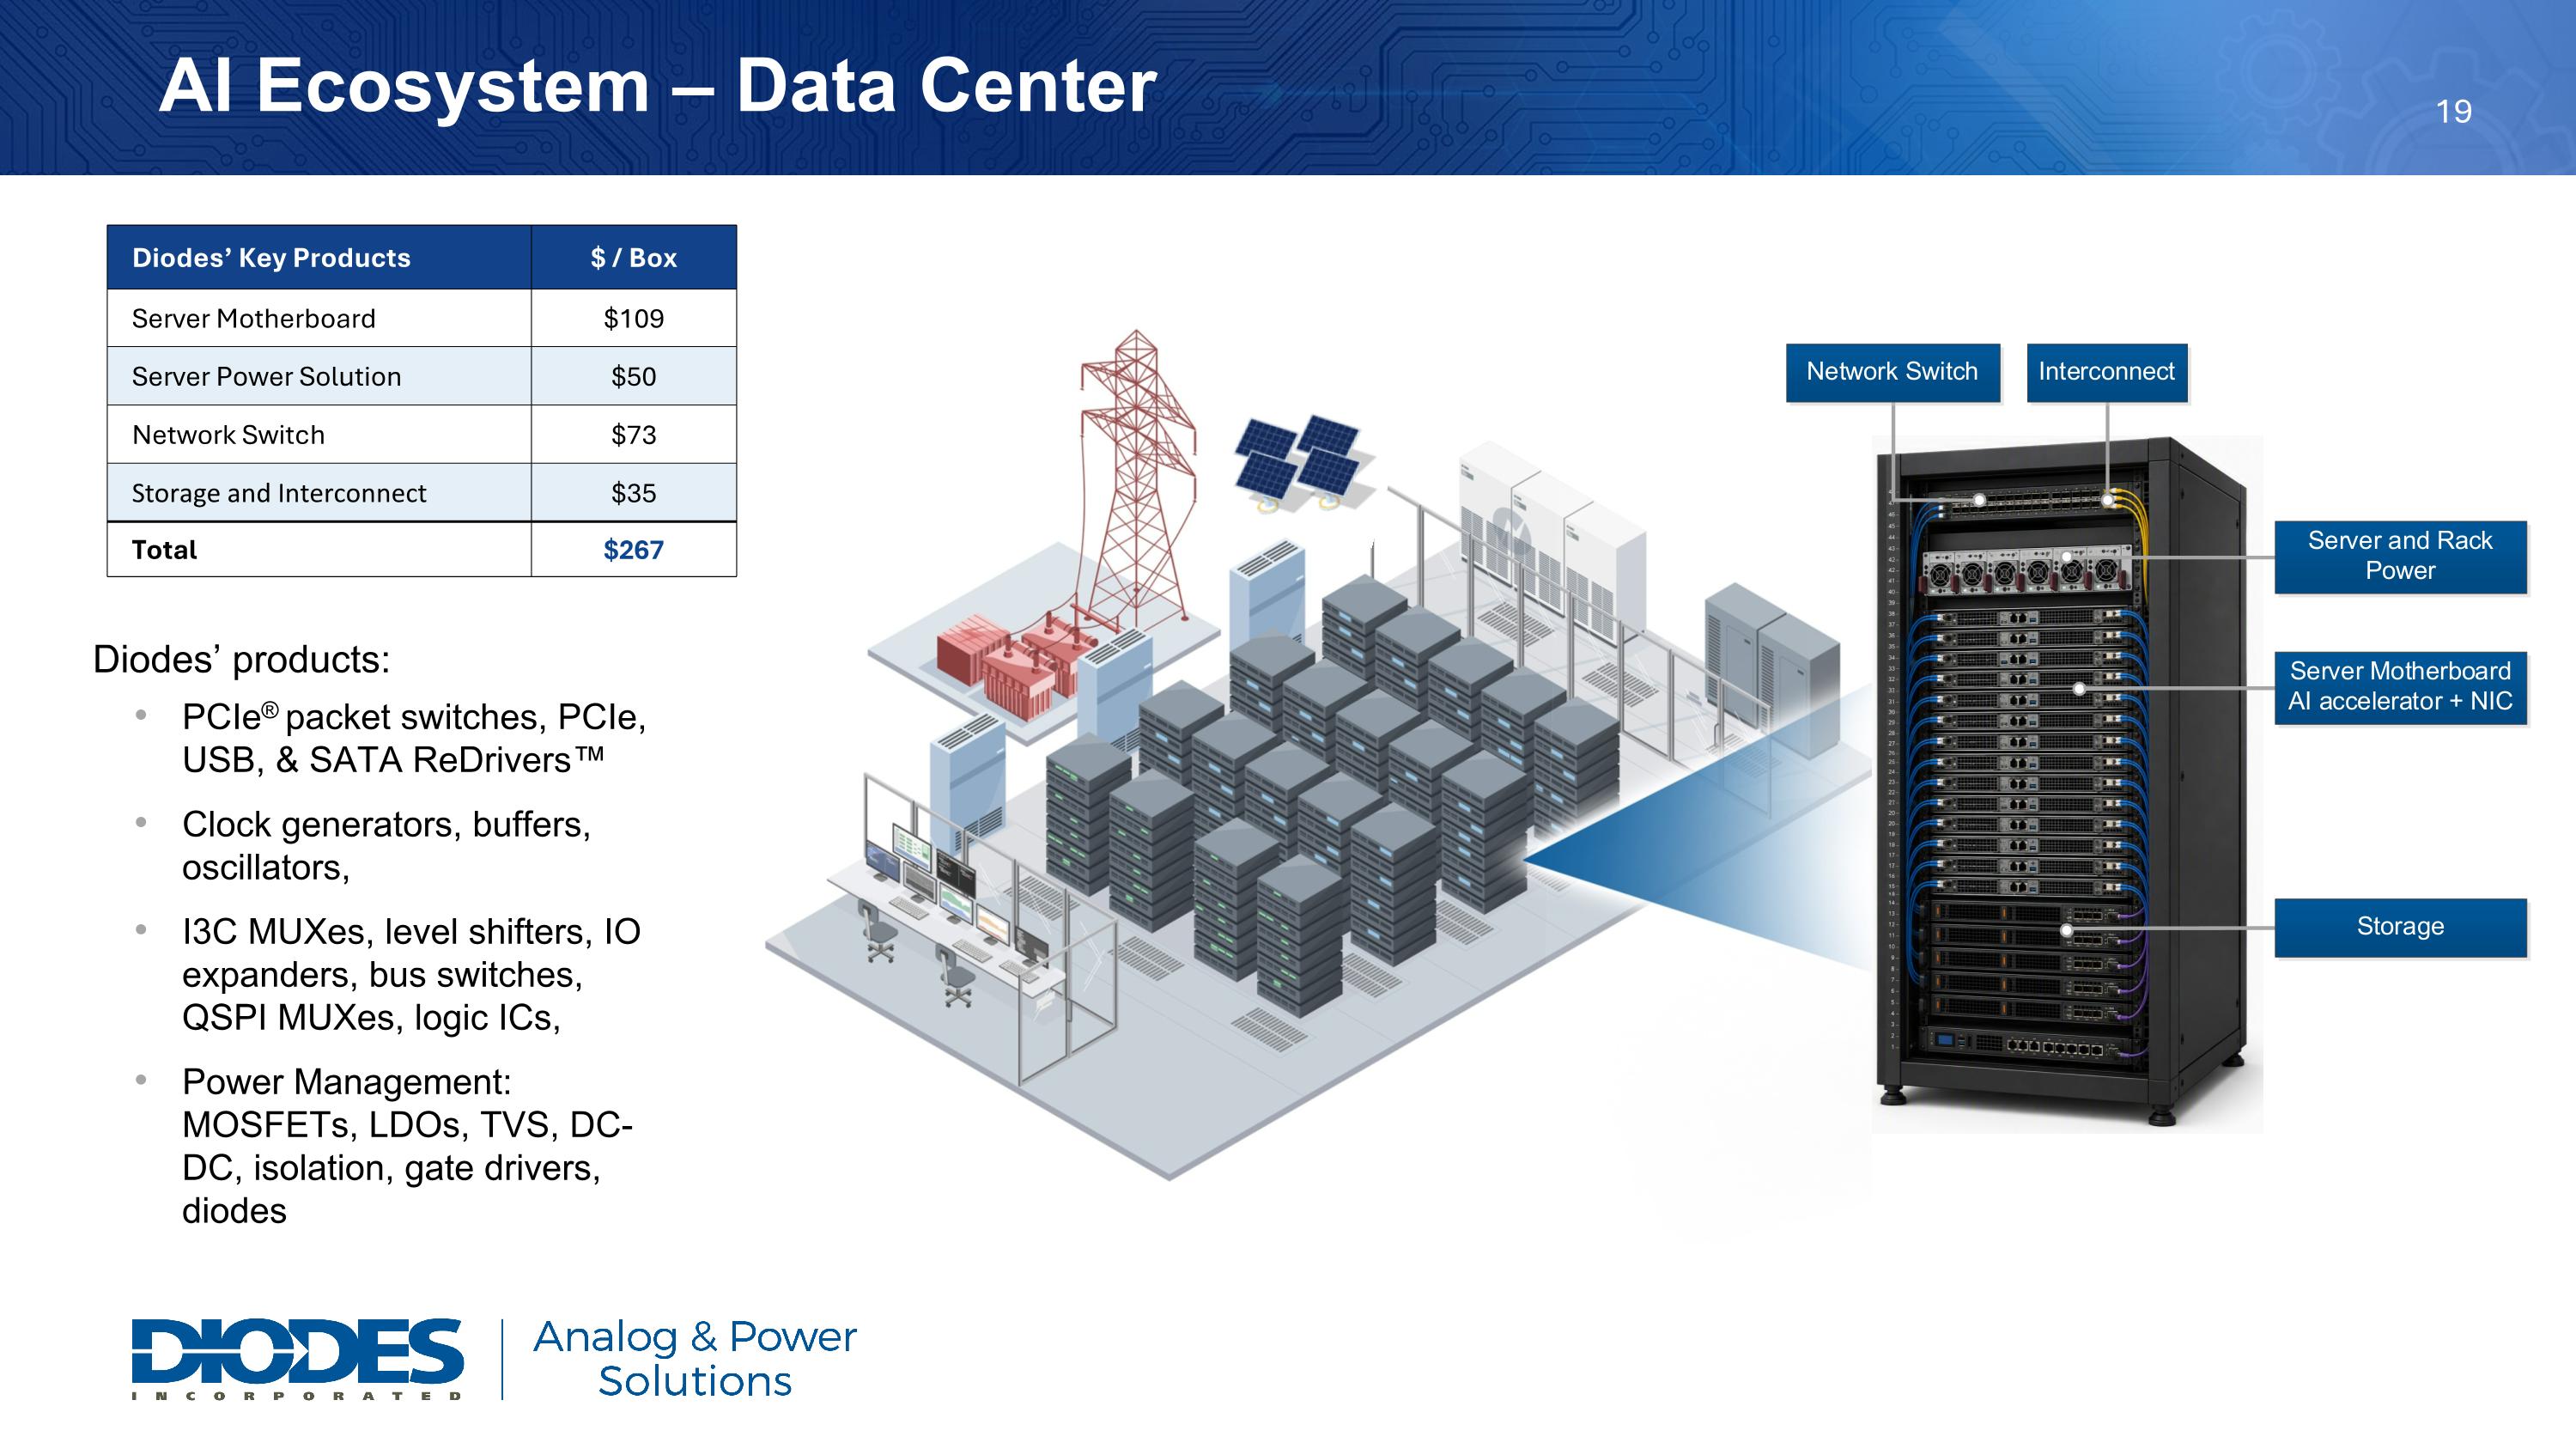
AI Ecosystem – Data Center Diodes’ Key Products $ / Box Server Motherboard $109 Server Power Solution $50 Network Switch $73 Storage and Interconnect $35 Total $267 Diodes’ products: PCIe® packet switches, PCIe, USB, & SATA ReDrivers™ Clock generators, buffers, oscillators, I3C MUXes, level shifters, IO expanders, bus switches, QSPI MUXes, logic ICs, Power Management: MOSFETs, LDOs, TVS, DC-DC, isolation, gate drivers, diodes

Slide 21

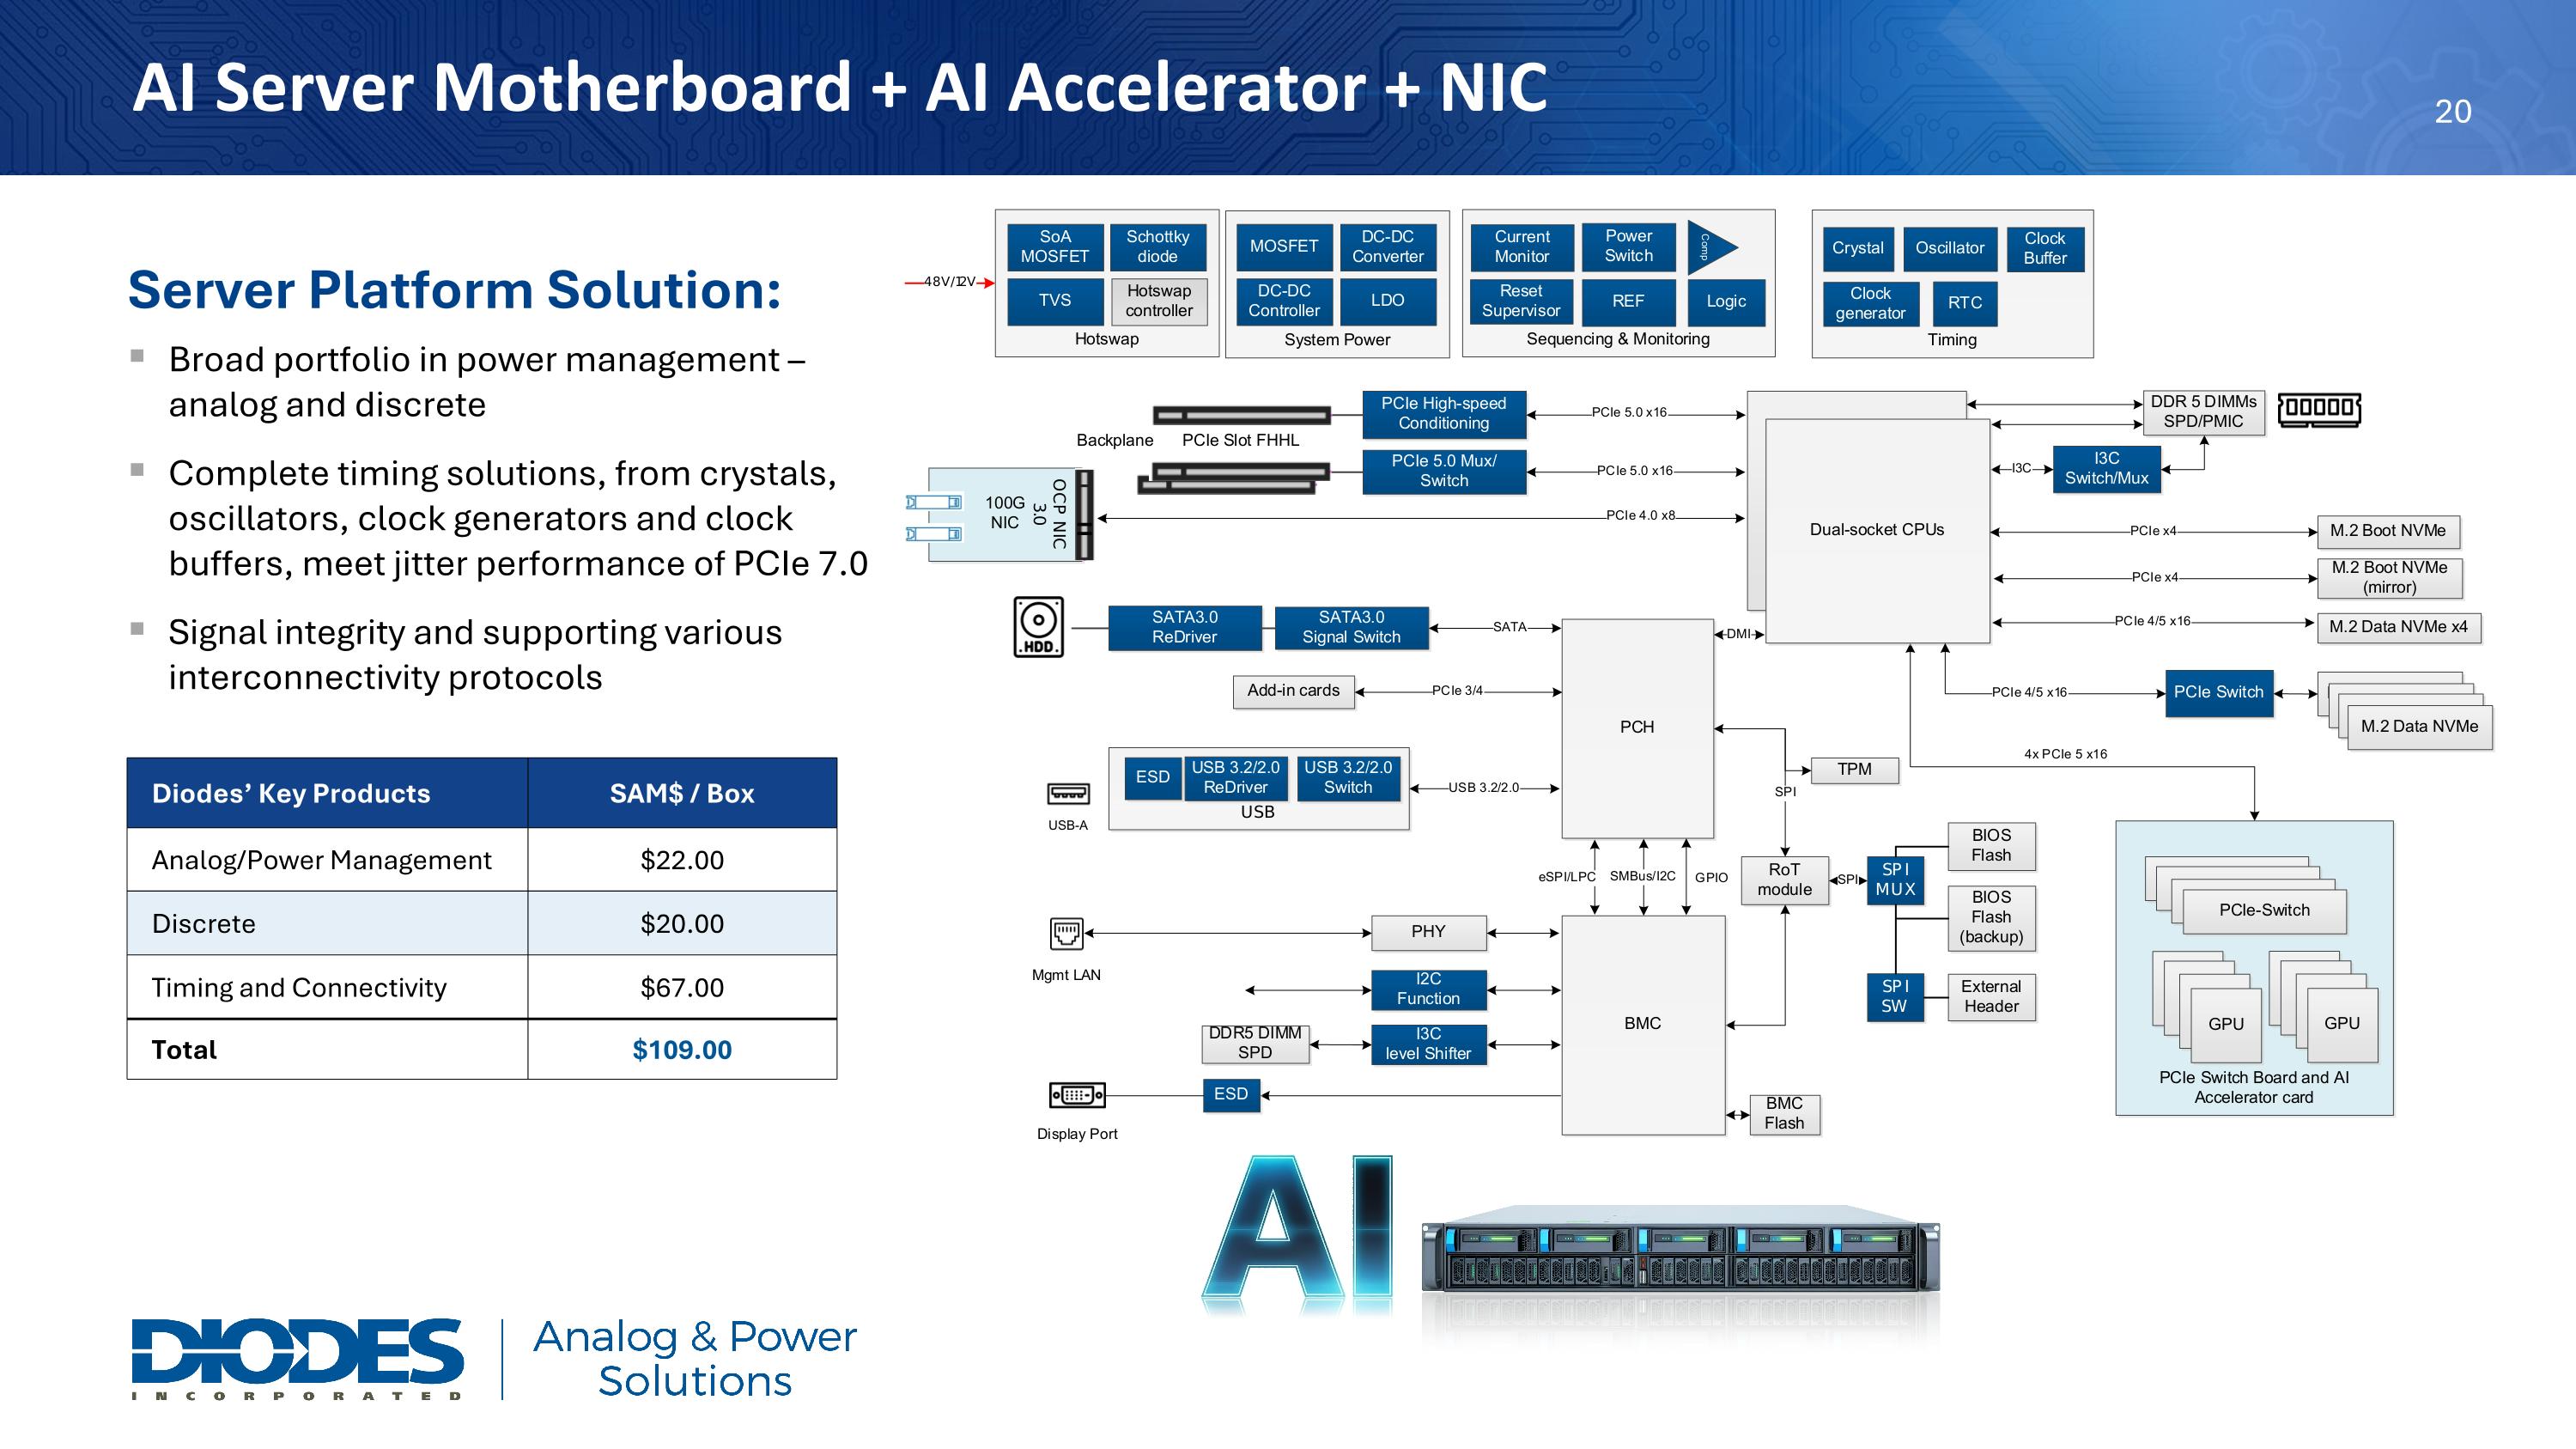
AI Server Motherboard + AI Accelerator + NIC Server Platform Solution: Broad portfolio in power management – analog and discrete Complete timing solutions, from crystals, oscillators, clock generators and clock buffers, meet jitter performance of PCIe 7.0 Signal integrity and supporting various interconnectivity protocols Diodes’ Key Products SAM$ / Box Analog/Power Management $22.00 Discrete $20.00 Timing and Connectivity $67.00 Total $109.00

Slide 22

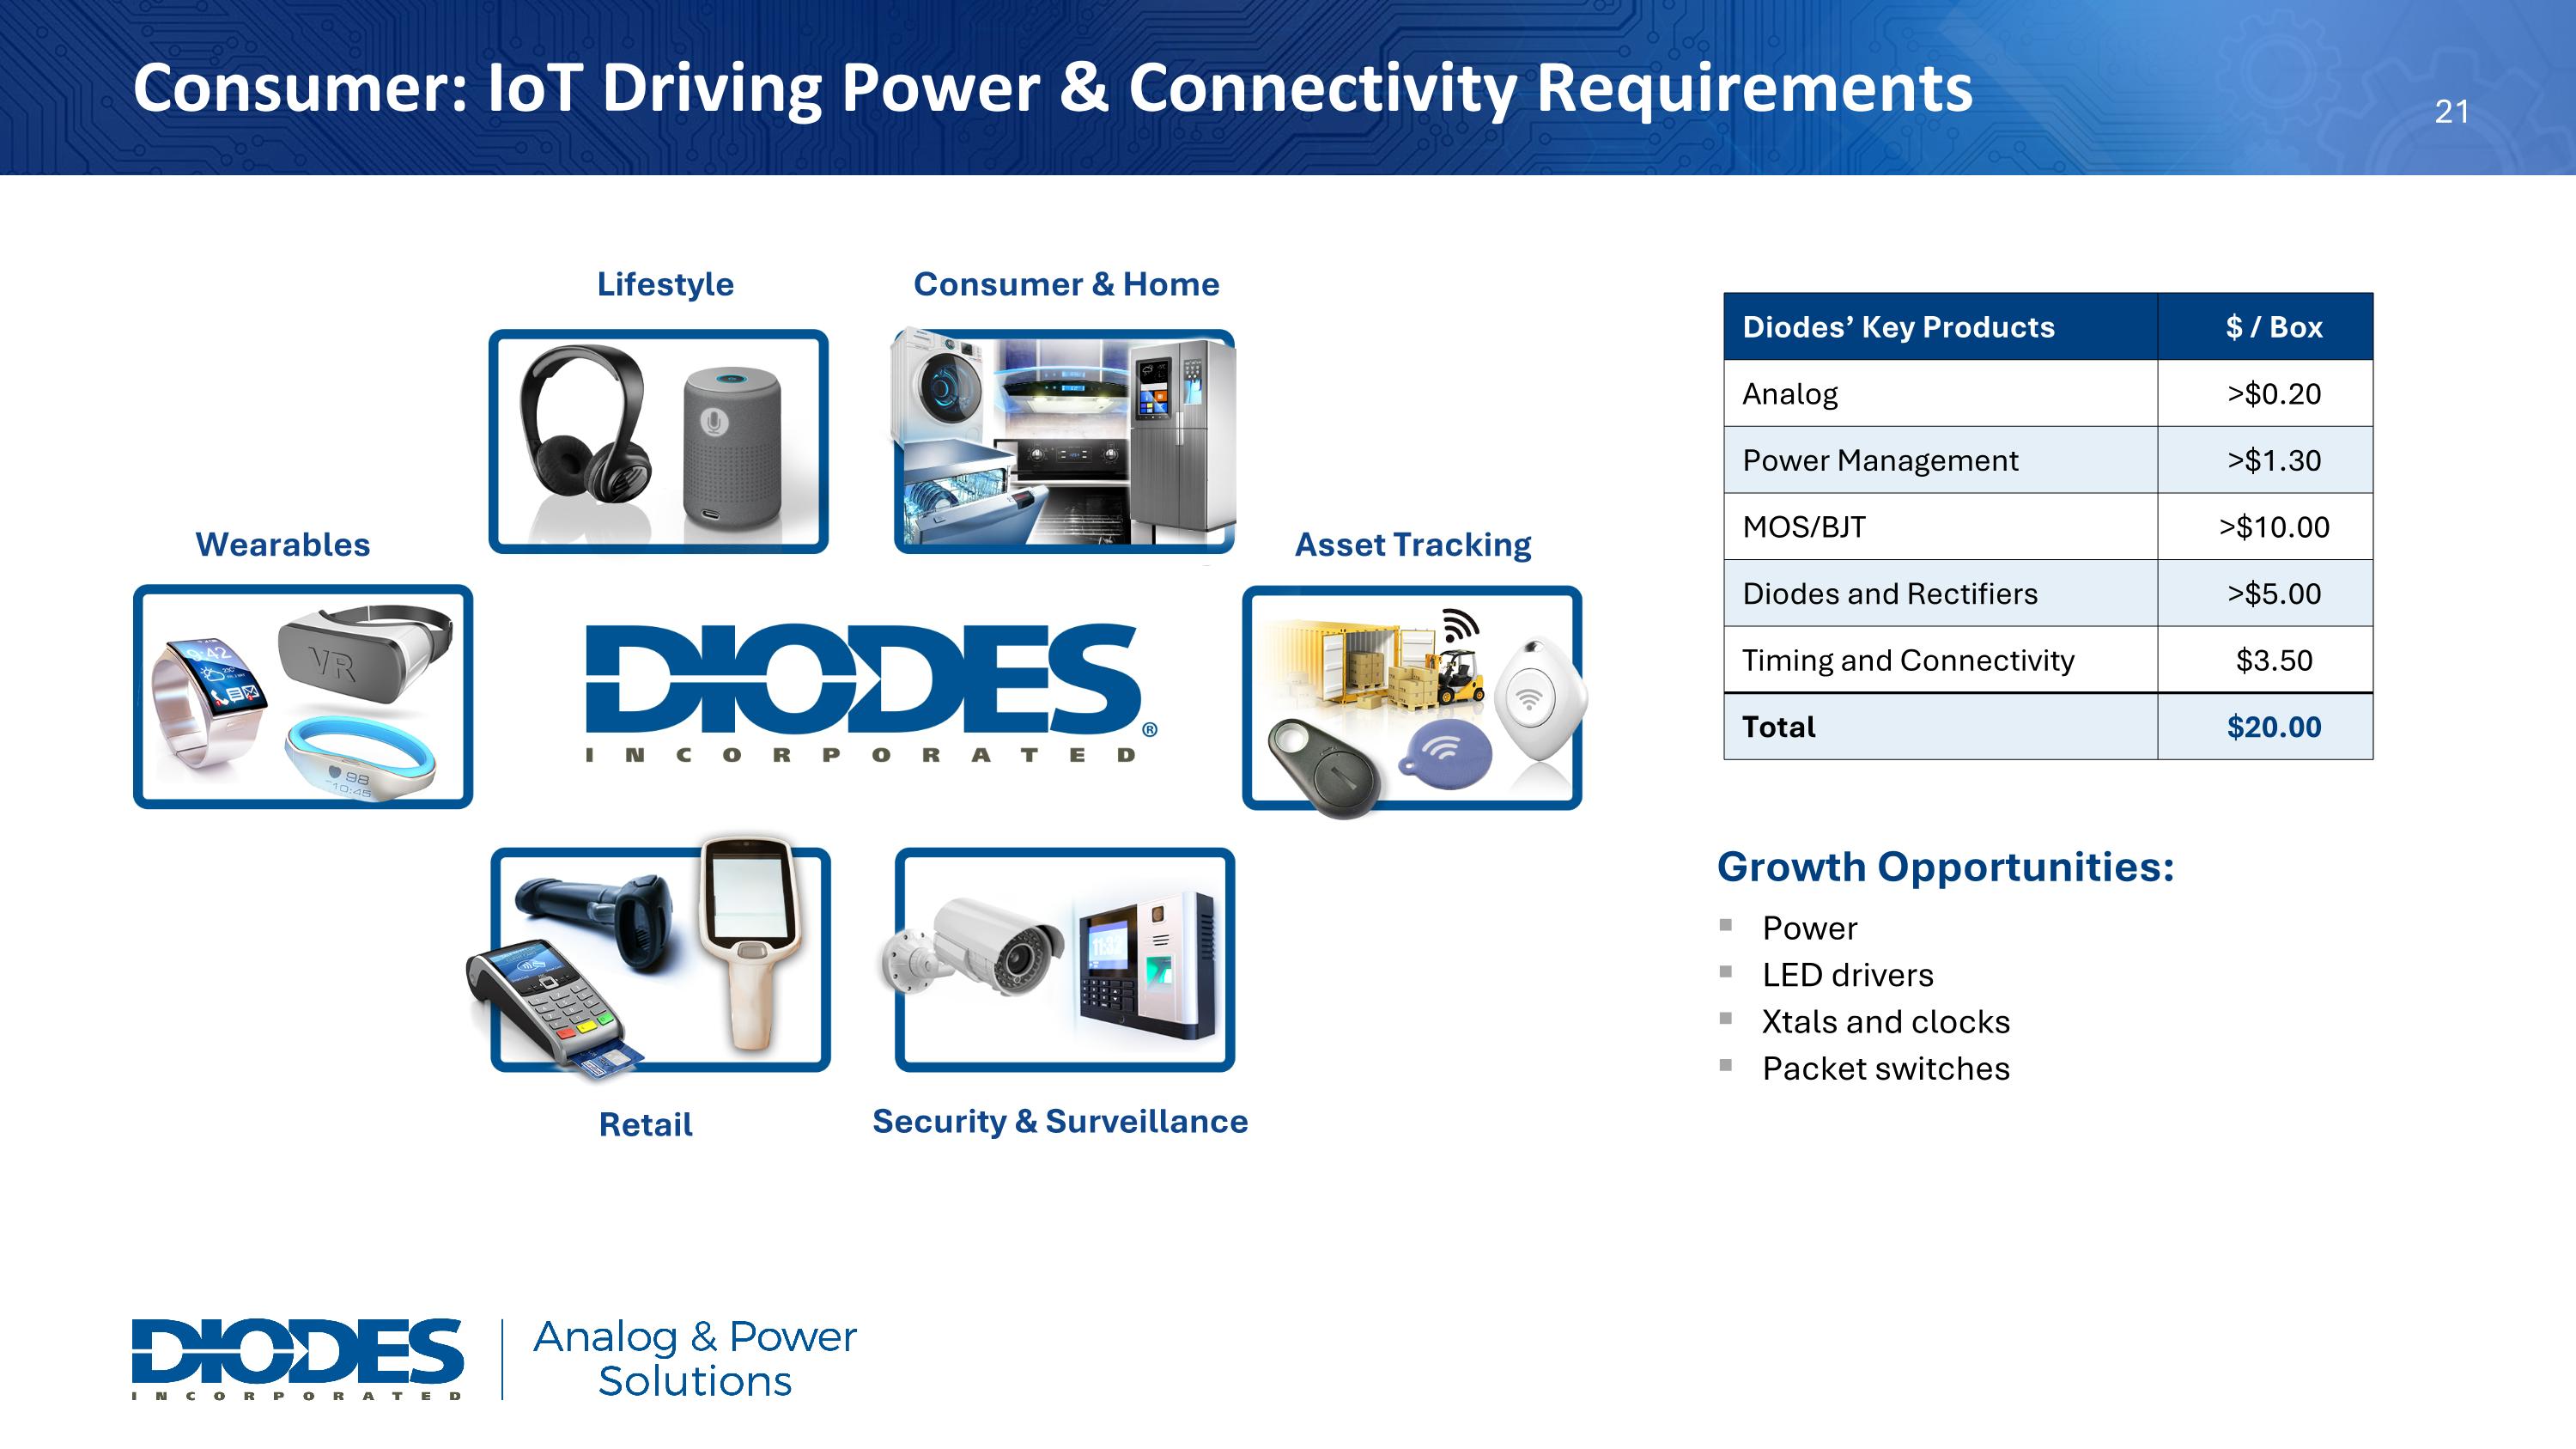
Consumer: IoT Driving Power & Connectivity Requirements Diodes’ Key Products $ / Box Analog >$0.20 Power Management >$1.30 MOS/BJT >$10.00 Diodes and Rectifiers >$5.00 Timing and Connectivity $3.50 Total $20.00 Lifestyle Wearables Consumer & Home Asset Tracking Security & Surveillance Retail Growth Opportunities: Power LED drivers Xtals and clocks Packet switches

Slide 23

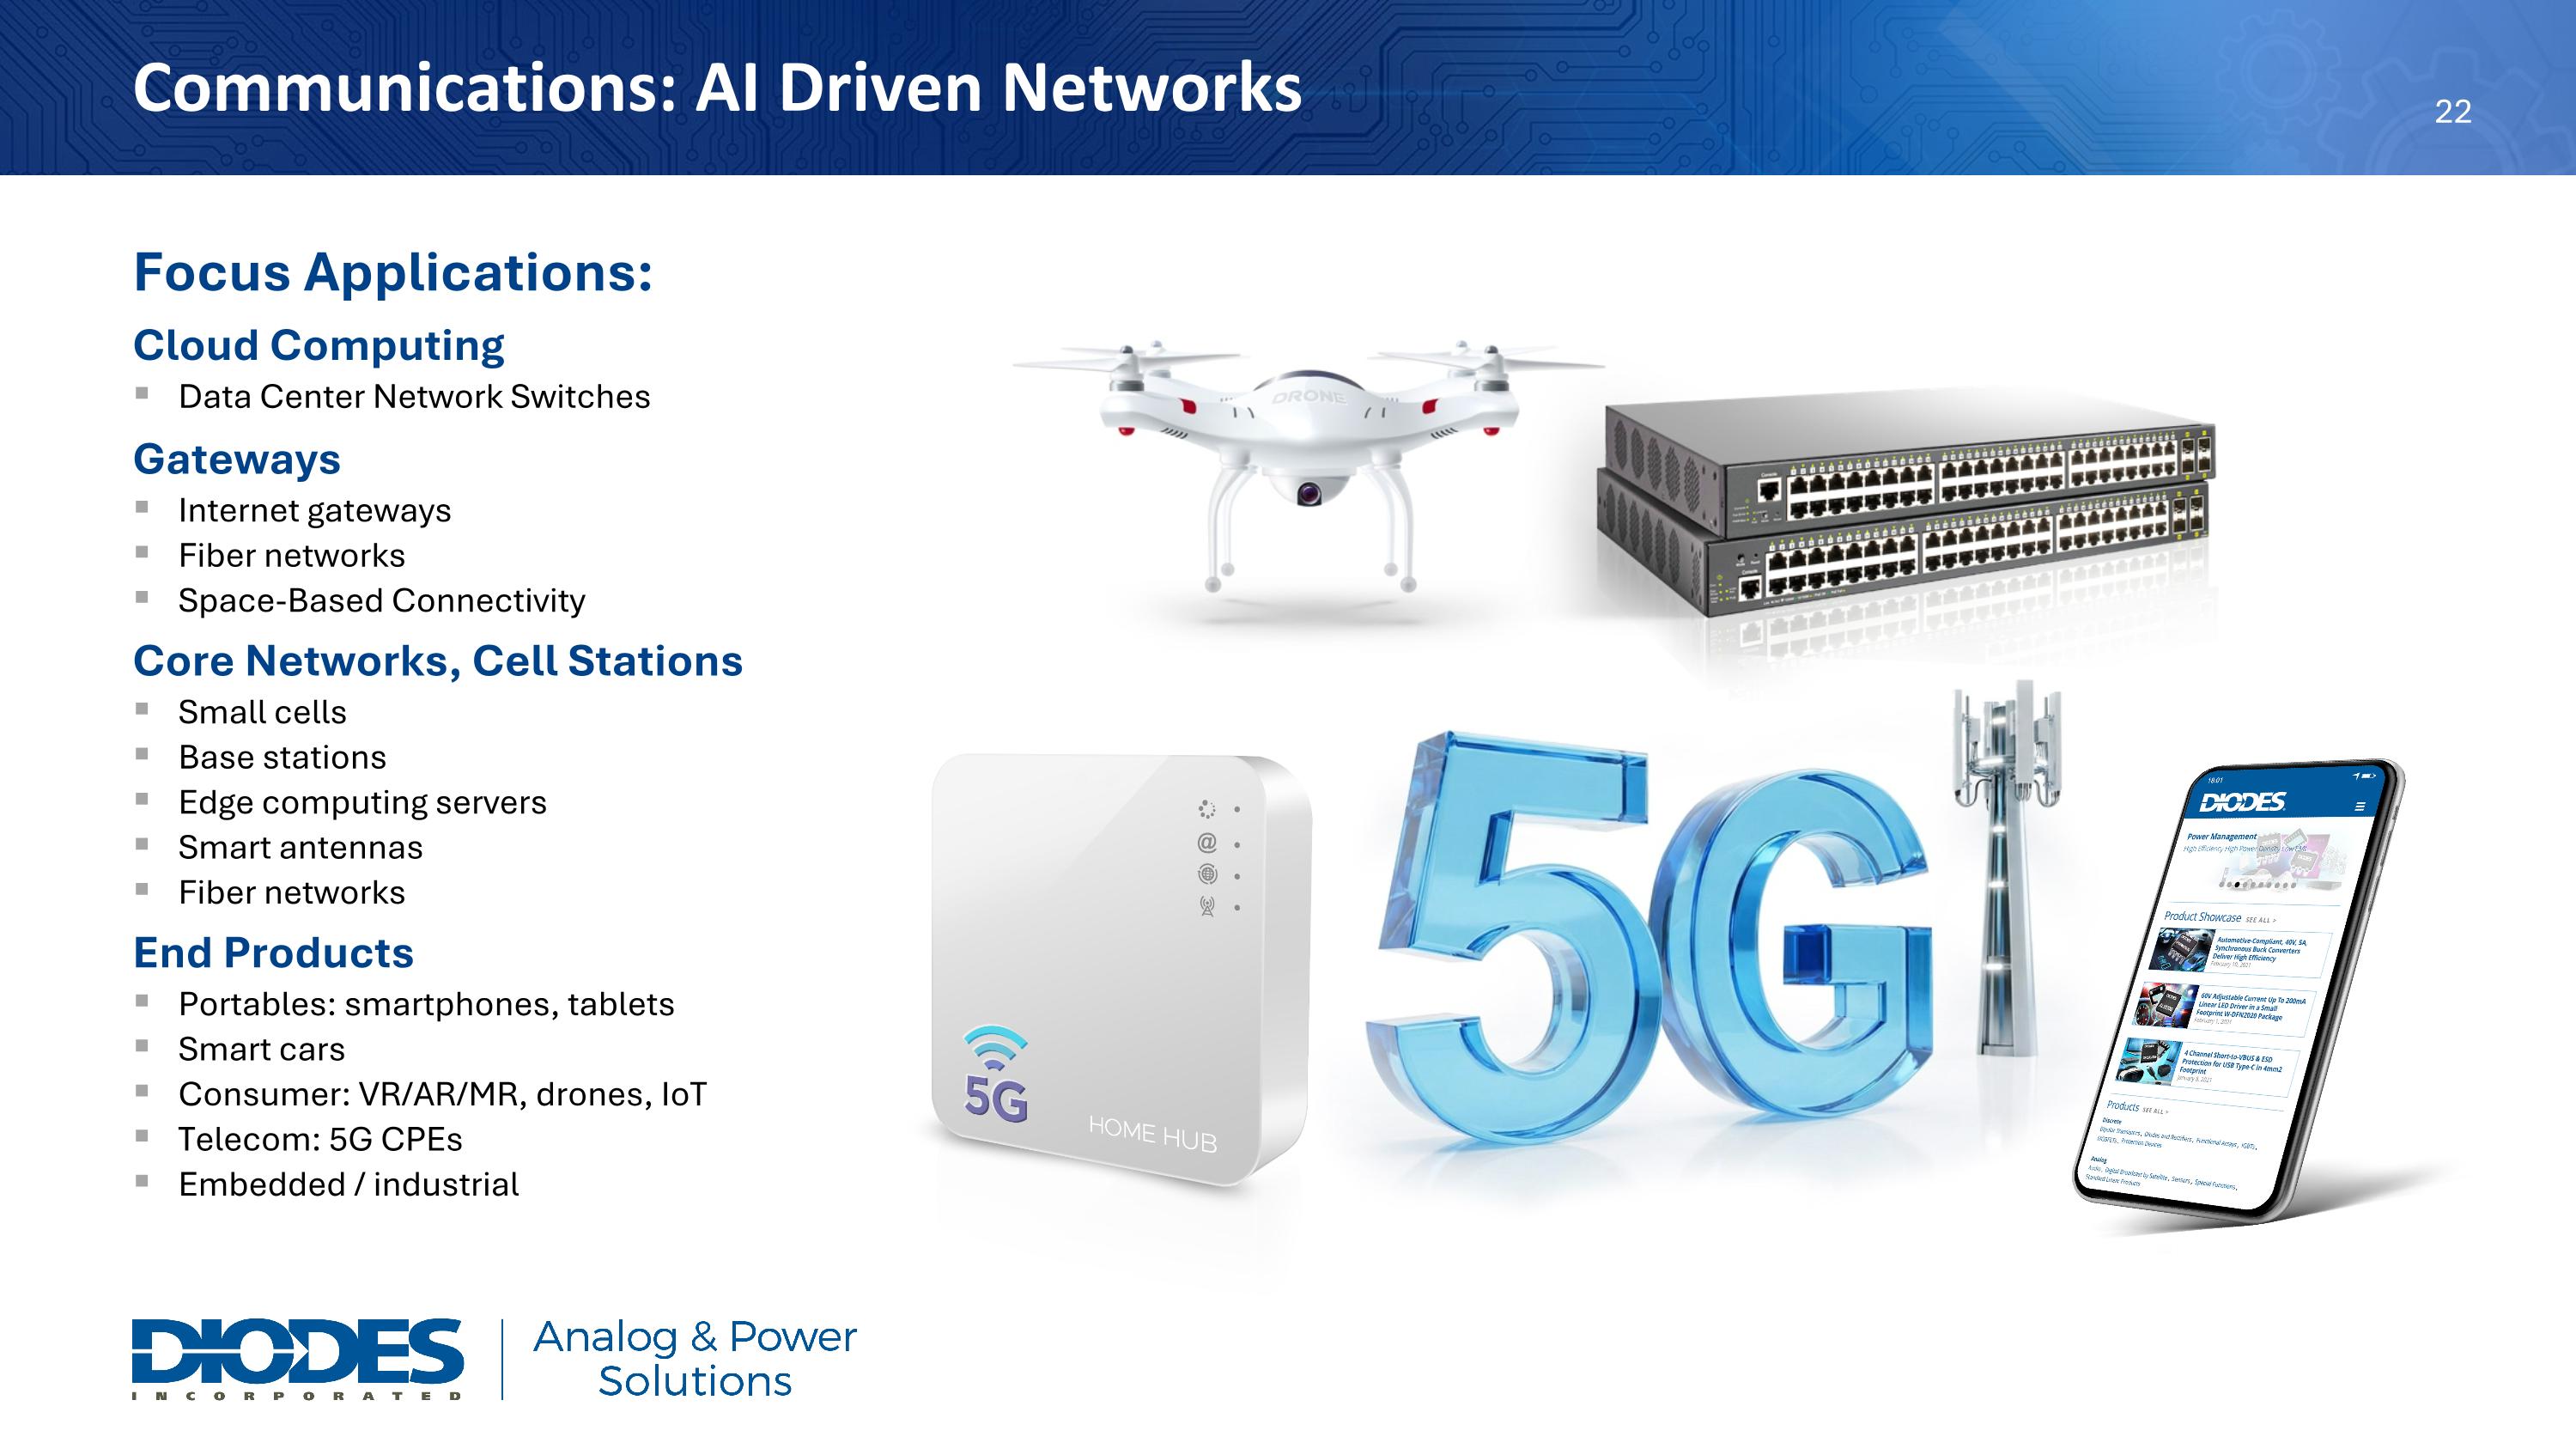
Focus Applications: Cloud Computing Data Center Network Switches Gateways Internet gateways Fiber networks Space-Based Connectivity Core Networks, Cell Stations Small cells Base stations Edge computing servers Smart antennas Fiber networks End Products Portables: smartphones, tablets Smart cars Consumer: VR/AR/MR, drones, IoT Telecom: 5G CPEs Embedded / industrial Communications: AI Driven Networks

Slide 24

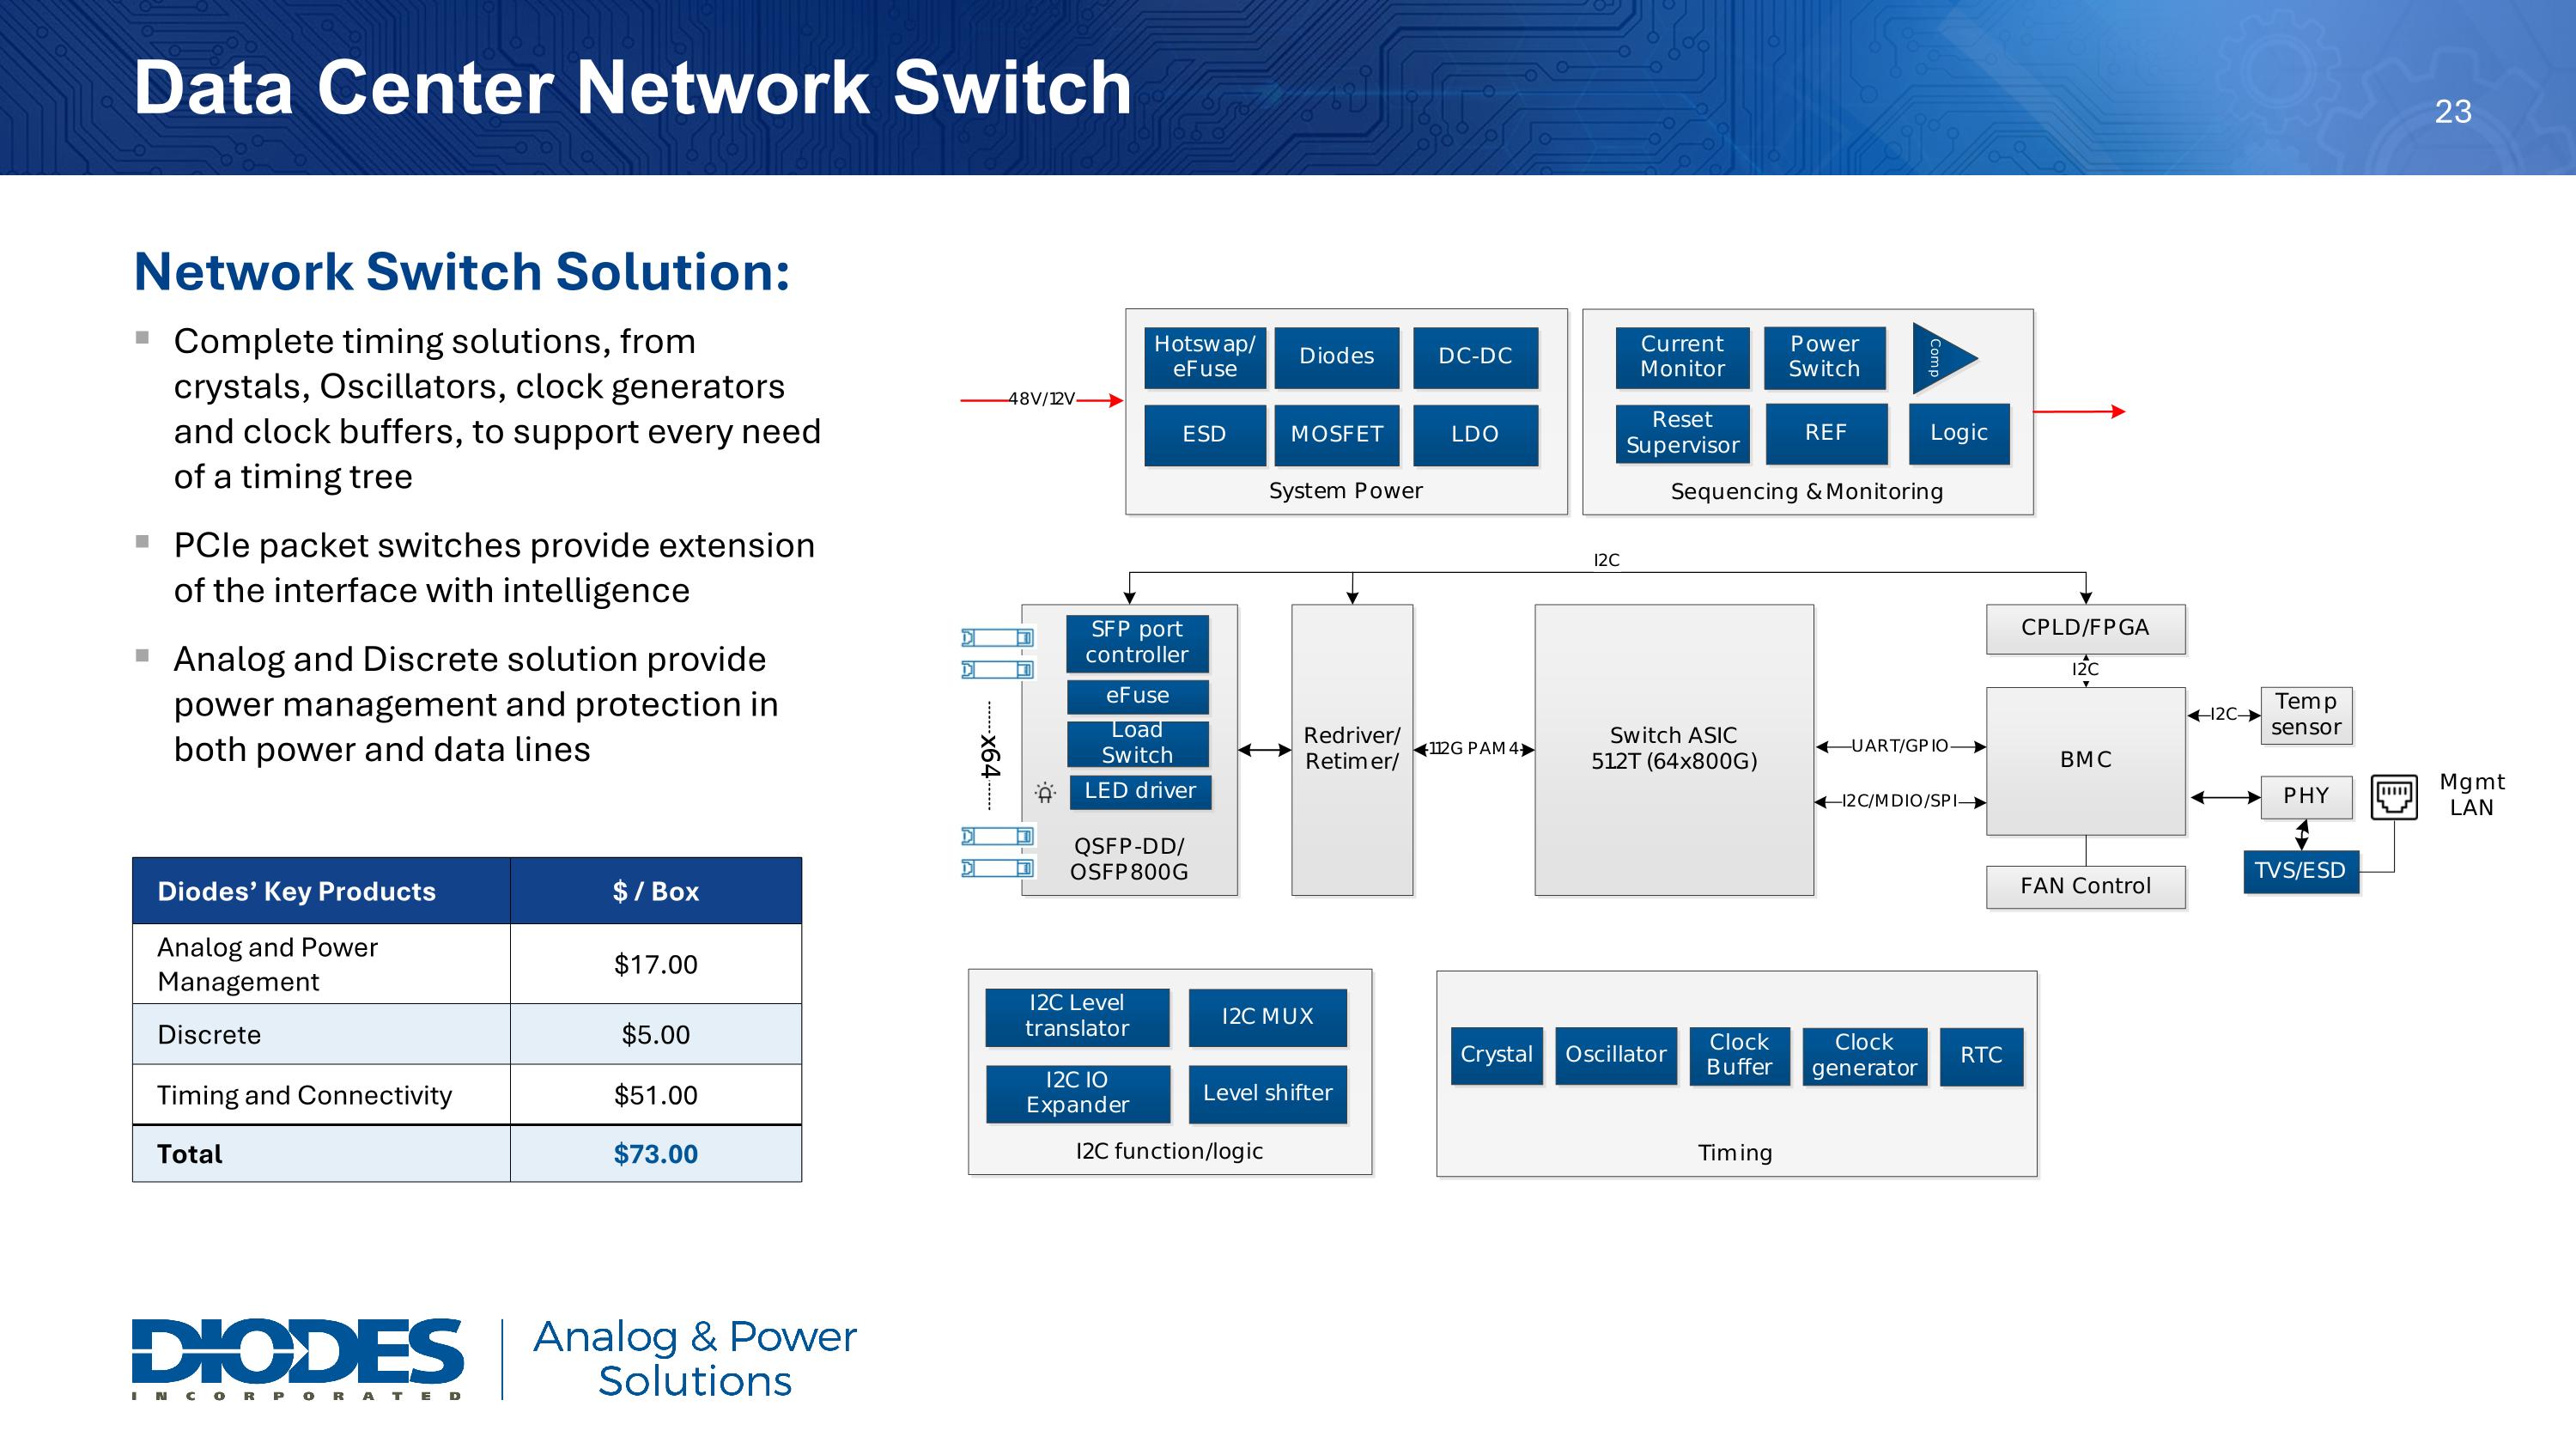
Data Center Network Switch Diodes’ Key Products $ / Box Analog and Power Management $17.00 Discrete $5.00 Timing and Connectivity $51.00 Total $73.00 Network Switch Solution: Complete timing solutions, from crystals, Oscillators, clock generators and clock buffers, to support every need of a timing tree PCIe packet switches provide extension of the interface with intelligence Analog and Discrete solution provide power management and protection in both power and data lines

Slide 25

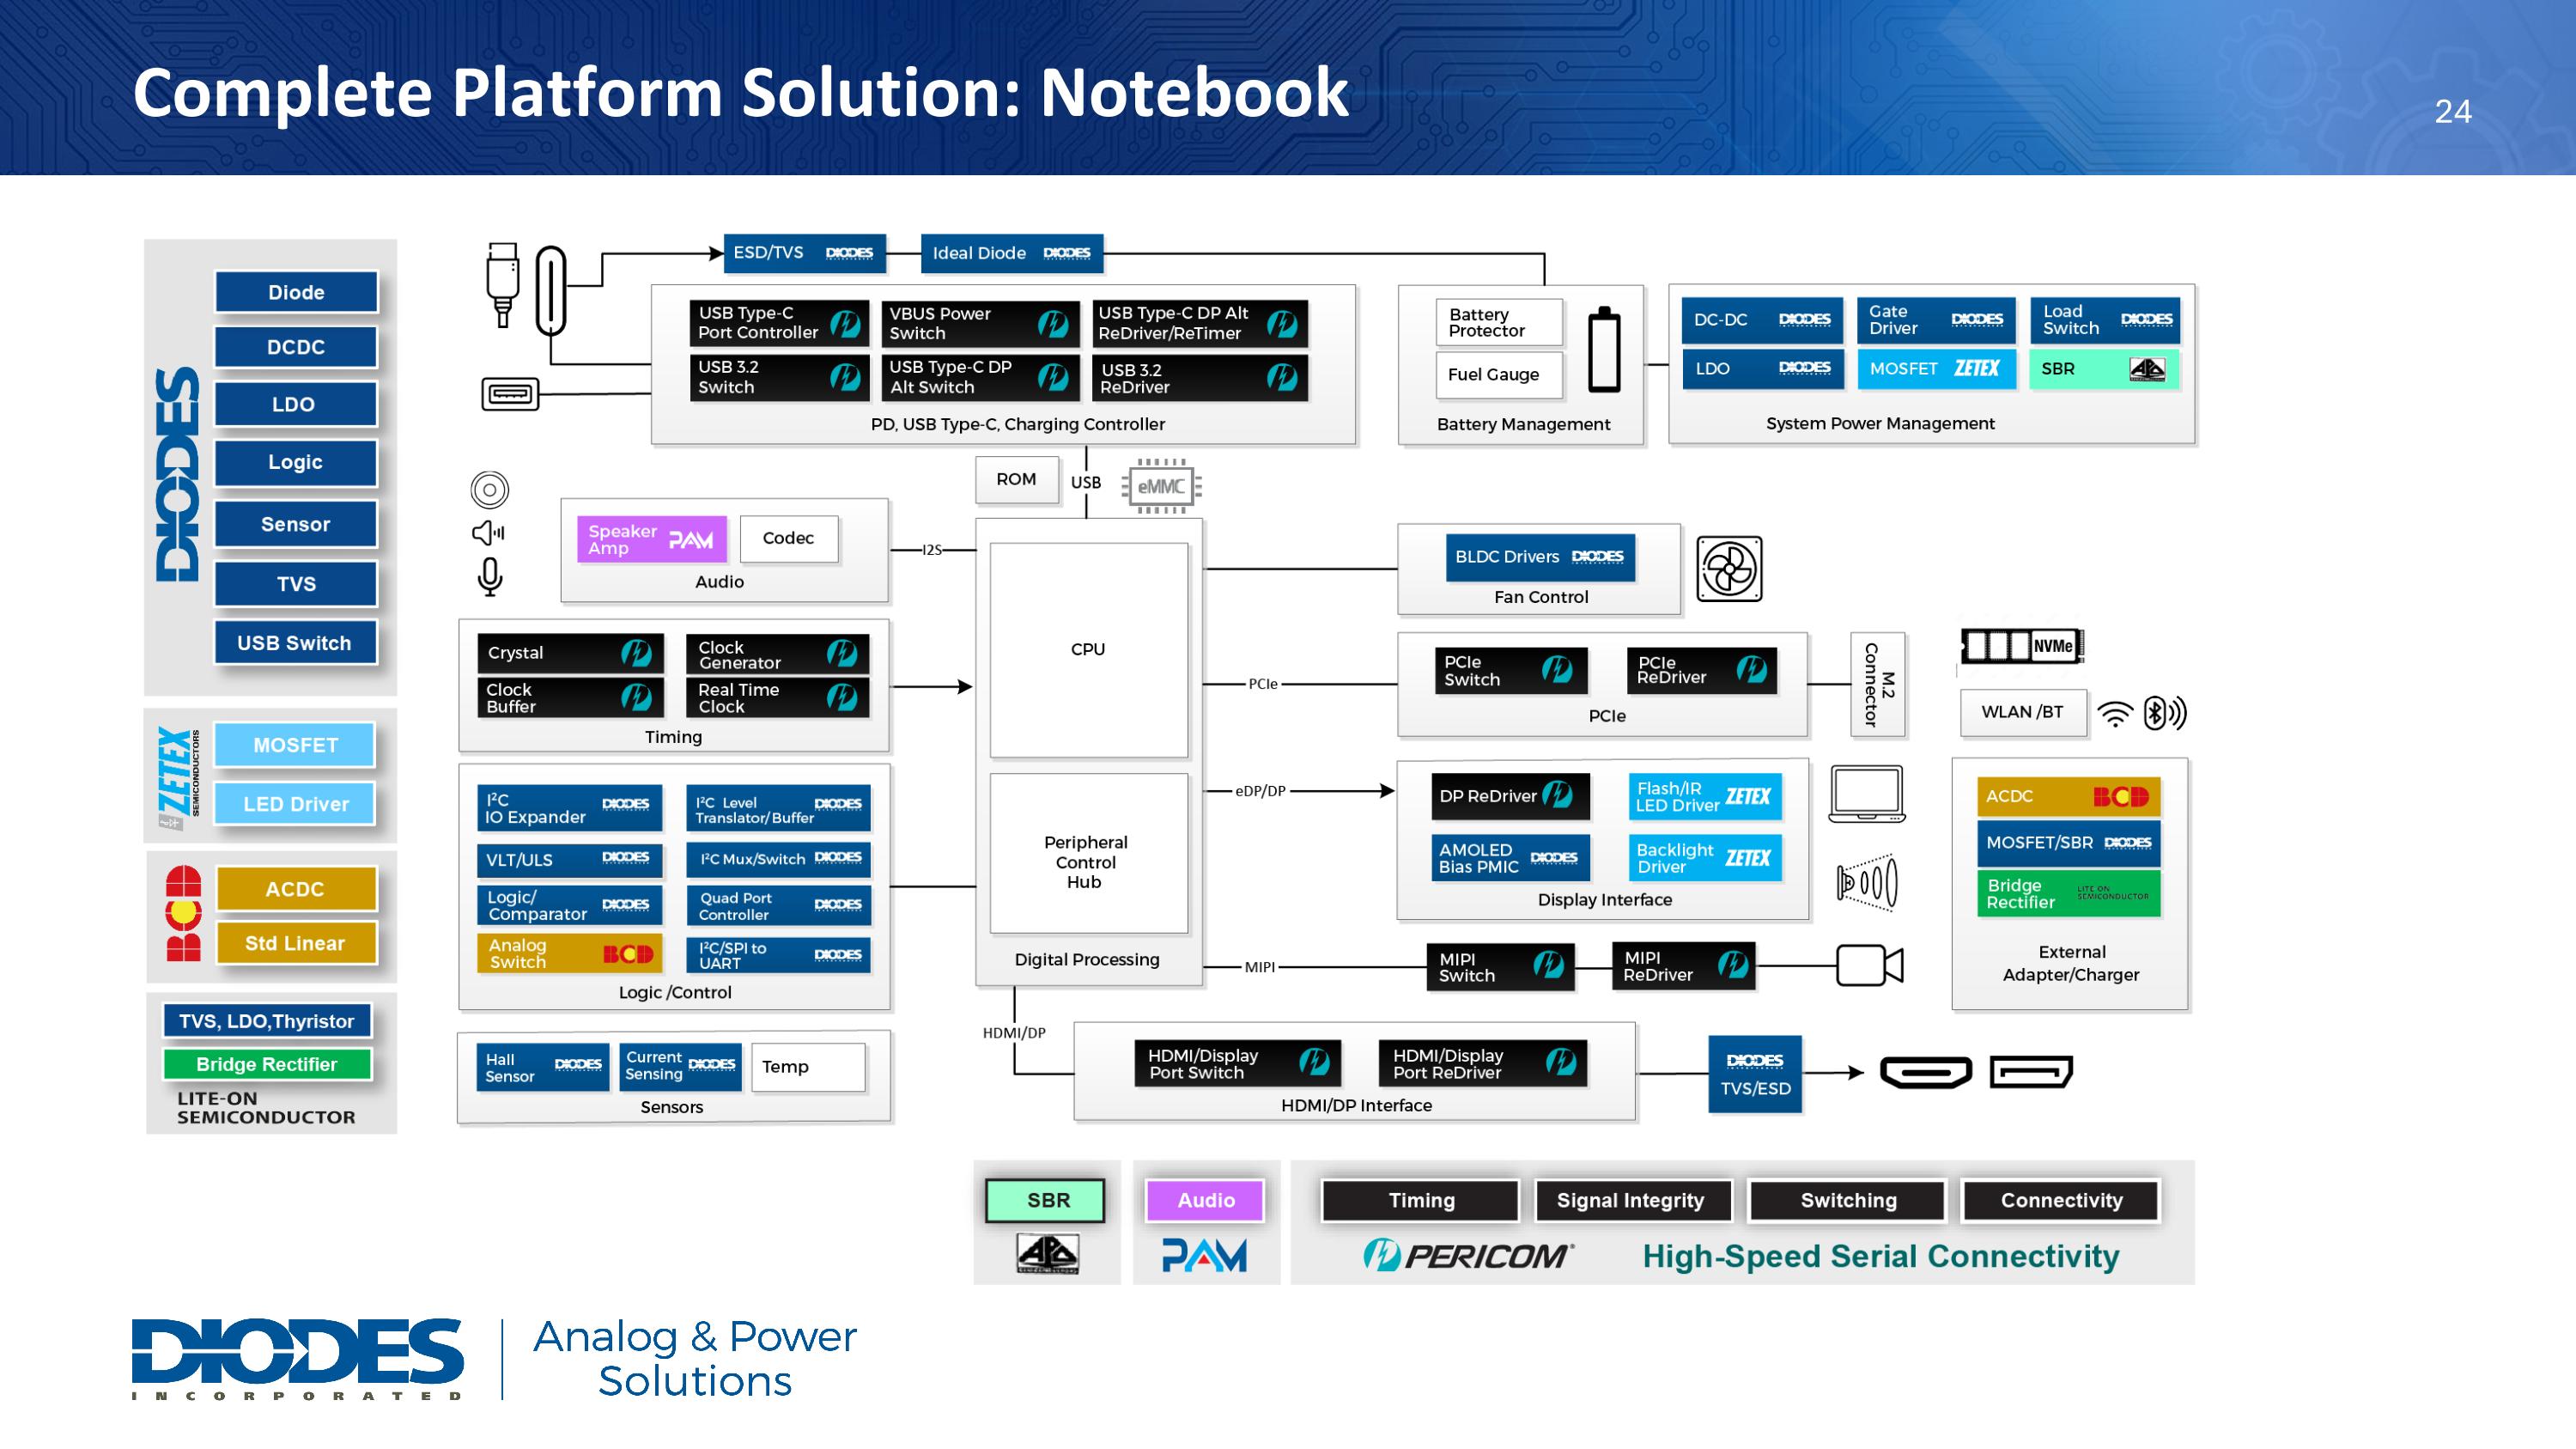
Complete Platform Solution: Notebook


Slide 26

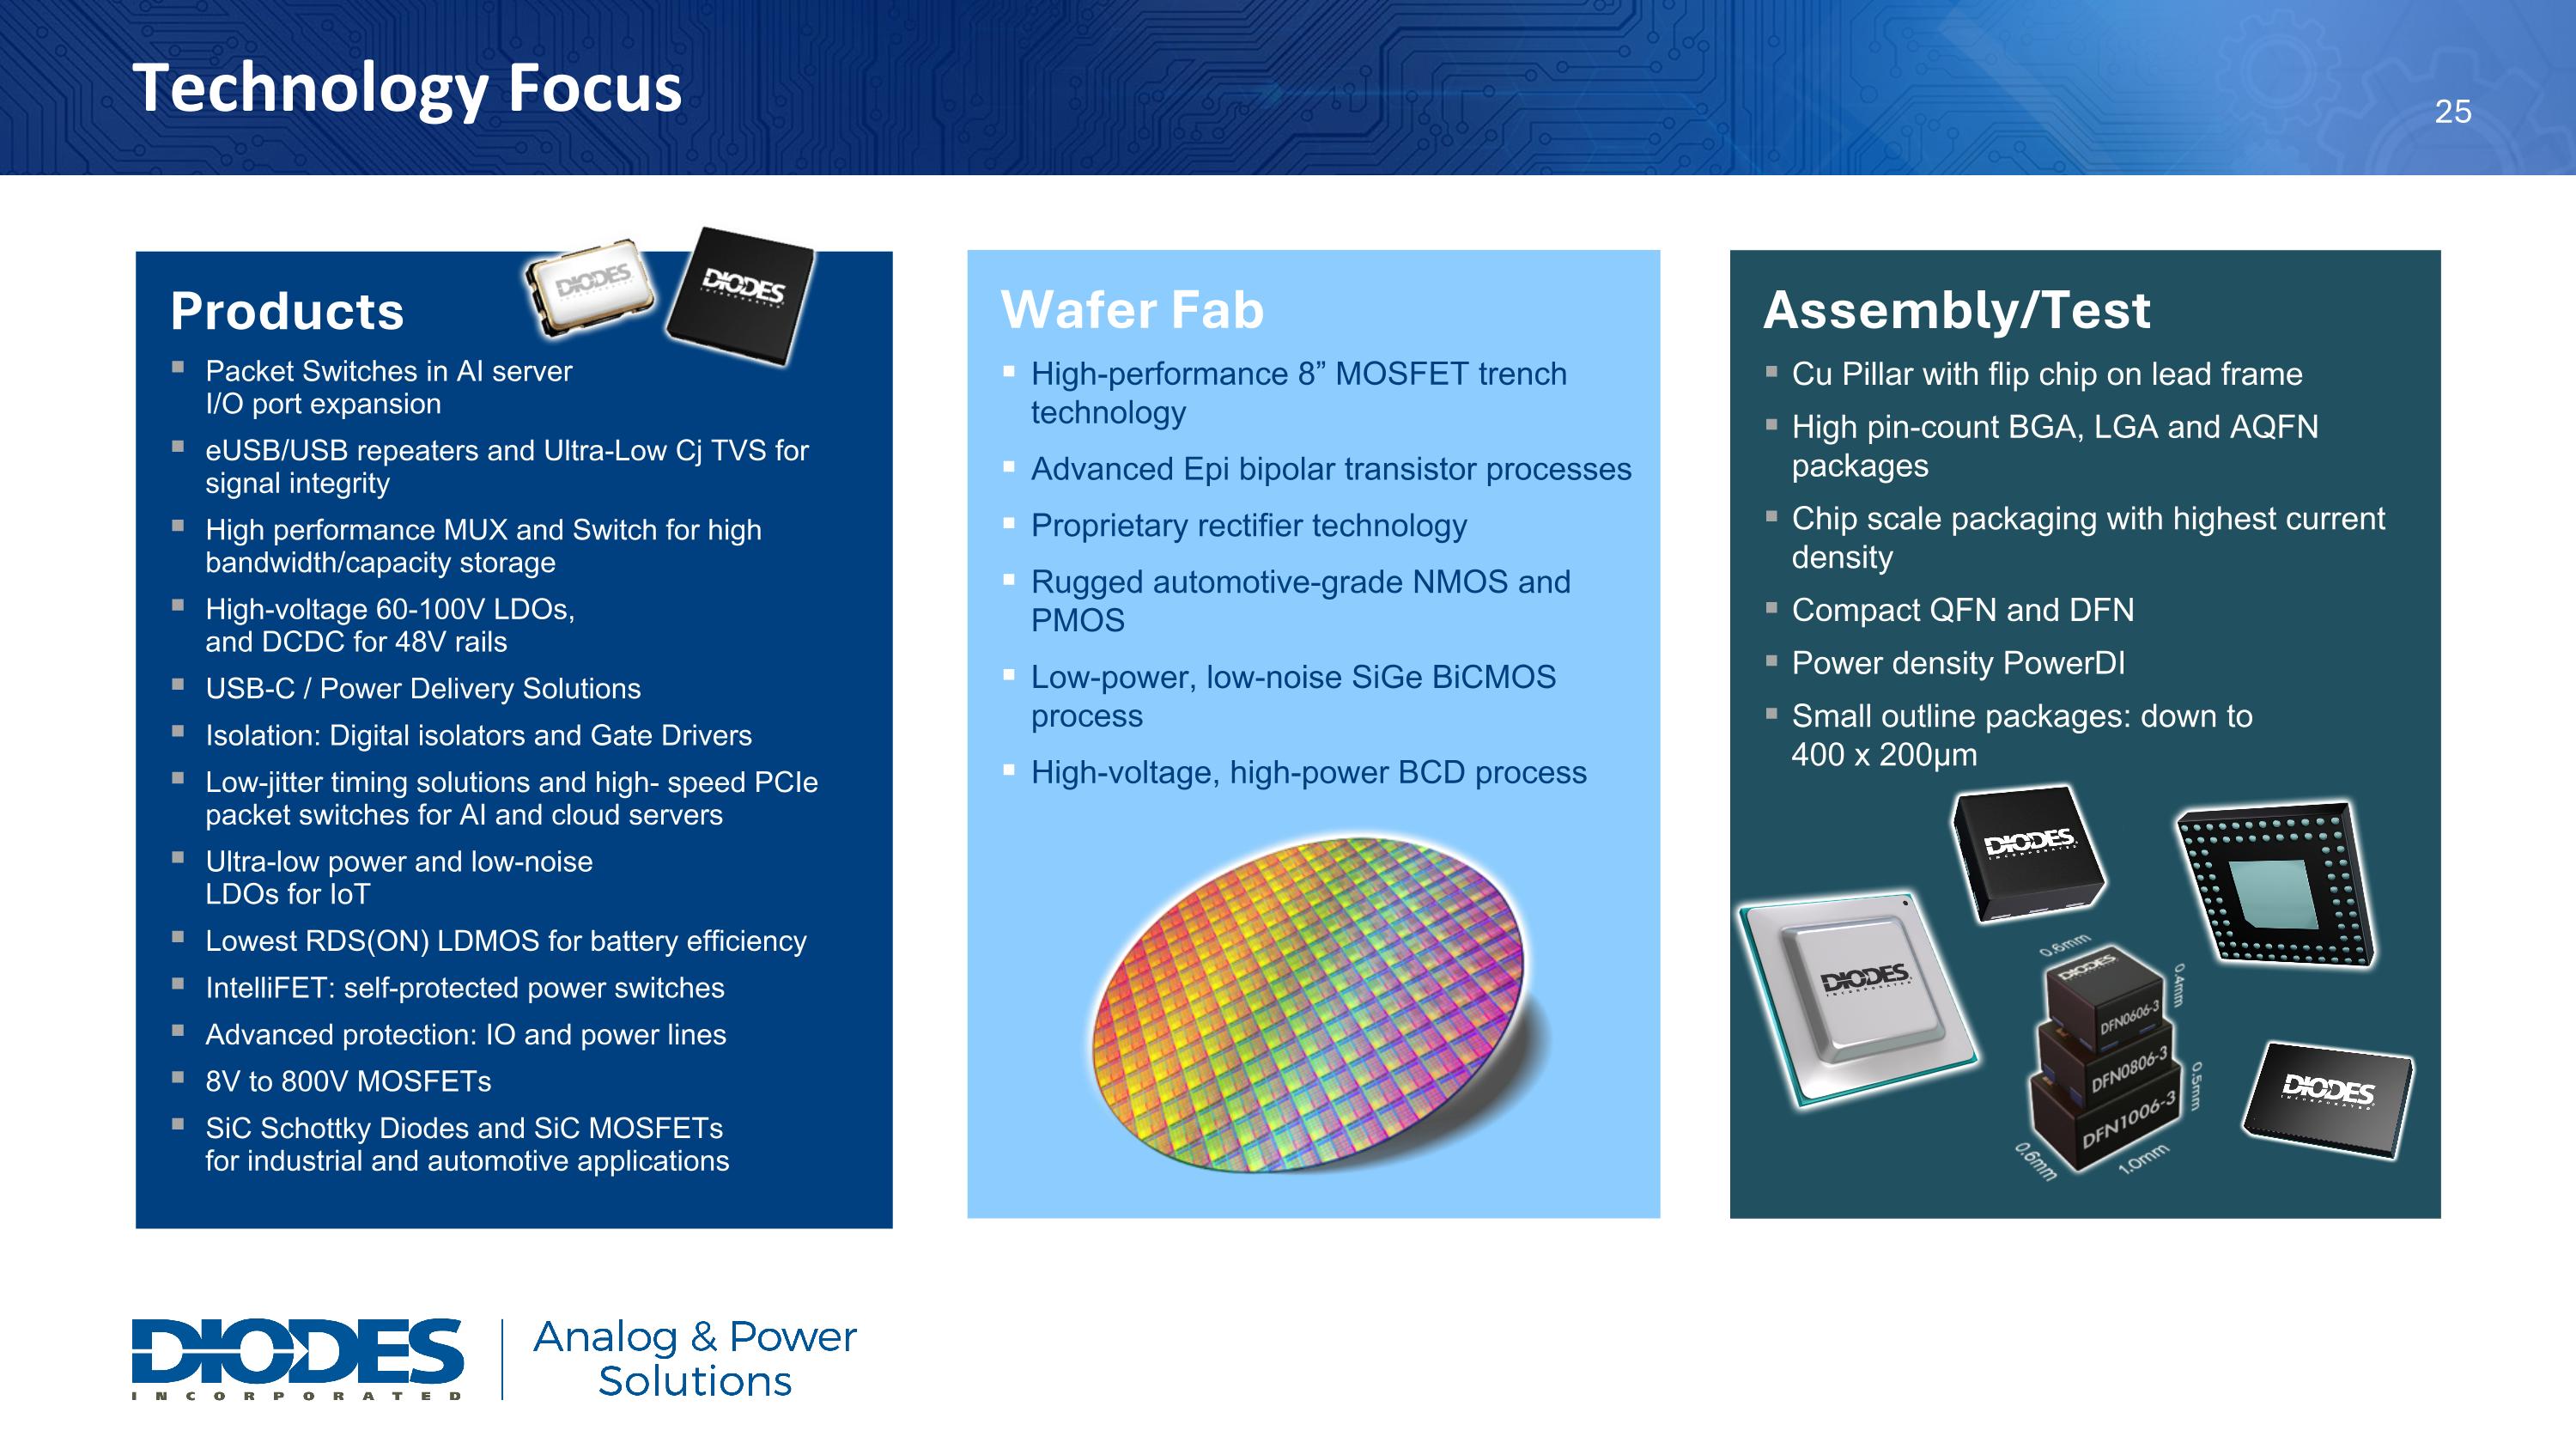
Products Packet Switches in AI server I/O port expansion eUSB/USB repeaters and Ultra-Low Cj TVS for signal integrity High performance MUX and Switch for high bandwidth/capacity storage High-voltage 60-100V LDOs, and DCDC for 48V rails USB-C / Power Delivery Solutions Isolation: Digital isolators and Gate Drivers Low-jitter timing solutions and high- speed PCIe packet switches for AI and cloud servers Ultra-low power and low-noise LDOs for IoT Lowest RDS(ON) LDMOS for battery efficiency IntelliFET: self-protected power switches Advanced protection: IO and power lines 8V to 800V MOSFETs SiC Schottky Diodes and SiC MOSFETs for industrial and automotive applications Assembly/Test Cu Pillar with flip chip on lead frame High pin-count BGA, LGA and AQFN packages Chip scale packaging with highest current density Compact QFN and DFN Power density PowerDI Small outline packages: down to 400 x 200μm Wafer Fab High-performance 8” MOSFET trench technology Advanced Epi bipolar transistor processes Proprietary rectifier technology Rugged automotive-grade NMOS and PMOS Low-power, low-noise SiGe BiCMOS process High-voltage, high-power BCD process Technology Focus

Slide 27

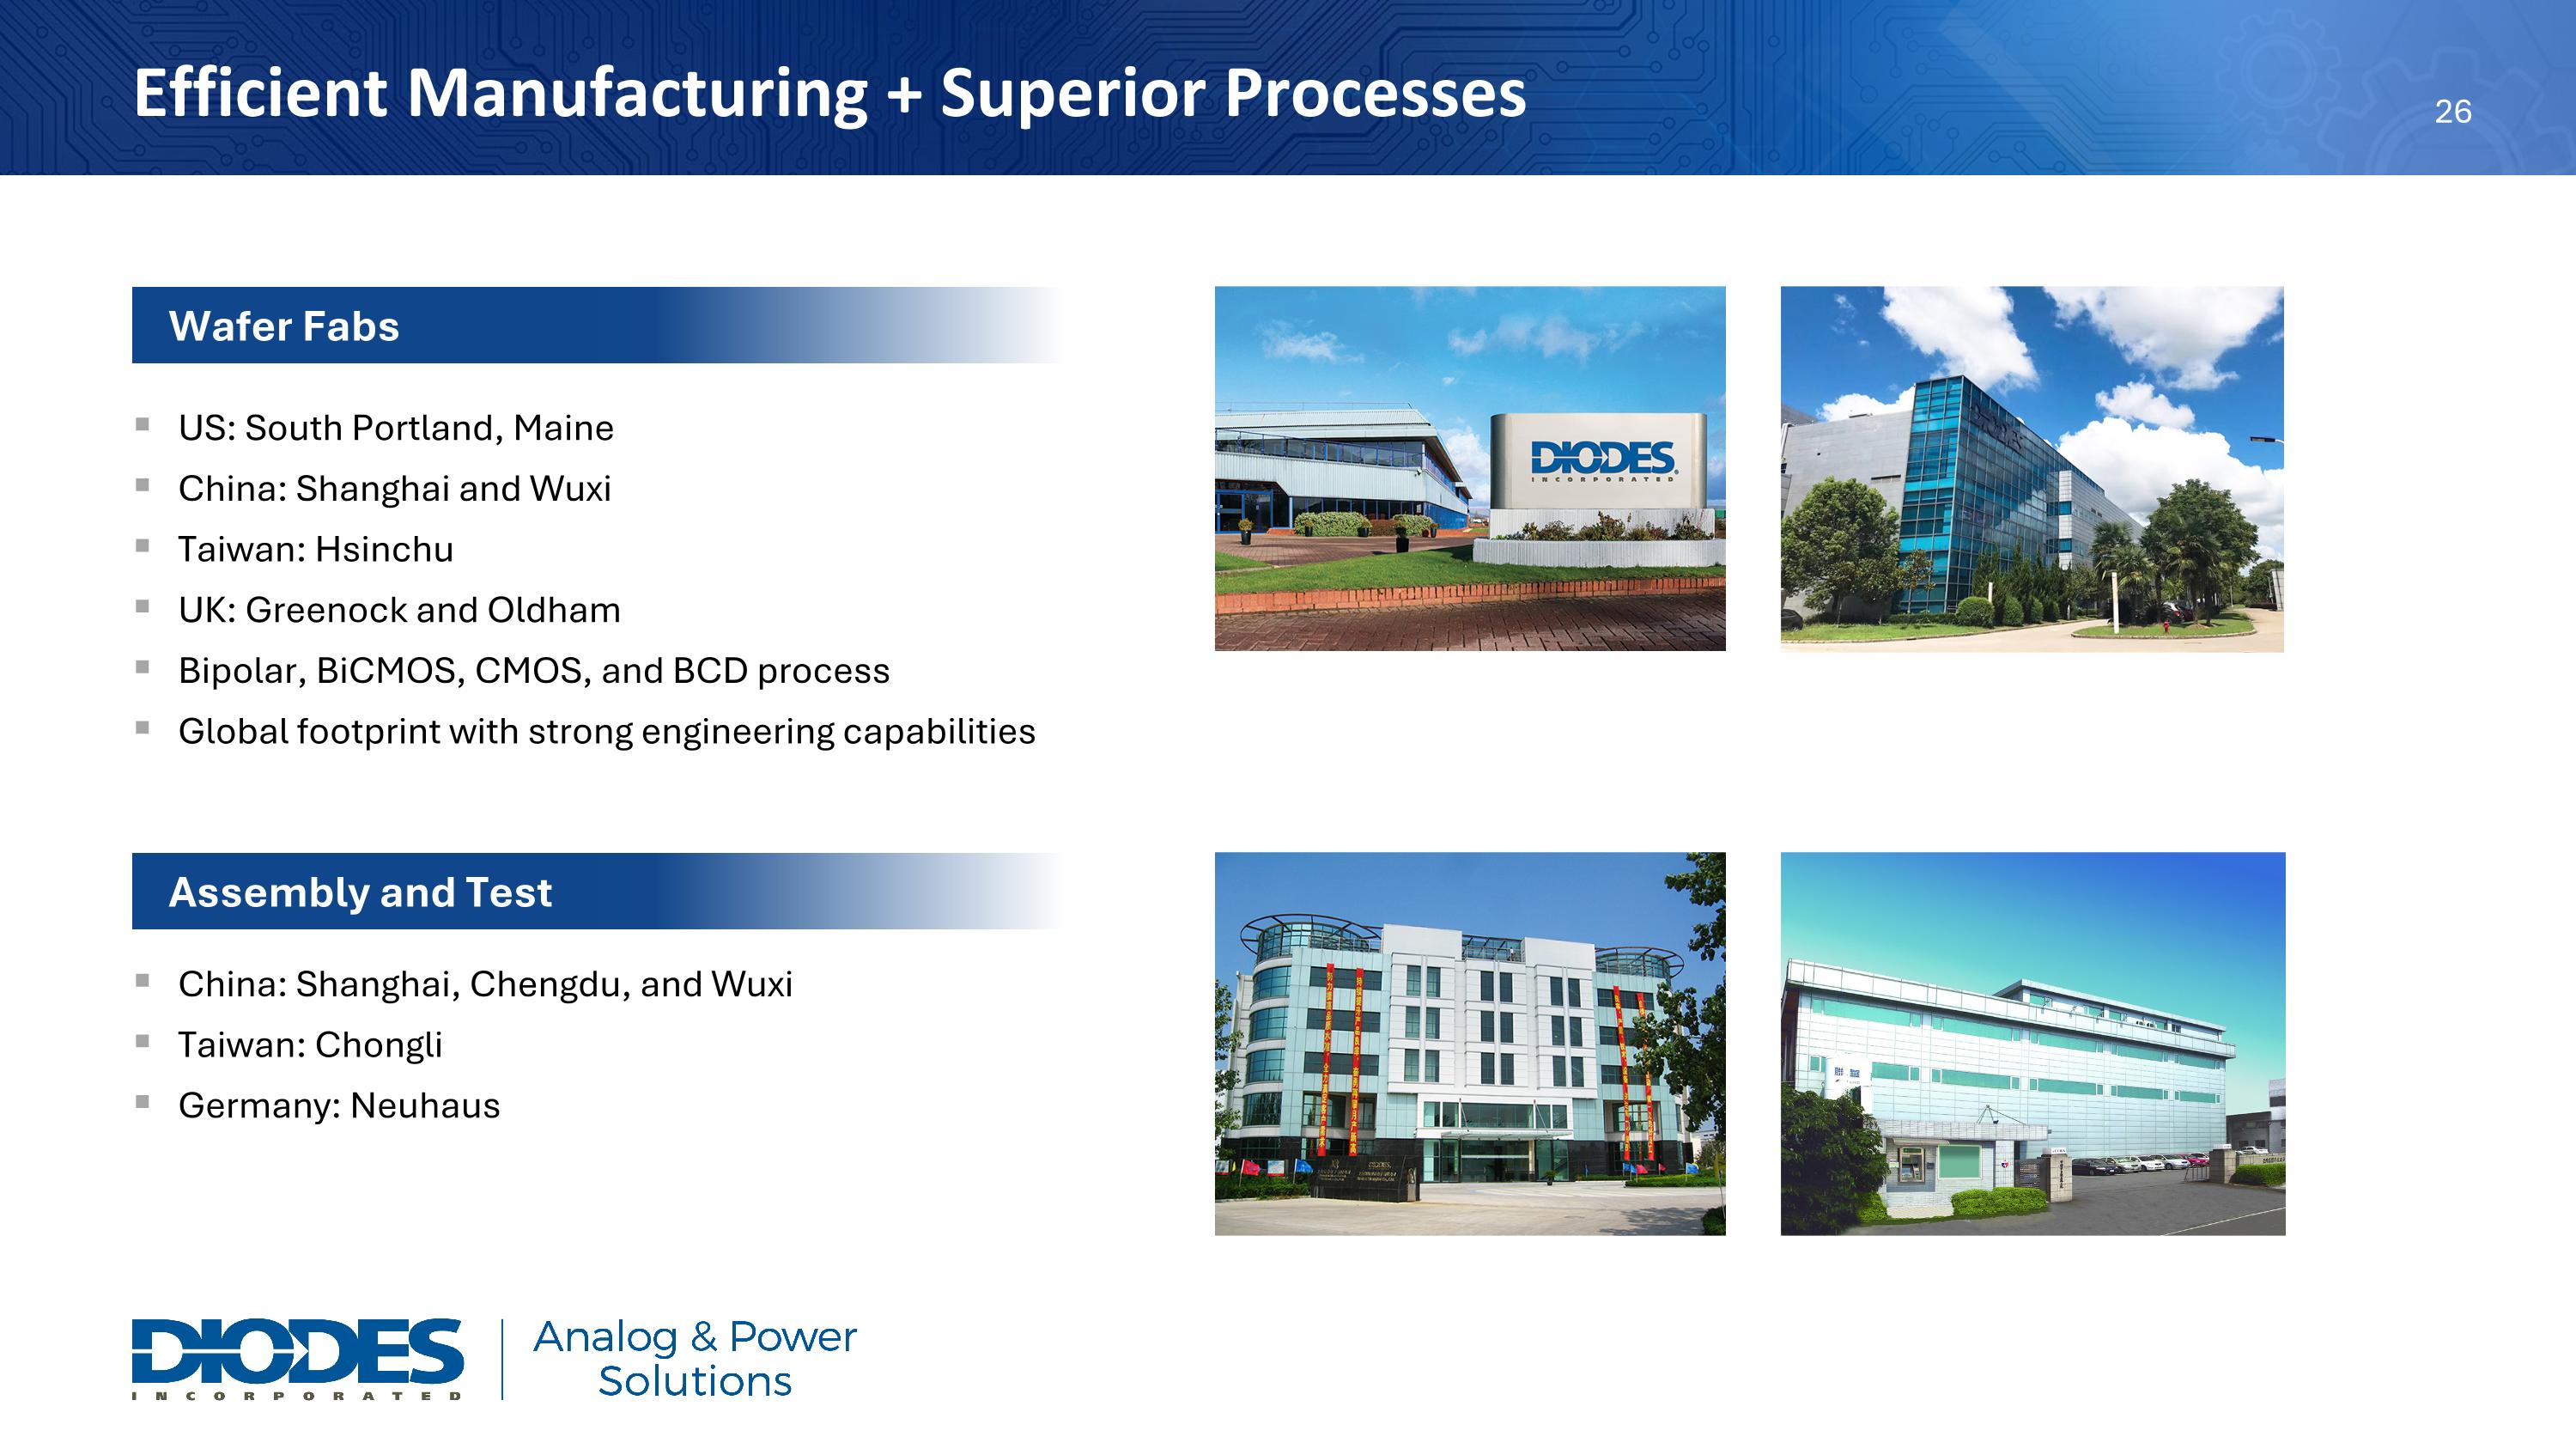
Efficient Manufacturing + Superior Processes Assembly and Test China: Shanghai, Chengdu, and Wuxi Taiwan: Chongli Germany: Neuhaus US: South Portland, Maine China: Shanghai and Wuxi Taiwan: Hsinchu UK: Greenock and Oldham Bipolar, BiCMOS, CMOS, and BCD process Global footprint with strong engineering capabilities Wafer Fabs

Slide 28

Revenue Profile for Second Quarter 2026

Slide 29

Income Statement – Second Quarter 2026 ($ in millions, except EPS) 2Q25 1Q256 2Q26 Net sales 366.2 405.5 445.5 Gross profit (GAAP) 115.3 128.8 147.6 Gross profit margin % (GAAP) 31.5% 31.8% 33.1% Net income (GAAP) 46.1 15.0 46.6 Net income (non-GAAP) 15.0 19.8 32.5 Diluted EPS (non-GAAP) 0.32 0.43 0.70 Cash flow from operations 41.5 64.3 68.5 EBITDA (non-GAAP) 84.5 49.4 83.5

Slide 30

Balance Sheet ($ in millions) Dec 31, 2024 Dec 31, 2025 June 30, 2026 Cash* 322 382 442 Inventory 475 472 505 Current assets 1,224 1,257 1,360 Total assets 2,386 2,448 2,583 Total debt 52 56 40 Total liabilities 517 510 561 Total equity 1,869 1,938 2,022 * Cash and cash equivalents, restricted cash, and short-term investments

Slide 31

Business Outlook - Third Quarter 2026 Revenue to be ~$510 million, +/- 3.0% Representing 30% growth over the prior year period and a 14% increase sequentially at the mid-point, which is significantly better than typical seasonality GAAP gross margin of 35%, +/- 1% Non-GAAP adjusted EPS is expected to be $1.05, plus or minus $0.10 *Guidance as provided on August 5, 2026 3-Year Targets (2028): $2B Revenue Gross Profit: $700M Gross Margin: 35%+ Non-GAAP EPS: $4.00+

Slide 32

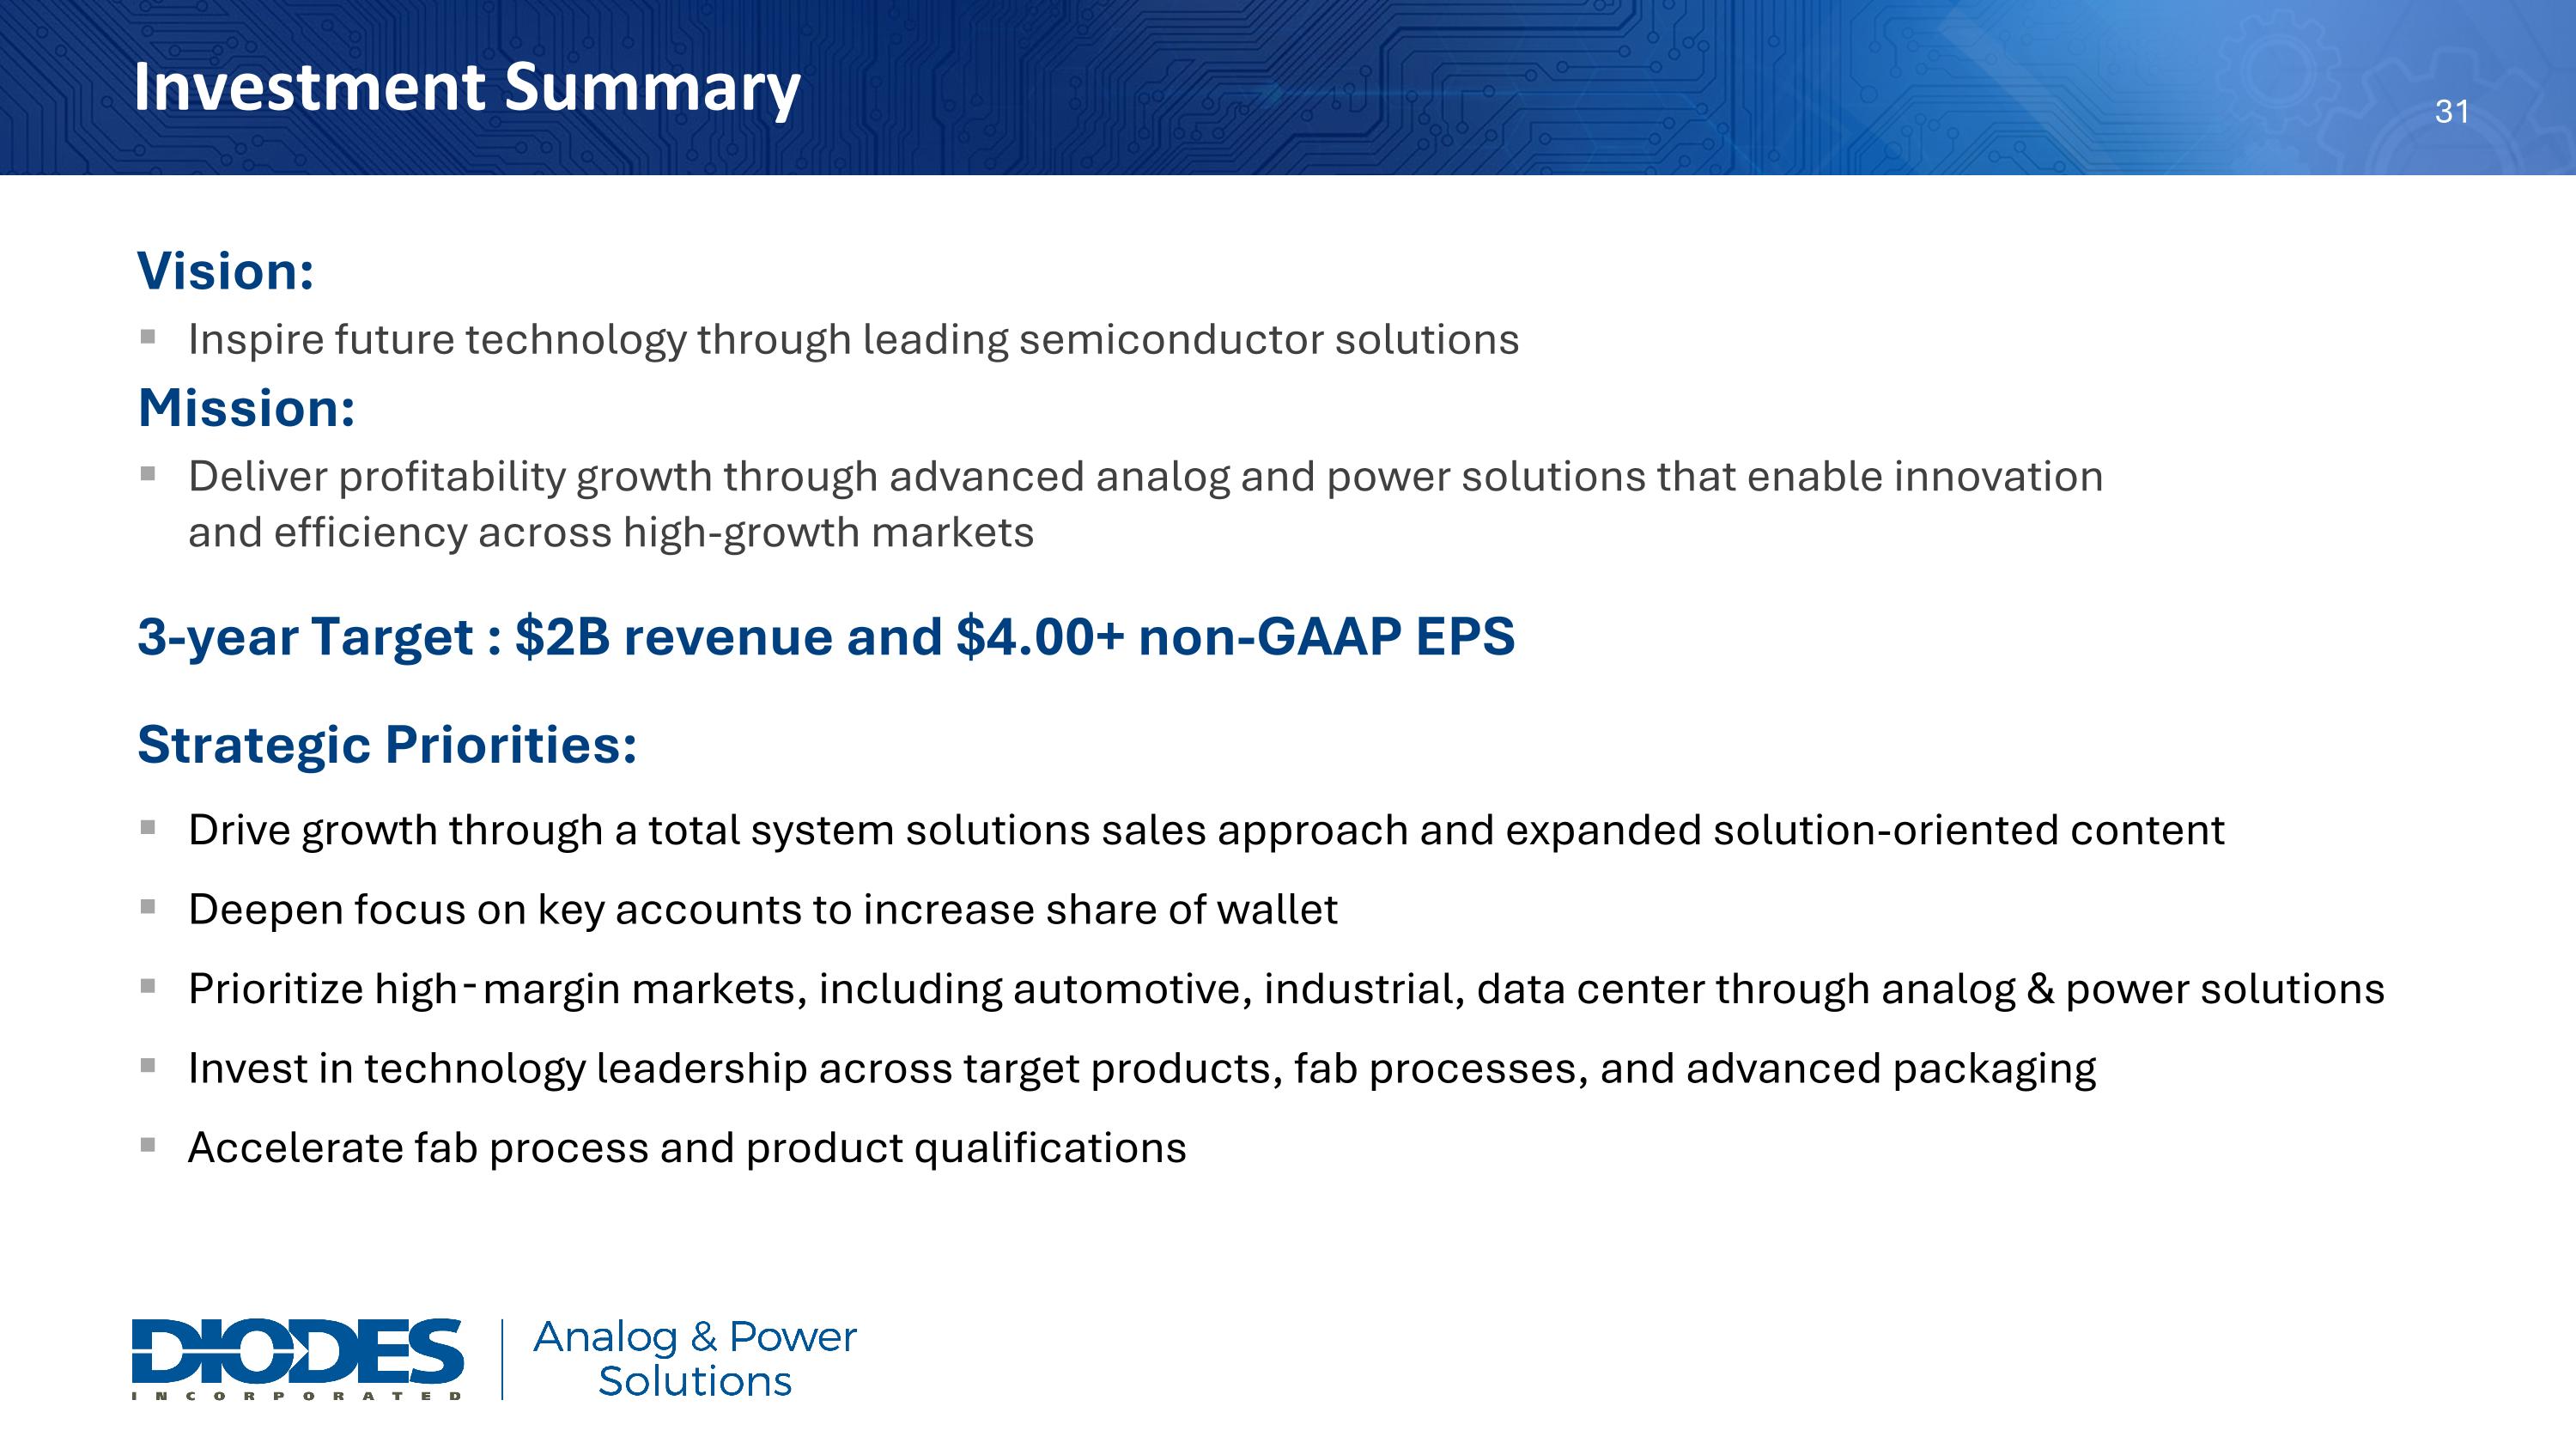
Investment Summary Vision: Inspire future technology through leading semiconductor solutions Mission: Deliver profitability growth through advanced analog and power solutions that enable innovation and efficiency across high-growth markets 3-year Target : $2B revenue and $4.00+ non-GAAP EPS Strategic Priorities: Drive growth through a total system solutions sales approach and expanded solution-oriented content Deepen focus on key accounts to increase share of wallet Prioritize high‑margin markets, including automotive, industrial, data center through analog & power solutions Invest in technology leadership across target products, fab processes, and advanced packaging Accelerate fab process and product qualifications



Slide 33