UNITED STATES
SECURITIES AND EXCHANGE COMMISSION
Washington, D.C. 20549
FORM 6-K
REPORT OF FOREIGN PRIVATE ISSUER
PURSUANT TO RULE 13a-16 or 15d-16
UNDER THE SECURITIES EXCHANGE ACT OF 1934
For the month of June, 2026
Commission File Number: 001-14946
Cemex, S.A.B. de C.V.
(Translation of Registrant’s name into English)
Avenida Ricardo Margáin Zozaya #325, Colonia Valle del Campestre
San Pedro Garza García, Nuevo León, 66265, Mexico
(Address of principal executive office)
Indicate by check mark whether the registrant files or will file annual reports under cover Form 20-F or Form 40-F.
Form 20-F ☒ Form 40-F ☐
Indicate by check mark if the registrant is submitting the Form 6-K in paper as permitted by Regulation S-T Rule 101(b)(1): ☐
Indicate by check mark if the registrant is submitting the Form 6-K in paper as permitted by Regulation S-T Rule 101(b)(7): ☐
We may disclose to prospective investors certain information that has not been previously publicly reported. This report and the information, statements, and opinions contained in this report do not constitute a public offer under any applicable legislation, an offer to sell, or solicitation of any offer to buy any securities or financial instruments, or any advice or recommendation with respect to such securities or other financial instruments. We have elected to provide the information in this report for informational purposes.
Cautionary Statement Regarding Forward-Looking Statements
This report contains, and the reports we will file or furnish in the future may contain, forward-looking statements within the meaning of Section 27A of the Securities Act of 1933, as amended, and Section 21E of the Securities Exchange Act of 1934, as amended. We intend these forward-looking statements to be covered by the “safe harbor” provisions for forward-looking statements within the meaning of applicable securities laws and regulations in all jurisdictions where such provisions exist, including but not limited to the United States Private Securities Litigation Reform Act of 1995. In some cases, these statements can be identified by the use of forward-looking words such as, but not limited to, “will,” “may,” “assume,” “might,” “should,” “could,” “continue,” “would,” “can,” “consider,” “anticipate,” “estimate,” “expect,” “envision,” “plan,” “believe,” “foresee,” “predict,” “potential,” “target,” “goal,” “strategy,” “intend,” “aimed,” or other forward-looking words. Unless otherwise indicated, these forward-looking statements reflect our current expectations and projections about the future, which are based on certain assumptions and on our knowledge of facts and circumstances as of the date such forward-looking statements are made. These forward-looking statements and information necessarily involve risks, uncertainties and assumptions, including, but not limited to, statements related to our plans, objectives, goals, targets and expectations (operative, financial or otherwise) and other important factors that could cause results and any estimate, projection and/or guidance presented in this report to differ materially from historical results, performance and/or achievements or those anticipated by forward-looking statements. Although we believe that our expectations are reasonable, we can give no assurance that these expectations will prove to be correct, and actual results, performance and/or achievements may vary, including materially, from historical results, performance and/or achievements or those anticipated by forward-looking statements due to various factors. Among others, such risks, uncertainties, assumptions, and other important factors that could cause results and any estimate, projection and/or guidance presented in this report to differ or fail to materialize, or that otherwise could have an impact on us include those discussed in this report and those detailed from time to time in our other filings with the U.S. Securities and Exchange Commission (the “SEC”), the Mexican National Banking and Securities Commission (Comisión Nacional Bancaria y de Valores) (the “CNBV”) and the Mexican Stock Exchange (Bolsa Mexicana de Valores) (the “MSE”), including, but not limited to:
| • | changes in general economic, political and social conditions, including government shutdowns, new governments or regimes and decisions implemented by such new governments or regimes, changes in laws or regulations in the countries in which we do business, elections, changes in inflation, interest and foreign exchange rates, employment levels, population growth, any slowdown in the flow of remittances into countries where we operate, consumer confidence, and the liquidity of the financial and capital markets in Mexico, the United States, the European Union (the “EU”), the United Kingdom or other countries in which we operate; |
| • | the cyclical activity of the construction sector and reduced construction activity in our end markets or reduced use in our end markets for our products; |
| • | our exposure to sectors that impact our and our clients’ businesses, particularly those operating in the commercial and residential construction sectors, and the public and private infrastructure and energy sectors; |
| • | volatility in pension plan asset values and liabilities, which may require cash or other contributions to the pension plans; |
| • | changes in spending levels for residential and commercial construction and general infrastructure projects; |
| • | the availability of short-term credit lines or working capital facilities, which can assist us in connection with market cycles; |
| • | any impact of not maintaining investment grade debt rating or not obtaining investment grade debt ratings from additional rating agencies on our cost of capital and on the cost of the products and services we purchase; |
| • | availability of raw materials and related fluctuating prices of raw materials, as well as of general goods and services, in particular increases in prices of raw materials, goods and services, as a result of inflation, trade barriers, measures imposed by governments or as a result of conflicts between countries that disrupt supply chains; |
| • | our ability to maintain and expand our distribution network and maintain favorable relationships with third parties who supply us with equipment, services and essential supplies; |
| • | competition in the markets in which we offer our products and services; |
| • | the impact of environmental cleanup costs and other remedial actions, and other environmental, climate and related liabilities relating to existing and/or divested businesses, assets and/or operations; |
| • | our ability to secure and permit aggregates reserves in strategically located areas in amounts that our operations require to operate or operate in a cost-efficient manner; |
| • | the timing and amount of federal, state, and local funding for infrastructure; |
| • | changes in our effective tax rate; |
| • | our ability to comply with regulations and implement technologies and other initiatives that aim to reduce and/or capture CO2 emissions and comply with related carbon emissions regulations in place in the jurisdictions where we have operations; |
| • | the legal and regulatory environment, including environmental, climate, trade, energy, tax, antitrust, sanctions, import and export controls, construction, human rights, and labor welfare, and acquisition-related rules and regulations in the countries and regions in which we have operations; |
| • | the effects of currency fluctuations on our results of operations and financial condition; |
| • | our ability to satisfy our obligations under our debt agreements, the indentures that govern our outstanding 5.450% Dollar denominated notes due 2029, 5.200% Dollar denominated notes due 2030, 3.875% Dollar denominated notes due 2031, and the Long-Term Notes 1, Long-Term Notes 2 and Long-Term Notes 3 in the Mexican market and our other debt instruments and financial obligations, and also regarding our subordinated notes with no fixed maturity and other financial obligations; |
| • | adverse legal or regulatory proceedings or disputes, such as class actions or enforcement or other proceedings brought by third parties, government and regulatory agencies, including antitrust investigations and claims; |
| • | our ability to protect our reputation and intellectual property; |
| • | our ability to consummate asset sales or consummate asset sales in terms favorable to us, fully integrate newly acquired businesses, achieve cost-savings from our cost-reduction initiatives, implement our pricing and commercial initiatives for our products and services, and generally meet our business strategy’s goals; |
| • | the increasing reliance on information technology infrastructure for our sales, invoicing, procurement, financial statements, and other processes that can adversely affect our sales and operations in the event that the infrastructure does not work as intended, experiences technical difficulties, or is subjected to invasion, disruption, or damage caused by circumstances beyond our control, including cyber-attacks, catastrophic events, power outages, natural disasters, computer system or network failures, or other security breaches; |
| • | the effects of climate change, in particular reflected in weather conditions, including, but not limited to, excessive rain and snow, shortage of usable water, wildfires and natural disasters, such as earthquakes, hurricanes, tornadoes and floods, that could affect our facilities or the markets in which we offer our products and services or from where we source our raw materials; |
| • | trade barriers, including, but not limited to, tariffs or import taxes, including those imposed by the United States to key markets in which we operate, in particular, Mexico, China and the EU, and changes in existing trade policies or changes to, or withdrawals from, free trade agreements, including the United States-Mexico-Canada Agreement, and the overall impact that the imposition or threat of trade barriers may cause on the overall economy of the countries in which we do business or that are part of our global supply chain; |
| • | availability and cost of trucks, railcars, barges, and ships, terminals, warehouses, as well as their licensed operators, drivers, staff and workers, for transport, loading and unloading of our materials or that are otherwise a part of our supply chain; |
| • | labor shortages and constraints; |
| • | our ability to hire, effectively compensate and retain our key personnel and maintain satisfactory labor relations; |
| • | our ability to detect and prevent money laundering, terrorism financing and corruption, as well as other illegal activities and how any measures implemented by governments to detect and prevent money laundering, terrorism financing and corruption, and other illegal activities, affect our customers, suppliers and countries in which we do business; |
| • | defaults, losses or disruptions in agreements, financial transactions or operations resulting from sanctions or restrictions imposed on any financial institution, including, but not limited to, banks, common representatives, trustees, payment processors, paying agents or other financial intermediaries, or any related parties; |
| • | terrorist and organized criminal activities, social unrest, as well as geopolitical events, such as global, regional or national instability, hostilities, war, and armed conflicts, including the current war between Russia and Ukraine, the ongoing war among Israel, the United States and the Islamic Republic of Iran, conflicts in the Middle East and any insecurity and hostilities in Mexico related to illegal activities or organized crime and any actions any government takes to prevent these illegal activities and organized crime; |
| • | the impact of pandemics, epidemics, or outbreaks of infectious diseases and the response of governments and other third parties, which could adversely affect, among other matters, the ability of our operating facilities to operate at full or any capacity, supply chains, international operations, availability of liquidity, investor confidence and consumer spending, as well as the availability of, and demand for, our products and services; |
| • | changes in the economy that affect demand for consumer goods, consequently affecting demand for our products and services; |
| • | the depth and duration of an economic slowdown or recession, instability in the business landscape and lack of availability of credit; |
| • | declarations of insolvency or bankruptcy, or becoming subject to similar proceedings; |
| • | natural disasters and other unforeseen events (including global health hazards such as COVID-19); |
| • | our ability to implement our climate action program in effect at any given time, if any, including our current “Future in Action” climate action and nature program, and to achieve our sustainability goals and objectives in effect at any given time, if any, including under our current “Future in Action” climate action and nature program; and |
| • | the other risks and uncertainties described under “Item 3. Key Information—Risk Factors” and elsewhere in our Annual Report on Form 20-F for the year ended December 31, 2025. |
Many factors could cause our expectations, expected results, and/or projections expressed in this report not being reached and/or not producing the expected benefits and/or results, as any such benefits or results are subject to uncertainties, costs, performance, and rate of success and/or implementation of technologies, some of which are not yet proven, among other factors. Should one or more of these risks or uncertainties materialize, or should underlying assumptions prove incorrect, actual results, performance and/or achievements may vary materially from historical results, performance, and/or achievements and/or results, performance, or achievements expressly or implicitly anticipated by the forward-looking statements, or otherwise could have an impact on us. Forward-looking statements should not be considered guarantees of future performance, and past results or developments are not indicative of results or developments in subsequent periods. Actual results, performance and/or achievements of our operations and the development of market conditions in which we operate, or other circumstances that may materialize, may differ materially from those described in, or suggested by, the forward-looking statements contained herein, and events referenced therein. Any or all of our forward-looking statements may turn out to be inaccurate and the factors identified above are not exhaustive. Accordingly, readers should not place undue reliance on forward-looking statements, as such forward-looking statements speak only as of the date on which they are made. The forward-looking statements and the information disclosed in this report are made as of the dates specified in this report and are subject to change without notice; and, except to the extent legally required, we expressly disclaim any obligation or undertaking to update or correct the information contained in this report, or revise any forward-looking statements in this report, whether to reflect new information, the occurrence of anticipated or unanticipated future events or circumstances, any change in our expectations regarding those forward-looking statements, any change in events, conditions, or circumstances on which any such statement is based, or otherwise. Readers should review future reports filed or furnished by us with the SEC, the CNBV and the MSE.
This report contains statistical data regarding, but not limited to, the production, distribution, marketing, and sale of cement, ready-mix concrete, clinker, aggregates, and Urbanization Solutions. We generated some of this data internally, and some was obtained from independent industry publications and reports, available as of the date of this report, that we believe to be reliable sources. We have not independently verified this data nor sought the consent of any organizations to refer to their reports in this report.
We act in strict compliance with antitrust laws and as such, among other measures, maintain an independent pricing policy that has been independently developed. Our policy’s core element is to price our products and services based on their quality and characteristics as well as their value to our customers. We do not accept any communications or agreements of any type with competitors regarding the determination of our prices for our products and services. Unless the context indicates otherwise, all references to pricing initiatives, price increases or price decreases, refer to our prices for our products.
This report includes certain financial measures that differ from financial information presented by Cemex in accordance with IFRS Accounting Standards (“IFRS”) in its financial statements and reports containing financial information. These aforementioned non-IFRS financial measures include “Operating EBITDA” (operating earnings before other expenses, net plus depreciation and amortization) and “Operating EBITDA Margin.” The closest financial measure to Operating EBITDA in our financial statements under IFRS is the line item of “Operating earnings before other expenses, net,” as Operating EBITDA adds depreciation and amortization to this line item. Our Operating EBITDA Margin is calculated by dividing our Operating EBITDA for the period by our revenues as reported in our financial statements for the same period. We believe there is no close IFRS financial measure to compare Operating EBITDA Margin. These non-IFRS financial measures are designed to complement and should not be considered superior to financial measures calculated in accordance with IFRS. Although Operating EBITDA and Operating EBITDA Margin are not measures of operating performance, an alternative to cash flows or a measure of financial position under IFRS, Operating EBITDA is the financial measure used by our management to review operating performance and profitability, for decision-making purposes and to allocate resources. Moreover, our Operating EBITDA is a measure used by our creditors to review our ability to internally fund capital expenditures, to service or incur debt and to comply with financial covenants under our financing agreements. Furthermore, our management regularly reviews our Operating EBITDA Margin by reportable segment and on a consolidated basis as a measure of performance and profitability. These non-IFRS financial measures do not have any standardized meaning and are therefore unlikely to be comparable to similarly titled measures presented by other companies. Non-IFRS financial measures presented in this report are being provided for informative purposes only and shall not be construed as investment, financial, or other advice.
The information, statements, and opinions contained in this report are for informational purposes and do not constitute a public offer under any applicable legislation, an offer to sell, or solicitation of any offer to buy any securities or financial instruments, or any advice or recommendation with respect to such securities or other financial instruments. You should not construe any such information or other material as legal, tax, investment, financial, or other advice. We are not responsible for any third-party information referenced in this report.
Cautionary Statement Regarding Environmental, Social, and Governance (“ESG”) and Sustainability-Related Data, Metrics, and Methodologies
This report includes non-financial metrics, estimates, or other information related to ESG and sustainability matters that are subject to significant uncertainties, which may include the methodology, collection, and verification of data, various estimates, and assumptions, and/or underlying data that is obtained from third parties, some of which cannot be independently verified.
The preparation of certain information on ESG and sustainability matters contained in this report requires the application of a number of key judgments, assumptions, and estimates. The reported measures in this report reflect good faith estimates, assumptions, and judgments at the given point in time. There is a risk that these judgments, estimates, or assumptions may subsequently prove to be incorrect and/or, to the extent legally required, may need to be restated or changed. The disclosure of information on sustainability-related matters is not yet subject to the same recognized or accepted reporting or accounting principles and rules as traditional financial information. Consequently, there are no commonly accepted reporting practices for us to follow, and ESG metrics among organizations in our industry may not be comparable. In addition, the underlying data, systems, and controls that support non-financial reporting are generally considerably less sophisticated than the systems and internal control for financial reporting and rely on manual processes. This may result in non-comparable information between organizations and/or between reporting periods within organizations as methodologies continue to develop and/or be socialized. The further development of or changes to accounting and/or reporting standards could materially impact the performance metrics, data points, and targets contained in this report, and the reader may not be able to compare non-financial information performance metrics, data points, or targets between reporting periods on a direct like-for-like basis.
Additionally, the information disclosed in this report contains references to “green,” “social,” “sustainable,” or equivalent-labelled activities, products, assets, or projects. There is currently no single globally recognized or accepted, consistent and comparable set of definitions or standards (legal, regulatory, or otherwise) of, nor widespread cross-market consensus (i) as to what constitutes, a “green,” “social,” “sustainable,” or having equivalent-labelled activity, product, or asset; (ii) as to what precise attributes are required for a particular activity, product, or asset to be defined as “green,” “social,” “sustainable” or such other equivalent label; or (iii) as to climate and sustainable funding and financing activities and their classification and reporting.
Therefore, there is little certainty, and no assurance or representation is given, that such activities, products, assets, or projects and/or reporting of such activities, products, assets or projects will meet any present or future expectations or requirements for describing or classifying such activities, products, assets or projects as “green,” “social,” “sustainable,” or attributing similar labels. We expect policies, regulatory requirements, standards, and definitions to be developed and continuously evolve over time.
Cautionary Statement Regarding Forward-Looking ESG or Sustainability Statements
Certain sections in this report contain ESG- or sustainability-related forward-looking statements, such as aims, ambitions, estimates, forecasts, plans, projections, targets, goals and other metrics, including but not limited to: climate and emissions, business and human rights, corporate governance, research and development and partnerships, development of products and services that intend to address sustainability-related concerns and sustainability related targets/ ambitions when finalized, including the implementation of technologies and other initiatives that aim to reduce and/or capture CO2 emissions.
These forward-looking statements also include references to specific programs, such as our current “Future in Action” climate action and nature program, as well as various ESG-related indicators, objectives or metrics disclosed previously or that may be disclosed in the future, none of which are guarantees and any and all of which may ultimately not be achieved or may be abandoned at any time, whether in part, in full, or within any specific timeframe. There are many significant uncertainties, assumptions, judgements, opinions, estimates, forecasts and statements made of future expectations underlying these forward-looking statements which could cause actual results, performance, outcomes or events to differ materially from those expressed or implied in these forward-looking statements, which include, but are not limited to:
| • | the extent and pace of climate change, including the timing and manifestation of physical and transition risks; |
| • | the macroeconomic environment; |
| • | uncertainty around future climate-related policy and regulations, including the timely implementation and integration of adequate government policies; |
| • | the effectiveness of actions of governments, legislators, regulators, businesses, investors, customers, and other stakeholders to mitigate the impact of climate and sustainability-related risks; |
| • | changes in customer behavior and demand, changes in the available technology for mitigation and the effectiveness of any such technologies, as some of these new technologies may be unproven; |
| • | excessive costs and expenses related to acquire and/or develop technology for mitigation; |
| • | the roll-out of low carbon infrastructure; |
| • | the availability and adoption of renewable energy in our value chain; |
| • | the development of carbon capture, circular utilization, and sequestration technologies, including the adoption of cost-effective carbon-related technologies such as carbon capture, utilization, and storage; |
| • | the availability of accurate, verifiable, reliable, consistent, and comparable climate-related data; |
| • | lack of transparency and comparability of climate-related forward-looking methodologies; |
| • | variation in approaches and outcomes, as variations in methodologies may lead to under or overestimates and consequently present exaggerated indication of climate-related risk; and |
| • | reliance on assumptions and future uncertainty (calculations of forward-looking metrics are complex and require many methodological choices and assumptions). |
Accordingly, undue reliance should not be placed on these forward-looking statements. Furthermore, changing national and international standards, industry and scientific practices, regulatory requirements, and market expectations regarding climate change, which remain under continuous development, are subject to different interpretations.
There can be no assurance that these standards, practices, requirements, and expectations will not be interpreted differently than our understanding when defining sustainability-related ambitions and targets or change in a manner that substantially increases the cost or effort for us to achieve such ambitions and targets.
SIGNATURE
Pursuant to the requirements of the Securities Exchange Act of 1934, Cemex, S.A.B. de C.V. has duly caused this report to be signed on its behalf by the undersigned, thereunto duly authorized.
| Cemex, S.A.B. de C.V. |
||||||
| (Registrant) | ||||||
| Date: June 1, 2026 | ||||||
| By: | /s/ Jaime Martínez Merla |
|||||
| Name: Jaime Martínez Merla | ||||||
| Title: Chief Comptroller | ||||||
EXHIBIT INDEX
| EXHIBIT NO. | DESCRIPTION |
|
| 1 | Certain information with respect to Cemex, S.A.B. de C.V. (NYSE: CX) and its direct and indirect subsidiaries. | |
Exhibit 1
The following summarizes certain information, including financial information, that we may disclose to prospective investors. The information set forth below updates the information contained in our annual report on Form 20-F for the year ended December 31, 2025 (the “2025 Annual Report”), filed with the U.S. Securities and Exchange Commission (the “SEC”) on April 24, 2026 and any other documents that we have filed or furnished with the SEC and should be read in conjunction therewith. Except as the context otherwise may require, references in this report to “Cemex,” the “Company,” “we,” “us” or “our” refer to Cemex, S.A.B. de C.V. and its consolidated entities. See note 3 to our audited consolidated financial statements included in the 2025 Annual Report for a description of our material accounting policies including our principles of consolidation.
Unless otherwise indicated, references in this report to “$” and “Dollars” are to United States Dollars, references to “€” are to Euros, references to “£,” “Pounds Sterling” and “Pounds” are to British Pounds, and references to “Ps,” “Mexican Pesos” and “Pesos” are to Mexican Pesos. References to “billion” mean one thousand million. References in this report to “CPOs” are to Cemex, S.A.B. de C.V.’s Ordinary Participation Certificates (Certificados de Participación Ordinarios), each CPO represents two Series A shares (as defined below) and one Series B share (as defined below) of Cemex, S.A.B. de C.V. References to “ADSs” are to American Depositary Shares of Cemex, S.A.B. de C.V., each ADS represents 10 CPOs.
Unless otherwise indicated, all information in this report excludes our operations in the Dominican Republic and Panama, which we disposed of in January 2025 and October 2025, respectively. For the period from January 1 to January 30, 2025, our operations in the Dominican Republic are reported in the income statements, net of income tax, in the single line item “Discontinued operations.” For the three-month period ended March 31, 2025, our operations in Panama are reported in the income statements, net of income tax, in the single line item “Discontinued operations.” See note 5.2 to Cemex, S.A.B. de C.V.’s 2025 audited consolidated financial statements included in the 2025 Annual Report for more information.
See notes 3.4, 18.1 and 18.2 to Cemex, S.A.B. de C.V.’s 2025 audited consolidated financial statements included in the 2025 Annual Report for a detailed description of our debt and other financial obligations. Total debt plus other financial obligations differs from the calculation of debt under our main credit agreements, being the Credit Agreement, dated as of October 29, 2021 (as last amended on October 30, 2023 and as further amended and/or restated from time to time, the “2023 Credit Agreement”), the Credit Agreement dated as of October 7, 2022 (as last amended on April 11, 2024 and as further amended and/or restated from time to time, the “Euro Credit Agreement”) and the Credit Agreement dated as of December 20, 2021, entered into with Banco Mercantil del Norte, S.A., Institución de Banca Múltiple, Grupo Financiero Banorte (as last amended on December 6, 2023 and as further amended and/or restated from time to time, the “Peso Bilateral Term Loan”) (collectively, the “Credit Agreements”). See “Management’s Discussion and Analysis of Financial Results of Operations—Liquidity and Capital Resources—Our Indebtedness” for more information.
Under IAS 32, Financial Instruments: Presentation (“IAS 32”), we concluded that our outstanding 5.125% Subordinated Notes and our 7.200% Subordinated Notes (together, the “Subordinated Notes”) do not meet the definition of financial liability, and consequently are classified in controlling interest stockholders’ equity within Other equity reserves. See note 22.2 to Cemex, S.A.B. de C.V.’s 2025 audited consolidated financial statements included in the 2025 Annual Report for a detailed description of the Subordinated Notes.
We also refer in various places within this report to non-IFRS measures, including “Operating EBITDA.” Operating EBITDA equals operating earnings before other expenses, net, plus depreciation and amortization expenses, as more fully explained in “Selected Consolidated Financial Information.” Additionally, we refer to “Operating EBITDA Margin,” which is calculated by dividing our Operating EBITDA by our revenues. The presentation of these non-IFRS measures is not meant to be considered in isolation or as a substitute for Cemex, S.A.B. de C.V.’s 2025 audited consolidated financial results prepared in accordance with IFRS as issued by the IASB.
We have approximated certain numbers in this report to their closest round numbers or a given number of decimal places. Due to rounding, figures shown as totals in tables may not be arithmetic aggregations of the figures preceding them.
1
CAUTIONARY STATEMENT REGARDING FORWARD-LOOKING STATEMENTS
This report contains, and the reports we will file or furnish in the future may contain, forward-looking statements within the meaning of Section 27A of the Securities Act of 1933, as amended (the “Securities Act”), and Section 21E of the Securities Exchange Act of 1934, as amended. We intend these forward-looking statements to be covered by the “safe harbor” provisions for forward-looking statements within the meaning of applicable securities laws and regulations in all jurisdictions where such provisions exist, including but not limited to the United States Private Securities Litigation Reform Act of 1995. In some cases, these statements can be identified by the use of forward-looking words such as, but not limited to, “will,” “may,” “assume,” “might,” “should,” “could,” “continue,” “would,” “can,” “consider,” “anticipate,” “estimate,” “expect,” “envision,” “plan,” “believe,” “foresee,” “predict,” “potential,” “target,” “goal,” “strategy,” “intend,” “aimed,” or other forward-looking words. Unless otherwise indicated, these forward-looking statements reflect our current expectations and projections about the future, which are based on certain assumptions and on our knowledge of facts and circumstances as of the date such forward-looking statements are made. These forward-looking statements and information necessarily involve risks, uncertainties and assumptions, including, but not limited to, statements related to our plans, objectives, goals, targets and expectations (operative, financial or otherwise) and other important factors that could cause results and any estimate, projection and/or guidance presented in this report to differ materially from historical results, performance and/or achievements or those anticipated by forward-looking statements. Although we believe that our expectations are reasonable, we can give no assurance that these expectations will prove to be correct, and actual results, performance and/or achievements may vary, including materially, from historical results, performance and/or achievements or those anticipated by forward-looking statements due to various factors. Among others, such risks, uncertainties, assumptions, and other important factors that could cause results and any estimate, projection and/or guidance presented in this report to differ or fail to materialize, or that otherwise could have an impact on us include those discussed in this report and those detailed from time to time in our other filings with the SEC, the Mexican National Banking and Securities Commission (Comisión Nacional Bancaria y de Valores) (the “CNBV”) and the Mexican Stock Exchange (Bolsa Mexicana de Valores) (the “MSE”), including, but not limited to:
| • | changes in general economic, political and social conditions, including government shutdowns, new governments or regimes and decisions implemented by such new governments or regimes, changes in laws or regulations in the countries in which we do business, elections, changes in inflation, interest and foreign exchange rates, employment levels, population growth, any slowdown in the flow of remittances into countries where we operate, consumer confidence, and the liquidity of the financial and capital markets in Mexico, the United States, the European Union (the “EU”), the United Kingdom or other countries in which we operate; |
| • | the cyclical activity of the construction sector and reduced construction activity in our end markets or reduced use in our end markets for our products; |
| • | our exposure to sectors that impact our and our clients’ businesses, particularly those operating in the commercial and residential construction sectors, and the public and private infrastructure and energy sectors; |
| • | volatility in pension plan asset values and liabilities, which may require cash or other contributions to the pension plans; |
| • | changes in spending levels for residential and commercial construction and general infrastructure projects; |
| • | the availability of short-term credit lines or working capital facilities, which can assist us in connection with market cycles; |
| • | any impact of not maintaining investment grade debt rating or not obtaining investment grade debt ratings from additional rating agencies on our cost of capital and on the cost of the products and services we purchase; |
| • | availability of raw materials and related fluctuating prices of raw materials, as well as of general goods and services, in particular increases in prices of raw materials, goods and services, as a result of inflation, trade barriers, measures imposed by governments or as a result of conflicts between countries that disrupt supply chains; |
2
| • | our ability to maintain and expand our distribution network and maintain favorable relationships with third parties who supply us with equipment, services and essential supplies; |
| • | competition in the markets in which we offer our products and services; |
| • | the impact of environmental cleanup costs and other remedial actions, and other environmental, climate and related liabilities relating to existing and/or divested businesses, assets and/or operations; |
| • | our ability to secure and permit aggregates reserves in strategically located areas in amounts that our operations require to operate or operate in a cost-efficient manner; |
| • | the timing and amount of federal, state, and local funding for infrastructure; |
| • | changes in our effective tax rate; |
| • | our ability to comply with regulations and implement technologies and other initiatives that aim to reduce and/or capture CO2 emissions and comply with related carbon emissions regulations in place in the jurisdictions where we have operations; |
| • | the legal and regulatory environment, including environmental, climate, trade, energy, tax, antitrust, sanctions, import and export controls, construction, human rights, and labor welfare, and acquisition-related rules and regulations in the countries and regions in which we have operations; |
| • | the effects of currency fluctuations on our results of operations and financial condition; |
| • | our ability to satisfy our obligations under our debt agreements, the indentures that govern our outstanding Notes (as defined herein) and our other debt instruments and financial obligations, and also regarding the Subordinated Notes with no fixed maturity and other financial obligations; |
| • | adverse legal or regulatory proceedings or disputes, such as class actions or enforcement or other proceedings brought by third parties, government and regulatory agencies, including antitrust investigations and claims; |
| • | our ability to protect our reputation and intellectual property; |
| • | our ability to consummate asset sales or consummate asset sales in terms favorable to us, fully integrate newly acquired businesses, achieve cost-savings from our cost-reduction initiatives, implement our pricing and commercial initiatives for our products and services, and generally meet our business strategy’s goals; |
| • | the increasing reliance on information technology infrastructure for our sales, invoicing, procurement, financial statements, and other processes that can adversely affect our sales and operations in the event that the infrastructure does not work as intended, experiences technical difficulties, or is subjected to invasion, disruption, or damage caused by circumstances beyond our control, including cyber-attacks, catastrophic events, power outages, natural disasters, computer system or network failures, or other security breaches; |
| • | the effects of climate change, in particular reflected in weather conditions, including, but not limited to, excessive rain and snow, shortage of usable water, wildfires and natural disasters, such as earthquakes, hurricanes, tornadoes and floods, that could affect our facilities or the markets in which we offer our products and services or from where we source our raw materials; |
| • | trade barriers, including, but not limited to, tariffs or import taxes, including those imposed by the United States to key markets in which we operate, in particular, Mexico, China and the EU, and changes in existing trade policies or changes to, or withdrawals from, free trade agreements, including the United States-Mexico-Canada Agreement (the “USMCA”), and the overall impact that the imposition or threat of trade barriers may cause on the overall economy of the countries in which we do business or that are part of our global supply chain; |
3
| • | availability and cost of trucks, railcars, barges, and ships, terminals, warehouses, as well as their licensed operators, drivers, staff and workers, for transport, loading and unloading of our materials or that are otherwise a part of our supply chain; |
| • | labor shortages and constraints; |
| • | our ability to hire, effectively compensate and retain our key personnel and maintain satisfactory labor relations; |
| • | our ability to detect and prevent money laundering, terrorism financing and corruption, as well as other illegal activities and how any measures implemented by governments to detect and prevent money laundering, terrorism financing and corruption, and other illegal activities, affect our customers, suppliers and countries in which we do business; |
| • | defaults, losses or disruptions in agreements, financial transactions or operations resulting from sanctions or restrictions imposed on any financial institution, including, but not limited to, banks, common representatives, trustees, payment processors, paying agents or other financial intermediaries, or any related parties; |
| • | terrorist and organized criminal activities, social unrest, as well as geopolitical events, such as global, regional or national instability, hostilities, war, and armed conflicts, including the current war between Russia and Ukraine, the ongoing war among Israel, the United States and the Islamic Republic of Iran, conflicts in the Middle East and any insecurity and hostilities in Mexico related to illegal activities or organized crime and any actions any government takes to prevent these illegal activities and organized crime; |
| • | the impact of pandemics, epidemics, or outbreaks of infectious diseases and the response of governments and other third parties, which could adversely affect, among other matters, the ability of our operating facilities to operate at full or any capacity, supply chains, international operations, availability of liquidity, investor confidence and consumer spending, as well as the availability of, and demand for, our products and services; |
| • | changes in the economy that affect demand for consumer goods, consequently affecting demand for our products and services; |
| • | the depth and duration of an economic slowdown or recession, instability in the business landscape and lack of availability of credit; |
| • | declarations of insolvency or bankruptcy, or becoming subject to similar proceedings; |
| • | natural disasters and other unforeseen events (including global health hazards such as COVID-19); |
| • | our ability to implement our climate action program in effect at any given time, if any, including our current “Future in Action” climate action and nature program, and to achieve our sustainability goals and objectives in effect at any given time, if any, including under our current “Future in Action” climate action and nature program; and |
| • | the other risks and uncertainties described under “Item 3. Key Information—Risk Factors” and elsewhere in the 2025 Annual Report. |
Many factors could cause our expectations, expected results, and/or projections expressed in this report not being reached and/or not producing the expected benefits and/or results, as any such benefits or results are subject to uncertainties, costs, performance, and rate of success and/or implementation of technologies, some of which are not yet proven, among other factors.
4
Should one or more of these risks or uncertainties materialize, or should underlying assumptions prove incorrect, actual results, performance and/or achievements may vary materially from historical results, performance, and/or achievements and/or results, performance, or achievements expressly or implicitly anticipated by the forward-looking statements, or otherwise could have an impact on us. Forward-looking statements should not be considered guarantees of future performance, and past results or developments are not indicative of results or developments in subsequent periods. Actual results, performance and/or achievements of our operations and the development of market conditions in which we operate, or other circumstances that may materialize, may differ materially from those described in, or suggested by, the forward-looking statements contained herein, and events referenced therein. Any or all of our forward-looking statements may turn out to be inaccurate and the factors identified above are not exhaustive. Accordingly, readers should not place undue reliance on forward-looking statements, as such forward-looking statements speak only as of the date on which they are made. The forward-looking statements and the information disclosed in this report are made as of the dates specified in this report and are subject to change without notice; and, except to the extent legally required, we expressly disclaim any obligation or undertaking to update or correct the information contained in this report, or revise any forward-looking statements in this report, whether to reflect new information, the occurrence of anticipated or unanticipated future events or circumstances, any change in our expectations regarding those forward-looking statements, any change in events, conditions, or circumstances on which any such statement is based, or otherwise. Readers should review future reports filed or furnished by us with the SEC, the CNBV and the MSE.
This report contains statistical data regarding, but not limited to, the production, distribution, marketing, and sale of cement, ready-mix concrete, clinker, aggregates, and Urbanization Solutions. We generated some of this data internally, and some was obtained from independent industry publications and reports, available as of the date of this report, that we believe to be reliable sources. We have not independently verified this data nor sought the consent of any organizations to refer to their reports in this report.
We act in strict compliance with antitrust laws and as such, among other measures, maintain an independent pricing policy that has been independently developed. Our policy’s core element is to price our products and services based on their quality and characteristics as well as their value to our customers. We do not accept any communications or agreements of any type with competitors regarding the determination of our prices for our products and services. Unless the context indicates otherwise, all references to pricing initiatives, price increases or price decreases, refer to our prices for our products.
This report includes certain non-IFRS financial measures that differ from financial information presented by Cemex in accordance with IFRS in its financial statements and reports containing financial information. These aforementioned non-IFRS financial measures include “Operating EBITDA” (operating earnings before other expenses, net plus depreciation and amortization) and “Operating EBITDA Margin.” The closest financial measure to Operating EBITDA in our financial statements under IFRS is the line item of “Operating earnings before other expenses, net,” as Operating EBITDA adds depreciation and amortization to this line item. Our Operating EBITDA Margin is calculated by dividing our Operating EBITDA for the period by our revenues as reported in our financial statements for the same period. We believe there is no close IFRS financial measure to compare Operating EBITDA Margin. These non-IFRS financial measures are designed to complement and should not be considered superior to financial measures calculated in accordance with IFRS. Although Operating EBITDA and Operating EBITDA Margin are not measures of operating performance, an alternative to cash flows or a measure of financial position under IFRS, Operating EBITDA is the financial measure used by our management to review operating performance and profitability, for decision-making purposes and to allocate resources. Moreover, our Operating EBITDA is a measure used by our creditors to review our ability to internally fund capital expenditures, to service or incur debt and to comply with financial covenants under our financing agreements. Furthermore, our management regularly reviews our Operating EBITDA Margin by reportable segment and on a consolidated basis as a measure of performance and profitability. These non-IFRS financial measures do not have any standardized meaning and are therefore unlikely to be comparable to similarly titled measures presented by other companies. Non-IFRS financial measures presented in this report are being provided for informative purposes only and shall not be construed as investment, financial, or other advice.
The information, statements, and opinions contained in this report are for informational purposes and do not constitute a public offer under any applicable legislation, an offer to sell, or solicitation of any offer to buy any securities or financial instruments, or any advice or recommendation with respect to such securities or other financial instruments. You should not construe any such information or other material as legal, tax, investment, financial, or other advice. We are not responsible for any third-party information referenced in this report.
5
CAUTIONARY STATEMENT REGARDING ENVIRONMENTAL, SOCIAL, AND GOVERNANCE
(“ESG”) AND SUSTAINABILITY-RELATED DATA, METRICS, AND METHODOLOGIES
This report includes non-financial metrics, estimates, or other information related to ESG and sustainability matters that are subject to significant uncertainties, which may include the methodology, collection, and verification of data, various estimates, and assumptions, and/or underlying data that is obtained from third parties, some of which cannot be independently verified.
The preparation of certain information on ESG and sustainability matters contained in this report requires the application of a number of key judgments, assumptions, and estimates. The reported measures in this report reflect good faith estimates, assumptions, and judgments at the given point in time. There is a risk that these judgments, estimates, or assumptions may subsequently prove to be incorrect and/or, to the extent legally required, may need to be restated or changed. The disclosure of information on sustainability-related matters is not yet subject to the same recognized or accepted reporting or accounting principles and rules as traditional financial information. Consequently, there are no commonly accepted reporting practices for us to follow, and ESG metrics among organizations in our industry may not be comparable. In addition, the underlying data, systems, and controls that support non-financial reporting are generally considerably less sophisticated than the systems and internal control for financial reporting and rely on manual processes. This may result in non-comparable information between organizations and/or between reporting periods within organizations as methodologies continue to develop and/or be socialized. The further development of or changes to accounting and/or reporting standards could materially impact the performance metrics, data points, and targets contained in this report, and the reader may not be able to compare non-financial information performance metrics, data points, or targets between reporting periods on a direct like-for-like basis.
Additionally, the information disclosed in this report contains references to “green,” “social,” “sustainable,” or equivalent-labelled activities, products, assets, or projects. There is currently no single globally recognized or accepted, consistent and comparable set of definitions or standards (legal, regulatory, or otherwise) of, nor widespread cross-market consensus (i) as to what constitutes, a “green,” “social,” “sustainable,” or having equivalent-labelled activity, product, or asset; (ii) as to what precise attributes are required for a particular activity, product, or asset to be defined as “green,” “social,” “sustainable” or such other equivalent label; or (iii) as to climate and sustainable funding and financing activities and their classification and reporting.
Therefore, there is little certainty, and no assurance or representation is given, that such activities, products, assets, or projects and/or reporting of such activities, products, assets or projects will meet any present or future expectations or requirements for describing or classifying such activities, products, assets or projects as “green,” “social,” “sustainable,” or attributing similar labels. We expect policies, regulatory requirements, standards, and definitions to be developed and continuously evolve over time.
CAUTIONARY STATEMENT REGARDING FORWARD-LOOKING ESG OR SUSTAINABILITY STATEMENTS
Certain sections in this report contain ESG- or sustainability-related forward-looking statements, such as aims, ambitions, estimates, forecasts, plans, projections, targets, goals and other metrics, including but not limited to: climate and emissions, business and human rights, corporate governance, research and development and partnerships, development of products and services that intend to address sustainability-related concerns and sustainability related targets/ ambitions when finalized, including the implementation of technologies and other initiatives that aim to reduce and/or capture CO2 emissions. These forward-looking statements also include references to specific programs, such as our current “Future in Action” climate action and nature program, as well as various ESG-related indicators, objectives or metrics disclosed previously or that may be disclosed in the future, none of which are guarantees and any and all of which may ultimately not be achieved or may be abandoned at any time, whether in part, in full, or within any specific timeframe. There are many significant uncertainties, assumptions, judgements, opinions, estimates, forecasts and statements made of future expectations underlying these forward-looking statements which could cause actual results, performance, outcomes or events to differ materially from those expressed or implied in these forward-looking statements, which include, but are not limited to:
| • | the extent and pace of climate change, including the timing and manifestation of physical and transition risks; |
6
| • | the macroeconomic environment; |
| • | uncertainty around future climate-related policy and regulations, including the timely implementation and integration of adequate government policies; |
| • | the effectiveness of actions of governments, legislators, regulators, businesses, investors, customers, and other stakeholders to mitigate the impact of climate and sustainability-related risks; |
| • | changes in customer behavior and demand, changes in the available technology for mitigation and the effectiveness of any such technologies, as some of these new technologies may be unproven; |
| • | excessive costs and expenses related to acquire and/or develop technology for mitigation; |
| • | the roll-out of low carbon infrastructure; |
| • | the availability and adoption of renewable energy in our value chain; |
| • | the development of carbon capture, circular utilization, and sequestration technologies, including the adoption of cost-effective carbon-related technologies such as carbon capture, utilization, and storage; |
| • | the availability of accurate, verifiable, reliable, consistent, and comparable climate-related data; |
| • | lack of transparency and comparability of climate-related forward-looking methodologies; |
| • | variation in approaches and outcomes, as variations in methodologies may lead to under or overestimates and consequently present exaggerated indication of climate-related risk; and |
| • | reliance on assumptions and future uncertainty (calculations of forward-looking metrics are complex and require many methodological choices and assumptions). |
Accordingly, undue reliance should not be placed on these forward-looking statements. Furthermore, changing national and international standards, industry and scientific practices, regulatory requirements, and market expectations regarding climate change, which remain under continuous development, are subject to different interpretations.
There can be no assurance that these standards, practices, requirements, and expectations will not be interpreted differently than our understanding when defining sustainability-related ambitions and targets or change in a manner that substantially increases the cost or effort for us to achieve such ambitions and targets.
7
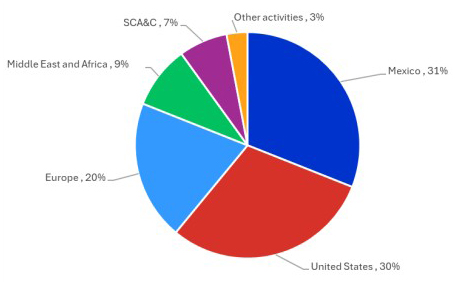
BREAKDOWN OF EXTERNAL REVENUES BY REPORTABLE SEGMENT FOR THE THREE-MONTH
PERIOD ENDED MARCH 31, 2026
The following chart indicates the geographic breakdown of our external revenues by reportable segment, for the three-month period ended March 31, 2026:
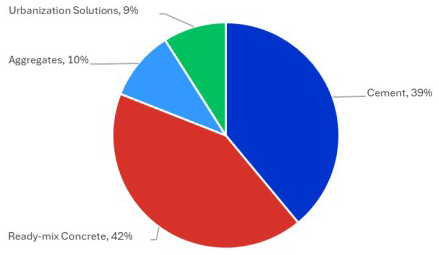
BREAKDOWN OF EXTERNAL REVENUES BY LINE OF BUSINESS FOR THE THREE-MONTH
PERIOD ENDED MARCH 31, 2026
The following chart indicates the breakdown of our external revenues by line of business for the three-month period ended March 31, 2026:
8
RECENT DEVELOPMENTS
Recent Developments Relating to Our Financial Obligations
2026 Credit Agreement
On May 28, 2026, Cemex, S.A.B. de C.V. signed a 5-year committed Dollar-denominated $3,000 million syndicated sustainability-linked revolving credit agreement (the “2026 Credit Agreement”), which proceeds will be used for general corporate purposes (including refinancing financial obligations of Cemex and its affiliates). The 2026 Credit Agreement, denominated exclusively in Dollars, maintains interest rate margin and financial covenants, consistent with an investment-grade capital structure, which provide for a maximum ratio of Consolidated Net Debt (as defined below) to Consolidated Operating EBITDA (as defined below) (“Consolidated Leverage Ratio”) of 3.75 times throughout the life of the loan and a minimum ratio of Consolidated Operating EBITDA to interest expense (“Consolidated Coverage Ratio”) of 2.75 times. All tranches under the 2026 Credit Agreement include a margin over the Secured Overnight Financing Rate (“SOFR”) from 85 basis points to 137.5 basis points, depending on the credit rating ranging from BBB+/Baa1 or higher in the lower end to BB+/Ba1 or lower in the higher end.
The 2026 Credit Agreement is guaranteed by Cemex Corp. Cemex will not be able to borrow under the 2026 Credit Agreement until certain conditions are satisfied, which Cemex currently expects to be satisfied in the short-term (possibly prior to June 30, 2026).
The 2026 Credit Agreement contains ongoing representations, warranties, affirmative and negative covenants, including financial covenants. Under the 2026 Credit Agreement, at the end of each quarter for each period of four consecutive quarters, Cemex must comply with a maximum Consolidated Leverage Ratio of 3.75 times and a minimum Consolidated Coverage Ratio of 2.75 times throughout the life of the credit agreement. These financial ratios are calculated using the consolidated amounts under IFRS. Under the 2026 Credit Agreement, (i) the Consolidated Leverage Ratio is calculated by dividing “Consolidated Net Debt” by “Consolidated Operating EBITDA” for the last 12 months as of the calculation date. Consolidated Net Debt equals debt, as reported in the statement of financial position, net of cash and cash equivalents, excluding any existing or future obligations under any securitization program and any subordinated notes of Cemex adjusted for net mark-to-market of all derivative instruments, as applicable, among other adjustments including in relation for business acquisitions or disposals; (ii) Consolidated Operating EBITDA, represents Operating EBITDA for the last 12 months as of the calculation date, as adjusted for any Operating EBITDA attributable to discontinued operations, and solely for the purpose of calculating the Consolidated Leverage Ratio on a pro forma basis for any material disposition and/or material acquisition; and (iii) Consolidated Coverage Ratio is calculated by dividing Consolidated Operating EBITDA by Consolidated Interest Expense for the last 12 months as of the calculation date. Cemex’s ability to comply with these ratios may be affected by economic conditions, volatility in foreign exchange rates, as well as by overall conditions in the financial and capital markets or other factors.
9
Accounts Receivables Securitization Program
On May 29, 2026, our accounts receivables securitization program in Mexico was fully repaid and terminated for an aggregate amount of Ps. 1,800 million.
EUAs Forward Program
As of the date of this report, the EUAs Forward Program (as defined herein) is comprised of 3 million EUAs for the years 2029 to 2035 for an aggregate amount of $344 million.
Recent Developments Relating to our Regulatory Matters and Legal Proceedings
Maceo, Colombia—Legal Proceedings in Colombia
In May 2026, the free trade zone benefits related to the Maceo Project expired. As of the date of this report, we do not expect this to have a material adverse effect on our results of operations, liquidity, or financial condition.
10
Imposition of Tariffs by the United States
On May 7, 2026, the U.S. Court of International Trade ruled that the 10% ad valorem tariff imposed by the United States in February 2026 on imports from substantially all trading partners under Section 122 of the Trade Act of 1974 (“Section 122 Tariffs”) are unlawful. The court’s ruling was limited to the successful plaintiffs and did not apply universally. The United States government appealed to the U.S. Court of Appeals for the Federal Circuit, which entered an administrative stay suspending the lower court’s order while it considers the appeal. As of the date of this report, the Section 122 Tariffs remain in effect until their statutory expiration on July 24, 2026 for most importers pending the outcome of the appeal. As of the date of this report, goods that comply with rules of origin established under the United States-Mexico-Canada Agreement (“USMCA”) remain exempt from Section 122 Tariffs.
The public comment periods for the two Section 301 investigations initiated by the United States Trade Representative in March 2026 have closed, and public hearings were held in late April and early May 2026. These investigations are expected to conclude and potentially result in the imposition of tariffs by July 24, 2026, concurrent with the expiration of the Section 122 Tariffs. The tariff rates applied pursuant to these Section 301 investigations could be equivalent to or exceed the country-specific reciprocal tariffs imposed by the United States in 2025 and invalidated by the U.S. Supreme Court in February 2026. The cement sector is among those specifically identified in the Section 301 investigation regarding structural excess capacity and overproduction in manufacturing sectors as unreasonable or discriminatory and burdensome or restrictive on U.S. commerce.
The USMCA is subject to a mandatory joint review, with the Free Trade Commission required to convene on July 1, 2026. At that review, each party must confirm in writing whether it wishes to extend the agreement for an additional 16-year term. If any party declines to confirm extension, the agreement shifts to annual reviews and would expire on July 1, 2036, unless the parties later reach a consensus on extension. Changes to the USMCA’s preferential treatment regime, including rules of origin, could affect the tariff treatment of products we import into the United States from Mexico and Canada.
As of the date of this report, according to our interpretation of applicable laws and regulations and the various court rulings, imports of our products from the main countries in which we have operations into the United States and/or from which we generally source products we import into the United States and/or from which products imported into the United States in our industry are generally sourced, are subject to the following tariffs on a country-by-country basis: (i) Mexico and Canada: 0% on USMCA-compliant products; 10% on non-USMCA-compliant products (subject to the ongoing judicial challenge to the Section 122 Tariffs); and for steel and aluminum products, tiered rates of 50%, 25%, 15%, 10%, or 0% depending on product category and country of origin; (ii) China: approximately 35%, considering estimates of the blended effective rate for Chinese goods; and (iii) other countries: 10% (subject to the ongoing judicial challenge to the Section 122 Tariffs), and for steel and aluminum products, tiered rates of 50%, 25%, 15%, 10%, or 0% depending on product category and country of origin. As of the date of this report, we believe that substantially all products we import into the United States from Mexico and Canada as part of our business are compliant with the USMCA.
SELECTED CONSOLIDATED FINANCIAL INFORMATION
The financial data set forth below for the three-month periods ended March 31, 2025 and 2026 have been derived from, and should be read in conjunction with, and are qualified in their entirety by reference to, Cemex, S.A.B. de C.V.’s unaudited condensed consolidated financial statements as of December 31, 2025 and March 31, 2026 and for the three-month periods ended March 31, 2025 and 2026 and the notes thereto included herein. In the opinion of management, the unaudited condensed consolidated financial statements reflect all adjustments (consisting of normal recurring items) that are necessary to properly present, in all material respects, the results for the interim periods. The interim results of operations for the three-month period ended March 31, 2026 are not indicative of operating results to be expected for the entire year.
Our audited consolidated financial statements included in the 2025 Annual Report were prepared in accordance with IFRS, which differ in significant respects from U.S. generally accepted accounting principles (“GAAP”). The regulations of the SEC do not require foreign private issuers that prepare their financial statements on the basis of IFRS (as published by the IASB) to reconcile such financial statements to U.S. GAAP. Accordingly, we do not reconcile our financial information to U.S. GAAP.
11
Cemex, S.A.B. de C.V.’s unaudited condensed consolidated financial statements as of December 31, 2025 and March 31, 2026 and for the three-month periods ended March 31, 2025 and 2026 included herein are prepared in accordance with International Accounting Standard 34 Interim Financial Reporting (“IAS 34”) as issued by the International Accounting Standards Board (“IASB”), on a basis consistent with the accounting policies used in the preparation and presentation of our audited consolidated financial statements included in the 2025 Annual Report.
CEMEX, S.A.B. DE C.V. AND SUBSIDIARIES
Selected Consolidated Financial Information
| For the Three- Month Period Ended March 31, |
||||||||
| 2025 | 2026 | |||||||
| (in millions of Dollars, except ratios and share and per share amounts) |
||||||||
| Statement of Income Information: |
||||||||
| Revenues |
$ | 3,614 | $ | 4,019 | ||||
| Cost of sales(1) |
(2,490 | ) | (2,699 | ) | ||||
| Gross profit |
1,124 | 1,320 | ||||||
| Operating expenses |
(834 | ) | (867 | ) | ||||
| Operating earnings before other expenses, net(2) |
290 | 453 | ||||||
| Other expenses, net |
(44 | ) | (43 | ) | ||||
| Operating earnings(2) |
246 | 410 | ||||||
| Financial items(3) |
(75 | ) | (92 | ) | ||||
| Share of profit of equity accounted investees |
5 | 7 | ||||||
| Earnings before income tax |
176 | 325 | ||||||
| Income tax |
(52 | ) | (94 | ) | ||||
| Discontinued operations(4) |
618 | 3 | ||||||
| Non-controlling interest net income |
8 | 6 | ||||||
| Controlling interest net income |
734 | 228 | ||||||
| Basic earnings per share(5)(6) |
0.0169 | 0.0054 | ||||||
| Diluted earnings per share(5)(6) |
0.0166 | 0.0052 | ||||||
| Basic earnings per share from continuing operations(5)(6) |
0.0027 | 0.0053 | ||||||
| Diluted earnings per share from continuing operations(5)(6) |
0.0026 | 0.0051 | ||||||
| Weighted-average number of shares outstanding - basic(5)(7) |
43,463 | 43,354 | ||||||
| Weighted-average number of shares outstanding - diluted(5)(7) |
44,122 | 43,895 | ||||||
| As of | ||||||||
| December 31, 2025 | March 31, 2026 | |||||||
| (in millions of Dollars) | ||||||||
| Statement of Financial Position Information: |
||||||||
| Cash and cash equivalents |
$ | 1,822 | $ | 687 | ||||
| Assets held for sale and other current assets(8) |
144 | 550 | ||||||
| Property, machinery and equipment, net and assets for the right-of-use, net(11) |
12,168 | 11,927 | ||||||
| Other assets |
14,811 | 14,936 | ||||||
| Total assets |
28,945 | 28,100 | ||||||
12
| As of | ||||||||
| December 31, 2025 | March 31, 2026 | |||||||
| (in millions of Dollars) | ||||||||
| Current debt |
1,187 | 397 | ||||||
| Other current liabilities |
6,160 | 6,122 | ||||||
| Non-current debt |
4,457 | 4,758 | ||||||
| Other non-current liabilities |
3,503 | 3,380 | ||||||
| Total liabilities |
15,307 | 14,657 | ||||||
| Non-controlling interest |
308 | 306 | ||||||
| Total controlling interest |
13,330 | 13,137 | ||||||
| For the Three-Month Period Ended March 31, |
||||||||
| 2025 | 2026 | |||||||
| (in millions of Dollars, except ratios and share and per share amounts) |
||||||||
| Other Financial Information: |
||||||||
| Book value per share(5)(9) |
$ | 0.3024 | $ | 0.2993 | ||||
| Operating EBITDA(10) |
595 | 794 | ||||||
| Capital expenditures |
249 | 156 | ||||||
| Depreciation and amortization of assets |
305 | 341 | ||||||
| Cash flows provided by operating activities from continuing operations |
37 | 310 | ||||||
| Basic earnings per CPO from continuing operations(5)(6) |
0.0081 | 0.0159 | ||||||
| Basic earnings per CPO(5)(6) |
0.0507 | 0.0162 | ||||||
| Total debt plus other financial obligations(11) |
7,460 | 6,859 | ||||||
| (1) | Cost of sales represents the production cost of inventories at the moment of sale and includes depreciation, amortization and depletion of assets involved in production, expenses related to storage in production plants, freight expenses of raw materials in plants and delivery expenses of our ready-mix concrete business. Our cost of sales excludes (i) expenses related to personnel and equipment comprising our selling network and those expenses related to warehousing at the points of sale and (ii) freight expenses of finished products from our producing plants to our points of sale and from our points of sale to our customers’ locations, which are all included as part of the line item titled “Operating expenses.” |
| (2) | In the income statements, we include the line item titled “Operating earnings before other expenses, net” considering that it is a subtotal relevant for the determination of our “Operating EBITDA” as explained in note 2 to Cemex, S.A.B. de C.V.’s 2025 audited consolidated financial statements included in the 2025 Annual Report. The line item of “Operating earnings before other expenses, net” allows for easy reconciliation of the amount in these financial statements under IFRS to the non-IFRS measure of Operating EBITDA by adding back depreciation and amortization. Under current IFRS, the inclusion of certain subtotals such as “Operating earnings before other expenses, net” and the display of the income statements varies significantly by industry and company according to specific needs. |
| (3) | Financial items include our financial expense and our financial income and other items, net, which includes net interest cost of pension liabilities, financial income, results from financial instruments, net (derivatives, fixed-income investments and other securities), foreign exchange results, effects of amortized cost on assets and liabilities and others, net. See notes 6 and 7 to Cemex, S.A.B. de C.V.’s unaudited condensed consolidated financial statements as of December 31, 2025 and March 31, 2026 and for the three-month periods ended March 31, 2025 and 2026 included herein. |
| (4) | Considering any component that has been disposed of or classified as held for sale and represents a separate major line of business, geographical area, or is part of a single disposal plan, our income statements present as part of the single line item of “Discontinued operations,” net of income tax, the results of: (a) Dominican Republic operations for the period from January 1 to January 30, 2025 and (b) Panama for the three-month period ended March 31, 2025. There were no discontinued operations for the three-month period ended March 31, 2026. See note 4.1 to Cemex, S.A.B. de C.V.’s unaudited condensed consolidated financial statements as of December 31, 2025 and March 31, 2026 and for the three-month periods ended March 31, 2025 and 2026 included herein. |
| (5) | Cemex, S.A.B. de C.V.’s capital stock consists of Series A shares and Series B shares. Each CPO represents two Series A shares and one Series B share. As of March 31, 2026, 99.99% of Cemex, S.A.B. de C.V.’s outstanding share capital was represented by CPOs, with each ADS representing 10 CPOs. No CPOs were repurchased in the three-month period ended March 31, 2025. During the three-month period ended March 31, 2026, 78,803,711 CPOs were repurchased under Cemex, S.A.B. de C.V.’s authorized repurchase programs, which |
13
| represented 0.543% of Cemex, S.A.B. de C.V.’s outstanding share capital as of December 31, 2025, at a weighted-average price in Mexican Pesos equivalent to $1.2678 (based on an exchange rate of Ps 17.2013 to $1.00 as of March 31, 2026) per CPO, which was equivalent to an amount of $99.9 million (based on an exchange rate of Ps 17.2013 to $1.00 as of March 31, 2026), excluding fees and value-added tax. |
| (6) | Earnings per share is calculated based upon the weighted-average number of shares outstanding during the year. Basic earnings per CPO is determined by multiplying the basic earnings per share for each period by three (the number of shares underlying each CPO). Basic earnings per CPO is presented solely for the convenience of the reader and does not represent a measure under IFRS. As shown in note 4.1 to Cemex, S.A.B. de C.V.’s unaudited condensed consolidated financial statements as of December 31, 2025 and March 31, 2026 and for the three-month periods ended March 31, 2025 and 2026 included herein, and in connection with our discontinued operations mentioned above, for the three-month period ended March 31, 2025, “Basic earnings per share” and “Diluted earnings per share” include $0.0027 and $0.0026, respectively, from “Continuing operations” and for the three-month period ended March 31, 2026, “Basic earnings per share” and “Diluted earnings per share” include $0.0053 and $0.0051, respectively. In addition, for the three-month period ended March 31, 2025, “Basic earnings per share” and “Diluted earnings per share” include $0.0142 and $0.0140, respectively, from “Discontinued operations” and for the three-month period ended March 31, 2026, “Basic earnings per share” and “Diluted earnings per share” include $0.0001 and $0.0001, respectively, from “Discontinued operations.” |
| (7) | Pursuant to the resolutions adopted at Cemex, S.A.B. de C.V.’s ordinary general shareholders’ meeting held on March 22, 2024, Cemex, S.A.B. de C.V. approved the payment of a $120 million dividend, payable in four equal installments. Cemex, S.A.B. de C.V. paid the fourth and last installment of a cash dividend to shareholders during the three-month period ended March 31, 2025 in the amounts of $0.013974 Mexican Pesos per share (equivalent to $0.000689 per share). No recapitalization of retained earnings was proposed at Cemex, S.A.B. de C.V.’s ordinary general shareholders’ meeting held on March 25, 2025. Pursuant to the resolutions adopted at Cemex, S.A.B. de C.V.’s ordinary general shareholders’ meeting held on March 25, 2025, Cemex, S.A.B. de C.V. approved the payment of a $130 million dividend, payable in four equal installments. Cemex, S.A.B. de C.V. paid the fourth and last installment of a cash dividend to shareholders during the three-month period ended March 31, 2026 in the amounts of $0.013127 Mexican Pesos per share (equivalent to $0.000750 per share). No recapitalization of retained earnings was proposed at Cemex, S.A.B. de C.V.’s ordinary general shareholders’ meeting held on March 26, 2026. Pursuant to the resolutions adopted at Cemex, S.A.B. de C.V.’s ordinary general shareholders’ meeting held on March 26, 2026, Cemex, S.A.B. de C.V. approved the payment of a $180 million dividend, payable in four equal installments. |
| (8) | As of December 31, 2025 and March 31, 2026 included assets held for sale for $42 million and $436 million, respectively. |
| (9) | Book value per share is calculated by dividing the total controlling interest by the number of shares outstanding. |
| (10) | “Operating EBITDA” equals operating earnings before other expenses, net, plus depreciation and amortization expenses. Although Operating EBITDA is not a measure of operating performance, an alternative to cash flows or a measure of financial position under IFRS, Operating EBITDA is the financial measure used by our chief executive officer (“CEO”) to review operating performance and profitability, for decision making purposes and to allocate resources. Moreover, Operating EBITDA is a measure used by our creditors to review our ability to internally fund capital expenditures, to service or incur debt and to comply with financial covenants under our financing agreements. See note 18.1 to Cemex, S.A.B. de C.V.’s 2025 audited consolidated financial statements included in the 2025 Annual Report. Our Operating EBITDA may not be comparable to similarly titled measures reported by other companies. Operating EBITDA is reconciled below to operating earnings before other expenses, net, as reported in the income statements, and to cash flows provided by operating activities from continuing operations before financial expense, coupons on the Subordinated Notes and income taxes, as reported in the cash flows statement. Financial expense as reported in the income statements does not include the coupon payments of Subordinated Notes in the three-month periods ended March 31, 2025 and 2026 of $37 million and $62 million, respectively, as described in note 18.2 to Cemex, S.A.B. de C.V.’s unaudited condensed consolidated financial statements as of December 31, 2025 and March 31, 2026 and for the three-month periods ended March 31, 2025 and 2026 included herein. |
| (11) | Other financial obligations include: (a) lease contracts as per IFRS 16; and (b) liabilities secured with accounts receivable. See note 15.2 to Cemex, S.A.B. de C.V.’s unaudited condensed consolidated financial statements as of December 31, 2025 and March 31, 2026 and for the three-month periods ended March 31, 2025 and 2026 included herein. |
| For the Three-Month Period Ended March 31, |
||||||||
| 2025 | 2026 | |||||||
| (in millions of Dollars) | ||||||||
| Reconciliation of cash flows provided by operating activities from continuing operations to Operating EBITDA |
||||||||
| Cash flow provided by operating activities from continuing operations |
$ | 37 | $ | 310 | ||||
| Plus/minus: |
||||||||
| Changes in working capital excluding income taxes |
484 | 453 | ||||||
| Depreciation and amortization of assets |
(305 | ) | (341 | ) | ||||
| Other items, net |
74 | 31 | ||||||
|
|
|
|
|
|||||
| Operating earnings before other expenses, net |
290 | 453 | ||||||
| Plus: |
||||||||
| Depreciation and amortization of assets |
305 | 341 | ||||||
|
|
|
|
|
|||||
| Operating EBITDA |
$ | 595 | $ | 794 | ||||
|
|
|
|
|
|||||
14
MANAGEMENT’S DISCUSSION AND ANALYSIS OF FINANCIAL CONDITION
AND RESULTS OF OPERATIONS
The following discussion and analysis should be read in conjunction with, and are qualified in their entirety by reference to, Cemex, S.A.B. de C.V.’s unaudited condensed consolidated financial statements as of December 31, 2025 and March 31, 2026 and for the three-month periods ended March 31, 2025 and 2026 included herein. Our material accounting policies are described in note 3 to Cemex, S.A.B. de C.V.’s 2025 audited consolidated financial statements included in the 2025 Annual Report.
On April 23, 2026, we announced our results for the three-month period ended March 31, 2026. The interim results of operations for the three-month period ended March 31, 2026 are not indicative of operating results to be expected for the entire year or any subsequent interim period. The following is a discussion of our results for the three-month period ended March 31, 2026 as compared to the same period in the prior year.
Consolidation of Our Results of Operations
Cemex, S.A.B. de C.V.’s unaudited condensed consolidated financial statements included herein include all entities in which we hold a controlling interest or which we otherwise control. Control exists, and consolidation is required, only when we have all of the following: (a) the power, directly or indirectly, to direct the relevant activities of an entity; (b) the exposure to variable returns from our involvement with such entity; and (c) the ability to use our power over such entity to affect its returns.
Investments in associates when we have significant influence, which is generally presumed with a minimum equity interest of 20% and/or joint venture arrangements, in which we and other third-party investors have joint control and have rights to the net assets of the arrangements, are accounted for by the equity method. Under the equity method, after acquisition, the investment’s original cost is adjusted for the proportional interest in the associate’s equity and earnings.
All balances and transactions between the group subsidiaries have been eliminated in consolidation.
Discontinued Operations
Considering the disposal of our operations, our income statements present as part of the single line item of “Discontinued operations” the results of operations, net of income tax, of the following transactions: (a) Dominican Republic operations for the period from January 1 to January 30, 2025 and (b) Panama for the three-month period ended March 31, 2025. There were no discontinued operations for the three-month period ended March 31, 2026. See note 4.1 to Cemex, S.A.B. de C.V.’s unaudited condensed consolidated financial statements as of December 31, 2025 and March 31, 2026 and for the three-month periods ended March 31, 2025 and 2026 included herein.
Acquisition of Operations
The operating results of newly acquired businesses are consolidated in Cemex, S.A.B. de C.V.’s unaudited condensed consolidated financial statements as of December 31, 2025 and March 31, 2026 and for the three-month periods ended March 31, 2025 and 2026 included herein beginning on the acquisition date. Therefore, all periods presented do not include operating results corresponding to newly acquired businesses before we assumed control.
Significant Transactions
For the three-month periods ended March 31, 2025 and 2026, our consolidated results reflect the following transactions:
| • | On January 30, 2025, we completed the sale of our operations in the Dominican Republic to Cementos Progreso Holdings, S.L., and its strategic partners for a total consideration of $928 million, after adjustments for final cash, debt, and working capital balances. The divested assets mainly consisted of one cement plant in the Dominican Republic consisting of two integrated production lines and related cement, concrete and aggregates assets; marine terminals and a commercialization business to Haiti. For the period from January 1 to January 30, 2025, our operations in the Dominican Republic are reported in the Income Statements, net of income tax, in the single line item “Discontinued operations,” including for the three-month period ended March 31, 2025 a gain on sale of $593 million, net of the reclassification of foreign currency translation effects accrued in equity until the date of loss of control and goodwill cancellation of $13 million. |
15
| • | On October 6, 2025, we closed the sale of substantially all of our operations and the majority of our assets in Panama to Grupo Estrella, for a total consideration of $200 million, subject to final adjustments. The divested assets mainly consist of one cement plant in Calzada Larga, Chilibre, which, as of December 31, 2024, had an installed cement capacity of around 1.2 million metric tons per year, and related cement, ready-mix concrete, aggregates assets, and rights to acquire additional reserves from operations in Panama. We retained our admixtures business in Panama. For the three-month period ended March 31, 2025, our operations in Panama are reported in the statements of income, net of income tax, in the single line item “Discontinued operations.” |
| • | On March 11, 2026, certain of our subsidiaries, as sellers (the “Colombia Sellers”), Cemex, S.A.B. de C.V., as guarantor of certain obligations of the Colombia Sellers, and Holcim, entered into a stock purchase agreement pursuant to which, subject to certain terms and conditions, Holcim will purchase the shares representing the capital stock of certain of our subsidiaries in Colombia, which main assets are a cement plant (Caracolito), a grinding mill (Santa Rosa), and a portfolio of ready-mix concrete, aggregates, mortar, and admixture plants, for a purchase price of $484.5 million, subject to closing adjustments. The transaction with Holcim is currently expected to close at the end of 2026, subject to customary closing conditions, including regulatory approvals. We are in the process of defining the operating model for the remaining assets that operate in Colombia and which are not part of the sale transaction. As of March 31, 2026, the assets and liabilities related to these operations are presented in the line items “Assets held for sale” and “Liabilities related to assets held for sale,” respectively. |
| • | On March 31, 2026, we completed the acquisition of all assets of Omega Products International, a stucco manufacturer in the western United States, for a total consideration of $190 million. The purchase price allocation to the identifiable assets acquired, liabilities assumed and any resulting goodwill, in accordance with IFRS 3, Business Combinations, is provisional and will be completed within the twelve-month measurement period from the acquisition date. See note 4.1 to Cemex, S.A.B. de C.V.’s unaudited condensed consolidated financial statements as of December 31, 2025 and March 31, 2026 and for the three-month periods ended March 31, 2025 and 2026 included herein. |
Consolidated Income Statements Data
The following table sets forth our selected consolidated Income Statements data for each of the three-month periods ended March 31, 2025 and 2026 expressed as a percentage of revenues.
| For the Three-Month Period Ended March 31, |
||||||||
| 2025 | 2026 | |||||||
| Revenues |
100 | % | 100 | % | ||||
| Cost of sales |
(68.9 | ) | (67.2 | ) | ||||
| Gross profit |
31.1 | 32.8 | ||||||
| Operating expenses |
(23.1 | ) | (21.5 | ) | ||||
| Operating earnings before other expenses, net |
8.0 | 11.3 | ||||||
| Other expenses, net |
(1.2 | ) | (1.1 | ) | ||||
| Operating earnings |
6.8 | 10.2 | ||||||
| Financial expense |
(3.2 | ) | (2.6 | ) | ||||
| Financial income and other items, net |
1.1 | 0.3 | ||||||
| Share of profit on equity accounted investees |
0.1 | 0.1 | ||||||
| Earnings before income tax |
4.8 | 8.0 | ||||||
16
| For the Three-Month Period Ended March 31, |
||||||||
| 2025 | 2026 | |||||||
| Income tax |
(1.4 | ) | (2.3 | ) | ||||
| Net income from continuing operations |
3.4 | 5.7 | ||||||
| Discontinued operations |
17.1 | 0.1 | ||||||
| Consolidated net income |
20.5 | 5.8 | ||||||
| Non-controlling interest net income |
0.2 | 0.1 | ||||||
| Controlling interest net income |
20.3 | 5.7 | ||||||
Key Components of Results of Operations
Revenues
Revenues are primarily comprised from the sale and distribution of cement, ready-mix concrete, aggregates, and Urbanization Solutions, which accounted for 96% of our consolidated external revenues for each of the three-month periods ended March 31, 2025 and 2026. We recognized revenues at a point in time or over time in the amount of the price, before tax on sales, expected to be received for goods and services supplied due to ordinary activities, as contractual performance obligations are fulfilled, and control of goods and services passes to the customer. Revenues are decreased by any trade discounts or volume rebates granted to customers. Transactions between related parties are eliminated in consolidation. Variable consideration is recognized when it is highly probable that a significant reversal in the amount of cumulative revenue recognized for the contract will not occur and is measured using the expected value or the most likely amount method, whichever is expected to better predict the amount based on the terms and conditions of the contract.
Cost of Sales
Cost of sales represents the production cost of inventories at the moment of sale, including raw materials and goods for resale, payroll related to the production phase, electricity, fuels, and other services, depreciation and amortization of assets involved in the production, maintenance, repairs and supplies, freight expenses of raw materials in plants and delivery expenses of our ready-mix concrete business, among other production costs. Cost of sales does not include (i) expenses related to personnel, equipment and services involved in sales activities and storage of product at points of sales, which are included in administrative and selling expenses, and (ii) freight expenses of finished products between plants and points of sale and freight expenses between points of sales and the customers’ facilities, which are included as part of distribution expenses. Administrative and selling expenses and distribution expenses are included in operating expenses. As a percentage of revenues, cost of sales represented 68.9% and 67.2% for the three-month periods ended March 31, 2025 and 2026, respectively.
Operating Expenses
Operating expenses comprise administrative and selling expenses and distribution and logistics expenses. Administrative expenses represent the expenses associated with personnel, services, and equipment, including depreciation and amortization related to managerial activities and back-office for our management. Sales expenses represent the expenses associated with personnel, services and equipment, including depreciation and amortization, involved specifically in sales activities. Distribution and logistics expenses refer to storage expenses at points of sales, including depreciation and amortization, as well as freight expenses of finished products between plants and points of sale and freight expenses between points of sales and the customers’ facilities. As a percentage of revenues, operating expenses represented 23.1% and 21.5% for the three-month periods ended March 31, 2025 and 2026, respectively. The main operating expenses are comprised of transportation cost, payroll of personnel, depreciation and amortization of assets related to the operating expenses, as well as professional legal, accounting, and advisory services and maintenance, repairs, and supplies accounted for 98% and 95% of consolidated operating expenses for the three-month periods ended March 31, 2025 and 2026, respectively.
17
Other Expenses, Net
The line item Other expenses, net consists primarily of revenues and expenses not directly related to our main activities or which are of nonrecurring nature, including impairment losses of long-lived assets, non-recurring sales of emission allowances, results on disposal of assets, which relates to sales of property plant and equipment, and restructuring costs, and losses in connection with property damages and natural disasters, among others. For the three-month periods ended March 31, 2025 and 2026, Other expenses, net, amounted to $44 million and $43 million, respectively. As a percentage of revenues, Other expenses, net, represented 1.2% and 1.1% for the three-month periods ended March 31, 2025 and 2026, respectively.
Financial Income and Other items, Net
Financial income and other items, net, includes (i) effects of amortized cost on assets and liabilities; (ii) net interest cost of defined benefit liabilities; (iii) results from financial instruments, net; (iv) foreign exchange results, comprising foreign exchange gains and losses in connection with the effects of foreign exchange fluctuations on our assets and liabilities denominated in currencies other than the Dollar; (v) financial income, which relates to income in connection with deposits and investments; and (vi) others. As a percentage of revenues, financial income, and other items, net, represented 1.1% and 0.3% for the three-month periods ended March 31, 2025 and 2026, respectively.
Income Tax
Income tax comprises current income taxes net of deferred income taxes. For both the three-month periods ended March 31, 2025 and 2026, our statutory income tax rate in Mexico was 30%. Our average effective tax rate equals the net amount of income tax revenue or expense divided by income or loss before income taxes, as these line items are reported in the income statement, was 29.5% and 28.9% for the three-month periods ended March 31, 2025 and 2026, respectively. The effects reflected in the income statement for income taxes include the amounts incurred during the period and the amounts of deferred income taxes, determined according to the income tax law applicable to each subsidiary, reflecting uncertainty in income tax treatments. Consolidated deferred income taxes represent the addition of the amounts determined in each subsidiary by applying the enacted statutory income tax rate or substantively enacted by the end of the reporting period to the total temporary differences resulting from comparing the book and taxable values of assets and liabilities, considering tax assets such as loss carryforwards and other recoverable taxes, to the extent that it is probable that future taxable profits will be available against which they can be utilized. The measurement of deferred income taxes at the reporting period reflects the tax consequences that follow how we expect to recover or settle the carrying amount of its assets and liabilities. Deferred income taxes for the period represent the difference between balances of deferred income taxes at the beginning and the end of the period. Deferred income tax assets and liabilities relating to different tax jurisdictions are not offset. The effect of a change in enacted statutory tax rates is recognized in the period in which the change is officially enacted.
Three-Month Period Ended March 31, 2026 Compared to Three-Month Period Ended March 31, 2025
Summarized in the table below are the percentage (%) increases (+) and decreases (-) for the three-month period ended March 31, 2026 compared to the three-month period ended March 31, 2025 in our (i) domestic cement and ready-mix concrete sales volumes, which refer entirely to sales to external customers, (ii) export sales volumes of cement, which include both sales to external customers and intragroup export sales from one reportable operating segment to another, and (iii) domestic cement and ready-mix concrete average sales prices for each of our reportable operating segments.
In 2025, we redefined our reportable operating segments to reflect a regional structure aligned with how our Chief Executive Officer, who serves as our Chief Operating Decision Maker (“CODM”), reviews financial and operating information for purposes of resource allocation and performance assessment. Our operations are organized and reported in five reportable operating segments: (1) Mexico, (2) United States, (3) Europe, (4) Middle East & Africa (“MEA”) and (5) South America, Central America and the Caribbean (“SCA&C”). The information presented for prior periods has been recast to reflect the current reportable operating segment structure. See “Item 5—Operating and Financial Review and Prospects—Results of Operations” in the 2025 Annual Report for additional information regarding our reportable operating segments and the change in segment reporting in 2025.
The line item “Other activities,” included to reconcile the total of reportable segments with the consolidated amounts from continuing operations, refers to the following: (1) our cement trade maritime operations, (2) Cemex, S.A.B. de C.V., (3) other corporate entities and finance subsidiaries and (4) other minor subsidiaries with different lines of business. The accounting policies applied to determine the financial information by reportable segment are consistent with those described in note 3 to Cemex, S.A.B. de C.V.’s 2025 audited consolidated financial statements included in the 2025 Annual Report.
18
The table below and the other volume data presented by reportable operating segment in this “Management’s Discussion and Analysis of Financial Condition and Results of Operations” section present Domestic Sales Volumes of cement and ready-mix concrete, consisting entirely of sales to external customers, as well as Export Sales Volumes of cement to both external customers and other operating segments, and Average Domestic Sales Prices in Local Currency of cement and ready-mix concrete, which refer to sales to external customers.
| Domestic Sales Volumes | Export Sales Volumes (Intragroup Transactions) |
Export Sales Volumes to External Customers |
Average Domestic Sales Prices in Local Currency(1) |
|||||||||||||||||||
| Reportable Segment | Cement | Ready-Mix Concrete |
Cement | Cement | Cement | Ready-Mix Concrete |
||||||||||||||||
| Mexico |
+6 | % | -6 | % | -69 | % | +19% | +6 | % | +3 | % | |||||||||||
| United States |
-1 | % | +2 | % | — | — | -3 | % | -3 | % | ||||||||||||
| Europe |
-7 | % | -9 | % | -48 | % | -17% | +1 | % | +2 | % | |||||||||||
| MEA |
+3 | % | +3 | % | — | -33% | +23 | % | +6 | % | ||||||||||||
| SCA&C |
+2 | % | -10 | % | — | +40% | +5 | % | +12 | % | ||||||||||||
“—” = Not Applicable
| (1) | Represents the average change in domestic cement and ready-mix concrete prices in local currency terms. For the purpose of our Europe and MEA reportable segments, which comprise non-Euro segments, the weighted average variance in local currency is determined and presented in Euros at the exchange rates in effect as of the end of the reporting period. For the purpose of our SCA&C reportable segment, which comprises non-Dollar segments, the weighted average variance in local currency is presented in Dollar terms at the exchange rates in effect as of the end of the reporting period. Weighted average changes for Europe, MEA and SCA&C reportable segments are based on total sales volumes in the respective segment. |
On a consolidated basis, our domestic cement sales volumes increased 1%, from 10.1 million tons in the three-month period ended March 31, 2025 to 10.2 million tons in the comparable period in 2026, and our ready-mix concrete sales volumes decreased 3%, from 10.4 million cubic meters in the three-month period ended March 31, 2025 to 10.1 million cubic meters in the comparable period in 2026. Our revenues increased 11%, from $3,614 million in the three-month period ended March 31, 2025 to $4,019 million for the same period in 2026, and our operating earnings before other expenses, net increased 56%, from $290 million in the three-month period ended March 31, 2025 to $453 million for the same period in 2026. See the table below for a breakdown according to reportable segment.
The following tables present selected financial information for revenues of both external revenues and revenues including intragroup transactions, as well as operating earnings before other expenses, net and Operating EBITDA for each of our reportable segments for the three-month periods ended March 31, 2025 and 2026. Variations in revenues determined on the basis of Dollars include the appreciation or depreciation which occurred during the period between the local currencies of the countries in the regions vis-à-vis the Dollar; therefore, such variations differ substantially from those based solely on the countries’ local currencies.
As mentioned above, our “Operating EBITDA” is the financial measure used by our CEO and other management when assessing segment performance and profitability and deciding how to allocate resource, and our “Operating Earnings Before Other Expenses, Net” is the closest line item to Operating EBITDA presented in our income statements under IFRS included elsewhere in this report and is a stepping stone for calculating Operating EBITDA by adding back depreciation and amortization.
19
| Reportable Segment |
Variation in Local Currency(1) |
Approximate Currency Fluctuations |
Variation in Dollars |
Revenues including intragroup transactions For the Three-Month Period Ended March 31, |
Variation in Local Currency(1) |
Approximate Currency Fluctuations |
Variation in Dollars |
External Revenues For the Three-Month Period Ended March 31, |
||||||||||||||||||||||||||||||||
| 2025 | 2026 | 2025 | 2026 | |||||||||||||||||||||||||||||||||||||
| Mexico |
+9 | % | +19 | % | +28 | % | $ | 981 | $ | 1,255 | +11 | % | +19 | % | +30 | % | $ | 955 | $ | 1,240 | ||||||||||||||||||||
| United States |
+1 | % | — | +1 | % | 1,190 | 1,196 | 0 | % | — | 0 | % | 1,190 | 1,194 | ||||||||||||||||||||||||||
| Europe |
-6 | % | +10 | % | +4 | % | 782 | 814 | -6 | % | +10 | % | +4 | % | 775 | 809 | ||||||||||||||||||||||||
| MEA |
+8 | % | +13 | % | +21 | % | 288 | 349 | +8 | % | +13 | % | +21 | % | 288 | 349 | ||||||||||||||||||||||||
| SCA&C |
+5 | % | — | +5 | % | 281 | 296 | +4 | % | — | +4 | % | 273 | 284 | ||||||||||||||||||||||||||
| Reportable Segments |
— | — | — | — | — | +11 | % | — | +11 | % | 3,481 | 3,876 | ||||||||||||||||||||||||||||
|
|
|
|
|
|
|
|
|
|
|
|
|
|
|
|
|
|
|
|
|
|||||||||||||||||||||
| Other Activities |
— | — | — | — | — | +8 | % | — | +8 | % | 133 | 143 | ||||||||||||||||||||||||||||
| Total Consolidated |
— | — | — | — | — | +11 | % | — | +11 | % | $ | 3,614 | $ | 4,019 | ||||||||||||||||||||||||||
|
|
|
|
|
|
|
|
|
|
|
|
|
|
|
|
|
|
|
|
|
|||||||||||||||||||||
“—” = Not Applicable
| (1) | Represents the variation in local currency terms. For the purposes of our Europe and MEA reportable segments, which comprise non-Euro segments, the weighted average variance in local currency is determined and presented in Euros at the exchange rates in effect as of the end of the reporting period. For the purposes of our SCA&C reportable segment, which comprises non-Dollar segments, the weighted average variance in local currency is presented in Dollar at the exchange rates in effect as of the end of the reporting period. |
| Reportable Segment | Operating Earnings Before Other Expenses, Net(1) For the Three-Month Period Ended March 31, |
Plus: Depreciation and amortization |
Operating EBITDA(2) For the Three-Month Period Ended March 31, |
|||||||||||||||||||||
| 2025 | 2026 | 2025 | 2026 | 2025 | 2026 | |||||||||||||||||||
| Mexico |
$ | 259 | $ | 397 | $ | 49 | $ | 56 | $ | 308 | $ | 453 | ||||||||||||
| United States |
63 | 56 | 127 | 134 | 190 | 190 | ||||||||||||||||||
| Europe |
7 | 25 | 62 | 66 | 69 | 91 | ||||||||||||||||||
| MEA |
34 | 42 | 14 | 19 | 48 | 61 | ||||||||||||||||||
| SCA&C |
40 | 44 | 15 | 22 | 55 | 66 | ||||||||||||||||||
| Reportable Segments |
403 | 564 | 267 | 297 | 670 | 861 | ||||||||||||||||||
| Other Activities |
(113 | ) | (111 | ) | 38 | 44 | (75 | ) | (67 | ) | ||||||||||||||
|
|
|
|
|
|
|
|
|
|
|
|
|
|||||||||||||
| Total Consolidated |
$ | 290 | $ | 453 | $ | 305 | $ | 341 | $ | 595 | $ | 794 | ||||||||||||
|
|
|
|
|
|
|
|
|
|
|
|
|
|||||||||||||
| (1) | We include the line item titled “Operating earnings before other expenses, net” in our income statements under IFRS considering that it is a subtotal relevant for the determination of our “Operating EBITDA” (Operating earnings before other expenses, net plus depreciation and amortization) as described in note 2 to Cemex, S.A.B. de C.V.’s 2025 audited consolidated financial statements included in the 2025 Annual Report. |
| (2) | Operating EBITDA is the financial measure used by our CEO to review operating performance and profitability, for decision-making purposes and to allocate resources. Moreover, Operating EBITDA is a measure used by our creditors to review our capacity to internally fund capital expenditures, to service or incur debt and to comply with financial covenants under our financing agreements, as described in note 18.1 to Cemex, S.A.B. de C.V.’s 2025 audited consolidated financial statements included in the 2025 Annual Report. Our Operating EBITDA is not a measure of operating performance, an alternative to cash flow or a measure of financial position under IFRS. Moreover, Operating EBITDA may not be comparable to other similarly titled measures of other companies. |
Revenues. Our consolidated revenues increased 11%, from $3,614 million in the three-month period ended March 31, 2025 to $4,019 million in the three-month period ended March 31, 2026. The increase in our revenues was mainly attributable to higher prices of our products and higher volumes, partially offset by weather-related volume disruptions in some of our markets. Set forth below is a quantitative and qualitative analysis of the various factors affecting our revenues on a reportable segment basis. To allow the analysis of each reportable segment on a stand-alone basis, our discussion of volume data and revenues information below is presented in both external revenues and revenues before eliminations resulting from consolidation, as described in note 4.2 to Cemex, S.A.B. de C.V.’s unaudited condensed consolidated financial statements as of December 31, 2025 and March 31, 2026 and for the three-month periods ended March 31, 2025 and 2026 included herein.
20
Mexico
Our domestic cement sales volumes to external customers from our operations in Mexico increased 6% in the three-month period ended March 31, 2026 compared to the same period in 2025, and ready-mix concrete sales volumes decreased 6% over the same period. Our revenues from our operations in Mexico represented 26% and 31% in Dollar terms of our consolidated external revenues in the three-month period ended March 31, 2025 and 2026, respectively. As of March 31, 2026, our operations in Mexico represented 17% of our total assets in Dollar terms. During the three-month period ended March 31, 2026, the recovery in cement sales volumes was driven by self-construction activity and government-backed social programs, including housing and rural roads, while ready-mix concrete volumes declined, reflecting continued softness in formal sector construction activity. Our cement export volumes from our operations in Mexico, which represented 3% of our Mexican cement sales volumes for the three-month period ended March 31, 2026, of which 61% corresponded to external customers and 39% corresponded to revenues from transactions with other operating segments, decreased 43% in the three-month period ended March 31, 2026 compared to 2025, mainly due to lower export to the United States. Of our total cement export volumes from our operations in Mexico during the three-month period ended March 31, 2026, which include both exports to external customers and exports to other operating segments, 69% was shipped to the United States and 31% to our SCA&C segment. Our average sales price of domestic cement from our operations in Mexico increased 6%, in Mexican Peso terms, in the three-month period ended March 31, 2026 compared to the same period in 2025, and our average sales price of ready-mix concrete increased 3%, in Mexican Peso terms, over the same period.
For the three-month period ended March 31, 2026, our Mexico segment’s external revenues were derived primarily from cement, which represented 57% of the segment’s external revenues, followed by ready-mix concrete at 32%, Urbanization Solutions at 8%, and aggregates at 3%.
As a result of increases in domestic cement sales volume, as well as increases in domestic cement and ready-mix concrete sales price partially offset by a decrease in ready-mix concrete sales volumes and a decrease in cement export sales, external revenues in Mexico, in Mexican Peso terms, increased 11% in the three-month period ended March 31, 2026 compared to the same period in 2025.
United States
Our domestic cement sales volumes to external customers from our operations in the United States decreased 1% in the three-month period ended March 31, 2026 compared to the same period in 2025, and ready-mix concrete sales volumes increased 2% over the same period. The decrease in domestic cement sales volumes was primarily attributable to adverse weather conditions in January and February, while ready-mix concrete sales volumes increased, reflecting a slight improvement in underlying market demand. Our operations in the United States represented 33% and 30% in Dollar terms of our consolidated external revenues for the three-month period ended March 31, 2025 and 2026, respectively. As of March 31, 2026, our operations in the United States represented 47% of our total assets in Dollar terms. Our average domestic cement sales prices of our operations in the United States decreased 3%, in Dollar terms, in the three-month period ended March 31, 2026 compared to the same period in 2025, and our average ready-mix concrete sales price decreased 3%, in Dollar terms, over the same period.
For the three-month period ended March 31, 2026, our United States segment’s external revenues were derived primarily from ready-mix concrete, which represented 56% of the segment’s external revenues, followed by cement at 23%, aggregates at 15%, and Urbanization Solutions at 6%.
As a result of decreases in domestic cement sales volumes and decreases in domestic cement and ready-mix concrete sales prices, partially offset by an increase in ready-mix concrete sales volumes, external revenues from our operations in the United States, in Dollar terms, remained relatively flat in the three-month period ended March 31, 2026 compared to the same period in 2025.
Europe
Our domestic cement sales volumes to external customers from our operations in Europe decreased 7% in the three-month period ended March 31, 2026 compared to the same period in 2025, and ready-mix concrete sales volumes decreased 9% over the same period. The decrease in domestic cement sales volumes was primarily attributable to adverse winter weather conditions and precipitation early in the quarter, partially offset by a recovery in demand as weather conditions normalized in March, continued infrastructure activity in Eastern Europe, and sustained housing activity in Spain. Our operations in Europe represented 21% and 20% in Dollar terms of our consolidated external revenues for the three-month periods ended March 31, 2025 and 2026, respectively.
21
Our cement export volumes from our operations in Europe, which represented 10% of our Europe cement sales volumes for the three-month period ended March 31, 2026, of which 57% corresponded to external customers and 43% corresponded to revenues from transactions with other operating segments, decreased 34% in the three-month period ended March 31, 2026 compared to the same period in 2025, mainly due to lower volumes exported in Europe. As of March 31, 2026, our operations in Europe represented 17% of our total assets in Dollar terms. Our average domestic cement sales prices of our operations in Europe increased 1%, in Euro terms, in the three-month period ended March 31, 2026 compared to the same period in 2025, and our average ready-mix concrete sales price increased 2%, in Euro terms, over the same period.
For the three-month period ended March 31, 2026, our Europe segment’s external revenues were derived primarily from ready-mix concrete, which represented 43% of the segment’s external revenues, followed by cement at 33%, aggregates at 19%, and Urbanization Solutions at 5%.
As a result of the appreciation of the Euro against the Dollar and increases in domestic ready-mix concrete sales prices, partially offset by decreases in domestic cement and ready-mix concrete sales volumes and a decrease in domestic cement sales prices, external revenues from our operations in Europe, in Dollar terms, increased 4% in the three-month period ended March 31, 2026 compared to the same period in 2025.
MEA
Our domestic cement sales volumes to external customers from our operations in the MEA segment increased 3% in the three-month period ended March 31, 2026 compared to the same period in 2025, and ready-mix concrete sales volumes increased 3% over the same period. The increase in volumes was primarily driven by strong demand across the region, supported by infrastructure activity, housing projects and favorable market conditions. Our operations in the MEA segment represented 8% and 9% in Dollar terms of our consolidated external revenues for the three-month periods ended March 31, 2025 and 2026, respectively. As of March 31, 2026, our operations in the MEA segment represented 4% of our total assets in Dollar terms. Our average domestic cement sales prices of our operations in MEA increased 23%, in Euro terms, in the three-month period ended March 31, 2026 compared to the same period in 2025, and our average ready-mix concrete sales price increased 6%, in Euro terms, over the same period.
For the three-month period ended March 31, 2026, our MEA segment’s external revenues were derived primarily from ready-mix concrete, which represented 70% of the segment’s external revenues, followed by cement at 20%, aggregates at 6%, and Urbanization Solutions at 4%.
As a result of increases in domestic cement and ready-mix concrete sales volumes and increases in domestic cement and ready-mix concrete sales prices, external revenues from our operations in the MEA segment, in Dollar terms, increased 21% in the three-month period ended March 31, 2026 compared to the same period in 2025.
SCA&C
Our domestic cement sales volumes to external customers from our operations in the SCA&C segment increased 2% in the three-month period ended March 31, 2026 compared to the same period in 2025, and ready-mix concrete sales volumes decreased 10% over the same period. The increase in cement volumes was primarily driven by growth in the informal sector in Colombia, as well as reconstruction efforts following Hurricane Melissa and tourism-related projects in Jamaica. Our operations in the SCA&C segment represented 8% and 7% in Dollar terms of our consolidated external revenues for the three-month period ended March 31, 2025 and 2026, respectively. Our cement export volumes from our operations in SCA&C, which represented 5% of our SCA&C cement sales volumes for the three-month period ended March 31, 2026, of which 100% corresponded to external customers, increased 40% in the three-month period ended March 31, 2026 compared to the same period in 2025. As of March 31, 2026, our operations in the SCA&C segment represented 5% of our total assets in Dollar terms. Our average domestic cement sales prices of our operations in the SCA&C segment increased 5%, in Dollar terms, in the three-month period ended March 31, 2026 compared to the same period in 2025, and our average ready-mix concrete sales price increased 12%, in Dollar terms, over the same period.
22
For the three-month period ended March 31, 2026, our SCA&C segment’s external revenues were derived primarily from cement, which represented 80% of the segment’s external revenues, followed by ready-mix concrete at 17%, aggregates at 3%, and Urbanization Solutions at less than 1%.
As a result of increases in domestic cement sales volumes and increases in domestic cement and ready-mix concrete sales prices, partially offset by a decrease in domestic ready-mix concrete sales volumes, external revenues from our operations in the SCA&C segment, in Dollar terms, increased 4% in the three-month period ended March 31, 2026 compared to the same period in 2025.
Other Activities (Revenues)
Revenues from our other activities segment increased 8% in the three-month period ended March 31, 2026 compared to the same period in 2025, in Dollar terms. Our revenues from our Other activities segment, which is mainly comprised of our international cement trading activities represented 4% in Dollar terms of our consolidated external revenues for the three-month period ended March 31, 2026.
Cost of Sales
Our cost of sales, including depreciation, increased 8%, from $2,490 million in the three-month period ended March 31, 2025 to $2,699 million in the same period in 2026. As a percentage of revenues, cost of sales decreased from 68.9% in the three-month period ended March 31, 2025 to 67.2% in the same period in 2026. The decrease as a percentage of revenues was mainly driven by operating leverage from higher revenues, ongoing benefits from our cost transformation initiatives, and lower maintenance activity in certain markets, partially offset by energy inflation, particularly in petcoke. Our cost of sales includes freight expenses of raw materials used in our producing plants.
Gross Profit
For the reasons described above, our gross profit increased 17%, from $1,124 million in the three-month period ended March 31, 2025 to $1,320 million in the same period in 2026. As a percentage of revenues, gross profit increased from 31.1% in the three-month period ended March 31, 2025 to 32.8% in the same period in 2026. In addition, our gross profit may not be directly comparable to those of other entities that include all their freight expenses in cost of sales. As described below, we include freight expenses of finished products from our producing plants to our points of sale and from our points of sale to our customers’ locations within operating expenses as part of distribution and logistics expenses.
Operating expenses
Our operating expenses, which are represented by administrative, selling, distribution and logistics expenses, increased 4%, from $834 million in the three-month period ended March 31, 2025 to $867 million in the same period in 2026. As a percentage of revenues, operating expenses decreased from 23.1% in the three-month period ended March 31, 2025 to 21.6% in the same period in 2026. The decrease as a percentage of revenues resulted primarily from higher revenues and operating expenses not increasing in the same proportion, supported by the ongoing benefits of our cost transformation initiatives, including improved operating efficiency and a leaner cost base. Our operating expenses include expenses related to personnel, equipment and services involved in sales activities and storage of product at points of sale, which are included as part of the operating expenses, as well as freight expenses of finished products between plants and points of sale and freight expenses between points of sale and the customers’ facilities, which are included as part of the line item “Distribution and logistics expenses.” For the three-month periods ended March 31, 2025 and 2026, selling expenses included as part of the line item “Operating expenses” amounted to $101 million and $102 million, respectively.
As discussed above, we include freight expenses of finished products from our producing plants to our points of sale and from our points of sale to our customers’ locations within distribution and logistics expenses, which in the aggregate represented costs of $394 million and $422 million in the three-month periods ended March 31, 2025 and 2026, respectively. As a percentage of revenues, distribution and logistics expenses decreased from 10.9% in the three-month period ended March 31, 2025 to 10.5% in the same period in 2026.
23
Operating Earnings Before Other Expenses, Net
For the reasons described above, our operating earnings before other expenses, net increased 56%, from $290 million in the three-month period ended March 31, 2025 to $453 million in the same period in 2026. As a percentage of revenues, operating earnings before other expenses, net increased from 8.0% in the three-month period ended March 31, 2025 to 11.3% in the same period in 2026. Additionally, set forth below is a quantitative and qualitative analysis of the effects of the various factors affecting our operating earnings before other expenses, net on a reportable segment basis.
Depreciation and Amortization
During the three-month period ended March 31, 2026, in Dollar terms, our depreciation and amortization amounted to $341 million, an increase of 12% compared to the same period in 2025. During the three-month period ended March 31, 2026, our capital expenditures amounted to $156 million, a 37% decrease compared to $249 million in the same period in 2025.
Operating EBITDA
Operating EBITDA is the key financial measure used by our CEO to review operating performance and profitability, for decision-making purposes and to allocate resources. Moreover, Operating EBITDA is an indicator used by Cemex’s creditors to measure our ability to internally fund capital expenditures, as well as our ability to service or incur debt and comply with financial covenants under its financing agreements. We present “Operating EBITDA” by reportable segment in the table beginning on page 20 of this report and in note 4.2 to Cemex, S.A.B. de C.V.’s unaudited condensed consolidated financial statements as of December 31, 2025 and March 31, 2026 and for the three-month periods ended March 31, 2025 and 2026 included herein. Operating EBITDA is not a measure of operating performance, an alternative to cash flows or a measure of financial position under IFRS. Moreover, Operating EBITDA may not be comparable to other similarly titled measures of other companies.
Considering the effects mentioned above, our Operating EBITDA increased 33%, from $595 million in the three-month period ended March 31, 2025 to $794 million in the same period in 2026. As a percentage of revenues our Operating EBITDA margin (which management considers a relevant profitability measure despite Operating EBITDA margin not being a measure of operating performance, an alternative to cash flows or a measure of financial position under IFRS) increased from 16.5% in the three-month period ended March 31, 2025 to 19.8% in the same period in 2026. Set forth below is a quantitative and qualitative analysis of the effects of the various factors affecting our operating earnings before other expenses, net and Operating EBITDA on a reportable segment basis.
For a reconciliation of Operating Earnings Before Other Expenses, Net to Operating EBITDA, see page 14 of this report.
Mexico
Our operating earnings before other expenses, net, from our operations in Mexico increased 38%, in Mexican Peso terms, and 53%, in Dollar terms, in the three-month period ended March 31, 2026 compared to the same period in 2025. Our operating earnings before other expenses, net from our operations in Mexico represented 89% and 88% of our total operating earnings before other expenses, net for the three-month period ended March 31, 2025 and 2026, respectively, in Dollar terms. The increase resulted primarily from the recovery in cement volumes, higher prices and the ongoing benefits of our cost transformation initiatives, as well as the appreciation of the Mexican Peso against the Dollar.
In the three-month period ended March 31, 2026 our Operating EBITDA from our operations in Mexico increased 32%, in Mexican Peso terms, and 47%, in Dollar terms, compared to the same period in 2025. In addition, our Operating EBITDA from our operations in Mexico represented 52% and 57% of our total consolidated Operating EBITDA for the three-month period ended March 31, 2025 and 2026, respectively, in Dollar terms.
24
United States
Our operating earnings before other expenses, net, from our operations in the United States decreased 11% in the three-month period ended March 31, 2026 compared to the same period in 2025, in Dollar terms. Our operating earnings before other expenses, net from our operations in the United States represented 22% and 12% of our total operating earnings before other expenses, net for the three-month period ended March 31, 2025 and 2026, respectively, in Dollar terms. The decrease resulted primarily from higher depreciation and amortization expenses reflecting the growth of our asset base, partially offset by the ongoing benefits of our cost transformation initiatives.
In the three-month period ended March 31, 2026, our Operating EBITDA from our operations in the United States remained substantially flat, in Dollar terms, compared to the same period in 2025. In addition, our Operating EBITDA from our operations in the United States represented 32% and 24% of our total consolidated Operating EBITDA for the three-month period ended March 31, 2025 and 2026, respectively, in Dollar terms.
Europe
Our operating earnings before other expenses, net, from our operations in Europe increased 235%, in Euro terms, and 257%, in Dollar terms, in the three-month period ended March 31, 2026 compared to the same period in 2025. Our operating earnings before other expenses, net from our operations in Europe represented 2% and 6% of our total operating earnings before other expenses, net for the three-month period ended March 31, 2025 and 2026, respectively, in Dollar terms. The increase resulted primarily from higher prices and the ongoing benefits of our cost transformation initiatives.
In the three-month period ended March 31, 2026, our Operating EBITDA from our operations in Europe increased 20%, in Euro terms, and 32%, in Dollar terms, compared to the same period in 2025. In addition, our Operating EBITDA from our operations in Europe represented 12% and 11% of our total consolidated Operating EBITDA for the three-month period ended March 31, 2025 and 2026, respectively, in Dollar terms.
MEA
Our operating earnings before other expenses, net, from our operations in the MEA segment increased 8%, in Euro terms, and 24%, in Dollar terms, in the three-month period ended March 31, 2026 compared to the same period in 2025. Our operating earnings before other expenses, net from our operations in the MEA segment represented 12% and 9% of our total operating earnings before other expenses, net for the three-month period ended March 31, 2025 and 2026, respectively, in Dollar terms. The increase resulted primarily from higher prices, the ongoing benefits of our cost transformation initiatives, and strong demand across the region.
In the three-month period ended March 31, 2026, our Operating EBITDA from our operations in the MEA segment increased 14%, in Euro terms, and 27%, in Dollar terms, compared to the same period in 2025. In addition, our Operating EBITDA from our operations in the MEA segment represented 8% of our total consolidated Operating EBITDA for both the three-month period ended March 31, 2025 and 2026, in Dollar terms.
SCA&C
Our operating earnings before other expenses, net, from our operations in the SCA&C segment increased 10%, in Dollar terms, in the three-month period ended March 31, 2026 compared to the same period in 2025. Our operating earnings before other expenses, net from our operations in SCA&C represented 14% and 10% of our total operating earnings before other expenses, net for the three-month period ended March 31, 2025 and 2026, respectively, in Dollar terms. The increase resulted primarily from higher cement volumes driven by growth in the informal sector in Colombia and reconstruction efforts following Hurricane Melissa in Jamaica, higher prices, and the ongoing benefits of our cost transformation initiatives.
In the three-month period ended March 31, 2026, our Operating EBITDA from our operations in SCA&C increased 20%, in Dollar terms, compared to the same period in 2025. In addition, our Operating EBITDA from our operations in SCA&C represented 9% and 8% of our total consolidated Operating EBITDA for the three-month period ended March 31, 2025 and 2026, respectively, in Dollar terms.
25
Other Expenses, Net. Our other expenses, net, decreased 2%, in Dollar terms, from an expense of $44 million in the three-month period ended March 31, 2025 to an expense of $43 million in the same period in 2026, mainly due to lower restructuring costs in connection with our cost transformation initiatives, partially offset by higher results from the sale of assets and other items, and higher impairment losses. See note 6 to Cemex, S.A.B. de C.V.’s unaudited condensed consolidated financial statements as of December 31, 2025 and March 31, 2026 and for the three-month periods ended March 31, 2025 and 2026 included herein.
The most significant items included under this caption for the three-month periods ended March 31, 2025 and 2026, are as follows:
| For the Three-Month Periods Ended March 31, |
||||||||
| 2025 | 2026 | |||||||
| (in millions of Dollars) | ||||||||
| Restructuring costs |
$ | (38 | ) | $ | (15 | ) | ||
| Results from the sale of assets and others, net |
(5 | ) | (21 | ) | ||||
| Impairment losses |
(1 | ) | (7 | ) | ||||
|
|
|
|
|
|||||
| $ | (44 | ) | $ | (43 | ) | |||
|
|
|
|
|
|||||
Financial Expenses. Our financial expense decreased 10%, from $115 million in the three-month period ended March 31, 2025 to $103 million in the same period in 2026, primarily attributable to lower average debt levels and the ongoing benefits of our proactive liability management initiatives during the three-month period ended March 31, 2026 compared to the same period in 2025. See note 18.1 to Cemex, S.A.B. de C.V.’s unaudited condensed consolidated financial statements as of December 31, 2025 and March 31, 2026 and for the three-month periods ended March 31, 2025 and 2026 included herein.
Financial Income and Other Items, Net. Our financial income and other items, net, in Dollar terms, decreased 72%, from an income of $40 million in the three-month period ended March 31, 2025 to an income of $11 million in the same period in 2026. The decrease was mainly due to a gain of $8 million in foreign exchange results in the three-month period ended March 31, 2026 compared to a gain of $67 million in the same period in 2025 that was mainly due to the fluctuation of the Mexican Peso against the Dollar. This decrease was partially compensated by a gain of $13 million in results from financial instruments, net in the three-month period ended March 31, 2026, compared to a loss of $16 million in the same period in 2025. See notes 7 and 15.4 to Cemex, S.A.B. de C.V.’s unaudited condensed consolidated financial statements as of December 31, 2025 and March 31, 2026 and for the three-month periods ended March 31, 2025 and 2026 included herein.
The most significant items included under this caption for the three-month periods ended March 31, 2025 and 2026 are as follows:
| For the Three-Month Periods Ended March 31, |
||||||||
| 2025 | 2026 | |||||||
| (in millions of Dollars) | ||||||||
| Financial income and other items, net: |
||||||||
| Foreign exchange results |
$ | 67 | $ | 8 | ||||
| Financial income |
10 | 15 | ||||||
| Results from financial instruments, net |
(16 | ) | 13 | |||||
| Net interest cost of defined benefit liabilities |
(7 | ) | (7 | ) | ||||
| Effects of amortized cost on assets and liabilities |
(14 | ) | (18 | ) | ||||
| Others |
– | – | ||||||
|
|
|
|
|
|||||
| $ | 40 | $ | 11 | |||||
|
|
|
|
|
|||||
Income Taxes. Our income tax effect in the Income Statements, which is comprised of current income taxes plus deferred income taxes, increased from an expense of $52 million in the three-month period ended March 31, 2025 to an expense of $94 million in the same period in 2026. Our current income tax expense increased from $57 million in the three-month period ended March 31, 2025 to $62 million in the same period in 2026.
26
The increase in our income tax expense was mainly due to higher pre-tax earnings in the three-month period ended March 31, 2026 compared to the same period in 2025, including the recognition of deferred income tax expenses associated with such higher earnings. Our deferred income tax (benefit) expense increased from a deferred income tax benefit of $5 million in the three-month period ended March 31, 2025 to a deferred income tax expense of $32 million in the same period in 2026. See note 17.1 to Cemex, S.A.B. de C.V.’s unaudited condensed consolidated financial statements as of December 31, 2025 and March 31, 2026 and for the three-month periods ended March 31, 2025 and 2026 included herein.
For both the three-month period ended March 31, 2025 and 2026, our statutory income tax rate in Mexico was 30%. Our average effective income tax rate decreased from 29.5% in the three-month periods ended March 31, 2025 to 28.9% in the same period in 2026, reflecting the increase in our income tax expense described above. Our average effective tax rate equals the net amount of income tax expense divided by earnings before income taxes, as these line items are reported in our consolidated income statement.
Net Income from Continuing Operations. For the reasons described above, our net income from continuing operations for the three-month period ended March 31, 2026 increased from $124 million in the three-month period ended March 31, 2025 to $231 million in the same period in 2026. As a percentage of revenues, net income from continuing operations represented 3.4% and 5.7% for the three-month period ended March 31, 2025 and 2026, respectively.
Discontinued Operations. For the three-month periods ended March 31, 2025 and 2026, our discontinued operations included in our consolidated statements of income amounted to a net income from discontinued operations of $618 million and $3 million, respectively, including a net disposal result on our operations in the Dominican Republic of $618 million in the three-month period ended March 31, 2025. As a percentage of revenues, income of discontinued operations, net of tax, represented 17.1% and 0.1% for the three-month periods ended March 31, 2025 and 2026, respectively. See note 4.1 to Cemex, S.A.B. de C.V.’s unaudited condensed consolidated financial statements as of December 31, 2025 and March 31, 2026 and for the three-month periods ended March 31, 2025 and 2026 included herein.
Consolidated Net Income. For the reasons described above, our consolidated net income (before deducting the portion allocable to non-controlling interest) for the three-month period ended March 31, 2026 decreased from a consolidated net income of $742 million in the three-month period ended March 31, 2025 to a consolidated net income of $234 million in the same period in 2026. The decrease was primarily attributable to the non-recurring net disposal result of $618 million on the sale of our operations in the Dominican Republic recognized in the three-month period ended March 31, 2025. As a percentage of revenues, consolidated net income represented 20.5% and 5.8% for the three-month period ended March 31, 2025 and 2026, respectively.
Non-controlling Interest Net Income. Changes in non-controlling interest net income in any period reflect changes in the percentage of the stock of our subsidiaries held by non-associated third parties as of the end of each month during the relevant period and the consolidated net income attributable to those subsidiaries.
Non-controlling interest net income decreased 25%, from an income of $8 million in the three-month period ended March 31, 2025 to an income of $6 million in the same period in 2026, primarily attributable to a decrease in the net income of the consolidated entities in which others have a non-controlling interest. See note 18.3 to Cemex, S.A.B. de C.V.’s unaudited condensed consolidated financial statements as of December 31, 2025 and March 31, 2026 and for the three-month periods ended March 31, 2025 and 2026 included herein.
Controlling Interest Net Income. Controlling interest net income represents the difference between our consolidated net income and non-controlling interest net income, which is the portion of our consolidated net income attributable to those of our subsidiaries in which non-associated third parties hold interests. For the reasons described above, our controlling interest net income decreased from $734 million in the three-month period ended March 31, 2025 to $228 million in the same period in 2026. As a percentage of revenues, controlling interest net income, represented 20.3% and 5.7% for the three-month period ended March 31, 2025 and 2026, respectively.
27
Liquidity and Capital Resources
Operating Activities
We have satisfied our operating liquidity needs primarily through the operation of our subsidiaries and expect to continue to do so for both the short and long-term. Although cash flow from our operations has historically met our overall liquidity needs for operations, servicing debt and funding capital expenditures and acquisitions, our subsidiaries are exposed to risks from changes in foreign currency exchange rates, price and currency controls, interest rates, inflation, governmental spending, social instability and other political, economic and/or social developments in the countries in which we operate, among other risks, any one of which may materially decrease our net income and cash from operations. Consequently, in order to meet our liquidity needs, we also rely on cost-cutting and operating improvements to optimize capacity utilization and maximize profitability, as well as borrowing under credit facilities, loans, proceeds of debt and equity offerings and proceeds from asset sales, including our account receivables securitizations. Our consolidated cash flows provided by operating activities from continuing operations were $37 million and $310 million in the three-month period ended March 31, 2025 and 2026, respectively. See our financial statements of cash flows for the three-month periods ended March 31, 2025 and 2026 included herein. Cemex management is of the opinion that working capital is sufficient for our current requirements.
Sources and Uses of Cash
Our review of sources and uses of cash below refers to nominal amounts included in our consolidated statements of cash flows for three-month periods ended March 31, 2025 and 2026.
Our primary sources and uses of cash during the three-month periods ended March 31, 2025 and 2026 were as follows:
| For the Three-Month Period Ended March 31, |
||||||||
| 2025 | 2026 | |||||||
| (in millions of Dollars) | ||||||||
| Operating Activities |
||||||||
| Consolidated net income |
$ | 742 | $ | 234 | ||||
| Discontinued operations |
618 | 3 | ||||||
| Net income from continuing operations |
124 | 231 | ||||||
| Adjustments to the cash flow other than changes in working capital |
397 | 532 | ||||||
| Changes in working capital, excluding income taxes |
(484 | ) | (453 | ) | ||||
| Cash flows provided by operating activities from continuing operations |
37 | 310 | ||||||
| Interest expense and income taxes paid |
(177 | ) | (169 | ) | ||||
| Net cash flows used in operating activities from continuing operations |
(140 | ) | 141 | |||||
| Net cash flows (used in) provided by operating activities from discontinued operations |
(3 | ) | — | |||||
| Net cash flows used in operating activities after interest and income taxes |
(143 | ) | 141 | |||||
| Investing Activities |
||||||||
| Purchase of property, machinery and equipment, net |
(158 | ) | (108 | ) | ||||
| Acquisition of intangible assets, net |
(105 | ) | (37 | ) | ||||
| (Acquisition) disposal of subsidiaries and associates, net |
862 | (199 | ) | |||||
| Non-current assets and others, net |
11 | 16 | ||||||
28
| Cash flows provided by (used in) investing activities from continuing operations |
610 | (328 | ) | |||||
| Net cash flows used in investing activities from discontinued operations |
(1 | ) | — | |||||
| Net cash flows provided by (used in) investing activities |
609 | (328 | ) | |||||
| Financing Activities |
||||||||
| Proceeds from new debt instruments |
— | 336 | ||||||
| Debt repayments |
(2 | ) | (817 | ) | ||||
| Other financial obligations, net |
(94 | ) | (124 | ) | ||||
| Dividends paid |
(30 | ) | (32 | ) | ||||
| Share repurchase program |
— | (100 | ) | |||||
| Shares in trust for future deliveries under share-based compensation |
— | (48 | ) | |||||
| Derivative financial instruments |
14 | (33 | ) | |||||
| Coupons on subordinated notes |
(26 | ) | (62 | ) | ||||
| Non-current liabilities, net |
(41 | ) | (59 | ) | ||||
| Net cash flows used in financing activities |
(179 | ) | (939 | ) | ||||
| Increase (decrease) in cash and cash equivalents from continuing operations |
291 | (1,126 | ) | |||||
| (Decrease) increase in cash and cash equivalents from discontinued operations |
(4 | ) | — | |||||
| Foreign currency translation effect on cash |
28 | (9 | ) | |||||
| Cash and cash equivalents at beginning of period |
864 | 1,822 | ||||||
| Cash and cash equivalents at end of period |
1,179 | 687 |
Three-month period ended March 31, 2026
During the three-month period ended March 31, 2026, excluding the negative foreign currency effect on our balances of cash and cash equivalents of $9 million, cash and cash equivalents from continuing operations decreased by $1,126 million. This decrease was the result of our net cash flows used in financing activities of $939 million and our net cash flows used in investing activities from continuing operations of $328 million, partially offset by our net cash flows provided by operating activities from continuing operations, which, after interest paid of $104 million and income taxes paid of $65 million, amounted to $141 million.
For the three-month period ended March 31, 2026, our net cash flows provided by operating activities included cash flows used in working capital, excluding income taxes, of $453 million. This amount was primarily comprised of cash flows used in trade accounts payable of $263 million, cash flows used in trade accounts receivable of $173 million, cash flows used in inventories of $28 million and cash flows used in other accounts receivable and other assets of $10 million, partially offset by cash flows provided by other accounts payable and accrued expenses of $21 million. The aggregate amount of net cash flows provided by operating activities from continuing operations, after interest paid of $104 million and income taxes paid of $65 million, amounted to $141 million.
During the three-month period ended March 31, 2026, our cash flows provided by operating activities from continuing operations before interest expense and income tax paid amounted to $310 million, an increase of $273 million, or 738%, compared to $37 million in the same period in 2025. This increase was mainly the result of an increase in net income from continuing operations of $107 million in the three-month period ended March 31, 2026 compared to the same period in 2025, supported by a decrease in cash flows used in working capital, excluding income taxes, of $31 million compared to the same period in 2025, which was primarily attributable to (i) a positive effect in other accounts payable and accrued expenses of $45 million, (ii) a positive effect in other accounts receivable and other assets of $50 million, and (iii) a positive effect in trade accounts receivable and inventories of $10 million in aggregate, partially offset by a negative effect in trade accounts payable of $74 million.
29
Considering the reasons mentioned above, during the three-month period ended March 31, 2026, the decrease in cash and cash equivalents from continuing operations was the result of (i) our net cash flows used in investing activities from continuing operations of $328 million, which was primarily comprised of acquisition of subsidiaries and associates, net, of $199 million, and purchase of property, machinery and equipment, net, and investment in intangible assets, for an aggregate amount of $145 million, partially offset by non-current assets and others, net, of $16 million; and (ii) our net cash flows used in financing activities of $939 million, which include debt repayments, other financial obligations, net, dividends paid, own shares repurchase program, shares in trust for future deliveries under share-based compensation, coupons on the Subordinated Notes, derivative financial instruments and non-current liabilities, net, for an aggregate amount of $1,275 million, partially offset by proceeds from new debt instruments of $336 million. These cash outflows were partially offset by our net cash flows provided by operating activities from continuing operations after interest and income taxes paid in cash of $141 million.
Three-month period ended March 31, 2025
During the three-month period ended March 31, 2025, excluding the positive foreign currency effect on our balances of cash and cash equivalents of $28 million, cash and cash equivalents from continuing operations increased by $291 million. This increase was the result of our net cash flows provided by investing activities from continuing operations of $610 million, partially offset by our net cash flows used in operating activities from continuing operations, which, after interest paid of $118 million and income taxes paid of $59 million, amounted to $143 million, and our net cash flows used in financing activities of $179 million.
For the three-month period ended March 31, 2025, our net cash flows used in operating activities included cash flows applied in working capital, excluding income taxes, of $484 million. This amount was primarily comprised of cash flows used in trade accounts payable of $189 million, cash flows used in trade accounts receivable of $177 million, cash flows used in other accounts receivable and other assets of $60 million, cash flows used in inventories of $34 million and cash flows used in other accounts payable and accrued expenses of $24 million.
During the three-month period ended March 31, 2025, our cash flows provided by operating activities from continuing operations before interest expense and income tax paid amounted to $37 million, a decrease of $224 million, or 86%, compared to $261 million in the same period in 2024. This decrease was mainly the result of an increase in cash flows used in working capital, excluding income taxes, of $38 million compared to the same period in 2024, which was primarily attributable to (i) a negative effect in other accounts receivable and other assets of $68 million, (ii) a negative effect in inventories of $27 million, and (iii) a negative effect in trade accounts payable of $5 million, partially offset by (iv) a positive effect in other accounts payable and accrued expenses of $50 million, and (v) a positive effect in trade accounts receivable of $12 million.
During the three-month period ended March 31, 2025, the increase in cash and cash equivalents from continuing operations was the result of our net cash flows provided by investing activities from continuing operations of $610 million, which was primarily comprised of disposal of subsidiaries, net, of $862 million and non-current assets and others, net, of $11 million, partially offset by investment in property, machinery and equipment, net, and investment in intangible assets, for an aggregate amount of $263 million, partially offset by (i) our net cash flows used in operating activities from continuing operations after interest paid and income taxes paid in cash of $143 million; and (ii) our net cash flows used in financing activities of $179 million, which include debt repayments, other financial obligations, net, dividends paid, coupons on the Subordinated Notes and non-current liabilities, net, for an aggregate amount of $193 million, partially offset by derivative financial instruments of $14 million.
As of March 31, 2026, we had the following lines of credit, of which the only committed portions refer to the revolving credit facilities under the 2023 Credit Agreement and the Euro Credit Agreement, at annual interest rates ranging between 3.25% and 4.75% depending on the negotiated currency:
| Lines of Credit | Available | |||||||
| (in millions of Dollars) | ||||||||
| Other lines of credit in foreign subsidiaries |
$ | 140 | $ | 105 | ||||
| Other lines of credit from banks |
1,020 | 1,020 | ||||||
| Revolving credit facility(1) |
2,347 | 2,347 | ||||||
|
|
|
|
|
|||||
| $ | 3,507 | $ | 3,472 | |||||
|
|
|
|
|
|||||
| (1) | Includes the 2023 Credit Agreement and the Euro Credit Agreement. |
30
As of March 31, 2026, we had $2,000 million available in our committed revolving credit tranche under the 2023 Credit Agreement and €300 million available in our committed revolving credit tranche under the Euro Credit Agreement. In connection with other lines of credit from banks, such uncommitted amounts are subject to the lenders’ availability. We expect that this, in addition to our proven capacity to continually refinance and replace short-term obligations, should generally enable us to meet liquidity needs in the next twelve months.
We have in the past and may from time to time in the future, subject to restrictions under our debt agreements and instruments, and depending upon market conditions and other factors our senior management deems relevant, refinance or repurchase our debt in privately negotiated or open market transactions, by tender offer or otherwise, at prices and on terms we deem appropriate (which may be at, above or below par), using cash generated from our operating activities or from the proceeds of asset sales or debt or capital transactions.
Capital Expenditures
Our capital expenditures incurred for the three-month periods ended March 31, 2025 and 2026 are as follows:
| Actual for the Three-Month Period Ended March 31, | ||||||||
| 2025 | 2026 | |||||||
| (in millions of Dollars) | ||||||||
| Mexico |
$ | 45 | $ | 29 | ||||
| United States |
104 | 82 | ||||||
| Europe |
55 | 23 | ||||||
| MEA |
8 | 8 | ||||||
| SCA&C |
32 | 14 | ||||||
| Others |
5 | — | ||||||
| Total consolidated |
249 | 156 | ||||||
| Of which: |
||||||||
| Expansion capital expenditures |
93 | 48 | ||||||
| Base capital expenditure |
156 | 108 | ||||||
For the three-month periods ended March 31, 2025 and 2026, we recognized $249 million and $156 million in capital expenditures from our continuing operations, respectively. As of March 31, 2026, in connection with our significant projects, we had capital expenditure commitments of $1,060 million, an amount that is expected to be incurred in the nine-month period ended December 31, 2026, based on the evolution of the related projects. The capital expenditure plan for the nine-month period ended December 31, 2026 is subject to change based on market and other conditions, and our consolidated results and financial resources.
Our Indebtedness
As of March 31, 2026, our indebtedness as presented in the statement of financial position, which does not include $2,000 million aggregate principal amount of the Subordinated Notes, amounted to $6,859 million (principal amount $6,881 million, excluding deferred issuance costs) of total debt plus other financial obligations. Of our total debt plus other financial obligations, 19% was current (including current maturities of non-current debt) and 81% was non-current. As of March 31, 2026, 67% of our total debt plus other financial obligations was Dollar-denominated, 11% was Euro-denominated, 3% was Pound Sterling-denominated, 17% was Mexican Peso-denominated, and 2% was denominated in other currencies. See notes 15.1 and 15.2 to Cemex, S.A.B. de C.V.’s unaudited condensed consolidated financial statements as of December 31, 2025 and March 31, 2026 and for the three-month periods ended March 31, 2025 and 2026 included herein.
31
2023 Credit Agreement
On October 29, 2021, Cemex, S.A.B. de C.V. entered into a New York-law credit agreement for up to $3.25 billion to refinance indebtedness and general corporate purposes (the “Original 2021 Credit Agreement”). The Original 2021 Credit Agreement consisted of a five-year amortizing term loan facility of $1,500 million and a five-year revolving facility of $1,750 million. The loans accrued interest at a rate per annum equal to the LIBOR rate plus a margin ranging from 100 basis points to 175 basis points, depending on our leverage ratio.
On June 5, 2023, the Original 2021 Credit Agreement was amended to provide for SOFR as the replacement benchmark rate for LIBOR, such that future SOFR-based loans will accrue interest as Term SOFR plus (i) a 0.11448%, 0.26161%, or 0.42826% per annum spread for one, three, and six-month interest periods, respectively and (ii) a margin between 100 and 175 basis points, depending on Cemex’s Consolidated Leverage Ratio (as defined in the Original 2021 Credit Agreement).
On October 30, 2023, Cemex, S.A.B. de C.V. signed and closed an amendment to the Original 2021 Credit Agreement to reduce the term loans by $500 million and increase the revolving commitments by $250 million under the Original 2021 Credit Agreement, and to extend the maturity of the credit agreement to October 2028. $500 million in term loans were prepaid shortly before the 2023 Credit Agreement became effective.
The main terms and conditions of the 2023 Credit Agreement are summarized as follows:
| • | final maturity in October 2028; |
| • | $1 billion in Term Loans (as defined in the 2023 Credit Agreement), amortizing in five equal semi- annual payments starting in October 2026; |
| • | $2 billion of commitments under a Revolving Facility (as defined in the 2023 Credit Agreement) maturing in October 2028; |
| • | all loans under the 2023 Credit Agreement bear interest at the same rate, including an applicable margin over the benchmark interest rate of between 100 and 175 basis points for SOFR-based loans (as defined in the 2023 Credit Agreement), depending on Cemex’s Consolidated Leverage Ratio (as defined in the 2023 Credit Agreement), with such margin being subject to positive or negative adjustments in an aggregate amount not to exceed five basis points, based on certain sustainability-linked performance metrics from the prior annual period; |
| • | financial covenants consistent with an investment grade capital structure, with a maximum leverage ratio of 3.75x throughout the life of the loan, and a minimum interest coverage ratio of 2.75x; and |
| • | guaranteed by Cemex Concretos, S.A. de C.V., Cemex Corp., Cemex Operaciones México, S.A. de C.V. (“COM”) and Cemex Innovation Holding Ltd. (“CIH”) (the “Refinancing Guarantors”). |
The 2023 Credit Agreement is denominated exclusively in Dollars and includes an interest rate margin grid that is about 25 basis points lower on average than that of the Original 2021 Credit Agreement. Furthermore, the 2023 Credit Agreement was executed under the 2023 Sustainability-Linked Financing Framework (the “SLFF”), which is aligned to the Company’s current “Future in Action” climate action and nature program and its ultimate vision of a carbon-neutral economy. The annual performance in respect of the three metrics referenced in the 2023 Credit Agreement, which are aligned with those provided for in the SLFF, may result in an adjustment of the interest rate margin of up to plus or minus five basis points, in line with other sustainability-linked loans from investment grade rated borrowers.
As of March 31, 2026, we reported an aggregate amount of outstanding debt of $1,000 million under the 2023 Credit Agreement. As of March 31, 2026, we had $2,000 million of availability under the committed revolving credit tranche under the 2023 Credit Agreement.
See “Recent Developments—Recent Developments Relating to our Financial Obligations—2026 Credit Agreement.”
32
Peso Bilateral Term Loan
On December 20, 2021, Cemex, S.A.B. de C.V. entered into the Peso Bilateral Term Loan for a principal amount of Ps 5,231 million under terms and conditions substantially similar to those of the Original 2021 Credit Agreement.
On December 6, 2023 and December 13, 2023, Cemex, S.A.B. de C.V. signed and closed, respectively, a refinancing of the Peso Bilateral Term Loan to extend its maturity to 2028. The Peso Bilateral Term Loan provided for a five-year amortizing Ps 6,000 million term loan with an interest rate margin dependent on leverage ratio slightly lower than that applicable prior to the refinancing. Other terms and conditions were substantially similar to those of the 2023 Credit Agreement. Cemex, S.A.B. de C.V.’s obligations under the Peso Bilateral Term Loan were guaranteed by the Refinancing Guarantors. The borrowing under the Peso Bilateral Term Loan was also made under the SLFF.
On January 7, 2026, Cemex, S.A.B. de C.V. fully repaid the Ps 6,000 million aggregate principal amount outstanding of the Peso Bilateral Term Loan, as part of our ongoing liability management and capital structure optimization strategy.
Euro Credit Agreement
On October 7, 2022, Cemex, S.A.B. de C.V. entered into a New York-law credit agreement for €500 million for general corporate purposes (including to refinance indebtedness) (the “Original 2022 EUR Credit Agreement”). The Original 2022 EUR Credit Agreement consisted of a 3-year non-amortizing term loan facility, and the loans accrued interest at a rate per annum equal to the EURIBOR rate plus a margin ranging from 115 basis points to 190 basis points, depending on our leverage ratio.
On April 11, 2024, Cemex, S.A.B. de C.V. signed and closed an amendment to the Original 2022 EUR Credit Agreement, pursuant to which we prepaid €50 million of the existing term loans, refinanced the remainder of the term loans under the Original 2022 EUR Credit Agreement with a €450 million term loan facility, provided for a new revolving facility of €300 million, extended the maturity of the term loan facility to April 2029 and set the maturity of the new revolving facility to April 2028.
The main terms and conditions of the Euro Credit Agreement are summarized as follows:
| • | final maturity of (x) the term loan facility in April 2029 and (y) the revolving facility in April 2028; |
| • | €450 million in term loans, amortizing in five equal semi-annual payments starting in April 2027; |
| • | €300 million of commitments under a revolving facility; |
| • | all loans under the Euro Credit Agreement bear interest at the same rate, including an applicable margin of between 140 and 215 basis points over the benchmark EURIBOR Rate (as defined in the Euro Credit Agreement), depending on Cemex’s Consolidated Leverage Ratio (as defined in the Euro Credit Agreement), with such margin being subject to positive or negative adjustments in an aggregate amount not to exceed five basis points, based on certain sustainability-linked performance metrics from the prior annual period; |
| • | financial covenants consistent with an investment grade capital structure, with a maximum leverage ratio of 3.75x throughout the life of the loan, and a minimum interest coverage ratio of 2.75x; and |
| • | guaranteed by the Refinancing Guarantors. |
The Euro Credit Agreement is denominated exclusively in Euro and includes an interest rate margin grid that is 25 basis points higher than that of the Original 2022 EUR Credit Agreement. Furthermore, the Euro Credit Agreement was executed under the SLFF. The annual performance in respect of the three metrics referenced in the Euro Credit Agreement, which are aligned with those provided for in the SLFF, may result in an adjustment of the interest rate margin of up to plus or minus five basis points, in line with other sustainability-linked loans from investment grade rated borrowers. As of March 31, 2026, the other terms and conditions of the Euro Credit Agreement were substantially similar to those of the 2023 Credit Agreement.
33
As of March 31, 2026, we reported an aggregate amount of outstanding debt of $520 million under the Euro Credit Agreement and we had drawn the entirety of the only term loan. As of March 31, 2026, we had $347 million of availability under the committed revolving credit tranche under the Euro Credit Agreement.
If we are unable to comply with our upcoming principal maturities under our indebtedness, or refinance or extend maturities of our indebtedness, our debt could be accelerated. Acceleration of our debt would have a material adverse effect on our financial condition. Some of our subsidiaries have issued or provided guarantees of certain of our indebtedness, as indicated in the table below.
| The Notes, excluding the CEBURES |
2023 Credit Agreement |
Euro Credit Agreement |
CEBURES | |||||||||||||
| $2,570 million (principal amount $2,578 million) |
$989 million (principal amount $1,000 million) |
$515 million (principal amount $520 million) |
$949 million (principal amount $948 million) |
|||||||||||||
| Amount Outstanding as of March 31, 2026(1) |
||||||||||||||||
| Cemex, S.A.B. de C.V. |
✓ | ✓ | ✓ | ✓ | ||||||||||||
| Cemex Operaciones México, S.A. de C.V. |
✓ | ✓ | ✓ | ✓ | ||||||||||||
| Cemex Concretos, S.A. de C.V. |
✓ | ✓ | ✓ | ✓ | ||||||||||||
| Cemex Corp. |
✓ | ✓ | ✓ | ✓ | ||||||||||||
| Cemex Innovation Holding Ltd. |
✓ | ✓ | ✓ | ✓ | ||||||||||||
| (1) | Includes Notes that have been repurchased and are held by Cemex. |
In addition, as of March 31, 2026, several of our other operating subsidiaries were borrowers under debt facilities or debt arrangements aggregating $132 million. See “Recent Developments—Recent Developments Relating to our Financial Obligations—2026 Credit Agreement” for information about the 2026 Credit Agreement.
Most of our current outstanding indebtedness was incurred to finance our acquisitions and to finance our capital expenditure programs. Historically, we have addressed our liquidity needs (including funds required to make scheduled principal and interest payments, refinance debt, and fund working capital and planned capital expenditures) with operating cash flow, securitizations, borrowings under credit facilities, proceeds of debt and equity offerings and proceeds from asset sales.
If (i) monetary policies to reduce inflation fail or induce a recession, (ii) policies in the largest economies diverge, resulting in Dollar appreciation with negative cross-border effects, (iii) energy and food price shocks cause inflation to persist for longer and weigh on investment and productivity growth, raising additional roadblocks in the recovery path, (iv) a global tightening of financial conditions triggers widespread emerging market debt distress, (v) a resurgence of the COVID-19 pandemic, or any related COVID-19 strain, or new pandemic or epidemic, hinders growth, further impacting financial institutions extending maturities to companies that have our credit rating or that are leveraged similarly to us, which become more restrictive and our operating results worsen significantly, (vi) we are unable to complete debt or equity offerings, (vii) we are unable to consummate asset sales, (viii) the rapid growth of cryptocurrencies without clear regulation leads to financial instability with negative effects for the global economy, or (ix) the proceeds of any divestitures and/or our cash flow or capital resources prove inadequate, among other events, we could face liquidity problems and may not be able to comply with our upcoming principal payments under our indebtedness or refinance our indebtedness. If we are unable to comply with our upcoming principal maturities under our indebtedness, or refinance or extend maturities of our indebtedness, our debt could be accelerated. Acceleration of our debt would have a material adverse effect on our business and financial condition.
34
Historically, we and our subsidiaries have sought and obtained waivers and amendments to several of our debt instruments relating to a number of financial ratios or other terms and conditions. Our ability to comply with these ratios or other terms and conditions may be affected by current global economic conditions and volatility in foreign exchange rates and the financial and capital markets, including the effects of the COVID-19 or other pandemic and geopolitical risks, such as the conflict between Russia and Ukraine and ongoing conflicts in the Middle East, on the financial sector and the ability of our lenders to grant waivers or amendments to companies that have our credit rating or that are highly leveraged like us. We may need to seek waivers or amendments in the future. However, we cannot assure you that any future waivers or amendments, if requested, will be obtained. If we or our subsidiaries are unable to comply with the provisions of our debt instruments and are unable to obtain a waiver or amendment, the indebtedness outstanding under such debt instruments could be accelerated. Acceleration of these debt instruments would have a material adverse effect on our financial condition.
Relevant Transactions Related to Our Indebtedness in the Three-Month Period Ended March 31, 2026
The following is a description of our most important transactions related to our indebtedness in the three-month period ended March 31, 2026:
| • | On January 7, 2026, Cemex, S.A.B. de C.V. fully repaid the Ps 6,000 million aggregate principal amount outstanding of the Peso Bilateral Term Loan, as part of our ongoing liability management and capital structure optimization strategy. |
| • | On February 19, 2026, Cemex, S.A.B. de C.V. issued Ps 5,500 million aggregate principal amount of its long-term notes (certificados bursátiles de largo plazo) with a five-year tenor at a floating annual interest rate of TIIE de Fondeo plus 0.70%, which are registered in Mexico. The Refinancing Guarantors fully and unconditionally guarantee the performance of all of Cemex, S.A.B. de C.V.’s obligations under the Long-Term Notes 3. |
| • | On March 19, 2026, Cemex, S.A.B. de C.V. repaid at maturity €400 million aggregate principal amount outstanding of 3.125% Euro-denominated notes due 2026 (the “March 2026 Euro Notes”), together with accrued and unpaid interest thereon up to, but excluding, the maturity date. |
For a description of the Credit Agreements and our 5.450% Dollar denominated notes due 2029 (the “November 2029 Dollar Notes”), 5.200% Dollar denominated notes due 2030 (the “September 2030 Dollar Notes”), 3.875% Dollar denominated notes due 2031 (the “July 2031 Dollar Notes”), and the Long-Term Notes 1, Long-Term Notes 2 and Long-Term Notes 3 in the Mexican market (the “CEBURES” and, collectively with the November 2029 Dollar Notes, the September 2030 Dollar Notes and the July 2031 Dollar Notes, the “Notes”), see “Management’s Discussion and Analysis of Financial Condition and Results of Operations—Liquidity and Capital Resources—Our Indebtedness.”
Our Other Financial Obligations
Other financial obligations in the consolidated statement of financial position as of December 31, 2025 and March 31, 2026 are detailed as follows:
| December 31, 2025 | March 31, 2026 | |||||||||||||||||||||||
| Current | Non- current |
Total | Current | Non- current |
Total | |||||||||||||||||||
| (in millions of dollars) | ||||||||||||||||||||||||
| Leases |
$ | 267 | $ | 868 | $ | 1,135 | $ | 256 | $ | 825 | $ | 1,081 | ||||||||||||
| Liabilities secured with accounts receivable |
681 | — | 681 | 623 | — | 623 | ||||||||||||||||||
|
|
|
|
|
|
|
|
|
|
|
|
|
|||||||||||||
| $948 | $868 | $1,816 | $879 | $825 | $1,704 | |||||||||||||||||||
|
|
|
|
|
|
|
|
|
|
|
|
|
|||||||||||||
35
Leases
We have several operating and administrative assets under lease contracts. We apply the recognition exemption for short-term leases and leases of low-value assets. See note 15.2 to Cemex, S.A.B. de C.V.’s unaudited condensed consolidated financial statements as of December 31, 2025 and March 31, 2026 and for the three-month periods ended March 31, 2025 and 2026 included herein.
Our Receivables Financing Arrangements
Our subsidiaries in Mexico, the United States, France and the United Kingdom are parties to sales of trade accounts receivable programs with financial institutions, referred to as securitization programs. As of December 31, 2025 and March 31, 2026, trade accounts receivable included receivables of $799 million and $816 million, respectively. Under these programs, our subsidiaries effectively do not surrender full control or the majority of risks and rewards associated with the trade accounts receivable sold. Therefore, the trade accounts receivable sold were not derecognized from the statement of financial position, and the funded amounts were recognized within the line item “Other financial obligations” and the difference in each year against the trade receivables sold was maintained as reserves. Trade accounts receivable qualifying for sale exclude amounts over a certain number of days past due or concentrations over certain limits to any customer, according to the terms of the programs. The portion of the accounts receivable sold maintained as reserves amounted to $118 million and $193 million as of December 31, 2025 and March 31, 2026, respectively. Therefore, the funded amount to us was $681 million and $623 million as of December 31, 2025 and March 31, 2026, respectively.
See “Recent Developments—Recent Developments Relating to our Financial Obligations—Accounts Receivable Securitization Program.”
Subordinated Notes
On June 8, 2021, we issued $1.0 billion aggregate principal amount of the 5.125% Subordinated Notes with no fixed maturity and subordinated to all senior obligations, and senior only to equity, in transactions exempt from registration pursuant to Rule 144A and Regulation S under the Securities Act. After issuance costs, we received $994 million. The net proceeds obtained were used to repurchase in full the balance then outstanding of perpetual debentures issued by subsidiaries and the repayment of debt.
On June 10, 2025, we issued $1.0 billion aggregate principal amount of the 7.200% Subordinated Notes with no fixed maturity and subordinated to all senior obligations, and senior only to equity, in transactions exempt from registration pursuant to Rule 144A and Regulation S under the Securities Act. After issuance costs, we received $989 million. The net proceeds obtained were used for general corporate purposes, including to repay debt or other financial obligations.
Under the Subordinated Notes, which do not have a maturity or repayment date or mandatory redemption date, interest may be deferred indefinitely at the sole discretion of Cemex, S.A.B. de C.V. In addition, the Subordinated Notes: (i) are not redeemable at the option of the holders of the Subordinated Notes, (ii) do not have the benefit of standard debt covenants, and (iii) do not include an event of default relating to a payment or covenant default with respect to any indebtedness of Cemex. Moreover, Cemex, S.A.B. de C.V. is in control of the instances that may lead to the repayment of the Subordinated Notes, including Cemex’s repurchase option on the fifth anniversary of each issuance, specific redemption events as well as those under a reorganization event under the applicable laws. In the hypothetical event of liquidation of the Cemex, S.A.B. de C.V., the holders of the Subordinated Notes would have a claim on any residual net assets available after all liabilities have been settled; therefore, the holders of the Subordinated Notes have no guarantee of collecting the principal amounts of the Subordinated Notes or any deferred accrued interest, if any.
Based on the above characteristics of the Subordinated Notes, included in contractual terms that are considered to be substantive, and legal considerations, under IAS 32, we concluded that the Subordinated Notes do not meet the definition of financial liability under IAS 32, and consequently are classified within controlling interest stockholders’ equity, within Other equity reserves. The Subordinated Notes do not meet the definition of financial liability under IAS 32 considering that they include no contractual obligation: (i) to deliver cash or another financial asset to another entity; or (ii) to exchange financial assets or financial liabilities with another entity under conditions that are potentially unfavorable to the issuer due to the following reasons:
36
| • | The noteholders have agreed to the deferral of interest and principal, given that, Cemex, S.A.B. de C.V. has the unilateral and unconditional right to perpetually defer the payment of principal and interest; |
| • | Except in the event of liquidation and provided all senior obligations are previously satisfied, Cemex, S.A.B. de C.V. controls any payments to be made to the noteholders, including in the event of bankruptcy reorganization under either the laws of Mexico (Ley de Concursos Mercantiles) or U.S. bankruptcy laws (Chapter 11); and |
| • | The Subordinated Notes contractually evidence a residual interest in the assets of Cemex, S.A.B. de C.V. after deducting all of its liabilities. Provided all senior obligations are previously satisfied, the only requirement to settle the Subordinated Notes would be in liquidation, which is akin to an equity instrument under IAS 32. |
Coupon accrued and payments on the Subordinated Notes for the three-month periods ended March 31, 2025 and 2026 were included within “Other equity reserves” and amounted to $37 million and $62 million, respectively.
Stock Repurchase Program
Under Mexican law, Cemex, S.A.B. de C.V.’s shareholders are the only ones authorized to approve the maximum amount of resources that can be allocated to the stock repurchase program at any annual ordinary general shareholders’ meeting. Unless otherwise instructed by Cemex, S.A.B. de C.V.’s shareholders, we are not required to purchase any minimum number of shares or securities representing such shares pursuant to any such program.
In connection with Cemex, S.A.B. de C.V.’s annual ordinary general shareholders’ meeting held on March 25, 2025 and March 26, 2026 proposals were approved to set the amount of $500 million or its equivalent in Mexican Pesos, each year and until the next annual ordinary general shareholders’ meeting, respectively, as the maximum amount of resources that Cemex, S.A.B. de C.V. can use to repurchase its own shares or securities that represent such shares. Cemex, S.A.B. de C.V.’s Board of Directors approved the policy and procedures for the operation of any stock repurchase program, and is authorized to determine the basis on which the repurchase and placement of such shares is made, appoint the persons who will be authorized to make the decision of repurchasing or reoffering such shares and appoint the persons responsible to make the transaction and furnish the corresponding notices to authorities. The Board of Directors of Cemex, S.A.B. de C.V. and/or attorneys-in-fact or delegates designated in turn, or the persons responsible for such transactions, will determine, in each case, if the repurchase is made with a charge to stockholders’ equity as long as the shares belong to Cemex, S.A.B. de C.V. or with a charge to share capital if it is resolved to convert the shares into non-subscribed shares to be held in treasury. We remain subject to certain restrictions regarding the repurchase of shares of our capital stock under the Credit Agreements and the indentures governing the outstanding Notes.
No CPOs were repurchased in the three-month period ended March 31, 2025. During the three-month period ended March 31, 2026, 78,803,711 CPOs were repurchased under Cemex, S.A.B. de C.V.’s authorized repurchase programs, which represented 0.543% of Cemex, S.A.B. de C.V.’s outstanding share capital as of December 31, 2025, at a weighted-average price in Mexican Pesos equivalent to $1.2678 (based on an exchange rate of Ps 17.2013 to $1.00 as of March 31, 2026) per CPO, which was equivalent to an amount of $99.9 million (based on an exchange rate of Ps 17.2013 to $1.00 as of March 31, 2026), excluding fees and value-added tax.
Trend Information
Other than as disclosed elsewhere in this report, we are not aware of any trends, uncertainties, demands, commitments or events for the three-month period ended March 31, 2026 that are reasonably likely to have a material and adverse effect on our revenues, income, profitability, liquidity or capital resources, or that would cause the disclosed financial information to be not necessarily indicative of future results of operations or financial conditions.
37
Summary of Material Contractual Obligations and Commercial Commitments
2023 Credit Agreement
On October 29, 2021, Cemex, S.A.B. de C.V. entered into the Original 2021 Credit Agreement for up to $3.25 billion to refinance indebtedness and general corporate purposes, which closed on November 8, 2021. On June 5, 2023, the Original 2021 Credit Agreement was amended to provide for SOFR as the replacement benchmark rate for LIBOR. On October 30, 2023, the Original 2021 Credit Agreement was further amended to refinance a portion of the Term Loans (as defined in the Original 2021 Credit Agreement) and Revolving Commitments (as defined in the Original 2021 Credit Agreement), and to extend the maturity of the credit agreement to October 2028. The 2023 Credit Agreement consists of a $1 billion five-year term loan facility amortizing in five equal semiannual payments starting in October 2026 and a $2 billion five-year committed revolving credit facility. The 2023 Credit Agreement has financial covenants consistent with an investment grade capital structure, with a maximum leverage ratio of 3.75x throughout the life of the facility, and a minimum interest coverage ratio of 2.75x. The 2023 Credit Agreement is denominated exclusively in Dollars and is the first debt to be issued under our latest updated SLFF, which is aligned to Cemex’s current “Future in Action” climate action and nature program and its ultimate vision of a carbon-neutral economy. The annual performance in respect of the three metrics referenced in the 2023 Credit Agreement, which are aligned with those provided for in the SLFF, may result in an adjustment of the interest rate margin of up to plus or minus five basis points, in line with other sustainability-linked loans from investment grade rated borrowers. Cemex, S.A.B. de C.V.’s obligations under the 2023 Credit Agreement are guaranteed by the Refinancing Guarantors.
As of March 31, 2026, we reported an aggregate principal amount of outstanding debt of $1,000 million under the 2023 Credit Agreement. As of March 31, 2026, the Term Loans under the 2023 Credit Agreement had an amortization profile of $200 million in semiannual principal payments (as such payments may be reduced as a result of prepayments) commencing in October 2026, plus any applicable interest, in accordance with the 2023 Credit Agreement. For a discussion of restrictions and covenants under the 2023 Credit Agreement, see “Management’s Discussion and Analysis of Financial Condition and Results of Operations—Liquidity and Capital Resources—Our Indebtedness.”
See “Recent Developments—Recent Developments Relating to our Financial Obligations—2026 Credit Agreement” for information about the 2026 Credit Agreement.
Peso Bilateral Term Loan
On December 20, 2021, Cemex, S.A.B. de C.V. entered into the Peso Bilateral Term Loan for a principal amount of Ps 5,231 million under terms and conditions substantially similar to those of the Original 2021 Credit Agreement. On December 6, 2023 we signed, and on December 13, 2023 we successfully closed, the refinancing of the Peso Bilateral Term Loan, extending the maturity to 2028. The term loan, denominated in Mexican Pesos, has an interest rate margin dependent on leverage ratio slightly lower than that applicable prior to the refinancing. Other terms and conditions are substantially similar to those of the 2023 Credit Agreement. Cemex, S.A.B. de C.V.’s obligations are guaranteed by the Refinancing Guarantors. The borrowing under the Peso Bilateral Term Loan is also made under the SLFF.
On January 7, 2026, Cemex, S.A.B. de C.V. fully repaid the Ps 6,000 million aggregate principal amount outstanding of the Peso Bilateral Term Loan, as part of our ongoing liability management and capital structure optimization strategy.
Euro Credit Agreement
On October 7, 2022, Cemex, S.A.B. de C.V. entered into and closed the Original 2022 EUR Credit Agreement for €500 million for general corporate purposes (including to refinance indebtedness). On April 11, 2024, the Original 2022 EUR Credit Agreement was amended to prepay a portion of the outstanding term loans thereunder, refinance the remainder of such term loans, provide new revolving commitments (with a final maturity of April 2028), and to extend the final maturity of the term loans under the amended credit agreement to April 2029. The Euro Credit Agreement consists of a €450 million five-year term loan facility amortizing in five equal-semi annual payments starting in April 2027 and a €300 million four-year committed revolving credit facility.
38
The Euro Credit Agreement has financial covenants consistent with an investment grade capital structure, with a maximum leverage ratio of 3.75x throughout the life of the facility, and a minimum interest coverage ratio of 2.75x. The Euro Credit Agreement is denominated exclusively in Euros and includes an interest rate margin grid that is 25 basis points higher than that of the Original 2022 EUR Credit Agreement. Furthermore, the Euro Credit Agreement is made under the SLFF. The annual performance in respect of the three metrics referenced in the Euro Credit Agreement, which are aligned with those provided for in the SLFF, may result in an adjustment of the interest rate margin of up to plus or minus five basis points, in line with other sustainability-linked loans from investment grade rated borrowers. Cemex, S.A.B. de C.V.’s obligations under the Euro Credit Agreement are guaranteed by the Refinancing Guarantors. As of March 31, 2026, we had drawn the entirety of the term loan under the Euro Credit Agreement for €450 million and had full availability under the €300 million revolving facility for the Euro Credit Agreement.
As of March 31, 2026, we reported an aggregate amount of outstanding debt of $520 million under the Euro Credit Agreement. For a discussion of restrictions and covenants under the Euro Credit Agreement, see “Item 3. Key Information—Risk Factors—Risks Relating to Our Indebtedness and Certain Other Obligations—The Credit Agreements, the indentures governing our outstanding Notes, and our other debt agreements and/or instruments contain several restrictions and covenants. Our failure to comply with such restrictions and covenants or any inability to capitalize on business opportunities or refinance our debt resulting from them could have a material adverse effect on our business and financial conditions” in the 2025 Annual Report.
Notes
The indentures governing our outstanding Notes impose operating and financial restrictions on us. These restrictions limit our ability, among other things, to: (i) incur debt, including restrictions on incurring debt at our subsidiaries, which are not parties to the indentures governing the Notes; (ii) pay dividends on stock; (iii) redeem stock or redeem subordinated debt; (iv) make investments; (v) guarantee indebtedness; and (vi) create or assume liens.
March 2026 Euro Notes. On March 19, 2019, Cemex, S.A.B. de C.V. issued €400 million aggregate principal amount of its March 2026 Euro Notes in transactions exempt from registration pursuant to Rule 144A and Regulation S under the Securities Act. The Refinancing Guarantors fully and unconditionally guarantee the performance of all obligations of Cemex, S.A.B. de C.V. under the March 2026 Euro Notes. On March 19, 2026, Cemex, S.A.B. de C.V. repaid at maturity the €400 million aggregate principal amount outstanding of the March 2026 Euro Notes.
November 2029 Dollar Notes. On November 19, 2019, Cemex, S.A.B. de C.V. issued $1.0 billion aggregate principal amount of its November 2029 Dollar Notes in transactions exempt from registration pursuant to Rule 144A and Regulation S under the Securities Act. The Refinancing Guarantors fully and unconditionally guarantee the performance of all obligations of Cemex, S.A.B. de C.V. under the November 2029 Dollar Notes.
September 2030 Dollar Notes. On September 17, 2020, Cemex, S.A.B. de C.V. issued $1.0 billion aggregate principal amount of its September 2030 Dollar Notes in transactions exempt from registration pursuant to Rule 144A and Regulation S under the Securities Act. The Refinancing Guarantors fully and unconditionally guarantee the performance of all of our obligations under the September 2030 Dollar Notes.
July 2031 Dollar Notes. On January 12, 2021, Cemex, S.A.B. de C.V. issued $1.75 billion aggregate principal amount of its July 2031 Dollar Notes in transactions exempt from registration pursuant to Rule 144A and Regulation S under the Securities Act. The Refinancing Guarantors fully and unconditionally guarantee the performance of all of our obligations under the July 2031 Dollar Notes.
During any period of time that the November 2029 Dollar Notes, September 2030 Dollar Notes, or the July 2031 Dollar Notes, respectively, have investment grade ratings from two rating agencies, Cemex, S.A.B. de C.V. and certain subsidiaries shall no longer be subject to certain covenants under the indentures governing the November 2029 Dollar Notes, September 2030 Dollar Notes, or the July 2031 Dollar Notes, as applicable.
39
On November 8, 2021, concurrently with funding under the Original 2021 Credit Agreement and in accordance with indentures that governed our then outstanding senior secured notes, Cemex entered into supplemental indentures to add COM and CIH as new guarantors to each of the Notes. Cemex Corp. and Cemex Concretos were already guarantors of the Notes. Also, concurrently with funding under the Original 2021 Credit Agreement and the full repayment of previous agreements, the provisions contained in the indentures governing the Notes that provide that any guarantor of the Notes shall be released of its guarantee obligations upon such a refinancing with debt not guaranteed by the guarantor were triggered. As a result, both the Credit Agreements and the Notes are now guaranteed exclusively by the Refinancing Guarantors. The original note guarantors that are no longer guaranteeing the Notes are Cemex España, S.A. (“Cemex España”), Cemex Asia B.V., Cemex Finance LLC, Cemex Africa & Middle East Investments B.V., Cemex France Gestion (S.A.S.), Cemex Research Group AG and Cemex UK.
CEBURES — Long-Term Notes 1. On October 5, 2023, Cemex, S.A.B. de C.V. issued Ps 1,000 million aggregate principal amount of its long-term notes (certificados bursátiles de largo plazo) with a 3-year tenor at a floating annual interest rate of TIIE 28 plus 0.45%, which are registered in Mexico. The Refinancing Guarantors fully and unconditionally guarantee the performance of all of our obligations under the Long-Term Notes 1. The Long-Term Notes 1 were issued under the SLFF and performance in respect of specific sustainability performance targets (the “SPTs”) referenced in the Long-Term Notes 1 may result in an adjustment to the financial conditions of the Long-Term Notes 1. The relevant SPT under the Long-Term Notes 1 consists of a reduction of Scope 1 and Scope 2 CO2 emissions per ton of cementitious product to 564 kg by the end of 2025. If we do not meet the SPTs by the established dates, the nominal value of the Long-Term Notes 1 would increase by 20 basis points.
CEBURES — Long-Term Notes 2. On October 5, 2023, Cemex, S.A.B. de C.V. issued Ps 5,000 million aggregate principal amount of its long-term notes (certificados bursátiles de largo plazo) with a 7-year tenor at a fixed annual interest rate of 11.48%, which are registered in Mexico. The Refinancing Guarantors fully and unconditionally guarantee the performance of all of our obligations under the Long-Term Notes 2. The Long-Term Notes 2 were issued under the SLFF and performance in respect of specific SPTs referenced in the Long-Term Notes 2 may result in an adjustment to the financial conditions of the Long-Term Notes 2. The relevant SPT under the Long-Term Notes 2 consists of a decrease of 513 kg by the end of 2027. If we do not meet the SPTs by the established dates, the interest rate on the Long-Term Notes 2 would increase by 25 basis points.
On February 20, 2024, we closed the reopening and placement of the Long-Term Notes 1 and Long-Term Notes 2, pursuant to which Cemex, S.A.B. de C.V. issued Ps 2 billion of the Long Term Notes 1 and Ps 3.5 billion of the Long Term Notes 2. The Long-Term Notes 1 and Long-Term Notes 2 issued pursuant to this reopening and placement have terms and conditions identical to those of Long-Term Notes 1 and Long-Term Notes 2 issued on October 5, 2023, with the exception of the issue date and the placement price.
CEBURES — Long-Term Notes 3. On February 19, 2026, Cemex, S.A.B. de C.V. issued Ps 5,500 million aggregate principal amount of its long-term notes (certificados bursátiles de largo plazo) with a five-year tenor at a floating annual interest rate of TIIE de Fondeo plus 0.70%, which are registered in Mexico. The Refinancing Guarantors fully and unconditionally guarantee the performance of all of Cemex, S.A.B. de C.V.’s obligations under the Long-Term Notes 3.
As of March 31, 2026, the aggregate principal amount outstanding under the CEBURES was Ps 17,000 million.
In connection with these issuances, Cemex negotiated interest rate and currency derivative instruments to synthetically change the financial risks profile of these issuances from the Peso to the Dollar.
Subordinated Notes
5.125% Subordinated Notes. On June 8, 2021, Cemex, S.A.B. de C.V. issued $1.0 billion aggregate principal amount of the 5.125% Subordinated Notes with no fixed maturity and subordinated to all senior obligations, and senior only to equity, in transactions exempt from registration pursuant to Rule 144A and Regulation S under the Securities Act.
7.200% Subordinated Notes. On June 10, 2025, we issued $1.0 billion aggregate principal amount of the 7.200% Subordinated Notes with no fixed maturity and subordinated to all senior obligations, and senior only to equity, in transactions exempt from registration pursuant to Rule 144A and Regulation S under the Securities Act.
40
As of March 31, 2026, we are in compliance with our payment obligations under the Credit Agreements, the Notes and the Subordinated Notes.
Commercial Commitments
On July 27, 2012, we entered into a Master Professional Services Agreement with IBM (the “IBM 2012 MPSA”). The IBM 2012 MPSA provided the framework for certain ordinary course of business-related services on a global scale, including: information technology, application development and maintenance, finance and accounting services, and human resources administration. The term of the IBM 2012 MPSA expired on August 31, 2022.
On March 31, 2021, we signed an amendment to the IBM 2012 MPSA by which the finance and accounting services were removed from the scope of such agreement and, on the same date, we entered into a new Master Services Agreement with IBM for the provision of finance and accounting services previously provided under the IBM 2012 MPSA (the “IBM 2021 MSA”). On June 30, 2021, we signed an amendment to the IBM 2021 MSA by which advanced cybersecurity services were incorporated into the agreement. On September 30, 2021, we signed another amendment to the IBM 2021 MSA by which the finance and accounting services were modified to incorporate advanced order-to-cash services. The cybersecurity services under the IBM 2021 MSA will end on June 30, 2026 and the finance and accounting services under the IBM 2021 MSA will end on December 31, 2028, unless terminated earlier. In comparison with the IBM 2012 MPSA, the IBM 2021 MSA includes provisions for automation, as well as provisions for increased consumption flexibility and a reassessment of service level requirements. We may terminate the IBM 2021 MSA (or a portion of it) at our discretion and without cause at any time by providing at least six months’ notice to IBM and paying the corresponding termination charges. Other termination rights may be available to us for a termination charge that varies depending on the reason for termination. IBM may terminate the IBM 2021 MSA if we (i) fail to make payments when due or (ii) become bankrupt and do not pay in advance for the services.
In August 2021, we entered into new agreements with three service providers in the fields of data processing services (back office) in finance, accounting and human resources; as well as information technology (“IT”) infrastructure services, support and maintenance of IT applications in the countries in which we operate, for a tenure of five to seven years at an average annual cost of approximately $60 million. The services provided under these agreements replaced the services provided under the IBM 2012 MPSA which expired in September 2022.
On October 25, 2022, we entered into a five-year agreement with Neoris for the acquisition of information technology solutions and services for an annual amount of at least $55 million.
With the intention of hedging a portion of our expected deficit of EUAs, in March 2024, we established a program to enter into physically settled forward purchase commitments for the acquisition of EUAs for our own use (the “EUAs Forward Program”). As of March 31, 2026, the EUAs Forward Program is comprised of 3.0 million EUAs for the years 2029 to 2035 for a total aggregate amount of $341 million.
See “Recent Developments—Recent Developments Relating to our Financial Obligations—EUAs Forward Program.”
As of March 31, 2026, we did not depend on any single one of our suppliers of goods or services to conduct our business.
Cash Requirements
As of March 31, 2026, we had material cash requirements as set forth in the table below.
| As of March 31, 2026 | ||||||||||||||||||||
| Less than 1 year |
1-3 years | 3-5 years | More than 5 years |
Total | ||||||||||||||||
| (in millions of Dollars) | ||||||||||||||||||||
| Non-current debt |
$ | 399 | $ | 1,262 | $ | 2,076 | $ | 1,440 | $ | 5,177 | ||||||||||
| Leases(1) |
322 | 367 | 237 | 436 | 1,362 | |||||||||||||||
| Total debt and other financial obligations |
721 | 1,629 | 2,313 | 1,876 | 6,539 | |||||||||||||||
| Interest payments on debt(2) |
239 | 432 | 298 | 44 | 1,013 | |||||||||||||||
| Pension plans and other benefits(3) |
144 | 270 | 271 | 645 | 1,330 | |||||||||||||||
| Acquisition of property, plant and equipment |
125 | 2 | – | – | 127 | |||||||||||||||
| Purchases of services, raw material, fuel and energy(4) |
549 | 594 | 364 | 521 | 2,028 | |||||||||||||||
|
|
|
|
|
|
|
|
|
|
|
|||||||||||
| Total cash requirements |
$ | 1,778 | $ | 2,927 | $ | 3,246 | $ | 3,086 | $ | 11,037 | ||||||||||
|
|
|
|
|
|
|
|
|
|
|
|||||||||||
41
| (1) | Represent nominal cash flows. As of March 31, 2026, the present value of future payments was $1,081 million, with $347 million due in one to three years and $209 million due in three to five years. |
| (2) | Estimated cash flows for floating rate debt were calculated using the interest rates in effect as of March 31, 2026. |
| (3) | These figures represent estimated annual payments under these benefits. See note 20 to Cemex, S.A.B. de C.V.’s 2025 audited consolidated financial statements included in the 2025 Annual Report. |
| (4) | Future payments for raw materials, services, fuel, energy and carbon allowances are based on contractual nominal cash flows. Estimates reflect aggregate average expected annual consumption under these commitments. |
Off-Balance Sheet Arrangements
We do not have any off-balance sheet arrangements that are reasonably likely to have a material effect on our financial condition, operating results and liquidity or capital resources.
Quantitative and Qualitative Market Disclosure
Our Derivative Financial Instruments
In the ordinary course of business, we are exposed to credit risk, interest rate risk, foreign exchange risk, equity risk, commodities risk and liquidity risk, considering the guidelines set forth by Cemex, S.A.B. de C.V.’s Board of Directors, which represent our risk management framework and are supervised by several of our Committees. Our management establishes specific policies that determine strategies focused on obtaining natural hedges or risk diversification to the extent possible, such as avoiding customer concentration on a determined market or aligning the currencies portfolio in which we incur our debt with those in which we generate our cash flows. As of December 31, 2025 and March 31, 2026, these strategies were sometimes complemented by the use of derivative financial instruments. See notes 18.4 and 15.4 to Cemex, S.A.B. de C.V.’s unaudited condensed consolidated financial statements as of December 31, 2025 and March 31, 2026 and for the three-month periods ended March 31, 2025 and 2026 included herein.
During the reported periods, in compliance with the guidelines established by our risk management committee, the restrictions set forth by our debt agreements and our hedging strategy, we held derivative instruments, with the objectives of, as the case may be: (a) changing the risk profile or fixing the price of fuels; (b) foreign exchange hedging; (c) hedge of forecasted transactions; (d) changing the risk of changes in market interest rates; and (e) other corporate purposes. See note 15.5 to Cemex, S.A.B. de C.V.’s unaudited condensed consolidated financial statements as of December 31, 2025 and March 31, 2026 and for the three-month periods ended March 31, 2025 and 2026 included herein.
As of December 31, 2025 and March 31, 2026 the notional amounts and fair values of our derivative instruments were as follows:
| As of December 31, 2025 | As of March 31, 2026 | |||||||||||||||||||
| Notional Amount |
Estimated Fair value |
Notional Amount |
Estimated Fair value |
Maturity Date |
||||||||||||||||
| (in millions of Dollars) | ||||||||||||||||||||
| Net investment hedge |
$ | 1,817 | $ | (94 | ) | $ | 1,887 | $ | (82 | ) | Mar 2031 | |||||||||
| Cross currency swaps |
658 | (1 | ) | 658 | (3 | ) | Oct 2030 | |||||||||||||
| Interest rate swaps. |
705 | 2 | 1,105 | 18 | Feb 2030 | |||||||||||||||
| Fuel price hedging |
247 | 3 | 183 | 64 | Dec 2027 | |||||||||||||||
|
|
|
|
|
|
|
|
|
|||||||||||||
| $ | 3,427 | $ | (90 | ) | $ | 3,833 | $ | (3 | ) | |||||||||||
|
|
|
|
|
|
|
|
|
|||||||||||||
42
Our Financial Derivative Instruments Hedging the Net Investment. As of December 31, 2025 and March 31, 2026, there are Dollar/Peso foreign exchange forward contracts for notional amounts of $492 million and $410 million, respectively. We have designated this program as a hedge for our net investment in Pesos, pursuant to which changes in the fair market value of these instruments are recognized as part of other equity reserves. For the three-month periods ended March 31, 2025 and 2026, these contracts generated losses of $16 million and $11 million, respectively, which partially offset currency translation effects in each year recognized in equity generated from our net assets denominated in Pesos.
In addition, as of December 31, 2025 and March 31, 2026, as part of our Peso net investment hedge strategy, there are additional Dollar/Peso capped forwards, structured with option contracts, for a notional amount of $784 million and $908 million, respectively. Changes in the fair market value of such capped forward contracts are also recognized as part of other equity reserves. For the three-month periods ended March 31, 2025 and 2026, these contracts generated losses of $2 million and $18 million, respectively, which partially offset currency translation effects recognized in equity generated from our net assets denominated in Pesos.
Moreover, as of December 31, 2025 and March 31, 2026, we held cross-currency swap and forward starting cross currency swap contracts for a notional amount of $541 million and $569 million, respectively. We designated this program as a hedge for our net investment in Euros. In addition, changes in fair value of these contracts related to the interest rate are initially recognized as part of other equity reserves, and are subsequently allocated through financial expense, as interest expense on the related loans is accrued in the income statements. For the three-month periods ended March 31, 2025 and 2026, changes in the fair value of these contracts generated losses of $4 million and $3 million, respectively, recognized in other equity reserves.
Our Cross Currency Swaps. As of both December 31, 2025 and March 31, 2026, we held cross-currency swap contracts for a notional amount of $658 million, in connection with the CEBURES. These contracts were designated as cash flow hedges to modify the rate and currency risk profile of the Long-Term Notes 1 and Long-Term Notes 2 from Peso to Dollar. For the three-month period ended March 31, 2025 and 2026, changes in the fair value of these contracts resulted in gains of $17 million and $8 million, respectively, which were recognized in other comprehensive income.
Our Interest Rate Swaps. As of both December 31, 2025 and March 31, 2026, we held interest rate swaps for a notional amount of $705 million, and fair value assets of $2 million and $6 million in the year ended December 31, 2025 and the three-month period ended March 31, 2026, respectively. For the three-month periods ended March 31, 2025 and 2026, changes in the fair value of these contracts generated losses of $6 million and gains of $4 million, respectively, were recognized in other comprehensive income. In addition, in anticipation of the potential incurrence of debt, during February 2026, we entered into treasury rate lock contracts for a notional amount of $400 million, designated as a cash flow hedge of the potential debt transaction. As of March 31, 2026, changes in the fair value of these contracts generated gains of $12 million recognized in other comprehensive income.
Our Fuel Price Hedging Derivatives. As of December 31, 2025 and March 31, 2026, we maintained financial derivative contracts negotiated to hedge the price of certain fuels in several operations, for aggregate notional amounts of $120 million and $91 million, respectively. We have designated these contracts as cash flow hedges of forecast transactions. For the three-month periods ended March 31, 2025 and 2026, changes in fair value of these contracts recognized in other equity reserves represented gains of $2 million and $52 million, respectively. In addition, as of December 31, 2025 and March 31, 2026, we held Brent oil and until maturity during March, 2026 coal call spreads, with a notional of $128 million and $92 million, respectively. Changes in the fair value of these contracts are recognized directly in the income statements as part of “Financial income and other items, net”. which resulted in losses of $2 million and gains of $13 million in the three-month periods ended March 31, 2025 and 2026, respectively.
43
Other Derivative Financial Instruments.
With respect to our existing financial derivatives, we may incur net losses and be subject to margin calls that will require cash. Likewise, if we enter into new derivative financial instruments, we may incur net losses and be subject to margin calls. The cash required to cover the margin calls may be substantial and may reduce the funds available to us for our operations or other capital needs.
As with any derivative financial instrument, we assume the creditworthiness risk of the counterparty, including the risk that the counterparty may not honor its obligations to us. Before entering into any derivative financial instrument, we evaluate, by reviewing credit ratings and our business relationship according to our policies, the creditworthiness of the financial institutions and corporations that are prospective counterparties to our derivative financial instruments. We select our counterparties to the extent we believe that they have the financial capacity to meet their obligations in relation to these instruments. Under current financial conditions and volatility, we cannot assure that risk of non-compliance with the obligations agreed to with such counterparties will always be minimal. See notes 18.4 and 18.5 to Cemex, S.A.B. de C.V.’s 2025 audited consolidated financial statements included in the 2025 Annual Report.
The fair value of derivative financial instruments is based on estimated settlement costs or quoted market prices and supported by confirmations of these values received from the counterparties to these financial instruments. The notional amounts of derivative financial instrument agreements are used to measure interest to be paid or received and do not represent the amount of exposure to credit loss.
Interest Rate Risk, Foreign Currency Risk, and Equity Risk
Interest Rate Risk. The table below presents tabular information of our fixed and floating rate non-current foreign currency-denominated debt as of March 31, 2026. Average floating interest rates are calculated based on forward rates in the yield curve as of March 31, 2026. Future cash flows represent contractual principal payments. The fair value of our floating rate non-current debt is determined by discounting future cash flows using borrowing rates available to us as of March 31, 2026 and is summarized as follows:
| Expected maturity dates as of March 31, 2026 | ||||||||||||||||||||||||||||
| Non-current debt(1) | 2026 | 2027 | 2028 | 2029 | After 2030 | Total | Fair Value |
|||||||||||||||||||||
| (in millions of Dollars, except percentages) | ||||||||||||||||||||||||||||
| Variable rate |
186 | 368 | 369 | 128 | 7 | 1,058 | 1,057 | |||||||||||||||||||||
| Average interest rate |
4.6 | % | 3.6 | % | 3.5 | % | 4.0 | % | 6.7 | % | ||||||||||||||||||
| Fixed rate |
210 | 258 | 256 | 752 | 2,621 | 4,097 | 4,053 | |||||||||||||||||||||
| Average interest rate |
3.6 | % | 3.6 | % | 3.5 | % | 5.4 | % | 4.5 | % | ||||||||||||||||||
| (1) | The information above includes the current maturities of the non-current debt. Total non-current debt as of March 31, 2026 does not include our other financial obligations and the Subordinated Notes for an aggregate amount of $2,000 million issued by consolidated entities. See notes 15.2 and 18.2 to Cemex, S.A.B. de C.V.’s unaudited condensed consolidated financial statements as of December 31, 2025 and March 31, 2026 and for the three-month periods ended March 31, 2025 and 2026 included herein. |
As of March 31, 2025, we were subject to the volatility of floating interest rates, which, if such rates were to increase, may adversely affect our financing cost and our net income. As of December 31, 2025, 20% of our long-term debt bore floating rates at a weighted average interest rate of SOFR plus 98 basis points. As of March 31, 2026, 18% of our long-term debt bore floating rates at a weighted average interest rate of SOFR plus 98 basis points. As of March 31, 2025 and 2026, if interest rates at that date had been 0.5% higher, with all other variables held constant, our net income for the three-month periods ended March 31, 2025 and 2026 would have been reduced by $2 million and $2 million, respectively, as a result of higher interest expense on variable-rate denominated debt. However, this analysis does not include the interest rate swaps held by us during the three-month periods ended March 31, 2025 and 2026. See notes 15.1 and 15.5 to Cemex, S.A.B. de C.V.’s unaudited condensed consolidated financial statements as of December 31, 2025 and March 31, 2026 and for the three-month periods ended March 31, 2025 and 2026 included herein.
44
Foreign Currency Risk. Due to our geographic diversification, our revenues and costs are generated in various countries and settled in different currencies. However, some of our production costs, including fuel and energy, and some of our cement prices, are periodically adjusted to take into account fluctuations between the Dollar and the other currencies in which we operate. For the three-month period ended March 31, 2026, 31% of our external revenues were generated in Mexico, 30% in the United States, 20% in Europe, 9% in the MEA, 7% in SCA&C and 3% in other activities.
As of March 31, 2025 and 2026, excluding from the sensitivity analysis the impact of translating the net assets of foreign operations into our reporting currency and considering a hypothetical 10% strengthening of the Dollar against the Mexican Peso, with all other variables held constant, our net income for the three-month periods ended March 31, 2025 and 2026 would have decreased by $147 million and $60 million, respectively, due to higher foreign exchange losses on our Dollar-denominated net monetary liabilities in consolidated entities with different functional currencies.
As of March 31, 2026, 67% of our total debt plus other financial obligations was Dollar-denominated, 11% was Euro-denominated, 17% was Mexican Peso-denominated, 3% was Pound Sterling-denominated, and 2% was denominated in other currencies. This creates foreign currency exposure, primarily due to Dollar-denominated debt compared to the various currencies in which our revenues are earned. We cannot guarantee that we will generate sufficient revenues in Dollars from our operations to service these obligations.
In addition, considering that Cemex, S.A.B. de C.V.’s functional currency for all assets, liabilities and transactions associated with its financial and holding company activities is the Dollar, there is foreign currency risk associated with the translation of subsidiaries’ net assets denominated in different currencies (Mexican Peso, Euro, Pound Sterling and other currencies) into Dollars. When the Dollar appreciates, the value of Cemex, S.A.B. de C.V.’s net assets denominated in other currencies decreases in terms of Dollars, generating negative foreign currency translation and reducing stockholders’ equity. Conversely, when the Dollar depreciates, the value of Cemex, S.A.B. de C.V.’s net assets denominated in other currencies would increase in terms of Dollars generating the opposite effect. As mentioned above in our derivative financial instruments section, we have implemented a Dollar/Peso foreign exchange forward contract program to hedge foreign currency translation in connection with our net assets denominated in Mexican Pesos. See notes 3.3 and 18.4 to Cemex, S.A.B. de C.V.’s 2025 audited consolidated financial statements included in the 2025 Annual Report.
Liquidity Risk. Liquidity risk represents the risk that we will not have sufficient funds available to meet our obligations. In addition to cash flows provided by our operating activities, in order to meet our overall liquidity needs for operations, servicing debt and funding capital expenditures and acquisitions, we rely on cost-cutting and operating improvements to optimize capacity utilization and maximize profitability, as well as borrowing under credit facilities, proceeds of debt and equity offerings, and proceeds from asset sales. We are exposed to risks from changes in foreign currency exchange rates, prices and currency controls, interest rates, inflation, governmental spending, social instability, and other political, economic, and/or social developments in the countries in which we operate, any one of which may materially affect our results and reduce cash from operations.
As of March 31, 2026, current liabilities, which included $1,276 million of current debt and other financial obligations, exceeded current assets by $877 million. Our management has adopted an operating strategy that maintains a negative working capital balance. For the three-month period ended March 31, 2026, we generated net cash flows provided by operating activities of $141 million. In addition, as of March 31, 2026, we had committed lines of credit under the revolving credit tranches of the 2023 Credit Agreement and the Euro Credit Agreement totaling $2,347 million, had $1,020 million under other uncommitted lines of credit subject to the lenders’ availability and $105 million under other lines of credit in foreign subsidiaries.
Investments, Acquisitions, and Divestitures
The transactions described below represent our principal investments, acquisitions, and divestitures completed during the three-month period ended March 31, 2026.
45
Investments and Acquisitions
On March 31, 2026, we completed the acquisition of all assets of Omega Products International, a stucco manufacturer in the western United States, for a total consideration of $190 million. The purchase price allocation to the identifiable assets acquired, liabilities assumed and any resulting goodwill, in accordance with IFRS 3, Business Combinations, is provisional and will be completed within the twelve-month measurement period from the acquisition date. See note 4.1 to Cemex, S.A.B. de C.V.’s unaudited condensed consolidated financial statements as of December 31, 2025 and March 31, 2026 and for the three-month periods ended March 31, 2025 and 2026 included herein.
Divestitures
During the three-month period ended March 31, 2026, we made divestitures of $21 million (which included fixed assets of $18 million).
Supplemental Guarantor Financial Information
Any debt securities to be issued by Cemex, S.A.B. de C.V. pursuant to a Registration Statement on Form F-3 may or may not be guaranteed by Cemex Corp. (the “Initial Guarantor”). The table below presents summarized financial information of Cemex, S.A.B. de C.V. and the Initial Guarantor on a combined basis (after intercompany eliminations and investment in subsidiaries eliminations) as of and for the year ended December 31, 2025 and as of and for the three-month period ended March 31, 2026. The combined information is provided in accordance with the reporting requirements of Rule 13-01 under SEC Regulation S-X for Cemex, S.A.B. de C.V. and the Initial Guarantor.
| As of and for the | ||||||||
| Year Ended December 31, 2025 |
Three Months Ended March 31, 2026 |
|||||||
| (in millions of Dollars) | ||||||||
| Income Statements: |
||||||||
| Revenues |
$ | 4,939 | $ | 1,384 | ||||
| Cost of sales |
3,162 | 878 | ||||||
| Gross profit |
1,777 | 506 | ||||||
| Combined net income |
1,164 | 265 | ||||||
| Statement of Financial Position: |
||||||||
| Total assets |
24,810 | 24,837 | ||||||
| Current debt |
1,172 | 370 | ||||||
| Other current liabilities |
6,266 | 6,795 | ||||||
| Non-current debt |
4,361 | 4,659 | ||||||
| Other non-current liabilities |
171 | 153 | ||||||
| Total liabilities |
11,970 | 11,977 | ||||||
OUR CORPORATE STRUCTURE AS OF MARCH 31, 2026
Cemex, S.A.B. de C.V. is an operating and a holding company that primarily operates its business through subsidiaries which, in turn, hold interests in Cemex’s cement, aggregates, ready-mix concrete and Urbanization Solutions operating companies, as well as other businesses. Cemex, S.A.B. de C.V. also owns a substantial part of the intangible assets and intellectual property used by it and its operating subsidiaries in connection with the conduct of their respective business operations worldwide. The following chart summarizes Cemex’s corporate structure as of March 31, 2026. Unless otherwise indicated, this chart includes Cemex’s approximate direct or indirect, or consolidated, percentage equity ownership or economic interest of each subsidiary included. The chart has been simplified to show only some of Cemex’s major holding companies and/or operating companies in most of the main countries in which Cemex operates, and/or relevant companies in which Cemex holds a significant direct or indirect interest and does not include all of Cemex’s operating subsidiaries and its intermediate holding companies.
46
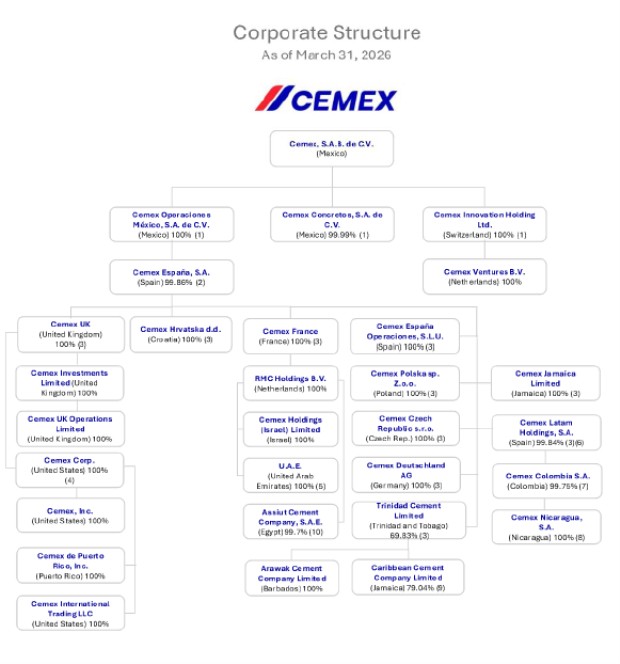
| (1) | Includes Cemex’s direct or indirect, or consolidated, interest. |
| (2) | Includes COM’s, CIH’s and Cemex, S.A.B. de C.V.’s interest, as well as shares held in Cemex España’s treasury. |
| (3) | Includes Cemex España’s direct or indirect, or consolidated, interest. |
| (4) | Includes Cemex UK’s direct or indirect, or consolidated, interest. |
| (5) | Represents Cemex España’s indirect economic interest in three companies incorporated in the United Arab Emirates: Cemex Topmix LLC, Cemex Supermix LLC and Cemex Falcon LLC. Cemex España indirectly owns a 49% equity interest in each of these companies and indirectly holds the remaining 51% of the economic benefits through agreements with other shareholders. |
| (6) | Represents outstanding shares of Cemex Latam Holdings, S.A.’s (“CLH”) capital stock and excludes treasury stock. |
| (7) | Represents CLH’s direct and indirect, or consolidated, interest in ordinary and preferred shares and excludes shares held in Cemex Colombia S.A.’s (“Cemex Colombia”) treasury. On December 16, 2025, the spin-off of Cemex Colombia S.A. was formalized, pursuant to which the companies Cemex Caracolito S.A., Cemex Concreto S.A., and Cemex Santa Rosa S.A. were created. Cemex Colombia S.A. survived the spin-off. |
| (8) | Includes Cemex Colombia’s 99% interest and Corporación Cementera Latinoamericana, S.L.U.’s 1% interest. |
| (9) | Includes Trinidad Cement Limited’s direct and indirect 74.08% interest and COM’s direct 4.96% interest. |
| (10) | Includes RMC Holdings B.V.’s direct or indirect, or consolidated, interest. |
47
INDEX TO THE CONDENSED CONSOLIDATED FINANCIAL STATEMENTS (UNAUDITED)
| Cemex, S.A.B. de C.V. and Subsidiaries: |
||||
| Condensed Consolidated Income Statements for the three-month periods ended March 31, 2026 and 2025 |
F-2 | |||
| Condensed Consolidated Comprehensive Income Statements for the three-month periods ended March 31, 2026 and 2025 |
F-3 | |||
| Condensed Consolidated Statements of Financial Position as of March 31, 2026 and December 31, 2025 |
F-4 | |||
| Condensed Consolidated Cash Flows Statements for the three-month periods ended March 31, 2026 and 2025 |
F-5 | |||
| Condensed Statements of Changes in Stockholders’ Equity for the three-month periods ended March 31, 2026 and 2025 |
F-6 | |||
| Notes to the Condensed Consolidated Financial Statements |
F-7 | |||
F-1
Cemex, S.A.B. de C.V. and Subsidiaries
Condensed Consolidated Income Statements
(Millions of U.S. Dollars, except for earnings per share)
| (Unaudited) For the three-month periods ended March 31, |
||||||||||||
| Notes | 2026 | 2025 | ||||||||||
| Revenues |
$ | 4,019 | 3,614 | |||||||||
| Cost of sales |
(2,699 | ) | (2,490 | ) | ||||||||
| Gross profit |
1,320 | 1,124 | ||||||||||
| Operating expenses |
5 | (867 | ) | (834 | ) | |||||||
| Operating earnings before other expenses, net |
453 | 290 | ||||||||||
| Other expenses, net |
6 | (43 | ) | (44 | ) | |||||||
|
|
|
|
|
|||||||||
| Operating earnings |
410 | 246 | ||||||||||
| Financial expense |
(103 | ) | (115 | ) | ||||||||
| Financial income and other items, net |
7 | 11 | 40 | |||||||||
| Share of profit of equity accounted investments |
7 | 5 | ||||||||||
|
|
|
|
|
|||||||||
| Earnings before income tax |
325 | 176 | ||||||||||
| Income tax |
17.1 | (94 | ) | (52 | ) | |||||||
|
|
|
|
|
|||||||||
| Net income from continuing operations |
231 | 124 | ||||||||||
| Discontinued operations |
4.1 | 3 | 618 | |||||||||
|
|
|
|
|
|||||||||
| CONSOLIDATED NET INCOME |
234 | 742 | ||||||||||
| Non-controlling interest net income |
6 | 8 | ||||||||||
|
|
|
|
|
|||||||||
| CONTROLLING INTEREST NET INCOME |
$ | 228 | 734 | |||||||||
|
|
|
|
|
|||||||||
| Basic earnings per share |
$ | 0.0054 | 0.0169 | |||||||||
| Basic earnings per share from continuing operations |
$ | 0.0053 | 0.0027 | |||||||||
| Diluted earnings per share |
$ | 0.0052 | 0.0166 | |||||||||
| Diluted earnings per share from continuing operations |
$ | 0.0051 | 0.0026 | |||||||||
|
|
|
|
|
|||||||||
The accompanying notes are part of these condensed consolidated financial statements.
F-2
Cemex, S.A.B. de C.V. and Subsidiaries
Condensed Consolidated Comprehensive Income Statements
(Millions of U.S. Dollars)
| (Unaudited) For the three-month periods ended March 31, |
||||||||||||
| Notes | 2026 | 2025 | ||||||||||
| CONSOLIDATED NET INCOME |
$ | 234 | 742 | |||||||||
| Items that will not be reclassified subsequently to the Income Statement |
||||||||||||
| Effects from strategic equity investments |
— | 4 | ||||||||||
|
|
|
|
|
|||||||||
| — | 4 | |||||||||||
| Items that are or may be reclassified subsequently to the Income Statement |
||||||||||||
| Results from derivative financial instruments designated as cash flow hedges |
15.4 | 76 | 13 | |||||||||
| Currency translation results of foreign subsidiaries |
(127 | ) | 145 | |||||||||
| Income tax results recognized directly in other comprehensive income |
(4 | ) | 3 | |||||||||
|
|
|
|
|
|||||||||
| (55) | 161 | |||||||||||
|
|
|
|
|
|||||||||
| Total items of other comprehensive income (loss), net |
(55 | ) | 165 | |||||||||
|
|
|
|
|
|||||||||
| CONSOLIDATED COMPREHENSIVE INCOME |
179 | 907 | ||||||||||
| Non-controlling interest comprehensive loss |
(2 | ) | (5 | ) | ||||||||
| CONTROLLING INTEREST COMPREHENSIVE INCOME |
$ | 181 | 912 | |||||||||
|
|
|
|
|
|||||||||
The accompanying notes are part of these condensed consolidated financial statements.
F-3
Cemex, S.A.B. de C.V. and Subsidiaries
Condensed Consolidated Statements of Financial Position
(Millions of U.S. Dollars)
| (Unaudited) | ||||||||||||
| As of March 31, | As of December 31, | |||||||||||
| Notes | 2026 | 2025 | ||||||||||
| ASSETS |
||||||||||||
| CURRENT ASSETS |
||||||||||||
| Cash and cash equivalents |
$ | 687 | 1,822 | |||||||||
| Trade accounts receivable |
8 | 1,949 | 1,770 | |||||||||
| Other accounts receivable |
946 | 834 | ||||||||||
| Inventories |
9 | 1,510 | 1,527 | |||||||||
| Assets held for sale and other current assets |
4.1, 10 | 550 | 144 | |||||||||
|
|
|
|
|
|||||||||
| Total current assets |
$ | 5,642 | 6,097 | |||||||||
|
|
|
|
|
|||||||||
| NON-CURRENT ASSETS |
||||||||||||
| Investments in associates and joint ventures |
11 | 797 | 792 | |||||||||
| Other investments and non-current accounts receivable |
223 | 212 | ||||||||||
| Property, machinery and equipment, net and assets for the right-of-use, net |
12 | 11,927 | 12,168 | |||||||||
| Intangible assets, net |
13 | 1,950 | 1,990 | |||||||||
| Goodwill |
14 | 7,077 | 7,170 | |||||||||
| Deferred income tax assets |
484 | 516 | ||||||||||
|
|
|
|
|
|||||||||
| Total non-current assets |
22,458 | 22,848 | ||||||||||
|
|
|
|
|
|||||||||
| TOTAL ASSETS |
$ | 28,100 | 28,945 | |||||||||
|
|
|
|
|
|||||||||
| LIABILITIES AND STOCKHOLDERS’ EQUITY |
||||||||||||
| CURRENT LIABILITIES |
||||||||||||
| Current debt |
15.1 | 397 | 1,187 | |||||||||
| Other current financial obligations |
15.2 | 879 | 948 | |||||||||
| Trade accounts payable |
2,802 | 3,092 | ||||||||||
| Income taxes payable |
465 | 438 | ||||||||||
| Other current liabilities |
16 | 1,828 | 1,682 | |||||||||
| Liabilities related to assets held for sale |
148 | — | ||||||||||
|
|
|
|
|
|||||||||
| Total current liabilities |
6,519 | 7,347 | ||||||||||
|
|
|
|
|
|||||||||
| NON-CURRENT LIABILITIES |
||||||||||||
| Non-current debt |
15.1 | 4,758 | 4,457 | |||||||||
| Other non-current financial obligations |
15.2 | 825 | 868 | |||||||||
| Pensions and other post-employment benefits |
554 | 588 | ||||||||||
| Deferred income tax liabilities |
601 | 601 | ||||||||||
| Other non-current liabilities |
1,400 | 1,446 | ||||||||||
|
|
|
|
|
|||||||||
| Total non-current liabilities |
8,138 | 7,960 | ||||||||||
|
|
|
|
|
|||||||||
| TOTAL LIABILITIES |
$ | 14,657 | 15,307 | |||||||||
|
|
|
|
|
|||||||||
| STOCKHOLDERS’ EQUITY |
||||||||||||
| Controlling interest: |
||||||||||||
| Common stock and additional paid-in capital |
18.1 | 7,699 | 7,699 | |||||||||
| Other equity reserves and subordinated notes |
18.2 | (687 | ) | (446 | ) | |||||||
| Retained earnings |
6,125 | 6,077 | ||||||||||
|
|
|
|
|
|||||||||
| Total controlling interest |
13,137 | 13,330 | ||||||||||
| Non-controlling interest |
306 | 308 | ||||||||||
|
|
|
|
|
|||||||||
| TOTAL STOCKHOLDERS’ EQUITY |
13,443 | 13,638 | ||||||||||
| TOTAL LIABILITIES AND STOCKHOLDERS’ EQUITY |
$ | 28,100 | 28,945 | |||||||||
|
|
|
|
|
|||||||||
The accompanying notes are part of these condensed consolidated financial statements.
F-4
Cemex, S.A.B. de C.V. and Subsidiaries
Condensed Consolidated Cash Flows
(Millions of U.S. Dollars)
| (Unaudited) For the three-month periods ended March 31, |
||||||||||||
| Notes | 2026 | 2025 | ||||||||||
| OPERATING ACTIVITIES |
||||||||||||
| Consolidated net income |
$ | 234 | 742 | |||||||||
| Discontinued operations |
3 | 618 | ||||||||||
|
|
|
|
|
|||||||||
| Net income from continuing operations |
231 | 124 | ||||||||||
| Adjustments for: |
||||||||||||
| Depreciation and amortization of assets |
341 | 305 | ||||||||||
| Impairment losses of long-lived assets |
6 | 7 | 1 | |||||||||
| Share of profit of equity accounted investments |
(7 | ) | (5 | ) | ||||||||
| Results on sale of associates, fixed assets and others |
5 | (31 | ) | |||||||||
| Financial expense, financial income and other financial items, net |
92 | 75 | ||||||||||
| Income taxes |
17 | 94 | 52 | |||||||||
| (Increase) in working capital, excluding income taxes |
(453 | ) | (484 | ) | ||||||||
|
|
|
|
|
|||||||||
| Cash flows provided by operating activities from continuing operations |
310 | 37 | ||||||||||
|
|
|
|
|
|||||||||
| Interest paid |
(104 | ) | (118 | ) | ||||||||
| Income taxes paid |
17 | (65 | ) | (59 | ) | |||||||
|
|
|
|
|
|||||||||
| Net cash flows provided by (used in) operating activities from continuing operations |
141 | (140 | ) | |||||||||
| Net cash flows (used in) operating activities from discontinued operations |
— | (3 | ) | |||||||||
|
|
|
|
|
|||||||||
| Net cash flows provided by (used in) operating activities after interest and income taxes |
141 | (143 | ) | |||||||||
|
|
|
|
|
|||||||||
| INVESTING ACTIVITIES |
||||||||||||
| Investment in property, machinery and equipment, net |
12 | (108 | ) | (158 | ) | |||||||
| Investment in intangible assets, net |
(37 | ) | (105 | ) | ||||||||
| (Acquisition) disposal of subsidiaries and associates, net |
4, 11 | (199 | ) | 862 | ||||||||
| Non-current assets and others, net |
16 | 11 | ||||||||||
|
|
|
|
|
|||||||||
| Cash flows (used in) provided by investing activities from continuing operations |
(328 | ) | 610 | |||||||||
| Net cash flows used in investing activities from discontinued operations |
— | (1 | ) | |||||||||
|
|
|
|
|
|||||||||
| Net cash flows (used in) provided by investing activities |
(328 | ) | 609 | |||||||||
|
|
|
|
|
|||||||||
| FINANCING ACTIVITIES |
||||||||||||
| Proceeds from new debt instruments |
15.1 | 336 | — | |||||||||
| Debt repayments |
15.1 | (817 | ) | (2 | ) | |||||||
| Other financial obligations, net |
15.2 | (124 | ) | (94 | ) | |||||||
| Dividends paid |
18.1 | (32 | ) | (30 | ) | |||||||
| Own shares repurchase program |
(100 | ) | — | |||||||||
| Shares in trust for future deliveries under share-based compensation |
(48 | ) | — | |||||||||
| Derivative financial instruments |
15.4 | (33 | ) | 14 | ||||||||
| Coupons on subordinated notes |
18.2 | (62 | ) | (26 | ) | |||||||
| Non-current liabilities, net |
(59 | ) | (41 | ) | ||||||||
|
|
|
|
|
|||||||||
| Net cash flows used in financing activities |
(939 | ) | (179 | ) | ||||||||
|
|
|
|
|
|||||||||
| Increase (decrease) in cash and cash equivalents from continuing operations |
(1,126 | ) | 291 | |||||||||
| (Decrease) in cash and cash equivalents from discontinued operations |
— | (4 | ) | |||||||||
| Foreign currency translation effect on cash |
(9 | ) | 28 | |||||||||
| Cash and cash equivalents at beginning of period |
1,822 | 864 | ||||||||||
|
|
|
|
|
|||||||||
| CASH AND CASH EQUIVALENTS AT END OF PERIOD |
$ | 687 | 1,179 | |||||||||
|
|
|
|
|
|||||||||
| Changes in working capital, excluding income taxes: |
||||||||||||
| Trade accounts receivable |
$ | (173 | ) | (177 | ) | |||||||
| Other accounts receivable and other assets |
(10 | ) | (60 | ) | ||||||||
| Inventories |
(28 | ) | (34 | ) | ||||||||
| Trade accounts payable |
(263 | ) | (189 | ) | ||||||||
| Other accounts payable and accrued expenses |
21 | (24 | ) | |||||||||
|
|
|
|
|
|||||||||
| (Increase) in working capital, excluding income taxes |
$ | (453 | ) | (484 | ) | |||||||
|
|
|
|
|
|||||||||
The accompanying notes are part of these condensed consolidated financial statements.
F-5
Cemex, S.A.B. de C.V. and Subsidiaries
Condensed Statements of Changes in Stockholders’ Equity
For the three-month periods ended March 31, 2026 and 2025 (Unaudited)
(Millions of U.S. Dollars)
| Notes | Common stock |
Additional paid-in capital |
Other equity reserves and subordinated notes |
Retained earnings |
Total controlling interest |
Non- controlling interest |
Total stockholders’ equity |
|||||||||||||||||||||||||
| Balance as of December 31, 2024 |
$ | 318 | 7,381 | (770 | ) | 5,247 | 12,176 | 301 | 12,477 | |||||||||||||||||||||||
| Net income for the period |
— | — | — | 734 | 734 | 8 | 742 | |||||||||||||||||||||||||
| Other comprehensive income (loss) for the period |
— | — | 178 | — | 178 | (13 | ) | 165 | ||||||||||||||||||||||||
|
|
|
|
|
|
|
|
|
|
|
|
|
|
|
|||||||||||||||||||
| Total comprehensive income for the period |
— | — | 178 | 734 | 912 | (5 | ) | 907 | ||||||||||||||||||||||||
|
|
|
|
|
|
|
|
|
|
|
|
|
|
|
|||||||||||||||||||
| Dividends declared |
18.1 | — | — | — | (130 | ) | (130 | ) | — | (130 | ) | |||||||||||||||||||||
| Share-based compensation |
— | — | 14 | — | 14 | — | 14 | |||||||||||||||||||||||||
| Coupons accrued on subordinated notes |
18.2 | — | — | (37 | ) | — | (37 | ) | — | (37 | ) | |||||||||||||||||||||
|
|
|
|
|
|
|
|
|
|
|
|
|
|
|
|||||||||||||||||||
| Balance as of March 31, 2025 |
$ | 318 | 7,381 | (615 | ) | 5,851 | 12,935 | 296 | 13,231 | |||||||||||||||||||||||
|
|
|
|
|
|
|
|
|
|
|
|
|
|
|
|||||||||||||||||||
| Balance as of December 31, 2025 |
318 | 7,381 | (446 | ) | 6,077 | 13,330 | 308 | 13,638 | ||||||||||||||||||||||||
| Net income for the period |
— | — | — | 228 | 228 | 6 | 234 | |||||||||||||||||||||||||
| Other comprehensive loss for the period |
— | — | (47 | ) | — | (47 | ) | (8 | ) | (55 | ) | |||||||||||||||||||||
|
|
|
|
|
|
|
|
|
|
|
|
|
|
|
|||||||||||||||||||
| Total comprehensive income for the period |
— | — | (47 | ) | 228 | 181 | (2 | ) | 179 | |||||||||||||||||||||||
|
|
|
|
|
|
|
|
|
|
|
|
|
|
|
|||||||||||||||||||
| Dividends declared |
18.1 | — | — | — | (180 | ) | (180 | ) | — | (180 | ) | |||||||||||||||||||||
| Own shares purchased under shares repurchase program |
— | — | (100 | ) | — | (100 | ) | — | (100 | ) | ||||||||||||||||||||||
| Shares in trust for future deliveries under share-based compensation |
— | — | (48 | ) | — | (48 | ) | — | (48 | ) | ||||||||||||||||||||||
| Share-based compensation |
— | — | 16 | — | 16 | — | 16 | |||||||||||||||||||||||||
| Coupons accrued on subordinated notes |
18.2 | — | — | (62 | ) | — | (62 | ) | — | (62 | ) | |||||||||||||||||||||
|
|
|
|
|
|
|
|
|
|
|
|
|
|
|
|||||||||||||||||||
| Balance as of March 31, 2026 |
$ | 318 | 7,381 | (687 | ) | 6,125 | 13,137 | 306 | 13,443 | |||||||||||||||||||||||
|
|
|
|
|
|
|
|
|
|
|
|
|
|
|
|||||||||||||||||||
The accompanying notes are part of these condensed consolidated financial statements.
F-6
Cemex, S.A.B. de C.V. and Subsidiaries
Notes to the Condensed Consolidated Financial Statements
As of March 31, 2026 and December 31, 2025 and for the three-month periods ended March 31, 2026 and 2025
(Millions of U.S. Dollars)
| 1) | DESCRIPTION OF BUSINESS |
Cemex, S.A.B. de C.V., originated in 1906, is a publicly traded variable stock corporation (Sociedad Anónima Bursátil de Capital Variable) organized under the laws of Mexico, and is the parent company of entities whose main activities are oriented to the construction industry, through the production, marketing, sale and distribution of cement, ready-mix concrete, aggregates, urbanization solutions and other construction materials and services. In addition, Cemex, S.A.B. de C.V. performs significant business and operational activities in Mexico.
The shares of Cemex, S.A.B. de C.V. are listed on the Mexican Stock Exchange (“MSE”) as Ordinary Participation Certificates (“CPOs”) (Certificados de Participación Ordinaria) under the symbol “CemexCPO.” Each CPO represents two series “A” shares and one series “B” share of the common stock of Cemex, S.A.B. de C.V. In addition, Cemex, S.A.B. de C.V.’s shares are listed on the New York Stock Exchange (“NYSE”) as American Depositary Shares (“ADSs”) under the symbol “CX.” Each ADS represents ten CPOs.
The terms “Cemex, S.A.B. de C.V.” and/or the “Parent Company” used in these accompanying notes to the financial statements refer to Cemex, S.A.B. de C.V. without its consolidated subsidiaries. The terms the “Company” or “Cemex” refer to Cemex, S.A.B. de C.V. together with its consolidated subsidiaries.
| 2) | BASIS OF PRESENTATION AND DISCLOSURE |
The condensed consolidated financial statements as of and for the three-month period ended March 31, 2026 have been prepared in accordance with International Accounting Standard 34 Interim Financial Reporting (“IAS 34”) as issued by the International Accounting Standards Board (“IASB”). These condensed consolidated financial statements do not include all of the information and disclosures required for a complete set of consolidated financial statements prepared in accordance with IFRS Accounting Standards as issued by the IASB. However, selected explanatory notes are included to explain events and transactions that are significant to an understanding of the changes in financial position and performance of Cemex since the last annual consolidated financial statements as of and for the year ended December 31, 2025. Accordingly, these condensed consolidated financial statements should be read in conjunction with the audited annual consolidated financial statements of Cemex as of and for the year ended December 31, 2025.
The accompanying condensed consolidated statements of financial position as of March 31, 2026, as well as the related Income Statements, the Comprehensive Income Statements, the Cash Flows Statements and the Changes in Stockholders’ Equity Statements for the three-month periods ended March 31, 2026 and 2025 and their related disclosures included in these notes to the condensed consolidated financial statements are unaudited.
The accounting policies that were applied to these condensed consolidated financial statements of March 31, 2026, are the same as those applied by Cemex in its consolidated financial statements as at and for the year ended December 31, 2025, considering as subsequently described in this note.
Presentation currency and definition of terms
The condensed consolidated financial statements and accompanying notes are presented in Dollars of the United States, unless otherwise specified. All amounts in these financial statements are stated in millions, except for earnings per share and prices per share. References to “U.S. Dollar,” “Dollar,” or “$” indicate Dollars of the United States. “Ps” or “Pesos,” refer to Mexican Pesos, “€” or “Euros,” to the currency used in some European Union (“EU”) countries and “£” or “Pounds,” to British Pounds sterling. Previously reported Dollar amounts for prior years are restated using closing exchange rates as of the reporting date if related transactions in other currencies remain unsettled. Dollar amounts should not be interpreted as actual amounts or as convertible at the stated rates.
Amounts disclosed in the notes regarding outstanding tax and legal proceedings (note 19), originate from jurisdictions where currencies differ from the Dollar. These amounts are presented in Dollar equivalents as of the end of the most recent year. Therefore, without any change to the original currency, these Dollar amounts may fluctuate over time due to exchange rate changes.
Discontinued operations (note 4.1)
Cemex reports as discontinued operations any component that has been disposed of or classified as held for sale and represents a separate major line of business, geographical area, or is part of a single disposal plan. The Income Statements and the Cash Flow Statements for prior periods were presented to consider the effects of additional discontinued operations that occurred in 2025.
F-7
Cemex, S.A.B. de C.V. and Subsidiaries
Notes to the Condensed Consolidated Financial Statements
As of March 31, 2026 and December 31, 2025 and for the three-month periods ended March 31, 2026 and 2025
(Millions of U.S. Dollars)
Condensed consolidated Income Statements
Cemex presents the line item “Operating earnings before other expenses, net” as a relevant subtotal for determining “Operating EBITDA” (Operating earnings before other expenses, net plus depreciation and amortization), which is calculated as operating earnings before other expenses, net, plus depreciation and amortization. This subtotal facilitates reconciliation between IFRS financial statements and the non-IFRS measure of Operating EBITDA. “Other expenses, net” primarily includes revenues and expenses not directly related to Cemex’s core activities or that are non-recurring, such as impairment losses on long-lived assets, results from assets disposal, and restructuring costs, among others. Under IFRS, the use of subtotals such “Operating earnings before other expenses, net” and the presentation of the Income Statement can vary significantly by industry and companies according to specific needs and requirements. Operating EBITDA is not a measure of operating performance, cash flows or financial position under IFRS.
However, Cemex’s chief executive officer uses Operating EBITDA to assess operating performance, profitability and resource allocation. Moreover, most of Cemex’s creditors also use this measure to evaluate the Company’s ability to fund capital expenditures, service or incur debt, and meet financial covenants. Cemex discloses Operating EBITDA in notes 4.2 and 18.1. Operating EBITDA may not be comparable to similarly titled measures used by other companies.
Condensed consolidated Cash Flows Statements
The Cash Flows Statements exclude the transactions that do not involve actual sources or uses, as detailed below:
| • | For the three-month periods ended March 31, 2026 and 2025, the increases in other financing obligations in connection with lease contracts negotiated during these periods for $31 and $54, respectively; |
| • | For the three-month periods ended March 31, 2026 and 2025, the portion of dividends declared during the years 2026 and 2025 that are still payable for $180 and $130, respectively (note 18.2). |
Newly issued IFRS adopted in 2026
Beginning January 1, 2026, Cemex adopted IFRS amendments that did not result in any material impact on its results of operation or financial position, and which are explained as follows:
| Standard |
Main topic |
|
| Amendments to the Classification and Measurement of Financial Instruments – Amendments to IFRS 9, Financial Instruments and IFRS 7, Financial Instruments: Disclosures |
The amendments to IFRS 9 and IFRS 7 clarify the derecognition of financial liabilities on the settlement date, allowing accounting options for electronic settlements and require additional disclosures for financial assets and liabilities with contingent terms, including Environmental, Social and Governance features. | |
| Contract referencing nature-dependent electricity contracts: Amendments to IFRS 9, Financial Instruments and IFRS 7, Financial Instruments: Disclosures |
The amendments allow a company to apply the own-use exemption to Power Purchase Agreement if the company has been, and expects to be, a net-purchaser of electricity for the contract period. | |
| 3) | MATERIAL ACCOUNTING POLICIES |
| 3.1) | USE OF ESTIMATES AND CRITICAL ASSUMPTIONS |
During the three-month period ended March 31, 2026, there were no significant changes in the critical accounting estimates and assumptions disclosed in Cemex’s consolidated financial statements as of and for the year ended December 31, 2025.
F-8
Cemex, S.A.B. de C.V. and Subsidiaries
Notes to the Condensed Consolidated Financial Statements
As of March 31, 2026 and December 31, 2025 and for the three-month periods ended March 31, 2026 and 2025
(Millions of U.S. Dollars)
Material accounting policies – continued
| 3.2) | FOREIGN CURRENCY TRANSACTIONS AND TRANSLATION OF FOREIGN CURRENCY FINANCIAL STATEMENTS |
The most significant closing exchange rates for the statement of financial position and the approximate average exchange rates (as determined using the closing exchange rates of each month within the period) for the Income Statements with respect Cemex’s main functional currencies to the Dollar as of March 31, 2026 and 2025 and December 31, 2025, were as follows:
| As of March 31, 2026 | As of December 31, 2025 | As of March 31, 2025 | ||||||||||||||||||||||
| Currency | Closing | Average | Closing | Average | Closing | Average | ||||||||||||||||||
| Peso |
17.94 | 17.55 | 18.01 | 19.19 | 20.48 | 20.58 | ||||||||||||||||||
| Euro |
0.8653 | 0.8517 | 0.8513 | 0.8851 | 0.9245 | 0.9495 | ||||||||||||||||||
| British Pound Sterling |
0.7560 | 0.7429 | 0.7420 | 0.7573 | 0.7740 | 0.7910 | ||||||||||||||||||
|
|
|
|
|
|
|
|
|
|
|
|
|
|||||||||||||
| 4) | BUSINESS COMBINATIONS, DIVESTITURES AND DISCONTINUED OPERATIONS AND SELECTED FINANCIAL INFORMATION BY REPORTABLE SEGMENT AND LINE OF BUSINESS |
| 4.1) | BUSINESS COMBINATIONS, DIVESTITURES AND DISCONTINUED OPERATIONS |
On March 31, 2026, Cemex completed the acquisition of all assets of Omega Products International, a stucco manufacturer in the western United States, for a total consideration of $190. The purchase price allocation to the identifiable assets acquired, liabilities assumed and any resulting goodwill, in accordance with IFRS 3, Business Combinations, is provisional and will be completed within the twelve-month measurement period from the acquisition date.
On March 12, 2026, Cemex entered into an agreement with the Holcim Group to sell the Caracolito cement plant, the Santa Rosa grinding mill, and a portfolio of more than 20 ready-mix concrete, aggregates, mortar, and admixture plants in Colombia, for a purchase price of $485. The transaction is currently expected to close at the end of 2026, subject to customary closing conditions, including regulatory approvals. As of March 31, 2026, the assets and liabilities related to these operations are presented in the line items “Assets held for sale” and “Liabilities related to assets held for sale,” respectively. Cemex is in the process of defining its operating model for its remaining assets that operate in Colombia and which are not part of the sale transaction.
The following table presents combined condensed information of the statement of financial position of the operations held for sale in Colombia as of March 31, 2026.
| March 31, 2026 | ||||
| Current assets |
$ | 44 | ||
| Property, machinery and equipment |
260 | |||
| Other non-current assets and goodwill |
90 | |||
|
|
|
|||
| Total assets |
394 | |||
| Current liabilities |
53 | |||
| Non-current liabilities |
91 | |||
|
|
|
|||
| Total liabilities |
144 | |||
|
|
|
|||
| Net assets sold or held for sale |
$ | 250 | ||
|
|
|
|||
F-9
Cemex, S.A.B. de C.V. and Subsidiaries
Notes to the Condensed Consolidated Financial Statements
As of March 31, 2026 and December 31, 2025 and for the three-month periods ended March 31, 2026 and 2025
(Millions of U.S. Dollars)
| 4.2) | SELECTED FINANCIAL INFORMATION BY REPORTABLE SEGMENT AND LINE OF BUSINESS |
Reportable segments
Cemex’s reportable segments, the basis for their identification, the geographical composition of each region and the basis for measuring segment results, are described in note 5.3 to Cemex’s consolidated financial statements as of and for the year ended December 31, 2025. There were no changes during the three-month period ended March 31, 2026 in the composition of Cemex’s reportable segments or in the measurement of segment performance. The line item “Other activities,” used to reconcile operating segments with consolidated amounts from continuing operations, includes cement and clinker trade maritime operations, non-operating transactions of the Parent Company, other corporate entities, finance subsidiaries, and other minor subsidiaries with different business lines.
Selected information of the consolidated Income Statements by operating segment for the three-month periods ended on March 31, 2026 and 2025, excluding the share of profits of equity accounted investees by reportable segment, was as follows:
| For the three-month period ended March 31, 2026 |
Sales (including intragroup transactions) |
Less: Intragroup transactions |
External revenues |
Operating EBITDA |
Less: Depreciation and amortization |
Operating earnings before other expenses, net |
Other expenses, net |
Financial expense |
Financial income and other items, net |
|||||||||||||||||||||||||||
| Mexico |
$ | 1,255 | (15 | ) | 1,240 | 453 | 56 | 397 | (30 | ) | (6 | ) | 1 | |||||||||||||||||||||||
| United States |
1,196 | (2 | ) | 1,194 | 190 | 134 | 56 | 10 | (13 | ) | (11 | ) | ||||||||||||||||||||||||
| EMEA |
||||||||||||||||||||||||||||||||||||
| Europe |
814 | (5 | ) | 809 | 91 | 66 | 25 | 6 | (10 | ) | (7 | ) | ||||||||||||||||||||||||
| Middle East and Africa |
349 | — | 349 | 61 | 19 | 42 | — | (3 | ) | 16 | ||||||||||||||||||||||||||
| SCA&C |
296 | (12 | ) | 284 | 66 | 22 | 44 | (6 | ) | (2 | ) | 2 | ||||||||||||||||||||||||
|
|
|
|
|
|
|
|
|
|
|
|
|
|
|
|
|
|
|
|||||||||||||||||||
| Operating segments |
3,876 | 861 | 297 | 564 | (20 | ) | (34 | ) | 1 | |||||||||||||||||||||||||||
| Other activities |
143 | (67 | ) | 44 | (111 | ) | (23 | ) | (69 | ) | 10 | |||||||||||||||||||||||||
|
|
|
|
|
|
|
|
|
|
|
|
|
|
|
|||||||||||||||||||||||
| Consolidated |
$ | 4,019 | 794 | 341 | 453 | (43 | ) | (103 | ) | 11 | ||||||||||||||||||||||||||
|
|
|
|
|
|
|
|
|
|
|
|
|
|
|
|||||||||||||||||||||||
| For the three-month period ended March 31, 2025 |
Sales (including intragroup transactions) |
Less: Intragroup transactions |
External revenues |
Operating EBITDA |
Less: Depreciation and amortization |
Operating earnings before other expenses, net |
Other expenses, net |
Financial expense |
Financial income and other items, net |
|||||||||||||||||||||||||||
| Mexico |
$ | 981 | (26 | ) | 955 | 308 | 49 | 259 | (4 | ) | (9 | ) | 32 | |||||||||||||||||||||||
| United States |
1,190 | — | 1,190 | 190 | 127 | 63 | 6 | (17 | ) | (8 | ) | |||||||||||||||||||||||||
| EMEA |
||||||||||||||||||||||||||||||||||||
| Europe |
782 | (7 | ) | 775 | 69 | 62 | 7 | (7 | ) | (9 | ) | (4 | ) | |||||||||||||||||||||||
| Middle East and Africa |
288 | — | 288 | 48 | 14 | 34 | 2 | (3 | ) | 1 | ||||||||||||||||||||||||||
| SCA&C |
281 | (8 | ) | 273 | 55 | 15 | 40 | 1 | (2 | ) | 5 | |||||||||||||||||||||||||
|
|
|
|
|
|
|
|
|
|
|
|
|
|
|
|
|
|
|
|||||||||||||||||||
| Operating segments |
3,481 | 670 | 267 | 403 | (2 | ) | (40 | ) | 26 | |||||||||||||||||||||||||||
| Other activities |
133 | (75 | ) | 38 | (113 | ) | (42 | ) | (75 | ) | 14 | |||||||||||||||||||||||||
|
|
|
|
|
|
|
|
|
|
|
|
|
|
|
|||||||||||||||||||||||
| Consolidated |
$ | 3,614 | 595 | 305 | 290 | (44 | ) | (115 | ) | 40 | ||||||||||||||||||||||||||
|
|
|
|
|
|
|
|
|
|
|
|
|
|
|
|||||||||||||||||||||||
F-10
Cemex, S.A.B. de C.V. and Subsidiaries
Notes to the Condensed Consolidated Financial Statements
As of March 31, 2026 and December 31, 2025 and for the three-month periods ended March 31, 2026 and 2025
(Millions of U.S. Dollars)
As of March 31, 2026 and December 31, 2025, the selected statement of financial position information by reportable segment was as follows:
| As of March 31, 2026 |
Current |
Associates |
Other Non- |
Total assets |
Total |
Net assets by |
Capital |
|||||||||||||||||||||
| Mexico |
$ | 1,564 | — | 3,285 | 4,849 | 1,395 | 3,454 | 29 | ||||||||||||||||||||
| United States |
1,135 | 233 | 11,722 | 13,090 | 2,654 | 10,436 | 82 | |||||||||||||||||||||
| EMEA |
||||||||||||||||||||||||||||
| Europe |
1,126 | 67 | 3,448 | 4,641 | 2,115 | 2,526 | 23 | |||||||||||||||||||||
| Middle East and Africa |
627 | — | 600 | 1,227 | 725 | 502 | 8 | |||||||||||||||||||||
| SCA&C |
276 | — | 1,103 | 1,379 | 436 | 943 | 14 | |||||||||||||||||||||
|
|
|
|
|
|
|
|
|
|
|
|
|
|
|
|||||||||||||||
| Operating segments |
4,728 | 300 | 20,158 | 25,186 | 7,325 | 17,861 | 156 | |||||||||||||||||||||
| Other activities |
478 | 497 | 1,503 | 2,478 | 7,184 | (4,706 | ) | — | ||||||||||||||||||||
| Assets held for sale |
436 | — | — | 436 | 148 | 288 | — | |||||||||||||||||||||
|
|
|
|
|
|
|
|
|
|
|
|
|
|
|
|||||||||||||||
| Total consolidated |
$ | 5,642 | 797 | 21,661 | 28,100 | 14,657 | 13,443 | 156 | ||||||||||||||||||||
|
|
|
|
|
|
|
|
|
|
|
|
|
|
|
|||||||||||||||
| As of December 31, 2025 |
Current |
Associates |
Other Non- |
Total assets |
Total |
Net assets by |
Capital |
|||||||||||||||||||||
| Mexico |
$ | 1,730 | — | 3,674 | 5,404 | 1,809 | 3,595 | 236 | ||||||||||||||||||||
| United States |
1,068 | 234 | 11,556 | 12,858 | 2,734 | 10,124 | 531 | |||||||||||||||||||||
| EMEA |
||||||||||||||||||||||||||||
| Europe |
1,096 | 66 | 3,574 | 4,736 | 2,299 | 2,437 | 269 | |||||||||||||||||||||
| Middle East and Africa |
867 | — | 620 | 1,487 | 782 | 705 | 65 | |||||||||||||||||||||
| SCA&C |
310 | — | 1,440 | 1,750 | 577 | 1,173 | 128 | |||||||||||||||||||||
|
|
|
|
|
|
|
|
|
|
|
|
|
|
|
|||||||||||||||
| Operating segments |
5,071 | 300 | 20,864 | 26,235 | 8,201 | 18,034 | 1,229 | |||||||||||||||||||||
| Other activities |
984 | 492 | 1,192 | 2,668 | 7,097 | (4,429 | ) | 14 | ||||||||||||||||||||
| Assets held for sale |
42 | — | — | 42 | 9 | 33 | — | |||||||||||||||||||||
|
|
|
|
|
|
|
|
|
|
|
|
|
|
|
|||||||||||||||
| Total consolidated |
$ | 6,097 | 792 | 22,056 | 28,945 | 15,307 | 13,638 | 1,243 | ||||||||||||||||||||
|
|
|
|
|
|
|
|
|
|
|
|
|
|
|
|||||||||||||||
The capital expenditures shown in the table above include purchases of property, machinery and equipment, stripping costs, and right of-use assets incurred during the period (notes 12.1 and 12.2). They do not include increases in assets related to asset retirement obligations.
F-11
Cemex, S.A.B. de C.V. and Subsidiaries
Notes to the Condensed Consolidated Financial Statements
As of March 31, 2026 and December 31, 2025 and for the three-month periods ended March 31, 2026 and 2025
(Millions of U.S. Dollars)
Selected financial information by reportable segment and line of business – continued
The Company’s main activities are oriented to the construction industry, mainly through production, marketing, sale and distribution of cement, ready-mix concrete, aggregates, urbanization solutions and other construction materials and services. Revenues including intragroup transactions and external customers by line of business and reportable segment for the three-month periods ended March 31, 2026 and 2025, were as follows:
| For the three-month period ended March 31, 2026 |
Cement |
Ready-mix |
Aggregates |
Urbanization |
Others |
Eliminations |
External |
|||||||||||||||||||||
| Mexico |
$ | 859 | 394 | 93 | 32 | 130 | (268 | ) | 1,240 | |||||||||||||||||||
| United States |
426 | 668 | 337 | 51 | 101 | (389 | ) | 1,194 | ||||||||||||||||||||
| EMEA |
||||||||||||||||||||||||||||
| Europe |
329 | 347 | 217 | 78 | 13 | (175 | ) | 809 | ||||||||||||||||||||
| Middle East and Africa |
82 | 245 | 61 | 32 | 3 | (74 | ) | 349 | ||||||||||||||||||||
| SCA&C |
249 | 47 | 13 | 10 | 15 | (50 | ) | 284 | ||||||||||||||||||||
| Operating segments |
1,945 | 1,701 | 721 | 203 | 262 | (956 | ) | 3,876 | ||||||||||||||||||||
|
|
|
|
|
|
|
|
|
|
|
|
|
|
|
|||||||||||||||
| Other activities |
— | — | — | — | 143 | — | 143 | |||||||||||||||||||||
|
|
|
|
|
|
|
|
|
|
|
|
|
|
|
|||||||||||||||
| Consolidated |
$ | 4,019 | ||||||||||||||||||||||||||
|
|
|
|||||||||||||||||||||||||||
| For the three-month period ended March 31, 2025 |
Cement |
Ready-mix concrete |
Aggregates |
Urbanization |
Others |
Eliminations |
External |
|||||||||||||||||||||
| Mexico |
$ | 668 | 321 | 77 | 27 | 107 | (245 | ) | 955 | |||||||||||||||||||
| United States |
439 | 671 | 304 | 50 | 98 | (372 | ) | 1,190 | ||||||||||||||||||||
| EMEA |
||||||||||||||||||||||||||||
| Europe |
322 | 339 | 212 | 74 | 18 | (190 | ) | 775 | ||||||||||||||||||||
| Middle East and Africa |
65 | 200 | 52 | 28 | 5 | (62 | ) | 288 | ||||||||||||||||||||
| SCA&C |
230 | 47 | 16 | 9 | 20 | (49 | ) | 273 | ||||||||||||||||||||
|
|
|
|
|
|
|
|
|
|
|
|
|
|
|
|||||||||||||||
| Operating segments |
1,724 | 1,578 | 661 | 188 | 248 | (918 | ) | 3,481 | ||||||||||||||||||||
| Other activities |
— | — | — | — | 133 | — | 133 | |||||||||||||||||||||
|
|
|
|
|
|
|
|
|
|
|
|
|
|
|
|||||||||||||||
| Consolidated |
$ | 3,614 | ||||||||||||||||||||||||||
|
|
|
|||||||||||||||||||||||||||
| 5) | OPERATING EXPENSES |
Administrative and selling expenses represent the expenses associated with personnel, services and equipment, including depreciation and amortization, related to managerial and back-office activities of the Company’s management, as well as selling activities, respectively. Distribution and logistics expenses refer to the expenses of storage at points of sales, including depreciation and amortization, as well as freight expenses of finished products between plants and points of sale and freight expenses between points of sales and the customers’ facilities.
Consolidated operating expenses by function for the three-month periods ended March 31, 2026 and 2025 are as follows:
| 2026 | 2025 | |||||||
| Administrative expenses |
$ | 343 | 339 | |||||
| Selling expenses |
102 | 101 | ||||||
|
|
|
|
|
|||||
| Administrative and selling expenses |
445 | 440 | ||||||
| Distribution and logistics expenses |
422 | 394 | ||||||
|
|
|
|
|
|||||
| Operating expenses |
$ | 867 | 834 | |||||
|
|
|
|
|
|||||
For the three-month periods ended March 31, 2026 and 2025, administrative expenses include depreciation and amortization of $54 and $45, respectively, and selling expenses include depreciation and amortization of $14 and $13, respectively.
F-12
Cemex, S.A.B. de C.V. and Subsidiaries
Notes to the Condensed Consolidated Financial Statements
As of March 31, 2026 and December 31, 2025 and for the three-month periods ended March 31, 2026 and 2025
(Millions of U.S. Dollars)
| 6) | OTHER EXPENSES, NET |
The detail of the caption “Other expenses, net” for the three-month periods ended March 31, 2026 and 2025 is as follows:
| 2026 | 2025 | |||||||
| Restructuring costs 1 |
$ | (15 | ) | (38 | ) | |||
| Results from the sale of assets and others |
(21 | ) | (5 | ) | ||||
| Impairment losses |
(7 | ) | (1 | ) | ||||
|
|
|
|
|
|||||
| $ | (43 | ) | (44 | ) | ||||
|
|
|
|
|
|||||
| 1 | Restructuring costs related with Cutting-Edge program mainly refer to severance payments and expenses related to the definitive closing of operating sites. |
| 7) | FINANCIAL INCOME AND OTHER ITEMS, NET |
The detail of financial income and other items, net for the three-month periods ended March 31, 2026 and 2025 was as follows:
| 2026 | 2025 | |||||||
| Foreign exchange results |
$ | 8 | 67 | |||||
| Financial income |
15 | 10 | ||||||
| Results from financial instruments, net (note 15.4) |
13 | (16 | ) | |||||
| Net interest cost of defined benefit liabilities |
(7 | ) | (7 | ) | ||||
| Effects of amortized cost on assets and liabilities |
(18 | ) | (14 | ) | ||||
| Others |
— | — | ||||||
|
|
|
|
|
|||||
| $ | 11 | 40 | ||||||
|
|
|
|
|
|||||
8) TRADE ACCOUNTS RECEIVABLE
As of March 31, 2026 and December 31, 2025, consolidated trade accounts receivable consisted of:
| March 31, 2026 | December 31, 2025 | |||||||
| Trade accounts receivable |
$ | 2,032 | 1,854 | |||||
| Allowances for expected credit losses |
(83 | ) | (84 | ) | ||||
|
|
|
|
|
|||||
| $ | 1,949 | 1,770 | ||||||
|
|
|
|
|
|||||
As of March 31, 2026 and December 31, 2025, trade accounts receivable include $816 and $799, respectively, related to receivables sold in several countries under securitization and factoring programs with recourse. Cemex retains control and the majority of risks and rewards for these trade accounts receivable. As a result, the receivables sold were not derecognized from the statement of financial position. The funded amounts to Cemex, $623 and $681 as of March 31, 2026 and December 31, 2025, respectively, are recognized in “Other financial obligations” (note 15.2).
| 9) | INVENTORIES |
As of March 31, 2026 and December 31, 2025, the consolidated balances of inventories were summarized as follows:
| March 31, 2026 | December 31, 2025 | |||||||
| Finished goods |
$ | 415 | 425 | |||||
| Materials and spare parts |
397 | 376 | ||||||
| Raw materials |
387 | 398 | ||||||
|
Work-in-process |
265 | 279 | ||||||
| Inventory in transit |
46 | 49 | ||||||
|
|
|
|
|
|||||
| $ | 1,510 | 1,527 | ||||||
|
|
|
|
|
|||||
F-13
Cemex, S.A.B. de C.V. and Subsidiaries
Notes to the Condensed Consolidated Financial Statements
As of March 31, 2026 and December 31, 2025 and for the three-month periods ended March 31, 2026 and 2025
(Millions of U.S. Dollars)
| 10) | ASSETS HELD FOR SALE AND OTHER CURRENT ASSETS |
As of March 31, 2026 and December 31, 2025, assets held for sale and other current assets were detailed as follows:
| March 31, 2026 | December 31, 2025 | |||||||
| Assets held for sale |
$ | 436 | 42 | |||||
| Other current assets |
114 | 102 | ||||||
|
|
|
|
|
|||||
| $ | 550 | 144 | ||||||
|
|
|
|
|
|||||
As of March 31, 2026, assets held for sale include the carrying amounts of Cemex’s operation in Colombia (note 4.1) for $394 and other assets held for sale of $42. As of March 31, 2026 and December 31, 2025, other current assets primarily consist of advance payments to inventory suppliers.
| 11) | INVESTMENTS IN ASSOCIATES AND JOINT VENTURES |
As of March 31, 2026 and December 31, 2025, the investments in common shares of associates and joint ventures, which are accounted under the equity method, were as follows:
| Associates |
Activity | Country | % | March 31, 2026 | December 31, 2025 | |||||||||||||||
| Camcem, S.A. de C.V. |
Cement | Mexico | 40.1 | $ | 480 | 470 | ||||||||||||||
| Concrete Supply Co. LLC |
Concrete | United States | 40.0 | 116 | 117 | |||||||||||||||
| Lehigh White Cement Company |
Cement | United States | 36.8 | 83 | 83 | |||||||||||||||
| Joint ventures |
||||||||||||||||||||
| Société d’Exploitation de Carrières |
Aggregates | France | 50.0 | 26 | 26 | |||||||||||||||
| Société Méridionale de Carrières |
Aggregates | France | 33.3 | 15 | 14 | |||||||||||||||
| Other companies |
— | — | — | 77 | 82 | |||||||||||||||
|
|
|
|
|
|||||||||||||||||
| $ | 797 | 792 | ||||||||||||||||||
|
|
|
|
|
|||||||||||||||||
| The breakdown is presented below: |
||||||||||||||||||||
| Acquisition cost |
|
$ | 299 | 334 | ||||||||||||||||
| Equity method recognition |
|
498 | 458 | |||||||||||||||||
|
|
|
|
|
|||||||||||||||||
| 12) | PROPERTY, MACHINERY AND EQUIPMENT, NET AND ASSETS FOR THE RIGHT-OF-USE, NET |
As of March 31, 2026 and December 31, 2025, property, machinery and equipment, net and assets for the right-of-use, net were summarized as follows:
| March 31, 2026 | December 31, 2025 | |||||||
| Property, machinery and equipment, net |
$ | 10,873 | 11,054 | |||||
| Assets for the right-of-use, net |
1,054 | 1,114 | ||||||
|
|
|
|
|
|||||
| $ | 11,927 | 12,168 | ||||||
|
|
|
|
|
|||||
| 12.1) | PROPERTY, MACHINERY AND EQUIPMENT, NET |
As of March 31, 2026 and December 31, 2025, consolidated property, machinery and equipment, net consisted of:
| March 31, 20261 | December 31, 2025 | |||||||
| Machinery and equipment |
$ | 12,770 | 13,095 | |||||
| Land and mineral reserves |
5,342 | 5,485 | ||||||
| Buildings |
2,967 | 2,994 | ||||||
| Construction in progress |
1,298 | 1,191 | ||||||
|
|
|
|
|
|||||
| Total property, machinery and equipment |
22,377 | 22,765 | ||||||
| Accumulated depreciation and depletion |
(11,504 | ) | (11,711 | ) | ||||
|
|
|
|
|
|||||
| Total property, machinery and equipment, net |
$ | 10,873 | 11,054 | |||||
|
|
|
|
|
|||||
| 1 | In connection with the divestiture of certain operations in Colombia (note 4.1), Cemex reclassified $260 from property, machinery and equipment to assets held for sale as of March 31, 2026. |
F-14
Cemex, S.A.B. de C.V. and Subsidiaries
Notes to the Condensed Consolidated Financial Statements
As of March 31, 2026 and December 31, 2025 and for the three-month periods ended March 31, 2026 and 2025
(Millions of U.S. Dollars)
| 12.2) | ASSETS FOR THE RIGHT-OF-USE, NET |
As of March 31, 2026 and December 31, 2025, consolidated assets for the right-of-use, net were related to:
| March 31, 2026 | December 31, 2025 | |||||||
| Machinery and equipment |
$ | 1,608 | 1,653 | |||||
| Land and mineral reserves |
477 | 491 | ||||||
| Buildings |
353 | 366 | ||||||
| Others |
82 | 82 | ||||||
|
|
|
|
|
|||||
| Total assets for the right-of-use |
2,520 | 2,592 | ||||||
| Accumulated depreciation |
(1,466 | ) | (1,478 | ) | ||||
|
|
|
|
|
|||||
| Total assets for the right-of-use, net |
$ | 1,054 | 1,114 | |||||
|
|
|
|
|
|||||
| 13) | INTANGIBLE ASSETS, NET |
As of March 31, 2026 and December 31, 2025, intangible assets of definite useful life were summarized as follows:
| March 31, 2026 | December 31, 2025 | |||||||
| Extraction rights |
$ | 1,868 | 1,876 | |||||
| Internally developed software |
1,332 | 1,311 | ||||||
| Mining projects, industrial property and trademarks |
83 | 85 | ||||||
| Other intangible assets |
438 | 450 | ||||||
|
|
|
|
|
|||||
| Total intangible assets |
3,721 | 3,722 | ||||||
| Accumulated amortization |
(1,771 | ) | (1,732 | ) | ||||
|
|
|
|
|
|||||
| Total intangible assets, net |
$ | 1,950 | 1,990 | |||||
|
|
|
|
|
|||||
For the three-month periods ended March 31, 2026 and 2025, the amortization of intangible assets of definite useful life was $60 and $51, respectively and were recognized within operating costs and expenses.
| 14) | GOODWILL |
As of March 31, 2026 and December 31, 2025, goodwill balances allocated by operating segment, net of cumulative impairment adjustments were as follows:
| March 31, 2026 | December 31, 2025 | |||||||
| United States |
$ | 5,894 | 5,894 | |||||
| Mexico |
417 | 416 | ||||||
| United Kingdom |
274 | 279 | ||||||
| France |
217 | 220 | ||||||
| Colombia |
54 | 136 | ||||||
| Other countries |
221 | 225 | ||||||
|
|
|
|
|
|||||
| $ | 7,077 | 7,170 | ||||||
|
|
|
|
|
|||||
As of March 31, 2026, goodwill of $86 related to operations in Colombia was reclassified to line item “Assets held for sale” (note 4.1).
| 14.1) | ANALYSIS OF GOODWILL IMPAIRMENT |
There were no triggering events during the three-month periods ended March 31, 2026 and 2025 that would have required Cemex to perform an interim goodwill impairment test. Cemex’s annual goodwill impairment test is performed during the last quarter of each year, or at any interim date when impairment indicators exist, in accordance with the methodology disclosed in Cemex’s consolidated financial statements as of and for the year ended December 31, 2025.
F-15
Cemex, S.A.B. de C.V. and Subsidiaries
Notes to the Condensed Consolidated Financial Statements
As of March 31, 2026 and December 31, 2025 and for the three-month periods ended March 31, 2026 and 2025
(Millions of U.S. Dollars)
| 15) | FINANCIAL INSTRUMENTS |
| 15.1) | CURRENT AND NON-CURRENT DEBT |
As of March 31, 2026 and December 31, 2025, Cemex’s consolidated debt summarized by interest rates and currencies, was as follows:
| March 31, 2026 | December 31, 2025 | |||||||||||||||||||||||
| Current | Non-current | Total | Current | Non-current | Total | |||||||||||||||||||
| Floating rate debt |
$ | 186 | 872 | 1,058 | $ | 505 | 879 | 1,384 | ||||||||||||||||
| Fixed rate debt |
211 | 3,886 | 4,097 | 682 | 3,578 | 4,260 | ||||||||||||||||||
|
|
|
|
|
|
|
|
|
|
|
|
|
|||||||||||||
| $ | 397 | 4,758 | 5,155 | $ | 1,187 | 4,457 | 5,644 | |||||||||||||||||
|
|
|
|
|
|
|
|
|
|
|
|
|
|||||||||||||
| March 31, 2026 | December 31, 2025 | |||||||||||||||||||||||||||||||
| Currency | Current | Non-current | Total | Effective rate | Current | Non-current | Total | Effective rate | ||||||||||||||||||||||||
| Dollars |
$ | 209 | 3,411 | 3,620 | 4.7 | % | $ | 210 | 3,413 | 3,623 | 4.7 | % | ||||||||||||||||||||
| Euros |
1 | 517 | 518 | 3.3 | % | 471 | 525 | 996 | 3.2 | % | ||||||||||||||||||||||
| Pesos |
167 | 782 | 949 | 9.6 | % | 499 | 475 | 974 | 9.8 | % | ||||||||||||||||||||||
| Other currencies |
20 | 48 | 68 | 5.2 | % | 7 | 44 | 51 | 5.1 | % | ||||||||||||||||||||||
|
|
|
|
|
|
|
|
|
|
|
|
|
|||||||||||||||||||||
| $ | 397 | 4,758 | 5,155 | $ | 1,187 | 4,457 | 5,644 | |||||||||||||||||||||||||
|
|
|
|
|
|
|
|
|
|
|
|
|
|||||||||||||||||||||
As of March 31, 2026 and December 31, 2025, from the total debt of $5,155 and $5,644, respectively, 97% and 98% was held in the Parent Company.
As of March 31, 2026 and December 31, 2025, Cemex’s consolidated debt summarized by type of instrument, was as follows:
| March 31, 2026 |
Current | Non- current |
December 31, 2025 |
Current | Non- current |
|||||||||||||
| Bank loans |
Bank loans | |||||||||||||||||
| Lines of credit, 2027 to 2033 |
$ | 27 | 98 | Lines of credit, 2026 to 2033 | $ | 16 | 95 | |||||||||||
| Syndicated loans, 2027 to 2029 |
— | 1,504 | Syndicated loans, 2026 to 2029 | 332 | 1,511 | |||||||||||||
|
|
|
|
|
|
|
|
|
|||||||||||
| 27 | 1,602 | 348 | 1,606 | |||||||||||||||
|
|
|
|
|
|
|
|
|
|||||||||||
| Notes payable |
Notes payable | |||||||||||||||||
| Medium-term notes, 2027 to 2031 |
167 | 3,352 | Medium-term notes, 2026 to 2031 | 636 | 3,044 | |||||||||||||
| Other notes payable, 2027 |
5 | 2 | Other notes payable, 2026 to 2027 | 6 | 4 | |||||||||||||
|
|
|
|
|
|
|
|
|
|||||||||||
| 172 | 3,354 | 642 | 3,048 | |||||||||||||||
|
|
|
|
|
|
|
|
|
|||||||||||
| Total bank loans and notes payable |
199 | 4,956 | Total bank loans and notes payable | 990 | 4,654 | |||||||||||||
| Current maturities |
198 | (198 | ) | Current maturities | 197 | (197 | ) | |||||||||||
|
|
|
|
|
|
|
|
|
|||||||||||
| $ | 397 | 4,758 | $ | 1,187 | 4,457 | |||||||||||||
|
|
|
|
|
|
|
|
|
|||||||||||
Changes in consolidated debt for the three-month period ended March 31, 2026 and for the year ended December 31, 2025, were as follows:
| March 31, 2026 | ||||
| Debt at beginning of period |
$ | 5,644 | ||
| Proceeds from new debt instruments |
336 | |||
| Debt repayments |
(817 | ) | ||
| Foreign currency translation and accretion effects |
(8 | ) | ||
|
|
|
|||
| Debt at end of period |
$ | 5,155 | ||
|
|
|
|||
During the three-month period ended March 31, 2026, significant debt transactions were as follows:
On January 7, 2026, Cemex fully repaid the Peso Bilateral Term Loan in the amount of Ps6,000.
F-16
Cemex, S.A.B. de C.V. and Subsidiaries
Notes to the Condensed Consolidated Financial Statements
As of March 31, 2026 and December 31, 2025 and for the three-month periods ended March 31, 2026 and 2025
(Millions of U.S. Dollars)
Current and non-current debt – continued
On February 19, 2026, Cemex completed the issuance of its long-term notes (certificados bursátiles de largo plazo) for an aggregate principal amount of Ps5,500, with a 5-year tenor at a floating annual interest rate of TIIE de Fondeo plus 0.70%. The notes are guaranteed by Cemex Concretos, S.A. de C.V., Cemex Operaciones México, S.A. de C.V., Cemex Corp. and Cemex Innovation Holding Ltd. The net proceeds from this issuance were used for general corporate purposes, including debt repayment.
On March 19, 2026, Cemex, S.A.B. de C.V. repaid at maturity €400 million aggregate principal amount outstanding of its 3.125% Senior Notes due 2026, together with accrued and unpaid interest thereon up to, but excluding, the maturity date.
The maturities of consolidated long-term debt as of March 31, 2026, were as follows:
| Bank loans | Notes payable | Total | ||||||||||
| 2027 |
$ | 622 | 2 | 624 | ||||||||
| 2028 |
625 | — | 625 | |||||||||
| 2029 |
129 | 751 | 880 | |||||||||
| 2030 |
2 | 1,192 | 1,194 | |||||||||
| 2031 and thereafter |
26 | 1,409 | 1,435 | |||||||||
|
|
|
|
|
|
|
|||||||
| $ | 1,404 | 3,354 | 4,758 | |||||||||
|
|
|
|
|
|
|
|||||||
Sustainability-linked financing framework
As of March 31, 2026 and December 31, 2025, Cemex’s consolidated debt totaled $5,155 and $5,644, respectively. Of these amounts, $2,148 in 2026 and $2,483 in 2025 were denominated in Dollars, Euros and Pesos under the 2023 Sustainability-linked Financing Framework (the “2023 SLFF”). This debt supports Cemex’s strategy to reduce CO2 emissions and contribute to a carbon-neutral economy.
As of March 31, 2026 and December 31, 2025, $1,504 and $1,843, respectively, of the debt under the 2023 SLFF, were from bank loans, including the 2023 Credit Agreement, the Euro Credit Agreement and the Peso Bilateral Term Loan (collectively, the “Bank Credit Agreements”). Under these agreements, annual performance against the 2023 SLFF metrics may adjust the interest rate margin by up to plus or minus 5 basis points (“bps”), consistent with other sustainability-linked facilities for investment-grade rated borrowers.
The remainder of the debt balance under the 2023 SLFF relates to the 2023 CEBURES. Of this, $167 in variable rate debt is linked to a single 2023 SLFF metric and may increase by 20 bps in nominal value at redemption. The remaining $477 in fixed rate debt is also tied to one metric and may result in a 25 bps annual increase to the interest rate for the last four semi-annual coupon payments.
Additionally, Cemex’s securitization programs (notes 8 and 15.2) are linked to the 2023 SLFF. Depending on performance against one or more metrics, these programs may incur an annual fee of up to 5 bps of the total facility amount. The 2023 SLFF is also linked to the revolving credit facilities of Banks Credit Agreement (“RCF”) for $2,347. As of March 31, 2026 and December 31, 2025, Cemex’s entire RCF remain available.
Financial Covenants
Under the Bank Credit Agreements, Cemex must maintain a maximum Consolidated Leverage Ratio of 3.75 and a minimum Consolidated Coverage Ratio of 2.75, measured at the end of each quarter for each rolling four-quarter period. These ratios are calculated using the consolidated amounts as defined in the agreements.
Consolidated Leverage Ratio
Under the Bank Credit Agreements, the ratio is calculated by dividing “Consolidated Net Debt” by “Consolidated EBITDA” for the last twelve months as of the calculation date. Consolidated Net Debt is defined as debt reported in the statement of financial position, less cash and cash equivalents. It excludes existing or future obligations under any securitization program and any subordinated notes of Cemex. It is also adjusted for net mark-to-market of all derivative instruments, as applicable, and other adjustments related to business acquisitions or disposals.
F-17
Cemex, S.A.B. de C.V. and Subsidiaries
Notes to the Condensed Consolidated Financial Statements
As of March 31, 2026 and December 31, 2025 and for the three-month periods ended March 31, 2026 and 2025
(Millions of U.S. Dollars)
Current and non-current debt – continued
Consolidated EBITDA: Under the Bank Credit Agreements, Operating EBITDA for the last twelve months as of the calculation date is adjusted for any discontinued EBITDA. This adjustment is used solely to calculate the Consolidated Leverage Ratio on a pro forma basis for any material disposition or acquisition.
Consolidated Coverage Ratio
Under the Bank Credit Agreements, this ratio equals Consolidated EBITDA divided by financial expense for the previous twelve months as of the calculation date.
As of March 31, 2026 and December 31, 2025, under the Bank Credit Agreements, the main consolidated financial ratios were as follows:
| Consolidated financial ratios | Refers to the compliance limits and calculations that were effective on each date |
|||||
| March 31, 2026 | December 31, 2025 | |||||
| Leverage ratio |
Limit | <=3.75 | <=3.75 | |||
| Calculation | 1.70 | 1.63 | ||||
|
|
|
|||||
| Coverage ratio |
Limit | >=2.75 | >=2.75 | |||
| Calculation | 9.17 | 8.37 | ||||
|
|
|
|||||
Cemex may face payment acceleration under the Bank Credit Agreement if it fails to comply with financial ratios and does not secure a waiver or negotiate compliance. This could have a significant impact on its operating results, liquidity, and financial position. Cemex’s ability to comply with these ratios may be affected by economic conditions, volatility in foreign exchange rates, as well as by overall conditions in the financial and capital markets or other factors. Cemex will reclassify all non-current debt as current if it fails to meet its covenants, causing a default, including if the financial ratios are not met, or if a cross-default clause is triggered. However, it will not reclassify non-current debt if it anticipates compliance with financial ratios, provided there are amendments or waivers for the next 12 months, a high likelihood of curing any violations during a remediation period, or a long-term refinancing agreement.
| 15.2) | OTHER FINANCIAL OBLIGATIONS |
As of March 31, 2026 and December 31, 2025, other financial obligations in the consolidated statement of financial position were detailed as follows:
| March 31, 2026 | December 31, 2025 | |||||||||||||||||||||||
| Current | Non-current | Total | Current | Non-current | Total | |||||||||||||||||||
| I. Leases |
$ | 256 | 825 | 1,081 | $ | 267 | 868 | 1,135 | ||||||||||||||||
| II. Liabilities secured with accounts receivable |
623 | — | 623 | 681 | — | 681 | ||||||||||||||||||
|
|
|
|
|
|
|
|
|
|
|
|
|
|||||||||||||
| $ | 879 | 825 | 1,704 | $ | 948 | 868 | 1,816 | |||||||||||||||||
|
|
|
|
|
|
|
|
|
|
|
|
|
|||||||||||||
Consolidated financial expenses related to lease contracts for the three-month periods ended March 31, 2026 and 2025, were $17 and $18, respectively. In connection with the liabilities secured by accounts receivable, as explained in note 8, the discount granted to acquirers of trade accounts receivable is recorded as financial expense, for the three-month periods ended March 31, 2026 and 2025 amounted to $9 and $10, respectively.
F-18
Cemex, S.A.B. de C.V. and Subsidiaries
Notes to the Condensed Consolidated Financial Statements
As of March 31, 2026 and December 31, 2025 and for the three-month periods ended March 31, 2026 and 2025
(Millions of U.S. Dollars)
| 15.3) | FAIR VALUE OF FINANCIAL INSTRUMENTS |
As of March 31, 2026 and December 31, 2025, the carrying amounts of financial assets and liabilities and their respective fair values were as follows:
| March 31, 2026 | December 31, 2025 | |||||||||||||||
| Carrying amount | Fair value | Carrying amount | Fair value | |||||||||||||
| Financial assets |
||||||||||||||||
| Derivative financial instruments (note 15.4) |
$ | 19 | 19 | $ | 10 | 10 | ||||||||||
| Other investments and non-current accounts receivable |
204 | 200 | 202 | 197 | ||||||||||||
|
|
|
|
|
|
|
|
|
|||||||||
| $ | 223 | 219 | $ | 212 | 207 | |||||||||||
|
|
|
|
|
|
|
|
|
|||||||||
| Financial liabilities |
||||||||||||||||
| Long-term debt (note 15.1) |
$ | 4,758 | 4,716 | $ | 4,457 | 4,478 | ||||||||||
| Other financial obligations (note 15.2) |
825 | 809 | 868 | 866 | ||||||||||||
| Derivative financial instruments (note 15.4) |
55 | 55 | 44 | 44 | ||||||||||||
|
|
|
|
|
|
|
|
|
|||||||||
| $ | 5,638 | 5,580 | $ | 5,369 | 5,388 | |||||||||||
|
|
|
|
|
|
|
|
|
|||||||||
| 15.4) | DERIVATIVE FINANCIAL INSTRUMENTS |
During the reported periods, in compliance with the guidelines established by its Risk Management Committee, the restrictions set forth by its debt agreements and its hedging strategy (note 15.5), Cemex held derivative instruments with the objectives explained in the following paragraphs.
As of March 31, 2026 and December 31, 2025, the notional amounts and fair values of Cemex’s derivative instruments were as follows:
| March 31, 2026 | December 31,2025 | |||||||||||||||
| Notional amount | Fair value | Notional amount | Fair value | |||||||||||||
| I. Financial derivative instruments hedging the net investment |
$ | 1,887 | (82 | ) | 1,817 | (94 | ) | |||||||||
| II. Cross currency swaps |
658 | (3 | ) | 658 | (1 | ) | ||||||||||
| III. Interest rate swaps |
1,105 | 18 | 705 | 2 | ||||||||||||
| IV. Fuel price hedging |
183 | 64 | 247 | 3 | ||||||||||||
|
|
|
|
|
|
|
|
|
|||||||||
| $ | 3,833 | (3 | ) | 3,427 | (90 | ) | ||||||||||
|
|
|
|
|
|
|
|
|
|||||||||
| I. | Net investment hedges |
As of March 31, 2026 and December 31, 2025, there are Dollar/Peso foreign exchange forward contracts for notional amounts of $410 and $492, respectively. Cemex has designated this program as a hedge of Cemex’s net investment in Pesos, pursuant to which changes in the fair market value of these instruments are recognized as part of “Other equity reserves”. For the three-month periods ended March 31, 2026 and 2025, these contracts generated losses of $11 and $16, respectively, which partially offset currency translation results in each year recognized in equity generated from Cemex’s net assets denominated in Pesos.
In addition, as of March 31, 2026 and December 31, 2025, as part of Cemex’s Peso net investment hedge strategy, there are additional Dollar/Peso capped forwards, structured with option contracts, for a notional amount of $908 and $784, respectively. Changes in the fair market value of such capped forward contracts are also recognized as part of “Other equity reserves”. For the three-month periods ended March 31, 2026 and 2025, these contracts generated losses of $18 and $2, respectively, which partially offset currency translation effects recognized in equity generated from Cemex’s net assets denominated in Pesos.
Moreover, as of March 31, 2026 and December 31, 2025, Cemex held cross-currency swap and forward starting cross currency swaps contracts for a notional amount of $569 and $541, respectively. Cemex has designated this program as a hedge of Cemex’s net investment in Euros. In addition, changes in the fair value of these contracts related to the interest are initially recognized as part of “Other equity reserves” and are subsequently allocated through financial expense, as interest expense on the related loans is accrued in the Income Statement. For the three-month periods ended March 31, 2026 and 2025, changes in the fair value of these contracts generated losses of $3 and of $4, recognized in “Other equity reserves”.
F-19
Cemex, S.A.B. de C.V. and Subsidiaries
Notes to the Condensed Consolidated Financial Statements
As of March 31, 2026 and December 31, 2025 and for the three-month periods ended March 31, 2026 and 2025
(Millions of U.S. Dollars)
Derivative financial instruments – continued
| II. | Cross currency swaps |
As of March 31, 2026 and December 31, 2025, Cemex held cross-currency swap contracts for a notional amount of $658, in both periods, related to the 2023 CEBURES, as described in note 15.1. These contracts were designated as cash flow hedges to modify the rate and currency risk profile of the 2023 CEBURES from Peso to Dollar. For the three-month periods ended March 31, 2026 and 2025, changes in the fair value of these contracts resulted in gains of $8 and of $17, respectively, which were recognized in other comprehensive income.
| III. | Interest rate swaps |
As of March 31, 2026 and December 31, 2025, Cemex held interest rate swaps for a notional amount of $705, in both periods, and fair value assets of $6 and $2, respectively. For the three-month periods ended March 31, 2026 and 2025, changes in the fair value of these contracts generated gains of $4 and losses of $6, respectively, which were recognized in other comprehensive income.
In addition, as part of a forecasted debt issuance, during February, 2026, Cemex entered into treasury rate lock contracts for a notional amount of $400. Cemex designated these treasury rate lock contracts as a cash flow hedge of the forecasted debt transaction. As of March 31, 2026, changes in fair value of these contracts generated gains of $12 recognized in other comprehensive income.
| IV. | Fuel price hedging |
As of March 31, 2026 and December 31, 2025, Cemex maintained financial derivative contracts negotiated to hedge the price of certain fuels in several operations, for aggregate notional amounts of $91 and $120, respectively. These contracts have been designated as cash flow hedges of forecast transactions. For the three-month period ended March 31, 2026 and 2025, changes in fair value of these contracts recognized in “Other equity reserves” represented gains of $52 and $2, respectively. In addition, as of March 31, 2026 and December 31, 2025, Cemex held Brent oil call spreads and until maturity during March, 2026 coal call spreads, with notional amounts of $92 and $128, respectively. Changes in the fair value of these contracts are recognized directly in the Income Statement as part of “Financial income and other items, net.” For the three-month periods ended March 31, 2026 and March 31, 2025, these contract resulted gains of $13 and losses of $2, respectively.
15.5) RISK MANAGEMENT
In the ordinary course of business, Cemex is exposed to credit risk, interest rate risk, foreign exchange risk, equity risk, commodity risk and liquidity risk. Cemex’s risk management framework, the policies established to manage each of these risks, and the use of derivative financial instruments as part of these strategies, are described in note 18.5 to Cemex’s consolidated financial statements as of and for the year ended December 31, 2025. There were no significant changes during the three-month period ended March 31, 2026 in Cemex’s risk management framework or in the policies applied.
The main risk categories are mentioned below:
Credit risk
As of March 31, 2026, the maximum exposure to credit risk is represented by the carrying amount of financial assets. Cemex’s estimated expected credit losses based on the ECL model amounted to $83 (note 8). There were no significant changes during the period in Cemex’s credit risk profile or in the policies for the authorization of credit to customers.
Interest rate risk
Cemex’s exposure to interest rate risk relates primarily to its long-term debt obligations with floating interest rates. As of March 31, 2026 and December 31, 2025, the SOFR rate was 3.68% and 3.87%, respectively, and the 3-month Euribor rate was 2.079% and 2.026%, respectively (note 15.1). There were no significant changes during the period in Cemex’s strategy to manage its exposure to fixed and floating interest rates.
F-20
Cemex, S.A.B. de C.V. and Subsidiaries
Notes to the Condensed Consolidated Financial Statements
As of March 31, 2026 and December 31, 2025 and for the three-month periods ended March 31, 2026 and 2025
(Millions of U.S. Dollars)
Risk management – continued
Liquidity risk
As of March 31, 2026, current liabilities, including $1,276 in current debt and other financial obligations, exceed current assets by $877. Management has adopted an operating strategy that maintains a negative working capital balance. For the three-month period ended March 31, 2026, Cemex generated $141 in net cash flows from operating activities. As of March 31, 2026, Cemex has a committed line of credit under the RCF totaling $2,347. Management considers Cemex will generate sufficient cash flows over the next twelve months, together with available committed credit facilities, to meet its current obligations.
| 16) | OTHER CURRENT LIABILITIES |
As of March 31, 2026 and December 31, 2025, consolidated other current liabilities were as follows:
| March 31, 2026 | December 31, 2025 | |||||||
| Other accounts payable and accrued expenses |
$ | 900 | 659 | |||||
| Provisions |
542 | 558 | ||||||
| Contract liabilities with customers |
323 | 369 | ||||||
| Interest payable |
63 | 96 | ||||||
|
|
|
|
|
|||||
| $ | 1,828 | 1,682 | ||||||
|
|
|
|
|
|||||
| 17) | INCOME TAXES |
| 17.1) | INCOME TAXES FOR THE PERIOD |
The amounts of income tax expense in the Income Statements for the three-month periods ended March 31 2026 and 2025 are summarized as follows:
| 2026 | 2025 | |||||||
| Current income tax expense |
$ | 62 | 57 | |||||
| Deferred income tax expense (benefit) |
32 | (5 | ) | |||||
|
|
|
|
|
|||||
| $ | 94 | 52 | ||||||
|
|
|
|
|
|||||
| 17.2) | SIGNIFICANT TAX PROCEEDINGS |
Cemex is involved in several ongoing tax proceedings which have not required the recognition of accruals since the Company does not consider probable and adverse resolution considering the evidence at its disposal. Nonetheless, the Company cannot assure obtaining favorable resolutions in each case. As of March 31, 2026, there has not been any notable change in respect to December 31, 2025 in connection with the most significant tax proceedings.
| 18) | STOCKHOLDERS’ EQUITY |
| 18.1) | COMMON STOCK AND ADDITIONAL PAID-IN CAPITAL |
On March 26, 2026, stockholders at the general ordinary shareholders’ meeting of Cemex, S.A.B. de C.V. approved: (a) the payment of a cash dividend for a total of $180 in four equal quarterly installments beginning in June 2026 and finalizing in March 2027; (b) setting the amount of $500 or its equivalent in Pesos as the maximum amount that during fiscal year 2026, and until the next ordinary general shareholders’ meeting of Cemex, S.A.B. de C.V. is held, Cemex, S.A.B. de C.V. may use for the acquisition of its own shares or securities representing such shares; and (c) the appointment of the members of the Board of Directors, the Audit Committee, the Corporate Practices and Finance Committee and, the Sustainability, Climate Action, Social Impact and Diversity Committee.
As of March 31, 2026 and December 31, 2025, Cemex, S.A.B. de C.V. did not issue shares in connection with its executive share-based compensation programs.
F-21
Cemex, S.A.B. de C.V. and Subsidiaries
Notes to the Condensed Consolidated Financial Statements
As of March 31, 2026 and December 31, 2025 and for the three-month periods ended March 31, 2026 and 2025
(Millions of U.S. Dollars)
| 18.2) | OTHER EQUITY RESERVES AND SUBORDINATED NOTES |
As of March 31, 2026 and December 31, 2025, the caption of other equity reserves and subordinated notes was integrated as follows:
| March 31, 2026 | December 31, 2025 | |||||||
| Other equity reserves |
$ | (2,670 | ) | (2,429 | ) | |||
| Subordinated notes |
1,983 | 1,983 | ||||||
|
|
|
|
|
|||||
| $ | (687 | ) | (446 | ) | ||||
|
|
|
|
|
|||||
Subordinated notes
As of March 31, 2026 and December 31, 2025, Cemex held $1,000 of 7.200% subordinated notes issued in June 2025 (the “2025 Subordinated Notes”) and $1,000 of 5.125% subordinated notes issued in June 2021 (the “2021 Subordinated Notes,” and jointly with the 2025 Subordinated Notes, the “Subordinated Notes”). The Subordinated Notes are classified within controlling interest stockholders’ equity under “Other equity reserves” in accordance with IAS 32, Financial Instruments: Presentation. There were no issuances, repurchases, or modifications to the Subordinated Notes during the three-month period ended March 31, 2026.
Coupon payments on the Subordinated Notes recognized within “Other equity reserves” amounted to $62 and $37 for the three-month periods ended March 31, 2026 and 2025, respectively.
| 19) | LEGAL PROCEEDINGS |
| 19.1) | PROVISIONS RESULTING FROM LEGAL PROCEEDINGS |
Cemex is involved in various significant legal proceedings, the adverse resolutions are deemed probable and imply the incurrence of losses and/or cash outflows or the delivery of other resources owned by Cemex. As a result, certain provisions and/or losses have been recognized in the financial statements, representing the best estimate of cash outflows. Cemex believes that it will not make significant expenditure over the amounts recorded. As of March 31, 2026, there has not been any notable change in respect to December 31, 2025 in connection with the most significant proceedings.
| 19.2) | CONTINGENCIES FROM LEGAL PROCEEDINGS |
Cemex is involved in various legal proceedings, which have not required the recognition of accruals, considering that the probability of loss is less than probable. Nonetheless, until all stages in the procedures are exhausted in each proceeding, Cemex cannot assure the achievement of a final favorable resolution. As of March 31, 2026, there has not been any notable change in respect to December 31, 2025 in connection with these contingencies.
| 19.3) | OTHER SIGNIFICANT PROCESSES |
Cemex’s other significant processes principally relate to the cement plant located in the municipality of Maceo, Colombia (the “Maceo Plant”). As of March 31, 2026, there has not been any notable change in respect to December 31, 2025 in connection with these matters.
| 20) | SUBSEQUENT EVENTS |
On May 28, 2026, Cemex entered into a U.S. Dollar-denominated $3,000 sustainability-linked syndicated revolving credit facility maturing in 2031 (the “2026 Credit Agreement”), the proceeds of which will be used for general corporate purposes, including the refinancing of financial obligations of Cemex and its subsidiaries. The 2026 Credit Agreement bears interest at a margin over SOFR ranging from 85 to 137.5 basis points based on Cemex’s credit rating and maintains a maximum Consolidated Leverage Ratio of 3.75 times and a minimum Consolidated Coverage Ratio of 2.75 times, consistent with an investment-grade capital structure. The 2026 Credit Agreement is guaranteed solely by Cemex Corp., a subsidiary of Cemex. Cemex will not be able to borrow under the 2026 Credit Agreement until certain conditions are satisfied, which Cemex currently expects to be satisfied in the short-term (possibly prior to June 30, 2026). As of the date of issuance of these condensed consolidated financial statements, no amounts were outstanding under the 2026 Credit Agreement.
F-22