 エドガーで原本を確認する
UNITED STATES
SECURITIES AND EXCHANGE COMMISSION
WASHINGTON, D.C. 20549
FORM 8-K
CURRENT REPORT
Pursuant to Section 13 or 15(d) of
the Securities Exchange Act of 1934
Date of Report (Date of Earliest Event Reported): May 28, 2026

VIASAT, INC.
(Exact Name of Registrant as Specified in its Charter)
| Delaware
|
000-21767
|
33-0174996
|
||
| (State or Other Jurisdiction of Incorporation) |
(Commission File No.) | (I.R.S. Employer Identification No.) |
6155 El Camino Real
Carlsbad, California 92009
(Address of Principal Executive Offices, Including Zip Code)
(760) 476-2200
(Registrant’s Telephone Number, Including Area Code)
Check the appropriate box below if the Form 8-K filing is intended to simultaneously satisfy the filing obligation of the registrant under any of the following provisions:
☐ Written communications pursuant to Rule 425 under the Securities Act (17 CFR 230.425)
☐ Soliciting material pursuant to Rule 14a-12 under the Exchange Act (17 CFR 240.14a-12)
☐ Pre-commencement communications pursuant to Rule 14d-2(b) under the Exchange Act (17 CFR 240.14d-2(b))
☐ Pre-commencement communications pursuant to Rule 13e-4(c) under the Exchange Act (17 CFR 240.13e-4(c))
| (Title of Each Class) |
(Trading |
(Name of Each Exchange |
||
| Common Stock, par value $0.0001 per share | VSAT | The Nasdaq Stock Market LLC |
Indicate by check mark whether the registrant is an emerging growth company as defined in Rule 405 of the Securities Act of 1933 (§230.405 of this chapter) or Rule 12b-2 of the Securities Exchange Act of 1934 (§240.12b-2 of this chapter).
Emerging growth company ☐
If an emerging growth company, indicate by check mark if the registrant has elected not to use the extended transition period for complying with any new or revised financial accounting standards provided pursuant to Section 13(a) of the Exchange Act. ☐
| Item 2.02 | Results of Operations and Financial Condition. |
On May 28, 2026, Viasat, Inc. released its financial results for the fourth quarter and fiscal year 2026 in a letter to shareholders that is available on the investor relations section of its website. A copy of the press release announcing the release of financial results is furnished herewith as Exhibit 99.1 and a copy of the letter to shareholders is furnished herewith as Exhibit 99.2.
The information contained herein and in the accompanying exhibits shall not be incorporated by reference into any filing of the registrant, whether made before or after the date hereof, regardless of any general incorporation language in such filing, unless expressly incorporated by specific reference to such filing. The information in this report, including the exhibit hereto, shall not be deemed to be “filed” for purposes of Section 18 of the Securities Exchange Act of 1934, as amended, or otherwise subject to the liabilities of that section or Sections 11 and 12(a)(2) of the Securities Act of 1933, as amended.
| Item 9.01 | Financial Statements and Exhibits. |
| (d) | Exhibits |
| Exhibit Number |
Description of Exhibit | |
| 99.1 | Press Release dated May 28, 2026 issued by Viasat, Inc. | |
| 99.2 | Viasat, Inc. fourth quarter and fiscal year 2026 letter to shareholders dated May 28, 2026 | |
| 104 | Cover Page Interactive Data File (embedded within the Inline XBRL document) |
2
SIGNATURES
Pursuant to the requirements of the Securities Exchange Act of 1934, the registrant has duly caused this report to be signed on its behalf by the undersigned hereunto duly authorized.
| Date: May 28, 2026 | Viasat, Inc. | |||
| By: | /s/ Brett Church |
|||
| Brett Church | ||||
| Associate General Counsel | ||||
3
Exhibit 99.1

Viasat Releases Fourth Quarter and Fiscal Year 2026 Financial Results
CARLSBAD, Calif., May 28, 2026 — Viasat, Inc. (NASDAQ: VSAT), a global leader in satellite communications, today published its fourth quarter and fiscal year 2026 financial results. A letter to shareholders and accompanying webcast slides are available on the Investor Relations section of the company’s website.
Conference Call Details
As previously announced, Management will host a conference call to discuss the results today, Thursday, May 28, 2026 at 2:30 p.m. PT (5:30 p.m. ET).
Access Information:
| • | Dial-in: (800) 715-9871 (U.S./Canada toll-free) or (646) 307-1963 (international) |
| • | Conference ID: 2206055 |
| • | Live webcast: Available on Viasat’s Investor Relations website. |
A replay of the call will be archived on the Investor Relations site.
# # #
About Viasat
Viasat is a global communications company that believes everyone and everything in the world can be connected. With offices in 24 countries around the world, our mission shapes how consumers, businesses, governments and militaries around the world communicate and connect. Viasat is developing the ultimate global communications network to power high-quality, reliable, secure, affordable, fast connections to positively impact people’s lives anywhere they are—on the ground, in the air or at sea, while building a sustainable future in space. In May 2023, Viasat completed its acquisition of Inmarsat, combining the teams, technologies and resources of the two companies to create a new global communications partner. Learn more at www.viasat.com, the Viasat News Room or follow us on LinkedIn, X, Instagram, Facebook, Bluesky, Threads, and YouTube.
Copyright © 2026 Viasat, Inc. All rights reserved. Viasat, the Viasat logo and the Viasat Signal are registered trademarks in the U.S. and in other countries of Viasat, Inc. All other product or company names mentioned are used for identification purposes only and may be trademarks of their respective owners.
Viasat, Inc. Contacts
Scott Goryl/Daniel Bleier, Corporate Communications, PR@viasat.com
Lisa Curran/Peter Lopez, Investor Relations, IR@viasat.com
Exhibit 99.2

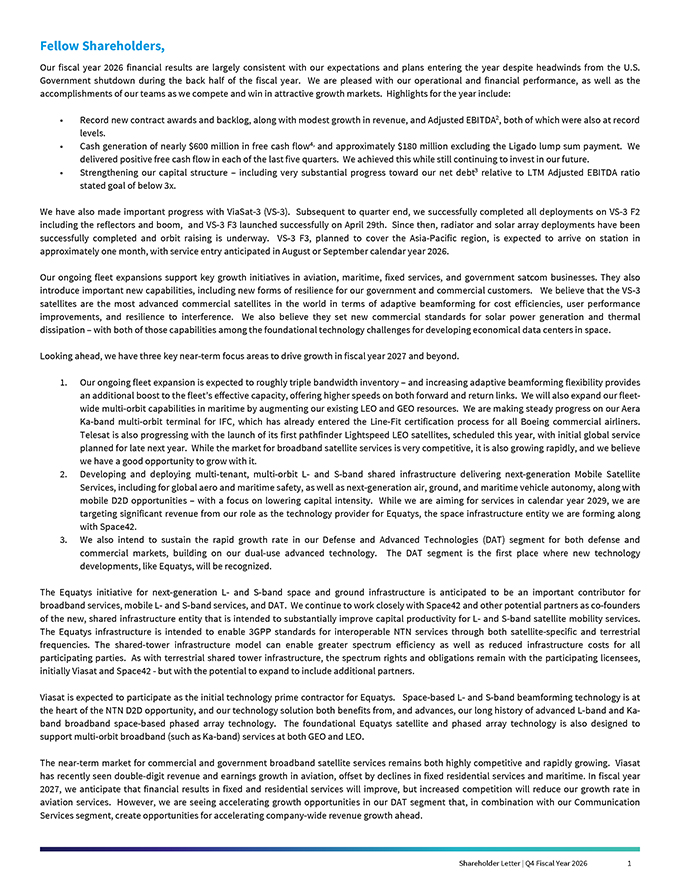
Viasat Q4 FY26 Shareholder Letter Fellow Shareholders, Our fiscal year 2026 financial results are largely consistent with our expectations and plans entering the year despite headwinds from the U.S. Government shutdown during the back half of the fiscal year. We are pleased with our operational and financial performance, as well as the accomplishments of our teams as we compete and win in attractive growth markets. Highlights for the year include: • Record new contract awards and backlog, along with modest growth in revenue, and Adjusted EBITDA2, both of which were also at record levels. • Cash generation of nearly $600 million in free cash flow4, and approximately $180 million excluding the Ligado lump sum payment. We delivered positive free cash flow in each of the last five quarters. We achieved this while still continuing to invest in our future. • Strengthening our capital structure – including very substantial progress toward our net debt3 relative to LTM Adjusted EBITDA ratio stated goal of below 3x. We have also made important progress with ViaSat-3 (VS-3). Subsequent to quarter end, we successfully completed all deployments on VS-3 F2 including the reflectors and boom, and VS-3 F3 launched successfully on April 29th. Since then, radiator and solar array deployments have been successfully completed and orbit raising is underway. VS-3 F3, planned to cover the Asia-Pacific region, is expected to arrive on station in approximately one month, with service entry anticipated in August or September calendar year 2026. Our ongoing fleet expansions support key growth initiatives in aviation, maritime, fixed services, and government satcom businesses. They also introduce important new capabilities, including new forms of resilience for our government and commercial customers. We believe that the VS-3 satellites are the most advanced commercial satellites in the world in terms of adaptive beamforming for cost efficiencies, user performance improvements, and resilience to interference. We also believe they set new commercial standards for solar power generation and thermal dissipation – with both of those capabilities among the foundational technology challenges for developing economical data centers in space. Looking ahead, we have three key near-term focus areas to drive growth in fiscal year 2027 and beyond. 1. Our ongoing fleet expansion is expected to roughly triple bandwidth inventory – and increasing adaptive beamforming flexibility provides an additional boost to the fleet’s effective capacity, offering higher speeds on both forward and return links. We will also expand our fleet-wide multi-orbit capabilities in maritime by augmenting our existing LEO and GEO resources. We are making steady progress on our Aera Ka-band multi-orbit terminal for IFC, which has already entered the Line-Fit certification process for all Boeing commercial airliners. Telesat is also progressing with the launch of its first pathfinder Lightspeed LEO satellites, scheduled this year, with initial global service planned for late next year. While the market for broadband satellite services is very competitive, it is also growing rapidly, and we believe we have a good opportunity to grow with it. 2. Developing and deploying multi-tenant, multi-orbit L- and S-band shared infrastructure delivering next-generation Mobile Satellite Services, including for global aero and maritime safety, as well as next-generation air, ground, and maritime vehicle autonomy, along with mobile D2D opportunities – with a focus on lowering capital intensity. While we are aiming for services in calendar year 2029, we are targeting significant revenue from our role as the technology provider for Equatys, the space infrastructure entity we are forming along with Space42. 3. We also intend to sustain the rapid growth rate in our Defense and Advanced Technologies (DAT) segment for both defense and commercial markets, building on our dual-use advanced technology. The DAT segment is the first place where new technology developments, like Equatys, will be recognized. The Equatys initiative for next-generation L- and S-band space and ground infrastructure is anticipated to be an important contributor for broadband services, mobile L- and S-band services, and DAT. We continue to work closely with Space42 and other potential partners as co-founders of the new, shared infrastructure entity that is intended to substantially improve capital productivity for L- and S-band satellite mobility services. The Equatys infrastructure is intended to enable 3GPP standards for interoperable NTN services through both satellite-specific and terrestrial frequencies. The shared-tower infrastructure model can enable greater spectrum efficiency as well as reduced infrastructure costs for all participating parties. As with terrestrial shared tower infrastructure, the spectrum rights and obligations remain with the participating licensees, initially Viasat and Space42 - but with the potential to expand to include additional partners. Viasat is expected to participate as the initial technology prime contractor for Equatys. Space-based L- and S-band beamforming technology is at the heart of the NTN D2D opportunity, and our technology solution both benefits from, and advances, our long history of advanced L-band and Ka- band broadband space-based phased array technology. The foundational Equatys satellite and phased array technology is also designed to support multi-orbit broadband (such as Ka-band) services at both GEO and LEO. The near-term market for commercial and government broadband satellite services remains both highly competitive and rapidly growing. Viasat has recently seen double-digit revenue and earnings growth in aviation, offset by declines in fixed residential services and maritime. In fiscal year 2027, we anticipate that financial results in fixed and residential services will improve, but increased competition will reduce our growth rate in aviation services. However, we are seeing accelerating growth opportunities in our DAT segment that, in combination with our Communication Services segment, create opportunities for accelerating company-wide revenue growth ahead. Shareholder Letter | Q4 Fiscal Year 2026 1 The space sector is poised to benefit from a number of exciting new defense, commercial and scientific initiatives, and we believe Viasat is well positioned to participate in a number of those.
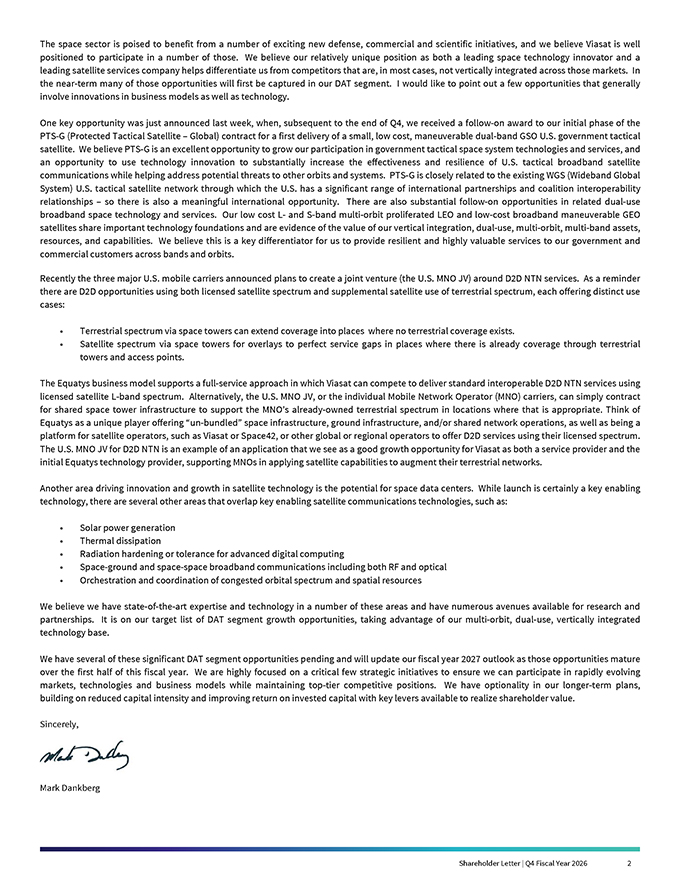
We believe our relatively unique position as both a leading space technology innovator and leading satellite services company helps differentiate us from competitors that are, in most cases, not vertically integrated across those markets. In the near-term many of those opportunities will first be captured in our DAT segment. I would like to point out a few opportunities that generally involve innovations in business models as well as technology. One key opportunity was just announced last week, when, subsequent to the end of Q4, we received a follow-on award to our initial phase of the PTS-G (Protected Tactical Satellite – Global) contract for a first delivery of a small, low cost, maneuverable dual-band GSO U.S. government tactical satellite. We believe PTS-G is an excellent opportunity to grow our participation in government tactical space system technologies and services, and an opportunity to use technology innovation to substantially increase the effectiveness and resilience of U.S. tactical broadband satellite communications while helping address potential threats to other orbits and systems. PTS-G is closely related to the existing WGS (Wideband Global System) U.S. tactical satellite network through which the U.S. has a significant range of international partnerships and coalition interoperability relationships – so there is also a meaningful international opportunity. There are also substantial follow-on opportunities in related dual-use broadband space technology and services. Our low cost L- and S-band multi-orbit proliferated LEO and low-cost broadband maneuverable GEO satellites share important technology foundations and are evidence of the value of our vertical integration, dual-use, multi-orbit, multi-band assets, resources, and capabilities. We believe this is a key differentiator for us to provide resilient and highly valuable services to our government and commercial customers across bands and orbits. Recently the three major U.S. mobile carriers announced plans to create a joint venture (the U.S. MNO JV) around D2D NTN services. As a reminder there are D2D opportunities using both licensed satellite spectrum and supplemental satellite use of terrestrial spectrum, each offering distinct use cases: • Terrestrial spectrum via space towers can extend coverage into places where no terrestrial coverage exists. • Satellite spectrum via space towers for overlays to perfect service gaps in places where there is already coverage through terrestrial towers and access points. The Equatys business model supports a full-service approach in which Viasat can compete to deliver standard interoperable D2D NTN services using licensed satellite L-band spectrum. Alternatively, the U.S. MNO JV, or the individual Mobile Network Operator (MNO) carriers, can simply contract for shared space tower infrastructure to support the MNO’s already-owned terrestrial spectrum in locations where that is appropriate. Think of Equatys as a unique player offering “un-bundled” space infrastructure, ground infrastructure, and/or shared network operations, as well as being platform for satellite operators, such as Viasat or Space42, or other global or regional operators to offer D2D services using their licensed spectrum. The U.S. MNO JV for D2D NTN is an example of an application that we see as a good growth opportunity for Viasat as both a service provider and the initial Equatys technology provider, supporting MNOs in applying satellite capabilities to augment their terrestrial networks. Another area driving innovation and growth in satellite technology is the potential for space data centers. While launch is certainly a key enabling technology, there are several other areas that overlap key enabling satellite communications technologies, such as: • Solar power generation • Thermal dissipation • Radiation hardening or tolerance for advanced digital computing • Space-ground and space-space broadband communications including both RF and optical • Orchestration and coordination of congested orbital spectrum and spatial resources We believe we have state-of-the-art expertise and technology in a number of these areas and have numerous avenues available for research and partnerships. It is on our target list of DAT segment growth opportunities, taking advantage of our multi-orbit, dual-use, vertically integrated technology base. We have several of these significant DAT segment opportunities pending and will update our fiscal year 2027 outlook as those opportunities mature over the first half of this fiscal year. We are highly focused on a critical few strategic initiatives to ensure we can participate in rapidly evolving markets, technologies and business models while maintaining top-tier competitive positions. We have optionality in our longer-term plans, building on reduced capital intensity and improving return on invested capital with key levers available to realize shareholder value. Sincerely, Mark Dankberg Shareholder Letter | Q4 Fiscal Year 2026 2 FY 2026 Year in Review Financial Highlights Achieved record awards of $4.9 billion, driven primarily by an 8% yearover- year (YoY) increase in the Communication Services segment.
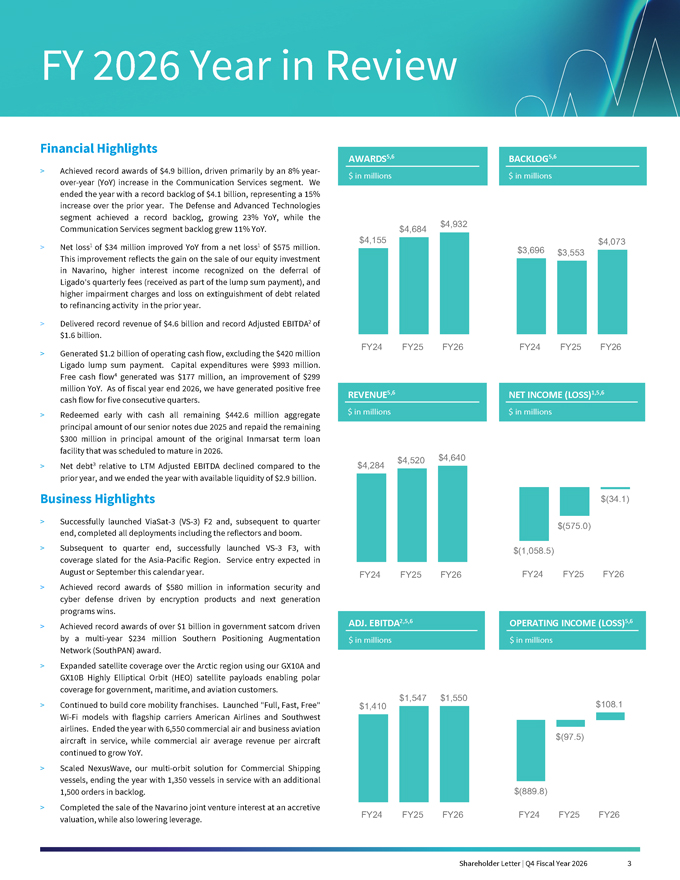
We ended the year with a record backlog of $4.1 billion, representing a 15% increase over the prior year. The Defense and Advanced Technologies segment achieved a record backlog, growing 23% YoY, while the Communication Services segment backlog grew 11% YoY. Net loss1 of $34 million improved YoY from a net loss1 of $575 million. This improvement reflects the gain on the sale of our equity investment in Navarino, higher interest income recognized on the deferral of Ligado’s quarterly fees (received as part of the lump sum payment), and higher impairment charges and loss on extinguishment of debt related to refinancing activity in the prior year. Delivered record revenue of $4.6 billion and record Adjusted EBITDA2 of $1.6 billion. > Generated $1.2 billion of operating cash flow, excluding the $420 million Ligado lump sum payment. Capital expenditures were $993 million. Free cash flow4 generated was $177 million, an improvement of $299 million YoY. As of fiscal year end 2026, we have generated positive free cash flow for five consecutive quarters. > Redeemed early with cash all remaining $442.6 million aggregate principal amount of our senior notes due 2025 and repaid the remaining $300 million in principal amount of the original Inmarsat term loan facility that was scheduled to mature in 2026. > Net debt3 relative to LTM Adjusted EBITDA declined compared to the prior year, and we ended the year with available liquidity of $2.9 billion. Business Highlights > Successfully launched ViaSat-3 (VS-3) F2 and, subsequent to quarter end, completed all deployments including the reflectors and boom. > Subsequent to quarter end, successfully launched VS-3 F3, with coverage slated for the Asia-Pacific Region. Service entry expected in August or September this calendar year. > Achieved record awards of $580 million in information security and cyber defense driven by encryption products and next generation programs wins. > Achieved record awards of over $1 billion in government satcom driven by a multi-year $234 million Southern Positioning Augmentation Network (SouthPAN) award. > Expanded satellite coverage over the Arctic region using our GX10A and GX10B Highly Elliptical Orbit (HEO) satellite payloads enabling polar coverage for government, maritime, and aviation customers. > Continued to build core mobility franchises. Launched “Full, Fast, Free” Wi-Fi models with flagship carriers American Airlines and Southwest airlines. Ended the year with 6,550 commercial air and business aviation aircraft in service, while commercial air average revenue per aircraft continued to grow YoY. > Scaled NexusWave, our multi-orbit solution for Commercial Shipping vessels, ending the year with 1,350 vessels in service with an additional 1,500 orders in backlog. Completed the sale of the Navarino joint venture interest at an accretive valuation, while also lowering leverage. AWARDS5,6 BACKLOG5,6 $ in millions REVENUE5,6 NET INCOME (LOSS)1,5,6 ADJ. EBITDA2,5,6 OPERATING INCOME (LOSS)5,6 Shareholder Letter | Q4 Fiscal Year 2026 3 Q4 FY2026 Financial Results Revenue for Q4 FY2026 was $1.2 billion, representing a 2% YoY increase.
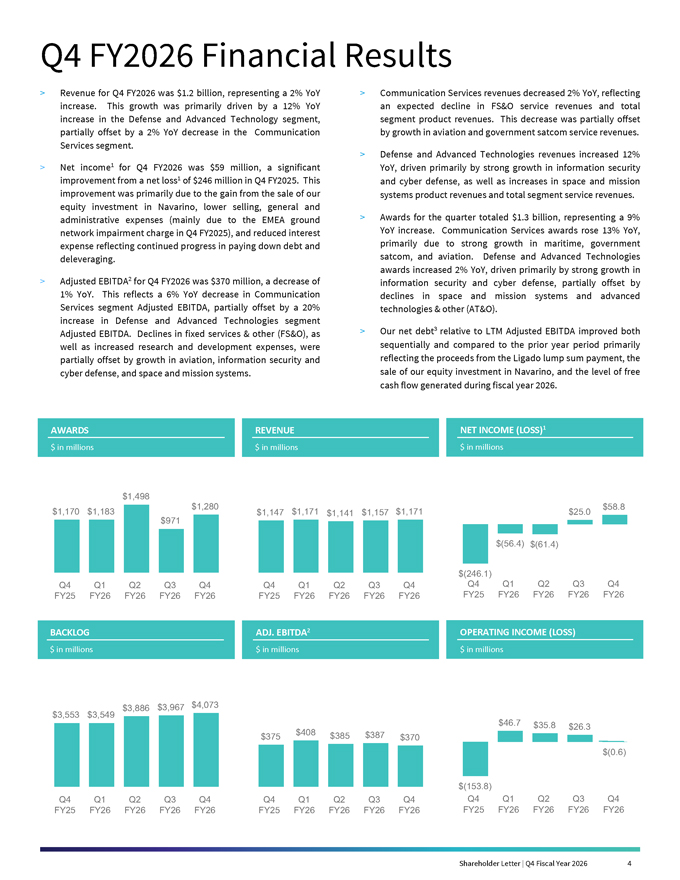
This growth was primarily driven by a 12% YoY increase in the Defense and Advanced Technology segment, partially offset by a 2% YoY decrease in the Communication Services segment. > Net income1 for Q4 FY2026 was $59 million, a significant improvement from a net loss1 of $246 million in Q4 FY2025. This improvement was primarily due to the gain from the sale of our equity investment in Navarino, lower selling, general and administrative expenses (mainly due to the EMEA ground network impairment charge in Q4 FY2025), and reduced interest expense reflecting continued progress in paying down debt and deleveraging. > Adjusted EBITDA2 for Q4 FY2026 was $370 million, a decrease of 1% YoY. This reflects a 6% YoY decrease in Communication Services segment Adjusted EBITDA, partially offset by a 20% increase in Defense and Advanced Technologies segment Adjusted EBITDA. Declines in fixed services & other (FS&O), as well as increased research and development expenses, were partially offset by growth in aviation, information security and cyber defense, and space and mission systems. > Communication Services revenues decreased 2% YoY, reflecting an expected decline in FS&O service revenues and total segment product revenues. This decrease was partially offset by growth in aviation and government satcom service revenues. > Defense and Advanced Technologies revenues increased 12% YoY, driven primarily by strong growth in information security and cyber defense, as well as increases in space and mission systems product revenues and total segment service revenues. > Awards for the quarter totaled $1.3 billion, representing a 9% YoY increase. Communication Services awards rose 13% YoY, primarily due to strong growth in maritime, government satcom, and aviation. Defense and Advanced Technologies awards increased 2% YoY, driven primarily by strong growth in information security and cyber defense, partially offset by declines in space and mission systems and advanced technologies & other (AT&O). > Our net debt3 relative to LTM Adjusted EBITDA improved both sequentially and compared to the prior year period primarily reflecting the proceeds from the Ligado lump sum payment, the sale of our equity investment in Navarino, and the level of free cash flow generated during fiscal year 2026. REVENUE $ in millions NET INCOME (LOSS)1 $ in millions REVENUE $ in millions NET INCOME (LOSS)1 $ in millions $1,170 $1,183 $1,498 $971 $1,280 Q4 FY25 Q1 FY26 Q2 FY26 Q3 FY26 Q4 FY26 BACKLOG $ in millions ADJ. EBITDA2 $ in millions OPERATING INCOME (LOSS) $ in millions $1,147 $1,171 $1,141 $1,157 $1,171 Q4 FY25 Q1 FY26 Q2 FY26 Q3 FY26 Q4 FY26 $(246.1) $(56.4) $(61.4) $25.0 $58.8 Q4 FY25 Q1 FY26 Q2 FY26 Q3 FY26 Q4 FY26 $3,553 $3,549 $3,886 $3,967 $4,073 Q4 FY25 Q1 FY26 Q2 FY26 Q3 FY26 Q4 FY26 $375 $408 $385 $387 $370 Q4 FY25 Q1 FY26 Q2 FY26 Q3 FY26 Q4 FY26 $(153.8) $46.7 $35.8 $26.3 $(0.6) Q4 FY25 Q1 FY26 Q2 FY26 Q3 FY26 Q4 FY26 AWARDS $ in millions $1,170 $1,183 $1,498 $971 $1,280 Q4 FY25 Q1 FY26 Q2 FY26 Q3 FY26 Q4 FY26 BACKLOG $ in millions ADJ.
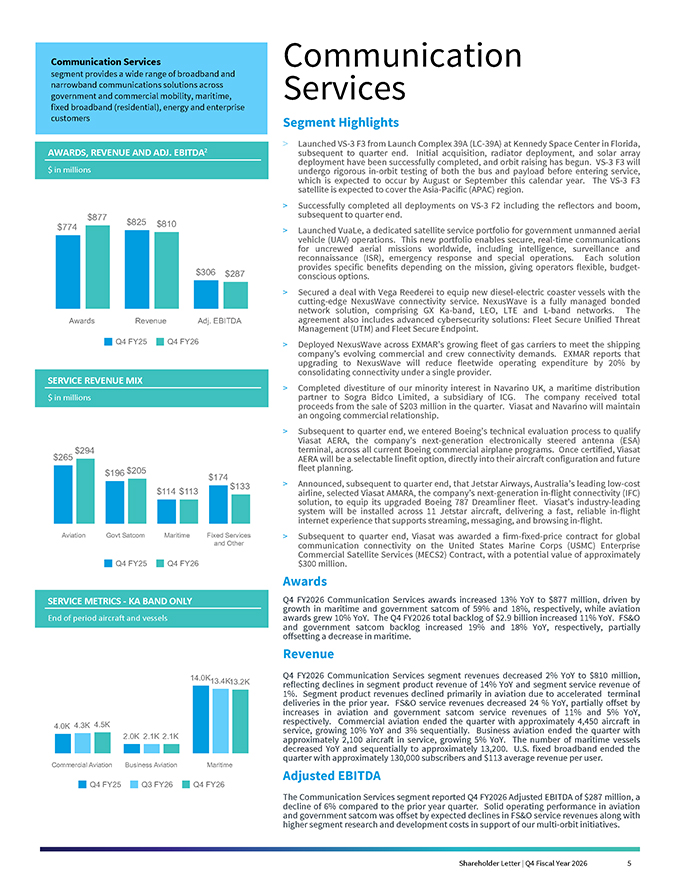
EBITDA2 $ in millions OPERATING INCOME (LOSS) $ in millions $1,147 $1,171 $1,141 $1,157 $1,171 Q4 FY25 Q1 FY26 Q2 FY26 Q3 FY26 Q4 FY26 $(246.1) $(56.4) $(61.4) $25.0 $58.8 Q4 FY25 Q1 FY26 Q2 FY26 Q3 FY26 Q4 FY26 $3,553 $3,549 $3,886 $3,967 $4,073 Q4 FY25 Q1 FY26 Q2 FY26 Q3 FY26 Q4 FY26 $375 $408 $385 $387 $370 Q4 FY25 Q1 FY26 Q2 FY26 Q3 FY26 Q4 FY26 $(153.8) $46.7 $35.8 $26.3 $(0.6) Q4 FY25 Q1 FY26 Q2 FY26 Q3 FY26 Q4 FY26 Shareholder Letter | Q4 Fiscal Year 2026 4 Communication Services segment provides a wide range of broadband and narrowband communications solutions across government and commercial mobility, maritime, fixed broadband (residential), energy and enterprise customers AWARDS, REVENUE AND ADJ. EBITDA2 $ in millions SERVICE REVENUE MIX SERVICE METRICS—KA BAND ONLY End of period aircraft and vessels $774 $825 $306 $877 $810 $287 Q4 FY25 Q4 FY26 Awards Revenue Adj. EBITDA $265 $196 $114 $174 $294 $205 $113 $133 Q4 FY25 Q4 FY26 Aviation Govt Satcom Maritime Fixed Services and Other 4.0K 2.0K 14.0K 4.3K 2.1K 13.4K 4.5K 2.1K 13.2K Q4 FY25 Q3 FY26 Q4 FY26 Commercial Aviation Business Aviation Maritime Communication Services Segment Highlights > Launched VS-3 F3 from Launch Complex 39A (LC-39A) at Kennedy Space Center in Florida, subsequent to quarter end. Initial acquisition, radiator deployment, solar array deployment and initial orbit raising have been successfully completed. VS-3 F3 will undergo rigorous in-orbit testing of both the bus and payload before entering service, which is expected to occur by August or September this calendar year. The VS-3 F3 satellite is expected to cover the Asia-Pacific (APAC) region. > Successfully completed all deployments on VS-3 F2 including the reflectors and boom, subsequent to quarter end. > Launched VuaLe, a dedicated satellite service portfolio for government unmanned aerial vehicle (UAV) operations. This new portfolio enables secure, real-time communications for uncrewed aerial missions worldwide, including intelligence, surveillance and reconnaissance (ISR), emergency response and special operations. Each solution provides specific benefits depending on the mission, giving operators flexible, budgetconscious options. > Secured a deal with Vega Reederei to equip new diesel-electric coaster vessels with the cutting-edge NexusWave connectivity service. NexusWave is a fully managed bonded network solution, comprising GX Ka-band, LEO, LTE and L-band networks. The agreement also includes advanced cybersecurity solutions: Fleet Secure Unified Threat Management (UTM) and Fleet Secure Endpoint. > Deployed NexusWave across EXMAR’s growing fleet of gas carriers to meet the shipping company’s evolving commercial and crew connectivity demands. EXMAR reports that upgrading to NexusWave will reduce fleetwide operating expenditure by 20% by consolidating connectivity under a single provider. > Completed divestiture of our minority interest in Navarino UK, a maritime distribution partner to Sogra Bidco Limited, a subsidiary of ICG. The company received total proceeds from the sale of $203 million in the quarter. Viasat and Navarino will maintain an ongoing commercial relationship. > Subsequent to quarter end, we entered Boeing’s technical evaluation process to qualify Viasat AERA, the company’s next-generation electronically steered antenna (ESA) terminal, across all current Boeing commercial airplane programs. Once certified, Viasat AERA will be a selectable linefit option, directly into their aircraft configuration and future fleet planning. > Announced, subsequent to quarter end, that Jetstar Airways, Australia’s leading low-cost airline, selected Viasat AMARA, the company’s next-generation in-flight connectivity (IFC) solution, to equip its upgraded Boeing 787 Dreamliner fleet. Viasat’s industry-leading system will be installed across 11 Jetstar aircraft, delivering a fast, reliable in-flight internet experience that supports streaming, messaging, and browsing in-flight. > Subsequent to quarter end, Viasat was awarded a firm-fixed-price contract for global communication connectivity on the United States Marine Corps (USMC) Enterprise Commercial Satellite Services (MECS2) Contract, with a potential value of approximately $300 million. Awards Q4 FY2026 Communication Services awards increased 13% YoY to $877 million, driven by growth in maritime and government satcom of 59% and 18%, respectively, while aviation awards grew 10% YoY. The Q4 FY2026 total backlog of $2.9 billion increased 11% YoY. FS&O and government satcom backlog increased 19% and 18% YoY, respectively, partially offsetting a decrease in maritime. Revenue Q4 FY2026 Communication Services segment revenues decreased 2% YoY to $810 million, reflecting declines in segment product revenue of 14% YoY and segment service revenue of 1%. Segment product revenues declined primarily in aviation due to accelerated terminal deliveries in the prior year. FS&O service revenues decreased 24 % YoY, partially offset by increases in aviation and government satcom service revenues of 11% and 5% YoY, respectively. Commercial aviation ended the quarter with approximately 4,450 aircraft in service, growing 10% YoY and 3% sequentially. Business aviation ended the quarter with approximately 2,100 aircraft in service, growing 5% YoY. The number of maritime vessels decreased YoY and sequentially to approximately 13,200. U.S. fixed broadband ended the quarter with approximately 130,000 subscribers and $113 average revenue per user. Adjusted EBITDA The Communication Services segment reported Q4 FY2026 Adjusted EBITDA of $287 million, a decline of 6% compared to the prior year quarter. Solid operating performance in aviation and government satcom was offset by expected declines in FS&O service revenues along with higher segment research and development costs in support of our multi-orbit initiatives.
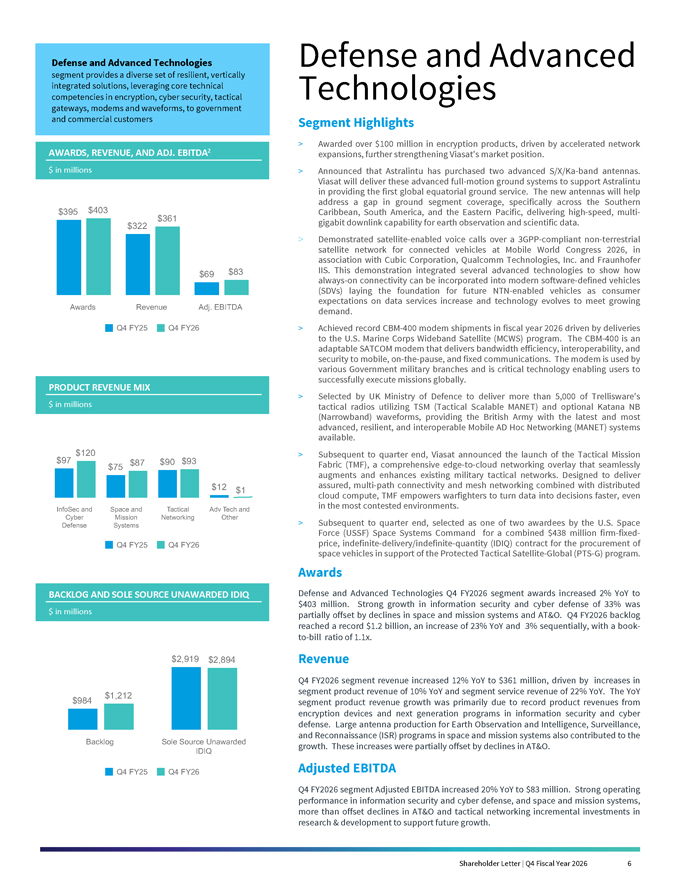
Shareholder Letter | Q4 Fiscal Year 2026 5 Defense and Advanced Technologies segment provides a diverse set of resilient, vertically integrated solutions, leveraging core technical competencies in encryption, cyber security, tactical gateways, modems and waveforms, to government and commercial customers AWARDS, REVENUE, AND ADJ. EBITDA2 PRODUCT REVENUE MIX BACKLOG AND SOLE SOURCE UNAWARDED IDIQ $395 $322 $69 $403 $361 $83 Q4 FY25 Q4 FY26 Awards Revenue Adj. EBITDA $97 $75 $90 $12 $120 $87 $93 $1 Q4 FY25 Q4 FY26 InfoSec and Cyber Defense Space and Mission Systems Tactical Networking Adv Tech and Other BACKLOG AND SOLE SOURCE UNAWARDED IDIQ $ in millions $984 $2,919 $1,212 $2,894 Q4 FY25 Q4 FY26 Defense and Advanced Technologies Segment Highlights > Awarded over $100 million in encryption products, driven by accelerated network expansions, further strengthening Viasat’s market position. > Announced that Astralintu has purchased two advanced S/X/Ka-band antennas. Viasat will deliver these advanced full-motion ground systems to support Astralintu in providing the first global equatorial ground service. The new antennas will help address a gap in ground segment coverage, specifically across the Southern Caribbean, South America, and the Eastern Pacific, delivering high-speed, multigigabit downlink capability for earth observation and scientific data. > Demonstrated satellite-enabled voice calls over a 3GPP-compliant non-terrestrial satellite network for connected vehicles at Mobile World Congress 2026, in association with Cubic Corporation, Qualcomm Technologies, Inc. and Fraunhofer IIS. This demonstration integrated several advanced technologies to show how always-on connectivity can be incorporated into modern software-defined vehicles (SDVs) laying the foundation for future NTN-enabled vehicles as consumer expectations on data services increase and technology evolves to meet growing demand. > Achieved record CBM-400 modem shipments in fiscal year 2026 driven by deliveries to the U.S. Marine Corps Wideband Satellite (MCWS) program. The CBM-400 is an adaptable SATCOM modem that delivers bandwidth efficiency, interoperability, and security to mobile, on-the-pause, and fixed communications. The modem is used by various Government military branches and is critical technology enabling users to successfully execute missions globally. > Selected by UK Ministry of Defence to deliver more than 5,000 of Trellisware’s tactical radios utilizing TSM (Tactical Scalable MANET) and optional Katana NB (Narrowband) waveforms, providing the British Army with the latest and most advanced, resilient, and interoperable Mobile AD Hoc Networking (MANET) systems available. > Subsequent to quarter end, Viasat announced the launch of the Tactical Mission Fabric (TMF), a comprehensive edge-to-cloud networking overlay that seamlessly augments and enhances existing military tactical networks. Designed to deliver assured, multi-path connectivity and mesh networking combined with distributed cloud compute, TMF empowers warfighters to turn data into decisions faster, even in the most contested environments. > Subsequent to quarter end, selected as one of two awardees by the U.S. Space Force (USSF) Space Systems Command for a combined $438 million firm-fixedprice, indefinite-delivery/indefinite-quantity (IDIQ) contract for the procurement of space vehicles in support of the Protected Tactical Satellite-Global (PTS-G) program. Awards Defense and Advanced Technologies Q4 FY2026 segment awards increased 2% YoY to $403 million. Strong growth in information security and cyber defense of 33% was partially offset by declines in space and mission systems and AT&O. Q4 FY2026 backlog reached a record $1.2 billion, an increase of 23% YoY and 3% sequentially, with a bookto- bill ratio of 1.1x. Revenue Q4 FY2026 segment revenue increased 12% YoY to $361 million, driven by increases in segment product revenue of 10% YoY and segment service revenue of 22% YoY. The YoY segment product revenue growth was primarily due to record product revenues from encryption devices and next generation programs in information security and cyber defense. Large antenna production for Earth Observation and Intelligence, Surveillance, and Reconnaissance (ISR) programs in space and mission systems also contributed to the growth. These increases were partially offset by declines in AT&O. Adjusted EBITDA Q4 FY2026 segment Adjusted EBITDA increased 20% YoY to $83 million. Strong operating performance in information security and cyber defense, and space and mission systems, more than offset declines in AT&O and tactical networking incremental investments in research & development to support future growth.
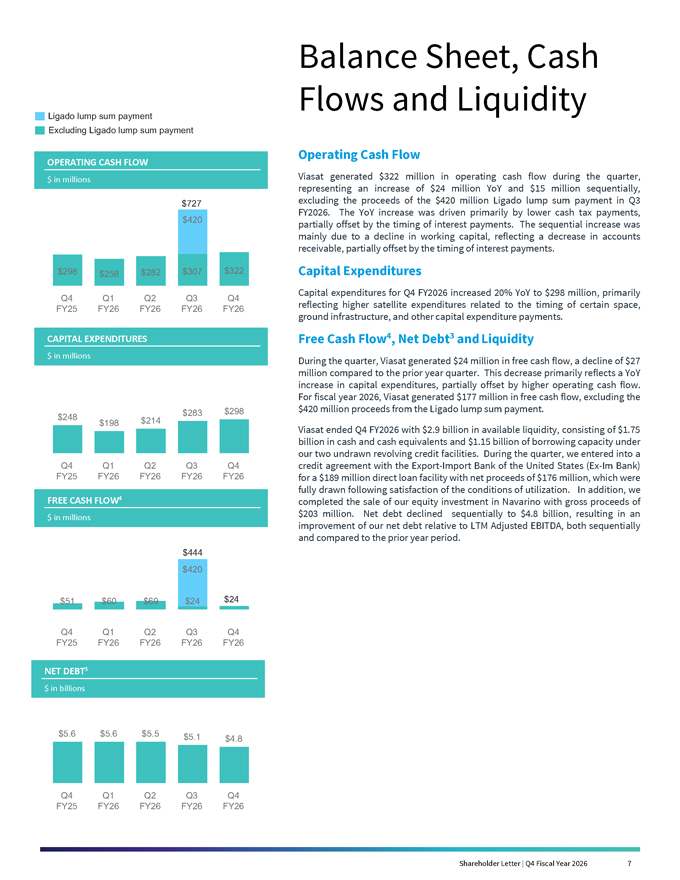
Shareholder Letter | Q4 Fiscal Year 2026 6 Ligado lump sum payment Excluding Ligado lump sum payment OPERATING CASH FLOW $ in millions CAPITAL EXPENDITURES FREE CASH FLOW4 NET DEBT3 $ in millions $298 $258 $282 $307 $322 $420 Q4 FY25 Q1 FY26 Q2 FY26 Q3 FY26 Q4 FY26 CAPITAL EXPENDITURES $ in millions $248 $198 $214 $283 $298 Q4 FY25 Q1 FY26 Q2 FY26 Q3 FY26 Q4 FY26 NET DEBT3 $ in billions $5.6 $5.6 $5.5 $5.1 $4.8 Q4 FY25 Q1 FY26 Q2 FY26 Q3 FY26 Q4 FY26 Balance Sheet, Cash Flows and Liquidity Operating Cash Flow Viasat generated $322 million in operating cash flow during the quarter, representing an increase of $24 million YoY and $15 million sequentially, excluding the proceeds of the $420 million Ligado lump sum payment in Q3 FY2026. The YoY increase was driven primarily by lower cash tax payments, partially offset by the timing of interest payments. The sequential increase was mainly due to a decline in working capital, reflecting a decrease in accounts receivable, partially offset by the timing of interest payments. Capital Expenditures Capital expenditures for Q4 FY2026 increased 20% YoY to $298 million, primarily reflecting higher satellite expenditures related to the timing of certain space, ground infrastructure, and other capital expenditure payments. Free Cash Flow4, Net Debt3 and Liquidity During the quarter, Viasat generated $24 million in free cash flow, a decline of $27 million compared to the prior year quarter. This decrease primarily reflects a YoY increase in capital expenditures, partially offset by higher operating cash flow. For fiscal year 2026, Viasat generated $177 million in free cash flow, excluding the $420 million proceeds from the Ligado lump sum payment. Viasat ended Q4 FY2026 with $2.9 billion in available liquidity, consisting of $1.75 billion in cash and cash equivalents and $1.15 billion of borrowing capacity under our two undrawn revolving credit facilities. During the quarter, we entered into a credit agreement with the Export-Import Bank of the United States (Ex-Im Bank) for a $189 million direct loan facility with net proceeds of $176 million, which were fully drawn following satisfaction of the conditions of utilization. In addition, we completed the sale of our equity investment in Navarino with gross proceeds of $203 million. Net debt declined sequentially to $4.8 billion, resulting in an improvement of our net debt relative to LTM Adjusted EBITDA, both sequentially and compared to the prior year period.

Shareholder Letter | Q4 Fiscal Year 2026 7 Outlook Our performance over fiscal year 2026 illustrates our continued ability to translate strategy into attractive financial results, with cash flow and net debt relative to LTM Adjusted EBITDA improvements as key indicators, and to balance near-term execution with long-term strategic positioning. We are proud of the resilience and commitment of our team to meet the challenges associated with cutting edge space technology. We made significant progress in fiscal year 2026 and are exiting the year stronger than we entered as evidenced by our record backlog, ongoing multi-orbit fleet expansion, and accelerating growth opportunities in our Defense and Advanced Technologies segment. • Revenue and Adjusted EBITDA: We expect mid-single-digit YoY revenue growth in FY2027 and Adjusted EBITDA to be flat to up slightly YoY, with stronger growth in second half of the fiscal year. o Communication Services Segment: We expect FY2027 segment revenue growth in the low single-digits YoY, driven by continued growth in aviation services, offset by a lower rate of decline in FS&O. o Defense and Advanced Technologies Segment: We expect FY2027 segment revenue growth in the mid-teens YoY, driven primarily by strong growth in information security and cyber defense, as well as space and mission systems and tactical networking. • Net Debt: We expect net debt relative to LTM Adjusted EBITDA to decrease slightly by the end of FY2027. • Capital Expenditures: We expect FY2027 capital expenditures of between $950 million and $1.0 billion, including approximately $325 million for Inmarsat related capital expenditures. • Operating and Free Cash Flow: For FY2027, we expect operating cash flow to be flat YoY and free cash flow generated to be approximately $180 million. Our free cash flow guidance excludes the benefit of the Ligado lump sum payments in both periods, as they are non-recurring. We are highly focused on a critical few strategic initiatives to ensure we can participate in rapidly evolving markets, technologies and business models while maintaining top-tier competitive positions. We are accelerating growth while investing prudently for our future and have line of sight to significant upside catalysts. We have optionality in our longer-term plans, building on reduced capital intensity and improving return on invested capital, with key levers available to realize shareholder value.
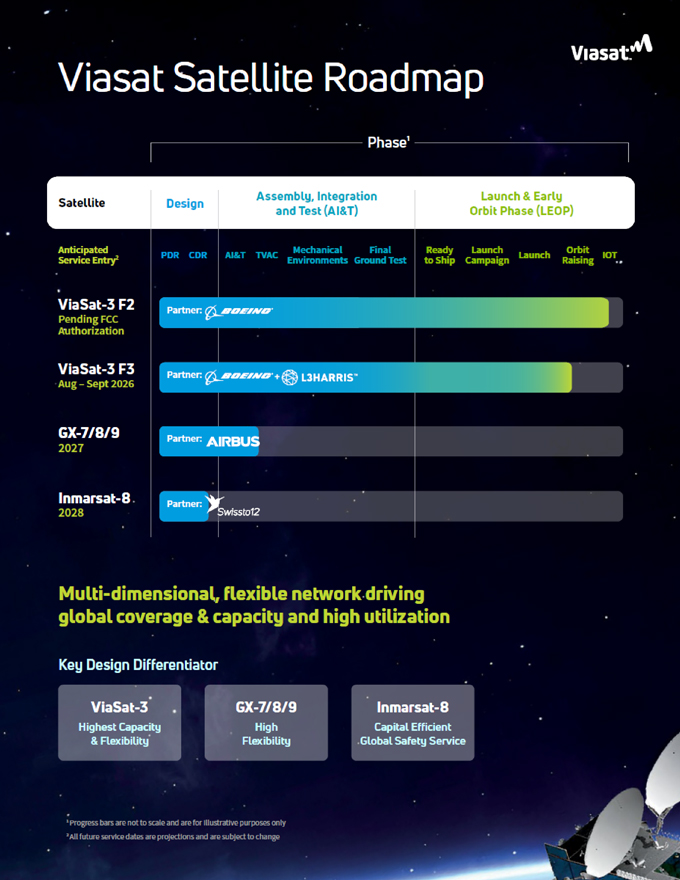
Shareholder Letter | Q4 Fiscal Year 2026 8 Visat Satellite Roadmap Satellite Design Assembly, Integration and Test (AI&T) Launch & Early Orbit Phase (LEOP) Multi-dimensional, flexible network driving global coverage & capacity and high utilizationKey Design Differentiator ViaSat-3 Highest Capacity & Flexibility GX-7/8/9 High Flexibility Inmarsat-8 Capital Efficient Global Safety Service 1 Progress bars are not to scale and are for illustrative purposes only 2 All future service dates are projections and are subject to change Endnotes 1.

Net income (loss) as used herein is defined as net income (loss) attributable to Viasat, Inc. common stockholders. 2. Adjusted EBITDA is defined as earnings before interest, income taxes, depreciation and amortization, as further adjusted to exclude certain non-cash items and non-recurring expenses such as stock-based compensation expense, acquisition and transaction related expenses, loss or gain on disposition of certain assets and/or related businesses, product lines or other similar investments, loss or gain on debt extinguishment, and nonrecurring impairment of satellites and networking assets. A reconciliation of Adjusted EBITDA to its closest GAAP equivalent is provided at the end of this letter under “Non- GAAP Financial Reconciliation.” See “Use of Non-GAAP Financial Information” for additional information. 3. Net debt is defined as total debt less cash and cash equivalents and short-term investments. A reconciliation of net debt to its closest GAAP equivalent is provided at the end of this letter under “Non-GAAP Financial Reconciliation.” See “Use of Non-GAAP Financial Information” for additional financial information. 4. Free cash flow is defined as net cash provided by (used in) operating activities less capital expenditures (purchase of property, equipment and satellites, and other assets). A reconciliation of free cash flow to its closest GAAP equivalent is provided at the end of this letter under “Non-GAAP Financial Reconciliation.” See “Use of Non-GAAP Financial Information” for additional financial information. 5. Reported continuing operations. 6. We completed the acquisition of Inmarsat on May 30, 2023, therefore our FY 2024 results include ten months of Inmarsat results.

Shareholder Letter | Q4 Fiscal Year 2026 10 Forward-Looking Statements This shareholder letter contains forward-looking statements regarding future events and our future results that are subject to the safe harbors created under the Securities Act of 1933 and the Securities Exchange Act of 1934. Forward-looking statements include, among others, statements regarding projections of earnings, revenue, Adjusted EBITDA, net leverage, free cash flow, capital expenditures, investments, costs, expected cost savings and synergies, return on capital or other financial items, including financial guidance and outlook and expectations for performance and results of operations in FY2027 and beyond; anticipated trends in our business or key markets; growth opportunities and the acceleration and durability of growth in our businesses; ability to successfully compete in our target markets, and durability or strengthening of competitive advantages; building shareholder value and strategic initiatives; the construction, completion, testing, launch, commencement of service, expected performance and benefits of satellites and satellite payloads (including satellites planned or under construction) and the timing thereof; the expected capacity, coverage, service speeds and other features of our satellites, and the cost, economics and benefits associated therewith; anticipated subscriber growth; development, introduction and integration of multi-orbit capabilities and terminals; the ability to capitalize on backlog and awards received and unawarded IDIQ contract vehicles; future economic conditions; the development, customer acceptance and anticipated performance of our technologies, products or services; our plans, objectives and strategies for future operations; the formation, design, business model, features, performance and benefits of the Equatys solution, and the expected timing of revenue and service availability; our ability to drive capital efficiency and improve resource utilization; the number of additional aircraft or vessels anticipated to be put into service with our connectivity systems; expected revenue from the Ligado settlement; and other characterizations of future events or circumstances, are forward-looking statements. Readers are cautioned that these forward-looking statements are only predictions and are subject to risks, uncertainties and assumptions that are difficult to predict. Factors that could cause actual results to differ materially include: our ability to realize the anticipated benefits of any existing or future satellite; unexpected expenses related to our satellite projects; risks associated with the construction, launch and operation of satellites, including the effect of any anomaly, launch, operational or deployment failure or degradation in satellite performance; capacity constraints in our business in the lead-up to the launch of services on new satellites; increasing levels of competition in our target markets; our ability to successfully implement our business plan on our anticipated timeline or at all; our ability to successfully develop, introduce and sell new technologies, products and services; audits by the U.S. Government; changes in the global business environment and economic conditions (including U.S. Government shutdowns); delays in approving U.S. Government budgets and cuts in government defense expenditures; our reliance on U.S. Government contracts, and on a small number of contracts which account for a significant percentage of our revenues; reduced demand for products and services as a result of continued constraints on capital spending by customers; changes in relationships with, or the financial condition of, key customers or suppliers; our reliance on a limited number of third parties to manufacture and supply our products; introduction of new technologies and other factors affecting the communications and defense industries generally; the effect of adverse regulatory changes (including changes affecting spectrum availability or permitted uses) on our ability to sell or deploy our products and services; changes in the way others use spectrum; our inability to access additional spectrum, use spectrum for additional purposes, and/or operate satellites at additional orbital locations; competing uses of the same spectrum or orbital locations that we utilize or seek to utilize; the effect of changes to global tax laws; our level of indebtedness and ability to comply with applicable debt covenants; our involvement in litigation, including intellectual property claims and litigation to protect our proprietary technology; any dispute with Ligado regarding the terms of the Ligado settlement; and our dependence on a limited number of key employees. In addition, please refer to the risk factors contained in our SEC filings available at www.sec.gov, including our most recent Annual Report on Form 10-K and Quarterly Reports on Form 10-Q. Readers are cautioned not to place undue reliance on any forward-looking statements, which speak only as of the date on which they are made. We undertake no obligation to revise or update any forward-looking statements for any reason.
Shareholder Letter | Q4 Fiscal Year 2026 11 Use of Non-GAAP Financial Information To supplement Viasat’s consolidated financial statements presented in accordance with generally accepted accounting principles (GAAP), Viasat uses non-GAAP net income (loss) attributable to Viasat, Inc., Adjusted EBITDA, net debt and free cash flow, measures Viasat believes are appropriate to enhance an overall understanding of Viasat’s past financial performance and prospects for the future. We believe non-GAAP net income (loss) attributable to Viasat, Inc. and Adjusted EBITDA provide useful information to both management and investors by excluding specific expenses that we believe are not indicative of our core operating results. We believe net debt provides useful information to both management and investors in order to monitor our leverage (including our ability to service our debt and make capital expenditures) and evaluate our consolidated balance sheet. A limitation associated with using net debt is that it subtracts cash and therefore may imply there is less debt than the most comparable GAAP measure. We believe free cash flow is an important liquidity metric because it measures, during a given period, the amount of cash generated that is available to repay debt obligations, make investments, fund acquisitions and for certain other activities. Free cash flow can vary significantly from period to period depending upon, among other things, operating asset and liability balances, service and product revenues, operating efficiencies, increases or decreases in purchases of property and equipment, subscriber additions (losses), subscriber churn, and other factors. In addition, since we have historically reported non-GAAP results to the investment community, we believe the inclusion of non-GAAP numbers provides consistency in our financial reporting and facilitates comparisons to Viasat’s historical operating results. Further, these non-GAAP results are among the primary indicators that management uses as a basis for evaluating the operating performance of our segments, allocating resources to such segments, planning and forecasting in future periods. The presentation of this additional information is not meant to be considered in isolation or as a substitute for measures of financial performance prepared in accordance with GAAP. A reconciliation of specific adjustments to GAAP results is provided in the tables below under “Non-GAAP Financial Reconciliation.” Copyright © 2026 Viasat, Inc. All rights reserved. Viasat, the Viasat logo and the Viasat signal are registered trademarks of Vias
Fourth Quarter Fiscal Year 2026 Results
Financial Results
| (In millions, except per share data) | Q4FY26 | Q4FY25 | Year-over-Year Change |
FY26 | FY25 | Year-Over-Year Change |
||||||||||||||||||
| Revenues |
$1,171.3 | $1,147.1 | 2% | $4,640.3 | $4,519.6 | 3% | ||||||||||||||||||
| Net income (loss) (1) |
$58.8 | ($246.1) | * | ($34.1) | ($575.0) | (94)% | ||||||||||||||||||
| Non-GAAP net income (loss) (1) |
($3.2) | ($3.0) | 5% | $143.3 | $21.1 | 577% | ||||||||||||||||||
| Adjusted EBITDA |
$369.9 | $374.8 | (1)% | $1,550.1 | $1,547.0 | 0% | ||||||||||||||||||
| Diluted per share net income (loss) (1) |
$0.41 | ($1.89) | * | ($0.25) | ($4.48) | (94)% | ||||||||||||||||||
| Non-GAAP diluted per share net income (loss) (1), (2) |
($0.02) | ($0.02) | 0% | $1.03 | $0.16 | 544% | ||||||||||||||||||
| Fully diluted weighted average shares (2) |
143.0 | 130.0 | 10% | 134.7 | 128.5 | 5% | ||||||||||||||||||
| New contract awards (3) |
$1,279.8 | $1,169.7 | 9% | $4,931.5 | $4,684.4 | 5% | ||||||||||||||||||
| Backlog (4) |
$4,072.9 | $3,552.8 | 15% | $4,072.9 | $3,552.8 | 15% | ||||||||||||||||||
|
Segment Results |
|
|||||||||||||||||||||||
| (In millions) |
Q4FY26 | Q4FY25 | |
Year-over-Year Change |
|
FY26 | FY25 | |
Year-Over-Year Change |
|
||||||||||||||
| Communication Services |
||||||||||||||||||||||||
| New contract awards (3) |
$876.7 | $774.4 | 13% | $3,333.4 | $3,100.8 | 8% | ||||||||||||||||||
| Revenues |
$810.3 | $825.0 | (2)% | $3,299.7 | $3,298.5 | 0% | ||||||||||||||||||
| Operating profit (loss) (5) |
$2.3 | ($136.1) | * | $152.6 | ($50.2) | * | ||||||||||||||||||
| Adjusted EBITDA |
$287.3 | $306.2 | (6)% | $1,264.1 | $1,261.7 | 0% | ||||||||||||||||||
| Defense and Advanced Technologies |
||||||||||||||||||||||||
| New contract awards (3) |
$403.1 | $395.3 | 2% | $1,598.1 | $1,583.7 | 1% | ||||||||||||||||||
| Revenues |
$361.0 | $322.1 | 12% | $1,340.6 | $1,221.1 | 10% | ||||||||||||||||||
| Operating profit (loss) (5) |
$62.2 | $48.1 | 29% | $216.3 | $216.7 | 0% | ||||||||||||||||||
|
Adjusted EBITDA |
$82.5 | $68.6 | 20% | $286.0 | $285.3 | 0% | ||||||||||||||||||
| (1) | Attributable to Viasat, Inc. common stockholders. |
| (2) | As the twelve months ended March 31, 2026 and three and twelve months ended March 31, 2025 financial information resulted in a net loss, the weighted average number of shares used to calculate basic and diluted net loss per share is the same, as diluted shares would be anti-dilutive. However, as the non-GAAP financial information for the twelve months ended March 31, 2026 and March 31, 2025 resulted in non-GAAP net income, 139.4 million and 130.4 million, respectively, diluted weighted average number of shares were used instead to calculate non-GAAP diluted net income per share. |
| (3) | Awards exclude future revenue under recurring consumer commitment arrangements. |
| (4) | Amounts include certain backlog adjustments due to contract changes and amendments. Our backlog includes contracts with subscribers for fixed broadband services in our Communication Services segment. Backlog does not include anticipated purchase orders and requests for the installation of in-flight connectivity systems or future recurring in-flight internet service revenues under our commercial in-flight internet agreements in our Communication Services segment. |
| (5) | Before corporate. |
| * | Percentage not meaningful. |
| Note: | Some totals may not foot due to rounding. |

| Shareholder Letter | Q4 Fiscal Year 2026 13 |
Fourth Quarter Fiscal Year 2026 Results (cont.)
Condensed Consolidated Statements of Operations
(Unaudited)
(In thousands, except per share data)
| Three months ended | Twelve months ended | |||||||||||||||
| March 31, 2026 | March 31, 2025 | March 31, 2026 | March 31, 2025 | |||||||||||||
| Revenues: |
||||||||||||||||
| Service revenues |
$ | 803,725 | $ | 797,371 | $ | 3,274,423 | $ | 3,225,776 | ||||||||
| Product revenues |
367,563 | 349,711 | 1,365,857 | 1,293,795 | ||||||||||||
|
|
|
|
|
|
|
|
|
|||||||||
| Total revenues |
1,171,288 | 1,147,082 | 4,640,280 | 4,519,571 | ||||||||||||
| Operating expenses: |
||||||||||||||||
| Cost of service revenues |
546,571 | 515,743 | 2,126,496 | 2,091,721 | ||||||||||||
| Cost of product revenues |
264,603 | 266,040 | 980,563 | 937,912 | ||||||||||||
| Selling, general and administrative (1) |
254,151 | 419,497 | 999,476 | 1,181,091 | ||||||||||||
| Independent research and development |
41,523 | 33,740 | 164,908 | 142,394 | ||||||||||||
| Amortization of acquired intangible assets |
65,064 | 65,847 | 260,712 | 263,933 | ||||||||||||
|
|
|
|
|
|
|
|
|
|||||||||
| Income (loss) from operations |
(624 | ) | (153,785 | ) | 108,125 | (97,480 | ) | |||||||||
| Interest (expense) income, net |
(65,484 | ) | (86,828 | ) | (154,401 | ) | (338,024 | ) | ||||||||
| (Loss) gain on extinguishment of debt, net |
— | — | (11,935 | ) | (99,814 | ) | ||||||||||
| Other income (expense), net (Q4FY26 includes gain on disposition of equity method investment) |
168,062 | — | 163,012 | (9,976 | ) | |||||||||||
|
|
|
|
|
|
|
|
|
|||||||||
| Income (loss) before income taxes |
101,954 | (240,613 | ) | 104,801 | (545,294 | ) | ||||||||||
| (Provision for) benefit from income taxes |
(40,081 | ) | (3,758 | ) | (116,223 | ) | 941 | |||||||||
| Equity in income (loss) of unconsolidated affiliates, net |
4,108 | 3,636 | 15,348 | 13,228 | ||||||||||||
|
|
|
|
|
|
|
|
|
|||||||||
| Net income (loss) |
65,981 | (240,735 | ) | 3,926 | (531,125 | ) | ||||||||||
| Less: net income (loss) attributable to noncontrolling interest, net of tax |
7,157 | 5,318 | 38,012 | 43,837 | ||||||||||||
|
|
|
|
|
|
|
|
|
|||||||||
| Net income (loss) attributable to Viasat, Inc. |
$ | 58,824 | $ | (246,053 | ) | $ | (34,086 | ) | $ | (574,962 | ) | |||||
|
|
|
|
|
|
|
|
|
|||||||||
| Diluted net income (loss) per share attributable to Viasat, Inc. common stockholders |
$ | 0.41 | $ | (1.89 | ) | $ | (0.25 | ) | $ | (4.48 | ) | |||||
|
|
|
|
|
|
|
|
|
|||||||||
| Diluted common equivalent shares (2) |
142,957 | 130,028 | 134,744 | 128,476 | ||||||||||||
|
AN ITEMIZED RECONCILIATION BETWEEN NET INCOME (LOSS) ATTRIBUTABLE TO VIASAT, INC. ON A GAAP BASIS AND NON-GAAP BASIS IS AS FOLLOWS: |
||||||||||||||||
| (In thousands, except per share data) | Three months ended | Twelve months ended | ||||||||||||||
| March 31, 2026 | March 31, 2025 | March 31, 2026 | March 31, 2025 | |||||||||||||
| GAAP net income (loss) attributable to Viasat, Inc. |
$ | 58,824 | $ | (246,053 | ) | $ | (34,086 | ) | $ | (574,962 | ) | |||||
| Amortization of acquired intangible assets |
65,064 | 65,847 | 260,712 | 263,933 | ||||||||||||
| Stock-based compensation expense |
22,142 | 16,917 | 81,070 | 80,385 | ||||||||||||
| Acquisition and transaction related expenses (3) |
4,062 | 6,761 | 24,392 | 64,467 | ||||||||||||
| Ground network impairment and related charges, net |
— | 169,400 | — | 169,400 | ||||||||||||
| Loss (gain) on extinguishment of debt, net |
— | — | 11,935 | 99,814 | ||||||||||||
| Other income (expense), net (Q4FY26 includes gain on disposition of equity method investment) |
(168,062 | ) | — | (163,012 | ) | 9,976 | ||||||||||
| Income tax effect (4) |
14,769 | (15,909 | ) | (37,760 | ) | (91,866 | ) | |||||||||
|
|
|
|
|
|
|
|
|
|||||||||
| Non-GAAP net income (loss) attributable to Viasat, Inc. |
$ | (3,201 | ) | $ | (3,037 | ) | $ | 143,251 | $ | 21,147 | ||||||
|
|
|
|
|
|
|
|
|
|||||||||
| Non-GAAP diluted net income (loss) per share attributable to Viasat, Inc. common stockholders |
$ | (0.02 | ) | $ | (0.02 | ) | $ | 1.03 | $ | 0.16 | ||||||
|
|
|
|
|
|
|
|
|
|||||||||
| Diluted common equivalent shares (2) |
136,503 | 130,028 | 139,390 | 130,408 | ||||||||||||
|
AN ITEMIZED RECONCILIATION BETWEEN NET INCOME (LOSS) ATTRIBUTABLE TO VIASAT, INC. AND ADJUSTED EBITDA IS AS FOLLOWS: |
||||||||||||||||
| (In thousands) | Three months ended | Twelve months ended | ||||||||||||||
| March 31, 2026 | March 31, 2025 | March 31, 2026 | March 31, 2025 | |||||||||||||
| GAAP net income (loss) attributable to Viasat, Inc. |
$ | 58,824 | $ | (246,053 | ) | $ | (34,086 | ) | $ | (574,962 | ) | |||||
| Provision for (benefit from) income taxes |
40,081 | 3,758 | 116,223 | (941 | ) | |||||||||||
| Interest expense (income), net |
65,484 | 86,828 | 154,401 | 338,024 | ||||||||||||
| Depreciation and amortization (5) |
347,327 | 337,182 | 1,359,159 | 1,360,807 | ||||||||||||
| Stock-based compensation expense |
22,142 | 16,917 | 81,070 | 80,385 | ||||||||||||
| Acquisition and transaction related expenses (3) |
4,062 | 6,761 | 24,392 | 64,467 | ||||||||||||
| Ground network impairment and related charges, net |
— | 169,400 | — | 169,400 | ||||||||||||
| Loss (gain) on extinguishment of debt, net |
— | — | 11,935 | 99,814 | ||||||||||||
| Other income (expense), net (Q4FY26 includes gain on disposition of equity method investment) |
(168,062 | ) | — | (163,012 | ) | 9,976 | ||||||||||
|
|
|
|
|
|
|
|
|
|||||||||
| Adjusted EBITDA |
$ | 369,858 | $ | 374,793 | $ | 1,550,082 | $ | 1,546,970 | ||||||||
|
|
|
|
|
|
|
|
|
|||||||||
| (1) | Amounts include ground network impairment and related charges, net, of approximately $169 million for the three and twelve months ended March 31, 2025. |
| (2) | As the twelve months ended March 31, 2026 and three and twelve months ended March 31, 2025 financial information resulted in a net loss, the weighted average number of shares used to calculate basic and diluted net loss per share is the same, as diluted shares would be anti-dilutive. However, as the non-GAAP financial information for the twelve months ended March 31, 2026 and March 31, 2025 resulted in non-GAAP net income, diluted weighted average number of shares were used instead to calculate non-GAAP diluted net income per share. |
| (3) | Costs typically consist of acquisition, integration, and disposition related costs. |
| (4) | The income tax effect is calculated using the tax rate applicable for the non-GAAP adjustments. |
| (5) | Including amortization of capitalized cloud computing implementation costs. |
| Shareholder Letter | Q4 Fiscal Year 2026 14 |
Fourth Quarter Fiscal Year 2026 Results (cont.)
AN ITEMIZED RECONCILIATION BETWEEN SEGMENT OPERATING PROFIT (LOSS) BEFORE CORPORATE
AND ADJUSTED EBITDA IS AS FOLLOWS:
(In thousands)
| Three months ended March 31, 2026 | Three months ended March 31, 2025 | |||||||||||||||||||||||
| Communication Services Segment |
Defense and Advanced Technologies Segment |
Total | Communication Services Segment |
Defense and Advanced Technologies Segment |
Total | |||||||||||||||||||
| Segment operating profit (loss) before corporate |
$ | 2,264 | $ | 62,176 | $ | 64,440 | $ | (136,051 | ) | $ | 48,113 | $ | (87,938 | ) | ||||||||||
| Depreciation (6) |
254,506 | 12,481 | 266,987 | 244,311 | 12,481 | 256,792 | ||||||||||||||||||
| Stock-based compensation expense |
13,495 | 8,647 | 22,142 | 10,298 | 6,619 | 16,917 | ||||||||||||||||||
| Other than acquired intangible assets amortization (5) |
9,398 | 5,878 | 15,276 | 9,375 | 5,168 | 14,543 | ||||||||||||||||||
| Acquisition and transaction related expenses (3) |
3,497 | 565 | 4,062 | 5,275 | 1,486 | 6,761 | ||||||||||||||||||
| Ground network impairment and related charges, net |
— | — | — | 169,400 | — | 169,400 | ||||||||||||||||||
| Equity in income (loss) of unconsolidated affiliates, net |
4,108 | — | 4,108 | 3,636 | — | 3,636 | ||||||||||||||||||
| Noncontrolling interest |
46 | (7,203 | ) | (7,157 | ) | (30 | ) | (5,288 | ) | (5,318 | ) | |||||||||||||
|
|
|
|
|
|
|
|
|
|
|
|
|
|
|
|
|
|
|
|||||||
| Adjusted EBITDA |
$ | 287,314 | $ | 82,544 | $ | 369,858 | $ | 306,214 | $ | 68,579 | $ | 374,793 | ||||||||||||
|
|
|
|
|
|
|
|
|
|
|
|
|
|
|
|
|
|
|
|||||||
| Twelve months ended March 31, 2026 | Twelve months ended March 31, 2025 | |||||||||||||||||||||||
| Communication Services Segment |
Defense and Advanced Technologies Segment |
Total | Communication Services Segment |
Defense and Advanced Technologies Segment |
Total | |||||||||||||||||||
| Segment operating profit (loss) before corporate |
$ | 152,553 | $ | 216,284 | $ | 368,837 | $ | (50,222 | ) | $ | 216,675 | $ | 166,453 | |||||||||||
| Depreciation (6) |
990,147 | 48,368 | 1,038,515 | 988,447 | 48,020 | 1,036,467 | ||||||||||||||||||
| Stock-based compensation expense |
48,685 | 32,385 | 81,070 | 48,760 | 31,625 | 80,385 | ||||||||||||||||||
| Other than acquired intangible assets amortization (5) |
37,321 | 22,611 | 59,932 | 41,373 | 19,034 | 60,407 | ||||||||||||||||||
| Acquisition and transaction related expenses (3) |
19,691 | 4,701 | 24,392 | 50,807 | 13,660 | 64,467 | ||||||||||||||||||
| Ground network impairment and related charges, net |
— | — | — | 169,400 | — | 169,400 | ||||||||||||||||||
| Equity in income (loss) of unconsolidated affiliates, net |
15,348 | — | 15,348 | 13,228 | — | 13,228 | ||||||||||||||||||
| Noncontrolling interest |
372 | (38,384 | ) | (38,012 | ) | (120 | ) | (43,717 | ) | (43,837 | ) | |||||||||||||
|
|
|
|
|
|
|
|
|
|
|
|
|
|
|
|
|
|
|
|||||||
| Adjusted EBITDA |
$ | 1,264,117 | $ | 285,965 | $ | 1,550,082 | $ | 1,261,673 | $ | 285,297 | $ | 1,546,970 | ||||||||||||
|
|
|
|
|
|
|
|
|
|
|
|
|
|
|
|
|
|
|
|||||||
| (6) | Depreciation expenses not specifically recorded in a particular segment have been allocated based on other indirect allocable costs, which management believes is a reasonable method. |
| Shareholder Letter | Q4 Fiscal Year 2026 15 |
Fourth Quarter Fiscal Year 2026 Results (cont.)
Condensed Consolidated Balance Sheets
(Unaudited)
(In thousands)
| As of | As of | |||||||
| Assets | March 31, 2026 | March 31, 2025 | ||||||
| Current assets: |
||||||||
| Cash and cash equivalents |
$ | 1,746,835 | $ | 1,612,105 | ||||
| Accounts receivable, net |
753,430 | 699,552 | ||||||
| Inventories |
281,220 | 293,943 | ||||||
| Prepaid expenses and other current assets |
342,522 | 282,343 | ||||||
|
|
|
|
|
|
|
|||
| Total current assets |
3,124,007 | 2,887,943 | ||||||
| Property, equipment and satellites, net |
7,272,637 | 7,405,664 | ||||||
| Operating lease right-of-use assets |
427,994 | 416,490 | ||||||
| Acquired intangible assets, net |
1,997,436 | 2,270,777 | ||||||
| Goodwill |
1,625,013 | 1,622,132 | ||||||
| Other assets |
779,509 | 845,778 | ||||||
|
|
|
|
|
|
|
|||
| Total assets |
$ | 15,226,596 | $ | 15,448,784 | ||||
|
|
|
|
|
|
|
|||
| As of | As of | |||||||
| Liabilities and Equity | March 31, 2026 | March 31, 2025 | ||||||
| Current liabilities: |
||||||||
| Accounts payable |
$ | 288,154 | $ | 264,300 | ||||
| Accrued and other liabilities |
951,192 | 908,529 | ||||||
| Current portion of long-term debt |
57,753 | 503,825 | ||||||
|
|
|
|
|
|
|
|||
| Total current liabilities | 1,297,099 | 1,676,654 | ||||||
| Senior notes |
3,664,848 | 3,652,882 | ||||||
| Other long-term debt |
2,726,004 | 2,879,402 | ||||||
| Non-current operating lease liabilities |
430,082 | 414,133 | ||||||
| Other liabilities |
2,379,301 | 2,181,153 | ||||||
|
|
|
|
|
|
|
|||
| Total liabilities | 10,497,334 | 10,804,224 | ||||||
|
|
|
|
|
|
|
|||
| Total Viasat Inc. stockholders’ equity |
4,660,301 | 4,553,831 | ||||||
| Noncontrolling interest in subsidiary |
68,961 | 90,729 | ||||||
|
|
|
|
|
|
|
|||
| Total equity |
4,729,262 | 4,644,560 | ||||||
|
|
|
|
|
|
|
|||
| Total liabilities and equity |
$ | 15,226,596 | $ | 15,448,784 | ||||
|
|
|
|
|
|
|
|||
| Shareholder Letter | Q4 Fiscal Year 2026 16 |
Non-GAAP Financial Reconciliation
AN ITEMIZED RECONCILIATION BETWEEN NET INCOME (LOSS) ATTRIBUTABLE TO VIASAT, INC.
AND ADJUSTED EBITDA IS AS FOLLOWS:
(In thousands)
| Three months ended | ||||||||||||||||||||
| March 31, 2026 | December 31, 2025 | September 30, 2025 | June 30, 2025 | March 31, 2025 | ||||||||||||||||
| GAAP net income (loss) attributable to Viasat, Inc. |
$ | 58,824 | $ | 24,968 | $ | (61,444 | ) | $ | (56,434 | ) | $ | (246,053 | ) | |||||||
| Provision for (benefit from) income taxes |
40,081 | 58,670 | 10,862 | 6,610 | 3,758 | |||||||||||||||
| Interest expense (income), net |
65,484 | (78,112 | ) | 80,962 | 86,067 | 86,828 | ||||||||||||||
| Depreciation and amortization (5) |
347,327 | 340,360 | 329,128 | 342,344 | 337,182 | |||||||||||||||
| Stock-based compensation expense |
22,142 | 24,099 | 20,122 | 14,707 | 16,917 | |||||||||||||||
| Acquisition and transaction related expenses (3) |
4,062 | 5,525 | 5,080 | 9,725 | 6,761 | |||||||||||||||
| Ground network impairment and related charges, net |
— | — | — | — | 169,400 | |||||||||||||||
| Loss (gain) on extinguishment of debt, net |
— | 11,647 | — | 288 | — | |||||||||||||||
| Other income (expense), net (Q4FY26 includes gain on disposition of equity method investment) |
(168,062 | ) | (114 | ) | — | 5,164 | — | |||||||||||||
|
|
|
|
|
|
|
|
|
|
|
|
|
|
|
|
||||||
| Adjusted EBITDA |
$ | 369,858 | $ | 387,043 | $ | 384,710 | $ | 408,471 | $ | 374,793 | ||||||||||
|
|
|
|
|
|
|
|
|
|
|
|
|
|
|
|
||||||
| NET DEBT | As of | |||||||||||||||||||
| (In thousands) | March 31, 2026 | December 31, 2025 | September 30, 2025 | June 30, 2025 | March 31, 2025 | |||||||||||||||
| Total debt |
$ | 6,585,115 | $ | 6,406,911 | $ | 6,731,043 | $ | 6,741,529 | $ | 7,204,275 | ||||||||||
| Less: cash and cash equivalents |
1,746,835 | 1,346,136 | 1,230,074 | 1,177,492 | 1,612,105 | |||||||||||||||
|
|
|
|
|
|
|
|
|
|
|
|
|
|
|
|
||||||
| Net debt |
$ | 4,838,280 | $ | 5,060,775 | $ | 5,500,969 | $ | 5,564,037 | $ | 5,592,170 | ||||||||||
|
|
|
|
|
|
|
|
|
|
|
|
|
|
|
|
||||||
FREE CASH FLOW
(In thousands)
| The following table reconciles free cash flow to Net cash provided by (used in) operating activities. |
|
|||||||||||||||||||||||||||
| Three months ended | Fiscal years ended | |||||||||||||||||||||||||||
| March 31, 2026 |
December 31, 2025 |
September 30, 2025 |
June 30, 2025 |
March 31, 2025 |
March 31, 2026 |
March 31, 2025 |
||||||||||||||||||||||
| Net cash provided by (used in) operating activities |
$ | 322,295 | $ | 726,888 | $ | 282,242 | $ | 258,460 | $ | 298,443 | $ | 1,589,885 | $ | 908,187 | ||||||||||||||
| Purchase of property, equipment and satellites, and other assets (capital expenditures) |
(298,341 | ) | (282,721 | ) | (213,699 | ) | (198,013 | ) | (247,723 | ) | (992,774 | ) | (1,030,182 | ) | ||||||||||||||
|
|
|
|
|
|
|
|
|
|
|
|
|
|
|
|||||||||||||||
| Free cash flow |
$ | 23,954 | $ | 444,167 | $ | 68,543 | $ | 60,447 | $ | 50,720 | $ | 597,111 | $ | (121,995 | ) | |||||||||||||
|
|
|
|
|
|
|
|
|
|
|
|
|
|
|
|||||||||||||||
| Shareholder Letter | Q4 Fiscal Year 2026 17 |
Selected Segment Financial Information
(Unaudited)
(In thousands)
| Three months ended | Twelve months ended | |||||||||||||||
| March 31, 2026 | March 31, 2025 | March 31, 2026 | March 31, 2025 | |||||||||||||
| Revenues: |
||||||||||||||||
| Communication services |
||||||||||||||||
| Aviation services |
$ | 294,109 | $ | 265,203 | $ | 1,191,426 | $ | 1,048,225 | ||||||||
| Government satcom services |
205,106 | 195,756 | 795,043 | 754,552 | ||||||||||||
| Maritime services |
112,717 | 113,947 | 463,061 | 477,968 | ||||||||||||
| Fixed services and other services |
132,700 | 173,950 | 607,693 | 741,601 | ||||||||||||
|
|
|
|
|
|
|
|
|
|||||||||
| Total services |
744,632 | 748,856 | 3,057,223 | 3,022,346 | ||||||||||||
| Total products |
65,651 | 76,110 | 242,428 | 276,139 | ||||||||||||
|
|
|
|
|
|
|
|
|
|||||||||
| Total communication services revenues |
810,283 | 824,966 | 3,299,651 | 3,298,485 | ||||||||||||
| Defense and advanced technologies |
||||||||||||||||
| Total services |
59,093 | 48,515 | 217,200 | 203,430 | ||||||||||||
| Information security and cyber defense products |
120,452 | 96,887 | 414,482 | 325,439 | ||||||||||||
| Space and mission systems products |
87,173 | 75,030 | 330,867 | 304,870 | ||||||||||||
| Tactical networking products |
93,045 | 89,605 | 329,417 | 319,577 | ||||||||||||
| Advanced technologies and other products |
1,242 | 12,079 | 48,663 | 67,770 | ||||||||||||
|
|
|
|
|
|
|
|
|
|||||||||
| Total products |
301,912 | 273,601 | 1,123,429 | 1,017,656 | ||||||||||||
|
|
|
|
|
|
|
|
|
|||||||||
| Total defense and advanced technologies revenues |
361,005 | 322,116 | 1,340,629 | 1,221,086 | ||||||||||||
| Elimination of intersegment revenues |
— | — | — | — | ||||||||||||
|
|
|
|
|
|
|
|
|
|||||||||
| Total revenues |
$ | 1,171,288 | $ | 1,147,082 | $ | 4,640,280 | $ | 4,519,571 | ||||||||
|
|
|
|
|
|
|
|
|
|||||||||
| Shareholder Letter | Q4 Fiscal Year 2026 18 |