UNITED STATES
SECURITIES AND EXCHANGE COMMISSION
WASHINGTON, D.C. 20549
FORM 8-K
CURRENT REPORT
Pursuant to Section 13 or 15(d)
of the Securities Exchange Act of 1934
Date of Report (Date of earliest event reported): April 27, 2026
NUCOR CORPORATION
(Exact name of Registrant as Specified in Its Charter)
| Delaware | 1-4119 | 13-1860817 | ||
| (State or Other Jurisdiction of Incorporation) |
(Commission File Number) |
(IRS Employer Identification No.) |
| 1915 Rexford Road, | ||
| Charlotte, NC | 28211 | |
| (Address of Principal Executive Offices) | (Zip Code) |
Registrant’s Telephone Number, Including Area Code: (704) 366-7000
Not Applicable
(Former Name or Former Address, if Changed Since Last Report)
Check the appropriate box below if the Form 8-K filing is intended to simultaneously satisfy the filing obligation of the registrant under any of the following provisions:
| ☐ | Written communications pursuant to Rule 425 under the Securities Act (17 CFR 230.425) |
| ☐ | Soliciting material pursuant to Rule 14a-12 under the Exchange Act (17 CFR 240.14a-12) |
| ☐ | Pre-commencement communications pursuant to Rule 14d-2(b) under the Exchange Act (17 CFR 240.14d-2(b)) |
| ☐ | Pre-commencement communications pursuant to Rule 13e-4(c) under the Exchange Act (17 CFR 240.13e-4(c)) |
Securities registered pursuant to Section 12(b) of the Act:
| Title of each class |
Trading |
Name of each exchange |
||
| Common Stock, par value $0.40 per share | NUE | New York Stock Exchange |
Indicate by check mark whether the registrant is an emerging growth company as defined in Rule 405 of the Securities Act of 1933 (§ 230.405 of this chapter) or Rule 12b-2 of the Securities Exchange Act of 1934 (§ 240.12b-2 of this chapter).
Emerging growth company ☐
If an emerging growth company, indicate by check mark if the registrant has elected not to use the extended transition period for complying with any new or revised financial accounting standards provided pursuant to Section 13(a) of the Exchange Act. ☐
| Item 2.02. | Results of Operations and Financial Condition. |
On April 27, 2026, Nucor Corporation issued a news release reporting its financial results for the quarter ended April 4, 2026. A copy of the news release is furnished as Exhibit 99.1 and incorporated herein by reference.
| Item 7.01. | Regulation FD Disclosure. |
On April 27, 2026, Nucor Corporation, in conjunction with the issuance of the aforementioned news release, posted an investor presentation to its Investor Relations website. A copy of the investor presentation is furnished as Exhibit 99.2 and incorporated herein by reference.
| Item 9.01. | Financial Statements and Exhibits. |
| (d) | Exhibits |
| 99.1 | News Release of Nucor Corporation dated April 27, 2026 | |
| 99.2 | Investor Presentation dated April 27, 2026 | |
| 104 | Cover Page from this Current Report on Form 8-K, formatted in Inline XBRL | |
The information contained in this Current Report on Form 8-K, including the exhibits attached hereto, is being furnished and shall not be deemed to be “filed” for the purposes of Section 18 of the Securities Exchange Act of 1934, as amended (the “Exchange Act”), or otherwise subject to the liabilities of that Section. Furthermore, the information contained in this Current Report on Form 8-K shall not be deemed to be incorporated by reference into any registration statement or other document filed pursuant to the Securities Act of 1933, as amended, or the Exchange Act, except as shall be expressly set forth by specific reference in any such registration statement or other document.
1
SIGNATURES
Pursuant to the requirements of the Securities Exchange Act of 1934, the registrant has duly caused this report to be signed on its behalf by the undersigned hereunto duly authorized.
| NUCOR CORPORATION | ||||||
| Date: April 27, 2026 | By: | /s/ John L. Sullivan |
||||
| John L. Sullivan | ||||||
| Chief Financial Officer, Treasurer and Executive Vice President |
||||||
2
Exhibit 99.1
| News Release |

|
Nucor Reports Results for the First Quarter of 2026
First Quarter of 2026 Highlights
| • | Net earnings attributable to Nucor stockholders of $743 million, or $3.23 per diluted share |
| • | Net sales of $9.50 billion |
| • | Net earnings before noncontrolling interests of $870 million; EBITDA of $1.51 billion |
CHARLOTTE, N.C. – April 27, 2026 - Nucor Corporation (NYSE: NUE) today announced consolidated net earnings attributable to Nucor stockholders of $743 million, or $3.23 per diluted share, for the first quarter of 2026. Nucor reported consolidated net earnings attributable to Nucor stockholders in the fourth quarter of 2025 of $378 million, or $1.64 per diluted share (adjusted net earnings of $400 million, or $1.73 per diluted share). Nucor reported net earnings attributable to Nucor stockholders in the first quarter of 2025 of $156 million, or $0.67 per diluted share (adjusted net earnings of $179 million, or $0.77 per diluted share).
“Nucor teammates delivered a strong start to 2026, with our steel mills segment achieving a new quarterly shipment record,” said Leon Topalian, Nucor’s Chair and Chief Executive Officer. “All three of our operating segments reported sequential earnings growth, driven by strong demand across key end markets, growing contributions from recent capital investments, and federal trade policies that continue to reduce the flood of unfairly traded imports into the United States. We enter the second quarter with real momentum, committed to executing our growth strategy, generating strong returns for our shareholders, and continuing our pursuit of becoming the safest steel company in the world.”
Earnings Before Income Taxes and Noncontrolling Interests by Segment (In millions)
| Three Months (13 Weeks) Ended | ||||||||||||
| April 4, 2026 | December 31, 2025 | April 5, 2025 | ||||||||||
| Steel mills |
$ | 1,128 | $ | 516 | $ | 231 | ||||||
| Steel products |
285 | 230 | 288 | |||||||||
| Raw materials |
45 | 24 | 29 | |||||||||
| Corporate/eliminations |
(362 | ) | (269 | ) | (263 | ) | ||||||
|
|
|
|
|
|
|
|||||||
| $ | 1,096 | $ | 501 | $ | 285 | |||||||
|
|
|
|
|
|
|
|||||||
Analysis of First Quarter of 2026 Results Compared to the Fourth Quarter of 2025
The increase in first quarter earnings was driven primarily by the increase in earnings in the steel mills segment, which experienced higher average selling prices and volumes across all product groups. The steel products segment had improved earnings due to increased volumes and stable average realized pricing. The raw materials segment had higher earnings in the first quarter due to increased average selling prices and volumes.
Financial Strength
At the end of the first quarter of 2026, Nucor had $2.48 billion in cash and cash equivalents and short-term investments on hand. The Company’s $2.25 billion revolving credit facility remains undrawn and does not expire until March 2030. The Company continues to have the strongest credit ratings in the North American steel sector (A-/A-/A3) with stable outlooks at Standard & Poor’s, Fitch Ratings and Moody’s, respectively.
Page 1 of 10
Nucor Executive Offices: 1915 Rexford Road, Charlotte, North Carolina 28211
Phone 704-366-7000 Fax 704-362-4208 www.nucor.com
Nucor Reports Results for the First Quarter of 2026 (Continued)
Commitment to Returning Capital to Stockholders
During the first quarter of 2026, Nucor repurchased approximately 0.7 million shares of its common stock at an average price of $175.19 per share. Nucor has returned approximately $250 million to stockholders in the form of share repurchases and dividend payments year-to-date. On February 20, 2026, Nucor’s Board of Directors approved a new share repurchase program under which Nucor is authorized to repurchase up to $4.00 billion of its common stock and terminated any previously authorized share repurchase programs. As of April 4, 2026, Nucor had approximately $3.97 billion remaining for repurchases under its authorized share repurchase program. This share repurchase authorization is discretionary and has no scheduled expiration date.
On February 20, 2026, Nucor’s Board of Directors declared a cash dividend of $0.56 per share. This cash dividend is payable on May 11, 2026, to stockholders of record as of March 31, 2026 and is Nucor’s 212th consecutive quarterly cash dividend.
Second Quarter of 2026 Outlook Compared to the First Quarter of 2026
We expect higher consolidated earnings in the second quarter of 2026, with improved earnings across all three operating segments. In the steel mills segment, the expected increase is due to higher realized selling prices with stable volumes. In the steel products segment, we expect improved earnings due to higher volumes on stable pricing. The raw materials segment is expected to have increased earnings due to higher realized pricing.
Earnings Conference Call
An earnings call is scheduled for April 28, 2026 at 10:00 a.m. Eastern Time to review Nucor’s first quarter of 2026 financial results and provide a business update. The call can be accessed via webcast from the Investor Relations section of Nucor’s website (nucor.com/investors). A presentation with supplemental information to accompany the call has been posted to Nucor’s Investor Relations website. A playback of the webcast will be posted to the same site within one day of the live event.
About Nucor
Nucor and its affiliates are manufacturers of steel and steel products, with operating facilities in the United States, Canada and Mexico. Products produced include: carbon and alloy steel — in bars, beams, sheet and plate; hollow structural section tubing; electrical conduit; steel racking; steel piling; steel joists and joist girders; steel deck; fabricated concrete reinforcing steel; cold finished steel; precision castings; steel fasteners; metal building systems; insulated metal panels; overhead doors; steel grating; wire and wire mesh; and utility structures. Nucor, through The David J. Joseph Company and its affiliates, also brokers ferrous and nonferrous metals, pig iron and hot briquetted iron / direct reduced iron; supplies ferro-alloys; and processes ferrous and nonferrous scrap. Nucor is North America’s largest recycler.
Non-GAAP Financial Measures
The Company uses certain non-GAAP (Generally Accepted Accounting Principles) financial measures in this news release, including EBITDA, adjusted net earnings attributable to Nucor stockholders and adjusted net earnings per diluted share. Generally, a non-GAAP financial measure is a numerical measure of a company’s performance or financial position that either excludes or includes amounts that are not normally excluded or included in the most directly comparable financial measure calculated and presented in accordance with GAAP.
Page 2 of 10
Nucor Executive Offices: 1915 Rexford Road, Charlotte, North Carolina 28211
Phone 704-366-7000 Fax 704-362-4208 www.nucor.com
Nucor Reports Results for the First Quarter of 2026 (Continued)
We define EBITDA as net earnings before noncontrolling interests, adding back the following items: interest expense (income), net; provision for income taxes; losses and impairments of assets; depreciation; and amortization. We define adjusted net earnings attributable to Nucor stockholders as net earnings attributable to Nucor stockholders adding back losses and impairments of assets, net of tax and noncontrolling interests. We define adjusted net earnings per diluted share as net earnings per diluted share adding back the per diluted share impact of losses and impairments of assets, net of tax and noncontrolling interests. Please note that other companies might define their non-GAAP financial measures differently than we do.
Management presents the non-GAAP financial measures of EBITDA, adjusted net earnings attributable to Nucor stockholders and adjusted net earnings per diluted share in this news release because it considers them to be important supplemental measures of performance. Management believes that these non-GAAP financial measures provide additional insight for analysts and investors evaluating the Company’s financial and operational performance by providing a consistent basis of comparison across periods.
Forward-Looking Statements
Certain statements contained in this news release are “forward-looking statements” that involve risks and uncertainties which we expect will or may occur in the future and may impact our business, financial condition and results of operations. The words “anticipate,” “believe,” “expect,” “intend,” “project,” “may,” “will,” “should,” “could” and similar expressions are intended to identify those forward-looking statements. These forward-looking statements reflect the Company’s best judgment based on current information, and, although we base these statements on circumstances that we believe to be reasonable when made, there can be no assurance that future events will not affect the accuracy of such forward-looking information. As such, the forward-looking statements are not guarantees of future performance, and actual results may vary materially from the projected results and expectations discussed in this news release. Factors that might cause the Company’s actual results to differ materially from those anticipated in forward-looking statements include, but are not limited to: (1) competitive pressure on sales and pricing, including pressure from imports and substitute materials; (2) U.S. and foreign trade policies affecting steel imports or exports; (3) the sensitivity of the results of our operations to general market conditions, and in particular, prevailing market steel prices and changes in the supply and cost of raw materials, including pig iron, iron ore and scrap steel; (4) the availability and cost of electricity and natural gas, which could negatively affect our cost of steel production or result in a delay or cancellation of existing or future drilling within our natural gas drilling programs; (5) critical equipment failures and business interruptions; (6) market demand for steel products, which, in the case of many of our products, is driven by the level of nonresidential construction activity in the United States; (7) impairment in the recorded value of inventory, equity investments, fixed assets, goodwill or other long-lived assets; (8) uncertainties and volatility surrounding the global economy, including excess world capacity for steel production, inflation and interest rate changes; (9) fluctuations in currency conversion rates; (10) significant changes in laws or government regulations affecting environmental compliance, including legislation and regulations that result in greater regulation of greenhouse gas emissions that could increase our energy costs, capital expenditures and operating costs or cause one or more of our permits to be revoked or make it more difficult to obtain permit modifications; (11) the cyclical nature of the steel industry; (12) capital investments and their impact on our performance; (13) our safety performance; (14) our ability to integrate businesses we acquire; and (15) the impact of any pandemic or public health situation.
Page 3 of 10
Nucor Executive Offices: 1915 Rexford Road, Charlotte, North Carolina 28211
Phone 704-366-7000 Fax 704-362-4208 www.nucor.com
Nucor Reports Results for the First Quarter of 2026 (Continued)
These and other factors are discussed in Nucor’s regulatory filings with the United States Securities and Exchange Commission, including those in “Item 1A. Risk Factors” of Nucor’s Annual Report on Form 10-K for the year ended December 31, 2025. The forward-looking statements contained in this news release speak only as of this date, and Nucor does not assume any obligation to update them, except as may be required by applicable law.
Contact Information
For Investor/Analyst Inquiries –
Chris Jacobi, chris.jacobi@nucor.com, or Paul Donnelly, paul.donnelly@nucor.com
For Media Inquiries –
Katherine Miller, katherine.miller@nucor.com
Page 4 of 10
Nucor Executive Offices: 1915 Rexford Road, Charlotte, North Carolina 28211
Phone 704-366-7000 Fax 704-362-4208 www.nucor.com
Nucor Reports Results for the First Quarter of 2026 (Continued)
Consolidated Financial Statements
Condensed Consolidated Statements of Earnings (Unaudited)
(In millions, except per share data)
| Three Months (13 Weeks) Ended | ||||||||||||
| April 4, 2026 | December 31, 2025 | April 5, 2025 | ||||||||||
| Net sales |
$ | 9,496 | $ | 7,687 | $ | 7,830 | ||||||
|
|
|
|
|
|
|
|||||||
| Costs, expenses and other: |
||||||||||||
| Cost of products sold |
7,995 | 6,825 | 7,225 | |||||||||
| Marketing, administrative and other expenses |
378 | 334 | 281 | |||||||||
| Equity in earnings of unconsolidated affiliates |
(7 | ) | (11 | ) | (4 | ) | ||||||
| Losses and impairments of assets |
15 | 27 | 29 | |||||||||
| Interest expense, net |
19 | 11 | 14 | |||||||||
|
|
|
|
|
|
|
|||||||
| 8,400 | 7,186 | 7,545 | ||||||||||
|
|
|
|
|
|
|
|||||||
| Earnings before income taxes and noncontrolling interests |
1,096 | 501 | 285 | |||||||||
| Provision for income taxes |
226 | 78 | 59 | |||||||||
|
|
|
|
|
|
|
|||||||
| Net earnings before noncontrolling interests |
870 | 423 | 226 | |||||||||
| Earnings attributable to noncontrolling interests |
127 | 45 | 70 | |||||||||
|
|
|
|
|
|
|
|||||||
| Net earnings attributable to Nucor stockholders |
$ | 743 | $ | 378 | $ | 156 | ||||||
|
|
|
|
|
|
|
|||||||
| Net earnings per share: |
||||||||||||
| Basic |
$ | 3.23 | $ | 1.64 | $ | 0.67 | ||||||
| Diluted |
$ | 3.23 | $ | 1.64 | $ | 0.67 | ||||||
| Average shares outstanding: |
||||||||||||
| Basic |
228.9 | 229.3 | 232.7 | |||||||||
| Diluted |
229.3 | 229.6 | 232.9 | |||||||||
Page 5 of 10
Nucor Executive Offices: 1915 Rexford Road, Charlotte, North Carolina 28211
Phone 704-366-7000 Fax 704-362-4208 www.nucor.com
Nucor Reports Results for the First Quarter of 2026 (Continued)
Condensed Consolidated Balance Sheets (Unaudited)
(In millions)
| April 4, 2026 | December 31, 2025 | |||||||
| ASSETS |
||||||||
| Current assets: |
||||||||
| Cash and cash equivalents |
$ | 2,226 | $ | 2,260 | ||||
| Short-term investments |
255 | 439 | ||||||
| Accounts receivable, net |
3,567 | 3,105 | ||||||
| Inventories, net |
5,644 | 5,462 | ||||||
| Other current assets |
396 | 499 | ||||||
|
|
|
|
|
|||||
| Total current assets |
12,088 | 11,765 | ||||||
| Property, plant and equipment, net |
15,596 | 15,306 | ||||||
| Goodwill |
4,295 | 4,297 | ||||||
| Other intangible assets, net |
2,817 | 2,880 | ||||||
| Other assets |
839 | 856 | ||||||
|
|
|
|
|
|||||
| Total assets |
$ | 35,635 | $ | 35,104 | ||||
|
|
|
|
|
|||||
| LIABILITIES |
||||||||
| Current liabilities: |
||||||||
| Short-term debt |
$ | 134 | $ | 122 | ||||
| Current portion of long-term debt and finance lease obligations |
113 | 90 | ||||||
| Accounts payable |
2,109 | 1,890 | ||||||
| Salaries, wages and related accruals |
701 | 882 | ||||||
| Accrued expenses and other current liabilities |
1,110 | 1,020 | ||||||
|
|
|
|
|
|||||
| Total current liabilities |
4,167 | 4,004 | ||||||
| Long-term debt and finance lease obligations due after one year |
6,877 | 6,909 | ||||||
| Deferred credits and other liabilities |
2,043 | 2,067 | ||||||
|
|
|
|
|
|||||
| Total liabilities |
13,087 | 12,980 | ||||||
|
|
|
|
|
|||||
| Commitments and contingencies |
||||||||
| EQUITY |
||||||||
| Nucor stockholders’ equity: |
||||||||
| Common stock |
152 | 152 | ||||||
| Additional paid-in capital |
2,274 | 2,253 | ||||||
| Retained earnings |
32,118 | 31,504 | ||||||
| Accumulated other comprehensive loss, net of income taxes |
(206 | ) | (194 | ) | ||||
| Treasury stock |
(12,885 | ) | (12,779 | ) | ||||
|
|
|
|
|
|||||
| Total Nucor stockholders’ equity |
21,453 | 20,936 | ||||||
| Noncontrolling interests |
1,095 | 1,188 | ||||||
|
|
|
|
|
|||||
| Total equity |
22,548 | 22,124 | ||||||
|
|
|
|
|
|||||
| Total liabilities and equity |
$ | 35,635 | $ | 35,104 | ||||
|
|
|
|
|
|||||
Page 6 of 10
Nucor Executive Offices: 1915 Rexford Road, Charlotte, North Carolina 28211
Phone 704-366-7000 Fax 704-362-4208 www.nucor.com
Nucor Reports Results for the First Quarter of 2026 (Continued)
Condensed Consolidated Statements of Cash Flows (Unaudited)
(In millions)
| Three Months (13 Weeks) Ended | ||||||||
| April 4, 2026 | April 5, 2025 | |||||||
| Operating activities: |
||||||||
| Net earnings before noncontrolling interests |
$ | 870 | $ | 226 | ||||
| Adjustments: |
||||||||
| Depreciation |
321 | 303 | ||||||
| Amortization |
63 | 65 | ||||||
| Impairment of assets |
15 | 12 | ||||||
| Stock-based compensation |
30 | 26 | ||||||
| Deferred income taxes |
(34 | ) | (31 | ) | ||||
| Distributions from affiliates |
6 | 6 | ||||||
| Equity in earnings of unconsolidated affiliates |
(7 | ) | (4 | ) | ||||
| Changes in assets and liabilities (exclusive of acquisitions and dispositions): |
||||||||
| Accounts receivable |
(463 | ) | (291 | ) | ||||
| Inventories |
(183 | ) | (150 | ) | ||||
| Accounts payable |
226 | 378 | ||||||
| Federal income taxes |
78 | 72 | ||||||
| Salaries, wages and related accruals |
(168 | ) | (308 | ) | ||||
| Other operating activities |
132 | 60 | ||||||
|
|
|
|
|
|||||
| Cash provided by operating activities |
886 | 364 | ||||||
|
|
|
|
|
|||||
| Investing activities: |
||||||||
| Capital expenditures |
(661 | ) | (859 | ) | ||||
| Investment in and advances to affiliates |
(2 | ) | — | |||||
| Disposition of plant and equipment |
14 | 3 | ||||||
| Acquisitions (net of cash acquired) |
— | (1 | ) | |||||
| Purchases of investments |
(141 | ) | (452 | ) | ||||
| Proceeds from the sale of investments |
326 | 127 | ||||||
| Other investing activities |
18 | 2 | ||||||
|
|
|
|
|
|||||
| Cash used in investing activities |
(446 | ) | (1,180 | ) | ||||
|
|
|
|
|
|||||
| Financing activities: |
||||||||
| Net change in short-term debt |
12 | (65 | ) | |||||
| Proceeds from issuance of long-term debt, net of discount |
— | 997 | ||||||
| Bond issuance costs |
— | (9 | ) | |||||
| Repayment of long-term debt |
(4 | ) | (4 | ) | ||||
| Proceeds from exercise of stock options |
4 | — | ||||||
| Payment of tax withholdings on certain stock-based compensation |
(3 | ) | — | |||||
| Distributions to noncontrolling interests |
(220 | ) | (172 | ) | ||||
| Cash dividends |
(129 | ) | (129 | ) | ||||
| Acquisition of treasury stock |
(125 | ) | (300 | ) | ||||
| Proceeds from government incentives |
— | 75 | ||||||
| Other financing activities |
(7 | ) | 21 | |||||
|
|
|
|
|
|||||
| Cash (used in) provided by financing activities |
(472 | ) | 414 | |||||
|
|
|
|
|
|||||
| Effect of exchange rate changes on cash |
(2 | ) | — | |||||
|
|
|
|
|
|||||
| Decrease in cash and cash equivalents |
(34 | ) | (402 | ) | ||||
| Cash and cash equivalents - beginning of year |
2,260 | 3,558 | ||||||
|
|
|
|
|
|||||
| Cash and cash equivalents - end of three months |
$ | 2,226 | $ | 3,156 | ||||
|
|
|
|
|
|||||
| Non-cash investing activity: |
||||||||
| Change in accrued plant and equipment purchases |
$ | (7 | ) | $ | 62 | |||
|
|
|
|
|
|||||
Page 7 of 10
Nucor Executive Offices: 1915 Rexford Road, Charlotte, North Carolina 28211
Phone 704-366-7000 Fax 704-362-4208 www.nucor.com
Nucor Reports Results for the First Quarter of 2026 (Continued)
Select Financial and Operational Data
| (Dollars in millions, tons in thousands, per unit amounts as noted) |
||||||||||||||||||||
| Three Months (13 Weeks) Ended | ||||||||||||||||||||
| April 4, 2026 | Dec. 31, 2025 | % Change | April 5, 2025 | Year Ago % Change |
||||||||||||||||
| Consolidated Financial & Operational Data |
||||||||||||||||||||
| Net Sales |
$ | 9,496 | $ | 7,687 | 24 | % | $ | 7,830 | 21 | % | ||||||||||
| External Average Sales Price per Ton |
$ | 1,279 | $ | 1,242 | 3 | % | $ | 1,146 | 12 | % | ||||||||||
| Sales Tons to External Customers |
7,427 | 6,191 | 20 | % | 6,830 | 9 | % | |||||||||||||
| Pre-Operating & Start-Up Costs |
$ | 108 | $ | 87 | 24 | % | $ | 170 | -36 | % | ||||||||||
| Pre-Operating & Start-Up Costs per Diluted Share |
$ | 0.36 | $ | 0.29 | $ | 0.56 | ||||||||||||||
| Number of Days in Period |
94 | 88 | 95 | |||||||||||||||||
| Steel Mills Segment Data | ||||||||||||||||||||
| Total Shipments |
7,028 | 5,906 | 19 | % | 6,463 | 9 | % | |||||||||||||
| Sales Tons to External Customers |
5,619 | 4,602 | 22 | % | 5,226 | 8 | % | |||||||||||||
| Percentage of Sales to Internal Customers |
20 | % | 22 | % | 19 | % | ||||||||||||||
| External Average Sales Price per Ton |
$ | 1,074 | $ | 1,019 | 5 | % | $ | 938 | 14 | % | ||||||||||
| Average Scrap/Scrap Substitute Cost per Gross Ton Used |
$ | 403 | $ | 380 | 6 | % | $ | 394 | 2 | % | ||||||||||
| Utilization |
86 | % | 82 | % | 80 | % | ||||||||||||||
| Steel Products Segment Data | ||||||||||||||||||||
| Sales Tons to External Customers |
1,159 | 1,025 | 13 | % | 1,048 | 11 | % | |||||||||||||
| External Average Sales Price per Ton |
$ | 2,405 | $ | 2,413 | 0 | % | $ | 2,294 | 5 | % | ||||||||||
Page 8 of 10
Nucor Executive Offices: 1915 Rexford Road, Charlotte, North Carolina 28211
Phone 704-366-7000 Fax 704-362-4208 www.nucor.com
Nucor Reports Results for the First Quarter of 2026 (Continued)
| Tonnage Data (In thousands) |
Three Months (13 Weeks) Ended | |||||||||||||||||||
| April 4, 2026 | Dec. 31, 2025 | % Change | April 5, 2025 | Year Ago % Change |
||||||||||||||||
| Steel mills total shipments: |
||||||||||||||||||||
| Sheet |
3,394 | 2,804 | 21 | % | 2,981 | 14 | % | |||||||||||||
| Bars |
2,308 | 2,007 | 15 | % | 2,290 | 1 | % | |||||||||||||
| Structural |
649 | 522 | 24 | % | 577 | 12 | % | |||||||||||||
| Plate |
647 | 552 | 17 | % | 577 | 12 | % | |||||||||||||
| Other |
30 | 21 | 43 | % | 38 | -21 | % | |||||||||||||
|
|
|
|
|
|
|
|
|
|
|
|||||||||||
| 7,028 | 5,906 | 19 | % | 6,463 | 9 | % | ||||||||||||||
|
|
|
|
|
|
|
|
|
|
|
|||||||||||
| Sales tons to outside customers: |
||||||||||||||||||||
| Steel mills |
5,619 | 4,602 | 22 | % | 5,226 | 8 | % | |||||||||||||
| Joist and deck |
185 | 218 | -15 | % | 182 | 2 | % | |||||||||||||
| Rebar fabrication products |
291 | 270 | 8 | % | 247 | 18 | % | |||||||||||||
| Tubular products |
318 | 228 | 39 | % | 270 | 18 | % | |||||||||||||
| Building systems |
55 | 54 | 2 | % | 48 | 15 | % | |||||||||||||
| Other steel products |
310 | 255 | 22 | % | 301 | 3 | % | |||||||||||||
| Raw materials |
649 | 564 | 15 | % | 556 | 17 | % | |||||||||||||
|
|
|
|
|
|
|
|
|
|
|
|||||||||||
| 7,427 | 6,191 | 20 | % | 6,830 | 9 | % | ||||||||||||||
|
|
|
|
|
|
|
|
|
|
|
|||||||||||
Page 9 of 10
Nucor Executive Offices: 1915 Rexford Road, Charlotte, North Carolina 28211
Phone 704-366-7000 Fax 704-362-4208 www.nucor.com
Nucor Reports Results for the First Quarter of 2026 (Continued)
Non-GAAP Financial Measures
Reconciliation of EBITDA (Unaudited)
(In millions)
| Three Months (13 Weeks) Ended | ||||||||||||
| April 4, 2026 | December 31, 2025 | April 5, 2025 | ||||||||||
| Net earnings before noncontrolling interests |
$ | 870 | $ | 423 | $ | 226 | ||||||
| Depreciation |
321 | 316 | 303 | |||||||||
| Amortization |
63 | 63 | 65 | |||||||||
| Losses and impairments of assets |
15 | 27 | 29 | |||||||||
| Interest expense, net |
19 | 11 | 14 | |||||||||
| Provision for income taxes |
226 | 78 | 59 | |||||||||
|
|
|
|
|
|
|
|||||||
| EBITDA |
$ | 1,514 | $ | 918 | $ | 696 | ||||||
|
|
|
|
|
|
|
|||||||
Reconciliation of Adjusted Net Earnings Attributable to Nucor Stockholders (Unaudited)
(In millions, except per share data)
| Three Months (13 Weeks) Ended | ||||||||||||||||
| December 31, 2025 | April 5, 2025 | |||||||||||||||
| Diluted EPS | Diluted EPS | |||||||||||||||
| Net earnings attributable to Nucor stockholders |
$ | 378 | $ | 1.64 | $ | 156 | $ | 0.67 | ||||||||
| Losses and impairments of assets, net of tax and noncontrolling interests |
22 | 0.09 | 23 | 0.10 | ||||||||||||
|
|
|
|
|
|
|
|
|
|||||||||
| Adjusted net earnings attributable to Nucor stockholders |
$ | 400 | $ | 1.73 | $ | 179 | $ | 0.77 | ||||||||
|
|
|
|
|
|
|
|
|
|||||||||
Page 10 of 10
Nucor Executive Offices: 1915 Rexford Road, Charlotte, North Carolina 28211
Phone 704-366-7000 Fax 704-362-4208 www.nucor.com

Exhibit 99.2 FIRST QUARTER 2026 EARNINGS CALL Leon Topalian Chair and CEO Steve Laxton President and COO Jack Sullivan CFO April 28, 2026

FORWARD-LOOKING STATEMENTS Certain statements made in this presentation may constitute forward-looking statements within the meaning of the Private Securities Litigation Reform Act of 1995. These statements involve risks and uncertainties. The words “anticipate,” “believe,” “expect,” “intend,” “may,” “project,” “will,” “should,” “could” and similar expressions are intended to identify forward-looking statements. These forward-looking statements reflect the Company’s best judgment based on current information, and although we base these statements on circumstances that we believe to be reasonable when made, there can be no assurance that future events will not affect the accuracy of such forward-looking information. The Company does not undertake any obligation to update these statements. The forward-looking statements are not guarantees of future performance, and actual results may vary materially from the projected results and expectations discussed in this presentation. Factors that might cause the Company’s actual results to differ materially from those anticipated in forward- looking statements include, but are not limited to: (1) competitive pressure on sales and pricing, including pressure from imports and substitute materials; (2) U.S. and foreign trade policies affecting steel imports or exports; (3) the sensitivity of the results of our operations to general market conditions, and in particular, prevailing market steel prices and changes in the supply and cost of raw materials, including pig iron, iron ore and scrap steel; (4) the availability and cost of electricity and natural gas, which could negatively affect our cost of steel production or result in a delay or cancellation of existing or future drilling within our natural gas drilling programs; (5) critical equipment failures and business interruptions; (6) market demand for steel products, which, in the case of many of our products, is driven by the level of nonresidential construction activity in the United States; (7) impairment in the recorded value of inventory, equity investments, fixed assets, goodwill or other long- lived assets; (8) uncertainties and volatility surrounding the global economy, including excess world capacity for steel production, inflation and interest rate changes; (9) fluctuations in currency conversion rates; (10) significant changes in laws or government regulations affecting environmental compliance, including legislation and regulations that result in greater regulation of greenhouse gas emissions that could increase our energy costs, capital expenditures and operating costs or cause one or more of our permits to be revoked or make it more difficult to obtain permit modifications; (11) the cyclical nature of the steel industry; (12) capital investments and their impact on our performance; (13) our safety performance; (14) our ability to integrate businesses we acquire; (15) the impact of any pandemic or public health situation; and (16) the risks discussed in “Item 1A. Risk Factors” of the Company’s most recent Annual Report on Form 10-K and elsewhere therein and in the other reports we file with the U.S. Securities and Exchange Commission. 2

NON-GAAP FINANCIAL MEASURES The Company uses certain non-GAAP (Generally Accepted Accounting Principles) financial measures in this presentation, including adjusted earnings, EBITDA and Free Cash Flow (FCF). Generally, a non-GAAP financial measure is a numerical measure of a company’s performance or financial position that either excludes or includes amounts that are not normally excluded or included in the most directly comparable financial measure calculated and presented in accordance with GAAP. We define EBITDA as net earnings before noncontrolling interests adding back the following items: interest expense, net; provision for income taxes; depreciation; amortization; and losses and impairments of assets. We define Free Cash Flow (FCF) as Cash Provided by Operating Activities less Capital Expenditures. Please note that other companies might define their non-GAAP financial measures differently than we do. Management presents non-GAAP financial measures because it considers them to be an important supplemental measure of performance. Management believes that these non-GAAP financial measures provide additional insight for analysts and investors evaluating the Company’s financial and operational performance by providing a consistent basis of comparison across periods. Non-GAAP financial measures have limitations as an analytical tool. Investors are encouraged to review the reconciliation of non-GAAP financial measures to their most directly comparable GAAP financial measures provided in this presentation, including in the accompanying tables located in the Appendix. 3

Q1 2026 FINANCIAL PERFORMANCE FINANCIAL METRICS 1 $1.5 billion EBITDA $743 million Net Earnings $3.23 EPS ~24% debt/cap; Balance Sheet & (2) Liquidity ~$3.2 billion liquidity $661 million Capital Expenditures Returns to NUE $254 million Shareholders • Dividend Payments • $129 million • $125 million • Share Repurchases (0.7 mm shares) (1) EBITDA is a non-GAAP financial measure. For a reconciliation of non-GAAP measures, please refer to the Appendix 4 (2) Liquidity defined as cash & equivalents, plus short-term investments, plus available revolver capacity of $2.25 billion facility less ~$1.6 billion outstanding floating-rate IRBs

Q1 2026 OPERATIONAL HIGHLIGHTS EXTERNAL MILL MILL SAFETY SHIPMENTS BACKLOGS UTILIZATION (1) (1) 0.75 7.4mm 4.7mm 86% YTD Injury & Illness Rate +20% vs. Q4 2025 +20% vs. Q4 2025 +400 bps vs. Q4 2025 SAFETY • 65 divisions had zero recordable injuries in Q1 2026 OUR #1 VALUE • Steel Mills: 7.0mm tons shipped in Q1, eclipsing RECORD QUARTERLY previous record of 6.7mm tons set in Q2 2021 STEEL MILL SHIPMENTS • Steel Products: 1.2mm tons shipped in Q1, +13% Q/Q • Steel Mills up 20% Q/Q; highest level since Q2 2021 GROWING BACKLOGS • Steel Products up 9% Q/Q, with increases across all major products • ~15% C&A finished import share in Q1 2026 STRONGER TRADE • Continued enforcement of trade laws is having its ENFORCEMENT intended effect, leading to meaningful declines in steel imports 5 (1) Based on net tons. External shipments include Steel Mills (~5.6mm), Steel Products (~1.2mm), and Raw Materials (~0.6mm)

WEST VIRGINIA PROJECT PROGRESSING – ON TIME AND ON BUDGET COMMISSIONING THROUGHOUT 2026 • Each area of new sheet mill is inspected, tested, and prepared for start-up • Pickle line commissioning underway • Additional equipment commissioning will begin over the summer and continue through the year PRODUCTION EXPECTED 2027 • Initial focus is on safe and reliable performance • Intentional, multi-phased ramp to full run-rate • Capacity utilization and product capabilities will expand through 2027 and 2028 1 Sequencing equipment commissioning across 2026 Spring Summer Fall to year-end ✓ HOT PICKLE AUTO MELT COLD CONSTRUCTION MILL LINE GALV LINE SHOP MILL GALV LINE 6 (1) Represents the beginning of the commissioning process

2026 GROWTH PRIORITIES TOWERS & STRUCTURES NUCOR BERKELEY RAMP-UPS OF GREENFIELDS GALV LINE RECENT PROJECTS Constructing two greenfield facilities Constructing a second 500K tpa 2025 projects are on track to be fully in IN and UT; complementing galvanizing line at Nucor Steel ramped and operating at EBITDA existing facilities in PA and AL Berkeley (SC) sheet mill positive run rates within the year Utah Towers & Structures Berkeley County, SC galv line Lexington, NC rebar micro mill Indiana Greenfield • Bar Mill projects: Lexington rebar micromill and Kingman melt shop • Ongoing customer qualifications; • Advanced capabilities to serve achieved EBITDA positive in March pole production ramp up in Q4’25 Southeast automotive customers • “First dip” at galv facility in Q2’26; • Equipment commissioning planned • Crawfordsville coating complex: full production by Q3’26 for mid-year Galv line ramping, paint line • Production startup expected to commissioning in 2H 2026 Utah Greenfield begin in the fall • “First dip” at galv facility by YE • Alabama T&S: Expect to reach an 2026; full production by mid-2027 EBITDA positive run rate by the summer 7

NEAR TO MEDIUM-TERM OUTLOOK STEEL 1 2 FLATS LONGS PRODUCTS Ø Backlog strength continues Ø Incremental demand Ø Mega projects across long products • Data centers • Demand driver for higher • Rebar & Structural backlog set • Energy margin, engineered products record highs • Border fence Ø Joist & Deck Ø Full impact of rebar trade case & • Data centers, warehouse • Steel bridges section 232 • Backlog extends through the • Service centers Ø Mega projects summer at pricing above Ø Lean service-center inventories • Data centers, CHIPS plants, current realized levels institutional buildings, stadiums, Ø Imports to retreat further YoY Ø Tube warehouses • CORE trade case / • Data centers & border fence full effect of Section 232 Ø Concrete bridges – IIJA/State Ø Rebar Fab • OCTG trade case pending funded • Backlog strength Ø Regional growth –Lexington & • Regional growth Kingman ramping Ø Energy – Renewables, • Automotive infrastructure, traditional power • Margin impacts from higher priced steel – rebar fab, joist & deck • Galv supply/spreads • Construction cost/Inflation • Residential market (new builds & • Residential new build market existing) impact appliance/water • Residential new build market heater/HVAC demand • New supply hitting market • Railcar • Rebar imports from S. Korea 8 (1) Flats include sheet and plate steel (2) Longs include bar and structural steel CATALYSTS MONITORING MONITORING CATALYSTS MONITORING CATALYSTS

CONSOLIDATED FINANCIAL RESULTS ($ in Millions except per share data) 1 2 Diluted EPS EBITDA Adj. for impairments $1.73 $3.23 $1,514 $0.77 $918 $1.64 $696 $0.67 Q1'25 Q4'25 Q1'26 Q1'25 Q4'25 Q1'26 3 Capital Expenditures Free Cash Flow $225 ($3) $859 ($495) $802 $661 Q1’25 Q4’25 Q1’26 Q1'25 Q4'25 Q1'26 (1) Adjusted Earnings in Q1’25 and Q4’25 excludes certain non-recurring charges. See appendix for a reconciliation of non-GAAP measures. (2) EBITDA is a non-GAAP financial measure. For a reconciliation of non-GAAP measures, please refer to the Appendix 9 (3) FCF represents operating cashflow minus capex

Q1 2026 SEGMENT RESULTS ADJUSTED PRE-TAX SEGMENT Q1 2026 VS Q4 2025 (1) EARNINGS $millions • Higher volumes $45 STEEL • Higher realized pricing $285 $57 MILLS $43 • Higher EBT/ton $392 $319 $24 $251 • Higher volumes $29 $1,128 STEEL • Stable realized pricing $843 $307 $793 PRODUCTS $522 • Stable EBT/ton $241 ($263) ($272) ($269) ($362) ($393) • Higher volumes RAW • Higher realized pricing MATERIALS (2) (3) Q1 2025 Q2 2025 Q3 2025 Q4 2025 Q1 2026 Steel Mills Steel Products Raw Materials Corporate/Eliminations (1) Total segment earnings before income taxes and non-controlling interests (3) Adjusted to exclude $6 million impairment in Steel Mills and $21 million impairment in Steel Products taken in Q4 2025. (2) Adjusted to exclude $10 million impairment in Steel Mills and $19 million impairment in For a reconciliation of non-GAAP measures, please refer to 10 Steel Products taken in Q1 2025. For a reconciliation of non-GAAP measures, please the Appendix. refer to the Appendix.

STRONG BALANCE SHEET & SHAREHOLDER RETURNS REMAIN PRIORITIES COMMITTED TO RETURNING AT LEAST 40% OF MAINTAINING FINANCIAL FLEXIBILITY ANNUAL NET EARNINGS 135% $USD in millions xLTM 1 as of April 4, 2026 Amount EBITDA % cap 2 Total Debt $7,124 1.4x 24% 69% 3 Cash and Cash Equivalents $2,481 46% 43% 34% Net Debt $4,643 0.9x 40% Total Equity & Non-Controlling Int. $22,548 76% Total Book Capitalization $29,672 100% 2022 2023 2024 2025 Q1 2026 (4) HIGHEST CREDIT RATINGS IN THE INDUSTRY MANAGEABLE DEBT MATURITY PROFILE Sr. Notes & IRBs Rating Long-term Short-term Outlook $2,000 Agency Rating Rating $1,500 S&P A- A-1 Stable $1,000 $4,692 Fitch A- F1 Stable $500 $1,015 $22 $550 $41 $500 $0 Moody’s A3 P-2 Stable 2026 2027 2028 2029 2030 2031+ Represents Nucor’s senior unsecured ratings (1) EBITDA is a non-GAAP financial measure. For a reconciliation of non-GAAP measures, please refer to the Appendix. (2) Total Debt includes Short-Term Debt, Current Portion of Long-Term Debt, Long-term Debt and Finance Lease Obligations 11 (3) Includes Cash and Cash Equivalents and Short-Term Investments (4) $2.25 billion revolver matures in 2030

Q2 2026 EARNINGS OUTLOOK IMPACT ON Q2 SEGMENT EXPECTATIONS FOR Q2 vs Q1 EARNINGS VS Q1 • Stable volumes Steel Mills • Higher average realized pricing • Higher volumes Steel Products • Stable average realized pricing • Stable volumes Raw Materials • Higher average realized pricing • Higher corporate expenses and Corp / Eliminations intersegment profits requiring elimination upon consolidation Consolidated • Higher compared to Q1 Earnings 12

APPENDIX 13

ENERGY STRATEGY MITIGATES RISK ENERGY COSTS REPRESENT Broad set of mitigation levers 1 ~10% OF CONVERSION COSTS ~$45/ton REGIONAL • Nucor’s 26 steel mills procure power from over 20 different utilities across our nationwide footprint DIVERSITY • As a large interruptible power customer, Nucor INTERRUPTIBLE steel mills provide a critical service in managing peak electricity demand, which can POWER lower overall rates Electricity Natural Gas Total • Entered into fixed price PPAs, hedging some RENEWABLE power cost exposure, while supporting the PPAS DRI PLANTS ACCOUNT FOR NEARLY addition of new lower GHG energy to the grid 2 HALF OF NATURAL GAS USAGE • Natural gas price risk is partially hedged through the use of derivative instruments NATURAL GAS HEDGING • Owned South Piceance gas wells provide ~80 million natural hedge - output of ~4 million MMBTU/yr MMBtu • Fixed rate natural gas contract at Trinidad LONG-TERM DRI plant runs through 2028 CONTRACTS • Long-term electricity contracts at Steel Mills Steel Mills DRI 14 1 Steel Mills only, based on full year 2025 energy costs 2 Louisiana and Trinidad; DRI plants represent ~2% of total electricity usage (Steel Mills and DRI plants combined)
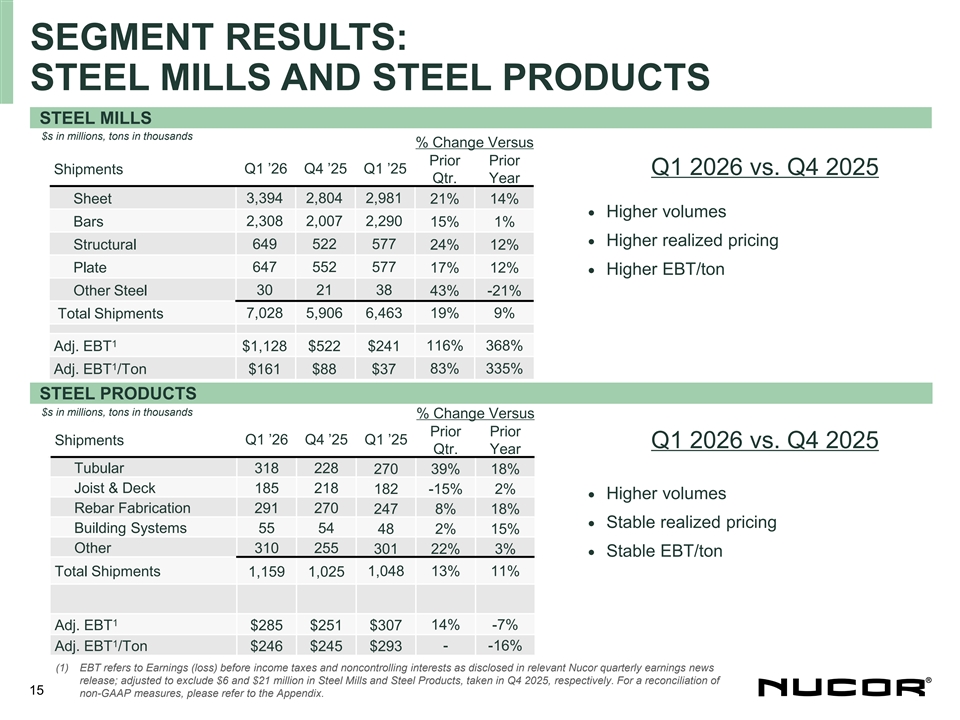
SEGMENT RESULTS: STEEL MILLS AND STEEL PRODUCTS STEEL MILLS $s in millions, tons in thousands % Change Versus Prior Prior Q1 ’26 Q4 ’25 Q1 ’25 Shipments Q1 2026 vs. Q4 2025 Qtr. Year Sheet 3,394 2,804 2,981 21% 14% • Higher volumes Bars 2,308 2,007 2,290 15% 1% • Higher realized pricing Structural 649 522 577 24% 12% 647 552 577 Plate 17% 12% • Higher EBT/ton 30 21 38 Other Steel 43% -21% Total Shipments 7,028 5,906 6,463 19% 9% 1 116% 368% Adj. EBT $1,128 $522 $241 1 83% 335% Adj. EBT /Ton $161 $88 $37 STEEL PRODUCTS $s in millions, tons in thousands % Change Versus Prior Prior Shipments Q1 ’26 Q4 ’25 Q1 ’25 Q1 2026 vs. Q4 2025 Qtr. Year Tubular 318 228 270 39% 18% Joist & Deck 185 218 182 -15% 2% • Higher volumes Rebar Fabrication 291 270 247 8% 18% • Stable realized pricing Building Systems 55 54 48 2% 15% Other 310 255 301 22% 3% • Stable EBT/ton Total Shipments 1,048 13% 11% 1,159 1,025 1 14% -7% Adj. EBT $285 $251 $307 1 Adj. EBT /Ton - -16% $246 $245 $293 (1) EBT refers to Earnings (loss) before income taxes and noncontrolling interests as disclosed in relevant Nucor quarterly earnings news release; adjusted to exclude $6 and $21 million in Steel Mills and Steel Products, taken in Q4 2025, respectively. For a reconciliation of 15 non-GAAP measures, please refer to the Appendix.

SEGMENT RESULTS: RAW MATERIALS RAW MATERIALS $s in millions, tons in thousands % Change Versus Q1 2026 vs. Q4 2025 Prior Prior Q1 ’26 Q4 ‘25 Q1 ’25 Production Qtr. Year • Higher volumes DRI 45% 2% 1,063 733 1,038 Scrap Processing 1,323 1,088 1,102 22% 20% • Higher realized pricing 1 Total Production 2,386 1,821 2,140 31% 12% 2 EBT $45 $24 $29 88% 55% (1) Total production excluding scrap brokerage activities. (2) EBT refers to Earnings (loss) before income taxes and noncontrolling interests as disclosed in relevant Nucor quarterly earnings news release 16

QUARTERLY SALES AND EARNINGS DATA SALES TONS (THOUSANDS) TO OUTSIDE CUSTOMERS EARNINGS STEEL STEEL PRODUCTS (LOSS) BEFORE INCOME TAXES COMP. SALES OTHER TOTAL PRICE TOTAL JOIST & REBAR TUBULAR BLDG STEEL STEEL RAW TOTAL NET SALES PER $ PER YEAR SHEET BARS BEAM* PLATE STEEL DECK FAB PRODS SYSTEMS PRODS PRODS MATLS TONS ($ MILLIONS) TON ($) ($ 000’S) TON 2026 $9,496 $1,279 $969 $137 Q1 2,787 1,667 554 611 5,619 185 291 318 55 310 1,159 649 7,427 Q2 Q3 Q4 YEAR 2025 2,475 1,702 495 554 5,226 182 247 270 48 301 1,048 556 6,830 $7,830 $1,146 $215 $33 Q1 2,449 1,507 513 575 5,044 217 306 243 64 311 1,141 635 6,820 $8,456 $1,240 $796 $126 Q2 Q3 2,440 1,515 472 549 4,976 254 356 206 62 305 1,183 615 6,774 $8,521 $1,258 $807 $125 Q4 2,220 1,412 436 534 4,602 218 270 228 54 255 1,025 564 6,191 $7,687 $1,242 $456 $77 YEAR 9,584 6,136 1,916 2,212 19,848 871 1,179 947 228 1,172 4,397 2,370 26,615 $32,494 $1,221 $2,274 $90 17 *Beam includes all structural steel

QUARTERLY SALES PRICES & SCRAP COST STEEL MILLS AVERAGE SCRAP AND SCRAP AVG EXTERNAL SUBSTITUTE COST SALES PRICE TOTAL SHEET BARS BEAM* PLATE PER NET TON PER GROSS PER NET STEEL TON USED TON USED 2026 2026 st st 1 Quarter $999 $1,013 $1,541 $1,151 $1,074 1 Quarter $403 $360 nd nd 2 Quarter 2 Quarter First Half First Half rd 3 Quarter rd 3 Quarter Nine Months Nine Months th th 4 Quarter 4 Quarter YEAR YEAR 2025 2025 st st 1 Quarter $888 $877 $1,300 $1,014 $938 1 Quarter $394 $352 nd nd 2 Quarter $1,008 $927 $1,352 $1,194 $1,041 2 Quarter $403 $360 $948 $900 $1,327 $1,106 $989 $398 $355 First Half First Half rd rd 3 Quarter $982 $961 $1,394 $1,182 $1,038 3 Quarter $391 $349 Nine Months $959 $920 $1,348 $1,131 $1,005 Nine Months $396 $354 th th $935 $975 $1,464 $1,113 $1,019 $380 $339 4 Quarter 4 Quarter YEAR $954 $933 $1,374 $1,126 $1,008 YEAR $392 $350 18 *Beam includes all structural steel

QUARTERLY SALES PRICE STEEL PRODUCTS STEEL PRODUCTS AVG EXTERNAL SALES PRICE PER JOIST & FABRICATED TUBULAR BUILDING OTHER STEEL TOTAL STEEL NET TON DECK REBAR PRODUCTS SYSTEMS PRODUCTS PRODUCTS 2026 st $2,454 $1,646 $1,661 $6,084 $3,193 $2,405 1 Quarter nd 2 Quarter First Half rd 3 Quarter Nine Months th 4 Quarter YEAR 2025 st 1 Quarter $2,734 $1,651 $1,351 $5,832 $2,838 $2,294 nd $2,605 $1,593 $1,559 $5,206 $2,876 $2,331 2 Quarter First Half $2,664 $1,619 $1,450 $5,472 $2,857 $2,313 rd 3 Quarter $2,438 $1,594 $1,621 $5,406 $3,061 $2,358 $2,576 $1,609 $1,499 $5,449 $2,926 $2,329 Nine Months th 4 Quarter $2,452 $1,654 $1,540 $5,574 $3,297 $2,413 YEAR $2,545 $1,619 $1,509 $5,479 $3,006 $2,348 19

RECONCILIATION OF GAAP TO NON-GAAP MEASURE - EBITDA $ in millions 2024 2025 LTM Q4 2025 Q1 2025 Q1 2026 Net earnings before $2,319 $2,038 $2,682 $423 $226 $870 non-controlling interests Net interest expense ($30) $59 $64 $11 $14 $19 Income taxes $583 $530 $697 $78 $59 $226 Depreciation expense $1,094 $1,226 $1,244 $316 $303 $321 Amortization expense $262 $254 $252 $63 $65 $63 Losses and impairments of assets $137 $67 $53 $27 $29 $15 EBITDA $4,365 $4,174 $4,992 $918 $696 $1,514 20
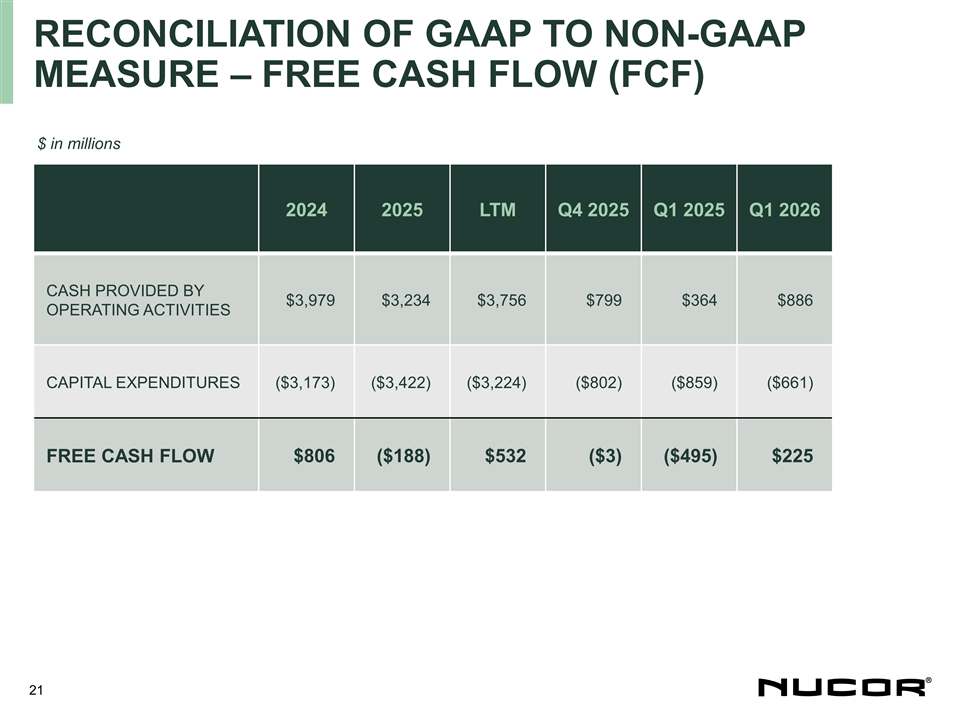
RECONCILIATION OF GAAP TO NON-GAAP MEASURE – FREE CASH FLOW (FCF) $ in millions 2024 2025 LTM Q4 2025 Q1 2025 Q1 2026 CASH PROVIDED BY $3,979 $3,234 $3,756 $799 $364 $886 OPERATING ACTIVITIES CAPITAL EXPENDITURES ($3,173) ($3,422) ($3,224) ($802) ($859) ($661) FREE CASH FLOW $806 ($188) $532 ($3) ($495) $225 21

RECONCILIATION OF GAAP TO NON-GAAP MEASURE – EARNINGS ATTRIBUTABLE TO NUCOR STOCKHOLDERS $ in millions Q4 2025 Q1 2025 Diluted EPS Diluted EPS NET EARNINGS ATTRIBUTABLE $378 $1.64 $156 $0.67 TO NUCOR STOCKHOLDERS LOSSES AND IMPAIRMENTS OF $22 $0.09 $23 $0.10 ASSETS, NET OF TAX ADJUSTED NET EARNINGS $400 $1.73 $179 $0.77 ATTRIBUTABLE TO NUCOR STOCKHOLDERS 22

RECONCILIATION OF GAAP TO NON-GAAP MEASURE – PRE-TAX SEGMENT EARNINGS $ in millions Q4 2025 Q1 2025 Steel Steel Raw Steel Steel Raw Mills Products Materials Mills Products Materials EARNINGS (LOSS) BEFORE $516 $230 $24 $231 $288 $29 INCOME TAXES AND NONCONTROLLING INTERESTS LOSSES AND IMPAIRMENTS OF $6 $21 -- $10 $19 -- ASSETS ADJUSTED EARNINGS (LOSS) BEFORE INCOME TAXES AND $522 $251 $24 $241 $307 $29 NONCONTROLLING INTERESTS 23