UNITED STATES
SECURITIES AND EXCHANGE COMMISSION
WASHINGTON, D.C. 20549
FORM 8-K
CURRENT REPORT
Pursuant to Section 13 or 15(d) of the
Securities Exchange Act of 1934
Date of Report (Date of earliest event reported): February 3, 2026
CNB FINANCIAL CORPORATION
(Exact name of registrant as specified in its charter)
| Pennsylvania | 001-39472 | 25-1450605 | ||
| (State or other jurisdiction of incorporation or organization) |
(Commission File Number) |
(I.R.S. Employer Identification No.) |
1 South Second Street
PO Box 42
Clearfield, Pennsylvania 16830
(Address of principal executive offices, zip code)
Registrant’s telephone number, including area code: (814) 765-9621
Not Applicable
(Former name or former address, if changed since last report)
Check the appropriate box below if the Form 8-K filing is intended to simultaneously satisfy the filing obligation of the registrant under any of the following provisions:
| ☐ | Written communications pursuant to Rule 425 under the Securities Act (17 CFR 230.425) |
| ☐ | Soliciting material pursuant to Rule 14a-12 under the Exchange Act (17 CFR 240.14a-12) |
| ☐ | Pre-commencement communications pursuant to Rule 14d-2(b) under the Exchange Act (17 CFR 240.14d-2(b)) |
| ☐ | Pre-commencement communications pursuant to Rule 13e-4(c) under the Exchange Act (17 CFR 240.13e-4(c)) |
Securities registered pursuant to Section 12(b) of the Act:
| Title of each class |
Trading |
Name of each exchange |
||
| Common Stock, no par value | CCNE | The NASDAQ Stock Market LLC | ||
| Depositary Shares (each representing a 1/40th interest in a share of 7.125% Series A Non-Cumulative, perpetual preferred stock) | CCNEP | The NASDAQ Stock Market LLC |
Indicate by check mark whether the registrant is an emerging growth company as defined in Rule 405 of the Securities Act of 1933 (§230.405 of this chapter) or Rule 12b-2 of the Securities Exchange Act of 1934 (§240.12b-2 of this chapter).
Emerging growth company ☐
If an emerging growth company, indicate by check mark if the registrant has elected not to use the extended transition period for complying with any new or revised financial accounting standards provided pursuant to Section 13(a) of the Exchange Act. ☐
| Item 7.01. | Regulation FD Disclosure. |
CNB Financial Corporation (the “Corporation”) (NASDAQ: CCNE), the parent company of CNB Bank, intends to use the materials furnished herewith in one or more meetings with investors beginning on February 4, 2026. The presentation will also be posted on the Corporation’s website at https://cnbbank.q4ir.com/events-and-presentations. A copy of the investor presentation is furnished hereto as Exhibit 99.1 and is hereby incorporated by reference herein.
The information contained in this Item 7.01, including Exhibit 99.1 attached hereto, shall not be deemed to be “filed” for the purposes of Section 18 of the Securities Exchange Act of 1934, as amended (the “Exchange Act”), or otherwise subject to the liabilities of such section, nor shall such information or exhibit be deemed incorporated by reference into any filing under the Securities Act of 1933, as amended, or the Exchange Act, except as may be expressly set forth by specific reference in such filing.
| Item 9.01. | Financial Statements and Exhibits |
(d) Exhibits
| Exhibit Number |
Description |
|
| 99.1 | Investor Presentation, dated February 4-5, 2026 | |
| 104 | Cover Page Interactive Data File (embedded within the Inline XBRL document) | |
SIGNATURE
Pursuant to the requirements of the Securities Exchange Act of 1934, the Registrant has duly caused this report to be signed on its behalf by the undersigned hereunto duly authorized.
| CNB FINANCIAL CORPORATION | ||||||
| Date: February 3, 2026 | By: | /s/ Tito L. Lima |
||||
| Tito L. Lima | ||||||
| Treasurer | ||||||

Exhibit 99.1 February 4-5, 2026 INVESTOR PRESENTATION OU R FA M IL Y OF B A N KS

CERTAIN IMPORTANT INFORMATION CAUTION REGARDING FORWARD LOOKING STATEMENTS This presentation includes forward-looking statements within the meaning of Section 27A of the Securities Act of 1933, as amended, and Section 21E of the Securities Exchange Act of 1934, as amended, with respect to the Corporation’s financial condition, liquidity, results of operations, future performance and business. These forward-looking statements are intended to be covered by the safe harbor for “forward-looking statements” provided by the Private Securities Litigation Reform Act of 1995. Forward-looking statements are those that are not historical facts. Forward-looking statements include statements with respect to beliefs, plans, objectives, goals, expectations, anticipations, estimates and intentions that are subject to significant risks and uncertainties and are subject to change based on various factors (some of which are beyond the Corporation’s control). Forward-looking statements often include the words “believes,” “expects,” “anticipates,” “estimates,” “forecasts,” “intends,” “plans,” “targets,” “potentially,” “probably,” “projects,” “outlook” or similar expressions or future conditional verbs such as “may,” “will,” “should,” “would” and “could.” The Corporation’s actual results may differ materially from those contemplated by the forward-looking statements, which are neither statements of historical fact nor guarantees or assurances of future performance. Such known and unknown risks, uncertainties and other factors that could cause the actual results to differ materially from the statements, include, but are not limited to, (i) adverse changes or conditions in capital and financial markets, including actual or potential stresses in the banking industry; (ii) changes in interest rates; (iii) the credit risks of lending activities, including our ability to estimate credit losses and the allowance for credit losses, as well as the effects of changes in the level of, and trends in, loan delinquencies and write-offs; (iv) effectiveness of our data security controls in the face of cyber attacks and any reputational risks following a cybersecurity incident; (v) changes in general business, industry or economic conditions or competition; (vi) changes in any applicable law, rule, regulation, policy, guideline or practice governing or affecting financial holding companies and their subsidiaries or with respect to tax or accounting principles or otherwise; (vii) adverse economic effects from international trade disputes, including threatened or implemented tariffs imposed by the U.S. and threatened or implemented tariffs imposed by foreign countries in retaliation, or similar events impacting economic activity; (viii) higher than expected costs or other difficulties related to integration of combined or merged businesses; (ix) the effects of business combinations and other acquisition transactions, including the inability to realize our loan and investment portfolios; (x) changes in the quality or composition of our loan and investment portfolios; (xi) adequacy of loan loss reserves; (xii) increased competition; (xiii) loss of certain key officers; (xiv) deposit attrition; (xv) rapidly changing technology; (xvi) unanticipated regulatory or judicial proceedings and liabilities and other costs; (xvii) changes in the cost of funds, demand for loan products or demand for financial services; and (xviii) other economic, competitive, governmental or technological factors affecting our operations, markets, products, services and prices. Such developments could have an adverse impact on the Corporation's financial position and results of operations. For more information about factors that could cause actual results to differ from those discussed in the forward-looking statements, please refer to the “Risk Factors” and “Management’s Discussion and Analysis of Financial Condition and Results of Operations” sections of and the forward-looking statement disclaimers in the Corporation’s annual and quarterly reports filed with the Securities and Exchange Commission. The forward-looking statements are based upon management’s beliefs and assumptions and are made as of the date of this presentation. Factors or events that could cause the Corporation’s actual results to differ may emerge from time to time, and it is not possible for the Corporation to predict all of them. The Corporation undertakes no obligation to publicly update or revise any forward-looking statements included in this presentation or to update the reasons why actual results could differ from those contained in such statements, whether as a result of new information, future events or otherwise, except to the extent required by law. In light of these risks, uncertainties and assumptions, the forward-looking events discussed in this presentation might not occur and you should not put undue reliance on any forward-looking statements. NON-GAAP FINANCIAL MEASURES This report contains references to financial measures that are not defined in GAAP. Management uses non-GAAP financial information in its analysis of the Corporation’s performance. Management believes that these non-GAAP measures provide a greater understanding of ongoing operations, enhance comparability of results of operations with prior periods and show the effects of significant gains and charges in the periods presented. The Corporation’s management believes that investors may use these non- GAAP measures to analyze the Corporation’s financial performance without the impact of unusual items or events that may obscure trends in the Corporation’s underlying performance. This non-GAAP data should be considered in addition to results prepared in accordance with GAAP, and is not a substitute for, or superior to, GAAP results. Limitations associated with non-GAAP financial measures include the risks that persons might disagree as to the appropriateness of items included in these measures and that different companies might calculate these measures differently. Non-GAAP measures reflected within the presentation include: Tangible common equity/tangible assets, Return on average tangible common equity, Adjusted return on average tangible common equity, Adjusted diluted earnings per common share, Net interest margin (fully tax equivalent basis), Adjusted efficiency ratio (fully tax equivalent) and Tangible book value per share. Note: GAAP stands for Generally Accepted Accounting Principles 2

CNB FINANCIAL CORPORATION § Holding Company for CNB Bank (Clearfield, PA), FINANCIAL HIGHLIGHTS serving the community since 1865 (As of 12/31/2025) § 75 full-service offices, one loan production office, one mobile office, two limited service offices across ASSETS: $8.4 billion Pennsylvania, New York, Ohio and Virginia DEPOSITS: § CNB Bank’s regional divisions (all under one charter) $7.0 billion include CNB Bank (Central and North Central PA); LOANS: $6.5 billion FCBank (Central OH), ERIEBANK (Northeast OH & Northwest PA), BankOnBuffalo (Western NY), Ridge View Bank (Southwest, VA), ESSA Bank (Northeast PA) and Impressia Bank, which operates across our entire footprint § Nasdaq: CCNE & CCNEP (1) § Market Capitalization: ~$805 million (1) Based on 29,473,352 share count reported as of December 31, 2025, in the January 27, 2026 Earnings Release and the January 29, 2026 closing stock price ($27.30) 3

INVESTMENT ACCRETION AND RETURNS (1) (1) TANGIBLE BOOK VALUE PER COMMON SHARE RETURN ON AVERAGE TANGIBLE COMMON EQUITY Book Value / Common $30.00 ROATCE ROAE 18.00% Share Tangible Book Value / $27.63 $25.00 $26.34 16.00% Common Share $24.57 $24.24 $23.48 $22.85 14.00% $22.39 $22.46 $20.00 $21.29 $20.22 $20.30 $20.00 12.00% $18.66 $17.45 $17.28 $15.00 $15.98 10.00% $14.64 $14.69 $14.01 $13.33 $11.96 $11.76 8.00% $10.00 6.00% $5.00 4.00% 2015 2016 2017 2018 2019 2020 2021 2022 2023 2024 2025 2025 $- Adj 2015 2016 2017 2018 2019 2020 2021 2022 2023 2024 2025 (2) DILUTED EARNINGS PER COMMON SHARE $3.50 $3.26 $3.16 $2.95 $3.00 $2.63 $2.55 $2.49 $2.39 $2.50 $2.21 $1.97 $2.00 $1.57 $1.54 $1.42 $1.50 $1.00 $0.50 $- 2015 2016 2017 2018 2019 2020 2021 2022 2023 2024 2025 2025 Adj (1) Return on average tangible common equity (ROATCE), adjusted return on tangible common equity, and tangible book value per common share are non-GAAP financial measures – see Appendix for reconciliations; Average equity includes both common and preferred equity in periods following the 2020 preferred equity issuance. Adjusted return on tangible common equity is adjusted to remove merger related expenses. (2) Diluted earnings per share includes merger costs in 2019, and merger costs, FHLB prepayment penalties and branch closure costs in 2020, and merger costs in 4 2025. Adjusted diluted earnings per common share is a non-GAAP financial measures – see Appendix for reconciliations Note: “CAGR” means Compound Annual Growth Rate.

CONSOLIDATED CAPITAL POSITION (1) 12/31/2025 16% 14% 14.91% 12% 11.54% 10% 9.70% 8% 8.36% 6% 4% 2% 0% Common equity / Total assets Tangible common equity / Tangible assets Common Equity Tier 1 Ratio Total Risk Based Capital Ratio ▪ The Corporation did not repurchase shares of common stock during the twelve months ended December 31, 2025; remaining capacity under the current program was 500,000 shares / $15.0 million as of December 31, 2025 5 (1) Tangible common equity / Tangible assets is a non-GAAP financial measure - see Appendix for reconciliation

DIVIDEND HISTORY HISTORICAL DIVIDEND PER COMMON SHARE $0.800 $0.700 $0.600 $0.500 $0.400 $0.300 $0.200 $0.100 $0.000 Common Dividend Special Dividend • The Corporation’s long, uninterrupted history of dividends to its common shareholders reflects a key component of its Total Shareholder Return • Common stock dividend yield of 2.75% as of December 31, 2025 • Common stock dividend payout ratio of 29% as of the twelve months ended December 31, 2025 6

DEPOSIT MIX AVERAGE COST OF INTEREST- (1) 12/31/2025 DEPOSIT MIX BEARING DEPOSITS 3.10% 3.00% 3.00% 2.90% SAVINGS 54.4% 2.80% 2.75% 2.70% TIME DEPOSITS 15.6% 2.60% 2.55% 2.50% 2.40% DEMAND - 2.30% DEMAND - NONINTEREST INTEREST 15.6% Q4 2024 Q3 2025 Q4 2025 14.4% (1) Deposit Mix excludes deposits classified as Deposits held for sale on the balance sheet at 12/31/2025. 7

DEPOSIT MIX (1) HISTORICAL DEPOSIT MIX (1) Deposit Mix excludes deposits classified as Deposits held for sale on the balance sheet at 12/31/2025. 8

LOAN PORTFOLIO COMPOSITION 12/31/2025 LOAN PORTFOLIO AVERAGE YIELD ON TOTAL LOANS (1) COMPOSITION & LOANS HELD FOR SALE COMMERCIAL 6.56% 6.54% MORTGAGE 6.54% 38.5% 6.52% 6.50% 6.50% 6.48% 6.46% COMMERCIAL & 6.44% INDUSTRIAL 6.44% RESIDENTIAL REAL 25.7% ESTATE 6.42% 33.8% 6.40% 6.38% Q4 2024 Q3 2025 Q4 2025 CONSUMER & OTHER 2.0% (1) Q3 2025 and Q4 2025 include the impact of the acquisition of ESSA Bancorp. 9

ADDITIONAL LOAN PORTFOLIO DETAIL § Well diversified Commercial & Industrial (“C&I”) portfolio with no single industry greater than 20% of total C&I portfolio § CNB has proven C&I underwriting practices and strong loan loss history § Commercial Mortgage portfolio is also well diversified with no single segment greater than 30% of the total Commercial Mortgage portfolio, and with the Commercial Office segment representing less than 8% of the total Commercial Mortgage portfolio (1) COMMERCIAL MORTGAGE DETAIL (12/31/2025) C&I DETAIL (12/31/2025) Finance and Educational Insurance Services Other Services 8.6% 4.6% Agriculture, Forestry, All Other 6.5% Fishing and Hunting 22.1% 4.1% Construction Apartments 7.7% Administrative and 29.7% Support and Waste Management Remediation Services Storage Units 3.8% 2.1% Retail Transportation 8.0% and Warehouse Warehousing 2.2% 3.8% Student Housing 1.1% Healthcare & Manufacturing Social Services 5.5% 11.2% All Other 22.3% Lodging Retail 14.8% 8.6% Manufacturing Office Mixed Use 19.4% 7.0% 6.9% 10 (1) Does not include construction loans

CONSERVATIVE CREDIT CULTURE 12/31/2025 NONACCRUAL LOANS BY TYPE NET CHARGE-OFFS/AVERAGE LOANS(1) 0.35% COMMERCIAL 0.30% REAL ESTATE 19.3% 0.25% COMMERCIAL & INDUSTRIAL 0.19% 0.20% 38.3% 0.17% 0.13% 0.15% RESIDENTIAL 0.09% MORTGAGE 0.10% 40.3% 0.06% 0.05% CONSUMER 2.1% 0.00% Q4 2024 Q3 2025 Q4 2025 FY 2024 FY 2025 HISTORICAL ASSET QUALITY 12/31/2024 9/30/2025 12/31/2025 NONACCRUAL LOANS $56,323 $36,013 $39,845 ACCRUAL LOANS GREATER THAN 89 DAYS 653 86 42 OREO 2,509 4,254 2,280 NONPERFORMING ASSETS $59,485 $40,353 $42,167 NONACCRUAL LOANS / LOANS 1.22% 0.56% 0.61% NPAs / ASSETS 0.96% 0.49% 0.50% ACL / NONACCRUAL LOANS 84.08% 187.94% 168.29% Note: “NPAs” means Non-Performing Assets. “ACL” means Allowance for Credit Losses. (1) Quarterly “Q” calendar periods presented are annualized, “FY” periods presented include full calendar year results. 11

RECENT QUARTERLY TRENDS 12

EARNINGS (1) DILUTED EARNINGS PER COMMON SHARE Unadjusted EPS Adjusted EPS $1.20 $1.10 $1.00 $0.87 $0.82 $0.80 $0.66 $0.66 $0.60 $0.40 $0.22 $0.20 $- Q4 2024 Q3 2025 Q4 2025 (1)Adjusted diluted earnings per share excludes merger related expenses and is a non-GAAP financial measure – see Appendix for reconciliations. 13
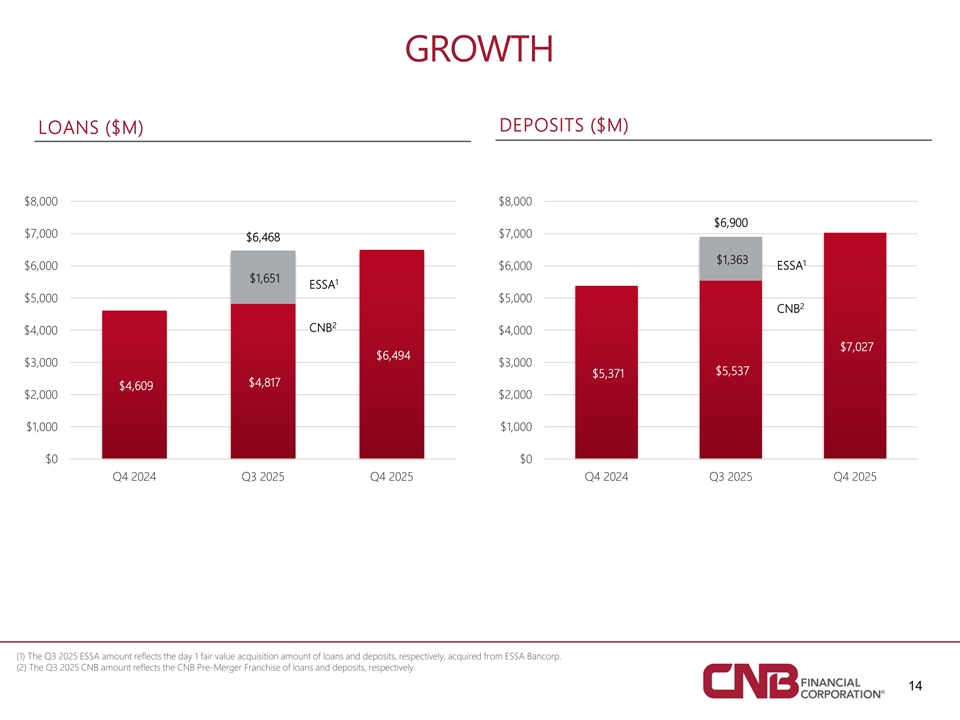
GROWTH DEPOSITS ($M) LOANS ($M) $8,000 $8,000 $6,900 $7,000 $7,000 $6,468 $1,363 1 ESSA $6,000 $6,000 $1,651 1 ESSA $5,000 $5,000 2 CNB 2 CNB $4,000 $4,000 $7,027 $6,494 $3,000 $3,000 $5,537 $5,371 $4,817 $4,609 $2,000 $2,000 $1,000 $1,000 $0 $0 Q4 2024 Q3 2025 Q4 2025 Q4 2024 Q3 2025 Q4 2025 (1) The Q3 2025 ESSA amount reflects the day 1 fair value acquisition amount of loans and deposits, respectively, acquired from ESSA Bancorp. (2) The Q3 2025 CNB amount reflects the CNB Pre-Merger Franchise of loans and deposits, respectively. 14

NET INTEREST MARGIN (“NIM”) & EFFICIENCY RATIO (1) (1) EFFICIENCY RATIO NIM NIM NIM Fully Tax Equiv. Efficiency Ratio Adjusted Efficiency Ratio, Fully Tax Equiv. 3.90% 3.84% 3.84% 80.00% 69.55% 3.80% 70.00% 64.56% 63.68% 63.02% 3.69% 3.69% 58.80% 57.67% 3.70% 60.00% 50.00% 3.60% 40.00% 3.50% 3.44% 3.43% 30.00% 3.40% 20.00% 3.30% 10.00% 3.20% 0.00% Q4 2024 Q3 2025 Q4 2025 Q4 2024 Q3 2025 Q4 2025 (1) Net interest margin fully tax equivalent and Adjusted efficiency ratio fully tax equivalent are non-GAAP financial measures – see Appendix for reconciliations. Adjusted efficiency ratio fully tax equivalent excludes merger related expenses. 15
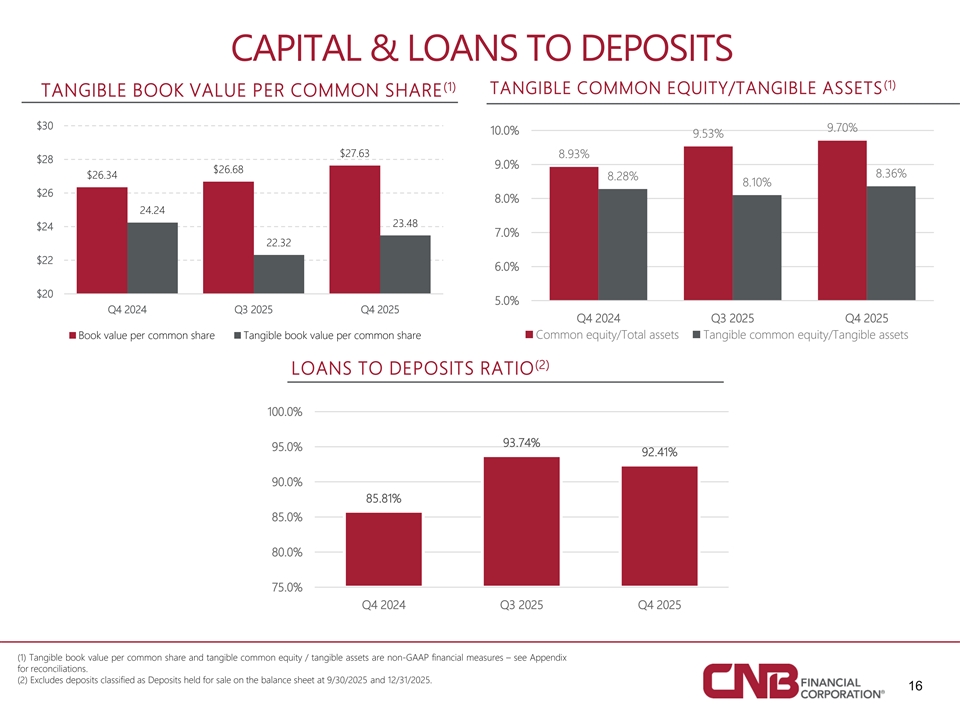
CAPITAL & LOANS TO DEPOSITS (1) (1) TANGIBLE COMMON EQUITY/TANGIBLE ASSETS TANGIBLE BOOK VALUE PER COMMON SHARE $30 9.70% 10.0% 9.53% $27.63 8.93% $28 9.0% $26.68 8.36% $26.34 8.28% 8.10% $26 8.0% 24.24 23.48 $24 7.0% 22.32 $22 6.0% $20 5.0% Q4 2024 Q3 2025 Q4 2025 Q4 2024 Q3 2025 Q4 2025 Book value per common share Tangible book value per common share Common equity/Total assets Tangible common equity/Tangible assets (2) LOANS TO DEPOSITS RATIO 100.0% 93.74% 95.0% 92.41% 90.0% 85.81% 85.0% 80.0% 75.0% Q4 2024 Q3 2025 Q4 2025 (1) Tangible book value per common share and tangible common equity / tangible assets are non-GAAP financial measures – see Appendix for reconciliations. (2) Excludes deposits classified as Deposits held for sale on the balance sheet at 9/30/2025 and 12/31/2025. 16

APPENDIX

NON-GAAP RECONCILIATION This presentation contains references to financial measures that are not defined in GAAP. Management uses non-GAAP financial information in its analysis of the Corporation’s performance. Management believes that these non-GAAP measures provide a greater understanding of ongoing operations, enhance comparability of results of operations with prior periods and show the effects of significant gains and charges in the periods presented. The Corporation’s management believes that investors may use these non-GAAP measures to analyze the Corporation’s financial performance without the impact of unusual items or events that may obscure trends in the Corporation’s underlying performance. This non-GAAP data should be considered in addition to results prepared in accordance with GAAP, and is not a substitute for, or superior to, GAAP results. Limitations associated with non-GAAP financial measures include the risks that persons might disagree as to the appropriateness of items included in these measures and that different companies might calculate these measures differently. A reconciliation of these non-GAAP financial measures is provided below (dollars in thousands, except per share data). For the year ending December 31, Dollars in thousands, except per share data 2015 2016 2017 2018 2019 2020 2021 2022 2023 2024 2025 Net Income Available to Common $22,735 $21,142 $24,524 $34,278 $40,382 $31,596 $53,405 $58,886 $53,718 $50,273 $61,829 Average Tangible Common Equity $167,637 $177,987 $198,282 $210,645 $245,825 $296,142 $329,012 $353,800 $448,355 $490,647 $583,908 Return on Average Tangible Common Equity (non-GAAP) 13.56% 11.88% 12.37% 16.27% 16.43% 10.67% 16.23% 16.64% 11.98% 10.25% 10.59% Adjusted calculation of return on average tangible common equity (non-GAAP): Net Income Available to Common $22,735 $21,142 $24,524 $34,278 $40,382 $31,596 $53,405 $58,886 $53,718 $50,273 $61,829 Add:merger transaction related expenses and the provision adjustment related to adoption of ASU 2025-08, net of tax (non-GAAP) - - - - - - - - - - 11,600 Adjusted net income available to common shareholders $ 22,735 $ 21,142 $ 24,524 $ 34,278 $ 40,382 $ 31,596 $ 53,405 $ 58,886 $ 53,718 $ 50,273 $ 73,429 Adjusted return on average tangible common equity (non-GAAP) 13.56% 11.88% 12.37% 16.27% 16.43% 10.67% 16.23% 16.64% 11.98% 10.25% 12.58% Note: ASU stands for Accounting Standard Update 18

NON-GAAP RECONCILIATION As of December 31, Dollars in thousands, except per share data 2015 2016 2017 2018 2019 2020 2021 2022 2023 2024 2025 Shareholders' Equity $201,913 $211,784 $243,910 $262,830 $304,966 $416,137 $442,847 $530,762 $571,247 $610,695 $872,127 Less: Preferred Equity - - - - - 57,785 57,785 57,785 57,785 57,785 57,785 Common Shareholders' Equity $201,913 $211,784 $243,910 $262,830 $304,966 $358,352 $385,062 $472,977 $513,462 $552,910 $814,342 Goodwill and Other Intangibles 2 7,194 3 8,730 3 8,730 3 8,730 38,730 43,749 43,749 43,749 43,874 43,874 88,512 Core Deposit Intangibles 2,396 2,854 1,625 727 160 567 460 364 280 206 33,693 LESS: Total Intangible Assets $29,590 $41,584 $40,355 $39,457 $38,890 $44,316 $44,209 $44,113 $44,154 $44,080 $122,205 Tangible Common Equity (non-GAAP) $172,323 $170,200 $203,555 $223,373 $266,076 $314,036 $340,853 $428,864 $469,308 $508,830 $692,137 Total Assets $2,285,136 $2,573,821 $2,768,773 $3,221,521 $3,763,659 $4,729,399 $5,328,939 $5,475,179 $5,752,957 $6,192,010 $8,396,435 Goodwill and Other Intangibles 27,194 3 8,730 3 8,730 38,730 38,730 43,749 43,749 43,749 43,874 43,874 88,512 Core Deposit Intangibles 2,396 2,854 1,625 727 160 567 460 364 280 206 33,693 LESS: Total Intangible Assets $29,590 $41,584 $40,355 $39,457 $38,890 $44,316 $44,209 $44,113 $44,154 $44,080 $122,205 Tangible Assets (non-GAAP) $2,255,546 $2,532,237 $2,728,418 $3,182,064 $3,724,769 $4,685,083 $5,284,730 $5,431,066 $5,708,803 $6,147,930 $8,274,230 Tangible Common Equity / Tangible Assets (non-GAAP) 7.64% 6.72% 7.46% 7.02% 7.14% 6.70% 6.45% 7.90% 8.22% 8.28% 8.36% Ending Shares Outstanding 14,408,430 14,467,815 15,264,740 15,207,281 15,247,985 16,833,008 16,855,062 21,121,346 20,896,439 20,987,992 29,473,352 Book Value Per Common Share $14.01 $14.64 $15.98 $17.28 $20.00 $21.29 $22.85 $22.39 $24.57 $26.34 $27.63 Tangible Book Value Per Common Share (non-GAAP) $11.96 $11.76 $13.33 $14.69 $17.45 $18.66 $20.22 $20.30 $22.46 $24.24 $23.48 19

NON-GAAP RECONCILIATION 20

NON-GAAP RECONCILIATION 21

NON-GAAP RECONCILIATION Three Months Ended Dollars in thousands, except per share data 12/31/2024 9/30/2025 12/31/2025 Calculation of net interest margin: Interest income $83,678 $108,645 $115,550 Interest expense 3 4,634 4 1,516 4 1,271 Net Interest Income 49,044 67,129 7 4,279 Average total earning assets $5,674,794 $7,209,366 $7,666,369 Net interest margin (GAAP) (annualized) 3.44% 3.69% 3.84% Calculation of net interest margin (fully tax equivalent basis) (non- GAAP): Interest income $83,678 $108,645 $115,550 Tax equivalent adjustment (non-GAAP) 284 314 338 Adjusted interest income (fully tax equivalent basis) (non-GAAP) 83,962 108,959 115,888 Interest expense 3 4,634 4 1,516 4 1,271 Net interest income (fully tax equivalent basis) (non-GAAP) 49,328 6 7,443 74,617 Average total earning assets $5,674,794 $7,209,366 $7,666,369 Less: average mark to market adjustment on investments (non-GAAP) (46,988) ( 39,121) ( 35,243) Adjusted average total earning assets, net of mark to market (non- GAAP) $5 ,721,782 $7 ,248,487 $7 ,701,612 Net interest margin, fully tax equivalent basis (non-GAAP) (annualized) 3.43% 3.69% 3.84% 22

NON-GAAP RECONCILIATION 23