UNITED STATES
SECURITIES AND EXCHANGE COMMISSION
WASHINGTON, D.C. 20549
FORM 8-K
CURRENT REPORT
Pursuant to Section 13 or 15(d)
of the Securities Exchange Act of 1934
Date of Report (Date of earliest event reported): January 26, 2026
NUCOR CORPORATION
(Exact name of Registrant as Specified in Its Charter)
| Delaware | 1-4119 | 13-1860817 | ||
| (State or Other Jurisdiction of Incorporation) |
(Commission File Number) |
(IRS Employer Identification No.) |
| 1915 Rexford Road, Charlotte, NC |
28211 | |
| (Address of Principal Executive Offices) | (Zip Code) |
Registrant’s Telephone Number, Including Area Code: (704) 366-7000
Not Applicable
(Former Name or Former Address, if Changed Since Last Report)
Check the appropriate box below if the Form 8-K filing is intended to simultaneously satisfy the filing obligation of the registrant under any of the following provisions:
| ☐ | Written communications pursuant to Rule 425 under the Securities Act (17 CFR 230.425) |
| ☐ | Soliciting material pursuant to Rule 14a-12 under the Exchange Act (17 CFR 240.14a-12) |
| ☐ | Pre-commencement communications pursuant to Rule 14d-2(b) under the Exchange Act (17 CFR 240.14d-2(b)) |
| ☐ | Pre-commencement communications pursuant to Rule 13e-4(c) under the Exchange Act (17 CFR 240.13e-4(c)) |
Securities registered pursuant to Section 12(b) of the Act:
| Title of each class |
Trading |
Name of each exchange |
||
| Common Stock, par value $0.40 per share | NUE | New York Stock Exchange |
Indicate by check mark whether the registrant is an emerging growth company as defined in Rule 405 of the Securities Act of 1933 (§ 230.405 of this chapter) or Rule 12b-2 of the Securities Exchange Act of 1934 (§ 240.12b-2 of this chapter).
Emerging growth company ☐
If an emerging growth company, indicate by check mark if the registrant has elected not to use the extended transition period for complying with any new or revised financial accounting standards provided pursuant to Section 13(a) of the Exchange Act. ☐
| Item 2.02. | Results of Operations and Financial Condition. |
On January 26, 2026, Nucor Corporation issued a news release reporting its financial results for the quarter ended December 31, 2025. A copy of the news release is furnished as Exhibit 99.1 and incorporated herein by reference.
| Item 7.01. | Regulation FD Disclosure. |
On January 26, 2026, Nucor Corporation, in conjunction with the issuance of the aforementioned news release, posted an investor presentation to its Investor Relations website. A copy of the investor presentation is furnished as Exhibit 99.2 and incorporated herein by reference.
| Item 9.01. | Financial Statements and Exhibits. |
| (d) | Exhibits |
| 99.1 | News Release of Nucor Corporation dated January 26, 2026 | |
| 99.2 | Investor Presentation dated January 26, 2026 | |
| 104 | Cover Page from this Current Report on Form 8-K, formatted in Inline XBRL | |
The information contained in this Current Report on Form 8-K, including the exhibits attached hereto, is being furnished and shall not be deemed to be “filed” for the purposes of Section 18 of the Securities Exchange Act of 1934, as amended (the “Exchange Act”), or otherwise subject to the liabilities of that Section. Furthermore, the information contained in this Current Report on Form 8-K shall not be deemed to be incorporated by reference into any registration statement or other document filed pursuant to the Securities Act of 1933, as amended, or the Exchange Act, except as shall be expressly set forth by specific reference in any such registration statement or other document.
1
SIGNATURES
Pursuant to the requirements of the Securities Exchange Act of 1934, the registrant has duly caused this report to be signed on its behalf by the undersigned hereunto duly authorized.
| NUCOR CORPORATION | ||||||
| Date: January 26, 2026 | By: | /s/ Stephen D. Laxton |
||||
| Stephen D. Laxton | ||||||
| President and Chief Operating Officer | ||||||
2
Exhibit 99.1
| News Release |

|
Nucor Reports Results for the Fourth Quarter of 2025
Fourth Quarter of 2025 Highlights
| • | Net earnings attributable to Nucor stockholders of $378 million, or $1.64 per diluted share |
| • | Adjusted net earnings attributable to Nucor stockholders of $400 million, or $1.73 per diluted share |
| • | Net sales of $7.69 billion |
| • | Net earnings before noncontrolling interests of $423 million; EBITDA of $918 million |
CHARLOTTE, N.C. – January 26, 2026—Nucor Corporation (NYSE: NUE) today announced consolidated net earnings attributable to Nucor stockholders of $378 million, or $1.64 per diluted share, for the fourth quarter of 2025. Excluding impairment charges taken during the quarter, Nucor’s fourth quarter of 2025 adjusted net earnings attributable to Nucor stockholders were $400 million, or $1.73 per diluted share. By comparison, Nucor reported consolidated net earnings attributable to Nucor stockholders of $607 million, or $2.63 per diluted share, for the third quarter of 2025 and $287 million, or $1.22 per diluted share, for the fourth quarter of 2024.
Reflected in the fourth quarter of 2025 losses and impairments of assets are charges of $21 million, or $0.08 per diluted share, related to the closure or repurposing of certain facilities in the steel products segment. Also included in the fourth quarter of 2025 losses and impairments of assets are charges of $6 million, or $0.01 per diluted share, related to the impairment of certain non-current assets in the steel mills segment.
“I want to thank our teammates for their tremendous work throughout 2025—delivering for our customers, advancing key growth projects, and making this Nucor’s safest year,” said Leon Topalian, Nucor’s Chair and Chief Executive Officer. “During the year, we brought several major projects online, including our new rebar micro-mill in Lexington, North Carolina, the Kingman, Arizona melt shop, our Alabama Towers and Structures facility, and our coating complex in Crawfordsville, Indiana. As these and other recently completed projects ramp up, they are beginning to deliver meaningful earnings contributions and we believe they will play an important role in strengthening our earnings power over time.
“Looking ahead to 2026, we are encouraged by robust demand in several key end markets, historically strong backlogs, and federal policies that support a vibrant domestic steel industry. Our focus remains on execution and generating strong, through-cycle returns for our shareholders.”
Earnings Before Income Taxes and Noncontrolling Interests by Segment (In millions)
| Three Months (13 Weeks) Ended | Twelve Months (52 Weeks) Ended | |||||||||||||||||||
| December 31, 2025 | October 4, 2025 | December 31, 2024 | December 31, 2025 | December 31, 2024 | ||||||||||||||||
| Steel mills |
$ | 516 | $ | 793 | $ | 169 | $ | 2,383 | $ | 2,226 | ||||||||||
| Steel products |
230 | 319 | 329 | 1,229 | 1,596 | |||||||||||||||
| Raw materials |
24 | 43 | 57 | 153 | 40 | |||||||||||||||
| Corporate/eliminations |
(269 | ) | (272 | ) | (165 | ) | (1,197 | ) | (960 | ) | ||||||||||
|
|
|
|
|
|
|
|
|
|
|
|||||||||||
| $ | 501 | $ | 883 | $ | 390 | $ | 2,568 | $ | 2,902 | |||||||||||
|
|
|
|
|
|
|
|
|
|
|
|||||||||||
Page 1 of 10
Nucor Executive Offices: 1915 Rexford Road, Charlotte, North Carolina 28211
Phone 704-366-7000 Fax 704-362-4208 www.nucor.com
Nucor Reports Results for the Fourth Quarter of 2025 (Continued)
Analysis of Fourth Quarter of 2025 Results Compared to the Third Quarter of 2025
The steel mills segment earnings decreased in the fourth quarter of 2025 due to lower volumes and margin compression, primarily in sheet. In the steel products segment, earnings declined in the fourth quarter on lower volumes and higher average costs per ton, partially offset by higher average realized pricing. The raw materials segment earnings decreased in the fourth quarter mainly as a result of two scheduled outages at our direct reduced iron facilities that were partially offset by insurance recoveries.
Financial Strength
At the end of the fourth quarter of 2025, Nucor had $2.70 billion in cash and cash equivalents and short-term investments on hand. The Company’s $2.25 billion revolving credit facility remains undrawn and does not expire until March 2030. The Company continues to have the strongest credit ratings in the North American steel sector (A-/A-/A3) with stable outlooks at Standard & Poor’s, Fitch Ratings and Moody’s, respectively.
Commitment to Returning Capital to Stockholders
During the fourth quarter of 2025, Nucor repurchased approximately 0.7 million shares of its common stock at an average price of $145.23 per share (approximately 5.4 million shares during the full year 2025 at an average price of $128.66 per share). As of December 31, 2025, Nucor had approximately $406 million remaining authorized and available for repurchases under its share repurchase program. This share repurchase authorization is discretionary and has no scheduled expiration date.
On December 1, 2025, Nucor’s Board of Directors declared a cash dividend of $0.56 per share. This cash dividend is payable on February 11, 2026, to stockholders of record as of December 31, 2025 and is Nucor’s 211th consecutive quarterly cash dividend. Nucor has increased its regular, or base, dividend for 53 consecutive years – every year since it first began paying dividends in 1973.
For the full year of 2025, Nucor returned approximately $1.2 billion to stockholders in the form of share repurchases and dividend payments.
First Quarter of 2026 Outlook Compared to the Fourth Quarter of 2025
We expect earnings to increase in the first quarter of 2026. Earnings in the first quarter of 2026 are expected to increase across all three of our operating segments, with the largest increase in the steel mills segment. In the steel mills segment, the expected increase is due to higher volumes and higher realized prices across all major product categories. In the steel products segment, we expect improved earnings in the first quarter due to increased volumes on stable pricing. The raw materials segment is expected to have increased earnings in the first quarter of 2026.
Earnings Conference Call
An earnings call is scheduled for January 27, 2026 at 10:00 a.m. Eastern Time to review Nucor’s fourth quarter and full year 2025 financial results and provide a business update. The call can be accessed via webcast from the Investor Relations section of Nucor’s website (nucor.com/investors). A presentation with supplemental information to accompany the call has been posted to Nucor’s Investor Relations website. A playback of the webcast will be posted to the same site within one day of the live event.
Page 2 of 10
Nucor Executive Offices: 1915 Rexford Road, Charlotte, North Carolina 28211
Phone 704-366-7000 Fax 704-362-4208 www.nucor.com
Nucor Reports Results for the Fourth Quarter of 2025 (Continued)
About Nucor
Nucor and its affiliates are manufacturers of steel and steel products, with operating facilities in the United States, Canada and Mexico. Products produced include: carbon and alloy steel — in bars, beams, sheet and plate; hollow structural section tubing; electrical conduit; steel racking; steel piling; steel joists and joist girders; steel deck; fabricated concrete reinforcing steel; cold finished steel; precision castings; steel fasteners; metal building systems; insulated metal panels; overhead doors; steel grating; wire and wire mesh; and utility structures. Nucor, through The David J. Joseph Company and its affiliates, also brokers ferrous and nonferrous metals, pig iron and hot briquetted iron / direct reduced iron; supplies ferro-alloys; and processes ferrous and nonferrous scrap. Nucor is North America’s largest recycler.
Non-GAAP Financial Measures
The Company uses certain non-GAAP (Generally Accepted Accounting Principles) financial measures in this news release, including EBITDA, adjusted net earnings attributable to Nucor stockholders and adjusted net earnings per diluted share. Generally, a non-GAAP financial measure is a numerical measure of a company’s performance or financial position that either excludes or includes amounts that are not normally excluded or included in the most directly comparable financial measure calculated and presented in accordance with GAAP.
We define EBITDA as net earnings before noncontrolling interests, adding back the following items: interest expense (income), net; provision for income taxes; losses and impairments of assets; depreciation; and amortization. We define adjusted net earnings attributable to Nucor stockholders as net earnings attributable to Nucor stockholders adding back losses and impairments of assets, net of tax and noncontrolling interests. We define adjusted net earnings per diluted share as net earnings per diluted share adding back the per diluted share impact of losses and impairments of assets, net of tax and noncontrolling interests. Please note that other companies might define their non-GAAP financial measures differently than we do.
Management presents the non-GAAP financial measures of EBITDA, adjusted net earnings attributable to Nucor stockholders and adjusted net earnings per diluted share in this news release because it considers them to be important supplemental measures of performance. Management believes that these non-GAAP financial measures provide additional insight for analysts and investors evaluating the Company’s financial and operational performance by providing a consistent basis of comparison across periods.
Forward-Looking Statements
Certain statements contained in this news release are “forward-looking statements” that involve risks and uncertainties which we expect will or may occur in the future and may impact our business, financial condition and results of operations. The words “anticipate,” “believe,” “expect,” “intend,” “project,” “may,” “will,” “should,” “could” and similar expressions are intended to identify those forward-looking statements. These forward-looking statements reflect the Company’s best judgment based on current information, and, although we base these statements on circumstances that we believe to be reasonable when made, there can be no assurance that future events will not affect the accuracy of such forward-looking information. As such, the forward-looking statements are not guarantees of future performance, and actual results may vary materially from the projected results and expectations discussed in this news release.
Page 3 of 10
Nucor Executive Offices: 1915 Rexford Road, Charlotte, North Carolina 28211
Phone 704-366-7000 Fax 704-362-4208 www.nucor.com
Nucor Reports Results for the Fourth Quarter of 2025 (Continued)
Factors that might cause the Company’s actual results to differ materially from those anticipated in forward-looking statements include, but are not limited to: (1) competitive pressure on sales and pricing, including pressure from imports and substitute materials; (2) U.S. and foreign trade policies affecting steel imports or exports; (3) the sensitivity of the results of our operations to general market conditions, and in particular, prevailing market steel prices and changes in the supply and cost of raw materials, including pig iron, iron ore and scrap steel; (4) the availability and cost of electricity and natural gas, which could negatively affect our cost of steel production or result in a delay or cancellation of existing or future drilling within our natural gas drilling programs; (5) critical equipment failures and business interruptions; (6) market demand for steel products, which, in the case of many of our products, is driven by the level of nonresidential construction activity in the United States; (7) impairment in the recorded value of inventory, equity investments, fixed assets, goodwill or other long-lived assets; (8) uncertainties and volatility surrounding the global economy, including excess world capacity for steel production, inflation and interest rate changes; (9) fluctuations in currency conversion rates; (10) significant changes in laws or government regulations affecting environmental compliance, including legislation and regulations that result in greater regulation of greenhouse gas emissions that could increase our energy costs, capital expenditures and operating costs or cause one or more of our permits to be revoked or make it more difficult to obtain permit modifications; (11) the cyclical nature of the steel industry; (12) capital investments and their impact on our performance; (13) our safety performance; (14) our ability to integrate businesses we acquire; and (15) the impact of any pandemic or public health situation. These and other factors are discussed in Nucor’s regulatory filings with the United States Securities and Exchange Commission, including those in “Item 1A. Risk Factors” of Nucor’s Annual Report on Form 10-K for the year ended December 31, 2024. The forward-looking statements contained in this news release speak only as of this date, and Nucor does not assume any obligation to update them, except as may be required by applicable law.
Contact Information
For Investor/Analyst Inquiries –
Chris Jacobi, chris.jacobi@nucor.com, or Paul Donnelly, paul.donnelly@nucor.com
For Media Inquiries –
Katherine Miller, katherine.miller@nucor.com
Page 4 of 10
Nucor Executive Offices: 1915 Rexford Road, Charlotte, North Carolina 28211
Phone 704-366-7000 Fax 704-362-4208 www.nucor.com
Nucor Reports Results for the Fourth Quarter of 2025 (Continued)
Consolidated Financial Statements
Condensed Consolidated Statements of Earnings (Unaudited)
(In millions, except per share data)
| Three Months (13 Weeks) Ended | Twelve Months (52 Weeks) Ended | |||||||||||||||||||
| Dec. 31, 2025 | Oct. 4, 2025 | Dec. 31, 2024 | Dec. 31, 2025 | Dec. 31, 2024 | ||||||||||||||||
| Net sales |
$ | 7,687 | $ | 8,521 | $ | 7,076 | $ | 32,494 | $ | 30,734 | ||||||||||
|
|
|
|
|
|
|
|
|
|
|
|||||||||||
| Costs, expenses and other: |
||||||||||||||||||||
| Cost of products sold |
6,825 | 7,333 | 6,449 | 28,616 | 26,632 | |||||||||||||||
| Marketing, administrative and other expenses |
334 | 300 | 240 | 1,219 | 1,123 | |||||||||||||||
| Equity in earnings of unconsolidated affiliates |
(11 | ) | (10 | ) | (6 | ) | (35 | ) | (30 | ) | ||||||||||
| Losses and impairments of assets |
27 | — | — | 67 | 137 | |||||||||||||||
| Interest expense (income), net |
11 | 15 | 3 | 59 | (30 | ) | ||||||||||||||
|
|
|
|
|
|
|
|
|
|
|
|||||||||||
| 7,186 | 7,638 | 6,686 | 29,926 | 27,832 | ||||||||||||||||
|
|
|
|
|
|
|
|
|
|
|
|||||||||||
| Earnings before income taxes and noncontrolling interests |
501 | 883 | 390 | 2,568 | 2,902 | |||||||||||||||
| Provision for income taxes |
78 | 200 | 45 | 530 | 583 | |||||||||||||||
|
|
|
|
|
|
|
|
|
|
|
|||||||||||
| Net earnings before noncontrolling interests |
423 | 683 | 345 | 2,038 | 2,319 | |||||||||||||||
| Earnings attributable to noncontrolling interests |
45 | 76 | 58 | 294 | 292 | |||||||||||||||
|
|
|
|
|
|
|
|
|
|
|
|||||||||||
| Net earnings attributable to Nucor stockholders |
$ | 378 | $ | 607 | $ | 287 | $ | 1,744 | $ | 2,027 | ||||||||||
|
|
|
|
|
|
|
|
|
|
|
|||||||||||
| Net earnings per share: |
||||||||||||||||||||
| Basic |
$ | 1.64 | $ | 2.63 | $ | 1.22 | $ | 7.53 | $ | 8.47 | ||||||||||
| Diluted |
$ | 1.64 | $ | 2.63 | $ | 1.22 | $ | 7.52 | $ | 8.46 | ||||||||||
| Average shares outstanding: |
||||||||||||||||||||
| Basic |
229.3 | 229.9 | 234.0 | 230.7 | 238.3 | |||||||||||||||
| Diluted |
229.6 | 230.2 | 234.3 | 230.9 | 238.5 | |||||||||||||||
Page 5 of 10
Nucor Executive Offices: 1915 Rexford Road, Charlotte, North Carolina 28211
Phone 704-366-7000 Fax 704-362-4208 www.nucor.com
Nucor Reports Results for the Fourth Quarter of 2025 (Continued)
Condensed Consolidated Balance Sheets (Unaudited)
(In millions)
| December 31, | ||||||||
| 2025 | 2024 | |||||||
| ASSETS |
||||||||
| Current assets: |
||||||||
| Cash and cash equivalents |
$ | 2,260 | $ | 3,558 | ||||
| Short-term investments |
439 | 581 | ||||||
| Accounts receivable, net |
3,105 | 2,675 | ||||||
| Inventories, net |
5,462 | 5,106 | ||||||
| Other current assets |
499 | 555 | ||||||
|
|
|
|
|
|||||
| Total current assets |
11,765 | 12,475 | ||||||
| Property, plant and equipment, net |
15,306 | 13,243 | ||||||
| Goodwill |
4,297 | 4,288 | ||||||
| Other intangible assets, net |
2,880 | 3,134 | ||||||
| Other assets |
856 | 800 | ||||||
|
|
|
|
|
|||||
| Total assets |
$ | 35,104 | $ | 33,940 | ||||
|
|
|
|
|
|||||
| LIABILITIES AND EQUITY |
||||||||
| Current liabilities: |
||||||||
| Short-term debt |
$ | 122 | $ | 225 | ||||
| Current portion of long-term debt and finance lease obligations |
90 | 1,042 | ||||||
| Accounts payable |
1,890 | 1,832 | ||||||
| Salaries, wages and related accruals |
882 | 903 | ||||||
| Accrued expenses and other current liabilities |
1,020 | 975 | ||||||
| Total current liabilities |
4,004 | 4,977 | ||||||
| Long-term debt and finance lease obligations due after one year |
6,909 | 5,683 | ||||||
| Deferred credits and other liabilities |
2,067 | 1,863 | ||||||
|
|
|
|
|
|||||
| Total liabilities |
12,980 | 12,523 | ||||||
|
|
|
|
|
|||||
| Commitments and contingencies |
||||||||
| Equity |
||||||||
| Nucor stockholders’ equity: |
||||||||
| Common stock |
152 | 152 | ||||||
| Additional paid-in capital |
2,253 | 2,223 | ||||||
| Retained earnings |
31,504 | 30,271 | ||||||
| Accumulated other comprehensive loss, net of income taxes |
(194 | ) | (208 | ) | ||||
| Treasury stock |
(12,779 | ) | (12,144 | ) | ||||
|
|
|
|
|
|||||
| Total Nucor stockholders’ equity |
20,936 | 20,294 | ||||||
| Noncontrolling interests |
1,188 | 1,123 | ||||||
|
|
|
|
|
|||||
| Total equity |
22,124 | 21,417 | ||||||
|
|
|
|
|
|||||
| Total liabilities and equity |
$ | 35,104 | $ | 33,940 | ||||
|
|
|
|
|
|||||
Page 6 of 10
Nucor Executive Offices: 1915 Rexford Road, Charlotte, North Carolina 28211
Phone 704-366-7000 Fax 704-362-4208 www.nucor.com
Nucor Reports Results for the Fourth Quarter of 2025 (Continued)
Condensed Consolidated Statements of Cash Flows (Unaudited)
(In millions)
| Year Ended December 31, | ||||||||
| 2025 | 2024 | |||||||
| Operating activities: | ||||||||
| Net earnings before noncontrolling interests |
$ | 2,038 | $ | 2,319 | ||||
| Adjustments: |
||||||||
| Depreciation |
1,226 | 1,094 | ||||||
| Amortization |
254 | 262 | ||||||
| Stock-based compensation |
133 | 132 | ||||||
| Deferred income taxes |
161 | (116 | ) | |||||
| Distributions from affiliates |
46 | 25 | ||||||
| Equity in earnings of unconsolidated affiliates |
(35 | ) | (30 | ) | ||||
| Losses and impairments of assets |
47 | 137 | ||||||
| Changes in assets and liabilities (exclusive of acquisitions and dispositions): |
||||||||
| Accounts receivable |
(428 | ) | 319 | |||||
| Inventories |
(366 | ) | 518 | |||||
| Accounts payable |
80 | (321 | ) | |||||
| Federal income taxes |
124 | 97 | ||||||
| Salaries, wages and related accruals |
2 | (385 | ) | |||||
| Other operating activities |
(48 | ) | (72 | ) | ||||
|
|
|
|
|
|||||
| Cash provided by operating activities |
3,234 | 3,979 | ||||||
|
|
|
|
|
|||||
| Investing activities: | ||||||||
| Capital expenditures |
(3,422 | ) | (3,173 | ) | ||||
| Investment in and advances to affiliates |
(1 | ) | — | |||||
| Sale of business |
— | 1 | ||||||
| Disposition of plant and equipment |
45 | 17 | ||||||
| Acquisitions (net of cash acquired) |
(2 | ) | (758 | ) | ||||
| Purchases of investments |
(985 | ) | (1,296 | ) | ||||
| Proceeds from the sale of investments |
1,140 | 1,487 | ||||||
| Other investing activities |
(1 | ) | (12 | ) | ||||
|
|
|
|
|
|||||
| Cash used in investing activities |
(3,226 | ) | (3,734 | ) | ||||
|
|
|
|
|
|||||
| Financing activities: | ||||||||
| Net change in short-term debt |
(102 | ) | 105 | |||||
| Proceeds from issuance of long-term debt, net of discount |
1,217 | — | ||||||
| Repayment of long-term debt |
(1,015 | ) | (10 | ) | ||||
| Bond issuance costs |
(9 | ) | — | |||||
| Proceeds from exercise of stock options |
5 | 4 | ||||||
|
|
|
|
|
|||||
| Payment of tax withholdings on certain stock-based compensation |
(32 | ) | (53 | ) | ||||
| Distributions to noncontrolling interests |
(249 | ) | (352 | ) | ||||
| Cash dividends |
(512 | ) | (522 | ) | ||||
| Acquisition of treasury stock |
(700 | ) | (2,217 | ) | ||||
| Proceeds from government incentives |
77 | — | ||||||
| Other financing activities |
5 | (13 | ) | |||||
|
|
|
|
|
|||||
| Cash used in financing activities |
(1,315 | ) | (3,058 | ) | ||||
|
|
|
|
|
|||||
| Effect of exchange rate changes on cash | 9 | (16 | ) | |||||
|
|
|
|
|
|||||
| Decrease in cash and cash equivalents | (1,298 | ) | (2,829 | ) | ||||
| Cash and cash equivalents—beginning of year |
3,558 | 6,387 | ||||||
|
|
|
|
|
|||||
| Cash and cash equivalents—end of year | $ | 2,260 | $ | 3,558 | ||||
|
|
|
|
|
|||||
| Non-cash investing activity: | ||||||||
| Change in accrued plant and equipment purchases |
$ | (26 | ) | $ | 115 | |||
|
|
|
|
|
|||||
Page 7 of 10
Nucor Executive Offices: 1915 Rexford Road, Charlotte, North Carolina 28211
Phone 704-366-7000 Fax 704-362-4208 www.nucor.com
Nucor Reports Results for the Fourth Quarter of 2025 (Continued)
Select Financial and Operational Data
| (Dollars in millions, tons in thousands, per unit amounts as noted) |
||||||||||||||||||||||||||||||||
| Three Months (13 Weeks) Ended | Twelve Months (52 Weeks) Ended | |||||||||||||||||||||||||||||||
| Dec. 31, 2025 |
Oct. 4, 2025 |
% Change |
Dec. 31, 2024 |
Year Ago % Change |
Dec. 31, 2025 |
Dec. 31, 2024 |
% Change |
|||||||||||||||||||||||||
| Consolidated Financial & Operational Data |
||||||||||||||||||||||||||||||||
| Net Sales |
$ | 7,687 | $ | 8,521 | -10 | % | $ | 7,076 | 9 | % | $ | 32,494 | $ | 30,734 | 6 | % | ||||||||||||||||
| External Average Sales Price per Ton |
$ | 1,242 | $ | 1,258 | -1 | % | $ | 1,168 | 6 | % | $ | 1,221 | $ | 1,241 | -2 | % | ||||||||||||||||
| Sales Tons to External Customers |
6,191 | 6,774 | -9 | % | 6,058 | 2 | % | 26,615 | 24,767 | 7 | % | |||||||||||||||||||||
| Pre-Operating & Start-Up Costs |
$ | 87 | $ | 103 | -16 | % | $ | 164 | -47 | % | $ | 496 | $ | 594 | -16 | % | ||||||||||||||||
| Pre-Operating & Start-Up Costs per Diluted Share |
$ | 0.29 | $ | 0.34 | $ | 0.53 | $ | 1.63 | $ | 1.89 | ||||||||||||||||||||||
| Number of Days in Period |
88 | 91 | 94 | 365 | 366 | |||||||||||||||||||||||||||
| Steel Mills Segment Data |
||||||||||||||||||||||||||||||||
| Total Shipments |
5,906 | 6,428 | -8 | % | 5,650 | 5 | % | 25,271 | 23,126 | 9 | % | |||||||||||||||||||||
| Sales Tons to External Customers |
4,602 | 4,976 | -8 | % | 4,580 | 0 | % | 19,848 | 18,480 | 7 | % | |||||||||||||||||||||
| Percentage of Sales to Internal Customers |
22 | % | 23 | % | 19 | % | 21 | % | 20 | % | ||||||||||||||||||||||
| External Average Sales Price per Ton |
$ | 1,019 | $ | 1,038 | -2 | % | $ | 926 | 10 | % | $ | 1,008 | $ | 1,013 | 0 | % | ||||||||||||||||
| Average Scrap/Scrap Substitute Cost per Gross Ton |
$ | 380 | $ | 391 | -3 | % | $ | 381 | 0 | % | $ | 392 | $ | 394 | -1 | % | ||||||||||||||||
| Utilization |
82 | % | 85 | % | 74 | % | 83 | % | 76 | % | ||||||||||||||||||||||
| Steel Products Segment Data |
||||||||||||||||||||||||||||||||
| Sales Tons to External Customers |
1,025 | 1,183 | -13 | % | 968 | 6 | % | 4,397 | 4,018 | 9 | % | |||||||||||||||||||||
| Average Sales Price per Ton |
$ | 2,413 | $ | 2,358 | 2 | % | $ | 2,448 | -1 | % | $ | 2,348 | $ | 2,510 | -6 | % | ||||||||||||||||
Page 8 of 10
Nucor Executive Offices: 1915 Rexford Road, Charlotte, North Carolina 28211
Phone 704-366-7000 Fax 704-362-4208 www.nucor.com
Nucor Reports Results for the Fourth Quarter of 2025 (Continued)
| Tonnage Data (In thousands) |
Three Months (13 Weeks) Ended | Twelve Months (52 Weeks) Ended | ||||||||||||||||||||||||||||||
| Dec. 31, 2025 |
Oct. 4, 2025 |
% Change |
Dec. 31, 2024 |
Year Ago % Change |
Dec. 31, 2025 |
Dec. 31, 2024 |
% Change |
|||||||||||||||||||||||||
| Steel mills total shipments: | ||||||||||||||||||||||||||||||||
| Sheet |
2,804 | 3,030 | -7 | % | 2,714 | 3 | % | 11,872 | 11,394 | 4 | % | |||||||||||||||||||||
| Bars |
2,007 | 2,190 | -8 | % | 1,887 | 6 | % | 8,635 | 7,730 | 12 | % | |||||||||||||||||||||
| Structural |
522 | 595 | -12 | % | 508 | 3 | % | 2,329 | 2,063 | 13 | % | |||||||||||||||||||||
| Plate |
552 | 594 | -7 | % | 502 | 10 | % | 2,329 | 1,797 | 30 | % | |||||||||||||||||||||
| Other |
21 | 19 | 11 | % | 39 | -46 | % | 106 | 142 | -25 | % | |||||||||||||||||||||
|
|
|
|
|
|
|
|
|
|
|
|
|
|
|
|
|
|||||||||||||||||
| 5,906 | 6,428 | -8 | % | 5,650 | 5 | % | 25,271 | 23,126 | 9 | % | ||||||||||||||||||||||
|
|
|
|
|
|
|
|
|
|
|
|
|
|
|
|
|
|||||||||||||||||
| Sales tons to outside customers: | ||||||||||||||||||||||||||||||||
| Steel mills |
4,602 | 4,976 | -8 | % | 4,580 | 0 | % | 19,848 | 18,480 | 7 | % | |||||||||||||||||||||
| Joist and deck |
218 | 254 | -14 | % | 178 | 22 | % | 871 | 712 | 22 | % | |||||||||||||||||||||
| Rebar fabrication products |
270 | 356 | -24 | % | 239 | 13 | % | 1,179 | 1,020 | 16 | % | |||||||||||||||||||||
| Tubular products |
228 | 206 | 11 | % | 221 | 3 | % | 947 | 856 | 11 | % | |||||||||||||||||||||
| Building systems |
54 | 62 | -13 | % | 57 | -5 | % | 228 | 238 | -4 | % | |||||||||||||||||||||
| Other steel products |
255 | 305 | -16 | % | 273 | -7 | % | 1,172 | 1,192 | -2 | % | |||||||||||||||||||||
| Raw materials |
564 | 615 | -8 | % | 510 | 11 | % | 2,370 | 2,269 | 4 | % | |||||||||||||||||||||
|
|
|
|
|
|
|
|
|
|
|
|
|
|
|
|
|
|||||||||||||||||
| 6,191 | 6,774 | -9 | % | 6,058 | 2 | % | 26,615 | 24,767 | 7 | % | ||||||||||||||||||||||
|
|
|
|
|
|
|
|
|
|
|
|
|
|
|
|
|
|||||||||||||||||
Page 9 of 10
Nucor Executive Offices: 1915 Rexford Road, Charlotte, North Carolina 28211
Phone 704-366-7000 Fax 704-362-4208 www.nucor.com
Nucor Reports Results for the Fourth Quarter of 2025 (Continued)
Non-GAAP Financial Measures
Reconciliation of EBITDA (Unaudited)
(In millions)
| Three Months (13 Weeks) Ended | Twelve Months (52 Weeks) Ended | |||||||||||||||||||
| Dec. 31, 2025 | Oct. 4, 2025 | Dec. 31, 2024 | Dec. 31, 2025 | Dec. 31, 2024 | ||||||||||||||||
| Net earnings before noncontrolling interests |
$ | 423 | $ | 683 | $ | 345 | $ | 2,038 | $ | 2,319 | ||||||||||
| Depreciation |
316 | 304 | 285 | 1,226 | 1,094 | |||||||||||||||
| Amortization |
63 | 63 | 73 | 254 | 262 | |||||||||||||||
| Losses and impairments of assets |
27 | — | — | 67 | 137 | |||||||||||||||
| Interest expense (income), net |
11 | 15 | 3 | 59 | (30 | ) | ||||||||||||||
| Provision for income taxes |
78 | 200 | 45 | 530 | 583 | |||||||||||||||
|
|
|
|
|
|
|
|
|
|
|
|||||||||||
| EBITDA |
$ | 918 | $ | 1,265 | $ | 751 | $ | 4,174 | $ | 4,365 | ||||||||||
|
|
|
|
|
|
|
|
|
|
|
|||||||||||
Reconciliation of Adjusted Net Earnings Attributable to Nucor Stockholders (Unaudited)
(In millions, except per share data)
| Three Months (13 Weeks) Ended | Twelve Months (52 Weeks) Ended | |||||||||||||||||||||||
| December 31, 2025 | December 31, 2025 | December 31, 2024 | ||||||||||||||||||||||
| Diluted EPS | Diluted EPS | Diluted EPS | ||||||||||||||||||||||
| Net earnings attributable to Nucor stockholders |
$ | 378 | $ | 1.64 | $ | 1,744 | $ | 7.52 | $ | 2,027 | $ | 8.46 | ||||||||||||
| Losses and impairments of assets, net of tax and noncontrolling interests |
22 | 0.09 | 45 | 0.19 | 103 | 0.44 | ||||||||||||||||||
|
|
|
|
|
|
|
|
|
|
|
|
|
|||||||||||||
| Adjusted net earnings attributable to Nucor stockholders |
$ | 400 | $ | 1.73 | $ | 1,789 | $ | 7.71 | $ | 2,130 | $ | 8.90 | ||||||||||||
|
|
|
|
|
|
|
|
|
|
|
|
|
|||||||||||||
Page 10 of 10
Nucor Executive Offices: 1915 Rexford Road, Charlotte, North Carolina 28211
Phone 704-366-7000 Fax 704-362-4208 www.nucor.com

Exhibit 99.2 FOURTH QUARTER 2025 EARNINGS CALL LEON TOPALIAN Chair and CEO STEVE LAXTON President, COO and CFO January 27, 2026
FORWARD-LOOKING STATEMENTS Certain statements made in this presentation may constitute forward-looking statements within the meaning of the Private Securities Litigation Reform Act of 1995. These statements involve risks and uncertainties. The words “anticipate,” “believe,” “expect,” “intend,” “may,” “project,” “will,” “should,” “could” and similar expressions are intended to identify forward-looking statements. These forward-looking statements reflect the Company’s best judgment based on current information, and although we base these statements on circumstances that we believe to be reasonable when made, there can be no assurance that future events will not affect the accuracy of such forward-looking information. The Company does not undertake any obligation to update these statements. The forward-looking statements are not guarantees of future performance, and actual results may vary materially from the projected results and expectations discussed in this presentation. Factors that might cause the Company’s actual results to differ materially from those anticipated in forward- looking statements include, but are not limited to: (1) competitive pressure on sales and pricing, including pressure from imports and substitute materials; (2) U.S. and foreign trade policies affecting steel imports or exports; (3) the sensitivity of the results of our operations to general market conditions, and in particular, prevailing market steel prices and changes in the supply and cost of raw materials, including pig iron, iron ore and scrap steel; (4) the availability and cost of electricity and natural gas, which could negatively affect our cost of steel production or result in a delay or cancellation of existing or future drilling within our natural gas drilling programs; (5) critical equipment failures and business interruptions; (6) market demand for steel products, which, in the case of many of our products, is driven by the level of nonresidential construction activity in the United States; (7) impairment in the recorded value of inventory, equity investments, fixed assets, goodwill or other long- lived assets; (8) uncertainties and volatility surrounding the global economy, including excess world capacity for steel production, inflation and interest rate changes; (9) fluctuations in currency conversion rates; (10) significant changes in laws or government regulations affecting environmental compliance, including legislation and regulations that result in greater regulation of greenhouse gas emissions that could increase our energy costs, capital expenditures and operating costs or cause one or more of our permits to be revoked or make it more difficult to obtain permit modifications; (11) the cyclical nature of the steel industry; (12) capital investments and their impact on our performance; (13) our safety performance; (14) our ability to integrate businesses we acquire; (15) the impact of any pandemic or public health situation; and (16) the risks discussed in “Item 1A. Risk Factors” of the Company’s most recent Annual Report on Form 10-K and elsewhere therein and in the other reports we file with the U.S. Securities and Exchange Commission. 2
NON-GAAP FINANCIAL MEASURES The Company uses certain non-GAAP (Generally Accepted Accounting Principles) financial measures in this presentation, including adjusted earnings, EBITDA and Free Cash Flow (FCF). Generally, a non-GAAP financial measure is a numerical measure of a company’s performance or financial position that either excludes or includes amounts that are not normally excluded or included in the most directly comparable financial measure calculated and presented in accordance with GAAP. We define EBITDA as net earnings before noncontrolling interests adding back the following items: interest expense, net; provision for income taxes; depreciation; amortization; and losses and impairments of assets. We define Free Cash Flow (FCF) as Cash Provided by Operating Activities less Capital Expenditures. Please note that other companies might define their non-GAAP financial measures differently than we do. Management presents non-GAAP financial measures because it considers them to be an important supplemental measure of performance. Management believes that these non-GAAP financial measures provide additional insight for analysts and investors evaluating the Company’s financial and operational performance by providing a consistent basis of comparison across periods. Non-GAAP financial measures have limitations as an analytical tool. Investors are encouraged to review the reconciliation of non-GAAP financial measures to their most directly comparable GAAP financial measures provided in this presentation, including in the accompanying tables located in the Appendix. 3
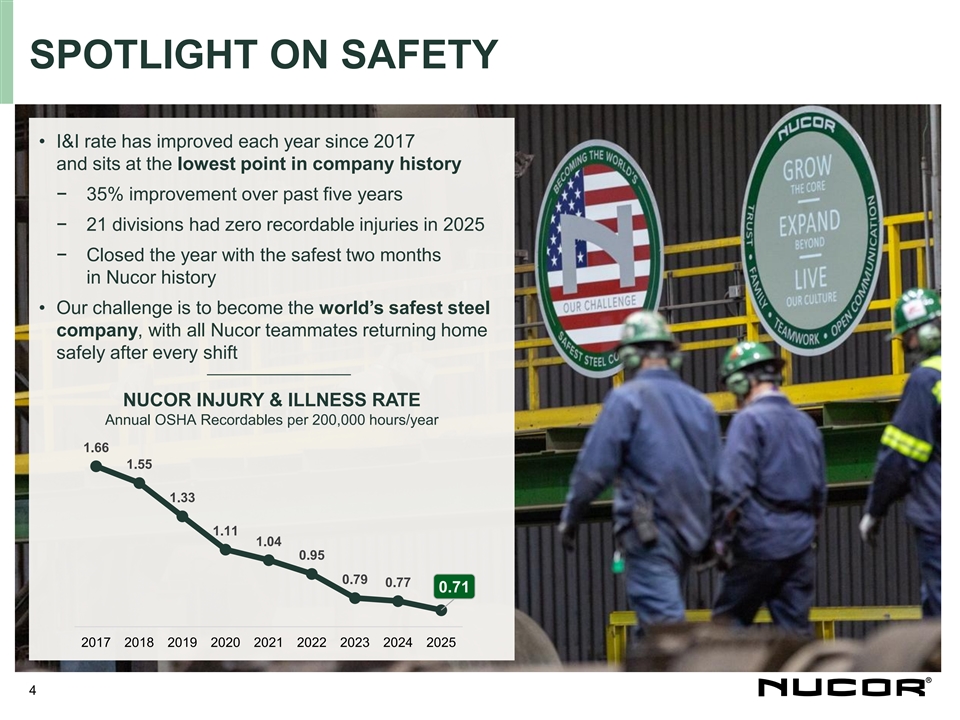
SPOTLIGHT ON SAFETY • I&I rate has improved each year since 2017 and sits at the lowest point in company history − 35% improvement over past five years − 21 divisions had zero recordable injuries in 2025 − Closed the year with the safest two months in Nucor history • Our challenge is to become the world’s safest steel company, with all Nucor teammates returning home safely after every shift NUCOR INJURY & ILLNESS RATE Annual OSHA Recordables per 200,000 hours/year 1.66 1.55 1.33 1.11 1.04 0.95 0.79 0.77 0.71 2017 2018 2019 2020 2021 2022 2023 2024 2025 4
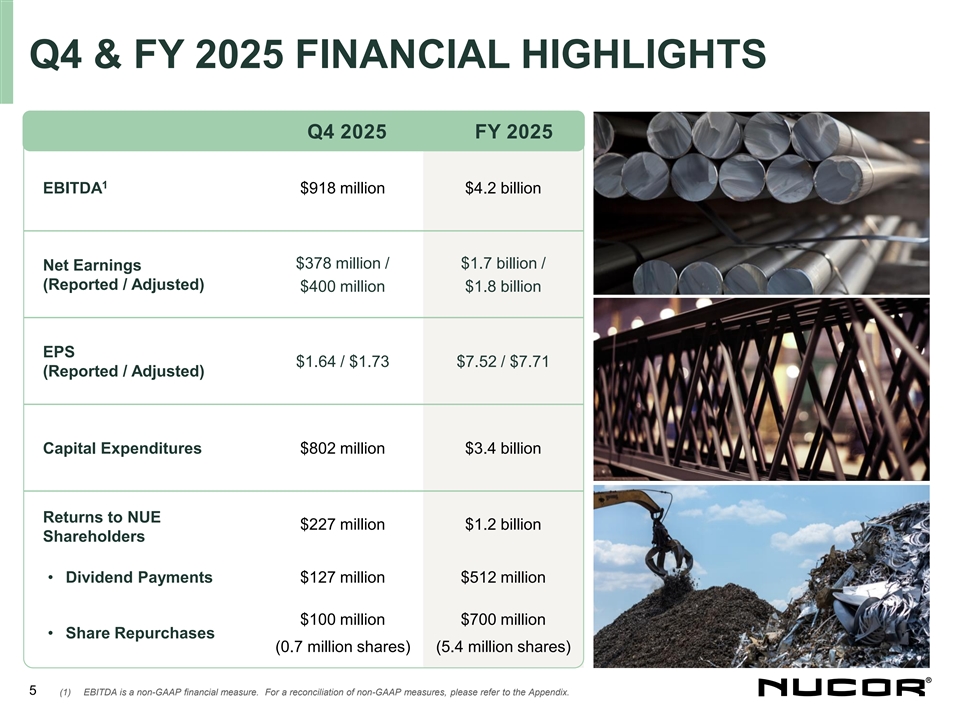
Q4 & FY 2025 FINANCIAL HIGHLIGHTS Q4 2025 FY 2025 1 EBITDA $918 million $4.2 billion $378 million / $1.7 billion / Net Earnings (Reported / Adjusted) $400 million $1.8 billion EPS $1.64 / $1.73 $7.52 / $7.71 (Reported / Adjusted) Capital Expenditures $802 million $3.4 billion Returns to NUE $227 million $1.2 billion Shareholders • Dividend Payments $127 million $512 million $100 million $700 million • Share Repurchases (0.7 million shares) (5.4 million shares) 5 (1) EBITDA is a non-GAAP financial measure. For a reconciliation of non-GAAP measures, please refer to the Appendix.
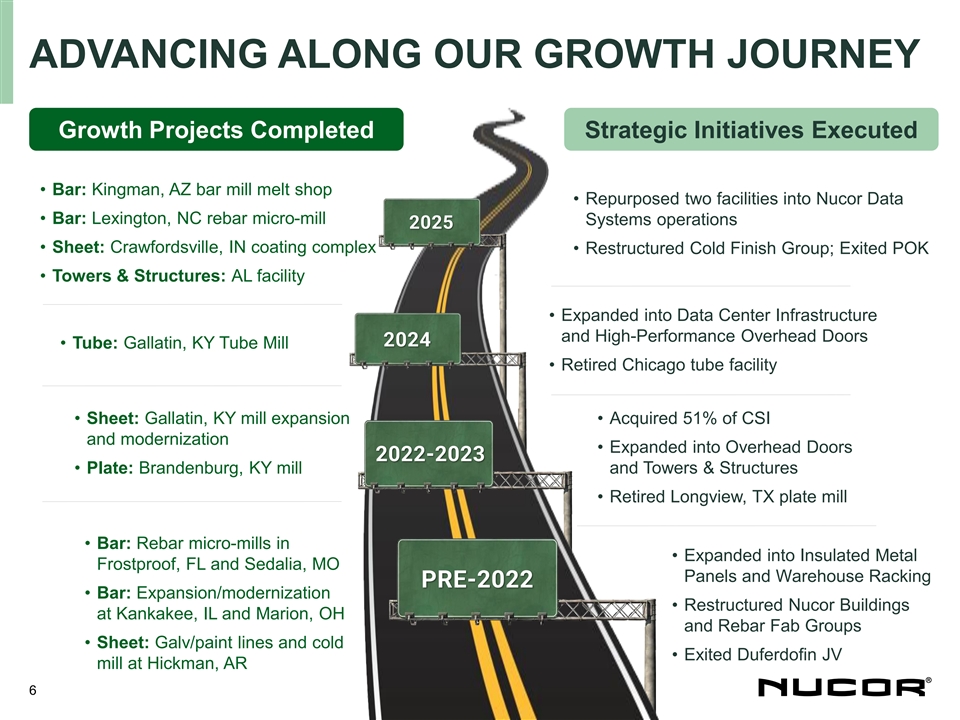
ADVANCING ALONG OUR GROWTH JOURNEY Growth Projects Completed Strategic Initiatives Executed • Bar: Kingman, AZ bar mill melt shop • Repurposed two facilities into Nucor Data • Bar: Lexington, NC rebar micro-mill Systems operations 2025 • Sheet: Crawfordsville, IN coating complex • Restructured Cold Finish Group; Exited POK • Towers & Structures: AL facility • Expanded into Data Center Infrastructure and High-Performance Overhead Doors 2024 • Tube: Gallatin, KY Tube Mill • Retired Chicago tube facility • Sheet: Gallatin, KY mill expansion • Acquired 51% of CSI and modernization • Expanded into Overhead Doors 2022-2023 • Plate: Brandenburg, KY mill and Towers & Structures • Retired Longview, TX plate mill • Bar: Rebar micro-mills in • Expanded into Insulated Metal Frostproof, FL and Sedalia, MO Panels and Warehouse Racking PRE-2022 • Bar: Expansion/modernization • Restructured Nucor Buildings at Kankakee, IL and Marion, OH and Rebar Fab Groups • Sheet: Galv/paint lines and cold • Exited Duferdofin JV mill at Hickman, AR 6
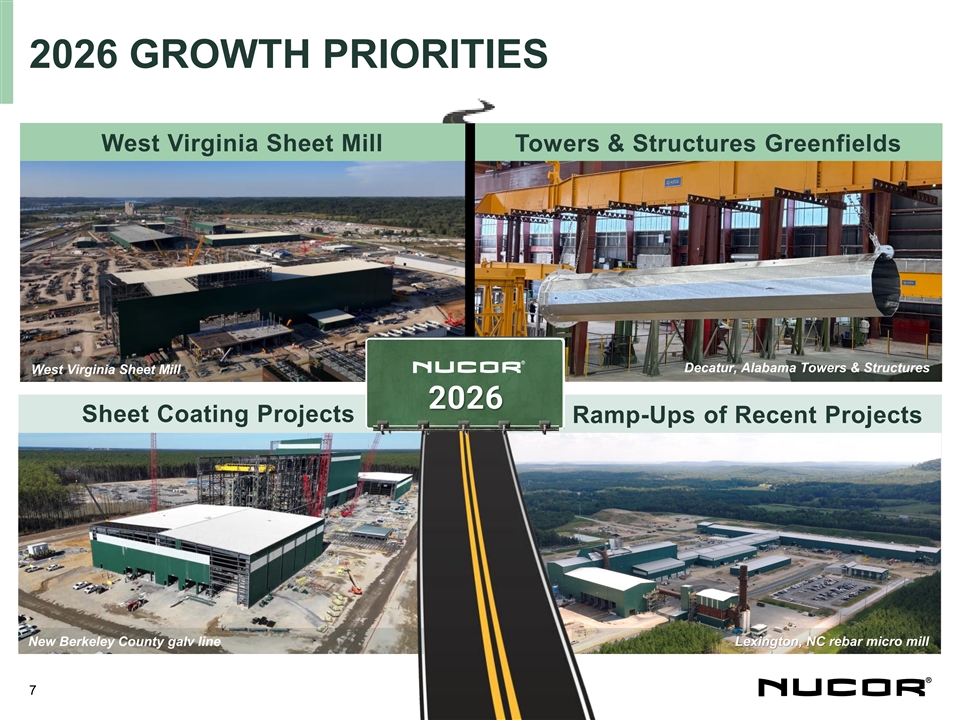
2026 GROWTH PRIORITIES West Virginia Sheet Mill Towers & Structures Greenfields Decatur, Alabama Towers & Structures West Virginia Sheet Mill 2026 Sheet Coating Projects Ramp-Ups of Recent Projects New Berkeley County galv line Lexington, NC rebar micro mill 7
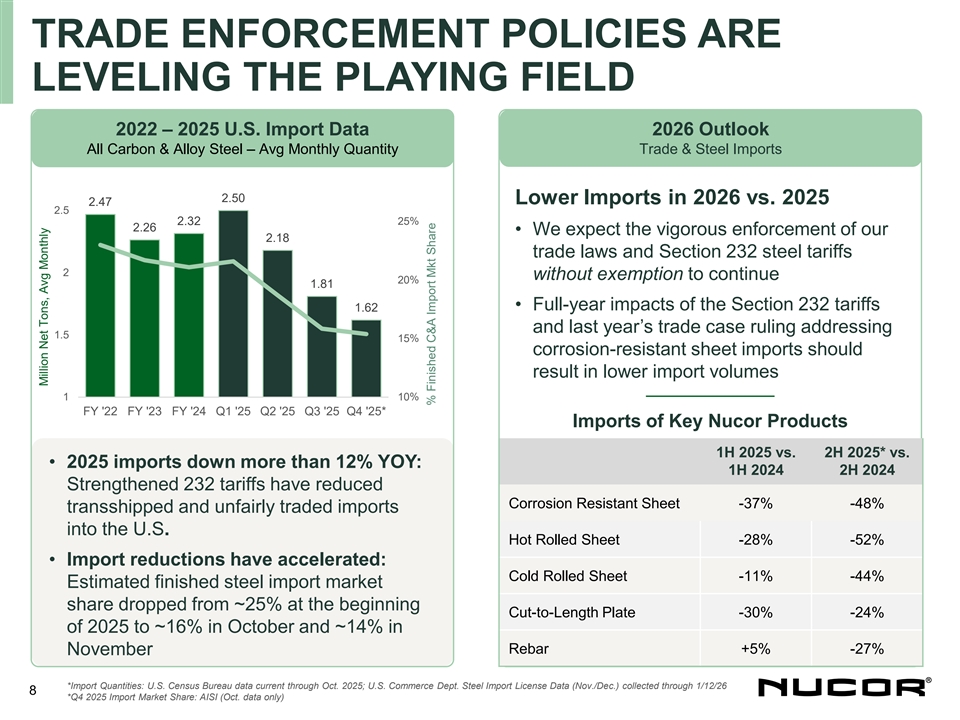
TRADE ENFORCEMENT POLICIES ARE LEVELING THE PLAYING FIELD 2022 – 2025 U.S. Import Data 2026 Outlook All Carbon & Alloy Steel – Avg Monthly Quantity Trade & Steel Imports 2.50 Lower Imports in 2026 vs. 2025 2.47 2.5 2.32 25% 2.26 • We expect the vigorous enforcement of our 2.18 trade laws and Section 232 steel tariffs 2 without exemption to continue 20% 1.81 • Full-year impacts of the Section 232 tariffs 1.62 and last year’s trade case ruling addressing 1.5 15% corrosion-resistant sheet imports should result in lower import volumes 1 10% FY '22 FY '23 FY '24 Q1 '25 Q2 '25 Q3 '25 Q4 '25* Imports of Key Nucor Products 1H 2025 vs. 2H 2025* vs. • 2025 imports down more than 12% YOY: 1H 2024 2H 2024 Strengthened 232 tariffs have reduced Corrosion Resistant Sheet -37% -48% transshipped and unfairly traded imports into the U.S. Hot Rolled Sheet -28% -52% • Import reductions have accelerated: Cold Rolled Sheet -11% -44% Estimated finished steel import market share dropped from ~25% at the beginning Cut-to-Length Plate -30% -24% of 2025 to ~16% in October and ~14% in Rebar +5% -27% November *Import Quantities: U.S. Census Bureau data current through Oct. 2025; U.S. Commerce Dept. Steel Import License Data (Nov./Dec.) collected through 1/12/26 8 *Q4 2025 Import Market Share: AISI (Oct. data only) Million Net Tons, Avg Monthly % Finished C&A Import Mkt Share
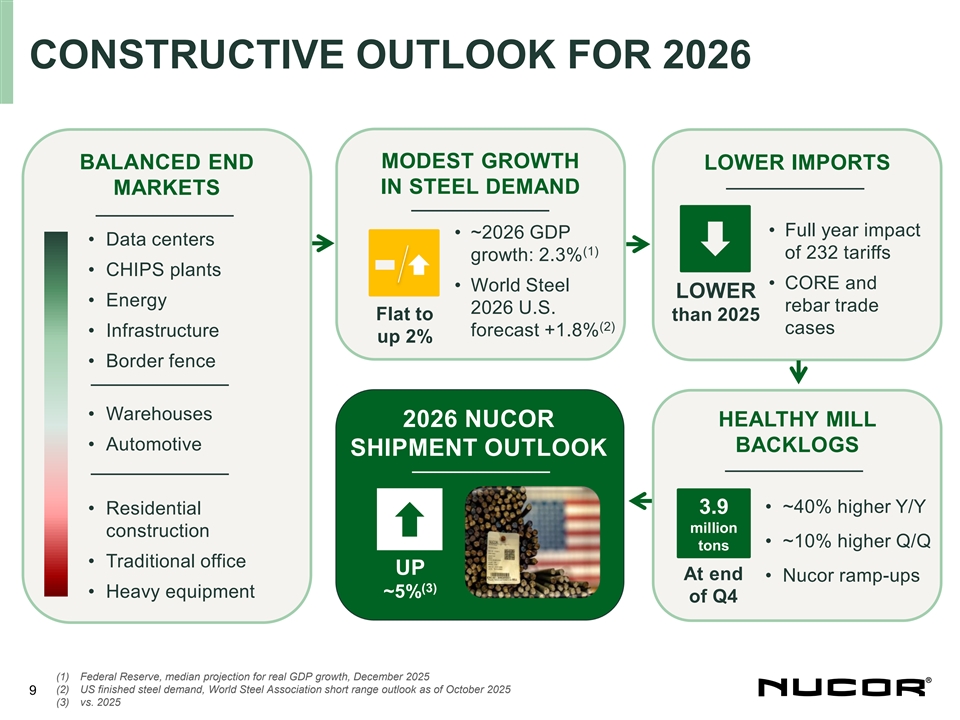
CONSTRUCTIVE OUTLOOK FOR 2026 MODEST GROWTH BALANCED END LOWER IMPORTS –––––––––––––––– MARKETS IN STEEL DEMAND –––––––––––––––– –––––––––––––––– • Full year impact • ~2026 GDP • Data centers (1) of 232 tariffs growth: 2.3% • CHIPS plants • CORE and • World Steel LOWER • Energy rebar trade 2026 U.S. Flat to than 2025 (2) cases forecast +1.8% • Infrastructure up 2% • Border fence –––––––––––––––– • Warehouses 2026 NUCOR HEALTHY MILL • Automotive BACKLOGS SHIPMENT OUTLOOK –––––––––––––––– –––––––––––––––– –––––––––––––––– • ~40% higher Y/Y • Residential 3.9 million construction • ~10% higher Q/Q tons • Traditional office UP At end • Nucor ramp-ups (3) ~5% • Heavy equipment of Q4 (1) Federal Reserve, median projection for real GDP growth, December 2025 (2) US finished steel demand, World Steel Association short range outlook as of October 2025 9 (3) vs. 2025
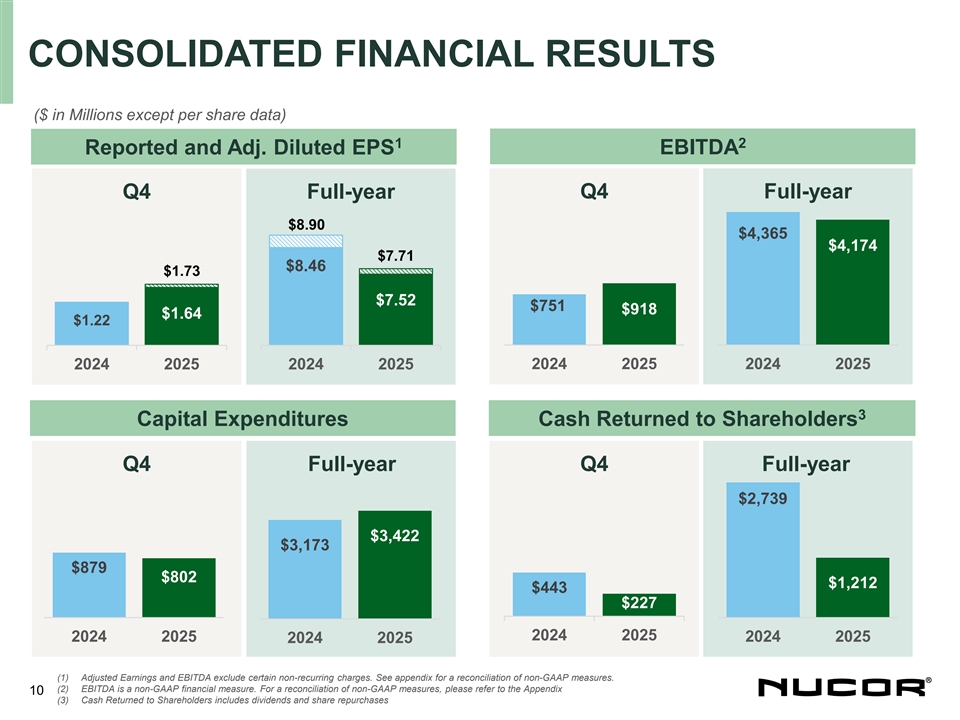
CONSOLIDATED FINANCIAL RESULTS ($ in Millions except per share data) 1 2 Reported and Adj. Diluted EPS EBITDA Q4 Full-year Q4 Full-year $8.90 $4,365 $4,174 $7.71 $8.46 $1.73 $7.52 $751 $918 $1.64 $1.22 2024 2025 2024 2025 2024 2025 2024 2025 3 Capital Expenditures Cash Returned to Shareholders Q4 Full-year Q4 Full-year $2,739 $3,422 $3,173 $879 $802 $1,212 $443 $227 2024 2025 2024 2025 2024 2025 2024 2025 (1) Adjusted Earnings and EBITDA exclude certain non-recurring charges. See appendix for a reconciliation of non-GAAP measures. (2) EBITDA is a non-GAAP financial measure. For a reconciliation of non-GAAP measures, please refer to the Appendix 10 (3) Cash Returned to Shareholders includes dividends and share repurchases
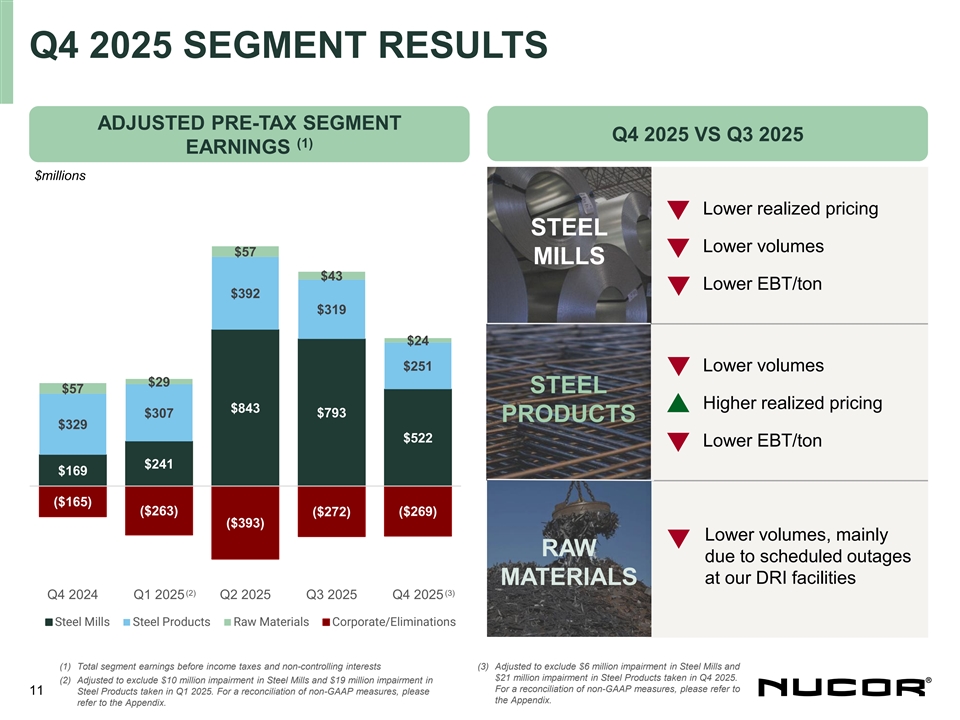
Q4 2025 SEGMENT RESULTS ADJUSTED PRE-TAX SEGMENT Q4 2025 VS Q3 2025 (1) EARNINGS $millions • Lower realized pricing STEEL • Lower volumes $57 MILLS $43 • Lower EBT/ton $392 $319 $24 $251 • Lower volumes $29 $57 STEEL • Higher realized pricing $843 $793 $307 PRODUCTS $329 $522 • Lower EBT/ton $241 $169 ($165) ($263) ($272) ($269) ($393) • Lower volumes, mainly RAW due to scheduled outages at our DRI facilities MATERIALS (2) (3) Q4 2024 Q1 2025 Q2 2025 Q3 2025 Q4 2025 Steel Mills Steel Products Raw Materials Corporate/Eliminations (1) Total segment earnings before income taxes and non-controlling interests (3) Adjusted to exclude $6 million impairment in Steel Mills and $21 million impairment in Steel Products taken in Q4 2025. (2) Adjusted to exclude $10 million impairment in Steel Mills and $19 million impairment in For a reconciliation of non-GAAP measures, please refer to 11 Steel Products taken in Q1 2025. For a reconciliation of non-GAAP measures, please the Appendix. refer to the Appendix.
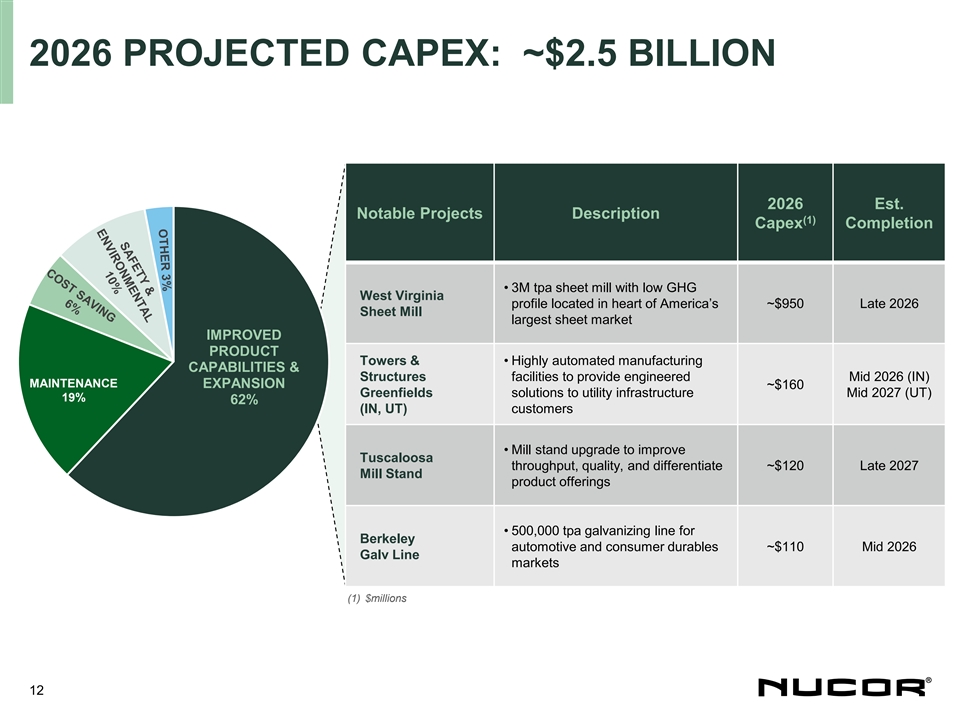
2026 PROJECTED CAPEX: ~$2.5 BILLION 2026 Est. Notable Projects Description (1) Capex Completion • 3M tpa sheet mill with low GHG West Virginia profile located in heart of America’s ~$950 Late 2026 Sheet Mill largest sheet market IMPROVED PRODUCT Towers & • Highly automated manufacturing CAPABILITIES & Structures facilities to provide engineered Mid 2026 (IN) MAINTENANCE EXPANSION ~$160 Greenfields solutions to utility infrastructure Mid 2027 (UT) 19% 62% (IN, UT) customers • Mill stand upgrade to improve Tuscaloosa throughput, quality, and differentiate ~$120 Late 2027 Mill Stand product offerings • 500,000 tpa galvanizing line for Berkeley automotive and consumer durables ~$110 Mid 2026 Galv Line markets (1) $millions 12
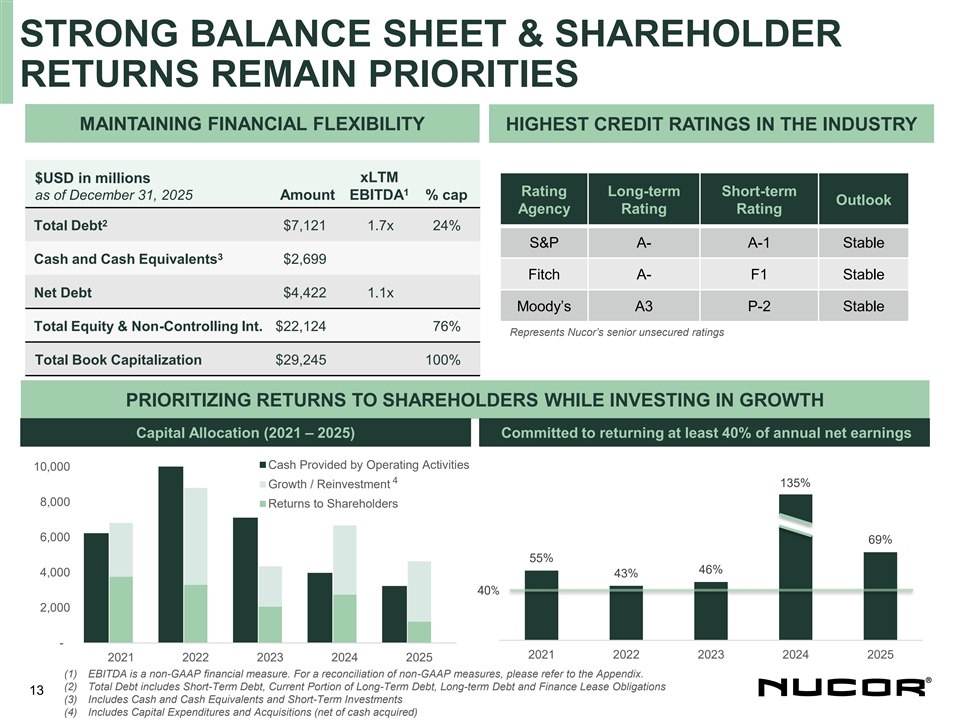
STRONG BALANCE SHEET & SHAREHOLDER RETURNS REMAIN PRIORITIES MAINTAINING FINANCIAL FLEXIBILITY HIGHEST CREDIT RATINGS IN THE INDUSTRY $USD in millions xLTM 1 Rating Long-term Short-term as of December 31, 2025 Amount EBITDA % cap Outlook Agency Rating Rating 2 Total Debt $7,121 1.7x 24% S&P A- A-1 Stable 3 Cash and Cash Equivalents $2,699 Fitch A- F1 Stable Net Debt $4,422 1.1x Moody’s A3 P-2 Stable Total Equity & Non-Controlling Int. $22,124 76% Represents Nucor’s senior unsecured ratings Total Book Capitalization $29,245 100% PRIORITIZING RETURNS TO SHAREHOLDERS WHILE INVESTING IN GROWTH Capital Allocation (2021 – 2025) Committed to returning at least 40% of annual net earnings Cash Provided by Operating Activities 10,000 4 135% Growth / Reinvestment 8,000 Returns to Shareholders 6,000 69% 55% 46% 4,000 43% 40% 2,000 - 2021 2022 2023 2024 2025 2021 2022 2023 2024 2025 (1) EBITDA is a non-GAAP financial measure. For a reconciliation of non-GAAP measures, please refer to the Appendix. (2) Total Debt includes Short-Term Debt, Current Portion of Long-Term Debt, Long-term Debt and Finance Lease Obligations 13 (3) Includes Cash and Cash Equivalents and Short-Term Investments (4) Includes Capital Expenditures and Acquisitions (net of cash acquired)
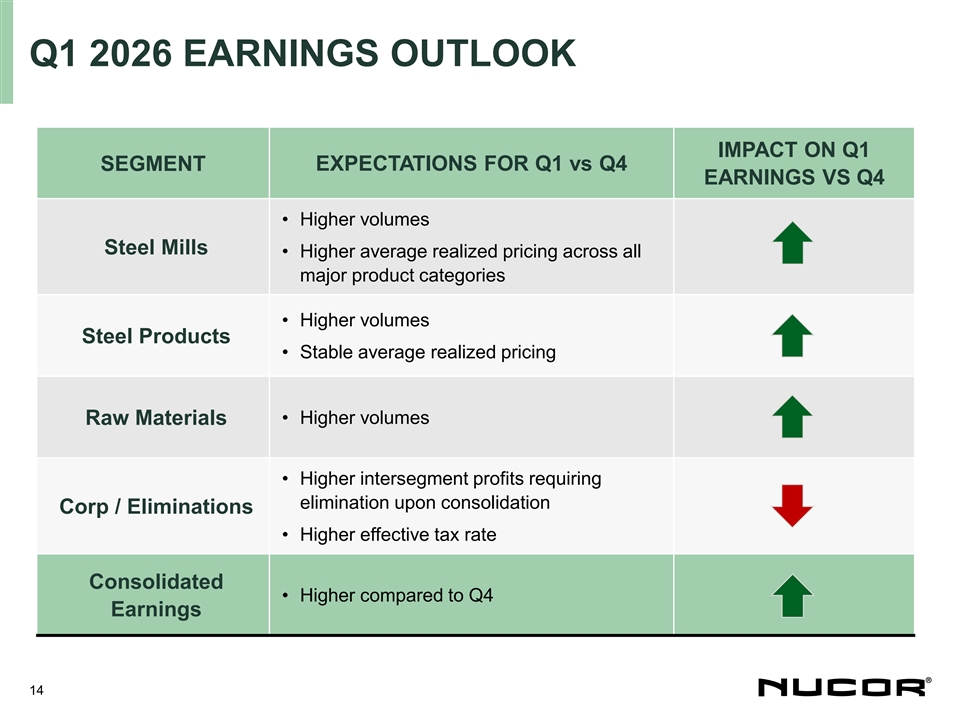
Q1 2026 EARNINGS OUTLOOK IMPACT ON Q1 SEGMENT EXPECTATIONS FOR Q1 vs Q4 EARNINGS VS Q4 • Higher volumes Steel Mills • Higher average realized pricing across all major product categories • Higher volumes Steel Products • Stable average realized pricing • Higher volumes Raw Materials • Higher intersegment profits requiring elimination upon consolidation Corp / Eliminations • Higher effective tax rate Consolidated • Higher compared to Q4 Earnings 14
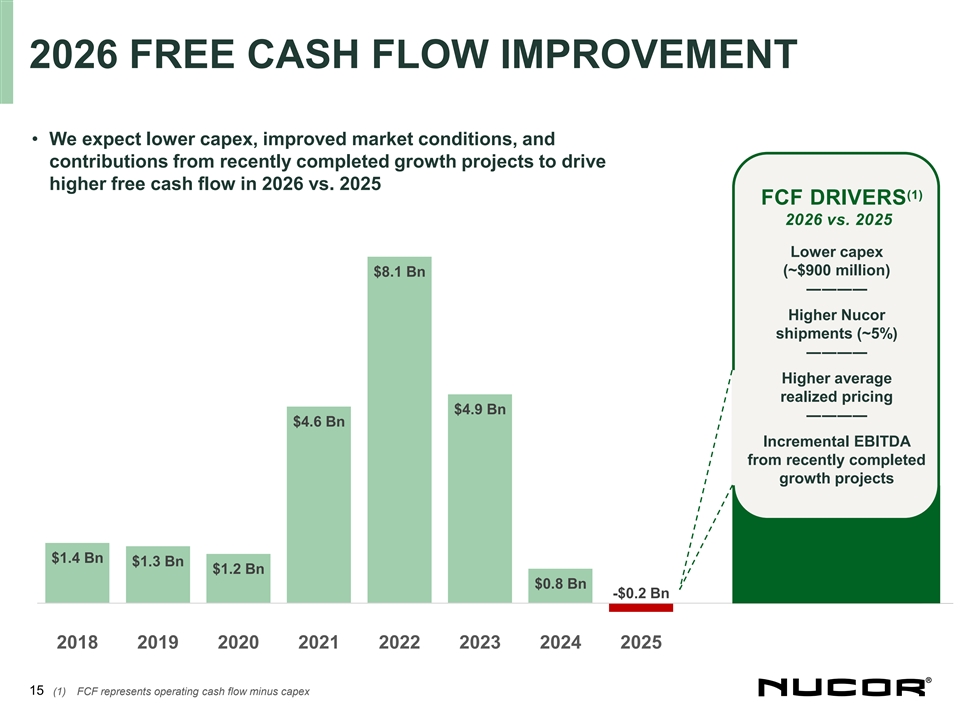
2026 FREE CASH FLOW IMPROVEMENT • We expect lower capex, improved market conditions, and contributions from recently completed growth projects to drive higher free cash flow in 2026 vs. 2025 (1) FCF DRIVERS 2026 vs. 2025 Lower capex (~$900 million) $8.1 Bn ―――― Higher Nucor shipments (~5%) ―――― Higher average realized pricing $4.9 Bn ―――― $4.6 Bn Incremental EBITDA from recently completed growth projects $1.4 Bn $1.3 Bn $1.2 Bn $0.8 Bn -$0.2 Bn 2018 2019 2020 2021 2022 2023 2024 2025 15 (1) FCF represents operating cash flow minus capex

APPENDIX 16
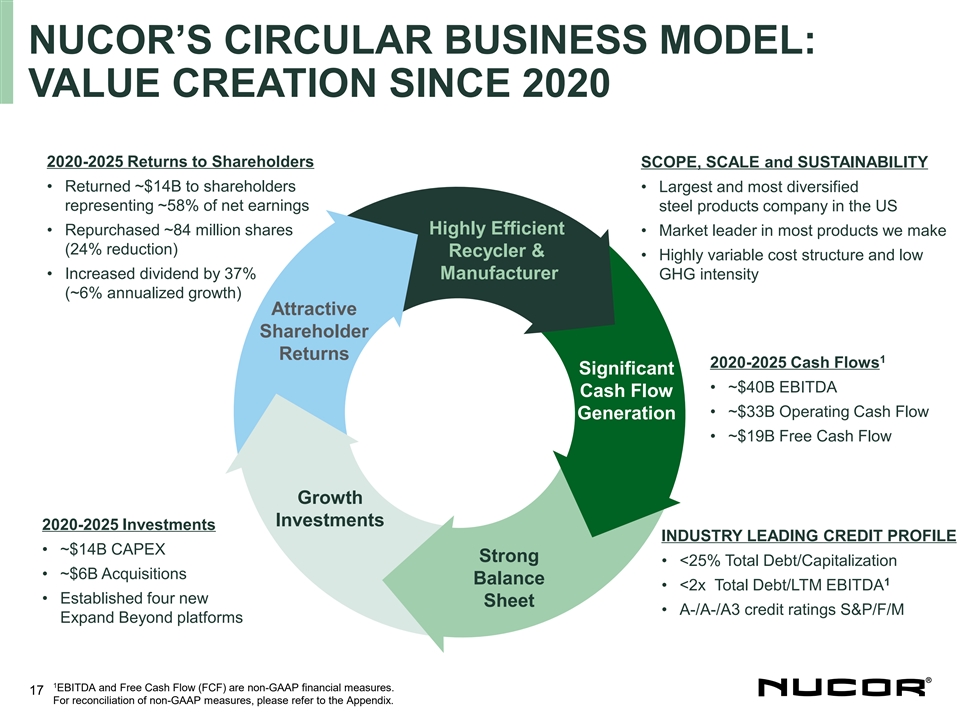
NUCOR’S CIRCULAR BUSINESS MODEL: VALUE CREATION SINCE 2020 2020-2025 Returns to Shareholders SCOPE, SCALE and SUSTAINABILITY • Returned ~$14B to shareholders • Largest and most diversified representing ~58% of net earnings steel products company in the US Highly Efficient • Repurchased ~84 million shares • Market leader in most products we make (24% reduction) Recycler & • Highly variable cost structure and low • Increased dividend by 37% Manufacturer GHG intensity (~6% annualized growth) Attractive Shareholder Returns 1 2020-2025 Cash Flows Significant • ~$40B EBITDA Cash Flow • ~$33B Operating Cash Flow Generation • ~$19B Free Cash Flow Growth Investments 2020-2025 Investments INDUSTRY LEADING CREDIT PROFILE • ~$14B CAPEX Strong • <25% Total Debt/Capitalization • ~$6B Acquisitions Balance 1 • <2x Total Debt/LTM EBITDA • Established four new Sheet • A-/A-/A3 credit ratings S&P/F/M Expand Beyond platforms 1 EBITDA and Free Cash Flow (FCF) are non-GAAP financial measures. 17 For reconciliation of non-GAAP measures, please refer to the Appendix.
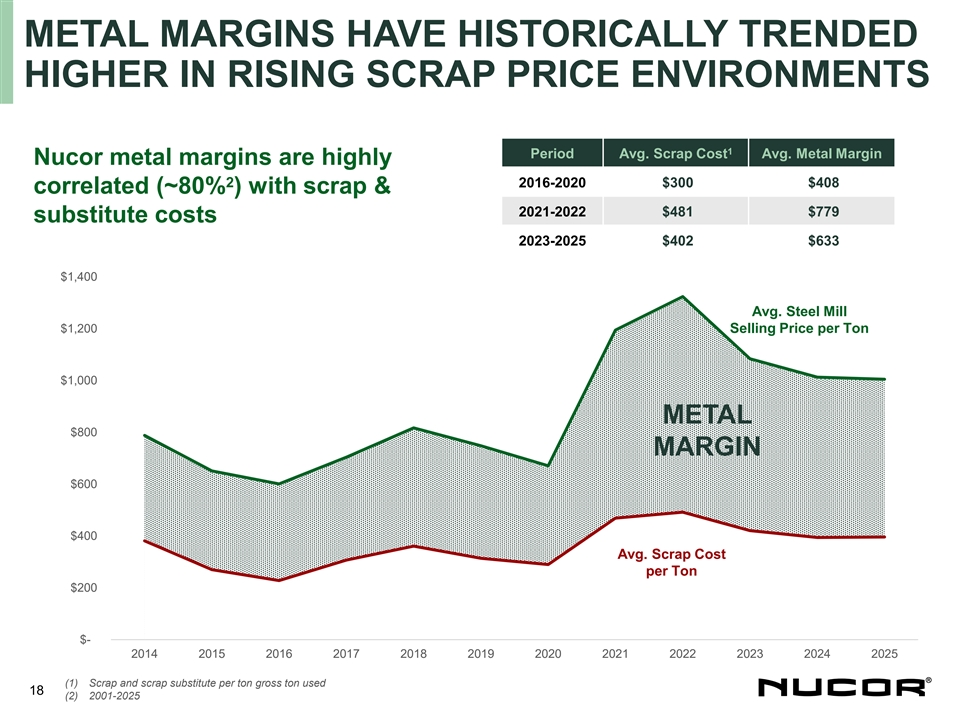
METAL MARGINS HAVE HISTORICALLY TRENDED HIGHER IN RISING SCRAP PRICE ENVIRONMENTS 1 Period Avg. Scrap Cost Avg. Metal Margin Nucor metal margins are highly 2 2016-2020 $300 $408 correlated (~80% ) with scrap & 2021-2022 $481 $779 substitute costs 2023-2025 $402 $633 $1,400 Avg. Steel Mill $1,200 Selling Price per Ton $1,000 METAL $800 MARGIN $600 $400 Avg. Scrap Cost per Ton $200 $- 2014 2015 2016 2017 2018 2019 2020 2021 2022 2023 2024 2025 (1) Scrap and scrap substitute per ton gross ton used 18 (2) 2001-2025
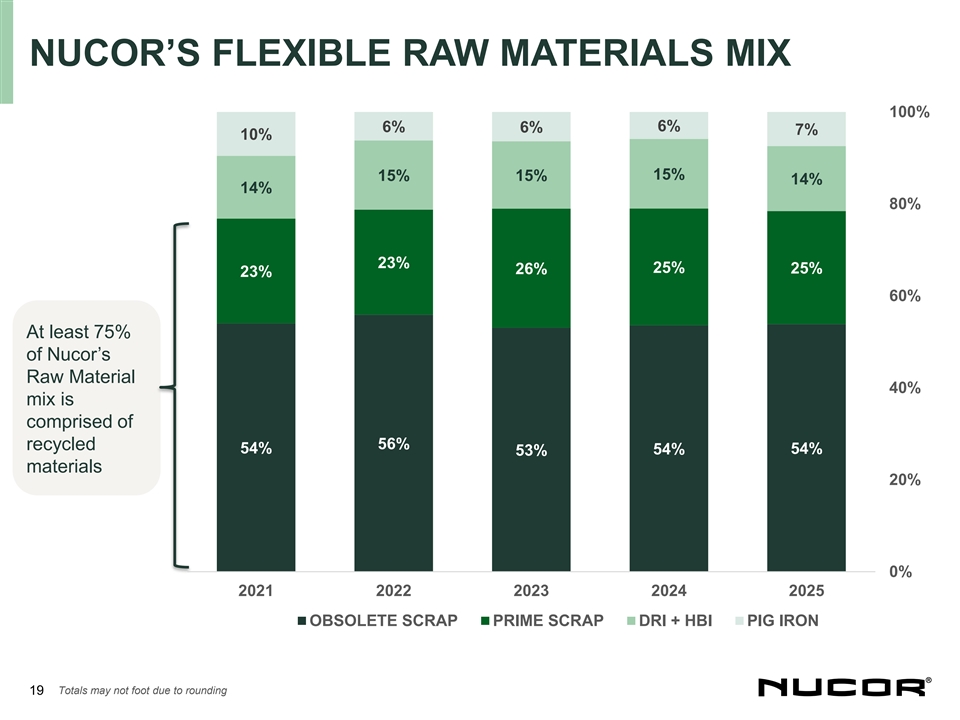
NUCOR’S FLEXIBLE RAW MATERIALS MIX 100% 6% 6% 6% 7% 10% 15% 15% 15% 14% 14% 80% 23% 25% 25% 26% 23% 60% At least 75% of Nucor’s Raw Material 40% mix is comprised of 56% recycled 54% 54% 54% 53% materials 20% 0% 2021 2022 2023 2024 2025 OBSOLETE SCRAP PRIME SCRAP DRI + HBI PIG IRON 19 Totals may not foot due to rounding
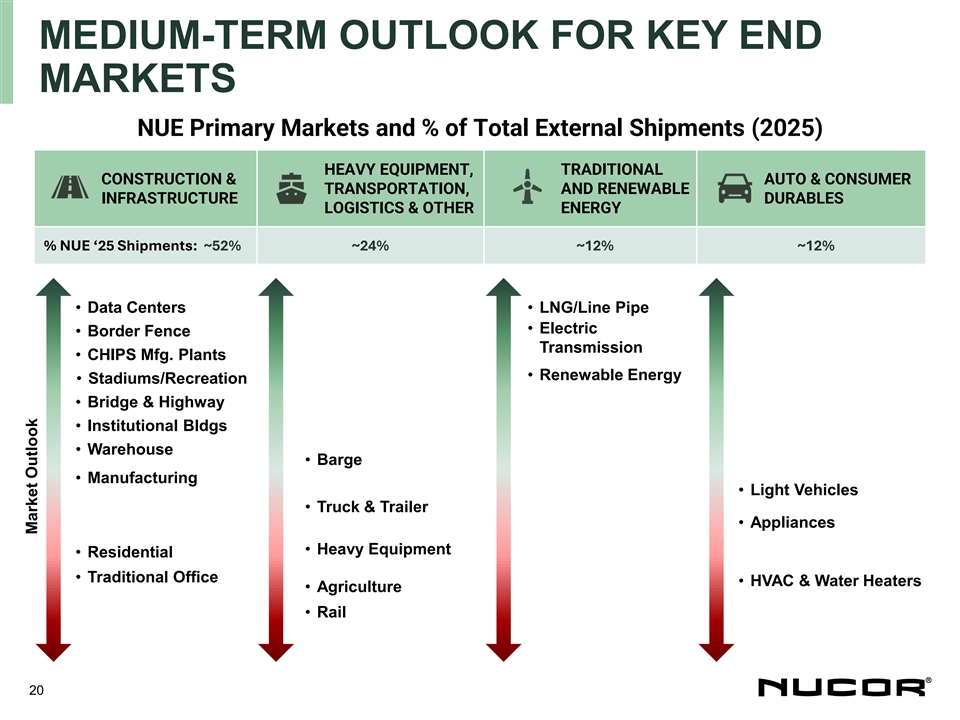
MEDIUM-TERM OUTLOOK FOR KEY END MARKETS NUE Primary Markets and % of Total External Shipments (2025) HEAVY EQUIPMENT, TRADITIONAL CONSTRUCTION & AUTO & CONSUMER TRANSPORTATION, AND RENEWABLE INFRASTRUCTURE DURABLES LOGISTICS & OTHER ENERGY % NUE ‘25 Shipments: ~52% ~24% ~12% ~12% • Data Centers • LNG/Line Pipe • Electric • Border Fence Transmission • CHIPS Mfg. Plants • Renewable Energy • Stadiums/Recreation • Bridge & Highway • Institutional Bldgs • Warehouse • Barge • Manufacturing • Light Vehicles • Truck & Trailer • Appliances • Heavy Equipment • Residential • Traditional Office • HVAC & Water Heaters • Agriculture • Rail 20 Market Outlook
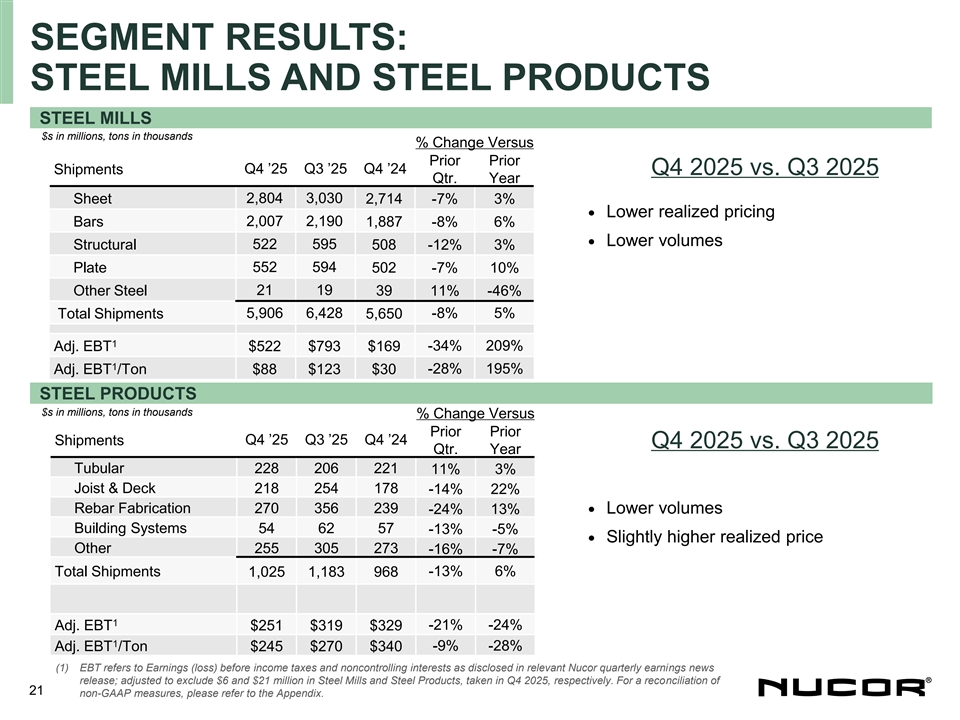
SEGMENT RESULTS: STEEL MILLS AND STEEL PRODUCTS STEEL MILLS $s in millions, tons in thousands % Change Versus Prior Prior Q4 ’25 Q3 ’25 Q4 ’24 Shipments Q4 2025 vs. Q3 2025 Qtr. Year Sheet 2,804 3,030 2,714 -7% 3% • Lower realized pricing Bars 2,007 2,190 1,887 -8% 6% • Lower volumes Structural 522 595 508 -12% 3% 552 594 Plate 502 -7% 10% 21 19 Other Steel 39 11% -46% Total Shipments 5,906 6,428 5,650 -8% 5% 1 -34% 209% Adj. EBT $522 $793 $169 1 -28% 195% Adj. EBT /Ton $88 $123 $30 STEEL PRODUCTS $s in millions, tons in thousands % Change Versus Prior Prior Shipments Q4 ’25 Q3 ’25 Q4 ’24 Q4 2025 vs. Q3 2025 Qtr. Year Tubular 228 206 221 11% 3% Joist & Deck 218 254 178 -14% 22% Rebar Fabrication 270 356 239• Lower volumes -24% 13% Building Systems 54 62 57 -13% -5% • Slightly higher realized price Other 255 305 273 -16% -7% Total Shipments -13% 6% 1,025 1,183 968 1 Adj. EBT $251 $319 $329 -21% -24% 1 -9% -28% Adj. EBT /Ton $245 $270 $340 (1) EBT refers to Earnings (loss) before income taxes and noncontrolling interests as disclosed in relevant Nucor quarterly earnings news release; adjusted to exclude $6 and $21 million in Steel Mills and Steel Products, taken in Q4 2025, respectively. For a reconciliation of 21 non-GAAP measures, please refer to the Appendix.
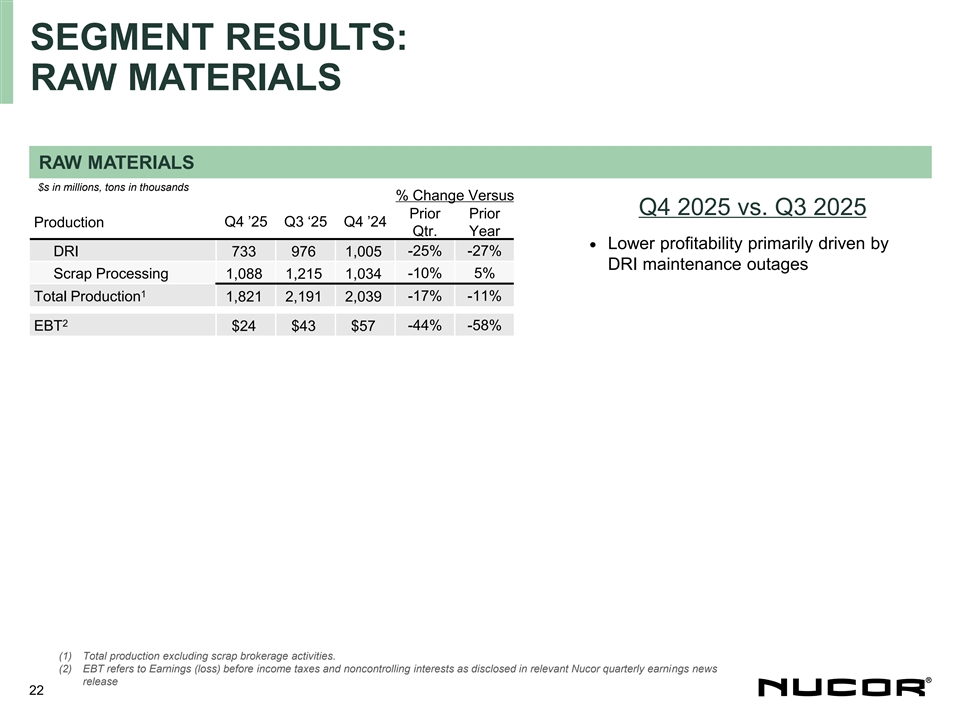
SEGMENT RESULTS: RAW MATERIALS RAW MATERIALS $s in millions, tons in thousands % Change Versus Q4 2025 vs. Q3 2025 Prior Prior Q4 ’25 Q3 ‘25 Q4 ’24 Production Qtr. Year • Lower profitability primarily driven by DRI -25% -27% 733 976 1,005 DRI maintenance outages Scrap Processing 1,088 1,215 1,034 -10% 5% 1 Total Production 1,821 2,191 2,039 -17% -11% 2 EBT $24 $43 $57 -44% -58% (1) Total production excluding scrap brokerage activities. (2) EBT refers to Earnings (loss) before income taxes and noncontrolling interests as disclosed in relevant Nucor quarterly earnings news release 22
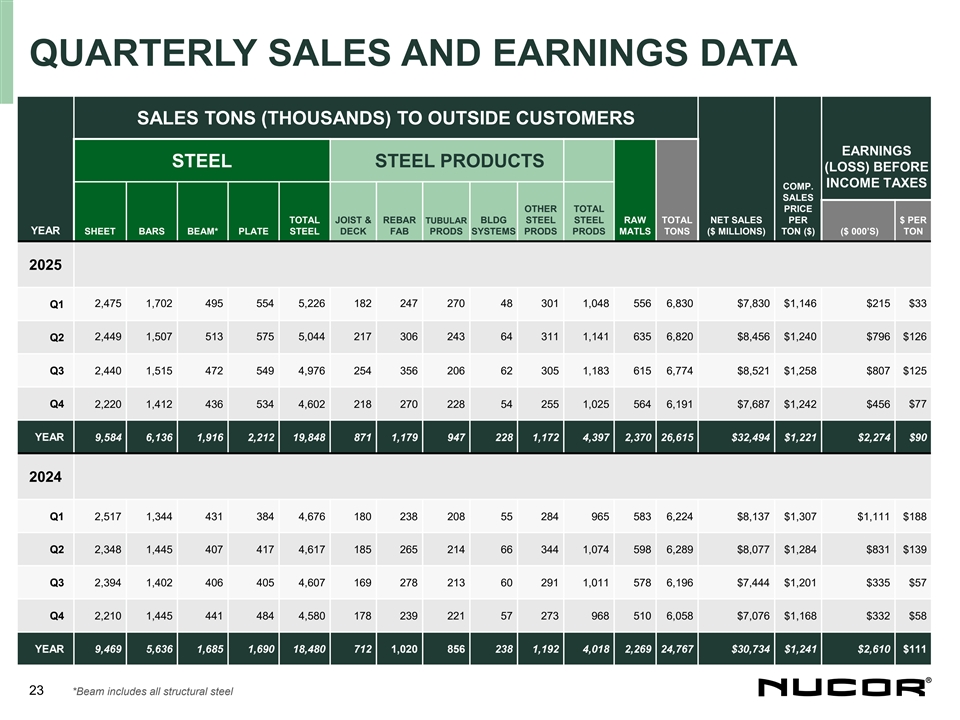
QUARTERLY SALES AND EARNINGS DATA SALES TONS (THOUSANDS) TO OUTSIDE CUSTOMERS EARNINGS STEEL STEEL PRODUCTS (LOSS) BEFORE INCOME TAXES COMP. SALES OTHER TOTAL PRICE TOTAL JOIST & REBAR TUBULAR BLDG STEEL STEEL RAW TOTAL NET SALES PER $ PER YEAR SHEET BARS BEAM* PLATE STEEL DECK FAB PRODS SYSTEMS PRODS PRODS MATLS TONS ($ MILLIONS) TON ($) ($ 000’S) TON 2025 2,475 1,702 495 554 5,226 182 247 270 48 301 1,048 556 6,830 $7,830 $1,146 $215 $33 Q1 2,449 1,507 513 575 5,044 217 306 243 64 311 1,141 635 6,820 $8,456 $1,240 $796 $126 Q2 Q3 2,440 1,515 472 549 4,976 254 356 206 62 305 1,183 615 6,774 $8,521 $1,258 $807 $125 Q4 2,220 1,412 436 534 4,602 218 270 228 54 255 1,025 564 6,191 $7,687 $1,242 $456 $77 YEAR 9,584 6,136 1,916 2,212 19,848 871 1,179 947 228 1,172 4,397 2,370 26,615 $32,494 $1,221 $2,274 $90 2024 Q1 2,517 1,344 431 384 4,676 180 238 208 55 284 965 583 6,224 $8,137 $1,307 $1,111 $188 Q2 2,348 1,445 407 417 4,617 185 265 214 66 344 1,074 598 6,289 $8,077 $1,284 $831 $139 Q3 2,394 1,402 406 405 4,607 169 278 213 60 291 1,011 578 6,196 $7,444 $1,201 $335 $57 Q4 2,210 1,445 441 484 4,580 178 239 221 57 273 968 510 6,058 $7,076 $1,168 $332 $58 YEAR 9,469 5,636 1,685 1,690 18,480 712 1,020 856 238 1,192 4,018 2,269 24,767 $30,734 $1,241 $2,610 $111 23 *Beam includes all structural steel
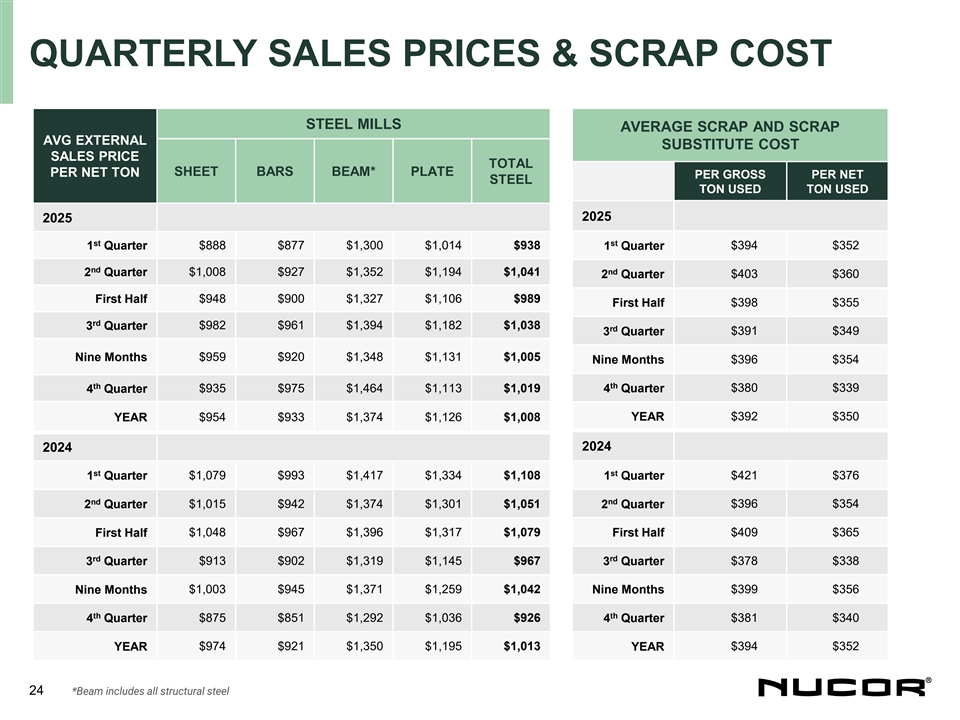
QUARTERLY SALES PRICES & SCRAP COST STEEL MILLS AVERAGE SCRAP AND SCRAP AVG EXTERNAL SUBSTITUTE COST SALES PRICE TOTAL SHEET BARS BEAM* PLATE PER NET TON PER GROSS PER NET STEEL TON USED TON USED 2025 2025 st st 1 Quarter $888 $877 $1,300 $1,014 $938 $394 $352 1 Quarter nd nd 2 Quarter $1,008 $927 $1,352 $1,194 $1,041 2 Quarter $403 $360 First Half $948 $900 $1,327 $1,106 $989 First Half $398 $355 rd 3 Quarter $982 $961 $1,394 $1,182 $1,038 rd $391 $349 3 Quarter Nine Months $959 $920 $1,348 $1,131 $1,005 Nine Months $396 $354 th th $935 $975 $1,464 $1,113 $1,019 4 Quarter $380 $339 4 Quarter $392 $350 YEAR $954 $933 $1,374 $1,126 $1,008 YEAR 2024 2024 st st 1 Quarter $1,079 $993 $1,417 $1,334 $1,108 1 Quarter $421 $376 nd nd 2 Quarter $1,015 $942 $1,374 $1,301 $1,051 2 Quarter $396 $354 $1,048 $967 $1,396 $1,317 $1,079 $409 $365 First Half First Half rd rd 3 Quarter $913 $902 $1,319 $1,145 $967 3 Quarter $378 $338 Nine Months $1,003 $945 $1,371 $1,259 $1,042 Nine Months $399 $356 th th 4 Quarter $875 $851 $1,292 $1,036 $926 4 Quarter $381 $340 YEAR $974 $921 $1,350 $1,195 $1,013 YEAR $394 $352 24 *Beam includes all structural steel
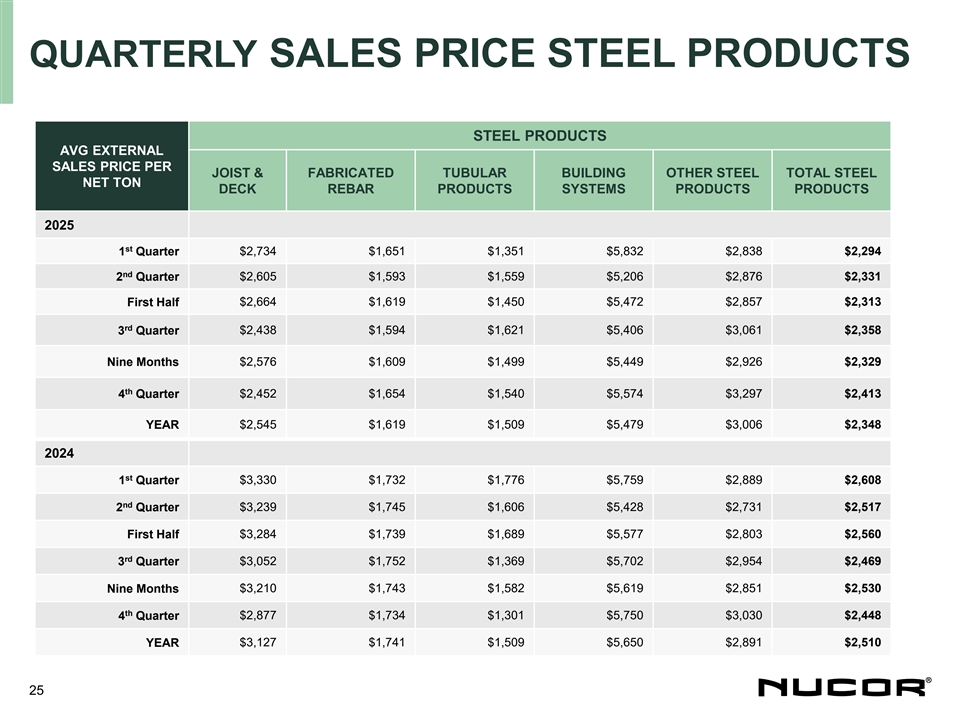
QUARTERLY SALES PRICE STEEL PRODUCTS STEEL PRODUCTS AVG EXTERNAL SALES PRICE PER JOIST & FABRICATED TUBULAR BUILDING OTHER STEEL TOTAL STEEL NET TON DECK REBAR PRODUCTS SYSTEMS PRODUCTS PRODUCTS 2025 st 1 Quarter $2,734 $1,651 $1,351 $5,832 $2,838 $2,294 nd 2 Quarter $2,605 $1,593 $1,559 $5,206 $2,876 $2,331 First Half $2,664 $1,619 $1,450 $5,472 $2,857 $2,313 rd 3 Quarter $2,438 $1,594 $1,621 $5,406 $3,061 $2,358 $2,576 $1,609 $1,499 $5,449 $2,926 $2,329 Nine Months th $2,452 $1,654 $1,540 $5,574 $3,297 $2,413 4 Quarter YEAR $2,545 $1,619 $1,509 $5,479 $3,006 $2,348 2024 st 1 Quarter $3,330 $1,732 $1,776 $5,759 $2,889 $2,608 nd 2 Quarter $3,239 $1,745 $1,606 $5,428 $2,731 $2,517 First Half $3,284 $1,739 $1,689 $5,577 $2,803 $2,560 rd 3 Quarter $3,052 $1,752 $1,369 $5,702 $2,954 $2,469 $3,210 $1,743 $1,582 $5,619 $2,851 $2,530 Nine Months th 4 Quarter $2,877 $1,734 $1,301 $5,750 $3,030 $2,448 YEAR $3,127 $1,741 $1,509 $5,650 $2,891 $2,510 25
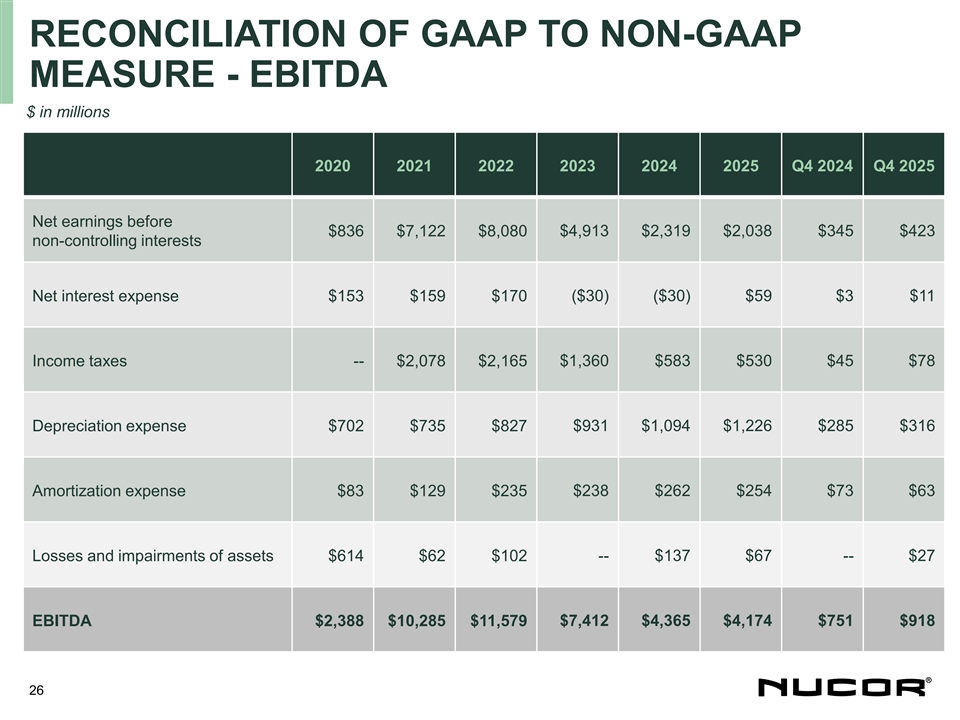
RECONCILIATION OF GAAP TO NON-GAAP MEASURE - EBITDA $ in millions 2020 2021 2022 2023 2024 2025 Q4 2024 Q4 2025 Net earnings before $836 $7,122 $8,080 $4,913 $2,319 $2,038 $345 $423 non-controlling interests Net interest expense $153 $159 $170 ($30) ($30) $59 $3 $11 Income taxes -- $2,078 $2,165 $1,360 $583 $530 $45 $78 Depreciation expense $702 $735 $827 $931 $1,094 $1,226 $285 $316 Amortization expense $83 $129 $235 $238 $262 $254 $73 $63 Losses and impairments of assets $614 $62 $102 -- $137 $67 -- $27 EBITDA $2,388 $10,285 $11,579 $7,412 $4,365 $4,174 $751 $918 26
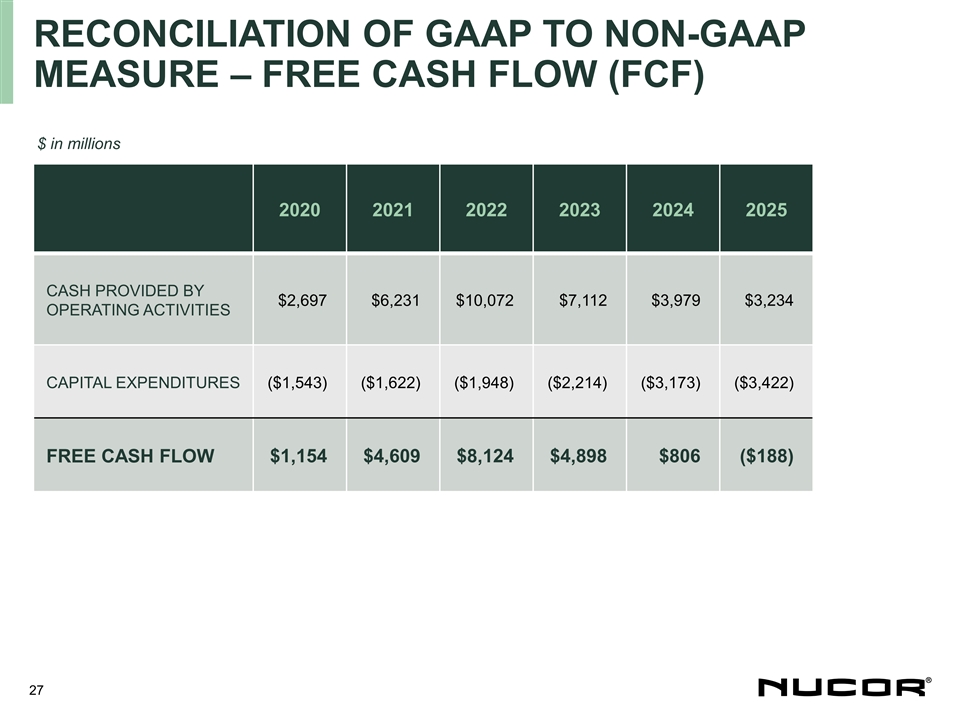
RECONCILIATION OF GAAP TO NON-GAAP MEASURE – FREE CASH FLOW (FCF) $ in millions 2020 2021 2022 2023 2024 2025 CASH PROVIDED BY $2,697 $6,231 $10,072 $7,112 $3,979 $3,234 OPERATING ACTIVITIES CAPITAL EXPENDITURES ($1,543) ($1,622) ($1,948) ($2,214) ($3,173) ($3,422) FREE CASH FLOW $1,154 $4,609 $8,124 $4,898 $806 ($188) 27
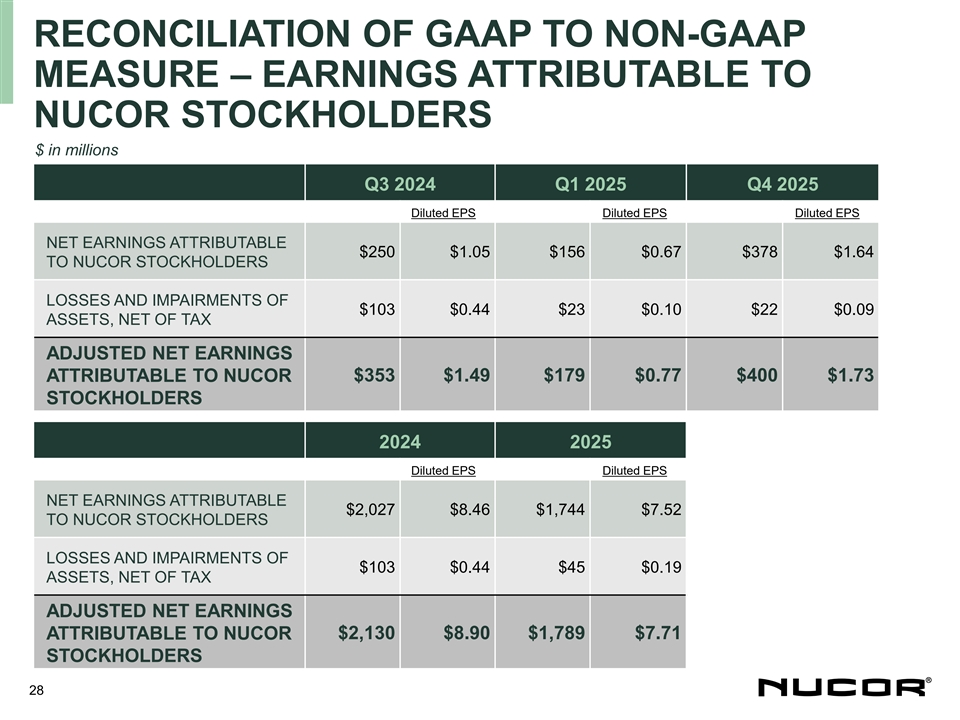
RECONCILIATION OF GAAP TO NON-GAAP MEASURE – EARNINGS ATTRIBUTABLE TO NUCOR STOCKHOLDERS $ in millions Q3 2024 Q1 2025 Q4 2025 Diluted EPS Diluted EPS Diluted EPS NET EARNINGS ATTRIBUTABLE $250 $1.05 $156 $0.67 $378 $1.64 TO NUCOR STOCKHOLDERS LOSSES AND IMPAIRMENTS OF $103 $0.44 $23 $0.10 $22 $0.09 ASSETS, NET OF TAX ADJUSTED NET EARNINGS $353 $1.49 $179 $0.77 $400 $1.73 ATTRIBUTABLE TO NUCOR STOCKHOLDERS 2024 2025 Diluted EPS Diluted EPS NET EARNINGS ATTRIBUTABLE $2,027 $8.46 $1,744 $7.52 TO NUCOR STOCKHOLDERS LOSSES AND IMPAIRMENTS OF $103 $0.44 $45 $0.19 ASSETS, NET OF TAX ADJUSTED NET EARNINGS ATTRIBUTABLE TO NUCOR $2,130 $8.90 $1,789 $7.71 STOCKHOLDERS 28
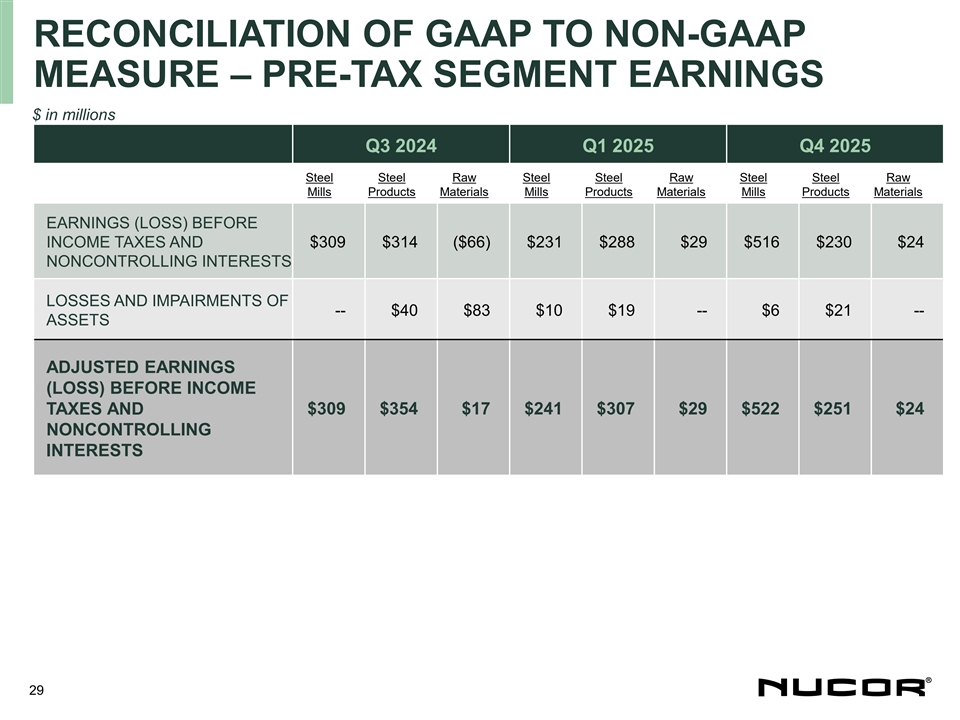
RECONCILIATION OF GAAP TO NON-GAAP MEASURE – PRE-TAX SEGMENT EARNINGS $ in millions Q3 2024 Q1 2025 Q4 2025 Steel Steel Raw Steel Steel Raw Steel Steel Raw Mills Products Materials Mills Products Materials Mills Products Materials EARNINGS (LOSS) BEFORE INCOME TAXES AND $309 $314 ($66) $231 $288 $29 $516 $230 $24 NONCONTROLLING INTERESTS LOSSES AND IMPAIRMENTS OF -- $40 $83 $10 $19 -- $6 $21 -- ASSETS ADJUSTED EARNINGS (LOSS) BEFORE INCOME TAXES AND $309 $354 $17 $241 $307 $29 $522 $251 $24 NONCONTROLLING INTERESTS 29