EX-99.2
Exhibit 99.2
MANAGEMENT’S DISCUSSION AND ANALYSIS OF FINANCIAL CONDITION AND RESULTS OF OPERATIONS
The following discussion and analysis of our financial condition and results of operations (the “MD&A”) should be read together with the unaudited condensed consolidated interim financial statements and the related notes to those statements included as Exhibit 99.1 to this Report on Form 6-K submitted to the Securities and Exchange Commission, or the SEC, on December 22, 2025. We also recommend that you read our discussion and analysis of financial condition and results of operations together with our audited financial statements and the notes thereto, which appear in our Annual Report on Form 20-F for the year ended December 31, 2024 as filed with the SEC on April 3, 2025 (the “Annual Report”).
In this section, unless otherwise indicated or the context otherwise requires, the terms “we,” “our,” “us,” “Apollomics,” “Apollomics’,” the “Company,” and “its” refer to Apollomics and its consolidated subsidiaries. All dollar amounts are expressed in thousands of United States dollars (“$”), unless otherwise indicated.
The following discussion contains forward-looking statements within the meaning of the federal securities laws, including Section 27A of the Securities Act of 1933, as amended (the “Securities Act”), and Section 21E of the Securities Exchange Act of 1934, as amended (the “Exchange Act”). Such forward-looking statements regarding the Company’s strategy, prospects, plans and objectives often contain words and phrases such as “could,” “should,” “will,” “may,” “believe,” “anticipate,” “intend,” “estimate,” “expect,” “project,” the negative of such terms and other similar expressions, although not all forward-looking statements contain such expressions. These forward-looking statements are based on management’s current expectations and assumptions about future events and are based on currently available information as to the outcome and timing of future events. Apollomics cautions you that these forward-looking statements are subject to numerous risks and uncertainties, most of which are difficult to predict and many of which are beyond the control of Apollomics. In addition, Apollomics cautions you that the forward-looking statements contained in this MD&A are subject to unknown risks, uncertainties and other factors, including: (i) the impact of any current or new government regulations in the United States and China affecting Apollomics’ operations and the continued listing of Apollomics’ securities; (ii) the inability to achieve successful clinical results or to obtain licensing of third-party intellectual property rights for future discovery and development of Apollomics’ oncology projects; (iii) the failure to commercialize product candidates and achieve market acceptance of such product candidates; (iv) the failure to protect Apollomics’ intellectual property; (v) breaches in data security; (vi) the risk that Apollomics may not be able to develop and maintain effective internal controls; (vii) unfavorable changes to the regulatory environment; and (viii) those risks and uncertainties discussed in the Annual Report on Form 20-F for the year ended December 31, 2024 (our “Annual Report”), filed by Apollomics Inc. with the U.S. Securities and Exchange Commission (“SEC”) under the heading “Risk Factors” and the other documents filed, or to be filed, by the Company with the SEC. Apollomics’ historical results are not necessarily indicative of the results that may be expected for any period in the future. Forward-looking statements speak only as of the date made by the Company. Apollomics undertakes no obligation to update publicly any of its forward-looking statements to reflect actual results, new information or future events, changes in assumptions or changes in other factors affecting forward-looking statements, except to the extent required by applicable law.
Overview
We are a clinical-stage biotechnology company focused on discovering and developing oncology therapies to address unmet medical needs, especially for difficult-to-treat and treatment-resistant cancers. Since our founding in 2015, we have built an oncology-focused pipeline, including product candidates that have progressed into clinical-stage development. Our lead program, vebreltinib, has demonstrated initial promising clinical results.
We were originally formed as CB Therapeutics Inc. as a result of a spin-off of Crown Bioscience International, which was completed on December 31, 2015. As a result, we became the owner of certain patent and intellectual property rights relating to some of our product candidates. For more information relating to the series of transactions resulting in our acquisition of these patent rights, please see the section of our Annual Report entitled “Intellectual Property Assignment.”
Our strategic focus is the development of novel therapies targeting difficult to treat cancers. We use both targeted, immuno-oncology, and other innovative approaches to address a range of cancer indications, such as lung cancer, brain cancer, and other solid tumors. Our pipeline includes a variety of cancer treatment programs that utilize tumor inhibitors, immune checkpoint inhibitors, monotherapies, combination therapies or a multi-functional protein with the goals to improve response rates and reduce chemo-resistance and toxicity compared to the current treatment standards. We have adopted a biomarker-driven diagnostic approach for patient screening to increase precision in identifying patients that can potentially benefit from target therapy.
Recent Events
On August 28, 2025, the Company announced that due to its cash position, it terminated all U.S. employees, including the Chief Executive Officer, Dr. Guo-Liang Yu, and Chief Financial Officer, Dr. Matthew Plunkett, effective as of August 29, 2025.
On September 2, 2025, the Company entered into subscription agreements for a private placement (PIPE) with certain accredited investors. The closing of the PIPE occurred on September 3, 2025. Pursuant to the PIPE Subscription Agreements, the Purchasers purchased an aggregate of 1.04 million Class A ordinary shares, par value $0.01 per share, of the Company, at a price per share of $3.9317, the closing price on August 29, 2025, representing aggregate gross proceeds to the company of $4.1 million, prior to the payment of fees and expenses.
On September 3, 2025, in connection with the PIPE financing, a new board of directors was appointed, which in turn appointed a new management team consisting of Mr. Howard Chen as Chairman of the Board and Chief Executive Officer of the Company, Mr. Yi-Kuei Chen as the Chief Operating Officer of the Company and Mr. Peter Lin as the Chief Financial Officer of the Company. With additional funding and new leadership, the Company has reversed its wind-up plans.
Trading Markets Update
The Company’s Class A Ordinary Shares and warrants are listed on Nasdaq under the trading symbols “APLM” and “APLMW,” respectively.
As a result of the August 28, 2025 announcement, trading in the Class A Ordinary Shares and Public Warrants was suspended beginning September 18, 2025, when the Company received a delisting determination letter from Nasdaq asserting that Nasdaq intended to delist the Company’s Class A Ordinary Shares and warrants based on the Nasdaq staff’s then-belief that the Company was a “public shell.” The Company appealed this determination, and based on materials submitted as part of the appeal process, Nasdaq staff determined that the Company was in compliance with Nasdaq’s continued listing requirements. The trading halt was therefore lifted and trading resumed on October 14, 2025.
As a result of the $4.1 million PIPE financing which closed on September 3, 2025, as well as revenues received in the second half of 2025, the Company continues to be in compliance with Nasdaq’s continued listing requirements, including requirements related to stockholders’ equity, to the extent applicable.
Our Product Candidates
The product candidates in our pipeline can be categorized into two groups based on their mechanisms of action, each of which contains product candidates at different stages of development: (i) tumor inhibitors and (ii) immuno-oncology drugs. We believe that having two groups of product candidates with different mechanisms of action will enable us to develop potential synergistic therapies that address unmet needs in cancer treatment.
Active Development Programs: Tumor Inhibitors
Vebreltinib (APL-101). Our most advanced product candidate is vebreltinib, a potent, oral active, highly selective c-Met inhibitor. Cancer cells often use c-Met activation to escape therapies targeting other signaling pathways. Capmatinib and tepotinib, two c-Met inhibitors, were approved by the FDA for the treatment of metastatic NSCLC with Met Exon 14 skipping in 2020 and 2021 under accelerated approval, respectively, followed by traditional approvals in 2022 and 2024, rendering Met Exon 14 skipping a clinically validated target. Avistone, our partner in China, received conditional approval from the NMPA for vebreltinib in November 2023 for the same indication. In addition, in April 2024, Avistone received conditional approval from the NMPA for vebreltinib for the treatment of gliomas with a PTPRZ1-MET fusion (ZM fusion) gene after failure of previous treatments. We believe that the potential of vebreltinib in cancers with genetic mutations, amplification or fusion of the c-Met gene presents a significant opportunity for us. We are investigating vebreltinib in clinical trials as a single agent for the potential treatment of NSCLC and other advanced tumors with c-Met alterations, and also as a combination therapy with epidermal growth factor receptor (“EGFR”) inhibitors. We have obtained orphan drug designation for vebreltinib for the “treatment of non-small cell lung cancer with MET genomic tumor aberrations,” which includes Met Exon 14 skipping and c-Met amplification. Our primary focus for the future development of vebreltinib will be for the treatment of NSCLC with c-Met Amplification. We intend to continue to explore the opportunity for combining vebreltinib with other approved drugs or product candidates.
APL-102. APL-102 is an oral active, small molecule Multiple Tyrosine Kinase Inhibitor (“MTKi”). Data regarding anti-tumor activity in multiple preclinical studies is included in the section of this Annual Report entitled “Our Other Tumor Inhibitor Programs—APL-102 (MTKi)”, such as models of liver cancer, breast cancer and esophageal cancer, both as a single agent and in combination with an anti-PD-1 antibody. Given that APL-102 inhibits several kinases that are aberrantly activated in cancer cells, we believe that APL-102 has the potential to overcome cancer treatment resistance. APL-102 is in a Phase 1 dose escalation clinical trial in China and is at the seventh dose level. As of the date of this Annual Report, dose-limiting toxicity has not been observed in human subjects.
Other Development Programs: Immuno-Oncology Product Candidates
Our three immuno-oncology product candidates consist of: APL-501, APL-502 and APL-801. These product candidates are designed to take advantage of the body’s immune system to fight cancer and include mono-specific and bi-specific antibodies that could release the natural brakes of immune response against cancer cells, as well as a novel cancer vaccine. Our current strategy is to identify development and commercialization partners for these product candidates to enable the most capital-efficient development programs in this highly competitive area.
APL-501. APL-501 is an anti-PD-1 antibody product candidate.
APL-502. APL-502 is an anti-PD-L1 antibody product candidate and is being developed by Chia Tai Tian Qing (“CTTQ”), our partner in China. APL-502 is being evaluated for treatment of at least six different cancers in Phase 3 studies in China.
Having our own anti-PD-1 and anti-PD-L1 antibody candidates allows us to develop single-agent and combination therapies based on PD-(L)1 inhibition and also enables us to, using these antibodies as backbones, design and generate novel molecules, such as multi-specific antibodies, which may have improved activity compared with currently marketed immune checkpoint inhibitor products.
Our pipeline also includes an anti-PD-L1/anti-CD40 bi-specific antibody, APL-801.
Product Candidate Development Status
The following chart summarizes the development status of our product candidates from clinical stage to discovery stage. Third parties also have ongoing clinical trials in their respective territories.
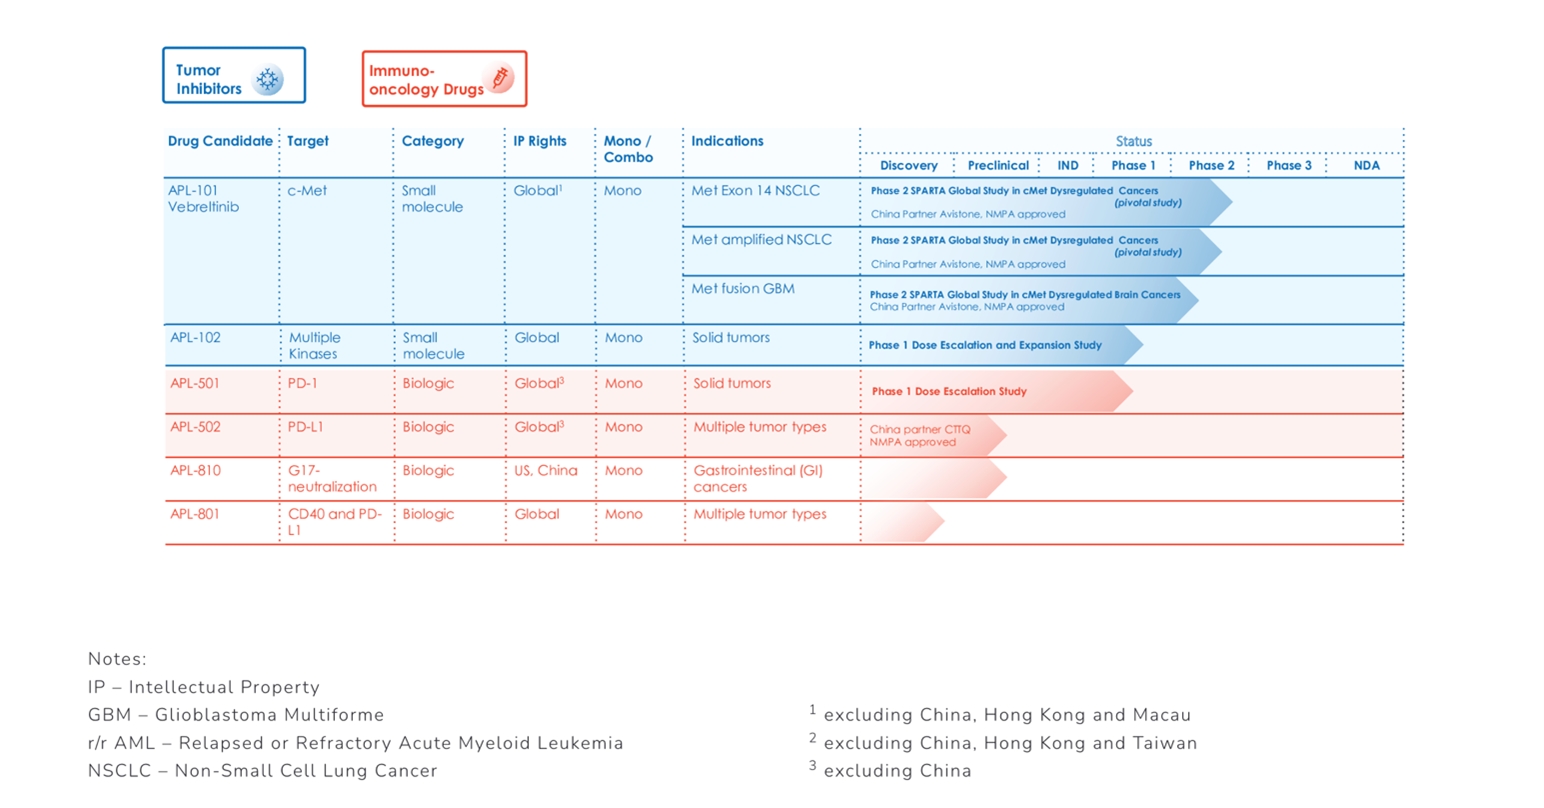
Key highlights of clinical trials conducted by third parties on our product candidates include:
•
Avistone has completed Phase 2 clinical development of vebreltinib in MET- altered NSCLC and a Phase 2/3 study in PTPRZ1-MET fusion GBM in China, and these studies have supported regulatory approvals for both indications;
•
CTTQ has conducted clinical trials for APL-502 in China into Phase 3 and obtained NMPA marketing approval in May 2024.
Apollomics is not responsible for, and does not have control over, clinical trials conducted by such third parties and does not have any direct financial interest in the development of our product candidates by such third parties. However, the development of our product candidates by such third parties has the potential to benefit the regulatory status and development costs of such product candidates in the geographies and trials for which we are responsible and have control over, due to our ability to access the developmental and clinical data from such third parties and to benefit from the feedback of such trials as information regarding such trials is made available. For more information regarding our arrangements with third parties, please see the section of our Annual Report entitled “Licensing and Collaboration Arrangements.”
Key Components of Our Results of Operations
Operating Expenses
Research and Development Expenses
Research and development expenses consist primarily of costs incurred for our research activities, including our discovery efforts and the development of our product candidates. We expense research and development costs as incurred, which include:
•
fees incurred under our agreements with Contract Research Organizations (or CROs), Contract Manufacturing Organizations (or CMOs) and clinical trial sites that conduct research and development activities on our behalf;
•
salaries, benefits, and other related costs, including share-based payment expenses, for our personnel engaged in research and development functions;
•
service fees incurred under agreements with independent consultants, including their fees and related travel expenses, engaged in research and development functions;
•
costs of laboratory supplies and acquiring, developing, and manufacturing study materials; and
•
facility-related expenses, which include direct depreciation costs and allocated expenses for rent and maintenance of facilities and other operating costs.
Research and development costs are expensed as incurred. Costs for certain development activities are recognized based on an evaluation of the progress to completion of specific tasks using information and data provided to us by our vendors and our clinical sites.
We cannot determine with certainty the duration and completion costs of the current or future clinical trials of our therapeutic candidates or if, when, or to what extent we will generate revenues from the commercialization and sale of any of our therapeutic candidates for which we or any partner obtain regulatory approval.
The duration, costs and timing of clinical trials and development of therapeutic candidates will depend on a variety of factors, including:
•
the scope, rate of progress, and expense of our ongoing, as well as any additional, clinical trials and other research and development activities;
•
future clinical trial results;
•
potential changes in government regulation; and
•
the timing and receipt of any regulatory approvals.
A change in the outcome of any of these variables with respect to the development of a therapeutic candidate could mean a significant change in the costs and timing associated with the development of that therapeutic candidate. For example, if the FDA or another regulatory authority were to require us to conduct clinical trials beyond that which we currently anticipate, or beyond which will be required for the completion of the clinical development of therapeutic candidates, or if we experience significant delays in the enrollment in any clinical trials, we could be required to expend significant additional financial resources and time on the completion of clinical development.
From inception through June 30, 2025, we have incurred $192.1 million in research and development expenses. We plan to increase our research and development expenses for the foreseeable future as we continue the development of our therapeutic candidates, the discovery and development of preclinical therapeutic candidates, and the development of our clinical programs.
We manage certain activities such as clinical trial operations, manufacture of therapeutic candidates, and preclinical animal toxicology studies through third-party CROs. The only costs we track by each therapeutic candidate are external costs such as services provided to us by CROs, manufacturing of preclinical and clinical drug products, and other outsourced research and development expenses. We do not assign or allocate internal costs such as salaries and benefits, facilities costs, lab supplies and the costs of preclinical research and studies to individual development programs.
Research and development activities are central to our business model. As a result of the focus on enrolling new patients with Met Amplification in the SPARTA study and other cost reductions in the SPARTA operations and completion of the uproleselan Phase 3 bridging study in China, we expect that our research and development expenses will decrease in the foreseeable future.
Administrative Expenses
Administrative expenses consist primarily of salaries, benefits, and other related costs, including share-based payment expense, for personnel in our executive, operations, legal, human resources, finance, and administrative functions. Administrative expenses also include professional fees for legal, patent, consulting, accounting, tax and audit services, travel expenses and facility-related expenses, which include direct depreciation costs and allocated expenses for rent and maintenance of facilities, technology, and other operating costs.
We expect that our administrative expenses will decrease substantially in the future in line with our strategic shift, as we decrease our administrative personnel, including the departure of two of our executive officers, and overall reduction of external expenses.
Other Expenses
Other expenses primarily relate to non operating expenses at the China subsidiary.
Other Income, Gains and Losses
Other Income
Other income primarily includes interest income primarily derived from our cash and cash equivalents.
Foreign Exchange Losses
Foreign exchange losses are a result of foreign exchange rate fluctuation.
Fair Value Change of Financial Liabilities at FVTPL
Fair value change of financial liabilities at FVTPL consist of non-cash impacts on our profit or loss as a result of the fair value change of the liabilities arising from warrants issued to certain independent investors.
Impairment Loss on Intangible Assets
Impairment loss on intangible assets of $1.5 million for the six months ended June 30, 2025 consisted of the full write down of the previously recorded intangible assets related to our license of EO1001 with Edison Oncology Holding Corporation. Impairment loss of $10.0 million for the six months ended June 30, 2024 consisted of the full write down of the previously recorded intangible assets related to our license of uproleselan in China.
Results of Operations
Comparison of the Six Months Ended June 2024 and 2025
The following table presents Apollomics’ unaudited condensed consolidated statements of operations and comprehensive loss data for the six months ended June 2024 and 2025:
|
|
|
|
|
|
|
|
|
|
|
|
|
|
|
|
|
|
|
Six months ended June 30, |
|
|
Change |
|
(In thousands, except percentages) |
|
2025 |
|
|
2024 |
|
|
$ |
|
|
% |
|
Revenue |
|
$ |
8,500 |
|
|
$ |
— |
|
|
$ |
8,500 |
|
|
|
100 |
% |
Other income |
|
|
83 |
|
|
|
1,737 |
|
|
|
(1,654 |
) |
|
|
(95 |
)% |
Foreign exchange losses |
|
|
(77 |
) |
|
|
(2 |
) |
|
|
(75 |
) |
|
|
3,750 |
% |
Fair value change of financial assets at FVTPL |
|
|
— |
|
|
|
198 |
|
|
|
(198 |
) |
|
|
(100 |
)% |
Fair value change of financial liabilities at FVTPL |
|
|
(384 |
) |
|
|
164 |
|
|
|
(548 |
) |
|
|
(334 |
)% |
Research and development expenses |
|
|
(4,620 |
) |
|
|
(16,926 |
) |
|
|
12,306 |
|
|
|
(73 |
)% |
Administrative expenses |
|
|
(14,488 |
) |
|
|
(10,153 |
) |
|
|
(4,335 |
) |
|
|
43 |
% |
Impairment of an intangible asset |
|
|
(1,500 |
) |
|
|
(10,000 |
) |
|
|
8,500 |
|
|
|
(85 |
)% |
Finance costs |
|
|
(35 |
) |
|
|
(134 |
) |
|
|
99 |
|
|
|
(74 |
)% |
Other expense |
|
|
(14 |
) |
|
|
(90 |
) |
|
|
76 |
|
|
|
(84 |
)% |
Loss before taxation |
|
|
(12,535 |
) |
|
|
(35,206 |
) |
|
|
22,671 |
|
|
|
(64 |
)% |
Income tax expenses |
|
|
(1 |
) |
|
|
— |
|
|
|
(1 |
) |
|
|
100 |
% |
Loss and total comprehensive loss for the
period, attributable to owners of the
Company |
|
$ |
(12,536 |
) |
|
$ |
(35,206 |
) |
|
$ |
22,670 |
|
|
|
(64 |
)% |
Research and Development
The following table summarizes the components of our research and development expenses for the six months ended June 2024 and 2025:
|
|
|
|
|
|
|
|
|
|
|
|
|
|
|
|
|
|
|
Six months ended June 30, |
|
|
Change |
|
(In thousands, except percentages) |
|
2025 |
|
|
2024 |
|
|
$ |
|
|
% |
|
R&D Third-Party Service Fees and Contractor Expenses: |
|
$ |
(3,524 |
) |
|
$ |
(9,868 |
) |
|
$ |
6,344 |
|
|
|
(64 |
)% |
APL-101 |
|
|
(3,190 |
) |
|
|
(7,150 |
) |
|
|
3,960 |
|
|
|
(55 |
)% |
APL-102 |
|
|
(59 |
) |
|
|
(48 |
) |
|
|
(11 |
) |
|
|
23 |
% |
APL-106 |
|
|
(216 |
) |
|
|
(1,492 |
) |
|
|
1,276 |
|
|
|
(86 |
)% |
APL-122 |
|
|
— |
|
|
|
(177 |
) |
|
|
177 |
|
|
|
(100 |
)% |
APL-501 |
|
|
27 |
|
|
|
(694 |
) |
|
|
721 |
|
|
|
(104 |
)% |
Discovery & other |
|
|
(86 |
) |
|
|
(307 |
) |
|
|
221 |
|
|
|
(72 |
)% |
R&D Employee Compensation and Benefits |
|
|
(308 |
) |
|
|
(3,343 |
) |
|
|
3,035 |
|
|
|
(91 |
)% |
R&D Employee Share Based Compensation |
|
|
(788 |
) |
|
|
(3,715 |
) |
|
|
2,927 |
|
|
|
(79 |
)% |
Total Research and Development Expenses |
|
$ |
(4,620 |
) |
|
$ |
(16,926 |
) |
|
$ |
12,306 |
|
|
|
(73 |
)% |
Research and development expenses for the six months ended June 30, 2025 were $4.6 million, compared to $16.9 million for the six months ended June 30, 2024. The decrease of $12.3 million (or -73%) is primarily due to the $6.3 million decrease in third party service fees and contractor expenses, the $3.0 million decrease in employee compensation and benefits, and the $2.9 million decrease in employee share-based compensation. The decrease in employee share-based compensation and employee compensation and benefits was primarily attributable to a reduction in headcount. The decrease in third party service fees and contractor expenses was attributable primarily to a decrease in spending on APL-101 and APL-106 due to project re-alignment.
We manage our R&D third-party service fees and our contractor expenses by product, which is shown in the table above. We do not allocate our R&D employee compensation and benefits, nor our R&D employee share-based compensation into our product lines.
Administrative Expenses
The following table summarizes the components of our administrative expenses for the six months ended June 30, 2024 and 2025:
|
|
|
|
|
|
|
|
|
|
|
|
|
|
|
|
|
|
|
Six months ended June 30, |
|
|
Change |
|
(In thousands, except percentages) |
|
2025 |
|
|
2024 |
|
|
$ |
|
|
% |
|
Administrative Employee Compensation and Benefits |
|
$ |
(1,048 |
) |
|
$ |
(1,623 |
) |
|
$ |
575 |
|
|
|
(35 |
)% |
Administrative Employee Share Based Compensation |
|
|
(2,486 |
) |
|
|
(4,511 |
) |
|
|
2,025 |
|
|
|
(45 |
)% |
Administrative Third-Party Service Fees |
|
|
(8,988 |
) |
|
|
(2,663 |
) |
|
|
(6,325 |
) |
|
|
238 |
% |
Operations |
|
|
(199 |
) |
|
|
(175 |
) |
|
|
(24 |
) |
|
|
14 |
% |
Rental and Maintenance |
|
|
(1 |
) |
|
|
(61 |
) |
|
|
60 |
|
|
|
(98 |
)% |
Travel Expenses |
|
|
(24 |
) |
|
|
(62 |
) |
|
|
38 |
|
|
|
(61 |
)% |
Sales and Marketing Expenses |
|
|
(9 |
) |
|
|
(7 |
) |
|
|
(2 |
) |
|
|
29 |
% |
Depreciation |
|
|
(133 |
) |
|
|
(189 |
) |
|
|
56 |
|
|
|
(30 |
)% |
Others |
|
|
(1,600 |
) |
|
|
(862 |
) |
|
|
(738 |
) |
|
|
86 |
% |
Total |
|
$ |
(14,488 |
) |
|
$ |
(10,153 |
) |
|
$ |
(4,335 |
) |
|
|
43 |
% |
Administrative expenses for the six months ended June 30, 2025 were $14.5 million, compared to $10.2 million for the six months ended June 30, 2024. The increase of $4.3 million (or 43%) was primarily due to a $6.3 million increase in administrative third-party service fees due to increases in legal costs, offset by a $2.0 million decrease in administrative employee share-based compensation for share options granted to incentivize employees, a $0.6 million decrease in administrative employee compensation and benefits due to reduced headcount and salary reductions, as well as a $0.7 million increase in other administrative expenses mainly due to increased listing expenses offset by decreased D&O insurance expense.
Other Expenses
Other expenses for the six months ended June 30, 2025, were $14 thousand, compared to $0.1 million for the six months ended June 30, 2024. Other expenses in the six months ended June 30, 2025 primarily include non-operating expenses at the China subsidiary.
Other Income
The following table summarizes the components of our other income for the six months ended June 30, 2024 and 2025:
|
|
|
|
|
|
|
|
|
|
|
|
|
|
|
|
|
|
|
Six months ended June 30, |
|
|
Change |
|
(In thousands, except percentages) |
|
2025 |
|
|
2024 |
|
|
$ |
|
|
% |
|
Interest income |
|
$ |
83 |
|
|
$ |
167 |
|
|
$ |
(84 |
) |
|
|
(50 |
)% |
Other |
|
|
— |
|
|
|
1,570 |
|
|
|
(1,570 |
) |
|
NM |
|
Total |
|
$ |
83 |
|
|
$ |
1,737 |
|
|
$ |
(1,654 |
) |
|
NM |
|
*NM – Percentage not meaningful
Other income was $83 thousand for the six months ended June 30, 2025, compared to $1.7 million for the six months ended June 30, 2024. The decrease of $1.7 million was primarily due to the Company recognizing $1.6 million in income related to the reversal of liabilities for licensing and option agreements in which the negotiation periods had lapsed, and a $0.1 million decrease in interest income mainly from our China investments.
Liquidity and Capital Resources
Funding Requirements
Since our inception, we have incurred significant operating losses. We expect to incur significant expenses and continuing operating losses for the foreseeable future as we advance the clinical development of our programs. We have funded our operations to date primarily with proceeds from sales of our equity securities.
The following table represents our cash and cash equivalents and highly liquid financial assets as of December 31, 2024 and June 30, 2025:
|
|
|
|
|
|
|
|
|
(In thousands) |
|
As of June 30, 2025 |
|
|
As of December 31, 2024 |
|
Cash and cash equivalents |
|
$ |
2,094 |
|
|
$ |
9,766 |
|
Total |
|
$ |
2,094 |
|
|
$ |
9,766 |
|
We may seek to raise any necessary additional capital through a combination of public or private equity offerings, debt financings, collaborations, strategic alliances, licensing arrangements and other marketing and distribution arrangements. There can be no assurance that we will be successful in acquiring additional funding at levels sufficient to fund our operations or on terms favorable to us. If we are unable to obtain adequate financing when needed, we may have to delay, reduce the scope of or suspend one or more of our preclinical studies and clinical trials, research and development programs or commercialization efforts. Because of the numerous risks and uncertainties associated with the development and commercialization of our product candidates and the extent to which we may enter into additional collaborations with third parties to participate in their development and commercialization, we are unable to estimate the amounts of increased capital outlays and operating expenditures associated with our current and anticipated preclinical studies and clinical trials. To the extent that we raise additional capital through additional collaborations, strategic alliances, or licensing arrangements with third parties, we may have to relinquish valuable rights to our product candidates, future revenue streams, research programs or product candidates or to grant licenses on terms that may not be favorable to us. If we do raise additional capital through public or private equity or convertible debt offerings, the ownership interest of our existing shareholders will be diluted, and the terms of these securities may include liquidation or other preferences that adversely affect our shareholders’ rights. If we raise additional capital through debt financing, we may be subject to covenants limiting or restricting our ability to take specific actions, such as incurring additional debt, making capital expenditures, or declaring dividends.
We have evaluated whether there are material uncertainties’ related to events or conditions that may cast significant doubt upon our ability to continue as a going concern within one year after the date of these financial statements.
Based upon our balance of cash and cash equivalents of $2.1 million as of June 30, 2025, we estimate that we will not have sufficient liquidity to continue as a going concern through at least June 30, 2026. We will require additional capital, from equity, debt or strategic partnerships, to continue as a going concern in the future. It is uncertain whether such capital will be available in amounts or on terms acceptable to the Company, if at all.
As of and for the six months June 30, 2025, we reported a net loss of $12.5 million, and accumulated losses of $713.3 million and net current liabilities of $0.3 million. These conditions indicate ongoing liquidity risk and the need for continued access to capital over the longer term, management has concluded that, based on its operating plan and existing cash resources, these conditions raise substantial doubt about our ability to continue as a going concern within one year after the date of the financial statements. If we are not able to obtain additional capital to meet our cash requirements in the future, our business, financial condition, results of operations and prospects could be materially and adversely affected. There can be no assurance that management’s attempts to raise additional capital will be successful.
Cash Flows
The following table summarizes our cash flows for the six months ended June 30, 2024 and 2025:
|
|
|
|
|
|
|
|
|
|
|
For the six months ended June 30, |
|
(In thousands) |
|
2025 |
|
|
2024 |
|
Net cash used in operating activities |
|
$ |
(7,624 |
) |
|
$ |
(15,988 |
) |
Net cash provided by investing activities |
|
|
48 |
|
|
|
5,747 |
|
Net cash (used in) or provided by financing activities |
|
|
(82 |
) |
|
|
4,120 |
|
Effects of exchange rate changes on cash and cash equivalents |
|
|
(14 |
) |
|
|
(6 |
) |
Net change in cash and cash equivalents |
|
$ |
(7,672 |
) |
|
$ |
(6,127 |
) |
Cash Flows Used in Operating Activities
Our cash flows from operating activities are significantly affected by the growth of our business, and are primarily related to research and development, and administrative expenses. Our operating cash flows are also affected by our working capital needs to support growth in personnel-related expenditures and fluctuations in accounts payable, accounts receivable and other current assets and liabilities.
Net cash used in operating activities was $(16.0) million for the six months ended June 30, 2024 resulting primarily from a net loss of $(35.2) million, adjusted for non-cash charges of $0.2 million in depreciation and amortization, including depreciation of operating right-of-use assets, $10.0 million of impairment charges on intangible assets, $(0.2) million in fair value change of financial liabilities at FVTPL, $8.2 million in share-based payments, and $0.9 million in working capital adjustments.
Net cash used in operating activities was $(7.6) million for the six months ended June 30, 2025 resulting primarily from a net loss of $(12.5) million, adjusted for non-cash charges of $0.1 million in depreciation and amortization, including depreciation of operating right-of-use of assets, $1.5 million of impairment charges on intangible assets, $0.4 million in fair value change of financial liabilities at FVTPL, $3.3 million in share-based payments, and $(0.4) million in working capital adjustments.
Cash Flows Provided by Investing Activities
Net cash provided by investing activities was $5.7 million for the six months ended June 30, 2024 resulting primarily from the proceeds from redemption of placement investments through FVTPL of $5.8 million.
Net cash provided by investing activities was $0.1 million for the six months ended June 30, 2025 resulting primarily from the proceeds from disposal of plant and equipment of $0.1 million.
Cash Flows Used in/Provided by Financing Activities
Net cash provided by financing activities was $4.1 million for the six months ended June 30, 2024 resulting primarily from the proceeds from the PIPE financing, net of transaction costs of $5.0 million offset by the net payment of bank loans of $(0.7) million and payment of interest of $(0.1) million.
Net cash used in financing activities was $(82) thousand for the six months ended June 30, 2025 resulting primarily from the repayment of lease liabilities of $(47) thousand and payment of interest of $(35) thousand.
Effects of Exchange Rate Changes on Cash and Cash Equivalents
Effects of exchange rate changes on cash and cash equivalents were insignificant for the six months ended June 30, 2024 and 2025.
Contractual Obligations and Commitments
The following table summarizes our contractual obligations as of June 30, 2025, and the effects such obligations are expected to have on our liquidity and cash flow in future periods (in thousands):
|
|
|
|
|
|
|
|
|
|
|
|
|
|
|
|
|
|
|
|
|
|
|
Payments due by period |
|
(In thousands) |
|
Total |
|
|
Less than 1 year |
|
|
1-2 years |
|
|
3-5 years |
|
|
More than 5 years |
|
Lease commitments |
|
$ |
744 |
|
|
$ |
203 |
|
|
$ |
414 |
|
|
$ |
127 |
|
|
$ |
— |
|
Legal commitments |
|
|
5,879 |
|
|
|
1,879 |
|
|
|
2,500 |
|
|
|
1,500 |
|
|
|
— |
|
Lease Commitments
Lease agreements are entered into for fixed lease terms of 12 to 60 months, without extension and termination options. Lease terms are negotiated on an individual basis and contain a wide range of different terms and conditions. In determining the lease term and assessing the length of the non-cancelable period, the Company applies the definition of a contract and determines the period for which the contract is enforceable. The Company recognized $0.9 million in right-of-use assets and $0.9 million in lease liabilities during the six months ended June 30, 2024 and $0.7 million in right-of-use assets and $0.7 million in lease liabilities during the six months ended June 30, 2025.
Legal Commitments
After the reporting date, in November 2025 the Company entered into a legally binding settlement agreement relating to the resolution of the claims discussed further in the Legal Proceedings section below. The Company recognized $5.9 million in general and administrative expenses on the statement of loss and $1.9 million in current liabilities and $4.0 million in non-current liabilities on the statement of financial position as of and for the six months ended June 30, 2025.
Off-Balance Sheet Arrangements
We did not have during the periods presented, and we do not currently have, any off-balance sheet arrangements that have, or are reasonably likely to have, a current or future significant effect on our financial condition, results of operations, liquidity, or cash flows.
Critical Accounting Policies and Estimates
This MD&A is based on our condensed consolidated interim financial statements, which have been prepared in accordance with accounting policies that conform with International Financial Reporting Standards (“IFRS”) issued by the International Accounting Standards Board (“IASB”). In the application of our accounting policies, our management is required to make judgments, estimates and assumptions about the carrying amounts of assets and liabilities that are not readily apparent from other sources. The estimates and underlying assumptions are based on historical experience and other factors that are considered to be relevant. Our actual results may differ from these estimates. The estimates and underlying assumptions are reviewed on an ongoing basis. Revisions to accounting estimates are recognized in the period in which the estimate is revised if the revision affects only that period, or in the period of the revision and future periods if the revision affects both current and future periods.
Our most critical accounting policies and estimates are summarized below. Please refer to Note 4 to our unaudited condensed consolidated interim financial statements included elsewhere in this filing for more details about our significant accounting policies and critical judgment and key estimates.
Legal Proceedings
On July 22, 2024, the Company received a copy of a Writ and Statement of Claim issued in the Grand Court of the Cayman Islands (the “Cayman Litigation”) by two minority investors in the Company, TWVC Goldlink Partners Investment Limited and TWVC Panglin Group Investment Limited (together, “TWVC”), both of whom was represented by Triwise Capital Management, Ltd. As previously disclosed, in December 2022, TWVC made a request to redeem certain preferred shares of the Company shortly before the consummation of the public merger with Maxpro Capital Acquisition Corporation. Following the request, the Company’s shareholders approved the merger with Maxpro Capital Acquisition Corporation, which triggered the cancellation of all private preferred share rights and conversion of the Company’s then outstanding private preferred shares to Ordinary Shares. Following the consummation of the merger, TWVC has been, and currently remain, registered shareholders of the Company and hold Ordinary Shares.
On November 19, 2025, the Company announced that it entered into a settlement agreement (the “Settlement Agreement”) to fully resolve and conclude all matters related to the Cayman Litigation (the “Settlement”). The Settlement Agreement fully resolved all disputes between the Company and TWVC. Under the Settlement Agreement, the Company has agreed to pay TWVC a total of $5.0 million in cash, to be made in several installments over a period of two years, plus approximately $0.9 million in associated legal expenses. As agreed in the Settlement Agreement, TWVC withdrew all claims against the Company and its affiliates, and the parties submitted the Settlement and Settlement Agreement for the court’s approval to conclude the associated litigation proceedings. The original amount of damages claimed by TWVC was approximately US$40 million, as disclosed in the Form 20-F filed in April 2025.
Emerging Growth Company
As defined in Section 102(b)(1) of the JOBS Act (the “JOBS Act”), we are an emerging growth company (“EGC”). As such, we will be eligible for and intends to rely on certain exemptions and reduced reporting requirements provided by the JOBS Act, including (a) the exemption from the auditor attestation requirements with respect to internal control over financial reporting under Section 404(b) of the Sarbanes-Oxley Act, (b) the exemptions from say-on-pay, say-on-frequency and say-on-golden parachute voting requirements and (c) reduced disclosure obligations regarding executive compensation in its periodic reports and proxy statements.
We will remain an EGC under the JOBS Act until the earliest of (i) the last day of the fiscal year in which the market value of our Class A Ordinary Shares that are held by non-affiliates exceeds $700 million as of the last business day of the second quarter of that fiscal year, (ii) the last day of the fiscal year in which it has total annual gross revenue of $1.235 billion or more during such fiscal year (as indexed for inflation), (iii) the date on which it was issued more than $1 billion in non-convertible debt in the prior three-year period or (iv) the last day of the fiscal year following the fifth anniversary of the date of the Closing.
Impairment of financial assets
The Company performs impairment assessment under expected credit loss (“ECL”) model on financial assets (including deposits, time deposits with original maturity over three months and cash and cash equivalents) which are subject to impairment under IFRS 9. The amount of ECL is updated at each reporting date to reflect changes in credit risk since initial recognition.
Lifetime ECL represents the ECL that will result from all possible default events over the expected life of the relevant instrument. In contrast,12-month ECL represents the portion of lifetime ECL that is expected to result from default events that are possible within 12 months after the reporting date. Assessments are done based on the Company’s historical credit loss experience, adjusted for factors that are specific to the debtors, general economic conditions and an assessment of both the current conditions at the reporting date as well as the forecast of future conditions.
For all financial instruments, the Company measures the loss allowance equal to 12-month ECL, unless when there has been a significant increase in credit risk since initial recognition, the Company recognizes lifetime ECL. The assessment of whether lifetime ECL should be recognized is based on significant increases in the likelihood or risk of a default occurring since initial recognition.
New Accounting Pronouncements
See Note 3, Principal Accounting Policies, to our unaudited condensed consolidated interim financial statements included elsewhere in this filing.
Quantitative and Qualitative Disclosures about Market Risk
We are exposed to a variety of market risks, including currency risk, concentration risks, interest rate risk, other price risk, credit and counterparty risk and liquidity risk, as set out below. We manage and monitor these exposures to ensure appropriate measures are implemented in a timely and effective manner. Save as disclosed below, we did not hedge or consider necessary to hedge any of these risks.
Currency Risk
Foreign currency risk is the risk that the value of a financial instrument fluctuates because of the change in foreign exchange rates. We primarily operate in the United States, PRC, and Australia, with most of the transactions settled in the U.S. dollar. Our presentation and functional currency is the U.S. dollar. Certain bank balances, deposits and other payables are denominated in Renminbi and Australian dollar, which exposes us to foreign currency risk.
We are not exposed to significant foreign exchange risk as there are no significant financial assets or liabilities of ours denominated in currencies other than U.S. dollars. We did not use any derivative contracts to hedge against our exposure to currency risk during the six months ended June 30, 2024 or 2025. However, our management monitors foreign exchange exposure and will consider hedging significant foreign currency exposure should the need arise.
The carrying amounts of our foreign currency denominated monetary assets and monetary liabilities at the end of each reporting period are as follows:
|
|
|
|
|
|
|
|
|
|
|
|
|
|
|
|
|
|
|
Assets |
|
|
Liabilities |
|
|
|
As of June 30, |
|
|
As of June 30, |
|
(In thousands) |
|
2025 |
|
|
2024 |
|
|
2025 |
|
|
2024 |
|
Renminbi (“RMB”) |
|
$ |
1,580 |
|
|
$ |
9,144 |
|
|
$ |
776 |
|
|
$ |
4,368 |
|
Australian Dollars (“AUD”) |
|
|
1,198 |
|
|
|
972 |
|
|
|
1,069 |
|
|
|
276 |
|
|
|
$ |
2,778 |
|
|
$ |
10,116 |
|
|
$ |
1,845 |
|
|
$ |
4,644 |
|
As of June 30, 2024 and 2025, (i) if Renminbi strengthened or weakened by 5% against the U.S. dollar with all other variables held constant, our loss for the six months June 30, 2024 and 2025 would decrease or increase by $124 thousand and decrease or increase by $49 thousand, respectively; and (ii) if the Australian dollar strengthened or weakened by 5% against the U.S. dollar with all other variables held constant, our loss for the six months ended June 30, 2024 and 2025 would decrease or increase by $3 thousand and decrease or increase by $9 thousand, respectively.
Concentration of Risks
The carrying amounts of financial instruments that potentially subject us to significant concentration of credit risk primarily consist of cash and cash equivalents. As of December 31, 2024 and June 30, 2025, we had RMB 17.2 million ($2.4 million) in cash and cash equivalents, and RMB 7.9 million ($1.1 million), respectively, in cash and cash equivalents which are held by financial institutions in the PRC. We continue to monitor the financial strength of the four financial institutions in the PRC where we hold our cash and cash equivalents. PRC state-owned banks are subject to a series of risk control regulatory standards, and PRC bank regulatory authorities are empowered to take over the operation and management when any of those banks faces a material credit crisis. We do not foresee substantial credit risk with respect to cash and cash equivalents held at these PRC state-owned banks. Meanwhile, the PRC does not have an official deposit insurance program, nor does it have an agency similar to what was the Federal Deposit Insurance Corporation (FDIC) in the U.S. In the event of bankruptcy of one of the financial institutions in which we have deposits or investments, we may be unlikely to claim our deposits or investments back in full. We selected reputable PRC financial institutions with high ratings to place our foreign currencies. We regularly monitor the rating of these PRC financial institutions to avoid any potential defaults. There has been no recent history of default in relation to these financial institutions.
Interest Rate Risk
We are exposed to fair value interest rate risk in relation to time deposits and lease liabilities. We are also exposed to cash flow interest rate risk in relation to variable-rate bank balances. Our cash flow interest rate risk is mainly concentrated on the fluctuation of interest rates on bank balances. Our management considers that the exposure of cash flow interest rate risk arising from variable-rate bank balances is insignificant.
Other Price Risk
We are exposed to fair value interest rate risk in relation to time deposits and lease liabilities. We are also exposed to cash flow interest rate risk in relation to variable-rate bank balances. Our cash flow interest rate risk is mainly concentrated on the fluctuation of interest rates on bank balances. We consider that the exposure of cash flow interest rate risk arising from variable-rate bank balances is insignificant.
Credit and Counterparty Risk
Credit and counterparty risk refers to the risk that a counterparty will default on its contractual obligations resulting in financial loss to us. In order to minimize the credit risk, we review the recoverable amount of each individual debt at the end of each reporting period to ensure that adequate impairment losses are made for irrecoverable amounts. In this regard, we consider that our credit and counterparty risk is significantly reduced.
Liquidity Risk
As of June 30, 2025, we recorded net (liabilities) of $(4.4) million. In the management of liquidity risk, we have reviewed our cash flow projections to ensure we maintain a level of cash and cash equivalents deemed adequate by the management to finance our operations and mitigate the effects of fluctuations in cash flows.
The following table details the remaining contractual maturity for our non-derivative financial liabilities and lease liabilities. The table has been drawn up based on the undiscounted cash flows of financial liabilities based on the earliest date on which we can be required to pay. The table includes both interest and principal cash flows. To the extent that interest flows are a floating rate, the undiscounted amount is derived from the interest rate at the end of each reporting period.
|
|
|
|
|
|
|
|
|
|
|
|
|
|
|
|
|
|
|
|
|
|
|
|
|
|
|
|
|
|
|
(In thousands, except percentages) |
|
|
|
|
|
|
|
|
|
|
|
|
|
|
|
|
|
|
|
|
|
|
|
Weighted average
interest rate |
|
% |
|
On demand or less than 1 month |
|
|
1 to 3 months |
|
|
3 months to 1 year |
|
|
1 to 2 years |
|
|
2 to 4 years |
|
|
Total undiscounted cash flows |
|
|
Carrying amount |
|
June 30, 2025 |
|
|
|
|
|
|
|
|
|
|
|
|
|
|
|
|
|
|
|
|
|
|
|
Other Payables |
|
N/A |
|
$ |
— |
|
|
$ |
8,063 |
|
|
$ |
- |
|
|
$ |
- |
|
|
$ |
- |
|
|
$ |
8,063 |
|
|
$ |
8,063 |
|
Legal liabilities |
|
N/A |
|
|
— |
|
|
|
— |
|
|
|
1,879 |
|
|
|
2,500 |
|
|
|
1,500 |
|
|
|
5,879 |
|
|
|
5,879 |
|
Total |
|
|
|
|
— |
|
|
|
8,063 |
|
|
|
1,879 |
|
|
|
2,500 |
|
|
|
1,500 |
|
|
|
13,942 |
|
|
|
13,942 |
|
Lease liabilities |
|
6.11 |
|
$ |
— |
|
|
$ |
51 |
|
|
$ |
152 |
|
|
$ |
414 |
|
|
$ |
127 |
|
|
|
793 |
|
|
|
744 |
|