Commission File No. |
Exact Name of Registrant as Specified in its Charter and Principal Office Address and Telephone Number |
State of Incorporation |
I.R.S. Employer Identification Number |
|||
1-16681 |
Spire Inc.
700 Market Street
St. Louis, 63101
314-342-0500 |
74-2976504 |
| ☐ | Written communications pursuant to Rule 425 under the Securities Act (17 CFR 230.425) |
| ☐ | Soliciting material pursuant to Rule 14a-12 under the Exchange Act (17 CFR 240.14a-12) |
| ☐ | Pre-commencement communications pursuant to Rule 14d-2(b) under the Exchange Act (17 CFR 240.14d-2(b)) |
| ☐ | Pre-commencement communications pursuant to Rule 13e-4(c) under the Exchange Act (17 CFR 240.13e-4(c)) |
Title of each class |
Trading Symbol(s) |
Name of each exchange
on which registered
|
||
| Common Stock $1.00 par value | SR | |||
| SR.PRA |
Item
7.01
|
Regulation FD Disclosure . |
Item
9.01
|
Financial Statements and Exhibits . |
| 99.1 | Investor presentation dated December 8, 2025. | |
| 104 | Cover Page Interactive Data File (embedded within the Inline XBRL document). | |
SPIRE INC. |
||||||
| Date: December 8, 2025 | By: | /s/ Adam Woodard |
||||
| Adam Woodard | ||||||
| Executive Vice President and Chief Financial Officer |
||||||

Exhibit 99.1 Investor Presentation December 2025

Spire at-a-glance Gas Utilities • Regulated natural gas LDCs serving 1.7M homes and businesses in AL, MO and MS • Operates ~63k miles of pipeline • Represents >99% of 10-year capex Gas Marketing • Provides natural gas marketing services throughout North America • Creates value by optimizing commodity, transportation and storage portfolio Midstream • Consists of STL Pipeline, MoGas Pipeline and storage facilities in WY and OK • Centered on highly-contracted assets with a utility gas supply focus 2 S p i r e | I n v e s t o r P r e s e n t a t i o n – D e c e m b e r 2 0 2 5

Strategy driving growth, value and sustainability At Spire, we’re focused on growing our businesses organically, investing in infrastructure and driving continuous improvement to deliver value. 90%+ regulated business mix $ 1 Robust 10-year capex plan 11.2B 2 5-7% long-term EPS growth Growing dividend for 23 consecutive years 23 Focus on sustainability 1 Includes Tennessee capex beginning in 2H FY26. Excludes storage capex after FY26. 2 Using FY27 guidance midpoint of $5.75 as a base. 3 S p i r e | I n v e s t o r P r e s e n t a t i o n – D e c e m b e r 2 0 2 5
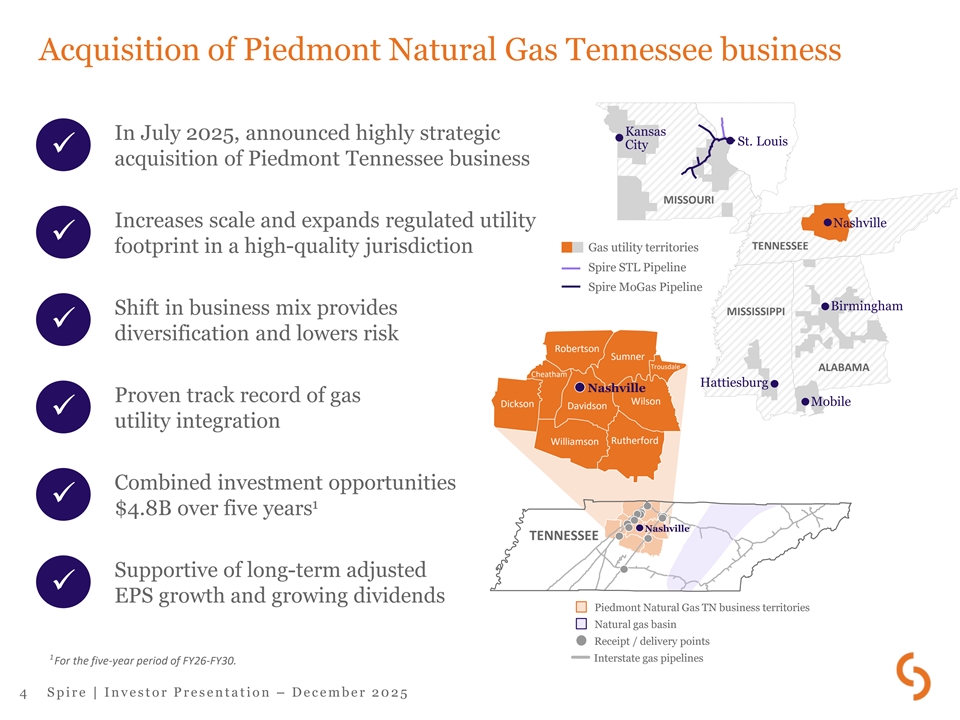
Acquisition of Piedmont Natural Gas Tennessee business Kansas In July 2025, announced highly strategic St. Louis City ✓ acquisition of Piedmont Tennessee business MISSOURI Increases scale and expands regulated utility Nashville ✓ TENNESSEE Gas utility territories footprint in a high-quality jurisdiction Spire STL Pipeline Spire MoGas Pipeline Birmingham Shift in business mix provides MISSISSIPPI ✓ diversification and lowers risk Robertson Sumner Trousdale ALABAMA Cheatham Hattiesburg Nashville Proven track record of gas Wilson Mobile Dickson Davidson ✓ utility integration Rutherford Williamson Combined investment opportunities ✓ 1 $4.8B over five years Nashville TENNESSEE Supportive of long-term adjusted ✓ EPS growth and growing dividends Piedmont Natural Gas TN business territories Natural gas basin Receipt / delivery points 1 Interstate gas pipelines For the five-year period of FY26-FY30. 4 S p i r e | I n v e s t o r P r e s e n t a t i o n – D e c e m b e r 2 0 2 5

Transaction terms – Acquisition of Piedmont Natural Gas Tennessee business • Acquiring 100% of the Piedmont Natural Gas Tennessee business from Duke Energy Transaction and • $2.48 billion enterprise value on a cash-free, debt-free basis, subject to customary closing adjustments purchase price – Purchase price represents 1.5´ 2026E rate base • Pursuing permanent financing plan consistent with Spire’s current credit ratings • Financing includes balanced mix of debt, equity and hybrid securities – $900M Junior Subordinated Notes (JSN) issued Nov. 24, 2025, comprised of: ▪ $450M 6.25% Series A JSN due 2056; resets June 1, 2031, to 5yr treasury rate + 2.556% Financing plan ▪ $450M 6.45% Series B JSN due 2056; resets June 1, 2036, to 5yr treasury rate + 2.327% 1 – $825M Spire Tennessee Senior Notes priced Dec. 4, 2025 – Minimal common equity to be issued • Evaluation process ongoing for sale of gas storage facilities as a source of funds • Hart-Scott-Rodino review completed Required 2 approvals • Tennessee Public Utility Commission approval pending Timing• Acquisition on track to close in Q1 of calendar 2026 1 Includes $130M 4.59% Senior Notes due 2029, $160M 4.77% Senior Notes due 2031, $105M 5.01% Senior Notes due 2033, $250M 5.29% Senior Notes due 2036 and $180M 2 5.44% Senior Notes due 2038. Coupons dependent on a funding date on or before Mar. 31, 2026. Docket No. 25-00074. 5 S p i r e | I n v e s t o r P r e s e n t a t i o n – D e c e m b e r 2 0 2 5

Acquisition significantly enhances Spire’s scale Spire Spire Spire Spire Gulf Tennessee Alabama Missouri Mississippi Pro forma $8.2B 1 Rate base $1.7B $4.6B $0.3B <$0.1B $1.6B (+24%) States AL MO AL MS TN 4 total states 1,950,000 Customers 430,000 1,213,000 84,000 18,000 205,000 (+12%) Miles of distribution and 69,800 24,400 32,700 4,400 1,200 7,100 transmission mains (+11%) and service pipe • Increases five-year capex plan from $3.9B to $4.8B (>22%) FY26-FY30E 1 Reflects fiscal 2026 year-end estimates. Amounts shown for Spire Alabama and Spire Gulf reflect total regulatory capitalization. For ratemaking purposes, the RSE mechanism in Alabama applies the return on equity to average regulatory common equity in the capital structure rather than rate base. 6 S p i r e | I n v e s t o r P r e s e n t a t i o n – D e c e m b e r 2 0 2 5

Earnings power driven by growth across jurisdictions 1 Utility rate base and total capitalization (Billions) FY26E FY30E $2.2 $1.6 $1.7 $2.1 20% 19% 21% 20% $0.3, 4% $8.2B $0.4, 4% $10.7B Missouri $4.6 $6.0 Gulf / Mississippi 56% Alabama 56% Tennessee 2 • Long-term EPS growth target of 5-7% supported by: – Robust rate base growth: ~7% in Missouri and ~7.5% in Tennessee – Regulated equity growth: ~6% in Alabama and Gulf – Strategic investments: 5-year capital plan of $4.8B (FY26-FY30E) – Constructive capital recovery mechanisms 1 Reflects year-end estimates. Amounts shown for Spire Alabama and Spire Gulf reflect total regulatory capitalization. For ratemaking purposes, the RSE mechanism in 2 Alabama applies the return on equity to average regulatory common equity in the capital structure rather than rate base. Using FY27 guidance midpoint of $5.75 as a base. 7 S p i r e | I n v e s t o r P r e s e n t a t i o n – D e c e m b e r 2 0 2 5

Constructive regulatory jurisdictions Spire Alabama and Spire Gulf Spire Mississippi Spire Missouri Tennessee RRA ranking Above Average / 1 Above Average / 3 Average / 2 Above Average / 3 Rate stabilization and Rate stabilization Historical test year – ARM – Rate setting mechanism equalization (RSE) – adjustment (RSA) – future test year after historical, with annual 1 forward test year formula ratemaking July 2026 true-up mechanism Effective date of rates Dec. 2024 Jan. 2025 Oct. 2025 Oct. 2025 Alabama: 9.5% – 9.9% 2 Allowed ROE 9.54% – 11.54% Not specified 9.8% Gulf: 9.7% – 10.3% 2 Allowed equity ratio actual up to 55.5% 50.0% Not specified 47.89% Infrastructure System Infrastructure rider Replacement Surcharge Weather normalization✓ ✓✓✓ Purchased gas rider✓ ✓✓✓ Pension/OPEB, Other trackers Cost Control Measure property tax, EE 1 The passage of Senate Bill 4 in April 2025 will allow for future test year ratemaking for rate cases filed after July 2026. 2 Settled Spire Missouri 2024 rate case did not specify ROE or equity ratio. Staff’s direct testimony included a recommended mid-point ROE of 9.63% and 53.19% equity ratio. 8 S p i r e | I n v e s t o r P r e s e n t a t i o n – D e c e m b e r 2 0 2 5

Capital plan overview 10-year capex forecast $11.2B (Millions) 5-year 10-year FY26E FY27E FY28E FY29E FY30E FY26 - FY30E FY26 - FY35E Missouri $535 $555 $595 $630 $675 $2,990 $7,075 Alabama, Gulf and MS 170 175 180 185 190 900 1,950 1 Tennessee 90 175 185 200 215 865 2,175 2 Midstream 14 1 1 1 1 18 23 $809 $906 $961 $1,016 $1,079 $4,773 $11,223 Total 10-year capex breakdown (FY26-FY35E) Other 11% • Investing in infrastructure while balancing customer affordability Customer 19% Safety and • Expect to recover ~96% of investments via expansion $11.2B reliability 70% forward test year ratemaking, true-up or capital recovery mechanisms 1 2 Includes Tennessee capex beginning 2H FY26. Excludes storage capex after FY26. 9 S p i r e | I n v e s t o r P r e s e n t a t i o n – D e c e m b e r 2 0 2 5

Significant system investment 1 Miles by decade of installation 6,000 • ~32,800 miles of natural gas mains in 5,235 5,181 Alabama, Mississippi and Missouri 5,000 3,950 3,662 4,000 3,625 • Robust pipeline replacement program 3,430 3,369 3,000 – Improves safety and reliability 1,830 2,000 – Results in fewer leaks and reduced methane 1,137 926 emissions 1,000 427 • Replacement program factors include: 0 – Leak rates – Material type 1 – Location Pipe material – System optimization and reliability – Maintenance reduction Steel-coated (Un) • ~$1.4B invested in pipeline upgrades 1% 39% Steel-coated (Pr) since 2020 3% 1% 2% Steel-bare (Un) Steel-bare (Pr) Cast Iron 54% Plastic 1 2024 U.S. Department of Transportation report. 10 S p i r e | I n v e s t o r P r e s e n t a t i o n – D e c e m b e r 2 0 2 5
Gas Utility update • Safely and reliably deliver natural gas • Robust investment in infrastructure modernization driving benefits for customers, shareholders and communities • Focus on cost management and customer affordability • Regulatory and legislative matters – In Sept. 2025, MoPSC approved stipulation and agreement in Spire Missouri rate case • $210M annual revenue increase • Rates effective Oct. 24, 2025 – In Nov. 2025, Spire Missouri filed for $30.3M in ISRS revenues – Spire Alabama and Spire Gulf rates approved and effective Dec. 2025 – SB 4 signed into law in Missouri enabling future test year ratemaking beginning July 2026 11 S p i r e | I n v e s t o r P r e s e n t a t i o n – D e c e m b e r 2 0 2 5

Spire Marketing overview • Provides natural gas marketing services throughout North America – Relationship-driven business delivering ~1.22 Bcf/d (2025) – Firm transport capacity of ~1 Bcf/d – Majority of business is wholesale – serving producers, pipelines, power generators, utilities and others – Retail operations provide marketing services to large C&I customers • Creates value by optimizing commodity, transportation and storage portfolio • Strong risk management • Consistent cash flow contributor 12 S p i r e | I n v e s t o r P r e s e n t a t i o n – D e c e m b e r 2 0 2 5

SLL Midstream – Pipeline Spire STL Pipeline • 65-mile pipeline providing safe, reliable, economical energy to Eastern Missouri • Strong performance since start of commercial operation in Nov. 2019 – Supports improved system reliability – Drives reduced methane emissions • FERC certificate permanent Spire MoGas / Omega Pipeline • Acquired in January 2024 for $175M – MoGas is 263-mile gas pipeline system primarily in Missouri – Omega is connected distribution system servicing Fort Leonard Wood – Bolsters resiliency and expands Missouri footprint • In Oct. 2025, FERC approved the merger of Spire STL Pipeline and Spire MoGas 13 S p i r e | I n v e s t o r P r e s e n t a t i o n – D e c e m b e r 2 0 2 5

Midstream – Storage Spire Storage West • Facility in Wyoming with five interconnects serving Western U.S. • 23 Bcf working gas capacity as of Sept. 30, 2025 • Expansion completed in July 2025 Spire Storage Salt Plains • Facility in Northern Oklahoma with two interconnects serving Midwestern U.S. • 11 Bcf working gas capacity as of Sept. 30, 2025 • Acquired in April 2023 14 S p i r e | I n v e s t o r P r e s e n t a t i o n – D e c e m b e r 2 0 2 5

FY25 adjusted earnings (Millions) $2.5 $(7.8) $22.8 $275.5 $10.6 $247.4 FY24 Gas Utility Midstream Gas Marketing Other & elims FY25 1 Overall adjusted earnings higher +$28.1M due to: • Gas Utility earnings (pre-tax) growth reflects: higher MO ISRS revenues (+$33.5M) and AL RSE (+5.0M); partially offset 2 by AL usage net of weather mitigation (-$3.0M), higher run-rate O&M (-$13.1M) and depreciation expense (-$14.0M) • Higher Midstream growth driven by additional storage capacity, contract renewals at higher rates and asset optimization; acquisition of MoGas; partially offset by higher O&M (-$13.1M) and depreciation expense due to scale • Gas Marketing results increased due to the business being well-positioned to create value, partially offset by higher storage and transportation fees • Other reflects lower corporate expense offset by the absence of FY24 (-$6.3M) after-tax benefit of an interest rate hedge and higher interest expense due to higher short-term balances 1 See adjusted earnings reconciliation to GAAP. 2 See Key FY25 variances in Appendix for run-rate O&M reconciliation. 15 S p i r e | I n v e s t o r P r e s e n t a t i o n – D e c e m b e r 2 0 2 5
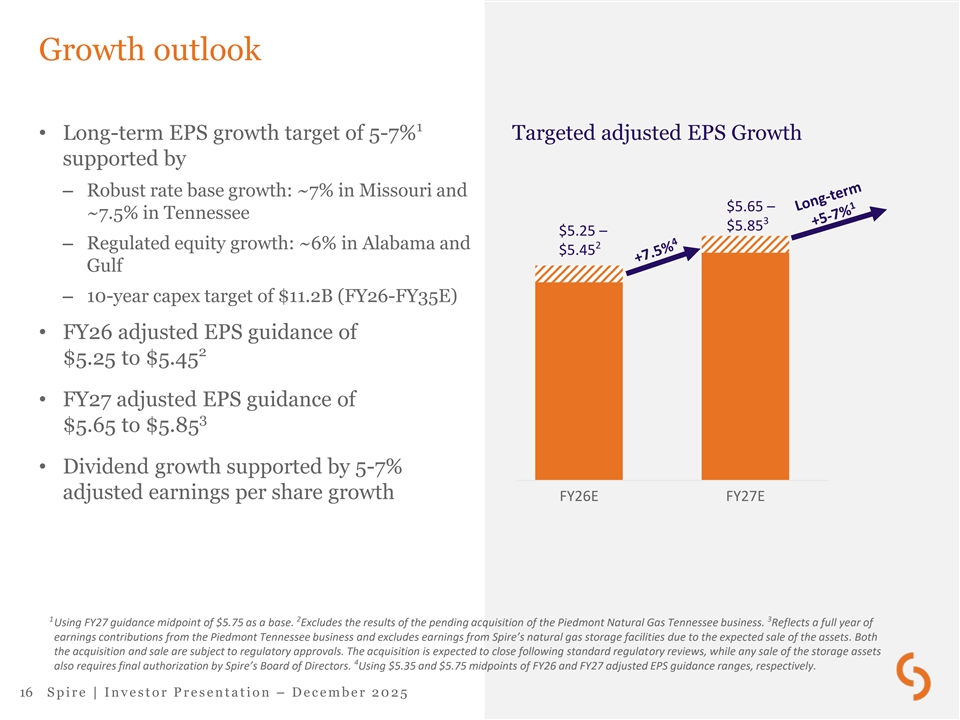
Growth outlook 1 • Long-term EPS growth target of 5-7% Targeted adjusted EPS Growth supported by – Robust rate base growth: ~7% in Missouri and $5.65 – ~7.5% in Tennessee 3 $5.85 $5.25 – – Regulated equity growth: ~6% in Alabama and 2 $5.45 Gulf – 10-year capex target of $11.2B (FY26-FY35E) • FY26 adjusted EPS guidance of 2 $5.25 to $5.45 • FY27 adjusted EPS guidance of 3 $5.65 to $5.85 • Dividend growth supported by 5-7% adjusted earnings per share growth FY26E FY27E 1 2 3 Using FY27 guidance midpoint of $5.75 as a base. Excludes the results of the pending acquisition of the Piedmont Natural Gas Tennessee business. Reflects a full year of earnings contributions from the Piedmont Tennessee business and excludes earnings from Spire’s natural gas storage facilities due to the expected sale of the assets. Both the acquisition and sale are subject to regulatory approvals. The acquisition is expected to close following standard regulatory reviews, while any sale of the storage assets 4 also requires final authorization by Spire’s Board of Directors. Using $5.35 and $5.75 midpoints of FY26 and FY27 adjusted EPS guidance ranges, respectively. 16 S p i r e | I n v e s t o r P r e s e n t a t i o n – D e c e m b e r 2 0 2 5
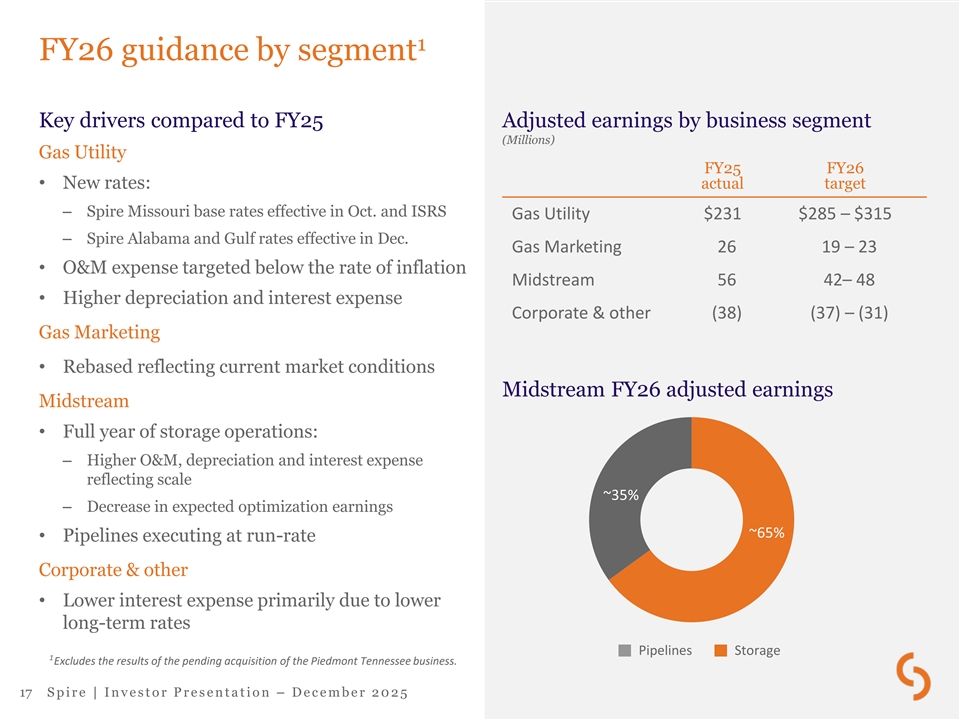
1 FY26 guidance by segment Key drivers compared to FY25 Adjusted earnings by business segment (Millions) Gas Utility FY25 FY26 • New rates: actual target – Spire Missouri base rates effective in Oct. and ISRS Gas Utility $231 $285 – $315 – Spire Alabama and Gulf rates effective in Dec. Gas Marketing 26 19 – 23 • O&M expense targeted below the rate of inflation Midstream 56 42– 48 • Higher depreciation and interest expense Corporate & other (38) (37) – (31) Gas Marketing • Rebased reflecting current market conditions Midstream FY26 adjusted earnings Midstream • Full year of storage operations: – Higher O&M, depreciation and interest expense reflecting scale ~35% – Decrease in expected optimization earnings ~65% • Pipelines executing at run-rate Corporate & other • Lower interest expense primarily due to lower long-term rates Pipelines Storage 1 Excludes the results of the pending acquisition of the Piedmont Tennessee business. 17 S p i r e | I n v e s t o r P r e s e n t a t i o n – D e c e m b e r 2 0 2 5

Base business financing plan Excludes Tennessee acquisition Debt maturities and expected issuances • Equity (Millions) – FY26E to FY28E: $0-$50M per year • Debt – Refinancing of maturities and funding of capital plan $700 $550 – $200M Spire Missouri First Mortgage $480 $100 1 Bonds issued Oct. 23 $45 $0 • Proceeds used for general corporate FY26E FY27E FY28E purposes Maturities Expected issuances • FFO/Debt target of 15-16% 1 Includes $150M 4.60% FMB due Sept. 15, 2030, and $50M 4.65% FMB due Jan. 15, 2031. 18 S p i r e | I n v e s t o r P r e s e n t a t i o n – D e c e m b e r 2 0 2 5

FY26 business priorities Operational excellence • Safely and reliably deliver natural gas • Deploy and recover capital efficiently • Focus on customer affordability, including cost management Regulatory • Achieve constructive regulatory outcomes • Prepare to file future test year rate case in Missouri Financial • Deliver adjusted EPS of $5.25 to $5.45 • Maintain balance sheet strength Acquisition of Tennessee business • Successfully finance and close acquisition • Conclude evaluation of storage asset sale • Integrate business seamlessly 19 S p i r e | I n v e s t o r P r e s e n t a t i o n – D e c e m b e r 2 0 2 5

Appendix 20 S p i r e | I n v e s t o r P r e s e n t a t i o n – D e c e m b e r 2 0 2 5

Forward-looking statements and use of non-GAAP measures This presentation contains forward-looking statements within the meaning of the Private Securities Litigation Reform Act of 1995. Our forward-looking statements in this presentation speak only as of today, and we assume no duty to update them. Forward- looking statements are typically identified by words such as, but not limited to: “estimates,” “expects,” “anticipates,” “intends,” “targets,” “plans,” “forecasts,” and similar expressions. Although our forward-looking statements are based on reasonable assumptions, various uncertainties and risk factors may cause future performance or results to be different than those anticipated. More complete descriptions and listings of these uncertainties and risk factors can be found in our annual (Form 10-K) and quarterly (Form 10-Q) filings with the Securities and Exchange Commission. This presentation also includes “adjusted earnings,” “adjusted earnings per share,” and “contribution margin,” which are non- GAAP measures used internally by management when evaluating the Company’s performance and results of operations. Adjusted earnings exclude from net income, as applicable, the after-tax impacts of fair-value accounting and timing adjustments associated with energy-related transactions, the impacts of acquisition, divestiture, and restructuring activities and the largely non-cash impacts of impairments and other non-recurring or unusual items such as certain regulatory, legislative, or GAAP standard- setting actions. The fair value and timing adjustments, which primarily impact the Gas Marketing segment, include net unrealized gains and losses on energy-related derivatives resulting from the current changes in fair value of financial and physical transactions prior to their completion and settlement, lower of cost or market inventory adjustments, and realized gains and losses on economic hedges prior to the sale of the physical commodity. Management believes that excluding these items provides a useful representation of the economic impact of actual settled transactions and overall results of ongoing operations. Contribution margin is defined as operating revenues less natural gas costs and gross receipts tax expense, which are directly passed on to customers and collected through revenues. These internal non-GAAP operating metrics should not be considered as an alternative to, or more meaningful than, GAAP measures such as operating income, net income or earnings per share. Reconciliation of adjusted earnings to net income is contained in our SEC filings and in the Appendix to this presentation. Note: Years shown in this presentation are fiscal years ended September 30. Investor Relations contact: Megan L. McPhail Managing Director, Investor Relations 314-309-6563 | Megan.McPhail@SpireEnergy.com 21 S p i r e | I n v e s t o r P r e s e n t a t i o n – D e c e m b e r 2 0 2 5
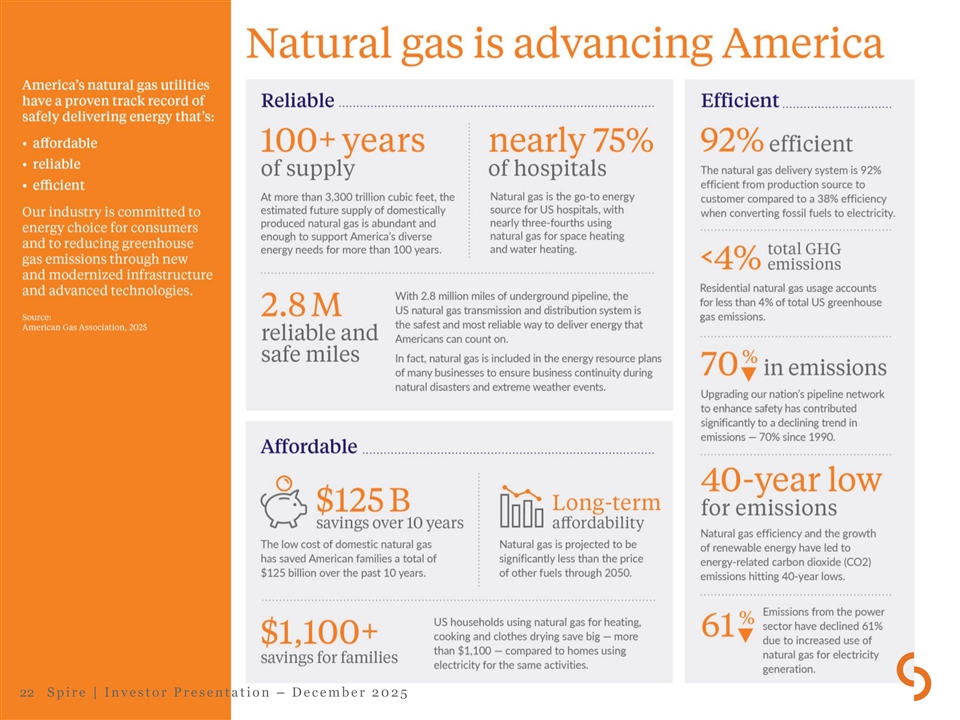
Helpful tips 22 S p i r e | I n v e s t o r P r e s e n t a t i o n – D e c e m b e r 2 0 2 5

Growing our dividend Annualized dividend per share 1 $3.30 $3.14 $3.02 $2.88 $2.74 $2.60 $2.49 $2.37 $2.25 $2.10 $1.96 $1.84 2015 2016 2017 2018 2019 2020 2021 2022 2023 2024 2025 2026 • 2026 annualized dividend increased 5.1% to $3.30 per share • Supported by long-term 5-7% adjusted earnings per share growth • 2026 marks 23 consecutive years of increases; 81 years of continuous payment • Part of the S&P’s Dividend Aristocrats Index • Targeted dividend payout ratio 55-65% 1 Quarterly dividend of $0.825 per share payable January 5, 2026, annualized. 23 S p i r e | I n v e s t o r P r e s e n t a t i o n – D e c e m b e r 2 0 2 5

Debt maturities and credit ratings Long-term debt maturities Credit ratings (Millions) Spire Inc. Spire Spire $800 $735 Senior Short-Term Missouri Alabama Unsecured Debt Senior Secured Senior Unsecured $100 $700 2.88% Moody’s Baa2 P-2 A1 A2 $90 $600 5.32% $30 BBB A-2 A BBB+ S&P $480 $500 7.9% • Moody’s outlook “Stable” $275 $400 $350 2.84% • S&P outlook “Negative” 5.30% $300 $200 $150 $130 4.6% 3.13% $100 $45 3.4% $100 $90 $19 7.0% 3.93% 4.88% $0 FY26 FY27 FY28 FY29 FY30 Spire Inc. Spire Missouri Spire Alabama 24 S p i r e | I n v e s t o r P r e s e n t a t i o n – D e c e m b e r 2 0 2 5

Natural gas as the affordable choice Electricity is 2x to 3x more expensive than natural gas in Spire’s states kWh equivalent 15.82¢ 13.80¢ 13.17¢ 5.92¢ 5.38¢ 4.55¢ Missouri Alabama Mississippi 1 2 Electricity Natural gas 1 US Energy Information Agency residential customer electric rates for the twelve-month average ending August 2025. 2 Represents Spire’s kWh equivalent current average residential customer rate. 25 S p i r e | I n v e s t o r P r e s e n t a t i o n – D e c e m b e r 2 0 2 5

1 Natural gas bills remain minimal portion of wallet 1.85% Missouri 1.48% 1.69% Alabama 1.35% 1.32% Mississippi 1.06% 2 3 Wallet Share Low Income Wallet Share Median Income 1 Reflects Spire’s average residential usage and current rates. 2 Low income is considered at or below 80% of the area median income, as determined by the U.S. Department of Housing and Urban Development. 3 Real median household income as determined by Federal Reserve Bank of St. Louis. 26 S p i r e | I n v e s t o r P r e s e n t a t i o n – D e c e m b e r 2 0 2 5

Regulatory construct Alabama Mississippi Missouri Tennessee Mississippi Public Alabama Public Service Commission Missouri Public Service Commission Tennessee Public Utility Commission Service Commission Above Average / 1 RRA ranking Above Average / 3 RRA ranking Average / 2 RRA ranking Above Average / 3 RRA Ranking Three members elected to 4-year Three members elected to 4-year Five members appointed by Governor Seven members appointed by state terms terms for 6-year terms officials for 6-year terms Name Term ends Name Term ends Name Term ends Name Term ends Cynthia Lee Almond, 2028 Nelson Carr Jan. 2028 Kayla Hahn, Chair Jan. 2030 David Jones, Chair June 2030 President Chris V. Beeker III 2026 Chris Brown Jan. 2028 Maida Coleman Aug. 2021 David Crowell June 2026 Jeremy Oden 2026 De’Keither Stamps Jan. 2028 Glen Kolkmeyer Apr. 2027 Clay Good June 2026 John Mitchell Apr. 2030 John Hie June 2030 1 Open seat Kenneth Hill June 2026 Herb Hilliard June 2029 Robin Morrison June 2026 1 Commissioner Jason Holsman resigned effective March 3, 2025. His seat is currently open. 27 S p i r e | I n v e s t o r P r e s e n t a t i o n – D e c e m b e r 2 0 2 5

FY25 adjusted earnings Per diluted Millions common share Twelve months ended September 30, 2025 2024 2025 2024 Net Income [GAAP] $ 271.7 $ 250.9 $ 4.37 $ 4.19 Fair value and timing adjustments, pre-tax ( 10.4) (12.4) (0.17) (0.22) Acquisition and restructuring activities, pre-tax 15.2 7.6 0.26 0.14 Income tax effect of adjustments ( 1.0) 1.3 (0.02) 0.02 1 Adjusted Earnings [non-GAAP] $ 275.5 $ 247.4 $ 4.44 $ 4.13 By segment Variance Gas Utility $ 231.4 $ 22 0.8 $ 10 .6 Gas Marketing 25.9 23 .4 2.5 56.3 33.5 22 .8 Midstream ( 38.1) ( 30.3) (7.8) Other Average diluted shares outstanding 58.7 56.3 1 See adjusted earnings reconciliation to GAAP in Appendix. 28 S p i r e | I n v e s t o r P r e s e n t a t i o n – D e c e m b e r 2 0 2 5

Key FY25 variances (Millions) As reported Pension Earnings Net reclass adjustments variance Twelve months ended September 30, 2025 2024 Notes 1 Contribution Margin MO ISRS (+$33.5); AL RSE (+$5.0); usage net of weather Gas Utility $ 1,236.7 $ 1, 199.2 $ ― $ ― $ 37 .5 mitigation: MO (no variance), AL (-$3.0) Gas Marketing 63.5 62 .1 $ ― (2.0) 3.4 Well positioned to create value; offset in part by higher storage and transportation fees Increased storage capacity, new contracts at higher rates Midstream 152.5 99 .6 52.9 $ ― $ ― and asset optimization; addition of MoGas Other and eliminations 2.5 0.6 $ ― $ ― 1.9 $ 1,455.2 $ 1, 361.5 $ ― $ (2.0) $ 95 .7 Operation and Maintenance Excluding bad debt decrease of $3.4, run-rate O&M is $13.1 Gas Utility $ 467.1 $ 452.8 $ 9.6 $ ( 5.0) $ 9.7 higher due to higher employee costs and operating expenses $ ― $ ― Gas Marketing 19.4 18 .2 1.2 Midstream 45.3 34 .7 (0.2) (2.3) 13.1 Higher operational costs due to higher activity; addition of MoGas Other and eliminations 10.3 1.7 $ ― 9.5 (0.9) Lower corporate costs $ 542.1 $ 507.4 $ 9.4 $ 2.2 $ 23 .1 $ ― Depreciation and Amortization 298.2 278.4 $ ― $ 19 .8 Rate base growth 2 $ ― $ ― Taxes, Other than Income Taxes 206.7 215.6 ( 8.9) Lower GRT, partially offset by higher property tax Interest Expense, Net 204.1 201.1 $ ― 5.4 ( 2.4) Higher LT and ST debt balances, partially offset by lower LT and ST rates Lower benefit of gas carrying cost credits (-$9.4); settlement Other Income, Net 11.6 22 .4 9.4 $ ― (20.2) of an interest rate hedge of $8.2 (pre-tax) in FY24; lower returns on non-qualified benefit plans Higher earnings and earnings mix Income Tax Expense 59.7 58 .7 $ ― (2.3) 3.3 1 Contribution margin (non-GAAP) is operating revenues less gas costs and gross receipts taxes. See contribution margin reconciliation to GAAP in Appendix. 2 Excludes gross receipts taxes. 29 S p i r e | I n v e s t o r P r e s e n t a t i o n – D e c e m b e r 2 0 2 5

FY25 throughput, customer, weather and margin data Spire Missouri Spire Alabama Twelve months ended September 30, 2025 2024 Variance 2025 2024 Variance Throughput (BCF) 75.0 69.0 9% 17.1 17.1 0% Residential 34.1 31.5 8% 9.6 9.6 0% Commercial & Industrial 47.9 46.4 3% 81.4 77.0 6% Transportation Total 157.0 146.9 7% 108.1 103.7 4% 1 Total Customers 1,213,375 1,208,565 0% 429,628 43 0,282 0% 2 Heating degree days vs Normal -8.7% -19.1% -4.2% -9.0% Heating degree days vs. prior year 11.8% 2.9% Margin (millions) $ 273.6 $ 252.0 $ 21.6 $ 141.2 $ 138.6 $ 2.6 Residential Commercial & Industrial 60.2 55.5 4.7 52.8 50.9 1.9 Transportation 21.5 20.9 0.6 107.3 104.0 3.3 3 24.2 51.1 (26.9) 7.4 13.2 (5.8) Weather Mitigation 4 Subtotal: Volumetric Margin $ 379.5 $ 379.5 $ — $ 308.7 $ 306.7 $ 2.0 Customer charges, ISRS, OSS, other 412.3 378.6 33.7 54.2 52.6 1.6 Total Contribution Margin $ 791.8 $ 758.1 $ 33.7 $ 362.9 $ 359.3 $ 3.6 1 Average customers for 12 months ended September 30, 2025. 2 Normal weather is based on heating degree days for past 30 years in each service territory. Spire Missouri reflects calendar degree days and Spire Alabama reflects billing degree days, which is consistent with contribution margin due to differences in tariffs. 3 Weather mitigation in Missouri applied to residential customers in FY24 and FY25 (applies to small commercial customers beginning October 24, 2025). 4 Includes -$3.0M for the net impact of weather mitigation and volumetric usage and +$5.0M RSE renewal. 30 S p i r e | I n v e s t o r P r e s e n t a t i o n – D e c e m b e r 2 0 2 5
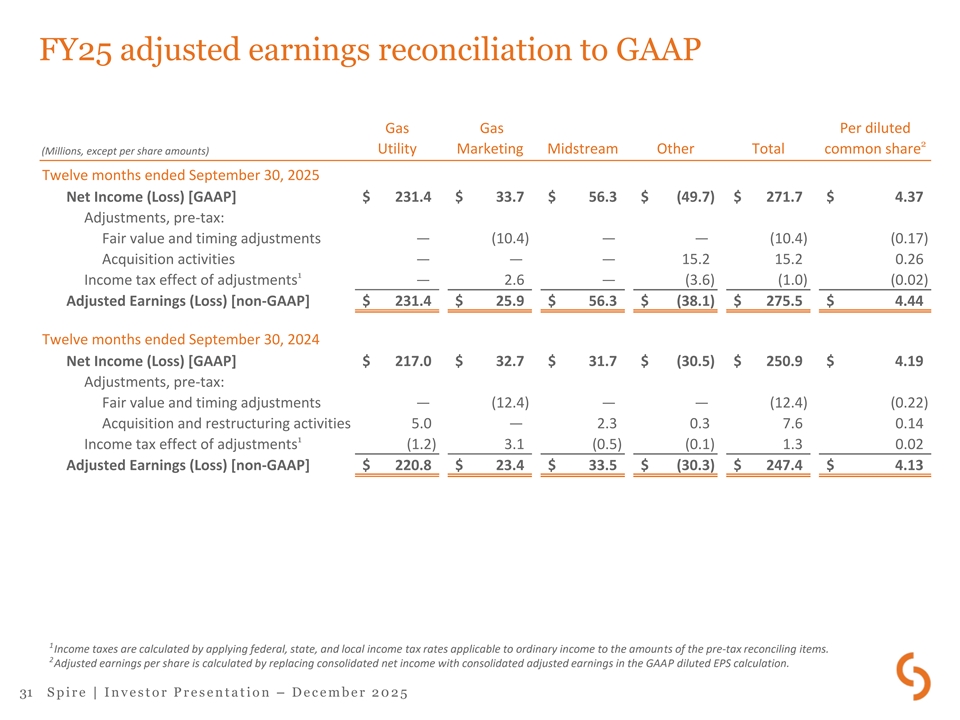
FY25 adjusted earnings reconciliation to GAAP Gas Gas Per diluted 2 Utility Marketing Midstream Other Total common share (Millions, except per share amounts) Twelve months ended September 30, 2025 Net Income (Loss) [GAAP] $ 231.4 $ 33.7 $ 56.3 $ (49.7) $ 271.7 $ 4.37 Adjustments, pre-tax: Fair value and timing adjustments — ( 10.4) — — ( 10.4) ( 0.17) Acquisition activities — — — 15.2 15.2 0.26 1 Income tax effect of adjustments — 2.6 — ( 3.6) ( 1.0) (0.02) Adjusted Earnings (Loss) [non-GAAP] $ 231.4 $ 25.9 $ 56.3 $ (38.1) $ 275.5 $ 4.44 Twelve months ended September 30, 2024 Net Income (Loss) [GAAP] $ 217.0 $ 32.7 $ 31.7 $ (30.5) $ 250.9 $ 4.19 Adjustments, pre-tax: Fair value and timing adjustments — (12.4) — — (12.4) (0.22) Acquisition and restructuring activities 5.0 — 2.3 0.3 7.6 0.14 1 Income tax effect of adjustments ( 1.2) 3.1 (0.5) (0.1) 1.3 0.02 Adjusted Earnings (Loss) [non-GAAP] $ 220.8 $ 23.4 $ 33.5 $ (30.3) $ 247.4 $ 4.13 1 Income taxes are calculated by applying federal, state, and local income tax rates applicable to ordinary income to the amounts of the pre-tax reconciling items. 2 Adjusted earnings per share is calculated by replacing consolidated net income with consolidated adjusted earnings in the GAAP diluted EPS calculation. 31 S p i r e | I n v e s t o r P r e s e n t a t i o n – D e c e m b e r 2 0 2 5

FY25 contribution margin reconciliation to GAAP Gas Gas (Millions) Utility Marketing Midstream Other Eliminations Consolidated Twelve months ended September 30, 2025 Operating Income (Loss) [GAAP] $ 406.2 $ 42.1 $ 83.8 $ (8.2) $ — $ 523.9 Operation and maintenance 467.1 19 .4 45.3 28 .3 (18.0) 542.1 Depreciation and amortization 27 7.6 1.0 19.2 0.4 — 298.2 Taxes, other than income taxes 201.3 1.2 4.2 0.1 (0.1) 206.7 Less: Gross receipts tax expense (115.5) (0.2) — — — (115.7) Contribution Margin [non-GAAP] 1,236.7 63.5 152.5 20.6 (18.1) 1,455.2 Natural gas costs 855.4 93 .5 3.0 — (46.4) 905.5 Gross receipts tax expense 11 5.5 0.2 — — — 115.7 Operating Revenues $ 2,207.6 $ 157.2 $ 155.5 $ 20.6 $ (64.5) $ 2,476.4 Twelve months ended September 30, 2024 Operating Income (Loss) [GAAP] $ 400.6 $ 41.2 $ 48.2 $ (1.7) $ — $ 488.3 Operation and maintenance 452.8 18 .2 34.7 18 .7 (17.0) 507.4 Depreciation and amortization 26 3.6 1.5 12 .8 0.5 — 27 8.4 Taxes, other than income taxes 210.2 1.4 3.9 0.1 — 215.6 Less: Gross receipts tax expense ( 128.0) ( 0.2) — — — ( 128.2) Contribution Margin [non-GAAP] 1,199.2 62.1 99.6 17.6 (17.0) 1,361.5 Natural gas costs 1,110.7 36 .9 1.1 — (45.4) 1,103.3 Gross receipts tax expense 12 8.0 0.2 — — — 12 8.2 Operating Revenues $ 2,437.9 $ 99.2 $ 100.7 $ 17.6 $ (62.4) $ 2,593.0 32 S p i r e | I n v e s t o r P r e s e n t a t i o n – D e c e m b e r 2 0 2 5