☐
|
REGISTRATION STATEMENT PURSUANT TO SECTION 12 OF THE SECURITIES EXCHANGE ACT OF 1934 |
☒
|
ANNUAL REPORT PURSUANT TO SECTION 13(a) OR 15(d) OF THE SECURITIES EXCHANGE ACT OF 1934. |
Canada |
6029 |
13-1942440 |
||
|
(Province or other jurisdiction of incorporation or organization) |
(Primary Standard Industrial Classification Code Number) |
(I.R.S. Employer Identification Number) |
Title of each class |
Trading Symbol |
Name of each exchange on which registered |
||
Common Shares |
CM |
New York Stock Exchange |
☒
Annual Information Form |
☒
Audited annual financial statements |
Common Shares |
926,610,598 |
|||
Class A Preferred Shares: |
||||
Series 47 |
18,000,000 |
|||
Series 54 |
750,000 |
1 |
||
Series 55 |
800,000 |
1 |
||
Series 56 |
600,000 |
|||
Series 57 |
500,000 |
|||
Series 58 |
500,000 |
1 |
||
Series 59 |
500,000 |
1 |
||
Series 60 |
450,000 |
1 |
||
Series 61 |
150,000 |
|||
Series 62 |
750,000 |
1 |
||
Series 63 |
450,000 |
1 |
||
1 |
The Series 54, 55, 58, 59, 60, 62 and 63 Class A Preferred Shares (NVCC) are held by a consolidated entity, CIBC LRCN Limited Recourse Capital Trust, in connection with the issuance of Limited Recourse Capital Notes (NVCC) (subordinated indebtedness) (“LRCNs”) by series: CAD$750 million principal amount of 4.000% LRCNs Series 2, CAD$800 million principal amount of 7.150% LRCNs Series 3, CAD$500 million principal amount of 6.987% LRCNs Series 4, USD$500 million principal amount of 6.950% LRCNs Series 5, CAD$450 million principal amount of 6.369% LRCNs Series 6, USD$750 million principal amount of 7.000% LRCNs Series 7 and CAD$450 million principal amount of 5.898% LRCNs Series 8, respectively. The Series 54, 55, 58, 59, 60, 62 and 63 Class A Preferred Shares are distributable to holders of such notes upon certain events. |
• |
Entire document |
• |
Section 2 |
• |
Section 3 |
• |
Section 5 |
Date: December 4, 2025 |
CANADIAN IMPERIAL BANK OF COMMERCE |
|||||
By: |
/s/ Harry Culham |
|||||
Harry Culham |
||||||
President and Chief Executive Officer |
||||||
By: |
/s/ Robert Sedran |
|||||
Robert Sedran |
||||||
Senior Executive Vice-President and |
||||||
Chief Financial Officer |
||||||
Exhibit |
Description of Exhibit |
|
B.3(a) |
Annual Information Form |
|
B.3(b) |
Audited consolidated financial statements for the year ended October 31, 2025 excerpted from pages 101-102 and 109-179 of the 2025 Annual Report of Canadian Imperial Bank of Commerce (“CIBC”) and the report of independent registered public accounting firm (PCAOB ID: 1263) to shareholders with respect to the report on financial statements related to the consolidated balance sheets as at October 31, 2025 and 2024, and the consolidated statements of income, comprehensive income, changes in equity and cash flows for the years then ended and the report of independent registered public accounting firm (PCAOB ID: 1263) on internal control over financial reporting under standards of the Public Company Accounting Oversight Board (United States) as of October 31, 2025 from pages 106-108 of the 2025 Annual Report of CIBC |
|
B.3(c) |
Management’s discussion and analysis excerpted from pages 1-100 of CIBC’s 2025 Annual Report |
|
B.3(d) |
Other Pages of CIBC’s 2025 Annual Report incorporated in Annual Information Form |
|
B.6(a)(1) |
Certifications required by Rule 13a-14(a)
|
|
B.6(a)(2) |
Certifications required by Rule 13a-14(b) and Section 1350 of Chapter 63 of Title 18 of the United States Code |
|
D.9 |
Consent of Independent Registered Public Accounting Firm |
|
97 |
CIBC’s SEC Clawback Policy |
|
101 |
Interactive Data File (formatted as Inline XBRL) |
|
104 |
Cover Page Interactive Data File (formatted as Inline XBRL and contained in Exhibit 101 |
|
Exhibit B.3(a): Annual Information Form

Canadian Imperial Bank of Commerce
ANNUAL INFORMATION FORM
December 3, 2025
TABLE OF CONTENTS
| 2 |
||||
| 3 |
||||
| 3 |
||||
| 3 |
||||
| 3 |
||||
| 3 |
||||
| 3 |
||||
| 4 |
||||
| 4 |
||||
| 4 |
||||
| 4 |
||||
| 4 |
||||
| 5 |
||||
| 6 |
||||
| 6 |
||||
| 6 |
||||
| 6 |
Certain Conditions of the Class A Preferred Shares as a Class |
|||
| 7 |
||||
| 7 |
||||
| 7 |
||||
| 7 |
||||
| 8 |
||||
| 8 |
||||
| 8 |
||||
| 9 |
Escrowed Securities and Securities Subject to Contractual Restriction on Transfer |
|||
| 9 |
||||
| 9 |
||||
| 9 |
||||
| 9 |
||||
| 10 |
||||
| 10 |
||||
| 10 |
||||
| 10 |
||||
| 10 |
||||
| 10 |
||||
| 10 |
||||
| 10 |
||||
| 10 |
||||
| 10 |
||||
| 12 |
||||
| 12 |
||||
| 12 |
||||
| 13 |
||||
| 15 |
||||
CIBC 2025 Annual Information Form 1
A NOTE ABOUT FORWARD-LOOKING STATEMENTS
From time to time, we make written or oral forward-looking statements within the meaning of certain securities laws, including in this Annual Information Form, in other filings with Canadian securities regulators or the U.S. Securities and Exchange Commission and in other communications. All such statements are made pursuant to the “safe harbour” provisions of, and are intended to be forward-looking statements under applicable Canadian and U.S. securities legislation, including the U.S. Private Securities Litigation Reform Act of 1995. These statements include, but are not limited to, statements made about our operations, business lines, financial condition, risk management, priorities, targets and sustainability commitments (including with respect to our sustainability ambitions and our environmental, social and governance (ESG) related activities), ongoing objectives, strategies, the regulatory environment in which we operate and outlook for calendar year 2026 and subsequent periods. Forward-looking statements are typically identified by the words “believe”, “expect”, “anticipate”, “intend”, “estimate”, “forecast”, “target”, “predict”, “commit”, “ambition”, “goal”, “strive”, “project”, “objective” and other similar expressions or future or conditional verbs such as “will”, “may”, “should”, “would” and “could”. By their nature, these statements require us to make assumptions, including the economic assumptions set out in this Annual Information Form, and are subject to inherent risks and uncertainties that may be general or specific. Given the potential negative economic impacts tied to the actual and proposed U.S. imposition of tariffs on Canada and other countries and their countermeasures, the softening labour market and uncertain political conditions in the U.S., the continuing impact of hybrid work arrangements and high interest rates on the U.S. real estate sector, and the war in Ukraine and conflict in the Middle East on the global economy, financial markets, and our business, results of operations, reputation and financial condition, there is inherently more uncertainty associated with our assumptions as compared to prior periods. A variety of factors, many of which are beyond our control, affect our operations, performance and results, and could cause actual results to differ materially from the expectations expressed in any of our forward-looking statements. These factors include: trade policies and tensions, including tariffs; inflationary pressures in the U.S.; global supply-chain disruptions; geopolitical risk, including from the war in Ukraine and conflict in the Middle East; the impact of post-pandemic hybrid work arrangements; credit, market, liquidity, strategic, insurance, operational, reputation, conduct and legal, regulatory and environmental risk; currency value and interest rate fluctuations, including as a result of market and oil price volatility; the effectiveness and adequacy of our risk management and valuation models and processes; legislative or regulatory developments in the jurisdictions where we operate, including the Organisation for Economic Co-operation and Development Common Reporting Standard, and regulatory reforms in the United Kingdom and Europe, the Basel Committee on Banking Supervision’s global standards for capital and liquidity reform, and those relating to bank recapitalization legislation and the payments system in Canada; amendments to, and interpretations of, risk-based capital guidelines and reporting instructions, and interest rate and liquidity regulatory guidance; exposure to, and the resolution of, significant litigation or regulatory matters, our ability to successfully appeal adverse outcomes of such matters and the timing, determination and recovery of amounts related to such matters; the effect of changes to accounting standards, rules and interpretations; changes in our estimates of reserves and allowances; changes in tax laws; changes to our credit ratings; political conditions and developments, including changes relating to economic or trade matters such as tariffs; the possible effect on our business of international conflicts, such as the war in Ukraine and conflict in the Middle East, and terrorism; natural disasters, disruptions to public infrastructure and other catastrophic events; the occurrence of public health emergencies and any related government policies and actions; reliance on third parties to provide components of our business infrastructure; potential disruptions to our information technology systems and services; increasing cyber security risks, which may include theft or disclosure of assets, unauthorized access to sensitive information, or operational disruption; social media risk; losses incurred as a result of internal or external fraud; anti-money laundering; the accuracy and completeness of information provided to us concerning clients and counterparties; the failure of third parties to comply with their obligations to us and our affiliates or associates; intensifying competition from established competitors and new entrants in the financial services industry, including through internet and mobile banking; technological change, including the use of data and artificial intelligence (AI) in our business; the heavy reliance on AI-related capital spending for U.S. growth and the uncertain employment impacts from its adoption; global capital market activity; changes in monetary and economic policy; general business and economic conditions worldwide, as well as in Canada, the U.S. and other countries where we have operations, including increasing Canadian household debt levels and global credit risks; climate change and other ESG-related risks, including our ability to implement various sustainability-related initiatives internally and with our clients under expected time frames and our ability to scale our sustainable finance products and services; our success in developing and introducing new products and services, expanding existing distribution channels, developing new distribution channels and realizing increased revenue from these channels; changes in client spending and saving habits; our ability to attract and retain key employees and executives; our ability to successfully execute our strategies and complete and integrate acquisitions and joint ventures; the risk that expected benefits of an acquisition, merger or divestiture will not be realized within the expected time frame or at all; and our ability to anticipate and manage the risks associated with these factors. This list is not exhaustive of the factors that may affect any of our forward-looking statements. These and other factors should be considered carefully and readers should not place undue reliance on our forward-looking statements. Any forward-looking statements contained in this Annual Information Form represent the views of management only as of the date hereof and are presented for the purpose of assisting our shareholders and financial analysts in understanding our financial position, objectives and priorities and anticipated financial performance as at and for the periods ended on the dates presented, and may not be appropriate for other purposes. We do not undertake to update any forward-looking statement that is contained in this Annual Information Form or in other communications except as required by law.
CIBC 2025 Annual Information Form 2
INFORMATION INCORPORATED BY REFERENCE
Certain disclosures in this Annual Information Form (AIF) are incorporated by reference from CIBC’s 2025 Annual Report for the year ended October 31, 2025. The table below identifies pages from the 2025 Annual Report which are incorporated by reference into this AIF. The 2025 Annual Report is available on SEDAR+ at www.sedarplus.com.
| AIF Item | 2025 Annual Report – Page Reference | |
| CORPORATE STRUCTURE |
||
| Intercorporate Relationships |
174 | |
| DESCRIPTION OF THE BUSINESS |
||
| The CIBC Organization |
1–100 | |
| Environmental and Social Policies |
50, 79 | |
| Risk Factors |
42–81 | |
| GENERAL DEVELOPMENT OF THE BUSINESS |
4, 13 | |
|
DIVIDENDS |
155–157 | |
| CAPITAL STRUCTURE |
155–157 | |
| DIRECTORS AND OFFICERS |
||
| Directors and Board Committees |
187 | |
| LEGAL PROCEEDINGS AND REGULATORY ACTIONS |
169–171 | |
| TRANSFER AGENT AND REGISTRAR |
186 | |
| FEES FOR SERVICES PROVIDED BY SHAREHOLDERS’ AUDITOR |
93 | |
|
GLOSSARY |
94–100 | |
Unless otherwise specified, this AIF presents information as at October 31, 2025.
Name, Address and Incorporation
Canadian Imperial Bank of Commerce (CIBC) is a diversified financial institution governed by the Bank Act (Canada), which constitutes its charter. CIBC was formed through the amalgamation of The Canadian Bank of Commerce and Imperial Bank of Canada in 1961. The Canadian Bank of Commerce was originally incorporated as Bank of Canada by special act of the legislature of the Province of Canada in 1858. Subsequently, the name was changed to The Canadian Bank of Commerce and it opened for business under that name in 1867. Imperial Bank of Canada was incorporated in 1875 by special act of the Parliament of Canada and commenced operations in that year. The address of the registered and head office of CIBC is 81 Bay Street, CIBC SQUARE, Toronto, Ontario, Canada, M5J 0E7.
Information about the intercorporate relationships among CIBC and its significant subsidiaries is provided in Note 25 to the consolidated financial statements included in the 2025 Annual Report.
CIBC is a leading North American financial institution. CIBC serves its clients through four main strategic business units (SBUs): Canadian Personal and Business Banking, Canadian Commercial Banking and Wealth Management, U.S. Commercial Banking and Wealth Management, and Capital Markets.
Canadian Personal and Business Banking provides clients across Canada with financial solutions, services and advice through our dedicated team members in banking centres and contact centres, as well as leading mobile and online banking platforms to help make their ambitions a reality.
Canadian Commercial Banking and Wealth Management provides high-touch, relationship-oriented banking and wealth management services to middle-market companies, entrepreneurs, high-net-worth individuals and families across Canada. Our offering also includes an online brokerage platform for retail clients and asset management services for institutional investors.
U.S. Commercial Banking and Wealth Management provides tailored, relationship-oriented banking and wealth management solutions across the U.S., focusing on middle-market and mid-corporate companies, entrepreneurs, high-net-worth individuals and families, as well as operating private and small business banking services in strategic markets across the U.S.
Capital Markets provides integrated global markets products and services, investment banking and corporate banking solutions, and top-ranked research to our clients around the world. Leveraging the capabilities of our differentiated platform, Capital Markets also delivers multi-currency payments and innovative solutions for clients across our bank.
CIBC 2025 Annual Information Form 3
Corporate and Other includes the following functional groups – Technology, Infrastructure and Innovation, Risk Management, People, Culture and Brand, and Finance and Enterprise Strategy, as well as other support groups. The expenses of these functional and support groups are generally allocated to the business lines within the SBUs. Corporate and Other also includes the results of CIBC Caribbean Bank Limited and other portfolio investments, as well as other income statement and balance sheet items not directly attributable to the business lines. Information about CIBC’s business lines and functional groups is provided in the 2025 Annual Report on pages 1 to 100.
A more complete description of services provided by Canadian Personal and Business Banking, Canadian Commercial Banking and Wealth Management, U.S. Commercial Banking and Wealth Management, and Capital Markets can be found in the 2025 Annual Report on pages 17 to 28.
External reporting changes were made in 2025, which affected the results of our SBUs. See the “External reporting changes” section in our 2025 Annual Report on page 2 for additional details.
CIBC was the fifth largest Canadian chartered bank in terms of market capitalization as at October 31, 2025.
Growth decelerated in Canada in 2025 as the economy was hit by elevated tariffs in some sectors and uncertainty over trade relations with the U.S. Although population growth was slowing, weak hiring resulted in an upward drift in the unemployment rate. Inflation remained close to the Bank of Canada’s 2% target rate, allowing the central bank to further lower its policy rate during the year to support growth ahead. Lower interest rates supported a strong year for equities and capital market activity, a mid-year upturn in housing starts, and moderate growth in mortgage and personal loans. Growth in business loans decelerated due to the impact of economic uncertainty on investment spending. The U.S. economy has remained stronger than Canada’s helped by a boom in capital spending for artificial intelligence, but has been impacted by slowing population growth that has held back job creation. While core inflation has yet to come back to target, the central bank resumed cutting interest rates in the wake of a modest upturn in unemployment.
Environmental and Social Policies
Additional information about our environmental policies and environmental and social risk can be found under “Management of risk – Top and emerging risks – Climate risk” and “Management of risk – Other risks – Environmental and social risk” on page 50 and page 79, respectively, of the 2025 Annual Report. Furthermore, CIBC’s Sustainability and Climate Reports and Public Accountability Statement summarize our commitment to our stakeholders and highlight the activities we are undertaking to achieve our sustainability ambitions.
These reports are available on our website at https://www.cibc.com/en/about-cibc/corporate-responsibility.html.
A discussion of risk factors related to CIBC and its business, and the steps taken to manage those risks appears throughout the 2025 Annual Report and in particular under the heading “Management of risk” on pages 42 to 81.
GENERAL DEVELOPMENT OF THE BUSINESS
At CIBC, our goal is to deliver superior client experience and top-tier shareholder returns while maintaining our financial strength.
As discussed in the “Overview” section in the 2025 Annual Report, CIBC has reported a scorecard of financial measures to evaluate and report on our progress to external stakeholders. These measures, for which CIBC has set through the cycle targets, which we currently define as three to five years, assuming a normal business environment and credit cycle, can be categorized into four key areas:
| 1. | Earnings Growth |
| • | Our target was an adjusted(1) diluted earnings per share (EPS) growth rate of 7% to 10% through the cycle. Going forward, we will continue to target an adjusted diluted EPS growth rate of 7% to 10% through the cycle. |
| 2. | Operating Leverage |
| • | Our target was to deliver positive adjusted operating leverage. Going forward, we will continue to target positive adjusted operating leverage through the cycle. |
| 3. | Shareholder Profitability and Return — Return on Common Shareholders’ Equity (ROE) / Dividend Payout Ratio / Total Shareholder Return (TSR) |
| • | Our target was an adjusted ROE of 15%+. Going forward, we will continue to target adjusted ROE of 15%+ through the cycle. |
| • | Our target was an adjusted dividend payout ratio in the range of 40% to 50% of earnings to common shareholders. Going forward, we will continue to target an adjusted dividend payout ratio of 40% to 50% through the cycle. |
| • | We continue to have an objective to deliver a TSR that exceeds the industry average, which we have defined as the Standard & Poor’s (S&P)/Toronto Stock Exchange (TSX) Composite Banks Index, over rolling three- and five-year periods. |
| 4. | Balance Sheet Strength |
| • | Our target was to actively manage our capital to maintain a strong and efficient capital base while supporting our business and returning capital to our shareholders. Going forward, we will continue to maintain a strong buffer to regulatory requirements. |
| • | The Liquidity Coverage Ratio (LCR) standard requires that, absent a situation of financial stress, the value of the ratio be no lower than 100%. |
| (1) | Adjusted measures are non-GAAP measures. For additional information and a reconciliation of reported results to adjusted results, where applicable, see the “Non-GAAP measures” section starting on page 13 of the 2025 Annual Report, available on SEDAR+ at www.sedarplus.com. |
CIBC 2025 Annual Information Form 4
Fiscal 2025 saw decelerating Canadian economic growth with higher unemployment, elevated tariffs in some sectors, and geopolitical pressures. This was offset by strong but volatile financial markets and stimulative monetary policy. In spite of these challenges, we delivered strong performance across all of our SBUs.
| 1. | Earnings Growth |
Reported diluted EPS was $8.57 in 2025, compared with $7.28 in 2024, up 18%. Reported diluted EPS was $5.17 in 2023.
| 2. | Operating Leverage |
Reported operating leverage(1) was 4.0% in 2025, compared with 9.1% in 2024 and (5.2)% in 2023.
| 3. | Shareholder Profitability and Return — Return on Common Shareholders’ Equity / Dividend Payout Ratio / Total Shareholder Return |
In 2025, reported ROE(1) of 14.3% was up from 13.4% in 2024. Reported ROE was 10.3% in 2023.
CIBC’s 2025 reported dividend payout ratio(1) was 45.0%, compared with 49.4% in 2024. The reported dividend payout ratio was 66.5% in 2023.
CIBC’s rolling TSR for the three years ended October 31, 2025 was 119.5%, compared with 73.7% for the S&P/TSX Composite Banks Index. For the five years ended October 31, 2025, our TSR was 199.8%, which was above the S&P/TSX Composite Banks Index of 159.1%.
| 4. | Balance Sheet Strength |
At the end of 2025, CIBC’s Common Equity Tier 1 (CET1) ratio(2) was 13.3%, compared with 13.3% in 2024 and 12.4% in 2023, well above the current regulatory requirement set by OSFI of 11.5%.
For the quarter ended October 31, 2025, our three-month daily average liquidity coverage ratio (LCR)(2) was 132% compared to 129% for the same period last year. LCR(2) was 135% in 2023. It measures unencumbered high-quality liquid assets (HQLA) that can be converted into cash to meet liquidity needs for a 30-calendar-day liquidity stress scenario.
CIBC has a common share dividend policy of maintaining a balance between the distribution of profits to shareholders and the need to retain capital for safety and soundness, and to support growth of the businesses. In the context of this overall policy, CIBC’s key criteria for considering dividend increases are the current payout ratio compared to the target, and its view on the sustainability of the level of current earnings through the cycle. Going forward, CIBC will continue to target an adjusted dividend payout ratio of 40% to 50%.
The cash dividends declared and paid per share for each class of CIBC shares and restrictions on the payment of dividends can be found on pages 155 to 157 of the 2025 Annual Report.
| (1) | Certain additional disclosures for these specified financial measures have been incorporated by reference and can be found in the “Financial Highlights” and “Glossary” sections on page 4 and page 94, respectively, of the 2025 Annual Report, available on SEDAR+ at www.sedarplus.com. |
| (2) | CET1 and LCR are calculated pursuant to OSFI’s Capital Adequacy Requirements (CAR) Guideline and OSFI’s Liquidity Adequacy Requirements (LAR) Guideline, respectively, which are both based on the Basel Committee on Banking Supervision (BCBS) standards. Certain additional disclosures for these specified financial measures have been incorporated by reference and can be found in the “Capital management” and “Liquidity risk” sections on page 31 and page 70, respectively, of the 2025 Annual Report, available on SEDAR+ at www.sedarplus.com. |
CIBC 2025 Annual Information Form 5
The following summary of CIBC’s capital structure is qualified in its entirety by CIBC’s by-laws and the actual terms and conditions of such shares. Additional detail on CIBC’s capital structure is provided on pages 37 to 40 and pages 155 to 157 of the 2025 Annual Report.
CIBC’s authorized common share capital consists of an unlimited number of common shares without nominal or par value. The holders of common shares are entitled to receive dividends as and when declared by the Board of Directors of CIBC (the Board), subject to the preference of holders of preferred shares. A holder of common shares is entitled to notice of and to attend all shareholders’ meetings, except meetings at which only holders of a specified class or series of shares are entitled to vote, and for all purposes will be entitled to one vote for each common share held. In the event of liquidation, dissolution or winding-up of CIBC, after payment of all outstanding deposits and debts and subject to the preference of any shares ranking senior to the common shares, the holders of common shares will be entitled to a pro rata distribution of the remaining assets of CIBC. The holders of common shares have no pre-emptive, subscription, redemption or conversion rights. The rights, preferences and privileges of the common shares are subject to the rights of the holders of preferred shares.
Description of Preferred Shares
CIBC is authorized to issue an unlimited number of Class A Preferred Shares and Class B Preferred Shares without nominal or par value, issuable in series, with such rights, privileges, restrictions and conditions as the Board may determine, provided that, for each class of preferred shares, the maximum aggregate consideration for all outstanding shares, at any time does not exceed $10 billion. The following series of Class A Preferred Shares(1) are currently outstanding: Series 47, 54, 55, 56, 57, 58, 59, 60, 61, 62 and 63. No Class B Preferred Shares are currently outstanding.
| (1) | Non-cumulative 5-Year Fixed Rate Reset Class A Preferred Shares Series 54, 55, 58, 59, 60, 62 and 63 (NVCC) (Preferred Shares Series 54, 55, 58, 59, 60, 62 and 63) are held by a consolidated entity, CIBC LRCN Limited Recourse Trust (the Limited Recourse Trust). |
The Bank Act (Canada) requires that banks maintain adequate capital in relation to their operations. The Superintendent of Financial Institutions (the Superintendent) establishes capital adequacy requirements for issuances of regulatory capital by banks. These requirements include that all regulatory capital must be able to absorb losses in a failed financial institution. Effective January 1, 2013, in accordance with capital adequacy requirements adopted by the Superintendent, non-common capital instruments issued after January 1, 2013, including preferred shares, must include non-viability contingent capital (NVCC) provisions, providing for the full and permanent automatic conversion (an NVCC Automatic Conversion) of such non-common capital instruments into common shares upon the occurrence of certain trigger events relating to financial viability (the NVCC Provisions) in order to qualify as regulatory capital.
The following describes certain general terms and conditions of the preferred shares.
Certain Conditions of the Class A Preferred Shares as a Class
The following is a summary of certain provisions attached to the Class A Preferred Shares as a class.
Priority
The Class A Preferred Shares of each series of Class A Preferred Shares rank on a parity with every other series of Class A Preferred Shares and rank in priority to the Class B Preferred Shares and the common shares of CIBC with respect to the payment of dividends and on the distribution of assets in the event of the liquidation, dissolution or winding-up of CIBC, provided that an NVCC Automatic Conversion as contemplated under the NVCC Provisions applicable to a series of Class A Preferred Shares has not occurred.
Restrictions on Creation of Additional Class A Preferred Shares
In addition to any shareholder approvals required by applicable law, the approval of the holders of the Class A Preferred Shares given in the manner described under “Modification” below, is required for any increase in the maximum aggregate consideration for which the Class A Preferred Shares may be issued and for the creation of any shares ranking prior to or on a parity with the Class A Preferred Shares.
Modification
Approval of amendments to the provisions of the Class A Preferred Shares as a class and any other authorization required to be given by the holders of Class A Preferred Shares may be given by a resolution carried by an affirmative vote of not less than 662/3% of the votes cast at a meeting at which the holders of 10% of the outstanding Class A Preferred Shares are present or represented by proxy or, if no quorum is present at such meeting, at an adjourned meeting at which the shareholders then present would form the necessary quorum.
Rights on Liquidation
In the event of the liquidation, dissolution or winding-up of CIBC, provided that an NVCC Automatic Conversion as contemplated under the NVCC Provisions applicable to a series of Class A Preferred Shares has not occurred, the holders of the Class A Preferred Shares will be entitled to receive an amount equal to the price at which such shares are issued together with such premium, if any, as shall have been provided for with respect to the Class A Preferred Shares of any series, together with all declared and unpaid dividends, before any amount is paid or any assets of CIBC are distributed to the holders of any shares ranking junior to the Class A Preferred Shares. Upon payment to the holders of the Class A Preferred Shares of the amounts so payable to them, they will not be entitled to share in any further distribution of the assets of CIBC. If an NVCC Automatic Conversion as contemplated under the NVCC Provisions applicable to a series of Class A Preferred Shares has occurred, all of the Class A Preferred Shares of such series shall have been converted into common shares of CIBC in accordance with a pre-determined conversion formula specified at the time of issuance of the Class A Preferred Shares of such series and will rank on parity with all other common shares of CIBC.
Voting Rights
Subject to the provisions of the Bank Act (Canada), the directors of CIBC are empowered to set voting rights, if any, for each series of Class A Preferred Shares.
CIBC 2025 Annual Information Form 6
Contingent Conversion of Certain Series of Class A Preferred Shares
All of CIBC’s currently outstanding Class A Preferred Shares were issued after January 1, 2013 and, accordingly, contain NVCC Provisions in their respective share terms and conditions. The number of common shares into which such Class A Preferred Shares would be converted upon an NVCC Automatic Conversion will be determined in accordance with a pre-determined conversion formula specified at the time of issuance of such Class A Preferred Shares.
Description of Limited Recourse Capital Notes
CIBC has outstanding CAD$750 million principal amount of 4.000% Limited Recourse Capital Notes Series 2 due January 28, 2082 (NVCC) (subordinated indebtedness), CAD$800 million principal amount of 7.150% Limited Recourse Capital Notes Series 3 due July 28, 2082 (NVCC) (subordinated indebtedness), CAD$500 million principal amount of 6.987% Limited Recourse Capital Notes Series 4 due July 28, 2084 (NVCC) (subordinated indebtedness), USD$500 million principal amount of 6.950% Limited Recourse Capital Notes Series 5 due January 28, 2085 (NVCC) (subordinated indebtedness), CAD$450 million principal amount of 6.369% Limited Recourse Capital Notes Series 6 due April 28, 2085 (NVCC) (subordinated indebtedness), USD$750 million principal amount of 7.000% Limited Recourse Capital Notes Series 7 due October 28, 2085 (NVCC) (subordinated indebtedness) and CAD$450 million principal amount of 5.898% Limited Recourse Capital Notes Series 8 due January 28, 2086 (NVCC) (subordinated indebtedness), collectively referred to as the “Notes”, which are reported as equity on the consolidated balance sheet, and carry the standard NVCC provisions necessary for them to qualify as Tier 1 regulatory capital under Basel III.
The following describes certain general terms and conditions of the Notes.
Certain Conditions of the Limited Recourse Capital Notes
The following is a summary of certain provisions attached to the Notes.
Priority
The Notes are junior, subordinated, unsecured indebtedness of CIBC and will rank subordinate to all of CIBC’s deposit liabilities and all other indebtedness (including all of CIBC’s other unsecured and subordinated indebtedness) from time to time issued and outstanding, except for such indebtedness which by its terms ranks equally in right of payment with, or is subordinate to, the Notes.
Limited Recourse
In the event of a non-payment by CIBC of the principal amount of, interest on, or redemption price for, the Notes when due, the sole remedy of holders of the Notes shall be the delivery of the Preferred Shares Series 54, 55, 58, 59, 60, 62 and 63, which are held in the Limited Recourse Trust and carry the standard NVCC provisions as described above.
Voting Rights
None, other than in certain limited circumstances.
Bank Act (Canada) Restrictions Related to Share Ownership
The Bank Act (Canada) contains restrictions on the issue, transfer, acquisition, beneficial ownership and voting of all shares of a chartered bank. By way of summary, no person, or persons acting jointly or in concert, shall be a major shareholder of a bank if the bank has equity of $12 billion or more (which would include CIBC). A person is a major shareholder of a bank where: (i) the aggregate of the shares of any class of voting shares beneficially owned by that person, by entities controlled by that person and by any person associated or acting jointly or in concert with that person (as contemplated by the Bank Act (Canada)) is more than 20% of that class of voting shares; or (ii) the aggregate of the shares of any class of non-voting shares beneficially owned by that person, by entities controlled by that person and by any person associated or acting jointly or in concert with that person (as contemplated by the Bank Act (Canada)) is more than 30% of that class of non-voting shares. No person, or persons acting jointly or in concert, shall have a significant interest in any class of shares of a bank, including CIBC, unless the person first receives the approval of the Minister of Finance (Canada). For purposes of the Bank Act (Canada), a person has a significant interest in a class of shares of a bank where the aggregate of any shares of the class beneficially owned by that person, by entities controlled by that person and by any person associated or acting jointly or in concert with that person (as contemplated by the Bank Act (Canada)) exceeds 10% of all of the outstanding shares of that class of shares of such bank.
In addition, the Bank Act (Canada) prohibits a bank, including CIBC, from recording in its securities register the transfer or issuance of shares of any class to His Majesty in right of Canada or of a province, an agent or agency of His Majesty, a government of a foreign country or any political subdivision of a foreign country, or an agent or agency of a foreign government. The Bank Act (Canada) also suspends the exercise of any voting rights attached to any share of a bank, including CIBC, that is beneficially owned by His Majesty in right of Canada or of a province, an agency of His Majesty, a government of a foreign country or any political subdivision of a foreign country, or any agency thereof.
CIBC funds its operations with client-sourced deposits, supplemented with a wide range of wholesale funding.
CIBC’s principal approach aims to fund its consolidated balance sheet with deposits primarily raised from personal and commercial banking channels. CIBC maintains a foundation of relationship-based core deposits, whose stability is regularly evaluated through internally developed statistical assessments.
We routinely access a range of short-term and long-term secured and unsecured funding sources diversified by geography, depositor type, instrument, currency and maturity. We raise long-term funding from existing programs including covered bonds, asset securitizations and unsecured debt.
Credit ratings assigned by external agencies impact CIBC’s ability to raise capital and funding in wholesale markets and related borrowing costs. Adverse movements in CIBC’s credit ratings could potentially result in higher financing costs, increased collateral pledging requirements and reduced access to capital markets. CIBC regularly reviews the impact of ratings downgrades and maintains liquidity buffers to ensure preparedness for continuity of operations under adverse conditions.
Additional information relating to CIBC’s liquidity management and credit ratings is available on pages 70 to 77 of the 2025 Annual Report under the heading “Management of risk – Liquidity risk”.
CIBC 2025 Annual Information Form 7
The table below provides the ratings for CIBC’s Class A Preferred Shares, Limited Recourse Capital Notes and debt obligations as at December 3, 2025:
| DBRS Limited (Morningstar DBRS) |
Fitch Ratings, Inc. (Fitch) |
Moody’s Investors Service, Inc. (Moody’s) |
Standard & Poor’s Ratings Services (S&P) |
|||||
|
Deposit/Counterparty(1) |
AA | AA | Aa2 | A+ | ||||
|
Senior debt(2) |
AA | AA |
Aa2 | A+ | ||||
|
Bail-in senior debt(3) |
AA(L) | AA- |
A2 | A- | ||||
|
Subordinated indebtedness |
A(H) | A |
Baa1 | A- | ||||
|
Subordinated indebtedness – NVCC(4) |
A(L) | A |
Baa1 | BBB+ | ||||
|
Limited recourse capital notes – NVCC(4)(5) |
BBB(H) | BBB+ |
Baa3 | BBB- | ||||
|
Preferred shares – NVCC(4)(5) |
Pfd-2 | BBB+ |
Baa3 | P-2(L) | ||||
|
Short-term debt |
R-1(H) | F1+ |
P-1 | A-1 | ||||
|
Outlook |
Stable |
Stable |
Stable | Stable | ||||
| (1) | Morningstar DBRS Long-Term Issuer Rating; Fitch Long-Term Deposit Rating and Derivative Counterparty Rating; Moody’s Long-Term Deposit and Counterparty Risk Assessment Rating; S&P’s Issuer Credit Rating. |
| (2) | Includes senior debt issued on or after September 23, 2018 which is not subject to bail-in regulations. |
| (3) | Comprises liabilities which are subject to conversion under the bail-in regulations. |
| (4) | Comprises instruments which are treated as NVCC in accordance with OSFI’s CAR Guideline. |
| (5) | Morningstar DBRS rating does not apply to limited recourse capital notes and associated preferred shares issued in USD. Fitch rating only applies to limited recourse capital notes and associated preferred shares issued in USD. |
The ratings should not be construed as a recommendation to buy, sell or hold CIBC securities. Ratings may be revised or withdrawn at any time by the respective rating agencies.
Definitions of rating categories are available on the respective rating agencies’ websites and are outlined in Appendix A. More detailed explanations of the various rating categories may be obtained directly from the rating agencies.
As is common practice, CIBC has paid fees charged by all four of the above-noted rating agencies for their rating services and, to certain of the rating agencies, for other services during the last two years. CIBC reasonably expects that such payments will continue to be made for services in the future.
CIBC maintains a listing of its common shares on the TSX and the New York Stock Exchange. CIBC maintains a listing of its Class A Preferred Shares on the TSX.
| (1) | From time to time, securities of CIBC may be listed on other stock exchanges or quotation systems by investors, brokers or others without the consent or involvement of CIBC. This section does not include debt instruments that are deposits. |
| 2024 | 2025 | |||||||||||||||||||||||||||||||||||||||||||||||
| Nov. | Dec. | Jan. | Feb. | Mar. | Apr. | May | Jun. | Jul. | Aug. | Sep. | Oct. | |||||||||||||||||||||||||||||||||||||
| Common Shares |
|
|||||||||||||||||||||||||||||||||||||||||||||||
| High | $ | 92.17 | $ | 95.50 | $ | 93.31 | $ | 89.72 | $ | 87.97 | $ | 87.00 | $ | 96.45 | $ | 97.04 | $ | 102.02 | $ | 107.13 | $ | 113.51 | $ | 117.13 | ||||||||||||||||||||||||
| Low | $ | 87.38 | $ | 89.06 | $ | 88.10 | $ | 81.26 | $ | 78.89 | $ | 76.17 | $ | 86.53 | $ | 91.94 | $ | 96.53 | $ | 97.81 | $ | 105.01 | $ | 111.29 | ||||||||||||||||||||||||
| Volume (thousands) | 54,174 | 111,840 | 77,423 | 57,001 | 115,988 | 100,617 | 57,430 | 77,279 | 65,807 | 45,770 | 67,664 | 62,819 | ||||||||||||||||||||||||||||||||||||
| Preferred Shares Series 41 |
|
|||||||||||||||||||||||||||||||||||||||||||||||
| High | $ | 25.00 | $ | 25.20 | $ | 25.00 | Redeemed January 31, 2025 | |||||||||||||||||||||||||||||||||||||||||
| Low | $ | 24.52 | $ | 24.62 | $ | 24.93 | ||||||||||||||||||||||||||||||||||||||||||
| Volume (thousands) | 163 | 1,395 | 4,228 | |||||||||||||||||||||||||||||||||||||||||||||
| Preferred Shares Series 43 |
|
|||||||||||||||||||||||||||||||||||||||||||||||
| High | $ | 24.70 | $ | 24.93 | $ | 24.85 | $ | 24.76 | $ | 24.85 | $ | 24.90 | $ | 24.98 | $ | 25.13 | $ | 25.00 | Redeemed July 31, 2025 | |||||||||||||||||||||||||||||
| Low | $ | 24.38 | $ | 24.35 | $ | 24.53 | $ | 24.37 | $ | 24.55 | $ | 24.00 | $ | 24.60 | $ | 24.92 | $ | 24.94 | ||||||||||||||||||||||||||||||
| Volume (thousands) | 4,297 | 5,227 | 2,116 | 3,725 | 20,882 | 12,457 | 3,850 | 39,079 | 74,678 | |||||||||||||||||||||||||||||||||||||||
| Preferred Shares Series 47 |
|
|||||||||||||||||||||||||||||||||||||||||||||||
| High | $ | 25.35 | $ | 25.53 | $ | 25.54 | $ | 25.55 | $ | 25.56 | $ | 25.36 | $ | 25.53 | $ | 25.70 | $ | 25.75 | $ | 25.92 | $ | 25.85 | $ | 26.17 | ||||||||||||||||||||||||
| Low | $ | 24.97 | $ | 25.20 | $ | 25.01 | $ | 25.25 | $ | 25.15 | $ | 24.01 | $ | 25.09 | $ | 25.31 | $ | 25.40 | $ | 25.59 | $ | 25.38 | $ | 25.39 | ||||||||||||||||||||||||
| Volume (thousands) | 610 | 151 | 404 | 415 | 318 | 101 | 200 | 116 | 156 | 213 | 466 | 241 | ||||||||||||||||||||||||||||||||||||
| (1) | Data from TMX Money. |
CIBC sold one issue of subordinated indebtedness during the year ended October 31, 2025, which is not listed or quoted on an exchange:
| • | $1.25 billion 4.15% Debentures due April 2, 2035 (NVCC) (subordinated indebtedness) were issued on April 2, 2025, at a price of 99.857%. |
CIBC 2025 Annual Information Form 8
Escrowed Securities and Securities Subject to Contractual Restriction on Transfer
The following securities were held in escrow or subject to contractual restriction on transfer as at October 31, 2025.
| Designation of class | Number of securities held in escrow or that are subject to a contractual restriction on transfer |
Percentage of class | ||||||
| Preferred Shares Series 54 (1) |
750,000 | 3.198 | % | |||||
| Preferred Shares Series 55 (1) |
800,000 | 3.412 | % | |||||
| Preferred Shares Series 58 (1) |
500,000 | 2.132 | % | |||||
| Preferred Shares Series 59 (1) |
500,000 | 2.132 | % | |||||
| Preferred Shares Series 60 (1) |
450,000 | 1.919 | % | |||||
| Preferred Shares Series 62 (1) |
750,000 | 3.198 | % | |||||
| Preferred Shares Series 63 (1) |
450,000 | 1.919 | % | |||||
| (1) | The Preferred Shares Series 54, 55, 58, 59, 60, 62, and 63 are held by the Limited Recourse Trust in connection with the issuance of the Limited Recourse Capital Notes. The Preferred Shares Series 54, 55, 58, 59, 60, 62, and 63 are distributable to holders of such Notes upon certain events. See “Certain Conditions of the Limited Recourse Capital Notes – Limited Recourse” section above. |
Directors and Board Committees
Information concerning the directors and board committees of CIBC is found on page 187 of the 2025 Annual Report.
All of the directors have held their principal occupation indicated on page 187 of the 2025 Annual Report for the past five years with the exception of the following:
| (i) | Marianne Harrison was President and Chief Executive Officer of John Hancock Life Insurance Company, the U.S. division of Toronto-based Manulife Financial Corporation from 2017 to 2023. |
| (ii) | Mark W. Podlasly was a member of the advisory board of the Manitoba Government – Crown Services from 2021 to 2023. |
| (iii) | Mary Lou K. Maher was the Canadian Managing Partner, Quality and Risk Management of KPMG Canada, and Global Head of Inclusion and Diversity of KPMG International from December 2017 to February 2021. |
Directors are elected annually. Under the Bank Act (Canada) and CIBC’s by-laws, a director’s term expires at the close of the next annual meeting of shareholders, which is scheduled for April 16, 2026.
The following are CIBC’s executive officers, their titles and their municipalities of residence, as at December 3, 2025:
| Name | Title | Municipality of Residence |
||
| Harry Culham | President and Chief Executive Officer, CIBC | Toronto, Ontario, Canada | ||
| Christian Exshaw | Senior Executive Vice-President and Group Head, Capital Markets | Toronto, Ontario, Canada | ||
| Frank Guse | Senior Executive Vice-President, Chief Risk Officer | Toronto, Ontario, Canada | ||
| Christina Kramer | Senior Executive Vice-President and Chief Administrative Officer | Toronto, Ontario, Canada | ||
| Kevin Li | Senior Executive Vice-President and Group Head, U.S. Region and President and CEO, CIBC Bank USA | Chicago, IL, United States | ||
| Hratch Panossian | Senior Executive Vice-President and Group Head, Personal and Business Banking | Toronto, Ontario, Canada | ||
| Susan Rimmer | Senior Executive Vice-President and Group Head, Commercial Banking and Wealth Management | Toronto, Ontario, Canada | ||
| Stephen Scholtz | Senior Vice-President, Global Chief Legal Officer | Etobicoke, Ontario, Canada | ||
| Robert Sedran | Senior Executive Vice-President, Chief Financial Officer and Enterprise Strategy | Toronto, Ontario, Canada | ||
| Sandy Sharman | Senior Executive Vice-President and Group Head, People, Culture and Brand | Toronto, Ontario, Canada | ||
| Amy South | Executive Vice-President, Office of the CEO and Chief of Staff | Toronto, Ontario, Canada |
All of the executive officers have held their present position or another executive position in CIBC for more than five years.
Shareholdings of Directors and Executive Officers
To CIBC’s knowledge, as at October 31, 2025, the directors and executive officers of CIBC as a group, beneficially owned, directly or indirectly, or exercised control or direction over less than 1% of the outstanding common shares of CIBC or CIBC Caribbean Bank Limited.
CIBC 2025 Annual Information Form 9
Corporate Cease Trade Orders or Bankruptcies
To CIBC’s knowledge, in the last 10 years, no director or executive officer of CIBC is or has been a director, chief executive officer or chief financial officer of a company that: (i) while that person was acting in that capacity, was the subject of a cease trade or similar order or an order that denied the company access to any exemption under securities legislation, for a period of more than 30 consecutive days; or (ii) was subject to such an order that was issued, after that person ceased to be a director or chief executive officer or chief financial officer, and which resulted from an event that occurred while that person was acting in the capacity as director, chief executive officer or chief financial officer. To CIBC’s knowledge, in the last 10 years, no director or executive officer of CIBC is or has been a director or executive officer of a company that, while that person was acting in that capacity or within a year of that person ceasing to act in that capacity, became bankrupt, made a proposal under any legislation relating to bankruptcy or insolvency or was subject to or instituted any proceedings, arrangement or compromise with creditors or had a receiver, receiver manager or trustee appointed to hold its assets.
To CIBC’s knowledge, no director or executive officer of CIBC: (i) has been subject to any penalties or sanctions imposed by a court relating to securities legislation or by a securities regulatory authority or has entered into a settlement agreement with a securities regulatory authority, or (ii) has been subject to any other penalties or sanctions imposed by a court or regulatory body that would likely be considered important to a reasonable investor in making an investment decision.
To CIBC’s knowledge, in the last 10 years, no director or executive officer has become bankrupt, made a proposal under any legislation relating to bankruptcy or insolvency, or was subject to or instituted any proceedings, arrangement or compromise with creditors, or had a receiver, receiver manager or trustee appointed to hold the assets of the director or executive officer.
To CIBC’s knowledge, no director or executive officer of CIBC or its subsidiaries has an existing or potential material conflict of interest with CIBC or any of its subsidiaries.
LEGAL PROCEEDINGS AND REGULATORY ACTIONS
A description of significant legal proceedings to which CIBC is a party is provided under the heading “Contingent liabilities and provisions” on pages 169 to 171 of the 2025 Annual Report.
INTEREST OF MANAGEMENT AND OTHERS IN MATERIAL TRANSACTIONS
To CIBC’s knowledge, no director or executive officer of CIBC, or any of their associates has any material interest, directly or indirectly, in any transaction within the three most recently completed financial years that has materially affected or is reasonably expected to materially affect CIBC.
The addresses for CIBC’s transfer agent and registrar are provided on page 186 of the 2025 Annual Report.
Ernst & Young LLP, Chartered Professional Accountants, Licensed Public Accountants, Toronto, Ontario, audited our Annual Consolidated Financial Statements, which comprise the consolidated balance sheets as of October 31, 2025 and October 31, 2024 and the related consolidated statements of income, comprehensive income, changes in equity, and cash flows for the years then ended, including the related notes and the effectiveness of our internal control over financial reporting as of October 31, 2025. Ernst & Young LLP is the independent public accountant with respect to the Bank within the context of the CPA Code of Professional Conduct of the Chartered Professional Accountants of Ontario and the rules and regulations adopted by the U.S. Securities and Exchange Commission (SEC) and the Public Company Accounting Oversight Board (United States).
The Audit Committee Mandate as approved by the Board is included in Appendix B. The members of the Audit Committee are listed below. Each member of the Audit Committee is independent and financially literate as defined by Canadian securities laws. At least one member of the Audit Committee has been designated by the Board as an “audit committee financial expert” as defined by the rules of the SEC.
This section describes the education and experience of CIBC’s Audit Committee members that is relevant to the performance of their responsibilities.
Each member of the Audit Committee is currently, or has previously been, responsible for a significant business operation. This experience is often in the capacity of president, chief executive officer, chief financial officer, chief operating officer, or as an advisor or consultant. Given the breadth and complexity of a financial institution’s accounting issues, the Audit Committee members participate from time to time in internal or external sessions related to accounting matters or developments. Travel and attendance costs are paid by CIBC. Further detail on the education and experience of each Audit Committee member is set out below.
CIBC 2025 Annual Information Form 10
Michelle L. Collins
Ms. Collins has been President of Cambium LLC since 2007. Cambium is a Chicago-based business and financial advisory firm that serves small and medium-sized businesses. She has 30 years of experience in corporate governance, investment banking, and private equity. She also has significant corporate board experience, having served as a director for several publicly traded companies across a wide range of industries. Ms. Collins is a director of CIBC Bancorp USA Inc. and CIBC Bank USA and chair of their Audit Committees. She is a Board member of Global Risk Institute, the Advisory Boards of Svoboda Capital Partners, LLC, and Cedar Street Asset Management. Ms. Collins serves on several philanthropic and non-profit boards, including the Griffin Museum of Science and Industry and Navy Pier, Inc., and is the former chair of the Board of Trustees of National Louis University. Ms. Collins received the Daniel H. Burnham Award for Distinguished Leadership in 2024 from the Chicagoland Chamber of Commerce in recognition for her remarkable accomplishments and contributions to the community. She received the Bertha Honoré Palmer Making History award for distinction in civic leadership in 2023 and is a past recipient of the Outstanding Leader Award for Business from the YWCA in recognition of her distinguished career in business, her community involvement and willingness to take on leadership positions on impacting women’s lives and racial justice. Ms. Collins holds a Bachelor of Arts degree in Economics from Yale University and a Master of Business Administration degree from Harvard Graduate School of Business.
Marianne Harrison
Ms. Harrison is the former President and Chief Executive Officer of John Hancock Life Insurance Company, the U.S. division of Toronto-based Manulife Financial Corporation, a role she retired from in April 2023. Ms. Harrison brings deep finance and accounting expertise, developed over almost 40 years in the financial industry including roles as Auditor for PwC, CFO of Wealth Management for TD Bank Group and Corporate Controller for Manulife Financial Corporation. Approximately half of her career was spent in finance and accounting roles and the other half in general management leading various businesses. In her role as President and CEO of both John Hancock and Manulife Canada, she was responsible for all aspects of profit and loss, which allowed her to acquire strong strategic leadership and management expertise. Ms. Harrison also brings substantial expertise in risk management, gained throughout her career in financial services and as an active member of the Segment Risk Committee while serving as President and CEO of John Hancock and Manulife Canada. Ms. Harrison earned her bachelor’s degree from the University of Western Ontario and a diploma in accounting from Wilfrid Laurier University. She is a Chartered Accountant and in 2016 was elected a Fellow of the Profession, the highest designation for professional achievement conferred by the Chartered Professional Accountants of Ontario.
Mary Lou Maher (Chair of the Audit Committee)
Ms. Maher was Canadian Managing Partner, Quality and Risk, KPMG Canada from 2017 to February 2021. She was also Global Head of Inclusion and Diversity KPMG International for the same period. Ms. Maher was with KPMG since 1983, in various executive and governance roles including Chief Financial Officer and Chief Human Resources Officer. Ms. Maher was a member of the World Economic Forum focused on Human Rights — the business perspective, and has served on other not-for-profit boards, including as Chair of Women’s College Hospital and member of CPA Ontario Council. She is a member of the Canadian Public Accountability Board. Ms. Maher created KPMG Canada’s first ever National Diversity Council and was the executive sponsor of pride@kpmg. Ms. Maher received the Wayne C. Fox Distinguished Alumni Award from McMaster University in recognition of her work on inclusion and diversity, was inducted into the Hall of Fame for the WXN 100 Top Most Powerful Women in Canada, received a Lifetime Achievement Award from Out on Bay Street (Proud Strong), and the Senior Leadership Award for Diversity from the Canadian Centre for Diversity and Inclusion. Ms. Maher completed the Competent Board for ESG Program. Ms. Maher holds a Bachelor of Commerce degree from McMaster University and holds the designation of FCPA, FCA.
Mark W. Podlasly
Mr. Podlasly, a member of the Cook’s Ferry Indian Band, Nlaka’pamux Nation in British Columbia, is the Chief Executive Officer at the First Nations Major Projects Coalition, a national 180 Indigenous nation collective that seeks ownership of major projects such as pipelines, electric utilities and mining support infrastructure. Mr. Podlasly counsels Indigenous governments across Canada on the establishment of trusts to invest revenues from resource development. He is Chair of the First Nations (Pacific Trails Pipeline) Group Limited Partnership (pipelines) and a Trustee of Nlaka’pamux Nation Legacy Trust. He is an Advisor to Public Matters, sits on the advisory board of Canada 2020, a Fellow at the Public Policy Forum of Canada, and a Director of the Development Partners Institute. In 2017, Mr. Podlasly was awarded the Governor General of Canada’s Meritorious Service Medal for Indigenous leadership in establishing Teach For Canada — Gakinaamaage, a non-profit organization that works with northern First Nations to recruit and support committed teachers. He has advised many leading international companies on corporate education, strategy, leadership and globalization programs. Mr. Podlasly is a regular speaker at global business and governance events. Mr. Podlasly holds a Bachelor of Arts degree from Trinity Western University, a Master of Public Administration from Harvard University and is a member of the Institute of Corporate Directors with the designation ICD.D.
Martine Turcotte
Ms. Turcotte was Vice Chair, Québec of BCE Inc. and Bell Canada from 2011 to 2020. She was Chief Legal Officer of BCE from 1999 to 2008 and of Bell Canada from 2003 to 2008 and she was Executive Vice-President and Chief Legal and Regulatory Officer of BCE and Bell Canada from 2008 to 2011. Ms. Turcotte has more than 25 years of strategic, legal and regulatory experience. In addition to the directorship in Empire Company Limited/Sobeys Inc., Ms. Turcotte is a member of the Board of Directors of Canadian Institute for Advanced Research (CIFAR), a member of the Board of Directors of the Institute for Governance of Private and Public Organizations (IGOPP) and she is a McGill Governor Emerita. Ms. Turcotte is a past recipient of the Canadian General Counsel Lifetime Achievement award, was inducted into the Hall of Fame of the Top 100 Most Powerful Women in Canada, received the title of Advocatus Emeritus from the Québec Bar Association for professional excellence, and was awarded both the Queen’s Gold and Diamond Jubilee Medals in recognition of her contributions to Canada. Ms. Turcotte is the former Chair of the Judicial Compensation and Benefits Commission. Ms. Turcotte holds a Bachelor degree in Civil Law and Common Law from McGill University and a Master of Business Administration degree from the London Business School.
CIBC 2025 Annual Information Form 11
PRE-APPROVAL POLICIES AND PROCEDURES
The Audit Committee has adopted the CIBC Policy on the Scope of Services of the Shareholders’ Auditor (the Scope of Services Policy) to provide a consistent approach for the engagement of the shareholders’ auditor. The Scope of Services Policy requires that work performed by the shareholders’ auditor for CIBC or its subsidiaries be pre-approved by the Audit Committee, along with the related fee for that work. The Audit Committee may establish pre-approval policies and procedures that are specific to a particular service. Under the Scope of Services Policy, the shareholders’ auditor will only perform audit, audit-related and tax work, and other work if pre-approved by the Audit Committee. The Audit Committee may approve exceptions to the Scope of Services Policy if it determines that such an exception is in the overriding best interests of CIBC, and the exception does not impair the independence of the shareholders’ auditor. However, certain non-audit activities set out in the Scope of Services Policy are generally prohibited and will not be considered for exception from the Policy. On a quarterly basis, the Audit Committee is presented with a summary report of all engagements of the shareholders’ auditor that are currently underway or have been completed since the prior quarter’s report, including engagements entered into pursuant to pre-approved limits. The summary report will describe the nature of each engagement, confirm that each engagement is in compliance with the Scope of Services Policy and state the fees received by the shareholders’ auditor for each engagement. The Scope of Services Policy also sets out ongoing relationship standards and requires that the shareholders’ auditor annually certify compliance with the Policy.
FEES FOR SERVICES PROVIDED BY SHAREHOLDERS’ AUDITOR
The information on professional service fees paid to the shareholders’ auditor is provided on page 93 of the 2025 Annual Report.
Additional information with respect to CIBC, including directors’ and officers’ remuneration and indebtedness, principal holders of CIBC’s securities and securities authorized for issuance under equity compensation plans, where applicable, is contained in CIBC’s management proxy circular for its most recent annual meeting of shareholders that included in its proceedings the election of directors. Additional financial information is provided in the 2025 Annual Report. These documents, as well as additional information relating to CIBC, are available on SEDAR+ at www.sedarplus.com.
For a description of Canadian bank resolution powers and the consequent risk factors attaching to certain liabilities of CIBC, reference is made to “Regulatory capital and total loss absorbing capacity (TLAC) requirements” on page 33 and “Outstanding share data” on page 39 of the 2025 Annual Report and https://www.cibc.com/content/dam/about_cibc/investor_relations/pdfs/debt_info/canadian-bail-in-website-disclosure-en.pdf. The information on our website does not form a part of this AIF.
CIBC 2025 Annual Information Form 12
Rating Definitions
Morningstar DBRS
| Short-term debt |
Rating: R-1 (high) |
Short-term debt ratings provide an opinion on the risk that an issuer will not meet its short-term financial obligations in a timely manner. Short-term debt rated R-1 (high) is of the highest credit quality, indicative of an entity with an exceptionally high capacity to repay its short-term financial obligations. R-1 is the highest of six short-term debt rating categories. The R-1 and R-2 categories are further denoted with “high”, “middle” and “low” subcategories.
| Long-term issuer rating |
Rating: AA | |
| Senior debt(1) |
Rating: AA | |
| Bail-in senior debt(2) |
Rating: AA (low) |
Long-term issuer and senior debt ratings provide an assessment of the risk that an issuer will not be able to meet its financial obligations in accordance with the terms under which an obligation has been issued. Credit ratings are based on quantitative and qualitative considerations relevant to the issuer, and the relative ranking of claims. Issuers and senior debt rated AA is ranked in the second highest of 10 categories. It is considered to be of superior credit quality, with capacity for payment considered to be high. The credit quality of issuers and obligations rated AA differs from the highest AAA category only to a small degree and is unlikely to be significantly susceptible to future events. The AA category is further denoted by the subcategories “high” and “low”. The absence of a “high” or “low” indicates a rating in the middle of the category.
| Subordinated indebtedness |
Rating: A (high) | |
| Subordinated indebtedness – NVCC |
Rating: A (low) |
Long-term debt rated A is ranked in the third highest of 10 categories. It is considered to be of good credit quality, with substantial capacity for payment. The A category is further denoted by the subcategories “high” and “low”. The absence of a “high” or “low” indicates a rating in the middle of the category.
| Limited recourse capital notes – NVCC |
Rating: BBB (high) |
Long-term debt rated BBB is ranked in the fourth highest of 10 categories. It is considered to be of adequate credit quality with acceptable capacity for payment. The BBB category is further denoted by the subcategories “high” and “low”. The absence of a “high” or “low” indicates a rating in the middle of the category.
| Preferred shares – NVCC |
Rating: Pfd-2 |
Preferred share ratings provide an assessment of the risk that an issuer will not be able to meet its dividend and principal obligations in accordance with the terms under which the preferred shares have been issued. Preferred shares rated Pfd-2 are of good credit quality with substantial protection of dividends and principal. A Pfd-2 rating is the second highest of six categories for preferred shares. Each category is further denoted by the subcategories “high” and “low”. The absence of a “high” or “low” indicates a rating in the middle of the category.
Fitch
| Short-term debt |
Rating: F1+ |
The F1 category is for obligations of the highest short-term credit quality and indicates the strongest intrinsic capacity to meet near-term obligations. The F1 rating is the highest of seven categories used for short-term debt; a “+” may be added to indicate very strong capacity to meet near-term obligations.
| Derivative counterparty rating |
Rating: AA | |
| Senior debt(1) Issuer default rating |
Rating: AA Rating: AA- |
|
| Bail-in senior debt(2) |
Rating: AA- |
Derivative counterparty ratings reflect a bank’s relative vulnerability to default, due to an inability to pay on any derivative contract with third-party, non-government counterparties. Ratings of individual securities or financial obligations of a corporate issuer address relative vulnerability to default on an ordinal scale. In addition, for financial obligations in corporate finance, a measure of recovery given default on that liability is also included in the rating assessment. Issuer default ratings (IDR) opine on an entity’s relative vulnerability to default on financial obligations. The threshold default risk addressed by the IDR is generally that of the financial obligations whose non-payment would best reflect the uncured failure of that entity. AA is the second highest of 11 rating categories for long-term obligations and indicates an assessment of very low default risk. This rating indicates a very strong capacity for payment of financial commitments that is not significantly susceptible to foreseeable events.
| Subordinated indebtedness |
Rating: A | |
| Subordinated indebtedness – NVCC |
Rating: A |
The A category is the third highest of the rating categories for long-term obligations and indicates an assessment of low default risk. The capacity for payment is considered strong but may be more susceptible to adverse business or economic conditions than that of higher rating categories.
| Limited recourse capital notes – NVCC |
Rating: BBB+ | |
| Preferred shares – NVCC |
Rating: BBB+ |
The BBB category is the fourth highest of the rating categories for long-term obligations and indicates an assessment of low default risk. The capacity for payment is considered adequate but adverse business or economic conditions are more likely to impair the capacity for payment.
The designation “+” or “-” may be used to denote relative position within certain major long-term rating categories, while the absence of such a modifier indicates a rating in the middle of the category.
| (1) | Includes senior debt issued on or after September 23, 2018 which is not subject to bail-in regulations. |
| (2) | Comprises liabilities that are subject to conversion under the bail-in regulations. |
CIBC 2025 Annual Information Form 13
Moody’s
| Short-term debt |
Rating: P-1 |
Short-term debt ratings are assessments of an issuer’s ability to repay obligations with an original maturity of 13 months or less. Moody’s has four categories of short-term ratings with the P-1 category being the highest credit quality. Borrowers rated P-1 have a superior ability to repay short-term debt obligations.
| Counterparty risk rating |
Rating: Aa2 | |
| Senior debt(1) |
Rating: Aa2 |
Counterparty risk ratings (CRR) are opinions of the ability of entities to honour their non-debt financial liabilities to unrelated counterparties such as derivatives and sale and repurchase transactions. CRRs also reflect the expected financial losses not covered by collateral, in the event such liabilities are not honoured.
Long-term debt ratings assess both the likelihood of default on contractual payments and the expected loss in the event of default on obligations with an original maturity of 11 months or more.
The Aa rating category is the second highest of nine categories and includes obligations judged to be high quality and subject to very low credit risk.
| Bail-in senior debt(2) |
Rating: A2 |
The A rating category is the third highest of nine categories and includes obligations judged to be upper medium grade and subject to low credit risk.
| Subordinated indebtedness |
Rating: Baa1 | |
| Subordinated indebtedness – NVCC |
Rating: Baa1 | |
| Limited recourse capital notes – NVCC |
Rating: Baa3 | |
| Preferred shares – NVCC |
Rating: Baa3 |
The Baa rating category is the fourth highest of nine categories on the long-term rating scale and includes obligations judged to be medium grade and subject to moderate credit risk and as such may possess certain speculative characteristics.
The modifiers 1, 2 and 3 are used with certain long-term rating categories to indicate that an obligation ranks in the higher, middle or lower range of the rating category respectively.
S&P
| Short-term debt |
Rating: A-1 |
The A-1 category is the highest of six categories used by S&P for short-term debt. An obligation rated A-1 indicates that the borrower’s capacity to meet its financial commitment with respect to the obligation is strong.
| Issuer credit rating |
Rating: A+ | |
| Senior debt(1) Bail-in senior debt(2) Subordinated indebtedness |
Rating: A+ Rating: A- Rating: A- |
Issuer credit ratings are a forward-looking opinion about an obligor’s overall creditworthiness. This opinion focuses on the obligor’s capacity and willingness to meet its financial commitments as they come due. It does not apply to any specific financial obligation, as it does not take into account the nature of and provisions of the obligation, its standing in bankruptcy or liquidation, statutory preferences, or the legality and enforceability of the obligation. Issue or debt ratings are a forward-looking opinion about the creditworthiness of an obligor with respect to a specific financial obligation, a specific class of financial obligations, or a specific financial program (including ratings on medium-term note programs and commercial paper programs). It takes into consideration the creditworthiness of guarantors, insurers, or other forms of credit enhancement on the obligation and takes into account the currency in which the obligation is denominated.
The A rating category is the third highest of 10 categories used by S&P for long-term debt obligations. Although the obligor’s ability to meet its financial commitment is strong, obligations rated A are somewhat more vulnerable to the negative effects of changes in circumstances and economic conditions when compared to obligations in higher rating categories.
| Subordinated indebtedness – NVCC Limited recourse capital notes – NVCC |
Rating: BBB+ Rating: BBB- |
The BBB rating category is the fourth highest of 10 categories used by S&P for long-term debt obligations. The obligor’s ability to meet its financial commitment is adequate, however, adverse economic conditions or changes in circumstances are more likely to lead to a weakening of this capacity.
A “+” or “-” may be used to denote the relative standing of a rating within each category.
| Preferred shares – NVCC (Canadian Preferred Share Scale) |
Rating: P-2 (low) |
P-2 is the second highest of the eight categories used by S&P in its Canadian Preferred Share Scale, which is a forward-looking opinion about the creditworthiness of the issuer with respect to a specific preferred share obligation issued in Canada. A “high” or “low” modifier may be used to indicate the relative standing of a credit within a particular rating category, while the absence of such a modifier indicates a rating in the middle of the category.
| (1) | Includes senior debt issued on or after September 23, 2018 which is not subject to bail-in regulations. |
| (2) | Comprises liabilities that are subject to conversion under the bail-in regulations. |
CIBC 2025 Annual Information Form 14
Canadian Imperial Bank of Commerce
Audit Committee Mandate
| 1. | Purpose |
| (1) | The primary functions of the Audit Committee (the “Committee”) are to: (i) fulfill its responsibilities for reviewing the integrity of CIBC’s financial statements and related management’s discussion and analysis (MD&A); (ii) monitor the system of internal control, including internal control over financial reporting; (iii) monitor CIBC’s compliance with legal and regulatory requirements; (iv) select the external auditors for shareholder approval; (v) review the qualifications, independence and audit quality of the external auditor; (vi) oversee the performance of the internal audit function; (vii) oversee the processes and controls around Environmental, Social and Governance (ESG) disclosures in the Annual Report, Sustainability Report, Climate Report and other material ESG disclosure documents; and (viii) act as the audit committee for certain federally regulated subsidiaries. |
| 2. | Responsibilities |
| (1) | Financial Reporting |
The Committee will be responsible for overseeing senior management concerning the establishment and maintenance of a system of processes and controls to ensure the integrity, accuracy and reliability of financial information. The Committee will review and recommend Board approval of:
| (a) | the annual audited consolidated financial statements of CIBC, the related MD&A and the external auditors’ report on the consolidated financial statements; |
| (b) | the interim consolidated financial statements of CIBC, the related MD&A and the external auditors’ review report on the interim consolidated financial statements; and |
| (c) | the Annual Information Form of CIBC, the Form 40-F of CIBC, and financial disclosure in a news release disclosing financial results. |
The Committee will review other material financial disclosures that are required by law to be reviewed by the Audit Committee, including those that are requested by regulators, and will periodically review select information provided to rating agencies and analysts relating to earnings guidance.
| (2) | Review Considerations |
In conducting its review of the annual consolidated financial statements or the interim consolidated financial statements, and the related MD&A, the Committee will:
| (a) | meet with management and the external auditors to discuss the financial statements and MD&A; |
| (b) | review the disclosures in the financial statements and the MD&A and satisfy itself that the financial statements, present fairly, in all material respects in accordance with International Financial Reporting Standards (IFRS), the financial position, results of operations and cash flows of CIBC; |
| (c) | review the reports prepared by the external auditors for the Committee summarizing their key findings and required communications in respect of the annual audit and the interim reviews; |
| (d) | discuss with management, the external auditors and internal legal counsel, as requested, any litigation claim or other contingency that could have a material effect on the financial statements; |
| (e) | review key areas of risk for material misstatement of the financial statements including critical accounting policies, models and estimates and other areas of measurement uncertainty or judgment underlying the financial statements and the MD&A as presented by management; |
| (f) | review areas of significant auditor judgment as it relates to their evaluation of accounting policies, accounting estimates and financial statement disclosures; discuss and review estimates with management and the external auditor, whether the external auditor considers estimates/models to be within an acceptable range and in accordance with IFRS; |
| (g) | review any material effects of regulatory and accounting changes, significant or unusual transactions, and the impact of material subsequent events between the reporting date and the approval date of the financial statements and the MD&A as presented by management; |
| (h) | review management and external auditor reports on the effectiveness of internal control over financial reporting; |
| (i) | review correspondence between the external auditor and management related to any substantive matters in the external auditors’ findings and any difficult or contentious matters noted by the external auditor; |
| (j) | review results of CIBC’s whistleblowing program; and |
| (k) | review any other matters related to the financial statements and the MD&A that are brought forward by the internal auditors, external auditors, management or which are required to be communicated to the Committee under auditing standards or applicable law. |
| (3) | External Auditors |
| (a) | General — The Committee will be responsible for overseeing the work of the external auditors in auditing and reviewing CIBC’s financial statements and internal control over financial reporting. |
| (b) | Appointment and Compensation — The Committee will recommend the appointment of the external auditors for shareholder approval, recommend the audit fee for Board approval, approve the annual audit engagement letter and any change in lead audit engagement partner. |
CIBC 2025 Annual Information Form 15
| The Committee will satisfy itself that the level of the audit fees are commensurate with the scope of work undertaken and conducive to a quality audit. The Committee will also assess whether any proposed change to the external auditor’s materiality level and/or scope continues to ensure a quality audit. |
| (c) | Audit Plan — At least annually, and as required, the Committee will review and approve the external auditors’ scope, terms of engagement and annual audit plan to ensure that it is risk based and addresses all relevant activities. The Committee will review any material changes to the scope of the plan and the coordination of work between the internal and external auditors. |
| (d) | Independence of External Auditors — At least annually, and before the external auditors issue their report on the annual financial statements, the Committee will review a formal written statement from the external auditors confirming their objectivity and independence, including their compliance with audit partner rotation requirements, and delineating all relationships between the external auditors and CIBC consistent with the rules of professional conduct adopted by the provincial institute or order of chartered professional accountants to which they belong or other regulatory bodies, as applicable. The Committee will also ensure that any concern raised by regulators or other stakeholders about the external auditors’ independence are appropriately reviewed and addressed. |
| (e) | Annual and Periodic Comprehensive Review of External Auditors — At least annually, the Committee will assess the qualifications, independence, application of professional skepticism and audit quality of the external auditors. The Committee will review a report by the external auditors describing: (i) their internal quality control procedures; and (ii) any material issues raised by their most recent internal quality control review or peer review of the external auditors, or by any inquiry or investigation by governmental or professional authorities within the preceding five years respecting one or more independent audits carried out by the external auditors and any steps taken to deal with any findings. The Committee will also review additional reports or communications of the external auditors as required by the Canadian Public Accountability Board, Office of the Superintendent of Financial Institutions, and the Public Company Accounting Oversight Board (United States). At least every five years, the Committee will conduct a periodic comprehensive review of the external auditors. |
| (f) | Pre-Approval of Audit and Non-Audit Services — The Committee will pre-approve any retainer of the external auditors for any audit and non-audit service to CIBC or its subsidiaries in accordance with law and Board approved policies and procedures. The Chair of the Committee may pre-approve on behalf of the Committee and may delegate pre-approval authority to a member of the Committee. The Committee may also establish pre-approval policies and procedures that are specific to a particular service and will review these policies or procedures annually to verify they continue to be appropriate. The decisions of any member of the Committee to whom this authority has been delegated, as well as any pre-approvals of a particular service must be presented to the full Committee for ratification at its next scheduled Committee meeting. |
| (g) | Hiring Practices — The Committee will review and approve policies regarding the hiring of partners, employees or former employees of the current or former external auditors. |
| (4) | Oversight of Internal Audit Function |
| The Committee will be responsible for overseeing the performance of the Internal Audit function, and ensuring that the Bank maintains, at all times, a qualified Chief Auditor, vested with sufficient independence, authority, stature, and resources to fulfill the duties and responsibilities of the position. |
| (a) | Organizational Framework — At least annually, the Committee will review and approve the Internal Audit Charter, including the organizational framework having regard to its role as an independent control function. |
| (b) | Chief Auditor — The Chief Auditor will have unfettered access to the Committee. Further, the Committee will: |
| (i) | review and recommend for Board approval their appointment or removal; |
| (ii) | annually review and recommend for Board approval their succession plan; |
| (iii) | annually review their goals and provide input on their performance assessment which is factored into compensation; and |
| (iv) | annually review and approve their mandate. |
| (c) | Effectiveness Review — At least annually, the Committee will: |
| (i) | review and recommend Board approval of the Internal Audit function’s financial plan and staff resources; |
| (ii) | review the Internal Audit function’s self-assessment of the independence and effectiveness of the Internal Audit function; and |
| (iii) | review the compliance of Internal Audit with professional standards. |
On a periodic basis, the Committee will engage an independent third party to assess the Internal Audit function in accordance with professional standards and the Committee will review the results of that assessment.
| (d) | Audit Plan and Financial Plan — At least annually, the Committee will review and approve the audit plan including the audit scope and the overall risk assessment methodology presented by the Chief Auditor to ensure that it is risk-based and addresses all relevant activities over a measurable cycle. On a quarterly basis, the Committee will review with the Chief Auditor the status of the audit plan and financial plan, and any changes needed, including a review of: |
| (i) | the results of audit activities, including any significant issues reported to management and management’s response and/or corrective actions and themes; |
| (ii) | the status of identified control weaknesses; |
| (iii) | the overall design and operating effectiveness of the system of internal control, risk management, governance systems and processes; |
| (iv) | any potential impairments to independence; |
CIBC 2025 Annual Information Form 16
| (v) | results from the quality assurance and improvement program; and |
| (vi) | any difficulties or disagreements with management or other stakeholders encountered by the Chief Auditor in the course of internal audits. |
At least annually, the Committee will review a report from the Chief Auditor with Internal Audit’s assessment of the oversight by Finance and Risk Management.
| (5) | Oversight of Finance Function |
| (a) | Organizational Framework — At least annually, the Committee will review and approve the Finance organizational framework, having regard to its role as an independent control function. |
| (b) | Chief Financial Officer — The Chief Financial Officer (CFO) will have unfettered access to the Committee. The Committee will ensure that the Bank maintains, at all times, a qualified CFO, vested with sufficient independence, authority, stature, and resources to fulfill the duties and responsibilities of the position. Further, the Committee will: |
| (i) | review and recommend for Board approval their appointment or removal; |
| (ii) | annually review their succession plan; |
| (iii) | annually review their goals and provide input on their performance assessment which is factored into compensation; and |
| (iv) | annually review and approve their mandate. |
| (c) | Effectiveness Review — At least annually, the Committee will: |
| (i) | review and recommend Board approval of the Finance function’s financial plan and staff resources; and |
| (ii) | review management’s assessment of the effectiveness of the Finance function. |
On a periodic basis, the Committee will engage an independent third party to assess the Finance function.
| (6) | Internal Control |
| (a) | General — The Committee will monitor the system of internal control and ensure that senior management establishes and maintains adequate and effective internal control systems and processes, including systems and processes that are designed to detect and prevent fraud. |
| (b) | Establishment, Review and Approval — The Committee will require management to implement and maintain appropriate policies and systems of internal control in accordance with applicable laws, regulations and guidance, including internal control over financial reporting and disclosure and to review, evaluate and approve these policies and systems of internal control. The Committee will review management’s annual report on internal control over financial reporting and the external auditors’ report on internal control over financial reporting. As part of this review at least annually, the Committee will consider and review the following with management, the external auditors and the Chief Auditor, as appropriate: |
| (i) | the effectiveness of, or weaknesses or deficiencies in: the design or operation of CIBC’s internal controls; the overall control environment for managing the reliability of reporting, compliance with regulatory requirements and operating effectiveness, and the impact of any identified weaknesses in internal controls on management’s conclusions; |
| (ii) | any significant changes in internal control over financial reporting that are disclosed, or considered for disclosure; |
| (iii) | any material issues raised by any inquiry or investigation by CIBC’s regulators as they pertain to responsibilities under this mandate; |
| (iv) | CIBC’s fraud prevention and detection program (including anti-bribery and anti-corruption), including deficiencies in internal controls that may impact the integrity of financial information, or may expose CIBC to other significant internal or external fraud losses and the extent of those losses and any disciplinary action in respect of fraud taken against management or other employees who have a significant role in financial reporting; |
| (v) | any related significant issues and recommendations of the external auditors and internal auditors together with management’s responses thereto; and |
| (vi) | consideration of matters that may be jointly addressed with other committees of the Board. |
| (7) | Certain Federally Regulated Subsidiaries — The Committee will be the audit committee for certain federally regulated subsidiaries of CIBC that require an audit committee under applicable law. |
| (8) | Regulatory Reports and Returns — The Committee will provide or review, as applicable, all reports and returns required of the Committee under applicable law. |
| (9) | Compliance with Legal and Regulatory Requirements — The Committee will review reports from management, the external auditor and the Chief Auditor on the assessment of compliance with applicable laws as they pertain to responsibilities under this mandate, and management’s plans to remediate any deficiencies identified. The Committee will report any material findings to the Board and recommend changes it considers appropriate. |
| (10) | Whistleblowing Procedures — The Committee will ensure that procedures are established for the receipt, retention and treatment of complaints received by CIBC from employees or others, confidentially and anonymously, regarding accounting, internal accounting controls, auditing matters and other wrongdoing as defined in the Whistleblower Policy. The Committee will review management reports on the procedures. |
| (11) | Adverse Investments and Transactions — The Committee will review any investments and transactions that could adversely affect the well-being of CIBC. |
CIBC 2025 Annual Information Form 17
| (12) | Committee Disclosure — The Committee will review and approve any audit committee disclosures required by securities regulators in CIBC’s disclosure documents. |
| (13) | Environmental, Social and Governance — The Committee will oversee the establishment and maintenance by management of a system of processes and controls to ensure the integrity, accuracy and reliability of ESG disclosures in the Annual Report, Sustainability Report, Climate Report, and other material ESG disclosure documents. |
| 3. | Membership |
| (1) | Number — The Committee will consist of at least three Board members. |
| (2) | Appointment or Removal of Members — The Board will appoint Committee members annually until the member’s resignation, disqualification or removal from the Committee or the Board. The Board may fill a vacancy in Committee membership. |
| (3) | Chair — The Board will appoint a Committee Chair from among the Committee members to preside over meetings; coordinate fulfilment of the Committee’s mandate; and oversee development of meeting agendas and workplans. The Chair may vote on any matter requiring a vote but does not have a second vote in the case of a tie. If the Chair is not available for a Committee meeting, Committee members may appoint a Chair from among the members who are present. |
| (4) | Qualifications — Each Committee member will meet the independence standards approved by the Board. No Committee member may be an officer or employee of the Bank or of an affiliate of the Bank. Committee membership will reflect a balance of experience and expertise required to fulfill the Committee’s mandate, notably relevant financial industry and risk management expertise. |
| Each Committee member will be financially literate or become financially literate within a reasonable period after appointment to the Committee. At least one member will be an “audit committee financial expert” in accordance with legal requirements. |
| (5) | Service on Multiple Audit Committees — No member of the Audit Committee may serve on the audit committees of more than two other public companies, unless the Board determines that this simultaneous service would not impair the ability of the member to effectively serve on the Audit Committee. |
| 4. | Meetings |
| (1) | Meetings — The Committee will hold at least four meetings annually and any other meetings as required to fulfill its mandate. Meetings may be called by the Committee Chair or a Committee member, the Chair of the Board, external auditors, Chief Auditor, Chief Financial Officer or the Chief Executive Officer. The external auditors are entitled to attend and be heard at each Committee meeting. CIBC management members and others may attend meetings as the Committee Chair considers appropriate. |
| (2) | Notice of Meeting — Notice of a meeting may be given in writing or by telephone or electronic means, at least 24 hours before the time fixed for the meeting, at the member’s contact information recorded with the Corporate Secretary. A member may waive notice of a meeting in any manner and attendance at a meeting is waiver of notice of the meeting, except where a member attends for the express purpose of objecting to the transaction of any business on the grounds that the meeting is not lawfully called. |
| (3) | Written Resolution — A resolution in writing signed by all members entitled to vote on that resolution at a Committee meeting will be as valid as if it had been passed at a Committee meeting. |
| (4) | Secretary and Minutes — The Corporate Secretary or any other person the Committee requests, will act as secretary at Committee meetings. The Corporate Secretary will record meeting minutes for Committee approval. |
| (5) | Quorum — A quorum for meetings is a majority of Committee members. If a quorum cannot be obtained, Board members who qualify as Committee members may, at the request of the Committee Chair, serve as Committee members for that meeting. |
| (6) | Access to Management and Outside Advisors — The Committee will have unrestricted access to the external auditors, management and employees of CIBC and authority to retain and terminate external counsel and other advisors to assist it in fulfilling its responsibilities. CIBC will provide funding, as determined by the Committee, for the service of an advisor. The Committee will be responsible for the appointment, compensation and oversight of an advisor. The Committee will hold portions of regularly scheduled meetings to meet separately with the Chief Auditor, the Chief Financial Officer and the external auditors. |
| (7) | Meetings Without Management — The Committee will hold portions of regularly scheduled meetings to meet without management members present. |
| (8) | Access to Other Committees — The Committee Chair or a member may request input of another Board committee on any responsibility in the Committee’s mandate. The Committee may also invite other directors to attend Committee meetings to leverage their skills, such as risk or compensation expertise, to support the Committee in carrying out its mandate. |
| (9) | Delegation — The Committee may designate a sub-committee to review any matter within the Committee’s mandate. |
| 5. | Reporting to the Board |
The Committee Chair will report to the Board on recommendations and material matters arising at Committee meetings and any significant matters that arise between Board meetings.
| 6. | Committee Member Development and Performance Review |
The Committee Chair will co-ordinate orientation and continuing director development programs, as needed, relating to the Committee’s mandate. At least annually, the Committee will evaluate and review its performance and the adequacy of the Committee’s mandate.
| 7. | Currency of the Committee Mandate |
This mandate was last revised and approved by the Board on June 5, 2025.
CIBC 2025 Annual Information Form 18
Consolidated financial statements |
102 |
||||
103 |
||||
106 |
||||
108 |
||||
109 |
||||
110 |
||||
111 |
||||
112 |
||||
113 |
||||
114 |
||||
| 114 | Note 1 | – | Basis of preparation and summary of material accounting policies | |||
| 125 | Note 2 | – | Fair value measurement | |||
| 132 | Note 3 | – | Significant transactions | |||
| 133 | Note 4 | – | Securities | |||
| 134 | Note 5 | – | Loans | |||
| 140 | Note 6 | – | Structured entities and derecognition of financial assets | |||
| 143 | Note 7 | – | Property and equipment | |||
| 144 | Note 8 | – | Goodwill, software and other intangible assets | |||
| 145 | Note 9 | – | Other assets | |||
| 146 | Note 10 | – | Deposits | |||
| 146 | Note 11 | – | Other liabilities | |||
| 146 | Note 12 | – | Derivative instruments | |||
| 150 | Note 13 | – | Designated accounting hedges | |||
| 154 | Note 14 | – | Subordinated indebtedness | |||
| 155 | Note 15 | – | Common and preferred shares and other equity instruments |
| 158 | Note 16 | – | Share-based payments | |||
| 160 | Note 17 | – | Post-employment benefits | |||
| 165 | Note 18 | – | Income taxes | |||
| 167 | Note 19 | – | Earnings per share | |||
| 167 | Note 20 | – | Commitments, guarantees and pledged assets | |||
| 169 | Note 21 | – | Contingent liabilities and provisions | |||
| 171 | Note 22 | – | Concentration of credit risk | |||
| 172 | Note 23 | – | Related-party transactions | |||
| 173 | Note 24 | – | Investments in equity-accounted associates and joint ventures | |||
| 174 | Note 25 | – | Significant subsidiaries | |||
| 175 | Note 26 | – | Financial instruments – disclosures | |||
| 176 | Note 27 | – | Offsetting financial assets and liabilities | |||
| 176 | Note 28 | – | Interest income and expense | |||
| 177 | Note 29 | – | Segmented and geographic information | |||
| 179 | Note 30 | – | Future accounting policy changes |
101 |
CIBC 2025 |
Consolidated financial statements |
Harry Culham |
Robert Sedran |
|||
| President and Chief Executive Officer | Chief Financial Officer | December 3, 2025 |
|
CIBC
2025 |
|
102 |
|
103 |
CIBC 2025 |
|
CIBC
2025 |
|
104 |
|
105 |
CIBC 2025 |
Consolidated financial statements |
Description of the matter |
As described in Note 1 and Note 5 of the consolidated financial statements, CIBC has recognized $4.7 billion in expected credit loss (ECL) allowances on its consolidated balance sheet. ECL allowances represent credit losses that reflect an unbiased and probability-weighted amount that is determined by evaluating a range of possible outcomes and reasonable and supportable information about past events, current conditions, and forecasts of future economic conditions. ECL allowances are measured at amounts equal to either (i) 12-month ECL; or (ii) lifetime ECL for those financial instruments that have experienced a significant increase in credit risk (SICR) since initial recognition or when there is objective evidence of impairment. |
| Auditing the allowance for credit losses was complex, involved significant auditor judgment, and required the involvement of specialists due to the inherent complexity of the models, the large volume of data used, assumptions, judgments, and the interrelationship of these variables in measuring the ECL. Significant assumptions and judgments with respect to the estimation of the allowance for credit losses include (i) the determination of when a loan has experienced a SICR; (ii) the forecast of forward-looking information (FLI) for multiple economic scenarios and the probability weighting of those scenarios; (iii) the models and methodologies used for the calculation of both 12-month and lifetime credit losses; and (iv) the application of expert credit judgment. Management has applied a heightened use of judgment in the areas noted above, when assessing the impact of the uncertain macroeconomic environment on the allowance for credit losses. |
How we addressed the matter in our audit |
We obtained an understanding, evaluated the design and tested the operating effectiveness of management’s controls over the allowance for credit losses, with the assistance of our internal specialists. The controls we tested included, amongst others, controls over technology, model validation and monitoring, economic forecasting, data completeness and accuracy, the determination of internal risk ratings for non-retail loans, and the governance and oversight controls over the review of the overall ECL, including the application of expert credit judgment. |
To test the allowance for credit losses, amongst other procedures, we assessed, with the assistance of our credit risk specialists, whether the methodology and assumptions used in significant models that estimate ECL are consistent with the requirements of IFRS 9. For a sample of models, our credit risk specialists reperformed the model validation and monitoring tests performed by management. This included an assessment of the thresholds used to determine a SICR. For a sample of FLI variables, with the assistance of our economic specialists, we evaluated management’s forecasting methodology and compared management’s FLI to independently derived forecasts and publicly available information. We also evaluated the scenario probability weights used in the ECL models. With the assistance of our credit risk specialists, we also evaluated management’s methodology and governance |
|
CIBC
2025 |
|
106 |
|
Consolidated financial statements |
over the application of expert credit judgment by evaluating that the amounts recorded were reflective of underlying credit and/or economic conditions. We tested the completeness and accuracy of data used in the measurement of the ECL by agreeing to source documents and systems and evaluated a sample of non-retail borrower risk ratings against CIBC’s risk rating scale. On a sample basis, we recalculated the ECL to test the mathematical accuracy of management’s models. We also assessed the adequacy of the disclosures related to allowance for credit losses. |
Description of the matter |
As described in Note 2 and Note 12 of the consolidated financial statements, CIBC has recognized $38.4 billion in derivative assets and $41.4 billion in derivative liabilities. The portfolio of derivative instruments is presented by level within the fair value hierarchy, with the majority of the portfolio classified as Level 2. While derivative instruments classified as Level 1 have quoted market prices, those classified as Level 2 and 3 require valuation techniques that use observable and non-observable market inputs and involve the application of management judgment. |
| Auditing the valuation of certain derivatives was complex and required the application of significant auditor judgment and involvement of valuation specialists where the fair value was determined based on complex models and/or significant non-observable market inputs. The inputs and modelling assumptions used to determine fair values that were subject to significant auditor judgment included, amongst others, correlations, volatilities and credit spreads. The valuation of derivatives is sensitive to these inputs as they are forward-looking and could be affected by future economic and market conditions. |
How we addressed the matter in our audit |
We obtained an understanding, evaluated the design and tested the operating effectiveness of management’s controls over the valuation of CIBC’s derivatives portfolio, with the assistance of our internal specialists. The controls we tested included, amongst others, controls over technology, the development and validation of models used to determine the fair value of derivatives, and controls over the independent price verification process, including the integrity of significant inputs described above. |
| To test the valuation of these derivatives, our audit procedures included, amongst others, an evaluation of the methodologies and significant inputs used by CIBC. With the assistance of our valuation specialists, we performed an independent valuation for a sample of derivatives to assess the modelling assumptions and significant inputs used by CIBC to estimate the fair value. We independently obtained significant inputs and assumptions from external market data, where available, in performing our independent valuation. For a sample of models, and with the assistance of our valuation specialists, we assessed the valuation methodologies used by CIBC to determine fair values. We also assessed the adequacy of the disclosures related to the fair value measurement of derivatives. |
Description of the matter |
As described in Note 1 and Note 18 of the consolidated financial statements, CIBC has disclosed its material accounting policies, estimates and assumptions in relation to accounting for uncertainty in income taxes. CIBC operates in a tax environment with constantly evolving and complex tax legislation for financial institutions. Uncertainty in tax positions may arise as tax legislation is subject to interpretation. Estimating uncertain tax provisions requires management judgment to be applied in the interpretation of tax laws across the various jurisdictions in which CIBC operates. This includes significant judgment in the determination of whether it is probable that CIBC’s tax filing positions will be sustained relating to certain complex tax positions and the measurement of such provisions when recognized. |
| Auditing CIBC’s uncertain tax provisions required the involvement of our tax professionals and the application of judgment, including the interpretation of applicable tax legislation and jurisprudence. |
How we addressed the matter in our audit |
With the assistance of our tax professionals, we obtained an understanding, evaluated the design and tested the operating effectiveness of management’s controls over CIBC’s uncertain tax provisions. This included, amongst others, controls over management’s assessment of the technical merits of tax positions and the process related to the measurement of any related income tax provisions. |
| With the assistance of our tax professionals, our audit procedures included, amongst others, an assessment of the technical merits of income tax positions taken by CIBC and the measurement of any related uncertain tax provisions recorded. We inspected and evaluated correspondence from the relevant income tax authorities, income tax advice obtained by CIBC from external advisors including income tax opinions, CIBC’s interpretations of tax laws and the assessment thereof with respect to uncertain tax positions. We evaluated the reasonability of CIBC’s treatment of any new information received during the year relating to these uncertain tax positions. We also assessed the adequacy of the disclosures related to uncertain tax positions. |
107 |
CIBC 2025 |
Consolidated financial statements |
|
CIBC
2025 ANNUAL REPORT |
|
108 |
|
Consolidated financial statements |
Millions of Canadian dollars, as at October 31 |
2025 |
2024 | ||||||
ASSETS |
||||||||
Cash and non-interest-bearing deposits with banks |
$ |
12,379 |
$ | 8,565 | ||||
Interest-bearing deposits with banks |
31,624 |
39,499 | ||||||
Securities (Note 4)
|
283,235 |
254,345 | ||||||
Cash collateral on securities borrowed |
21,697 |
17,028 | ||||||
Securities purchased under resale agreements |
86,695 |
83,721 | ||||||
Loans (Note 5)
|
||||||||
Residential mortgages |
287,033 |
280,672 | ||||||
Personal |
47,866 |
46,681 | ||||||
Credit card |
21,581 |
20,551 | ||||||
Business and government (1)
|
237,416 |
214,305 | ||||||
Allowance for credit losses |
(4,392 |
) |
(3,917 | ) | ||||
589,504 |
558,292 | |||||||
Other |
||||||||
Derivative instruments (Note 12)
|
38,352 |
36,435 | ||||||
Property and equipment (Note 7)
|
3,443 |
3,359 | ||||||
Goodwill (Note 8)
|
5,475 |
5,443 | ||||||
Software and other intangible assets (Note 8)
|
2,894 |
2,830 | ||||||
Investments in equity-accounted associates and joint ventures (Note 24)
|
808 |
785 | ||||||
Deferred tax assets (Note 18)
|
1,027 |
821 | ||||||
Other assets (Note 9)
|
39,805 |
30,862 | ||||||
91,804 |
80,535 | |||||||
Total assets |
$ |
1,116,938 |
$ |
1,041,985 | ||||
LIABILITIES AND EQUITY |
||||||||
Deposits (Note 10)
|
||||||||
Personal |
$ |
258,139 |
$ | 252,894 | ||||
Business and government |
457,284 |
435,499 | ||||||
Bank |
26,723 |
20,009 | ||||||
Secured borrowings |
65,978 |
56,455 | ||||||
808,124 |
764,857 | |||||||
Obligations related to securities sold short |
24,244 |
21,642 | ||||||
Cash collateral on securities lent |
6,031 |
7,997 | ||||||
Obligations related to securities sold under repurchase agreements |
130,042 |
110,153 | ||||||
Other |
||||||||
Derivative instruments (Note 12)
|
41,411 |
40,654 | ||||||
Deferred tax liabilities (Note 18)
|
47 |
49 | ||||||
Other liabilities (1) (Note 11)
|
34,807 |
30,161 | ||||||
76,265 |
70,864 | |||||||
Subordinated indebtedness (Note 14)
|
7,819 |
7,465 | ||||||
Total liabilities |
1,052,525 |
982,978 | ||||||
Equity |
||||||||
Preferred shares and other equity instruments (Note 15)
|
6,369 |
4,946 | ||||||
Common shares (Note 15)
|
16,845 |
17,011 | ||||||
Contributed surplus |
226 |
159 | ||||||
Retained earnings |
36,471 |
33,471 | ||||||
Accumulated other comprehensive income (AOCI) |
4,218 |
3,148 | ||||||
Total shareholders’ equity |
64,129 |
58,735 | ||||||
Non-controlling interests |
284 |
272 | ||||||
Total equity |
64,413 |
59,007 | ||||||
Total liabilities and equity |
$ |
1,116,938 |
$ | 1,041,985 | ||||
| (1) | Includes customers’ liability under acceptances of $10 million (2024: $6 million) in business and government loans and acceptances of $10 million (2024: $6 million) in other liabilities. Prior year amounts have been revised to conform to the presentation adopted in 2025. |
Harry Culham |
Mary Lou Maher |
|
President and Chief Executive Officer |
Director |
109 |
CIBC 2025 ANNUAL REPORT |
| Consolidated financial statements |
Millions of Canadian dollars, except as noted, for the year ended October 31 |
2025 |
2024 |
||||||
| Interest income (Note 28)
(1)
|
||||||||
| Loans |
$ |
32,074 |
$ | 33,925 | ||||
| Securities |
9,045 |
9,560 | ||||||
| Securities borrowed or purchased under resale agreements |
5,260 |
5,811 | ||||||
| Deposits with banks and other |
2,382 |
2,889 | ||||||
48,761 |
52,185 | |||||||
| Interest expense (Note 28)
|
||||||||
| Deposits |
25,110 |
30,476 | ||||||
| Securities sold short |
565 |
625 | ||||||
| Securities lent or sold under repurchase agreements |
6,521 |
6,334 | ||||||
| Subordinated indebtedness |
407 |
510 | ||||||
| Other |
389 |
545 | ||||||
32,992 |
38,490 | |||||||
| Net interest income |
15,769 |
13,695 | ||||||
| Non-interest income |
||||||||
| Underwriting and advisory fees |
915 |
707 | ||||||
| Deposit and payment fees |
996 |
958 | ||||||
| Credit fees |
1,015 |
1,218 | ||||||
| Card fees |
402 |
414 | ||||||
| Investment management and custodial fees |
2,241 |
1,980 | ||||||
| Mutual fund fees |
2,019 |
1,796 | ||||||
| Income from insurance activities, net |
317 |
356 | ||||||
| Commissions on securities transactions |
554 |
431 | ||||||
| Gains (losses) from financial instruments measured/designated at fair value through profit or loss (FVTPL), net |
4,022 |
3,226 | ||||||
| Gains (losses) from debt securities measured at fair value through other comprehensive income (FVOCI) and amortized cost, net |
(14 |
) |
43 | |||||
| Foreign exchange other than trading (FXOTT) |
369 |
386 | ||||||
| Income from equity-accounted associates and joint ventures (Note 24)
|
117 |
79 | ||||||
| Other |
411 |
317 | ||||||
13,364 |
11,911 | |||||||
| Total revenue |
29,133 |
25,606 | ||||||
| Provision for credit losses (Note 5)
|
2,342 |
2,001 | ||||||
| Non-interest expenses |
||||||||
| Employee compensation and benefits |
9,266 |
8,261 | ||||||
| Occupancy costs |
847 |
830 | ||||||
| Computer, software and office equipment |
2,946 |
2,719 | ||||||
| Communications |
395 |
362 | ||||||
| Advertising and business development |
398 |
344 | ||||||
| Professional fees |
284 |
257 | ||||||
| Business and capital taxes |
124 |
128 | ||||||
| Other (Notes 3 and 8)
|
1,592 |
1,538 | ||||||
15,852 |
14,439 | |||||||
| Income before income taxes |
10,939 |
9,166 | ||||||
| Income taxes (Note 18)
|
2,485 |
2,012 | ||||||
| Net income |
$ |
8,454 |
$ | 7,154 | ||||
| Net income attributable to non-controlling interests |
$ |
25 |
$ | 39 | ||||
| Preferred shareholders and other equity instrument holders |
$ |
364 |
$ | 263 | ||||
| Common shareholders |
8,065 |
6,852 | ||||||
| Net income attributable to equity shareholders |
$ |
8,429 |
$ | 7,115 | ||||
| Earnings per share (EPS) (Note 19)
|
||||||||
| Basic |
$ |
8.62 |
$ | 7.29 | ||||
| Diluted |
8.57 |
7.28 | ||||||
| Dividends per common share (Note 15)
|
3.88 |
3.60 | ||||||
| (1) | Interest income included $44.3 billion for the year ended October 31, 2025 (2024: $48.5 billion) calculated based on the effective interest rate method. |
| CIBC 2025 ANNUAL REPORT |
|
110 |
|
| Consolidated financial statements |
Millions of Canadian dollars, for the year ended October 31 |
2025 |
2024 |
||||||
| Net income |
$ |
8,454 |
$ |
7,154 | ||||
| Other comprehensive income (loss) (OCI), net of income tax, that is subject to subsequent reclassification to net income |
||||||||
| Net foreign currency translation adjustments |
||||||||
| Net gains (losses) on investments in foreign operations |
400 |
281 | ||||||
| Net gains (losses) on hedges of investments in foreign operations |
(365 |
) |
(267 | ) | ||||
35 |
14 |
|||||||
| Net change in debt securities measured at FVOCI |
||||||||
| Net gains (losses) on debt securities measured at FVOCI |
368 |
127 | ||||||
| Net (gains) losses reclassified to net income |
(14 |
) |
(27 | ) | ||||
354 |
100 | |||||||
| Net change in cash flow hedges |
||||||||
| Net gains (losses) on derivatives designated as cash flow hedges |
1,419 |
2,348 | ||||||
| Net (gains) losses reclassified to net income |
(928 |
) |
(813 | ) | ||||
491 |
1,535 | |||||||
| OCI, net of income tax, that is not subject to subsequent reclassification to net income |
||||||||
| Net gains (losses) on post-employment defined benefit plans |
208 |
250 | ||||||
| Net gains (losses) due to fair value change of fair value option (FVO) liabilities attributable to changes in credit risk |
(34 |
) |
(216 | ) | ||||
| Net gains (losses) on equity securities designated at FVOCI |
18 |
(13 | ) | |||||
192 |
21 | |||||||
| Total other comprehensive income (loss) (1)
|
1,072 |
1,670 | ||||||
| Comprehensive income |
$ |
9,526 |
$ | 8,824 | ||||
| Comprehensive income attributable to non-controlling interests |
$ |
25 |
$ | 39 | ||||
| Preferred shareholders and other equity instrument holders |
$ |
364 |
$ | 263 | ||||
| Common shareholders |
9,137 |
8,522 | ||||||
| Comprehensive income attributable to equity shareholders |
$ |
9,501 |
$ | 8,785 | ||||
| (1) | Includes $43 million of gains for 2025 (2024: $113 million of gains) relating to our investments in equity-accounted associates and joint ventures. |
Millions of Canadian dollars, for the year ended October 31 |
2025 |
2024 |
||||||
| Income tax (expense) benefit allocated to each component of OCI |
||||||||
| Subject to subsequent reclassification to net income |
||||||||
| Net foreign currency translation adjustments |
||||||||
| Net gains (losses) on investments in foreign operations |
$ |
(12 |
) |
$ | (5 | ) | ||
| Net gains (losses) on hedges of investments in foreign operations |
(68 |
) |
– | |||||
(80 |
) |
(5 | ) | |||||
| Net change in debt securities measured at FVOCI |
||||||||
| Net gains (losses) on debt securities measured at FVOCI |
(74 |
) |
(12 | ) | ||||
| Net (gains) losses reclassified to net income |
5 |
10 | ||||||
(69 |
) |
(2 | ) | |||||
| Net change in cash flow hedges |
||||||||
| Net gains (losses) on derivatives designated as cash flow hedges |
(546 |
) |
(903 | ) | ||||
| Net (gains) losses reclassified to net income |
357 |
313 | ||||||
(189 |
) |
(590 | ) | |||||
| Not subject to subsequent reclassification to net income |
||||||||
| Net gains (losses) on post-employment defined benefit plans |
(66 |
) |
(68 | ) | ||||
| Net gains (losses) due to fair value change of FVO liabilities attributable to changes in credit risk |
13 |
83 | ||||||
| Net gains (losses) on equity securities designated at FVOCI |
(6 |
) |
4 | |||||
(59 |
) |
19 | ||||||
| Total income tax (expense) benefit allocated to each component of OCI |
$ |
(397 |
) |
$ | (578 | ) | ||
111 |
CIBC 2025 ANNUAL REPORT |
| Consolidated financial statements |
Millions of Canadian dollars, for the year ended October 31 |
2025 |
2024 |
||||||
| Preferred shares and other equity instruments (Note 15)
|
||||||||
| Balance at beginning of year |
$ |
4,946 |
$ | 4,925 | ||||
| Issue of preferred shares and limited recourse capital notes (LRCNs) |
2,770 |
1,000 | ||||||
| Redemption of preferred shares and LRCNs |
(1,350 |
) |
(975 | ) | ||||
| Treasury shares |
3 |
(4 | ) | |||||
| Balance at end of year |
$ |
6,369 |
$ | 4,946 | ||||
| Common shares (Note 15)
|
||||||||
| Balance at beginning of year |
$ |
17,011 |
$ | 16,082 | ||||
| Issue of common shares |
168 |
1,019 | ||||||
| Purchase of common shares for cancellation |
(335 |
) |
(90 | ) | ||||
| Treasury shares |
1 |
– | ||||||
| Balance at end of year |
$ |
16,845 |
$ | 17,011 | ||||
| Contributed surplus |
||||||||
| Balance at beginning of year |
$ |
159 |
$ | 109 | ||||
| Compensation expense arising from equity-settled share-based awards |
20 |
16 | ||||||
| Exercise of stock options and settlement of other equity-settled share-based awards |
(10 |
) |
(9 | ) | ||||
| Other (1)
|
57 |
43 | ||||||
| Balance at end of year |
$ |
226 |
$ | 159 | ||||
| Retained earnings |
||||||||
| Balance at beginning of year |
$ |
33,471 |
30,352 | |||||
| Net income attributable to equity shareholders |
8,429 |
7,115 | ||||||
| Dividends and distributions (Note 15)
|
||||||||
| Preferred and other equity instruments |
(364 |
) |
(263 | ) | ||||
| Common |
(3,629 |
) |
(3,382 | ) | ||||
| Premium on purchase of common shares for cancellation |
(1,396 |
) |
(329 | ) | ||||
| Realized gains (losses) on equity securities designated at FVOCI reclassified from AOCI |
2 |
(15 | ) | |||||
| Other |
(42 |
) |
(7 | ) | ||||
| Balance at end of year |
$ |
36,471 |
$ | 33,471 | ||||
| AOCI, net of income tax |
||||||||
| AOCI, net of income tax, that is subject to subsequent reclassification to net income |
||||||||
| Net foreign currency translation adjustments |
||||||||
| Balance at beginning of year |
$ |
2,176 |
$ | 2,162 | ||||
| Net change in foreign currency translation adjustments |
35 |
14 | ||||||
| Balance at end of year |
$ |
2,211 |
$ | 2,176 | ||||
| Net gains (losses) on debt securities measured at FVOCI |
||||||||
| Balance at beginning of year |
$ |
(307 |
) |
$ | (407 | ) | ||
| Net change in debt securities measured at FVOCI |
354 |
100 | ||||||
| Balance at end of year |
$ |
47 |
$ | (307 | ) | |||
| Net gains (losses) on cash flow hedges |
||||||||
| Balance at beginning of year |
$ |
509 |
$ | (1,026 | ) | |||
| Net change in cash flow hedges |
491 |
1,535 | ||||||
| Balance at end of year |
$ |
1,000 |
$ | 509 | ||||
| AOCI, net of income tax, that is not subject to subsequent reclassification to net income |
||||||||
| Net gains (losses) on post-employment defined benefit plans |
||||||||
| Balance at beginning of year |
$ |
842 |
$ | 592 | ||||
| Net change in post-employment defined benefit plans |
208 |
250 | ||||||
| Balance at end of year |
$ |
1,050 |
$ | 842 | ||||
| Net gains (losses) due to fair value change of FVO liabilities attributable to changes in credit risk |
||||||||
| Balance at beginning of year |
$ |
(88 |
) |
$ | 128 | |||
| Net change attributable to changes in credit risk |
(34 |
) |
(216 | ) | ||||
| Balance at end of year |
$ |
(122 |
) |
$ | (88 | ) | ||
| Net gains (losses) on equity securities designated at FVOCI |
||||||||
| Balance at beginning of year |
$ |
16 |
$ | 14 | ||||
| Net gains (losses) on equity securities designated at FVOCI |
18 |
(13 | ) | |||||
| Realized (gains) losses on equity securities designated at FVOCI reclassified to retained earnings |
(2 |
) |
15 | |||||
| Balance at end of year |
$ |
32 |
$ | 16 | ||||
| Total AOCI, net of income tax |
$ |
4,218 |
$ | 3,148 | ||||
| Non-controlling interests |
||||||||
| Balance at beginning of year |
$ |
272 |
$ | 232 | ||||
| Net income attributable to non-controlling interests |
25 |
39 | ||||||
| Dividends |
(9 |
) |
(8 | ) | ||||
| Other |
(4 |
) |
9 | |||||
| Balance at end of year |
$ |
284 |
$ | 272 | ||||
| Equity at end of year |
$ |
64,413 |
$ | 59,007 | ||||
| (1) | Includes the portion of the estimated tax benefit related to employee stock options that is incremental to the amount recognized in the consolidated statement of income. |
| CIBC 2025 ANNUAL REPORT |
|
112 |
|
Consolidated financial statements |
Millions of Canadian dollars, for the year ended October 31 |
2025 |
2024 |
||||||
Cash flows provided by (used in) operating activities |
||||||||
Net income |
$ |
8,454 |
$ | 7,154 | ||||
Adjustments to reconcile net income to cash flows provided by (used in) operating activities: |
||||||||
Provision for credit losses |
2,342 |
2,001 | ||||||
Amortization and impairment (1)
|
1,178 |
1,170 | ||||||
Stock options and restricted shares expense |
20 |
16 | ||||||
Deferred income taxes |
(257 |
) |
(244 | ) | ||||
Losses (gains) from debt securities measured at FVOCI and amortized cost |
14 |
(43 | ) | |||||
Net losses (gains) on disposal of property and equipment |
(2 |
) |
(1 | ) | ||||
Other non-cash items, net |
(16 |
) |
(1,822 | ) | ||||
Net changes in operating assets and liabilities |
||||||||
Interest-bearing deposits with banks |
7,875 |
(4,597 | ) | |||||
Loans, net of repayments |
(33,381 |
) |
(28,930 | ) | ||||
Deposits, net of withdrawals |
37,183 |
34,467 | ||||||
Obligations related to securities sold short |
2,602 |
2,976 | ||||||
Accrued interest receivable |
44 |
(711 | ) | |||||
Accrued interest payable |
(983 |
) |
452 | |||||
Derivative assets |
(1,921 |
) |
(3,240 | ) | ||||
Derivative liabilities |
328 |
(813 | ) | |||||
Securities measured at FVTPL |
(22,817 |
) |
(23,319 | ) | ||||
Other assets and liabilities measured/designated at FVTPL |
5,090 |
3,431 | ||||||
Current income taxes |
(489 |
) |
(257 | ) | ||||
Cash collateral on securities lent |
(1,966 |
) |
(84 | ) | ||||
Obligations related to securities sold under repurchase agreements |
19,889 |
23,035 | ||||||
Cash collateral on securities borrowed |
(4,669 |
) |
(2,377 | ) | ||||
Securities purchased under resale agreements |
(2,974 |
) |
(3,537 | ) | ||||
Other, net |
(1,706 |
) |
6,361 | |||||
Net cash flows provided by (used in) operating activities |
13,838 |
11,088 | ||||||
Cash flows provided by (used in) financing activities |
||||||||
Issue of subordinated indebtedness |
1,250 |
2,250 | ||||||
Redemption/repurchase/maturity of subordinated indebtedness |
(1,069 |
) |
(1,536 | ) | ||||
Issue of preferred shares and LRCNs, net of issuance cost |
2,757 |
996 | ||||||
Redemption of preferred shares and LRCNs |
(1,350 |
) |
(975 | ) | ||||
Issue of common shares for cash |
158 |
312 | ||||||
Purchase of common shares for cancellation |
(1,731 |
) |
(419 | ) | ||||
Net sale (purchase) of treasury shares |
4 |
(4 | ) | |||||
Dividends and distributions paid |
(3,993 |
) |
(2,947 | ) | ||||
Repayment of lease liabilities |
(309 |
) |
(287 | ) | ||||
Other, net |
(29 |
) |
– | |||||
Net cash flows provided by (used in) financing activities |
(4,312 |
) |
(2,610 | ) | ||||
Cash flows provided by (used in) investing activities |
||||||||
Purchase of securities measured/designated at FVOCI and amortized cost |
(98,369 |
) |
(76,528 | ) | ||||
Proceeds from sale of securities measured/designated at FVOCI and amortized cost |
46,299 |
29,761 | ||||||
Proceeds from maturity of debt securities measured at FVOCI and amortized cost |
47,404 |
27,105 | ||||||
Net sale (purchase) of property, equipment, software and other intangible assets |
(1,109 |
) |
(1,089 | ) | ||||
Net cash flows provided by (used in) investing activities |
(5,775 |
) |
(20,751 | ) | ||||
Effect of exchange rate changes on cash and non-interest-bearing deposits with banks |
63 |
22 | ||||||
Net increase (decrease) in cash and non-interest-bearing deposits with banks during the year |
3,814 |
(12,251 | ) | |||||
Cash and non-interest-bearing deposits with banks at beginning of year |
8,565 |
20,816 | ||||||
Cash and non-interest-bearing deposits with banks at end of year (2)
|
$ |
12,379 |
$ | 8,565 | ||||
Cash interest paid |
$ |
33,975 |
$ | 38,038 | ||||
Cash interest received |
46,993 |
49,761 | ||||||
Cash dividends received |
1,812 |
1,713 | ||||||
Cash income taxes paid |
3,231 |
2,513 | ||||||
| (1) | Comprises amortization and impairment of buildings, right-of-use |
| (2) | Includes restricted cash of $579 million (2024: $466 million) and interest-bearing demand deposits with Bank of Canada. |
113 |
CIBC 2025 |
Consolidated financial statements |
Note 1 |
Basis of preparation and summary of material accounting policies |
|
CIBC
2025 |
|
114 |
|
Consolidated financial statements |
| I) | The business purpose of the portfolio; |
| II) | The risks that are being managed and the type of business activities that are being carried out on a day-to-day |
| III) | The basis on which performance of the portfolio is being evaluated; and |
| IV) | The frequency and significance of sales activity. |
115 |
CIBC 2025 |
| Consolidated financial statements |
• |
The probability of default (PD) is an estimate of the likelihood of default over a given time horizon; |
• |
The loss given default (LGD) is an estimate of the loss arising in the case where a default occurs at a given time; and |
• |
The exposure at default (EAD) is an estimate of the exposure at a future default date. |
| CIBC 2025 |
|
116 |
|
| Consolidated financial statements |
117 |
CIBC 2025 |
| Consolidated financial statements |
• |
Our contractual right to receive cash flows from the assets has expired; or |
• |
We transfer our contractual rights to receive the cash flows of the financial asset or where applicable the transfer also meets the criteria of a qualifying pass-through arrangement, and we have: (i) transferred substantially all the risks and rewards of ownership, or (ii) neither retained nor transferred substantially all the risks and rewards, but have not retained control. |
| CIBC 2025 |
|
118 |
|
| Consolidated financial statements |
119 |
CIBC 2025 |
| Consolidated financial statements |
| • | Buildings – 40 years |
| • | Computer equipment – 3 to 7 years |
| • | Office furniture, equipment and other – 4 to 15 years |
| • | Leasehold improvements – over the lesser of the estimated useful life of the asset and the lease term, including reasonably assured renewal periods |
| CIBC 2025 ANNUAL REPORT |
|
120 |
|
| Consolidated financial statements |
| • | Software – 5 to 10 years |
| • | Contract-based intangibles – 8 to 15 years |
| • | Core deposit and customer relationship intangibles – 3 to 16 years |
121 |
CIBC 2025 ANNUAL REPORT |
| Consolidated financial statements |
| CIBC 2025 ANNUAL REPORT |
|
122 |
|
| Consolidated financial statements |
123 |
CIBC 2025 ANNUAL REPORT |
| Consolidated financial statements |
| CIBC 2025 ANNUAL REPORT |
|
124 |
|
| Consolidated financial statements |
Note 2 |
Fair value measurement |
| • | Level 1 – Unadjusted quoted market prices in active markets for identical assets or liabilities we can access at the measurement date. Bid prices, ask prices or prices within the bid and ask, which are the most representative of the fair value, are used as appropriate to measure fair value. Fair value is best evidenced by an independent quoted market price for the same instrument in an active market. An active market is one where transactions are occurring with sufficient frequency and volume to provide quoted prices on an ongoing basis. |
| • | Level 2 – Quoted prices for identical assets or liabilities in markets that are inactive or observable market quotes for similar instruments, or use of valuation techniques where all significant inputs are observable. Inactive markets may be characterized by a significant decline in the volume and level of observed trading activity or through large or erratic bid/offer spreads. In instances where traded markets do not exist or are not considered sufficiently active, we measure fair value using valuation models. |
| • | Level 3 – Non-observable or indicative prices or use of valuation techniques where one or more significant inputs are non-observable. |
125 |
CIBC 2025 |
| Consolidated financial statements |
| CIBC 2025 |
|
126 |
|
| Consolidated financial statements |
| Carrying value | ||||||||||||||||||||||||||||||
| $ millions, as at October 31 | Amortized cost |
Mandatorily measured at FVTPL |
Designated at FVTPL |
Fair value through OCI |
Total | Fair value |
Fair value over (under) carrying value |
|||||||||||||||||||||||
| 2025 |
Financial assets |
|||||||||||||||||||||||||||||
| Cash and deposits with banks |
$ |
44,003 |
$ |
– |
$ |
– |
$ |
– |
$ |
44,003 |
$ |
44,003 |
$ |
– |
||||||||||||||||
| Securities |
65,471 |
128,859 |
– |
88,905 |
283,235 |
283,173 |
(62 |
) | ||||||||||||||||||||||
| Cash collateral on securities borrowed |
21,697 |
– |
– |
– |
21,697 |
21,697 |
– |
|||||||||||||||||||||||
| Securities purchased under resale agreements |
69,044 |
17,651 |
– |
– |
86,695 |
86,695 |
– |
|||||||||||||||||||||||
| Loans |
||||||||||||||||||||||||||||||
| Residential mortgages |
286,456 |
3 |
– |
– |
286,459 |
287,328 |
869 |
|||||||||||||||||||||||
| Personal |
46,710 |
– |
– |
– |
46,710 |
46,774 |
64 |
|||||||||||||||||||||||
| Credit card |
20,639 |
– |
– |
– |
20,639 |
20,651 |
12 |
|||||||||||||||||||||||
| Business and government (1)
|
235,136 |
485 |
75 |
– |
235,696 |
235,802 |
106 |
|||||||||||||||||||||||
| Derivative instruments |
– |
38,352 |
– |
– |
38,352 |
38,352 |
– |
|||||||||||||||||||||||
| Other assets | 25,069 |
674 |
– |
– |
25,743 |
25,743 |
– |
|||||||||||||||||||||||
Financial liabilities |
||||||||||||||||||||||||||||||
| Deposits |
||||||||||||||||||||||||||||||
| Personal |
$ |
238,211 |
$ |
– |
$ |
19,928 |
$ |
– |
$ |
258,139 |
$ |
258,629 |
$ |
490 |
||||||||||||||||
| Business and government |
434,003 |
– |
23,281 |
– |
457,284 |
458,321 |
1,037 |
|||||||||||||||||||||||
| Bank |
26,723 |
– |
– |
– |
26,723 |
26,723 |
– |
|||||||||||||||||||||||
| Secured borrowings |
65,151 |
– |
827 |
– |
65,978 |
66,210 |
232 |
|||||||||||||||||||||||
| Derivative instruments | – |
41,411 |
– |
– |
41,411 |
41,411 |
– |
|||||||||||||||||||||||
| Obligations related to securities sold short |
– |
24,244 |
– |
– |
24,244 |
24,244 |
– |
|||||||||||||||||||||||
| Cash collateral on securities lent |
6,031 |
– |
– |
– |
6,031 |
6,031 |
– |
|||||||||||||||||||||||
| Obligations related to securities sold under repurchase agreements |
121,907 |
– |
8,135 |
– |
130,042 |
130,042 |
– |
|||||||||||||||||||||||
| Other liabilities (1)
|
22,357 |
220 |
8 |
– |
22,585 |
22,585 |
– |
|||||||||||||||||||||||
| Subordinated indebtedness | 7,819 |
– |
– |
– |
7,819 |
8,091 |
272 |
|||||||||||||||||||||||
| 2024 |
Financial assets |
|||||||||||||||||||||||||||||
| Cash and deposits with banks |
$ | 48,064 | $ | – | $ | – | $ | – | $ | 48,064 | $ | 48,064 | $ | – | ||||||||||||||||
| Securities |
71,610 | 106,042 | – | 76,693 | 254,345 | 253,437 | (908 | ) | ||||||||||||||||||||||
| Cash collateral on securities borrowed |
17,028 | – | – | – | 17,028 | 17,028 | – | |||||||||||||||||||||||
| Securities purchased under resale agreements |
58,744 | 24,977 | – | – | 83,721 | 83,721 | – | |||||||||||||||||||||||
| Loans |
||||||||||||||||||||||||||||||
| Residential mortgages |
280,220 | 3 | – | – | 280,223 | 279,805 | (418 | ) | ||||||||||||||||||||||
| Personal |
45,739 | – | – | – | 45,739 | 45,750 | 11 | |||||||||||||||||||||||
| Credit card |
19,649 | – | – | – | 19,649 | 19,682 | 33 | |||||||||||||||||||||||
| Business and government (1)
|
212,460 | 116 | 105 | – | 212,681 | 212,750 | 69 | |||||||||||||||||||||||
| Derivative instruments |
– | 36,435 | – | – | 36,435 | 36,435 | – | |||||||||||||||||||||||
| Other assets | 20,121 | 364 | – | – | 20,485 | 20,485 | – | |||||||||||||||||||||||
| Financial liabilities |
||||||||||||||||||||||||||||||
| Deposits |
||||||||||||||||||||||||||||||
| Personal |
$ | 235,593 | $ | – | $ | 17,301 | $ | – | $ | 252,894 | $ | 253,378 | $ | 484 | ||||||||||||||||
| Business and government |
414,441 | – | 21,058 | – | 435,499 | 436,528 | 1,029 | |||||||||||||||||||||||
| Bank |
20,009 | – | – | – | 20,009 | 20,009 | – | |||||||||||||||||||||||
| Secured borrowings |
55,285 | – | 1,170 | – | 56,455 | 56,588 | 133 | |||||||||||||||||||||||
| Derivative instruments |
– | 40,654 | – | – | 40,654 | 40,654 | – | |||||||||||||||||||||||
| Obligations related to securities sold short |
– | 21,642 | – | – | 21,642 | 21,642 | – | |||||||||||||||||||||||
| Cash collateral on securities lent |
7,997 | – | – | – | 7,997 | 7,997 | – | |||||||||||||||||||||||
| Obligations related to securities sold under repurchase agreements |
100,407 | – | 9,746 | – | 110,153 | 110,153 | – | |||||||||||||||||||||||
| Other liabilities (1)
|
20,657 | 158 | 19 | – | 20,834 | 20,834 | – | |||||||||||||||||||||||
| Subordinated indebtedness | 7,465 | – | – | – | 7,465 | 7,698 | 233 | |||||||||||||||||||||||
| (1) | Includes customers’ liability under acceptances of $10 million (2024: $6 million) in business and government loans and acceptances of $10 million (2024: $6 million) in other liabilities. Prior year amounts have been revised to conform to the presentation adopted in 2025. |
127 |
CIBC 2025 ANNUAL REPORT |
| Consolidated financial statements |
$ millions, as at October 31 |
2025 |
2024 |
||||||||||||||||||||||||
Positive |
Negative |
Net |
Positive |
Negative |
Net |
|||||||||||||||||||||
| Held for trading |
||||||||||||||||||||||||||
| Interest rate derivatives |
||||||||||||||||||||||||||
| Over-the-counter |
– Forward rate agreements |
$ |
86 |
$ |
182 |
$ |
(96 |
) |
$ | 135 | $ | 239 | $ | (104 | ) | |||||||||||
| – Swap contracts |
5,106 |
5,307 |
(201 |
) |
6,149 | 9,124 | (2,975 | ) | ||||||||||||||||||
| – Purchased options |
809 |
– |
809 |
358 | – | 358 | ||||||||||||||||||||
| – Written options |
– |
609 |
(609 |
) |
– | 309 | (309 | ) | ||||||||||||||||||
6,001 |
6,098 |
(97 |
) |
6,642 | 9,672 | (3,030 | ) | |||||||||||||||||||
| Exchange-traded |
– Futures contracts |
– |
– |
– |
– | – | – | |||||||||||||||||||
| – Purchased options |
2 |
– |
2 |
2 | – | 2 | ||||||||||||||||||||
| – Written options |
– |
3 |
(3 |
) |
– | 2 | (2 | ) | ||||||||||||||||||
2 |
3 |
(1 |
) |
2 | 2 | – | ||||||||||||||||||||
| Total interest rate derivatives |
6,003 |
6,101 |
(98 |
) |
6,644 | 9,674 | (3,030 | ) | ||||||||||||||||||
| Foreign exchange derivatives |
||||||||||||||||||||||||||
| Over-the-counter |
– Forward contracts |
7,173 |
6,243 |
930 |
7,378 | 6,379 | 999 | |||||||||||||||||||
| – Swap contracts |
4,979 |
7,174 |
(2,195 |
) |
5,056 | 7,944 | (2,888 | ) | ||||||||||||||||||
| – Purchased options |
640 |
– |
640 |
443 | – | 443 | ||||||||||||||||||||
| – Written options |
– |
578 |
(578 |
) |
– | 535 | (535 | ) | ||||||||||||||||||
| Total foreign exchange derivatives |
12,792 |
13,995 |
(1,203 |
) |
12,877 | 14,858 | (1,981 | ) | ||||||||||||||||||
| Credit derivatives |
||||||||||||||||||||||||||
| Over-the-counter |
– Credit default swap contracts – protection purchased |
77 |
1 |
76 |
46 | 3 | 43 | |||||||||||||||||||
| – Credit default swap contracts – protection sold |
– |
85 |
(85 |
) |
– | 52 | (52 | ) | ||||||||||||||||||
| Total credit derivatives |
77 |
86 |
(9 |
) |
46 | 55 | (9 | ) | ||||||||||||||||||
| Equity derivatives |
||||||||||||||||||||||||||
| Over-the-counter |
5,618 |
9,239 |
(3,621 |
) |
4,989 | 6,401 | (1,412 | ) | ||||||||||||||||||
| Exchange-traded |
5,761 |
5,213 |
548 |
5,821 | 4,712 | 1,109 | ||||||||||||||||||||
| Total equity derivatives |
11,379 |
14,452 |
(3,073 |
) |
10,810 | 11,113 | (303 | ) | ||||||||||||||||||
| Precious metal and other commodity derivatives |
||||||||||||||||||||||||||
| Over-the-counter |
3,513 |
4,414 |
(901 |
) |
2,692 | 3,906 | (1,214 | ) | ||||||||||||||||||
| Exchange-traded |
268 |
189 |
79 |
416 | 241 | 175 | ||||||||||||||||||||
| Total precious metal and other commodity derivatives |
3,781 |
4,603 |
(822 |
) |
3,108 | 4,147 | (1,039 | ) | ||||||||||||||||||
| Total held for trading |
34,032 |
39,237 |
(5,205 |
) |
33,485 | 39,847 | (6,362 | ) | ||||||||||||||||||
| Held for ALM |
||||||||||||||||||||||||||
| Interest rate derivatives |
||||||||||||||||||||||||||
| Over-the-counter |
– Forward rate agreements |
– |
– |
– |
– | – | – | |||||||||||||||||||
| – Swap contracts |
101 |
1,171 |
(1,070 |
) |
124 | (410 | ) | 534 | ||||||||||||||||||
| – Purchased options |
4 |
– |
4 |
3 | – | 3 | ||||||||||||||||||||
| – Written options |
– |
1 |
(1 |
) |
– | 2 | (2 | ) | ||||||||||||||||||
| Total interest rate derivatives |
105 |
1,172 |
(1,067 |
) |
127 | (408 | ) | 535 | ||||||||||||||||||
| Foreign exchange derivatives |
||||||||||||||||||||||||||
| Over-the-counter |
– Forward contracts |
27 |
63 |
(36 |
) |
28 | 82 | (54 | ) | |||||||||||||||||
| – Swap contracts |
4,026 |
937 |
3,089 |
2,620 | 1,129 | 1,491 | ||||||||||||||||||||
| Total foreign exchange derivatives |
4,053 |
1,000 |
3,053 |
2,648 | 1,211 | 1,437 | ||||||||||||||||||||
| Equity derivatives |
||||||||||||||||||||||||||
| Over-the-counter |
162 |
2 |
160 |
174 | 4 | 170 | ||||||||||||||||||||
| Total equity derivatives |
162 |
2 |
160 |
174 | 4 | 170 | ||||||||||||||||||||
| Precious metal and other commodity derivatives |
||||||||||||||||||||||||||
| Over-the-counter |
– |
– |
– |
1 | – | 1 | ||||||||||||||||||||
| Total precious metal and other commodity derivatives |
– |
– |
– |
1 | – | 1 | ||||||||||||||||||||
| Total held for ALM |
4,320 |
2,174 |
2,146 |
2,950 | 807 | 2,143 | ||||||||||||||||||||
| Total fair value |
38,352 |
41,411 |
(3,059 |
) |
36,435 | 40,654 | (4,219 | ) | ||||||||||||||||||
| Less: effect of netting |
(24,469 |
) |
(24,469 |
) |
– |
(21,777 | ) | (21,777 | ) | – | ||||||||||||||||
| Total fair value of derivative instruments |
$ |
13,883 |
$ |
16,942 |
$ |
(3,059 |
) |
$ | 14,658 | $ | 18,877 | $ | (4,219 | ) | ||||||||||||
| CIBC 2025 ANNUAL REPORT |
|
128 |
|
| Consolidated financial statements |
Level 1 |
Level 2 |
Level 3 |
||||||||||||||||||||||||||||||||||||||||||
Quoted market price |
Valuation technique – observable market inputs |
Valuation technique – non-observable market inputs
|
Total 2025 |
Total 2024 |
||||||||||||||||||||||||||||||||||||||||
$ millions, as at October 31 |
2025 |
2024 |
2025 |
2024 |
2025 |
2024 |
||||||||||||||||||||||||||||||||||||||
| Financial assets |
||||||||||||||||||||||||||||||||||||||||||||
| Amortized cost securities |
$ |
– |
$ |
– | $ |
64,642 |
$ |
69,961 |
$ |
767 |
$ |
741 |
$ |
65,409 |
$ |
70,702 |
||||||||||||||||||||||||||||
| Loans |
||||||||||||||||||||||||||||||||||||||||||||
| Residential mortgages |
– |
– |
– |
– |
287,325 |
279,802 |
287,325 |
279,802 |
||||||||||||||||||||||||||||||||||||
| Personal |
– |
– |
– |
46,774 |
45,750 |
46,774 |
45,750 |
|||||||||||||||||||||||||||||||||||||
| Credit card |
– |
– |
– |
– |
20,651 |
19,682 |
20,651 |
19,682 |
||||||||||||||||||||||||||||||||||||
| Business and government |
– |
– |
– |
– |
235,232 |
212,523 |
235,232 |
212,523 |
||||||||||||||||||||||||||||||||||||
| Financial liabilities |
||||||||||||||||||||||||||||||||||||||||||||
| Deposits |
||||||||||||||||||||||||||||||||||||||||||||
| Personal |
$ |
– |
$ |
– |
$ |
73,757 |
$ |
82,620 |
$ |
4,167 |
$ |
5,232 |
$ |
77,924 |
$ |
87,852 |
||||||||||||||||||||||||||||
| Business and government |
– |
– |
193,978 |
191,616 |
3,596 |
4,681 |
197,574 |
196,297 |
||||||||||||||||||||||||||||||||||||
| Bank |
– |
– |
8,737 |
9,420 |
– |
– |
8,737 |
9,420 |
||||||||||||||||||||||||||||||||||||
| Secured borrowings |
– |
– |
62,356 |
50,546 |
3,027 |
4,872 |
65,383 |
55,418 |
||||||||||||||||||||||||||||||||||||
| Subordinated indebtedness |
– |
– |
8,091 |
7,698 |
– |
– |
8,091 |
7,698 |
||||||||||||||||||||||||||||||||||||
Level 1 |
Level 2 |
Level 3 |
||||||||||||||||||||||||||||||||||||||||||
Quoted market price |
Valuation technique – observable market inputs |
Valuation technique – non-observable market inputs |
Total 2025 |
Total 2024 |
||||||||||||||||||||||||||||||||||||||||
$ millions, as at October 31 |
2025 |
2024 |
2025 |
2024 |
2025 |
2024 |
||||||||||||||||||||||||||||||||||||||
| Financial assets |
||||||||||||||||||||||||||||||||||||||||||||
| Debt securities measured at FVTPL |
||||||||||||||||||||||||||||||||||||||||||||
| Government issued or guaranteed |
$ |
6,222 |
$ |
4,258 |
$ |
34,635 |
$ |
32,328 |
$ |
– |
$ |
– |
$ |
40,857 |
$ |
36,586 |
||||||||||||||||||||||||||||
| Corporate and other debt |
– |
– |
4,537 |
4,385 |
103 |
– |
4,640 |
4,385 |
||||||||||||||||||||||||||||||||||||
| Mortgage- and asset-backed |
– |
– |
7,193 |
4,213 |
392 |
70 |
7,585 |
4,283 |
||||||||||||||||||||||||||||||||||||
6,222 |
4,258 |
46,365 |
40,926 |
495 |
70 |
53,082 |
45,254 |
|||||||||||||||||||||||||||||||||||||
| Loans measured at FVTPL |
||||||||||||||||||||||||||||||||||||||||||||
| Business and government |
– |
– |
485 |
116 |
75 |
(1)
|
105 |
(1) |
560 |
221 |
||||||||||||||||||||||||||||||||||
| Residential mortgages |
– |
– |
3 |
3 |
– |
– |
3 |
3 |
||||||||||||||||||||||||||||||||||||
– |
– |
488 |
119 |
75 |
105 |
563 |
224 |
|||||||||||||||||||||||||||||||||||||
| Debt securities measured at FVOCI |
||||||||||||||||||||||||||||||||||||||||||||
| Government issued or guaranteed |
9,206 |
2,760 |
63,917 |
60,051 |
– |
– |
73,123 |
62,811 |
||||||||||||||||||||||||||||||||||||
| Corporate and other debt |
– |
– |
10,106 |
9,083 |
– |
– |
10,106 |
9,083 |
||||||||||||||||||||||||||||||||||||
| Mortgage- and asset-backed |
– |
– |
4,656 |
4,127 |
– |
– |
4,656 |
4,127 |
||||||||||||||||||||||||||||||||||||
9,206 |
2,760 |
78,679 |
73,261 |
– |
– |
87,885 |
76,021 |
|||||||||||||||||||||||||||||||||||||
| Corporate equity mandatorily measured at FVTPL and designated at FVOCI |
74,686 |
59,904 |
1,048 |
916 |
1,063 |
640 |
76,797 |
61,460 |
||||||||||||||||||||||||||||||||||||
| Securities purchased under resale agreements measured at FVTPL |
– |
– |
17,651 |
24,977 |
– |
– |
17,651 |
24,977 |
||||||||||||||||||||||||||||||||||||
| Other assets |
– |
– |
674 |
364 |
– |
– |
674 |
364 |
||||||||||||||||||||||||||||||||||||
| Derivative instruments |
||||||||||||||||||||||||||||||||||||||||||||
| Interest rate |
2 |
2 |
6,027 |
6,718 |
79 |
51 |
6,108 |
6,771 |
||||||||||||||||||||||||||||||||||||
| Foreign exchange |
– |
– |
16,845 |
15,525 |
– |
– |
16,845 |
15,525 |
||||||||||||||||||||||||||||||||||||
| Credit |
– |
– |
41 |
2 |
36 |
44 |
77 |
46 |
||||||||||||||||||||||||||||||||||||
| Equity |
5,761 |
5,821 |
5,729 |
5,157 |
51 |
6 |
11,541 |
10,984 |
||||||||||||||||||||||||||||||||||||
| Precious metal and other commodity |
55 |
32 |
3,726 |
3,077 |
– |
– |
3,781 |
3,109 |
||||||||||||||||||||||||||||||||||||
5,818 |
5,855 |
32,368 |
30,479 |
166 |
101 |
38,352 |
36,435 |
|||||||||||||||||||||||||||||||||||||
| Total financial assets |
$ |
95,932 |
$ |
72,777 |
$ |
177,273 |
$ |
171,042 |
$ |
1,799 |
$ |
916 |
$ |
275,004 |
$ |
244,735 |
||||||||||||||||||||||||||||
| Financial liabilities |
||||||||||||||||||||||||||||||||||||||||||||
| Deposits and other liabilities (2)
|
$ |
– |
$ |
– |
$ |
(43,788 |
) |
$ |
(39,290 |
) |
$ |
(476 |
) |
$ |
(416 |
) |
$ |
(44,264 |
) |
$ |
(39,706 |
) | ||||||||||||||||||||||
| Obligations related to securities sold short |
(6,150 |
) |
(9,199 |
) |
(18,094 |
) |
(12,443 |
) |
– |
– |
(24,244 |
) |
(21,642 |
) | ||||||||||||||||||||||||||||||
| Obligations related to securities sold under repurchase agreements |
– |
– |
(8,135 |
) |
(9,746 |
) |
– |
– |
(8,135 |
) |
(9,746 |
) | ||||||||||||||||||||||||||||||||
| Derivative instruments |
||||||||||||||||||||||||||||||||||||||||||||
| Interest rate |
(3 |
) |
(2 |
) |
(6,215 |
) |
(8,236 |
) |
(1,055 |
) |
(1,028 |
) |
(7,273 |
) |
(9,266 |
) | ||||||||||||||||||||||||||||
| Foreign exchange |
– |
– |
(14,977 |
) |
(16,065 |
) |
(18 |
) |
(4 |
) |
(14,995 |
) |
(16,069 |
) | ||||||||||||||||||||||||||||||
| Credit |
– |
– |
(45 |
) |
(5 |
) |
(41 |
) |
(50 |
) |
(86 |
) |
(55 |
) | ||||||||||||||||||||||||||||||
| Equity |
(5,212 |
) |
(4,712 |
) |
(9,213 |
) |
(6,404 |
) |
(29 |
) |
(1 |
) |
(14,454 |
) |
(11,117 |
) | ||||||||||||||||||||||||||||
| Precious metal and other commodity |
(48 |
) |
(39 |
) |
(4,555 |
) |
(4,108 |
) |
– |
– |
(4,603 |
) |
(4,147 |
) | ||||||||||||||||||||||||||||||
(5,263 |
) |
(4,753 |
) |
(35,005 |
) |
(34,818 |
) |
(1,143 |
) |
(1,083 |
) |
(41,411 |
) |
(40,654 |
) | |||||||||||||||||||||||||||||
| Total financial liabilities |
$ |
(11,413 |
) |
$ |
(13,952 |
) | $ |
(105,022 |
) |
$ |
(96,297 |
) | $ |
(1,619 |
) |
$ |
(1,499 |
) |
$ |
(118,054 |
) |
$ |
(111,748 |
) | ||||||||||||||||||||
| (1) | Includes loans designated at FVTPL. |
| (2) | Comprises deposits designated at FVTPL of $43,723 million (2024: $39,008 million), net bifurcated embedded derivative liabilities of $313 million (2024: $521 million), other liabilities designated at FVTPL of $8 million (2024: $ 19 million), and other financial liabilities measured at fair value of $220 million (2024: $158 million). |
129 |
CIBC 2025 |
| Consolidated financial statements |
Net gains (losses) included in income (1)
|
||||||||||||||||||||||||||||||||||||
$ millions, for the year ended October 31 |
Opening balance |
Realized |
Unrealized (2)
|
Net unrealized gains (losses) included in OCI (3)
|
Transfer in to Level 3 |
Transfer out of Level 3 |
Purchases/ Issuances |
Sales/ Settlements |
Closing balance |
|||||||||||||||||||||||||||
| 2025 |
||||||||||||||||||||||||||||||||||||
| Debt securities measured at FVTPL |
||||||||||||||||||||||||||||||||||||
| Corporate and other debt |
$ |
– |
$ |
– |
$ |
(78 |
) |
$ |
(2 |
) |
$ |
– |
$ |
– |
$ |
183 |
$ |
– |
$ |
103 |
||||||||||||||||
| Mortgage- and asset-backed |
70 |
– |
(1 |
) |
– |
386 |
– |
106 |
(169 |
) |
392 |
|||||||||||||||||||||||||
| Loans measured at FVTPL |
||||||||||||||||||||||||||||||||||||
| Business and government |
105 |
– |
1 |
– |
– |
– |
178 |
(209 |
) |
75 |
||||||||||||||||||||||||||
| Corporate equity mandatorily measured at FVTPL and designated at FVOCI |
640 |
– |
69 |
15 |
– |
– |
400 |
(61 |
) |
1,063 |
||||||||||||||||||||||||||
| Derivative instruments |
||||||||||||||||||||||||||||||||||||
| Interest rate |
51 |
– |
45 |
– |
– |
(17 |
) |
– |
– |
79 |
||||||||||||||||||||||||||
| Foreign exchange |
– |
– |
– |
– |
– |
– |
– |
– |
– |
|||||||||||||||||||||||||||
| Credit |
44 |
– |
(8 |
) |
– |
– |
– |
– |
– |
36 |
||||||||||||||||||||||||||
| Equity |
6 |
– |
5 |
– |
40 |
(11 |
) |
11 |
– |
51 |
||||||||||||||||||||||||||
| Total assets |
$ |
916 |
$ |
– |
$ |
33 |
$ |
13 |
$ |
426 |
$ |
(28 |
) |
$ |
878 |
$ |
(439 |
) |
$ |
1,799 |
||||||||||||||||
| Deposits and other liabilities (4)
|
$ |
(416 |
) |
$ |
8 |
$ |
(127 |
) |
$ |
– |
$ |
(4 |
) |
$ |
2 |
$ |
(120 |
) |
$ |
181 |
$ |
(476 |
) | |||||||||||||
| Derivative instruments |
||||||||||||||||||||||||||||||||||||
| Interest rate |
(1,028 |
) |
– |
(263 |
) |
– |
– |
190 |
– |
46 |
(1,055 |
) | ||||||||||||||||||||||||
| Foreign exchange |
(4 |
) |
– |
(49 |
) |
– |
– |
35 |
– |
– |
(18 |
) | ||||||||||||||||||||||||
| Credit |
(50 |
) |
– |
9 |
– |
– |
– |
– |
– |
(41 |
) | |||||||||||||||||||||||||
| Equity |
(1 |
) |
– |
3 |
– |
(5 |
) |
14 |
(40 |
) |
– |
(29 |
) | |||||||||||||||||||||||
| Total liabilities |
$ |
(1,499 |
) |
$ |
8 |
$ |
(427 |
) |
$ |
– |
$ |
(9 |
) |
$ |
241 |
$ |
(160 |
) |
$ |
227 |
$ |
(1,619 |
) | |||||||||||||
| 2024 |
||||||||||||||||||||||||||||||||||||
| Debt securities measured at FVTPL |
||||||||||||||||||||||||||||||||||||
| Corporate and other debt |
$ | – | $ | – | $ | – | $ | – | $ | – | $ | – | $ | – | $ | – | $ | – | ||||||||||||||||||
| Mortgage- and asset-backed |
151 | – | (3 | ) | – | – | – | 84 | (162 | ) | 70 | |||||||||||||||||||||||||
| Loans measured at FVTPL |
||||||||||||||||||||||||||||||||||||
| Business and government |
144 | – | 5 | – | – | – | – | (44 | ) | 105 | ||||||||||||||||||||||||||
| Corporate equity mandatorily measured at FVTPL and designated at FVOCI |
587 | 7 | 26 | (17 | ) | – | – | 113 | (76 | ) | 640 | |||||||||||||||||||||||||
| Derivative instruments |
||||||||||||||||||||||||||||||||||||
| Interest rate |
21 | – | 97 | – | – | (67 | ) | – | – | 51 | ||||||||||||||||||||||||||
| Foreign exchange |
– | – | – | – | – | – | – | – | – | |||||||||||||||||||||||||||
| Credit |
46 | (6 | ) | 2 | – | – | – | 2 | – | 44 | ||||||||||||||||||||||||||
| Equity |
4 | – | 2 | – | 2 | (6 | ) | 5 | (1 | ) | 6 | |||||||||||||||||||||||||
| Total assets |
$ | 953 | $ | 1 | $ | 129 | $ | (17 | ) | $ | 2 | $ | (73 | ) | $ | 204 | $ | (283 | ) | $ | 916 | |||||||||||||||
| Deposits and other liabilities (4)
|
$ | (242 | ) | $ | (14 | ) | $ | (156 | ) | $ | – | $ | (3 | ) | $ | 17 | $ | (120 | ) | $ | 102 | $ | (416 | ) | ||||||||||||
| Derivative instruments |
||||||||||||||||||||||||||||||||||||
| Interest rate |
(1,817 | ) | – | 297 | – | – | 425 | (8 | ) | 75 | (1,028 | ) | ||||||||||||||||||||||||
| Foreign exchange |
– | – | (31 | ) | – | – | 27 | – | – | (4 | ) | |||||||||||||||||||||||||
| Credit |
(52 | ) | 1 | 1 | – | (2 | ) | – | – | 2 | (50 | ) | ||||||||||||||||||||||||
| Equity |
(5 | ) | – | (1 | ) | – | (3 | ) | 4 | – | 4 | (1 | ) | |||||||||||||||||||||||
| Total liabilities |
$ | (2,116 | ) | $ | (13 | ) | $ | 110 | $ | – | $ | (8 | ) | $ | 473 | $ | (128 | ) | $ | 183 | $ | (1,499 | ) | |||||||||||||
| (1) | Cumulative AOCI gains or losses related to equity securities designated at FVOCI are reclassified from AOCI to retained earnings at the time of disposal or derecognition. |
| (2) | Comprises unrealized gains and losses relating to the assets and liabilities held at the end of the reporting year. |
| (3) | Foreign exchange translation on debt securities and loans measured at FVTPL held by foreign operations and denominated in the same currency as the foreign operations is included in OCI. |
| (4) | Includes deposits designated at FVTPL of $263 million (2024: $211 million), net bifurcated embedded derivative liabilities of $205 million (2024: $186 million) and other liabilities designated at FVTPL of $8 million (2024: $19 million). |
| CIBC 2025 |
|
130 |
|
Consolidated financial statements |
Range of inputs |
||||||||||||||||||||||||
$ millions, as at October 31 |
2025 |
Valuation techniques |
Key non-observable inputs |
Low |
High |
|||||||||||||||||||
Debt securities measured at FVTPL |
||||||||||||||||||||||||
Corporate and other debt |
$ |
103 |
Discounted cash flow | Recovery r ate |
50.5 | % | 75.7 | % | ||||||||||||||||
Mortgage- and asset-backed |
392 |
Discounted cash flow | Credit spread | 3.4 | % | 3.5 | % | |||||||||||||||||
Corporate equity mandatorily measured at FVTPL and designated at FVOCI |
||||||||||||||||||||||||
Limited partnerships and private companies |
1,063 |
Adjusted net asset value |
(1) |
Net asset value |
(2) |
n/a | n/a | |||||||||||||||||
| Valuation multiple | Earnings multiple | 14.9 | x | 29.4 | x | |||||||||||||||||||
| Proxy share price | Proxy share price |
(2) |
n/a | n/a | ||||||||||||||||||||
Loans measured at FVTPL Business and government |
75 |
Discounted cash flow | Credit spread | 2.1 | % | 2.1 | % | |||||||||||||||||
Derivative instruments |
||||||||||||||||||||||||
Interest rate |
79 |
Proprietary model |
(3) |
n/a | n/a | n/a | ||||||||||||||||||
| Option model | Market volatility | 59.7 | % | 84.7 | % | |||||||||||||||||||
| Probability of contingent settlement | 80.0 | % | 100.0 | % | ||||||||||||||||||||
Credit |
36 |
Market proxy or direct broker quote | Market proxy or direct broker quote | 36.2 | % | 36.2 | % | |||||||||||||||||
Equity |
51 |
Option model | Market correlation | 9.5 | % | 96.4 | % | |||||||||||||||||
Total assets |
$ |
1,799 |
||||||||||||||||||||||
Deposits and other liabilities |
||||||||||||||||||||||||
|
Deposits designated at FVTPL and net bifurcated embedded derivative liabilities |
$ |
(468 |
) |
Option model | Market volatility | 8.3 | % | 84.7 | % | |||||||||||||||
| Market correlation | (100.0 | )% | 100.0 | % | ||||||||||||||||||||
Other liabilities designated at FVTPL |
(8 |
) |
Option model | Funding ratio | 49.0 | % | 49.0 | % | ||||||||||||||||
Derivative instruments |
||||||||||||||||||||||||
Interest rate |
(1,055 |
) |
Proprietary model |
(3) |
n/a | n/a | n/a | |||||||||||||||||
| Option model | Market volatility | 59.7 | % | 84.7 | % | |||||||||||||||||||
| Probability of contingent settlement | 100.0 | % | 100.0 | % | ||||||||||||||||||||
Foreign exchange |
(18 |
) |
Option model | Probability of contingent settlement | 100.0 | % | 100.0 | % | ||||||||||||||||
Credit |
(41 |
) |
Market proxy or direct broker quote | Market proxy or direct broker quote | 36.2 | % | 36.2 | % | ||||||||||||||||
Equity |
(29 |
) |
Option model | Market correlation | 10.9 | % | 96.4 | % | ||||||||||||||||
Total liabilities |
$ |
(1,619 |
) |
|||||||||||||||||||||
| (1) | Adjusted net asset value is determined using reported net asset values obtained from the fund manager or general partner of the limited partnership or the limited liability company and may be adjusted for current market levels where appropriate. |
| (2) | The range of net asset value price or proxy share price has not been disclosed due to the wide range and diverse nature of the investments. |
| (3) | Using valuation techniques that we consider to be non-observable. |
| n/a | Not applicable. |
131 |
CIBC 2025 |
Consolidated financial statements |
| • | Certain business and government deposit liabilities, certain secured borrowings and certain obligations related to securities sold under repurchase agreements that are economically hedged with derivatives and other financial instruments, and certain financial liabilities that have one or more embedded derivatives that significantly modify the cash flows of the host liability but are not bifurcated from the host instrument; and |
| • | Our mortgage commitments to retail clients to provide mortgages at fixed rates that are economically hedged with derivatives and other financial instruments. |
Note 3 |
Significant transactions |
|
CIBC
2025 |
|
132 |
|
Consolidated financial statements |
Note 4 |
Securities |
$ millions, as at October 31 |
2025 |
2024 | ||||||
Securities measured and designated at FVOCI |
$ |
88,905 |
$ | 76,693 | ||||
Securities measured at amortized cost (1)
|
65,471 |
71,610 | ||||||
Securities mandatorily measured and designated at FVTPL |
128,859 |
106,042 | ||||||
Total securities |
$ |
283,235 |
$ | 254,345 | ||||
| (1) | During the year, less than $1 million of amortized cost debt securities were disposed of, generally shortly before their maturity, resulting in a realized gain of nil (2024: a realized gain of nil). |
Residual term to contractual maturity |
||||||||||||||||||||||||||||||||||||||||||||||||||||||||||||||||||||
$ millions, as at October 31 |
Within 1 year |
1 to 5 years |
5 to 10 years |
Over 10 years |
No specific maturity |
2025 Total |
2024 Total |
|||||||||||||||||||||||||||||||||||||||||||||||||||||||||||||
Carrying value |
Yield (1)
|
Carrying value |
Yield (1)
|
Carrying value |
Yield (1)
|
Carrying value |
Yield (1)
|
Carrying value |
Yield (1)
|
Carrying value |
Yield (1)
|
Carrying value |
Yield (1)
|
|||||||||||||||||||||||||||||||||||||||||||||||||||||||
Debt securities measured at FVOCI |
||||||||||||||||||||||||||||||||||||||||||||||||||||||||||||||||||||
Securities issued or guaranteed by: |
||||||||||||||||||||||||||||||||||||||||||||||||||||||||||||||||||||
Canadian federal government |
$ |
2,922 |
4.0 |
% |
$ |
10,756 |
3.2 |
% |
$ |
1,845 |
3.5 |
% |
$ |
– |
– |
% |
$ |
– |
– |
% |
$ |
15,523 |
3.4 |
% |
$ | 11,685 | 3.8 | % | ||||||||||||||||||||||||||||||||||||||||
Other Canadian governments |
487 |
2.4 |
1,757 |
2.8 |
14,009 |
3.1 |
240 |
3.4 |
– |
– |
16,493 |
3.1 |
16,414 | 3.2 | ||||||||||||||||||||||||||||||||||||||||||||||||||||||
U.S. Treasury and agencies |
12,651 |
3.3 |
18,385 |
3.8 |
2,315 |
4.2 |
– |
– |
– |
– |
33,351 |
3.6 |
29,152 | 3.9 | ||||||||||||||||||||||||||||||||||||||||||||||||||||||
Other foreign governments |
4,076 |
3.2 |
3,597 |
4.2 |
80 |
5.5 |
3 |
6.6 |
– |
– |
7,756 |
3.7 |
5,560 | 4.4 | ||||||||||||||||||||||||||||||||||||||||||||||||||||||
Mortgage-backed securities (2)
|
189 |
3.9 |
2,966 |
3.5 |
203 |
2.7 |
351 |
4.5 |
– |
– |
3,709 |
3.6 |
3,470 | 4.1 | ||||||||||||||||||||||||||||||||||||||||||||||||||||||
Asset-backed securities |
516 |
4.6 |
– |
– |
41 |
4.9 |
390 |
4.8 |
– |
– |
947 |
4.7 |
657 | 5.9 | ||||||||||||||||||||||||||||||||||||||||||||||||||||||
Corporate and other debt |
3,011 |
4.2 |
6,580 |
4.4 |
499 |
4.6 |
16 |
4.4 |
– |
– |
10,106 |
4.3 |
9,083 | 4.7 | ||||||||||||||||||||||||||||||||||||||||||||||||||||||
$ |
23,852 |
$ |
44,041 |
$ |
18,992 |
$ |
1,000 |
$ |
– |
$ |
87,885 |
$ | 76,021 | |||||||||||||||||||||||||||||||||||||||||||||||||||||||
Securities measured at amortized cost |
||||||||||||||||||||||||||||||||||||||||||||||||||||||||||||||||||||
Securities issued or guaranteed by: |
||||||||||||||||||||||||||||||||||||||||||||||||||||||||||||||||||||
Canadian federal government |
$ |
431 |
0.8 |
% |
$ |
2,469 |
3.2 |
% |
$ |
593 |
3.5 |
% |
$ |
– |
– |
% |
$ |
– |
– |
% |
$ |
3,493 |
2.9 |
% |
$ | 2,904 | 2.5 | % | ||||||||||||||||||||||||||||||||||||||||
Other Canadian governments |
1,561 |
1.8 |
9,977 |
2.7 |
8,193 |
3.5 |
266 |
3.4 |
– |
– |
19,997 |
2.9 |
21,634 | 3.0 | ||||||||||||||||||||||||||||||||||||||||||||||||||||||
U.S. Treasury and agencies |
8,261 |
1.6 |
19,291 |
3.3 |
1,538 |
4.0 |
– |
– |
– |
– |
29,090 |
2.8 |
33,727 | 2.5 | ||||||||||||||||||||||||||||||||||||||||||||||||||||||
Other foreign governments |
369 |
3.0 |
557 |
3.3 |
472 |
1.7 |
158 |
2.6 |
– |
– |
1,556 |
2.7 |
1,527 | 2.5 | ||||||||||||||||||||||||||||||||||||||||||||||||||||||
Mortgage-backed securities (3)
|
441 |
2.8 |
3,106 |
2.7 |
639 |
2.4 |
347 |
3.5 |
– |
– |
4,533 |
2.7 |
5,297 | 3.3 | ||||||||||||||||||||||||||||||||||||||||||||||||||||||
Asset-backed securities |
147 |
5.7 |
346 |
4.4 |
– |
– |
1,864 |
5.6 |
– |
– |
2,357 |
5.5 |
2,236 | 6.0 | ||||||||||||||||||||||||||||||||||||||||||||||||||||||
Corporate and other debt |
980 |
1.9 |
2,734 |
3.3 |
731 |
4.4 |
– |
– |
– |
– |
4,445 |
3.2 |
4,285 | 3.3 | ||||||||||||||||||||||||||||||||||||||||||||||||||||||
$ |
12,190 |
$ |
38,480 |
$ |
12,166 |
$ |
2,635 |
$ |
– |
$ |
65,471 |
$ | 71,610 | |||||||||||||||||||||||||||||||||||||||||||||||||||||||
Debt securities mandatorily measured and designated at FVTPL |
||||||||||||||||||||||||||||||||||||||||||||||||||||||||||||||||||||
Securities issued or guaranteed by: |
||||||||||||||||||||||||||||||||||||||||||||||||||||||||||||||||||||
Canadian federal government |
$ |
2,409 |
$ |
10,040 |
$ |
3,202 |
$ |
1,154 |
$ |
– |
$ |
16,805 |
$ | 17,799 | ||||||||||||||||||||||||||||||||||||||||||||||||||||||
Other Canadian governments |
1,728 |
1,315 |
1,152 |
6,289 |
– |
10,484 |
9,909 | |||||||||||||||||||||||||||||||||||||||||||||||||||||||||||||
U.S. Treasury and agencies |
698 |
6,934 |
1,530 |
3,336 |
– |
12,498 |
6,750 | |||||||||||||||||||||||||||||||||||||||||||||||||||||||||||||
Other foreign governments |
212 |
810 |
48 |
– |
– |
1,070 |
2,128 | |||||||||||||||||||||||||||||||||||||||||||||||||||||||||||||
Mortgage-backed securities (4)
|
572 |
4,391 |
646 |
– |
– |
5,609 |
3,980 | |||||||||||||||||||||||||||||||||||||||||||||||||||||||||||||
Asset-backed securities |
278 |
291 |
923 |
484 |
– |
1,976 |
303 | |||||||||||||||||||||||||||||||||||||||||||||||||||||||||||||
Corporate and other debt |
759 |
2,400 |
706 |
775 |
– |
4,640 |
4,385 | |||||||||||||||||||||||||||||||||||||||||||||||||||||||||||||
$ |
6,656 |
$ |
26,181 |
$ |
8,207 |
$ |
12,038 |
$ |
– |
$ |
53,082 |
$ | 45,254 | |||||||||||||||||||||||||||||||||||||||||||||||||||||||
Corporate equity mandatorily measured at FVTPL and designated at FVOCI |
$ |
– |
– |
% |
$ |
– |
– |
% |
$ |
– |
– |
% |
$ |
– |
– |
% |
$ |
76,797 |
n/m |
$ |
76,797 |
n/m |
$ | 61,460 | n/m | |||||||||||||||||||||||||||||||||||||||||||
Total securities (5)
|
$ |
42,698 |
$ |
108,702 |
$ |
39,365 |
$ |
15,673 |
$ |
76,797 |
$ |
283,235 |
$ | 254,345 | ||||||||||||||||||||||||||||||||||||||||||||||||||||||
| (1) | Represents the weighted-average yield, which is determined by applying the weighted average of the yields of individual fixed income securities. |
| (2) | Includes securities backed by mortgages insured by the Canada Mortgage and Housing Corporation (CMHC), with amortized cost of $3,177 million (2024: $2,832 million) and fair value of $3,180 million (2024: $2,827 million); securities issued by Federal National Mortgage Association (Fannie Mae), with amortized cost of $ 222 million (2024: $284 million) and fair value of $217 million (2024: $275 million); securities issued by Federal Home Loan Mortgage Corporation (Freddie Mac), with amortized cost of $78 million (2024: $103 million) and fair value of $76 million (2024: $99 million); and securities issued by Government National Mortgage Association, a U.S. government corporation (Ginnie Mae), with amortized cost of $239 million (2024: $274 million) and fair value of $236 million (2024: $269 million). |
| (3) | Includes securities backed by mortgages insured by the CMHC, with amortized cost of $2,632 million (2024: $2,585 million) and fair value of $2,634 million (2024: $2,582 million); securities issued by Fannie Mae, with amortized cost of $198 million (2024: $471 million) and fair value of $189 million (2024: $448 million); securities issued by Freddie Mac, with amortized cost of $1,009 million (2024: $1,536 million) and fair value of $968 million (2024: $1,450 million); and securities issued by Ginnie Mae, with amortized cost of $156 million (2024: $123 million) and fair value of $155 million (2024: $118 million). |
| (4) | Includes securities backed by mortgages insured by the CMHC of $5,608 million (2024: $3,977 million). |
| (5) | Includes securities denominated in U.S. dollars with carrying value of $139.9 billion (2024: $126.7 billion) and securities denominated in other foreign currencies with carrying value of $ 17.3 billion (2024: $12.4 billion). |
| n/m | Not meaningful. |
133 |
CIBC 2025 |
Consolidated financial statements |
$ millions, as at October 31 |
2025 |
2024 | ||||||||||||||||||||||||||||||||||
|
Cost/ Amortized cost (1)
|
Gross unrealized gains |
Gross unrealized losses |
Fair value |
Cost/ Amortized cost (1)
|
Gross unrealized gains |
Gross unrealized losses |
Fair
value
|
|||||||||||||||||||||||||||||
Securities issued or guaranteed by: |
||||||||||||||||||||||||||||||||||||
Canadian federal government |
$ |
15,531 |
$ |
9 |
$ (17 |
) |
$ |
15,523 |
$ | 11,715 | $ | 1 | $ | (31 | ) | $ | 11,685 | |||||||||||||||||||
Other Canadian governments |
16,484 |
50 |
(41 |
) |
16,493 |
16,506 | 9 | (101 | ) | 16,414 | ||||||||||||||||||||||||||
U.S. Treasury and agencies |
33,345 |
64 |
(58 |
) |
33,351 |
29,362 | 10 | (220 | ) | 29,152 | ||||||||||||||||||||||||||
Other foreign governments |
7,727 |
31 |
(2 |
) |
7,756 |
5,542 | 22 | (4 | ) | 5,560 | ||||||||||||||||||||||||||
Mortgage-backed securities |
3,716 |
5 |
(12 |
) |
3,709 |
3,493 | – | (23 | ) | 3,470 | ||||||||||||||||||||||||||
Asset-backed securities |
947 |
– |
– |
947 |
656 | 1 | – | 657 | ||||||||||||||||||||||||||||
Corporate and other debt |
10,092 |
17 |
(3 |
) |
10,106 |
9,085 | 7 | (9 | ) | 9,083 | ||||||||||||||||||||||||||
87,842 |
176 |
(133 |
) |
87,885 |
76,359 | 50 | (388 | ) | 76,021 | |||||||||||||||||||||||||||
Corporate equity (2)
|
979 |
65 |
(24 |
) |
1,020 |
653 | 51 | (32 | ) | 672 | ||||||||||||||||||||||||||
Total |
$ |
88,821 |
$ |
241 |
$ |
(157 |
) |
$ |
88,905 |
$ | 77,012 | $ | 101 | $ | (420 | ) | $ | 76,693 | ||||||||||||||||||
| (1) | Net of allowance for credit losses for debt securities measured at FVOCI of $23 million (2024: $19 million). |
| (2) | Includes restricted stock. |
$ millions, for the year ended October 31 |
2025 |
2024 | ||||||
Realized gains |
$ |
50 |
$ | 64 | ||||
Realized losses |
(27 |
) |
(26 | ) | ||||
(Provision for) reversal of credit losses on debt securities |
(3 |
) |
3 | |||||
Total |
$ |
20 |
$ | 41 | ||||
| Stage 1 | Stage 2 | Stage 3 | ||||||||||||||||
$ millions, as at or for the year ended October 31 |
Collective provision 12-month ECLperforming |
Collective provision lifetime ECL performing |
Collective and individual provision lifetime ECL credit-impaired
(1)
|
Total | ||||||||||||||
2025 |
Debt securities measured at FVOCI and amortized cost |
|||||||||||||||||
Balance at beginning of year |
$ |
7 |
$ |
17 |
$ |
12 |
$ |
36 |
||||||||||
Provision for (reversal of) credit losses (2)
|
(1 |
) |
2 |
36 |
37 |
|||||||||||||
Write-offs |
– |
– |
– |
– |
||||||||||||||
Foreign exchange and other |
– |
1 |
1 |
2 |
||||||||||||||
| Balance at end of year | $ |
6 |
$ |
20 |
$ |
49 |
$ |
75 |
||||||||||
Comprises: |
||||||||||||||||||
Debt securities measured at FVOCI |
$ |
3 |
$ |
20 |
$ |
– |
$ |
23 |
||||||||||
Debt securities measured at amortized cost |
3 |
– |
49 |
52 |
||||||||||||||
| 2024 | Debt securities measured at FVOCI and amortized cost |
|||||||||||||||||
Balance at beginning of year |
$ | 8 | $ | 20 | $ | 14 | $ | 42 | ||||||||||
Reversal of credit losses (2)
|
– | (3 | ) | (2 | ) | (5 | ) | |||||||||||
Write-offs |
– | – | – | – | ||||||||||||||
Foreign exchange and other |
(1 | ) | – | – | (1 | ) | ||||||||||||
| Balance at end of year | $ | 7 | $ | 17 | $ | 12 | $ | 36 | ||||||||||
Comprises: |
||||||||||||||||||
Debt securities measured at FVOCI |
$ | 2 | $ | 17 | $ | – | $ | 19 | ||||||||||
Debt securities measured at amortized cost |
5 | – | 12 | 17 | ||||||||||||||
| (1) | Includes stage 3 ECL allowance on originated credit-impaired amortized cost debt securities. |
| (2) | Included in gains (losses) from debt securities measured at FVOCI and amortized cost, net on our consolidated statement of income. |
Note 5 |
Loans (1)(2)
|
$ millions, as at October 31 |
2025 |
2024 | ||||||||||||||||||||||||||||||||||||||||||||||||||
Gross amount |
Stage 3 allowance |
Stages 1 and 2 allowance |
Total allowance |
Net total |
Allowances as a % of gross loans |
Gross amount |
Stage 3 allowance |
Stages 1 and 2 allowance |
Total allowance |
Net total |
Allowances as a % of gross loans |
|||||||||||||||||||||||||||||||||||||||||
Residential mortgages (
3 ) |
$ |
287,033 |
$ |
306 |
$ |
268 |
$ |
574 |
$ |
286,459 |
0.2 |
% |
$ | 280,672 | $ | 234 | $ | 215 | $ | 449 | $ | 280,223 | 0.2 | % | ||||||||||||||||||||||||||||
Personal |
47,866 |
185 |
971 |
1,156 |
46,710 |
2.4 |
46,681 | 190 | 752 | 942 | 45,739 | 2.0 | ||||||||||||||||||||||||||||||||||||||||
Credit card |
21,581 |
– |
942 |
942 |
20,639 |
4.4 |
20,551 | – | 902 | 902 | 19,649 | 4.4 | ||||||||||||||||||||||||||||||||||||||||
Business and government (
3 )(
4 ) |
237,416 |
491 |
1,229 |
1,720 |
235,696 |
0.7 |
214,305 | 392 | 1,232 | 1,624 | 212,681 | 0.8 | ||||||||||||||||||||||||||||||||||||||||
Total |
$ |
593,896 |
$ |
982 |
$ |
3,410 |
$ |
4,392 |
$ |
589,504 |
0.7 |
% |
$ | 562,209 | $ | 816 | $ | 3,101 | $ | 3,917 | $ | 558,292 | 0.7 | % | ||||||||||||||||||||||||||||
| (1) | Loans are net of unearned income of $1,017 million (2024: $815 million). |
| (2) | Includes gross loans of $136.5 billion (2024: $120.4 billion) denominated in U.S. dollars and $13.7 billion (2024: $11.2 billion) denominated in other foreign currencies. |
| (3) | Includes $3 million of residential mortgages (202 4 : $3 million) and $560 million of business and government loans (2024 : $221 million) that are measured and designated at FVTPL. |
| (4) | Includes customers’ liability under acceptances of $10 million (2024: $6 million) in business and government loans. Prior year amounts have been revised to conform to the presentation adopted in 2025. |
|
CIBC
2025 |
|
134 |
|
Consolidated financial statements |
$ millions, as at or for the year ended October 31 |
2025 |
|||||||||||||||
Stage 1 |
Stage 2 |
Stage 3 |
||||||||||||||
Collective provision 12-month ECL
performing |
Collective provision lifetime ECL performing |
Collective and individual provision lifetime ECL credit-impaired
|
Total |
|||||||||||||
Residential mortgages |
||||||||||||||||
Balance at beginning of year |
$ |
89 |
$ |
126 |
$ |
234 |
$ |
449 |
||||||||
Provision for (reversal of) credit losses |
||||||||||||||||
Originations net of repayments and other derecognitions (1)
|
15 |
(23 |
) |
(73 |
) |
(81 |
) |
|||||||||
Changes in model |
– |
– |
– |
– |
||||||||||||
Net remeasurement (2)
|
(134 |
) |
176 |
209 |
251 |
|||||||||||
Transfers (2)
|
||||||||||||||||
– to 12-month ECL |
141 |
(133 |
) |
(8 |
) |
– |
||||||||||
– to lifetime ECL performing |
(10 |
) |
31 |
(21 |
) |
– |
||||||||||
– to lifetime ECL credit-impaired |
– |
(9 |
) |
9 |
– |
|||||||||||
Total provision for (reversal of) credit losses (3)
|
12 |
42 |
116 |
170 |
||||||||||||
Write-offs (4)
|
– |
– |
(12 |
) |
(12 |
) |
||||||||||
Recoveries |
– |
– |
6 |
6 |
||||||||||||
Interest income on impaired loans |
– |
– |
(36 |
) |
(36 |
) |
||||||||||
Foreign exchange and other |
(1 |
) |
– |
(2 |
) |
(3 |
) |
|||||||||
Balance at end of year |
$ |
100 |
$ |
168 |
$ |
306 |
$ |
574 |
||||||||
Personal |
||||||||||||||||
Balance at beginning of year |
$ |
247 |
$ |
546 |
$ |
190 |
$ |
983 |
||||||||
Provision for (reversal of) credit losses |
||||||||||||||||
Originations net of repayments and other derecognitions (1)
|
40 |
(45 |
) |
(25 |
) |
(30 |
) |
|||||||||
Changes in model |
(15 |
) |
97 |
– |
82 |
|||||||||||
Net remeasurement (2)
|
(575 |
) |
795 |
484 |
704 |
|||||||||||
Transfers (2)
|
||||||||||||||||
– to 12-month ECL |
623 |
(616 |
) |
(7 |
) |
– |
||||||||||
– to lifetime ECL performing |
(68 |
) |
90 |
(22 |
) |
– |
||||||||||
– to lifetime ECL credit-impaired |
(4 |
) |
(70 |
) |
74 |
– |
||||||||||
Total provision for (reversal of) credit losses (3)
|
1 |
251 |
504 |
756 |
||||||||||||
Write-offs (4)
|
– |
– |
(571 |
) |
(571 |
) |
||||||||||
Recoveries |
– |
– |
74 |
74 |
||||||||||||
Interest income on impaired loans |
– |
– |
(8 |
) |
(8 |
) |
||||||||||
Foreign exchange and other |
(1 |
) |
6 |
(4 |
) |
1 |
||||||||||
Balance at end of year |
$ |
247 |
$ |
803 |
$ |
185 |
$ |
1,235 |
||||||||
Credit card |
||||||||||||||||
Balance at beginning of year |
$ |
295 |
$ |
660 |
$ |
– |
$ |
955 |
||||||||
Provision for (reversal of) credit losses |
||||||||||||||||
Originations net of repayments and other derecognitions (1)
|
36 |
(33 |
) |
– |
3 |
|||||||||||
Changes in model |
(26 |
) |
32 |
– |
6 |
|||||||||||
Net remeasurement (2)
|
(740 |
) |
1,165 |
391 |
816 |
|||||||||||
Transfers (2)
|
||||||||||||||||
– to 12-month ECL |
846 |
(846 |
) |
– |
– |
|||||||||||
– to lifetime ECL performing |
(77 |
) |
77 |
– |
– |
|||||||||||
– to lifetime ECL credit-impaired |
(3 |
) |
(338 |
) |
341 |
– |
||||||||||
Total provision for (reversal of) credit losses (3)
|
36 |
57 |
732 |
825 |
||||||||||||
Write-offs (4)
|
– |
– |
(884 |
) |
(884 |
) |
||||||||||
Recoveries |
– |
– |
152 |
152 |
||||||||||||
Interest income on impaired loans |
– |
– |
– |
– |
||||||||||||
Foreign exchange and other |
– |
– |
– |
– |
||||||||||||
Balance at end of year |
$ |
331 |
$ |
717 |
$ |
– |
$ |
1,048 |
||||||||
Business and government |
||||||||||||||||
Balance at beginning of year |
$ |
265 |
$ |
1,061 |
$ |
401 |
$ |
1,727 |
||||||||
Provision for (reversal of) credit losses |
||||||||||||||||
Originations net of repayments and other derecognitions (1)
|
52 |
(105 |
) |
(66 |
) |
(119 |
) |
|||||||||
Changes in model |
79 |
(81 |
) |
(4 |
) |
(6 |
) |
|||||||||
Net remeasurement (2)
|
(63 |
) |
340 |
439 |
716 |
|||||||||||
Transfers (2)
|
||||||||||||||||
– to 12-month ECL |
162 |
(158 |
) |
(4 |
) |
– |
||||||||||
– to lifetime ECL performing |
(48 |
) |
55 |
(7 |
) |
– |
||||||||||
– to lifetime ECL credit-impaired |
– |
(177 |
) |
177 |
– |
|||||||||||
Total provision for (reversal of) credit losses (3)
|
182 |
(126 |
) |
535 |
591 |
|||||||||||
Write-offs (4)
|
– |
– |
(409 |
) |
(409 |
) |
||||||||||
Recoveries |
– |
– |
54 |
54 |
||||||||||||
Interest income on impaired loans |
– |
– |
(94 |
) |
(94 |
) |
||||||||||
Foreign exchange and other |
5 |
(3 |
) |
11 |
13 |
|||||||||||
Balance at end of year |
$ |
452 |
$ |
932 |
$ |
498 |
$ |
1,882 |
||||||||
Total ECL allowance (5)
|
$ |
1,130 |
$ |
2,620 |
$ |
989 |
$ |
4,739 |
||||||||
Comprises: |
||||||||||||||||
Loans |
$ |
983 |
$ |
2,427 |
$ |
982 |
$ |
4,392 |
||||||||
Undrawn credit facilities and other off-balance sheet exposures (6)
|
147 |
193 |
7 |
347 |
||||||||||||
| (1) | Excludes the disposal and write-off of impaired loans. |
| (2) | Transfers represent stage movements of ECL allowances before net measurement. Net remeasurement represents the current period change in ECL allowances for transfers, net write-offs, changes in forecasts of forward-looking information, parameter updates, and partial repayments in the year. |
| (3) | Provision for (reversal of) credit losses for loans, and undrawn credit facilities and other off-balance sheet exposures is presented as Provision for (reversal of) credit losses on our consolidated statement of income. |
| (4) | We generally continue to pursue collection on the amounts that were written off. The degree of collection efforts varies from one jurisdiction to another, depending on the local regulations and original agreements with customers. |
| (5) | See Note 4 for the ECL allowance on debt securities measured at FVOCI and amortized cost. The ECL allowances for other financial assets classified at amortized cost were immaterial as at October 31, 2025 and October 31, 2024 and were excluded from the table above. Financial assets other than loans that are classified at amortized cost are presented on our consolidated balance sheet net of ECL allowances. |
| (6) | Included in Other liabilities on our consolidated balance sheet. |
135 |
CIBC 2025 |
Consolidated financial statements |
$ millions, as at or for the year ended October 31 |
2024 | |||||||||||||||||||
| Stage 1 | Stage 2 | Stage 3 | ||||||||||||||||||
| Collective provision 12-month ECL
performing |
Collective provision lifetime ECL performing |
Collective and individual provision lifetime ECL credit-impaired
|
Total | |||||||||||||||||
Residential mortgages |
||||||||||||||||||||
Balance at beginning of year |
$ | 90 | $ | 142 | $ | 224 | $ | 456 | ||||||||||||
Provision for (reversal of) credit losses |
||||||||||||||||||||
Originations net of repayments and other derecognitions (1)
|
15 | (19 | ) | (55 | ) | (59 | ) | |||||||||||||
Changes in model |
– | 4 | 11 | 15 | ||||||||||||||||
Net remeasurement (2)
|
(115 | ) | 96 | 95 | 76 | |||||||||||||||
Transfers (2)
|
||||||||||||||||||||
– to 12-month ECL |
109 | (107 | ) | (2 | ) | – | ||||||||||||||
– to lifetime ECL performing |
(10 | ) | 19 | (9 | ) | – | ||||||||||||||
– to lifetime ECL credit-impaired |
– | (8 | ) | 8 | – | |||||||||||||||
Total provision for (reversal of) credit losses (3)
|
(1 | ) | (15 | ) | 48 | 32 | ||||||||||||||
Write-offs (4)
|
– | – | (18 | ) | (18 | ) | ||||||||||||||
Recoveries |
– | – | 7 | 7 | ||||||||||||||||
Interest income on impaired loans |
– | – | (30 | ) | (30 | ) | ||||||||||||||
Foreign exchange and other |
– | (1 | ) | 3 | 2 | |||||||||||||||
Balance at end of year |
$ | 89 | $ | 126 | $ | 234 | $ | 449 | ||||||||||||
Personal |
||||||||||||||||||||
Balance at beginning of year |
$ | 174 | $ | 709 | $ | 181 | $ | 1,064 | ||||||||||||
Provision for (reversal of) credit losses |
||||||||||||||||||||
Originations net of repayments and other derecognitions (1)
|
32 | (58 | ) | (42 | ) | (68 | ) | |||||||||||||
Changes in model |
54 | (127 | ) | (6 | ) | (79 | ) | |||||||||||||
Net remeasurement (2)
|
(544 | ) | 631 | 466 | 553 | |||||||||||||||
Transfers (2)
|
||||||||||||||||||||
– to 12-month ECL |
591 | (588 | ) | (3 | ) | – | ||||||||||||||
– to lifetime ECL performing |
(63 | ) | 74 | (11 | ) | – | ||||||||||||||
– to lifetime ECL credit-impaired |
– | (96 | ) | 96 | – | |||||||||||||||
Total provision for (reversal of) credit losses (3)
|
70 | (164 | ) | 500 | 406 | |||||||||||||||
Write-offs (4)
|
– | – | (545 | ) | (545 | ) | ||||||||||||||
Recoveries |
– | – | 62 | 62 | ||||||||||||||||
Interest income on impaired loans |
– | – | (7 | ) | (7 | ) | ||||||||||||||
Foreign exchange and other |
3 | 1 | (1 | ) | 3 | |||||||||||||||
Balance at end of year |
$ | 247 | $ | 546 | $ | 190 | $ | 983 | ||||||||||||
Credit card |
||||||||||||||||||||
Balance at beginning of year |
$ | 181 | $ | 591 | $ | – | $ | 772 | ||||||||||||
Provision for (reversal of) credit losses |
||||||||||||||||||||
Originations net of repayments and other derecognitions (1)
|
22 | (30 | ) | – | (8 | ) | ||||||||||||||
Changes in model |
86 | (34 | ) | – | 52 | |||||||||||||||
Net remeasurement (2)
|
(413 | ) | 771 | 394 | 752 | |||||||||||||||
Transfers (2)
|
||||||||||||||||||||
– to 12-month ECL |
491 | (491 | ) | – | – | |||||||||||||||
– to lifetime ECL performing |
(72 | ) | 72 | – | – | |||||||||||||||
– to lifetime ECL credit-impaired |
– | (219 | ) | 219 | – | |||||||||||||||
Total provision for (reversal of) credit losses (3)
|
114 | 69 | 613 | 796 | ||||||||||||||||
Write-offs (4)
|
– | – | (739 | ) | (739 | ) | ||||||||||||||
Recoveries |
– | – | 126 | 126 | ||||||||||||||||
Interest income on impaired loans |
– | – | – | – | ||||||||||||||||
Foreign exchange and other |
– | – | – | – | ||||||||||||||||
Balance at end of year |
$ | 295 | $ | 660 | $ | – | $ | 955 | ||||||||||||
Business and government |
||||||||||||||||||||
Balance at beginning of year |
$ | 294 | $ | 864 | $ | 667 | $ | 1,825 | ||||||||||||
Provision for (reversal of) credit losses |
||||||||||||||||||||
Originations net of repayments and other derecognitions (1)
|
22 | (82 | ) | (48 | ) | (108 | ) | |||||||||||||
Changes in model |
(28 | ) | 46 | – | 18 | |||||||||||||||
Net remeasurement (2)
|
(194 | ) | 569 | 482 | 857 | |||||||||||||||
Transfers (2)
|
||||||||||||||||||||
– to 12-month ECL |
215 | (201 | ) | (14 | ) | – | ||||||||||||||
– to lifetime ECL performing |
(39 | ) | 47 | (8 | ) | – | ||||||||||||||
– to lifetime ECL credit-impaired |
– | (187 | ) | 187 | – | |||||||||||||||
Total provision for (reversal of) credit losses (3)
|
(24 | ) | 192 | 599 | 767 | |||||||||||||||
Write-offs (4)
|
– | – | (874 | ) | (874 | ) | ||||||||||||||
Recoveries |
– | – | 77 | 77 | ||||||||||||||||
Interest income on impaired loans |
– | – | (84 | ) | (84 | ) | ||||||||||||||
Foreign exchange and other |
(5 | ) | 5 | 16 | 16 | |||||||||||||||
Balance at end of year |
$ | 265 | $ | 1,061 | $ | 401 | $ | 1,727 | ||||||||||||
Total ECL allowance (5)
|
$ | 896 | $ | 2,393 | $ | 825 | $ | 4,114 | ||||||||||||
Comprises: |
||||||||||||||||||||
Loans |
$ | 800 | $ | 2,301 | $ | 816 | $ | 3,917 | ||||||||||||
Undrawn credit facilities and other off-balance sheet exposures (6)
|
96 | 92 | 9 | 197 | ||||||||||||||||
|
CIBC
2025 |
|
136 |
|
Consolidated financial statements |
| • | Determining when a SICR of a loan has occurred; |
| • | Measuring both 12-month and lifetime credit losses; and |
| • | Forecasting forward-looking information for multiple scenarios and determining the probability weighting of the scenarios driven by the changes in the macroeconomic environment. |
137 |
CIBC 2025 |
Consolidated financial statements |
| Base case | Upside case | Downside case | ||||||||||||||||||||||
As at October 31, 2025 |
Average value over the next 12 months |
Average value over the remaining forecast period (1)
|
Average value over the next 12 months |
Average value over the remaining forecast period (1)
|
Average value over the next 12 months |
Average value over the remaining forecast period (1)
|
||||||||||||||||||
Real GDP year-over-year growth |
||||||||||||||||||||||||
Canada (2)
|
1.1 |
% |
2.0 |
% |
1.7 |
% |
2.4 |
% |
(0.4 |
)% |
1.1 |
|||||||||||||
United States |
2.0 |
% |
1.8 |
% |
2.8 |
% |
2.8 |
% |
0.7 |
% |
1.0 |
% |
||||||||||||
Unemployment rate |
||||||||||||||||||||||||
Canada (2)
|
6.8 |
% |
6.1 |
% |
6.4 |
% |
5.5 |
% |
7.4 |
% |
7.0 |
% |
||||||||||||
United States |
4.4 |
% |
4.1 |
% |
3.9 |
% |
3.5 |
% |
5.0 |
% |
4.6 |
% |
||||||||||||
Canadian Housing Price Index growth (2)
|
0.8 |
% |
2.7 |
% |
3.9 |
% |
4.7 |
% |
(3.7 |
)% |
(0.5 |
)% |
||||||||||||
Canadian household debt service ratio |
14.6 |
% |
14.7 |
% |
14.3 |
% |
14.4 |
% |
15.2 |
% |
15.6 |
% |
||||||||||||
West Texas Intermediate Oil Price (US$) |
$ |
70 |
$ |
67 |
$ |
74 |
$ |
83 |
$ |
54 |
$ |
58 |
||||||||||||
As at October 31, 2024 |
||||||||||||||||||||||||
Real GDP year-over-year growth |
||||||||||||||||||||||||
Canada (2)
|
1.6 | % | 2.3 | % | 2.5 | % | 2.7 | % | 0.4 | % | 1.4 | % | ||||||||||||
United States |
2.0 | % | 2.0 | % | 3.0 | % | 2.9 | % | 0.7 | % | 0.9 | % | ||||||||||||
Unemployment rate |
||||||||||||||||||||||||
Canada (2)
|
6.6 | % | 5.9 | % | 5.7 | % | 5.2 | % | 7.2 | % | 6.8 | % | ||||||||||||
United States |
4.5 | % | 4.0 | % | 3.7 | % | 3.3 | % | 5.1 | % | 4.7 | % | ||||||||||||
Canadian Housing Price Index growth (2)
|
2.6 | % | 2.5 | % | 7.1 | % | 4.0 | % | (2.3 | )% | 0.9 | % | ||||||||||||
Canadian household debt service ratio |
14.8 | % | 14.8 | % | 14.4 | % | 14.7 | % | 15.3 | % | 15.2 | % | ||||||||||||
West Texas Intermediate Oil Price (US$) |
$ | 78 | $ | 74 | $ | 88 | $ | 100 | $ | 60 | $ | 61 | ||||||||||||
(1) |
The remaining forecast period is generally four years. |
(2) |
In our ECL calculation process, Canadian Real GDP year-over-year growth and Canadian unemployment rate are forecasted at the provincial level while Canadian Housing Price Index growth is forecasted at the municipal level. As a result, the forecasts for individual provinces or municipalities reflected in our ECL will differ from the national forecasts presented above. |
|
CIBC
2025 |
|
138 |
|
| Consolidated financial statements |
$ millions, as at October 31 |
2025 |
2024 |
||||||||||||||||||||||||||||||
Stage 1 |
Stage 2 |
Stage 3 (2)(3)
|
Total |
Stage 1 |
Stage 2 |
Stage 3 (2)(3)
|
Total |
|||||||||||||||||||||||||
| Residential mortgages |
||||||||||||||||||||||||||||||||
| – Exceptionally low |
$ |
171,983 |
$ |
227 |
$ |
– |
$ |
172,210 |
$ | 160,515 | $ | 6,130 | $ | – | $ | 166,645 | ||||||||||||||||
| – Very low |
85,628 |
1,171 |
– |
86,799 |
81,198 | 5,926 | – | 87,124 | ||||||||||||||||||||||||
| – Low |
10,987 |
2,749 |
– |
13,736 |
10,329 | 3,638 | – | 13,967 | ||||||||||||||||||||||||
| – Medium |
1,041 |
7,071 |
– |
8,112 |
851 | 6,534 | – | 7,385 | ||||||||||||||||||||||||
| – High |
11 |
1,859 |
– |
1,870 |
7 | 1,561 | – | 1,568 | ||||||||||||||||||||||||
| – Default |
– |
– |
1,097 |
1,097 |
– | – | 790 | 790 | ||||||||||||||||||||||||
| – Not rated |
2,808 |
183 |
218 |
3,209 |
2,757 | 232 | 204 | 3,193 | ||||||||||||||||||||||||
| Gross residential mortgages (4)(5)
|
272,458 |
13,260 |
1,315 |
287,033 |
255,657 | 24,021 | 994 | 280,672 | ||||||||||||||||||||||||
| ECL allowance |
100 |
168 |
306 |
574 |
89 | 126 | 234 | 449 | ||||||||||||||||||||||||
| Net residential mortgages |
272,358 |
13,092 |
1,009 |
286,459 |
255,568 | 23,895 | 760 | 280,223 | ||||||||||||||||||||||||
| Personal |
||||||||||||||||||||||||||||||||
| – Exceptionally low |
18,316 |
136 |
– |
18,452 |
16,689 | 83 | – | 16,772 | ||||||||||||||||||||||||
| – Very low |
10,794 |
324 |
– |
11,118 |
9,685 | 12 | – | 9,697 | ||||||||||||||||||||||||
| – Low |
6,404 |
2,104 |
– |
8,508 |
10,498 | 1,374 | – | 11,872 | ||||||||||||||||||||||||
| – Medium |
4,502 |
2,506 |
– |
7,008 |
3,848 | 1,822 | – | 5,670 | ||||||||||||||||||||||||
| – High |
759 |
922 |
– |
1,681 |
465 | 1,102 | – | 1,567 | ||||||||||||||||||||||||
| – Default |
– |
– |
253 |
253 |
– | – | 260 | 260 | ||||||||||||||||||||||||
| – Not rated |
779 |
30 |
37 |
846 |
782 | 29 | 32 | 843 | ||||||||||||||||||||||||
| Gross personal (5)
|
41,554 |
6,022 |
290 |
47,866 |
41,967 | 4,422 | 292 | 46,681 | ||||||||||||||||||||||||
| ECL allowance |
222 |
749 |
185 |
1,156 |
221 | 531 | 190 | 942 | ||||||||||||||||||||||||
| Net personal |
41,332 |
5,273 |
105 |
46,710 |
41,746 | 3,891 | 102 | 45,739 | ||||||||||||||||||||||||
| Credit card |
||||||||||||||||||||||||||||||||
| – Exceptionally low |
7,117 |
– |
– |
7,117 |
7,185 | – | – | 7,185 | ||||||||||||||||||||||||
| – Very low |
443 |
– |
– |
443 |
502 | – | – | 502 | ||||||||||||||||||||||||
| – Low |
6,727 |
380 |
– |
7,107 |
6,800 | 4 | – | 6,804 | ||||||||||||||||||||||||
| – Medium |
5,008 |
1,116 |
– |
6,124 |
3,853 | 1,512 | – | 5,365 | ||||||||||||||||||||||||
| – High |
6 |
594 |
– |
600 |
2 | 522 | – | 524 | ||||||||||||||||||||||||
| – Default |
– |
– |
– |
– |
– | – | – | – | ||||||||||||||||||||||||
| – Not rated |
184 |
6 |
– |
190 |
165 | 6 | – | 171 | ||||||||||||||||||||||||
| Gross credit card |
19,485 |
2,096 |
– |
21,581 |
18,507 | 2,044 | – | 20,551 | ||||||||||||||||||||||||
| ECL allowance |
302 |
640 |
– |
942 |
279 | 623 | – | 902 | ||||||||||||||||||||||||
| Net credit card |
19,183 |
1,456 |
– |
20,639 |
18,228 | 1,421 | – | 19,649 | ||||||||||||||||||||||||
| Business and government |
||||||||||||||||||||||||||||||||
| – Investment grade |
119,315 |
875 |
– |
120,190 |
101,809 | 722 | – | 102,531 | ||||||||||||||||||||||||
| – Non-investment grade |
102,145 |
8,807 |
– |
110,952 |
97,131 | 9,000 | – | 106,131 | ||||||||||||||||||||||||
| – Watch list |
61 |
3,901 |
– |
3,962 |
25 | 3,745 | – | 3,770 | ||||||||||||||||||||||||
| – Default |
– |
– |
2,031 |
2,031 |
– | – | 1,628 | 1,628 | ||||||||||||||||||||||||
| – Not rated |
269 |
12 |
– |
281 |
230 | 15 | – | 245 | ||||||||||||||||||||||||
| Gross business and government (4)(6)
|
221,790 |
13,595 |
2,031 |
237,416 |
199,195 | 13,482 | 1,628 | 214,305 | ||||||||||||||||||||||||
| ECL allowance |
359 |
870 |
491 |
1,720 |
211 | 1,021 | 392 | 1,624 | ||||||||||||||||||||||||
| Net business and government |
221,431 |
12,725 |
1,540 |
235,696 |
198,984 | 12,461 | 1,236 | 212,681 | ||||||||||||||||||||||||
| Total net amount of loans |
$ |
554,304 |
$ |
32,546 |
$ |
2,654 |
$ |
589,504 |
$ | 514,526 | $ | 41,668 | $ | 2,098 | $ | 558,292 | ||||||||||||||||
| (1) | The table excludes debt securities measured at FVOCI, for which ECL allowances of $23 million (2024: $ 19 million) were recognized in AOCI. In addition, the table excludes debt securities classified at amortized cost, for which ECL allowances of $52 million were recognized as at October 31, 2025 (2024: $17 million). Other financial assets classified at amortized cost were also excluded from the table above as their ECL allowances were immaterial as at October 31, 2025 and October 31, 2024. Financial assets other than loans that are classified as amortized cost are presented on our consolidated balance sheet net of ECL allowances. |
| (2) | Excludes foreclosed assets of $2 million (2024: $8 million), which were included in Other assets on our consolidated balance sheet. |
| (3) | As at October 31, 2025, 92% (2024: 93%) of stage 3 impaired loans were either fully or partially collateralized. |
| (4) | Includes $3 million (2024: $3 million) of residential mortgages and $560 million (2024: $221 million) of business and government loans that are measured and designated at FVTPL. |
| (5) | The internal risk rating grades presented for residential mortgages and certain personal loans do not take into account loan guarantees or insurance issued by the Canadian government (federal or provincial), Canadian government agencies, or private insurers, as the determination of whether a SICR has occurred for these loans is based on relative changes in the loans’ lifetime PD without considering collateral or other credit enhancements. |
| (6) | Includes customers’ liability under acceptances of $10 million (2024: $6 million). |
139 |
CIBC 2025 |
| Consolidated financial statements |
$ millions, as at October 31 |
2025 |
2024 |
||||||||||||||||||||||||||||||
Stage 1 |
Stage 2 |
Stage 3 |
Total |
Stage 1 |
Stage 2 |
Stage 3 |
Total |
|||||||||||||||||||||||||
| Retail |
||||||||||||||||||||||||||||||||
| – Exceptionally low |
$ |
176,040 |
$ |
190 |
$ |
– |
$ |
176,230 |
$ | 164,577 | $ | 117 | $ | – | $ | 164,694 | ||||||||||||||||
| – Very low |
14,237 |
572 |
– |
14,809 |
15,112 | 4 | – | 15,116 | ||||||||||||||||||||||||
| – Low |
14,867 |
1,705 |
– |
16,572 |
14,988 | 984 | – | 15,972 | ||||||||||||||||||||||||
| – Medium |
2,449 |
1,508 |
– |
3,957 |
2,263 | 1,280 | – | 3,543 | ||||||||||||||||||||||||
| – High |
545 |
422 |
– |
967 |
325 | 539 | – | 864 | ||||||||||||||||||||||||
| – Default |
– |
– |
46 |
46 |
– | – | 43 | 43 | ||||||||||||||||||||||||
| – Not rated |
620 |
8 |
– |
628 |
565 | 9 | – | 574 | ||||||||||||||||||||||||
| Gross retail |
208,758 |
4,405 |
46 |
213,209 |
197,830 | 2,933 | 43 | 200,806 | ||||||||||||||||||||||||
| ECL allowance |
54 |
131 |
– |
185 |
42 | 52 | – | 94 | ||||||||||||||||||||||||
| Net retail |
208,704 |
4,274 |
46 |
213,024 |
197,788 | 2,881 | 43 | 200,712 | ||||||||||||||||||||||||
| Business and government |
||||||||||||||||||||||||||||||||
| – Investment grade |
179,496 |
579 |
– |
180,075 |
156,560 | 571 | – | 157,131 | ||||||||||||||||||||||||
| – Non-investment grade |
79,909 |
2,659 |
– |
82,568 |
66,788 | 3,018 | – | 69,806 | ||||||||||||||||||||||||
| – Watch list |
57 |
1,046 |
– |
1,103 |
28 | 878 | – | 906 | ||||||||||||||||||||||||
| – Default |
– |
– |
217 |
217 |
– | – | 123 | 123 | ||||||||||||||||||||||||
| – Not rated |
947 |
42 |
– |
989 |
1,117 | 91 | – | 1,208 | ||||||||||||||||||||||||
| Gross business and government |
260,409 |
4,326 |
217 |
264,952 |
224,493 | 4,558 | 123 | 229,174 | ||||||||||||||||||||||||
| ECL allowance |
93 |
62 |
7 |
162 |
54 | 40 | 9 | 103 | ||||||||||||||||||||||||
| Net business and government |
260,316 |
4,264 |
210 |
264,790 |
224,439 | 4,518 | 114 | 229,071 | ||||||||||||||||||||||||
| Total net undrawn credit facilities and other off-balance sheet exposures |
$ |
469,020 |
$ |
8,538 |
$ |
256 |
$ |
477,814 |
$ | 422,227 | $ | 7,399 | $ | 157 | $ | 429,783 | ||||||||||||||||
Note 6 |
Structured entities and derecognition of financial assets |
|
CIBC
2025 ANNUAL REPORT |
|
140 |
|
Consolidated financial statements |
141 |
CIBC 2025 ANNUAL REPORT |
Consolidated financial statements |
$ millions, as at October 31, 2025 |
Single-seller and multi-seller
conduits |
Third-party structured vehicles |
Loan financing |
Other (1)
|
||||||||||||
On-balance sheet assets at carrying value (2)
|
||||||||||||||||
Cash and non-interest-bearing deposits with banks |
$ |
– |
$ |
– |
$ |
– |
$ |
943 |
||||||||
Securities |
592 |
6,022 |
– |
791 |
||||||||||||
Loans |
135 |
1,676 |
19,341 |
303 |
||||||||||||
Investments in equity-accounted associates and joint ventures |
– |
51 |
– |
1 |
||||||||||||
Total |
$ |
727 |
$ |
7,749 |
$ |
19,341 |
$ |
2,038 |
||||||||
October 31, 2024 |
$ | 377 | $ | 4,977 | $ | 10,640 | $ | 1,795 | ||||||||
On-balance sheet liabilities at carrying value (2)
|
||||||||||||||||
Deposits |
$ |
– |
$ |
– |
$ |
– |
$ |
948 |
||||||||
Derivatives (3)
|
– |
– |
– |
41 |
||||||||||||
Other |
– |
– |
– |
267 |
||||||||||||
Total |
$ |
– |
$ |
– |
$ |
– |
$ |
1,256 |
||||||||
October 31, 2024 |
$ | – | $ | – | $ | – | $ | 1,050 | ||||||||
Maximum exposure to loss, net of hedges |
||||||||||||||||
Investments and loans |
$ |
727 |
$ |
7,749 |
$ |
19,341 |
$ |
1,095 |
||||||||
Notional of written derivatives, less fair value losses |
– |
– |
– |
18 |
||||||||||||
Liquidity, credit facilities and commitments |
22,197 |
(4)
|
2,065 |
10,428 |
201 |
|||||||||||
Less: hedges of investments, loans and written derivatives exposure |
– |
– |
– |
(18 |
) |
|||||||||||
Total |
$ |
22,924 |
$ |
9,814 |
$ |
29,769 |
$ |
1,296 |
||||||||
October 31, 2024 |
$ | 17,014 | $ | 6,630 | $ | 19,166 | $ | 1,323 | ||||||||
| (1) | Includes Community Reinvestment Act |
| (2) | Excludes SEs established by CMHC, Fannie Mae, Freddie Mac, Ginnie Mae, FHLB, Federal Farm Credit Bank, and Student Loan Marketing Association. |
| (3) | Comprises written credit default swaps (CDS) and total return swaps (TRS) under which we assume exposures. Excludes foreign exchange derivatives, interest rate derivatives and other derivatives provided as part of normal client facilitation. |
| (4) | Excludes an additional $8.4 billion (2024: $6.2 billion) relating to our backstop liquidity facilities provided to the multi-seller conduits as part of their commitment to fund purchases of additional assets. Also excludes $592 million (2024: $276 million) of our direct investments in the multi-seller conduits which we consider investment exposure. |
|
CIBC
2025 ANNUAL REPORT |
|
142 |
|
Consolidated financial statements |
$ millions, as at October 31 |
2025 |
2024 |
||||||||||||||
Carrying amount |
Fair value |
Carrying amount |
Fair value |
|||||||||||||
Residential mortgage securitizations (1)
|
$ |
14,368 |
$ |
14,426 |
$ | 14,612 | $ | 14,598 | ||||||||
Securities held by counterparties as collateral under repurchase agreements (2)
|
104,799 |
104,799 |
72,433 | 72,433 | ||||||||||||
Securities lent for cash collateral (2)
|
1,507 |
1,507 |
2,637 | 2,637 | ||||||||||||
Securities lent for securities collateral (2)
|
21,420 |
21,420 |
21,712 | 21,712 | ||||||||||||
Transferred financial assets |
$ |
142,094 |
$ |
142,152 |
$ | 111,394 | $ | 111,380 | ||||||||
Associated liabilities (3)
|
$ |
142,478 |
$ |
142,443 |
$ | 111,704 | $ | 111,655 | ||||||||
| (1) | Consists mainly of Canadian residential mortgage loans transferred to Canada Housing Trust. Certain cash in transit balances related to the securitization process amounting to $470 million (2024: $410 million) have been applied to reduce these balances. |
| (2) | Does not include over-collateralization of assets pledged. Repurchase and securities lending arrangements are conducted with both CIBC-owned and third-party assets on a pooled basis. The carrying amounts represent an estimated allocation related to the transfer of our own financial assets. |
| (3) | Includes the obligation to return off-balance sheet securities collateral on securities lent and fair value hedge basis adjustments. |
Note 7 |
Property and equipment |
$ millions, as at or for the year ended October 31 |
Right-of-
use assets |
Land and buildings (1)
|
Computer equipment |
Office furniture, equipment and other (1)
|
Leasehold improvements (1)
|
Total |
||||||||||||||||||||
2025 |
Cost |
|||||||||||||||||||||||||
Balance at beginning of year |
$ |
2,933 |
$ |
831 |
$ |
1,087 |
$ |
956 |
$ |
1,670 |
$ |
7,477 |
||||||||||||||
Additions (2)
|
236 |
46 |
68 |
134 |
200 |
684 |
||||||||||||||||||||
Disposals (3)
|
(120 |
) |
(14 |
) |
(231 |
) |
(83 |
) |
(47 |
) |
(495 |
) |
||||||||||||||
Adjustments (4)
|
5 |
1 |
2 |
3 |
2 |
13 |
||||||||||||||||||||
Balance at end of year |
$ |
3,054 |
$ |
864 |
$ |
926 |
$ |
1,010 |
$ |
1,825 |
$ |
7,679 |
||||||||||||||
2024 |
Balance at end of year |
$ | 2,933 | $ | 831 | $ | 1,087 | $ | 956 | $ | 1,670 | $ | 7,477 | |||||||||||||
2025 |
Accumulated depreciation |
|||||||||||||||||||||||||
Balance at beginning of year |
$ |
1,290 |
$ |
359 |
$ |
897 |
$ |
547 |
$ |
1,025 |
$ |
4,118 |
||||||||||||||
Depreciation and impairment |
269 |
19 |
85 |
60 |
85 |
518 |
||||||||||||||||||||
Disposals (3)
|
(90 |
) |
(7 |
) |
(230 |
) |
(35 |
) |
(44 |
) |
(406 |
) |
||||||||||||||
Adjustments (4)
|
2 |
1 |
1 |
1 |
1 |
6 |
||||||||||||||||||||
Balance at end of year |
$ |
1,471 |
$ |
372 |
$ |
753 |
$ |
573 |
$ |
1,067 |
$ |
4,236 |
||||||||||||||
2024 |
Balance at end of year |
$ | 1,290 | $ | 359 | $ | 897 | $ | 547 | $ | 1,025 | $ | 4,118 | |||||||||||||
Net book value |
||||||||||||||||||||||||||
As at October 31, 2025 |
$ |
1,583 |
$ |
492 |
$ |
173 |
$ |
437 |
$ |
758 |
$ |
3,443 |
||||||||||||||
As at October 31, 2024 |
$ | 1,643 | $ | 472 | $ | 190 | $ | 409 | $ | 645 | $ | 3,359 | ||||||||||||||
| (1) | Includes $427 million (2024: $196 million) of work-in-progress not subject to depreciation. |
| (2) | Includes impact of lease modifications. |
| (3) | Includes write-offs of fully depreciated assets. |
| (4) | Includes foreign currency translation adjustments. |
143 |
CIBC 2025 |
Consolidated financial statements |
Note 8 |
Goodwill, software and other intangible assets |
| CGUs | ||||||||||||||||||
$ millions, as at or for the year ended October 31 |
Canadian Wealth Management |
U.S. Commercial Banking and Wealth Management |
Other | Total | ||||||||||||||
2025 |
Balance at beginning of year |
$ |
884 |
$ |
4,318 |
$ |
241 |
$ |
5,443 |
|||||||||
Impairment |
– |
– |
– |
– |
||||||||||||||
Adjustments (1)
|
– |
31 |
1 |
32 |
||||||||||||||
Balance at end of year |
$ |
884 |
$ |
4,349 |
$ |
242 |
$ |
5,475 |
||||||||||
2024 |
Balance at beginning of year | $ | 884 | $ | 4,300 | $ | 241 | $ | 5,425 | |||||||||
Impairment |
– | – | – | – | ||||||||||||||
Adjustments (1)
|
– | 18 | – | 18 | ||||||||||||||
| Balance at end of year | $ | 884 | $ | 4,318 | $ | 241 | $ | 5,443 | ||||||||||
| (1) | Includes foreign currency translation adjustments. |
| CIBC 2025 |
|
144 |
|
| Consolidated financial statements |
$ millions, as at or for the year ended October 31 |
Software (1)
|
Core deposit intangibles (2)
|
Contract based |
Customer relationships (3)
|
Total | |||||||||||||||||
| 2025 |
Gross carrying amount |
|||||||||||||||||||||
| Balance at beginning of year |
$ |
5,705 |
$ |
53 |
$ |
11 |
$ |
381 |
$ |
6,150 |
||||||||||||
| Additions |
719 |
– |
– |
– |
719 |
|||||||||||||||||
| Disposals (4)
|
(67 |
) |
(20 |
)
|
– |
(4 |
) |
(91 |
) | |||||||||||||
| Adjustments (5)
|
3 |
1 |
– |
1 |
5 |
|||||||||||||||||
| Balance at end of year |
$ |
6,360 |
$ |
34 |
$ |
11 |
$ |
378 |
$ |
6,783 |
||||||||||||
| 2024 |
Balance at end of year |
$ | 5,705 | $ | 53 | $ | 11 | $ | 381 | $ | 6,150 | |||||||||||
| 2025 |
Accumulated amortization |
|||||||||||||||||||||
| Balance at beginning of year |
$ |
3,190 |
$ |
43 |
$ |
9 |
$ |
194 |
$ |
3,436 |
||||||||||||
| Amortization and impairment (6)
|
615 |
5 |
1 |
39 |
660 |
|||||||||||||||||
| Disposals (4)
|
(67 |
) |
(20 |
) |
– |
(4 |
) |
(91 |
) | |||||||||||||
| Adjustments (5)
|
(2 |
) |
1 |
– |
1 |
– |
||||||||||||||||
| Balance at end of year |
$ |
3,736 |
$ |
29 |
$ |
10 |
$ |
230 |
$ |
4,005 |
||||||||||||
| 2024 |
Balance at end of year |
$ | 3,190 | $ | 43 | $ | 9 | $ | 194 | $ | 3,436 | |||||||||||
| Net book value | ||||||||||||||||||||||
| As at October 31, 2025 |
$ |
2,624 |
$ |
5 |
$ |
1 |
$ |
148 |
$ |
2,778 |
||||||||||||
| As at October 31, 2024 |
$ | 2,515 | $ | 10 | $ | 2 | $ | 187 | $ | 2,714 | ||||||||||||
| (1) | Includes $1,078 million (2024: $1,062 million) of work-in-progress not subject to amortization. |
| (2) | Acquired as part of the acquisition of The PrivateBank. |
| (3) | Represents customer relationships associated with past acquisitions including of the Canadian Costco credit card portfolio in 2022. |
| (4) | Includes write-offs of fully amortized assets. |
(5) |
Includes foreign currency translation. |
(6) |
Includes impairment of work-in-progress. |
Note 9 |
Other assets |
$ millions, as at October 31 |
2025 |
2024 | ||||||
| Accrued interest receivable |
$ |
4,169 |
$ | 4,213 | ||||
| Defined benefit asset (Note 17)
|
1,678 |
1,378 | ||||||
| Precious metals (1)
|
6,492 |
4,195 | ||||||
| Brokers’ client accounts |
11,745 |
7,967 | ||||||
| Current tax receivable |
2,912 |
2,611 | ||||||
| Other prepayments |
595 |
588 | ||||||
| Derivative collateral receivable |
8,132 |
7,067 | ||||||
| Accounts receivable |
1,698 |
1,238 | ||||||
| Carbon emission allowances (2)
|
649 |
11 | ||||||
| Other (2)(3)
|
1,735 |
1,594 | ||||||
| Total other assets |
$ |
39,805 |
$ | 30,862 | ||||
| (1) | Includes gold and silver bullion that are measured at fair value using unadjusted market prices quoted in active markets. |
(2) |
Carbon emission allowances were previously presented within Other. Prior year amounts have been revised to conform to the presentation adopted in 2025. |
| (3) | Includes investments in subleases of $619 million as at October 31, 2025 (2024: $625 million). For the year ended October 31, 2025, finance income related to our investments in subleases was $42 million (2024: $43 million). Future lease payments receivable are $546 million over the next five years, and $329 million thereafter until expiry of the subleases. |
145 |
CIBC 2025 |
| Consolidated financial statements |
Note 10 |
Deposits (1)(2)
|
$ millions, as at October 31 |
Payable on demand (3)
|
Payable after notice (4)
|
Payable on a fixed date (5)(6)
|
2025 Total |
2024 Total |
|||||||||||||||
| Personal |
$ |
15,185 |
$ |
145,592 |
$ |
97,362 |
$ |
258,139 |
$ | 252,894 | ||||||||||
| Business and government (7)
|
109,376 |
128,092 |
219,816 |
457,284 |
435,499 | |||||||||||||||
| Bank |
17,649 |
337 |
8,737 |
26,723 |
20,009 | |||||||||||||||
| Secured borrowings (8)
|
– |
– |
65,978 |
65,978 |
56,455 | |||||||||||||||
| Total deposits |
$ |
142,210 |
$ |
274,021 |
$ |
391,893 |
$ |
808,124 |
$ | 764,857 | ||||||||||
| Comprises: |
||||||||||||||||||||
| Held at amortized cost |
$ |
764,401 |
$ | 725,849 | ||||||||||||||||
| Designated at fair value |
43,723 |
39,008 | ||||||||||||||||||
| Total deposits |
$ |
808,124 |
$ | 764,857 | ||||||||||||||||
| Deposits include: (9)
|
||||||||||||||||||||
| Non-interest-bearing deposits |
||||||||||||||||||||
| Canada |
$ |
91,074 |
$ | 84,460 | ||||||||||||||||
| U.S. |
12,894 |
12,927 | ||||||||||||||||||
| Other international |
5,963 |
5,691 | ||||||||||||||||||
| Interest-bearing deposits |
||||||||||||||||||||
| Canada |
549,270 |
526,186 | ||||||||||||||||||
| U.S. |
107,607 |
101,141 | ||||||||||||||||||
| Other international |
41,316 |
34,452 | ||||||||||||||||||
| Total deposits |
$ |
808,124 |
$ | 764,857 | ||||||||||||||||
| (1) | Includes deposits of $298.3 billion (2024: $288.4 billion) denominated in U.S. dollars and deposits of $70 billion (2024: $52.9 billion) denominated in other foreign currencies. |
| (2) | Net of purchased notes of $0.5 billion (2024: $0.6 billion). |
| (3) | Includes all deposits for which we do not have the right to require notice of withdrawal. These deposits are generally chequing accounts. |
| (4) | Includes all deposits for which we can legally require notice of withdrawal. These deposits are generally savings accounts. |
| (5) | Includes all deposits that mature on a specified date. These deposits are generally term deposits, guaranteed investment certificates, and similar instruments. |
| (6) | Includes $67.0 billion (2024: $61.1 billion) of deposits which are subject to the bank recapitalization (bail-in) conversion regulations issued by the Department of Finance Canada. These regulations provide certain statutory powers to the Canada Deposit Insurance Corporation, including the ability to convert specified eligible shares and liabilities of CIBC into common shares in the event that CIBC is determined to be non-viable. |
| (7) | Includes $17.3 billion (2024: $15.5 billion) of structured note liabilities that were sold upon issuance to third-party financial intermediaries, who may resell the notes to retail investors in foreign jurisdictions. |
| (8) | Comprises liabilities issued by or as a result of activities associated with the securitization of residential mortgages, Covered Bond Programme, and consolidated securitization vehicles. |
| (9) | Classification is based on geographical location of the CIBC office. |
Note 11 |
Other liabilities |
$ millions, as at October 31 |
2025 |
2024 |
||||||
| Accrued interest payable |
$ |
3,999 |
$ | 4,982 | ||||
| Defined benefit liability (Note 17)
|
457 |
460 | ||||||
| Gold and silver certificates |
220 |
158 | ||||||
| Brokers’ client accounts |
6,566 |
5,951 | ||||||
| Derivative collateral payable |
5,799 |
4,459 | ||||||
| Negotiable instruments |
970 |
1,079 | ||||||
| Accrued employee compensation and benefits |
5,073 |
3,899 | ||||||
| Accounts payable and accrued expenses |
3,461 |
3,202 | ||||||
| Other (1)(2)
|
8,262 |
5,971 | ||||||
| Total other liabilities |
$ |
34,807 |
$ | 30,161 | ||||
| (1) | Includes the carrying value of our lease liabilities, which was $1,981 million as at October 31, 2025 (2024: $2,028 million). The undiscounted cash flows related to the contractual maturity of our lease liabilities are $336 million for the period less than 1 year, $1,076million between years 1-5, and $997million thereafter until expiry of the leases. During the year ended October 31, 2025, interest expense on lease liabilities was $71 million (2024: $72 million). |
| (2) | Includes customers’ liability under acceptances of $10 million (2024: $6 million). Prior year amounts have been revised to conform to the presentation adopted in 2025. |
Note 12 |
Derivative instruments |
$ millions, as at October 31 |
2025 |
2024 |
||||||||||||||
Assets |
Liabilities |
Assets |
Liabilities |
|||||||||||||
| Trading (Note 2)
|
$ |
34,032 |
$ |
39,237 |
$ | 33,485 | $ | 39,847 | ||||||||
| ALM (Note 2)
(1)
|
4,320 |
2,174 |
2,950 | 807 | ||||||||||||
| Total |
$ |
38,352 |
$ |
41,411 |
$ | 36,435 | $ | 40,654 | ||||||||
| (1) | Comprised of derivatives that qualify for hedge accounting under IAS 39 and derivatives used for economic hedges. |
| CIBC 2025 ANNUAL REPORT |
|
146 |
|
| Consolidated financial statements |
147 |
CIBC 2025 ANNUAL REPORT |
| Consolidated financial statements |
$ millions, as at October 31 |
2025 |
2024 |
||||||||||||||||||||||||||||||
Residual term to contractual maturity |
||||||||||||||||||||||||||||||||
Less than 1 year |
1 to 5 years |
Over 5 years |
Total notional amounts |
Trading |
ALM |
Trading |
ALM |
|||||||||||||||||||||||||
| Interest rate derivatives |
||||||||||||||||||||||||||||||||
| Over-the-counter |
||||||||||||||||||||||||||||||||
| Forward rate agreements |
$ |
11,943 |
$ |
370 |
$ |
1 |
$ |
12,314 |
$ |
12,132 |
$ |
182 |
$ | 9,420 | $ | 55 | ||||||||||||||||
| Centrally cleared forward rate agreements |
85,716 |
36,273 |
– |
121,989 |
121,989 |
– |
88,699 | – | ||||||||||||||||||||||||
| Swap contracts |
60,103 |
173,279 |
115,227 |
348,609 |
322,574 |
26,035 |
273,138 | 18,882 | ||||||||||||||||||||||||
| Centrally cleared swap contracts |
4,527,608 |
2,499,849 |
1,532,881 |
8,560,338 |
7,626,410 |
933,928 |
4,805,504 | 921,539 | ||||||||||||||||||||||||
| Purchased options |
102,507 |
28,507 |
2,121 |
133,135 |
130,705 |
2,430 |
47,772 | 644 | ||||||||||||||||||||||||
| Written options |
103,715 |
31,717 |
2,605 |
138,037 |
137,750 |
287 |
54,189 | 43 | ||||||||||||||||||||||||
4,891,592 |
2,769,995 |
1,652,835 |
9,314,422 |
8,351,560 |
962,862 |
5,278,722 | 941,163 | |||||||||||||||||||||||||
| Exchange-traded |
||||||||||||||||||||||||||||||||
| Futures contracts |
29,936 |
5,372 |
– |
35,308 |
35,258 |
50 |
16,112 | 6 | ||||||||||||||||||||||||
| Purchased options |
1,121 |
– |
– |
1,121 |
1,121 |
– |
1,069 | – | ||||||||||||||||||||||||
| Written options |
121 |
– |
– |
121 |
121 |
– |
4,069 | – | ||||||||||||||||||||||||
31,178 |
5,372 |
– |
36,550 |
36,500 |
50 |
21,250 | 6 | |||||||||||||||||||||||||
| Total interest rate derivatives |
4,922,770 |
2,775,367 |
1,652,835 |
9,350,972 |
8,388,060 |
962,912 |
5,299,972 | 941,169 | ||||||||||||||||||||||||
| Foreign exchange derivatives |
||||||||||||||||||||||||||||||||
| Over-the-counter |
||||||||||||||||||||||||||||||||
| Forward contracts |
1,107,993 |
31,812 |
1,582 |
1,141,387 |
1,126,831 |
14,556 |
851,206 | 14,723 | ||||||||||||||||||||||||
| Swap contracts |
280,000 |
311,127 |
175,966 |
767,093 |
666,914 |
100,179 |
567,930 | 71,540 | ||||||||||||||||||||||||
| Purchased options |
82,699 |
2,103 |
– |
84,802 |
84,802 |
– |
72,180 | – | ||||||||||||||||||||||||
| Written options |
82,965 |
2,760 |
– |
85,725 |
85,125 |
600 |
82,384 | 678 | ||||||||||||||||||||||||
1,553,657 |
347,802 |
177,548 |
2,079,007 |
1,963,672 |
115,335 |
1,573,700 | 86,941 | |||||||||||||||||||||||||
| Exchange-traded |
||||||||||||||||||||||||||||||||
| Futures contracts |
60 |
– |
– |
60 |
60 |
– |
352 | – | ||||||||||||||||||||||||
| Purchased options |
541 |
– |
– |
541 |
541 |
– |
67 | – | ||||||||||||||||||||||||
| Written options |
423 |
– |
– |
423 |
423 |
– |
292 | – | ||||||||||||||||||||||||
1,024 |
– |
– |
1,024 |
1,024 |
– |
711 | – | |||||||||||||||||||||||||
| Total foreign exchange derivatives |
1,554,681 |
347,802 |
177,548 |
2,080,031 |
1,964,696 |
115,335 |
1,574,411 | 86,941 | ||||||||||||||||||||||||
| Credit derivatives |
||||||||||||||||||||||||||||||||
| Over-the-counter |
||||||||||||||||||||||||||||||||
| Credit default swap contracts – protection purchased |
1,565 |
1,414 |
185 |
3,164 |
3,164 |
– |
2,782 | 19 | ||||||||||||||||||||||||
| Centrally cleared credit default swap contracts – protection purchased |
36 |
2,836 |
2,092 |
4,964 |
4,964 |
– |
3,071 | – | ||||||||||||||||||||||||
| Credit default swap contracts – protection sold |
103 |
520 |
103 |
726 |
726 |
– |
936 | – | ||||||||||||||||||||||||
| Centrally cleared credit default swap contracts – protection sold |
– |
1,556 |
1,394 |
2,950 |
2,950 |
– |
1,743 | – | ||||||||||||||||||||||||
| Total credit derivatives |
1,704 |
6,326 |
3,774 |
11,804 |
11,804 |
– |
8,532 | 19 | ||||||||||||||||||||||||
| Equity derivatives |
||||||||||||||||||||||||||||||||
| Over-the-counter |
117,883 |
62,742 |
1,282 |
181,907 |
178,673 |
3,234 |
163,965 | 2,357 | ||||||||||||||||||||||||
| Exchange-traded |
78,747 |
54,757 |
984 |
134,488 |
134,488 |
– |
159,341 | – | ||||||||||||||||||||||||
| Total equity derivatives |
196,630 |
117,499 |
2,266 |
316,395 |
313,161 |
3,234 |
323,306 | 2,357 | ||||||||||||||||||||||||
| Precious metal and other commodity derivatives |
||||||||||||||||||||||||||||||||
| Over-the-counter |
57,167 |
26,283 |
949 |
84,399 |
84,396 |
3 |
83,474 | 13 | ||||||||||||||||||||||||
| Centrally cleared commodity derivatives |
183 |
169 |
– |
352 |
352 |
– |
336 | – | ||||||||||||||||||||||||
| Exchange-traded |
32,261 |
11,708 |
455 |
44,424 |
44,424 |
– |
32,094 | – | ||||||||||||||||||||||||
| Total precious metal and other commodity derivatives |
89,611 |
38,160 |
1,404 |
129,175 |
129,172 |
3 |
115,904 | 13 | ||||||||||||||||||||||||
| Total notional amount |
$ |
6,765,396 |
$ |
3,285,154 |
$ |
1,837,827 |
$ |
11,888,377 |
$ |
10,806,893 |
$ |
1,081,484 |
$ | 7,322,125 | $ | 1,030,499 | ||||||||||||||||
| Of which: |
||||||||||||||||||||||||||||||||
| Over-the-counter |
$ |
6,622,186 |
$ |
3,213,317 |
$ |
1,836,388 |
$ |
11,671,891 |
$ |
10,590,457 |
$ |
1,081,434 |
$ | 7,108,729 | $ | 1,030,493 | ||||||||||||||||
| Exchange-traded |
143,210 |
71,837 |
1,439 |
216,486 |
216,436 |
50 |
213,396 | 6 | ||||||||||||||||||||||||
| CIBC 2025 |
|
148 |
|
| Consolidated financial statements |
$ millions, as at October 31 |
2025 |
2024 |
||||||||||||||||||||||||||||||||||||||
Current replacement cost (1)
|
Credit equivalent amount (2)
|
Risk- weighted amount |
Current replacement cost (1)
|
Credit equivalent amount (2)
|
Risk- weighted amount |
|||||||||||||||||||||||||||||||||||
Trading |
ALM |
Total |
Trading |
ALM |
Total |
|||||||||||||||||||||||||||||||||||
| Interest rate derivatives |
||||||||||||||||||||||||||||||||||||||||
| Over-the-counter |
||||||||||||||||||||||||||||||||||||||||
| Forward rate agreements |
$ |
3 |
$ |
6 |
$ |
9 |
$ |
32 |
$ |
15 |
$ | 2 | $ | 1 | $ | 3 | $ | 31 | $ | 15 | ||||||||||||||||||||
| Swap contracts |
1,311 |
95 |
1,406 |
3,921 |
1,047 |
1,070 | 131 | 1,201 | 3,016 | 710 | ||||||||||||||||||||||||||||||
| Purchased options |
30 |
4 |
34 |
118 |
45 |
22 | 1 | 23 | 68 | 24 | ||||||||||||||||||||||||||||||
| Written options |
4 |
2 |
6 |
50 |
14 |
2 | 1 | 3 | 20 | 6 | ||||||||||||||||||||||||||||||
1,348 |
107 |
1,455 |
4,121 |
1,121 |
1,096 | 134 | 1,230 | 3,135 | 755 | |||||||||||||||||||||||||||||||
| Exchange-traded |
1 |
– |
1 |
80 |
3 |
2 | – | 2 | 35 | 1 | ||||||||||||||||||||||||||||||
| Total interest rate derivatives |
1,349 |
107 |
1,456 |
4,201 |
1,124 |
1,098 | 134 | 1,232 | 3,170 | 756 | ||||||||||||||||||||||||||||||
| Foreign exchange derivatives |
||||||||||||||||||||||||||||||||||||||||
| Over-the-counter |
||||||||||||||||||||||||||||||||||||||||
| Forward contracts |
1,658 |
72 |
1,730 |
5,954 |
2,019 |
1,923 | 308 | 2,231 | 5,985 | 2,010 | ||||||||||||||||||||||||||||||
| Swap contracts |
305 |
527 |
832 |
3,092 |
560 |
326 | 512 | 838 | 2,818 | 482 | ||||||||||||||||||||||||||||||
| Purchased options |
164 |
– |
164 |
487 |
147 |
183 | – | 183 | 498 | 171 | ||||||||||||||||||||||||||||||
| Written options |
24 |
– |
24 |
226 |
77 |
19 | – | 19 | 165 | 52 | ||||||||||||||||||||||||||||||
2,151 |
599 |
2,750 |
9,759 |
2,803 |
2,451 | 820 | 3,271 | 9,466 | 2,715 | |||||||||||||||||||||||||||||||
| Exchange-traded |
– |
– |
– |
1,697 |
68 |
– | – | – | 499 | 20 | ||||||||||||||||||||||||||||||
| Total foreign exchange derivatives |
2,151 |
599 |
2,750 |
11,456 |
2,871 |
2,451 | 820 | 3,271 | 9,965 | 2,735 | ||||||||||||||||||||||||||||||
| Credit derivatives |
||||||||||||||||||||||||||||||||||||||||
| Over-the-counter |
||||||||||||||||||||||||||||||||||||||||
| Credit default swap contracts |
||||||||||||||||||||||||||||||||||||||||
| – protection purchased |
2 |
– |
2 |
164 |
16 |
2 | – | 2 | 121 | 14 | ||||||||||||||||||||||||||||||
| – protection sold |
– |
– |
– |
17 |
4 |
– | – | – | 18 | 4 | ||||||||||||||||||||||||||||||
| Total credit derivatives |
2 |
– |
2 |
181 |
20 |
2 | – | 2 | 139 | 18 | ||||||||||||||||||||||||||||||
| Equity derivatives |
||||||||||||||||||||||||||||||||||||||||
| Over-the-counter |
320 |
32 |
352 |
5,841 |
1,338 |
365 | 59 | 424 | 4,179 | 1,048 | ||||||||||||||||||||||||||||||
| Exchange-traded |
922 |
– |
922 |
5,073 |
155 |
1,364 | – | 1,364 | 5,502 | 161 | ||||||||||||||||||||||||||||||
| Total equity derivatives |
1,242 |
32 |
1,274 |
10,914 |
1,493 |
1,729 | 59 | 1,788 | 9,681 | 1,209 | ||||||||||||||||||||||||||||||
| Precious metal and other commodity derivatives |
||||||||||||||||||||||||||||||||||||||||
| Over-the-counter |
1,766 |
7 |
1,773 |
3,465 |
1,540 |
1,165 | 30 | 1,195 | 2,406 | 956 | ||||||||||||||||||||||||||||||
| Exchange-traded |
6 |
– |
6 |
2,595 |
104 |
83 | – | 83 | 1,930 | 77 | ||||||||||||||||||||||||||||||
| Total precious metal and other commodity derivatives |
1,772 |
7 |
1,779 |
6,060 |
1,644 |
1,248 | 30 | 1,278 | 4,336 | 1,033 | ||||||||||||||||||||||||||||||
| RWA related to non-trade exposures to central counterparties |
534 |
414 | ||||||||||||||||||||||||||||||||||||||
| RWA related to CVA capital charge |
3,057 |
3,381 | ||||||||||||||||||||||||||||||||||||||
| Total derivatives |
$ |
6,516 |
$ |
745 |
$ |
7,261 |
$ |
32,812 |
$ |
10,743 |
$ | 6,528 | $ | 1,043 | $ | 7,571 | $ | 27,291 | $ | 9,546 | ||||||||||||||||||||
| (1) | Current replacement cost reflects the current mark-to-market value of derivatives offset by eligible financial collateral, where present. |
| (2) | Under IMM, expected effective positive exposure (EEPE) is used, which computes, through simulation, the expected exposures with consideration to the expected movements in underlying risk factor and netting/collateral agreements. The EAD is calculated as EEPE multiplied by the prescribed alpha factor of 1.4. The EAD under SA-CCR is calculated as the sum of replacement cost and potential future exposure, multiplied by the prescribed alpha factor of 1.4. |
149 |
CIBC 2025 |
Consolidated financial statements |
$ millions, as at October 31 |
2025 |
2024 |
||||||||||||||||||||||||||||||
Canada |
U.S. |
Other countries |
Total |
Canada |
U.S. |
Other countries |
Total |
|||||||||||||||||||||||||
Derivative instruments |
||||||||||||||||||||||||||||||||
By counterparty type |
||||||||||||||||||||||||||||||||
Financial institutions |
$ |
1,072 |
$ |
1,407 |
$ |
931 |
$ |
3,410 |
$ | 1,389 | $ | 1,826 | $ | 1,102 | $ | 4,317 | ||||||||||||||||
Governments |
590 |
16 |
62 |
668 |
796 | – | 54 | 850 | ||||||||||||||||||||||||
Corporate |
1,870 |
861 |
452 |
3,183 |
1,524 | 409 | 471 | 2,404 | ||||||||||||||||||||||||
Total derivative instruments |
$ |
3,532 |
$ |
2,284 |
$ |
1,445 |
$ |
7,261 |
$ | 3,709 | $ | 2,235 | $ | 1,627 | $ | 7,571 | ||||||||||||||||
Note 13 |
Designated accounting hedges |
| • | Utilization of hedging instruments that have a non-zero fair value at the inception of the hedge relationship; |
| • | Differences in fixed rates, when contractual coupons of the fixed rate hedged items are designated; |
| • | Differences in the discounting factors between the hedged item and the hedging instruments arising from different rate reset frequencies and timing of cash flows; and |
| • | Differences in the discount curves to determine the basis adjustments of the hedged items and the fair value of the hedging derivatives, including from the application of CVA to the valuation of derivatives when they are applicable. |
|
CIBC
2025 ANNUAL REPORT |
|
150 |
|
Consolidated financial statements |
|
Notional amount of the hedging instrument (1)
|
Maturity range |
Fair value of the hedging derivatives |
Gains (losses) on changes in fair value used for calculating hedge ineffectiveness |
|||||||||||||||||||||||||||
$ millions, as at October 31 |
Less than 1 year |
1-5 years |
Over 5 years |
Assets |
Liabilities |
|||||||||||||||||||||||||
2025 |
Cash flow hedges |
|||||||||||||||||||||||||||||
Foreign exchange risk |
||||||||||||||||||||||||||||||
Cross-currency interest rate swaps |
$ |
40,826 |
$ |
21,322 |
$ |
19,504 |
$ |
– |
$ |
1,383 |
$ |
419 |
$ |
686 |
||||||||||||||||
Interest rate risk |
||||||||||||||||||||||||||||||
Interest rate swaps |
53,148 |
1,052 |
49,251 |
2,845 |
– |
7 |
568 |
|||||||||||||||||||||||
Equity share price risk |
||||||||||||||||||||||||||||||
Equity swaps |
2,836 |
2,836 |
– |
– |
150 |
2 |
713 |
|||||||||||||||||||||||
$ |
96,810 |
$ |
25,210 |
$ |
68,755 |
$ |
2,845 |
$ |
1,533 |
$ |
428 |
$ |
1,967 |
|||||||||||||||||
NIFO hedges |
||||||||||||||||||||||||||||||
Foreign exchange risk |
||||||||||||||||||||||||||||||
Foreign exchange forwards |
$ |
8,934 |
$ |
8,934 |
$ |
– |
$ |
– |
$ |
55 |
$ |
107 |
$ |
(64 |
) |
|||||||||||||||
Deposits (2)
|
32,799 |
32,799 |
– |
– |
n/a |
n/a |
(233 |
) |
||||||||||||||||||||||
$ |
41,733 |
$ |
41,733 |
$ |
– |
$ |
– |
$ |
55 |
$ |
107 |
$ |
(297 |
) |
||||||||||||||||
Fair value hedges |
||||||||||||||||||||||||||||||
Interest rate risk |
||||||||||||||||||||||||||||||
Interest rate swaps |
$ |
206,770 |
$ |
86,092 |
$ |
83,050 |
$ |
37,628 |
$ |
43 |
$ |
988 |
$ |
(158 |
) |
|||||||||||||||
Foreign exchange / interest rate risk |
||||||||||||||||||||||||||||||
Cross-currency interest rate swaps |
58,556 |
17,314 |
33,774 |
7,468 |
2,667 |
526 |
63 |
|||||||||||||||||||||||
Interest rate swaps |
29,331 |
8,146 |
18,720 |
2,465 |
– |
1 |
315 |
|||||||||||||||||||||||
$ |
294,657 |
$ |
111,552 |
$ |
135,544 |
$ |
47,561 |
$ |
2,710 |
$ |
1,515 |
$ |
220 |
|||||||||||||||||
Total |
$ |
433,200 |
$ |
178,495 |
$ |
204,299 |
$ |
50,406 |
$ |
4,298 |
$ |
2,050 |
$ |
1,890 |
||||||||||||||||
2024 |
Cash flow hedges |
|||||||||||||||||||||||||||||
Foreign exchange risk |
||||||||||||||||||||||||||||||
Cross-currency interest rate swaps |
$ | 29,207 | $ | 14,559 | $ | 14,648 | $ | – | $ | 1,008 | $ | 366 | $ | 713 | ||||||||||||||||
Interest rate risk |
||||||||||||||||||||||||||||||
Interest rate swaps |
41,233 | 1,462 | 38,178 | 1,593 | – | 8 | 1,625 | |||||||||||||||||||||||
Equity share price risk |
||||||||||||||||||||||||||||||
Equity swaps |
2,087 | 1,810 | 277 | – | 156 | 3 | 920 | |||||||||||||||||||||||
| $ | 72,527 | $ | 17,831 | $ | 53,103 | $ | 1,593 | $ | 1,164 | $ | 377 | $ | 3,258 | |||||||||||||||||
NIFO hedges |
||||||||||||||||||||||||||||||
Foreign exchange risk |
||||||||||||||||||||||||||||||
Foreign exchange forwards |
$ | 7,658 | $ | 7,658 | $ | – | $ | – | $ | 15 | $ | 106 | $ | (51 | ) | |||||||||||||||
Deposits (2)
|
32,084 | 32,084 | – | – | n/a | n/a | (216 | ) | ||||||||||||||||||||||
| $ | 39,742 | $ | 39,742 | $ | – | $ | – | $ | 15 | $ | 106 | $ | (267 | ) | ||||||||||||||||
Fair value hedges |
||||||||||||||||||||||||||||||
Interest rate risk |
||||||||||||||||||||||||||||||
Interest rate swaps |
$ | 267,334 | $ | 118,011 | $ | 117,322 | $ | 32,001 | $ | 77 | $ | 926 | $ | (2,116 | ) | |||||||||||||||
Foreign exchange / interest rate risk |
||||||||||||||||||||||||||||||
Cross-currency interest rate swaps |
41,491 | 13,249 | 25,647 | 2,595 | 1,617 | 758 | 51 | |||||||||||||||||||||||
Interest rate swaps |
21,336 | 6,591 | 14,257 | 488 | – | 15 | 694 | |||||||||||||||||||||||
| $ | 330,161 | $ | 137,851 | $ | 157,226 | $ | 35,084 | $ | 1,694 | $ | 1,699 | $ | (1,371 | ) | ||||||||||||||||
Total |
$ | 442,430 | $ | 195,424 | $ | 210,329 | $ | 36,677 | $ | 2,873 | $ | 2,182 | $ | 1,620 | ||||||||||||||||
| (1) | For some hedge relationships, we apply a combination of derivatives to hedge the underlying exposures; therefore, the notional amounts of the derivatives generally exceed the carrying amount of the hedged items. |
| (2) | Notional amount represents the principal amount of deposits as at October 31, 2025 and October 31, 2024. |
| n/a | Not applicable. |
151 |
CIBC 2025 ANNUAL REPORT |
| Consolidated financial statements |
As at October 31 |
Average exchange rate (1)
|
Average fixed interest rate (1)
|
Average share price |
|||||||||||||||||
| 2025 |
Cash flow hedges |
|||||||||||||||||||
| Foreign exchange risk |
||||||||||||||||||||
| Cross-currency interest rate swaps |
AUD – CAD | 0.90 |
n/a |
n/a |
||||||||||||||||
| EUR – CAD | 1.53 |
n/a |
n/a |
|||||||||||||||||
| GBP – CAD | 1.77 |
n/a |
n/a |
|||||||||||||||||
| Interest rate risk |
||||||||||||||||||||
| Interest rate swaps |
n/a |
CAD | 2.83 |
% |
n/a |
|||||||||||||||
n/a |
USD | 3.68 |
% |
n/a |
||||||||||||||||
| Equity share price risk |
||||||||||||||||||||
| Equity swaps |
n/a |
n/a |
$ |
89.81 |
||||||||||||||||
| NIFO hedges |
||||||||||||||||||||
| Foreign exchange risk |
||||||||||||||||||||
| Foreign exchange forwards |
AUD – CAD | 0.93 |
n/a |
n/a |
||||||||||||||||
| HKD – CAD | 0.18 |
n/a |
n/a |
|||||||||||||||||
| Fair value hedges |
||||||||||||||||||||
| Interest rate risk |
||||||||||||||||||||
| Interest rate swaps |
n/a |
CAD | 2.90 |
% |
n/a |
|||||||||||||||
| Foreign exchange / interest rate risk |
||||||||||||||||||||
| Cross-currency interest rate swaps |
EUR – CAD | 1.50 |
0.94 |
% |
n/a |
|||||||||||||||
| CHF – CAD | 1.41 |
n/a |
n/a |
|||||||||||||||||
| USD – CAD | 1.42 |
2.56 |
% |
n/a |
||||||||||||||||
| Interest rate swaps |
n/a |
CHF | 0.26 |
% |
n/a |
|||||||||||||||
n/a |
EUR | 1.24 |
% |
n/a |
||||||||||||||||
n/a |
GBP | 1.14 |
% |
n/a |
||||||||||||||||
n/a |
USD | 3.82 |
% |
n/a |
||||||||||||||||
| 2024 |
Cash flow hedges |
|||||||||||||||||||
| Foreign exchange risk |
||||||||||||||||||||
| Cross-currency interest rate swaps |
AUD – CAD | 0.91 | n/a | n/a | ||||||||||||||||
| EUR – CAD | 1.47 | n/a | n/a | |||||||||||||||||
| GBP – CAD | 1.70 | n/a | n/a | |||||||||||||||||
| Interest rate risk |
||||||||||||||||||||
| Interest rate swaps |
n/a | CAD | 3.44 | % | n/a | |||||||||||||||
| n/a | USD | 4.09 | % | n/a | ||||||||||||||||
| Equity share price risk |
||||||||||||||||||||
| Equity swaps |
n/a | n/a | $ | 72.68 | ||||||||||||||||
| NIFO hedges |
||||||||||||||||||||
| Foreign exchange risk |
||||||||||||||||||||
| Foreign exchange forwards |
AUD – CAD | 0.92 | n/a | n/a | ||||||||||||||||
| HKD – CAD | 0.18 | n/a | n/a | |||||||||||||||||
| Fair value hedges |
||||||||||||||||||||
| Interest rate risk |
||||||||||||||||||||
| Interest rate swaps |
n/a | CAD | 3.71 | % | n/a | |||||||||||||||
| Foreign exchange / interest rate risk |
||||||||||||||||||||
| Cross-currency interest rate swaps |
EUR – CAD | 1.46 | 0.63 | % | n/a | |||||||||||||||
| CHF – CAD | 1.38 | n/a | n/a | |||||||||||||||||
| USD – CAD | 1.32 | 2.06 | % | n/a | ||||||||||||||||
| Interest rate swaps |
n/a | CHF | 0.23 | % | n/a | |||||||||||||||
| n/a | EUR | 0.89 | % | n/a | ||||||||||||||||
| n/a | GBP | 0.82 | % | n/a | ||||||||||||||||
| (1) | Includes average foreign exchange rates and interest rates relating to significant hedging relationships. |
| n/a | Not applicable. |
| CIBC 2025 |
|
152 |
|
| Consolidated financial statements |
Carrying amount of the hedged item |
Accumulated amount of fair value hedge adjustments on the hedged item |
Gains (losses) on change in fair value used for calculating hedge ineffectiveness |
||||||||||||||||||||
$ millions, as at or for the year ended October 31 |
Assets |
Liabilities |
Assets |
Liabilities |
||||||||||||||||||
| 2025 |
Cash flow hedges (1)
|
|||||||||||||||||||||
| Foreign exchange risk |
||||||||||||||||||||||
| Deposits |
$ |
– |
$ |
22,807 |
n/a |
n/a |
$ |
(687 |
) | |||||||||||||
| Interest rate risk |
||||||||||||||||||||||
| Loans |
53,148 |
– |
n/a |
n/a |
(565 |
) | ||||||||||||||||
| Equity share price risk |
||||||||||||||||||||||
| Share-based payment |
– |
2,824 |
n/a |
n/a |
(713 |
) | ||||||||||||||||
$ |
53,148 |
$ |
25,631 |
n/a |
n/a |
$ |
(1,965 |
) | ||||||||||||||
| NIFO hedges |
$ |
41,733 |
$ |
– |
n/a |
n/a |
$ |
297 |
||||||||||||||
| Fair value hedges (2)
|
||||||||||||||||||||||
| Interest rate risk |
||||||||||||||||||||||
| Securities |
$ |
85,323 |
$ |
– |
$ |
931 |
$ |
– |
$ |
1,114 |
||||||||||||
| Loans |
11,014 |
– |
97 |
– |
(186 |
) | ||||||||||||||||
| Deposits |
– |
99,987 |
– |
(664 |
) |
(741 |
) | |||||||||||||||
| Subordinated indebtedness |
– |
5,530 |
– |
142 |
(60 |
) | ||||||||||||||||
| Foreign exchange / interest rate risk |
||||||||||||||||||||||
| Securities |
14 |
– |
– |
– |
– |
|||||||||||||||||
| Deposits |
– |
31,903 |
– |
(375 |
) |
(372 |
) | |||||||||||||||
$ |
96,351 |
$ |
137,420 |
$ |
1,028 |
$ |
(897 |
) |
$ |
(245 |
) | |||||||||||
| 2024 |
Cash flow hedges (1)
|
|||||||||||||||||||||
| Foreign exchange risk |
||||||||||||||||||||||
| Deposits |
$ | – | $ | 16,524 | n/a | n/a | $ | (710 | ) | |||||||||||||
| Interest rate risk |
||||||||||||||||||||||
| Loans |
41,233 | – | n/a | n/a | (1,622 | ) | ||||||||||||||||
| Equity share price risk |
||||||||||||||||||||||
| Share-based payment |
– | 2,074 | n/a | n/a | (920 | ) | ||||||||||||||||
| $ | 41,233 | $ | 18,598 | n/a | n/a | $ | (3,252 | ) | ||||||||||||||
| NIFO hedges |
$ | 39,742 | $ | – | n/a | n/a | $ | 267 | ||||||||||||||
| Fair value hedges (2)
|
||||||||||||||||||||||
| Interest rate risk |
||||||||||||||||||||||
| Securities |
$ | 72,816 | $ | – | $ | (115 | ) | $ | – | $ | 3,446 | |||||||||||
| Loans |
51,302 | – | 770 | – | 1,057 | |||||||||||||||||
| Deposits |
– | 133,104 | – | (1,142 | ) | (2,135 | ) | |||||||||||||||
| Subordinated indebtedness |
– | 6,189 | – | 96 | (207 | ) | ||||||||||||||||
| Foreign exchange / interest rate risk |
||||||||||||||||||||||
| Deposits |
– | 21,531 | – | (733 | ) | (741 | ) | |||||||||||||||
| $ | 124,118 | $ | 160,824 | $ | 655 | $ | (1,779 | ) | $ | 1,420 | ||||||||||||
| (1) | As at October 31, 2025, the amount remaining in AOCI related to discontinued cash flow hedges was a net gain of $544 million (2024: net loss of $198 million). |
| (2) | As at October 31, 2025, the accumulated fair value hedge net asset adjustment remaining on the consolidated balance sheet related to discontinued fair value hedges was $126 million (2024: net liability adjustment of $286 million). |
| n/a | Not applicable. |
$ millions, for the year ended October 31 |
Beginning balance of AOCI – hedge reserve (after-tax)
|
Change in the value of the hedging instrument recognized in OCI (before-tax) |
Amount reclassified from accumulated OCI to income (before-tax) (1)
|
Tax benefit (expense) |
Ending balance of AOCI hedge reserve (after-tax) |
Hedge ineffectiveness gains (losses) recognized in income |
||||||||||||||||||||
| 2025 |
Cash flow hedges |
|||||||||||||||||||||||||
| Foreign exchange risk |
$ |
(20 |
) |
$ |
687 |
$ |
(672 |
) |
$ |
(4 |
) |
$ |
(9 |
) |
$ |
(1 |
) | |||||||||
| Interest rate risk |
396 |
565 |
79 |
(179 |
) |
861 |
3 |
|||||||||||||||||||
| Equity share price risk |
133 |
713 |
(692 |
) |
(6 |
) |
148 |
– |
||||||||||||||||||
$ |
509 |
$ |
1,965 |
$ |
(1,285 |
) |
$ |
(189 |
) |
$ |
1,000 |
$ |
2 |
|||||||||||||
| NIFO hedges – foreign exchange risk |
||||||||||||||||||||||||||
| Hedges of net investment in foreign operations |
$ |
(3,215 |
) |
$ |
(297 |
) |
$ |
– |
$ |
(68 |
) |
$ |
(3,580 |
) |
$ |
– |
||||||||||
| 2024 |
Cash flow hedges |
|||||||||||||||||||||||||
| Foreign exchange risk |
$ | (27 | ) | $ | 710 | $ | (701 | ) | $ | (2 | ) | $ | (20 | ) | $ | 3 | ||||||||||
| Interest rate risk |
(970 | ) | 1,622 | 270 | (526 | ) | 396 | 3 | ||||||||||||||||||
| Equity share price risk |
(29 | ) | 920 | (696 | ) | (62 | ) | 133 | – | |||||||||||||||||
| $ | (1,026 | ) | $ | 3,252 | $ | (1,127 | ) | $ | (590 | ) | $ | 509 | $ | 6 | ||||||||||||
| NIFO hedges – foreign exchange risk |
||||||||||||||||||||||||||
| Hedges of net investment in foreign operations |
$ | (2,948 | ) | $ | (267 | ) | $ | – | $ | – | $ | (3,215 | ) | $ | – | |||||||||||
| (1) | During the year ended October 31, 2025, the amount reclassified from AOCI to net income for cash flow hedges of forecasted transactions that were no longer expected to occur was nil (2024: nil). |
153 |
CIBC 2025 |
Consolidated financial statements |
$ millions, for the year ended October 31 |
Gains (losses) on the hedging instruments |
Gains (losses) on the hedged items attributable to hedged risk |
Hedge ineffectiveness gains (losses) recognized in income |
|||||||||||
2025 |
Fair value hedges |
|||||||||||||
Interest rate risk |
$ |
(158 |
) |
$ |
127 |
$ |
(31 |
) |
||||||
Foreign exchange / interest rate risk |
378 |
(372 |
) |
6 |
||||||||||
$ |
220 |
$ |
(245 |
) |
$ |
(25 |
) |
|||||||
2024 |
Fair value hedges |
|||||||||||||
Interest rate risk |
$ | (2,116 | ) | $ | 2,161 | $ | 45 | |||||||
Foreign exchange / interest rate risk |
745 | (741 | ) | 4 | ||||||||||
| $ | (1,371 | ) | $ | 1,420 | $ | 49 | ||||||||
Note 14 |
Subordinated indebtedness |
$ millions, as at October 31 |
2025 |
2024 |
||||||||||||||||||||||||||||||||
Earliest date redeemable |
||||||||||||||||||||||||||||||||||
Interest rate % |
Contractual maturity date |
At greater of Canada Yield Price (1)
and par |
At par |
Denominated in foreign currency |
Par value |
Carrying value (2)
|
Par value |
Carrying value (2)
|
||||||||||||||||||||||||||
| 8.70 | May 25, 2029 |
(3) |
$ |
25 |
$ |
30 |
$ | 25 | $ | 31 | ||||||||||||||||||||||||
| 2.01 | (4)(5) |
July 21, 2030 | July 21, 2025 | – |
– |
1,000 | 979 | |||||||||||||||||||||||||||
| 11.60 | January 7, 2031 | January 7, 1996 | 200 |
192 |
200 | 186 | ||||||||||||||||||||||||||||
| 1.96 | (4)(6) |
April 21, 2031 | April 21, 2026 | 1,000 |
988 |
1,000 | 958 | |||||||||||||||||||||||||||
| 10.80 | May 15, 2031 | May 15, 2021 | 150 |
144 |
150 | 140 | ||||||||||||||||||||||||||||
| 4.20 | (4)(7) |
April 7, 2032 | April 7, 2027 | 1,000 |
1,003 |
1,000 | 993 | |||||||||||||||||||||||||||
| 8.70 | May 25, 2032 |
(3) |
25 |
33 |
25 | 33 | ||||||||||||||||||||||||||||
| 5.33 | (4)(8) |
January 20, 2033 | January 20, 2028 | 1,000 |
1,011 |
1,000 | 1,060 | |||||||||||||||||||||||||||
| 5.35 | (4)(9) |
April 20, 2033 | April 20, 2028 | 750 |
765 |
750 | 750 | |||||||||||||||||||||||||||
| 8.70 | May 25, 2033 |
(3) |
25 |
34 |
25 | 34 | ||||||||||||||||||||||||||||
| 5.30 | (4)(10) |
January 16, 2034 | January 16, 2029 | 1,250 |
1,293 |
1,250 | 1,250 | |||||||||||||||||||||||||||
| 4.90 | (4)(11) |
June 12, 2034 | June 12, 2029 | 1,000 |
1,034 |
1,000 | 1,000 | |||||||||||||||||||||||||||
| 4.15 | (4)(12) |
April 2, 2035 | April 2, 2030 | 1,250 |
1,252 |
– | – | |||||||||||||||||||||||||||
| 8.70 | May 25, 2035 |
(3) |
25 |
35 |
25 | 35 | ||||||||||||||||||||||||||||
| Floating | (13) |
July 31, 2084 | July 27, 1990 | US$38 million | – |
– |
53 | 53 | ||||||||||||||||||||||||||
| Floating | (14) |
August 31, 2085 | August 20, 1991 | US$10 million | – |
– |
13 | 13 | ||||||||||||||||||||||||||
7,700 |
7,814 |
7,516 | 7,515 | |||||||||||||||||||||||||||||||
Subordinated indebtedness sold short (held) for trading purposes |
5 |
5 |
(50 | ) | (50 | ) | ||||||||||||||||||||||||||||
Total subordinated indebtedness |
$ |
7,705 |
$ |
7,819 |
$ | 7,466 | $ | 7,465 | ||||||||||||||||||||||||||
| (1) | Canada Yield Price: a price calculated at the time of redemption to provide a yield to maturity equal to the yield of a Government of Canada bond of appropriate maturity plus a pre-determined spread. |
| (2) | Carrying values of fixed-rate subordinated indebtedness notes reflect the impact of interest rate hedges in an effective hedge relationship. |
| (3) | Not redeemable prior to maturity date. |
| (4) | Debentures are also subject to a non-viability contingent capital (NVCC) provision, necessary for the Debentures to qualify as Tier 2 regulatory capital under Basel III. As such, the Debentures are automatically converted into common shares upon the occurrence of a Trigger Event as described in the capital adequacy guidelines. In such an event, the Debentures are convertible into a number of common shares, determined by dividing 150% of the par value plus accrued and unpaid interest by the average common share price (as defined in the relevant prospectus supplements) subject to a minimum price of $2.50 per share (subject to adjustment in certain events as defined in the relevant prospectus supplements). |
| (5) | On July 21, 2025, we redeemed all $ 1.0 billion of our 2.01% Debentures due July 21, 2030. In accordance with their terms, the Debentures were redeemed at 100% of their principal amount, together with accrued and unpaid interest thereon. |
| (6) | Interest rate is fixed at the indicated rate until the earliest date redeemable at par by CIBC and, thereafter, at a rate of 0.56% above the three-month Canadian dollar bankers’ acceptance rate or an appropriate alternative rate. |
| ( 7 ) |
Interest rate is fixed at the indicated rate until the earliest date redeemable at par by CIBC and, thereafter, at Daily Compounded Canadian Overnight Repo Rate Average (CORRA) plus 1.69%. |
| ( 8 ) |
Interest rate is fixed at the indicated rate until the earliest date redeemable at par by CIBC and, thereafter, at Daily Compounded CORRA plus 2.37%. |
| ( 9 ) |
Interest rate is fixed at the indicated rate until the earliest date redeemable at par by CIBC and, thereafter, at Daily Compounded CORRA plus 2.23%. |
| (1 0 ) |
Interest rate is fixed at the indicated rate until the earliest date redeemable at par by CIBC and, thereafter, at Daily Compounded CORRA plus 2.02%. |
| (1 1 ) |
Interest rate is fixed at the indicated rate until the earliest date redeemable at par by CIBC and, thereafter, at Daily Compounded CORRA plus 1.56%. |
| (1 2 ) |
Interest rate is fixed at the indicated rate until the earliest date redeemable at par by CIBC and, thereafter, at Daily Compounded CORRA plus 1.72%. |
| (1 3 ) |
On January 31, 2025, we redeemed all US$38 million of our Floating Rate Subordinated Capital Debentures due 2084. In accordance with their terms, the Debentures were redeemed at 100% of their principal amount, together with accrued and unpaid interest thereon. |
| (1 4 ) |
On February 28, 2025, we redeemed all US$10 million of our Floating Rate Subordinated Capital Debentures due 2085. In accordance with their terms, the Debentures were redeemed at 100% of their principal amount, together with accrued and unpaid interest thereon. |
|
CIBC 2025 |
|
154 |
Consolidated financial statements |
Note 15 |
Common and preferred shares and other equity instruments |
$ millions, except number of shares and per share amounts, as at or for the year ended October 31 |
2025 |
2024 |
||||||||||||||||||||||||||||||
Shares outstanding |
Dividends and distributions paid |
Shares outstanding |
Dividends and distributions paid |
|||||||||||||||||||||||||||||
|
Number of shares |
Amount |
Amount |
$ per share |
Number of shares |
Amount |
Amount |
$ per share |
|||||||||||||||||||||||||
Common shares |
926,610,598 |
$ |
16,842 |
$ |
3,629 |
$ |
3.88 |
942,285,419 | $ | 17,009 | $ | 3,382 | $ | 3.60 | ||||||||||||||||||
Class A Preferred Shares |
||||||||||||||||||||||||||||||||
Series 39 (1)
|
– |
– |
– |
– |
– | – | 11 | 0.70 | ||||||||||||||||||||||||
Series 41 (2)
|
– |
– |
3 |
0.24 |
12,000,000 | 300 | 12 | 0.98 | ||||||||||||||||||||||||
Series 43 (3)
|
– |
– |
7 |
0.59 |
12,000,000 | 300 | 9 | 0.79 | ||||||||||||||||||||||||
Series 47 |
18,000,000 |
450 |
26 |
1.47 |
18,000,000 | 450 | 27 | 1.47 | ||||||||||||||||||||||||
Series 49 (4)
|
– |
– |
– |
– |
– | – | 8 | 0.65 | ||||||||||||||||||||||||
Series 51 (5)
|
– |
– |
– |
– |
– | – | 10 | 0.97 | ||||||||||||||||||||||||
Series 56 |
600,000 |
600 |
44 |
73.65 |
600,000 | 600 | 44 | 73.65 | ||||||||||||||||||||||||
Series 57 |
500,000 |
500 |
37 |
73.37 |
500,000 | 500 | 22 | 42.92 | ||||||||||||||||||||||||
Series 61 |
150,000 |
150 |
6 |
37.95 |
– | – | – | – | ||||||||||||||||||||||||
Total |
$ |
1,700 |
$ |
123 |
$ | 2,150 | $ | 143 | ||||||||||||||||||||||||
Treasury shares – common shares (6)
|
3,438 |
$ |
3 |
9,179 | $ | 2 | ||||||||||||||||||||||||||
Treasury shares – preferred shares (6)
|
(1,223 |
) |
(1 |
) |
(3,778 | ) | (4 | ) | ||||||||||||||||||||||||
Other Equity Instruments (7)
|
||||||||||||||||||||||||||||||||
Limited Recourse Capital Notes Series 1 (8)
|
$ |
– |
$ |
30 |
4.375 % |
$ | 750 | $ | 33 | 4.375 % | ||||||||||||||||||||||
Limited Recourse Capital Notes Series 2 |
750 |
30 |
4.000 % |
750 | 30 | 4.000 % | ||||||||||||||||||||||||||
Limited Recourse Capital Notes Series 3 |
800 |
57 |
7.150 % |
800 | 57 | 7.150 % | ||||||||||||||||||||||||||
Limited Recourse Capital Notes Series 4 |
500 |
38 |
6.987 % |
500 | – | 6.987 % |
||||||||||||||||||||||||||
Limited Recourse Capital Notes Series 5 (9)
|
693 |
48 |
6.950 % |
– | – | – | ||||||||||||||||||||||||||
Limited Recourse Capital Notes Series 6 |
450 |
17 |
6.369 % |
– | – | – | ||||||||||||||||||||||||||
Limited Recourse Capital Notes Series 7 (9)
|
1,027 |
21 |
7.000 % |
– | – | – | ||||||||||||||||||||||||||
Limited Recourse Capital Notes Series 8 |
450 |
– |
5.898 % |
– | – | – | ||||||||||||||||||||||||||
Total |
$ |
4,670 |
$ |
241 |
$ | 2,800 | $ | 120 | – | |||||||||||||||||||||||
| (1) | Series 39 preferred shares were redeemed at par value for a total price of $400 million on July 31, 2024. |
| (2) | Series 41 preferred shares were redeemed at par value for a total price of $300 million on January 31, 2025. |
| (3) | Series 43 preferred shares were redeemed at par value for a total price of $300 million on July 31, 2025. |
| (4) | Series 49 preferred shares were redeemed at par value for a total price of $325 million on April 30, 2024. |
| (5) | Series 51 preferred shares were redeemed at par value for a total price of $250 million on July 31, 2024. |
| (6) | A long position in our own shares is shown as a negative number, which reduces the number of shares outstanding. A short position is shown as a positive number, which adds to the number of shares outstanding. See Note 1 to the consolidated financial statements for the accounting policy on treasury shares. |
| (7) | See the “Limited Recourse Capital Notes (LRCNs)” section below for details. |
(8) |
Limited Recourse Capital Notes Series 1 were redeemed at their principal amount of $750 million on September 29, 2025. |
(9) |
For Limited Recourse Capital Notes – Series 5 and Series 7, the amount represents the Canadian dollar equivalent of the U.S. dollar notional amount. |
$ millions, except number of shares, as at or for the year ended October 31 |
2025 |
2024 |
||||||||||||||
|
Number of shares |
Amount |
Number of shares |
Amount |
|||||||||||||
Balance at beginning of year |
942,294,598 |
$ |
17,011 |
931,098,941 | $ | 16,082 | ||||||||||
Issuance pursuant to: |
||||||||||||||||
Equity-settled share-based compensation plans |
2,824,550 |
168 |
2,593,751 | 148 | ||||||||||||
Shareholder investment plan (1)
|
629 |
– |
10,986,157 | 698 | ||||||||||||
Employee share purchase plan (2)
|
– |
– |
2,626,726 | 173 | ||||||||||||
945,119,777 |
$ |
17,179 |
947,305,575 | $ | 17,101 | |||||||||||
Purchase of common shares for cancellation |
(18,500,000 |
) |
(335 |
) |
(5,000,000 | ) | (90 | ) | ||||||||
Treasury shares |
(5,741 |
) |
1 |
(10,977 | ) | – | ||||||||||
Balance at end of year |
926,614,036 |
$ |
16,845 |
942,294,598 | $ | 17,011 | ||||||||||
| (1) | Commencing with dividends paid on January 28, 2025 and for future dividends declared until further notice, common shares received by participants under the shareholder investment plan were purchased from the open market, a change from issuance from Treasury. For the share purchase option, this change became effective February 1, 2025. Commencing with the dividends paid on July 29, 2024, common shares received by participants were issued from Treasury without a discount. |
| (2) | Commencing October 11, 2024, employee contributions to our Canadian ESPP were invested to acquire common shares in the open market. Previously, these shares were issued from Treasury. |
155 |
CIBC 2025 |
Consolidated financial statements |
$ millions, except number of shares, as at or for the year ended October 31 |
2025 |
2024 | Total | |||||||||||||||||||||
| TSX approval date |
Number
of shares
|
Amount |
Number
of shares
|
Amount |
Number
of shares
|
Amount | ||||||||||||||||||
September 5, 2024 (1)
|
15,000,000 |
$ |
1,338 | 5,000,000 | $ | 419 | 20,000,000 | $ | 1,757 | |||||||||||||||
September 5, 2025 (2)
|
3,500,000 |
393 | – | – | 3,500,000 | 393 | ||||||||||||||||||
Total |
18,500,000 |
$ |
1,731 | 5,000,000 | $ | 419 | 23,500,000 | $ | 2,150 | |||||||||||||||
| (1) | Common shares were repurchased at an average price of $87.80 under this NCIB. |
| (2) | Common shares were repurchased at an average price of $112.54 under this NCIB. |
| $ millions, except per share amounts, outstanding as at October 31, 2025 | ||||||||||||||||||||||||||
| Par value |
Cash redemption price per share |
Current dividend rate |
Issue date | Dividend payment frequency |
Dividends per share (1)
|
Next dividend
reset date
(2)
|
Dividend after reset |
Earliest specified redemption date (3)(4)
|
||||||||||||||||||
Series 47 (5)(6)
|
$ | 450 | $ | 25.00 | 5.878 | % | January 18, 2018 | Quarterly | $ | 0.367375 | January 31, 2028 | GoC (7) + 2.45 % |
January 31, 2028 | |||||||||||||
Series 56 |
600 | 1,000.00 | 7.365 | % | September 16, 2022 | Semi-annual |
36.825 | October 28, 2027 | GoC (7) + 4.20 % |
-October 28, 2027 |
||||||||||||||||
Series 57 |
500 | 1,000.00 | 7.337 | % | March 12, 2024 | Semi-annual |
36.685 | April 12, 2029 | GoC (7) + 3.90 % |
-April 12, 2029
|
||||||||||||||||
Series 61 |
150 | 1,000.00 | 6.369 | % | March 24, 2025 | Semi-annual |
31.845 | April 28, 2030 | GoC (7) + 3.65 % |
-
April 28, 2030 |
||||||||||||||||
| (1) | Dividends may be adjusted depending on the timing of issuance or redemption. |
| (2) | Subsequent interest reset dates are every five years from the date shown. |
| (3) | Redemptions are subject to regulatory approval and certain provisions of the shares. Redemptions may be in whole or in part. |
| (4) | Redemptions are at par. Subsequent redemption dates are every five years after this date. |
| (5) | Interest rate was reset January 31, 2023. |
| (6) | Holders have the right to convert their shares on a one-for-one basis into Non-cumulative Floating Rate Class A Preferred Shares Series 48 (NVCC) (Series 48 shares), subject to certain conditions, on January 31, 2023 and on January 31 every five years thereafter. Holders of the Series 48 shares will be entitled to receive a quarterly floating rate dividend, if declared, equal to the three-month Government of Canada Treasury Bill yield plus 2.45%. Holders of the then outstanding Series 48 shares may convert their shares on a one-for-one basis into Series 47 shares, subject to certain conditions, on January 31, 2028 and on January 31 every five years thereafter. |
| (7) | The prevailing five-year Government of Canada bond yield. |
| $ millions, outstanding as at October 31, 2025 | ||||||||||||||||||||||||
|
Par
value
|
Current interest rate |
Issue date | Payment frequency |
Next interest
reset date
(2)
|
Interest rate reference after reset |
Earliest specified redemption date (3)
|
Maturity date | |||||||||||||||||
Series 2 |
$ | 750 | 4.000 |
% | September 14, 2021 | Semi-annual | January 28, 2027 | GoC (4) + 3.10 % |
-January 28, 2027
(5)
|
January 28, 2082 | ||||||||||||||
Series 3 |
$ | 800 | 7.150 |
% | June 15, 2022 | Semi-annual | July 28, 2027 | GoC (4) + 4.00 % |
-July 28, 2027
(5)
|
July 28, 2082 | ||||||||||||||
Series 4 |
$ | 500 | 6.987 |
% | June 25, 2024 | Semi-annual | July 28, 2029 | GoC (4) + 3.70 % |
-July 28, 2029
(5)
|
July 28, 2084 | ||||||||||||||
Series 5 |
US$ | 500 | 6.950 |
% | November 5, 2024 | Quarterly | January 28, 2030 | UST (6) + 2.83 % |
January 28, 2030 (7)
|
January 28, 2085 | ||||||||||||||
Series 6 |
$ | 450 | 6.369 | % | March 24, 2025 | Semi-annual | April 30, 2030 | GoC (4) + 3.65 % |
-April 28, 2030
(5)
|
April 28, 2085 | ||||||||||||||
Series 7 |
US$ | 750 | 7.000 |
% | July 14, 2025 | Quarterly | October 28, 2030 | UST (6) + 3.00 % |
October 28, 2030 (7)
|
October 28, 2085 | ||||||||||||||
Series 8 |
$ | 450 | 5.898 | % | September 29, 2025 | Semi-annual |
January 28, 2031 | GoC (4) + 3.11 % |
-January 28, 2031 (5)
|
January 28, 2086 | ||||||||||||||
| (1) | LRCN Series 2, 3, 4, 5, 6, 7, and 8 (NVCC) (subordinated indebtedness) were concurrently issued with Non-cumulative 5-Year Fixed Rate Reset Class A Preferred Shares Series 54, 55, 58, 59, 60, 62, and 63 (NVCC), respectively, which are held by the consolidated entity, Limited Recourse Trust, and, as a result, eliminated in CIBC’s consolidated financial statements. In the event of non-payment by CIBC of the principal amount of, interest on, or redemption price for the LRCNs when due, the sole remedy of each LRCN Note holder is limited to that holder’s proportionate share of the Series’ Class A Preferred Shares held in the Limited Recourse Trust. |
| (2) | Subsequent interest reset dates are five years from the date shown, with the last interest rate reset date five years before the maturity date. |
| (3) | Redemptions are subject to regulatory approval. Redemptions may be in whole or in part. |
| (4) | The prevailing five-year Government of Canada bond yield. |
| (5) | Redemptions are at par. Subsequent redemption dates are every five years after this date. |
| (6) | The prevailing five-year US Treasury rate. |
| (7) | Redemptions are at par. Subsequent redemption dates are every January 28, April 28, July 28 and October 28 after this date. |
|
CIBC
2025 |
|
156 |
|
Consolidated financial statements |
$ millions, as at October 31 |
2025 |
2024 | ||||||||
CET1 capital |
$ |
47,718 |
$ | 44,516 | ||||||
Tier 1 capital |
A | 54,105 |
49,481 | |||||||
Total capital |
62,287 |
56,809 | ||||||||
Total RWA |
B | 357,803 |
333,502 | |||||||
CET1 ratio |
13.3 |
% |
13.3 | % | ||||||
Tier 1 capital ratio |
15.1 |
% |
14.8 | % | ||||||
Total capital ratio |
17.4 |
% |
17.0 | % | ||||||
Leverage ratio exposure |
C | $ |
1,261,098 |
$ | 1,155,432 | |||||
Leverage ratio |
A/C | 4.3 |
% |
4.3 | % | |||||
TLAC available |
D | $ |
114,102 |
$ | 101,062 | |||||
TLAC ratio |
D/B | 31.9 |
% |
30.3 | % | |||||
TLAC leverage ratio |
D/C | 9.0 |
% |
8.7 | % | |||||
157 |
CIBC 2025 |
Consolidated financial statements |
Note 16 |
Share-based payments |
|
CIBC
2025 |
|
158 |
|
Consolidated financial statements |
As at or for the year ended October 31 |
2025 |
2024 | ||||||||||||||
Number of stock options |
Weighted- average exercise price (1)
|
Number of stock options |
Weighted- average exercise price |
|||||||||||||
Outstanding at beginning of year |
15,967,581 |
$ |
58.55 |
14,688,079 | $ | 58.47 | ||||||||||
Granted |
2,422,512 |
94.35 |
3,973,361 | 56.55 | ||||||||||||
Exercised (2)
|
(2,824,550 |
) |
54.71 |
(2,593,751 | ) | 52.72 | ||||||||||
Forfeited/cancelled/expired |
(44,171 |
) |
66.86 |
(100,108 | ) | 60.44 | ||||||||||
Outstanding at end of year |
15,521,372 |
$ |
64.81 |
15,967,581 | $ | 58.55 | ||||||||||
Exercisable at end of year |
4,508,217 |
$ |
58.94 |
5,033,423 | $ | 55.17 | ||||||||||
Available for grant |
4,427,783 |
6,806,124 | ||||||||||||||
| (1) | For foreign currency-denominated options granted and exercised during the year, the weighted-average exercise prices are converted using exchange rates as at the grant date and settlement date, respectively. The weighted-average exercise price of outstanding balances as at October 31, 2025 reflects the conversion of foreign currency-denominated options at the year-end exchange rate. |
| (2) | The weighted-average share price at the date of exercise was $96.04 (2024: $65.04). |
As at October 31, 2025 |
Stock options outstanding |
Stock options vested |
||||||||||||||||||||||
Range of exercise prices |
Number outstanding |
Weighted- average contractual life remaining |
Weighted- average exercise price |
Number outstanding |
Weighted- average exercise price |
|||||||||||||||||||
$1.00 – $50.00 |
29,118 |
0.21 |
$ |
39.44 |
29,118 |
$ |
39.44 |
|||||||||||||||||
$50.01 – $60.00 |
10,327,462 |
6.59 |
57.10 |
2,988,762 |
55.22 |
|||||||||||||||||||
$60.01 – $70.00 |
484,573 |
2.12 |
60.01 |
484,573 |
60.01 |
|||||||||||||||||||
$70.01 – $80.00 |
2,266,832 |
6.09 |
70.05 |
1,005,764 |
70.05 |
|||||||||||||||||||
$90.01 – $100.00 |
2,413,387 |
9.10 |
94.35 |
– |
94.35 |
|||||||||||||||||||
Total |
15,521,372 |
6.75 |
$ |
64.84 |
4,508,217 |
$ |
58.94 |
|||||||||||||||||
For the year ended October 31 |
2025 |
2024 | ||||||
Weighted-average assumptions |
||||||||
Risk-free interest rate |
2.66 |
% |
3.74 | % | ||||
Expected dividend yield |
4.65 |
% |
7.50 | % | ||||
Expected share price volatility |
15.60 |
% |
19.47 | % | ||||
Expected life |
6 years |
6 years | ||||||
Share price/exercise price |
$ |
94.35 |
$ | 56.55 | ||||
159 |
CIBC 2025 |
| Consolidated financial statements |
Note 17 |
Post-employment benefits |
| CIBC 2025 ANNUAL REPORT |
|
160 |
|
| Consolidated financial statements |
| Pension plans | Other post-employment plans | |||||||||||||||
$ millions, as at or for the year ended October 31 |
2025 |
2024 | 2025 |
2024 | ||||||||||||
| Defined benefit obligation |
||||||||||||||||
| Balance at beginning of year |
$ |
7,942 |
$ | 7,060 | $ |
419 |
$ | 422 | ||||||||
| Current service cost |
227 |
190 | 5 |
5 | ||||||||||||
| Interest cost on defined benefit obligation |
386 |
396 | 20 |
24 | ||||||||||||
| Employee contributions |
3 |
4 | – |
– | ||||||||||||
| Benefits paid |
(382 |
) |
(365 | ) | (30 |
) |
(32 | ) | ||||||||
| Settlement payments |
– |
(79 | ) | – |
– | |||||||||||
| Foreign exchange rate changes and other |
4 |
5 | – |
– | ||||||||||||
| Net actuarial (gains) losses on defined benefit obligation |
80 |
731 | 6 |
– | ||||||||||||
| Balance at end of year |
$ |
8,260 |
$ | 7,942 | $ |
420 |
$ | 419 | ||||||||
| Plan assets |
||||||||||||||||
| Fair value at beginning of year |
$ |
9,326 |
$ | 8,091 | $ |
– |
$ | – | ||||||||
| Interest income on plan assets (1)
|
462 |
459 | – |
– | ||||||||||||
| Net actuarial gains (losses) on plan assets (1)
|
385 |
1,079 | – |
– | ||||||||||||
| Employer contributions |
181 |
146 | 30 |
32 | ||||||||||||
| Employee contributions |
3 |
4 | – |
– | ||||||||||||
| Benefits paid |
(382 |
) |
(365 | ) | (30 |
) |
(32 | ) | ||||||||
| Settlement payments |
– |
(79 | ) | – |
– | |||||||||||
| Plan administration costs |
(7 |
) |
(8 | ) | – |
– | ||||||||||
| Increase (decrease) due to plan settlements |
– |
(10 | ) | – |
– | |||||||||||
| Foreign exchange rate changes and other |
7 |
9 | – |
– | ||||||||||||
| Fair value at end of year |
$ |
9,975 |
$ | 9,326 | $ |
– |
$ | – | ||||||||
| Net defined benefit asset (liability) |
1,715 |
1,384 | (420 |
) |
(419 | ) | ||||||||||
| Valuation allowance (2)
|
(74 |
) |
(47 | ) | – |
– | ||||||||||
| Net defined benefit asset (liability), net of valuation allowance |
$ |
1,641 |
$ | 1,337 | $ |
(420 |
) |
$ | (419 | ) | ||||||
| (1) | The actual return on plan assets for the year was a gain of $847 million (2024: gain of $1,538 million). |
| (2) | The valuation allowance reflects the effect of asset ceiling on plans with a net defined benefit asset. |
| Pension plans | Other post-employment plans | |||||||||||||||
$ millions, as at October 31 |
2025 |
2024 | 2025 |
2024 | ||||||||||||
| Other assets |
$ |
1,678 |
$ | 1,378 | $ |
– |
$ | – | ||||||||
| Other liabilities |
(37 |
) |
(41 | ) | (420 |
) |
(419 | ) | ||||||||
| Net defined benefit asset (liability), net of valuation allowance |
$ |
1,641 |
$ | 1,337 | $ |
(420 |
) |
$ | (419 | ) | ||||||
| Pension plans | Other post-employment plans | |||||||||||||||
$ millions, as at October 31 |
2025 |
2024 | 2025 |
2024 | ||||||||||||
| Defined benefit obligation |
||||||||||||||||
| Canada |
$ |
7,592 |
$ | 7,291 | $ |
391 |
$ | 389 | ||||||||
| U.S. and the Caribbean |
668 |
651 | 29 |
30 | ||||||||||||
| Defined benefit obligation at end of year |
$ |
8,260 |
$ | 7,942 | $ |
420 |
$ | 419 | ||||||||
| Plan assets |
||||||||||||||||
| Canada |
$ |
9,006 |
$ | 8,441 | $ |
– |
$ | – | ||||||||
| U.S. and the Caribbean |
969 |
885 | – |
– | ||||||||||||
| Plan assets at end of year |
$ |
9,975 |
$ | 9,326 | $ |
– |
$ | – | ||||||||
161 |
CIBC 2025 ANNUAL REPORT |
| Consolidated financial statements |
Pension plans |
Other post-employment plans |
|||||||||||||||
$ millions, for the year ended October 31 |
2025 |
2024 |
2025 |
2024 |
||||||||||||
| Current service cost (1)
|
$ |
227 |
$ | 190 | $ |
5 |
$ | 5 | ||||||||
| Past service cost |
– |
– | – |
– | ||||||||||||
| Interest cost on defined benefit obligation |
386 |
396 | 20 |
24 | ||||||||||||
| Interest income on plan assets |
(462 |
) |
(459 | ) | – |
– | ||||||||||
| Interest expense on effect of asset ceiling |
3 |
1 | – |
– | ||||||||||||
| Special termination benefits |
– |
– | – |
– | ||||||||||||
| Plan administration costs |
7 |
8 | – |
– | ||||||||||||
| Net defined benefit plan expense recognized in net income |
$ |
161 |
$ | 136 | $ |
25 |
$ | 29 | ||||||||
| (1) | The 2025 and 2024 current service costs were calculated using separate discount rates of 4.88% and 5.61%, respectively, to reflect the longer duration of future benefits payments associated with the additional year of service to be earned by the plan’s active participants. |
Pension plans |
Other post-employment plans |
|||||||||||||||
$ millions, for the year ended October 31 |
2025 |
2024 |
(1) |
2025 |
2024 |
|||||||||||
| Actuarial gains (losses) on defined benefit obligation arising from changes in: |
||||||||||||||||
| Demographic assumptions |
$ |
– |
$ | (1 | ) | $ |
– |
$ | 34 | |||||||
| Financial assumptions |
(46 |
) |
(768 | ) | (4 |
) |
(36 | ) | ||||||||
| Experience |
(34 |
) |
38 | (2 |
) |
2 | ||||||||||
| Net actuarial gains (losses) on plan assets |
385 |
1,079 | – |
– | ||||||||||||
| Changes in asset ceiling excluding interest income |
(25 |
) |
(30 | ) | – |
– | ||||||||||
| Net remeasurement gains (losses) recognized in OCI |
$ |
280 |
$ | 318 | $ |
(6 |
) |
$ | – | |||||||
| (1) | Includes the transfer of the accumulated actuarial losses of $5 million to retained earnings upon the settlement of a pension plan for one of our subsidiaries. |
Pension plans |
Other post-employment plans |
|||||||||||||||
$ millions, as at October 31 |
2025 |
2024 |
2025 |
2024 |
||||||||||||
| Active members |
$ |
3,757 |
$ | 3,558 | $ |
79 |
$ | 74 | ||||||||
| Deferred members |
510 |
490 | – |
– | ||||||||||||
| Retired members |
3,325 |
3,243 | 312 |
315 | ||||||||||||
| Total |
$ |
7,592 |
$ | 7,291 | $ |
391 |
$ | 389 | ||||||||
| Pension plans | Other post-employment plans | |||||||||||||||
As at October 31 |
2025 |
2024 | 2025 |
2024 | ||||||||||||
| Weighted-average duration, in years |
12.7 |
12.9 | 10.2 |
10.3 | ||||||||||||
| CIBC 2025 |
|
162 |
|
| Consolidated financial statements |
$ millions, as at October 31 |
2025 |
2024 | ||||||||||||||
| Asset category (1)
|
||||||||||||||||
| Canadian equity securities (2)
|
$ |
523 |
6 |
% |
$ | 472 | 6 | % | ||||||||
| Debt securities (3)
|
||||||||||||||||
| Government bonds |
5,794 |
64 |
5,419 | 64 | ||||||||||||
| Corporate bonds |
315 |
4 |
403 | 5 | ||||||||||||
6,109 |
68 |
5,822 | 69 | |||||||||||||
| Investment funds (4)
|
||||||||||||||||
| Canadian equity funds |
43 |
– |
35 | – | ||||||||||||
| U.S. equity funds |
421 |
5 |
694 | 8 | ||||||||||||
| International equity funds (5)
|
45 |
– |
37 | – | ||||||||||||
| Global equity funds (5)
|
1,415 |
16 |
1,150 | 15 | ||||||||||||
| Fixed income funds |
107 |
1 |
103 | 1 | ||||||||||||
2,031 |
22 |
2,019 | 24 | |||||||||||||
| Other (2)
|
||||||||||||||||
| Alternative investments (6)
|
2,471 |
27 |
2,399 | 28 | ||||||||||||
| Cash and cash equivalents and other |
249 |
3 |
339 | 4 | ||||||||||||
| Obligations related to securities sold under repurchase agreements and securities sold short |
(2,377 |
) |
(26 |
) |
(2,610 | ) | (31 | ) | ||||||||
343 |
4 |
128 | 1 | |||||||||||||
| Total |
$ |
9,006 |
100 |
% |
$ | 8,441 | 100 | % | ||||||||
| (1) | Asset categories are based upon risk classification including synthetic exposure through derivatives. The fair value of derivatives as at October 31, 2025 was a net derivative liability of $29 million (2024: net derivative liability of $30 million). |
| (2) | Pension benefit plan assets include CIBC issued securities and deposits of nil (2024: nil), representing nil of Canadian plan assets (2024: nil). All of the equity securities held as at October 31, 2025 and 2024 have daily quoted prices in active markets except hedge funds, infrastructure, and private equity. |
| (3) | All debt securities held as at October 31, 2025 and 2024 are investment grade, of which $372 million (2024: $285 million) have daily quoted prices in active markets. |
| (4) | $40 million (2024: $33 million) of the investment funds are directly held as at October 31, 2025 and have daily quoted prices in active markets. |
| (5) | Global equity funds include North American and international investments, whereas International equity funds do not include North American investments. |
| (6) | Comprised of private equity, infrastructure, private debt and real estate funds. |
| Pension plans | Other post-employment plans |
|||||||||||||||
As at October 31 |
2025 |
2024 | 2025 |
2024 | ||||||||||||
| Discount rate |
4.8 |
% |
4.8 | % | 4.7 |
% |
4.8 | % | ||||||||
| Rate of compensation increase (1)
|
2.5 |
% |
2.5 | % | n/a |
n/a | ||||||||||
| (1) | Rates of compensation increase for 2025 and 2024 reflect the use of a salary growth rate assumption table that is based on the age and tenure of the employees. The table yields a weighted-average salary growth rate of approximately 2.5% per annum (2024: 2.5%). |
| n/a | Not applicable |
As at October 31 |
2025 |
2024 | ||||||
| Longevity at age 65 for current retired members |
||||||||
| Males |
23.6 |
23.6 | ||||||
| Females |
24.7 |
24.7 | ||||||
| Longevity at age 65 for current members aged 45 |
||||||||
| Males |
24.5 |
24.5 | ||||||
| Females |
25.6 |
25.6 | ||||||
For the year ended October 31 |
2025 |
2024 | ||||||
| Health-care cost trend rates assumed for next year |
4.9 |
% |
4.9 | % | ||||
| Rate to which the cost trend rate is assumed to decline |
4.0 |
% |
4.0 | % | ||||
| Year that the rate reaches the ultimate trend rate |
2040 |
2040 | ||||||
163 |
CIBC 2025 |
Consolidated financial statements |
| Estimated increase (decrease) in defined benefit obligation | Pension plans | Other post-employment plans |
||||||
$ millions, as at October 31 |
2025 |
2025 |
||||||
Discount rate (100 basis point change) |
||||||||
Decrease in assumption |
$ |
1,054 |
$ |
44 |
||||
Increase in assumption |
(889 |
) |
(37 |
) |
||||
Rate of compensation increase (100 basis point change) |
||||||||
Decrease in assumption |
(205 |
) |
– |
|||||
Increase in assumption |
217 |
– |
||||||
Health-care cost trend rates (100 basis point change) |
||||||||
Decrease in assumption |
n/a |
(13 |
) |
|||||
Increase in assumption |
n/a |
15 |
||||||
Future mortality |
||||||||
1 year shorter life expectancy |
(167 |
) |
(8 |
) |
||||
1 year longer life expectancy |
161 |
8 |
||||||
| n/a | Not applicable. |
$ millions, for the year ended October 31 |
2026 | 2027 | 2028 | 2029 | 2030 | 2031–2035 | Total | |||||||||||||||||||||
Defined benefit pension plans |
$ | 375 | $ | 387 | $ | 402 | $ | 417 | $ | 433 | $ | 2,374 | $ | 4,388 | ||||||||||||||
Other post-employment plans |
26 | 27 | 27 | 28 | 28 | 142 | 278 | |||||||||||||||||||||
Total |
$ | 401 | $ | 414 | $ | 429 | $ | 445 | $ | 461 | $ | 2,516 | $ | 4,666 | ||||||||||||||
$ millions, for the year ended October 31 |
2025 |
2024 | ||||||
Defined contribution pension plans |
$ |
84 |
$ | 72 | ||||
Government pension plans (1)
|
227 |
197 | ||||||
Total |
$ |
311 |
$ | 269 | ||||
| (1) | Includes Canada Pension Plan, Quebec Pension Plan, and U.S. Federal Insurance Contributions Act. |
|
CIBC
2025 ANNUAL REPORT |
|
164 |
|
Consolidated financial statements |
Note 18 |
Income taxes |
$ millions, for the year ended October 31 |
2025 |
2024 |
||||||
Consolidated statement of income |
||||||||
Provision for (reversal of) current income taxes |
||||||||
Adjustments for prior years |
$ |
15 |
$ | (38 | ) | |||
Current income tax expense |
2,727 |
2,294 | ||||||
2,742 |
2,256 | |||||||
Provision for (reversal of) deferred income taxes |
||||||||
Adjustments for prior years |
(11 |
) |
37 | |||||
Effect of changes in tax rates and laws |
2 |
4 | ||||||
Origination and reversal of temporary differences |
(248 |
) |
(285 | ) | ||||
(257 |
) |
(244 | ) | |||||
Total income taxes |
2,485 |
2,012 | ||||||
OCI |
397 |
578 | ||||||
Total comprehensive income |
$ |
2,882 |
$ | 2,590 | ||||
$ millions, for the year ended October 31 |
2025 |
2024 |
||||||
Current income taxes |
||||||||
Federal (1)
|
$ |
1,247 |
$ | 1,242 | ||||
Provincial |
803 |
795 | ||||||
Foreign |
976 |
671 | ||||||
3,026 |
2,708 | |||||||
Deferred income taxes |
||||||||
Federal |
(150 |
) |
(116 | ) | ||||
Provincial |
(97 |
) |
(82 | ) | ||||
Foreign |
103 |
80 | ||||||
(144 |
) |
(118 | ) | |||||
Total |
$ |
2,882 |
$ | 2,590 | ||||
(1) |
Includes the impact of global minimum corporate tax (GMT). |
$ millions, for the year ended October 31 |
2025 |
2024 |
||||||||||||||
Combined Canadian federal and provincial income tax rate applied to income before income taxes |
$ |
3,040 |
27.8 |
% |
$ | 2,548 | 27.8 | % | ||||||||
Income taxes adjusted for the effect of: |
||||||||||||||||
Foreign operations subject to different tax rates |
(487 |
) |
(4.5 |
) |
(485 | ) | (5.4 | ) | ||||||||
Other (1)
|
(68 |
) |
(0.6 |
) |
(51 | ) | (0.5 | ) | ||||||||
Income taxes in the consolidated statement of income |
$ |
2,485 |
22.7 |
% |
$ | 2,012 | 21.9 | % | ||||||||
(1) |
Includes the impact of GMT and tax-exempt income. Prior year amounts have been revised to conform to the presentation adopted in 2025. |
165 |
CIBC 2025 ANNUAL REPORT |
Consolidated financial statements |
$ millions, for the year ended October 31, 2025 |
Net asset Nov. 1, 2024 |
Recognized in net income |
Recognized in OCI |
Other |
(1)
|
Net asset Oct. 31, 2025 |
||||||||||||||
Deferred tax assets |
||||||||||||||||||||
Allowance for credit losses |
$ |
440 |
$ |
2 |
$ |
– |
$ |
2 |
$ |
444 |
||||||||||
Deferred compensation |
728 |
196 |
– |
57 |
981 |
|||||||||||||||
Financial instruments revaluation |
8 |
10 |
(15 |
) |
(3 |
) |
– |
|||||||||||||
Deferred income |
248 |
49 |
– |
(9 |
) |
288 |
||||||||||||||
Other |
197 |
22 |
(3 |
) |
12 |
228 |
||||||||||||||
$ |
1,621 |
$ |
279 |
$ |
(18 |
) |
$ |
59 |
$ |
1,941 |
||||||||||
Deferred tax liabilities |
||||||||||||||||||||
Intangible assets |
$ |
(402 |
) |
$ |
20 |
$ |
– |
$ |
– |
$ |
(382 |
) |
||||||||
Property and equipment |
(90 |
) |
6 |
– |
– |
(84 |
) |
|||||||||||||
Pension and employee benefits |
(218 |
) |
(6 |
) |
(66 |
) |
(1 |
) |
(291 |
) |
||||||||||
Goodwill |
(93 |
) |
(1 |
) |
– |
– |
(94 |
) |
||||||||||||
Financial instruments revaluation |
(12 |
) |
(1 |
) |
(33 |
) |
4 |
(42 |
) |
|||||||||||
Other |
(34 |
) |
(40 |
) |
4 |
2 |
(68 |
) |
||||||||||||
$ |
(849 |
) |
$ |
(22 |
) |
$ |
(95 |
) |
$ |
5 |
$ |
(961 |
) |
|||||||
Total net deferred tax assets |
$ |
772 |
$ |
257 |
$ |
(113 |
) |
$ |
64 |
$ |
980 |
|||||||||
| (1) | Includes foreign currency translation adjustments. |
| $ millions, for the year ended October 31, 2024 | Net asset Nov. 1, 2023 |
|
Recognized in net income |
|
Recognized in OCI |
|
Other |
(1) |
Net asset Oct. 31, 2024 |
| ||||||||||
Deferred tax assets |
||||||||||||||||||||
| Allowance for credit losses |
$ | 401 | $ | 38 | $ | – | $ | 1 | $ | 440 | ||||||||||
| Deferred compensation |
427 | 255 | – | 46 | 728 | |||||||||||||||
| Financial instruments revaluation |
91 | (19 | ) | (59 | ) | (5 | ) | 8 | ||||||||||||
| Deferred income |
235 | 13 | – | – | 248 | |||||||||||||||
| Other |
158 | 31 | 2 | 6 | 197 | |||||||||||||||
| $ | 1,312 | $ | 318 | $ | (57 | ) | $ | 48 | $ | 1,621 | ||||||||||
Deferred tax liabilities |
||||||||||||||||||||
| Intangible assets |
$ | (392 | ) | $ | (10 | ) | $ | – | $ | – | $ | (402 | ) | |||||||
| Property and equipment |
(67 | ) | (22 | ) | – | (1 | ) | (90 | ) | |||||||||||
| Pension and employee benefits |
(132 | ) | (19 | ) | (68 | ) | 1 | (218 | ) | |||||||||||
| Goodwill |
(91 | ) | (1 | ) | – | (1 | ) | (93 | ) | |||||||||||
| Financial instruments revaluation |
(13 | ) | – | – | 1 | (12 | ) | |||||||||||||
| Other |
(10 | ) | (22 | ) | 1 | (3 | ) | (34 | ) | |||||||||||
| $ | (705 | ) | $ | (74 | ) | $ | (67 | ) | $ | (3 | ) | $ | (849 | ) | ||||||
| Total net deferred tax assets |
$ | 607 | $ | 244 | $ | (124 | ) | $ | 45 | $ | 772 | |||||||||
| (1) | Includes foreign currency translation adjustments. |
| CIBC 2025 |
|
166 |
|
| Consolidated financial statements |
Note 19 |
Earnings per share |
$ millions, except per share amounts, for the year ended October 31 |
2025 |
2024 | ||||||
| Basic EPS |
||||||||
| Net income attributable to equity shareholders |
$ |
8,429 |
$ | 7,115 |
||||
| Less: Preferred share dividends and distributions on other equity instruments |
364 |
263 | ||||||
| Net income attributable to common shareholders |
8,065 |
6,852 | ||||||
| Weighted-average common shares outstanding (thousands) |
935,374 |
939,352 | ||||||
| Basic EPS |
$ |
8.62 |
$ | 7.29 | ||||
| Diluted EPS |
||||||||
| Net income attributable to common shareholders |
$ |
8,065 |
$ | 6,852 | ||||
| Weighted-average common shares outstanding (thousands) |
935,374 |
939,352 | ||||||
| Add: Stock options potentially exercisable (1) (thousands) |
5,301 |
2,360 | ||||||
| Weighted-average diluted common shares outstanding (thousands) |
940,675 |
941,712 | ||||||
| Diluted EPS |
$ |
8.57 |
$ | 7.28 | ||||
| (1) | Excludes average options outstanding of |
Note 20 |
Commitments, guarantees and pledged assets |
$ millions, as at October 31 |
2025 |
2024 | ||||||
| Contract amounts | ||||||||
| Unutilized credit commitments (1)
|
$ |
420,442 |
$ | 383,882 | ||||
| Backstop liquidity facilities |
31,194 |
23,734 | ||||||
| Standby and performance letters of credit |
26,358 |
22,181 | ||||||
| Documentary and commercial letters of credit |
167 |
183 | ||||||
| Other commitments to extend credit |
2,722 |
10,431 | ||||||
| Total |
$ |
480,883 |
$ | 440,411 | ||||
| ( 1 ) |
Includes $201.5 billion (2024: $189.6 billion) of personal, home equity and credit card lines, which are unconditionally cancellable at our discretion. |
167 |
CIBC 2025 |
Consolidated financial statements |
$ millions, as at October 31 |
2025 |
2024 |
||||||
Assets pledged in relation to: |
||||||||
Securities lending |
$ |
93,433 |
$ | 63,072 | ||||
Obligations related to securities sold under repurchase agreements |
130,197 |
109,151 | ||||||
Obligations related to securities sold short |
24,244 |
21,642 | ||||||
Securitizations |
18,090 |
20,105 | ||||||
Covered bonds |
51,638 |
39,257 | ||||||
Derivatives |
22,733 |
24,200 | ||||||
Foreign governments and central banks (1)
|
285 |
560 | ||||||
Clearing systems, payment systems, and depositories (2)
|
1,486 |
1,605 | ||||||
Other |
12 |
11 | ||||||
Total |
$ |
342,118 |
$ | 279,603 | ||||
(1) |
Includes assets pledged to maintain access to central bank facilities in foreign jurisdictions. |
(2) |
Includes assets pledged in order to participate in clearing and payment systems and depositories. |
|
CIBC
2025 |
|
168 |
|
Consolidated financial statements |
Note 21 |
Contingent liabilities and provisions |
169 |
CIBC 2025 ANNUAL REPORT |
Consolidated financial statements |
|
CIBC
2025 ANNUAL REPORT |
|
170 |
|
Consolidated financial statements |
$ millions, for the year ended October 31 |
2025 |
2024 | ||||||
Balance at beginning of year |
$ |
108 |
$ | 140 | ||||
Additional new provisions recognized |
82 |
41 | ||||||
Less: |
||||||||
Amounts incurred and charged against existing provisions |
(40 |
) |
(70 | ) | ||||
Unused amounts reversed and other adjustments (1)
|
(46 |
) |
(3 | ) | ||||
Balance at end of year |
$ |
104 |
$ | 108 | ||||
| (1) | Includes foreign currency translation adjustments. |
Note 22 |
Concentration of credit risk |
$ millions, as at October 31 |
2025 |
2024 |
||||||||||||||||||||||||||||||
Canada |
U.S. |
Other countries |
Total |
Canada |
U.S. |
Other countries |
Total |
|||||||||||||||||||||||||
| On-balance sheet |
||||||||||||||||||||||||||||||||
| Major assets (1)(2)(3)
|
$ |
657,015 |
$ |
288,069 |
$ |
118,402 |
$ |
1,063,486 |
$ | 627,621 | $ | 259,280 | $ | 110,984 | $ | 997,885 | ||||||||||||||||
| Off-balance sheet |
||||||||||||||||||||||||||||||||
| Credit-related arrangements |
||||||||||||||||||||||||||||||||
| Financial institutions |
$ |
48,031 |
$ |
36,436 |
$ |
7,959 |
$ |
92,426 |
$ | 46,567 | $ | 31,083 | $ | 6,522 | $ | 84,172 | ||||||||||||||||
| Governments |
11,022 |
129 |
126 |
11,277 |
10,913 | 153 | 15 | 11,081 | ||||||||||||||||||||||||
| Retail |
211,289 |
1,250 |
684 |
213,223 |
199,324 | 1,125 | 525 | 200,974 | ||||||||||||||||||||||||
| Corporate |
85,458 |
60,355 |
18,144 |
163,957 |
80,644 | 49,994 | 13,546 | 144,184 | ||||||||||||||||||||||||
| Total |
$ |
355,800 |
$ |
98,170 |
$ |
26,913 |
$ |
480,883 |
$ | 337,448 | $ | 82,355 | $ | 20,608 | $ | 440,411 | ||||||||||||||||
| (1) | Major assets consist of cash and deposits with banks, loans and acceptances net of allowance for credit losses, securities, securities borrowed or purchased under resale agreements, and derivative instruments. |
| (2) | Includes Canadian currency of $630.8 billion (2024: $596.4 billion) and foreign currencies of $432.7 billion (2024: $401.5 billion). |
| (3) | No industry or foreign jurisdiction accounted for 10% or more of loans and acceptances , net of allowance for credit losses, with the exception of the U.S., which accounted for 17% as at October 31, 2025 (2024: 15%), the real estate and construction sector , which across all jurisdictions accounted for 10% as at October 31, 2025 (2024: 10%) and the financial institutions Canadian residential mortgages accounted for 48% as at October 31, 2025 (2024: 49%) of loans and acceptancessector , which across all jurisdictions accounted for 10% as at October 31, 2025 (2024: 8%)., net of allowance for credit losses. |
171 |
CIBC 2025 |
| Consolidated financial statements |
Note 23 |
Related-party transactions |
(1) |
Key management personnel are defined as those persons having authority and responsibility for planning, directing and controlling the activities of CIBC directly or indirectly and comprise the members of the Board (referred to as directors), the Group Executive Leadership Team (Group ELT) and certain named officers per the Bank Act |
$ millions, for the year ended October 31 |
2025 |
2024 | ||||||||||||||
Directors |
Senior officers |
Directors | Senior officers |
|||||||||||||
| Short-term benefits (1)
|
$ |
2 |
$ |
29 |
$ | 2 | $ | 20 | ||||||||
| Post-employment benefits |
– |
2 |
– | 2 | ||||||||||||
| Share-based benefits (2)
|
2 |
53 |
2 | 35 | ||||||||||||
| Termination benefits (3)
|
– |
1 |
– | 1 | ||||||||||||
| Total compensation |
$ |
4 |
$ |
85 |
$ | 4 | $ | 58 | ||||||||
| (1) | Comprises salaries, statutory and non-statutory benefits related to senior officers and fees related to directors recognized during the year. Also includes annual incentive plan payments related to senior officers on a cash basis. |
| (2) | Comprises grant-date fair values of awards granted in the year. |
| (3) | Comprises payments made in the period to key management personnel and former key management personnel. |
| CIBC 2025 |
|
172 |
|
| Consolidated financial statements |
Note 24 |
Investments in equity-accounted associates and joint ventures |
$ millions, for the year ended October 31 |
2025 |
2024 | ||||||
| Net income |
$ |
106 |
$ | 68 | ||||
| OCI |
43 |
113 | ||||||
| Total comprehensive income |
$ |
149 |
$ | 181 | ||||
$ millions, for the year ended October 31 |
2025 |
2024 | ||||||
| Net income |
$ |
11 |
$ | 11 | ||||
| OCI |
– |
– | ||||||
| Total comprehensive income |
$ |
11 |
$ | 11 | ||||
173 |
CIBC 2025 |
| Consolidated financial statements |
Note 25 |
Significant subsidiaries |
$ millions, as at October 31, 2025 |
||||||||
| Subsidiary name (1)
|
Address of head or principal office |
|
|
Book value of shares owned by CIBC |
(2) | |||
Canada and U.S. |
||||||||
| CIBC Asset Management Inc. |
Toronto, Ontario, Canada | $ |
444 |
|||||
| CIBC BA Limited |
Toronto, Ontario, Canada | – |
(3) | |||||
| CIBC Bancorp USA Inc. |
Chicago, Illinois, U.S. | 10,595 |
||||||
| Canadian Imperial Holdings Inc. |
New York, New York, U.S. | |||||||
| CIBC Inc. |
New York, New York, U.S. | |||||||
| CIBC World Markets Corp. |
New York, New York, U.S. | |||||||
| CIBC Bank USA |
Chicago, Illinois, U.S. | |||||||
| CIBC Private Wealth Group, LLC |
Atlanta, Georgia, U.S. | |||||||
| CIBC Delaware Trust Company |
Wilmington, Delaware, U.S. | |||||||
| CIBC National Trust Company |
Atlanta, Georgia, U.S. | |||||||
| CIBC Private Wealth Advisors, Inc. |
Chicago, Illinois, U.S. | |||||||
| CIBC Investor Services Inc. |
Toronto, Ontario, Canada | 25 |
||||||
| CIBC Life Insurance Company Limited |
Toronto, Ontario, Canada | 23 |
||||||
| CIBC Mortgage Funding Inc. |
Toronto, Ontario, Canada | 4,000 |
||||||
| CIBC Mortgages Inc. |
Toronto, Ontario, Canada | 230 |
||||||
| CIBC Securities Inc. |
Toronto, Ontario, Canada | 72 |
||||||
| CIBC Trust Corporation |
Toronto, Ontario, Canada | 591 |
||||||
| CIBC World Markets Inc. |
Toronto, Ontario, Canada | 306 |
||||||
| CIBC Wood Gundy Financial Services Inc. |
Toronto, Ontario, Canada | |||||||
| CIBC Wood Gundy Financial Services (Quebec) Inc. |
Montreal, Quebec, Canada | |||||||
| INTRIA Items Inc. |
Mississauga, Ontario, Canada | 100 |
||||||
International |
||||||||
| CIBC Australia Ltd. |
Sydney, New South Wales, Australia | 19 |
||||||
| CIBC Capital Markets (Europe) S.A. |
Luxembourg | 1,757 |
||||||
| CIBC Cayman Holdings Limited |
George Town, Grand Cayman, Cayman Islands | 1,742 |
||||||
| CIBC Cayman Bank Limited |
George Town, Grand Cayman, Cayman Islands | |||||||
| CIBC Cayman Capital Limited |
George Town, Grand Cayman, Cayman Islands | |||||||
| CIBC Cayman Reinsurance Limited |
George Town, Grand Cayman, Cayman Islands | |||||||
| CIBC Investments (Cayman) Limited |
George Town, Grand Cayman, Cayman Islands | 2,820 |
||||||
| CIBC Caribbean Bank Limited (91.7%) |
Warrens, St. Michael, Barbados | |||||||
| CIBC Caribbean Bank and Trust Company (Cayman) Limited (91.7%) |
George Town, Grand Cayman, Cayman Islands | |||||||
| CIBC Fund Administration Services (Asia) Limited (91.7%) |
Hong Kong, China | |||||||
| CIBC Caribbean Bank (Bahamas) Limited (87.3%) |
Nassau, The Bahamas | |||||||
| Sentry Insurance Brokers Ltd. (87.3%) |
Nassau, The Bahamas | |||||||
| CIBC Caribbean Bank (Barbados) Limited (91.7%) |
Warrens, St. Michael, Barbados | |||||||
| CIBC Caribbean Bank (Cayman) Limited (91.7%) |
George Town, Grand Cayman, Cayman Islands | |||||||
| FirstCaribbean International Finance Corporation (Netherlands Antilles) N.V. (91.7%) |
Curaçao, Netherlands Antilles | |||||||
| FirstCaribbean International Bank (Curaçao) N.V. (91.7%) |
Curaçao, Netherlands Antilles | |||||||
| CIBC Caribbean Bank (Jamaica) Limited (91.7%) |
Kingston, Jamaica | |||||||
| CIBC Caribbean Bank (Trinidad and Tobago) Limited (91.7%) |
Maraval, Port of Spain, Trinidad & Tobago | |||||||
| CIBC Caribbean Trust Company (Bahamas) Limited (91.7%) |
Nassau, The Bahamas | |||||||
| CIBC Caribbean Wealth Management Bank (Barbados) Limited (91.7%) |
Warrens, St. Michael, Barbados | |||||||
| CIBC World Markets (Japan) Inc. |
Tokyo, Japan | 48 |
||||||
| (1) | Each subsidiary is incorporated or organized under the laws of the state or country in which the principal office is situated, except for Canadian Imperial Holdings Inc., CIBC Inc., CIBC World Markets Corp., CIBC Private Wealth Group, LLC, CIBC Private Wealth Advisors, Inc., and CIBC Bancorp USA Inc., which were incorporated or organized under the laws of the State of Delaware, U.S.; CIBC National Trust Company, which was organized under the laws of the U.S.; and CIBC World Markets (Japan) Inc., which was incorporated in Barbados. |
| (2) | The book value of shares of subsidiaries is shown at cost and may include non-voting common and preferred shares. These amounts are eliminated upon consolidation. |
| (3) | The book value of shares owned by CIBC is less than $1 million. |
| CIBC 2025 |
|
174 |
|
| Consolidated financial statements |
Note 26 |
Financial instruments – disclosures |
Description |
Section |
|||
| For each type of risk arising from financial instruments, an entity shall disclose: the exposure to risks and how they arise; objectives, policies and processes used for managing the risks; methods used to measure the risk; and description of collateral. | Risk overview |
|||
| Credit risk |
||||
| Market risk |
||||
| Liquidity risk |
||||
| Operational risk |
||||
| Reputation and legal risks |
||||
| Regulatory compliance risk |
||||
| Conduct and culture risk |
||||
| Credit risk: gross exposure to credit risk, credit quality and concentration of exposures. |
Credit risk |
|||
| Market risk: trading portfolios – Value-at-Risk; non-trading portfolios – interest rate risk, foreign exchange risk and equity risk. | Market risk |
|||
| Liquidity risk: liquid assets, maturity of financial assets and liabilities, and credit commitments. |
Liquidity risk |
$ millions, as at October 31 |
IRB approach |
Standardized approach |
Other credit risk (1)
|
Securitization approach |
Total subject to credit risk |
Not subject to credit risk |
Total consolidated balance sheet |
|||||||||||||||||||||||
| 2025 |
Cash and deposits with banks |
$ |
38,725 |
$ |
2,864 |
$ |
2,414 |
$ |
– |
$ |
44,003 |
$ |
– |
$ |
44,003 |
|||||||||||||||
| Securities |
150,549 |
5,594 |
– |
3,696 |
159,839 |
123,396 |
283,235 |
|||||||||||||||||||||||
| Cash collateral on securities borrowed |
21,694 |
3 |
– |
– |
21,697 |
– |
21,697 |
|||||||||||||||||||||||
| Securities purchased under resale agreements |
66,181 |
– |
– |
2,863 |
69,044 |
17,651 |
86,695 |
|||||||||||||||||||||||
| Loans (2)
|
548,529 |
16,267 |
1,155 |
25,086 |
591,037 |
2,859 |
593,896 |
|||||||||||||||||||||||
| Allowance for credit losses |
(4,085 |
) |
(307 |
) |
– |
– |
(4,392 |
) |
– |
(4,392 |
) | |||||||||||||||||||
| Derivative instruments |
38,352 |
– |
– |
– |
38,352 |
– |
38,352 |
|||||||||||||||||||||||
| Other assets |
25,125 |
1,832 |
9,769 |
130 |
36,856 |
16,596 |
53,452 |
|||||||||||||||||||||||
| Total credit exposures |
$ |
885,070 |
$ |
26,253 |
$ |
13,338 |
$ |
31,775 |
$ |
956,436 |
$ |
160,502 |
$ |
1,116,938 |
||||||||||||||||
| 2024 |
Total credit exposures |
$ | 839,643 | $ | 24,493 | $ | 12,107 | $ | 23,509 | $ | 899,752 | $ | 142,233 | $ | 1,041,985 | |||||||||||||||
| (1) | Includes credit risk exposures arising from other assets that are subject to the credit risk framework but are not included in the standardized or IRB frameworks, including other balance sheet assets which are risk-weighted at 100%, significant investments in the capital of non-financial institutions, and amounts below the thresholds for capital deduction that are risk-weighted at 250%. |
(2) |
Includes customers’ liability under acceptances of $10 million. |
175 |
CIBC 2025 |
| Consolidated financial statements |
Note 27 |
Offsetting financial assets and liabilities |
| Amounts subject to enforceable netting agreements | ||||||||||||||||||||||||||||||||||
| |
Gross amounts of recognized financial instruments |
|
Gross amounts offset on the consolidated balance sheet |
(1) |
Related amounts not set-off on the consolidated balance sheet |
|
|
Amounts not subject to enforceable netting agreements |
(4) |
|
Net amounts presented on the consolidated balance sheet |
| ||||||||||||||||||||||
| $ millions, as at October 31 | Net amounts |
|
Financial instruments |
(2) |
Collateral received |
(3) |
Net amounts |
| ||||||||||||||||||||||||||
| 2025 |
Financial assets |
|||||||||||||||||||||||||||||||||
| Derivatives |
$ |
32,224 |
$ |
(46 |
) |
$ |
32,178 |
$ |
(24,469 |
) |
$ |
(6,474 |
) |
$ |
1,235 |
$ |
6,174 |
$ |
38,352 |
|||||||||||||||
| Cash collateral on securities borrowed |
21,697 |
– |
21,697 |
– |
(21,161 |
) |
536 |
– |
21,697 |
|||||||||||||||||||||||||
| Securities purchased under resale agreements |
108,220 |
(21,525 |
) |
86,695 |
– |
(86,584 |
) |
111 |
– |
86,695 |
||||||||||||||||||||||||
| Total |
$ |
162,141 |
$ |
(21,571 |
) |
$ |
140,570 |
$ |
(24,469 |
) |
$ |
(114,219 |
) |
$ |
1,882 |
$ |
6,174 |
$ |
146,744 |
|||||||||||||||
| Financial liabilities |
||||||||||||||||||||||||||||||||||
| Derivatives |
$ |
35,634 |
$ |
(46 |
) |
$ |
35,588 |
$ |
(24,469 |
) |
$ |
(9,494 |
) |
$ |
1,625 |
$ |
5,823 |
$ |
41,411 |
|||||||||||||||
| Cash collateral on securities lent |
6,031 |
– |
6,031 |
– |
(5,989 |
) |
42 |
– |
6,031 |
|||||||||||||||||||||||||
| Obligations related to securities sold under repurchase agreements |
151,567 |
(21,525 |
) |
130,042 |
– |
(129,997 |
) |
45 |
– |
130,042 |
||||||||||||||||||||||||
| Total |
$ |
193,232 |
$ |
(21,571 |
) |
$ |
171,661 |
$ |
(24,469 |
) |
$ |
(145,480 |
) |
$ |
1,712 |
$ |
5,823 |
$ |
177,484 |
|||||||||||||||
| 2024 |
Financial assets |
|||||||||||||||||||||||||||||||||
| Derivatives |
$ | 29,965 | $ | (40 | ) | $ | 29,925 | $ | (21,777 | ) | $ | (4,394 | ) | $ | 3,754 | $ | 6,510 | $ | 36,435 | |||||||||||||||
| Cash collateral on securities borrowed |
17,028 | – | 17,028 | – | (14,432 | ) | 2,596 | – | 17,028 | |||||||||||||||||||||||||
| Securities purchased under resale agreements |
86,497 | (2,776 | ) | 83,721 | – | (80,010 | ) | 3,711 | – | 83,721 | ||||||||||||||||||||||||
| Total |
$ | 133,490 | $ | (2,816 | ) | $ | 130,674 | $ | (21,777 | ) | $ | (98,836 | ) | $ | 10,061 | $ | 6,510 | $ | 137,184 | |||||||||||||||
| Financial liabilities |
||||||||||||||||||||||||||||||||||
| Derivatives |
$ | 35,361 | $ | (40 | ) | $ | 35,321 | $ | (21,777 | ) | $ | (7,842 | ) | $ | 5,702 | $ | 5,333 | $ | 40,654 | |||||||||||||||
| Cash collateral on securities lent |
7,997 | – | 7,997 | – | (5,169 | ) | 2,828 | – | 7,997 | |||||||||||||||||||||||||
| Obligations related to securities sold under repurchase agreements |
112,929 | (2,776 | ) | 110,153 | – | (109,368 | ) | 785 | – | 110,153 | ||||||||||||||||||||||||
| Total |
$ | 156,287 | $ | (2,816 | ) | $ | 153,471 | $ | (21,777 | ) | $ | (122,379 | ) | $ | 9,315 | $ | 5,333 | $ | 158,804 | |||||||||||||||
| (1) | Comprises amounts related to financial instruments which qualify for offsetting. This amount excludes derivatives which are settled-to-market (STM) as STM derivatives are settled on a daily basis, resulting in derecognition, rather than offsetting, of the related amounts. |
| (2) | Comprises amounts subject to set-off under enforceable netting agreements, such as ISDA agreements, derivative exchange or clearing counterparty agreements, global master repurchase agreements, and global master securities lending agreements. Under such arrangements, all outstanding transactions governed by the relevant agreement can be offset if an event of default or other predetermined event occurs. |
| (3) | Collateral received and pledged amounts are reflected at fair value, but have been limited to the net balance sheet exposure so as not to include any over-collateralization. |
| (4) | Includes exchange-traded derivatives and derivatives which are STM. |
Note 28 |
Interest income and expense |
$ millions, for the year ended October 31 |
Interest income |
Interest expense |
||||||||
2025 |
Measured at amortized cost (1)(2)
|
$ |
41,094 |
$ |
30,385 |
|||||
| Debt securities measured at FVOCI (1)
|
3,242 |
n/a |
||||||||
| Other (3)
|
4,425 |
2,607 |
||||||||
| Total |
$ |
48,761 |
$ |
32,992 |
||||||
| 2024 | Measured at amortized cost (1)(2)
|
$ | 44,748 | $ | 36,253 | |||||
| Debt securities measured at FVOCI (1)
|
3,709 | n/a | ||||||||
| Other (3)
|
3,728 | 2,237 | ||||||||
| Total |
$ | 52,185 | $ | 38,490 | ||||||
| (1) | Interest income for financial instruments that are measured at amortized cost and debt securities that are measured at FVOCI is calculated using the effective interest rate method. |
| (2) | Includes interest income on sublease-related assets and interest expense on lease liabilities under IFRS 16. |
| (3) | Includes interest income and expense and dividend income for financial instruments that are mandatorily measured and designated at FVTPL and equity securities designated at FVOCI. |
| n/a | Not applicable. |
| CIBC 2025 |
|
176 |
|
Consolidated financial statements |
Note 29 |
Segmented and geographic information |
• |
Our Simplii Financial direct banking business and Investor’s Edge direct investing business, previously reported in Capital Markets and Direct Financial Services were realigned with Canadian Personal and Business Banking and Canadian Commercial Banking and Wealth Management, respectively; and |
• |
Our CIBC Cleary Gull U.S. mid-market investment banking business was realigned from Capital Markets to U.S. Commercial Banking and Wealth Management. |
177 |
CIBC 2025 |
Consolidated financial statements |
| $ millions, for the year ended October 31 | Canadian Personal and Business Banking |
Canadian Commercial Banking and Wealth Management |
U.S. Commercial Banking and Wealth Management |
Capital Markets |
Corporate and Other |
CIBC Total |
Canada (1)
|
U.S. (1)
|
Caribbean (1)
|
Other countries (1)
|
||||||||||||||||||||||||||||||||
2025 |
Net interest income (2)
|
$ |
9,629 |
$ |
2,960 |
$ |
2,205 |
$ |
501 |
$ |
474 |
$ |
15,769 |
$ |
10,278 |
$ |
3,080 |
$ |
2,246 |
$ |
165 |
|||||||||||||||||||||
Non-interest income (3)(4)
|
2,402 |
3,942 |
1,011 |
5,647 |
362 |
13,364 |
8,995 |
2,852 |
480 |
1,037 |
||||||||||||||||||||||||||||||||
Total revenue |
12,031 |
6,902 |
3,216 |
6,148 |
836 |
29,133 |
19,273 |
5,932 |
2,726 |
1,202 |
||||||||||||||||||||||||||||||||
Provision for credit losses |
1,764 |
166 |
175 |
208 |
29 |
2,342 |
1,947 |
256 |
29 |
110 |
||||||||||||||||||||||||||||||||
Amortization and impairment (5)
|
231 |
2 |
106 |
2 |
837 |
1,178 |
960 |
140 |
57 |
21 |
||||||||||||||||||||||||||||||||
Other non-interest expenses |
5,836 |
3,520 |
1,755 |
2,853 |
710 |
14,674 |
11,130 |
2,566 |
624 |
354 |
||||||||||||||||||||||||||||||||
Income (loss) before income taxes |
4,200 |
3,214 |
1,180 |
3,085 |
(740 |
) |
10,939 |
5,236 |
2,970 |
2,016 |
717 |
|||||||||||||||||||||||||||||||
Income taxes (2)
|
1,093 |
873 |
222 |
812 |
(515 |
) |
2,485 |
1,290 |
754 |
232 |
209 |
|||||||||||||||||||||||||||||||
Net income (loss) |
$ |
3,107 |
$ |
2,341 |
$ |
958 |
$ |
2,273 |
$ |
(225 |
) |
$ |
8,454 |
$ |
3,946 |
$ |
2,216 |
$ |
1,784 |
$ |
508 |
|||||||||||||||||||||
Net income (loss) attributable to: |
||||||||||||||||||||||||||||||||||||||||||
Non-controlling interests |
$ |
– |
$ |
– |
$ |
– |
$ |
– |
$ |
25 |
$ |
25 |
$ |
– |
$ |
– |
$ |
25 |
$ |
– |
||||||||||||||||||||||
Equity shareholders |
3,107 |
2,341 |
958 |
2,273 |
(250 |
) |
8,429 |
3,946 |
2,216 |
1,759 |
508 |
|||||||||||||||||||||||||||||||
Average assets (6)(7)
|
$ |
339,909 |
$ |
103,855 |
$ |
64,415 |
$ |
378,541 |
$ |
217,565 |
$ |
1,104,285 |
$ |
835,506 |
$ |
189,079 |
$ |
55,069 |
$ |
24,631 |
||||||||||||||||||||||
2024 (8)
|
Net interest income (2)
|
$ | 8,592 | $ | 2,232 | $ | 1,906 | $ | 303 | $ | 662 | $ | 13,695 | $ | 9,095 | $ | 2,569 | $ | 1,865 | $ | 166 | |||||||||||||||||||||
Non-interest income (3)(4)
|
2,350 | 3,786 | 914 | 4,497 | 364 | 11,911 | 8,249 | 2,265 | 626 | 771 | ||||||||||||||||||||||||||||||||
Total revenue |
10,942 | 6,018 | 2,820 | 4,800 | 1,026 | 25,606 | 17,344 | 4,834 | 2,491 | 937 | ||||||||||||||||||||||||||||||||
Provision for |
1,233 | 123 | 560 | 84 | 1 | 2,001 | 1,375 | 623 | 1 | 2 | ||||||||||||||||||||||||||||||||
Amortization and impairment (5)
|
229 | 2 | 98 | 9 | 832 | 1,170 | 956 | 130 | 64 | 20 | ||||||||||||||||||||||||||||||||
Other non-interest expenses |
5,477 | 3,064 | 1,620 | 2,470 | 638 | 13,269 | 10,108 | 2,259 | 607 | 295 | ||||||||||||||||||||||||||||||||
Income (loss) before income taxes |
4,003 | 2,829 | 542 | 2,237 | (445 | ) | 9,166 | 4,905 | 1,822 | 1,819 | 620 | |||||||||||||||||||||||||||||||
Income taxes (2)
|
1,098 | 766 | 42 | 608 | (502 | ) | 2,012 | 1,284 | 422 | 125 | 181 | |||||||||||||||||||||||||||||||
Net income (loss) |
$ | 2,905 | $ | 2,063 | $ | 500 | $ | 1,629 | $ | 57 | $ | 7,154 | $ | 3,621 | $ | 1,400 | $ | 1,694 | $ | 439 | ||||||||||||||||||||||
Net income (loss) attributable to: |
||||||||||||||||||||||||||||||||||||||||||
Non-controlling interests |
$ | – | $ | – | $ | – | $ | – | $ | 39 | $ | 39 | $ | – | $ | – | $ | 39 | $ | – | ||||||||||||||||||||||
Equity shareholders |
2,905 | 2,063 | 500 | 1,629 | 18 | 7,115 | 3,621 | 1,400 | 1,655 | 439 | ||||||||||||||||||||||||||||||||
Average assets (6)(7)
|
$ | 333,793 | $ | 95,536 | $ | 60,820 | $ | 315,314 | $ | 199,670 | $ | 1,005,133 | $ | 750,500 | $ | 177,688 | $ | 52,862 | $ | 24,083 | ||||||||||||||||||||||
| (1) | Net income and average assets are allocated based on the geographic location where they are recorded. |
| (2) | Capital Markets net interest income and income taxes include taxable equivalent basis (TEB) adjustments of nil (2024: $ 16 million) with an equivalent offset in Corporate and Other. TEB adjustment and related offset are no longer applied since the third quarter of 2024 upon the enactment of Bill C-59 in June 2024, which eliminated the dividend received deduction for Canadian banks. |
| (3) | The fee and commission income within non-interest income consists primarily of underwriting and advisory fees, deposit and payment fees, credit fees, card fees, investment management and custodial fees, mutual fund fees and commissions on securities transactions. Underwriting and advisory fees are earned primarily in Capital Markets with the remainder earned in Canadian Commercial Banking and Wealth Management. Deposit and payment fees are earned primarily in Canadian Personal and Business Banking, with the remainder earned mainly in Canadian Commercial Banking and Wealth Management, Capital Markets, and Corporate and Other. Credit fees are earned primarily in Canadian Commercial Banking and Wealth Management, Capital Markets, and U.S. Commercial Banking and Wealth Management. Card fees are earned primarily in Canadian Personal and Business Banking, with the remainder earned mainly in Corporate and Other. Investment management and custodial fees are earned primarily in Canadian Commercial Banking and Wealth Management and U.S. Commercial Banking and Wealth Management, with the remainder earned mainly in Corporate and Other. Mutual fund fees are earned primarily in Canadian Commercial Banking and Wealth Management and U.S. Commercial Banking and Wealth Management. Commissions on securities transactions are earned primarily in Capital Markets, and Canadian Commercial Banking and Wealth Management. |
| (4) | Includes intersegment revenue, which represents internal sales commissions and revenue allocations under the Product Owner/Customer Segment/Distributor Channel allocation management model. |
| (5) | Comprises amortization and impairment of buildings, right-of-use assets, furniture, equipment, leasehold improvements, software and other intangible assets, and goodwill. |
| (6) | Assets are disclosed on an average basis as this measure is most relevant to a financial institution and is the measure reviewed by management. |
| (7) | Average balances are calculated as a weighted average of daily closing balances. |
| (8) | Certain prior year information has been restated. See the “External reporting changes” section for additional details. |
$ millions, for the year ended October 31 |
2025 |
2024 |
||||||
Canadian Personal and Business Banking (1)
|
$ |
12,031 |
$ | 10,942 | ||||
Canadian Commercial Banking and Wealth Management (1)
|
||||||||
Commercial banking |
$ |
2,710 |
$ | 2,465 | ||||
Wealth management |
4,192 |
3,553 | ||||||
$ |
6,902 |
$ | 6,018 | |||||
U.S. Commercial Banking and Wealth Management (1)
|
||||||||
Commercial banking |
$ |
2,224 |
$ | 1,971 | ||||
Wealth management |
992 |
849 | ||||||
$ |
3,216 |
$ | 2,820 | |||||
Capital Markets (1)(2)
|
||||||||
Global markets |
$ |
3,996 |
$ | 3,055 | ||||
Corporate and investment banking |
2,152 |
1,745 | ||||||
$ |
6,148 |
$ | 4,800 | |||||
Corporate and Other (2)
|
||||||||
International banking |
$ |
905 |
$ | 980 | ||||
Other |
(69 |
) |
46 | |||||
$ |
836 |
$ | 1,026 | |||||
| (1) | Certain prior year information has been restated. See the “External reporting changes” section for additional details. |
| (2) | Capital Markets net interest income nil (2024: $16 includes TEB adjustments ofmillion) with an equivalent offset in Corporate and Other. TEB adjustment and related offset
are no longer applied since the third quarter of 2024 upon the enactment of Bill C-59 in June 2024, which eliminated the dividend received deduction for Canadian banks. |
|
CIBC
2025 |
|
178 |
|
Consolidated financial statements |
Note 30 |
Future accounting policy changes |
179 |
CIBC 2025 |
Management’s discussion and analysis |
2 |
||
2 |
||
| 2 | Our strategy | |
| 2 | Performance against objectives | |
4 |
||
5 |
||
| 5 | Year in review – 2025 | |
| 5 | Outlook for calendar year 2026 |
|
5 |
||
1 |
CIBC 2025 |
Management’s discussion and analysis |
| • | Our Simplii Financial direct banking business and Investor’s Edge direct investing business, previously reported in Capital Markets and Direct Financial Services were realigned with Canadian Personal and Business Banking and Canadian Commercial Banking and Wealth Management, respectively; and |
| • | Our CIBC Cleary Gull U.S. mid-market investment banking business was realigned from Capital Markets to U.S. Commercial Banking and Wealth Management. |
| • | Growing our mass affluent and private wealth franchise; |
| • | Expanding our digital-first personal banking capabilities; |
| • | Delivering connectivity and differentiation to our clients; and |
| • | Enabling, simplifying and protecting our bank. |
|
Earnings growth To assess our earnings growth, we monitor our earnings per share (EPS). In 2025, our reported and adjusted
(1) (1) Going forward, we will continue to target an adjusted (1) diluted EPS |
Reported diluted EPS ($) 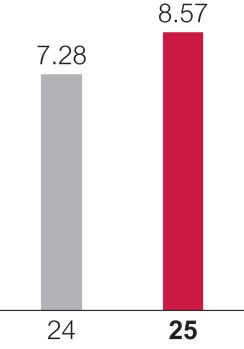 |
Adjusted diluted EPS ($) 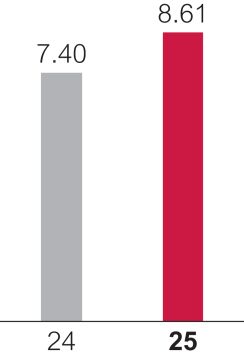 |
||
|
Operating leverage Operating leverage, defined as the difference between the year-over-year percentage change in revenue and year-over-year percentage change in
non-interest expenses, is a measure of the relative growth rates of revenue and expenses. In 2025, our reported and adjusted(1) operating leverage was 4.0% and 3.1%, respectively, compared with 9.1% and 1.2%, respectively, in 2024.Going forward, we will continue to target positive adjusted (1) operating leverage through the cycle. |
Reported operating leverage (%) 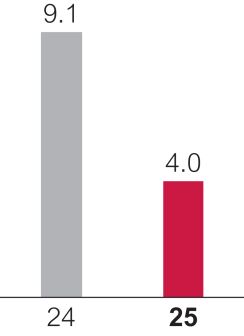 |
Adjusted operating leverage (%) 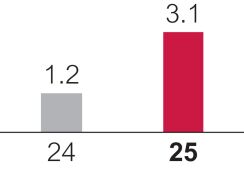 |
||
| (1) | Adjusted measures are non-GAAP measures. For additional information and a reconciliation of reported results to adjusted results, where applicable, see the “Non-GAAP measures” section. |
|
CIBC
2025 |
|
2 |
|
Management’s discussion and analysis |
|
Shareholder profitability and return We have three metrics to measure shareholder profitability and return: 1.
Return on common shareholders’ equity (ROE)
ROE, defined as the ratio of net income to average(2) common shareholders’ equity, is a key measure of profitability. In 2025, our reported and adjusted(1) ROE were at 14.3% and 14.4%, respectively, compared with 13.4% and 13.7% in 2024, respectively, and below our through the cycle target of 15%+, driven mainly by higher regulatory capital requirements. Going forward, we will continue to target an adjusted (1) ROE of 15%+ through the cycle. |
ROE (%) 
|
Adjusted ROE (%) 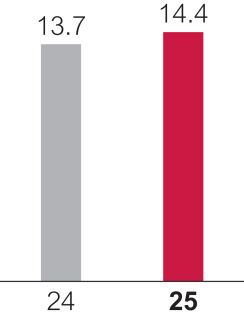
|
||
|
2.
Dividend payout ratio
Dividend payout ratio is defined as the ratio of common share dividends paid as a percentage of net income after preferred share dividends, premiums on preferred share redemptions, and distributions on other equity instruments. Key criteria for considering dividend increases are our current level of payout relative to our target and our view on the sustainability of our current earnings level. In 2025, our reported and adjusted (1) dividend payout ratios were 45.0% and 44.8%, respectively, compared with 49.4% and 48.5% in 2024, respectively.Going forward, we will continue to target an adjusted (1) dividend payout ratio of 40% to 50% through the cycle. |
Reported dividend payout ratio (%) 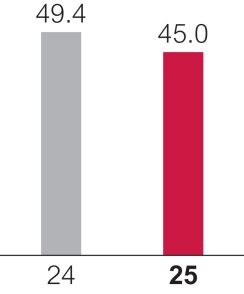
|
Adjusted dividend payout ratio (%) 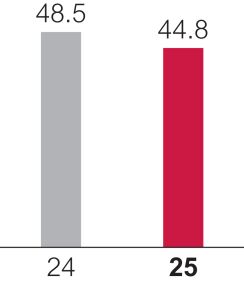
|
||
|
3.
Total shareholder return (TSR)
TSR is the ultimate measure of shareholder value, and the output of delivering against the financial targets within our control. We continue to have an objective to deliver a TSR that exceeds the industry average, which we have defined as the Standard & Poor’s (S&P)/Toronto Stock Exchange (TSX) Composite Banks Index, over rolling three- and five-year periods. For the three years ended October 31, 2025, our TSR was 119.5% (2024: 36.4%), which was above the S&P/TSX Composite Banks Index of 73.7%. For the five years ended October 31, 2025, our TSR was 199.8% (2024: 102.9%), which was above the S&P/TSX Composite Banks Index return over the same period of 159.1%. |
Rolling three-year TSR (%) 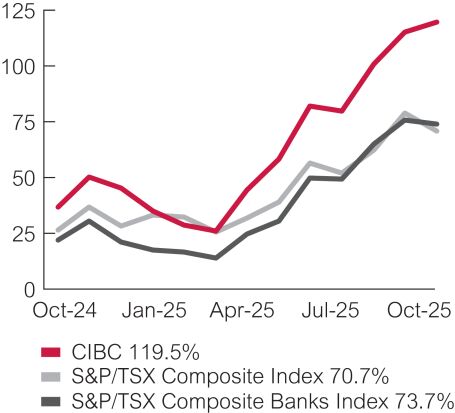
|
Rolling five-year TSR (%) 
|
|
Balance sheet strength Maintaining a strong balance sheet is foundational to our long-term success. Our goal is to maintain strong capital and liquidity positions. We look to constantly balance our objectives of holding a prudent amount of excess capital for unexpected events and environmental uncertainties, investing in our core businesses, growing through acquisitions and returning capital to our shareholders. 1.
Common Equity Tier 1 (CET1) ratio
We actively manage our capital to maintain a strong and efficient capital base while supporting our business growth and returning capital to our shareholders. For the year ended October 31, 2025, our CET1 (3) ratio was 13.3%, compared with 13.3% in 2024, well above the current regulatory requirement set by the Office of the Superintendent of Financial Institutions (OSFI).Going forward, we will continue to maintain a strong buffer to regulatory requirements. 2.
Liquidity coverage ratio (LCR)
Our ability to meet our near-term financial obligations is measured through the LCR. It measures unencumbered high-quality liquid assets (HQLA) that can be converted into cash to meet liquidity needs in a
30-calendar-day For the quarter ended October 31, 2025, our three-month daily average LCR (3) was 132% compared to 129% for the same period last year. |
CET1 ratio (%) 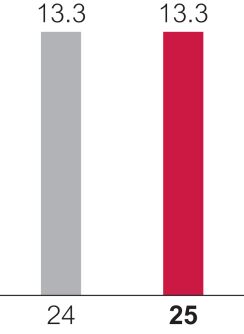
|
|
|
LCR (%) 
|
| (1) | Adjusted measures are non-GAAP measures. For additional information and a reconciliation of reported results to adjusted results, where applicable, see the “Non-GAAP measures” section. |
| (2) | Average balances are calculated as a weighted average of daily closing balances. |
| (3) | Our capital ratios are calculated pursuant to OSFI’s Capital Adequacy Requirements (CAR) Guideline and the LCR is calculated pursuant to OSFI’s Liquidity Adequacy Requirements (LAR) Guideline, which are both based on Basel Committee on Banking Supervision (BCBS) standards. For additional information, see the “Capital management” and “Liquidity risk” sections. |
3 |
CIBC 2025 |
Management’s discussion and analysis |
| As at or for the year ended October 31 | 2025 |
2024 | ||||||||
Financial results |
||||||||||
Net interest income |
$ |
15,769 |
$ | 13,695 | ||||||
Non-interest income |
13,364 |
11,911 | ||||||||
Total revenue |
29,133 |
25,606 | ||||||||
Provision for credit losses |
2,342 |
2,001 | ||||||||
Non-interest expenses |
15,852 |
14,439 | ||||||||
Income before income taxes |
10,939 |
9,166 | ||||||||
Income taxes |
2,485 |
2,012 | ||||||||
Net income |
$ |
8,454 |
$ | 7,154 | ||||||
Net income attributable to non-controlling interests |
25 |
39 | ||||||||
Preferred shareholders and other equity instrument holders |
364 |
263 | ||||||||
Common shareholders |
8,065 |
6,852 | ||||||||
Net income attributable to equity shareholders |
$ |
8,429 |
$ | 7,115 | ||||||
Financial measures |
||||||||||
Reported efficiency ratio (1)
|
54.4 |
% |
56.4 | % | ||||||
Reported operating leverage (1)
|
4.0 |
% |
9.1 | % | ||||||
Loan loss ratio (1)
|
0.33 |
% |
0.32 | % | ||||||
Reported return on common shareholders’ equity (1)
|
14.3 |
% |
13.4 | % | ||||||
Net interest margin (1)
|
1.43 |
% |
1.36 | % | ||||||
Net interest margin on average interest-earning assets (1)(2)
|
1.55 |
% |
1.47 | % | ||||||
Return on average assets (1)(2)
|
0.77 |
% |
0.71 | % | ||||||
Return on average interest-earning assets (1)(2)
|
0.83 |
% |
0.77 | % | ||||||
Reported effective tax rate |
22.7 |
% |
21.9 | % | ||||||
Common share information |
||||||||||
Per share ($) |
– basic earnings |
$ |
8.62 |
$ | 7.29 | |||||
– reported diluted earnings |
8.57 |
7.28 | ||||||||
– dividends |
3.88 |
3.60 | ||||||||
– book value (1)
|
62.33 |
57.08 | ||||||||
Closing share price ($) |
116.21 |
87.11 | ||||||||
Shares outstanding (thousands) |
– weighted-average basic |
935,374 |
939,352 | |||||||
– weighted-average diluted |
940,675 |
941,712 | ||||||||
– end of period |
926,614 |
942,295 | ||||||||
Market capitalization ($ millions) |
$ |
107,682 |
$ | 82,083 | ||||||
Value measures |
||||||||||
Total shareholder return |
39.05 |
% |
87.56 | % | ||||||
Dividend yield (based on closing share price) |
3.3 |
% |
4.1 | % | ||||||
Reported dividend payout ratio (1)
|
45.0 |
% |
49.4 | % | ||||||
Market value to book value ratio |
1.86 |
1.53 | ||||||||
Selected financial measures – adjusted (3)
|
||||||||||
Adjusted efficiency ratio |
54.3 |
% |
55.8 | % | ||||||
Adjusted operating leverage |
3.1 |
% |
1.2 | % | ||||||
Adjusted return on common shareholders’ equity |
14.4 |
% |
13.7 | % | ||||||
Adjusted effective tax rate |
22.7 |
% |
22.0 | % | ||||||
Adjusted diluted earnings per share ($) |
$ |
8.61 |
$ | 7.40 | ||||||
Adjusted dividend payout ratio |
44.8 |
% |
48.5 | % | ||||||
On- and off-balance sheet information |
||||||||||
Cash, deposits with banks and securities |
$ |
327,238 |
$ | 302,409 | ||||||
Loans and acceptances, net of allowance for credit losses |
589,504 |
558,292 | ||||||||
Total assets |
1,116,938 |
1,041,985 | ||||||||
Deposits |
808,124 |
764,857 | ||||||||
Common shareholders’ equity (1)
|
57,760 |
53,789 | ||||||||
Average assets (2)
|
1,104,285 |
1,005,133 | ||||||||
Average interest-earning assets (1)(2)
|
1,015,644 |
929,604 | ||||||||
Average common shareholders’ equity (1)(2)
|
56,321 |
51,025 | ||||||||
Assets under administration (AUA) (1)(4)(5)
|
3,998,199 |
3,600,069 | ||||||||
Assets under management (AUM) (1)(5)
|
430,982 |
383,264 | ||||||||
Balance sheet quality (All-in basis) and liquidity measures (6)
|
||||||||||
Risk-weighted assets (RWA) ($ millions) |
||||||||||
Total RWA |
$ |
357,803 |
$ | 333,502 | ||||||
Capital ratios |
||||||||||
CET1 ratio |
13.3 |
% |
13.3 | % | ||||||
Tier 1 capital ratio |
15.1 |
% |
14.8 | % | ||||||
Total capital ratio |
17.4 |
% |
17.0 | % | ||||||
Leverage ratio |
4.3 |
% |
4.3 | % | ||||||
Total loss absorbing capacity (TLAC) ratio |
31.9 |
% |
30.3 | % | ||||||
TLAC leverage ratio |
9.0 |
% |
8.7 | % | ||||||
LCR (7)
|
132 |
% |
129 | % | ||||||
Net stable funding ratio (NSFR) |
116 |
% |
115 | % | ||||||
Other information |
||||||||||
Full-time equivalent employees |
49,824 |
48,525 | ||||||||
| (1) | For additional information on the composition of these specified financial measures, see the “Glossary” section. |
| (2) | Average balances are calculated as a weighted average of daily closing balances. |
| (3) | Adjusted measures are non-GAAP measures. Adjusted measures are calculated in the same manner as reported measures, except that financial information included in the calculation of adjusted measures is adjusted to exclude the impact of items of note. For additional information and a reconciliation of reported results to adjusted results, where applicable, see the “Non-GAAP measures” section. |
| (4) | Includes the full contract amount of AUA or custody under a 50/50 joint venture between CIBC and The Bank of New York Mellon of $3,117.4 billion as at October 31, 2025 (2024: $2,814.6 billion). |
| (5) | AUM amounts are included in the amounts reported under AUA. |
| (6) | RWA and our capital ratios are calculated pursuant to OSFI’s CAR Guideline, the leverage ratio is calculated pursuant to OSFI’s Leverage Requirements Guideline, and the LCR and NSFR are calculated pursuant to OSFI’s LAR Guideline, all of which are based on BCBS standards. For additional information, see the “Capital management” and “Liquidity risk” sections. |
| (7) | Average for the three months ended October 31 for each respective year. |
|
CIBC
2025 |
|
4 |
|
Management’s discussion and analysis |
5 |
CIBC 2025 |
Management’s discussion and analysis |
| • | $45 million ($33 million after-tax) amortization and impairment of acquisition-related intangible assets ($20 million after-tax in Canadian Personal and Business Banking, and $13 million after-tax in U.S. Commercial Banking and Wealth Management). |
| • | $103 million ($77 million after-tax) charge related to the special assessment imposed by the Federal Deposit Insurance Corporation (FDIC) on U.S. depository institutions, which impacted CIBC Bank USA (U.S. Commercial Banking and Wealth Management); and |
| • | $56 million ($41 million after-tax) amortization and impairment of acquisition-related intangible assets ($19 million after-tax in Canadian Personal and Business Banking, and $22 million after-tax in U.S. Commercial Banking and Wealth Management). |
| (1) | Adjusted measures are non-GAAP measures. For additional information and a reconciliation of reported results to adjusted results, where applicable, see the “Non-GAAP measures” section. |
$ millions, for the year ended October 31 |
2025 |
2024 | ||||||||
Non-trading net interest income |
$ |
16,893 |
$ | 14,648 | ||||||
Trading net interest income (1)
|
(1,124 |
) |
(953 | ) | ||||||
Total net interest income |
A | $ |
15,769 |
$ | 13,695 | |||||
Average trading interest-earning assets |
140,073 |
109,676 | ||||||||
Average non-trading interest-earning assets |
875,571 |
819,928 | ||||||||
Total average interest-earning assets |
B | 1,015,644 |
929,604 | |||||||
Net interest margin on average interest-earning assets |
A/B | 1.55 |
% |
1.47 | % | |||||
Net interest margin on average interest-earning assets (excluding trading) (1)
|
1.93 |
% |
1.79 | % | ||||||
| (1) | See the “Glossary – Trading activities and trading net interest income” and “Glossary – Net interest margin on average interest-earning assets (excluding trading)” sections for additional information. |
|
CIBC
2025 |
|
6 |
|
Management’s discussion and analysis |
$ millions, for the year ended October 31 |
2025 |
2024 | ||||||
Underwriting and advisory fees |
$ |
915 |
$ | 707 | ||||
Deposit and payment fees |
996 |
958 | ||||||
Credit fees |
1,015 |
1,218 | ||||||
Card fees |
402 |
414 | ||||||
Investment management and custodial fees (1)(2)
|
2,241 |
1,980 | ||||||
Mutual fund fees (2)
|
2,019 |
1,796 | ||||||
Income from insurance activities, net |
317 |
356 | ||||||
Commissions on securities transactions |
554 |
431 | ||||||
Gains (losses) from financial instruments measured/designated at fair value through profit or loss (FVTPL), net (3)
|
4,022 |
3,226 | ||||||
Gains (losses) from debt securities measured at fair value through other comprehensive income (FVOCI) and amortized cost, net |
(14 |
) |
43 | |||||
Foreign exchange other than trading |
369 |
386 | ||||||
Income from equity-accounted associates and joint ventures (2)
|
117 |
79 | ||||||
Other |
411 |
317 | ||||||
Total non-interest income |
$ |
13,364 |
$ | 11,911 | ||||
| (1) | Custodial fees directly recognized by CIBC are included in Investment management and custodial fees. Our proportionate share of the custodial fees from the joint ventures which CIBC has with The Bank of New York Mellon are included within Income from equity-accounted associates and joint ventures. |
| (2) | Investment management fees and mutual fund fees are driven by various factors, including the amount of AUM. Investment management fees in our asset management and private wealth management businesses are generally driven by the amount of AUM, while investment management fees in our retail brokerage business are driven by a combination of the amount of AUA and, to a lesser extent, other factors not directly related to the amount of AUA (e.g., flat fees on a per account basis). |
| (3) | Includes $174 million of gains (2024: $82 million of gains) relating to non-trading financial instruments measured/designated at FVTPL. |
$ millions, for the year ended October 31 |
2025 |
2024 | ||||||
Net interest income |
$ |
(1,124 |
) |
$ | (937 | ) | ||
Non-interest income (2)
|
3,848 |
3,144 | ||||||
Total trading revenue |
$ |
2,724 |
$ | 2,207 | ||||
Interest rates |
$ |
586 |
$ | 518 | ||||
Foreign exchange |
1,027 |
969 | ||||||
Equities |
844 |
540 | ||||||
Commodities |
264 |
179 | ||||||
Other |
3 |
1 | ||||||
Total trading revenue |
$ |
2,724 |
$ | 2,207 | ||||
| (1) | Trading activities and related risk management strategies can periodically shift trading income between net interest income and non-interest income. Therefore, we view total trading income as the most appropriate measure of trading performance. For additional information, see the “Glossary – Trading activities and trading net interest income” section. |
| (2) | Reported as part of the Gains (losses) from financial instruments measured/designated at FVTPL in the consolidated statement of income, which consist of a gain of $3,848 million (2024: $3,144 million) related to trading financial instruments measured/designated at FVTPL and a gain of $174 million (2024: $82 million) relating to non-trading financial instruments measured/designated at FVTPL. |
7 |
CIBC 2025 |
Management’s discussion and analysis |
$ millions, for the year ended October 31 |
2025 |
2024 | ||||||
Provision for credit losses – impaired |
||||||||
Canadian Personal and Business Banking (1)
|
$ |
1,365 |
$ | 1,169 | ||||
Canadian Commercial Banking and Wealth Management (1)
|
112 |
75 | ||||||
U.S. Commercial Banking and Wealth Management (1)
|
268 |
449 | ||||||
Capital Markets (1)
|
117 |
55 | ||||||
Corporate and Other |
25 |
12 | ||||||
1,887 |
1,760 | |||||||
Provision for (reversal of) credit losses – performing |
||||||||
Canadian Personal and Business Banking (1)
|
399 |
64 | ||||||
Canadian Commercial Banking and Wealth Management (1)
|
54 |
48 | ||||||
U.S. Commercial Banking and Wealth Management (1)
|
(93 |
) |
111 | |||||
Capital Markets (1)
|
91 |
29 | ||||||
Corporate and Other |
4 |
(11 | ) | |||||
455 |
241 | |||||||
Total provision for credit losses |
$ |
2,342 |
$ | 2,001 | ||||
| (1) | Certain prior year information has been restated. See the “External reporting changes” section for additional details. |
$ millions, for the year ended October 31 |
2025 |
2024 | ||||||
Employee compensation and benefits |
||||||||
Salaries (1)
|
$ |
4,642 |
$ | 4,267 | ||||
Performance-based compensation |
3,501 |
2,992 | ||||||
Benefits |
1,123 |
1,002 | ||||||
9,266 |
8,261 | |||||||
Occupancy costs |
847 |
830 | ||||||
Computer, software and office equipment |
2,946 |
2,719 | ||||||
Communications |
395 |
362 | ||||||
Advertising and business development |
398 |
344 | ||||||
Professional fees |
284 |
257 | ||||||
Business and capital taxes |
124 |
128 | ||||||
Other |
1,592 |
1,538 | ||||||
Total non-interest expenses |
$ |
15,852 |
$ | 14,439 | ||||
| (1) | Includes termination benefits. |
|
CIBC
2025 |
|
8 |
|
Management’s discussion and analysis |
$ millions, for the year ended October 31 |
2025 |
2024 | ||||||
Income taxes |
$ |
2,485 |
$ | 2,012 | ||||
Goods and Services Tax (GST), Harmonized Sales Tax (HST) and sales taxes |
550 |
502 | ||||||
Payroll taxes |
467 |
406 | ||||||
Capital taxes |
79 |
82 | ||||||
Property and business taxes |
78 |
69 | ||||||
Total indirect taxes (1)
|
1,174 |
1,059 | ||||||
Total taxes |
$ |
3,659 |
$ | 3,071 | ||||
Reported effective tax rate |
22.7 |
% |
21.9 | % | ||||
Total taxes as a percentage of net income before deduction of total taxes |
30.2 |
% |
30.0 | % |
| (1) | Certain amounts are based on a paid or payable basis and do not factor in capitalization and subsequent amortization. |
2025 |
2024 | |||||||
vs. |
vs. | |||||||
$ millions, for the year ended October 31 |
2024 |
2023 | ||||||
Estimated increase in: |
||||||||
Total revenue |
$ |
212 |
$ | 44 | ||||
Provision for credit losses |
11 |
5 | ||||||
Non-interest expenses |
102 |
23 | ||||||
Income taxes |
25 |
4 | ||||||
Net income |
74 |
12 | ||||||
Impact on EPS: |
||||||||
Basic |
$ |
0.08 |
$ | 0.01 | ||||
Diluted |
0.08 |
0.01 | ||||||
Average USD appreciation relative to CAD |
3.2 |
% |
0.8 | % | ||||
$ millions, except per share amounts, for the three months ended |
2025 |
2024 | ||||||||||||||||||||||||||||||||||||||||
Oct. 31 |
Jul. 31 |
Apr. 30 |
Jan. 31 |
Oct. 31 | Jul. 31 | Apr. 30 | Jan. 31 | |||||||||||||||||||||||||||||||||||
Revenue |
||||||||||||||||||||||||||||||||||||||||||
Canadian Personal and Business Banking (1)
|
$ |
3,188 |
$ |
3,061 |
$ |
2,859 |
$ |
2,923 |
$ | 2,842 | $ | 2,775 | $ | 2,646 | $ | 2,679 | ||||||||||||||||||||||||||
Canadian Commercial Banking and Wealth Management (1)
|
1,836 |
1,723 |
1,640 |
1,703 |
1,602 | 1,523 | 1,456 | 1,437 | ||||||||||||||||||||||||||||||||||
U.S. Commercial Banking and Wealth Management (1)
|
810 |
790 |
769 |
847 |
733 | 731 | 669 | 687 | ||||||||||||||||||||||||||||||||||
Capital Markets (1)(2)
|
1,523 |
1,506 |
1,545 |
1,574 |
1,155 | 1,092 | 1,243 | 1,310 | ||||||||||||||||||||||||||||||||||
Corporate and Other (2)
|
219 |
174 |
209 |
234 |
285 | 483 | 150 | 108 | ||||||||||||||||||||||||||||||||||
Total revenue |
$ |
7,576 |
$ |
7,254 |
$ |
7,022 |
$ |
7,281 |
$ | 6,617 | $ | 6,604 | $ | 6,164 | $ | 6,221 | ||||||||||||||||||||||||||
Net interest income |
$ |
4,132 |
$ |
4,048 |
$ |
3,788 |
$ |
3,801 |
$ | 3,633 | $ | 3,532 | $ | 3,281 | $ | 3,249 | ||||||||||||||||||||||||||
Non-interest income |
3,444 |
3,206 |
3,234 |
3,480 |
2,984 | 3,072 | 2,883 | 2,972 | ||||||||||||||||||||||||||||||||||
Total revenue |
7,576 |
7,254 |
7,022 |
7,281 |
6,617 | 6,604 | 6,164 | 6,221 | ||||||||||||||||||||||||||||||||||
Provision for credit losses |
605 |
559 |
605 |
573 |
419 | 483 | 514 | 585 | ||||||||||||||||||||||||||||||||||
Non-interest expenses |
4,179 |
3,976 |
3,819 |
3,878 |
3,791 | 3,682 | 3,501 | 3,465 | ||||||||||||||||||||||||||||||||||
Income before income taxes |
2,792 |
2,719 |
2,598 |
2,830 |
2,407 | 2,439 | 2,149 | 2,171 | ||||||||||||||||||||||||||||||||||
Income taxes |
612 |
623 |
591 |
659 |
525 | 644 | 400 | 443 | ||||||||||||||||||||||||||||||||||
Net income |
$ |
2,180 |
$ |
2,096 |
$ |
2,007 |
$ |
2,171 |
$ | 1,882 | $ | 1,795 | $ | 1,749 | $ | 1,728 | ||||||||||||||||||||||||||
Net income attributable to: |
||||||||||||||||||||||||||||||||||||||||||
Non-controlling interests |
$ |
6 |
$ |
2 |
$ |
9 |
$ |
8 |
$ | 8 | $ | 9 | $ | 10 | $ | 12 | ||||||||||||||||||||||||||
Equity shareholders |
2,174 |
2,094 |
1,998 |
2,163 |
1,874 | 1,786 | 1,739 | 1,716 | ||||||||||||||||||||||||||||||||||
EPS |
– basic |
$ |
2.21 |
$ |
2.16 |
$ |
2.05 |
$ |
2.20 |
$ | 1.91 | $ | 1.83 | $ | 1.79 | $ | 1.77 | |||||||||||||||||||||||||
– diluted |
2.20 |
2.15 |
2.04 |
2.19 |
1.90 | 1.82 | 1.79 | 1.77 | ||||||||||||||||||||||||||||||||||
| (1) | Certain prior year information has been restated. See “External reporting changes” for additional details. |
| (2) | Commencing in the third quarter of 2024, tax equivalent basis (TEB) reporting is no longer applicable to certain dividends received on or after January 1, 2024. In the third quarter of 2024, the enactment of the denial of the dividends received deduction resulted in a TEB reversal for dividends received on or after January 1, 2024 that were reflected in the first and second quarters of 2024 as an item of note. Prior to the third quarter of 2024, Capital Markets revenue and income taxes were reported on a TEB with an equivalent offset in the revenue and income taxes of Corporate and Other. |
9 |
CIBC 2025 |
Management’s discussion and analysis |
|
CIBC
2025 |
|
10 |
|
Management’s discussion and analysis |
| $ millions, for the year ended October 31 | |
Canadian Personal and Business Banking |
|
|
Canadian Commercial Banking and Wealth Management |
|
|
U.S. Commercial Banking and Wealth Management |
|
|
Capital Markets |
(2) |
|
Corporate and Other |
(2) |
|
CIBC Total |
|
||||||||
2024 (1)
|
Net interest income |
$ | 8,592 | $ | 2,232 | $ | 1,906 | $ | 303 | $ | 662 | $ | 13,695 | |||||||||||||
Non-interest income |
2,350 | 3,786 | 914 | 4,497 | 364 | 11,911 | ||||||||||||||||||||
Total revenue |
10,942 | 6,018 | 2,820 | 4,800 | 1,026 | 25,606 | ||||||||||||||||||||
Provision for credit losses |
1,233 | 123 | 560 | 84 | 1 | 2,001 | ||||||||||||||||||||
Non-interest expenses |
5,706 | 3,066 | 1,718 | 2,479 | 1,470 | 14,439 | ||||||||||||||||||||
Income (loss) before income taxes |
4,003 | 2,829 | 542 | 2,237 | (445 | ) | 9,166 | |||||||||||||||||||
Income taxes |
1,098 | 766 | 42 | 608 | (502 | ) | 2,012 | |||||||||||||||||||
Net income |
$ | 2,905 | $ | 2,063 | $ | 500 | $ | 1,629 | $ | 57 | $ | 7,154 | ||||||||||||||
| Net income attributable to: | ||||||||||||||||||||||||||
Non-controlling interests |
$ | – | $ | – | $ | – | $ | – | $ | 39 | $ | 39 | ||||||||||||||
Equity shareholders |
2,905 | 2,063 | 500 | 1,629 | 18 | 7,115 | ||||||||||||||||||||
2023 (1)
|
Net interest income |
$ | 7,941 | $ | 1,969 | $ | 1,889 | $ | 1,091 | $ | (65 | ) | $ | 12,825 | ||||||||||||
Non-interest income |
2,183 | 3,682 | 824 | 3,420 | 398 | 10,507 | ||||||||||||||||||||
Total revenue |
10,124 | 5,651 | 2,713 | 4,511 | 333 | 23,332 | ||||||||||||||||||||
Provision for (reversal of) credit losses |
1,015 | 143 | 850 | (10 | ) | 12 | 2,010 | |||||||||||||||||||
Non-interest expenses |
5,525 | 2,809 | 1,483 | 2,235 | 2,297 | 14,349 | ||||||||||||||||||||
Income (loss) before income taxes |
3,584 | 2,699 | 380 | 2,286 | (1,976 | ) | 6,973 | |||||||||||||||||||
Income taxes |
979 | 722 | (2 | ) | 643 | (408 | ) | 1,934 | ||||||||||||||||||
Net income (loss) |
$ | 2,605 | $ | 1,977 | $ | 382 | $ | 1,643 | $ | (1,568 | ) | $ | 5,039 | |||||||||||||
Net income (loss) attributable to: |
||||||||||||||||||||||||||
Non-controlling interests |
$ | – | $ | – | $ | – | $ | – | $ | 38 | $ | 38 | ||||||||||||||
Equity shareholders |
2,605 | 1,977 | 382 | 1,643 | (1,606 | ) | 5,001 | |||||||||||||||||||
| (1) | Certain prior year information has been restated. See “External reporting changes” for additional details. |
| (2) | Capital Markets net interest income and income taxes include TEB adjustments of $16 million (2023: $254 million) with an equivalent offset in Corporate and Other. TEB adjustment and related offset is no longer applied since the third quarter of 2024 upon the enactment of Bill C-59 in June 2024, which eliminated the dividend received deduction for Canadian banks. |
11 |
CIBC 2025 |
Management’s discussion and analysis |
|
CIBC
2025 |
|
12 |
|
Management’s discussion and analysis |
13 |
CIBC 2025 |
Management’s discussion and analysis |
|
The following table provides a reconciliation of GAAP (reported) results to
non-GAAP (adjusted) results on a segmented basis. |
||||||||||||||||||||||||||||||||||||
$ millions, for the year ended October 31, 2025 |
Canadian Personal and Business Banking |
Canadian Commercial Banking and Wealth Management |
U.S. Commercial Banking and Wealth Management |
Capital Markets |
Corporate and Other |
CIBC Total |
U.S. Commercial Banking and Wealth Management (US$ millions) |
|||||||||||||||||||||||||||||
Operating results – reported |
||||||||||||||||||||||||||||||||||||
Total revenue |
$ |
12,031 |
$ |
6,902 |
$ |
3,216 |
$ |
6,148 |
$ |
836 |
$ |
29,133 |
$ |
2,293 |
||||||||||||||||||||||
Provision for credit losses |
1,764 |
166 |
175 |
208 |
29 |
2,342 |
124 |
|||||||||||||||||||||||||||||
Non-interest expenses |
6,067 |
3,522 |
1,861 |
2,855 |
1,547 |
15,852 |
1,326 |
|||||||||||||||||||||||||||||
Income (loss) before income taxes |
4,200 |
3,214 |
1,180 |
3,085 |
(740 |
) |
10,939 |
843 |
||||||||||||||||||||||||||||
Income taxes |
1,093 |
873 |
222 |
812 |
(515 |
) |
2,485 |
158 |
||||||||||||||||||||||||||||
Net income (loss) |
3,107 |
2,341 |
958 |
2,273 |
(225 |
) |
8,454 |
685 |
||||||||||||||||||||||||||||
Net income attributable to non-controlling interests |
– |
|
– |
|
|
– |
|
|
– |
|
25 |
25 |
|
– |
|
|||||||||||||||||||||
Preferred shareholders and other equity instrument holders |
|
– |
|
|
– |
|
|
– |
|
|
– |
|
364 |
364 |
|
– |
|
|||||||||||||||||||
Common shareholders |
3,107 |
2,341 |
958 |
2,273 |
(614 |
) |
8,065 |
685 |
||||||||||||||||||||||||||||
Net income (loss) attributable to equity shareholders |
3,107 |
2,341 |
958 |
2,273 |
(250 |
) |
8,429 |
685 |
||||||||||||||||||||||||||||
Diluted EPS ($) |
$ |
8.57 |
||||||||||||||||||||||||||||||||||
Impact of items of note (1)
|
||||||||||||||||||||||||||||||||||||
Non-interest expenses |
||||||||||||||||||||||||||||||||||||
Amortization and impairment of acquisition-related intangible assets |
$ |
(27 |
) |
$ |
– |
|
$ |
(18 |
) |
$ |
– |
|
$ |
– |
|
$ |
(45 |
) |
$ |
(13 |
) |
|||||||||||||||
Impact of items of note on non-interest expenses |
(27 |
) |
|
– |
|
(18 |
) |
|
– |
|
|
– |
|
(45 |
) |
(13 |
) |
|||||||||||||||||||
Total pre-tax impact of items of note on net income |
27 |
|
– |
|
18 |
|
– |
|
|
– |
|
45 |
13 |
|||||||||||||||||||||||
Income taxes |
||||||||||||||||||||||||||||||||||||
Amortization and impairment of acquisition-related intangible assets |
7 |
|
– |
|
5 |
|
– |
|
|
– |
|
12 |
4 |
|||||||||||||||||||||||
Impact of items of note on income taxes |
7 |
|
– |
|
5 |
|
– |
|
|
– |
|
12 |
4 |
|||||||||||||||||||||||
Total after-tax impact of items of note on net income |
$ |
20 |
$ |
– |
|
$ |
13 |
$ |
– |
|
$ |
– |
|
$ |
33 |
$ |
9 |
|||||||||||||||||||
Impact of items of note on diluted EPS ($) (2)
|
$ |
0.04 |
||||||||||||||||||||||||||||||||||
Operating results – adjusted (3)
|
||||||||||||||||||||||||||||||||||||
Total revenue – adjusted |
$ |
12,031 |
$ |
6,902 |
$ |
3,216 |
$ |
6,148 |
$ |
836 |
$ |
29,133 |
$ |
2,293 |
||||||||||||||||||||||
Provision for credit losses – adjusted |
1,764 |
166 |
175 |
208 |
29 |
2,342 |
124 |
|||||||||||||||||||||||||||||
Non-interest expenses – adjusted |
6,040 |
3,522 |
1,843 |
2,855 |
1,547 |
15,807 |
1,313 |
|||||||||||||||||||||||||||||
Income (loss) before income taxes – adjusted |
4,227 |
3,214 |
1,198 |
3,085 |
(740 |
) |
10,984 |
856 |
||||||||||||||||||||||||||||
Income taxes – adjusted |
1,100 |
873 |
227 |
812 |
(515 |
) |
2,497 |
162 |
||||||||||||||||||||||||||||
Net income (loss) – adjusted |
3,127 |
2,341 |
971 |
2,273 |
(225 |
) |
8,487 |
694 |
||||||||||||||||||||||||||||
Net income attributable to non-controlling interests – adjusted |
|
– |
|
|
– |
|
|
– |
|
|
– |
|
25 |
25 |
|
– |
|
|||||||||||||||||||
Preferred shareholders and other equity instrument holders – adjusted |
|
– |
|
|
– |
|
|
– |
|
|
– |
|
364 |
364 |
|
– |
|
|||||||||||||||||||
Common shareholders – adjusted |
3,127 |
2,341 |
971 |
2,273 |
(614 |
) |
8,098 |
694 |
||||||||||||||||||||||||||||
Net income (loss) attributable to equity shareholders – adjusted |
3,127 |
2,341 |
971 |
2,273 |
(250 |
) |
8,462 |
694 |
||||||||||||||||||||||||||||
Adjusted diluted EPS ($) |
$ |
8.61 |
||||||||||||||||||||||||||||||||||
| (1) | Items of note are removed from reported results to calculate adjusted results. |
| (2) | Includes the impact of rounding differences between diluted EPS and adjusted diluted EPS. |
| (3) | Adjusted to exclude the impact of items of note. Adjusted measures are non-GAAP measures. |
| (4) | Certain prior year information has been restated. See “External reporting changes” for additional details. |
|
CIBC
2025 |
|
14 |
|
Management’s discussion and analysis |
$ millions, for the year ended October 31, 2024 (4)
|
|
Canadian Personal and Business Banking |
|
|
Canadian Commercial Banking and Wealth Management |
|
|
U.S. Commercial Banking and Wealth Management |
|
|
Capital Markets |
|
|
Corporate and Other |
|
|
CIBC Total |
|
|
U.S. Commercial Banking and Wealth Management (US$ millions) |
|
|||||||||||
Operating results – reported |
||||||||||||||||||||||||||||||||
Total revenue |
$ | 10,942 | $ | 6,018 | $ | 2,820 | $ | 4,800 | $ | 1,026 | $ | 25,606 | $ | 2,074 | ||||||||||||||||||
Provision for credit losses |
1,233 | 123 | 560 | 84 | 1 | 2,001 | 412 | |||||||||||||||||||||||||
Non-interest expenses |
5,706 | 3,066 | 1,718 | 2,479 | 1,470 | 14,439 | 1,263 | |||||||||||||||||||||||||
Income (loss) before income taxes |
4,003 | 2,829 | 542 | 2,237 | (445 | ) | 9,166 | 399 | ||||||||||||||||||||||||
Income taxes |
1,098 | 766 | 42 | 608 | (502 | ) | 2,012 | 31 | ||||||||||||||||||||||||
Net income |
2,905 | 2,063 | 500 | 1,629 | 57 | 7,154 | 368 | |||||||||||||||||||||||||
Net income attributable to non-controlling interests |
– | – | – | – | 39 | 39 | – | |||||||||||||||||||||||||
Preferred shareholders and other equity instrument holders |
– | – | – | – | 263 | 263 | – | |||||||||||||||||||||||||
Common shareholders |
2,905 | 2,063 | 500 | 1,629 | (245 | ) | 6,852 | 368 | ||||||||||||||||||||||||
Net income attributable to equity shareholders |
2,905 | 2,063 | 500 | 1,629 | 18 | 7,115 | 368 | |||||||||||||||||||||||||
Diluted EPS ($) |
$ | 7.28 | ||||||||||||||||||||||||||||||
Impact of items of note (1)
|
||||||||||||||||||||||||||||||||
Non-interest expenses |
||||||||||||||||||||||||||||||||
Amortization and impairment of acquisition-related intangible assets |
$ | (26 | ) | $ | – | $ | (30 | ) | $ | – | $ | – | $ | (56 | ) | $ | (22 | ) | ||||||||||||||
Charge related to the special assessment imposed by the FDIC |
– | – | (103 | ) | – | – | (103 | ) | (77 | ) | ||||||||||||||||||||||
Impact of items of note on non-interest expenses |
(26 | ) | – | (133 | ) | – | – | (159 | ) | (99 | ) | |||||||||||||||||||||
Total pre-tax impact of items of note on net income |
26 | – | 133 | – | – | 159 | 99 | |||||||||||||||||||||||||
Income taxes |
||||||||||||||||||||||||||||||||
Amortization and impairment of acquisition-related intangible assets |
7 | – | 8 | – | – | 15 | 6 | |||||||||||||||||||||||||
Charge related to the special assessment imposed by the FDIC |
– | – | 26 | – | – | 26 | 19 | |||||||||||||||||||||||||
Impact of items of note on income taxes |
7 | – | 34 | – | – | 41 | 25 | |||||||||||||||||||||||||
Total after-tax impact of items of note on net income |
$ | 19 | $ | – | $ | 99 | $ | – | $ | – | $ | 118 | $ | 74 | ||||||||||||||||||
Impact of items of note on diluted EPS ($) (2)
|
$ | 0.12 | ||||||||||||||||||||||||||||||
Operating results – adjusted (3)
|
||||||||||||||||||||||||||||||||
Total revenue – adjusted |
$ | 10,942 | $ | 6,018 | $ | 2,820 | $ | 4,800 | $ | 1,026 | $ | 25,606 | $ | 2,074 | ||||||||||||||||||
Provision for credit losses – adjusted |
1,233 | 123 | 560 | 84 | 1 | 2,001 | 412 | |||||||||||||||||||||||||
Non-interest expenses – adjusted |
5,680 | 3,066 | 1,585 | 2,479 | 1,470 | 14,280 | 1,164 | |||||||||||||||||||||||||
Income (loss) before income taxes – adjusted |
4,029 | 2,829 | 675 | 2,237 | (445 | ) | 9,325 | 498 | ||||||||||||||||||||||||
Income taxes – adjusted |
1,105 | 766 | 76 | 608 | (502 | ) | 2,053 | 56 | ||||||||||||||||||||||||
Net income – adjusted |
2,924 | 2,063 | 599 | 1,629 | 57 | 7,272 | 442 | |||||||||||||||||||||||||
Net income attributable to non-controlling interests – adjusted |
– | – | – | – | 39 | 39 | – | |||||||||||||||||||||||||
Preferred shareholders and other equity instrument holders – adjusted |
– | – | – | – | 263 | 263 | – | |||||||||||||||||||||||||
Common shareholders – adjusted |
2,924 | 2,063 | 599 | 1,629 | (245 | ) | 6,970 | 442 | ||||||||||||||||||||||||
Net income attributable to equity shareholders – adjusted |
2,924 | 2,063 | 599 | 1,629 | 18 | 7,233 | 442 | |||||||||||||||||||||||||
Adjusted diluted EPS ($) |
$ | 7.40 |
$ millions, for the year ended October 31 |
Canadian Personal and Business Banking |
Canadian Commercial Banking and Wealth Management |
U.S. Commercial Banking and Wealth Management |
Capital Markets |
Corporate and Other |
CIBC Total |
U.S. Commercial Banking and Wealth Management (US$ millions) |
|||||||||||||||||||||||||||
2025 |
Net income (loss) |
$ |
3,107 |
$ |
2,341 |
$ |
958 |
$ |
2,273 |
$ |
(225 |
) |
$ |
8,454 |
$ |
685 |
||||||||||||||||||
Add: provision for credit losses |
1,764 |
166 |
175 |
208 |
29 |
2,342 |
124 |
|||||||||||||||||||||||||||
Add: income taxes |
1,093 |
873 |
222 |
812 |
(515 |
) |
2,485 |
158 |
||||||||||||||||||||||||||
Pre-provision (reversal), pre-tax earnings (losses) (1)
|
5,964 |
3,380 |
1,355 |
3,293 |
(711 |
) |
13,281 |
967 |
||||||||||||||||||||||||||
Pre-tax impact of items of note (2)
|
27 |
– |
18 |
– |
– |
45 |
13 |
|||||||||||||||||||||||||||
Adjusted pre-provision (reversal), pre-tax earnings (losses) (3)
|
$ |
5,991 |
$ |
3,380 |
$ |
1,373 |
$ |
3,293 |
$ |
(711 |
) |
$ |
13,326 |
$ |
980 |
|||||||||||||||||||
2024 (4)
|
Net income |
$ | 2,905 | $ | 2,063 | $ | 500 | $ | 1,629 | $ | 57 | $ | 7,154 | $ | 368 | |||||||||||||||||||
Add: provision for credit losses |
1,233 | 123 | 560 | 84 | 1 | 2,001 | 412 | |||||||||||||||||||||||||||
Add: income taxes |
1,098 | 766 | 42 | 608 | (502 | ) | 2,012 | 31 | ||||||||||||||||||||||||||
Pre-provision (reversal), pre-tax earnings (losses) (1)
|
5,236 | 2,952 | 1,102 | 2,321 | (444 | ) | 11,167 | 811 | ||||||||||||||||||||||||||
Pre-tax impact of items of note (2)
|
26 | – | 133 | – | – | 159 | 99 | |||||||||||||||||||||||||||
Adjusted pre-provision (reversal), pre-tax earnings (losses) (3)
|
$ | 5,262 | $ | 2,952 | $ | 1,235 | $ | 2,321 | $ | (444 | ) | $ | 11,326 | $ | 910 | |||||||||||||||||||
| (1) | Non-GAAP measure. |
| (2) | Items of note are removed from reported results to calculate adjusted results. |
| (3) | Adjusted to exclude the impact of items of note. Adjusted measures are non-GAAP measures. |
| (4) | Certain prior year information has been restated. See “External reporting changes” for additional details. |
15 |
CIBC 2025 |
Management’s discussion and analysis |
|
CIBC
2025 |
|
16 |
|
Management’s discussion and analysis |
| • | Building highly-engaged client relationships by being our clients’ trusted partner for everyday financial solutions; |
| • | Growing our mass affluent business through our differentiated advisory network, innovative platforms and digital capabilities; and |
| • | Enhancing operational excellence through our people, technology and processes. |
| • | Launched CIBC Real-Time Experience (CIBC CRTeX), which leverages advanced analytics and AI to deliver personalized insights and banking experiences to enhance our overall relationships with clients. |
| • | Introduced our new Costco Banking Offer to provide Costco members with exclusive access to additional rewards when they open their first bank account with CIBC and started driving volumes through the roll out of CIBC Kiosks rotating at various Costco warehouses. |
| • | Launched a new, innovative, no annual fee CIBC Adapta Mastercard that automatically adapts to spending practices and rewards more for everyday purchases. |
| • | Partnered with Skip to offer CIBC credit and debit card clients access to exclusive benefits. |
| • | Ranked #1 among the major banks for the third consecutive year in J.D. Power’s 2025 Canada Credit Card Satisfaction Study, improving year-over-year in every category. |
| • | Opened a new banking centre at Toronto Pearson International Airport, welcoming a range of clients, including newcomers and international students. |
| • | Ranked #1 in Canadian mobile banking, earning the highest ranking among the Big 6 banks in Surviscor’s 2025 Consumer Mobile Banking Experience Review. |
| • | Introduced transit fee waivers, allowing clients to purchase tickets, reload cards, or tap at fare readers without these transactions counting toward monthly limits. |
| • | Leading with advice, our Imperial Service team developed and deepened relationships, which helped contribute to CIBC’s 2nd place ranking (Securities and Investment Management Association) among the Big 6 banks for total mutual funds net sales. |
| • | Ranked #1 by ISS Market Intelligence Investor Economics Deposit Report among no fee chequing account providers in Canada for our Simplii Financial offering for both total balances and number of accounts. |
| • | Established a new tiered Smart Account, which offers clients up to three accounts with unlimited transactions, enhanced benefits and rewards and automatic tier upgrades as they deepen their relationship with CIBC. |
| • | Launched CIBC’s Skilled Trades Business Banking Program, offering business owners comprehensive solutions, exclusive offers and expert advice. This program builds on the success of our first-of-its-kind skilled trades Personal Banking program. |
| • |
Launched the Business Client Advice Centre (BCAC) for improved client experience; and, launched a Skilled Trades Campaign and a dedicated BCAC line for the campaign. |
17 |
CIBC 2025 ANNUAL REPORT |
Management’s discussion and analysis |
| • | Achieved record-high net promoter scores for Personal Banking and Imperial Service reflecting an exceptional level of client satisfaction. |
| • | Reached a significant milestone of 10 million digitally registered clients. |
| • | Saved a significant number of hours for our frontline team through process and technology enhancements, resulting in substantial efficiency gains. |
| • | Improved client experience by refreshing our award-winning mobile banking app through enhancements, such as Smart Search, home screen navigation and void cheque features. |
| • | Introduced several improvements to simplify and enhance the experience of Business Banking clients and team members across all processes, products and channels. |
| • | Established disputes automation for credit cards, decreasing call volumes and increasing service levels. |
| • | Enhanced client-initiated Credit Limit Increase in mobile and online banking, providing real-time decisions, reducing contact centre calls and improving client experience. |
| • | Launched a digital end-of-term mortgage renewal featuring e-sign capabilities, expected to save a considerable number of frontline hours. |
| • | Launched Digital Account Funding so clients can fund their accounts when opening an account digitally through FastApp. |
|
Revenue (1) ($ billions) |
Net income (1) ($ millions) |
Operating leverage (1) (%) |
Average loans and acceptances (1)(2)(3) ($ billions) |
Average deposits (1)(3) ($ billions) |
||||
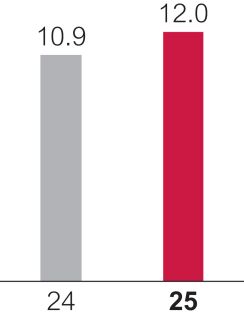
|
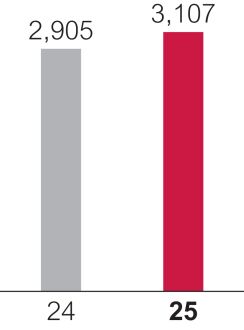
|
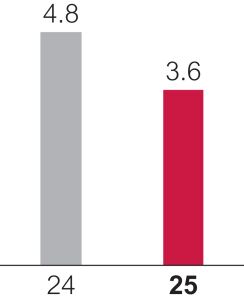
|
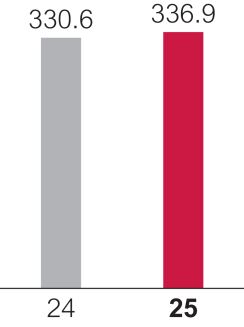
|
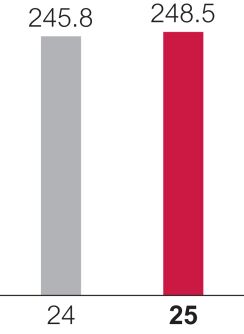
|
| (1) | Certain prior year information has been restated. See the “External reporting changes” section for additional details. |
| (2) | Loan amounts are stated before any related allowances. |
| (3) | Average balances are calculated as a weighted average of daily closing balances. |
| • | Delivering seamless everyday banking solutions and best-in-class personalized advice to our clients; |
| • | Driving growth in key client segments by leveraging our differentiated front-line team, client engagement platforms and partnerships to acquire new clients and deepen existing relationships; and |
| • | Modernizing infrastructure and simplifying our operations to unlock front-line capacity, enhance client experience across channels and create capacity to reinvest in growth. |
|
CIBC
2025 |
|
18 |
|
Management’s discussion and analysis |
$ millions, for the year ended October 31 |
2025 |
2024 (2)
|
||||||
Revenue |
$ |
12,031 |
$ | 10,942 | ||||
Provision for credit losses |
||||||||
Impaired |
1,365 |
1,169 | ||||||
Performing |
399 |
64 | ||||||
Total provision for credit losses |
1,764 |
1,233 | ||||||
Non-interest expenses |
6,067 |
5,706 | ||||||
Income before income taxes |
4,200 |
4,003 | ||||||
Income taxes |
1,093 |
1,098 | ||||||
Net income |
$ |
3,107 |
$ | 2,905 | ||||
Net income attributable to: |
||||||||
Equity shareholders |
$ |
3,107 |
$ | 2,905 | ||||
Total revenue |
||||||||
Net interest income |
$ |
9,629 |
$ | 8,592 | ||||
Non-interest income (3)
|
2,402 |
2,350 | ||||||
$ |
12,031 |
$ | 10,942 | |||||
Net interest margin on average interest-earning assets (4)
|
2.88 |
% |
2.61 | % | ||||
Efficiency ratio |
50.4 |
% |
52.1 | % | ||||
Operating leverage |
3.6 |
% |
4.8 | % | ||||
Return on equity (5)
|
25.0 |
% |
24.6 | % | ||||
Average allocated common equity (5)
|
$ |
12,410 |
$ | 11,826 | ||||
Average assets ($ billions) |
$ |
339.9 |
$ | 333.8 | ||||
Average loans and acceptances ($ billions) |
$ |
336.9 |
$ | 330.6 | ||||
Average deposits ($ billions) |
$ |
248.5 |
$ | 245.8 | ||||
Full-time equivalent employees |
13,827 |
13,757 | ||||||
| (1) | For additional segmented information, see Note 29 to the consolidated financial statements. |
| (2) | Certain prior year information has been restated. See the “External reporting changes” section for additional details. |
| (3) | Includes intersegment revenue, which represents internal sales commissions and revenue allocations under the Product Owner/Customer Segment/Distributor Channel allocation management model. |
| (4) | For additional information on the composition, see the “Glossary” section. |
| (5) | For additional information, see the “Non-GAAP measures” section. |
19 |
CIBC 2025 |
Management’s discussion and analysis |
| • | Delivering risk-controlled growth with a focus on relationship-banking and increasing connectivity to deepen relationships; |
| • | Focusing on high-growth market segments; and |
| • | Modernizing and simplifying our processes and systems. |
| • | Maintained strong net promoter score results in Commercial Banking, Private Banking and Wood Gundy, reflecting the confidence, loyalty and satisfaction that sets us apart as a trusted partner for our clients. |
| • | Continued to increase the number of financial plans completed, while maintaining focus on deepening client relationships and fostering strong partnerships. |
| • | Achieved strong year-over-year growth in commercial loans and deposits through proactive engagement and tailored solutions. |
| • | Wood Gundy ranked second overall among the Big 5 banks by Investment Executive Brokerage Report Card for the fourth consecutive year – a strong statement on the confidence of our advisory team. |
| • | Investor’s Edge ranked first among the Big 5 banks in J.D. Power’s do-it-yourself |
| • | CIBC was recognized as Canada’s Top Private Bank by Global Finance and Global Banking & Finance Review, for its leadership and client-centric approach. |
| • | CIBC Asset Management ranked second among the Big 6 banks in year-to-date long-term mutual fund net sales as of October 2025, according to the Securities and Investment Management Association. |
| • | Advanced our modernization journey by upgrading platforms and streamlining digital processes, enabling faster and simpler client experiences, while driving efficiency. |
| • | Enhanced productivity through continued increased adoption of sales enablement tools, including Salesforce. |
| • | Introduced First Home Savings Account to Wood Gundy, expanding our product suite to meet the evolving needs of Canadians and their families. |
|
CIBC
2025 |
|
20 |
|
Management’s discussion and analysis |
|
Revenue (1) ($ billions) |
Net income (1) ($ millions) |
Operating leverage (1) (%) |
Average loans (1)(2)(3) ($ billions) |
Average deposits (1)(3) ($ billions) |
||||
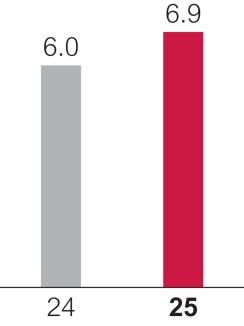
|
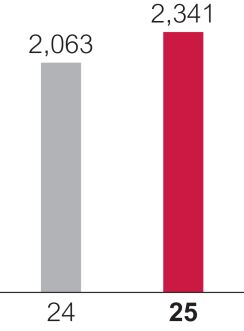
|
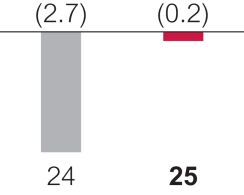
|
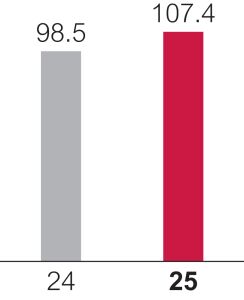
|
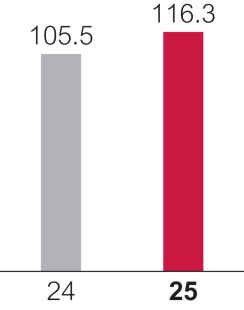
|
||||
|
Average commercial banking loans (1)(2)(3)(4) ($ billions) |
Average commercial banking deposits (1)(3) ($ billions) |
Assets under administration and management (5)
($ billions)
|
Canadian retail mutual funds and exchange- traded funds ($ billions) |
|||||
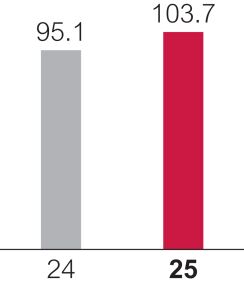
|
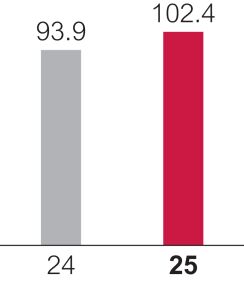
|
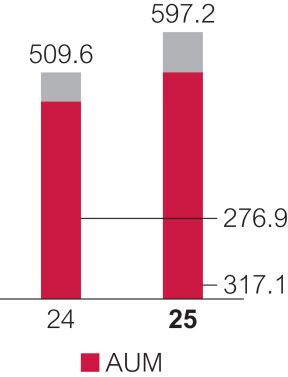
|
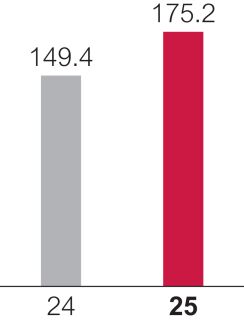
|
|||||
| (1) | Certain prior year information has been restated. See the “External reporting changes” section for additional details. |
| (2) | Loan amounts are stated before any related allowances. |
| (3) | Average balances are calculated as a weighted average of daily closing balances. |
| (4) | Comprises loans and acceptances and notional amount of letters of credit. |
| (5) | AUM amounts are included in the amounts reported under AUA. |
| • | Deepening client relationships and increasing connectivity; |
| • | Focusing on high-growth segments, while investing in our capabilities; and |
| • | Empowering teams with improved technology, processes and data. |
21 |
CIBC 2025 |
Management’s discussion and analysis |
$ millions, for the year ended October 31 |
2025 |
2024 (2)
|
||||||
Revenue |
||||||||
Commercial banking |
$ |
2,710 |
$ | 2,465 | ||||
Wealth management |
4,192 |
3,553 | ||||||
Total revenue |
6,902 |
6,018 | ||||||
Provision for credit losses |
||||||||
Impaired |
112 |
75 | ||||||
Performing |
54 |
48 | ||||||
Total provision for credit losses |
166 |
123 | ||||||
Non-interest expenses |
3,522 |
3,066 | ||||||
Income before income taxes |
3,214 |
2,829 | ||||||
Income taxes |
873 |
766 | ||||||
Net income |
$ |
2,341 |
$ | 2,063 | ||||
Net income attributable to: |
||||||||
Equity shareholders |
$ |
2,341 |
$ | 2,063 | ||||
Total revenue |
||||||||
Net interest income |
$ |
2,960 |
$ | 2,232 | ||||
Non-interest income (3)
|
3,942 |
3,786 | ||||||
$ |
6,902 |
$ | 6,018 | |||||
Net interest margin on average interest-earning assets (4)
|
2.90 |
% |
3.04 | % | ||||
Efficiency ratio |
51.0 |
% |
50.9 | % | ||||
Operating leverage |
(0.2 |
)% |
(2.7 | )% | ||||
Return on equity (5)
|
23.6 |
% |
21.7 | % | ||||
Average allocated common equity (5)
|
$ |
9,904 |
$ | 9,521 | ||||
Average assets ($ billions) |
$ |
103.9 |
$ | 95.5 | ||||
Average loans ($ billions) |
$ |
107.4 |
$ | 98.5 | ||||
Average deposits ($ billions) |
$ |
116.3 |
$ | 105.5 | ||||
AUA ($ billions) |
$ |
597.2 |
$ | 509.6 | ||||
AUM ($ billions) |
$ |
317.1 |
$ | 276.9 | ||||
Full-time equivalent employees |
6,190 |
5,879 | ||||||
| (1) | For additional segmented information, see Note 29 to the consolidated financial statements. |
| (2) | Certain prior year information has been restated. See the “External reporting changes” section for additional details. |
| (3) | Includes intersegment revenue, which represents internal sales commissions and revenue allocations under the Product Owner/Customer Segment/Distributor Channel allocation management model. |
| (4) | For additional information on the composition, see the “Glossary” section. |
| (5) | For additional information, see the “Non-GAAP measures” section. |
|
CIBC
2025 |
|
22 |
|
Management’s discussion and analysis |
| • | Building and deepening client relationships; |
| • | Strengthening and diversifying our deposit base; |
| • | Improving efficiency and capabilities through data and technology; and |
| • | Advancing the growth and transformation of our business. |
| • | Continued growth in relationship expansion efforts across all areas of the bank that drove new business and delivered more services across our bank to our existing clients. |
| • | Generated loan growth through new strategic client relationships and developed additional private banking business with existing commercial and wealth clients. |
| • | Maintained positive AUM and AUA net flows. |
| • | Further enhanced the strong connectivity with our Capital Markets team to provide a range of financial solutions to U.S. commercial and wealth clients. |
| • | Ranked #6 Registered Investment Advisor in Barron’s |
| • | CIBC Private Wealth remains Private Asset Management’s |
| • | Maintained a diversified deposit base across our commercial, private banking and personal clients. |
| • | Expanded deposit gathering by attracting new clients to our CIBC Agility digital banking platform that provides flexible online banking. |
| • | Earned recognition from Money.com for having the Best High-Yield Savings Accounts of 2025. |
| • | Continued investments in modernizing our bank, including enhancements to our wires platform, expanded client relationship management tools and enhanced anti-money laundering capabilities, helping to transform our bank to support future growth. |
| • | Enhanced our award-winning Private Wealth investment platform, allowing us to deliver improved client experience. |
| • | Advancements in risk management capabilities leading to better data analytics, which enhanced insights into our loan and deposit portfolios. |
| • | Continued growth of our Wealth Management franchise, a business that provides strong returns on capital by building scale, acquiring top talent and deploying technology that drives industry-leading client experiences. |
| • | Maintained risk-controlled growth in Commercial Banking, while strategically allocating capital, to deliver new products and services. |
| • | Continued to enhance our risk culture to support our growth. |
|
Revenue (1) (US$ billions) |
Net income (1) ($ millions) |
Net income (1) (US$ millions) |
Operating leverage (1) (% in U.S. dollars) |
|||
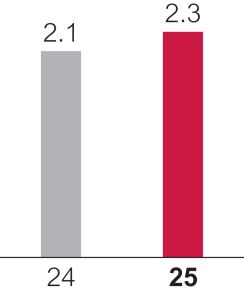
|
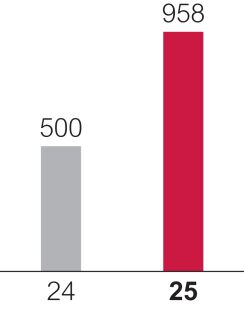
|
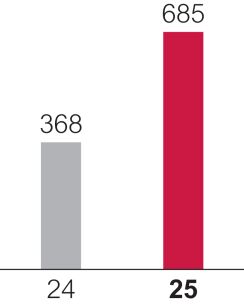
|
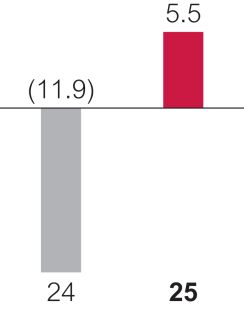
|
|||
| (1) | Certain prior year information has been restated. See the “External reporting changes” section for additional details. |
23 |
CIBC 2025 |
Management’s discussion and analysis |
|
Average loans (1)(2) (US$ billions) |
Average deposits (2) (US$ billions) |
Average commercial banking loans (1)(2) (US$ billions) |
Assets under administration and management (3) (US$ billions) |
|||
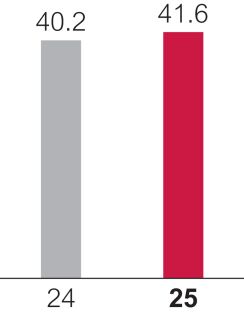
|
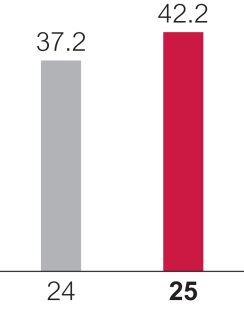
|
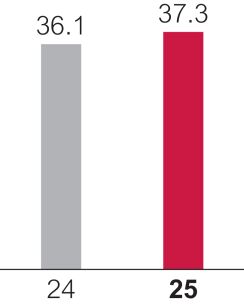
|
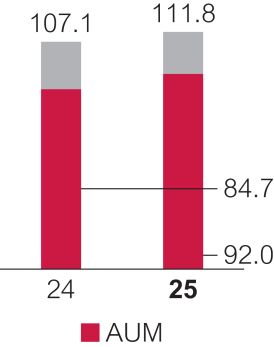
|
|||
| (1) | Loan amounts are stated before any related allowances. |
| (2) | Average balances are calculated as a weighted average of daily closing balances. |
| (3) | AUM amounts are included in the amounts reported under AUA. |
| • | Expanding Private Wealth Management with a focus on strategic relationships; |
| • | Growing Commercial Banking by delivering the full connected capabilities of our bank, industry expertise and deepening client relationships; and |
| • | Investing in people, technology and infrastructure to further scale our platform, drive connectivity and enhance data-driven decisioning. |
$ millions, for the year ended October 31 |
2025 |
2024 (2)
|
||||||
Revenue |
||||||||
Commercial banking |
$ |
2,224 |
$ | 1,971 | ||||
Wealth management |
992 |
849 | ||||||
Total revenue |
3,216 |
2,820 | ||||||
Provision for (reversal of) credit losses |
||||||||
Impaired |
268 |
449 | ||||||
Performing |
(93 |
) |
111 | |||||
Total provision for credit losses |
175 |
560 | ||||||
Non-interest expenses |
1,861 |
1,718 | ||||||
Income before income taxes |
1,180 |
542 | ||||||
Income taxes |
222 |
42 | ||||||
Net income |
$ |
958 |
$ | 500 | ||||
Net income attributable to: |
||||||||
Equity shareholders |
$ |
958 |
$ | 500 | ||||
Total revenue |
||||||||
Net interest income |
$ |
2,205 |
$ | 1,906 | ||||
Non-interest income |
1,011 |
914 | ||||||
$ |
3,216 |
$ | 2,820 | |||||
Average allocated common equity (3)
|
$ |
11,380 |
$ | 11,051 | ||||
Average assets ($ billions) |
$ |
64.4 |
$ | 60.8 | ||||
Average loans ($ billions) |
$ |
58.1 |
$ | 54.7 | ||||
Average deposits ($ billions) |
$ |
59.0 |
$ | 50.6 | ||||
AUA ($ billions) (4)
|
$ |
156.8 |
$ | 149.2 | ||||
AUM ($ billions) (4)
|
$ |
129.1 |
$ | 117.9 | ||||
Full-time equivalent employees |
3,189 |
3,005 | ||||||
| (1) | For additional segmented information, see Note 29 to the consolidated financial statements. |
| (2) | Certain prior year information has been restated. See the “External reporting changes” section for additional details. |
| (3) | For additional information, see the “Non-GAAP measures” section. |
| (4) | Includes certain Canadian Commercial Banking and Wealth Management assets that U.S. Commercial Banking and Wealth Management provides sub-advisory services for. |
|
CIBC
2025 |
|
24 |
|
Management’s discussion and analysis |
US$ millions, for the year ended October 31 |
2025 |
2024 (2)
|
||||||
Revenue |
||||||||
Commercial banking |
$ |
1,585 |
$ | 1,450 | ||||
Wealth management |
708 |
624 | ||||||
Total revenue |
2,293 |
2,074 | ||||||
Provision for (reversal of) credit losses |
||||||||
Impaired |
191 |
330 | ||||||
Performing |
(67 |
) |
82 | |||||
Total provision for credit losses |
124 |
412 | ||||||
Non-interest expenses |
1,326 |
1,263 | ||||||
Income before income taxes |
843 |
399 | ||||||
Income taxes |
158 |
31 | ||||||
Net income |
$ |
685 |
$ | 368 | ||||
Net income attributable to: |
||||||||
Equity shareholders |
$ |
685 |
$ | 368 | ||||
Total revenue |
||||||||
Net interest income |
$ |
1,572 |
$ | 1,402 | ||||
Non-interest income |
721 |
672 | ||||||
$ |
2,293 |
$ | 2,074 | |||||
Net interest margin on average interest-earning assets (3)
|
3.79 |
% |
3.49 | % | ||||
Efficiency ratio |
57.9 |
% |
60.9 | % | ||||
Operating leverage |
5.5 |
% |
(11.9 | )% | ||||
Return on equity (4)
|
8.4 |
% |
4.5 | % | ||||
Average allocated common equity (4)
|
$ |
8,111 |
$ | 8,129 | ||||
Average assets ($ billions) |
$ |
46.1 |
$ | 44.7 | ||||
Average loans ($ billions) |
$ |
41.6 |
$ | 40.2 | ||||
Average deposits ($ billions) |
$ |
42.2 |
$ | 37.2 | ||||
AUA ($ billions) (5)
|
$ |
111.8 |
$ | 107.1 | ||||
AUM ($ billions) (5)
|
$ |
92.0 |
$ | 84.7 | ||||
| (1) | For additional segmented information, see Note 29 to the consolidated financial statements. |
| (2) | Certain prior year information has been restated. See the “External reporting changes” section for additional details. |
| (3) | For additional information on the composition, see the “Glossary” section. |
| (4) | For additional information, see the “Non-GAAP measures” section. |
| (5) | Includes certain Canadian Commercial Banking and Wealth Management assets that U.S. Commercial Banking and Wealth Management provides sub-advisory services for. |
25 |
CIBC 2025 |
Management’s discussion and analysis |
| • | Delivering the leading capital markets platform in Canada to our Strategic and Focus clients; |
| • | Building a North American client platform with global capabilities; and |
| • | Focusing on connectivity to accelerate growth and deepen relationships across our bank. |
| • | Continued delivering industry-leading advice and capital markets solutions by expanding our capabilities and expertise, securing a market share of 14.2% among Strategic and Focus clients in Canada, while maintaining leading growth, productivity, efficiency and returns versus peers. |
| • | Maintained resource discipline and selectively invested in innovative capabilities and technology to further grow with our clients, strengthen our platform, and simplify processes to enable our client-focused culture. |
| • | Recognized by Global Finance for the third consecutive year as the Best Investment Bank in Canada and for our leadership in environmental and social sustainability financing, receiving three sustainable finance awards from Global Finance, including Best Sustainable Finance Bank in Canada. |
| • | Recognized by Global Capital for the second consecutive year as the Most Impressive SSA House for the Canadian Market and Canada Derivatives House of the Year. |
| • | Awarded Best Market Maker/Authorised Participant – Fixed Income Exchange Traded Funds (ETF) in Canada by ETF Express. |
| • | Continued to expand our U.S. franchise by making key strategic hires and adding capabilities for our corporate, institutional and private capital clients to enable double-digit revenue growth. |
| • | Built out leveraged finance capabilities, technology and expertise in the U.S. to expand our business with financial sponsors, pension funds and corporate clients in this fast-growing product area. |
| • | Furthered our reputation as a leader in the renewable energy sector in the U.S., ranking sixth among investment banks for renewables project financing, according to InfraLogic and IJGlobal. |
| • | Ranked #1 for US$ Supranational, Sovereign, and Agency by Market Axess. |
| • | Awarded Financial Adviser of the Year in North America by IJGlobal for the second consecutive year. |
| • | Recognized as the Global Lender of the Year by IJGlobal ESG Awards. |
| • | Delivered Capital Markets solutions to personal banking, high-net-worth and commercial banking clients across our bank. |
| • | Further expanded our industry-first Canadian Depositary Receipts lineup as part of our ongoing commitment to developing innovative, market-based solutions that meet investor needs. |
| • | Focused on connectivity to deepen relationships across the bank by making referrals to Commercial Banking and Wealth Management, ensuring our clients experience one strong integrated bank. |
| • | Accelerated growth for our Global Structured Notes and Market-Linked GICs offerings, reaching a record high of $43 billion outstanding. |
| • | Financial advisor to Innergex Renewable Energy Inc. on its sale to CDPQ for a transaction value of approximately $10 billion and participant on $1.2 billion in new credit facilities for CDPQ Bidco to support the acquisition. |
| • | Financial advisor to Brookfield Asset Management and Birch Hill Equity Partners on the acquisition of a majority interest in First National Financial Corporation for a transaction value of approximately $3.6 billion including acting as co-underwriter, joint bookrunner and co-lead arranger on a new revolver and term loan for Regal Bidco Inc. and active joint bookrunner on an $800 million multi tranche issue of senior notes for First National Financial Corporation to support the transaction. |
| • | Financial advisor to Gildan Activewear Inc. on the acquisition of HanesBrands Inc. for a transaction value of approximately US$4.4 billion including acting as co-underwriter, joint bookrunner and co-lead arranger on a new US$1.2 billion bridge and US$1.1 billion in term loans, and active bookrunner on a US$1.2 billion dual tranche issue of senior unsecured notes in support of the transaction. |
| • | Joint lead arranger and joint bookrunner on approximately US$2.5 billion of senior secured credit facilities to finance the acquisition of a majority of GFL’s Environmental Services business by BC Partners and Apollo and hedge counterparty in support of the transaction. |
| • | Joint bookrunner on the issuance of $2.1 billion of subscription receipts, $2.3 billion of multi tranche senior notes and $500 million of hybrid notes, and joint bookrunner and co-lead arranger on a new $2.5 billion bridge, $850 million term loan and a $500 million increase to the existing revolver in connection with Keyera Corp.’s acquisition of Plains Midstream Canada ULC’s natural gas liquids business and select U.S. assets. |
| • | Exclusive advisor, sole lead placement agent, left lead arranger and administrative agent and swap coordinator to Boldyn Networks U.S. on a US$1.2 billion financing to support the integration of its U.S. businesses and fuel future growth and innovation. |
|
CIBC
2025 |
|
26 |
|
Management’s discussion and analysis |
| • | Financial advisor, joint lead placement agent, mandated lead arranger, and hedge counterparty to Adven Group Oy on an approximately € 675 million refinancing to enable its growth trajectory. |
| • | Sustainability structuring agent in partnership with CIBC Caribbean who also acted as lead arranger on the Government of Barbados’ bespoke US$300 million (equivalent) sustainability-linked loan and debt-for-climate resilience loan facility. CIBC also acted as joint bookrunner or joint lead arranger on multiple green and sustainable bond issuances, including TransAlta’s $450 million green bond, Hydro One’s aggregate $750 million dual-tranche sustainability and green bonds, and Government of Canada’s February 2025 $2 billion green bond. |
|
Revenue (1) ($ billions) |
Net income (1) ($ millions) |
Operating leverage (1) (%) |
||
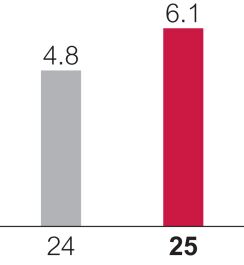
|
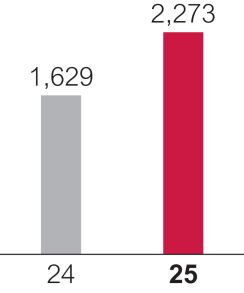
|
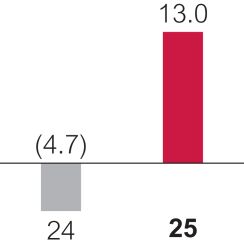
|
||
|
Average loans and acceptances (1)(2) ($ billions) |
Average deposits (1)(2) ($ billions) |
Average value-at-risk ($ millions) |
||

|
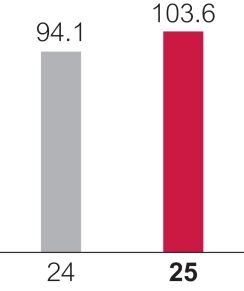
|
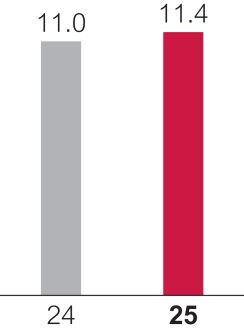
|
||
| (1) | Certain prior year information has been restated. See the “External reporting changes” section for additional details. |
| (2) | Average balances are calculated as a weighted average of daily closing balances. |
| • | Maintaining our focused approach to client coverage in Canada; |
| • | Growing our North American platform by further expanding our U.S. reach and broadening the services offered to clients; and |
| • | Strengthening our connectivity, technology and innovation efforts to bring more of our bank’s offerings to our clients. |
27 |
CIBC 2025 |
Management’s discussion and analysis |
$ millions, for the year ended October 31 |
2025 |
2024 (2)
|
||||||
Revenue |
||||||||
Global markets (2)
|
$ |
3,996 |
$ | 3,055 | ||||
Corporate and investment banking |
2,152 |
1,745 | ||||||
Total revenue (3)
|
6,148 |
4,800 | ||||||
Provision for credit losses |
||||||||
Impaired |
117 |
55 | ||||||
Performing |
91 |
29 | ||||||
Total provision for credit losses |
208 |
84 | ||||||
Non-interest expenses |
2,855 |
2,479 | ||||||
Income before income taxes |
3,085 |
2,237 | ||||||
Income taxes (3)
|
812 |
608 | ||||||
Net income |
$ |
2,273 |
$ | 1,629 | ||||
Net income attributable to: |
||||||||
Equity shareholders |
$ |
2,273 |
$ | 1,629 | ||||
Efficiency ratio |
46.4 |
% |
51.7 | % | ||||
Operating leverage |
13.0 |
% |
(4.7 | )% | ||||
Return on equity (4)
|
22.1 |
% |
17.9 | % | ||||
Average allocated common equity (4)
|
$ |
10,291 |
$ | 9,100 | ||||
Average assets ($ billions) |
$ |
378.5 |
$ | 315.3 | ||||
Average loans and acceptances ($ billions) |
$ |
69.9 |
$ | 60.6 | ||||
Average deposits ($ billions) |
$ |
103.6 |
$ | 94.1 | ||||
Full-time equivalent employees |
2,011 |
1,858 | ||||||
| (1) | For additional segmented information, see Note 29 to the consolidated financial statements. |
| (2) | Certain prior year information has been restated. See the “External reporting changes” section for additional details. In addition to the changes to our SBUs, our foreign exchange and payments business is now included in Global markets within Capital Markets. Previously, this business was included in Direct Financial Services within Capital Markets together with Simplii and Investor’s Edge. Prior period information has been restated. |
| (3) | Prior to the enactment of the Federal tax measure that denied the dividends received deduction for Canadian banks in June 2024, Capital Markets revenue and income taxes were reported on a TEB with an equivalent offset in the revenue and income taxes of Corporate and Other. Accordingly, the 2024 revenue and income taxes included a TEB adjustment of $16 million for dividends received before January 1, 2024. |
| (4) | For additional information, see the “Non-GAAP measures” section. |
|
CIBC
2025 |
|
28 |
|
Management’s discussion and analysis |
$ millions, for the year ended October 31 |
2025 |
2024 | ||||||
Revenue |
||||||||
International banking |
$ |
905 |
$ | 980 | ||||
Other |
(69 |
) |
46 | |||||
Total revenue (2)
|
836 |
1,026 | ||||||
Provision for (reversal of) credit losses |
||||||||
Impaired |
25 |
12 | ||||||
Performing |
4 |
(11 | ) | |||||
Total provision for credit losses |
29 |
1 | ||||||
Non-interest expenses |
1,547 |
1,470 | ||||||
Loss before income taxes |
(740 |
) |
(445 | ) | ||||
Income taxes (2)
|
(515 |
) |
(502 | ) | ||||
Net income (loss) |
$ |
(225 |
) |
$ | 57 | |||
Net income (loss) attributable to: |
||||||||
Non-controlling interests |
$ |
25 |
$ | 39 | ||||
Equity shareholders |
(250 |
) |
18 | |||||
Full-time equivalent employees (3)
|
24,607 |
24,026 | ||||||
| (1) | For additional segmented information, see Note 29 to the consolidated financial statements. |
| (2) | Prior to the enactment of the Federal tax measure that denied the dividends received deduction for Canadian banks in June 2024, Capital Markets revenue and income taxes were reported on a TEB with an equivalent offset in the revenue and income taxes of Corporate and Other. Accordingly, the 2024 revenue and income taxes included a TEB adjustment offset of $16 million for dividends received before January 1, 2024. |
| (3) | Includes full-time equivalent employees for which the expenses are allocated to the business lines within the SBUs. The majority of the full-time equivalent employees for functional and support costs of CIBC Bank USA are included in the U.S. Commercial Banking and Wealth Management SBU. |
29 |
CIBC 2025 |
Management’s discussion and analysis |
$ millions, as at October 31 |
2025 |
2024 (1)
|
||||||
Assets |
||||||||
Cash and deposits with banks |
$ |
44,003 |
$ | 48,064 | ||||
Securities |
283,235 |
254,345 | ||||||
Securities borrowed and purchased under resale agreements |
108,392 |
100,749 | ||||||
Loans and acceptances |
589,504 |
558,292 | ||||||
Derivative instruments |
38,352 |
36,435 | ||||||
Other assets |
53,452 |
44,100 | ||||||
Total assets |
$ |
1,116,938 |
$ | 1,041,985 | ||||
Liabilities and equity |
||||||||
Deposits |
$ |
808,124 |
$ | 764,857 | ||||
Obligations related to securities lent, sold short and under repurchase agreements |
160,317 |
139,792 | ||||||
Derivative instruments |
41,411 |
40,654 | ||||||
Other liabilities (1)
|
34,854 |
30,210 | ||||||
Subordinated indebtedness |
7,819 |
7,465 | ||||||
Equity |
64,413 |
59,007 | ||||||
Total liabilities and equity |
$ |
1,116,938 |
$ | 1,041,985 | ||||
| (1) | Includes acceptances of $10 million (2024: $6 million). Prior year amounts have been revised to conform to the presentation adopted in 2025. |
|
CIBC
2025 |
|
30 |
|
Management’s discussion and analysis |
| • | Acts as a buffer to absorb unexpected losses while providing sustainable returns to our shareholders; |
| • | Enables our businesses to grow and execute on our strategy; |
| • | Demonstrates balance sheet strength and our commitment to prudent balance sheet management; and |
| • | Supports us in maintaining a favourable credit standing and raising additional capital or other funding on attractive terms. |
31 |
CIBC 2025 |
Management’s discussion and analysis |
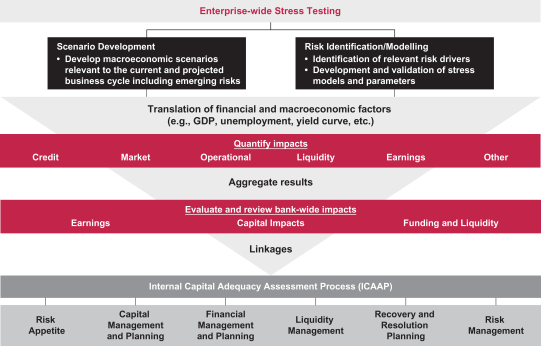
|
CIBC
2025 |
|
32 |
|
Management’s discussion and analysis |
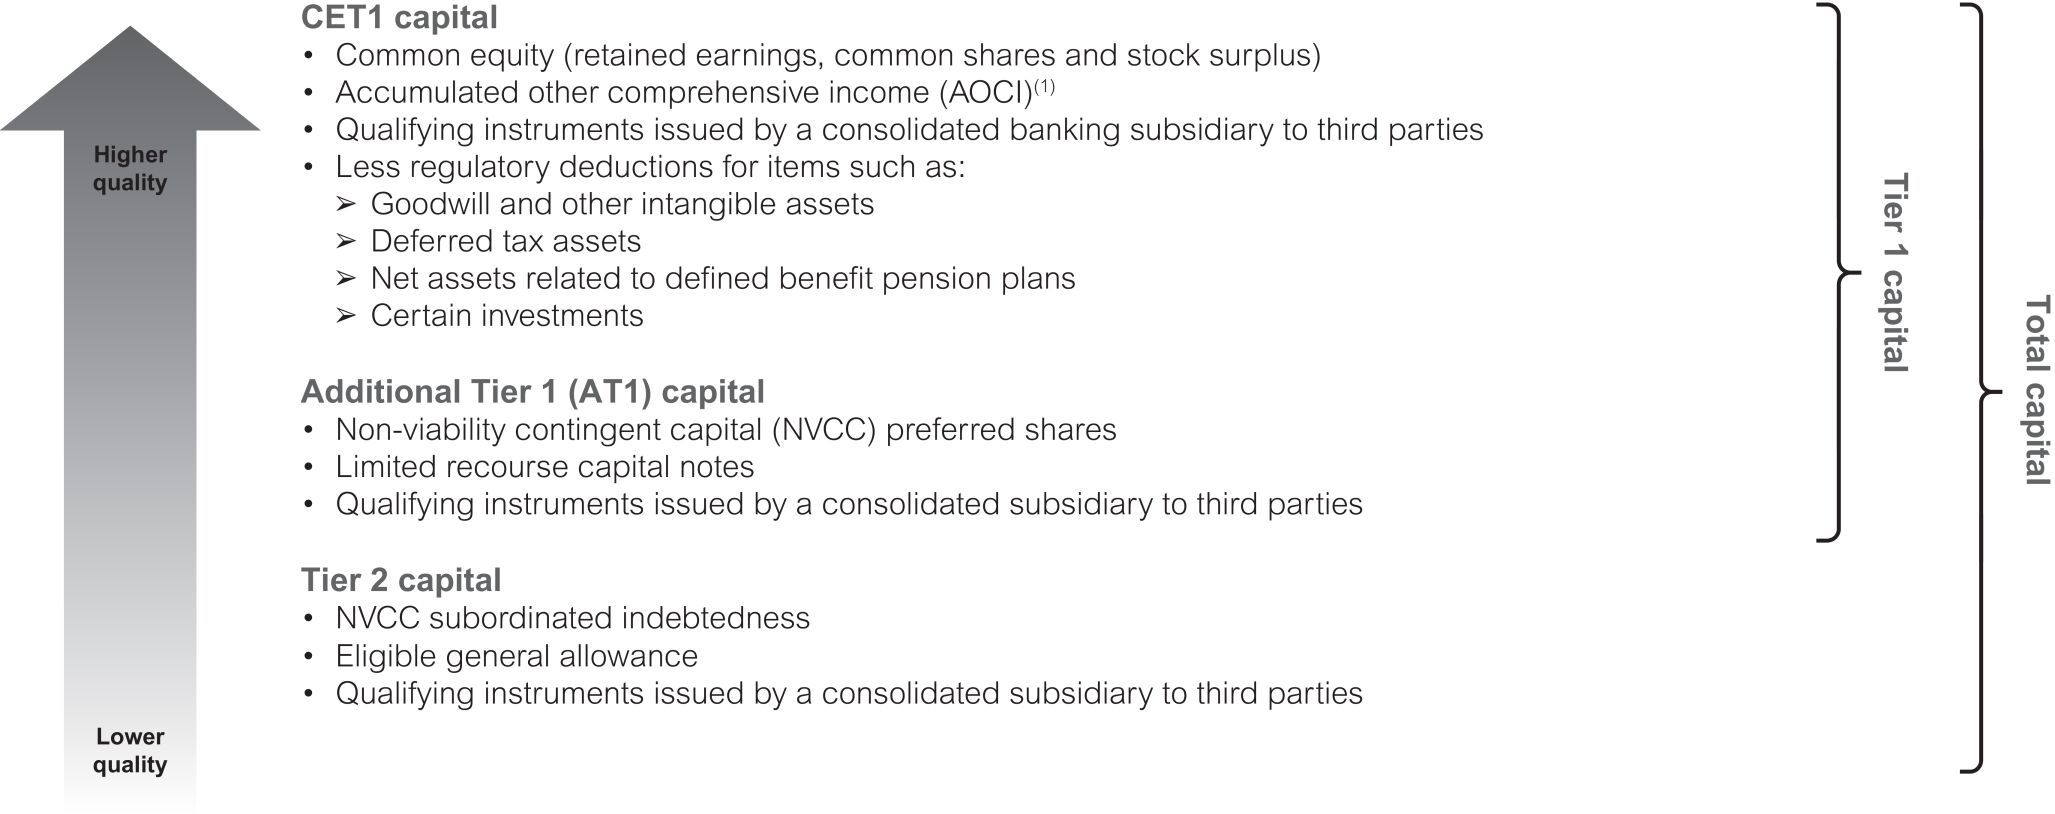
| (1) | Excluding AOCI relating to cash flow hedges and changes to fair value option (FVO) liabilities attributable to changes in own credit risk. |
| (i) | On-balance sheet assets less Tier 1 capital regulatory adjustments; |
| (ii) | Derivative exposures; |
| (iii) | Securities financing transaction exposures; and |
| (iv) | Off-balance sheet exposures (such as commitments, direct credit substitutes, letters of credit, and securitization exposures). |
As at October 31, 2025 |
Minimum |
Capital conservation buffer |
D-SIB
buffer |
Pillar 1 targets (1)
|
Domestic Stability Buffer |
Target including all buffer requirements |
||||||||||||||||||
CET1 ratio |
4.5 |
% |
2.5 |
% |
1.0 |
% |
8.0 |
% |
3.5 |
% |
11.5 |
% |
||||||||||||
Tier 1 capital ratio |
6.0 |
% |
2.5 |
% |
1.0 |
% |
9.5 |
% |
3.5 |
% |
13.0 |
% |
||||||||||||
Total capital ratio |
8.0 |
% |
2.5 |
% |
1.0 |
% |
11.5 |
% |
3.5 |
% |
15.0 |
% |
||||||||||||
Leverage ratio |
3.0 |
% |
n/a |
0.5 |
% |
3.5 |
% |
n/a |
3.5 |
% |
||||||||||||||
TLAC ratio |
18.0 |
% |
2.5 |
% |
1.0 |
% |
21.5 |
% |
3.5 |
% |
25.0 |
% |
||||||||||||
TLAC leverage ratio |
6.75 |
% |
n/a |
0.5 |
% |
7.25 |
% |
n/a |
7.25 |
% |
||||||||||||||
| (1) | The countercyclical capital buffer applicable to CIBC is insignificant as at October 31, 2025. |
| n/a | Not applicable. |
33 |
CIBC 2025 |
Management’s discussion and analysis |
Risk category |
Permissible regulatory capital approaches |
Approach adopted by CIBC |
||
| Credit risk (1)
|
Basel provides three approaches for calculating credit risk capital requirements: • Standardized approach (SA) • Foundation internal ratings-based (FIRB) • Advanced internal ratings-based (AIRB) OSFI expects financial institutions in Canada with Total capital in excess of $5 billion to use the internal ratings-based (IRB) approach for all material portfolios and credit businesses. OSFI provides two approaches for calculating counterparty credit risk (CCR) for derivatives transactions: • Standardized approach (SA-CCR)
• Internal model method (IMM) OSFI provides four approaches for calculating CCR for repo-style transactions: • Comprehensive approach, with supervisory haircuts • Comprehensive approach, with own estimate haircuts • Repo VaR approach • IMM Permitted approaches for equity positions in the banking book (which includes equity investments in funds) include: • Standardized • Market-based • Look-through • Mandate-based • Fall-back Basel provides the following approaches for calculating capital requirements for securitization positions: • Internal ratings-based approach (SEC-IRBA)
• Internal assessment approach (SEC-IAA)
• External ratings-based approach (SEC-ERBA)
• Standardized approach (SEC-SA)
|
We have adopted the IRB (FIRB and AIRB) approach for the majority of our credit portfolios. Under this methodology, we utilize our own internal estimates to determine probability of default (PD), and maturity and either regulatory prescribed (FIRB), or internal (AIRB) estimates for loss given default (LGD) and exposure at default (EAD). We utilize the standardized approach for CIBC Caribbean, risk-rated individuals, sovereign wealth funds, the acquired Canadian Costco credit card portfolio, and other small portfolios. We periodically review portfolios under the standardized approach for consideration of adoption of the IRB approach. CIBC applies the IMM approach for calculating CCR exposure for qualifying derivative transactions. Certain transactions are under the
SA-CCR approach.The comprehensive approach, with supervisory haircuts, is used for credit risk mitigation for repo-style transactions. |
||
|
We use the standardized approach for equity positions in the banking book and both the look-through and mandate-based approaches for equity investments in funds. |
||||
|
We use
SEC-IRBA, SEC-IAA, SEC-ERBA and SEC-SA for securitization exposures in the banking book. |
||||
| Credit Valuation Adjustments (CVA) risk |
CVA risk capital requirements can be calculated under the following approaches: • Basic approach (BA-CVA)
• Standardized approach (SA-CVA)
|
CIBC applies the standardized approach to calculate CVA risk capital for most of our counterparties and applies the basic approach for a small subset of counterparties. | ||
| Market risk |
Market risk capital requirements can be determined under the following approaches: • Standardized approach • Internal models approach |
CIBC applies the sensitivity-based standardized approach to calculate market risk capital under the Fundamental Review of the Trading Book (FRTB) rules. |
||
| Operational risk |
Operational risk capital requirements can be determined under the following approaches: • Standardized approach • Simplified standardized approach (SSA) |
We use the standardized approach based on OSFI rules to calculate operational risk capital. | ||
| (1) | Includes CCR. |
|
CIBC
2025 |
|
34 |
|
Management’s discussion and analysis |
$ millions, as at October 31 |
2025 |
2024 | ||||||
Common Equity Tier 1 (CET1) capital: instruments and reserves |
||||||||
Directly issued qualifying common share capital plus related stock surplus |
$ |
17,071 |
$ | 17,170 | ||||
Retained earnings |
36,471 |
33,471 | ||||||
AOCI (and other reserves) |
4,218 |
3,148 | ||||||
Common share capital issued by subsidiaries and held by third parties (amount allowed in group CET1) |
123 |
119 | ||||||
CET1 capital before regulatory adjustments |
57,883 |
53,908 | ||||||
CET1 capital: regulatory adjustments |
||||||||
Prudential valuation adjustments |
22 |
4 | ||||||
Goodwill (net of related tax liabilities) |
5,392 |
5,360 | ||||||
Other intangibles other than mortgage-servicing rights (net of related tax liabilities) |
2,490 |
2,456 | ||||||
Deferred tax assets excluding those arising from temporary differences (net of related tax liabilities) |
17 |
15 | ||||||
Defined benefit pension fund net assets (net of related tax liabilities) |
1,276 |
1,045 | ||||||
Other |
968 |
512 | ||||||
Total regulatory adjustments to CET1 capital |
10,165 |
9,392 | ||||||
CET1 capital |
47,718 |
44,516 | ||||||
Additional Tier 1 (AT1) capital: instruments |
||||||||
Directly issued qualifying AT1 instruments plus related stock surplus (1)
|
6,369 |
4,946 | ||||||
AT1 instruments issued by subsidiaries and held by third parties (amount allowed in AT1) |
18 |
19 | ||||||
AT1 capital |
6,387 |
4,965 | ||||||
Tier 1 capital (T1 = CET1 + AT1) |
54,105 |
49,481 | ||||||
Tier 2 capital: instruments and provisions |
||||||||
Directly issued qualifying Tier 2 instruments plus related stock surplus (2)
|
7,325 |
6,920 | ||||||
Tier 2 instruments issued by subsidiaries and held by third parties (amount allowed in Tier 2) |
18 |
17 | ||||||
Collective allowances |
839 |
391 | ||||||
Tier 2 capital (T2) |
8,182 |
7,328 | ||||||
Total capital (TC = T1 + T2) |
$ |
62,287 |
$ | 56,809 | ||||
RWA consisting of: |
||||||||
Credit risk |
$ |
294,848 |
$ | 274,503 | ||||
Market risk |
12,243 |
12,188 | ||||||
Operational risk |
50,712 |
46,811 | ||||||
Total RWA |
$ |
357,803 |
$ | 333,502 | ||||
Capital ratios |
||||||||
CET1 ratio |
13.3 |
% |
13.3 | % | ||||
Tier 1 capital ratio |
15.1 |
% |
14.8 | % | ||||
Total capital ratio |
17.4 |
% |
17.0 | % | ||||
Leverage ratios |
||||||||
Leverage ratio exposure |
$ |
1,261,098 |
$ | 1,155,432 | ||||
Leverage ratio |
4.3 |
% |
4.3 | % | ||||
TLAC ratio and TLAC leverage ratio |
||||||||
TLAC available |
$ |
114,102 |
$ | 101,062 | ||||
TLAC ratio |
31.9 |
% |
30.3 | % | ||||
TLAC leverage ratio |
9.0 |
% |
8.7 | % | ||||
| (1) | Comprised of non-viability contingent capital (NVCC) preferred shares and LRCNs. |
| (2) | Comprised of certain debentures which qualify as NVCC. |
35 |
CIBC 2025 |
Management’s discussion and analysis |
$ millions, for the year ended October 31 |
2025 |
2024 | ||||||
CET1 capital |
||||||||
Balance at beginning of year |
$ |
44,516 |
$ | 40,327 | ||||
Shares issued in lieu of cash dividends (add back) |
– |
698 | ||||||
Other issue of common shares |
168 |
321 | ||||||
Purchase of common shares for cancellation |
(335 |
) |
(90 | ) | ||||
Premium on purchase of common shares for cancellation |
(1,396 |
) |
(329 | ) | ||||
Dividends and distributions |
(3,993 |
) |
(3,645 | ) | ||||
Net income attributable to equity shareholders |
8,429 |
7,115 | ||||||
Change in AOCI balances |
||||||||
Currency translation differences |
35 |
14 | ||||||
Securities measured at FVOCI |
370 |
102 | ||||||
Cash flow hedges (1)
|
491 |
1,535 | ||||||
Fair value change of FVO liabilities attributable to changes in credit risk |
(34 |
) |
(216 | ) | ||||
Post-employment defined benefit plans |
208 |
250 | ||||||
Removal of own credit spread (net of tax) |
36 |
314 | ||||||
Goodwill and other intangible assets (deduction, net of related tax liabilities) |
(66 |
) |
(88 | ) | ||||
Shortfall of allowance to expected losses |
– |
– | ||||||
Other, including regulatory adjustments (1)
|
(711 |
) |
(1,792 | ) | ||||
Balance at end of year |
$ |
47,718 |
$ | 44,516 | ||||
AT1 capital |
||||||||
Balance at beginning of year |
$ |
4,965 |
$ | 4,943 | ||||
AT1 eligible capital issues |
2,770 |
1,000 | ||||||
Redeemed capital |
(1,350 |
) |
(975 | ) | ||||
Other, including regulatory adjustments |
2 |
(3 | ) | |||||
Balance at end of year |
$ |
6,387 |
$ | 4,965 | ||||
Tier 2 capital |
||||||||
Balance at beginning of year |
$ |
7,328 |
$ | 6,849 | ||||
New Tier 2 eligible capital issues |
1,250 |
2,250 | ||||||
Redeemed capital |
(1,000 |
) |
(1,500 | ) | ||||
Other, including change in regulatory adjustments |
604 |
(271 | ) | |||||
Balance at end of year |
$ |
8,182 |
$ | 7,328 | ||||
Total capital balance at end of year |
$ |
62,287 |
$ | 56,809 | ||||
| (1) | Net change in cash flow hedges is included in “Change in AOCI balances” then derecognized in “Other, including regulatory adjustments”. |
|
CIBC
2025 |
|
36 |
|
Management’s discussion and analysis |
$ millions, as at October 31 |
2025 |
2024 | ||||||||||||||
RWA |
Minimum total capital required (1)
|
RWA | Minimum total capital required (1)
|
|||||||||||||
Credit risk (2)
|
||||||||||||||||
Standardized approach |
||||||||||||||||
Corporate |
$ |
7,474 |
$ |
598 |
$ | 6,868 | $ | 549 | ||||||||
Sovereign |
1,316 |
105 |
1,293 | 103 | ||||||||||||
Banks |
317 |
25 |
328 | 26 | ||||||||||||
Real estate secured personal lending |
1,182 |
95 |
1,139 | 91 | ||||||||||||
Commercial real estate |
353 |
28 |
463 | 37 | ||||||||||||
Other retail |
3,585 |
287 |
3,607 | 289 | ||||||||||||
Trading book |
135 |
11 |
125 | 10 | ||||||||||||
Equity |
6,628 |
530 |
3,623 | 290 | ||||||||||||
Securitization (3)
|
5,443 |
435 |
4,655 | 372 | ||||||||||||
Central counterparty (CCP) |
877 |
70 |
684 | 55 | ||||||||||||
CVA |
3,057 |
245 |
3,381 | 271 | ||||||||||||
Other credit RWA |
12,988 |
1,039 |
15,114 | 1,209 | ||||||||||||
43,355 |
3,468 |
41,280 | 3,302 | |||||||||||||
AIRB approach (4)
|
||||||||||||||||
Corporate |
79,028 |
6,322 |
74,100 | 5,928 | ||||||||||||
Sovereign (5)
|
5,508 |
441 |
5,153 | 412 | ||||||||||||
Real estate secured personal lending |
42,338 |
3,387 |
40,328 | 3,226 | ||||||||||||
Commercial real estate |
30,762 |
2,461 |
30,003 | 2,400 | ||||||||||||
Qualifying revolving retail |
21,533 |
1,723 |
19,749 | 1,580 | ||||||||||||
Other retail |
10,805 |
864 |
12,123 | 970 | ||||||||||||
Trading book |
1,259 |
101 |
777 | 62 | ||||||||||||
Securitization (3)
|
6,161 |
493 |
4,580 | 366 | ||||||||||||
197,394 |
15,792 |
186,813 | 14,944 | |||||||||||||
FIRB approach (4)
|
||||||||||||||||
Corporate |
44,035 |
3,523 |
38,709 | 3,097 | ||||||||||||
Banks |
4,852 |
388 |
3,482 | 279 | ||||||||||||
Commercial real estate |
178 |
14 |
198 | 16 | ||||||||||||
Trading book |
5,034 |
403 |
4,021 | 322 | ||||||||||||
54,099 |
4,328 |
46,410 | 3,714 | |||||||||||||
Total credit risk |
294,848 |
23,588 |
274,503 | 21,960 | ||||||||||||
Market risk |
||||||||||||||||
Sensitivities-based methodology |
8,791 |
703 |
9,584 | 767 | ||||||||||||
Default risk charge |
1,490 |
119 |
1,265 | 101 | ||||||||||||
Risk residual add-on
|
1,962 |
157 |
1,339 | 107 | ||||||||||||
Total market risk |
12,243 |
979 |
12,188 | 975 | ||||||||||||
Operational risk |
50,712 |
4,057 |
46,811 | 3,745 | ||||||||||||
Total RWA |
$ |
357,803 |
$ |
28,624 |
$ | 333,502 | $ | 26,680 | ||||||||
| (1) | Refers to the minimum standard established by the BCBS before the application of the capital conservation buffer and any other capital buffers that may be established by regulators from time to time. It is calculated by multiplying RWA by 8%. |
| (2) | Credit risk includes CCR, which comprises derivative and repo-style transactions. Credit risk for CIBC Caribbean are calculated under the standardized approach. |
| (3) | Includes securitization exposures that are risk-weighted at 1250%. |
| (4) | Includes RWA relating to certain commercial loans which are determined using the supervisory slotting approach. |
| (5) | Includes residential mortgages insured by Canada Mortgage and Housing Corporation (CMHC), an agency of the Government of Canada, and government-guaranteed student loans. |
$ millions, except number of shares, as at or for the year ended October 31 |
2025 |
2024 | Total | |||||||||||||||||||||
| TSX approval date | Number of shares |
Amount |
Number of shares |
Amount | Number of shares |
Amount | ||||||||||||||||||
September 5, 2024 (1)
|
15,000,000 |
$ |
1,338 |
5,000,000 | $ | 419 | 20,000,000 | $ | 1,757 | |||||||||||||||
September 5, 2025 (2)
|
3,500,000 |
393 |
– | – | 3,500,000 | 393 | ||||||||||||||||||
Total |
18,500,000 |
$ |
1,731 |
5,000,000 | $ | 419 | 23,500,000 | $ | 2,150 | |||||||||||||||
| (1) | Common shares were repurchased at an average price of $87.80 under this NCIB. |
| (2) | Common shares were repurchased at an average price of $112.54 under this NCIB. |
37 |
CIBC 2025 |
Management’s discussion and analysis |
|
CIBC
2025 |
|
38 |
|
Management’s discussion and analysis |
Shares outstanding |
||||||||
$ millions, except number of shares and per share amounts, as at October 31, 2025 |
Number of shares |
Amount |
||||||
Common shares |
926,610,598 |
$ |
16,842 |
|||||
Treasury shares – common shares (1)
|
3,438 |
3 |
||||||
Preferred shares |
||||||||
Series 47 (NVCC) |
18,000,000 |
450 |
||||||
Series 56 (NVCC) |
600,000 |
600 |
||||||
Series 57 (NVCC) |
500,000 |
500 |
||||||
Series 61 (NVCC) |
150,000 |
150 |
||||||
Treasury shares – preferred shares (1)
|
(1,223 |
) |
(1 |
) |
||||
Limited recourse capital notes |
||||||||
4.000% Limited Recourse Capital Notes Series 2 (NVCC) |
n/a |
750 |
||||||
7.150% Limited Recourse Capital Notes Series 3 (NVCC) |
n/a |
800 |
||||||
6.987% Limited Recourse Capital Notes Series 4 (NVCC) |
n/a |
500 |
||||||
6.950% Limited Recourse Capital Notes Series 5 (NVCC) (2)
|
n/a |
693 |
||||||
6.369% Limited Recourse Capital Notes Series 6 (NVCC) |
n/a |
450 |
||||||
7.000% Limited Recourse Capital Notes Series 7 (NVCC) (2)
|
n/a |
1,027 |
||||||
5.898% Limited Recourse Capital Notes Series 8 (NVCC) |
n/a |
450 |
||||||
Subordinated indebtedness |
||||||||
1.96% Debentures due April 21, 2031 (NVCC) |
n/a |
1,000 |
||||||
4.20% Debentures due April 7, 2032 (NVCC) |
n/a |
1,000 |
||||||
5.33% Debentures due January 20, 2033 (NVCC) |
n/a |
1,000 |
||||||
5.35% Debentures due April 20, 2033 (NVCC) |
n/a |
750 |
||||||
5.30% Debentures due January 16, 2034 (NVCC) |
n/a |
1,250 |
||||||
4.90% Debentures due June 12, 2034 (NVCC) |
n/a |
1,000 |
||||||
4.15% Debentures due April 2, 2035 (NVCC) |
n/a |
1,250 |
||||||
Stock options outstanding |
15,521,372 |
|||||||
| (1) | A long position in our own shares is shown as a negative number, which reduces the number of shares outstanding. A short position is shown as a positive number, which adds to the number of shares outstanding. See Note 1 to the consolidated financial statements for the accounting policy on treasury shares. |
| (2) | For Limited Recourse Capital Notes (LRCNs) – Series 5 and Series 7, the amount represents the Canadian dollar equivalent of the U.S. dollar notional amount. |
| n/a | Not applicable. |
39 |
CIBC 2025 |
Management’s discussion and analysis |
|
CIBC
2025 |
|
40 |
|
Management’s discussion and analysis |
$ millions, as at October 31 |
2025 |
2024 | ||||||||||||||||||||||
|
Cash, investments and loans (1)
|
Liquidity, credit facilities and commitments |
Written credit derivatives (2)
|
Investments and loans (1)
|
Liquidity, credit facilities and commitments |
Written credit derivatives (2)
|
|||||||||||||||||||
Single-seller and multi-seller conduits |
$ |
727 |
$ |
22,197 |
(3)
|
$ |
– |
$ | 377 | $ | 16,637 |
(3) |
$ | – | ||||||||||
Third-party structured vehicles |
7,749 |
2,065 |
– |
4,977 | 1,653 | – | ||||||||||||||||||
Loan financing |
19,341 |
10,428 |
– |
10,640 | 8,526 | – | ||||||||||||||||||
Other |
2,038 |
201 |
59 |
1,795 | 255 | 71 | ||||||||||||||||||
| (1) | Excludes securities issued by, retained interest in, and derivatives with entities established by CMHC, Federal National Mortgage Association, Federal Home Loan Mortgage Corporation, Government National Mortgage Association, Federal Home Loan Banks, Federal Farm Credit Bank, and Student Loan Marketing Association. |
| (2) | Disclosed amounts reflect the outstanding notional of written credit derivatives. The negative fair value recorded on the consolidated balance sheet was $41 million (2024: $50 million). Notional of $53 million (2024: $66 million) was hedged with credit derivatives protection from third parties. The fair value of these hedges net of CVA was $35 million (2024: $44 million). An additional notional of $6 million (2024: $6 million) was hedged through a limited recourse note. |
| (3) | Excludes an additional $8.4 billion (2024: $6.2 billion) relating to our backstop liquidity facilities provided to the multi-seller conduits as part of their commitment to fund purchases of additional assets. Also excludes $592 million (2024: $276 million) of our direct investments in the multi-seller conduits which we consider investment exposure. |
41 |
CIBC 2025 |
| Management’s discussion and analysis |
42 |
||
| 43 | ||
| 44 | ||
| 45 | ||
| 45 | ||
| 46 | Risk input into performance and compensation | |
| 47 | ||
| 48 | ||
| 49 | ||
| 49 | ||
| 49 | ||
50 |
||
53 |
||
54 |
||
| 54 | ||
| 54 | ||
| 55 | ||
| 56 | ||
| 58 | ||
| 60 | ||
| 62 | ||
| 63 | Loans contractually past due but not impaired | |
| 63 | Exposure to certain countries and regions | |
| 64 | ||
| 64 | ||
65 |
||
| 65 | ||
| 65 | ||
| 65 | ||
| 65 | ||
| 65 | ||
| 66 | ||
| 68 | ||
| 69 | ||
70 |
||
| 70 | ||
| 70 | ||
| 70 | ||
| 71 | ||
| 75 | ||
| 76 | ||
77 |
||
| 77 | ||
| 77 | ||
| 79 | ||
| 81 | ||
| 81 | ||
| 81 | ||
| 81 | ||
• |
CIBC, SBU, functional group-level and regional risk appetite statements; |
• |
Risk frameworks, policies, procedures and limits to align activities with our risk appetite; |
• |
Regular risk reports to identify and communicate risk levels; |
• |
An independent control framework to identify and test the design and operating effectiveness of our key controls; |
• |
Stress testing to consider the potential impact of changes in the business environment on capital, liquidity and earnings; |
• |
Proactive consideration of risk mitigation options in order to optimize results; and |
• |
Oversight through our risk-focused committees and governance structure. |
(i) |
As the first line of defence, CIBC’s Management, in SBUs and functional groups, own the risks and are accountable and responsible for identifying and assessing risks inherent in its activities in accordance with the CIBC risk appetite. In addition, Management establishes and maintains controls to mitigate such risks and support operational resilience. Management may include Governance Groups within the business to facilitate the Control Framework, Operational Risk Management and Operational Resilience Framework and other risk-related processes. A Governance Group refers to a group within Business Unit Management (first line of defence) whose focus is to support Management in meeting their governance, risk and control activities. A Governance Group is considered the first line of defence, in conjunction with Business Unit Management. Control Groups, which typically reside within centralized functions, provide subject matter expertise to Business Unit Management and/or implement/maintain enterprise-wide control programs and activities. While Control Groups collaborate with Business Unit Management in identifying and managing risk, they also challenge risk decisions and risk mitigation strategies. |
(ii) |
The second line of defence is independent from the first line of defence and provides an enterprise-wide view of specific risk types, guidance and effective challenge to risk and control activities. Risk Management is the primary second line of defence. Risk Management may leverage subject matter expertise of other groups (e.g., third parties or Control Groups) to inform their independent assessments, as appropriate. |
(iii) |
As the third line of defence, CIBC’s Internal Audit is responsible for providing reasonable assurance to senior management and the Audit Committee of the Board on the effectiveness of CIBC’s governance practices, risk management processes, and Internal Control as a part of its risk-based audit plan and in accordance with its mandate as described in the Internal Audit Charter. |
| CIBC 2025 ANNUAL REPORT |
|
42 |
|
| Management’s discussion and analysis |
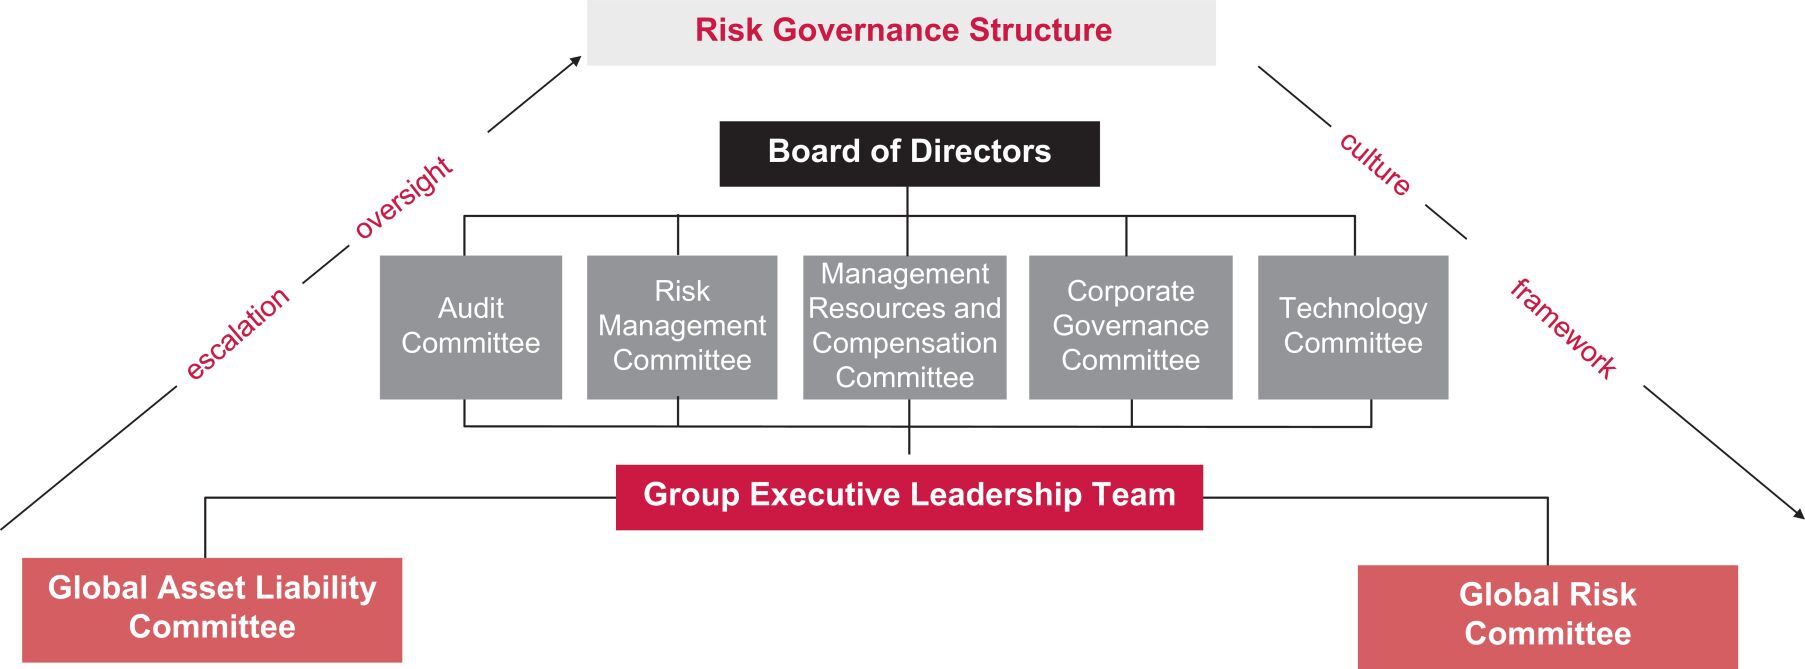
• |
Global Asset Liability Committee (GALCO): |
• |
Global Risk Committee (GRC): |
43 |
CIBC 2025 |
Management’s discussion and analysis |
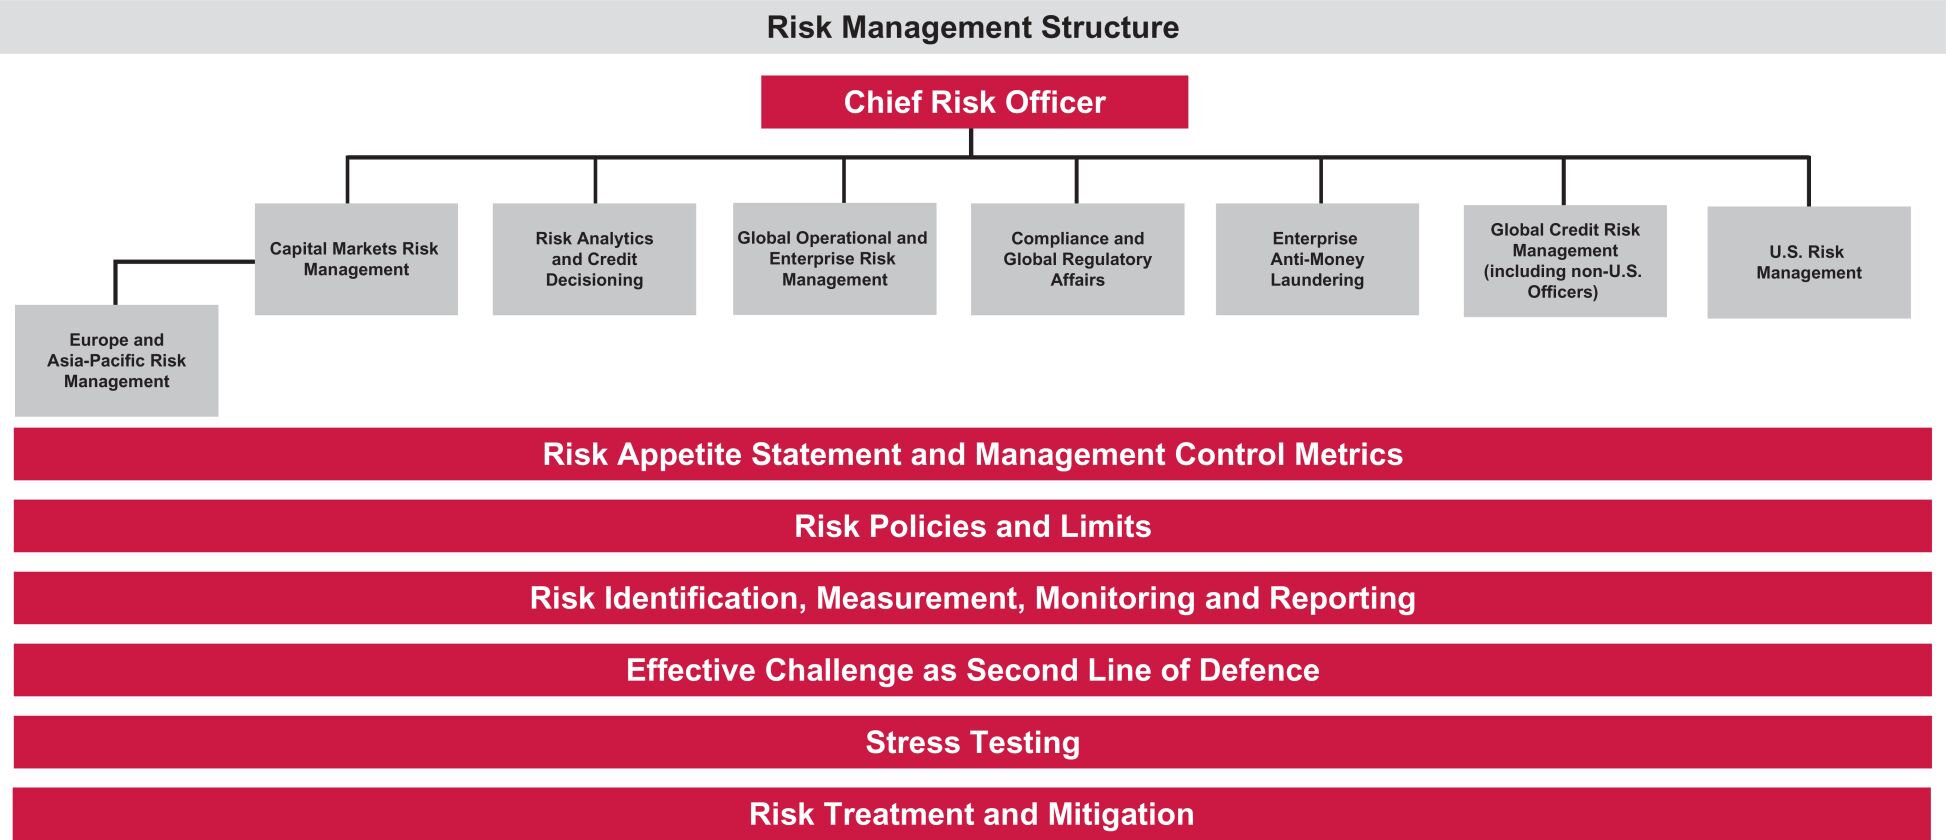
| • | Developing our risk appetite and associated management control metrics; |
| • | Setting risk strategy to manage risks in alignment with our risk appetite and business strategy; |
| • | Establishing and communicating risk frameworks, policies, procedures and limits to mitigate risks in alignment with risk strategy; |
| • | Measuring, monitoring and reporting on risk levels; |
| • | Identifying and assessing emerging and potential strategic risks; |
| • | Adjudicating transactions, as applicable; |
| • | Reviewing and performing effective challenge on business risk assessments; and |
| • | Ensuring compliance with applicable regulatory and anti-money laundering (AML) requirements. |
| • | Capital Markets Risk Management (CMRM) – This group provides independent oversight of the measurement, monitoring and control of market risks (both trading and non-trading), and trading credit risk (also called counterparty credit risk, which includes CVA risk) across CIBC’s portfolios, and effective challenge and sound risk management oversight to the treasury, including with respect to liquidity and funding risk management and SIRR management function within CIBC. |
| • | Europe and Asia-Pacific Risk Management – This group carries out the mandate of CIBC Risk Management at a regional level under the leadership of the Senior Vice-President, Chief Risk Officer, Europe & APAC, with oversight from the Management Committees and CIBC Luxembourg Board. The group provides independent oversight for the identification, management, measurement, monitoring and mitigation of risks in Europe and Asia. |
| • | Risk Analytics and Credit Decisioning – This group is responsible for the management and oversight of credit risk in the personal and business banking lending portfolios (such as residential mortgages, credit cards, loans/lines of credit, and indirect auto lending), including the development of analytics to optimize credit performance and AML outcomes within CIBC’s risk appetite. This group is also responsible for all auto-adjudicated business banking loans. |
| • | Global Operational and Enterprise Risk Management (GOERM) – This group is responsible for the oversight of all enterprise-wide operational risks globally and will establish and provide an independent risk perspective and ongoing strategic direction for various enterprise risk functions, while providing overall leadership to risk-wide business management and transformation activities. GOERM is responsible for enterprise-wide analysis, including the measuring and monitoring of risk appetite, enterprise-wide stress testing and reporting, environmental risk, risk culture, strategic risk management, allowance for credit loss assessment and reporting, risk models and model quantification, economic and regulatory capital methodologies, as well as risk data management. |
| • | Compliance and Global Regulatory Affairs (CGRA) – This group is responsible for designing and implementing an effective enterprise-wide framework to manage and mitigate regulatory compliance risk at CIBC, to be executed by CGRA and the other Oversight Functions (as defined in the Regulatory Compliance Management Policy). CGRA also provides oversight of conduct and culture risk, including sales practice risk and effective challenge of compensation plan changes. In addition, the Privacy Office under CGRA manages CIBC’s privacy-related risks and supports the protection of the privacy of all CIBC client and employee information. Overall, CGRA is responsible for maintaining strong relationships with our prudential, privacy, and market conduct regulators and acts as a liaison between the regulators and CIBC. |
|
CIBC
2025 |
|
44 |
|
Management’s discussion and analysis |
| • | Enterprise Anti-Money Laundering (Enterprise AML) – This group is responsible for all aspects of AML, anti-terrorist financing (ATF), and Sanction Programs globally for CIBC and its controlled subsidiaries, including providing advice with respect to, and independent oversight of compliance with, all regulatory requirements relating to AML/ATF and sanctions in all business and functional groups globally. Furthermore, Enterprise AML executes a risk-based approach to deter, detect and report suspected Money Laundering/Terrorist Financing and sanctioned activities, in accordance with the Enterprise AML Framework, Enterprise AML/ATF Policy, Enterprise Sanctions Policy, and their supporting standards. |
| • | Global Credit Risk Management – This group is responsible for the adjudication and oversight of credit risks associated with CIBC’s business banking (manually adjudicated loans only), commercial, corporate, and wealth management credit portfolios, management of the risks in the bank’s investment portfolios, as well as management of special loan portfolios. Effective for the first quarter of 2026, Global Credit Risk was reorganized into Corporate and Private Credit Risk, which includes trading credit risk, and Commercial and Wealth Credit Risk, which includes global special loans. |
| • | U.S. Risk Management – This group carries out the mandate of CIBC Risk Management at a regional level under the leadership of the U.S. CRO, with oversight from the Risk Management Committee of the CIBC Board and the Risk Committees of the Boards of CIBC Bank USA and CIBC Bancorp USA Inc. (CIBC Bancorp). The group proactively identifies, assesses, and monitors risks across our U.S. operations, ensuring robust controls and timely mitigation strategies. Through diligent risk oversight, the team enables strong and risk-controlled execution of our business strategy while safeguarding the bank’s financial strength and reputation. |
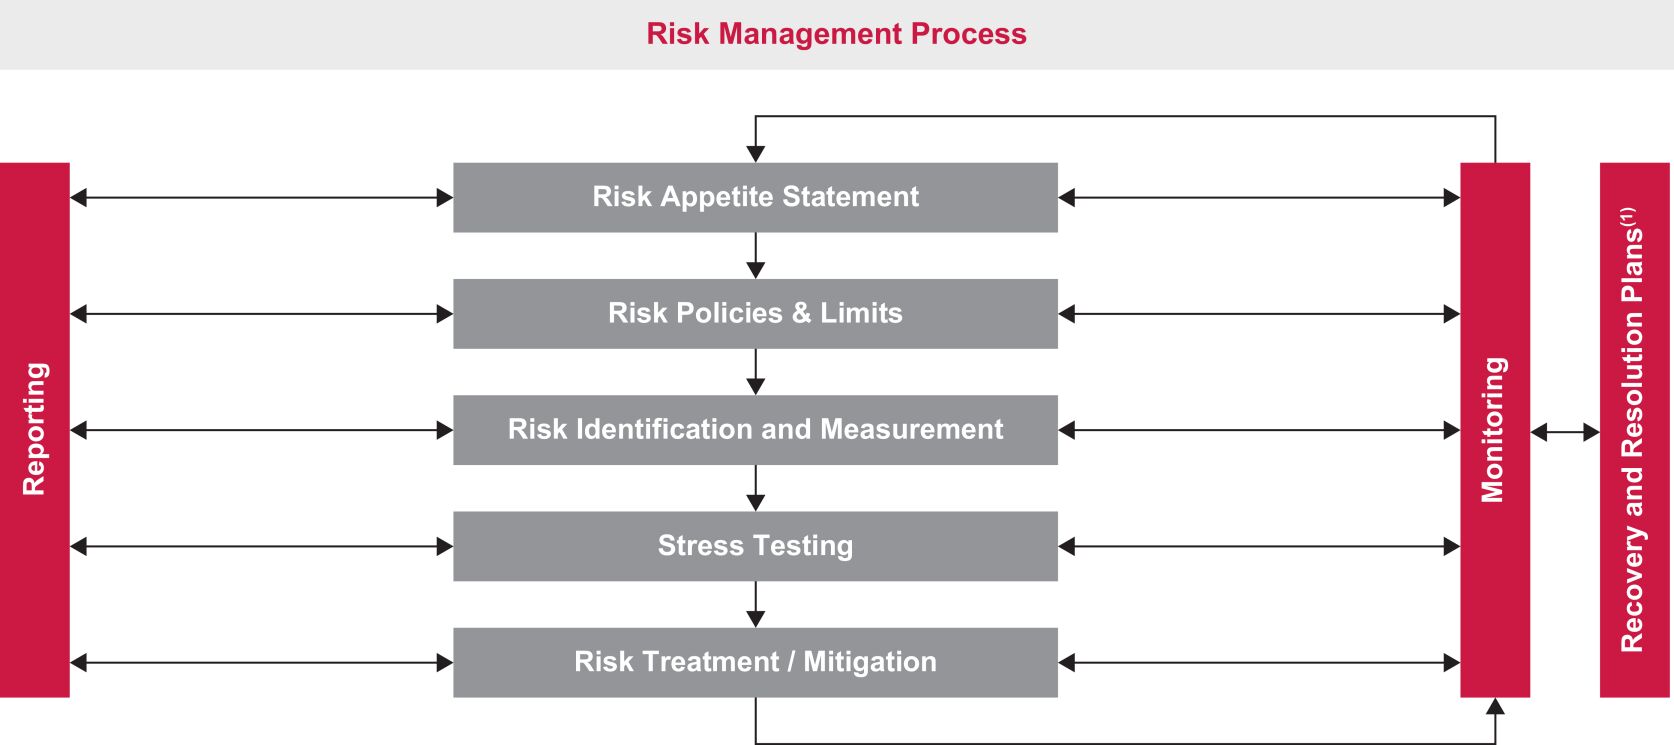
| (1) | For additional information refer to the “Capital management” section. |
| • | Safeguarding our reputation and brand; |
| • | Doing the right thing for our clients/stakeholders; |
| • | Engaging in client-oriented businesses after understanding the potential risks and rewards; |
| • | Making our client’s goals our own in a professional and radically simple manner; |
| • | Managing a balance between risk and returns; |
| • | Retaining a prudent attitude towards tail and event risk; |
| • | Meeting regulatory expectations and/or identifying and having plans in place to address any issues in a timely manner; |
| • | Achieving/maintaining an AA rating; and |
| • | Meeting our expectations with respect to our sustainability priorities. |
45 |
CIBC 2025 |
Management’s discussion and analysis |
| • | Promoting, through both formal and informal channels, a shared accountability of risk identification, management and mitigation; |
| • | Cultivating an environment of transparency and effective challenge, open communication and robust discussion of risk; |
| • | Setting the appropriate “tone at the top” and “tone from the middle” through clear communication and reinforcement; and |
| • | Identifying and reinforcing behaviours that are aligned with risk appetite, and reporting and addressing misaligned behaviours. |
| • | Reviewing and recommending for Board approval annual performance and compensation, including changes to compensation targets, if any, for the CEO, Senior Management, and Heads of Oversight Functions; |
| • | Approving annual compensation for any employee whose total direct compensation exceeds the materiality threshold determined by the Committee; |
| • | Assessing the appropriateness of compensation based on business performance and risks undertaken; |
| • | Reviewing and recommending for Board approval the aggregate annual incentive compensation and allocations to the SBUs and the functional groups; |
| • | Approving CIBC’s compensation philosophy and any material changes to CIBC’s compensation principles or practices; |
| • | Reviewing material compensation policies and approving any material changes to such policies or any new material compensation policies; |
| • | Reviewing and recommending Board approval of new material compensation plans and changes to existing material compensation plans; and |
| • | Reviewing a report on non-material plans. |
|
CIBC
2025 |
|
46 |
|
Management’s discussion and analysis |
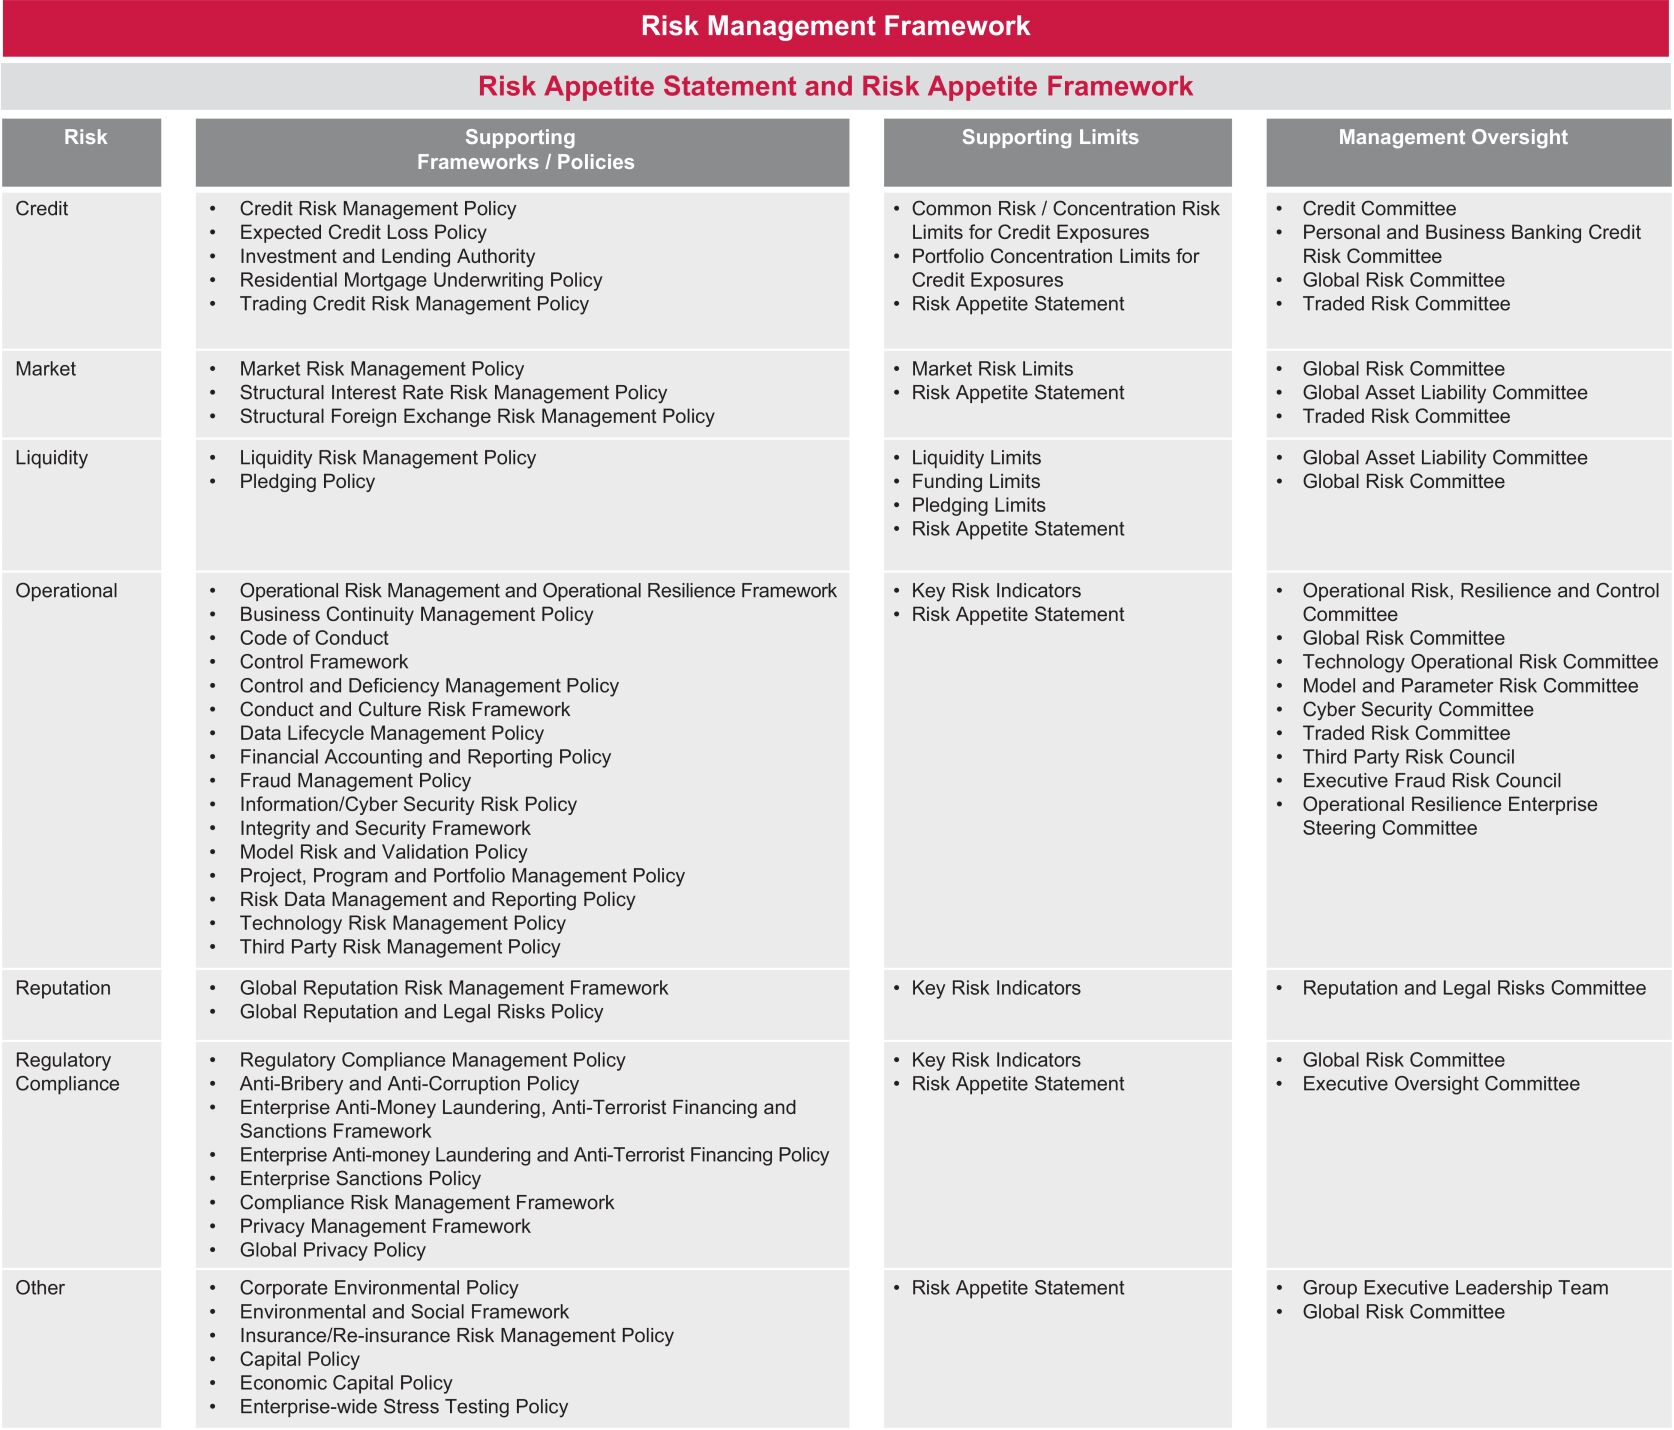
47 |
CIBC 2025 |
Management’s discussion and analysis |
| • | Regular assessment of risks associated with lending and trading credit exposures; |
| • | Ongoing monitoring of trading and non-trading portfolios; |
| • | Assessment of risks in new business activities and processes; |
| • | Assessment of risks in complex and unusual business transactions; |
| • | Regular monitoring of the overall risk profile considering market developments and trends, and external and internal events; and |
| • | Ongoing monitoring of management operations and processes. |
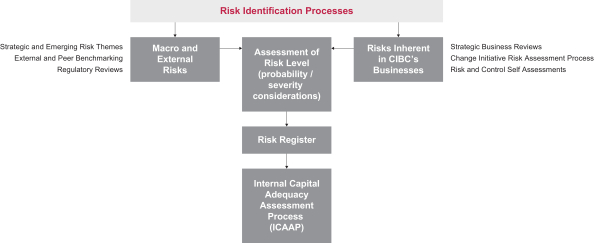
|
CIBC
2025 |
|
48 |
|
Management’s discussion and analysis |
| • | Governance and oversight by management committees, including the Model and Parameter Risk Committee (MPRC), senior management and the Board; |
| • | Policies, standards and procedures to outline applicable roles and responsibilities of the various oversight groups and to provide guidance to identify, measure, control and monitor model risk throughout the model’s life cycle; and |
| • | Controls for key operational aspects of model risk management including maintaining a model inventory, model risk ranking, model risk attestation and ongoing monitoring and reporting. |
| • | Review of model documentation; |
| • | Comprehensive, systematic testing of key model parameters on implementation to ensure results are as expected; |
| • | Review data quality, ensuring that data used in the model is complete and representative for the intended purpose; |
| • | Replication of the risk quantification process to determine whether the model implementation is faithful to the model specifications; |
| • | Review of whether the model/parameter concepts and assumptions are appropriate and robust; |
| • | Accuracy testing to assess the calibration and accuracy of the risk components including, for example, the discriminative power of rating systems and the reasonableness of capital parameters; |
| • | Sensitivity testing to analyze the sensitivity of model/parameter outputs to model/parameter assumptions and key inputs; |
| • | Scenario and stress testing of the model outputs to key inputs; |
| • | Back-testing by comparing actual results with model-generated risk measures; |
| • | Benchmarking to other models and comparable internal and external data; |
| • | Review of the internal usage of the model/parameter applications to ensure consistency of application; |
| • | Reporting of model status to the MPRC, supported through an up-to-date |
| • | A quarterly attestation process for model owners in order to ensure compliance with the Model Risk and Validation Policy; and |
| • | A comprehensive validation report that identifies the conditions for valid application of the model and summarizes these findings to the model owners, developers and users. |
49 |
CIBC 2025 |
Management’s discussion and analysis |
| • | Conflicts in the Middle East; |
| • | The war in Ukraine; and, |
| • | Rising civil unrest and activism globally. |
|
CIBC
2025 |
|
50 |
|
Management’s discussion and analysis |
51 |
CIBC 2025 |
Management’s discussion and analysis |
|
CIBC
2025 |
|
52 |
|
| Management’s discussion and analysis |
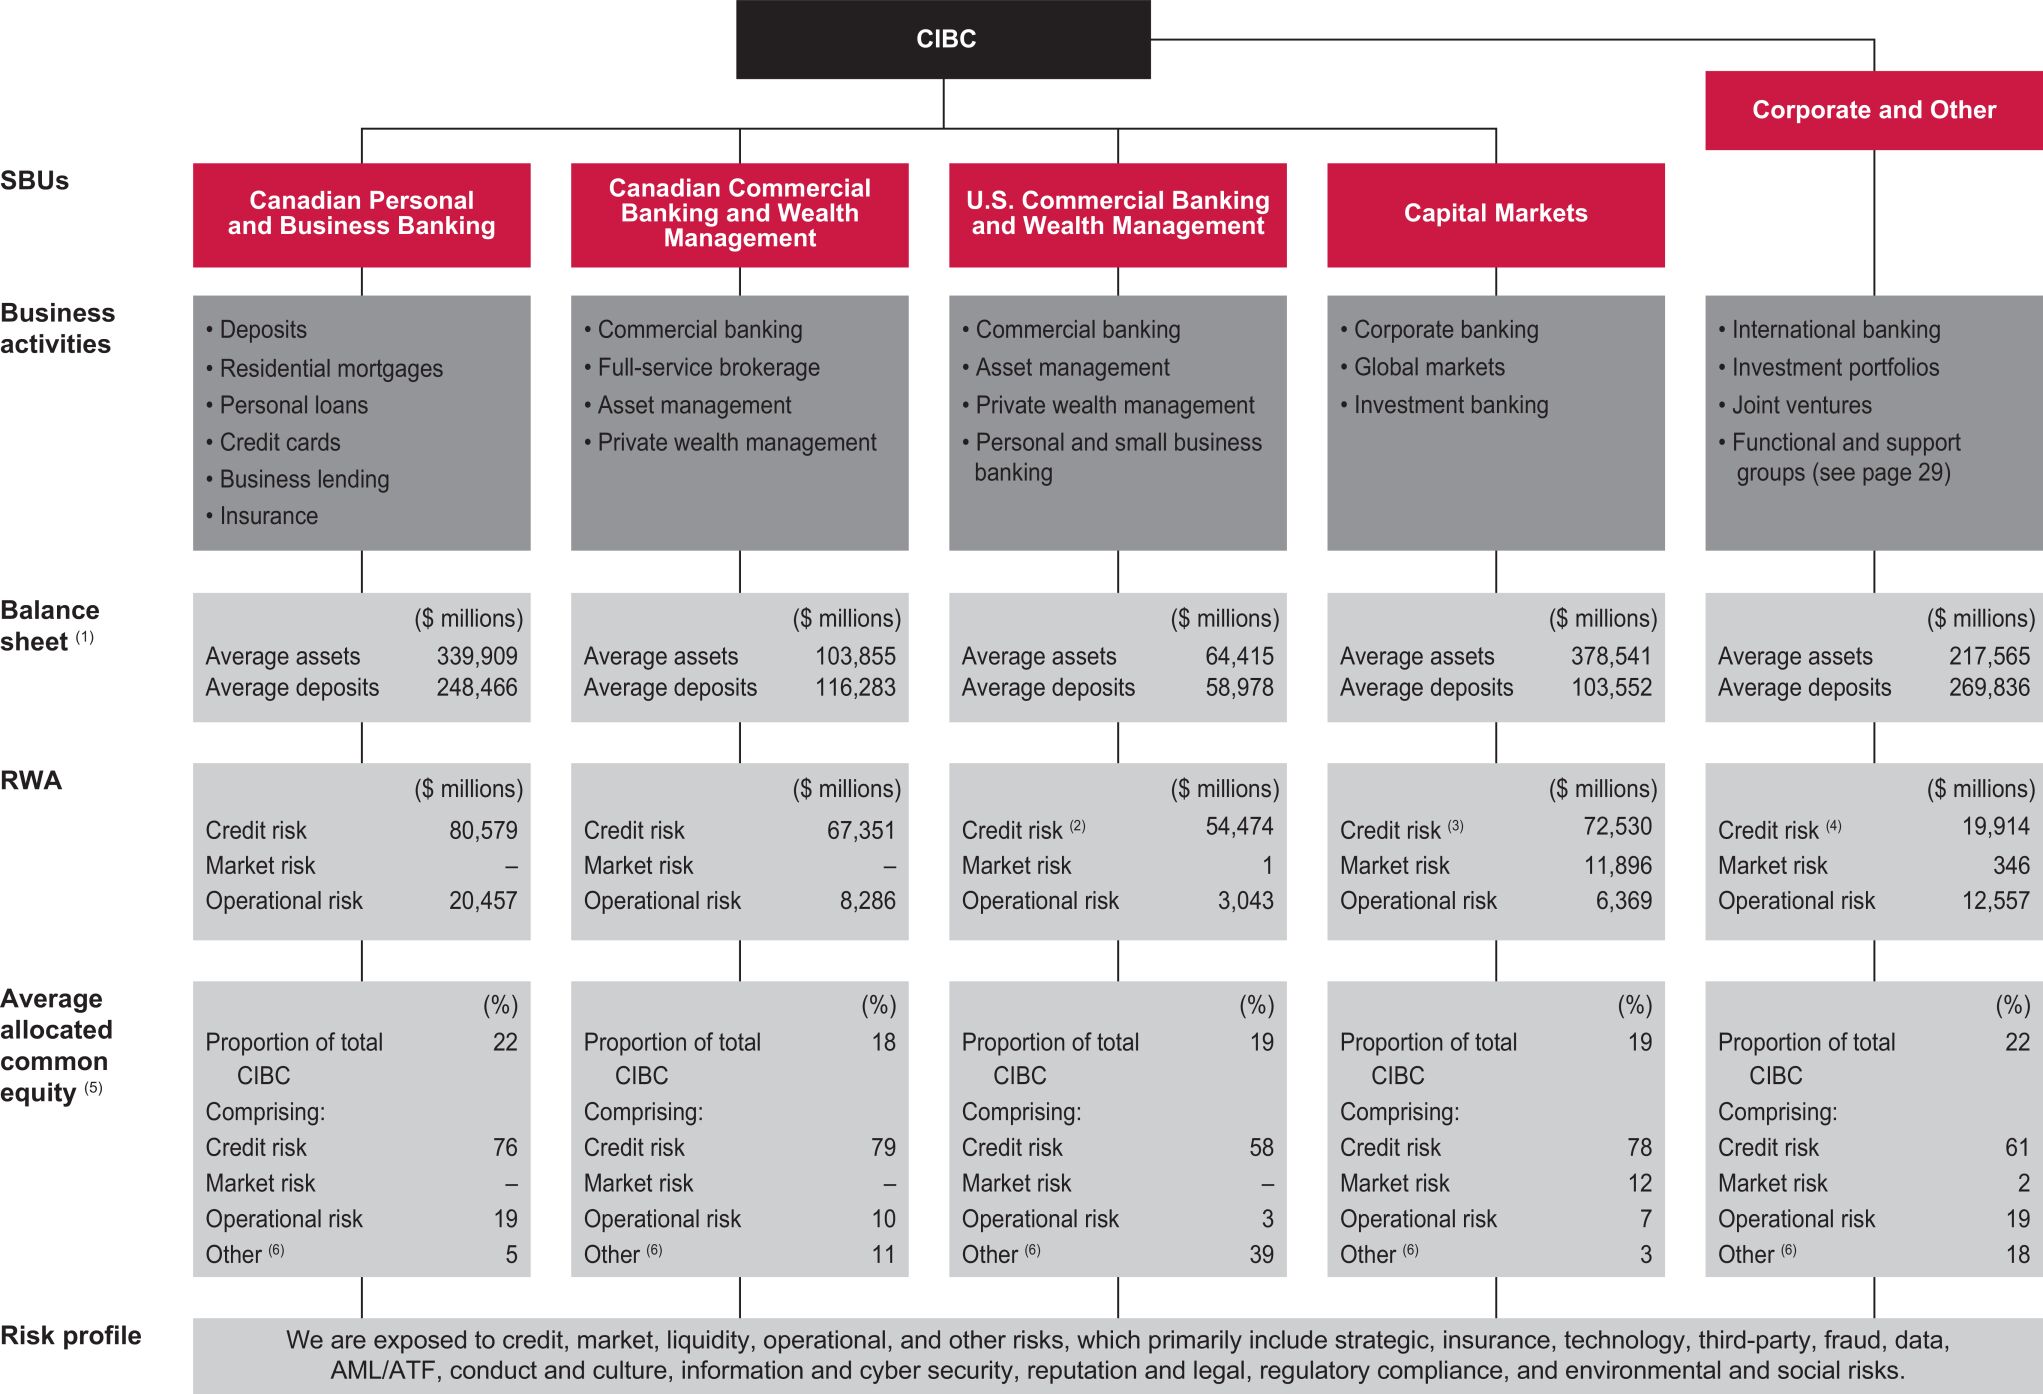
(1) |
Average balances are calculated as a weighted average of daily closing balances. |
(2) |
Includes CCR and CVA of $13 million, which comprises derivatives and repo-style transactions. |
(3) |
Includes CCR and CVA of $15,501 million, which comprises derivatives and repo-style transactions. |
(4) |
Includes CCR and CVA of $637 million, which comprises derivatives and repo-style transactions. |
(5) |
Average allocated common equity is a non-GAAP measure. For additional information on the composition of this non-GAAP measure, see the “Non-GAAP measures” section. |
(6) |
Represents average allocated common equity relating to capital deductions, such as goodwill and intangible assets, in accordance with the rules in OSFI’s CAR Guideline. |
53 |
CIBC 2025 |
| Management’s discussion and analysis |
• |
Model Validation is responsible for the oversight of model validation practices. Model validation constitutes the independent set of processes, activities and ongoing documentary evidence that models and parameters are sound and CIBC can rely on their output. |
• |
Model Quantification is responsible for the design, development and continuous improvement to risk rating methodologies and credit models that support credit adjudication and ECL, across corporate commercial, personal and business lending segments. |
• |
Enterprise Risk Management is responsible for enterprise-wide reporting and analysis, including enterprise-wide stress testing, ECL, risk data systems and economic capital. |
• |
Risk Regulatory Initiatives is responsible for oversight, governance and delivery of regulatory and strategic initiatives and large enterprise-wide regulatory initiatives. |
• |
Environmental Risk Management is responsible for developing the environmental strategy, setting environmental performance standards and targets, and reporting on performance for material indicators. |
| CIBC 2025 |
|
54 |
| Management’s discussion and an alysis |
55 |
CIBC 2025 |
Management’s discussion and an alys is |
| • | PD – the probability that the obligor will default within the next 12 months. |
| • | EAD – the estimate of the amount that will be drawn at the time of default. |
| • | LGD – the expected severity of loss as the result of the default, expressed as a percentage of the EAD. |
| (1) | These parameters differ from those used in the calculation of ECL under IFRS 9. See the “Accounting and control matters” section for further details. |
CIBC |
S&P |
Moody’s |
||||||||||
Grade |
rating |
equivalent |
equivalent |
|||||||||
Investment grade |
00–47 | AAA to BBB- | Aaa to Baa3 | |||||||||
Non-investment grade |
51–67 | BB+ to B- | Ba1 to B3 | |||||||||
Watch list |
70–80 | CCC+ to C | Caa1 to Ca | |||||||||
Default |
90 | D | C |
|
CIBC
2025 ANNUAL REPORT |
|
56 |
|
Management’s discussion and analysis |
Risk level |
PD bands |
|||
Exceptionally low |
0.01%–0.20% | |||
Very low |
0.21%–0.50% | |||
Low |
0.51%–2.00% | |||
Medium |
2.01%–10.00% | |||
High |
10.01%–99.99% | |||
Default |
100% |
57 |
CIBC 2025 |
Management’s discussion and an aly sis |
$ millions, as at October 31 |
2025 |
2024 |
||||||||||||||||||||||
IRB approach |
Standardized approach |
Total |
IRB approach |
Standardized approach |
Total |
|||||||||||||||||||
Business and government portfolios |
||||||||||||||||||||||||
Corporate |
||||||||||||||||||||||||
Drawn |
$ |
206,412 |
$ |
7,218 |
$ |
213,630 |
$ | 186,995 | $ | 6,717 | $ | 193,712 | ||||||||||||
Undrawn commitments |
58,702 |
969 |
59,671 |
54,122 | 1,005 | 55,127 | ||||||||||||||||||
Repo-style transactions |
335,746 |
– |
335,746 |
308,047 | 1 | 308,048 | ||||||||||||||||||
Other off-balance sheet |
14,659 |
381 |
15,040 |
13,307 | 331 | 13,638 | ||||||||||||||||||
OTC derivatives |
13,581 |
136 |
13,717 |
10,970 | 126 | 11,096 | ||||||||||||||||||
629,100 |
8,704 |
637,804 |
573,441 | 8,180 | 581,621 | |||||||||||||||||||
Sovereign |
||||||||||||||||||||||||
Drawn |
188,329 |
8,728 |
197,057 |
187,765 | 7,802 | 195,567 | ||||||||||||||||||
Undrawn commitments |
8,386 |
297 |
8,683 |
8,101 | 178 | 8,279 | ||||||||||||||||||
Repo-style transactions |
55,556 |
– |
55,556 |
54,661 | – | 54,661 | ||||||||||||||||||
Other off-balance sheet |
1,906 |
143 |
2,049 |
1,595 | 156 | 1,751 | ||||||||||||||||||
OTC derivatives |
2,416 |
– |
2,416 |
2,545 | – | 2,545 | ||||||||||||||||||
256,593 |
9,168 |
265,761 |
254,667 | 8,136 | 262,803 | |||||||||||||||||||
Banks |
||||||||||||||||||||||||
Drawn |
11,664 |
1,066 |
12,730 |
12,076 | 1,298 | 13,374 | ||||||||||||||||||
Undrawn commitments |
841 |
– |
841 |
555 | – | 555 | ||||||||||||||||||
Repo-style transactions |
71,881 |
– |
71,881 |
45,493 | – | 45,493 | ||||||||||||||||||
Other off-balance sheet |
3,529 |
– |
3,529 |
2,176 | – | 2,176 | ||||||||||||||||||
OTC derivatives |
6,817 |
– |
6,817 |
5,291 | – | 5,291 | ||||||||||||||||||
94,732 |
1,066 |
95,798 |
65,591 | 1,298 | 66,889 | |||||||||||||||||||
Gross business and government portfolios |
980,425 |
18,938 |
999,363 |
893,699 | 17,614 | 911,313 | ||||||||||||||||||
Less: collateral held for repo-style transactions |
437,601 |
– |
437,601 |
388,767 | – | 388,767 | ||||||||||||||||||
Net business and government portfolios |
542,824 |
18,938 |
561,762 |
504,932 | 17,614 | 522,546 | ||||||||||||||||||
Retail portfolios |
||||||||||||||||||||||||
Real estate secured personal lending |
||||||||||||||||||||||||
Drawn |
295,526 |
3,087 |
298,613 |
290,545 | 3,028 | 293,573 | ||||||||||||||||||
Undrawn commitments |
37,986 |
– |
37,986 |
36,393 | 2 | 36,395 | ||||||||||||||||||
333,512 |
3,087 |
336,599 |
326,938 | 3,030 | 329,968 | |||||||||||||||||||
Qualifying revolving retail |
||||||||||||||||||||||||
Drawn |
24,157 |
2,870 |
27,027 |
22,894 | 3,119 | 26,013 | ||||||||||||||||||
Undrawn commitments |
70,592 |
4,226 |
74,818 |
63,866 | 3,979 | 67,845 | ||||||||||||||||||
Other off-balance sheet |
451 |
120 |
571 |
411 | 114 | 525 | ||||||||||||||||||
95,200 |
7,216 |
102,416 |
87,171 | 7,212 | 94,383 | |||||||||||||||||||
Other retail |
||||||||||||||||||||||||
Drawn |
15,857 |
873 |
16,730 |
15,199 | 829 | 16,028 | ||||||||||||||||||
Undrawn commitments |
3,767 |
– |
3,767 |
3,430 | 1 | 3,431 | ||||||||||||||||||
Other off-balance sheet |
7 |
– |
7 |
6 | – | 6 | ||||||||||||||||||
19,631 |
873 |
20,504 |
18,635 | 830 | 19,465 | |||||||||||||||||||
Small and medium enterprises (SME) retail |
||||||||||||||||||||||||
Drawn |
2,887 |
– |
2,887 |
3,183 | – | 3,183 | ||||||||||||||||||
Undrawn commitments |
1,143 |
– |
1,143 |
1,217 | – | 1,217 | ||||||||||||||||||
Other off-balance sheet |
25 |
– |
25 |
27 | – | 27 | ||||||||||||||||||
4,055 |
– |
4,055 |
4,427 | – | 4,427 | |||||||||||||||||||
Total retail portfolios |
452,398 |
11,176 |
463,574 |
437,171 | 11,072 | 448,243 | ||||||||||||||||||
Securitization exposures (1)
|
40,180 |
30,105 |
70,285 |
30,901 | 21,251 | 52,152 | ||||||||||||||||||
Gross credit exposure (2)
|
1,473,003 |
60,219 |
1,533,222 |
1,361,771 | 49,937 | 1,411,708 | ||||||||||||||||||
Less: collateral held for repo-style transactions |
437,601 |
– |
437,601 |
388,767 | – | 388,767 | ||||||||||||||||||
Net credit exposure (2)
|
$ |
1,035,402 |
$ |
60,219 |
$ |
1,095,621 |
$ | 973,004 | $ | 49,937 | $ | 1,022,941 | ||||||||||||
| (1) | OSFI guidelines define a hierarchy of approaches for treating securitization exposures in our banking book. Depending on the underlying characteristics, exposures are eligible for either the SA or the IRB approach. The SEC-ERBA, which is inclusive of SEC-IAA, includes exposures that qualify for the IRB approach, as well as exposures under the SA. |
| (2) | Excludes exposures arising from derivative and repo-style transactions which are cleared through qualified central counterparties (QCCPs) as well as credit risk exposures arising from other assets that are subject to the credit risk framework, including other balance sheet assets which are risk-weighted at 100%, significant investments in the capital of non-financial institutions which are risk-weighted at 1250%, settlement risk, and amounts below the thresholds for deduction which are risk-weighted at 250%. Non-trading equity exposures are also excluded and are subject to a range of risk-weightings dependent on the nature of the security. |
|
CIBC
2025 ANNUAL REPORT |
|
58 |
|
Management’s discussion and analysis |
$ millions, as at October 31 |
Risk-weight category |
2025 |
2024 | |||||||||||||||||||||||||||||||||
0% |
1–20% |
21–50% |
51–75% |
76–100% |
101–150% |
>150% |
Total |
Total | ||||||||||||||||||||||||||||
Corporate |
$ |
– |
$ |
– |
$ |
– |
$ |
9 |
$ |
8,396 |
$ |
299 |
$ |
– |
$ |
8,704 |
$ | 8,179 | ||||||||||||||||||
Sovereign |
7,248 |
598 |
308 |
– |
959 |
56 |
– |
9,169 |
8,137 | |||||||||||||||||||||||||||
Banks |
– |
945 |
39 |
– |
30 |
52 |
– |
1,066 |
1,298 | |||||||||||||||||||||||||||
Real estate secured personal lending |
– |
715 |
1,947 |
298 |
119 |
7 |
– |
3,086 |
3,030 | |||||||||||||||||||||||||||
Other retail |
– |
4,143 |
– |
3,933 |
12 |
1 |
– |
8,089 |
8,042 | |||||||||||||||||||||||||||
Total |
$ |
7,248 |
$ |
6,401 |
$ |
2,294 |
$ |
4,240 |
$ |
9,516 |
$ |
415 |
$ |
– |
$ |
30,114 |
$ | 28,686 | ||||||||||||||||||
$ millions, as at October 31, 2025 |
Canada |
U.S. |
Europe |
Other |
Total |
|||||||||||||||
Drawn |
$ |
190,240 |
$ |
180,725 |
$ |
21,839 |
$ |
13,601 |
$ |
406,405 |
||||||||||
Undrawn commitments |
36,642 |
23,140 |
5,683 |
2,464 |
67,929 |
|||||||||||||||
Repo-style transactions |
6,161 |
9,069 |
4,935 |
5,417 |
25,582 |
|||||||||||||||
Other off-balance sheet |
9,876 |
7,663 |
1,545 |
1,010 |
20,094 |
|||||||||||||||
OTC derivatives |
13,406 |
4,620 |
2,808 |
1,980 |
22,814 |
|||||||||||||||
Total |
$ |
256,325 |
$ |
225,217 |
$ |
36,810 |
$ |
24,472 |
$ |
542,824 |
||||||||||
October 31, 2024 |
$ | 237,346 | $ | 216,408 | $ | 27,539 | $ | 23,639 | $ | 504,932 | ||||||||||
| (1) | Excludes securitization exposures, and exposures under the SA. Substantially all of our retail exposures under the AIRB approach are based in Canada. |
| (2) | Classification by country is primarily based on domicile of debtor or customer. |
59 |
CIBC 2025 |
Management’s discussion and analysis |
Undrawn |
Repo-style |
Other off- |
OTC |
2025 |
2024 | |||||||||||||||||||||||
$ millions, as at October 31 |
Drawn |
commitments |
transactions |
balance sheet |
derivatives |
Total |
Total | |||||||||||||||||||||
Commercial mortgages |
$ |
9,074 |
$ |
17 |
$ |
– |
$ |
– |
$ |
– |
$ |
9,091 |
$ | 7,832 | ||||||||||||||
Financial institutions |
103,109 |
13,497 |
24,028 |
6,875 |
13,079 |
160,588 |
142,612 | |||||||||||||||||||||
Retail and wholesale |
13,500 |
4,411 |
– |
542 |
354 |
18,807 |
17,844 | |||||||||||||||||||||
Business services |
14,084 |
4,079 |
57 |
1,126 |
351 |
19,697 |
19,299 | |||||||||||||||||||||
Manufacturing – capital goods |
6,558 |
2,963 |
– |
494 |
303 |
10,318 |
8,858 | |||||||||||||||||||||
Manufacturing – consumer goods |
7,184 |
2,074 |
– |
234 |
175 |
9,667 |
9,281 | |||||||||||||||||||||
Real estate and construction |
55,825 |
10,053 |
– |
2,333 |
627 |
68,838 |
65,926 | |||||||||||||||||||||
Agriculture |
8,938 |
1,489 |
– |
74 |
130 |
10,631 |
9,934 | |||||||||||||||||||||
Oil and gas |
2,420 |
3,580 |
– |
480 |
1,160 |
7,640 |
6,822 | |||||||||||||||||||||
Mining |
2,059 |
1,360 |
– |
798 |
1,375 |
5,592 |
4,901 | |||||||||||||||||||||
Forest products |
722 |
553 |
– |
169 |
32 |
1,476 |
1,114 | |||||||||||||||||||||
Hardware and software |
6,050 |
2,644 |
114 |
162 |
349 |
9,319 |
7,382 | |||||||||||||||||||||
Telecommunications and cable |
3,694 |
746 |
– |
258 |
437 |
5,135 |
3,896 | |||||||||||||||||||||
Publishing, printing and broadcasting |
492 |
118 |
– |
11 |
19 |
640 |
859 | |||||||||||||||||||||
Transportation |
7,470 |
3,764 |
– |
498 |
521 |
12,253 |
11,664 | |||||||||||||||||||||
Utilities |
17,524 |
9,250 |
– |
5,238 |
1,643 |
33,655 |
30,628 | |||||||||||||||||||||
Education, health and social services |
10,540 |
1,827 |
3 |
281 |
153 |
12,804 |
12,535 | |||||||||||||||||||||
Governments |
137,162 |
5,504 |
1,380 |
521 |
2,106 |
146,673 |
143,545 | |||||||||||||||||||||
Total |
$ |
406,405 |
$ |
67,929 |
$ |
25,582 |
$ |
20,094 |
$ |
22,814 |
$ |
542,824 |
$ | 504,932 | ||||||||||||||
$ millions, as at October 31 |
2025 |
2024 | ||||||||||||||||||||||
EAD |
||||||||||||||||||||||||
| Risk level | Real estate secured personal lending |
Qualifying revolving retail |
Other retail |
SME retail |
Total |
Total | ||||||||||||||||||
Exceptionally low |
$ |
208,494 |
$ |
57,310 |
$ |
3,603 |
$ |
395 |
$ |
269,802 |
$ | 264,361 | ||||||||||||
Very low |
73,973 |
11,977 |
3,832 |
869 |
90,651 |
83,228 | ||||||||||||||||||
Low |
32,030 |
15,414 |
7,201 |
1,548 |
56,193 |
55,896 | ||||||||||||||||||
Medium |
16,695 |
7,840 |
3,570 |
990 |
29,095 |
28,540 | ||||||||||||||||||
High |
1,286 |
2,589 |
1,332 |
189 |
5,396 |
4,189 | ||||||||||||||||||
Default |
1,034 |
70 |
93 |
64 |
1,261 |
957 | ||||||||||||||||||
Total |
$ |
333,512 |
$ |
95,200 |
$ |
19,631 |
$ |
4,055 |
$ |
452,398 |
$ | 437,171 | ||||||||||||
|
CIBC
2025 ANNUAL REPORT |
|
60 |
|
Management’s discussion and analysis |
| Residential mortgages (1) (2) |
HELOC (3)
|
Total | ||||||||||||||||||||||||||||||||||||||||||||||
$ billions, as at October 31, 2025 |
Insured | Uninsured | Uninsured | Insured | Uninsured | |||||||||||||||||||||||||||||||||||||||||||
Ontario (4)
|
$ |
16.2 |
10 |
% |
$ |
138.4 |
90 |
% |
$ |
11.3 |
100 |
% |
$ |
16.2 |
10 |
% |
$ |
149.7 |
90 |
% |
||||||||||||||||||||||||||||
British Columbia and territories (5)
|
5.0 |
10 |
46.1 |
90 |
4.1 |
100 |
5.0 |
9 |
50.2 |
91 |
||||||||||||||||||||||||||||||||||||||
Alberta |
8.6 |
33 |
17.2 |
67 |
1.8 |
100 |
8.6 |
31 |
19.0 |
69 |
||||||||||||||||||||||||||||||||||||||
Quebec |
4.9 |
19 |
20.7 |
81 |
1.3 |
100 |
4.9 |
18 |
22.0 |
82 |
||||||||||||||||||||||||||||||||||||||
Central prairie provinces |
2.3 |
35 |
4.3 |
65 |
0.5 |
100 |
2.3 |
32 |
4.8 |
68 |
||||||||||||||||||||||||||||||||||||||
Atlantic provinces |
2.3 |
26 |
6.5 |
74 |
0.7 |
100 |
2.3 |
24 |
7.2 |
76 |
||||||||||||||||||||||||||||||||||||||
Canadian portfolio (6)(7)
|
39.3 |
14 |
233.2 |
86 |
19.7 |
100 |
39.3 |
13 |
252.9 |
87 |
||||||||||||||||||||||||||||||||||||||
U.S. portfolio (6)
|
– |
– |
2.8 |
100 |
0.1 |
100 |
– |
– |
2.9 |
100 |
||||||||||||||||||||||||||||||||||||||
Other international portfolio (6)
|
– |
– |
3.4 |
100 |
– |
– |
– |
– |
3.4 |
100 |
||||||||||||||||||||||||||||||||||||||
Total portfolio |
$ |
39.3 |
14 |
% |
$ |
239.4 |
86 |
% |
$ |
19.8 |
100 |
% |
$ |
39.3 |
13 |
% |
$ |
259.2 |
87 |
% |
||||||||||||||||||||||||||||
October 31, 2024 |
$ | 42.3 | 15 | % | $ | 231.4 | 85 | % | $ | 19.6 | 100 | % | $ | 42.3 | 14 | % | $ | 251.0 | 86 | % | ||||||||||||||||||||||||||||
| (1) | Balances reflect principal values. |
| (2) | As at October 31, 2025, our Canadian condominium mortgages were $44.2 billion (2024: $42.0 billion), of which 15% (2024: 16%) were insured. |
| (3) | We did not have any insured HELOCs as at October 31, 2025 and 2024. |
| (4) | Includes $7.0 billion (2024: $7.6 billion) of insured residential mortgages, $85.6 billion (2024: $83.2 billion) of uninsured residential mortgages, and $6.7 billion (2024: $6.5 billion) of HELOCs in the Greater Toronto Area (GTA). |
| (5) | Includes $2.2 billion (2024: $2.4 billion) of insured residential mortgages, $31.3 billion (2024: $30.9 billion) of uninsured residential mortgages, and $2.6 billion (2024: $2.5 billion) of HELOCs in the Greater Vancouver Area (GVA). |
| (6) | Geographic location is based on the address of the property. |
| (7) | 51% (2024: 55%) of insurance on Canadian residential mortgages is provided by CMHC and the remaining by two private Canadian insurers, both rated at least AA (low) by Morningstar DBRS. |
For the year ended October 31 |
2025 |
2024 | ||||||||||||||
Residential mortgages |
HELOC |
Residential mortgages |
HELOC | |||||||||||||
Ontario (2)
|
66 |
% |
67 |
% |
66 | % | 66 | % | ||||||||
British Columbia and territories (3)
|
63 |
65 |
63 | 63 | ||||||||||||
Alberta |
69 |
72 |
71 | 71 | ||||||||||||
Quebec |
68 |
70 |
68 | 70 | ||||||||||||
Central prairie provinces |
69 |
73 |
70 | 73 | ||||||||||||
Atlantic provinces |
66 |
68 |
66 | 68 | ||||||||||||
Canadian portfolio (4)
|
66 |
68 |
66 | 66 | ||||||||||||
U.S. portfolio (4)
|
64 |
53 |
66 | n/m | ||||||||||||
Other international portfolio (4)
|
68 |
% |
n/m |
72 | % | n/m | ||||||||||
| (1) | LTV ratios for newly originated and acquired residential mortgages and HELOCs are calculated based on weighted average. |
| (2) | Average LTV ratios for our uninsured GTA residential mortgages originated during the year were 66% (2024: 67%). |
| (3) | Average LTV ratios for our uninsured GVA residential mortgages originated during the year were 63% (2024: 62%). |
| (4) | Geographic location is based on the address of the property. |
| n/m | Not meaningful. |
| Insured | Uninsured | |||||||
October 31, 2025 (1)(2
)
|
59 |
% |
55 |
% |
||||
October 31, 2024 (1)(2)
|
54 | % | 52 | % | ||||
| (1) | LTV ratios for residential mortgages are calculated based on weighted averages. The house price estimates for October 31, 2025 and 2024 are based on the Forward Sortation Area (FSA) level indices from the Teranet – National Bank National Composite House Price Index (Teranet) as of September 30, 2025 and 2024, respectively. Teranet is an independent estimate of the rate of change in Canadian home prices. |
| (2) | Average LTV ratio on our uninsured GTA residential mortgage portfolio was 58% (2024: 53%). Average LTV ratio on our uninsured GVA residential mortgage portfolio was 49% (2024: 45%). |
Contractual payment basis |
||||||||||||||||||||||||||||||||
| 0–5 years |
>5–10 years |
>10–15 years |
>15–20 years |
>20–25 years |
>25–30 years |
>30–35 years |
>35 years | |||||||||||||||||||||||||
Canadian portfolio |
||||||||||||||||||||||||||||||||
October 31, 2025 |
– |
% |
1 |
% |
2 |
% |
13 |
% |
41 |
% |
43 |
% |
– |
% |
– |
% |
||||||||||||||||
October 31, 2024 |
– | % | – | % | 2 | % | 12 | % | 45 | % | 41 | % | – | % | – | % | ||||||||||||||||
U.S. portfolio |
||||||||||||||||||||||||||||||||
October 31, 2025 |
– |
% |
– |
% |
– |
% |
3 |
% |
29 |
% |
68 |
% |
– |
% |
– |
% |
||||||||||||||||
October 31, 2024 |
– | % | – | % | – | % | 2 | % | 15 | % | 83 | % | – | % | – | % | ||||||||||||||||
Other international portfolio |
||||||||||||||||||||||||||||||||
October 31, 2025 |
9 |
% |
12 |
% |
21 |
% |
21 |
% |
22 |
% |
14 |
% |
1 |
% |
– |
% |
||||||||||||||||
October 31, 2024 |
7 | % | 12 | % | 20 | % | 21 | % | 23 | % | 16 | % | 1 | % | – | % | ||||||||||||||||
61 |
CIBC 2025 |
Management’s discussion and analysis |
Current customer payment basis |
||||||||||||||||||||||||||||||||
| 0–5 years | >5–10 years |
>10–15 years |
>15–20 years |
>20–25 years |
>25–30 years |
>30–35 years |
>35 years (1)
|
|||||||||||||||||||||||||
Canadian portfolio |
||||||||||||||||||||||||||||||||
October 31, 2025 |
1 |
% |
3 |
% |
10 |
% |
20 |
% |
32 |
% |
27 |
% |
2 |
% |
5 |
% |
||||||||||||||||
October 31, 2024 |
1 | % | 3 | % | 7 | % | 17 | % | 32 | % | 26 | % | 3 | % | 11 | % | ||||||||||||||||
U.S. portfolio |
||||||||||||||||||||||||||||||||
October 31, 2025 |
1 |
% |
3 |
% |
8 |
% |
9 |
% |
25 |
% |
54 |
% |
– |
% |
– |
% |
||||||||||||||||
October 31, 2024 |
1 | % | 3 | % | 7 | % | 9 | % | 14 | % | 66 | % | – | % | – | % | ||||||||||||||||
Other international portfolio |
||||||||||||||||||||||||||||||||
October 31, 2025 |
9 |
% |
13 |
% |
20 |
% |
21 |
% |
22 |
% |
14 |
% |
1 |
% |
– |
% |
||||||||||||||||
October 31, 2024 |
7 | % | 12 | % | 20 | % | 21 | % | 23 | % | 16 | % | 1 | % | – | % | ||||||||||||||||
| (1) | Includes variable rate mortgages of $12.8 billion (2024: $28.9 billion), of which nil (2024: $17.6 billion) relates to mortgages in which all of the fixed contractual payments are currently being applied to interest based on the rates in effect at October 31, 2025 and October 31, 2024, respectively, and the terms of the mortgages, with the portion of the contractual interest requirement not met by the payments being added to the principal. Since the amortization profile reflected in this table is based on the current amount of existing contractual payments, it does not reflect that the contractual payment amount is required to be increased at the time of renewal by the amount necessary to reduce the amortization period down to the period in effect at the time the mortgage was originally provided. |
$ millions, as at or for the year ended October 31 |
2025 |
2024 | ||||||||||||||||||||||
Business and government loans |
Consumer loans |
Total |
Business and government loans |
Consumer loans |
Total | |||||||||||||||||||
Gross impaired loans |
||||||||||||||||||||||||
Balance at beginning of year |
$ |
1,628 |
$ |
1,286 |
$ |
2,914 |
$ | 1,956 | $ | 1,034 | $ | 2,990 | ||||||||||||
Classified as impaired during the year |
2,050 |
3,328 |
5,378 |
1,848 | 2,775 | 4,623 | ||||||||||||||||||
Transferred to performing during the year |
(172 |
) |
(506 |
) |
(678 |
) |
(162 | ) | (475 | ) | (637 | ) | ||||||||||||
Net repayments (1)
|
(1,067 |
) |
(1,037 |
) |
(2,104 |
) |
(1,139 | ) | (747 | ) | (1,886 | ) | ||||||||||||
Amounts written off |
(409 |
) |
(1,467 |
) |
(1,876 |
) |
(874 | ) | (1,302 | ) | (2,176 | ) | ||||||||||||
Foreign exchange and other |
1 |
1 |
2 |
(1 | ) | 1 | – | |||||||||||||||||
Balance at end of year |
$ |
2,031 |
$ |
1,605 |
$ |
3,636 |
$ | 1,628 | $ | 1,286 | $ | 2,914 | ||||||||||||
Allowance for credit losses – impaired loans |
$ |
491 |
$ |
491 |
$ |
982 |
$ | 392 | $ | 424 | $ | 816 | ||||||||||||
Net impaired loans (2)
|
||||||||||||||||||||||||
Balance at beginning of year |
$ |
1,236 |
$ |
862 |
$ |
2,098 |
$ | 1,289 | $ | 629 | $ | 1,918 | ||||||||||||
Net change in gross impaired |
403 |
319 |
722 |
(328 | ) | 252 | (76 | ) | ||||||||||||||||
Net change in allowance |
(99 |
) |
(67 |
) |
(166 |
) |
275 | (19 | ) | 256 | ||||||||||||||
Balance at end of year |
$ |
1,540 |
$ |
1,114 |
$ |
2,654 |
$ | 1,236 | $ | 862 | $ | 2,098 | ||||||||||||
Net impaired loans as a percentage of net loans and acceptances |
0.45 |
% |
0.38 | % | ||||||||||||||||||||
| (1) | Includes disposal of loans. |
| (2) | Net impaired loans are gross impaired loans net of stage 3 allowance for credit losses. |
|
CIBC
2025 |
|
62 |
|
Management’s discussion and a naly sis |
$ millions, as at October 31 |
31 to 90 days |
Over 90 days |
2025 Total |
2024 Total |
||||||||||||
Residential mortgages |
$ |
1,239 |
$ |
– |
$ |
1,239 |
$ | 1,216 | ||||||||
Personal |
251 |
– |
251 |
261 | ||||||||||||
Credit card |
259 |
181 |
440 |
392 | ||||||||||||
Business and government |
327 |
– |
327 |
226 | ||||||||||||
Total |
$ |
2,076 |
$ |
181 |
$ |
2,257 |
$ |
2,095 | ||||||||
Direct exposures |
||||||||||||||||||||||||||||||||||||||||||||||||
Funded |
Unfunded |
Derivative MTM receivables and repo-style transactions (1)
|
||||||||||||||||||||||||||||||||||||||||||||||
$ millions, as at October 31, 2025 |
Corporate |
Sovereign |
Banks |
Total funded (A) |
Corporate |
Banks |
Total unfunded (B) |
Corporate |
Sovereign |
Banks |
Net exposure (C) |
Total direct exposure (A)+(B)+(C) |
||||||||||||||||||||||||||||||||||||
U.K. |
$ |
11,560 |
$ |
1,011 |
$ |
2,610 |
$ |
15,181 |
$ |
10,298 |
$ |
1,297 |
$ |
11,595 |
$ |
390 |
$ |
57 |
$ |
595 |
$ |
1,042 |
$ |
27,818 |
||||||||||||||||||||||||
Europe excluding U.K. (2)
|
10,197 |
2,632 |
9,449 |
22,278 |
7,845 |
2,789 |
10,634 |
453 |
91 |
1,562 |
2,106 |
35,018 |
||||||||||||||||||||||||||||||||||||
Caribbean |
5,676 |
2,382 |
5,169 |
13,227 |
2,420 |
3,623 |
6,043 |
51 |
– |
249 |
300 |
19,570 |
||||||||||||||||||||||||||||||||||||
Latin America (3)
|
649 |
22 |
30 |
701 |
598 |
1 |
599 |
3 |
61 |
– |
64 |
1,364 |
||||||||||||||||||||||||||||||||||||
Asia |
2,834 |
1,668 |
1,826 |
6,328 |
421 |
757 |
1,178 |
– |
441 |
1,684 |
2,125 |
9,631 |
||||||||||||||||||||||||||||||||||||
Oceania (4)
|
6,083 |
1,235 |
930 |
8,248 |
3,915 |
242 |
4,157 |
33 |
1 |
45 |
79 |
12,484 |
||||||||||||||||||||||||||||||||||||
Other |
189 |
– |
27 |
216 |
509 |
1 |
510 |
– |
– |
4 |
4 |
730 |
||||||||||||||||||||||||||||||||||||
Total (5)
|
$ |
37,188 |
$ |
8,950 |
$ |
20,041 |
$ |
66,179 |
$ |
26,006 |
$ |
8,710 |
$ |
34,716 |
$ |
930 |
$ |
651 |
$ |
4,139 |
$ |
5,720 |
$ |
106,615 |
||||||||||||||||||||||||
October 31, 2024 |
$ |
32,732 |
$ |
10,255 |
$ |
14,484 |
$ |
57,471 |
$ |
20,602 |
$ |
6,625 |
$ |
27,227 |
$ |
891 |
$ |
911 |
$ |
2,607 |
$ |
4,409 |
$ |
89,107 |
||||||||||||||||||||||||
(1) |
The amounts shown are net of CVA and collateral. Collateral on derivative MTM receivables was $8.7 billion (2024: $8.3 billion), collateral on repo-style transactions was $160.3 billion (2024: $112.0 billion), and both comprise cash and investment grade debt securities. |
(2) |
Exposures to Russia and Ukraine are de minimis. |
(3) |
Includes Mexico, Central America and South America. |
(4) |
Includes Australia and New Zealand. |
(5) |
Excludes exposure of $6,588 million (2024: $6,419 million) to supranationals (a multinational organization or a political union comprising member nation-states). |
63 |
CIBC 2025 |
Management’s discussion and analysis |
|
CIBC
2025 ANNUAL REPORT |
|
64 |
|
Management’s discussion and analysis |
| • | Board limits control consolidated market risk; |
| • | Management limits control market risk for CIBC overall and are lower than the Board limits to allow for a buffer in the event of extreme market moves and/or extraordinary client needs; |
| • | Tier 2 limits control market risk at the business unit level; and |
| • | Tier 3 limits control market risk at the sub-business unit or desk level. |
| • | VaR enables the meaningful estimation of potential for losses in different businesses and asset classes. VaR is determined by the coherent modelling of VaR for each of interest rate, credit spread, equity, foreign exchange, and commodity, along with the portfolio effect arising from the interrelationship of the different risks (diversification effect): |
| • | Interest rate risk measures the impact of changes in interest rates and volatilities on cash instruments and derivatives. |
| • | Credit spread risk measures the impact of changes in credit spreads of provincial, municipal and agency bonds, sovereign bonds, corporate bonds, securitized products, and credit derivatives such as credit default swaps. |
| • | Equity risk measures the impact of changes in equity prices and volatilities. |
| • | Foreign exchange risk measures the impact of changes in foreign exchange rates and volatilities. |
| • | Commodity risk measures the impact of changes in commodity prices and volatilities, including the basis between related commodities. |
| • | Diversification effect reflects the risk reduction achieved across various financial instrument types, asset class, currencies, and regions. The extent of the diversification benefit depends on the correlation between the assets and risk factors in the portfolio at a particular time. |
65 |
CIBC 2025 |
Management’s discussion and analysis
|
• |
Price, rate and volatility sensitivities measure the change in value of a portfolio in response to a small change in a given underlying market factor, so that component risks may be examined in isolation, and the portfolio rebalanced or hedged accordingly to achieve a desired exposure. |
• |
Stressed VaR enables the meaningful estimation of the risks in different businesses and asset classes under stressful conditions. Changes to rates, prices, volatilities, and spreads over a 10-day horizon from a stressful historical period are applied to current positions to determine stressed VaR. |
• |
Back-testing validates the effectiveness of risk measurement through analysis of observed and theoretical profit and loss outcomes. |
• |
Stress testing and scenario analysis provide insight into portfolio behaviour under extreme circumstances. |
| • | Market risk capital is calculated under the standardized approach, including a default risk charge and the residual risk add-on, which is a charge for risk factors not captured well under the sensitivities based method. |
$ millions, as at October 31 |
2025 |
2024 |
||||||||||||||||||||||||||||||||||
Subject to market risk |
Subject to market risk |
|||||||||||||||||||||||||||||||||||
Consolidated balance sheet |
Trading |
Non- trading |
Not subject to market risk |
Consolidated balance sheet |
Trading |
Non- trading |
Not subject to market risk |
Non-traded riskprimary risk sensitivity |
||||||||||||||||||||||||||||
Cash and non-interest-bearing deposits with banks |
$ |
12,379 |
$ |
– |
$ |
3,138 |
$ |
9,241 |
$ |
8,565 |
$ |
– |
$ |
3,328 |
$ |
5,237 |
Foreign exchange |
|||||||||||||||||||
Interest-bearing deposits with banks |
31,624 |
– |
31,624 |
– |
39,499 |
– |
39,499 |
– |
Interest rate |
|||||||||||||||||||||||||||
Securities |
283,235 |
123,157 |
160,078 |
– |
254,345 |
100,969 |
153,376 |
– |
Interest rate, equity |
|||||||||||||||||||||||||||
Cash collateral on securities borrowed |
21,697 |
– |
21,697 |
– |
17,028 |
– |
17,028 |
– |
Interest rate |
|||||||||||||||||||||||||||
Securities purchased under resale agreements |
86,695 |
17,651 |
69,044 |
– |
83,721 |
24,977 |
58,744 |
– |
Interest rate |
|||||||||||||||||||||||||||
Loans |
||||||||||||||||||||||||||||||||||||
Residential mortgages |
287,033 |
– |
287,033 |
– |
280,672 |
– |
280,672 |
– |
Interest rate |
|||||||||||||||||||||||||||
Personal |
47,866 |
– |
47,866 |
– |
46,681 |
– |
46,681 |
– |
Interest rate |
|||||||||||||||||||||||||||
Credit card |
21,581 |
– |
21,581 |
– |
20,551 |
– |
20,551 |
– |
Interest rate |
|||||||||||||||||||||||||||
Business and government (1)
|
237,416 |
443 |
236,973 |
– |
214,305 |
101 |
214,204 |
– |
Interest rate |
|||||||||||||||||||||||||||
Allowance for credit losses |
(4,392 |
) |
– |
(4,392 |
) |
– |
(3,917 |
) |
– |
(3,917 |
) |
– |
Interest rate |
|||||||||||||||||||||||
Derivative instruments |
38,352 |
34,030 |
4,322 |
– |
36,435 |
33,482 |
2,953 |
– |
Interest rate, |
|||||||||||||||||||||||||||
foreign exchange |
||||||||||||||||||||||||||||||||||||
Other assets |
53,452 |
7,684 |
27,556 |
18,212 |
44,100 |
3,132 |
26,055 |
14,913 |
Interest rate, equity, |
|||||||||||||||||||||||||||
foreign exchange |
||||||||||||||||||||||||||||||||||||
Total assets |
$ |
1,116,938 |
$ |
182,965 |
$ |
906,520 |
$ |
27,453 |
$ |
1,041,985 |
$ |
162,661 |
$ |
859,174 |
$ |
20,150 |
||||||||||||||||||||
Deposits |
$ |
808,124 |
$ |
30,543 |
(2)
|
$ |
710,110 |
$ |
67,471 |
$ |
764,857 |
$ |
28,041 |
(2) |
$ |
673,215 |
$ |
63,601 |
Interest rate |
|||||||||||||||||
Obligations related to securities sold short |
24,244 |
24,101 |
143 |
– |
21,642 |
21,425 |
217 |
– |
Interest rate |
|||||||||||||||||||||||||||
Cash collateral on securities lent |
6,031 |
– |
6,031 |
– |
7,997 |
– |
7,997 |
– |
Interest rate |
|||||||||||||||||||||||||||
Obligations related to securities sold under repurchase agreements |
130,042 |
– |
130,042 |
– |
110,153 |
– |
110,153 |
– |
Interest rate |
|||||||||||||||||||||||||||
Derivative instruments |
41,411 |
40,236 |
1,175 |
– |
40,654 |
39,115 |
1,539 |
– |
Interest rate, |
|||||||||||||||||||||||||||
foreign exchange |
||||||||||||||||||||||||||||||||||||
Other liabilities (1)
|
34,854 |
4,032 |
16,854 |
13,968 |
30,210 |
3,261 |
13,808 |
13,141 |
Interest rate |
|||||||||||||||||||||||||||
Subordinated indebtedness |
7,819 |
– |
7,819 |
– |
7,465 |
– |
7,465 |
– |
Interest rate |
|||||||||||||||||||||||||||
Total liabilities |
$ |
1,052,525 |
$ |
98,912 |
$ |
872,174 |
$ |
81,439 |
$ |
982,978 |
$ |
91,842 |
$ |
814,394 |
$ |
76,742 |
||||||||||||||||||||
| (1) | Includes customers’ liability under acceptances of $10 million (2024: $6 million) in business and government loans and acceptances of $10 million (2024: $6 million) in other liabilities. Prior year amounts have been revised to conform to the presentation adopted in 2025. |
| (2) | Comprises FVO deposits which are considered trading for market risk purposes, including certain deposit notes that have equity risk exposures and are economically hedged by trading books. |
| • | The use of historical data for estimating future events will not encompass all potential events, particularly those that are extreme in nature. |
| • | The use of a one-day holding period assumes that all positions can be liquidated, or the risks offset in one day. This may not fully reflect the market risk arising at times of severe illiquidity, when a one-day period may be insufficient to liquidate or hedge all positions fully. |
| • | The use of a 99% confidence level does not take into account losses that might occur beyond this level of confidence. |
| • | VaR is calculated on the basis of exposures outstanding at the close of business and assumes no management action to mitigate losses. |
|
CIBC
2025 ANNUAL REPORT |
|
66 |
|
Management’s discussion and analysis |
$ millions, as at or for the year ended October 31 |
2025 |
2024 | ||||||||||||||||||||||||||||||
High |
Low |
As at |
Average |
High | Low | As at | Average | |||||||||||||||||||||||||
Interest rate risk |
$ |
14.2 |
$ |
4.1 |
$ |
11.8 |
$ |
7.9 |
$ | 18.7 | $ | 4.6 | $ | 6.3 | $ | 9.2 | ||||||||||||||||
Credit spread risk |
2.9 |
1.0 |
1.5 |
1.7 |
3.8 | 1.6 | 1.9 | 2.4 | ||||||||||||||||||||||||
Equity risk |
15.9 |
5.0 |
5.0 |
9.2 |
8.4 | 4.5 | 6.9 | 6.0 | ||||||||||||||||||||||||
Foreign exchange risk |
3.6 |
0.5 |
0.7 |
1.1 |
7.3 | 0.5 | 0.6 | 1.3 | ||||||||||||||||||||||||
Commodity risk |
9.0 |
1.1 |
2.5 |
3.3 |
5.2 | 1.2 | 1.2 | 2.8 | ||||||||||||||||||||||||
Diversification effect (1)
|
n/m |
n/m |
(12.2 |
) |
(11.8 |
) |
n/m | n/m | (9.4 | ) | (10.7 | ) | ||||||||||||||||||||
Total VaR (one-day measure) |
$ |
16.1 |
$ |
6.6 |
$ |
9.3 |
$ |
11.4 |
$ | 18.8 | $ | 5.8 | $ | 7.5 | $ | 11.0 | ||||||||||||||||
(1) |
Total VaR is less than the sum of the VaR of the different market risk types resulting from a portfolio diversification effect. |
n/m |
Not meaningful. It is not meaningful to compute a diversification effect because the high and low may occur on different days for different risk types. |
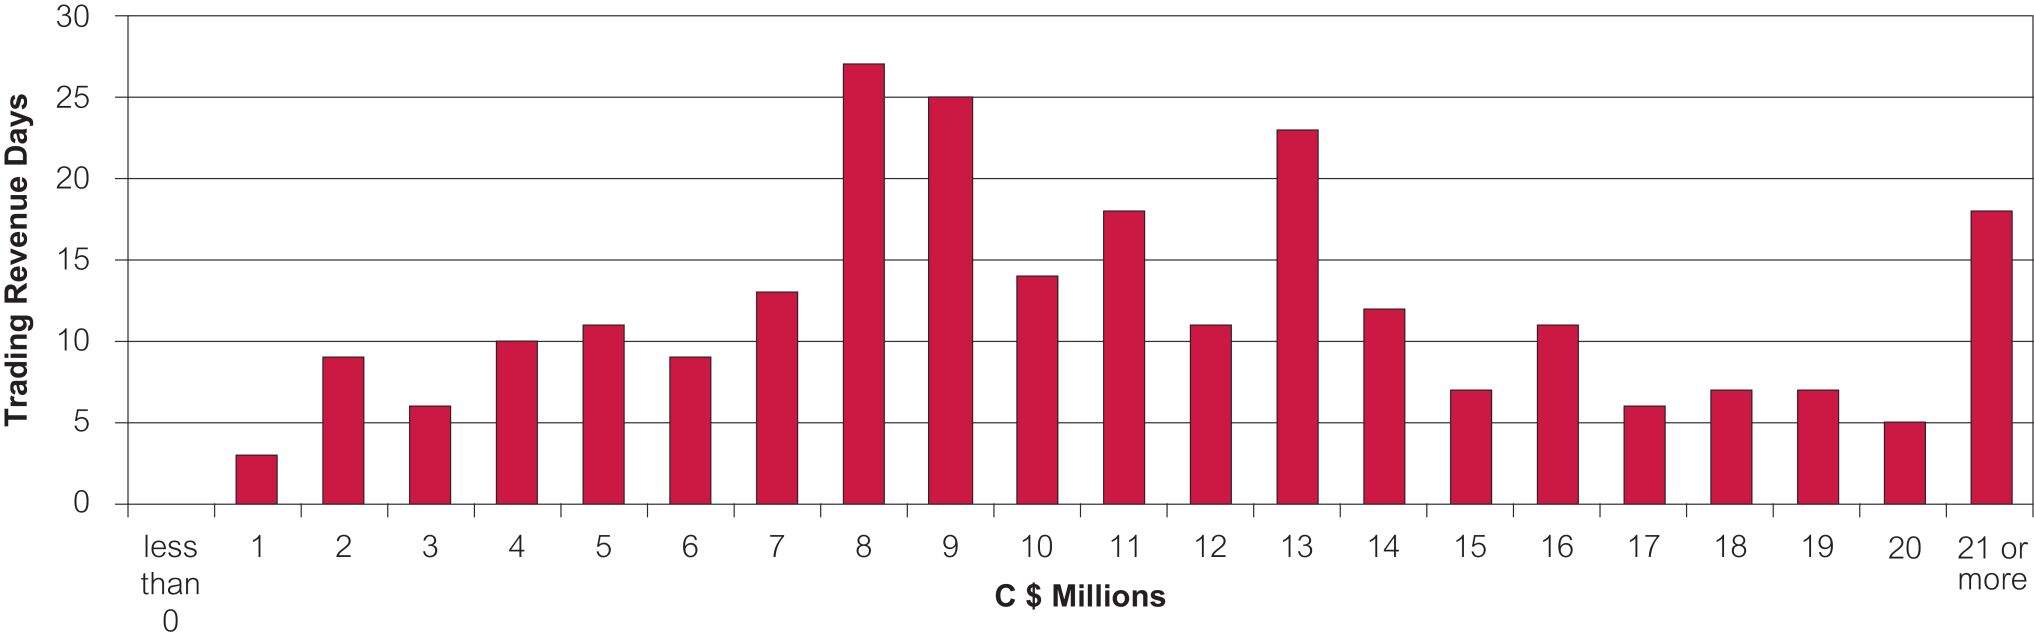
67 |
CIBC 2025 |
Management’s discussion and analysis |
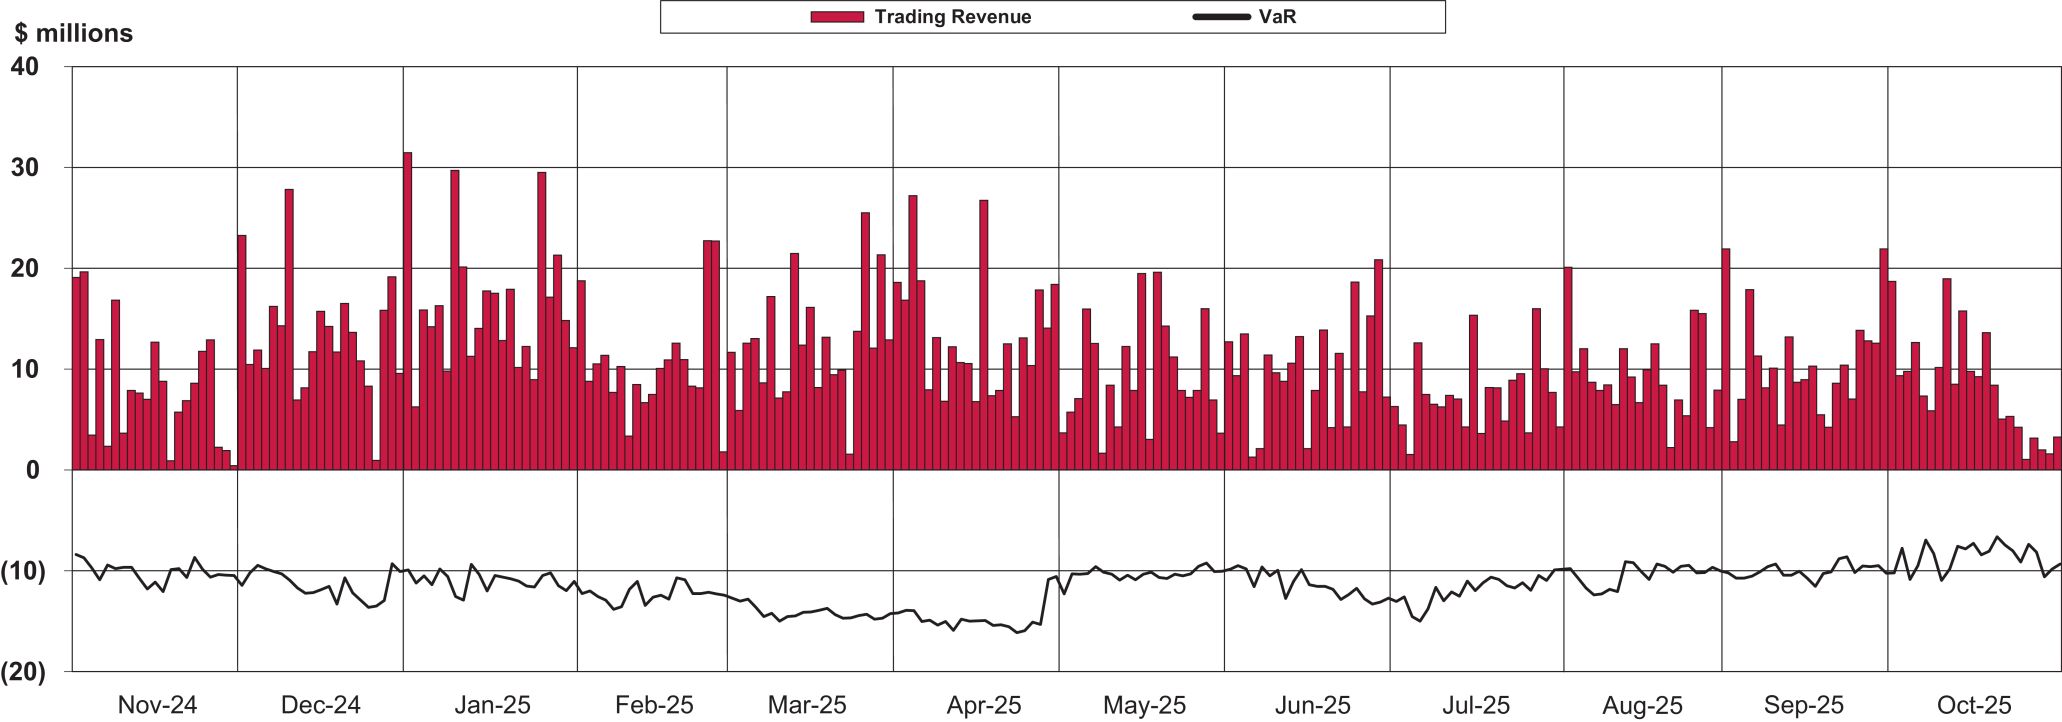
|
CIBC
2025 ANNUAL REPORT |
|
68 |
|
Management’s discussion and analysis |
$ millions (pre-tax), as at October 31 |
2025 |
2024 |
||||||||||||||||||||||
CAD (1)
|
USD |
Total |
CAD (1)
|
USD |
Total |
|||||||||||||||||||
100 basis point increase in interest rates |
||||||||||||||||||||||||
Increase (decrease) in net interest income |
$ |
137 |
$ |
26 |
$ |
163 |
$ | 159 | $ |
45 | $ |
204 | ||||||||||||
Increase (decrease) in EVE |
(1,168 |
) |
(510 |
) |
(1,678 |
) |
(956 | ) | (400 | ) | (1,356 | ) | ||||||||||||
100 basis point decrease in interest rates |
||||||||||||||||||||||||
Increase (decrease) in net interest income |
(220 |
) |
(29 |
) |
(249 |
) |
(193 | ) | (49 | ) | (242 | ) | ||||||||||||
Increase (decrease) in EVE |
1,025 |
500 |
1,525 |
829 | 408 | 1,237 | ||||||||||||||||||
| (1) | Includes CAD and other currency exposures. |
$ millions, as at October 31 |
Cost | Fair value | ||||||||
2025 |
Equity securities designated at FVOCI |
$ |
979 |
$ |
1,020 |
|||||
Equity-accounted investments in associates (1)
|
144 |
291 |
||||||||
Total |
$ |
1,123 |
$ |
1,311 |
||||||
| 2024 | Equity securities designated at FVOCI |
$ | 653 | $ | 672 | |||||
Equity-accounted investments in associates (1)
|
145 | 253 | ||||||||
| Total | $ | 798 | $ | 925 | ||||||
| (1) | Excludes our equity-accounted joint ventures. See Note 24 to the consolidated financial statements for further details. |
69 |
CIBC 2025 |
Management’s discussion and analysis |
|
CIBC
2025 ANNUAL REPORT |
|
70 |
|
Management’s discussion and analysis |
$ millions, as at October 31 |
Bank owned liquid assets |
Securities received as collateral |
Total liquid assets |
Encumbered liquid assets |
Unencumbered liquid assets (1)
|
|||||||||||||||||
2025 |
Cash and deposits with banks |
$ |
44,003 |
$ |
– |
$ |
44,003 |
$ |
285 |
$ |
43,718 |
|||||||||||
Securities issued or guaranteed by sovereigns, central banks, and multilateral development banks |
188,603 |
119,484 |
308,087 |
167,774 |
140,313 |
|||||||||||||||||
Other debt securities |
7,273 |
14,675 |
21,948 |
11,065 |
10,883 |
|||||||||||||||||
Equities |
72,778 |
44,189 |
116,967 |
76,927 |
40,040 |
|||||||||||||||||
Canadian government guaranteed National Housing Act mortgage-backed securities |
31,690 |
4,053 |
35,743 |
23,275 |
12,468 |
|||||||||||||||||
|
Other liquid assets (2)
|
20,834 |
4,616 |
25,450 |
10,708 |
14,742 |
|||||||||||||||||
Total |
$ |
365,181 |
$ |
187,017 |
$ |
552,198 |
$ |
290,034 |
$ |
262,164 |
||||||||||||
2024 |
Cash and deposits with banks | $ | 48,064 | $ | – | $ | 48,064 | $ | 560 | $ | 47,504 | |||||||||||
Securities issued or guaranteed by sovereigns, central banks, and multilateral development banks |
178,324 | 108,499 | 286,823 | 146,992 | 139,831 | |||||||||||||||||
| Other debt securities | 6,093 | 11,328 | 17,421 | 3,696 | 13,725 | |||||||||||||||||
| Equities | 58,102 | 33,424 | 91,526 | 54,269 | 37,257 | |||||||||||||||||
Canadian government guaranteed National Housing Act mortgage-backed securities |
35,155 | 2,038 | 37,193 | 20,263 | 16,930 | |||||||||||||||||
| Other liquid assets (2)
|
16,021 | 2,849 | 18,870 | 8,971 | 9,899 | |||||||||||||||||
| Total | $ | 341,759 | $ | 158,138 | $ | 499,897 | $ | 234,751 | $ | 265,146 | ||||||||||||
| (1) | Unencumbered liquid assets are defined as on-balance sheet assets, assets borrowed or purchased under resale agreements, and other off-balance sheet collateral received less encumbered liquid assets. |
| (2) | Includes cash pledged as collateral for derivatives transactions, select ABS and precious metals. |
$ millions, as at October 31 |
2025 |
2024 |
||||||
CIBC (parent) |
$ |
171,850 |
$ |
185,357 |
||||
Domestic subsidiaries |
16,327 |
7,882 |
||||||
Foreign subsidiaries |
73,987 |
71,907 |
||||||
Total |
$ |
262,164 |
$ |
265,146 |
||||
| Encumbered | Unencumbered | Total assets | ||||||||||||||||||||
$ millions, as at October 31 |
Pledged as collateral |
Other (1)
|
Available as collateral |
Other (2)
|
||||||||||||||||||
2025 |
Cash and deposits with banks |
$ |
– |
$ |
285 |
$ |
43,718 |
$ |
– |
$ |
44,003 |
|||||||||||
|
Securities (3)
|
259,632 |
6,842 |
205,978 |
– |
472,452 |
|||||||||||||||||
|
Loans, net of allowance for credit losses (4)
|
– |
67,227 |
23,509 |
498,760 |
589,496 |
|||||||||||||||||
Other assets |
8,132 |
– |
6,492 |
77,190 |
91,814 |
|||||||||||||||||
Total |
$ |
267,764 |
$ |
74,354 |
$ |
279,697 |
$ |
575,950 |
$ |
1,197,765 |
||||||||||||
2024 |
Cash and deposits with banks | $ | – | $ | 560 | $ | 47,504 | $ | – | $ | 48,064 | |||||||||||
| Securities (3)
|
206,861 | 7,117 | 200,712 | – | 414,690 | |||||||||||||||||
| Loans, net of allowance for credit losses (4)
|
– | 57,998 | 26,919 | 473,369 | 558,286 | |||||||||||||||||
| Other assets | 7,067 | – | 4,195 | 69,279 | 80,541 | |||||||||||||||||
| Total | $ | 213,928 | $ | 65,675 | $ | 279,330 | $ | 542,648 | $ | 1,101,581 | ||||||||||||
(1) |
Includes assets supporting CIBC’s long-term funding activities and assets restricted for legal or other reasons, such as restricted cash. |
(2) |
Other unencumbered assets are not subject to any restrictions on their use to secure funding or as collateral, however, they are not considered immediately available to existing borrowing programs. |
(3) |
Total securities comprise certain on-balance sheet securities, as well as off-balance sheet securities received under resale agreements, secured borrowings transactions, and collateral-for-collateral |
(4) |
Loans included as available as collateral represent the loans underlying National Housing Act mortgage-backed securities and Federal Home Loan Banks eligible loans. |
71 |
CIBC 2025 |
Management’s discussion and analysis |
$ millions, average of the three months ended October 31, 2025 |
Total unweighted value (1)
|
Total weighted value (2)
|
||||||||
HQLA |
||||||||||
| 1 | HQLA | n/a |
$ |
200,399 |
||||||
Cash outflows |
||||||||||
| 2 | Retail deposits and deposits from small business customers, of which: |
$ |
231,029 |
18,010 |
||||||
| 3 | Stable deposits |
100,387 |
3,012 |
|||||||
| 4 | Less stable deposits |
130,642 |
14,998 |
|||||||
| 5 | Unsecured wholesale funding, of which: |
250,329 |
104,154 |
|||||||
| 6 | Operational deposits (all counterparties) and deposits in networks of cooperative banks |
137,665 |
33,243 |
|||||||
| 7 | Non-operational deposits (all counterparties) |
93,576 |
51,823 |
|||||||
| 8 | Unsecured debt |
19,088 |
19,088 |
|||||||
| 9 | Secured wholesale funding |
n/a |
32,717 |
|||||||
| 10 | Additional requirements, of which: |
197,190 |
41,544 |
|||||||
| 11 | Outflows related to derivative exposures and other collateral requirements |
22,649 |
7,818 |
|||||||
| 12 | Outflows related to loss of funding on debt products |
6,152 |
6,152 |
|||||||
| 13 | Credit and liquidity facilities |
168,389 |
27,574 |
|||||||
| 14 | Other contractual funding obligations |
4,776 |
4,290 |
|||||||
| 15 | Other contingent funding obligations |
478,548 |
9,468 |
|||||||
| 16 | Total cash outflows |
n/a |
210,183 |
|||||||
Cash inflows |
||||||||||
| 17 | Secured lending (e.g. reverse repos) |
135,812 |
25,868 |
|||||||
| 18 | Inflows from fully performing exposures |
18,765 |
9,436 |
|||||||
| 19 | Other cash inflows | 22,920 |
22,920 |
|||||||
| 20 | Total cash inflows |
$ |
177,497 |
$ |
58,224 |
|||||
Total adjusted value |
||||||||||
| 21 | Total HQLA |
n/a |
$ |
200,399 |
||||||
| 22 | Total net cash outflows |
n/a |
$ |
151,959 |
||||||
| 23 | LCR |
n/a |
132 |
% |
||||||
$ millions, average of the three months ended July 31, 2025 |
Total adjusted value | |||||||||
| 24 | Total HQLA |
n/a | $ | 200,482 | ||||||
| 25 | Total net cash outflows | n/a | $ | 157,823 | ||||||
| 26 | LCR | n/a | 127 | % | ||||||
(1) |
Unweighted inflow and outflow values are calculated as outstanding balances maturing or callable within 30 days of various categories or types of liabilities, off-balance sheet items or contractual receivables. |
(2) |
Weighted values are calculated after the application of haircuts (for HQLA) and inflow and outflow rates prescribed by OSFI. |
n/a |
Not applicable as per the LCR common disclosure template. |
|
CIBC
2025 ANNUAL REPORT |
|
72 |
|
Management’s discussion and analysis |
73 |
CIBC 2025 |
Management’s discussion and analysis |
a |
b |
c |
d |
e |
||||||||||||||||||||||||||
Unweighted value by residual maturity |
||||||||||||||||||||||||||||||
$ millions, as at October 31, 2025 |
No maturity |
<6 months |
6 months to <1 year |
>1 year |
Weighted value |
|||||||||||||||||||||||||
ASF item |
||||||||||||||||||||||||||||||
| 1 | Capital |
$ |
64,162 |
$ |
– |
$ |
– |
$ |
7,325 |
$ |
71,487 |
|||||||||||||||||||
| 2 | Regulatory capital |
64,162 |
– |
– |
7,325 |
71,487 |
||||||||||||||||||||||||
| 3 | Other capital instruments |
– |
– |
– |
– |
– |
||||||||||||||||||||||||
| 4 | Retail deposits and deposits from small business customers |
204,661 |
50,730 |
20,326 |
19,017 |
272,767 |
||||||||||||||||||||||||
| 5 | Stable deposits |
90,721 |
21,222 |
9,885 |
9,864 |
125,601 |
||||||||||||||||||||||||
| 6 | Less stable deposits |
113,940 |
29,508 |
10,441 |
9,153 |
147,166 |
||||||||||||||||||||||||
| 7 |
Wholesale funding |
208,085 |
197,976 |
68,183 |
118,862 |
271,617 |
||||||||||||||||||||||||
| 8 | Operational deposits |
141,175 |
4,701 |
3 |
– |
72,939 |
||||||||||||||||||||||||
| 9 | Other wholesale funding |
66,910 |
193,275 |
68,180 |
118,862 |
198,678 |
||||||||||||||||||||||||
| 10 | Liabilities with matching interdependent assets |
– |
1,264 |
966 |
12,522 |
– |
||||||||||||||||||||||||
| 11 | Other liabilities |
– |
|
95,424 (1)
|
|
11,789 |
||||||||||||||||||||||||
| 12 | NSFR derivative liabilities |
9,790 (1)
|
||||||||||||||||||||||||||||
| 13 | All other liabilities and equity not included in the above categories |
– |
73,783 |
125 |
11,726 |
11,789 |
||||||||||||||||||||||||
| 14 | Total ASF |
627,660 |
||||||||||||||||||||||||||||
RSF item |
||||||||||||||||||||||||||||||
| 15 | Total NSFR HQLA |
26,569 |
||||||||||||||||||||||||||||
| 16 | Deposits held at other financial institutions for operational purposes |
– |
3,123 |
– |
106 |
1,667 |
||||||||||||||||||||||||
| 17 | Performing loans and securities |
127,207 |
133,365 |
76,407 |
342,017 |
448,941 |
||||||||||||||||||||||||
| 18 | Performing loans to financial institutions secured by Level 1 HQLA |
– |
19,372 |
4,869 |
207 |
3,627 |
||||||||||||||||||||||||
| 19 | Performing loans to financial institutions secured by non-Level 1 HQLA and unsecured performing loans to financial institutions |
4,309 |
54,682 |
7,074 |
14,336 |
28,122 |
||||||||||||||||||||||||
| 20 | Performing loans to non-financial corporate clients, loans to retail and small business customers, and loans to sovereigns, central banks and publicsector entities, of which: |
80,256 |
23,041 |
19,263 |
134,385 |
203,691 |
||||||||||||||||||||||||
| 21 | With a risk weight of less than or equal to 35% under the Basel II standardized approach for credit risk |
– |
– |
– |
– |
– |
||||||||||||||||||||||||
| 22 | Performing residential mortgages, of which: |
18,958 |
34,448 |
44,445 |
182,310 |
182,919 |
||||||||||||||||||||||||
| 23 | With a risk weight of less than or equal to 35% under the Basel II standardized approach for credit risk |
18,958 |
34,366 |
44,368 |
176,590 |
177,978 |
||||||||||||||||||||||||
| 24 | Securities that are not in default and do not qualify as HQLA, including exchange-traded equities |
23,684 |
1,822 |
756 |
10,779 |
30,582 |
||||||||||||||||||||||||
| 25 | Assets with matching interdependent liabilities |
– |
1,264 |
966 |
12,522 |
– |
||||||||||||||||||||||||
| 26 | Other assets |
17,275 |
|
87,448 (1)
|
|
48,480 |
||||||||||||||||||||||||
| 27 | Physical traded commodities, including gold |
6,492 |
5,518 |
|||||||||||||||||||||||||||
| 28 | Assets posted as initial margin for derivative contracts and contributions to default funds of central counterparties |
12,964 (1)
|
11,019 |
|||||||||||||||||||||||||||
| 29 | NSFR derivative assets |
|
10,555 (1)
|
|
764 |
|||||||||||||||||||||||||
| 30 | NSFR derivative liabilities before deduction of variation margin posted |
|
27 (1)
|
|
1,067 |
|||||||||||||||||||||||||
| 31 | All other assets not included in the above categories |
10,783 |
54,376 |
193 |
9,333 |
30,112 |
||||||||||||||||||||||||
| 32 | Off-balance sheet items |
|
505,253 (1)
|
|
17,483 |
|||||||||||||||||||||||||
| 33 | Total RSF |
$ |
543,140 |
|||||||||||||||||||||||||||
| 34 | NSFR |
116 |
% |
|||||||||||||||||||||||||||
$ millions, as at July 31, 2025 |
Weighted value |
|||||||||||||||||||||||||||||
| 35 | Total ASF | $ | 613,114 | |||||||||||||||||||||||||||
| 36 | Total RSF | $ | 532,026 | |||||||||||||||||||||||||||
| 37 | NSFR | 115 | % | |||||||||||||||||||||||||||
$ millions, as at October 31, 2024 |
Weighted value |
|||||||||||||||||||||||||||||
| 38 | Total ASF | $ | 579,137 | |||||||||||||||||||||||||||
| 39 | Total RSF | $ | 503,435 | |||||||||||||||||||||||||||
| 40 | NSFR | 115 | % | |||||||||||||||||||||||||||
| (1) | No assigned time period per disclosure template design. |
|
CIBC
2025 |
|
74 |
|
Management’s discussion and analysis |
$ millions, as at October 31, 2025 |
Less than 1 month |
1–3 months |
3–6 months |
6–12 months |
Less than 1 year total |
1–2 years |
Over 2 years |
Total | ||||||||||||||||||||||||
Deposits from banks (1)
|
$ |
2,605 |
$ |
460 |
$ |
617 |
$ |
2,340 |
$ |
6,022 |
$ |
– |
$ |
– |
$ |
6,022 |
||||||||||||||||
Certificates of deposit and commercial paper |
14,076 |
10,783 |
20,043 |
30,253 |
75,155 |
1,296 |
– |
76,451 |
||||||||||||||||||||||||
Bearer deposit notes and bankers’ acceptances |
331 |
871 |
4,351 |
1,284 |
6,837 |
– |
– |
6,837 |
||||||||||||||||||||||||
Senior unsecured medium-term notes (2)
|
– |
2,160 |
4,487 |
13,079 |
19,726 |
20,151 |
28,624 |
68,501 |
||||||||||||||||||||||||
Senior unsecured structured notes |
– |
– |
70 |
46 |
116 |
– |
70 |
186 |
||||||||||||||||||||||||
Covered bonds/asset-backed securities |
||||||||||||||||||||||||||||||||
Mortgage securitization (3)
|
– |
750 |
200 |
951 |
1,901 |
2,153 |
11,198 |
15,252 |
||||||||||||||||||||||||
Covered bonds |
– |
2,803 |
6,762 |
8,811 |
18,376 |
7,761 |
22,124 |
48,261 |
||||||||||||||||||||||||
Cards securitization |
– |
117 |
– |
1,359 |
1,476 |
– |
989 |
2,465 |
||||||||||||||||||||||||
Subordinated liabilities |
– |
– |
– |
– |
– |
– |
7,819 |
7,819 |
||||||||||||||||||||||||
Other (4)
|
– |
– |
– |
– |
– |
– |
8 |
8 |
||||||||||||||||||||||||
Total |
$ |
17,012 |
$ |
17,944 |
$ |
36,530 |
$ |
58,123 |
$ |
129,609 |
$ |
31,361 |
$ |
70,832 |
$ |
231,802 |
||||||||||||||||
Of which: |
||||||||||||||||||||||||||||||||
Secured |
$ |
– |
$ |
3,670 |
$ |
6,962 |
$ |
11,121 |
$ |
21,753 |
$ |
9,914 |
$ |
34,311 |
$ |
65,978 |
||||||||||||||||
Unsecured |
17,012 |
14,274 |
29,568 |
47,002 |
107,856 |
21,447 |
36,521 |
165,824 |
||||||||||||||||||||||||
Total |
$ |
17,012 |
$ |
17,944 |
$ |
36,530 |
$ |
58,123 |
$ |
129,609 |
$ |
31,361 |
$ |
70,832 |
$ |
231,802 |
||||||||||||||||
October 31, 2024 |
$ | 25,956 | $ | 11,157 | $ | 43,907 | $ | 36,822 | $ | 117,842 | $ | 34,558 | $ | 62,917 | $ | 215,317 | ||||||||||||||||
(1) |
Includes non-negotiable term deposits from banks. |
(2) |
Includes wholesale funding liabilities which are subject to conversion under bail-in regulations. See the “Capital management” section for additional details. |
(3) |
Includes $500 million (2024: $500 million) of HELOC securitization. |
(4) |
Includes Federal Home Loan Bank (FHLB) deposits. |
$ billions, as at October 31 |
2025 |
2024 |
||||||||||||||
CAD |
$ |
49.8 |
21 |
% |
$ |
48.8 |
23 |
% |
||||||||
USD |
124.2 |
54 |
124.3 |
57 |
||||||||||||
Other |
57.8 |
25 |
42.2 |
20 |
||||||||||||
Total |
$ |
231.8 |
100 |
% |
$ |
215.3 |
100 |
% |
||||||||
75 |
CIBC 2025 |
Management’s discussion and analysis |
As at October 31, 2025 |
Morningstar DBRS |
Fitch |
Moody’s |
S&P |
||||||||||||||||||||||||||||
Deposit/Counterparty (1)
|
AA |
AA |
Aa2 |
A+ |
||||||||||||||||||||||||||||
Senior debt (2)
|
AA |
AA |
Aa2 |
A+ |
||||||||||||||||||||||||||||
Bail-in senior debt (3)
|
AA(L) |
AA- |
A2 |
A- |
||||||||||||||||||||||||||||
Subordinated indebtedness |
A(H) |
A |
Baa1 |
A- |
||||||||||||||||||||||||||||
Subordinated indebtedness – NVCC (4)
|
A(L) |
A |
Baa1 |
BBB+ |
||||||||||||||||||||||||||||
Limited recourse capital notes – NVCC (4)(5)
|
BBB(H) |
BBB+ |
Baa3 |
BBB- |
||||||||||||||||||||||||||||
Preferred shares – NVCC (4)(5)
|
Pfd-2 |
BBB+ |
Baa3 |
P-2(L) |
||||||||||||||||||||||||||||
Short-term debt |
R-1(H) |
F1+ |
P-1 |
A-1 |
||||||||||||||||||||||||||||
Outlook |
Stable |
Stable |
Stable |
Stable |
||||||||||||||||||||||||||||
| (1) | Morningstar DBRS Long-Term Issuer Rating; Fitch Long-Term Deposit Rating and Derivative Counterparty Rating; Moody’s Long-Term Deposit and Counterparty Risk Assessment Rating; S&P’s Issuer Credit Rating. |
| (2) | Includes senior debt issued on or after September 23, 2018 which is not subject to bail-in regulations. |
| (3) | Comprises liabilities which are subject to conversion under bail-in regulations. See the “Capital management” section for additional details. |
| (4) | Comprises instruments which are treated as NVCC in accordance with OSFI’s CAR Guideline. |
| (5) | Morningstar DBRS rating does not apply to limited recourse capital notes and associated preferred shares issued in USD. Fitch rating only applies to limited recourse capital notes and associated preferred shares issued in USD. |
$ billions, as at October 31 |
2025 |
2024 |
||||||
One-notch downgrade |
$ |
– |
$ |
– |
||||
Two-notch downgrade |
0.1 |
0.1 |
||||||
Three-notch downgrade |
0.4 |
0.3 |
||||||
| $ millions, as at October 31, 2025 | Less than 1 month |
1–3 months |
3–6 months |
6–9 months |
9–12 months |
1–2 years |
2–5 years |
Over 5 years |
No specified maturity |
Total | ||||||||||||||||||||||||||||||
Assets |
||||||||||||||||||||||||||||||||||||||||
Cash and non-interest-bearing deposits with banks (1)
|
$ |
12,379 |
$ |
– |
$ |
– |
$ |
– |
$ |
– |
$ |
– |
$ |
– |
$ |
– |
$ |
– |
$ |
12,379 |
||||||||||||||||||||
Interest-bearing deposits with banks |
31,624 |
– |
– |
– |
– |
– |
– |
– |
– |
31,624 |
||||||||||||||||||||||||||||||
Securities |
15,132 |
7,574 |
6,635 |
6,602 |
6,755 |
34,882 |
73,820 |
55,038 |
76,797 |
283,235 |
||||||||||||||||||||||||||||||
Cash collateral on securities borrowed |
21,697 |
– |
– |
– |
– |
– |
– |
– |
– |
21,697 |
||||||||||||||||||||||||||||||
Securities purchased under resale agreements |
48,191 |
16,407 |
11,948 |
4,711 |
1,085 |
4,322 |
31 |
– |
– |
86,695 |
||||||||||||||||||||||||||||||
Loans |
||||||||||||||||||||||||||||||||||||||||
Residential mortgages |
5,570 |
11,306 |
22,139 |
18,681 |
30,614 |
84,232 |
104,412 |
10,079 |
– |
287,033 |
||||||||||||||||||||||||||||||
Personal |
1,082 |
439 |
960 |
725 |
627 |
705 |
5,004 |
5,941 |
32,383 |
47,866 |
||||||||||||||||||||||||||||||
Credit card |
453 |
906 |
1,360 |
1,360 |
1,360 |
5,438 |
10,704 |
– |
– |
21,581 |
||||||||||||||||||||||||||||||
Business and government (2)
|
5,092 |
9,057 |
13,280 |
17,994 |
13,736 |
55,665 |
87,796 |
22,994 |
11,802 |
237,416 |
||||||||||||||||||||||||||||||
Allowance for credit losses |
– |
– |
– |
– |
– |
– |
– |
– |
(4,392 |
) |
(4,392 |
) |
||||||||||||||||||||||||||||
Derivative instruments |
1,112 |
7,349 |
3,399 |
2,167 |
1,829 |
7,110 |
8,807 |
6,579 |
– |
38,352 |
||||||||||||||||||||||||||||||
Other assets |
– |
– |
– |
– |
– |
– |
– |
– |
53,452 |
53,452 |
||||||||||||||||||||||||||||||
Total assets |
$ |
142,332 |
$ |
53,038 |
$ |
59,721 |
$ |
52,240 |
$ |
56,006 |
$ |
192,354 |
$ |
290,574 |
$ |
100,631 |
$ |
170,042 |
$ |
1,116,938 |
||||||||||||||||||||
October 31, 2024 (2)
|
$ | 130,008 | $ | 45,680 | $ | 57,993 | $ | 52,094 | $ | 61,184 | $ | 186,218 | $ | 260,975 | $ | 101,546 | $ | 146,287 | $ | 1,041,985 | ||||||||||||||||||||
Liabilities |
||||||||||||||||||||||||||||||||||||||||
Deposits (3)
|
$ |
43,722 |
$ |
36,883 |
$ |
61,945 |
$ |
54,413 |
$ |
47,718 |
$ |
48,626 |
$ |
70,730 |
$ |
27,856 |
$ |
416,231 |
$ |
808,124 |
||||||||||||||||||||
Obligations related to securities sold short |
24,244 |
– |
– |
– |
– |
– |
– |
– |
– |
24,244 |
||||||||||||||||||||||||||||||
Cash collateral on securities lent |
6,031 |
– |
– |
– |
– |
– |
– |
– |
– |
6,031 |
||||||||||||||||||||||||||||||
Obligations related to securities sold under repurchase agreements |
91,742 |
32,572 |
1,060 |
734 |
934 |
– |
3,000 |
– |
– |
130,042 |
||||||||||||||||||||||||||||||
Derivative instruments |
2,924 |
7,635 |
4,157 |
3,136 |
2,333 |
6,625 |
4,787 |
9,814 |
– |
41,411 |
||||||||||||||||||||||||||||||
Other liabilities (2)
|
21 |
43 |
66 |
70 |
69 |
270 |
633 |
808 |
32,874 |
34,854 |
||||||||||||||||||||||||||||||
Subordinated indebtedness |
– |
– |
– |
– |
– |
– |
33 |
7,786 |
– |
7,819 |
||||||||||||||||||||||||||||||
Equity |
– |
– |
– |
– |
– |
– |
– |
– |
64,413 |
64,413 |
||||||||||||||||||||||||||||||
Total liabilities and equity |
$ |
168,684 |
$ |
77,133 |
$ |
67,228 |
$ |
58,353 |
$ |
51,054 |
$ |
55,521 |
$ |
79,183 |
$ |
46,264 |
$ |
513,518 |
$ |
1,116,938 |
||||||||||||||||||||
October 31, 2024 (2)
|
$ | 188,502 | $ | 48,833 | $ | 75,616 | $ | 49,168 | $ | 46,158 | $ | 55,388 | $ | 73,705 | $ | 39,445 | $ | 465,170 | $ | 1,041,985 | ||||||||||||||||||||
| (1) | Cash includes interest-bearing demand deposits with the Bank of Canada. |
| (2) | Includes customers’ liability under acceptances of $ 10 million (2024: $6 million) in business and government loans and acceptances of $10 million (2024: $6 million) in other liabilities. Prior year amounts have been revised to conform to the presentation adopted in 2025. |
| (3) | Comprises $258.1 billion (2024: $252.9 billion) of personal deposits; $523.3 billion (2024: $492.0 billion) of business and government deposits and secured borrowings; and $26.7 billion (2024: $20.0 billion) of bank deposits. |
|
CIBC
2025 ANNUAL REPORT |
|
76 |
|
Management’s discussion and analysis |
$ millions, as at October 31, 2025 |
Less than 1 month |
1–3 months |
3–6 months |
6–9 months |
9–12 months |
1–2 years |
2–5 years |
Over 5 years |
No specified maturity (1)
|
Total | ||||||||||||||||||||||||||||||
Unutilized credit commitments |
$ |
2,457 |
$ |
9,030 |
$ |
5,805 |
$ |
8,686 |
$ |
7,594 |
$ |
25,457 |
$ |
92,976 |
$ |
5,201 |
$ |
263,236 |
$ |
420,442 |
||||||||||||||||||||
Standby and performance letters of credit |
7,414 |
3,579 |
4,089 |
5,071 |
4,229 |
896 |
852 |
228 |
– |
26,358 |
||||||||||||||||||||||||||||||
Backstop liquidity facilities |
56 |
30,347 |
66 |
171 |
185 |
369 |
– |
– |
– |
31,194 |
||||||||||||||||||||||||||||||
Documentary and commercial letters of credit |
85 |
38 |
20 |
4 |
1 |
– |
19 |
– |
– |
167 |
||||||||||||||||||||||||||||||
Other |
|
2,667 |
(2)
|
– |
– |
– |
– |
– |
– |
– |
55 |
2,722 |
||||||||||||||||||||||||||||
Total |
$ |
12,679 |
$ |
42,994 |
$ |
9,980 |
$ |
13,932 |
$ |
12,009 |
$ |
26,722 |
$ |
93,847 |
$ |
5,429 |
$ |
263,291 |
$ |
480,883 |
||||||||||||||||||||
October 31, 2024 |
$ | 18,455 | $ | 35,462 | $ | 8,910 | $ | 11,720 | $ | 12,084 | $ | 26,766 | $ | 77,636 | $ | 3,562 | $ | 245,816 | $ | 440,411 | ||||||||||||||||||||
| (1) | Includes $201.5 billion (2024: $189.6 billion) of personal, home equity and credit card lines, which are unconditionally cancellable at our discretion. |
| (2) | Includes forward-dated securities financing trades. |
| $ millions, as at October 31, 2025 | Less than 1 month |
1–3 months |
3–6 months |
6–9 months |
9–12 months |
1–2 years |
2–5 years |
Over 5 years |
Total | |||||||||||||||||||||||||||
Purchase obligations (1)
|
$ |
149 |
$ |
241 |
$ |
270 |
$ |
275 |
$ |
232 |
$ |
566 |
$ |
741 |
$ |
229 |
$ |
2,703 |
||||||||||||||||||
Investment commitments |
– |
1 |
12 |
– |
2 |
9 |
46 |
483 |
553 |
|||||||||||||||||||||||||||
Future lease commitments (2)
|
1 |
4 |
6 |
6 |
7 |
35 |
93 |
421 |
573 |
|||||||||||||||||||||||||||
Pension contributions (3)
|
15 |
30 |
45 |
45 |
45 |
– |
– |
– |
180 |
|||||||||||||||||||||||||||
Underwriting commitments |
1,045 |
– |
– |
– |
– |
– |
– |
– |
1,045 |
|||||||||||||||||||||||||||
Total |
$ |
1,210 |
$ |
276 |
$ |
333 |
$ |
326 |
$ |
286 |
$ |
610 |
$ |
880 |
$ |
1,133 |
$ |
5,054 |
||||||||||||||||||
October 31, 2024 (2)
|
$ | 607 | $ | 263 | $ | 292 | $ | 321 | $ | 279 | $ | 737 | $ | 850 | $ | 1,203 | $ | 4,552 | ||||||||||||||||||
| (1) | Obligations that are legally binding agreements whereby we agree to purchase products or services with specific minimum or baseline quantities defined at fixed, minimum or variable prices over a specified period of time are defined as purchase obligations. Purchase obligations are included through to the termination date specified in the respective agreements, even if the contract is renewable. Many of the purchase agreements for goods and services include clauses that would allow us to cancel the agreement prior to expiration of the contract within a specific notice period. However, the amount above includes our obligations without regard to such termination clauses (unless actual notice of our intention to terminate the agreement has been communicated to the counterparty). The table excludes purchases of debt and equity instruments that settle within standard market time frames. |
| (2) | Excludes lease obligations that are accounted for under IFRS 16, which are recognized on the consolidated balance sheet, and operating and tax expenses relating to lease commitments. The table includes lease obligations that are not accounted for under IFRS 16, including those related to future starting lease commitments for which we have not yet recognized a lease liability and right-of-use |
| (3) | Includes estimated minimum funding contributions for our funded defined benefit pension plans in Canada, the U.S., the U.K., and the Caribbean. Estimated minimum funding contributions are included only for the next annual period as the minimum contributions are affected by various factors, such as market performance and regulatory requirements, and are therefore subject to significant variability. |
77 |
CIBC 2025 |
Management’s discussion and analysis |
|
CIBC
2025 ANNUAL REPORT |
|
78 |
|
Management’s discussion and analysis |
79 |
CIBC 2025 |
Management’s discussion and analysis |
|
CIBC
2025 |
|
80 |
|
Management’s discussion and analysis |
81 |
CIBC 2025 |
Management’s discussion and analysis |
$ millions, as at October 31 |
2025 |
2024 |
||||||||||||||
Level 3 |
Total (1)
|
Level 3 |
Total (1)
|
|||||||||||||
Assets |
||||||||||||||||
Securities and loans measured at FVTPL |
$ |
1,099 |
0.8 |
% |
$ |
612 |
0.6 |
% |
||||||||
Equity securities designated at FVOCI |
534 |
0.6 |
203 |
0.3 |
||||||||||||
Derivative instruments |
166 |
0.4 |
101 |
0.3 |
||||||||||||
Total |
$ |
1,799 |
0.7 |
% |
$ |
916 |
0.4 |
% |
||||||||
Liabilities |
||||||||||||||||
Deposits and other liabilities (2)
|
$ |
476 |
1.1 |
% |
$ |
416 |
1.0 |
% |
||||||||
Derivative instruments |
1,143 |
2.8 |
1,083 |
2.7 |
||||||||||||
Total |
$ |
1,619 |
1.4 |
% |
$ |
1,499 |
1.3 |
% |
||||||||
(1) |
Represents the percentage of Level 3 assets and liabilities over total assets and liabilities for each reported category that are carried on the consolidated balance sheet at fair value. |
(2) |
Includes FVO deposits and bifurcated embedded derivatives. |
|
CIBC
2025 ANNUAL REPORT |
|
82 |
|
Management’s discussion and analysis |
| • | Determining when a significant increase in credit risk of a loan has occurred; |
| • | Measuring both 12-month and lifetime credit losses; and |
| • | Forecasting forward-looking information for multiple scenarios and determining the probability weighting of each scenario. |
Regulatory Capital |
IFRS 9 |
|||
| PD |
Through-the-cycle long-run average PD throughout a full economic cycle |
Point-in-time 12-month or lifetime PD based on current conditions and relevant forward-looking assumptions |
||
| LGD |
Downturn LGD based on losses that would be expected in an economic downturn and subject to certain regulatory floors Discounted using the cost of capital or opportunity cost |
Unbiased probability-weighted LGD based on estimated LGD including impact of relevant forward-looking assumptions such as changes in collateral value Discounted using the effective interest rate |
||
| EAD | Based on the drawn balance plus expected utilization of any undrawn portion prior to default, and cannot be lower than the drawn balance | Amortization and repayment of principal and interest from the balance sheet date to the default date is also captured | ||
| Other | ECL is discounted from the default date to the reporting date | |||
83 |
CIBC 2025 |
Management’s discussion and analysis |
| • | We have transferred substantially all the risks and rewards of the asset; or |
| • | We have neither transferred nor retained substantially all the risks and rewards of the asset, but have transferred control of the asset. |
|
CIBC
2025 |
|
84 |
|
Management’s discussion and analysis |
85 |
CIBC 2025 |
Management’s discussion and analysis |
|
(1) |
Key management personnel are defined as those persons having authority and responsibility for planning, directing and controlling the activities of CIBC directly or indirectly and comprise the members of the Board (referred to as directors), Group ELT and certain named officers per the Bank Act |
|
CIBC
2025 |
|
86 |
|
Management’s discussion and analysis |
87 |
CIBC 2025 |
Management’s discussion and analysis |
| Average balance (1)
|
Interest | Average rate | ||||||||||||||||||||||||||||||||||||
$ millions, for the year ended October 31 |
2025 |
2024 | 2023 | 2025 |
2024 | 2023 | 2025 |
2024 | 2023 | |||||||||||||||||||||||||||||
Domestic assets (2)
|
||||||||||||||||||||||||||||||||||||||
Cash and deposits with banks |
$ |
12,308 |
$ | 12,159 | $ | 23,261 | $ |
465 |
$ | 774 | $ | 1,265 | 3.78 |
% |
6.37 | % | 5.44 | % | ||||||||||||||||||||
Securities |
130,315 |
114,317 | 99,012 | 5,428 |
5,473 | 4,629 | 4.17 |
4.79 | 4.68 | |||||||||||||||||||||||||||||
Securities borrowed or purchased under resale agreements |
40,434 |
30,394 | 30,377 | 1,827 |
1,691 | 1,646 | 4.52 |
5.56 | 5.42 | |||||||||||||||||||||||||||||
Loans |
Residential mortgages |
277,571 |
269,759 | 265,871 | 11,204 |
12,454 | 11,236 | 4.04 |
4.62 | 4.23 | ||||||||||||||||||||||||||||
Personal |
44,493 |
43,476 | 43,029 | 3,124 |
3,638 | 3,382 | 7.02 |
8.37 | 7.86 | |||||||||||||||||||||||||||||
Credit card |
19,912 |
18,687 | 16,335 | 2,804 |
2,480 | 2,080 | 14.08 |
13.27 | 12.73 | |||||||||||||||||||||||||||||
Business and government |
111,409 |
103,026 | 97,113 | 6,099 |
6,831 | 5,888 | 5.47 |
6.63 | 6.06 | |||||||||||||||||||||||||||||
Total loans |
453,385 |
434,948 | 422,348 | 23,231 |
25,403 | 22,586 | 5.12 |
5.84 | 5.35 | |||||||||||||||||||||||||||||
Other interest-bearing assets |
6,235 |
4,699 | 5,556 | 293 |
254 | 254 | 4.70 |
5.41 | 4.57 | |||||||||||||||||||||||||||||
Derivative instruments |
13,612 |
14,484 | 15,569 | – |
– | – | – |
– | – | |||||||||||||||||||||||||||||
Customers’ liability under acceptances |
11 |
5,907 | 11,497 | – |
– | – | – |
– | – | |||||||||||||||||||||||||||||
Other non-interest-bearing assets |
29,779 |
21,076 | 23,779 | – |
– | – | – |
– | – | |||||||||||||||||||||||||||||
Total domestic assets |
686,079 |
637,984 | 631,399 | 31,244 |
33,595 | 30,380 | 4.55 |
5.27 | 4.81 | |||||||||||||||||||||||||||||
Foreign assets (2)
|
||||||||||||||||||||||||||||||||||||||
Cash and deposits with banks |
47,411 |
43,717 | 36,817 | 1,917 |
2,115 | 1,612 | 4.04 |
4.84 | 4.38 | |||||||||||||||||||||||||||||
Securities |
144,682 |
125,979 | 97,449 | 3,617 |
4,087 | 2,712 | 2.50 |
3.24 | 2.78 | |||||||||||||||||||||||||||||
Securities borrowed or purchased under resale agreements |
70,266 |
67,679 | 53,527 | 3,433 |
4,120 | 2,920 | 4.89 |
6.09 | 5.46 | |||||||||||||||||||||||||||||
Loans |
Residential mortgages |
5,850 |
5,569 | 5,294 | 273 |
267 | 251 | 4.67 |
4.79 | 4.74 | ||||||||||||||||||||||||||||
Personal |
1,416 |
1,319 | 1,335 | 105 |
98 | 65 | 7.42 |
7.43 | 4.87 | |||||||||||||||||||||||||||||
Credit card |
169 |
151 | 143 | 36 |
32 | 30 | 21.30 |
21.19 | 20.98 | |||||||||||||||||||||||||||||
Business and government |
112,737 |
96,332 | 94,599 | 7,940 |
7,701 | 6,894 | 7.04 |
7.99 | 7.29 | |||||||||||||||||||||||||||||
Total loans |
120,172 |
103,371 | 101,371 | 8,354 |
8,098 | 7,240 | 6.95 |
7.83 | 7.14 | |||||||||||||||||||||||||||||
Other interest-bearing assets |
3,557 |
2,566 | 2,480 | 196 |
170 | 155 | 5.51 |
6.63 | 6.25 | |||||||||||||||||||||||||||||
Derivative instruments |
23,176 |
15,075 | 16,866 | – |
– | – | – |
– | – | |||||||||||||||||||||||||||||
Other non-interest-bearing assets |
8,942 |
8,762 | 8,212 | – |
– | – | – |
– | – | |||||||||||||||||||||||||||||
Total foreign assets |
418,206 |
367,149 | 316,722 | 17,517 |
18,590 | 14,639 | 4.19 |
5.06 | 4.62 | |||||||||||||||||||||||||||||
Total assets |
$ |
1,104,285 |
$ | 1,005,133 | $ | 948,121 | $ |
48,761 |
$ | 52,185 | $ | 45,019 | 4.42 |
% |
5.19 | % | 4.75 | % | ||||||||||||||||||||
Domestic liabilities (2)
|
||||||||||||||||||||||||||||||||||||||
Deposits |
Personal |
$ |
230,685 |
$ | 224,154 | $ | 214,833 | $ |
4,374 |
$ | 5,759 | $ | 4,474 | 1.90 |
% |
2.57 | % | 2.08 | % | |||||||||||||||||||
Business and government |
245,886 |
228,570 | 232,733 | 8,896 |
11,710 | 11,395 | 3.62 |
5.12 | 4.90 | |||||||||||||||||||||||||||||
Bank |
2,727 |
1,990 | 1,219 | 65 |
71 | 35 | 2.38 |
3.57 | 2.87 | |||||||||||||||||||||||||||||
Secured borrowings |
54,523 |
46,278 | 44,538 | 2,339 |
2,554 | 2,324 | 4.29 |
5.52 | 5.22 | |||||||||||||||||||||||||||||
Total deposits |
533,821 |
500,992 | 493,323 | 15,674 |
20,094 | 18,228 | 2.94 |
4.01 | 3.69 | |||||||||||||||||||||||||||||
Derivative instruments |
14,740 |
17,904 | 19,507 | – |
– | – | – |
– | – | |||||||||||||||||||||||||||||
Acceptances |
11 |
5,913 | 11,497 | – |
– | – | – |
– | – | |||||||||||||||||||||||||||||
Obligations related to securities sold short |
17,625 |
19,526 | 15,236 | 451 |
517 | 334 | 2.56 |
2.65 | 2.19 | |||||||||||||||||||||||||||||
Obligations related to securities lent or sold under repurchase agreements |
21,696 |
18,527 | 22,139 | 1,036 |
1,155 | 1,181 | 4.78 |
6.23 | 5.33 | |||||||||||||||||||||||||||||
Other liabilities |
23,945 |
17,963 | 19,159 | 172 |
263 | 292 | 0.72 |
1.46 | 1.52 | |||||||||||||||||||||||||||||
Subordinated indebtedness |
7,957 |
7,349 | 6,470 | 407 |
505 | 453 | 5.11 |
6.87 | 7.00 | |||||||||||||||||||||||||||||
Total domestic liabilities |
619,795 |
588,174 | 587,331 | 17,740 |
22,534 | 20,488 | 2.86 |
3.83 | 3.49 | |||||||||||||||||||||||||||||
Foreign liabilities (2)
|
||||||||||||||||||||||||||||||||||||||
Deposits |
Personal |
24,497 |
22,420 | 19,891 | 589 |
635 | 419 | 2.40 |
2.83 | 2.11 | ||||||||||||||||||||||||||||
Business and government |
208,890 |
189,217 | 172,446 | 7,745 |
8,409 | 6,871 | 3.71 |
4.44 | 3.98 | |||||||||||||||||||||||||||||
Bank |
24,155 |
23,951 | 23,110 | 833 |
1,113 | 932 | 3.45 |
4.65 | 4.03 | |||||||||||||||||||||||||||||
Secured borrowings |
5,752 |
4,515 | 4,172 | 269 |
225 | 183 | 4.68 |
4.98 | 4.39 | |||||||||||||||||||||||||||||
Total deposits |
263,294 |
240,103 | 219,619 | 9,436 |
10,382 | 8,405 | 3.58 |
4.32 | 3.83 | |||||||||||||||||||||||||||||
Derivative instruments |
25,099 |
18,634 | 21,133 | – |
– | – | – |
– | – | |||||||||||||||||||||||||||||
Obligations related to securities sold short |
2,921 |
2,609 | 2,524 | 114 |
108 | 74 | 3.90 |
4.14 | 2.93 | |||||||||||||||||||||||||||||
Obligations related to securities lent or sold under repurchase agreements |
124,937 |
93,953 | 62,000 | 5,485 |
5,179 | 3,102 | 4.39 |
5.51 | 5.00 | |||||||||||||||||||||||||||||
Other liabilities |
5,657 |
5,230 | 4,146 | 217 |
282 | 120 | 3.84 |
5.39 | 2.89 | |||||||||||||||||||||||||||||
Subordinated indebtedness |
– |
75 | 100 | – |
5 | 5 | – |
6.67 | 5.00 | |||||||||||||||||||||||||||||
Total foreign liabilities |
421,908 |
360,604 | 309,522 | 15,252 |
15,956 | 11,706 | 3.62 |
4.42 | 3.78 | |||||||||||||||||||||||||||||
Total liabilities |
1,041,703 |
948,778 | 896,853 | 32,992 |
38,490 | 32,194 | 3.17 |
4.06 | 3.59 | |||||||||||||||||||||||||||||
Shareholders’ equity |
62,299 |
56,116 | 51,055 | – |
– | – | – |
– | – | |||||||||||||||||||||||||||||
Non-controlling interests |
283 |
239 | 213 | – |
– | – | – |
– | – | |||||||||||||||||||||||||||||
Total liabilities and equity |
$ |
1,104,285 |
$ | 1,005,133 | $ | 948,121 | $ |
32,992 |
$ | 38,490 | $ | 32,194 | 2.99 |
% |
3.83 | % | 3.40 | % | ||||||||||||||||||||
Net interest income and net interest margin (3)
|
$ |
15,769 |
$ | 13,695 | $ | 12,825 | 1.43 |
% |
1.36 | % | 1.35 | % | ||||||||||||||||||||||||||
Additional disclosures: Non-interest-bearing deposit liabilities |
||||||||||||||||||||||||||||||||||||||
Domestic |
$ |
83,597 |
$ | 78,749 | $ | 83,530 | ||||||||||||||||||||||||||||||||
Foreign |
21,198 |
19,779 | 22,990 | |||||||||||||||||||||||||||||||||||
| (1) | Average balances are calculated as a weighted average of daily closing balances. |
| (2) | Classification as domestic or foreign is based on domicile of debtor or customer. |
| (3) | Net interest income as a percentage of average assets. |
|
CIBC
2025 |
|
88 |
|
Management’s discussion and analysis |
$ millions |
2025/2024 |
2024/2023 | ||||||||||||||||||||||||
Increase (decrease) due to change in: |
Increase (decrease) due to change in: | |||||||||||||||||||||||||
Average balance |
Average rate |
Total |
Average balance |
Average rate |
Total | |||||||||||||||||||||
Domestic assets (1)
|
||||||||||||||||||||||||||
Cash and deposits with banks |
$ |
9 |
$ |
(318 |
) |
$ |
(309 |
) |
$ | (604 | ) | $ | 113 | $ | (491 | ) | ||||||||||
Securities |
766 |
(811 |
) |
(45 |
) |
716 | 128 | 844 | ||||||||||||||||||
Securities borrowed or purchased under resale agreements |
559 |
(423 |
) |
136 |
1 | 44 | 45 | |||||||||||||||||||
Loans |
Residential mortgages |
361 |
(1,611 |
) |
(1,250 |
) |
164 | 1,054 | 1,218 | |||||||||||||||||
Personal |
85 |
(599 |
) |
(514 |
) |
35 | 221 | 256 | ||||||||||||||||||
Credit card |
163 |
161 |
324 |
299 | 101 | 400 | ||||||||||||||||||||
Business and government |
556 |
(1,288 |
) |
(732 |
) |
359 | 584 | 943 | ||||||||||||||||||
Total loans |
1,165 |
(3,337 |
) |
(2,172 |
) |
857 | 1,960 | 2,817 | ||||||||||||||||||
Other interest-bearing assets |
83 |
(44 |
) |
39 |
(39 | ) | 39 | – | ||||||||||||||||||
Change in domestic interest income |
2,582 |
(4,933 |
) |
(2,351 |
) |
931 | 2,284 | 3,215 | ||||||||||||||||||
Foreign assets (1)
|
||||||||||||||||||||||||||
Cash and deposits with banks |
179 |
(377 |
) |
(198 |
) |
302 | 201 | 503 | ||||||||||||||||||
Securities |
607 |
(1,077 |
) |
(470 |
) |
794 | 581 | 1,375 | ||||||||||||||||||
Securities borrowed or purchased under resale agreements |
157 |
(844 |
) |
(687 |
) |
772 | 428 | 1,200 | ||||||||||||||||||
Loans |
Residential mortgages |
13 |
(7 |
) |
6 |
13 | 3 | 16 | ||||||||||||||||||
Personal |
7 |
– |
7 |
(1 | ) | 34 | 33 | |||||||||||||||||||
Credit card |
4 |
– |
4 |
2 | – | 2 | ||||||||||||||||||||
Business and government |
1,311 |
(1,072 |
) |
239 |
126 | 681 | 807 | |||||||||||||||||||
Total loans |
1,335 |
(1,079 |
) |
256 |
140 | 718 | 858 | |||||||||||||||||||
Other interest-bearing assets |
66 |
(40 |
) |
26 |
5 | 10 | 15 | |||||||||||||||||||
Change in foreign interest income |
2,344 |
(3,417 |
) |
(1,073 |
) |
2,013 | 1,938 | 3,951 | ||||||||||||||||||
Total change in interest income |
$ |
4,926 |
$ |
(8,350 |
) |
$ |
(3,424 |
) |
$ | 2,944 | $ | 4,222 | $ | 7,166 | ||||||||||||
Domestic liabilities (1)
|
||||||||||||||||||||||||||
Deposits |
Personal |
$ |
168 |
$ |
(1,553 |
) |
$ |
(1,385 |
) |
$ | 194 | $ | 1,091 | $ | 1,285 | |||||||||||
Business and government |
887 |
(3,701 |
) |
(2,814 |
) |
(204 | ) | 519 | 315 | |||||||||||||||||
Bank |
26 |
(32 |
) |
(6 |
) |
22 | 14 | 36 | ||||||||||||||||||
Secured borrowings |
455 |
(670 |
) |
(215 |
) |
91 | 139 | 230 | ||||||||||||||||||
Total deposits |
1,536 |
(5,956 |
) |
(4,420 |
) |
103 | 1,763 | 1,866 | ||||||||||||||||||
Obligations related to securities sold short |
(50 |
) |
(16 |
) |
(66 |
) |
94 | 89 | 183 | |||||||||||||||||
Obligations related to securities lent or sold under repurchase agreements |
198 |
(317 |
) |
(119 |
) |
(193 | ) | 167 | (26 | ) | ||||||||||||||||
Other liabilities |
88 |
(179 |
) |
(91 |
) |
(18 | ) | (11 | ) | (29 | ) | |||||||||||||||
Subordinated indebtedness |
42 |
(140 |
) |
(98 |
) |
62 | (10 | ) | 52 | |||||||||||||||||
Change in domestic interest expense |
1,814 |
(6,608 |
) |
(4,794 |
) |
48 | 1,998 | 2,046 | ||||||||||||||||||
Foreign liabilities (1)
|
||||||||||||||||||||||||||
Deposits |
Personal |
59 |
(105 |
) |
(46 |
) |
53 | 163 | 216 | |||||||||||||||||
Business and government |
874 |
(1,538 |
) |
(664 |
) |
668 | 870 | 1,538 | ||||||||||||||||||
Bank |
9 |
(289 |
) |
(280 |
) |
34 | 147 | 181 | ||||||||||||||||||
Secured borrowings |
62 |
(18 |
) |
44 |
15 | 27 | 42 | |||||||||||||||||||
Total deposits |
1,004 |
(1,950 |
) |
(946 |
) |
770 | 1,207 | 1,977 | ||||||||||||||||||
Obligations related to securities sold short |
13 |
(7 |
) |
6 |
2 | 32 | 34 | |||||||||||||||||||
Obligations related to securities lent or sold under repurchase agreements |
1,708 |
(1,402 |
) |
306 |
1,599 | 478 | 2,077 | |||||||||||||||||||
Other liabilities |
23 |
(88 |
) |
(65 |
) |
31 | 131 | 162 | ||||||||||||||||||
Subordinated indebtedness |
(5 |
) |
– |
(5 |
) |
(1 | ) | 1 | – | |||||||||||||||||
Change in foreign interest expense |
2,743 |
(3,447 |
) |
(704 |
) |
2,401 | 1,849 | 4,250 | ||||||||||||||||||
Total change in interest expense |
$ |
4,557 |
$ |
(10,055 |
) |
$ |
(5,498 |
) |
$ | 2,449 | $ | 3,847 | $ | 6,296 | ||||||||||||
Change in total net interest income |
$ |
369 |
$ |
1,705 |
$ |
2,074 |
$ | 495 | $ | 375 | $ | 870 | ||||||||||||||
| (1) | Classification as domestic or foreign is based on domicile of debtor or customer. |
89 |
CIBC 2025 |
Management’s discussion and analysis |
| Canada (1)
|
U.S. (1)
|
Other (1)
|
Total | |||||||||||||||||||||||||||||||||||||||||
| $ millions, as at October 31 | 2025 |
2024 | 2025 |
2024 | 2025 |
2024 | 2025 |
2024 | ||||||||||||||||||||||||||||||||||||
Residential mortgages |
$ |
280,521 |
$ | 274,371 | $ |
2,862 |
$ | 2,810 | $ |
3,076 |
$ | 3,042 | $ |
286,459 |
$ | 280,223 | ||||||||||||||||||||||||||||
Personal |
45,288 |
44,412 | 621 |
522 | 801 |
805 | 46,710 |
45,739 | ||||||||||||||||||||||||||||||||||||
Credit card |
20,428 |
19,457 | 28 |
28 | 183 |
164 | 20,639 |
19,649 | ||||||||||||||||||||||||||||||||||||
Total net consumer loans |
346,237 |
338,240 |
|
3,511 |
|
3,360 | 4,060 |
4,011 | 353,808 |
345,611 | ||||||||||||||||||||||||||||||||||
Non-residential mortgages |
5,574 |
5,042 | – |
– | 191 |
246 | 5,765 |
5,288 | ||||||||||||||||||||||||||||||||||||
Financial institutions |
17,637 |
15,019 | 36,161 |
25,382 | 6,798 |
6,124 | 60,596 |
46,525 | ||||||||||||||||||||||||||||||||||||
Retail and wholesale |
9,971 |
9,638 | 3,535 |
2,999 | 701 |
843 | 14,207 |
13,480 | ||||||||||||||||||||||||||||||||||||
Business services |
9,621 |
9,873 | 6,235 |
6,145 | 2,380 |
2,271 | 18,236 |
18,289 | ||||||||||||||||||||||||||||||||||||
Manufacturing – capital goods |
2,152 |
2,007 | 2,713 |
2,591 | 76 |
42 | 4,941 |
4,640 | ||||||||||||||||||||||||||||||||||||
Manufacturing – consumer goods |
5,770 |
5,646 | 1,686 |
1,618 | 246 |
239 | 7,702 |
7,503 | ||||||||||||||||||||||||||||||||||||
Real estate and construction |
32,483 |
31,070 | 22,997 |
22,504 | 1,364 |
1,367 | 56,844 |
54,941 | ||||||||||||||||||||||||||||||||||||
Agriculture |
8,987 |
8,206 | 155 |
122 | 49 |
41 | 9,191 |
8,369 | ||||||||||||||||||||||||||||||||||||
Oil and gas |
2,312 |
2,302 | 1,154 |
1,316 | - |
39 | 3,466 |
3,657 | ||||||||||||||||||||||||||||||||||||
Mining |
933 |
1,331 | 381 |
71 | 1,234 |
968 | 2,548 |
2,370 | ||||||||||||||||||||||||||||||||||||
Forest products |
663 |
506 | 205 |
151 | - |
– | 868 |
657 | ||||||||||||||||||||||||||||||||||||
Hardware and software |
1,120 |
1,048 | 4,839 |
3,829 | 1,128 |
747 | 7,087 |
5,624 | ||||||||||||||||||||||||||||||||||||
Telecommunications and cable |
849 |
723 | 1,923 |
1,315 | 976 |
566 | 3,748 |
2,604 | ||||||||||||||||||||||||||||||||||||
Publishing, printing and broadcasting |
171 |
250 | 329 |
387 | 53 |
68 | 553 |
705 | ||||||||||||||||||||||||||||||||||||
Transportation |
3,165 |
3,160 | 2,659 |
2,329 | 2,270 |
2,173 | 8,094 |
7,662 | ||||||||||||||||||||||||||||||||||||
Utilities |
4,610 |
6,312 | 7,450 |
5,638 | 5,264 |
4,955 | 17,324 |
16,905 | ||||||||||||||||||||||||||||||||||||
Education, health and social services |
4,252 |
4,117 | 6,498 |
5,908 | 92 |
298 | 10,842 |
10,323 | ||||||||||||||||||||||||||||||||||||
Governments |
2,403 |
2,217 | 441 |
289 | 2,069 |
1,865 | 4,913 |
4,371 | ||||||||||||||||||||||||||||||||||||
Stage 1 and 2 allowance for credit losses (2)(3)
|
(362 |
) |
(307 | ) | (797 |
) |
(858 | ) | (70 |
) |
(67 | ) | (1,229 |
) |
(1,232 | ) | ||||||||||||||||||||||||||||
Total net business and government loans, including acceptances |
112,311 |
108,160 |
|
98,564 |
|
81,736 | 24,821 |
22,785 |
|
235,696 |
|
212,681 | ||||||||||||||||||||||||||||||||
Total net loans and acceptances |
$ | 458,548 |
$ | 446,400 | $ |
102,075 |
$ | 85,096 | $ |
28,881 |
$ | 26,796 | $ |
589,504 |
$ | 558,292 | ||||||||||||||||||||||||||||
| (1) | Classification by country is primarily based on domicile of debtor or customer. |
| (2) | Stage 3 allowance for credit losses is allocated to business and government loans, including acceptances, by category above. |
| (3) | Includes the allocation of Stage 1 and 2 allowance for credit losses based on the geographic location where they are recorded. |
| $ millions, as at or for the year ended October 31 | 2025 |
2024 | ||||||
Balance at beginning of year |
$ |
4,114 |
$ | 4,117 | ||||
Provision for credit losses |
2,342 |
2,001 | ||||||
Write-offs |
||||||||
Residential mortgages |
12 |
18 | ||||||
Personal |
571 |
545 | ||||||
Credit card |
884 |
739 | ||||||
Business and government |
409 |
874 | ||||||
Total write-offs |
1,876 |
2,176 | ||||||
Recoveries |
||||||||
Residential mortgages |
6 |
7 | ||||||
Personal |
74 |
62 | ||||||
Credit card |
152 |
126 | ||||||
Business and government |
54 |
77 | ||||||
Total recoveries |
286 |
272 | ||||||
Net write-offs |
1,590 |
1,904 | ||||||
Interest income on impaired loans |
(138 |
) |
(121 | ) | ||||
Foreign exchange and other |
11 |
21 | ||||||
Balance at end of year |
$ |
4,739 |
$ | 4,114 | ||||
Comprises: |
||||||||
Loans |
$ |
4,392 |
$ | 3,917 | ||||
Undrawn credit facilities and other off-balance sheet exposures |
347 |
197 | ||||||
Ratio of net write-offs during the year to average loans outstanding during the year |
||||||||
Residential mortgages |
– |
% |
– | % | ||||
Personal |
1.08 |
1.08 | ||||||
Credit card |
3.65 |
3.25 | ||||||
Business and government |
0.16 |
0.40 | ||||||
|
CIBC
2025 |
|
90 |
|
Management’s discussion and analysis |
$ millions, as at October 31 |
2025 |
2024 | ||||||
Canada |
||||||||
Atlantic provinces |
$ |
17,353 |
$ | 16,885 | ||||
Quebec |
50,017 |
45,892 | ||||||
Ontario |
250,824 |
243,890 | ||||||
Prairie provinces |
16,296 |
16,009 | ||||||
Alberta, Northwest Territories and Nunavut |
48,495 |
49,068 | ||||||
British Columbia and Yukon |
78,034 |
76,762 | ||||||
Stage 1 and 2 allowance for credit losses allocated to Canada (2)(3)
|
(2,471 |
) |
(2,106 | ) | ||||
Total Canada |
458,548 |
446,400 | ||||||
U.S. (2)(3)
|
102,075 |
85,096 | ||||||
Other countries (2)(3)
|
28,881 |
26,796 | ||||||
Total net loans and acceptances |
$ |
589,504 |
$ | 558,292 | ||||
| (1) | Classification by country is primarily based on domicile of debtor or customer. |
| (2) | Includes the allocation of Stage 1 and 2 allowance for credit losses based on the geographic location where they are recorded. |
| (3) | For Canada, Stage 3 allowance for credit losses is allocated to provinces above, including acceptances. For U.S. and Other countries, amounts are net of Stage 3 allowances for credit losses. |
$ millions, as at October 31 |
2025 |
2024 | ||||||||||||||||||||||||||||||
Floating |
Fixed rate |
Non-rate
sensitive |
Total |
Floating | Fixed rate |
Non-rate
sensitive |
Total | |||||||||||||||||||||||||
Loans |
||||||||||||||||||||||||||||||||
Residential mortgages |
$ |
111,527 |
$ |
175,506 |
$ |
– |
$ |
287,033 |
$ | 88,696 | $ | 191,976 | $ | – | $ | 280,672 | ||||||||||||||||
Personal |
38,109 |
9,757 |
– |
47,866 |
37,450 | 9,231 | – | 46,681 | ||||||||||||||||||||||||
Credit card |
– |
– |
21,581 |
21,581 |
– | – | 20,551 | 20,551 | ||||||||||||||||||||||||
Business and government |
220,697 |
16,413 |
306 |
237,416 |
200,093 | 13,933 | 279 | 214,305 | ||||||||||||||||||||||||
Gross loans |
370,333 |
201,676 |
21,887 |
593,896 |
326,239 | 215,140 | 20,830 | 562,209 | ||||||||||||||||||||||||
Allowance for credit losses |
(4,392 |
) |
(3,917 | ) | ||||||||||||||||||||||||||||
Net loans |
$ |
589,504 |
$ | 558,292 | ||||||||||||||||||||||||||||
91 |
CIBC 2025 |
Management’s discussion and analysis |
| Canada (1)
|
U.S. (1)
|
Other (1)
|
Total | |||||||||||||||||||||||||||||||||||||||||
$ millions, as at October 31 |
2025 |
2024 | 2025 |
2024 | 2025 |
2024 | 2025 |
2024 | ||||||||||||||||||||||||||||||||||||
Gross impaired loans |
||||||||||||||||||||||||||||||||||||||||||||
Residential mortgages |
$ |
1,080 |
$ | 770 | $ |
17 |
$ | 20 | $ |
218 |
$ | 204 | $ |
1,315 |
$ | 994 | ||||||||||||||||||||||||||||
Personal |
242 |
247 | 10 |
11 | 38 |
34 | 290 |
292 | ||||||||||||||||||||||||||||||||||||
Total gross impaired consumer loans |
1,322 |
1,017 | 27 |
31 | 256 |
238 | 1,605 |
1,286 | ||||||||||||||||||||||||||||||||||||
Non-residential mortgages |
12 |
32 | – |
– | 5 |
14 | 17 |
46 | ||||||||||||||||||||||||||||||||||||
Financial institutions |
44 |
27 | 95 |
86 | – |
– | 139 |
113 | ||||||||||||||||||||||||||||||||||||
Retail, wholesale and business services |
179 |
115 | 74 |
69 | 65 |
56 | 318 |
240 | ||||||||||||||||||||||||||||||||||||
Manufacturing – consumer and capital goods |
95 |
28 | 125 |
141 | – |
3 | 220 |
172 | ||||||||||||||||||||||||||||||||||||
Real estate and construction |
167 |
152 | 470 |
543 | 46 |
26 | 683 |
721 | ||||||||||||||||||||||||||||||||||||
Agriculture |
29 |
90 | – |
– | – |
– | 29 |
90 | ||||||||||||||||||||||||||||||||||||
Resource-based industries |
63 |
64 | 15 |
– | – |
– | 78 |
64 | ||||||||||||||||||||||||||||||||||||
Telecommunications, media and technology |
6 |
3 | 85 |
56 | 374 |
– | 465 |
59 | ||||||||||||||||||||||||||||||||||||
Transportation |
10 |
9 | – |
2 | 1 |
2 | 11 |
13 | ||||||||||||||||||||||||||||||||||||
Utilities |
– |
– | 28 |
– | – |
– | 28 |
– | ||||||||||||||||||||||||||||||||||||
Other |
13 |
18 | 30 |
92 | – |
– | 43 |
110 | ||||||||||||||||||||||||||||||||||||
Total gross impaired – business and government loans |
618 |
538 | 922 |
989 | 491 |
101 | 2,031 |
1,628 | ||||||||||||||||||||||||||||||||||||
Total gross impaired loans |
1,940 |
1,555 | 949 |
1,020 | 747 |
339 | 3,636 |
2,914 | ||||||||||||||||||||||||||||||||||||
Other past due loans (2)
|
178 |
158 | – |
– | 3 |
3 | 181 |
161 | ||||||||||||||||||||||||||||||||||||
Total gross impaired and other past due loans |
2,118 |
1,713 | 949 |
1,020 | 750 |
342 | 3,817 |
3,075 | ||||||||||||||||||||||||||||||||||||
Allowance for credit losses |
||||||||||||||||||||||||||||||||||||||||||||
Residential mortgages |
202 |
120 | 6 |
7 | 98 |
107 | 306 |
234 | ||||||||||||||||||||||||||||||||||||
Personal |
154 |
160 | 3 |
5 | 28 |
25 | 185 |
190 | ||||||||||||||||||||||||||||||||||||
Total allowance – consumer loans |
356 |
280 | 9 |
12 | 126 |
132 | 491 |
424 | ||||||||||||||||||||||||||||||||||||
Non-residential mortgages |
4 |
– | – |
– | 1 |
7 | 5 |
7 | ||||||||||||||||||||||||||||||||||||
Financial institutions |
18 |
14 | 8 |
12 | – |
2 | 26 |
28 | ||||||||||||||||||||||||||||||||||||
Retail, wholesale and business services |
69 |
74 | 22 |
25 | 28 |
19 | 119 |
118 | ||||||||||||||||||||||||||||||||||||
Manufacturing – consumer and capital goods |
45 |
12 | 8 |
15 | – |
1 | 53 |
28 | ||||||||||||||||||||||||||||||||||||
Real estate and construction |
42 |
21 | 30 |
104 | 23 |
15 | 95 |
140 | ||||||||||||||||||||||||||||||||||||
Agriculture |
15 |
17 | – |
– | – |
– | 15 |
17 | ||||||||||||||||||||||||||||||||||||
Resource-based industries |
44 |
36 | – |
– | – |
– | 44 |
36 | ||||||||||||||||||||||||||||||||||||
Telecommunications, media and technology |
2 |
1 | 3 |
4 | 109 |
– | 114 |
5 | ||||||||||||||||||||||||||||||||||||
Transportation |
1 |
2 | – |
– | 1 |
1 | 2 |
3 | ||||||||||||||||||||||||||||||||||||
Utilities |
– |
– | 14 |
– | – |
– | 14 |
– | ||||||||||||||||||||||||||||||||||||
Other |
4 |
6 | – |
4 | – |
– | 4 |
10 | ||||||||||||||||||||||||||||||||||||
Total allowance – business and government loans |
244 |
183 | 85 |
164 | 162 |
45 | 491 |
392 | ||||||||||||||||||||||||||||||||||||
Total allowance for credit losses |
600 |
463 | 94 |
176 | 288 |
177 | 982 |
816 | ||||||||||||||||||||||||||||||||||||
Net impaired loans |
||||||||||||||||||||||||||||||||||||||||||||
Residential mortgages |
878 |
650 | 11 |
13 | 120 |
97 | 1,009 |
760 | ||||||||||||||||||||||||||||||||||||
Personal |
88 |
87 | 7 |
6 | 10 |
9 | 105 |
102 | ||||||||||||||||||||||||||||||||||||
Total net impaired consumer loans |
966 |
737 | 18 |
19 | 130 |
106 | 1,114 |
862 | ||||||||||||||||||||||||||||||||||||
Non-residential mortgages |
8 |
32 | – |
– | 4 |
7 | 12 |
39 | ||||||||||||||||||||||||||||||||||||
Financial institutions |
26 |
13 | 87 |
74 | – |
(2 | ) | 113 |
85 | |||||||||||||||||||||||||||||||||||
Retail, wholesale and business services |
110 |
41 | 52 |
44 | 37 |
37 | 199 |
122 | ||||||||||||||||||||||||||||||||||||
Manufacturing – consumer and capital goods |
50 |
16 | 117 |
126 | – |
2 | 167 |
144 | ||||||||||||||||||||||||||||||||||||
Real estate and construction |
125 |
131 | 440 |
439 | 23 |
11 | 588 |
581 | ||||||||||||||||||||||||||||||||||||
Agriculture |
14 |
73 | – |
– | – |
– | 14 |
73 | ||||||||||||||||||||||||||||||||||||
Resource-based industries |
19 |
28 | 15 |
– | – |
– | 34 |
28 | ||||||||||||||||||||||||||||||||||||
Telecommunications, media and technology |
4 |
2 | 82 |
52 | 265 |
– | 351 |
54 | ||||||||||||||||||||||||||||||||||||
Transportation |
9 |
7 | – |
2 | – |
1 | 9 |
10 | ||||||||||||||||||||||||||||||||||||
Utilities |
– |
– | 14 |
– | – |
– | 14 |
– | ||||||||||||||||||||||||||||||||||||
Other |
9 |
12 | 30 |
88 | – |
– | 39 |
100 | ||||||||||||||||||||||||||||||||||||
Total net impaired – business and government loans |
374 |
355 | 837 |
825 | 329 |
56 | 1,540 |
1,236 | ||||||||||||||||||||||||||||||||||||
Total net impaired loans |
$ |
1,340 |
$ | 1,092 | $ |
855 |
$ | 844 | $ |
459 |
$ | 162 | $ |
2,654 |
$ | 2,098 | ||||||||||||||||||||||||||||
| (1) | Classification by country is primarily based on domicile of debtor or customer. |
| (2) | Represents loans where repayment of principal or payment of interest is contractually in arrears between 90 and 180 days. |
|
CIBC
2025 |
|
92 |
|
Management’s discussion and analysis |
| Average balance (1)
|
Interest | Rate | ||||||||||||||||||||||
$ millions, for the year ended October 31 |
2025 |
2024 | 2025 |
2024 | 2025 |
2024 | ||||||||||||||||||
Deposits in domestic bank offices (2)
|
||||||||||||||||||||||||
Payable on demand |
||||||||||||||||||||||||
Personal |
$ |
11,904 |
$ | 11,132 | $ |
9 |
$ | 8 | 0.08 |
% |
0.07 | % | ||||||||||||
Business and government |
71,550 |
68,152 | 1,765 |
2,131 | 2.47 |
3.13 | ||||||||||||||||||
Bank |
14,425 |
12,658 | 399 |
475 | 2.77 |
3.75 | ||||||||||||||||||
Payable after notice |
||||||||||||||||||||||||
Personal |
130,095 |
117,556 | 1,114 |
1,328 | 0.86 |
1.13 | ||||||||||||||||||
Business and government |
91,536 |
79,210 | 2,974 |
4,006 | 3.25 |
5.06 | ||||||||||||||||||
Bank |
942 |
447 | 31 |
22 | 3.29 |
4.92 | ||||||||||||||||||
Payable on a fixed date |
||||||||||||||||||||||||
Personal |
95,142 |
101,461 | 3,414 |
4,616 | 3.59 |
4.55 | ||||||||||||||||||
Business and government |
157,591 |
150,813 | 6,795 |
8,551 | 4.31 |
5.67 | ||||||||||||||||||
Bank |
3,298 |
3,640 | 127 |
186 | 3.85 |
5.11 | ||||||||||||||||||
Secured borrowings |
54,523 |
46,278 | 2,339 |
2,554 | 4.29 |
5.52 | ||||||||||||||||||
Total domestic |
631,006 |
591,347 | 18,967 |
23,877 | 3.01 |
4.04 | ||||||||||||||||||
Deposits in foreign bank offices |
||||||||||||||||||||||||
Payable on demand |
||||||||||||||||||||||||
Personal |
2,497 |
2,342 | 2 |
2 | 0.08 |
0.09 | ||||||||||||||||||
Business and government |
33,693 |
28,842 | 620 |
575 | 1.84 |
1.99 | ||||||||||||||||||
Bank |
14 |
38 | 1 |
3 | 7.14 |
7.89 | ||||||||||||||||||
Payable after notice |
||||||||||||||||||||||||
Personal |
10,288 |
9,421 | 215 |
240 | 2.09 |
2.55 | ||||||||||||||||||
Business and government |
25,735 |
22,926 | 1,050 |
1,114 | 4.08 |
4.86 | ||||||||||||||||||
Payable on a fixed date |
||||||||||||||||||||||||
Personal |
5,256 |
4,662 | 209 |
200 | 3.98 |
4.29 | ||||||||||||||||||
Business and government |
74,671 |
67,844 | 3,437 |
3,742 | 4.60 |
5.52 | ||||||||||||||||||
Bank |
8,203 |
9,158 | 340 |
498 | 4.14 |
5.44 | ||||||||||||||||||
Secured borrowings |
5,752 |
4,515 | 269 |
225 | 4.68 |
4.98 | ||||||||||||||||||
Total foreign |
166,109 |
149,748 | 6,143 |
6,599 | 3.70 |
4.41 | ||||||||||||||||||
Total deposits |
$ |
797,115 |
$ | 741,095 | $ |
25,110 |
$ | 30,476 | 3.15 |
% |
4.11 % | |||||||||||||
| (1) | Average balances are calculated as a weighted average of daily closing balances. |
| (2) | Deposits by foreign depositors in our domestic bank offices amounted to $97.8 billion (2024: $90.7 billion). |
$ millions, for the year ended October 31 |
2025 |
2024 | ||||||
Audit fees (1)
|
$ |
31.7 |
$ | 28.8 | ||||
Audit-related fees (2)
|
4.5 |
3.3 | ||||||
Tax fees (3)
|
2.8 |
2.1 | ||||||
All other fees (4)
|
0.2 |
0.7 | ||||||
Total |
$ |
39.2 |
$ | 34.9 | ||||
| (1) | For the audit of CIBC’s annual financial statements and the audit of certain of our subsidiaries, as well as other services normally provided by the principal auditor in connection with CIBC’s statutory and regulatory filings. Audit fees also include the audit of internal control over financial reporting under the standards of the Public Company Accounting Oversight Board (United States). |
| (2) | For the assurance and related services that are reasonably related to the performance of the audit or review of CIBC’s consolidated financial statements, including accounting consultation, various agreed upon procedures and assurance reports and translation of financial reports. |
| (3) | For tax compliance and advisory services. |
| (4) | Includes fees for non-audit services. |
93 |
CIBC 2025 |
Management’s discussion and analysis |
|
CIBC
2025 |
|
94 |
|
Management’s discussion and analysis |
95 |
CIBC 2025 |
Management’s discussion and analysis |
|
CIBC
2025 |
|
96 |
|
Management’s discussion and analysis |
97 |
CIBC 2025 |
Management’s discussion and analysis |
|
CIBC
2025 |
|
98 |
|
Management’s discussion and analysis |
99 |
CIBC 2025 |
Management’s discussion and analysis |
|
CIBC
2025 |
|
100 |
Exhibit B.3(d): Other Pages of CIBC’s 2025 Annual Report incorporated in Annual Information Form
| ● | “Transfer Agent and Registrar” page 186 |
| ● | “Directors and Board Committees” page 187 |
Shareholder information
Fiscal Year
November 1st to October 31st
Key Dates
Reporting dates 2026
First quarter results – Thursday, February 26, 2026
Second quarter results – Thursday, May 28, 2026
Third quarter results – Thursday, August 27, 2026
Fourth quarter results – Thursday, December 3, 2026
Annual Meeting of Shareholders 2026
CIBC’s Annual Meeting of Shareholders will be held on April 16, 2026. For more details, please visit our Annual Meeting webpage at https://www.cibc.com/en/about-cibc/investor-relations/annual-meeting.html.
Common shares of CIBC (CM) are listed on the Toronto Stock Exchange and the New York Stock Exchange. Preferred shares are listed on the Toronto Stock Exchange.
Dividends
Quarterly dividends were paid on CIBC common and preferred shares in 2025:
Common shares
| Record date | Payment date | Dividends per share | Number of common shares on record date |
|||
| Sep 29/25 | Oct 28/25 | $0.97 | 928,768,222 | |||
| Jun 27/25 | Jul 28/25 | $0.97 | 931,638,836 | |||
| Mar 28/25 | Apr 28/25 | $0.97 | 938,188,664 | |||
| Dec 27/24 | Jan 28/25 | $0.97 | 942,347,049 |
Preferred shares
| Stock | Series 47 | Series 56 | Series 57 | Series 61 | ||||||
| Ticker symbol | CM.PR.S | n/a | n/a | n/a | ||||||
| Quarterly dividend | $0.367375 | n/a | n/a | n/a | ||||||
| Semi-annual dividend | n/a | $36.825000 | $36.685000 | $31.845000 |
2026 dividend payment dates
(Subject to approval by the CIBC Board of Directors)
| Record dates | Payment dates | |
| December 29, 2025 | January 28, 2026 | |
| March 27, 2026 | April 28, 2026 | |
| June 29, 2026 | July 28, 2026 | |
| September 28, 2026 | October 28, 2026 |
Eligible dividends
CIBC designates any and all dividends paid or deemed for Canadian federal, provincial or territorial income tax purposes to be paid on or after January 1, 2006 to be “eligible dividends”, unless otherwise indicated in respect of dividends paid subsequent to this notification, and hereby notifies all recipients of such dividends of this designation.
Normal course issuer bid
CIBC is conducting a normal course issuer bid to purchase common shares for cancellation in the open market at market price until the earlier of: (i) CIBC purchasing 20 million common shares: (ii) CIBC providing a notice of termination, or (iii) September 9, 2026. A copy of the Notice of Intention to Make a Normal Course Issuer Bid that CIBC filed with the Toronto Stock Exchange may be obtained without charge by contacting the Corporate Secretary.
Regulatory capital
Information on CIBC’s regulatory capital instruments and regulatory capital position may be found at https://www.cibc.com/en/about-cibc/investor-relations/regulatory-capital-instruments.html.
Credit ratings
Credit rating information can be found on pages 75–76 in this Annual Report.
Shareholder investment plan
All Canadian and U.S. resident registered holders of CIBC common shares and designated Class A preferred shares may participate in one or more of the following options and pay no brokerage commissions or service charges:
Dividend reinvestment option – Canadian residents may have dividends reinvested in additional CIBC common shares.
Share purchase option – Canadian residents may purchase up to $50,000 of additional CIBC common shares during the fiscal year.
Stock dividend option – U.S. residents may elect to receive stock dividends on CIBC common shares.
Further information is available through TSX Trust Company and on the CIBC website at www.cibc.com.
| 185 | CIBC 2025 ANNUAL REPORT |
Transfer agent and registrar
For information relating to shareholdings, shareholder investment plan, dividends, direct dividend deposit, dividend reinvestment accounts and lost certificates, or to eliminate duplicate mailings of shareholder material, please contact:
TSX Trust Company, 301-100 Adelaide St. West, Toronto, ON M5H 4H1,
416 682-3860 or 1 800 387-0825 (Canada and the U.S. only), fax 416-361-0470, Email: shareholderinquiries@tmx.com,
website: www.tsxtrust.com.
Common and preferred shares are transferable in Canada at the offices of our agent, TSX Trust Company, in Toronto, Montreal, Calgary and Vancouver.
In the U.S., common shares are transferable at:
Computershare Inc., By Mail: P.O. Box 43078 Providence, RI 02940; By Overnight Delivery: 150 Royall St., Canton, MA 02021, 1 800-522-6645, website: www.computershare.com/investor.
Registered shareholders can opt to have their shares recorded electronically in the Direct Registration System (DRS). Please contact our transfer agent for details.
How to reach us:
| CIBC Head Office 81 Bay Street, CIBC SQUARE, Toronto, Ontario, Canada M5J 0E7 SWIFT code: CIBCCATT Website: www.cibc.com |
Investor Relations Email: Mailbox.InvestorRelations@cibc.com |
Corporate Secretary Email: corporate.secretary@cibc.com |
Client Complaint Appeals Office (CCAO) Toll-free across Canada: 1-888-947-5207 Email: mailbox.clientcomplaintappeals@cibc.com |
| CIBC Telephone Banking Toll-free across Canada: 1 800 465-2422 |
Communications and Public Affairs Email: Mailbox.Communications@cibc.com |
Client Care Toll-free across Canada: 1 800 465-2255 Email: client.care@cibc.com |
||||
Where to find more information
CIBC Annual Report 2025
Additional print copies of the Annual Report will be available in March 2026 and may be obtained by emailing Mailbox.InvestorRelations@cibc.com. The Annual Report is also available online at www.cibc.com/ca/investor-relations/annual-reports.html.
Des exemplaires supplémentaires du Rapport annuel seront disponibles en mars 2026 et peuvent être commandés par courriel à relationsinvestisseurs@cibc.com. Le Rapport annuel est aussi disponible à l’adresse www.cibc.com/ca/investor-relations/annual-reports-fr.html.
CIBC Sustainability Report and Public Accountability Statement 2025
This report reviews our economic, environmental, social and governance activities over the past year and will be available in March 2026 at https://www.cibc.com/en/about-cibc/corporate-responsibility.html.
Management Proxy Circular 2026
The Management Proxy Circular contains information for shareholders about CIBC’s annual meeting, including information relating to the election of CIBC’s directors, appointment of auditors and shareholder proposals, as well as other matters. The 2026 Proxy Circular will be available in March 2026 at www.cibc.com.
Corporate Governance
CIBC’s Statement of Corporate Governance Practices describes the governance framework that guides the Board and management in fulfilling their obligations to CIBC and our shareholders. This statement and other information on Corporate Governance at CIBC, including our CIBC Code of Conduct for all employees and Directors, can be found on our corporate website at www.cibc.com/ca/inside-cibc/governance/governance-practices.html.
Regulatory Filings
In Canada with the Canadian Securities Administrators at www.sedarplus.com.
In the U.S. with the U.S. Securities and Exchange Commission at www.sec.gov/edgar.shtml.
Incorporation
Canadian Imperial Bank of Commerce (CIBC) is a diversified financial institution governed by the Bank Act (Canada). CIBC was formed through the amalgamation of The Canadian Bank of Commerce and Imperial Bank of Canada in 1961.
The Canadian Bank of Commerce was originally incorporated as Bank of Canada by special act of the legislature of the Province of Canada in 1858. Subsequently, the name was changed to The Canadian Bank of Commerce and it opened for business under that name in 1867. Imperial Bank of Canada was incorporated in 1875 by special act of the Parliament of Canada and commenced operations in that year.
Trademarks
Trademarks used in this Annual Report which are owned by Canadian Imperial Bank of Commerce, or its subsidiaries in Canada and/or other countries include, “Adapta”, “Ambition”, “Ambitions Made Real”, “Aventura”, “CIBC Agility”, “CIBC Bank USA Smart Account”, the CIBC logo, “CIBC CRTeX”, “CIBC eAdvantage”, “CIBC ForeignCash Online”, “CIBC Global Money Transfer”, “CIBC GoalPlanner”, “CIBC Investor’s Edge”, “CIBC Miracle Day”, “CIBC Mobile Banking”, “CIBC Private Wealth”, “CIBC Smart”, “CIBC Smart Planner”, “CIBC SmartBanking”, “Simplii Financial” and “Wood Gundy”. All other trademarks mentioned in this annual report which are not owned by Canadian Imperial Bank of Commerce or its subsidiaries are the property of their respective owners.
| CIBC 2025 ANNUAL REPORT | 186 |
Board of Directors:
| Katharine B. Stevenson Chair of the Board CIBC Corporate Director Toronto, Ontario, Canada Joined in 2011 |
Ammar Aljoundi (RMC) President and Chief Executive Officer Agnico Eagle Mines Limited Toronto, Ontario, Canada Joined in 2022 |
Nanci E. Caldwell (CGC – Chair, MRCC, TC) Corporate Director Woodside, California, U.S.A. Joined in 2015 |
Michelle L. Collins (AC) President Cambium LLC Chicago, Illinois, U.S.A. Joined in 2017 |
|||
| Harry Culham President and Chief Executive Officer Toronto, Ontario, Canada Joined in 2025 |
Marianne Harrison (AC, RMC) Corporate Director Dover, New Hampshire, U.S.A. Joined in 2025 |
Kevin J. Kelly (MRCC – Chair, CGC) Corporate Director Toronto, Ontario, Canada Joined in 2013 |
Christine E. Larsen (MRCC, TC) Corporate Director Montclair, New Jersey, U.S.A. Joined in 2016 |
|||
| Mary Lou Maher (AC – Chair, CGC) Corporate Director Toronto, Ontario, Canada Joined in 2021 |
William F. Morneau (TC – Chair, CGC, RMC) Corporate Director Toronto, Ontario, Canada Joined in 2022 |
Mark W. Podlasly (AC, RMC) Chief Executive Officer First Nations Major Projects Coalition Vancouver, B.C., Canada Joined in 2023 |
François L. Poirier (RMC) President and Chief Executive Officer TC Energy Corporation Joined in 2024 |
|||
| Martine Turcotte (AC, MRCC) Corporate Director Verdun, Québec, Canada Joined in 2014 |
Barry L. Zubrow (RMC – Chair, CGC, TC) Chief Executive Officer ITB LLC West Palm Beach, Florida, U.S.A. Joined in 2015 |
|||||
AC – Audit Committee
CGC – Corporate Governance Committee
MRCC – Management Resources and Compensation Committee
RMC – Risk Management Committee
TC – Technology Committee
| 187 | CIBC 2025 ANNUAL REPORT |
Exhibit B.6(a)(1) Certifications required by Rule 13a-14(a)
CERTIFICATIONS
I, Harry Culham, certify that:
1. I have reviewed this annual report on Form 40-F of Canadian Imperial Bank of Commerce;
2. Based on my knowledge, this report does not contain any untrue statement of a material fact or omit to state a material fact necessary to make the statements made, in light of the circumstances under which such statements were made, not misleading with respect to the period covered by this report;
3. Based on my knowledge, the financial statements, and other financial information included in this report, fairly present in all material respects the financial condition, results of operations and cash flows of the issuer as of, and for, the periods presented in this report;
4. The issuer’s other certifying officer and I are responsible for establishing and maintaining disclosure controls and procedures (as defined in Exchange Act Rules 13a-15(e) and 15d-15(e)) and internal control over financial reporting (as defined in Exchange Act Rules 13a-15(f) and 15d-15(f)) for the issuer and have:
(a) Designed such disclosure controls and procedures, or caused such disclosure controls and procedures to be designed under our supervision, to ensure that material information relating to the issuer, including its consolidated subsidiaries, is made known to us by others within those entities, particularly during the period in which this report is being prepared;
(b) Designed such internal control over financial reporting, or caused such internal control over financial reporting to be designed under our supervision, to provide reasonable assurance regarding the reliability of financial reporting and the preparation of financial statements for external purposes in accordance with generally accepted accounting principles;
(c) Evaluated the effectiveness of the issuer’s disclosure controls and procedures and presented in this report our conclusions about the effectiveness of the disclosure controls and procedures, as of the end of the period covered by this report based on such evaluation; and
(d) Disclosed in this report any change in the issuer’s internal control over financial reporting that occurred during the period covered by the annual report that has materially affected, or is reasonably likely to materially affect, the issuer’s internal control over financial reporting; and
5. The issuer’s other certifying officer and I have disclosed, based on our most recent evaluation of internal control over financial reporting, to the issuer’s auditors and the audit committee of the issuer’s board of directors (or persons performing the equivalent functions):
(a) All significant deficiencies and material weaknesses in the design or operation of internal control over financial reporting which are reasonably likely to adversely affect the issuer’s ability to record, process, summarize and report financial information; and
(b) Any fraud, whether or not material, that involves management or other employees who have a significant role in the issuer’s internal control over financial reporting.
| Date: December 4, 2025 | /s/ Harry Culham
|
|||||
|
Harry Culham |
||||||
| President and Chief Executive Officer |
||||||
I, Robert Sedran, certify that:
1. I have reviewed this annual report on Form 40-F of Canadian Imperial Bank of Commerce;
2. Based on my knowledge, this report does not contain any untrue statement of a material fact or omit to state a material fact necessary to make the statements made, in light of the circumstances under which such statements were made, not misleading with respect to the period covered by this report;
3. Based on my knowledge, the financial statements, and other financial information included in this report, fairly present in all material respects the financial condition, results of operations and cash flows of the issuer as of, and for, the periods presented in this report;
4. The issuer’s other certifying officer and I are responsible for establishing and maintaining disclosure controls and procedures (as defined in Exchange Act Rules 13a-15(e) and 15d-15(e)) and internal control over financial reporting (as defined in Exchange Act Rules 13a-15(f) and 15d-15(f)) for the issuer and have:
(a) Designed such disclosure controls and procedures, or caused such disclosure controls and procedures to be designed under our supervision, to ensure that material information relating to the issuer, including its consolidated subsidiaries, is made known to us by others within those entities, particularly during the period in which this report is being prepared;
(b) Designed such internal control over financial reporting, or caused such internal control over financial reporting to be designed under our supervision, to provide reasonable assurance regarding the reliability of financial reporting and the preparation of financial statements for external purposes in accordance with generally accepted accounting principles;
(c) Evaluated the effectiveness of the issuer’s disclosure controls and procedures and presented in this report our conclusions about the effectiveness of the disclosure controls and procedures, as of the end of the period covered by this report based on such evaluation; and
(d) Disclosed in this report any change in the issuer’s internal control over financial reporting that occurred during the period covered by the annual report that has materially affected, or is reasonably likely to materially affect, the issuer’s internal control over financial reporting; and
5. The issuer’s other certifying officer and I have disclosed, based on our most recent evaluation of internal control over financial reporting, to the issuer’s auditors and the audit committee of the issuer’s board of directors (or persons performing the equivalent functions):
(a) All significant deficiencies and material weaknesses in the design or operation of internal control over financial reporting which are reasonably likely to adversely affect the issuer’s ability to record, process, summarize and report financial information; and
(b) Any fraud, whether or not material, that involves management or other employees who have a significant role in the issuer’s internal control over financial reporting.
| Date: December 4, 2025 |
/s/ Robert Sedran
|
|||||
|
Robert Sedran |
|
|
||||
| Senior Executive Vice-President and |
||||||
| Chief Financial Officer |
||||||
Exhibit B.6(a)(2): Certifications required by Rule 13a-14(b) and Section 1350 of Chapter 63 of Title 18 of the United States Code
Certification pursuant to Section 906 of the Sarbanes-Oxley Act of 2002
In connection with the annual report of Canadian Imperial Bank of Commerce (“CIBC”) filed under cover of a Form 40-F for the period ended October 31, 2025 as filed with the Securities and Exchange Commission on the date hereof (the “Report”), I, Harry Culham, President and Chief Executive Officer of CIBC, certify that:
| (1) | the Report fully complies with the requirements of section 13(a) or 15(d) of the Securities Exchange Act of 1934; and |
| (2) | the information contained in the Report fairly presents, in all material respects, the financial condition and results of operations of CIBC. |
| /s/ Harry Culham | ||||
| ------------------------------------------ | ||||
| Harry Culham | ||||
| President and Chief Executive Officer |
Date: December 4, 2025
In connection with the annual report of Canadian Imperial Bank of Commerce (“CIBC”) filed under cover of a Form 40-F for the period ended October 31, 2025 as filed with the Securities and Exchange Commission on the date hereof (the “Report”), I, Robert Sedran, Senior Executive Vice-President and Chief Financial Officer of CIBC, certify that:
| (1) | the Report fully complies with the requirements of section 13(a) or 15(d) of the Securities Exchange Act of 1934; and |
| (2) | the information contained in the Report fairly presents, in all material respects, the financial condition and results of operations of CIBC. |
| /s/ Robert Sedran | ||||
| --------------------------------------- | ||||
| Robert Sedran | ||||
| Senior Executive Vice-President and | ||||
| Chief Financial Officer |
Date: December 4, 2025
Exhibit D.9: Consent of Independent Registered Public Accounting Firm
Consent of Independent Registered Public Accounting Firm
We consent to the incorporation by reference in the following Registration Statements:
(1) Form F-3 nos. 333-219550; 333-220284; 333-272447; and 333-282307
(2) Form S-8 nos. 333-09874; 333-130283; and 333-218913
of Canadian Imperial Bank of Commerce (“CIBC”) and the use herein of our reports of independent registered public accounting firm dated December 3, 2025, with respect to the consolidated financial statements of CIBC, which comprise the consolidated balance sheets of CIBC as at October 31, 2025 and 2024, and the consolidated statements of income, comprehensive income, changes in equity and cash flows for the years then ended and CIBC’s effectiveness of internal control over financial reporting as of October 31, 2025, each of which is included in Exhibit B.3(b) incorporated by reference in this Annual Report on Form 40-F.
We also consent to the reference to us under the caption “Experts”, which appears in the Annual Information Form included in Exhibit B.3(a) incorporated by reference in this Annual Report on Form 40-F, which is incorporated by reference in such Registration Statements.
|
/s/ Ernst & Young LLP
|
||||
|
Chartered Professional Accountants Licensed Public Accountants Toronto, Canada December 3, 2025 |
||||
Exhibit 97

Canadian Imperial Bank of Commerce
SEC Clawback Policy
|
Current issue:
|
November 2025
|
|
| Approved:
|
Management Resources and Compensation Committee (“MRCC”)
|
|
| Approval date:
|
October 22, 2025
|
|
| Next review:
|
October 2027
|
|
| 1.0 | Summary |
This clawback policy (“Policy”) applies to Canadian Imperial Bank of Commerce (“CIBC”) with common shares listed on the New York Stock Exchange (“NYSE”). This Policy requires the recovery of erroneously awarded compensation in order to satisfy the requirements of Section 303A.14 of the NYSE Listed Company Manual (the “Clawback Listing Standards”) and to satisfy the requirements of Rule 10D-1 (“Rule 10D-1”), as adopted by the US Securities and Exchange Commission (“SEC”) pursuant to the Securities Exchange Act of 1934 (the “Exchange Act”) to implement Section 954 of the Dodd-Frank Wall Street Reform and Consumer Protection Act of 2010 (“Dodd-Frank Act”).
This Policy was adopted by the CIBC Board of Directors (“Board”) on November 29, 2023 (the “Adoption Date”). The terms of this Policy will apply to any Erroneously Awarded Compensation that a current or former Executive Officer (as such terms are defined in Section 4.0 of this Policy) received on or after October 2, 2023 (the “Effective Date”), even if such compensation was approved, awarded, or granted to the Executive Officer prior to the Effective Date. Subject to applicable law, CIBC’s Management Resources and Compensation Committee (the “Committee”) may effect forfeiture or recoupment under this Policy from any amount of compensation approved, awarded, granted, payable or paid to the Executive Officer prior to, on or after the Adoption Date.
| 2.0 | Intent |
The purpose of this Policy is to establish a framework through which CIBC can ensure compliance with Section 10D of the Exchange Act and the Clawback Listing Standards for the recovery of Erroneously Awarded Compensation that a current or former Executive Officer received on or after the Effective Date and should not have received had CIBC’s financial statements been accurately presented.
Failure to adhere to these requirements may result in CIBC being subject to delisting from the NYSE where it does not adopt and comply with the Policy, regulatory criticism, legal and reputational risks, enforcement actions and/or financial fines and penalties.
| 3.0 | Audience and Scope |
This Policy applies to CIBC’s Executive Officers.
| 4.0 | Guiding Principles |
This Policy is based on key guiding principles that enable a robust approach for effective management and governance of Dodd-Frank Act compliance and risk related to CIBC’s Executive Officers. The guiding principles are the following:
| • | In the event that CIBC is required to prepare a Restatement that corrects an error in |
| previously issued financial statements that is material to the previously issued financial statements, or that would result in a material misstatement if the error were corrected in the current period or left uncorrected in the current period, CIBC must recover, reasonably promptly, from any of its current or former Executive Officers Erroneously Awarded Compensation that was received on or after the Effective Date during Recovery Period, based on the erroneous data, in excess of what would have been received by the Executive Officer under the Restatement. |
| • | For the purposes of this Policy: |
“Erroneously Awarded Compensation” means the amount of Incentive-Based Compensation received by an Executive Officer that exceeds the amount of Incentive-Based Compensation that otherwise would have been received had it been determined based on the restated financial statements and will not be reduced, based on or otherwise calculated with regard to taxes paid with respect to such amounts.
“Executive Officer” includes all of CIBC’s current or former executive officers, as determined by the Committee, in accordance with the Clawback Listing Standards and Rule 10D-1 and the definition of executive officer as defined in Rule 10D-1(d).
“Financial Reporting Measures” are measures that are determined and presented in accordance with the accounting principles used in preparing CIBC’s financial statements, and any measures that are derived wholly or in part from such measures, including stock price and total shareholder return.
“Incentive-Based Compensation” means any compensation that is granted, earned, or vested based wholly or in part upon the attainment of any Financial Reporting Measure. An Executive Officer’s outstanding Incentive-Based Compensation, whether vested or unvested, will be subject to forfeiture, and the payment an Executive Officer receives in respect of any Incentive-Based Compensation will be subject to recoupment. Incentive-Based Compensation includes, but is not limited to:
| - | Non-equity incentive plan awards that are earned based wholly or in part on satisfying a Financial Reporting Measure performance goal; |
| - | Bonuses received from a bonus pool, the size of which is determined based wholly or in part on satisfying a Financial Reporting Measure performance goal; |
| - | Other cash awards based on satisfaction of a Financial Reporting Measure performance goal; |
| - | Restricted stock, restricted stock units, performance share units, performance stock awards, stock options, and stock appreciation rights (“SARS”) that are granted or become vested based wholly or in part on satisfying a financial reporting measure performance goal; and |
| - | Proceeds received upon the sale of shares acquired through an incentive plan that were granted or vested based wholly or in part on satisfying a Financial Reporting Measure performance goal. |
“Restatement” means an accounting restatement of CIBC’s financial statements due to material noncompliance with any financial reporting requirement under the federal securities laws, including any required accounting restatement to correct an error in previously issued financial statements that is material to the previously issued financial statements, or that would result in a material misstatement if the error were corrected in the current period or left uncorrected in the current period.
| • | This Policy requires the recovery of Erroneously Awarded Compensation received on or after the Effective Date by a person: |
| - | After beginning service as an Executive Officer; |
| - | Who served as an Executive Officer at any time during the Recovery Period (and any subsequent changes in an Executive Officer’s employment status, including retirement or termination of employment, do not affect CIBC’s rights to recover Incentive-Based Compensation pursuant to this Policy); |
| - | While CIBC has a class of securities listed on a national securities exchange such as the NYSE; and |
| - | During the Recovery Period. |
| • | This Policy applies to all Incentive-Based Compensation that is received on or after the Effective Date in excess of what would have been received by the Executive Officer under the Restatement. CIBC’s obligation to recover Erroneously Awarded Compensation is not dependent on if or when the restated financial statements are filed. |
| • | For the avoidance of doubt, Incentive-Based Compensation does not include annual salary, compensation awarded based on completion of a specified period of service, or compensation awarded based on subjective standards, strategic measures, or operational measures, unless also based on attainment of a Financial Reporting Measure. |
| • | The Policy applies to Erroneously Awarded Compensation received on or after the Effective Date during the Recovery Period. For purposes of this Policy: |
| - | Incentive-Based Compensation will be deemed to be received (or would have been received in the absence of an elective deferral of payment by the individual) during, or in respect of the fiscal period during which the Financial Reporting Measure specified in the Incentive-Based Compensation award is attained, even if the payment or grant occurs (or would have been received in the absence of an elective deferral of payment by the individual) after the end of the period in question. |
| - | For Incentive-Based Compensation based on stock price or total shareholder return, where the amount of the Erroneously Awarded Compensation is not subject to mathematical recalculation directly from the information in Restatement: |
| ◾ | The amount will be based on a reasonable estimate of the effect of the Restatement on the stock price or total shareholder return upon which the Incentive-Based Compensation was received; and |
| ◾ | CIBC will maintain documentation of the determination of that reasonable estimate and provide such documentation to the NYSE. |
| • | For purposes of this Policy “Recovery Period” means the three completed fiscal years immediately preceding the date that CIBC is required to prepare the Restatement. In determining the relevant Recovery Period, the date that CIBC is required to prepare the Restatement (as described above) will be the earlier of: |
| - | The date CIBC’s Board, a committee of the Board, or officer(s) authorized to take such action if Board action is not required, concludes, or reasonably should have concluded, that CIBC is required to prepare a Restatement due to the material noncompliance of CIBC with any financial reporting requirement under applicable securities laws, including any required Restatement to correct an error in previously issued financial statements that is material to the previously issued financial statements, or that would result in a material misstatement if the error were corrected in the current period or left uncorrected in the current period; or |
| - | The date a court, regulator, or other legally authorized body directs CIBC to prepare a Restatement. |
| • | The relevant Recovery Period will include any transition period (that results from a change in CIBC’s fiscal year) within or immediately following those three completed fiscal years; provided, however, a transition period between the last day of CIBC’s previous fiscal year end and the first day of its new fiscal year that comprises a period of nine to 12 months would be deemed a completed fiscal year for purposes of the Recovery Period. |
| • | The Committee will take actions necessary to cause CIBC to recover Erroneously Awarded Compensation reasonably promptly, in compliance with this Policy except to the extent that the Committee has determined that pursuing recovery would be impracticable, as determined by the Committee in accordance with Rule 10D-1 and the Clawback Listing Standards. |
| • | The exceptions to recovery of Erroneously Awarded Compensation are as follows: |
| - | The direct expense paid to a third party to assist in enforcing this Policy would exceed the amount to be recovered provided that before concluding that it would be impractical to recover any amount of Erroneously Awarded Compensation based on this exception, CIBC will make a reasonable attempt to recover such Erroneously Awarded Compensation, document such reasonable attempt(s) and provide such documentation to the NYSE; |
| - | The recovery would violate applicable Canadian law where such law was adopted prior to November 28, 2022 provided that before concluding that it would be impracticable to recover any amount of Erroneously Awarded Compensation based on this exception, CIBC must obtain an opinion of Canadian counsel, acceptable to the NYSE, that recovery would result in such a violation, and must provide such opinion to the NYSE; or |
| - | Recovery would likely cause an otherwise tax-qualified retirement plan, under which benefits are broadly available to employees of CIBC or a subsidiary, to fail to meet the requirements of 26 U.S.C. 401(a(13) or 26 U.S.C. 411(a) and regulations thereunder. |
| • | CIBC will not indemnify any Executive Officer against the loss of Erroneously Awarded |
| Compensation and will not pay or reimburse any Executive Officer for premiums, for any insurance policy to fund such executive’s potential repayment obligations. |
| 5.0 | Method of Clawback |
The Committee will determine, in its sole discretion, the method of recovering any Erroneously Awarded Compensation pursuant to this Policy, which may include, without limitation:
| - | requiring reimbursement of cash Erroneously Awarded Compensation previously paid; |
| - | seeking recovery of any gain realized on the vesting, exercise, settlement, sale, transfer, or other disposition of any equity-based awards; |
| - | offsetting the recouped amount from any compensation otherwise owed by CIBC or any subsidiary to the Executive Officer; |
| - | cancelling outstanding vested or unvested equity awards; and/or |
| - | taking any other remedial and recovery action, as determined by the Committee; provided, however, that any such action under this Section 5.0 will be subject to applicable law and will be subject to compliance with Section 409A of the Internal Revenue Code. |
| 6.0 | Monitoring, Oversight and Suspension of Outstanding Incentive-Based Compensation |
The Committee is responsible for oversight and management of compliance with the requirements of Section 10D of the Exchange Act and the Clawback Listing Standards. This authority includes the obligation to determine (i) whether a Restatement has occurred for the purposes of this Policy, Rule 10D-1 and the Clawback Listing Standards and (ii) the amount of Erroneously Awarded Compensation. The Committee may retain and rely upon the advice and determinations of legal counsel, accountants and other relevant experts to operate and administer this Policy. Any interpretation of this Policy by the Committee and any decision made by it with respect to this Policy will be final, binding and conclusive on all persons.
After a determination by the Committee that a Restatement may have occurred, the Committee may suspend the vesting or settlement of all Incentive-Based Compensation that the Committee determines may be forfeited under this Policy or otherwise subject to offset pursuant to Section 5.0, in which case and subject to the terms of this Section 6.0, Incentive-Based Compensation subject to the suspension: (i) if unvested, will not continue to vest, and (ii) otherwise will not be distributed or permitted to be exercised or otherwise vested. In the event the term of an option award will expire during a period of suspension, the executive Officer will be permitted to exercise the option before it expires; however settlement of the option award following such exercise will remain suspended and the securities otherwise deliverable upon settlement shall remain subject to forfeiture under the terms of this Policy.
Following suspension of Incentive-Based Compensation as outlined above, the Committee will determine as promptly as practicable whether the suspended Incentive-Based Compensation is to be forfeited or whether the suspension of the Incentive-Based Compensation is to be ended. For Incentive-Based Compensation that are ultimately not forfeited, the following provisions will apply upon the Committee’s determination to lift the suspension:
| - | Unvested awards that would have continued to vest by their original terms during the suspension will thereafter continue to vest in accordance with their original terms; |
| - | Unvested awards that otherwise would have vested during the suspension will vest as soon as practicable and otherwise consistent with their original terms; |
| - | Cash awards such as annual bonus withheld during the suspension will be immediately payable; |
| - | In no event will distribution of cash or shares be made to an Executive Officer with respect to Incentive-Based Compensation if, by reason of termination of employment or otherwise, the Executive Officer would have forfeited the Incentive-Based Compensation if the Incentive-Based Compensation had not been suspended; and |
| - | Distribution or settlement of Incentive-Based Compensation will be made no later than the latest date on which such distribution or settlement would be required to avoid additional tax by reason of Section 409A of the Internal Revenue Code; provided, however, that if such distribution or settlement occurs during a period when such Incentive-Based Compensation remains suspended pursuant to this section, then the after-tax proceeds of such distribution or settlement shall be held in escrow until such time as such Incentive-Based Compensation is no longer subject to a suspension or such amounts are determined to have been forfeited by the Committee. |
| 7.0 | Notice |
Before the Committee determines to seek recovery pursuant to this Policy, it shall provide the Executive Officer with written notice and the opportunity to be heard at a Committee or Board meeting (either in person or via telephone).
8.0 Amendment and Interpretation
The Committee may amend this Policy from time to time in its discretion, and will amend this Policy as it deems necessary, appropriate or advisable to reflect the regulations adopted by the SEC and to comply with any rules or standards adopted by a national securities exchange on which CIBC’s securities are then listed. The Committee is authorized to interpret and construe this Policy and to make all determinations necessary, appropriate, or advisable for the administration of this Policy. It is intended that this Policy be interpreted in a manner that is consistent with the requirements of Rule 10D-1 and any applicable rules or standards adopted by the SEC and any national securities exchange on which CIBC’s securities are then listed.
9.0 Other Recoupment Rights
The Committee intends that this Policy will be applied to the fullest extent of the law. The Committee may require that any employment agreement, equity award agreement, or similar agreement entered into, amended or restated on or after the Adoption Date shall, as a condition to the grant of any benefit thereunder, require an Executive Officer to agree to abide by the terms of this Policy and the application of this Policy to any Incentive-Based Compensation award made prior to the Effective Date. Any right of recoupment under this Policy is in addition to, and not in lieu of, any other remedies or rights of recoupment that may be available to CIBC pursuant to the terms of any other recoupment or recoupment policy, any similar policy in any employment agreement, equity award agreement, or similar agreement and any other legal remedies available to CIBC.
10.0 Successors
This Policy shall be binding and enforceable against all Executive Officers and their beneficiaries, heirs, executors, administrators or other legal representatives.
11.0 Disclosure Obligations
CIBC will file all disclosures with respect to this Policy required by applicable SEC filings and rules.
12.0 Entire Agreement
To the extent inconsistent with this Policy, this Policy supersedes all prior contracts, agreements and understandings, written or oral, with any Executive Officer. In the event any contract, agreement or understanding with any executive officer is inconsistent with the terms of this Policy, the terms of this Policy shall govern.
13.0 Maintenance and Review
The Committee will review and approve this Policy at least every two years, or earlier, if substantive changes are required to reflect new regulations adopted by the SEC or any new rules or standards adopted by the NYSE. Substantive changes require the approval of the Committee and non-substantive changes may be approved by CIBC’s Senior Vice-President, Rewards, Recognition and Performance, Human Resources. This Policy was last reviewed and approved by the Committee on October 22, 2025. The next full review will be in October 2027.