falseFY0000009631NYZ4Amounts that are subject to master netting arrangements or similar agreements but were not offset in the Consolidated Statement of Financial Position because they did not meet the net settlement/simultaneous settlement criteria; or because the rights of set off are conditional upon the default of the counterparty only.Cash and financial instrument collateral amounts received or pledged in relation to the total amounts of financial assets and financial liabilities, including those that were not offset in the Consolidated Statement of Financial Position. These amounts are disclosed at fair value and the rights of set off are conditional upon the default of the counterparty.Derivative financial instruments assets include cash collateral of $4,774 million (2024 – $4,505 million) and non-cash collateral of $1,009 million (2024 – $1,054 million). Derivative financial instruments liabilities include cash collateral of $11,750 million (2024 – $10,847 million) and non-cash collateral of $2,226 million (2024 – $718 million).Not intended to represent the Bank’s actual exposure to credit risk, as a variety of credit mitigation strategies are employed in addition to offsetting and collateral arrangements.Balances are net of allowances, which are $1 (2024 – $1).Notional amounts relating to derivatives that are hedging multiple risks in both assets and liabilities are included in more than one category.Includes undistributed retained earnings of $76 (2024 – $74) related to a foreign associated corporation, which is subject to local regulatory restriction.Represents amounts on account of share-based payments (refer to Note 25).Includes Share from associates, Employee benefits, Own credit risk, and Insurance contracts.The fair value of precious metals is determined based on quoted market prices and forward spot prices, where applicable, less the cost to sell.Excludes debt investment securities measured at amortized cost of $23,722 (October 31, 2024 – $29,412).Net of allowances of $4 (2024 – $3).Represents cash and non-interest-bearing deposits with financial institutions (refer to Note 5).The amounts presented are net of collateral and master netting agreements at the product level. The total amounts relating to netting and collateral were $37,853 (2024 – $35,510) for CRA, and $102,031 (2024 – $87,284) for CEA.Amounts are included under total derivatives above. Amounts include exposures settled directly through central counterparties and exposures settled through clearing members of central counterparties.Includes interest income on financial assets measured at amortized cost and FVOCI, calculated using the effective interest method, of $56,404 for the year ended October 31, 2025 (October 31, 2024 – $59,871).Effective Q1 2025, changes were made to the methodology used to allocate certain income, expenses and balance sheet items between business segments. Prior period results for each segment have been reclassified to conform with the current period’s methodology.These amounts represent the unrealized gains and losses from fair value changes of Level 3 instruments still held at the end of the period that are recorded in the Consolidated Statement of Income.Certain unrealized gains and losses on interest rate derivative contracts are largely offset by mark-to-market changes on embedded derivatives on certain deposit liabilities in the Consolidated Statement of Income.Certain unrealized gains and losses on derivative assets and liabilities are largely offset by mark-to-market changes on other instruments included in trading revenues in the Consolidated Statement of Income, since these instruments act as an economic hedge to certain derivative assets and liabilities.Gains or losses for items in Level 3 may be offset with losses or gains on related hedges in Level 1 or Level 2.The valuation of private equity securities utilizes net asset values as reported by fund managers. Net asset values are not considered observable as the Bank cannot redeem these instruments at such values. The range for net asset values per unit or price per share has not been disclosed for these instruments since the valuations are not model-based.The range of estimates represents the actual lowest and highest level inputs used to fair value financial instruments within each financial statement category.The average fair value of trading derivatives’ market valuation for the year ended October 31, 2024 was: favourable $29,999 and unfavourable $32,133. Average fair value amounts are based on the latest 13 month-end balances.Portfolios where the customer account level ‘Probability of Default’ has not been determined have been included in the ‘Loans not graded’ category.Deposits payable after notice include deposits for which the Bank may require notice of withdrawal, generally savings accounts.Comprises changes due to enhanced IFRS 9 models, including changes to reflect previously established expert credit judgment overlays that are now incorporated in the model.Interest income on impaired loans for residential mortgages, personal loans, credit cards, and business and government loans totaled $439 (2024 – $443).Allowance for credit losses on off-balance sheet exposures is recorded in other liabilities in the Consolidated Statement of Financial Position.Divestitures are included in the foreign exchange and other movements.Fund management contracts are attributable to the previously acquired Dynamic Funds business (formerly DundeeWealth Inc.), MD Financial Management Inc., and Jarislowsky Fraser Limited.Loan balances are presented net of allowance for credit losses.Excludes up to a maximum amount of $1.6 billion (2024 – $1.4 billion) relating to backstop liquidity facilities provided by the Bank to these multi-seller conduits based on future asset purchases by these conduits.The regulatory capital ratios are based on Basel III requirements as determined in accordance with OSFI Guideline – Capital Adequacy Requirements (November 2023).The leverage ratios are based on Basel III requirements as determined in accordance with OSFI Guideline – Leverage Requirements (February 2023).These debentures contain non-viability contingent capital (NVCC) provisions. Under such NVCC provisions, outstanding debentures are convertible into a variable number of common shares if OSFI announces that the Bank has ceased, or is about to cease, to be viable, or if a federal or provincial government in Canada publicly announces that the Bank has accepted or agreed to accept a capital injection, or equivalent support, from the federal government or any provincial government or political subdivision or agent thereof without which the Bank would have been determined by OSFI to be non-viable. If such a conversion were to occur, the debentures would be converted into common shares pursuant to an automatic conversion formula defined as 150% of the par value plus accrued and unpaid interest divided by the conversion price and, where applicable, subject to translation at foreign exchange rates in effect at the time of conversion. The conversion price is based on the greater of: (i) a floor price of $5.00 (subject to adjustments in certain events as set out in the respective prospectus supplements), and (ii) the current market price of the Bank’s common shares at the time of the trigger event (10-day weighted average).In accordance with the provisions of the Capital Adequacy Guideline of the Superintendent, all redemptions are subject to regulatory approval and subject to the terms in the relevant prospectus.The carrying value of subordinated debentures may differ from par value due to the impact of fair value hedges used for managing interest rate risk and subordinated debentures held for market-making purposes.Applies to non-retail portfolio.After credit risk mitigation.The Bank (or immediate parent of an entity) owns 100% of the outstanding voting shares of each subsidiary unless otherwise noted.The recognized asset is limited by the present value of economic benefits available from a reduction in future contributions to a plan and from the ability to pay plan expenses from the fund.Other benefit plans past service costs relate to certain post-retirement plan amendments.Includes outstanding balances of guarantees, standby letters of credit and commercial letters of credit which may expire undrawn.Includes the undrawn component of committed credit and liquidity facilities.Excludes mortgages related to covered bonds held by the Bank or used for securities lending transactions.Includes assets that have been received from counterparties through normal course of business in securities financing and derivative transactions.Non-retail drawn includes loans, acceptances, deposits with financial institutions and FVOCI debt securities. Retail drawn includes residential mortgages, credit cards, lines of credit, other personal loans and small business treated as other regulatory retail.Exposure at default is presented after credit risk mitigation. Exposures exclude equity securities and other assets. Portfolios under the Standardized Approach are reported net of specific allowances for credit losses and net of collateral amounts treated under the Comprehensive Approach.Geographic segmentation is based upon the location of the ultimate risk of the credit exposure.Includes the Bank’s insurance subsidiaries’ assets and all other assets which are not subject to credit and market risks.Amounts for IRB exposures are reported gross of allowances and amounts for standardized exposures are reported net of allowances.Represents amounts expensed during the year.Represents equity-based awards granted during the year.In Q1 2025, the Bank entered into an agreement to sell its banking operations in Colombia, Costa Rica and Panama to Davivienda. The transaction was completed on December 1, 2025. Refer to Note 35 for details.The Bank made a capital contribution to Scotiabank Colpatria S.A. in May 2025 which increased its ownership interest to 56.00% following the subsequent issuance of additional shares.Business line revenues and provision for income taxes are reported on a taxable equivalent basis, with the offset in the Other segment. Effective January 1, 2024, the Bank no longer claims the dividend received deduction on Canadian shares that are mark-to-market property, which has resulted in a lower TEB gross-up for fiscal 2024.Includes all other smaller operating segments and corporate adjustments.Includes all other smaller operating segments and corporate adjustments, such as the elimination of the tax-exempt income gross-up reported in net interest income and non-interest income and provision for income taxes for the year ended October 31, 2024 amounting to $55 to arrive at the amounts reported in the Consolidated Statement of Income, differences in the actual amount of costs incurred and charged to the operating segments.The weighted-average rates of increase in future compensation shown for other benefit plans do not include Canadian flexible post-retirement benefits plans established in fiscal 2005, as they are not impacted by future compensation increases.Includes impairment charge on software and other intangible assets in the Other segment.Interest income is reported net of interest expense as management relies primarily on net interest income as a performance measure.Card revenues and Banking services fees are mainly earned in Canadian and International Banking. Mutual fund, Brokerage fees and Investment management and trust fees are primarily earned in Global Wealth Management. Underwriting and other advisory fees are predominantly earned in Global Banking and Markets.Includes net income (on a taxable equivalent basis) from investments in associated corporations for Canadian Banking – $19; International Banking – $152; Global Banking and Markets – $1; and Other – $436.Interest on LRCN is non-deferrable, however, non-payment of interest that is not cured within five business days results in a Recourse Event. A Recourse Event of the respective Series occurs if (a) there is non-payment in cash by the Bank of the principal amount, together with any accrued and unpaid interest, on the maturity date, (b) there is non-payment in cash of interest which is not cured within 5 business days, (c) there is non-payment in cash of the redemption price in connection with the redemption of the LRCNs, (d) an event of default occurs (i.e. bankruptcy, insolvency, or liquidation of the Bank), or (e) there is an NVCC Trigger Event. Upon the occurrence of a Recourse Event, the noteholder’s sole recourse will be limited to their proportionate share of the Series’ respective assets held in Scotiabank LRCN Trust, a consolidated entity, which consist initially of the respective AT1 Notes or, following an NVCC Trigger Event, common shares. Refer to Note 23(c) – Restriction on payment of dividends and retirement of shares.On January 31, 2025, the Bank issued USD$1,000 million of 7.350% Fixed Rate Resetting Limited Recourse Capital Notes Series 6 (NVCC) (“LRCN Series 6”). In connection with the issuance of LRCN Series 6, the Bank issued U.S.$1,000 million of Fixed Rate Resetting Perpetual Subordinated Additional Tier 1 Capital Notes (NVCC) (“the Series 6 AT1 Notes”) to Scotiabank LRCN Trust to be held as trust assets in connection with the LRCN structure.The securities rank pari passu to each other and are the Bank’s direct unsecured obligations, ranking subordinate to Bank’s other subordinated indebtedness.On June 4, 2025, the Bank redeemed US $1,250 million 4.900% Fixed Rate Resetting Perpetual Subordinated Additional Tier 1 Capital Notes at 100% of their principal amount plus accrued and unpaid interest. The redemption of these AT1 Notes resulted in a foreign currency loss of $22 million recorded in Retained Earnings.While interest is payable on the securities when it becomes due, the Bank may, at its sole discretion and with notice, cancel interest payments. Refer to Note 23(c) – Restriction on payment of dividends and retirement of shares.On June 15, 2021, the Bank issued $1,250 million 3.70% Fixed Rate Resetting Limited Recourse Capital Notes Series 1 (NVCC) (“LRCN Series 1”). In connection with the issuance of LRCN Series 1, the Bank issued $1,250 million of Fixed Rate Resetting Perpetual Subordinated Additional Tier 1 Capital Notes (NVCC) (“the Series 1 AT1 Notes”) to Scotiabank LRCN Trust to be held as trust assets in connection with the LRCN structure.On October 7, 2021, the Bank issued U.S.$600 million 3.625% Fixed Rate Resetting Limited Recourse Capital Notes Series 2 (NVCC) (“LRCN Series 2”). In connection with the issuance of LRCN Series 2, the Bank issued U.S.$600 million of Fixed Rate Resetting Perpetual Subordinated Additional Tier 1 Capital Notes (NVCC) (“the Series 2 AT1 Notes”) to Scotiabank LRCN Trust to be held as trust assets in connection with the LRCN structure.On June 16, 2022, the Bank issued $1,500 million 7.023% Fixed Rate Resetting Limited Recourse Capital Notes Series 3 (NVCC) (“LRCN Series 3”). In connection with the issuance of LRCN Series 3, the Bank issued $1,500 million of Fixed Rate Resetting Perpetual Subordinated Additional Tier 1 Capital Notes (NVCC) (“the Series 3 AT1 Notes”) to Scotiabank LRCN Trust to be held as trust assets in connection with the LRCN structure.On October 25, 2022, the Bank issued U.S.$750 million 8.625% Fixed Rate Resetting Limited Recourse Capital Notes Series 4 (NVCC) (“LRCN Series 4”). In connection with the issuance of LRCN Series 4, the Bank issued U.S.$750 million of Fixed Rate Resetting Perpetual Subordinated Additional Tier 1 Capital Notes (NVCC) (“the Series 4 AT1 Notes”) to Scotiabank LRCN Trust to be held as trust assets in connection with the LRCN structure.On January 12, 2024, the Bank issued U.S.$750 million 8.000% Fixed Rate Resetting Limited Recourse Capital Notes Series 5 (NVCC) (“LRCN Series 5”). In connection with the issuance of LRCN Series 5, the Bank issued U.S.$750 million of Fixed Rate Resetting Perpetual Subordinated Additional Tier 1 Capital Notes (NVCC) (“the Series 5 AT1 Notes”) to Scotiabank LRCN Trust to be held as trust assets in connection with the LRCN structure.Interest income recognized on impaired loans during the year ended October 31, 2025 was $95 (2024 – $84).The notional amounts represent the amount to which a rate or price is applied to determine the amount of cash flows to be exchanged.Represents fixed rate instruments.Represents the fair value of financial assets and liabilities where the carrying amount is not a reasonable approximation of fair value. Represents the weighted-average yield of fixed income securities.Geographic segmentation is based on the location of the property for residential mortgages; otherwise, the residence of the borrower.98.8% of acceptances reside outside Canada (October 31, 2024 – 96.5%).Loans and acceptances denominated in U.S. dollars were $119,788 (2024 – $137,804), in Chilean pesos $10,885 (2024 – $39,425), Mexican pesos $12,754 (2024 – $31,522), and in other foreign currencies $24,665 (2024 – $54,549).These amounts represent embedded derivatives bifurcated from structured note liabilities measured at amortized cost.Geographic segmentation of trading loans is based upon the location of the ultimate risk of the underlying asset.Loans are primarily denominated in U.S. dollars.Includes trading loans that serve as a hedge to loan-based credit total return swaps.Includes trading loans that serve as hedges to total return swaps, hedges for precious metal certificate liabilities and loans subject to sale through syndication.Changes in fair value attributable to changes in the Bank’s own credit risk are recorded in other comprehensive income. Other changes in fair value are recorded in non-interest income – trading revenues. The offsetting fair value changes from associated derivatives is also recorded in non-interest income – trading revenues.Change in the difference between the contractual maturity amount and the carrying value.The cumulative change in fair value is measured from the instrument’s date of initial recognition.In the normal course of business, the Bank’s regulated Dealer subsidiary purchases and sells the Bank’s common shares to facilitate trading/institutional client activity. During fiscal 2025, the number of such shares bought was 30,855,084 and sold was 30,855,333 (2024 – 26,564,849 bought and 26,566,901 sold).Stage 3 includes purchased or originated credit-impaired loans.Includes credit risk changes as a result of significant increases in credit risk, changes in credit risk that did not result in a transfer between stages, changes in model inputs and assumptions and changes due to drawdowns of undrawn commitments.In the current year, the Bank recorded a goodwill write-down of $589 million pre-tax within the Latin America and Caribbean & Central America CGUs in relation to its agreement to sell banking operations in Colombia, Costa Rica and Panama. Refer to Note 35 for details.In fiscal 2024, the Bank recorded a goodwill write-down of $92 million pre-tax within the Latin America CGU in relation to its agreement to sell CrediScotia Financiera, a subsidiary in Peru. Refer to Note 35 for details.Does not include over-collateralization of assets pledged.The fair value of transferred assets is $252,558 (2024 – $232,811) and the fair value of the associated liabilities is $189,144 (2024 – $190,449), for a net position of $63,414 (2024 – $42,362).Liabilities for securities lending arrangements only include amounts related to cash collateral received. For securities received as collateral, refer to Note 34(a)(iv).Computer software comprises purchased software of $262 (2024 – $194), internally generated software of $1,633 (2024 – $1,939), and in process software not subject to amortization of $896 (2024 – $900).The local regulator requires financial institutions to set aside reserves for general banking risks. These reserves are not required under IFRS, and represent undistributed retained earnings related to a foreign associated corporation, which are subject to local regulatory restrictions. As of October 31, 2025, these reserves amounted to $76 (2024 – $74).On December 27, 2024, the Bank completed the acquisition of an additional 10% ownership interest, bringing the total ownership interest in KeyCorp to 14.9% (refer to Note 35 for further details). The Bank has significant influence over KeyCorp through a combination of its ownership interest and board representation. Based on the quoted price on the New York Stock Exchange, the market value of the Bank’s investment in KeyCorp was $4,018 as at Oct 31, 2025. During the year, dividends received from KeyCorp of $140 were recognized as a reduction in the carrying value of the investment in associate.Based on the quoted price on the Shanghai Stock Exchange, the market value of the Bank’s Investment in Bank of Xi’an Co. Ltd. was $617 (October 31, 2024 – $570). The Bank has significant influence over the Bank of Xi’an Co. Ltd. through a combination of its ownership interest and board representation.Represents the date of the most recent financial statements.Based on the most recent available financial statements.For Consolidated Statement of Financial Position presentation, deferred tax assets and liabilities are assessed by legal entity. As a result, the net deferred tax assets of $1,839 (2024 – $1,545) are represented by deferred tax assets of $3,253 (2024 – $2,942), and deferred tax liabilities of $1,414 (2024 – $1,397) on the Consolidated Statement of Financial Position.Excludes non-routine benefit expense items such as past service costs, curtailment charges and settlement charges.Includes $39 (2024 – $36) of investment property.Loans past due 30 days or less are not presented in this analysis as they are not administratively considered past due.For loans where payment deferrals were granted, deferred payments are not considered past due and such loans are not aged further during the deferral period. Regular aging of the loans resumes, after the end of the deferral period.All loans that are over 90 days past due are considered impaired with the exception of credit card receivables which are considered impaired when 180 days past due.Other exposures include off-balance sheet lending instruments such as letters of credit, letters of guarantees, securitizations, derivatives and repo-style transactions (reverse repurchase agreements, repurchase agreements, securities lending and securities borrowing), net of related collateral.Non-controlling interest holders for Scotiabank Colpatria S.A. have a right to sell their holding to the Bank after the end of the 7th anniversary (January 17, 2019) and at subsequent pre-agreed intervals, into the future, at fair market value that can be settled at the Bank’s discretion, by issuance of common shares or cash.Range of non-controlling interest % for other subsidiaries.These exposures are classified as sovereign exposures and are included in the non-retail category.Includes off-balance sheet lending instruments such as letters of credit, letters of guarantees, securitizations, derivatives and repo-style transactions (reverse repurchase agreements, repurchase agreements and securities lending and borrowing), net of related collateral.PD Ranges as at October 31, 2025. The Range does not include the upper boundary for the row.Includes $56.3 billion in mortgages guaranteed by Canada Mortgage Housing Corporation and federally backed privately insured mortgages.Includes $52.8 billion in mortgages guaranteed by Canada Mortgage Housing Corporation and federally backed privately insured mortgages.The interest income/expense on financial assets/liabilities are calculated using the effective interest method.Includes interest on lease liabilities of $125 (2024 – $119) and insurance finance expense of $33 (2024 – $30).In the current year, the Bank recognized an impairment loss of $165 million pre-tax in relation to its agreement to sell banking operations in Colombia, Costa Rica and Panama. Refer to Note 35 for details.Effective November 1, 2024, and until such time as the Bank elects otherwise, the Bank has suspended the discount to the Average Market Price (as defined in the Plan) for dividend reinvestments and stock dividends under the Plan and has discontinued issuances of common shares from treasury under the Plan. Additionally, effective November 1, 2024, and until such time as the Bank elects otherwise, purchases of common shares under the Plan will be made in the secondary market in accordance with the provisions of the Plan.Based on preliminary estimates, the Bank expects to make contributions of $158 million to the SPP (excluding the defined contribution provision), $79 million to all other defined benefit pension plans, $66 million to other benefit plans and $217 million to all defined contribution plans for the year ending October 31, 2026.Refer to Note 23 (b) for further details on the redemption of the equity instrument. Includes a net impairment loss recorded in Q1 2025 related to the agreement to sell the banking operations in Colombia, Costa Rica and Panama. Refer to Note 35 for details. The balance excludes reverse repurchase activities of $0 million (2024 – nil) reported in Loans on the Consolidated Statement of Financial Position.Deposits denominated in U.S. dollars amount to $297,065 (2024 – $295,316), deposits denominated in Chilean pesos amount to $20,053 (2024 – $19,271), deposits denominated in Mexican pesos amount to $35,941 (2024 – $34,416) and deposits denominated in other foreign currencies amount to $117,530 (2024 – $109,683).All deposits that mature on a specified date, generally term deposits, guaranteed investments certificates and similar instruments.The majority of foreign term deposits are in excess of $100,000.Represents principal amount owed net of write-offs.The fair value of the transferred assets is $15,298 (2024 – $18,092) and the fair value of the associated liabilities is $15,593 (2024 – $17,692), for a net position of $(295) (2024 – $400).These include cash held in trust and trust permitted investment assets, including repurchase style transactions of mortgage-backed securities, acquired as part of principal reinvestment account that the Bank is required to maintain in order to participate in the programs.Excludes amounts associated with other assets of $(12). The provision for credit losses, net of these amounts, is $4,714.Allowance for credit losses on acceptances is recorded against the financial asset in the Consolidated Statement of Financial Position.Excludes amounts associated with other assets and reversal of impairment losses of $(11). The provision for credit losses, net of these amounts, is $4,051.Excludes allowance for credit losses for other financial assets including acceptances, investment securities, deposits with banks, off-balance sheet credit risks and reverse repos which amounted to $191.Excludes allowance for credit losses for other financial assets including acceptances, investment securities, deposits with banks, off-balance sheet credit risks and reverse repos which amounted to $200.Lower average tax rate applicable to subsidiaries and foreign branches includes the impact of the GMT which increased the effective tax rate by 0.8%. Deposits payable on demand include deposits for which the Bank may not have the right to notice of withdrawal, generally chequing accounts.Represents discounted value of lease liabilities.CME 3-month Term SOFR.Includes net income (on a taxable equivalent basis) from investments in associated corporations for Canadian Banking – $(9); International Banking – $130; and Other – $77.Includes net income from investments in associated corporations for Canada – $(68), Mexico – $11, Peru – $4, Chile – $6, Caribbean and Central America – $109, and Other International – $136.Revenues are attributed to countries based on where services are performed or assets are recorded.Includes net income from investments in associated corporations for Canada – $(12), United States – $362, Mexico – $9, Peru – $4, Chile – $7, Caribbean and Central America – $132, and Other International – $106.Includes dividend income on equity securities.Earnings per share calculations are based on full dollar and share amounts.Certain options were not included in the calculation of diluted earnings per share as they were anti-dilutive. The maximum potential amount of future payments represents those guarantees that can be quantified and excludes other guarantees that cannot be quantified. As many of these guarantees will not be drawn upon and the maximum potential amount of future payments listed above does not consider the possibility of recovery under recourse or collateral provisions, the above amounts are not indicative of future cash requirements, credit risk, or the Bank’s expected losses from these arrangements.Includes liquidity facilities, and excludes commitments which are unconditionally cancellable at the Bank’s discretion at any time.Includes assets pledged in order to participate in clearing and payment systems and depositories, or pledged to have access to the facilities of central banks in foreign jurisdictions.On September 29, 2025, the Bank issued USD$1,000 million of 6.875% Fixed Rate Resetting Limited Recourse Capital Notes Series 7 (NVCC) (“LRCN Series 7”). In connection with the issuance of LRCN Series 7, the Bank issued U.S.$1,000 million of Fixed Rate Resetting Perpetual Subordinated Additional Tier 1 Capital Notes (NVCC) (“the Series 7 AT1 Notes”) to Scotiabank LRCN Trust to be held as trust assets in connection with the LRCN structure.Distributions paid from November 1 to October 31 in the relevant fiscal year per face amount of $1,000 or U.S.$1,000, as applicable.The then-prevailing five-year Government of Canada yield.The then-prevailing five-year U.S. Treasury Rate.Effective November 1, 2024, credit spread VaR also captures issuer-specific credit spread volatility which was previously included in debt specific VaR.Each security is redeemable at the sole discretion of the Bank on the first reset date and every quarter or five years, as applicable, thereafter. Limited Recourse Capital Notes (LRCN) Series 1 and Series 3 are also redeemable in the one month period preceding each reset date. The securities are also redeemable following a regulatory or tax event, as described in the offering documents. All redemptions are subject to regulatory consent and occur at a redemption price of par plus accrued and unpaid interest (unless canceled, where applicable).This measure has been disclosed in this document in accordance with OSFI Guideline – Total Loss Absorbing Capacity (September 2018). 0000009631 2024-10-31 0000009631 2025-10-31 0000009631 2024-11-01 2025-10-31 0000009631 2023-11-01 2024-10-31 0000009631 2025-08-01 2025-10-31 0000009631 2024-12-02 2024-12-02 0000009631 2018-07-01 2018-07-31 0000009631 2023-06-30 0000009631 2025-06-30 0000009631 2022-12-31 0000009631 2023-02-01 0000009631 2025-05-28 2025-05-28 0000009631 2025-05-28 0000009631 2023-04-30 0000009631 2023-02-01 2023-04-30 0000009631 2023-10-31 0000009631 bns:ExchangeTraded1Member bns:ForeignExchangeAndGoldContractsMember 2024-10-31 0000009631 bns:TradingDerivativesMember ifrs-full:SwapContractMember bns:OverTheCounter1Member bns:ForeignExchangeAndGoldContractsMember 2024-10-31 0000009631 bns:TradingDerivativesMember bns:SpotAndForwardsMember bns:OverTheCounter1Member bns:ForeignExchangeAndGoldContractsMember 2024-10-31 0000009631 bns:HedgingDerivativeMember bns:EquityDerivativesMember bns:OverTheCounter1Member bns:OtherDerivativesMember 2024-10-31 0000009631 bns:CreditDerivativeMember bns:SettledThroughCentralCounterpartiesMember bns:OtherDerivativesMember 2024-10-31 0000009631 bns:OverTheCounter1Member bns:OtherDerivativesMember 2024-10-31 0000009631 bns:HedgingDerivativeMember bns:OverTheCounter1Member bns:OtherDerivativesMember 2024-10-31 0000009631 bns:CommodityAndOtherContractsMember bns:OverTheCounter1Member bns:OtherDerivativesMember 2024-10-31 0000009631 bns:CreditDerivativeMember bns:OverTheCounter1Member bns:OtherDerivativesMember 2024-10-31 0000009631 bns:EquityDerivativesMember bns:OverTheCounter1Member bns:OtherDerivativesMember 2024-10-31 0000009631 ifrs-full:FuturesContractMember bns:ExchangeTraded1Member bns:InterestRateContractsMember 2024-10-31 0000009631 bns:HedgingDerivativeMember 2024-10-31 0000009631 bns:OtherDerivativesMember 2024-10-31 0000009631 bns:HedgingDerivativeMember bns:OtherDerivativesMember 2024-10-31 0000009631 bns:CommodityAndOtherContractsMember bns:SettledThroughCentralCounterpartiesMember bns:OtherDerivativesMember 2024-10-31 0000009631 bns:HedgingDerivativeMember bns:InterestRateContractsMember 2024-10-31 0000009631 bns:InterestRateContractsMember 2024-10-31 0000009631 bns:TradingDerivativesMember bns:ExchangeTraded1Member bns:InterestRateContractsMember 2024-10-31 0000009631 bns:ExchangeTraded1Member bns:InterestRateContractsMember 2024-10-31 0000009631 bns:TradingDerivativesMember ifrs-full:ForwardContractMember bns:OverTheCounter1Member bns:InterestRateContractsMember 2024-10-31 0000009631 ifrs-full:ForwardContractMember bns:OverTheCounter1Member bns:InterestRateContractsMember 2024-10-31 0000009631 bns:TradingDerivativesMember bns:CommodityAndOtherContractsMember bns:ExchangeTraded1Member bns:OtherDerivativesMember 2024-10-31 0000009631 bns:TradingDerivativesMember bns:EquityDerivativesMember bns:ExchangeTraded1Member bns:OtherDerivativesMember 2024-10-31 0000009631 bns:TradingDerivativesMember bns:ForeignExchangeAndGoldContractsMember 2024-10-31 0000009631 ifrs-full:SwapContractMember bns:SettledThroughCentralCounterpartiesMember bns:InterestRateContractsMember 2024-10-31 0000009631 bns:HedgingDerivativeMember bns:SettledThroughCentralCounterpartiesMember bns:InterestRateContractsMember 2024-10-31 0000009631 bns:OptionsPurchasedMember bns:ExchangeTraded1Member bns:InterestRateContractsMember 2024-10-31 0000009631 bns:TradingDerivativesMember bns:OptionsPurchasedMember bns:ExchangeTraded1Member bns:InterestRateContractsMember 2024-10-31 0000009631 bns:TradingDerivativesMember ifrs-full:FuturesContractMember bns:ExchangeTraded1Member bns:InterestRateContractsMember 2024-10-31 0000009631 bns:TradingDerivativesMember ifrs-full:SwapContractMember bns:OverTheCounter1Member bns:InterestRateContractsMember 2024-10-31 0000009631 bns:TradingDerivativesMember bns:OptionsPurchasedMember bns:OverTheCounter1Member bns:InterestRateContractsMember 2024-10-31 0000009631 bns:SettledThroughCentralCounterpartiesMember bns:InterestRateContractsMember 2024-10-31 0000009631 ifrs-full:SwapContractMember bns:OverTheCounter1Member bns:ForeignExchangeAndGoldContractsMember 2024-10-31 0000009631 bns:OptionsPurchasedMember bns:OverTheCounter1Member bns:ForeignExchangeAndGoldContractsMember 2024-10-31 0000009631 bns:OptionsWrittenMember bns:OverTheCounter1Member bns:ForeignExchangeAndGoldContractsMember 2024-10-31 0000009631 bns:TradingDerivativesMember bns:ExchangeTraded1Member bns:ForeignExchangeAndGoldContractsMember 2024-10-31 0000009631 bns:HedgingDerivativeMember bns:SpotAndForwardsMember bns:OverTheCounter1Member bns:ForeignExchangeAndGoldContractsMember 2024-10-31 0000009631 bns:SpotAndForwardsMember bns:OverTheCounter1Member bns:ForeignExchangeAndGoldContractsMember 2024-10-31 0000009631 bns:HedgingDerivativeMember ifrs-full:SwapContractMember bns:OverTheCounter1Member bns:ForeignExchangeAndGoldContractsMember 2024-10-31 0000009631 bns:TradingDerivativesMember bns:OptionsWrittenMember bns:OverTheCounter1Member bns:InterestRateContractsMember 2024-10-31 0000009631 bns:SpotAndForwardsMember bns:SettledThroughCentralCounterpartiesMember bns:ForeignExchangeAndGoldContractsMember 2024-10-31 0000009631 bns:OverTheCounter1Member bns:ForeignExchangeAndGoldContractsMember 2024-10-31 0000009631 bns:HedgingDerivativeMember bns:OverTheCounter1Member bns:ForeignExchangeAndGoldContractsMember 2024-10-31 0000009631 bns:SettledThroughCentralCounterpartiesMember bns:OtherDerivativesMember 2024-10-31 0000009631 bns:TradingDerivativesMember bns:SettledThroughCentralCounterpartiesMember bns:OtherDerivativesMember 2024-10-31 0000009631 bns:OptionsWrittenMember bns:ExchangeTraded1Member bns:InterestRateContractsMember 2024-10-31 0000009631 bns:TradingDerivativesMember bns:OptionsWrittenMember bns:ExchangeTraded1Member bns:InterestRateContractsMember 2024-10-31 0000009631 bns:TradingDerivativesMember ifrs-full:ForwardContractMember bns:SettledThroughCentralCounterpartiesMember bns:InterestRateContractsMember 2024-10-31 0000009631 bns:TradingDerivativesMember bns:OverTheCounter1Member bns:InterestRateContractsMember 2024-10-31 0000009631 bns:OverTheCounter1Member bns:InterestRateContractsMember 2024-10-31 0000009631 bns:HedgingDerivativeMember bns:OverTheCounter1Member bns:InterestRateContractsMember 2024-10-31 0000009631 bns:OptionsWrittenMember bns:OverTheCounter1Member bns:InterestRateContractsMember 2024-10-31 0000009631 bns:OptionsPurchasedMember bns:OverTheCounter1Member bns:InterestRateContractsMember 2024-10-31 0000009631 ifrs-full:SwapContractMember bns:OverTheCounter1Member bns:InterestRateContractsMember 2024-10-31 0000009631 bns:HedgingDerivativeMember ifrs-full:SwapContractMember bns:OverTheCounter1Member bns:InterestRateContractsMember 2024-10-31 0000009631 bns:ExchangeTraded1Member bns:OtherDerivativesMember 2024-10-31 0000009631 bns:TradingDerivativesMember bns:ExchangeTraded1Member bns:OtherDerivativesMember 2024-10-31 0000009631 bns:HedgingDerivativeMember ifrs-full:SwapContractMember bns:SettledThroughCentralCounterpartiesMember bns:InterestRateContractsMember 2024-10-31 0000009631 ifrs-full:ForwardContractMember bns:SettledThroughCentralCounterpartiesMember bns:InterestRateContractsMember 2024-10-31 0000009631 bns:HedgingDerivativeMember bns:ForeignExchangeAndGoldContractsMember 2024-10-31 0000009631 bns:SettledThroughCentralCounterpartiesMember bns:ForeignExchangeAndGoldContractsMember 2024-10-31 0000009631 bns:TradingDerivativesMember ifrs-full:SwapContractMember bns:SettledThroughCentralCounterpartiesMember bns:InterestRateContractsMember 2024-10-31 0000009631 ifrs-full:FuturesContractMember bns:ExchangeTraded1Member bns:ForeignExchangeAndGoldContractsMember 2024-10-31 0000009631 bns:CommodityAndOtherContractsMember bns:ExchangeTraded1Member bns:OtherDerivativesMember 2024-10-31 0000009631 bns:EquityDerivativesMember bns:ExchangeTraded1Member bns:OtherDerivativesMember 2024-10-31 0000009631 bns:ForeignExchangeAndGoldContractsMember 2024-10-31 0000009631 bns:TradingDerivativesMember bns:OptionsWrittenMember bns:OverTheCounter1Member bns:ForeignExchangeAndGoldContractsMember 2024-10-31 0000009631 bns:TradingDerivativesMember bns:OptionsPurchasedMember bns:OverTheCounter1Member bns:ForeignExchangeAndGoldContractsMember 2024-10-31 0000009631 bns:TradingDerivativesMember ifrs-full:FuturesContractMember bns:ExchangeTraded1Member bns:ForeignExchangeAndGoldContractsMember 2024-10-31 0000009631 bns:TradingDerivativesMember bns:InterestRateContractsMember 2024-10-31 0000009631 bns:TradingDerivativesMember bns:SettledThroughCentralCounterpartiesMember bns:InterestRateContractsMember 2024-10-31 0000009631 bns:TradingDerivativesMember bns:CommodityAndOtherContractsMember bns:OverTheCounter1Member bns:OtherDerivativesMember 2024-10-31 0000009631 bns:TradingDerivativesMember bns:CreditDerivativeMember bns:OverTheCounter1Member bns:OtherDerivativesMember 2024-10-31 0000009631 bns:TradingDerivativesMember bns:EquityDerivativesMember bns:OverTheCounter1Member bns:OtherDerivativesMember 2024-10-31 0000009631 bns:TradingDerivativesMember bns:SettledThroughCentralCounterpartiesMember bns:ForeignExchangeAndGoldContractsMember 2024-10-31 0000009631 bns:TradingDerivativesMember bns:SpotAndForwardsMember bns:SettledThroughCentralCounterpartiesMember bns:ForeignExchangeAndGoldContractsMember 2024-10-31 0000009631 bns:TradingDerivativesMember bns:OverTheCounter1Member bns:ForeignExchangeAndGoldContractsMember 2024-10-31 0000009631 bns:TradingDerivativesMember 2024-10-31 0000009631 bns:TradingDerivativesMember bns:OtherDerivativesMember 2024-10-31 0000009631 bns:TradingDerivativesMember bns:CommodityAndOtherContractsMember bns:SettledThroughCentralCounterpartiesMember bns:OtherDerivativesMember 2024-10-31 0000009631 bns:TradingDerivativesMember bns:CreditDerivativeMember bns:SettledThroughCentralCounterpartiesMember bns:OtherDerivativesMember 2024-10-31 0000009631 bns:TradingDerivativesMember bns:OverTheCounter1Member bns:OtherDerivativesMember 2024-10-31 0000009631 ifrs-full:SwapContractMember ifrs-full:LaterThanFiveYearsMember bns:InterestRateContractsMember 2024-10-31 0000009631 bns:OptionsPurchasedMember ifrs-full:NotLaterThanOneYearMember bns:InterestRateContractsMember 2024-10-31 0000009631 bns:OptionsPurchasedMember ifrs-full:LaterThanOneYearAndNotLaterThanFiveYearsMember bns:InterestRateContractsMember 2024-10-31 0000009631 bns:OptionsPurchasedMember ifrs-full:LaterThanFiveYearsMember bns:InterestRateContractsMember 2024-10-31 0000009631 bns:CreditDerivativeMember ifrs-full:LaterThanOneYearAndNotLaterThanFiveYearsMember bns:OtherDerivativesMember 2024-10-31 0000009631 bns:CreditDerivativeMember ifrs-full:LaterThanFiveYearsMember bns:OtherDerivativesMember 2024-10-31 0000009631 bns:SpotAndForwardsMember ifrs-full:NotLaterThanOneYearMember bns:ForeignExchangeAndGoldContractsMember 2024-10-31 0000009631 ifrs-full:SwapContractMember ifrs-full:NotLaterThanOneYearMember bns:ForeignExchangeAndGoldContractsMember 2024-10-31 0000009631 ifrs-full:SwapContractMember ifrs-full:LaterThanOneYearAndNotLaterThanFiveYearsMember bns:ForeignExchangeAndGoldContractsMember 2024-10-31 0000009631 ifrs-full:SwapContractMember ifrs-full:LaterThanFiveYearsMember bns:ForeignExchangeAndGoldContractsMember 2024-10-31 0000009631 bns:OptionsPurchasedMember ifrs-full:NotLaterThanOneYearMember bns:ForeignExchangeAndGoldContractsMember 2024-10-31 0000009631 ifrs-full:SwapContractMember ifrs-full:LaterThanOneYearAndNotLaterThanFiveYearsMember bns:InterestRateContractsMember 2024-10-31 0000009631 bns:SpotAndForwardsMember ifrs-full:LaterThanFiveYearsMember bns:ForeignExchangeAndGoldContractsMember 2024-10-31 0000009631 bns:SpotAndForwardsMember ifrs-full:LaterThanOneYearAndNotLaterThanFiveYearsMember bns:ForeignExchangeAndGoldContractsMember 2024-10-31 0000009631 ifrs-full:ForwardContractMember ifrs-full:LaterThanOneYearAndNotLaterThanFiveYearsMember bns:InterestRateContractsMember 2024-10-31 0000009631 ifrs-full:SwapContractMember ifrs-full:NotLaterThanOneYearMember bns:InterestRateContractsMember 2024-10-31 0000009631 bns:CreditDerivativeMember bns:OtherDerivativesMember 2024-10-31 0000009631 bns:CommodityAndOtherContractsMember bns:OtherDerivativesMember 2024-10-31 0000009631 ifrs-full:FuturesContractMember bns:ForeignExchangeAndGoldContractsMember 2024-10-31 0000009631 bns:SpotAndForwardsMember bns:ForeignExchangeAndGoldContractsMember 2024-10-31 0000009631 ifrs-full:SwapContractMember bns:ForeignExchangeAndGoldContractsMember 2024-10-31 0000009631 bns:OptionsPurchasedMember bns:ForeignExchangeAndGoldContractsMember 2024-10-31 0000009631 bns:OptionsWrittenMember bns:ForeignExchangeAndGoldContractsMember 2024-10-31 0000009631 bns:EquityDerivativesMember bns:OtherDerivativesMember 2024-10-31 0000009631 ifrs-full:FuturesContractMember bns:InterestRateContractsMember 2024-10-31 0000009631 ifrs-full:ForwardContractMember bns:InterestRateContractsMember 2024-10-31 0000009631 ifrs-full:SwapContractMember bns:InterestRateContractsMember 2024-10-31 0000009631 bns:OptionsPurchasedMember bns:InterestRateContractsMember 2024-10-31 0000009631 bns:OptionsWrittenMember bns:InterestRateContractsMember 2024-10-31 0000009631 ifrs-full:LaterThanOneYearAndNotLaterThanFiveYearsMember bns:ForeignExchangeAndGoldContractsMember 2024-10-31 0000009631 ifrs-full:LaterThanFiveYearsMember bns:ForeignExchangeAndGoldContractsMember 2024-10-31 0000009631 ifrs-full:NotLaterThanOneYearMember bns:OtherDerivativesMember 2024-10-31 0000009631 ifrs-full:LaterThanOneYearAndNotLaterThanFiveYearsMember bns:OtherDerivativesMember 2024-10-31 0000009631 ifrs-full:LaterThanFiveYearsMember bns:OtherDerivativesMember 2024-10-31 0000009631 ifrs-full:ForwardContractMember ifrs-full:LaterThanFiveYearsMember bns:InterestRateContractsMember 2024-10-31 0000009631 ifrs-full:NotLaterThanOneYearMember bns:InterestRateContractsMember 2024-10-31 0000009631 ifrs-full:LaterThanOneYearAndNotLaterThanFiveYearsMember bns:InterestRateContractsMember 2024-10-31 0000009631 ifrs-full:LaterThanFiveYearsMember bns:InterestRateContractsMember 2024-10-31 0000009631 ifrs-full:NotLaterThanOneYearMember bns:ForeignExchangeAndGoldContractsMember 2024-10-31 0000009631 bns:CommodityAndOtherContractsMember ifrs-full:LaterThanOneYearAndNotLaterThanFiveYearsMember bns:OtherDerivativesMember 2024-10-31 0000009631 bns:CommodityAndOtherContractsMember ifrs-full:LaterThanFiveYearsMember bns:OtherDerivativesMember 2024-10-31 0000009631 ifrs-full:NotLaterThanOneYearMember 2024-10-31 0000009631 ifrs-full:LaterThanOneYearAndNotLaterThanFiveYearsMember 2024-10-31 0000009631 bns:CommodityAndOtherContractsMember ifrs-full:NotLaterThanOneYearMember bns:OtherDerivativesMember 2024-10-31 0000009631 ifrs-full:ForwardContractMember ifrs-full:NotLaterThanOneYearMember bns:InterestRateContractsMember 2024-10-31 0000009631 bns:OptionsPurchasedMember ifrs-full:LaterThanFiveYearsMember bns:ForeignExchangeAndGoldContractsMember 2024-10-31 0000009631 bns:OptionsWrittenMember ifrs-full:NotLaterThanOneYearMember bns:ForeignExchangeAndGoldContractsMember 2024-10-31 0000009631 bns:OptionsWrittenMember ifrs-full:LaterThanOneYearAndNotLaterThanFiveYearsMember bns:ForeignExchangeAndGoldContractsMember 2024-10-31 0000009631 bns:OptionsWrittenMember ifrs-full:LaterThanFiveYearsMember bns:ForeignExchangeAndGoldContractsMember 2024-10-31 0000009631 ifrs-full:FuturesContractMember ifrs-full:NotLaterThanOneYearMember bns:InterestRateContractsMember 2024-10-31 0000009631 ifrs-full:FuturesContractMember ifrs-full:LaterThanOneYearAndNotLaterThanFiveYearsMember bns:InterestRateContractsMember 2024-10-31 0000009631 bns:OptionsWrittenMember ifrs-full:NotLaterThanOneYearMember bns:InterestRateContractsMember 2024-10-31 0000009631 bns:OptionsWrittenMember ifrs-full:LaterThanOneYearAndNotLaterThanFiveYearsMember bns:InterestRateContractsMember 2024-10-31 0000009631 bns:OptionsWrittenMember ifrs-full:LaterThanFiveYearsMember bns:InterestRateContractsMember 2024-10-31 0000009631 bns:EquityDerivativesMember ifrs-full:NotLaterThanOneYearMember bns:OtherDerivativesMember 2024-10-31 0000009631 bns:EquityDerivativesMember ifrs-full:LaterThanOneYearAndNotLaterThanFiveYearsMember bns:OtherDerivativesMember 2024-10-31 0000009631 bns:EquityDerivativesMember ifrs-full:LaterThanFiveYearsMember bns:OtherDerivativesMember 2024-10-31 0000009631 bns:CreditDerivativeMember ifrs-full:NotLaterThanOneYearMember bns:OtherDerivativesMember 2024-10-31 0000009631 ifrs-full:LaterThanFiveYearsMember 2024-10-31 0000009631 ifrs-full:FuturesContractMember ifrs-full:NotLaterThanOneYearMember bns:ForeignExchangeAndGoldContractsMember 2024-10-31 0000009631 ifrs-full:FuturesContractMember ifrs-full:LaterThanOneYearAndNotLaterThanFiveYearsMember bns:ForeignExchangeAndGoldContractsMember 2024-10-31 0000009631 bns:OptionsPurchasedMember ifrs-full:LaterThanOneYearAndNotLaterThanFiveYearsMember bns:ForeignExchangeAndGoldContractsMember 2024-10-31 0000009631 bns:ExchangeTraded1Member bns:SettledThroughCentralCounterpartiesMember 2024-10-31 0000009631 bns:SettledThroughCentralCounterpartiesMember 2024-10-31 0000009631 bns:OverTheCounter1Member bns:SettledThroughCentralCounterpartiesMember 2024-10-31 0000009631 bns:OtherCurrenciesMember ifrs-full:LaterThanFiveYearsAndNotLaterThanTenYearsMember 2024-10-31 0000009631 bns:OtherCurrenciesMember ifrs-full:LaterThanTenYearsMember 2024-10-31 0000009631 currency:MXN ifrs-full:LaterThanFiveYearsAndNotLaterThanTenYearsMember 2024-10-31 0000009631 currency:MXN ifrs-full:LaterThanTenYearsMember 2024-10-31 0000009631 currency:MXN bns:WithNoSpecificMaturityMember 2024-10-31 0000009631 currency:MXN 2024-10-31 0000009631 bns:OtherCurrenciesMember ifrs-full:LaterThanThreeMonthsAndNotLaterThanOneYearMember 2024-10-31 0000009631 bns:OtherCurrenciesMember ifrs-full:LaterThanOneYearAndNotLaterThanFiveYearsMember 2024-10-31 0000009631 bns:OtherForeignGovernmentDebtMember ifrs-full:LaterThanFiveYearsAndNotLaterThanTenYearsMember 2024-10-31 0000009631 bns:OtherForeignGovernmentDebtMember ifrs-full:LaterThanOneYearAndNotLaterThanFiveYearsMember 2024-10-31 0000009631 bns:OtherForeignGovernmentDebtMember ifrs-full:LaterThanThreeMonthsAndNotLaterThanOneYearMember 2024-10-31 0000009631 bns:UnitedStatesTreasuryAndOtherUnitedStatesAgencyDebtMember 2024-10-31 0000009631 currency:MXN ifrs-full:LaterThanThreeMonthsAndNotLaterThanOneYearMember 2024-10-31 0000009631 currency:MXN ifrs-full:LaterThanOneYearAndNotLaterThanFiveYearsMember 2024-10-31 0000009631 bns:OtherTradingSecuritiesMember ifrs-full:LaterThanOneYearAndNotLaterThanFiveYearsMember 2024-10-31 0000009631 bns:OtherTradingSecuritiesMember ifrs-full:LaterThanThreeMonthsAndNotLaterThanOneYearMember 2024-10-31 0000009631 bns:EquitySecuritiesMember 2024-10-31 0000009631 bns:EquitySecuritiesMember bns:WithNoSpecificMaturityMember 2024-10-31 0000009631 bns:OtherForeignGovernmentDebtMember 2024-10-31 0000009631 bns:OtherForeignGovernmentDebtMember ifrs-full:LaterThanTenYearsMember 2024-10-31 0000009631 ifrs-full:NotLaterThanThreeMonthsMember 2024-10-31 0000009631 bns:OtherForeignGovernmentDebtMember ifrs-full:NotLaterThanThreeMonthsMember 2024-10-31 0000009631 bns:OtherCurrenciesMember ifrs-full:NotLaterThanThreeMonthsMember 2024-10-31 0000009631 bns:OtherTradingSecuritiesMember ifrs-full:NotLaterThanThreeMonthsMember 2024-10-31 0000009631 bns:UnitedStatesTreasuryAndOtherUnitedStatesAgencyDebtMember ifrs-full:NotLaterThanThreeMonthsMember 2024-10-31 0000009631 bns:CanadianProvincialAndMunicipalDebtMember ifrs-full:NotLaterThanThreeMonthsMember 2024-10-31 0000009631 bns:CanadianFederalGovernmentIssuedOrGuaranteedDebtMember ifrs-full:NotLaterThanThreeMonthsMember 2024-10-31 0000009631 ifrs-full:LaterThanThreeMonthsAndNotLaterThanOneYearMember 2024-10-31 0000009631 bns:OtherTradingSecuritiesMember 2024-10-31 0000009631 currency:CAD ifrs-full:NotLaterThanThreeMonthsMember 2024-10-31 0000009631 currency:USD ifrs-full:NotLaterThanThreeMonthsMember 2024-10-31 0000009631 currency:MXN ifrs-full:NotLaterThanThreeMonthsMember 2024-10-31 0000009631 ifrs-full:LaterThanFiveYearsAndNotLaterThanTenYearsMember 2024-10-31 0000009631 ifrs-full:LaterThanTenYearsMember 2024-10-31 0000009631 bns:WithNoSpecificMaturityMember 2024-10-31 0000009631 bns:OtherCurrenciesMember bns:WithNoSpecificMaturityMember 2024-10-31 0000009631 bns:OtherCurrenciesMember 2024-10-31 0000009631 currency:CAD ifrs-full:LaterThanOneYearAndNotLaterThanFiveYearsMember 2024-10-31 0000009631 currency:CAD ifrs-full:LaterThanThreeMonthsAndNotLaterThanOneYearMember 2024-10-31 0000009631 currency:USD ifrs-full:LaterThanOneYearAndNotLaterThanFiveYearsMember 2024-10-31 0000009631 currency:USD ifrs-full:LaterThanThreeMonthsAndNotLaterThanOneYearMember 2024-10-31 0000009631 currency:CAD 2024-10-31 0000009631 currency:CAD bns:WithNoSpecificMaturityMember 2024-10-31 0000009631 currency:CAD ifrs-full:LaterThanTenYearsMember 2024-10-31 0000009631 currency:CAD ifrs-full:LaterThanFiveYearsAndNotLaterThanTenYearsMember 2024-10-31 0000009631 bns:UnitedStatesTreasuryAndOtherUnitedStatesAgencyDebtMember ifrs-full:LaterThanFiveYearsAndNotLaterThanTenYearsMember 2024-10-31 0000009631 bns:UnitedStatesTreasuryAndOtherUnitedStatesAgencyDebtMember ifrs-full:LaterThanTenYearsMember 2024-10-31 0000009631 currency:USD 2024-10-31 0000009631 currency:USD bns:WithNoSpecificMaturityMember 2024-10-31 0000009631 currency:USD ifrs-full:LaterThanTenYearsMember 2024-10-31 0000009631 currency:USD ifrs-full:LaterThanFiveYearsAndNotLaterThanTenYearsMember 2024-10-31 0000009631 bns:CanadianProvincialAndMunicipalDebtMember ifrs-full:LaterThanOneYearAndNotLaterThanFiveYearsMember 2024-10-31 0000009631 bns:CanadianProvincialAndMunicipalDebtMember ifrs-full:LaterThanFiveYearsAndNotLaterThanTenYearsMember 2024-10-31 0000009631 bns:CanadianProvincialAndMunicipalDebtMember ifrs-full:LaterThanTenYearsMember 2024-10-31 0000009631 bns:CanadianProvincialAndMunicipalDebtMember 2024-10-31 0000009631 bns:UnitedStatesTreasuryAndOtherUnitedStatesAgencyDebtMember ifrs-full:LaterThanThreeMonthsAndNotLaterThanOneYearMember 2024-10-31 0000009631 bns:UnitedStatesTreasuryAndOtherUnitedStatesAgencyDebtMember ifrs-full:LaterThanOneYearAndNotLaterThanFiveYearsMember 2024-10-31 0000009631 bns:CanadianFederalGovernmentIssuedOrGuaranteedDebtMember ifrs-full:LaterThanFiveYearsAndNotLaterThanTenYearsMember 2024-10-31 0000009631 bns:CanadianFederalGovernmentIssuedOrGuaranteedDebtMember ifrs-full:LaterThanOneYearAndNotLaterThanFiveYearsMember 2024-10-31 0000009631 bns:CanadianFederalGovernmentIssuedOrGuaranteedDebtMember ifrs-full:LaterThanThreeMonthsAndNotLaterThanOneYearMember 2024-10-31 0000009631 bns:CanadianFederalGovernmentIssuedOrGuaranteedDebtMember ifrs-full:LaterThanTenYearsMember 2024-10-31 0000009631 bns:CanadianFederalGovernmentIssuedOrGuaranteedDebtMember 2024-10-31 0000009631 bns:CanadianProvincialAndMunicipalDebtMember ifrs-full:LaterThanThreeMonthsAndNotLaterThanOneYearMember 2024-10-31 0000009631 bns:OtherTradingSecuritiesMember ifrs-full:LaterThanFiveYearsAndNotLaterThanTenYearsMember 2024-10-31 0000009631 bns:OtherTradingSecuritiesMember ifrs-full:LaterThanTenYearsMember 2024-10-31 0000009631 bns:OtherTradingSecuritiesMember bns:WithNoSpecificMaturityMember 2024-10-31 0000009631 bns:OtherCountriesMember 2024-10-31 0000009631 country:CA 2024-10-31 0000009631 srt:EuropeMember 2024-10-31 0000009631 country:US 2024-10-31 0000009631 bns:CreditRiskEquivalentMember 2024-10-31 0000009631 bns:CreditRiskAmountMember 2024-10-31 0000009631 bns:ForeignCurrencyForwardContractsMember bns:DepositLiabilitiesMember ifrs-full:NotLaterThanOneYearMember ifrs-full:HedgesOfNetInvestmentInForeignOperationsMember ifrs-full:CurrencyRiskMember 2024-10-31 0000009631 bns:TotalReturnSwapsMember bns:DepositLiabilitiesMember ifrs-full:NotLaterThanOneYearMember ifrs-full:CashFlowHedgesMember ifrs-full:EquityPriceRiskMember 2024-10-31 0000009631 ifrs-full:SwapContractMember bns:DepositLiabilitiesMember ifrs-full:NotLaterThanOneYearMember ifrs-full:FairValueHedgesMember ifrs-full:InterestRateRiskMember 2024-10-31 0000009631 ifrs-full:SwapContractMember bns:DepositLiabilitiesMember ifrs-full:LaterThanOneYearAndNotLaterThanFiveYearsMember ifrs-full:FairValueHedgesMember ifrs-full:InterestRateRiskMember 2024-10-31 0000009631 bns:ForeignCurrencyDepositLiabilitiesMember bns:DepositLiabilitiesMember ifrs-full:NotLaterThanOneYearMember ifrs-full:HedgesOfNetInvestmentInForeignOperationsMember ifrs-full:CurrencyRiskMember 2024-10-31 0000009631 bns:Cash1Member bns:DepositLiabilitiesMember ifrs-full:CashFlowHedgesMember ifrs-full:CurrencyRiskMember 2024-10-31 0000009631 ifrs-full:SwapContractMember bns:DepositLiabilitiesMember ifrs-full:CashFlowHedgesMember ifrs-full:CurrencyRiskMember 2024-10-31 0000009631 ifrs-full:SwapContractMember bns:DepositLiabilitiesMember ifrs-full:LaterThanFiveYearsMember ifrs-full:CashFlowHedgesMember ifrs-full:CurrencyRiskMember 2024-10-31 0000009631 bns:DepositLiabilitiesMember 2024-10-31 0000009631 bns:DepositLiabilitiesMember ifrs-full:LaterThanFiveYearsMember 2024-10-31 0000009631 bns:ForeignCurrencyDepositLiabilitiesMember bns:DepositLiabilitiesMember ifrs-full:HedgesOfNetInvestmentInForeignOperationsMember ifrs-full:CurrencyRiskMember 2024-10-31 0000009631 bns:ForeignCurrencyForwardContractsMember bns:DepositLiabilitiesMember ifrs-full:HedgesOfNetInvestmentInForeignOperationsMember ifrs-full:CurrencyRiskMember 2024-10-31 0000009631 bns:TotalReturnSwapsMember bns:DepositLiabilitiesMember ifrs-full:CashFlowHedgesMember ifrs-full:EquityPriceRiskMember 2024-10-31 0000009631 bns:DepositLiabilitiesMember ifrs-full:NotLaterThanOneYearMember ifrs-full:CashFlowHedgesMember bns:CurrencyOrInterestRateRiskMember 2024-10-31 0000009631 bns:DepositLiabilitiesMember ifrs-full:LaterThanOneYearAndNotLaterThanFiveYearsMember ifrs-full:CashFlowHedgesMember bns:CurrencyOrInterestRateRiskMember 2024-10-31 0000009631 bns:DepositLiabilitiesMember ifrs-full:LaterThanFiveYearsMember ifrs-full:CashFlowHedgesMember bns:CurrencyOrInterestRateRiskMember 2024-10-31 0000009631 bns:DepositLiabilitiesMember ifrs-full:CashFlowHedgesMember bns:CurrencyOrInterestRateRiskMember 2024-10-31 0000009631 bns:Cash1Member bns:DepositLiabilitiesMember ifrs-full:NotLaterThanOneYearMember ifrs-full:CashFlowHedgesMember ifrs-full:CurrencyRiskMember 2024-10-31 0000009631 ifrs-full:SwapContractMember bns:DepositLiabilitiesMember ifrs-full:CashFlowHedgesMember ifrs-full:InterestRateRiskMember 2024-10-31 0000009631 ifrs-full:SwapContractMember bns:DepositLiabilitiesMember ifrs-full:LaterThanFiveYearsMember ifrs-full:CashFlowHedgesMember ifrs-full:InterestRateRiskMember 2024-10-31 0000009631 ifrs-full:SwapContractMember bns:DepositLiabilitiesMember ifrs-full:FairValueHedgesMember ifrs-full:InterestRateRiskMember 2024-10-31 0000009631 ifrs-full:SwapContractMember bns:DepositLiabilitiesMember ifrs-full:LaterThanFiveYearsMember ifrs-full:FairValueHedgesMember ifrs-full:InterestRateRiskMember 2024-10-31 0000009631 ifrs-full:SwapContractMember bns:DepositLiabilitiesMember ifrs-full:NotLaterThanOneYearMember ifrs-full:CashFlowHedgesMember ifrs-full:CurrencyRiskMember 2024-10-31 0000009631 ifrs-full:SwapContractMember bns:DepositLiabilitiesMember ifrs-full:LaterThanOneYearAndNotLaterThanFiveYearsMember ifrs-full:CashFlowHedgesMember ifrs-full:CurrencyRiskMember 2024-10-31 0000009631 bns:DepositLiabilitiesMember ifrs-full:LaterThanOneYearAndNotLaterThanFiveYearsMember 2024-10-31 0000009631 bns:DepositLiabilitiesMember ifrs-full:NotLaterThanOneYearMember 2024-10-31 0000009631 ifrs-full:SwapContractMember bns:DepositLiabilitiesMember ifrs-full:NotLaterThanOneYearMember ifrs-full:CashFlowHedgesMember ifrs-full:InterestRateRiskMember 2024-10-31 0000009631 ifrs-full:SwapContractMember bns:DepositLiabilitiesMember ifrs-full:LaterThanOneYearAndNotLaterThanFiveYearsMember ifrs-full:CashFlowHedgesMember ifrs-full:InterestRateRiskMember 2024-10-31 0000009631 bns:TotalReturnSwapsMember bns:DepositLiabilitiesMember ifrs-full:LaterThanOneYearAndNotLaterThanFiveYearsMember ifrs-full:CashFlowHedgesMember ifrs-full:EquityPriceRiskMember 2024-10-31 0000009631 ifrs-full:SwapContractMember ifrs-full:FairValueHedgesMember ifrs-full:InterestRateRiskMember 2024-10-31 0000009631 ifrs-full:SwapContractMember ifrs-full:CashFlowHedgesMember ifrs-full:InterestRateRiskMember 2024-10-31 0000009631 ifrs-full:SwapContractMember bns:USDCADMember ifrs-full:CashFlowHedgesMember bns:CurrencyOrInterestRateRiskMember 2024-10-31 0000009631 bns:SeniorNoteLiabilitiesMember 2024-10-31 0000009631 bns:FairValueThroughOtherComprehensiveIncomeMember ifrs-full:LaterThanOneYearAndNotLaterThanFiveYearsMember 2024-10-31 0000009631 bns:FairValueThroughOtherComprehensiveIncomeMember ifrs-full:LaterThanFiveYearsAndNotLaterThanTenYearsMember 2024-10-31 0000009631 bns:FairValueThroughOtherComprehensiveIncomeMember bns:UsTreasuryAndOtherUsAgencyDebtMember ifrs-full:LaterThanFiveYearsAndNotLaterThanTenYearsMember 2024-10-31 0000009631 bns:FairValueThroughOtherComprehensiveIncomeMember bns:OtherForeignGovernmentDebtMember ifrs-full:LaterThanThreeMonthsAndNotLaterThanOneYearMember 2024-10-31 0000009631 ifrs-full:NotLaterThanThreeMonthsMember bns:DebtInstrumentsMember 2024-10-31 0000009631 ifrs-full:LaterThanThreeMonthsAndNotLaterThanOneYearMember bns:DebtInstrumentsMember 2024-10-31 0000009631 bns:FairValueThroughOtherComprehensiveIncomeMember ifrs-full:NotLaterThanThreeMonthsMember 2024-10-31 0000009631 bns:FairValueThroughOtherComprehensiveIncomeMember ifrs-full:LaterThanThreeMonthsAndNotLaterThanOneYearMember 2024-10-31 0000009631 ifrs-full:FinancialAssetsAtAmortisedCostMember bns:UsTreasuryAndOtherUsAgencyDebtMember ifrs-full:LaterThanOneYearAndNotLaterThanFiveYearsMember 2024-10-31 0000009631 ifrs-full:FinancialAssetsAtAmortisedCostMember bns:UsTreasuryAndOtherUsAgencyDebtMember ifrs-full:LaterThanThreeMonthsAndNotLaterThanOneYearMember 2024-10-31 0000009631 currency:MXV ifrs-full:LaterThanThreeMonthsAndNotLaterThanOneYearMember 2024-10-31 0000009631 ifrs-full:FinancialAssetsAtAmortisedCostMember ifrs-full:LaterThanOneYearAndNotLaterThanFiveYearsMember 2024-10-31 0000009631 ifrs-full:FinancialAssetsAtAmortisedCostMember ifrs-full:LaterThanFiveYearsAndNotLaterThanTenYearsMember 2024-10-31 0000009631 bns:FairValueThroughOtherComprehensiveIncomeMember bns:UsTreasuryAndOtherUsAgencyDebtMember ifrs-full:LaterThanTenYearsMember 2024-10-31 0000009631 currency:MXV ifrs-full:LaterThanFiveYearsAndNotLaterThanTenYearsMember 2024-10-31 0000009631 currency:MXV ifrs-full:NotLaterThanThreeMonthsMember 2024-10-31 0000009631 bns:FairValueThroughOtherComprehensiveIncomeMember bns:CanadianProvincialAndMunicipalDebtMember 2024-10-31 0000009631 bns:FairValueThroughOtherComprehensiveIncomeMember bns:UsTreasuryAndOtherUsAgencyDebtMember 2024-10-31 0000009631 ifrs-full:FinancialAssetsAtAmortisedCostMember bns:OtherForeignGovernmentDebtMember ifrs-full:NotLaterThanThreeMonthsMember 2024-10-31 0000009631 ifrs-full:FinancialAssetsAtAmortisedCostMember bns:OtherForeignGovernmentDebtMember ifrs-full:LaterThanOneYearAndNotLaterThanFiveYearsMember 2024-10-31 0000009631 ifrs-full:FinancialAssetsAtAmortisedCostMember bns:OtherForeignGovernmentDebtMember ifrs-full:LaterThanThreeMonthsAndNotLaterThanOneYearMember 2024-10-31 0000009631 bns:FairValueThroughProfitAndLossMember bns:DebtInstrumentsMember 2024-10-31 0000009631 bns:FairValueThroughProfitAndLossMember bns:WithNoSpecificMaturityMember 2024-10-31 0000009631 bns:FairValueThroughProfitAndLossMember 2024-10-31 0000009631 ifrs-full:FinancialAssetsAtAmortisedCostMember bns:UsTreasuryAndOtherUsAgencyDebtMember ifrs-full:LaterThanFiveYearsAndNotLaterThanTenYearsMember 2024-10-31 0000009631 ifrs-full:FinancialAssetsAtAmortisedCostMember 2024-10-31 0000009631 bns:FairValueThroughProfitAndLossMember bns:EquityInstrumentsMember bns:WithNoSpecificMaturityMember 2024-10-31 0000009631 bns:FairValueThroughProfitAndLossMember bns:EquityInstrumentsMember 2024-10-31 0000009631 bns:FairValueThroughProfitAndLossMember ifrs-full:NotLaterThanThreeMonthsMember bns:DebtInstrumentsMember 2024-10-31 0000009631 bns:FairValueThroughOtherComprehensiveIncomeMember bns:CanadianFederalGovernmentIssuedOrGuaranteedDebtMember ifrs-full:LaterThanOneYearAndNotLaterThanFiveYearsMember 2024-10-31 0000009631 bns:FairValueThroughOtherComprehensiveIncomeMember bns:CanadianFederalGovernmentIssuedOrGuaranteedDebtMember ifrs-full:LaterThanThreeMonthsAndNotLaterThanOneYearMember 2024-10-31 0000009631 ifrs-full:FinancialAssetsAtAmortisedCostMember bns:UsTreasuryAndOtherUsAgencyDebtMember ifrs-full:NotLaterThanThreeMonthsMember 2024-10-31 0000009631 bns:FairValueThroughOtherComprehensiveIncomeMember bns:CanadianFederalGovernmentIssuedOrGuaranteedDebtMember ifrs-full:LaterThanTenYearsMember 2024-10-31 0000009631 bns:FairValueThroughOtherComprehensiveIncomeMember bns:CanadianFederalGovernmentIssuedOrGuaranteedDebtMember ifrs-full:LaterThanFiveYearsAndNotLaterThanTenYearsMember 2024-10-31 0000009631 ifrs-full:FinancialAssetsAtAmortisedCostMember bns:OtherForeignGovernmentDebtMember ifrs-full:LaterThanFiveYearsAndNotLaterThanTenYearsMember 2024-10-31 0000009631 ifrs-full:FinancialAssetsAtAmortisedCostMember bns:CorporateDebtMember ifrs-full:LaterThanOneYearAndNotLaterThanFiveYearsMember 2024-10-31 0000009631 currency:MXV bns:WithNoSpecificMaturityMember 2024-10-31 0000009631 currency:MXV 2024-10-31 0000009631 ifrs-full:LaterThanFiveYearsAndNotLaterThanTenYearsMember bns:DebtInstrumentsMember 2024-10-31 0000009631 ifrs-full:LaterThanTenYearsMember bns:DebtInstrumentsMember 2024-10-31 0000009631 ifrs-full:FinancialAssetsAtAmortisedCostMember bns:OtherForeignGovernmentDebtMember ifrs-full:LaterThanTenYearsMember 2024-10-31 0000009631 ifrs-full:FinancialAssetsAtAmortisedCostMember ifrs-full:LaterThanTenYearsMember 2024-10-31 0000009631 bns:FairValueThroughProfitAndLossMember ifrs-full:LaterThanTenYearsMember 2024-10-31 0000009631 bns:FairValueThroughProfitAndLossMember ifrs-full:LaterThanFiveYearsAndNotLaterThanTenYearsMember 2024-10-31 0000009631 bns:FairValueThroughOtherComprehensiveIncomeMember bns:OtherDebtMember ifrs-full:LaterThanFiveYearsAndNotLaterThanTenYearsMember 2024-10-31 0000009631 ifrs-full:FinancialAssetsAtAmortisedCostMember bns:UsTreasuryAndOtherUsAgencyDebtMember ifrs-full:LaterThanTenYearsMember 2024-10-31 0000009631 bns:FairValueThroughProfitAndLossMember ifrs-full:NotLaterThanThreeMonthsMember 2024-10-31 0000009631 bns:FairValueThroughProfitAndLossMember ifrs-full:LaterThanOneYearAndNotLaterThanFiveYearsMember bns:DebtInstrumentsMember 2024-10-31 0000009631 ifrs-full:FinancialAssetsAtAmortisedCostMember bns:CanadianFederalAndProvincialGovernmentIssuedOrGuaranteedDebtMember ifrs-full:LaterThanThreeMonthsAndNotLaterThanOneYearMember 2024-10-31 0000009631 ifrs-full:FinancialAssetsAtAmortisedCostMember bns:CanadianFederalAndProvincialGovernmentIssuedOrGuaranteedDebtMember ifrs-full:NotLaterThanThreeMonthsMember 2024-10-31 0000009631 bns:FairValueThroughOtherComprehensiveIncomeMember ifrs-full:LaterThanTenYearsMember 2024-10-31 0000009631 ifrs-full:FinancialAssetsAtAmortisedCostMember bns:CanadianFederalAndProvincialGovernmentIssuedOrGuaranteedDebtMember ifrs-full:LaterThanFiveYearsAndNotLaterThanTenYearsMember 2024-10-31 0000009631 bns:FairValueThroughOtherComprehensiveIncomeMember bns:OtherDebtMember ifrs-full:NotLaterThanThreeMonthsMember 2024-10-31 0000009631 bns:FairValueThroughOtherComprehensiveIncomeMember bns:OtherDebtMember ifrs-full:LaterThanTenYearsMember 2024-10-31 0000009631 bns:FairValueThroughOtherComprehensiveIncomeMember bns:OtherForeignGovernmentDebtMember ifrs-full:LaterThanOneYearAndNotLaterThanFiveYearsMember 2024-10-31 0000009631 bns:FairValueThroughOtherComprehensiveIncomeMember bns:OtherDebtMember ifrs-full:LaterThanThreeMonthsAndNotLaterThanOneYearMember 2024-10-31 0000009631 bns:FairValueThroughProfitAndLossMember ifrs-full:LaterThanOneYearAndNotLaterThanFiveYearsMember 2024-10-31 0000009631 bns:FairValueThroughProfitAndLossMember ifrs-full:LaterThanThreeMonthsAndNotLaterThanOneYearMember 2024-10-31 0000009631 currency:MXV ifrs-full:LaterThanOneYearAndNotLaterThanFiveYearsMember 2024-10-31 0000009631 ifrs-full:FinancialAssetsAtAmortisedCostMember bns:CanadianFederalAndProvincialGovernmentIssuedOrGuaranteedDebtMember ifrs-full:LaterThanOneYearAndNotLaterThanFiveYearsMember 2024-10-31 0000009631 bns:FairValueThroughOtherComprehensiveIncomeMember bns:CanadianProvincialAndMunicipalDebtMember ifrs-full:NotLaterThanThreeMonthsMember 2024-10-31 0000009631 bns:FairValueThroughOtherComprehensiveIncomeMember bns:OtherDebtMember ifrs-full:LaterThanOneYearAndNotLaterThanFiveYearsMember 2024-10-31 0000009631 bns:FairValueThroughOtherComprehensiveIncomeMember bns:OtherForeignGovernmentDebtMember ifrs-full:NotLaterThanThreeMonthsMember 2024-10-31 0000009631 bns:FairValueThroughOtherComprehensiveIncomeMember bns:OtherForeignGovernmentDebtMember ifrs-full:LaterThanTenYearsMember 2024-10-31 0000009631 bns:FairValueThroughOtherComprehensiveIncomeMember bns:OtherForeignGovernmentDebtMember ifrs-full:LaterThanFiveYearsAndNotLaterThanTenYearsMember 2024-10-31 0000009631 bns:FairValueThroughOtherComprehensiveIncomeMember bns:CanadianProvincialAndMunicipalDebtMember ifrs-full:LaterThanFiveYearsAndNotLaterThanTenYearsMember 2024-10-31 0000009631 bns:FairValueThroughOtherComprehensiveIncomeMember bns:CanadianProvincialAndMunicipalDebtMember ifrs-full:LaterThanOneYearAndNotLaterThanFiveYearsMember 2024-10-31 0000009631 bns:FairValueThroughOtherComprehensiveIncomeMember bns:UsTreasuryAndOtherUsAgencyDebtMember ifrs-full:LaterThanOneYearAndNotLaterThanFiveYearsMember 2024-10-31 0000009631 bns:FairValueThroughOtherComprehensiveIncomeMember bns:UsTreasuryAndOtherUsAgencyDebtMember ifrs-full:LaterThanThreeMonthsAndNotLaterThanOneYearMember 2024-10-31 0000009631 bns:FairValueThroughOtherComprehensiveIncomeMember bns:UsTreasuryAndOtherUsAgencyDebtMember ifrs-full:NotLaterThanThreeMonthsMember 2024-10-31 0000009631 bns:FairValueThroughOtherComprehensiveIncomeMember bns:CanadianProvincialAndMunicipalDebtMember ifrs-full:LaterThanThreeMonthsAndNotLaterThanOneYearMember 2024-10-31 0000009631 ifrs-full:FinancialAssetsAtAmortisedCostMember bns:CorporateDebtMember ifrs-full:LaterThanTenYearsMember 2024-10-31 0000009631 ifrs-full:FinancialAssetsAtAmortisedCostMember bns:CorporateDebtMember 2024-10-31 0000009631 ifrs-full:LaterThanOneYearAndNotLaterThanFiveYearsMember bns:DebtInstrumentsMember 2024-10-31 0000009631 bns:FairValueThroughOtherComprehensiveIncomeMember bns:CanadianFederalGovernmentIssuedOrGuaranteedDebtMember ifrs-full:NotLaterThanThreeMonthsMember 2024-10-31 0000009631 ifrs-full:FinancialAssetsAtAmortisedCostMember ifrs-full:NotLaterThanThreeMonthsMember 2024-10-31 0000009631 ifrs-full:FinancialAssetsAtAmortisedCostMember ifrs-full:LaterThanThreeMonthsAndNotLaterThanOneYearMember 2024-10-31 0000009631 bns:FairValueThroughOtherComprehensiveIncomeMember bns:CanadianFederalGovernmentIssuedOrGuaranteedDebtMember 2024-10-31 0000009631 bns:FairValueThroughOtherComprehensiveIncomeMember bns:CanadianProvincialAndMunicipalDebtMember ifrs-full:LaterThanTenYearsMember 2024-10-31 0000009631 bns:FairValueThroughOtherComprehensiveIncomeMember 2024-10-31 0000009631 ifrs-full:FinancialAssetsAtAmortisedCostMember bns:CanadianFederalAndProvincialGovernmentIssuedOrGuaranteedDebtMember 2024-10-31 0000009631 ifrs-full:FinancialAssetsAtAmortisedCostMember bns:UsTreasuryAndOtherUsAgencyDebtMember 2024-10-31 0000009631 ifrs-full:FinancialAssetsAtAmortisedCostMember bns:OtherForeignGovernmentDebtMember 2024-10-31 0000009631 bns:FairValueThroughOtherComprehensiveIncomeMember bns:OtherForeignGovernmentDebtMember 2024-10-31 0000009631 bns:FairValueThroughOtherComprehensiveIncomeMember bns:OtherDebtMember 2024-10-31 0000009631 bns:DebtInstrumentsMember 2024-10-31 0000009631 bns:FairValueThroughOtherComprehensiveIncomeMember bns:CommonSharesMember bns:WithNoSpecificMaturityMember 2024-10-31 0000009631 bns:FairValueThroughOtherComprehensiveIncomeMember bns:CommonSharesMember 2024-10-31 0000009631 bns:FairValueThroughOtherComprehensiveIncomeMember bns:WithNoSpecificMaturityMember 2024-10-31 0000009631 ifrs-full:FinancialAssetsMeasuredAtFairValueThroughOtherComprehensiveIncomeCategoryMember bns:DebtInvestmentsMember 2024-10-31 0000009631 ifrs-full:FinancialAssetsAtAmortisedCostCategoryMember bns:DebtInvestmentsMember 2024-10-31 0000009631 ifrs-full:InvestmentsInEquityInstrumentsMeasuredAtFairValueThroughOtherComprehensiveIncomeMember ifrs-full:EquityInvestmentsMember 2024-10-31 0000009631 ifrs-full:FinancialAssetsAtFairValueThroughProfitOrLossCategoryMember ifrs-full:EquityInvestmentsMember 2024-10-31 0000009631 ifrs-full:FinancialAssetsAtFairValueThroughProfitOrLossCategoryMember bns:DebtInvestmentsMember 2024-10-31 0000009631 ifrs-full:FinancialAssetsMeasuredAtFairValueThroughOtherComprehensiveIncomeCategoryMember bns:UsTreasuryAndOtherUsAgencyDebtMember 2024-10-31 0000009631 ifrs-full:FinancialAssetsMeasuredAtFairValueThroughOtherComprehensiveIncomeCategoryMember 2024-10-31 0000009631 ifrs-full:FinancialAssetsMeasuredAtFairValueThroughOtherComprehensiveIncomeCategoryMember bns:CanadianProvincialAndMunicipalDebtMember 2024-10-31 0000009631 ifrs-full:FinancialAssetsMeasuredAtFairValueThroughOtherComprehensiveIncomeCategoryMember bns:CanadianFederalGovernmentIssuedOrGuaranteedDebtMember 2024-10-31 0000009631 ifrs-full:FinancialAssetsMeasuredAtFairValueThroughOtherComprehensiveIncomeCategoryMember bns:OtherDebtMember 2024-10-31 0000009631 ifrs-full:FinancialAssetsMeasuredAtFairValueThroughOtherComprehensiveIncomeCategoryMember bns:OtherForeignGovernmentDebtMember 2024-10-31 0000009631 bns:CanadianFederalGovernmentIssuedOrGuaranteedDebtMember bns:FinancialAssetsAtFairValueInvestmentSecuritiesMember 2024-10-31 0000009631 bns:OtherForeignGovernmentDebtMember bns:FinancialAssetsAtCarryingValueInvestmentSecuritiesMember 2024-10-31 0000009631 bns:CorporateDebtMember bns:FinancialAssetsAtCarryingValueInvestmentSecuritiesMember 2024-10-31 0000009631 bns:FinancialAssetsAtCarryingValueInvestmentSecuritiesMember 2024-10-31 0000009631 bns:FinancialAssetsAtFairValueInvestmentSecuritiesMember 2024-10-31 0000009631 bns:CorporateDebtMember bns:FinancialAssetsAtFairValueInvestmentSecuritiesMember 2024-10-31 0000009631 bns:CanadianFederalGovernmentIssuedOrGuaranteedDebtMember bns:FinancialAssetsAtCarryingValueInvestmentSecuritiesMember 2024-10-31 0000009631 bns:UsTreasuryAndOtherUsAgencyDebtMember bns:FinancialAssetsAtCarryingValueInvestmentSecuritiesMember 2024-10-31 0000009631 bns:OtherForeignGovernmentDebtMember bns:FinancialAssetsAtFairValueInvestmentSecuritiesMember 2024-10-31 0000009631 bns:UsTreasuryAndOtherUsAgencyDebtMember bns:FinancialAssetsAtFairValueInvestmentSecuritiesMember 2024-10-31 0000009631 ifrs-full:InvestmentsInEquityInstrumentsMeasuredAtFairValueThroughOtherComprehensiveIncomeMember 2024-10-31 0000009631 ifrs-full:InvestmentsInEquityInstrumentsMeasuredAtFairValueThroughOtherComprehensiveIncomeMember bns:CommonSharesMember 2024-10-31 0000009631 ifrs-full:GrossCarryingAmountMember ifrs-full:ConsumerLoansMember 2024-10-31 0000009631 bns:CreditCardMember ifrs-full:FinancialAssetsIndividuallyAssessedForCreditLossesMember 2024-10-31 0000009631 bns:NetCarryingAmountMember bns:CreditCardMember 2024-10-31 0000009631 bns:BusinessAndGovernmentMember ifrs-full:FinancialAssetsIndividuallyAssessedForCreditLossesMember 2024-10-31 0000009631 bns:NetCarryingAmountMember bns:BusinessAndGovernmentMember 2024-10-31 0000009631 ifrs-full:FinancialAssetsIndividuallyAssessedForCreditLossesMember 2024-10-31 0000009631 bns:NetCarryingAmountMember 2024-10-31 0000009631 ifrs-full:GrossCarryingAmountMember bns:BusinessAndGovernmentMember 2024-10-31 0000009631 bns:ResidentialMortgagesMember ifrs-full:FinancialAssetsIndividuallyAssessedForCreditLossesMember 2024-10-31 0000009631 bns:NetCarryingAmountMember bns:ResidentialMortgagesMember 2024-10-31 0000009631 ifrs-full:ConsumerLoansMember ifrs-full:FinancialAssetsIndividuallyAssessedForCreditLossesMember 2024-10-31 0000009631 bns:NetCarryingAmountMember ifrs-full:ConsumerLoansMember 2024-10-31 0000009631 ifrs-full:GrossCarryingAmountMember bns:CreditCardMember 2024-10-31 0000009631 ifrs-full:GrossCarryingAmountMember bns:ResidentialMortgagesMember 2024-10-31 0000009631 ifrs-full:GrossCarryingAmountMember 2024-10-31 0000009631 country:CO 2024-10-31 0000009631 country:PE 2024-10-31 0000009631 bns:BusinessAndGovernmentMember country:CL 2024-10-31 0000009631 bns:CreditCardMember bns:OtherInternationalMember 2024-10-31 0000009631 country:MX 2024-10-31 0000009631 country:CL 2024-10-31 0000009631 bns:BusinessAndGovernmentMember bns:OtherInternationalMember 2024-10-31 0000009631 bns:BusinessAndGovernmentMember country:CA 2024-10-31 0000009631 bns:BusinessAndGovernmentMember country:MX 2024-10-31 0000009631 bns:ResidentialMortgagesMember country:CL 2024-10-31 0000009631 ifrs-full:ConsumerLoansMember country:CL 2024-10-31 0000009631 bns:CreditCardMember country:CL 2024-10-31 0000009631 bns:BusinessAndGovernmentMember country:CO 2024-10-31 0000009631 bns:BusinessAndGovernmentMember country:PE 2024-10-31 0000009631 bns:CreditCardMember country:PE 2024-10-31 0000009631 ifrs-full:ConsumerLoansMember country:PE 2024-10-31 0000009631 bns:ResidentialMortgagesMember country:PE 2024-10-31 0000009631 bns:CreditCardMember country:MX 2024-10-31 0000009631 ifrs-full:ConsumerLoansMember country:MX 2024-10-31 0000009631 bns:ResidentialMortgagesMember country:MX 2024-10-31 0000009631 bns:BusinessAndGovernmentMember country:US 2024-10-31 0000009631 ifrs-full:ConsumerLoansMember country:US 2024-10-31 0000009631 bns:ResidentialMortgagesMember country:CA 2024-10-31 0000009631 ifrs-full:ConsumerLoansMember country:CA 2024-10-31 0000009631 bns:CreditCardMember country:CA 2024-10-31 0000009631 bns:CreditCardMember country:CO 2024-10-31 0000009631 ifrs-full:ConsumerLoansMember country:CO 2024-10-31 0000009631 bns:ResidentialMortgagesMember country:CO 2024-10-31 0000009631 bns:OtherInternationalMember 2024-10-31 0000009631 ifrs-full:ConsumerLoansMember bns:OtherInternationalMember 2024-10-31 0000009631 bns:ResidentialMortgagesMember bns:OtherInternationalMember 2024-10-31 0000009631 ifrs-full:FinancialInstrumentsCreditimpairedMember country:CO 2024-10-31 0000009631 ifrs-full:FinancialInstrumentsCreditimpairedMember 2024-10-31 0000009631 ifrs-full:FinancialInstrumentsCreditimpairedMember country:CA 2024-10-31 0000009631 ifrs-full:FinancialInstrumentsCreditimpairedMember country:PE 2024-10-31 0000009631 ifrs-full:ConsumerLoansMember ifrs-full:FinancialInstrumentsCreditimpairedMember 2024-10-31 0000009631 ifrs-full:FinancialInstrumentsCreditimpairedMember country:MX 2024-10-31 0000009631 ifrs-full:FinancialInstrumentsCreditimpairedMember bns:OtherInternationalMember 2024-10-31 0000009631 bns:BusinessAndGovernmentMember ifrs-full:FinancialInstrumentsCreditimpairedMember 2024-10-31 0000009631 ifrs-full:FinancialInstrumentsCreditimpairedMember country:US 2024-10-31 0000009631 bns:ResidentialMortgagesMember ifrs-full:FinancialInstrumentsCreditimpairedMember 2024-10-31 0000009631 ifrs-full:FinancialInstrumentsCreditimpairedMember country:CL 2024-10-31 0000009631 bns:UndrawnLoanCommitmentsRetailMember bns:LoansNotGradedMember 2024-10-31 0000009631 bns:UndrawnLoanCommitmentsRetailMember bns:StageTwoExposureMember bns:LoansNotGradedMember 2024-10-31 0000009631 bns:LoansNotGradedMember bns:UndrawnLoanCommitmentsRetailMember bns:StageOneExposureMember 2024-10-31 0000009631 bns:VeryHighProbabilityOfDefaultMember bns:UndrawnLoanCommitmentsRetailMember 2024-10-31 0000009631 bns:UndrawnLoanCommitmentsRetailMember bns:StageTwoExposureMember bns:VeryHighProbabilityOfDefaultMember 2024-10-31 0000009631 bns:VeryHighProbabilityOfDefaultMember bns:UndrawnLoanCommitmentsRetailMember bns:StageOneExposureMember 2024-10-31 0000009631 bns:HighProbabilityOfDefaultMember bns:UndrawnLoanCommitmentsRetailMember 2024-10-31 0000009631 bns:HighProbabilityOfDefaultMember bns:UndrawnLoanCommitmentsRetailMember bns:StageTwoExposureMember 2024-10-31 0000009631 bns:MediumProbabilityOfDefaultMember bns:UndrawnLoanCommitmentsRetailMember bns:StageTwoExposureMember 2024-10-31 0000009631 bns:UndrawnLoanCommitmentsRetailMember bns:StageOneExposureMember bns:MediumProbabilityOfDefaultMember 2024-10-31 0000009631 bns:LowProbabilityOfDefaultMember bns:UndrawnLoanCommitmentsRetailMember 2024-10-31 0000009631 bns:LowProbabilityOfDefaultMember bns:UndrawnLoanCommitmentsRetailMember bns:StageTwoExposureMember 2024-10-31 0000009631 bns:UndrawnLoanCommitmentsRetailMember bns:StageOneExposureMember bns:VeryLowProbabilityOfDefaultMember 2024-10-31 0000009631 bns:HighProbabilityOfDefaultMember bns:UndrawnLoanCommitmentsRetailMember bns:StageOneExposureMember 2024-10-31 0000009631 bns:UndrawnLoanCommitmentsRetailMember bns:MediumProbabilityOfDefaultMember 2024-10-31 0000009631 bns:LowProbabilityOfDefaultMember bns:UndrawnLoanCommitmentsRetailMember bns:StageOneExposureMember 2024-10-31 0000009631 bns:VeryLowProbabilityOfDefaultMember bns:UndrawnLoanCommitmentsRetailMember 2024-10-31 0000009631 bns:VeryLowProbabilityOfDefaultMember bns:UndrawnLoanCommitmentsRetailMember bns:StageTwoExposureMember 2024-10-31 0000009631 bns:LoansNotGradedMember bns:UndrawnLoanCommitmentsBusinessAndGovernmentMember bns:StageOneExposureMember 2024-10-31 0000009631 bns:UndrawnLoanCommitmentsBusinessAndGovernmentMember bns:LoansNotGradedMember 2024-10-31 0000009631 bns:UndrawnLoanCommitmentsBusinessAndGovernmentMember bns:DefaultMember 2024-10-31 0000009631 bns:DefaultMember bns:UndrawnLoanCommitmentsBusinessAndGovernmentMember bns:StageThreeExposureMember 2024-10-31 0000009631 bns:UndrawnLoanCommitmentsBusinessAndGovernmentMember 2024-10-31 0000009631 bns:UndrawnLoanCommitmentsBusinessAndGovernmentMember bns:StageThreeExposureMember 2024-10-31 0000009631 bns:UndrawnLoanCommitmentsBusinessAndGovernmentMember bns:StageTwoExposureMember 2024-10-31 0000009631 bns:UndrawnLoanCommitmentsBusinessAndGovernmentMember bns:StageOneExposureMember 2024-10-31 0000009631 bns:WatchListMember bns:UndrawnLoanCommitmentsBusinessAndGovernmentMember 2024-10-31 0000009631 bns:WatchListMember bns:UndrawnLoanCommitmentsBusinessAndGovernmentMember bns:StageTwoExposureMember 2024-10-31 0000009631 bns:UndrawnLoanCommitmentsBusinessAndGovernmentMember bns:StageOneExposureMember bns:InvestmentGradeMember 2024-10-31 0000009631 bns:UndrawnLoanCommitmentsBusinessAndGovernmentMember bns:StageTwoExposureMember bns:InvestmentGradeMember 2024-10-31 0000009631 bns:InvestmentGradeMember bns:UndrawnLoanCommitmentsBusinessAndGovernmentMember 2024-10-31 0000009631 bns:UndrawnLoanCommitmentsBusinessAndGovernmentMember bns:StageOneExposureMember bns:NoninvestmentGradeMember 2024-10-31 0000009631 bns:NoninvestmentGradeMember bns:UndrawnLoanCommitmentsBusinessAndGovernmentMember 2024-10-31 0000009631 bns:UndrawnLoanCommitmentsBusinessAndGovernmentMember bns:StageTwoExposureMember bns:NoninvestmentGradeMember 2024-10-31 0000009631 bns:ResidentialMortgagesMember 2024-10-31 0000009631 bns:ResidentialMortgagesMember ifrs-full:FloatingInterestRateMember 2024-10-31 0000009631 ifrs-full:ConsumerLoansMember ifrs-full:NotLaterThanOneYearMember 2024-10-31 0000009631 ifrs-full:ConsumerLoansMember ifrs-full:LaterThanOneYearAndNotLaterThanFiveYearsMember 2024-10-31 0000009631 bns:ResidentialMortgagesMember ifrs-full:LaterThanTenYearsMember 2024-10-31 0000009631 bns:ResidentialMortgagesMember ifrs-full:LaterThanFiveYearsAndNotLaterThanTenYearsMember 2024-10-31 0000009631 bns:BusinessAndGovernmentMember bns:NoStatedMaturityMember 2024-10-31 0000009631 bns:ResidentialMortgagesMember ifrs-full:FixedInterestRateMember 2024-10-31 0000009631 bns:ResidentialMortgagesMember bns:NonRateSensitiveMember 2024-10-31 0000009631 ifrs-full:ConsumerLoansMember ifrs-full:FixedInterestRateMember 2024-10-31 0000009631 ifrs-full:ConsumerLoansMember ifrs-full:FloatingInterestRateMember 2024-10-31 0000009631 ifrs-full:ConsumerLoansMember ifrs-full:LaterThanFiveYearsAndNotLaterThanTenYearsMember 2024-10-31 0000009631 ifrs-full:ConsumerLoansMember ifrs-full:LaterThanTenYearsMember 2024-10-31 0000009631 bns:BusinessAndGovernmentMember ifrs-full:NotLaterThanOneYearMember 2024-10-31 0000009631 bns:BusinessAndGovernmentMember ifrs-full:LaterThanOneYearAndNotLaterThanFiveYearsMember 2024-10-31 0000009631 bns:BusinessAndGovernmentMember ifrs-full:LaterThanFiveYearsAndNotLaterThanTenYearsMember 2024-10-31 0000009631 bns:BusinessAndGovernmentMember ifrs-full:LaterThanTenYearsMember 2024-10-31 0000009631 bns:CreditCardMember 2024-10-31 0000009631 ifrs-full:FloatingInterestRateMember 2024-10-31 0000009631 bns:BusinessAndGovernmentMember 2024-10-31 0000009631 bns:BusinessAndGovernmentMember ifrs-full:FloatingInterestRateMember 2024-10-31 0000009631 bns:NoStatedMaturityMember 2024-10-31 0000009631 bns:ResidentialMortgagesMember ifrs-full:LaterThanOneYearAndNotLaterThanFiveYearsMember 2024-10-31 0000009631 bns:ResidentialMortgagesMember ifrs-full:NotLaterThanOneYearMember 2024-10-31 0000009631 bns:BusinessAndGovernmentMember ifrs-full:FixedInterestRateMember 2024-10-31 0000009631 bns:BusinessAndGovernmentMember bns:NonRateSensitiveMember 2024-10-31 0000009631 bns:CreditCardMember ifrs-full:FixedInterestRateMember 2024-10-31 0000009631 bns:CreditCardMember bns:NoStatedMaturityMember 2024-10-31 0000009631 ifrs-full:ConsumerLoansMember bns:NoStatedMaturityMember 2024-10-31 0000009631 ifrs-full:ConsumerLoansMember 2024-10-31 0000009631 ifrs-full:ConsumerLoansMember bns:NonRateSensitiveMember 2024-10-31 0000009631 ifrs-full:FixedInterestRateMember 2024-10-31 0000009631 bns:NonRateSensitiveMember 2024-10-31 0000009631 bns:ResidentialMortgagesMember bns:NoStatedMaturityMember 2024-10-31 0000009631 ifrs-full:ConsumerLoansMember ifrs-full:FinancialAssetsPastDueButNotImpairedMember ifrs-full:LaterThanOneMonthAndNotLaterThanTwoMonthsMember 2024-10-31 0000009631 ifrs-full:ConsumerLoansMember ifrs-full:FinancialAssetsPastDueButNotImpairedMember ifrs-full:LaterThanTwoMonthsAndNotLaterThanThreeMonthsMember 2024-10-31 0000009631 ifrs-full:FinancialAssetsPastDueButNotImpairedMember ifrs-full:LaterThanTwoMonthsAndNotLaterThanThreeMonthsMember 2024-10-31 0000009631 ifrs-full:FinancialAssetsPastDueButNotImpairedMember ifrs-full:LaterThanThreeMonthsMember 2024-10-31 0000009631 ifrs-full:FinancialAssetsPastDueButNotImpairedMember 2024-10-31 0000009631 bns:BusinessAndGovernmentMember ifrs-full:FinancialAssetsPastDueButNotImpairedMember ifrs-full:LaterThanTwoMonthsAndNotLaterThanThreeMonthsMember 2024-10-31 0000009631 bns:BusinessAndGovernmentMember ifrs-full:FinancialAssetsPastDueButNotImpairedMember ifrs-full:LaterThanOneMonthAndNotLaterThanTwoMonthsMember 2024-10-31 0000009631 bns:CreditCardMember ifrs-full:FinancialAssetsPastDueButNotImpairedMember ifrs-full:LaterThanTwoMonthsAndNotLaterThanThreeMonthsMember 2024-10-31 0000009631 bns:CreditCardMember ifrs-full:FinancialAssetsPastDueButNotImpairedMember ifrs-full:LaterThanOneMonthAndNotLaterThanTwoMonthsMember 2024-10-31 0000009631 bns:BusinessAndGovernmentMember ifrs-full:FinancialAssetsPastDueButNotImpairedMember 2024-10-31 0000009631 ifrs-full:ConsumerLoansMember ifrs-full:FinancialAssetsPastDueButNotImpairedMember 2024-10-31 0000009631 bns:CreditCardMember ifrs-full:FinancialAssetsPastDueButNotImpairedMember 2024-10-31 0000009631 bns:CreditCardMember ifrs-full:FinancialAssetsPastDueButNotImpairedMember ifrs-full:LaterThanThreeMonthsMember 2024-10-31 0000009631 ifrs-full:FinancialAssetsPastDueButNotImpairedMember ifrs-full:LaterThanOneMonthAndNotLaterThanTwoMonthsMember 2024-10-31 0000009631 bns:ResidentialMortgagesMember ifrs-full:FinancialAssetsPastDueButNotImpairedMember 2024-10-31 0000009631 bns:ResidentialMortgagesMember ifrs-full:FinancialAssetsPastDueButNotImpairedMember ifrs-full:LaterThanOneMonthAndNotLaterThanTwoMonthsMember 2024-10-31 0000009631 bns:ResidentialMortgagesMember ifrs-full:FinancialAssetsPastDueButNotImpairedMember ifrs-full:LaterThanTwoMonthsAndNotLaterThanThreeMonthsMember 2024-10-31 0000009631 ifrs-full:LoansAcquiredInBusinessCombinationMember 2024-10-31 0000009631 ifrs-full:SecuritisationsMember bns:OtherRelatedAssetsMember 2024-10-31 0000009631 ifrs-full:SecuritisationsMember bns:ResidentialMortgageLoansMember 2024-10-31 0000009631 bns:OtherFinancialAssets1Member bns:RepurchaseAgreementMember 2024-10-31 0000009631 bns:OtherFinancialAssets1Member ifrs-full:SecuritiesLendingMember 2024-10-31 0000009631 bns:OtherFinancialAssets1Member 2024-10-31 0000009631 ifrs-full:SecuritisationsMember 2024-10-31 0000009631 bns:ScotiabankCoveredBondGuarantorLimitedPartnershipMember bns:DepositsFromBusinessAndGovernmentMember 2024-10-31 0000009631 bns:StructuredFinanceEntitiesMember 2024-10-31 0000009631 bns:CanadianMultisellerConduitsThatTheBankAdministersMember 2024-10-31 0000009631 ifrs-full:UnconsolidatedStructuredEntitiesMember 2024-10-31 0000009631 bns:CapitalFundingVehiclesMember 2024-10-31 0000009631 bns:InternallyGeneratedSoftwareMember 2024-10-31 0000009631 bns:InProcessSoftwareNotSubjectToAmortizationMember 2024-10-31 0000009631 bns:PurchasedSoftwareMember 2024-10-31 0000009631 ifrs-full:PensionDefinedBenefitPlansMember ifrs-full:WhollyOrPartlyFundedDefinedBenefitPlansMember 2024-10-31 0000009631 bns:OtherBenefitPlansMember ifrs-full:WhollyOrPartlyFundedDefinedBenefitPlansMember 2024-10-31 0000009631 bns:OtherBenefitPlansMember ifrs-full:WhollyUnfundedDefinedBenefitPlansMember 2024-10-31 0000009631 ifrs-full:PensionDefinedBenefitPlansMember ifrs-full:WhollyUnfundedDefinedBenefitPlansMember 2024-10-31 0000009631 bns:ActuarialAssumptionOfDiscountRatesForAllPlansMember bns:OtherBenefitPlansMember 2024-10-31 0000009631 bns:ActuarialAssumptionOfDiscountRatesForCanadianPlansMember ifrs-full:PensionDefinedBenefitPlansMember 2024-10-31 0000009631 bns:ActuarialAssumptionOfDiscountRatesForCanadianPlansMember bns:OtherBenefitPlansMember 2024-10-31 0000009631 ifrs-full:ActuarialAssumptionOfDiscountRatesMember ifrs-full:PensionDefinedBenefitPlansMember 2024-10-31 0000009631 ifrs-full:ActuarialAssumptionOfDiscountRatesMember bns:OtherBenefitPlansMember 2024-10-31 0000009631 bns:ActuarialAssumptionOfDiscountRatesForAllPlansMember ifrs-full:PensionDefinedBenefitPlansMember 2024-10-31 0000009631 bns:OtherBenefitPlansMember ifrs-full:CountryOfDomicileMember 2024-10-31 0000009631 ifrs-full:PensionDefinedBenefitPlansMember ifrs-full:ForeignCountriesMember 2024-10-31 0000009631 bns:OtherPensionPlansMember ifrs-full:CountryOfDomicileMember 2024-10-31 0000009631 bns:DomesticScotiabankPensionPlanMember ifrs-full:CountryOfDomicileMember 2024-10-31 0000009631 bns:OtherBenefitPlansMember ifrs-full:ForeignCountriesMember 2024-10-31 0000009631 bns:DirectorsMember 2024-10-31 0000009631 bns:CreditRiskExposureDrawnNonRetailMember ifrs-full:CreditRiskMember 2024-10-31 0000009631 ifrs-full:CreditRiskMember 2024-10-31 0000009631 bns:OtherMarketRiskExposuresOthersMember ifrs-full:CreditRiskMember 2024-10-31 0000009631 bns:SecuritizationMember 2024-10-31 0000009631 bns:CanadaMortgageHousingCorporationProgramMember 2024-10-31 0000009631 bns:ForeignGovernmentsAndCentralBanksMember 2024-10-31 0000009631 bns:BankOfCanadaMember 2024-10-31 0000009631 ifrs-full:OtherAssetsMember 2024-10-31 0000009631 bns:ExchangeTradedDerivativeTransactionsMember 2024-10-31 0000009631 bns:ClearingSystemPaymentSystemsAndDepositoriesMember 2024-10-31 0000009631 bns:OverTheCounterDerivativesMember 2024-10-31 0000009631 bns:SecuritiesBorrowingAndLendingMember 2024-10-31 0000009631 bns:CoveredBondsMember 2024-10-31 0000009631 bns:NonRetailMember bns:StandardizedPortfolioMember 2024-10-31 0000009631 bns:RetailMember bns:StandardizedPortfolioMember 2024-10-31 0000009631 bns:RealEstateSecuredMember bns:RetailMember bns:StandardizedPortfolioMember 2024-10-31 0000009631 bns:OtherExposuresMember ifrs-full:CreditRiskMember 2024-10-31 0000009631 bns:ActuarialAssumptionOfDiscountRatesForInterestOnServiceCostOfCanadianPlansMember bns:OtherBenefitPlansMember 2024-10-31 0000009631 bns:ActuarialAssumptionOfDiscountRatesForServiceCostOfCanadianPlansMember ifrs-full:PensionDefinedBenefitPlansMember 2024-10-31 0000009631 bns:ActuarialAssumptionOfDiscountRatesForInterestOnServiceCostOfCanadianPlansMember ifrs-full:PensionDefinedBenefitPlansMember 2024-10-31 0000009631 bns:ActuarialAssumptionOfDiscountRatesForDefinedBenefitObligationsOfCanadianPlansMember bns:OtherBenefitPlansMember 2024-10-31 0000009631 bns:ActuarialAssumptionOfDiscountRatesForNetInterestCostOfCanadianPlansMember ifrs-full:PensionDefinedBenefitPlansMember 2024-10-31 0000009631 bns:ActuarialAssumptionOfDiscountRatesForInterestOnServiceCostOfAllPlansMember bns:OtherBenefitPlansMember 2024-10-31 0000009631 bns:ActuarialAssumptionOfDiscountRatesForDefinedBenefitObligationsOfCanadianPlansMember ifrs-full:PensionDefinedBenefitPlansMember 2024-10-31 0000009631 bns:ActuarialAssumptionOfDiscountRatesForNetInterestCostOfAllPlansMember bns:OtherBenefitPlansMember 2024-10-31 0000009631 bns:ActuarialAssumptionOfDiscountRatesForServiceCostOfAllPlansMember ifrs-full:PensionDefinedBenefitPlansMember 2024-10-31 0000009631 bns:ActuarialAssumptionOfDiscountRatesForNetInterestCostOfCanadianPlansMember bns:OtherBenefitPlansMember 2024-10-31 0000009631 bns:ActuarialAssumptionOfDiscountRatesForInterestOnServiceCostOfAllPlansMember ifrs-full:PensionDefinedBenefitPlansMember 2024-10-31 0000009631 bns:ActuarialAssumptionOfDiscountRatesForServiceCostOfAllPlansMember bns:OtherBenefitPlansMember 2024-10-31 0000009631 bns:ActuarialAssumptionOfDiscountRatesForDefinedBenefitObligationsOfAllPlansMember ifrs-full:PensionDefinedBenefitPlansMember 2024-10-31 0000009631 bns:ActuarialAssumptionOfDiscountRatesForDefinedBenefitObligationsOfAllPlansMember bns:OtherBenefitPlansMember 2024-10-31 0000009631 bns:ActuarialAssumptionOfDiscountRatesForServiceCostOfCanadianPlansMember bns:OtherBenefitPlansMember 2024-10-31 0000009631 bns:ActuarialAssumptionOfDiscountRatesForNetInterestCostOfAllPlansMember ifrs-full:PensionDefinedBenefitPlansMember 2024-10-31 0000009631 bns:DeferredTaxAssetsOtherMember 2024-10-31 0000009631 bns:DeferredTaxAssetPropertyAndEquipmentMember 2024-10-31 0000009631 bns:DeferredTaxAssetsDeferredIncomeMember 2024-10-31 0000009631 bns:DeferredTaxAssetsOwnCreditRiskMember 2024-10-31 0000009631 bns:DeferredTaxAssetsDeferredCompensationMember 2024-10-31 0000009631 bns:DeferredTaxAssetsAllowanceForCreditLossesMember 2024-10-31 0000009631 bns:DeferredTaxAssetsTaxLossCarryForwardsMember 2024-10-31 0000009631 bns:DeferredTaxAssetsSecuritiesMember 2024-10-31 0000009631 bns:DeferredTaxAssetsPensionAndOtherPostretirementBenefitsMember 2024-10-31 0000009631 bns:DeferredTaxAssetsLeaseLiabilitiesMember 2024-10-31 0000009631 bns:BankOfNovaScotiaMember ifrs-full:UnconsolidatedStructuredEntitiesMember 2024-10-31 0000009631 bns:UninsuredResidentialMortgageBackedSecuritiesMember bns:ScotiabankCoveredBondGuarantorLimitedPartnershipMember 2024-10-31 0000009631 bns:UnsecuredPersonalLineOfCreditReceivablesMember bns:HalifaxReceivablesTrustMember bns:DepositsFromBusinessAndGovernmentMember 2024-10-31 0000009631 bns:CreditCardReceivableMember bns:TrilliumcreditCardTrustIiMember 2024-10-31 0000009631 ifrs-full:LoansAndReceivablesCategoryMember 2024-10-31 0000009631 bns:OtherForeignCurrenciesMember 2024-10-31 0000009631 currency:CLP 2024-10-31 0000009631 ifrs-full:SwapContractMember bns:GBPCADMember ifrs-full:CashFlowHedgesMember ifrs-full:CurrencyRiskMember 2024-10-31 0000009631 bns:ForeignCurrencyForwardContractsMember bns:USDCADMember ifrs-full:HedgesOfNetInvestmentInForeignOperationsMember ifrs-full:CurrencyRiskMember 2024-10-31 0000009631 bns:ForeignCurrencyForwardContractsMember bns:CLPCADMember ifrs-full:HedgesOfNetInvestmentInForeignOperationsMember ifrs-full:CurrencyRiskMember 2024-10-31 0000009631 bns:ForeignCurrencyForwardContractsMember bns:CADPENMember ifrs-full:HedgesOfNetInvestmentInForeignOperationsMember ifrs-full:CurrencyRiskMember 2024-10-31 0000009631 ifrs-full:SwapContractMember bns:USDCADMember ifrs-full:CashFlowHedgesMember ifrs-full:CurrencyRiskMember 2024-10-31 0000009631 ifrs-full:SwapContractMember bns:EURCADMember ifrs-full:CashFlowHedgesMember ifrs-full:CurrencyRiskMember 2024-10-31 0000009631 bns:ForeignCurrencyForwardContractsMember bns:CADMXNMember ifrs-full:HedgesOfNetInvestmentInForeignOperationsMember ifrs-full:CurrencyRiskMember 2024-10-31 0000009631 ifrs-full:RecurringFairValueMeasurementMember ifrs-full:IFRS9Member 2024-10-31 0000009631 ifrs-full:RecurringFairValueMeasurementMember ifrs-full:IFRS9Member ifrs-full:Level2OfFairValueHierarchyMember 2024-10-31 0000009631 ifrs-full:AtFairValueMember 2024-10-31 0000009631 bns:CreditDerivativeMember ifrs-full:DerivativesMember bns:OtherDerivativesMember bns:DerivativesHeldForTradingMember 2024-10-31 0000009631 bns:CommodityAndOtherContractsMember ifrs-full:DerivativesMember bns:OtherDerivativesMember bns:DerivativesHeldForTradingMember 2024-10-31 0000009631 ifrs-full:DerivativesMember 2024-10-31 0000009631 ifrs-full:DerivativesMember bns:HedgingDerivativesMember 2024-10-31 0000009631 ifrs-full:DerivativesMember bns:InterestRateContractsMember bns:DerivativesHeldForTradingMember 2024-10-31 0000009631 ifrs-full:ForwardContractMember ifrs-full:DerivativesMember bns:ForeignExchangeAndGoldContractsMember bns:DerivativesHeldForTradingMember 2024-10-31 0000009631 ifrs-full:SwapContractMember ifrs-full:DerivativesMember bns:ForeignExchangeAndGoldContractsMember bns:DerivativesHeldForTradingMember 2024-10-31 0000009631 ifrs-full:OptionContractMember ifrs-full:DerivativesMember bns:ForeignExchangeAndGoldContractsMember bns:DerivativesHeldForTradingMember 2024-10-31 0000009631 ifrs-full:DerivativesMember bns:ForeignExchangeAndGoldContractsMember bns:DerivativesHeldForTradingMember 2024-10-31 0000009631 ifrs-full:DerivativesMember bns:OtherDerivativesMember bns:DerivativesHeldForTradingMember 2024-10-31 0000009631 ifrs-full:ForwardContractMember ifrs-full:DerivativesMember bns:ForeignExchangeAndGoldContractsMember bns:HedgingDerivativesMember 2024-10-31 0000009631 ifrs-full:SwapContractMember ifrs-full:DerivativesMember bns:InterestRateContractsMember bns:HedgingDerivativesMember 2024-10-31 0000009631 ifrs-full:DerivativesMember bns:DerivativesHeldForTradingMember 2024-10-31 0000009631 ifrs-full:ForwardContractMember ifrs-full:DerivativesMember bns:InterestRateContractsMember bns:DerivativesHeldForTradingMember 2024-10-31 0000009631 ifrs-full:SwapContractMember ifrs-full:DerivativesMember bns:InterestRateContractsMember bns:DerivativesHeldForTradingMember 2024-10-31 0000009631 ifrs-full:OptionContractMember ifrs-full:DerivativesMember bns:InterestRateContractsMember bns:DerivativesHeldForTradingMember 2024-10-31 0000009631 bns:EquityDerivativesMember ifrs-full:DerivativesMember bns:OtherDerivativesMember bns:HedgingDerivativesMember 2024-10-31 0000009631 ifrs-full:DerivativesMember bns:ForeignExchangeAndGoldContractsMember bns:HedgingDerivativesMember 2024-10-31 0000009631 bns:EquityDerivativesMember ifrs-full:DerivativesMember bns:OtherDerivativesMember bns:DerivativesHeldForTradingMember 2024-10-31 0000009631 ifrs-full:SwapContractMember ifrs-full:DerivativesMember bns:ForeignExchangeAndGoldContractsMember bns:HedgingDerivativesMember 2024-10-31 0000009631 bns:TotalReturnSwapsMember ifrs-full:CashFlowHedgesMember ifrs-full:EquityPriceRiskMember 2024-10-31 0000009631 bns:DerivativeFinancialInstrumentsAssets1Member 2024-10-31 0000009631 bns:MaduroAndCurielsBankNVMember 2024-10-31 0000009631 bns:BankOfXianCoLtdMember 2024-10-31 0000009631 bns:UndrawnLoanCommitmentsRetailMember 2024-10-31 0000009631 bns:UndrawnLoanCommitmentsRetailMember bns:StageTwoExposureMember 2024-10-31 0000009631 bns:UndrawnLoanCommitmentsRetailMember bns:StageOneExposureMember 2024-10-31 0000009631 bns:DecemberTwoThousandAndThirtyThreeMember ifrs-full:FixedInterestRateMember 2024-10-31 0000009631 bns:AugustTwoThousandAndThirtyFourMember ifrs-full:FixedInterestRateMember 2024-10-31 0000009631 bns:MayTwoThousandThirtyTwoMember ifrs-full:FixedInterestRateMember 2024-10-31 0000009631 bns:DecemberTwoThousandAndThirtyTwoMember ifrs-full:FixedInterestRateMember 2024-10-31 0000009631 bns:AugustTwoThousandAndThirtyThreeMember ifrs-full:FixedInterestRateMember 2024-10-31 0000009631 bns:MayTwoThousandThirtySevenMember ifrs-full:FixedInterestRateMember 2024-10-31 0000009631 bns:DeferredTaxLiabilitiesOthersMember 2024-10-31 0000009631 bns:DeferredTaxLiabilitiesDeferredCompensationMember 2024-10-31 0000009631 bns:DeferredTaxLiabilitiesPensionAndOtherPostretirementBenefitsMember 2024-10-31 0000009631 bns:DeferredTaxLiabilitiesIntangibleAssetsMember 2024-10-31 0000009631 bns:DeferredTaxLiabilityPropertyAndEquipmentMember 2024-10-31 0000009631 bns:DeferredTaxLiabilitiesDeferredIncomeMember 2024-10-31 0000009631 bns:DeferredTaxLiabilitiesCashFlowHedgesMember 2024-10-31 0000009631 bns:DeferredTaxLiabilitiesInvestmentInSubsidiariesAndAssociatesMember 2024-10-31 0000009631 bns:DeferredTaxLiabilitiesSecuritiesMember 2024-10-31 0000009631 ifrs-full:PensionDefinedBenefitPlansMember 2024-10-31 0000009631 bns:OtherBenefitPlansMember 2024-10-31 0000009631 ifrs-full:ForeignCountriesMember bns:GrupoFinancieroScotiabankInverlatSADeCVMember 2024-10-31 0000009631 ifrs-full:CountryOfDomicileMember bns:TheBankOfNovaScotiaTrustCompanyMember 2024-10-31 0000009631 ifrs-full:CountryOfDomicileMember bns:MdFinancialManagementCanadaMember 2024-10-31 0000009631 ifrs-full:CountryOfDomicileMember bns:BnsInvestmentsIncMember 2024-10-31 0000009631 ifrs-full:CountryOfDomicileMember bns:ScotiaCapitalIncMember 2024-10-31 0000009631 ifrs-full:CountryOfDomicileMember bns:TangerineBankMember 2024-10-31 0000009631 ifrs-full:ForeignCountriesMember bns:ScotiaPeruHoldingsSaMember 2024-10-31 0000009631 ifrs-full:ForeignCountriesMember bns:MultiaccionesS.A.SMember 2024-10-31 0000009631 ifrs-full:CountryOfDomicileMember bns:ScotiaMortgageCorporationMember 2024-10-31 0000009631 ifrs-full:ForeignCountriesMember bns:TheBankOfNovaScotiaInternationalLimitedMember 2024-10-31 0000009631 ifrs-full:ForeignCountriesMember bns:ScotialUruguayHoldingsSaMember 2024-10-31 0000009631 ifrs-full:CountryOfDomicileMember bns:NationalTrustCompanyMember 2024-10-31 0000009631 ifrs-full:CountryOfDomicileMember bns:JarislowskyFraserLimitedCanadaMember 2024-10-31 0000009631 ifrs-full:CountryOfDomicileMember bns:ScotiaDealerAdvantageIncMember 2024-10-31 0000009631 ifrs-full:ForeignCountriesMember bns:ScotiabankBrasilSaBancoMultiploMember 2024-10-31 0000009631 ifrs-full:ForeignCountriesMember bns:ScotiaHoldingsUSALLCMember 2024-10-31 0000009631 ifrs-full:ForeignCountriesMember bns:ScotiabankCaribbeanHoldingsLtdMember 2024-10-31 0000009631 ifrs-full:ForeignCountriesMember bns:ScotiabankBarbadosLimitedMember 2024-10-31 0000009631 ifrs-full:ForeignCountriesMember bns:NovaScotiaInversionesLimitadaMember 2024-10-31 0000009631 ifrs-full:CountryOfDomicileMember bns:RoynatIncMember 2024-10-31 0000009631 ifrs-full:ForeignCountriesMember bns:ScotiabankRepublicaDominicanaSABancoMultipleMember 2024-10-31 0000009631 ifrs-full:CountryOfDomicileMember bns:ScotiaSecuritiesIncMember 2024-10-31 0000009631 bns:BaselThreeNormsMember bns:RetailMember bns:AdvancedInternalRatingsBasedPortfolioMember 2024-10-31 0000009631 bns:BaselThreeNormsMember bns:RetailMember bns:MediumLowProbabilityOfDefaultMember bns:AdvancedInternalRatingsBasedPortfolioMember 2024-10-31 0000009631 bns:BaselThreeNormsMember bns:RetailMember bns:HighProbabilityOfDefaultMember bns:AdvancedInternalRatingsBasedPortfolioMember 2024-10-31 0000009631 bns:BaselThreeNormsMember bns:RetailMember bns:ExtremelyHighProbabilityOfDefaultMember bns:AdvancedInternalRatingsBasedPortfolioMember 2024-10-31 0000009631 bns:BaselThreeNormsMember bns:RetailMember bns:LowProbabilityOfDefaultMember bns:AdvancedInternalRatingsBasedPortfolioMember 2024-10-31 0000009631 bns:BaselThreeNormsMember bns:RetailMember bns:VeryLowProbabilityOfDefaultMember bns:AdvancedInternalRatingsBasedPortfolioMember 2024-10-31 0000009631 bns:BaselThreeNormsMember bns:RetailMember bns:ExceptionallyLowProbabilityOfDefaultMember bns:AdvancedInternalRatingsBasedPortfolioMember 2024-10-31 0000009631 bns:BaselThreeNormsMember bns:RetailMember bns:MediumProbabilityOfDefaultMember bns:AdvancedInternalRatingsBasedPortfolioMember 2024-10-31 0000009631 bns:BaselThreeNormsMember bns:RetailMember bns:DefaultMember bns:AdvancedInternalRatingsBasedPortfolioMember 2024-10-31 0000009631 bns:BaselThreeNormsMember srt:EuropeMember 2024-10-31 0000009631 bns:BaselThreeNormsMember bns:BankMember bns:NonRetailMember bns:AdvancedInternalRatingsBasedPortfolioMember 2024-10-31 0000009631 bns:BaselThreeNormsMember bns:SovereignMember bns:NonRetailMember bns:AdvancedInternalRatingsBasedPortfolioMember 2024-10-31 0000009631 bns:BaselThreeNormsMember 2024-10-31 0000009631 bns:BaselThreeNormsMember bns:BankMember bns:NonRetailMember bns:StandardizedPortfolioMember 2024-10-31 0000009631 bns:BaselThreeNormsMember bns:OtherRetailMember bns:RetailMember bns:StandardizedPortfolioMember 2024-10-31 0000009631 bns:BaselThreeNormsMember country:CO 2024-10-31 0000009631 bns:BaselThreeNormsMember bns:RetailMember bns:StandardizedPortfolioMember 2024-10-31 0000009631 bns:BaselThreeNormsMember bns:NonRetailMember bns:StandardizedPortfolioMember 2024-10-31 0000009631 bns:BaselThreeNormsMember bns:NonRetailMember bns:AdvancedInternalRatingsBasedPortfolioMember 2024-10-31 0000009631 bns:BaselThreeNormsMember bns:CorporateMember bns:NonRetailMember bns:StandardizedPortfolioMember 2024-10-31 0000009631 bns:BaselThreeNormsMember bns:AllOtherCountriesMember 2024-10-31 0000009631 bns:BaselThreeNormsMember bns:RetailMember 2024-10-31 0000009631 bns:BaselThreeNormsMember bns:CaribbeanMember 2024-10-31 0000009631 bns:BaselThreeNormsMember country:CL 2024-10-31 0000009631 bns:BaselThreeNormsMember country:MX 2024-10-31 0000009631 bns:BaselThreeNormsMember country:PE 2024-10-31 0000009631 bns:BaselThreeNormsMember bns:LatinAmericaOtherMember 2024-10-31 0000009631 bns:BaselThreeNormsMember bns:CorporateMember bns:NonRetailMember bns:AdvancedInternalRatingsBasedPortfolioMember 2024-10-31 0000009631 bns:BaselThreeNormsMember country:US 2024-10-31 0000009631 bns:BaselThreeNormsMember bns:OtherRetailMember bns:RetailMember bns:AdvancedInternalRatingsBasedPortfolioMember 2024-10-31 0000009631 bns:BaselThreeNormsMember country:CA 2024-10-31 0000009631 bns:BaselThreeNormsMember bns:QualifyingRevolvingMember bns:RetailMember bns:AdvancedInternalRatingsBasedPortfolioMember 2024-10-31 0000009631 bns:BaselThreeNormsMember bns:RealEstateSecuredMember bns:RetailMember bns:AdvancedInternalRatingsBasedPortfolioMember 2024-10-31 0000009631 bns:BaselThreeNormsMember bns:NonRetailMember 2024-10-31 0000009631 bns:BaselThreeNormsMember bns:SovereignMember bns:NonRetailMember bns:StandardizedPortfolioMember 2024-10-31 0000009631 bns:BaselThreeNormsMember bns:RealEstateSecuredMember bns:RetailMember bns:StandardizedPortfolioMember 2024-10-31 0000009631 ifrs-full:SubsidiariesWithMaterialNoncontrollingInterestsMember 2024-10-31 0000009631 bns:ActuarialAssumptionOfMedicalCostTrendInitialRatesMember bns:OtherBenefitPlansMember 2024-10-31 0000009631 bns:ActuarialAssumptionOfMedicalCostTrendUltimateRatesMember bns:OtherBenefitPlansMember 2024-10-31 0000009631 srt:LatinAmericaMember 2024-10-31 0000009631 ifrs-full:ConsumerLoansMember bns:VeryLowProbabilityOfDefaultMember 2024-10-31 0000009631 bns:MediumProbabilityOfDefaultMember ifrs-full:ConsumerLoansMember bns:StageTwoExposureMember 2024-10-31 0000009631 ifrs-full:ConsumerLoansMember bns:StageOneExposureMember bns:MediumProbabilityOfDefaultMember 2024-10-31 0000009631 bns:VeryHighProbabilityOfDefaultMember bns:ResidentialMortgagesMember bns:StageTwoExposureMember 2024-10-31 0000009631 bns:ResidentialMortgagesMember bns:VeryHighProbabilityOfDefaultMember 2024-10-31 0000009631 bns:LoansNotGradedMember bns:CreditCardMember 2024-10-31 0000009631 bns:CreditCardMember bns:HighProbabilityOfDefaultMember 2024-10-31 0000009631 bns:CreditCardMember bns:StageOneExposureMember bns:VeryHighProbabilityOfDefaultMember 2024-10-31 0000009631 bns:CreditCardMember bns:StageTwoExposureMember bns:VeryHighProbabilityOfDefaultMember 2024-10-31 0000009631 bns:VeryLowProbabilityOfDefaultMember bns:CreditCardMember bns:StageTwoExposureMember 2024-10-31 0000009631 bns:CreditCardMember bns:VeryLowProbabilityOfDefaultMember 2024-10-31 0000009631 bns:LoansNotGradedMember bns:CreditCardMember bns:StageOneExposureMember 2024-10-31 0000009631 bns:LoansNotGradedMember bns:CreditCardMember bns:StageTwoExposureMember 2024-10-31 0000009631 bns:CreditCardMember bns:StageOneExposureMember bns:HighProbabilityOfDefaultMember 2024-10-31 0000009631 bns:CreditCardMember bns:StageTwoExposureMember bns:HighProbabilityOfDefaultMember 2024-10-31 0000009631 bns:CreditCardMember bns:StageTwoExposureMember bns:LowProbabilityOfDefaultMember 2024-10-31 0000009631 bns:CreditCardMember bns:StageOneExposureMember bns:VeryLowProbabilityOfDefaultMember 2024-10-31 0000009631 bns:MediumProbabilityOfDefaultMember bns:CreditCardMember bns:StageTwoExposureMember 2024-10-31 0000009631 bns:LowProbabilityOfDefaultMember bns:CreditCardMember bns:StageOneExposureMember 2024-10-31 0000009631 bns:CreditCardMember bns:LowProbabilityOfDefaultMember 2024-10-31 0000009631 bns:CreditCardMember bns:StageOneExposureMember bns:MediumProbabilityOfDefaultMember 2024-10-31 0000009631 bns:LowProbabilityOfDefaultMember ifrs-full:ConsumerLoansMember bns:StageTwoExposureMember 2024-10-31 0000009631 bns:LowProbabilityOfDefaultMember ifrs-full:ConsumerLoansMember bns:StageOneExposureMember 2024-10-31 0000009631 ifrs-full:ConsumerLoansMember bns:StageOneExposureMember bns:VeryLowProbabilityOfDefaultMember 2024-10-31 0000009631 ifrs-full:ConsumerLoansMember bns:StageOneExposureMember 2024-10-31 0000009631 ifrs-full:ConsumerLoansMember bns:StageTwoExposureMember 2024-10-31 0000009631 bns:HighProbabilityOfDefaultMember ifrs-full:ConsumerLoansMember bns:StageTwoExposureMember 2024-10-31 0000009631 ifrs-full:ConsumerLoansMember bns:StageOneExposureMember bns:HighProbabilityOfDefaultMember 2024-10-31 0000009631 bns:DefaultMember ifrs-full:ConsumerLoansMember bns:StageThreeExposureMember 2024-10-31 0000009631 ifrs-full:ConsumerLoansMember bns:DefaultMember 2024-10-31 0000009631 ifrs-full:ConsumerLoansMember bns:LoansNotGradedMember 2024-10-31 0000009631 bns:VeryHighProbabilityOfDefaultMember ifrs-full:ConsumerLoansMember bns:StageOneExposureMember 2024-10-31 0000009631 bns:VeryHighProbabilityOfDefaultMember ifrs-full:ConsumerLoansMember bns:StageTwoExposureMember 2024-10-31 0000009631 bns:LoansNotGradedMember ifrs-full:ConsumerLoansMember bns:StageOneExposureMember 2024-10-31 0000009631 ifrs-full:ConsumerLoansMember bns:StageTwoExposureMember bns:LoansNotGradedMember 2024-10-31 0000009631 ifrs-full:ConsumerLoansMember bns:HighProbabilityOfDefaultMember 2024-10-31 0000009631 bns:ResidentialMortgagesMember bns:StageTwoExposureMember 2024-10-31 0000009631 bns:ResidentialMortgagesMember bns:StageThreeExposureMember 2024-10-31 0000009631 ifrs-full:ConsumerLoansMember bns:StageThreeExposureMember 2024-10-31 0000009631 bns:MediumProbabilityOfDefaultMember ifrs-full:ConsumerLoansMember 2024-10-31 0000009631 bns:VeryHighProbabilityOfDefaultMember ifrs-full:ConsumerLoansMember 2024-10-31 0000009631 bns:CreditCardMember bns:MediumProbabilityOfDefaultMember 2024-10-31 0000009631 bns:ResidentialMortgagesMember bns:StageOneExposureMember 2024-10-31 0000009631 bns:CreditCardMember bns:StageTwoExposureMember 2024-10-31 0000009631 bns:CreditCardMember bns:StageOneExposureMember 2024-10-31 0000009631 ifrs-full:ConsumerLoansMember bns:LowProbabilityOfDefaultMember 2024-10-31 0000009631 bns:CreditCardMember bns:VeryHighProbabilityOfDefaultMember 2024-10-31 0000009631 bns:LoansNotGradedMember bns:ResidentialMortgagesMember bns:StageOneExposureMember 2024-10-31 0000009631 bns:LoansNotGradedMember bns:ResidentialMortgagesMember bns:StageTwoExposureMember 2024-10-31 0000009631 bns:LoansNotGradedMember bns:ResidentialMortgagesMember 2024-10-31 0000009631 bns:VeryHighProbabilityOfDefaultMember bns:ResidentialMortgagesMember bns:StageOneExposureMember 2024-10-31 0000009631 bns:HighProbabilityOfDefaultMember bns:ResidentialMortgagesMember bns:StageTwoExposureMember 2024-10-31 0000009631 bns:ResidentialMortgagesMember bns:StageOneExposureMember bns:HighProbabilityOfDefaultMember 2024-10-31 0000009631 bns:HighProbabilityOfDefaultMember bns:ResidentialMortgagesMember 2024-10-31 0000009631 bns:MediumProbabilityOfDefaultMember bns:ResidentialMortgagesMember bns:StageTwoExposureMember 2024-10-31 0000009631 bns:MediumProbabilityOfDefaultMember bns:ResidentialMortgagesMember bns:StageOneExposureMember 2024-10-31 0000009631 bns:ResidentialMortgagesMember bns:StageOneExposureMember bns:VeryLowProbabilityOfDefaultMember 2024-10-31 0000009631 bns:ResidentialMortgagesMember bns:StageTwoExposureMember bns:VeryLowProbabilityOfDefaultMember 2024-10-31 0000009631 bns:ResidentialMortgagesMember bns:VeryLowProbabilityOfDefaultMember 2024-10-31 0000009631 bns:MediumProbabilityOfDefaultMember bns:ResidentialMortgagesMember 2024-10-31 0000009631 bns:ResidentialMortgagesMember bns:StageOneExposureMember bns:LowProbabilityOfDefaultMember 2024-10-31 0000009631 bns:LowProbabilityOfDefaultMember bns:ResidentialMortgagesMember bns:StageTwoExposureMember 2024-10-31 0000009631 bns:ResidentialMortgagesMember bns:LowProbabilityOfDefaultMember 2024-10-31 0000009631 bns:DefaultMember bns:ResidentialMortgagesMember 2024-10-31 0000009631 bns:DefaultMember bns:ResidentialMortgagesMember bns:StageThreeExposureMember 2024-10-31 0000009631 bns:DefaultMember bns:TotalRetailLoansMember bns:StageThreeExposureMember 2024-10-31 0000009631 bns:DefaultMember bns:TotalRetailLoansMember 2024-10-31 0000009631 bns:BusinessAndGovernmentMember bns:StageOneExposureMember bns:LoansNotGradedMember 2024-10-31 0000009631 bns:NoninvestmentGradeMember bns:BusinessAndGovernmentMember bns:StageTwoExposureMember 2024-10-31 0000009631 bns:BusinessAndGovernmentMember bns:NoninvestmentGradeMember 2024-10-31 0000009631 bns:TotalRetailLoansMember bns:StageOneExposureMember bns:LoansNotGradedMember 2024-10-31 0000009631 bns:TotalNonRetailLoansMember bns:WatchListMember 2024-10-31 0000009631 bns:NoninvestmentGradeMember bns:TotalNonRetailLoansMember 2024-10-31 0000009631 bns:TotalNonRetailLoansMember bns:InvestmentGradeMember 2024-10-31 0000009631 bns:TotalNonRetailLoansMember 2024-10-31 0000009631 bns:TotalNonRetailLoansMember bns:StageThreeExposureMember 2024-10-31 0000009631 bns:TotalNonRetailLoansMember bns:DefaultMember 2024-10-31 0000009631 bns:DefaultMember bns:TotalNonRetailLoansMember bns:StageThreeExposureMember 2024-10-31 0000009631 bns:TotalNonRetailLoansMember bns:LoansNotGradedMember 2024-10-31 0000009631 bns:TotalNonRetailLoansMember bns:StageOneExposureMember bns:WatchListMember 2024-10-31 0000009631 bns:WatchListMember bns:TotalNonRetailLoansMember bns:StageTwoExposureMember 2024-10-31 0000009631 bns:LoansNotGradedMember bns:TotalNonRetailLoansMember bns:StageTwoExposureMember 2024-10-31 0000009631 bns:InvestmentGradeMember bns:TotalNonRetailLoansMember bns:StageOneExposureMember 2024-10-31 0000009631 bns:TotalNonRetailLoansMember bns:StageTwoExposureMember bns:InvestmentGradeMember 2024-10-31 0000009631 bns:TotalNonRetailLoansMember bns:StageOneExposureMember 2024-10-31 0000009631 bns:TotalNonRetailLoansMember bns:StageTwoExposureMember 2024-10-31 0000009631 bns:TotalNonRetailLoansMember bns:StageOneExposureMember bns:NoninvestmentGradeMember 2024-10-31 0000009631 bns:TotalNonRetailLoansMember bns:StageTwoExposureMember bns:NoninvestmentGradeMember 2024-10-31 0000009631 bns:LoansNotGradedMember bns:TotalRetailLoansMember 2024-10-31 0000009631 bns:LoansNotGradedMember bns:TotalNonRetailLoansMember bns:StageOneExposureMember 2024-10-31 0000009631 bns:BusinessAndGovernmentMember bns:StageTwoExposureMember 2024-10-31 0000009631 bns:BusinessAndGovernmentMember bns:StageTwoExposureMember bns:WatchListMember 2024-10-31 0000009631 bns:BusinessAndGovernmentMember bns:WatchListMember 2024-10-31 0000009631 bns:InvestmentGradeMember bns:BusinessAndGovernmentMember bns:StageOneExposureMember 2024-10-31 0000009631 bns:StageThreeExposureMember 2024-10-31 0000009631 bns:LoansNotGradedMember bns:BusinessAndGovernmentMember bns:StageTwoExposureMember 2024-10-31 0000009631 bns:BusinessAndGovernmentMember bns:LoansNotGradedMember 2024-10-31 0000009631 bns:BusinessAndGovernmentMember bns:StageOneExposureMember 2024-10-31 0000009631 bns:BusinessAndGovernmentMember bns:StageTwoExposureMember bns:InvestmentGradeMember 2024-10-31 0000009631 bns:DefaultMember bns:BusinessAndGovernmentMember 2024-10-31 0000009631 bns:TotalRetailLoansMember bns:VeryLowProbabilityOfDefaultMember 2024-10-31 0000009631 bns:VeryLowProbabilityOfDefaultMember bns:TotalRetailLoansMember bns:StageTwoExposureMember 2024-10-31 0000009631 bns:TotalRetailLoansMember bns:StageOneExposureMember bns:VeryLowProbabilityOfDefaultMember 2024-10-31 0000009631 bns:BusinessAndGovernmentMember bns:InvestmentGradeMember 2024-10-31 0000009631 bns:TotalRetailLoansMember bns:VeryHighProbabilityOfDefaultMember 2024-10-31 0000009631 bns:VeryHighProbabilityOfDefaultMember bns:TotalRetailLoansMember bns:StageTwoExposureMember 2024-10-31 0000009631 bns:VeryHighProbabilityOfDefaultMember bns:TotalRetailLoansMember bns:StageOneExposureMember 2024-10-31 0000009631 bns:TotalRetailLoansMember 2024-10-31 0000009631 bns:TotalRetailLoansMember bns:StageThreeExposureMember 2024-10-31 0000009631 bns:TotalRetailLoansMember bns:StageTwoExposureMember 2024-10-31 0000009631 bns:TotalRetailLoansMember bns:StageOneExposureMember 2024-10-31 0000009631 bns:TotalRetailLoansMember bns:HighProbabilityOfDefaultMember 2024-10-31 0000009631 bns:HighProbabilityOfDefaultMember bns:TotalRetailLoansMember bns:StageTwoExposureMember 2024-10-31 0000009631 bns:HighProbabilityOfDefaultMember bns:TotalRetailLoansMember bns:StageOneExposureMember 2024-10-31 0000009631 bns:MediumProbabilityOfDefaultMember bns:TotalRetailLoansMember 2024-10-31 0000009631 bns:TotalRetailLoansMember bns:StageTwoExposureMember bns:MediumProbabilityOfDefaultMember 2024-10-31 0000009631 bns:TotalRetailLoansMember bns:StageOneExposureMember bns:MediumProbabilityOfDefaultMember 2024-10-31 0000009631 bns:WatchListMember bns:BusinessAndGovernmentMember bns:StageOneExposureMember 2024-10-31 0000009631 bns:NoninvestmentGradeMember bns:BusinessAndGovernmentMember bns:StageOneExposureMember 2024-10-31 0000009631 bns:LowProbabilityOfDefaultMember bns:TotalRetailLoansMember bns:StageTwoExposureMember 2024-10-31 0000009631 bns:TotalRetailLoansMember bns:StageOneExposureMember bns:LowProbabilityOfDefaultMember 2024-10-31 0000009631 bns:TotalRetailLoansMember bns:StageTwoExposureMember bns:LoansNotGradedMember 2024-10-31 0000009631 bns:TotalRetailLoansMember bns:LowProbabilityOfDefaultMember 2024-10-31 0000009631 bns:JuneTwoThousandTwentyFiveMember ifrs-full:FixedInterestRateMember 2024-10-31 0000009631 bns:DecemberTwoThousandTwentyFiveMember ifrs-full:FixedInterestRateMember 2024-10-31 0000009631 bns:DerivativeFinancialInstrumentsLiabilities1Member 2024-10-31 0000009631 ifrs-full:LoansAcquiredInBusinessCombinationMember bns:StageThreeMember 2024-10-31 0000009631 bns:CreditValuationAdjustmentMember 2024-10-31 0000009631 ifrs-full:Level1OfFairValueHierarchyMember ifrs-full:RecurringFairValueMeasurementMember ifrs-full:IFRS9Member 2024-10-31 0000009631 ifrs-full:Level3OfFairValueHierarchyMember ifrs-full:RecurringFairValueMeasurementMember ifrs-full:IFRS9Member 2024-10-31 0000009631 bns:SecuritiesPurchasedUnderResaleAgreementsAndSecuritiesBorrowedMember 2024-10-31 0000009631 bns:LiquidityFacilitiesMember 2024-10-31 0000009631 bns:StandbyLettersOfCreditAndLettersOfGuaranteeMember 2024-10-31 0000009631 bns:IndemnificationsMember 2024-10-31 0000009631 bns:BaselThreeNormsMember bns:GovernmentGuaranteedResidentialMortgagesMember bns:NonRetailMember bns:AdvancedInternalRatingsBasedPortfolioMember 2024-10-31 0000009631 bns:BaselThreeNormsMember bns:NonRetailMember bns:EquivalentExternalRatingStandardAndPoorsCccPlusMember bns:InternalGradeWatchListMember bns:AdvancedInternalRatingsBasedPortfolioMember 2024-10-31 0000009631 bns:BaselThreeNormsMember bns:NonRetailMember srt:StandardPoorsCCCRatingMember bns:InternalGradeWatchListMember bns:AdvancedInternalRatingsBasedPortfolioMember 2024-10-31 0000009631 bns:BaselThreeNormsMember bns:NonRetailMember srt:StandardPoorsBBRatingMember bns:InternalNonInvestmentGrade1Member bns:AdvancedInternalRatingsBasedPortfolioMember 2024-10-31 0000009631 bns:BaselThreeNormsMember bns:NonRetailMember bns:EquivalentExternalRatingStandardAndPoorsaToaMinusMember bns:InvestmentGradeMember bns:AdvancedInternalRatingsBasedPortfolioMember 2024-10-31 0000009631 bns:BaselThreeNormsMember bns:NonRetailMember bns:EquivalentExternalRatingStandardAndPoorsAaaToAaPlusMember bns:InvestmentGradeMember bns:AdvancedInternalRatingsBasedPortfolioMember 2024-10-31 0000009631 bns:BaselThreeNormsMember bns:NonRetailMember bns:EquivalentExternalRatingStandardAndPoorsAaToAPlusMember bns:InvestmentGradeMember bns:AdvancedInternalRatingsBasedPortfolioMember 2024-10-31 0000009631 bns:BaselThreeNormsMember bns:NonRetailMember bns:EquivalentExternalRatingStandardAndPoorsBbbPlusMember bns:InvestmentGradeMember bns:AdvancedInternalRatingsBasedPortfolioMember 2024-10-31 0000009631 bns:BaselThreeNormsMember bns:NonRetailMember bns:EquivalentExternalRatingStandardAndPoorsbPlusMember bns:InternalNonInvestmentGrade1Member bns:AdvancedInternalRatingsBasedPortfolioMember 2024-10-31 0000009631 bns:BaselThreeNormsMember bns:NonRetailMember bns:EquivalentExternalRatingStandardAndPoorsBbMinusMember bns:InternalNonInvestmentGrade1Member bns:AdvancedInternalRatingsBasedPortfolioMember 2024-10-31 0000009631 bns:BaselThreeNormsMember bns:NonRetailMember bns:EquivalentExternalRatingStandardAndPoorsBbbMinusMember bns:InvestmentGradeMember bns:AdvancedInternalRatingsBasedPortfolioMember 2024-10-31 0000009631 bns:BaselThreeNormsMember bns:NonRetailMember bns:EquivalentExternalRatingStandardAndPoorsBbPlusMember bns:InternalNonInvestmentGrade1Member bns:AdvancedInternalRatingsBasedPortfolioMember 2024-10-31 0000009631 bns:BaselThreeNormsMember bns:NonRetailMember bns:InternalGradeDefaultMember bns:AdvancedInternalRatingsBasedPortfolioMember 2024-10-31 0000009631 bns:BaselThreeNormsMember bns:ExcludingResidentialMortgagesMember bns:NonRetailMember bns:AdvancedInternalRatingsBasedPortfolioMember 2024-10-31 0000009631 bns:BaselThreeNormsMember bns:NonRetailMember bns:EquivalentExternalRatingStandardAndPoorsbTobMinusMember bns:InternalNonInvestmentGrade1Member bns:AdvancedInternalRatingsBasedPortfolioMember 2024-10-31 0000009631 bns:BaselThreeNormsMember bns:NonRetailMember srt:StandardPoorsBBBRatingMember bns:InvestmentGradeMember bns:AdvancedInternalRatingsBasedPortfolioMember 2024-10-31 0000009631 bns:BaselThreeNormsMember bns:NonRetailMember bns:EquivalentExternalRatingStandardAndPoorsDefaultMember bns:InternalGradeWatchListMember bns:AdvancedInternalRatingsBasedPortfolioMember 2024-10-31 0000009631 bns:BaselThreeNormsMember bns:NonRetailMember bns:EquivalentExternalRatingStandardandPoorsCCCMinusToCCMember bns:InternalGradeWatchListMember bns:AdvancedInternalRatingsBasedPortfolioMember 2024-10-31 0000009631 bns:OtherCreditRiskExposureRepo-StyleTransactionsMember ifrs-full:CreditRiskMember 2024-10-31 0000009631 bns:ReverseRepurchaseAgreementsMember 2024-10-31 0000009631 bns:StandardSecuritiesBorrowingAgreementsMember 2024-10-31 0000009631 bns:CommitmentsToExtendCreditOriginalTermToMaturityOfOneYearOrLessMember 2024-10-31 0000009631 bns:SecuritiesPurchaseAndOtherCommitmentMember 2024-10-31 0000009631 ifrs-full:SecuritiesLendingMember 2024-10-31 0000009631 bns:CommercialLetterOfCreditMember 2024-10-31 0000009631 bns:OtherMarketRiskExposuresAlsoSubjectToCreditRiskMember ifrs-full:CreditRiskMember 2024-10-31 0000009631 bns:OtherCreditRiskExposureOver-The-CounterDerivativesMember ifrs-full:CreditRiskMember 2024-10-31 0000009631 country:CA ifrs-full:LaterThanFiveYearsMember 2024-10-31 0000009631 country:CA ifrs-full:LaterThanOneYearAndNotLaterThanFiveYearsMember 2024-10-31 0000009631 country:CA bns:LaterThanSixMonthAndNotLaterThanTwelveMonthsMember 2024-10-31 0000009631 country:CA bns:LaterThanThreeMonthAndNotLaterThanSixMonthsMember 2024-10-31 0000009631 country:CA bns:LessThanThreeMonthsMember 2024-10-31 0000009631 bns:OtherCreditRiskExposureEquityMember ifrs-full:CreditRiskMember 2024-10-31 0000009631 bns:EmployeeStockOptionsMember 2024-10-31 0000009631 ifrs-full:NotMeasuredAtFairValueInStatementOfFinancialPositionButForWhichFairValueIsDisclosedMember ifrs-full:IFRS9Member ifrs-full:Level2OfFairValueHierarchyMember 2024-10-31 0000009631 ifrs-full:NotMeasuredAtFairValueInStatementOfFinancialPositionButForWhichFairValueIsDisclosedMember ifrs-full:IFRS9Member 2024-10-31 0000009631 ifrs-full:FairValueHedgesMember 2024-10-31 0000009631 bns:StockAppreciationRightsMember 2024-10-31 0000009631 bns:CommonSharesMember 2024-10-31 0000009631 bns:OtherNonControllingInterestsMember 2024-10-31 0000009631 bns:ScotiabankTrinidadAndTobagoLimitedFiftyPointNineZeroPercentMember 2024-10-31 0000009631 bns:ScotiabankChileSAMember 2024-10-31 0000009631 bns:ScotiabankColpatriaSAMember 2024-10-31 0000009631 bns:ScotiaGroupJamaicaLimitedMember 2024-10-31 0000009631 bns:CreditRiskExposureDrawnRetailMember ifrs-full:CreditRiskMember 2024-10-31 0000009631 ifrs-full:NotMeasuredAtFairValueInStatementOfFinancialPositionButForWhichFairValueIsDisclosedMember ifrs-full:FinancialAssetsAtAmortisedCostCategoryMember ifrs-full:IFRS9Member ifrs-full:Level2OfFairValueHierarchyMember 2024-10-31 0000009631 ifrs-full:NotMeasuredAtFairValueInStatementOfFinancialPositionButForWhichFairValueIsDisclosedMember ifrs-full:FinancialAssetsAtAmortisedCostCategoryMember ifrs-full:IFRS9Member 2024-10-31 0000009631 ifrs-full:Level1OfFairValueHierarchyMember ifrs-full:NotMeasuredAtFairValueInStatementOfFinancialPositionButForWhichFairValueIsDisclosedMember ifrs-full:FinancialAssetsAtAmortisedCostCategoryMember ifrs-full:IFRS9Member 2024-10-31 0000009631 bns:ObligationsRelatedToSecuritiesSoldUnderRepurchaseAgreementsAndSecuritiesLentMember 2024-10-31 0000009631 ifrs-full:SwapContractMember ifrs-full:CashFlowHedgesMember ifrs-full:CurrencyRiskMember 2024-10-31 0000009631 bns:ForeignCurrencyForwardContractsMember bns:NetInvestmentHedgesMember ifrs-full:CurrencyRiskMember 2024-10-31 0000009631 ifrs-full:CashFlowHedgesMember 2024-10-31 0000009631 bns:NetInvestmentHedgesMember 2024-10-31 0000009631 bns:Cash1Member ifrs-full:CashFlowHedgesMember ifrs-full:CurrencyRiskMember 2024-10-31 0000009631 ifrs-full:CashFlowHedgesMember bns:EquityPriceRiskReturnSwapMember 2024-10-31 0000009631 ifrs-full:SwapContractMember ifrs-full:CashFlowHedgesMember bns:CurrencyOrInterestRateRiskMember 2024-10-31 0000009631 bns:OtherSharebasedPaymentPlansMember 2024-10-31 0000009631 bns:DepositLiabilitiesMember bns:NetInvestmentHedgesMember ifrs-full:CurrencyRiskMember 2024-10-31 0000009631 ifrs-full:CashFlowHedgesMember ifrs-full:CurrencyRiskMember 2024-10-31 0000009631 ifrs-full:HedgesOfNetInvestmentInForeignOperationsMember ifrs-full:CurrencyRiskMember 2024-10-31 0000009631 ifrs-full:CashFlowHedgesMember ifrs-full:EquityPriceRiskMember 2024-10-31 0000009631 ifrs-full:CashFlowHedgesMember ifrs-full:InterestRateRiskMember 2024-10-31 0000009631 ifrs-full:CashFlowHedgesMember bns:CurrencyOrInterestRateRiskMember 2024-10-31 0000009631 bns:BusinessAndGovernmentMember bns:StageOneMember 2024-10-31 0000009631 bns:BusinessAndGovernmentMember bns:StageThreeMember 2024-10-31 0000009631 bns:BusinessAndGovernmentMember bns:StageTwoMember 2024-10-31 0000009631 ifrs-full:Level3OfFairValueHierarchyMember ifrs-full:NotMeasuredAtFairValueInStatementOfFinancialPositionButForWhichFairValueIsDisclosedMember ifrs-full:IFRS9Member 2024-10-31 0000009631 bns:InvestmentSecuritiesMember ifrs-full:FairValueHedgesMember ifrs-full:InterestRateRiskMember 2024-10-31 0000009631 ifrs-full:LoanCommitmentsMember ifrs-full:FairValueHedgesMember ifrs-full:InterestRateRiskMember 2024-10-31 0000009631 bns:OtherCreditRiskExposureSecuritizationMember ifrs-full:CreditRiskMember 2024-10-31 0000009631 bns:SubordinatedDebentureMember ifrs-full:FairValueHedgesMember ifrs-full:InterestRateRiskMember 2024-10-31 0000009631 bns:DepositLiabilitiesMember ifrs-full:FairValueHedgesMember ifrs-full:InterestRateRiskMember 2024-10-31 0000009631 bns:DepositsFromBankMember 2024-10-31 0000009631 bns:BusinessAndGovernmentDepositsMember 2024-10-31 0000009631 bns:PersonalDepositMember 2024-10-31 0000009631 country:GB 2024-10-31 0000009631 bns:RemainingForecastPeriodCreditLossesMember bns:SeverePessimisticMember bns:GlobalCopperPriceMember 2024-10-31 0000009631 bns:OverNextTwelveMonthsMember bns:SeverePessimisticMember bns:GlobalCopperPriceMember 2024-10-31 0000009631 bns:RemainingForecastPeriodCreditLossesMember bns:SeverePessimisticMember bns:GlobalWtiOilPriceMember 2024-10-31 0000009631 bns:OverNextTwelveMonthsMember bns:SeverePessimisticMember bns:GlobalWtiOilPriceMember 2024-10-31 0000009631 bns:OverNextTwelveMonthsMember bns:BaseCaseScenarioMember bns:GlobalWtiOilPriceMember 2024-10-31 0000009631 bns:RemainingForecastPeriodCreditLossesMember bns:BaseCaseScenarioMember bns:GlobalCopperPriceMember 2024-10-31 0000009631 bns:OverNextTwelveMonthsMember bns:BaseCaseScenarioMember bns:GlobalCopperPriceMember 2024-10-31 0000009631 bns:RemainingForecastPeriodCreditLossesMember bns:PessimisticScenarioMember bns:GlobalWtiOilPriceMember 2024-10-31 0000009631 bns:OverNextTwelveMonthsMember bns:PessimisticScenarioMember bns:GlobalWtiOilPriceMember 2024-10-31 0000009631 bns:RemainingForecastPeriodCreditLossesMember bns:OptimisticScenarioMember bns:GlobalWtiOilPriceMember 2024-10-31 0000009631 bns:OverNextTwelveMonthsMember bns:OptimisticScenarioMember bns:GlobalWtiOilPriceMember 2024-10-31 0000009631 bns:RemainingForecastPeriodCreditLossesMember bns:BaseCaseScenarioMember bns:GlobalWtiOilPriceMember 2024-10-31 0000009631 bns:OverNextTwelveMonthsMember bns:OptimisticScenarioMember bns:GlobalCopperPriceMember 2024-10-31 0000009631 bns:RemainingForecastPeriodCreditLossesMember bns:OptimisticScenarioMember bns:GlobalCopperPriceMember 2024-10-31 0000009631 bns:OverNextTwelveMonthsMember bns:PessimisticScenarioMember bns:GlobalCopperPriceMember 2024-10-31 0000009631 bns:RemainingForecastPeriodCreditLossesMember bns:PessimisticScenarioMember bns:GlobalCopperPriceMember 2024-10-31 0000009631 bns:DeferredStockUnitPlanMember 2024-10-31 0000009631 bns:RestrictedShareUnitPlanMember 2024-10-31 0000009631 bns:DirectorsDeferredStockUnitPlanMember 2024-10-31 0000009631 ifrs-full:RecurringFairValueMeasurementMember ifrs-full:TradingEquitySecuritiesMember ifrs-full:IFRS9Member ifrs-full:Level2OfFairValueHierarchyMember 2024-10-31 0000009631 ifrs-full:RecurringFairValueMeasurementMember ifrs-full:TradingEquitySecuritiesMember ifrs-full:IFRS9Member ifrs-full:Level1OfFairValueHierarchyMember 2024-10-31 0000009631 ifrs-full:Level1OfFairValueHierarchyMember ifrs-full:RecurringFairValueMeasurementMember bns:OtherForeignGovernmentsDebtMember ifrs-full:IFRS9Member 2024-10-31 0000009631 ifrs-full:Level1OfFairValueHierarchyMember ifrs-full:RecurringFairValueMeasurementMember bns:UsTreasuryAndOtherUsAgencyDebtMember ifrs-full:IFRS9Member 2024-10-31 0000009631 ifrs-full:Level1OfFairValueHierarchyMember ifrs-full:RecurringFairValueMeasurementMember bns:CanadianProvincialAndMunicipalDebtMember ifrs-full:IFRS9Member 2024-10-31 0000009631 ifrs-full:Level1OfFairValueHierarchyMember ifrs-full:RecurringFairValueMeasurementMember bns:CanadianFederalGovernmentAndGovernmentGuaranteedDebtMember ifrs-full:IFRS9Member 2024-10-31 0000009631 ifrs-full:RecurringFairValueMeasurementMember bns:OtherForeignGovernmentsDebtMember ifrs-full:IFRS9Member 2024-10-31 0000009631 ifrs-full:RecurringFairValueMeasurementMember bns:UsTreasuryAndOtherUsAgencyDebtMember ifrs-full:IFRS9Member 2024-10-31 0000009631 ifrs-full:RecurringFairValueMeasurementMember bns:CanadianProvincialAndMunicipalDebtMember ifrs-full:IFRS9Member 2024-10-31 0000009631 ifrs-full:RecurringFairValueMeasurementMember bns:CanadianFederalGovernmentAndGovernmentGuaranteedDebtMember ifrs-full:IFRS9Member 2024-10-31 0000009631 ifrs-full:RecurringFairValueMeasurementMember ifrs-full:TradingEquitySecuritiesMember ifrs-full:IFRS9Member 2024-10-31 0000009631 ifrs-full:RecurringFairValueMeasurementMember ifrs-full:TradingEquitySecuritiesMember ifrs-full:IFRS9Member ifrs-full:Level3OfFairValueHierarchyMember 2024-10-31 0000009631 ifrs-full:RecurringFairValueMeasurementMember bns:CorporateAndOtherDebtMember ifrs-full:IFRS9Member 2024-10-31 0000009631 ifrs-full:RecurringFairValueMeasurementMember bns:CorporateAndOtherDebtMember ifrs-full:IFRS9Member ifrs-full:Level3OfFairValueHierarchyMember 2024-10-31 0000009631 ifrs-full:RecurringFairValueMeasurementMember bns:CorporateAndOtherDebtMember ifrs-full:IFRS9Member ifrs-full:Level1OfFairValueHierarchyMember 2024-10-31 0000009631 ifrs-full:RecurringFairValueMeasurementMember bns:UsTreasuryAndOtherUsAgencyDebtMember ifrs-full:IFRS9Member ifrs-full:Level2OfFairValueHierarchyMember 2024-10-31 0000009631 ifrs-full:Level2OfFairValueHierarchyMember ifrs-full:RecurringFairValueMeasurementMember bns:OtherForeignGovernmentsDebtMember ifrs-full:IFRS9Member 2024-10-31 0000009631 ifrs-full:Level2OfFairValueHierarchyMember ifrs-full:RecurringFairValueMeasurementMember bns:CorporateAndOtherDebtMember ifrs-full:IFRS9Member 2024-10-31 0000009631 ifrs-full:Level2OfFairValueHierarchyMember ifrs-full:RecurringFairValueMeasurementMember bns:CanadianFederalGovernmentAndGovernmentGuaranteedDebtMember ifrs-full:IFRS9Member 2024-10-31 0000009631 ifrs-full:RecurringFairValueMeasurementMember bns:CanadianProvincialAndMunicipalDebtMember ifrs-full:IFRS9Member ifrs-full:Level2OfFairValueHierarchyMember 2024-10-31 0000009631 ifrs-full:Level2OfFairValueHierarchyMember ifrs-full:RecurringFairValueMeasurementMember bns:TradingLoansMember ifrs-full:IFRS9Member 2024-10-31 0000009631 ifrs-full:RecurringFairValueMeasurementMember bns:TradingLoansMember ifrs-full:IFRS9Member 2024-10-31 0000009631 ifrs-full:Level2OfFairValueHierarchyMember ifrs-full:RecurringFairValueMeasurementMember bns:OtherTradingAssetsMember ifrs-full:IFRS9Member 2024-10-31 0000009631 ifrs-full:RecurringFairValueMeasurementMember bns:OtherTradingAssetsMember ifrs-full:IFRS9Member 2024-10-31 0000009631 ifrs-full:RecurringFairValueMeasurementMember bns:CommodityContractsMember ifrs-full:IFRS9Member ifrs-full:Level3OfFairValueHierarchyMember 2024-10-31 0000009631 ifrs-full:RecurringFairValueMeasurementMember bns:CommodityContractsMember ifrs-full:IFRS9Member 2024-10-31 0000009631 ifrs-full:RecurringFairValueMeasurementMember bns:InterestRateContractsMember ifrs-full:IFRS9Member ifrs-full:Level2OfFairValueHierarchyMember 2024-10-31 0000009631 ifrs-full:Level2OfFairValueHierarchyMember ifrs-full:RecurringFairValueMeasurementMember bns:ForeignExchangeAndGoldContractsMember ifrs-full:IFRS9Member 2024-10-31 0000009631 ifrs-full:RecurringFairValueMeasurementMember bns:EquityContractsMember ifrs-full:IFRS9Member ifrs-full:Level2OfFairValueHierarchyMember 2024-10-31 0000009631 ifrs-full:Level2OfFairValueHierarchyMember ifrs-full:RecurringFairValueMeasurementMember bns:CreditContractsMember ifrs-full:IFRS9Member 2024-10-31 0000009631 ifrs-full:RecurringFairValueMeasurementMember bns:CommodityContractsMember ifrs-full:IFRS9Member ifrs-full:Level2OfFairValueHierarchyMember 2024-10-31 0000009631 ifrs-full:RecurringFairValueMeasurementMember bns:CreditContractsMember ifrs-full:IFRS9Member 2024-10-31 0000009631 ifrs-full:RecurringFairValueMeasurementMember bns:InterestRateContractsMember ifrs-full:IFRS9Member 2024-10-31 0000009631 ifrs-full:RecurringFairValueMeasurementMember bns:ForeignExchangeAndGoldContractsMember ifrs-full:IFRS9Member 2024-10-31 0000009631 ifrs-full:RecurringFairValueMeasurementMember bns:EquityContractsMember ifrs-full:IFRS9Member ifrs-full:Level3OfFairValueHierarchyMember 2024-10-31 0000009631 ifrs-full:RecurringFairValueMeasurementMember bns:EquityContractsMember ifrs-full:IFRS9Member 2024-10-31 0000009631 ifrs-full:RecurringFairValueMeasurementMember bns:CreditContractsMember ifrs-full:IFRS9Member ifrs-full:Level3OfFairValueHierarchyMember 2024-10-31 0000009631 ifrs-full:RecurringFairValueMeasurementMember bns:EquityContractsMember ifrs-full:IFRS9Member ifrs-full:Level1OfFairValueHierarchyMember 2024-10-31 0000009631 bns:CashAndDepositsWithFinancialInstitutionsMember 2024-10-31 0000009631 bns:PerformanceShareUnitPlanMember 2024-10-31 0000009631 ifrs-full:PensionDefinedBenefitPlansMember bns:FundedStatusMember 2024-10-31 0000009631 bns:OtherBenefitPlansMember bns:FundedStatusMember 2024-10-31 0000009631 ifrs-full:PensionDefinedBenefitPlansMember bns:AdditionalDetailsMember 2024-10-31 0000009631 bns:MaleMember ifrs-full:PensionDefinedBenefitPlansMember country:US bns:RetiringCurrentlyAtAgeSixtyFiveMember 2024-10-31 0000009631 bns:MaleMember ifrs-full:PensionDefinedBenefitPlansMember country:CA bns:RetiringCurrentlyAtAgeSixtyFiveMember 2024-10-31 0000009631 bns:MaleMember bns:OtherBenefitPlansMember country:MX bns:CurrentlyAgedFortyFiveAndRetiringAtAgeSixtyFiveMember 2024-10-31 0000009631 bns:FemaleMember ifrs-full:PensionDefinedBenefitPlansMember country:US bns:CurrentlyAgedFortyFiveAndRetiringAtAgeSixtyFiveMember 2024-10-31 0000009631 bns:FemaleMember bns:OtherBenefitPlansMember country:MX bns:CurrentlyAgedFortyFiveAndRetiringAtAgeSixtyFiveMember 2024-10-31 0000009631 bns:MaleMember bns:OtherBenefitPlansMember country:MX bns:RetiringCurrentlyAtAgeSixtyFiveMember 2024-10-31 0000009631 bns:MaleMember bns:OtherBenefitPlansMember country:US bns:RetiringCurrentlyAtAgeSixtyFiveMember 2024-10-31 0000009631 bns:MaleMember ifrs-full:PensionDefinedBenefitPlansMember country:MX bns:CurrentlyAgedFortyFiveAndRetiringAtAgeSixtyFiveMember 2024-10-31 0000009631 bns:FemaleMember ifrs-full:PensionDefinedBenefitPlansMember country:MX bns:RetiringCurrentlyAtAgeSixtyFiveMember 2024-10-31 0000009631 bns:FemaleMember bns:OtherBenefitPlansMember country:MX bns:RetiringCurrentlyAtAgeSixtyFiveMember 2024-10-31 0000009631 bns:MaleMember ifrs-full:PensionDefinedBenefitPlansMember country:CA bns:CurrentlyAgedFortyFiveAndRetiringAtAgeSixtyFiveMember 2024-10-31 0000009631 bns:FemaleMember ifrs-full:PensionDefinedBenefitPlansMember country:MX bns:CurrentlyAgedFortyFiveAndRetiringAtAgeSixtyFiveMember 2024-10-31 0000009631 bns:FemaleMember bns:OtherBenefitPlansMember country:US bns:CurrentlyAgedFortyFiveAndRetiringAtAgeSixtyFiveMember 2024-10-31 0000009631 bns:MaleMember bns:OtherBenefitPlansMember country:US bns:CurrentlyAgedFortyFiveAndRetiringAtAgeSixtyFiveMember 2024-10-31 0000009631 bns:MaleMember bns:OtherBenefitPlansMember country:CA bns:CurrentlyAgedFortyFiveAndRetiringAtAgeSixtyFiveMember 2024-10-31 0000009631 bns:FemaleMember ifrs-full:PensionDefinedBenefitPlansMember country:CA bns:CurrentlyAgedFortyFiveAndRetiringAtAgeSixtyFiveMember 2024-10-31 0000009631 bns:FemaleMember bns:OtherBenefitPlansMember country:CA bns:CurrentlyAgedFortyFiveAndRetiringAtAgeSixtyFiveMember 2024-10-31 0000009631 bns:FemaleMember ifrs-full:PensionDefinedBenefitPlansMember country:CA bns:RetiringCurrentlyAtAgeSixtyFiveMember 2024-10-31 0000009631 bns:FemaleMember bns:OtherBenefitPlansMember country:CA bns:RetiringCurrentlyAtAgeSixtyFiveMember 2024-10-31 0000009631 bns:MaleMember ifrs-full:PensionDefinedBenefitPlansMember country:US bns:CurrentlyAgedFortyFiveAndRetiringAtAgeSixtyFiveMember 2024-10-31 0000009631 bns:FemaleMember ifrs-full:PensionDefinedBenefitPlansMember country:US bns:RetiringCurrentlyAtAgeSixtyFiveMember 2024-10-31 0000009631 bns:MaleMember ifrs-full:PensionDefinedBenefitPlansMember country:MX bns:RetiringCurrentlyAtAgeSixtyFiveMember 2024-10-31 0000009631 bns:FemaleMember bns:OtherBenefitPlansMember country:US bns:RetiringCurrentlyAtAgeSixtyFiveMember 2024-10-31 0000009631 bns:MaleMember bns:OtherBenefitPlansMember country:CA bns:RetiringCurrentlyAtAgeSixtyFiveMember 2024-10-31 0000009631 ifrs-full:Level2OfFairValueHierarchyMember ifrs-full:RecurringFairValueMeasurementMember bns:CommodityContractsMember ifrs-full:IFRS9Member 2024-10-31 0000009631 ifrs-full:Level2OfFairValueHierarchyMember ifrs-full:RecurringFairValueMeasurementMember bns:ForeignExchangeAndGoldContractsMember ifrs-full:IFRS9Member 2024-10-31 0000009631 ifrs-full:Level2OfFairValueHierarchyMember ifrs-full:RecurringFairValueMeasurementMember bns:CreditContractsMember ifrs-full:IFRS9Member 2024-10-31 0000009631 ifrs-full:RecurringFairValueMeasurementMember bns:CreditContractsMember ifrs-full:IFRS9Member ifrs-full:Level3OfFairValueHierarchyMember 2024-10-31 0000009631 ifrs-full:RecurringFairValueMeasurementMember bns:CreditContractsMember ifrs-full:IFRS9Member 2024-10-31 0000009631 ifrs-full:RecurringFairValueMeasurementMember bns:CommodityContractsMember ifrs-full:IFRS9Member ifrs-full:Level3OfFairValueHierarchyMember 2024-10-31 0000009631 ifrs-full:RecurringFairValueMeasurementMember bns:CommodityContractsMember ifrs-full:IFRS9Member 2024-10-31 0000009631 ifrs-full:Level2OfFairValueHierarchyMember ifrs-full:RecurringFairValueMeasurementMember bns:InterestRateContractsMember ifrs-full:IFRS9Member 2024-10-31 0000009631 ifrs-full:RecurringFairValueMeasurementMember bns:EquityContractsMember ifrs-full:IFRS9Member ifrs-full:Level1OfFairValueHierarchyMember 2024-10-31 0000009631 ifrs-full:Level2OfFairValueHierarchyMember ifrs-full:RecurringFairValueMeasurementMember bns:EquityContractsMember ifrs-full:IFRS9Member 2024-10-31 0000009631 ifrs-full:Level3OfFairValueHierarchyMember ifrs-full:RecurringFairValueMeasurementMember bns:InterestRateContractsMember ifrs-full:IFRS9Member 2024-10-31 0000009631 ifrs-full:RecurringFairValueMeasurementMember bns:InterestRateContractsMember ifrs-full:IFRS9Member 2024-10-31 0000009631 ifrs-full:RecurringFairValueMeasurementMember bns:ForeignExchangeAndGoldContractsMember ifrs-full:IFRS9Member 2024-10-31 0000009631 ifrs-full:RecurringFairValueMeasurementMember bns:EquityContractsMember ifrs-full:IFRS9Member ifrs-full:Level3OfFairValueHierarchyMember 2024-10-31 0000009631 ifrs-full:RecurringFairValueMeasurementMember bns:EquityContractsMember ifrs-full:IFRS9Member 2024-10-31 0000009631 ifrs-full:LaterThanOneYearAndNotLaterThanTwoYearsMember 2024-10-31 0000009631 ifrs-full:LaterThanFourYearsAndNotLaterThanFiveYearsMember 2024-10-31 0000009631 ifrs-full:LaterThanTwoYearsAndNotLaterThanThreeYearsMember 2024-10-31 0000009631 ifrs-full:LaterThanThreeYearsAndNotLaterThanFourYearsMember 2024-10-31 0000009631 bns:AdditionalTier1CapitalInstrumentsOneMember 2024-10-31 0000009631 bns:LimitedRecourseCapitalNotesSeriesFiveMember 2024-10-31 0000009631 bns:LimitedRecourseCapitalNotesSeriesThreeMember 2024-10-31 0000009631 bns:LimitedRecourseCapitalNotesSeriesFourMember 2024-10-31 0000009631 bns:LimitedRecourseCapitalNotesSeriesTwoMember 2024-10-31 0000009631 bns:AdditionalTier1CapitalInstrumentsTwoMember 2024-10-31 0000009631 bns:LimitedRecourseCapitalNotesSeriesOneMember 2024-10-31 0000009631 bns:UsMultisellerConduitMember bns:BusinessAndGovernmentLoansMember 2024-10-31 0000009631 ifrs-full:TopOfRangeMember 2024-10-31 0000009631 ifrs-full:LiquidityRiskMember 2024-10-31 0000009631 bns:ValueatRiskMember ifrs-full:MarketRiskMember 2024-10-31 0000009631 ifrs-full:LaterThanOneYearAndNotLaterThanTwoYearsMember ifrs-full:LiquidityRiskMember 2024-10-31 0000009631 ifrs-full:LiquidityRiskMember ifrs-full:LaterThanTwoYearsAndNotLaterThanFiveYearsMember 2024-10-31 0000009631 ifrs-full:LiquidityRiskMember ifrs-full:LaterThanFiveYearsMember 2024-10-31 0000009631 ifrs-full:LiquidityRiskMember ifrs-full:NotLaterThanOneMonthMember 2024-10-31 0000009631 ifrs-full:LiquidityRiskMember ifrs-full:LaterThanOneMonthAndNotLaterThanThreeMonthsMember 2024-10-31 0000009631 ifrs-full:LaterThanThreeMonthsAndNotLaterThanSixMonthsMember ifrs-full:LiquidityRiskMember 2024-10-31 0000009631 bns:LaterThanSixMonthsAndNotLaterThanNineMonthsMember ifrs-full:LiquidityRiskMember 2024-10-31 0000009631 bns:LaterThanNineMonthsAndNotLaterThanOneYearMember ifrs-full:LiquidityRiskMember 2024-10-31 0000009631 ifrs-full:LiquidityRiskMember bns:NoSpecificMaturityMember 2024-10-31 0000009631 bns:ScotiabankCoveredBondGuarantorLimitedPartnershipMember bns:GuaranteedLinkedNotesMember 2024-10-31 0000009631 ifrs-full:SecuritiesLendingMember 2024-10-31 0000009631 ifrs-full:DebtSecuritiesMember 2024-10-31 0000009631 ifrs-full:OrdinarySharesMember 2024-10-31 0000009631 bns:GuaranteedLinkedNotesMember 2024-10-31 0000009631 bns:SettledThroughCentralCounterpartiesMember bns:OtherDerivativesMember 2025-10-31 0000009631 bns:TradingDerivativesMember bns:SettledThroughCentralCounterpartiesMember bns:OtherDerivativesMember 2025-10-31 0000009631 bns:TradingDerivativesMember bns:CreditDerivativeMember bns:OverTheCounter1Member bns:OtherDerivativesMember 2025-10-31 0000009631 bns:TradingDerivativesMember 2025-10-31 0000009631 bns:TradingDerivativesMember bns:OtherDerivativesMember 2025-10-31 0000009631 bns:TradingDerivativesMember bns:CommodityAndOtherContractsMember bns:SettledThroughCentralCounterpartiesMember bns:OtherDerivativesMember 2025-10-31 0000009631 bns:TradingDerivativesMember bns:CreditDerivativeMember bns:SettledThroughCentralCounterpartiesMember bns:OtherDerivativesMember 2025-10-31 0000009631 bns:TradingDerivativesMember bns:OverTheCounter1Member bns:OtherDerivativesMember 2025-10-31 0000009631 bns:TradingDerivativesMember bns:CommodityAndOtherContractsMember bns:OverTheCounter1Member bns:OtherDerivativesMember 2025-10-31 0000009631 bns:TradingDerivativesMember bns:OptionsPurchasedMember bns:OverTheCounter1Member bns:InterestRateContractsMember 2025-10-31 0000009631 bns:TradingDerivativesMember ifrs-full:SwapContractMember bns:OverTheCounter1Member bns:InterestRateContractsMember 2025-10-31 0000009631 bns:TradingDerivativesMember ifrs-full:SwapContractMember bns:OverTheCounter1Member bns:ForeignExchangeAndGoldContractsMember 2025-10-31 0000009631 bns:TradingDerivativesMember bns:SpotAndForwardsMember bns:OverTheCounter1Member bns:ForeignExchangeAndGoldContractsMember 2025-10-31 0000009631 bns:TradingDerivativesMember bns:SettledThroughCentralCounterpartiesMember bns:InterestRateContractsMember 2025-10-31 0000009631 bns:TradingDerivativesMember ifrs-full:SwapContractMember bns:SettledThroughCentralCounterpartiesMember bns:InterestRateContractsMember 2025-10-31 0000009631 bns:TradingDerivativesMember ifrs-full:ForwardContractMember bns:SettledThroughCentralCounterpartiesMember bns:InterestRateContractsMember 2025-10-31 0000009631 bns:TradingDerivativesMember bns:OverTheCounter1Member bns:InterestRateContractsMember 2025-10-31 0000009631 bns:TradingDerivativesMember bns:OptionsWrittenMember bns:OverTheCounter1Member bns:InterestRateContractsMember 2025-10-31 0000009631 bns:OverTheCounter1Member bns:ForeignExchangeAndGoldContractsMember 2025-10-31 0000009631 bns:OptionsWrittenMember bns:OverTheCounter1Member bns:ForeignExchangeAndGoldContractsMember 2025-10-31 0000009631 bns:OptionsPurchasedMember bns:OverTheCounter1Member bns:ForeignExchangeAndGoldContractsMember 2025-10-31 0000009631 ifrs-full:SwapContractMember bns:OverTheCounter1Member bns:ForeignExchangeAndGoldContractsMember 2025-10-31 0000009631 bns:SpotAndForwardsMember bns:SettledThroughCentralCounterpartiesMember bns:ForeignExchangeAndGoldContractsMember 2025-10-31 0000009631 bns:TradingDerivativesMember bns:ExchangeTraded1Member bns:InterestRateContractsMember 2025-10-31 0000009631 bns:ExchangeTraded1Member bns:InterestRateContractsMember 2025-10-31 0000009631 bns:HedgingDerivativeMember bns:ForeignExchangeAndGoldContractsMember 2025-10-31 0000009631 bns:TradingDerivativesMember ifrs-full:FuturesContractMember bns:ExchangeTraded1Member bns:InterestRateContractsMember 2025-10-31 0000009631 bns:TradingDerivativesMember bns:SpotAndForwardsMember bns:SettledThroughCentralCounterpartiesMember bns:ForeignExchangeAndGoldContractsMember 2025-10-31 0000009631 bns:TradingDerivativesMember bns:OverTheCounter1Member bns:ForeignExchangeAndGoldContractsMember 2025-10-31 0000009631 bns:TradingDerivativesMember bns:OptionsWrittenMember bns:OverTheCounter1Member bns:ForeignExchangeAndGoldContractsMember 2025-10-31 0000009631 bns:TradingDerivativesMember bns:OptionsPurchasedMember bns:OverTheCounter1Member bns:ForeignExchangeAndGoldContractsMember 2025-10-31 0000009631 bns:HedgingDerivativeMember bns:OverTheCounter1Member bns:InterestRateContractsMember 2025-10-31 0000009631 bns:HedgingDerivativeMember ifrs-full:SwapContractMember bns:OverTheCounter1Member bns:InterestRateContractsMember 2025-10-31 0000009631 bns:HedgingDerivativeMember 2025-10-31 0000009631 bns:HedgingDerivativeMember bns:OtherDerivativesMember 2025-10-31 0000009631 bns:HedgingDerivativeMember bns:OverTheCounter1Member bns:OtherDerivativesMember 2025-10-31 0000009631 bns:HedgingDerivativeMember bns:EquityDerivativesMember bns:OverTheCounter1Member bns:OtherDerivativesMember 2025-10-31 0000009631 ifrs-full:FuturesContractMember bns:ExchangeTraded1Member bns:InterestRateContractsMember 2025-10-31 0000009631 bns:HedgingDerivativeMember bns:OverTheCounter1Member bns:ForeignExchangeAndGoldContractsMember 2025-10-31 0000009631 bns:HedgingDerivativeMember ifrs-full:SwapContractMember bns:OverTheCounter1Member bns:ForeignExchangeAndGoldContractsMember 2025-10-31 0000009631 bns:HedgingDerivativeMember bns:SpotAndForwardsMember bns:OverTheCounter1Member bns:ForeignExchangeAndGoldContractsMember 2025-10-31 0000009631 bns:HedgingDerivativeMember bns:InterestRateContractsMember 2025-10-31 0000009631 bns:HedgingDerivativeMember bns:SettledThroughCentralCounterpartiesMember bns:InterestRateContractsMember 2025-10-31 0000009631 ifrs-full:SwapContractMember bns:OverTheCounter1Member bns:InterestRateContractsMember 2025-10-31 0000009631 bns:OptionsWrittenMember bns:ExchangeTraded1Member bns:InterestRateContractsMember 2025-10-31 0000009631 bns:OptionsPurchasedMember bns:ExchangeTraded1Member bns:InterestRateContractsMember 2025-10-31 0000009631 bns:CommodityAndOtherContractsMember bns:SettledThroughCentralCounterpartiesMember bns:OtherDerivativesMember 2025-10-31 0000009631 bns:OtherDerivativesMember 2025-10-31 0000009631 bns:CommodityAndOtherContractsMember bns:ExchangeTraded1Member bns:OtherDerivativesMember 2025-10-31 0000009631 bns:EquityDerivativesMember bns:OverTheCounter1Member bns:OtherDerivativesMember 2025-10-31 0000009631 bns:CreditDerivativeMember bns:OverTheCounter1Member bns:OtherDerivativesMember 2025-10-31 0000009631 bns:CommodityAndOtherContractsMember bns:OverTheCounter1Member bns:OtherDerivativesMember 2025-10-31 0000009631 bns:OverTheCounter1Member bns:OtherDerivativesMember 2025-10-31 0000009631 bns:CreditDerivativeMember bns:SettledThroughCentralCounterpartiesMember bns:OtherDerivativesMember 2025-10-31 0000009631 bns:SettledThroughCentralCounterpartiesMember bns:ForeignExchangeAndGoldContractsMember 2025-10-31 0000009631 bns:ForeignExchangeAndGoldContractsMember 2025-10-31 0000009631 bns:EquityDerivativesMember bns:ExchangeTraded1Member bns:OtherDerivativesMember 2025-10-31 0000009631 bns:ExchangeTraded1Member bns:ForeignExchangeAndGoldContractsMember 2025-10-31 0000009631 bns:TradingDerivativesMember bns:ExchangeTraded1Member bns:ForeignExchangeAndGoldContractsMember 2025-10-31 0000009631 ifrs-full:ForwardContractMember bns:OverTheCounter1Member bns:InterestRateContractsMember 2025-10-31 0000009631 bns:TradingDerivativesMember ifrs-full:ForwardContractMember bns:OverTheCounter1Member bns:InterestRateContractsMember 2025-10-31 0000009631 bns:ExchangeTraded1Member bns:OtherDerivativesMember 2025-10-31 0000009631 bns:TradingDerivativesMember bns:ExchangeTraded1Member bns:OtherDerivativesMember 2025-10-31 0000009631 bns:TradingDerivativesMember bns:OptionsWrittenMember bns:ExchangeTraded1Member bns:InterestRateContractsMember 2025-10-31 0000009631 bns:TradingDerivativesMember bns:OptionsPurchasedMember bns:ExchangeTraded1Member bns:InterestRateContractsMember 2025-10-31 0000009631 bns:HedgingDerivativeMember ifrs-full:SwapContractMember bns:SettledThroughCentralCounterpartiesMember bns:InterestRateContractsMember 2025-10-31 0000009631 bns:TradingDerivativesMember ifrs-full:FuturesContractMember bns:ExchangeTraded1Member bns:ForeignExchangeAndGoldContractsMember 2025-10-31 0000009631 bns:TradingDerivativesMember bns:InterestRateContractsMember 2025-10-31 0000009631 bns:OptionsPurchasedMember bns:OverTheCounter1Member bns:InterestRateContractsMember 2025-10-31 0000009631 bns:TradingDerivativesMember bns:CommodityAndOtherContractsMember bns:ExchangeTraded1Member bns:OtherDerivativesMember 2025-10-31 0000009631 bns:TradingDerivativesMember bns:EquityDerivativesMember bns:ExchangeTraded1Member bns:OtherDerivativesMember 2025-10-31 0000009631 bns:TradingDerivativesMember bns:ForeignExchangeAndGoldContractsMember 2025-10-31 0000009631 bns:TradingDerivativesMember bns:SettledThroughCentralCounterpartiesMember bns:ForeignExchangeAndGoldContractsMember 2025-10-31 0000009631 bns:OptionsWrittenMember bns:OverTheCounter1Member bns:InterestRateContractsMember 2025-10-31 0000009631 ifrs-full:FuturesContractMember bns:ExchangeTraded1Member bns:ForeignExchangeAndGoldContractsMember 2025-10-31 0000009631 bns:InterestRateContractsMember 2025-10-31 0000009631 bns:SettledThroughCentralCounterpartiesMember bns:InterestRateContractsMember 2025-10-31 0000009631 ifrs-full:SwapContractMember bns:SettledThroughCentralCounterpartiesMember bns:InterestRateContractsMember 2025-10-31 0000009631 ifrs-full:ForwardContractMember bns:SettledThroughCentralCounterpartiesMember bns:InterestRateContractsMember 2025-10-31 0000009631 bns:OverTheCounter1Member bns:InterestRateContractsMember 2025-10-31 0000009631 bns:SpotAndForwardsMember bns:OverTheCounter1Member bns:ForeignExchangeAndGoldContractsMember 2025-10-31 0000009631 bns:TradingDerivativesMember bns:EquityDerivativesMember bns:OverTheCounter1Member bns:OtherDerivativesMember 2025-10-31 0000009631 bns:OptionsWrittenMember ifrs-full:LaterThanFiveYearsMember bns:ForeignExchangeAndGoldContractsMember 2025-10-31 0000009631 bns:OptionsWrittenMember ifrs-full:LaterThanOneYearAndNotLaterThanFiveYearsMember bns:ForeignExchangeAndGoldContractsMember 2025-10-31 0000009631 bns:OptionsWrittenMember ifrs-full:NotLaterThanOneYearMember bns:ForeignExchangeAndGoldContractsMember 2025-10-31 0000009631 bns:CommodityAndOtherContractsMember ifrs-full:NotLaterThanOneYearMember bns:OtherDerivativesMember 2025-10-31 0000009631 bns:CreditDerivativeMember ifrs-full:LaterThanFiveYearsMember bns:OtherDerivativesMember 2025-10-31 0000009631 bns:CreditDerivativeMember ifrs-full:LaterThanOneYearAndNotLaterThanFiveYearsMember bns:OtherDerivativesMember 2025-10-31 0000009631 bns:CreditDerivativeMember ifrs-full:NotLaterThanOneYearMember bns:OtherDerivativesMember 2025-10-31 0000009631 ifrs-full:LaterThanOneYearAndNotLaterThanFiveYearsMember 2025-10-31 0000009631 ifrs-full:NotLaterThanOneYearMember 2025-10-31 0000009631 bns:OptionsPurchasedMember ifrs-full:NotLaterThanOneYearMember bns:ForeignExchangeAndGoldContractsMember 2025-10-31 0000009631 ifrs-full:SwapContractMember ifrs-full:LaterThanFiveYearsMember bns:ForeignExchangeAndGoldContractsMember 2025-10-31 0000009631 bns:CommodityAndOtherContractsMember ifrs-full:LaterThanFiveYearsMember bns:OtherDerivativesMember 2025-10-31 0000009631 bns:CommodityAndOtherContractsMember ifrs-full:LaterThanOneYearAndNotLaterThanFiveYearsMember bns:OtherDerivativesMember 2025-10-31 0000009631 bns:SpotAndForwardsMember ifrs-full:LaterThanFiveYearsMember bns:ForeignExchangeAndGoldContractsMember 2025-10-31 0000009631 bns:SpotAndForwardsMember ifrs-full:LaterThanOneYearAndNotLaterThanFiveYearsMember bns:ForeignExchangeAndGoldContractsMember 2025-10-31 0000009631 bns:SpotAndForwardsMember ifrs-full:NotLaterThanOneYearMember bns:ForeignExchangeAndGoldContractsMember 2025-10-31 0000009631 ifrs-full:FuturesContractMember ifrs-full:LaterThanOneYearAndNotLaterThanFiveYearsMember bns:ForeignExchangeAndGoldContractsMember 2025-10-31 0000009631 ifrs-full:FuturesContractMember ifrs-full:NotLaterThanOneYearMember bns:ForeignExchangeAndGoldContractsMember 2025-10-31 0000009631 ifrs-full:LaterThanFiveYearsMember 2025-10-31 0000009631 ifrs-full:SwapContractMember bns:InterestRateContractsMember 2025-10-31 0000009631 bns:OptionsWrittenMember ifrs-full:LaterThanFiveYearsMember bns:InterestRateContractsMember 2025-10-31 0000009631 ifrs-full:SwapContractMember ifrs-full:LaterThanOneYearAndNotLaterThanFiveYearsMember bns:ForeignExchangeAndGoldContractsMember 2025-10-31 0000009631 ifrs-full:SwapContractMember ifrs-full:NotLaterThanOneYearMember bns:ForeignExchangeAndGoldContractsMember 2025-10-31 0000009631 ifrs-full:FuturesContractMember bns:InterestRateContractsMember 2025-10-31 0000009631 ifrs-full:ForwardContractMember ifrs-full:LaterThanFiveYearsMember bns:InterestRateContractsMember 2025-10-31 0000009631 ifrs-full:ForwardContractMember bns:InterestRateContractsMember 2025-10-31 0000009631 ifrs-full:SwapContractMember bns:ForeignExchangeAndGoldContractsMember 2025-10-31 0000009631 bns:OptionsPurchasedMember bns:ForeignExchangeAndGoldContractsMember 2025-10-31 0000009631 bns:OptionsWrittenMember bns:ForeignExchangeAndGoldContractsMember 2025-10-31 0000009631 bns:EquityDerivativesMember bns:OtherDerivativesMember 2025-10-31 0000009631 bns:CreditDerivativeMember bns:OtherDerivativesMember 2025-10-31 0000009631 bns:CommodityAndOtherContractsMember bns:OtherDerivativesMember 2025-10-31 0000009631 ifrs-full:FuturesContractMember ifrs-full:NotLaterThanOneYearMember bns:InterestRateContractsMember 2025-10-31 0000009631 bns:OptionsPurchasedMember bns:InterestRateContractsMember 2025-10-31 0000009631 bns:OptionsWrittenMember bns:InterestRateContractsMember 2025-10-31 0000009631 ifrs-full:FuturesContractMember bns:ForeignExchangeAndGoldContractsMember 2025-10-31 0000009631 bns:SpotAndForwardsMember bns:ForeignExchangeAndGoldContractsMember 2025-10-31 0000009631 ifrs-full:LaterThanFiveYearsMember bns:ForeignExchangeAndGoldContractsMember 2025-10-31 0000009631 ifrs-full:NotLaterThanOneYearMember bns:OtherDerivativesMember 2025-10-31 0000009631 ifrs-full:LaterThanOneYearAndNotLaterThanFiveYearsMember bns:OtherDerivativesMember 2025-10-31 0000009631 ifrs-full:LaterThanFiveYearsMember bns:OtherDerivativesMember 2025-10-31 0000009631 ifrs-full:LaterThanOneYearAndNotLaterThanFiveYearsMember bns:InterestRateContractsMember 2025-10-31 0000009631 ifrs-full:LaterThanFiveYearsMember bns:InterestRateContractsMember 2025-10-31 0000009631 ifrs-full:FuturesContractMember ifrs-full:LaterThanFiveYearsMember bns:ForeignExchangeAndGoldContractsMember 2025-10-31 0000009631 ifrs-full:NotLaterThanOneYearMember bns:ForeignExchangeAndGoldContractsMember 2025-10-31 0000009631 ifrs-full:LaterThanOneYearAndNotLaterThanFiveYearsMember bns:ForeignExchangeAndGoldContractsMember 2025-10-31 0000009631 ifrs-full:FuturesContractMember ifrs-full:LaterThanOneYearAndNotLaterThanFiveYearsMember bns:InterestRateContractsMember 2025-10-31 0000009631 ifrs-full:NotLaterThanOneYearMember bns:InterestRateContractsMember 2025-10-31 0000009631 ifrs-full:SwapContractMember ifrs-full:LaterThanFiveYearsMember bns:InterestRateContractsMember 2025-10-31 0000009631 ifrs-full:SwapContractMember ifrs-full:LaterThanOneYearAndNotLaterThanFiveYearsMember bns:InterestRateContractsMember 2025-10-31 0000009631 ifrs-full:SwapContractMember ifrs-full:NotLaterThanOneYearMember bns:InterestRateContractsMember 2025-10-31 0000009631 ifrs-full:ForwardContractMember ifrs-full:LaterThanOneYearAndNotLaterThanFiveYearsMember bns:InterestRateContractsMember 2025-10-31 0000009631 ifrs-full:ForwardContractMember ifrs-full:NotLaterThanOneYearMember bns:InterestRateContractsMember 2025-10-31 0000009631 bns:OptionsWrittenMember ifrs-full:LaterThanOneYearAndNotLaterThanFiveYearsMember bns:InterestRateContractsMember 2025-10-31 0000009631 bns:OptionsWrittenMember ifrs-full:NotLaterThanOneYearMember bns:InterestRateContractsMember 2025-10-31 0000009631 bns:OptionsPurchasedMember ifrs-full:LaterThanFiveYearsMember bns:InterestRateContractsMember 2025-10-31 0000009631 bns:OptionsPurchasedMember ifrs-full:LaterThanOneYearAndNotLaterThanFiveYearsMember bns:InterestRateContractsMember 2025-10-31 0000009631 bns:OptionsPurchasedMember ifrs-full:NotLaterThanOneYearMember bns:InterestRateContractsMember 2025-10-31 0000009631 bns:EquityDerivativesMember ifrs-full:NotLaterThanOneYearMember bns:OtherDerivativesMember 2025-10-31 0000009631 bns:EquityDerivativesMember ifrs-full:LaterThanOneYearAndNotLaterThanFiveYearsMember bns:OtherDerivativesMember 2025-10-31 0000009631 bns:EquityDerivativesMember ifrs-full:LaterThanFiveYearsMember bns:OtherDerivativesMember 2025-10-31 0000009631 bns:OptionsPurchasedMember ifrs-full:LaterThanFiveYearsMember bns:ForeignExchangeAndGoldContractsMember 2025-10-31 0000009631 bns:OptionsPurchasedMember ifrs-full:LaterThanOneYearAndNotLaterThanFiveYearsMember bns:ForeignExchangeAndGoldContractsMember 2025-10-31 0000009631 bns:SettledThroughCentralCounterpartiesMember 2025-10-31 0000009631 bns:OverTheCounter1Member bns:SettledThroughCentralCounterpartiesMember 2025-10-31 0000009631 bns:ExchangeTraded1Member bns:SettledThroughCentralCounterpartiesMember 2025-10-31 0000009631 bns:WithNoSpecificMaturityMember 2025-10-31 0000009631 ifrs-full:LaterThanTenYearsMember 2025-10-31 0000009631 ifrs-full:LaterThanFiveYearsAndNotLaterThanTenYearsMember 2025-10-31 0000009631 currency:CAD ifrs-full:LaterThanThreeMonthsAndNotLaterThanOneYearMember 2025-10-31 0000009631 bns:CanadianProvincialAndMunicipalDebtMember ifrs-full:LaterThanThreeMonthsAndNotLaterThanOneYearMember 2025-10-31 0000009631 bns:CanadianProvincialAndMunicipalDebtMember ifrs-full:LaterThanOneYearAndNotLaterThanFiveYearsMember 2025-10-31 0000009631 bns:CanadianProvincialAndMunicipalDebtMember ifrs-full:LaterThanFiveYearsAndNotLaterThanTenYearsMember 2025-10-31 0000009631 currency:USD ifrs-full:NotLaterThanThreeMonthsMember 2025-10-31 0000009631 currency:CAD ifrs-full:NotLaterThanThreeMonthsMember 2025-10-31 0000009631 ifrs-full:NotLaterThanThreeMonthsMember 2025-10-31 0000009631 bns:OtherTradingSecuritiesMember ifrs-full:NotLaterThanThreeMonthsMember 2025-10-31 0000009631 bns:CanadianFederalGovernmentIssuedOrGuaranteedDebtMember ifrs-full:NotLaterThanThreeMonthsMember 2025-10-31 0000009631 bns:OtherCurrenciesMember ifrs-full:NotLaterThanThreeMonthsMember 2025-10-31 0000009631 currency:MXN ifrs-full:NotLaterThanThreeMonthsMember 2025-10-31 0000009631 bns:OtherForeignGovernmentDebtMember ifrs-full:NotLaterThanThreeMonthsMember 2025-10-31 0000009631 bns:UnitedStatesTreasuryAndOtherUnitedStatesAgencyDebtMember ifrs-full:NotLaterThanThreeMonthsMember 2025-10-31 0000009631 bns:CanadianProvincialAndMunicipalDebtMember ifrs-full:NotLaterThanThreeMonthsMember 2025-10-31 0000009631 bns:CanadianFederalGovernmentIssuedOrGuaranteedDebtMember ifrs-full:LaterThanOneYearAndNotLaterThanFiveYearsMember 2025-10-31 0000009631 bns:CanadianFederalGovernmentIssuedOrGuaranteedDebtMember ifrs-full:LaterThanFiveYearsAndNotLaterThanTenYearsMember 2025-10-31 0000009631 bns:CanadianFederalGovernmentIssuedOrGuaranteedDebtMember ifrs-full:LaterThanTenYearsMember 2025-10-31 0000009631 bns:CanadianFederalGovernmentIssuedOrGuaranteedDebtMember 2025-10-31 0000009631 bns:CanadianFederalGovernmentIssuedOrGuaranteedDebtMember ifrs-full:LaterThanThreeMonthsAndNotLaterThanOneYearMember 2025-10-31 0000009631 bns:OtherCurrenciesMember ifrs-full:LaterThanOneYearAndNotLaterThanFiveYearsMember 2025-10-31 0000009631 bns:OtherCurrenciesMember ifrs-full:LaterThanFiveYearsAndNotLaterThanTenYearsMember 2025-10-31 0000009631 bns:OtherCurrenciesMember ifrs-full:LaterThanTenYearsMember 2025-10-31 0000009631 bns:OtherCurrenciesMember bns:WithNoSpecificMaturityMember 2025-10-31 0000009631 bns:OtherCurrenciesMember 2025-10-31 0000009631 ifrs-full:LaterThanThreeMonthsAndNotLaterThanOneYearMember 2025-10-31 0000009631 currency:MXN ifrs-full:LaterThanOneYearAndNotLaterThanFiveYearsMember 2025-10-31 0000009631 currency:MXN ifrs-full:LaterThanFiveYearsAndNotLaterThanTenYearsMember 2025-10-31 0000009631 currency:MXN ifrs-full:LaterThanTenYearsMember 2025-10-31 0000009631 currency:MXN bns:WithNoSpecificMaturityMember 2025-10-31 0000009631 currency:MXN 2025-10-31 0000009631 bns:OtherCurrenciesMember ifrs-full:LaterThanThreeMonthsAndNotLaterThanOneYearMember 2025-10-31 0000009631 currency:USD ifrs-full:LaterThanOneYearAndNotLaterThanFiveYearsMember 2025-10-31 0000009631 currency:USD ifrs-full:LaterThanFiveYearsAndNotLaterThanTenYearsMember 2025-10-31 0000009631 currency:USD ifrs-full:LaterThanTenYearsMember 2025-10-31 0000009631 currency:USD bns:WithNoSpecificMaturityMember 2025-10-31 0000009631 currency:USD 2025-10-31 0000009631 currency:MXN ifrs-full:LaterThanThreeMonthsAndNotLaterThanOneYearMember 2025-10-31 0000009631 currency:CAD ifrs-full:LaterThanOneYearAndNotLaterThanFiveYearsMember 2025-10-31 0000009631 currency:CAD ifrs-full:LaterThanFiveYearsAndNotLaterThanTenYearsMember 2025-10-31 0000009631 currency:CAD ifrs-full:LaterThanTenYearsMember 2025-10-31 0000009631 currency:CAD bns:WithNoSpecificMaturityMember 2025-10-31 0000009631 currency:CAD 2025-10-31 0000009631 currency:USD ifrs-full:LaterThanThreeMonthsAndNotLaterThanOneYearMember 2025-10-31 0000009631 bns:UnitedStatesTreasuryAndOtherUnitedStatesAgencyDebtMember ifrs-full:LaterThanThreeMonthsAndNotLaterThanOneYearMember 2025-10-31 0000009631 bns:CanadianProvincialAndMunicipalDebtMember 2025-10-31 0000009631 bns:CanadianProvincialAndMunicipalDebtMember ifrs-full:LaterThanTenYearsMember 2025-10-31 0000009631 bns:OtherForeignGovernmentDebtMember ifrs-full:LaterThanOneYearAndNotLaterThanFiveYearsMember 2025-10-31 0000009631 bns:OtherForeignGovernmentDebtMember ifrs-full:LaterThanThreeMonthsAndNotLaterThanOneYearMember 2025-10-31 0000009631 bns:UnitedStatesTreasuryAndOtherUnitedStatesAgencyDebtMember 2025-10-31 0000009631 bns:UnitedStatesTreasuryAndOtherUnitedStatesAgencyDebtMember ifrs-full:LaterThanTenYearsMember 2025-10-31 0000009631 bns:UnitedStatesTreasuryAndOtherUnitedStatesAgencyDebtMember ifrs-full:LaterThanFiveYearsAndNotLaterThanTenYearsMember 2025-10-31 0000009631 bns:UnitedStatesTreasuryAndOtherUnitedStatesAgencyDebtMember ifrs-full:LaterThanOneYearAndNotLaterThanFiveYearsMember 2025-10-31 0000009631 bns:OtherTradingSecuritiesMember ifrs-full:LaterThanThreeMonthsAndNotLaterThanOneYearMember 2025-10-31 0000009631 bns:EquitySecuritiesMember 2025-10-31 0000009631 bns:EquitySecuritiesMember bns:WithNoSpecificMaturityMember 2025-10-31 0000009631 bns:OtherForeignGovernmentDebtMember 2025-10-31 0000009631 bns:OtherForeignGovernmentDebtMember ifrs-full:LaterThanTenYearsMember 2025-10-31 0000009631 bns:OtherForeignGovernmentDebtMember ifrs-full:LaterThanFiveYearsAndNotLaterThanTenYearsMember 2025-10-31 0000009631 bns:OtherTradingSecuritiesMember 2025-10-31 0000009631 bns:OtherTradingSecuritiesMember ifrs-full:LaterThanTenYearsMember 2025-10-31 0000009631 bns:OtherTradingSecuritiesMember ifrs-full:LaterThanFiveYearsAndNotLaterThanTenYearsMember 2025-10-31 0000009631 bns:OtherTradingSecuritiesMember ifrs-full:LaterThanOneYearAndNotLaterThanFiveYearsMember 2025-10-31 0000009631 country:US 2025-10-31 0000009631 country:CA 2025-10-31 0000009631 bns:OtherCountriesMember 2025-10-31 0000009631 srt:EuropeMember 2025-10-31 0000009631 bns:CreditRiskAmountMember 2025-10-31 0000009631 bns:CreditRiskEquivalentMember 2025-10-31 0000009631 ifrs-full:ForwardContractMember ifrs-full:DerivativesMember bns:ForeignExchangeAndGoldContractsMember bns:DerivativesHeldForTradingMember 2025-10-31 0000009631 ifrs-full:DerivativesMember bns:InterestRateContractsMember bns:DerivativesHeldForTradingMember 2025-10-31 0000009631 ifrs-full:OptionContractMember ifrs-full:DerivativesMember bns:InterestRateContractsMember bns:DerivativesHeldForTradingMember 2025-10-31 0000009631 ifrs-full:SwapContractMember ifrs-full:DerivativesMember bns:InterestRateContractsMember bns:DerivativesHeldForTradingMember 2025-10-31 0000009631 ifrs-full:ForwardContractMember ifrs-full:DerivativesMember bns:InterestRateContractsMember bns:DerivativesHeldForTradingMember 2025-10-31 0000009631 ifrs-full:OptionContractMember ifrs-full:DerivativesMember bns:ForeignExchangeAndGoldContractsMember bns:DerivativesHeldForTradingMember 2025-10-31 0000009631 ifrs-full:SwapContractMember ifrs-full:DerivativesMember bns:ForeignExchangeAndGoldContractsMember bns:DerivativesHeldForTradingMember 2025-10-31 0000009631 bns:CommodityAndOtherContractsMember ifrs-full:DerivativesMember bns:OtherDerivativesMember bns:DerivativesHeldForTradingMember 2025-10-31 0000009631 bns:CreditDerivativeMember ifrs-full:DerivativesMember bns:OtherDerivativesMember bns:DerivativesHeldForTradingMember 2025-10-31 0000009631 bns:EquityDerivativesMember ifrs-full:DerivativesMember bns:OtherDerivativesMember bns:DerivativesHeldForTradingMember 2025-10-31 0000009631 ifrs-full:DerivativesMember bns:DerivativesHeldForTradingMember 2025-10-31 0000009631 ifrs-full:DerivativesMember bns:OtherDerivativesMember bns:DerivativesHeldForTradingMember 2025-10-31 0000009631 ifrs-full:DerivativesMember bns:ForeignExchangeAndGoldContractsMember bns:DerivativesHeldForTradingMember 2025-10-31 0000009631 bns:DepositLiabilitiesMember ifrs-full:LaterThanOneYearAndNotLaterThanFiveYearsMember ifrs-full:FairValueHedgesMember bns:CurrencyOrInterestRateRiskMember 2025-10-31 0000009631 bns:DepositLiabilitiesMember ifrs-full:FairValueHedgesMember bns:CurrencyOrInterestRateRiskMember 2025-10-31 0000009631 bns:DepositLiabilitiesMember ifrs-full:NotLaterThanOneYearMember ifrs-full:CashFlowHedgesMember bns:CurrencyOrInterestRateRiskMember 2025-10-31 0000009631 ifrs-full:SwapContractMember bns:DepositLiabilitiesMember ifrs-full:LaterThanFiveYearsMember ifrs-full:CashFlowHedgesMember ifrs-full:InterestRateRiskMember 2025-10-31 0000009631 bns:ForeignCurrencyDepositLiabilitiesMember bns:DepositLiabilitiesMember ifrs-full:NotLaterThanOneYearMember ifrs-full:HedgesOfNetInvestmentInForeignOperationsMember ifrs-full:CurrencyRiskMember 2025-10-31 0000009631 bns:ForeignCurrencyForwardContractsMember bns:DepositLiabilitiesMember ifrs-full:HedgesOfNetInvestmentInForeignOperationsMember ifrs-full:CurrencyRiskMember 2025-10-31 0000009631 bns:ForeignCurrencyForwardContractsMember bns:DepositLiabilitiesMember ifrs-full:NotLaterThanOneYearMember ifrs-full:HedgesOfNetInvestmentInForeignOperationsMember ifrs-full:CurrencyRiskMember 2025-10-31 0000009631 bns:TotalReturnSwapsMember bns:DepositLiabilitiesMember ifrs-full:CashFlowHedgesMember ifrs-full:EquityPriceRiskMember 2025-10-31 0000009631 ifrs-full:SwapContractMember bns:DepositLiabilitiesMember ifrs-full:LaterThanFiveYearsMember ifrs-full:FairValueHedgesMember ifrs-full:InterestRateRiskMember 2025-10-31 0000009631 ifrs-full:SwapContractMember bns:DepositLiabilitiesMember ifrs-full:FairValueHedgesMember ifrs-full:InterestRateRiskMember 2025-10-31 0000009631 bns:ForeignCurrencyDepositLiabilitiesMember bns:DepositLiabilitiesMember ifrs-full:HedgesOfNetInvestmentInForeignOperationsMember ifrs-full:CurrencyRiskMember 2025-10-31 0000009631 ifrs-full:SwapContractMember bns:DepositLiabilitiesMember ifrs-full:LaterThanFiveYearsMember ifrs-full:CashFlowHedgesMember ifrs-full:CurrencyRiskMember 2025-10-31 0000009631 ifrs-full:SwapContractMember bns:DepositLiabilitiesMember ifrs-full:NotLaterThanOneYearMember ifrs-full:FairValueHedgesMember ifrs-full:InterestRateRiskMember 2025-10-31 0000009631 ifrs-full:SwapContractMember bns:DepositLiabilitiesMember ifrs-full:LaterThanOneYearAndNotLaterThanFiveYearsMember ifrs-full:FairValueHedgesMember ifrs-full:InterestRateRiskMember 2025-10-31 0000009631 bns:ForeignCurrencyForwardContractsMember bns:DepositLiabilitiesMember ifrs-full:CashFlowHedgesMember ifrs-full:CurrencyRiskMember 2025-10-31 0000009631 bns:DepositLiabilitiesMember ifrs-full:CashFlowHedgesMember bns:CurrencyOrInterestRateRiskMember 2025-10-31 0000009631 bns:DepositLiabilitiesMember ifrs-full:LaterThanOneYearAndNotLaterThanFiveYearsMember ifrs-full:CashFlowHedgesMember bns:CurrencyOrInterestRateRiskMember 2025-10-31 0000009631 bns:DepositLiabilitiesMember ifrs-full:LaterThanFiveYearsMember ifrs-full:CashFlowHedgesMember bns:CurrencyOrInterestRateRiskMember 2025-10-31 0000009631 ifrs-full:SwapContractMember bns:DepositLiabilitiesMember ifrs-full:LaterThanOneYearAndNotLaterThanFiveYearsMember ifrs-full:CashFlowHedgesMember ifrs-full:InterestRateRiskMember 2025-10-31 0000009631 bns:Cash1Member bns:DepositLiabilitiesMember ifrs-full:NotLaterThanOneYearMember ifrs-full:CashFlowHedgesMember ifrs-full:CurrencyRiskMember 2025-10-31 0000009631 bns:Cash1Member bns:DepositLiabilitiesMember ifrs-full:CashFlowHedgesMember ifrs-full:CurrencyRiskMember 2025-10-31 0000009631 bns:TotalReturnSwapsMember bns:DepositLiabilitiesMember ifrs-full:NotLaterThanOneYearMember ifrs-full:CashFlowHedgesMember ifrs-full:EquityPriceRiskMember 2025-10-31 0000009631 bns:TotalReturnSwapsMember bns:DepositLiabilitiesMember ifrs-full:LaterThanOneYearAndNotLaterThanFiveYearsMember ifrs-full:CashFlowHedgesMember ifrs-full:EquityPriceRiskMember 2025-10-31 0000009631 ifrs-full:SwapContractMember bns:DepositLiabilitiesMember ifrs-full:CashFlowHedgesMember ifrs-full:CurrencyRiskMember 2025-10-31 0000009631 ifrs-full:SwapContractMember bns:DepositLiabilitiesMember ifrs-full:NotLaterThanOneYearMember ifrs-full:CashFlowHedgesMember ifrs-full:CurrencyRiskMember 2025-10-31 0000009631 bns:DepositLiabilitiesMember 2025-10-31 0000009631 bns:DepositLiabilitiesMember ifrs-full:LaterThanFiveYearsMember 2025-10-31 0000009631 bns:DepositLiabilitiesMember ifrs-full:LaterThanOneYearAndNotLaterThanFiveYearsMember 2025-10-31 0000009631 ifrs-full:SwapContractMember bns:DepositLiabilitiesMember ifrs-full:CashFlowHedgesMember ifrs-full:InterestRateRiskMember 2025-10-31 0000009631 bns:DepositLiabilitiesMember ifrs-full:NotLaterThanOneYearMember 2025-10-31 0000009631 ifrs-full:SwapContractMember bns:DepositLiabilitiesMember ifrs-full:LaterThanOneYearAndNotLaterThanFiveYearsMember ifrs-full:CashFlowHedgesMember ifrs-full:CurrencyRiskMember 2025-10-31 0000009631 ifrs-full:SwapContractMember bns:DepositLiabilitiesMember ifrs-full:NotLaterThanOneYearMember ifrs-full:CashFlowHedgesMember ifrs-full:InterestRateRiskMember 2025-10-31 0000009631 bns:ForeignCurrencyForwardContractsMember bns:DepositLiabilitiesMember ifrs-full:NotLaterThanOneYearMember ifrs-full:CashFlowHedgesMember ifrs-full:CurrencyRiskMember 2025-10-31 0000009631 ifrs-full:SwapContractMember ifrs-full:FairValueHedgesMember ifrs-full:InterestRateRiskMember 2025-10-31 0000009631 ifrs-full:SwapContractMember ifrs-full:CashFlowHedgesMember ifrs-full:InterestRateRiskMember 2025-10-31 0000009631 ifrs-full:SwapContractMember bns:USDCADMember ifrs-full:CashFlowHedgesMember bns:CurrencyOrInterestRateRiskMember 2025-10-31 0000009631 bns:SeniorNoteLiabilitiesMember 2025-10-31 0000009631 bns:FairValueThroughProfitAndLossMember ifrs-full:LaterThanOneYearAndNotLaterThanFiveYearsMember 2025-10-31 0000009631 bns:FairValueThroughOtherComprehensiveIncomeMember bns:CanadianFederalGovernmentIssuedOrGuaranteedDebtMember ifrs-full:LaterThanThreeMonthsAndNotLaterThanOneYearMember 2025-10-31 0000009631 ifrs-full:NotLaterThanThreeMonthsMember bns:DebtInstrumentsMember 2025-10-31 0000009631 ifrs-full:FinancialAssetsAtAmortisedCostMember bns:UsTreasuryAndOtherUsAgencyDebtMember ifrs-full:LaterThanThreeMonthsAndNotLaterThanOneYearMember 2025-10-31 0000009631 ifrs-full:FinancialAssetsAtAmortisedCostMember bns:CorporateDebtMember 2025-10-31 0000009631 currency:MXV ifrs-full:LaterThanThreeMonthsAndNotLaterThanOneYearMember 2025-10-31 0000009631 bns:FairValueThroughOtherComprehensiveIncomeMember bns:CanadianProvincialAndMunicipalDebtMember ifrs-full:NotLaterThanThreeMonthsMember 2025-10-31 0000009631 ifrs-full:FinancialAssetsAtAmortisedCostMember bns:UsTreasuryAndOtherUsAgencyDebtMember ifrs-full:LaterThanOneYearAndNotLaterThanFiveYearsMember 2025-10-31 0000009631 bns:FairValueThroughOtherComprehensiveIncomeMember bns:CanadianFederalGovernmentIssuedOrGuaranteedDebtMember ifrs-full:NotLaterThanThreeMonthsMember 2025-10-31 0000009631 bns:FairValueThroughOtherComprehensiveIncomeMember ifrs-full:LaterThanFiveYearsAndNotLaterThanTenYearsMember 2025-10-31 0000009631 ifrs-full:FinancialAssetsAtAmortisedCostMember bns:OtherForeignGovernmentDebtMember ifrs-full:LaterThanFiveYearsAndNotLaterThanTenYearsMember 2025-10-31 0000009631 ifrs-full:FinancialAssetsAtAmortisedCostMember bns:OtherForeignGovernmentDebtMember ifrs-full:LaterThanTenYearsMember 2025-10-31 0000009631 currency:MXV ifrs-full:NotLaterThanThreeMonthsMember 2025-10-31 0000009631 ifrs-full:FinancialAssetsAtAmortisedCostMember bns:CorporateDebtMember ifrs-full:LaterThanOneYearAndNotLaterThanFiveYearsMember 2025-10-31 0000009631 ifrs-full:FinancialAssetsAtAmortisedCostMember bns:OtherForeignGovernmentDebtMember ifrs-full:LaterThanOneYearAndNotLaterThanFiveYearsMember 2025-10-31 0000009631 ifrs-full:FinancialAssetsAtAmortisedCostMember bns:OtherForeignGovernmentDebtMember ifrs-full:NotLaterThanThreeMonthsMember 2025-10-31 0000009631 bns:FairValueThroughOtherComprehensiveIncomeMember bns:CanadianFederalGovernmentIssuedOrGuaranteedDebtMember ifrs-full:LaterThanOneYearAndNotLaterThanFiveYearsMember 2025-10-31 0000009631 ifrs-full:FinancialAssetsAtAmortisedCostMember bns:CanadianFederalAndProvincialGovernmentIssuedOrGuaranteedDebtMember ifrs-full:LaterThanFiveYearsAndNotLaterThanTenYearsMember 2025-10-31 0000009631 ifrs-full:FinancialAssetsAtAmortisedCostMember bns:UsTreasuryAndOtherUsAgencyDebtMember ifrs-full:LaterThanFiveYearsAndNotLaterThanTenYearsMember 2025-10-31 0000009631 bns:FairValueThroughProfitAndLossMember ifrs-full:LaterThanFiveYearsAndNotLaterThanTenYearsMember 2025-10-31 0000009631 bns:FairValueThroughProfitAndLossMember ifrs-full:LaterThanTenYearsMember 2025-10-31 0000009631 ifrs-full:FinancialAssetsAtAmortisedCostMember bns:UsTreasuryAndOtherUsAgencyDebtMember ifrs-full:LaterThanTenYearsMember 2025-10-31 0000009631 bns:FairValueThroughOtherComprehensiveIncomeMember bns:CanadianFederalGovernmentIssuedOrGuaranteedDebtMember ifrs-full:LaterThanFiveYearsAndNotLaterThanTenYearsMember 2025-10-31 0000009631 currency:MXV ifrs-full:LaterThanFiveYearsAndNotLaterThanTenYearsMember 2025-10-31 0000009631 currency:MXV bns:WithNoSpecificMaturityMember 2025-10-31 0000009631 currency:MXV 2025-10-31 0000009631 bns:FairValueThroughProfitAndLossMember bns:WithNoSpecificMaturityMember 2025-10-31 0000009631 bns:FairValueThroughProfitAndLossMember 2025-10-31 0000009631 bns:FairValueThroughOtherComprehensiveIncomeMember bns:OtherDebtMember ifrs-full:NotLaterThanThreeMonthsMember 2025-10-31 0000009631 bns:FairValueThroughOtherComprehensiveIncomeMember bns:OtherDebtMember ifrs-full:LaterThanThreeMonthsAndNotLaterThanOneYearMember 2025-10-31 0000009631 bns:FairValueThroughOtherComprehensiveIncomeMember bns:OtherForeignGovernmentDebtMember ifrs-full:LaterThanOneYearAndNotLaterThanFiveYearsMember 2025-10-31 0000009631 bns:FairValueThroughOtherComprehensiveIncomeMember bns:OtherForeignGovernmentDebtMember ifrs-full:NotLaterThanThreeMonthsMember 2025-10-31 0000009631 bns:FairValueThroughProfitAndLossMember ifrs-full:NotLaterThanThreeMonthsMember bns:DebtInstrumentsMember 2025-10-31 0000009631 bns:FairValueThroughProfitAndLossMember bns:DebtInstrumentsMember 2025-10-31 0000009631 bns:FairValueThroughOtherComprehensiveIncomeMember bns:CanadianFederalGovernmentIssuedOrGuaranteedDebtMember ifrs-full:LaterThanTenYearsMember 2025-10-31 0000009631 bns:FairValueThroughOtherComprehensiveIncomeMember bns:CanadianProvincialAndMunicipalDebtMember ifrs-full:LaterThanFiveYearsAndNotLaterThanTenYearsMember 2025-10-31 0000009631 bns:FairValueThroughOtherComprehensiveIncomeMember bns:CanadianProvincialAndMunicipalDebtMember ifrs-full:LaterThanTenYearsMember 2025-10-31 0000009631 bns:FairValueThroughOtherComprehensiveIncomeMember bns:UsTreasuryAndOtherUsAgencyDebtMember ifrs-full:LaterThanFiveYearsAndNotLaterThanTenYearsMember 2025-10-31 0000009631 bns:FairValueThroughOtherComprehensiveIncomeMember bns:UsTreasuryAndOtherUsAgencyDebtMember ifrs-full:LaterThanTenYearsMember 2025-10-31 0000009631 bns:FairValueThroughOtherComprehensiveIncomeMember bns:OtherForeignGovernmentDebtMember ifrs-full:LaterThanFiveYearsAndNotLaterThanTenYearsMember 2025-10-31 0000009631 bns:FairValueThroughProfitAndLossMember ifrs-full:NotLaterThanThreeMonthsMember 2025-10-31 0000009631 currency:MXV ifrs-full:LaterThanOneYearAndNotLaterThanFiveYearsMember 2025-10-31 0000009631 bns:FairValueThroughOtherComprehensiveIncomeMember bns:OtherForeignGovernmentDebtMember ifrs-full:LaterThanTenYearsMember 2025-10-31 0000009631 bns:FairValueThroughOtherComprehensiveIncomeMember bns:OtherDebtMember ifrs-full:LaterThanFiveYearsAndNotLaterThanTenYearsMember 2025-10-31 0000009631 bns:FairValueThroughOtherComprehensiveIncomeMember bns:OtherDebtMember ifrs-full:LaterThanTenYearsMember 2025-10-31 0000009631 bns:FairValueThroughProfitAndLossMember bns:EquityInstrumentsMember bns:WithNoSpecificMaturityMember 2025-10-31 0000009631 bns:FairValueThroughProfitAndLossMember bns:EquityInstrumentsMember 2025-10-31 0000009631 bns:FairValueThroughProfitAndLossMember ifrs-full:LaterThanOneYearAndNotLaterThanFiveYearsMember bns:DebtInstrumentsMember 2025-10-31 0000009631 ifrs-full:FinancialAssetsAtAmortisedCostMember ifrs-full:LaterThanOneYearAndNotLaterThanFiveYearsMember 2025-10-31 0000009631 ifrs-full:FinancialAssetsAtAmortisedCostMember ifrs-full:LaterThanFiveYearsAndNotLaterThanTenYearsMember 2025-10-31 0000009631 ifrs-full:FinancialAssetsAtAmortisedCostMember ifrs-full:LaterThanTenYearsMember 2025-10-31 0000009631 ifrs-full:LaterThanFiveYearsAndNotLaterThanTenYearsMember bns:DebtInstrumentsMember 2025-10-31 0000009631 ifrs-full:LaterThanTenYearsMember bns:DebtInstrumentsMember 2025-10-31 0000009631 bns:DebtInstrumentsMember 2025-10-31 0000009631 ifrs-full:FinancialAssetsAtAmortisedCostMember bns:CorporateDebtMember ifrs-full:LaterThanThreeMonthsAndNotLaterThanOneYearMember 2025-10-31 0000009631 ifrs-full:FinancialAssetsAtAmortisedCostMember ifrs-full:NotLaterThanThreeMonthsMember 2025-10-31 0000009631 ifrs-full:FinancialAssetsAtAmortisedCostMember ifrs-full:LaterThanThreeMonthsAndNotLaterThanOneYearMember 2025-10-31 0000009631 ifrs-full:FinancialAssetsAtAmortisedCostMember bns:CanadianFederalAndProvincialGovernmentIssuedOrGuaranteedDebtMember 2025-10-31 0000009631 ifrs-full:FinancialAssetsAtAmortisedCostMember bns:UsTreasuryAndOtherUsAgencyDebtMember 2025-10-31 0000009631 ifrs-full:FinancialAssetsAtAmortisedCostMember bns:OtherForeignGovernmentDebtMember 2025-10-31 0000009631 ifrs-full:FinancialAssetsAtAmortisedCostMember 2025-10-31 0000009631 ifrs-full:LaterThanThreeMonthsAndNotLaterThanOneYearMember bns:DebtInstrumentsMember 2025-10-31 0000009631 ifrs-full:LaterThanOneYearAndNotLaterThanFiveYearsMember bns:DebtInstrumentsMember 2025-10-31 0000009631 bns:FairValueThroughOtherComprehensiveIncomeMember bns:CanadianFederalGovernmentIssuedOrGuaranteedDebtMember 2025-10-31 0000009631 bns:FairValueThroughOtherComprehensiveIncomeMember bns:CanadianProvincialAndMunicipalDebtMember 2025-10-31 0000009631 bns:FairValueThroughOtherComprehensiveIncomeMember bns:UsTreasuryAndOtherUsAgencyDebtMember 2025-10-31 0000009631 bns:FairValueThroughOtherComprehensiveIncomeMember bns:OtherForeignGovernmentDebtMember 2025-10-31 0000009631 bns:FairValueThroughOtherComprehensiveIncomeMember bns:OtherDebtMember 2025-10-31 0000009631 ifrs-full:FinancialAssetsAtAmortisedCostMember bns:CorporateDebtMember ifrs-full:LaterThanTenYearsMember 2025-10-31 0000009631 bns:FairValueThroughOtherComprehensiveIncomeMember ifrs-full:LaterThanTenYearsMember 2025-10-31 0000009631 bns:FairValueThroughOtherComprehensiveIncomeMember ifrs-full:LaterThanOneYearAndNotLaterThanFiveYearsMember 2025-10-31 0000009631 bns:FairValueThroughOtherComprehensiveIncomeMember ifrs-full:LaterThanThreeMonthsAndNotLaterThanOneYearMember 2025-10-31 0000009631 bns:FairValueThroughOtherComprehensiveIncomeMember ifrs-full:NotLaterThanThreeMonthsMember 2025-10-31 0000009631 bns:FairValueThroughOtherComprehensiveIncomeMember bns:UsTreasuryAndOtherUsAgencyDebtMember ifrs-full:LaterThanThreeMonthsAndNotLaterThanOneYearMember 2025-10-31 0000009631 bns:FairValueThroughOtherComprehensiveIncomeMember bns:UsTreasuryAndOtherUsAgencyDebtMember ifrs-full:NotLaterThanThreeMonthsMember 2025-10-31 0000009631 bns:FairValueThroughOtherComprehensiveIncomeMember bns:CanadianProvincialAndMunicipalDebtMember ifrs-full:LaterThanOneYearAndNotLaterThanFiveYearsMember 2025-10-31 0000009631 bns:FairValueThroughOtherComprehensiveIncomeMember bns:CanadianProvincialAndMunicipalDebtMember ifrs-full:LaterThanThreeMonthsAndNotLaterThanOneYearMember 2025-10-31 0000009631 ifrs-full:FinancialAssetsAtAmortisedCostMember bns:CanadianFederalAndProvincialGovernmentIssuedOrGuaranteedDebtMember ifrs-full:LaterThanOneYearAndNotLaterThanFiveYearsMember 2025-10-31 0000009631 ifrs-full:FinancialAssetsAtAmortisedCostMember bns:CanadianFederalAndProvincialGovernmentIssuedOrGuaranteedDebtMember ifrs-full:LaterThanThreeMonthsAndNotLaterThanOneYearMember 2025-10-31 0000009631 ifrs-full:FinancialAssetsAtAmortisedCostMember bns:CanadianFederalAndProvincialGovernmentIssuedOrGuaranteedDebtMember ifrs-full:NotLaterThanThreeMonthsMember 2025-10-31 0000009631 bns:FairValueThroughOtherComprehensiveIncomeMember bns:OtherForeignGovernmentDebtMember ifrs-full:LaterThanThreeMonthsAndNotLaterThanOneYearMember 2025-10-31 0000009631 bns:FairValueThroughOtherComprehensiveIncomeMember bns:UsTreasuryAndOtherUsAgencyDebtMember ifrs-full:LaterThanOneYearAndNotLaterThanFiveYearsMember 2025-10-31 0000009631 bns:FairValueThroughOtherComprehensiveIncomeMember bns:WithNoSpecificMaturityMember 2025-10-31 0000009631 bns:FairValueThroughOtherComprehensiveIncomeMember 2025-10-31 0000009631 ifrs-full:FinancialAssetsAtAmortisedCostMember bns:OtherForeignGovernmentDebtMember ifrs-full:LaterThanThreeMonthsAndNotLaterThanOneYearMember 2025-10-31 0000009631 bns:FairValueThroughOtherComprehensiveIncomeMember bns:OtherDebtMember ifrs-full:LaterThanOneYearAndNotLaterThanFiveYearsMember 2025-10-31 0000009631 bns:FairValueThroughProfitAndLossMember ifrs-full:LaterThanThreeMonthsAndNotLaterThanOneYearMember 2025-10-31 0000009631 bns:FairValueThroughOtherComprehensiveIncomeMember bns:CommonSharesMember bns:WithNoSpecificMaturityMember 2025-10-31 0000009631 bns:FairValueThroughOtherComprehensiveIncomeMember bns:CommonSharesMember 2025-10-31 0000009631 ifrs-full:FinancialAssetsAtAmortisedCostCategoryMember bns:DebtInvestmentsMember 2025-10-31 0000009631 ifrs-full:FinancialAssetsMeasuredAtFairValueThroughOtherComprehensiveIncomeCategoryMember bns:DebtInvestmentsMember 2025-10-31 0000009631 ifrs-full:FinancialAssetsAtFairValueThroughProfitOrLossCategoryMember bns:DebtInvestmentsMember 2025-10-31 0000009631 ifrs-full:FinancialAssetsAtFairValueThroughProfitOrLossCategoryMember ifrs-full:EquityInvestmentsMember 2025-10-31 0000009631 ifrs-full:InvestmentsInEquityInstrumentsMeasuredAtFairValueThroughOtherComprehensiveIncomeMember ifrs-full:EquityInvestmentsMember 2025-10-31 0000009631 ifrs-full:FinancialAssetsMeasuredAtFairValueThroughOtherComprehensiveIncomeCategoryMember bns:CanadianFederalGovernmentIssuedOrGuaranteedDebtMember 2025-10-31 0000009631 ifrs-full:FinancialAssetsMeasuredAtFairValueThroughOtherComprehensiveIncomeCategoryMember bns:UsTreasuryAndOtherUsAgencyDebtMember 2025-10-31 0000009631 ifrs-full:FinancialAssetsMeasuredAtFairValueThroughOtherComprehensiveIncomeCategoryMember bns:OtherForeignGovernmentDebtMember 2025-10-31 0000009631 ifrs-full:FinancialAssetsMeasuredAtFairValueThroughOtherComprehensiveIncomeCategoryMember 2025-10-31 0000009631 ifrs-full:FinancialAssetsMeasuredAtFairValueThroughOtherComprehensiveIncomeCategoryMember bns:CanadianProvincialAndMunicipalDebtMember 2025-10-31 0000009631 ifrs-full:FinancialAssetsMeasuredAtFairValueThroughOtherComprehensiveIncomeCategoryMember bns:OtherDebtMember 2025-10-31 0000009631 bns:CorporateDebtMember bns:FinancialAssetsAtCarryingValueInvestmentSecuritiesMember 2025-10-31 0000009631 bns:CorporateDebtMember bns:FinancialAssetsAtFairValueInvestmentSecuritiesMember 2025-10-31 0000009631 bns:CanadianFederalGovernmentIssuedOrGuaranteedDebtMember bns:FinancialAssetsAtCarryingValueInvestmentSecuritiesMember 2025-10-31 0000009631 bns:CanadianFederalGovernmentIssuedOrGuaranteedDebtMember bns:FinancialAssetsAtFairValueInvestmentSecuritiesMember 2025-10-31 0000009631 bns:FinancialAssetsAtCarryingValueInvestmentSecuritiesMember 2025-10-31 0000009631 bns:FinancialAssetsAtFairValueInvestmentSecuritiesMember 2025-10-31 0000009631 bns:OtherForeignGovernmentDebtMember bns:FinancialAssetsAtCarryingValueInvestmentSecuritiesMember 2025-10-31 0000009631 bns:OtherForeignGovernmentDebtMember bns:FinancialAssetsAtFairValueInvestmentSecuritiesMember 2025-10-31 0000009631 bns:UsTreasuryAndOtherUsAgencyDebtMember bns:FinancialAssetsAtCarryingValueInvestmentSecuritiesMember 2025-10-31 0000009631 bns:UsTreasuryAndOtherUsAgencyDebtMember bns:FinancialAssetsAtFairValueInvestmentSecuritiesMember 2025-10-31 0000009631 ifrs-full:InvestmentsInEquityInstrumentsMeasuredAtFairValueThroughOtherComprehensiveIncomeMember 2025-10-31 0000009631 ifrs-full:InvestmentsInEquityInstrumentsMeasuredAtFairValueThroughOtherComprehensiveIncomeMember bns:CommonSharesMember 2025-10-31 0000009631 ifrs-full:ConsumerLoansMember ifrs-full:FinancialAssetsIndividuallyAssessedForCreditLossesMember 2025-10-31 0000009631 bns:NetCarryingAmountMember ifrs-full:ConsumerLoansMember 2025-10-31 0000009631 ifrs-full:GrossCarryingAmountMember bns:CreditCardMember 2025-10-31 0000009631 bns:CreditCardMember ifrs-full:FinancialAssetsIndividuallyAssessedForCreditLossesMember 2025-10-31 0000009631 ifrs-full:GrossCarryingAmountMember ifrs-full:ConsumerLoansMember 2025-10-31 0000009631 bns:NetCarryingAmountMember bns:BusinessAndGovernmentMember 2025-10-31 0000009631 ifrs-full:GrossCarryingAmountMember bns:ResidentialMortgagesMember 2025-10-31 0000009631 bns:ResidentialMortgagesMember ifrs-full:FinancialAssetsIndividuallyAssessedForCreditLossesMember 2025-10-31 0000009631 bns:NetCarryingAmountMember bns:CreditCardMember 2025-10-31 0000009631 ifrs-full:GrossCarryingAmountMember bns:BusinessAndGovernmentMember 2025-10-31 0000009631 bns:BusinessAndGovernmentMember ifrs-full:FinancialAssetsIndividuallyAssessedForCreditLossesMember 2025-10-31 0000009631 bns:NetCarryingAmountMember bns:ResidentialMortgagesMember 2025-10-31 0000009631 ifrs-full:GrossCarryingAmountMember 2025-10-31 0000009631 ifrs-full:FinancialAssetsIndividuallyAssessedForCreditLossesMember 2025-10-31 0000009631 bns:NetCarryingAmountMember 2025-10-31 0000009631 bns:BusinessAndGovernmentMember country:CO 2025-10-31 0000009631 bns:CreditCardMember country:CO 2025-10-31 0000009631 ifrs-full:ConsumerLoansMember country:CO 2025-10-31 0000009631 bns:BusinessAndGovernmentMember bns:OtherInternationalMember 2025-10-31 0000009631 bns:CreditCardMember bns:OtherInternationalMember 2025-10-31 0000009631 bns:ResidentialMortgagesMember country:CO 2025-10-31 0000009631 bns:BusinessAndGovernmentMember country:PE 2025-10-31 0000009631 bns:CreditCardMember country:PE 2025-10-31 0000009631 ifrs-full:ConsumerLoansMember country:PE 2025-10-31 0000009631 bns:CreditCardMember country:MX 2025-10-31 0000009631 country:PE 2025-10-31 0000009631 bns:CreditCardMember country:CA 2025-10-31 0000009631 bns:BusinessAndGovernmentMember country:CA 2025-10-31 0000009631 bns:ResidentialMortgagesMember country:PE 2025-10-31 0000009631 bns:BusinessAndGovernmentMember country:CL 2025-10-31 0000009631 bns:OtherInternationalMember 2025-10-31 0000009631 ifrs-full:ConsumerLoansMember bns:OtherInternationalMember 2025-10-31 0000009631 bns:ResidentialMortgagesMember bns:OtherInternationalMember 2025-10-31 0000009631 bns:ResidentialMortgagesMember country:CA 2025-10-31 0000009631 ifrs-full:ConsumerLoansMember country:CA 2025-10-31 0000009631 bns:BusinessAndGovernmentMember country:MX 2025-10-31 0000009631 bns:ResidentialMortgagesMember country:CL 2025-10-31 0000009631 ifrs-full:ConsumerLoansMember country:CL 2025-10-31 0000009631 bns:CreditCardMember country:CL 2025-10-31 0000009631 bns:ResidentialMortgagesMember country:MX 2025-10-31 0000009631 bns:BusinessAndGovernmentMember country:US 2025-10-31 0000009631 ifrs-full:ConsumerLoansMember country:US 2025-10-31 0000009631 country:CO 2025-10-31 0000009631 country:CL 2025-10-31 0000009631 country:MX 2025-10-31 0000009631 ifrs-full:ConsumerLoansMember country:MX 2025-10-31 0000009631 ifrs-full:FinancialInstrumentsCreditimpairedMember country:CO 2025-10-31 0000009631 ifrs-full:FinancialInstrumentsCreditimpairedMember 2025-10-31 0000009631 bns:ResidentialMortgagesMember ifrs-full:FinancialInstrumentsCreditimpairedMember 2025-10-31 0000009631 ifrs-full:FinancialInstrumentsCreditimpairedMember country:CL 2025-10-31 0000009631 ifrs-full:FinancialInstrumentsCreditimpairedMember country:CA 2025-10-31 0000009631 ifrs-full:FinancialInstrumentsCreditimpairedMember bns:OtherInternationalMember 2025-10-31 0000009631 ifrs-full:FinancialInstrumentsCreditimpairedMember country:PE 2025-10-31 0000009631 bns:BusinessAndGovernmentMember ifrs-full:FinancialInstrumentsCreditimpairedMember 2025-10-31 0000009631 ifrs-full:ConsumerLoansMember ifrs-full:FinancialInstrumentsCreditimpairedMember 2025-10-31 0000009631 ifrs-full:FinancialInstrumentsCreditimpairedMember country:MX 2025-10-31 0000009631 bns:UndrawnLoanCommitmentsRetailMember bns:StageOneExposureMember bns:HighProbabilityOfDefaultMember 2025-10-31 0000009631 bns:MediumProbabilityOfDefaultMember bns:UndrawnLoanCommitmentsRetailMember 2025-10-31 0000009631 bns:UndrawnLoanCommitmentsRetailMember bns:StageTwoExposureMember bns:MediumProbabilityOfDefaultMember 2025-10-31 0000009631 bns:UndrawnLoanCommitmentsRetailMember bns:StageOneExposureMember bns:MediumProbabilityOfDefaultMember 2025-10-31 0000009631 bns:UndrawnLoanCommitmentsRetailMember bns:StageTwoExposureMember bns:LowProbabilityOfDefaultMember 2025-10-31 0000009631 bns:LowProbabilityOfDefaultMember bns:UndrawnLoanCommitmentsRetailMember bns:StageOneExposureMember 2025-10-31 0000009631 bns:LoansNotGradedMember bns:UndrawnLoanCommitmentsRetailMember 2025-10-31 0000009631 bns:UndrawnLoanCommitmentsRetailMember bns:StageTwoExposureMember bns:LoansNotGradedMember 2025-10-31 0000009631 bns:UndrawnLoanCommitmentsRetailMember bns:LowProbabilityOfDefaultMember 2025-10-31 0000009631 bns:VeryLowProbabilityOfDefaultMember bns:UndrawnLoanCommitmentsRetailMember 2025-10-31 0000009631 bns:UndrawnLoanCommitmentsRetailMember bns:StageTwoExposureMember bns:VeryLowProbabilityOfDefaultMember 2025-10-31 0000009631 bns:VeryLowProbabilityOfDefaultMember bns:UndrawnLoanCommitmentsRetailMember bns:StageOneExposureMember 2025-10-31 0000009631 bns:UndrawnLoanCommitmentsRetailMember bns:VeryHighProbabilityOfDefaultMember 2025-10-31 0000009631 bns:UndrawnLoanCommitmentsRetailMember bns:StageTwoExposureMember bns:VeryHighProbabilityOfDefaultMember 2025-10-31 0000009631 bns:UndrawnLoanCommitmentsRetailMember bns:StageOneExposureMember bns:VeryHighProbabilityOfDefaultMember 2025-10-31 0000009631 bns:HighProbabilityOfDefaultMember bns:UndrawnLoanCommitmentsRetailMember 2025-10-31 0000009631 bns:HighProbabilityOfDefaultMember bns:UndrawnLoanCommitmentsRetailMember bns:StageTwoExposureMember 2025-10-31 0000009631 bns:UndrawnLoanCommitmentsRetailMember bns:StageOneExposureMember bns:LoansNotGradedMember 2025-10-31 0000009631 bns:LoansNotGradedMember bns:UndrawnLoanCommitmentsBusinessAndGovernmentMember 2025-10-31 0000009631 bns:LoansNotGradedMember bns:UndrawnLoanCommitmentsBusinessAndGovernmentMember bns:StageTwoExposureMember 2025-10-31 0000009631 bns:UndrawnLoanCommitmentsBusinessAndGovernmentMember 2025-10-31 0000009631 bns:UndrawnLoanCommitmentsBusinessAndGovernmentMember bns:StageThreeExposureMember 2025-10-31 0000009631 bns:NoninvestmentGradeMember bns:UndrawnLoanCommitmentsBusinessAndGovernmentMember bns:StageTwoExposureMember 2025-10-31 0000009631 bns:UndrawnLoanCommitmentsBusinessAndGovernmentMember bns:StageOneExposureMember bns:NoninvestmentGradeMember 2025-10-31 0000009631 bns:DefaultMember bns:UndrawnLoanCommitmentsBusinessAndGovernmentMember bns:StageThreeExposureMember 2025-10-31 0000009631 bns:WatchListMember bns:UndrawnLoanCommitmentsBusinessAndGovernmentMember 2025-10-31 0000009631 bns:WatchListMember bns:UndrawnLoanCommitmentsBusinessAndGovernmentMember bns:StageTwoExposureMember 2025-10-31 0000009631 bns:UndrawnLoanCommitmentsBusinessAndGovernmentMember bns:StageTwoExposureMember 2025-10-31 0000009631 bns:UndrawnLoanCommitmentsBusinessAndGovernmentMember bns:StageOneExposureMember 2025-10-31 0000009631 bns:NoninvestmentGradeMember bns:UndrawnLoanCommitmentsBusinessAndGovernmentMember 2025-10-31 0000009631 bns:UndrawnLoanCommitmentsBusinessAndGovernmentMember bns:StageOneExposureMember bns:LoansNotGradedMember 2025-10-31 0000009631 bns:DefaultMember bns:UndrawnLoanCommitmentsBusinessAndGovernmentMember 2025-10-31 0000009631 bns:InvestmentGradeMember bns:UndrawnLoanCommitmentsBusinessAndGovernmentMember bns:StageOneExposureMember 2025-10-31 0000009631 bns:UndrawnLoanCommitmentsBusinessAndGovernmentMember bns:StageTwoExposureMember bns:InvestmentGradeMember 2025-10-31 0000009631 bns:InvestmentGradeMember bns:UndrawnLoanCommitmentsBusinessAndGovernmentMember 2025-10-31 0000009631 bns:BusinessAndGovernmentMember ifrs-full:LaterThanFiveYearsAndNotLaterThanTenYearsMember 2025-10-31 0000009631 bns:BusinessAndGovernmentMember ifrs-full:LaterThanTenYearsMember 2025-10-31 0000009631 bns:BusinessAndGovernmentMember bns:NoStatedMaturityMember 2025-10-31 0000009631 bns:BusinessAndGovernmentMember 2025-10-31 0000009631 bns:BusinessAndGovernmentMember ifrs-full:FloatingInterestRateMember 2025-10-31 0000009631 bns:BusinessAndGovernmentMember ifrs-full:FixedInterestRateMember 2025-10-31 0000009631 bns:BusinessAndGovernmentMember bns:NonRateSensitiveMember 2025-10-31 0000009631 ifrs-full:ConsumerLoansMember 2025-10-31 0000009631 ifrs-full:ConsumerLoansMember ifrs-full:FloatingInterestRateMember 2025-10-31 0000009631 ifrs-full:ConsumerLoansMember ifrs-full:FixedInterestRateMember 2025-10-31 0000009631 ifrs-full:ConsumerLoansMember bns:NonRateSensitiveMember 2025-10-31 0000009631 bns:ResidentialMortgagesMember 2025-10-31 0000009631 bns:ResidentialMortgagesMember ifrs-full:FloatingInterestRateMember 2025-10-31 0000009631 bns:CreditCardMember 2025-10-31 0000009631 ifrs-full:ConsumerLoansMember bns:NoStatedMaturityMember 2025-10-31 0000009631 bns:ResidentialMortgagesMember ifrs-full:FixedInterestRateMember 2025-10-31 0000009631 bns:ResidentialMortgagesMember bns:NonRateSensitiveMember 2025-10-31 0000009631 ifrs-full:ConsumerLoansMember ifrs-full:LaterThanOneYearAndNotLaterThanFiveYearsMember 2025-10-31 0000009631 ifrs-full:ConsumerLoansMember ifrs-full:LaterThanFiveYearsAndNotLaterThanTenYearsMember 2025-10-31 0000009631 ifrs-full:ConsumerLoansMember ifrs-full:LaterThanTenYearsMember 2025-10-31 0000009631 ifrs-full:FloatingInterestRateMember 2025-10-31 0000009631 ifrs-full:FixedInterestRateMember 2025-10-31 0000009631 bns:NonRateSensitiveMember 2025-10-31 0000009631 bns:NoStatedMaturityMember 2025-10-31 0000009631 bns:CreditCardMember bns:NoStatedMaturityMember 2025-10-31 0000009631 bns:CreditCardMember ifrs-full:FixedInterestRateMember 2025-10-31 0000009631 ifrs-full:ConsumerLoansMember ifrs-full:NotLaterThanOneYearMember 2025-10-31 0000009631 bns:ResidentialMortgagesMember ifrs-full:NotLaterThanOneYearMember 2025-10-31 0000009631 bns:BusinessAndGovernmentMember ifrs-full:NotLaterThanOneYearMember 2025-10-31 0000009631 bns:ResidentialMortgagesMember bns:NoStatedMaturityMember 2025-10-31 0000009631 bns:ResidentialMortgagesMember ifrs-full:LaterThanTenYearsMember 2025-10-31 0000009631 bns:ResidentialMortgagesMember ifrs-full:LaterThanFiveYearsAndNotLaterThanTenYearsMember 2025-10-31 0000009631 bns:ResidentialMortgagesMember ifrs-full:LaterThanOneYearAndNotLaterThanFiveYearsMember 2025-10-31 0000009631 bns:BusinessAndGovernmentMember ifrs-full:LaterThanOneYearAndNotLaterThanFiveYearsMember 2025-10-31 0000009631 ifrs-full:ConsumerLoansMember ifrs-full:FinancialAssetsPastDueButNotImpairedMember 2025-10-31 0000009631 bns:BusinessAndGovernmentMember ifrs-full:FinancialAssetsPastDueButNotImpairedMember 2025-10-31 0000009631 bns:BusinessAndGovernmentMember ifrs-full:FinancialAssetsPastDueButNotImpairedMember ifrs-full:LaterThanTwoMonthsAndNotLaterThanThreeMonthsMember 2025-10-31 0000009631 ifrs-full:ConsumerLoansMember ifrs-full:FinancialAssetsPastDueButNotImpairedMember ifrs-full:LaterThanOneMonthAndNotLaterThanTwoMonthsMember 2025-10-31 0000009631 ifrs-full:ConsumerLoansMember ifrs-full:FinancialAssetsPastDueButNotImpairedMember ifrs-full:LaterThanTwoMonthsAndNotLaterThanThreeMonthsMember 2025-10-31 0000009631 bns:CreditCardMember ifrs-full:FinancialAssetsPastDueButNotImpairedMember 2025-10-31 0000009631 ifrs-full:FinancialAssetsPastDueButNotImpairedMember ifrs-full:LaterThanTwoMonthsAndNotLaterThanThreeMonthsMember 2025-10-31 0000009631 ifrs-full:FinancialAssetsPastDueButNotImpairedMember ifrs-full:LaterThanOneMonthAndNotLaterThanTwoMonthsMember 2025-10-31 0000009631 bns:ResidentialMortgagesMember ifrs-full:FinancialAssetsPastDueButNotImpairedMember ifrs-full:LaterThanOneMonthAndNotLaterThanTwoMonthsMember 2025-10-31 0000009631 bns:CreditCardMember ifrs-full:FinancialAssetsPastDueButNotImpairedMember ifrs-full:LaterThanOneMonthAndNotLaterThanTwoMonthsMember 2025-10-31 0000009631 bns:BusinessAndGovernmentMember ifrs-full:FinancialAssetsPastDueButNotImpairedMember ifrs-full:LaterThanOneMonthAndNotLaterThanTwoMonthsMember 2025-10-31 0000009631 ifrs-full:FinancialAssetsPastDueButNotImpairedMember 2025-10-31 0000009631 bns:CreditCardMember ifrs-full:FinancialAssetsPastDueButNotImpairedMember ifrs-full:LaterThanThreeMonthsMember 2025-10-31 0000009631 bns:CreditCardMember ifrs-full:FinancialAssetsPastDueButNotImpairedMember ifrs-full:LaterThanTwoMonthsAndNotLaterThanThreeMonthsMember 2025-10-31 0000009631 bns:ResidentialMortgagesMember ifrs-full:FinancialAssetsPastDueButNotImpairedMember ifrs-full:LaterThanTwoMonthsAndNotLaterThanThreeMonthsMember 2025-10-31 0000009631 bns:ResidentialMortgagesMember ifrs-full:FinancialAssetsPastDueButNotImpairedMember 2025-10-31 0000009631 ifrs-full:FinancialAssetsPastDueButNotImpairedMember ifrs-full:LaterThanThreeMonthsMember 2025-10-31 0000009631 ifrs-full:LoansAcquiredInBusinessCombinationMember 2025-10-31 0000009631 ifrs-full:SecuritisationsMember bns:ResidentialMortgageLoansMember 2025-10-31 0000009631 ifrs-full:SecuritisationsMember bns:OtherRelatedAssetsMember 2025-10-31 0000009631 bns:OtherFinancialAssets1Member bns:RepurchaseAgreementMember 2025-10-31 0000009631 bns:OtherFinancialAssets1Member ifrs-full:SecuritiesLendingMember 2025-10-31 0000009631 bns:OtherFinancialAssets1Member 2025-10-31 0000009631 ifrs-full:SecuritisationsMember 2025-10-31 0000009631 bns:ScotiabankCoveredBondGuarantorLimitedPartnershipMember bns:DepositsFromBusinessAndGovernmentMember 2025-10-31 0000009631 ifrs-full:UnconsolidatedStructuredEntitiesMember 2025-10-31 0000009631 bns:CapitalFundingVehiclesMember 2025-10-31 0000009631 bns:StructuredFinanceEntitiesMember 2025-10-31 0000009631 bns:CanadianMultisellerConduitsThatTheBankAdministersMember 2025-10-31 0000009631 bns:InternallyGeneratedSoftwareMember 2025-10-31 0000009631 bns:InProcessSoftwareNotSubjectToAmortizationMember 2025-10-31 0000009631 bns:PurchasedSoftwareMember 2025-10-31 0000009631 bns:RangesOfExercisePricesForOutstandingShareOptionsThreeMember bns:EmployeeStockOptionsMember 2025-10-31 0000009631 bns:RangesOfExercisePricesForOutstandingShareOptionsTwoMember bns:EmployeeStockOptionsMember 2025-10-31 0000009631 bns:RangesOfExercisePricesForOutstandingShareOptionsOneMember bns:EmployeeStockOptionsMember 2025-10-31 0000009631 bns:EmployeeStockOptionsMember 2025-10-31 0000009631 bns:OtherBenefitPlansMember ifrs-full:WhollyUnfundedDefinedBenefitPlansMember 2025-10-31 0000009631 ifrs-full:PensionDefinedBenefitPlansMember ifrs-full:WhollyOrPartlyFundedDefinedBenefitPlansMember 2025-10-31 0000009631 bns:OtherBenefitPlansMember ifrs-full:WhollyOrPartlyFundedDefinedBenefitPlansMember 2025-10-31 0000009631 ifrs-full:PensionDefinedBenefitPlansMember ifrs-full:WhollyUnfundedDefinedBenefitPlansMember 2025-10-31 0000009631 bns:ActuarialAssumptionOfDiscountRatesForAllPlansMember bns:OtherBenefitPlansMember 2025-10-31 0000009631 bns:ActuarialAssumptionOfDiscountRatesForCanadianPlansMember ifrs-full:PensionDefinedBenefitPlansMember 2025-10-31 0000009631 bns:ActuarialAssumptionOfDiscountRatesForCanadianPlansMember bns:OtherBenefitPlansMember 2025-10-31 0000009631 ifrs-full:ActuarialAssumptionOfDiscountRatesMember ifrs-full:PensionDefinedBenefitPlansMember 2025-10-31 0000009631 ifrs-full:ActuarialAssumptionOfDiscountRatesMember bns:OtherBenefitPlansMember 2025-10-31 0000009631 bns:ActuarialAssumptionOfDiscountRatesForAllPlansMember ifrs-full:PensionDefinedBenefitPlansMember 2025-10-31 0000009631 bns:OtherBenefitPlansMember ifrs-full:ForeignCountriesMember 2025-10-31 0000009631 bns:DomesticScotiabankPensionPlanMember ifrs-full:CountryOfDomicileMember 2025-10-31 0000009631 bns:OtherPensionPlansMember ifrs-full:CountryOfDomicileMember 2025-10-31 0000009631 ifrs-full:PensionDefinedBenefitPlansMember ifrs-full:ForeignCountriesMember 2025-10-31 0000009631 bns:OtherBenefitPlansMember ifrs-full:CountryOfDomicileMember 2025-10-31 0000009631 bns:OneYearActuarialAssumptionOfLifeExpectancyRatesMember bns:OtherBenefitPlansMember country:MX 2025-10-31 0000009631 bns:OneYearActuarialAssumptionOfLifeExpectancyRatesMember ifrs-full:PensionDefinedBenefitPlansMember country:MX 2025-10-31 0000009631 bns:ZeroPointTwoFivePercentageActuarialAssumptionOfExpectedRatesOfSalaryIncreasesMember ifrs-full:PensionDefinedBenefitPlansMember 2025-10-31 0000009631 bns:OnePercentageActuarialAssumptionOfMedicalCostTrendRatesMember bns:OtherBenefitPlansMember 2025-10-31 0000009631 bns:OneYearActuarialAssumptionOfLifeExpectancyRatesMember bns:OtherBenefitPlansMember country:CA 2025-10-31 0000009631 bns:OneYearActuarialAssumptionOfLifeExpectancyRatesMember ifrs-full:PensionDefinedBenefitPlansMember country:CA 2025-10-31 0000009631 bns:OneYearActuarialAssumptionOfLifeExpectancyRatesMember bns:OtherBenefitPlansMember country:US 2025-10-31 0000009631 bns:OneYearActuarialAssumptionOfLifeExpectancyRatesMember ifrs-full:PensionDefinedBenefitPlansMember country:US 2025-10-31 0000009631 bns:DirectorsMember 2025-10-31 0000009631 bns:RevisedBaselThreeNormsMember bns:RealEstateSecuredMember bns:RetailMember bns:AdvancedInternalRatingsBasedPortfolioMember 2025-10-31 0000009631 bns:RevisedBaselThreeNormsMember bns:QualifyingRevolvingMember bns:RetailMember bns:AdvancedInternalRatingsBasedPortfolioMember 2025-10-31 0000009631 bns:RevisedBaselThreeNormsMember bns:OtherRetailMember bns:RetailMember bns:AdvancedInternalRatingsBasedPortfolioMember 2025-10-31 0000009631 bns:RevisedBaselThreeNormsMember bns:RetailMember 2025-10-31 0000009631 bns:RevisedBaselThreeNormsMember bns:CaribbeanMember 2025-10-31 0000009631 bns:RevisedBaselThreeNormsMember bns:LatinAmericaOtherMember 2025-10-31 0000009631 bns:RevisedBaselThreeNormsMember bns:AllOtherCountriesMember 2025-10-31 0000009631 bns:RevisedBaselThreeNormsMember 2025-10-31 0000009631 bns:RevisedBaselThreeNormsMember bns:CorporateMember bns:NonRetailMember bns:AdvancedInternalRatingsBasedPortfolioMember 2025-10-31 0000009631 bns:RevisedBaselThreeNormsMember bns:OtherRetailMember bns:RetailMember bns:StandardizedPortfolioMember 2025-10-31 0000009631 bns:RevisedBaselThreeNormsMember bns:RealEstateSecuredMember bns:RetailMember bns:StandardizedPortfolioMember 2025-10-31 0000009631 bns:RevisedBaselThreeNormsMember bns:NonRetailMember 2025-10-31 0000009631 bns:RevisedBaselThreeNormsMember bns:SovereignMember bns:NonRetailMember bns:StandardizedPortfolioMember 2025-10-31 0000009631 bns:RevisedBaselThreeNormsMember bns:BankMember bns:NonRetailMember bns:StandardizedPortfolioMember 2025-10-31 0000009631 bns:RevisedBaselThreeNormsMember bns:CorporateMember bns:NonRetailMember bns:StandardizedPortfolioMember 2025-10-31 0000009631 bns:RevisedBaselThreeNormsMember bns:SovereignMember bns:NonRetailMember bns:AdvancedInternalRatingsBasedPortfolioMember 2025-10-31 0000009631 bns:RevisedBaselThreeNormsMember srt:EuropeMember 2025-10-31 0000009631 bns:RevisedBaselThreeNormsMember country:CO 2025-10-31 0000009631 bns:RevisedBaselThreeNormsMember country:PE 2025-10-31 0000009631 bns:RevisedBaselThreeNormsMember country:MX 2025-10-31 0000009631 bns:RevisedBaselThreeNormsMember country:CL 2025-10-31 0000009631 bns:RevisedBaselThreeNormsMember country:US 2025-10-31 0000009631 bns:RevisedBaselThreeNormsMember country:CA 2025-10-31 0000009631 bns:RevisedBaselThreeNormsMember bns:RetailMember bns:AdvancedInternalRatingsBasedPortfolioMember 2025-10-31 0000009631 bns:RevisedBaselThreeNormsMember bns:NonRetailMember bns:AdvancedInternalRatingsBasedPortfolioMember 2025-10-31 0000009631 bns:RevisedBaselThreeNormsMember bns:NonRetailMember bns:StandardizedPortfolioMember 2025-10-31 0000009631 bns:RevisedBaselThreeNormsMember bns:RetailMember bns:StandardizedPortfolioMember 2025-10-31 0000009631 bns:RevisedBaselThreeNormsMember bns:BankMember bns:NonRetailMember bns:AdvancedInternalRatingsBasedPortfolioMember 2025-10-31 0000009631 ifrs-full:CreditRiskMember 2025-10-31 0000009631 bns:OtherMarketRiskExposuresOthersMember ifrs-full:CreditRiskMember 2025-10-31 0000009631 bns:CreditRiskExposureDrawnNonRetailMember ifrs-full:CreditRiskMember 2025-10-31 0000009631 bns:RevisedBaselThreeNormsMember bns:NonRetailMember bns:EquivalentExternalRatingStandardAndPoorsBbPlusMember bns:InternalNonInvestmentGrade1Member bns:AdvancedInternalRatingsBasedPortfolioMember 2025-10-31 0000009631 bns:RevisedBaselThreeNormsMember bns:NonRetailMember srt:StandardPoorsBBRatingMember bns:InternalNonInvestmentGrade1Member bns:AdvancedInternalRatingsBasedPortfolioMember 2025-10-31 0000009631 bns:RevisedBaselThreeNormsMember bns:NonRetailMember bns:EquivalentExternalRatingStandardAndPoorsBbbMinusMember bns:InvestmentGradeMember bns:AdvancedInternalRatingsBasedPortfolioMember 2025-10-31 0000009631 bns:RevisedBaselThreeNormsMember bns:NonRetailMember srt:StandardPoorsCCCRatingMember bns:InternalGradeWatchListMember bns:AdvancedInternalRatingsBasedPortfolioMember 2025-10-31 0000009631 bns:RevisedBaselThreeNormsMember bns:NonRetailMember bns:EquivalentExternalRatingStandardAndPoorsbTobMinusMember bns:InternalNonInvestmentGrade1Member bns:AdvancedInternalRatingsBasedPortfolioMember 2025-10-31 0000009631 bns:RevisedBaselThreeNormsMember bns:NonRetailMember bns:EquivalentExternalRatingStandardAndPoorsCccPlusMember bns:InternalGradeWatchListMember bns:AdvancedInternalRatingsBasedPortfolioMember 2025-10-31 0000009631 bns:RevisedBaselThreeNormsMember bns:NonRetailMember bns:EquivalentExternalRatingStandardAndPoorsAaToAPlusMember bns:InvestmentGradeMember bns:AdvancedInternalRatingsBasedPortfolioMember 2025-10-31 0000009631 bns:RevisedBaselThreeNormsMember bns:NonRetailMember bns:EquivalentExternalRatingStandardandPoorsCCCMinusToCCMember bns:InternalGradeWatchListMember bns:AdvancedInternalRatingsBasedPortfolioMember 2025-10-31 0000009631 bns:RevisedBaselThreeNormsMember bns:NonRetailMember bns:EquivalentExternalRatingStandardAndPoorsAaaToAaPlusMember bns:InvestmentGradeMember ifrs-full:BottomOfRangeMember bns:AdvancedInternalRatingsBasedPortfolioMember 2025-10-31 0000009631 bns:RevisedBaselThreeNormsMember bns:NonRetailMember bns:EquivalentExternalRatingStandardAndPoorsAaaToAaPlusMember bns:InvestmentGradeMember ifrs-full:TopOfRangeMember bns:AdvancedInternalRatingsBasedPortfolioMember 2025-10-31 0000009631 bns:RevisedBaselThreeNormsMember bns:NonRetailMember bns:InternalGradeDefaultMember bns:AdvancedInternalRatingsBasedPortfolioMember 2025-10-31 0000009631 bns:RevisedBaselThreeNormsMember bns:NonRetailMember bns:EquivalentExternalRatingStandardAndPoorsBbMinusMember bns:InternalNonInvestmentGrade1Member bns:AdvancedInternalRatingsBasedPortfolioMember 2025-10-31 0000009631 bns:RevisedBaselThreeNormsMember bns:NonRetailMember bns:EquivalentExternalRatingStandardAndPoorsaToaMinusMember bns:InvestmentGradeMember bns:AdvancedInternalRatingsBasedPortfolioMember 2025-10-31 0000009631 bns:RevisedBaselThreeNormsMember bns:NonRetailMember bns:EquivalentExternalRatingStandardAndPoorsDefaultMember bns:InternalGradeWatchListMember bns:AdvancedInternalRatingsBasedPortfolioMember 2025-10-31 0000009631 bns:RevisedBaselThreeNormsMember bns:NonRetailMember bns:EquivalentExternalRatingStandardAndPoorsbPlusMember bns:InternalNonInvestmentGrade1Member bns:AdvancedInternalRatingsBasedPortfolioMember 2025-10-31 0000009631 bns:RevisedBaselThreeNormsMember bns:NonRetailMember bns:EquivalentExternalRatingStandardAndPoorsBbbPlusMember bns:InvestmentGradeMember bns:AdvancedInternalRatingsBasedPortfolioMember 2025-10-31 0000009631 bns:RevisedBaselThreeNormsMember bns:NonRetailMember srt:StandardPoorsBBBRatingMember bns:InvestmentGradeMember bns:AdvancedInternalRatingsBasedPortfolioMember 2025-10-31 0000009631 bns:RevisedBaselThreeNormsMember bns:RetailMember bns:MediumProbabilityOfDefaultMember ifrs-full:BottomOfRangeMember bns:AdvancedInternalRatingsBasedPortfolioMember 2025-10-31 0000009631 bns:RevisedBaselThreeNormsMember bns:RetailMember bns:HighProbabilityOfDefaultMember ifrs-full:TopOfRangeMember bns:AdvancedInternalRatingsBasedPortfolioMember 2025-10-31 0000009631 bns:RevisedBaselThreeNormsMember bns:RetailMember bns:HighProbabilityOfDefaultMember ifrs-full:BottomOfRangeMember bns:AdvancedInternalRatingsBasedPortfolioMember 2025-10-31 0000009631 bns:RevisedBaselThreeNormsMember bns:RetailMember bns:ExtremelyHighProbabilityOfDefaultMember ifrs-full:TopOfRangeMember bns:AdvancedInternalRatingsBasedPortfolioMember 2025-10-31 0000009631 bns:RevisedBaselThreeNormsMember bns:RetailMember bns:ExtremelyHighProbabilityOfDefaultMember ifrs-full:BottomOfRangeMember bns:AdvancedInternalRatingsBasedPortfolioMember 2025-10-31 0000009631 bns:RevisedBaselThreeNormsMember bns:RetailMember bns:DefaultMember bns:AdvancedInternalRatingsBasedPortfolioMember 2025-10-31 0000009631 bns:RevisedBaselThreeNormsMember bns:RetailMember bns:VeryLowProbabilityOfDefaultMember ifrs-full:BottomOfRangeMember bns:AdvancedInternalRatingsBasedPortfolioMember 2025-10-31 0000009631 bns:RevisedBaselThreeNormsMember bns:RetailMember bns:LowProbabilityOfDefaultMember ifrs-full:TopOfRangeMember bns:AdvancedInternalRatingsBasedPortfolioMember 2025-10-31 0000009631 bns:RevisedBaselThreeNormsMember bns:RetailMember bns:LowProbabilityOfDefaultMember ifrs-full:BottomOfRangeMember bns:AdvancedInternalRatingsBasedPortfolioMember 2025-10-31 0000009631 bns:RevisedBaselThreeNormsMember bns:RetailMember bns:MediumLowProbabilityOfDefaultMember ifrs-full:TopOfRangeMember bns:AdvancedInternalRatingsBasedPortfolioMember 2025-10-31 0000009631 bns:RevisedBaselThreeNormsMember bns:RetailMember bns:MediumLowProbabilityOfDefaultMember ifrs-full:BottomOfRangeMember bns:AdvancedInternalRatingsBasedPortfolioMember 2025-10-31 0000009631 bns:RevisedBaselThreeNormsMember bns:RetailMember bns:MediumProbabilityOfDefaultMember ifrs-full:TopOfRangeMember bns:AdvancedInternalRatingsBasedPortfolioMember 2025-10-31 0000009631 bns:RevisedBaselThreeNormsMember bns:RetailMember bns:ExceptionallyLowProbabilityOfDefaultMember ifrs-full:TopOfRangeMember bns:AdvancedInternalRatingsBasedPortfolioMember 2025-10-31 0000009631 bns:RevisedBaselThreeNormsMember bns:RetailMember bns:ExceptionallyLowProbabilityOfDefaultMember ifrs-full:BottomOfRangeMember bns:AdvancedInternalRatingsBasedPortfolioMember 2025-10-31 0000009631 bns:RevisedBaselThreeNormsMember bns:RetailMember bns:VeryLowProbabilityOfDefaultMember ifrs-full:TopOfRangeMember bns:AdvancedInternalRatingsBasedPortfolioMember 2025-10-31 0000009631 bns:CanadaMortgageHousingCorporationProgramMember 2025-10-31 0000009631 bns:ExchangeTradedDerivativeTransactionsMember 2025-10-31 0000009631 bns:ForeignGovernmentsAndCentralBanksMember 2025-10-31 0000009631 bns:BankOfCanadaMember 2025-10-31 0000009631 ifrs-full:OtherAssetsMember 2025-10-31 0000009631 bns:ClearingSystemPaymentSystemsAndDepositoriesMember 2025-10-31 0000009631 bns:OverTheCounterDerivativesMember 2025-10-31 0000009631 bns:SecuritiesBorrowingAndLendingMember 2025-10-31 0000009631 bns:CoveredBondsMember 2025-10-31 0000009631 bns:SecuritizationMember 2025-10-31 0000009631 bns:NonRetailMember bns:StandardizedPortfolioMember 2025-10-31 0000009631 bns:RealEstateSecuredMember bns:RetailMember bns:StandardizedPortfolioMember 2025-10-31 0000009631 bns:RetailMember bns:StandardizedPortfolioMember 2025-10-31 0000009631 bns:RevisedBaselThreeNormsMember bns:RealEstateSecuredHomeEquityLineOfCreditMember bns:RetailMember bns:ExceptionallyLowProbabilityOfDefaultMember bns:AdvancedInternalRatingsBasedPortfolioMember 2025-10-31 0000009631 bns:RevisedBaselThreeNormsMember bns:RealEstateSecuredMortgagesMember bns:RetailMember bns:ExceptionallyLowProbabilityOfDefaultMember bns:AdvancedInternalRatingsBasedPortfolioMember 2025-10-31 0000009631 bns:RevisedBaselThreeNormsMember bns:RealEstateSecuredMortgagesMember bns:RetailMember bns:MediumProbabilityOfDefaultMember bns:AdvancedInternalRatingsBasedPortfolioMember 2025-10-31 0000009631 bns:RevisedBaselThreeNormsMember bns:OtherRetailMember bns:RetailMember bns:LowProbabilityOfDefaultMember bns:AdvancedInternalRatingsBasedPortfolioMember 2025-10-31 0000009631 bns:RevisedBaselThreeNormsMember bns:QualifyingRevolvingMember bns:RetailMember bns:LowProbabilityOfDefaultMember bns:AdvancedInternalRatingsBasedPortfolioMember 2025-10-31 0000009631 bns:RevisedBaselThreeNormsMember bns:RealEstateSecuredMortgagesMember bns:RetailMember bns:LowProbabilityOfDefaultMember bns:AdvancedInternalRatingsBasedPortfolioMember 2025-10-31 0000009631 bns:RevisedBaselThreeNormsMember bns:QualifyingRevolvingMember bns:RetailMember bns:HighProbabilityOfDefaultMember bns:AdvancedInternalRatingsBasedPortfolioMember 2025-10-31 0000009631 bns:RevisedBaselThreeNormsMember bns:RealEstateSecuredHomeEquityLineOfCreditMember bns:RetailMember bns:HighProbabilityOfDefaultMember bns:AdvancedInternalRatingsBasedPortfolioMember 2025-10-31 0000009631 bns:RevisedBaselThreeNormsMember bns:RealEstateSecuredMortgagesMember bns:RetailMember bns:HighProbabilityOfDefaultMember bns:AdvancedInternalRatingsBasedPortfolioMember 2025-10-31 0000009631 bns:RevisedBaselThreeNormsMember bns:QualifyingRevolvingMember bns:RetailMember bns:MediumProbabilityOfDefaultMember bns:AdvancedInternalRatingsBasedPortfolioMember 2025-10-31 0000009631 bns:RevisedBaselThreeNormsMember bns:OtherRetailMember bns:RetailMember bns:ExceptionallyLowProbabilityOfDefaultMember bns:AdvancedInternalRatingsBasedPortfolioMember 2025-10-31 0000009631 bns:RevisedBaselThreeNormsMember bns:QualifyingRevolvingMember bns:RetailMember bns:ExceptionallyLowProbabilityOfDefaultMember bns:AdvancedInternalRatingsBasedPortfolioMember 2025-10-31 0000009631 bns:RevisedBaselThreeNormsMember bns:OtherRetailMember bns:RetailMember bns:ExtremelyHighProbabilityOfDefaultMember bns:AdvancedInternalRatingsBasedPortfolioMember 2025-10-31 0000009631 bns:RevisedBaselThreeNormsMember bns:QualifyingRevolvingMember bns:RetailMember bns:ExtremelyHighProbabilityOfDefaultMember bns:AdvancedInternalRatingsBasedPortfolioMember 2025-10-31 0000009631 bns:RevisedBaselThreeNormsMember bns:OtherRetailMember bns:RetailMember bns:MediumLowProbabilityOfDefaultMember bns:AdvancedInternalRatingsBasedPortfolioMember 2025-10-31 0000009631 bns:RevisedBaselThreeNormsMember bns:QualifyingRevolvingMember bns:RetailMember bns:MediumLowProbabilityOfDefaultMember bns:AdvancedInternalRatingsBasedPortfolioMember 2025-10-31 0000009631 bns:RevisedBaselThreeNormsMember bns:OtherRetailMember bns:RetailMember bns:HighProbabilityOfDefaultMember bns:AdvancedInternalRatingsBasedPortfolioMember 2025-10-31 0000009631 bns:RevisedBaselThreeNormsMember bns:RealEstateSecuredMortgagesMember bns:RetailMember bns:ExtremelyHighProbabilityOfDefaultMember bns:AdvancedInternalRatingsBasedPortfolioMember 2025-10-31 0000009631 bns:RevisedBaselThreeNormsMember bns:RealEstateSecuredMortgagesMember bns:RetailMember bns:VeryLowProbabilityOfDefaultMember bns:AdvancedInternalRatingsBasedPortfolioMember 2025-10-31 0000009631 bns:RevisedBaselThreeNormsMember bns:OtherRetailMember bns:RetailMember bns:DefaultMember bns:AdvancedInternalRatingsBasedPortfolioMember 2025-10-31 0000009631 bns:RevisedBaselThreeNormsMember bns:OtherRetailMember bns:RetailMember bns:VeryLowProbabilityOfDefaultMember bns:AdvancedInternalRatingsBasedPortfolioMember 2025-10-31 0000009631 bns:RevisedBaselThreeNormsMember bns:RealEstateSecuredHomeEquityLineOfCreditMember bns:RetailMember bns:VeryLowProbabilityOfDefaultMember bns:AdvancedInternalRatingsBasedPortfolioMember 2025-10-31 0000009631 bns:RevisedBaselThreeNormsMember bns:RealEstateSecuredHomeEquityLineOfCreditMember bns:RetailMember bns:MediumLowProbabilityOfDefaultMember bns:AdvancedInternalRatingsBasedPortfolioMember 2025-10-31 0000009631 bns:RevisedBaselThreeNormsMember bns:QualifyingRevolvingMember bns:RetailMember bns:DefaultMember bns:AdvancedInternalRatingsBasedPortfolioMember 2025-10-31 0000009631 bns:RevisedBaselThreeNormsMember bns:RealEstateSecuredMortgagesMember bns:RetailMember bns:MediumLowProbabilityOfDefaultMember bns:AdvancedInternalRatingsBasedPortfolioMember 2025-10-31 0000009631 bns:RevisedBaselThreeNormsMember bns:OtherRetailMember bns:RetailMember bns:MediumProbabilityOfDefaultMember bns:AdvancedInternalRatingsBasedPortfolioMember 2025-10-31 0000009631 bns:RevisedBaselThreeNormsMember bns:QualifyingRevolvingMember bns:RetailMember bns:VeryLowProbabilityOfDefaultMember bns:AdvancedInternalRatingsBasedPortfolioMember 2025-10-31 0000009631 bns:RevisedBaselThreeNormsMember bns:RealEstateSecuredHomeEquityLineOfCreditMember bns:RetailMember bns:DefaultMember bns:AdvancedInternalRatingsBasedPortfolioMember 2025-10-31 0000009631 bns:RevisedBaselThreeNormsMember bns:RealEstateSecuredMortgagesMember bns:RetailMember bns:DefaultMember bns:AdvancedInternalRatingsBasedPortfolioMember 2025-10-31 0000009631 bns:RevisedBaselThreeNormsMember bns:NonRetailMember bns:EquivalentExternalRatingStandardAndPoorsAaaToAaPlusMember bns:InvestmentGradeMember bns:AdvancedInternalRatingsBasedPortfolioMember 2025-10-31 0000009631 bns:RevisedBaselThreeNormsMember bns:ExcludingResidentialMortgagesMember bns:NonRetailMember bns:AdvancedInternalRatingsBasedPortfolioMember 2025-10-31 0000009631 bns:RevisedBaselThreeNormsMember bns:GovernmentGuaranteedResidentialMortgagesMember bns:NonRetailMember bns:AdvancedInternalRatingsBasedPortfolioMember 2025-10-31 0000009631 bns:EquivalentExternalRatingStandardAndPoorsBbbMinusMember bns:InvestmentGradeMember 2025-10-31 0000009631 bns:InternalGradeDefaultMember 2025-10-31 0000009631 srt:StandardPoorsBBRatingMember bns:InternalNonInvestmentGrade1Member 2025-10-31 0000009631 bns:EquivalentExternalRatingStandardAndPoorsBbMinusMember bns:InternalNonInvestmentGrade1Member 2025-10-31 0000009631 bns:EquivalentExternalRatingStandardAndPoorsbPlusMember bns:InternalNonInvestmentGrade1Member 2025-10-31 0000009631 bns:EquivalentExternalRatingStandardAndPoorsAaToAPlusMember bns:InvestmentGradeMember 2025-10-31 0000009631 bns:InternalGradeWatchListMember 2025-10-31 0000009631 bns:EquivalentExternalRatingStandardAndPoorsBbPlusMember bns:InternalNonInvestmentGrade1Member 2025-10-31 0000009631 bns:EquivalentExternalRatingStandardAndPoorsBbbPlusMember bns:InvestmentGradeMember 2025-10-31 0000009631 bns:EquivalentExternalRatingStandardAndPoorsaToaMinusMember bns:InvestmentGradeMember 2025-10-31 0000009631 srt:StandardPoorsCCCRatingMember bns:InternalGradeWatchListMember 2025-10-31 0000009631 bns:EquivalentExternalRatingStandardandPoorsCCCMinusToCCMember bns:InternalGradeWatchListMember 2025-10-31 0000009631 srt:StandardPoorsBBBRatingMember bns:InvestmentGradeMember 2025-10-31 0000009631 bns:EquivalentExternalRatingStandardAndPoorsAaaToAaPlusMember bns:InvestmentGradeMember ifrs-full:BottomOfRangeMember 2025-10-31 0000009631 bns:EquivalentExternalRatingStandardAndPoorsAaaToAaPlusMember bns:InvestmentGradeMember ifrs-full:TopOfRangeMember 2025-10-31 0000009631 bns:EquivalentExternalRatingStandardAndPoorsCccPlusMember bns:InternalGradeWatchListMember 2025-10-31 0000009631 bns:EquivalentExternalRatingStandardAndPoorsbTobMinusMember bns:InternalNonInvestmentGrade1Member 2025-10-31 0000009631 bns:OtherExposuresMember ifrs-full:CreditRiskMember 2025-10-31 0000009631 bns:OnePercentageActuarialAssumptionOfDiscountRatesMember ifrs-full:PensionDefinedBenefitPlansMember 2025-10-31 0000009631 bns:OnePercentageActuarialAssumptionOfDiscountRatesMember bns:OtherBenefitPlansMember 2025-10-31 0000009631 bns:ActuarialAssumptionOfDiscountRatesForServiceCostOfCanadianPlansMember ifrs-full:PensionDefinedBenefitPlansMember 2025-10-31 0000009631 bns:ActuarialAssumptionOfDiscountRatesForDefinedBenefitObligationsOfCanadianPlansMember bns:OtherBenefitPlansMember 2025-10-31 0000009631 bns:ActuarialAssumptionOfDiscountRatesForNetInterestCostOfCanadianPlansMember ifrs-full:PensionDefinedBenefitPlansMember 2025-10-31 0000009631 bns:ActuarialAssumptionOfDiscountRatesForServiceCostOfCanadianPlansMember bns:OtherBenefitPlansMember 2025-10-31 0000009631 bns:ActuarialAssumptionOfDiscountRatesForDefinedBenefitObligationsOfCanadianPlansMember ifrs-full:PensionDefinedBenefitPlansMember 2025-10-31 0000009631 bns:ActuarialAssumptionOfDiscountRatesForNetInterestCostOfAllPlansMember bns:OtherBenefitPlansMember 2025-10-31 0000009631 bns:ActuarialAssumptionOfDiscountRatesForInterestOnServiceCostOfCanadianPlansMember ifrs-full:PensionDefinedBenefitPlansMember 2025-10-31 0000009631 bns:ActuarialAssumptionOfDiscountRatesForNetInterestCostOfCanadianPlansMember bns:OtherBenefitPlansMember 2025-10-31 0000009631 bns:ActuarialAssumptionOfDiscountRatesForInterestOnServiceCostOfAllPlansMember ifrs-full:PensionDefinedBenefitPlansMember 2025-10-31 0000009631 bns:ActuarialAssumptionOfDiscountRatesForInterestOnServiceCostOfAllPlansMember bns:OtherBenefitPlansMember 2025-10-31 0000009631 bns:ActuarialAssumptionOfDiscountRatesForServiceCostOfAllPlansMember bns:OtherBenefitPlansMember 2025-10-31 0000009631 bns:ActuarialAssumptionOfDiscountRatesForDefinedBenefitObligationsOfAllPlansMember ifrs-full:PensionDefinedBenefitPlansMember 2025-10-31 0000009631 bns:ActuarialAssumptionOfDiscountRatesForDefinedBenefitObligationsOfAllPlansMember bns:OtherBenefitPlansMember 2025-10-31 0000009631 bns:ActuarialAssumptionOfDiscountRatesForNetInterestCostOfAllPlansMember ifrs-full:PensionDefinedBenefitPlansMember 2025-10-31 0000009631 bns:ActuarialAssumptionOfDiscountRatesForInterestOnServiceCostOfCanadianPlansMember bns:OtherBenefitPlansMember 2025-10-31 0000009631 bns:ActuarialAssumptionOfDiscountRatesForServiceCostOfAllPlansMember ifrs-full:PensionDefinedBenefitPlansMember 2025-10-31 0000009631 bns:DeferredTaxAssetsPensionAndOtherPostretirementBenefitsMember 2025-10-31 0000009631 bns:DeferredTaxAssetsOwnCreditRiskMember 2025-10-31 0000009631 bns:DeferredTaxAssetsTaxLossCarryForwardsMember 2025-10-31 0000009631 bns:DeferredTaxAssetsAllowanceForCreditLossesMember 2025-10-31 0000009631 bns:DeferredTaxAssetsDeferredCompensationMember 2025-10-31 0000009631 bns:DeferredTaxAssetsDeferredIncomeMember 2025-10-31 0000009631 bns:DeferredTaxAssetPropertyAndEquipmentMember 2025-10-31 0000009631 bns:DeferredTaxAssetsSecuritiesMember 2025-10-31 0000009631 bns:DeferredTaxAssetsLeaseLiabilitiesMember 2025-10-31 0000009631 bns:DeferredTaxAssetsOtherMember 2025-10-31 0000009631 bns:BankOfNovaScotiaMember ifrs-full:UnconsolidatedStructuredEntitiesMember 2025-10-31 0000009631 bns:MayTwoThousandThirtySevenMember ifrs-full:FixedInterestRateMember 2025-10-31 0000009631 bns:AugustTwoThousandAndThirtyFourMember ifrs-full:FixedInterestRateMember 2025-10-31 0000009631 bns:DecemberTwoThousandAndThirtyThreeMember ifrs-full:FixedInterestRateMember 2025-10-31 0000009631 bns:AugustTwoThousandAndThirtyThreeMember ifrs-full:FixedInterestRateMember 2025-10-31 0000009631 bns:DecemberTwoThousandAndThirtyTwoMember ifrs-full:FixedInterestRateMember 2025-10-31 0000009631 bns:MayTwoThousandThirtyTwoMember ifrs-full:FixedInterestRateMember 2025-10-31 0000009631 bns:JuneTwoThousandTwentyFiveMember ifrs-full:FixedInterestRateMember 2025-10-31 0000009631 bns:DecemberTwoThousandTwentyFiveMember ifrs-full:FixedInterestRateMember 2025-10-31 0000009631 bns:UnsecuredPersonalLineOfCreditReceivablesMember bns:HalifaxReceivablesTrustMember bns:DepositsFromBusinessAndGovernmentMember 2025-10-31 0000009631 bns:CreditCardReceivableMember bns:TrilliumcreditCardTrustIiMember 2025-10-31 0000009631 ifrs-full:LoansAndReceivablesCategoryMember 2025-10-31 0000009631 bns:UninsuredResidentialMortgageBackedSecuritiesMember bns:ScotiabankCoveredBondGuarantorLimitedPartnershipMember 2025-10-31 0000009631 currency:CLP 2025-10-31 0000009631 bns:OtherForeignCurrenciesMember 2025-10-31 0000009631 bns:ForeignCurrencyForwardContractsMember bns:USDCADMember ifrs-full:HedgesOfNetInvestmentInForeignOperationsMember ifrs-full:CurrencyRiskMember 2025-10-31 0000009631 bns:ForeignCurrencyForwardContractsMember bns:CLPCADMember ifrs-full:HedgesOfNetInvestmentInForeignOperationsMember ifrs-full:CurrencyRiskMember 2025-10-31 0000009631 ifrs-full:SwapContractMember bns:USDCADMember ifrs-full:CashFlowHedgesMember ifrs-full:CurrencyRiskMember 2025-10-31 0000009631 ifrs-full:SwapContractMember bns:EURCADMember ifrs-full:CashFlowHedgesMember ifrs-full:CurrencyRiskMember 2025-10-31 0000009631 ifrs-full:SwapContractMember bns:GBPCADMember ifrs-full:CashFlowHedgesMember ifrs-full:CurrencyRiskMember 2025-10-31 0000009631 bns:ForeignCurrencyForwardContractsMember bns:CADMXNMember ifrs-full:HedgesOfNetInvestmentInForeignOperationsMember ifrs-full:CurrencyRiskMember 2025-10-31 0000009631 bns:ForeignCurrencyForwardContractsMember bns:CADPENMember ifrs-full:HedgesOfNetInvestmentInForeignOperationsMember ifrs-full:CurrencyRiskMember 2025-10-31 0000009631 bns:PurchasedLoansMember 2025-10-31 0000009631 ifrs-full:RecurringFairValueMeasurementMember ifrs-full:IFRS9Member ifrs-full:Level2OfFairValueHierarchyMember 2025-10-31 0000009631 ifrs-full:RecurringFairValueMeasurementMember ifrs-full:IFRS9Member 2025-10-31 0000009631 ifrs-full:AtFairValueMember 2025-10-31 0000009631 ifrs-full:DerivativesMember bns:ForeignExchangeAndGoldContractsMember bns:HedgingDerivativesMember 2025-10-31 0000009631 ifrs-full:SwapContractMember ifrs-full:DerivativesMember bns:InterestRateContractsMember bns:HedgingDerivativesMember 2025-10-31 0000009631 bns:EquityDerivativesMember ifrs-full:DerivativesMember bns:OtherDerivativesMember bns:HedgingDerivativesMember 2025-10-31 0000009631 ifrs-full:DerivativesMember 2025-10-31 0000009631 ifrs-full:DerivativesMember bns:HedgingDerivativesMember 2025-10-31 0000009631 ifrs-full:SwapContractMember ifrs-full:DerivativesMember bns:ForeignExchangeAndGoldContractsMember bns:HedgingDerivativesMember 2025-10-31 0000009631 ifrs-full:ForwardContractMember ifrs-full:DerivativesMember bns:ForeignExchangeAndGoldContractsMember bns:HedgingDerivativesMember 2025-10-31 0000009631 bns:TotalReturnSwapsMember ifrs-full:CashFlowHedgesMember ifrs-full:EquityPriceRiskMember 2025-10-31 0000009631 bns:DerivativeFinancialInstrumentsAssets1Member 2025-10-31 0000009631 bns:MaduroAndCurielsBankNVMember 2025-10-31 0000009631 bns:BankOfXianCoLtdMember 2025-10-31 0000009631 bns:KeycorpMember 2025-10-31 0000009631 bns:UndrawnLoanCommitmentsRetailMember 2025-10-31 0000009631 bns:UndrawnLoanCommitmentsRetailMember bns:StageTwoExposureMember 2025-10-31 0000009631 bns:UndrawnLoanCommitmentsRetailMember bns:StageOneExposureMember 2025-10-31 0000009631 bns:DeferredTaxLiabilitiesIntangibleAssetsMember 2025-10-31 0000009631 bns:DeferredTaxLiabilitiesOthersMember 2025-10-31 0000009631 bns:DeferredTaxLiabilitiesDeferredIncomeMember 2025-10-31 0000009631 bns:DeferredTaxLiabilitiesCashFlowHedgesMember 2025-10-31 0000009631 bns:DeferredTaxLiabilitiesPensionAndOtherPostretirementBenefitsMember 2025-10-31 0000009631 bns:DeferredTaxLiabilitiesDeferredCompensationMember 2025-10-31 0000009631 bns:DeferredTaxLiabilityPropertyAndEquipmentMember 2025-10-31 0000009631 bns:DeferredTaxLiabilitiesSecuritiesMember 2025-10-31 0000009631 bns:DeferredTaxLiabilitiesInvestmentInSubsidiariesAndAssociatesMember 2025-10-31 0000009631 ifrs-full:PensionDefinedBenefitPlansMember 2025-10-31 0000009631 bns:OtherBenefitPlansMember 2025-10-31 0000009631 ifrs-full:ForeignCountriesMember bns:GrupoFinancieroScotiabankInverlatSADeCVMember 2025-10-31 0000009631 ifrs-full:CountryOfDomicileMember bns:MdFinancialManagementCanadaMember 2025-10-31 0000009631 ifrs-full:ForeignCountriesMember bns:ScotiaHoldingsUSALLCMember 2025-10-31 0000009631 ifrs-full:CountryOfDomicileMember bns:ScotiaMortgageCorporationMember 2025-10-31 0000009631 ifrs-full:CountryOfDomicileMember bns:RoynatIncMember 2025-10-31 0000009631 ifrs-full:ForeignCountriesMember bns:TheBankOfNovaScotiaInternationalLimitedMember 2025-10-31 0000009631 ifrs-full:ForeignCountriesMember bns:MultiaccionesS.A.SMember 2025-10-31 0000009631 ifrs-full:CountryOfDomicileMember bns:ScotiaCapitalIncMember 2025-10-31 0000009631 ifrs-full:CountryOfDomicileMember bns:JarislowskyFraserLimitedCanadaMember 2025-10-31 0000009631 ifrs-full:ForeignCountriesMember bns:ScotiaPeruHoldingsSaMember 2025-10-31 0000009631 ifrs-full:CountryOfDomicileMember bns:ScotiaDealerAdvantageIncMember 2025-10-31 0000009631 ifrs-full:CountryOfDomicileMember bns:TheBankOfNovaScotiaTrustCompanyMember 2025-10-31 0000009631 ifrs-full:ForeignCountriesMember bns:ScotialUruguayHoldingsSaMember 2025-10-31 0000009631 ifrs-full:ForeignCountriesMember bns:ScotiabankBrasilSaBancoMultiploMember 2025-10-31 0000009631 ifrs-full:ForeignCountriesMember bns:ScotiabankCaribbeanHoldingsLtdMember 2025-10-31 0000009631 ifrs-full:ForeignCountriesMember bns:ScotiabankBarbadosLimitedMember 2025-10-31 0000009631 ifrs-full:CountryOfDomicileMember bns:TangerineBankMember 2025-10-31 0000009631 ifrs-full:CountryOfDomicileMember bns:ScotiaSecuritiesIncMember 2025-10-31 0000009631 ifrs-full:ForeignCountriesMember bns:NovaScotiaInversionesLimitadaMember 2025-10-31 0000009631 ifrs-full:CountryOfDomicileMember bns:BnsInvestmentsIncMember 2025-10-31 0000009631 ifrs-full:ForeignCountriesMember bns:ScotiabankRepublicaDominicanaSABancoMultipleMember 2025-10-31 0000009631 ifrs-full:CountryOfDomicileMember bns:NationalTrustCompanyMember 2025-10-31 0000009631 bns:EquivalentExternalRatingStandardAndPoorsBbMinusMember bns:InternalNonInvestmentGrade1Member ifrs-full:BottomOfRangeMember 2025-10-31 0000009631 bns:EquivalentExternalRatingStandardAndPoorsbPlusMember bns:InternalNonInvestmentGrade1Member ifrs-full:TopOfRangeMember 2025-10-31 0000009631 bns:EquivalentExternalRatingStandardAndPoorsbPlusMember bns:InternalNonInvestmentGrade1Member ifrs-full:BottomOfRangeMember 2025-10-31 0000009631 bns:EquivalentExternalRatingStandardAndPoorsbTobMinusMember bns:InternalNonInvestmentGrade1Member ifrs-full:TopOfRangeMember 2025-10-31 0000009631 bns:EquivalentExternalRatingStandardAndPoorsbTobMinusMember bns:InternalNonInvestmentGrade1Member ifrs-full:BottomOfRangeMember 2025-10-31 0000009631 bns:EquivalentExternalRatingStandardAndPoorsCccPlusMember bns:InternalGradeWatchListMember ifrs-full:TopOfRangeMember 2025-10-31 0000009631 bns:EquivalentExternalRatingStandardAndPoorsBbbMinusMember bns:InvestmentGradeMember ifrs-full:BottomOfRangeMember 2025-10-31 0000009631 bns:EquivalentExternalRatingStandardAndPoorsBbPlusMember bns:InternalNonInvestmentGrade1Member ifrs-full:TopOfRangeMember 2025-10-31 0000009631 bns:EquivalentExternalRatingStandardAndPoorsBbPlusMember bns:InternalNonInvestmentGrade1Member ifrs-full:BottomOfRangeMember 2025-10-31 0000009631 srt:StandardPoorsBBRatingMember bns:InternalNonInvestmentGrade1Member ifrs-full:TopOfRangeMember 2025-10-31 0000009631 srt:StandardPoorsBBRatingMember bns:InternalNonInvestmentGrade1Member ifrs-full:BottomOfRangeMember 2025-10-31 0000009631 bns:EquivalentExternalRatingStandardAndPoorsBbMinusMember bns:InternalNonInvestmentGrade1Member ifrs-full:TopOfRangeMember 2025-10-31 0000009631 bns:EquivalentExternalRatingStandardandPoorsCCCMinusToCCMember bns:InternalGradeWatchListMember ifrs-full:TopOfRangeMember 2025-10-31 0000009631 bns:EquivalentExternalRatingStandardandPoorsCCCMinusToCCMember bns:InternalGradeWatchListMember ifrs-full:BottomOfRangeMember 2025-10-31 0000009631 bns:InternalGradeWatchListMember ifrs-full:TopOfRangeMember 2025-10-31 0000009631 bns:EquivalentExternalRatingStandardAndPoorsCccPlusMember bns:InternalGradeWatchListMember ifrs-full:BottomOfRangeMember 2025-10-31 0000009631 srt:StandardPoorsCCCRatingMember bns:InternalGradeWatchListMember ifrs-full:TopOfRangeMember 2025-10-31 0000009631 srt:StandardPoorsCCCRatingMember bns:InternalGradeWatchListMember ifrs-full:BottomOfRangeMember 2025-10-31 0000009631 bns:EquivalentExternalRatingStandardAndPoorsaToaMinusMember bns:InvestmentGradeMember ifrs-full:BottomOfRangeMember 2025-10-31 0000009631 bns:EquivalentExternalRatingStandardAndPoorsBbbPlusMember bns:InvestmentGradeMember ifrs-full:TopOfRangeMember 2025-10-31 0000009631 bns:EquivalentExternalRatingStandardAndPoorsBbbPlusMember bns:InvestmentGradeMember ifrs-full:BottomOfRangeMember 2025-10-31 0000009631 srt:StandardPoorsBBBRatingMember bns:InvestmentGradeMember ifrs-full:TopOfRangeMember 2025-10-31 0000009631 srt:StandardPoorsBBBRatingMember bns:InvestmentGradeMember ifrs-full:BottomOfRangeMember 2025-10-31 0000009631 bns:EquivalentExternalRatingStandardAndPoorsBbbMinusMember bns:InvestmentGradeMember ifrs-full:TopOfRangeMember 2025-10-31 0000009631 bns:EquivalentExternalRatingStandardAndPoorsAaToAPlusMember bns:InvestmentGradeMember ifrs-full:TopOfRangeMember 2025-10-31 0000009631 bns:EquivalentExternalRatingStandardAndPoorsAaToAPlusMember bns:InvestmentGradeMember ifrs-full:BottomOfRangeMember 2025-10-31 0000009631 bns:EquivalentExternalRatingStandardAndPoorsaToaMinusMember bns:InvestmentGradeMember ifrs-full:TopOfRangeMember 2025-10-31 0000009631 bns:InternalGradeWatchListMember ifrs-full:BottomOfRangeMember 2025-10-31 0000009631 bns:RevisedBaselThreeNormsMember bns:RetailMember bns:HighProbabilityOfDefaultMember bns:AdvancedInternalRatingsBasedPortfolioMember 2025-10-31 0000009631 bns:RevisedBaselThreeNormsMember bns:RealEstateSecuredHomeEquityLineOfCreditMember bns:RetailMember bns:AdvancedInternalRatingsBasedPortfolioMember 2025-10-31 0000009631 bns:RevisedBaselThreeNormsMember bns:RealEstateSecuredMortgagesMember bns:RetailMember bns:AdvancedInternalRatingsBasedPortfolioMember 2025-10-31 0000009631 bns:RevisedBaselThreeNormsMember bns:RetailMember bns:ExtremelyHighProbabilityOfDefaultMember bns:AdvancedInternalRatingsBasedPortfolioMember 2025-10-31 0000009631 bns:RevisedBaselThreeNormsMember bns:RetailMember bns:LowProbabilityOfDefaultMember bns:AdvancedInternalRatingsBasedPortfolioMember 2025-10-31 0000009631 bns:RevisedBaselThreeNormsMember bns:RetailMember bns:MediumLowProbabilityOfDefaultMember bns:AdvancedInternalRatingsBasedPortfolioMember 2025-10-31 0000009631 bns:RevisedBaselThreeNormsMember bns:RetailMember bns:VeryLowProbabilityOfDefaultMember bns:AdvancedInternalRatingsBasedPortfolioMember 2025-10-31 0000009631 bns:RevisedBaselThreeNormsMember bns:RetailMember bns:ExceptionallyLowProbabilityOfDefaultMember bns:AdvancedInternalRatingsBasedPortfolioMember 2025-10-31 0000009631 bns:RevisedBaselThreeNormsMember bns:RetailMember bns:MediumProbabilityOfDefaultMember bns:AdvancedInternalRatingsBasedPortfolioMember 2025-10-31 0000009631 bns:RetailMember bns:AdvancedInternalRatingsBasedPortfolioMember 2025-10-31 0000009631 ifrs-full:SubsidiariesWithMaterialNoncontrollingInterestsMember 2025-10-31 0000009631 bns:ActuarialAssumptionOfMedicalCostTrendUltimateRatesMember bns:OtherBenefitPlansMember 2025-10-31 0000009631 bns:ActuarialAssumptionOfMedicalCostTrendInitialRatesMember bns:OtherBenefitPlansMember 2025-10-31 0000009631 ifrs-full:ConsumerLoansMember bns:MediumProbabilityOfDefaultMember 2025-10-31 0000009631 bns:ResidentialMortgagesMember bns:StageOneExposureMember bns:LoansNotGradedMember 2025-10-31 0000009631 bns:ResidentialMortgagesMember bns:StageTwoExposureMember bns:LoansNotGradedMember 2025-10-31 0000009631 bns:ResidentialMortgagesMember bns:StageOneExposureMember bns:MediumProbabilityOfDefaultMember 2025-10-31 0000009631 bns:VeryHighProbabilityOfDefaultMember bns:ResidentialMortgagesMember 2025-10-31 0000009631 bns:CreditCardMember bns:StageOneExposureMember 2025-10-31 0000009631 bns:VeryHighProbabilityOfDefaultMember bns:CreditCardMember bns:StageOneExposureMember 2025-10-31 0000009631 bns:VeryLowProbabilityOfDefaultMember bns:CreditCardMember bns:StageOneExposureMember 2025-10-31 0000009631 bns:VeryLowProbabilityOfDefaultMember bns:CreditCardMember bns:StageTwoExposureMember 2025-10-31 0000009631 bns:HighProbabilityOfDefaultMember bns:CreditCardMember 2025-10-31 0000009631 bns:CreditCardMember bns:StageTwoExposureMember bns:VeryHighProbabilityOfDefaultMember 2025-10-31 0000009631 bns:VeryLowProbabilityOfDefaultMember bns:CreditCardMember 2025-10-31 0000009631 bns:CreditCardMember bns:StageOneExposureMember bns:LowProbabilityOfDefaultMember 2025-10-31 0000009631 bns:LowProbabilityOfDefaultMember bns:CreditCardMember bns:StageTwoExposureMember 2025-10-31 0000009631 bns:CreditCardMember bns:LowProbabilityOfDefaultMember 2025-10-31 0000009631 bns:HighProbabilityOfDefaultMember bns:CreditCardMember bns:StageTwoExposureMember 2025-10-31 0000009631 bns:MediumProbabilityOfDefaultMember bns:CreditCardMember bns:StageOneExposureMember 2025-10-31 0000009631 bns:CreditCardMember bns:StageTwoExposureMember bns:MediumProbabilityOfDefaultMember 2025-10-31 0000009631 bns:MediumProbabilityOfDefaultMember bns:CreditCardMember 2025-10-31 0000009631 bns:LowProbabilityOfDefaultMember ifrs-full:ConsumerLoansMember 2025-10-31 0000009631 bns:LowProbabilityOfDefaultMember ifrs-full:ConsumerLoansMember bns:StageTwoExposureMember 2025-10-31 0000009631 bns:LowProbabilityOfDefaultMember ifrs-full:ConsumerLoansMember bns:StageOneExposureMember 2025-10-31 0000009631 bns:HighProbabilityOfDefaultMember bns:CreditCardMember bns:StageOneExposureMember 2025-10-31 0000009631 bns:HighProbabilityOfDefaultMember ifrs-full:ConsumerLoansMember 2025-10-31 0000009631 ifrs-full:ConsumerLoansMember bns:StageOneExposureMember 2025-10-31 0000009631 ifrs-full:ConsumerLoansMember bns:StageTwoExposureMember 2025-10-31 0000009631 ifrs-full:ConsumerLoansMember bns:StageThreeExposureMember 2025-10-31 0000009631 ifrs-full:ConsumerLoansMember bns:VeryLowProbabilityOfDefaultMember 2025-10-31 0000009631 bns:VeryLowProbabilityOfDefaultMember ifrs-full:ConsumerLoansMember bns:StageOneExposureMember 2025-10-31 0000009631 bns:VeryHighProbabilityOfDefaultMember ifrs-full:ConsumerLoansMember 2025-10-31 0000009631 bns:DefaultMember ifrs-full:ConsumerLoansMember 2025-10-31 0000009631 ifrs-full:ConsumerLoansMember bns:StageOneExposureMember bns:VeryHighProbabilityOfDefaultMember 2025-10-31 0000009631 ifrs-full:ConsumerLoansMember bns:StageThreeExposureMember bns:DefaultMember 2025-10-31 0000009631 bns:VeryHighProbabilityOfDefaultMember ifrs-full:ConsumerLoansMember bns:StageTwoExposureMember 2025-10-31 0000009631 ifrs-full:ConsumerLoansMember bns:StageOneExposureMember bns:HighProbabilityOfDefaultMember 2025-10-31 0000009631 bns:HighProbabilityOfDefaultMember ifrs-full:ConsumerLoansMember bns:StageTwoExposureMember 2025-10-31 0000009631 bns:LoansNotGradedMember ifrs-full:ConsumerLoansMember bns:StageTwoExposureMember 2025-10-31 0000009631 ifrs-full:ConsumerLoansMember bns:LoansNotGradedMember 2025-10-31 0000009631 bns:LoansNotGradedMember ifrs-full:ConsumerLoansMember bns:StageOneExposureMember 2025-10-31 0000009631 bns:VeryHighProbabilityOfDefaultMember bns:CreditCardMember 2025-10-31 0000009631 bns:ResidentialMortgagesMember bns:LoansNotGradedMember 2025-10-31 0000009631 bns:ResidentialMortgagesMember bns:StageThreeExposureMember 2025-10-31 0000009631 bns:CreditCardMember bns:LoansNotGradedMember 2025-10-31 0000009631 bns:CreditCardMember bns:StageTwoExposureMember 2025-10-31 0000009631 ifrs-full:ConsumerLoansMember bns:StageTwoExposureMember bns:MediumProbabilityOfDefaultMember 2025-10-31 0000009631 ifrs-full:ConsumerLoansMember bns:StageOneExposureMember bns:MediumProbabilityOfDefaultMember 2025-10-31 0000009631 ifrs-full:ConsumerLoansMember bns:StageTwoExposureMember bns:VeryLowProbabilityOfDefaultMember 2025-10-31 0000009631 bns:CreditCardMember bns:StageOneExposureMember bns:LoansNotGradedMember 2025-10-31 0000009631 bns:LoansNotGradedMember bns:CreditCardMember bns:StageTwoExposureMember 2025-10-31 0000009631 bns:VeryHighProbabilityOfDefaultMember bns:ResidentialMortgagesMember bns:StageOneExposureMember 2025-10-31 0000009631 bns:ResidentialMortgagesMember bns:StageTwoExposureMember bns:VeryHighProbabilityOfDefaultMember 2025-10-31 0000009631 bns:HighProbabilityOfDefaultMember bns:ResidentialMortgagesMember 2025-10-31 0000009631 bns:ResidentialMortgagesMember bns:StageTwoExposureMember bns:HighProbabilityOfDefaultMember 2025-10-31 0000009631 bns:MediumProbabilityOfDefaultMember bns:ResidentialMortgagesMember 2025-10-31 0000009631 bns:MediumProbabilityOfDefaultMember bns:ResidentialMortgagesMember bns:StageTwoExposureMember 2025-10-31 0000009631 bns:ResidentialMortgagesMember bns:StageTwoExposureMember 2025-10-31 0000009631 bns:ResidentialMortgagesMember bns:StageOneExposureMember 2025-10-31 0000009631 bns:ResidentialMortgagesMember bns:VeryLowProbabilityOfDefaultMember 2025-10-31 0000009631 bns:HighProbabilityOfDefaultMember bns:ResidentialMortgagesMember bns:StageOneExposureMember 2025-10-31 0000009631 bns:LowProbabilityOfDefaultMember bns:ResidentialMortgagesMember 2025-10-31 0000009631 bns:VeryLowProbabilityOfDefaultMember bns:ResidentialMortgagesMember bns:StageOneExposureMember 2025-10-31 0000009631 bns:VeryLowProbabilityOfDefaultMember bns:ResidentialMortgagesMember bns:StageTwoExposureMember 2025-10-31 0000009631 bns:DefaultMember bns:ResidentialMortgagesMember 2025-10-31 0000009631 bns:DefaultMember bns:ResidentialMortgagesMember bns:StageThreeExposureMember 2025-10-31 0000009631 bns:LowProbabilityOfDefaultMember bns:ResidentialMortgagesMember bns:StageOneExposureMember 2025-10-31 0000009631 bns:LowProbabilityOfDefaultMember bns:ResidentialMortgagesMember bns:StageTwoExposureMember 2025-10-31 0000009631 bns:DefaultMember bns:TotalRetailLoansMember 2025-10-31 0000009631 bns:TotalRetailLoansMember bns:LoansNotGradedMember 2025-10-31 0000009631 bns:TotalRetailLoansMember bns:StageTwoExposureMember bns:LoansNotGradedMember 2025-10-31 0000009631 bns:WatchListMember bns:BusinessAndGovernmentMember bns:StageOneExposureMember 2025-10-31 0000009631 bns:WatchListMember bns:BusinessAndGovernmentMember bns:StageTwoExposureMember 2025-10-31 0000009631 bns:WatchListMember bns:BusinessAndGovernmentMember 2025-10-31 0000009631 bns:LoansNotGradedMember bns:TotalNonRetailLoansMember bns:StageOneExposureMember 2025-10-31 0000009631 bns:TotalNonRetailLoansMember bns:StageOneExposureMember 2025-10-31 0000009631 bns:TotalNonRetailLoansMember bns:StageTwoExposureMember 2025-10-31 0000009631 bns:TotalNonRetailLoansMember bns:StageThreeExposureMember 2025-10-31 0000009631 bns:TotalNonRetailLoansMember bns:StageTwoExposureMember bns:LoansNotGradedMember 2025-10-31 0000009631 bns:TotalNonRetailLoansMember bns:StageOneExposureMember bns:InvestmentGradeMember 2025-10-31 0000009631 bns:TotalNonRetailLoansMember bns:StageTwoExposureMember bns:InvestmentGradeMember 2025-10-31 0000009631 bns:WatchListMember bns:TotalNonRetailLoansMember bns:StageOneExposureMember 2025-10-31 0000009631 bns:TotalNonRetailLoansMember bns:StageThreeExposureMember bns:DefaultMember 2025-10-31 0000009631 bns:DefaultMember bns:TotalNonRetailLoansMember 2025-10-31 0000009631 bns:NoninvestmentGradeMember bns:TotalNonRetailLoansMember bns:StageOneExposureMember 2025-10-31 0000009631 bns:TotalNonRetailLoansMember 2025-10-31 0000009631 bns:WatchListMember bns:TotalNonRetailLoansMember bns:StageTwoExposureMember 2025-10-31 0000009631 bns:TotalNonRetailLoansMember bns:WatchListMember 2025-10-31 0000009631 bns:TotalNonRetailLoansMember bns:InvestmentGradeMember 2025-10-31 0000009631 bns:TotalRetailLoansMember bns:StageThreeExposureMember bns:DefaultMember 2025-10-31 0000009631 bns:TotalRetailLoansMember bns:VeryLowProbabilityOfDefaultMember 2025-10-31 0000009631 bns:BusinessAndGovernmentMember bns:StageTwoExposureMember bns:LoansNotGradedMember 2025-10-31 0000009631 bns:BusinessAndGovernmentMember bns:LoansNotGradedMember 2025-10-31 0000009631 bns:LoansNotGradedMember bns:TotalNonRetailLoansMember 2025-10-31 0000009631 bns:TotalNonRetailLoansMember bns:StageTwoExposureMember bns:NoninvestmentGradeMember 2025-10-31 0000009631 bns:NoninvestmentGradeMember bns:TotalNonRetailLoansMember 2025-10-31 0000009631 bns:InvestmentGradeMember bns:BusinessAndGovernmentMember bns:StageOneExposureMember 2025-10-31 0000009631 bns:BusinessAndGovernmentMember bns:StageTwoExposureMember bns:InvestmentGradeMember 2025-10-31 0000009631 bns:BusinessAndGovernmentMember bns:StageOneExposureMember bns:LoansNotGradedMember 2025-10-31 0000009631 bns:BusinessAndGovernmentMember bns:StageOneExposureMember 2025-10-31 0000009631 bns:StageThreeExposureMember 2025-10-31 0000009631 bns:BusinessAndGovernmentMember bns:DefaultMember 2025-10-31 0000009631 bns:NoninvestmentGradeMember bns:BusinessAndGovernmentMember bns:StageTwoExposureMember 2025-10-31 0000009631 bns:NoninvestmentGradeMember bns:BusinessAndGovernmentMember bns:StageOneExposureMember 2025-10-31 0000009631 bns:LoansNotGradedMember bns:TotalRetailLoansMember bns:StageOneExposureMember 2025-10-31 0000009631 bns:TotalRetailLoansMember bns:StageOneExposureMember 2025-10-31 0000009631 bns:TotalRetailLoansMember bns:StageTwoExposureMember 2025-10-31 0000009631 bns:TotalRetailLoansMember bns:StageThreeExposureMember 2025-10-31 0000009631 bns:TotalRetailLoansMember 2025-10-31 0000009631 bns:VeryHighProbabilityOfDefaultMember bns:TotalRetailLoansMember 2025-10-31 0000009631 bns:TotalRetailLoansMember bns:StageTwoExposureMember bns:VeryHighProbabilityOfDefaultMember 2025-10-31 0000009631 bns:VeryHighProbabilityOfDefaultMember bns:TotalRetailLoansMember bns:StageOneExposureMember 2025-10-31 0000009631 bns:BusinessAndGovernmentMember bns:StageTwoExposureMember 2025-10-31 0000009631 bns:VeryLowProbabilityOfDefaultMember bns:TotalRetailLoansMember bns:StageTwoExposureMember 2025-10-31 0000009631 bns:TotalRetailLoansMember bns:StageOneExposureMember bns:VeryLowProbabilityOfDefaultMember 2025-10-31 0000009631 bns:BusinessAndGovernmentMember bns:NoninvestmentGradeMember 2025-10-31 0000009631 bns:BusinessAndGovernmentMember bns:InvestmentGradeMember 2025-10-31 0000009631 bns:MediumProbabilityOfDefaultMember bns:TotalRetailLoansMember bns:StageTwoExposureMember 2025-10-31 0000009631 bns:TotalRetailLoansMember bns:StageOneExposureMember bns:MediumProbabilityOfDefaultMember 2025-10-31 0000009631 bns:TotalRetailLoansMember bns:MediumProbabilityOfDefaultMember 2025-10-31 0000009631 bns:LowProbabilityOfDefaultMember bns:TotalRetailLoansMember 2025-10-31 0000009631 bns:TotalRetailLoansMember bns:StageTwoExposureMember bns:LowProbabilityOfDefaultMember 2025-10-31 0000009631 bns:LowProbabilityOfDefaultMember bns:TotalRetailLoansMember bns:StageOneExposureMember 2025-10-31 0000009631 bns:HighProbabilityOfDefaultMember bns:TotalRetailLoansMember 2025-10-31 0000009631 bns:TotalRetailLoansMember bns:StageTwoExposureMember bns:HighProbabilityOfDefaultMember 2025-10-31 0000009631 bns:HighProbabilityOfDefaultMember bns:TotalRetailLoansMember bns:StageOneExposureMember 2025-10-31 0000009631 bns:DerivativeFinancialInstrumentsLiabilities1Member 2025-10-31 0000009631 ifrs-full:LoansAcquiredInBusinessCombinationMember bns:StageThreeMember 2025-10-31 0000009631 bns:CreditValuationAdjustmentMember 2025-10-31 0000009631 ifrs-full:RecurringFairValueMeasurementMember ifrs-full:IFRS9Member ifrs-full:Level1OfFairValueHierarchyMember 2025-10-31 0000009631 ifrs-full:RecurringFairValueMeasurementMember ifrs-full:IFRS9Member ifrs-full:Level3OfFairValueHierarchyMember 2025-10-31 0000009631 bns:SecuritiesPurchasedUnderResaleAgreementsAndSecuritiesBorrowedMember 2025-10-31 0000009631 bns:TwoThousandElevenToTwoThousandAndTwentyMember 2025-10-31 0000009631 bns:IndemnificationsMember 2025-10-31 0000009631 bns:LiquidityFacilitiesMember 2025-10-31 0000009631 bns:StandbyLettersOfCreditAndLettersOfGuaranteeMember 2025-10-31 0000009631 bns:KeycorpMember 2025-10-31 0000009631 bns:OtherCreditRiskExposureRepo-StyleTransactionsMember ifrs-full:CreditRiskMember 2025-10-31 0000009631 bns:ReverseRepurchaseAgreementsMember 2025-10-31 0000009631 bns:StandardSecuritiesBorrowingAgreementsMember 2025-10-31 0000009631 bns:CommitmentsToExtendCreditOriginalTermToMaturityOfOneYearOrLessMember 2025-10-31 0000009631 bns:SecuritiesPurchaseAndOtherCommitmentMember 2025-10-31 0000009631 ifrs-full:SecuritiesLendingMember 2025-10-31 0000009631 bns:CommercialLetterOfCreditMember 2025-10-31 0000009631 bns:OtherMarketRiskExposuresAlsoSubjectToCreditRiskMember ifrs-full:CreditRiskMember 2025-10-31 0000009631 bns:OtherCreditRiskExposureOver-The-CounterDerivativesMember ifrs-full:CreditRiskMember 2025-10-31 0000009631 country:CA bns:LessThanThreeMonthsMember 2025-10-31 0000009631 country:CA bns:LaterThanThreeMonthAndNotLaterThanSixMonthsMember 2025-10-31 0000009631 country:CA bns:LaterThanSixMonthAndNotLaterThanTwelveMonthsMember 2025-10-31 0000009631 country:CA ifrs-full:LaterThanOneYearAndNotLaterThanFiveYearsMember 2025-10-31 0000009631 country:CA ifrs-full:LaterThanFiveYearsMember 2025-10-31 0000009631 bns:OtherCreditRiskExposureEquityMember ifrs-full:CreditRiskMember 2025-10-31 0000009631 ifrs-full:NotMeasuredAtFairValueInStatementOfFinancialPositionButForWhichFairValueIsDisclosedMember ifrs-full:IFRS9Member 2025-10-31 0000009631 ifrs-full:Level2OfFairValueHierarchyMember ifrs-full:NotMeasuredAtFairValueInStatementOfFinancialPositionButForWhichFairValueIsDisclosedMember ifrs-full:IFRS9Member 2025-10-31 0000009631 ifrs-full:FairValueHedgesMember 2025-10-31 0000009631 bns:StockAppreciationRightsMember 2025-10-31 0000009631 bns:CommonSharesMember 2025-10-31 0000009631 bns:OtherNonControllingInterestsMember 2025-10-31 0000009631 bns:ScotiabankTrinidadAndTobagoLimitedFiftyPointNineZeroPercentMember 2025-10-31 0000009631 bns:ScotiaGroupJamaicaLimitedMember 2025-10-31 0000009631 bns:ScotiabankChileSAMember 2025-10-31 0000009631 bns:ScotiabankColpatriaSAMember 2025-10-31 0000009631 bns:CreditRiskExposureDrawnRetailMember ifrs-full:CreditRiskMember 2025-10-31 0000009631 ifrs-full:SwapContractMember ifrs-full:FairValueHedgesMember bns:CurrencyOrInterestRateRiskMember 2025-10-31 0000009631 bns:DepositLiabilitiesMember ifrs-full:FairValueHedgesMember bns:CurrencyOrInterestRateRiskMember 2025-10-31 0000009631 ifrs-full:NotMeasuredAtFairValueInStatementOfFinancialPositionButForWhichFairValueIsDisclosedMember ifrs-full:FinancialAssetsAtAmortisedCostCategoryMember ifrs-full:IFRS9Member 2025-10-31 0000009631 ifrs-full:Level2OfFairValueHierarchyMember ifrs-full:NotMeasuredAtFairValueInStatementOfFinancialPositionButForWhichFairValueIsDisclosedMember ifrs-full:FinancialAssetsAtAmortisedCostCategoryMember ifrs-full:IFRS9Member 2025-10-31 0000009631 ifrs-full:Level1OfFairValueHierarchyMember ifrs-full:NotMeasuredAtFairValueInStatementOfFinancialPositionButForWhichFairValueIsDisclosedMember ifrs-full:FinancialAssetsAtAmortisedCostCategoryMember ifrs-full:IFRS9Member 2025-10-31 0000009631 bns:ObligationsRelatedToSecuritiesSoldUnderRepurchaseAgreementsAndSecuritiesLentMember 2025-10-31 0000009631 bns:NetInvestmentHedgesMember 2025-10-31 0000009631 ifrs-full:SwapContractMember ifrs-full:CashFlowHedgesMember ifrs-full:CurrencyRiskMember 2025-10-31 0000009631 bns:Cash1Member ifrs-full:CashFlowHedgesMember ifrs-full:CurrencyRiskMember 2025-10-31 0000009631 ifrs-full:SwapContractMember ifrs-full:CashFlowHedgesMember bns:CurrencyOrInterestRateRiskMember 2025-10-31 0000009631 bns:ForeignCurrencyForwardContractsMember bns:NetInvestmentHedgesMember ifrs-full:CurrencyRiskMember 2025-10-31 0000009631 ifrs-full:CashFlowHedgesMember bns:EquityPriceRiskReturnSwapMember 2025-10-31 0000009631 ifrs-full:CashFlowHedgesMember 2025-10-31 0000009631 bns:OtherSharebasedPaymentPlansMember 2025-10-31 0000009631 bns:DepositLiabilitiesMember bns:NetInvestmentHedgesMember ifrs-full:CurrencyRiskMember 2025-10-31 0000009631 bns:ForeignCurrencyForwardContractsMember ifrs-full:CashFlowHedgesMember ifrs-full:CurrencyRiskMember 2025-10-31 0000009631 ifrs-full:Level1OfFairValueHierarchyMember ifrs-full:NotMeasuredAtFairValueInStatementOfFinancialPositionButForWhichFairValueIsDisclosedMember ifrs-full:IFRS9Member 2025-10-31 0000009631 ifrs-full:CashFlowHedgesMember ifrs-full:InterestRateRiskMember 2025-10-31 0000009631 ifrs-full:CashFlowHedgesMember bns:CurrencyOrInterestRateRiskMember 2025-10-31 0000009631 ifrs-full:CashFlowHedgesMember ifrs-full:CurrencyRiskMember 2025-10-31 0000009631 ifrs-full:CashFlowHedgesMember ifrs-full:EquityPriceRiskMember 2025-10-31 0000009631 ifrs-full:HedgesOfNetInvestmentInForeignOperationsMember ifrs-full:CurrencyRiskMember 2025-10-31 0000009631 bns:BusinessAndGovernmentMember bns:StageTwoMember 2025-10-31 0000009631 bns:BusinessAndGovernmentMember bns:StageOneMember 2025-10-31 0000009631 bns:BusinessAndGovernmentMember bns:StageThreeMember 2025-10-31 0000009631 bns:InterestBearingDepositsMember country:US 2025-10-31 0000009631 bns:InterestBearingDepositsMember bns:OtherInternationalMember 2025-10-31 0000009631 bns:InterestBearingDepositsMember country:CO 2025-10-31 0000009631 bns:NonInterestBearingMember country:CO 2025-10-31 0000009631 bns:NonInterestBearingMember bns:OtherInternationalMember 2025-10-31 0000009631 bns:InterestBearingDepositsMember country:MX 2025-10-31 0000009631 bns:InterestBearingDepositsMember bns:PersonalDepositMember 2025-10-31 0000009631 bns:NonInterestBearingMember country:PE 2025-10-31 0000009631 bns:InterestBearingDepositsMember country:CL 2025-10-31 0000009631 bns:NonInterestBearingMember country:CL 2025-10-31 0000009631 bns:NonInterestBearingMember country:MX 2025-10-31 0000009631 bns:InterestBearingDepositsMember country:PE 2025-10-31 0000009631 bns:InterestBearingDepositsMember 2025-10-31 0000009631 bns:NonInterestBearingMember country:US 2025-10-31 0000009631 bns:InterestBearingDepositsMember country:CA 2025-10-31 0000009631 bns:NonInterestBearingMember country:CA 2025-10-31 0000009631 bns:NonInterestBearingMember 2025-10-31 0000009631 bns:NonInterestBearingMember bns:PersonalDepositMember 2025-10-31 0000009631 bns:InterestBearingDepositsMember bns:BusinessAndGovernmentDepositsMember 2025-10-31 0000009631 bns:NonInterestBearingMember bns:BusinessAndGovernmentDepositsMember 2025-10-31 0000009631 bns:InterestBearingDepositsMember bns:DepositsFromBankMember 2025-10-31 0000009631 bns:NonInterestBearingMember bns:DepositsFromBankMember 2025-10-31 0000009631 ifrs-full:Level3OfFairValueHierarchyMember ifrs-full:NotMeasuredAtFairValueInStatementOfFinancialPositionButForWhichFairValueIsDisclosedMember ifrs-full:IFRS9Member 2025-10-31 0000009631 bns:InvestmentSecuritiesMember ifrs-full:FairValueHedgesMember ifrs-full:InterestRateRiskMember 2025-10-31 0000009631 ifrs-full:LoanCommitmentsMember ifrs-full:FairValueHedgesMember ifrs-full:InterestRateRiskMember 2025-10-31 0000009631 country:GB 2025-10-31 0000009631 bns:DepositsFromBankMember 2025-10-31 0000009631 bns:BusinessAndGovernmentDepositsMember 2025-10-31 0000009631 bns:PersonalDepositMember 2025-10-31 0000009631 bns:OtherCreditRiskExposureSecuritizationMember ifrs-full:CreditRiskMember 2025-10-31 0000009631 bns:SubordinatedDebentureMember ifrs-full:FairValueHedgesMember ifrs-full:InterestRateRiskMember 2025-10-31 0000009631 bns:DepositLiabilitiesMember ifrs-full:FairValueHedgesMember ifrs-full:InterestRateRiskMember 2025-10-31 0000009631 bns:OverNextTwelveMonthsMember bns:SeverePessimisticMember bns:GlobalCopperPriceMember 2025-10-31 0000009631 bns:RemainingForecastPeriodCreditLossesMember bns:PessimisticScenarioMember bns:GlobalWtiOilPriceMember 2025-10-31 0000009631 bns:RemainingForecastPeriodCreditLossesMember bns:OptimisticScenarioMember bns:GlobalCopperPriceMember 2025-10-31 0000009631 bns:OverNextTwelveMonthsMember bns:BaseCaseScenarioMember bns:GlobalWtiOilPriceMember 2025-10-31 0000009631 bns:RemainingForecastPeriodCreditLossesMember bns:BaseCaseScenarioMember bns:GlobalWtiOilPriceMember 2025-10-31 0000009631 bns:RemainingForecastPeriodCreditLossesMember bns:SeverePessimisticMember bns:GlobalCopperPriceMember 2025-10-31 0000009631 bns:OverNextTwelveMonthsMember bns:PessimisticScenarioMember bns:GlobalCopperPriceMember 2025-10-31 0000009631 bns:RemainingForecastPeriodCreditLossesMember bns:PessimisticScenarioMember bns:GlobalCopperPriceMember 2025-10-31 0000009631 bns:OverNextTwelveMonthsMember bns:OptimisticScenarioMember bns:GlobalWtiOilPriceMember 2025-10-31 0000009631 bns:OverNextTwelveMonthsMember bns:BaseCaseScenarioMember bns:GlobalCopperPriceMember 2025-10-31 0000009631 bns:RemainingForecastPeriodCreditLossesMember bns:BaseCaseScenarioMember bns:GlobalCopperPriceMember 2025-10-31 0000009631 bns:OverNextTwelveMonthsMember bns:OptimisticScenarioMember bns:GlobalCopperPriceMember 2025-10-31 0000009631 bns:RemainingForecastPeriodCreditLossesMember bns:OptimisticScenarioMember bns:GlobalWtiOilPriceMember 2025-10-31 0000009631 bns:OverNextTwelveMonthsMember bns:PessimisticScenarioMember bns:GlobalWtiOilPriceMember 2025-10-31 0000009631 bns:OverNextTwelveMonthsMember bns:SeverePessimisticMember bns:GlobalWtiOilPriceMember 2025-10-31 0000009631 bns:RemainingForecastPeriodCreditLossesMember bns:SeverePessimisticMember bns:GlobalWtiOilPriceMember 2025-10-31 0000009631 bns:DeferredStockUnitPlanMember 2025-10-31 0000009631 bns:RestrictedShareUnitPlanMember 2025-10-31 0000009631 bns:DirectorsDeferredStockUnitPlanMember 2025-10-31 0000009631 ifrs-full:Level2OfFairValueHierarchyMember ifrs-full:RecurringFairValueMeasurementMember bns:CanadianFederalGovernmentAndGovernmentGuaranteedDebtMember ifrs-full:IFRS9Member 2025-10-31 0000009631 ifrs-full:RecurringFairValueMeasurementMember ifrs-full:TradingEquitySecuritiesMember ifrs-full:IFRS9Member 2025-10-31 0000009631 ifrs-full:RecurringFairValueMeasurementMember bns:CorporateAndOtherDebtMember ifrs-full:IFRS9Member 2025-10-31 0000009631 ifrs-full:RecurringFairValueMeasurementMember bns:OtherForeignGovernmentsDebtMember ifrs-full:IFRS9Member 2025-10-31 0000009631 ifrs-full:RecurringFairValueMeasurementMember bns:UsTreasuryAndOtherUsAgencyDebtMember ifrs-full:IFRS9Member 2025-10-31 0000009631 ifrs-full:Level2OfFairValueHierarchyMember ifrs-full:RecurringFairValueMeasurementMember bns:CanadianProvincialAndMunicipalDebtMember ifrs-full:IFRS9Member 2025-10-31 0000009631 ifrs-full:RecurringFairValueMeasurementMember bns:CorporateAndOtherDebtMember ifrs-full:IFRS9Member ifrs-full:Level1OfFairValueHierarchyMember 2025-10-31 0000009631 ifrs-full:Level1OfFairValueHierarchyMember ifrs-full:RecurringFairValueMeasurementMember ifrs-full:TradingEquitySecuritiesMember ifrs-full:IFRS9Member 2025-10-31 0000009631 ifrs-full:RecurringFairValueMeasurementMember bns:CanadianProvincialAndMunicipalDebtMember ifrs-full:IFRS9Member 2025-10-31 0000009631 ifrs-full:RecurringFairValueMeasurementMember bns:CanadianFederalGovernmentAndGovernmentGuaranteedDebtMember ifrs-full:IFRS9Member 2025-10-31 0000009631 ifrs-full:RecurringFairValueMeasurementMember bns:CanadianFederalGovernmentAndGovernmentGuaranteedDebtMember ifrs-full:IFRS9Member ifrs-full:Level1OfFairValueHierarchyMember 2025-10-31 0000009631 ifrs-full:Level1OfFairValueHierarchyMember ifrs-full:RecurringFairValueMeasurementMember bns:CanadianProvincialAndMunicipalDebtMember ifrs-full:IFRS9Member 2025-10-31 0000009631 ifrs-full:RecurringFairValueMeasurementMember bns:CorporateAndOtherDebtMember ifrs-full:IFRS9Member ifrs-full:Level3OfFairValueHierarchyMember 2025-10-31 0000009631 ifrs-full:Level3OfFairValueHierarchyMember ifrs-full:RecurringFairValueMeasurementMember ifrs-full:TradingEquitySecuritiesMember ifrs-full:IFRS9Member 2025-10-31 0000009631 ifrs-full:Level1OfFairValueHierarchyMember ifrs-full:RecurringFairValueMeasurementMember bns:UsTreasuryAndOtherUsAgencyDebtMember ifrs-full:IFRS9Member 2025-10-31 0000009631 ifrs-full:RecurringFairValueMeasurementMember bns:OtherForeignGovernmentsDebtMember ifrs-full:IFRS9Member ifrs-full:Level1OfFairValueHierarchyMember 2025-10-31 0000009631 ifrs-full:RecurringFairValueMeasurementMember bns:CorporateAndOtherDebtMember ifrs-full:IFRS9Member ifrs-full:Level2OfFairValueHierarchyMember 2025-10-31 0000009631 ifrs-full:RecurringFairValueMeasurementMember ifrs-full:TradingEquitySecuritiesMember ifrs-full:IFRS9Member ifrs-full:Level2OfFairValueHierarchyMember 2025-10-31 0000009631 ifrs-full:RecurringFairValueMeasurementMember bns:UsTreasuryAndOtherUsAgencyDebtMember ifrs-full:IFRS9Member ifrs-full:Level2OfFairValueHierarchyMember 2025-10-31 0000009631 ifrs-full:RecurringFairValueMeasurementMember bns:OtherForeignGovernmentsDebtMember ifrs-full:IFRS9Member ifrs-full:Level2OfFairValueHierarchyMember 2025-10-31 0000009631 ifrs-full:RecurringFairValueMeasurementMember bns:TradingLoansMember ifrs-full:IFRS9Member ifrs-full:Level2OfFairValueHierarchyMember 2025-10-31 0000009631 ifrs-full:RecurringFairValueMeasurementMember bns:TradingLoansMember ifrs-full:IFRS9Member 2025-10-31 0000009631 ifrs-full:Level3OfFairValueHierarchyMember ifrs-full:RecurringFairValueMeasurementMember bns:TradingLoansMember ifrs-full:IFRS9Member 2025-10-31 0000009631 ifrs-full:RecurringFairValueMeasurementMember bns:OtherTradingAssetsMember ifrs-full:IFRS9Member 2025-10-31 0000009631 ifrs-full:RecurringFairValueMeasurementMember bns:OtherTradingAssetsMember ifrs-full:IFRS9Member ifrs-full:Level2OfFairValueHierarchyMember 2025-10-31 0000009631 ifrs-full:Level3OfFairValueHierarchyMember ifrs-full:RecurringFairValueMeasurementMember bns:InterestRateContractsMember ifrs-full:IFRS9Member 2025-10-31 0000009631 ifrs-full:Level3OfFairValueHierarchyMember ifrs-full:RecurringFairValueMeasurementMember bns:ForeignExchangeAndGoldContractsMember ifrs-full:IFRS9Member 2025-10-31 0000009631 ifrs-full:RecurringFairValueMeasurementMember bns:EquityContractsMember ifrs-full:IFRS9Member ifrs-full:Level3OfFairValueHierarchyMember 2025-10-31 0000009631 ifrs-full:RecurringFairValueMeasurementMember bns:CommodityContractsMember ifrs-full:IFRS9Member 2025-10-31 0000009631 ifrs-full:Level2OfFairValueHierarchyMember ifrs-full:RecurringFairValueMeasurementMember bns:CommodityContractsMember ifrs-full:IFRS9Member 2025-10-31 0000009631 ifrs-full:Level2OfFairValueHierarchyMember ifrs-full:RecurringFairValueMeasurementMember bns:CreditContractsMember ifrs-full:IFRS9Member 2025-10-31 0000009631 ifrs-full:RecurringFairValueMeasurementMember bns:EquityContractsMember ifrs-full:IFRS9Member ifrs-full:Level2OfFairValueHierarchyMember 2025-10-31 0000009631 ifrs-full:Level2OfFairValueHierarchyMember ifrs-full:RecurringFairValueMeasurementMember bns:ForeignExchangeAndGoldContractsMember ifrs-full:IFRS9Member 2025-10-31 0000009631 ifrs-full:RecurringFairValueMeasurementMember bns:ForeignExchangeAndGoldContractsMember ifrs-full:IFRS9Member 2025-10-31 0000009631 ifrs-full:RecurringFairValueMeasurementMember bns:EquityContractsMember ifrs-full:IFRS9Member 2025-10-31 0000009631 ifrs-full:RecurringFairValueMeasurementMember bns:CreditContractsMember ifrs-full:IFRS9Member 2025-10-31 0000009631 ifrs-full:Level3OfFairValueHierarchyMember ifrs-full:RecurringFairValueMeasurementMember bns:CreditContractsMember ifrs-full:IFRS9Member 2025-10-31 0000009631 ifrs-full:RecurringFairValueMeasurementMember bns:InterestRateContractsMember ifrs-full:IFRS9Member 2025-10-31 0000009631 ifrs-full:Level2OfFairValueHierarchyMember ifrs-full:RecurringFairValueMeasurementMember bns:InterestRateContractsMember ifrs-full:IFRS9Member 2025-10-31 0000009631 ifrs-full:Level3OfFairValueHierarchyMember ifrs-full:RecurringFairValueMeasurementMember bns:CommodityContractsMember ifrs-full:IFRS9Member 2025-10-31 0000009631 ifrs-full:RecurringFairValueMeasurementMember bns:EquityContractsMember ifrs-full:IFRS9Member ifrs-full:Level1OfFairValueHierarchyMember 2025-10-31 0000009631 bns:CashAndDepositsWithFinancialInstitutionsMember 2025-10-31 0000009631 bns:SubordinatedDebenturesNonViabilityContingentCapitalMember 2025-10-31 0000009631 bns:OtherOperatingSegmentMember 2025-10-31 0000009631 bns:PerformanceShareUnitPlanMember 2025-10-31 0000009631 ifrs-full:BottomOfRangeMember 2025-10-31 0000009631 ifrs-full:TopOfRangeMember 2025-10-31 0000009631 bns:OtherBenefitPlansMember bns:FundedStatusMember 2025-10-31 0000009631 ifrs-full:PensionDefinedBenefitPlansMember bns:FundedStatusMember 2025-10-31 0000009631 ifrs-full:PensionDefinedBenefitPlansMember bns:AdditionalDetailsMember 2025-10-31 0000009631 bns:MaleMember ifrs-full:PensionDefinedBenefitPlansMember country:US bns:RetiringCurrentlyAtAgeSixtyFiveMember 2025-10-31 0000009631 bns:MaleMember bns:OtherBenefitPlansMember country:US bns:RetiringCurrentlyAtAgeSixtyFiveMember 2025-10-31 0000009631 bns:MaleMember bns:OtherBenefitPlansMember country:MX bns:CurrentlyAgedFortyFiveAndRetiringAtAgeSixtyFiveMember 2025-10-31 0000009631 bns:FemaleMember ifrs-full:PensionDefinedBenefitPlansMember country:MX bns:CurrentlyAgedFortyFiveAndRetiringAtAgeSixtyFiveMember 2025-10-31 0000009631 bns:FemaleMember ifrs-full:PensionDefinedBenefitPlansMember country:US bns:CurrentlyAgedFortyFiveAndRetiringAtAgeSixtyFiveMember 2025-10-31 0000009631 bns:FemaleMember bns:OtherBenefitPlansMember country:MX bns:CurrentlyAgedFortyFiveAndRetiringAtAgeSixtyFiveMember 2025-10-31 0000009631 bns:FemaleMember ifrs-full:PensionDefinedBenefitPlansMember country:MX bns:RetiringCurrentlyAtAgeSixtyFiveMember 2025-10-31 0000009631 bns:FemaleMember ifrs-full:PensionDefinedBenefitPlansMember country:US bns:RetiringCurrentlyAtAgeSixtyFiveMember 2025-10-31 0000009631 bns:FemaleMember bns:OtherBenefitPlansMember country:MX bns:RetiringCurrentlyAtAgeSixtyFiveMember 2025-10-31 0000009631 bns:MaleMember ifrs-full:PensionDefinedBenefitPlansMember country:CA bns:CurrentlyAgedFortyFiveAndRetiringAtAgeSixtyFiveMember 2025-10-31 0000009631 bns:MaleMember bns:OtherBenefitPlansMember country:MX bns:RetiringCurrentlyAtAgeSixtyFiveMember 2025-10-31 0000009631 bns:FemaleMember bns:OtherBenefitPlansMember country:US bns:CurrentlyAgedFortyFiveAndRetiringAtAgeSixtyFiveMember 2025-10-31 0000009631 bns:MaleMember bns:OtherBenefitPlansMember country:CA bns:CurrentlyAgedFortyFiveAndRetiringAtAgeSixtyFiveMember 2025-10-31 0000009631 bns:FemaleMember ifrs-full:PensionDefinedBenefitPlansMember country:CA bns:CurrentlyAgedFortyFiveAndRetiringAtAgeSixtyFiveMember 2025-10-31 0000009631 bns:FemaleMember bns:OtherBenefitPlansMember country:CA bns:CurrentlyAgedFortyFiveAndRetiringAtAgeSixtyFiveMember 2025-10-31 0000009631 bns:FemaleMember ifrs-full:PensionDefinedBenefitPlansMember country:CA bns:RetiringCurrentlyAtAgeSixtyFiveMember 2025-10-31 0000009631 bns:MaleMember ifrs-full:PensionDefinedBenefitPlansMember country:US bns:CurrentlyAgedFortyFiveAndRetiringAtAgeSixtyFiveMember 2025-10-31 0000009631 bns:FemaleMember bns:OtherBenefitPlansMember country:CA bns:RetiringCurrentlyAtAgeSixtyFiveMember 2025-10-31 0000009631 bns:MaleMember bns:OtherBenefitPlansMember country:US bns:CurrentlyAgedFortyFiveAndRetiringAtAgeSixtyFiveMember 2025-10-31 0000009631 bns:MaleMember ifrs-full:PensionDefinedBenefitPlansMember country:CA bns:RetiringCurrentlyAtAgeSixtyFiveMember 2025-10-31 0000009631 bns:MaleMember ifrs-full:PensionDefinedBenefitPlansMember country:MX bns:CurrentlyAgedFortyFiveAndRetiringAtAgeSixtyFiveMember 2025-10-31 0000009631 bns:MaleMember ifrs-full:PensionDefinedBenefitPlansMember country:MX bns:RetiringCurrentlyAtAgeSixtyFiveMember 2025-10-31 0000009631 bns:FemaleMember bns:OtherBenefitPlansMember country:US bns:RetiringCurrentlyAtAgeSixtyFiveMember 2025-10-31 0000009631 bns:MaleMember bns:OtherBenefitPlansMember country:CA bns:RetiringCurrentlyAtAgeSixtyFiveMember 2025-10-31 0000009631 ifrs-full:BottomOfRangeMember bns:RangesOfExercisePricesForOutstandingShareOptionsOneMember bns:EmployeeStockOptionsMember 2025-10-31 0000009631 ifrs-full:TopOfRangeMember bns:RangesOfExercisePricesForOutstandingShareOptionsOneMember bns:EmployeeStockOptionsMember 2025-10-31 0000009631 ifrs-full:BottomOfRangeMember bns:RangesOfExercisePricesForOutstandingShareOptionsTwoMember bns:EmployeeStockOptionsMember 2025-10-31 0000009631 ifrs-full:TopOfRangeMember bns:RangesOfExercisePricesForOutstandingShareOptionsTwoMember bns:EmployeeStockOptionsMember 2025-10-31 0000009631 ifrs-full:BottomOfRangeMember bns:RangesOfExercisePricesForOutstandingShareOptionsThreeMember bns:EmployeeStockOptionsMember 2025-10-31 0000009631 ifrs-full:TopOfRangeMember bns:RangesOfExercisePricesForOutstandingShareOptionsThreeMember bns:EmployeeStockOptionsMember 2025-10-31 0000009631 ifrs-full:RecurringFairValueMeasurementMember bns:InterestRateContractsMember ifrs-full:IFRS9Member ifrs-full:Level2OfFairValueHierarchyMember 2025-10-31 0000009631 ifrs-full:Level1OfFairValueHierarchyMember ifrs-full:RecurringFairValueMeasurementMember bns:EquityContractsMember ifrs-full:IFRS9Member 2025-10-31 0000009631 ifrs-full:RecurringFairValueMeasurementMember bns:ForeignExchangeAndGoldContractsMember ifrs-full:IFRS9Member ifrs-full:Level2OfFairValueHierarchyMember 2025-10-31 0000009631 ifrs-full:RecurringFairValueMeasurementMember bns:CreditContractsMember ifrs-full:IFRS9Member ifrs-full:Level3OfFairValueHierarchyMember 2025-10-31 0000009631 ifrs-full:Level3OfFairValueHierarchyMember ifrs-full:RecurringFairValueMeasurementMember bns:EquityContractsMember ifrs-full:IFRS9Member 2025-10-31 0000009631 ifrs-full:Level3OfFairValueHierarchyMember ifrs-full:RecurringFairValueMeasurementMember bns:InterestRateContractsMember ifrs-full:IFRS9Member 2025-10-31 0000009631 ifrs-full:RecurringFairValueMeasurementMember bns:CommodityContractsMember ifrs-full:IFRS9Member ifrs-full:Level2OfFairValueHierarchyMember 2025-10-31 0000009631 ifrs-full:RecurringFairValueMeasurementMember bns:CreditContractsMember ifrs-full:IFRS9Member ifrs-full:Level2OfFairValueHierarchyMember 2025-10-31 0000009631 ifrs-full:RecurringFairValueMeasurementMember bns:EquityContractsMember ifrs-full:IFRS9Member ifrs-full:Level2OfFairValueHierarchyMember 2025-10-31 0000009631 ifrs-full:RecurringFairValueMeasurementMember bns:CommodityContractsMember ifrs-full:IFRS9Member 2025-10-31 0000009631 ifrs-full:RecurringFairValueMeasurementMember bns:CreditContractsMember ifrs-full:IFRS9Member 2025-10-31 0000009631 ifrs-full:RecurringFairValueMeasurementMember bns:EquityContractsMember ifrs-full:IFRS9Member 2025-10-31 0000009631 ifrs-full:RecurringFairValueMeasurementMember bns:ForeignExchangeAndGoldContractsMember ifrs-full:IFRS9Member 2025-10-31 0000009631 ifrs-full:RecurringFairValueMeasurementMember bns:InterestRateContractsMember ifrs-full:IFRS9Member 2025-10-31 0000009631 ifrs-full:Level3OfFairValueHierarchyMember ifrs-full:RecurringFairValueMeasurementMember bns:CommodityContractsMember ifrs-full:IFRS9Member 2025-10-31 0000009631 ifrs-full:LaterThanThreeYearsAndNotLaterThanFourYearsMember 2025-10-31 0000009631 ifrs-full:LaterThanFourYearsAndNotLaterThanFiveYearsMember 2025-10-31 0000009631 ifrs-full:LaterThanOneYearAndNotLaterThanTwoYearsMember 2025-10-31 0000009631 ifrs-full:LaterThanTwoYearsAndNotLaterThanThreeYearsMember 2025-10-31 0000009631 bns:LimitedRecourseCapitalNotesSeriesFiveMember 2025-10-31 0000009631 bns:LimitedRecourseCapitalNotesSeriesSevenMember 2025-10-31 0000009631 bns:LimitedRecourseCapitalNotesSeriesSixMember 2025-10-31 0000009631 bns:AdditionalTier1CapitalInstrumentsOneMember 2025-10-31 0000009631 bns:LimitedRecourseCapitalNotesSeriesOneMember 2025-10-31 0000009631 bns:LimitedRecourseCapitalNotesSeriesTwoMember 2025-10-31 0000009631 bns:LimitedRecourseCapitalNotesSeriesThreeMember 2025-10-31 0000009631 bns:LimitedRecourseCapitalNotesSeriesFourMember 2025-10-31 0000009631 bns:AdditionalTier1CapitalInstrumentsTwoMember 2025-10-31 0000009631 bns:SeriesOneAdditionalTierOneCapitalInstrumentsMember 2025-10-31 0000009631 bns:SeriesTwoAdditionalTierOneCapitalInstrumentsMember 2025-10-31 0000009631 bns:SeriesThreeAdditionalTierOneCapitalInstrumentsMember 2025-10-31 0000009631 bns:SeriesFourAdditionalTierOneCapitalInstrumentsMember 2025-10-31 0000009631 bns:SeriesFiveAdditionalTierOneCapitalInstrumentsMember 2025-10-31 0000009631 bns:SeriesSixAdditionalTierOneCapitalInstrumentsMember 2025-10-31 0000009631 bns:SeriesSevenAdditionalTierOneCapitalInstrumentsMember 2025-10-31 0000009631 bns:TwoThousandEighteenToTwoThousandAndTwentyMember ifrs-full:SubsidiariesMember 2025-10-31 0000009631 bns:TwoThousandFourteenToTwoThousandEighteenMember ifrs-full:SubsidiariesMember 2025-10-31 0000009631 bns:UsMultisellerConduitMember bns:BusinessAndGovernmentLoansMember 2025-10-31 0000009631 ifrs-full:LiquidityRiskMember 2025-10-31 0000009631 bns:ValueatRiskMember ifrs-full:MarketRiskMember 2025-10-31 0000009631 ifrs-full:LiquidityRiskMember ifrs-full:NotLaterThanOneMonthMember 2025-10-31 0000009631 ifrs-full:LiquidityRiskMember ifrs-full:LaterThanOneMonthAndNotLaterThanThreeMonthsMember 2025-10-31 0000009631 ifrs-full:LaterThanThreeMonthsAndNotLaterThanSixMonthsMember ifrs-full:LiquidityRiskMember 2025-10-31 0000009631 bns:LaterThanSixMonthsAndNotLaterThanNineMonthsMember ifrs-full:LiquidityRiskMember 2025-10-31 0000009631 bns:LaterThanNineMonthsAndNotLaterThanOneYearMember ifrs-full:LiquidityRiskMember 2025-10-31 0000009631 ifrs-full:LaterThanOneYearAndNotLaterThanTwoYearsMember ifrs-full:LiquidityRiskMember 2025-10-31 0000009631 ifrs-full:LaterThanTwoYearsAndNotLaterThanFiveYearsMember ifrs-full:LiquidityRiskMember 2025-10-31 0000009631 ifrs-full:LaterThanFiveYearsMember ifrs-full:LiquidityRiskMember 2025-10-31 0000009631 ifrs-full:LiquidityRiskMember bns:NoSpecificMaturityMember 2025-10-31 0000009631 ifrs-full:AssetsAndLiabilitiesClassifiedAsHeldForSaleMember bns:ColombiaCostaRicaAndPanamaMember 2025-10-31 0000009631 bns:ScotiabankCoveredBondGuarantorLimitedPartnershipMember bns:GuaranteedLinkedNotesMember 2025-10-31 0000009631 ifrs-full:SecuritiesLendingMember 2025-10-31 0000009631 ifrs-full:DebtSecuritiesMember 2025-10-31 0000009631 ifrs-full:OrdinarySharesMember 2025-10-31 0000009631 bns:GuaranteedLinkedNotesMember 2025-10-31 0000009631 ifrs-full:FinancialForecastOfProfitOrLossForCashgeneratingUnitMeasurementInputMember 2025-10-31 0000009631 bns:PriceEarningMultipleMember 2025-10-31 0000009631 ifrs-full:BottomOfRangeMember ifrs-full:ForeignCountriesMember 2025-10-31 0000009631 bns:MaduroAndCurielsBankNVMember 2023-11-01 2024-10-31 0000009631 bns:BankOfXianCoLtdMember 2023-11-01 2024-10-31 0000009631 bns:MayTwoThousandThirtySevenMember ifrs-full:FixedInterestRateMember 2023-11-01 2024-10-31 0000009631 bns:DecemberTwoThousandAndThirtyTwoMember ifrs-full:FixedInterestRateMember 2023-11-01 2024-10-31 0000009631 bns:AugustTwoThousandAndThirtyThreeMember ifrs-full:FixedInterestRateMember 2023-11-01 2024-10-31 0000009631 bns:DecemberTwoThousandAndThirtyThreeMember ifrs-full:FixedInterestRateMember 2023-11-01 2024-10-31 0000009631 bns:AugustTwoThousandAndThirtyFourMember ifrs-full:FixedInterestRateMember 2023-11-01 2024-10-31 0000009631 bns:MayTwoThousandThirtyTwoMember ifrs-full:FixedInterestRateMember 2023-11-01 2024-10-31 0000009631 ifrs-full:BottomOfRangeMember 2023-11-01 2024-10-31 0000009631 ifrs-full:TopOfRangeMember 2023-11-01 2024-10-31 0000009631 bns:TwoThousandAndTwentyFourStockOptionMember 2023-11-01 2024-10-31 0000009631 bns:DeferredTaxAssetPropertyAndEquipmentMember 2023-11-01 2024-10-31 0000009631 bns:DeferredTaxAssetsOtherMember 2023-11-01 2024-10-31 0000009631 bns:DeferredTaxAssetsMember 2023-11-01 2024-10-31 0000009631 bns:DeferredTaxLiabilitiesInvestmentInSubsidiariesAndAssociatesMember 2023-11-01 2024-10-31 0000009631 bns:DeferredTaxAssetsAllowanceForCreditLossesMember 2023-11-01 2024-10-31 0000009631 bns:DeferredTaxLiabilitiesDeferredIncomeMember 2023-11-01 2024-10-31 0000009631 bns:DeferredTaxLiabilitiesDeferredCompensationMember 2023-11-01 2024-10-31 0000009631 bns:DeferredTaxAssetsTaxLossCarryForwardsMember 2023-11-01 2024-10-31 0000009631 bns:DeferredTaxAssetsDeferredCompensationMember 2023-11-01 2024-10-31 0000009631 bns:DeferredTaxAssetsDeferredIncomeMember 2023-11-01 2024-10-31 0000009631 bns:DeferredTaxLiabilitiesSecuritiesMember 2023-11-01 2024-10-31 0000009631 bns:DeferredTaxLiabilitiesMember 2023-11-01 2024-10-31 0000009631 bns:DeferredTaxAssetsSecuritiesMember 2023-11-01 2024-10-31 0000009631 bns:DeferredTaxAssetsPensionAndOtherPostretirementBenefitsMember 2023-11-01 2024-10-31 0000009631 bns:DeferredTaxAssetsLeaseLiabilitiesMember 2023-11-01 2024-10-31 0000009631 bns:DeferredTaxLiabilitiesOthersMember 2023-11-01 2024-10-31 0000009631 bns:DeferredTaxLiabilitiesIntangibleAssetsMember 2023-11-01 2024-10-31 0000009631 bns:DeferredTaxLiabilityPropertyAndEquipmentMember 2023-11-01 2024-10-31 0000009631 bns:DeferredTaxLiabilitiesPensionAndOtherPostretirementBenefitsMember 2023-11-01 2024-10-31 0000009631 ifrs-full:OperatingSegmentsMember bns:CanadianBankingMember 2023-11-01 2024-10-31 0000009631 ifrs-full:OperatingSegmentsMember bns:InternationalBankingMember 2023-11-01 2024-10-31 0000009631 ifrs-full:OperatingSegmentsMember bns:GlobalWealthManagementMember 2023-11-01 2024-10-31 0000009631 ifrs-full:OperatingSegmentsMember bns:GlobalBankingAndMarketsMember 2023-11-01 2024-10-31 0000009631 ifrs-full:OperatingSegmentsMember bns:OtherSmallerOperatingSegmentsAndCorporateAdjustmentsMember 2023-11-01 2024-10-31 0000009631 ifrs-full:OperatingSegmentsMember bns:CaribbeanAndCentralAmericaMember 2023-11-01 2024-10-31 0000009631 ifrs-full:OperatingSegmentsMember country:CO 2023-11-01 2024-10-31 0000009631 ifrs-full:OperatingSegmentsMember country:CL 2023-11-01 2024-10-31 0000009631 ifrs-full:OperatingSegmentsMember country:PE 2023-11-01 2024-10-31 0000009631 ifrs-full:OperatingSegmentsMember country:MX 2023-11-01 2024-10-31 0000009631 ifrs-full:OperatingSegmentsMember 2023-11-01 2024-10-31 0000009631 ifrs-full:OperatingSegmentsMember country:US 2023-11-01 2024-10-31 0000009631 ifrs-full:OperatingSegmentsMember country:CA 2023-11-01 2024-10-31 0000009631 ifrs-full:OperatingSegmentsMember bns:OtherInternationalMember 2023-11-01 2024-10-31 0000009631 bns:OtherBenefitPlansMember country:CA 2023-11-01 2024-10-31 0000009631 ifrs-full:PensionDefinedBenefitPlansMember country:MX 2023-11-01 2024-10-31 0000009631 bns:OtherBenefitPlansMember country:US 2023-11-01 2024-10-31 0000009631 bns:OtherBenefitPlansMember country:MX 2023-11-01 2024-10-31 0000009631 ifrs-full:PensionDefinedBenefitPlansMember country:CA 2023-11-01 2024-10-31 0000009631 ifrs-full:PensionDefinedBenefitPlansMember country:US 2023-11-01 2024-10-31 0000009631 bns:OtherBenefitPlansMember 2023-11-01 2024-10-31 0000009631 ifrs-full:InvestmentPropertyMember bns:NonQuotedMember ifrs-full:PensionDefinedBenefitPlansMember 2023-11-01 2024-10-31 0000009631 bns:CashAndCashEquivalents1Member ifrs-full:PensionDefinedBenefitPlansMember 2023-11-01 2024-10-31 0000009631 ifrs-full:PensionDefinedBenefitPlansMember 2023-11-01 2024-10-31 0000009631 bns:OtherSecuritiesMember bns:NonQuotedMember ifrs-full:PensionDefinedBenefitPlansMember 2023-11-01 2024-10-31 0000009631 bns:FixedIncomeInvestments1Member bns:QuoteInAnActiveMarketMember ifrs-full:PensionDefinedBenefitPlansMember 2023-11-01 2024-10-31 0000009631 bns:FixedIncomeInvestments1Member bns:NonQuotedMember ifrs-full:PensionDefinedBenefitPlansMember 2023-11-01 2024-10-31 0000009631 ifrs-full:InvestmentPropertyMember bns:QuoteInAnActiveMarketMember bns:OtherBenefitPlansMember 2023-11-01 2024-10-31 0000009631 bns:FixedIncomeInvestments1Member bns:QuoteInAnActiveMarketMember bns:OtherBenefitPlansMember 2023-11-01 2024-10-31 0000009631 bns:EquitySecurities1Member bns:QuoteInAnActiveMarketMember bns:OtherBenefitPlansMember 2023-11-01 2024-10-31 0000009631 bns:EquitySecurities1Member bns:NonQuotedMember ifrs-full:PensionDefinedBenefitPlansMember 2023-11-01 2024-10-31 0000009631 bns:EquitySecurities1Member bns:OtherBenefitPlansMember 2023-11-01 2024-10-31 0000009631 bns:FixedIncomeInvestments1Member ifrs-full:PensionDefinedBenefitPlansMember 2023-11-01 2024-10-31 0000009631 bns:FixedIncomeInvestments1Member bns:OtherBenefitPlansMember 2023-11-01 2024-10-31 0000009631 ifrs-full:InvestmentPropertyMember ifrs-full:PensionDefinedBenefitPlansMember 2023-11-01 2024-10-31 0000009631 ifrs-full:InvestmentPropertyMember bns:OtherBenefitPlansMember 2023-11-01 2024-10-31 0000009631 bns:OtherSecuritiesMember ifrs-full:PensionDefinedBenefitPlansMember 2023-11-01 2024-10-31 0000009631 bns:EquitySecurities1Member ifrs-full:PensionDefinedBenefitPlansMember 2023-11-01 2024-10-31 0000009631 bns:EquitySecurities1Member bns:QuoteInAnActiveMarketMember ifrs-full:PensionDefinedBenefitPlansMember 2023-11-01 2024-10-31 0000009631 bns:CaribbeanAndCentralAmericaMember 2023-11-01 2024-10-31 0000009631 bns:OtherInternationalMember 2023-11-01 2024-10-31 0000009631 country:CA 2023-11-01 2024-10-31 0000009631 country:MX 2023-11-01 2024-10-31 0000009631 country:PE 2023-11-01 2024-10-31 0000009631 country:CL 2023-11-01 2024-10-31 0000009631 bns:KeyManagementPersonnelDirectorsAndTheirCloseFamilyMembersMember 2023-11-01 2024-10-31 0000009631 bns:AssociatesAndJointVenturesMember 2023-11-01 2024-10-31 0000009631 bns:OtherAssetsAndReversalOfImpairmentLossMember 2023-11-01 2024-10-31 0000009631 bns:ResidentialMortgagesPersonalLoansCreditCardsTotalRetailLoansBusinessAndGovernmentExcludingOtherAssetsMember 2023-11-01 2024-10-31 0000009631 ifrs-full:SubsidiariesWithMaterialNoncontrollingInterestsMember 2023-11-01 2024-10-31 0000009631 bns:EmployeeStockOptionsMember 2023-11-01 2024-10-31 0000009631 ifrs-full:OrdinarySharesMember 2023-11-01 2024-10-31 0000009631 bns:LitigationAndOtherMember 2023-11-01 2024-10-31 0000009631 ifrs-full:FinancialAssetsAtAmortisedCostMember bns:UsTreasuryAndOtherUsAgencyDebtMember ifrs-full:LaterThanOneYearAndNotLaterThanFiveYearsMember 2023-11-01 2024-10-31 0000009631 ifrs-full:FinancialAssetsAtAmortisedCostMember bns:UsTreasuryAndOtherUsAgencyDebtMember ifrs-full:LaterThanFiveYearsAndNotLaterThanTenYearsMember 2023-11-01 2024-10-31 0000009631 ifrs-full:FinancialAssetsAtAmortisedCostMember bns:UsTreasuryAndOtherUsAgencyDebtMember ifrs-full:LaterThanTenYearsMember 2023-11-01 2024-10-31 0000009631 ifrs-full:FinancialAssetsAtAmortisedCostMember bns:OtherForeignGovernmentDebtMember ifrs-full:NotLaterThanThreeMonthsMember 2023-11-01 2024-10-31 0000009631 bns:FairValueThroughOtherComprehensiveIncomeMember bns:OtherDebtMember ifrs-full:LaterThanThreeMonthsAndNotLaterThanOneYearMember 2023-11-01 2024-10-31 0000009631 bns:FairValueThroughOtherComprehensiveIncomeMember bns:OtherDebtMember ifrs-full:LaterThanOneYearAndNotLaterThanFiveYearsMember 2023-11-01 2024-10-31 0000009631 bns:FairValueThroughOtherComprehensiveIncomeMember bns:OtherDebtMember ifrs-full:LaterThanFiveYearsAndNotLaterThanTenYearsMember 2023-11-01 2024-10-31 0000009631 ifrs-full:FinancialAssetsAtAmortisedCostMember bns:UsTreasuryAndOtherUsAgencyDebtMember ifrs-full:LaterThanThreeMonthsAndNotLaterThanOneYearMember 2023-11-01 2024-10-31 0000009631 bns:FairValueThroughOtherComprehensiveIncomeMember bns:OtherDebtMember ifrs-full:NotLaterThanThreeMonthsMember 2023-11-01 2024-10-31 0000009631 bns:FairValueThroughOtherComprehensiveIncomeMember bns:CanadianFederalGovernmentIssuedOrGuaranteedDebtMember ifrs-full:LaterThanThreeMonthsAndNotLaterThanOneYearMember 2023-11-01 2024-10-31 0000009631 bns:FairValueThroughOtherComprehensiveIncomeMember bns:CanadianFederalGovernmentIssuedOrGuaranteedDebtMember ifrs-full:LaterThanOneYearAndNotLaterThanFiveYearsMember 2023-11-01 2024-10-31 0000009631 bns:FairValueThroughOtherComprehensiveIncomeMember bns:CanadianFederalGovernmentIssuedOrGuaranteedDebtMember ifrs-full:LaterThanFiveYearsAndNotLaterThanTenYearsMember 2023-11-01 2024-10-31 0000009631 bns:FairValueThroughOtherComprehensiveIncomeMember bns:CanadianFederalGovernmentIssuedOrGuaranteedDebtMember ifrs-full:LaterThanTenYearsMember 2023-11-01 2024-10-31 0000009631 ifrs-full:FinancialAssetsAtAmortisedCostMember bns:UsTreasuryAndOtherUsAgencyDebtMember ifrs-full:NotLaterThanThreeMonthsMember 2023-11-01 2024-10-31 0000009631 bns:FairValueThroughOtherComprehensiveIncomeMember bns:OtherForeignGovernmentDebtMember ifrs-full:LaterThanTenYearsMember 2023-11-01 2024-10-31 0000009631 ifrs-full:FinancialAssetsAtAmortisedCostMember bns:CanadianFederalAndProvincialGovernmentIssuedOrGuaranteedDebtMember 2023-11-01 2024-10-31 0000009631 ifrs-full:FinancialAssetsAtAmortisedCostMember bns:UsTreasuryAndOtherUsAgencyDebtMember 2023-11-01 2024-10-31 0000009631 ifrs-full:FinancialAssetsAtAmortisedCostMember bns:OtherForeignGovernmentDebtMember 2023-11-01 2024-10-31 0000009631 ifrs-full:FinancialAssetsAtAmortisedCostMember bns:CorporateDebtMember ifrs-full:LaterThanTenYearsMember 2023-11-01 2024-10-31 0000009631 ifrs-full:FinancialAssetsAtAmortisedCostMember bns:CorporateDebtMember 2023-11-01 2024-10-31 0000009631 bns:FairValueThroughOtherComprehensiveIncomeMember bns:CanadianFederalGovernmentIssuedOrGuaranteedDebtMember ifrs-full:NotLaterThanThreeMonthsMember 2023-11-01 2024-10-31 0000009631 bns:FairValueThroughOtherComprehensiveIncomeMember bns:OtherForeignGovernmentDebtMember ifrs-full:LaterThanThreeMonthsAndNotLaterThanOneYearMember 2023-11-01 2024-10-31 0000009631 bns:FairValueThroughOtherComprehensiveIncomeMember bns:OtherForeignGovernmentDebtMember ifrs-full:LaterThanOneYearAndNotLaterThanFiveYearsMember 2023-11-01 2024-10-31 0000009631 bns:FairValueThroughOtherComprehensiveIncomeMember bns:CanadianProvincialAndMunicipalDebtMember 2023-11-01 2024-10-31 0000009631 bns:FairValueThroughOtherComprehensiveIncomeMember bns:UsTreasuryAndOtherUsAgencyDebtMember 2023-11-01 2024-10-31 0000009631 bns:FairValueThroughOtherComprehensiveIncomeMember bns:OtherForeignGovernmentDebtMember 2023-11-01 2024-10-31 0000009631 bns:FairValueThroughOtherComprehensiveIncomeMember bns:OtherDebtMember 2023-11-01 2024-10-31 0000009631 bns:FairValueThroughOtherComprehensiveIncomeMember bns:UsTreasuryAndOtherUsAgencyDebtMember ifrs-full:NotLaterThanThreeMonthsMember 2023-11-01 2024-10-31 0000009631 bns:FairValueThroughOtherComprehensiveIncomeMember bns:UsTreasuryAndOtherUsAgencyDebtMember ifrs-full:LaterThanThreeMonthsAndNotLaterThanOneYearMember 2023-11-01 2024-10-31 0000009631 bns:FairValueThroughOtherComprehensiveIncomeMember bns:UsTreasuryAndOtherUsAgencyDebtMember ifrs-full:LaterThanOneYearAndNotLaterThanFiveYearsMember 2023-11-01 2024-10-31 0000009631 bns:FairValueThroughOtherComprehensiveIncomeMember bns:UsTreasuryAndOtherUsAgencyDebtMember ifrs-full:LaterThanFiveYearsAndNotLaterThanTenYearsMember 2023-11-01 2024-10-31 0000009631 bns:FairValueThroughOtherComprehensiveIncomeMember bns:UsTreasuryAndOtherUsAgencyDebtMember ifrs-full:LaterThanTenYearsMember 2023-11-01 2024-10-31 0000009631 bns:FairValueThroughOtherComprehensiveIncomeMember bns:OtherForeignGovernmentDebtMember ifrs-full:NotLaterThanThreeMonthsMember 2023-11-01 2024-10-31 0000009631 bns:FairValueThroughOtherComprehensiveIncomeMember bns:CanadianProvincialAndMunicipalDebtMember ifrs-full:LaterThanTenYearsMember 2023-11-01 2024-10-31 0000009631 bns:FairValueThroughOtherComprehensiveIncomeMember bns:CanadianProvincialAndMunicipalDebtMember ifrs-full:NotLaterThanThreeMonthsMember 2023-11-01 2024-10-31 0000009631 bns:FairValueThroughOtherComprehensiveIncomeMember bns:CanadianProvincialAndMunicipalDebtMember ifrs-full:LaterThanThreeMonthsAndNotLaterThanOneYearMember 2023-11-01 2024-10-31 0000009631 bns:FairValueThroughOtherComprehensiveIncomeMember bns:CanadianProvincialAndMunicipalDebtMember ifrs-full:LaterThanOneYearAndNotLaterThanFiveYearsMember 2023-11-01 2024-10-31 0000009631 bns:FairValueThroughOtherComprehensiveIncomeMember bns:CanadianProvincialAndMunicipalDebtMember ifrs-full:LaterThanFiveYearsAndNotLaterThanTenYearsMember 2023-11-01 2024-10-31 0000009631 ifrs-full:FinancialAssetsAtAmortisedCostMember bns:CanadianFederalAndProvincialGovernmentIssuedOrGuaranteedDebtMember ifrs-full:NotLaterThanThreeMonthsMember 2023-11-01 2024-10-31 0000009631 ifrs-full:FinancialAssetsAtAmortisedCostMember bns:CanadianFederalAndProvincialGovernmentIssuedOrGuaranteedDebtMember ifrs-full:LaterThanThreeMonthsAndNotLaterThanOneYearMember 2023-11-01 2024-10-31 0000009631 ifrs-full:FinancialAssetsAtAmortisedCostMember bns:CanadianFederalAndProvincialGovernmentIssuedOrGuaranteedDebtMember ifrs-full:LaterThanOneYearAndNotLaterThanFiveYearsMember 2023-11-01 2024-10-31 0000009631 ifrs-full:FinancialAssetsAtAmortisedCostMember bns:CanadianFederalAndProvincialGovernmentIssuedOrGuaranteedDebtMember ifrs-full:LaterThanFiveYearsAndNotLaterThanTenYearsMember 2023-11-01 2024-10-31 0000009631 bns:FairValueThroughOtherComprehensiveIncomeMember bns:OtherForeignGovernmentDebtMember ifrs-full:LaterThanFiveYearsAndNotLaterThanTenYearsMember 2023-11-01 2024-10-31 0000009631 bns:FairValueThroughOtherComprehensiveIncomeMember bns:CanadianFederalGovernmentIssuedOrGuaranteedDebtMember 2023-11-01 2024-10-31 0000009631 ifrs-full:FinancialAssetsAtAmortisedCostMember bns:OtherForeignGovernmentDebtMember ifrs-full:LaterThanThreeMonthsAndNotLaterThanOneYearMember 2023-11-01 2024-10-31 0000009631 ifrs-full:FinancialAssetsAtAmortisedCostMember bns:OtherForeignGovernmentDebtMember ifrs-full:LaterThanOneYearAndNotLaterThanFiveYearsMember 2023-11-01 2024-10-31 0000009631 ifrs-full:FinancialAssetsAtAmortisedCostMember bns:OtherForeignGovernmentDebtMember ifrs-full:LaterThanFiveYearsAndNotLaterThanTenYearsMember 2023-11-01 2024-10-31 0000009631 ifrs-full:FinancialAssetsAtAmortisedCostMember bns:OtherForeignGovernmentDebtMember ifrs-full:LaterThanTenYearsMember 2023-11-01 2024-10-31 0000009631 ifrs-full:FinancialAssetsAtAmortisedCostMember bns:CorporateDebtMember ifrs-full:LaterThanOneYearAndNotLaterThanFiveYearsMember 2023-11-01 2024-10-31 0000009631 bns:FairValueThroughOtherComprehensiveIncomeMember bns:OtherDebtMember ifrs-full:LaterThanTenYearsMember 2023-11-01 2024-10-31 0000009631 ifrs-full:Level2OfFairValueHierarchyMember bns:InvestmentInEquitySecuritiesMember 2023-11-01 2024-10-31 0000009631 ifrs-full:GrossCarryingAmountMember bns:TechnologyAssetsMember 2023-11-01 2024-10-31 0000009631 ifrs-full:GrossCarryingAmountMember ifrs-full:LandAndBuildingsMember 2023-11-01 2024-10-31 0000009631 ifrs-full:GrossCarryingAmountMember 2023-11-01 2024-10-31 0000009631 ifrs-full:GrossCarryingAmountMember bns:Equipment1Member 2023-11-01 2024-10-31 0000009631 ifrs-full:GrossCarryingAmountMember ifrs-full:LeaseholdImprovementsMember 2023-11-01 2024-10-31 0000009631 ifrs-full:GrossCarryingAmountMember ifrs-full:RightofuseAssetsMember 2023-11-01 2024-10-31 0000009631 ifrs-full:AccumulatedDepreciationAndAmortisationMember ifrs-full:ComputerSoftwareMember bns:FiniteLifeIntangibleAssetsMember 2023-11-01 2024-10-31 0000009631 ifrs-full:AccumulatedDepreciationAndAmortisationMember ifrs-full:OtherIntangibleAssetsMember bns:FiniteLifeIntangibleAssetsMember 2023-11-01 2024-10-31 0000009631 ifrs-full:AccumulatedDepreciationAndAmortisationMember 2023-11-01 2024-10-31 0000009631 ifrs-full:RetainedEarningsMember 2023-11-01 2024-10-31 0000009631 bns:RecognizedInOtherComprehensiveIncomeMember 2023-11-01 2024-10-31 0000009631 bns:OtherBenefitPlansMember ifrs-full:CountryOfDomicileMember 2023-11-01 2024-10-31 0000009631 bns:OtherBenefitPlansMember ifrs-full:ForeignCountriesMember 2023-11-01 2024-10-31 0000009631 bns:DomesticScotiabankPensionPlanMember ifrs-full:CountryOfDomicileMember 2023-11-01 2024-10-31 0000009631 bns:OtherPensionPlansMember ifrs-full:CountryOfDomicileMember 2023-11-01 2024-10-31 0000009631 ifrs-full:CountryOfDomicileMember 2023-11-01 2024-10-31 0000009631 ifrs-full:GrossCarryingAmountMember ifrs-full:ComputerSoftwareMember bns:FiniteLifeIntangibleAssetsMember 2023-11-01 2024-10-31 0000009631 ifrs-full:GrossCarryingAmountMember ifrs-full:OtherIntangibleAssetsMember bns:FiniteLifeIntangibleAssetsMember 2023-11-01 2024-10-31 0000009631 srt:LatinAmericaMember 2023-11-01 2024-10-31 0000009631 ifrs-full:AccumulatedDepreciationAndAmortisationMember ifrs-full:LeaseholdImprovementsMember 2023-11-01 2024-10-31 0000009631 ifrs-full:AccumulatedDepreciationAndAmortisationMember bns:TechnologyAssetsMember 2023-11-01 2024-10-31 0000009631 ifrs-full:AccumulatedDepreciationAndAmortisationMember bns:Equipment1Member 2023-11-01 2024-10-31 0000009631 ifrs-full:AccumulatedDepreciationAndAmortisationMember ifrs-full:LandAndBuildingsMember 2023-11-01 2024-10-31 0000009631 ifrs-full:AccumulatedDepreciationAndAmortisationMember ifrs-full:RightofuseAssetsMember 2023-11-01 2024-10-31 0000009631 bns:BusinessAndGovernmentMember 2023-11-01 2024-10-31 0000009631 bns:ResidentialMortgagesMember 2023-11-01 2024-10-31 0000009631 ifrs-full:ConsumerLoansMember 2023-11-01 2024-10-31 0000009631 bns:CreditCardMember 2023-11-01 2024-10-31 0000009631 bns:SeniorNoteLiabilitiesMember 2023-11-01 2024-10-31 0000009631 bns:TradingAssetsMember ifrs-full:Level3OfFairValueHierarchyMember 2023-11-01 2024-10-31 0000009631 bns:InvestmentSecuritiesMember ifrs-full:Level3OfFairValueHierarchyMember 2023-11-01 2024-10-31 0000009631 bns:CaribbeanAndCentralAmericaMember 2023-11-01 2024-10-31 0000009631 bns:GlobalWealthManagementMember 2023-11-01 2024-10-31 0000009631 bns:ActuarialAssumptionOfMedicalCostTrendUltimateRatesMember bns:OtherBenefitPlansMember 2023-11-01 2024-10-31 0000009631 ifrs-full:ForeignCountriesMember 2023-11-01 2024-10-31 0000009631 bns:TotalRetailLoansMember 2023-11-01 2024-10-31 0000009631 ifrs-full:ConsumerLoansMember bns:StageOneMember 2023-11-01 2024-10-31 0000009631 bns:ResidentialMortgagesMember bns:StageOneMember 2023-11-01 2024-10-31 0000009631 bns:TotalRetailLoansMember bns:StageOneMember 2023-11-01 2024-10-31 0000009631 bns:TotalRetailLoansMember bns:StageTwoMember 2023-11-01 2024-10-31 0000009631 bns:TotalRetailLoansMember bns:StageThreeMember 2023-11-01 2024-10-31 0000009631 bns:ResidentialMortgagesMember bns:StageThreeMember 2023-11-01 2024-10-31 0000009631 bns:BusinessAndGovernmentMember bns:StageOneMember 2023-11-01 2024-10-31 0000009631 bns:BusinessAndGovernmentMember bns:StageTwoMember 2023-11-01 2024-10-31 0000009631 bns:BusinessAndGovernmentMember bns:StageThreeMember 2023-11-01 2024-10-31 0000009631 bns:CreditCardMember bns:StageTwoMember 2023-11-01 2024-10-31 0000009631 bns:CreditCardMember bns:StageOneMember 2023-11-01 2024-10-31 0000009631 bns:CreditCardMember bns:StageThreeMember 2023-11-01 2024-10-31 0000009631 bns:ResidentialMortgagesMember bns:StageTwoMember 2023-11-01 2024-10-31 0000009631 ifrs-full:ConsumerLoansMember bns:StageThreeMember 2023-11-01 2024-10-31 0000009631 ifrs-full:ConsumerLoansMember bns:StageTwoMember 2023-11-01 2024-10-31 0000009631 ifrs-full:CashFlowHedgesMember ifrs-full:EquityPriceRiskMember 2023-11-01 2024-10-31 0000009631 ifrs-full:CashFlowHedgesMember ifrs-full:CurrencyRiskMember 2023-11-01 2024-10-31 0000009631 ifrs-full:CashFlowHedgesMember bns:CurrencyOrInterestRateRiskMember 2023-11-01 2024-10-31 0000009631 ifrs-full:CashFlowHedgesMember ifrs-full:InterestRateRiskMember 2023-11-01 2024-10-31 0000009631 ifrs-full:HedgesOfNetInvestmentInForeignOperationsMember ifrs-full:CurrencyRiskMember 2023-11-01 2024-10-31 0000009631 ifrs-full:CashFlowHedgesMember 2023-11-01 2024-10-31 0000009631 bns:OtherNonControllingInterestsMember 2023-11-01 2024-10-31 0000009631 bns:ScotiaGroupJamaicaLimitedMember 2023-11-01 2024-10-31 0000009631 bns:ScotiabankChileSAMember 2023-11-01 2024-10-31 0000009631 bns:ScotiabankTrinidadAndTobagoLimitedFiftyPointNineZeroPercentMember 2023-11-01 2024-10-31 0000009631 ifrs-full:SwapContractMember ifrs-full:FairValueHedgesMember ifrs-full:InterestRateRiskMember 2023-11-01 2024-10-31 0000009631 ifrs-full:FairValueHedgesMember 2023-11-01 2024-10-31 0000009631 bns:SubordinatedDebentureMember ifrs-full:FairValueHedgesMember ifrs-full:InterestRateRiskMember 2023-11-01 2024-10-31 0000009631 bns:InvestmentSecuritiesMember ifrs-full:FairValueHedgesMember ifrs-full:InterestRateRiskMember 2023-11-01 2024-10-31 0000009631 ifrs-full:LoanCommitmentsMember ifrs-full:FairValueHedgesMember ifrs-full:InterestRateRiskMember 2023-11-01 2024-10-31 0000009631 bns:DepositLiabilitiesMember ifrs-full:FairValueHedgesMember ifrs-full:InterestRateRiskMember 2023-11-01 2024-10-31 0000009631 bns:ObligationsRelatedToSecuritiesSoldShortMember ifrs-full:Level3OfFairValueHierarchyMember 2023-11-01 2024-10-31 0000009631 ifrs-full:SwapContractMember ifrs-full:CashFlowHedgesMember ifrs-full:CurrencyRiskMember 2023-11-01 2024-10-31 0000009631 ifrs-full:SwapContractMember ifrs-full:CashFlowHedgesMember ifrs-full:InterestRateRiskMember 2023-11-01 2024-10-31 0000009631 bns:ForeignCurrencyForwardContractsMember bns:NetInvestmentHedgesMember ifrs-full:CurrencyRiskMember 2023-11-01 2024-10-31 0000009631 bns:DepositLiabilitiesMember bns:NetInvestmentHedgesMember ifrs-full:CurrencyRiskMember 2023-11-01 2024-10-31 0000009631 bns:NetInvestmentHedgesMember 2023-11-01 2024-10-31 0000009631 ifrs-full:CashFlowHedgesMember bns:EquityPriceRiskReturnSwapMember 2023-11-01 2024-10-31 0000009631 bns:Cash1Member ifrs-full:CashFlowHedgesMember ifrs-full:CurrencyRiskMember 2023-11-01 2024-10-31 0000009631 ifrs-full:SwapContractMember ifrs-full:CashFlowHedgesMember bns:CurrencyOrInterestRateRiskMember 2023-11-01 2024-10-31 0000009631 bns:ForeignCurrencyForwardContractsMember ifrs-full:CashFlowHedgesMember ifrs-full:CurrencyRiskMember 2023-11-01 2024-10-31 0000009631 bns:OtherSharebasedPaymentPlansMember 2023-11-01 2024-10-31 0000009631 bns:EmployeeStockOwnershipPlanMember 2023-11-01 2024-10-31 0000009631 bns:EmployeeStockOptionsMember bns:SalariesAndEmployeeBenefitsMember 2023-11-01 2024-10-31 0000009631 bns:OverNextTwelveMonthsMember bns:BaseCaseScenarioMember country:MX 2023-11-01 2024-10-31 0000009631 bns:RemainingForecastPeriodCreditLossesMember bns:BaseCaseScenarioMember country:MX 2023-11-01 2024-10-31 0000009631 bns:RemainingForecastPeriodCreditLossesMember bns:SeverePessimisticMember country:CO 2023-11-01 2024-10-31 0000009631 bns:OptimisticScenarioMember country:CL bns:OverNextTwelveMonthsMember 2023-11-01 2024-10-31 0000009631 bns:RemainingForecastPeriodCreditLossesMember bns:OptimisticScenarioMember country:CL 2023-11-01 2024-10-31 0000009631 bns:PessimisticScenarioMember country:CL bns:OverNextTwelveMonthsMember 2023-11-01 2024-10-31 0000009631 bns:RemainingForecastPeriodCreditLossesMember bns:BaseCaseScenarioMember country:PE 2023-11-01 2024-10-31 0000009631 bns:OverNextTwelveMonthsMember bns:OptimisticScenarioMember country:PE 2023-11-01 2024-10-31 0000009631 bns:OptimisticScenarioMember country:PE bns:RemainingForecastPeriodCreditLossesMember 2023-11-01 2024-10-31 0000009631 bns:RemainingForecastPeriodCreditLossesMember bns:SeverePessimisticMember country:CA 2023-11-01 2024-10-31 0000009631 bns:OverNextTwelveMonthsMember bns:SeverePessimisticMember country:CA 2023-11-01 2024-10-31 0000009631 bns:RemainingForecastPeriodCreditLossesMember bns:PessimisticScenarioMember country:CA 2023-11-01 2024-10-31 0000009631 bns:RemainingForecastPeriodCreditLossesMember bns:OptimisticScenarioMember bns:CaribbeanMember 2023-11-01 2024-10-31 0000009631 bns:RemainingForecastPeriodCreditLossesMember bns:BaseCaseScenarioMember country:CO 2023-11-01 2024-10-31 0000009631 bns:OverNextTwelveMonthsMember bns:BaseCaseScenarioMember country:CO 2023-11-01 2024-10-31 0000009631 bns:RemainingForecastPeriodCreditLossesMember bns:PessimisticScenarioMember country:PE 2023-11-01 2024-10-31 0000009631 bns:OverNextTwelveMonthsMember bns:PessimisticScenarioMember country:PE 2023-11-01 2024-10-31 0000009631 bns:RemainingForecastPeriodCreditLossesMember bns:OptimisticScenarioMember country:US 2023-11-01 2024-10-31 0000009631 bns:OverNextTwelveMonthsMember bns:OptimisticScenarioMember bns:CaribbeanMember 2023-11-01 2024-10-31 0000009631 bns:OverNextTwelveMonthsMember bns:SeverePessimisticMember bns:CaribbeanMember 2023-11-01 2024-10-31 0000009631 bns:RemainingForecastPeriodCreditLossesMember bns:SeverePessimisticMember bns:CaribbeanMember 2023-11-01 2024-10-31 0000009631 bns:OverNextTwelveMonthsMember bns:SeverePessimisticMember country:CL 2023-11-01 2024-10-31 0000009631 bns:OverNextTwelveMonthsMember bns:BaseCaseScenarioMember bns:CaribbeanMember 2023-11-01 2024-10-31 0000009631 bns:OverNextTwelveMonthsMember bns:PessimisticScenarioMember bns:CaribbeanMember 2023-11-01 2024-10-31 0000009631 bns:RemainingForecastPeriodCreditLossesMember bns:PessimisticScenarioMember country:MX 2023-11-01 2024-10-31 0000009631 bns:OverNextTwelveMonthsMember bns:BaseCaseScenarioMember country:CL 2023-11-01 2024-10-31 0000009631 bns:RemainingForecastPeriodCreditLossesMember bns:PessimisticScenarioMember bns:CaribbeanMember 2023-11-01 2024-10-31 0000009631 bns:RemainingForecastPeriodCreditLossesMember bns:BaseCaseScenarioMember country:US 2023-11-01 2024-10-31 0000009631 bns:OverNextTwelveMonthsMember bns:BaseCaseScenarioMember country:US 2023-11-01 2024-10-31 0000009631 bns:RemainingForecastPeriodCreditLossesMember bns:PessimisticScenarioMember country:US 2023-11-01 2024-10-31 0000009631 bns:OverNextTwelveMonthsMember bns:BaseCaseScenarioMember country:CA 2023-11-01 2024-10-31 0000009631 bns:RemainingForecastPeriodCreditLossesMember bns:BaseCaseScenarioMember country:CA 2023-11-01 2024-10-31 0000009631 bns:OverNextTwelveMonthsMember bns:OptimisticScenarioMember country:CA 2023-11-01 2024-10-31 0000009631 bns:RemainingForecastPeriodCreditLossesMember bns:BaseCaseScenarioMember country:CL 2023-11-01 2024-10-31 0000009631 bns:RemainingForecastPeriodCreditLossesMember bns:BaseCaseScenarioMember bns:CaribbeanMember 2023-11-01 2024-10-31 0000009631 bns:OverNextTwelveMonthsMember bns:PessimisticScenarioMember country:MX 2023-11-01 2024-10-31 0000009631 bns:RemainingForecastPeriodCreditLossesMember bns:SeverePessimisticMember country:US 2023-11-01 2024-10-31 0000009631 bns:OverNextTwelveMonthsMember bns:SeverePessimisticMember country:MX 2023-11-01 2024-10-31 0000009631 bns:RemainingForecastPeriodCreditLossesMember bns:SeverePessimisticMember country:MX 2023-11-01 2024-10-31 0000009631 bns:RemainingForecastPeriodCreditLossesMember bns:OptimisticScenarioMember country:CO 2023-11-01 2024-10-31 0000009631 bns:OverNextTwelveMonthsMember bns:PessimisticScenarioMember country:CO 2023-11-01 2024-10-31 0000009631 bns:RemainingForecastPeriodCreditLossesMember bns:PessimisticScenarioMember country:CO 2023-11-01 2024-10-31 0000009631 bns:RemainingForecastPeriodCreditLossesMember bns:OptimisticScenarioMember country:MX 2023-11-01 2024-10-31 0000009631 bns:RemainingForecastPeriodCreditLossesMember bns:OptimisticScenarioMember country:CA 2023-11-01 2024-10-31 0000009631 bns:OverNextTwelveMonthsMember bns:PessimisticScenarioMember country:CA 2023-11-01 2024-10-31 0000009631 bns:OverNextTwelveMonthsMember bns:SeverePessimisticMember country:US 2023-11-01 2024-10-31 0000009631 bns:RemainingForecastPeriodCreditLossesMember bns:SeverePessimisticMember country:CL 2023-11-01 2024-10-31 0000009631 bns:OverNextTwelveMonthsMember bns:SeverePessimisticMember country:PE 2023-11-01 2024-10-31 0000009631 bns:RemainingForecastPeriodCreditLossesMember bns:SeverePessimisticMember country:PE 2023-11-01 2024-10-31 0000009631 bns:OverNextTwelveMonthsMember bns:SeverePessimisticMember country:CO 2023-11-01 2024-10-31 0000009631 bns:OverNextTwelveMonthsMember bns:BaseCaseScenarioMember country:PE 2023-11-01 2024-10-31 0000009631 bns:OverNextTwelveMonthsMember bns:OptimisticScenarioMember country:US 2023-11-01 2024-10-31 0000009631 bns:OverNextTwelveMonthsMember bns:PessimisticScenarioMember country:US 2023-11-01 2024-10-31 0000009631 bns:OverNextTwelveMonthsMember bns:OptimisticScenarioMember country:MX 2023-11-01 2024-10-31 0000009631 bns:RemainingForecastPeriodCreditLossesMember bns:PessimisticScenarioMember country:CL 2023-11-01 2024-10-31 0000009631 bns:OverNextTwelveMonthsMember bns:OptimisticScenarioMember country:CO 2023-11-01 2024-10-31 0000009631 bns:DerivativeFinancialInstrumentsMember ifrs-full:Level3OfFairValueHierarchyMember 2023-11-01 2024-10-31 0000009631 bns:PreferredSharesAndOtherEquityInstrumentsMember 2023-11-01 2024-10-31 0000009631 bns:CommonEquityMember 2023-11-01 2024-10-31 0000009631 ifrs-full:NoncontrollingInterestsMember 2023-11-01 2024-10-31 0000009631 ifrs-full:EquityAttributableToOwnersOfParentMember 2023-11-01 2024-10-31 0000009631 ifrs-full:AccumulatedOtherComprehensiveIncomeMember bns:EquityInstrumentsFairValueOtherComprehensiveIncomeMember 2023-11-01 2024-10-31 0000009631 ifrs-full:AccumulatedOtherComprehensiveIncomeMember bns:DebtInstrumentsFairValueOtherComprehensiveIncomeMember 2023-11-01 2024-10-31 0000009631 ifrs-full:AccumulatedOtherComprehensiveIncomeMember ifrs-full:ReserveOfExchangeDifferencesOnTranslationMember 2023-11-01 2024-10-31 0000009631 ifrs-full:AccumulatedOtherComprehensiveIncomeMember bns:OtherMember 2023-11-01 2024-10-31 0000009631 ifrs-full:AccumulatedOtherComprehensiveIncomeMember ifrs-full:ReserveOfCashFlowHedgesMember 2023-11-01 2024-10-31 0000009631 ifrs-full:OrdinarySharesMember 2023-11-01 2024-10-31 0000009631 ifrs-full:OtherReservesMember 2023-11-01 2024-10-31 0000009631 bns:StockAppreciationRightsMember 2023-11-01 2024-10-31 0000009631 bns:OtherSmallerOperatingSegmentsAndCorporateAdjustmentsMember 2023-11-01 2024-10-31 0000009631 bns:CanadianBankingMember 2023-11-01 2024-10-31 0000009631 bns:InternationalBankingMember 2023-11-01 2024-10-31 0000009631 bns:RestrictedShareUnitPlanMember 2023-11-01 2024-10-31 0000009631 bns:DeferredStockUnitPlanMember 2023-11-01 2024-10-31 0000009631 bns:ProbabilityWeightedScenariosMember 2023-11-01 2024-10-31 0000009631 bns:BaseCaseScenarioMember 2023-11-01 2024-10-31 0000009631 bns:BaseCaseScenarioMember ifrs-full:PreviouslyStatedMember 2023-11-01 2024-10-31 0000009631 bns:PessimisticScenarioMember 2023-11-01 2024-10-31 0000009631 bns:PerformanceShareUnitPlanMember 2023-11-01 2024-10-31 0000009631 bns:OtherBenefitPlansMember bns:AnnualBenefitExpenseMember 2023-11-01 2024-10-31 0000009631 ifrs-full:PensionDefinedBenefitPlansMember bns:AnnualBenefitExpenseMember 2023-11-01 2024-10-31 0000009631 ifrs-full:PensionDefinedBenefitPlansMember bns:ChangeInBenefitObligationMember 2023-11-01 2024-10-31 0000009631 bns:OtherBenefitPlansMember bns:ChangeInBenefitObligationMember 2023-11-01 2024-10-31 0000009631 bns:OtherBenefitPlansMember bns:ChangesInFairValueMember 2023-11-01 2024-10-31 0000009631 ifrs-full:PensionDefinedBenefitPlansMember bns:ChangesInFairValueMember 2023-11-01 2024-10-31 0000009631 ifrs-full:PensionDefinedBenefitPlansMember ifrs-full:EffectOfAssetCeilingMember 2023-11-01 2024-10-31 0000009631 bns:OtherBenefitPlansMember bns:AdditionalDetailsMember 2023-11-01 2024-10-31 0000009631 ifrs-full:PensionDefinedBenefitPlansMember bns:AdditionalDetailsMember 2023-11-01 2024-10-31 0000009631 ifrs-full:PensionDefinedBenefitPlansMember bns:RemeasurementsMember 2023-11-01 2024-10-31 0000009631 bns:OtherBenefitPlansMember bns:RemeasurementsMember 2023-11-01 2024-10-31 0000009631 bns:TradingAssetsMember 2023-11-01 2024-10-31 0000009631 bns:InvestmentSecuritiesMember 2023-11-01 2024-10-31 0000009631 bns:ObligationsRelatingToShortSellingOfSecuritiesMember 2023-11-01 2024-10-31 0000009631 bns:RemainingForecastPeriodCreditLossesMember bns:OptimisticScenarioMember bns:GlobalGdpAndPppMember 2023-11-01 2024-10-31 0000009631 bns:OverNextTwelveMonthsMember bns:PessimisticScenarioMember bns:GlobalGdpAndPppMember 2023-11-01 2024-10-31 0000009631 bns:RemainingForecastPeriodCreditLossesMember bns:PessimisticScenarioMember bns:GlobalGdpAndPppMember 2023-11-01 2024-10-31 0000009631 bns:RemainingForecastPeriodCreditLossesMember bns:SeverePessimisticMember bns:GlobalGdpAndPppMember 2023-11-01 2024-10-31 0000009631 bns:OverNextTwelveMonthsMember bns:SeverePessimisticMember bns:GlobalGdpAndPppMember 2023-11-01 2024-10-31 0000009631 bns:OverNextTwelveMonthsMember bns:BaseCaseScenarioMember bns:GlobalGdpAndPppMember 2023-11-01 2024-10-31 0000009631 bns:BaseCaseScenarioMember bns:GlobalGdpAndPppMember bns:RemainingForecastPeriodCreditLossesMember 2023-11-01 2024-10-31 0000009631 bns:OverNextTwelveMonthsMember bns:OptimisticScenarioMember bns:GlobalGdpAndPppMember 2023-11-01 2024-10-31 0000009631 ifrs-full:InterestRateRiskMember bns:HighMember 2023-11-01 2024-10-31 0000009631 ifrs-full:InterestRateRiskMember bns:LowMember 2023-11-01 2024-10-31 0000009631 ifrs-full:EquityPriceRiskMember 2023-11-01 2024-10-31 0000009631 ifrs-full:EquityPriceRiskMember bns:AverageMember 2023-11-01 2024-10-31 0000009631 ifrs-full:EquityPriceRiskMember bns:HighMember 2023-11-01 2024-10-31 0000009631 ifrs-full:EquityPriceRiskMember bns:LowMember 2023-11-01 2024-10-31 0000009631 ifrs-full:InterestRateRiskMember 2023-11-01 2024-10-31 0000009631 ifrs-full:InterestRateRiskMember bns:AverageMember 2023-11-01 2024-10-31 0000009631 ifrs-full:CreditRiskMember 2023-11-01 2024-10-31 0000009631 ifrs-full:CreditRiskMember bns:AverageMember 2023-11-01 2024-10-31 0000009631 ifrs-full:CreditRiskMember bns:HighMember 2023-11-01 2024-10-31 0000009631 ifrs-full:CreditRiskMember bns:LowMember 2023-11-01 2024-10-31 0000009631 bns:CreditPlusInterestRiskMember 2023-11-01 2024-10-31 0000009631 bns:CreditPlusInterestRiskMember bns:AverageMember 2023-11-01 2024-10-31 0000009631 bns:CreditPlusInterestRiskMember bns:HighMember 2023-11-01 2024-10-31 0000009631 bns:CreditPlusInterestRiskMember bns:LowMember 2023-11-01 2024-10-31 0000009631 bns:AverageMember 2023-11-01 2024-10-31 0000009631 bns:HighMember 2023-11-01 2024-10-31 0000009631 bns:LowMember 2023-11-01 2024-10-31 0000009631 ifrs-full:CommodityPriceRiskMember bns:HighMember 2023-11-01 2024-10-31 0000009631 ifrs-full:CommodityPriceRiskMember bns:LowMember 2023-11-01 2024-10-31 0000009631 bns:DebtSpecificMember 2023-11-01 2024-10-31 0000009631 bns:DebtSpecificMember bns:AverageMember 2023-11-01 2024-10-31 0000009631 bns:DebtSpecificMember bns:HighMember 2023-11-01 2024-10-31 0000009631 bns:DebtSpecificMember bns:LowMember 2023-11-01 2024-10-31 0000009631 ifrs-full:CommodityPriceRiskMember 2023-11-01 2024-10-31 0000009631 ifrs-full:CommodityPriceRiskMember bns:AverageMember 2023-11-01 2024-10-31 0000009631 ifrs-full:CurrencyRiskMember 2023-11-01 2024-10-31 0000009631 ifrs-full:CurrencyRiskMember bns:AverageMember 2023-11-01 2024-10-31 0000009631 ifrs-full:CurrencyRiskMember bns:HighMember 2023-11-01 2024-10-31 0000009631 ifrs-full:CurrencyRiskMember bns:LowMember 2023-11-01 2024-10-31 0000009631 ifrs-full:RiskDiversificationEffectMember 2023-11-01 2024-10-31 0000009631 ifrs-full:RiskDiversificationEffectMember bns:AverageMember 2023-11-01 2024-10-31 0000009631 bns:HundredBasisPointsDecreaseMember 2023-11-01 2024-10-31 0000009631 bns:HundredBasisPointsIncreaseMember 2023-11-01 2024-10-31 0000009631 ifrs-full:SecuritiesLendingMember 2023-11-01 2024-10-31 0000009631 bns:OtherSegmentMember bns:CrediscotiaFinancieraSaMember 2023-11-01 2024-10-31 0000009631 bns:CrediscotiaFinancieraSaMember srt:LatinAmericaMember 2023-11-01 2024-10-31 0000009631 bns:ImpairedLoansMember 2023-11-01 2024-10-31 0000009631 bns:DomesticScotiabankPensionPlanMember 2023-11-01 2024-10-31 0000009631 bns:OtherDefinedBenefitPensionPlansMember 2023-11-01 2024-10-31 0000009631 bns:DefinedContributionPensionPlansMember 2023-11-01 2024-10-31 0000009631 bns:DcPensionContributionsFundedFromPensionPlanSurplusMember 2023-11-01 2024-10-31 0000009631 bns:UnaffiliatedStructuredEntitiesMember 2023-11-01 2024-10-31 0000009631 bns:StageThreeMember 2023-11-01 2024-10-31 0000009631 bns:StageTwoMember 2023-11-01 2024-10-31 0000009631 bns:EquityContractsMember ifrs-full:Level3OfFairValueHierarchyMember ifrs-full:OptionPricingModelMember 2024-11-01 2025-10-31 0000009631 bns:InterestRateContractsMember ifrs-full:Level3OfFairValueHierarchyMember ifrs-full:OptionPricingModelMember 2024-11-01 2025-10-31 0000009631 bns:CommodityContractsMember ifrs-full:Level3OfFairValueHierarchyMember ifrs-full:DiscountedCashFlowMember 2024-11-01 2025-10-31 0000009631 bns:PrivateEquitySecuritiesMember ifrs-full:Level3OfFairValueHierarchyMember ifrs-full:MarketComparableCompaniesMember 2024-11-01 2025-10-31 0000009631 ifrs-full:BottomOfRangeMember bns:EquityRiskMember 2024-11-01 2025-10-31 0000009631 bns:MaduroAndCurielsBankNVMember 2024-11-01 2025-10-31 0000009631 bns:KeycorpMember 2024-11-01 2025-10-31 0000009631 bns:BankOfXianCoLtdMember 2024-11-01 2025-10-31 0000009631 bns:DecemberTwoThousandAndThirtyTwoMember ifrs-full:FixedInterestRateMember 2024-11-01 2025-10-31 0000009631 bns:AugustTwoThousandAndThirtyThreeMember ifrs-full:FixedInterestRateMember 2024-11-01 2025-10-31 0000009631 bns:JuneTwoThousandTwentyFiveMember ifrs-full:FixedInterestRateMember 2024-11-01 2025-10-31 0000009631 bns:DecemberTwoThousandTwentyFiveMember ifrs-full:FixedInterestRateMember 2024-11-01 2025-10-31 0000009631 bns:MayTwoThousandThirtyTwoMember ifrs-full:FixedInterestRateMember 2024-11-01 2025-10-31 0000009631 bns:DecemberTwoThousandAndThirtyThreeMember ifrs-full:FixedInterestRateMember 2024-11-01 2025-10-31 0000009631 bns:AugustTwoThousandAndThirtyFourMember ifrs-full:FixedInterestRateMember 2024-11-01 2025-10-31 0000009631 bns:MayTwoThousandThirtySevenMember ifrs-full:FixedInterestRateMember 2024-11-01 2025-10-31 0000009631 bns:ShareBasedCompensationsAwardTrancheOneMember 2024-11-01 2025-10-31 0000009631 bns:ShareBasedCompensationsAwardTrancheTwoMember 2024-11-01 2025-10-31 0000009631 bns:TwoThousandAndTwentyFiveStockOptionsMember 2024-11-01 2025-10-31 0000009631 bns:DeferredTaxAssetsLeaseLiabilitiesMember 2024-11-01 2025-10-31 0000009631 bns:DeferredTaxAssetsOtherMember 2024-11-01 2025-10-31 0000009631 bns:DeferredTaxAssetsMember 2024-11-01 2025-10-31 0000009631 bns:DeferredTaxLiabilitiesIntangibleAssetsMember 2024-11-01 2025-10-31 0000009631 bns:DeferredTaxLiabilitiesOthersMember 2024-11-01 2025-10-31 0000009631 bns:DeferredTaxLiabilitiesMember 2024-11-01 2025-10-31 0000009631 bns:DeferredTaxLiabilitiesDeferredCompensationMember 2024-11-01 2025-10-31 0000009631 bns:DeferredTaxLiabilitiesDeferredIncomeMember 2024-11-01 2025-10-31 0000009631 bns:DeferredTaxLiabilityPropertyAndEquipmentMember 2024-11-01 2025-10-31 0000009631 bns:DeferredTaxAssetsSecuritiesMember 2024-11-01 2025-10-31 0000009631 bns:DeferredTaxLiabilitiesSecuritiesMember 2024-11-01 2025-10-31 0000009631 bns:DeferredTaxLiabilitiesInvestmentInSubsidiariesAndAssociatesMember 2024-11-01 2025-10-31 0000009631 bns:DeferredTaxAssetPropertyAndEquipmentMember 2024-11-01 2025-10-31 0000009631 bns:DeferredTaxAssetsPensionAndOtherPostretirementBenefitsMember 2024-11-01 2025-10-31 0000009631 bns:DeferredTaxAssetsAllowanceForCreditLossesMember 2024-11-01 2025-10-31 0000009631 bns:DeferredTaxAssetsDeferredCompensationMember 2024-11-01 2025-10-31 0000009631 bns:DeferredTaxAssetsDeferredIncomeMember 2024-11-01 2025-10-31 0000009631 bns:DeferredTaxLiabilitiesPensionAndOtherPostretirementBenefitsMember 2024-11-01 2025-10-31 0000009631 bns:DeferredTaxAssetsTaxLossCarryForwardsMember 2024-11-01 2025-10-31 0000009631 bns:DomesticScotiabankPensionPlanMember 2024-11-01 2025-10-31 0000009631 bns:OtherDefinedBenefitPensionPlansMember 2024-11-01 2025-10-31 0000009631 bns:OtherBenefitPlansMember 2024-11-01 2025-10-31 0000009631 bns:DefinedContributionPensionPlansMember 2024-11-01 2025-10-31 0000009631 ifrs-full:OperatingSegmentsMember bns:OtherSmallerOperatingSegmentsAndCorporateAdjustmentsMember 2024-11-01 2025-10-31 0000009631 ifrs-full:OperatingSegmentsMember bns:CanadianBankingMember 2024-11-01 2025-10-31 0000009631 ifrs-full:OperatingSegmentsMember bns:InternationalBankingMember 2024-11-01 2025-10-31 0000009631 ifrs-full:OperatingSegmentsMember bns:GlobalWealthManagementMember 2024-11-01 2025-10-31 0000009631 ifrs-full:OperatingSegmentsMember bns:GlobalBankingAndMarketsMember 2024-11-01 2025-10-31 0000009631 ifrs-full:OperatingSegmentsMember country:CA 2024-11-01 2025-10-31 0000009631 ifrs-full:OperatingSegmentsMember country:US 2024-11-01 2025-10-31 0000009631 ifrs-full:OperatingSegmentsMember country:MX 2024-11-01 2025-10-31 0000009631 ifrs-full:OperatingSegmentsMember country:PE 2024-11-01 2025-10-31 0000009631 ifrs-full:OperatingSegmentsMember country:CL 2024-11-01 2025-10-31 0000009631 ifrs-full:OperatingSegmentsMember country:CO 2024-11-01 2025-10-31 0000009631 ifrs-full:OperatingSegmentsMember bns:CaribbeanAndCentralAmericaMember 2024-11-01 2025-10-31 0000009631 ifrs-full:OperatingSegmentsMember bns:OtherInternationalMember 2024-11-01 2025-10-31 0000009631 ifrs-full:OperatingSegmentsMember 2024-11-01 2025-10-31 0000009631 bns:OtherBenefitPlansMember country:CA 2024-11-01 2025-10-31 0000009631 ifrs-full:PensionDefinedBenefitPlansMember country:MX 2024-11-01 2025-10-31 0000009631 bns:OtherBenefitPlansMember country:US 2024-11-01 2025-10-31 0000009631 bns:OtherBenefitPlansMember country:MX 2024-11-01 2025-10-31 0000009631 ifrs-full:PensionDefinedBenefitPlansMember country:CA 2024-11-01 2025-10-31 0000009631 ifrs-full:PensionDefinedBenefitPlansMember country:US 2024-11-01 2025-10-31 0000009631 bns:EquitySecurities1Member bns:NonQuotedMember bns:OtherBenefitPlansMember 2024-11-01 2025-10-31 0000009631 bns:EquitySecurities1Member ifrs-full:PensionDefinedBenefitPlansMember 2024-11-01 2025-10-31 0000009631 bns:EquitySecurities1Member bns:OtherBenefitPlansMember 2024-11-01 2025-10-31 0000009631 bns:OtherSecuritiesMember bns:NonQuotedMember ifrs-full:PensionDefinedBenefitPlansMember 2024-11-01 2025-10-31 0000009631 ifrs-full:InvestmentPropertyMember bns:NonQuotedMember ifrs-full:PensionDefinedBenefitPlansMember 2024-11-01 2025-10-31 0000009631 bns:CashAndCashEquivalents1Member ifrs-full:PensionDefinedBenefitPlansMember 2024-11-01 2025-10-31 0000009631 ifrs-full:PensionDefinedBenefitPlansMember 2024-11-01 2025-10-31 0000009631 bns:FixedIncomeInvestments1Member bns:QuoteInAnActiveMarketMember bns:OtherBenefitPlansMember 2024-11-01 2025-10-31 0000009631 bns:FixedIncomeInvestments1Member bns:NonQuotedMember ifrs-full:PensionDefinedBenefitPlansMember 2024-11-01 2025-10-31 0000009631 bns:EquitySecurities1Member bns:NonQuotedMember ifrs-full:PensionDefinedBenefitPlansMember 2024-11-01 2025-10-31 0000009631 bns:EquitySecurities1Member bns:QuoteInAnActiveMarketMember bns:OtherBenefitPlansMember 2024-11-01 2025-10-31 0000009631 ifrs-full:InvestmentPropertyMember bns:QuoteInAnActiveMarketMember bns:OtherBenefitPlansMember 2024-11-01 2025-10-31 0000009631 bns:FixedIncomeInvestments1Member bns:QuoteInAnActiveMarketMember ifrs-full:PensionDefinedBenefitPlansMember 2024-11-01 2025-10-31 0000009631 bns:FixedIncomeInvestments1Member ifrs-full:PensionDefinedBenefitPlansMember 2024-11-01 2025-10-31 0000009631 bns:FixedIncomeInvestments1Member bns:OtherBenefitPlansMember 2024-11-01 2025-10-31 0000009631 ifrs-full:InvestmentPropertyMember ifrs-full:PensionDefinedBenefitPlansMember 2024-11-01 2025-10-31 0000009631 ifrs-full:InvestmentPropertyMember bns:OtherBenefitPlansMember 2024-11-01 2025-10-31 0000009631 bns:OtherSecuritiesMember ifrs-full:PensionDefinedBenefitPlansMember 2024-11-01 2025-10-31 0000009631 bns:EquitySecurities1Member bns:QuoteInAnActiveMarketMember ifrs-full:PensionDefinedBenefitPlansMember 2024-11-01 2025-10-31 0000009631 country:CA 2024-11-01 2025-10-31 0000009631 country:US 2024-11-01 2025-10-31 0000009631 country:MX 2024-11-01 2025-10-31 0000009631 country:PE 2024-11-01 2025-10-31 0000009631 country:CL 2024-11-01 2025-10-31 0000009631 bns:CaribbeanAndCentralAmericaMember 2024-11-01 2025-10-31 0000009631 bns:OtherInternationalMember 2024-11-01 2025-10-31 0000009631 bns:KeyManagementPersonnelDirectorsAndTheirCloseFamilyMembersMember 2024-11-01 2025-10-31 0000009631 ifrs-full:ForeignCountriesMember bns:ScotiabankColpatriaSAMember 2024-11-01 2025-10-31 0000009631 ifrs-full:ForeignCountriesMember bns:ScotiabankBrasilSaBancoMultiploMember 2024-11-01 2025-10-31 0000009631 ifrs-full:ForeignCountriesMember bns:ScotiabankChileSAMember 2024-11-01 2025-10-31 0000009631 ifrs-full:ForeignCountriesMember bns:GrupoFinancieroScotiabankInverlatSADeCVMember 2024-11-01 2025-10-31 0000009631 ifrs-full:ForeignCountriesMember bns:ScotiabankInverlatSaMember 2024-11-01 2025-10-31 0000009631 ifrs-full:ForeignCountriesMember bns:ScotiaPeruHoldingsSaMember 2024-11-01 2025-10-31 0000009631 ifrs-full:ForeignCountriesMember bns:ScotiabankPeruSaaMember 2024-11-01 2025-10-31 0000009631 ifrs-full:ForeignCountriesMember bns:MultiaccionesS.A.SMember 2024-11-01 2025-10-31 0000009631 ifrs-full:CountryOfDomicileMember bns:RoynatIncMember 2024-11-01 2025-10-31 0000009631 ifrs-full:CountryOfDomicileMember bns:ScotiaDealerAdvantageIncMember 2024-11-01 2025-10-31 0000009631 ifrs-full:ForeignCountriesMember bns:ScotiaHoldingsUSALLCMember 2024-11-01 2025-10-31 0000009631 ifrs-full:ForeignCountriesMember bns:ScotiaCapitalUSAIncMember 2024-11-01 2025-10-31 0000009631 ifrs-full:ForeignCountriesMember bns:ScotiaFinancingUSALLCMember 2024-11-01 2025-10-31 0000009631 ifrs-full:ForeignCountriesMember bns:NovaScotiaInversionesLimitadaMember 2024-11-01 2025-10-31 0000009631 ifrs-full:CountryOfDomicileMember bns:JarislowskyFraserLimitedCanadaMember 2024-11-01 2025-10-31 0000009631 ifrs-full:CountryOfDomicileMember bns:ScotiaSecuritiesIncMember 2024-11-01 2025-10-31 0000009631 ifrs-full:CountryOfDomicileMember bns:TangerineBankMember 2024-11-01 2025-10-31 0000009631 ifrs-full:CountryOfDomicileMember bns:TheBankOfNovaScotiaTrustCompanyMember 2024-11-01 2025-10-31 0000009631 ifrs-full:CountryOfDomicileMember bns:ScotiaMortgageCorporationMember 2024-11-01 2025-10-31 0000009631 ifrs-full:CountryOfDomicileMember bns:NationalTrustCompanyMember 2024-11-01 2025-10-31 0000009631 ifrs-full:ForeignCountriesMember bns:ScotiabankIrelandDesignatedActivityCompanyMember 2024-11-01 2025-10-31 0000009631 ifrs-full:CountryOfDomicileMember bns:ScotiaCapitalIncMember 2024-11-01 2025-10-31 0000009631 ifrs-full:CountryOfDomicileMember bns:BnsInvestmentsIncMember 2024-11-01 2025-10-31 0000009631 ifrs-full:CountryOfDomicileMember bns:OneEightThreeTwoAssetManagementLpMember 2024-11-01 2025-10-31 0000009631 ifrs-full:CountryOfDomicileMember bns:MontrealTrustCompanyOfCanadaMember 2024-11-01 2025-10-31 0000009631 ifrs-full:CountryOfDomicileMember bns:MdFinancialManagementCanadaMember 2024-11-01 2025-10-31 0000009631 ifrs-full:ForeignCountriesMember bns:ScotiabankBarbadosLimitedMember 2024-11-01 2025-10-31 0000009631 ifrs-full:ForeignCountriesMember bns:TheBankOfNovaScotiaInternationalLimitedMember 2024-11-01 2025-10-31 0000009631 ifrs-full:ForeignCountriesMember bns:TheBankOfNovaScotiaTrustCompanyBahamasLimitedMember 2024-11-01 2025-10-31 0000009631 ifrs-full:ForeignCountriesMember bns:ScotiabankBahamasLimitedMember 2024-11-01 2025-10-31 0000009631 ifrs-full:ForeignCountriesMember bns:ScotiabankAndTrustCaymanLimitedMember 2024-11-01 2025-10-31 0000009631 ifrs-full:ForeignCountriesMember bns:GrupoBnsDeCostaRicaSaMember 2024-11-01 2025-10-31 0000009631 ifrs-full:ForeignCountriesMember bns:ScotialUruguayHoldingsSaMember 2024-11-01 2025-10-31 0000009631 ifrs-full:ForeignCountriesMember bns:ScotiabankUruguaySAMember 2024-11-01 2025-10-31 0000009631 ifrs-full:ForeignCountriesMember bns:ScotiabankRepublicaDominicanaSABancoMultipleMember 2024-11-01 2025-10-31 0000009631 ifrs-full:ForeignCountriesMember bns:ScotiabankCaribbeanHoldingsLtdMember 2024-11-01 2025-10-31 0000009631 ifrs-full:ForeignCountriesMember bns:ScotiaGroupJamaicaLimitedMember 2024-11-01 2025-10-31 0000009631 ifrs-full:ForeignCountriesMember bns:ScotiabankTrinidadAndTobagoLimitedMember 2024-11-01 2025-10-31 0000009631 bns:AssociatesAndJointVenturesMember 2024-11-01 2025-10-31 0000009631 bns:ScotiabankColpatriaSAMember 2024-11-01 2025-10-31 0000009631 bns:EquivalentExternalRatingStandardAndPoorsAaaToAaPlusMember bns:InvestmentGradeMember bns:EquivalentExternalRatingDominionBondRatingServiceDefaultMember 2024-11-01 2025-10-31 0000009631 bns:EquivalentExternalRatingStandardAndPoorsAaToAPlusMember bns:InvestmentGradeMember bns:EquivalentExternalRatingMoodyDefaultMember 2024-11-01 2025-10-31 0000009631 bns:EquivalentExternalRatingStandardAndPoorsaToaMinusMember bns:InvestmentGradeMember bns:EquivalentExternalRatingMoodyDefaultMember 2024-11-01 2025-10-31 0000009631 bns:EquivalentExternalRatingStandardAndPoorsaToaMinusMember bns:InvestmentGradeMember bns:EquivalentExternalRatingDominionBondRatingServiceDefaultMember 2024-11-01 2025-10-31 0000009631 bns:EquivalentExternalRatingStandardAndPoorsBbPlusMember bns:InternalNonInvestmentGrade1Member bns:EquivalentExternalRatingDominionBondRatingServiceDefaultMember 2024-11-01 2025-10-31 0000009631 bns:EquivalentExternalRatingStandardAndPoorsBbbPlusMember bns:InvestmentGradeMember bns:EquivalentExternalRatingDominionBondRatingServiceDefaultMember 2024-11-01 2025-10-31 0000009631 srt:StandardPoorsBBBRatingMember bns:InvestmentGradeMember bns:EquivalentExternalRatingDominionBondRatingServiceDefaultMember 2024-11-01 2025-10-31 0000009631 srt:StandardPoorsBBBRatingMember bns:InvestmentGradeMember bns:EquivalentExternalRatingMoodyDefaultMember 2024-11-01 2025-10-31 0000009631 bns:EquivalentExternalRatingStandardAndPoorsAaToAPlusMember bns:InvestmentGradeMember bns:EquivalentExternalRatingDominionBondRatingServiceDefaultMember 2024-11-01 2025-10-31 0000009631 bns:EquivalentExternalRatingStandardAndPoorsBbbMinusMember bns:InvestmentGradeMember bns:EquivalentExternalRatingMoodyDefaultMember 2024-11-01 2025-10-31 0000009631 bns:EquivalentExternalRatingStandardandPoorsCCCMinusToCCMember bns:InternalGradeWatchListMember bns:EquivalentExternalRatingMoodyDefaultMember 2024-11-01 2025-10-31 0000009631 bns:EquivalentExternalRatingStandardAndPoorsbTobMinusMember bns:InternalNonInvestmentGrade1Member bns:EquivalentExternalRatingDominionBondRatingServiceDefaultMember 2024-11-01 2025-10-31 0000009631 bns:EquivalentExternalRatingStandardAndPoorsAaaToAaPlusMember bns:InvestmentGradeMember bns:EquivalentExternalRatingMoodyDefaultMember 2024-11-01 2025-10-31 0000009631 bns:EquivalentExternalRatingStandardAndPoorsBbbPlusMember bns:InvestmentGradeMember bns:EquivalentExternalRatingMoodyDefaultMember 2024-11-01 2025-10-31 0000009631 bns:EquivalentExternalRatingStandardAndPoorsbPlusMember bns:InternalNonInvestmentGrade1Member bns:EquivalentExternalRatingDominionBondRatingServiceDefaultMember 2024-11-01 2025-10-31 0000009631 bns:EquivalentExternalRatingStandardAndPoorsbPlusMember bns:InternalNonInvestmentGrade1Member bns:EquivalentExternalRatingMoodyDefaultMember 2024-11-01 2025-10-31 0000009631 bns:EquivalentExternalRatingStandardAndPoorsbPlusMember bns:InternalNonInvestmentGrade1Member bns:EquivalentExternalRatingStandardAndPoorsDefaultMember 2024-11-01 2025-10-31 0000009631 bns:EquivalentExternalRatingStandardAndPoorsbTobMinusMember bns:InternalNonInvestmentGrade1Member bns:EquivalentExternalRatingStandardAndPoorsDefaultMember 2024-11-01 2025-10-31 0000009631 bns:EquivalentExternalRatingStandardAndPoorsCccPlusMember bns:InternalGradeWatchListMember bns:EquivalentExternalRatingStandardAndPoorsDefaultMember 2024-11-01 2025-10-31 0000009631 srt:StandardPoorsCCCRatingMember bns:InternalGradeWatchListMember bns:EquivalentExternalRatingStandardAndPoorsDefaultMember 2024-11-01 2025-10-31 0000009631 bns:EquivalentExternalRatingStandardandPoorsCCCMinusToCCMember bns:InternalGradeWatchListMember bns:EquivalentExternalRatingStandardAndPoorsDefaultMember 2024-11-01 2025-10-31 0000009631 bns:InternalGradeDefaultMember bns:EquivalentExternalRatingStandardAndPoorsDefaultMember 2024-11-01 2025-10-31 0000009631 bns:EquivalentExternalRatingStandardAndPoorsBbbPlusMember bns:InvestmentGradeMember bns:EquivalentExternalRatingStandardAndPoorsDefaultMember 2024-11-01 2025-10-31 0000009631 srt:StandardPoorsBBBRatingMember bns:InvestmentGradeMember bns:EquivalentExternalRatingStandardAndPoorsDefaultMember 2024-11-01 2025-10-31 0000009631 bns:EquivalentExternalRatingStandardAndPoorsBbbMinusMember bns:InvestmentGradeMember bns:EquivalentExternalRatingStandardAndPoorsDefaultMember 2024-11-01 2025-10-31 0000009631 bns:EquivalentExternalRatingStandardAndPoorsBbPlusMember bns:InternalNonInvestmentGrade1Member bns:EquivalentExternalRatingStandardAndPoorsDefaultMember 2024-11-01 2025-10-31 0000009631 srt:StandardPoorsBBRatingMember bns:InternalNonInvestmentGrade1Member bns:EquivalentExternalRatingStandardAndPoorsDefaultMember 2024-11-01 2025-10-31 0000009631 bns:EquivalentExternalRatingStandardAndPoorsBbMinusMember bns:InternalNonInvestmentGrade1Member bns:EquivalentExternalRatingStandardAndPoorsDefaultMember 2024-11-01 2025-10-31 0000009631 srt:StandardPoorsBBRatingMember bns:InternalNonInvestmentGrade1Member bns:EquivalentExternalRatingMoodyDefaultMember 2024-11-01 2025-10-31 0000009631 bns:EquivalentExternalRatingStandardAndPoorsBbPlusMember bns:InternalNonInvestmentGrade1Member bns:EquivalentExternalRatingMoodyDefaultMember 2024-11-01 2025-10-31 0000009631 srt:StandardPoorsCCCRatingMember bns:InternalGradeWatchListMember bns:EquivalentExternalRatingMoodyDefaultMember 2024-11-01 2025-10-31 0000009631 bns:EquivalentExternalRatingStandardAndPoorsCccPlusMember bns:InternalGradeWatchListMember bns:EquivalentExternalRatingMoodyDefaultMember 2024-11-01 2025-10-31 0000009631 bns:EquivalentExternalRatingStandardAndPoorsBbbMinusMember bns:InvestmentGradeMember bns:EquivalentExternalRatingDominionBondRatingServiceDefaultMember 2024-11-01 2025-10-31 0000009631 bns:EquivalentExternalRatingStandardAndPoorsaToaMinusMember bns:InvestmentGradeMember bns:EquivalentExternalRatingStandardAndPoorsDefaultMember 2024-11-01 2025-10-31 0000009631 bns:EquivalentExternalRatingStandardAndPoorsBbMinusMember bns:InternalNonInvestmentGrade1Member bns:EquivalentExternalRatingDominionBondRatingServiceDefaultMember 2024-11-01 2025-10-31 0000009631 bns:EquivalentExternalRatingStandardAndPoorsBbMinusMember bns:InternalNonInvestmentGrade1Member bns:EquivalentExternalRatingMoodyDefaultMember 2024-11-01 2025-10-31 0000009631 srt:StandardPoorsBBRatingMember bns:InternalNonInvestmentGrade1Member bns:EquivalentExternalRatingDominionBondRatingServiceDefaultMember 2024-11-01 2025-10-31 0000009631 bns:EquivalentExternalRatingStandardAndPoorsbTobMinusMember bns:InternalNonInvestmentGrade1Member bns:EquivalentExternalRatingMoodyDefaultMember 2024-11-01 2025-10-31 0000009631 bns:EquivalentExternalRatingStandardAndPoorsAaaToAaPlusMember bns:InvestmentGradeMember bns:EquivalentExternalRatingStandardAndPoorsDefaultMember 2024-11-01 2025-10-31 0000009631 bns:EquivalentExternalRatingStandardAndPoorsAaToAPlusMember bns:InvestmentGradeMember bns:EquivalentExternalRatingStandardAndPoorsDefaultMember 2024-11-01 2025-10-31 0000009631 bns:OtherAssetsAndReversalOfImpairmentLossMember 2024-11-01 2025-10-31 0000009631 bns:ResidentialMortgagesPersonalLoansCreditCardsTotalRetailLoansBusinessAndGovernmentExcludingOtherAssetsMember 2024-11-01 2025-10-31 0000009631 ifrs-full:TopOfRangeMember 2024-11-01 2025-10-31 0000009631 bns:RetailMember bns:AdvancedInternalRatingsBasedPortfolioMember 2024-11-01 2025-10-31 0000009631 ifrs-full:SubsidiariesWithMaterialNoncontrollingInterestsMember 2024-11-01 2025-10-31 0000009631 bns:EmployeeStockOptionsMember 2024-11-01 2025-10-31 0000009631 ifrs-full:OrdinarySharesMember 2024-11-01 2025-10-31 0000009631 bns:LitigationAndOtherMember 2024-11-01 2025-10-31 0000009631 ifrs-full:FinancialAssetsAtAmortisedCostMember bns:CorporateDebtMember ifrs-full:LaterThanOneYearAndNotLaterThanFiveYearsMember 2024-11-01 2025-10-31 0000009631 ifrs-full:FinancialAssetsAtAmortisedCostMember bns:CorporateDebtMember ifrs-full:LaterThanTenYearsMember 2024-11-01 2025-10-31 0000009631 bns:FairValueThroughOtherComprehensiveIncomeMember bns:CanadianFederalGovernmentIssuedOrGuaranteedDebtMember ifrs-full:LaterThanThreeMonthsAndNotLaterThanOneYearMember 2024-11-01 2025-10-31 0000009631 bns:FairValueThroughOtherComprehensiveIncomeMember bns:CanadianFederalGovernmentIssuedOrGuaranteedDebtMember ifrs-full:LaterThanOneYearAndNotLaterThanFiveYearsMember 2024-11-01 2025-10-31 0000009631 bns:FairValueThroughOtherComprehensiveIncomeMember bns:CanadianFederalGovernmentIssuedOrGuaranteedDebtMember ifrs-full:LaterThanFiveYearsAndNotLaterThanTenYearsMember 2024-11-01 2025-10-31 0000009631 bns:FairValueThroughOtherComprehensiveIncomeMember bns:CanadianFederalGovernmentIssuedOrGuaranteedDebtMember ifrs-full:LaterThanTenYearsMember 2024-11-01 2025-10-31 0000009631 bns:FairValueThroughOtherComprehensiveIncomeMember bns:CanadianProvincialAndMunicipalDebtMember ifrs-full:NotLaterThanThreeMonthsMember 2024-11-01 2025-10-31 0000009631 ifrs-full:FinancialAssetsAtAmortisedCostMember bns:OtherForeignGovernmentDebtMember ifrs-full:LaterThanTenYearsMember 2024-11-01 2025-10-31 0000009631 bns:FairValueThroughOtherComprehensiveIncomeMember bns:OtherDebtMember 2024-11-01 2025-10-31 0000009631 ifrs-full:FinancialAssetsAtAmortisedCostMember bns:CanadianFederalAndProvincialGovernmentIssuedOrGuaranteedDebtMember 2024-11-01 2025-10-31 0000009631 ifrs-full:FinancialAssetsAtAmortisedCostMember bns:UsTreasuryAndOtherUsAgencyDebtMember 2024-11-01 2025-10-31 0000009631 ifrs-full:FinancialAssetsAtAmortisedCostMember bns:OtherForeignGovernmentDebtMember 2024-11-01 2025-10-31 0000009631 ifrs-full:FinancialAssetsAtAmortisedCostMember bns:CorporateDebtMember 2024-11-01 2025-10-31 0000009631 bns:FairValueThroughOtherComprehensiveIncomeMember bns:CanadianFederalGovernmentIssuedOrGuaranteedDebtMember ifrs-full:NotLaterThanThreeMonthsMember 2024-11-01 2025-10-31 0000009631 bns:FairValueThroughOtherComprehensiveIncomeMember bns:UsTreasuryAndOtherUsAgencyDebtMember ifrs-full:LaterThanFiveYearsAndNotLaterThanTenYearsMember 2024-11-01 2025-10-31 0000009631 bns:FairValueThroughOtherComprehensiveIncomeMember bns:UsTreasuryAndOtherUsAgencyDebtMember ifrs-full:LaterThanTenYearsMember 2024-11-01 2025-10-31 0000009631 bns:FairValueThroughOtherComprehensiveIncomeMember bns:OtherForeignGovernmentDebtMember ifrs-full:NotLaterThanThreeMonthsMember 2024-11-01 2025-10-31 0000009631 bns:FairValueThroughOtherComprehensiveIncomeMember bns:OtherForeignGovernmentDebtMember ifrs-full:LaterThanFiveYearsAndNotLaterThanTenYearsMember 2024-11-01 2025-10-31 0000009631 bns:FairValueThroughOtherComprehensiveIncomeMember bns:UsTreasuryAndOtherUsAgencyDebtMember 2024-11-01 2025-10-31 0000009631 bns:FairValueThroughOtherComprehensiveIncomeMember bns:OtherForeignGovernmentDebtMember 2024-11-01 2025-10-31 0000009631 ifrs-full:FinancialAssetsAtAmortisedCostMember bns:OtherForeignGovernmentDebtMember ifrs-full:LaterThanFiveYearsAndNotLaterThanTenYearsMember 2024-11-01 2025-10-31 0000009631 bns:FairValueThroughOtherComprehensiveIncomeMember bns:CanadianProvincialAndMunicipalDebtMember ifrs-full:LaterThanFiveYearsAndNotLaterThanTenYearsMember 2024-11-01 2025-10-31 0000009631 bns:FairValueThroughOtherComprehensiveIncomeMember bns:CanadianProvincialAndMunicipalDebtMember ifrs-full:LaterThanTenYearsMember 2024-11-01 2025-10-31 0000009631 bns:FairValueThroughOtherComprehensiveIncomeMember bns:UsTreasuryAndOtherUsAgencyDebtMember ifrs-full:NotLaterThanThreeMonthsMember 2024-11-01 2025-10-31 0000009631 bns:FairValueThroughOtherComprehensiveIncomeMember bns:UsTreasuryAndOtherUsAgencyDebtMember ifrs-full:LaterThanThreeMonthsAndNotLaterThanOneYearMember 2024-11-01 2025-10-31 0000009631 bns:FairValueThroughOtherComprehensiveIncomeMember bns:UsTreasuryAndOtherUsAgencyDebtMember ifrs-full:LaterThanOneYearAndNotLaterThanFiveYearsMember 2024-11-01 2025-10-31 0000009631 ifrs-full:FinancialAssetsAtAmortisedCostMember bns:UsTreasuryAndOtherUsAgencyDebtMember ifrs-full:LaterThanOneYearAndNotLaterThanFiveYearsMember 2024-11-01 2025-10-31 0000009631 ifrs-full:FinancialAssetsAtAmortisedCostMember bns:UsTreasuryAndOtherUsAgencyDebtMember ifrs-full:LaterThanFiveYearsAndNotLaterThanTenYearsMember 2024-11-01 2025-10-31 0000009631 ifrs-full:FinancialAssetsAtAmortisedCostMember bns:UsTreasuryAndOtherUsAgencyDebtMember ifrs-full:LaterThanTenYearsMember 2024-11-01 2025-10-31 0000009631 ifrs-full:FinancialAssetsAtAmortisedCostMember bns:OtherForeignGovernmentDebtMember ifrs-full:NotLaterThanThreeMonthsMember 2024-11-01 2025-10-31 0000009631 ifrs-full:FinancialAssetsAtAmortisedCostMember bns:OtherForeignGovernmentDebtMember ifrs-full:LaterThanThreeMonthsAndNotLaterThanOneYearMember 2024-11-01 2025-10-31 0000009631 ifrs-full:FinancialAssetsAtAmortisedCostMember bns:OtherForeignGovernmentDebtMember ifrs-full:LaterThanOneYearAndNotLaterThanFiveYearsMember 2024-11-01 2025-10-31 0000009631 ifrs-full:FinancialAssetsAtAmortisedCostMember bns:CanadianFederalAndProvincialGovernmentIssuedOrGuaranteedDebtMember ifrs-full:LaterThanThreeMonthsAndNotLaterThanOneYearMember 2024-11-01 2025-10-31 0000009631 ifrs-full:FinancialAssetsAtAmortisedCostMember bns:CanadianFederalAndProvincialGovernmentIssuedOrGuaranteedDebtMember ifrs-full:LaterThanOneYearAndNotLaterThanFiveYearsMember 2024-11-01 2025-10-31 0000009631 bns:FairValueThroughOtherComprehensiveIncomeMember bns:CanadianFederalGovernmentIssuedOrGuaranteedDebtMember 2024-11-01 2025-10-31 0000009631 bns:FairValueThroughOtherComprehensiveIncomeMember bns:CanadianProvincialAndMunicipalDebtMember 2024-11-01 2025-10-31 0000009631 ifrs-full:FinancialAssetsAtAmortisedCostMember bns:CanadianFederalAndProvincialGovernmentIssuedOrGuaranteedDebtMember ifrs-full:LaterThanFiveYearsAndNotLaterThanTenYearsMember 2024-11-01 2025-10-31 0000009631 ifrs-full:FinancialAssetsAtAmortisedCostMember bns:UsTreasuryAndOtherUsAgencyDebtMember ifrs-full:LaterThanThreeMonthsAndNotLaterThanOneYearMember 2024-11-01 2025-10-31 0000009631 bns:FairValueThroughOtherComprehensiveIncomeMember bns:OtherDebtMember ifrs-full:NotLaterThanThreeMonthsMember 2024-11-01 2025-10-31 0000009631 bns:FairValueThroughOtherComprehensiveIncomeMember bns:OtherDebtMember ifrs-full:LaterThanThreeMonthsAndNotLaterThanOneYearMember 2024-11-01 2025-10-31 0000009631 bns:FairValueThroughOtherComprehensiveIncomeMember bns:OtherDebtMember ifrs-full:LaterThanOneYearAndNotLaterThanFiveYearsMember 2024-11-01 2025-10-31 0000009631 bns:FairValueThroughOtherComprehensiveIncomeMember bns:OtherDebtMember ifrs-full:LaterThanFiveYearsAndNotLaterThanTenYearsMember 2024-11-01 2025-10-31 0000009631 bns:FairValueThroughOtherComprehensiveIncomeMember bns:OtherDebtMember ifrs-full:LaterThanTenYearsMember 2024-11-01 2025-10-31 0000009631 ifrs-full:FinancialAssetsAtAmortisedCostMember bns:CanadianFederalAndProvincialGovernmentIssuedOrGuaranteedDebtMember ifrs-full:NotLaterThanThreeMonthsMember 2024-11-01 2025-10-31 0000009631 bns:FairValueThroughOtherComprehensiveIncomeMember bns:CanadianProvincialAndMunicipalDebtMember ifrs-full:LaterThanThreeMonthsAndNotLaterThanOneYearMember 2024-11-01 2025-10-31 0000009631 bns:FairValueThroughOtherComprehensiveIncomeMember bns:CanadianProvincialAndMunicipalDebtMember ifrs-full:LaterThanOneYearAndNotLaterThanFiveYearsMember 2024-11-01 2025-10-31 0000009631 bns:FairValueThroughOtherComprehensiveIncomeMember bns:OtherForeignGovernmentDebtMember ifrs-full:LaterThanThreeMonthsAndNotLaterThanOneYearMember 2024-11-01 2025-10-31 0000009631 bns:FairValueThroughOtherComprehensiveIncomeMember bns:OtherForeignGovernmentDebtMember ifrs-full:LaterThanOneYearAndNotLaterThanFiveYearsMember 2024-11-01 2025-10-31 0000009631 bns:FairValueThroughOtherComprehensiveIncomeMember bns:OtherForeignGovernmentDebtMember ifrs-full:LaterThanTenYearsMember 2024-11-01 2025-10-31 0000009631 ifrs-full:FinancialAssetsAtAmortisedCostMember bns:CorporateDebtMember ifrs-full:LaterThanThreeMonthsAndNotLaterThanOneYearMember 2024-11-01 2025-10-31 0000009631 ifrs-full:TopOfRangeMember bns:EquityRiskMember 2024-11-01 2025-10-31 0000009631 ifrs-full:Level2OfFairValueHierarchyMember bns:InvestmentInEquitySecuritiesMember 2024-11-01 2025-10-31 0000009631 bns:EquityContracts1Member ifrs-full:Level3OfFairValueHierarchyMember ifrs-full:OptionPricingModelMember 2024-11-01 2025-10-31 0000009631 ifrs-full:GrossCarryingAmountMember ifrs-full:LeaseholdImprovementsMember 2024-11-01 2025-10-31 0000009631 ifrs-full:GrossCarryingAmountMember ifrs-full:RightofuseAssetsMember 2024-11-01 2025-10-31 0000009631 ifrs-full:GrossCarryingAmountMember 2024-11-01 2025-10-31 0000009631 ifrs-full:GrossCarryingAmountMember ifrs-full:LandAndBuildingsMember 2024-11-01 2025-10-31 0000009631 ifrs-full:GrossCarryingAmountMember bns:Equipment1Member 2024-11-01 2025-10-31 0000009631 ifrs-full:GrossCarryingAmountMember bns:TechnologyAssetsMember 2024-11-01 2025-10-31 0000009631 ifrs-full:AccumulatedDepreciationAndAmortisationMember ifrs-full:ComputerSoftwareMember bns:FiniteLifeIntangibleAssetsMember 2024-11-01 2025-10-31 0000009631 ifrs-full:AccumulatedDepreciationAndAmortisationMember ifrs-full:OtherIntangibleAssetsMember bns:FiniteLifeIntangibleAssetsMember 2024-11-01 2025-10-31 0000009631 ifrs-full:AccumulatedDepreciationAndAmortisationMember 2024-11-01 2025-10-31 0000009631 bns:RecognizedInOtherComprehensiveIncomeMember 2024-11-01 2025-10-31 0000009631 ifrs-full:RetainedEarningsMember 2024-11-01 2025-10-31 0000009631 bns:OtherBenefitPlansMember ifrs-full:CountryOfDomicileMember 2024-11-01 2025-10-31 0000009631 bns:OtherPensionPlansMember ifrs-full:CountryOfDomicileMember 2024-11-01 2025-10-31 0000009631 ifrs-full:PensionDefinedBenefitPlansMember ifrs-full:ForeignCountriesMember 2024-11-01 2025-10-31 0000009631 bns:DomesticScotiabankPensionPlanMember ifrs-full:CountryOfDomicileMember 2024-11-01 2025-10-31 0000009631 bns:OtherBenefitPlansMember ifrs-full:ForeignCountriesMember 2024-11-01 2025-10-31 0000009631 bns:AdvancedInternalRatingsBasedPortfolioMember 2024-11-01 2025-10-31 0000009631 bns:RetailMember ifrs-full:TopOfRangeMember bns:StandardizedPortfolioMember 2024-11-01 2025-10-31 0000009631 ifrs-full:CountryOfDomicileMember 2024-11-01 2025-10-31 0000009631 ifrs-full:GrossCarryingAmountMember ifrs-full:ComputerSoftwareMember bns:FiniteLifeIntangibleAssetsMember 2024-11-01 2025-10-31 0000009631 srt:LatinAmericaMember 2024-11-01 2025-10-31 0000009631 bns:CaribbeanAndCentralAmericaMember 2024-11-01 2025-10-31 0000009631 ifrs-full:AccumulatedDepreciationAndAmortisationMember ifrs-full:LandAndBuildingsMember 2024-11-01 2025-10-31 0000009631 ifrs-full:AccumulatedDepreciationAndAmortisationMember bns:Equipment1Member 2024-11-01 2025-10-31 0000009631 ifrs-full:AccumulatedDepreciationAndAmortisationMember bns:TechnologyAssetsMember 2024-11-01 2025-10-31 0000009631 ifrs-full:AccumulatedDepreciationAndAmortisationMember ifrs-full:LeaseholdImprovementsMember 2024-11-01 2025-10-31 0000009631 ifrs-full:AccumulatedDepreciationAndAmortisationMember ifrs-full:RightofuseAssetsMember 2024-11-01 2025-10-31 0000009631 bns:ResidentialMortgagesMember 2024-11-01 2025-10-31 0000009631 ifrs-full:ConsumerLoansMember 2024-11-01 2025-10-31 0000009631 bns:CreditCardMember 2024-11-01 2025-10-31 0000009631 bns:BusinessAndGovernmentMember 2024-11-01 2025-10-31 0000009631 bns:SeniorNoteLiabilitiesMember 2024-11-01 2025-10-31 0000009631 bns:DerivativeFinancialAssetsMember bns:CreditContractsMember ifrs-full:Level3OfFairValueHierarchyMember 2024-11-01 2025-10-31 0000009631 bns:InvestmentSecuritiesMember ifrs-full:Level3OfFairValueHierarchyMember 2024-11-01 2025-10-31 0000009631 bns:DerivativeFinancialAssetsMember bns:InterestRateContractsMember ifrs-full:Level3OfFairValueHierarchyMember 2024-11-01 2025-10-31 0000009631 bns:DerivativeFinancialAssetsMember bns:CommodityContractsMember ifrs-full:Level3OfFairValueHierarchyMember 2024-11-01 2025-10-31 0000009631 bns:DerivativeFinancialAssetsMember bns:EquityContractsMember ifrs-full:Level3OfFairValueHierarchyMember 2024-11-01 2025-10-31 0000009631 bns:InvestmentSecuritiesMember bns:EquitySecurities1Member ifrs-full:Level3OfFairValueHierarchyMember 2024-11-01 2025-10-31 0000009631 bns:InvestmentSecuritiesMember bns:CorporateAndOtherDebtMember ifrs-full:Level3OfFairValueHierarchyMember 2024-11-01 2025-10-31 0000009631 ifrs-full:OfficeEquipmentMember ifrs-full:BottomOfRangeMember 2024-11-01 2025-10-31 0000009631 ifrs-full:OfficeEquipmentMember ifrs-full:TopOfRangeMember 2024-11-01 2025-10-31 0000009631 bns:BuildingFittingsMember 2024-11-01 2025-10-31 0000009631 ifrs-full:BuildingsMember 2024-11-01 2025-10-31 0000009631 bns:DerivativeFinancialLiabilitiesMember bns:InterestRateContractsMember ifrs-full:Level3OfFairValueHierarchyMember 2024-11-01 2025-10-31 0000009631 bns:DerivativeFinancialLiabilitiesMember bns:EquityContractsMember ifrs-full:Level3OfFairValueHierarchyMember 2024-11-01 2025-10-31 0000009631 bns:DerivativeFinancialLiabilitiesMember bns:CommodityContractsMember ifrs-full:Level3OfFairValueHierarchyMember 2024-11-01 2025-10-31 0000009631 bns:DerivativeFinancialLiabilitiesMember bns:CreditContractsMember ifrs-full:Level3OfFairValueHierarchyMember 2024-11-01 2025-10-31 0000009631 bns:GlobalWealthManagementMember 2024-11-01 2025-10-31 0000009631 bns:GlobalBankingAndMarketsMember 2024-11-01 2025-10-31 0000009631 bns:SubordinatedDebenturesNonViabilityContingentCapitalMember 2024-11-01 2025-10-31 0000009631 bns:ActuarialAssumptionOfMedicalCostTrendUltimateRatesMember bns:OtherBenefitPlansMember 2024-11-01 2025-10-31 0000009631 ifrs-full:GrossCarryingAmountMember ifrs-full:OtherIntangibleAssetsMember bns:FiniteLifeIntangibleAssetsMember 2024-11-01 2025-10-31 0000009631 ifrs-full:ForeignCountriesMember 2024-11-01 2025-10-31 0000009631 ifrs-full:ComputerSoftwareMember 2024-11-01 2025-10-31 0000009631 ifrs-full:Level3OfFairValueHierarchyMember 2024-11-01 2025-10-31 0000009631 ifrs-full:OtherIntangibleAssetsMember ifrs-full:TopOfRangeMember 2024-11-01 2025-10-31 0000009631 ifrs-full:OtherIntangibleAssetsMember ifrs-full:BottomOfRangeMember 2024-11-01 2025-10-31 0000009631 ifrs-full:ConsumerLoansMember bns:StageThreeMember 2024-11-01 2025-10-31 0000009631 ifrs-full:ConsumerLoansMember bns:StageTwoMember 2024-11-01 2025-10-31 0000009631 ifrs-full:ConsumerLoansMember bns:StageOneMember 2024-11-01 2025-10-31 0000009631 bns:TotalRetailLoansMember 2024-11-01 2025-10-31 0000009631 bns:CreditCardMember bns:StageOneMember 2024-11-01 2025-10-31 0000009631 bns:CreditCardMember bns:StageThreeMember 2024-11-01 2025-10-31 0000009631 bns:TotalRetailLoansMember bns:StageOneMember 2024-11-01 2025-10-31 0000009631 bns:BusinessAndGovernmentMember bns:StageThreeMember 2024-11-01 2025-10-31 0000009631 bns:TotalRetailLoansMember bns:StageTwoMember 2024-11-01 2025-10-31 0000009631 bns:BusinessAndGovernmentMember bns:StageOneMember 2024-11-01 2025-10-31 0000009631 bns:ResidentialMortgagesMember bns:StageOneMember 2024-11-01 2025-10-31 0000009631 bns:BusinessAndGovernmentMember bns:StageTwoMember 2024-11-01 2025-10-31 0000009631 bns:CreditCardMember bns:StageTwoMember 2024-11-01 2025-10-31 0000009631 bns:TotalRetailLoansMember bns:StageThreeMember 2024-11-01 2025-10-31 0000009631 bns:ResidentialMortgagesMember bns:StageTwoMember 2024-11-01 2025-10-31 0000009631 bns:ResidentialMortgagesMember bns:StageThreeMember 2024-11-01 2025-10-31 0000009631 ifrs-full:BottomOfRangeMember bns:ScotiabankChileSAMember 2024-11-01 2025-10-31 0000009631 ifrs-full:TopOfRangeMember bns:ScotiabankChileSAMember 2024-11-01 2025-10-31 0000009631 ifrs-full:TopOfRangeMember bns:ScotiaGroupJamaicaLimitedMember 2024-11-01 2025-10-31 0000009631 ifrs-full:TopOfRangeMember bns:ScotiabankTrinidadAndTobagoLimitedFiftyPointNineZeroPercentMember 2024-11-01 2025-10-31 0000009631 ifrs-full:BottomOfRangeMember bns:ScotiabankColpatriaSAMember 2024-11-01 2025-10-31 0000009631 ifrs-full:TopOfRangeMember bns:ScotiabankColpatriaSAMember 2024-11-01 2025-10-31 0000009631 ifrs-full:BottomOfRangeMember bns:OtherNonControllingInterestsMember 2024-11-01 2025-10-31 0000009631 ifrs-full:TopOfRangeMember bns:OtherNonControllingInterestsMember 2024-11-01 2025-10-31 0000009631 ifrs-full:BottomOfRangeMember 2024-11-01 2025-10-31 0000009631 ifrs-full:CashFlowHedgesMember bns:CurrencyOrInterestRateRiskMember 2024-11-01 2025-10-31 0000009631 ifrs-full:CashFlowHedgesMember ifrs-full:InterestRateRiskMember 2024-11-01 2025-10-31 0000009631 ifrs-full:CashFlowHedgesMember 2024-11-01 2025-10-31 0000009631 ifrs-full:HedgesOfNetInvestmentInForeignOperationsMember ifrs-full:CurrencyRiskMember 2024-11-01 2025-10-31 0000009631 ifrs-full:CashFlowHedgesMember ifrs-full:EquityPriceRiskMember 2024-11-01 2025-10-31 0000009631 ifrs-full:CashFlowHedgesMember ifrs-full:CurrencyRiskMember 2024-11-01 2025-10-31 0000009631 bns:OtherNonControllingInterestsMember 2024-11-01 2025-10-31 0000009631 bns:ScotiabankChileSAMember 2024-11-01 2025-10-31 0000009631 bns:ScotiaGroupJamaicaLimitedMember 2024-11-01 2025-10-31 0000009631 bns:ScotiabankTrinidadAndTobagoLimitedFiftyPointNineZeroPercentMember 2024-11-01 2025-10-31 0000009631 bns:TradingAssetsMember bns:TradingLoansMember ifrs-full:Level3OfFairValueHierarchyMember 2024-11-01 2025-10-31 0000009631 bns:DerivativeFinancialAssetsMember bns:ForeignExchangeAndGoldContractsMember ifrs-full:Level3OfFairValueHierarchyMember 2024-11-01 2025-10-31 0000009631 bns:TradingAssetsMember ifrs-full:Level3OfFairValueHierarchyMember 2024-11-01 2025-10-31 0000009631 bns:TradingAssetsMember bns:EquitySecurities1Member ifrs-full:Level3OfFairValueHierarchyMember 2024-11-01 2025-10-31 0000009631 ifrs-full:SwapContractMember ifrs-full:FairValueHedgesMember bns:CurrencyOrInterestRateRiskMember 2024-11-01 2025-10-31 0000009631 bns:SubordinatedDebentureMember ifrs-full:FairValueHedgesMember ifrs-full:InterestRateRiskMember 2024-11-01 2025-10-31 0000009631 bns:InvestmentSecuritiesMember ifrs-full:FairValueHedgesMember ifrs-full:InterestRateRiskMember 2024-11-01 2025-10-31 0000009631 ifrs-full:LoanCommitmentsMember ifrs-full:FairValueHedgesMember ifrs-full:InterestRateRiskMember 2024-11-01 2025-10-31 0000009631 bns:DepositLiabilitiesMember ifrs-full:FairValueHedgesMember ifrs-full:InterestRateRiskMember 2024-11-01 2025-10-31 0000009631 ifrs-full:SwapContractMember ifrs-full:FairValueHedgesMember ifrs-full:InterestRateRiskMember 2024-11-01 2025-10-31 0000009631 ifrs-full:FairValueHedgesMember 2024-11-01 2025-10-31 0000009631 bns:DepositLiabilitiesMember ifrs-full:FairValueHedgesMember bns:CurrencyOrInterestRateRiskMember 2024-11-01 2025-10-31 0000009631 bns:TradingAssetsMember bns:CorporateAndOtherDebtMember ifrs-full:Level3OfFairValueHierarchyMember 2024-11-01 2025-10-31 0000009631 bns:ObligationsRelatedToSecuritiesSoldShortMember ifrs-full:Level3OfFairValueHierarchyMember 2024-11-01 2025-10-31 0000009631 bns:NetInvestmentHedgesMember 2024-11-01 2025-10-31 0000009631 bns:DepositLiabilitiesMember bns:NetInvestmentHedgesMember ifrs-full:CurrencyRiskMember 2024-11-01 2025-10-31 0000009631 bns:ForeignCurrencyForwardContractsMember bns:NetInvestmentHedgesMember ifrs-full:CurrencyRiskMember 2024-11-01 2025-10-31 0000009631 ifrs-full:CashFlowHedgesMember bns:EquityPriceRiskReturnSwapMember 2024-11-01 2025-10-31 0000009631 bns:ForeignCurrencyForwardContractsMember ifrs-full:CashFlowHedgesMember ifrs-full:CurrencyRiskMember 2024-11-01 2025-10-31 0000009631 bns:Cash1Member ifrs-full:CashFlowHedgesMember ifrs-full:CurrencyRiskMember 2024-11-01 2025-10-31 0000009631 ifrs-full:SwapContractMember ifrs-full:CashFlowHedgesMember bns:CurrencyOrInterestRateRiskMember 2024-11-01 2025-10-31 0000009631 ifrs-full:SwapContractMember ifrs-full:CashFlowHedgesMember ifrs-full:InterestRateRiskMember 2024-11-01 2025-10-31 0000009631 ifrs-full:SwapContractMember ifrs-full:CashFlowHedgesMember ifrs-full:CurrencyRiskMember 2024-11-01 2025-10-31 0000009631 bns:OtherSharebasedPaymentPlansMember 2024-11-01 2025-10-31 0000009631 bns:EmployeeStockOwnershipPlanMember 2024-11-01 2025-10-31 0000009631 bns:EmployeeStockOptionsMember bns:SalariesAndEmployeeBenefitsMember 2024-11-01 2025-10-31 0000009631 bns:RemainingForecastPeriodCreditLossesMember bns:SeverePessimisticMember country:CO 2024-11-01 2025-10-31 0000009631 bns:OverNextTwelveMonthsMember bns:SeverePessimisticMember bns:CaribbeanMember 2024-11-01 2025-10-31 0000009631 bns:OverNextTwelveMonthsMember bns:PessimisticScenarioMember country:PE 2024-11-01 2025-10-31 0000009631 bns:RemainingForecastPeriodCreditLossesMember bns:PessimisticScenarioMember country:PE 2024-11-01 2025-10-31 0000009631 bns:OverNextTwelveMonthsMember bns:BaseCaseScenarioMember country:CA 2024-11-01 2025-10-31 0000009631 bns:RemainingForecastPeriodCreditLossesMember bns:BaseCaseScenarioMember country:CA 2024-11-01 2025-10-31 0000009631 bns:OverNextTwelveMonthsMember bns:PessimisticScenarioMember country:MX 2024-11-01 2025-10-31 0000009631 bns:RemainingForecastPeriodCreditLossesMember bns:PessimisticScenarioMember country:MX 2024-11-01 2025-10-31 0000009631 bns:RemainingForecastPeriodCreditLossesMember bns:OptimisticScenarioMember country:CO 2024-11-01 2025-10-31 0000009631 bns:OverNextTwelveMonthsMember bns:PessimisticScenarioMember country:CO 2024-11-01 2025-10-31 0000009631 bns:RemainingForecastPeriodCreditLossesMember bns:PessimisticScenarioMember country:CO 2024-11-01 2025-10-31 0000009631 bns:OverNextTwelveMonthsMember bns:SeverePessimisticMember country:CO 2024-11-01 2025-10-31 0000009631 bns:OverNextTwelveMonthsMember bns:PessimisticScenarioMember country:CL 2024-11-01 2025-10-31 0000009631 bns:RemainingForecastPeriodCreditLossesMember bns:PessimisticScenarioMember country:CL 2024-11-01 2025-10-31 0000009631 bns:RemainingForecastPeriodCreditLossesMember bns:OptimisticScenarioMember bns:CaribbeanMember 2024-11-01 2025-10-31 0000009631 bns:OverNextTwelveMonthsMember bns:PessimisticScenarioMember bns:CaribbeanMember 2024-11-01 2025-10-31 0000009631 bns:RemainingForecastPeriodCreditLossesMember bns:PessimisticScenarioMember bns:CaribbeanMember 2024-11-01 2025-10-31 0000009631 bns:RemainingForecastPeriodCreditLossesMember bns:OptimisticScenarioMember country:MX 2024-11-01 2025-10-31 0000009631 bns:OverNextTwelveMonthsMember bns:SeverePessimisticMember country:CA 2024-11-01 2025-10-31 0000009631 bns:SeverePessimisticMember country:CA bns:RemainingForecastPeriodCreditLossesMember 2024-11-01 2025-10-31 0000009631 bns:RemainingForecastPeriodCreditLossesMember bns:SeverePessimisticMember bns:CaribbeanMember 2024-11-01 2025-10-31 0000009631 bns:RemainingForecastPeriodCreditLossesMember bns:BaseCaseScenarioMember country:CL 2024-11-01 2025-10-31 0000009631 bns:RemainingForecastPeriodCreditLossesMember bns:OptimisticScenarioMember country:CL 2024-11-01 2025-10-31 0000009631 bns:OverNextTwelveMonthsMember bns:SeverePessimisticMember country:MX 2024-11-01 2025-10-31 0000009631 bns:OverNextTwelveMonthsMember bns:BaseCaseScenarioMember bns:CaribbeanMember 2024-11-01 2025-10-31 0000009631 bns:RemainingForecastPeriodCreditLossesMember bns:BaseCaseScenarioMember bns:CaribbeanMember 2024-11-01 2025-10-31 0000009631 bns:OverNextTwelveMonthsMember bns:OptimisticScenarioMember bns:CaribbeanMember 2024-11-01 2025-10-31 0000009631 bns:OverNextTwelveMonthsMember bns:OptimisticScenarioMember country:MX 2024-11-01 2025-10-31 0000009631 bns:OverNextTwelveMonthsMember bns:BaseCaseScenarioMember country:CL 2024-11-01 2025-10-31 0000009631 bns:OverNextTwelveMonthsMember bns:BaseCaseScenarioMember country:PE 2024-11-01 2025-10-31 0000009631 bns:RemainingForecastPeriodCreditLossesMember bns:SeverePessimisticMember country:CL 2024-11-01 2025-10-31 0000009631 bns:OverNextTwelveMonthsMember bns:SeverePessimisticMember country:PE 2024-11-01 2025-10-31 0000009631 bns:RemainingForecastPeriodCreditLossesMember bns:SeverePessimisticMember country:PE 2024-11-01 2025-10-31 0000009631 bns:OverNextTwelveMonthsMember bns:SeverePessimisticMember country:US 2024-11-01 2025-10-31 0000009631 bns:RemainingForecastPeriodCreditLossesMember bns:SeverePessimisticMember country:US 2024-11-01 2025-10-31 0000009631 bns:RemainingForecastPeriodCreditLossesMember bns:SeverePessimisticMember country:MX 2024-11-01 2025-10-31 0000009631 bns:OverNextTwelveMonthsMember bns:SeverePessimisticMember country:CL 2024-11-01 2025-10-31 0000009631 bns:RemainingForecastPeriodCreditLossesMember bns:OptimisticScenarioMember country:US 2024-11-01 2025-10-31 0000009631 bns:OverNextTwelveMonthsMember bns:PessimisticScenarioMember country:US 2024-11-01 2025-10-31 0000009631 bns:RemainingForecastPeriodCreditLossesMember bns:PessimisticScenarioMember country:US 2024-11-01 2025-10-31 0000009631 bns:RemainingForecastPeriodCreditLossesMember bns:OptimisticScenarioMember country:CA 2024-11-01 2025-10-31 0000009631 bns:OverNextTwelveMonthsMember bns:PessimisticScenarioMember country:CA 2024-11-01 2025-10-31 0000009631 bns:RemainingForecastPeriodCreditLossesMember bns:PessimisticScenarioMember country:CA 2024-11-01 2025-10-31 0000009631 bns:RemainingForecastPeriodCreditLossesMember bns:OptimisticScenarioMember country:PE 2024-11-01 2025-10-31 0000009631 bns:RemainingForecastPeriodCreditLossesMember bns:BaseCaseScenarioMember country:PE 2024-11-01 2025-10-31 0000009631 bns:OverNextTwelveMonthsMember bns:OptimisticScenarioMember country:PE 2024-11-01 2025-10-31 0000009631 bns:RemainingForecastPeriodCreditLossesMember bns:BaseCaseScenarioMember country:MX 2024-11-01 2025-10-31 0000009631 bns:OverNextTwelveMonthsMember bns:OptimisticScenarioMember country:CL 2024-11-01 2025-10-31 0000009631 bns:OverNextTwelveMonthsMember bns:OptimisticScenarioMember country:US 2024-11-01 2025-10-31 0000009631 bns:OverNextTwelveMonthsMember bns:BaseCaseScenarioMember country:US 2024-11-01 2025-10-31 0000009631 bns:RemainingForecastPeriodCreditLossesMember bns:BaseCaseScenarioMember country:US 2024-11-01 2025-10-31 0000009631 bns:OverNextTwelveMonthsMember bns:BaseCaseScenarioMember country:MX 2024-11-01 2025-10-31 0000009631 bns:OverNextTwelveMonthsMember bns:BaseCaseScenarioMember country:CO 2024-11-01 2025-10-31 0000009631 bns:RemainingForecastPeriodCreditLossesMember bns:BaseCaseScenarioMember country:CO 2024-11-01 2025-10-31 0000009631 bns:OverNextTwelveMonthsMember bns:OptimisticScenarioMember country:CO 2024-11-01 2025-10-31 0000009631 bns:OverNextTwelveMonthsMember bns:OptimisticScenarioMember country:CA 2024-11-01 2025-10-31 0000009631 bns:DerivativeFinancialInstrumentsMember ifrs-full:Level3OfFairValueHierarchyMember 2024-11-01 2025-10-31 0000009631 bns:PreferredSharesAndOtherEquityInstrumentsMember 2024-11-01 2025-10-31 0000009631 bns:CommonEquityMember 2024-11-01 2025-10-31 0000009631 ifrs-full:EquityAttributableToOwnersOfParentMember 2024-11-01 2025-10-31 0000009631 ifrs-full:NoncontrollingInterestsMember 2024-11-01 2025-10-31 0000009631 ifrs-full:BottomOfRangeMember bns:EmployeeStockOwnershipPlanMember 2024-11-01 2025-10-31 0000009631 ifrs-full:TopOfRangeMember bns:EmployeeStockOwnershipPlanMember 2024-11-01 2025-10-31 0000009631 ifrs-full:AccumulatedOtherComprehensiveIncomeMember ifrs-full:ReserveOfCashFlowHedgesMember 2024-11-01 2025-10-31 0000009631 ifrs-full:AccumulatedOtherComprehensiveIncomeMember bns:OtherMember 2024-11-01 2025-10-31 0000009631 ifrs-full:AccumulatedOtherComprehensiveIncomeMember ifrs-full:ReserveOfExchangeDifferencesOnTranslationMember 2024-11-01 2025-10-31 0000009631 ifrs-full:AccumulatedOtherComprehensiveIncomeMember bns:DebtInstrumentsFairValueOtherComprehensiveIncomeMember 2024-11-01 2025-10-31 0000009631 ifrs-full:AccumulatedOtherComprehensiveIncomeMember bns:EquityInstrumentsFairValueOtherComprehensiveIncomeMember 2024-11-01 2025-10-31 0000009631 ifrs-full:OrdinarySharesMember 2024-11-01 2025-10-31 0000009631 ifrs-full:OtherReservesMember 2024-11-01 2025-10-31 0000009631 bns:StockAppreciationRightsMember 2024-11-01 2025-10-31 0000009631 bns:CanadianBankingMember 2024-11-01 2025-10-31 0000009631 bns:InternationalBankingMember 2024-11-01 2025-10-31 0000009631 bns:GlobalBankingAndMarketsMember 2024-11-01 2025-10-31 0000009631 bns:OtherSmallerOperatingSegmentsAndCorporateAdjustmentsMember 2024-11-01 2025-10-31 0000009631 bns:RestrictedShareUnitPlanMember 2024-11-01 2025-10-31 0000009631 bns:DeferredStockUnitPlanMember 2024-11-01 2025-10-31 0000009631 ifrs-full:LegalProceedingsProvisionMember 2024-11-01 2025-10-31 0000009631 bns:PessimisticScenarioMember 2024-11-01 2025-10-31 0000009631 bns:BaseCaseScenarioMember 2024-11-01 2025-10-31 0000009631 bns:BaseCaseScenarioMember ifrs-full:PreviouslyStatedMember 2024-11-01 2025-10-31 0000009631 bns:ProbabilityWeightedScenariosMember 2024-11-01 2025-10-31 0000009631 dei:BusinessContactMember 2024-11-01 2025-10-31 0000009631 bns:PerformanceShareUnitPlanMember 2024-11-01 2025-10-31 0000009631 ifrs-full:PensionDefinedBenefitPlansMember bns:ChangeInBenefitObligationMember 2024-11-01 2025-10-31 0000009631 ifrs-full:PensionDefinedBenefitPlansMember bns:AnnualBenefitExpenseMember 2024-11-01 2025-10-31 0000009631 bns:OtherBenefitPlansMember bns:AnnualBenefitExpenseMember 2024-11-01 2025-10-31 0000009631 bns:OtherBenefitPlansMember bns:ChangeInBenefitObligationMember 2024-11-01 2025-10-31 0000009631 bns:OtherBenefitPlansMember bns:ChangesInFairValueMember 2024-11-01 2025-10-31 0000009631 ifrs-full:PensionDefinedBenefitPlansMember bns:ChangesInFairValueMember 2024-11-01 2025-10-31 0000009631 ifrs-full:PensionDefinedBenefitPlansMember ifrs-full:EffectOfAssetCeilingMember 2024-11-01 2025-10-31 0000009631 bns:OtherBenefitPlansMember bns:AdditionalDetailsMember 2024-11-01 2025-10-31 0000009631 ifrs-full:PensionDefinedBenefitPlansMember bns:AdditionalDetailsMember 2024-11-01 2025-10-31 0000009631 ifrs-full:PensionDefinedBenefitPlansMember bns:RemeasurementsMember 2024-11-01 2025-10-31 0000009631 bns:OtherBenefitPlansMember bns:RemeasurementsMember 2024-11-01 2025-10-31 0000009631 bns:RangesOfExercisePricesForOutstandingShareOptionsOneMember bns:EmployeeStockOptionsMember 2024-11-01 2025-10-31 0000009631 bns:RangesOfExercisePricesForOutstandingShareOptionsTwoMember bns:EmployeeStockOptionsMember 2024-11-01 2025-10-31 0000009631 bns:RangesOfExercisePricesForOutstandingShareOptionsThreeMember bns:EmployeeStockOptionsMember 2024-11-01 2025-10-31 0000009631 ifrs-full:LeaseholdImprovementsMember 2024-11-01 2025-10-31 0000009631 bns:AdditionalTier1CapitalInstrumentsOneMember 2024-11-01 2025-10-31 0000009631 bns:AdditionalTier1CapitalInstrumentsTwoMember 2024-11-01 2025-10-31 0000009631 bns:LimitedRecourseCapitalNotesSeriesOneMember 2024-11-01 2025-10-31 0000009631 bns:LimitedRecourseCapitalNotesSeriesTwoMember 2024-11-01 2025-10-31 0000009631 bns:LimitedRecourseCapitalNotesSeriesThreeMember 2024-11-01 2025-10-31 0000009631 bns:LimitedRecourseCapitalNotesSeriesFourMember 2024-11-01 2025-10-31 0000009631 bns:LimitedRecourseCapitalNotesSeriesFiveMember 2024-11-01 2025-10-31 0000009631 bns:LimitedRecourseCapitalNotesSeriesSevenMember 2024-11-01 2025-10-31 0000009631 bns:LimitedRecourseCapitalNotesSeriesSixMember 2024-11-01 2025-10-31 0000009631 bns:LimitedRecourseCapitalNotesMember 2024-11-01 2025-10-31 0000009631 bns:TradingAssetsMember 2024-11-01 2025-10-31 0000009631 bns:InvestmentSecuritiesMember 2024-11-01 2025-10-31 0000009631 bns:ObligationsRelatingToShortSellingOfSecuritiesMember 2024-11-01 2025-10-31 0000009631 bns:OverNextTwelveMonthsMember bns:OptimisticScenarioMember bns:GlobalGdpAndPppMember 2024-11-01 2025-10-31 0000009631 bns:RemainingForecastPeriodCreditLossesMember bns:SeverePessimisticMember bns:GlobalGdpAndPppMember 2024-11-01 2025-10-31 0000009631 bns:OverNextTwelveMonthsMember bns:SeverePessimisticMember bns:GlobalGdpAndPppMember 2024-11-01 2025-10-31 0000009631 bns:RemainingForecastPeriodCreditLossesMember bns:OptimisticScenarioMember bns:GlobalGdpAndPppMember 2024-11-01 2025-10-31 0000009631 bns:OverNextTwelveMonthsMember bns:PessimisticScenarioMember bns:GlobalGdpAndPppMember 2024-11-01 2025-10-31 0000009631 bns:RemainingForecastPeriodCreditLossesMember bns:PessimisticScenarioMember bns:GlobalGdpAndPppMember 2024-11-01 2025-10-31 0000009631 bns:OverNextTwelveMonthsMember bns:BaseCaseScenarioMember bns:GlobalGdpAndPppMember 2024-11-01 2025-10-31 0000009631 bns:RemainingForecastPeriodCreditLossesMember bns:BaseCaseScenarioMember bns:GlobalGdpAndPppMember 2024-11-01 2025-10-31 0000009631 bns:KeycorpMember 2024-11-01 2025-10-31 0000009631 bns:ValueatRiskMember ifrs-full:MarketRiskMember 2024-11-01 2025-10-31 0000009631 ifrs-full:EquityPriceRiskMember 2024-11-01 2025-10-31 0000009631 ifrs-full:EquityPriceRiskMember bns:AverageMember 2024-11-01 2025-10-31 0000009631 ifrs-full:EquityPriceRiskMember bns:HighMember 2024-11-01 2025-10-31 0000009631 ifrs-full:EquityPriceRiskMember bns:LowMember 2024-11-01 2025-10-31 0000009631 ifrs-full:InterestRateRiskMember 2024-11-01 2025-10-31 0000009631 ifrs-full:InterestRateRiskMember bns:AverageMember 2024-11-01 2025-10-31 0000009631 ifrs-full:InterestRateRiskMember bns:HighMember 2024-11-01 2025-10-31 0000009631 ifrs-full:InterestRateRiskMember bns:LowMember 2024-11-01 2025-10-31 0000009631 ifrs-full:CreditRiskMember bns:HighMember 2024-11-01 2025-10-31 0000009631 ifrs-full:CreditRiskMember bns:LowMember 2024-11-01 2025-10-31 0000009631 ifrs-full:CreditRiskMember 2024-11-01 2025-10-31 0000009631 ifrs-full:CreditRiskMember bns:AverageMember 2024-11-01 2025-10-31 0000009631 ifrs-full:RiskDiversificationEffectMember 2024-11-01 2025-10-31 0000009631 ifrs-full:RiskDiversificationEffectMember bns:AverageMember 2024-11-01 2025-10-31 0000009631 ifrs-full:CommodityPriceRiskMember 2024-11-01 2025-10-31 0000009631 ifrs-full:CommodityPriceRiskMember bns:AverageMember 2024-11-01 2025-10-31 0000009631 ifrs-full:CommodityPriceRiskMember bns:HighMember 2024-11-01 2025-10-31 0000009631 ifrs-full:CommodityPriceRiskMember bns:LowMember 2024-11-01 2025-10-31 0000009631 ifrs-full:CurrencyRiskMember bns:HighMember 2024-11-01 2025-10-31 0000009631 ifrs-full:CurrencyRiskMember bns:LowMember 2024-11-01 2025-10-31 0000009631 bns:AverageMember 2024-11-01 2025-10-31 0000009631 bns:HighMember 2024-11-01 2025-10-31 0000009631 bns:LowMember 2024-11-01 2025-10-31 0000009631 ifrs-full:CurrencyRiskMember 2024-11-01 2025-10-31 0000009631 ifrs-full:CurrencyRiskMember bns:AverageMember 2024-11-01 2025-10-31 0000009631 bns:CreditPlusInterestRiskMember 2024-11-01 2025-10-31 0000009631 bns:CreditPlusInterestRiskMember bns:AverageMember 2024-11-01 2025-10-31 0000009631 bns:CreditPlusInterestRiskMember bns:HighMember 2024-11-01 2025-10-31 0000009631 bns:CreditPlusInterestRiskMember bns:LowMember 2024-11-01 2025-10-31 0000009631 bns:HundredBasisPointsDecreaseMember bns:CanadaDollarsMember 2024-11-01 2025-10-31 0000009631 bns:HundredBasisPointsDecreaseMember bns:UnitedStatesofAmericaDollarsMember 2024-11-01 2025-10-31 0000009631 bns:HundredBasisPointsDecreaseMember 2024-11-01 2025-10-31 0000009631 bns:HundredBasisPointsIncreaseMember bns:CanadaDollarsMember 2024-11-01 2025-10-31 0000009631 bns:HundredBasisPointsIncreaseMember bns:UnitedStatesofAmericaDollarsMember 2024-11-01 2025-10-31 0000009631 bns:HundredBasisPointsIncreaseMember 2024-11-01 2025-10-31 0000009631 bns:ColombiaCostaRicaAndPanamaMember 2024-11-01 2025-10-31 0000009631 ifrs-full:SecuritiesLendingMember 2024-11-01 2025-10-31 0000009631 bns:KeycorpMember 2024-11-01 2025-10-31 0000009631 bns:OtherSegmentMember bns:CrediscotiaFinancieraSaMember 2024-11-01 2025-10-31 0000009631 bns:ColombiaCostaRicaAndPanamaMember srt:LatinAmericaMember 2024-11-01 2025-10-31 0000009631 bns:ImpairedLoansMember 2024-11-01 2025-10-31 0000009631 bns:UnaffiliatedStructuredEntitiesMember 2024-11-01 2025-10-31 0000009631 bns:ColombiaCostaRicaAndPanamaMember 2024-11-01 2025-10-31 0000009631 bns:StageThreeMember 2024-11-01 2025-10-31 0000009631 bns:StageTwoMember 2024-11-01 2025-10-31 0000009631 ifrs-full:OrdinarySharesMember 2025-05-28 0000009631 ifrs-full:BottomOfRangeMember 2023-02-01 0000009631 ifrs-full:TopOfRangeMember 2023-02-01 0000009631 bns:KeycorpMember 2024-12-27 2024-12-27 0000009631 bns:KeycorpMember 2024-12-27 2024-12-27 0000009631 ifrs-full:TopOfRangeMember bns:KeycorpMember 2024-12-27 2024-12-27 0000009631 bns:KeycorpMember 2024-12-27 0000009631 bns:KeycorpMember 2024-12-27 0000009631 bns:ColombiaCostaRicaAndPanamaMember 2025-01-06 2025-01-06 0000009631 bns:ColombiaCostaRicaAndPanamaMember 2025-01-06 0000009631 bns:KeycorpMember 2025-08-01 2025-10-31 0000009631 bns:OtherSegmentMember bns:CrediscotiaFinancieraSaMember 2025-08-01 2025-10-31 0000009631 bns:CrediscotiaFinancieraSaMember 2025-02-28 0000009631 bns:ColombiaCostaRicaAndPanamaMember 2025-02-28 0000009631 bns:AdditionalTier1CapitalInstrumentsTwoMember 2025-06-04 0000009631 bns:AdditionalTier1CapitalInstrumentsTwoMember 2025-06-04 2025-06-04 0000009631 ifrs-full:LegalProceedingsProvisionMember 2021-11-01 2021-11-30 0000009631 ifrs-full:MajorBusinessCombinationMember 2025-12-01 2025-12-01 0000009631 bns:ColombiaCostaRicaAndPanamaMember bns:OtherSegmentMember 2025-11-01 2026-01-31 0000009631 bns:InvestmentSecuritiesMember ifrs-full:Level3OfFairValueHierarchyMember 2023-10-31 0000009631 bns:TradingAssetsMember ifrs-full:Level3OfFairValueHierarchyMember 2023-10-31 0000009631 bns:BusinessAndGovernmentMember 2023-10-31 0000009631 ifrs-full:AllowanceForCreditLossesMember 2023-10-31 0000009631 bns:AllowanceForCreditLossesOnAcceptancesMember 2023-10-31 0000009631 bns:AllowanceForCreditLossesOnOffBalanceSheetExposuresMember 2023-10-31 0000009631 bns:ResidentialMortgagesMember 2023-10-31 0000009631 ifrs-full:ConsumerLoansMember 2023-10-31 0000009631 bns:CreditCardMember 2023-10-31 0000009631 ifrs-full:ConsumerLoansMember bns:StageTwoMember 2023-10-31 0000009631 bns:TotalRetailLoansMember bns:StageThreeMember 2023-10-31 0000009631 bns:TotalRetailLoansMember 2023-10-31 0000009631 bns:CreditCardMember bns:StageOneMember 2023-10-31 0000009631 ifrs-full:ConsumerLoansMember bns:StageOneMember 2023-10-31 0000009631 bns:TotalRetailLoansMember bns:StageTwoMember 2023-10-31 0000009631 ifrs-full:GrossCarryingAmountMember bns:BusinessAndGovernmentMember 2023-10-31 0000009631 bns:TotalRetailLoansMember bns:StageOneMember 2023-10-31 0000009631 ifrs-full:GrossCarryingAmountMember bns:BusinessAndGovernmentMember bns:StageThreeMember 2023-10-31 0000009631 bns:ResidentialMortgagesMember bns:StageTwoMember 2023-10-31 0000009631 bns:ResidentialMortgagesMember bns:StageThreeMember 2023-10-31 0000009631 ifrs-full:GrossCarryingAmountMember bns:BusinessAndGovernmentMember bns:StageOneMember 2023-10-31 0000009631 ifrs-full:GrossCarryingAmountMember bns:BusinessAndGovernmentMember bns:StageTwoMember 2023-10-31 0000009631 ifrs-full:ConsumerLoansMember bns:StageThreeMember 2023-10-31 0000009631 bns:ResidentialMortgagesMember bns:StageOneMember 2023-10-31 0000009631 bns:CreditCardMember bns:StageTwoMember 2023-10-31 0000009631 ifrs-full:AccumulatedDepreciationAndAmortisationMember bns:Equipment1Member 2023-10-31 0000009631 ifrs-full:GrossCarryingAmountMember 2023-10-31 0000009631 ifrs-full:GrossCarryingAmountMember ifrs-full:RightofuseAssetsMember 2023-10-31 0000009631 ifrs-full:GrossCarryingAmountMember ifrs-full:LandAndBuildingsMember 2023-10-31 0000009631 ifrs-full:GrossCarryingAmountMember bns:Equipment1Member 2023-10-31 0000009631 ifrs-full:GrossCarryingAmountMember bns:TechnologyAssetsMember 2023-10-31 0000009631 ifrs-full:GrossCarryingAmountMember ifrs-full:LeaseholdImprovementsMember 2023-10-31 0000009631 ifrs-full:AccumulatedDepreciationAndAmortisationMember ifrs-full:LeaseholdImprovementsMember 2023-10-31 0000009631 ifrs-full:AccumulatedDepreciationAndAmortisationMember bns:TechnologyAssetsMember 2023-10-31 0000009631 ifrs-full:AccumulatedDepreciationAndAmortisationMember ifrs-full:LandAndBuildingsMember 2023-10-31 0000009631 ifrs-full:AccumulatedDepreciationAndAmortisationMember 2023-10-31 0000009631 ifrs-full:AccumulatedDepreciationAndAmortisationMember ifrs-full:RightofuseAssetsMember 2023-10-31 0000009631 bns:GlobalBankingAndMarketsMember 2023-10-31 0000009631 srt:LatinAmericaMember 2023-10-31 0000009631 bns:CaribbeanAndCentralAmericaMember 2023-10-31 0000009631 bns:CanadianBankingMember 2023-10-31 0000009631 bns:GlobalWealthManagementMember 2023-10-31 0000009631 ifrs-full:AccumulatedDepreciationAndAmortisationMember ifrs-full:ComputerSoftwareMember bns:FiniteLifeIntangibleAssetsMember 2023-10-31 0000009631 ifrs-full:AccumulatedDepreciationAndAmortisationMember ifrs-full:OtherIntangibleAssetsMember bns:FiniteLifeIntangibleAssetsMember 2023-10-31 0000009631 ifrs-full:GrossCarryingAmountMember bns:FundManagementContractsMember 2023-10-31 0000009631 ifrs-full:GrossCarryingAmountMember bns:OtherIndefiniteLifeIntangibleAssetsMember 2023-10-31 0000009631 ifrs-full:GrossCarryingAmountMember ifrs-full:ComputerSoftwareMember bns:FiniteLifeIntangibleAssetsMember 2023-10-31 0000009631 ifrs-full:GrossCarryingAmountMember ifrs-full:OtherIntangibleAssetsMember bns:FiniteLifeIntangibleAssetsMember 2023-10-31 0000009631 bns:LitigationAndOtherMember 2023-10-31 0000009631 ifrs-full:OrdinarySharesMember 2023-10-31 0000009631 bns:EmployeeStockOptionsMember 2023-10-31 0000009631 bns:LitigationAndOtherMember 2024-10-31 0000009631 ifrs-full:CashFlowHedgesMember 2023-10-31 0000009631 ifrs-full:HedgesOfNetInvestmentInForeignOperationsMember ifrs-full:CurrencyRiskMember 2023-10-31 0000009631 ifrs-full:CashFlowHedgesMember ifrs-full:InterestRateRiskMember 2023-10-31 0000009631 ifrs-full:CashFlowHedgesMember bns:CurrencyOrInterestRateRiskMember 2023-10-31 0000009631 ifrs-full:CashFlowHedgesMember ifrs-full:CurrencyRiskMember 2023-10-31 0000009631 ifrs-full:CashFlowHedgesMember ifrs-full:EquityPriceRiskMember 2023-10-31 0000009631 bns:TradingAssetsMember ifrs-full:Level3OfFairValueHierarchyMember 2024-10-31 0000009631 bns:InvestmentSecuritiesMember ifrs-full:Level3OfFairValueHierarchyMember 2024-10-31 0000009631 bns:ObligationsRelatedToSecuritiesSoldShortMember ifrs-full:Level3OfFairValueHierarchyMember 2024-10-31 0000009631 bns:CreditCardMember bns:StageOneMember 2024-10-31 0000009631 bns:ResidentialMortgagesMember bns:StageTwoMember 2024-10-31 0000009631 bns:ResidentialMortgagesMember bns:StageThreeMember 2024-10-31 0000009631 ifrs-full:ConsumerLoansMember bns:StageTwoMember 2024-10-31 0000009631 bns:ResidentialMortgagesMember bns:StageOneMember 2024-10-31 0000009631 bns:NetAmountMember bns:BusinessAndGovernmentMember 2024-10-31 0000009631 bns:NetAmountMember bns:BusinessAndGovernmentMember bns:StageOneMember 2024-10-31 0000009631 bns:TotalRetailLoansMember bns:StageTwoMember 2024-10-31 0000009631 ifrs-full:ConsumerLoansMember bns:StageThreeMember 2024-10-31 0000009631 bns:TotalRetailLoansMember bns:StageOneMember 2024-10-31 0000009631 bns:TotalRetailLoansMember bns:StageThreeMember 2024-10-31 0000009631 ifrs-full:ConsumerLoansMember bns:StageOneMember 2024-10-31 0000009631 bns:CreditCardMember bns:StageTwoMember 2024-10-31 0000009631 bns:NetAmountMember bns:BusinessAndGovernmentMember bns:StageTwoMember 2024-10-31 0000009631 bns:NetAmountMember bns:BusinessAndGovernmentMember bns:StageThreeMember 2024-10-31 0000009631 ifrs-full:AllowanceForCreditLossesMember ifrs-full:ConsumerLoansMember bns:StageThreeMember 2024-10-31 0000009631 ifrs-full:ConsumerLoansMember ifrs-full:AllowanceForCreditLossesMember bns:StageTwoMember 2024-10-31 0000009631 ifrs-full:AllowanceForCreditLossesMember ifrs-full:ConsumerLoansMember bns:StageOneMember 2024-10-31 0000009631 bns:ResidentialMortgagesMember ifrs-full:AllowanceForCreditLossesMember bns:StageOneMember 2024-10-31 0000009631 ifrs-full:AllowanceForCreditLossesMember 2024-10-31 0000009631 ifrs-full:AllowanceForCreditLossesMember bns:StageThreeMember 2024-10-31 0000009631 ifrs-full:AllowanceForCreditLossesMember bns:CreditCardMember bns:StageTwoMember 2024-10-31 0000009631 ifrs-full:AllowanceForCreditLossesMember bns:CreditCardMember bns:StageOneMember 2024-10-31 0000009631 ifrs-full:ConsumerLoansMember ifrs-full:AllowanceForCreditLossesMember 2024-10-31 0000009631 ifrs-full:AllowanceForCreditLossesMember bns:BusinessAndGovernmentMember bns:StageOneMember 2024-10-31 0000009631 ifrs-full:AllowanceForCreditLossesMember bns:CreditCardMember 2024-10-31 0000009631 ifrs-full:AllowanceForCreditLossesMember bns:StageTwoMember 2024-10-31 0000009631 ifrs-full:AllowanceForCreditLossesMember bns:ResidentialMortgagesMember 2024-10-31 0000009631 bns:ResidentialMortgagesMember ifrs-full:AllowanceForCreditLossesMember bns:StageThreeMember 2024-10-31 0000009631 ifrs-full:AllowanceForCreditLossesMember bns:ResidentialMortgagesMember bns:StageTwoMember 2024-10-31 0000009631 ifrs-full:AllowanceForCreditLossesMember bns:StageOneMember 2024-10-31 0000009631 bns:BusinessAndGovernmentMember ifrs-full:AllowanceForCreditLossesMember 2024-10-31 0000009631 ifrs-full:AllowanceForCreditLossesMember bns:BusinessAndGovernmentMember bns:StageThreeMember 2024-10-31 0000009631 ifrs-full:AllowanceForCreditLossesMember bns:BusinessAndGovernmentMember bns:StageTwoMember 2024-10-31 0000009631 bns:AllowanceForCreditLossesOnOffBalanceSheetExposuresMember 2024-10-31 0000009631 bns:AllowanceForCreditLossesOnAcceptancesMember 2024-10-31 0000009631 bns:PreferredSharesAndOtherEquityInstrumentsMember 2023-10-31 0000009631 bns:CommonEquityMember 2023-10-31 0000009631 ifrs-full:OtherReservesMember 2023-10-31 0000009631 ifrs-full:AccumulatedOtherComprehensiveIncomeMember bns:EquityInstrumentsFairValueOtherComprehensiveIncomeMember 2023-10-31 0000009631 ifrs-full:AccumulatedOtherComprehensiveIncomeMember ifrs-full:ReserveOfExchangeDifferencesOnTranslationMember 2023-10-31 0000009631 ifrs-full:AccumulatedOtherComprehensiveIncomeMember bns:OtherMember 2023-10-31 0000009631 ifrs-full:OrdinarySharesMember 2023-10-31 0000009631 ifrs-full:RetainedEarningsMember 2023-10-31 0000009631 ifrs-full:AccumulatedOtherComprehensiveIncomeMember bns:DebtInstrumentsFairValueOtherComprehensiveIncomeMember 2023-10-31 0000009631 ifrs-full:AccumulatedOtherComprehensiveIncomeMember ifrs-full:ReserveOfCashFlowHedgesMember 2023-10-31 0000009631 ifrs-full:EquityAttributableToOwnersOfParentMember 2023-10-31 0000009631 ifrs-full:NoncontrollingInterestsMember 2023-10-31 0000009631 bns:DerivativeFinancialInstrumentsMember ifrs-full:Level3OfFairValueHierarchyMember 2023-10-31 0000009631 bns:DerivativeFinancialInstrumentsMember ifrs-full:Level3OfFairValueHierarchyMember 2024-10-31 0000009631 bns:OtherBenefitPlansMember bns:ChangeInBenefitObligationMember 2023-10-31 0000009631 ifrs-full:PensionDefinedBenefitPlansMember bns:ChangeInBenefitObligationMember 2023-10-31 0000009631 ifrs-full:PensionDefinedBenefitPlansMember ifrs-full:EffectOfAssetCeilingMember 2023-10-31 0000009631 bns:OtherBenefitPlansMember bns:ChangesInFairValueMember 2023-10-31 0000009631 ifrs-full:PensionDefinedBenefitPlansMember bns:ChangesInFairValueMember 2023-10-31 0000009631 ifrs-full:PensionDefinedBenefitPlansMember ifrs-full:EffectOfAssetCeilingMember 2024-10-31 0000009631 ifrs-full:PensionDefinedBenefitPlansMember bns:FundedStatusMember ifrs-full:OtherAssetsMember 2024-10-31 0000009631 bns:OtherBenefitPlansMember bns:FundedStatusMember ifrs-full:OtherAssetsMember 2024-10-31 0000009631 bns:OtherBenefitPlansMember bns:ChangeInBenefitObligationMember 2024-10-31 0000009631 ifrs-full:PensionDefinedBenefitPlansMember bns:ChangeInBenefitObligationMember 2024-10-31 0000009631 bns:OtherBenefitPlansMember bns:ChangesInFairValueMember 2024-10-31 0000009631 ifrs-full:PensionDefinedBenefitPlansMember bns:FundedStatusMember bns:Otherliabilities1Member 2024-10-31 0000009631 ifrs-full:PensionDefinedBenefitPlansMember bns:ChangesInFairValueMember 2024-10-31 0000009631 bns:OtherBenefitPlansMember bns:FundedStatusMember bns:Otherliabilities1Member 2024-10-31 0000009631 bns:CaribbeanAndCentralAmericaMember 2024-10-31 0000009631 bns:GlobalBankingAndMarketsMember 2024-10-31 0000009631 bns:GlobalWealthManagementMember 2024-10-31 0000009631 bns:CanadianBankingMember 2024-10-31 0000009631 ifrs-full:NoncontrollingInterestsMember 2024-10-31 0000009631 ifrs-full:EquityAttributableToOwnersOfParentMember 2024-10-31 0000009631 ifrs-full:RetainedEarningsMember 2024-10-31 0000009631 ifrs-full:OrdinarySharesMember 2024-10-31 0000009631 ifrs-full:OtherReservesMember 2024-10-31 0000009631 ifrs-full:AccumulatedOtherComprehensiveIncomeMember bns:OtherMember 2024-10-31 0000009631 ifrs-full:AccumulatedOtherComprehensiveIncomeMember ifrs-full:ReserveOfCashFlowHedgesMember 2024-10-31 0000009631 ifrs-full:AccumulatedOtherComprehensiveIncomeMember bns:EquityInstrumentsFairValueOtherComprehensiveIncomeMember 2024-10-31 0000009631 ifrs-full:AccumulatedOtherComprehensiveIncomeMember bns:DebtInstrumentsFairValueOtherComprehensiveIncomeMember 2024-10-31 0000009631 ifrs-full:AccumulatedOtherComprehensiveIncomeMember ifrs-full:ReserveOfExchangeDifferencesOnTranslationMember 2024-10-31 0000009631 bns:CommonEquityMember 2024-10-31 0000009631 bns:PreferredSharesAndOtherEquityInstrumentsMember 2024-10-31 0000009631 ifrs-full:GrossCarryingAmountMember ifrs-full:ComputerSoftwareMember bns:FiniteLifeIntangibleAssetsMember 2024-10-31 0000009631 ifrs-full:GrossCarryingAmountMember ifrs-full:OtherIntangibleAssetsMember bns:FiniteLifeIntangibleAssetsMember 2024-10-31 0000009631 ifrs-full:AccumulatedDepreciationAndAmortisationMember ifrs-full:ComputerSoftwareMember bns:FiniteLifeIntangibleAssetsMember 2024-10-31 0000009631 ifrs-full:AccumulatedDepreciationAndAmortisationMember ifrs-full:OtherIntangibleAssetsMember bns:FiniteLifeIntangibleAssetsMember 2024-10-31 0000009631 bns:FundManagementContractsMember 2024-10-31 0000009631 bns:OtherIndefiniteLifeIntangibleAssetsMember 2024-10-31 0000009631 ifrs-full:GrossCarryingAmountMember bns:FundManagementContractsMember 2024-10-31 0000009631 ifrs-full:OtherIntangibleAssetsMember bns:FiniteLifeIntangibleAssetsMember 2024-10-31 0000009631 ifrs-full:GrossCarryingAmountMember bns:OtherIndefiniteLifeIntangibleAssetsMember 2024-10-31 0000009631 ifrs-full:AccumulatedDepreciationAndAmortisationMember 2024-10-31 0000009631 ifrs-full:ComputerSoftwareMember bns:FiniteLifeIntangibleAssetsMember 2024-10-31 0000009631 ifrs-full:GrossCarryingAmountMember bns:Equipment1Member 2024-10-31 0000009631 ifrs-full:LandAndBuildingsMember 2024-10-31 0000009631 bns:Equipment1Member 2024-10-31 0000009631 bns:TechnologyAssetsMember 2024-10-31 0000009631 ifrs-full:LeaseholdImprovementsMember 2024-10-31 0000009631 ifrs-full:RightofuseAssetsMember 2024-10-31 0000009631 ifrs-full:GrossCarryingAmountMember ifrs-full:LandAndBuildingsMember 2024-10-31 0000009631 ifrs-full:GrossCarryingAmountMember ifrs-full:RightofuseAssetsMember 2024-10-31 0000009631 ifrs-full:GrossCarryingAmountMember ifrs-full:LeaseholdImprovementsMember 2024-10-31 0000009631 ifrs-full:GrossCarryingAmountMember bns:TechnologyAssetsMember 2024-10-31 0000009631 ifrs-full:AccumulatedDepreciationAndAmortisationMember ifrs-full:RightofuseAssetsMember 2024-10-31 0000009631 ifrs-full:AccumulatedDepreciationAndAmortisationMember bns:Equipment1Member 2024-10-31 0000009631 ifrs-full:AccumulatedDepreciationAndAmortisationMember bns:TechnologyAssetsMember 2024-10-31 0000009631 ifrs-full:AccumulatedDepreciationAndAmortisationMember ifrs-full:LeaseholdImprovementsMember 2024-10-31 0000009631 ifrs-full:AccumulatedDepreciationAndAmortisationMember ifrs-full:LandAndBuildingsMember 2024-10-31 0000009631 bns:InvestmentSecuritiesMember bns:CorporateAndOtherDebtMember ifrs-full:Level3OfFairValueHierarchyMember 2024-10-31 0000009631 bns:DerivativeFinancialAssetsMember bns:CreditContractsMember ifrs-full:Level3OfFairValueHierarchyMember 2024-10-31 0000009631 bns:TradingAssetsMember bns:CorporateAndOtherDebtMember ifrs-full:Level3OfFairValueHierarchyMember 2024-10-31 0000009631 bns:InvestmentSecuritiesMember bns:EquitySecurities1Member ifrs-full:Level3OfFairValueHierarchyMember 2024-10-31 0000009631 bns:DerivativeFinancialAssetsMember bns:EquityContractsMember ifrs-full:Level3OfFairValueHierarchyMember 2024-10-31 0000009631 bns:DerivativeFinancialAssetsMember bns:CommodityContractsMember ifrs-full:Level3OfFairValueHierarchyMember 2024-10-31 0000009631 bns:TradingAssetsMember bns:EquitySecurities1Member ifrs-full:Level3OfFairValueHierarchyMember 2024-10-31 0000009631 ifrs-full:GrossCarryingAmountMember bns:BusinessAndGovernmentMember bns:StageOneMember 2024-10-31 0000009631 ifrs-full:GrossCarryingAmountMember bns:BusinessAndGovernmentMember bns:StageThreeMember 2024-10-31 0000009631 ifrs-full:GrossCarryingAmountMember bns:BusinessAndGovernmentMember bns:StageTwoMember 2024-10-31 0000009631 bns:DerivativeFinancialLiabilitiesMember bns:CreditContractsMember ifrs-full:Level3OfFairValueHierarchyMember 2024-10-31 0000009631 bns:DerivativeFinancialLiabilitiesMember bns:InterestRateContractsMember ifrs-full:Level3OfFairValueHierarchyMember 2024-10-31 0000009631 bns:DerivativeFinancialLiabilitiesMember bns:EquityContractsMember ifrs-full:Level3OfFairValueHierarchyMember 2024-10-31 0000009631 bns:DerivativeFinancialLiabilitiesMember bns:CommodityContractsMember ifrs-full:Level3OfFairValueHierarchyMember 2024-10-31 0000009631 ifrs-full:Level3OfFairValueHierarchyMember 2024-10-31 0000009631 bns:LitigationAndOtherMember 2025-10-31 0000009631 bns:DerivativeFinancialAssetsMember bns:EquityContractsMember ifrs-full:Level3OfFairValueHierarchyMember 2025-10-31 0000009631 bns:TradingAssetsMember bns:TradingLoansMember ifrs-full:Level3OfFairValueHierarchyMember 2025-10-31 0000009631 bns:TradingAssetsMember ifrs-full:Level3OfFairValueHierarchyMember 2025-10-31 0000009631 bns:InvestmentSecuritiesMember ifrs-full:Level3OfFairValueHierarchyMember 2025-10-31 0000009631 bns:DerivativeFinancialAssetsMember bns:InterestRateContractsMember ifrs-full:Level3OfFairValueHierarchyMember 2025-10-31 0000009631 bns:DerivativeFinancialAssetsMember bns:ForeignExchangeAndGoldContractsMember ifrs-full:Level3OfFairValueHierarchyMember 2025-10-31 0000009631 bns:InvestmentSecuritiesMember bns:EquitySecurities1Member ifrs-full:Level3OfFairValueHierarchyMember 2025-10-31 0000009631 bns:InvestmentSecuritiesMember bns:CorporateAndOtherDebtMember ifrs-full:Level3OfFairValueHierarchyMember 2025-10-31 0000009631 bns:TradingAssetsMember bns:EquitySecurities1Member ifrs-full:Level3OfFairValueHierarchyMember 2025-10-31 0000009631 bns:DerivativeFinancialAssetsMember bns:CreditContractsMember ifrs-full:Level3OfFairValueHierarchyMember 2025-10-31 0000009631 bns:DerivativeFinancialAssetsMember bns:CommodityContractsMember ifrs-full:Level3OfFairValueHierarchyMember 2025-10-31 0000009631 bns:DerivativeFinancialLiabilitiesMember bns:CommodityContractsMember ifrs-full:Level3OfFairValueHierarchyMember 2025-10-31 0000009631 bns:DerivativeFinancialLiabilitiesMember bns:EquityContractsMember ifrs-full:Level3OfFairValueHierarchyMember 2025-10-31 0000009631 bns:DerivativeFinancialLiabilitiesMember bns:InterestRateContractsMember ifrs-full:Level3OfFairValueHierarchyMember 2025-10-31 0000009631 bns:DerivativeFinancialLiabilitiesMember bns:CreditContractsMember ifrs-full:Level3OfFairValueHierarchyMember 2025-10-31 0000009631 ifrs-full:Level3OfFairValueHierarchyMember 2025-10-31 0000009631 bns:ResidentialMortgagesMember bns:StageTwoMember 2025-10-31 0000009631 bns:NetAmountMember bns:BusinessAndGovernmentMember bns:StageTwoMember 2025-10-31 0000009631 ifrs-full:ConsumerLoansMember bns:StageThreeMember 2025-10-31 0000009631 bns:ResidentialMortgagesMember bns:StageThreeMember 2025-10-31 0000009631 bns:CreditCardMember bns:StageTwoMember 2025-10-31 0000009631 bns:CreditCardMember bns:StageOneMember 2025-10-31 0000009631 bns:TotalRetailLoansMember bns:StageThreeMember 2025-10-31 0000009631 bns:TotalRetailLoansMember bns:StageTwoMember 2025-10-31 0000009631 ifrs-full:ConsumerLoansMember bns:StageTwoMember 2025-10-31 0000009631 ifrs-full:ConsumerLoansMember bns:StageOneMember 2025-10-31 0000009631 bns:TotalRetailLoansMember bns:StageOneMember 2025-10-31 0000009631 bns:ResidentialMortgagesMember bns:StageOneMember 2025-10-31 0000009631 bns:NetAmountMember bns:BusinessAndGovernmentMember bns:StageThreeMember 2025-10-31 0000009631 bns:NetAmountMember bns:BusinessAndGovernmentMember 2025-10-31 0000009631 bns:NetAmountMember bns:BusinessAndGovernmentMember bns:StageOneMember 2025-10-31 0000009631 ifrs-full:AllowanceForCreditLossesMember 2025-10-31 0000009631 bns:AllowanceForCreditLossesOnAcceptancesMember 2025-10-31 0000009631 bns:AllowanceForCreditLossesOnOffBalanceSheetExposuresMember 2025-10-31 0000009631 ifrs-full:AllowanceForCreditLossesMember bns:BusinessAndGovernmentMember bns:StageTwoMember 2025-10-31 0000009631 ifrs-full:AllowanceForCreditLossesMember bns:ResidentialMortgagesMember bns:StageOneMember 2025-10-31 0000009631 bns:ResidentialMortgagesMember ifrs-full:AllowanceForCreditLossesMember bns:StageTwoMember 2025-10-31 0000009631 ifrs-full:AllowanceForCreditLossesMember bns:ResidentialMortgagesMember bns:StageThreeMember 2025-10-31 0000009631 ifrs-full:AllowanceForCreditLossesMember bns:ResidentialMortgagesMember 2025-10-31 0000009631 ifrs-full:AllowanceForCreditLossesMember ifrs-full:ConsumerLoansMember bns:StageOneMember 2025-10-31 0000009631 ifrs-full:AllowanceForCreditLossesMember ifrs-full:ConsumerLoansMember bns:StageTwoMember 2025-10-31 0000009631 ifrs-full:AllowanceForCreditLossesMember ifrs-full:ConsumerLoansMember bns:StageThreeMember 2025-10-31 0000009631 ifrs-full:AllowanceForCreditLossesMember ifrs-full:ConsumerLoansMember 2025-10-31 0000009631 ifrs-full:AllowanceForCreditLossesMember bns:CreditCardMember bns:StageOneMember 2025-10-31 0000009631 ifrs-full:AllowanceForCreditLossesMember bns:CreditCardMember bns:StageTwoMember 2025-10-31 0000009631 ifrs-full:AllowanceForCreditLossesMember bns:CreditCardMember 2025-10-31 0000009631 bns:BusinessAndGovernmentMember ifrs-full:AllowanceForCreditLossesMember bns:StageOneMember 2025-10-31 0000009631 ifrs-full:AllowanceForCreditLossesMember bns:BusinessAndGovernmentMember bns:StageThreeMember 2025-10-31 0000009631 bns:BusinessAndGovernmentMember ifrs-full:AllowanceForCreditLossesMember 2025-10-31 0000009631 ifrs-full:AllowanceForCreditLossesMember bns:StageOneMember 2025-10-31 0000009631 ifrs-full:AllowanceForCreditLossesMember bns:StageTwoMember 2025-10-31 0000009631 ifrs-full:AllowanceForCreditLossesMember bns:StageThreeMember 2025-10-31 0000009631 bns:DerivativeFinancialInstrumentsMember ifrs-full:Level3OfFairValueHierarchyMember 2025-10-31 0000009631 ifrs-full:PensionDefinedBenefitPlansMember bns:FundedStatusMember ifrs-full:OtherAssetsMember 2025-10-31 0000009631 ifrs-full:PensionDefinedBenefitPlansMember bns:ChangeInBenefitObligationMember 2025-10-31 0000009631 bns:OtherBenefitPlansMember bns:ChangesInFairValueMember 2025-10-31 0000009631 ifrs-full:PensionDefinedBenefitPlansMember bns:ChangesInFairValueMember 2025-10-31 0000009631 bns:OtherBenefitPlansMember bns:FundedStatusMember ifrs-full:OtherAssetsMember 2025-10-31 0000009631 ifrs-full:PensionDefinedBenefitPlansMember bns:FundedStatusMember bns:Otherliabilities1Member 2025-10-31 0000009631 ifrs-full:PensionDefinedBenefitPlansMember ifrs-full:EffectOfAssetCeilingMember 2025-10-31 0000009631 bns:OtherBenefitPlansMember bns:ChangeInBenefitObligationMember 2025-10-31 0000009631 bns:OtherBenefitPlansMember bns:FundedStatusMember bns:Otherliabilities1Member 2025-10-31 0000009631 bns:GlobalBankingAndMarketsMember 2025-10-31 0000009631 bns:GlobalWealthManagementMember 2025-10-31 0000009631 bns:CanadianBankingMember 2025-10-31 0000009631 bns:CaribbeanAndCentralAmericaMember 2025-10-31 0000009631 srt:LatinAmericaMember 2025-10-31 0000009631 ifrs-full:AccumulatedOtherComprehensiveIncomeMember ifrs-full:ReserveOfCashFlowHedgesMember 2025-10-31 0000009631 ifrs-full:NoncontrollingInterestsMember 2025-10-31 0000009631 bns:PreferredSharesAndOtherEquityInstrumentsMember 2025-10-31 0000009631 bns:CommonEquityMember 2025-10-31 0000009631 ifrs-full:OtherReservesMember 2025-10-31 0000009631 ifrs-full:AccumulatedOtherComprehensiveIncomeMember bns:OtherMember 2025-10-31 0000009631 ifrs-full:EquityAttributableToOwnersOfParentMember 2025-10-31 0000009631 ifrs-full:AccumulatedOtherComprehensiveIncomeMember bns:EquityInstrumentsFairValueOtherComprehensiveIncomeMember 2025-10-31 0000009631 ifrs-full:AccumulatedOtherComprehensiveIncomeMember bns:DebtInstrumentsFairValueOtherComprehensiveIncomeMember 2025-10-31 0000009631 ifrs-full:OrdinarySharesMember 2025-10-31 0000009631 ifrs-full:RetainedEarningsMember 2025-10-31 0000009631 ifrs-full:AccumulatedOtherComprehensiveIncomeMember ifrs-full:ReserveOfExchangeDifferencesOnTranslationMember 2025-10-31 0000009631 ifrs-full:GrossCarryingAmountMember ifrs-full:OtherIntangibleAssetsMember bns:FiniteLifeIntangibleAssetsMember 2025-10-31 0000009631 ifrs-full:AccumulatedDepreciationAndAmortisationMember 2025-10-31 0000009631 ifrs-full:GrossCarryingAmountMember ifrs-full:ComputerSoftwareMember bns:FiniteLifeIntangibleAssetsMember 2025-10-31 0000009631 bns:FundManagementContractsMember 2025-10-31 0000009631 bns:OtherIndefiniteLifeIntangibleAssetsMember 2025-10-31 0000009631 ifrs-full:ComputerSoftwareMember bns:FiniteLifeIntangibleAssetsMember 2025-10-31 0000009631 ifrs-full:OtherIntangibleAssetsMember bns:FiniteLifeIntangibleAssetsMember 2025-10-31 0000009631 ifrs-full:GrossCarryingAmountMember bns:FundManagementContractsMember 2025-10-31 0000009631 ifrs-full:GrossCarryingAmountMember bns:OtherIndefiniteLifeIntangibleAssetsMember 2025-10-31 0000009631 ifrs-full:AccumulatedDepreciationAndAmortisationMember ifrs-full:ComputerSoftwareMember bns:FiniteLifeIntangibleAssetsMember 2025-10-31 0000009631 ifrs-full:AccumulatedDepreciationAndAmortisationMember ifrs-full:OtherIntangibleAssetsMember bns:FiniteLifeIntangibleAssetsMember 2025-10-31 0000009631 ifrs-full:RightofuseAssetsMember 2025-10-31 0000009631 ifrs-full:AccumulatedDepreciationAndAmortisationMember bns:Equipment1Member 2025-10-31 0000009631 ifrs-full:AccumulatedDepreciationAndAmortisationMember bns:TechnologyAssetsMember 2025-10-31 0000009631 ifrs-full:AccumulatedDepreciationAndAmortisationMember ifrs-full:LeaseholdImprovementsMember 2025-10-31 0000009631 ifrs-full:AccumulatedDepreciationAndAmortisationMember ifrs-full:RightofuseAssetsMember 2025-10-31 0000009631 ifrs-full:LandAndBuildingsMember 2025-10-31 0000009631 bns:Equipment1Member 2025-10-31 0000009631 bns:TechnologyAssetsMember 2025-10-31 0000009631 ifrs-full:LeaseholdImprovementsMember 2025-10-31 0000009631 ifrs-full:GrossCarryingAmountMember ifrs-full:RightofuseAssetsMember 2025-10-31 0000009631 ifrs-full:AccumulatedDepreciationAndAmortisationMember ifrs-full:LandAndBuildingsMember 2025-10-31 0000009631 ifrs-full:GrossCarryingAmountMember ifrs-full:LeaseholdImprovementsMember 2025-10-31 0000009631 ifrs-full:GrossCarryingAmountMember bns:TechnologyAssetsMember 2025-10-31 0000009631 ifrs-full:GrossCarryingAmountMember bns:Equipment1Member 2025-10-31 0000009631 ifrs-full:GrossCarryingAmountMember ifrs-full:LandAndBuildingsMember 2025-10-31 iso4217:CAD xbrli:pure xbrli:shares utr:Year iso4217:USD utr:Month utr:Day iso4217:EUR iso4217:CAD xbrli:shares iso4217:USD utr:lb iso4217:USD utr:bbl iso4217:USD xbrli:shares utr:D utr:Y
UNITED STATES
SECURITIES AND EXCHANGE COMMISSION
Washington, D.C. 20549
Form 40-F
[Check one]
|
☐
|
REGISTRATION STATEMENT PURSUANT TO SECTION 12 OF THE SECURITIES EXCHANGE ACT OF 1934 |
or
|
☒
|
ANNUAL REPORT PURSUANT TO SECTION 13(a) OR 15(d) OF THE SECURITIES EXCHANGE ACT OF 1934 |
For the fiscal year ended October 31, 2025
Commission File Number
002-09048
THE BANK OF NOVA SCOTIA
(Exact name of Registrant as specified in its charter)
(Province or other jurisdiction of incorporation or organization)
6029
(Primary Standard Industrial Classification Code Number)
Not Applicable
(I.R.S. Employer Identification Number (if applicable))
40 Temperance Street, Toronto, Ontario,
Canada M5H 0B4
(416) 866-3672
(Address and telephone number of Registrant’s principal executive offices)
The Bank of Nova Scotia, 250 Vesey Street,
New York,
N.Y
., U.S.A. 10281
Attention: Hector Becil
(212) 225-5000
(Name, address (including zip code) and telephone number (including area code) of agent for service in the United States)
Securities registered or to be registered pursuant to Section 12(b) of the Securities Exchange Act of 1934 (“Exchange Act”).
|
|
|
|
|
| |
|
|
|
|
|
|
|
|
New York Stock Exchange Toronto Stock Exchange |
Securities registered or to be registered pursuant to Section 12(g) of the Exchange Act.
Not applicable
(Title of Class)
Securities for which there is a reporting obligation pursuant to Section 15(d) of the Exchange Act.
Not applicable
(Title of Class)
For annual reports, indicate by check mark the information filed with this Form:
|
|
|
|
☒
|
|
☒
Audited annual financial statements |
Indicate the number of outstanding shares of each of the issuer’s classes of capital or common stock as of the close of the period covered by the annual report
|
|
|
|
|
| Common Shares |
|
|
1,236,305,738 |
|
Indicate by check mark whether the Registrant (1) has filed all reports required to be filed by Section 13 or 15(d) of the Exchange Act during the preceding 12 months (or for such shorter period that the Registrant was required to file such reports) and (2) has been subject to such filing requirements for the past 90 days.
Yes ☒ No ☐
Indicate by check mark whether the Registrant has submitted electronically every Interactive Data File required to be submitted pursuant to Rule 405 of Regulation
S-T
(§232.405 of this chapter) during the preceding 12 months (or for such shorter period that the Registrant was required to submit such files).
Yes ☒ No ☐
Indicate by check mark whether the registrant is an emerging growth company as defined in Rule
12b-2
of the Exchange Act.
If an emerging growth company that prepares its financial statements in accordance with U.S. GAAP, indicate by check mark if the registrant has elected not to use the extended transition period for complying with any new or revised financial accounting standards† provided pursuant to Section 13(a) of the Exchange Act. ☐
Indicate by check mark whether the registrant has filed a report on and attestation to its management’s assessment of the effectiveness of its internal control over financial reporting under Section 404(b) of the Sarbanes-Oxley Act (15 U.S.C. 7262(b)) by the registered public accounting firm that prepared or issued its audit report. ☒
If securities are registered pursuant to Section 12(b) of the Exchange Act, indicate by check mark whether the financial statements of the registrant included in the filing reflect the correction of an error to previously issued financial statements.
☐
Indicate by check mark whether any of those error corrections are restatements that required a recovery analysis of incentive-based compensation received by any of the registrant’s executive officers during the relevant recovery period pursuant to
§240.10D-1(b). ☐
|
|
|
|
|
|
KPMG LLP |
|
Toronto, ON, Canada |
|
85 |
† |
The term “new or revised financial accounting standard” refers to any update issued by the Financial Accounting Standards Board to its Accounting Standards Codification after April 5, 2012. |
DISCLOSURE CONTROLS AND PROCEDURES
Management’s Responsibility for Financial Information is described on page 140 of the Bank’s Annual Report (“Annual Report”) set forth in Exhibit 99.3, 2025 Consolidated Financial Statements. In addition, The Bank of Nova Scotia’s (the “Bank”) Audit and Conduct Review Committee of the Board of Directors has reviewed, and the Board of Directors has reviewed and approved, the 2025 Consolidated Financial Statements and Management’s Discussion and Analysis prior to release. The Bank is committed to providing timely, accurate and balanced disclosure of all material information and to providing fair and equal access to such information. The Bank’s disclosure policies and practices are published on its website.
Disclosure Controls and Procedures
The Bank’s disclosure controls and procedures are designed to provide reasonable assurance that information is accumulated and communicated to the Bank’s management, including the Chief Executive Officer (“CEO”) and Chief Financial Officer (“CFO”), as appropriate, to allow timely decisions regarding required disclosure.
As of October 31, 2025, the Bank’s management, with the participation of the CEO and CFO, evaluated the effectiveness of its disclosure controls and procedures, as defined under the rules adopted by the United States Securities and Exchange Commission (“SEC”) and the Canadian securities regulatory authorities, and have concluded that the Bank’s disclosure controls and procedures are effective.
Internal control over financial reporting
Management of the Bank is responsible for establishing and maintaining adequate internal control over financial reporting. These controls include policies and procedures that: (1) pertain to the maintenance of records that, in reasonable detail, accurately and fairly reflect the transactions and dispositions of the assets of the Bank; (2) provide reasonable assurance that transactions are recorded as necessary to permit preparation of financial statements in accordance with International Financial Reporting Standards as issued by the International Accounting Standards Board, and that receipts and expenditures of the Bank are being made only in accordance with authorizations of management and directors of the Bank; and (3) provide reasonable assurance regarding prevention or timely detection of unauthorized acquisition, use or disposition of the Bank’s assets that could have a material effect on the financial statements.
All control systems contain inherent limitations, no matter how well designed. As a result, the Bank’s management acknowledges that its internal control over financial reporting will not prevent or detect all misstatements due to error or fraud. In addition, management’s evaluation of controls can provide only reasonable, not absolute, assurance that all control issues that may result in material misstatements, if any, have been detected.
Management assessed the effectiveness of internal control over financial reporting, using the Committee of Sponsoring Organizations of the Treadway Commission (COSO) 2013 framework, and based on that assessment concluded that internal control over financial reporting was effective as of October 31, 2025.
Changes in internal control over financial reporting
There have been no changes in the Bank’s internal control over financial reporting that have materially affected, or are reasonably likely to materially affect, the Bank’s internal control over financial reporting during the year ended October 31, 2025.
MANAGEMENT’S INTERNAL CONTROL OVER FINANCIAL REPORTING
Management’s assessment of the effectiveness of internal control over financial reporting and the Report of Independent Registered Public Accounting Firm on Internal Control Over Financial Reporting are provided on pages 116 and 146 of the Annual Report set forth as Exhibit 99.2 and Exhibit 99.3, respectively.
AUDIT COMMITTEE FINANCIAL EXPERTS
All of the members of the Bank’s Audit and Conduct Review Committee of the Board of Directors (“audit committee”) are financially literate and independent, and one or more members of the audit committee meets the definition of a financial expert. As of December 2, 2025, the Bank’s Board of Directors has determined that Benita M. Warmbold, W. Dave Dowrich, Aaron W. Regent, and Steven C. Van Wyk are audit committee financial experts and are independent, as that term is defined by the New York Stock Exchange’s (“NYSE”) corporate governance standards applicable to the Bank.
The SEC has indicated that the designation of a person as an audit committee financial expert does not impose on such person any duties, obligations or liability that are greater than the duties, obligations and liability imposed on such person as a member of the audit committee and board of directors in the absence of such designation.
The Bank has adopted a code of ethics, entitled “Scotiabank Code of Conduct” (the “Code”). The Code applies to all directors, officers, employees and contingent workers of the Bank. The full text of the Code is set forth in Exhibit 99.7 and is also available on the Bank’s website at www.scotiabank.com, in the Governance section, and is available in print to any person, without charge, upon written request to the Corporate Secretary of the Bank at the Toronto executive office address shown above. The Whistleblower Policy is also posted on the Bank’s website. The Whistleblower Policy supports adherence to the Code. Future amendments to the Code and waivers, if any, for directors and executive officers will be disclosed on the Bank’s website. There were no waivers under the Code granted in fiscal 2025. The information on, or information that can be accessed through, the Bank’s website is not part of and is not incorporated by reference into this annual report. The Bank’s website address is included as an inactive textual reference only.
PRINCIPAL ACCOUNTANT FEES AND SERVICES
The disclosure about principal accountant fees and services, found under “Fees paid to the shareholders’ auditors” in Table 80 of the Annual Report set forth as Exhibit 99.2, Management’s Discussion and Analysis, are incorporated by reference herein.
Less than 1% of the above services, related to translation and preparation of statutory financial statements of certain subsidiary companies, were approved pursuant to an exemption under paragraph (c)(7)(i)(C) of Rule
2-01
of Regulation
S-X
from the requirement that the audit committee
pre-approve
the services. The majority of the hours expended on the audits of the 2025 and 2024 consolidated financial statements were attributable to work performed by the full-time permanent employees of the Bank’s independent auditors, KPMG LLP or its affiliates.
OFF-BALANCE
SHEET ARRANGEMENTS
The disclosure provided under
“Off-balance
Sheet Arrangements” included in the Annual Report set forth as Exhibit 99.2, Management’s Discussion and Analysis, is incorporated by reference herein.
The disclosure provided under “Contractual maturities and obligations” included in the Annual Report set forth as Exhibit 99.2, Management’s Discussion and Analysis, is incorporated by reference herein.
IDENTIFICATION OF THE AUDIT COMMITTEE
As of December 2, 2025, the Bank’s audit committee is composed of the following directors: Benita M. Warmbold (Chair and financial expert), W. Dave Dowrich (financial expert), Michael B. Medline, Aaron W. Regent (financial expert), and Steven C. Van Wyk (financial expert).
SUMMARY OF SIGNIFICANT CORPORATE GOVERNANCE DIFFERENCES
A summary of significant ways corporate governance practices followed by the Bank differ from corporate governance practices required to be followed by U.S. domestic companies under the NYSE’s listing standards (disclosure required by Section 303A.11 of the NYSE Listed Company Manual) is available on the Bank’s website at
https://www.scotiabank.com/ca/en/about/our-company/governance.html.
The information on, or information that can be accessed through, the Bank’s website is not part of and is not incorporated by reference into this annual report. This website address is included as an inactive textual reference only.
DISCLOSURE PURSUANT TO SECTION 13(r) OF THE EXCHANGE ACT
Pursuant to Section 13(r) of the Exchange Act, the Bank is required to disclose whether it or any of its affiliates knowingly engaged in certain activities, transactions or dealings relating to the Government of Iran or with certain individuals or entities that are the subject of sanctions under U.S. law. Disclosure is generally required even where the activities, transactions or dealings were conducted outside the United States in compliance with applicable law.
During the fiscal year ending October 31, 2025, the Bank identified an account held by a customer that may meet the definition of the “Government of Iran” under U.S. sanctions administered by the U.S. Department of the Treasury’s Office of Foreign Assets Control. During this period, the Bank maintained accounts and an outstanding mortgage loan for the customer, all denominated in Canadian dollars. Approximately $160,800 Canadian dollars in transactions were processed through the customer’s accounts in the relevant period, and the Bank has continued to receive payments in Canadian dollars on the mortgage loan. The Bank intends to close the customer’s accounts and to maintain the mortgage loan to the extent doing so remains permissible under applicable law. The Bank’s gross revenue and net profit attributable to this customer during the relevant period was de minimis.
Registrant undertakes to make available, in person or by telephone, representatives to respond to inquiries made by the Commission staff, and to furnish promptly, when requested to do so by the Commission staff, information relating to: the securities registered pursuant to Form
40-F;
the securities in relation to which the obligation to file an annual report on Form
40-F
arises; or transactions in said securities.
Pursuant to the requirements of the Exchange Act, the Registrant certifies that it meets all of the requirements for filing on Form
40-F
and has duly caused this annual report to be signed on its behalf by the undersigned, thereto duly authorized.
|
|
|
|
|
|
|
Registrant: |
|
|
|
|
|
|
|
|
|
|
|
|
By: |
|
/s/ Rajagopal Viswanathan |
|
|
|
|
|
|
Name: Rajagopal Viswanathan |
|
|
|
|
|
|
Title: Group Head and Chief Financial Officer |
EX-97.1
2
d936350dex971.htm
EX-97.1
EX-97.1
Exhibit 97.1
THE BANK OF NOVA SCOTIA
Dodd-Frank Clawback Policy
The
Board of Directors (the “Board”) of The Bank of Nova Scotia (the “Bank”) has adopted this Dodd-Frank Clawback Policy (this “Policy”) in accordance with the applicable provisions of The New
York Stock Exchange Listed Company Manual (the “Clawback Rules”), promulgated pursuant to the final rules adopted by the Securities and Exchange Commission enacting the clawback standards under Section 954 of the Dodd-Frank
Wall Street Reform and Consumer Protection Act. The Human Capital and Compensation Committee (the “Committee”) is designated to administer this Policy. Capitalized terms not otherwise defined in this Policy have the meanings given
to them under the Clawback Rules, which are attached to this Policy as Appendix A.
| I. |
Recovery of Erroneously Awarded Incentive Compensation
|
The Bank shall comply with the Clawback Rules and reasonably promptly recover Erroneously Awarded Compensation Received by current or former Executive Officers
of the Bank (“Covered Individuals”) in the event the Bank is required to prepare an accounting restatement due to the Bank’s material non-compliance with any financial reporting
requirement under the securities laws, including any required accounting restatement to correct an error in previously issued financial statements that is material to the previously issued financial statements, or that would result in a material
misstatement if the error were corrected in the current period or left uncorrected in the current period. The Committee may determine to not recover Erroneously Awarded Compensation pursuant to this Policy in circumstances where non-enforcement is expressly permitted by the Clawback Rules, including where recovery would violate applicable home country laws in effect before November 28, 2022.
The Committee shall determine the Bank’s Covered Individuals in a manner consistent with the Clawback Rules.
| III. |
Covered Compensation
|
This Policy applies to the Incentive-based Compensation Received by a Covered Individual: (1) after such Covered Individual began service as an Executive
Officer; (2) who served as an Executive Officer at any time during the performance period for that Incentive-based Compensation; (3) while the Bank has a class of securities listed on a US national securities exchange or a US national
securities association; and (4) during the three completed fiscal years immediately preceding the date that the Bank is required to prepare an accounting restatement as described above (or during any transition period, that results from a
change in the Bank’s fiscal year, within or immediately following those three completed fiscal years, as determined in accordance with the Clawback Rules). Notwithstanding the foregoing, this Policy shall not apply to Incentive-based
Compensation Received by a Covered Individual prior to the effective date of this Policy.
1
The amount of Incentive-based Compensation subject to this Policy is the Erroneously Awarded Compensation,
which is be the amount of Incentive-based Compensation Received by a Covered Individual that exceeds the amount of Incentive-based Compensation that otherwise would have been Received by the Covered Individual had it been determined based on the
restated amount (or otherwise determined in accordance with the Clawback Rules), and will be computed without regard to any taxes paid by the Covered Individual (or withheld from the Incentive-based Compensation). The Committee shall make all
determinations regarding the amount of Erroneously Awarded Compensation.
The Committee shall determine, in its sole discretion, the manner in which any Erroneously Awarded Compensation shall be recovered. Methods of recovery may
include, but are not limited to: (1) seeking direct repayment from the Covered Individual; (2) reducing (subject to applicable law and the terms and conditions of the applicable plan, program or arrangement pursuant to which the
incentive-based compensation was paid) the amount that would otherwise be payable to the Covered Individual under any compensation, bonus, incentive, equity and other benefit plan, agreement, policy or arrangement maintained by the Bank or any of
its affiliates; (3) cancelling any award (whether cash- or equity-based) or portion thereof previously granted to the Covered Individual; or (4) any combination of the foregoing.
This Policy applies on a no-fault basis, and Covered Individuals will be subject to recovery under this Policy without
regard to their personal culpability.
| VI. |
Other Bank Arrangements
|
This Policy shall be in addition to, and not in lieu of, any other clawback, recovery or recoupment policy maintained by the Bank from time to time, as well as
any clawback, recovery or recoupment provision in any of the Bank’s plans, awards or individual agreements (including the clawback, recovery and recoupment provisions in the Bank’s equity award agreements) (collectively, “Other
Bank Arrangement”) and any other rights or remedies available to the Bank, including termination of employment; provided, however, that there is no intention to, nor shall there be, any duplicative recoupment of the same compensation under
more than one policy, plan, award or agreement. In addition, no Other Bank Arrangement shall serve to restrict the scope or the recoverability of Erroneously Awarded Compensation under this Policy or in any way limit recovery in compliance with the
Clawback Rules.
Notwithstanding anything to the contrary set forth in any policy, arrangement, bylaws, charter, certificate of incorporation or plan of the Bank or any
individual agreement between a Covered Individual and the Bank or any of its affiliates, no Covered Individual shall be entitled to indemnification from the Bank or any of its affiliates for the amount that is or may be recovered by the Bank
pursuant to this Policy; provided, however, that to the extent expense advancement or reimbursement is available to a Covered Individual, this Policy shall not serve to prohibit such advancement or reimbursement.
2
| VIII. |
Administration; Interpretation
|
The Committee shall interpret and construe this Policy consistent with the Clawback Rules and applicable laws and regulation and shall make all determinations
necessary, appropriate or advisable for the administration of this Policy. Any determinations made by the Committee shall be final, binding and conclusive on all affected individuals. As required by the Clawback Rules, the Bank shall provide public
disclosures related to this Policy and any applicable recoveries of Erroneously Awarded Compensation. To the extent this Policy conflicts or is inconsistent with the Clawback Rules, the Clawback Rules shall govern. In no event is this Policy
intended to be broader than, or require recoupment in addition to, that required pursuant to the Clawback Rules.
| IX. |
Amendment or Termination of this Policy
|
The Board reserves the right to amend this Policy at any time and for any reason, subject to applicable law and the Clawback Rules. To the extent that the
Clawback Rules cease to be in force or cease to apply to the Bank, this Policy shall also cease to be in force.
Approved and Adopted: approved by the
Board of Directors on May 24, 2023 prior to the December 1, 2023 regulatory compliance date for Canadian issuers and on May 27, 2025.
3
Appendix A
Clawback
Rules
303A.14 Erroneously Awarded Compensation
(a)
This Section 303A.14 prohibits the initial or continued listing of any security of an issuer that is not in compliance with the requirements of any portion hereof.
(b) Implementation.
| (i) |
The effective date (“Effective Date”) of this Section 303A.14 is October 2, 2023 and
Canadian issuers listed on a US stock exchange will have 60 days to comply with the new requirements (i.e., December 1, 2023).
|
| (ii) |
Each listed issuer must adopt the recovery policy required by this Section 303A.14 (“Recovery
Policy”) no later than 60 days following the Effective Date.
|
| (iii) |
Each listed issuer must comply with its Recovery Policy for all incentive-based compensation Received (as such
term is defined in Section 303A.14(e) below) by executive officers on or after the Effective Date;
|
| (iv) |
Each listed issuer must provide the required disclosures in the applicable SEC filings required on or after the
Effective Date.
|
(c) Requirements.
The requirements of this Section 303A.14 are as follows:
(1) Recovery of Erroneously Awarded Compensation. The issuer must adopt and comply with a written Recovery Policy providing that the issuer will
recover reasonably promptly the amount of erroneously awarded incentive-based compensation in the event that the issuer is required to prepare an accounting restatement due to the material noncompliance of the issuer with any financial reporting
requirement under the securities laws, including any required accounting restatement to correct an error in previously issued financial statements that is material to the previously issued financial statements, or that would result in a material
misstatement if the error were corrected in the current period or left uncorrected in the current period.
| (i) |
The Issuer’s Recovery Policy must apply to all incentive-based compensation received by a person:
|
| |
(A) |
After beginning service as an executive officer;
|
| |
(B) |
Who served as an executive officer at any time during the performance period for that incentive-based
compensation;
|
| |
(C) |
While the issuer has a class of securities listed on a national securities exchange or a national securities
association; and
|
4
(D) During the three completed fiscal years immediately preceding the date that the issuer
is required to prepare an accounting restatement as described in paragraph (c)(1) of this Section 303A.14. In addition to these last three completed fiscal years, the recovery policy must apply to any transition period (that results from a
change in the issuer’s fiscal year) within or immediately following those three completed fiscal years. However, a transition period between the last day of the issuer’s previous fiscal year end and the first day of its new fiscal year
that comprises a period of nine to 12 months would be deemed a completed fiscal year. An issuer’s obligation to recover erroneously awarded compensation is not dependent on if or when the restated financial statements are filed.
(ii) For purposes of determining the relevant recovery period, the date that an issuer is required to prepare an accounting restatement as described in
paragraph (c)(1) of this Section 303A.14 is the earlier to occur of:
(A) The date the issuer’s board of directors, a committee
of the board of directors, or the officer or officers of the issuer authorized to take such action if board action is not required, concludes, or reasonably should have concluded, that the issuer is required to prepare an accounting restatement as
described in paragraph (c)(1) of this Section 303A.14; or
(B) The date a court, regulator, or other legally authorized body directs
the issuer to prepare an accounting restatement as described in paragraph (c)(1) of this Section 303A.14.
(iii) The amount of incentive-based
compensation that must be subject to the issuer’s recovery policy (“erroneously awarded compensation”) is the amount of incentive-based compensation received that exceeds the amount of incentive-based compensation that otherwise
would have been received had it been determined based on the restated amounts, and must be computed without regard to any taxes paid. For incentive-based compensation based on stock price or total shareholder return, where the amount of erroneously
awarded compensation is not subject to mathematical recalculation directly from the information in an accounting restatement:
(A) The
amount must be based on a reasonable estimate of the effect of the accounting restatement on the stock price or total shareholder return upon which the incentive- based compensation was received; and
(B) The issuer must maintain documentation of the determination of that reasonable estimate and provide such documentation to the Exchange.
(iv) The issuer must recover erroneously awarded compensation in compliance with its recovery policy except to the extent that the conditions of
paragraphs (c)(1)(iv)(A), (B), or (C) of this Section 303A.14 are met, and the issuer’s committee of independent directors responsible for executive compensation decisions, or in the absence of such a committee, a majority of the
independent directors serving on the board, has made a determination that recovery would be impracticable.
(A) The direct expense paid to
a third party to assist in enforcing the policy would exceed the amount to be recovered. Before concluding that it would be impracticable to recover any amount of erroneously awarded compensation based on expense of enforcement, the issuer must make
a reasonable attempt to recover such erroneously awarded compensation, document such reasonable attempt(s) to recover, and provide that documentation to the Exchange.
5
(B) Recovery would violate home country law where that law was adopted prior to
November 28, 2022. Before concluding that it would be impracticable to recover any amount of erroneously awarded compensation based on violation of home country law, the issuer must obtain an opinion of home country counsel, acceptable to the
Exchange, that recovery would result in such a violation, and must provide such opinion to the Exchange.
(C) Recovery would likely cause
an otherwise tax-qualified retirement plan, under which benefits are broadly available to employees of the registrant, to fail to meet the requirements of 26 U.S.C. 401(a)(13) or 26 U.S.C. 411(a) and
regulations thereunder.
(v) The issuer is prohibited from indemnifying any executive officer or former executive officer against the loss of erroneously
awarded compensation.
(2) The issuer must file all disclosures with respect to such Recovery Policy in accordance with the requirements of the Federal
securities laws, including the disclosure required by the applicable Commission filings
(d) General Exemptions
The requirements of this Section 303A.14 do not apply to the listing of:
(1) A security futures product cleared by a clearing agency that is registered pursuant to section 17A of the Act (15 U.S.C. 78q-1) or that is exempt from the registration requirements of section 17A(b)(7)(A) (15 U.S.C. 78q-1(b)(7)(A));
(2) A standardized option, as defined in 17 CFR 240.9b-1(a)(4), issued by a clearing agency that is
registered pursuant to section 17A of the Act (15 U.S.C. 78q-1);
(3) Any security issued by a unit
investment trust, as defined in 15 U.S.C. 80a-4(2);
(4) Any security issued by a management company, as defined in 15 U.S.C. 80a-4(3), that is registered under Section 8 of the Investment Company Act of 1940 (15 U.S.C. 80a-8), if such management company has not awarded incentive-based
compensation to any executive officer of the company in any of the last three fiscal years, or in the case of a company that has been listed for less than three fiscal years, since the listing of the company.
(e) Definitions. Unless the context otherwise requires, the following definitions apply for purposes of this Section 303A.14:
Executive Officer. An executive officer is the issuer’s president, principal financial officer, principal accounting officer (or if there is no such accounting officer, the controller), any vice-president of the issuer in charge of a principal business unit, division, or function (such as sales, administration, or finance), any other officer who performs a policy-making function, or any other person who performs similar policy- making functions for the issuer. Executive officers of the issuer’s parent(s) or subsidiaries are deemed executive officers of the issuer if they perform such policy making functions for the issuer. In addition, when the issuer is a limited partnership, officers or employees of the general partner(s) who perform policy-making functions for the limited partnership are deemed officers of the limited partnership. When the issuer is a trust, officers, or employees of the trustee(s) who perform policy-making functions for the trust are deemed officers of the trust. Policy-making function is not intended to include policy- making functions that are not significant. Identification of an executive officer for purposes of this Section 303A.14 would include at a minimum executive officers identified pursuant to 17 CFR 229.401(b).
6
Financial reporting measures. Financial reporting measures are measures that are determined and presented in accordance with the
accounting principles used in preparing the issuer’s financial statements, and any measures that are derived wholly or in part from such measures. Stock price and total shareholder return are also financial reporting measures. A financial
reporting measure need not be presented within the financial statements or included in a filing with the Commission.
Incentive-based
compensation. Incentive-based compensation is any compensation that is granted, earned, or vested based wholly or in part upon the attainment of a financial reporting measure.
Received. Incentive-based compensation is deemed received in the issuer’s fiscal period during which the financial reporting
measure specified in the incentive-based compensation award is attained, even if the payment or grant of the incentive-based compensation occurs after the end of that period.
7
EX-99.1
3
d936350dex991.htm
EX-99.1
EX-99.1
Exhibit 99.1
The Bank of Nova Scotia
ANNUAL
INFORMATION
FORM
DECEMBER
2, 2025

TABLE OF CONTENTS
|
|
|
|
|
|
|
|
|
| |
|
AIF
Page No. |
|
|
MD&A Reference |
|
| Distribution Notice
|
|
|
1 |
|
|
|
|
|
| Financial Data
|
|
|
1 |
|
|
|
|
|
| Forward-looking Statements
|
|
|
1 |
|
|
|
|
|
| CORPORATE STRUCTURE
|
|
|
2 |
|
|
|
|
|
| Name, Address and Place of Incorporation
|
|
|
2 |
|
|
|
|
|
| Intercorporate Relationships
|
|
|
2 |
|
|
|
|
|
| GENERAL DEVELOPMENT OF THE BANK’S BUSINESS
|
|
|
3 |
|
|
|
|
|
| Three-Year History
|
|
|
3 |
|
|
|
|
|
| DESCRIPTION OF THE BANK’S BUSINESS
|
|
|
3 |
|
|
|
|
|
| General Summary
|
|
|
3 |
|
|
|
pp. 45-59 |
|
| Sustainability Strategies
|
|
|
8 |
|
|
|
|
|
| Risk Factors
|
|
|
8 |
|
|
|
pp. 76-115 |
|
| DIVIDENDS
|
|
|
8 |
|
|
|
|
|
| DESCRIPTION OF THE BANK’S CAPITAL STRUCTURE
|
|
|
8 |
|
|
|
pp. 60-67 |
|
| Common Shares
|
|
|
9 |
|
|
|
|
|
| Preferred Shares – General
|
|
|
9 |
|
|
|
|
|
| Certain Provisions of the Preferred Shares
|
|
|
9 |
|
|
|
|
|
| Other Equity Instruments – Subordinated Capital Notes – General
|
|
|
11 |
|
|
|
|
|
| Certain Provisions of the Subordinated Capital Notes
|
|
|
12 |
|
|
|
|
|
| Constraints on Ownership of the Bank’s Shares
|
|
|
13 |
|
|
|
|
|
| Credit Ratings of Securities and Liquidity
|
|
|
13 |
|
|
|
|
|
| MARKET FOR SECURITIES OF THE BANK
|
|
|
14 |
|
|
|
|
|
| Trading Price and Volume
|
|
|
15 |
|
|
|
|
|
| Prior Sales
|
|
|
15 |
|
|
|
|
|
| DIRECTORS AND EXECUTIVE OFFICERS OF THE BANK
|
|
|
16 |
|
|
|
|
|
| Directors and Board Committees of the Bank
|
|
|
16 |
|
|
|
|
|
| Executive Officers of the Bank
|
|
|
17 |
|
|
|
|
|
| Cease Trade Orders, Bankruptcies, Penalties or Sanctions
|
|
|
19 |
|
|
|
|
|
| Shareholdings of Management
|
|
|
20 |
|
|
|
|
|
| LEGAL PROCEEDINGS AND REGULATORY ACTIONS
|
|
|
20 |
|
|
|
|
|
| INTEREST OF MANAGEMENT AND OTHERS IN MATERIAL TRANSACTIONS
|
|
|
21 |
|
|
|
|
|
| TRANSFER AGENT AND REGISTRAR
|
|
|
21 |
|
|
|
|
|
| CONFLICTS OF INTEREST
|
|
|
21 |
|
|
|
|
|
| EXPERTS
|
|
|
21 |
|
|
|
|
|
| THE BANK’S AUDIT AND CONDUCT REVIEW COMMITTEE
|
|
|
21 |
|
|
|
|
|
| Auditor
|
|
|
22 |
|
|
|
Table 80 on p. 129 |
|
| ADDITIONAL INFORMATION
|
|
|
23 |
|
|
|
|
|
| Schedule A – Definition of Credit Ratings
|
|
|
24 |
|
|
|
|
|
| Schedule B – Audit and Conduct Review Committee Charter
|
|
|
27 |
|
|
|
|
|
INFORMATION IS AT OCTOBER 31, 2025, UNLESS OTHERWISE NOTED.
Distribution Notice
When this Annual Information Form is provided to security holders or other interested parties, it must be accompanied by copies of all the documents (or
excerpts thereof) incorporated herein by reference. Portions of this Annual Information Form of The Bank of Nova Scotia (the “Bank”, “Scotiabank”, “we” or “our”) dated December 2, 2025 (the
“AIF”), are disclosed in the Management’s Discussion and Analysis for the year ended October 31, 2025 (the “MD&A”). The MD&A is also available on SEDAR+ at www.sedarplus.ca.
Financial Data
Except as otherwise noted, all
information is given at or for the year ended October 31, 2025. Amounts are expressed in Canadian dollars. Financial information is presented in accordance with International Financial Reporting Standards (“IFRS”) as issued by the
International Accounting Standards Board, unless otherwise noted.
Forward-looking Statements
From time to time, our public communications include oral or written forward-looking statements. Statements of this type are included in this document, and may
be included in other filings with Canadian securities regulators or the U.S. Securities and Exchange Commission (“SEC”), or in other communications. In addition, representatives of the Bank may include forward-looking statements orally
to analysts, investors, the media and others. All such statements are made pursuant to the “safe harbor” provisions of the U.S. Private Securities Litigation Reform Act of 1995 and any applicable Canadian securities legislation.
Forward-looking statements may include, but are not limited to, statements made in this document, the Management’s Discussion and Analysis in the Bank’s 2025 Annual Report under the headings “Outlook” and in other statements
regarding the Bank’s objectives, strategies to achieve those objectives, the regulatory environment in which the Bank operates, anticipated financial results, and the outlook for the Bank’s businesses and for the Canadian, U.S. and
global economies. Such statements are typically identified by words or phrases such as “believe,” “expect,” “aim,” “achieve,” “foresee,” “forecast,” “anticipate,”
“intend,” “estimate,” “outlook,” “seek,” “schedule,” “plan,” “goal,” “strive,” “target,” “project,” “commit,”
“objective,” and similar expressions of future or conditional verbs, such as “will,” “may,” “should,” “would,” “might,” “can” and “could” and positive
and negative variations thereof.
By their very nature, forward-looking statements require us to make assumptions and are subject to inherent risks and
uncertainties, which give rise to the possibility that our predictions, forecasts, projections, expectations or conclusions will not prove to be accurate, that our assumptions may not be correct and that our financial performance objectives, vision
and strategic goals will not be achieved.
We caution readers not to place undue reliance on these statements as a number of risk factors, many of which
are beyond our control and effects of which can be difficult to predict, could cause our actual results to differ materially from the expectations, targets, estimates or intentions expressed in such forward-looking statements.
The future outcomes that relate to forward-looking statements may be influenced by many factors, including but not limited to: general economic and market conditions in the countries in which we operate and globally; changes in currency and interest rates; increased funding costs and market volatility due to market illiquidity and competition for funding; the failure of third parties to comply with their obligations to the Bank and its affiliates, including relating to the care and control of information, and other risks arising from the Bank’s use of third parties; changes in monetary, fiscal, or economic policy and tax legislation and interpretation; changes in laws and regulations or in supervisory expectations or requirements, including capital, interest rate and liquidity requirements and guidance, and the effect of such changes on funding costs; geopolitical risk (including policies and other changes related to, or affecting, economic or trade matters, including tariffs, countermeasures, tariff mitigation policies and tax-related risks); changes to our credit ratings; the possible effects on our business and the global economy of war, conflicts or terrorist actions and unforeseen consequences arising from such actions; technological changes, including open banking and the use of data and artificial intelligence in our business, and technology resiliency; operational and infrastructure risks; reputational risks; the accuracy and completeness of information the Bank receives on customers and counterparties; the timely development and introduction of new products and services, and the extent to which products or services previously sold by the Bank require the Bank to incur liabilities or absorb losses not contemplated at their origination; our ability to execute our strategic plans, including the successful completion of acquisitions and dispositions, including obtaining regulatory approvals; critical accounting estimates and the effect of changes to accounting standards, rules and interpretations on these estimates; global capital markets activity; the Bank’s ability to attract, develop and retain key executives; the evolution of various types of fraud or other criminal behaviour to which the Bank is exposed; anti-money laundering; disruptions or attacks (including cyberattacks) on the Bank’s information technology, internet connectivity, network accessibility, or other voice or data communications systems or services, which may result in data breaches, unauthorized access to sensitive information, denial of service and potential incidents of identity theft; increased competition in the geographic and business areas in which we operate, including through internet and mobile banking and non-traditional competitors; exposure related to significant litigation and regulatory matters; environmental, social and governance risks, including climate-related risk, our ability to implement various sustainability-related initiatives (both internally and with our clients and other stakeholders) under expected time frames, and our ability to scale our sustainable-finance products and services; the occurrence of natural and unnatural catastrophic events and claims resulting from such events, including disruptions to public infrastructure, such as transportation, communications, power or water supply; inflationary pressures; global supply-chain disruptions; Canadian housing and household indebtedness; the emergence or continuation of widespread health emergencies or pandemics, including their impact on the local, national or global economies, financial market conditions and the Bank’s business, results of operations, financial condition and prospects; and the Bank’s anticipation of and success in managing the risks implied by the foregoing.
- 1 -
A substantial amount of the Bank’s business involves making loans or otherwise committing resources to specific companies, industries or countries. Unforeseen events affecting such borrowers, industries or countries could have a material adverse effect on the Bank’s financial results, businesses, financial condition or liquidity. These and other factors may cause the Bank’s actual performance to differ materially from that contemplated by forward-looking statements. The Bank cautions that the preceding list is not exhaustive of all possible risk factors and other factors could also adversely affect the Bank’s results, for more information, please see the “Risk Management” section of the Bank’s 2025 Annual Report, as may be updated by quarterly reports.
Material economic assumptions underlying the forward-looking statements contained in this document are set out in the 2025 Annual Report under the headings
“Outlook”, as updated by quarterly reports. The “Outlook” and “2026 Priorities” sections are based on the Bank’s views and the actual outcome is uncertain. Readers should consider the above-noted factors
when reviewing these sections. When relying on forward-looking statements to make decisions with respect to the Bank and its securities, investors and others should carefully consider the preceding factors, other uncertainties and potential events.
Any forward-looking statements contained in this document represent the views of management only as of the date hereof and are presented for the purpose
of assisting the Bank’s shareholders and analysts in understanding the Bank’s financial position, objectives and priorities, and anticipated financial performance as at and for the periods ended on the dates presented, and may not be
appropriate for other purposes. Except as required by law, the Bank does not undertake to update any forward-looking statements, whether written or oral, that may be made from time to time by or on its behalf.
Additional information relating to the Bank can be located on the SEDAR+ website at www.sedarplus.ca and on the EDGAR section of the SEC’s website at
www.sec.gov.
CORPORATE STRUCTURE
Name, Address
and Place of Incorporation
The Bank was granted a charter under the laws of the Province of Nova Scotia in 1832 and commenced operations in Halifax,
Nova Scotia in that year. Since 1871, the Bank has been a chartered bank under the Bank Act (Canada) (the “Bank Act”). The Bank is a Schedule I bank under the Bank Act and the Bank Act is its charter. The head office of the Bank
is located at 1709 Hollis Street, Halifax, Nova Scotia, B3J 1W1 and its executive offices are at 40 Temperance Street, Toronto, Ontario, M5H 0B4. A copy of the Bank’s by-laws is available on
www.sedarplus.ca.
Intercorporate Relationships
Each
international principal subsidiary of the Bank is incorporated or established and existing under the laws of the jurisdiction in which its principal office is located, with the exception of Scotia Holdings (USA) LLC and Scotia Financing (USA) LLC
which are incorporated and existing under the laws of the State of Delaware. Each Canadian principal subsidiary of the Bank is incorporated or established and existing under the laws of Canada, except for 1832 Asset Management L.P., Scotia Capital
Inc. and Scotia Securities Inc. which are incorporated or established and existing under the laws of the Province of Ontario.
The intercorporate
relationships among the Bank and its principal subsidiaries are described in note 30 of the consolidated financial statements for the year ended October 31, 2025, which are incorporated herein by reference.
- 2 -
GENERAL DEVELOPMENT OF THE BANK’S BUSINESS
Three-Year History
As reported in accordance with IFRS,
for the fiscal year ended October 31, 2025, the Bank’s net income attributable to common shareholders was $7,283 million, down from $7,286 million in 2024. The Bank’s net income attributable to common shareholders was $6,919 million
in 20231. Earnings per share (on a diluted basis) for the fiscal year ended October 31, 2025 was $5.67, compared to $5.87 in 2024 and $5.72 in 20231.
Return on equity for the fiscal year ended October 31, 2025 was 9.7%, compared to 10.2% in 2024 and
10.3% in 20231. In fiscal 2025, the Bank’s actual dividend payout ratio was approximately 73.7%, compared to 71% in 2024 and 72.3% in
2023.1
For additional information on the Bank’s businesses, see the descriptions provided
below and on pages 45 to 59 of the MD&A.
Certain acquisitions and dispositions that have influenced the general development of the Bank’s
business over the past three years are summarized below, for additional information on acquisitions and divestitures, see note 35 of the consolidated financial statements for the year ended October 31, 2025.
On February 28, 2025, the Bank completed the sale of CrediScotia Financiera S.A. (CrediScotia), a wholly-owned consumer finance subsidiary in Peru, to
Banco Santander S.A. (España), upon receiving regulatory approvals and satisfying closing conditions.
On January 6, 2025, the Bank entered
into an agreement with Davivienda to transfer its banking operations in Colombia, Costa Rica and Panama in exchange for an approximately 20% ownership stake in the newly combined entity of Davivienda. The Bank’s ownership will consist of
14.99% voting common shares and the remainder in non-voting preferred shares. On November 24, 2025, the Bank announced that all required regulatory approvals had been received for completion of the
transfer. On December 1, 2025, the Bank completed the transaction to combine the operations of both institutions to operate under a new holding company, Davivienda Group. Following completion of such transaction, the Bank designated two
individuals (one being independent) to serve on the Board of Directors of Davivienda Group.
On December 27, 2024, the Bank completed its acquisition
of an approximate ownership interest of 14.9% or 163 million shares in KeyCorp. The acquisition was completed in two stages – an initial investment of 4.9% (“Initial Investment”) on August 30, 2024, and an additional
investment of approximately 10% (“Additional Investment”) on December 27, 2024. The acquisition was completed through all-cash purchases of newly issued voting common shares, at a fixed price
of U.S.$17.17 per share, resulting in total cash consideration paid of approximately U.S.$2.8 billion ($4.1 billion). Following completion of the Additional Investment, the Bank designated two individuals to serve on KeyCorp’s Board of
Directors.
On October 31, 2023, the Bank completed the sale of its 20% equity interest in Canadian Tire’s Financial Services business
(“CTFS”) to Canadian Tire Corporation.
On September 26, 2022, the Bank announced Brian Porter’s decision to retire as President
and Chief Executive Officer, effective January 31, 2023. The Bank’s Board of Directors appointed Scott Thomson as CEO of the Bank, effective February 1, 2023. Mr. Thomson initially served as President, effective December 1,
2022, with responsibility for the Bank’s four business lines. To support the transition, Mr. Porter was a Strategic Advisor to Mr. Thomson from February 1, 2023 to April 30, 2023.
DESCRIPTION OF THE BANK’S BUSINESS
General
Summary
The Bank’s strategic vision is to be our clients’ most trusted financial partner and deliver sustainable, profitable growth.
Guided by our purpose: “for every future,” we help our clients, their families and their communities achieve success through a broad range of advice, products, and services, including personal and commercial banking, wealth management
and private banking, corporate and investment banking, and capital markets.
| 1 |
The Bank adopted IFRS 17 effective November 1, 2023. As required under the new accounting standard, prior
period amounts have been restated.
|
- 3 -
For the year ended October 31, 2025, the Bank’s operating segments are: Canadian Banking,
International Banking, Global Wealth Management, Global Banking and Markets and Other.
Canadian Banking provides a full suite of financial advice and
banking solutions, supported by an excellent customer experience, to over 11 million customers. Retail, Small Business Banking and Commercial Banking customers receive service through its network of 892 branches and 3,542 automated banking
machines (ABMs), as well as online, mobile and telephone banking, and specialized sales teams. Canadian Banking also provides an alternative self-directed banking solution to Tangerine customers.
International Banking is comprised of a strong and universal banking franchise that provides financial advice and solutions to over 8 million Retail,
Commercial and GBM clients. Its geographic presence spans more than 12 countries, including Mexico, Chile, Peru, Brazil, Uruguay, and various markets in the Caribbean, with a relevant local presence in all core markets. The Bank’s unique
geographical footprint ensures robust connectivity within the North American corridor.
Global Wealth Management is focused on delivering comprehensive
wealth management advice and solutions to clients across Scotiabank’s footprint. Global Wealth Management serves over 2 million investment fund and advisory clients across 12 countries – administering over $750 billion in
assets.
Global Banking and Markets (GBM) provides corporate clients with lending and transaction services, investment banking advice and access to
capital markets. GBM is a full-service wholesale bank in the Americas, serving clients across Canada, the United States, Latin America, Europe and Asia-Pacific.
The Other segment includes Group Treasury, investments in certain associated corporations, and smaller operating segments and corporate items which are not
allocated to a business line. Group Treasury is primarily responsible for Balance Sheet, Liquidity and Interest Rate Risk management, which includes the Bank’s wholesale funding.
Collectively, the Bank has 86,431 employees (full-time equivalent) and our customers are served by a network of 2,128 branches and offices, as of the
financial year end (October 31, 2025).
A more complete description of services provided by each of the Bank’s major business lines is available in
the MD&A, on pages 45 to 59 inclusive, and those pages are herein incorporated by reference.
Competition
The Canadian banking system consists of numerous banks and other financial institutions. Certain large Canadian banks are required by law to be widely held
because their equity exceeds a threshold of $12 billion. These banks compete nationwide through extensive branch networks, ABMs, telephone, internet and mobile banking offerings. In total, the Canadian system includes 35 domestic banks, 15
foreign banks and numerous credit unions and caisses populaires. More broadly, the Canadian financial services industry includes thousands of institutions such as life insurance companies, property and casualty insurers, consumer finance companies,
independent investment dealers and independent retail mutual fund management companies.
Competition is reflected in the range of products and services
offered, innovation in features, services, technology and delivery, as well as the various pricing schemes adopted. Additionally, a growing number of service providers in the Canadian marketplace are offering alternative channels and competition in
the payments space. The increased number of new entrants into the financial services sector in recent years has also underscored an enhanced level of competition.
The Bank is a global financial services provider offering a diverse range of products and services, including personal, commercial, corporate and investment
banking. In providing these services and products, the Bank competes with local and international banks and other financial institutions.
Supervision and Regulation in Canada
As a
Canadian Schedule I Bank, the Bank’s activities in Canada are governed by the Bank Act, which is one of four main federal statutes governing the financial services industry in Canada. The other three statutes cover trust and loan companies,
insurance companies and co-operative credit associations.
In accordance with the Bank Act, an organization may engage in and carry on the business of banking and such business generally as pertains to the business of banking.
- 4 -
The Bank Act grants Canadian chartered banks broad powers of investment in the securities of other corporations and entities, but imposes limits upon substantial investments. Under the Bank Act, generally a bank has a substantial investment in a body corporate when (a) voting rights attached to the voting shares beneficially owned by the bank and by entities controlled by the bank exceed 10% of the voting rights attached to the outstanding voting shares of the body corporate, or (b) the total number of shares of the body corporate that are beneficially owned by the bank and entities controlled by the bank represent more than 25% of the total shareholders’ equity of the body corporate. In addition, under the Bank Act, a bank has a substantial investment in an unincorporated entity where the ownership interests in such entity beneficially owned by that bank and by entities controlled by that bank exceed 25% of all ownership interests in such entity. A Canadian chartered bank is permitted to have a substantial investment in entities whose activities are consistent with those of certain prescribed permitted substantial investments. In general, a bank will be permitted to invest in an entity that carries on any financial services activity. Further, a bank may generally invest in entities that carry on commercial activities that are related to the promotion, sale, delivery or distribution of a financial product or service. A bank may also invest in entities that provide professional investment management to closed-end funds and mutual funds, engage in the distribution of mutual funds and provide consulting and agency services for real property or service financial institutions and the bank may have downstream holding companies to hold these investments. In certain cases, the approval of the Minister of Finance (the “Minister”) or the Superintendent of Financial Institutions Canada (the “Superintendent”) is required prior to making the investment and/or the bank is required to control the entity. Canadian chartered banks may offer through their branch network credit or charge-card related insurance, creditors’ disability insurance, creditors’ life insurance, creditors’ loss of employment insurance, creditors’ vehicle inventory insurance, export credit insurance, mortgage insurance and travel insurance.
Without Minister approval, no person or group of associated persons may own
more than 10% of any class of shares of the Bank. No person may be a major shareholder of a bank if the bank has equity of $12 billion or more (which includes the Bank). A person is a major shareholder of a bank if: (a) the aggregate of
shares of any class of voting shares beneficially owned by that person and that are beneficially owned by any entities controlled by that person is more than 20% of that class of voting shares; or (b) the aggregate of shares of any class of non-voting shares beneficially owned by that person and that are beneficially owned by any entities controlled by that person is more than 30% of that class of non-voting
shares. Ownership of the Bank’s shares by Canadian or foreign governments is prohibited under the Bank Act. The Bank Act provides for limited circumstances in which the Canadian federal government may be permitted to acquire shares of a bank,
including the Bank, if the Minister and Governor in Council were to conclude that to do so would promote stability in the financial system. While the government holds any shares of a bank, including the Bank, the Minister may impose certain terms
and conditions, including conditions on the payment by the Bank of dividends on any of its shares.
The Superintendent is responsible to the Minister for
the administration of the Bank Act. The Superintendent is required to make an annual examination of each bank to ensure compliance with the Bank Act and to ensure that each bank is in sound financial condition. The Superintendent shall report on its
bank examinations to the Minister. The Bank is also required to disclose certain financial information. The Bank is subject to regulation by the Canada Deposit Insurance Corporation and the Financial Consumer Agency of Canada, and the activities of
the Bank in Canada are subject to various other federal statutory provisions, including the Proceeds of Crime (Money Laundering) and Terrorist Financing Act which applies to all of the Bank’s businesses in Canada. The activities of the
Bank’s trust subsidiaries and insurance subsidiaries are regulated in Canada under the Trust and Loan Companies Act and the Insurance Companies Act, respectively, and under provincial laws in respect of their activities in the
provinces. Certain activities of the Bank and its subsidiaries acting as securities brokers, dealers (including investment and mutual fund dealers), underwriters and advisors (including investment counsel and portfolio managers) are regulated in
Canada under provincial securities legislation and, in some cases, by self-regulatory organizations, such as the Canadian Investment Regulatory Organization (CIRO) for investment dealers and mutual fund dealers.
Bank Recapitalization (Bail-In) Regime
On September 23, 2018, the regulations under the Canada Deposit Insurance Corporation Act (Canada) (the “CDIC Act”) and the Bank Act (collectively, the “Bail-In Regulations”) which provides the details of conversion, issuance and compensation regimes for bail-in instruments issued by domestic systemically important banks, including the Bank, came into force. Pursuant to the CDIC Act, in circumstances where the Superintendent of Financial Institutions has determined that the Bank has ceased, or is about to cease, to be viable, the Governor in Council may, upon a recommendation of the Minister of Finance that they are of the opinion that it is in the public interest to do so, grant an order directing CDIC to convert all or a portion of certain shares and liabilities of the Bank into common shares of the Bank.
- 5 -
For a description of the Canadian bank resolution powers and the consequent risk factors attaching to certain liabilities of the Bank reference is made to the Bank’s website under Regulatory Disclosures for Fixed Income Investors2. The information on our website does not form part of this Annual Information Form.
International Supervision and Regulation
Capital adequacy for Canadian banks is regulated by the Office of the Superintendent of Financial Institutions (“OSFI”) and subject to the revised
capital adequacy requirements as published by the Basel Committee on Banking Supervision (BCBS) and commonly referred to as Basel III, as adopted by Canada. Additional information on the regulatory capital of the Bank and developments facing the
Bank are described under the headings “Regulatory capital” and “Regulatory capital developments” on pages 61-62 of the MD&A, respectively, and those sections are incorporated herein by reference.
Automatic Exchange of Information
Under the
initiative of the Organization for Economic Co-Operation and Development, many countries have committed to automatic exchange of information relating to accounts held by tax residents of signatory countries,
using a Common Reporting Standard (“CRS”). Canada’s automatic exchange of financial account information arrangements with jurisdictions, other than the U.S., has been implemented in accordance with the CRS and the implementation of
the CRS legislation in Canada was effective July 1, 2017. The Bank meets its obligations imposed under the CRS, in accordance with local laws, in Canada and all applicable jurisdictions in which it operates.
Supervision and Regulation Outside Canada – Key Jurisdictions
United States
The activities of the Bank
and its subsidiaries in the U.S. are subject to federal and state supervision, regulation and examination by bank regulatory and other governmental agencies. The Bank is subject to the Bank Holding Company Act of 1956 (“BHCA”) and the
International Banking Act of 1978 and associated regulations of the Board of Governors of the Federal Reserve System (the “Federal Reserve Board”). The Federal Reserve Board and other banking regulators oversee the operation of the
Bank’s branches, offices and subsidiaries in the U.S. The SEC, state securities regulators and self- regulatory organizations, such as the Financial Industry Regulatory Authority, regulate its broker-dealer subsidiary and the SEC, effective
November 1, 2021, regulates the Bank’s security-based swaps dealer business and the Commodity Futures Trading Commission (“CFTC”) oversees the Bank’s swaps and commodities trading and clearing businesses.
The Bank is a “financial holding company” under the BHCA. This status allows a broad range of financial activities to be undertaken in the U.S.
Provisions of the Federal Reserve Act place certain limitations and restrictions on the transactions that the Bank’s U.S. branch and agency can engage in with affiliates of the Bank.
The Bank, as a non-U.S. bank with U.S. operations, is required by U.S. anti-money laundering laws, to take certain
steps to prevent, detect and report individuals and entities involved in international money laundering and the financing of terrorism. Failure of a financial institution to comply with these requirements could have serious legal and reputational
consequences for the institution.
The Bank is also subject to the Dodd-Frank Wall Street Reform and Consumer Protection Act (the “Dodd-Frank
Act”). Dodd-Frank Act reforms include heightened consumer protection, revised regulation of over-the-counter derivatives markets, restrictions on proprietary
trading and the ownership and sponsorship of private investment funds by banks and their affiliates (referred to as the Volcker Rule), imposition of heightened prudential standards, and broader application of leverage and risk-based capital
requirements.
The Bank is subject to the enhanced prudential standards and early remediation requirements of sections 165 (implemented by Regulation YY)
and 166 of the Dodd-Frank Act (the “FBO Rule”) for bank holding companies and foreign banking organizations. With respect to foreign banking organizations, the overall intent of Section 165 and Regulation YY is to strengthen the
regulation of the U.S. operations of foreign banking organizations by requiring home country capital certification consistent with the Basel capital framework, home country capital stress tests comparable to U.S. standards,
| 2 |
Visit webpage at
https://www.scotiabank.com/ca/en/about/investors-shareholders/regulatory-disclosures/canadian-bank-resolution-powers-including-bail-in.html.
|
- 6 -
maintenance of a liquidity buffer for U.S. branches and agencies and establishment of a U.S. risk committee
with the appointment of a U.S. Chief Risk Officer. The Bank has a Chief Risk Officer for the U.S., a U.S. Risk Committee and complies with the FBO Rule. The Bank is not currently required to form a U.S. intermediate holding company under the FBO
Rule. In October 2019, the Federal Reserve finalized its rules to further tailor the regulatory framework for enhanced prudential standards and the U.S. Basel III capital and liquidity requirements applicable to domestic banking organizations and
foreign banking organizations (FBOs), with which the Bank is complying.
Mexico
Grupo Financiero Scotiabank Inverlat, S.A. de C.V. is an “affiliate holding company” pursuant to the Law to Regulate Financial Groups and the
Regulations for the Establishment of Foreign Affiliates Financial Institutions in Mexico. The governing authority is the Ministry of Finance of Public Credit, as well as those supervising and regulatory authorities which are the Central Bank of
Mexico, the National Banking and Securities Commission and the National Commission for the Protection of the Users of Financial Services.
Peru
Scotiabank Peru S.A.A. is a
“banking company” pursuant to the Law of the Banking System, Insurance and Private Pension Funds Administrators and applicable rules for financial groups enacted by the Superintendency of Banking System, Insurance and Private Pension
Funds Administrators (“SBS”) and the Superintendency of Securities Market (“SMV”). Beside SBS and SMV, the other governing authorities are the Central Bank of Peru, and the National Institution for the Defense of Competition
and Intellectual Property, in charge, among other functions, of the protection of consumers of financial services.
Pursuant to SBS and SMV regulations on
ownership and control of supervised companies, Scotiabank Peru S.A.A. also reports on its holding company shareholder Scotia Peru Holdings S.A.
Chile
Scotiabank Chile
(“Scotiabank Chile”) is a special stock corporation governed by the provisions of the General Banking Act and by the provisions applicable to listed corporations contained in the Corporations Act. It is supervised by the Financial
Markets Commission (CMF), which is an autonomous institution related to the Chilean Government through the Ministry of Finance. Scotiabank Chile is also governed by the Central Bank of Chile and the National Consumer Service (Sernac), the latter
being responsible for, among other functions, consumer protection with regards to financial services, in accordance with the provisions of the Financial Consumer Protection Act. Scotiabank Chile’s subsidiaries are supervised by the CMF,
according to their respective business lines.
Colombia
Prior to December 1, 2025, Scotiabank Colpatria S.A., a subsidiary of the Bank, was a bank incorporated in compliance with the regulations of the
Financial Superintendence of Colombia (Superintendencia Financiera de Colombia or “SFC”). The SFC is the supervisor of the national banking, insurance, pension funds, and securities markets under Colombian laws, with the purpose of
assuring their stability, efficiency and transparency, as well as maintaining and fostering a sound and balanced development of the financial system as a whole, while protecting the interests of the public in Colombia. The SFC was responsible for
inspecting, supervising and controlling Scotiabank Colpatria S.A. Additionally, the SFC promotes, organizes and develops regulations in order to ensure the protection of investors, depositors, shareholders and stakeholders. The SFC is also
responsible for financial customer protection.
United Kingdom
In respect of its London Branch, the Bank is authorized in the United Kingdom by the Prudential Regulation Authority (PRA) and subject to regulation by the
Financial Conduct Authority (FCA) and limited regulation by the PRA. The Bank’s subsidiary in the United Kingdom, Scotiabank Europe Limited (formerly Scotiabank Europe plc), has been placed into voluntary liquidation.
Republic of Ireland
In respect of the Bank’s Irish subsidiary, Scotiabank (Ireland) Designated Activity Company, the Bank is authorized and regulated in Ireland by the Central Bank of Ireland.
- 7 -
Singapore
In respect of its Singapore Branch, the Bank is authorised and regulated in Singapore by the Monetary Authority of Singapore.
Other Jurisdictions
Outside of the U.S.,
Mexico, Peru, Chile, Colombia, the United Kingdom, Ireland and Singapore, each of the Bank’s branches, agencies and subsidiaries, many of which are banks in their own right, is also subject to the regulatory requirements of the jurisdiction in
which it conducts its business.
Certain other regulatory developments facing the Bank are described on pages 120 to 121 inclusive of the MD&A and
those pages are incorporated herein by reference.
Sustainability Strategies
Each year, the Bank publishes information about its corporate sustainability activities in an annual Sustainability Report. The Sustainability Report provides
details about the Bank’s priorities and performance related to environmental (including climate), social and governance policies and strategies. Sustainability-related reporting can be found on the Bank’s website within the
Responsibility and Impact section, ESG Publications and Policies page at https://www.scotiabank.com/ca/en/about/responsibility-impact/esg-publications-policies.html.
Risk Factors
The risks faced by the Bank are described
on pages 76 to 115 inclusive of the MD&A and those pages are incorporated herein by reference.
DIVIDENDS
Restrictions on payment of dividends and retirement of shares
The restrictions on payment of dividends and retirement of shares faced by the Bank are described in note 23(c) of the consolidated financial statements for
the year ended October 31, 2025, which are incorporated herein by reference.
Dividend Payments
In fiscal 2025, the Bank’s actual common share dividend payout ratio was approximately 73.7%, compared to 71% in 2024. The Bank has declared and paid the
following dividends on its common shares and preferred shares over the past three completed financial years:
|
|
|
|
|
|
|
|
|
|
|
|
|
| |
|
2025 |
|
|
2024(1) |
|
|
2023 |
|
| Common Shares
|
|
$ |
4.32 |
|
|
$ |
4.24 |
|
|
$ |
4.18 |
|
| Series 40
|
|
|
|
|
|
$ |
0.303125 |
|
|
$ |
1.212500 |
|
| (1) |
On January 29, 2024, the Bank redeemed all of its issued and outstanding Preferred Shares, Series 40.
|
DESCRIPTION OF THE BANK’S CAPITAL STRUCTURE
The following summary of the Bank’s share capital is qualified in its entirety by the Bank’s by-laws and
the actual terms and conditions of such securities. For more details on the Bank’s capital structure, see pages 60 to 67 of the MD&A and notes 20 and 23 of the consolidated financial statements for the year ended October 31, 2025. The Bank
incorporates those pages and notes by reference.
- 8 -
Common Shares
The authorized common share capital of the Bank consists of an unlimited number of common shares, without nominal or par value, of which 1,236,305,738 common
shares were issued and outstanding as at October 31, 2025.
Holders of the Bank’s common shares are entitled to vote at all meetings of the
shareholders of the Bank except meetings at which only holders of a specified class, other than common shares, or series of shares of the Bank are entitled to vote. Common shareholders are entitled to receive dividends, as and when declared by the
Board of Directors of the Bank on the common shares.
After the payment to the holders of the preferred shares of the amount or amounts to which they may
be entitled, the holders of the Bank’s common shares shall be entitled to receive the remaining property of the Bank upon liquidation, dissolution or winding-up thereof.
For information on the Bank’s normal course issuer bid, see note 23 of the consolidated financial statements for the year ended October 31, 2025,
which is incorporated herein by reference.
Preferred Shares – General
The authorized preferred share capital of the Bank consists of an unlimited number of preferred shares without nominal or par value issuable in series. The
term “Preferred Shares” shall refer to all authorized preferred shares of the Bank.
As at October 31, 2025, no
Non-cumulative Preferred Shares were outstanding.
The Preferred Shares, if outstanding, are entitled to
preference over the common shares and over any other shares of the Bank ranking junior to the Preferred Shares with respect to the payment of dividends and upon any distribution of assets in the event of liquidation, dissolution or winding-up of the Bank.
The Bank may not create, without the approval of the holders of outstanding Preferred Shares,
any other class of shares ranking prior to or on a parity with the Preferred Shares, increase the authorized number of Preferred Shares or amend the provisions attaching to the Preferred Shares.
Any approval to be given by the holders of the outstanding Preferred Shares may be given by a resolution carried by the affirmative vote of not less than 66
2/3% of the votes cast at a meeting of holders of Preferred Shares at which a majority of the outstanding Preferred Shares is represented or, if no quorum is present at such meeting, at any adjourned meeting at which no quorum requirements would
apply.
In accordance with capital adequacy requirements adopted by OSFI, non-common capital instruments issued
after January 1, 2013, including Preferred Shares, must include terms providing for the full and permanent conversion of such securities into common shares upon the occurrence of certain trigger events relating to financial viability (the Non-Viability Contingent Capital or “NVCC requirements”) in order to qualify as regulatory capital.
Certain Provisions of the Preferred Shares
Dividends
The holders of the Preferred Shares,
if outstanding, will be entitled to receive either a fixed or floating rate quarterly non- cumulative preferential cash dividend, as and when declared by the Board of Directors of the Bank, subject to the
provisions of the Bank Act, on the third last business day of each of January, April, July and October in each year at the rate specified in the terms of each series. If the Board of Directors of the Bank does not declare the dividends, or any part
thereof, on an outstanding series of Preferred Shares on or before the dividend payment date for a particular quarter, then the entitlement of the holders of such series of Preferred Shares to receive such dividends, or to any part thereof, for such
quarter shall be forever extinguished.
- 9 -
Redemption
Preferred Shares outstanding from time to time will not be redeemable prior to the date specified in the terms for each series. Subject to the provisions of
the Bank Act, the prior consent of the Superintendent and to certain conditions being met, the Bank may redeem at the time specified in the terms of each series all or any part of an outstanding series of Preferred Shares at the Bank’s option
without the consent of the holder, by the payment of an amount in cash for each such share so redeemed as specified in the terms of each series.
Notice
of any redemption of any series of Preferred Shares will be given by the Bank at least 30 days and not more than 60 days prior to the date fixed for redemption. If less than all the outstanding Preferred Shares in any series are at any time to be
redeemed, the shares to be redeemed will be redeemed pro rata, disregarding fractions.
Rights Upon Dissolution or Winding-Up
In the event of the liquidation, dissolution or winding-up of the Bank, the holders of any series of the Preferred
Shares outstanding shall be entitled to receive the share value or face value per Preferred Share (as set out in the rights, privileges, restrictions and conditions attaching to such Preferred Shares), together with all dividends declared and unpaid
to the date of payment before any amount shall be paid or any assets of the Bank distributed to the holders of any shares ranking junior to the Preferred Shares. The holders of any series of the Preferred Shares outstanding shall not be entitled to
share in any further distribution of the assets of the Bank.
Restrictions on Dividends and Retirement of Shares
So long as any shares of a series of Preferred Shares are outstanding, the Bank will not, without the approval of the holders of the relevant series of
Preferred Shares:
| |
(a) |
declare, pay or set apart for payment any dividends on the common shares of the Bank or any other shares
ranking junior to the series of Preferred Shares (other than stock dividends payable in shares ranking junior to the series of Preferred Shares);
|
| |
(b) |
redeem, purchase or otherwise retire any common shares or any other shares ranking junior to the series of
Preferred Shares (except out of the net cash proceeds of a substantially concurrent issue of shares ranking junior to the series of Preferred Shares);
|
| |
(c) |
redeem, purchase or otherwise retire less than all of the series of Preferred Shares; or
|
| |
(d) |
except pursuant to any purchase obligation, sinking fund, retraction privilege or mandatory redemption
provisions attaching to any series of Preferred Shares of the Bank, redeem, purchase or otherwise retire any other shares ranking on a parity with the series of Preferred Shares;
|
unless, in each case, all dividends up to and including those payable on the dividend payment date for the last completed period for which dividends shall be
payable shall have been declared and paid or set apart for payment in respect of each series of cumulative preferred shares of the Bank then issued and outstanding and on all other cumulative shares ranking on a parity with the preferred shares of
the Bank and there shall have been paid or set apart for payment all declared dividends in respect of each series of non-cumulative preferred shares of the Bank (including the series of Preferred Shares) then
issued and outstanding and on all other non-cumulative shares ranking on a parity with the Preferred Shares of the Bank.
Purchase for Cancellation
Subject to the
provisions of the Bank Act, the prior consent of the Superintendent and certain conditions being met, the Bank may at any time purchase for cancellation any series of Preferred Shares outstanding, in the open market at the lowest price or prices, as
determined to be advisable, at which in the opinion of the Board of Directors of the Bank such shares are obtainable.
Issuance of Other
Series of Preferred Shares
The Bank may issue other series of preferred shares ranking on parity with the Preferred Shares without the authorization of
the holders of any outstanding Preferred Shares.
- 10 -
Voting Rights
Subject to the provisions of the Bank Act, the holders of a series of Preferred Shares as such will not be entitled to receive notice of, attend, or vote at,
any meeting of the shareholders of the Bank unless and until the first time at which the Board of Directors of the Bank has not declared the whole dividend on such series of Preferred Shares in respect of any quarter. In that event, the holders of
such Preferred Shares will be entitled to receive notice of, and to attend, meetings of shareholders at which directors of the Bank are to be elected and will be entitled to one vote for each Preferred Share held. The voting rights of the holders of
such series of Preferred Shares shall forthwith cease upon payment by the Bank of the first dividend on the series of Preferred Shares to which the holders are entitled subsequent to the time such voting rights first arose until such time as the
Bank may again fail to declare the whole dividend on such series of Preferred Shares in any quarter, in which event such voting rights shall become effective again and so on from time to time.
Other Equity Instruments – Subordinated Capital Notes - General
The Bank currently has outstanding (a) US$1.25 billion 4.650% Fixed to Floating Rate Non-Cumulative
Subordinated AT1 Capital Notes (NVCC) (“2017 AT1 Capital Notes”), (b) $1.25 billion 3.70% Fixed Rate Resetting Limited Recourse Capital Notes, Series 1 (NVCC) (“3.70% LRCNs”), (c) $1.25 billion 3.70% Fixed Rate
Resetting Perpetual Subordinated AT1 Capital Notes (NVCC) (“3.70% AT1 Capital Notes”), (d) US$600 million 3.625% Fixed Rate Resetting Limited Recourse Capital Notes, Series 2 (NVCC) (“3.625% LRCNs”), (e)
US$600 million 3.625% Fixed Rate Resetting Perpetual Subordinated AT1 Capital Notes (NVCC) (“3.625% AT1 Capital Notes”), (f) $1.5 billion 7.023% Fixed Rate Resetting Limited Recourse Capital Notes, Series 3 (NVCC)
(“7.023% LRCNs”), (g) $1.5 billion 7.023% Fixed Rate Resetting Perpetual Subordinated AT1 Capital Notes (NVCC) (“7.023% AT1 Capital Notes”), (h) US$750 million 8.625% Fixed Rate Resetting Limited Recourse Capital
Notes, Series 4 (NVCC) (“8.625% LRCNs”), (i) US$750 million 8.625% Fixed Rate Resetting Perpetual Subordinated AT1 Capital Notes (NVCC) (“8.625% AT1 Capital Notes”), (j) US$750 million 8.000% Fixed Rate Resetting
Limited Recourse Capital Notes, Series 5 (NVCC) (“8.000% LRCNs”), (k) US$750 million 8.000% Fixed Rate Resetting Perpetual Subordinated AT1 Capital Notes (NVCC) (“8.000% AT1 Capital Notes”, (l) US$1.0 billion 7.350%
Fixed Rate Resetting Limited Recourse Capital Notes, Series 6 (NVCC) (“7.350% LRCNs”), (m) US$1.0 billion 7.350% Fixed Rate Resetting Perpetual Subordinated AT1 Capital Notes (NVCC) (“7.350% AT1 Capital Notes”), (n)
US$1.0 billion 6.875% Fixed Rate Resetting Limited Recourse Capital Notes, Series 7 (NVCC) (“6.875% LRCNs”), and (o) US$1.0 billion 6.875% Fixed Rate Resetting Perpetual Subordinated AT1 Capital Notes (NVCC) (“6.875%
AT1 Capital Notes”, and together with the 2017 AT1 Capital Notes, the 3.70% LRCNs, the 3.70% AT1 Capital Notes, the 3.625% LRCNs, the 3.625% AT1 Capital Notes, the 7.023% LRCNs, the 7.023% AT1 Capital Notes, the 8.625% LRCNs, the 8.625% AT1
Capital Notes the 8.000% LRCNs, the 8.000% AT1 Capital Notes, the 7.350% LRCNs, the 7.350% AT1 Capital Notes, and the 6.875% LRCNs the “Subordinated Capital Notes”). The Subordinated Capital Notes have been determined to be compound
instruments that have both equity and liability features. For more details, see note 23 of the consolidated financial statements for the year ended October 31, 2025.
The Subordinated Capital Notes are direct unsecured obligations of the Bank and rank pari passu with each other and subordinate to all of the Bank’s
indebtedness and in right of payment equally with and not prior to indebtedness that ranks equally in right of payment with, or is subordinated to, the Subordinated Capital Notes (other than indebtedness which by its terms ranks subordinate to the
Subordinated Capital Notes). The Subordinated Capital Notes constitute subordinated indebtedness for the purposes of the Bank Act. In the event of the Bank’s insolvency or winding-up (i) a Recourse
Event (as defined below) will have occurred and pursuant to the limited recourse feature described below, an investment in the 3.70% LRCNs, the 3.625% LRCNs, the 7.023% LRCNs, the 8.625% LRCNs, the 8.000% LRCNs, the 7.350% LRCNs, and the 6.875%
LRCNs (collectively, the “LRCNs”), will become an investment in the corresponding 3.70% AT1 Capital Notes, 3.625% AT1 Capital Notes, 7.023% AT1 Capital Notes, 8.625% AT1 Capital Notes, 8.000% AT1 Capital Notes, 7.350% AT1 Capital Notes,
and 6.875% AT1 Capital Notes, respectively, and will be subject to the subordination provisions of such notes, and (ii) the 2017 AT1 Capital Notes, the 3.70% AT1 Capital Notes, the 3.625% AT1 Capital Notes, the 7.023% AT1 Capital Notes, the
8.625% AT1 Capital Notes, the 8.000% AT1 Capital Notes, the 7.350% AT1 Capital Notes, and the 6.875% AT1 Capital Notes (collectively, the “AT1 Capital Notes”) will rank ahead of the Bank’s common shares and Preferred Shares.
The AT1 Capital Notes include terms providing for the full and permanent conversion of such securities into common shares of the Bank upon the occurrence of
certain trigger events relating to NVCC requirements in order to qualify as regulatory capital. If a non-viability contingent capital trigger event will have occurred, the terms and conditions of the LRCNs and
the AT1 Capital Notes, including with respect to priority and subordination, will no longer be relevant as the holders of such instruments will have received common shares of the Bank, which will rank on parity with all other outstanding common
shares of the Bank.
- 11 -
Certain Provisions of the Subordinated Capital Notes
Distributions and Restrictions on Dividend and Retirement of Shares
Interest on the 2017 AT1 Capital Notes accrues at a floating rate, resets quarterly and is payable quarterly. Interest on each of the 3.70% LRCNs, the 3.70%
AT1 Capital Notes, the 3.625% LRCNs, the 3.625% AT1 Capital Notes, the 7.023% LRCNs, the 7.023% AT1 Capital Notes, the 8.625% LRCNs, the 8.625% AT1 Capital Notes, the 8.000% LRCNs, the 8.000% AT1 Capital Notes, the 7.350% LRCNs, and the 7.350% AT1
Capital Notes is payable quarterly in arrears at a fixed rate for the initial five years and thereafter, interest will reset every five years and accrue at a fixed rate. Interest on each of the 6.875% LRCNs and the 6.875% AT1 Capital Notes is
payable quarterly in arrears at a fixed rate for the initial ten years and thereafter, interest will reset every five years and accrue at a fixed rate. While interest on the AT1 Capital Notes is payable on a quarterly basis, the Bank may, at its
discretion, with prior notice, cancel the interest payments on the AT1 Capital Notes. If the Bank does not pay the interest in full to the note holders, the Bank will not declare dividends on its common shares or Preferred Shares or redeem or
otherwise retire such shares until the month commencing after the Bank resumes full interest payments on the AT1 Capital Notes, unless such interest has been waived by the note holders.
Interest will be due and payable on the AT1 Capital Notes on an interest payment date only if it is not cancelled by the Bank. Any cancelled interest payments
will not be cumulative. The Bank has the sole and absolute discretion (i) at any time in respect of the 2017 AT1 Capital Notes and (ii) at any time while the 3.70% AT1 Capital Notes, the 3.625% AT1 Capital Notes, the 7.023% AT1 Capital
Notes, the 8.625% AT1 Capital Notes, the 8.000% AT1 Capital Notes, the 7.350% AT1 Capital Notes and the 6.875% AT1 Capital Notes are no longer held by the LRT Trustee (defined below), and for any reason to cancel (in whole or in part), with notice
to the holders of the AT1 Capital Notes, any interest payment that would otherwise be payable on any interest payment date. As a result, the holder of AT1 Capital Notes may not receive any interest on any interest payment date or at any other times,
and the holder will have no claims whatsoever in respect of that cancelled interest.
Interest payments on the LRCNs are
non-deferrable, however, non-payment in cash of interest that is not cured within 5 business days results in a Recourse Event. Upon a Recourse Event, the holders of such
LRCNs will receive the respective AT1 Capital Notes.
Maturity and Redemption
The LRCNs have a stated maturity. The AT1 Capital Notes have no scheduled maturity or redemption date. Accordingly, the Bank is not required to make any
repayment of the principal amount of the AT1 Capital Notes except in the event of bankruptcy or insolvency and provided that the NVCC requirements have not been triggered. The Subordinated Capital Notes are redeemable at the sole discretion of the
Bank five years (or ten years, in the case of the 6.875% LRCNs and the 6.875% AT1 Capital Notes) after their issuance and every quarter or five years, as applicable, thereafter. The Subordinated Capital Notes are also redeemable following certain
regulatory or tax events, in accordance with their terms. All redemptions are subject to regulatory consent. For more details, see note 23 of the consolidated financial statements for the year ended October 31, 2025.
Limited Recourse
The 3.70% AT1 Capital Notes,
the 3.625% AT1 Capital Notes, the 7.023% AT1 Capital Notes, the 8.625% AT1 Capital Notes, the 8.000% AT1 Capital Notes, the 7.350% AT1 Capital Notes and the 6.875% AT1 Capital Notes (collectively, the “LRCN AT1 Capital Notes”) were
issued by the Bank in connection with the Bank’s concurrent issuance of the respective LRCNs. The LRCN AT1 Capital Notes are held by Computershare Trust Company of Canada as trustee (the “LRT Trustee”) for Scotiabank LRCN Trust
(the “Limited Recourse Trust”) for the benefit of the holders of corresponding LRCNs.
In the event of the occurrence of certain recourse events (each, a “Recourse Event”), which include (a) the non-payment in cash by the Bank of the principal amount of the LRCNs, together with any accrued and unpaid interest, on the maturity date, (b) the non-payment in cash by the Bank of the redemption price for the LRCNs when due in connection with a redemption of the LRCNs, (c) the non-payment in cash of interest for the LRCNs when due which is not cured within 5 business days, (d) an event of default (i.e. bankruptcy, insolvency, or liquidation of the Bank), or (e) a non-viability contingent capital trigger event, the trustee of the Limited Recourse Trust will deliver to holders of LRCNs their proportionate share of the assets then held by the Limited Recourse Trust, which will, except in limited circumstances, consist of the LRCN AT1 Capital Notes (other than in the case of a non-viability contingent capital trigger event, in which case such assets will be the common shares issued upon conversion of the related LRCN AT1 Capital Notes), in each case in full satisfaction of the Bank’s obligations under the LRCNs.
- 12 -
Purchase for Cancellation
Subject to regulatory consent, the Bank may at any time and from time to time, repurchase for cancellation any Subordinated Capital Notes in the open market,
by tender or by private agreement, in any manner and at any price or at differing prices.
If at any time the Bank repurchases for cancellation the LRCNs,
then the Bank shall, subject to regulatory consent, redeem such aggregate principal amount of the related LRCN AT1 Capital Notes that is equal to the aggregate principal amount of LRCNs purchased for cancellation by the Bank.
Events of Default
An event of default in
respect of the Subordinated Capital Notes will occur only if the Bank becomes bankrupt or insolvent or becomes subject to the provisions of the Winding-up and Restructuring Act (Canada), consents to the
institution of bankruptcy or insolvency proceedings against it, resolves to wind-up, liquidate or dissolve, is ordered wound-up or otherwise acknowledges its insolvency.
None of a default in the performance of any covenant contained in a trust indenture relating to the Subordinated Capital Notes, a failure to make a payment on the Subordinated Capital Notes when due (including any interest payment, whether as a
result of cancellation or otherwise) or an NVCC automatic conversion upon the occurrence of a trigger event will constitute an event of default (although the non-payment by the Bank of the principal amount,
together with any accrued and unpaid interest, on their maturity date, the non-payment in cash by the Bank of the redemption price when due in connection with a redemption of the LRCNs, and a non-viability contingent capital trigger event will constitute a recourse event for the LRCNs).
Issuance of other Senior or Pari Passu Securities
The terms governing the Subordinated Capital Notes do not limit the Bank’s ability to incur additional indebtedness or to issue or repurchase securities,
other than the restriction on retirement of shares noted above. The Bank may incur additional indebtedness without the authorization of the holders of the Subordinated Capital Notes.
Voting Rights
Holders of Subordinated Capital
Notes are not entitled to any rights of holders of common shares, including any rights of shareholders to receive notice, to attend or to vote at any meeting of the shareholders of the Bank. If the Subordinated Capital Notes are converted into
common shares of the Bank under NVCC requirements, holders of the Subordinated Capital Notes will become holders of the Bank’s common shares and will only have rights as holders of common shares.
Constraints on Ownership of the Bank’s Shares
The
Bank Act contains restrictions on the issue, transfer, acquisition, beneficial ownership and voting of all shares of a chartered bank. Please refer to the section above entitled “Description of the Bank’s Business – General Summary
– Supervision and Regulation in Canada” for a summary of these restrictions.
Credit Ratings of Securities and Liquidity
Credit ratings affect the Bank’s access to capital markets and borrowing costs, as well as the terms on which the Bank can conduct derivative and hedging
transactions. The credit ratings and outlook that the rating agencies assign to the Bank are based on their own views and methodologies. The following ratings have been assigned to the Bank’s securities by the rating agencies noted below,
which are independent third parties. Credit ratings, including stability or provisional ratings, are not recommendations to purchase, sell or hold a security as they do not comment on market price or suitability for a particular investor. Ratings
may not reflect the potential impact of all risks on the value of securities. In addition, real or anticipated changes in the rating assigned to a security will generally affect the market value of that security. Ratings are subject to revision or
withdrawal at any time by the rating agency. Each rating listed in the chart below should be evaluated independently of any other rating applicable to the Bank’s debt, Subordinated Capital Notes and Tier 1 Capital.
- 13 -
|
|
|
|
|
|
|
|
|
|
|
|
|
|
|
|
|
| |
|
Fitch Ratings
(Fitch)
|
|
Moody’s Investor
Service
(Moody’s)
|
|
Morningstar
DBRS Limited
|
|
Standard & Poor’s
Ratings Services
(S&P)
|
| |
|
Rating |
|
Rank(1) |
|
Rating |
|
Rank(1) |
|
Rating |
|
Rank(1) |
|
Rating |
|
Rank(1) |
| Legacy Senior Debt(2)
|
|
AA |
|
2 of 10 |
|
Aa2 |
|
2 of 9 |
|
AA |
|
2 of 10 |
|
A+ |
|
3 of 10 |
| Senior Debt(3)
|
|
AA- |
|
2 of 10 |
|
A2 |
|
3 of 9 |
|
AA (low) |
|
2 of 10 |
|
A- |
|
3 of 10 |
| Short-term deposits/commercial paper
|
|
F1+ |
|
1 of 6 |
|
P-1 |
|
1 of 4 |
|
R-1(high) |
|
1 of 10 |
|
A-1 |
|
1 of 6 |
| Subordinated debt
|
|
A |
|
3 of 10 |
|
Baa1 |
|
4 of 9 |
|
A (high) |
|
3 of 10 |
|
A- |
|
3 of 10 |
| Subordinated debt (NVCC)(4)
|
|
A |
|
3 of 10 |
|
Baa1 (hyb) |
|
4 of 9 |
|
A(low) |
|
3 of 10 |
|
BBB+ |
|
4 of 10 |
| Subordinated additional tier 1 capital notes
(NVCC)(4)
|
|
BBB+ |
|
4 of 10 |
|
Baa3 (hyb) |
|
4 of 9 |
|
BBB (high) |
|
4 of 10 |
|
BBB- |
|
3 of 9 |
| Limited Recourse Capital
Notes
(NVCC)(4)
|
|
BBB+ |
|
4 of 10 |
|
Baa3 (hyb) |
|
4 of 9 |
|
BBB (high) |
|
4 of 10 |
|
BBB- |
|
3 of 9 |
| Outlook
|
|
Stable |
|
N/A |
|
Stable |
|
N/A |
|
Stable |
|
N/A |
|
Stable |
|
N/A |
| (1) |
Rank, according to each rating agency’s public website, refers to the assigned ratings ranking of all
major assignable ratings for each debt of share class, 1 being the highest. Each assignable major rating may be modified further (+/-, high/low, 1/2/3) to show relative standing within the major rating categories.
|
| (2) |
Includes: (a) Senior debt issued prior to September 23, 2018; and (b) Senior debt issued on or after
September 23, 2018 which is excluded from the Bank recapitalization “bail-in” regime.
|
| (3) |
Subject to conversion under the bank recapitalization
“bail-in” regime.
|
| (4) |
Non-Viability Contingent Capital (NVCC)
|
On June 9, 2025, Fitch affirmed the Bank’s ratings and maintained the Outlook at Stable.
On December 5, 2024, Moody’s affirmed the Bank’s ratings and maintained the Outlook at Stable.
On April 17, 2025, Morningstar DBRS affirmed the Bank’s ratings and maintained the Outlook at Stable.
On October 24, 2025, S&P affirmed the Bank’s ratings and maintained the Outlook at Stable.
The Bank makes payments in the ordinary course to the credit rating agencies for the rating services associated with the assignment of the credit ratings
noted above. In addition, the Bank made customary payments in respect of certain other services provided to the Bank by the aforementioned credit rating agencies.
A definition of the categories of each rating as at December 2, 2025, has been obtained from the respective rating agency’s website and is outlined in
Schedule A, and a more detailed explanation may be obtained from the applicable rating agency.
MARKET FOR SECURITIES OF THE BANK
The Bank’s common shares are listed under the stock symbol “BNS” on the Toronto Stock Exchange (“TSX”) and the New York Stock
Exchange (“NYSE”). From time to time, the Bank also has deposit notes and other securities listed on the U.K. Listing Authority, Singapore Exchange, Swiss Stock Exchange and Taiwan Exchange.
- 14 -
Trading Price and Volume
The following table sets out the price range and trading volume of the Bank’s securities on the TSX (as reported by Bloomberg) for the periods indicated:
|
|
|
|
|
| |
|
Common
Shares |
|
| November 2024
|
|
|
|
|
| -High Price ($)
|
|
$ |
79.93 |
|
| -Low Price ($)
|
|
$ |
71.58 |
|
| -Volume (‘000)
|
|
|
113,461 |
|
|
|
|
|
|
| December 2024
|
|
|
|
|
| -High Price ($)
|
|
$ |
80.14 |
|
| -Low Price ($)
|
|
$ |
75.91 |
|
| -Volume (‘000)
|
|
|
123,050 |
|
|
|
|
|
|
| January 2025
|
|
|
|
|
| -High Price ($)
|
|
$ |
78.06 |
|
| -Low Price ($)
|
|
$ |
72.50 |
|
| -Volume (‘000)
|
|
|
153,187 |
|
|
|
|
|
|
| February 2025
|
|
|
|
|
| -High Price ($)
|
|
$ |
73.13 |
|
| -Low Price ($)
|
|
$ |
68.00 |
|
| -Volume (‘000)
|
|
|
121,062 |
|
|
|
|
|
|
| March 2025
|
|
|
|
|
| -High Price ($)
|
|
$ |
72.56 |
|
| -Low Price ($)
|
|
$ |
66.92 |
|
| -Volume (‘000)
|
|
|
181,081 |
|
|
|
|
|
|
| April 2025
|
|
|
|
|
| -High Price ($)
|
|
$ |
69.02 |
|
| -Low Price ($)
|
|
$ |
62.57 |
|
| -Volume (‘000)
|
|
|
208,137 |
|
|
|
|
|
|
| May 2025
|
|
|
|
|
| -High Price ($)
|
|
$ |
74.03 |
|
| -Low Price ($)
|
|
$ |
68.66 |
|
| -Volume (‘000)
|
|
|
116,562 |
|
|
|
|
|
|
| June 2025
|
|
|
|
|
| -High Price ($)
|
|
$ |
75.65 |
|
| -Low Price ($)
|
|
$ |
72.86 |
|
| -Volume (‘000)
|
|
|
156,685 |
|
|
|
|
|
|
| July 2025
|
|
|
|
|
| -High Price ($)
|
|
$ |
77.95 |
|
| -Low Price ($)
|
|
$ |
74.06 |
|
| -Volume (‘000)
|
|
|
151,367 |
|
|
|
|
|
|
| August 2025
|
|
|
|
|
| -High Price ($)
|
|
$ |
86.41 |
|
| -Low Price ($)
|
|
$ |
76.08 |
|
| -Volume (‘000)
|
|
|
128,006 |
|
|
|
|
|
|
| September 2025
|
|
|
|
|
| -High Price ($)
|
|
$ |
90.35 |
|
| -Low Price ($)
|
|
$ |
85.00 |
|
| -Volume (‘000)
|
|
|
142,717 |
|
|
|
|
|
|
| October 2025
|
|
|
|
|
| -High Price ($)
|
|
$ |
92.16 |
|
| -Low Price ($)
|
|
$ |
88.21 |
|
| -Volume (‘000)
|
|
|
158,557 |
|
|
|
|
|
|
Prior Sales
From time to
time, the Bank issues principal at risk notes, which are securities issued by the Bank for which the amount payable at maturity is determined by reference to the price, value or level of an underlying interest, including one or more indices,
exchange traded funds or a notional basket of equities or other securities or combination of any of the foregoing. For information about the Bank’s issuance of subordinated indebtedness and other equity instruments since October 31, 2024,
see notes 20 and 23 of the consolidated financial statements for the year ended October 31, 2025, which are incorporated herein by reference.
- 15 -
DIRECTORS AND EXECUTIVE OFFICERS OF THE BANK
Directors and Board Committees of the Bank
The following
table sets out the Bank’s directors as of December 2, 2025. The term of office of each director expires at the close of the Bank’s next annual meeting of shareholders. Information concerning the nominees proposed by management for
election as directors at the annual meeting of shareholders will be contained in the Bank’s 2026 Management Proxy Circular.
|
|
|
|
|
| Name and Place of Residence
|
|
Board Committee
Memberships
|
|
Principal Occupation
|
|
|
|
| Nora A. Aufreiter
Toronto, Ontario, Canada
(Director since August 25, 2014)
|
|
HCOB – Chair RC
|
|
Corporate Director |
|
|
|
| Guillermo E. Babatz
Mexico City, Mexico
(Director since January 28, 2014)
|
|
HCOB RC
|
|
Managing Partner of Atik Capital, S.C., an advisory firm that specializes in structuring financial solutions for its clients |
|
|
|
| Daniel (Don) H. Callahan
North Palm Beach, Florida, U.S.A.
(Director since June 15, 2021)
|
|
RC TC
|
|
Corporate Director |
|
|
|
| W. Dave Dowrich
Brooklyn, New York, U.S.A.
(Director since June 1, 2022)
|
|
ACRC CGC
|
|
Senior Executive Vice President and Chief Financial Officer of Teachers Insurance and Annuity Association of America (TIAA) |
|
|
|
| Michael B. Medline
Toronto, Ontario, Canada
(Director since September 1, 2023)
|
|
ACRC CGC – Chair
|
|
Corporate Director |
|
|
|
| Lynn K. Patterson
Toronto, Ontario, Canada
(Director since September 1, 2020)
|
|
HCOB RC – Chair
|
|
Corporate Director |
|
|
|
| Una M. Power
Vancouver, British Columbia, Canada
(Director since April 12, 2016)
|
|
HCOB RC
|
|
Corporate Director |
|
|
|
| Aaron W. Regent
Toronto, Ontario, Canada
(Director since April 9, 2013)
|
|
ACRC CGC
HCOB RC
TC
|
|
Chair of the Board of the Bank and Founder, Chairman, and Chief Executive Officer of Magris Performance Materials Inc., a leading North American performance minerals company |
|
|
|
| Sandra J. Stuart
Vancouver, British Columbia, Canada
(Director since September 1, 2023)
|
|
RC TC
|
|
Corporate Director |
|
|
|
| L. Scott Thomson
Toronto, Ontario, Canada
(Director since April 12, 2016)
|
|
None |
|
President and Chief Executive Officer of the Bank |
|
|
|
| Steven C. Van Wyk
Chicago, Illinois, U.S.A.
(Director since November 15, 2024)
|
|
ACRC TC – Chair
|
|
Corporate Director |
|
|
|
| Benita M. Warmbold Toronto, Ontario, Canada
(Director since October 29, 2018)
|
|
ACRC – Chair CGC |
|
Corporate Director |
- 16 -
Notes:
ACRC
– Audit and Conduct Review Committee
CGC – Corporate Governance Committee
HCOB – Human Capital and Compensation Committee
RC –
Risk Committee
TC – Technology Committee
All
directors have held the positions, or other executive positions with the same, predecessor or associated firms, set out in this AIF for the past five years with the exception of: W. Dave Dowrich, who prior to joining TIAA in 2021 was Senior
Executive Vice President and Chief Financial Officer of Prudential Financial’s International Businesses, and prior to Prudential Financial, held several executive positions with AIG from 2013 to 2020 in Japan and the U.S., including the role
of Chief Financial Officer of AIG Japan and Asia Pacific; Michael B. Medline, who prior to November 2025 was President and Chief Executive Officer of Empire Company Limited and Sobeys Inc.; L. Scott Thomson, who prior to November 2022 was President
and Chief Executive Officer of Finning International Inc.; and Steven C. Van Wyk, who from January 2021 until April 2024 was Chief Information Officer of HSBC Bank PLC and prior to December 2020 was Chief Information Officer of PNC Financial
Services Group, Inc.
L. Scott Thomson is not independent, due to his position as President and Chief Executive Officer of the Bank.
Executive Officers of the Bank
The following are the
Bank’s executive officers, their titles and places of residence in Canada (except as otherwise noted) as of December 2, 2025:
|
|
|
| Name and Principal Occupation
|
|
Place of
Residence
|
|
|
| L. Scott Thomson
President and Chief Executive Officer
|
|
Toronto, Ontario |
|
|
| Rajagopal Viswanathan
Group Head and Chief Financial Officer
|
|
Oakville, Ontario |
|
|
| Jacqueline Allard
Group Head, Global Wealth Management
|
|
Toronto, Ontario |
|
|
| Francisco Aristeguieta Silva
Group Head, International and Global Transaction Banking
|
|
Florida, U.S.A. |
|
|
| Aris Bogdaneris
Group Head, Canadian Banking
|
|
Toronto, Ontario |
|
|
| Travis Machen
Chief Executive Officer and Group Head, Global Banking and Markets
|
|
Texas, U.S.A. |
|
|
| Jenny Poulos
Chief Human Resources Officer
|
|
Toronto, Ontario |
|
|
| Shannon McGinnis
Chief Risk Officer
|
|
Toronto, Ontario |
|
|
| Philip Thomas
Group Head and Chief Strategy and Operating Officer
|
|
Cobourg, Ontario |
|
|
| Tim Clark
Group Head and Chief Information Officer
|
|
Oakville, Ontario |
|
|
| Ian Arellano
Executive Vice President and General Counsel
|
|
Toronto, Ontario |
|
|
| Anique Asher
Executive Vice President, Real Estate Secured Lending
|
|
Etobicoke, Ontario |
|
|
| Sebastian Arcuri
Executive Vice President & Country Head, Peru
|
|
Lima, Peru |
|
|
| Todd Barnes
Executive Vice President, Canadian Wealth Management Investment Advisory
|
|
Oakville, Ontario |
|
|
| Paul Baroni
Executive Vice President, Finance and Chief Financial Officer, Canadian Banking
|
|
Toronto, Ontario |
- 17 -
|
|
|
| Name and Principal Occupation
|
|
Place of
Residence
|
|
|
| Scott Gamble
Executive Vice President, Retail Sales
|
|
Burlington, Ontario |
|
|
| Erin Griffiths
Executive Vice President, Global Wealth Solutions
|
|
Toronto, Ontario |
|
|
| Pablo Elek Hansberg
Executive Vice President and Country Head, Mexico
|
|
Mexico City, Mexico |
|
|
| Nicole Frew
Executive Vice President and Co-Head, Global Banking and Markets,
U.S.
|
|
New York, U.S.A. |
|
|
| Tracy Gomes
Executive Vice President & Chief Risk Officer, Canadian Banking, Global Wealth Management and Credit
Risk
|
|
Etobicoke, Ontario |
|
|
| Neal Kerr
Executive Vice President, Global Asset Management
|
|
Toronto, Ontario |
|
|
| Brandon Konigsberg
Executive Vice President and Group Treasurer
|
|
New York, U.S.A. |
|
|
| Christopher Manning
Executive Vice President, Canadian Commercial Banking
|
|
Mississauga, Ontario |
|
|
| Loretta Marcoccia
Executive Vice President and Chief Global Operations Officer
|
|
Etobicoke, Ontario |
|
|
| Joseph Martinez
Executive Vice President & Chief Security Officer
|
|
Toronto, Ontario |
|
|
| Diego Masola
Executive Vice President and Country Head, Chile
|
|
Santiago, Chile |
|
|
| Greg Palaschuk
Executive Vice President and Chief Operating Officer, Canadian Banking
|
|
North Vancouver, British Columbia |
|
|
| Simona Salter
Executive Vice President, Cards, Loyalty, Payments & Client Experience
|
|
Thornhill, Ontario |
|
|
| Anya M. Schnoor
Executive Vice President, Global Insurance
|
|
Toronto, Ontario |
|
|
| Paul Scurfield
Executive Vice President & Global Head, Capital Markets
|
|
Toronto, Ontario |
|
|
| Ryan Smalley
Executive Vice President, Enterprise & Non-Financial Risk
|
|
Pennsylvania, U.S.A. |
|
|
| Meigan Terry
Executive Vice President & Chief Global Corporate and Public Affairs Officer
|
|
Toronto, Ontario |
|
|
| Maria A. Theofilaktidis
Executive Vice-President and Chief Auditor
|
|
Toronto, Ontario |
|
|
| Chad Wallace
Executive Vice President, Global Transaction Banking
|
|
New York, U.S.A. |
|
|
| Julie Walsh
Executive Vice President & Chief Compliance Officer
|
|
Toronto, Ontario |
|
|
| Terri-Lee Weeks
Executive Vice President, Tangerine
|
|
Toronto, Ontario |
All of the executive officers of the Bank have been actively engaged for more than five years in the affairs of the Bank in executive or senior management capacities, except: L. Scott Thomson, who prior to November 2022 was President and Chief Executive Officer of Finning International Inc.; Jacqueline Allard, who prior to September 2023, was an Executive Vice President responsible for consumer lending and international banking businesses from January 2019 to July 2023 at Royal Bank of Canada; Francisco Aristeguieta Silva, who prior to May 2023, was CEO Institutional Services from July 2020 to January 2023 at State Street Corp; Aris Bogdaneris, who prior to September 2023, was a member of the Management Board from June 2015 to July 2023 at ING Bank; Travis Machen, who prior to May 2024, was Managing Director from July 2021 to May 2024 at Morgan Stanley & Co.
- 18 -
and Managing Director from May 2013 to July 2021 at JP Morgan Securities; Eugenia (Jenny) Poulos, who prior to October 2023, was Senior Vice President, Talent Services & Operations from July 2020 to September 2023 and Senior Vice President Workforce Strategy and Employee Experience from July 2017 to June 2020 each at Royal Bank of Canada; Tim Clark, who prior to November 2024, was Executive Vice President and Chief Information Officer, Canadian Banking, Capital Markets and Corporate from January 2022 to November 2024 and Senior Vice President and Chief Information Officer, Business Segment and Digital Technology from September 2019 to December 2021 each at Toronto-Dominion Bank; Sebastian Arcuri who prior to September 2024, was Founder of GlobalArch Consulting Fintech Group from January 2023 to June 2024 and Global Head Efficiency and Productivity, Consumer Private and Business Banking from January 2021 to December 2021 and Managing Director of Consumer, Private and Business Banking for South East Asia and South Asia from July 2014 to December 2020 each at Standard Chartered Bank; Pablo Elek Hansberg, who prior to May 2025, was Head International Wealth and Premier Banking from March 2021 to April 2025 at HSBC México S.A., Institución de Banca Múltiple, Grupo Financiero HSBC and Managing Director Retail Bank from September 2017 to March 2021 and Executive Vice President Retail Banking from April 2016 to March 2021 each at Santander Bank Mexico; Brandon Konigsberg, who prior to November 2024, was Founder of Kobra Group Consulting, from January 2021 to November 2024 and Managing Director Finance and Treasury from 1996 to December 2020 at JPMorgan Chase; Joseph Martinez, who prior to October 2025, was Senior Vice President, Chief Security Officer from January 2022 to October 2025 and Chief Information Security Officer from October 2015 to December 2021 each at Aon plc; Shannon McGinnis who prior to April 2024, was Executive Vice President, Non-Financial Risk Management from December 2021 to April 2024 and Senior Vice President, Enterprise and Operational Risk Management from February 2020 to December 2021 each at Toronto-Dominion Bank Group; Greg Palaschuk, who prior to August 2025, was Executive Vice President and Chief Financial Officer from March 2020 to July 2025 at Finning International Inc.; Simona Salter, who prior to June 2025, was Senior Vice President, Client Experience Office at Sun Life Canada from September 2022 to May 2025 and Vice President CX Loyalty and Client Engagement Transformation from May 2022 to September 2022, Vice President Personal and Commercial Banking Strategy and Client Experience Management from August 2021 to May 2022, Vice President Client Experience and Loyalty from December 2020 to August 2021 and Vice President Payments Strategy and Digital Commerce from July 2017 to December 2020 each at Royal Bank of Canada; Ryan Smalley, who prior to January 2025, was Executive Vice President and Chief Operational Risk Officer from November 2022 to January 2025 and Executive Vice President and Chief Information Security Officer from November 2019 to November 2022 and each at The PNC Financial Services Group, Inc.; Chad Wallace, who prior to March 2025, was Executive Vice President – Global Head of Corporate Solutions from March 2022 to February 2025 at Mastercard Incorporated and Managing Director – Global Head of Digital Transaction Banking from April 2019 to March 2022 at The Goldman Sachs Group, Inc. and Terri-Lee Weeks, who prior to September 2021, was Senior Vice President, Personal Savings & Investments at Royal Bank of Canada.
Cease Trade Orders, Bankruptcies, Penalties or Sanctions
To the best of the Bank’s knowledge, the Bank confirms that no director or executive officer of the Bank:
| |
(a) |
is, as at the date of this AIF or has been within the last 10 years, a director, chief executive officer or
chief financial officer of any company that was the subject of a cease trade order or similar order or an order that denied the relevant company access to any exemption under securities legislation, for a period of more than 30 consecutive days that
was issued:
|
| |
(i) |
while the director or executive officer was acting in the capacity as director, chief executive officer or
chief financial officer; or
|
| |
(ii) |
after the director or executive officer ceased to be a director, chief executive officer or chief financial
officer and which resulted from an event that occurred while that person was acting in the capacity as director, chief executive officer or chief financial officer;
|
| |
(b) |
is, as at the date of this AIF, or has been within the last 10 years, a director or executive officer of any
company that, while that person was acting in that capacity or within a year of that person ceasing to act in that capacity, became bankrupt, made a proposal under any legislation relating to bankruptcy or insolvency or was subject to or instituted
any proceedings, arrangement or compromise with creditors or had a receiver, receiver manager or trustee appointed to hold its assets; or
|
| |
(c) |
has, or within 10 years before the date of this AIF, become bankrupt, made a proposal under any legislation
relating to bankruptcy or insolvency, or become subject to or instituted any proceedings, arrangement or compromise with creditors, or had a receiver, receiver manager or trustee appointed to hold the assets of the director or executive officer.
|
To the best of the Bank’s knowledge, none of the directors or executive officers of the Bank have been subject to (a) any penalties or sanctions imposed by a court relating to Canadian securities legislation or by a Canadian securities regulatory authority or have entered into a settlement agreement with a Canadian securities regulatory authority; or (b) any other penalties or sanctions imposed by a court or a regulatory body that would likely be considered important to a reasonable investor in making an investment decision.
- 19 -
Shareholdings of Management
To the knowledge of the Bank, as at October 31, 2025, the directors and executive officers of the Bank as a group beneficially owned, directly or indirectly,
or exercised control or direction over less than one per cent of the outstanding common shares of the Bank. As at October 31, 2025, the Bank’s directors or executive officers own, or exercise control or direction over, less than one
percent of the outstanding shares of any of the Bank’s subsidiaries.
LEGAL PROCEEDINGS AND REGULATORY ACTIONS
In the ordinary course of business, the Bank and its subsidiaries are and have been subject to a variety of legal proceedings, including civil claims and
lawsuits, regulatory examinations, investigations, audits, and requests for information by various governmental regulatory agencies and law enforcement authorities in various jurisdictions. Some of these matters may involve novel legal theories and
interpretations and may be advanced under criminal as well as civil statutes, and some proceedings could result in the imposition of civil, regulator enforcement or criminal penalties. The Bank reviews the status of all proceedings on an ongoing
basis and will exercise judgment in resolving them in such manner as the Bank believes to be in its best interest. In view of the inherent difficulty of predicting the outcome of such matters, the Bank cannot state what the eventual outcome of such
matters will be. However, based on current knowledge, management does not believe that liabilities, if any, arising from pending litigation or regulatory proceedings will have a material adverse effect on the consolidated financial statements for
the year ended October 31, 2025 or results of operations of the Bank.
Legal provisions are established when it becomes probable that the Bank will
incur an expense related to a legal action or regulatory proceeding and the amount can be reliably estimated. Such provisions are recorded at the best estimate of the amount required to settle any obligation related to these legal actions as at the
balance sheet date, taking into account the risks and uncertainties surrounding the obligation. Management and internal and external experts are involved in estimating any amounts that may be required. The actual costs of resolving these claims may
vary significantly from the amount of the legal provisions. The Bank’s estimate involves significant judgement, given the varying stages of the proceedings, the fact that the Bank’s liability, if any, has yet to be determined and the
fact that the underlying matters will change from time to time. As such, there is a possibility that the ultimate resolution of those legal actions may be material to the Bank’s consolidated results of operations for any particular reporting
period.
From time to time, in the ordinary course of business, the Bank and its subsidiaries have been and may be subject to penalties or sanctions
imposed by securities regulatory authorities, which may include late filing fees, or have entered or may enter into settlement agreements with securities regulatory authorities. As the Bank and its subsidiaries are subject to numerous regulatory
authorities around the world, fees, administrative penalties, settlement agreements and sanctions may be categorized differently by each regulator. Any such penalties imposed under these categories against the Bank and its subsidiaries, however, are
not material, nor would they likely be considered important to a reasonable investor in making an investment decision. During the 2025 fiscal year, the Bank and its subsidiaries have not entered into any material settlement agreements with a court
relating to securities legislation or with a securities regulatory authority.3
For more details, see
note 22 of the consolidated financial statements for the year ended October 31, 2025.
On May 11, 2023, it was announced that the Bank
entered into resolutions, including monetary penalties of US $22.5 million, with the U.S. SEC (US $7.5 million), and the CFTC (US $15 million), relating to electronic communications on unauthorized mobile devices and communications channels by
certain personnel of the Bank’s U.S. broker-dealer, U.S. swap dealer and U.S. futures commission merchant. This amount was previously fully provisioned. In addition, the Bank agreed to retain a compliance consultant to review, among other
things, the Bank’s policies and procedures, training, surveillance, technological solutions, and disciplinary framework related to communication channels and the preservation of electronic communications. Such consultant’s term has
concluded. The resolutions also required the Bank to report – for a period of two years – to the SEC and CFTC any discipline imposed on personnel of the Bank’s U.S. broker-dealer, U.S. swap dealer and U.S. futures commission
merchant for violations of the Bank’s policies and procedures concerning the preservation of electronic communications, including those found on personal devices. Such reporting period has expired.
| 3 |
National Instrument 14-101 limits the meaning of “securities
legislation” to Canadian provincial and territorial legislation and “securities regulatory authority” to Canadian provincial and territorial securities regulatory authorities.
|
- 20 -
The Bank, through its Peruvian subsidiary, is engaged in a legal action related to certain value-added tax
assessed amounts and associated interest totaling $176 million, which arose from certain client transactions that occurred prior to the Bank’s acquisition of the subsidiary. The legal action in Peru relating to the original assessed
amount was concluded in favour of the Government of Peru in May 2024. Accordingly, the Bank paid $34 million representing the principal and associated reasonable interest, which was recorded in
non-interest expenses – other. In November 2021, the Peruvian Constitutional Court dismissed the matter relating to the accrued default interest for procedural reasons. With respect to this default
interest component, and in relation to the Constitutional Court of Peru’s treatment of Scotiabank Peru, in October 2022, the Bank filed a request for arbitration against the Republic of Peru before the International Centre for the Settlement
of Investment Disputes (the “ICSID”), pursuant to the provisions of the Canada-Peru Free Trade Agreement. This case is currently proceeding through the arbitration process. In Q3 2024, the Bank recorded a legal provision of
$142 million in other liabilities – provisions, representing the amount at issue in the arbitration. The Bank intends to continue to vigorously advance its position.
INTEREST OF MANAGEMENT AND OTHERS IN MATERIAL TRANSACTIONS
To the best of the Bank’s knowledge, the Bank confirms that there are no directors or executive officers or any associate or affiliate of a director or
executive officer with a material interest in any transaction within the three most recently completed financial years or during the current financial year that has materially affected or will materially affect the Bank.
TRANSFER AGENT AND REGISTRAR
Computershare Trust Company
of Canada is the Bank’s transfer agent and registrar at the following addresses:
Computershare Trust Company of Canada, 320 Bay Street, 14th Floor,
Toronto, Ontario, M5H 4A6 and Computershare Trust Company, N.A., C/O Shareholder Services, 150 Royall Street, Canton, MA, USA 02021.
CONFLICTS OF
INTEREST
To the knowledge of the Bank, no director or executive officer of the Bank has an existing or potential material conflict of interest with
the Bank or any of its subsidiaries.
EXPERTS
The
Bank’s Auditors are KPMG LLP, Bay Adelaide Centre, 333 Bay Street, Suite 4600, Toronto, Ontario, M5H 2S5. KPMG LLP is independent of the Bank within the meaning of the relevant rules and related interpretations prescribed by the relevant
professional bodies in Canada and any applicable legislation or regulation.
THE BANK’S AUDIT AND CONDUCT REVIEW COMMITTEE
A copy of the Bank’s Audit and Conduct Review Committee charter is attached to this AIF as Schedule B and can also be found on the Bank’s website
at www.scotiabank.com in the Board of Directors section.
The following directors are members of the Audit and Conduct Review Committee as of
December 2, 2025: Benita M. Warmbold (Chair and financial expert), W. Dave Dowrich (financial expert), Michael B. Medline, Aaron W. Regent (financial expert), and Steven C. Van Wyk (financial expert). All of the members of the Committee are
financially literate and independent as defined by Canadian and United States securities law. The Bank’s Board of Directors has designated each of Benita M. Warmbold, W. Dave Dowrich, Aaron W. Regent, and Steven C. Van Wyk as an ‘audit
committee financial expert’, as that term is defined by United States securities laws.
The education and related experience (as applicable) of each
Audit and Conduct Review Committee member is described below.
Benita M. Warmbold (Chair) – Ms. Warmbold is a corporate director and the former Senior Managing Director and Chief Financial Officer of the Canada Pension Plan (“CPP”) Investment Board, having retired from the latter in July 2017. Over her nine years at CPP Investment Board, Ms. Warmbold was responsible for finance, risk, performance, tax, internal audit, legal, technology, data, and investment operations. Prior to joining the CPP Investment Board in 2008, Ms. Warmbold held senior leadership positions with Northwater Capital, Canada Development Investment Corporation, and KPMG. She is former Chair of the Canadian Public Accountability Board and a former member of the Intact Centre on Climate Adaptation Advisory Board. Ms. Warmbold holds a B.Comm. (Honours) from Queen’s University and is a Chartered Professional Accountant and a Fellow of CPA Ontario.
- 21 -
Ms. Warmbold is a Fellow of the Institute of Corporate Directors and is a WXN Hall of Fame inductee.
W. Dave Dowrich – Mr. Dowrich is Senior Executive Vice President and Chief Financial Officer of Teachers Insurance and Annuity Association
of America (“TIAA”). In addition to the core finance responsibilities, his remit also includes TIAA’s Enterprise Transformation, the investment strategy of the enterprise’s General Account, as well as TIAA Ventures, the
strategic venture capital function of TIAA. Prior to joining TIAA in 2021, Mr. Dowrich served as CFO, International Businesses at Prudential Financial Inc., based in Tokyo, Japan. Prior to Prudential Financial, Mr. Dowrich held several
executive positions with American International Group (“AIG”) from 2013 to 2020 in Japan and the U.S., including the role of Chief Financial Officer of AIG Japan and Asia Pacific. Previously, Mr. Dowrich held senior roles in
investment banking at Goldman Sachs and Credit Suisse. He began his career as a pension consulting actuary in Toronto, Ontario. Mr. Dowrich has a B.Sc. in actuarial science and applied statistics from the University of Toronto and an M.B.A. in
finance from the Wharton School of the University of Pennsylvania. He is a Fellow of the Society of Actuaries, an Associate of the Canadian Institute of Actuaries, and a Member of the American Academy of Actuaries.
Michael B. Medline - Mr. Medline is a corporate director and the former President & Chief Executive Officer of Empire Company Limited
(Empire) and Sobeys Inc. having served from January 2017 to November 2025. In this role, he oversaw the implementation of Empire’s climate action plan and associated initiatives. Mr. Medline is a proven leader with a strong track record
of success in Canadian retail. He has held senior retail leadership positions at Canadian Tire Corporation, including President & Chief Executive Officer. He began his career working with the Ontario Securities Commission, followed by two
years practicing law with McCarthy Tétrault. He was Corporate Counsel for PepsiCo Canada before moving to Abitibi Consolidated Inc. where he held a variety of roles including Senior Vice President, Strategy and Corporate Development.
Mr. Medline serves on the Board of Trustees for SickKids (and is the Chair of its Human Resources Committee), the Board of Governors for Huron University College at Western University, and as a trustee on the William & Mary Business
School Foundation Board. He is past Chair of the Retail Council of Canada as well as the Grocery Foundation and was formerly on the Board of Governors for Canada’s Sports Hall of Fame, Board of Directors for SickKids Foundation, and The
BlackNorth Initiative. Mr. Medline holds an M.B.A. from Raymond A. Mason School of Business, William & Mary; an LL.B. from the University of Toronto; and a B.A. from Huron University College at Western University.
Aaron W. Regent – Mr. Regent is Chair of the Board of Scotiabank. He is the Founder, Chairman, and Chief Executive Officer of Magris
Performance Materials Inc., a leading North American performance materials company. He was President and Chief Executive Officer of Barrick Gold Corporation from January 2009 to June 2012. Previously, Mr. Regent was Senior Managing Partner of
Brookfield Asset Management, Co-Chief Executive Officer of the Brookfield Infrastructure Group, an asset management company, and President and Chief Executive Officer of Falconbridge Limited. Mr. Regent
holds a B.A. from the University of Western Ontario. He is a Chartered Professional Accountant and a Fellow of CPA Ontario.
Steven C. Van Wyk –
Mr. Van Wyk is a corporate director and the former Group Chief Information Officer (CIO) of HSBC Bank PLC. Throughout his 40-year career, he held senior-level domestic and international information
technology roles, including CIO of PNC Financial Services Group, Inc., Global CIO of ING Groep N.V., and multiple roles with Morgan Stanley, including several years as CIO/Chief Operating Officer of its Individual Investor Group. Mr. Van Wyk
holds a B.A. in business management and accounting with a minor in computer science from the University of Central Iowa and was awarded an honorary Doctorate of Public Service from Central College in 2019. He is a Certified Public Accountant,
Certified Internal Auditor, and Series 27 Financial/Operations Principal. Mr. Van Wyk chairs the Board of the Banking Industry Architecture Network, a non-profit seeking to establish a common architecture
framework for enabling banking interoperability.
Auditor
Please refer to Table 80 on page 129 of the MD&A, which is incorporated herein by reference, for disclosure relating to the fees paid by the Bank
to the Bank’s Auditor, KPMG LLP, in each of the last two fiscal years. The nature of these services is described below:
| |
• |
|
Audit services generally relate to the statutory audits and review of financial statements, regulatory required
attestation reports, as well as services associated with registration statements, prospectuses, periodic reports and other documents filed with securities regulatory bodies or other documents issued in connection with securities offerings.
|
| |
• |
|
Audit-related services include special attest services not directly linked to the financial statements, review of
controls and procedures related to regulatory reporting, audits of employee benefit plans and consultation and training on
|
- 22 -
| |
accounting and financial reporting.
|
| |
• |
|
Tax services outside of the audit scope relate primarily to specified review procedures required by local tax
authorities, attestation on tax returns of certain subsidiaries as required by local tax authorities, and review to determine compliance with an agreement with the tax authorities.
|
| |
• |
|
Other non-audit services are primarily for the review and translation of
English language financial statements into other languages and other services.
|
The Audit and Conduct Review Committee has adopted
policies and procedures (the “Policies”) for the pre-approval of services performed by the Bank’s Auditor. The objective of the Policies is to specify the scope of services permitted to be
performed by the Bank’s Auditor and to ensure the independence of the Bank’s Auditor is not compromised through engaging them for other services. The Policies state that the Audit and Conduct Review Committee shall pre-approve the following: audit services (all such engagements provided by the Bank’s Auditor as well as all such engagements provided by any other registered public accounting firm); and other permitted
services to be provided by the Bank’s Auditor (primarily audit and audit-related services). The Bank’s Auditor shall not be engaged in the provision of tax or other non- audit services, without the
pre-approval of the Audit and Conduct Review Committee. The Policies also enumerate pre- approved services including specific audit, audit-related and other limited
non-audit services that are consistent with the independence requirements of the U.S. Sarbanes-Oxley Act of 2002 (SOX) and related SEC rules, Canadian independence standards for auditor and applicable legal
requirements. The Policies are applicable to the Bank, its subsidiaries and entities that are required to be consolidated by the Bank. The Audit and Conduct Review Committee shall review and approve the Policies on a regular basis. The Policies do
not delegate any of the Audit and Conduct Review Committee’s responsibilities to management of the Bank.
ADDITIONAL INFORMATION
Additional information relating to the Bank may be found on the SEDAR+ website at www.sedarplus.ca and on the SEC’s website at www.sec.gov. For a
description of Canadian bank resolution powers and the consequent risk factors attaching to certain liabilities of the Bank reference is made to www.scotiabank.com/ca/en/about/investors-shareholders/regulatory-
disclosures/canadian-bank-resolution-powers-including-bail-in.html. Such information may also be found at www.sedarplus.ca and at www.sec.gov/submit-filings. Information contained in or otherwise accessible
through the websites mentioned in this Annual Information Form does not form a part of this Annual Information Form. All references in this Annual Information Form to websites are inactive textual references and are for your information only.
Additional information, including directors’ and officers’ compensation, indebtedness and options to purchase securities, principal holders of the Bank’s securities and interests of insiders in material transactions, where
applicable, is contained in the Management Proxy Circular. Additional financial information is provided in the Bank’s consolidated financial statements and MD&A for the year ended October 31, 2025. A copy of such documents may be
obtained upon request from the Corporate Secretary’s Department, at 40 Temperance Street, Toronto, Ontario, M5H 0B4 Tel: (416) 866-3672. E-mail:
corporate.secretary@scotiabank.com.
- 23 -
Schedule A
Definition of Credit Ratings
Fitch Ratings
A short-term issuer or obligation rating is based in all cases on the short-term vulnerability to default of the rated entity and relates to the capacity to
meet financial obligations in accordance with the documentation governing the relevant obligation. Short-term deposit ratings may be adjusted for loss severity. Short-Term Ratings are assigned to obligations whose initial maturity is viewed as
“short term” based on market convention (a long-term rating can also be used to rate an issue with short maturity). Typically, this means a timeframe of up to 13 months for corporate, sovereign, and structured obligations and up to 36
months for obligations in U.S. public finance markets. A rating of “F1+” denotes the highest short-term credit quality, indicating the strongest intrinsic capacity for the timely payment of financial commitments. The added
“+” denotes an exceptionally strong credit feature.
Fitch publishes credit ratings that are forward-looking opinions on the relative ability
of an entity or obligation to meet financial commitments. Issuer Default Ratings (IDRs) are assigned to corporations, sovereign entities, and financial institutions, such as banks, leasing companies and insurers, and public finance entities (local
and regional governments). Issue-level ratings are also assigned and often include an expectation of recovery, which may be notched above or below the issuer-level rating. A rating of “AA” denotes expectation of very low default risk and
indicates very strong capacity for payment of financial commitments; this capacity is not significantly vulnerable to foreseeable events. A rating of “A” denotes expectations of low default risk and the capacity for payment of financial
commitments is considered strong; this capacity may, nevertheless, be more vulnerable to adverse business or economic conditions than is the case for higher ratings. A rating of “BBB” indicates that expectations of default risk are
currently low. The capacity for payment of financial commitments is considered adequate, but adverse business or economic conditions are more likely to impair this capacity.
Within some of the rating levels, Fitch further differentiates the rankings by adding the modifiers “+” or “-” to denote relative
status within major rating categories.
Positive or Negative Outlooks do not imply that a rating change is inevitable, and similarly, ratings with Stable
Outlooks can be raised or lowered without a prior revision to the Outlook. A Negative or Positive Outlook could also be assigned to an issuer/transaction whose credit profile has weakened or improved but where Fitch expects the credit profile to
return within the next two years to a level consistent with the current rating, albeit with some execution risk or uncertainty.
Stable Outlooks can be
raised or lowered without a prior revision to the Outlook.
Moody’s
Moody’s short-term ratings are assigned to obligations with an original maturity of thirteen months or less and reflect both on the likelihood of a
default or impairment on contractual financial obligations and the expected financial loss suffered in the event of default or impairment. Ratings of Prime-1 (or P-1)
reflect a superior ability to repay short-term obligations.
Moody’s long-term ratings are assigned to issuers or obligations with an original
maturity of eleven months or more and reflect both on the likelihood of a default or impairment on contractual financial obligations and the expected financial loss suffered in the event of default or impairment. Obligations rated “Aa”
are judged to be of high quality and are subject to very low credit risk. Obligations rated “A” are judged to be upper-medium grade and are subject to low credit risk. Obligations rated “Baa” are judged to be medium-grade and
subject to moderate credit risk and as such may possess certain speculative characteristics. Moody’s appends numerical modifiers 1, 2, and 3 to each generic rating classification from Aa through Caa. The modifier 1 indicates that the
obligation ranks in the higher end of its generic rating category; the modifier 2 indicates a mid-range ranking; and the modifier 3 indicates a ranking in the lower end of that generic rating category.
Additionally, a “(hyb)” indicator is appended to all ratings of hybrid securities issued by banks, insurers, finance companies, and securities
firms.
The Moody’s rating outlook is an opinion regarding the likely rating direction over the medium term. The “Stable” outlook
indicates a low likelihood of a rating change over the medium term.
- 24 -
Morningstar DBRS Limited
The Morningstar DBRS’ short-term debt rating scale provides an opinion on the risk that an issuer will not meet its short- term financial obligations in
a timely manner. The R-1 and R-2 rating categories are further denoted by the subcategories “high”, “middle” and “low”. An obligation
rated R-1(high) is of the highest credit quality and indicates the capacity for the payment of short- term financial obligations as they fall due is exceptionally high; unlikely to be adversely affected by
future events.
The Morningstar DBRS long-term rating scale provides an opinion on the risk of default. That is, the risk that an issuer will fail to
satisfy its financial obligations in accordance with the terms under which a long-term obligation has been issued. Credit ratings are based on quantitative and qualitative considerations relevant to the issuer, and the relative ranking of claims.
All rating categories from AA to CCC contain the subcategories “(high)” and “(low)”. The absence of either a “(high)” or “(low)” designation indicates the rating is in the middle of the category.
Long-term financial obligations rated “AA” are of superior credit quality and capacity for the payment of financial obligations is considered high; credit quality differs from AAA only to a small degree; unlikely to be significantly
vulnerable to future events. Long-term financial obligations rated “A” are of good credit quality and capacity for payment of financial obligations is substantial, but of lesser credit quality than AA; and may be vulnerable to future
events, but qualifying negative factors are considered manageable.
The Morningstar DBRS preferred share rating scale is used in the Canadian securities
market reflects an opinion of the risk that a borrower will not fulfill its related obligations in a timely manner, with respect to both dividend and principal commitments. Every Morningstar DBRS rating using the preferred share rating scale is
based on quantitative and qualitative considerations relevant to the issuing entity. This scale may also apply to certain hybrid securities. Each rating category may be denoted by the subcategories “high” and “low”. The
absence of either a “high” or “low” designation indicates the rating is in the middle of the category. Preferred shares rated Pfd-2 are generally of good credit quality. Protection of
dividends and principal is still substantial, but earnings, the balance sheet and coverage ratios are not as strong as Pfd-1 rated companies. Generally, Pfd-2 ratings
correspond with issuers with an A category or higher reference point.
Rating trends provide guidance in respect of an opinion of Morningstar DBRS
regarding the outlook for the credit rating in question. Rating trends have three categories - “Positive”, “Stable” or “Negative”. The rating trend indicates the direction in which Morningstar DBRS considers the
credit rating may move if present circumstances continue. The conditions that lead to the assignment of a Negative or Positive trend are generally resolved within a 12-month period. Morningstar DBRS’s
trends and ratings are under regular surveillance.
S&P
S&P short-term issue credit ratings are generally assigned to those obligations considered short-term in the relevant market, typically with an original
maturity of no more than 365 days. Short-term issue credit ratings are also used to indicate the creditworthiness of an obligor with respect to put features on long-term obligations. A short-term obligation rated
“A-1” is rated in the highest category and indicates S&P’s view that an obligor’s capacity to meet its financial commitments on the obligation is strong.
S&P long-term issue credit ratings are based, in varying degrees, on S&P Global Ratings’ analysis of the following considerations: likelihood of
payment – the capacity and willingness of the obligor to meet its financial commitments on an obligation in accordance with the terms of the obligation; the nature and provisions of the financial obligation, and the promise they impute; and
the protection afforded by, and relative position of, the financial obligation in the event of a bankruptcy, reorganization, or other arrangement under the laws of bankruptcy and other laws affecting creditors’ rights. A rating in the
“A” category means the obligation is somewhat more susceptible to the adverse effects of changes in circumstances and economic conditions than obligations in higher-rated categories. However, the obligor’s capacity to meet its
financial commitments on the obligation is still strong. An obligation rated in the “BBB” category indicates that the obligation exhibits adequate protection parameters. However, adverse economic conditions or changing circumstances are
more likely to weaken the obligor’s capacity to meet its financial commitments on the obligation. Ratings from AA to CCC may be modified by the addition of a plus (+) or minus (–) sign to show relative standing within the major rating
categories.
An S&P Global Ratings preferred share rating on the Canadian scale is a forward-looking opinion about the creditworthiness of an obligor with respect to a specific preferred share obligation issued in the Canadian market relative to preferred shares issued by other issuers in the Canadian market. There is a direct correspondence between the specific ratings assigned on the Canadian preferred share scale and the various rating levels on the global debt rating scale of S&P Global Ratings. The Canadian scale rating is fully determined by the applicable global scale rating, and there are no additional analytical criteria associated with the determination of ratings on the Canadian scale.
- 25 -
It is the practice of S&P Global Ratings to present ratings on an issuer’s preferred shares on both the global rating scale and on the Canadian national scale when listing the ratings for a particular issuer. A reference to “high” or “low” reflects the relative strength within the rating category, and the absence of either a “high” or “low” designation indicates the rating is in the middle of the category.
An S&P Global Ratings outlook assesses the potential direction of a long-term credit rating over the intermediate term, which is generally up to two years
for investment grade and generally up to one year for speculative grade. In determining a rating outlook, consideration is given to any changes in economic and/or fundamental business conditions. Stable reflects a rating is not likely to change.
- 26 -
Schedule B
THE BANK OF NOVA SCOTIA
CHARTER
AUDIT AND CONDUCT REVIEW COMMITTEE OF THE BOARD OF DIRECTORS
The Audit and Conduct Review Committee of the Board of Directors (the “Committee”) has the responsibilities and duties as outlined below and
serves as the Bank’s audit committee, conduct review committee and consumer protection committee.
AUDIT
| 1. |
To perform such duties as may be required by:
|
| |
a. |
the Bank Act (the “Bank Act”), the regulations thereunder and guidelines of the Office of
the Superintendent of Financial Institutions Canada (“OSFI”); and
|
| |
b. |
other applicable legislation and regulations, including those of the Ontario Securities Commission and the
Canadian Securities Administrators, the Toronto Stock Exchange, the New York Stock Exchange, the Securities and Exchange Commission and the Sarbanes-Oxley Act, 2002,
|
as more fully described under the heading “Duties” below.
| 2. |
To assist the Board of Directors (the “Board”) in fulfilling its oversight responsibilities for:
|
| |
a. |
the integrity of the Bank’s consolidated financial statements and related quarterly results releases;
|
| |
b. |
the system of internal control, including internal control over financial reporting and disclosure controls and
procedures (“internal controls”);
|
| |
c. |
the external auditor’s qualifications, independence and performance; and
|
| |
d. |
the Bank’s finance, compliance (including anti-money laundering, anti-terrorist financing and sanctions)
and internal audit functions.
|
| 3. |
To perform such other duties as may from time to time be assigned to the Committee by the Board.
|
| 4. |
To act as the audit committee for any federally chartered Canadian financial institution beneficially owned by
the Bank as determined by the Board.
|
The Committee has authority to:
| 1. |
conduct or authorize investigations into any matters within its scope of responsibility;
|
| 2. |
retain, as appropriate and at the Bank’s expense, independent counsel, accountants or others to advise
the Committee or assist in the conduct of an investigation;
|
| 3. |
meet with Bank officers, the external auditor or outside counsel, as necessary;
|
| 4. |
determine appropriate funding for independent advisors;
|
- 27 -
| 5. |
communicate directly with the internal and external auditors;
|
| 6. |
receive all material correspondence between the external auditor and management related to audit and interim
review findings; and
|
| 7. |
call a meeting of the Board to consider any matter of concern to the Committee.
|
The Committee shall:
Financial
Information
| 1. |
review the quarterly and annual consolidated financial statements of the Bank prior to approval by the Board
and disclosure to the public, and satisfy itself that the financial statements present fairly the financial position, results of operations and cash flows of the Bank;
|
| |
a. |
review should include discussion with management and the external auditor of significant issues, including
significant accounting policies, regarding the financial results, accounting principles, practices and management estimates and judgments;
|
| 2. |
satisfy itself that the Bank’s accounting practices are prudent and appropriate;
|
| 3. |
review the quarterly and annual Management’s Discussion & Analysis of Financial Condition and
Results of Operations (“MD&A”) prior to review and approval by the Board;
|
| 4. |
review any material proposed changes in accounting standards and securities policies or regulation relevant to
the Bank’s consolidated financial statements and approve any material changes in accounting policies related to the Bank’s consolidated financial statements;
|
| 5. |
review sustainability (including climate-related) disclosures to be included in financial reporting as required
by regulators or that may be required by law;
|
| 6. |
review any tax matters material to the financial statements;
|
| 7. |
be satisfied that adequate procedures are in place for the review of the Bank’s public disclosure of all
consolidated financial statements, related quarterly results press releases and financial information extracted or derived from the Bank’s consolidated financial statements and periodically assess the adequacy of these procedures;
|
| 8. |
review material financial press releases prior to public disclosure;
|
| 9. |
review earnings press releases, as well as financial information and earnings guidance provided to analysts and
rating agencies prior to public disclosure;
|
| 10. |
review investments and transactions that could adversely affect the well-being of the Bank brought to its
attention by the external auditor or by any officer of the Bank;
|
| 11. |
discuss significant financial risk exposures and the steps management of the Bank has taken to monitor, control
and report such exposures;
|
| 12. |
review and recommend to the Board for approval the Annual Information Form and Form 40-F; and
|
| 13. |
review the process relating to and the certifications of the Chief Executive Officer and the Chief Financial
Officer on the integrity of the Bank’s quarterly and annual consolidated financial statements.
|
- 28 -
Internal Controls
| 14. |
require Bank management to implement and maintain appropriate internal control policies and procedures
including anti-fraud controls, as part of the Bank’s overall internal control framework;
|
| 15. |
receive and review reports from management and internal audit on the design and operating effectiveness of the
internal control framework and any significant control breakdowns, including any reports concerning significant deficiencies and material weaknesses in the design or operation of internal controls which are reasonably likely to adversely affect the
Bank’s ability to record, process, summarize and report financial information, and any fraud involving management or other employees who have a significant role in the Bank’s internal controls;
|
| |
a. |
as part of this review, the Committee should discuss with management whether any deficiencies identified may be
systemic or pervasive; and
|
| 16. |
receive and review the external auditor’s audit report on the Bank’s internal controls over
financial reporting as of the Bank’s year end.
|
Finance
| 17. |
oversee the Finance Department, having regard to its independence, by:
|
| |
a. |
reviewing and approving the appointment and/or removal of the Chief Financial Officer of the Bank;
|
| |
b. |
annually reviewing and approving the mandate of the Chief Financial Officer and the charter of the Finance
Department;
|
| |
c. |
annually reviewing and approving the organizational structure of the Finance Department;
|
| |
d. |
annually reviewing and approving the Finance Department’s risk appetite statement, resources and budget;
|
| |
e. |
annually assessing the effectiveness of the Chief Financial Officer and the effectiveness of the Finance
Department, and annually approving the performance review of the Chief Financial Officer, taking into consideration any regulatory findings with respect to the finance function;
|
| |
f. |
conveying its views to the Human Capital and Compensation Committee on the following matters:
|
| |
i. |
the assessment of the effectiveness and performance review of the Chief Financial Officer;
|
| |
ii. |
considerations to be factored into the total compensation to be paid to the Chief Financial Officer; and
|
| |
iii. |
succession planning for the role of Chief Financial Officer;
|
| |
g. |
overseeing that the Finance Department has unfettered access and a functional reporting line to the Committee;
|
| |
h. |
periodically requesting independent reviews of the Finance Department, reviewing the results of such reviews
and reporting such results to the Board; and
|
| |
i. |
overseeing that deficiencies identified related to the Finance Department are remedied within an appropriate
time frame and reporting to the Board on the progress of necessary corrective actions.
|
Compliance
| 18. |
approve the Compliance Risk Summary Framework;
|
| 19. |
receive reports from management on the Bank’s compliance with legal and regulatory requirements and the
adequacy and effectiveness of the Bank’s compliance controls, including:
|
| |
a. |
review the annual and other periodic reports of the Global Compliance Function; and
|
- 29 -
| |
b. |
follow up with management on plans to remediate any deficiencies identified in reports and on any regulatory
recommendations or findings, and discuss if weaknesses may exist elsewhere;
|
| 20. |
meet, on its own or with the Board, with representatives of OSFI to discuss OSFI’s supervisory results;
|
| 21. |
meet with Bank management to review and discuss the Bank’s response to OSFI’s recommendations and
suggestions pursuant to their supervisory activities;
|
| 22. |
review any issues raised by Internal Audit that address the appropriateness and effectiveness of the
Bank’s Compliance Risk Summary Framework and management of significant compliance risks;
|
| 23. |
oversee the Global Compliance Function, having regard to its independence, by:
|
| |
a. |
reviewing and approving the appointment and/or removal of the Chief Compliance Officer;
|
| |
b. |
annually reviewing and approving the mandate for the Chief Compliance Officer and the charter of the Global
Compliance Function;
|
| |
c. |
annually reviewing and approving the organizational structure of the Global Compliance Function;
|
| |
d. |
annually reviewing and approving the Global Compliance Function’s risk appetite statement, resources and
budget;
|
| |
e. |
annually assessing the effectiveness of the Chief Compliance Officer and the effectiveness of the Global
Compliance Function, and annually approving the performance review of the Chief Compliance Officer, taking into consideration any regulatory findings with respect to the Global Compliance Function;
|
| |
f. |
conveying its view to the Human Capital and Compensation Committee on the following matters:
|
| |
i. |
the assessment of the effectiveness and performance review of the Chief Compliance Officer;
|
| |
ii. |
considerations to be factored into the total compensation to be paid to the Chief Compliance Officer; and
|
| |
iii. |
succession planning for the role of Chief Compliance Officer;
|
| |
g. |
with respect to the Swap Dealer Chief Compliance Officer (“SD CCO”) and the Security-Based Swap
Dealer Chief Compliance Officer (“SBSD CCO”):
|
| |
i. |
reviewing and approving the appointment and/or removal of the SD CCO and the SBSD CCO;
|
| |
ii. |
reviewing annual reports from the SD CCO and the SBSD CCO; and
|
| |
iii. |
reviewing and approving the total compensation to be paid to the SD CCO and the SBSD CCO;
|
| |
h. |
overseeing that the Global Compliance Function has unfettered access and a functional reporting line to the
Committee;
|
| |
i. |
periodically requesting independent reviews of the Global Compliance Function, reviewing the results of such
reviews and reporting such results to the Board; and
|
| |
j. |
overseeing that deficiencies identified related to the Global Compliance Function are remedied within an
appropriate time frame and reporting to the Board on the progress of necessary corrective actions.
|
Anti-Money
Laundering (AML)
| 24. |
oversee the Bank’s Enterprise Anti-Money Laundering and Anti-Terrorist Financing and Sanctions program
(collectively, the “AML Program”);
|
| 25. |
review and approve the Bank’s Enterprise Anti-Money Laundering and Anti-Terrorist Financing and Sanctions
Policy and any
|
- 30 -
| |
significant changes thereto; |
| 26. |
receive reports on the Bank’s compliance with legal and regulatory anti-money laundering requirements;
|
| 27. |
review any issues raised that address the appropriateness and effectiveness of the Bank’s AML Program and
management of significant risks with this program;
|
| 28. |
regularly meet with the Group Chief Anti-Money Laundering Officer to discuss the effectiveness of the
Bank’s AML Program; and
|
| 29. |
oversee the Enterprise Anti-Money Laundering and Anti-Terrorist Financing and Sanctions function (collectively,
the “AML Function”), having regard to its independence, by:
|
| |
a. |
reviewing and approving the appointment and/or removal of the Group Chief Anti-Money Laundering Officer;
|
| |
b. |
annually reviewing and approving the job description and mandate of the Group Chief Anti-Money Laundering
Officer and the charter of the AML Function;
|
| |
c. |
annually reviewing and approving the organizational structure of the AML Function and its oversight of first
line controls and operations;
|
| |
d. |
annually reviewing and approving the AML Function resources, budget, annual plan and material plan changes;
|
| |
e. |
annually assessing the effectiveness of the Group Chief Anti-Money Laundering Officer and the effectiveness of
the AML Function, and annually approving the performance review of the Group Chief Anti-Money Laundering Officer, taking into consideration any regulatory findings with respect to the AML Function;
|
| |
f. |
conveying its view to the Chief Compliance Officer and the Human Capital and Compensation Committee on the
following matters:
|
| |
i. |
the assessment of the effectiveness and performance review of the Group Chief Anti-Money Laundering Officer;
|
| |
ii. |
considerations to be factored into the total compensation to be paid to the Group Chief Anti-Money Laundering
Officer; and
|
| |
iii. |
succession planning for the role of Group Chief Anti-Money Laundering Officer;
|
| |
g. |
overseeing that the AML Function has unfettered access to the Committee;
|
| |
h. |
periodically requesting independent reviews of the AML Function, reviewing the results of such reviews and
reporting such results to the Board; and
|
| |
i. |
overseeing that deficiencies identified related to the AML Function are remedied within an appropriate time
frame and reporting to the Board on the progress of necessary corrective actions.
|
Internal Audit
| 30. |
review the quarterly and other reports of the Chief Auditor;
|
| 31. |
review any matters of significance that arose from non-audit
engagements performed by the Audit Department;
|
| 32. |
review with the Chief Auditor matters of significance impacting audit scope, the Audit Department charter,
information access, resource limitations, or other difficulties encountered by the Audit Department;
|
| 33. |
regularly meet with the Chief Auditor with and/or without management, to discuss the effectiveness of the
Bank’s internal control, risk management (including anti-money laundering) and governance processes;
|
- 31 -
| 34. |
oversee the Audit Department, having regard to its independence, by:
|
| |
a. |
reviewing the qualifications and competencies, and approving the appointment and/or removal of the Chief
Auditor;
|
| |
b. |
annually reviewing and approving the mandate of the Chief Auditor and the charter of the Audit Department;
|
| |
c. |
annually reviewing and approving the organizational structure of the Audit Department;
|
| |
d. |
reviewing and approving the annual audit plan, (and material changes thereto), overall risk assessment
methodology, budgets and resources of the Audit Department;
|
| |
e. |
annually assessing the effectiveness of the Chief Auditor and the Audit Department, taking into consideration
the objectivity and independence of the Bank’s internal audit function, and annually approving the performance review of the Chief Auditor, taking into consideration any regulatory findings with respect to the Audit Department;
|
| |
f. |
conveying its view to the Human Capital and Compensation Committee on the following matters:
|
| |
i. |
the assessment of the effectiveness and performance review of the Chief Auditor;
|
| |
ii. |
considerations to be factored into the total compensation to be paid to the Chief Auditor; and
|
| |
iii. |
succession planning for the role of Chief Auditor;
|
| |
g. |
periodically reviewing results of the internal Quality Assurance and Improvement Program;
|
| |
h. |
periodically requesting independent reviews of the Audit Department, reviewing the results of such reviews and
reporting such results to the Board;
|
| |
i. |
overseeing that deficiencies identified related to the Audit Department are remedied within an appropriate time
frame and reporting to the Board on the progress of necessary corrective actions; and
|
| |
j. |
advising the Board of any recommendations for the continuous improvement of the Audit Department;
|
| 35. |
ensure the Audit Department has unfettered access and a direct and independent reporting line to the Committee;
|
| 36. |
provide for an open avenue of communication between the Audit Department and the Board;
|
| 37. |
ensure that the Audit Department’s recommendations are adequately considered and acted on, by providing
the Audit Department with the authority to follow-up on observations and recommendations; and
|
| 38. |
review and approve the Internal Audit Third Party Risk Management Policy.
|
External Auditor
| 39. |
have responsibility for the oversight of the external auditor who reports directly to the Committee;
|
| 40. |
recommend to the Board the retention or termination of the Bank’s external auditor, subject to
shareholder ratification;
|
| 41. |
review and approve the annual audit plan and letter(s) of engagement, and as part of such review, satisfy
itself that the Bank’s audit plan is risk based and covers all relevant activities over a measurable cycle;
|
| 42. |
annually review the external auditor’s opinion on the annual financial statements, including the key
audit matters and critical audit matters contained therein;
|
| 43. |
review and evaluate the external auditor’s qualifications, performance, professional skepticism and
independence, including a review and evaluation of the lead audit partner, taking into consideration the opinions of management and the Bank’s Audit Department in such evaluation and any concerns raised by OSFI or other stakeholders about the
external auditor’s
|
- 32 -
| 44. |
consistent with the Committee’s annual assessment and periodic comprehensive review of the external
auditors, the Committee shall establish a policy that stipulates the criteria for the Bank tendering the contract for the role of the Bank’s external auditor;
|
| |
a. |
as part of this policy and any review undertaken by the Committee, the Committee should periodically consider
whether to put the external auditor contract out for tender, taking into consideration the length of the current external auditor’s tenure and the risks that tenure may pose to the external auditor’s objectivity and independence;
|
| 45. |
receive the Canadian Public Accountability Board’s (“CPAB”) annual public report, along with
any notices required to be communicated by the external auditor to the Committee, including those required by CPAB, OSFI and the Public Company Accounting Oversight Board (“PCAOB”);
|
| 46. |
review and recommend to the Board the annual fee for the audit of the Bank’s consolidated financial
statements and internal control over financial reporting;
|
| |
a. |
as part of this review, the Committee should satisfy itself that the level of audit fees is commensurate with
the scope of work undertaken in consideration of financial reporting risks;
|
| 47. |
review and pre-approve in accordance with established pre-approval policy, all services to be provided by the external auditor, including audit and audit related services and permitted tax and non-audit services;
|
| 48. |
delegate the authority to pre-approve
non-audit services to a member of the Committee;
|
| 49. |
review external auditor services pre-approved by the delegate of the
Committee;
|
| 50. |
review annually the total fees paid to the external auditor by required categories;
|
| 51. |
at least annually, obtain and review reporting from the external auditor describing:
|
| |
a. |
the firm’s internal quality-control procedures;
|
| |
b. |
the firm’s internal procedures to ensure independence;
|
| |
c. |
any material issues raised by the most recent internal quality-control review, or peer review, of the firm, or
by any inquiry or investigation by governmental or professional authorities, within the preceding five years, regarding one or more independent audits of the Bank carried out by the firm, and any steps taken to deal with any such issues;
|
| |
d. |
the skill and resources (amount and type) of the firm; and
|
| |
e. |
an assessment of all relationships between the external auditor and the Bank that pertain to independence;
|
| 52. |
review and recommend to the Board the rotation plan for partners on the engagement;
|
| 53. |
meet with the external auditor and with management to discuss the quarterly and the annual consolidated
financial statements and the Bank’s disclosure under any MD&A;
|
| 54. |
review with management and the external auditor all matters required to be communicated to the Committee under
generally accepted auditing standards;
|
| 55. |
review with the external auditor any audit problems or difficulties and management’s response;
|
| 56. |
discuss with the external auditor, as considered necessary by the Committee, any OSFI returns, investments or
transactions reviewed by the Committee;
|
| 57. |
resolve any disputes between the external auditor and management; and
|
- 33 -
| 58. |
review and approve policies for the Bank’s employment of current and former employees or partners of the
current or former external auditor.
|
Other Duties
| 59. |
review the periodic reports on litigation matters;
|
| 60. |
review such returns as specified by OSFI;
|
| 61. |
review such other periodic disclosure documents as required by regulators or that may be required by law;
|
| 62. |
provide for an open avenue of communication between internal audit, the external auditor and the Board;
|
| 63. |
annually, review the charter for the Committee and evaluate the Committee’s effectiveness in fulfilling
its mandate;
|
| 64. |
prepare a committee report for inclusion in the Bank’s management proxy circular; and
|
| 65. |
institute and oversee special investigations as needed.
|
CONDUCT REVIEW
| 1. |
To perform the duties with respect to the Bank’s policies and procedures for ensuring its transactions
with its related parties comply with Part XI of the Bank Act and any regulations thereunder as more fully described under the heading “Duties” below.
|
| 2. |
In the event a widely held bank holding company or insurance holding company has a significant interest in any
class of shares of the Bank:
|
| |
a. |
to establish policies for entering into transactions referred to in subsection 495.1(1) of the Bank Act,
including transactions with a holding company or any other related party of the Bank that is an entity in which the holding company has a substantial investment; and
|
| |
b. |
to review certain of the Bank’s transactions that are referred to in subsection 495.3(1) of the Bank Act
including any transaction with a widely held insurance or bank holding company or any other related party in which they hold a substantial investment.
|
| 3. |
To perform such duties as are required by the Bank Act to be dealt with by a committee of the Board concerning
the monitoring of adherence to procedures for identifying potential conflicts of interest and for resolving such conflicts of interest, for restricting the use of confidential information, and as more fully described under the heading
“Duties” below.
|
| 4. |
To assist the Board in fulfilling its oversight responsibilities for:
|
| |
a. |
setting standards of conduct and ethical behaviour; and
|
| |
b. |
conduct reviews and culture as it relates to conduct risk.
|
| 5. |
To perform such other duties as are required under the Bank Act or by OSFI, or as may from time to time be
assigned by the Board.
|
| 6. |
To act as the conduct review committee for any federally chartered Canadian financial institution beneficially
owned by the Bank as determined by the Board.
|
- 34 -
| 1. |
Establish criteria for determining whether the value of transactions with related parties of the Bank is
nominal or immaterial to the Bank;
|
| 2. |
Approve the terms and conditions of:
|
| |
a. |
loans, other than margin loans, to senior officers of the Bank on terms and conditions more favourable to the
senior officers than those offered to the public; and
|
| |
b. |
loans to spouses or common-law partners of senior officers of the Bank
on the security of mortgages of the principal residences of such spouses or common-law partners on terms and conditions more favourable than those offered to the public;
|
| 3. |
Approve the practice of the Bank making financial services, other than loans or guarantees, available to senior
officers of the Bank or to spouses or common-law partners, or children who are less than 18 years of age of senior officers of the Bank, on terms and conditions more favourable than those offered to the
public, provided the financial services are offered by the Bank to its employees on those favourable terms and conditions;
|
| 4. |
Require Bank management to establish policies and procedures to enable the Bank to verify that its transactions
with related parties of the Bank comply with Part XI of the Bank Act and to review those policies and procedures and their effectiveness. These policies and procedures should, among other things, enable management to verify that:
|
| |
a. |
all related party transactions are on terms and conditions at least as favourable to the Bank as market terms
and conditions, other than transactions referred to in clauses 2 and 3 above;
|
| |
b. |
loans to full-time senior officers, other than margin loans and mortgages on their principal residences, do not
exceed the greater of twice their annual salaries and $100,000;
|
| |
c. |
aggregate loans or guarantees to, and investments in the securities of any related party (subject to certain
exceptions) do not exceed 2% of the Bank’s regulatory capital unless the approval of 2/3 of the Board has been obtained; and
|
| |
d. |
aggregate loans or guarantees to, and investments in the securities of all related parties (subject to certain
exceptions) do not exceed 50% of the Bank’s regulatory capital;
|
| 5. |
Review the practices of the Bank to identify any transactions with related parties of the Bank that may have a
material effect on the stability or solvency of the Bank;
|
| 6. |
Monitor the procedures established by the Board to resolve conflicts of interest, including techniques for the
identification of potential conflict situations and for restricting the use of confidential information;
|
| 7. |
Review and, if appropriate, recommend for Board approval any material changes to the Scotiabank Code of Conduct
which includes the standards of conduct and ethical behaviour for employees, officers and directors of the Bank and its subsidiaries and recommend for approval by the Board any exceptions from the Scotiabank Code of Conduct, as appropriate;
|
| 8. |
Review reports from the Global Compliance Function on compliance with the Scotiabank Code of Conduct and any
instances of material deviation therefrom with corrective actions taken;
|
| 9. |
Review the annual letter of certification from the Executive Vice President and Chief Compliance Officer on
completion of the Scotiabank Code of Conduct acknowledgment by directors, officers, and employees;
|
| 10. |
Monitor the Bank’s exposure to material risks relating to conduct, and anti-bribery and anti-corruption
matters by reviewing the Bank’s risk management practices including its identification, measurement, monitoring and assessment of these types of risks;
|
| 11. |
Require management to establish processes and review and approve the policy established for the receipt,
retention, treatment and resolution of complaints received by the Bank regarding accounting, internal accounting controls or auditing matters,
|
- 35 -
| |
including confidential, anonymous submissions from employees, as part of the Bank’s Whistleblower Policy (Enterprise-wide), and carry out the Committee’s responsibilities under the
Bank’s Whistleblower Policy (Enterprise-wide), as required; |
| 12. |
Review matters reported to the Committee regarding the Bank’s Whistleblower program;
|
| 13. |
Review matters reported to the Committee included in the Chief Compliance Officer Report as it relates to the
Enterprise Conduct and Ethics programs, and anti-bribery and anti-corruption matters;
|
| 14. |
Review with management the results of their assessment of the Bank’s conduct, and anti-bribery and
anti-corruption risks, and their plans to remediate any material deficiencies identified; and
|
| 15. |
Monitor the processes established by the Bank to mitigate conduct risk.
|
CONSUMER PROTECTION
| 1. |
To perform such duties as are required by the Bank Act to be dealt with by a committee of the Board with
respect to the Bank’s procedures for complying with the consumer provisions, including Part XII.2 of the Bank Act and its associated regulations and any Financial Consumer Agency of Canada (“FCAC”) guidance, as more fully described
under the heading “Duties” below.
|
| 2. |
To perform such other duties as are required under the Bank Act or by OSFI or the FCAC, or as may from time to
time be assigned by the Board.
|
| 3. |
To act as the consumer protection committee for any federally chartered Canadian financial institution
beneficially owned by the Bank as determined by the Board.
|
| 1. |
Require Bank management to establish procedures for complying with the consumer provisions, including Part
XII.2 of the Bank Act and its associated regulations and any FCAC guidance;
|
| 2. |
Review such procedures referred to in clause 1 above to determine whether they are appropriate to ensure that
the Bank is complying with the consumer provisions; and
|
| 3. |
Require Bank management to report at least annually to the Committee on the implementation of the procedures
and on any other activities that the Bank carries out in relation to the protection of its customers.
|
COMMITTEE OPERATIONS
After each meeting of the Committee, the Committee is required to report to the Board on matters reviewed by the Committee and on the
Committee’s recommendations at the next regularly scheduled Board meeting. The Committee shall also report as required to the Risk Committee on relevant issues.
The Chair of the Committee shall review, for completeness, the Board’s report to OSFI with respect to conduct review matters on the
Committee’s activities during the year. This report must be filed within 90 days after the Bank’s financial year-end.
The Chair of the Committee shall review, for completeness, the Board’s report to FCAC with respect to consumer protection matters on the
Committee’s activities during the year. This report must be filed within 90 days after the Bank’s financial year-end.
The Committee shall review and assess the adequacy of this Charter on an annual basis and report the results of this review to the Corporate
Governance Committee of the Board.
- 36 -
The Committee shall consist of a minimum of three Directors. No member of the Committee may serve on more than three audit committees of public
company boards without the consent of the Corporate Governance Committee and the Board.
Each member must be financially literate or
become financially literate within a reasonable period of time subsequent to his/her appointment to the Committee. At least one member must be a financial expert. There should also be a reasonable representation of other key competencies on the
Committee, as determined by the Corporate Governance Committee.
The Committee is composed entirely of independent directors as defined in applicable laws, rules and regulations and as determined pursuant to
the Director Independence Standards approved by the Board for Committee members.
No member of the Committee may be an officer or employee
of the Bank or of any of its subsidiaries or affiliates. No member may be a person who is affiliated with the Bank.
Directors’ fees
are the only compensation a member of the Committee may be paid by the Bank.
| 3. |
Appointment of Committee Members
|
Members of the Committee are appointed or reappointed annually by the Board, upon the recommendation of the Corporate Governance Committee,
such appointments to take effect immediately following the annual meeting of the shareholders of the Bank. Members of the Committee shall hold office until their successors are appointed, or until they cease to be Directors of the Bank.
Vacancies may be filled for the remainder of the current term of appointment of members of the Committee by the Board, subject to the
requirements under the headings “Structure” and “Independence” above.
| 5. |
Appointment and Qualifications of Committee Chair
|
The Board shall appoint from the Committee membership, a Chair for the Committee to preside at meetings. In the absence of the Chair, one of
the other members of the Committee present shall be chosen by the Committee to preside at that meeting.
The Chair for the Committee must
have all of the qualifications for Committee membership and have accounting or related financial management expertise.
Meetings of the Committee may be called by the Chair, by any two members of the Committee or the external auditor. Members may participate in
meetings in person or by telephone, electronic or other communications facilities.
Written resolutions in lieu of a meeting are
permitted, solely in accordance with the Bank Act.
The Committee shall hold an in camera session immediately prior to and/or following
the conclusion of the regular agenda matters. The Committee shall also hold in camera sessions, separately at each Committee meeting, with each of the Chief Financial Officer, Chief Compliance Officer, Chief Auditor and the external auditor. The
Committee shall also hold in camera sessions with the Group Chief Anti-Money Laundering Officer, as appropriate. The Committee shall also meet separately, at least quarterly, with management. The Committee may also meet with the Chief Risk Officer,
as requested by the Committee or management from time to time.
To facilitate communication between the Committee and the Risk Committee,
the Chair of the Risk Committee shall receive notice of all Committee meetings and may attend Committee meetings by invitation as a non-voting observer.
- 37 -
The Committee may invite any director, officer or employee or any other person to attend
meetings to assist the Committee with its deliberations.
Notice of meeting of the Committee shall be sent by prepaid mail, by personal delivery or other means of transmitted or recorded communication
or by telephone at least 12 hours before the meeting to each member of the Committee at the member’s address or communication number last recorded with the Corporate Secretary. A Committee member may in any manner waive notice of a meeting of
the Committee and attendance at a meeting is a waiver of notice of the meeting, except where a member attends for the express purpose of objecting to the transaction of any business on the ground that the meeting is not lawfully called.
| 3. |
Notice to the Internal Auditor and External Auditor
|
The Chief Auditor and the external auditor are entitled to receive notice of every meeting of the Committee and, at the expense of the Bank, to
attend and be heard at each meeting and to have the opportunity to discuss matters with the independent directors, without the presence of management.
The Committee shall meet at least quarterly.
The quorum for a meeting of the Committee shall be a majority of its members, subject to a minimum of two members.
The Committee may designate a sub-committee to review any matter within the Committee’s mandate.
The Corporate Secretary or, in the absence of the Corporate Secretary, an Assistant Corporate Secretary of the Bank shall act as Secretary of
the Committee.
Minutes of meetings of the Committee shall be recorded and maintained by the Corporate Secretary and subsequently
presented to the Committee and to the Board, if required by the Board.
This Charter was last reviewed and approved by the Board on
October 28, 2025 and is effective November 1, 2025.
- 38 -
ENHANCED DISCLOSURE TASK FORCE (EDTF) RECOMMENDATIONS
The Enhanced Disclosure Task Force (EDTF) was established by the Financial Stability Board in May 2012 with the goal of developing fundamental disclosure principles. On October 29, 2012, the EDTF published its report, “Enhancing the Risk Disclosures of Banks,” which sets forth recommendations around improving risk disclosures and identifies existing leading practice risk disclosures.
Below is the index of all these recommendations to facilitate easy reference in the Bank’s annual report and other public disclosure documents available on www.scotiabank.com/investorrelations.
|
|
|
|
|
|
|
|
|
|
|
|
|
|
|
|
|
|
|
|
|
| |
|
|
|
|
|
|
|
| |
|
|
|
|
|
|
|
| |
|
Type of risk |
|
Number |
|
Disclosure |
|
MD&A |
|
|
|
|
|
|
|
|
|
| |
|
General |
|
1 |
|
The index of risks to which the business is exposed. |
|
|
16 |
|
|
|
|
|
|
|
|
|
|
|
| |
2 |
|
The Bank’s risk terminology, measures and key parameters. |
|
|
76-83 |
|
|
|
|
|
|
|
|
|
| |
3 |
|
Top and emerging risks, and the changes during the reporting period. |
|
|
|
|
|
|
|
|
|
|
|
|
| |
4 |
|
Discussion on the regulatory development and plans to meet new regulatory ratios. |
|
|
60-63, 120-121
|
|
|
|
|
|
|
|
|
|
| |
|
Risk governance,
risk management
and business
model |
|
5 |
|
The Bank’s Risk Governance structure. |
|
|
78-80 |
|
|
|
|
|
|
|
|
|
|
|
| |
6 |
|
Description of risk culture and procedures applied to support the culture. |
|
|
80-83 |
|
|
|
|
|
|
|
|
|
| |
7 |
|
Description of key risks from the Bank’s business model. |
|
|
84 |
|
|
|
|
|
|
|
|
|
| |
8 |
|
Stress testing use within the Bank’s risk governance and capital management. |
|
|
80-82 |
|
|
|
|
|
|
|
|
|
| |
|
Capital
Adequacy and
risk-weighted
assets |
|
9 |
|
Pillar 1 capital requirements, and the impact for global systemically important banks. |
|
|
60-63 |
|
|
|
208 |
|
|
|
4, 5 |
|
|
|
| |
10 |
|
a) Regulatory capital components. |
|
|
64 |
|
|
|
|
|
|
|
22-24 |
|
| |
|
|
b) Reconciliation of the accounting balance sheet to the regulatory balance sheet. |
|
|
|
|
|
|
|
|
|
|
18-19 |
|
| |
11 |
|
Flow statement of the movements in regulatory capital since the previous reporting period, including changes in common equity tier 1, additional tier 1 and tier 2 capital. |
|
|
65-66 |
|
|
|
|
|
|
|
100 |
|
| |
12 |
|
Discussion of targeted level of capital, and the plans on how to establish this. |
|
|
60-63 |
|
|
|
|
|
|
|
|
|
| |
13 |
|
Analysis of risk-weighted assets by risk type, business, and market risk RWAs. |
|
|
68-73, 84, 127 |
|
|
|
178 |
|
|
|
56-61, 73-75, 76-78, 82, 97, 103 |
|
| |
14 |
|
Analysis of the capital requirements for each Basel asset class. |
|
|
68-73 |
|
|
|
178, 224-228
|
|
|
|
16-17, 37-62, 71-78, 82, 87-90 |
|
| |
15 |
|
Tabulate credit risk in the Banking Book. |
|
|
68-73 |
|
|
|
225 |
|
|
|
16-17, 37-62, 82, 87-90 |
|
| |
16 |
|
Flow statements reconciling the movements in risk-weighted assets for each risk-weighted asset type. |
|
|
68-73 |
|
|
|
|
|
|
|
63, 81, 102 |
|
| |
17 |
|
Discussion of Basel III Back-testing requirement including credit risk model performance and validation. |
|
|
69-71 |
|
|
|
|
|
|
|
64-67, 107 |
|
| |
|
Liquidity Funding |
|
18 |
|
Analysis of the Bank’s liquid assets. |
|
|
103-108 |
|
|
|
|
|
|
|
|
|
|
|
| |
|
|
|
19 |
|
Encumbered and unencumbered assets analyzed by balance sheet category. |
|
|
105 |
|
|
|
|
|
|
|
|
|
|
|
| |
|
|
|
20 |
|
Consolidated total assets, liabilities and off-balance sheet commitments analyzed by remaining contractual maturity at the balance sheet date. |
|
|
109-111 |
|
|
|
|
|
|
|
|
|
|
|
| |
|
|
|
21 |
|
Analysis of the Bank’s sources of funding and a description of the Bank’s funding strategy. |
|
|
108-109 |
|
|
|
|
|
|
|
|
|
|
|
| |
|
Market Risk |
|
22 |
|
Linkage of market risk measures for trading and non-trading portfolios and the balance sheet. |
|
|
102 |
|
|
|
|
|
|
|
|
|
|
|
| |
23 |
|
Discussion of significant trading and non-trading market risk factors. |
|
|
97-103 |
|
|
|
|
|
|
|
|
|
| |
24 |
|
Discussion of changes in period on period VaR results as well as VaR assumptions, limitations, backtesting and validation. |
|
|
97-103 |
|
|
|
|
|
|
|
|
|
| |
25 |
|
Other risk management techniques e.g. stress tests, tail risk and market liquidity horizon. |
|
|
97-103 |
|
|
|
|
|
|
|
|
|
| |
|
Credit Risk |
|
26 |
|
Analysis of the aggregate credit risk exposures, including details of both personal and wholesale lending. |
|
|
91-96, 123-127
|
|
|
|
188-189, 225-228 |
|
|
|
6, 37-40, 44-61, 73-78 |
|
|
|
| |
27 |
|
Discussion of the policies for identifying impaired loans, defining impairments and renegotiated loans, and explaining loan forbearance policies. |
|
|
|
|
|
|
158-160 |
|
|
|
|
|
| |
28 |
|
Reconciliations of the opening and closing balances of impaired loans and impairment allowances during the year. |
|
|
93, 122-125 |
|
|
|
189 |
|
|
|
34-35 |
|
| |
29 |
|
Analysis of counterparty credit risk that arises from derivative transactions. |
|
|
88-90 |
|
|
|
176-179 |
|
|
|
108 |
|
| |
30 |
|
Discussion of credit risk mitigation, including collateral held for all sources of credit risk. |
|
|
89-91, 94 |
|
|
|
|
|
|
|
|
|
| |
|
Other risks |
|
31 |
|
Quantified measures of the management of operational risk. |
|
|
72, 112-113 |
|
|
|
|
|
|
|
|
|
|
|
| |
32 |
|
Discussion of publicly known risk items. |
|
|
85-87 |
|
|
|
205-206 |
|
|
|
|
|
| |
|
|
|
|
|
|
|
|
|
|
|
|
|
|
|
|
|
|
|
|
|
2025 Scotiabank Annual Report
Management’s Discussion and Analysis (MD&A) is provided to enable readers to assess the Bank’s financial condition and results of operations as at and for the year ended October 31, 2025. The MD&A should be read in conjunction with the Bank’s 2025 Consolidated Financial Statements, including the Notes. This MD&A is dated December 2, 2025.
Additional information relating to the Bank, including the Bank’s 2025 Annual Report, are available on the Bank’s website at www.scotiabank.com. As well, the Bank’s 2025 Annual Report and Annual Information Form are available on the SEDAR+ website at www.sedarplus.ca and on the EDGAR section of the SEC’s website at www.sec.gov.
2025 Scotiabank Annual Report
|
Management’s Discussion and Analysis
FORWARD LOOKING STATEMENTS
From time to time, our public communications include oral or written forward-looking statements. Statements of this type are included in this document, and may be included in other filings with Canadian securities regulators or the U.S. Securities and Exchange Commission (SEC), or in other communications. In addition, representatives of the Bank may include forward-looking statements orally to analysts, investors, the media and others. All such statements are made pursuant to the “safe harbor” provisions of the U.S. Private Securities Litigation Reform Act of 1995 and any applicable Canadian securities legislation. Forward-looking statements may include, but are not limited to, statements made in this document, the Management’s Discussion and Analysis in the Bank’s 2025 Annual Report under the headings “Outlook” and in other statements regarding the Bank’s objectives, strategies to achieve those objectives, the regulatory environment in which the Bank operates, anticipated financial results, and the outlook for the Bank’s businesses and for the Canadian, U.S. and global economies. Such statements are typically identified by words or phrases such as “believe,” “expect,” “aim,” “achieve,” “foresee,” “forecast,” “anticipate,” “intend,” “estimate,” “outlook,” “seek,” “schedule,” “plan,” “goal,” “strive,” “target,” “project,” “commit,” “objective,” and similar expressions of future or conditional verbs, such as “will,” “may,” “should,” “would,” “might,” “can” and “could” and positive and negative variations thereof.
By their very nature, forward-looking statements require us to make assumptions and are subject to inherent risks and uncertainties, which give rise to the possibility that our predictions, forecasts, projections, expectations or conclusions will not prove to be accurate, that our assumptions may not be correct and that our financial performance objectives, vision and strategic goals will not be achieved.
We caution readers not to place undue reliance on these statements as a number of risk factors, many of which are beyond our control and effects of which can be difficult to predict, could cause our actual results to differ materially from the expectations, targets, estimates or intentions expressed in such forward-looking statements.
The future outcomes that relate to forward-looking statements may be influenced by many factors, including but not limited to: general economic and market conditions in the countries in which we operate and globally; changes in currency and interest rates; increased funding costs and market volatility due to market illiquidity and competition for funding; the failure of third parties to comply with their obligations to the Bank and its affiliates, including relating to the care and control of information, and other risks arising from the Bank’s use of third parties; changes in monetary, fiscal, or economic policy and tax legislation and interpretation; changes in laws and regulations or in supervisory expectations or requirements, including capital, interest rate and liquidity requirements and guidance, and the effect of such changes on funding costs; geopolitical risk (including policies and other changes related to, or affecting, economic or trade matters, including tariffs, countermeasures, tariff mitigation policies and
tax-related
risks); changes to our credit ratings; the possible effects on our business and the global economy of war, conflicts or terrorist actions and unforeseen consequences arising from such actions; technological changes, including open banking and the use of data and artificial intelligence in our business, and technology resiliency; operational and infrastructure risks; reputational risks; the accuracy and completeness of information the Bank receives on customers and counterparties; the timely development and introduction of new products and services, and the extent to which products or services previously sold by the Bank require the Bank to incur liabilities or absorb losses not contemplated at their origination; our ability to execute our strategic plans, including the successful completion of acquisitions and dispositions, including obtaining regulatory approvals; critical accounting estimates and the effect of changes to accounting standards, rules and interpretations on these estimates; global capital markets activity; the Bank’s ability to attract, develop and retain key executives; the evolution of various types of fraud or other criminal behaviour to which the Bank is exposed; anti-money laundering; disruptions or attacks (including cyberattacks) on the Bank’s information technology, internet connectivity, network accessibility, or other voice or data communications systems or services, which may result in data breaches, unauthorized access to sensitive information, denial of service and potential incidents of identity theft; increased competition in the geographic and business areas in which we operate, including through internet and mobile banking and
non-traditional
competitors; exposure related to significant litigation and regulatory matters; environmental, social and governance risks, including climate-related risk, our ability to implement various sustainability-related initiatives (both internally and with our clients and other stakeholders) under expected time frames, and our ability to scale our sustainable-finance products and services; the occurrence of natural and unnatural catastrophic events and claims resulting from such events, including disruptions to public infrastructure, such as transportation, communications, power or water supply; inflationary pressures; global supply-chain disruptions; Canadian housing and household indebtedness; the emergence or continuation of widespread health emergencies or pandemics, including their impact on the local, national or global economies, financial market conditions and the Bank’s business, results of operations, financial condition and prospects; and the Bank’s anticipation of and success in managing the risks implied by the foregoing. A substantial amount of the Bank’s business involves making loans or otherwise committing resources to specific companies, industries or countries. Unforeseen events affecting such borrowers, industries or countries could have a material adverse effect on the Bank’s financial results, businesses, financial condition or liquidity. These and other factors may cause the Bank’s actual performance to differ materially from that contemplated by forward-looking statements. The Bank cautions that the preceding list is not exhaustive of all possible risk factors and other factors could also adversely affect the Bank’s results, for more information, please see the “Risk Management” section of the Bank’s 2025 Annual Report, as may be updated by quarterly reports.
Material economic assumptions underlying the forward-looking statements contained in this document are set out in the 2025 Annual Report under the headings “Outlook”, as updated by quarterly reports. The “Outlook” and “2026 Priorities” sections are based on the Bank’s views and the actual outcome is uncertain. Readers should consider the above-noted factors when reviewing these sections. When relying on forward-looking statements to make decisions with respect to the Bank and its securities, investors and others should carefully consider the preceding factors, other uncertainties and potential events.
Any forward-looking statements contained in this document represent the views of management only as of the date hereof and are presented for the purpose of assisting the Bank’s shareholders and analysts in understanding the Bank’s financial position, objectives and priorities, and anticipated financial performance as at and for the periods ended on the dates presented, and may not be appropriate for other purposes. Except as required by law, the Bank does not undertake to update any forward-looking statements, whether written or oral, that may be made from time to time by or on its behalf.
Additional information relating to the Bank, including the Bank’s Annual Information Form, can be located on the SEDAR+ website at www.sedarplus.ca and on the EDGAR section of the SEC’s website at www.sec.gov.
|
2025 Scotiabank Annual Report
|
|
|
|
|
|
|
|
|
|
|
|
| As at and for the years ended October 31 |
|
|
|
|
2024 |
|
Operating results ($ millions) |
|
|
|
|
|
|
|
|
|
|
|
|
|
|
|
19,252 |
|
|
|
|
|
|
|
|
14,418 |
|
|
|
|
|
|
|
|
33,670 |
|
Provision for credit losses |
|
|
|
|
|
|
4,051 |
|
|
|
|
|
|
|
|
19,695 |
|
|
|
|
|
|
|
|
2,032 |
|
|
|
|
|
|
|
|
7,892 |
|
Net income attributable to common shareholders |
|
|
|
|
|
|
7,286 |
|
|
|
|
|
|
|
|
|
|
Basic earnings per share ($) |
|
|
|
|
|
|
5.94 |
|
Diluted earnings per share ($) |
|
|
|
|
|
|
5.87 |
|
|
|
|
|
|
|
|
10.2 |
|
Return on tangible common equity (%) (2)
|
|
|
|
|
|
|
12.6 |
|
Productivity ratio (%) (1)
|
|
|
|
|
|
|
58.5 |
|
Operating leverage (%) (1)
|
|
|
|
|
|
|
1.5 |
|
Net interest margin (%) (2)
|
|
|
|
|
|
|
2.16 |
|
Financial position information ($ millions) |
|
|
|
|
|
|
|
|
Cash and deposits with financial institutions |
|
|
|
|
|
|
63,860 |
|
|
|
|
|
|
|
|
129,727 |
|
|
|
|
|
|
|
|
760,829 |
|
|
|
|
|
|
|
|
1,412,027 |
|
|
|
|
|
|
|
|
943,849 |
|
|
|
|
|
|
|
|
73,590 |
|
Preferred shares and other equity instruments |
|
|
|
|
|
|
8,779 |
|
Assets under administration (1)
|
|
|
|
|
|
|
771,454 |
|
Assets under management (1)
|
|
|
|
|
|
|
373,030 |
|
Capital and liquidity measures |
|
|
|
|
|
|
|
|
Common Equity Tier 1 (CET1) capital ratio (%) (3)
|
|
|
|
|
|
|
13.1 |
|
Tier 1 capital ratio (%) (3)
|
|
|
|
|
|
|
15.0 |
|
Total capital ratio (%) (3)
|
|
|
|
|
|
|
16.7 |
|
Total loss absorbing capacity (TLAC) ratio (%) (4)
|
|
|
|
|
|
|
29.7 |
|
|
|
|
|
|
|
|
4.4 |
|
TLAC Leverage ratio (%) (4)
|
|
|
|
|
|
|
8.8 |
|
Risk-weighted assets ($ millions) (3)
|
|
|
|
|
|
|
463,992 |
|
Liquidity coverage ratio (LCR) (%) (6)
|
|
|
|
|
|
|
131 |
|
Net stable funding ratio (NSFR) (%) (6)
|
|
|
|
|
|
|
119 |
|
|
|
|
|
|
|
|
|
|
Net impaired loans ($ millions) |
|
|
|
|
|
|
4,685 |
|
Allowance for credit losses ($ millions) (7)
|
|
|
|
|
|
|
6,736 |
|
Gross impaired loans as a % of loans and acceptances (1)
|
|
|
|
|
|
|
0.88 |
|
Net impaired loans as a % of loans and acceptances (1)
|
|
|
|
|
|
|
0.61 |
|
Provision for credit losses as a % of average net loans and acceptances (1)(8)
|
|
|
|
|
|
|
0.53 |
|
Provision for credit losses on impaired loans as a % of average net loans and acceptances (1)(8)
|
|
|
|
|
|
|
0.52 |
|
Net write-offs as a % of average net loans and acceptances (1)
|
|
|
|
|
|
|
0.46 |
|
|
|
|
|
|
|
|
|
|
Adjusted total revenue ($ millions) |
|
|
|
|
|
|
33,813 |
|
Adjusted non-interest expenses ($ millions) |
|
|
|
|
|
|
18,961 |
|
Adjusted net income ($ millions) |
|
|
|
|
|
|
8,627 |
|
Adjusted diluted earnings per share ($) |
|
|
|
|
|
|
6.47 |
|
Adjusted return on equity (%) |
|
|
|
|
|
|
11.3 |
|
Adjusted return on tangible common equity (%) |
|
|
|
|
|
|
13.7 |
|
Adjusted productivity ratio (%) |
|
|
|
|
|
|
56.1 |
|
Adjusted operating leverage (%) |
|
|
|
|
|
|
2.3 |
|
|
|
|
|
|
|
|
|
|
Closing share price ($) (TSX) |
|
|
|
|
|
|
71.69 |
|
Shares outstanding (millions) |
|
|
|
|
|
|
|
|
|
|
|
|
|
|
|
1,226 |
|
|
|
|
|
|
|
|
1,232 |
|
|
|
|
|
|
|
|
1,244 |
|
Dividends paid per share ($) |
|
|
|
|
|
|
4.24 |
|
|
|
|
|
|
|
|
6.5 |
|
Market capitalization ($ millions) (TSX) |
|
|
|
|
|
|
89,214 |
|
Book value per common share ($) (1)
|
|
|
|
|
|
|
59.14 |
|
Market value to book value multiple (1)
|
|
|
|
|
|
|
1.2 |
|
Price to earnings multiple (trailing 4 quarters) (1)
|
|
|
|
|
|
|
12.0 |
|
|
|
|
|
|
|
|
|
|
Employees (full-time equivalent) |
|
|
|
|
|
|
88,488 |
|
|
|
|
|
|
|
|
2,236 |
|
| (1) |
Refer to Glossary on page 136 for the description of the measure. |
| (2) |
Refer to Non-GAAP Measures section starting on page 20. |
| (3) |
The regulatory capital ratios are based on Basel III requirements as determined in accordance with the Office of the Superintendent of Financial Institutions (OSFI) Guideline – Capital Adequacy Requirements. |
| (4) |
This measure has been disclosed in this document in accordance with OSFI Guideline – Total Loss Absorbing Capacity. |
| (5) |
The leverage ratios are based on Basel III requirements as determined in accordance with OSFI Guideline – Leverage Requirements. |
| (6) |
The LCR and NSFR are calculated in accordance with OSFI Guideline – Liquidity Adequacy Requirements (LAR). |
| (7) |
Includes allowance for credit losses on all financial assets – loans, acceptances, off-balance sheet exposures, debt securities, and deposits with financial institutions. |
| (8) |
Includes provision for credit losses on certain financial assets – loans, acceptances, and off-balance sheet exposures. |
2025 Scotiabank Annual Report
|
Management’s Discussion and Analysis
The Bank uses a number of financial measures and ratios to assess its performance, as well as the performance of its operating segments. Some of these financial measures and ratios are presented on a
non-GAAP
basis and are not calculated in accordance with Generally Accepted Accounting Principles (GAAP), which are based on International Financial Reporting Standards (IFRS) as issued by the International Accounting Standards Board (IASB), are not defined by GAAP and do not have standardized meanings and therefore might not be comparable to similar financial measures and ratios disclosed by other issuers. The Bank believes that
non-GAAP
measures and ratios are useful as they provide readers with a better understanding of how management assesses performance. These
non-GAAP
measures and ratios are used throughout this report and defined below.
Adjusted results and diluted earnings per share
The following tables present a reconciliation of GAAP reported financial results to
non-GAAP
adjusted financial results. Management considers both reported and adjusted results and measures useful in assessing underlying ongoing business performance. Adjusted results and measures remove certain specified items from revenue,
non-interest
expenses, income taxes and
non-controlling
interests. Presenting results on both a reported basis and adjusted basis allows readers to assess the impact of certain items on results for the periods presented, and to better assess results and trends excluding those items that may not be reflective of ongoing business performance.
T2
Reconciliation of reported and adjusted results
|
|
|
|
|
|
|
|
|
|
|
|
| As at October 31 ($ millions) |
|
|
|
|
2024 |
|
|
|
|
|
|
|
|
|
|
|
|
|
|
|
|
$ |
19,252 |
|
|
|
|
|
|
|
|
14,418 |
|
|
|
|
|
|
|
|
33,670 |
|
Provision for credit losses |
|
|
|
|
|
|
4,051 |
|
|
|
|
|
|
|
|
19,695 |
|
|
|
|
|
|
|
|
9,924 |
|
|
|
|
|
|
|
|
2,032 |
|
|
|
|
|
|
|
$ |
7,892 |
|
Net income (loss) attributable to non-controlling interests in subsidiaries (NCI) |
|
|
|
|
|
|
134 |
|
Net income attributable to equity holders |
|
|
|
|
|
|
7,758 |
|
Net income attributable to preferred shareholders and other equity instrument holders |
|
|
|
|
|
|
472 |
|
Net income attributable to common shareholders |
|
|
|
|
|
$ |
7,286 |
|
|
|
|
|
|
|
|
|
|
Adjusting items impacting non-interest income and total revenue (Pre-tax)
|
|
|
|
|
|
|
|
|
(a) Divestitures and wind-down of operations |
|
|
|
|
|
$ |
143 |
|
(d) Amortization of acquisition-related intangible assets |
|
|
|
|
|
|
– |
|
Total non-interest income and total revenue adjusting items (Pre-tax)
|
|
|
|
|
|
|
143 |
|
Adjusting items impacting non-interest expenses (Pre-tax)
|
|
|
|
|
|
|
|
|
(a) Divestitures and wind-down of operations |
|
|
|
|
|
|
(7 |
) |
(b) Restructuring charge and severance provisions |
|
|
|
|
|
|
53 |
|
|
|
|
|
|
|
|
176 |
|
(d) Amortization of acquisition-related intangible assets |
|
|
|
|
|
|
72 |
|
(e) Impairment of non-financial assets |
|
|
|
|
|
|
440 |
|
Total non-interest expense adjusting items (Pre-tax)
|
|
|
|
|
|
|
734 |
|
Total impact of adjusting items on net income before taxes |
|
|
|
|
|
|
877 |
|
Impact of adjusting items on income tax expense |
|
|
|
|
|
|
|
|
(a) Divestitures and wind-down of operations |
|
|
|
|
|
|
(46 |
) |
(b) Restructuring charge and severance provisions |
|
|
|
|
|
|
(15 |
) |
|
|
|
|
|
|
|
– |
|
(d) Amortization of acquisition-related intangible assets |
|
|
|
|
|
|
(20 |
) |
(e) Impairment of non-financial assets |
|
|
|
|
|
|
(61 |
) |
Total impact of adjusting items on income tax expense |
|
|
|
|
|
|
(142 |
) |
Total impact of adjusting items on net income |
|
|
|
|
|
|
735 |
|
Impact of adjusting items on NCI |
|
|
|
|
|
|
(2 |
) |
Total impact of adjusting items on net income attributable to equity holders |
|
|
|
|
|
$ |
733 |
|
|
|
|
|
|
|
|
|
|
Adjusted net interest income |
|
|
|
|
|
$ |
19,252 |
|
Adjusted non-interest income |
|
|
|
|
|
|
14,561 |
|
|
|
|
|
|
|
|
33,813 |
|
Adjusted provision for credit losses |
|
|
|
|
|
|
4,051 |
|
Adjusted non-interest expenses |
|
|
|
|
|
|
18,961 |
|
Adjusted income before taxes |
|
|
|
|
|
|
10,801 |
|
Adjusted income tax expense |
|
|
|
|
|
|
2,174 |
|
|
|
|
|
|
|
$ |
8,627 |
|
Adjusted net income attributable to NCI |
|
|
|
|
|
|
136 |
|
Adjusted net income attributable to equity holders |
|
|
|
|
|
|
8,491 |
|
Adjusted net income attributable to preferred shareholders and other equity instrument holders |
|
|
|
|
|
|
472 |
|
Adjusted net income attributable to common shareholders |
|
|
|
|
|
$ |
8,019 |
|
|
2025 Scotiabank Annual Report
T2A
Reconciliation of reported and adjusted diluted earnings per common share
|
|
|
|
|
|
|
|
|
|
|
|
| As at and for the year ended October 31 ($ millions) |
|
|
|
|
2024 |
|
|
|
|
|
|
|
|
|
|
Net income attributable to common shareholders |
|
|
|
|
|
$ |
7,286 |
|
Foreign currency loss on redemption of Subordinated Additional Tier 1 Capital Notes |
|
|
|
|
|
|
– |
|
Net income attributable to common shareholders used to calculate basic earnings per common share |
|
|
|
|
|
|
7,286 |
|
Dilutive impact of share-based payment options and others |
|
|
|
|
|
|
(49 |
) |
Net income attributable to common shareholders (diluted) |
|
|
|
|
|
|
7,237 |
|
Weighted average number of diluted common shares outstanding (millions) |
|
|
|
|
|
|
1,232 |
|
Diluted earnings per common share (in dollars) |
|
|
|
|
|
$ |
5.87 |
|
|
|
|
|
|
|
|
|
|
Net income attributable to common shareholders used to calculate basic earnings per common share |
|
|
|
|
|
$ |
7,286 |
|
Impact of adjusting items on net income attributable to common shareholders (1)
|
|
|
|
|
|
|
733 |
|
Foreign currency loss on redemption of Subordinated Additional Tier 1 Capital Notes |
|
|
|
|
|
|
– |
|
Adjusted net income attributable to common shareholders used to calculate adjusted basic earnings per common share |
|
|
|
|
|
|
8,019 |
|
Dilutive impact of share-based payment options and others |
|
|
|
|
|
|
(49 |
) |
Adjusted net income attributable to common shareholders (diluted) |
|
|
|
|
|
|
7,970 |
|
Weighted average number of diluted common shares outstanding (millions) |
|
|
|
|
|
|
1,232 |
|
Adjusted diluted earnings per common share (in dollars) |
|
|
|
|
|
$ |
6.47 |
|
Impact of adjustments on diluted earnings per share (in dollars) |
|
|
|
|
|
$ |
0.60 |
|
| (1) |
Refer to Table T2 for details of adjusting items. |
T3
Impact of adjustments on (income)/expenses
|
|
|
|
|
|
|
|
|
|
|
|
|
|
|
|
|
|
|
|
|
|
|
|
|
|
|
|
|
|
|
|
|
|
|
|
| |
|
|
|
|
For the three months ended |
|
| |
|
|
|
|
2024 |
|
|
|
|
|
October 31, 2024 |
|
|
|
|
|
|
|
|
|
|
| ($ millions) |
|
|
|
|
|
|
|
|
|
|
|
|
|
|
|
|
|
|
|
|
|
|
|
|
(a) Divestitures and wind-down of operations |
|
|
|
|
|
|
|
|
|
$ |
136 |
|
|
$ |
90 |
|
|
|
|
|
|
|
|
|
|
$ |
– |
|
|
$ |
– |
|
(b) Restructuring charge and severance provisions |
|
|
|
|
|
|
|
|
|
|
53 |
|
|
|
38 |
|
|
|
|
|
|
|
|
|
|
|
53 |
|
|
|
38 |
|
|
|
|
|
|
|
|
|
|
|
|
176 |
|
|
|
176 |
|
|
|
|
|
|
|
|
|
|
|
– |
|
|
|
– |
|
(d) Amortization of acquisition-related intangible assets |
|
|
|
|
|
|
|
|
|
|
72 |
|
|
|
52 |
|
|
|
|
|
|
|
|
|
|
|
19 |
|
|
|
13 |
|
Impairment of non-financial assets: |
|
|
|
|
|
|
|
|
|
|
|
|
|
|
|
|
|
|
|
|
|
|
|
|
|
|
|
|
|
|
|
|
(e) Investment in associates |
|
|
|
|
|
|
|
|
|
|
343 |
|
|
|
309 |
|
|
|
|
|
|
|
|
|
|
|
343 |
|
|
|
309 |
|
(e) Intangible assets including software |
|
|
|
|
|
|
|
|
|
|
97 |
|
|
|
70 |
|
|
|
|
|
|
|
|
|
|
|
97 |
|
|
|
70 |
|
|
|
|
|
|
|
|
|
|
|
$ |
877 |
|
|
$ |
735 |
|
|
|
|
|
|
|
|
|
|
$ |
512 |
|
|
$ |
430 |
|
|
|
|
|
|
|
|
|
|
|
|
|
|
|
$ |
0.60 |
|
|
|
|
|
|
|
|
|
|
|
|
|
|
$ |
0.35 |
|
|
|
|
|
|
|
|
|
|
|
|
|
|
|
|
(9 bps |
) |
|
|
|
|
|
|
|
|
|
|
|
|
|
|
(5 bps |
) |
| (1) |
Including related impacts on regulatory capital and risk-weighted assets. |
The Bank’s fiscal 2025 and 2024 results were adjusted for the following items. These amounts were recorded in the Other operating segment, unless otherwise noted.
| |
a) |
Divestitures and wind-down of operations |
In Q1 2025, the Bank entered into an agreement to sell its banking operations in Colombia, Costa Rica and Panama in exchange for an approximately 20% ownership stake in the newly combined entity of Davivienda. On that date, the Bank recognized an impairment loss of $1,362 million ($1,355 million after-tax) as the banking operations that are part of the transaction were classified as held for sale. As of October 31, 2025, the Bank has recognized a total impairment loss of $1,422 million in non-interest expense and a credit of $45 million in
non-interest
income (collectively $1,342 million after-tax). These subsequent changes represent changes in the carrying value of net assets being sold and fair value of shares to be received less costs to sell, as well as changes in foreign currency.
In Q2 2025, the Bank completed the sale of CrediScotia Financiera S.A. (CrediScotia), a wholly-owned consumer finance subsidiary in Peru, to Banco Santander S.A. (Espana). The Bank recognized an additional loss of $9 million in
non-interest
income – other upon closing. In Q3 2024, the Bank had recognized an impairment loss of $143 million in
non-interest
income and a recovery of expenses of $7 million in
non-interest
expenses – salaries and employee benefits (collectively $90 million
after-tax),
the majority of which relates to goodwill.
For further details, please refer to Note 35 of the consolidated financial statements.
| |
b) |
Restructuring charge and severance provisions |
In Q4 2025, the Bank recorded a restructuring charge and severance provision as well as other related charges of $373 million ($270 million after-tax) primarily related to workforce reductions. These amounts reflect actions taken by the Bank to simplify its organizational structure in Canadian Banking, restructure and right-size Asia operations in Global Banking and Markets and regionalize activities across its international footprint, in line with the Bank’s enterprise strategy. For further details, please refer to Note 22 of the consolidated financial statements.
2025 Scotiabank Annual Report
|
Management’s Discussion and Analysis
In Q4 2024, the Bank recorded severance provisions of $53 million ($38 million
after-tax)
related to the Bank’s continued efforts to streamline its organizational structure and support execution of the Bank’s strategy.
In Q4 2025, the Bank recognized a legal provision of $74 million ($54 million after-tax) related to several civil and other litigation matters.
In Q3 2024, the Bank recognized a $176 million expense for legal actions in Peru relating to certain value-added tax assessed amounts and associated interest. The legal actions arose from certain client transactions that occurred prior to the Bank’s acquisition of its Peruvian subsidiary. For further details, please refer to Note 22 of the consolidated financial statements.
| |
d) |
Amortization of acquisition-related intangible assets |
These costs relate to the amortization of intangible assets recognized upon the acquisition of businesses, excluding software. The costs are recorded in
non-interest
expenses – depreciation and amortization for the Canadian Banking, International Banking and Global Wealth Management operating segments, and
non-interest
income – net income from investments in associated corporations for the Other operating segment.
| |
e) |
Impairment of non-financial assets |
In Q4 2024, the Bank recorded impairment charges of $343 million ($309 million after-tax) related to its investment in associate, Bank of Xi’an Co. Ltd. in China, driven primarily by the continued weakening of the economic outlook in China and whose market value has remained below the Bank’s carrying value for a prolonged period. In Q4 2024, the Bank recorded an impairment of software intangible assets of $97 million ($70 million after-tax).
In addition to the above, the following adjustment also impacted earnings per share calculation.
| |
f) |
Foreign currency loss on redemption of Subordinated Additional Tier 1 Capital Note |
In Q3 2025, the Bank redeemed all outstanding U.S. $1,250 million 4.900% Fixed Rate Resetting Perpetual Subordinated Additional Tier 1 Capital Notes (AT1 Note). The redemption resulted in a foreign currency loss of $22 million, which was recognized in retained earnings. The loss was deducted from net income attributable to common shareholders for the purposes of calculating basic and diluted earnings per share (EPS). For the adjusted diluted EPS calculation, the loss was added back as an adjusting item (refer to Table T2A for reconciliation). Please also refer to Note 23 (b) and Note 32 of the consolidated financial statements.
T4
Reconciliation of reported and adjusted results by business line
|
|
|
|
|
|
|
|
|
|
|
|
|
|
|
|
|
|
|
|
|
|
|
|
|
|
|
| |
|
For the year ended October 31, 2025 (1)
|
|
|
|
|
|
|
|
|
| ($ millions) |
|
|
|
|
|
|
|
|
|
|
Global Banking
and Markets |
|
|
|
|
|
|
|
Reported net income (loss) |
|
|
|
|
|
|
|
|
|
|
|
|
|
|
|
|
|
|
|
|
|
|
|
|
Net income attributable to non-controlling interests in subsidiaries (NCI) |
|
|
|
|
|
|
|
|
|
|
|
|
|
|
|
|
|
|
|
|
|
|
|
|
Reported net income attributable to equity holders |
|
|
|
|
|
|
|
|
|
|
|
|
|
|
|
|
|
|
|
|
|
|
|
|
Reported net income attributable to preferred shareholders and other equity instrument holders |
|
|
|
|
|
|
|
|
|
|
|
|
|
|
|
|
|
|
|
|
|
|
|
|
Reported net income attributable to common shareholders |
|
|
|
|
|
|
|
|
|
|
|
|
|
|
|
|
|
|
|
|
|
|
|
|
|
|
|
|
|
|
|
|
|
|
|
|
|
|
|
|
|
|
|
|
|
|
|
|
|
Adjusting items impacting non-interest income and total revenue (Pre-tax)
|
|
|
|
|
|
|
|
|
|
|
|
|
|
|
|
|
|
|
|
|
|
|
|
|
Divestitures and wind-down of operations |
|
|
|
|
|
|
|
|
|
|
|
|
|
|
|
|
|
|
|
|
|
|
|
|
Amortization of acquisition-related intangible assets |
|
|
|
|
|
|
|
|
|
|
|
|
|
|
|
|
|
|
|
|
|
|
|
|
Total non-interest income adjustments (Pre-tax) |
|
|
|
|
|
|
|
|
|
|
|
|
|
|
|
|
|
|
|
|
|
|
|
|
Adjusting items impacting non-interest expenses (Pre-tax)
|
|
|
|
|
|
|
|
|
|
|
|
|
|
|
|
|
|
|
|
|
|
|
|
|
Divestitures and wind-down of operations |
|
|
|
|
|
|
|
|
|
|
|
|
|
|
|
|
|
|
|
|
|
|
|
|
Restructuring charge and severance provisions |
|
|
|
|
|
|
|
|
|
|
|
|
|
|
|
|
|
|
|
|
|
|
|
|
|
|
|
|
|
|
|
|
|
|
|
|
|
|
|
|
|
|
|
|
|
|
|
|
|
Amortization of acquisition-related intangible assets |
|
|
|
|
|
|
|
|
|
|
|
|
|
|
|
|
|
|
|
|
|
|
|
|
Total non-interest expenses adjustments (Pre-tax)
|
|
|
|
|
|
|
|
|
|
|
|
|
|
|
|
|
|
|
|
|
|
|
|
|
Total impact of adjusting items on net income before taxes |
|
|
|
|
|
|
|
|
|
|
|
|
|
|
|
|
|
|
|
|
|
|
|
|
Total impact of adjusting items on income tax expense |
|
|
|
|
|
|
|
|
|
|
|
|
|
|
|
|
|
|
|
|
|
|
|
|
Total impact of adjusting items on net income |
|
|
|
|
|
|
|
|
|
|
|
|
|
|
|
|
|
|
|
|
|
|
|
|
Impact of adjusting items on NCI |
|
|
|
|
|
|
|
|
|
|
|
|
|
|
|
|
|
|
|
|
|
|
|
|
Total impact of adjusting items on net income attributable to equity holders |
|
|
|
|
|
|
|
|
|
|
|
|
|
|
|
|
|
|
|
|
|
|
|
|
Adjusted net income (loss) |
|
|
|
|
|
|
|
|
|
|
|
|
|
|
|
|
|
|
|
|
|
|
|
|
Adjusted net income attributable to equity holders |
|
|
|
|
|
|
|
|
|
|
|
|
|
|
|
|
|
|
|
|
|
|
|
|
Adjusted net income attributable to common shareholders |
|
|
|
|
|
|
|
|
|
|
|
|
|
|
|
|
|
|
|
|
|
|
|
|
| (1) |
Refer to Business Line Overview on page 42. |
|
2025 Scotiabank Annual Report
|
|
|
|
|
|
|
|
|
|
|
|
|
|
|
|
|
|
|
|
|
|
|
|
|
|
|
| |
|
For the year ended October 31, 2024 (1)
|
|
|
|
|
|
|
|
|
| ($ millions) |
|
|
|
|
|
|
|
Global Wealth Management (2)
|
|
|
Global Banking and Markets (2)
|
|
|
|
|
|
Total |
|
Reported net income (loss) |
|
$ |
3,777 |
|
|
$ |
2,706 |
|
|
$ |
1,428 |
|
|
$ |
1,478 |
|
|
$ |
(1,497 |
) |
|
$ |
7,892 |
|
Net income attributable to non-controlling interests in subsidiaries (NCI) |
|
|
– |
|
|
|
125 |
|
|
|
10 |
|
|
|
– |
|
|
|
(1 |
) |
|
|
134 |
|
Reported net income attributable to equity holders |
|
|
3,777 |
|
|
|
2,581 |
|
|
|
1,418 |
|
|
|
1,478 |
|
|
|
(1,496 |
) |
|
|
7,758 |
|
Reported net income attributable to preferred shareholders and other equity instrument holders |
|
|
1 |
|
|
|
1 |
|
|
|
1 |
|
|
|
1 |
|
|
|
468 |
|
|
|
472 |
|
Reported net income attributable to common shareholders |
|
$ |
3,776 |
|
|
$ |
2,580 |
|
|
$ |
1,417 |
|
|
$ |
1,477 |
|
|
$ |
(1,964 |
) |
|
$ |
7,286 |
|
|
|
|
|
|
|
|
|
|
|
|
|
|
|
|
|
|
|
|
|
|
|
|
|
|
Adjusting items impacting non-interest income and total revenue (Pre-tax)
|
|
|
|
|
|
|
|
|
|
|
|
|
|
|
|
|
|
|
|
|
|
|
|
|
Divestitures and wind-down of operations |
|
$ |
– |
|
|
$ |
– |
|
|
$ |
– |
|
|
$ |
– |
|
|
$ |
143 |
|
|
$ |
143 |
|
Adjusting items impacting non-interest expenses (Pre-tax)
|
|
|
|
|
|
|
|
|
|
|
|
|
|
|
|
|
|
|
|
|
|
|
|
|
Divestitures and wind-down of operations |
|
|
– |
|
|
|
– |
|
|
|
– |
|
|
|
– |
|
|
|
(7 |
) |
|
|
(7 |
) |
Restructuring charge and severance provisions |
|
|
– |
|
|
|
– |
|
|
|
– |
|
|
|
– |
|
|
|
53 |
|
|
|
53 |
|
|
|
|
– |
|
|
|
– |
|
|
|
– |
|
|
|
– |
|
|
|
176 |
|
|
|
176 |
|
Amortization of acquisition-related intangible assets |
|
|
4 |
|
|
|
32 |
|
|
|
36 |
|
|
|
– |
|
|
|
– |
|
|
|
72 |
|
Impairment of non-financial assets |
|
|
– |
|
|
|
– |
|
|
|
– |
|
|
|
– |
|
|
|
440 |
|
|
|
440 |
|
Total non-interest expenses adjustments (Pre-tax)
|
|
|
4 |
|
|
|
32 |
|
|
|
36 |
|
|
|
– |
|
|
|
662 |
|
|
|
734 |
|
Total impact of adjusting items on net income before taxes |
|
|
4 |
|
|
|
32 |
|
|
|
36 |
|
|
|
– |
|
|
|
805 |
|
|
|
877 |
|
Total impact of adjusting items on income tax expense |
|
|
(1 |
) |
|
|
(9 |
) |
|
|
(10 |
) |
|
|
– |
|
|
|
(122 |
) |
|
|
(142 |
) |
Total impact of adjusting items on net income |
|
|
3 |
|
|
|
23 |
|
|
|
26 |
|
|
|
– |
|
|
|
683 |
|
|
|
735 |
|
Impact of adjusting items on NCI |
|
|
– |
|
|
|
– |
|
|
|
– |
|
|
|
– |
|
|
|
(2 |
) |
|
|
(2 |
) |
Total impact of adjusting items on net income attributable to equity holders |
|
|
3 |
|
|
|
23 |
|
|
|
26 |
|
|
|
– |
|
|
|
681 |
|
|
|
733 |
|
Adjusted net income (loss) |
|
$ |
3,780 |
|
|
$ |
2,729 |
|
|
$ |
1,454 |
|
|
$ |
1,478 |
|
|
$ |
(814 |
) |
|
$ |
8,627 |
|
Adjusted net income attributable to equity holders |
|
$ |
3,780 |
|
|
$ |
2,604 |
|
|
$ |
1,444 |
|
|
$ |
1,478 |
|
|
$ |
(815 |
) |
|
$ |
8,491 |
|
Adjusted net income attributable to common shareholders |
|
$ |
3,779 |
|
|
$ |
2,603 |
|
|
$ |
1,443 |
|
|
$ |
1,477 |
|
|
$ |
(1,283 |
) |
|
$ |
8,019 |
|
| (1) |
Refer to Business Line Overview on page 42. |
| (2) |
Effective Q1 2025, changes were made to the methodology used to allocate certain income, expenses and balance sheet items between business segments. Prior period results for each segment have been reclassified to conform with the current period’s methodology. Refer to page 42 for further details. |
International Banking business segment results are analyzed on a constant dollar basis which is a
non-GAAP
measure. Under the constant dollar basis, prior period amounts are recalculated using current period average foreign currency rates. The following table presents the reconciliation between reported, adjusted and constant dollar results for International Banking for prior periods. The Bank believes that constant dollar is useful for readers to understand business performance without the impact of foreign currency translation and is used by management to assess the performance of the business segment. The tables below are computed on a basis that is different than the table “Impact of foreign currency translation” in Overview of Performance on page 30.
T5
Reconciliation of International Banking’s reported and adjusted results and constant dollar results
|
|
|
|
|
|
|
|
|
|
|
|
|
| For the year ended October 31 ($ millions) |
|
|
|
| (Taxable equivalent basis) |
|
Reported
results |
|
|
Foreign
exchange |
|
|
Constant
dollar |
|
|
|
$ |
8,867 |
|
|
$ |
11 |
|
|
$ |
8,856 |
|
|
|
|
2,999 |
|
|
|
19 |
|
|
|
2,980 |
|
|
|
|
11,866 |
|
|
|
30 |
|
|
|
11,836 |
|
Provision for credit losses |
|
|
2,285 |
|
|
|
(8 |
) |
|
|
2,293 |
|
|
|
|
6,170 |
|
|
|
49 |
|
|
|
6,121 |
|
|
|
|
705 |
|
|
|
1 |
|
|
|
704 |
|
|
|
$ |
2,706 |
|
|
$ |
(12 |
) |
|
$ |
2,718 |
|
Net income attributable to non-controlling interest in subsidiaries |
|
$ |
125 |
|
|
$ |
(3 |
) |
|
$ |
128 |
|
Net income attributable to equity holders of the Bank |
|
$ |
2,581 |
|
|
$ |
(9 |
) |
|
$ |
2,590 |
|
|
|
|
|
|
|
|
|
|
|
|
|
|
Average assets ($ billions) |
|
$ |
231 |
|
|
$ |
(1 |
) |
|
$ |
232 |
|
Average liabilities ($ billions) |
|
$ |
179 |
|
|
$ |
1 |
|
|
$ |
178 |
|
2025 Scotiabank Annual Report
|
Management’s Discussion and Analysis
|
|
|
|
|
|
|
|
|
|
|
|
|
| For the year ended October 31 ($ millions) |
|
|
|
| (Taxable equivalent basis) |
|
Adjusted
results |
|
|
Foreign
exchange |
|
|
Constant
dollar
adjusted |
|
|
|
$ |
8,867 |
|
|
$ |
11 |
|
|
$ |
8,856 |
|
|
|
|
2,999 |
|
|
|
19 |
|
|
|
2,980 |
|
|
|
|
11,866 |
|
|
|
30 |
|
|
|
11,836 |
|
Provision for credit losses |
|
|
2,285 |
|
|
|
(8 |
) |
|
|
2,293 |
|
|
|
|
6,138 |
|
|
|
49 |
|
|
|
6,089 |
|
|
|
|
714 |
|
|
|
1 |
|
|
|
713 |
|
|
|
$ |
2,729 |
|
|
$ |
(12 |
) |
|
$ |
2,741 |
|
Net income attributable to non-controlling interest in subsidiaries |
|
$ |
125 |
|
|
$ |
(3 |
) |
|
$ |
128 |
|
Net income attributable to equity holders of the Bank |
|
$ |
2,604 |
|
|
$ |
(9 |
) |
|
$ |
2,613 |
|
| (1) |
Effective Q1 2025, changes were made to the methodology used to allocate certain income, expenses and balance sheet items between business segments. Prior period results for each segment have been reclassified to conform with the current period’s methodology. Refer to page 42 for further details. |
Earning and
non-earning
assets, core earning assets, core net interest income and net interest margin
Net interest margin is a
non-GAAP
ratio that is used to measure the return generated by the Bank’s core earning assets, net of the cost of funding. Net interest margin is calculated as core net interest income divided by average core earning assets. Management uses net interest margin to measure profitability and how efficiently the Bank earns income from its core earning assets relative to the cost of funding those assets.
Components of net interest margin are defined below:
Earning assets are defined as income generating assets which include deposits with financial institutions, trading assets, investment securities, investments in associates, securities borrowed or purchased under resale agreements, loans net of allowances, and customers’ liability under acceptances. This is a
non-GAAP
measure.
Non-earning
assets are defined as cash, precious metals, derivative financial instruments, property and equipment, goodwill and intangible assets, deferred tax assets and other assets. This is a
non-GAAP
measure.
Core earning assets are defined as interest-bearing deposits with financial institutions, investment securities and loans, net of allowances. This is a
non-GAAP
measure. The Bank believes that this measure is useful for readers as it presents the main interest-generating assets and eliminates the impact of trading businesses.
Core net interest income is defined as net interest income earned from core earning assets. This is a
non-GAAP
measure.
T6
Calculation of net interest margin
|
|
|
|
|
|
|
|
|
|
|
|
| For the year ended October 31
|
|
|
|
|
2024 |
|
Average total assets - Reported (1)
|
|
|
|
|
|
$ |
1,419,284 |
|
|
|
|
|
|
|
|
108,110 |
|
Average total earning assets (1)
|
|
|
|
|
|
$ |
1,311,174 |
|
|
|
|
|
|
|
|
|
|
|
|
|
|
|
|
|
146,307 |
|
Securities purchased under resale agreements |
|
|
|
|
|
|
|
|
|
|
|
|
|
|
|
193,090 |
|
|
|
|
|
|
|
|
53,819 |
|
Average core earning assets (1) (A) |
|
|
|
|
|
$ |
917,958 |
|
Net Interest Income - Reported |
|
|
|
|
|
$ |
19,252 |
|
Less: Non-core net interest income |
|
|
|
|
|
|
(620 |
) |
Core net interest income (B) |
|
|
|
|
|
$ |
19,872 |
|
Net interest margin (B/A) |
|
|
|
|
|
|
2.16 |
% |
| (1) |
Average balances represent the average of daily balances for the period. |
|
2025 Scotiabank Annual Report
|
|
|
|
|
|
|
|
|
|
|
|
| For the year ended October 31
|
|
|
|
|
|
|
Average total assets - Reported (2)
|
|
|
|
|
|
$ |
449,469 |
|
|
|
|
|
|
|
|
4,393 |
|
Average total earning assets (2)
|
|
|
|
|
|
$ |
445,076 |
|
|
|
|
|
|
|
|
|
|
|
|
|
|
|
|
|
16,380 |
|
Average core earning assets (2)
|
|
|
|
|
|
$ |
428,696 |
|
Net Interest Income - Reported |
|
|
|
|
|
$ |
10,185 |
|
Less: Non-core net interest income |
|
|
|
|
|
|
2 |
|
|
|
|
|
|
|
$ |
10,183 |
|
|
|
|
|
|
|
|
2.38 |
% |
| (1) |
Effective Q1 2025, changes were made to the methodology used to allocate certain income, expenses and balance sheet items between business segments. Prior period results for each segment have been reclassified to conform with the current period’s methodology. Refer to page 42 for further details. |
| (2) |
Average balances represent the average of daily balances for the period. |
|
|
|
|
|
|
|
|
|
|
|
|
| For the year ended October 31
|
|
|
|
|
|
|
Average total assets - Reported (2)
|
|
|
|
|
|
$ |
231,456 |
|
|
|
|
|
|
|
|
15,949 |
|
Average total earning assets (2)
|
|
|
|
|
|
$ |
215,507 |
|
|
|
|
|
|
|
|
|
|
|
|
|
|
|
|
|
6,407 |
|
Securities purchased under resale agreements |
|
|
|
|
|
|
|
|
|
|
|
|
|
|
|
4,063 |
|
|
|
|
|
|
|
|
6,660 |
|
Average core earning assets (2)
|
|
|
|
|
|
$ |
198,377 |
|
Net Interest Income - Reported |
|
|
|
|
|
$ |
8,867 |
|
Less: Non-core net interest income |
|
|
|
|
|
|
123 |
|
|
|
|
|
|
|
$ |
8,744 |
|
|
|
|
|
|
|
|
4.41 |
% |
| (1) |
Effective Q1 2025, changes were made to the methodology used to allocate certain income, expenses and balance sheet items between business segments. Prior period results for each segment have been reclassified to conform with the current period’s methodology. Refer to page 42 for further details. |
| (2) |
Average balances represent the average of daily balances for the period. |
Global Banking and Markets
|
|
|
|
|
|
|
|
|
|
|
|
| For the year ended October 31
|
|
|
|
|
|
|
Average total assets - Reported (2)
|
|
|
|
|
|
$ |
494,595 |
|
|
|
|
|
|
|
|
39,787 |
|
Average total earning assets (2)
|
|
|
|
|
|
$ |
454,808 |
|
|
|
|
|
|
|
|
|
|
|
|
|
|
|
|
|
132,210 |
|
Securities purchased under resale agreements |
|
|
|
|
|
|
|
|
|
|
|
|
|
|
|
189,027 |
|
|
|
|
|
|
|
|
32,078 |
|
Average core earning assets (2)
|
|
|
|
|
|
$ |
101,493 |
|
Net Interest Income - Reported |
|
|
|
|
|
$ |
1,102 |
|
Less: Non-core net interest income |
|
|
|
|
|
|
(475 |
) |
|
|
|
|
|
|
$ |
1,577 |
|
|
|
|
|
|
|
|
1.55 |
% |
| (1) |
Effective Q1 2025, changes were made to the methodology used to allocate certain income, expenses and balance sheet items between business segments. Prior period results for each segment have been reclassified to conform with the current period’s methodology. Refer to page 42 for further details. |
| (2) |
Average balances represent the average of daily balances for the period. |
Return on equity is a profitability measure that presents the net income attributable to common shareholders as a percentage of average common shareholders’ equity.
Adjusted return on equity is a
non-GAAP
ratio which represents adjusted net income attributable to common shareholders as a percentage of average common shareholders’ equity.
Attributed capital and operating segment return on equity
The amount of common equity allocated to each operating segment is referred to as attributed capital. The attribution of capital within each operating segment is intended to approximate a percentage of the Basel III common equity capital requirements based on credit, market and operational risks and leverage inherent within each operating segment. Attributed capital is a
non-GAAP
measure. The Bank attributes capital to its business lines to approximate 11.5% of the Basel III common equity capital requirements.
2025 Scotiabank Annual Report
|
Management’s Discussion and Analysis
Return on equity for the operating segments is calculated as a ratio of net income attributable to common shareholders of the operating segment and the capital attributed. This is a
non-GAAP
measure. Management uses operating segment return on equity to evaluate the performance of its operating segments.
Adjusted return on equity for the operating segments is calculated as a ratio of adjusted net income attributable to common shareholders of the operating segment and the capital attributed. This is a
non-GAAP
measure.
Return on equity by operating segment
T7
Return on equity by operating segment
|
|
|
|
|
|
|
|
|
|
|
|
|
|
|
|
|
|
|
|
|
|
|
|
|
|
|
|
|
|
|
|
| For the year ended October 31, 2025 ($ millions) |
|
|
|
|
|
|
|
|
|
|
Global Banking
and Markets |
|
|
|
|
|
|
|
|
|
|
|
|
|
|
|
|
|
|
|
|
|
|
|
|
|
|
|
|
|
|
|
|
Net income (loss) attributable to common shareholders |
|
|
|
|
|
|
|
|
|
|
|
|
|
|
|
|
|
|
|
|
|
|
|
|
Total average common equity (2)
|
|
|
|
|
|
|
|
|
|
|
|
|
|
|
|
|
|
|
|
|
|
|
|
|
|
|
|
|
|
|
|
|
|
|
|
|
|
|
|
|
|
|
|
|
|
|
|
|
|
|
|
|
|
|
|
|
|
|
|
|
|
|
|
|
|
|
|
|
|
|
|
|
|
|
Net income (loss) attributable to common shareholders |
|
|
|
|
|
|
|
|
|
|
|
|
|
|
|
|
|
|
|
|
|
|
|
|
|
|
|
|
|
|
|
|
|
|
|
|
|
|
|
|
|
|
|
|
|
|
|
|
|
| (1) |
Includes dividends paid on preferred shares and other equity instruments of $506. |
| (2) |
Average amounts calculated using methods intended to approximate the daily average balances for the period. |
| (4) |
Refer to Table on page 20. |
|
|
|
|
|
|
|
|
|
|
|
|
|
|
|
|
|
|
|
|
|
|
|
|
|
|
|
|
|
|
|
|
| For the year ended October 31, 2024 ($ millions) |
|
|
|
|
|
|
|
Global Wealth Management (1)
|
|
|
Global Banking and Markets (1)
|
|
|
|
|
|
Total |
|
|
|
|
|
|
|
|
|
|
|
|
|
|
|
|
|
|
|
|
|
|
|
|
|
|
Net income (loss) attributable to common shareholders |
|
$ |
3,776 |
|
|
$ |
2,580 |
|
|
$ |
1,417 |
|
|
$ |
1,477 |
|
|
$ |
(1,964 |
) (2) |
|
$ |
7,286 |
|
Total average common equity (3)
|
|
|
20,585 |
|
|
|
19,148 |
|
|
|
10,210 |
|
|
|
15,342 |
|
|
|
5,842 |
|
|
|
71,127 |
|
|
|
|
18.3 |
% |
|
|
13.5 |
% |
|
|
13.9 |
% |
|
|
9.6 |
% |
|
|
nm |
(4) |
|
|
10.2 |
% |
|
|
|
|
|
|
|
|
|
|
|
|
|
|
|
|
|
|
|
|
|
|
|
|
|
Net income (loss) attributable to common shareholders |
|
|
3,779 |
|
|
|
2,603 |
|
|
|
1,443 |
|
|
|
1,477 |
|
|
|
(1,283 |
) (2) |
|
|
8,019 |
|
|
|
|
18.4 |
% |
|
|
13.6 |
% |
|
|
14.1 |
% |
|
|
9.6 |
% |
|
|
nm |
(4) |
|
|
11.3 |
% |
| (1) |
Effective Q1 2025, changes were made to the methodology used to allocate certain income, expenses and balance sheet items between business segments. Prior period results for each segment have been reclassified to conform with the current period’s methodology. Refer to page 42 for further details. |
| (2) |
Includes dividends paid on preferred shares and other equity instruments of $468. |
| (3) |
Average amounts calculated using methods intended to approximate the daily average balances for the period. |
| (5) |
Refer to Table on page 20. |
Return on tangible common equity
Return on tangible common equity (ROTCE) is a profitability measure that is calculated by dividing the net income attributable to common shareholders, adjusted for the amortization of intangibles (excluding software), by average tangible common equity. Tangible common equity is defined as common shareholders’ equity adjusted for goodwill and intangible assets (excluding software), net of deferred taxes. This is a
non-GAAP
ratio. Management uses ROTCE to assess the Bank’s performance and ability to use its tangible common equity to generate returns.
Adjusted return on tangible common equity represents adjusted net income attributable to common shareholders as a percentage of average tangible common equity. This is a
non-GAAP
ratio.
T8
Return on tangible common equity
|
|
|
|
|
|
|
|
|
|
|
|
| For the years ended October 31 ($ millions) |
|
|
|
|
2024 |
|
|
|
|
|
|
|
|
|
|
Average common equity – reported (1)
|
|
|
|
|
|
$ |
71,127 |
|
|
|
|
|
|
|
|
(9,056 |
) |
Average acquisition-related intangibles (net of deferred tax) (1)
|
|
|
|
|
|
|
(3,629 |
) |
Average tangible common equity (1)
|
|
|
|
|
|
$ |
58,442 |
|
Net income attributable to common shareholders – reported |
|
|
|
|
|
$ |
7,286 |
|
Amortization of acquisition-related intangible assets (after-tax)
(3)
|
|
|
|
|
|
|
52 |
|
Net income attributable to common shareholders adjusted for amortization of acquisition-related intangible assets (after-tax)
|
|
|
|
|
|
$ |
7,338 |
|
Return on tangible common equity – reported |
|
|
|
|
|
|
12.6 |
% |
|
|
|
|
|
|
|
|
|
Adjusted net income attributable to common shareholders |
|
|
|
|
|
$ |
8,019 |
|
Return on tangible common equity – adjusted |
|
|
|
|
|
|
13.7 |
% |
| (1) |
Average amounts calculated using methods intended to approximate the daily average balances for the period. |
| (2) |
Includes imputed goodwill from investments in associates. |
| (3) |
Refer to Table on page 20. |
|
2025 Scotiabank Annual Report
Adjusted productivity ratio
Adjusted productivity ratio represents adjusted
non-interest
expenses as a percentage of adjusted total revenue. This is a
non-GAAP
ratio.
Management uses the productivity ratio as a measure of the Bank’s efficiency. A lower ratio indicates improved productivity.
Adjusted operating leverage
This financial metric measures the rate of growth in adjusted total revenue less the rate of growth in adjusted
non-interest
expenses. This is a
non-GAAP
ratio.
Management uses operating leverage as a way to assess the degree to which the Bank can increase operating income by increasing revenue.
Trading-related revenue (Taxable equivalent basis)
Trading-related revenue consists of net interest income and
non-interest
income. Included are unrealized gains and losses on trading security positions held, realized gains and losses from the purchase and sale of securities, fees and commissions from trading securities borrowing and lending activities, and gains and losses on trading derivatives. Underwriting and other advisory fees, which are shown separately in the Consolidated Statement of Income, are excluded. Trading-related revenue includes certain net interest income and
non-interest
income items on a taxable equivalent basis (TEB). This methodology grosses up
tax-exempt
income earned on certain securities to an equivalent before tax basis. This is a
non-GAAP
measure.
Management believes that this basis for measurement of trading-related revenue provides a uniform comparability of net interest income and
non-interest
income arising from both taxable and
non-taxable
sources and facilitates a consistent basis of measurement. While other banks also use TEB, their methodology may not be comparable to the Bank’s methodology.
Adjusted effective tax rate
The adjusted effective tax rate is calculated by dividing adjusted income tax expense by adjusted income before taxes. This is a
non-GAAP
ratio.
Adjusted dividend payout ratio
Adjusted dividend payout ratio is defined as common dividends as a percentage of adjusted net income attributable to common shareholders. The reported net income attributable to common shareholders is adjusted to remove the impact of adjusting items, net of income taxes. This is a non-GAAP measure.
Pre-tax, pre-provision earnings
Pre-tax, pre-provision earnings is a non-GAAP measure and is calculated as the difference between revenues and expenses. The Bank believes this measure to be useful for readers as it measures the Bank’s operating profit before subtracting credit losses and taxes.
2025 Scotiabank Annual Report
|
Management’s Discussion and Analysis
Financial Results: 2025 vs 2024
Net income was $7,758 million compared to $7,892 million, a decrease of 2%. The decrease was driven primarily by higher non-interest expenses, income taxes and provision for credit losses, partly offset by higher net interest income and non-interest income. Diluted earnings per share (EPS) were $5.67 in fiscal 2025 compared to $5.87 last year. Return on equity was 9.7% this year compared to 10.2% in fiscal 2024.
Adjusting items impacting net income in the current year were a net charge of $1,752 million
after-tax
($1,927 million
pre-tax).
The net impact of the adjusting items on diluted earnings per share was $1.42 and on Basel III Common Equity Tier 1 (CET1) ratio was negative 20 basis points. In the prior year, adjusting items were a net charge of $735 million
after-tax
($877 million
pre-tax),
with an impact on diluted earnings per share of $0.60 and on Basel III Common Equity Tier 1 (CET1) ratio of negative nine basis points. Refer to
Non-GAAP
Measures starting on page 20 for further details.
Adjusted net income was $9,510 million compared to $8,627 million, an increase of 10%. The increase was driven primarily by higher net interest income and non-interest income, partly offset by higher non-interest expenses, income taxes and provision for credit losses. Adjusted diluted EPS was $7.09 compared to $6.47, and adjusted return on equity was 11.8% compared to 11.3%.
Net interest income was $21,522 million compared to $19,252 million, an increase of $2,270 million or 12% due primarily to a higher net interest margin and loan growth inclusive of the conversion of bankers’ acceptances to loans resulting from the cessation of CDOR in June 2024 (“BA conversion”). Higher net interest income was driven by the Other segment due mainly to lower funding costs, as well as increases in Canadian Banking from asset and deposit growth, Global Banking and Markets driven by higher corporate lending margins and deposit growth, and Global Wealth Management from growth in loans and deposits. The net interest margin was 2.33%, an increase of 17 basis points primarily from significantly lower funding costs driven by central bank rate cuts and higher margins in Global Banking and Markets. This was partly offset by lower deposit margins in Canadian Banking, and increased levels of high quality, lower yielding treasury assets.
Non-interest
income was $16,219 million, an increase of $1,801 million or 12%. Adjusted
non-interest
income was $16,209 million, an increase of $1,648 million or 11%. The increase was driven mainly by higher wealth management revenue, trading related revenues, underwriting and advisory fees, and net income from associated corporations, partially offset by lower banking revenues.
The provision for credit losses was $4,714 million compared to $4,051 million last year, an increase of $663 million due mainly to higher provisions on performing loans. The provision for credit losses ratio increased nine basis points to 62 basis points. The provision for credit losses on performing loans increased by $460 million driven by the impact of credit migration, an unfavourable macroeconomic outlook primarily driven by the U.S. tariffs, and business growth, mainly in the International retail portfolio. The increase in provision for credit losses on impaired loans this year was due primarily to higher formations in Canadian Banking.
Non-interest
expenses were $22,518 million compared to $19,695 million, an increase of $2,823 million or 14%. Adjusted
non-interest
expenses were $20,581 million compared to $18,961 million, an increase of $1,620 million or 9%. The increase was mainly driven by higher personnel costs, including performance and share-based compensation, inflationary adjustments and annual increases, higher technology and advertising and business development costs to support strategic and regulatory initiatives, as well as the negative impact of foreign currency translation, partly offset by lower depreciation and amortization. Operating leverage was negative 2.2% on a reported basis and positive 3.0% on an adjusted basis.
The effective tax rate was 26.2% compared to 20.5% due primarily to the impairment loss related to the announced sale of the banking operations in Colombia, Costa Rica and Panama, lower income in lower tax jurisdictions and the implementation of the Global Minimum Tax (GMT), partially offset by higher non-deductible expenses and the impairment charge on Bank of Xi’an Co in the prior year. On an adjusted basis, the effective tax rate was 23.5% compared to 20.1% primarily due to lower income in lower tax jurisdictions and the implementation of the GMT.
The Basel III Common Equity Tier 1 (CET1) ratio was 13.2% as at October 31, 2025, compared to 13.1% last year.
Medium-term financial objectives
The following table provides a summary of our 2025 performance against our medium-term financial objectives:
|
|
|
|
|
|
|
|
|
|
|
|
|
| |
|
| |
|
|
|
|
|
|
|
| |
|
|
|
|
Reported |
|
|
|
|
Diluted earnings per share growth of 7%+ |
|
|
|
|
|
|
(3.4) |
% |
|
|
9.6% |
|
|
|
|
|
|
|
|
9.7 |
% |
|
|
11.8% |
|
Achieve positive operating leverage |
|
|
|
|
|
|
Negative 2.2 |
% |
|
|
Positive 3.0% |
|
Maintain strong capital ratios |
|
|
|
|
|
|
CET1 capital ratio of 13.2 |
% |
|
|
N/A |
|
| (1) |
Refer to Non-GAAP Measures on page 20. |
|
|
|
|
|
In fiscal 2025, the total shareholder return on the Bank’s shares was 36%, compared to the total return of the S&P/TSX Composite Index of 29%. The total compound annual shareholder return on the Bank’s shares over the past five years was 17.1%, and 9.6% over the past 10 years. This is below the total annual return of the S&P/TSX Composite Index over the past five years and ten years of 17.7% and 11.7%, respectively. Dividends per share totaled $4.32 for the year, an increase of 1.9% from 2024. The Bank’s target payout range is 40-50%. The dividend payout ratio for the year was 73.7% on a reported basis and 60.7% on an adjusted basis. The Board of Directors approved a quarterly dividend of $1.10 per common share, at its meeting on December 1, 2025. This quarterly dividend applies to shareholders of record at the close of business on January 6, 2026, and is payable January 28, 2026. |
|
|
|
C1 Closing common share price as at October 31
|
|
2025 Scotiabank Annual Report
Management’s Discussion and Analysis
| Overview of Performance
|
|
|
|
|
|
|
|
|
|
|
|
| For the years ended October 31 |
|
|
|
|
2024 |
|
Closing market price per common share ($) |
|
|
|
|
|
|
71.69 |
|
Dividends paid ($ per share) |
|
|
|
|
|
|
4.24 |
|
|
|
|
|
|
|
|
6.5 |
|
Increase (decrease) in share price (%) |
|
|
|
|
|
|
27.7 |
|
Total annual shareholder return (%) (1)
|
|
|
|
|
|
|
35.9 |
|
| (1) |
Refer to Glossary on page 136 for the description of the measure. |
On December 27, 2024, the Bank completed its acquisition of an approximate ownership interest of 14.9% or 163 million shares in KeyCorp. The acquisition was completed in two stages – an initial investment of 4.9% (Initial Investment) on August 30, 2024, and an additional investment of approximately 10% (Additional Investment) on December 27, 2024. The acquisition was completed through
all-cash
purchases of newly issued voting common shares, at a fixed price of U.S.$17.17 per share, resulting in total cash consideration paid of approximately U.S.$2.8 billion ($4.1 billion). Following completion of the Additional Investment, the Bank designated two individuals to serve on KeyCorp’s Board of Directors.
Effective December 27, 2024, the combined 14.9% investment was accounted for as an investment in associate as the Bank has significant influence over KeyCorp as defined under IFRS, given its board representation and ownership interest. The Initial Investment of 4.9% previously accounted for at fair value through other comprehensive income was derecognized and included in the cost base of the investment in associate in Q1 2025. The difference between the fixed transaction price and the quoted share price of KeyCorp on the date of Additional Investment (U.S.$17.20) was recognized as a gain in non-interest income – other in Q1 2025, with a corresponding increase in the carrying value of the investment in associate. The carrying amount of the investment in associate upon closing was U.S.$2.8 billion ($4.1 billion), and represents the Bank’s share of KeyCorp’s net assets, adjusted for goodwill and other intangibles. The total impact to the Bank’s common equity Tier 1 (CET1) ratio from the transaction was a decrease of approximately 49 basis points.
For the three and twelve months ended October 31, 2025, $117 million ($111 million
after-tax)
and $362 million ($338 million
after-tax),
respectively, was recorded in net income from investments in associated corporations, representing the Bank’s share of KeyCorp’s financial results.
Sale of banking operations in Colombia, Costa Rica and Panama
On January 6, 2025, the Bank entered into an agreement with Davivienda to sell its banking operations in Colombia, Costa Rica and Panama in exchange for an approximately 20% ownership stake in the newly combined entity of Davivienda. The Bank’s ownership will consist of 14.99% voting common shares and the remainder in
non-voting
preferred shares.
On the date of the agreement, the Bank’s operations that are part of this transaction were classified as held for sale in accordance with IFRS 5 and an impairment loss of $1,362 million ($1,355 million
after-tax)
was recorded in
non-interest
expenses – other within the Other operating segment, representing the write-down of goodwill ($589 million), intangibles ($151 million), property and equipment ($290 million) and the remaining in other assets.
As of October 31, 2025, the Bank has recognized a total impairment loss of $1,422 million in non-interest expense and a credit of $45 million in non-interest income (collectively $1,342 million after-tax). The loss was recorded in the Other operating segment. The held for sale operations included total assets of $24 billion and total liabilities of $22 billion, consisting primarily of loans and deposits, and the total cumulative foreign currency translation losses, net of hedges was $249 million.
The total impact of the transaction to the Bank’s CET1 capital ratio was a decrease of approximately 13 basis points as of October 31, 2025.
On December 1, 2025, the Bank completed the sale of its banking operations in Colombia, Costa Rica and Panama to Davivienda Group upon receiving all regulatory approvals and satisfying all customary closing conditions. Following the closing date, the Bank’s investment will be accounted for as an investment in associate since the Bank has significant influence over Davivienda’s combined operations as defined under IFRS, given its board representation and ownership interest. Additionally, total assets and liabilities will be derecognized and the Bank is expected to record a loss in Q1 2026 of approximately $300 million after-tax in the Other segment, primarily relating to the release of cumulative foreign currency translation losses, net of hedges.
The CET1 ratio for Q1 2026 is expected to benefit by approximately 10 basis points, primarily from the reduction in risk-weighted assets, net of the Davivienda Investment.
Strategy, Economic Summary and Outlook
The Bank’s strategic vision is to be our clients’ most trusted financial partner and deliver sustainable, profitable growth. Our vision is driven by four strategic pillars:
| |
(i) |
Grow and scale in priority businesses, leveraging connectivity across North America and optimizing capital in lower return businesses. |
| |
(ii) |
Earn more primary clients to build deeper, more meaningful relationships with a focus on value over volume. |
| |
(iii) |
Focus on making it easier for our clients to do business with us and improving experiences, while streamlining and digitizing processes. |
| |
(iv) |
Win as one team by bringing the whole bank to our clients, while building and strengthening our culture where all employees can thrive. |
Our strategy is underpinned by strong risk management practices to keep our bank and our clients safe, and a robust balance sheet that provides flexibility and growth opportunities across changing market conditions.
The global economic landscape continues to be shaped by developments in U.S. trade policy. While there is now a better sense of the tariff landscape, there remains much uncertainty about how these changes in trade policy will impact economies and financial markets. There is accumulating evidence that these policies and the associated uncertainty are weighing more heavily on the U.S. than on many other countries. In many countries fiscal packages will dampen but not eliminate the macroeconomic consequences of the tariffs on the U.S. and its trading partners.
2025 Scotiabank Annual Report
|
Management’s Discussion and Analysis
The U.S. Federal Reserve is expected to lower its policy rate through the first half of 2026. Though inflation remains elevated, there are clear signs of a slowdown in the non-technological sectors of the U.S. economy. The labour market is softening and there are rising indications of economic damage in the goods sector of the U.S. economy even though this weakness is masked by rapid investments in the technology sector. This sluggishness suggests the Federal Reserve will lower interest rates by another 100 basis points in coming months. The U.S. will nevertheless maintain a significantly tighter stance relative to other central banks as the U.S. economy adapts to a higher tariff and inflation environment. Restrictive monetary policy and uncertainty surrounding the impact of tariffs are leading to modest growth this year before the economy benefits from some fiscal support next year. The economy is expected to grow by 1.9% in 2025 and 1.6% in 2026.
U.S. trade policy is also significantly impacting Canada. The direct impact of the tariffs on Canadian goods, the uncertainty caused by U.S. policies and the indirect impacts on Canada of a weaker U.S. economy will weigh on growth this year and next. Policy measures announced by the Federal government are likely to provide some offset to the headwinds coming from the U.S. economy, notably as they relate to private investment. This should lead to growth of 1.4% next year, stronger than the 1.2% expected in 2025. There are upside risks to this forecast if, as expected, additional measures are announced as part of the Federal government’s plan to transform the economy. Given that inflation remains above the Bank of Canada’s target, we anticipate the Bank of Canada will remain on hold through the first half of 2026 and subsequently raise its policy rate by 50 basis points by the end of next year.
Latin American economies are moving at different speeds, faced with divergent performances at home and varying impacts from developments in the global economy. Mexico’s economy, already facing weak domestic demand, has been further weighed by U.S. tariffs and softer growth stateside that leave it on track for only a marginal expansion in 2025 and weak growth in 2026. The country’s central bank has also used up most of its easing space, leaving Mexican households and businesses with little additional policy support. Peru’s economy continues to exceed expectations with strong growth and low inflation, as the country mostly benefits from strong copper and gold prices boosting export revenues. Growth should remain firm next year despite some uncertainty and headwinds associated with April elections. Chile has also not faced a significant direct impact from U.S. tariffs, with domestic conditions remaining firm thanks to positive investment trends. The result of December’s second round presidential election vote remains uncertain – with important implications for 2026’s economic performance. In the Caribbean, Jamaican and Dominican Republic economic activity will be affected by the impacts of Hurricane Melissa which caused significant damage in both countries. Jamaica was more heavily impacted by the hurricane and rebuilding efforts will be substantial. This should eventually lead to a strong rebound in activity, but the near-term consequences of the hurricane will weigh on the outlook.
The Bank expects to generate strong earnings growth in 2026. Strong revenue growth, excluding the impact of divestitures, is underpinned by growth in both net interest income and non-interest revenue. Higher net interest income is expected to be driven by both loan and deposit growth and net interest margin expansion. Non-interest revenue is expected to grow across all business segments. Earnings are expected to also benefit from lower provision for credit losses, partially offset by the impact of a higher tax rate. The Bank expects modest expense growth, excluding the impact of divestitures, as technology spend to strengthen and strategically grow the Bank will be partly offset by the benefit from productivity initiatives. The Bank is expected to generate positive operating leverage. The capital and liquidity metrics are expected to remain strong in 2026.
Impact of Foreign Currency Translation
The impact of foreign currency translation on net income is shown in the table below.
T10
Impact of foreign currency translation
|
|
|
|
|
|
|
|
|
|
|
|
|
|
|
|
|
|
|
|
| |
|
|
|
|
2024 |
|
| For the fiscal years |
|
|
|
|
|
|
|
Average
exchange rate |
|
|
% Change |
|
U.S. Dollar/Canadian Dollar |
|
|
|
|
|
|
|
|
|
|
0.735 |
|
|
|
(0.9 |
)% |
Mexican Peso/Canadian Dollar |
|
|
|
|
|
|
|
|
|
|
13.091 |
|
|
|
(2.5 |
)% |
Peruvian Sol/Canadian Dollar |
|
|
|
|
|
|
|
|
|
|
2.757 |
|
|
|
(1.1 |
)% |
Colombian Peso/Canadian Dollar |
|
|
|
|
|
|
|
|
|
|
2,943.081 |
|
|
|
(11.1 |
)% |
Chilean Peso/Canadian Dollar |
|
|
|
|
|
|
|
|
|
|
682.082 |
|
|
|
9.2 |
% |
|
|
|
|
|
|
|
|
|
|
|
|
Impact on net income (1) ($ millions except EPS) |
|
|
|
|
2024
vs. 2023 |
|
|
|
|
|
|
|
$ |
(31 |
) |
|
|
|
|
|
|
|
243 |
|
|
|
|
|
|
|
|
(70 |
) |
Other items (net of tax) (2)
|
|
|
|
|
|
|
(56 |
) |
|
|
|
|
|
|
$ |
86 |
|
Earnings per share (diluted) |
|
|
|
|
|
$ |
0.07 |
|
Impact by business line ($ millions) (3)
|
|
|
|
|
|
|
|
|
|
|
|
|
|
|
$ |
2 |
|
|
|
|
|
|
|
|
90 |
|
|
|
|
|
|
|
|
– |
|
Global Banking and Markets |
|
|
|
|
|
|
5 |
|
|
|
|
|
|
|
|
(11 |
) |
| |
|
|
|
|
|
$ |
86 |
|
| (1) |
Includes impact of all currencies. |
| (2) |
Includes the impact of foreign currency hedges. |
| (3) |
Effective Q1 2025, changes were made to the methodology used to allocate certain income, expenses and balance sheet items between business segments. Prior period results for each segment have been reclassified to conform with the current period’s methodology. Refer to page 42 for further details. |
|
2025 Scotiabank Annual Report
Management’s Discussion and Analysis
| Overview of Performance
Impact of Closed Divestitures
On January 6, 2025, the Bank announced the sale of its banking operations in Colombia, Costa Rica and Panama to Davivienda Group. The sale was completed on December 1, 2025 upon receiving all regulatory approvals and satisfying all customary closing conditions. In addition, on February 28, 2025, the Bank completed the sale of CrediScotia Financiera S.A. (Peru), which was announced in fiscal 2024. The table below reflects the earnings impact of these operations in the current and prior fiscal year. For further details on divestitures, refer to Note 35 in the accompanying consolidated financial statements.
T11
Impact of divested operations
|
|
|
|
|
|
|
|
|
|
|
|
| ($ millions) |
|
|
|
|
2024 |
|
|
|
|
|
|
|
$ |
1,169 |
|
|
|
|
|
|
|
|
596 |
|
|
|
|
|
|
|
|
1,765 |
|
Provision for credit losses |
|
|
|
|
|
|
742 |
|
|
|
|
|
|
|
|
1,113 |
|
|
|
|
|
|
|
|
(90 |
) |
Income tax expense (recovery) |
|
|
|
|
|
|
(29 |
) |
|
|
|
|
|
|
$ |
(61 |
) |
Net income (loss) attributable to non-controlling interests (NCI) |
|
|
|
|
|
|
(49 |
) |
Net income (loss) attributable to equity holders - relating to divested operations |
|
|
|
|
|
$ |
(12 |
) |
Average Loans ($ billions) |
|
|
|
|
|
|
18 |
|
Average Deposits ($ billions) |
|
|
|
|
|
$ |
17 |
|
2025 Scotiabank Annual Report
|
Management’s Discussion and Analysis
GROUP FINANCIAL PERFORMANCE
T12
Group financial performance
|
|
|
|
|
|
|
|
|
|
|
|
| As at October 31 ($ millions) |
|
|
|
|
2024 |
|
|
|
|
|
|
|
|
|
|
|
|
|
|
|
|
$ |
19,252 |
|
|
|
|
|
|
|
|
14,418 |
|
|
|
|
|
|
|
|
33,670 |
|
Provision for credit losses |
|
|
|
|
|
|
4,051 |
|
|
|
|
|
|
|
|
19,695 |
|
|
|
|
|
|
|
|
9,924 |
|
|
|
|
|
|
|
|
2,032 |
|
|
|
|
|
|
|
$ |
7,892 |
|
Net income attributable to non-controlling interests in subsidiaries (NCI) |
|
|
|
|
|
$ |
134 |
|
Net income attributable to equity holders of the Bank |
|
|
|
|
|
$ |
7,758 |
|
|
|
|
Other Financial Data and Measures |
|
|
|
|
|
|
|
|
|
|
|
|
|
|
|
10.2 |
% |
|
|
|
|
|
|
|
2.16 |
% |
|
|
|
|
|
|
|
20.5 |
% |
Provision for credit losses – performing (Stage 1 and 2) |
|
|
|
|
|
$ |
121 |
|
Provision for credit losses – impaired (Stage 3) |
|
|
|
|
|
$ |
3,930 |
|
Provision for credit losses as a percentage of average net loans and acceptances (annualized) (1)
|
|
|
|
|
|
|
0.53 |
% |
Provision for credit losses on impaired loans as a percentage of average net loans and acceptances (annualized) (1)
|
|
|
|
|
|
|
0.52 |
% |
Net write-offs as percentage of average net loans and acceptances (annualized) (1)
|
|
|
|
|
|
|
0.46 |
% |
| (1) |
Refer to Glossary on page 136 for the description of the measure. |
| (2) |
Refer to Non-GAAP Measures starting on page 20. |
T12A
Adjusted Group financial performance
(1)
|
|
|
|
|
|
|
|
|
|
|
|
| As at October 31 ($ millions) |
|
|
|
|
2024 |
|
|
|
|
|
|
|
|
|
|
|
|
|
|
|
|
$ |
19,252 |
|
|
|
|
|
|
|
|
14,561 |
|
|
|
|
|
|
|
|
33,813 |
|
Provision for credit losses |
|
|
|
|
|
|
4,051 |
|
|
|
|
|
|
|
|
18,961 |
|
|
|
|
|
|
|
|
10,801 |
|
|
|
|
|
|
|
|
2,174 |
|
|
|
|
|
|
|
$ |
8,627 |
|
Net income attributable to non-controlling interests in subsidiaries (NCI) |
|
|
|
|
|
$ |
136 |
|
Net income attributable to equity holders of the Bank |
|
|
|
|
|
$ |
8,491 |
|
| (1) |
Refer to Non-GAAP Measures starting on page 20. |
Net income was $7,758 million compared to $7,892 million, a decrease of 2%. The decrease was driven primarily by higher non-interest expenses, income taxes and provision for credit losses, partly offset by higher net interest income and non-interest income.
Adjusted net income was $9,510 million compared to $8,627 million, an increase of 10%. The increase was driven primarily by higher net interest income and non-interest income, partly offset by higher non-interest expenses, income taxes and provision for credit losses.
Net interest income was $21,522 million compared to $19,252 million, an increase of $2,270 million or 12% due primarily to a higher net interest margin, and loan growth inclusive of the conversion of bankers’ acceptances to loans resulting from the cessation of CDOR in June 2024 (“BA conversion”). Higher net interest income was driven by the Other segment due mainly to lower funding costs, as well as increases in Canadian Banking from asset and deposit growth, Global Banking and Markets driven by higher contribution from capital market activities, higher corporate lending margins and deposit growth and Global Wealth Management from strong loan growth, and higher margins and growth in deposits.
The net interest margin was 2.33%, an increase of 17 basis points primarily from significantly lower funding costs driven by central bank rate cuts and higher margins in Global Banking and Markets. This was partly offset by lower deposit margins in Canadian Banking, and increased levels of high quality, lower yielding treasury assets.
|
2025 Scotiabank Annual Report
Management’s Discussion and Analysis
| Group Financial Performance
T13
Average balance sheet
(1)
and net interest income
|
|
|
|
|
|
|
|
|
|
|
|
|
|
|
|
|
|
|
|
|
|
|
|
|
|
|
|
| |
|
|
|
|
2024 |
|
|
|
|
|
|
|
|
| For the fiscal years ($ billions) |
|
|
|
|
|
|
|
|
|
|
Average
balance |
|
|
Interest |
|
|
Average
rate |
|
|
|
|
|
|
|
|
|
|
|
|
|
|
|
|
|
|
|
|
|
|
|
|
|
|
Deposits with financial institutions |
|
|
|
|
|
|
|
|
|
|
|
|
|
$ |
64.5 |
|
|
$ |
3.1 |
|
|
|
4.79 |
% |
|
|
|
|
|
|
|
|
|
|
|
|
|
|
|
146.3 |
|
|
|
1.7 |
|
|
|
1.13 |
% |
Securities purchased under resale agreements and securities borrowed |
|
|
|
|
|
|
|
|
|
|
|
|
|
|
193.1 |
|
|
|
1.6 |
|
|
|
0.83 |
% |
|
|
|
|
|
|
|
|
|
|
|
|
|
|
|
147.6 |
|
|
|
7.5 |
|
|
|
5.09 |
% |
|
|
|
|
|
|
|
|
|
|
|
|
|
|
|
|
|
|
|
|
|
|
|
|
|
|
|
|
|
|
|
|
|
|
|
|
|
|
|
|
343.6 |
|
|
|
16.0 |
|
|
|
4.67 |
% |
|
|
|
|
|
|
|
|
|
|
|
|
|
|
|
105.5 |
|
|
|
8.8 |
|
|
|
8.32 |
% |
|
|
|
|
|
|
|
|
|
|
|
|
|
|
|
17.3 |
|
|
|
3.2 |
|
|
|
18.53 |
% |
|
|
|
|
|
|
|
|
|
|
|
|
|
|
|
289.9 |
|
|
|
19.8 |
|
|
|
6.82 |
% |
Allowance for credit losses |
|
|
|
|
|
|
|
|
|
|
|
|
|
|
(6.6 |
) |
|
|
|
|
|
|
|
|
|
|
|
|
|
|
|
|
|
|
|
|
|
|
$ |
749.7 |
|
|
$ |
47.8 |
|
|
|
6.38 |
% |
Customers’ liability under acceptances |
|
|
|
|
|
|
|
|
|
|
|
|
|
|
10.0 |
|
|
|
|
|
|
|
|
|
Total average earning assets (2)
|
|
|
|
|
|
|
|
|
|
|
|
|
|
$ |
1,311.2 |
|
|
$ |
61.7 |
|
|
|
4.70 |
% |
|
|
|
|
|
|
|
|
|
|
|
|
|
|
|
108.1 |
|
|
|
|
|
|
|
|
|
|
|
|
|
|
|
|
|
|
|
|
|
|
|
$ |
1,419.3 |
|
|
$ |
61.7 |
|
|
|
4.34 |
% |
|
|
|
|
|
|
|
|
|
|
|
|
|
|
|
|
|
|
|
|
|
|
|
|
|
|
|
|
|
|
|
|
|
|
|
|
|
|
|
|
|
|
|
|
|
|
|
|
|
|
|
|
|
|
|
|
|
|
|
|
|
|
|
|
$ |
292.4 |
|
|
$ |
9.5 |
|
|
|
3.25 |
% |
|
|
|
|
|
|
|
|
|
|
|
|
|
|
|
610.2 |
|
|
|
28.2 |
|
|
|
4.63 |
% |
|
|
|
|
|
|
|
|
|
|
|
|
|
|
|
49.1 |
|
|
|
1.8 |
|
|
|
3.58 |
% |
|
|
|
|
|
|
|
|
|
|
|
|
|
|
$ |
951.7 |
|
|
$ |
39.5 |
|
|
|
4.15 |
% |
Obligations related to securities sold under repurchase agreements and securities lent |
|
|
|
|
|
|
|
|
|
|
|
|
|
|
176.2 |
|
|
|
0.7 |
|
|
|
0.40 |
% |
|
|
|
|
|
|
|
|
|
|
|
|
|
|
|
8.5 |
|
|
|
0.5 |
|
|
|
5.74 |
% |
Other interest-bearing liabilities |
|
|
|
|
|
|
|
|
|
|
|
|
|
|
73.0 |
|
|
|
1.7 |
|
|
|
2.37 |
% |
Total interest-bearing liabilities |
|
|
|
|
|
|
|
|
|
|
|
|
|
$ |
1,209.4 |
|
|
$ |
42.4 |
|
|
|
3.51 |
% |
Financial instruments designated at fair value through profit or loss |
|
|
|
|
|
|
|
|
|
|
|
|
|
|
33.5 |
|
|
|
|
|
|
|
|
|
Other liabilities including acceptances |
|
|
|
|
|
|
|
|
|
|
|
|
|
|
94.9 |
|
|
|
|
|
|
|
|
|
|
|
|
|
|
|
|
|
|
|
|
|
|
|
|
81.5 |
|
|
|
|
|
|
|
|
|
Total liabilities and equity |
|
|
|
|
|
|
|
|
|
|
|
|
|
$ |
1,419.3 |
|
|
$ |
42.4 |
|
|
|
2.99 |
% |
|
|
|
|
|
|
|
|
|
|
|
|
|
|
|
|
|
|
$ |
19.3 |
|
|
|
|
|
| (1) |
Average of daily balances. |
| (2) |
Refer to Non-GAAP Measures on Page 20. |
| (3) |
Includes non-controlling interest of $1.7 (2024 – $1.7). |
2025 Scotiabank Annual Report
|
Management’s Discussion and Analysis
|
|
|
|
|
|
|
|
|
|
|
|
|
|
|
|
|
| For the fiscal years ($ millions) |
|
|
|
|
2024 |
|
|
|
|
|
|
|
|
|
|
|
|
|
|
|
|
|
|
|
|
|
|
|
$ |
869 |
|
|
|
|
|
|
|
|
|
|
|
|
1,955 |
|
|
|
|
|
|
|
|
|
|
|
|
1,585 |
|
|
|
|
|
|
|
|
|
|
|
$ |
4,409 |
|
|
|
|
|
|
|
|
|
|
|
|
|
|
|
|
|
|
|
|
|
|
|
|
$ |
2,282 |
|
|
|
|
|
|
|
|
|
|
|
|
1,251 |
|
|
|
|
|
Investment management and trust |
|
|
|
|
|
|
|
|
|
|
|
|
Investment management and custody |
|
|
|
|
|
|
840 |
|
|
|
|
|
Personal and corporate trust |
|
|
|
|
|
|
256 |
|
|
|
|
|
|
|
|
|
|
|
|
1,096 |
|
|
|
|
|
Total wealth management revenues |
|
|
|
|
|
$ |
4,629 |
|
|
|
|
|
Underwriting and advisory fees |
|
|
|
|
|
|
702 |
|
|
|
|
|
Non-trading foreign exchange |
|
|
|
|
|
|
930 |
|
|
|
|
|
|
|
|
|
|
|
|
1,634 |
|
|
|
|
|
Net gain on sale of investment securities |
|
|
|
|
|
|
48 |
|
|
|
|
|
Net income from investments in associated corporations |
|
|
|
|
|
|
198 |
|
|
|
|
|
Insurance service results |
|
|
|
|
|
|
470 |
|
|
|
|
|
Other fees and commissions |
|
|
|
|
|
|
1,247 |
|
|
|
|
|
|
|
|
|
|
|
|
151 |
|
|
|
|
|
Total non-interest income |
|
|
|
|
|
$ |
14,418 |
|
|
|
|
|
Non-GAAP Adjusting items (1)
|
|
|
|
|
|
|
|
|
|
|
|
|
Divestitures and wind-down of operations (2)
|
|
|
|
|
|
|
143 |
|
|
|
|
|
Amortization of acquisition-related intangible assets (3)
|
|
|
|
|
|
|
– |
|
|
|
|
|
Adjusted non-interest income (1)
|
|
|
|
|
|
$ |
14,561 |
|
|
|
|
|
| (1) |
Refer to Non-GAAP Measures on page 20. |
| (2) |
Recorded in Other Non-interest Income. |
| (3) |
Recorded in net income from investments in associated corporations. |
|
Sources of non-interest income in 2025 |
Non-interest
income was $16,219 million, an increase of $1,801 million or 12%. Adjusted
non-interest
income was $16,209 million, an increase of $1,648 million or 11%. The increase was driven mainly by higher wealth management revenue, trading related revenues, underwriting and advisory fees, and net income from associated corporations, partially offset by lower banking revenues.
Wealth management revenues increased $533 million or 12% from higher mutual fund revenues, brokerage fees, and investment management and trust revenues.
Net income from investments in associated corporations increased $436 million or 220%, primarily related to the KeyCorp investment.
Other fee and commissions revenue increased $406 million or 33%, due mainly to higher volume of securities borrowing and lending activities.
Underwriting and advisory fees increased $262 million or 37%, due mainly to higher new issuance activities in equity and debt capital markets.
Trading revenues increased $350 million or 21%, due mainly to higher client-driven trading activity in Global Banking and Markets related to fixed income and currency trading, net of lower equities trading, as well as higher trading revenues in International Banking.
Banking revenues decreased $271 million or 6%, due mainly to lower credit fees from banker’s acceptances, partly offset by higher deposit and payment services fees and higher card revenues.
|
2025 Scotiabank Annual Report
Management’s Discussion and Analysis
| Group Financial Performance
T15
Trading-related revenues
(1)
|
|
|
|
|
|
|
|
|
|
|
|
| For the fiscal years ($ millions) |
|
|
|
|
|
|
Trading-related revenue (TEB)
|
|
|
|
|
|
|
|
|
|
|
|
|
|
|
$ |
(252 |
) |
|
|
|
|
|
|
|
|
|
|
|
|
|
|
|
|
1,686 |
|
Other fees and commissions |
|
|
|
|
|
|
613 |
|
Total trading-related revenue (TEB) |
|
|
|
|
|
$ |
2,047 |
|
Taxable equivalent adjustment |
|
|
|
|
|
|
(52 |
) |
Trading-related revenue (Non-TEB)
|
|
|
|
|
|
$ |
1,995 |
|
| (1) |
Refer to Non-GAAP Measures on page 20. |
| (2) |
Effective Q1 2025, changes were made to the methodology used to allocate certain income, expenses and balance sheet items between business segments. Prior period results for each segment have been reclassified to conform with the current period’s methodology. Refer to page 42 for further details. |
| (3) |
Trading-related revenue consists of net interest income and non-interest income. Included are unrealized gains and losses on trading security positions held, realized gains and losses from the purchase and sale of trading securities, fees and commissions from securities borrowing and lending activities, and gains and losses on trading derivatives. Underwriting and other advisory fees, which are shown separately in the Consolidated Statement of Income, are excluded. |
Provision for Credit Losses
The provision for credit losses was $4,714 million compared to $4,051 million, an increase of $663 million. The provision for credit losses ratio was 62 basis points compared to 53 basis points. This was due mainly to higher provisions on performing loans, primarily in the Canadian Banking and International Banking portfolios, as well as impaired loans mainly in Canadian Banking.
The provision for credit losses on performing loans was $581 million compared to $121 million. The provision increased by $460 million driven by the impact of credit migration, an unfavourable macroeconomic outlook primarily driven by the U.S. tariffs, as well as business growth, mainly in the International retail portfolio.
The provision for credit losses on impaired loans was $4,133 million compared to $3,930 million. The provision for credit losses ratio on impaired loans was 54 basis points compared to 52 basis points. The increase in provision this year was due primarily to higher formations in Canadian Banking.
T16
Provision for credit losses by business line
|
|
|
|
|
|
|
|
|
|
|
|
|
|
|
|
|
|
|
|
|
|
|
|
|
|
|
|
| |
|
|
|
|
2024 |
|
|
|
|
|
|
|
|
| For the fiscal years ($ millions) |
|
Performing
(Stage 1 and 2) |
|
|
|
|
|
|
|
|
Performing
(Stage 1 and 2) |
|
|
Impaired
(Stage 3) |
|
|
Total |
|
|
|
|
|
|
|
|
|
|
|
|
|
|
|
|
|
|
|
|
|
|
|
|
|
|
|
|
|
|
|
|
|
|
|
|
|
|
|
|
$ |
109 |
|
|
$ |
1,257 |
|
|
$ |
1,366 |
|
|
|
|
|
|
|
|
|
|
|
|
|
|
|
|
18 |
|
|
|
307 |
|
|
|
325 |
|
|
|
|
|
|
|
|
|
|
|
|
|
|
|
|
127 |
|
|
|
1,564 |
|
|
|
1,691 |
|
|
|
|
|
|
|
|
|
|
|
|
|
|
|
|
|
|
|
|
|
|
|
|
|
|
|
|
|
|
|
|
|
|
|
|
|
|
|
|
|
(138 |
) |
|
|
2,040 |
|
|
|
1,902 |
|
|
|
|
|
|
|
|
|
|
|
|
|
|
|
|
89 |
|
|
|
297 |
|
|
|
386 |
|
|
|
|
|
|
|
|
|
|
|
|
|
|
|
|
(49 |
) |
|
|
2,337 |
|
|
|
2,288 |
|
|
|
|
|
|
|
|
|
|
|
|
|
|
|
|
3 |
|
|
|
24 |
|
|
|
27 |
|
Global Banking and Markets |
|
|
|
|
|
|
|
|
|
|
|
|
|
|
43 |
|
|
|
5 |
|
|
|
48 |
|
|
|
|
|
|
|
|
|
|
|
|
|
|
|
|
– |
|
|
|
– |
|
|
|
– |
|
Provision for credit losses on loans, acceptances and off-balance sheet exposures |
|
|
|
|
|
|
|
|
|
|
|
|
|
$ |
124 |
|
|
$ |
3,930 |
|
|
$ |
4,054 |
|
|
|
|
|
|
|
|
|
|
|
|
|
|
|
$ |
(3 |
) |
|
$ |
– |
|
|
$ |
(3 |
) |
|
|
|
|
|
|
|
|
|
|
|
|
|
|
|
– |
|
|
|
– |
|
|
|
– |
|
Global Banking and Markets |
|
|
|
|
|
|
|
|
|
|
|
|
|
|
(1 |
) |
|
|
– |
|
|
|
(1 |
) |
|
|
|
|
|
|
|
|
|
|
|
|
|
|
|
1 |
|
|
|
– |
|
|
|
1 |
|
Provision for credit losses on debt securities and deposits with banks |
|
|
|
|
|
|
|
|
|
|
|
|
|
$ |
(3 |
) |
|
$ |
– |
|
|
$ |
(3 |
) |
Total provision for credit losses |
|
|
|
|
|
|
|
|
|
|
|
|
|
$ |
121 |
|
|
$ |
3,930 |
|
|
$ |
4,051 |
|
2025 Scotiabank Annual Report
|
Management’s Discussion and Analysis
T16A
Provision for credit losses against impaired financial instruments by business line
|
|
|
|
|
|
|
|
|
|
|
|
| For the fiscal years ($ millions) |
|
|
|
|
2024 |
|
|
|
|
|
|
|
|
|
|
Retail |
|
|
|
|
|
$ |
1,257 |
|
Commercial |
|
|
|
|
|
|
307 |
|
|
|
|
|
|
|
$ |
1,564 |
|
|
|
|
|
|
|
|
|
|
Caribbean and Central America |
|
|
|
|
|
$ |
194 |
|
Latin America |
|
|
|
|
|
|
|
|
Mexico |
|
|
|
|
|
|
404 |
|
Peru |
|
|
|
|
|
|
554 |
|
Chile |
|
|
|
|
|
|
587 |
|
Colombia |
|
|
|
|
|
|
532 |
|
Other Latin America |
|
|
|
|
|
|
66 |
|
Total Latin America |
|
|
|
|
|
|
2,143 |
|
|
|
|
|
|
|
$ |
2,337 |
|
|
|
|
|
|
|
$ |
24 |
|
Global Banking and Markets |
|
|
|
|
|
|
|
|
Canada |
|
|
|
|
|
$ |
(12 |
) |
U.S. |
|
|
|
|
|
|
24 |
|
Asia and Europe |
|
|
|
|
|
|
(7 |
) |
|
|
|
|
|
|
$ |
5 |
|
Total |
|
|
|
|
|
$ |
3,930 |
|
T17
Provision for credit losses as a percentage of average net loans and acceptances
(1)(2)
|
|
|
|
|
|
|
|
|
|
|
|
| For the fiscal years (%) |
|
|
|
|
2024 |
|
|
|
|
|
|
|
|
|
|
Retail |
|
|
|
|
|
|
0.39 |
% |
Commercial |
|
|
|
|
|
|
0.35 |
|
|
|
|
|
|
|
|
0.38 |
|
|
|
|
|
|
|
|
|
|
Retail |
|
|
|
|
|
|
2.42 |
|
Commercial |
|
|
|
|
|
|
0.44 |
|
|
|
|
|
|
|
|
1.37 |
|
|
|
|
|
|
|
|
0.11 |
|
Global Banking and Markets |
|
|
|
|
|
|
0.04 |
|
Provisions against impaired loans |
|
|
|
|
|
|
0.52 |
|
Provisions against performing loans |
|
|
|
|
|
|
0.01 |
|
Provision for credit losses as a percentage of average net loans and acceptances |
|
|
|
|
|
|
0.53 |
% |
| (1) |
Includes provision for credit losses on certain financial assets - loans, acceptances, and off-balance sheet exposures. |
| (2) |
Refer to Glossary on page 136 for the description of the measure. |
T18
Net write-offs
(1)
as a percentage of average net loans and acceptances
(2)
|
|
|
|
|
|
|
|
|
|
|
|
| For the fiscal years (%) |
|
|
|
|
2024 |
|
|
|
|
|
|
|
|
|
|
Retail |
|
|
|
|
|
|
0.34 |
% |
Commercial |
|
|
|
|
|
|
0.26 |
|
|
|
|
|
|
|
|
0.32 |
|
|
|
|
|
|
|
|
|
|
Retail |
|
|
|
|
|
|
2.43 |
|
Commercial |
|
|
|
|
|
|
0.20 |
|
|
|
|
|
|
|
|
1.25 |
|
|
|
|
|
|
|
|
0.05 |
|
Global Banking and Markets |
|
|
|
|
|
|
– |
|
Total |
|
|
|
|
|
|
0.46 |
% |
| |
|
|
|
|
|
|
|
|
| (1) |
Write-offs net of recoveries. |
| (2) |
Refer to Glossary on page 136 for the description of the measure. |
|
2025 Scotiabank Annual Report
Management’s Discussion and Analysis
| Group Financial Performance
T19
Non-interest
expenses and productivity
|
|
|
|
|
|
|
|
|
|
|
|
|
|
|
|
|
| For the fiscal years ($ millions) |
|
|
|
|
2024 |
|
|
|
|
Salaries and employee benefits |
|
|
|
|
|
|
|
|
|
|
|
|
Salaries |
|
|
|
|
|
$ |
5,663 |
|
|
|
|
|
Performance-based compensation |
|
|
|
|
|
|
2,170 |
|
|
|
|
|
Share-based payments |
|
|
|
|
|
|
371 |
|
|
|
|
|
Other employee benefits |
|
|
|
|
|
|
1,651 |
|
|
|
|
|
|
|
|
|
|
|
$ |
9,855 |
|
|
|
|
|
|
|
|
|
|
|
|
|
|
|
|
|
|
Premises |
|
|
|
|
|
|
571 |
|
|
|
|
|
Technology |
|
|
|
|
|
|
2,325 |
|
|
|
|
|
|
|
|
|
|
|
$ |
2,896 |
|
|
|
|
|
Depreciation and amortization |
|
|
|
|
|
|
|
|
|
|
|
|
Depreciation |
|
|
|
|
|
|
730 |
|
|
|
|
|
Amortization of intangible assets |
|
|
|
|
|
|
1,030 |
|
|
|
|
|
|
|
|
|
|
|
$ |
1,760 |
|
|
|
|
|
|
|
|
|
|
|
|
|
|
|
|
|
|
|
|
|
|
|
|
$ |
381 |
|
|
|
|
|
|
|
|
|
|
|
|
|
|
|
|
|
|
Advertising and business development |
|
|
|
|
|
$ |
614 |
|
|
|
|
|
|
|
|
|
|
|
|
|
|
|
|
|
|
|
|
|
|
|
|
$ |
793 |
|
|
|
|
|
|
|
|
|
|
|
|
|
|
|
|
|
|
Business and capital taxes |
|
|
|
|
|
|
|
|
|
|
|
|
Business taxes |
|
|
|
|
|
|
617 |
|
|
|
|
|
Capital taxes |
|
|
|
|
|
|
65 |
|
|
|
|
|
|
|
|
|
|
|
$ |
682 |
|
|
|
|
|
|
|
|
|
|
|
$ |
2,714 |
|
|
|
|
|
|
|
|
|
|
|
|
|
|
|
|
|
|
Total non-interest expenses |
|
|
|
|
|
$ |
19,695 |
|
|
|
|
|
Non-GAAP adjusting items (1) : |
|
|
|
|
|
|
|
|
|
|
|
|
Divestitures and wind-down of operations |
|
|
|
|
|
|
7 |
|
|
|
|
|
Restructuring charge and severance provisions |
|
|
|
|
|
|
(53 |
) |
|
|
|
|
Legal provision |
|
|
|
|
|
|
(176 |
) |
|
|
|
|
Amortization of acquisition-related intangible assets |
|
|
|
|
|
|
(72 |
) |
|
|
|
|
Impairment of non-financial assets |
|
|
|
|
|
|
(440 |
) |
|
|
|
|
|
|
|
|
|
|
|
(734 |
) |
|
|
|
|
|
|
|
|
|
|
|
|
|
|
|
|
|
Salaries and employee benefits |
|
|
|
|
|
|
(46 |
) |
|
|
|
|
Depreciation and amortization |
|
|
|
|
|
|
(169 |
) |
|
|
|
|
Professional |
|
|
|
|
|
|
– |
|
|
|
|
|
Other |
|
|
|
|
|
|
(519 |
) |
|
|
|
|
|
|
|
|
|
|
|
(734 |
) |
|
|
|
|
Adjusted non-interest expenses (1)
|
|
|
|
|
|
$ |
18,961 |
|
|
|
|
|
|
|
|
|
|
|
|
58.5 |
% |
|
|
|
|
Adjusted productivity ratio (1)
|
|
|
|
|
|
|
56.1 |
% |
|
|
|
|
| (1) |
Refer to Non-GAAP Measures starting on page 20. |
| (2) |
Refer to Glossary on page 136 for the description of the measure. |
|
Direct and indirect taxes $ millions
|
Non-interest
expenses were $22,518 million compared to $19,695 million, an increase of $2,823 million or 14%. Included in non-interest expenses is an impairment loss of $1,422 million related to the announced sale of the banking operations in Colombia, Costa Rica and Panama, restructuring charge and severance provisions of $373 million and legal provisions of $74 million.
Adjusted
non-interest
expenses were $20,581 million compared to $18,961 million, an increase of $1,620 million or 9%. The increase was mainly driven by higher personnel costs, including performance and share-based compensation, inflationary adjustments and annual increases, higher technology and advertising and business development costs to support strategic and regulatory initiatives, as well as the negative impact of foreign currency translation, partly offset by lower depreciation and amortization.
The technology costs reflect the Bank’s medium-term commitment to modernize and scale data and analytics capabilities, cloud migration, and
digitization, as well as continued investment in core foundational enterprise security and architecture.
The productivity ratio was 59.7% compared to 58.5%. The adjusted productivity ratio was 54.5% compared to 56.1%. Operating leverage was negative 2.2% on a reported basis and positive 3.0% on an adjusted basis.
Provision for Income Taxes
The effective tax rate was 26.2% compared to 20.5% due primarily to the impairment loss related to the announced sale of the banking operations in Colombia, Costa Rica and Panama, lower income in lower tax jurisdictions and the implementation of the Global Minimum Tax (GMT), partially offset by higher
non-deductible
expenses and the impairment charge on Bank of Xi’an Co in the prior year. On an adjusted basis, the effective tax rate was 23.5% compared to 20.1% primarily due to lower income in lower tax jurisdictions and the implementation of the GMT.
2025 Scotiabank Annual Report
|
Management’s Discussion and Analysis
T20
Fourth quarter financial results
|
|
|
|
|
|
|
|
|
|
|
|
|
|
|
| |
|
For the three months ended |
|
|
|
|
|
| ($ millions) |
|
|
|
|
July 31
2025 |
|
|
October 31
2024 |
|
|
|
|
|
|
|
|
|
|
|
|
|
|
|
|
|
|
|
|
$ |
5,493 |
|
|
$ |
4,923 |
|
|
|
|
|
|
|
|
3,993 |
|
|
|
3,603 |
|
|
|
|
|
|
|
|
9,486 |
|
|
|
8,526 |
|
Provision for credit losses |
|
|
|
|
|
|
1,041 |
|
|
|
1,030 |
|
|
|
|
|
|
|
|
5,089 |
|
|
|
5,296 |
|
|
|
|
|
|
|
|
829 |
|
|
|
511 |
|
|
|
|
|
|
|
$ |
2,527 |
|
|
$ |
1,689 |
|
Net income attributable to non-controlling interests in subsidiaries (NCI) |
|
|
|
|
|
|
80 |
|
|
|
47 |
|
Net income attributable to equity holders of the Bank |
|
|
|
|
|
$ |
2,447 |
|
|
$ |
1,642 |
|
Preferred shareholders and other equity instrument holders |
|
|
|
|
|
|
134 |
|
|
|
121 |
|
|
|
|
|
|
|
|
2,313 |
|
|
|
1,521 |
|
|
|
|
|
|
|
|
|
|
|
|
|
|
Adjusting items impacting non-interest income and total revenue (Pre-tax)
|
|
|
|
|
|
|
|
|
|
|
|
|
Divestitures and wind-down of operations |
|
|
|
|
|
$ |
– |
|
|
$ |
– |
|
Amortization of acquisition-related intangible assets |
|
|
|
|
|
|
8 |
|
|
|
– |
|
Total non-interest income adjusting items (Pre-tax) |
|
|
|
|
|
|
8 |
|
|
|
– |
|
Adjusting items impacting non-interest expenses (Pre-tax)
|
|
|
|
|
|
|
|
|
|
|
|
|
Divestitures and wind-down of operations |
|
|
|
|
|
|
(23 |
) |
|
|
– |
|
Restructuring charge and severance provisions |
|
|
|
|
|
|
– |
|
|
|
53 |
|
|
|
|
|
|
|
|
– |
|
|
|
– |
|
Amortization of acquisition-related intangible assets |
|
|
|
|
|
|
17 |
|
|
|
19 |
|
Impairment of non-financial assets |
|
|
|
|
|
|
– |
|
|
|
440 |
|
Total non-interest expense adjusting items (Pre-tax)
|
|
|
|
|
|
|
(6 |
) |
|
|
512 |
|
Total impact of adjusting items on net income before taxes |
|
|
|
|
|
|
2 |
|
|
|
512 |
|
Impact of adjusting items on income tax expense |
|
|
|
|
|
|
|
|
|
|
|
|
Divestitures and wind-down of operations |
|
|
|
|
|
|
(6 |
) |
|
|
– |
|
Restructuring charge and severance provisions |
|
|
|
|
|
|
– |
|
|
|
(15 |
) |
|
|
|
|
|
|
|
– |
|
|
|
– |
|
Amortization of acquisition-related intangible assets |
|
|
|
|
|
|
(5 |
) |
|
|
(6 |
) |
Impairment of non-financial assets |
|
|
|
|
|
|
– |
|
|
|
(61 |
) |
Total impact of adjusting items on income tax expense |
|
|
|
|
|
|
(11 |
) |
|
|
(82 |
) |
Total impact of adjusting items on net income |
|
|
|
|
|
|
(9 |
) |
|
|
430 |
|
Impact of adjusting items on NCI |
|
|
|
|
|
|
37 |
|
|
|
– |
|
Total impact of adjusting items on net income attributable to equity holders |
|
|
|
|
|
$ |
28 |
|
|
$ |
430 |
|
|
|
|
|
|
|
|
|
|
|
|
|
|
Adjusted net interest income |
|
|
|
|
|
$ |
5,493 |
|
|
$ |
4,923 |
|
Adjusted non-interest income |
|
|
|
|
|
|
4,001 |
|
|
|
3,603 |
|
|
|
|
|
|
|
|
9,494 |
|
|
|
8,526 |
|
Adjusted provision for credit losses |
|
|
|
|
|
|
1,041 |
|
|
|
1,030 |
|
Adjusted non-interest expenses |
|
|
|
|
|
|
5,095 |
|
|
|
4,784 |
|
Adjusted income tax expense |
|
|
|
|
|
|
840 |
|
|
|
593 |
|
|
|
|
|
|
|
$ |
2,518 |
|
|
$ |
2,119 |
|
Adjusted net income attributable to non-controlling interests in subsidiaries (NCI) |
|
|
|
|
|
|
43 |
|
|
|
47 |
|
Adjusted net income attributable to equity holders of the Bank |
|
|
|
|
|
$ |
2,475 |
|
|
$ |
2,072 |
|
Preferred shareholders and other equity instrument holders |
|
|
|
|
|
|
134 |
|
|
|
121 |
|
|
|
|
|
|
|
|
2,341 |
|
|
|
1,951 |
|
| (1) |
Refer to Non-GAAP Measures starting on page 20. |
|
2025 Scotiabank Annual Report
Management’s Discussion and Analysis
| Group Financial Performance
Net income was $2,206 million compared to $1,689 million, an increase of 31%. Adjusted net income also increased 21% from $2,119 million to $2,558 million. The increase was driven primarily by higher net interest income and non-interest income, partly offset by higher non-interest expenses and income taxes.
Net income was $2,206 million compared to $2,527 million, a decrease of 13%. The decrease was driven primarily by higher non-interest expenses from the restructuring charge, partly offset by lower income taxes and higher net interest income and non-interest income. Adjusted net income was $2,558 million compared to $2,518 million, an increase of 2%. The increase was driven primarily by higher net interest income, non-interest income and lower income taxes, partly offset by higher non-interest expenses and provision for credit losses.
Revenues were $9,803 million compared to $8,526 million, an increase of 15%.
Net interest income was $5,586 million compared to $4,923 million, an increase of $663 million or 13%. The increase was due primarily to a higher net interest margin, loan growth and the positive impact of foreign currency translation. The net interest margin was 2.40%, an increase of 25 basis points mainly from significantly lower funding costs driven by central bank rate cuts, and higher margins in International Banking and Global Banking and Markets.
Non-interest income was $4,217 million, an increase of $614 million or 17%. Adjusted non-interest income was $4,181 million, an increase of $578 million or 16%. The increase was due mainly to higher income from associated corporations primarily related to the KeyCorp investment, as well as higher wealth management revenues, underwriting and advisory fees, trading-related revenues, and banking fees.
Revenues were $9,803 million compared to $9,486 million, an increase of 3%.
Net interest income increased $93 million or 2%, due primarily to a higher net interest margin, and the positive impact of foreign currency translation. The net interest margin increased four basis points, mainly driven by higher business line margins.
Non-interest income increased $224 million or 6%. Adjusted non-interest income was up $180 million or 4%. The increase was due mainly to higher wealth management revenues, other fee and commission revenues, and underwriting and advisory fees.
Provision for credit losses
The provision for credit losses was $1,113 million compared to $1,030 million, an increase of $83 million. The provision for credit losses ratio was 58 basis points compared to 54 basis points.
Provision for credit losses on performing loans was $71 million compared to a reversal of $13 million. The provision this period was primarily related to business growth, mainly in the International retail portfolio, as well as credit migration impacting Canadian Banking and Corporate loan book, partly offset by the impact of the improving macroeconomic outlook.
Provision for credit losses on impaired loans was $1,042 million compared to $1,043 million. The provision for credit losses ratio on impaired loans was 54 basis points compared to 55 basis points. The decrease was due primarily to lower provisions in the retail portfolio, partly offset by higher provisions in the Canadian commercial portfolio.
The provision for credit losses was $1,113 million compared to $1,041 million, an increase of $72 million. The provision for credit losses ratio was 58 basis points compared to 55 basis points.
Provision for credit losses on performing loans was $71 million compared to $66 million. The provision this period was primarily related to business growth, mainly in the International retail portfolio, as well as credit migration impacting Canadian Banking and Corporate loan book, partly offset by the impact of the improving macroeconomic outlook.
Provision for credit losses on impaired loans was $1,042 million compared to $975 million, an increase of $67 million or 7% mainly in retail. The provision for credit losses ratio on impaired loans was 54 basis points compared to 51 basis points.
Non-interest expenses were $5,828 million compared to $5,296 million, an increase of $532 million or 10%. Adjusted non-interest expenses were $5,308 million compared to $4,784 million, an increase of $524 million or 11%, driven mainly by higher personnel costs, including performance-based compensation, higher technology and advertising and business development costs to support strategic and regulatory initiatives, as well as the negative impact of foreign currency translation.
The productivity ratio was 59.4% compared to 62.1%. The adjusted productivity ratio was 54.3% compared to 56.1%. Year-to-date operating leverage was negative 2.2% and positive 3.0% on adjusted basis.
Non-interest expenses were up $739 million or 14%. Adjusted non-interest expenses were $5,308 million, an increase of $213 million or 4%, driven by higher personnel costs, including performance-based compensation, higher technology and advertising and business development costs to support strategic and regulatory initiatives, and the negative impact of foreign currency translation. This was partly offset by lower professional fees and depreciation and amortization.
The productivity ratio was 59.4% compared to 53.7%. The adjusted productivity ratio was 54.3% compared to 53.7%.
2025 Scotiabank Annual Report
|
Management’s Discussion and Analysis
Provision for income taxes
The effective tax rate was 22.9% compared to 23.2%. On an adjusted basis the effective tax rate was 23.6% compared to 21.8% due primarily to lower income in lower tax jurisdictions and the implementation of the GMT.
The effective tax rate was 22.9% compared to 24.7% and on an adjusted basis the effective tax rate was 23.6% compared to 25.0% due primarily to higher income in lower tax jurisdictions and withholding taxes paid in the prior quarter.
T21
Quarterly financial highlights
|
|
|
|
|
|
|
|
|
|
|
|
|
|
|
|
|
|
|
|
|
|
|
|
|
|
|
|
|
|
|
|
|
|
|
| |
|
For the three months ended |
|
|
|
|
|
|
|
|
|
|
| ($ millions) |
|
|
|
|
July 31
2025 |
|
|
April 30
2025 |
|
|
January 31
2025 |
|
|
October 31
2024 |
|
|
July 31
2024 |
|
|
April 30
2024 |
|
|
January 31
2024 |
|
|
|
|
|
|
|
|
|
|
|
|
|
|
|
|
|
|
|
|
|
|
|
|
|
|
|
|
|
|
|
|
|
|
|
|
|
|
|
|
$ |
5,493 |
|
|
$ |
5,270 |
|
|
$ |
5,173 |
|
|
$ |
4,923 |
|
|
$ |
4,862 |
|
|
$ |
4,694 |
|
|
$ |
4,773 |
|
|
|
|
|
|
|
|
3,993 |
|
|
|
3,810 |
|
|
|
4,199 |
|
|
|
3,603 |
|
|
|
3,502 |
|
|
|
3,653 |
|
|
|
3,660 |
|
|
|
|
|
|
|
$ |
9,486 |
|
|
$ |
9,080 |
|
|
$ |
9,372 |
|
|
$ |
8,526 |
|
|
$ |
8,364 |
|
|
$ |
8,347 |
|
|
$ |
8,433 |
|
Provision for credit losses |
|
|
|
|
|
|
1,041 |
|
|
|
1,398 |
|
|
|
1,162 |
|
|
|
1,030 |
|
|
|
1,052 |
|
|
|
1,007 |
|
|
|
962 |
|
|
|
|
|
|
|
|
5,089 |
|
|
|
5,110 |
|
|
|
6,491 |
|
|
|
5,296 |
|
|
|
4,949 |
|
|
|
4,711 |
|
|
|
4,739 |
|
|
|
|
|
|
|
|
829 |
|
|
|
540 |
|
|
|
726 |
|
|
|
511 |
|
|
|
451 |
|
|
|
537 |
|
|
|
533 |
|
|
|
|
|
|
|
$ |
2,527 |
|
|
$ |
2,032 |
|
|
$ |
993 |
|
|
$ |
1,689 |
|
|
$ |
1,912 |
|
|
$ |
2,092 |
|
|
$ |
2,199 |
|
Basic earnings per share ($) |
|
|
|
|
|
|
1.84 |
|
|
|
1.48 |
|
|
|
0.82 |
|
|
|
1.23 |
|
|
|
1.43 |
|
|
|
1.59 |
|
|
|
1.70 |
|
Diluted earnings per share ($) |
|
|
|
|
|
|
1.84 |
|
|
|
1.48 |
|
|
|
0.66 |
|
|
|
1.22 |
|
|
|
1.41 |
|
|
|
1.57 |
|
|
|
1.68 |
|
Net interest margin (%) (1)
|
|
|
|
|
|
|
2.36 |
|
|
|
2.31 |
|
|
|
2.23 |
|
|
|
2.15 |
|
|
|
2.14 |
|
|
|
2.17 |
|
|
|
2.19 |
|
Effective tax rate (%) (2)
|
|
|
|
|
|
|
24.7 |
|
|
|
21.0 |
|
|
|
42.2 |
|
|
|
23.2 |
|
|
|
19.1 |
|
|
|
20.4 |
|
|
|
19.5 |
|
|
|
|
|
|
|
|
|
|
|
|
|
|
|
|
|
|
|
|
|
|
|
|
|
|
|
|
|
|
|
|
|
|
Adjusting items impacting non-interest income and total revenue (Pre-tax)
|
|
|
|
|
|
|
|
|
|
|
|
|
|
|
|
|
|
|
|
|
|
|
|
|
|
|
|
|
|
|
|
|
Divestitures and wind-down of operations |
|
|
|
|
|
$ |
– |
|
|
$ |
9 |
|
|
$ |
– |
|
|
$ |
– |
|
|
$ |
143 |
|
|
$ |
– |
|
|
$ |
– |
|
Amortization of acquisition-related intangible assets |
|
|
|
|
|
|
8 |
|
|
|
9 |
|
|
|
– |
|
|
|
– |
|
|
|
– |
|
|
|
– |
|
|
|
– |
|
Total non-interest income and total revenue adjusting items (Pre-tax)
|
|
|
|
|
|
|
8 |
|
|
|
18 |
|
|
|
– |
|
|
|
– |
|
|
|
143 |
|
|
|
– |
|
|
|
– |
|
Adjusting items impacting non-interest expenses (Pre-tax)
|
|
|
|
|
|
|
|
|
|
|
|
|
|
|
|
|
|
|
|
|
|
|
|
|
|
|
|
|
|
|
|
|
Divestitures and wind-down of operations |
|
|
|
|
|
|
(23 |
) |
|
|
26 |
|
|
|
1,362 |
|
|
|
– |
|
|
|
(7 |
) |
|
|
– |
|
|
|
– |
|
Restructuring charge and severance provisions |
|
|
|
|
|
|
– |
|
|
|
– |
|
|
|
– |
|
|
|
53 |
|
|
|
– |
|
|
|
– |
|
|
|
– |
|
|
|
|
|
|
|
|
– |
|
|
|
– |
|
|
|
– |
|
|
|
– |
|
|
|
176 |
|
|
|
– |
|
|
|
– |
|
Amortization of acquisition-related intangible assets |
|
|
|
|
|
|
17 |
|
|
|
17 |
|
|
|
18 |
|
|
|
19 |
|
|
|
17 |
|
|
|
18 |
|
|
|
18 |
|
Impairment of non-financial assets |
|
|
|
|
|
|
– |
|
|
|
– |
|
|
|
– |
|
|
|
440 |
|
|
|
– |
|
|
|
– |
|
|
|
– |
|
Total non-interest expenses adjusting items (Pre-tax)
|
|
|
|
|
|
|
(6 |
) |
|
|
43 |
|
|
|
1,380 |
|
|
|
512 |
|
|
|
186 |
|
|
|
18 |
|
|
|
18 |
|
Total impact of adjusting items on net income before taxes |
|
|
|
|
|
|
2 |
|
|
|
61 |
|
|
|
1,380 |
|
|
|
512 |
|
|
|
329 |
|
|
|
18 |
|
|
|
18 |
|
Impact of adjusting items on income tax expense |
|
|
|
|
|
|
(11 |
) |
|
|
(21 |
) |
|
|
(11 |
) |
|
|
(82 |
) |
|
|
(50 |
) |
|
|
(5 |
) |
|
|
(5 |
) |
Total impact of adjusting items on net income |
|
|
|
|
|
|
(9 |
) |
|
|
40 |
|
|
|
1,369 |
|
|
|
430 |
|
|
|
279 |
|
|
|
13 |
|
|
|
13 |
|
|
|
|
|
|
|
$ |
2,518 |
|
|
$ |
2,072 |
|
|
$ |
2,362 |
|
|
$ |
2,119 |
|
|
$ |
2,191 |
|
|
$ |
2,105 |
|
|
$ |
2,212 |
|
Adjusted diluted earnings per share |
|
|
|
|
|
$ |
1.88 |
|
|
$ |
1.52 |
|
|
$ |
1.76 |
|
|
$ |
1.57 |
|
|
$ |
1.63 |
|
|
$ |
1.58 |
|
|
$ |
1.69 |
|
| (1) |
Refer to Non-GAAP Measures starting on page 20. |
| (2) |
Refer to Glossary on page 136 for the description of the measure. |
Earnings over the two-year period were driven by higher net interest income and generally higher non-interest income. Provisions for credit losses, non-interest expenses and provisions for income taxes were generally higher. Earnings during this period were impacted by adjusting items.
|
2025 Scotiabank Annual Report
Management’s Discussion and Analysis
| Group Financial Performance
Canadian Banking net interest income over the period has increased, driven by asset and deposit growth and the benefit of the BA conversion. International Banking net interest income is stable with improvements in lending mix and the positive impact from central bank rate decreases. Global Wealth Management fee-based revenues increased during the period from AUM and AUA market appreciation and higher net sales. Global Banking and Markets revenues are affected by market conditions that impact client activity and have trended upwards due to positive market conditions in the capital markets and business banking businesses, supported by higher underwriting and advisory fees. Revenues in the Other segment were impacted by higher term funding costs, and income from associated corporations, both of which have improved in 2025.
Provision for credit losses
Provision for credit losses have trended upward during the period driven by higher performing loans, due primarily to credit quality migration and significant deterioration in the macroeconomic outlook in Canadian Banking, which reflects the continued uncertainty related to U.S. tariffs. The increase in provision for credit losses on impaired loans this year was due primarily to higher formations in the Canadian Banking portfolio.
Non-interest expenses for the period reflect the Bank’s continued investment in personnel and technology to support strategy and business growth, as well as the impact of inflation. This was partly offset by expense management and efficiency initiatives. The impact of foreign currency translation also contributed to fluctuations over the period. Non-interest expenses during the period were impacted by adjusting items.
Provision for income taxes
The effective tax rate was 22.9% this quarter. The average effective tax rate was 24.1% over the period and was impacted by implementation of the GMT, divestitures, restructuring charge and net income earned in foreign jurisdictions, as well as the variability of tax exempt dividend income and inflationary benefits.
2025 Scotiabank Annual Report
|
Management’s Discussion and Analysis
The Bank’s businesses are grouped into four business lines: Canadian Banking, International Banking, Global Wealth Management and Global Banking and Markets. The Bank’s other smaller operating segments and corporate adjustments are included in the Other segment.
Segment measurement methodologies
The Bank analyzes revenue on a taxable equivalent basis (TEB) for business lines. This methodology grosses up
tax-exempt
income earned on certain securities reported in either net interest income or
non-interest
income to an equivalent before tax basis. It also grosses up net income from associated corporations to normalize the effective tax rate in the business lines. Corresponding increases are made to the provision for income taxes; hence, there is no impact on the segment’s net income. Management believes that this basis for measurement provides a uniform comparability of income arising from both taxable and
non-taxable
sources and facilitates a consistent basis of measurement. While other banks also use TEB, their methodology may not be comparable to the Bank’s methodology. The elimination of the TEB
gross-up
is recorded in the Other segment; hence, there is no impact on the consolidated results. Effective January 1, 2024, in line with the provisions of Bill C-59, the Bank no longer claims the dividend received deduction on Canadian shares that are mark-to-market property, which resulted in a lower TEB gross-up.
International Banking business segment results are analyzed on a constant dollar basis. Under the constant dollar basis, prior period amounts are recalculated using current period average foreign currency rates thereby eliminating the impact of foreign currency translation. The Bank believes that reporting in constant dollar is useful for readers in assessing ongoing business performance.
The Other segment includes Group Treasury, investments in certain associated corporations, and smaller operating segments and corporate items which are not allocated to a business line. Group Treasury is primarily responsible for balance sheet, liquidity and interest rate risk management, which includes the Bank’s wholesale funding activities.
Funds transfer pricing (FTP) is the process by which the Bank prices intra-company borrowing or lending between the business segments and the Other segment. Through consideration of interest rate and liquidity risk characteristics of assets, liabilities and
off-balance
sheet exposures, this process aims to manage these risks through Group Treasury and enables risk-adjusted management reporting of business segment results. Periodically, the methodology and assumptions used in the FTP process are adjusted to reflect customer behaviours, market dynamics and other factors, which may impact the financial results of the business segments.
Changes in business line allocation methodology
Effective the first quarter of 2025, the Bank made voluntary changes to its allocation methodology impacting business segment presentation. The new methodology includes updates related to the Bank’s FTP, head office expense allocations, and allocations between business segments. Prior period results and ratios for each segment have been revised to conform with the current period’s methodology. Further details on the changes are as follows:
| |
1. |
FTP methodology was updated, primarily related to the allocation of substantially all liquidity costs to the business lines from the Other segment, reflecting the Bank’s strategic objective to maintain higher liquidity ratios. |
| |
2. |
Periodically, the Bank updates its allocation methodologies. This includes a comprehensive update to the allocation of head office expenses across countries within International Banking, updates to the allocation of clients and associated revenue, expenses, and balances between International Banking, Global Banking and Markets, and Global Wealth Management to align with the strategy, as well as updates to the allocation of head office expenses and income taxes from the Other segment to the business segments. |
| |
3. |
To be consistent with the reporting of its recent minority investment in KeyCorp, the Bank has also made changes to the reporting of certain minority investments in International Banking (Bank of Xi’an Co. Ltd.) and Global Wealth Management (Bank of Beijing Scotia Asset Management), which are now reported in the Other segment. |
|
2025 Scotiabank Annual Report
Management’s Discussion and Analysis
| Business Line Overview
|
|
|
|
|
KEY PERFORMANCE INDICATORS FOR ALL BUSINESS LINES |
|
|
|
|
|
|
|
|
|
|
|
Management uses a number of key metrics to monitor business line performance: |
|
|
|
|
|
|
|
|
|
|
|
|
|
Provision for credit losses ratio |
Below are the results of the Bank’s operating segments for 2025:
T22
Financial performance – Reported
|
|
|
|
|
|
|
|
|
|
|
|
|
|
|
|
|
|
|
|
|
|
|
|
|
|
|
|
|
|
|
|
| For the year ended October 31, 2025 ($ millions) |
|
Canadian
Banking |
|
|
International
Banking |
|
|
Global Wealth
Management |
|
|
Global Banking
and Markets |
|
|
Other |
|
|
|
|
|
|
|
|
|
|
|
|
|
|
|
|
|
|
|
|
|
|
|
|
|
|
|
|
|
|
|
|
|
|
|
|
|
|
|
|
|
|
|
|
|
|
|
|
|
|
|
|
|
|
|
|
|
|
|
|
|
|
|
|
|
|
|
|
|
|
|
|
|
|
|
|
|
|
|
Provision for credit losses |
|
|
|
|
|
|
|
|
|
|
|
|
|
|
|
|
|
|
|
|
|
|
|
|
|
|
|
|
|
|
|
|
|
|
|
|
|
|
|
|
|
|
|
|
|
|
|
|
|
Provision for income taxes (1)
|
|
|
|
|
|
|
|
|
|
|
|
|
|
|
|
|
|
|
|
|
|
|
|
|
|
|
|
|
|
|
|
|
|
|
|
|
|
|
|
|
|
|
|
|
|
|
|
|
|
Net income attributable to non-controlling interests in subsidiaries |
|
|
|
|
|
|
|
|
|
|
|
|
|
|
|
|
|
|
|
|
|
|
|
|
Net income attributable to equity holders of the Bank |
|
|
|
|
|
|
|
|
|
|
|
|
|
|
|
|
|
|
|
|
|
|
|
|
|
|
|
|
|
|
|
|
|
|
|
|
|
|
|
|
|
|
|
|
|
|
|
|
|
Total average assets ($ billions) |
|
|
|
|
|
|
|
|
|
|
|
|
|
|
|
|
|
|
|
|
|
|
|
|
Total average liabilities ($ billions) |
|
|
|
|
|
|
|
|
|
|
|
|
|
|
|
|
|
|
|
|
|
|
|
|
| (1) |
Taxable equivalent basis. Refer to Glossary on page 136. |
| (2) |
Refer to Non-GAAP Measures on page 20 for the description of the measure. |
|
|
|
|
|
|
|
|
|
|
|
|
|
|
|
|
|
|
|
|
|
|
|
|
|
|
|
|
|
|
|
|
| For the year ended October 31, 2024 ($ millions) |
|
|
|
|
|
|
|
Global Wealth Management (1)
|
|
|
Global Banking and Markets (1)
|
|
|
|
|
|
Total |
|
|
|
$ |
10,185 |
|
|
$ |
8,867 |
|
|
$ |
786 |
|
|
$ |
1,102 |
|
|
$ |
(1,688 |
) |
|
$ |
19,252 |
|
|
|
|
2,848 |
|
|
|
2,999 |
|
|
|
4,803 |
|
|
|
3,959 |
|
|
|
(191 |
) |
|
|
14,418 |
|
|
|
|
13,033 |
|
|
|
11,866 |
|
|
|
5,589 |
|
|
|
5,061 |
|
|
|
(1,879 |
) |
|
|
33,670 |
|
Provision for credit losses |
|
|
1,691 |
|
|
|
2,285 |
|
|
|
27 |
|
|
|
47 |
|
|
|
1 |
|
|
|
4,051 |
|
|
|
|
6,125 |
|
|
|
6,170 |
|
|
|
3,655 |
|
|
|
3,122 |
|
|
|
623 |
|
|
|
19,695 |
|
Provision for income taxes (2)
|
|
|
1,440 |
|
|
|
705 |
|
|
|
479 |
|
|
|
414 |
|
|
|
(1,006 |
) |
|
|
2,032 |
|
|
|
$ |
3,777 |
|
|
$ |
2,706 |
|
|
$ |
1,428 |
|
|
$ |
1,478 |
|
|
$ |
(1,497 |
) |
|
$ |
7,892 |
|
Net income attributable to non-controlling interests in subsidiaries |
|
|
– |
|
|
|
125 |
|
|
|
10 |
|
|
|
– |
|
|
|
(1 |
) |
|
|
134 |
|
Net income attributable to equity holders of the Bank |
|
$ |
3,777 |
|
|
$ |
2,581 |
|
|
$ |
1,418 |
|
|
$ |
1,478 |
|
|
$ |
(1,496 |
) |
|
$ |
7,758 |
|
|
|
|
18.3 |
% |
|
|
13.5 |
% |
|
|
13.9 |
% |
|
|
9.6 |
% |
|
|
nm |
|
|
|
10.2 |
% |
Total average assets ($ billions) |
|
$ |
449 |
|
|
$ |
231 |
|
|
$ |
35 |
|
|
$ |
495 |
|
|
$ |
209 |
|
|
$ |
1,419 |
|
Total average liabilities ($ billions) |
|
$ |
389 |
|
|
$ |
179 |
|
|
$ |
41 |
|
|
$ |
475 |
|
|
$ |
254 |
|
|
$ |
1,338 |
|
| (1) |
Effective Q1 2025, changes were made to the methodology used to allocate certain income, expenses and balance sheet items between business segments. Prior period results for each segment have been reclassified to conform with the current period’s methodology. Refer to page 42 for further details. |
| (2) |
Taxable equivalent basis. Refer to Glossary on page 136. |
| (3) |
Refer to Non-GAAP Measures on page 20 for the description of the measure. |
2025 Scotiabank Annual Report
|
Management’s Discussion and Analysis
T22A
Financial performance – Adjusted
|
|
|
|
|
|
|
|
|
|
|
|
|
|
|
|
|
|
|
|
|
|
|
|
|
|
|
|
|
|
|
|
| For the year ended October 31, 2025 ($ millions) (1)
|
|
Canadian
Banking |
|
|
International
Banking |
|
|
Global Wealth
Management |
|
|
Global Banking
and Markets |
|
|
Other |
|
|
|
|
|
|
|
|
|
|
|
|
|
|
|
|
|
|
|
|
|
|
|
|
|
|
|
|
|
|
|
|
|
|
|
|
|
|
|
|
|
|
|
|
|
|
|
|
|
|
|
|
|
|
|
|
|
|
|
|
|
|
|
|
|
|
|
|
|
|
|
|
|
|
|
|
|
|
|
Provision for credit losses |
|
|
|
|
|
|
|
|
|
|
|
|
|
|
|
|
|
|
|
|
|
|
|
|
|
|
|
|
|
|
|
|
|
|
|
|
|
|
|
|
|
|
|
|
|
|
|
|
|
Provision for income taxes (2)
|
|
|
|
|
|
|
|
|
|
|
|
|
|
|
|
|
|
|
|
|
|
|
|
|
|
|
|
|
|
|
|
|
|
|
|
|
|
|
|
|
|
|
|
|
|
|
|
|
|
Net income attributable to non-controlling interests in subsidiaries |
|
|
|
|
|
|
|
|
|
|
|
|
|
|
|
|
|
|
|
|
|
|
|
|
Net income attributable to equity holders of the Bank |
|
|
|
|
|
|
|
|
|
|
|
|
|
|
|
|
|
|
|
|
|
|
|
|
| (1) |
Refer to Non-GAAP Measures on page 20 for the description of the adjustments. |
| (2) |
Taxable equivalent basis. Refer to Glossary on page 136. |
|
|
|
|
|
|
|
|
|
|
|
|
|
|
|
|
|
|
|
|
|
|
|
|
|
|
|
|
|
|
|
|
| For the year ended October 31, 2024 ($ millions) (1)
|
|
|
|
|
|
|
|
Global Wealth Management (2)
|
|
|
Global Banking and Markets (2)
|
|
|
|
|
|
Total |
|
|
|
$ |
10,185 |
|
|
$ |
8,867 |
|
|
$ |
786 |
|
|
$ |
1,102 |
|
|
$ |
(1,688 |
) |
|
$ |
19,252 |
|
|
|
|
2,848 |
|
|
|
2,999 |
|
|
|
4,803 |
|
|
|
3,959 |
|
|
|
(48 |
) |
|
|
14,561 |
|
|
|
|
13,033 |
|
|
|
11,866 |
|
|
|
5,589 |
|
|
|
5,061 |
|
|
|
(1,736 |
) |
|
|
33,813 |
|
Provision for credit losses |
|
|
1,691 |
|
|
|
2,285 |
|
|
|
27 |
|
|
|
47 |
|
|
|
1 |
|
|
|
4,051 |
|
|
|
|
6,121 |
|
|
|
6,138 |
|
|
|
3,619 |
|
|
|
3,122 |
|
|
|
(39 |
) |
|
|
18,961 |
|
Provision for income taxes (3)
|
|
|
1,441 |
|
|
|
714 |
|
|
|
489 |
|
|
|
414 |
|
|
|
(884 |
) |
|
|
2,174 |
|
|
|
$ |
3,780 |
|
|
$ |
2,729 |
|
|
$ |
1,454 |
|
|
$ |
1,478 |
|
|
$ |
(814 |
) |
|
$ |
8,627 |
|
Net income attributable to non-controlling interests in subsidiaries |
|
|
– |
|
|
|
125 |
|
|
|
10 |
|
|
|
– |
|
|
|
1 |
|
|
|
136 |
|
Net income attributable to equity holders of the Bank |
|
$ |
3,780 |
|
|
$ |
2,604 |
|
|
$ |
1,444 |
|
|
$ |
1,478 |
|
|
$ |
(815 |
) |
|
$ |
8,491 |
|
| (1) |
Refer to Non-GAAP Measures on page 20 for the description of the adjustments. |
| (2) |
Effective Q1 2025, changes were made to the methodology used to allocate certain income, expenses and balance sheet items between business segments. Prior period results for each segment have been reclassified to conform with the current period’s methodology. Refer to page 42 for further details. |
| (3) |
Taxable equivalent basis. Refer to Glossary on page 136. |
|
2025 Scotiabank Annual Report
Management’s Discussion and Analysis
| Canadian Banking
|
|
|
|
|
|
|
|
|
|
|
|
Earn primary client relationships
Accelerated the Mortgage+ program – a customizable bundle with a preferred mortgage rate, everyday banking account and other retail products, with 90% penetration on new originations and significant increase in mortgage renewal rates.
Leveraged Scene+ program to drive debit and credit card growth, increasing the penetration of Scotia payment products among members to 26%.
Improved client attrition by 150 bps to its lowest level in recent years, through higher quality acquisition, focus on cross-sell and streamlining everyday service tasks to capture and maintain deeper client relationships.
Grow and scale in priority businesses
Launched major salesforce effectiveness programs nationally, improving sales practices across Retail, Small Business and Commercial Banking.
Maintained solid growth in Retail deposits and investments. Retail mutual fund assets under management grew ~12% from last year, driven by strong sales performance.
Launched the new Scotiabank Passport ® Visa Infinite Privilege Card, an elite travel credit card tailored to Canadians seeking a superior travel experience.
Launched the new Smart Savings tools on our Money Master account, helping clients automate their savings and earn a boosted interest rate, achieving a significant increase in deepening client relationships since the launch.
Make it easy to do business with us
Expanded our virtual advice teams in Retail and Business Banking, improving overall advisor coverage and making it easier for clients to access advice.
Accelerated the shift to digital, with digital adoption up 70 bps and share of sales revenue from digital and virtual channels reaching 15%.
First bank in Canada to fully integrate Nova Credit into a digital onboarding experience, giving newcomers a seamless experience when opening chequing, savings and credit card accounts online, reducing the need for branch visits.
Built our momentum to increase collaboration across teams and business lines and bring the whole bank to our clients, achieving 18% growth in closed referrals between Retail, Wealth, Small Business and Commercial.
Named as one of the Best Workplaces ™ in Canada by Great Place to Work for the 6 th year in a row.
Named one of Canada’s Top Employers for Young People 2025 by Mediacorp Canada for the 5 th consecutive year.
Named Canada’s Best Bank at the 2025 Euromoney Awards for Excellence for the 2 nd consecutive year.
Named Bank of the Year in Canada for the 6 th consecutive year by The Banker, which recognizes financial institutions for their performance, and strategic and technological advancements.
J.D. Power ranked Tangerine Bank highest in Personal Banking Client Satisfaction among Midsize Banks for the 14 th consecutive year, with top rankings across six of the study’s seven key dimensions – including ‘Level of trust’.
|
|
|
Canadian Banking provides a full suite of financial advice and banking solutions, supported by an excellent customer experience, to over 11 million customers. Retail, Small Business Banking and Commercial Banking customers receive service through its network of 892 branches and 3,542 automated banking machines (ABMs), as well as online, mobile and telephone banking, and specialized sales teams. Canadian Banking also provides an alternative self-directed banking solution to Tangerine customers. Canadian Banking comprises the following areas:
• |
|
Retail Banking provides financial advice and solutions along with banking products, including debit cards, chequing accounts, credit cards, investments, mortgages, personal loans, and related creditor insurance products to retail customers, including automotive dealers and their customers, providing retail automotive financing solutions. Tangerine Bank provides banking products, including chequing and saving accounts, credit cards, mortgages, loans, and investments to self-directed customers. |
• |
|
Business Banking delivers advice and a full suite of lending, deposit, cash management and trade finance solutions to small, medium, and large businesses, including the Roynat franchise, which provides clients with innovative financing alternatives through both public and private markets. |
We aim to be Canada’s most trusted and data-driven bank with market-leading client advice, and sustainable growth in earnings and return on equity. Canadian Banking will continue to execute its long-term strategy to deliver stable and consistent earnings, including businesses and products that deliver higher returns on equity and lower risk-weighted assets. Ongoing efforts focus on deepening relationships with clients to increase engagement, loyalty and primacy, investing in digital and analytical capabilities to understand and anticipate customer needs, and developing a high-quality and diverse team of Scotiabank employees.
2025 Scotiabank Annual Report
|
Management’s Discussion and Analysis
• |
|
Increase client primacy across Retail, Tangerine, Small Business and Commercial Banking, with segment driven value propositions, personalization, and client experience. |
• |
|
Strengthen the ecosystem and harness the full potential of Scene+ to drive higher deposit and card balances and capture share of wallet. |
• |
|
Sales and channel effectiveness: Fully embed sales effectiveness enhancements across Retail, Small Business and Commercial Banking to drive consistency, and ramp up our digital and virtual capabilities to enable more specialization in human assisted channels. |
• |
|
Deliver productivity-enabled investments, including process optimization, automation and digitization, to unlock savings, fund future growth, and improve organizational agility. |
• |
|
Realize Tangerine’s full potential as a digital challenger: Strengthen foundational capabilities and capitalize on opportunities as one of Canada’s leading digital challenger banks. |
• |
|
& analytics, technology, and digital capabilities: Strengthen capabilities across data, technology and digital to support client experience and insight-driven decision-making, and bolster technological resiliency. |
T23
Canadian Banking financial performance
|
|
|
|
|
|
|
|
|
|
|
|
| Taxable equivalent basis ($ millions) |
|
|
|
|
|
|
|
|
|
|
|
|
|
|
|
|
|
|
|
|
|
$ |
10,185 |
|
|
|
|
|
|
|
|
2,848 |
|
|
|
|
|
|
|
|
13,033 |
|
Provision for credit losses |
|
|
|
|
|
|
1,691 |
|
|
|
|
|
|
|
|
6,125 |
|
|
|
|
|
|
|
|
1,440 |
|
|
|
|
|
|
|
$ |
3,777 |
|
Net income attributable to non-controlling interests in subsidiaries |
|
|
|
|
|
|
– |
|
Net income attributable to equity holders of the Bank |
|
|
|
|
|
$ |
3,777 |
|
|
|
|
Key ratios and other financial data |
|
|
|
|
|
|
|
|
|
|
|
|
|
|
|
18.3 |
% |
|
|
|
|
|
|
|
47.0 |
% |
|
|
|
|
|
|
|
2.38 |
% |
|
|
|
|
|
|
|
27.6 |
% |
Provision for credit losses – performing (Stages 1 and 2) |
|
|
|
|
|
$ |
127 |
|
Provision for credit losses – impaired (Stage 3) |
|
|
|
|
|
$ |
1,564 |
|
Provision for credit losses as a percentage of average net loans and acceptances (4)
|
|
|
|
|
|
|
0.38 |
% |
Provision for credit losses on impaired loans as a percentage of average net loans and acceptances (4)
|
|
|
|
|
|
|
0.35 |
% |
Net write-offs as a percentage of average net loans and acceptances (4)
|
|
|
|
|
|
|
0.32 |
% |
|
|
|
Selected Consolidated Statement of Financial Position data (average balances) |
|
|
|
|
|
|
|
|
|
|
|
|
|
|
$ |
445,076 |
|
|
|
|
|
|
|
|
449,469 |
|
|
|
|
|
|
|
|
367,441 |
|
|
|
|
|
|
|
|
388,957 |
|
| (1) |
Effective Q1 2025, changes were made to the methodology used to allocate certain income, expenses and balance sheet items between business segments. Prior period results for each segment have been reclassified to conform with the current period’s methodology. Refer to page 42 for further details. |
| (2) |
Includes net (loss) income from investments in associated corporations of $19 (2024 – $(9)). |
| (3) |
Refer to Non-GAAP Measures on page 20 for the description of the measure. |
| (4) |
Refer to Glossary on page 136 for the description of the measure. |
T23A
Adjusted Canadian Banking financial performance
(1)
|
|
|
|
|
|
|
|
|
|
|
|
| ($ millions) |
|
|
|
|
|
|
|
|
|
|
|
|
|
|
|
|
|
|
|
|
|
$ |
10,185 |
|
|
|
|
|
|
|
|
2,848 |
|
|
|
|
|
|
|
|
13,033 |
|
Provision for credit losses |
|
|
|
|
|
|
1,691 |
|
|
|
|
|
|
|
|
6,121 |
|
|
|
|
|
|
|
|
5,221 |
|
|
|
|
|
|
|
|
1,441 |
|
|
|
|
|
|
|
$ |
3,780 |
|
Net income attributable to non-controlling interests in subsidiaries (NCI) |
|
|
|
|
|
|
– |
|
Net income attributable to equity holders |
|
|
|
|
|
$ |
3,780 |
|
| (1) |
Refer to Non-GAAP Measures on page 20 for the description of the adjustments. |
| (2) |
Effective Q1 2025, changes were made to the methodology used to allocate certain income, expenses and balance sheet items between business segments. Prior period results for each segment have been reclassified to conform with the current period’s methodology. Refer to page 42 for further details. |
| (3) |
Includes adjustment for amortization of acquisition-related intangible assets of $4 (2024 – $4). |
|
2025 Scotiabank Annual Report
Management’s Discussion and Analysis
| Canadian Banking
Net income attributable to equity holders was $3,425 million compared to $3,777 million, a decrease of 9%. Adjusted net income attributable to equity holders was $3,428 million compared to $3,780 million, a decrease of 9%. The decrease was driven primarily by higher provision for credit losses and
non-interest
expenses, partly offset by higher net interest income and
non-interest
income.
Average assets and liabilities
Average assets were $463 billion compared to $449 billion. The increase was due primarily to growth of $13 billion or 5% in residential mortgages.
Average liabilities were $382 billion compared to $389 billion. The decrease was due primarily to a reduction of $16 billion in bankers’ acceptances liabilities due to the BA conversion, partly offset by growth of $5 billion or 4% in
non-personal
deposits, primarily in demand accounts, and $5 billion or 2% in personal deposits, mainly in chequing and savings products.
Revenues were $13,425 million compared to $13,033 million, an increase of 3%.
Net interest income was $10,484 million compared to $10,185 million, an increase of 3%. The increase was due primarily to solid asset and deposit growth, and the benefit of the BA conversion, partly offset by lower net interest margin. The net interest margin declined nine basis points to 2.29% due primarily to lower deposit margins reflecting the impact of Bank of Canada’s rate cuts, partly offset by an increase in asset margins.
Non-interest
income was $2,941 million compared to $2,848 million, an increase of 3%. The increase was due primarily to elevated private equity gains, higher mutual fund distribution fees and insurance income, partly offset by lower banking fees, including the impact of the BA conversion.
Retail Banking revenues were $9,880 million compared to $9,820 million, an increase of 1%.
Net interest income was $7,701 million compared to $7,758 million, a decrease of 1%, due primarily to lower deposit margins reflecting the impact of Bank of Canada’s rate cuts, partly offset by solid asset and deposit growth, and higher asset margins.
Non-interest
income was $2,179 million compared to $2,062 million, an increase of 6%, due primarily to higher insurance revenue, mutual fund distribution fees, and banking revenue.
Total Business Banking revenues were $3,545 million compared to $3,213 million, an increase of 10%.
Net interest income was $2,783 million compared to $2,427 million, an increase of 15%, due primarily to solid deposit growth, the benefit of the BA conversion, and improved margins.
Non-interest
income was $762 million compared to $786 million, a decrease of 3%, due primarily to lower banking fees, including the impact of the BA conversion, partly offset by elevated private equity gains.
Provision for credit losses
The provision for credit losses was $2,293 million compared to $1,691 million, an increase of $602 million. The provision for credit losses ratio was 50 basis points compared to 38 basis points.
The provision for credit losses on performing loans was $399 million compared to $127 million. The provision increased by $272 million driven by credit quality migration and significant deterioration in the macroeconomic outlook impacting both the retail and commercial portfolios.
The provision for credit losses on impaired loans was $1,894 million compared to $1,564 million. The provision for credit losses ratio on impaired loans was 41 basis points compared to 35 basis points. This was due primarily to higher formations in retail mortgages and unsecured portfolios, as well as commercial formations.
Non-interest
expenses were $6,405 million compared to $6,125 million, an increase of 5%. The increase was due primarily to higher technology costs related to new systems and infrastructure implemented, increased project spend supporting key strategic and regulatory initiatives, as well as general inflationary increases. The productivity ratio was 47.7% compared to 47.0%.
Provision for income taxes
The effective tax rate was 27.5%, compared to 27.6%.
Canadian Banking expects to generate strong earnings growth from good revenue growth and moderating loan losses from elevated levels in 2025. Revenue in Canadian Banking is expected to be driven by growth in loans and deposits, and a stable interest rate environment. Retail and Small Business Banking revenue growth is expected to accelerate through continued deposit mix improvements and loan growth. Commercial earnings growth will be driven by growth in loans and deposits, while maintaining the focus on profitability. Earnings growth in Tangerine is expected to remain modest, as we execute upfront strategic investments to drive more significant medium-term revenue lift. The segment will continue to maintain strong expense discipline while balancing investments in strategic initiatives to drive future growth, with a focus on generating positive operating leverage. Provision for credit losses is anticipated to recover from the elevated levels experienced in 2025. Earnings growth will be supported by the continued focus on client primacy across all segments.
|
Total revenue by sub-segment $ millions
|
|
Average loans and acceptances $ billions
|
2025 Scotiabank Annual Report
|
Management’s Discussion and Analysis
|
|
|
|
|
| |
|
|
|
|
|
|
|
|
|
Earn primary client relationships
Strengthened IB Retail by implementing a segmented operating model that improved client quality, deepened relationships, and enhanced client journeys through tailored digital capabilities, driving a 7% increase in primary clients compared to the prior year.
Enhanced Commercial client relationships by introducing a new segmentation and coverage model, resulting in a 3% increase in Cash Management clients compared to the prior year.
Deepened engagement in Global Banking and Markets by focusing on client payroll growth and enhancing CRM systems to better serve client needs, achieving a 5% increase in Cash Management clients compared to the prior year.
Grow and scale in priority markets
Maintained our position across most markets, sustaining franchise value in deposits and loans.
In Latin America League Tables, GBM is ranked 5 th in Mergers and Acquisitions (M&A), 2 nd in Equity Capital Market (ECM) and 6 th in Debt Capital Market (DCM).
Executed the sale of CrediScotia Financiera, a wholly owned consumer finance subsidiary in Peru, as part of our strategy to focus on core operations.
Announced the Davivienda transaction, transferring our Colombia, Costa Rica, and Panama operations, and reinforcing our commitment with priority markets. Agreement includes referral arrangements in Wealth Management and GBM, leveraging our strong capabilities to enhance returns on capital deployed.
Make it easy to do business with us
Executed on the structural transformation outlined at Investor Day 2023. Begun operating under a simplified, regionally aligned business model and structure focused on client segments.
Increased client acquisition through virtual and digital channels to 23%, up 469 bps compared to the prior year, strengthening operational efficiency across the footprint.
Continuous progress in building scalable solutions to better serve our clients’ needs. Select highlights include:
Launched scalable digital-first client onboarding and deposit account opening in Retail, starting with Mexico.
Rolled-out Global Treasury Portal within ScotiaConnect 2.0 for business clients in Mexico through regionally scalable solution.
Released Wallets ecosystem, enabling Apple Pay, Google Pay, etc. for personal clients across International Banking.
Expanded behavioral biometrics authentication technology to protect the Bank and our clients.
Renewed our talent pool by promoting internal talent and attracting top-industry leaders for targeted roles.
Strengthened culture and management processes, resulting in strong employee engagement as per internal employee satisfaction surveys while executing on our business transformation.
Recognized as a Great Place to Work ® in Peru.
Ranked as a Top Employer in Chile with Certified Excellence in Employee Conditions by Top Employer.
Recognized by Global Finance as Latin America’s Best Bank for Sustainable Transparency, Sustainable Infrastructure & Project Finance, and Payments & Collections, and as Best Bank in Chile for Sustainable Finance (second year).
Recognized by Euromoney as Latin America’s Best Investment Bank for Financing and Sustainable Finance, and Best Bank for Trade Finance Products in Mexico and Latin America.
Recognized for Private Banking Excellence by Euromoney as Best International Private Bank (Bahamas, Jamaica, Cayman Islands) and Best Private Bank for Digital Solutions in Peru.
Named Best Private Bank of the Year in Mexico and Bank of the Year in Bahamas, Barbados, Jamaica, Trinidad & Tobago, and Turks & Caicos by The Banker.
|
|
|
International Banking is comprised of a strong and universal banking franchise that provides financial advice and solutions to over 8 million Retail, Commercial and GBM clients. Its geographic presence spans more than 12 countries, including Mexico, Chile, Peru, Brazil, Uruguay, and various markets in the Caribbean, with a relevant local presence in all core markets. The Bank’s unique geographical footprint ensures robust connectivity within the North American corridor.
International Banking aims to achieve sustainable earnings growth by strategically targeting priority segments and geographies. The focus is on deepening client relationships to enhance engagement and primacy, managing credit risk prudently, accelerating deposit growth, and prioritizing expansion in markets with scale opportunities. International Banking will continue to maintain a strong emphasis on expense management while executing our long-term vision of building a robust client franchise across priority segments and geographies, supported by a diverse and talented team. International Banking business has successfully undergone a structural transformation and is now well positioned to deliver sustainable earnings and profitability growth, while effectively navigating market challenges.
|
2025 Scotiabank Annual Report
Management’s Discussion and Analysis
| International Banking
• |
|
Deepen client relationships : Strengthen relationships by launching tailored value propositions in IB Retail to drive acquisition, deepen engagement, and enhance retention. Roll out segmented and consistent IB Commercial offerings focused on cash management and cross-border solutions to deliver improved client experience. |
• |
|
Grow and scale in priority markets : Focus on strategic segments and geographies while preserving franchise value across other businesses. Expand Global Transaction Banking by leveraging existing assets and capabilities to reinforce our balance sheet. Capture efficiencies through regionalization of support functions, elimination of stranded costs, and deployment of scalable technologies. |
• |
|
Make it easy to do business with us : Leverage segmentation, digitization, and personalization to deliver regional solutions and boost productivity, competitiveness and improve client experience. |
• |
|
: Continue to strengthen culture and management processes, align incentives to drive accountability and execution, and deliver on sustainability commitments. |
T24
International Banking financial performance – Reported
|
|
|
|
|
|
|
|
|
|
|
|
| Taxable equivalent basis ($ millions) |
|
|
|
|
|
|
|
|
|
|
|
|
|
|
|
|
|
|
|
|
|
$ |
8,867 |
|
|
|
|
|
|
|
|
2,999 |
|
|
|
|
|
|
|
|
11,866 |
|
Provision for credit losses |
|
|
|
|
|
|
2,285 |
|
|
|
|
|
|
|
|
6,170 |
|
|
|
|
|
|
|
|
705 |
|
|
|
|
|
|
|
$ |
2,706 |
|
Net income attributable to non-controlling interests in subsidiaries |
|
|
|
|
|
|
125 |
|
Net income attributable to equity holders of the Bank |
|
|
|
|
|
$ |
2,581 |
|
|
|
|
Key ratios and other financial data |
|
|
|
|
|
|
|
|
|
|
|
|
|
|
|
13.5 |
% |
|
|
|
|
|
|
|
52.0 |
% |
|
|
|
|
|
|
|
4.41 |
% |
|
|
|
|
|
|
|
20.6 |
% |
Provision for credit losses – performing (Stages 1 and 2) |
|
|
|
|
|
$ |
(52 |
) |
Provision for credit losses – impaired (Stage 3) |
|
|
|
|
|
$ |
2,337 |
|
Provision for credit losses as a percentage of average net loans and acceptances (4)
|
|
|
|
|
|
|
1.37 |
% |
Provision for credit losses on impaired loans as a percentage of average net loans and acceptances (4)
|
|
|
|
|
|
|
1.40 |
% |
Net write-offs as a percentage of average net loans and acceptances (4)
|
|
|
|
|
|
|
1.25 |
% |
|
|
|
Selected Consolidated Statement of Financial Position data (average balances) |
|
|
|
|
|
|
|
|
|
|
|
|
|
|
$ |
215,507 |
|
|
|
|
|
|
|
|
231,456 |
|
|
|
|
|
|
|
|
130,227 |
|
|
|
|
|
|
|
|
178,579 |
|
| (1) |
Effective Q1 2025, changes were made to the methodology used to allocate certain income, expenses and balance sheet items between business segments. Prior period results for each segment have been reclassified to conform with the current period’s methodology. Refer to page 42 for further details. |
| (2) |
Includes income (on a taxable equivalent basis) from associated corporations of $152 (2024 – $130). This income from associated corporations includes a tax normalization adjustment of $34 (2024 – $27). |
| (3) |
Refer to Non-GAAP Measures on page 20 for the description of the measure. |
| (4) |
Refer to Glossary on page 136 for the description of the measure. |
T24A
Adjusted International Banking financial performance
(1)
|
|
|
|
|
|
|
|
|
|
|
|
| ($ millions) |
|
|
|
|
|
|
|
|
|
|
|
|
|
|
|
|
|
|
|
|
|
$ |
8,867 |
|
|
|
|
|
|
|
|
2,999 |
|
|
|
|
|
|
|
|
11,866 |
|
Provision for credit losses |
|
|
|
|
|
|
2,285 |
|
|
|
|
|
|
|
|
6,138 |
|
|
|
|
|
|
|
|
3,443 |
|
|
|
|
|
|
|
|
714 |
|
|
|
|
|
|
|
$ |
2,729 |
|
Net income attributable to non-controlling interests (NCI) |
|
|
|
|
|
|
125 |
|
Net income attributable to equity holders |
|
|
|
|
|
$ |
2,604 |
|
| (1) |
Refer to Non-GAAP Measures on page 20 for the description of the adjustments. |
| (2) |
Effective Q1 2025, changes were made to the methodology used to allocate certain income, expenses and balance sheet items between business segments. Prior period results for each segment have been reclassified to conform with the current period’s methodology. Refer to page 42 for further details. |
| (3) |
Includes adjustment for amortization of acquisition-related intangible assets of $28 (2024 – $32). |
2025 Scotiabank Annual Report
|
Management’s Discussion and Analysis
Net income attributable to equity holders was $2,631 million compared to $2,581 million, an increase of 2%. The increase was driven primarily by higher
non-interest
income, lower
non-interest
expenses and the positive impact of foreign currency translation. This was partly offset by higher income taxes, higher provision for credit losses. Adjusted net income attributable to equity holders was $2,651 million compared to $2,604 million, an increase of 2%.
Financial Performance on an Adjusted and Constant Dollar Basis
The discussion below on the results of operations is on an adjusted and constant dollar basis. Under the constant dollar basis, prior period amounts are recalculated using current period average foreign currency rates, which is a
non-GAAP
financial measure (refer to
Non-GAAP
Measures on page 20). The Bank believes that constant dollar is useful for readers in assessing ongoing business performance without the impact of foreign currency translation and is used by management to assess the performance of the business segment. Ratios are on a reported basis.
T25
International Banking financial performance on reported and constant dollar basis
|
|
|
|
|
|
|
|
|
|
|
|
| Taxable equivalent basis ($ millions) |
|
|
|
|
|
|
|
|
|
|
|
|
$ |
8,856 |
|
|
|
|
|
|
|
|
2,980 |
|
|
|
|
|
|
|
|
11,836 |
|
Provision for credit losses |
|
|
|
|
|
|
2,293 |
|
|
|
|
|
|
|
|
6,121 |
|
|
|
|
|
|
|
|
704 |
|
Net income on constant dollar basis |
|
|
|
|
|
$ |
2,718 |
|
Net income attributable to non-controlling interests in subsidiaries on a constant dollar basis |
|
|
|
|
|
|
128 |
|
Net income attributable to equity holders of the Bank on a constant dollar basis |
|
|
|
|
|
$ |
2,590 |
|
|
|
|
Selected Consolidated Statement of Financial Position data (average balances) |
|
|
|
|
|
|
|
|
|
|
|
|
|
|
$ |
231,900 |
|
|
|
|
|
|
|
|
177,824 |
|
| (1) |
Effective Q1 2025, changes were made to the methodology used to allocate certain income, expenses and balance sheet items between business segments. Prior period results for each segment have been reclassified to conform with the current period’s methodology. Refer to page 42 for further details. |
| (2) |
Includes net income from investments in associated corporations of $152 (2024 – $132). |
T25A
International Banking financial performance on adjusted and constant dollar basis
|
|
|
|
|
|
|
|
|
|
|
|
| Taxable equivalent basis ($ millions) |
|
|
|
|
|
|
|
|
|
|
|
|
$ |
8,856 |
|
|
|
|
|
|
|
|
2,980 |
|
|
|
|
|
|
|
|
11,836 |
|
Provision for credit losses |
|
|
|
|
|
|
2,293 |
|
|
|
|
|
|
|
|
6,089 |
|
|
|
|
|
|
|
|
713 |
|
Net income on constant dollar basis |
|
|
|
|
|
$ |
2,741 |
|
Net income attributable to non-controlling interests in subsidiaries on a constant dollar basis |
|
|
|
|
|
|
128 |
|
Net income attributable to equity holders of the Bank on a constant dollar basis |
|
|
|
|
|
$ |
2,613 |
|
| (1) |
Effective Q1 2025, changes were made to the methodology used to allocate certain income, expenses and balance sheet items between business segments. Prior period results for each segment have been reclassified to conform with the current period’s methodology. Refer to page 42 for further details. |
| (2) |
Includes adjustment for amortization of acquisition-related intangible assets of $28 (2024 – $32). |
|
Average loans and acceptances |
|
Average earning assets by region |
|
2025 Scotiabank Annual Report
Management’s Discussion and Analysis
| International Banking
Net income attributable to equity holders was $2,631 million compared to $2,590 million, an increase of 2%. Adjusted net income attributable to equity holders was $2,651 million compared to $2,613 million. The increase was driven primarily by higher non-interest income and net interest income, partly offset by higher income taxes, provision for credit losses and non-interest expenses.
Average assets were $227 billion, a decrease of $5 billion or 2%. Total loans decreased by 3%, primarily in Mexico, Brazil and Peru. The decrease was driven by an 8% reduction in business loans, in line with the Bank’s capital deployment strategy. This was partly offset by an increase of 3% in retail loans, mostly mortgages.
Average liabilities were $175 billion, a decrease of $3 billion or 1%. Total deposits were in line with previous year, and personal deposits increased by 1% mainly in Mexico, while non-personal deposits were in line with previous year. Term deposits decreased by 3%, and non-term deposits increased by 5% mainly in Peru and Chile.
Revenues were $12,043 million compared to $11,836 million, an increase of 2%.
Net interest income was $8,866 million compared to $8,856 million, in line with the prior period. Net interest margin increased by nine basis points to 4.50%, driven by lower funding costs due to declines in central bank rates.
Non-interest income was $3,177 million compared to $2,980 million, an increase of 7%. This was driven mainly by higher capital markets revenues in Chile and Mexico, corporate loan fees in Colombia, and banking fees in Uruguay.
Provision for credit losses
The provision for credit loss was $2,309 million compared to $2,293 million, an increase of $16 million. The provision for credit losses ratio was 141 basis points compared to 137 basis points.
The provision for credit losses on performing loans was $129 million compared to a reversal of $52 million. The provision this period was driven by retail portfolio growth, credit quality migration in the commercial portfolio along with the continued unfavourable macroeconomic outlook.
The provision for credit losses on impaired loans was $2,180 million compared to $2,345 million. The provision for credit losses ratio on impaired loans was 134 basis points compared to 140 basis points. This was due primarily to a decrease in retail provisions driven by lower formations mainly in Colombia and Peru, due in part to the CrediScotia divestiture.
Non-interest expenses were $6,164 million compared to $6,121 million, an increase of 1%, driven mainly by higher technology costs and salaries and employee benefits. This was offset by lower depreciation and amortization in Colombia. The business continues to realize the benefits from its efficiency initiatives, despite an inflationary environment.
Provision for income taxes
The effective tax rate was 21.9% compared to 20.6%. On an adjusted basis, the effective tax rate was 21.9% compared to 20.7%. The increase was due primarily to the impact of the GMT in the current year and lower inflationary adjustments in Mexico partially offset by higher tax exempt income.
International Banking earnings, excluding divestitures, are expected to increase modestly. Good growth in pre-tax pre-provision earnings is expected to be offset by slightly elevated loan loss provisions and a higher tax rate. Revenues, excluding the impact of divestures, are expected to grow, supported by strong performance across retail, commercial, and GBM segments, with good loan and deposit growth. Expenses, excluding the impact of divestures, are projected to modestly increase below inflation rates, reflecting the benefits from productivity initiatives. The segment will continue to invest selectively to grow profitably across the markets while generating positive operating leverage.
2025 Scotiabank Annual Report
|
Management’s Discussion and Analysis
Global Wealth Management
|
|
|
|
|
| |
|
2025 Achievements |
|
|
| |
|
Earn primary client relationships
Through our commitment to provide clients with Total Wealth advice, Scotia’s Wealth Management businesses reached an all-time high in client satisfaction, as measured by Net Promotor Score.
Continued to build strong momentum in broadening investment advice to retail clients, growing our retail mutual fund client base by 450 bps since last year.
Launched multiple new investment solutions for clients in Canada and internationally, including additional ETF funds, and private asset mandates as part of our strategic relationship with Sun Life Capital Management.
Scaled Total Wealth capabilities across our international footprint, including expanded capabilities in Mexico, Chile and the Caribbean.
Entered a strategic referral arrangement with ICICI Bank Canada to provide their clients with access to Scotia Wealth Management advice and solutions in Canada.
Grow and scale in priority businesses
Ranked as the 3 rd largest wealth management business in Canada, based on total net income for publicly traded banks as of July 31, 2025.
Continued strong momentum across our Wealth and Asset Management businesses, with AUA and AUM growing by 13% and 16%, respectively.
Global Asset Management ranked #2 in Canadian retail mutual funds (excluding money market funds) by market share among bank-owned peers.
International Wealth Management delivered double-digit earnings growth, supported by strong growth in Mexico, as we deliver Total Wealth advice and investment solutions to our international clients.
Successfully launched our Signature Banking offering in Canada tailored to a wider segment of high-net-worth clients with a service-focused banking solution.
Make it easy to do business with us
Completed full deployment of a new financial planning tool across all advisory business lines in Canada to enhance Total Wealth advice and planning to our clients.
Deployed our enhanced mobile app across Scotia Wealth Management businesses, providing clients access to new digital capabilities and opportunities to engage with advisors in a seamless manner.
Launched the new elite credit card for Private Banking clients that provides a variety of travel rewards and lifestyle benefits.
The Scotia Smart Investor platform continued to play an integral role in helping our Retail clients invest and plan for their future, with a 37% year-over-year lift in AUM and a 33% increase in the number of accounts activated through Smart Investor.
Continued to enhance the client experience across our international footprint by implementing a new client portal in Chile to provide clients with leading digital capabilities.
Win as one team
Continued focus on delivering the entire bank to clients and driving partnerships across businesses. Referrals across our Wealth, Retail and Commercial Banking businesses reached a new all-time high in fiscal 2025.
Continued building out a modern data-driven organization that leverages Digital & AI capabilities across our operations and advisor teams to enhance workflows, decision-making, and productivity.
Improvement in employee engagement scores year-over-year supported by various initiatives.
Select awards
Recognized with seven Euromoney Private Banking Awards for 2025: Latin America’s Best for Fund Selection, Jamaica’s Best International Private Bank, Mexico’s Best for Family Office Services, Peru’s Best for Digital Solutions, The Bahamas’ Best International Private Bank, The Cayman Islands’ Best International Private Bank, and Canada’s Best for Succession Planning.
Scotia Wealth Management earned two Global Finance Best Private Bank Awards for 2026 (awarded in fiscal year 2025) - Best Private Bank in the Bahamas, Caribbean & Central America.
Scotia Wealth Management was recognized with two PWM/The Banker 2024 Global Private Banking Awards (awarded in fiscal year 2025): Best Private Bank in North America for Wealthy Women, and Best Private Bank in North America for Education and Training of Private Bankers.
Scotia Global Asset Management’s investment teams were recognized with 21 awards at the 2024 FundGrade A+ Awards and with 10 individual 2024 LSEG Lipper awards across 7 categories (both awarded in fiscal year 2025).
Scotia Investments Jamaica received the World Finance Pension Fund Award 2025.
Scotia iTRADE ranked 2 nd among the Big 5 banks in the 2025 MoneySense Best Online Brokers in Canada.
|
|
|
Business Profile
Global Wealth Management is focused on delivering comprehensive wealth management advice and solutions to clients across Scotiabank’s footprint. Global Wealth Management serves over 2 million investment fund and advisory clients across 12 countries – administering over $750 billion in assets.
52
|
2025 Scotiabank Annual Report
Management’s Discussion and Analysis
| Global Wealth Management
Global Wealth Management has built a robust client-centric business with comprehensive advice, products, and platforms to meet a broad range of client needs.
Global Wealth Management is comprised of the following businesses:
| |
• |
|
Online brokerage (Scotia iTRADE), Scotia Financial Planning (Scotiabank), Full-service brokerage (ScotiaMcLeod and MD Financial Management), Scotiatrust, Private Banking, Private Investment Counsel (Scotia Jarislowsky Fraser, and MD Financial Management). |
| |
• |
|
Retail mutual funds, Exchange Traded Funds, Liquid Alternatives, Institutional Funds/Strategies. |
Scotiatrust, ScotiaMcLeod, Scotia iTRADE, Private Banking, Private Investment Counsel, 1832 Asset Management and Dynamic Funds are top performers in key industry metrics.
Global Wealth Management continues to execute on its mission to provide clients with strong risk-adjusted investment results and financial planning to deliver wealth solutions that meet their complex needs. The focus continues to be delivering comprehensive advice and planning to best serve clients in the current economic environment and through all market conditions. To maintain our strong momentum towards that focus, Global Wealth Management is continuing to enhance our Total Wealth advice capabilities in Canadian and international markets as well as broaden our proprietary and third-party distribution capabilities.
In addition, Global Wealth Management is focused on building a unified data, analytics, and operations foundation to personalize client experiences and accelerate growth.
| |
• |
|
Earn primary client relationships: Evolve Total Wealth model to do even more financial planning across our Canadian and international footprint, and broaden investment advice to Retail clients to win new clients and deepen relationships. |
| |
• |
|
Grow and scale in priority businesses: Maximize momentum in Canada across Wealth and Asset Management through our distribution channels and salesforce, while continuing to scale capabilities in international markets to accelerate growth. |
| |
• |
|
Make it easier to do business with us: Deliver innovative, streamlined digital client solutions and modernize our advisor tools and platforms to deliver a leading client experience, while investing in our people to grow our integrated team. |
| |
• |
|
Deepen partnerships with Retail, Small Business and Commercial Banking to deliver the whole Bank to clients, and foster an inclusive culture that reflects our communities and our Scotia Bond. |
T26
Global Wealth Management financial performance
|
|
|
|
|
|
|
|
|
|
|
|
| Taxable equivalent basis ($ millions) |
|
|
|
|
|
|
|
|
|
|
|
|
|
|
|
|
|
|
|
|
|
$ |
786 |
|
|
|
|
|
|
|
|
4,803 |
|
|
|
|
|
|
|
|
5,589 |
|
Provision for credit losses |
|
|
|
|
|
|
27 |
|
|
|
|
|
|
|
|
3,655 |
|
|
|
|
|
|
|
|
479 |
|
|
|
|
|
|
|
$ |
1,428 |
|
Net income attributable to non-controlling interests in subsidiaries |
|
|
|
|
|
|
10 |
|
Net income attributable to equity holders of the Bank |
|
|
|
|
|
$ |
1,418 |
|
|
|
|
Key ratios and other financial data |
|
|
|
|
|
|
|
|
|
|
|
|
|
|
|
13.9 |
% |
|
|
|
|
|
|
|
65.4 |
% |
|
|
|
|
|
|
|
25.1 |
% |
|
|
|
Selected Consolidated Statement of Financial Position data (average balances) |
|
|
|
|
|
|
|
|
|
|
|
|
|
|
$ |
25,843 |
|
|
|
|
|
|
|
|
35,468 |
|
|
|
|
|
|
|
|
36,673 |
|
|
|
|
|
|
|
|
40,967 |
|
|
|
|
|
|
|
|
|
|
|
|
|
Assets under administration (3)
|
|
|
|
|
|
$ |
704 |
|
Assets under management (3)
|
|
|
|
|
|
$ |
373 |
|
| (1) |
Effective Q1 2025, changes were made to the methodology used to allocate certain income, expenses and balance sheet items between business segments. Prior period results for each segment have been reclassified to conform with the current period’s methodology. Refer to page 42 for further details. |
| (2) |
Refer to Non-GAAP Measures on page 20 for the description of the measure. |
| (3) |
Refer to Glossary on page 136 for the description of the measure. |
2025 Scotiabank Annual Report
|
Management’s Discussion and Analysis
T26A
Adjusted Global Wealth Management financial performance
(1)
|
|
|
|
|
|
|
|
|
|
|
|
| ($ millions) |
|
|
|
|
|
|
|
|
|
|
|
|
|
|
|
|
|
|
|
|
|
$ |
786 |
|
|
|
|
|
|
|
|
4,803 |
|
|
|
|
|
|
|
|
5,589 |
|
Provision for credit losses |
|
|
|
|
|
|
27 |
|
|
|
|
|
|
|
|
3,619 |
|
|
|
|
|
|
|
|
1,943 |
|
|
|
|
|
|
|
|
489 |
|
|
|
|
|
|
|
$ |
1,454 |
|
Net income attributable to non-controlling interests in subsidiaries (NCI) |
|
|
|
|
|
|
10 |
|
Net income attributable to equity holders |
|
|
|
|
|
$ |
1,444 |
|
| (1) |
Refer to Non-GAAP Measures on page 20 for the description of the adjustments. |
| (2) |
Effective Q1 2025, changes were made to the methodology used to allocate certain income, expenses and balance sheet items between business segments. Prior period results for each segment have been reclassified to conform with the current period’s methodology. Refer to page 42 for further details. |
| (3) |
Includes adjustment for Amortization of acquisition-related intangible assets of $36 (2024 – $36). |
|
2025 Scotiabank Annual Report
Management’s Discussion and Analysis
| Global Wealth Management
Net income attributable to equity holders was $1,670 million compared to $1,418 million, an increase of 18%. The increase was driven primarily by higher non-interest income and net interest income, partly offset by higher non-interest expenses. Adjusted net income attributable to equity holders was $1,696 million compared to $1,444 million, an increase of 17%.
Assets under management (AUM) and assets under administration (AUA)
Assets under management were $432 billion compared to $373 billion, an increase of 16%, and assets under administration were $797 billion compared to $704 billion, an increase of 13%, driven by market appreciation and higher net sales.
Revenues were $6,428 million compared to $5,589 million, an increase of 15%.
Net interest income was $1,025 million compared to $786 million, an increase of 31%, driven by strong loan and deposit growth, and improved margins.
Non-interest income was $5,403 million compared to $4,803 million, an increase of 12%. The increase was due primarily to higher mutual fund, brokerage and investment management fees, driven by assets under management and assets under administration growth.
Revenues were $5,572 million compared to $4,829 million, an increase of 15%. The increase was due primarily to higher mutual fund, brokerage, and investment management fees, driven by assets under management and assets under administration growth, and higher net interest income driven by loan and deposit growth, and improved margins.
Revenues of $856 million compared to $760 million, an increase of 13%. The growth was due primarily to higher mutual fund fees, investment management fees and brokerage revenues, driven by assets under management and assets under administration growth in Mexico, Peru, and Chile, and net interest income, driven by loan and deposit growth, and improved margins.
Provision for credit losses
The provision for credit losses was $14 million compared to $27 million, a decrease of $13 million. The provision for credit losses ratio was five basis points compared to 11 basis points.
Provision for credit losses on performing loans was $9 million, compared to $3 million.
Provision for credit losses on impaired loans was $5 million, compared to $24 million. The provision for credit losses ratio on impaired loans was two basis points compared to nine basis points. The higher provisions last year were driven by higher formations, mainly related to two impaired loan accounts in Canada.
Non-interest expenses were $4,144 million compared to $3,655 million, an increase of 13%, due primarily to higher volume-related expenses, technology costs, and sales force expansion to support business growth.
Provision for income taxes
The effective tax rate was 26.0%, compared to 25.1%, due to the implementation of the GMT in certain jurisdictions.
Global Wealth Management expects to generate strong earnings growth in 2026. Revenue growth is expected to be driven by strong business volumes, retail mutual fund volume growth through active management and multi-brand distribution in Canada; market appreciation; solid growth across our advisory business and Private Banking; and continued expansion across our key international markets. The segment will continue to invest in the business through ongoing enhancements to digital client and advisor capabilities.
|
Total revenue by sub-segment $ millions
|
|
Wealth management assets under administration (AUA) $ billions, as at October 31
|
|
Wealth management assets under management (AUM) $ billions, as at October 31
|
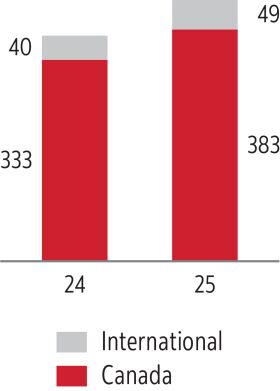
2025 Scotiabank Annual Report
|
Management’s Discussion and Analysis
Global Banking and Markets
|
|
|
|
|
| |
|
|
|
|
|
|
|
|
|
Earn primary client relationships
Launched first Mortgage Capital Markets funding transactions on a newly created platform in the U.S.
Sustained a strong M&A pipeline despite slowdown in announced deals due to market uncertainty and delivered record M&A revenue in the year.
Brought in strong senior leaders to bolster our talent and drive profitable growth in alignment with our strategy.
Grow and scale in priority markets
In 2025, GBM has improved its League table ranking positions across Canada and the U.S.
In Canadian League Tables, GBM ranked 4 th in M&A and 3 rd in Debt Capital Market (DCM).
In the U.S., GBM is ranked 18 th in DCM.
Make it easy to do business with us
Enhanced client onboarding process via introduction of a workflow tool providing process transparency to Front office, reducing overall onboarding time and minimizing onboarding forms.
Migrated most of the GBM data platform to cloud and executed conversion of 4,500 legacy trades in preparation for Mexico’s interest rate benchmark reform.
Executed a significant Synthetic Risk Transfer transaction to support the Bank’s capital strategy.
Facilitated Cedar Leaf Capital entry into First Nations Finance Authority’s dealer syndicate.
Select awards and deal highlights
Recognized by Environmental Finance 2025 Sustainable Debt Awards: Sustainability Bond of the Year – Financial Institutions.
Recognized by Global Finance Gordon Platt Foreign Exchange Award for 2025: Best Foreign Exchange (FX) Bank in Canada for the second year in a row.
Recognized by the SCI Risk Sharing Awards 2025 as the North American Arranger of the Year for leadership in structured credit and risk-sharing transactions.
Joint Bookrunner on several notable mandates this year, including:
Served as Active Bookrunner for Thermo Fisher Scientific’s USD $2.5 billion senior note offering, Scotiabank’s first mandate in the U.S. Healthcare sector.
Acted as Joint Bookrunner in Severn Trent Utilities Finance Plc’s EUR € 850 million sustainable bond issuance, Severn Trent’s largest-ever EUR benchmark deal.
Acted as Ratings Advisor and Joint Bookrunner on Northwest Healthcare Properties REIT’s inaugural CAD $500 million bond offering, securing 80% of the final order book.
Supported CAD $15 billion business combination between Whitecap Resources and Veren, acting as Joint Bookrunner on a CAD $1 billion credit facility.
Strengthened market position with key ABS transactions, including Centersquare’s $885 million inaugural ABS, GM Financial’s $1.25 billion deal, and Porsche Financial Services’ $966 million issuance.
Financial Advisor on several marquee transactions this year, including:
Played a key role in one of the largest power sector transactions in recent years, acting as financial advisor to NRG Energy on its US $12 billion acquisition of LS Power’s ~13 GW power generation portfolio and virtual power plant platform.
Acted as exclusive financial advisor to Carcetti Capital Corp. on its acquisition of the Hemlo Gold Mine from Barrick Mining Corp. for up to US$1.09 billion, while also providing financing as sole underwriter of a US$225 million credit facility and sole bookrunner for a CAD $575 million bought deal private placement of subscription receipts—one of the Bank’s largest-ever sole bookrunner roles.
Acted as financial advisor on the CAD $15 billion business combination between Whitecap Resources and Veren, supporting strategic execution and financing.
Played a key role in Gold Fields Limited’s CAD $1.93 billion acquisition of Osisko Mining Inc., acting as Agent and Mandated Lead Arranger on a US$750 million bridge financing, Joint Bookrunner on the subsequent USD bond issuance, and Sole FX Provider.
|
|
|
Global Banking and Markets (GBM) provides corporate clients with lending and transaction services, investment banking advice and access to capital markets. GBM is a full-service wholesale bank in the Americas, serving clients across Canada, the United States, Latin America, Europe and Asia-Pacific.
|
2025 Scotiabank Annual Report
Management’s Discussion and Analysis
| Global Banking and Markets
Global Banking and Markets’ ambition is to deliver sustainable and profitable growth for shareholders, driven by disciplined capital allocation across our footprint. To achieve this vision, GBM is focused on increasing relevance with clients with leading financial advice and solutions and on expanding the Bank’s full-service corporate offering and prioritizing client relationships where we can provide incremental value beyond lending. We are leveraging regional and institutional capabilities to deliver for our clients with focused growth in businesses and markets supported by our strategic framework.
| |
• |
|
Earn primary client relationships: Advance primary client relationships by expanding and deepening repeatable fee-based offerings together with refining our approach to capital and liquidity pricing to deliver enhanced value for clients and shareholders. |
| |
• |
|
Grow and scale in priority markets: Accelerate growth in priority markets by deepening our North American footprint – in the U.S., execute significant upgrades in cash management and invest in infrastructure to enable scalable expansion and regulatory alignment. |
| |
• |
|
Make it easy to do business with us: Streamline delivery with a client-first global coverage model to lead our clients’ advisory needs and win event-based mandates (e.g. M&A, Leveraged Finance), driving alpha with high margins. |
| |
• |
|
Advance a unified strategy by aligning client coverage across GBM and the broader enterprise and strengthening our senior banker bench in Canada and the U.S. to improve client connectivity, expand partnership opportunities and deliver the whole bank to our clients. |
T27
Global Banking and Markets financial performance
|
|
|
|
|
|
|
|
|
|
|
|
| Taxable equivalent basis ($ millions) |
|
|
|
|
|
|
|
|
|
|
|
|
|
|
|
|
|
|
|
|
|
$ |
1,102 |
|
|
|
|
|
|
|
|
3,959 |
|
|
|
|
|
|
|
|
5,061 |
|
Provision for credit losses |
|
|
|
|
|
|
47 |
|
|
|
|
|
|
|
|
3,122 |
|
|
|
|
|
|
|
|
414 |
|
|
|
|
|
|
|
$ |
1,478 |
|
Net income attributable to non-controlling interests in subsidiaries |
|
|
|
|
|
|
– |
|
Net income attributable to equity holders of the Bank |
|
|
|
|
|
$ |
1,478 |
|
|
|
|
Key ratios and other financial data |
|
|
|
|
|
|
|
|
|
|
|
|
|
|
|
9.6 |
% |
|
|
|
|
|
|
|
61.7 |
% |
|
|
|
|
|
|
|
1.55 |
% |
|
|
|
|
|
|
|
21.9 |
% |
Provision for credit losses – performing (Stages 1 and 2) |
|
|
|
|
|
$ |
42 |
|
Provision for credit losses – impaired (Stage 3) |
|
|
|
|
|
$ |
5 |
|
Provision for credit losses as a percentage of average net loans and acceptances (4)
|
|
|
|
|
|
|
0.04 |
% |
Provision for credit losses on impaired loans as a percentage of average net loans and acceptances (4)
|
|
|
|
|
|
|
– |
% |
Net write-offs as a percentage of average net loans and acceptances (4)
|
|
|
|
|
|
|
– |
% |
|
|
|
Selected Consolidated Statement of Financial Position data (average balances) |
|
|
|
|
|
|
|
|
|
|
|
|
|
|
$ |
132,210 |
|
|
|
|
|
|
|
|
111,670 |
|
|
|
|
|
|
|
|
454,808 |
|
|
|
|
|
|
|
|
494,595 |
|
|
|
|
|
|
|
|
172,023 |
|
|
|
|
|
|
|
|
475,212 |
|
| (1) |
Effective Q1 2025, changes were made to the methodology used to allocate certain income, expenses and balance sheet items between business segments. Prior period results for each segment have been reclassified to conform with the current period’s methodology. Refer to page 42 for further details. |
| (2) |
Includes the gross-up of tax-exempt income earned on certain securities reported in non-interest income for the year ended October 31, 2025 – nil (October 31, 2024 – $52). |
| (3) |
Refer to Non-GAAP Measures on page 20 for the description of the measure. |
| (4) |
Refer to Glossary on page 136 for the description of the measure. |
2025 Scotiabank Annual Report
|
Management’s Discussion and Analysis
Global Banking and Markets reported net income attributable to equity holders of $1,922 million, compared to $1,478 million, an increase of 30%. The increase was driven primarily by higher non-interest income, higher net interest income, and the positive impact of foreign currency translation. This was partly offset by higher non-interest expenses, higher provision for credit losses, and higher income taxes.
Average assets and liabilities
Average assets were $509 billion compared to $495 billion, an increase of 3%. The increase was due mainly to higher securities purchased under resale agreements, higher trading securities and the impact of foreign currency translation, partly offset by lower corporate loans and acceptances of $15 billion or 13%.
Average liabilities were $520 billion compared to $475 billion, an increase of 9%. The increase was due mainly to higher securities sold under repurchase agreements, higher deposit volumes of $4 billion or 3%, and the impact of foreign currency translation.
Revenues were $6,166 million compared to $5,061 million, an increase of 22%. The increase was due primarily to higher non-interest income, higher net interest income and the positive impact of foreign currency translation.
Net interest income was $1,400 million compared to $1,102 million, an increase of 27%. The increase was due primarily to higher net interest income from corporate lending margins, higher deposit volumes, and capital market activities.
Non-interest income was $4,766 million compared to $3,959 million, an increase of 20%. The increase was due primarily to higher fixed income and equities trading-related revenues, higher fee and commission revenues and higher underwriting and advisory fees.
Provision for credit losses
The provision for credit losses was $97 million compared to $47 million, an increase of $50 million. The provision for credit losses ratio was eight basis points compared to four basis points.
The provision for credit losses on performing loans was $43 million compared to $42 million. The provision this period was driven primarily by credit quality migration in the U.S. and Canada.
The provision for credit losses on impaired loans was $54 million compared to $5 million, due primarily to one account. The provision for credit losses ratio on impaired loans was five basis points.
Non-interest expenses were $3,563 million compared to $3,122 million, an increase of 14%. The increase was due primarily to higher personnel costs, including performance-based compensation, higher technology costs to support business growth and the negative impact of foreign currency translation.
Provision for income taxes
The effective tax rate was 23.3% compared to 21.9% the prior year, due mainly to the change in earnings mix across jurisdictions.
Global Banking and Markets earnings are expected to grow modestly in 2026, after a very strong performance in 2025, focused on North American markets and sustainable client engagement. The revenue momentum is expected to continue, benefiting from the investments in talent and technology and constructive markets. The business is committed to advancing its position in priority markets and deepening client relationships to capture greater share of wallet and fee income. Fixed Income, Currencies, and Commodities (FICC) is expected to lead capital markets revenue growth and business banking is expected to expand at a measured pace maintaining our focus on client profitability. Expense growth is expected to outpace revenue growth driven by necessary investments in talent and technology in priority segments and markets, to position the business for continued future growth.
|
Capital markets revenue by business line $ millions
|
|
Composition of average assets $ billions
|
|
2025 Scotiabank Annual Report
Management’s Discussion and Analysis
| Other
The Other segment includes Group Treasury, investments in certain associated corporations, and smaller operating segments and corporate items which are not allocated to a business line. Group Treasury is primarily responsible for Balance Sheet, Liquidity and Interest Rate Risk management, which includes the Bank’s wholesale funding.
Net interest income,
non-interest
income, and the provision for income taxes in each period include the elimination of
tax-exempt
income
gross-up.
This amount is included in the operating segments, which are reported on a taxable equivalent basis.
Net income from associated corporations and the provision for income taxes in each period include the tax normalization adjustments related to the
gross-up
of income from associated companies. This adjustment normalizes the effective tax rate in the divisions to better present the contribution of the associated companies to the divisional results.
T28
Other financial performance
|
|
|
|
|
|
|
|
|
|
|
|
| ($ millions) |
|
|
|
|
|
|
|
|
|
|
|
|
|
|
|
|
|
|
|
|
|
$ |
(1,688 |
) |
Non-interest income (2)(3)(4)
|
|
|
|
|
|
|
(191 |
) |
|
|
|
|
|
|
|
(1,879 |
) |
Provision for credit losses |
|
|
|
|
|
|
1 |
|
|
|
|
|
|
|
|
623 |
|
|
|
|
|
|
|
|
(1,006 |
) |
|
|
|
|
|
|
$ |
(1,497 |
) |
Net income (loss) attributable to non-controlling interests in subsidiaries |
|
|
|
|
|
|
(1 |
) |
Net income (loss) attributable to equity holders |
|
|
|
|
|
$ |
(1,496 |
) |
| (1) |
Effective Q1 2025, changes were made to the methodology used to allocate certain income, expenses and balance sheet items between business segments. Prior period results for each segment have been reclassified to conform with the current period’s methodology. Refer to page 42 for further details. |
| (2) |
Includes net residual funds transfer pricing, and the elimination of the tax-exempt income gross-up reported in net interest income, non-interest income, and provision for income taxes in the business segments, which are reported on a taxable equivalent basis. |
| (3) |
Includes net income from investments in associated corporations of $436 (2024 – $77). |
| (4) |
Includes elimination of fees paid to Canadian Banking by Canadian Wealth Management for administrative support and other services provided by Canadian Banking to the Global Wealth Management businesses. These are reported as revenues in Canadian Banking and operating expenses in Global Wealth Management. |
T28A
Adjusted Other financial performance
(1)
|
|
|
|
|
|
|
|
|
|
|
|
| ($ millions) |
|
|
|
|
|
|
|
|
|
|
|
|
|
|
|
|
|
|
|
|
|
$ |
(1,688 |
) |
|
|
|
|
|
|
|
(48 |
) |
|
|
|
|
|
|
|
(1,736 |
) |
Provision for credit losses |
|
|
|
|
|
|
1 |
|
|
|
|
|
|
|
|
(39 |
) |
|
|
|
|
|
|
|
(1,698 |
) |
|
|
|
|
|
|
|
(884 |
) |
|
|
|
|
|
|
$ |
(814 |
) |
Net income (loss) attributable to non-controlling interests (NCI) |
|
|
|
|
|
|
1 |
|
Net income (loss) attributable to equity holders |
|
|
|
|
|
$ |
(815 |
) |
| (1) |
Refer to Non-GAAP Measures on page 20 for the description of the adjustments. |
| (2) |
Effective Q1 2025, changes were made to the methodology used to allocate certain income, expenses and balance sheet items between business segments. Prior period results for each segment have been reclassified to conform with the current period’s methodology. Refer to page 42 for further details. |
| (3) |
Includes adjustment for divestitures and wind-down of operations of $(36) (2024 – $143) and amortization of intangible assets of $26 (2024 – nil). |
| (4) |
Includes adjustment for legal provision of $74 (2024 – $176), restructuring charge and severance provisions of $373 (2024 – $53) and divestitures and wind-down of operations of $1,422 (2024 – $(7)). Includes adjustment for impairment of non-financial assets of $440 for the year ended October 31, 2024. |
The Other segment reported a net loss attributable to equity holders of $1,859 million compared to a net loss of $1,496 million, including adjusting items of $1,512 million in the current period, compared to adjusting items of $681 million in the prior year (refer to Non-GAAP measures on page 20). Adjusted net income attributable to equity holders was a loss of $347 million compared to a net loss of $815 million in the prior year. The lower loss of $468 million was due to higher revenues resulting primarily from lower funding costs, partly offset by higher non-interest expenses.
Revenues were negative $321 million compared to negative $1,879 million in the prior year. Adjusted revenues were negative $331 million compared to negative $1,736 million in the prior year. The improvement of $1,405 million is due primarily to lower funding costs as a result of central bank rate decreases in the current and prior year, and higher income from associated corporations primarily related to the KeyCorp investment.
Non-interest expenses were $2,242 million, compared to $623 million. Included in non-interest expenses is an impairment loss of $1,422 million related to the announced sale of the banking operations in Colombia, Costa Rica and Panama, restructuring charge and severance provisions of $373 million and legal provisions of $74 million. Adjusted non-interest expenses were $373 million compared to a recovery of $39 million in the prior year. The increase of $412 million is due mainly to higher project costs and higher pension-related expenses.
The loss in the Other segment is expected to improve in fiscal 2026. The improved results are expected to be driven primarily by lower funding costs as a result of liabilities repricing at lower interest rates, as well as the repricing of fixed rate assets at higher interest rates.
2025 Scotiabank Annual Report
|
Management’s Discussion and Analysis
GROUP FINANCIAL CONDITION
T29
Condensed statement of financial position
|
|
|
|
|
|
|
|
|
|
|
|
|
|
|
|
|
|
|
|
|
|
|
|
|
|
|
| As at October 31 ($ billions) |
|
|
|
|
2024 |
|
|
Change |
|
|
Volume
Change |
|
|
FX
Change |
|
|
|
|
|
|
|
|
|
|
|
|
|
|
|
|
|
|
|
|
|
|
Cash, deposits with financial institutions and precious metals |
|
|
|
|
|
$ |
66.4 |
|
|
|
7.1 |
% |
|
|
5.4 |
% |
|
|
1.7 |
% |
|
|
|
|
|
|
|
129.7 |
|
|
|
17.4 |
|
|
|
15.8 |
|
|
|
1.6 |
|
Securities purchased under resale agreements and securities borrowed |
|
|
|
|
|
|
200.6 |
|
|
|
1.2 |
|
|
|
– |
|
|
|
1.2 |
|
Derivative financial instruments |
|
|
|
|
|
|
44.4 |
|
|
|
4.9 |
|
|
|
(1.0 |
) |
|
|
5.9 |
|
|
|
|
|
|
|
|
152.8 |
|
|
|
(1.9 |
) |
|
|
(3.1 |
) |
|
|
1.2 |
|
|
|
|
|
|
|
|
760.8 |
|
|
|
1.3 |
|
|
|
0.2 |
|
|
|
1.1 |
|
|
|
|
|
|
|
|
57.3 |
|
|
|
15.4 |
|
|
|
14.0 |
|
|
|
1.4 |
|
|
|
|
|
|
|
$ |
1,412.0 |
|
|
|
3.4 |
% |
|
|
2.0 |
% |
|
|
1.4 |
% |
|
|
|
|
|
|
|
|
|
|
|
|
|
|
|
|
|
|
|
|
|
|
|
|
|
|
|
|
|
|
|
|
|
$ |
943.8 |
|
|
|
2.4 |
% |
|
|
1.1 |
% |
|
|
1.3 |
% |
Derivative financial instruments |
|
|
|
|
|
|
51.3 |
|
|
|
9.3 |
|
|
|
8.8 |
|
|
|
0.5 |
|
Obligations related to securities sold under repurchase agreements and securities lent |
|
|
|
|
|
|
190.5 |
|
|
|
(0.7 |
) |
|
|
(2.1 |
) |
|
|
1.4 |
|
|
|
|
|
|
|
|
134.5 |
|
|
|
13.2 |
|
|
|
10.5 |
|
|
|
2.7 |
|
|
|
|
|
|
|
|
7.8 |
|
|
|
(1.8 |
) |
|
|
(2.1 |
) |
|
|
0.3 |
|
|
|
|
|
|
|
$ |
1,327.9 |
|
|
|
3.3 |
% |
|
|
1.9 |
% |
|
|
1.4 |
% |
|
|
|
|
|
|
|
|
|
|
|
|
|
|
|
|
|
|
|
|
|
|
|
|
|
|
|
|
|
|
|
|
|
$ |
73.6 |
|
|
|
4.6 |
% |
|
|
3.6 |
% |
|
|
1.0 |
% |
Preferred shares and other equity instruments |
|
|
|
|
|
|
8.8 |
|
|
|
13.2 |
|
|
|
13.2 |
|
|
|
– |
|
Non-controlling interests in subsidiaries |
|
|
|
|
|
|
1.7 |
|
|
|
0.8 |
|
|
|
0.2 |
|
|
|
0.6 |
|
|
|
|
|
|
|
$ |
84.1 |
|
|
|
5.4 |
% |
|
|
4.5 |
% |
|
|
0.9 |
% |
Total liabilities and equity |
|
|
|
|
|
$ |
1,412.0 |
|
|
|
3.4 |
% |
|
|
2.0 |
% |
|
|
1.4 |
% |
| (1) |
Includes net impact of foreign currency translation, primarily change in spot rates on the translation of assets and liabilities from functional currency to Canadian dollar equivalent. |
|
Loan portfolio loans & acceptances, $ billions, as at October 31 |
|
Deposits $ billions, as at October 31 |
Statement of Financial Position
The Bank’s total assets were $1,460 billion as at October 31, 2025, an increase of $48 billion from October 31, 2024. Cash, deposits with financial institutions and precious metals increased $5 billion due mainly to higher amounts at central banks and increases in gold position and price. Trading assets increased $22 billion due mainly to higher trading securities held as a hedge on derivatives. Securities purchased under resale agreements and securities borrowed increased $2 billion due mainly to higher client activity. Derivative instrument assets increased $2 billion due mainly to changes in valuations. Investment securities decreased $3 billion due mainly to lower holdings of common equities in the treasury portfolio. Loans increased $10 billion. Residential mortgages were up $19 billion due mainly to growth in Canada and personal loans increased $4 billion mainly in Latin America, which were partly offset by lower business and government loans, mainly in Asia and Canada. Other assets increased $9 billion due mainly to the Bank’s investment in KeyCorp and higher collateral requirements relating to capital markets businesses.
Total liabilities were $1,371 billion as at October 31, 2025, an increase of $44 billion from October 31, 2024. Total deposits increased $22 billion. Personal deposits of $302 billion increased $3 billion mainly in Latin America and business and government deposits were higher by $28 billion, mainly in U.S., Europe, Canada and Latin America, which were partly offset by lower deposits by financial institutions, mainly in Asia. Derivative instrument liabilities increased by $5 billion due mainly to changes in valuations. Other liabilities increased $18 billion due mainly to new issuances of financial instruments designated at fair value through profit or loss and higher obligations related to securities sold short.
Total equity was $89 billion, an increase of $5 billion from October 31, 2024. Equity was higher due to current year earnings of $7,758 million less dividends paid of $5,875 million, other comprehensive income of $2,397 million, and net preferred shares and other equity instruments issuances of $1,160 million less share buybacks of $913 million. Other comprehensive income mainly consisted of gains on derivative instruments designated as cash flow hedges of $1,057 million, foreign currency translation of $708 million, and net change in fair value of debt securities measured through other comprehensive income of $533 million.
Scotiabank is committed to maintaining a strong capital base to support the risks associated with its diversified businesses. Strong capital levels contribute to financial safety for the Bank’s customers, foster investor confidence and support strong credit ratings. It also allows the Bank to take advantage of growth opportunities as they arise and enhance shareholder returns through increased dividends.
|
2025 Scotiabank Annual Report
Management’s Discussion and Analysis
| Group Financial Condition
The Bank’s capital management framework includes a comprehensive internal capital adequacy assessment process (ICAAP), aimed at ensuring that the Bank’s capital is adequate to meet current and future risks and achieve its strategic objectives. Key components of the Bank’s ICAAP include sound corporate governance; creating a comprehensive risk appetite for the Bank; managing and monitoring capital, both currently and prospectively; and utilizing appropriate financial metrics which relate risk to capital, including internal capital and regulatory capital measures.
The Bank has a sound capital management framework to measure, deploy and monitor its available capital and assess its adequacy. Capital is managed in accordance with the Board-approved Capital Management Policy. In addition, the Board reviews and approves the Bank’s annual capital and strategic plans. The Asset-Liability Committee and senior executive management provide governance over the capital management process. The Bank’s Finance, Group Treasury and Global Risk Management groups take a coordinated approach to implementing the Bank’s capital plan.
The risk appetite framework that establishes enterprise-wide risk tolerances in addition to capital limits is detailed in the Risk Management section “Risk Appetite”. The framework encompasses medium-term targets with respect to regulatory capital thresholds, earnings and other risk-based parameters. These limits drive behaviour to ensure the Bank achieves the following overall objectives: exceed regulatory and internal capital targets, manage capital levels commensurate with the risk profile of the Bank, maintain strong credit ratings and provide the Bank’s shareholders with acceptable returns.
Canadian banks are subject to the revised capital adequacy requirements as published by the Basel Committee on Banking Supervision (BCBS) and commonly referred to as Basel III. Under Basel III, there are three primary risk-based regulatory capital ratios used to assess capital adequacy: Common Equity Tier 1 (CET1), Tier 1 and Total capital, which are determined by dividing those capital components by risk-weighted assets (RWA). Basel III also provides guidance on
non-viability
contingent capital (NVCC). The guidance stipulates that in order to qualify as regulatory capital,
non-common
share capital instruments must be convertible into common equity upon a trigger event as defined within the guidance.
C22
Minimum Regulatory Capital Requirements (as at October 31, 2025)
The Office of the Superintendent of Financial Institutions, Canada (OSFI) has issued guidelines, reporting requirements and disclosure guidance which are consistent with the international implementation of Basel III. OSFI requires Canadian deposit-taking institutions to meet minimum requirements related to risk-weighted assets of 7%, 8.5% and 10.5% for CET1, Tier 1 and Total capital ratios, respectively, which includes the capital conservation buffer of 2.5%. OSFI has also designated the Bank a domestic systemically important bank
(D-SIB),
increasing its minimum capital ratio requirements by 1% across all tiers of capital, in line with the requirements for Global Systemically Important Banks. OSFI’s minimum Pillar 1 capital ratio requirements are 8.0%, 9.5% and 11.5% for Common Equity Tier 1, Tier 1 and Total capital ratios, respectively.
In June 2018, OSFI implemented the Domestic Stability Buffer, to be held by Domestic Systemically Important Banks
(D-SIBs)
as an additional Pillar 2 buffer. Breaches of this buffer will not result in banks being subject to automatic constraints on capital distributions. Instead, OSFI will require a remediation plan to address any shortfall to their minimum. Supervisory interventions pursuant to OSFI’s Guide to Intervention would occur in cases where a remediation plan is not produced or executed in a timely manner satisfactory to OSFI. OSFI undertakes a review of the buffer on a semi-annual basis, in June and December, and any changes to the buffer are made public, along with supporting rationale. In exceptional circumstances, OSFI may make and announce adjustments to the buffer
in-between
scheduled review dates. In addition, OSFI may subsequently vary the minimum requirements for individual
D-SIBs
or groups of
D-SIBs,
as a supervisory measure.
Effective November 1, 2023, the Domestic Stability Buffer (DSB) was increased to 3.5% of total risk-weighted assets. This DSB requirement of 3.5% was maintained by OSFI in their most recent June 2025 announcement. OSFI’s minimum regulatory capital ratio requirements, including the
D-SIB
1.0% surcharge and its DSB are: 11.5%, 13.0% and 15.0% for Common Equity Tier 1 (CET1), Tier 1 and Total capital ratios, respectively. In addition, the Bank is presently subject to a BCBS countercyclical buffer requirement of approximately eight basis points.
In addition to risk-based capital ratio requirements, Basel III introduced a simpler, non risk-based Leverage ratio requirement to act as a supplementary measure to its risk-based capital requirements. The Leverage ratio is defined as a ratio of Basel III Tier 1 capital to a leverage exposure measure which includes on-balance sheet assets and off-balance sheet commitments, derivatives and securities financing transactions, as defined within the requirements. OSFI’s Basel III Leverage Ratio Requirements Guideline and Public Disclosure Requirements outline the application and disclosure of the Basel III Leverage ratio in Canada.
2025 Scotiabank Annual Report
|
Management’s Discussion and Analysis
Institutions are expected to maintain an operating buffer above the 3.5% minimum, which includes the D-SIB surcharge of 0.5%.
Total Loss Absorbing Capacity (TLAC)
OSFI has issued its guideline on Total Loss Absorbing Capacity (TLAC), which applies to Canada’s
D-SIBs
as part of the Federal Government’s
bail-in
regime. The standard is intended to address the sufficiency of a systemically important bank’s loss absorbing capacity to support its recapitalization in the event of its failure.
D-SIBs
are required to maintain a minimum risk-based TLAC ratio and a minimum TLAC leverage ratio. TLAC is defined as the aggregate of NVCC Tier 1 capital, NVCC Tier 2 capital, and other TLAC instruments that are subject to conversion in whole or in part into common shares under the Canada Deposit Insurance Corporation (CDIC) Act and meet all of the eligibility criteria under the guidelines. The Bank’s minimum TLAC ratio requirements consist of 25.0% of RWA (including OSFI’s 3.5% DSB) and 7.25% of leverage ratio exposures. As noted above, OSFI may subsequently vary the minimum TLAC requirements for
D-SIBs.
Where a
D-SIB
falls below the minimum TLAC requirements, OSFI may take any measures deemed appropriate, including measures set out in the Bank Act (Canada). As at October 31, 2025, the Bank exceeds the OSFI minimum TLAC and TLAC leverage ratios.
OSFI’s Parental Stand-Alone Total Loss Absorbing Capacity (Solo TLAC) framework
In September 2023, OSFI finalized changes to its Solo TLAC Framework, effective the first quarter of 2024. Under this framework, OSFI established a risk-based Solo TLAC ratio, which builds on the risk-based TLAC ratio set out in OSFI’s TLAC Guideline and the risk-based capital ratios described within OSFI’s Capital Adequacy Requirements Guideline. The risk-based Solo TLAC ratio is the primary basis used by OSFI to assess the sufficiency of TLAC that is readily available to the domestic Parent Bank and to assess the Parent’s ability to act as a source of strength for its subsidiaries and/or other affiliates.
D-SIBs
are required to maintain a minimum Solo TLAC ratio of 21.5% on a continuous basis. Public disclosure of a
D-SIBs’
Solo TLAC ratio is not presently a requirement. OSFI plans to consult on its data assurance and its future public disclosure expectations in due course. The Bank remains compliant with OSFI’s Solo TLAC requirements.
Revised Basel III reforms
Effective the second quarter of fiscal 2023, the Bank adopted the Revised Basel III reforms in accordance with OSFI’s revised Capital Adequacy Requirements Guideline, Leverage Ratio Requirements Guideline, and Pillar 3 Disclosures Guideline for domestic systematically important banks
(D-SIBs).
OSFI’s requirements are substantially aligned with the BCBS’ Revised Basel III reforms with some differences, primarily in residential real estate and qualifying revolving retail exposures.
The final Basel III reforms implemented in the second quarter of 2023 primarily impact the calculation of RWA and include:
| |
• |
|
a revised standardized approach for credit risk, with increased granularity of prescribed risk weights for credit cards, mortgages and business loans; |
| |
• |
|
revisions to the internal ratings-based approach for credit risk with new requirements for internally developed model parameters under the Advanced Internal Ratings-Based Approach (AIRB), including scope restrictions which limit certain asset classes to only the Foundation Internal Ratings-Based (FIRB) approach; |
| |
• |
|
a revised standardized approach for operational risk, which builds on the existing standardized approach including the recognition of an institution’s operational risk loss experience; |
| |
• |
|
revisions to the measurement of the Leverage ratio and a Leverage ratio buffer, which will take the form of a Tier 1 capital buffer set at 50% of a D-SIB’s 1.0% risk-weighted surcharge capital buffer; and |
| |
• |
|
an aggregate output floor, which will ensure that banks’ RWAs generated by internal models are not lower than 72.5% of RWAs as calculated by the Basel III framework’s standardized approaches. There is an international phase-in period for the 72.5% aggregate capital output floor from 2023 until 2028, beginning at 65% for Canadian banks in the second quarter of 2023. |
Additionally, the revised market risk framework and credit valuation adjustment (CVA) framework were implemented in the first quarter of 2024. The main changes include:
| |
• |
|
revised standardized and modelled approaches for market risk capital requirements; and |
| |
• |
|
a new standardized approach for CVA (SA-CVA) similar to the standardized approach for market risk. |
Internationally, adoption of the revised Basel III reforms is varied across jurisdictions. While a number of BCBS members have finalized their revised Basel III reforms guidelines, delays continue to persist in several key jurisdictions.
The Bank continues to monitor and prepare for developments impacting regulatory capital requirements.
Regulatory capital developments
OSFI defers further increases to the Basel III standardized capital output floor
In February 2025, OSFI announced its deferral of increases to the Basel III standardized capital output floor until further notice. OSFI has noted that there remains uncertainty about when other jurisdictions will fully implement Basel III and it will not extend its implementation lead.
As noted above, Canada concluded its implementation of the revised Basel III 2017 reforms in early 2024 and established an accelerated
phase-in
of the Basel III standardized capital output floor, calibrated at 65% in 2023, increasing in the first quarter by 2.5% per year through to 72.5% in 2026. OSFI’s announcement of a deferral maintains the capital floor calibration at the 2024 level of 67.5% indefinitely, delaying further increases to 70% and 72.5%, until further notice. Moreover, OSFI has committed to notifying affected banks at least two years prior to resuming an increase to the Basel III standardized capital output floor.
OSFI guideline for the capital and liquidity treatment of crypto-asset exposures
In February 2025, OSFI published its guideline for the capital and liquidity treatment of crypto-asset exposures, effective for the Bank in the first quarter of 2026. The guideline incorporates the BCBS standards for crypto-asset exposures, as updated in November 2024, and it replaces OSFI’s interim advisory on the regulatory treatment of crypto-asset exposures.
Within the guideline, crypto-asset exposures are defined and categorized by type. Regulatory capital treatments for their credit risk, counterparty credit risk and market risk are prescribed. In addition, OSFI published final amendments to its Pillar 3 Disclosure Guidelines, incorporating new crypto-asset disclosure requirements also effective the first quarter of fiscal 2026.
|
2025 Scotiabank Annual Report
Management’s Discussion and Analysis
| Group Financial Condition
Planning, managing and monitoring capital
Capital is managed and monitored based on planned changes in the Bank’s strategy, identified changes in its operating environment or changes in its risk profile. As part of the Bank’s comprehensive ICAAP, sources and uses of capital are measured and monitored on an ongoing basis through financial metrics, including regulatory thresholds, and internal capital. These results are used in capital planning and strategic decision-making.
The Bank’s assessment of capital adequacy is in the context of its current position and its expected future risk profile and position relative to its internal targets while considering the potential impact of various stress scenarios. Specific scenarios are selected based on the current economic conditions and business events facing the Bank. In addition, the Bank’s forward looking capital adequacy assessment includes a consideration of the results of more severe multi-risk scenarios within its enterprise-wide stress testing. This testing is used to determine the extent to which severe, but plausible events, impact the Bank’s capital.
The Bank sets internal regulatory capital targets to ensure the Bank’s available capital is sufficient within the context of its risk appetite.
The Bank’s internal target includes an adequate buffer over the regulatory minimum ensuring sufficient flexibility for future capital deployment and in consideration of the Bank’s risk appetite, the volatility of planning assumptions, the results from stress testing and contingency planning.
The Bank has a comprehensive risk management framework to ensure that the risks taken while conducting its business activities are consistent with its risk appetite, its impact on capital relative to internal targets, and that there is an appropriate balance between risk and return. Refer to the Risk Management section for further discussion on the Bank’s risk management framework. In managing the Bank’s capital base, close attention is paid to the cost and availability of the various types of capital, desired leverage, changes in the assets and risk-weighted assets, and the opportunities to profitably deploy capital. The amount of capital required for the business risks being assumed, and to meet regulatory requirements, is balanced against the goal of generating an appropriate return for the Bank’s shareholders.
Capital is generated internally through net earnings after dividend payments. As well, capital is generated by the issuance of common shares, preferred shares and other equity instruments, and subordinated debentures, net of redemptions.
The Bank deploys capital to support sustainable, long-term revenue and net income growth. The growth can be through existing businesses by attracting new customers, increasing cross-selling activities to existing customers, adding new products and enhancing sales productivity, or through acquisitions. All major initiatives to deploy capital are subject to rigorous analysis, validation of business case assumptions and evaluation of expected benefits. Key financial criteria include impact on earnings per share, capital ratios, return on invested capital, expected payback period and internal rate of return based on discounted cash flows.
Regulatory capital and total loss absorbing capacity ratios
The Bank continues to maintain strong, high quality capital levels which position it well for future business growth and opportunities. The CET1 ratio as at October 31, 2025 was 13.2%, an increase of approximately 10 basis points from the prior year. The ratio benefited from strong internal capital generation, revaluation gains on FVOCI securities, partly offset by the completion of the Bank’s investment in KeyCorp, the impairment loss related to the announced sale of banking operations in Colombia, Costa Rica and Panama to Davivienda, the impact of Q4 adjustment items, and share repurchases under the Bank’s Normal Course Issuer Bid.
The Bank’s Tier 1 capital ratio was 15.3% as at October 31, 2025, an increase of approximately 30 basis points from the prior year, due primarily to the above noted impacts to the CET1 ratio and issuances of U.S. $1 billion of Limited Recourse Capital Notes in each of the first and fourth quarters of 2025 partly offset by a redemption of U.S. $1.25 billion of subordinated Additional Tier 1 Capital Notes in the third quarter.
The Bank’s Total capital ratio was 17.1% as at October 31, 2025, an increase of approximately 40 basis points from 2024, due primarily to the above noted redemptions, issuances and impacts to the Tier 1 capital ratio.
The TLAC ratio was 29.1% as at October 31, 2025, a decrease of approximately 60 basis points from the prior year, primarily from higher RWA.
The Leverage ratio was 4.5% as at October 31, 2025, an increase of approximately 10 basis points from the prior year, with growth in Tier 1 capital due to the above noted Additional Tier 1 Capital issuances, partly offset by increases in leverage exposure amounts.
The TLAC Leverage ratio was 8.5%, a decrease of approximately 30 basis points from 2024, primarily due to increased leverage exposures partly offset by higher available TLAC.
The Bank’s capital, leverage and TLAC ratios continue to be in excess of OSFI’s minimum capital ratio requirements for 2025. In 2026, the Bank will continue to maintain strong capital ratios, continuing to optimize capital deployment in line with its strategic plans.
C23
Continuity of Common Equity Tier 1 ratio
(1)
| (1) |
This measure has been disclosed in this document in accordance with OSFI Guideline – Capital Adequacy Requirements (November 2023). |
2025 Scotiabank Annual Report
|
Management’s Discussion and Analysis
T30
Regulatory capital
(1)
and total loss absorbing capacity (TLAC)
(2)
ratios
|
|
|
|
|
|
|
|
|
|
|
|
| As at October 31 ($ millions) |
|
|
|
|
2024 |
|
Common Equity Tier 1 capital |
|
|
|
|
|
|
|
|
|
|
|
|
|
|
$ |
73,590 |
|
Qualifying non-controlling interest in common equity of subsidiaries |
|
|
|
|
|
|
683 |
|
Goodwill and intangibles, net of deferred tax liabilities (4)
|
|
|
|
|
|
|
(15,044 |
) |
Threshold related deductions |
|
|
|
|
|
|
– |
|
Net deferred tax assets (excluding those arising from temporary differences) |
|
|
|
|
|
|
(451 |
) |
Other Common Equity Tier 1 capital deductions (5)
|
|
|
|
|
|
|
1,853 |
|
|
|
|
|
|
|
|
60,631 |
|
Additional Tier 1 capital |
|
|
|
|
|
|
|
|
|
|
|
|
|
|
|
– |
|
Subordinated additional Tier 1 capital notes (NVCC) |
|
|
|
|
|
|
3,249 |
|
Limited recourse capital notes (NVCC) |
|
|
|
|
|
|
5,530 |
|
Capital instrument liabilities – trust securities (6)
|
|
|
|
|
|
|
– |
|
Other Tier 1 capital adjustments (7)
|
|
|
|
|
|
|
89 |
|
|
|
|
|
|
|
|
69,499 |
|
|
|
|
|
|
|
|
|
|
Subordinated debentures, net of amortization |
|
|
|
|
|
|
6,190 |
|
Allowance for credit losses eligible for inclusion in Tier 2 and excess allowance (re: IRB approach) |
|
|
|
|
|
|
1,942 |
|
Qualifying non-controlling interest in Tier 2 capital of subsidiaries |
|
|
|
|
|
|
77 |
|
|
|
|
|
|
|
|
8,209 |
|
|
|
|
|
|
|
|
77,708 |
|
Non-regulatory capital elements of TLAC |
|
|
|
|
|
|
|
|
External TLAC instruments |
|
|
|
|
|
|
59,092 |
|
TLAC deductions and other adjustments |
|
|
|
|
|
|
952 |
|
TLAC available after deductions |
|
|
|
|
|
|
137,752 |
|
Risk-weighted assets ($ billions) (1)
|
|
|
|
|
|
|
|
|
|
|
|
|
|
|
|
398.2 |
|
|
|
|
|
|
|
|
14.7 |
|
|
|
|
|
|
|
|
51.1 |
|
|
|
|
|
|
|
$ |
464.0 |
|
Regulatory Capital (1) and TLAC (2) ratios |
|
|
|
|
|
|
|
|
|
|
|
|
|
|
|
13.1 |
% |
|
|
|
|
|
|
|
15.0 |
% |
|
|
|
|
|
|
|
16.7 |
% |
Total loss absorbing capacity |
|
|
|
|
|
|
29.7 |
% |
|
|
|
|
|
|
|
|
|
|
|
|
|
|
|
$ |
1,563,140 |
|
|
|
|
|
|
|
|
4.4 |
% |
Total loss absorbing capacity leverage ratio (2)
|
|
|
|
|
|
|
8.8 |
% |
| (1) |
The regulatory capital ratios are based on Basel III requirements as determined in accordance with OSFI Guideline – Capital Adequacy Requirements (November 2023). |
| (2) |
This measure has been disclosed in this document in accordance with OSFI Guideline – Total Loss Absorbing Capacity (September 2018). |
| (3) |
Includes Other Reserves adjusted for regulatory capital purposes. |
| (4) |
Reported amounts are based on OSFI’s requirements that goodwill relating to investments in associates be classified as goodwill for regulatory reporting purposes. |
| (5) |
Other CET1 capital deductions under Basel III include gains/losses due to changes in own credit risk on fair valued liabilities, pension plan assets and other items. |
| (6) |
Non-qualifying capital instruments. |
| (7) |
Other Tier 1 capital adjustments under Basel III rules include eligible non-controlling interests in subsidiaries. |
| (8) |
The leverage ratios are based on Basel III requirements as determined in accordance with OSFI Guideline – Leverage Requirements (February 2023). |
|
2025 Scotiabank Annual Report
Management’s Discussion and Analysis
| Group Financial Condition
T31
Changes in regulatory capital
|
|
|
|
|
|
|
|
|
|
|
|
| For the fiscal years ($ millions) |
|
|
|
|
2024 |
|
Total capital, beginning of year |
|
|
|
|
|
$ |
75,651 |
|
Changes in Common Equity Tier 1 |
|
|
|
|
|
|
|
|
Net income attributable to common equity holders of the Bank |
|
|
|
|
|
|
7,286 |
|
Dividends paid to equity holders of the Bank |
|
|
|
|
|
|
(5,198 |
) |
|
|
|
|
|
|
|
1,945 |
|
Shares repurchased/redeemed |
|
|
|
|
|
|
– |
|
Gains/losses due to changes in own credit risk on fair valued liabilities |
|
|
|
|
|
|
723 |
|
Movements in accumulated other comprehensive income, excluding cash flow hedges |
|
|
|
|
|
|
(1,577 |
) |
Change in non-controlling interest in common equity of subsidiaries |
|
|
|
|
|
|
(80 |
) |
Change in goodwill and other intangible assets (net of related tax liability) (1)
|
|
|
|
|
|
|
694 |
|
Other changes including regulatory adjustments below: |
|
|
|
|
|
|
(202 |
) |
– Deferred tax assets that rely on future profitability (excluding those arising from temporary differences) |
|
|
|
|
|
|
(220 |
) |
|
|
|
|
|
|
|
(86 |
) |
– Other capital deductions |
|
|
|
|
|
|
85 |
|
|
|
|
|
|
|
|
19 |
|
Changes in Common Equity Tier 1 |
|
|
|
|
|
$ |
3,591 |
|
Changes in Additional Tier 1 Capital |
|
|
|
|
|
|
|
|
|
|
|
|
|
|
|
1,004 |
|
|
|
|
|
|
|
|
(300 |
) |
Other changes including regulatory adjustments |
|
|
|
|
|
|
(20 |
) |
Changes in Additional Tier 1 Capital |
|
|
|
|
|
$ |
684 |
|
Changes in Tier 2 Capital |
|
|
|
|
|
|
|
|
|
|
|
|
|
|
|
1,000 |
|
|
|
|
|
|
|
|
(3,250 |
) |
Allowance for credit losses eligible for inclusion in Tier 2 and Excess Allowance under IRB (2)
|
|
|
|
|
|
|
11 |
|
Other changes including regulatory adjustments |
|
|
|
|
|
|
21 |
|
Changes in Tier 2 Capital |
|
|
|
|
|
$ |
(2,218 |
) |
Total capital generated (used) |
|
|
|
|
|
$ |
2,057 |
|
Total capital, end of year |
|
|
|
|
|
$ |
77,708 |
|
| (1) |
Reported amounts are based on OSFI’s requirements that goodwill relating to investments in associates be classified as goodwill for regulatory reporting purposes. |
| (2) |
Eligible allowances for 2025 and 2024. |
2025 Scotiabank Annual Report
|
Management’s Discussion and Analysis
Regulatory capital components
The Bank’s regulatory capital is divided into three components – CET1, Additional Tier 1 capital and Tier 2 capital, depending on their degree of permanency and loss absorbency. All components of capital provide support for banking operations and protect depositors.
CET1 consists primarily of common shareholders’ equity, regulatory derived
non-controlling
interest capital, and prescribed regulatory adjustments or deductions. These regulatory deductions include goodwill, intangible assets (net of deferred tax liabilities), deferred tax assets that rely on future profitability, defined-benefit pension assets and the shortfall (if any) of the allowance for credit losses to regulatory parameter-based expected losses.
Additional Tier 1 capital consists primarily of qualifying
non-cumulative
preferred shares, and qualifying other equity instruments (as described in Note 23 of the consolidated financial statements). Tier 2 capital consists mainly of qualifying subordinated debentures and eligible allowances for credit losses.
The Bank’s CET1 capital was $62.8 billion as at October 31, 2025, an increase of approximately $2.1 billion from the prior year due primarily to:
| |
• |
|
$1.9 billion growth from internal capital generation, net of dividends paid; |
| |
• |
|
$0.2 billion from share issuances, mainly related to stock options; |
| |
• |
|
$1.3 billion from movements in Accumulated Other Comprehensive Income, excluding cash flow hedges, primarily from the impact of foreign currency translation and changes in the fair values of investment securities; and |
| |
• |
|
$0.5 billion from changes in the regulatory deductions from own credit risk on fair value liabilities. |
| |
• |
|
$0.9 billion from common share buybacks under the Bank’s Normal Course Issuer Bid; and |
| |
• |
|
$0.9 billion from higher regulatory deductions and other regulatory adjustments. |
The Bank’s Tier 1 capital increased by $3.3 billion to $72.8 billion, primarily due to the above noted impacts to CET1 capital and U.S. $2.0 billion (C$2.8 billion) issuances of Limited Recourse Capital Notes partly offset by a redemption of U.S. $1.25 billion (C$1.7 billion) of AT1 Notes.
Total capital increased by $3.2 billion during the year to $80.9 billion, mainly due to the above noted impacts to CET1 and Tier 1 capital.
|
CET1 capital %, as at October 31 |
|
Dividend growth dollars per share |
|
Internally generated capital $ billions, for years ended October 31 |
The annual dividend in 2025 was $4.32, an increase of $0.08 from 2024. The Board of Directors approved a quarterly dividend of $1.10 per common share, at its meeting on December 1, 2025. This quarterly dividend applies to shareholders of record at the close of business on January 6, 2026, and is payable January 28, 2026.
T32
Selected capital management activity
|
|
|
|
|
|
|
|
|
|
|
|
For the fiscal years ($ millions) |
|
|
|
|
2024 |
|
|
|
|
|
|
|
|
|
|
|
|
|
|
|
|
$ |
5,198 |
|
Preferred and other equity instruments |
|
|
|
|
|
|
472 |
|
|
|
|
|
|
|
|
1,945 |
|
Common shares repurchased for cancellation under the Normal Course |
|
|
|
|
|
|
|
|
|
|
|
|
|
|
|
– |
|
Preferred shares and other equity instruments issued |
|
|
|
|
|
|
1,004 |
|
Preferred shares and other equity instruments redeemed |
|
|
|
|
|
|
300 |
|
Maturity, redemption and repurchase of subordinated debentures |
|
|
|
|
|
|
3,250 |
|
| (1) |
Represents primarily cash received for stock options exercised during the year and common shares issued pursuant to the Shareholder Dividend and Share Purchase Plan. |
| (2) |
Represents reduction to common shares and Retained Earnings, including tax. |
On May 28, 2025, the Bank announced that OSFI and the Toronto Stock Exchange approved a normal course issuer bid (the “2025 NCIB”) pursuant to which it may repurchase for cancellation up to 20 million of the Bank’s common shares. Purchases under the 2025 NCIB commenced on May 30, 2025, and will terminate upon the earlier of: (i) the Bank purchasing the maximum number of common shares under the 2025 NCIB, (ii) the Bank providing a notice of termination, or (iii) May 29, 2026.
From the commencement of the 2025 NCIB until October 31, 2025, the Bank repurchased and cancelled approximately 10.8 million common shares at an average price of $82.57 per share for a total amount of $913 million, including tax.
The Bank did not have an active normal course issuer bid and did not repurchase any common shares pursuant to a normal course issuer bid during the year ended October 31, 2024.
|
2025 Scotiabank Annual Report
Management’s Discussion and Analysis
| Group Financial Condition
Share data and other capital instruments
The Bank’s common and preferred share data, as well as certain other capital instruments, are shown in T33. Further details, including exchangeability features, are discussed in Note 20 and Note 23 of the consolidated financial statements.
T33
Shares and other instruments
|
|
|
|
|
|
|
|
|
|
|
|
|
|
|
|
|
|
|
|
|
|
| As at October 31, 2025 |
|
|
|
|
Dividends declared per share (1)
|
|
|
|
|
|
|
|
|
|
$ |
22,067 |
|
|
$ |
4.32 |
|
|
|
1,236,306 |
|
|
|
n/a |
|
|
|
|
|
|
NVCC Additional Tier 1 Securities (3)(5)
|
|
|
|
|
|
|
|
|
|
|
|
|
Subordinated Additional Tier 1 Capital Notes (6)
|
|
U.S.$ |
1,250 |
|
|
U.S.$ |
17.4317 |
|
|
|
6.821 |
|
|
|
1,250 |
|
Subordinated Additional Tier 1 Capital Notes (7)
|
|
U.S.$ |
– |
|
|
U.S.$ |
– |
|
|
|
4.900 |
|
|
|
– |
|
Limited Recourse Capital Notes Series 1 (8)
|
|
$ |
1,250 |
|
|
$ |
9.2500 |
|
|
|
3.700 |
|
|
|
1,250 |
|
Limited Recourse Capital Notes Series 2 (9)
|
|
U.S.$ |
600 |
|
|
U.S.$ |
9.0625 |
|
|
|
3.625 |
|
|
|
600 |
|
Limited Recourse Capital Notes Series 3 (10)
|
|
$ |
1,500 |
|
|
$ |
17.5575 |
|
|
|
7.023 |
|
|
|
1,500 |
|
Limited Recourse Capital Notes Series 4 (11)
|
|
U.S.$ |
750 |
|
|
U.S.$ |
21.5625 |
|
|
|
8.625 |
|
|
|
750 |
|
Limited Recourse Capital Notes Series 5 (12)
|
|
U.S.$ |
750 |
|
|
U.S.$ |
20.0000 |
|
|
|
8.000 |
|
|
|
750 |
|
Limited Recourse Capital Notes Series 6 (13)
|
|
U.S.$ |
1,000 |
|
|
U.S.$ |
18.3750 |
|
|
|
7.350 |
|
|
|
1,000 |
|
Limited Recourse Capital Notes Series 7 (14)
|
|
U.S.$ |
1,000 |
|
|
U.S.$ |
20.8160 |
|
|
|
6.875 |
|
|
|
1,000 |
|
|
|
|
|
|
NVCC Subordinated Debentures (3)
|
|
|
|
|
|
|
|
|
|
|
|
|
Subordinated debentures due June 2025 (15)
|
|
|
|
|
|
|
|
|
|
$ |
– |
|
|
|
8.900 |
|
Subordinated debentures due December 2025 |
|
|
|
|
|
|
|
|
|
U.S.$ |
1,250 |
|
|
|
4.500 |
|
Subordinated debentures due May 2032 |
|
|
|
|
|
|
|
|
|
$ |
1,750 |
|
|
|
3.934 |
|
Subordinated debentures due December 2032 |
|
|
|
|
|
|
|
|
|
JPY |
33,000 |
|
|
|
1.800 |
|
Subordinated debentures due August 2033 |
|
|
|
|
|
|
|
|
|
$ |
1,000 |
|
|
|
5.679 |
|
Subordinated debentures due December 2033 |
|
|
|
|
|
|
|
|
|
JPY |
12,000 |
|
|
|
1.830 |
|
Subordinated debentures due August 2034 |
|
|
|
|
|
|
|
|
|
$ |
1,000 |
|
|
|
4.959 |
|
Subordinated debentures due May 2037 |
|
|
|
|
|
|
|
|
|
U.S.$ |
1,250 |
|
|
|
4.588 |
|
|
|
|
|
|
|
|
|
|
|
|
|
|
|
|
|
|
|
Scotiabank Trust Securities – Series 2006-1 issued by Scotiabank Capital Trust (16a,b)
|
|
$ |
750 |
|
|
|
28.25 |
|
|
|
5.650 |
|
|
|
750 |
|
|
|
|
|
|
|
|
|
|
|
|
|
|
|
|
|
|
|
Outstanding options granted under the Stock Option Plans to purchase common shares (2)
|
|
|
|
|
|
|
|
|
|
|
|
10,087 |
|
|
|
|
| (1) |
|
Dividends declared from November 1, 2024 to October 31, 2025. |
| (2) |
|
Dividends on common shares are paid quarterly, if and when declared. As at November 21, 2025, the number of outstanding common shares and options was 1,236,011 thousand and 9,901 thousand, respectively. |
| (3) |
|
These securities contain Non-Viability Contingent Capital (NVCC) provisions necessary to qualify as regulatory capital under Basel III. Refer to Notes 20 and 23 of the consolidated financial statements in the Bank’s 2025 Annual Report for further details. |
| (4) |
|
Distributions per face amount of $1,000 or U.S.$1,000 semi-annually or quarterly, as applicable. |
| (5) |
|
Quarterly distributions are recorded in each fiscal quarter if and when paid. |
| (6) |
|
In respect of these securities, on June 28, 2023, the Bank announced the interest rate transition from three-month USD LIBOR to three-month Term SOFR, plus a spread adjustment of 26.161 bps, for interest periods commencing on or after July 12, 2023. |
| (7) |
|
On June 4, 2025, the Bank redeemed US $1,250 million 4.900% Fixed Rate Resetting Perpetual Subordinated Additional Tier 1 Capital Notes at 100% of their principal amount plus accrued and unpaid interest. The redemption of these AT1 Notes resulted in a foreign currency loss of $22 million recorded in Retained Earnings. |
| (8) |
|
Subsequent to the initial five-year fixed rate period ending on July 27, 2026, and resetting every five years thereafter, the distributions will be determined by the sum of the five-year Government of Canada Yield plus 2.761%. |
| (9) |
|
Subsequent to the initial five-year fixed rate period ending on October 27, 2026, and resetting every five years thereafter, the distributions will be determined by the sum of the five-year U.S. Treasury rate plus 2.613%. |
| (10) |
|
Subsequent to the initial five-year fixed rate period ending on July 27, 2027, and resetting every five years thereafter, the distributions, if and when paid, will be determined by the sum of the five-year Government of Canada Yield plus 3.95%. |
| (11) |
|
Subsequent to the initial five-year fixed rate period ending on October 27, 2027, and resetting every five years thereafter, the distributions will be determined by the sum of the five-year U.S. Treasury rate plus 4.389%. |
| (12) |
|
Subsequent to the initial five-year fixed rate period ending on January 27, 2029, and resetting every five years thereafter, the distributions, if and when paid, will be determined by the sum of the five-year U.S. Treasury rate plus 4.017%. |
| (13) |
|
On January 31, 2025, the Bank issued US$1,000 million 7.350% Fixed Rate Resetting Limited Recourse Capital Notes Series 6 (NVCC) (“LRCN Series 6”). In connection with the issuance of LRCN Series 6, the Bank issued US$1,000 million of Fixed Rate Resetting Perpetual Subordinated Additional Tier1 Capital Notes (NVCC) (“the Series 6 AT1 Notes”) to Scotiabank LRCN Trust to be held as trust assets in connection with the LRCN structure. Subsequent to the initial five-year fixed rate period ending on April 27, 2030, and resetting every five years thereafter, the distributions will be determined by the sum of the five-year US Treasury rate plus 2.903%. For more details, refer to Note 23 of the consolidated financial statements. |
| (14) |
|
On September 29, 2025, the Bank issued US$1,000 million 6.875% Fixed Rate Resetting Limited Recourse Capital Notes Series 7 (NVCC) (“LRCN Series 7”). In connection with the issuance of LRCN Series 7, the Bank issued US$1,000 million of Fixed Rate Resetting Perpetual Subordinated Additional Tier1 Capital Notes (NVCC) (“the Series 7 AT1 Notes”) to Scotiabank LRCN Trust to be held as trust assets in connection with the LRCN structure. Subsequent to the initial ten-year fixed rate period ending on October 27, 2035, and resetting every five years thereafter, the distributions will be determined by the sum of the five-year US Treasury rate plus 2.734%. For more details, refer to Note 23 of the consolidated financial statements. |
| (15) |
|
On June 20, 2025, all $250 million of outstanding 8.9% subordinated debentures matured. The principal plus accrued interest were paid to noteholders on the maturity date. |
| (16)(a) |
|
On September 28, 2006, Scotiabank Capital Trust issued 750,000 Scotiabank Trust Securities – Series 2006-1 (Scotia BaTS II Series 2006-1). The holders of Scotia BaTS II Series 2006-1 are entitled to receive non-cumulative fixed cash distributions payable semi-annually in an amount of $28.25 per security. With regulatory approval, these securities may be redeemed in whole upon the occurrence of certain tax or regulatory capital changes, or in whole or in part on December 30, 2011 and on any distribution date thereafter at the option of Scotiabank Capital Trust. The holder has the right at any time to exchange their security into Non-cumulative Preferred Shares Series S of the Bank. The Series S shares will be entitled to cash dividends payable semi-annually in an amount of $0.4875 per $25.00 share. Refer to Note 23(c) – Restrictions on payment of dividends and retirement of shares. The Scotia BaTS II Series 2006-1 may be automatically exchanged, without the consent of the holder, into Non-cumulative Preferred Shares Series T of the Bank in the following circumstances: (i) proceedings are commenced for the winding-up of the Bank; (ii) the Superintendent takes control of the Bank or its assets; (iii) the Bank has a Tier 1 Capital ratio of less than 5% or a Total Capital ratio of less than 8%; or (iv) the Superintendent has directed the Bank to increase its capital or provide additional liquidity and the Bank elects such automatic exchange or the Bank fails to comply with such direction. The Series T shares will be entitled to non-cumulative cash dividends payable semi-annually in an amount of $0.625 per $25.00 share. If there is an automatic exchange of the Scotia BaTS II Series 2006-1 into Preferred Shares Series T of the Bank, then the Bank would become the sole beneficiary of the Trust. |
| (16)(b) |
|
No cash distributions will be payable on the Scotia BaTS II Series 2006-1 in the event that the regular dividend is not declared on the Bank’s preferred shares and, if no preferred shares are outstanding, the Bank’s common shares. In such a circumstance the net distributable funds of the Trust will be payable to the Bank as the holder of the residual interest in the Trust. Should the Trust fail to pay the semi-annual distributions on the Scotia BaTS II Series 2006-1 in full, the Bank will not declare dividends, of any kind on any of its preferred or common shares for a specified period of time. Refer to Note 23(c) - Restrictions on payment of dividends and retirement of shares of the consolidated financial statements. |
2025 Scotiabank Annual Report
|
Management’s Discussion and Analysis
Regulatory capital requirements are based on OSFI’s target minimum percentage of risk-weighted assets (RWA). RWA represent the Bank’s exposure to credit, market and operational risks and are computed by applying a combination of the OSFI approved Bank’s internal risk models and OSFI prescribed risk weights to on and
off-balance
sheet exposures. In addition, OSFI has adopted the revised Basel III aggregate output floor, which ensures that the Bank’s total RWA are not lower than 72.5% of RWA as calculated by the revised Basel III framework’s standardized approaches. The output floor has been set at 72.5% with an international
phase-in
period from 2023 to 2028. For Canadian banks, the floor is presently at 67.5%. As noted above, OSFI has deferred any further increases to the floor and has committed to notifying affected banks at least two years prior to resuming an increase to the Basel III standardized capital output floor.
As at year end, the Bank’s RWA of $474.5 billion, represents an increase of approximately $10.5 billion, or 2.3%, from 2024, due primarily to higher RWA from credit risk due to book quality, operational risk, FX translation from a weaker Canadian dollar, partly offset by lower asset growth and decrease in market risk RWA.
Credit risk-weighted assets
Credit risk measures the risk that a borrower or counterparty will fail to honour its financial or contractual obligations to the Bank.
The credit risk component consists of on and
off-balance
sheet claims. The Basel III rules are not applied to traditional balance sheet categories but to categories of on and
off-balance
sheet exposures which represent general classes of assets or exposure types (e.g. Large Corporate,
Mid-size
Corporate, Small and Medium Enterprise, Sovereign, Bank, Retail Mortgages, Other Retail, Equity, etc.) based on their different underlying risk characteristics. Generally, while calculating capital requirements, exposure types are analyzed by the following credit risk exposure
sub-types:
drawn, undrawn, repo-style transactions,
(OTC) derivatives, exchange-traded derivatives and other
off-balance
sheet claims.
Credit risk-weighted assets increased by $8.1 billion to $406.3 billion. The key drivers or components of the change are reflected in Table T34 below.
T34
Flow statement for Basel III credit risk-weighted assets ($ millions)
|
|
|
|
|
|
|
|
|
|
|
|
|
|
|
|
|
|
|
|
| |
|
|
|
|
2024 |
|
|
|
|
|
|
Credit risk-weighted assets movement by key driver ($ millions) |
|
|
|
|
Of which
counterparty
credit risk |
|
|
Credit risk |
|
|
Of which
counterparty
credit risk |
|
Credit risk-weighted assets as at beginning of year |
|
|
|
|
|
|
|
|
|
$ |
378,670 |
|
|
$ |
16,276 |
|
|
|
|
|
|
|
|
|
|
|
|
(5,165 |
) |
|
|
246 |
|
|
|
|
|
|
|
|
|
|
|
|
17,516 |
|
|
|
662 |
|
|
|
|
|
|
|
|
|
|
|
|
6,640 |
|
|
|
635 |
|
Methodology and policy (4)
|
|
|
|
|
|
|
|
|
|
|
776 |
|
|
|
776 |
|
Acquisitions and disposals |
|
|
|
|
|
|
|
|
|
|
2,749 |
|
|
|
– |
|
Foreign exchange movements |
|
|
|
|
|
|
|
|
|
|
(3,033 |
) |
|
|
165 |
|
|
|
|
|
|
|
|
|
|
|
|
– |
|
|
|
– |
|
Credit risk-weighted assets as at end of year
|
|
|
|
|
|
|
|
|
|
$ |
398,153 |
|
|
$ |
18,760 |
|
| (1) |
Book size is defined as organic changes in book size and composition (including new business and maturing loans). |
| (2) |
Book quality is defined as quality of book changes caused by experience such as underlying customer behaviour or demographics, including changes through model calibrations/realignments. |
| (3) |
Model updates are defined as model implementation, change in model scope or any change to address model enhancement. |
| (4) |
Methodology and policy is defined as methodology changes to the calculations driven by regulatory policy changes, such as new regulation (e.g. Basel III revision). |
T35
Internal rating scale
(1)
and mapping to external rating agencies
|
|
|
|
|
|
|
|
|
|
|
| Equivalent Rating |
|
|
|
|
|
|
|
|
|
|
External Rating – S&P and Fitch |
|
External Rating – Moody’s |
|
External Rating – Morningstar DBRS |
|
|
|
|
|
|
|
|
|
|
|
|
Investment
grade |
|
99-98 |
|
0.0000% – 0.0565% |
|
|
|
|
|
|
95 |
|
0.0565% – 0.0693% |
|
|
|
|
|
|
90 |
|
0.0693% – 0.0833% |
|
|
|
|
|
|
87 |
|
0.0833% – 0.1243% |
|
|
|
|
|
|
|
|
85 |
|
0.1243% – 0.1976% |
|
|
|
|
|
|
|
|
83 |
|
0.1976% – 0.2743% |
|
|
|
|
|
|
Non-Investment
grade |
|
80 |
|
0.2743% – 0.3806% |
|
|
|
|
|
|
77 |
|
0.3806% – 0.7061% |
|
|
|
|
|
|
75 |
|
0.7061% – 1.4290% |
|
|
|
|
|
|
73 |
|
1.4290% – 2.4715% |
|
|
|
|
|
|
70 |
|
2.4715% – 6.2065% |
|
|
|
|
|
|
Watch list |
|
65 |
|
6.2065% – 15.9382% |
|
|
|
|
|
|
60 |
|
15.9382% – 28.5499% |
|
|
|
|
|
|
40 |
|
28.5499% – 48.3748% |
|
|
|
|
|
|
30 |
|
48.3748% – 100.0000% |
|
|
|
|
|
|
Default |
|
21 |
|
100% |
| (1) |
Applies to non-retail portfolio. |
| (2) |
PD Ranges as at October 31, 2025. The Range does not include the upper boundary for the row. |
|
2025 Scotiabank Annual Report
Management’s Discussion and Analysis
| Group Financial Condition
T36
Non-retail
IRB portfolio exposure by internal rating grade
(1)
|
|
|
|
|
|
|
|
|
|
|
|
|
|
|
|
|
|
|
|
|
|
|
|
|
|
|
|
|
|
|
|
|
|
|
|
|
|
|
|
|
|
|
|
|
|
|
|
| As at October 31 ($ millions) |
|
|
|
|
|
2024 |
|
|
|
|
|
|
|
|
|
|
|
|
|
| Grade |
|
|
|
|
|
|
|
|
|
|
|
|
|
|
|
|
|
|
|
|
|
|
|
|
|
|
|
|
|
|
|
|
|
|
|
|
|
|
|
|
|
|
|
|
|
|
|
|
|
|
|
|
|
|
|
|
|
|
|
|
157,031 |
|
|
|
1,030 |
|
|
|
– |
|
|
|
14 |
|
|
|
1 |
|
| |
|
|
|
|
|
|
|
|
|
|
|
|
|
|
|
|
|
|
|
|
|
|
|
|
|
67,710 |
|
|
|
11,758 |
|
|
|
0.06 |
|
|
|
34 |
|
|
|
17 |
|
| |
|
|
|
|
|
|
|
|
|
|
|
|
|
|
|
|
|
|
|
|
|
|
|
|
|
48,113 |
|
|
|
10,146 |
|
|
|
0.07 |
|
|
|
43 |
|
|
|
21 |
|
| |
|
|
|
|
|
|
|
|
|
|
|
|
|
|
|
|
|
|
|
|
|
|
|
|
|
63,699 |
|
|
|
11,320 |
|
|
|
0.09 |
|
|
|
34 |
|
|
|
18 |
|
| |
|
|
|
|
|
|
|
|
|
|
|
|
|
|
|
|
|
|
|
|
|
|
|
|
|
49,920 |
|
|
|
15,343 |
|
|
|
0.16 |
|
|
|
39 |
|
|
|
31 |
|
| |
|
|
|
|
|
|
|
|
|
|
|
|
|
|
|
|
|
|
|
|
|
|
|
|
|
69,342 |
|
|
|
22,379 |
|
|
|
0.22 |
|
|
|
36 |
|
|
|
32 |
|
|
|
|
|
|
|
|
|
|
|
|
|
|
|
|
|
|
|
|
|
|
|
|
|
|
|
|
54,770 |
|
|
|
21,985 |
|
|
|
0.30 |
|
|
|
37 |
|
|
|
40 |
|
| |
|
|
|
|
|
|
|
|
|
|
|
|
|
|
|
|
|
|
|
|
|
|
|
|
|
40,729 |
|
|
|
19,244 |
|
|
|
0.42 |
|
|
|
39 |
|
|
|
47 |
|
| |
|
|
|
|
|
|
|
|
|
|
|
|
|
|
|
|
|
|
|
|
|
|
|
|
|
27,324 |
|
|
|
18,610 |
|
|
|
1.05 |
|
|
|
38 |
|
|
|
68 |
|
| |
|
|
|
|
|
|
|
|
|
|
|
|
|
|
|
|
|
|
|
|
|
|
|
|
|
10,140 |
|
|
|
7,975 |
|
|
|
1.74 |
|
|
|
36 |
|
|
|
79 |
|
| |
|
|
|
|
|
|
|
|
|
|
|
|
|
|
|
|
|
|
|
|
|
|
|
|
|
3,791 |
|
|
|
3,282 |
|
|
|
3.11 |
|
|
|
34 |
|
|
|
87 |
|
|
|
|
|
|
|
|
|
|
|
|
|
|
|
|
|
|
|
|
|
|
|
|
|
|
|
|
1,592 |
|
|
|
2,473 |
|
|
|
10.79 |
|
|
|
40 |
|
|
|
155 |
|
| |
|
|
|
|
|
|
|
|
|
|
|
|
|
|
|
|
|
|
|
|
|
|
|
|
|
986 |
|
|
|
1,972 |
|
|
|
20.59 |
|
|
|
40 |
|
|
|
200 |
|
| |
|
|
|
|
|
|
|
|
|
|
|
|
|
|
|
|
|
|
|
|
|
|
|
|
|
889 |
|
|
|
1,665 |
|
|
|
36.17 |
|
|
|
37 |
|
|
|
187 |
|
| |
|
|
|
|
|
|
|
|
|
|
|
|
|
|
|
|
|
|
|
|
|
|
|
|
|
232 |
|
|
|
361 |
|
|
|
60.41 |
|
|
|
43 |
|
|
|
156 |
|
|
|
|
|
|
|
|
|
|
|
|
|
|
|
|
|
|
|
|
|
|
|
|
|
|
|
|
1,313 |
|
|
|
3,529 |
|
|
|
100.00 |
|
|
|
42 |
|
|
|
269 |
|
|
|
|
|
|
|
|
|
|
|
|
|
|
|
|
|
|
|
|
|
|
|
|
|
|
|
|
597,581 |
|
|
|
153,072 |
|
|
|
0.57 |
|
|
|
31 |
|
|
|
26 |
|
Government guaranteed residential mortgages |
|
|
|
|
|
|
|
|
|
|
|
|
|
|
|
|
|
|
|
|
|
|
|
53,319 |
|
|
|
– |
|
|
|
– |
|
|
|
18 |
|
|
|
– |
|
|
|
|
|
|
|
|
|
|
|
|
|
|
|
|
|
|
|
|
|
|
|
|
|
|
|
|
650,900 |
|
|
|
153,072 |
|
|
|
0.52 |
|
|
|
30 |
|
|
|
24 |
|
| (1) |
Excludes securitization exposures. |
| (2) |
Excludes government guaranteed residential mortgages of $50.8 billion ($53.3 billion in 2024). |
| (3) |
After credit risk mitigation. |
| (4) |
RWA – Risk-Weighted Assets. |
| (5) |
PD – Probability of Default. |
| (6) |
LGD – Loss Given Default. |
| (8) |
Exposure at default used as basis for estimated weightings. |
| (9) |
Gross defaulted exposures, before any related allowances. |
Credit risk-weighted assets –
non-retail
The Bank uses the Internal Ratings Based (IRB) approach under Basel III to determine minimum regulatory capital requirements for credit risk in its Canadian, U.S. and European credit portfolios, and for a significant portion of its international corporate and commercial portfolios. The remaining credit portfolios are subject to the Standardized approach, which relies on the external credit ratings (Fitch, Morningstar DBRS, S&P) of exposures and/or borrowers, if available, or prescribed risk weights by counterparty type or exposure type to compute regulatory capital for credit risk. For the Bank’s Corporate, Bank and Sovereign IRB portfolios, the key risk measures used in the quantification of regulatory capital for credit risk include probability of default (PD), loss given default (LGD) and exposure at default (EAD).
| |
• |
|
Probability of default (PD) measures the likelihood that a borrower, with an assigned Internal Grade (IG) rating, will default within a one-year time horizon. IG ratings are a component of the Bank’s risk rating system. Each of the Bank’s internal borrower IG depending on the borrower type is mapped to a PD. |
| |
• |
|
Loss given default (LGD) measures the severity of loss on a facility in the event of a borrower’s default. LGD segments are determined based on facility characteristics such as seniority, collateral type, collateral coverage and other structural elements. Each LGD segment is assigned a LGD estimate. LGD is based on the concept of economic loss and is calculated using the present value of repayments, recoveries and related direct and indirect expenses. |
| |
• |
|
Exposure at default (EAD) measures the expected exposure on a facility at the time of default. |
Under the Advanced Internal Ratings Based (AIRB) approach, all three risk measures are estimated using the Bank’s historical data, as well as available external benchmarks, and are updated on a regular basis. The historical data used for estimating these risk measures exceeds the minimum five-year AIRB requirement for PD estimates and the minimum seven-year AIRB requirement for LGD and EAD estimates.
Under Basel III there are IRB requirements for internally developed model parameters under AIRB including scope restrictions which limit certain asset classes to only the Foundation Internal Ratings Based (FIRB) approach. For those asset classes (e.g. Large Corporates, Banks, etc.) the FIRB utilizes the Bank’s internally modeled PD parameters combined with internationally prescribed LGD and EAD parameters.
Further adjustments, as required under the Basel III Framework and OSFI’s requirements set out in its Domestic Implementation Notes, including any input floor requirements, are applied to average estimates obtained from historical data. These adjustments incorporate the regulatory requirements pertaining to:
| |
• |
|
Long-run estimation of PD, which requires that PD estimates capture average default experience over a reasonable mix of high-default and low-default years of the economic cycle; |
| |
• |
|
Downturn estimation for internally modeled AIRB LGD, which requires that LGD estimates appropriately reflect conditions observed during periods where credit losses are substantially higher than average; |
| |
• |
|
Downturn estimation for internally modeled AIRB EAD, which requires that EAD estimates appropriately reflect conditions observed during periods of economic downturn; and |
| |
• |
|
The addition of a margin of conservatism, which is related to the likely range of errors based on the identification and quantification of the various sources of uncertainty inherent in historical estimates. |
2025 Scotiabank Annual Report
|
Management’s Discussion and Analysis
These risk measures are used in the calculation of regulatory capital requirements based on the Basel framework. The credit quality distribution of the Bank’s IRB
non-retail
portfolio is shown in Table T36. Portfolio average PD increased year-over-year mainly due to model updates and book quality while average LGD and RW stayed flat over the prior year.
The risk measures are subject to a rigorous back-testing framework which uses the Bank’s historical data to ensure that they are appropriately calibrated. Based on results obtained from the back-testing process, risk measures are reviewed,
re-calibrated
and independently validated on at least an annual basis in order to reflect the implications of new data, technical advances and other relevant information.
| |
• |
|
As PD estimates represent long-run parameters, back-testing is performed using historical data spanning at least one full economic cycle. Realized PDs are back-tested using pre-defined criteria, and the results are then aggregated to provide an overall assessment of the appropriateness of each PD estimate; |
| |
• |
|
The back-testing for AIRB LGD and EAD estimates is conducted from both long-run and downturn perspectives, in order to ensure that these estimates are adequately conservative to reflect both long-run and downturn conditions. |
Portfolio-level back-testing results, based on a comparison of estimated and realized parameters for the four-quarter period ended at July 31, 2025, are shown in Table T37. During this period the actual experiences of PD, LGD and CCF were all lower than the estimates as reflected within the risk parameters.
T37
Portfolio-level comparison of estimated and actual
non-retail
percentages
|
|
|
|
|
|
|
|
|
|
|
|
| |
|
|
|
|
|
|
|
|
|
0.78 |
|
|
|
0.44 |
|
|
|
|
41.73 |
|
|
|
17.03 |
|
|
|
|
50.22 |
|
|
|
49.05 |
|
| (1) |
Estimated parameters are based on portfolio count-weighted averages at Q3/24, whereas actual parameters are based on count-weighted averages of realized parameters during the subsequent four quarters. |
| (2) |
(EAD) back-testing of the Bank’s credit conversion factor (CCF) parameters is performed through Limit Factor (LF) back-testing. EAD is computed using the total limit multiplied by the estimated LF. |
Credit risk-weighted assets – Canadian retail
The AIRB approach is used to determine minimum regulatory capital requirements for the retail credit portfolio in Canada. The retail portfolio is comprised of the following Basel-based pools:
| |
• |
|
Residential real estate secured exposures mainly consist of conventional and high ratio residential mortgages and all other products opened under the Scotia Total Equity Plan (STEP), such as mortgage loans, credit cards and secured lines of credit; |
| |
• |
|
Qualifying revolving retail exposures (QRRE) consist of unsecured credit cards and lines of credit, including transactors and revolvers; |
| |
• |
|
Other retail consists of term loans (secured and unsecured), as well as credit cards and lines of credit which are secured by assets other than real estate or do not meet the QRRE definition. |
For the AIRB portfolios, the following models and parameters are estimated, subject to parameter input floors as required by OSFI:
| |
• |
|
Probability of Default (PD) is the likelihood that the facility will default within the next 12 months. |
| |
• |
|
Loss Given Default (LGD) measures the estimated economic loss as a proportion of the defaulted balance. |
| |
• |
|
Exposure at Default (EAD) is the portion of expected exposures at time of default. |
The data observation period used for PD/EAD/LGD estimates meets the five year minimum. Various statistical techniques including predictive modeling and decision trees were used to develop models. The models assign accounts into homogenous segments using internal and external borrower/facility-level credit experience. Every month, exposures are automatically
re-rated
based on risk and loss characteristics. PD, LGD and EAD estimates are then assigned to each of these segments incorporating the following regulatory requirements:
| |
• |
|
PD incorporates the average long run default experience over an economic cycle. This long run average includes a mix of high and low default years. |
| |
• |
|
LGD and EAD include historical data covering stressed years. |
| |
• |
|
LGD and EAD are adjusted to reflect downturn conditions and when PDs are highly correlated with each of the parameters. |
| |
• |
|
Sources of uncertainty are reviewed regularly to ensure uncertainties are identified, quantified and included in calculations so that all parameter estimates reflect appropriate levels of conservatism. |
|
2025 Scotiabank Annual Report
Management’s Discussion and Analysis
| Group Financial Condition
The table below summarizes the credit quality distribution of the Bank’s AIRB retail portfolio as at October 31, 2025.
Year-over-year the Bank’s AIRB retail portfolio parameters and average risk weights at the total portfolio level remained stable.
T38
Retail AIRB portfolio exposure by PD range
(1)
|
|
|
|
|
|
|
|
|
|
|
|
|
|
|
|
|
|
|
|
|
|
|
|
|
|
|
|
|
|
|
|
|
|
|
|
|
|
|
|
|
|
|
|
|
|
| As at October 31 ($ millions) |
|
|
|
|
2024 |
|
| Category |
|
PD Range |
|
|
|
|
|
|
|
|
|
|
|
|
|
|
|
|
|
|
|
|
|
|
|
|
|
|
|
|
|
|
|
|
0.0000% – 0.0500% |
|
|
|
|
|
|
|
|
|
|
|
|
|
|
|
|
|
|
|
|
|
|
145,243 |
|
|
|
3,873 |
|
|
|
0.05 |
|
|
|
22 |
|
|
|
3 |
|
|
|
0.0501% – 0.1999% |
|
|
|
|
|
|
|
|
|
|
|
|
|
|
|
|
|
|
|
|
|
|
148,919 |
|
|
|
12,705 |
|
|
|
0.16 |
|
|
|
37 |
|
|
|
9 |
|
|
|
0.2000% – 0.9999% |
|
|
|
|
|
|
|
|
|
|
|
|
|
|
|
|
|
|
|
|
|
|
79,011 |
|
|
|
22,791 |
|
|
|
0.63 |
|
|
|
43 |
|
|
|
29 |
|
|
|
1.0000% – 2.9999% |
|
|
|
|
|
|
|
|
|
|
|
|
|
|
|
|
|
|
|
|
|
|
25,478 |
|
|
|
15,667 |
|
|
|
2.07 |
|
|
|
57 |
|
|
|
61 |
|
|
|
3.0000% – 9.9999% |
|
|
|
|
|
|
|
|
|
|
|
|
|
|
|
|
|
|
|
|
|
|
7,524 |
|
|
|
8,812 |
|
|
|
5.81 |
|
|
|
77 |
|
|
|
117 |
|
|
|
10.0000% – 19.9999% |
|
|
|
|
|
|
|
|
|
|
|
|
|
|
|
|
|
|
|
|
|
|
3,232 |
|
|
|
4,002 |
|
|
|
14.29 |
|
|
|
39 |
|
|
|
124 |
|
|
|
20.0000% – 99.9999% |
|
|
|
|
|
|
|
|
|
|
|
|
|
|
|
|
|
|
|
|
|
|
2,263 |
|
|
|
3,528 |
|
|
|
43.74 |
|
|
|
50 |
|
|
|
156 |
|
|
|
100% |
|
|
|
|
|
|
|
|
|
|
|
|
|
|
|
|
|
|
|
|
|
|
975 |
|
|
|
3,030 |
|
|
|
100.00 |
|
|
|
52 |
|
|
|
311 |
|
|
|
|
|
|
|
|
|
|
|
|
|
|
|
|
|
|
|
|
|
|
|
|
|
|
412,645 |
|
|
|
74,408 |
|
|
|
1.02 |
|
|
|
35 |
|
|
|
18 |
|
| (1) |
After credit risk mitigation. |
| (2) |
RWA – Risk-Weighted Assets. |
| (3) |
PD – Probability of Default. |
| (4) |
LGD – Loss Given Default. |
| (6) |
Exposure at default used as basis for estimated weightings. |
| (7) |
Gross defaulted exposures, before any related allowances. |
All AIRB models and parameters are monitored on a quarterly basis and independently validated annually by the Global Risk Management group. These models are tested to ensure rank ordering and back testing of parameters is appropriate. Comparison of estimated and actual loss parameters for the period ended October 31, 2025 is shown in Table T39. During this period the actual experience was generally more favourable to the estimates as reflected by the risk parameters; however, for Secured Lines of Credit PDs and Qualifying Revolving Retail Exposures’ LGDs, actual values are slightly elevated as they reflect the most recent year of defaults and economic losses while estimates reflect the long run overall portfolio averages.
T39
Estimated and actual loss parameters
(1)(2)
|
|
|
|
|
|
|
|
|
|
|
|
|
|
|
|
|
|
|
|
|
|
|
|
|
|
|
|
|
|
|
|
| ($ millions) |
|
|
|
|
|
|
|
|
|
|
|
|
|
|
|
|
|
|
Residential real estate secured |
|
|
|
|
|
|
|
|
|
|
|
|
|
|
|
|
|
|
|
|
|
|
|
|
|
|
|
|
|
|
|
|
|
|
|
|
|
|
|
|
|
|
|
|
|
|
|
|
|
|
|
|
0.57 |
|
|
|
0.50 |
|
|
|
– |
|
|
|
– |
|
|
|
– |
|
|
|
– |
|
|
|
|
0.48 |
|
|
|
0.44 |
|
|
|
15.65 |
|
|
|
8.83 |
|
|
|
– |
|
|
|
– |
|
|
|
|
0.29 |
|
|
|
0.30 |
|
|
|
22.63 |
|
|
|
15.63 |
|
|
|
191 |
|
|
|
173 |
|
Qualifying revolving retail exposures |
|
|
1.64 |
|
|
|
1.45 |
|
|
|
93.72 |
|
|
|
96.86 |
|
|
|
853 |
|
|
|
829 |
|
|
|
|
2.03 |
|
|
|
1.52 |
|
|
|
67.74 |
|
|
|
54.32 |
|
|
|
15 |
|
|
|
14 |
|
| (1) |
Estimated values are based on the models in place four quarters prior to the reporting date. |
| (2) |
Actual values are aligned with model updates implemented during the period. |
| (3) |
Account weighted aggregation. |
| (4) |
Default weighted aggregation. |
| (5) |
EAD is estimated for revolving products only. |
| (6) |
Actual based on accounts not at default as at four quarters prior to reporting date. |
| (7) |
Actual LGD calculated based on 24 month recovery period after default and therefore excludes any recoveries received after the 24 month period. |
| (8) |
Actual and estimated LGD for insured mortgages are not shown; actual LGD includes the insurance benefit, whereas estimated LGD may not. |
Credit risk-weighted assets – International retail
International retail credit portfolios follow the Standardized approach and consist of the following components:
| |
• |
|
Residential real estate secured lending; and |
| |
• |
|
Other regulatory retail, mainly consisting of term loans and credit card and lines of credit transactors and revolvers. |
Under the standardized approach, each of the above components is risk-weighted based on prescribed risk weights, which consider borrower or facility attributes, such as,
transactors vs. revolvers, and drawn vs. undrawn.
Market risk is the risk of loss from changes in market prices including interest rates, credit spreads, equity prices, foreign exchange rates, and commodity prices, the correlations between them, and their levels of volatility.
2025 Scotiabank Annual Report
|
Management’s Discussion and Analysis
Market Risk – Market Risk-Weighted Assets
In the first quarter of 2024, OSFI implemented the revised market risk framework following the Fundamental Review of the Trading Book (FRTB) as part of the Basel III reforms, including revised standardized and modelled approaches for market risk capital requirements. The Bank applies the standardized approach (FRTB-SA) for calculating market risk capital. Below are the market risk requirements as at October 31, 2025 and 2024:
T40
Total market risk capital
(1)
|
|
|
|
|
|
|
|
|
|
|
|
| ($ millions) |
|
|
|
|
2024 |
|
General interest rate risk |
|
|
|
|
|
$ |
80 |
|
|
|
|
|
|
|
|
145 |
|
|
|
|
|
|
|
|
90 |
|
|
|
|
|
|
|
|
42 |
|
|
|
|
|
|
|
|
371 |
|
|
|
|
|
|
|
|
400 |
|
|
|
|
|
|
|
|
49 |
|
Total market risk capital (2)
|
|
|
|
|
|
$ |
1,177 |
|
| (1) |
The Bank uses the standardized approach for calculating market risk capital. |
| (2) |
Equates to $12,786 of market risk-weighted assets (2024 – $14,710). |
T41
Risk-weighted assets movement by key drivers
|
|
|
|
|
|
|
|
|
|
|
| |
|
|
|
|
|
|
| |
|
|
|
|
2024 |
|
RWA as at beginning of the year |
|
|
|
|
|
$ |
12,040 |
|
Movement in risk levels (1)
|
|
|
|
|
|
|
(1,184 |
) |
|
|
|
|
|
|
|
– |
|
Methodology and policy (3)
|
|
|
|
|
|
|
3,854 |
|
Acquisitions and divestitures |
|
|
|
|
|
|
– |
|
RWA as at end of the year |
|
|
|
|
|
$ |
14,710 |
|
| (1) |
Movement in risk levels are defined as changes in risk due to position changes and market movements. Foreign exchange movements are embedded within Movement in risk levels. |
| (2) |
Model updates are defined as updates to the model to reflect recent experience, change in model scope. |
| (3) |
Methodology and policy is defined as methodology changes to the calculations driven by regulatory policy changes, such as new regulations (e.g. Revised Basel III), including regulatory interpretation. The impact in 2024 represents the impact from transitioning from the prior modelled approaches to the new standardized approach under FRTB. |
Market risk-weighted assets decreased by $1.9 billion to $12.8 billion, as shown in the table above. This was primarily due to movements in risk levels including position changes and market movements.
Market Risk – CVA Risk-Weighted Assets
Credit Valuation Adjustment (CVA) is the adjustment to the risk free
value of transactions to account for the potential default of a counterparty. CVA risk is the risk of loss arising from changing CVA values in response to changes in counterparty credit spreads and market risk factors.
Following the implementation of the revised OSFI Capital Adequacy Requirements (CAR) in Q1 2024, the Bank applies primarily the standardized approach
(SA-CVA)
for calculating CVA capital as approved by OSFI, and for netting sets carved out from
SA-CVA,
the basic approach
(BA-CVA).
CVA capital covers derivatives; securities financing transaction (SFT) positions which are not fair valued for accounting purposes are excluded from CVA Capital.
Operational risk is the risk of loss, whether direct or indirect, to which the Bank is exposed due to external events, human error, or the inadequacy or failure of processes, procedures, systems or controls.
Consistent with OSFI’s adoption of the revised Basel III reforms, the Bank applies the Standardized Approach (SA) for calculating operational risk capital requirements. Under the SA, operational risk capital is determined based on the existing gross income approach further supplemented by a scalar or internal loss multiplier (ILM) that recognizes the Bank’s operational risk loss experience.
Operational risk-weighted assets increased by $4.3 billion during the year to $55.4 billion, due primarily to growth in the Bank’s gross income and an increase to the Bank’s ILM.
The Bank utilizes economic capital methodologies and measures to calculate internal capital. Internal capital is a measure of the unexpected losses inherent in the Bank’s business activities. The calculation of internal capital relies on models that are subject to independent vetting and validation as required by the Bank’s Model Risk Management Policy.
Management assesses its risk profile to determine those risks for which the Bank should attribute internal capital. The major risk categories included in internal capital are:
| |
• |
|
Credit risk covers derivatives, repo-style transactions, securitizations, corporate and commercial loans and retail products. The measurement of internal capital mainly leverages the Bank’s internal credit risk ratings and a Monte-Carlo simulation model calibrated based on the Bank’s actual experience in probabilities of default, exposures at default, expected severity of loss in the event of default, concentration and diversification. |
| |
• |
|
Market risk for internal capital incorporates the higher of: a Market Risk VaR calibrated to a higher 99.95% confidence interval, and regulatory capital components under the new standardized approaches. For the banking book, structural interest rate and foreign exchange risks leverage a modelled approach based on Economic Value of Equity (EVE) sensitivities. |
|
2025 Scotiabank Annual Report
Management’s Discussion and Analysis
| Group Financial Condition
| |
• |
|
Operational risk for internal capital is calculated based on an approach consistent with the Bank’s regulatory capital requirements including a conservative forward-looking view of gross income. |
| |
• |
|
Other risks include additional risks for which internal capital is attributed, such as business risk, significant investments, insurance risk and real estate risk. |
In addition, the Bank’s measure of internal capital includes a diversification benefit which recognizes that all of the above risks will not occur simultaneously. The Bank also includes the full amount of goodwill and intangible assets in the internal capital amount.
For further discussion on risk management and details on credit, market and operational risks, refer to the Risk Management section.
Off-Balance Sheet Arrangements
In the normal course of business, the Bank enters into contractual arrangements that are either consolidated or not required to be consolidated in its financial statements but could have a current or future impact on the Bank’s financial performance or financial condition. These arrangements can be classified into the following categories: structured entities, securitizations, guarantees and other commitments.
Structured entities are designed to accomplish certain well-defined objectives and for which voting or similar rights are not the dominant factor in deciding who controls the entity. The Bank may become involved with structured entities either at the formation stage or at a later date. The Bank controls an investee when it is exposed, or has rights, to variable returns from its involvement with the investee and has the ability to affect those returns through its power over the investee. The Bank’s arrangements with structured entities include:
| |
• |
|
Structured entities that are used to provide a wide range of services to customers, such as structured entities established to allow clients to securitize their financial assets while facilitating cost-efficient financing, and to provide certain investment opportunities. |
| |
• |
|
Structured entities that the Bank sponsors and actively manages. |
The Bank consolidates all structured entities that it controls which includes a U.S. based multi-seller conduit and certain funding and other vehicles. For many of the structured entities that are used to provide services to customers, the Bank does not guarantee the performance of the structured entities’ underlying assets and does not absorb any related losses. For other structured entities, such as securitization and investment vehicles, the Bank may be exposed to credit, market, liquidity, or operational risks. Noteholders of securitizations may also be exposed to these risks. The Bank may earn fees based on the nature of its association with a structured entity.
Unconsolidated structured entities
There are two primary types of association the Bank has with unconsolidated structured entities:
| |
• |
|
Canadian multi-seller conduits administered by the Bank; and |
| |
• |
|
Structured finance entities. |
The Bank earned total fees of $118 million in 2025 (October 31, 2024 – $73 million) from certain structured entities in which it had a significant interest at the end of the year but did not consolidate. More information with respect to the Bank’s involvement with these unconsolidated structured entities, including details of liquidity facilities and maximum loss exposure by category is provided below and in Note 14(b) to the consolidated financial statements.
Canadian multi-seller conduits administered by the Bank
In 2025, the Bank established Temperance Street Funding Trust, a Canadian multi-seller conduit. The Bank sponsors a total of three Canadian-based multi-seller conduits that are not consolidated. The Bank earned commercial paper issuance fees, program management fees, liquidity fees and other fees from these multi-seller conduits, which totaled $55 million in 2025, compared to $54 million in 2024. These multi-seller conduits purchase high-quality financial assets and finance these assets through the issuance of highly-rated commercial paper.
As further described below, the Bank’s exposure to these
off-balance
sheet conduits primarily consists of liquidity support and temporary holdings of commercial paper. Although the Bank has power over the relevant activities of the conduits, it has limited exposure to variability in returns, which results in the Bank not consolidating the three Canadian conduits. The Bank has a process to monitor these exposures and significant events impacting the conduits to ensure there is no change in control, which could require the Bank to consolidate the assets and liabilities of the conduits at fair value.
A significant portion of the conduits’ assets have been structured to receive credit enhancements from the sellers, including overcollateralization protection and cash reserve accounts. Each asset purchased by the conduits is supported by a backstop liquidity facility provided by the Bank in the form of a liquidity asset purchase agreement (LAPA) or a liquidity agreement (LA). The primary purpose of the backstop liquidity facility is to provide an alternative source of financing in the event the conduits are unable to access the commercial paper market. Under the terms of the LAPA or LA, in most cases, the Bank is not obliged to purchase defaulted assets.
The Bank’s primary exposure to the Canadian-based conduits is the liquidity support provided, with total liquidity facilities of $8.6 billion as at October 31, 2025 (October 31, 2024 – $7.7 billion). The year-over-year increase was primarily driven by the establishment of Temperance Street Funding Trust. As at October 31, 2025, total commercial paper outstanding for the Canadian-based conduits was $7 billion (October 31, 2024 – $6.4 billion) and the Bank held 0.37% (October 31, 2024 – 0.1%) of the total commercial paper issued by these conduits. Table T42 presents a summary of assets purchased and held by the Bank’s three Canadian multi-seller conduits as at October 31, 2025 and 2024, by underlying exposure.
All of the funded assets have at least an equivalent rating of AA or higher based on the Bank’s internal rating program; and assets held in these conduits were investment grade as at October 31, 2025 and 2024.
2025 Scotiabank Annual Report
|
Management’s Discussion and Analysis
T42
Assets held by Bank-sponsored Canadian-based multi-seller conduits
|
|
|
|
|
|
|
|
|
|
|
|
|
|
|
|
|
|
|
|
|
|
|
|
|
|
|
|
| |
|
|
|
|
2024 |
|
|
|
|
|
|
|
|
| As at October 31 ($ millions) |
|
|
|
|
|
|
|
|
|
|
Funded
assets |
|
|
Unfunded
commitments |
|
|
|
|
|
|
|
|
|
|
|
|
|
|
|
|
|
|
$ |
2,957 |
|
|
$ |
578 |
|
|
$ |
3,535 |
|
|
|
|
|
|
|
|
|
|
|
|
|
|
|
|
– |
|
|
|
459 |
|
|
|
459 |
|
Canadian residential mortgages |
|
|
|
|
|
|
|
|
|
|
|
|
|
|
2,643 |
|
|
|
264 |
|
|
|
2,907 |
|
Equipment leases and rental contracts |
|
|
|
|
|
|
|
|
|
|
|
|
|
|
607 |
|
|
|
39 |
|
|
|
646 |
|
|
|
|
|
|
|
|
|
|
|
|
|
|
|
|
92 |
|
|
|
26 |
|
|
|
118 |
|
|
|
|
|
|
|
|
|
|
|
|
|
|
|
$ |
6,299 |
|
|
$ |
1,366 |
|
|
$ |
7,665 |
|
| (1) |
Exposure to the Bank is through global-style liquidity facilities. |
| (2) |
These assets are substantially sourced from Canada. |
Structured finance entities
The Bank has interests in structured finance entities used to assist corporate clients in accessing cost-efficient financing through their securitization structures. The Bank’s maximum authorized amount from structured finance entities was $22,670 million as at October 31, 2025 (October 31, 2024 – $11,469 million). The year-over-year increase was due to normal business operations and new transactions.
The Bank provides senior credit facilities to unaffiliated structured entities that are established by third parties to acquire and/or originate loans for the purposes of issuing collateralized loan obligations (CLOs). These credit facilities benefit from subordinated capital provided by either the collateral manager or third-party investors via subordinated financing, capital injection or asset contribution. Subordinated capital represents the first loss tranche which absorbs losses prior to the Bank’s senior exposure. The Bank’s broker-dealer affiliate acts as the arranger and placement agent for the CLOs. Proceeds from the sale of the CLOs are used to repay the senior credit facilities. The Bank does not consolidate these entities as it does not have decision making power over their relevant activities, which include the acquisition and/or origination of loans and overall management of the underlying portfolio. The Bank’s maximum authorized amount was $20,735 million as at October 31, 2025 (October 31, 2024 – $9,743 million), relating to credit facilities extended to these entities, of which $8,114 million was funded (October 31, 2024 – $4,243 million). The increase in the Bank’s maximum authorized amount during the year was driven by the addition of new financing facilities.
Other
off-balance
sheet arrangements
The Bank uses a funding vehicle to transfer credit exposure on certain loan assets and purchases credit protection against eligible credit events from this vehicle. The vehicle collateralizes its obligation using cash proceeds received through the issuance of guarantee-linked notes. Loan assets are not sold or assigned to the vehicle and remain on the Bank’s Consolidated Statement of Financial Position. The total principal balance of guarantee-linked notes issued by this vehicle and outstanding was $1,697 million as at October 31, 2025 (October 31, 2024 – $1,002 million). These are included in Deposits – Business and government on the Bank’s Consolidated Statement of Financial Position.
Other unconsolidated structured entities
The Bank sponsors unconsolidated structured entities including mutual funds, in which it has insignificant or no interest at the reporting date. The Bank is a sponsor when it is significantly involved in the design and formation at inception of the structured entity, and the Bank’s name is used by the structured entity to create an awareness of the instruments being backed by the Bank’s reputation and obligation. The Bank also considers other factors, such as its continuing involvement and obligations to determine if, in substance, the Bank is a sponsor. For the year ended October 31, 2025, the Bank earned $2,851 million (October 31, 2024 – $2,547 million) income from its involvement with the unconsolidated
Bank-sponsored
structured entities, all of which is from Bank-sponsored mutual funds.
The Bank securitizes fully insured residential mortgage loans, originated by the Bank and third parties, through the creation of mortgage-backed securities that are sold to Canada Housing Trust (CHT), Canada Mortgage and Housing Corporation (CMHC) or third-party investors, as an efficient source of financing. The sale of such mortgages does not meet the derecognition requirements where the Bank retains substantially all of the risks and rewards of ownership of the securitized mortgages. The transferred mortgages continue to be recognized on the Consolidated Statement of Financial Position, along with the proceeds from sale treated as secured borrowings. More details have been provided in Note 13 of the consolidated financial statements.
Third-party originated mortgages purchased by the Bank and social housing mortgage pools originated by the Bank that are securitized and sold, qualify for derecognition where the Bank transfers substantially all of the risks and rewards of ownership to third parties. As at October 31, 2025, the outstanding amount of
off-balance
sheet securitized third-party originated mortgages was $23,870 million (October 31, 2024 – $24,837 million) and
off-balance
sheet securitized social housing pools was $1,330 million (October 31, 2024 – $1,148 million).
The Bank securitizes a portion of its Canadian personal and small business credit card receivables (receivables) through Trillium Credit Card Trust II (Trillium), a consolidated Bank-sponsored structured entity. Trillium issues senior and subordinated notes to investors. The proceeds of such issuances are used to purchase
co-ownership
interests in the receivables originated by the Bank. The sale of such
co-ownership
interests does not qualify for derecognition and therefore the receivables continue to be recognized on the Bank’s Consolidated Statement of Financial Position. Recourse of the noteholders is limited to the purchased
co-ownership
interests. During the year, $682 million receivables were securitized through Trillium (2024 – $585 million).
The Bank securitizes a portion of its Canadian auto loans through its Securities Term Auto Receivables Trust program. During the year, $2,990 million of its Canadian auto loan receivables were securitized through Securitized Term Auto Receivables Trust
2025-A
(START
2025-A)
and $2,937 million through Securitized Term Auto Receivables Trust (SSTRT), both Bank-sponsored consolidated structured entities. These entities issue offered notes to third-party investors which are included as Deposits – Business and government on the Consolidated Statement of Financial Position. Recourse of the noteholders is limited to the receivables and a cash reserve account. The sale of the underlying auto loan receivables does not qualify for derecognition, and the receivables continue to be recognized on the Bank’s Consolidated Statement of Financial Position.
|
2025 Scotiabank Annual Report
Management’s Discussion and Analysis
| Group Financial Condition
Guarantees and other commitments
Guarantees and other commitments are
fee-based
products that the Bank provides to its customers. These products can be categorized as follows:
| |
• |
|
Standby letters of credit and letters of guarantee. As at October 31, 2025, these amounted to $86 billion, compared to $63 billion last year. These instruments are issued at the request of a Bank customer to secure the customer’s payment or performance obligations to a third party. |
| |
• |
|
Liquidity facilities. These generally provide an alternate source of funding to asset-backed commercial paper conduits in the event a general market disruption prevents the conduits from issuing commercial paper or, in some cases, when certain specified conditions or performance measures are not met; |
| |
• |
|
Indemnification contracts. In the ordinary course of business, the Bank enters into many contracts where it may indemnify contract counterparties for certain aspects of its operations that are dependent on other parties’ performance, or if certain events occur. The Bank cannot estimate, in all cases, the maximum potential future amount that may be payable, nor the amount of collateral or assets available under recourse provisions that would mitigate any such payments. Historically, the Bank has not made any significant payments under these indemnities; |
| |
• |
|
Loan commitments. The Bank has commitments to extend credit, subject to specific conditions, which represent undertakings to make credit available in the form of loans or other financings for specific amounts and maturities. As at October 31, 2025, these commitments amounted to $276 billion, compared to $273 billion last year. The higher year-over-year amount is primarily due to an impact from foreign currency translation. |
These guarantees and loan commitments may expose the Bank to credit or liquidity risks, and are subject to the Bank’s standard review and approval processes. For the guaranteed products, the dollar amounts represent the maximum risk of loss in the event of a total default by the guaranteed parties, and are stated before any reduction for recoveries under recourse provisions, insurance policies or collateral held or pledged.
Detailed information on guarantees and loan commitments is disclosed in Note 33 in the consolidated financial statements.
Given the nature of the Bank’s main business activities, financial instruments make up a substantial portion of the Bank’s financial position and are integral to the Bank’s business. Assets that are financial instruments include cash resources, securities, securities purchased under resale agreements, loans and customers’ liability under acceptances. Financial instrument liabilities include deposits, acceptances, obligations related to securities sold under repurchase agreements, obligations related to securities sold short, subordinated debentures and capital instrument liabilities. In addition, the Bank uses derivative financial instruments for both trading and hedging purposes.
Financial instruments are generally carried at fair value, except for
non-trading
loans and receivables, certain securities and most financial liabilities, which are carried at amortized cost unless designated as fair value through profit and loss at inception.
Unrealized gains and losses on the following items are recorded in other comprehensive income (OCI):
| |
• |
|
debt instruments measured at fair value through OCI, |
| |
• |
|
equity instruments measured at fair value through OCI, |
| |
• |
|
derivatives designated as cash flow hedges, and |
| |
• |
|
financial instruments designated as net investment hedges. |
Gains and losses on derecognition of debt instruments at FVOCI are reclassified from OCI to the Consolidated Statement of Income under
non-interest
income. Gains and losses on derecognition of equity instruments designated at FVOCI are not reclassified from OCI to the Consolidated Statement of Income. Gains and losses on cash flow hedges and net investment hedges are recorded in the Consolidated Statement of Income when the hedged item affects income.
The Bank’s accounting policies for derivatives and hedging activities are further described in Note 3 to the consolidated financial statements.
Interest income and expense on
non-trading
interest-bearing financial instruments are recorded in the Consolidated Statement of Income as part of net interest income. Credit losses related to loans are recorded in the provision for credit losses in the Consolidated Statement of Income. Interest income and expense, as well as gains and losses, on trading securities and trading loans are recorded in
non-interest
income – trading revenues. Dividends received on equity instruments measured at FVOCI are recorded in interest income in the Consolidated Statement of Income as part of net interest income.
Several risks arise from transacting financial instruments, including credit risk, liquidity risk, operational risk and market risk. The Bank manages these risks using extensive risk management policies and practices, including various Board-approved risk management limits.
A discussion of the Bank’s risk management policies and practices can be found in the Risk Management section on pages 76 to 115. In addition, Note 34 to the consolidated financial statements presents the Bank’s exposure to credit risk, liquidity risk and market risks arising from financial instruments as well as the Bank’s corresponding risk management policies and procedures.
There are various measures that reflect the level of risk associated with the Bank’s portfolio of financial instruments. For example, the interest rate risk arising from the Bank’s financial instruments can be estimated by calculating the impact of a 100 basis point increase or decrease in interest rates on annual income, and the economic value of shareholders’ equity, as described on page 98. For trading activities, Table T51 discloses the average
one-day
Value at Risk by risk factor. For derivatives, based on the maturity profile of the notional amount of the Bank’s derivative financial instruments, only 16% (2024 – 19%) had a term to maturity greater than five years.
Note 9 to the consolidated financial statements provides details about derivatives used in trading and hedging activities, including notional amounts, remaining term to maturity, credit risk and fair values.
The fair value of the Bank’s financial instruments is provided in Note 6 to the consolidated financial statements along with a description of how these amounts were determined.
The fair value of the Bank’s financial instruments was unfavourable when compared to their carrying value by $1.3 billion as at October 31, 2025 (October 31, 2024 – unfavourable $1.4 billion). This difference relates mainly to loan assets, debt investment securities measured at amortized cost, deposit liabilities, subordinated debentures and other liabilities. These changes are primarily driven by movements in interest rates and by volume changes. Fair value estimates are based on market conditions as at October 31, 2025, and may not be reflective of future fair values. Further information on how fair values are estimated is contained in the section on critical accounting policies and estimates.
Disclosures specific to certain financial instruments designated at fair value through profit and loss can be found in Note 8 to the consolidated financial statements. These designations were made primarily to significantly reduce accounting mismatches.
2025 Scotiabank Annual Report
|
Management’s Discussion and Analysis
Effective risk management is fundamental to the success and resilience of the Bank and is recognized as key in the Bank’s overall approach to strategy management. Scotiabank has a strong, disciplined risk culture where managing risk is a responsibility shared by all of the Bank’s employees.
Risk Management Framework
The Enterprise Risk Management Framework (the Framework or ERMF) is a key source of information for the Board of Directors, executive management, and other stakeholders of the Bank that:
| |
• |
|
outlines the Bank’s risk governance and oversight, risk identification and measurement, risk assessment and control management, risk monitoring and testing, risk reporting and escalation and other key elements of the Bank’s risk management framework; and |
| |
• |
|
serves as an over-arching framework for all elements of the Bank’s risk management activities, and a source document to which all other risk management frameworks and policies must be aligned. |
All local risk management frameworks must be aligned with this Framework, in accordance with the type and scale of their activities and local regulatory requirements and are subject to advice and counsel by Global Risk Management.
Risk Management Principles
Risk-taking and risk management activities across the enterprise are guided by the following principles:
Balancing Risk and Reward –
business and risk decisions are consistent with strategies and risk appetite.
Understand the Risks –
all material risks to which the Bank is exposed, including both financial and
non-financial,
are identified and managed.
Forward Thinking –
emerging risks and potential vulnerabilities are proactively identified and managed.
Shared Accountability –
every employee is responsible for managing risk.
Client Focus –
understanding our clients and their needs is essential to all business and risk decision-making.
Protect our Brand –
all risk-taking activities must be in line with the Bank’s risk appetite, our Scotiabank Code of Conduct (our “Code”), including values and behaviours (ScotiaBond), and framework principles.
Controls –
maintaining a robust and resilient control environment to protect our stakeholders and to manage risk in alignment with the Bank’s Risk Appetite.
Compensation –
performance and compensation structures reinforce ScotiaBond values and behaviours and promote sound risk taking behaviour considering the compensation-related regulatory environment.
Financial Resilience –
maintaining financial resilience to withstand financial stress. Capital and liquidity management are fundamental to financial resilience as they ensure the Bank can absorb shocks and meet its obligations during periods of stress.
Operational Resilience –
maintaining operational resilience to effectively prepare for, respond to, and recover from operational disruptions to the provision of services that have the potential to cause intolerable harm to clients, or threaten the viability of the Bank, or cause instability to the financial system. This could in turn impact the Bank’s financial resilience and its ability to meet obligations during periods of stress. Effective enterprise risk management requires an understanding of how risk types are interconnected, which in turn supports financial and operational resilience.
The Three Lines of Defence (3LoD) model is a foundational component of the Bank’s Enterprise Risk Management Framework, supporting a robust and resilient risk management lifecycle. It delineates clear roles and responsibilities across the organization to ensure effective risk ownership, oversight, and assurance. Together, these lines form an integrated structure that promotes accountability, transparency, and continuous improvement across the risk lifecycle.
|
2025 Scotiabank Annual Report
Management’s Discussion and Analysis
| Risk Management
Standardizing data elements around risk assessments is crucial for consistency and clarity in assessing and managing risks. The Bank’s Enterprise Risk Taxonomy (ERT) serves as the definitive source for risk names and definitions, providing a common reference for categorizing risks. This facilitates better communication and understanding across departments by categorizing and defining risks uniformly.
The Bank’s Principal Risk types are reviewed annually as part of the Assessment of Risks process to determine that they adequately reflect the Bank’s risk profile. Principal Risks are defined as:
Those risks which management considers of primary importance: i) having a significant impact or influence on the Bank’s primary business and revenue generating activities (Financial Risks) or ii) inherent in the Bank’s business and can have significant negative strategic, business, financial and/or reputational consequences
(Non-Financial
Risks).
Principal Risks are assessed on an annual basis considering, amongst other things, the following factors:
| |
• |
|
Potential impact (direct or indirect) on the Bank’s financial results, operations, management and strategy |
| |
• |
|
Effect on the Bank’s long-term prospects and ongoing viability |
| |
• |
|
Regulatory focus and/or social concern |
| |
• |
|
Short to mid-term macroeconomic and market environment |
| |
• |
|
Financial and human resources required to manage and monitor the risk |
| |
• |
|
Establishment of key risk indicators, performance indicators or management limits to monitor and control the risk |
| |
• |
|
Peer identification and global best practices |
| |
• |
|
Regular monitoring and reporting to the Board on the risk is warranted |
Principal Risks are categorized into two main groups (Financial and Non-Financial):
Credit, Liquidity, Market
These are risks that are directly associated with the Bank’s primary business and revenue generating activities. The Bank understands these risks well and takes them on to generate sustainable, consistent and predictable earnings. Financial risks are generally quantifiable and are relatively predictable. The Bank has a higher risk appetite for financial risks which are a fundamental part of doing business; but only when they are well understood, within established limits, and meet the desired strategic priorities and risk return profile.
Operational, Model, Data, Compliance, Money Laundering /Terrorist Financing and Sanctions, Environmental, Social & Governance (ESG), Cyber Security & Information Technology (IT), Strategic, Reputational
These are risks that are inherent in the Bank’s business and can have significant negative strategic, business, financial and/or reputational consequences if not managed properly. In comparison to financial risks,
non-financial
risks are less predictable and more difficult to define and measure. The Bank has low risk appetite for
non-financial
risks and mitigates these accordingly.
Transverse risks are risks that do not exist in isolation but instead manifest through other recognized risk channels or types (for example, ESG Risk, Reputational Risk, Culture Risk, and Strategic Risk). Distinct risk events could be the result of a specific risk type or a combination of financial and
non-financial
transverse risks. The Bank manages these risks through risk-specific teams which coordinate cross-functionally to address and respond to the broader risk environment. This is supported by comprehensive risk reporting, established escalation channels, and data standardization which enables effective aggregate analysis and effective decision-making.
Risk Management Lifecycle
Effective risk management is a continuous and integrated process that underpins the Bank’s ability to achieve its strategic objectives while safeguarding its financial and operational resilience. Each component of the risk management lifecycle operates in an ongoing and iterative manner, reflecting the dynamic nature of the risk environment. The Bank’s Risk Management Framework provides a standardized structure that promotes consistency across these components, enabling the Bank to assess, manage, and monitor risk in a disciplined and transparent way. This standardization enhances the Bank’s ability to evaluate the effectiveness of its risk management practices and supports informed decision-making across the enterprise.
The primary goals of risk management are to ensure that the outcomes of risk-taking activities are consistent with the Bank’s ScotiaBond (Values & Behaviours), strategies and risk appetite, and that there is an appropriate balance between risk and reward to maximize shareholder value. This Framework provides the foundation for achieving these goals.
The Framework is applied on an enterprise-wide basis and consists of five key elements:
| |
• |
|
Risk Governance and Oversight |
| |
• |
|
Risk Identification and Measurement |
| |
• |
|
Risk Assessment and Control Management |
| |
• |
|
Risk Monitoring and Testing |
| |
• |
|
Risk Reporting and Escalation |
2025 Scotiabank Annual Report
|
Management’s Discussion and Analysis
Risk Governance and Oversight
Effective risk management begins with effective risk governance and oversight.
Risk governance and oversight serves as the structural backbone that ensures risk-taking activities are aligned with the Bank’s strategic objectives and risk appetite. The Board of Directors, supported by the Corporate Governance Committee, the Risk Committee, the Audit and Conduct Review Committee, the Human Capital and Compensation Committee, and the Technology Committee, plays a central role in overseeing the Bank’s risk profile. These bodies are responsible for approving principal risk policies, frameworks, and/or limits, and for overseeing that management operates within the defined Enterprise Risk Appetite Framework. This governance structure is complemented by executive leadership who are accountable for embedding risk considerations into strategic planning and operational execution.
The Bank has a well-established risk governance structure, with an active and engaged Board of Directors supported by an experienced executive management team. Decision-making is highly centralized through several executive and senior risk management committees.
The Bank’s Board of Directors and its Committees provide oversight and governance over the Bank’s risk management program which is supported by the President and Chief Executive Officer (CEO) and Chief Risk Officer (CRO).
The Risk Governance Structure of the Bank is set out below.
|
2025 Scotiabank Annual Report
Management’s Discussion and Analysis
| Risk Management
Board of Directors:
as the top of the Bank’s risk management governance structure, provides oversight, either directly or through its committees, to satisfy itself that decision making is aligned with the Bank’s strategies and risk appetite. The Board receives regular updates on the key risks of the Bank (including a quarterly comprehensive summary of the Bank’s risk profile and performance of the portfolio against defined limits). The Board approves key risk policies, frameworks, and limits, and ensures the implementation of the appropriate processes by management to manage those risks and to adhere to the policies and frameworks.
Corporate Governance Committee of the Board:
acts in an advisory capacity to the Board to enhance the Bank’s corporate governance through a continuing assessment of the Bank’s approach to corporate governance and makes policy recommendations in support of the Bank’s purpose, culture and strategy.
Risk Committee of the Board:
assists the Board in fulfilling its responsibilities for the review of the Bank’s risk appetite and identifying and monitoring key financial and
non-financial
risks and the oversight of the promotion and maintenance of a strong risk culture throughout the Bank. The Committee assists the Board by providing oversight of the risk management function at the Bank. This includes periodically reviewing and approving the Bank’s key risk management policies, frameworks and limits and satisfying itself that management is operating within the Bank’s Enterprise Risk Appetite Framework. The Committee oversees the Bank’s sustainability-related risks, specifically the Bank’s environmental (including climate), social, and governance (ESG) risks. The Committee also oversees the independence of Global Risk Management, including the effectiveness of the head of this function, as well as the function itself.
Audit and Conduct Review Committee of the Board:
assists the Board by providing oversight on the effectiveness of the Bank’s system of internal controls. The Committee oversees the integrity of the Bank’s consolidated financial statements and related quarterly results. This includes oversight of all financial reporting as well as the external auditor’s qualifications, independence and performance. This Committee assists the Board in fulfilling its oversight responsibilities for setting standards of conduct and ethical behaviour, the oversight of conduct reviews, culture as it relates to conduct risk, and the oversight of compliance with the consumer provisions. The Committee also oversees the Bank’s compliance with legal and regulatory requirements, and oversees the Global Finance, Global Compliance (including anti-money laundering, anti-terrorist financing and sanctions) and Audit Department functions at the Bank. The Committee also oversees the independence of each of these control functions, including the effectiveness of the heads of these functions, as well as the functions themselves.
Human Capital and Compensation Committee of the Board:
in conjunction with the Risk Committee of the Board, satisfies itself that adequate procedures are in place to identify, assess and manage the risks (including conduct risk) associated with the Bank’s material compensation programs and that such procedures are consistent with the Bank’s risk management programs. The Committee has further responsibilities relating to talent management, succession planning and total rewards.
Technology Committee of the Board:
assists the Board in fulfilling its oversight responsibilities with respect to technology-based risk management in coordination with the Risk Committee. The Committee oversees the Bank’s technology strategy and technology investment and innovation. The Committee reviews, approves or recommends for Board approval, the Bank’s significant technology frameworks, policies and supporting standards and internal controls, and monitors risks related to the use of technology. The Committee also reviews the independence of the Technology function, including the effectiveness of the head of this function, as well as the function itself.
President and Chief Executive Officer (CEO):
reports directly to the Board and is responsible for defining, communicating and implementing the strategic direction, goals and core values for Scotiabank that maximize long term shareholder value and returns, and meeting the needs of the Bank’s other key stakeholders. The CEO oversees the establishment of the Bank’s risk appetite, in collaboration with the CRO and CFO, which is consistent with the Bank’s short- and long-term strategy, business and capital plans, as well as compensation programs.
Global Risk Management (GRM):
is an independent second line of defence that provides oversight of enterprise-wide risk management and is led by the Group Head & CRO. The CRO reports directly to the Chief Executive Officer and has a functional reporting line to the Risk Committee of the Board of Directors. The CRO also maintains unfettered access to the Board and its committees, ensuring the independence, authority, and transparency of the Risk Function. GRM accountabilities include the management of all principal risks globally. Furthermore, as a senior member of the Bank’s executive team, the CRO provides independent and effective challenge to strategic and capital allocation decisions, ensuring they align with the Bank’s Risk Appetite Statement and support sustainable performance against the Bank’s Balanced Scorecard objectives. GRM is responsible for providing effective challenge and reasonable assurance to executive management, the Board of Directors and shareholders that risks are actively identified, managed and communicated to all key stakeholders. GRM’s accountability is to ensure that the outcomes of risk-taking activities optimize and protect long-term value by using insight and partnership to drive business impact and safeguards trust.
Global Compliance & AML:
is an independent second line of defence that is responsible for oversight of Compliance Risk, ML/TF Risk & Sanctions Risk and is led by the EVP & Chief Compliance Officer and supported by the Group Chief Anti-Money Laundering Officer (Group CAMLO). Within this structure, Global Compliance provides effective challenge and oversight to business lines and corporate functions assessing the adequacy of, adherence to, and effectiveness of the Bank’s
compliance controls, and for opining to the Board on whether, based on the independent monitoring and testing conducted, the controls are sufficiently robust to achieve compliance with the applicable regulatory requirements. It also provides oversight and effective challenge to the Bank’s management of bribery and corruption risk. Global AML under the Group CAMLO is responsible for maintaining the AML/ATF and Sanctions program which is designed to comply in all material respects with the regulations to which it is subject, and to protect the Bank from being used to launder illicit funds, finance terrorism, violate or evade sanctions. This group also develops AML/ATF and Sanctions policies and control standards to effectively manage money laundering, terrorist financing, and sanctions risks and provides risk-based independent oversight, risk assessment and effective challenge to the first line of defence.
Global Finance:
is led by the Group Head & Chief Financial Officer (CFO) and is responsible for setting enterprise-wide financial strategies which support the Bank’s ability to maximize sustainable shareholder value. Global Finance actively manages the reliable and timely reporting of financial information to management, the Board of Directors, shareholders, regulators, as well as other stakeholders. This reporting includes the Bank’s consolidated financial statements and related quarterly and annual results, as well as all financial reporting related regulatory filings. Global Finance executes the Bank’s financial, liquidity and capital management strategies with appropriate governance and control, while ensuring its processes are efficient and effective.
Audit Department:
reports functionally to the Audit and Conduct Review Committee of the Board on the design and operating effectiveness of the Bank’s risk management processes. The mission of the Audit Department is to provide the Board and Management with independent, risk-based, and objective assurance over the Bank’s internal controls, risk management and governance processes which strengthen the Bank’s ability to create, protect and sustain value.
2025 Scotiabank Annual Report
|
Management’s Discussion and Analysis
The Audit Department provides value-added insights and advisory services* in support of the Bank’s strategic objectives in addition to developing talent for the Bank. The Audit Department enhances the Bank’s reputation and credibility with its stakeholders.
Business Lines:
as the first line of defence, own the risks generated by their activities, are accountable for effective management of the risks within their Business Lines and functions through identifying, assessing, mitigating, monitoring and reporting the risks. Business lines and corporate functions actively design and implement effective controls as well as governance activities to manage risk and maintain activities within risk appetite and policies. Further, business lines have processes to be able to effectively identify, assess, monitor and report against allocated risk appetite limits and are in compliance with relevant policies, standards and guidelines. The Business Risk Management functions (“1B”) play an important role in assisting the Risk Owners (“1A”) in identifying, assessing, monitoring, reporting, and mitigating risks; and establishing risk governance, internal controls, and reporting frameworks. While Business Lines may rely on corporate and support functions to execute certain activities (i.e., technology, procurement, etc.), Business Lines ultimately maintain accountability for the risks generated by their activities and timely remediation of gaps.
Corporate & Support Functions:
refer to the departments that execute activities supporting the overall operations of the organization and/or provide assistance and services to the core business operations. These functions typically include human resources, technology, operations, etc. that play a crucial role in ensuring the smooth functioning of the Bank.
* Subject to not impairing the Audit Department’s independence or objectivity.
Risk Oversight Requirements
| |
• |
|
Each principal risk identified by the Bank must be governed by a clearly articulated risk management governance document (Frameworks and Policies) aligned with the Bank’s overarching risk appetite and governance standards. |
| |
• |
|
Policies should be developed in consultation with stakeholders across risk management, control functions, business lines, and the Audit Department, and must reflect regulatory expectations, industry best practices, and internal governance principles. |
| |
• |
|
Policy and Framework development must align with the Bank’s Policy of Policies to ensure consistency and alignment in risk management practices across the Enterprise. |
| |
• |
|
Committee governance structures must be established to manage each principal risk, with designated risk committees or governance bodies accountable for monitoring exposures, reviewing metrics, and ensuring mitigation strategies are in place. |
| |
• |
|
Dedicated second line resources must be in place to provide effective challenge and oversight of the risk. |
| |
• |
|
Risk appetite statements must be established to define the Bank’s appetite for the risk and how it is measured and monitored. |
| |
• |
|
Risk appetite metrics must be supported by management limits, early warning thresholds, risk appetite limits, and key risk indicators, as appropriate for the risk. |
| |
• |
|
Adequate and effective monitoring and reporting must be established to the Board and executive and senior management, including from subsidiaries, with clear escalation lines. |
| |
• |
|
Board and executive management must have clearly defined roles and responsibilities in relation to risk identification, assessment, measurement, monitoring, and reporting to support effective governance and oversight. |
Effective risk management requires clear articulation of the Bank’s risk appetite and how the Bank’s risk profile aligns with the Bank’s strategy and managed in relation to that appetite.
The Enterprise Risk Appetite Framework (ERAF) defines the types and levels of risk the Bank is willing to accept to meet its strategic and financial goals. It aligns with the Bank’s vision and strategy, reinforcing a strong risk culture and ensuring decisions stay within set boundaries.
The ERAF is integrated into strategic, capital, and financial planning, as well as compensation programs. It is reviewed annually by senior management and approved by the Board.
Each Principal Risk, Business Line, and Key Subsidiary must have its own Risk Appetite Statement (RAS), aligned with the ERAF and tailored to its operations, including alignment to local requirements where relevant.
The ERAF includes both qualitative and quantitative measures, supported by management-level limits and controls. Key metrics ensure effective management of Principal Risks within regulatory constraints, keep reputational risk top of mind, and support strategic execution within defined operating parameters, helping the Bank maintain its risk posture over time.
|
2025 Scotiabank Annual Report
Management’s Discussion and Analysis
| Risk Management
Culture Risk and Risk Culture
Culture Risk is the risk that the Bank’s actual culture diverges from its stated desired culture. This misalignment can weaken risk management, impair decision making, and undermine the Bank’s ability to meet strategic and regulatory expectations.
Risk Culture focuses specifically on how risk is understood, discussed, and managed across the organization. A strong risk culture reinforces accountability, ethical conduct, and alignment with the Bank’s risk appetite.
Effective risk management requires a strong, robust, and pervasive risk culture where every Bank employee understands and recognizes their role as a risk manager and is responsible for identifying and managing risks.
The Bank has identified four key themes of a strong Risk Culture: tone from the top, accountability, risk management and people management. These key themes are predicated on our ScotiaBond values and behaviours, and enables employees to identify risk taking activities that are beyond the established risk appetite.
Elements that influence and support the Bank’s Risk Culture:
| • |
|
Governance: Senior management is responsible for culture risk management. The Board is responsible for the Bank’s culture and promotes a risk culture that stresses integrity and effective risk management. |
| • |
|
Decision-making on risk issues is highly centralized: the flow of information and transactions to senior and executive committees keeps management well informed of the risks the Bank faces and ensures that transactions and risks are aligned with the Bank’s risk appetite. |
| • |
|
Scotiabank Code of Conduct: describes standards of conduct required of Employees, Contingent Workers, Directors and officers of the Bank. All Scotiabankers are required to receive, read and comply with our Code, and any other applicable Scotiabank policies and affirm their compliance within the required timeline on an annual basis. |
| • |
|
ScotiaBond: the Bank’s culture ambition reflects the Bank’s values and behaviours. Our values are: Client-centric – Deliver a differentiated experience that creates value for our clients; Integrity – Make the right decisions for our clients, each other, and our Bank; Inclusion – Value and leverage differences and diverse perspectives; Accountability – Take initiative to sustainably and profitably grow our Bank. |
| • |
|
Communication: the Bank actively communicates risk appetite to help embed appropriate risk taking into the Bank’s Risk Culture, to reinforce and champion ScotiaBond values and behaviours, and promote desired culture. |
| • |
|
Training: Risk Culture is continually reinforced by providing effective and informative mandatory and non-mandatory training modules for all employees on a variety of risk management topics. |
| • |
|
Compensation: the Bank’s compensation, rewards and recognition, and incentive programs are designed to support and reinforce appropriate risk behaviours, ensure compliance with compensation-related principles and regulations and discourage behaviours that conflict with ScotiaBond values and behaviours, and our Code – ensuring undesired behaviours are not incentivized or rewarded. |
| • |
|
Employee goals: all employees across the Bank have an accountability goal assigned to them annually. |
| • |
|
Executive mandates: all Executives across the Bank have risk management responsibilities within their mandates. |
Risk Identification and Measurement
Effective risk management requires a comprehensive process to identify risks and assess their materiality.
Risk Identification and Measurement encompasses both known and potential or unknown risks. The Bank’s approach ensures that risks are not only identified through current exposures and trends but also proactively assessed for emerging threats and vulnerabilities that may not yet be fully understood or realized. This comprehensive view supports a resilient and forward-looking risk management framework.
The Bank defines Risk as the potential impact of deviations from expected outcomes on the Bank’s earnings, capital, liquidity, reputation and resilience caused by internal and external vulnerabilities.
Risk Identification and Measurement is performed on an ongoing basis through the following:
| • |
|
Transactions – risks, including credit and market exposures, are assessed by the business lines as risk owners with GRM providing review and effective challenge, as applicable |
| • |
|
Monitoring – risks are identified by constantly monitoring and reporting current trends and analysis, top and emerging risks and internal and external significant adverse events impacting the Bank |
| • |
|
New Products and Services – new or significant change to products, services and/or supporting technology are assessed for potential risks through the New Initiatives Risk Assessment Program |
2025 Scotiabank Annual Report
|
Management’s Discussion and Analysis
| • |
|
Strategic Investments – investment transactions are thoroughly reviewed for risks and are approved by the Operating Committee with advice and counsel from the Strategic Transactions and Investment Committee who provides direction and guidance on effective allocation and prioritization of resources |
The Bank’s measurement of risk is a key component of its risk management framework. The measurement methodologies may apply to a group of risks or a single risk type and are supported by an assessment of qualitative risk factors to ensure the level of risks are within the Bank’s risk appetite. The Bank utilizes various risk techniques such as: models, stress testing, scenario and sensitivity analysis, and back testing using data with forward-looking projections based on plausible and worst-case economic and financial market events to support its risk measurement activities.
Internal Capital Adequacy Assessment Process (ICAAP)
On an annual basis, the Bank undergoes a Bank-wide Assessment of Risks that identifies the principal risks faced by the Bank for the Internal Capital Adequacy Assessment Process and the determination of internal capital. This process evaluates the risks and determines the pervasiveness of the risk across multiple business lines, the significance of the risk to a specific business line, the likelihood and potential impact of the risk and whether the risk may cause unexpected losses in income and therefore would be mitigated by internal capital. The process also reviews other evolving and emerging risks and includes qualitative considerations such as strategic, economic and ESG risk factors. The identified risks are ascribed a rating of how probable and impactful they may be and are used as an important input for the ICAAP and the determination of internal capital.
As part of this annual risk assessment process the Bank’s Principal Risks for the year are identified through consultation with various risk owners and/or stakeholders and approved by the Operational Risk Committee and the Risk Management Committee.
The use of quantitative risk methodologies and models is subject to effective oversight and a strong governance framework which includes the application of sound and experienced judgment. The development, design, independent review and testing, and approval of models are subject to the Model Risk Management Policy.
The Bank employs models for a number of important risk measurement and management processes including: regulatory and internal capital, internal risk management, valuation/pricing and financial reporting, meeting initial margin requirements, business decision-making for risk management, and stress testing.
Stress testing programs at both the enterprise-wide level and individual risk level allow the Bank to estimate the potential impact on the Bank’s performance resulting from significant changes in market conditions, credit environment, liquidity demands, or other risk factors. Enterprise-wide stress testing is also integrated with both the strategic and financial planning processes, as well as financial crisis management planning. The development, approval and
on-going
review of the Bank’s stress testing programs are subject to policy, and the oversight of the Stress & Scenarios Committee (SSC) or other management committees as appropriate. The SSC is also responsible for reviewing and approving stress testing, climate risk, and expected credit loss scenarios for implementation and use. Each stress testing program is developed with input from a broad base of stakeholders, and results are integrated into management decision making processes for capital adequacy and/or allocation, funding requirements and strategy, risk appetite setting, and limit determinations. The stress testing programs are designed to capture a number of stress scenarios with differing severities and time horizons.
Other stress tests are conducted, as required, at the enterprise-wide level and within specific functional areas to test the decision-making processes of the senior management team and key personnel, by simulating a potential stress scenario. Simulated stress scenarios may include several complexities and disruptions through which senior management are engaged to make certain key decisions. Generally, the objectives of the simulations can include testing (1) the executability of activation protocols, (2) operational readiness, (3) the flexibility of the executive decision-making process, and (4) the process by which actions to be taken are prioritized. The exercises may also be designed to test the applicability and relevance of available data and the timeliness of reporting for decision making under stressed/crisis conditions.
Scenario analysis is a forward-looking Operational Risk Management (“ORM”) tool utilized by the Bank to actively manage risk by assessing low likelihood, high impact, hypothetical events. Through this process, hypothetical events are analyzed to allow for the identification of potential operational risks or threats and an assessment of the adequacy of controls. The output of this analysis may lead to a mitigation of risk exposures, and ultimately, a reduction in operational losses. This also allows for assessments related to material catastrophic risk exposures (e.g. technology or fraud scenarios, as well as physical risks related to climate change, earthquake, hurricane, forest fire, pandemics, and significant adverse events).
Risk Assessment and Control Management
Effective risk assessment and control management is foundational to the Bank’s Risk Management Framework, it enables the organization to identify, evaluate, manage and control risks in alignment with its strategic objectives and risk appetite.
The Bank has developed key risk assessment processes to comprehensively assess materiality of risks and effectiveness of controls to ensure risks are effectively managed.
Risk response is the process for designing and implementing actions to address risk issues to ensure risks are managed proactively and effectively to minimize any impact on the Bank. Key strategies include:
| • |
|
Risk Mitigation: Involves taking steps to reduce the likelihood or impact of a risk. This process begins when the Risk Owner’s management acknowledges the risk and determines a corrective action plan. |
|
2025 Scotiabank Annual Report
Management’s Discussion and Analysis
| Risk Management
| • |
|
Risk Avoidance: Risks are avoided when management determines that the risk is outside of the risk appetite or that a cost-effective solution is not available and decides not to pursue the activity which creates the risk. |
| • |
|
Risk Transfer: Risks are transferred when management acknowledges the risk and determines that the risk is more appropriately covered by insurance. |
The Bank’s risk control activities are integral to maintaining a robust risk management environment and is an important component of corporate governance. The Bank is committed to meet OSFI’s requirements and guidelines when conducting business activities which involve exposure to risk.
The Bank’s Internal Control System is designed to mitigate risks to the Bank and ensure that control activities are defined at every level of the organization, including approval and authorization limits, segregation of duties, physical and logical access controls, and information processing and reconciliation controls. Internal control underpins all activities the Bank undertakes to meet its objectives and its obligations to all its stakeholders.
Risk Monitoring and Testing
The Bank is committed to remaining vigilant and responsive to potential risks to ensure that all business activities operate within the approved risk appetite limits, thresholds, or guidelines. This proactive approach to risk management is essential for safeguarding the Bank’s financial stability, reputation, and regulatory compliance. By maintaining a comprehensive view of risk exposures, the Bank can promptly address any emerging threats and ensure that its risk profile remains within the established risk appetite. A component of risk monitoring is business oversight in which the effectiveness of controls and identification of issues or trends are discussed in committee meetings or similar forums. Risk Monitoring also includes surveillance monitoring in which employee and client activities are reviewed to identify instances of misconduct or
non-compliance.
Risk Appetite Metrics are Key Risk Indicators (KRIs) that are monitored as part of the Enterprise Risk Appetite Framework. Management monitors additional metrics, such as KRIs, Key Performance Indicators (KPIs), and Key Control Indicators (KCIs) that assist in the oversight of risk management activities across the Bank.
Risk limits are a fundamental mechanism for governing risk-taking activities within the boundaries established by the Board of Directors and executive management. These limits are aligned with the Bank’s approved risk appetite and tolerances and are designed to ensure that risk exposures remain within acceptable levels across financial, operational, compliance, and strategic dimensions.
| • |
|
Reinforce accountability by clearly assigning responsibility for managing risk within defined thresholds. |
| • |
|
Prevent excessive risk-taking that could compromise the Bank’s financial stability, reputation, or regulatory compliance. |
| • |
|
Promote a culture of risk awareness and disciplined decision-making throughout the organisation. |
By setting clear and measurable boundaries, limits support the effective implementation of the Bank’s risk management strategy and ensure consistency with its overall risk governance framework.
Testing is a critical component of the Bank’s risk monitoring activities. It provides assurance that internal controls are appropriately designed and operating effectively to mitigate risks. The Bank’s testing program supports proactive risk management by identifying control weaknesses, supporting the validation of remediation efforts, and reinforcing accountability across the First and Second Lines of Defence.
Testing activities are risk-based and prioritized according to, among other factors, the materiality and complexity of the control environment, regulatory expectations, and the maturity of existing monitoring. Annual testing plans are subject to review and approval by relevant governance committees. Testing may include walkthroughs, control design assessments, data analysis techniques and operating effectiveness testing using sampling methodologies.
Within the ERM framework, regular updates to senior management and the Board, including the Enterprise Risk Management (ERM) Quarterly Risk Report (QRR), provide aggregate measures of risk across the Bank’s global operations. These reports ensure adherence to risk appetite and limits while offering a clear overview of the Bank’s risk profile and performance. Senior leadership uses this information to assess the organization’s risk exposure.
The Bank’s escalation processes are crucial for risk monitoring and reporting, ensuring timely identification and communication of potential risks. Risk owners are responsible for continuously tracking risk metrics and identifying any breaches of limits or early warning thresholds. When breaches of early warning thresholds or risk appetite limits occur, or if there are any other deteriorating trends in the risk profile that could impact the organization’s stability and performance, risk owners must promptly escalate these issues to senior management and/or the Board. This ensures that timely and necessary actions can be taken to mitigate the risks and maintain the Bank’s risk posture and compliance with regulatory requirements.
2025 Scotiabank Annual Report
|
Management’s Discussion and Analysis
T43
Exposure to risks arising from the activities of the Bank’s businesses
| (1) |
Average assets for the Other segment include certain non-earning assets related to the business lines. |
| (2) |
Attributed Capital is a combination of regulatory: (i) Risk-based capital and (ii) Leverage capital. |
| (3) |
Includes Attributed Capital for significant investments, goodwill, intangibles and leverage capital. |
| (4) |
Risk-weighted assets (RWA) are as at October 31, 2025 as measured for regulatory purposes in accordance with Basel III. |
|
2025 Scotiabank Annual Report
Management’s Discussion and Analysis
| Risk Management
The Bank is exposed to a variety of top and emerging risks. These risks can potentially affect the Bank’s business strategies, financial performance, and reputation. As part of our risk management approach, we monitor our operating environment to identify, assess, review, and manage a broad range of top and emerging risks and drivers of those risks to undertake appropriate risk mitigation strategies.
Risk drivers are identified using a risk identification system whereby information is gathered and consolidated from a variety of internal and external sources including industry research and peer analysis, Senior Management expertise, and risk reporting from our international operations. The results of this research, in conjunction with internal risk assessments across the Bank’s principal risks and Business Lines, help identify the impact of top and emerging risk drivers, which, along with mitigation activities, are summarized and reported to Executives and the Board of Directors on a quarterly basis.
The external risk environment continues to be characterized by an unprecedented rate of change and interconnectivity on a global scale. Drivers of risk are becoming less predictable and require a more agile approach to respond quickly to mitigate their impacts. While emerging risk drivers continue to be concentrated in
non-financial
areas, they have the potential to interact and amplify other top risks, including financial ones, in ways that can be difficult to predict. This year, the impacts of U.S. imposed tariffs and continued trade and government policy uncertainty have been key interconnected risk drivers.
The Bank’s top and emerging risk drivers are as follows:
As technology advances, cyber threats continue to evolve in sophistication and scope, which could impact the Bank directly and/or its third-party service providers. These threats manifest as attacks on critical functions or infrastructure, including but not limited to, client facing systems and may result in financial loss, data theft, regulatory consequences, reputational damage or operational disruption to the Bank. The inherent risk of cyber threats continues to increase as attack surfaces grow with the adoption of new technologies and cloud services. Geopolitical conflicts have increased the severity and frequency of cyber threats and state-sanctioned cyber attacks on critical infrastructure, public facing services and emerging technologies. Advancements in Generative AI and Large Language Models (LLM) create additional attack vectors that enable new forms of cyber attacks to commit fraud or exfiltrate sensitive data and personally identifiable information.
The Bank’s overall cyber security and IT program continues to adapt to the evolving and complex cyber threat landscape, and investments in cyber defences, including proactive and adaptive security measures, and IT infrastructure to strengthen its operational resilience. As threat actors look to exploit the weakest link in a system, frequent monitoring of critical suppliers and effective contingency planning helps mitigate the vulnerability to cyber attacks on third parties and safeguards critical assets to ensure business continuity. The Bank also maintains cyber insurance coverage to help mitigate potential losses linked to cyber incidents. The insurance coverage limit is regularly reviewed and evaluated to ensure it meets the Bank’s needs.
Tariffs and Trade Policy Uncertainty
Heightened economic uncertainty driven by the impact of tariffs and changing government policy may contribute to a slowdown in economic and trade activity. This is occurring in an already uncertain macroeconomic environment for the Bank’s clients who may also be dealing with higher borrowing costs and could further dampen consumer demand and investor confidence. In addition, existing sectoral and
non-CUSMA
compliant goods tariffs on Mexico and Canada could impact key exports creating headwinds for the Bank in its priority markets.
Proactive provisioning, stress testing, and regular monitoring of the environment supports the Bank’s preparedness for a significant downturn, while fostering a deeper understanding of how evolving conditions affect the Bank’s risk profiles and business performance. Ongoing monitoring of liquidity, deposit levels, and credit quality keeps the Bank adept in responding to this changing environment and protects against potential impacts of macroeconomic uncertainty. Portfolios are monitored for delinquency trends, and collections measures are being deployed to mitigate potential impacts to the Bank’s most vulnerable borrowers.
Client Repayment Vulnerability and Recession Risks
After a period of elevated interest rates, most central banks have lowered their policy rates, which should support economies that are actively dealing with tariffs and economic uncertainty. As well, the lag effects of higher interest rates may continue to increase portfolio impacts, including provisions and delinquencies as clients continue to face higher refinancing costs, weakening consumer demand and higher unemployment. This environment also increases the risk of recession or a market downturn, which can put further pressure on consumer and business confidence, loan demand and real estate markets and may result in lower earnings and higher credit losses for the Bank.
The Bank has measures in place to monitor and mitigate impacts on its portfolios (i.e., stress testing, downturn readiness playbooks), while continuing its proactive client outreach. The effectiveness of collection efforts remains critical to sustaining momentum in impaired loan management and driving overall portfolio health. In addition, the Bank’s strategic shift places focus on allocating capital to more mature, priority markets with an emphasis on lower cost deposits and client primacy that helps reduce credit risk.
Changing Government Policy
Recent developments suggest a possible trend toward increased government engagement in economic and regulatory matters that may include more active fiscal measures aimed at achieving specific outcomes. Though the direction of such policies remains uncertain, governments are working towards increasing economic growth, national strength and resilience, including more restrictive trade policies, promotion of industrial policy and supporting national corporate champions. This new policy environment will create uncertainty as previous rules and operating principles for businesses are upended that could result in inflation, higher longer term borrowing costs and sovereign risk concerns. It could also lead to headwinds for the Bank in its priority markets, particularly the North American corridor, as political relationships change and policy uncertainty accelerates, requiring strategic adjustments.
Government Affairs, Compliance, Global AML and Economics teams continue to monitor the changing political and economic landscape across the Bank’s operating footprint, communicating broadly to clients and employees, and supporting stress testing and scenario analysis. These teams regularly update the Bank’s leadership to support a continuous understanding of the evolving environment and its impact on the Bank’s risk profile, strategy and business performance. In Canada, recent legislative efforts, such as the One Canadian Economy Act, may help advance major projects and stimulate economic activity, potentially supporting loan demand and employment.
2025 Scotiabank Annual Report
|
Management’s Discussion and Analysis
Rising costs of climate change and new climate guidelines increase regulatory oversight and stakeholder expectations to demonstrate strong governance in managing climate risks. The increased intensity and frequency of severe weather events highlights the potential impacts of diverse physical risks due to climate change, which include damage to properties and disruptions to operations that can negatively impact profitability. The changing corporate and political environment in the US and Canada could result in reduced support for climate-related regulation and funding for climate initiatives, creating uncertainty that could limit clients’ ability or willingness to reduce emissions. Under current laws and evolving climate regulations, which include management of nature-related risks and their impacts, making exaggerated or misleading sustainability claims or “greenwashing”, either intentionally or due to data collection and reporting challenges, can create legal and reputational risks. For further details please refer to the ESG Risk section on page 113.
The Bank continues to maintain compliance with evolving climate regulations across its global footprint. To manage physical risks, there are several mechanisms to identify, mitigate, and assess potential Bank losses, while disaster recovery planning is focused on ensuring uninterrupted operations for localized disasters and weather-related events. The Bank has a public ESG policy that restricts lending to the Oil & Gas industry within the Arctic, thermal coal mining or coal power generation and new nature-related sustainability policies for activities in UNESCO World Heritage sites and RAMSAR wetlands.
The potential for political miscalculations and conflict escalations remains a key concern. Geopolitical uncertainty and a fracturing global economy continues as many geopolitical conflicts remain unresolved, including U.S.-China tensions, the continuing war in Ukraine, and the ongoing conflict in the Middle East. Geopolitical tensions are accelerating in complexity and speed with risk increasingly manifesting in interconnected ways that could disrupt global trade, supply chains or operations, and cause market volatility. Financial institutions have limited influence over broad geopolitical dynamics and resulting impacts could require strategic adjustments to manage changes to client and investor confidence and to address a higher risk of financial instability.
The Bank seeks to grow and do business in countries that have a track record of economic growth and institutional stability, while continuing to invest in its priority markets within the North American corridor. The Bank monitors geopolitical developments through various pillars and threat intelligence coordination, and monitors regions with geopolitical conflicts to ensure operations, including sanctions related controls continue to be fully compliant with evolving laws. The Bank’s stress testing programs help evaluate the potential impacts of severe economic scenarios, and the Bank can draw from its extensive experience operating in emerging markets across the globe to manage volatility, and right scaling exposure when necessary. As well, the Bank’s strong and varied client base, robust liquidity levels and diversified funding programs help manage disruptions or market dislocations.
Increasing Regulatory Scrutiny and Changing Regulatory Landscape
As a global financial institution, the Bank operates under various legal and regulatory frameworks that affect its businesses. The growing volume, complexity, and pace of regulatory obligations, combined with continued scrutiny and increasing fines and penalties across the Bank’s footprint is competing for limited resources and is a challenge when balancing compliance with innovation amidst growing competition in the
non-regulated
financial industry. The Bank strives to monitor and evaluate the emerging regulatory developments and to implement the necessary changes to ensure compliance. However, any inadvertent
non-compliance
may expose the Bank to fines, penalties, litigation, regulatory sanctions, enforcement actions and restrictions or prohibitions on its business activities. These consequences may adversely affect the Bank’s financial performance, its business strategy execution and its reputation.
The Bank continues to monitor changes in regulatory guidance from regulators and to assess the impact of new regulations and increasing scrutiny across its operating footprint. It continues to coordinate regulatory examinations as part of its compliance program and work with peers to promote consistent guidance and requirements across jurisdictions. Although some regulators have indicated a desire to ease financial rules to support lending and economic growth, the Bank is continuing to invest in infrastructure to address immediate compliance challenges while building resilience for the years ahead, supported by a robust funding model and risk culture with the appropriate regulatory talent. For additional information on some of the key regulatory developments that potentially impact the Bank’s operations, see “Regulatory Developments” on page 120.
Increasing Reliance on Third Party Services
The Bank continues to rely on third parties for the delivery of some critical services. The growing concentration of dominant third and nth parties for the delivery of these critical services, combined with attempts to keep up with technological advancements requires oversight and monitoring of complex third- and
nth-party
arrangements, and their compensating controls. Using third-party service providers increases the risk of attacks, breaches, or disruptions due to the Bank’s reduced oversight and control over their technology and security. This can interrupt critical functions or infrastructure, including but not limited to, client facing systems and may result in financial loss, data theft, regulatory consequences, reputational damage or operational disruption to the Bank. Resiliency and preparedness for third party disruptions, including contingency planning and identification of alternative vendors, is an area of increasing focus.
The Bank aims to be “Resilient by Design” and has established an operational resilience program to support engagements with third party service providers, including defining critical suppliers, enhancing continuous monitoring, increasing the frequency of risk assessments and developing vendor disruption strategies. The Bank continues to invest in enhancing its governance of third parties, resourcing capabilities, and technology to ensure it manages third party risk prudently.
External Fraud, Scams and Insider Risks
The Bank and the industry as a whole continues to be exposed to the threat of increasing fraud given the uncertain economic climate, rapid digitization, and the adoption of new technologies. The Bank anticipates that it will continue to experience fraud losses driven by external threats and scams, including first party fraud. First party fraud involves deceptive actions by clients who knowingly engage in false or deceptive activities relating to financial transactions on an account issued in their name for personal gain. As well, the financial industry continues to observe an increased number of insider risk cases, leading to new or emerging threats. These cases can lead to data being compromised, intellectual property theft, business disruptions, as well as regulatory, operational and compliance risks. It can also lead to fraud, which historically has been driven by external factors, including service providers to the Bank and its customers.
Despite the Bank’s investments in fraud prevention and detection programs, capabilities, measures and defences, it may not prevent against all fraudulent activity which could result in financial loss, reputational damage or operational disruptions in the Bank’s businesses. The Bank is continuously enhancing its fraud oversight functions and governance structures to ensure a coordinated response to fraud attacks and to support future business growth in line with its strategy.
|
2025 Scotiabank Annual Report
Management’s Discussion and Analysis
| Risk Management
Data Quality and Availability
The increasing role of data in processes, models and operations, its potential for bias, and the increasing sensitivities and concerns on appropriate use of data in the decision-making process, can all result in reputational risk. Models leveraging data with poor quality may impair the Bank’s ability to meet regulatory disclosure requirements and increase compliance and operational costs. As data volumes grow exponentially, driven in part by Gen AI, the risk of inaccurate, incomplete, or untimely data is increasing. This can hinder effective reporting, governance, and risk profiling, and may compromise compliance with regulatory requirements, including the accuracy of disclosures. Challenges in data availability and quality amplify these risks, potentially impacting decision making and leading to higher costs.
The Bank has policies that outline guiding principles on how to manage the risks of using data, in alignment to the latest regulations on data and AI, while incorporating data ethics into its Code and training. The Bank continues to modernize its data management processes, expanding data governance and increasing the scope and thoroughness of its data quality validations.
AI introduces risks such as operational disruptions, security vulnerabilities, including a higher risk of fraud, regulatory challenges, and ethical concerns. Maintaining competitiveness through AI adoption including Gen AI, Agentic AI and LLM is vital for the Bank as it aims to leverage the technology for improved decision-making, enhanced client experience and process optimisation. However, keeping pace with the latest advancements poses new risks, including additional model governance requirements, potential copyright and intellectual property infringement, spread of misinformation and inaccuracy of outputs, which could ultimately erode consumer trust and confidence. Rapid adoption and ease of use of Gen AI and Agentic AI technologies also leads to increased competitive pressures from
non-regulated
FinTech companies that have lower cost structures and regulator oversight.
The Bank is addressing the risks of further AI adoption, including malicious use, data vulnerabilities, and regulatory scrutiny, by operationalizing its AI Risk Management Program through cross functional collaboration and embedding robust procedures across business units, while increasing employee awareness by expanding training, ultimately building trust and oversight across the organization. To address the increasing regulatory scrutiny on the use of AI, and potentially inconsistent AI rules across jurisdictions, the Bank must stay abreast of emerging regulations and continue to establish robust governance with adaptable risk management frameworks as it continues to expand its use of emerging AI technologies across different geographies.
Outdated software and complex technology infrastructure can lead to ineffective change management, increased regulatory and strategic risk, and require investments to adapt to new technologies and react to competitive risks. Risks and impacts emanating from digital innovations such as cloud computing, Gen AI, machine learning and process automation, require continued investments to respond to changing customer needs, regulatory expectations, and cyber threats, while staying competitive with peers and new entrants. Rapid digitalization has created greater dependency on technology to carry out critical business processes and as digital service usage continues to increase, stakeholder tolerance for downtime has reduced.
Technology is a focus for the Bank and is a key enabler for the Bank’s clients to do business easily, for automating processes, and for driving innovation, including better risk analytics. Managing legacy IT platforms to stay competitive with digital-first players that offer faster, cheaper, and more accessible services requires the Bank to continue investing in digital infrastructure, enhancements to cybersecurity, while adapting to new technologies. The Bank is strategically increasing its technology investments to address legacy platforms, which should reduce system vulnerabilities and increase flexibility to adopt new technologies cost-effectively. The Bank remains focused on ensuring sufficient resourcing for software updates and to accelerate the remediation of expired software, while cloud investments should support software modernization and application rationalization.
Change management and execution risks could remain elevated as the pace of regulatory projects and scale of transformational efforts across the Bank accelerates. It remains essential that change execution is managed effectively by modernizing critical technology and mitigating key person risk. Successful project delivery in support of the Bank’s strategy could be at risk if overdue regulatory actions, resource constraints and maintenance of critical operations is not addressed.
The Bank continues to strengthen its issues management processes to mitigate against execution risk by enhancing the reporting and tracking of issues to further improve visibility and oversight, and to improve closure rates. As well, processes and operations are managed through a structured risk framework that insists on strong governance, ongoing project assessments through the life cycle, a separation of duties, and thorough testing, supported by post-implementation reviews.
The external risk landscape remains defined by an extraordinary pace of change and global interconnectivity. Risk drivers have the potential to interact with and intensify key financial and non-financial risks in complex and unforeseen ways. This high degree of interconnectedness is intensifying as interdependencies among top risk drivers deepen – where a cyber breach can cascade into operational outages, liquidity stress, and reputational damage, while credit deterioration in stressed sectors can trigger funding challenges and regulatory pressures – creating systemic vulnerabilities that amplify overall impact across the Bank.
These increasingly unpredictable risk drivers can lead to contagion risks and demand a more agile and responsive approach to mitigation. The Bank actively monitors the risk environment across its operating footprint and coordinates responses to events across stakeholders and functional groups. Stress testing programmes are used to evaluate the potential impact of severe economic scenarios, while scenario planning helps the Bank prepare for a range of interconnected risk events and explore a range of possible future impacts – such as economic downturns, regulatory shifts, or climate-related disruptions – and assess their potential impact on operations, portfolios, and strategy. By modeling these scenarios, the Bank can identify vulnerabilities, test the resilience of its risk frameworks and enhance decision-making.
The grey shaded text and tables marked with an asterisk (*) in the following sections of Management’s Discussion and Analysis (MD&A) form an integral part of the Bank’s 2025 Consolidated Financial Statements. These disclosures are presented in accordance with IFRS 7, Financial Instruments: Disclosures, which permits specific risk information to be disclosed in the MD&A and incorporated by cross-reference in the financial statements. These sections provide discussion on the Bank’s risk management framework to monitor, evaluate, measure and manage credit, market and liquidity risk. As such, these shaded sections should be read in conjunction with the 2025 Consolidated Financial Statements.
2025 Scotiabank Annual Report
|
Management’s Discussion and Analysis
Principal Risks – Financial
Credit risk is the risk of loss resulting from the failure of a borrower or counterparty to honour its financial or contractual obligations to the Bank. Credit risk arises in the Bank’s direct lending operations, and in its funding, investment and trading activities where counterparties have repayment or other obligations to the Bank.
• |
|
The Bank’s overall loan book as of October 31, 2025 increased to $779 billion versus $768 billion as of October 31, 2024, led by an increase in Residential mortgages, despite decline in Business and Government lending. Residential mortgages were $370 billion as of October 31, 2025, with 84% in Canada. The corporate loan book, which accounts for 36% of the total loan book is composed of 50% of loans with an investment grade rating as of October 31, 2025, compared to 51% of the total loan book in October 31, 2024. |
• |
|
Loans and acceptances (Personal, and Business and Government lending) remained diversified by region, industry and customer. Regional exposure is spread across our key markets (Canada 68%, United States 8%, Chile 7%, Mexico 6% and Other 11%). Financial Services constitutes 4% of overall gross exposures (before consideration of collateral) and was $32 billion. These exposures are predominately to highly rated counterparties and are generally collateralized. |
The effective management of credit risk requires the establishment of an appropriate risk culture. Key credit risk policies and appetite statements are important elements used to create this culture.
The Board of Directors, either directly or through the Risk Committee (the Board), reviews and approves the Bank’s Credit Risk Appetite limits annually and Credit Risk limits and thresholds biennially.
• |
|
The objectives of the Credit Risk Appetite are to ensure that: |
|
– |
|
target markets and product offerings are well defined at both the enterprise-wide and business line levels; |
|
– |
|
the risk parameters for new underwritings and for the portfolios as a whole are clearly specified; and |
|
– |
|
transactions, including origination, syndication, loan sales and hedging, are managed in a manner that is consistent with the Bank’s risk appetite. |
• |
|
The Credit Risk Policy articulates the credit risk management framework, including: |
|
– |
|
credit risk management policies; |
|
– |
|
the credit risk management program; |
|
– |
|
credit risk management for trading and investment activities; and |
|
– |
|
Single Name and Aggregate limits, beyond which credit applications must be escalated to the Board for approval. |
GRM develops the credit risk management framework and policies that detail, among other things, the credit risk rating systems and associated parameter estimates; the delegation of authority for granting credit; the methodology and calculation of the allowance for credit losses; and the authorization of write-offs.
Corporate and commercial credit exposures are segmented by various business lines and/or by major industry type. Aggregate credit risk limits for each of these segments are also reviewed and approved biennially by the Board. Portfolio management objectives and risk diversification are key factors in setting these limits.
Consistent with the Board-approved limits, borrower limits are set within the context of established lending criteria and guidelines for individual borrowers, particular industries, countries and certain types of lending, to ensure the Bank does not have excessive concentration to any single borrower, or related group of borrowers, particular industry sector or geographic region. Through the portfolio management process, loans may be syndicated to reduce overall exposure to a single name. For certain segments of the portfolio, credit derivative contracts are also used to mitigate the risk of loss due to borrower default. Risk is also mitigated through the selective sale of loans.
Banking units and GRM regularly review the various segments of the credit portfolio on an enterprise-wide basis to assess the impact of economic trends or specific events on the performance of the portfolio, and to determine whether corrective action is required. These reviews include the examination of the risk factors for particular products, industries and countries. The results of these reviews are reported to the Risk Management Committee and, when significant, to the Board.
The Bank’s credit risk rating systems support the determination of key credit risk parameter estimates (Probability of Default (PD), Loss-Given-Default (LGD) and Exposure at Default (EAD)) that are applicable to both Retail and Business Banking portfolios and are designed to measure customer credit and transaction risk. The parameters are an integral part of enterprise-wide policies and procedures encompassing governance, risk management, and control structure, and are used in various internal and regulatory credit risk quantification calculations.
The Bank’s credit risk rating system is subject to a comprehensive validation, governance and oversight framework. The objectives of this framework are to ensure that:
• |
|
Credit risk rating methodologies and parameters are appropriately designed and developed, independently validated, and regularly reviewed, and that the results of each process are adequately documented; and |
• |
|
The validation process represents an effective challenge to the design and development process including an assessment of risk measures. |
The Bank’s credit risk rating methodologies and parameters are reviewed and validated at least annually. Units within GRM are responsible for design, and development of credit risk rating methodologies and parameters. Separate units within GRM are responsible for validation and review. The operation of these separate units is functionally independent from the business units responsible for originating exposures. Within GRM, these units are also independent from the units involved in risk rating approval and credit adjudication.
|
2025 Scotiabank Annual Report
Management’s Discussion and Analysis
| Risk Management
Business Banking credit risk ratings and associated risk parameters affect lending decisions, and loan pricing. Both Business Banking and Retail Banking’s credit risk rating systems affect the computation of the allowance for credit losses, and regulatory capital.
Corporate and commercial credit exposure arises in the Bank’s business lines.
The Bank’s risk rating system utilizes internal grade (IG) ratings – a 17 point scale used to differentiate the risk of default of borrowers, and the risk of loss on facilities. The general relationship between the Bank’s IG ratings and external agency ratings is shown in table T35.
IG ratings are also used to define credit adjudication authority levels appropriate to the size and risk of each credit application. Lower-rated credits require increasingly more senior management involvement depending upon the aggregate exposure. Where a credit exceeds the authority delegated to a credit unit, credit units will refer the request – with its recommendation – to a senior credit committee for adjudication. In certain cases, these must be referred to the Risk Committee of the Board of Directors.
Credit adjudication units within GRM analyze and evaluate all significant credit requests for corporate and commercial credit exposures, to ensure that risks are adequately assessed, properly approved, continually monitored and actively managed. The decision-making process begins with an assessment of the credit risk of the individual borrower or counterparty. Key factors considered in the assessment include:
| • |
|
The borrower’s management; |
| • |
|
The borrower’s current and projected financial results and credit statistics; |
| • |
|
The industry in which the borrower operates; |
| • |
|
Environmental and Climate Change risks (including regulatory or reputational impacts); |
Based on this assessment, a risk rating is assigned to the individual borrower or counterparty, using the Bank’s risk rating systems.
A separate risk rating is also assigned at the facility level, taking into consideration additional factors, such as security, seniority of claim, structure, term and any other forms of credit risk mitigation that affect the amount of potential loss in the event of a default of the facility. Security typically takes the form of charges over inventory, receivables, real estate, and operating assets when lending to corporate and commercial borrowers; and cash or treasuries for trading lines such as securities lending, repurchase transactions, and derivatives. The types of acceptable collateral, and related valuation processes are documented in risk management policies and manuals.
Other forms of credit risk mitigation include third party guarantees and, in the case of derivatives facilities, master netting agreements.
Internal borrower and facility risk ratings are assigned when a facility is first authorized, and are promptly
re-evaluated
and adjusted, if necessary, as a result of changes to the customer’s financial condition or business prospects.
Re-evaluation
is an ongoing process, and is done in the context of general economic changes, specific industry prospects, and event risks, such as revised financial projections, interim financial results and extraordinary announcements.
The internal credit risk ratings are also considered as part of the Bank’s adjudication limits. Single borrower limits are much lower for higher risk borrowers than low risk borrowers.
The credit adjudication process also uses a risk-adjusted profitability model to ensure that the client and transaction structure offers an appropriate return for a given level of risk. For the corporate portfolio, and the large borrowers in International, the Loan Portfolio Management Group reviews the profitability model results, together with external benchmarks, and provides an opinion on the relative return and pricing of each transaction above a minimum threshold.
Individual credit exposures are regularly monitored by both the business line units and GRM for any signs of deterioration. In addition, the business line units and GRM conduct a review and risk analysis of each borrower annually, or more frequently for higher-risk borrowers. If, in the judgement of management, an account requires the expertise of specialists in workouts and restructurings, it will be transferred to a special accounts management group for monitoring and resolution.
Credit Risk Mitigation – Collateral/Security
Traditional
Non-Retail
Products (e.g. Operating lines of Credit, Term Loans)
Collateral values are accurately identified at the outset and throughout the tenure of a transaction by using standard evaluation methodologies. Collateral valuation estimates are conducted at a frequency that is appropriate to the frequency by which the market value fluctuates, using the collateral type and the borrower risk profile.
In addition, when it is not cost effective to monitor highly volatile collateral (e.g. accounts receivable, inventory), appropriate lending margins are applied to compensate (e.g. accounts receivable are capped at 80% of value, inventory at 50%). The frequency of collateral valuations is also increased when early warning signals of a borrower’s deteriorating financial condition are identified.
Borrowers are required to confirm adherence to covenants, including confirmation of collateral values on a periodic basis, which are used by the Bank to provide early warning signals of collateral value deterioration. Periodic inspections of physical collateral are performed where appropriate and where reasonable means of doing so are available.
Bank procedures require verification, including certification by banking officers during initial, annual, and periodic reviews, that collateral values/margins/etc. have been assessed and, where necessary, steps have been taken to mitigate any decreased collateral values.
The Bank does not use automated valuation models (AVMs) for valuation purposes for traditional
non-retail
products. GRM performs its own valuations of companies based on various factors such as book value, discounted book value, enterprise value, etc.
2025 Scotiabank Annual Report
|
Management’s Discussion and Analysis
Commercial/Corporate Real Estate
New or updated appraisals are generally obtained at inception of a new facility, as well as during loan modifications, loan workouts and troubled debt restructure. The primary reason for requiring a new appraisal is if, in the reasonable opinion of the banking execution unit, or GRM, there has been a material change in value. Additionally, none of the appraisal guidelines contained within the policies dissuade the Bank from requesting an appraisal more frequently if an adverse change in market conditions, sponsorship, credit worthiness, or other underwriting assumptions is realized or expected.
Appraisals must be in writing and must contain sufficient information and analysis to support the Bank’s decision to make the loan. Moreover, in rendering an opinion of the property’s market value, third party appraisers are responsible for establishing the scope of work necessary to develop credible assignment results. The appraisal must meet the regulatory and industry requirements which, depending on the type of property being appraised, contain any or all of the following three approaches to value:
| |
i. |
comparable sales approach |
| |
ii. |
replacement cost approach |
The appraiser must disclose the rationale for the omission of any valuation approach. Furthermore, the appraiser must disclose whether the subject property was physically inspected and whether anyone provided significant assistance to the person signing the appraisal report. The report must contain a presentation and explanation of the assumptions used in determining value under each of the above mentioned approaches.
Review of every appraisal is conducted by the banking units and GRM to confirm that the appraisal identifies all of the relevant issues for the specific asset class, location and economic environment and incorporates all appropriate valuation methodologies and assumptions.
When third party appraisers are used, they must be accredited and satisfactory to the Bank. In addition, GRM validates any third party valuations via internal desktop estimates based on comparables, reversionary calculations or the income capitalization approach.
Traded products are transactions such as OTC derivatives (including foreign exchange and commodity based transactions), and Securities Financing Transactions (including repurchase/reverse repurchase agreements, and securities lending/borrowing). Credit risks arising from traded products cannot be determined with certainty at the outset, because during the tenure of a transaction the dollar value of the counterparty’s obligation to the Bank will be affected by changes in the capital markets (such as changes in stock prices, interest rates, and exchange rates). The Bank adjudicates credit exposures arising from transacting in traded products by considering their current fair value plus an additional component to reflect potential future changes in their
value. The credit adjudication process also includes an evaluation of potential
wrong-way
risk, which arises when the exposure to a counterparty is positively correlated to the probability of default of that counterparty.
Credit risk associated with traded products is managed within the same credit adjudication process as the lending business. The Bank considers the credit risk arising from lending activities, as well as the potential credit risk arising from transacting in traded products with that counterparty.
Credit risk mitigation – collateral/security
Derivatives are generally transacted under industry standard International Swaps and Derivatives Association (ISDA) master netting agreements, which allow for a single net settlement of all transactions covered by that agreement in the event of a default or early termination of the transactions. ISDA agreements are frequently accompanied by an ISDA Credit Support Annex (CSA), the terms of which may vary according to each party’s view of the other party’s creditworthiness. CSAs and regulation in some jurisdictions can require both parties to post initial margin (regulatory and
non-regulatory).
CSAs also allow for variation margin to be called if total uncollateralized
exposure exceeds an agreed upon threshold. Such variation margin provisions can be
one-way
(only one party will ever post collateral) or bilateral (either party may post depending upon which party is
The CSA will also detail the types of collateral that are acceptable to each party, and the haircuts that will be applied against each collateral type. The terms of the ISDA master netting agreements and CSAs are taken into consideration in the calculation of counterparty credit risk exposure.
For derivative transactions, investment grade counterparties account for approximately 88% of the credit risk. Approximately 31% of the Bank’s derivative counterparty exposures are to bank counterparties, as defined under Basel III revision. After taking into consideration, where applicable, netting and collateral arrangements, no net credit risk amount arising from traded products transactions with any single counterparty was considered material to the financial position of the Bank as at October 31, 2025. No individual exposure to an investment grade bilateral counterparty exceeded $1,679 million and no individual exposure to a corporate counterparty exceeded $1,233 million.
Retail credit exposures arise in the Canadian Banking and International Banking business lines.
The decision-making process for retail loans ensures that credit risks are adequately assessed, properly approved, continually monitored and actively managed. Generally, credit decisions and limit assignments for consumer loans are processed by proven adjudication software and are based on strategies that utilize a robust combination of key financial and customer risk indicators and segmentation in addition to credit bureau information and internal risk ratings generated using predictive credit scoring models.
The Bank’s credit adjudication and portfolio management methodologies are designed to ensure consistent underwriting and early identification of problem loans in line with our risk appetite. The Bank’s rigorous credit underwriting and retail risk strategies and modeling methodologies are more customer focused than product focused. The Bank’s view is that a customer-centric approach provides better risk assessment than product-based approaches, a more consistent experience to the customer, and should result in lower loan losses over time.
All credit scoring and policy changes are primarily initiated by units within GRM that are functionally independent from the business units responsible for retail portfolios. Risk models and parameters are also subject to independent validation and review from the units involved in the design and development of models. The review process includes referral to the appropriate Senior Credit Committee for approval, where required. Consumer credit portfolios are reviewed at least monthly to identify emerging trends in loan quality and to assess whether corrective action is required.
|
2025 Scotiabank Annual Report
Management’s Discussion and Analysis
| Risk Management
The Bank’s consumer risk rating systems are oriented to borrower or transaction risk. Each retail exposure is assigned a risk grade based on the customer’s credit history and/or internal credit score. The Bank’s automated risk rating systems assess the ongoing credit-worthiness of individual customers on a monthly basis. This process provides for meaningful and timely identification and management of problem loans.
The risk rating system under the AIRB approach is subject to regular review and ongoing performance monitoring of key components. Risk model validations are conducted independently from the areas responsible for rating system development and implementation, to ensure effective independence in design and performance review.
Customer behavior characteristics which are used as inputs within the Bank’s Basel III AIRB models are consistent with those used by the Bank’s Canadian consumer risk rating systems. The International portfolios are subject to the Standardized approach at this time.
Credit risk mitigation – collateral/security
The property values for residential real estate secured exposures are confirmed at origination through a variety of validation methodologies, including AVM and full appraisals
(in-person
inspection). The appraisal is completed by a third party, Bank approved appraiser. For monitoring of material portfolios, property values are indexed quarterly to house prices. For loan impairment within material portfolios, residential property values are
re-confirmed
using third party AVMs.
Where AVM values are used, these AVM values are subject to routine validation through a continuous random sampling process that back-tests AVM values against available property appraisals (primarily third party AVMs). Where third party appraisals are obtained, the Bank relies on the professional industry accreditation of the appraiser. Samples of approved appraisal reports are reviewed by the Bank’s senior appraisers to ensure consistent appraisal quality and satisfactory appraisal values. The third party appraisers are selected from a
pre-approved
list of Bank-vetted appraisers.
IFRS 9 Financial Instruments, requires the consideration of past events, current conditions and reasonable and supportable forward-looking information over the life of the exposure to measure expected credit losses. Furthermore, to assess significant increases in credit risk, IFRS 9 requires that entities assess changes in the risk of a default occurring over the expected life of a financial instrument when determining staging. Consistent with the requirements of IFRS 9, the Bank considers both quantitative and qualitative information in the assessment of a significant increase in credit risk.
The Bank’s models are calibrated to consider past performance and macroeconomic forward-looking variables as inputs, as further described below. In the current year, the Bank enhanced certain of its IFRS 9 models, with the enhanced models exhibiting higher sensitivity to changes in the macroeconomic outlook. Expert credit judgement may be applied in circumstances where, in the Bank’s view, the inputs, assumptions, and/or modelling techniques do not capture all relevant risk factors, including the emergence of economic or political events up to the date of the financial statements. Expert credit judgement is applied in the assessment of underlying credit deterioration and migration of balances to progressive stages.
The Bank has generated a forward-looking base case scenario and three alternate forward-looking scenarios (one optimistic and two pessimistic) as key inputs into the expected credit loss provisioning models. Given the uncertainty surrounding U.S. trade policies and the direction of tariffs, the scenarios as at October 31, 2025 have varying assumptions of imposed tariffs. The base case scenario assumes tariffs announced and implemented, avoiding speculation on future announcements, including potential trade deals and tariff pauses. Differing assumptions are reflected in the alternate scenarios described below. As new information comes to light in the future, the scenarios and assumptions will be updated accordingly.
U.S. trade policies and related uncertainty have shaped the economic environment over the past year and weighed on the outlook. The Canadian and U.S. forecasts have been adjusted frequently as new developments emerged. In Canada, tariff-sensitive sectors and regions are showing earlier-than-expected weakness, resulting in a softer 2025 growth profile than expected last year. In contrast, the U.S. has shown surprising resilience, supported by strong AI-related activity. As a result, the U.S. growth profile for 2025 is slightly stronger than forecast last year. Persistent upside surprises to U.S. growth, combined with stubborn inflation, delayed the start of monetary easing relative to last year’s expectations. With inflation in both countries now closer to target and economic activity softening, the Bank of Canada and the U.S. Federal Reserve have shifted their focus from inflation control toward supporting growth, though upside inflation risks remain. Economic activity in both countries is expected to improve somewhat in 2026 as tariff impacts fade and, in Canada, as stimulus measures and infrastructure plans from the federal budget take effect.
The optimistic scenario features somewhat stronger economic activity relative to the base case. The pessimistic scenario features a negative demand-type shock with globally tighter financial conditions, weaker growth and inflation, and lower monetary policy rates than in the base case scenario. It also assumes a combination of U.S. imposed tariffs on world economies, including an effective tariff of 7.5% on imports from Canada and Mexico, while facing no retaliation from these countries. The very pessimistic scenario features a strong stagflationary impulse that leads to a protracted period of financial market uncertainty. It also assumes U.S. imposed tariffs with a magnitude about three times that of the pessimistic scenario. Under this scenario, all countries retaliate. This results in higher inflation, requiring central banks to raise their policy rates to higher levels than in the base case in order to bring inflation under control, which is dampening economic activity.
2025 Scotiabank Annual Report
|
Management’s Discussion and Analysis
The following section provides additional detail on certain key macroeconomic variables used to calculate the modelled estimate for the allowance for credit losses (see page 190 for all key variables). Further changes in these variables up to the date of the consolidated financial statements are incorporated through expert credit judgement.
Gross Domestic Product (GDP):
Relative to last year, GDP levels in both countries are higher due to historical data revisions. In Canada, we expect growth of about 1.2% in 2025 – a slower pace than anticipated last year, reflecting tariff impacts – before modestly improving to 1.6% in 2026, remaining below potential in both years. In contrast, deterioration in the U.S. outlook is expected to continue into 2026, with growth projected at 1.8% in 2025 and slowing further to 1.4% in 2026.
The base case scenario anticipates a rise in the unemployment rate in both Canada and the U.S. from current levels and relative to last year. In Canada, the unemployment rate is projected to peak at 7.3% at the end of 2025 before gradually normalizing. In the U.S., it is expected to peak at about 4.5% in early 2026 before stabilizing.
T44
Allowance for credit losses by business line
|
|
|
|
|
|
|
|
|
|
|
|
| As at October 31 ($ millions) |
|
|
|
|
2024 |
|
|
|
|
|
|
|
|
|
|
|
|
|
|
|
|
$ |
1,977 |
|
|
|
|
|
|
|
|
614 |
|
|
|
|
|
|
|
$ |
2,591 |
|
|
|
|
|
|
|
|
|
|
|
|
|
|
|
|
|
|
|
Caribbean and Central America |
|
|
|
|
|
$ |
424 |
|
|
|
|
|
|
|
|
598 |
|
|
|
|
|
|
|
|
607 |
|
|
|
|
|
|
|
|
617 |
|
|
|
|
|
|
|
|
354 |
|
|
|
|
|
|
|
|
92 |
|
|
|
|
|
|
|
|
1,006 |
|
|
|
|
|
|
|
$ |
3,698 |
|
|
|
|
|
|
|
$ |
47 |
|
Global Banking and Markets |
|
|
|
|
|
$ |
198 |
|
|
|
|
|
|
|
$ |
2 |
|
|
|
|
|
|
|
|
|
|
Allowance for credit losses on loans |
|
|
|
|
|
$ |
6,536 |
|
Allowance for credit losses on: |
|
|
|
|
|
|
|
|
|
|
|
|
|
|
$ |
1 |
|
Off-balance sheet exposures |
|
|
|
|
|
|
186 |
|
Debt securities and deposits with financial institutions |
|
|
|
|
|
|
13 |
|
Total Allowance for credit losses |
|
|
|
|
|
$ |
6,736 |
|
|
2025 Scotiabank Annual Report
Management’s Discussion and Analysis
| Risk Management
Allowance for credit losses
The total allowance for credit losses as at October 31, 2025 was $7,654 million compared to $6,736 million in the prior year. The allowance for credit losses ratio was 98 basis points, an increase of 10 basis points. The allowance for credit losses for loans was $7,463 million, an increase of $927 million from October 31, 2024.
The allowance for credit losses on performing loans was higher at $5,122 million compared to $4,482 million as at October 31, 2024. The allowance for performing loans ratio was 68 basis points, an increase of seven basis points. The increase was driven by credit quality migration and deterioration in the macroeconomic outlook in Canadian Banking and International retail portfolio growth. This also reflects the continued uncertainty related to U.S. tariffs, primarily impacting the Canadian Banking portfolios. The impact of foreign currency translation increased the allowance by $151 million.
The allowance for credit losses on impaired loans increased by $287 million to $2,341 million from $2,054 million last year. The allowance for credit losses on impaired loans ratio was 30 basis points, an increase of three basis points. The increase was due primarily to higher provisions in Canadian and International Banking, and the impact of foreign currency translation of $104 million.
The allowance for credit losses on impaired loans in Canadian Banking increased by $116 million to $667 million, due primarily to higher commercial and retail provisions. In International Banking, the allowance for credit losses on impaired loans increased by $194 million to $1,653 million, due primarily to higher retail and commercial provisions, and the impact of foreign currency translation. In Global Banking and Markets, the allowance for credit losses on impaired loans decreased by $20 million to $3 million, mainly due to the write-off of one account. In Global Wealth Management, the allowance for credit losses on impaired loans decreased by $3 million to $18 million.
T45
Impaired loans by business line
|
|
|
|
|
|
|
|
|
|
|
|
|
|
|
|
|
|
|
|
|
|
|
|
|
|
|
|
| |
|
|
|
|
2024 |
|
|
|
|
|
|
|
|
| As at October 31 ($ millions) |
|
|
|
|
|
|
|
|
|
|
|
|
|
|
|
|
|
|
|
|
|
|
|
|
|
|
|
|
|
|
|
|
|
|
|
|
|
|
|
|
|
|
|
|
|
|
|
|
|
|
|
|
|
|
|
|
|
$ |
1,212 |
|
|
$ |
365 |
|
|
$ |
847 |
|
|
|
|
|
|
|
|
|
|
|
|
|
|
|
|
840 |
|
|
|
186 |
|
|
|
654 |
|
|
|
|
|
|
|
|
|
|
|
|
|
|
|
$ |
2,052 |
|
|
$ |
551 |
|
|
$ |
1,501 |
|
|
|
|
|
|
|
|
|
|
|
|
|
|
|
|
|
|
|
|
|
|
|
|
|
|
Caribbean and Central America |
|
|
|
|
|
|
|
|
|
|
|
|
|
$ |
665 |
|
|
$ |
158 |
|
|
$ |
507 |
|
|
|
|
|
|
|
|
|
|
|
|
|
|
|
|
|
|
|
|
|
|
|
|
|
|
|
|
|
|
|
|
|
|
|
|
|
|
|
|
|
1,343 |
|
|
|
424 |
|
|
|
919 |
|
|
|
|
|
|
|
|
|
|
|
|
|
|
|
|
715 |
|
|
|
385 |
|
|
|
330 |
|
|
|
|
|
|
|
|
|
|
|
|
|
|
|
|
1,249 |
|
|
|
281 |
|
|
|
968 |
|
|
|
|
|
|
|
|
|
|
|
|
|
|
|
|
322 |
|
|
|
109 |
|
|
|
213 |
|
|
|
|
|
|
|
|
|
|
|
|
|
|
|
|
166 |
|
|
|
102 |
|
|
|
64 |
|
|
|
|
|
|
|
|
|
|
|
|
|
|
|
|
3,795 |
|
|
|
1,301 |
|
|
|
2,494 |
|
|
|
|
|
|
|
|
|
|
|
|
|
|
|
$ |
4,460 |
|
|
$ |
1,459 |
|
|
$ |
3,001 |
|
|
|
|
|
|
|
|
|
|
|
|
|
|
|
$ |
71 |
|
|
$ |
21 |
|
|
$ |
50 |
|
Global Banking and Markets |
|
|
|
|
|
|
|
|
|
|
|
|
|
|
|
|
|
|
|
|
|
|
|
|
|
|
|
|
|
|
|
|
|
|
|
|
|
|
$ |
47 |
|
|
$ |
1 |
|
|
$ |
46 |
|
|
|
|
|
|
|
|
|
|
|
|
|
|
|
|
109 |
|
|
|
22 |
|
|
|
87 |
|
|
|
|
|
|
|
|
|
|
|
|
|
|
|
|
– |
|
|
|
– |
|
|
|
– |
|
|
|
|
|
|
|
|
|
|
|
|
|
|
|
$ |
156 |
|
|
$ |
23 |
|
|
$ |
133 |
|
|
|
|
|
|
|
|
|
|
|
|
|
|
|
$ |
6,739 |
|
|
$ |
2,054 |
|
|
$ |
4,685 |
|
|
|
|
|
|
|
|
|
|
|
|
| |
|
|
|
|
|
|
| As at October 31 ($ millions) |
|
|
|
|
2024 |
|
Net impaired loans as a % of loans and acceptances (1)
|
|
|
|
|
|
|
0.61 |
% |
Allowance against impaired loans as a % of gross impaired loans (1)
|
|
|
|
|
|
|
30 |
% |
| (1) |
Refer to Glossary on page 136 for the description of the measure. |
Gross impaired loans increased to $7,244 million as at October 31, 2025, from $6,739 million last year. The increase was due primarily to formations mainly in Canadian Banking and International retail portfolio, as well as the impact of foreign currency translation.
Impaired loans in Canadian Banking increased by $227 million, due primarily to higher formations in the commercial and retail portfolios, mainly mortgages and unsecured portfolios. In International Banking, impaired loans increased by $355 million, due primarily to retail formations in Mexico and Chile, as well as the impact of foreign currency translation. Impaired loans in Global Banking and Markets decreased by $98 million, due primarily to higher write-offs and lower formations. Impaired loans in Global Wealth Management increased by $21 million due to new formations. The gross impaired loan ratio was 93 basis points as at October 31, 2025, an increase of five basis points.
Net impaired loans, after deducting the allowance for credit losses, were $4,903 million as at October 31, 2025, an increase of $218 million from the prior year. Net impaired loans as a percentage of loans and acceptances were 0.63% as at October 31, 2025, an increase of two basis point from 0.61% last year.
2025 Scotiabank Annual Report
|
Management’s Discussion and Analysis
Gross impaired loans in the retail portfolio increased by $156 million or 13% from last year, due primarily to higher formations in mortgages and unsecured portfolios. The allowance for credit losses on impaired loans in the retail portfolio was $413 million, up $48 million or 13% from last year due to higher formations.
In the commercial loan portfolio, gross impaired loans increased $71 million to $911 million due primarily to higher formations. The allowance for credit losses on impaired loans was $254 million, up $68 million or 37% from last year due to higher formations.
In the retail portfolio, gross impaired loans increased by $315 million to $2,567 million, due primarily to higher formations in Mexico and Chile, as well as the impact of foreign currency translation. The allowance for credit losses on impaired loans in the retail portfolio was $1,020 million, an increase of $126 million or 14% from last year, due primarily to higher formations, as well as the impact of foreign currency translation.
In the commercial portfolio, gross impaired loans were $2,248 million, an increase of $40 million from last year, due primarily to the impact of foreign currency translation. The allowance for credit losses on impaired loans was $633 million, an increase of $68 million or 12% from last year, due primarily to higher formations as well as the impact of foreign currency translation.
Gross impaired loans in Global Wealth Management were $92 million, an increase of $21 million from last year, due primarily to new formations. The allowance for credit losses on impaired loans was $18 million, a decrease of $3 million from last year due primarily to lower provisions.
Global Banking and Markets
Gross impaired loans in Global Banking and Markets decreased by $98 million to $58 million, due primarily to lower formations and higher write-offs. The allowance for credit losses on impaired loans was $3 million, a decrease of $20 million from last year, due to higher write-offs.
The Bank’s exposure to various countries and types of borrowers are well diversified (see T64 and T67). Chart C27 shows loans and acceptances by geography. Ontario represents the largest Canadian exposure at 37% of the total. Latin America was 19% of the total exposure and the U.S. was 8%.
Chart C28 shows loans and acceptances by type of borrower (see T67). Excluding loans to households, the largest industry exposures were real estate and construction (8%), financial services (4% including banks and
non-banks)
and wholesale and retail (4%).
To mitigate exposures in its performing corporate portfolios, the Bank uses diversification by company, industry, and country, with loan sales and credit derivatives used sparingly. In 2025, loan sales totaled $0.6 billion, compared to $1.1 billion in 2024. As at October 31, 2025, no credit derivatives were used to mitigate loan exposures in the portfolios (October 31, 2024 – nil). The Bank actively monitors industry and country concentrations. As in the case with all industry exposures, the Bank continues to closely follow developing trends and takes additional steps to mitigate risk as warranted.
Overview of loan portfolio
The Bank has a well-diversified portfolio by product, business and geography. Details of certain portfolios of current focus are highlighted below.
|
Well diversified in Canada and internationally... loans and acceptances, October 2025 |
|
... and in household and business lending loans and acceptances, October 2025 |
|
2025 Scotiabank Annual Report
Management’s Discussion and Analysis
| Risk Management
Real estate secured lending
A large portion of the Bank’s lending portfolio is comprised of residential mortgages and consumer loans, which are well diversified by borrower. As at October 31, 2025, these loans accounted for $499 billion or 64% of the Bank’s total loans and acceptances outstanding (October 31, 2024 – $475 billion or 62%). Of these, $394 billion or 79% are real estate secured loans (October 31, 2024 – $374 billion or 79%). The tables below provide more details by portfolio.
Insured and uninsured residential mortgages and home equity lines of credit
The following table presents amounts of insured and uninsured residential mortgages and home equity lines of credit (HELOCs), by geographic area.
T46
Insured and uninsured residential mortgages and HELOCs, by geographic areas
(1)
|
|
|
|
|
|
|
|
|
|
|
|
|
|
|
|
|
|
|
|
|
|
|
|
|
|
|
|
|
|
|
|
|
|
|
|
|
|
|
|
|
|
|
|
|
|
|
|
|
| |
|
|
|
| |
|
|
|
|
Home equity lines of credit |
|
|
|
|
|
|
|
|
|
|
|
|
|
|
|
|
|
|
|
|
|
|
|
|
|
|
|
|
|
|
|
|
|
|
|
|
|
|
|
|
|
|
|
|
|
|
|
|
|
|
|
|
|
|
|
|
|
|
|
|
|
|
|
|
|
|
|
|
|
|
|
|
|
|
|
|
|
|
|
|
|
|
|
|
|
|
|
|
|
|
|
|
|
|
|
|
|
|
|
|
|
|
|
|
|
|
|
|
|
|
|
|
|
|
|
|
|
|
|
|
|
|
|
|
|
|
|
|
|
|
|
|
|
|
|
|
|
|
|
|
|
|
|
|
|
|
|
|
|
|
|
|
|
|
|
|
|
|
|
|
|
|
|
|
|
|
|
|
|
|
|
|
|
|
|
|
|
|
|
|
|
|
|
|
|
|
|
|
|
|
|
|
|
|
|
|
|
|
|
|
|
|
|
|
|
|
|
|
|
|
|
|
|
|
|
|
|
|
|
|
|
|
|
|
|
|
|
|
|
|
|
|
|
|
|
|
|
|
|
|
|
|
|
|
|
|
|
|
|
|
|
|
|
|
|
|
|
|
|
|
|
|
|
|
|
|
|
|
|
|
|
|
|
|
|
|
|
|
|
|
|
|
|
|
|
|
|
|
|
|
|
|
|
|
|
|
|
|
|
|
|
|
|
|
|
|
|
|
|
|
|
|
|
|
|
|
|
|
|
|
|
|
|
|
|
|
|
|
|
|
|
|
|
|
|
|
|
|
|
|
|
|
|
|
|
|
|
|
|
|
|
British Columbia & Territories |
|
|
|
|
|
|
|
|
|
|
|
|
|
|
|
|
|
|
|
|
|
|
|
|
|
|
|
|
|
|
|
|
|
|
|
|
|
|
|
|
|
|
|
|
|
|
|
|
|
|
|
|
|
|
|
|
|
|
|
|
|
|
|
|
|
|
|
|
|
|
|
|
|
|
|
|
|
|
|
|
|
|
|
|
|
|
|
|
|
|
|
|
|
|
|
|
|
|
|
|
|
|
|
|
|
|
|
|
|
|
|
|
|
|
|
|
|
|
|
|
|
|
|
|
|
|
|
|
|
|
|
|
|
|
|
|
|
|
|
|
|
|
|
|
|
|
|
|
|
|
|
|
|
|
|
|
|
|
|
|
|
|
|
|
|
|
|
|
|
|
|
|
|
|
|
|
|
|
|
|
|
|
|
|
|
|
|
|
|
|
|
|
|
|
|
| |
|
2024 |
|
|
|
$ |
71,696 |
|
|
|
24.1 |
% |
|
$ |
225,981 |
|
|
|
75.9 |
% |
|
$ |
297,677 |
|
|
|
100 |
% |
|
$ |
– |
|
|
|
– |
% |
|
$ |
23,297 |
|
|
|
100 |
% |
|
$ |
23,297 |
|
|
|
100 |
% |
|
|
|
– |
|
|
|
– |
|
|
|
53,264 |
|
|
|
100 |
|
|
|
53,264 |
|
|
|
100 |
|
|
|
– |
|
|
|
– |
|
|
|
– |
|
|
|
– |
|
|
|
– |
|
|
|
– |
|
|
|
$ |
71,696 |
|
|
|
20.4 |
% |
|
$ |
279,245 |
|
|
|
79.6 |
% |
|
$ |
350,941 |
|
|
|
100 |
% |
|
$ |
– |
|
|
|
– |
% |
|
$ |
23,297 |
|
|
|
100 |
% |
|
$ |
23,297 |
|
|
|
100 |
% |
| (1) |
The measures in this section have been disclosed in this document as required by OSFI Guideline – B20 – Residential Mortgage Underwriting Practices and Procedures (January 2018). |
| (2) |
Default insurance is contractual coverage for the life of eligible facilities whereby the Bank’s exposure to real estate secured lending is protected against potential shortfalls caused by borrower default. This insurance is provided by either government-backed entities or private mortgage insurers. |
| (3) |
The province represents the location of the property in Canada. |
| (4) |
Includes multi-residential dwellings (4+ units) of $4,392 (October 31, 2024 – $3,796) of which $3,767 are insured (October 31, 2024 – $3,024). |
| (5) |
Variable rate mortgages account for 34% (October 31, 2024 – 30%) of the Bank’s total Canadian residential mortgage portfolio. |
Amortization period ranges for residential mortgages
The following table presents the distribution of residential mortgages by remaining amortization periods, and by geographic areas.
T47
Distribution of residential mortgages by remaining amortization periods, and by geographic areas
(1)
|
|
|
|
|
|
|
|
|
|
|
|
|
|
|
|
|
|
|
|
|
|
|
|
|
| |
|
|
|
| |
|
Residential mortgages by remaining amortization periods |
|
|
|
|
|
|
|
|
|
|
|
|
|
|
|
|
|
|
|
|
|
|
|
|
|
|
|
|
|
|
|
|
|
|
|
|
|
|
|
|
|
|
|
|
|
|
|
|
|
|
|
|
|
|
|
|
|
|
|
|
|
|
|
|
|
|
|
|
|
|
| |
|
2024 |
|
|
|
|
36.1 |
% |
|
|
34.9 |
% |
|
|
27.7 |
% |
|
|
0.9 |
% |
|
|
0.4 |
% |
|
|
100 |
% |
|
|
|
64.5 |
% |
|
|
17.9 |
% |
|
|
16.6 |
% |
|
|
1.0 |
% |
|
|
– |
% |
|
|
100 |
% |
| (1) |
The measures in this section have been disclosed in this document as required by OSFI Guideline – B20 – Residential Mortgage Underwriting Practices and Procedures (January 2018). |
The Canadian residential mortgage portfolio is 77% uninsured (October 31, 2024 – 76%). The average
(LTV) ratio of the uninsured portfolio is 54% (October 31, 2024 – 51%).
The following table presents the weighted average LTV ratio for total newly originated uninsured residential mortgages and home equity lines of credit during the year, which include mortgages for purchases, refinances with a request for additional funds and transfers from other financial institutions, by geographic areas.
2025 Scotiabank Annual Report
|
Management’s Discussion and Analysis
|
|
|
|
|
|
|
|
|
|
|
|
|
|
|
|
|
|
|
|
|
|
|
For the year ended October 31, 2025 |
|
| |
|
|
|
Residential mortgages
LTV% |
|
|
Home equity lines of credit (2)
LTV% |
|
|
|
|
|
|
|
|
|
|
|
|
|
|
|
|
|
|
|
|
|
|
|
|
|
|
|
|
|
|
|
|
|
|
|
|
|
|
|
|
|
|
|
|
|
|
|
|
|
|
|
|
|
|
|
|
|
|
|
|
|
|
|
|
|
|
|
British Columbia & Territories |
|
|
|
|
|
|
|
|
|
|
|
|
|
|
|
|
|
|
|
|
|
|
|
|
|
|
|
|
|
|
|
|
|
|
|
| |
|
|
|
|
For the year ended October 31, 2024 |
|
|
|
|
|
|
61.7 |
% |
|
|
62.1 |
% |
|
|
|
|
|
71.1 |
% |
|
|
n/a |
|
| (1) |
The measures in this section have been disclosed in this document as required by OSFI Guideline – B20 – Residential Mortgage Underwriting Practices and Procedures (January 2018). |
| (2) |
Includes all home equity lines of credit (HELOC). For Scotia Total Equity Plan HELOCs, LTV is calculated based on the sum of residential mortgages and the authorized limit for related HELOCs, divided by the value of the related residential property, and presented on a weighted average basis for newly originated mortgages and HELOCs. |
| (3) |
The province represents the location of the property in Canada. |
Potential impact on residential mortgages and real estate home equity lines of credit in the event of an economic downturn
As part of its stress testing program, the Bank analyzes the impact of various combinations of home price declines and unemployment increases on the Bank’s residential mortgage portfolios. Those results continue to show that credit losses and impacts on capital ratios are within a level the Bank considers manageable. In addition, the Bank has undertaken extensive
all-Bank
scenario analyses to assess the impact to the enterprise of different scenarios and is confident that it has the financial resources to withstand even a very negative outlook.
Commercial real estate exposures
The Bank’s commercial real estate portfolio was $60.0 billion (October 31, 2024 – $66.0 billion), or 7.7% (October 31, 2024 – 8.6%) of the Bank’s total loans and acceptances outstanding as at October 31, 2025. This portfolio is comprised of 74% of loans to the residential and industrial sector (October 31, 2024 – 73%) both with relatively stable fundamentals in the long term. Total exposure to the Office subsector (entities engaged in the construction, development, or ownership of office properties as a business) represents approximately 7% of the commercial real estate portfolio (October 31, 2024 – 9%), of which approximately 56% are investment grade facilities (October 31, 2024 – 60%). U.S. office exposure represents approximately 0.3% (October 31, 2024 – 0.4%) of the portfolio.
Loans to Canadian condominium developers
The Bank had loans outstanding to Canadian condominium developers of $3,485 million as at October 31, 2025 (October 31, 2024 – $3,238 million), representing approximately 6% of the commercial real estate portfolio, of which approximately 74% are investment grade facilities, in line with the prior year. This portfolio primarily focuses on top-tier developers with experience managing through business cycles.
Regional
non-retail
exposures
The Bank’s exposures outside Canada and the U.S. are diversified by region and product and are sized appropriately relative to the creditworthiness of the counterparties (61% of the exposures are to investment grade counterparties based on a combination of internal and external ratings). The Bank’s exposures are carried at amortized cost or fair value using observable inputs, with negligible amounts valued using models with unobservable inputs (Level 3). There were no significant events during the year that materially impacted the Bank’s exposures.
The Bank’s exposure to sovereigns was $52.6 billion as at October 31, 2025 (October 31, 2024 – $58.9 billion), $13.1 billion to banks (October 31, 2024 – $15.5 billion) and $103.8 billion to corporates (October 31, 2024 – $111.0 billion).
In addition to exposures detailed in the table below, the Bank had indirect exposures consisting of securities exposures to
non-European
entities whose parent company is domiciled in Europe of $0.01 billion as at October 31, 2025 (October 31, 2024 – $0.3 billion).
The Bank’s regional credit exposures are distributed as follows:
T49
Bank’s regional credit exposures distribution
|
|
|
|
|
|
|
|
|
|
|
|
|
|
|
|
|
|
|
|
|
|
|
|
|
|
|
|
|
|
|
|
|
|
|
|
|
|
|
|
|
2024 |
|
|
|
|
|
|
|
|
|
|
| ($ millions) |
|
Loans and loan equivalents (1)
|
|
|
Deposits
with
financial
institutions |
|
|
|
|
|
|
|
|
|
|
|
|
|
|
|
|
|
Total |
|
|
|
|
|
|
|
|
|
|
|
|
|
|
|
|
|
|
|
|
|
|
|
|
|
|
|
|
|
|
|
$ |
125,228 |
|
Caribbean and Central America |
|
|
|
|
|
|
|
|
|
|
|
|
|
|
|
|
|
|
|
|
|
|
|
|
|
|
|
|
|
|
24,521 |
|
|
|
|
|
|
|
|
|
|
|
|
|
|
|
|
|
|
|
|
|
|
|
|
|
|
|
|
|
|
|
|
25,083 |
|
|
|
|
|
|
|
|
|
|
|
|
|
|
|
|
|
|
|
|
|
|
|
|
|
|
|
|
|
|
|
|
18,192 |
|
|
|
|
|
|
|
|
|
|
|
|
|
|
|
|
|
|
|
|
|
|
|
|
|
|
|
|
|
|
|
|
29,458 |
|
|
|
|
|
|
|
|
|
|
|
|
|
|
|
|
|
|
|
|
|
|
|
|
|
|
|
|
|
|
|
|
778 |
|
|
|
|
|
|
|
|
|
|
|
|
|
|
|
|
|
|
|
|
|
|
|
|
|
|
|
|
|
|
|
$ |
223,260 |
|
| (1) |
Allowances for credit losses are $637 million. Letters of credit and guarantees are included as funded exposure as they have been issued. Included in loans and loans equivalent are letters of credit and guarantees which total $14,576 million as at October 31, 2025 (October 31, 2024 – $14,446 million). |
| (2) |
Exposures for securities are calculated taking into account derivative positions where the security is the underlying reference asset and short trading positions, with net short positions in brackets. |
| (3) |
SFT comprise of securities purchased under resale agreements, obligations related to securities sold under repurchase agreements and securities lending and borrowing transactions. Gross and net funded exposures represent all net positive positions after taking into account collateral. Collateral held against derivatives was $8,978 million and collateral held against SFT was $127,966 million. |
| (4) |
Undrawn commitments represent an estimate of the contractual amount that may be drawn upon by the obligor and include commitments to issue letters of credit on behalf of other banks in a syndicated bank lending arrangement. |
| (5) |
Includes Mexico, Chile, Peru, Colombia, Brazil, Uruguay, Venezuela, Ecuador and Argentina. |
| (6) |
Includes Middle East and Africa. |
|
2025 Scotiabank Annual Report
Management’s Discussion and Analysis
| Risk Management
|
|
|
Market Risk
Market risk is the risk of loss from changes in market prices and rates (including interest rates, credit spreads, equity prices, foreign exchange rates and commodity prices), the correlations between them, and their levels of volatility. Market risk includes trading risk, investment risk, structural interest rate risk and structural foreign exchange risk.
|
Below is an index of market risk disclosures:
The risk of loss due to changes in the level and/or the volatility of interest rates. This risk affects instruments such as, but not limited to, debt securities, loans, mortgages, deposits and derivatives.
Interest rate risks are managed through sensitivity analysis (including economic value of equity and net interest income), stress testing, and VaR limits and mitigated through portfolio diversification and hedges using interest rate derivatives and debt securities.
The risk of loss due to changes in the market price and volatility of credit, or the creditworthiness of issuers. This risk is mainly concentrated in loan and debt securities portfolios. Risk is managed through sensitivity,
stress testing and VaR limits and mitigated through hedges using credit derivatives.
The risk of loss resulting from changes in currency exchange rates and exchange rate volatility. Foreign currency denominated debt and other securities as well as future cash flows in foreign currencies are exposed to this type of risk. Risk is managed through sensitivity, stress testing and VaR limits and mitigated through hedges using foreign exchange positions and derivatives.
The risk of loss due to changes in prices, volatility or any other equity related risk factor of individual equity or equity linked securities. This risk affects instruments such as, but not limited to, equities, exchange traded funds, mutual funds, derivatives and other equity linked products. Risk is managed through sensitivity, stress testing and VaR limits and mitigated through hedges using physical equity and derivatives instruments.
The risk of loss due to changes in prices or volatility of metal, energy and agriculture products. Risk is managed through sensitivity, stress testing and VaR limits and mitigated through derivative hedges.
The following maps risk factors to trading and
non-trading
activities:
|
|
|
|
|
|
|
|
|
|
|
|
|
|
|
|
|
Interest rate risk
Foreign currency risk
|
|
Interest rate risk
Credit spread risk
Foreign currency risk
Equity risk
|
|
Interest rate risk
Credit spread risk
Foreign currency risk
Equity risk
Commodity risk
|
|
|
Market risk governance |
|
The Board of Directors reviews and approves market risk policies and limits annually. The Bank’s Asset-Liability Committee (ALCO), Treasury Risk Committee (TRC) and Market Risk Management and Policy Committee (MRMPC) oversee the application of the framework set by the Board, and monitor the Bank’s market risk exposures and the activities that give rise to these exposures. The MRMPC and TRC establish specific operating policies and sets limits at the product, portfolio, business unit and business line levels, and for the Bank in total. Limits are reviewed at least annually.
Global Risk Management provides independent oversight of all significant market risks, supporting the MRMPC, TRC and ALCO with analysis, risk measurement, monitoring, reporting, proposals for standards and support for new product development. To ensure compliance with policies and limits, market risk exposures are independently monitored on a continuing basis, either by Global Risk Management or the back offices. They provide senior management, business units, the ALCO, TRC, and the MRMPC with a series of reports on market risk exposures by business line and risk type.
Market risk is also managed through the use of a variety of hedging instruments, including derivatives and securities. These instruments are approved for trading by Global Risk Management and the effectiveness of hedging activity is captured through limits on net exposure to risk factors.
The Bank uses a variety of metrics and models to measure and control market risk exposures. These measurements are selected based on an assessment of the nature of risks in a particular activity. The principal measurement techniques applied to market risk exposure are Value at Risk (VaR), stress testing, and sensitivity analysis. The use and attributes of each of these techniques are noted in the Risk Measurement Summary.
VaR is a statistical method of measuring potential loss due to market risk based upon a common confidence interval and time ho rizon. The Bank calculates VaR daily using a 99 % confidence level, and a holding period for its trading portfolios. This means that once in every 100 days, the trading positions are expected to lose more than the VaR estimate. The Bank calculates VaR using historical simulation based on 300 days of market data. Effective November 1, 2024, credit spread VaR also captures issuer-specific credit spread volatility which was previously included in debt specific VaR.
|
2025 Scotiabank Annual Report
|
Management’s Discussion and Analysis
|
|
All material risk factors are captured in VaR. Where historical data is not available, proxies are used to establish the relevant volatility for VaR until sufficient data is available. Changes in VaR between reporting periods are generally due to changes in positions, volatilities and/or correlations between asset classes. Backtesting is also an important and necessary part of the VaR process. The Bank backtests the actual trading profit and loss against the VaR result to validate the quality and accuracy of the Bank’s VaR model. The Board reviews VaR results quarterly.
A limitation of VaR is that it only reflects the recent history of market volatility. To complement this measure, stress testing examines the impact that abnormally large changes in market factors and periods of prolonged inactivity might have on trading portfolios. Stress testing scenarios are designed to include large shifts in risk factors as well as historical and theoretical multi risk market events. Historical scenarios capture severe movements over periods that are significantly longer than the one-day holding period captured in VaR, such as the Silicon Valley Bank Crisis Scenario, COVID-19 Scenario or the 2008 Financial Crisis Scenario. Stress testing is a dynamic tool which provides management with information on potential losses due to tail events.
The Bank subjects its trading portfolios to a series of daily stress tests. The stress testing program is an essential component of the Bank’s comprehensive risk management framework which complements the VaR methodology and other risk measures and controls employed by the Bank.
In trading portfolios, sensitivity analysis is used to measure the effect of changes in risk factors, including prices and volatility, on financial products and portfolios. These measures apply across product types and geographies and are used for limit monitoring and management reporting.
In non-trading portfolios, sensitivity analysis assesses the effect of changes in interest rates on current earnings and on the economic value of equity. It is applied globally to each of the major currencies within the Bank’s operations. The Bank’s sensitivity analysis for limit and disclosure purposes is measured through positive and negative parallel shifts in the underlying interest rate curves. These calculations are based on models that consider a number of inputs and are on a constant balance sheet and make no assumptions for management actions that may mitigate the risks. The Bank also performs sensitivity analysis using various non-parallel interest rate curve shifts, for example: curve steepeners, curve flatteners and curve twists.
Validation of market risk models Prior to the implementation of new market risk models, validation and testing are conducted. Validation is conducted when the model is initially developed and when any significant changes are made to the model. The models are also subject to ongoing validation, the frequency of which is determined by model risk ratings. Models may also be triggered for earlier revalidation when there have been significant structural changes in the market or changes to the composition of the portfolio. Model validation includes backtesting, and additional analysis such as:
Theoretical review or tests to demonstrate whether assumptions made within the internal model are appropriate; and
Impact tests including stress testing that would occur under historical and hypothetical market conditions.
The validation process is governed by the Bank’s Model Risk Management Policy.
|
Credit Valuation Adjustment (CVA) is the adjustment to risk free
value of transactions to account for the potential default of a counterparty. CVA risk is the risk of loss arising from changing CVA values in response to changes in counterparty credit spreads and market risk factors.
The CVA risk management framework is governed as part of the Bank’s risk management policies which are designed to ensure effective oversight and control of market risk and CVA risks. Regular risk reporting to senior management provides aggregate measures of risk for CVA and is used to ensure compliance with risk appetite, policies, limits, and guidelines. The framework includes independent control units responsible for maintaining the integrity and effectiveness of CVA risk management practices. These units operate separately from the lines of business to ensure unbiased oversight. Regular independent reviews are conducted to assess the effectiveness of the CVA risk management and hedging framework. The governance structure and Bank policies ensure that data acquisition for CVA calculation is independent of the lines of business.
Senior management is actively involved in the risk control process. They oversee the implementation of policies and procedures to identify, measure, monitor, and control CVA risks. Updates to the CVA risk management framework and policies are approved by senior management committees. Senior management receives regular reports on CVA risk exposures and the effectiveness of hedging strategies. This continuous monitoring helps in making informed dec
isi
ons and maintaining a robust risk management framework.
|
|
|
Funding and investment activities Market risk arising from the Bank’s funding and investment activities is identified, managed and controlled through the Bank’s asset-liability management processes. The Asset-Liability Committee meets monthly to review risks and opportunities, and evaluate performance including the effectiveness of hedging strategies.
Interest rate risk arising from the Bank’s lending, funding and investment activities is managed in accordance with Board-approved policies and global limits, which are designed to control the risk to net interest income and economic value of equity. The net interest income (NII) sensitivity measures the effect of a specified change in interest rates on the Bank’s annual net interest income over the next twelve months, while the economic value of equity (EVE) sensitivity measures the impact of a specified change in interest rates on the present value of the Bank’s net assets. Limits for both measurements are set according to the documented risk appetite of the Bank. Board-level limit utilization is reported to both the Asset-Liability Committee and the Board on a regular basis. Any limit exceptions are reported according to the Limit Monitoring and Compliance Policy of the Bank.
|
|
2025 Scotiabank Annual Report
Management’s Discussion and Analysis
| Risk Management
|
|
The net interest income and the economic value of equity result from the differences between yields earned on the Bank’s non-trading assets and interest expense paid on its liabilities. Net interest income and economic value of equity sensitivities measure the risk to the Bank’s earnings and capital arising from adverse movements in interest rates that affect the Bank’s banking book position. The Bank’s banking book position reflects the mismatch of the maturity and re-pricing characteristics between the assets and liabilities and optional elements embedded in the Bank’s structural balance sheet (e.g. mortgage prepayment). The mismatch and embedded optional elements are inherent in the non-trading operations of the Bank and exposes it to changes of interest rates. The Asset-Liability Committee provides strategic direction for the management of structural interest rate risk within the risk appetite framework authorized by the Board of Directors. The asset/liability management strategy is executed by Group Treasury with the objective of protecting net interest income within established risk tolerances.
|
Simulation modeling, sensitivity analysis and stress testing are used to assess exposures and for limit monitoring of the Bank’s interest rate risk in the banking book. The Bank’s interest rate risk exposure is estimated by simulating the banking book position under a range of rate shocks. The simulations incorporate maturities, renewal, and repricing characteristics of the banking book along with prepayment and redemption behaviour of loans and cashable investment products. Calculations are generally based on the earlier of contractual
re-pricing
or maturity of
on-balance
sheet and
off-balance
sheet assets and liabilities, although certain assets and liabilities such as credit cards and deposits without a fixed maturity are assigned a maturity profile based on the longevity of the exposure. Expected prepayments from loans and cashable investment products are also incorporated into the exposure calculations.
|
Table T50 shows the pro-forma pre-tax impact on the Bank’s net interest income over the next twelve months and economic value of equity of an immediate and sustained 100 basis points parallel increase and decrease in interest rate across major currencies as defined by the Bank. The interest rate sensitivities tabulated are based on models that consider a number of inputs and are on a constant balance sheet. There are no assumptions made for management actions that may mitigate risk. Based on the Bank’s interest rate positions as at October 31, 2025, an immediate and sustained 100 basis point increase in interest rates across all major currencies and maturities would increase pre-tax net interest income by approximately $
236 million over the next 12 months, assuming no further management actions. During fiscal 2025, this measure ranged between increase of $ 102 million and increase of $ 236 million.
|
This same increase in interest rates would result in an
pre-tax
decrease in the present value of the Bank’s net assets of approximately $1,568 million. During fiscal 2025, this measure ranged between $1,147 million and $1,568 million. The directional sensitivity of these
two k
ey metrics is largely determined by the difference in time horizons (net interest income captures the impact over the next twelve months only, whereas economic value considers the potential impact of interest rate changes on the present value of all future cash flows). The net interest income and economic value results are compared to the authorized Board limits. Both interest rate sensitivities remained within the Bank’s approved consolidated limits in the reporting period.
|
|
|
|
|
|
|
|
|
|
|
|
|
|
|
|
|
|
|
|
|
|
|
|
|
|
|
|
|
|
|
|
|
T50 Structural interest sensitivity* |
|
|
|
|
|
|
|
|
|
|
|
|
|
|
|
|
|
|
|
|
|
|
|
|
|
|
|
|
|
|
|
|
|
|
|
|
|
|
|
|
|
|
|
|
|
|
|
|
|
|
|
|
|
|
|
|
|
|
|
|
|
|
|
|
|
|
|
|
| |
|
|
|
|
2024 |
|
| |
|
|
|
|
|
|
|
Economic
Value of
Equity |
|
|
Net
Interest
Income |
|
| As at October 31 ($ millions) |
|
|
|
|
|
|
|
|
|
|
|
|
|
|
|
|
|
|
|
|
|
|
|
|
|
|
|
|
|
|
|
|
|
|
|
|
|
|
|
|
|
|
|
|
|
|
|
|
|
|
|
100bp increase in rates |
|
|
|
|
|
|
|
|
|
|
|
|
|
|
|
|
|
|
|
|
|
|
|
|
|
|
|
|
|
|
|
|
|
|
|
|
|
|
|
|
|
|
|
|
|
|
|
|
|
|
|
|
|
|
|
|
|
|
$ |
(1,338 |
) |
|
$ |
(21 |
) |
100bp decrease in rates |
|
|
|
|
|
|
|
|
|
|
|
|
|
|
|
|
|
|
|
|
|
|
|
|
|
|
|
|
|
|
|
|
|
|
|
|
|
|
|
|
|
|
|
|
|
|
|
|
|
|
|
|
|
|
|
|
|
|
$ |
780 |
|
|
$ |
(31 |
) |
As per OSFI Capital Adequacy Requirements (CAR), an internal risk transfer is defined as an internal record of a transfer of risk within the banking or trading book, or between the banking and trading book.
In certain cases, it is more efficient for the Bank to hedge a banking book’s interest rate risk exposure through an internal risk transfer to a trading desk which can externalize the risk to the market. This activity is governed by regulatory defined parameters to ensure the market risk is externalized.
|
|
Foreign currency risk in the Bank’s unhedged funding and investment activities arises primarily from the Bank’s net investments in foreign operations as well as foreign currency earnings in its domestic and remitting foreign branch operations.
The Bank’s foreign currency exposure to its net investments in foreign operations is controlled by a Board-approved limit. This limit considers factors such as potential volatility to shareholders’ equity as well as the potential impact on capital ratios from foreign exchange fluctuations. On a monthly basis, the Asset-Liability Committee reviews the Bank’s foreign currency net investment exposures and determines the appropriate hedging strategies. These may include funding the investments in the same currency or using other financial instruments, including derivatives.
Foreign currency translation gains and losses from net investments in foreign operations, net of related hedging activities and tax effects, are recorded in accumulated other comprehensive income within shareholders’ equity. However, the Bank’s regulatory capital ratios are not materially affected by these foreign exchange fluctuations because the risk-weighted assets of the foreign operations tend to move in a similar direction.
The Bank is also subject to foreign currency translation risk on the earnings of its domestic and remitting foreign branch operations. The Bank forecasts foreign currency revenues and expenses, over a number of future fiscal quarters. The Asset-Liability Committee also assesses
|
2025 Scotiabank Annual Report
|
Management’s Discussion and Analysis
|
economic data trends and forecasts to determine if some or all of the estimated future foreign currency revenues and expenses should be hedged. Hedging instruments normally include foreign currency spot and forward contracts, as well as foreign currency options and swaps. Certain of these economic hedges may not qualify for hedge accounting resulting in a potential for a mismatch in the timing of the recognition of economic hedge gains/losses and the underlying foreign earnings translation gains/losses. In accordance with IFRS, foreign currency translation gains and losses relating to monetary and non-monetary items are recorded directly in earnings.
As at October 31, 2025, a one percent increase (decrease) in the Canadian dollar against all currencies in which the Bank operates decreases (increases) the Bank’s before-tax annual earnings by approximately $ 40 million (October 31, 2024 – $45 million) in the absence of hedging activity, due primarily from exposure to U.S. dollars from the Bank’s operations in the U.S. and activities conducted internationally in this currency and from exposures to Latin American currencies. A similar change in the Canadian dollar as at October 31, 2025 would increase (decrease) the unrealized foreign currency translation losses in the accumulated other comprehensive income in equity by approximately $ 396 million (October 31, 2024 – $ 324 million), net of hedging.
Equity risk is the risk of loss due to adverse movements in equity prices. Equity price risk is often classified into two categories: general equity risk, which refers to the sensitivity of an instrument or portfolio’s value to changes in the overall level of equity prices, and specific equity risk, which refers to that portion of an individual equity instrument’s price volatility that is determined by entity-specific characteristics.
The Bank is exposed to equity risk through its equity investment portfolios, which are controlled by Board-approved portfolio and VaR limits. Equity investments include common and preferred shares, as well as a diversified portfolio of third-party managed funds.
The majority of the Bank’s equity investment portfolios are managed by Group Treasury under the strategic direction of the ALCO. Group Treasury delegates the management of a portion of equity and equity-related portfolios to other external fund managers to take advantage of these fund managers’ expertise in particular market niches and products.
Investment portfolio risks The Bank holds investment portfolios to meet liquidity and statutory reserve requirements and for investment purposes. These portfolios expose the Bank to interest rate, foreign currency, credit spread and equity risks. Debt investments primarily consist of government, agency, and corporate bonds. Equity investments include common and preferred shares, as well as a diversified portfolio of third-party managed funds. The majority of these securities are valued using prices obtained from external sources. These portfolios are controlled by a Board-approved policy and limits.
The Bank’s policies, processes and controls for trading activities are designed to achieve a balance between pursuing profitable trading opportunities and managing earnings volatility within a framework of sound and prudent practices. Trading activities are primarily customer focused.
|
The designation of an instrument as a trading instrument is determined by the Bank’s Market Risk Management policies. OSFI’s Capital Adequacy Requirements (CAR) guideline prescribes a list of instrument types which are presumed to be part of a Bank’s trading portfolio. To assign these instruments to the banking book, certain criteria must be met including OSFI’s approval.
The Bank’s list of these instruments include equity positions which are outside of the trading business and primarily held for investment, membership in exchanges or to manage the stock-based compensation program. There are also fixed income positions which include positions held for liquidity or regulatory purposes, positions within Wealth Management and loans held as available for sale. As of October 31, 2025, the market value of the instruments mentioned above is $4,483 million in total.
There has been no case where instruments have been moved between the trading and banking book since October 31, 2024.
|
Market risk arising from the Bank’s trading activities is managed in accordance with Board-approved policies, and aggregate VaR and stress testing limits. Trading portfolios are in accordance with the Bank’s valuation policies. Positions are daily and valuations are independently reviewed by GRM or finance units on a regular basis. These units also provide profit and loss reporting, as well as VaR and limit compliance reporting to business unit management and executive management for evaluation and action as appropriate. The quality of the Bank’s VaR is validated by regular backtesting analysis, in which the VaR is compared to both theoretical profit and loss results based on fixed end of day positions and actual reported profit and loss. A VaR at the 99 % confidence interval is an indication of a 1 % probability that losses will exceed the VaR if positions remain unchanged during the next business day. Trading positions are however managed dynamically and, as a result, actual profit/loss backtesting exceptions are uncommon. Aging reports are used to monitor the frequency of turnover of trading portfolio inventory.
Value at Risk (VaR) is a key measure of market risk in the Bank’s trading activities. In fiscal 2025, the total VaR for trading activities averaged $ 13.6 million, compared to $ 14.9 million in 2024. The change was mainly driven by lower equity and foreign exchange risk.
|
|
|
|
|
|
|
|
|
|
|
|
|
|
|
|
|
|
|
|
|
|
|
|
|
|
|
|
|
|
|
|
|
|
|
|
|
|
T51 Market risk measures* |
|
|
|
|
|
|
|
|
|
|
|
|
|
|
|
|
|
|
|
|
|
|
|
|
|
|
|
|
|
|
|
|
|
|
|
|
|
|
|
|
|
|
|
|
|
|
|
|
|
|
|
|
|
|
|
|
|
|
|
|
|
|
|
|
|
|
|
|
|
|
|
|
|
|
|
|
|
| |
|
|
|
|
|
|
|
2024 |
|
|
|
|
|
|
|
|
|
|
|
| ($ millions) |
|
|
|
|
|
|
|
|
|
|
|
|
|
|
|
|
Year end |
|
|
Avg |
|
|
High |
|
|
Low |
|
Credit Spread plus Interest Rate |
|
|
|
|
|
|
|
|
|
|
|
|
|
|
|
|
|
|
|
|
|
$ |
12.5 |
|
|
$ |
13.6 |
|
|
$ |
34.3 |
|
|
$ |
6.8 |
|
|
|
|
|
|
|
|
|
|
|
|
|
|
|
|
|
|
|
|
|
|
|
|
7.3 |
|
|
|
8.4 |
|
|
|
13.6 |
|
|
|
5.9 |
|
Interest Rate |
|
|
|
|
|
|
|
|
|
|
|
|
|
|
|
|
|
|
|
|
|
|
17.5 |
|
|
|
12.3 |
|
|
|
26.9 |
|
|
|
5.8 |
|
Equities |
|
|
|
|
|
|
|
|
|
|
|
|
|
|
|
|
|
|
|
|
|
|
5.4 |
|
|
|
5.1 |
|
|
|
10.1 |
|
|
|
3.0 |
|
Foreign Exchange |
|
|
|
|
|
|
|
|
|
|
|
|
|
|
|
|
|
|
|
|
|
|
2.9 |
|
|
|
3.2 |
|
|
|
9.4 |
|
|
|
1.1 |
|
Commodities |
|
|
|
|
|
|
|
|
|
|
|
|
|
|
|
|
|
|
|
|
|
|
2.8 |
|
|
|
2.6 |
|
|
|
4.6 |
|
|
|
1.3 |
|
Debt Specific |
|
|
|
|
|
|
|
|
|
|
|
|
|
|
|
|
|
|
|
|
|
|
3.6 |
|
|
|
3.4 |
|
|
|
4.8 |
|
|
|
2.3 |
|
Diversification Effect |
|
|
|
|
|
|
|
|
|
|
|
|
|
|
|
|
|
|
|
|
|
|
(15.0 |
) |
|
|
(13.1 |
) |
|
|
n.m. |
|
|
|
n.m. |
|
|
|
|
|
|
|
|
|
|
|
|
|
|
|
|
|
|
|
|
|
|
|
$ |
12.1 |
|
|
$ |
14.9 |
|
|
$ |
24.2 |
|
|
$ |
8.3 |
|
|
(1) Effective November 1, 2024, credit spread VaR also captures issuer-specific credit spread volatility which was previously included in debt specific VaR. |
|
2025 Scotiabank Annual Report
Management’s Discussion and Analysis
| Risk Management
Description of trading revenue components and graphical comparison of VaR to daily P&L
Chart C29 compares the daily trading revenue distribution to daily VaR results. Trading revenue includes changes in portfolio value as well as the impact of new trades, commissions, fees and reserves. Some components of revenue which are calculated less frequently are
pro-rated.
Trading revenue averaged $16.3 million per day, increased from $13.0 million in 2024. Revenue was positive on 100% of trading days during the year, which was the same as the level in 2024. The largest
single-day
trading revenue gain in this fiscal year was $43.4 million which occurred on November 1, 2024.
|
Daily trading revenue vs. VaR $ millions, November 1, 2024 to October 31, 2025
|
Credit valuation adjustment (CVA) risk
Credit Valuation Adjustment (CVA) is the difference between the risk free value of a portfolio and the true value of that portfolio, accounting for the possible default of a counterparty. The CVA adjustment aims to identify the impact of Counterparty Risk.
CVA risk management framework
The CVA risk management is part of the Bank’s market risk management framework. The framework includes a market risk limit structure to control the level of risk taken by the Bank. This involves setting limits on various risk factors, such as interest rates, foreign exchange rates, and counterparty credit spreads. The Bank uses various tools to measure CVA risk, including stress testing and sensitivity analysis. Regular management reports are produced to monitor market risk exposure. These reports provide insights into the Bank’s risk profile and help in making informed decisions.
Senior management role in the CVA risk management framework.
Senior management is actively involved in the risk control process. They oversee the implementation of policies and procedures to identify, measure, monitor, and control CVA risks. Updates to the CVA risk management framework are approved by senior management committees such as the Market Risk Management & Policy Committee (MRMPC) and the Senior Credit Committee (SCC). Material changes to policies and processes are reviewed and approved by senior executives. Senior management receives regular reports on CVA risk exposures and the effectiveness of hedging strategies. This continuous monitoring helps in making informed decisions and maintaining a robust risk management framework. Senior management ensures that adequate resources are allocated to CVA risk management. This includes staffing independent control units and providing the necessary tools and systems for effective risk management.
An overview of the governance of the CVA risk management framework
The CVA (Credit Valuation Adjustment) risk management framework is governed by the Bank’s risk management policies which are designed to ensure effective oversight and control of market risk, including CVA risks. Regular risk reporting to senior management provides aggregate measures of risk for CVA and is used to ensure compliance with risk appetite, policies, limits, and guidelines. The framework includes independent control units responsible for maintaining the integrity and effectiveness of CVA risk management practices. These units operate separately from the lines of business to ensure unbiased oversight. Regular independent reviews are conducted to assess the effectiveness of the CVA risk management framework. These reviews help identify any gaps or areas for improvement and ensure that the framework remains robust and effective. The governance structure and Bank policies ensure that data acquisition for CVA calculation is independent of the lines of business. This independence is crucial for maintaining the accuracy and reliability of the data used in risk assessments.
Processes implemented to identify, measure, monitor and control CVA risks, including policies for hedging CVA risk and the processes for monitoring the continuing effectiveness of hedges
The Bank uses a variety of metrics and models to measure and control CVA risk exposures. These measurements are selected based on an assessment of the nature of risks of CVA. The principal measurement techniques are stress testing and sensitivity analysis.
To ensure compliance with policies and limits, CVA risk exposures are independently monitored on a continuing basis by Global Risk Management. They provide senior management, business units and the MRMPC with a series of reports on CVA risk exposures.
CVA risk is managed using a variety of hedging instruments, including derivatives and securities. These instruments are approved for trading by Global Risk Management and the effectiveness of hedging activity is captured through limits on net exposure to risk factors.
2025 Scotiabank Annual Report
|
Management’s Discussion and Analysis
Market risk linkage to Consolidated Statement of Financial Position
Trading assets and liabilities are generally
daily and included in trading risk measures and market risk capital. Derivatives captured under trading risk measures are related to market making and hedging of trading exposures. A comparison of Consolidated Statement of Financial Position items which are covered under the trading and
non-trading
risk measures is provided in the table below.
T52
Market risk linkage to Consolidated Statement of Financial Position of the Bank
|
|
|
|
|
|
|
|
|
|
|
|
|
|
|
|
|
|
|
| |
|
|
|
|
|
Consolidated
Statement of
Financial
Position |
|
|
|
|
|
|
|
|
Not subject to
market risk |
|
|
Primary risk sensitivity of non-trading risk
|
|
|
|
|
|
|
|
|
|
|
|
|
|
|
|
|
|
|
|
|
|
|
|
|
|
|
|
|
|
|
|
|
|
|
|
|
|
|
Derivative financial instruments |
|
|
|
|
|
|
|
|
|
|
|
|
|
|
|
|
|
Interest rate, FX, equity |
|
|
|
|
|
|
|
|
|
|
|
|
|
|
|
|
|
|
Interest rate, FX, equity |
|
|
|
|
|
|
|
|
|
|
|
|
|
|
|
|
|
|
|
|
|
|
|
|
|
|
|
|
|
|
|
|
|
|
|
|
|
|
|
|
|
|
|
|
|
|
|
|
|
|
|
|
|
|
|
|
|
|
|
|
|
|
|
|
|
|
|
|
|
|
|
|
|
|
|
|
|
|
|
|
|
|
|
|
|
|
|
|
|
|
|
|
|
|
Interest rate, FX, equity |
Financial instruments designated at fair value through profit or loss |
|
|
|
|
|
|
|
|
|
|
|
|
|
|
|
|
|
|
Obligations related to securities sold short |
|
|
|
|
|
|
|
|
|
|
|
|
|
|
|
|
|
|
Derivative financial instruments |
|
|
|
|
|
|
|
|
|
|
|
|
|
|
|
|
|
Interest rate, FX, equity |
|
|
|
|
|
|
|
|
|
|
|
|
|
|
|
|
|
|
|
Pension and other benefit liabilities |
|
|
|
|
|
|
|
|
|
|
|
|
|
|
|
|
|
Interest rate, credit spread, equity |
|
|
|
|
|
|
|
|
|
|
|
|
|
|
|
|
|
|
|
|
|
|
|
|
|
|
|
|
|
|
|
|
|
|
|
|
|
|
| (1) |
Includes goodwill, intangibles, other assets and securities purchased under resale agreements and securities borrowed. |
| (2) |
Gold and silver certificates and bullion included in other liabilities. |
| (3) |
Includes obligations related to securities sold under repurchase agreements and securities lent and other liabilities. |
|
|
|
|
|
|
|
|
|
|
|
|
|
|
|
|
|
|
|
|
|
|
|
| |
|
Market Risk Measure |
|
|
|
|
Consolidated
Statement of
Financial
Position |
|
|
Trading Risk |
|
|
|
|
|
Not subject to
market risk |
|
|
Primary risk sensitivity of non-trading risk
|
|
|
|
$ |
2,540 |
|
|
$ |
2,540 |
|
|
$ |
– |
|
|
$ |
– |
|
|
|
n/a |
|
|
|
|
129,727 |
|
|
|
129,032 |
|
|
|
695 |
|
|
|
– |
|
|
|
Interest rate, FX |
|
Derivative financial instruments |
|
|
44,379 |
|
|
|
39,736 |
|
|
|
4,643 |
|
|
|
– |
|
|
|
Interest rate, FX, equity |
|
|
|
|
152,832 |
|
|
|
– |
|
|
|
152,832 |
|
|
|
– |
|
|
|
Interest rate, FX, equity |
|
|
|
|
760,829 |
|
|
|
– |
|
|
|
760,829 |
|
|
|
– |
|
|
|
Interest rate, FX |
|
|
|
|
321,720 |
|
|
|
448 |
|
|
|
– |
|
|
|
321,272 |
|
|
|
n/a |
|
|
|
$ |
1,412,027 |
|
|
$ |
171,756 |
|
|
$ |
918,999 |
|
|
$ |
321,272 |
|
|
|
|
|
|
|
$ |
943,849 |
|
|
$ |
– |
|
|
$ |
901,328 |
|
|
$ |
42,521 |
|
|
|
Interest rate, FX, equity |
|
Financial instruments designated at fair value through profit or loss |
|
|
36,341 |
|
|
|
36,341 |
|
|
|
– |
|
|
|
– |
|
|
|
Interest rate, equity |
|
Obligations related to securities sold short |
|
|
35,042 |
|
|
|
35,042 |
|
|
|
– |
|
|
|
– |
|
|
|
n/a |
|
Derivative financial instruments |
|
|
51,260 |
|
|
|
45,652 |
|
|
|
5,608 |
|
|
|
– |
|
|
|
Interest rate, FX, equity |
|
|
|
|
578 |
|
|
|
578 |
|
|
|
– |
|
|
|
– |
|
|
|
n/a |
|
Pension and other benefit liabilities |
|
|
1,587 |
|
|
|
– |
|
|
|
1,587 |
|
|
|
– |
|
|
|
Interest rate, credit spread, equity |
|
|
|
|
259,294 |
|
|
|
275 |
|
|
|
– |
|
|
|
259,019 |
|
|
|
n/a |
|
|
|
$ |
1,327,951 |
|
|
$ |
117,888 |
|
|
$ |
908,523 |
|
|
$ |
301,540 |
|
|
|
|
|
| (1) |
Includes goodwill, intangibles, other assets and securities purchased under resale agreements and securities borrowed. |
| (2) |
Gold and silver certificates and bullion included in other liabilities. |
| (3) |
Includes obligations related to securities sold under repurchase agreements and securities lent and other liabilities. |
Derivative instruments and structured transactions
The Bank uses derivatives to meet customer needs, generate revenues from trading activities, manage market and credit risks arising from its lending, and for funding and investment activities. The Bank uses several types of derivative products, including interest rate swaps, futures and options, to hedge interest rate risk exposure. Forward contracts, swaps and options are used to manage foreign currency risk exposures. Credit exposures in its lending and investment books may be managed using credit default swaps. As a dealer, the Bank markets a range of derivatives to its customers, including interest rate, foreign exchange, equity, commodity and credit derivatives.
Market risk arising from derivatives transactions is subject to the control, reporting and analytical techniques noted above. Additional controls and analytical techniques are applied to address certain market-related risks that are unique to derivative products.
|
2025 Scotiabank Annual Report
Management’s Discussion and Analysis
| Risk Management
Structured transactions are specialized transactions that may involve combinations of cash, other financial assets and derivatives designed to meet the specific risk management or financial requirements of customers. These transactions are carefully evaluated by the Bank to identify and address the credit, market, legal, tax, reputational and other risks, and are subject to a cross-functional review and
sign-off
by Trading Management, Global Risk Management, Taxation, Finance and Legal departments. Large structured transactions are also subject to review by senior risk management committees and evaluated in accordance with the procedures described below in Reputational Risk.
The market risk in these transactions is usually minimal, and returns are earned by providing structuring expertise and by taking credit risk. Once executed, structured transactions are subject to the same ongoing credit reviews and market risk analysis as other types of derivatives transactions. This review and analysis includes careful monitoring of the quality of the reference assets, and ongoing valuation of the derivatives and reference assets.
|
| Liquidity Risk Liquidity risk is the risk that the Bank is unable to meet its financial obligations in a timely manner at reasonable prices. Financial obligations include liabilities to depositors, payments due under derivative contracts, settlement of securities borrowing and repurchase transactions, and lending and investment commitments. Effective liquidity risk management is essential to maintain the confidence of depositors and counterparties, manage the Bank’s cost of funds and to support core business activities, even under adverse circumstances. Liquidity risk is managed within the framework of policies and limits that are approved by the Board of Directors. The Board receives reports on risk exposures and performance against approved limits. The Asset-Liability Committee (ALCO) and the Treasury Risk Committee (TRC) provide senior management oversight of liquidity risk. The key elements of the liquidity risk framework are: Measurement and modeling – the Bank’s liquidity model measures and forecasts cash inflows and outflows, including off-balance sheet cash flows on a daily basis. Risk is managed by a set of key limits over the maximum net cash outflow by currency over specified short-term horizons (cash gaps), a minimum level of core liquidity, and liquidity stress tests. Reporting – Global Risk Management provides independent oversight of all significant liquidity risks, supporting the ALCO and TRC with analysis, risk measurement, stress testing, monitoring and reporting. Stress testing – the Bank performs liquidity stress testing on a regular basis, to evaluate the effect of both industry-wide and Bank-specific disruptions on the Bank’s liquidity position. Liquidity stress testing has many purposes including: Helping the Bank understand the potential behavior of various on-balance sheet and off-balance sheet positions in circumstances of stress; and Based on this knowledge, facilitating the development of risk mitigation and contingency plans. The Bank’s liquidity stress tests consider the effect of changes in funding assumptions, depositor behavior and the market value of liquid assets. The Bank performs industry standard stress tests, the results of which are reviewed at senior levels of the organization and are considered in making liquidity management decisions. Contingency planning – the Bank maintains a liquidity contingency plan that specifies an approach for analyzing and responding to actual and potential liquidity events. The plan outlines an appropriate governance structure for the management and monitoring of liquidity events, processes for effective internal and external communication, and identifies potential counter measures to be considered at various stages of an event. A contingency plan is maintained both at the parent-level as well as for major subsidiaries. Funding diversification – the Bank actively manages the diversification of its deposit liabilities by source, type of depositor, instrument, term and geography. Core liquidity – the Bank maintains a pool of highly liquid, unencumbered assets that can be readily sold or pledged to secure borrowings under stressed market conditions or due to Bank-specific events. The Bank also maintains liquid assets to support its intra-day settlement obligations in payment, depository and clearing systems. The Bank’s foreign operations have liquidity management frameworks that are similar to the Bank’s framework. Local deposits are managed from a liquidity risk perspective based on the local management frameworks and regulatory requirements. The Bank is subject to liquidity risk relating to its use of derivatives to meet customer needs, generate revenues from trading activities, manage market and credit risks arising from its lending, funding and investment activities, and lower its cost of capital. The maturity profile of the notional amounts of the Bank’s derivative instruments is summarized in Note 9(b) of the consolidated financial statements. Liquid assets are a key component of liquidity management and the Bank holds these types of assets in sufficient quantity to meet potential needs for liquidity management. Liquid assets can be used to generate cash either through sale, repurchase transactions or other transactions where these assets can be used as collateral to generate cash, or by allowing the asset to mature. Liquid assets include deposits at central banks, deposits with financial institutions, call and other short-term loans, marketable securities, precious metals and securities received as collateral from securities financing and derivative transactions. Liquid assets do not include borrowing capacity from central bank facilities. |
Marketable securities are securities traded in active markets, which can be converted to cash within a timeframe that is in accordance with the Bank’s liquidity management framework. Assets are assessed considering a number of factors, including the expected time it would take to convert them to cash.
Marketable securities included in liquid assets are comprised of securities specifically held as a liquidity buffer or for asset liability management purposes; trading securities, which are primarily held by Global Banking and Markets; and collateral received for securities financing and derivative transactions.
2025 Scotiabank Annual Report
|
Management’s Discussion and Analysis
The Bank maintains large holdings of unencumbered liquid assets to support its operations. These assets generally can be sold or pledged to meet the Bank’s obligations. As at October 31, 2025, unencumbered liquid assets were $327 billion (October 31, 2024 – $310 billion). Securities, including National Housing Act (NHA) mortgage-backed securities, comprised 80% of liquid assets (October 31, 2024 – 81%). Other unencumbered liquid assets, comprising cash and deposits with central banks, deposits with financial institutions and precious metals, were 20% (October 31, 2024 – 19%). The increase in total unencumbered liquid assets was attributable to an increase in other liquid securities, NHA mortgage backed securities, cash and deposits with central banks, foreign government obligations and precious metals, partly offset by a decrease in Canada government obligations and deposits with financial institutions.
The carrying values outlined in the liquid asset table are consistent with the carrying values in the Bank’s Consolidated Statement of Financial Position as at October 31, 2025. The liquidity value of the portfolio will vary under different stress events as different assumptions are used for the stress scenarios.
The Bank’s liquid asset pool is summarized in the following table:
|
|
|
|
|
|
|
|
|
|
|
|
|
|
|
|
|
|
|
|
|
|
|
|
|
|
|
|
|
|
|
|
|
| |
|
|
|
|
|
|
|
|
|
|
|
|
|
|
|
|
Unencumbered
liquid assets |
|
|
|
|
|
|
|
|
|
|
| As at October 31, 2025 ($ millions) |
|
|
|
|
Securities received as
collateral from securities
financing and derivative
transactions |
|
|
|
|
|
|
|
|
|
|
|
|
|
|
|
|
|
|
|
| Cash and deposits with central banks |
|
|
|
|
|
|
|
|
|
|
|
|
|
|
|
|
|
|
|
|
|
|
|
|
|
|
|
|
|
|
|
|
| Deposits with financial institutions |
|
|
|
|
|
|
|
|
|
|
|
|
|
|
|
|
|
|
|
|
|
|
|
|
|
|
|
|
|
|
|
|
| Precious metals |
|
|
|
|
|
|
|
|
|
|
|
|
|
|
|
|
|
|
|
|
|
|
|
|
|
|
|
|
|
|
|
|
| Securities: |
|
|
|
|
|
|
|
|
|
|
|
|
|
|
|
|
|
|
|
|
|
|
|
|
|
|
|
|
|
|
|
|
| Canadian government obligations |
|
|
|
|
|
|
|
|
|
|
|
|
|
|
|
|
|
|
|
|
|
|
|
|
|
|
|
|
|
|
|
|
| Foreign government obligations |
|
|
|
|
|
|
|
|
|
|
|
|
|
|
|
|
|
|
|
|
|
|
|
|
|
|
|
|
|
|
|
|
| Other securities |
|
|
|
|
|
|
|
|
|
|
|
|
|
|
|
|
|
|
|
|
|
|
|
|
|
|
|
|
|
|
|
|
| NHA mortgage-backed securities |
|
|
|
|
|
|
|
|
|
|
|
|
|
|
|
|
|
|
|
|
|
|
|
|
|
|
|
|
|
|
|
|
| Total |
|
|
|
|
|
|
|
|
|
|
|
|
|
|
|
|
|
|
|
|
|
|
|
|
|
|
|
|
|
|
|
|
|
|
|
|
|
|
|
| |
|
|
|
|
|
|
|
|
|
|
Encumbered
liquid assets |
|
|
|
|
|
Unencumbered
liquid assets |
|
|
|
|
|
|
|
|
|
|
| As at October 31, 2024 ($ millions) |
|
Bank-owned
liquid assets |
|
|
Securities received as
collateral from securities
financing and derivative
transactions |
|
|
Total liquid
assets |
|
|
Pledged as
collateral |
|
|
|
|
|
|
|
|
Available as
collateral |
|
|
Other |
|
| Cash and deposits with central banks |
|
$ |
55,976 |
|
|
$ |
– |
|
|
$ |
55,976 |
|
|
$ |
– |
|
|
$ |
5,991 |
|
|
|
|
|
|
$ |
49,985 |
|
|
$ |
– |
|
| Deposits with financial institutions |
|
|
7,884 |
|
|
|
– |
|
|
|
7,884 |
|
|
|
– |
|
|
|
82 |
|
|
|
|
|
|
|
7,802 |
|
|
|
– |
|
| Precious metals |
|
|
2,540 |
|
|
|
– |
|
|
|
2,540 |
|
|
|
– |
|
|
|
– |
|
|
|
|
|
|
|
2,540 |
|
|
|
– |
|
| Securities: |
|
|
|
|
|
|
|
|
|
|
|
|
|
|
|
|
|
|
|
|
|
|
|
|
|
|
|
|
|
|
|
|
| Canadian government obligations |
|
|
71,915 |
|
|
|
26,062 |
|
|
|
97,977 |
|
|
|
34,572 |
|
|
|
– |
|
|
|
|
|
|
|
63,405 |
|
|
|
– |
|
| Foreign government obligations |
|
|
121,072 |
|
|
|
129,991 |
|
|
|
251,063 |
|
|
|
126,371 |
|
|
|
– |
|
|
|
|
|
|
|
124,692 |
|
|
|
– |
|
| Other securities |
|
|
75,223 |
|
|
|
101,262 |
|
|
|
176,485 |
|
|
|
143,862 |
|
|
|
– |
|
|
|
|
|
|
|
32,623 |
|
|
|
– |
|
| NHA mortgage-backed securities |
|
|
35,546 |
|
|
|
– |
|
|
|
35,546 |
|
|
|
6,584 |
|
|
|
– |
|
|
|
|
|
|
|
28,962 |
|
|
|
– |
|
| Total |
|
$ |
370,156 |
|
|
$ |
257,315 |
|
|
$ |
627,471 |
|
|
$ |
311,389 |
|
|
$ |
6,073 |
|
|
|
|
|
|
$ |
310,009 |
|
|
$ |
– |
|
| (1) |
Assets which are restricted from being used to secure funding for legal or other reasons. |
A summary of total unencumbered liquid assets held by the parent bank and its branches, and domestic and foreign subsidiaries, is presented below:
T54
Total unencumbered liquid assets held by the parent bank and its branches, and domestic and foreign subsidiaries
|
|
|
|
|
|
|
|
|
|
|
|
As at October 31
($ millions) |
|
|
|
|
2024 |
|
| The Bank of Nova Scotia (Parent) |
|
|
|
|
|
$ |
235,378 |
|
| Bank domestic subsidiaries |
|
|
|
|
|
|
32,769 |
|
| Bank foreign subsidiaries |
|
|
|
|
|
|
41,862 |
|
| Total |
|
|
|
|
|
$ |
310,009 |
|
The Bank’s liquidity pool is held across major currencies, mostly comprised of Canadian and U.S. dollar holdings. As shown above, the vast majority (85%) of liquid assets are held by the Bank’s corporate office, branches of the Bank, and Canadian subsidiaries of the Bank. The Bank monitors and ensures compliance in relation to minimum levels of liquidity required and assets held within each entity, and/or jurisdiction. Potential regulatory restrictions on the transferability of liquid assets held in Bank foreign subsidiaries are taken into consideration in the Bank’s liquidity management framework.
|
2025 Scotiabank Annual Report
Management’s Discussion and Analysis
| Risk Management
In the course of the Bank’s
activities, securities and other assets are pledged to secure an obligation, participate in clearing or settlement systems, or operate in a foreign jurisdiction. Securities are also pledged under repurchase agreements. A summary of encumbered and unencumbered assets is presented below:
|
|
|
|
|
|
|
|
|
|
|
|
|
|
|
|
|
|
|
|
|
|
|
|
|
|
|
|
|
|
|
|
|
| |
|
|
|
|
|
|
|
|
|
|
|
|
|
|
|
|
|
|
|
|
|
|
|
|
|
|
|
|
|
|
|
|
|
collateral from securities financing and derivative
transactions |
|
|
|
|
|
|
|
|
|
|
|
|
|
|
Available as collateral (2)
|
|
|
|
|
Cash and deposits with central banks |
|
|
|
|
|
|
|
|
|
|
|
|
|
|
|
|
|
|
|
|
|
|
|
|
|
|
|
|
|
|
|
|
Deposits with financial institutions |
|
|
|
|
|
|
|
|
|
|
|
|
|
|
|
|
|
|
|
|
|
|
|
|
|
|
|
|
|
|
|
|
|
|
|
|
|
|
|
|
|
|
|
|
|
|
|
|
|
|
|
|
|
|
|
|
|
|
|
|
|
|
|
|
|
|
|
|
|
|
|
|
|
|
|
|
|
|
|
|
|
|
|
|
|
|
|
|
|
|
|
|
|
|
|
|
|
|
Canadian government obligations |
|
|
|
|
|
|
|
|
|
|
|
|
|
|
|
|
|
|
|
|
|
|
|
|
|
|
|
|
|
|
|
|
Foreign government obligations |
|
|
|
|
|
|
|
|
|
|
|
|
|
|
|
|
|
|
|
|
|
|
|
|
|
|
|
|
|
|
|
|
|
|
|
|
|
|
|
|
|
|
|
|
|
|
|
|
|
|
|
|
|
|
|
|
|
|
|
|
|
|
|
|
|
|
|
|
|
|
|
|
|
|
|
|
|
|
|
|
|
|
|
|
|
|
|
|
|
|
|
|
|
|
|
|
|
|
Loans classified as liquid assets: |
|
|
|
|
|
|
|
|
|
|
|
|
|
|
|
|
|
|
|
|
|
|
|
|
|
|
|
|
|
|
|
|
NHA mortgage-backed securities |
|
|
|
|
|
|
|
|
|
|
|
|
|
|
|
|
|
|
|
|
|
|
|
|
|
|
|
|
|
|
|
|
|
|
|
|
|
|
|
|
|
|
|
|
|
|
|
|
|
|
|
|
|
|
|
|
|
|
|
|
|
|
|
|
|
Other financial assets (4)
|
|
|
|
|
|
|
|
|
|
|
|
|
|
|
|
|
|
|
|
|
|
|
|
|
|
|
|
|
|
|
|
|
|
|
|
|
|
|
|
|
|
|
|
|
|
|
|
|
|
|
|
|
|
|
|
|
|
|
|
|
|
|
|
|
|
|
|
|
|
|
|
|
|
|
|
|
|
|
|
|
|
|
|
|
|
|
|
|
|
|
|
|
|
|
|
|
|
|
|
|
|
|
|
|
|
| |
|
|
|
|
|
|
|
|
|
|
Encumbered assets |
|
|
|
|
|
Unencumbered assets |
|
|
|
|
|
|
|
|
|
|
|
|
|
Bank-owned
assets |
|
|
collateral from securities financing and derivative
transactions |
|
|
Total assets |
|
|
Pledged as
collateral |
|
|
|
|
|
|
|
|
Available as collateral (2)
|
|
|
|
|
Cash and deposits with central banks |
|
$ |
55,976 |
|
|
$ |
– |
|
|
$ |
55,976 |
|
|
$ |
– |
|
|
$ |
5,991 |
|
|
|
|
|
|
$ |
49,985 |
|
|
$ |
– |
|
Deposits with financial institutions |
|
|
7,884 |
|
|
|
– |
|
|
|
7,884 |
|
|
|
– |
|
|
|
82 |
|
|
|
|
|
|
|
7,802 |
|
|
|
– |
|
|
|
|
2,540 |
|
|
|
– |
|
|
|
2,540 |
|
|
|
– |
|
|
|
– |
|
|
|
|
|
|
|
2,540 |
|
|
|
– |
|
|
|
|
|
|
|
|
|
|
|
|
|
|
|
|
|
|
|
|
|
|
|
|
|
|
|
|
|
|
|
|
|
|
Canadian government obligations |
|
|
71,915 |
|
|
|
26,062 |
|
|
|
97,977 |
|
|
|
34,572 |
|
|
|
– |
|
|
|
|
|
|
|
63,405 |
|
|
|
– |
|
Foreign government obligations |
|
|
121,072 |
|
|
|
129,991 |
|
|
|
251,063 |
|
|
|
126,371 |
|
|
|
– |
|
|
|
|
|
|
|
124,692 |
|
|
|
– |
|
|
|
|
75,223 |
|
|
|
101,262 |
|
|
|
176,485 |
|
|
|
143,862 |
|
|
|
– |
|
|
|
|
|
|
|
32,623 |
|
|
|
– |
|
|
|
|
4,534 |
|
|
|
10,677 |
|
|
|
15,211 |
|
|
|
4,415 |
|
|
|
– |
|
|
|
|
|
|
|
– |
|
|
|
10,796 |
|
Loans classified as liquid assets: |
|
|
|
|
|
|
|
|
|
|
|
|
|
|
|
|
|
|
|
|
|
|
|
|
|
|
|
|
|
|
|
|
NHA mortgage-backed securities |
|
|
35,546 |
|
|
|
– |
|
|
|
35,546 |
|
|
|
6,584 |
|
|
|
– |
|
|
|
|
|
|
|
28,962 |
|
|
|
– |
|
|
|
|
732,932 |
|
|
|
– |
|
|
|
732,932 |
|
|
|
6,642 |
|
|
|
79,812 |
|
|
|
|
|
|
|
17,173 |
|
|
|
629,305 |
|
Other financial assets (4)
|
|
|
249,058 |
|
|
|
(193,018 |
) |
|
|
56,040 |
|
|
|
13,148 |
|
|
|
– |
|
|
|
|
|
|
|
– |
|
|
|
42,892 |
|
|
|
|
55,347 |
|
|
|
– |
|
|
|
55,347 |
|
|
|
– |
|
|
|
– |
|
|
|
|
|
|
|
– |
|
|
|
55,347 |
|
|
|
$ |
1,412,027 |
|
|
$ |
74,974 |
|
|
$ |
1,487,001 |
|
|
$ |
335,594 |
|
|
$ |
85,885 |
|
|
|
|
|
|
$ |
327,182 |
|
|
$ |
738,340 |
|
| (1) |
Assets which are restricted from being used to secure funding for legal or other reasons. |
| (2) |
Assets that are readily available in the normal course of business to secure funding or meet collateral needs including central bank borrowing immediately available. |
| (3) |
Other unencumbered assets are not subject to any restrictions on their use to secure funding or as collateral but the Bank would not consider them to be readily available. These include loans, a portion of which may be used to access central bank facilities outside of the normal course or to raise secured funding through the Bank’s secured funding programs. |
| (4) |
Securities received as collateral against other financial assets are included within liquid securities and other securities. |
As of October 31, 2025, total encumbered assets of the Bank were $480 billion (October 31, 2024 – $421 billion). Of the remaining $1,113 billion (October 31, 2024 – $1,066 billion) of unencumbered assets, $347 billion (October 31, 2024 – $327 billion) are considered readily available in the normal course of business to secure funding or meet collateral needs as detailed above.
In some
derivative contracts, the Bank would be required to post additional collateral or receive less collateral in the event its credit rating was downgraded. The Bank maintains access to sufficient collateral to meet these obligations in the event of a downgrade of its ratings by one or more of the rating agencies. As at October 31, 2025, the potential adverse impact on derivatives collateral that would result from a one, two or three-notch downgrade of the Bank’s rating below its lowest current rating was $21 million, $1,061 million or $2,013 million, respectively.
Encumbered liquid assets are not considered to be available for liquidity management purposes. Liquid assets which are used to hedge derivative positions in trading books or for hedging purposes are considered to be available for liquidity management provided they meet the criteria discussed in liquid assets above.
Credit ratings are one of the factors that impact the Bank’s access to capital markets and the terms on which it can conduct derivatives, hedging transactions and borrow funds. The credit ratings and outlook that the rating agencies assign to the Bank are based on their own views and methodologies.
The Bank continues to have strong credit ratings and its deposits and legacy senior debt are rated AA by Fitch Ratings, Aa2 by Moody’s, AA by Morningstar DBRS and A+ by Standard and Poor’s (S&P). The Bank’s bail-inable senior debt is rated
AA-
by Fitch Ratings, A2 by Moody’s, AA (low) by Morningstar DBRS, and
A-
by S&P. As of October 31, 2025, all rating agencies have a Stable outlook on the Bank.
2025 Scotiabank Annual Report
|
Management’s Discussion and Analysis
Credit ratings are not recommendations to purchase, sell or hold a security and are subject to revision or withdrawal at any time by the rating agency.
The Liquidity Coverage Ratio (LCR) measure is based on a
30-day
liquidity stress scenario, with assumptions defined in the Liquidity Adequacy Requirements (LAR) Guideline issued by the Office of the Superintendent of Financial Institutions (OSFI). The LCR is calculated as the ratio of high quality liquid assets (HQLA) to net cash outflows. The Bank is subject to a regulatory minimum LCR of 100%.
HQLA are defined in the LAR Guideline and are grouped into three main categories with varying haircuts applied to arrive at the amount included in the total weighted value in the table that follows.
The total weighted values for net cash outflows for the next 30 days are derived by applying the assumptions specified in the LAR Guideline to specific items, including loans, deposits, maturing debt, derivative transactions and commitments to extend credit.
The following table presents the Bank’s average LCR for the quarter ended October 31, 2025 based on the average daily position in the quarter.
T56
Bank’s average LCR
(1)
|
|
|
|
|
|
|
|
|
| For the quarter ended October 31, 2025 ($ millions) (2)
|
|
Total unweighted value (Average) (3)
|
|
|
Total weighted value (Average) (4)
|
|
High-quality liquid assets |
|
|
|
|
|
|
|
|
Total high-quality liquid assets (HQLA) |
|
|
* |
|
|
|
|
|
|
|
|
|
|
|
|
|
|
Retail deposits and deposits from small business customers, of which: |
|
$ |
264,966 |
|
|
$ |
28,225 |
|
|
|
|
106,841 |
|
|
|
3,462 |
|
|
|
|
158,125 |
|
|
|
24,763 |
|
Unsecured wholesale funding, of which: |
|
|
279,580 |
|
|
|
115,344 |
|
Operational deposits (all counterparties) and deposits in networks of cooperative banks |
|
|
110,842 |
|
|
|
26,701 |
|
Non-operational deposits (all counterparties) |
|
|
159,368 |
|
|
|
79,273 |
|
|
|
|
9,370 |
|
|
|
9,370 |
|
Secured wholesale funding |
|
|
* |
|
|
|
100,004 |
|
Additional requirements, of which: |
|
|
263,735 |
|
|
|
62,704 |
|
Outflows related to derivative exposures and other collateral requirements |
|
|
51,254 |
|
|
|
29,461 |
|
Outflows related to loss of funding on debt products |
|
|
5,722 |
|
|
|
5,722 |
|
Credit and liquidity facilities |
|
|
206,759 |
|
|
|
27,521 |
|
Other contractual funding obligations |
|
|
3,433 |
|
|
|
3,338 |
|
Other contingent funding obligations (5)
|
|
|
624,324 |
|
|
|
8,880 |
|
|
|
|
|
|
|
|
|
|
|
|
|
|
|
|
|
|
|
Secured lending (e.g. reverse repos) |
|
$ |
343,904 |
|
|
$ |
51,274 |
|
Inflows from fully performing exposures |
|
|
35,034 |
|
|
|
20,001 |
|
|
|
|
37,313 |
|
|
|
37,313 |
|
|
|
|
|
|
|
|
|
|
|
|
|
| |
|
|
|
|
|
|
|
|
|
|
|
|
|
|
|
|
|
|
|
|
|
|
|
|
Liquidity coverage ratio (%) |
|
|
|
|
|
|
|
|
|
|
|
| For the quarter ended October 31, 2024 ($ millions) |
|
|
|
|
|
|
|
|
|
* |
|
|
$ |
261,820 |
|
|
|
|
* |
|
|
$ |
200,386 |
|
Liquidity coverage ratio (%) |
|
|
* |
|
|
|
131 |
% |
| * |
Disclosure is not required under regulatory guideline. |
| (1) |
The LCR is calculated in accordance with OSFI’s LAR Guideline (April 2025). |
| (2) |
Based on the average daily positions of the 62 business days in the quarter. |
| (3) |
Unweighted values represent outstanding balances maturing or callable within the next 30 days. |
| (4) |
Weighted values represent balances calculated after the application of HQLA haircuts or inflow and outflow rates, as prescribed by the OSFI LAR Guideline. |
| (5) |
Total unweighted value includes uncommitted credit and liquidity facilities, guarantees and letters of credit, outstanding debt securities with remaining maturity greater than 30 days, and other contractual cash outflows. |
| (6) |
Total adjusted value represents balances calculated after the application of both haircuts and inflow and outflow rates and any applicable caps. |
HQLA is substantially comprised of Level 1 assets (as defined in the LAR Guideline), such as cash, deposits with central banks available to the Bank in times of stress, and highly rated securities issued or guaranteed by governments, central banks and supranational entities.
The Bank’s average LCR for the quarter ended October 31, 2025 was lower than the prior year mainly due to higher net cash outflows from securities borrowing and lending activities, partially offset by higher HQLA and lower outflows from unsecured wholesale funding. The Bank monitors its significant currency exposures, Canadian and U.S. dollars, in accordance with its liquidity risk management framework and risk appetite.
|
2025 Scotiabank Annual Report
Management’s Discussion and Analysis
| Risk Management
The Net Stable Funding Ratio (NSFR) requires institutions to maintain a stable funding profile in relation to the composition of their assets and
off-balance
sheet exposures. It is calculated as the ratio of available stable funding (ASF) to required stable funding (RSF), with assumptions defined in the LAR Guideline. The Bank is subject to a regulatory minimum NSFR of 100%.
ASF is defined as the portion of capital and liabilities expected to be reliable over the time horizons considered by the NSFR. RSF is a function of the liquidity characteristics and residual maturities of the various assets held by the Bank as well as those of its
off-balance
sheet exposures.
The total weighted values for ASF and RSF included in the table that follows are derived by applying the assumptions specified in the LAR Guideline to balance sheet items, including capital instruments, wholesale funding, deposits, loans and mortgages, securities, derivatives and
off-balance
sheet items such as commitments to extend credit.
The following table presents the Bank’s NSFR as at October 31, 2025.
|
|
|
|
|
|
|
|
|
|
|
|
|
|
|
|
|
|
|
|
|
| |
|
Unweighted Value by Residual Maturity |
|
|
|
|
|
|
|
|
|
|
|
|
|
|
|
|
|
| Available Stable Funding (ASF) Item |
|
| Capital: |
|
$ |
95,055 |
|
|
$ |
– |
|
|
$ |
– |
|
|
$ |
– |
|
|
$ |
95,055 |
|
| Regulatory capital |
|
|
95,055 |
|
|
|
– |
|
|
|
– |
|
|
|
– |
|
|
|
95,055 |
|
| Other capital instruments |
|
|
– |
|
|
|
– |
|
|
|
– |
|
|
|
– |
|
|
|
– |
|
| Retail deposits and deposits from small business customers: |
|
|
235,752 |
|
|
|
82,064 |
|
|
|
37,544 |
|
|
|
46,532 |
|
|
|
364,132 |
|
| Stable deposits |
|
|
93,462 |
|
|
|
31,256 |
|
|
|
13,256 |
|
|
|
15,689 |
|
|
|
146,765 |
|
| Less stable deposits |
|
|
142,290 |
|
|
|
50,808 |
|
|
|
24,288 |
|
|
|
30,843 |
|
|
|
217,367 |
|
| Wholesale funding: |
|
|
217,209 |
|
|
|
362,852 |
|
|
|
54,776 |
|
|
|
129,992 |
|
|
|
322,618 |
|
| Operational deposits |
|
|
110,078 |
|
|
|
– |
|
|
|
– |
|
|
|
– |
|
|
|
55,039 |
|
| Other wholesale funding |
|
|
107,131 |
|
|
|
362,852 |
|
|
|
54,776 |
|
|
|
129,992 |
|
|
|
267,579 |
|
| Liabilities with matching interdependent assets |
|
|
– |
|
|
|
1,759 |
|
|
|
1,296 |
|
|
|
12,814 |
|
|
|
– |
|
| Other liabilities: |
|
|
33,447 |
|
|
|
124,748 |
|
|
|
23,599 |
|
| NSFR derivative liabilities |
|
|
|
|
|
|
8,794 |
|
|
|
|
|
| All other liabilities and equity not included in the above categories |
|
|
33,447 |
|
|
|
90,883 |
|
|
|
2,944 |
|
|
|
22,127 |
|
|
|
23,599 |
|
|
|
|
|
|
|
|
|
|
|
|
|
|
|
|
|
|
|
|
|
|
|
| Required Stable Funding (RSF) Item |
|
| Total NSFR high-quality liquid assets (HQLA) |
|
|
|
|
|
|
|
|
|
|
|
|
|
|
|
|
|
$ |
28,833 |
|
| Deposits held at other financial institutions for operational purposes |
|
$ |
1,303 |
|
|
$ |
– |
|
|
$ |
– |
|
|
$ |
– |
|
|
$ |
652 |
|
| Performing loans and securities: |
|
|
118,673 |
|
|
|
308,557 |
|
|
|
105,608 |
|
|
|
431,791 |
|
|
|
567,659 |
|
| Performing loans to financial institutions secured by Level 1 HQLA |
|
|
1 |
|
|
|
68,221 |
|
|
|
1,877 |
|
|
|
– |
|
|
|
4,411 |
|
Performing loans to financial institutions secured by non-Level 1 HQLA and unsecured performing loans to financial institutions |
|
|
2,409 |
|
|
|
111,773 |
|
|
|
11,751 |
|
|
|
19,716 |
|
|
|
40,247 |
|
Performing loans to non-financial corporate clients, loans to retail and small business customers, and loans to sovereigns, central banks and PSEs, of which: |
|
|
66,517 |
|
|
|
94,120 |
|
|
|
50,497 |
|
|
|
165,995 |
|
|
|
269,268 |
|
| With a risk weight of less than or equal to 35% under the Basel II standardised approach for credit risk |
|
|
– |
|
|
|
360 |
|
|
|
645 |
|
|
|
5,709 |
|
|
|
4,213 |
|
| Performing residential mortgages, of which: |
|
|
22,521 |
|
|
|
33,694 |
|
|
|
41,369 |
|
|
|
240,561 |
|
|
|
225,469 |
|
| With a risk weight of less than or equal to 35% under the Basel II standardised approach for credit risk |
|
|
22,521 |
|
|
|
30,535 |
|
|
|
37,464 |
|
|
|
211,648 |
|
|
|
197,361 |
|
| Securities that are not in default and do not qualify as HQLA, including exchange-traded equities |
|
|
27,225 |
|
|
|
749 |
|
|
|
114 |
|
|
|
5,519 |
|
|
|
28,264 |
|
| Assets with matching interdependent liabilities (4)
|
|
|
– |
|
|
|
1,759 |
|
|
|
1,296 |
|
|
|
12,814 |
|
|
|
– |
|
| Other assets: |
|
|
8,048 |
|
|
|
161,336 |
|
|
|
73,764 |
|
| Physical traded commodities, including gold |
|
|
8,048 |
|
|
|
|
|
|
|
|
|
|
|
|
|
|
|
6,841 |
|
| Assets posted as initial margin for derivative contracts and contributions to default funds of CCPs |
|
|
|
|
|
|
18,534 |
|
|
|
15,754 |
|
| NSFR derivative assets |
|
|
|
|
|
|
5,327 |
|
|
|
– |
|
| NSFR derivative liabilities before deduction of variation margin posted |
|
|
|
|
|
|
28,522 |
|
|
|
1,426 |
|
| All other assets not included in the above categories |
|
|
– |
|
|
|
59,212 |
|
|
|
1 |
|
|
|
49,740 |
|
|
|
49,743 |
|
|
Off-balance sheet items |
|
|
|
|
|
|
546,572 |
|
|
|
20,990 |
|
|
|
|
|
|
|
|
|
|
|
|
|
|
|
|
|
|
|
|
|
|
Net Stable Funding Ratio (%) |
|
|
|
|
|
|
|
|
|
|
|
|
|
|
|
|
|
|
|
|
| (1) |
The NSFR is calculated in accordance with OSFI’s LAR guideline (April 2025). |
| (2) |
Items in the “no maturity” time bucket do not have a stated maturity. These may include, but are not limited to, items such as capital with perpetual maturity, non-maturity deposits, short positions, open maturity positions, non-HQLA equities, and physical traded commodities. |
| (3) |
Weighted values represent balances calculated after the application of ASF and RSF rates, as prescribed by the LAR Guideline. |
| (4) |
Interdependent assets and liabilities are primarily comprised of transactions related to the Canada Mortgage Bond program. |
2025 Scotiabank Annual Report
|
Management’s Discussion and Analysis
|
|
|
|
|
| |
|
|
|
| As at October 31, 2024
|
| Total ASF |
|
$ |
781,957 |
|
| Total RSF |
|
|
656,747 |
|
| Net stable funding ratio (%) |
|
|
119 |
% |
Available stable funding (ASF) is primarily provided by the Bank’s large pool of retail, small business and corporate customer deposits; secured and unsecured wholesale funding and capital. Required stable funding (RSF) primarily originates from the Bank’s loan and mortgage portfolio, securities holdings,
off-balance
sheet items and other assets.
The Bank’s NSFR as at October 31, 2025 was lower than the prior year mainly due to increased RSF for performing loans and securities, partially offset by higher ASF from retail and small business deposits.
|
| The Bank ensures that its funding sources are well diversified. Funding concentrations are regularly monitored and analyzed by type. The sources of funding are capital, deposits from retail and commercial clients sourced through the Canadian and international branch network, deposits from financial institutions as well as wholesale debt issuances. Capital and personal deposits are key components of the Bank’s core funding and these amounted to $403 billion as at October 31, 2025 (October 31, 2024 – $398 billion). The increase since October 31, 2024 is due to growth in personal deposits of $3 billion and common equity of $ 1 billion from earnings , net of Shareholder Dividend and Share Purchase Plan. The Bank’s funding is also comprised of commercial deposits, particularly those of an operating or relationship nature. Core funding is augmented by wholesale debt issuances, the longer term (original maturity over 1 year) portion of which amounts to $ 199 billion (October 31, 2024 – $206 billion). Longer term wholesale debt issuances include senior notes, mortgage securitizations, asset-backed securities and covered bonds. The Bank operates in many different currencies and countries. From a funding perspective, the most significant currencies are Canadian and U.S. dollars. With respect to the Bank’s operations outside Canada, there are different funding strategies depending on the nature of the activities in each country. For those countries where the Bank operates a branch banking subsidiary, the strategy is for the subsidiary to be substantially self-funding in its local market. For other subsidiaries or branches outside Canada where local deposit gathering capability is not sufficient, funding is provided through the wholesale funding activities of the Bank. From an overall funding perspective, the Bank’s objective is to achieve an appropriate balance between the cost and the stability of funding. Diversification of funding sources is a key element of the funding strategy. The Bank’s wholesale debt diversification strategy is primarily executed via the Bank’s main wholesale funding centres, located in Toronto, New York, London and Singapore. The majority of these funds are sourced in Canadian and U.S. dollars. Where required, these funds are swapped to fund assets in different currencies. The funding strategy deployed by wholesale funding centres and the management of associated risks, such as geographic and currency risk, are managed centrally within the framework of policies and limits that are approved by the Board of Directors. In the normal course, the Bank uses a mix of unsecured and secured wholesale funding instruments across a variety of markets. The choice of instruments and markets is based on a number of factors, including relative cost, market capacity and diversification of funding. Market conditions can change over time, impacting cost and capacity in particular markets or instruments. Changing market conditions can include periods of stress where the availability of funding in particular markets or instruments is constrained. In these circumstances, the Bank would increase its focus on sources of funding in functioning markets and secured funding instruments. Should a period of extreme stress exist such that all wholesale funding sources are constrained, the Bank maintains a pool of liquid assets to mitigate its liquidity risk. This pool includes cash, deposits with central banks and securities. In Canada, the Bank raises short and longer-term wholesale debt through the issuance of senior unsecured notes. Additional longer-term wholesale debt may be generated through the Bank’s Canadian Debt and Equity Shelf, the securitization of Canadian insured residential mortgages through CMHC programs (such as Canada Mortgage Bonds), uninsured residential mortgages through the Bank’s Covered Bond Program, retail credit card receivables through the Trillium Credit Card Trust II program and retail indirect auto loan receivables through the Securitized Term Auto Receivables Trust program. CMHC securitization programs, while included in the Bank’s view of wholesale debt issuance, do not entail the run-off risk that can be experienced in funding raised from capital markets. Outside of Canada, short-term wholesale debt may be raised through the issuance of negotiable certificates of deposit in the United States, the United Kingdom, and the issuance of commercial paper in the United States. The Bank operates longer-term wholesale debt issuance registered programs in the United States, such as its SEC Registered Debt and Equity Shelf, and non-registered programs, such as the securitization of retail indirect auto loan receivables through the Securitized Term Auto Receivables Trust program and retail credit card receivables through the Trillium Credit Card Trust II program. The Bank may issue through its Covered Bond Program (listed with the U.K. Listing Authority and the Swiss Stock Exchange), in Europe, the United Kingdom, the United States, Australia and Switzerland. The Bank also raises longer-term funding across a variety of currencies through its Australian Medium Term Note Programme, European Medium Term Note Programme (listed with the U.K. Listing Authority and the Swiss Stock Exchange) and Singapore Medium Term Note Programme (listed with the Singapore Exchange and the Taiwan Exchange). |
The Department of Finance’s
bail-in
regulations under the Canada Deposit Insurance Corporation (CDIC) Act and the Bank Act, became effective September 23, 2018. Senior long-term debt issued by the Bank on or after September 23, 2018, that has an original term greater than 400 days and is marketable, subject to certain exceptions, is subject to the Canadian Bank Recapitalization
(Bail-in)
regime. Under the
Bail-in
regime, in circumstances when the Superintendent of Financial Institutions has determined that a bank may no longer be viable, the Governor in Council may, upon a recommendation of the Minister of Finance that they are of the opinion that it is in the public interest to do so, grant an order directing the CDIC to convert all or a portion of certain shares and liabilities of that bank into common shares.
|
2025 Scotiabank Annual Report
Management’s Discussion and Analysis
| Risk Management
The table below provides the remaining contractual maturities of funding raised through wholesale funding. In the Consolidated Statement of Financial Position, these liabilities are primarily included in Business & Government Deposits.
|
|
|
|
|
|
|
|
|
|
|
|
|
|
|
|
|
|
|
|
|
|
|
|
|
|
|
|
|
|
|
|
|
|
|
|
|
|
|
|
|
|
|
|
|
|
|
|
|
|
|
|
| |
|
|
|
|
|
|
|
|
|
|
|
|
|
|
|
|
|
|
|
|
|
|
|
|
|
|
|
|
|
|
| |
|
|
|
|
|
|
|
|
|
|
|
|
|
|
|
|
|
|
|
|
|
|
|
|
|
|
|
|
|
|
|
|
|
|
|
|
|
|
|
|
| Bearer deposit notes, commercial paper and certificate of deposits |
|
|
|
|
|
|
|
|
|
|
|
|
|
|
|
|
|
|
|
|
|
|
|
|
|
|
|
|
|
|
|
|
|
|
|
|
|
|
|
|
Asset-backed commercial paper (3)
|
|
|
|
|
|
|
|
|
|
|
|
|
|
|
|
|
|
|
|
|
|
|
|
|
|
|
|
|
|
|
|
|
|
|
|
|
|
|
|
|
| |
|
|
|
|
|
|
|
|
|
|
|
|
|
|
|
|
|
|
|
|
|
|
|
|
|
|
|
|
|
|
|
|
|
|
|
|
|
|
|
|
| |
|
|
|
|
|
|
|
|
|
|
|
|
|
|
|
|
|
|
|
|
|
|
|
|
|
|
|
|
|
|
|
|
|
|
|
|
|
|
|
|
| Asset-backed securities |
|
|
|
|
|
|
|
|
|
|
|
|
|
|
|
|
|
|
|
|
|
|
|
|
|
|
|
|
|
|
|
|
|
|
|
|
|
|
|
|
| Covered bonds |
|
|
|
|
|
|
|
|
|
|
|
|
|
|
|
|
|
|
|
|
|
|
|
|
|
|
|
|
|
|
|
|
|
|
|
|
|
|
|
|
Mortgage securitization (6)
|
|
|
|
|
|
|
|
|
|
|
|
|
|
|
|
|
|
|
|
|
|
|
|
|
|
|
|
|
|
|
|
|
|
|
|
|
|
|
|
|
Subordinated debentures (7)
|
|
|
|
|
|
|
|
|
|
|
|
|
|
|
|
|
|
|
|
|
|
|
|
|
|
|
|
|
|
|
|
|
|
|
|
|
|
|
|
|
| Total wholesale funding sources |
|
|
|
|
|
|
|
|
|
|
|
|
|
|
|
|
|
|
|
|
|
|
|
|
|
|
|
|
|
|
|
|
|
|
|
|
|
|
|
|
|
|
|
|
|
|
|
|
|
|
|
| |
|
|
|
|
|
|
|
|
|
|
|
|
|
|
|
|
|
|
|
|
|
|
|
|
|
|
|
|
|
|
|
|
|
|
|
|
|
|
|
|
|
|
|
|
|
|
|
|
|
|
|
| Unsecured funding |
|
|
|
|
|
|
|
|
|
|
|
|
|
|
|
|
|
|
|
|
|
|
|
|
|
|
|
|
|
|
|
|
|
|
|
|
|
|
|
|
| Secured funding |
|
|
|
|
|
|
|
|
|
|
|
|
|
|
|
|
|
|
|
|
|
|
|
|
|
|
|
|
|
|
|
|
|
|
|
|
|
|
|
|
|
|
|
|
|
|
|
|
|
|
|
|
|
|
|
|
|
|
|
|
|
|
|
|
|
|
|
|
|
|
|
|
|
|
|
|
|
|
|
|
|
|
|
|
|
|
|
|
|
|
|
|
| |
|
Less than
1 month |
|
|
|
|
|
|
|
|
|
|
|
|
|
|
|
|
|
|
|
|
|
|
|
>5 years |
|
|
Total |
|
| |
|
$ |
3,858 |
|
|
$ |
1,455 |
|
|
$ |
455 |
|
|
$ |
318 |
|
|
$ |
158 |
|
|
$ |
6,244 |
|
|
$ |
– |
|
|
$ |
– |
|
|
$ |
– |
|
|
$ |
6,244 |
|
| Bearer deposit notes, commercial paper and certificate of deposits |
|
|
6,612 |
|
|
|
12,754 |
|
|
|
17,407 |
|
|
|
12,087 |
|
|
|
8,307 |
|
|
|
57,167 |
|
|
|
1,251 |
|
|
|
269 |
|
|
|
182 |
|
|
|
58,869 |
|
Asset-backed commercial paper (3)
|
|
|
2,248 |
|
|
|
5,831 |
|
|
|
2,435 |
|
|
|
139 |
|
|
|
– |
|
|
|
10,653 |
|
|
|
– |
|
|
|
– |
|
|
|
– |
|
|
|
10,653 |
|
| |
|
|
2,073 |
|
|
|
88 |
|
|
|
2,200 |
|
|
|
2,613 |
|
|
|
794 |
|
|
|
7,768 |
|
|
|
2,949 |
|
|
|
7,934 |
|
|
|
12,337 |
|
|
|
30,988 |
|
| |
|
|
243 |
|
|
|
5,699 |
|
|
|
6,429 |
|
|
|
6,613 |
|
|
|
1,682 |
|
|
|
20,666 |
|
|
|
16,714 |
|
|
|
29,520 |
|
|
|
17,945 |
|
|
|
84,845 |
|
| Asset-backed securities |
|
|
– |
|
|
|
1 |
|
|
|
– |
|
|
|
– |
|
|
|
908 |
|
|
|
909 |
|
|
|
1,218 |
|
|
|
770 |
|
|
|
844 |
|
|
|
3,741 |
|
| Covered bonds |
|
|
– |
|
|
|
1,515 |
|
|
|
4,983 |
|
|
|
2,088 |
|
|
|
916 |
|
|
|
9,502 |
|
|
|
16,039 |
|
|
|
17,251 |
|
|
|
4,143 |
|
|
|
46,935 |
|
Mortgage securitization (6)
|
|
|
– |
|
|
|
650 |
|
|
|
1,710 |
|
|
|
887 |
|
|
|
235 |
|
|
|
3,482 |
|
|
|
3,061 |
|
|
|
7,099 |
|
|
|
3,844 |
|
|
|
17,486 |
|
Subordinated debentures (7)
|
|
|
– |
|
|
|
47 |
|
|
|
– |
|
|
|
280 |
|
|
|
– |
|
|
|
327 |
|
|
|
1,788 |
|
|
|
201 |
|
|
|
7,430 |
|
|
|
9,746 |
|
| Total wholesale funding sources |
|
$ |
15,034 |
|
|
$ |
28,040 |
|
|
$ |
35,619 |
|
|
$ |
25,025 |
|
|
$ |
13,000 |
|
|
$ |
116,718 |
|
|
$ |
43,020 |
|
|
$ |
63,044 |
|
|
$ |
46,725 |
|
|
$ |
269,507 |
|
|
|
|
|
|
|
|
|
|
|
|
| |
|
|
|
|
|
|
|
|
|
|
|
|
|
|
|
|
|
|
|
|
|
|
|
|
|
|
|
|
|
|
|
|
|
|
|
|
|
|
|
|
|
|
|
|
|
|
|
|
|
|
|
| Unsecured funding |
|
$ |
12,786 |
|
|
$ |
20,042 |
|
|
$ |
26,492 |
|
|
$ |
21,911 |
|
|
$ |
10,941 |
|
|
$ |
92,172 |
|
|
$ |
22,702 |
|
|
$ |
37,924 |
|
|
$ |
37,894 |
|
|
$ |
190,692 |
|
| Secured funding |
|
|
2,248 |
|
|
|
7,998 |
|
|
|
9,127 |
|
|
|
3,114 |
|
|
|
2,059 |
|
|
|
24,546 |
|
|
|
20,318 |
|
|
|
25,120 |
|
|
|
8,831 |
|
|
|
78,815 |
|
| (1) |
Wholesale funding sources exclude obligations related to securities sold under repurchase agreements and bankers’ acceptances, which are disclosed in the contractual maturities table below. Amounts are based on remaining term to maturity. |
| (2) |
Only includes commercial bank deposits. |
| (3) |
Wholesale funding sources also exclude asset-backed commercial paper (ABCP) issued by certain ABCP conduits that are not consolidated for financial reporting purposes. |
| (5) |
Includes structured notes issued to institutional investors. |
| (6) |
Represents residential mortgages funded through Canadian Federal Government agency sponsored programs. Funding accessed through such programs does not impact the funding capacity of the Bank in its own name. |
| (7) |
Although subordinated debentures are a component of regulatory capital, they are included in this table in accordance with EDTF recommended disclosures. |
Wholesale funding generally bears a higher risk of
run-off
in a stressed environment than other sources of funding. The Bank mitigates this risk through funding diversification, ongoing engagement with investors and by maintaining a large holding of unencumbered liquid assets. Unencumbered liquid assets of $327 billion as at October 31, 2025 (October 31, 2024 – $310 billion) were well in excess of wholesale funding sources that mature in the next twelve months.
|
Contractual maturities and obligations The table below provides the maturity of assets and liabilities as well as the off-balance sheet commitments as at October 31, 2025, based on the contractual maturity date. |
From a liquidity risk perspective the Bank considers factors other than contractual maturity in the assessment of liquid assets or in determining expected future cash flows. In particular, for securities with a fixed maturity date, the ability and time horizon to raise cash from these securities is more relevant to liquidity management than contractual maturity. For other assets and deposits the Bank uses assumptions about rollover rates to assess liquidity risk for normal course and stress scenarios. Similarly, the Bank uses assumptions to assess the potential drawdown of credit commitments in various scenarios.
The Bank’s contractual obligations include contracts and purchase obligations, including agreements to purchase goods and services that are enforceable, legally binding on the Bank and affect the Bank’s liquidity and capital resource needs. The Bank leases a large number of its branches, offices and other locations. The majority of these leases are for a term of five years, with options to renew.
2025 Scotiabank Annual Report
|
Management’s Discussion and Analysis
|
|
|
|
|
|
|
|
|
|
|
|
|
|
|
|
|
|
|
|
|
|
|
|
|
|
|
|
|
|
|
|
|
|
|
|
|
|
|
|
|
T59 Contractual maturities* |
|
|
|
|
|
|
|
|
|
|
|
|
|
|
|
|
|
|
|
|
|
|
|
|
|
|
|
|
|
|
|
|
|
|
|
|
|
|
|
|
|
|
|
|
|
($ millions) |
|
|
|
|
|
|
|
|
|
|
|
|
|
|
|
|
|
|
|
|
|
|
|
|
|
|
|
|
|
|
| |
|
|
|
|
|
|
|
|
|
|
|
|
|
|
|
|
|
|
|
|
|
|
|
|
|
|
|
|
|
|
|
|
|
|
|
|
|
|
|
|
Cash and deposits with financial institutions and precious metals |
|
|
|
|
|
|
|
|
|
|
|
|
|
|
|
|
|
|
|
|
|
|
|
|
|
|
|
|
|
|
|
|
|
|
|
|
|
|
|
|
| |
|
|
|
|
|
|
|
|
|
|
|
|
|
|
|
|
|
|
|
|
|
|
|
|
|
|
|
|
|
|
|
|
|
|
|
|
|
|
|
|
Securities purchased under resale agreements and securities borrowed |
|
|
|
|
|
|
|
|
|
|
|
|
|
|
|
|
|
|
|
|
|
|
|
|
|
|
|
|
|
|
|
|
|
|
|
|
|
|
|
|
Derivative financial instruments |
|
|
|
|
|
|
|
|
|
|
|
|
|
|
|
|
|
|
|
|
|
|
|
|
|
|
|
|
|
|
|
|
|
|
|
|
|
|
|
|
Investment securities – FVOCI |
|
|
|
|
|
|
|
|
|
|
|
|
|
|
|
|
|
|
|
|
|
|
|
|
|
|
|
|
|
|
|
|
|
|
|
|
|
|
|
|
Investment securities – amortized cost |
|
|
|
|
|
|
|
|
|
|
|
|
|
|
|
|
|
|
|
|
|
|
|
|
|
|
|
|
|
|
|
|
|
|
|
|
|
|
|
|
Investment securities – FVTPL |
|
|
|
|
|
|
|
|
|
|
|
|
|
|
|
|
|
|
|
|
|
|
|
|
|
|
|
|
|
|
|
|
|
|
|
|
|
|
|
|
| |
|
|
|
|
|
|
|
|
|
|
|
|
|
|
|
|
|
|
|
|
|
|
|
|
|
|
|
|
|
|
|
|
|
|
|
|
|
|
|
|
| |
|
|
|
|
|
|
|
|
|
|
|
|
|
|
|
|
|
|
|
|
|
|
|
|
|
|
|
|
|
|
|
|
|
|
|
|
|
|
|
|
| |
|
|
|
|
|
|
|
|
|
|
|
|
|
|
|
|
|
|
|
|
|
|
|
|
|
|
|
|
|
|
|
|
|
|
|
|
|
|
|
|
| |
|
|
|
|
|
|
|
|
|
|
|
|
|
|
|
|
|
|
|
|
|
|
|
|
|
|
|
|
|
|
|
|
|
|
|
|
|
|
|
|
| |
|
|
|
|
|
|
|
|
|
|
|
|
|
|
|
|
|
|
|
|
|
|
|
|
|
|
|
|
|
|
|
|
|
|
|
|
|
|
|
|
Allowance for credit losses |
|
|
|
|
|
|
|
|
|
|
|
|
|
|
|
|
|
|
|
|
|
|
|
|
|
|
|
|
|
|
|
|
|
|
|
|
|
|
|
|
Customers’ liabilities under acceptances |
|
|
|
|
|
|
|
|
|
|
|
|
|
|
|
|
|
|
|
|
|
|
|
|
|
|
|
|
|
|
|
|
|
|
|
|
|
|
|
|
| |
|
|
|
|
|
|
|
|
|
|
|
|
|
|
|
|
|
|
|
|
|
|
|
|
|
|
|
|
|
|
|
|
|
|
|
|
|
|
|
|
| |
|
|
|
|
|
|
|
|
|
|
|
|
|
|
|
|
|
|
|
|
|
|
|
|
|
|
|
|
|
|
|
|
|
|
|
|
|
|
|
|
|
|
|
|
|
|
|
|
|
|
|
|
|
|
|
|
|
|
|
|
|
|
|
|
|
|
|
|
|
|
|
|
|
|
|
|
|
|
|
|
|
|
|
|
|
|
|
|
|
|
|
|
|
|
|
|
|
|
|
|
|
|
|
|
|
|
|
|
|
|
|
|
|
|
|
|
|
|
|
|
|
|
|
| |
|
|
|
|
|
|
|
|
|
|
|
|
|
|
|
|
|
|
|
|
|
|
|
|
|
|
|
|
|
|
|
|
|
|
|
|
|
|
|
|
| |
|
|
|
|
|
|
|
|
|
|
|
|
|
|
|
|
|
|
|
|
|
|
|
|
|
|
|
|
|
|
|
|
|
|
|
|
|
|
|
|
| |
|
|
|
|
|
|
|
|
|
|
|
|
|
|
|
|
|
|
|
|
|
|
|
|
|
|
|
|
|
|
|
|
|
|
|
|
|
|
|
|
| |
|
|
|
|
|
|
|
|
|
|
|
|
|
|
|
|
|
|
|
|
|
|
|
|
|
|
|
|
|
|
|
|
|
|
|
|
|
|
|
|
Financial instruments designated at fair value through profit or loss |
|
|
|
|
|
|
|
|
|
|
|
|
|
|
|
|
|
|
|
|
|
|
|
|
|
|
|
|
|
|
|
|
|
|
|
|
|
|
|
|
| |
|
|
|
|
|
|
|
|
|
|
|
|
|
|
|
|
|
|
|
|
|
|
|
|
|
|
|
|
|
|
|
|
|
|
|
|
|
|
|
|
Obligations related to securities sold short |
|
|
|
|
|
|
|
|
|
|
|
|
|
|
|
|
|
|
|
|
|
|
|
|
|
|
|
|
|
|
|
|
|
|
|
|
|
|
|
|
Derivative financial instruments |
|
|
|
|
|
|
|
|
|
|
|
|
|
|
|
|
|
|
|
|
|
|
|
|
|
|
|
|
|
|
|
|
|
|
|
|
|
|
|
|
Obligations related to securities sold under repurchase agreements and securities lent |
|
|
|
|
|
|
|
|
|
|
|
|
|
|
|
|
|
|
|
|
|
|
|
|
|
|
|
|
|
|
|
|
|
|
|
|
|
|
|
|
| |
|
|
|
|
|
|
|
|
|
|
|
|
|
|
|
|
|
|
|
|
|
|
|
|
|
|
|
|
|
|
|
|
|
|
|
|
|
|
|
|
| |
|
|
|
|
|
|
|
|
|
|
|
|
|
|
|
|
|
|
|
|
|
|
|
|
|
|
|
|
|
|
|
|
|
|
|
|
|
|
|
|
| |
|
|
|
|
|
|
|
|
|
|
|
|
|
|
|
|
|
|
|
|
|
|
|
|
|
|
|
|
|
|
|
|
|
|
|
|
|
|
|
|
Total liabilities and equity |
|
|
|
|
|
|
|
|
|
|
|
|
|
|
|
|
|
|
|
|
|
|
|
|
|
|
|
|
|
|
|
|
|
|
|
|
|
|
|
|
Off-balance sheet commitments |
|
|
|
|
|
|
|
|
|
|
|
|
|
|
|
|
|
|
|
|
|
|
|
|
|
|
|
|
|
|
|
|
|
|
|
|
|
|
|
|
| |
|
|
|
|
|
|
|
|
|
|
|
|
|
|
|
|
|
|
|
|
|
|
|
|
|
|
|
|
|
|
|
|
|
|
|
|
|
|
|
|
Guarantees and letters of credit (4)
|
|
|
|
|
|
|
|
|
|
|
|
|
|
|
|
|
|
|
|
|
|
|
|
|
|
|
|
|
|
|
|
|
|
|
|
|
|
|
|
|
(1) |
Includes primarily impaired mortgages. |
(2) |
Includes primarily overdrafts and impaired loans. |
|
(3) Includes the undrawn component of committed credit and liquidity facilities. (4) Includes outstanding balances of guarantees, standby letters of credit and commercial letters of credit which may expire undrawn. |
|
2025 Scotiabank Annual Report
Management’s Discussion and Analysis
| Risk Management
| |
|
$ |
|
|
|
$ |
|
|
|
$ |
|
|
|
$ |
|
|
|
$ |
|
|
|
$ |
|
|
|
$ |
|
|
|
$ |
|
|
|
$ |
|
|
|
$ |
|
|
T59 Contractual maturities* |
|
|
|
|
|
|
|
|
|
|
|
|
|
|
|
|
|
|
|
|
|
|
|
|
|
|
|
|
|
|
|
|
|
|
| |
|
|
|
|
|
|
|
|
|
|
($ millions) |
|
|
|
|
|
|
|
|
|
|
|
|
|
|
|
|
|
|
|
|
|
|
|
|
|
|
|
|
|
|
|
|
|
|
|
|
|
|
|
|
|
|
|
|
|
|
|
|
|
|
|
|
|
|
|
|
|
|
|
|
|
|
|
|
|
|
|
|
|
|
|
Cash and deposits with financial institutions and precious metals |
|
$ |
59,871 |
|
|
$ |
600 |
|
|
$ |
100 |
|
|
$ |
45 |
|
|
$ |
53 |
|
|
$ |
152 |
|
|
$ |
272 |
|
|
$ |
221 |
|
|
$ |
5,086 |
|
|
$ |
66,400 |
|
|
|
|
2,183 |
|
|
|
3,233 |
|
|
|
3,782 |
|
|
|
3,925 |
|
|
|
3,620 |
|
|
|
8,484 |
|
|
|
21,126 |
|
|
|
22,003 |
|
|
|
61,371 |
|
|
|
129,727 |
|
Securities purchased under resale agreements and securities borrowed |
|
|
165,155 |
|
|
|
19,828 |
|
|
|
10,573 |
|
|
|
1,722 |
|
|
|
2,569 |
|
|
|
– |
|
|
|
696 |
|
|
|
– |
|
|
|
– |
|
|
|
200,543 |
|
Derivative financial instruments |
|
|
3,545 |
|
|
|
5,929 |
|
|
|
3,118 |
|
|
|
2,584 |
|
|
|
1,844 |
|
|
|
6,774 |
|
|
|
9,718 |
|
|
|
10,867 |
|
|
|
– |
|
|
|
44,379 |
|
Investment securities – FVOCI |
|
|
3,404 |
|
|
|
7,194 |
|
|
|
6,525 |
|
|
|
4,316 |
|
|
|
3,825 |
|
|
|
19,546 |
|
|
|
46,178 |
|
|
|
27,238 |
|
|
|
3,162 |
|
|
|
121,388 |
|
Investment securities – amortized cost |
|
|
16 |
|
|
|
919 |
|
|
|
706 |
|
|
|
1,136 |
|
|
|
994 |
|
|
|
1,860 |
|
|
|
4,935 |
|
|
|
18,846 |
|
|
|
– |
|
|
|
29,412 |
|
Investment securities – FVTPL |
|
|
2 |
|
|
|
– |
|
|
|
– |
|
|
|
– |
|
|
|
– |
|
|
|
– |
|
|
|
26 |
|
|
|
– |
|
|
|
2,004 |
|
|
|
2,032 |
|
|
|
|
40,996 |
|
|
|
43,071 |
|
|
|
49,443 |
|
|
|
52,476 |
|
|
|
48,186 |
|
|
|
163,815 |
|
|
|
242,835 |
|
|
|
55,047 |
|
|
|
64,960 |
|
|
|
760,829 |
|
|
|
|
5,215 |
|
|
|
9,719 |
|
|
|
17,163 |
|
|
|
19,002 |
|
|
|
21,784 |
|
|
|
97,508 |
|
|
|
135,961 |
|
|
|
40,720 |
|
|
|
3,869 |
|
|
|
350,941 |
|
|
|
|
3,499 |
|
|
|
3,470 |
|
|
|
3,379 |
|
|
|
4,807 |
|
|
|
3,598 |
|
|
|
12,012 |
|
|
|
25,695 |
|
|
|
6,582 |
|
|
|
43,337 |
|
|
|
106,379 |
|
|
|
|
– |
|
|
|
– |
|
|
|
– |
|
|
|
– |
|
|
|
– |
|
|
|
– |
|
|
|
– |
|
|
|
– |
|
|
|
17,374 |
|
|
|
17,374 |
|
|
|
|
32,282 |
|
|
|
29,882 |
|
|
|
28,901 |
|
|
|
28,667 |
|
|
|
22,804 |
|
|
|
54,295 |
|
|
|
81,179 |
|
|
|
7,745 |
|
|
|
6,916 |
|
|
|
292,671 |
|
Allowance for credit losses |
|
|
– |
|
|
|
– |
|
|
|
– |
|
|
|
– |
|
|
|
– |
|
|
|
– |
|
|
|
– |
|
|
|
– |
|
|
|
(6,536 |
) |
|
|
(6,536 |
) |
Customers’ liabilities under acceptances |
|
|
39 |
|
|
|
57 |
|
|
|
36 |
|
|
|
10 |
|
|
|
6 |
|
|
|
– |
|
|
|
– |
|
|
|
– |
|
|
|
– |
|
|
|
148 |
|
|
|
|
– |
|
|
|
– |
|
|
|
– |
|
|
|
– |
|
|
|
– |
|
|
|
– |
|
|
|
– |
|
|
|
– |
|
|
|
57,169 |
|
|
|
57,169 |
|
|
|
|
275,211 |
|
|
|
80,831 |
|
|
|
74,283 |
|
|
|
66,214 |
|
|
|
61,097 |
|
|
|
200,631 |
|
|
|
325,786 |
|
|
|
134,222 |
|
|
|
193,752 |
|
|
|
1,412,027 |
|
| |
|
|
|
|
|
|
|
|
|
|
|
|
|
|
|
|
|
|
|
|
|
|
|
|
|
|
|
|
|
|
|
|
|
|
|
|
|
|
|
|
|
| |
|
$ |
|
|
|
$ |
|
|
|
$ |
|
|
|
$ |
|
|
|
$ |
|
|
|
$ |
|
|
|
$ |
|
|
|
$ |
|
|
|
$ |
|
|
|
$ |
|
|
|
|
|
|
|
|
|
|
|
|
|
|
|
|
|
|
|
|
|
|
|
|
|
|
|
|
|
|
|
|
|
|
|
|
|
|
|
|
|
|
|
|
|
$ |
88,575 |
|
|
$ |
77,322 |
|
|
$ |
68,891 |
|
|
$ |
57,925 |
|
|
$ |
43,415 |
|
|
$ |
64,530 |
|
|
$ |
76,309 |
|
|
$ |
24,977 |
|
|
$ |
441,905 |
|
|
$ |
943,849 |
|
|
|
|
16,273 |
|
|
|
23,956 |
|
|
|
24,000 |
|
|
|
22,746 |
|
|
|
19,827 |
|
|
|
19,423 |
|
|
|
12,430 |
|
|
|
138 |
|
|
|
160,028 |
|
|
|
298,821 |
|
|
|
|
72,302 |
|
|
|
53,366 |
|
|
|
44,891 |
|
|
|
35,179 |
|
|
|
23,588 |
|
|
|
45,107 |
|
|
|
63,879 |
|
|
|
24,839 |
|
|
|
281,877 |
|
|
|
645,028 |
|
Financial instruments designated at fair value through profit or loss |
|
|
510 |
|
|
|
1,045 |
|
|
|
2,132 |
|
|
|
1,609 |
|
|
|
1,833 |
|
|
|
5,330 |
|
|
|
8,887 |
|
|
|
14,995 |
|
|
|
– |
|
|
|
36,341 |
|
|
|
|
40 |
|
|
|
57 |
|
|
|
36 |
|
|
|
10 |
|
|
|
6 |
|
|
|
– |
|
|
|
– |
|
|
|
– |
|
|
|
– |
|
|
|
149 |
|
Obligations related to securities sold short |
|
|
272 |
|
|
|
1,988 |
|
|
|
1,120 |
|
|
|
1,803 |
|
|
|
816 |
|
|
|
3,638 |
|
|
|
7,114 |
|
|
|
9,413 |
|
|
|
8,878 |
|
|
|
35,042 |
|
Derivative financial instruments |
|
|
2,754 |
|
|
|
4,595 |
|
|
|
2,429 |
|
|
|
2,301 |
|
|
|
1,857 |
|
|
|
7,647 |
|
|
|
11,705 |
|
|
|
17,972 |
|
|
|
– |
|
|
|
51,260 |
|
Obligations related to securities sold under repurchase agreements and securities lent |
|
|
186,240 |
|
|
|
3,427 |
|
|
|
93 |
|
|
|
437 |
|
|
|
44 |
|
|
|
208 |
|
|
|
– |
|
|
|
– |
|
|
|
– |
|
|
|
190,449 |
|
|
|
|
– |
|
|
|
– |
|
|
|
– |
|
|
|
251 |
|
|
|
– |
|
|
|
1,740 |
|
|
|
– |
|
|
|
5,842 |
|
|
|
– |
|
|
|
7,833 |
|
|
|
|
533 |
|
|
|
759 |
|
|
|
1,285 |
|
|
|
1,267 |
|
|
|
979 |
|
|
|
3,142 |
|
|
|
6,860 |
|
|
|
8,954 |
|
|
|
39,249 |
|
|
|
63,028 |
|
|
|
|
– |
|
|
|
– |
|
|
|
– |
|
|
|
– |
|
|
|
– |
|
|
|
– |
|
|
|
– |
|
|
|
– |
|
|
|
84,076 |
|
|
|
84,076 |
|
Total liabilities and equity |
|
|
278,924 |
|
|
|
89,193 |
|
|
|
75,986 |
|
|
|
65,603 |
|
|
|
48,950 |
|
|
|
86,235 |
|
|
|
110,875 |
|
|
|
82,153 |
|
|
|
574,108 |
|
|
|
1,412,027 |
|
Off-balance sheet commitments |
|
|
|
|
|
|
|
|
|
|
|
|
|
|
|
|
|
|
|
|
|
|
|
|
|
|
|
|
|
|
|
|
|
|
|
|
|
|
|
|
|
|
$ |
1,538 |
|
|
$ |
9,568 |
|
|
$ |
15,403 |
|
|
$ |
18,291 |
|
|
$ |
12,075 |
|
|
$ |
58,806 |
|
|
$ |
144,972 |
|
|
$ |
8,818 |
|
|
$ |
– |
|
|
$ |
269,471 |
|
Guarantees and letters of credit (4)
|
|
|
– |
|
|
|
– |
|
|
|
– |
|
|
|
– |
|
|
|
– |
|
|
|
– |
|
|
|
– |
|
|
|
– |
|
|
|
64,016 |
|
|
|
64,016 |
|
(1) |
Includes primarily impaired mortgages. |
(2) |
Includes primarily overdrafts and impaired loans. |
(3) Includes the undrawn component of committed credit and liquidity facilities. (4) Includes outstanding balances of guarantees, standby letters of credit and commercial letters of credit which may expire undrawn. |
2025 Scotiabank Annual Report
|
Management’s Discussion and Analysis
Principal Risks –
Non-Financial
Money Laundering, Terrorist Financing and Sanctions Risk
Money Laundering / Terrorist Financing (ML/TF) and Sanctions risks are the susceptibility of Scotiabank to be used by individuals or organizations to launder the proceeds of crime, finance terrorism, or violate economic sanctions. It also includes the risk that Scotiabank does not comply with applicable Anti-Money Laundering (AML)/Anti-Terrorist Financing (ATF) or Sanctions legislation or does not apply adequate controls reasonably designed to deter and detect ML/TF and sanctions violations or to file required regulatory reports.
Money laundering, terrorist financing and sanctions risks are managed throughout the Bank via the operation of the Bank’s AML/ATF and Sanctions Program (“the AML/ATF Program”). The Group Chief Anti-Money Laundering Officer is responsible for the AML/ATF Program, which includes the development and application of compliance policies, procedures, the assessment of money laundering, terrorist-financing and sanctions risks, and the maintenance of an ongoing training program. The effectiveness of the AML/ATF and Sanctions Program is subject to regular review and independent assessment conducted by the Audit Department. Global AML establishes enterprise standards to assess clients for money laundering, terrorist financing and sanctions risk.
The Bank conducts an enterprise-wide annual self-assessment of the money laundering/terrorist financing (ML/TF) and sanctions risks inherent in its business units, as well as an assessment of the control measures in place to manage those risks. The process is led by Global AML, the results of which are shared with the Bank’s senior management. All active employees are provided with mandatory AML/ATF and Sanctions training on an annual basis. The Bank performs Client Due Diligence sufficient to form a reasonable belief that it knows the true identity of its clients, including in the case of an entity, its material ultimate beneficial owners.
The Bank will not maintain anonymous accounts, nor will it maintain accounts for shell banks. Consistent with a risk-based approach, the Bank assesses the risks of its clients and, where appropriate, conducts enhanced due diligence on those who are considered higher risk. The Bank also conducts ongoing risk tailored monitoring of its clients to detect and report suspicious transactions and activity, and conducts client and transaction screening against terrorist, sanctions, and other designated watch-lists. The Bank has no appetite for its products and services to be used to facilitate money laundering, terrorist financing, or sanctions evasion. The Bank takes appropriate action to prevent, detect, and report such activities to regulators in line with applicable laws and regulations.
Operational risk is the risk of loss resulting from people, inadequate processes and systems, or from external events. It exists in some form in each of the Bank’s business and support activities, and third parties with whom the Bank has entered a business or strategic arrangement for outsourcing activities, the provision of products or services, or other benefits. It can result in financial loss, regulatory sanctions and damage to the Bank’s reputation. Operational risk management refers to the discipline of systematic identification, assessment, measurement, mitigation, monitoring, and reporting of operational risk.
The Bank’s Operational Risk Management Framework (ORMF) outlines a structured approach for the effective management of enterprise-wide operational risk in a manner consistent with best practices and regulatory requirements, including those issued by OSFI in their Operational Risk and Resilience Guideline (OSFI
E-21).
The ORMF is supplemented by additional policies, processes, standards and methodologies. The ORMF supports the governance and management of all
non-financial
risks. The Framework is approved by the Bank’s Board of Directors and addresses program governance, risk culture and risk appetite along with the following key program components:
Risk Identification and Assessment
Risk identification and assessment is a critical part of effectively managing operational risk. Risks are identified, classified and assessed. Their potential impact is evaluated and reported to management and the Board. Operational risk management tools and programs are in place to support the identification and assessment of operational risk with each having their defined methodology and/or standards. The key tools include Risk and Control Self-Assessment (RCSA), Scenario Analysis, and New Initiatives Risk Assessment (NIRA).
A key component of risk management is quantifying the size and scope of the Bank’s operational risk exposure. The collection and analysis of operational risk event (ORE) data and operational risk capital values provide meaningful information to measure operational risk. The data provides meaningful information for assessing and mitigating operational risk exposure at the Bank as a result of event root cause analysis and evaluation of internal controls. Timely, accurate and complete reporting of internal operational risk events, and their analysis, ensures that the Bank maintains a strong risk culture, promotes transparency, and enables the following:
| • |
|
Monitoring risk exposure, and to assess if the Bank is operating within risk appetite. |
| • |
|
Contributes to the assessment of the effectiveness of the operational control environment. |
| • |
|
Causal analysis to identify deficiencies and control failures that can be mitigated to prevent recurrence of future events. |
| • |
|
Compliance with Basel III Standardized Approach (SA) requirements for the calculation of operational risk capital. |
refers to regulatory and internal capital which is quantified as a reserve for unexpected losses resulting from operational risk. Operational risk capital is a component of the total amount of risk capital that the Bank holds. Loss data from OREs are collected in the Bank’s Operational Risk Management System and used for reporting purposes. When combined with Business Indicator Component (BIC)
1
data, the loss data captured from OREs is a critical input for the calculation of the Bank’s Internal Loss Multiplier (ILM)
2
, which is included in the operational risk regulatory capital calculation.
Risk Mitigation and Control
Operational risk response decisions include mitigation, transfer, acceptance, and avoidance of operational risks. The appropriate response will be determined based on consideration of the nature of the risks, their potential impacts and the consideration of our Code and risk appetite thresholds. Through the Bank’s operational risk management tools, issues such as deficiencies in the design or operating effectiveness of a control
|
1 |
Business Indicator Component (BIC) is calculated by multiplying the Business Indicator (BI) by set of regulatory determined marginal coefficients. The BI is a financial statement-based proxy for operational risk. |
|
2 |
Internal Loss Multiplier (ILM) is a scaling factor that is based on an institution’s average historical losses and the BIC. |
|
2025 Scotiabank Annual Report
Management’s Discussion and Analysis
| Risk Management
may be identified. When issues are identified, action plans can be developed to address them, or, where appropriate, the risk associated with these issues can be accepted. Action plans are managed by action owners to ensure the detailed plans are executed timely and effectively.
Controls are identified and assessed through the various operational risk management tools. In cases where controls are deemed deficient a response will be required which will in turn help to mitigate residual risk.
Risk Monitoring, Analytics, and Reporting
The Bank has processes in place for the ongoing monitoring of operational risk. These monitoring activities can provide an early warning of emerging issues, triggering timely management response. In addition, these activities allow for review and analysis of the risk profile in relation to risk appetite or other key indicators to identify when potential risk events may be approaching or exceeding thresholds, requiring action and/or escalation. Operational risk data is collected in risk systems and used for reporting. Operational risk reporting facilitates distribution and escalation of operational risk information to the relevant parties, including the Operational Risk Committee, as well as senior management and the Board via the Enterprise Risk Management report. It provides stakeholders involved in operational risk management activities access to reliable data in a consistent and timely manner to support risk-based decision making.
Cyber Security and Information Technology (IT) Risk
Cyber Security Risk is the risk of loss of confidentiality, integrity, or availability of information, data, or information systems and reflect the potential adverse impacts to organizational operations (i.e., mission, functions, image, or reputation) and assets, clients, and other stakeholders. Information Technology Risk is the risk of financial loss, disruption or damage to reputation from a failure of information technology systems.
The Cyber Security and IT risk landscape continues to evolve across the financial industry. The increasing use of digital delivery channels to deliver financial services exposes the Bank to various vectors of attack. Threat actors, including individuals, organized crime rings and nation state sponsored entities, continue to target financial institutions to steal data, money or to disrupt operations. These events can adversely impact the Bank’s operational environment, our customers and other third parties.
In 2025, the Board of Directors approved a revised Enterprise Cyber Security and Information Technology Risk Management Framework to ensure ongoing alignment with the evolving IT and cyber risk landscape. Supported by comprehensive policies and governance structures, this framework safeguards the Bank and its customers’ information and ensures a secure, resilient, and reliable technology environment in support of the Bank’s business objectives. During the year, the Bank enhanced its cyber security capabilities, strengthened its risk culture through targeted training and awareness initiatives, and accelerated the remediation of identified issues. These actions were taken to defend against evolving threats and minimize potential impacts to the business.
Compliance risk is the risk of an activity not being conducted in conformity with applicable laws, rules, regulations, prescribed practices (“regulatory requirements”), internal policies and procedures, and ethical standards expected by regulators, clients, investors, employees, and other stakeholders. Compliance risk is comprised of regulatory compliance risk, conduct risk, privacy risk, and anti-bribery and anti-corruption (“ABAC”) risk.
Regulatory compliance risk
is the risk that a business activity may not be conducted in conformity with all applicable regulatory requirements wherever the Bank does business.
arises from actions or behaviours of the Bank’s officers, directors, employees, or the Bank’s business that do not align with our ScotiaBond values and behaviours or the Scotiabank Code of Conduct. This risk can adversely impact the Bank, clients, employees, or integrity of financial markets. Conduct risk is influenced by organizational culture and is manifested in employee conduct.
arises when there are contraventions of applicable privacy laws, regulations, standards, and regulatory expectations; when ethical or operational standards set out in our Code or other policies, procedures, manuals, or guidelines are not followed; and when employees fail to treat client, employee, and third-party Personally Identifiable Information (“PII”) in accordance with established security safeguards.
arises when there are contraventions of applicable ABAC laws, regulations, standards, and regulatory expectations, as well as ethical or operational standards set out in our Code or other frameworks, policies, standards, operating procedures, or guidelines related to bribery and corruption.
The Audit and Conduct Review Committee of the Board (the “ACRC”) approves the Compliance Risk Summary Framework, which provides an overview of the key governance components, responsibilities, and programs that enable the Bank to effectively manage Compliance Risk as a core component of its enterprise-wide Compliance program. The Bank is required to comply with
E-13
guidelines as set out by OSFI with respect to the management of regulatory compliance risk. Regulatory compliance management at the Bank is governed by the Compliance Management Framework (“CMF”). The CMF’s primary objective is to provide assurance that the Bank’s business activities are conducted in compliance with all applicable regulations and within the Bank’s risk appetite.
Environmental, Social and Governance Risk
Environmental, Social and Governance (ESG) Risk is the risk that an environmental (including climate risk), social, or governance event, or condition, which if occurs could cause an actual or potential negative impact to the Bank.
The Bank considers Environmental Risk to be the potential adverse impacts to the Bank because of climate change and/or damage to the natural environment or biodiversity, such as land, water, plants, natural resources, ecosystems, and the atmosphere. The physical and transition risks associated with climate change are a component of Environmental Risk.
Social Risk is the risk of potential adverse impacts to the Bank that can arise due to the mismanagement of social considerations that can cause actual or perceived negative impacts on people and communities. Social considerations include, but are not limited to, human rights (including human trafficking and modern slavery); Indigenous rights; labour standards and working conditions; inclusion; community health, safety, and security; disadvantaged and vulnerable groups; cultural property and heritage; and land acquisition and involuntary resettlement.
Corporate governance refers to the oversight mechanisms and the way in which the Bank is governed. It encompasses the Bank’s policies and processes, how decisions are made, and how it deals with the various interests of, and relationships with, its many stakeholders, including shareholders, customers, employees, regulators, and the broader community. Governance Risk is the risk of potential adverse impacts to the Bank stemming from poor or ineffective corporate governance mechanisms and controls.
2025 Scotiabank Annual Report
|
Management’s Discussion and Analysis
The Board of Directors and its committees provide oversight of ESG Risk to ensure alignment with the Bank’s strategies and risk appetite. It also approves key risk policies, frameworks and limits. The following Board committees provide ongoing oversight:
| • |
|
: Retains oversight of ESG Risks, including climate-related risks, and periodically reviews and approves the Bank’s key risk management policies, frameworks, and limits to ensure that management is operating within the Bank’s Enterprise Risk Appetite Framework. |
| • |
|
Corporate Governance Committee : Evaluates the Bank’s environmental and social performance and assesses best practices for ESG disclosure; examines current and emerging ESG topics, considers their implications on the Bank’s strategy and reviews the Bank’s annual ESG Report; and acts in an advisory capacity through a continuing assessment of the Bank’s approach to corporate governance and makes policy recommendations, including on topics such as human rights. |
| • |
|
& Conduct Review Committe e: Oversees climate-related disclosure as part of the Bank’s financial reporting, sets standards of conduct for ethical behaviour and oversees conduct risk management, and consumer protection. |
| • |
|
: Oversees human capital and compensation strategies related to inclusion, employee health, safety, and well-being and other ESG policies and practices. |
The Board of Directors is supported by the President and Chief Executive Officer (CEO) and Chief Risk Officer (CRO). The CRO has delegated their authority over the oversight of ESG risk to the Operational Risk Committee (ORC). The ORC provides effective oversight and challenge of the Bank’s management of environmental and social risks. Its responsibilities include monitoring of the ESG risk profile, reviewing and approving ESG Risk frameworks, policies, risk appetite statements and limits.
The Bank actively monitors policy and legislative requirements through ongoing dialogue with government, industry, and stakeholders in the countries where it operates. Scotiabank regularly meets with various external stakeholders, including industry associations, with respect to roles that banks can play on ESG related issues and to share best practices.
The Bank’s approach for the effective management of ESG risk is governed by our ESG Risk Management Framework in a manner consistent with the Enterprise-wide Risk Management Framework. The ESG Risk Management Framework describes the guiding principles, program elements, and roles and responsibilities relating to the Bank’s management of ESG risk and establishes the minimum requirements for the integration of ESG risk considerations into the decision-making processes across other risk types and business strategies, activities and internal operations. This framework assists the Bank as we continue to advance our capabilities in managing ESG risks in a manner that is consistent with regulatory requirements, industry standards, best practices, and risk appetite.
The ESG Risk Management framework is supported by additional policies, processes, and guidelines, designed to help mitigate ESG Risk or advance responsible practices. For example, Scotiabank is a signatory to the Equator Principles (EPs) framework, which enables the Bank, in partnership with our clients, to identify, assess, manage and report environmental and social risks and impacts associated with the large-scale infrastructure and industrial development projects. We also have policies in place related to our financing activities to oil and gas projects in the Arctic Circle, and to projects related to thermal coal mining and power, UNESCO World Heritage Sites and Wetlands of International Importance, and illegal logging and wildlife trade. Our approach to respecting and promoting human rights is communicated in our Code and in the Global Human Rights Statement. The Bank has set a number of enterprise-wide commitments that aim to address climate-related risks and opportunities, such as our commitment to provide $350 billion in climate-related finance by 2030 to support clients in their strategies to address climate change and other environmental goals. Our Climate Related Finance Framework outlines the financial product and services we offer in support of this commitment. Additional information on the Bank’s approach to climate change risk management and strategy will be provided in our 2025 Sustainability Report.
Data Management Risk is the risk of exposure to the financial and
non-financial
consequences caused by people, inadequate processes and systems related to data governance, data quality, data architecture and/or data ethics.
The Data Risk Management Framework provides an overview of the key governance components for the data management risk and oversight activities across the Bank. The Data Risk Management Policy defines key guiding principles for managing data risk, including the interaction model and roles and responsibilities for key stakeholders involved in managing data management risk across the Bank.
Model risk is the risk of adverse financial (e.g. inadequate capital, financial losses, inadequate liquidity, underfunding of defined benefit pension plans) operational, and/or reputational consequences arising from the design, development, implementation and/or use of a model. It can originate from, among other things, inappropriate specification; incorrect parameter estimates; flawed hypotheses and/or assumptions; mathematical computation errors; inaccurate, inappropriate or incomplete data; inappropriate, improper or unintended usage; and inadequate monitoring and/or controls.
Model risk is managed through a structured framework that outlines minimum compliance requirements aligned with OSFI’s revised
E-23
Model Risk Management Guideline. This framework spans the entire model lifecycle – from identification and assessment to monitoring and remediation.
All models that meet the Bank’s definition – including those developed internally or sourced from vendors – are governed by the Model Risk Management Framework (MRMF). The MRMF is supported by a suite of policies, standards, and guidelines that ensure consistent and effective model risk management across the organization, including well-defined roles and responsibilities for key stakeholders across the lifecycle.
The Bank’s model risk appetite – expressed through the Enterprise Model Risk Score – is based on aggregated indicators such as persistent performance breaches, policy exceptions, and material issues. This score reflects the Bank’s tolerance for model-related risk and is reported quarterly in the Enterprise Risk Management (ERM) Report.
|
2025 Scotiabank Annual Report
Management’s Discussion and Analysis
| Risk Management
Reputational risk is the risk that negative publicity or stakeholder sentiment regarding Scotiabank’s conduct, business practices or associations, whether true or not, will adversely affect its revenues, operations or client base, or require other defensive measures.
The Bank has an Enterprise Reputational Risk Policy, as well as other policies and procedures for managing reputational risk. Reputational risk is managed and controlled by our Code, governance practices and risk management programs, policies, procedures, and training. All directors, officers and employees have a responsibility to conduct their activities in accordance with our Code, and in a manner that minimizes reputational risk. The activities of the Legal; Global Tax; Corporate Secretary; Global Communications; Global Compliance & AML, and Global Risk Management departments, as well as the Reputational Risk Committee, are particularly oriented to the management of reputational risk.
Strategic Risk is the risk that the enterprise, business lines or corporate functions will make strategic choices that are ineffective or insufficiently resilient to changes in the business environment or fail to achieve the Bank’s strategic vision in the execution of the Bank’s strategy.
The Board is ultimately responsible for oversight of strategic risk, by ensuring a robust strategic planning process and approving, on an annual basis, the strategic plan for the Bank. Changes in our business strategy can impact our risk appetite and therefore the Annual Strategy Report to the Board of Directors considers linkages between the Bank’s Enterprise Risk Appetite Framework and the enterprise strategy, business line strategies and how the corporate functions support the business lines in the execution of their strategic plans. The Board reviews this material, along with other relevant strategic and financial presentations by management throughout the year in order to provide the appropriate governance.
The strategic planning process is managed by Enterprise Strategy which supports the management of strategic risk throughout the planning process by ensuring alignment across our business, financial, capital and risk planning. Global Risk Management also provides oversight of strategic risk by providing independent reviews throughout the strategic planning process, establishing enterprise risk frameworks, and independently monitoring and reporting on the level of risk established against our risk appetite metrics.
The development, evaluation and execution of the Bank’s strategic plans is owned by the Management team of the Bank. They participate actively in the annual planning process and on an ongoing basis, Heads of Business Lines and Corporate Functions identify, manage, and assess the internal and external risks that could impede achievement of, or progress of, strategic objectives. The executive management team regularly meets to evaluate the effectiveness of the Bank’s strategic plan, and consider what amendments, if any, are required.
2025 Scotiabank Annual Report
|
Management’s Discussion and Analysis
Controls and Accounting Policies
Management’s responsibility for financial information contained in this annual report is described on page 140.
Disclosure controls and procedures
The Bank’s disclosure controls and procedures are designed to provide reasonable assurance that information is accumulated and communicated to the Bank’s management, including the President and Chief Executive Officer and the Group Head and Chief Financial Officer, as appropriate, to allow timely decisions regarding required disclosure.
As of October 31, 2025, the Bank’s management, with the participation of the President and Chief Executive Officer and the Group Head and Chief Financial Officer, evaluated the effectiveness of its disclosure controls and procedures, as defined under the rules adopted by the U.S. Securities and Exchange Commission (SEC) and the Canadian securities regulatory authorities, and have concluded that the Bank’s disclosure controls and procedures are effective.
Internal control over financial reporting
Management of the Bank is responsible for establishing and maintaining adequate internal control over financial reporting. These controls include policies and procedures that:
| • |
|
pertain to the maintenance of records that, in reasonable detail, accurately and fairly reflect the transactions and dispositions of the assets of the Bank; |
| • |
|
provide reasonable assurance that transactions are recorded as necessary to permit preparation of financial statements in accordance with International Financial Reporting Standards (IFRS) as issued by the International Accounting Standards Board (IASB), and that receipts and expenditures are being made only in accordance with authorizations of management and directors of the Bank; and |
| • |
|
provide reasonable assurance regarding prevention or timely detection of unauthorized acquisition, use or disposition of the Bank’s assets that could have a material effect on the financial statements. |
All control systems contain inherent limitations, no matter how well designed. As a result, the Bank’s management acknowledges that its internal control over financial reporting will not prevent or detect all misstatements due to error or fraud. In addition, management’s evaluation of controls can provide only reasonable, not absolute, assurance that all control issues that may result in material misstatements, if any, have been detected.
Management assessed the effectiveness of internal control over financial reporting, using the Internal Control-Integrated Framework 2013 issued by the Committee of Sponsoring Organizations of the Treadway Commission (COSO), and based on that assessment concluded that internal control over financial reporting was effective as of October 31, 2025. There are no material weaknesses that have been identified by management in this regard. KPMG LLP, the independent auditors appointed by the shareholders of the Bank, who have audited the consolidated financial statements, have also audited internal control over financial reporting as of October 31, 2025.
Changes in internal control over financial reporting
During the year ended October 31, 2025, there have been no changes in the Bank’s internal control over financial reporting that have materially affected, or are reasonably likely to materially affect, the Bank’s internal control over financial reporting.
Critical Accounting Policies and Estimates
The Bank’s accounting policies are integral to understanding and interpreting the financial results reported in this annual report. Note 3 to the consolidated financial statements summarizes the material accounting policies used in preparing the Bank’s consolidated financial statements. Certain of these policies require management to make estimates, assumptions and subjective judgments that are difficult, complex, and often relate to matters that are inherently uncertain. The policies discussed below are particularly important to the presentation of the Bank’s financial position and results of operations, as changes in the estimates, assumptions and judgments could have a material impact on the Bank’s consolidated financial statements. These estimates, assumptions and judgments are adjusted in the normal course of business to reflect changing underlying circumstances.
Allowance for credit losses
The allowance for credit losses, using an expected credit loss approach as required under IFRS 9, is estimated using valuation models and incorporates inputs, assumptions and techniques that involve a high degree of management judgment. Under IFRS 9 expected credit loss methodology, an allowance is recorded for expected credit losses on financial assets regardless of whether there has been an actual loss event. The Bank recognizes an allowance at an amount equal to 12 month expected credit losses if the credit risk at the reporting date has not increased significantly since initial recognition (Stage 1). When a financial asset experiences a significant increase in credit risk (SIR) after origination but is not considered to be in default, it is included in Stage 2 and subject to lifetime expected credit losses. Financial assets that are in default are included in Stage 3. Similar to Stage 2, the allowance for credit losses for Stage 3 financial assets captures the lifetime expected credit losses.
The main drivers in allowance for credit loss changes that are subject to significant judgment include the following:
| • |
|
Determination of parameters such as probability of default (PD), loss given default (LGD) and exposure at default (EAD). |
| • |
|
Forecast of macroeconomic variables for multiple scenarios and probability weighting of the scenarios. |
Qualitative adjustments or overlays may also be made as temporary adjustments using expert credit judgment in circumstances where, in the Bank’s view, the existing regulatory guidance, inputs, assumptions, and/or modelling techniques do not capture all relevant risk factors. The use of management overlays requires significant judgment that may impact the amount of allowance recognized.
Measurement of expected credit losses
The PD, EAD, and LGD inputs used to estimate expected credit losses are modelled based on historical default and loss experience, and macroeconomic variables that are closely related with credit losses in the relevant portfolio.
|
2025 Scotiabank Annual Report
Management’s Discussion and Analysis
| Controls and Accounting Policies
Details of these statistical parameters/inputs are as follows:
| • |
|
PD – The probability of default is an estimate of the likelihood of default over a given time horizon. A default may only happen at a certain time over the remaining estimated life, if the facility has not been previously derecognized and is still in the portfolio. |
| • |
|
EAD – The exposure at default is an estimate of the exposure at a future default date, considering expected changes in the exposure after the reporting date, including repayments of principal and interest, whether scheduled by contract or otherwise, expected drawdowns on committed facilities, and accrued interest from missed payments. |
| • |
|
LGD – The loss given default is an estimate of the loss arising in the case where a default occurs at a given time. It is based on the difference between the contractual cash flows due and those that the lender would expect to receive, including from the realization of any collateral. It is usually expressed as a percentage of the EAD. |
Forward-looking macroeconomic scenarios
The Bank uses a broad range of forward-looking economic information as inputs to its models of expected credit losses and the related allowance. These include real GDP, unemployment rates, consumer price index, central bank interest rates, and house price indices, amongst others. The allowance is determined using four probability-weighted, forward-looking scenarios. The Bank considers both internal and external sources of information and data in order to create unbiased projections and forecasts. The scenarios are prepared using forecasts generated by Scotiabank Economics (SE). The forecasts are generated using both internally and externally developed models whose outputs are modified by SE as necessary to formulate a ‘base case’ view of the most probable future direction of economic developments. SE also develops a representative range of other possible forecast scenarios. More specifically, the process involves the development of three additional economic scenarios to which relative probabilities are assigned. The development of the baseline and alternative scenarios is overseen by a governance committee that consists of internal stakeholders from across the Bank. The final baseline and alternative scenarios reflect significant review and oversight and incorporate judgment both in the determination of the scenarios’ forecasts and the probability weights that are assigned to them.
Significant increase in credit risk
The assessment of SIR since origination of a financial asset considers borrower-specific quantitative and qualitative information without consideration of collateral, and the impact of forward-looking information. Quantitative models may not always be able to capture all reasonable and supportable information that may indicate a SIR. Qualitative factors may be assessed to supplement the gap. Examples of situations include changes in adjudication criteria for a particular group of borrowers, changes in portfolio composition, and natural disaster events impacting certain portfolios.
For retail exposures, a SIR is assessed based on thresholds that exist by product which consider the change in PD. The thresholds used for PD migration are reviewed and assessed at least annually unless there is a significant change in credit risk management practices in which case the review is brought forward.
For
non-retail
exposures, the Bank uses an internal risk rating scale (IG codes). All
non-retail
exposures have an IG code assigned that reflects the PD of the borrower. Both borrower specific and
non-borrower
specific (i.e. macroeconomic) forward-looking information is considered and reflected in the IG rating. SIR is evaluated based on the migration of the exposures among IG codes.
Fair value of financial instruments
All financial instruments are measured at fair value on initial recognition. Subsequent measurement of a financial instrument depends on its classification. The contractual cash flow characteristics of a financial instrument and the business model under which it is held determine such classification.
Non-trading
loans and receivables, certain securities and most financial liabilities are carried at amortized cost unless classified or designated as fair value through profit and loss or fair value through other comprehensive income at inception.
The fair value of a financial asset or liability is the price that would be received to sell an asset or paid to transfer a liability in an orderly transaction between market participants in the principal, or in its absence, the most advantageous market to which the Bank has access at the measurement date.
The Bank discloses the classification of all financial instruments carried at fair value in a hierarchy based on the determination of fair value. The best evidence of fair value for a financial instrument is the quoted price in an active market. Fair value based on unadjusted quoted market prices for identical instruments in active markets represents a Level 1 valuation. Quoted prices are not always available for
(OTC) transactions, as well as transactions in inactive or illiquid markets. OTC transactions are valued using internal models that maximize the use of observable inputs to estimate fair value. The chosen valuation technique incorporates all the factors that market participants would consider in pricing a transaction. When fair value is based on all significant market observable inputs, the valuation is classified as Level 2. Financial instruments traded in a less active market can be valued using indicative market prices, the present value of cash flows or other valuation techniques. Fair value estimates normally do not consider forced or liquidation sales. Where financial instruments trade in inactive markets or when using models where observable parameters do not exist, significant management judgement is required for valuation methodologies and model inputs. Valuations that require the significant use of unobservable inputs are considered Level 3. The calculation of estimated fair value is based on market conditions at a specific point in time and therefore may not be reflective of future fair values.
The Bank has controls and processes in place to ensure that the valuation of financial instruments is appropriately determined. Global Risk Management (GRM) is responsible for the design and application of the Bank’s risk management framework. GRM is independent of the Bank’s business units and is overseen by Executive Management and the Board of Directors. Senior management committees within GRM oversee and establish standards that are critical in ensuring that appropriate valuation methodologies and policies are in place for determining fair value.
Where possible, valuations are based on quoted prices or observable inputs obtained from active markets. GRM oversees a monthly Independent Price Verification (IPV) process to ensure the reliability and accuracy of prices and inputs used in the determination of fair value. The IPV process is performed by price verification groups that are independent of the business. The Bank maintains an approved list of pricing sources that are used in the IPV process. These sources include, but are not limited to, brokers, dealers and consensus pricing services. The valuation policies relating to the IPV process require that all pricing or rate sources be external to the Bank. At least annually, an independent assessment of pricing or rate sources is performed by GRM to determine the market presence or market representative levels.
Where quoted prices are not readily available, such as for transactions in
markets, internal models that maximize the use of observable inputs are used to estimate fair value. An independent second-line model risk management function within GRM oversees the initial model validation, approval and ongoing validation and the performance monitoring of valuation models used in determining fair value. Model development and validation processes are governed by the Bank’s Model Risk Management Policy.
In determining fair value for certain instruments or portfolios of instruments, valuation adjustments or reserves may be required to arrive at a more accurate representation of fair value. The Bank’s policy of applying valuation reserves to a portfolio of instruments is approved by a senior management committee.
2025 Scotiabank Annual Report
|
Management’s Discussion and Analysis
These reserves can include adjustments for credit risk, bid-offer spreads, unobservable parameters, funding costs and constraints on prices in inactive or illiquid markets. The methodology for the calculation of valuation reserves is reviewed at least annually by senior management.
Valuation adjustments recorded against the fair value of financial assets and financial liabilities totaled $103 million as at October 31, 2025 (2024 – $81 million), net of any write-offs. The majority of the year-over-year change is due to widening of counterparty credit spreads during the year.
As at October 31, 2025, a net funding valuation adjustment (FVA) representing an excess of funding benefit adjustment over funding cost adjustment of $136 million (2024 – $165 million),
pre-tax,
was recorded for uncollateralized derivative instruments.
The Bank provides pension and other benefit plans for eligible employees globally. Pension benefits are offered in the form of defined benefit pension plans (generally based on an employee’s length of service and earnings) and defined contribution pension plans (where the Bank’s contribution is fixed and there is no legal or constructive obligation to pay further amounts). Other benefits include post-retirement health care, dental care and life insurance, along with other long-term employee benefits, such as long-term disability benefits.
The employee benefit expenses and related benefit obligation are calculated using actuarial methods and certain actuarial assumptions. These assumptions are based on management’s best estimate and are reviewed and approved annually. The most significant assumption is the discount rate used to determine the defined benefit obligation, which is set by reference to the yields on high quality corporate bonds that have durations that match the terms of the Bank’s obligations. Separate discount rates are used to determine the annual benefit expense in Canada and the U.S. These rates are determined with reference to the yields on high quality corporate bonds with durations that match the various components of the annual benefit expense. The discount rate used to determine the annual benefit expense for all other plans is the same as the rate used to determine the defined benefit obligation. Other key assumptions include future compensation, health care costs, employee turnover, retirement age and mortality. When making these estimates, management considers expectations of future economic trends and business conditions, including inflation rates, as well as other factors, such as plan-specific experience and best practices.
Actual experience that differs from assumptions made by management will result in a net actuarial gain or loss recognized immediately in other comprehensive income, except for other long-term employee benefits, where they are recognized in the Consolidated Statement of Income.
Note 27 of the consolidated financial statements contains details of the Bank’s employee benefit plans, such as the disclosure of pension and other benefit amounts, management’s key assumptions, and a sensitivity analysis of changes in these assumptions on the employee benefit obligation and expense.
Management exercises judgment in determining the provision for income taxes and deferred income tax assets and liabilities. The provision is based on management’s expectations regarding the income tax consequences of transactions and events during the period. Management interprets the tax legislation for each jurisdiction in which the Bank operates and makes assumptions about the expected timing of the reversal of deferred income tax assets and liabilities. If management’s interpretations of the legislation differ from those of the tax authorities, or if the actual timing of the reversals of the deferred income tax assets and liabilities is not as anticipated, the provision for income taxes could increase or decrease in future periods.
The Bank maintains provisions for uncertain tax positions that it believes appropriately reflect the risk of tax positions under discussion, audit, dispute or appeal with tax authorities, or which are otherwise considered to involve uncertainty. These provisions are made using the Bank’s best estimate of the amount expected to be paid based on an assessment of all relevant factors, which are reviewed at the end of each reporting period. It is possible that additional liability and income tax expense could arise in the future, depending on the acceptance of the Bank’s tax positions by the relevant tax authorities in the jurisdictions in which the Bank operates.
Note 26 of the consolidated financial statements contains further details with respect to the Bank’s provisions for income taxes.
In the normal course of business, the Bank enters arrangements with structured entities on behalf of its customers and for its own purposes. These structured entities can be generally categorized as multi-seller commercial paper conduits, Bank funding vehicles and structured finance entities. Further details are provided in the
Off-balance
sheet arrangements section on page 73.
Management is required to exercise judgement to determine whether a structured entity should be consolidated. This evaluation involves understanding the arrangements, determining whether decisions about the relevant activities are made by means of voting rights or other contractual arrangements, and determining whether the Bank controls the structured entity.
The Bank controls an investee when it is exposed, or has rights, to variable returns from its involvement with the investee and has the ability to affect those returns through its power over the investee. The three elements of control are:
| • |
|
exposure, or rights, to variable returns from involvement with the investee; and |
| • |
|
the ability to use power over the investee to affect the amount of the Bank’s returns. |
This definition of control applies to circumstances:
| • |
|
when voting rights or similar rights give the Bank power, including situations where the Bank holds less than a majority of voting rights or involving potential voting rights; |
| • |
|
when an investee is designed so that voting rights are not the dominant factor in deciding who controls the investee (i.e., relevant activities are directed by contractual arrangements); |
| • |
|
involving agency relationships; and |
| • |
|
when the Bank has control over specified assets of an investee. |
The Bank does not control an investee when it is acting in an agent’s capacity. The Bank assesses whether it is an agent by determining whether it is primarily engaged to act on behalf and for the benefit of another party or parties. Factors that the Bank considers in this assessment include the scope of its decision-making authority over the investee, the rights held by other parties, the remuneration to which it is entitled, and the Bank’s exposure to variability of returns from other interests that it holds in the investee. The analysis uses both qualitative and quantitative analytical techniques and involves the use of a number of assumptions about the business environment in which the structured entity operates and the amount and timing of future cash flows.
|
2025 Scotiabank Annual Report
Management’s Discussion and Analysis
| Controls and Accounting Policies
The Bank reassesses whether it controls an investee if facts and circumstances indicate that one or more of the three elements of control change. Management is required to exercise judgement to determine if a change in control event has occurred. During 2025, there were no change in control events that caused the Bank to change its control conclusion of its multi-seller conduits or other structured entities.
As described in Note 14 to the consolidated financial statements and in the discussion of
off-balance
sheet arrangements, the Bank does not control the three Canadian-based multi-seller conduits that it sponsors and they are not required to be consolidated on the Bank’s Consolidated Statement of Financial Position. The Bank controls its U.S.-based multi-seller conduit and consolidates it on the Bank’s Consolidated Statement of Financial Position.
For impairment testing, goodwill acquired in a business combination is, on the acquisition date, allocated to each of the Bank’s groups of cash-generating units (CGU) that are expected to benefit from the particular acquisition. Goodwill is not amortized but tested for impairment annually and when circumstances indicate that the carrying value may be impaired. At each reporting date, goodwill is reviewed to determine whether there is any indication of impairment. Each CGU to which goodwill is allocated for impairment testing reflects the lowest level at which goodwill is monitored for internal management purposes.
The Bank determines the carrying value of the CGU using a regulatory capital approach based on credit, market, operational risks and leverage, consistent with the Bank’s capital attribution for business line performance measurement. Corporate capital that is not directly attributable is allocated to each CGU on a proportional basis. The recoverable amount is the greater of fair value less costs of disposal (FVLCD) and value in use (VIU). If either FVLCD or VIU exceeds the carrying amount, there is no need to determine the other. An impairment loss is recognized if the carrying amount of the CGU exceeds the recoverable amount. An impairment loss on goodwill is not reversed.
FVLCD is the price that would be received from the sale of a CGU in an orderly transaction between market participants, less costs of disposal, at the measurement date. In determining FVLCD, an appropriate valuation model is used which considers various factors, including normalized net income, price earnings multiples, and control premiums. These calculations are corroborated by valuation multiples and quoted share prices for publicly traded subsidiaries or other available fair value indicators.
VIU is the present value of the future cash flows expected to be derived from a CGU. The determination of VIU involves judgment in estimating future cash flows, terminal growth rate and discount rate. The future cash flows are based on management approved budgets and plans which factor in market trends, macroeconomic conditions, forecasted earnings and business strategy for the CGU. The terminal growth rate is based on the long-term growth expectations in the relevant countries, while the discount rate is based on the cost of capital.
Significant judgment is applied in determining the recoverable amounts of the CGU and assessing whether certain events or circumstances constitute objective evidence of impairment.
Goodwill was assessed for annual impairment based on the methodology described above as at July 31, 2025, and no impairment was determined to exist. As of October 31, 2025, there were no significant changes to this assessment. For additional information, see Note 17 of the consolidated financial statements.
Intangible assets with indefinite useful lives are not amortized but tested for impairment annually and when circumstances indicate that the carrying value may be impaired. Intangible assets with finite useful lives are amortized over the estimated useful life of the asset and are tested for impairment only when events and circumstances indicate impairment. Indefinite and finite life intangible assets are reviewed at each reporting date to determine whether there is any indication of impairment.
The recoverable amount is the greater of fair value less costs of disposal (FVLCD) and value in use (VIU). If either FVLCD or VIU exceeds the carrying amount, there is no need to determine the other. The VIU method is used by the Bank to determine the recoverable amount of intangible assets. In determining VIU, a discounted cash flow valuation model is used which incorporates key assumptions, such as management-approved cash flow projections, terminal growth rate and the applicable discount rate. An impairment loss is recognized if the carrying amount of the intangible asset exceeds its recoverable amount. Impairment losses recognized in prior periods are reassessed at each reporting period for any indication that the loss has decreased or no longer exists. An impairment loss recognized in a prior period shall be reversed only if there has been a change in the estimates used to determine the asset’s recoverable amount since the last impairment was recognized. The reversal of an impairment loss reflects an increase in the estimated service potential of an asset, either from use or from sale, and does not only result from the passage of time. An impairment loss is reversed only to the extent that the intangible asset’s carrying amount does not exceed the carrying amount that would have been determined if no impairment loss had been recognized.
The recoverable amount is significantly impacted by the discount rate and the terminal value. Significant judgment is applied in determining the intangible asset’s recoverable amount and assessing whether certain events or circumstances constitute objective evidence of impairment.
Indefinite life intangible assets were assessed for annual impairment based on the methodology described above as at July 31, 2025, and no impairment was determined to exist. As of October 31, 2025, there were no significant changes to this assessment. For additional information on both indefinite life and finite life intangible assets, see Note 17 of the consolidated financial statements.
Derecognition of financial assets
Financial assets are derecognized when the contractual rights to the cash flows from the asset have expired, which occurs with repayment by the borrower or upon substantial modification of the asset terms. Assets are also derecognized when the Bank transfers the contractual rights to receive the cash flows from the financial asset or has assumed an obligation to pay those cash flows to an independent third-party, and the Bank has transferred substantially all the risks and rewards of ownership of that asset to an independent third-party.
Management must apply judgement in determining whether a modification of the contractual terms of the financial asset is substantial. For loans, this includes the nature of the modification and the extent of changes to contractual terms including interest rate, authorized amount and term.
Management must also apply judgement in determining, based on specific facts and circumstances, whether the Bank has retained or transferred substantially all the risks and rewards of ownership of the financial asset. Where substantially all the risks and rewards of ownership of the financial asset are neither retained nor transferred, the Bank derecognizes the transferred asset only if it has lost control over that asset. If the Bank retains control over the asset, it will continue to recognize the asset to the extent of its continuing involvement.
Most assets transferred under repurchase agreements, securities lending agreements, securitizations of fully insured Canadian residential mortgages, and securitizations of credit card receivables do not qualify for derecognition. The Bank continues to record the transferred assets on the Consolidated Statement of Financial Position as secured financings.
2025 Scotiabank Annual Report
|
Management’s Discussion and Analysis
Further information on derecognition of financial assets can be found in Note 13 of the consolidated financial statements.
The Bank recognizes a provision if, because of a past event, the Bank has a present legal or constructive obligation that can be estimated reliably, and it is probable that an outflow of economic benefits will be required to settle the obligation. Probable in this context means more likely than not. Significant judgement is required in determining whether a present obligation exists and in estimating the probability, timing, and amount of any future outflows.
In the ordinary course of business, the Bank and its subsidiaries are routinely defendants in, or parties to a number of pending and threatened legal actions and regulatory proceedings, including actions brought on behalf of various classes of claimants. In view of the inherent difficulty of predicting the outcome of such matters, the Bank cannot state what the eventual outcome of such matters will be.
Legal provisions are established when it becomes probable that the Bank will incur an expense related to a legal action and the amount can be reliably estimated. Such provisions are recorded at the best estimate of the amount required to settle any obligation related to these legal actions as at the balance sheet date, considering the risks and uncertainties surrounding the obligation. Management and internal and external experts are involved in estimating any amounts that may be required. The actual costs of resolving these claims may vary significantly from the amount of the legal provisions. The Bank’s estimate involves significant judgement, given the varying stages of the proceedings, the fact that the Bank’s liability, if any, has yet to be determined and the fact that the underlying matters will change from time to time. As such, there is a possibility that the ultimate resolution of those legal actions may be material to the Bank’s consolidated results of operations for any reporting period.
The Bank, through its Peruvian subsidiary, is engaged in a legal action related to certain value-added tax assessed amounts and associated interest totaling $176 million, which arose from certain client transactions that occurred prior to the Bank’s acquisition of the subsidiary. The legal action in Peru relating to the original assessed amount was concluded in favour of the Government of Peru in May 2024. Accordingly, the Bank paid $34 million representing the principal and associated reasonable interest, which was recorded in
non-interest
expenses – other. In November 2021, the Peruvian Constitutional Court dismissed the matter relating to the accrued default interest for procedural reasons. With respect to this default interest component, and in relation to the Constitutional Court of Peru’s treatment of Scotiabank Peru, in October 2022, the Bank filed a request for arbitration against the Republic of Peru before the International Centre for the Settlement of Investment Disputes (ICSID), pursuant to the provisions of the Canada-Peru Free Trade Agreement. This case is currently proceeding through the arbitration process. In Q3 2024, the Bank recorded a legal provision of $142 million in other liabilities – provisions, representing the amount at issue in the arbitration. The Bank intends to continue to vigorously advance its position.
Future Accounting Developments
The Bank actively monitors developments and changes in accounting standards from the IASB, as well as requirements from the other regulatory bodies, including OSFI. The Bank is currently assessing the impact of adoption of new standards issued by the IASB on its consolidated financial statements and also evaluating the alternative elections available on transition.
Effective November 1, 2026
IFRS 9 Financial Instruments and IFRS 7 Financial Instruments: Disclosures – Amendments
On May 30, 2024, the IASB issued “Amendments to the Classification and Measurement of Financial Instruments (Amendments to IFRS 9 and IFRS 7)” to address post-implementation review findings of IFRS 9
.
The amendments introduce an accounting policy choice to derecognize financial liabilities settled through an electronic payment system before the settlement date upon meeting certain conditions. The amendments clarify the assessment of contractual cash flow characteristics of financial assets based on contingent events, such as interest rates linked to environmental, social and governance (ESG) targets, the treatment of
non-recourse
assets, and contractually linked instruments. The amendments introduce new disclosure requirements for financial instruments with contractual terms that can change cash flows due to events not directly related to changes in basic lending risks, such as certain loans subject to ESG targets. Additionally, the amendments change some of the disclosure requirements for equity instruments designated at fair value through other comprehensive income.
The amendments are effective for the Bank on November 1, 2026, and early adoption is permitted. The Bank is required to apply the amendments retrospectively but is not required to restate prior periods. The Bank is currently assessing the impact of these amendments.
Effective November 1, 2027
IFRS 18 Presentation and Disclosure in Financial Statements
The IASB issued IFRS 18
Presentation and Disclosure in Financial Statements
on April 9, 2024, to replace IAS 1
Presentation of Financial Statements
and
is effective for annual periods beginning on or after January 1, 2027. IFRS 18 introduces a defined structure for the presentation of the statement of
income, including required totals and subtotals, as well as aggregating and disaggregating principles to categorize financial information. The standard
also requires all Management-defined performance measures to be disclosed in the notes to the financial statements.
IFRS 18 will be effective for the Bank on November 1, 2027, with early adoption permitted. The Bank is currently assessing the impact of this new standard.
The Bank continues to monitor global regulatory developments relating to a broad spectrum of topics, in order to ensure that control functions and business lines are responsive on a timely basis and business impacts, if any, are minimized. A high-level summary of some of the key regulatory developments that have the potential of impacting the Bank’s operations is included below.
The Organisation for Economic
Co-operation
and Development published Pillar Two model rules in December 2021 as part of its efforts toward international tax reform. The rules aim to have large multinational enterprises, with consolidated revenues in excess of
€
750 million, pay a minimum effective tax of 15%. These rules apply to the Bank effective November 1, 2024, and have been enacted or substantively enacted in certain jurisdictions in which the Bank operates, including Canada, whose Global Minimum Tax (GMT) Act was enacted in June 2024.
|
2025 Scotiabank Annual Report
Management’s Discussion and Analysis
| Controls and Accounting Policies
The IASB previously issued amendments to IAS 12 Income Taxes for a temporary mandatory exception from the recognition and disclosure of deferred taxes related to the implementation of Pillar Two GMT rules, which the Bank has applied.
For the twelve months ended October 31, 2025, the impact of the GMT on the Bank’s effective tax rate was approximately 0.8%, and was primarily related to its operations in certain Caribbean jurisdictions and Ireland.
On July 4, 2025, the One Big Beautiful Bill Act was enacted into U.S. law, which codifies certain of the 2017 Tax Cuts and Jobs Act provisions, making them permanent. There has not been any significant impact on the consolidated effective tax rate, however, we continue to monitor any future developments.
Related Party Transactions
Compensation of key management personnel of the Bank
Key management personnel are those persons having authority and responsibility for planning, directing and controlling the activities of the Bank, directly or indirectly, and comprise the directors of the Bank, the President and Chief Executive Officer, certain direct reports of the President and Chief Executive Officer and Group Heads.
T60
Compensation of key management personnel of the Bank
|
|
|
|
|
|
|
|
|
|
|
|
| For the year ended October 31 ($ millions) |
|
|
|
|
2024 |
|
Salaries and cash incentives (1)
|
|
|
|
|
|
$ |
25 |
|
|
|
|
|
|
|
|
29 |
|
Pension and other benefits (1)
|
|
|
|
|
|
|
2 |
|
|
|
|
|
|
|
$ |
56 |
|
| (1) |
Represents amounts expensed during the year. |
| (2) |
Represents equity-based awards granted during the year. |
Directors can use some or all of their director fees earned to buy common shares of the Bank at market rates through the Director’s Share Purchase Plan.
Non-officer
directors may elect to receive all or a portion of their fees in the form of deferred stock units which vest immediately. Refer to Note 25 – Share-based payments for further details of these plans.
T61
Loans and deposits of key management personnel
Loans are currently granted to key management personnel at market terms and conditions.
|
|
|
|
|
|
|
|
|
|
|
|
| As at October 31 ($ millions) |
|
|
|
|
2024 |
|
|
|
|
|
|
|
$ |
10 |
|
|
|
|
|
|
|
|
5 |
|
The Bank’s committed credit exposure to companies controlled by directors totaled $263 million as at October 31, 2025 (October 31, 2024 – $267 million) while actual utilized amounts were $186 million (October 31, 2024 – $199 million).
Transactions with associates and joint ventures
In the ordinary course of business, the Bank provides normal banking services and enters into transactions with its associated and other related corporations on terms similar to those offered to
non-related
parties. If these transactions are eliminated on consolidation, they are not disclosed as related party transactions. Transactions between the Bank and its associated companies and joint ventures also qualify as related party transactions and were recorded as follows:
T62
Transactions with associates and joint ventures
|
|
|
|
|
|
|
|
|
|
|
|
| As at and for the year ended October 31 ($ millions) |
|
|
|
|
2024 |
|
|
|
|
|
|
|
$ |
(15 |
) |
|
|
|
|
|
|
|
209 |
|
|
|
|
|
|
|
|
253 |
|
Guarantees and commitments |
|
|
|
|
|
|
46 |
|
Scotiabank principal pension plan
The Bank manages assets of $6.4 billion (October 31, 2024 – $6.0 billion) which is a portion of the Scotiabank principal pension plan assets and earned $7.0 million in fees (October 31, 2024 – $6.7 million).
The oversight responsibilities of the Audit and Conduct Review Committee (ACRC) with respect to related party transactions include reviewing the Related Party Policy and transactions with related parties that may materially affect the Bank and to ensure compliance with the Bank Act. The Bank Act requirements encompass a broader definition of a related party and the transactions than is set out in International Accounting Standard 24
Related Party Disclosures
. The Bank has various procedures in place to ensure that related party information is identified and reported to the ACRC on a semi-annual basis. The ACRC is provided with reports that reflect the Bank’s compliance with its Policy.
The Bank’s Internal Audit department carries out audit procedures as necessary to provide the ACRC with reasonable assurance that the Bank’s policies and procedures to identify, authorize and report related party transactions are appropriately designed and operating effectively in compliance with the Bank Act.
2025 Scotiabank Annual Report
|
Management’s Discussion and Analysis
T63
Net income by geographic segment
|
|
|
|
|
|
|
|
|
|
|
|
|
|
|
|
|
|
|
|
|
|
|
|
|
|
|
|
|
|
|
|
|
|
|
|
|
|
|
|
|
|
|
|
|
|
|
|
|
|
|
|
|
|
|
|
|
|
|
|
|
|
|
|
|
|
|
|
|
|
|
|
|
|
|
|
|
|
|
|
|
|
|
| |
|
|
|
|
|
|
|
|
|
|
|
|
|
|
|
|
|
|
|
|
|
|
|
|
|
|
|
|
|
| For the fiscal year ($ millions) |
|
|
|
|
|
|
|
|
|
|
|
|
|
|
|
|
|
|
|
|
|
Caribbean
and
Central
America |
|
|
|
|
|
|
|
|
|
|
|
Canada |
|
|
U.S. |
|
|
Mexico |
|
|
Peru |
|
|
Chile |
|
|
Colombia |
|
|
Caribbean
and
Central
America |
|
|
Other
Inter-
national |
|
|
Total |
|
|
|
|
|
|
|
|
|
|
|
|
|
|
|
|
|
|
|
|
|
|
|
|
|
|
|
|
|
|
|
|
|
|
|
|
|
|
|
|
|
|
|
|
|
$ |
9,207 |
|
|
$ |
664 |
|
|
$ |
2,397 |
|
|
$ |
1,422 |
|
|
$ |
2,020 |
|
|
$ |
690 |
|
|
$ |
1,842 |
|
|
$ |
1,010 |
|
|
$ |
19,252 |
|
|
|
|
|
|
|
|
|
|
|
|
|
|
|
|
|
|
|
|
|
|
|
|
|
|
|
|
|
|
|
|
|
|
|
|
|
|
|
|
|
|
|
|
|
|
8,535 |
|
|
|
1,578 |
|
|
|
1,032 |
|
|
|
546 |
|
|
|
455 |
|
|
|
486 |
|
|
|
1,180 |
|
|
|
606 |
|
|
|
14,418 |
|
Provision for credit losses |
|
|
|
|
|
|
|
|
|
|
|
|
|
|
|
|
|
|
|
|
|
|
|
|
|
|
|
|
|
|
|
|
|
|
|
|
|
|
|
|
|
|
|
|
1,701 |
|
|
|
28 |
|
|
|
380 |
|
|
|
501 |
|
|
|
626 |
|
|
|
561 |
|
|
|
150 |
|
|
|
104 |
|
|
|
4,051 |
|
|
|
|
|
|
|
|
|
|
|
|
|
|
|
|
|
|
|
|
|
|
|
|
|
|
|
|
|
|
|
|
|
|
|
|
|
|
|
|
|
|
|
|
|
|
11,207 |
|
|
|
1,309 |
|
|
|
1,867 |
|
|
|
869 |
|
|
|
1,143 |
|
|
|
794 |
|
|
|
1,454 |
|
|
|
1,052 |
|
|
|
19,695 |
|
|
|
|
|
|
|
|
|
|
|
|
|
|
|
|
|
|
|
|
|
|
|
|
|
|
|
|
|
|
|
|
|
|
|
|
|
|
|
|
|
|
|
|
|
|
1,002 |
|
|
|
146 |
|
|
|
280 |
|
|
|
140 |
|
|
|
119 |
|
|
|
(49 |
) |
|
|
303 |
|
|
|
91 |
|
|
|
2,032 |
|
|
|
|
|
|
|
|
|
|
|
|
|
|
|
|
|
|
|
|
|
|
|
|
|
|
|
|
|
|
|
|
|
|
|
|
|
|
|
|
|
|
|
|
|
|
3,832 |
|
|
|
759 |
|
|
|
902 |
|
|
|
458 |
|
|
|
587 |
|
|
|
(130 |
) |
|
|
1,115 |
|
|
|
369 |
|
|
|
7,892 |
|
Net income attributable to non-controlling interests in subsidiaries |
|
|
|
|
|
|
|
|
|
|
|
|
|
|
|
|
|
|
|
|
|
|
|
|
|
|
|
|
|
|
|
|
|
|
|
|
|
|
|
|
|
|
|
|
– |
|
|
|
– |
|
|
|
24 |
|
|
|
3 |
|
|
|
42 |
|
|
|
(50 |
) |
|
|
115 |
|
|
|
– |
|
|
|
134 |
|
Net income attributable to equity holders of the Bank |
|
|
|
|
|
|
|
|
|
|
|
|
|
|
|
|
|
|
|
|
|
|
|
|
|
|
|
|
|
|
|
|
|
|
|
|
|
|
|
|
|
|
|
$ |
3,832 |
|
|
$ |
759 |
|
|
$ |
878 |
|
|
$ |
455 |
|
|
$ |
545 |
|
|
$ |
(80 |
) |
|
$ |
1,000 |
|
|
$ |
369 |
|
|
$ |
7,758 |
|
|
|
|
|
|
|
|
|
|
|
|
|
|
|
|
|
|
|
|
|
|
|
|
|
|
|
|
|
|
|
|
|
|
|
|
|
|
|
|
|
|
|
|
|
|
708 |
|
|
|
– |
|
|
|
– |
|
|
|
2 |
|
|
|
18 |
|
|
|
– |
|
|
|
3 |
|
|
|
2 |
|
|
|
733 |
|
Adjusted net income (loss) attributable to equity holders of the Bank (2)
|
|
|
|
|
|
|
|
|
|
|
|
|
|
|
|
|
|
|
|
|
|
|
|
|
|
|
|
|
|
|
|
|
|
|
|
|
|
|
|
|
|
|
|
$ |
4,540 |
|
|
$ |
759 |
|
|
$ |
878 |
|
|
$ |
457 |
|
|
$ |
563 |
|
|
$ |
(80 |
) |
|
$ |
1,003 |
|
|
$ |
371 |
|
|
$ |
8,491 |
|
| (1) |
Effective Q1 2025, changes were made to the methodology used to allocate certain income, expenses and balance sheet items between business segments. Prior period results for each segment have been reclassified to conform with the current period’s methodology. Refer to page 42 for further details. |
| (2) |
Refer to Non-GAAP Measures starting on page 20. |
T64
Loans and acceptances by geography
|
|
|
|
|
|
|
|
|
|
|
|
| As at October 31 ($ billions) |
|
|
|
|
2024 |
|
|
|
|
|
|
|
|
|
|
|
|
|
|
|
|
$ |
24.9 |
|
|
|
|
|
|
|
|
44.2 |
|
|
|
|
|
|
|
|
281.9 |
|
Manitoba and Saskatchewan |
|
|
|
|
|
|
21.0 |
|
|
|
|
|
|
|
|
55.9 |
|
|
|
|
|
|
|
|
95.5 |
|
|
|
|
|
|
|
|
523.4 |
|
|
|
|
|
|
|
|
59.3 |
|
|
|
|
|
|
|
|
44.2 |
|
|
|
|
|
|
|
|
21.0 |
|
|
|
|
|
|
|
|
49.2 |
|
|
|
|
|
|
|
|
11.3 |
|
|
|
|
|
|
|
|
|
|
|
|
|
|
|
|
|
14.0 |
|
|
|
|
|
|
|
|
10.5 |
|
Caribbean and Central America |
|
|
|
|
|
|
25.9 |
|
|
|
|
|
|
|
|
8.7 |
|
|
|
|
|
|
|
|
59.1 |
|
|
|
|
|
|
|
$ |
767.5 |
|
Total allowance for credit losses |
|
|
|
|
|
|
(6.5 |
) |
Total loans and acceptances net of allowance for credit losses |
|
|
|
|
|
$ |
761.0 |
|
T65
Gross impaired loans by geographic segment
|
|
|
|
|
|
|
|
|
|
|
|
| As at October 31 ($ millions) |
|
|
|
|
2024 |
|
|
|
|
|
|
|
$ |
2,158 |
|
|
|
|
|
|
|
|
109 |
|
|
|
|
|
|
|
|
1,343 |
|
|
|
|
|
|
|
|
715 |
|
|
|
|
|
|
|
|
1,249 |
|
|
|
|
|
|
|
|
322 |
|
|
|
|
|
|
|
|
843 |
|
|
|
|
|
|
|
$ |
6,739 |
|
|
2025 Scotiabank Annual Report
Management’s Discussion and Analysis
| Supplementary Data
T66
Provision against impaired financial instruments by geographic segment
|
|
|
|
|
|
|
|
|
|
|
|
| For the fiscal years ($ millions) |
|
|
|
|
2024 |
|
|
|
|
|
|
|
$ |
1,571 |
|
|
|
|
|
|
|
|
24 |
|
|
|
|
|
|
|
|
404 |
|
|
|
|
|
|
|
|
554 |
|
|
|
|
|
|
|
|
592 |
|
|
|
|
|
|
|
|
532 |
|
|
|
|
|
|
|
|
253 |
|
|
|
|
|
|
|
$ |
3,930 |
|
T67
Loans and acceptances by type of borrower
|
|
|
|
|
|
|
|
|
|
|
|
| As at October 31 ($ billions) |
|
|
|
|
2024 |
|
|
|
|
|
|
|
$ |
350.9 |
|
|
|
|
|
|
|
|
106.4 |
|
|
|
|
|
|
|
|
17.4 |
|
|
|
|
|
|
|
$ |
474.7 |
|
|
|
|
|
|
|
|
|
|
|
|
|
|
|
|
$ |
29.7 |
|
|
|
|
|
|
|
|
0.9 |
|
|
|
|
|
|
|
|
29.9 |
|
Real estate and contractors |
|
|
|
|
|
|
66.0 |
|
|
|
|
|
|
|
|
7.1 |
|
|
|
|
|
|
|
|
9.7 |
|
|
|
|
|
|
|
|
17.6 |
|
|
|
|
|
|
|
|
17.0 |
|
|
|
|
|
|
|
|
3.8 |
|
|
|
|
|
|
|
|
6.4 |
|
|
|
|
|
|
|
|
2.2 |
|
|
|
|
|
|
|
|
25.0 |
|
|
|
|
|
|
|
|
7.9 |
|
|
|
|
|
|
|
|
21.7 |
|
|
|
|
|
|
|
|
1.9 |
|
|
|
|
|
|
|
|
10.8 |
|
|
|
|
|
|
|
|
2.8 |
|
|
|
|
|
|
|
|
25.2 |
|
|
|
|
|
|
|
|
7.2 |
|
|
|
|
|
|
|
$ |
292.8 |
|
|
|
|
|
|
|
$ |
767.5 |
|
Total allowance for credit losses |
|
|
|
|
|
|
(6.5 |
) |
Total loans and acceptances net of allowance for credit losses |
|
|
|
|
|
$ |
761.0 |
|
| (1) |
Deposit taking institutions and securities firms. |
| (2) |
Other includes $9.6 billion in wealth management, $3.5 billion in services and $3.1 billion in financing products. |
| (3) |
Includes central banks, regional and local governments, supra-national agencies. |
T68
Off-balance
sheet credit instruments
|
|
|
|
|
|
|
|
|
|
|
|
| As at October 31 ($ billions) |
|
|
|
|
2024 |
|
Commitments to extend credit (1)
|
|
|
|
|
|
$ |
272.8 |
|
Standby letters of credit and letters of guarantee |
|
|
|
|
|
|
63.0 |
|
Securities lending, securities purchase commitments and other |
|
|
|
|
|
|
60.3 |
|
|
|
|
|
|
|
$ |
396.1 |
|
| (1) |
Includes liquidity facilities, and excludes commitments which are unconditionally cancellable at the Bank’s discretion at any time. |
2025 Scotiabank Annual Report
|
Management’s Discussion and Analysis
T69
Changes in net impaired loans
|
|
|
|
|
|
|
|
|
|
|
|
| For the fiscal years ($ millions) |
|
|
|
|
2024 |
|
|
|
|
|
|
|
|
|
|
Balance at beginning of year |
|
|
|
|
|
$ |
5,726 |
|
|
|
|
|
|
|
|
|
|
|
|
|
|
|
|
|
9,495 |
|
|
|
|
|
|
|
|
– |
|
|
|
|
|
|
|
|
(2,394 |
) |
|
|
|
|
|
|
|
(1,744 |
) |
|
|
|
|
|
|
|
(79 |
) |
|
|
|
|
|
|
|
5,278 |
|
|
|
|
|
|
|
|
|
|
|
|
|
|
|
|
|
(100 |
) |
|
|
|
|
|
|
|
(2,145 |
) |
|
|
|
|
|
|
|
(1,356 |
) |
|
|
|
|
|
|
|
(484 |
) |
|
|
|
|
|
|
|
(4,085 |
) |
Foreign exchange and other |
|
|
|
|
|
|
(180 |
) |
|
|
|
|
|
|
$ |
6,739 |
|
Allowance for credit losses on financial instruments |
|
|
|
|
|
|
|
|
Balance at beginning of year |
|
|
|
|
|
$ |
1,881 |
|
Provision for credit losses |
|
|
|
|
|
|
3,930 |
|
|
|
|
|
|
|
|
(4,085 |
) |
|
|
|
|
|
|
|
|
|
|
|
|
|
|
|
|
24 |
|
|
|
|
|
|
|
|
288 |
|
|
|
|
|
|
|
|
190 |
|
|
|
|
|
|
|
|
60 |
|
|
|
|
|
|
|
|
562 |
|
Foreign exchange and other |
|
|
|
|
|
|
(234 |
) |
|
|
|
|
|
|
$ |
2,054 |
|
|
|
|
|
|
|
|
|
|
Balance at beginning of year |
|
|
|
|
|
$ |
3,845 |
|
Net change in gross impaired loans |
|
|
|
|
|
|
1,013 |
|
Net change in allowance for credit losses on impaired financial instruments |
|
|
|
|
|
|
(173 |
) |
|
|
|
|
|
|
$ |
4,685 |
|
T70
Provision for credit losses
|
|
|
|
|
|
|
|
|
|
|
|
| For the fiscal years ($ millions) |
|
|
|
|
2024 |
|
|
|
|
|
|
|
$ |
4,591 |
|
|
|
|
|
|
|
|
(99 |
) |
|
|
|
|
|
|
|
(562 |
) |
Provision for credit losses on impaired financial instruments |
|
|
|
|
|
|
3,930 |
|
Provision for credit losses – performing financial instruments |
|
|
|
|
|
|
121 |
|
Total Provision for credit losses |
|
|
|
|
|
$ |
4,051 |
|
|
2025 Scotiabank Annual Report
Management’s Discussion and Analysis
| Supplementary Data
T71
Provision for credit losses against impaired financial instruments by type of borrower
|
|
|
|
|
|
|
|
|
|
|
|
| For the fiscal years ($ millions) |
|
|
|
|
2024 |
|
|
|
|
|
|
|
$ |
250 |
|
|
|
|
|
|
|
|
1,885 |
|
|
|
|
|
|
|
|
1,165 |
|
|
|
|
|
|
|
|
3,300 |
|
|
|
|
|
|
|
|
|
|
|
|
|
|
|
|
|
34 |
|
|
|
|
|
|
|
|
– |
|
|
|
|
|
|
|
|
137 |
|
Real estate and contractors |
|
|
|
|
|
|
108 |
|
|
|
|
|
|
|
|
– |
|
|
|
|
|
|
|
|
87 |
|
|
|
|
|
|
|
|
6 |
|
|
|
|
|
|
|
|
73 |
|
|
|
|
|
|
|
|
2 |
|
|
|
|
|
|
|
|
– |
|
|
|
|
|
|
|
|
9 |
|
|
|
|
|
|
|
|
– |
|
|
|
|
|
|
|
|
22 |
|
|
|
|
|
|
|
|
32 |
|
|
|
|
|
|
|
|
6 |
|
|
|
|
|
|
|
|
69 |
|
|
|
|
|
|
|
|
9 |
|
|
|
|
|
|
|
|
35 |
|
|
|
|
|
|
|
|
1 |
|
|
|
|
|
|
|
|
630 |
|
Provision for credit losses on impaired financial instruments |
|
|
|
|
|
$ |
3,930 |
|
T72
Impaired loans by type of borrower
|
|
|
|
|
|
|
|
|
|
|
|
|
|
|
|
|
|
|
|
|
|
|
|
|
|
|
|
|
|
|
|
|
| |
|
|
|
|
|
|
|
2024 |
|
|
|
|
|
|
|
|
|
| As at October 31 ($ millions) |
|
|
|
|
Allowance
for credit
losses |
|
|
|
|
|
|
|
|
Gross |
|
|
Allowance
for credit
losses |
|
|
Net |
|
|
|
|
|
|
|
|
|
|
|
|
|
|
|
|
|
|
|
$ |
2,372 |
|
|
$ |
645 |
|
|
$ |
1,727 |
|
|
|
|
|
|
|
|
|
|
|
|
|
|
|
|
|
|
|
|
1,117 |
|
|
|
621 |
|
|
|
496 |
|
|
|
|
|
|
|
|
|
|
|
|
|
|
|
|
|
|
|
|
– |
|
|
|
– |
|
|
|
– |
|
|
|
|
|
|
|
|
|
|
|
|
|
|
|
|
|
|
|
$ |
3,489 |
|
|
$ |
1,266 |
|
|
$ |
2,223 |
|
|
|
|
|
|
|
|
|
|
|
|
|
|
|
|
|
|
|
|
|
|
|
|
|
|
|
|
|
|
|
|
|
|
|
|
|
|
|
|
|
|
|
|
|
|
|
|
|
141 |
|
|
|
57 |
|
|
|
84 |
|
|
|
|
|
|
|
|
|
|
|
|
|
|
|
|
|
|
|
|
– |
|
|
|
– |
|
|
|
– |
|
|
|
|
|
|
|
|
|
|
|
|
|
|
|
|
|
|
|
|
487 |
|
|
|
189 |
|
|
|
298 |
|
Real estate and contractors |
|
|
|
|
|
|
|
|
|
|
|
|
|
|
|
|
|
|
768 |
|
|
|
147 |
|
|
|
621 |
|
|
|
|
|
|
|
|
|
|
|
|
|
|
|
|
|
|
|
|
30 |
|
|
|
5 |
|
|
|
25 |
|
|
|
|
|
|
|
|
|
|
|
|
|
|
|
|
|
|
|
|
351 |
|
|
|
75 |
|
|
|
276 |
|
|
|
|
|
|
|
|
|
|
|
|
|
|
|
|
|
|
|
|
33 |
|
|
|
9 |
|
|
|
24 |
|
|
|
|
|
|
|
|
|
|
|
|
|
|
|
|
|
|
|
|
338 |
|
|
|
82 |
|
|
|
256 |
|
|
|
|
|
|
|
|
|
|
|
|
|
|
|
|
|
|
|
|
71 |
|
|
|
7 |
|
|
|
64 |
|
|
|
|
|
|
|
|
|
|
|
|
|
|
|
|
|
|
|
|
6 |
|
|
|
3 |
|
|
|
3 |
|
|
|
|
|
|
|
|
|
|
|
|
|
|
|
|
|
|
|
|
53 |
|
|
|
19 |
|
|
|
34 |
|
|
|
|
|
|
|
|
|
|
|
|
|
|
|
|
|
|
|
|
1 |
|
|
|
1 |
|
|
|
– |
|
|
|
|
|
|
|
|
|
|
|
|
|
|
|
|
|
|
|
|
56 |
|
|
|
16 |
|
|
|
40 |
|
|
|
|
|
|
|
|
|
|
|
|
|
|
|
|
|
|
|
|
133 |
|
|
|
32 |
|
|
|
101 |
|
|
|
|
|
|
|
|
|
|
|
|
|
|
|
|
|
|
|
|
81 |
|
|
|
20 |
|
|
|
61 |
|
|
|
|
|
|
|
|
|
|
|
|
|
|
|
|
|
|
|
|
198 |
|
|
|
49 |
|
|
|
149 |
|
|
|
|
|
|
|
|
|
|
|
|
|
|
|
|
|
|
|
|
81 |
|
|
|
14 |
|
|
|
67 |
|
|
|
|
|
|
|
|
|
|
|
|
|
|
|
|
|
|
|
|
172 |
|
|
|
61 |
|
|
|
111 |
|
|
|
|
|
|
|
|
|
|
|
|
|
|
|
|
|
|
|
|
250 |
|
|
|
2 |
|
|
|
248 |
|
|
|
|
|
|
|
|
|
|
|
|
|
|
|
|
|
|
|
$ |
3,250 |
|
|
$ |
788 |
|
|
$ |
2,462 |
|
|
|
|
|
|
|
|
|
|
|
|
|
|
|
|
|
|
|
$ |
6,739 |
|
|
$ |
2,054 |
|
|
$ |
4,685 |
|
2025 Scotiabank Annual Report
|
Management’s Discussion and Analysis
T73
Total credit risk exposures by geography
(1)(2)
|
|
|
|
|
|
|
|
|
|
|
|
|
|
|
|
|
|
|
|
|
|
|
|
|
|
|
|
|
|
|
|
|
| |
|
|
|
|
|
|
|
2024 |
|
|
|
|
|
|
|
| |
|
|
|
|
|
|
|
|
|
|
|
|
|
|
|
|
|
|
|
|
|
|
|
| As at October 31 ($ millions) |
|
|
|
|
|
|
|
|
|
|
|
|
|
|
|
|
|
|
|
Total |
|
|
|
|
|
|
|
|
|
|
|
|
|
|
|
|
|
|
|
|
|
|
|
|
|
|
|
$ |
783,178 |
|
|
|
|
|
|
|
|
|
|
|
|
|
|
|
|
|
|
|
|
|
|
|
|
|
|
|
|
238,201 |
|
|
|
|
|
|
|
|
|
|
|
|
|
|
|
|
|
|
|
|
|
|
|
|
|
|
|
|
60,179 |
|
|
|
|
|
|
|
|
|
|
|
|
|
|
|
|
|
|
|
|
|
|
|
|
|
|
|
|
58,439 |
|
|
|
|
|
|
|
|
|
|
|
|
|
|
|
|
|
|
|
|
|
|
|
|
|
|
|
|
32,609 |
|
|
|
|
|
|
|
|
|
|
|
|
|
|
|
|
|
|
|
|
|
|
|
|
|
|
|
|
15,015 |
|
|
|
|
|
|
|
|
|
|
|
|
|
|
|
|
|
|
|
|
|
|
|
|
|
|
|
|
|
|
|
|
|
|
|
|
|
|
|
|
|
|
|
|
|
|
|
|
|
|
|
|
|
|
|
|
|
38,776 |
|
Caribbean and Central America |
|
|
|
|
|
|
|
|
|
|
|
|
|
|
|
|
|
|
|
|
|
|
|
|
|
|
36,170 |
|
|
|
|
|
|
|
|
|
|
|
|
|
|
|
|
|
|
|
|
|
|
|
|
|
|
|
|
17,742 |
|
|
|
|
|
|
|
|
|
|
|
|
|
|
|
|
|
|
|
|
|
|
|
|
|
|
|
|
25,136 |
|
|
|
|
|
|
|
|
|
|
|
|
|
|
|
|
|
|
|
|
|
|
|
|
|
|
|
$ |
1,305,445 |
|
|
|
$ |
535,326 |
|
|
$ |
99,011 |
|
|
$ |
131,677 |
|
|
$ |
539,431 |
|
|
$ |
1,305,445 |
|
|
|
|
|
|
|
|
|
| (1) |
Geographic segmentation is based upon the location of the ultimate risk of the credit exposure. Includes all credit risk portfolios and excludes equities and other assets. |
| (2) |
Amounts represent exposure at default. |
| (3) |
Includes off-balance sheet lending instruments such as letters of credit, letters of guarantee, derivatives, securitization and repo-style transactions after collateral. |
T74
IRB credit risk exposures by maturity
(1)(2)
|
|
|
|
|
|
|
|
|
|
|
|
|
|
|
|
|
|
|
|
|
|
|
|
|
|
|
|
|
| |
|
|
|
|
|
|
|
2024 |
|
|
|
|
|
|
|
|
| Residual maturity as at October 31 ($ millions) |
|
|
|
|
|
|
|
|
|
|
|
|
|
|
|
|
Total |
|
|
|
|
|
|
|
|
|
|
|
|
|
|
|
|
|
|
|
|
|
|
|
|
|
|
|
|
|
|
|
|
|
|
|
|
|
|
|
|
|
|
|
|
|
|
|
|
$ |
260,784 |
|
|
|
|
|
|
|
|
|
|
|
|
|
|
|
|
|
|
|
|
|
|
|
|
301,844 |
|
|
|
|
|
|
|
|
|
|
|
|
|
|
|
|
|
|
|
|
|
|
|
|
55,993 |
|
|
|
|
|
|
|
|
|
|
|
|
|
|
|
|
|
|
|
|
|
|
|
$ |
618,621 |
|
|
|
|
|
|
|
|
|
|
|
|
|
|
|
|
|
|
|
|
|
|
|
|
|
|
|
|
|
|
|
|
|
|
|
|
|
|
|
|
|
|
|
|
|
|
|
|
$ |
123,229 |
|
|
|
|
|
|
|
|
|
|
|
|
|
|
|
|
|
|
|
|
|
|
|
|
234,961 |
|
|
|
|
|
|
|
|
|
|
|
|
|
|
|
|
|
|
|
|
|
|
|
|
15,540 |
|
|
|
|
|
|
|
|
|
|
|
|
|
|
|
|
|
|
|
|
|
|
|
|
93,400 |
|
|
|
|
|
|
|
|
|
|
|
|
|
|
|
|
|
|
|
|
|
|
|
$ |
467,130 |
|
|
|
|
|
|
|
|
|
|
|
|
|
|
|
|
|
|
|
|
|
|
|
$ |
1,085,751 |
|
|
|
$ |
766,991 |
|
|
$ |
205,624 |
|
|
$ |
113,136 |
|
|
$ |
1,085,751 |
|
|
|
|
|
|
|
|
|
| (1) |
Remaining term to maturity of the credit exposure. Includes all credit risk portfolios and excludes equity securities and other assets. |
| (2) |
Exposure at default, before credit risk mitigation. |
| (3) |
Off-balance sheet lending instruments, such as letters of credit, letters of guarantee, securitization, derivatives and repo-style transactions after collateral. |
| (4) |
Credit cards and lines of credit with unspecified maturity. |
|
2025 Scotiabank Annual Report
Management’s Discussion and Analysis
| Supplementary Data
T75
Total credit risk exposures and risk-weighted assets
|
|
|
|
|
|
|
|
|
|
|
|
|
|
|
|
|
|
|
|
|
|
|
|
|
|
|
|
|
|
|
|
|
|
|
|
|
|
|
|
|
| |
|
|
|
|
|
|
|
2024 |
|
|
|
|
|
|
|
| |
|
|
|
|
|
|
|
|
|
|
|
|
|
Total |
|
|
|
|
|
|
|
|
|
|
|
| As at October 31 ($ millions) |
|
|
|
|
|
|
|
|
|
|
|
|
|
|
|
|
|
|
|
|
|
|
|
|
|
Risk-
weighted
assets |
|
|
|
|
|
|
|
|
|
|
|
|
|
|
|
|
|
|
|
|
|
|
|
|
|
|
|
|
|
|
|
|
|
|
|
|
|
|
|
|
|
|
|
|
|
|
|
|
|
|
|
|
|
|
|
|
|
|
|
|
|
|
|
|
|
|
|
|
|
|
|
|
|
|
|
|
|
|
|
|
|
|
|
|
|
|
|
|
|
|
|
|
|
|
|
|
|
|
|
|
|
|
|
|
|
$ |
246,526 |
|
|
$ |
125,359 |
|
|
|
|
|
|
|
|
|
|
|
|
|
|
|
|
|
|
|
|
|
|
|
|
|
|
|
|
|
|
|
|
80,749 |
|
|
|
32,574 |
|
|
|
|
|
|
|
|
|
|
|
|
|
|
|
|
|
|
|
|
|
|
|
|
|
|
|
|
|
|
|
|
47,919 |
|
|
|
13,873 |
|
|
|
|
|
|
|
|
|
|
|
|
|
|
|
|
|
|
|
|
|
|
|
|
|
|
|
|
|
|
|
|
375,194 |
|
|
|
171,806 |
|
|
|
|
|
|
|
|
|
|
|
|
|
|
|
|
|
|
|
|
|
|
|
|
|
|
|
|
|
|
|
|
|
|
|
|
|
|
|
|
|
|
|
|
|
|
|
|
|
|
|
|
|
|
|
|
|
|
|
|
|
|
|
|
|
|
|
|
|
19,913 |
|
|
|
5,916 |
|
|
|
|
|
|
|
|
|
|
|
|
|
|
|
|
|
|
|
|
|
|
|
|
|
|
|
|
|
|
|
|
14,756 |
|
|
|
6,946 |
|
|
|
|
|
|
|
|
|
|
|
|
|
|
|
|
|
|
|
|
|
|
|
|
|
|
|
|
|
|
|
|
14,521 |
|
|
|
3,687 |
|
|
|
|
|
|
|
|
|
|
|
|
|
|
|
|
|
|
|
|
|
|
|
|
|
|
|
|
|
|
|
|
49,190 |
|
|
|
16,549 |
|
|
|
|
|
|
|
|
|
|
|
|
|
|
|
|
|
|
|
|
|
|
|
|
|
|
|
|
|
|
|
|
|
|
|
|
|
|
|
|
|
|
|
|
|
|
|
|
|
|
|
|
|
|
|
|
|
|
|
|
|
|
|
|
|
|
|
|
|
268,887 |
|
|
|
11,368 |
|
|
|
|
|
|
|
|
|
|
|
|
|
|
|
|
|
|
|
|
|
|
|
|
|
|
|
|
|
|
|
|
3,506 |
|
|
|
551 |
|
|
|
|
|
|
|
|
|
|
|
|
|
|
|
|
|
|
|
|
|
|
|
|
|
|
|
|
|
|
|
|
6,043 |
|
|
|
620 |
|
|
|
|
|
|
|
|
|
|
|
|
|
|
|
|
|
|
|
|
|
|
|
|
|
|
|
|
|
|
|
|
278,436 |
|
|
|
12,539 |
|
|
|
|
|
|
|
|
|
|
|
|
|
|
|
|
|
|
|
|
|
|
|
|
|
|
|
|
|
|
|
|
|
|
|
|
|
|
|
|
|
|
|
|
|
|
|
|
|
|
|
|
|
|
|
|
|
|
|
|
|
|
|
|
|
|
|
|
|
535,326 |
|
|
|
142,643 |
|
|
|
|
|
|
|
|
|
|
|
|
|
|
|
|
|
|
|
|
|
|
|
|
|
|
|
|
|
|
|
|
99,011 |
|
|
|
40,071 |
|
|
|
|
|
|
|
|
|
|
|
|
|
|
|
|
|
|
|
|
|
|
|
|
|
|
|
|
|
|
|
|
68,483 |
|
|
|
18,180 |
|
|
|
|
|
|
|
|
|
|
|
|
|
|
|
|
|
|
|
|
|
|
|
|
|
|
|
|
|
|
|
$ |
702,820 |
|
|
$ |
200,894 |
|
|
|
|
|
|
|
|
|
|
|
|
|
|
|
|
|
|
|
|
|
|
|
|
|
|
|
|
|
|
|
|
|
|
|
|
|
|
Retail residential mortgages |
|
|
|
|
|
|
|
|
|
|
|
|
|
|
|
|
|
|
|
|
|
|
|
|
|
|
|
|
|
|
|
|
|
|
|
|
|
|
|
|
|
|
|
|
|
|
|
|
|
|
|
|
|
|
|
|
|
|
|
|
|
|
|
|
|
|
$ |
289,602 |
|
|
$ |
48,567 |
|
|
|
|
|
|
|
|
|
|
|
|
|
|
|
|
|
|
|
|
|
|
|
|
|
|
|
|
|
|
|
|
289,602 |
|
|
|
48,567 |
|
|
|
|
|
|
|
|
|
|
|
|
|
|
|
|
|
|
|
|
|
|
|
|
|
|
|
|
|
|
|
|
|
|
|
|
|
|
|
|
|
|
|
|
|
|
|
|
|
|
|
|
|
|
|
|
|
|
|
|
|
|
|
|
|
|
|
|
|
23,452 |
|
|
|
4,535 |
|
|
|
|
|
|
|
|
|
|
|
|
|
|
|
|
|
|
|
|
|
|
|
|
|
|
|
|
|
|
|
|
56,913 |
|
|
|
2,379 |
|
|
|
|
|
|
|
|
|
|
|
|
|
|
|
|
|
|
|
|
|
|
|
|
|
|
|
|
|
|
|
|
80,365 |
|
|
|
6,914 |
|
Qualifying retail revolving exposures |
|
|
|
|
|
|
|
|
|
|
|
|
|
|
|
|
|
|
|
|
|
|
|
|
|
|
|
|
|
|
|
|
|
|
|
|
|
|
|
|
|
|
|
|
|
|
|
|
|
|
|
|
|
|
|
|
|
|
|
|
|
|
|
|
|
|
|
28,904 |
|
|
|
19,329 |
|
|
|
|
|
|
|
|
|
|
|
|
|
|
|
|
|
|
|
|
|
|
|
|
|
|
|
|
|
|
|
|
58,300 |
|
|
|
9,541 |
|
|
|
|
|
|
|
|
|
|
|
|
|
|
|
|
|
|
|
|
|
|
|
|
|
|
|
|
|
|
|
|
87,204 |
|
|
|
28,870 |
|
|
|
|
|
|
|
|
|
|
|
|
|
|
|
|
|
|
|
|
|
|
|
|
|
|
|
|
|
|
|
|
|
|
|
|
|
|
|
|
|
|
|
|
|
|
|
|
|
|
|
|
|
|
|
|
|
|
|
|
|
|
|
|
|
|
|
|
|
75,802 |
|
|
|
52,541 |
|
|
|
|
|
|
|
|
|
|
|
|
|
|
|
|
|
|
|
|
|
|
|
|
|
|
|
|
|
|
|
|
6,458 |
|
|
|
3,178 |
|
|
|
|
|
|
|
|
|
|
|
|
|
|
|
|
|
|
|
|
|
|
|
|
|
|
|
|
|
|
|
|
82,260 |
|
|
|
55,719 |
|
|
|
|
|
|
|
|
|
|
|
|
|
|
|
|
|
|
|
|
|
|
|
|
|
|
|
|
|
|
|
|
|
|
|
|
|
|
|
|
|
|
|
|
|
|
|
|
|
|
|
|
|
|
|
|
|
|
|
|
|
|
|
|
|
|
|
|
|
417,760 |
|
|
|
124,972 |
|
|
|
|
|
|
|
|
|
|
|
|
|
|
|
|
|
|
|
|
|
|
|
|
|
|
|
|
|
|
|
|
121,671 |
|
|
|
15,098 |
|
|
|
|
|
|
|
|
|
|
|
|
|
|
|
|
|
|
|
|
|
|
|
|
|
|
|
|
|
|
|
$ |
539,431 |
|
|
$ |
140,070 |
|
|
|
|
|
|
|
|
|
|
|
|
|
|
|
|
|
|
|
|
|
|
|
|
|
|
|
|
|
|
|
|
37,657 |
|
|
|
7,791 |
|
|
|
|
|
|
|
|
|
|
|
|
|
|
|
|
|
|
|
|
|
|
|
|
|
|
|
|
|
|
|
|
25,537 |
|
|
|
5,801 |
|
|
|
|
|
|
|
|
|
|
|
|
|
|
|
|
|
|
|
|
|
|
|
|
|
|
|
|
|
|
|
|
– |
|
|
|
4,631 |
|
|
|
|
|
|
|
|
|
|
|
|
|
|
|
|
|
|
|
|
|
|
|
|
|
|
|
|
|
|
|
$ |
1,305,445 |
|
|
$ |
359,187 |
|
|
|
|
|
|
|
|
|
|
|
|
|
|
|
|
|
|
|
|
|
|
|
|
|
|
|
|
|
|
|
|
7,751 |
|
|
|
18,644 |
|
|
|
|
|
|
|
|
|
|
|
|
|
|
|
|
|
|
|
|
|
|
|
|
|
|
|
|
|
|
|
|
46,798 |
|
|
|
20,322 |
|
|
|
|
|
|
|
|
|
|
|
|
|
|
|
|
|
|
|
|
|
|
|
|
|
|
|
|
|
|
|
$ |
1,359,994 |
|
|
$ |
398,153 |
|
| (1) |
Portfolios under the Standardized Approach are reported net of specific allowances for credit losses and net of collateral amounts treated under the Comprehensive Approach. |
| (2) |
Outstanding amount for on-balance sheet exposures and loan equivalent amount for off-balance sheet exposures, after credit risk mitigation. |
| (3) |
Other exposures include off-balance sheet lending instruments, such as letters of credit, letters of guarantee, non-trading derivatives and repo-style exposures, after collateral. |
| (4) |
Other assets include amounts related to central counterparties, net of capital deductions. |
2025 Scotiabank Annual Report
|
Management’s Discussion and Analysis
T76
Volume/rate analysis of change in net interest income
|
|
|
|
|
|
|
|
|
|
|
|
|
|
|
|
|
|
|
|
|
|
|
|
|
|
|
|
| |
|
Increase (decrease) due to change in:
2025 versus 2024 |
|
|
Increase (decrease) due to change in:
2024 versus 2023 |
|
|
|
|
|
|
|
|
| ($ millions) |
|
|
|
|
|
|
|
|
|
|
Average
volume |
|
|
Average
rate |
|
|
Net
change |
|
|
|
|
|
|
|
|
|
|
|
|
|
|
|
|
|
|
|
|
|
|
|
|
|
|
|
|
|
|
|
|
|
|
|
|
|
|
|
|
$ |
1,064 |
|
|
$ |
3,771 |
|
|
$ |
4,835 |
|
Total interest-bearing liabilities |
|
|
|
|
|
|
|
|
|
|
|
|
|
|
(301 |
) |
|
|
4,146 |
|
|
|
3,845 |
|
Change in net interest income |
|
|
|
|
|
|
|
|
|
|
|
|
|
$ |
1,365 |
|
|
$ |
(375 |
) |
|
$ |
990 |
|
|
|
|
|
|
|
|
|
|
|
|
|
|
|
|
|
|
|
|
|
|
|
|
|
|
|
|
|
|
|
|
|
|
|
|
|
|
|
|
|
|
|
|
|
|
|
$ |
(589 |
) |
|
$ |
205 |
|
|
$ |
(384 |
) |
|
|
|
|
|
|
|
|
|
|
|
|
|
|
|
372 |
|
|
|
(570 |
) |
|
|
(198 |
) |
Securities purchased under resale agreements |
|
|
|
|
|
|
|
|
|
|
|
|
|
|
41 |
|
|
|
83 |
|
|
|
124 |
|
|
|
|
|
|
|
|
|
|
|
|
|
|
|
|
1,281 |
|
|
|
1,244 |
|
|
|
2,525 |
|
|
|
|
|
|
|
|
|
|
|
|
|
|
|
|
|
|
|
|
|
|
|
|
|
|
|
|
|
|
|
|
|
|
|
|
|
|
|
|
|
(262 |
) |
|
|
1,037 |
|
|
|
775 |
|
|
|
|
|
|
|
|
|
|
|
|
|
|
|
|
197 |
|
|
|
674 |
|
|
|
871 |
|
|
|
|
|
|
|
|
|
|
|
|
|
|
|
|
244 |
|
|
|
18 |
|
|
|
262 |
|
|
|
|
|
|
|
|
|
|
|
|
|
|
|
|
(220 |
) |
|
|
1,080 |
|
|
|
860 |
|
|
|
|
|
|
|
|
|
|
|
|
|
|
|
|
(41 |
) |
|
|
2,809 |
|
|
|
2,768 |
|
|
|
|
|
|
|
|
|
|
|
|
|
|
|
$ |
1,064 |
|
|
$ |
3,771 |
|
|
$ |
4,835 |
|
|
|
|
|
|
|
|
|
|
|
|
|
|
|
|
|
|
|
|
|
|
|
|
|
|
|
|
|
|
|
|
|
|
|
|
|
|
|
|
|
|
|
|
|
|
|
|
|
|
|
|
|
|
|
|
|
|
|
|
|
|
|
|
|
|
|
|
|
|
|
|
|
|
|
|
|
|
|
$ |
362 |
|
|
$ |
1,418 |
|
|
$ |
1,780 |
|
|
|
|
|
|
|
|
|
|
|
|
|
|
|
|
(468 |
) |
|
|
2,447 |
|
|
|
1,979 |
|
|
|
|
|
|
|
|
|
|
|
|
|
|
|
|
(188 |
) |
|
|
259 |
|
|
|
71 |
|
|
|
|
|
|
|
|
|
|
|
|
|
|
|
|
(294 |
) |
|
|
4,124 |
|
|
|
3,830 |
|
Obligations related to securities sold under repurchase agreements |
|
|
|
|
|
|
|
|
|
|
|
|
|
|
178 |
|
|
|
(194 |
) |
|
|
(16 |
) |
|
|
|
|
|
|
|
|
|
|
|
|
|
|
|
(43 |
) |
|
|
62 |
|
|
|
19 |
|
Other interest-bearing liabilities |
|
|
|
|
|
|
|
|
|
|
|
|
|
|
(142 |
) |
|
|
154 |
|
|
|
12 |
|
Total interest-bearing liabilities |
|
|
|
|
|
|
|
|
|
|
|
|
|
$ |
(301 |
) |
|
$ |
4,146 |
|
|
$ |
3,845 |
|
T77
Provision for income and other taxes
|
|
|
|
|
|
|
|
|
|
|
|
|
|
|
|
|
| For the fiscal years ($ millions) |
|
|
|
|
2024 |
|
|
|
|
|
|
|
|
|
|
|
|
|
|
|
|
|
|
|
|
|
|
|
$ |
2,032 |
|
|
|
|
|
|
|
|
|
|
|
|
|
|
|
|
|
|
|
|
|
|
|
|
|
|
|
|
|
530 |
|
|
|
|
|
Business and capital taxes |
|
|
|
|
|
|
682 |
|
|
|
|
|
Harmonized sales tax and other |
|
|
|
|
|
|
482 |
|
|
|
|
|
|
|
|
|
|
|
|
1,694 |
|
|
|
|
|
Total income and other taxes (1)
|
|
|
|
|
|
$ |
3,726 |
|
|
|
|
|
Net income before income taxes |
|
|
|
|
|
$ |
9,924 |
|
|
|
|
|
Effective income tax rate (%) (2)
|
|
|
|
|
|
|
20.5 |
|
|
|
|
|
|
|
|
|
|
|
|
32.1 |
|
|
|
|
|
| (1) |
Comprising $2,545 of Canadian taxes (2024 – $1,953) and $1,977 of foreign taxes (2024 – $1,773). |
| (2) |
Refer to Glossary on page 136 for the description of the measure. |
| (3) |
Total income and other taxes as a percentage of net income before income and other taxes. |
|
2025 Scotiabank Annual Report
Management’s Discussion and Analysis
| Supplementary Data
T78
Assets under administration and management
(1)
|
|
|
|
|
|
|
|
|
|
|
|
| ($ billions) |
|
|
|
|
2024 |
|
Assets under administration |
|
|
|
|
|
|
|
|
|
|
|
|
|
|
|
|
|
|
|
|
|
|
|
$ |
242.9 |
|
Investment management and trust |
|
|
|
|
|
|
198.6 |
|
|
|
|
|
|
|
|
441.5 |
|
|
|
|
|
|
|
|
233.7 |
|
|
|
|
|
|
|
|
96.3 |
|
|
|
|
|
|
|
$ |
771.5 |
|
|
|
|
|
|
|
|
|
|
|
|
|
|
|
|
|
|
|
$ |
100.1 |
|
|
|
|
|
|
|
|
217.1 |
|
|
|
|
|
|
|
|
55.8 |
|
|
|
|
|
|
|
$ |
373.0 |
|
| (1) |
Refer to Glossary on page 136 for the description of the measure. |
T79
Changes in assets under administration and management
(1)
|
|
|
|
|
|
|
|
|
|
|
|
| As at October 31 ($ billions) |
|
|
|
|
2024 |
|
Assets under administration |
|
|
|
|
|
|
|
|
Balance at beginning of year |
|
|
|
|
|
$ |
673.6 |
|
|
|
|
|
|
|
|
9.7 |
|
Impact of market changes, including foreign currency translation |
|
|
|
|
|
|
88.2 |
|
|
|
|
|
|
|
$ |
771.5 |
|
| (1) |
Refer to Glossary on page 136 for the description of the measure. |
|
|
|
|
|
|
|
|
|
|
|
|
| As at October 31 ($ billions) |
|
|
|
|
2024 |
|
|
|
|
|
|
|
|
|
|
Balance at beginning of year |
|
|
|
|
|
$ |
316.6 |
|
|
|
|
|
|
|
|
(0.1 |
) |
Impact of market changes, including foreign currency translation |
|
|
|
|
|
|
56.5 |
|
|
|
|
|
|
|
$ |
373.0 |
|
T80
Fees paid to the shareholders’ auditors
|
|
|
|
|
|
|
|
|
|
|
|
| For the fiscal years ($ millions) |
|
|
|
|
2024 |
|
|
|
|
|
|
|
$ |
39.1 |
|
|
|
|
|
|
|
|
1.2 |
|
Tax services outside of the audit scope |
|
|
|
|
|
|
0.4 |
|
|
|
|
|
|
|
|
1.2 |
|
Total Bank and Subsidiaries |
|
|
|
|
|
$ |
41.9 |
|
|
|
|
|
|
|
|
3.6 |
|
|
|
|
|
|
|
$ |
45.5 |
|
2025 Scotiabank Annual Report
|
Management’s Discussion and Analysis
Selected Quarterly Information
T81
Selected quarterly information
|
|
|
|
|
|
|
|
|
|
|
|
|
|
|
|
|
|
|
|
|
|
|
|
|
|
|
|
|
|
|
|
|
|
|
|
| |
|
|
|
|
2024 |
|
|
|
|
|
|
|
|
|
|
| As at and for the quarter ended |
|
|
|
|
|
|
|
|
|
|
|
|
|
Q4 |
|
|
Q3 |
|
|
Q2 |
|
|
Q1 |
|
Operating results ($ millions) |
|
|
|
|
|
|
|
|
|
|
|
|
|
|
|
|
|
|
|
|
|
|
|
|
|
|
|
|
|
|
|
|
|
|
|
|
|
|
|
|
|
|
|
|
|
|
|
|
|
|
|
4,923 |
|
|
|
4,862 |
|
|
|
4,694 |
|
|
|
4,773 |
|
|
|
|
|
|
|
|
|
|
|
|
|
|
|
|
|
|
|
|
3,603 |
|
|
|
3,502 |
|
|
|
3,653 |
|
|
|
3,660 |
|
|
|
|
|
|
|
|
|
|
|
|
|
|
|
|
|
|
|
|
8,526 |
|
|
|
8,364 |
|
|
|
8,347 |
|
|
|
8,433 |
|
Provision for credit losses |
|
|
|
|
|
|
|
|
|
|
|
|
|
|
|
|
|
|
1,030 |
|
|
|
1,052 |
|
|
|
1,007 |
|
|
|
962 |
|
|
|
|
|
|
|
|
|
|
|
|
|
|
|
|
|
|
|
|
5,296 |
|
|
|
4,949 |
|
|
|
4,711 |
|
|
|
4,739 |
|
|
|
|
|
|
|
|
|
|
|
|
|
|
|
|
|
|
|
|
511 |
|
|
|
451 |
|
|
|
537 |
|
|
|
533 |
|
|
|
|
|
|
|
|
|
|
|
|
|
|
|
|
|
|
|
|
1,689 |
|
|
|
1,912 |
|
|
|
2,092 |
|
|
|
2,199 |
|
Net income attributable to common shareholders |
|
|
|
|
|
|
|
|
|
|
|
|
|
|
|
|
|
|
1,521 |
|
|
|
1,756 |
|
|
|
1,943 |
|
|
|
2,066 |
|
|
|
|
|
|
|
|
|
|
|
|
|
|
|
|
|
|
|
|
|
|
|
|
|
|
|
|
|
|
|
|
|
|
Basic earnings per share ($) |
|
|
|
|
|
|
|
|
|
|
|
|
|
|
|
|
|
|
1.23 |
|
|
|
1.43 |
|
|
|
1.59 |
|
|
|
1.70 |
|
Diluted earnings per share ($) |
|
|
|
|
|
|
|
|
|
|
|
|
|
|
|
|
|
|
1.22 |
|
|
|
1.41 |
|
|
|
1.57 |
|
|
|
1.68 |
|
|
|
|
|
|
|
|
|
|
|
|
|
|
|
|
|
|
|
|
8.3 |
|
|
|
9.8 |
|
|
|
11.2 |
|
|
|
11.8 |
|
Return on tangible common equity (%) (2)
|
|
|
|
|
|
|
|
|
|
|
|
|
|
|
|
|
|
|
10.1 |
|
|
|
11.9 |
|
|
|
13.8 |
|
|
|
14.6 |
|
Productivity ratio (%) (1)
|
|
|
|
|
|
|
|
|
|
|
|
|
|
|
|
|
|
|
62.1 |
|
|
|
59.2 |
|
|
|
56.4 |
|
|
|
56.2 |
|
Net interest margin (%) (2)
|
|
|
|
|
|
|
|
|
|
|
|
|
|
|
|
|
|
|
2.15 |
|
|
|
2.14 |
|
|
|
2.17 |
|
|
|
2.19 |
|
Financial position information ($ billions) |
|
|
|
|
|
|
|
|
|
|
|
|
|
|
|
|
|
|
|
|
|
|
|
|
|
|
|
|
|
|
|
|
Cash and deposits with financial institutions |
|
|
|
|
|
|
|
|
|
|
|
|
|
|
|
|
|
|
63.9 |
|
|
|
58.3 |
|
|
|
58.6 |
|
|
|
67.2 |
|
|
|
|
|
|
|
|
|
|
|
|
|
|
|
|
|
|
|
|
129.7 |
|
|
|
134.0 |
|
|
|
132.3 |
|
|
|
126.4 |
|
|
|
|
|
|
|
|
|
|
|
|
|
|
|
|
|
|
|
|
760.8 |
|
|
|
759.2 |
|
|
|
753.5 |
|
|
|
743.9 |
|
|
|
|
|
|
|
|
|
|
|
|
|
|
|
|
|
|
|
|
1,412.0 |
|
|
|
1,402.4 |
|
|
|
1,399.4 |
|
|
|
1,392.9 |
|
|
|
|
|
|
|
|
|
|
|
|
|
|
|
|
|
|
|
|
943.8 |
|
|
|
949.2 |
|
|
|
942.0 |
|
|
|
939.8 |
|
|
|
|
|
|
|
|
|
|
|
|
|
|
|
|
|
|
|
|
73.6 |
|
|
|
72.7 |
|
|
|
70.6 |
|
|
|
70.0 |
|
Preferred shares and other equity instruments |
|
|
|
|
|
|
|
|
|
|
|
|
|
|
|
|
|
|
8.8 |
|
|
|
8.8 |
|
|
|
8.8 |
|
|
|
8.8 |
|
Assets under administration (1)
|
|
|
|
|
|
|
|
|
|
|
|
|
|
|
|
|
|
|
771.5 |
|
|
|
761.0 |
|
|
|
738.9 |
|
|
|
715.9 |
|
Assets under management (1)
|
|
|
|
|
|
|
|
|
|
|
|
|
|
|
|
|
|
|
373.0 |
|
|
|
363.9 |
|
|
|
348.6 |
|
|
|
339.6 |
|
Capital and liquidity measures |
|
|
|
|
|
|
|
|
|
|
|
|
|
|
|
|
|
|
|
|
|
|
|
|
|
|
|
|
|
|
|
|
Common Equity Tier 1 (CET1) capital ratio (%) (3)
|
|
|
|
|
|
|
|
|
|
|
|
|
|
|
|
|
|
|
13.1 |
|
|
|
13.3 |
|
|
|
13.2 |
|
|
|
12.9 |
|
Tier 1 capital ratio (%) (3)
|
|
|
|
|
|
|
|
|
|
|
|
|
|
|
|
|
|
|
15.0 |
|
|
|
15.3 |
|
|
|
15.2 |
|
|
|
14.8 |
|
Total capital ratio (%) (3)
|
|
|
|
|
|
|
|
|
|
|
|
|
|
|
|
|
|
|
16.7 |
|
|
|
17.1 |
|
|
|
17.1 |
|
|
|
16.7 |
|
Total loss absorbing capacity (TLAC) ratio (%) (4)
|
|
|
|
|
|
|
|
|
|
|
|
|
|
|
|
|
|
|
29.7 |
|
|
|
29.1 |
|
|
|
28.9 |
|
|
|
28.9 |
|
|
|
|
|
|
|
|
|
|
|
|
|
|
|
|
|
|
|
|
4.4 |
|
|
|
4.5 |
|
|
|
4.4 |
|
|
|
4.3 |
|
TLAC Leverage ratio (%) (4)
|
|
|
|
|
|
|
|
|
|
|
|
|
|
|
|
|
|
|
8.8 |
|
|
|
8.5 |
|
|
|
8.4 |
|
|
|
8.4 |
|
Risk-weighted assets ($ billions) (3)
|
|
|
|
|
|
|
|
|
|
|
|
|
|
|
|
|
|
|
464.0 |
|
|
|
453.7 |
|
|
|
450.2 |
|
|
|
451.0 |
|
Liquidity coverage ratio (LCR) (%) (6)
|
|
|
|
|
|
|
|
|
|
|
|
|
|
|
|
|
|
|
131 |
|
|
|
133 |
|
|
|
129 |
|
|
|
132 |
|
Net stable funding ratio (NSFR) (%) (6)
|
|
|
|
|
|
|
|
|
|
|
|
|
|
|
|
|
|
|
119 |
|
|
|
117 |
|
|
|
117 |
|
|
|
117 |
|
|
|
|
|
|
|
|
|
|
|
|
|
|
|
|
|
|
|
|
|
|
|
|
|
|
|
|
|
|
|
|
|
|
Net impaired loans ($ millions) |
|
|
|
|
|
|
|
|
|
|
|
|
|
|
|
|
|
|
4,685 |
|
|
|
4,449 |
|
|
|
4,399 |
|
|
|
4,215 |
|
Allowance for credit losses ($ millions) (7)
|
|
|
|
|
|
|
|
|
|
|
|
|
|
|
|
|
|
|
6,736 |
|
|
|
6,860 |
|
|
|
6,768 |
|
|
|
6,597 |
|
Gross impaired loans as a % of loans and acceptances (1)
|
|
|
|
|
|
|
|
|
|
|
|
|
|
|
|
|
|
|
0.88 |
|
|
|
0.84 |
|
|
|
0.83 |
|
|
|
0.80 |
|
Net impaired loans as a % of loans and acceptances (1)
|
|
|
|
|
|
|
|
|
|
|
|
|
|
|
|
|
|
|
0.61 |
|
|
|
0.58 |
|
|
|
0.57 |
|
|
|
0.55 |
|
Provision for credit losses as a % of average net loans and acceptances (annualized) (1)(8)
|
|
|
|
|
|
|
|
|
|
|
|
|
|
|
|
|
|
|
0.54 |
|
|
|
0.55 |
|
|
|
0.54 |
|
|
|
0.50 |
|
Provision for credit losses on impaired loans as a % of average net loans and acceptances (annualized) (1)(8)
|
|
|
|
|
|
|
|
|
|
|
|
|
|
|
|
|
|
|
0.55 |
|
|
|
0.51 |
|
|
|
0.52 |
|
|
|
0.49 |
|
Net write-offs as a % of average net loans and acceptances (annualized) (1)
|
|
|
|
|
|
|
|
|
|
|
|
|
|
|
|
|
|
|
0.51 |
|
|
|
0.45 |
|
|
|
0.48 |
|
|
|
0.42 |
|
|
|
|
|
|
|
|
|
|
|
|
|
|
|
|
|
|
|
|
|
|
|
|
|
|
|
|
|
|
|
|
|
|
Adjusted total revenue ($ millions) |
|
|
|
|
|
|
|
|
|
|
|
|
|
|
|
|
|
|
8,526 |
|
|
|
8,507 |
|
|
|
8,347 |
|
|
|
8,433 |
|
Adjusted non-interest expenses ($ millions) |
|
|
|
|
|
|
|
|
|
|
|
|
|
|
|
|
|
|
4,784 |
|
|
|
4,763 |
|
|
|
4,693 |
|
|
|
4,721 |
|
Adjusted net income ($ millions) |
|
|
|
|
|
|
|
|
|
|
|
|
|
|
|
|
|
|
2,119 |
|
|
|
2,191 |
|
|
|
2,105 |
|
|
|
2,212 |
|
Adjusted diluted earnings per share ($) |
|
|
|
|
|
|
|
|
|
|
|
|
|
|
|
|
|
|
1.57 |
|
|
|
1.63 |
|
|
|
1.58 |
|
|
|
1.69 |
|
Adjusted return on equity (%) |
|
|
|
|
|
|
|
|
|
|
|
|
|
|
|
|
|
|
10.6 |
|
|
|
11.3 |
|
|
|
11.3 |
|
|
|
11.9 |
|
Adjusted return on tangible common equity (%) |
|
|
|
|
|
|
|
|
|
|
|
|
|
|
|
|
|
|
12.8 |
|
|
|
13.7 |
|
|
|
13.8 |
|
|
|
14.6 |
|
Adjusted productivity ratio (%) |
|
|
|
|
|
|
|
|
|
|
|
|
|
|
|
|
|
|
56.1 |
|
|
|
56.0 |
|
|
|
56.2 |
|
|
|
56.0 |
|
|
|
|
|
|
|
|
|
|
|
|
|
|
|
|
|
|
|
|
|
|
|
|
|
|
|
|
|
|
|
|
|
|
Closing share price ($) (TSX) |
|
|
|
|
|
|
|
|
|
|
|
|
|
|
|
|
|
|
71.69 |
|
|
|
64.47 |
|
|
|
63.16 |
|
|
|
62.87 |
|
Shares outstanding (millions) |
|
|
|
|
|
|
|
|
|
|
|
|
|
|
|
|
|
|
|
|
|
|
|
|
|
|
|
|
|
|
|
|
|
|
|
|
|
|
|
|
|
|
|
|
|
|
|
|
|
|
|
1,238 |
|
|
|
1,230 |
|
|
|
1,223 |
|
|
|
1,214 |
|
|
|
|
|
|
|
|
|
|
|
|
|
|
|
|
|
|
|
|
1,243 |
|
|
|
1,235 |
|
|
|
1,228 |
|
|
|
1,221 |
|
|
|
|
|
|
|
|
|
|
|
|
|
|
|
|
|
|
|
|
1,244 |
|
|
|
1,237 |
|
|
|
1,230 |
|
|
|
1,222 |
|
Dividends paid per share ($) |
|
|
|
|
|
|
|
|
|
|
|
|
|
|
|
|
|
|
1.06 |
|
|
|
1.06 |
|
|
|
1.06 |
|
|
|
1.06 |
|
|
|
|
|
|
|
|
|
|
|
|
|
|
|
|
|
|
|
|
6.3 |
|
|
|
6.6 |
|
|
|
6.4 |
|
|
|
7.0 |
|
Market capitalization ($ billions) (TSX) |
|
|
|
|
|
|
|
|
|
|
|
|
|
|
|
|
|
|
89.2 |
|
|
|
79.8 |
|
|
|
77.7 |
|
|
|
76.8 |
|
Book value per common share ($) (1)
|
|
|
|
|
|
|
|
|
|
|
|
|
|
|
|
|
|
|
59.14 |
|
|
|
58.78 |
|
|
|
57.40 |
|
|
|
57.26 |
|
Market value to book value multiple (1)
|
|
|
|
|
|
|
|
|
|
|
|
|
|
|
|
|
|
|
1.2 |
|
|
|
1.1 |
|
|
|
1.1 |
|
|
|
1.1 |
|
Price to earnings multiple (trailing 4 quarters) (1)
|
|
|
|
|
|
|
|
|
|
|
|
|
|
|
|
|
|
|
12.0 |
|
|
|
11.3 |
|
|
|
10.5 |
|
|
|
10.3 |
|
| (1) |
Refer to Glossary on page 136 for the description of the measure. |
| (2) |
Refer to page 20 for a discussion of non-GAAP measures. |
| (3) |
Regulatory capital ratios are based on Basel III requirements as determined in accordance with OSFI Guideline – Capital Adequacy Requirements. |
| (4) |
This measure has been disclosed in this document in accordance with OSFI Guideline – Total Loss Absorbing Capacity. |
| (5) |
The leverage ratios are based on Basel III requirements as determined in accordance with OSFI Guideline – Leverage Requirements. |
| (6) |
The LCR and NSFR are calculated in accordance with OSFI Guideline – Liquidity Adequacy Requirements (LAR). |
| (7) |
Includes allowance for credit losses on all financial assets – loans, acceptances, off-balance sheet exposures, debt securities, and deposits with financial institutions. |
| (8) |
Includes provision for credit losses on certain financial assets – loans, acceptances and off-balance sheet exposures. |
|
2025 Scotiabank Annual Report
Management’s Discussion and Analysis
| Supplementary Data
Selected Annual Information
T82
Selected annual information
|
|
|
|
|
|
|
|
|
|
|
|
|
|
|
|
|
| ($ millions) |
|
|
|
|
2024 |
|
|
2023 |
|
|
|
|
|
|
|
$ |
33,670 |
|
|
$ |
32,214 |
|
Net income attributable to: |
|
|
|
|
|
|
|
|
|
|
|
|
Equity holders of the Bank |
|
|
|
|
|
|
7,758 |
|
|
|
7,338 |
|
Non-controlling interests in subsidiaries |
|
|
|
|
|
|
134 |
|
|
|
112 |
|
|
|
|
|
|
|
$ |
7,892 |
|
|
$ |
7,450 |
|
Basic earnings per share (in dollars) |
|
|
|
|
|
$ |
5.94 |
|
|
$ |
5.78 |
|
Diluted earnings per share (in dollars) |
|
|
|
|
|
|
5.87 |
|
|
|
5.72 |
|
Dividends paid per common share (in dollars) |
|
|
|
|
|
|
4.24 |
|
|
|
4.18 |
|
|
|
|
|
|
|
|
1,412,027 |
|
|
|
1,411,043 |
|
|
|
|
|
|
|
|
943,849 |
|
|
|
952,333 |
|
Ten-Year
Statistical Review
T83
Condensed Consolidated Statement of Financial Position
|
|
|
|
|
|
|
|
|
|
|
|
|
|
|
|
|
|
|
|
|
|
|
|
|
|
|
|
|
|
|
|
|
|
|
|
|
|
|
|
|
|
|
|
|
|
|
|
|
|
|
|
| As at October 31 ($ millions) |
|
|
|
|
|
|
|
|
|
|
|
|
|
|
|
|
|
|
|
|
|
|
|
|
|
2017 |
|
|
2016 |
|
|
|
|
|
|
|
|
|
|
|
|
|
|
|
|
|
|
|
|
|
|
|
|
|
|
|
|
|
|
|
|
|
|
|
|
|
|
|
|
|
|
Cash, deposits with financial institutions and Precious metals |
|
|
|
|
|
$ |
66,400 |
|
|
$ |
91,249 |
|
|
$ |
66,438 |
|
|
$ |
87,078 |
|
|
$ |
77,641 |
|
|
$ |
50,429 |
|
|
$ |
65,460 |
|
|
$ |
65,380 |
|
|
$ |
54,786 |
|
|
|
|
|
|
|
|
129,727 |
|
|
|
117,868 |
|
|
|
113,154 |
|
|
|
146,312 |
|
|
|
117,839 |
|
|
|
127,488 |
|
|
|
100,262 |
|
|
|
98,464 |
|
|
|
108,561 |
|
Securities purchased under resale agreements and securities borrowed |
|
|
|
|
|
|
200,543 |
|
|
|
199,325 |
|
|
|
175,313 |
|
|
|
127,739 |
|
|
|
119,747 |
|
|
|
131,178 |
|
|
|
104,018 |
|
|
|
95,319 |
|
|
|
92,129 |
|
|
|
|
|
|
|
|
152,832 |
|
|
|
118,237 |
|
|
|
110,008 |
|
|
|
75,199 |
|
|
|
111,389 |
|
|
|
82,359 |
|
|
|
78,396 |
|
|
|
69,269 |
|
|
|
72,919 |
|
|
|
|
|
|
|
|
760,829 |
|
|
|
750,911 |
|
|
|
744,987 |
|
|
|
636,986 |
|
|
|
603,263 |
|
|
|
592,483 |
|
|
|
551,834 |
|
|
|
504,369 |
|
|
|
480,164 |
|
|
|
|
|
|
|
|
101,696 |
|
|
|
133,453 |
|
|
|
139,518 |
|
|
|
111,530 |
|
|
|
106,587 |
|
|
|
102,224 |
|
|
|
98,523 |
|
|
|
82,472 |
|
|
|
87,707 |
|
|
|
|
|
|
|
$ |
1,412,027 |
|
|
$ |
1,411,043 |
|
|
$ |
1,349,418 |
|
|
$ |
1,184,844 |
|
|
$ |
1,136,466 |
|
|
$ |
1,086,161 |
|
|
$ |
998,493 |
|
|
$ |
915,273 |
|
|
$ |
896,266 |
|
|
|
|
|
|
|
|
|
|
|
|
|
|
|
|
|
|
|
|
|
|
|
|
|
|
|
|
|
|
|
|
|
|
|
|
|
|
|
|
|
|
|
|
|
|
|
|
$ |
943,849 |
|
|
$ |
952,333 |
|
|
$ |
916,181 |
|
|
$ |
797,259 |
|
|
$ |
750,838 |
|
|
$ |
733,390 |
|
|
$ |
676,534 |
|
|
$ |
625,367 |
|
|
$ |
611,877 |
|
Obligations related to securities sold under repurchase agreements and securities lent |
|
|
|
|
|
|
190,449 |
|
|
|
160,007 |
|
|
|
139,025 |
|
|
|
123,469 |
|
|
|
137,763 |
|
|
|
124,083 |
|
|
|
101,257 |
|
|
|
95,843 |
|
|
|
97,083 |
|
|
|
|
|
|
|
|
7,833 |
|
|
|
9,693 |
|
|
|
8,469 |
|
|
|
6,334 |
|
|
|
7,405 |
|
|
|
7,252 |
|
|
|
5,698 |
|
|
|
5,935 |
|
|
|
7,633 |
|
|
|
|
|
|
|
|
185,820 |
|
|
|
210,439 |
|
|
|
210,994 |
|
|
|
184,890 |
|
|
|
169,957 |
|
|
|
151,244 |
|
|
|
147,324 |
|
|
|
126,503 |
|
|
|
121,852 |
|
|
|
|
|
|
|
|
1,327,951 |
|
|
|
1,332,472 |
|
|
|
1,274,669 |
|
|
|
1,111,952 |
|
|
|
1,065,963 |
|
|
|
1,015,969 |
|
|
|
930,813 |
|
|
|
853,648 |
|
|
|
838,445 |
|
|
|
|
|
|
|
|
73,590 |
|
|
|
68,767 |
|
|
|
65,150 |
|
|
|
64,750 |
|
|
|
62,819 |
|
|
|
63,638 |
|
|
|
61,044 |
|
|
|
55,454 |
|
|
|
52,657 |
|
Preferred shares and other equity instruments |
|
|
|
|
|
|
8,779 |
|
|
|
8,075 |
|
|
|
8,075 |
|
|
|
6,052 |
|
|
|
5,308 |
|
|
|
3,884 |
|
|
|
4,184 |
|
|
|
4,579 |
|
|
|
3,594 |
|
Non-controlling interests in subsidiaries |
|
|
|
|
|
|
1,707 |
|
|
|
1,729 |
|
|
|
1,524 |
|
|
|
2,090 |
|
|
|
2,376 |
|
|
|
2,670 |
|
|
|
2,452 |
|
|
|
1,592 |
|
|
|
1,570 |
|
|
|
|
|
|
|
|
84,076 |
|
|
|
78,571 |
|
|
|
74,749 |
|
|
|
72,892 |
|
|
|
70,503 |
|
|
|
70,192 |
|
|
|
67,680 |
|
|
|
61,625 |
|
|
|
57,821 |
|
| |
|
|
|
|
|
$ |
1,412,027 |
|
|
$ |
1,411,043 |
|
|
$ |
1,349,418 |
|
|
$ |
1,184,844 |
|
|
$ |
1,136,466 |
|
|
$ |
1,086,161 |
|
|
$ |
998,493 |
|
|
$ |
915,273 |
|
|
$ |
896,266 |
|
| (1) |
The amounts for the years ended October 31, 2018 to October 31, 2025 have been prepared in accordance with IFRS 9; prior period amounts have not been restated. |
| (2) |
The Bank adopted IFRS 17 effective November 1, 2023. As required under the new accounting standard, prior period amounts have been restated. Amounts for fiscal 2016 to 2022 have been prepared in accordance with IFRS 4 and have not been restated. |
| (3) |
The amounts for the years ended October 31, 2020 to October 31, 2025 have been prepared in accordance with IFRS 16; prior year amounts have not been restated. |
T84
Condensed Consolidated Statement of Income
|
|
|
|
|
|
|
|
|
|
|
|
|
|
|
|
|
|
|
|
|
|
|
|
|
|
|
|
|
|
|
|
|
|
|
|
|
|
|
|
|
|
|
|
|
|
|
|
|
|
|
|
For the year ended October 31
($ millions) |
|
|
|
|
|
|
|
|
|
|
2022 |
|
|
2021 |
|
|
2020 |
|
|
2019 |
|
|
2018 |
|
|
2017 |
|
|
2016 |
|
|
|
|
|
|
|
|
|
|
|
|
|
|
|
|
|
|
|
|
|
|
|
|
|
|
|
|
|
|
|
|
|
|
|
|
|
|
|
|
|
|
Net interest income (2)(3)
|
|
|
|
|
|
$ |
19,252 |
|
|
$ |
18,262 |
|
|
$ |
18,115 |
|
|
$ |
16,961 |
|
|
$ |
17,320 |
|
|
$ |
17,177 |
|
|
$ |
16,191 |
|
|
$ |
15,035 |
|
|
$ |
14,292 |
|
Non-interest income (2)(4)
|
|
|
|
|
|
|
14,418 |
|
|
|
13,952 |
|
|
|
13,301 |
|
|
|
14,291 |
|
|
|
14,016 |
|
|
|
13,857 |
|
|
|
12,584 |
|
|
|
12,120 |
|
|
|
12,058 |
|
|
|
|
|
|
|
|
33,670 |
|
|
|
32,214 |
|
|
|
31,416 |
|
|
|
31,252 |
|
|
|
31,336 |
|
|
|
31,034 |
|
|
|
28,775 |
|
|
|
27,155 |
|
|
|
26,350 |
|
Provision for credit losses (2)
|
|
|
|
|
|
|
4,051 |
|
|
|
3,422 |
|
|
|
1,382 |
|
|
|
1,808 |
|
|
|
6,084 |
|
|
|
3,027 |
|
|
|
2,611 |
|
|
|
2,249 |
|
|
|
2,412 |
|
Non-interest expenses (3)(4)
|
|
|
|
|
|
|
19,695 |
|
|
|
19,121 |
|
|
|
17,102 |
|
|
|
16,618 |
|
|
|
16,856 |
|
|
|
16,737 |
|
|
|
15,058 |
|
|
|
14,630 |
|
|
|
14,540 |
|
|
|
|
|
|
|
|
9,924 |
|
|
|
9,671 |
|
|
|
12,932 |
|
|
|
12,826 |
|
|
|
8,396 |
|
|
|
11,270 |
|
|
|
11,106 |
|
|
|
10,276 |
|
|
|
9,398 |
|
|
|
|
|
|
|
|
2,032 |
|
|
|
2,221 |
|
|
|
2,758 |
|
|
|
2,871 |
|
|
|
1,543 |
|
|
|
2,472 |
|
|
|
2,382 |
|
|
|
2,033 |
|
|
|
2,030 |
|
|
|
|
|
|
|
$ |
7,892 |
|
|
$ |
7,450 |
|
|
$ |
10,174 |
|
|
$ |
9,955 |
|
|
$ |
6,853 |
|
|
$ |
8,798 |
|
|
$ |
8,724 |
|
|
$ |
8,243 |
|
|
$ |
7,368 |
|
Net income attributable to non-controlling interests in subsidiaries |
|
|
|
|
|
|
134 |
|
|
|
112 |
|
|
|
258 |
|
|
|
331 |
|
|
|
75 |
|
|
|
408 |
|
|
|
176 |
|
|
|
238 |
|
|
|
251 |
|
Net income attributable to equity holders of the Bank |
|
|
|
|
|
$ |
7,758 |
|
|
$ |
7,338 |
|
|
$ |
9,916 |
|
|
$ |
9,624 |
|
|
$ |
6,778 |
|
|
$ |
8,390 |
|
|
$ |
8,548 |
|
|
$ |
8,005 |
|
|
$ |
7,117 |
|
Preferred shareholders and other equity instrument holders |
|
|
|
|
|
|
472 |
|
|
|
419 |
|
|
|
260 |
|
|
|
233 |
|
|
|
196 |
|
|
|
182 |
|
|
|
187 |
|
|
|
129 |
|
|
|
130 |
|
|
|
|
|
|
|
$ |
7,286 |
|
|
$ |
6,919 |
|
|
$ |
9,656 |
|
|
$ |
9,391 |
|
|
$ |
6,582 |
|
|
$ |
8,208 |
|
|
$ |
8,361 |
|
|
$ |
7,876 |
|
|
$ |
6,987 |
|
| (1) |
The Bank adopted IFRS 17 effective November 1, 2023. As required under the new accounting standard, prior period amounts have been restated. Amounts for fiscal 2016 to 2022 have been prepared in accordance with IFRS 4 and have not been restated. |
| (2) |
The amounts for the years ended October 31, 2018 to October 31, 2025 have been prepared in accordance with IFRS 9; prior year amounts have not been restated. |
| (3) |
The amounts for the years ended October 31, 2020 to October 31, 2025 have been prepared in accordance with IFRS 16; prior year amounts have not been restated. |
| (4) |
The amounts for the years ended October 31, 2019 to October 31, 2025 have been prepared in accordance with IFRS 15; prior year amounts have not been restated. |
2025 Scotiabank Annual Report
|
Management’s Discussion and Analysis
T85
Consolidated Statement of Changes in Equity
|
|
|
|
|
|
|
|
|
|
|
|
|
|
|
|
|
|
|
|
|
|
|
|
|
|
|
|
|
| For the year ended October 31 ($ millions) |
|
|
|
|
|
|
|
|
|
|
2022 |
|
|
2021 |
|
|
2020 |
|
|
2019 |
|
|
|
|
|
|
|
|
|
|
|
|
|
|
|
|
|
|
|
|
|
|
|
|
|
|
|
|
|
|
Balance at beginning of year |
|
|
|
|
|
$ |
20,109 |
|
|
$ |
18,707 |
|
|
$ |
18,507 |
|
|
$ |
18,239 |
|
|
$ |
18,264 |
|
|
$ |
18,234 |
|
|
|
|
|
|
|
|
1,945 |
|
|
|
1,402 |
|
|
|
706 |
|
|
|
268 |
|
|
|
59 |
|
|
|
255 |
|
Purchased for cancellation |
|
|
|
|
|
|
– |
|
|
|
– |
|
|
|
(506 |
) |
|
|
– |
|
|
|
(84 |
) |
|
|
(225 |
) |
|
|
|
|
|
|
$ |
22,054 |
|
|
$ |
20,109 |
|
|
$ |
18,707 |
|
|
$ |
18,507 |
|
|
$ |
18,239 |
|
|
$ |
18,264 |
|
|
|
|
|
|
|
|
|
|
|
|
|
|
|
|
|
|
|
|
|
|
|
|
|
|
|
|
|
|
Balance at beginning of year |
|
|
|
|
|
|
55,673 |
|
|
|
53,761 |
|
|
|
51,354 |
|
|
|
46,345 |
|
|
|
44,439 |
|
|
|
41,414 |
|
|
|
|
|
|
|
|
– |
|
|
|
(1 |
) |
|
|
– |
|
|
|
– |
|
|
|
– |
|
|
|
(58 |
) |
|
|
|
|
|
|
|
55,673 |
|
|
|
53,760 |
|
|
|
51,354 |
|
|
|
46,345 |
|
|
|
44,439 |
|
|
|
41,356 |
|
Net income attributable to common shareholders of the Bank |
|
|
|
|
|
|
7,286 |
|
|
|
6,919 |
|
|
|
9,656 |
|
|
|
9,391 |
|
|
|
6,582 |
|
|
|
8,208 |
|
|
|
|
|
|
|
|
(5,198 |
) |
|
|
(5,003 |
) |
|
|
(4,858 |
) |
|
|
(4,371 |
) |
|
|
(4,363 |
) |
|
|
(4,260 |
) |
Purchase of shares for cancellation and premium on redemption |
|
|
|
|
|
|
– |
|
|
|
– |
|
|
|
(2,367 |
) |
|
|
– |
|
|
|
(330 |
) |
|
|
(850 |
) |
Foreign currency loss on redemption of Subordinated Additional Tier 1 Capital Notes |
|
|
|
|
|
|
– |
|
|
|
– |
|
|
|
– |
|
|
|
– |
|
|
|
– |
|
|
|
– |
|
|
|
|
|
|
|
|
(10 |
) |
|
|
(3 |
) |
|
|
(24 |
) |
|
|
(11 |
) |
|
|
17 |
|
|
|
(15 |
) |
|
|
|
|
|
|
$ |
57,751 |
|
|
$ |
55,673 |
|
|
$ |
53,761 |
|
|
$ |
51,354 |
|
|
$ |
46,345 |
|
|
$ |
44,439 |
|
Accumulated other comprehensive income (loss) |
|
|
|
|
|
|
|
|
|
|
|
|
|
|
|
|
|
|
|
|
|
|
|
|
|
|
|
|
Balance at beginning of year |
|
|
|
|
|
|
(6,931 |
) |
|
|
(7,166 |
) |
|
|
(5,333 |
) |
|
|
(2,125 |
) |
|
|
570 |
|
|
|
992 |
|
|
|
|
|
|
|
|
– |
|
|
|
– |
|
|
|
– |
|
|
|
– |
|
|
|
– |
|
|
|
– |
|
|
|
|
|
|
|
|
(6,931 |
) |
|
|
(7,166 |
) |
|
|
(5,333 |
) |
|
|
(2,125 |
) |
|
|
570 |
|
|
|
992 |
|
Other comprehensive income (loss) |
|
|
|
|
|
|
784 |
|
|
|
278 |
|
|
|
(1,564 |
) |
|
|
(3,134 |
) |
|
|
(2,668 |
) |
|
|
(422 |
) |
|
|
|
|
|
|
|
– |
|
|
|
(43 |
) |
|
|
(269 |
) |
|
|
(74 |
) |
|
|
(27 |
) |
|
|
– |
|
|
|
|
|
|
|
$ |
(6,147 |
) |
|
$ |
(6,931 |
) |
|
$ |
(7,166 |
) |
|
$ |
(5,333 |
) |
|
$ |
(2,125 |
) |
|
$ |
570 |
|
|
|
|
|
|
|
|
|
|
|
|
|
|
|
|
|
|
|
|
|
|
|
|
|
|
|
|
|
|
Balance at beginning of year |
|
|
|
|
|
|
(84 |
) |
|
|
(152 |
) |
|
|
222 |
|
|
|
360 |
|
|
|
365 |
|
|
|
404 |
|
|
|
|
|
|
|
|
13 |
|
|
|
14 |
|
|
|
10 |
|
|
|
7 |
|
|
|
5 |
|
|
|
7 |
|
|
|
|
|
|
|
|
3 |
|
|
|
54 |
|
|
|
(384 |
) |
|
|
(145 |
) |
|
|
(10 |
) |
|
|
(46 |
) |
|
|
|
|
|
|
$ |
(68 |
) |
|
$ |
(84 |
) |
|
$ |
(152 |
) |
|
$ |
222 |
|
|
$ |
360 |
|
|
$ |
365 |
|
|
|
|
|
|
|
$ |
73,590 |
|
|
$ |
68,767 |
|
|
$ |
65,150 |
|
|
$ |
64,750 |
|
|
$ |
62,819 |
|
|
$ |
63,638 |
|
Preferred shares and other equity instruments |
|
|
|
|
|
|
|
|
|
|
|
|
|
|
|
|
|
|
|
|
|
|
|
|
|
|
|
|
Balance at beginning of year |
|
|
|
|
|
|
8,075 |
|
|
|
8,075 |
|
|
|
6,052 |
|
|
|
5,308 |
|
|
|
3,884 |
|
|
|
4,184 |
|
Net income attributable to preferred shareholders and other equity instrument holders of the Bank |
|
|
|
|
|
|
472 |
|
|
|
419 |
|
|
|
260 |
|
|
|
233 |
|
|
|
196 |
|
|
|
182 |
|
Preferred and other equity instrument dividends |
|
|
|
|
|
|
(472 |
) |
|
|
(419 |
) |
|
|
(260 |
) |
|
|
(233 |
) |
|
|
(196 |
) |
|
|
(182 |
) |
|
|
|
|
|
|
|
1,004 |
|
|
|
– |
|
|
|
2,523 |
|
|
|
2,003 |
|
|
|
1,689 |
|
|
|
– |
|
|
|
|
|
|
|
|
(300 |
) |
|
|
– |
|
|
|
(500 |
) |
|
|
(1,259 |
) |
|
|
(265 |
) |
|
|
(300 |
) |
|
|
|
|
|
|
$ |
8,779 |
|
|
$ |
8,075 |
|
|
$ |
8,075 |
|
|
$ |
6,052 |
|
|
$ |
5,308 |
|
|
$ |
3,884 |
|
Non-controlling interests |
|
|
|
|
|
|
|
|
|
|
|
|
|
|
|
|
|
|
|
|
|
|
|
|
|
|
|
|
Balance at beginning of year |
|
|
|
|
|
|
1,729 |
|
|
|
1,524 |
|
|
|
2,090 |
|
|
|
2,376 |
|
|
|
2,670 |
|
|
|
2,452 |
|
|
|
|
|
|
|
|
– |
|
|
|
– |
|
|
|
– |
|
|
|
– |
|
|
|
– |
|
|
|
– |
|
|
|
|
|
|
|
|
1,729 |
|
|
|
1,524 |
|
|
|
2,090 |
|
|
|
2,376 |
|
|
|
2,670 |
|
|
|
2,452 |
|
Net income attributable to non-controlling interests |
|
|
|
|
|
|
134 |
|
|
|
112 |
|
|
|
258 |
|
|
|
331 |
|
|
|
75 |
|
|
|
408 |
|
Distributions to non-controlling interests |
|
|
|
|
|
|
(88 |
) |
|
|
(101 |
) |
|
|
(115 |
) |
|
|
(123 |
) |
|
|
(148 |
) |
|
|
(150 |
) |
Effect of foreign exchange and others |
|
|
|
|
|
|
(68 |
) |
|
|
194 |
|
|
|
(709 |
) |
|
|
(494 |
) |
|
|
(221 |
) |
|
|
(40 |
) |
|
|
|
|
|
|
$ |
1,707 |
|
|
$ |
1,729 |
|
|
$ |
1,524 |
|
|
$ |
2,090 |
|
|
$ |
2,376 |
|
|
$ |
2,670 |
|
Total equity at end of year |
|
|
|
|
|
$ |
84,076 |
|
|
$ |
78,571 |
|
|
$ |
74,749 |
|
|
$ |
72,892 |
|
|
$ |
70,503 |
|
|
$ |
70,192 |
|
| (1) |
The Bank adopted IFRS 17 effective November 1, 2023. As required under the new accounting standard, prior period amounts have been restated. Amounts for fiscal 2016 to 2022 have been prepared in accordance with IFRS 4 and have not been restated. |
| (2) |
Represents amounts on account of share-based payments (refer to Note 25 in the consolidated financial statements). |
T86
Consolidated Statement of Comprehensive Income
|
|
|
|
|
|
|
|
|
|
|
|
|
|
|
|
|
|
|
|
|
|
|
|
|
|
|
|
|
| For the year ended October 31 ($ millions) |
|
|
|
|
|
|
|
|
|
|
2022 |
|
|
2021 |
|
|
2020 |
|
|
2019 |
|
|
|
|
|
|
|
$ |
7,892 |
|
|
$ |
7,450 |
|
|
$ |
10,174 |
|
|
$ |
9,955 |
|
|
$ |
6,853 |
|
|
$ |
8,798 |
|
Other comprehensive income (loss), net of income taxes: |
|
|
|
|
|
|
|
|
|
|
|
|
|
|
|
|
|
|
|
|
|
|
|
|
|
|
|
|
Items that will be reclassified subsequently to net income |
|
|
|
|
|
|
|
|
|
|
|
|
|
|
|
|
|
|
|
|
|
|
|
|
|
|
|
|
Net change in unrealized foreign currency translation gains (losses) |
|
|
|
|
|
|
(1,865 |
) |
|
|
942 |
|
|
|
2,454 |
|
|
|
(3,520 |
) |
|
|
(2,239 |
) |
|
|
(819 |
) |
Net change in unrealized gains (losses) on securities (debt and equity) (2)
|
|
|
|
|
|
|
n/a |
|
|
|
n/a |
|
|
|
n/a |
|
|
|
n/a |
|
|
|
n/a |
|
|
|
n/a |
|
Net change in fair value due to change in debt instruments measured at fair value through other comprehensive income (2)
|
|
|
|
|
|
|
612 |
|
|
|
378 |
|
|
|
(1,212 |
) |
|
|
(600 |
) |
|
|
293 |
|
|
|
105 |
|
Net change in gains (losses) on derivative instruments designated as cash flow hedges |
|
|
|
|
|
|
2,343 |
|
|
|
245 |
|
|
|
(4,537 |
) |
|
|
(806 |
) |
|
|
(32 |
) |
|
|
708 |
|
Net changes in finance income/(expense) from insurance contracts (1)
|
|
|
|
|
|
|
1 |
|
|
|
(17 |
) |
|
|
– |
|
|
|
– |
|
|
|
– |
|
|
|
– |
|
Other comprehensive income (loss) from investments in associates |
|
|
|
|
|
|
(1 |
) |
|
|
(16 |
) |
|
|
(344 |
) |
|
|
37 |
|
|
|
(2 |
) |
|
|
103 |
|
Items that will not be reclassified subsequently to net income |
|
|
|
|
|
|
|
|
|
|
|
|
|
|
|
|
|
|
|
|
|
|
|
|
|
|
|
|
Net change in remeasurement of employee benefit plan asset and liability |
|
|
|
|
|
|
(136 |
) |
|
|
114 |
|
|
|
678 |
|
|
|
1,335 |
|
|
|
(465 |
) |
|
|
(815 |
) |
Net change in fair value due to change in equity instruments designated at fair value through other comprehensive income (2)
|
|
|
|
|
|
|
338 |
|
|
|
(180 |
) |
|
|
(74 |
) |
|
|
408 |
|
|
|
(85 |
) |
|
|
95 |
|
Net change in fair value due to change in own credit risk on financial liabilities designated under the fair value option |
|
|
|
|
|
|
(581 |
) |
|
|
(985 |
) |
|
|
1,444 |
|
|
|
(199 |
) |
|
|
(298 |
) |
|
|
8 |
|
Other comprehensive income (loss) from investments in associates |
|
|
|
|
|
|
1 |
|
|
|
2 |
|
|
|
2 |
|
|
|
5 |
|
|
|
(8 |
) |
|
|
(10 |
) |
Other comprehensive income (loss) |
|
|
|
|
|
|
712 |
|
|
|
483 |
|
|
|
(1,589 |
) |
|
|
(3,340 |
) |
|
|
(2,836 |
) |
|
|
(625 |
) |
|
|
|
|
|
|
$ |
8,604 |
|
|
$ |
7,933 |
|
|
$ |
8,585 |
|
|
$ |
6,615 |
|
|
$ |
4,017 |
|
|
$ |
8,173 |
|
Comprehensive income (loss) attributable to: |
|
|
|
|
|
|
|
|
|
|
|
|
|
|
|
|
|
|
|
|
|
|
|
|
|
|
|
|
Common shareholders of the Bank |
|
|
|
|
|
$ |
8,070 |
|
|
$ |
7,197 |
|
|
$ |
8,092 |
|
|
$ |
6,257 |
|
|
$ |
3,914 |
|
|
$ |
7,786 |
|
Preferred shareholders and other equity instrument holders of the Bank |
|
|
|
|
|
|
472 |
|
|
|
419 |
|
|
|
260 |
|
|
|
233 |
|
|
|
196 |
|
|
|
182 |
|
Non-controlling interests in subsidiaries |
|
|
|
|
|
|
62 |
|
|
|
317 |
|
|
|
233 |
|
|
|
125 |
|
|
|
(93 |
) |
|
|
205 |
|
| |
|
|
|
|
|
$ |
8,604 |
|
|
$ |
7,933 |
|
|
$ |
8,585 |
|
|
$ |
6,615 |
|
|
$ |
4,017 |
|
|
$ |
8,173 |
|
| (1) |
The Bank adopted IFRS 17 effective November 1, 2023. As required under the new accounting standard, prior period amounts have been restated. Amounts for fiscal 2016 to 2022 have been prepared in accordance with IFRS 4 and have not been restated. |
| (2) |
The amounts for the years ended October 31, 2018 to October 31, 2025 have been prepared in accordance with IFRS 9; prior period amounts have not been restated. |
|
2025 Scotiabank Annual Report
Management’s Discussion and Analysis
| Supplementary Data
|
|
|
|
|
|
|
|
|
|
|
|
|
|
|
2018 |
|
|
|
|
|
2017 |
|
|
2016 |
|
|
|
|
|
|
|
|
|
|
|
|
|
|
|
|
| $ |
15,644 |
|
|
|
|
|
|
$ |
15,513 |
|
|
$ |
15,141 |
|
| |
2,708 |
|
|
|
|
|
|
|
313 |
|
|
|
391 |
|
| |
(118 |
) |
|
|
|
|
|
|
(182 |
) |
|
|
(19 |
) |
| $ |
18,234 |
|
|
|
|
|
|
$ |
15,644 |
|
|
$ |
15,513 |
|
|
|
|
|
|
|
|
|
|
|
|
|
|
|
|
| |
38,117 |
|
|
|
|
|
|
|
34,752 |
|
|
|
31,316 |
|
| |
(564 |
) |
|
|
|
|
|
|
– |
|
|
|
– |
|
| |
37,553 |
|
|
|
|
|
|
|
34,752 |
|
|
|
31,316 |
|
| |
8,361 |
|
|
|
|
|
|
|
7,876 |
|
|
|
6,987 |
|
| |
(3,985 |
) |
|
|
|
|
|
|
(3,668 |
) |
|
|
(3,468 |
) |
| |
(514 |
) |
|
|
|
|
|
|
(827 |
) |
|
|
(61 |
) |
|
|
|
|
|
|
|
|
|
|
|
|
|
|
|
| |
(1 |
) |
|
|
|
|
|
|
(16 |
) |
|
|
(22 |
) |
| $ |
41,414 |
|
|
|
|
|
|
$ |
38,117 |
|
|
$ |
34,752 |
|
|
|
|
|
|
|
|
|
|
|
|
|
|
|
|
| |
1,577 |
|
|
|
|
|
|
|
2,240 |
|
|
|
2,455 |
|
| |
51 |
|
|
|
|
|
|
|
– |
|
|
|
– |
|
| |
1,628 |
|
|
|
|
|
|
|
2,240 |
|
|
|
2,455 |
|
| |
(693 |
) |
|
|
|
|
|
|
(663 |
) |
|
|
(215 |
) |
| |
57 |
|
|
|
|
|
|
|
– |
|
|
|
– |
|
| $ |
992 |
|
|
|
|
|
|
$ |
1,577 |
|
|
$ |
2,240 |
|
|
|
|
|
|
|
|
|
|
|
|
|
|
|
|
| |
116 |
|
|
|
|
|
|
|
152 |
|
|
|
173 |
|
| |
6 |
|
|
|
|
|
|
|
8 |
|
|
|
7 |
|
| |
282 |
|
|
|
|
|
|
|
(44 |
) |
|
|
(28 |
) |
| $ |
404 |
|
|
|
|
|
|
$ |
116 |
|
|
$ |
152 |
|
| $ |
61,044 |
|
|
|
|
|
|
$ |
55,454 |
|
|
$ |
52,657 |
|
|
|
|
|
|
|
|
|
|
|
|
|
|
|
|
| |
4,579 |
|
|
|
|
|
|
|
3,594 |
|
|
|
2,934 |
|
|
187 |
|
|
|
|
|
|
|
129 |
|
|
|
130 |
|
| |
(187 |
) |
|
|
|
|
|
|
(129 |
) |
|
|
(130 |
) |
| |
300 |
|
|
|
|
|
|
|
1,560 |
|
|
|
1,350 |
|
| |
(695 |
) |
|
|
|
|
|
|
(575 |
) |
|
|
(690 |
) |
| $ |
4,184 |
|
|
|
|
|
|
$ |
4,579 |
|
|
$ |
3,594 |
|
|
|
|
|
|
|
|
|
|
|
|
|
|
|
|
| |
1,592 |
|
|
|
|
|
|
|
1,570 |
|
|
|
1,460 |
|
| |
(97 |
) |
|
|
|
|
|
|
– |
|
|
|
– |
|
| |
1,495 |
|
|
|
|
|
|
|
1,570 |
|
|
|
1,460 |
|
| |
176 |
|
|
|
|
|
|
|
238 |
|
|
|
251 |
|
| |
(199 |
) |
|
|
|
|
|
|
(133 |
) |
|
|
(116 |
) |
| |
980 |
|
|
|
|
|
|
|
(83 |
) |
|
|
(25 |
) |
| $ |
2,452 |
|
|
|
|
|
|
$ |
1,592 |
|
|
$ |
1,570 |
|
| $ |
67,680 |
|
|
|
|
|
|
$ |
61,625 |
|
|
$ |
57,821 |
|
|
|
|
|
|
|
|
|
|
|
|
|
|
|
|
2018 |
|
|
|
|
|
2017 |
|
|
2016 |
|
| $ |
8,724 |
|
|
|
|
|
|
$ |
8,243 |
|
|
$ |
7,368 |
|
|
|
|
|
|
|
|
|
|
|
|
|
|
|
|
|
|
|
|
|
|
|
|
|
|
|
|
|
|
|
| |
(606 |
) |
|
|
|
|
|
|
(1,259 |
) |
|
|
396 |
|
|
n/a |
|
|
|
|
|
|
|
(55 |
) |
|
|
(172 |
) |
|
(252 |
) |
|
|
|
|
|
|
n/a |
|
|
|
n/a |
|
|
(361 |
) |
|
|
|
|
|
|
(28 |
) |
|
|
258 |
|
| |
– |
|
|
|
|
|
|
|
– |
|
|
|
– |
|
| |
66 |
|
|
|
|
|
|
|
56 |
|
|
|
31 |
|
|
|
|
|
|
|
|
|
|
|
|
|
|
|
|
| |
318 |
|
|
|
|
|
|
|
592 |
|
|
|
(716 |
) |
|
60 |
|
|
|
|
|
|
|
n/a |
|
|
|
n/a |
|
|
(22 |
) |
|
|
|
|
|
|
(21 |
) |
|
|
(16 |
) |
| |
(7 |
) |
|
|
|
|
|
|
6 |
|
|
|
(10 |
) |
| |
(804 |
) |
|
|
|
|
|
|
(709 |
) |
|
|
(229 |
) |
| $ |
7,920 |
|
|
|
|
|
|
$ |
7,534 |
|
|
$ |
7,139 |
|
|
|
|
|
|
|
|
|
|
|
|
|
|
|
|
| $ |
7,668 |
|
|
|
|
|
|
$ |
7,213 |
|
|
$ |
6,772 |
|
| |
187 |
|
|
|
|
|
|
|
129 |
|
|
|
130 |
|
| |
65 |
|
|
|
|
|
|
|
192 |
|
|
|
237 |
|
| $ |
7,920 |
|
|
|
|
|
|
$ |
7,534 |
|
|
$ |
7,139 |
|
2025 Scotiabank Annual Report
|
Management’s Discussion and Analysis
|
|
|
|
|
|
|
|
|
|
|
|
|
|
|
|
|
|
|
|
|
|
|
|
|
|
|
|
|
|
|
|
|
|
|
|
|
| For the year ended October 31 |
|
|
|
|
|
|
|
|
|
|
2022 |
|
|
2021 |
|
|
2020 |
|
|
2019 |
|
|
|
|
|
|
|
|
|
|
|
|
|
|
|
|
|
|
|
|
|
|
|
|
|
|
|
|
|
|
Basic earnings per share ($) |
|
|
|
|
|
|
5.94 |
|
|
|
5.78 |
|
|
|
8.05 |
|
|
|
7.74 |
|
|
|
5.43 |
|
|
|
6.72 |
|
Diluted earnings per share ($) |
|
|
|
|
|
|
5.87 |
|
|
|
5.72 |
|
|
|
8.02 |
|
|
|
7.70 |
|
|
|
5.30 |
|
|
|
6.68 |
|
|
|
|
|
|
|
|
10.2 |
|
|
|
10.3 |
|
|
|
14.8 |
|
|
|
14.7 |
|
|
|
10.4 |
|
|
|
13.1 |
|
Productivity ratio (%) (2)
|
|
|
|
|
|
|
58.5 |
|
|
|
59.4 |
|
|
|
54.4 |
|
|
|
53.2 |
|
|
|
53.8 |
|
|
|
53.9 |
|
|
|
|
|
|
|
|
0.56 |
|
|
|
0.53 |
|
|
|
0.79 |
|
|
|
0.86 |
|
|
|
0.59 |
|
|
|
0.83 |
|
Net interest margin (%) (3)
|
|
|
|
|
|
|
2.16 |
|
|
|
2.12 |
|
|
|
2.20 |
|
|
|
2.23 |
|
|
|
2.27 |
|
|
|
2.44 |
|
|
|
|
|
|
|
|
|
|
|
|
|
|
|
|
|
|
|
|
|
|
|
|
|
|
|
|
|
|
Common Equity Tier 1 (CET1) capital ratio (%) (4)
|
|
|
|
|
|
|
13.1 |
|
|
|
13.0 |
|
|
|
11.5 |
|
|
|
12.3 |
|
|
|
11.8 |
|
|
|
11.1 |
|
Tier 1 capital ratio (%) (4)
|
|
|
|
|
|
|
15.0 |
|
|
|
14.8 |
|
|
|
13.2 |
|
|
|
13.9 |
|
|
|
13.3 |
|
|
|
12.2 |
|
Total capital ratio (%) (4)
|
|
|
|
|
|
|
16.7 |
|
|
|
17.2 |
|
|
|
15.3 |
|
|
|
15.9 |
|
|
|
15.5 |
|
|
|
14.2 |
|
|
|
|
|
|
|
|
4.4 |
|
|
|
4.2 |
|
|
|
4.2 |
|
|
|
4.8 |
|
|
|
4.7 |
|
|
|
4.2 |
|
|
|
|
|
|
|
|
|
|
|
|
|
|
|
|
|
|
|
|
|
|
|
|
|
|
|
|
|
|
Closing share price ($) (TSX) |
|
|
|
|
|
|
71.69 |
|
|
|
56.15 |
|
|
|
65.85 |
|
|
|
81.14 |
|
|
|
55.35 |
|
|
|
75.54 |
|
Number of shares outstanding (millions) |
|
|
|
|
|
|
1,244 |
|
|
|
1,214 |
|
|
|
1,191 |
|
|
|
1,215 |
|
|
|
1,211 |
|
|
|
1,216 |
|
Dividends paid per share ($) |
|
|
|
|
|
|
4.24 |
|
|
|
4.18 |
|
|
|
4.06 |
|
|
|
3.60 |
|
|
|
3.60 |
|
|
|
3.49 |
|
|
|
|
|
|
|
|
6.5 |
|
|
|
6.5 |
|
|
|
5.1 |
|
|
|
5.2 |
|
|
|
5.8 |
|
|
|
4.9 |
|
Price to earnings multiple (trailing 4 quarters) (2)
|
|
|
|
|
|
|
12.0 |
|
|
|
9.7 |
|
|
|
8.2 |
|
|
|
10.5 |
|
|
|
10.2 |
|
|
|
11.2 |
|
Book value per common share ($) (2)
|
|
|
|
|
|
|
59.14 |
|
|
|
56.64 |
|
|
|
54.68 |
|
|
|
53.28 |
|
|
|
51.85 |
|
|
|
52.33 |
|
|
|
|
|
|
|
|
|
|
|
|
|
|
|
|
|
|
|
|
|
|
|
|
|
|
|
|
|
|
Average total assets ($ millions) |
|
|
|
|
|
|
1,419,284 |
|
|
|
1,396,092 |
|
|
|
1,281,708 |
|
|
|
1,157,213 |
|
|
|
1,160,584 |
|
|
|
1,056,063 |
|
Number of branches and offices |
|
|
|
|
|
|
2,236 |
|
|
|
2,379 |
|
|
|
2,439 |
|
|
|
2,573 |
|
|
|
2,618 |
|
|
|
3,109 |
|
|
|
|
|
|
|
|
88,488 |
|
|
|
89,483 |
|
|
|
90,979 |
|
|
|
89,488 |
|
|
|
91,447 |
|
|
|
101,380 |
|
Number of automated banking machines |
|
|
|
|
|
|
8,533 |
|
|
|
8,679 |
|
|
|
8,610 |
|
|
|
8,610 |
|
|
|
8,791 |
|
|
|
9,391 |
|
| (1) |
The Bank adopted IFRS 17 effective November 1, 2023. As required under the new accounting standard, prior period amounts have been restated. Amounts for fiscal 2016 to 2022 have been prepared in accordance with IFRS 4 and have not been restated. |
| (2) |
Refer to Glossary on page 136 for the description of the measure. |
| (3) |
Refer to page 20 for a discussion of non-GAAP measures. |
| (4) |
2024 and 2025 regulatory capital ratios are based on Basel III requirements as determined in accordance with OSFI Guideline – Capital Adequacy Requirements (November 2023). Effective Q2 2023, regulatory capital ratios were based on Basel III requirements as determined in accordance with OSFI Guideline – Capital Adequacy Requirements (February 2023). Prior period regulatory capital ratios were prepared in accordance with OSFI Guideline – Capital Adequacy Requirements (November 2018). |
| (5) |
Leverage ratios for 2023 to 2025 are based on Basel III requirements as determined in accordance with OSFI Guideline – Leverage Requirements (February 2023). Prior period leverage ratios were prepared in accordance with OSFI Guideline – Leverage Requirements (November 2018). |
| (6) |
Based on the average of the high and low common share price for the year. |
|
2025 Scotiabank Annual Report
Management’s Discussion and Analysis
| Supplementary Data
|
|
|
|
|
|
|
|
|
|
|
|
|
|
|
|
|
|
|
2018 |
|
|
|
|
|
2017 |
|
|
2016 |
|
|
|
|
|
|
|
|
|
|
|
|
|
|
|
|
| |
6.90 |
|
|
|
|
|
|
|
6.55 |
|
|
|
5.80 |
|
| |
6.82 |
|
|
|
|
|
|
|
6.49 |
|
|
|
5.77 |
|
| |
14.5 |
|
|
|
|
|
|
|
14.6 |
|
|
|
13.8 |
|
| |
52.3 |
|
|
|
|
|
|
|
53.9 |
|
|
|
55.2 |
|
| |
0.92 |
|
|
|
|
|
|
|
0.90 |
|
|
|
0.81 |
|
| |
2.46 |
|
|
|
|
|
|
|
2.46 |
|
|
|
2.38 |
|
|
|
|
|
|
|
|
|
|
|
|
|
|
|
|
| |
11.1 |
|
|
|
|
|
|
|
11.5 |
|
|
|
11.0 |
|
| |
12.5 |
|
|
|
|
|
|
|
13.1 |
|
|
|
12.4 |
|
| |
14.3 |
|
|
|
|
|
|
|
14.9 |
|
|
|
14.6 |
|
| |
4.5 |
|
|
|
|
|
|
|
4.7 |
|
|
|
4.5 |
|
|
|
|
|
|
|
|
|
|
|
|
|
|
|
|
| |
70.65 |
|
|
|
|
|
|
|
83.28 |
|
|
|
72.08 |
|
| |
1,227 |
|
|
|
|
|
|
|
1,199 |
|
|
|
1,208 |
|
| |
3.28 |
|
|
|
|
|
|
|
3.05 |
|
|
|
2.88 |
|
| |
4.2 |
|
|
|
|
|
|
|
4.0 |
|
|
|
4.7 |
|
| |
10.2 |
|
|
|
|
|
|
|
12.7 |
|
|
|
12.4 |
|
| |
49.75 |
|
|
|
|
|
|
|
46.24 |
|
|
|
43.59 |
|
|
|
|
|
|
|
|
|
|
|
|
|
|
|
|
| |
945,683 |
|
|
|
|
|
|
|
912,619 |
|
|
|
913,844 |
|
| |
3,095 |
|
|
|
|
|
|
|
3,003 |
|
|
|
3,113 |
|
| |
97,021 |
|
|
|
|
|
|
|
87,761 |
|
|
|
88,901 |
|
| |
9,029 |
|
|
|
|
|
|
|
8,140 |
|
|
|
8,144 |
|
2025 Scotiabank Annual Report
|
Allowance for Credit Losses:
An allowance set aside which, in management’s opinion, is adequate to absorb credit-related losses on all financial assets and
off-balance
sheet exposures subject to impairment assessment. It includes allowances for performing financial assets and impaired financial assets.
Allowance for Credit Losses Ratio:
The ratio of period end total allowance for credit losses (excluding debt securities and deposits with financial institutions) divided by gross loans and acceptances.
Allowance for Impaired Loans Ratio:
The ratio of period end impaired allowance for credit losses (excluding debt securities and deposits with financial institutions) divided by gross loans and acceptances.
Allowance for Performing Loans Ratio:
The ratio of period end performing allowance for credit losses (excluding debt securities and deposits with financial institutions) divided by gross loans and acceptances.
Allowance against Impaired Loans as a % of Gross Impaired Loans:
The ratio of allowance against impaired loans to gross impaired loans.
Assets Under Administration (AUA):
Assets administered by the Bank which are beneficially owned by clients and therefore not reported on the Bank’s Consolidated Statement of Financial Position. Services provided for AUA are of an administrative nature, such as trusteeship, custodial, safekeeping, income collection and distribution, securities trade settlements, customer reporting, and other similar services.
Assets Under Management (AUM):
Assets managed by the Bank on a discretionary basis and in respect of which the Bank earns investment management fees. AUM are beneficially owned by clients and are therefore not reported on the Bank’s Consolidated Statement of Financial Position. Some AUM are also administered assets and are therefore included in assets under administration.
Bankers’ Acceptances (BAs):
Negotiable, short-term debt securities, guaranteed for a fee by the issuer’s bank.
A unit of measure defined as
one-hundredth
of one percent.
Book Value per Common Share:
Common shareholders’ equity divided by the number of outstanding common shares at the end of the period.
Canadian Overnight Repo Rate Average (CORRA):
CORRA measures the cost of overnight general collateral funding in Canadian dollars using Government of Canada treasury bills and bonds as collateral for repurchase transactions.
Common Equity Tier 1 (CET1), Tier 1 and Total Capital Ratios:
Under Basel III, there are three primary regulatory capital ratios used to assess capital adequacy, CET1, Tier 1 and Total capital ratios, which are determined by dividing those capital components by their respective risk-weighted assets.
CET1 consists primarily of common shareholders’ equity net of regulatory adjustments. These regulatory adjustments include goodwill, intangible assets net of deferred tax liabilities, deferred tax assets that rely on future profitability, defined-benefit pension fund net assets, shortfall of credit provision to expected losses and significant investments in common equity of other financial institutions.
Tier 1 includes CET1 and additional Tier 1 capital which consists primarily of qualifying
non-cumulative
preferred shares,
non-cumulative
subordinated additional Tier 1 capital notes and limited recourse capital notes. Tier 2 capital consists mainly of qualifying subordinated debentures and the eligible allowances for credit losses.
Total capital is comprised of CET1 capital, Tier 1 capital and Tier 2 capital.
Debt obligations of the Bank for which the payment of all amounts of interest and principal are unconditionally and irrevocably guaranteed by a limited partnership and secured by a pledge of the covered bond portfolio. The assets in the covered bond portfolio held by the limited partnership consist of first lien Canadian uninsured residential mortgages or first lien Canadian residential mortgages insured under CMHC Mortgage Insurance, respectively, and their related security interest.
Financial contracts whose value is derived from an underlying price, interest rate, exchange rate or price index. Forwards, options and swaps are all derivative instruments.
Dividends per common share divided by the average of the high and low share price in the relevant period.
The effective tax rate is the overall tax rate paid by the Bank on its earned income. The effective tax rate is calculated by dividing the Bank’s income tax expenses by the income before taxes.
The price that would be received to sell an asset or paid to transfer a liability in an orderly transaction between market participants in the principal, or in its absence, the most advantageous market to which the Bank has access at the measurement date.
Foreign Exchange Contracts:
Commitments to buy or sell a specified amount of foreign currency on a set date and at a predetermined rate of exchange.
Forward Rate Agreement (FRA):
A contract between two parties, whereby a designated interest rate, applied to a notional principal amount, is locked in for a specified period of time. The difference between the contracted rate and prevailing market rate is paid in cash on the settlement date. These agreements are used to protect against, or take advantage of, future interest rate movements.
Commitments to buy or sell designated amounts of commodities, securities or currencies on a specified date at a predetermined price. Futures are traded on recognized exchanges. Gains and losses on these contracts are settled daily, based on closing market prices.
Gross Impaired Loans as a % of Loans and Acceptances:
The ratio of gross impaired loans, debt investments and
off-balance
sheet exposures expressed as a percentage of loans and acceptances.
Protecting against price, interest rate or foreign exchange exposures by taking positions that are expected to react to market conditions in an offsetting manner.
Loans on which the Bank no longer has reasonable assurance as to the timely collection of interest and principal, or where a contractual payment is past due for a prescribed period or the customer is declared to be bankrupt.
The ratio of Basel III Tier 1 capital to a leverage exposure measure which includes
on-balance
sheet assets and
off-balance
sheet commitments, derivatives and securities financing transactions, as defined within the OSFI Leverage Requirements Guideline.
Liquidity Coverage Ratio (LCR):
The ratio of high quality liquid assets to stressed net cash outflows over a 30 calendar day time horizon, as defined within the OSFI Liquidity Adequacy Requirements Guideline.
The valuation of certain financial instruments at fair value as of the Consolidated Statement of Financial Position date.
Market Value to Book Value Multiple:
This financial valuation metric is calculated by dividing the current closing share price of the period by the book value per common share.
Net Impaired Loans as a % of Loans and Acceptances:
The ratio of net impaired loans, debt investments and
off-balance
sheet exposures expressed as a percentage of loans and acceptances.
Net interest margin is used to measure the return generated by the Bank’s core earning assets, net of the cost of funding. Net interest margin is calculated as core net interest income divided by average core earning assets.
Net Stable Funding Ratio (NSFR):
The ratio of available stable funding to required stable funding, as defined within the OSFI Liquidity Adequacy Requirements Guideline.
Net Write-offs as a % of Average Net Loans and Acceptances:
The ratio of net write-offs expressed as a percentage of average net loans and acceptances.
|
2025 Scotiabank Annual Report
Non-Viability
Contingent Capital (NVCC):
In order to qualify for inclusion in regulatory capital, all
non-common
Tier 1 and Tier 2 capital instruments must be capable of absorbing losses at the point of
non-viability
of a financial institution. This will ensure that investors in such instruments bear losses before taxpayers where the government determines that it is in the public interest to rescue a
non-viable
bank.
Notional Principal Amounts:
The contract or principal amounts used to determine payments for certain
off-balance
sheet instruments and derivatives, such as FRAs, interest rate swaps and cross-currency swaps. The amounts are termed “notional” because they are not usually exchanged themselves, serving only as the basis for calculating amounts that do change hands.
Off-Balance
Sheet Instruments:
These are indirect credit commitments, including undrawn commitments to extend credit and derivative instruments, which are not recorded on the Bank’s balance sheet under IFRS.
This financial metric measures the rate of growth in total revenue less the rate of growth in
non-interest
expenses.
Contracts between buyer and seller giving the buyer of the option the right, but not the obligation, to buy (call) or sell (put) a specified commodity, financial instrument or currency at a set price or rate on or before a specified future date.
The Office of the Superintendent of Financial Institutions Canada, the regulator of Canadian banks.
Price to Earnings Multiple (Trailing 4 Quarters):
Closing share price at period end divided by cumulative basic earnings per common share (EPS) of the past 4 quarters.
This ratio represents
non-interest
expenses as a percentage of total revenue. Management uses the productivity ratio as a measure of the Bank’s efficiency.
Provision for Credit Losses (PCL) as a % of Average Net Loans and Acceptances:
The ratio of PCL on loans, acceptances and
off-balance
sheet exposures expressed as a percentage of average net loans and acceptances.
Provision for Credit Losses (PCL) on Impaired Loans as a % of Average Net Loans and Acceptances:
PCL on impaired loans ratio is calculated using PCL on impaired loans, acceptances and
off-balance
sheet exposures as a percentage of average net loans and acceptances.
Repos is short for “obligations related to securities sold under repurchase agreements” – a short-term transaction where the Bank sells assets, normally government bonds, to a client and simultaneously agrees to repurchase them on a specified date and at a specified price. It is a form of short-term funding.
Net income expressed as a percentage of total average assets.
Net income attributable to common shareholders, expressed as a percentage of average common shareholders’ equity. The Bank attributes capital to its business lines on a basis that approximates 11.5% of Basel III common equity capital requirements which includes credit, market and operational risks and leverage inherent in each operating segment. Return on equity for the operating segments is calculated as a ratio of net income attributable to common shareholders of the operating segment and the capital attributed.
Return on Tangible Common Equity (ROTCE):
Return on Tangible Common Equity is calculated by dividing the net income attributable to common shareholders, adjusted for the amortization of intangibles (excluding software), by average tangible common equity. Tangible common equity is defined as common shareholders’ equity adjusted for goodwill and acquisition-related intangible assets (excluding software), net of deferred taxes.
Reverse repos is short for “securities purchased under resale agreements” – a short-term transaction where the Bank purchases assets, normally government bonds, from a client and simultaneously agrees to resell them on a specified date and at a specified price. It is a form of short-term collateralized lending.
Comprised of three broad categories including credit risk, market risk and operational risk, which are computed under the Basel III Framework in accordance with OSFI Guideline – Capital Adequacy Requirements (November 2023). Risk-weighted assets for credit risk are calculated using modelled parameters, formulas and risk-weight requirements as specified by the Basel III Framework. In addition, the Bank uses both internal models and standardized approaches to calculate market risk capital and standardized approaches for operational risk capital which are converted to risk-weighted assets.
The process by which financial assets (typically loans) are transferred to a trust, which normally issues a series of different classes of asset-backed securities to investors to fund the purchase of loans.
A structured entity is defined as an entity created to accomplish a narrow and well-defined objective. A structured entity may take the form of a corporation, trust, partnership or unincorporated entity. Structured entities are often created with legal arrangements that impose strict and sometimes permanent limits on the decision-making powers of their governing board, trustee or management over the operations of the entity.
Standby Letters of Credit and Letters of Guarantee:
Written undertakings by the Bank, at the request of the customer, to provide assurance of payment to a third-party regarding the customer’s obligations and liabilities to that third-party.
Structured Credit Instruments:
A wide range of financial products which includes Collateralized Debt Obligations, Collateralized Loan Obligations, Structured Investment Vehicles, and Asset-Backed Securities. These instruments represent investments in pools of credit-related assets, whose values are primarily dependent on the performance of the underlying pools.
Interest rate swaps are agreements to exchange streams of interest payments, typically one at a floating rate, the other at a fixed rate, over a specified period of time, based on notional principal amounts. Cross-currency swaps are agreements to exchange payments in different currencies over predetermined periods of time.
Taxable Equivalent Basis (TEB):
The Bank analyzes net interest income,
non-interest
income, and total revenue on a taxable equivalent basis (TEB). This methodology grosses up
tax-exempt
income earned on certain securities reported in either net interest income or
non-interest
income to an equivalent before tax basis. A corresponding increase is made to the provision for income taxes; hence, there is no impact on net income. Management believes that this basis for measurement provides a uniform comparability of net interest income and
non-interest
income arising from both taxable and
non-taxable
sources and facilitates a consistent basis of measurement. While other banks also use TEB, their methodology may not be comparable to the Bank’s methodology. For purposes of segmented reporting, a segment’s revenue and provision for income taxes are grossed up by the taxable equivalent amount. The elimination of the TEB
gross-up
is recorded in the Other segment.
Total Annual Shareholder Return (TSR):
Total annual shareholder return is calculated as the overall change in share price, plus any dividends paid during the year; this sum is then divided by the share price at the beginning of the year to arrive at the TSR. Total annual shareholder return assumes reinvestment of quarterly dividends.
Total Loss Absorbing Capacity (TLAC):
The aggregate of NVCC Tier 1 capital, NVCC Tier 2 capital, and other TLAC instruments that are subject to conversion in whole or in part into common shares under the CDIC Act and meet all of the eligibility criteria under the OSFI guideline – Total Loss Absorbing Capacity (September 2018).
Other TLAC Instruments include prescribed shares and liabilities that are subject to conversion into common shares pursuant to the CDIC Act and which meet all of the eligibility criteria set out in the Total Loss Absorbing Capacity (TLAC) Guidelines.
An estimate of the potential loss that might result from holding a position for a specified period of time, with a given level of statistical confidence.
A graph showing the term structure of interest rates, plotting the yields of similar quality bonds by term to maturity.
2025 Scotiabank Annual Report
|
Exposure at Default (EAD):
Generally represents the expected gross exposure – outstanding amount for
on-balance
sheet exposure and loan equivalent amount for
off-balance
sheet exposure at default.
Probability of Default (PD):
Measures the likelihood that a borrower will default within a
one-year
time horizon, expressed as a percentage.
Loss Given Default (LGD):
Measures the severity of loss on a facility in the event of a borrower’s default, expressed as a percentage of exposure at default.
Defined as a debt obligation of a corporation, partnership, or proprietorship.
Defined as a debt obligation of a bank or bank equivalent.
Defined as a debt obligation of a sovereign, central bank, multi development banks and public sector entities (PSEs) as defined in the OSFI Guideline – Capital Adequacy Requirements (November 2023).
On-balance
sheet investments in asset-backed securities, mortgage-backed securities, collateralized loan obligations and collateralized debt obligations,
off-balance
sheet liquidity lines to the Bank’s own sponsored and third-party conduits and credit enhancements.
Loans to individuals against residential property (four units or less).
Revolving personal lines of credit secured by residential real estate.
Qualifying Revolving Retail Exposures:
Credit cards and unsecured lines of credit for individuals.
All other personal loans.
Outstanding amounts for loans, leases, acceptances, deposits with banks and FVOCI debt securities.
Unutilized portion of authorized committed credit lines.
Reverse repurchase agreements (reverse repos) and repurchase agreements (repos), securities lending and borrowing.
derivatives contracts refers to financial instruments which are traded through a dealer network rather than through an exchange.
Direct credit substitutes, such as standby letters of credit and guarantees, trade letters of credit, and performance letters of credit and guarantees.
Exchange-Traded Derivative Contracts:
Exchange-traded derivative contracts are derivative contracts (e.g. futures contracts and options) that are transacted on an organized futures exchange. These include futures contracts (both long and short positions), purchased options and written options.
Qualifying Central Counterparty (QCCP):
A licensed central counterparty is considered “qualifying” when it is compliant with the International Organization of Securities Commissions (IOSCO) standards and is able to assist clearing member banks in properly capitalizing for CCP exposures.
Asset Value Correlation Multiplier (AVC):
Basel III has higher risk-weights on exposures to certain Financial Institutions (FIs) relative to the
non-financial
corporate sector by introducing an AVC. The correlation factor in the risk-weight formula is multiplied by this AVC factor of 1.25 for all exposures to regulated FIs whose total assets are greater than or equal to U.S. $150 billion and all exposures to unregulated FIs.
Specific
Wrong-Way
Risk (WWR):
Specific
Wrong-Way
Risk arises when the exposure to a particular counterparty is positively correlated with the probability of default of the counterparty due to the nature of the transactions with the counterparty.
Basel III Regulatory Capital Floor:
Since the introduction of Basel II in 2008, OSFI has prescribed a minimum regulatory capital floor for institutions that use the advanced internal ratings-based approach for credit risk. Effective Q2 2023, the capital floor
add-on
is determined under the Basel III Framework by comparing RWA generated for internally modelled standardized portfolios to RWA calculated under a fully standardized approach at the required capital floor calibration. A shortfall to the capital floor RWA requirement is added to the Bank’s RWA.
|
2025 Scotiabank Annual Report
Option pricing modelOption pricing modelInterest rate volatilityGeneral Partner valuations per net asset valueUST +2.734SOFR+2.90961%GOC +2.761UST +2.613GOC +3.95UST +4.389UST +4.017UST +2.903P5D
|
|
Consolidated
Financial Statements
|
Table of Contents
2025 Scotiabank Annual Report
|
Consolidated Financial Statements
MANAGEMENT’S RESPONSIBILITY FOR FINANCIAL INFORMATION
The management of The Bank of Nova Scotia (the Bank) is responsible for the integrity and fair presentation of the financial information contained in this Annual Report. The consolidated financial statements have been prepared in accordance with International Financial Reporting Standards (IFRS) as issued by the International Accounting Standards Board (IASB). The consolidated financial statements also comply with the accounting requirements of the Bank Act.
The consolidated financial statements, where necessary, include amounts which are based on the best estimates and judgment of management. Financial information presented elsewhere in this Annual Report is consistent with that shown in the consolidated financial statements.
Management has always recognized the importance of the Bank maintaining and reinforcing the highest possible standards of conduct in all of its actions, including the preparation and dissemination of statements fairly presenting the financial condition of the Bank. In this regard, management has developed and maintains a system of accounting and reporting which provides for the necessary internal controls to ensure that transactions are properly authorized and recorded, assets are safeguarded against unauthorized use or disposition, and liabilities are recognized. The system is augmented by written policies and procedures, the careful selection and training of qualified staff, the establishment of organizational structures providing an appropriate and well-defined division of responsibilities, and the communication of our Code throughout the Bank.
Management, under the supervision of and the participation of the President and Chief Executive Officer and the Group Head and Chief Financial Officer, have a process in place to evaluate disclosure controls and procedures and internal control over financial reporting in line with Canadian and U.S. securities regulations.
The system of internal controls is further supported by a professional staff of internal auditors who conduct periodic audits of all aspects of the Bank’s operations. As well, the Bank’s Chief Auditor has full and free access to, and meets periodically with the Audit and Conduct Review Committee of the Board of Directors. In addition, the Bank’s compliance function maintains policies, procedures and programs directed at ensuring compliance with regulatory requirements, including conflict of interest rules.
The Office of the Superintendent of Financial Institutions Canada, which is mandated to protect the rights and interests of the depositors and creditors of the Bank, examines and enquires into the business and affairs of the Bank, as deemed necessary, to determine whether the provisions of the Bank Act are being complied with, and that the Bank is in a sound financial condition.
The Audit and Conduct Review Committee, composed entirely of outside directors, reviews the consolidated financial statements with both management and the independent auditors before such statements are approved by the Board of Directors and submitted to the shareholders of the Bank.
The Audit and Conduct Review Committee reviews and reports its findings to the Board of Directors on all related party transactions that may have a material impact on the Bank.
KPMG LLP, the independent auditors appointed by the shareholders of the Bank, have audited the consolidated financial position of the Bank as at October 31, 2025 and October 31, 2024 and its consolidated financial performance and its consolidated cash flows for each of the years in the
two-year
period ended October 31, 2025 prepared in accordance with IFRS as issued by the International Accounting Standards Board (IASB) in accordance with Canadian generally accepted auditing standards and the standards of the Public Company Accounting Oversight Board (United States) and the effectiveness of internal control over financial reporting and have expressed their opinions upon completion of such audits in the reports to the shareholders. The Shareholders’ Auditors have full and free access to, and meet periodically with, the Audit and Conduct Review Committee to discuss their audits, including any findings as to the integrity of the Bank’s accounting, financial reporting and related matters.
Scott Thomson
President and Chief Executive Officer
Raj Viswanathan
Group Head and Chief Financial Officer
Toronto, Canada
December 2, 2025
|
2025 Scotiabank Annual Report
(This page intentionally left blank)
2025 Scotiabank Annual Report
|
(This page intentionally left blank)
|
2025 Scotiabank Annual Report
(This page intentionally left blank)
2025 Scotiabank Annual Report
|
Consolidated Financial Statements
REPORT OF INDEPENDENT REGISTERED PUBLIC ACCOUNTING FIRM
To the Shareholders and Board of Directors of The Bank of Nova Scotia
Opinion on the Consolidated Financial Statements
We have audited the accompanying consolidated statements of financial position of The Bank of Nova Scotia (the Bank) as of October 31, 2025 and 2024, the related consolidated statements of income, comprehensive income, changes in equity and cash flows for the years then ended, and the related notes (collectively, the consolidated financial statements). In our opinion, the consolidated financial statements present fairly, in all material respects, the financial position of the Bank as of October 31, 2025 and 2024, and its financial performance and its cash flows for the years then ended, in conformity with International Financial Reporting Standards (IFRS) as issued by the International Accounting Standards Board (IASB).
We also have audited, in accordance with the standards of the Public Company Accounting Oversight Board (United States) (PCAOB), the Bank’s internal control over financial reporting as of October 31, 2025, based on criteria established in
Internal Control – Integrated Framework (2013)
issued by the Committee of Sponsoring Organizations of the Treadway Commission, and our report dated December 2, 2025 expressed an unqualified opinion on the effectiveness of the Bank’s internal control over financial reporting.
These consolidated financial statements are the responsibility of the Bank’s management. Our responsibility is to express an opinion on these consolidated financial statements based on our audits. We are a public accounting firm registered with the PCAOB and are required to be independent with respect to the Bank in accordance with the U.S. federal securities laws and the applicable rules and regulations of the Securities and Exchange Commission and the PCAOB.
We conducted our audits in accordance with the standards of the PCAOB. Those standards require that we plan and perform the audit to obtain reasonable assurance about whether the consolidated financial statements are free of material misstatement, whether due to error or fraud. Our audits included performing procedures to assess the risks of material misstatement of the consolidated financial statements, whether due to error or fraud, and performing procedures that respond to those risks. Such procedures included examining, on a test basis, evidence regarding the amounts and disclosures in the consolidated financial statements.
Our audits also included evaluating the accounting principles used and significant estimates made by management, as well as evaluating the overall presentation of the consolidated financial statements. We believe that our audits provide a reasonable basis for our opinion.
The critical audit matters communicated below are matters arising from the current period audit of the consolidated financial statements that were communicated or required to be communicated to the Audit and Conduct Review Committee and that: (1) relate to accounts or disclosures that are material to the consolidated financial statements and (2) involved our especially challenging, subjective, or complex judgments. The communication of critical audit matters does not alter in any way our opinion on the consolidated financial statements, taken as a whole, and we are not, by communicating the critical audit matters below, providing separate opinions on the critical audit matters or on the accounts or disclosures to which they relate.
(i) Assessment of Allowance for Credit Losses (ACL)
Refer to Notes 3 and 12 to the consolidated financial statements.
The Bank’s ACL on loans was $7,463 million as at October 31, 2025. The Bank applies a three-stage approach to measure the ACL, using an expected credit loss (ECL) approach as required under IFRS 9 Financial Instruments. The Bank’s ACL calculations are outputs of a set of complex models. The ACL calculations reflect unbiased probability-weighted outcomes that consider multiple scenarios based on reasonable and supportable forecasts. The probability of default (PD), loss given default (LGD) and exposure at default (EAD) inputs used to estimate ECL are modeled based on historical default and loss experience, and macroeconomic variables that are closely related with credit losses in the relevant portfolio. The Bank assesses whether there has been a significant increase in credit risk since origination or where the financial asset is in default. If there has been a significant increase in credit risk or the financial asset is in default, then lifetime ACL is recorded; otherwise, an ACL equal to
12-month
expected credit losses is recorded. The estimation of ECL for each stage and the assessment of significant increases in credit risk consider information about past events and current conditions, as well as forecasts of future events and economic conditions. The estimation and application of forward-looking information requires significant judgment. Qualitative adjustments or overlays may also be recorded as temporary adjustments using expert credit judgment where the inputs, assumptions and/or models do not capture all relevant risk factors. The use of management overlays requires significant judgment that may impact the amount of ACL recognized.
We identified the assessment of the ACL as a critical audit matter. Significant auditor judgment was required because there was a high degree of measurement uncertainty due to the significant management judgments inherent in certain of the Bank’s key modeled inputs and methodologies. These management judgments impact certain inputs, assumptions, qualitative adjustments or overlays, and the determination of when there has been a significant increase in credit risk. The assessment of the ACL also required significant auditor attention and complex auditor judgment to apply and evaluate the results of audit procedures. Further, specialized skills and knowledge, including experience in the industry, were required to apply audit procedures and evaluate the results of those procedures.
The following are the primary procedures we performed to address this critical audit matter. With the assistance of our credit risk and economics professionals with specialized skills, industry knowledge and relevant experience, we evaluated the design and tested the operating effectiveness of certain internal controls related to the Bank’s ACL process. These included internal controls related to: (1) initial and periodic validation and performance monitoring of models used to derive key modeled inputs into the ACL calculations being PD, LGD and EAD; (2) benchmarking of certain macroeconomic variables, model validation associated with the derivation of the remaining variables and the alternative scenarios and review of probability weights used in the ACL models; (3) the methodology used to determine whether there has been a significant increase in credit risk; and (4) the methodology and assumptions used in the determination of qualitative adjustments or overlays. Additionally, for non-retail loans, we tested certain internal controls related to loan reviews over the determination of loan risk grades. We involved credit risk and economics professionals with specialized skills, industry knowledge and relevant experience who assisted in: (1) evaluating the methodology and models used to derive key modeled inputs into the ACL calculations being PD, LGD and EAD and the determination of whether there has been a significant increase in credit risk; (2) assessing the appropriateness of certain underlying macroeconomic variables against external economic data, evaluating the models used to derive other macroeconomic variables and evaluating the assumptions associated with the alternative economic scenarios and the related probabilities; and (3) assessing the qualitative adjustments or overlays by applying our knowledge of the industry and credit judgment to evaluate the appropriateness of the Bank’s underlying methodology and assumptions.
|
2025 Scotiabank Annual Report
Consolidated Financial Statements
Additionally, for a selection of non-retail loans, we evaluated the Bank’s assigned loan risk grades against the Bank’s borrower risk rating methodology.
(ii) Assessment of the Measurement of Fair Value of Certain Financial Instruments
Refer to Notes 3 and 6 to the consolidated financial statements.
The Bank measures certain financial assets and financial liabilities at fair value on a recurring basis. Where such financial instruments trade in inactive markets or when using internal models where observable parameters do not exist, significant management judgment is required in the selection of valuation techniques and model inputs. The valuation techniques used in determining the fair value of financial instruments include internal models and net asset valuations. The significant unobservable inputs used in the Bank’s valuation techniques include general partner valuations per net asset values (NAVs), interest rate volatility, equity volatility and equity correlation.
We identified the assessment of the measurement of fair value for certain financial instruments as a critical audit matter. Significant auditor judgment was required because there was a high degree of measurement uncertainty due to significant judgments inherent in the Bank’s valuation techniques and significant unobservable inputs used to develop the fair value of certain financial assets and financial liabilities. The assessment of the fair value also required significant auditor attention and complex auditor judgment to apply and evaluate the results of audit procedures. Further, specialized skills and knowledge, including experience in the industry, were required to apply audit procedures and evaluate the results of those procedures.
The following are the primary procedures we performed to address this critical audit matter. We evaluated the design and tested the operating effectiveness of certain internal controls related to the Bank’s processes to determine the fair value of certain financial instruments with the assistance of valuation and information technology professionals with specialized skills, industry knowledge and relevant experience. These included internal controls related to: (1) model validation at inception and periodically; (2) management’s review of NAVs; (3) independent price verification, including assessment of rate sources; and (4) segregation of duties and access controls. With the assistance of valuation professionals with specialized skills, industry knowledge and relevant experience, we tested the fair value of a selection of certain financial instruments. Depending on the nature of the financial instruments, we did this by comparing the NAVs to external information or by developing an independent estimate of fair value and comparing it to the fair value determined by the Bank.
(iii) Assessment of Uncertain Tax Provisions
Refer to Notes 3 and 26 to the consolidated financial statements.
The Bank maintains provisions for uncertain tax positions that it believes appropriately reflect the risk of tax positions under discussion, audit, dispute, or appeal with tax authorities, or which are otherwise considered to involve uncertainty. These provisions are made using the Bank’s best estimate of the amount expected to be paid based on an assessment of all relevant factors, which are reviewed at the end of each reporting period.
We identified the assessment of some uncertain tax provisions as a critical audit matter. Significant auditor judgment was required because there was a high degree of measurement uncertainty due to the significant judgments inherent in the Bank’s interpretation of tax legislation and its best estimate of the ultimate resolution of tax positions. This required significant auditor attention and complex auditor judgment to evaluate the results of audit procedures. Further, specialized skills, industry knowledge, and relevant experience were required to apply audit procedures and evaluate the results of those procedures.
The following are the primary procedures we performed to address this critical audit matter. We evaluated the design and tested the operating effectiveness of certain internal controls related to the Bank’s income tax uncertainties process with the assistance of taxation professionals with specialized skills, industry knowledge and relevant experience. These included internal controls related to: (1) the interpretation of tax legislation and the evaluation of the technical merits of tax positions; and (2) the determination of the best estimate of the provision required for these tax uncertainties. We involved tax professionals with specialized skills and knowledge, who assisted in: (1) evaluating the Bank’s interpretations of tax legislation based on our knowledge and experience; (2) reading and evaluating advice obtained by the Bank from external counsel, and considering its impact on the measurement, if applicable, of the uncertain tax provisions; and (3) inspecting correspondence with applicable taxation authorities.
Chartered Professional Accountants, Licensed Public Accountants
We have served as the Bank’s auditor since 2006 and as joint auditor for 14 years prior to that.
2025 Scotiabank Annual Report
|
Consolidated Financial Statements
REPORT OF INDEPENDENT REGISTERED PUBLIC ACCOUNTING FIRM
To the Shareholders and Board of Directors of The Bank of Nova Scotia
Opinion on Internal Control Over Financial Reporting
We have audited The Bank of Nova Scotia’s (the Bank) internal control over financial reporting as of October 31, 2025, based on criteria established in
Internal Control – Integrated Framework (2013)
issued by the Committee of Sponsoring Organizations of the Treadway Commission. In our opinion, the Bank maintained, in all material respects, effective internal control over financial reporting as of October 31, 2025, based on criteria established in
Internal Control – Integrated Framework (2013)
issued by the Committee of Sponsoring Organizations of the Treadway Commission.
We also have audited, in accordance with the standards of the Public Company Accounting Oversight Board (United States) (PCAOB), the consolidated statements of financial position of the Bank as of October 31, 2025, and 2024, the related consolidated statements of income, comprehensive income, changes in equity and cash flows for the years then ended, and the related notes (collectively, the consolidated financial statements), and our report dated December 2, 2025 expressed an unqualified opinion on those consolidated financial statements.
The Bank’s management is responsible for maintaining effective internal control over financial reporting and for its assessment of the effectiveness of internal control over financial reporting, included in the Controls and Accounting Policies section of Management’s Discussion and Analysis under the heading “Internal control over financial reporting”. Our responsibility is to express an opinion on the Bank’s internal control over financial reporting based on our audit. We are a public accounting firm registered with the PCAOB and are required to be independent with respect to the Bank in accordance with the U.S. federal securities laws and the applicable rules and regulations of the Securities and Exchange Commission and the PCAOB.
We conducted our audit in accordance with the standards of the PCAOB. Those standards require that we plan and perform the audit to obtain reasonable assurance about whether effective internal control over financial reporting was maintained in all material respects. Our audit of internal control over financial reporting included obtaining an understanding of internal control over financial reporting, assessing the risk that a material weakness exists, and testing and evaluating the design and operating effectiveness of internal control based on the assessed risk. Our audit also included performing such other procedures as we considered necessary in the circumstances. We believe that our audit provides a reasonable basis for our opinion.
Definition and Limitations of Internal Control Over Financial Reporting
A company’s internal control over financial reporting is a process designed to provide reasonable assurance regarding the reliability of financial reporting and the preparation of financial statements for external purposes in accordance with generally accepted accounting principles. A company’s internal control over financial reporting includes those policies and procedures that (1) pertain to the maintenance of records that, in reasonable detail, accurately and fairly reflect the transactions and dispositions of the assets of the company; (2) provide reasonable assurance that transactions are recorded as necessary to permit preparation of financial statements in accordance with generally accepted accounting principles, and that receipts and expenditures of the company are being made only in accordance with authorizations of management and directors of the company; and (3) provide reasonable assurance regarding prevention or timely detection of unauthorized acquisition, use, or disposition of the company’s assets that could have a material effect on the financial statements.
Because of its inherent limitations, internal control over financial reporting may not prevent or detect misstatements. Also, projections of any evaluation of effectiveness to future periods are subject to the risk that controls may become inadequate because of changes in conditions, or that the degree of compliance with the policies or procedures may deteriorate.
Chartered Professional Accountants, Licensed Public Accountants
|
2025 Scotiabank Annual Report
Consolidated Financial Statements
|
|
|
|
|
|
|
|
|
|
|
|
|
Consolidated Statement of Financial Position
|
|
|
|
|
|
|
|
|
|
| As at October 31 ($ millions) |
|
Note |
|
|
|
|
|
2024 |
|
|
|
|
|
|
|
|
|
|
|
|
|
|
Cash and deposits with financial institutions |
|
|
5 |
|
|
|
|
|
|
$ |
63,860 |
|
Precious metals |
|
|
|
|
|
|
|
|
|
|
2,540 |
|
Trading assets |
|
|
|
|
|
|
|
|
|
|
|
|
Securities |
|
|
7 |
(a) |
|
|
|
|
|
|
119,912 |
|
Loans |
|
|
7 |
(b) |
|
|
|
|
|
|
7,649 |
|
Other |
|
|
|
|
|
|
|
|
|
|
2,166 |
|
|
|
|
|
|
|
|
|
|
|
|
129,727 |
|
Securities purchased under resale agreements and securities borrowed |
|
|
|
|
|
|
|
|
|
|
200,543 |
|
Derivative financial instruments |
|
|
9 |
|
|
|
|
|
|
|
44,379 |
|
Investment securities |
|
|
11 |
|
|
|
|
|
|
|
152,832 |
|
Loans |
|
|
|
|
|
|
|
|
|
|
|
|
Residential mortgages |
|
|
12 |
|
|
|
|
|
|
|
350,941 |
|
Personal loans |
|
|
12 |
|
|
|
|
|
|
|
106,379 |
|
Credit cards |
|
|
12 |
|
|
|
|
|
|
|
17,374 |
|
Business and government |
|
|
12 |
|
|
|
|
|
|
|
292,671 |
|
|
|
|
|
|
|
|
|
|
|
|
767,365 |
|
Allowance for credit losses |
|
|
12 |
(e) |
|
|
|
|
|
|
6,536 |
|
|
|
|
|
|
|
|
|
|
|
|
760,829 |
|
Other |
|
|
|
|
|
|
|
|
|
|
|
|
Customers’ liability under acceptances, net of allowance |
|
|
|
|
|
|
|
|
|
|
148 |
|
Property and equipment |
|
|
15 |
|
|
|
|
|
|
|
5,252 |
|
Investments in associates |
|
|
16 |
|
|
|
|
|
|
|
1,821 |
|
Goodwill and other intangible assets |
|
|
17 |
|
|
|
|
|
|
|
16,853 |
|
Deferred tax assets |
|
|
26 |
(c) |
|
|
|
|
|
|
2,942 |
|
Other assets |
|
|
18 |
|
|
|
|
|
|
|
30,301 |
|
|
|
|
|
|
|
|
|
|
|
|
57,317 |
|
|
|
|
|
|
|
|
|
|
|
$ |
1,412,027 |
|
|
|
|
|
|
|
|
|
|
|
|
|
|
Deposits |
|
|
|
|
|
|
|
|
|
|
|
|
Personal |
|
|
19 |
|
|
|
|
|
|
$ |
298,821 |
|
Business and government |
|
|
19 |
|
|
|
|
|
|
|
600,114 |
|
Financial institutions |
|
|
19 |
|
|
|
|
|
|
|
44,914 |
|
|
|
|
|
|
|
|
|
|
|
|
943,849 |
|
Financial instruments designated at fair value through profit or loss |
|
|
8 |
|
|
|
|
|
|
|
36,341 |
|
Other |
|
|
|
|
|
|
|
|
|
|
|
|
Acceptances |
|
|
|
|
|
|
|
|
|
|
149 |
|
Obligations related to securities sold short |
|
|
|
|
|
|
|
|
|
|
35,042 |
|
Derivative financial instruments |
|
|
9 |
|
|
|
|
|
|
|
51,260 |
|
Obligations related to securities sold under repurchase agreements and securities lent |
|
|
|
|
|
|
|
|
|
|
190,449 |
|
Subordinated debentures |
|
|
20 |
|
|
|
|
|
|
|
7,833 |
|
Other liabilities |
|
|
21 |
|
|
|
|
|
|
|
63,028 |
|
|
|
|
|
|
|
|
|
|
|
|
347,761 |
|
|
|
|
|
|
|
|
|
|
|
|
1,327,951 |
|
|
|
|
|
|
|
|
|
|
|
|
|
|
Common equity |
|
|
|
|
|
|
|
|
|
|
|
|
Common shares |
|
|
23 |
(a) |
|
|
|
|
|
|
22,054 |
|
Retained earnings |
|
|
|
|
|
|
|
|
|
|
57,751 |
|
Accumulated other comprehensive income (loss) |
|
|
|
|
|
|
|
|
|
|
(6,147 |
) |
Other reserves |
|
|
|
|
|
|
|
|
|
|
(68 |
) |
Total common equity |
|
|
|
|
|
|
|
|
|
|
73,590 |
|
Preferred shares and other equity instruments |
|
|
23 |
(b) |
|
|
|
|
|
|
8,779 |
|
Total equity attributable to equity holders of the Bank |
|
|
|
|
|
|
|
|
|
|
82,369 |
|
Non-controlling interests in subsidiaries |
|
|
30 |
(b) |
|
|
|
|
|
|
1,707 |
|
|
|
|
|
|
|
|
|
|
|
|
84,076 |
|
|
|
|
|
|
|
|
|
|
|
$ |
1,412,027 |
|
|
|
|
|
|
Aaron W. Regent |
|
Scott Thomson |
|
|
| Chair of the Board |
|
President and Chief Executive Officer |
|
|
The accompanying notes are an integral part of these consolidated financial statements.
2025 Scotiabank Annual Report
|
Consolidated Financial Statements
Consolidated Statement of Income
|
|
|
|
|
|
|
|
|
|
|
|
|
| For the year ended October 31 ($ millions) |
|
|
|
|
|
|
|
2024 |
|
|
|
|
|
|
|
|
|
|
|
|
|
|
|
|
|
31 |
|
|
|
|
|
|
|
|
|
Loans |
|
|
|
|
|
$ |
44,293 |
|
|
$ |
47,811 |
|
Securities |
|
|
|
|
|
|
7,941 |
|
|
|
9,160 |
|
Securities purchased under resale agreements and securities borrowed |
|
|
|
|
|
|
2,808 |
|
|
|
1,602 |
|
Deposits with financial institutions |
|
|
|
|
|
|
2,560 |
|
|
|
3,086 |
|
|
|
|
|
|
|
|
57,602 |
|
|
|
61,659 |
|
Interest expense |
|
|
31 |
|
|
|
|
|
|
|
|
|
Deposits |
|
|
|
|
|
|
33,425 |
|
|
|
39,480 |
|
Subordinated debentures |
|
|
|
|
|
|
385 |
|
|
|
490 |
|
Other |
|
|
|
|
|
|
2,270 |
|
|
|
2,437 |
|
|
|
|
|
|
|
|
36,080 |
|
|
|
42,407 |
|
Net interest income |
|
|
|
|
|
|
21,522 |
|
|
|
19,252 |
|
|
|
|
|
|
|
|
|
|
|
|
|
|
Card revenues |
|
|
|
|
|
|
892 |
|
|
|
869 |
|
Banking services fees |
|
|
|
|
|
|
1,997 |
|
|
|
1,955 |
|
Credit fees |
|
|
|
|
|
|
1,249 |
|
|
|
1,585 |
|
Mutual funds |
|
|
|
|
|
|
2,564 |
|
|
|
2,282 |
|
Brokerage fees |
|
|
|
|
|
|
1,436 |
|
|
|
1,251 |
|
Investment management and trust |
|
|
|
|
|
|
1,162 |
|
|
|
1,096 |
|
Underwriting and advisory fees |
|
|
|
|
|
|
964 |
|
|
|
702 |
|
Non-trading foreign exchange |
|
|
|
|
|
|
948 |
|
|
|
930 |
|
Trading revenues |
|
|
|
|
|
|
1,984 |
|
|
|
1,634 |
|
Net gain on sale of investment securities |
|
|
11 |
(e) |
|
|
71 |
|
|
|
48 |
|
Net income from investments in associated corporations |
|
|
16 |
|
|
|
608 |
|
|
|
198 |
|
Insurance service results |
|
|
|
|
|
|
485 |
|
|
|
470 |
|
Other fees and commissions |
|
|
|
|
|
|
1,653 |
|
|
|
1,247 |
|
Other |
|
|
|
|
|
|
206 |
|
|
|
151 |
|
|
|
|
|
|
|
|
16,219 |
|
|
|
14,418 |
|
Total revenue |
|
|
|
|
|
|
37,741 |
|
|
|
33,670 |
|
Provision for credit losses |
|
|
12 |
(e) |
|
|
4,714 |
|
|
|
4,051 |
|
|
|
|
|
|
|
|
33,027 |
|
|
|
29,619 |
|
|
|
|
|
|
|
|
|
|
|
|
|
|
Salaries and employee benefits |
|
|
|
|
|
|
10,824 |
|
|
|
9,855 |
|
Premises and technology |
|
|
|
|
|
|
3,297 |
|
|
|
2,896 |
|
Depreciation and amortization |
|
|
|
|
|
|
1,604 |
|
|
|
1,760 |
|
Communications |
|
|
|
|
|
|
384 |
|
|
|
381 |
|
Advertising and business development |
|
|
|
|
|
|
672 |
|
|
|
614 |
|
Professional |
|
|
|
|
|
|
880 |
|
|
|
793 |
|
Business and capital taxes |
|
|
|
|
|
|
708 |
|
|
|
682 |
|
Other |
|
|
|
|
|
|
4,149 |
|
|
|
2,714 |
|
|
|
|
|
|
|
|
22,518 |
|
|
|
19,695 |
|
Income before taxes |
|
|
|
|
|
|
10,509 |
|
|
|
9,924 |
|
Income tax expense |
|
|
26 |
|
|
|
2,751 |
|
|
|
2,032 |
|
Net income |
|
|
|
|
|
$ |
7,758 |
|
|
$ |
7,892 |
|
Net income attributable to non-controlling interests in subsidiaries |
|
|
30 |
(b) |
|
|
(31 |
) |
|
|
134 |
|
Net income attributable to equity holders of the Bank |
|
|
|
|
|
$ |
7,789 |
|
|
$ |
7,758 |
|
Preferred shareholders and other equity instrument holders |
|
|
|
|
|
|
506 |
|
|
|
472 |
|
Common shareholders |
|
|
|
|
|
$ |
7,283 |
|
|
$ |
7,286 |
|
Earnings per common share (in dollars) |
|
|
|
|
|
|
|
|
|
|
|
|
Basic |
|
|
32 |
|
|
$ |
5.84 |
|
|
$ |
5.94 |
|
Diluted |
|
|
32 |
|
|
|
5.67 |
|
|
|
5.87 |
|
Dividends paid per common share (in dollars) |
|
|
23 |
(a) |
|
|
4.32 |
|
|
|
4.24 |
|
| (1) |
Includes interest income on financial assets measured at amortized cost and FVOCI, calculated using the effective interest method, of $ 56,404 for the year ended October 31, 2025 (October 31, 2024 – $59,871). |
The accompanying notes are an integral part of these consolidated financial statements.
148
|
2025 Scotiabank Annual Report
Consolidated Financial Statements
Consolidated Statement of Comprehensive Income
|
|
|
|
|
|
|
|
|
| For the year ended October 31 ($ millions) |
|
|
|
|
2024 |
|
Net income |
|
|
|
|
|
$ |
7,892 |
|
Other comprehensive income (loss) |
|
|
|
|
|
|
|
|
Items that will be reclassified subsequently to net income |
|
|
|
|
|
|
|
|
Net change in unrealized foreign currency translation gains (losses): |
|
|
|
|
|
|
|
|
Net unrealized foreign currency translation gains (losses) |
|
|
|
|
|
|
(2,511 |
) |
Net gains (losses) on hedges of net investments in foreign operations |
|
|
|
|
|
|
886 |
|
Income tax expense (benefit): |
|
|
|
|
|
|
|
|
Net unrealized foreign currency translation gains (losses) |
|
|
|
|
|
|
2 |
|
Net gains (losses) on hedges of net investments in foreign operations |
|
|
|
|
|
|
238 |
|
|
|
|
|
|
|
|
(1,865 |
) |
Net change in fair value due to change in debt instruments measured at fair value through
other comprehensive income: |
|
|
|
|
|
|
|
|
Net gains (losses) in fair value |
|
|
|
|
|
|
2,977 |
|
Reclassification of net (gains) losses to net income |
|
|
|
|
|
|
(2,126 |
) |
Income tax expense (benefit): |
|
|
|
|
|
|
|
|
Net gains (losses) in fair value |
|
|
|
|
|
|
806 |
|
Reclassification of net (gains) losses to net income |
|
|
|
|
|
|
(567 |
) |
|
|
|
|
|
|
|
612 |
|
Net change in gains (losses) on derivative instruments designated as cash flow hedges: |
|
|
|
|
|
|
|
|
Net gains (losses) on derivative instruments designated as cash flow hedges |
|
|
|
|
|
|
5,195 |
|
Reclassification of net (gains) losses to net income |
|
|
|
|
|
|
(2,000 |
) |
Income tax expense (benefit): |
|
|
|
|
|
|
|
|
Net gains (losses) on derivative instruments designated as cash flow hedges |
|
|
|
|
|
|
1,363 |
|
Reclassification of net (gains) losses to net income |
|
|
|
|
|
|
(511 |
) |
|
|
|
|
|
|
|
2,343 |
|
Net changes in finance income/(expense) from insurance contracts: |
|
|
|
|
|
|
|
|
Net finance income/(expense) from insurance contracts |
|
|
|
|
|
|
2 |
|
Income tax expense (benefit) |
|
|
|
|
|
|
1 |
|
|
|
|
|
|
|
|
1 |
|
Other comprehensive income (loss) from investments in associates |
|
|
|
|
|
|
(1 |
) |
Items that will not be reclassified subsequently to net income |
|
|
|
|
|
|
|
|
Net change in remeasurement of employee benefit plan asset and liability: |
|
|
|
|
|
|
|
|
Actuarial gains (losses) on employee benefit plans |
|
|
|
|
|
|
(195 |
) |
Income tax expense (benefit) |
|
|
|
|
|
|
(59 |
) |
|
|
|
|
|
|
|
(136 |
) |
Net change in fair value due to change in equity instruments designated at fair value through
other comprehensive income: |
|
|
|
|
|
|
|
|
Net gains (losses) in fair value |
|
|
|
|
|
|
444 |
|
Income tax expense (benefit) |
|
|
|
|
|
|
106 |
|
|
|
|
|
|
|
|
338 |
|
Net change in fair value due to change in own credit risk on financial liabilities designated
under the fair value option: |
|
|
|
|
|
|
|
|
Change in fair value due to change in own credit risk on financial liabilities designated under the fair value option |
|
|
|
|
|
|
(804 |
) |
Income tax expense (benefit) |
|
|
|
|
|
|
(223 |
) |
|
|
|
|
|
|
|
(581 |
) |
Other comprehensive income (loss) from investments in associates |
|
|
|
|
|
|
1 |
|
Other comprehensive income (loss) |
|
|
|
|
|
|
712 |
|
Comprehensive income |
|
|
|
|
|
$ |
8,604 |
|
Comprehensive income (loss) attributable to non-controlling interests |
|
|
|
|
|
|
62 |
|
Comprehensive income attributable to equity holders of the Bank |
|
|
|
|
|
$ |
8,542 |
|
Preferred shareholders and other equity instrument holders |
|
|
|
|
|
|
472 |
|
Common shareholders |
|
|
|
|
|
$ |
8,070 |
|
The accompanying notes are an integral part of these consolidated financial statements.
2025 Scotiabank Annual Report
|
Consolidated Financial Statements
Consolidated Statement of Changes in Equity
|
|
|
|
|
|
|
|
|
|
|
|
|
|
|
|
|
|
|
|
|
|
|
|
|
|
|
|
|
|
|
|
|
|
|
|
|
|
|
|
|
|
|
|
|
|
|
|
|
|
|
|
|
| |
|
For the year ended October 31, 2025 |
|
| |
|
|
|
|
|
|
|
Accumulated other comprehensive income (loss) |
|
|
|
|
|
|
|
|
|
|
|
|
|
|
|
|
|
|
|
| ($ millions) |
|
Common
shares
(Note 23) |
|
|
|
|
|
Foreign
currency
translation |
|
|
Debt
instruments
FVOCI |
|
|
Equity
instruments
FVOCI |
|
|
Cash flow
hedges |
|
|
|
|
|
Other
reserves |
|
|
Total
common
equity |
|
|
Preferred
shares and
other equity
instruments
(Note 23) |
|
|
Total attributable
to equity
holders |
|
|
Non-
controlling
interests in
subsidiaries
(Note 30(b)) |
|
|
Total |
|
| Balance as at October 31, 2024 |
|
|
|
|
|
|
|
|
|
|
|
|
|
|
|
|
|
|
|
|
|
|
|
|
|
|
|
|
|
|
|
|
|
|
|
|
|
|
|
|
|
|
|
|
|
|
|
|
|
|
|
|
| Net income |
|
|
|
|
|
|
|
|
|
|
|
|
|
|
|
|
|
|
|
|
|
|
|
|
|
|
|
|
|
|
|
|
|
|
|
|
|
|
|
|
|
|
|
|
|
|
|
|
|
|
|
|
| Other comprehensive income (loss) |
|
|
|
|
|
|
|
|
|
|
|
|
|
|
|
|
|
|
|
|
|
|
|
|
|
|
|
|
|
|
|
|
|
|
|
|
|
|
|
|
|
|
|
|
|
|
|
|
|
|
|
|
| Total comprehensive income |
|
|
|
|
|
|
|
|
|
|
|
|
|
|
|
|
|
|
|
|
|
|
|
|
|
|
|
|
|
|
|
|
|
|
|
|
|
|
|
|
|
|
|
|
|
|
|
|
|
|
|
|
| Shares/instruments issued |
|
|
|
|
|
|
|
|
|
|
|
|
|
|
|
|
|
|
|
|
|
|
|
|
|
|
|
|
|
|
|
|
|
|
|
|
|
|
|
|
|
|
|
|
|
|
|
|
|
|
|
|
| Shares repurchased/redeemed |
|
|
|
|
|
|
|
|
|
|
|
|
|
|
|
|
|
|
|
|
|
|
|
|
|
|
|
|
|
|
|
|
|
|
|
|
|
|
|
|
|
|
|
|
|
|
|
|
|
|
|
|
| Dividends and distributions paid to equity holders |
|
|
|
|
|
|
|
|
|
|
|
|
|
|
|
|
|
|
|
|
|
|
|
|
|
|
|
|
|
|
|
|
|
|
|
|
|
|
|
|
|
|
|
|
|
|
|
|
|
|
|
|
| |
|
|
|
|
|
|
|
|
|
|
|
|
|
|
|
|
|
|
|
|
|
|
|
|
|
|
|
|
|
|
|
|
|
|
|
|
|
|
|
|
|
|
|
|
|
|
|
|
|
|
|
|
| Foreign currency loss on redemption of Subordinated Additional Tier 1 |
|
|
|
|
|
|
|
|
|
|
|
|
|
|
|
|
|
|
|
|
|
|
|
|
|
|
|
|
|
|
|
|
|
|
|
|
|
|
|
|
|
|
|
|
|
|
|
|
|
|
|
|
| |
|
|
|
|
|
|
|
|
|
|
|
|
|
|
|
|
|
|
|
|
|
|
|
|
|
|
|
|
|
|
|
|
|
|
|
|
|
|
|
|
|
|
|
|
|
|
|
|
|
|
|
|
| Other |
|
|
|
|
|
|
|
|
|
|
|
|
|
|
|
|
|
|
|
|
|
|
|
|
|
|
|
|
|
|
|
|
|
|
|
|
|
|
|
|
|
|
|
|
|
|
|
|
|
|
|
|
| Balance as at October 31, 2025 |
|
|
|
|
|
|
|
|
|
|
|
|
|
|
|
|
|
|
|
|
|
|
|
|
|
|
|
|
|
|
|
|
|
|
|
|
|
|
|
|
|
|
|
|
|
|
|
|
|
|
|
|
|
|
| |
|
For the year ended October 31, 2024 |
|
| |
|
|
|
|
|
|
|
Accumulated other comprehensive income (loss) |
|
|
|
|
|
|
|
|
|
|
|
|
|
|
|
|
|
|
|
| ($ millions) |
|
Common
shares
(Note 23) |
|
|
|
|
|
Foreign
currency
translation |
|
|
Debt
instruments
FVOCI |
|
|
Equity
instruments
FVOCI |
|
|
Cash flow
hedges |
|
|
|
|
|
Other
reserves |
|
|
Total
common
equity |
|
|
Preferred
shares and
other equity
instruments
(Note 23) |
|
|
Total attributable
to equity
holders |
|
|
Non-
controlling
interests in
subsidiaries
(Note 30(b)) |
|
|
Total |
|
| Balance as at October 31, 2023 |
|
$ |
20,109 |
|
|
$ |
55,673 |
|
|
$ |
(1,755 |
) |
|
$ |
(1,104 |
) |
|
$ |
14 |
|
|
$ |
(4,545 |
) |
|
$ |
459 |
|
|
$ |
(84 |
) |
|
$ |
68,767 |
|
|
$ |
8,075 |
|
|
$ |
76,842 |
|
|
$ |
1,729 |
|
|
$ |
78,571 |
|
| Net income |
|
|
– |
|
|
|
7,286 |
|
|
|
– |
|
|
|
– |
|
|
|
– |
|
|
|
– |
|
|
|
– |
|
|
|
– |
|
|
|
7,286 |
|
|
|
472 |
|
|
|
7,758 |
|
|
|
134 |
|
|
|
7,892 |
|
| Other comprehensive income (loss) |
|
|
– |
|
|
|
– |
|
|
|
(1,804 |
) |
|
|
613 |
|
|
|
325 |
|
|
|
2,348 |
|
|
|
(698 |
) |
|
|
– |
|
|
|
784 |
|
|
|
– |
|
|
|
784 |
|
|
|
(72 |
) |
|
|
712 |
|
| Total comprehensive income |
|
$ |
– |
|
|
$ |
7,286 |
|
|
$ |
(1,804 |
) |
|
$ |
613 |
|
|
$ |
325 |
|
|
$ |
2,348 |
|
|
$ |
(698 |
) |
|
$ |
– |
|
|
$ |
8,070 |
|
|
$ |
472 |
|
|
$ |
8,542 |
|
|
$ |
62 |
|
|
$ |
8,604 |
|
| Shares/instruments issued |
|
|
1,945 |
|
|
|
– |
|
|
|
– |
|
|
|
– |
|
|
|
– |
|
|
|
– |
|
|
|
– |
|
|
|
(4 |
) |
|
|
1,941 |
|
|
|
1,004 |
|
|
|
2,945 |
|
|
|
– |
|
|
|
2,945 |
|
| Shares repurchased/redeemed |
|
|
– |
|
|
|
– |
|
|
|
– |
|
|
|
– |
|
|
|
– |
|
|
|
– |
|
|
|
– |
|
|
|
– |
|
|
|
– |
|
|
|
(300 |
) |
|
|
(300 |
) |
|
|
– |
|
|
|
(300 |
) |
| Dividends and distributions paid to equity holders |
|
|
– |
|
|
|
(5,198 |
) |
|
|
– |
|
|
|
– |
|
|
|
– |
|
|
|
– |
|
|
|
– |
|
|
|
– |
|
|
|
(5,198 |
) |
|
|
(472 |
) |
|
|
(5,670 |
) |
|
|
(88 |
) |
|
|
(5,758 |
) |
| |
|
|
– |
|
|
|
– |
|
|
|
– |
|
|
|
– |
|
|
|
– |
|
|
|
– |
|
|
|
– |
|
|
|
13 |
|
|
|
13 |
|
|
|
– |
|
|
|
13 |
|
|
|
– |
|
|
|
13 |
|
| Other |
|
|
– |
|
|
|
(10 |
) |
|
|
– |
|
|
|
– |
|
|
|
– |
|
|
|
– |
|
|
|
– |
|
|
|
7 |
|
|
|
(3 |
) |
|
|
– |
|
|
|
(3 |
) |
|
|
4 |
|
|
|
1 |
|
| Balance as at October 31, 2024 |
|
$ |
22,054 |
|
|
$ |
57,751 |
|
|
$ |
(3,559 |
) |
|
$ |
(491 |
) |
|
$ |
339 |
|
|
$ |
(2,197 |
) |
|
$ |
(239 |
) |
|
$ |
(68 |
) |
|
$ |
73,590 |
|
|
$ |
8,779 |
|
|
$ |
82,369 |
|
|
$ |
1,707 |
|
|
$ |
84,076 |
|
| (1) |
Includes undistributed retained earnings of $76 (2024 – $74) related to a foreign associated corporation, which is subject to local regulatory restriction. |
| (2) |
Includes Share from associates, Employee benefits, Own credit risk, and Insurance contracts. |
| (3) |
Represents amounts on account of share-based payments (refer to Note 25). |
| (4) |
Refer to Note 23 (b) for further details on the redemption of the equity instrument. |
The accompanying notes are an integral part of these consolidated financial statements Consolidated Statement of Cash Flows
|
2025 Scotiabank Annual Report
Consolidated Financial Statements
|
|
|
|
|
|
|
|
|
| Sources (uses) of cash flows for the year ended October 31 ($ millions) |
|
|
|
|
2024 |
|
Cash flows from operating activities |
|
|
|
|
|
|
|
|
Net income |
|
|
|
|
|
$ |
7,892 |
|
Adjustment for: |
|
|
|
|
|
|
|
|
Net interest income |
|
|
|
|
|
|
(19,252 |
) |
Depreciation and amortization |
|
|
|
|
|
|
1,760 |
|
Provision for credit losses |
|
|
|
|
|
|
4,051 |
|
Impairment on investments in associates |
|
|
|
|
|
|
343 |
|
Equity-settled share-based payment expense |
|
|
|
|
|
|
13 |
|
Net gain on sale of investment securities |
|
|
|
|
|
|
(48 |
) |
Net (gain)/loss on divestitures |
|
|
|
|
|
|
136 |
|
Net income from investments in associated corporations |
|
|
|
|
|
|
(198 |
) |
Income tax expense |
|
|
|
|
|
|
2,032 |
|
Changes in operating assets and liabilities: |
|
|
|
|
|
|
|
|
Trading assets |
|
|
|
|
|
|
(11,370 |
) |
Securities purchased under resale agreements and securities borrowed |
|
|
|
|
|
|
108 |
|
Loans |
|
|
|
|
|
|
(17,712 |
) |
Deposits |
|
|
|
|
|
|
(816 |
) |
Obligations related to securities sold short |
|
|
|
|
|
|
(1,690 |
) |
Obligations related to securities sold under repurchase agreements and securities lent |
|
|
|
|
|
|
28,753 |
|
Net derivative financial instruments |
|
|
|
|
|
|
4,159 |
|
Other, net |
|
|
|
|
|
|
457 |
|
Interest and dividends received |
|
|
|
|
|
|
61,292 |
|
Interest paid |
|
|
|
|
|
|
(42,273 |
) |
Income tax paid |
|
|
|
|
|
|
(1,985 |
) |
Net cash from/(used in) operating activities |
|
|
|
|
|
|
15,652 |
|
Cash flows from investing activities |
|
|
|
|
|
|
|
|
Interest-bearing deposits with financial institutions |
|
|
|
|
|
|
25,557 |
|
Purchase of investment securities |
|
|
|
|
|
|
(108,281 |
) |
Proceeds from sale and maturity of investment securities |
|
|
|
|
|
|
76,794 |
|
Acquisition/divestiture of subsidiaries, associated corporations or business units, net of cash acquired |
|
|
|
|
|
|
– |
|
Property and equipment, net of disposals |
|
|
|
|
|
|
(489 |
) |
Other, net |
|
|
|
|
|
|
(1,031 |
) |
Net cash from/(used in) investing activities |
|
|
|
|
|
|
(7,450 |
) |
Cash flows from financing activities |
|
|
|
|
|
|
|
|
Proceeds from issue of subordinated debentures |
|
|
|
|
|
|
1,000 |
|
Redemption of subordinated debentures |
|
|
|
|
|
|
(3,250 |
) |
Proceeds from preferred shares and other equity instruments issued |
|
|
|
|
|
|
1,004 |
|
Redemption of preferred shares and other equity instruments |
|
|
|
|
|
|
(300 |
) |
Proceeds from common shares issued |
|
|
|
|
|
|
1,945 |
|
Common shares purchased for cancellation |
|
|
|
|
|
|
– |
|
Cash dividends and distributions paid |
|
|
|
|
|
|
(5,670 |
) |
Distributions to non-controlling interests |
|
|
|
|
|
|
(88 |
) |
Payment of lease liabilities |
|
|
|
|
|
|
(303 |
) |
Other, net |
|
|
|
|
|
|
(3,176 |
) |
Net cash from/(used in) financing activities |
|
|
|
|
|
|
(8,838 |
) |
Effect of exchange rate changes on cash and cash equivalents |
|
|
|
|
|
|
(131 |
) |
Net change in cash and cash equivalents |
|
|
|
|
|
|
(767 |
) |
Cash and cash equivalents at beginning of year (1)
|
|
|
|
|
|
|
10,173 |
|
Cash and cash equivalents at end of year (1)
|
|
|
|
|
|
$ |
9,406 |
|
| (1) |
Represents cash and non-interest-bearing deposits with financial institutions (refer to Note 5). |
The accompanying notes are an integral part of these consolidated financial statements.
2025 Scotiabank Annual Report
|
Consolidated Financial Statements
|
| Notes to the 2025 Consolidated Financial Statements |
Table of Contents
|
2025 Scotiabank Annual Report
Consolidated Financial Statements
The Bank of Nova Scotia (the Bank) is a chartered Schedule I bank under the Bank Act (Canada) (the Bank Act) and is regulated by the Office of the Superintendent of Financial Institutions (OSFI). The Bank is a global financial services provider offering a diverse range of products and services, including personal, commercial, corporate and investment banking. The head office of the Bank is located at 1709 Hollis Street, Halifax, Nova Scotia, Canada and its executive offices are at 40 Temperance Street, Toronto, Canada. The common shares of the Bank are listed on the Toronto Stock Exchange (TSX) and the New York Stock Exchange.
These consolidated financial statements were prepared in accordance with International Financial Reporting Standards (IFRS) as issued by the International Accounting Standards Board (IASB) and accounting requirements of OSFI in accordance with Section 308 of the Bank Act. Section 308 states that, except as otherwise specified by OSFI, the financial statements are to be prepared in accordance with IFRS.
The consolidated financial statements for the year ended October 31, 2025 have been approved by the Board of Directors for issue on December 2, 2025.
The consolidated financial statements have been prepared on the historical cost basis except for the following material items that are measured at fair value in the Consolidated Statement of Financial Position:
| |
• |
|
Financial assets and liabilities measured at fair value through profit or loss |
| |
• |
|
Financial assets and liabilities designated at fair value through profit or loss |
| |
• |
|
Derivative financial instruments |
| |
• |
|
Equity instruments designated at fair value through other comprehensive income |
| |
• |
|
Debt instruments measured at fair value through other comprehensive income |
Functional and presentation currency
These consolidated financial statements are presented in Canadian dollars, which is the Bank’s functional currency. All financial information presented in Canadian dollars has been rounded to the nearest million unless otherwise stated.
Management’s use of estimates, assumptions and judgments
The Bank’s accounting policies require estimates, assumptions and judgments that relate to matters that are inherently uncertain. The Bank has established procedures to ensure that accounting policies are applied consistently. Estimates and underlying assumptions are reviewed on an ongoing basis. Revisions to accounting estimates are recognized in the year in which the estimates are revised.
Use of estimates and assumptions
The preparation of these consolidated financial statements requires management to make estimates and assumptions that affect the reported amount of assets and liabilities at the date of the consolidated financial statements, and other comprehensive income and income and expenses during the reporting period. Estimates made by management are based on historical experience and other factors and assumptions that are believed to be reasonable. Key areas of estimation uncertainty include those relating to the allowance for credit losses, the fair value of financial instruments (including derivatives), corporate income taxes, employee benefits, goodwill and intangible assets, the fair value of all identifiable assets and liabilities as a result of business combinations, impairment of
non-financial
assets and provisions. The Bank has utilized estimates, assumptions and judgments that reflect this uncertainty. While management makes its best estimates and assumptions, actual results could differ from these and other estimates.
Currently, there continues to be uncertainty surrounding U.S. trade policies and the impact of tariffs. This results in increased measurement uncertainty for estimates used in financial reporting. In particular, the allowance for credit losses, using an expected credit loss approach as required under IFRS 9, is estimated using complex models and incorporates inputs, assumptions, and techniques that require a high degree of judgement and is heavily dependent on the forecast of macroeconomic variables. Due to the ongoing uncertainty surrounding U.S. trade policy and tariffs, estimates and valuation models applied based on conditions and information existing as at October 31, 2025 may be significantly different from the actual outcome.
In the preparation of these consolidated financial statements, management is required to make significant judgments in the classification and presentation of transactions and instruments and accounting for the Bank’s involvement with other entities.
2025 Scotiabank Annual Report
|
Consolidated Financial Statements
Significant estimates, assumptions and judgments have been made in the following areas and are discussed as noted in the consolidated financial statements:
|
|
|
| Allowance for credit losses |
|
Note 3 Note 12(e) |
|
|
| Fair value of financial instruments |
|
Note 3 Note 6 |
|
|
| Corporate income taxes |
|
Note 3 Note 26 |
|
|
| Employee benefits |
|
Note 3 Note 27 |
|
|
| Goodwill and intangible assets |
|
Note 3 Note 17 |
|
|
| Fair value of all identifiable assets and liabilities as a result of business combinations |
|
Note 3 Note 35 |
|
|
| Impairment of investment securities |
|
Note 3 Note 11 |
|
|
| Impairment of non-financial assets |
|
Note 3 Note 15 Note 17 |
|
|
| Structured entities |
|
Note 3 Note 14 |
|
|
| De facto control of other entities |
|
Note 3 Note 30 |
|
|
| Derecognition of financial assets and liabilities |
|
Note 3 Note 13 |
|
|
| Provisions |
|
Note 3 Note 22 |
|
Material Accounting Policies |
The material accounting policies used in the preparation of these consolidated financial statements, including any additional accounting requirements of OSFI, as set out below, have been applied consistently to all periods presented in these consolidated financial statements.
The consolidated financial statements include the assets, liabilities, financial performance and cash flows of the Bank and all of its subsidiaries, after elimination of intercompany transactions and balances. Subsidiaries are defined as entities controlled by the Bank. The Bank’s subsidiaries can be classified as entities controlled through voting interests or structured entities. The Bank consolidates a subsidiary from the date it obtains control. For the Bank to control an entity, all three elements of control should be in existence:
| |
• |
|
power over the investee; |
| |
• |
|
exposure, or rights, to variable returns from involvement with the investee; and |
| |
• |
|
the ability to use power over the investee to affect the amount of the Bank’s returns. |
The Bank does not control an investee when it is acting as an agent. The Bank assesses whether it is an agent by determining whether it is primarily engaged to act on behalf of and for the benefit of another party or parties. The Bank reassesses whether it controls an investee if facts and circumstances indicate that one or more of the elements of control have changed.
Voting-interest subsidiaries
Control is presumed with an ownership interest of more than 50% of the voting rights in an entity unless there are other factors that indicate that the Bank does not control the entity despite having more than 50% of voting rights.
The Bank may consolidate an entity when it owns less than 50% of the voting rights when it has one or more other attributes of power:
| |
• |
|
by virtue of an agreement, over more than half of the voting rights; |
| |
• |
|
to govern the financial and operating policies of the entity under a statute or an agreement; |
| |
• |
|
to appoint or remove the majority of the members of the board of directors or equivalent governing body and control of the entity is by that board or body; or |
| |
• |
|
to govern the financial and operating policies of the entity through the size of its holding of voting rights relative to the size and dispersion of holding of the other vote holders and voting patterns at shareholder meetings (i.e., de facto control). |
Non-controlling
interests are presented within equity in the Consolidated Statement of Financial Position separate from equity attributable to equity holders of the Bank. The net income attributable to
non-controlling
interests is presented separately in the Consolidated Statement of Income. Partial sales and incremental purchases of interests in subsidiaries that do not result in a change of control are accounted for as equity transactions with
non-controlling
interest holders. Any difference between the carrying amount of the interest and the transaction amount is recorded as an adjustment to retained earnings.
Structured entities are designed to accomplish certain well-defined objectives and for which voting or similar rights are not the dominant factor in deciding who controls the entity. The Bank controls an entity when it is exposed, or has rights, to variable returns from its involvement with the investee and has the ability to affect those returns through its power over the investee.
The Bank consolidates all structured entities that it controls.
|
2025 Scotiabank Annual Report
Consolidated Financial Statements
Investments in associates
An associate is an entity in which the Bank has significant influence, but not control, over the operating and financial policies of the entity.
Investments in associates are recognized initially at cost, which includes the purchase price and other costs directly attributable to the purchase. Associates are accounted for using the equity method, which reflects the Bank’s share of the increase or decrease of the post-acquisition earnings and other movements in the associate’s equity.
Investments in associates are evaluated for impairment at the end of each financial reporting period, or more frequently if events or changes in circumstances indicate the existence of objective evidence of impairment.
For purposes of applying the equity method for an investment that has a different reporting period from the Bank, adjustments are made for the effects of any significant events or transactions that occur between the reporting date of the investment and the reporting date of the Bank.
The Bank’s investments in joint arrangements over which the Bank has joint control are classified as either joint operations or joint ventures, depending on the contractual rights and obligations of each investor, rather than the legal structure of the joint arrangement.
Similar to accounting for investments in associates, for joint ventures, investments are recognized initially at cost and accounted for using the equity method, which reflects the Bank’s share of the increase or decrease of the post-acquisition earnings and other movements in the joint venture’s equity. Investments in joint ventures are evaluated for impairment at the end of each financial reporting period, or more frequently if events or changes in circumstances indicate the existence of objective evidence of impairment.
For joint operations, the Bank recognizes its direct rights to, and its share of jointly held assets, liabilities, revenues and expenses. These have been incorporated in the consolidated financial statements under the appropriate headings.
Translation of foreign currencies
The financial statements of each of the Bank’s foreign operations are measured using its functional currency, being the currency of the primary economic environment of the foreign operation.
Translation gains and losses related to the Bank’s monetary items are recognized in
non-interest
income in the Consolidated Statement of Income. Revenues and expenses denominated in foreign currencies are translated using average exchange rates. Foreign currency
non-monetary
items that are measured at historical cost are translated into the functional currency at historical rates. Foreign currency
non-monetary
items measured at fair value are translated into functional currency using the rate of exchange at the date the fair value was determined. Foreign currency gains and losses on
non-monetary
items are recognized in the Consolidated Statement of Income or Consolidated Statement of Comprehensive Income consistent with the gain or loss on the
non-monetary
item.
Unrealized gains and losses arising upon translation of foreign operations, together with any gains or losses arising from hedges of those net investment positions to the extent effective, are credited or charged to net change in unrealized foreign currency translation gains/losses in other comprehensive income in the Consolidated Statement of Comprehensive Income. On disposal or meeting the definition of partial disposal of a foreign operation, an appropriate portion of the translation differences previously recognized in other comprehensive income are recognized in the Consolidated Statement of Income.
Financial assets and liabilities
Recognition and initial measurement
The Bank, on the date of origination or purchase, recognizes loans, debt and equity securities, deposits and subordinated debentures at the fair value of the consideration paid or received.
Regular-way
purchases and sales of financial assets are recognized on the settlement date. All other financial assets and liabilities, including derivatives, are initially recognized on the trade date at which the Bank becomes a party to the contractual provisions of the instrument.
The initial measurement of a financial asset or liability is at fair value plus transaction costs that are directly attributable to its purchase or issuance. For instruments measured at fair value through profit or loss, transaction costs are recognized immediately in profit or loss.
Classification and measurement, derecognition, and impairment of financial instruments
Classification and measurement
Classification and measurement of financial assets
Financial assets include both debt and equity instruments, are classified into one of the following measurement categories:
| |
• |
|
Fair value through other comprehensive income (FVOCI); |
| |
• |
|
Fair value through profit or loss (FVTPL); |
| |
• |
|
Elected at fair value through other comprehensive income (Equities only); or |
Debt instruments, including loans and debt securities, are classified into one of the following measurement categories:
| |
• |
|
Fair value through other comprehensive income (FVOCI); |
| |
• |
|
Fair value through profit or loss (FVTPL); or |
Classification of debt instruments is determined based on:
| (i) |
The business model under which the asset is held; and |
| (ii) |
The contractual cash flow characteristics of the instrument. |
2025 Scotiabank Annual Report
|
Consolidated Financial Statements
Business model assessment
A business model assessment involves determining how financial assets are managed to generate cash flows. The Bank’s business model assessment is based on the following categories:
| |
• |
|
Held to collect: The objective of this business model is to hold assets and collect contractual cash flows. Any sales of the asset are incidental to the objective of the model. |
| |
• |
|
Held to collect and for sale: Both collecting contractual cash flows and sales are integral to achieving the objectives of the business model. |
| |
• |
|
Other business model: The business model is neither nor and for sale. |
The Bank assesses the business model at a portfolio level reflective of how groups of assets are managed together to achieve a particular business objective. For the assessment of a business model, the Bank takes into consideration the following factors:
| |
• |
|
How the performance of assets in a portfolio is evaluated and reported to group heads and other key decision makers within the Bank’s business lines; |
| |
• |
|
How compensation is determined for the Bank’s business lines’ management that manages the assets; |
| |
• |
|
How the business lines’ management is compensated for managing the Bank’s assets based on the fair value or the contractual cash flows collected; |
| |
• |
|
Whether the assets are held for trading purposes; |
| |
• |
|
The risks that affect the performance of assets held within a business model and how those risks are managed; and |
| |
• |
|
The frequency and volume of sales in prior periods and expectations about future sales activity. |
Contractual cash flow characteristics assessment
The contractual cash flow characteristics assessment involves assessing the contractual features of an instrument to determine if they give rise to cash flows that are consistent with a basic lending arrangement. Contractual cash flows are consistent with a basic lending arrangement if they represent cash flows that are solely payments of principal and interest on the principal amount outstanding (SPPI).
Principal is defined as the fair value of the instrument at initial recognition. Principal may change over the life of the instrument due to repayments or amortization of premium/discount.
Interest is defined as the consideration for the time value of money and the credit risk associated with the principal amount outstanding and for other basic lending risks and costs (liquidity risk and administrative costs), and a profit margin.
If the Bank identifies any contractual features that could significantly modify the cash flows of the instrument such that they are no longer consistent with a basic lending arrangement, the related financial asset is classified and measured at FVTPL.
Debt instruments measured at amortized cost
Debt instruments are measured at amortized cost if they are held within a business model whose objective is to hold for collection of contractual cash flows where those cash flows represent solely payments of principal and interest. After initial measurement, debt instruments in this category are carried at amortized cost. Interest income on these instruments is recognized in interest income using the effective interest rate method. The effective interest rate is the rate that discounts estimated future cash payments or receipts through the expected life of the financial asset to the gross carrying amount of a financial asset. Amortized cost is calculated by taking into account any discount or premium on the acquisition, transaction costs and fees that are an integral part of the effective interest rate.
Impairment on debt instruments measured at amortized cost is calculated using the expected credit loss approach. Loans and debt securities measured at amortized cost are presented net of the allowance for credit losses (ACL) in the Statement of Financial Position.
Debt instruments measured at FVOCI
Debt instruments are measured at FVOCI if they are held within a business model whose objective is to hold for collection of contractual cash flows and for selling financial assets, where the assets’ cash flows represent payments that are solely payments of principal and interest. Subsequent to initial recognition, unrealized gains and losses on debt instruments measured at FVOCI are recorded in other comprehensive income (OCI), unless the instrument is designated in a fair value hedge relationship. When designated in a fair value hedge relationship, any changes in fair value due to changes in the hedged risk are recognized in
Non-interest
income in the Consolidated Statement of Income, along with changes in fair value of the hedging instrument. Upon derecognition, realized gains and losses are reclassified from OCI and recorded in
Non-interest
income in the Consolidated Statement of Income. Foreign exchange gains and losses that relate to the amortized cost of the debt instrument are recognized in the Consolidated Statement of Income. Premiums, discounts and related transaction costs are amortized over the expected life of the instrument to Interest income in the Consolidated Statement of Income using the effective interest rate method.
Impairment on debt instruments measured at FVOCI is determined using the expected credit loss approach. The ACL on debt instruments measured at FVOCI does not reduce the carrying amount of the asset in the Consolidated Statement of Financial Position, which remains at its fair value. Instead, an amount equal to the allowance that would arise if the assets were measured at amortized cost is recognized in OCI with a corresponding charge to provision for credit losses in the Consolidated Statement of Income. The accumulated allowance recognized in OCI is recycled to the Consolidated Statement of Income upon derecognition of the debt instrument.
Debt instruments measured at FVTPL
Debt instruments are measured at FVTPL if assets:
| (i) |
are held for trading purposes; |
| (ii) |
are held as part of a portfolio managed on a fair value basis; or |
| (iii) |
whose cash flows do not represent payments that are solely payments of principal and interest. |
These instruments are measured at fair value in the Consolidated Statement of Financial Position, with transaction costs recognized immediately in the Consolidated Statement of Income as part of
Non-interest
income. Realized and unrealized gains and losses are recognized as part of
Non-interest
income in the Consolidated Statement of Income.
Debt instruments designated at FVTPL
The Bank designates certain debt instruments at FVTPL upon initial recognition, and the designation is irrevocable. The FVTPL designation is available when a fair value is reliably estimated, and doing so eliminates or significantly reduces an accounting mismatch which would otherwise arise.
156
|
2025 Scotiabank Annual Report
Consolidated Financial Statements
Debt instruments designated at FVTPL are recorded in the Consolidated Statement of Financial Position at fair value. Changes in fair value are recognized in
Non-interest
income in the Consolidated Statement of Income.
Equity instruments are classified into one of the following measurement categories:
| |
• |
|
Fair value through profit or loss (FVTPL); or |
| |
• |
|
Elected at fair value through other comprehensive income (FVOCI). |
Equity instruments measured at FVTPL
Equity instruments are measured at FVTPL, unless an election is made to designate them at FVOCI upon purchase, with transaction costs recognized immediately in the Consolidated Statement of Income as part of
Non-interest
income. Subsequent to initial recognition, the changes in fair value and dividends received are recognized in the Consolidated Statement of Income.
Equity instruments measured at FVOCI
At initial recognition, the Bank has an option to classify
non-trading
equity instruments at FVOCI. This election is irrevocable and is made on an
basis.
Gains and losses on these instruments, including when derecognized/sold, are recorded in OCI and are not subsequently reclassified to the Consolidated Statement of Income. As such, there is no specific impairment requirement. Dividends received are recorded in Interest income in the Consolidated Statement of Income. Any transaction costs incurred upon purchase of the security are added to the cost basis of the security and are not reclassified to the Consolidated Statement of Income on sale of the security.
Classification and measurement of financial liabilities
Financial liabilities are classified into one of the following measurement categories:
| |
• |
|
Fair value through profit or loss (FVTPL); |
Financial liabilities measured at FVTPL
Financial liabilities measured at FVTPL are held principally for the purpose of repurchasing in the near term, or form part of a portfolio of identified financial instruments that are managed together and for which there is evidence of a recent actual pattern of short term profit-taking. Financial liabilities are recognized on a trade date basis and accounted for at fair value, with changes in fair value and any gains or losses recognized in the Consolidated Statement of Income as part of the
non-interest
income. Transaction costs are expensed as incurred.
Financial liabilities measured at amortized cost
Deposits, subordinated notes and debentures are accounted for at amortized cost. Interest on deposits, calculated using the effective interest rate method, is recognized as interest expense. Interest on subordinated notes and debentures, including capitalized transaction costs, is recognized using the effective interest rate method as interest expense.
Financial liabilities designated at FVTPL
The Bank designates certain financial liabilities at FVTPL upon initial recognition, and the designation is irrevocable. The FVTPL designation is available when a fair value is reliably estimated.
Financial liabilities are designated at FVTPL when it meets one of the following criteria:
| |
• |
|
The designation eliminates or significantly reduces an accounting mismatch which would otherwise arise; or |
| |
• |
|
A group of financial liabilities are managed and their performance is evaluated on a fair value basis, in line with a documented risk management strategy; or |
| |
• |
|
The financial liability contains one or more embedded derivatives which significantly modify the cash flows otherwise required. |
Financial liabilities designated at FVTPL are recorded in the Consolidated Statement of Financial Position at fair value. Any changes in fair value are recognized in
Non-interest
income in the Consolidated Statement of Income, except for changes in fair value arising from changes in the Bank’s own credit risk which are recognized in OCI. Changes in fair value due to changes in the Bank’s own credit risk are not subsequently reclassified to the Consolidated Statement of Income upon derecognition/extinguishment of the liabilities.
Determination of fair value
The fair value of a financial asset or liability is the price that would be received to sell an asset or paid to transfer a liability in an orderly transaction between market participants in the principal, or in its absence, the most advantageous market to which the Bank has access at the measurement date.
The Bank values instruments carried at fair value using quoted market prices, where available. Fair value based on unadjusted quoted market prices for identical instruments in active markets represents a Level 1 valuation. When quoted market prices are not available, the Bank maximizes the use of observable inputs within valuation models. When a fair value is based on all significant market observable inputs, the valuation is classified as Level 2. Valuations that require the significant use of unobservable inputs are considered Level 3.
Inception gains and losses are only recognized where the valuation is dependent on observable market data; otherwise, they are deferred and amortized over the life of the related contract or until the valuation inputs become observable.
IFRS 13,
Fair Value Measurement
permits a measurement exception that allows an entity to determine the fair value of a group of financial assets and liabilities with offsetting risks based on the sale or transfer of its net exposure to a particular risk (or risks). The Bank has adopted this exception through an accounting policy choice. Consequently, the fair values of certain portfolios of financial instruments are determined based on the net exposure of those instruments to market, credit or funding risk.
In determining fair value for certain instruments or portfolios of instruments, valuation adjustments or reserves may be required to arrive at a more accurate representation of fair value. These adjustments include those made for credit risk,
bid-offer
spreads, unobservable parameters, funding costs and constraints on prices in inactive or illiquid markets.
2025 Scotiabank Annual Report
|
Consolidated Financial Statements
Derecognition of financial assets and liabilities
Derecognition of financial assets
A financial asset is derecognized when the contractual rights to the cash flows from the asset has expired; or the Bank transfers the contractual rights to receive the cash flows from the financial asset; or has assumed an obligation to pay those cash flows to an independent third-party; or the Bank has transferred substantially all the risks and rewards of ownership of that asset to an independent third-party. Management determines whether substantially all the risk and rewards of ownership have been transferred by quantitatively comparing the variability in cash flows before and after the transfer. If the variability in cash flows remains significantly similar subsequent to the transfer, the Bank has retained substantially all of the risks and rewards of ownership.
Where substantially all the risks and rewards of ownership of the financial asset are neither retained nor transferred, the Bank derecognizes the transferred asset only if it has lost control over that asset. Control over the asset is represented by the practical ability to sell the transferred asset. If the Bank retains control over the asset, it will continue to recognize the asset to the extent of its continuing involvement. At times such continuing involvement may be in the form of investment in senior or subordinated tranches of notes issued by
non-consolidated
structured entities.
On derecognition of a financial asset, the difference between the carrying amount and the sum of (i) the consideration received (including any new asset obtained less any new liability assumed) and (ii) any cumulative gain or loss that had been recognized in other comprehensive income is recognized in the Consolidated Statement of Income.
Transfers of financial assets that do not qualify for derecognition are reported as secured financings in the Consolidated Statement of Financial Position.
The derecognition criteria are applied to the transfer of part of an asset, rather than the asset as a whole, only if such part comprises specifically identified cash flows from the asset, a fully proportionate share of the cash flows from the asset, or a fully proportionate share of specifically identified cash flows from the asset.
Derecognition of financial liabilities
A financial liability is derecognized when the obligation under the liability is discharged, canceled or expires. If an existing financial liability is replaced by another from the same counterparty on substantially different terms, or the terms of the existing liability are substantially modified, such an exchange or modification is treated as a derecognition of the original liability and the recognition of a new liability at fair value. The difference in the respective carrying amount of the existing liability and the new liability is recognized as a gain/loss in the Consolidated Statement of Income.
Impairment
The Bank applies a three-stage approach to measure allowance for credit losses, using an expected credit loss approach as required under IFRS 9, for the following categories of financial instruments that are not measured at fair value through profit or loss:
| |
• |
|
Amortized cost financial assets; |
| |
• |
|
Debt securities classified as FVOCI; |
| |
• |
|
Off-balance sheet loan commitments; and |
| |
• |
|
Financial guarantee contracts. |
Expected credit loss impairment model
The Bank’s allowance for credit losses calculations are outputs of models with a number of underlying assumptions regarding the choice of variable inputs and their interdependencies. The expected credit loss impairment model reflects the present value of all cash shortfalls related to default events either (i) over the following twelve months or (ii) over the expected life of a financial instrument depending on credit deterioration from inception. The allowance for credit losses reflects an unbiased, probability-weighted outcome which considers multiple scenarios based on reasonable and supportable forecasts.
This impairment model measures credit loss allowances using a three-stage approach based on the extent of credit deterioration since origination:
|
• |
|
Stage 1 – Where there has not been a significant increase in credit risk (SIR) since initial recognition of a financial instrument, an amount equal to 12 months expected credit loss is recorded. The expected credit loss is computed using a probability of default (PD) occurring over the next 12 months. For those instruments with a remaining maturity of less than 12 months, a PD corresponding to remaining term to maturity is used. |
|
• |
|
Stage 2 – When a financial instrument experiences a SIR subsequent to origination but is not considered to be in default, it is included in Stage 2. This requires the computation of expected credit loss based on the PD over the remaining estimated life of the financial instrument. |
|
• |
|
Stage 3 – Financial instruments that are considered to be in default are included in this stage. Similar to Stage 2, the allowance for credit losses captures the lifetime expected credit losses. |
Measurement of expected credit loss
The PD, exposure at default (EAD), and loss given default (LGD) inputs used to estimate expected credit losses are modelled based on macroeconomic variables that are closely related with credit losses in the relevant portfolio.
Details of these statistical parameters/inputs are as follows:
|
• |
|
PD – The probability of default is an estimate of the likelihood of default over a given time horizon. A default may only happen at a certain time over the remaining estimated life if the facility has not been previously derecognized and is still in the portfolio. |
|
• |
|
EAD – The exposure at default is an estimate of the exposure at a future default date, considering expected changes in the exposure after the reporting date, including repayments of principal and interest, whether scheduled by contract or otherwise, expected drawdowns on committed facilities, and accrued interest from missed payments. |
|
• |
|
LGD – The loss given default is an estimate of the loss arising in the case where a default occurs at a given time. It is based on the difference between the contractual cash flows due and those that the lender would expect to receive, including from the realization of any collateral. It is usually expressed as a percentage of the EAD. |
|
2025 Scotiabank Annual Report
Consolidated Financial Statements
Forward-looking information
The estimation of expected credit losses for each stage and the assessment of SIR consider information about past events and current conditions as well as reasonable and supportable forecasts of future events and economic conditions. The estimation and application of forward-looking information may require significant judgment.
In its models, the Bank relies on a broad range of forward-looking economic information as inputs, such as: GDP growth, unemployment rates, central bank interest rates, and house price indices. The inputs and models used for calculating expected credit losses may not always capture all characteristics of the market at the date of the financial statements. Qualitative adjustments or overlays may be made as temporary adjustments using expert credit judgment.
Multiple forward-looking scenarios
The Bank determines its allowance for credit losses using four probability-weighted forward-looking scenarios. The Bank considers both internal and external sources of information and data in order to achieve unbiased projections and forecasts. The scenarios are prepared using forecasts generated by Scotiabank Economics (SE). The forecasts are created using internal and external models which are modified by SE as necessary to formulate a ‘base case’ view of the most probable future direction of relevant economic variables as well as a representative range of other possible forecast scenarios. The process involves the development of three additional economic scenarios and consideration of the relative probabilities of each outcome.
The ‘base case’ represents the most likely outcome and is aligned with information used by the Bank for other purposes such as strategic planning and budgeting. The other scenarios represent more optimistic and more pessimistic outcomes. The Bank has identified and documented key drivers of credit risk and credit losses for each portfolio of financial instruments and, using an analysis of historical data, has estimated relationships between macroeconomic variables, credit risk, and credit losses.
Assessment of significant increase in credit risk
At each reporting date, the Bank assesses whether there has been a SIR for exposures since initial recognition by comparing the risk of default occurring over the remaining expected life from the reporting date and the date of initial recognition. The assessment considers borrower-specific quantitative and qualitative information without consideration of collateral, and the impact of forward-looking macroeconomic factors.
The common assessments for SIR on retail and
non-retail
portfolios include macroeconomic outlook, management judgment, and delinquency and monitoring. Forward-looking macroeconomic factors are a key component of the macroeconomic outlook. The importance and relevance of each specific macroeconomic factor depends on the type of product, characteristics of the financial instruments and the borrower and the geographical region. Quantitative models may not always be able to capture all reasonable and supportable information that may indicate a SIR. Qualitative factors may be assessed to supplement the gap. Examples of situations include changes in adjudication criteria for a particular group of borrowers, changes in portfolio composition, and natural disasters impacting certain portfolios. With regards to delinquency and monitoring, there is a rebuttable presumption that the credit risk of the financial instrument has increased since initial recognition when contractual payments are more than 30 days overdue.
Retail portfolio – For retail exposures, a SIR is assessed based on thresholds that exist by product which consider the change in PD. The thresholds used for PD migration are reviewed and assessed at least annually unless there is a significant change in credit risk management practices, in which case the review is brought forward.
Non-retail
portfolio – The Bank uses a risk rating scale (IG codes) for its
non-retail
exposures. All
non-retail
exposures have an IG code assigned that reflects the PD of the borrower. Both borrower specific and
non-borrower
specific (i.e. macroeconomic) forward-looking information is considered and reflected in the IG rating. SIR is evaluated based on the migration of the exposures among IG codes.
When measuring expected credit loss, the Bank considers the maximum contractual period over which the Bank is exposed to credit risk. All contractual terms are considered when determining the expected life, including prepayment, and extension and rollover options. For certain revolving credit facilities, such as credit cards, the expected life is estimated based on the period over which the Bank is exposed to credit risk and how the credit losses are mitigated by management actions.
Presentation of allowance for credit losses in the Statement of Financial Position
|
• |
|
Financial assets measured at amortized cost: as a deduction from the gross carrying amount of the financial assets; |
|
• |
|
Debt instruments measured at fair value through other comprehensive income: no allowance is recognized in the Statement of Financial Position because the carrying value of these assets is their fair value. However, the allowance determined is presented in the accumulated other comprehensive income; |
|
• |
|
Off-balance sheet credit risks include undrawn lending commitments, letters of credit and letters of guarantee: as a provision in other liabilities. |
Modified financial assets
If the terms of a financial asset are modified or an existing financial asset is replaced with a new one, an assessment is made to determine if the existing financial asset should be derecognized. Where a modification does not result in derecognition, the date of origination continues to be used to determine SIR. Where a modification results in derecognition, the new financial asset is recognized at its fair value on the modification date. The modification date is also the date of origination for this new asset.
The Bank may modify the contractual terms of loans for either commercial or credit reasons. The terms of a loan in good standing may be modified for commercial reasons to provide competitive pricing to borrowers. Loans are also modified for credit reasons where the contractual terms are modified to grant a concession to a borrower that may be experiencing financial difficulty.
For all financial assets, modifications of the contractual terms may result in derecognition of the original asset when the changes to the terms of the loans are considered substantial. These terms include interest rate, authorized amount or term. The original loan is derecognized, and the new loan is recognized at its fair value. The difference between the carrying value of the derecognized asset and the fair value of the new asset is recognized in the Consolidated Statement of Income.
2025 Scotiabank Annual Report
|
Consolidated Financial Statements
For all loans, performing and credit-impaired, where the modification of terms did not result in the derecognition of the loan, the gross carrying amount of the modified loan is recalculated based on the present value of the modified cash flows discounted at the original effective interest rate
,
and any gain or loss from the modification is recorded in the provision for credit losses line in the Consolidated Statement of Income.
The Bank considers a financial instrument to be in default when one or more loss events occur after the date of initial recognition of the instrument, and the loss event has a negative impact on the estimated future cash flows of the instrument that can be reliably estimated. This includes events that indicate:
|
• |
|
significant financial difficulty of the borrower; |
|
• |
|
default or delinquency in interest or principal payments; |
|
• |
|
high probability of the borrower entering a phase of bankruptcy or a financial reorganization; |
|
• |
|
measurable decrease in the estimated future cash flows from the loan or the underlying assets that back the loan. |
The Bank considers that default has occurred and classifies the financial asset as impaired when it is more than 90 days past due, except for credit card receivables that are treated as defaulted when 180 days past due, unless reasonable and supportable information demonstrates that a more lagging default criterion is appropriate.
The Bank writes off an impaired financial asset (and the related impairment allowance), either partially or in full, when there is no realistic prospect of recovery. Where financial assets are secured,
write-off
is generally after receipt of any proceeds from the realization of security. In circumstances where the net realizable value of any collateral has been determined and there is no reasonable expectation of further recovery,
write-off
may be earlier. Credit card receivables 180 days past due are
written-off.
In subsequent periods, any recoveries of amounts previously written off are credited to the provision for credit losses in the Consolidated Statement of Income.
All purchased loans are initially measured at fair value on the date of acquisition. As a result, no allowance for credit losses would be recorded in the Consolidated Statement of Financial Position on the date of acquisition. Purchased loans may fit into either of the two categories: Performing loans or Purchased Credit-Impaired (PCI) loans.
Purchased performing loans follow the same accounting as originated performing loans and are reflected in Stage 1 on the date of the acquisition. They will be subject to a 12 month allowance for credit losses
,
which is recorded as a provision for credit losses in the Consolidated Statement of Income. The fair value adjustment set up for these loans on the date of acquisition is amortized into interest income over the life of these loans.
PCI loans are reflected in Stage 3 and are always subject to lifetime allowance for credit losses. Any changes in the expected cash flows since the date of acquisition are recorded as a charge/recovery in the provision for credit losses in the Consolidated Statement of Income at the end of all reporting periods subsequent to the date of acquisition.
Offsetting of financial instruments
Financial assets and financial liabilities with the same counterparty are offset, with the net amount reported in the Consolidated Statement of Financial Position, only if there is a legally enforceable right to offset the recognized amounts and there is an intention to settle on a net basis, or to realize the assets and settle the liabilities simultaneously. When financial assets and financial liabilities are offset in the Consolidated Statement of Financial Position, the related income and expense items will also be offset in the Consolidated Statement of Income, unless specifically prohibited by an applicable accounting standard.
Cash and deposits with financial institutions
Cash and deposits with financial institutions comprise cash, cash equivalents, demand deposits with banks and other financial institutions, and highly liquid investments that are readily convertible to cash, subject to an insignificant risk of changes in value. These investments are those with less than three months maturity from the date of acquisition.
Precious metals are carried at fair value less costs to sell, and any changes in value are credited or charged to
non-interest
income – trading revenues in the Consolidated Statement of Income.
Securities purchased and sold under resale agreements
Securities purchased under resale agreements (reverse repurchase agreements) require the purchase of securities by the Bank from a counterparty with an agreement entered to resell the securities at a fixed price at a future date. Since the Bank is reselling the securities at a fixed price at a future date, the risks and rewards have not been transferred to the Bank. The Bank has the right to liquidate the securities purchased in the event of counterparty default.
Whereas securities sold under agreements to repurchase (repurchase agreements) require the sale of securities by the Bank to a counterparty with an agreement entered simultaneously to purchase the securities back at a fixed price at a future date. Since the Bank is purchasing the securities back at a fixed price at a future date, the risks and rewards have not been transferred from the Bank. The counterparty has the right to use the collateral pledged by the Bank in the event of default.
These agreements are treated as collateralized financing arrangements and are initially recognized at amortized cost. The party disbursing the cash takes possession of the securities serving as collateral for the financing and having a market value equal to, or more than, the principal amount loaned. The securities received under reverse repurchase agreements and securities delivered under repurchase agreements are not recognized on, or derecognized from, the Consolidated Statement of Financial Position, unless the risks and rewards of ownership are obtained or relinquished. The related interest income and interest expense are recorded on an accrual basis using the effective interest rate in the Consolidated Statement of Income.
|
2025 Scotiabank Annual Report
Consolidated Financial Statements
Obligations related to securities sold short
Obligations related to securities sold short arise in dealing and market-making activities where debt securities and equity shares are sold without possessing such securities.
Similarly, if securities purchased under an agreement to resell are subsequently sold to third parties, the obligation to return the securities is recorded as a short sale within obligations related to securities sold short in the Consolidated Statement of Financial Position. These trading liabilities are measured at fair value with any gains or losses included in
non-interest
income – trading revenues in the Consolidated Statement of Income. Interest expense accruing on debt securities sold short is recorded in the Consolidated Statement of Income.
Securities lending and borrowing
Securities lending and borrowing transactions are usually collateralized by securities or cash. The transfer of the securities to counterparties is only reflected on the Consolidated Statement of Financial Position if the risks and rewards of ownership are also transferred. For cash collateral advanced or received, the Bank presents these transactions as securities sold under a repurchase agreement or securities purchased under a reverse repurchase agreement, respectively. Interest income on cash collateral paid and interest expense on cash collateral received together with securities lending income and securities borrowing fee are reported in the Consolidated Statement of Income.
Securities borrowed are not recognized on the Consolidated Statement of Financial Position unless they are then sold to third parties, in which case the obligation to return the securities is recorded as a trading liability and measured at fair value with any gains or losses included
in non-interest
income – trading revenues, in the Consolidated Statement of Income.
Derivative instruments are contracts whose value is derived from interest rates, foreign exchange rates, commodity prices, equity prices or other financial variables. Most derivative instruments can be characterized as interest rate contracts, foreign exchange and gold contracts, commodity contracts, equity contracts or credit contracts. Derivative instruments are either exchange-traded contracts or negotiated
contracts. Negotiated
contracts include swaps, forwards and options.
The Bank enters into these derivative contracts for trading purposes, as well as to manage its risk exposures (i.e., to manage the Bank’s
non-trading
interest rate, foreign currency and other risk exposures). Trading activities are undertaken to meet the needs of the Bank’s customers, as well as for the Bank’s own account.
Derivatives embedded in other financial liabilities or host contracts are treated as separate stand-alone derivatives when the following conditions are met:
| |
• |
|
their economic characteristics and risks are not closely related to those of the host contract; |
| |
• |
|
a separate instrument with the same terms as the embedded derivative would meet the definition of a derivative; and |
| |
• |
|
the combined contract is not held for trading or designated at fair value through profit or loss. |
Where an embedded derivative is separable from the host contract but the fair value, as at the acquisition or reporting date, cannot be reliably measured separately, the entire combined contract is measured at fair value. All embedded derivatives are presented on the Consolidated Statement of Financial Position on a combined basis with the host contracts. Changes in fair value of embedded derivatives that are separated from the host contract are recognized in
non-interest
income in the Consolidated Statement of Income.
All derivatives, including embedded derivatives that must be separately accounted for, are recorded at fair value in the Consolidated Statement of Financial Position. The determination of the fair value of derivatives includes consideration of credit risk, estimated funding costs and ongoing direct costs over the life of the instruments. Inception gains or losses on derivatives are only recognized where the valuation is dependent on observable market data; otherwise, they are deferred and amortized over the life of the related contract, or until the valuation inputs become observable.
The gains and losses resulting from changes in fair values of trading derivatives are included in
non-interest
income – trading revenues in the Consolidated Statement of Income.
Changes in the fair value of derivatives that do not qualify for hedge accounting are recorded in the Consolidated Statement of Income in
non-interest
income – other. Where derivative instruments are used to manage the volatility of share-based payment expense, these derivatives are carried at fair value with changes in the fair value in relation to units hedged included in
non-interest
expenses – salaries and employee benefits in the Consolidated Statement of Income.
Changes in the fair value of derivatives that qualify for hedge accounting are recorded as
non-interest
income – other in the Consolidated Statement of Income for fair value hedges and other comprehensive income in the Consolidated Statement of Comprehensive Income for cash flow hedges and net investment hedges.
The Bank has elected to continue to apply the hedge accounting requirements of IAS 39. Also, the Bank has implemented the additional hedge accounting disclosures that are required by the IFRS 9 related amendments to IFRS 7
Financial Instruments: Disclosures
.
The Bank formally documents all hedging relationships and its risk management objective and strategy for undertaking these hedge transactions at inception. The hedge documentation includes identification of the asset, liability, firm commitment or highly probable forecasted transaction being hedged, the nature of the risk being hedged, the hedging instrument used, and the method used to assess the effectiveness of the hedge.
The Bank also formally assesses, both at each hedge’s inception and on an ongoing basis, whether the hedging instruments are highly effective in offsetting changes in fair value or cash flows of the hedged items within an
80-125%
range. This assessment incorporates a comparison of critical terms of the hedged and hedging item, and regression analysis, in order to determine (i) whether the hedge relationship is expected to be highly effective going forward (i.e. prospective effectiveness assessment) and (ii) whether the hedge was actually highly effective for the designated period (i.e. retrospective effectiveness assessment).
Hedge ineffectiveness is measured and recorded in
non-interest
income – other in the Consolidated Statement of Income.
There are three types of hedges: (i) fair value hedges, (ii) cash flow hedges and (iii) net investment hedges.
2025 Scotiabank Annual Report
|
Consolidated Financial Statements
For fair value hedges, the change in fair value of the hedging instrument is offset in the Consolidated Statement of Income by the change in fair value of the hedged item attributable to the hedged risk. For hedges that are discontinued, the hedged item is no longer adjusted for changes in fair value. The cumulative fair value adjustment of the hedged item is amortized to interest income over its remaining term to maturity or written off to
non-interest
income directly if the hedged item ceases to exist. The Bank uses fair value hedges primarily to convert fixed rate financial instruments to floating rate financial instruments. Hedged items include debt securities, loans, deposit liabilities and subordinated debentures. Hedging instruments include single-currency interest rate swaps and cross-currency interest rate swaps.
For cash flow hedges, the change in fair value of the hedging instrument, to the extent effective, is recorded in other comprehensive income until the corresponding gains and losses on the hedged item are recognized in income. For hedges that are discontinued, the cumulative unrealized gain or loss recognized in other comprehensive income is reclassified to interest income and/or salaries and employee benefits as the variability in the cash flows of hedged item affects income. However, if the hedged item is derecognized or the forecasted transaction is no longer expected to occur, the unrealized gain or loss is reclassified immediately to
non-interest
income and/or salaries and employee benefits. The Bank uses cash flow hedges primarily to hedge the variability in cash flows relating to floating rate financial instruments and highly probable forecasted revenues and expenses. Hedged items include debt securities, loans, deposit liabilities, subordinated debentures and highly probable forecasted transactions. Hedging instruments include single-currency interest rate swaps, cross-currency interest rate swaps, total return swaps, foreign currency forwards and foreign currency assets or liabilities.
For net investment hedges, the change in fair value of the hedging instrument, to the extent effective, is recorded in other comprehensive income until the corresponding cumulative translation adjustments on the hedged net investment are recognized in income. The Bank designates foreign currency liabilities and foreign currency forwards as hedging instruments to manage the foreign currency exposure and impact on capital ratios arising from foreign operations.
Land is carried at cost. Buildings (including building fittings), equipment, and leasehold improvements are carried at cost less accumulated depreciation and accumulated impairment losses, if any. Cost includes expenditures that are directly attributable to the acquisition of the asset. Depreciation is calculated using the straight-line method over the estimated useful life of the related asset less any residual value as follows: buildings – up to 40 years; building fittings – up to 15 years; equipment – 3 to 10 years; and leasehold improvements – lease term determined by the Bank. Depreciation expense is included in the Consolidated Statement of Income under
non-interest
expenses – depreciation and amortization. Depreciation methods, useful lives and residual values are reassessed at each financial
year-end
and adjusted as appropriate.
When major components of buildings and equipment have different useful lives, they are accounted for separately and depreciated over each component’s estimated useful life.
Net gains and losses on disposal are included in
non-interest
income – other in the Consolidated Statement of Income in the year of disposal.
Non-current
non-financial
assets (and disposal groups) are classified as held for sale if their carrying amount will be recovered principally through a sale transaction rather than through continuing use. These assets meet the criteria for classification as held for sale if they are available for immediate sale in their present condition and their sale is considered highly probable to occur within one year.
Non-current
non-financial
assets classified as held for sale are measured at the lower of their carrying amount and fair value less costs to sell and are presented within other assets in the Consolidated Statement of Financial Position. Any subsequent write-down to fair value less costs to sell is recognized in the Consolidated Statement of Income, in
non-interest
income or
non-interest
expense. Any subsequent increase in the fair value less costs to sell, to the extent this does not exceed the cumulative write-down, is also recognized in
non-interest
income or
non-interest
expense, together with any realized gains or losses on disposal.
Non-financial
assets acquired in exchange for loans as part of an orderly realization are recorded as assets held for sale or assets held for use. If the acquired asset does not meet the requirement to be considered held for sale, the asset is considered held for use, measured initially at cost which equals the carrying value of the loan and accounted for in the same manner as a similar asset acquired in the normal course of business.
Business combinations and goodwill
The Bank follows the acquisition method of accounting for the acquisition of a business. The Bank considers the date on which control is obtained, and it legally transfers the consideration for the acquired assets and assumed liabilities of the subsidiary, to be the date of acquisition. The cost of an acquisition is measured at the fair value of the consideration paid. The fair value of the consideration transferred by the Bank in a business combination is calculated as the sum of the acquisition date fair value of the assets transferred by the Bank, the liabilities incurred by the Bank to former owners of the acquiree, and the equity interests, including any options, issued by the Bank. The Bank recognizes the acquisition date fair values of any previously held investment in the subsidiary and contingent consideration as part of the consideration transferred in exchange for the acquisition. A gain or loss on any previously held investments of an acquiree is recognized in
non-interest
income – other in the Consolidated Statement of Income.
In general, all identifiable assets acquired (including intangible assets) and liabilities assumed (including any contingent liabilities) are measured at the acquisition date fair value. The Bank records identifiable intangible assets irrespective of whether the assets have been recognized by the acquiree before the business combination.
Non-controlling
interests, if any, are recognized at their proportionate share of the fair value of identifiable assets and liabilities, unless otherwise indicated. Where the Bank has an obligation to purchase a
non-controlling
interest for cash or another financial asset, a financial liability is recognized based on management’s best estimate of the present value of the redemption amount. Where the Bank has a corresponding option to settle the purchase of a
non-controlling
interest by issuing its own common shares, no financial liability is recorded.
Any excess of the cost of acquisition over the Bank’s share of the net fair value of the identifiable assets acquired and liabilities assumed is recorded as goodwill. If the cost of acquisition is less than the fair value of the Bank’s share of the identifiable assets acquired and liabilities assumed, the resulting gain is recognized immediately in
non-interest
income – other in the Consolidated Statement of Income.
|
2025 Scotiabank Annual Report
Consolidated Financial Statements
During the measurement period (which is within one year from the acquisition date), the Bank may, on a retrospective basis, adjust the amounts recognized at the acquisition date to reflect new information obtained about facts and circumstances that existed as of the acquisition date.
The Bank accounts for acquisition-related costs as expenses in the periods in which the costs are incurred and the services are received.
Subsequent to acquisition, the Bank accounts for the following assets and liabilities recognized in a business combination as described below:
| |
• |
|
Contingent liabilities, until resolved, are measured at the higher of the amount that would be recognized as a provision or the amount initially recognized, with any change recognized in the Consolidated Statement of Income. |
| |
• |
|
Indemnification assets are measured on the same basis as the item to which the indemnification relates. |
| |
• |
|
Contingent consideration classified as a liability is measured at fair value, with any change recognized in the Consolidated Statement of Income. |
| |
• |
|
Liabilities to non-controlling interest holders when remeasured at the end of each reporting period, a corresponding change is recorded in equity. |
After initial recognition of goodwill in a business combination, goodwill in aggregate is measured at cost less any accumulated impairment losses. Goodwill is not amortized but tested for impairment annually and when circumstances indicate that the carrying value may be impaired.
Goodwill is reviewed at each reporting date to determine whether there is any indication of impairment. For the purpose of impairment testing, goodwill acquired in a business combination is, on the acquisition date, allocated to each of the Bank’s group of cash-generating units (CGUs) that is expected to benefit from the combination. CGUs to which goodwill has been allocated are aggregated so that the level at which impairment is tested reflects the lowest level at which goodwill is monitored for internal management purposes.
The Bank determines the carrying value of the CGU using a regulatory capital approach based on credit, market, operational risks and leverage, consistent with the Bank’s capital attribution for business line performance measurement. Corporate capital that is not directly attributable is allocated to each CGU on a proportional basis, based on the relative attributed capital prior to the corporate capital allocation. The recoverable amount is the greater of fair value less costs of disposal (FVLCD) and value in use (VIU). If either FVLCD or VIU exceeds the carrying amount, there is no need to determine the other. An impairment loss is recognized if the carrying amount of the CGU exceeds the recoverable amount. An impairment loss on goodwill is not reversed.
FVLCD is the price that would be received from the sale of a CGU in an orderly transaction between market participants, less cost of disposal, at the measurement date. In determining FVLCD, an appropriate valuation model is used which considers various factors, including normalized net income, control premiums and price earnings multiples. These calculations are corroborated by valuation multiples and quoted share prices for publicly traded subsidiaries or other available fair value indicators.
VIU is the present value of the future cash flows expected to be derived from a CGU. The determination of VIU involves judgment in estimating cash flow projections, discount rate and terminal growth rate. The future cash flows are based on management approved budgets and plans which factor in market trends, macroeconomic conditions, forecasted earnings and business strategy for the CGU. The discount rate is based on the cost of capital while the terminal growth rate is based on the long-term growth expectations in the relevant countries.
Intangible assets represent identifiable
non-monetary
assets and are acquired either separately, through a business combination, or generated internally. The Bank’s intangible assets are mainly comprised of computer software, customer relationships, contract intangibles, core deposit intangibles and fund management contracts.
The cost of a separately acquired intangible asset includes its purchase price and directly attributable costs of preparing the asset for its intended use. Intangibles acquired as part of a business combination are initially recognized at fair value.
In respect of internally generated intangible assets, initial measurement includes all directly attributable costs necessary to create, produce and prepare the asset to be capable of operating in the manner intended by management.
After initial recognition, an intangible asset is carried at its cost less any accumulated amortization and accumulated impairment losses.
Intangible assets that have finite useful lives are initially measured at cost and amortized on a straight-line basis over their useful lives as follows: computer software – up to 10 years; and other intangible assets – 5 to 20 years. Amortization expense is included in the Consolidated Statement of Income under operating expenses – depreciation and amortization. As intangible assets are
non-financial
assets, the impairment model for
non-financial
assets is applied. Intangible assets with indefinite useful lives are not amortized but are tested for impairment annually and when circumstances indicate that the carrying value may be impaired. Intangible assets with finite useful lives are only tested for impairment when events or circumstances indicate that the carrying value may be impaired.
Impairment of
non-financial
assets
The carrying amount of the Bank’s
non-financial
assets, other than goodwill, indefinite life intangible assets and deferred tax assets, which are separately addressed, is reviewed at each reporting date to determine whether there is any indication of impairment. For the purpose of impairment testing,
non-financial
assets that cannot be tested individually are grouped together into the smallest group of assets that generate cash inflows from continuing use that are largely independent from the cash inflows of other assets or groups of assets.
If any indication of impairment exists, the asset’s recoverable amount is estimated. The recoverable amount of an asset or CGU is the greater of its value in use and its fair value less costs of disposal. The Bank’s corporate assets do not generate separate cash inflows. If there is an indication that a corporate asset may be impaired, then the recoverable amount is determined for the CGU to which the corporate asset belongs.
An impairment loss is recognized if the carrying amount of an asset or a CGU exceeds its recoverable amount. Impairment losses of continuing operations are recognized in the Consolidated Statement of Income in those expense categories consistent with the nature of the impaired asset. Impairment losses recognized in prior periods are reassessed at each reporting date for any indication that the loss had decreased or no longer exists. An impairment loss is reversed if there has been a change in the estimates used to determine the recoverable amount. An impairment loss is reversed only to the extent that the asset’s carrying amount does not exceed the carrying amount that would have been determined, net of depreciation or amortization, if no impairment loss had been recognized. Such reversal is recognized in the Consolidated Statement of Income.
Significant judgment is applied in determining the
non-financial
asset’s recoverable amount and assessing whether certain events or circumstances constitute objective evidence of impairment.
2025 Scotiabank Annual Report
|
Consolidated Financial Statements
The Bank follows the balance sheet liability method for corporate income taxes. Under this method, deferred tax assets and liabilities represent the cumulative amount of tax applicable to temporary differences, which are the differences between the carrying amount of the assets and liabilities, and their values for tax purposes. Deferred tax assets are recognized only to the extent it is probable that sufficient taxable profits will be available against which the benefit of these deferred tax assets can be utilized.
Deferred tax assets and liabilities are measured using enacted or substantively enacted tax rates expected to apply to taxable income in the years in which those temporary differences are expected to be recovered or settled.
Deferred and current tax assets and liabilities are only offset when they arise in the same tax reporting group and where the Bank has both the legal right and the intention to settle on a net basis or to realize the asset and settle the liability simultaneously.
The Bank maintains provisions for uncertain tax positions that it believes appropriately reflect the risk of tax positions under discussion, audit, dispute or appeal with tax authorities, or which are otherwise considered to involve uncertainty. These provisions are made using the Bank’s best estimate of the amount expected to be paid based on an assessment of all relevant factors, which are reviewed at the end of each reporting period. It is possible that additional liability and income tax expense could arise in the future, depending on the acceptance of the Bank’s tax positions by the relevant tax authorities in the jurisdictions in which the Bank operates.
Income tax is recognized in the Consolidated Statement of Income, except where it relates to items recognized in other comprehensive income or directly in equity, in which case income tax is recognized in the same line as the related item.
At inception of a contract, the Bank assesses whether a contract is, or contains, a lease. A contract is a lease if the contract conveys the right to control the use of an identified asset for a period of time in exchange for consideration. When the Bank is a lessee, it recognizes a
(ROU) asset and a lease liability, except for short-term leases for assets that have a lease term of 12 months or less and leases of low value items. For short-term leases and low value items, the Bank recognizes the lease payment associated with these leases as an expense on a straight-line basis over the lease term.
A ROU is an asset that represents a lessee’s right to use an underlying asset for the lease term. The ROU asset is initially measured at cost, which is based on the initial amount of the lease liability, any direct costs incurred, any lease payments made at or before the commencement date net of lease incentives received and estimated decommissioning costs.
The ROU asset is subsequently measured at cost less accumulated depreciation and accumulated impairment losses, if any. The ROU asset is depreciated using the straight-line method from the commencement date to the earlier of the end of the useful life of the ROU asset or the end of the lease term. The depreciation is recorded in Depreciation and amortization in the Consolidated Statement of Income. In addition, the ROU asset is adjusted for certain remeasurements of the lease liability.
At commencement date, the Bank initially measures the lease liability at the present value of the future lease payments, discounted using the Bank’s incremental borrowing rate that takes into account the Bank’s credit risk and economic environment in which the lease is entered. The lease liability is subsequently measured at amortized cost using the effective interest method. It is
re-measured
if the Bank changes its assessment of whether it will exercise a purchase, extension or termination option. Interest expense is recorded in Interest expense – other in the Consolidated Statement of Income.
When the lease liability is
re-measured
in this way, a corresponding adjustment is made to the carrying amount of the ROU asset or is recorded in profit or loss if the carrying amount of the
asset has been reduced to zero.
The Bank presents ROU assets in Property and equipment and lease liabilities in Other liabilities in the Consolidated Statement of Financial Position.
The Bank’s expectation of exercising the option to renew a lease is determined by assessing if the Bank is “reasonably certain” to exercise that option. The Bank will be reasonably certain to exercise an option when factors create a significant economic incentive to do so. This assessment considers the following criteria: key locations for its branch network, locations on which the Bank has spent significant capital on renovation work, contribution to profit, value of locations based on current economic environment and the remaining term of existing leases.
A provision, including for restructuring, is recognized if, as a result of a past event, the Bank has a present legal or constructive obligation that can be estimated reliably, and it is probable that an outflow of economic benefits will be required to settle the obligation.
The amount recognized as a provision is the Bank’s best estimate of the consideration required to settle the present obligation, taking into account the risks and uncertainties surrounding the obligation. If the effect of the time value of money is considered material, provisions are determined by discounting the expected future cash flows at a
pre-tax
rate that reflects current market assessments of the time value of money and, where appropriate, the risks specific to the liability. The increase in the provision due to the passage of time is recorded as interest expense – other in the Consolidated Statement of Income.
The Bank identifies its insurance contracts under which it accepts significant insurance risk from another party (the policyholder) by agreeing to compensate the policyholder if a specified uncertain future event (the insured event) adversely affects the policyholder. For short duration contracts, the Bank applies the premium allocation approach which requires that the expected premium be recognized into income over the coverage period and a liability for remaining coverage be established to the extent that cash inflows are received earlier than the recognition of premiums into insurance revenue. A liability for incurred claims is established based on expected claims and expenses, with a risk adjustment for
non-financial
risk, required to settle past insured events.
|
2025 Scotiabank Annual Report
Consolidated Financial Statements
For long duration contracts, the Bank recognizes probability-weighted discounted fulfilment cashflows and a risk adjustment for
non-financial
risk for groups of contracts. To the extent that those groups of contracts are expected to be profitable, a contractual service margin liability is recognized on the Consolidated Statement of Financial Position which represents unearned profits that will be recognized in the Consolidated Statement of Income in the future over the life of the contract.
Insurance revenue is earned over the period the Bank provides insurance coverage and as risk is released. For all insurance contracts, losses on onerous contracts are recognized in income immediately.
A guarantee is a contract that contingently requires the Bank to make specified payments to reimburse the holder for a loss it incurs because a specified debtor failed to make payment when due in accordance with the original or modified terms of a debt instrument. Guarantees include standby letters of credit, letters of guarantee, indemnifications, credit enhancements and other similar contracts. Guarantees that qualify as a derivative are accounted for in accordance with the policy for derivative instruments. For guarantees that do not qualify as a derivative, a liability is recorded for the fair value of the obligation assumed at inception. The fair value of the obligation at inception is generally based on the discounted cash flow of the premium to be received for the guarantee, resulting in a corresponding asset. Subsequent to initial recognition, such guarantees are measured at the higher of the initial amount, less amortization to recognize any fee income earned over the period, and the best estimate of the amount required to settle any financial obligation arising as a result of the guarantee. Any increase in the liability is reported in the Consolidated Statement of Income.
The Bank provides pension and other benefit plans for eligible employees globally. Pension benefits are offered in the form of defined benefit pension plans (generally based on an employee’s length of service and earnings) and defined contribution pension plans (where the Bank’s contribution is fixed and there is no legal or constructive obligation to pay further amounts). Other benefits provided include post-retirement health care, dental care and life insurance, along with other long-term employee benefits, such as long-term disability benefits.
Defined benefit pension plans and other post-retirement benefit plans
The cost of these employee benefits is actuarially determined each year using the projected unit credit method. The calculation uses management’s best estimate of a number of assumptions, including the discount rate, future compensation, health care costs, mortality, as well as the retirement age of employees. The most significant assumption is the discount rate used to determine the defined benefit obligation, which is set by reference to the yields on high quality corporate bonds that have durations that match the terms of the Bank’s obligations. Separate discount rates are used to determine the annual benefit expense in Canada and the U.S. These rates are determined with reference to the yields on high quality corporate bonds with durations that match the various components of the annual benefit expense. The discount rate used to determine the annual benefit expense for all other plans is the same as the rate used to determine the defined benefit obligation.
The Bank’s net asset or liability in respect of employee benefit plans is calculated separately for each plan as the difference between the present value of future benefits earned in respect of service for prior periods and the fair value of plan assets. The net asset or liability is included in other assets and other liabilities, as appropriate, in the Consolidated Statement of Financial Position. When the net amount in the Consolidated Statement of Financial Position is an asset, the recognized asset is limited to the present value of any economic benefits available in the form of refunds from the plan or reductions in future contributions to the plan.
The current service cost, net interest expense (income), past service cost (credit), settlement gain (loss) and administrative expense are recognized in net income. Net interest expense (income) is calculated by applying the discount rate to the net defined benefit asset or liability. When the benefits of a plan are improved (reduced), a past service cost (credit) is recognized immediately in net income.
Remeasurements comprising of actuarial gains and losses, the effect of the asset ceiling and the return on plan assets in excess of or less than the interest income on the fair value of assets are recognized immediately in the Consolidated Statement of Financial Position, with a charge or credit to the Statement of Other Comprehensive Income (OCI) in the period in which they occur. Amounts recorded in OCI are not recycled to the Consolidated Statement of Income.
Other long-term employee benefits
Other long-term employee benefits are accounted for similarly to defined benefit pension plans and other post-retirement benefit plans described above, except that remeasurements are recognized in the Consolidated Statement of Income in the period in which they arise.
Defined contribution plans
The costs of such plans are equal to contributions payable by the Bank to employees’ accounts for service rendered during the period and expensed.
Short-term employee benefits
Short-term employee benefits are expensed as the related service is provided and a liability is measured on an undiscounted basis net of payments made.
Interest and similar income and expenses
For all
non-trading
interest-bearing financial instruments, interest income or expense is recorded in net interest income using the effective interest rate. This is the rate that exactly discounts estimated future cash payments or receipts through the expected life of the financial instrument or a shorter period, where appropriate, to the gross carrying amount of the financial asset or financial liability. The calculation takes into account all the contractual terms of the financial instrument (for example, prepayment options) and includes any fees or incremental costs that are directly attributable to the instrument and are an integral part of the effective interest rate, but not future credit losses.
For trading financial instruments,
changes including related interest income or expense are recorded in
non-interest
income – trading revenues.
The carrying amount of interest-bearing financial instruments, measured at amortized cost or classified as FVOCI, is adjusted if the Bank revises its estimates of payments or receipts. The adjusted carrying amount is calculated based on the original effective interest rate and the change in carrying amount is recorded as
non-interest
income in the Consolidated Statement of Income.
2025 Scotiabank Annual Report
|
Consolidated Financial Statements
Once the carrying value of a financial asset or a group of similar financial assets has been reduced due to an impairment loss, interest income continues to be recognized based on net effective interest rate inherent in the investment.
Loan origination costs are deferred and amortized into interest income using the effective interest method over the expected term of the loan. Loan fees are recognized in interest income over the appropriate lending or commitment period. Mortgage prepayment fees are recognized in interest income when received, unless they relate to a minor modification to the terms of the mortgage, in which case the fees are deferred and amortized using the effective interest method over the remaining period of the original mortgage.
Loan syndication fees are deferred and amortized in interest income over the term of the loan where the yield the Bank retains is less than that of the comparable lenders in the syndicate.
Loan commitment fees for loans that are likely to be drawn down and other credit related fees are deferred (together with any incremental costs) and recognized as part of the interest income on the loan. When it is unlikely that a loan will be drawn down, the loan commitment fees are recognized in
non-interest
income.
Fee and commission revenues
Revenue is recognized once the Bank’s customer has obtained control of the service. The transfer of control occurs when the Bank’s customer has the ability to direct the use of and obtain the benefits of the banking services and the contractual performance obligation to the customer has been satisfied. The Bank records revenue gross of expenses where it is the principal in performing a service to the customer and net of expenses where the Bank is an agent for these services. The assessment of principal or agent requires judgement on the basis of whether the Bank controls the services before they are transferred to the customer. From time to time, the Bank may receive variable consideration such as performance fees. These fees are only recognized when it is highly probable that the Bank will not need to reverse a significant amount of revenue.
Card revenues include interchange fees, annual fees and other card related fees. Interchange fees are calculated as a percentage of the transaction and are recognized on the transaction date. Annual fees are recognized in income over 12 months. Other card fees are transaction-based and are recognized on the transaction date.
The Bank operates various loyalty points programs, which allow customers to accumulate points when using the Bank’s products and services. Loyalty point liabilities are subject to periodic remeasurement to reflect the expected cost of redemption. Where the customer has the option to redeem points for statement credits, the cost of the loyalty program is presented net of card fees. Where points can only be redeemed for goods or services, interchange revenue allocated to the loyalty rewards is recognized when the rewards are redeemed. Reward costs are recorded in
non-interest
expenses.
Banking services fees consist of fees earned on personal, business and government deposit activities. Personal deposit-related fees consist of account maintenance and various transaction-based services. Business and government deposit-related fees consist of commercial deposit and treasury management services and other cash management services. These fees are recognized on the transaction date or over time as services are provided to the customer.
Credit fees include fees earned for providing letters of credit and guarantee, loan commitments, bankers’ acceptances, and for arranging loan syndications. These fees are recognized on the transaction date or over time as services are provided based on contractual agreements with the customer.
Mutual funds fees include management and administration fees which are earned in the Bank’s wealth management business. These fees are calculated as a percentage of the fund’s net asset value and recognized as the service is provided. From time to time, the Bank may also recognize performance fees from some funds. These fees are only recognized to the extent that it is highly probable that a significant reversal of revenue will not occur.
Brokerage fees relate to fees earned for providing full-service and discount brokerage services to clients. These fees are contractually agreed and can be asset-based or linked to individual transactions. Such fees are recognized as the service is provided to clients or on the trade date.
Investment management and trust fees include administration, trust services and other investment services provided to clients. These fees are contractually agreed upon and can be linked to portfolio values or individual transactions. Such fees are recognized as the service is provided to clients to the extent that it is highly probable that a significant reversal of revenue will not occur.
Underwriting and other advisory fees relate to fees earned for services provided to clients in relation to the placement of debt and equities. Such fees also include services to clients for mergers, acquisitions, financial restructurings and other corporate finance activities. These fees are recognized when the service has been performed and/or contractual milestones are completed. Performance and completion fees are variable consideration and generally contingent on the successful completion of a transaction.
Other fees and commissions include commissions earned on the sale of third party insurance products to the Bank’s customers. Such fees and commissions are recognized when the performance obligation is completed.
Fee and commission expenses
Fee and commission expenses relate to transaction and service fees which are expensed as the services are received.
Dividend income on equity securities is recognized when the Bank’s right to receive payment is established, which is on the
ex-dividend
date for listed equity securities.
Share-based payments awarded to employees are recognized as compensation expense in the Consolidated Statement of Income over the vesting period based on the number of awards expected to vest, including the impact of expected forfeitures. For awards that are delivered in tranches, each tranche is considered a separate award and accounted for separately.
Plain vanilla options and other awards that must be settled for shares are classified as equity awards. Equity-classified awards are expensed based on the grant date fair value with a corresponding increase to equity – other reserves in the Consolidated Statement of Financial Position. If an option is exercised, both the exercise price proceeds together with the amount recorded in other reserves is credited to equity – common shares in the Consolidated Statement of Financial Position.
|
2025 Scotiabank Annual Report
Consolidated Financial Statements
Stock appreciation rights and other awards that must be settled for cash are classified as liabilities. Liability-classified awards are remeasured to fair value at each reporting date while they remain outstanding, with any changes in fair value recognized in compensation expense in the period. The liability is expensed over the vesting period, which incorporates the remeasurement of the fair value and a revised forfeiture rate that anticipates units expected to vest.
For plain vanilla options and stock appreciation rights, the Bank estimates fair value using an option pricing model. The option pricing model requires inputs such as the exercise price of the option, the current share price, the risk-free interest rate, expected dividends, expected volatility (calculated using an equal weighting of implied and historical volatility) and specific employee exercise behaviour patterns based on statistical data. For other awards, fair value is the quoted market price of the Bank’s common shares at the reporting date.
Where derivatives are used to economically hedge share-based payment expense, related
gains and losses are included in
non-interest
expenses – salaries and employee benefits in the Consolidated Statement of Income.
Dividends on common and preferred shares and other equity instruments are recognized as a liability and deducted from equity when they are declared and no longer at the discretion of the Bank.
Management’s internal view is the basis for the determination of operating segments. The operating segments are those whose operating results are regularly reviewed by the Bank’s chief operating decision-maker to make decisions about resources to be allocated to the segment and assess its performance. The Bank has four operating segments: Canadian Banking, International Banking, Global Wealth Management and Global Banking and Markets. The Other category represents smaller operating segments, including Group Treasury and other corporate items, which are not allocated to an operating segment. These segments offer different products and services and are managed separately based on the Bank’s management and internal reporting structure.
The results of these business segments are based upon the internal financial reporting systems of the Bank. The accounting policies used in these segments are generally consistent with those followed in the preparation of the consolidated financial statements by the Bank. The only notable accounting measurement difference is the grossing up of revenues which are
tax-exempt
and income from associate corporations to an equivalent
before-tax
basis for those affected segments. This change in measurement enables comparison of income arising from taxable and
tax-exempt
sources.
Given the complexity of the Bank, various estimates and allocation methodologies are used in the preparation of the business segment financial information. The funding value of assets and liabilities is transfer-priced at wholesale market rates, and corporate expenses are allocated to each segment on an equitable basis using various parameters. As well, capital is apportioned to the business segments on a risk-based methodology. Transactions between segments are recorded within segment results as if conducted with a third-party and are eliminated on consolidation.
Basic EPS is computed by dividing net income for the period attributable to the Bank’s common shareholders by the weighted-average number of common shares outstanding during the period.
Diluted EPS is calculated by dividing adjusted net income for the period attributable to common shareholders by the weighted-average number of diluted common shares outstanding for the period. In the calculation of diluted earnings per share, earnings are adjusted for changes in income or expenses that would result from the issuance of dilutive shares. The weighted-average number of diluted common shares outstanding for the period reflects the potential dilution that would occur if options, securities or other contracts that entitle their holders to obtain common shares had been outstanding from the beginning of the period (or a later date) to the end of the period (or an earlier date). Instruments determined to have an antidilutive impact for the period are excluded from the calculation of diluted EPS.
The number of additional shares for inclusion in diluted EPS for share-based payment options is determined using the treasury share method. Under this method, the net number of incremental common shares is determined by assuming that
stock options are exercised and the proceeds are used to purchase common shares at the average market price during the period.
The number of additional shares associated with capital instruments that potentially result in the issuance of common shares is based on the terms of the contract. On occurrence of contingencies as specified in the
Non-Viability
Contingent Capital (NVCC) instruments, the number of additional common shares associated with the NVCC subordinated debentures, NVCC subordinated additional Tier 1 capital notes, NVCC limited recourse capital notes and NVCC preferred shares is based on an automatic conversion formula as set out in the respective prospectus supplements.
|
Future Accounting Developments |
The Bank actively monitors developments and changes in accounting standards from the IASB, as well as requirements from the other regulatory bodies, including OSFI. The Bank is currently assessing the impact of adoption of new standards issued by the IASB on its consolidated financial statements and also evaluating the alternative elections available on transition.
Effective November 1, 2026
IFRS 9
and IFRS 7
– Amendments
On May 30, 2024, the IASB issued “Amendments to the Classification and Measurement of Financial Instruments (Amendments to IFRS 9 and IFRS 7)” to address post-implementation review findings of IFRS 9
.
The amendments introduce an accounting policy choice to derecognize financial liabilities settled through an electronic payment system before the settlement date upon meeting certain conditions. The amendments clarify the assessment of contractual cash flow characteristics of financial assets based on contingent events, such as interest rates linked to environmental, social and governance (ESG) targets, the treatment of
non-recourse
assets, and contractually linked instruments. The amendments introduce new disclosure requirements for financial instruments with contractual terms that can change cash flows due to events not directly related to changes in basic lending risks, such as certain loans subject to ESG targets. Additionally, the amendments change some of the disclosure requirements for equity instruments designated at fair value through other comprehensive income.
2025 Scotiabank Annual Report
|
Consolidated Financial Statements
The amendments are effective for the Bank on November 1, 2026, and early adoption is permitted. The Bank is required to apply the amendments retrospectively but is not required to restate prior periods. The Bank is currently assessing the impact of these amendments.
Effective November 1, 2027
IFRS 18
Presentation and Disclosure in Financial Statements
The IASB issued IFRS 18
Presentation and Disclosure in Financial Statements
on April 9, 2024, to replace IAS 1
Presentation of Financial Statements
and is effective for annual periods beginning on or after January 1, 2027. IFRS 18 introduces a defined structure for the presentation of the statement of income, including required totals and subtotals, as well as aggregating and disaggregating principles to categorize financial information. The standard also requires all Management-defined performance measures to be disclosed in the notes to the financial statements.
IFRS 18 will be effective for the Bank on November 1, 2027, with early adoption permitted. The Bank is currently assessing the impact of this new standard.
|
Cash and Deposits with Financial Institutions |
|
|
|
|
|
|
|
|
|
| As at October 31 ($ millions) |
|
|
|
|
2024 |
|
Cash and non-interest-bearing deposits with financial institutions |
|
|
|
|
|
$ |
9,406 |
|
| Interest-bearing deposits with financial institutions |
|
|
|
|
|
|
54,454 |
|
| Total |
|
|
|
|
|
$ |
63,860 |
(1) |
| (1) |
Net of allowances of $4 (2024 – $3). |
The Bank is required to maintain balances with central banks, other regulatory authorities and certain counterparties. These amounted to $6,759 million (2024 – $5,322 million) and are included above.
|
Fair Value of Financial Instruments |
Determination of fair value
The calculation of fair value is based on market conditions at a specific point in time and therefore may not be reflective of future fair values. The Bank has controls and processes in place to ensure that the valuation of financial instruments is appropriately determined.
The Bank discloses the classification of all financial instruments carried at fair value in a hierarchy based on the determination of fair value. The best evidence of fair value for a financial instrument is the quoted price in an active market. Fair value based on unadjusted quoted market prices for identical instruments in active markets represents a Level 1 valuation. Where possible, valuations are based on quoted prices or observable inputs obtained from active markets.
Independent Price Verification (IPV) is undertaken to assess the accuracy of prices and inputs used in the determination of fair value. The IPV process is performed by price verification groups that are independent of the business. The Bank maintains a list of approved pricing sources that are used in the IPV process. These sources include, but are not limited to, brokers, exchanges and pricing services. The valuation policies relating to the IPV process require that all pricing or rate sources used be external to the Bank. At least annually, an independent assessment of pricing or rate sources is performed to determine the market presence and reliability of market levels.
Quoted prices are not always available for
(OTC) transactions as well as for transactions in inactive or illiquid markets. OTC transactions are valued using internal models that maximize the use of observable inputs to estimate fair value. The chosen valuation technique incorporates all the factors that market participants would take into account in pricing a transaction. When fair value is based on all significant market observable inputs, the valuation is classified as Level 2. Financial instruments traded in a less active market can be valued using indicative market prices, the present value of cash flows or other valuation techniques. Fair value estimates normally do not consider forced or liquidation sales.
Where financial instruments trade in inactive markets or when using models where observable parameters do not exist, significant management judgment is required for valuation methodologies and model inputs. Valuations that require the significant use of unobservable inputs are considered Level 3.
The specific inputs and valuation techniques used in determining the fair value of financial instruments are noted below. For Level 3 instruments, additional information is disclosed in the Level 3 sensitivity analysis on page 173.
The fair values of cash and deposits with banks, securities purchased under resale agreements and securities borrowed, customers’ liability under acceptances, obligations related to securities sold under repurchase agreements and securities lent, acceptances, and obligations related to securities sold short are assumed to approximate their carrying values, either due to their short-term nature or because they are frequently repriced to current market rates.
Trading loans are comprised of loans that serve as hedges to total return swaps, hedges for precious metal certificate liabilities and loans subject to sale through syndication. Trading loans that serve as hedges to loan-based credit total return swaps and precious metals certificate liabilities are valued using consensus prices from Bank approved independent pricing services. The fair value of loans subject to sale through syndication approximates their carrying value due to the short-term nature of these loans.
Government issued or guaranteed securities
The fair values of government issued or guaranteed debt securities are primarily based on unadjusted quoted prices in active markets, where available. Where quoted prices in active markets are not available, the fair value is determined by utilizing recent transaction prices, reliable broker quotes, or pricing services, which derive fair values using only observable valuation inputs, which are significant to the fair values.
|
2025 Scotiabank Annual Report
Consolidated Financial Statements
For securities for which quoted prices are not available, the Bank uses a discounted cash flow method, using the effective yield of a similar instrument adjusted for instrument-specific risk factors that are observable inputs such as credit spread and contracted features.
Corporate and other debt securities are valued using unadjusted quoted prices from independent market data providers or third-party broker quotes from an active market. Where direct prices from active markets are not available, the valuation is performed with a yield-based valuation approach. In some instances, interpolated yields of similar bonds are used to price securities. The Bank uses pricing models with observable inputs from market sources such as credit spread, and interest rate curves. These inputs are verified through an IPV process on a monthly basis.
For certain securities where there is no active market, no consensus market pricing and no indicative or executable independent third-party quotes, the Bank uses pricing by third-party providers or internal pricing models and cannot readily observe the significant inputs used to price such instruments.
Mortgage-backed securities
The fair value of residential mortgage-backed securities is primarily determined using broker quotes and independent market data providers. In limited circumstances, an internal price-based model may be used with the unobservable inputs that are significant to the fair value.
The fair value of equity securities is based on unadjusted quoted prices in active markets, where available. Where equity securities are less frequently traded, the most recent exchange-quoted pricing is used to determine fair value.
For private equity securities, where quoted prices in active markets are not readily available, the fair value is determined as a multiple of the underlying earnings or percentage of underlying net asset value obtained from third-party general partner statements.
Fair values of exchange-traded derivatives are based on unadjusted quoted market prices from an active market. Fair values of
(OTC) derivatives or inactive exchange-traded derivatives are determined using pricing models, which take into account observable valuation inputs such as current market and contractual prices of the underlying instruments, as well as time value and yield curve or volatility factors underlying the positions. The determination of the fair value of derivatives includes consideration of credit risk, estimated funding costs and ongoing direct costs over the life of the instruments.
Derivative products valued using a valuation technique with market-observable inputs mainly include interest rate swaps and options, currency swaps and forward foreign exchange contracts. The most frequently applied valuation techniques include forward pricing and swap models, using present value calculations. The models incorporate various inputs including foreign exchange spot, forward rates and interest rate curves.
Derivative products valued using a valuation technique with significant unobservable inputs, such as volatility, correlation, and forward curves, may include long dated contracts (interest rate swaps, currency swaps, option contracts, commodity contracts and certain credit default swaps) and other derivative products that reference a basket of assets.
The estimated fair value of loans carried at amortized cost reflects changes in the general level of interest rates and creditworthiness of borrowers that have occurred since the loans were originated or purchased. The particular valuation methods used are as follows:
| |
• |
|
Canadian fixed rate residential mortgages are fair valued by discounting the expected future contractual cash flows, taking into account expected prepayments and using management’s best estimate of average market interest rates currently offered for mortgages with similar remaining terms. |
| |
• |
|
For fixed rate business and government loans, fair value is determined by discounting the expected future contractual cash flows at market interest rates for loans with similar credit risks. |
| |
• |
|
For all other fixed rate loans, fair value is determined by discounting the expected future contractual cash flows of these loans at market interest rates. |
| |
• |
|
For all floating rate loans fair value is assumed to equal carrying value. |
The fair value of loans is not adjusted for the value of any credit protection the Bank has purchased to mitigate credit risk.
The fair values of deposits payable on demand or after notice or floating rate deposits payable on a fixed date is assumed to equal carrying value.
The estimated fair values of Canadian personal fixed rate deposits payable on a fixed date are fair valued by discounting the expected future contractual cash outflows, using management’s best estimate of average market interest rates currently offered for deposits with similar remaining terms.
Deposits under the Canada Mortgage Bond (CMB) program are fair valued by discounting expected future contractual cash flows using market observable inputs.
For all other fixed rate deposits, fair value is determined by discounting the expected future contractual cash flows of these deposits at interest rates currently offered for deposits with similar terms.
For structured notes containing embedded features that are bifurcated from plain vanilla notes, the fair value of the embedded derivatives is determined using option pricing models with observable inputs similar to other interest rate or equity derivative contracts.
Certain deposits that are designated at FVTPL are structured notes. Their coupon or repayment terms can be linked to the performance of market parameters such as interest rates, equities, and foreign currencies. The fair value of these structured notes is determined using models which incorporate observable market inputs, such as interest rate curves, equity prices, equity volatility and foreign exchange rates. Some structured notes may have significant unobservable inputs to model valuation such as interest rate volatility and equity correlation.
Obligations related to securities sold short
The fair values of these obligations are based on the fair value of the underlying securities, which can include debt or equity securities. The method used to determine fair value is based on the quoted market prices where available in an active market.
2025 Scotiabank Annual Report
|
Consolidated Financial Statements
Subordinated debentures and other liabilities
The fair values of subordinated debentures, including debentures issued by subsidiaries which are included in other liabilities, are determined by reference to quoted market prices where available or market prices for debt with similar terms and risks. The fair values of other liabilities are determined by the discounted contractual cash flow method with appropriate currency swap curves for the remaining term or market prices for instruments with similar terms and risks.
Fair value of financial instruments
The following table sets out the fair values of financial instruments of the Bank using the valuation methods and assumptions described above. The fair values disclosed do not include
non-financial
assets, such as property and equipment, investments in associates, precious metals, goodwill and other intangible assets.
|
|
|
|
|
|
|
|
|
|
|
|
|
|
|
|
|
| |
|
|
|
|
2024 |
|
| As at October 31 ($ millions) |
|
|
|
|
|
|
|
Total
fair
value |
|
|
Total
carrying
value |
|
|
|
|
|
|
|
|
|
|
|
|
|
|
|
|
|
|
Cash and deposits with financial institutions |
|
|
|
|
|
|
|
|
|
$ |
63,860 |
|
|
$ |
63,860 |
|
Trading assets |
|
|
|
|
|
|
|
|
|
|
129,727 |
|
|
|
129,727 |
|
Securities purchased under resale agreements and securities borrowed |
|
|
|
|
|
|
|
|
|
|
200,543 |
|
|
|
200,543 |
|
Derivative financial instruments |
|
|
|
|
|
|
|
|
|
|
44,379 |
|
|
|
44,379 |
|
Investment securities – FVOCI and FVTPL |
|
|
|
|
|
|
|
|
|
|
123,420 |
|
|
|
123,420 |
|
Investment securities – Amortized cost |
|
|
|
|
|
|
|
|
|
|
28,422 |
|
|
|
29,412 |
|
Loans |
|
|
|
|
|
|
|
|
|
|
757,825 |
|
|
|
760,829 |
|
Customers’ liability under acceptances |
|
|
|
|
|
|
|
|
|
|
148 |
|
|
|
148 |
|
Other financial assets |
|
|
|
|
|
|
|
|
|
|
22,467 |
|
|
|
22,467 |
|
|
|
|
|
|
|
|
|
|
|
|
|
|
|
|
|
|
Deposits |
|
|
|
|
|
|
|
|
|
|
941,290 |
|
|
|
943,849 |
|
Financial instruments designated at fair value through profit or loss |
|
|
|
|
|
|
|
|
|
|
36,341 |
|
|
|
36,341 |
|
Acceptances |
|
|
|
|
|
|
|
|
|
|
149 |
|
|
|
149 |
|
Obligations related to securities sold short |
|
|
|
|
|
|
|
|
|
|
35,042 |
|
|
|
35,042 |
|
Derivative financial instruments |
|
|
|
|
|
|
|
|
|
|
51,260 |
|
|
|
51,260 |
|
Obligations related to securities sold under repurchase agreements and
securities lent |
|
|
|
|
|
|
|
|
|
|
190,449 |
|
|
|
190,449 |
|
Subordinated debentures |
|
|
|
|
|
|
|
|
|
|
7,814 |
|
|
|
7,833 |
|
Other financial liabilities |
|
|
|
|
|
|
|
|
|
|
53,342 |
|
|
|
53,387 |
|
Changes in interest rates, credit spreads and liquidity costs are the main cause of changes in the fair value of the Bank’s financial instruments resulting in a favourable or unfavourable variance compared to carrying value. For the Bank’s financial instruments carried at cost or amortized cost, the carrying value is not adjusted to reflect increases or decreases in fair value due to market fluctuations, including those due to interest rate changes. For FVOCI investment securities, derivatives and financial instruments measured at FVTPL or designated as fair value through profit or loss, the carrying value is adjusted regularly to reflect the fair value.
|
2025 Scotiabank Annual Report
Consolidated Financial Statements
The following table outlines the fair value hierarchy of instruments carried at fair value on a recurring basis and of instruments not carried at fair value.
|
|
|
|
|
|
|
|
|
|
|
|
|
|
|
|
|
|
|
|
|
|
|
|
|
|
|
|
|
|
|
|
|
| |
|
|
|
|
2024 |
|
| As at October 31 ($ millions) |
|
|
|
|
|
|
|
|
|
|
|
|
|
Level 1 |
|
|
Level 2 |
|
|
Level 3 |
|
|
Total |
|
Instruments carried at fair value on a recurring basis: |
|
|
|
|
|
|
|
|
|
|
|
|
|
|
|
|
|
|
|
|
|
|
|
|
|
|
|
|
|
|
|
|
Assets: |
|
|
|
|
|
|
|
|
|
|
|
|
|
|
|
|
|
|
|
|
|
|
|
|
|
|
|
|
|
|
|
|
|
|
|
|
|
|
|
|
|
|
|
|
|
|
|
|
|
|
$ |
– |
|
|
$ |
2,540 |
|
|
$ |
– |
|
|
$ |
2,540 |
|
Trading assets |
|
|
|
|
|
|
|
|
|
|
|
|
|
|
|
|
|
|
|
|
|
|
|
|
|
|
|
|
|
|
|
|
Loans |
|
|
|
|
|
|
|
|
|
|
|
|
|
|
|
|
|
|
– |
|
|
|
7,649 |
|
|
|
– |
|
|
|
7,649 |
|
Canadian federal government and government guaranteed debt |
|
|
|
|
|
|
|
|
|
|
|
|
|
|
|
|
|
|
11,229 |
|
|
|
3,742 |
|
|
|
– |
|
|
|
14,971 |
|
Canadian provincial and municipal debt |
|
|
|
|
|
|
|
|
|
|
|
|
|
|
|
|
|
|
6,228 |
|
|
|
2,185 |
|
|
|
– |
|
|
|
8,413 |
|
U.S. treasury and other U.S. agencies’ debt |
|
|
|
|
|
|
|
|
|
|
|
|
|
|
|
|
|
|
15,050 |
|
|
|
– |
|
|
|
– |
|
|
|
15,050 |
|
Other foreign governments’ debt |
|
|
|
|
|
|
|
|
|
|
|
|
|
|
|
|
|
|
422 |
|
|
|
9,932 |
|
|
|
– |
|
|
|
10,354 |
|
Corporate and other debt |
|
|
|
|
|
|
|
|
|
|
|
|
|
|
|
|
|
|
4,940 |
|
|
|
6,990 |
|
|
|
4 |
|
|
|
11,934 |
|
Equity securities |
|
|
|
|
|
|
|
|
|
|
|
|
|
|
|
|
|
|
59,081 |
|
|
|
88 |
|
|
|
21 |
|
|
|
59,190 |
|
Other |
|
|
|
|
|
|
|
|
|
|
|
|
|
|
|
|
|
|
– |
|
|
|
2,166 |
|
|
|
– |
|
|
|
2,166 |
|
|
|
|
|
|
|
|
|
|
|
|
|
|
|
|
|
|
|
$ |
96,950 |
|
|
$ |
32,752 |
|
|
$ |
25 |
|
|
$ |
129,727 |
|
|
|
|
|
|
|
|
|
|
|
|
|
|
|
|
|
|
|
|
|
|
|
|
|
|
|
|
|
|
|
|
|
|
Canadian federal government and government guaranteed debt |
|
|
|
|
|
|
|
|
|
|
|
|
|
|
|
|
|
$ |
12,739 |
|
|
$ |
8,801 |
|
|
$ |
– |
|
|
$ |
21,540 |
|
Canadian provincial and municipal debt |
|
|
|
|
|
|
|
|
|
|
|
|
|
|
|
|
|
|
12,823 |
|
|
|
4,702 |
|
|
|
– |
|
|
|
17,525 |
|
U.S. treasury and other U.S. agencies’ debt |
|
|
|
|
|
|
|
|
|
|
|
|
|
|
|
|
|
|
39,999 |
|
|
|
6,377 |
|
|
|
– |
|
|
|
46,376 |
|
Other foreign governments’ debt |
|
|
|
|
|
|
|
|
|
|
|
|
|
|
|
|
|
|
3,940 |
|
|
|
25,346 |
|
|
|
– |
|
|
|
29,286 |
|
Corporate and other debt |
|
|
|
|
|
|
|
|
|
|
|
|
|
|
|
|
|
|
133 |
|
|
|
3,359 |
|
|
|
35 |
|
|
|
3,527 |
|
Equity securities |
|
|
|
|
|
|
|
|
|
|
|
|
|
|
|
|
|
|
2,983 |
|
|
|
317 |
|
|
|
1,866 |
|
|
|
5,166 |
|
|
|
|
|
|
|
|
|
|
|
|
|
|
|
|
|
|
|
$ |
72,617 |
|
|
$ |
48,902 |
|
|
$ |
1,901 |
|
|
$ |
123,420 |
|
Derivative financial instruments |
|
|
|
|
|
|
|
|
|
|
|
|
|
|
|
|
|
|
|
|
|
|
|
|
|
|
|
|
|
|
|
|
Interest rate contracts |
|
|
|
|
|
|
|
|
|
|
|
|
|
|
|
|
|
$ |
– |
|
|
$ |
11,584 |
|
|
$ |
– |
|
|
$ |
11,584 |
|
Foreign exchange and gold contracts |
|
|
|
|
|
|
|
|
|
|
|
|
|
|
|
|
|
|
– |
|
|
|
26,004 |
|
|
|
– |
|
|
|
26,004 |
|
Equity contracts |
|
|
|
|
|
|
|
|
|
|
|
|
|
|
|
|
|
|
150 |
|
|
|
4,313 |
|
|
|
44 |
|
|
|
4,507 |
|
Credit contracts |
|
|
|
|
|
|
|
|
|
|
|
|
|
|
|
|
|
|
– |
|
|
|
180 |
|
|
|
2 |
|
|
|
182 |
|
Commodity contracts |
|
|
|
|
|
|
|
|
|
|
|
|
|
|
|
|
|
|
– |
|
|
|
2,095 |
|
|
|
7 |
|
|
|
2,102 |
|
|
|
|
|
|
|
|
|
|
|
|
|
|
|
|
|
|
|
$ |
150 |
|
|
$ |
44,176 |
|
|
$ |
53 |
|
|
$ |
44,379 |
|
Liabilities: |
|
|
|
|
|
|
|
|
|
|
|
|
|
|
|
|
|
|
|
|
|
|
|
|
|
|
|
|
|
|
|
|
|
|
|
|
|
|
|
|
|
|
|
|
|
|
|
|
|
|
$ |
– |
|
|
$ |
193 |
|
|
$ |
– |
|
|
$ |
193 |
|
Financial liabilities designated at fair
value through profit or loss |
|
|
|
|
|
|
|
|
|
|
|
|
|
|
|
|
|
|
– |
|
|
|
36,341 |
|
|
|
– |
|
|
|
36,341 |
|
Obligations related to securities sold short |
|
|
|
|
|
|
|
|
|
|
|
|
|
|
|
|
|
|
30,721 |
|
|
|
4,319 |
|
|
|
2 |
|
|
|
35,042 |
|
|
|
|
|
|
|
|
|
|
Derivative financial instruments |
|
|
|
|
|
|
|
|
|
|
|
|
|
|
|
|
|
|
|
|
|
|
|
|
|
|
|
|
|
|
|
|
Interest rate contracts |
|
|
|
|
|
|
|
|
|
|
|
|
|
|
|
|
|
|
– |
|
|
|
17,895 |
|
|
|
13 |
|
|
|
17,908 |
|
Foreign exchange and gold contracts |
|
|
|
|
|
|
|
|
|
|
|
|
|
|
|
|
|
|
– |
|
|
|
25,900 |
|
|
|
– |
|
|
|
25,900 |
|
Equity contracts |
|
|
|
|
|
|
|
|
|
|
|
|
|
|
|
|
|
|
139 |
|
|
|
4,687 |
|
|
|
19 |
|
|
|
4,845 |
|
Credit contracts |
|
|
|
|
|
|
|
|
|
|
|
|
|
|
|
|
|
|
– |
|
|
|
46 |
|
|
|
1 |
|
|
|
47 |
|
Commodity contracts |
|
|
|
|
|
|
|
|
|
|
|
|
|
|
|
|
|
|
– |
|
|
|
2,550 |
|
|
|
10 |
|
|
|
2,560 |
|
|
|
|
|
|
|
|
|
|
|
|
|
|
|
|
|
|
|
$ |
139 |
|
|
$ |
51,078 |
|
|
$ |
43 |
|
|
$ |
51,260 |
|
|
|
|
|
|
|
|
|
|
Instruments not carried at fair value (4) : |
|
|
|
|
|
|
|
|
|
|
|
|
|
|
|
|
|
|
|
|
|
|
|
|
|
|
|
|
|
|
|
|
Assets: |
|
|
|
|
|
|
|
|
|
|
|
|
|
|
|
|
|
|
|
|
|
|
|
|
|
|
|
|
|
|
|
|
Investment securities – amortized cost |
|
|
|
|
|
|
|
|
|
|
|
|
|
|
|
|
|
$ |
1,127 |
|
|
$ |
27,295 |
|
|
$ |
– |
|
|
$ |
28,422 |
|
|
|
|
|
|
|
|
|
|
|
|
|
|
|
|
|
|
|
|
– |
|
|
|
– |
|
|
|
399,139 |
|
|
|
399,139 |
|
|
|
|
|
|
|
|
|
|
Liabilities: |
|
|
|
|
|
|
|
|
|
|
|
|
|
|
|
|
|
|
|
|
|
|
|
|
|
|
|
|
|
|
|
|
|
|
|
|
|
|
|
|
|
|
|
|
|
|
|
|
|
|
|
– |
|
|
|
411,838 |
|
|
|
– |
|
|
|
411,838 |
|
Subordinated debentures |
|
|
|
|
|
|
|
|
|
|
|
|
|
|
|
|
|
|
– |
|
|
|
7,814 |
|
|
|
– |
|
|
|
7,814 |
|
Other liabilities |
|
|
|
|
|
|
|
|
|
|
|
|
|
|
|
|
|
|
– |
|
|
|
21,563 |
|
|
|
499 |
|
|
|
22,062 |
|
| (1) |
The fair value of precious metals is determined based on quoted market prices and forward spot prices, where applicable, less the cost to sell. |
| (2) |
Excludes debt investment securities measured at amortized cost of $23,722 (October 31, 2024 – $29,412). |
| (3) |
These amounts represent embedded derivatives bifurcated from structured note liabilities measured at amortized cost. |
| (4) |
Represents the fair value of financial assets and liabilities where the carrying amount is not a reasonable approximation of fair value. |
| (5) |
Represents fixed rate instruments. |
2025 Scotiabank Annual Report
|
Consolidated Financial Statements
Level 3 instrument fair value changes
Financial instruments categorized as Level 3 in the fair value hierarchy as at October 31, 2025, comprised of loans, structured corporate bonds, equity securities and derivatives.
The following table summarizes the changes in Level 3 instruments carried at fair value for the year ended October 31, 2025.
All positive balances represent assets and negative balances represent liabilities. Consequently, positive amounts indicate purchases of assets or settlements of liabilities and negative amounts indicate sales of assets or issuances of liabilities.
|
|
|
|
|
|
|
|
|
|
|
|
|
|
|
|
|
|
|
|
|
|
|
|
|
|
|
|
|
|
|
|
|
| |
|
|
|
| ($ millions) |
|
Fair value
November 1
2024 |
|
|
Gains/(losses) recorded in income (1)
|
|
|
Gains/(losses)
recorded in
OCI |
|
|
Purchases/
Issuances |
|
|
Sales/
Settlements |
|
|
Transfers
into/out of
Level 3 |
|
|
Fair value
October 31
2025 |
|
|
Change in unrealized gains/(losses) recorded in income for instruments still held (2)
|
|
| Trading assets |
|
|
|
|
|
|
|
|
|
|
|
|
|
|
|
|
|
|
|
|
|
|
|
|
|
|
|
|
|
|
|
|
| Loans |
|
$ |
– |
|
|
|
|
|
|
|
|
|
|
|
|
|
|
|
|
|
|
|
|
|
|
|
|
|
|
|
|
|
| Corporate and other debt |
|
|
4 |
|
|
|
|
|
|
|
|
|
|
|
|
|
|
|
|
|
|
|
|
|
|
|
|
|
|
|
|
|
| Equity securities |
|
|
21 |
|
|
|
|
|
|
|
|
|
|
|
|
|
|
|
|
|
|
|
|
|
|
|
|
|
|
|
|
|
|
|
|
25 |
|
|
|
|
|
|
|
|
|
|
|
|
|
|
|
|
|
|
|
|
|
|
|
|
|
|
|
|
|
|
|
|
|
|
|
|
|
|
| Investment securities |
|
|
|
|
|
|
|
|
|
|
|
|
|
|
|
|
|
|
|
|
|
|
|
|
|
|
|
|
|
|
|
|
| Corporate and other debt |
|
|
35 |
|
|
|
|
|
|
|
|
|
|
|
|
|
|
|
|
|
|
|
|
|
|
|
|
|
|
|
|
|
| Equity securities |
|
|
1,866 |
|
|
|
|
|
|
|
|
|
|
|
|
|
|
|
|
|
|
|
|
|
|
|
|
|
|
|
|
|
|
|
|
1,901 |
|
|
|
|
|
|
|
|
|
|
|
|
|
|
|
|
|
|
|
|
|
|
|
|
|
|
|
|
|
|
|
|
|
|
|
|
|
|
| Derivative financial instruments – assets |
|
|
|
|
|
|
|
|
|
|
|
|
|
|
|
|
|
|
|
|
|
|
|
|
|
|
|
|
|
|
|
|
| Interest rate contracts |
|
|
– |
|
|
|
|
|
|
|
|
|
|
|
|
|
|
|
|
|
|
|
|
|
|
|
|
|
|
|
|
|
| Foreign exchange and gold contracts |
|
|
– |
|
|
|
|
|
|
|
|
|
|
|
|
|
|
|
|
|
|
|
|
|
|
|
|
|
|
|
|
|
| Equity contracts |
|
|
44 |
|
|
|
|
|
|
|
|
|
|
|
|
|
|
|
|
|
|
|
|
|
|
|
|
|
|
|
|
|
| Credit contracts |
|
|
2 |
|
|
|
|
|
|
|
|
|
|
|
|
|
|
|
|
|
|
|
|
|
|
|
|
|
|
|
|
|
| Commodity contracts |
|
|
7 |
|
|
|
|
|
|
|
|
|
|
|
|
|
|
|
|
|
|
|
|
|
|
|
|
|
|
|
|
|
|
|
|
|
|
|
|
|
|
| Derivative financial instruments – liabilities |
|
|
|
|
|
|
|
|
|
|
|
|
|
|
|
|
|
|
|
|
|
|
|
|
|
|
|
|
|
|
|
|
| Interest rate contracts |
|
|
(13 |
) |
|
|
|
|
|
|
|
|
|
|
|
|
|
|
|
|
|
|
|
|
|
|
|
|
|
|
|
|
| Equity contracts |
|
|
(19 |
) |
|
|
|
|
|
|
|
|
|
|
|
|
|
|
|
|
|
|
|
|
|
|
|
|
|
|
|
|
| Credit contracts |
|
|
(1 |
) |
|
|
|
|
|
|
|
|
|
|
|
|
|
|
|
|
|
|
|
|
|
|
|
|
|
|
|
|
| Commodity contracts |
|
|
(10 |
) |
|
|
|
|
|
|
|
|
|
|
|
|
|
|
|
|
|
|
|
|
|
|
|
|
|
|
|
|
|
|
|
10 |
|
|
|
|
|
|
|
|
|
|
|
|
|
|
|
|
|
|
|
|
|
|
|
|
|
|
|
|
|
| Obligations related to securities sold short |
|
|
(2 |
) |
|
|
|
|
|
|
|
|
|
|
|
|
|
|
|
|
|
|
|
|
|
|
|
|
|
|
|
|
| Total |
|
$ |
1,934 |
|
|
|
|
|
|
|
|
|
|
|
|
|
|
|
|
|
|
|
|
|
|
|
|
|
|
|
|
|
| (1) |
Gains or losses for items in Level 3 may be offset with losses or gains on related hedges in Level 1 or Level 2. |
| (2) |
These amounts represent the unrealized gains and losses from fair value changes of Level 3 instruments still held at the end of the period that are recorded in the Consolidated Statement of Income. |
| (3) |
Certain unrealized gains and losses on derivative assets and liabilities are largely offset by changes on other instruments included in trading revenues in the Consolidated Statement of Income, since these instruments act as an economic hedge to certain derivative assets and liabilities. |
| (4) |
Certain unrealized gains and losses on interest rate derivative contracts are largely offset by mark-to-market changes on embedded derivatives on certain deposit liabilities in the Consolidated Statement of Income. |
The following table summarizes the changes in Level 3 instruments carried at fair value for the year ended October 31, 2024.
|
|
|
|
|
|
|
|
|
|
|
|
|
|
|
|
|
|
|
|
|
|
|
|
|
|
|
|
|
| |
|
As at October 31, 2024 |
|
| ($ millions) |
|
Fair value
November 1
2023 |
|
|
Gains/(losses) recorded in income (1)
|
|
|
Gains/(losses)
recorded
in OCI |
|
|
Purchases/
Issuances |
|
|
Sales/
Settlements |
|
|
Transfers
into/out of
Level 3 |
|
|
Fair value
October 31
2024 |
|
| Trading assets |
|
|
20 |
|
|
|
(1 |
) |
|
|
– |
|
|
|
44 |
|
|
|
(22 |
) |
|
|
(16 |
) |
|
|
25 |
|
| Investment securities |
|
|
1,749 |
|
|
|
100 |
|
|
|
(25 |
) |
|
|
251 |
|
|
|
(207 |
) |
|
|
33 |
|
|
|
1,901 |
|
| Derivative financial instruments |
|
|
15 |
|
|
|
(11 |
) |
|
|
– |
|
|
|
9 |
|
|
|
(9 |
) |
|
|
6 |
|
|
|
10 |
|
| Obligations related to securities sold short |
|
|
– |
|
|
|
– |
|
|
|
– |
|
|
|
– |
|
|
|
– |
|
|
|
(2 |
) |
|
|
(2 |
) |
| (1) |
Gains or losses for items in Level 3 may be offset with losses or gains on related hedges in Level 1 or Level 2. |
Significant transfers can occur between the fair value hierarchy levels when additional or new information regarding valuation inputs and their refinement and observability becomes available. The Bank recognizes transfers between levels of the fair value hierarchy at the end of the reporting period during which the change has occurred.
The following significant transfers made between Levels 1 and 2 were based on whether the fair value was determined using quoted market prices from an active market.
|
2025 Scotiabank Annual Report
Consolidated Financial Statements
During the year ended October 31, 2025:
| |
• |
|
Trading assets of $620 million, investment securities of $2,310 million and obligations related to securities sold short of $265 million were transferred out of Level 2 into Level 1. |
| |
• |
|
Trading assets of $914 million, investment securities of $1,532 million and obligations related to securities sold short of $268 million were transferred out of Level 1 into Level 2. |
During the year ended October 31, 2024:
| |
• |
|
Trading assets of $1,867 million, investment securities of $3,010 million and obligations related to securities sold short of $396 million were transferred out of Level 2 into Level 1. |
| |
• |
|
Trading assets of $712 million, investment securities of $698 million and obligations related to securities sold short of $6 million were transferred out of Level 1 into Level 2. |
There was
no
significant transfer into and out of Level 3 during the year ended October 31, 2025 and October 31, 2024.
Level 3 sensitivity analysis
The table below sets out information about significant unobservable inputs used in measuring financial instruments categorized as Level 3 in the fair value hierarchy.
|
|
|
|
|
|
|
|
|
|
|
|
|
|
|
|
|
| |
|
Valuation technique |
|
|
|
Significant unobservable inputs |
|
|
|
Range of estimates for unobservable inputs (1)
|
|
|
|
|
Changes in fair value
from reasonably
possible alternatives
($ millions) |
|
|
|
|
|
|
|
|
| Investment securities |
|
|
|
|
|
General Partner valuations |
|
|
|
|
|
|
|
|
|
|
|
|
|
|
|
|
|
|
Private equity securities (2)
|
|
Market comparable |
|
|
|
per net asset value |
|
|
|
|
n/a |
|
|
|
|
(84)/84 |
|
|
|
|
|
|
|
|
| Derivative financial instruments |
|
|
|
|
|
|
|
|
|
|
|
|
|
|
|
|
|
|
|
|
|
|
|
|
| Interest rate contracts |
|
Option pricing |
|
|
|
Interest rate |
|
|
|
|
|
|
|
|
|
|
|
|
model |
|
|
|
volatility |
|
|
|
|
59% - 220% |
|
|
|
|
(1)/1 |
|
|
|
|
|
|
|
|
| Equity contracts |
|
Option pricing |
|
|
|
Equity volatility |
|
|
|
|
5% - 397% |
|
|
|
|
|
|
|
model |
|
|
|
Equity correlation |
|
|
|
|
(114%) - 114% |
|
|
|
|
(45)/45 |
| Commodity contracts |
|
Discounted cash flow |
|
|
|
Forward curves |
|
|
|
|
9% - 15% |
|
|
|
|
(5)/5 |
| (1) |
The range of estimates represents the actual lowest and highest level inputs used to fair value financial instruments within each financial statement category. |
| (2) |
The valuation of private equity securities utilizes net asset values as reported by fund managers. Net asset values are not considered observable as the Bank cannot redeem these instruments at such values. The range for net asset values per unit or price per share has not been disclosed for these instruments since the valuations are not model-based. |
The Bank applies judgment in determining unobservable inputs used to calculate the fair value of Level 3 instruments.
The following section discusses the significant unobservable inputs for Level 3 instruments.
General Partner (GP) Valuations per Net Asset Value
Net asset values provided by GPs represent the fair value of investments in private equity securities.
Correlation becomes an input into equity derivative pricing when the relationship between price movements of two or more of the underlying assets is relevant.
Volatility for equity derivatives is a measure of the underlying price fluctuation. Interest rate volatility measures variability of a security yield or interest rate. Historic volatility is often calculated as the annualized standard deviation of daily price or yield variation for a given time period. Implied volatility is such that, when input into an option pricing model, returns a value equal to the current market value of the option.
Monthly forward curves for commodity contracts are required inputs to valuation. A portion of the forward curves are unobservable.
2025 Scotiabank Annual Report
|
Consolidated Financial Statements
An analysis of the carrying value of trading securities is as follows:
|
|
|
|
|
|
|
|
|
|
|
|
|
|
|
|
|
|
|
|
|
|
|
|
|
|
|
|
|
| As at October 31, 2025 ($ millions) |
|
Remaining term to maturity |
|
|
|
|
| |
|
Within three
months |
|
|
Three to
twelve
months |
|
|
One to
five years |
|
|
Five to ten
years |
|
|
Over ten
years |
|
|
No specific
maturity |
|
|
|
|
| |
|
|
|
|
|
|
|
|
|
|
|
|
|
|
|
|
|
|
|
|
|
|
|
|
|
|
|
|
| Canadian federal government issued or guaranteed debt |
|
|
|
|
|
|
|
|
|
|
|
|
|
|
|
|
|
|
|
|
|
|
|
|
|
|
|
|
| Canadian provincial and municipal debt |
|
|
|
|
|
|
|
|
|
|
|
|
|
|
|
|
|
|
|
|
|
|
|
|
|
|
|
|
| U.S. treasury and other U.S. agency debt |
|
|
|
|
|
|
|
|
|
|
|
|
|
|
|
|
|
|
|
|
|
|
|
|
|
|
|
|
| Other foreign government debt |
|
|
|
|
|
|
|
|
|
|
|
|
|
|
|
|
|
|
|
|
|
|
|
|
|
|
|
|
| Equity securities |
|
|
|
|
|
|
|
|
|
|
|
|
|
|
|
|
|
|
|
|
|
|
|
|
|
|
|
|
| Other |
|
|
|
|
|
|
|
|
|
|
|
|
|
|
|
|
|
|
|
|
|
|
|
|
|
|
|
|
| Total |
|
|
|
|
|
|
|
|
|
|
|
|
|
|
|
|
|
|
|
|
|
|
|
|
|
|
|
|
Total by currency (in Canadian equivalent): |
|
|
|
|
|
|
|
|
|
|
|
|
|
|
|
|
|
|
|
|
|
|
|
|
|
|
|
|
| Canadian dollar |
|
|
|
|
|
|
|
|
|
|
|
|
|
|
|
|
|
|
|
|
|
|
|
|
|
|
|
|
| U.S. dollar |
|
|
|
|
|
|
|
|
|
|
|
|
|
|
|
|
|
|
|
|
|
|
|
|
|
|
|
|
| Mexican peso |
|
|
|
|
|
|
|
|
|
|
|
|
|
|
|
|
|
|
|
|
|
|
|
|
|
|
|
|
| Other currencies |
|
|
|
|
|
|
|
|
|
|
|
|
|
|
|
|
|
|
|
|
|
|
|
|
|
|
|
|
| Total trading securities |
|
|
|
|
|
|
|
|
|
|
|
|
|
|
|
|
|
|
|
|
|
|
|
|
|
|
|
|
|
|
|
| As at October 31, 2024 ($ millions) |
|
Remaining term to maturity |
|
|
|
|
| |
|
Within three
months |
|
|
Three to
twelve
months |
|
|
One to
five years |
|
|
Five to ten
years |
|
|
Over ten
years |
|
|
No specific
maturity |
|
|
|
|
| |
|
|
|
|
|
|
|
|
|
|
|
|
|
|
|
|
|
|
|
|
|
|
|
|
|
|
|
|
| Canadian federal government issued or guaranteed debt |
|
$ |
352 |
|
|
$ |
1,646 |
|
|
$ |
6,182 |
|
|
$ |
3,626 |
|
|
$ |
3,165 |
|
|
$ |
– |
|
|
$ |
14,971 |
|
| Canadian provincial and municipal debt |
|
|
920 |
|
|
|
893 |
|
|
|
1,774 |
|
|
|
937 |
|
|
|
3,889 |
|
|
|
– |
|
|
|
8,413 |
|
| U.S. treasury and other U.S. agency debt |
|
|
1,724 |
|
|
|
2,439 |
|
|
|
7,237 |
|
|
|
2,461 |
|
|
|
1,189 |
|
|
|
– |
|
|
|
15,050 |
|
| Other foreign government debt |
|
|
1,458 |
|
|
|
3,663 |
|
|
|
3,883 |
|
|
|
1,046 |
|
|
|
304 |
|
|
|
– |
|
|
|
10,354 |
|
| Equity securities |
|
|
– |
|
|
|
– |
|
|
|
– |
|
|
|
– |
|
|
|
– |
|
|
|
59,190 |
|
|
|
59,190 |
|
| Other |
|
|
316 |
|
|
|
2,468 |
|
|
|
5,792 |
|
|
|
2,728 |
|
|
|
623 |
|
|
|
7 |
|
|
|
11,934 |
|
| Total |
|
$ |
4,770 |
|
|
$ |
11,109 |
|
|
$ |
24,868 |
|
|
$ |
10,798 |
|
|
$ |
9,170 |
|
|
$ |
59,197 |
|
|
$ |
119,912 |
|
Total by currency (in Canadian equivalent): |
|
|
|
|
|
|
|
|
|
|
|
|
|
|
|
|
|
|
|
|
|
|
|
|
|
|
|
|
| Canadian dollar |
|
$ |
1,570 |
|
|
$ |
3,452 |
|
|
$ |
9,779 |
|
|
$ |
5,029 |
|
|
$ |
7,397 |
|
|
$ |
27,688 |
|
|
$ |
54,915 |
|
| U.S. dollar |
|
|
1,604 |
|
|
|
3,643 |
|
|
|
10,711 |
|
|
|
4,426 |
|
|
|
1,570 |
|
|
|
24,796 |
|
|
|
46,750 |
|
| Mexican peso |
|
|
704 |
|
|
|
1,714 |
|
|
|
2,135 |
|
|
|
101 |
|
|
|
63 |
|
|
|
59 |
|
|
|
4,776 |
|
| Other currencies |
|
|
892 |
|
|
|
2,300 |
|
|
|
2,243 |
|
|
|
1,242 |
|
|
|
140 |
|
|
|
6,654 |
|
|
|
13,471 |
|
| Total trading securities |
|
$ |
4,770 |
|
|
$ |
11,109 |
|
|
$ |
24,868 |
|
|
$ |
10,798 |
|
|
$ |
9,170 |
|
|
$ |
59,197 |
|
|
$ |
119,912 |
|
The following table provides the geographic breakdown of trading loans:
|
|
|
|
|
|
|
|
|
| As at October 31 ($ millions) |
|
|
|
|
2024 |
|
| |
|
|
|
|
|
|
|
|
| |
|
|
|
|
|
$ |
6,154 |
|
| |
|
|
|
|
|
|
458 |
|
| |
|
|
|
|
|
|
980 |
|
| Other |
|
|
|
|
|
|
57 |
|
| Total |
|
|
|
|
|
$ |
7,649 |
|
| (1) |
Geographic segmentation of trading loans is based upon the location of the ultimate risk of the underlying asset. |
| (2) |
Loans are primarily denominated in U.S. dollars. |
| (3) |
Includes trading loans that serve as a hedge to loan-based credit total return swaps. |
| (4) |
Includes trading loans that serve as hedges to total return swaps, hedges for precious metal certificate liabilities and loans subject to sale through syndication. |
|
2025 Scotiabank Annual Report
Consolidated Financial Statements
|
Financial Instruments Designated at Fair Value Through Profit or Loss |
In accordance with its risk management strategy, the Bank has elected to designate certain senior note liabilities at fair value through profit or loss to reduce an accounting mismatch between fair value changes in these instruments and fair value changes in related derivatives, and where a hybrid financial liability contains one or more embedded derivatives that are not closely related to the host contract. Changes in fair value of financial liabilities arising from the Bank’s own credit risk are recognized in other comprehensive income, without subsequent reclassification to net income.
The cumulative fair value adjustment due to own credit risk is determined at a point in time by comparing the present value of expected future cash flows over the term of these liabilities discounted at the Bank’s effective funding rate, and the present value of expected future cash flows discounted at a benchmark rate.
The following table presents the fair value of financial liabilities designated at fair value through profit or loss and their changes in fair value.
|
|
|
|
|
|
|
|
|
|
|
|
|
|
|
|
|
|
|
|
|
|
|
|
|
| |
|
|
|
|
|
|
|
Cumulative change in FV (2)
|
|
| |
|
As at |
|
|
For the year ended |
|
|
|
|
| October 31 ($ millions) |
|
|
|
|
2024 |
|
|
|
|
|
2024 |
|
|
|
|
|
2024 |
|
| Liabilities: |
|
|
|
|
|
|
|
|
|
|
|
|
|
|
|
|
|
|
|
|
|
|
|
|
Senior note liabilities (3)
|
|
|
|
|
|
$ |
36,341 |
|
|
|
|
|
|
$ |
(4,515 |
) |
|
|
|
|
|
$ |
4,140 |
|
| (1) |
Change in the difference between the contractual maturity amount and the carrying value. |
| (2) |
The cumulative change in fair value is measured from the instrument’s date of initial recognition. |
| (3) |
Changes in fair value attributable to changes in the Bank’s own credit risk are recorded in other comprehensive income. Other changes in fair value are recorded in non-interest income – trading revenues. The offsetting fair value changes from associated derivatives is also recorded in non-interest income – trading revenues. |
The following table presents the changes in fair value attributable to changes in the Bank’s own credit risk for financial liabilities designated at fair value through profit or loss as well as their contractual maturity and carrying amounts.
|
|
|
|
|
|
|
|
|
|
|
|
|
|
|
|
|
|
|
|
|
| |
|
Senior Note Liabilities |
|
| ($ millions) |
|
Contractual
maturity
amount |
|
|
Carrying
value |
|
|
Difference
between
contractual
maturity
amount and
carrying value |
|
|
Changes in fair value
for the period
attributable to
changes in own
credit risk recorded
in other
comprehensive
income
Gains/(losses) |
|
|
Cumulative changes in fair value attributable to changes in own credit risk (1)
Gains/(losses) |
|
| As at October 31, 2025 |
|
|
|
|
|
|
|
|
|
|
|
|
|
|
|
|
|
|
|
|
| As at October 31, 2024 |
|
$ |
40,481 |
|
|
$ |
36,341 |
|
|
$ |
4,140 |
|
|
$ |
(804 |
) |
|
$ |
(913 |
) |
| (1) |
The cumulative change in fair value is measured from the instrument’s date of initial recognition. |
2025 Scotiabank Annual Report
|
Consolidated Financial Statements
|
Derivative Financial Instruments |
The following table provides the aggregate notional amounts of derivative financial instruments outstanding by type and segregated between those used by the Bank in its dealer capacity (Trading) and those derivatives designated in hedging relationships. The notional amounts of these contracts represent the derivatives volume outstanding and do not represent the potential gain or loss associated with the market risk or credit risk of such instruments. Credit derivatives within other derivative contracts are comprised primarily of purchased and sold credit default swap transactions. To a lesser extent, this category also includes total return swaps referenced to loans and debt securities. Commodity and other contracts includes energy, precious metals other than gold and other commodities.
|
|
|
|
|
|
|
|
|
|
|
|
|
|
|
|
|
|
|
|
|
|
|
|
|
| |
|
|
|
|
2024 |
|
| As at October 31 ($ millions) |
|
Trading |
|
|
Hedging |
|
|
Total |
|
|
Trading |
|
|
Hedging |
|
|
Total |
|
|
|
|
|
|
|
|
|
|
|
|
|
|
|
|
|
|
|
|
|
|
|
|
|
|
Exchange-traded: |
|
|
|
|
|
|
|
|
|
|
|
|
|
|
|
|
|
|
|
|
|
|
|
|
Futures |
|
|
|
|
|
|
|
|
|
|
|
|
|
$ |
606,019 |
|
|
$ |
– |
|
|
$ |
606,019 |
|
Options purchased |
|
|
|
|
|
|
|
|
|
|
|
|
|
|
5,848 |
|
|
|
– |
|
|
|
5,848 |
|
Options written |
|
|
|
|
|
|
|
|
|
|
|
|
|
|
5,430 |
|
|
|
– |
|
|
|
5,430 |
|
|
|
|
|
|
|
|
|
|
|
|
|
|
|
|
617,297 |
|
|
|
– |
|
|
|
617,297 |
|
|
|
|
|
|
|
|
|
|
|
|
|
|
|
|
|
|
|
|
|
|
|
|
|
|
Forward rate agreements |
|
|
|
|
|
|
|
|
|
|
|
|
|
|
215 |
|
|
|
– |
|
|
|
215 |
|
Swaps |
|
|
|
|
|
|
|
|
|
|
|
|
|
|
427,122 |
|
|
|
53,481 |
|
|
|
480,603 |
|
Options purchased |
|
|
|
|
|
|
|
|
|
|
|
|
|
|
45,572 |
|
|
|
– |
|
|
|
45,572 |
|
Options written |
|
|
|
|
|
|
|
|
|
|
|
|
|
|
49,595 |
|
|
|
– |
|
|
|
49,595 |
|
|
|
|
|
|
|
|
|
|
|
|
|
|
|
|
522,504 |
|
|
|
53,481 |
|
|
|
575,985 |
|
(settled through central counterparties): |
|
|
|
|
|
|
|
|
|
|
|
|
|
|
|
|
|
|
|
|
|
|
|
|
Forward rate agreements |
|
|
|
|
|
|
|
|
|
|
|
|
|
|
86,657 |
|
|
|
– |
|
|
|
86,657 |
|
Swaps |
|
|
|
|
|
|
|
|
|
|
|
|
|
|
5,694,823 |
|
|
|
278,314 |
|
|
|
5,973,137 |
|
Options purchased |
|
|
|
|
|
|
|
|
|
|
|
|
|
|
– |
|
|
|
– |
|
|
|
– |
|
Options written |
|
|
|
|
|
|
|
|
|
|
|
|
|
|
– |
|
|
|
– |
|
|
|
– |
|
|
|
|
|
|
|
|
|
|
|
|
|
|
|
|
5,781,480 |
|
|
|
278,314 |
|
|
|
6,059,794 |
|
Total |
|
|
|
|
|
|
|
|
|
|
|
|
|
$ |
6,921,281 |
|
|
$ |
331,795 |
|
|
$ |
7,253,076 |
|
Foreign exchange and gold contracts |
|
|
|
|
|
|
|
|
|
|
|
|
|
|
|
|
|
|
|
|
|
|
|
|
Exchange-traded: |
|
|
|
|
|
|
|
|
|
|
|
|
|
|
|
|
|
|
|
|
|
|
|
|
Futures |
|
|
|
|
|
|
|
|
|
|
|
|
|
$ |
21,952 |
|
|
$ |
– |
|
|
$ |
21,952 |
|
Options purchased |
|
|
|
|
|
|
|
|
|
|
|
|
|
|
– |
|
|
|
– |
|
|
|
– |
|
Options written |
|
|
|
|
|
|
|
|
|
|
|
|
|
|
– |
|
|
|
– |
|
|
|
– |
|
|
|
|
|
|
|
|
|
|
|
|
|
|
|
|
21,952 |
|
|
|
– |
|
|
|
21,952 |
|
|
|
|
|
|
|
|
|
|
|
|
|
|
|
|
|
|
|
|
|
|
|
|
|
|
Spot and forwards |
|
|
|
|
|
|
|
|
|
|
|
|
|
|
541,732 |
|
|
|
21,156 |
|
|
|
562,888 |
|
Swaps |
|
|
|
|
|
|
|
|
|
|
|
|
|
|
771,246 |
|
|
|
108,558 |
|
|
|
879,804 |
|
Options purchased |
|
|
|
|
|
|
|
|
|
|
|
|
|
|
25,135 |
|
|
|
– |
|
|
|
25,135 |
|
Options written |
|
|
|
|
|
|
|
|
|
|
|
|
|
|
36,390 |
|
|
|
– |
|
|
|
36,390 |
|
|
|
|
|
|
|
|
|
|
|
|
|
|
|
|
1,374,503 |
|
|
|
129,714 |
|
|
|
1,504,217 |
|
(settled through central counterparties): |
|
|
|
|
|
|
|
|
|
|
|
|
|
|
|
|
|
|
|
|
|
|
|
|
Spot and forwards |
|
|
|
|
|
|
|
|
|
|
|
|
|
|
24,865 |
|
|
|
– |
|
|
|
24,865 |
|
Swaps |
|
|
|
|
|
|
|
|
|
|
|
|
|
|
– |
|
|
|
– |
|
|
|
– |
|
Options purchased |
|
|
|
|
|
|
|
|
|
|
|
|
|
|
– |
|
|
|
– |
|
|
|
– |
|
Options written |
|
|
|
|
|
|
|
|
|
|
|
|
|
|
– |
|
|
|
– |
|
|
|
– |
|
|
|
|
|
|
|
|
|
|
|
|
|
|
|
|
24,865 |
|
|
|
– |
|
|
|
24,865 |
|
Total |
|
|
|
|
|
|
|
|
|
|
|
|
|
$ |
1,421,320 |
|
|
$ |
129,714 |
|
|
$ |
1,551,034 |
|
Other derivative contracts |
|
|
|
|
|
|
|
|
|
|
|
|
|
|
|
|
|
|
|
|
|
|
|
|
Exchange-traded: |
|
|
|
|
|
|
|
|
|
|
|
|
|
|
|
|
|
|
|
|
|
|
|
|
Equity |
|
|
|
|
|
|
|
|
|
|
|
|
|
$ |
59,329 |
|
|
$ |
– |
|
|
$ |
59,329 |
|
Credit |
|
|
|
|
|
|
|
|
|
|
|
|
|
|
– |
|
|
|
– |
|
|
|
– |
|
Commodity and other contracts |
|
|
|
|
|
|
|
|
|
|
|
|
|
|
46,304 |
|
|
|
– |
|
|
|
46,304 |
|
|
|
|
|
|
|
|
|
|
|
|
|
|
|
|
105,633 |
|
|
|
– |
|
|
|
105,633 |
|
|
|
|
|
|
|
|
|
|
|
|
|
|
|
|
|
|
|
|
|
|
|
|
|
|
Equity |
|
|
|
|
|
|
|
|
|
|
|
|
|
|
83,455 |
|
|
|
965 |
|
|
|
84,420 |
|
Credit |
|
|
|
|
|
|
|
|
|
|
|
|
|
|
18,086 |
|
|
|
– |
|
|
|
18,086 |
|
Commodity and other contracts |
|
|
|
|
|
|
|
|
|
|
|
|
|
|
36,596 |
|
|
|
– |
|
|
|
36,596 |
|
|
|
|
|
|
|
|
|
|
|
|
|
|
|
|
138,137 |
|
|
|
965 |
|
|
|
139,102 |
|
(settled through central counterparties): |
|
|
|
|
|
|
|
|
|
|
|
|
|
|
|
|
|
|
|
|
|
|
|
|
Equity |
|
|
|
|
|
|
|
|
|
|
|
|
|
|
– |
|
|
|
– |
|
|
|
– |
|
Credit |
|
|
|
|
|
|
|
|
|
|
|
|
|
|
9,069 |
|
|
|
– |
|
|
|
9,069 |
|
Commodity and other contracts |
|
|
|
|
|
|
|
|
|
|
|
|
|
|
251 |
|
|
|
– |
|
|
|
251 |
|
|
|
|
|
|
|
|
|
|
|
|
|
|
|
|
9,320 |
|
|
|
– |
|
|
|
9,320 |
|
Total |
|
|
|
|
|
|
|
|
|
|
|
|
|
$ |
253,090 |
|
|
$ |
965 |
|
|
$ |
254,055 |
|
Total notional amounts outstanding |
|
|
|
|
|
|
|
|
|
|
|
|
|
$ |
8,595,691 |
|
|
$ |
462,474 |
|
|
$ |
9,058,165 |
|
| (1) |
The notional amounts represent the amount to which a rate or price is applied to determine the amount of cash flows to be exchanged. |
|
2025 Scotiabank Annual Report
Consolidated Financial Statements
(b) |
Remaining term to maturity |
The following table summarizes the remaining term to maturity of the notional amounts of the Bank’s derivative financial instruments by type:
|
|
|
|
|
|
|
|
|
|
|
|
|
|
|
|
|
| As at October 31, 2025 ($ millions) |
|
Within one year |
|
|
One to five years |
|
|
Over five years |
|
|
Total |
|
|
|
|
|
|
|
|
|
|
|
|
|
|
|
|
|
|
Futures |
|
|
|
|
|
|
|
|
|
|
|
|
|
|
|
|
Forward rate agreements |
|
|
|
|
|
|
|
|
|
|
|
|
|
|
|
|
Swaps |
|
|
|
|
|
|
|
|
|
|
|
|
|
|
|
|
Options purchased |
|
|
|
|
|
|
|
|
|
|
|
|
|
|
|
|
Options written |
|
|
|
|
|
|
|
|
|
|
|
|
|
|
|
|
|
|
|
|
|
|
|
|
|
|
|
|
|
|
|
|
|
Foreign exchange and gold contracts |
|
|
|
|
|
|
|
|
|
|
|
|
|
|
|
|
Futures |
|
|
|
|
|
|
|
|
|
|
|
|
|
|
|
|
Spot and forwards |
|
|
|
|
|
|
|
|
|
|
|
|
|
|
|
|
Swaps |
|
|
|
|
|
|
|
|
|
|
|
|
|
|
|
|
Options purchased |
|
|
|
|
|
|
|
|
|
|
|
|
|
|
|
|
Options written |
|
|
|
|
|
|
|
|
|
|
|
|
|
|
|
|
|
|
|
|
|
|
|
|
|
|
|
|
|
|
|
|
|
Other derivative contracts |
|
|
|
|
|
|
|
|
|
|
|
|
|
|
|
|
Equity |
|
|
|
|
|
|
|
|
|
|
|
|
|
|
|
|
Credit |
|
|
|
|
|
|
|
|
|
|
|
|
|
|
|
|
Commodity and other contracts |
|
|
|
|
|
|
|
|
|
|
|
|
|
|
|
|
|
|
|
|
|
|
|
|
|
|
|
|
|
|
|
|
|
Total |
|
|
|
|
|
|
|
|
|
|
|
|
|
|
|
|
|
|
|
|
|
| As at October 31, 2024 ($ millions) |
|
Within one year |
|
|
One to five years |
|
|
Over five years |
|
|
Total |
|
|
|
|
|
|
|
|
|
|
|
|
|
|
|
|
|
|
Futures |
|
$ |
478,886 |
|
|
$ |
127,133 |
|
|
$ |
– |
|
|
$ |
606,019 |
|
Forward rate agreements |
|
|
85,447 |
|
|
|
1,217 |
|
|
|
208 |
|
|
|
86,872 |
|
Swaps |
|
|
2,190,218 |
|
|
|
2,760,062 |
|
|
|
1,503,460 |
|
|
|
6,453,740 |
|
Options purchased |
|
|
30,562 |
|
|
|
18,095 |
|
|
|
2,763 |
|
|
|
51,420 |
|
Options written |
|
|
23,960 |
|
|
|
19,897 |
|
|
|
11,168 |
|
|
|
55,025 |
|
|
|
|
2,809,073 |
|
|
|
2,926,404 |
|
|
|
1,517,599 |
|
|
|
7,253,076 |
|
Foreign exchange and gold contracts |
|
|
|
|
|
|
|
|
|
|
|
|
|
|
|
|
Futures |
|
|
16,289 |
|
|
|
5,663 |
|
|
|
– |
|
|
|
21,952 |
|
Spot and forwards |
|
|
543,486 |
|
|
|
38,039 |
|
|
|
6,228 |
|
|
|
587,753 |
|
Swaps |
|
|
210,318 |
|
|
|
455,694 |
|
|
|
213,792 |
|
|
|
879,804 |
|
Options purchased |
|
|
18,121 |
|
|
|
6,788 |
|
|
|
226 |
|
|
|
25,135 |
|
Options written |
|
|
28,533 |
|
|
|
7,662 |
|
|
|
195 |
|
|
|
36,390 |
|
|
|
|
816,747 |
|
|
|
513,846 |
|
|
|
220,441 |
|
|
|
1,551,034 |
|
Other derivative contracts |
|
|
|
|
|
|
|
|
|
|
|
|
|
|
|
|
Equity |
|
|
103,234 |
|
|
|
39,521 |
|
|
|
994 |
|
|
|
143,749 |
|
Credit |
|
|
12,661 |
|
|
|
9,553 |
|
|
|
4,941 |
|
|
|
27,155 |
|
Commodity and other contracts |
|
|
57,307 |
|
|
|
25,467 |
|
|
|
377 |
|
|
|
83,151 |
|
|
|
|
173,202 |
|
|
|
74,541 |
|
|
|
6,312 |
|
|
|
254,055 |
|
Total |
|
$ |
3,799,022 |
|
|
$ |
3,514,791 |
|
|
$ |
1,744,352 |
|
|
$ |
9,058,165 |
|
As with other financial assets, derivative instruments are subject to credit risk. Credit risk arises from the possibility that counterparties may default on their obligations to the Bank. However, whereas the credit risk of other financial assets is represented by the principal amount net of any applicable allowance for credit losses, the credit risk associated with derivatives is normally a small fraction of the notional amount of the derivative instrument.
Derivative contracts generally expose the Bank to credit loss if changes in market rates affect a counterparty’s position unfavourably and the counterparty defaults on payment. Accordingly, exposure to credit risk of derivatives is represented by the positive fair value of the instrument.
Negotiated
derivatives generally present greater credit exposure than exchange-traded contracts. The net change in the exchange-traded contracts is normally settled daily in cash with the exchange. Holders of these contracts look to the exchange for performance under the contract.
The Bank strives to limit credit risk by dealing with counterparties that it believes are creditworthy, and investment grade counterparties account for a significant portion of the credit risk exposure arising from the Bank’s derivative transactions as at October 31, 2025. To control credit risk associated with derivatives, the Bank uses similar credit risk management activities and procedures to the approaches used in the lending business in assessing and adjudicating exposure. The Bank utilizes a risk metric, potential future exposure (PFE) for derivatives, to measure utilization against established credit limits to the counterparty.
2025 Scotiabank Annual Report
|
Consolidated Financial Statements
PFE measures the effect that changes in the market have on derivative exposures throughout the lifetime of the counterparties’ trades. Additionally, PFE considers risk mitigants such as netting and collateralization. PFE limits and utilization for derivatives counterparties are authorized and monitored by the Bank’s risk management unit.
The Bank obtains the benefit of netting by entering into master netting arrangements with counterparties (typically industry standard International Swaps and Derivatives Association (ISDA) agreements), which allow for a single net settlement of all transactions covered by that agreement in the event of a default or early termination of the transactions. In this manner, the credit risk associated with favourable contracts is eliminated by the master netting arrangement to the extent that unfavourable contracts with the same counterparty are not settled before favourable contracts.
Collateralization is typically documented by way of an ISDA Credit Support Annex (CSA), the terms of which may vary according to each party’s view of the other party’s creditworthiness. CSAs can require one party to post initial margin at the onset of each transaction. CSAs also allow for variation margin to be called if total uncollateralized
exposure exceeds an agreed upon threshold. Such variation margin provisions can be one way (only one party will ever post collateral) or
bi-lateral
(either party may post collateral depending upon which party is
The CSA will also detail the types of collateral that are acceptable to each party, and the adjustments that will be applied against each collateral type. The terms of the ISDA master netting agreements and CSAs are taken into consideration in the calculation of counterparty credit risk exposure (see also page 90 of the 2025 Annual Report).
Derivative instruments used by the Bank include credit derivatives in its investment and loan portfolios: credit protection is sold as an alternative to acquiring exposure to bond or loan assets, and bought to manage or mitigate credit exposures.
The following table summarizes the credit exposure of the Bank’s derivative financial instruments. The credit risk amount (CRA) represents the estimated replacement cost, or positive fair value, for all contracts. CRA takes into account master netting or collateral arrangements that have been made
1
. CRA does not reflect actual or expected losses.
The credit equivalent amount (CEA) is the exposure at default (EAD) prescribed in the Capital Adequacy Requirements (CAR) Guidelines of the Office of the Superintendent of Financial Institutions (OSFI). The risk-weighted asset is calculated by multiplying the CEA by the capital requirement (K) times 12.5, where K is a function of the probability of default (PD), loss given default (LGD), maturity and prescribed correlation factors. Commodity and other contracts includes energy, precious metals other than gold, and other commodities.
|
|
|
|
|
|
|
|
|
|
|
|
|
|
|
|
|
|
|
|
|
|
|
|
|
|
|
|
|
|
|
|
|
|
|
| |
|
|
|
|
|
|
2024 |
|
| As at October 31 ($ millions) |
|
Notional amount |
|
|
Credit risk amount (CRA) (1)
|
|
|
Credit equivalent amount (CEA) (1)
|
|
|
|
|
|
|
|
Notional amount |
|
|
Credit risk amount (CRA) (1)
|
|
|
Credit equivalent amount (CEA) (1)
|
|
|
Risk-
Weighted
Assets |
|
| |
|
|
|
|
|
|
|
|
|
|
|
|
|
|
|
|
|
|
|
|
|
|
|
|
|
|
|
|
|
|
|
|
|
|
| Futures |
|
|
|
|
|
|
|
|
|
|
|
|
|
|
|
|
|
|
|
$ |
606,019 |
|
|
$ |
– |
|
|
$ |
27 |
|
|
$ |
1 |
|
| Forward rate agreements |
|
|
|
|
|
|
|
|
|
|
|
|
|
|
|
|
|
|
|
|
86,872 |
|
|
|
70 |
|
|
|
88 |
|
|
|
57 |
|
| Swaps |
|
|
|
|
|
|
|
|
|
|
|
|
|
|
|
|
|
|
|
|
6,453,740 |
|
|
|
4,052 |
|
|
|
4,157 |
|
|
|
876 |
|
| Options purchased |
|
|
|
|
|
|
|
|
|
|
|
|
|
|
|
|
|
|
|
|
51,420 |
|
|
|
13 |
|
|
|
229 |
|
|
|
56 |
|
| Options written |
|
|
|
|
|
|
|
|
|
|
|
|
|
|
|
|
|
|
|
|
55,025 |
|
|
|
– |
|
|
|
16 |
|
|
|
4 |
|
|
|
|
|
|
|
|
|
|
|
|
|
|
|
|
|
|
|
|
|
|
7,253,076 |
|
|
|
4,135 |
|
|
|
4,517 |
|
|
|
994 |
|
Foreign exchange and gold contracts |
|
|
|
|
|
|
|
|
|
|
|
|
|
|
|
|
|
|
|
|
|
|
|
|
|
|
|
|
|
|
|
|
|
|
| Futures |
|
|
|
|
|
|
|
|
|
|
|
|
|
|
|
|
|
|
|
|
21,952 |
|
|
|
– |
|
|
|
354 |
|
|
|
7 |
|
| Spot and forwards |
|
|
|
|
|
|
|
|
|
|
|
|
|
|
|
|
|
|
|
|
587,753 |
|
|
|
1,560 |
|
|
|
4,868 |
|
|
|
1,168 |
|
| Swaps |
|
|
|
|
|
|
|
|
|
|
|
|
|
|
|
|
|
|
|
|
879,804 |
|
|
|
40 |
|
|
|
7,965 |
|
|
|
1,472 |
|
| Options purchased |
|
|
|
|
|
|
|
|
|
|
|
|
|
|
|
|
|
|
|
|
25,135 |
|
|
|
343 |
|
|
|
633 |
|
|
|
214 |
|
| Options written |
|
|
|
|
|
|
|
|
|
|
|
|
|
|
|
|
|
|
|
|
36,390 |
|
|
|
– |
|
|
|
19 |
|
|
|
4 |
|
|
|
|
|
|
|
|
|
|
|
|
|
|
|
|
|
|
|
|
|
|
1,551,034 |
|
|
|
1,943 |
|
|
|
13,839 |
|
|
|
2,865 |
|
Other derivative contracts |
|
|
|
|
|
|
|
|
|
|
|
|
|
|
|
|
|
|
|
|
|
|
|
|
|
|
|
|
|
|
|
|
|
|
| Equity |
|
|
|
|
|
|
|
|
|
|
|
|
|
|
|
|
|
|
|
|
143,749 |
|
|
|
1,586 |
|
|
|
10,848 |
|
|
|
1,742 |
|
| Credit |
|
|
|
|
|
|
|
|
|
|
|
|
|
|
|
|
|
|
|
|
27,155 |
|
|
|
107 |
|
|
|
141 |
|
|
|
29 |
|
| Commodity and other contracts |
|
|
|
|
|
|
|
|
|
|
|
|
|
|
|
|
|
|
|
|
83,151 |
|
|
|
1,098 |
|
|
|
3,259 |
|
|
|
487 |
|
|
|
|
|
|
|
|
|
|
|
|
|
|
|
|
|
|
|
|
|
|
254,055 |
|
|
|
2,791 |
|
|
|
14,248 |
|
|
|
2,258 |
|
| Credit Valuation Adjustment |
|
|
|
|
|
|
|
|
|
|
|
|
|
|
|
|
|
|
|
|
– |
|
|
|
– |
|
|
|
– |
|
|
|
4,631 |
|
| Total derivatives |
|
|
|
|
|
|
|
|
|
|
|
|
|
|
|
|
|
|
|
$ |
9,058,165 |
|
|
$ |
8,869 |
|
|
$ |
32,604 |
|
|
$ |
10,748 |
|
Amount settled through central counterparties (2)
|
|
|
|
|
|
|
|
|
|
|
|
|
|
|
|
|
|
|
|
|
|
|
|
|
|
|
|
|
|
|
|
|
|
|
| Exchange-traded |
|
|
|
|
|
|
|
|
|
|
|
|
|
|
|
|
|
|
|
|
744,882 |
|
|
|
– |
|
|
|
5,158 |
|
|
|
117 |
|
| |
|
|
|
|
|
|
|
|
|
|
|
|
|
|
|
|
|
|
|
|
6,093,979 |
|
|
|
– |
|
|
|
1,063 |
|
|
|
21 |
|
| |
|
|
|
|
|
|
|
|
|
|
|
|
|
|
|
|
|
|
|
$ |
6,838,861 |
|
|
$ |
– |
|
|
$ |
6,221 |
|
|
$ |
138 |
|
| (1) |
The amounts presented are net of collateral and master netting agreements at the product level. The total amounts relating to netting and collateral were $37,853 (2024 – $35,510) for CRA, and $102,031 (2024 – $87,284) for CEA. |
| (2) |
Amounts are included under total derivatives above. Amounts include exposures settled directly through central counterparties and exposures settled through clearing members of central counterparties. |
|
1 |
Regulatory haircuts prescribed by the OSFI CAR Guidelines are applied to the collateral balances of the CRA measure. |
|
2025 Scotiabank Annual Report
Consolidated Financial Statements
The following table summarizes the fair value of derivatives segregated by type and segregated between trading and those derivatives designated in hedging relationships.
|
|
|
|
|
|
|
|
|
|
|
|
|
|
|
|
|
|
|
|
|
|
|
|
|
|
|
|
|
| As at October 31 ($ millions) |
|
|
|
|
|
|
|
|
|
|
2024 |
|
| |
|
Average fair value |
|
|
|
|
|
|
|
|
|
|
| |
|
Favourable |
|
|
Unfavourable |
|
|
Favourable |
|
|
Unfavourable |
|
|
|
|
|
Favourable |
|
|
Unfavourable |
|
| |
|
|
|
|
|
|
|
|
|
|
|
|
|
|
|
|
|
|
|
|
|
|
|
|
|
|
|
|
| |
|
|
|
|
|
|
|
|
|
|
|
|
|
|
|
|
|
|
|
|
|
|
|
|
|
|
|
|
| Forward rate agreements |
|
|
|
|
|
|
|
|
|
|
|
|
|
|
|
|
|
|
|
|
|
$ |
70 |
|
|
$ |
72 |
|
| Swaps |
|
|
|
|
|
|
|
|
|
|
|
|
|
|
|
|
|
|
|
|
|
|
7,767 |
|
|
|
9,357 |
|
| Options |
|
|
|
|
|
|
|
|
|
|
|
|
|
|
|
|
|
|
|
|
|
|
803 |
|
|
|
496 |
|
|
|
|
|
|
|
|
|
|
|
|
|
|
|
|
|
|
|
|
|
|
|
|
8,640 |
|
|
|
9,925 |
|
Foreign exchange and gold contracts |
|
|
|
|
|
|
|
|
|
|
|
|
|
|
|
|
|
|
|
|
|
|
|
|
|
|
|
|
| Forwards |
|
|
|
|
|
|
|
|
|
|
|
|
|
|
|
|
|
|
|
|
|
|
6,672 |
|
|
|
5,482 |
|
| Swaps |
|
|
|
|
|
|
|
|
|
|
|
|
|
|
|
|
|
|
|
|
|
|
11,110 |
|
|
|
14,272 |
|
| Options |
|
|
|
|
|
|
|
|
|
|
|
|
|
|
|
|
|
|
|
|
|
|
492 |
|
|
|
446 |
|
|
|
|
|
|
|
|
|
|
|
|
|
|
|
|
|
|
|
|
|
|
|
|
18,274 |
|
|
|
20,200 |
|
Other derivative contracts |
|
|
|
|
|
|
|
|
|
|
|
|
|
|
|
|
|
|
|
|
|
|
|
|
|
|
|
|
| Equity |
|
|
|
|
|
|
|
|
|
|
|
|
|
|
|
|
|
|
|
|
|
|
4,469 |
|
|
|
4,844 |
|
| Credit |
|
|
|
|
|
|
|
|
|
|
|
|
|
|
|
|
|
|
|
|
|
|
182 |
|
|
|
47 |
|
| Commodity and other contracts |
|
|
|
|
|
|
|
|
|
|
|
|
|
|
|
|
|
|
|
|
|
|
2,102 |
|
|
|
2,560 |
|
|
|
|
|
|
|
|
|
|
|
|
|
|
|
|
|
|
|
|
|
|
|
|
6,753 |
|
|
|
7,451 |
|
| Trading derivatives’ market valuation |
|
|
|
|
|
|
|
|
|
|
|
|
|
|
|
|
|
|
|
|
|
$ |
33,667 |
|
|
$ |
37,576 |
|
| |
|
|
|
|
|
|
|
|
|
|
|
|
|
|
|
|
|
|
|
|
|
|
|
|
|
|
|
|
| |
|
|
|
|
|
|
|
|
|
|
|
|
|
|
|
|
|
|
|
|
|
|
|
|
|
|
|
|
| Swaps |
|
|
|
|
|
|
|
|
|
|
|
|
|
|
|
|
|
|
|
|
|
$ |
2,944 |
|
|
$ |
7,983 |
|
Foreign exchange and gold contracts |
|
|
|
|
|
|
|
|
|
|
|
|
|
|
|
|
|
|
|
|
|
|
|
|
|
|
|
|
| Forwards |
|
|
|
|
|
|
|
|
|
|
|
|
|
|
|
|
|
|
|
|
|
|
410 |
|
|
|
255 |
|
| Swaps |
|
|
|
|
|
|
|
|
|
|
|
|
|
|
|
|
|
|
|
|
|
|
7,320 |
|
|
|
5,445 |
|
|
|
|
|
|
|
|
|
|
|
|
|
|
|
|
|
|
|
|
|
|
|
$ |
7,730 |
|
|
$ |
5,700 |
|
Other derivative contracts |
|
|
|
|
|
|
|
|
|
|
|
|
|
|
|
|
|
|
|
|
|
|
|
|
|
|
|
|
| Equity |
|
|
|
|
|
|
|
|
|
|
|
|
|
|
|
|
|
|
|
|
|
$ |
38 |
|
|
$ |
1 |
|
| Hedging derivatives’ market valuation |
|
|
|
|
|
|
|
|
|
|
|
|
|
|
|
|
|
|
|
|
|
$ |
10,712 |
|
|
$ |
13,684 |
|
| Total derivative financial instruments as per Statement of Financial Position |
|
|
|
|
|
|
|
|
|
|
|
|
|
|
|
|
|
|
|
|
|
$ |
44,379 |
|
|
$ |
51,260 |
|
| (1) |
The average fair value of trading derivatives’ market valuation for the year ended October 31, 2024 was: favourable $29,999 and unfavourable $32,133. Average fair value amounts are based on the latest 13 month-end balances. |
The Bank manages interest rate risk, foreign currency risk and equity risk through hedge accounting transactions.
Interest rate risk
Single-currency interest rate swaps are used to hedge interest rate risk exposure. In fair value hedges of interest rate risk, the interest rate exposure from fixed rate assets and liabilities is converted from fixed to floating rate exposure. In cash flow hedges of interest rate risk, the interest rate exposure from floating rate assets and liabilities is converted from floating to fixed rate exposure. The Bank generally hedges interest rate risk only to the extent of benchmark interest rates.
Foreign currency risk
In fair value hedges, cross-currency swaps and single-currency interest rate swaps are used to manage foreign currency exposure in conjunction with interest rate exposure. Cross-currency interest rate swaps or a combination of cross-currency basis swaps and single-currency interest rate swaps are mainly used to convert a foreign currency fixed rate exposure to a functional currency floating rate exposure. In hedges of both foreign currency and interest rate exposure, the interest rate risk is generally hedged only to the extent of the benchmark interest rate.
In cash flow hedges, cross-currency interest rate swaps, single-currency interest rate swaps, foreign currency forwards and foreign currency assets or liabilities are used to manage foreign currency exposure, or a combined foreign currency and interest rate exposure. Cross-currency interest rate swaps are used to offset the foreign currency exposure by exchanging the interest cash flows in one currency to another currency. Single-currency interest rate swaps may be used in conjunction with cross-currency swaps to convert the foreign currency exposure or resulting functional currency exposure from floating to fixed. Foreign currency forwards and foreign currency denominated assets and liabilities are used to offset the exposure arising from highly probable future cash flows, including purchase considerations for business acquisitions and sale proceeds for business divestitures that are denominated in a foreign currency. In hedges of both foreign currency and interest rate exposure, the interest rate risk is generally hedged only to the extent of the benchmark interest rate.
In net investment hedges, the Bank designates foreign currency liabilities and foreign currency forwards as hedging instruments to manage foreign currency exposure. The designated
non-derivative
liabilities are denominated in the functional currency of the net investment, such that the foreign currency translation impact from the net investment will be offset by the foreign currency impact from the designated liabilities. The foreign currency forward contracts are structured to sell the functional currency of the net investment in return for the Bank’s functional currency.
Equity risk
Equity risk is created by the Bank’s share-based compensation plans awarded to employees. In cash flow hedges, total return swaps are mainly used to offset the equity exposure by exchanging interest payments for payments based on the returns on the underlying shares.
2025 Scotiabank Annual Report
|
Consolidated Financial Statements
For all of the risks identified above, the economic relationship and hedge ratio are determined using a qualitative and quantitative assessment. This assessment incorporates comparison of critical terms of the hedged and hedging item, and regression analysis. For regression analysis, a hedging relationship is considered highly effective when all of the following criteria are met: correlation between the variables in the regression is at least 0.8 or greater; slope of the regression is within a
0.8-1.25
range; and confidence level of the slope is at least 95%. The main sources of hedge ineffectiveness include the following:
| |
• |
|
The use of different discount curves to value the hedged item and the hedging derivative in fair value hedges, in order to reflect the reduced credit risk of collateralized derivatives; |
| |
• |
|
Differences in key terms such as the underlying reference interest rate tenor, reset/settlement frequency and floating spread between the hedging instruments and the hedged item. |
The Bank has elected to continue to apply the hedge accounting requirements of IAS 39. However, the Bank has implemented the additional hedge accounting disclosures that are required by the IFRS 9 related amendments to IFRS 7 “
Financial Instruments: Disclosures
”.
The following table summarizes the notional amounts of derivatives and carrying amounts of cash and deposit liabilities designated as hedging instruments.
|
|
|
|
|
|
|
|
|
|
|
|
|
|
|
|
|
|
|
|
|
|
|
|
|
|
|
|
|
|
|
|
|
| |
|
|
|
|
2024 |
|
| |
|
|
|
|
|
|
| |
|
Remaining term to maturity |
|
|
|
|
|
Remaining term to maturity |
|
|
|
|
| As at October 31 ($ millions) |
|
Within one year |
|
|
One to five years |
|
|
Over five years |
|
|
Total |
|
|
Within one year |
|
|
One to five years |
|
|
Over five years |
|
|
Total |
|
| |
|
|
|
|
|
|
|
|
|
|
|
|
|
|
|
|
|
|
|
|
|
|
|
|
|
|
|
|
|
|
|
|
| Interest rate risk – swaps |
|
|
|
|
|
|
|
|
|
|
|
|
|
|
|
|
|
$ |
32,689 |
|
|
$ |
137,123 |
|
|
$ |
25,427 |
|
|
$ |
195,239 |
|
| Foreign currency/interest rate risk – swaps |
|
|
|
|
|
|
|
|
|
|
|
|
|
|
|
|
|
|
– |
|
|
|
– |
|
|
|
– |
|
|
|
– |
|
|
|
|
|
|
|
|
|
|
| |
|
|
|
|
|
|
|
|
|
|
|
|
|
|
|
|
|
|
|
|
|
|
|
|
|
|
|
|
|
|
|
|
| Interest rate risk – swaps |
|
|
|
|
|
|
|
|
|
|
|
|
|
|
|
|
|
|
29,411 |
|
|
|
72,802 |
|
|
|
13,160 |
|
|
|
115,373 |
|
| Foreign currency/interest rate risk – swaps |
|
|
|
|
|
|
|
|
|
|
|
|
|
|
|
|
|
|
5,516 |
|
|
|
19,291 |
|
|
|
4,359 |
|
|
|
29,166 |
|
| Foreign currency risk |
|
|
|
|
|
|
|
|
|
|
|
|
|
|
|
|
|
|
|
|
|
|
|
|
|
|
|
|
|
|
|
|
| Swaps |
|
|
|
|
|
|
|
|
|
|
|
|
|
|
|
|
|
|
50,198 |
|
|
|
93,095 |
|
|
|
19,808 |
|
|
|
163,101 |
|
| Foreign currency forwards |
|
|
|
|
|
|
|
|
|
|
|
|
|
|
|
|
|
|
– |
|
|
|
– |
|
|
|
– |
|
|
|
– |
|
| Cash |
|
|
|
|
|
|
|
|
|
|
|
|
|
|
|
|
|
|
74 |
|
|
|
– |
|
|
|
– |
|
|
|
74 |
|
| Equity risk – total return swaps |
|
|
|
|
|
|
|
|
|
|
|
|
|
|
|
|
|
|
278 |
|
|
|
687 |
|
|
|
– |
|
|
|
965 |
|
|
|
|
|
|
|
|
|
|
| |
|
|
|
|
|
|
|
|
|
|
|
|
|
|
|
|
|
|
|
|
|
|
|
|
|
|
|
|
|
|
|
|
| Foreign currency risk |
|
|
|
|
|
|
|
|
|
|
|
|
|
|
|
|
|
|
|
|
|
|
|
|
|
|
|
|
|
|
|
|
| Foreign currency forwards |
|
|
|
|
|
|
|
|
|
|
|
|
|
|
|
|
|
|
21,156 |
|
|
|
– |
|
|
|
– |
|
|
|
21,156 |
|
| Deposit liabilities |
|
|
|
|
|
|
|
|
|
|
|
|
|
|
|
|
|
|
7,571 |
|
|
|
– |
|
|
|
– |
|
|
|
7,571 |
|
| Total |
|
|
|
|
|
|
|
|
|
|
|
|
|
|
|
|
|
$ |
146,893 |
|
|
$ |
322,998 |
|
|
$ |
62,754 |
|
|
$ |
532,645 |
|
| (1) |
Notional amounts relating to derivatives that are hedging multiple risks in both assets and liabilities are included in more than one category. |
|
2025 Scotiabank Annual Report
Consolidated Financial Statements
The following table shows the average rate or price of significant hedging instruments.
|
|
|
|
|
|
|
|
|
|
|
|
|
|
|
|
|
|
|
|
|
|
|
|
|
| |
|
|
|
|
2024 |
|
| |
|
|
|
|
|
|
| As at October 31 |
|
Fixed interest rate |
|
|
FX rate |
|
|
Price |
|
|
Fixed interest rate |
|
|
FX rate |
|
|
Price |
|
| |
|
|
|
|
|
|
|
|
|
|
|
|
|
|
|
|
|
|
|
|
|
|
|
|
| Interest rate risk – swaps |
|
|
|
|
|
|
|
|
|
|
|
|
|
|
3.16 |
% |
|
|
n/a |
|
|
|
n/a |
|
|
|
|
|
|
|
|
| |
|
|
|
|
|
|
|
|
|
|
|
|
|
|
|
|
|
|
|
|
|
|
|
|
| Interest rate risk – swaps |
|
|
|
|
|
|
|
|
|
|
|
|
|
|
3.16 |
% |
|
|
n/a |
|
|
|
n/a |
|
| Foreign currency/interest rate risk – swaps |
|
|
|
|
|
|
|
|
|
|
|
|
|
|
|
|
|
|
|
|
|
|
|
|
| |
|
|
|
|
|
|
|
|
|
|
|
|
|
|
1.89 |
% |
|
|
1.30 |
|
|
|
n/a |
|
| Foreign currency risk |
|
|
|
|
|
|
|
|
|
|
|
|
|
|
|
|
|
|
|
|
|
|
|
|
| Swaps |
|
|
|
|
|
|
|
|
|
|
|
|
|
|
|
|
|
|
|
|
|
|
|
|
| |
|
|
|
|
|
|
|
|
|
|
|
|
|
|
n/a |
|
|
|
1.31 |
|
|
|
n/a |
|
| |
|
|
|
|
|
|
|
|
|
|
|
|
|
|
n/a |
|
|
|
1.46 |
|
|
|
n/a |
|
| |
|
|
|
|
|
|
|
|
|
|
|
|
|
|
n/a |
|
|
|
1.70 |
|
|
|
n/a |
|
| Equity price risk – total return swaps |
|
|
|
|
|
|
|
|
|
|
|
|
|
|
n/a |
|
|
|
n/a |
|
|
$ |
69.11 |
|
|
|
|
|
|
|
|
| |
|
|
|
|
|
|
|
|
|
|
|
|
|
|
|
|
|
|
|
|
|
|
|
|
| Foreign currency risk – foreign currency forwards |
|
|
|
|
|
|
|
|
|
|
|
|
|
|
|
|
|
|
|
|
|
|
|
|
| |
|
|
|
|
|
|
|
|
|
|
|
|
|
|
n/a |
|
|
|
1.35 |
|
|
|
n/a |
|
| |
|
|
|
|
|
|
|
|
|
|
|
|
|
|
n/a |
|
|
|
0.0014 |
|
|
|
n/a |
|
| |
|
|
|
|
|
|
|
|
|
|
|
|
|
|
n/a |
|
|
|
0.07 |
|
|
|
n/a |
|
| |
|
|
|
|
|
|
|
|
|
|
|
|
|
|
n/a |
|
|
|
0.36 |
|
|
|
n/a |
|
| (1) |
The notional weighted average rate or price is calculated in aggregate for all of the Bank’s hedge relationships, including hedges of assets and liabilities. |
For fair value hedges, the following table contains information related to items designated as hedging instruments, hedged items and ineffectiveness.
|
|
|
|
|
|
|
|
|
|
|
|
|
|
|
|
|
|
|
|
|
|
|
|
|
|
|
|
|
|
|
|
|
|
|
|
|
| |
|
Carrying amount of the hedging instruments (1)
|
|
|
|
|
|
|
|
|
|
|
|
Accumulated amount of fair value hedge adjustment gains/ (losses) on the hedged item (4)
|
|
| For the year ended October 31, 2025 ($ millions) |
|
Assets |
|
|
Liabilities |
|
|
|
|
|
Gains/
(losses) on
hedging instrument
used to calculate
hedge
ineffectiveness |
|
|
Gains/
(losses) on
hedged item
used to calculate
hedge
ineffectiveness |
|
|
Ineffectiveness recorded in non-interest
income – other |
|
|
Carrying amount of the hedged item (3)
|
|
|
Active
hedges |
|
|
Discontinued
hedges |
|
| |
|
|
|
|
|
|
|
|
|
|
|
|
|
|
|
|
|
|
|
|
|
|
|
|
|
|
|
|
|
|
|
|
|
|
|
|
Interest rate risk – swaps |
|
|
|
|
|
|
|
|
|
|
|
|
|
|
|
|
|
|
|
|
|
|
|
|
|
|
|
|
|
|
|
|
|
|
|
|
| Investment securities |
|
|
|
|
|
|
|
|
|
|
|
|
|
|
|
|
|
|
|
|
|
|
|
|
|
|
|
|
|
|
|
|
|
|
|
|
| Loans |
|
|
|
|
|
|
|
|
|
|
|
|
|
|
|
|
|
|
|
|
|
|
|
|
|
|
|
|
|
|
|
|
|
|
|
|
| Deposit liabilities |
|
|
|
|
|
|
|
|
|
|
|
|
|
|
|
|
|
|
|
|
|
|
|
|
|
|
|
|
|
|
|
|
|
|
|
|
| Subordinated debentures |
|
|
|
|
|
|
|
|
|
|
|
|
|
|
|
|
|
|
|
|
|
|
|
|
|
|
|
|
|
|
|
|
|
|
|
|
|
|
|
|
|
|
|
|
|
|
Foreign currency/interest |
|
|
|
|
|
|
|
|
|
|
|
|
|
|
|
|
|
|
|
|
|
|
|
|
|
|
|
|
|
|
|
|
|
|
|
|
| |
|
|
|
|
|
|
|
|
|
|
|
|
|
|
|
|
|
|
|
|
|
|
|
|
|
|
|
|
|
|
|
|
|
|
|
|
| Deposit liabilities |
|
|
|
|
|
|
|
|
|
|
|
|
|
|
|
|
|
|
|
|
|
|
|
|
|
|
|
|
|
|
|
|
|
|
|
|
| Total |
|
|
|
|
|
|
|
|
|
|
|
|
|
|
|
|
|
|
|
|
|
|
|
|
|
|
|
|
|
|
|
|
|
|
|
|
(1) |
Comprises unrealized gains/losses and are recorded within derivative financial instruments in assets and liabilities, respectively, in the Consolidated Statement of Financial Position. |
(2) |
Includes ineffectiveness related to hedges discontinued during the year ended October 31, 2025. |
(3) |
This represents the carrying value on the Consolidated Statement of Financial Position and comprises amortized cost before allowance for credit losses, plus fair value hedge adjustment, except for investment securities which are carried at fair value. |
(4) |
This represents the accumulated fair value hedge adjustment and is a component of the carrying amount of the hedged item, except for investment securities which are carried at fair value. |
|
|
|
|
|
|
|
|
|
|
|
|
|
|
|
|
|
|
|
|
|
|
|
|
|
|
|
|
|
|
|
|
|
|
|
|
|
| |
|
Carrying amount of the hedging instruments (1)
|
|
|
|
|
|
|
|
|
|
|
|
Accumulated amount of fair value hedge adjustment gains/ (losses) on the hedged item (4)
|
|
| For the year ended October 31, 2024 ($ millions) |
|
Assets |
|
|
Liabilities |
|
|
|
|
|
Gains/
(losses) on
hedging instrument
used to calculate
hedge
ineffectiveness |
|
|
Gains/
(losses) on
hedged item
used to calculate
hedge
ineffectiveness |
|
|
Ineffectiveness recorded in non-interest
income – other |
|
|
Carrying amount of the hedged item (3)
|
|
|
Active
hedges |
|
|
Discontinued
hedges |
|
| |
|
|
|
|
|
|
|
|
|
|
|
|
|
|
|
|
|
|
|
|
|
|
|
|
|
|
|
|
|
|
|
|
|
|
|
|
Interest rate risk – swaps |
|
$ |
2,064 |
|
|
$ |
(2,672 |
) |
|
|
|
|
|
$ |
(197 |
) |
|
$ |
160 |
|
|
$ |
(37 |
) |
|
|
|
|
|
|
|
|
|
|
|
|
| Investment securities |
|
|
|
|
|
|
|
|
|
|
|
|
|
|
(1,493 |
) |
|
|
1,484 |
|
|
|
(9 |
) |
|
$ |
72,595 |
|
|
$ |
1,274 |
|
|
$ |
(1,392 |
) |
| Loans |
|
|
|
|
|
|
|
|
|
|
|
|
|
|
(876 |
) |
|
|
851 |
|
|
|
(25 |
) |
|
|
91,354 |
|
|
|
(35 |
) |
|
|
(268 |
) |
| Deposit liabilities |
|
|
|
|
|
|
|
|
|
|
|
|
|
|
1,955 |
|
|
|
(1,959 |
) |
|
|
(4 |
) |
|
|
(71,363 |
) |
|
|
986 |
|
|
|
446 |
|
| Subordinated debentures |
|
|
|
|
|
|
|
|
|
|
|
|
|
|
217 |
|
|
|
(216 |
) |
|
|
1 |
|
|
|
(4,293 |
) |
|
|
21 |
|
|
|
(1 |
) |
| Total |
|
$ |
2,064 |
|
|
$ |
(2,672 |
) |
|
|
|
|
|
$ |
(197 |
) |
|
$ |
160 |
|
|
$ |
(37 |
) |
|
$ |
88,293 |
|
|
$ |
2,246 |
|
|
$ |
(1,215 |
) |
(1) |
Comprises unrealized gains/losses and are recorded within derivative financial instruments in assets and liabilities, respectively, in the Consolidated Statement of Financial Position. |
(2) |
Includes ineffectiveness related to hedges discontinued during the year ended October 31, 2024. |
(3) |
This represents the carrying value on the Consolidated Statement of Financial Position and comprises amortized cost before allowance for credit losses, plus fair value hedge adjustment, except for investment securities which are carried at fair value. |
(4) |
This represents the accumulated fair value hedge adjustment and is a component of the carrying amount of the hedged item, except for investment securities which are carried at fair value. |
2025 Scotiabank Annual Report
|
Consolidated Financial Statements
For cash flow hedges and net investment hedges, the following table contains information related to items designated as hedging instruments, hedged items and ineffectiveness.
|
|
|
|
|
|
|
|
|
|
|
|
|
|
|
|
|
|
|
|
|
|
|
|
|
| |
|
Carrying amount of the hedging instruments (1)
|
|
|
|
|
|
|
|
| For the year ended October 31, 2025 ($ millions) |
|
Assets |
|
|
Liabilities |
|
|
|
|
|
Gains/(losses) on
hedging instrument
used to calculate
hedge ineffectiveness |
|
|
Gains/(losses) on hypothetical derivative used to calculate hedge ineffectiveness (3)
|
|
|
Ineffectiveness recorded in non-interest
income – other (4)
|
|
| |
|
|
|
|
|
|
|
|
|
|
|
|
|
|
|
|
|
|
|
|
|
|
|
|
| Interest rate risk – swaps |
|
|
|
|
|
|
|
|
|
|
|
|
|
|
|
|
|
|
|
|
|
|
|
|
| Foreign currency/interest rate risk – swaps |
|
|
|
|
|
|
|
|
|
|
|
|
|
|
|
|
|
|
|
|
|
|
|
|
| Foreign currency risk |
|
|
|
|
|
|
|
|
|
|
|
|
|
|
|
|
|
|
|
|
|
|
|
|
| Swaps |
|
|
|
|
|
|
|
|
|
|
|
|
|
|
|
|
|
|
|
|
|
|
|
|
| Foreign currency forwards |
|
|
|
|
|
|
|
|
|
|
|
|
|
|
|
|
|
|
|
|
|
|
|
|
| Cash |
|
|
|
|
|
|
|
|
|
|
|
|
|
|
|
|
|
|
|
|
|
|
|
|
| Equity risk – total return swaps |
|
|
|
|
|
|
|
|
|
|
|
|
|
|
|
|
|
|
|
|
|
|
|
|
|
|
|
|
|
|
|
|
|
|
|
|
|
|
|
|
|
|
|
|
|
|
|
|
|
| |
|
|
|
|
|
|
|
|
|
|
|
|
|
|
|
|
|
|
|
|
|
|
|
|
| Foreign currency risk |
|
|
|
|
|
|
|
|
|
|
|
|
|
|
|
|
|
|
|
|
|
|
|
|
| Foreign currency forwards |
|
|
|
|
|
|
|
|
|
|
|
|
|
|
|
|
|
|
|
|
|
|
|
|
| Deposit liabilities |
|
|
|
|
|
|
|
|
|
|
|
|
|
|
|
|
|
|
|
|
|
|
|
|
|
|
|
|
|
|
|
|
|
|
|
|
|
|
|
|
|
|
|
|
|
|
|
|
|
| Total |
|
|
|
|
|
|
|
|
|
|
|
|
|
|
|
|
|
|
|
|
|
|
|
|
| (1) |
Comprises unrealized gains/losses for derivative instruments and are recorded within derivative financial instruments in assets and liabilities, respectively, in the Consolidated Statement of Financial Position. |
| (2) |
Includes ineffectiveness related to hedges discontinued during the year ended October 31, 2025. |
| (3) |
For cash flow hedges, hypothetical derivatives having critical terms which match those of the underlying hedged item are used to assess hedge ineffectiveness. |
| (4) |
For cash flow hedges, ineffectiveness is only recognized in the Consolidated Statement of Income when the life-to-date cumulative change in the hedging instrument exceeds the cumulative change in the hypothetical derivative. |
|
|
|
|
|
|
|
|
|
|
|
|
|
|
|
|
|
|
|
|
|
|
|
|
|
|
|
|
|
| |
|
Carrying amount of the hedging instruments (1)
|
|
|
|
|
|
|
|
| For the year ended October 31, 2024 ($ millions) |
|
Assets |
|
|
Liabilities |
|
|
|
|
|
Gains/(losses) on
hedging instrument
used to calculate
hedge ineffectiveness |
|
|
Gains/(losses) on hypothetical derivative used to calculate hedge ineffectiveness (3)
|
|
|
Ineffectiveness recorded in non-interest
income – other (4)
|
|
| |
|
|
|
|
|
|
|
|
|
|
|
|
|
|
|
|
|
|
|
|
|
|
|
|
| Interest rate risk – swaps |
|
$ |
1,865 |
|
|
$ |
(4,699 |
) |
|
|
|
|
|
$ |
1,775 |
|
|
$ |
1,774 |
|
|
$ |
29 |
|
| Foreign currency/interest rate risk – swaps |
|
|
245 |
|
|
|
(2,407 |
) |
|
|
|
|
|
|
1,363 |
|
|
|
1,369 |
|
|
|
7 |
|
| Foreign currency risk |
|
|
|
|
|
|
|
|
|
|
|
|
|
|
|
|
|
|
|
|
|
|
|
|
| Swaps |
|
|
6,090 |
|
|
|
(3,650 |
) |
|
|
|
|
|
|
1,826 |
|
|
|
1,787 |
|
|
|
10 |
|
| Foreign currency forwards |
|
|
– |
|
|
|
– |
|
|
|
|
|
|
|
5 |
|
|
|
5 |
|
|
|
– |
|
| Cash |
|
|
74 |
|
|
|
– |
|
|
|
|
|
|
|
9 |
|
|
|
9 |
|
|
|
– |
|
| Equity risk – total return swaps |
|
|
38 |
|
|
|
(1 |
) |
|
|
|
|
|
|
263 |
|
|
|
263 |
|
|
|
– |
|
|
|
|
8,312 |
|
|
|
(10,757 |
) |
|
|
|
|
|
|
5,241 |
|
|
|
5,207 |
|
|
|
46 |
|
| |
|
|
|
|
|
|
|
|
|
|
|
|
|
|
|
|
|
|
|
|
|
|
|
|
| Foreign currency risk |
|
|
|
|
|
|
|
|
|
|
|
|
|
|
|
|
|
|
|
|
|
|
|
|
| Foreign currency forwards |
|
|
410 |
|
|
|
(255 |
) |
|
|
|
|
|
|
178 |
|
|
|
178 |
|
|
|
– |
|
| Deposit liabilities |
|
|
n/a |
|
|
|
(7,571 |
) |
|
|
|
|
|
|
(62 |
) |
|
|
(62 |
) |
|
|
– |
|
|
|
|
410 |
|
|
|
(7,826 |
) |
|
|
|
|
|
|
116 |
|
|
|
116 |
|
|
|
– |
|
| Total |
|
$ |
8,722 |
|
|
$ |
(18,583 |
) |
|
|
|
|
|
$ |
5,357 |
|
|
$ |
5,323 |
|
|
$ |
46 |
|
| (1) |
Comprises unrealized gains/losses for derivative instruments and are recorded within derivative financial instruments in assets and liabilities, respectively, in the Consolidated Statement of Financial Position. |
| (2) |
Includes ineffectiveness related to hedges discontinued during the year ended October 31, 2024. |
| (3) |
For cash flow hedges, hypothetical derivatives having critical terms which match those of the underlying hedged item are used to assess hedge ineffectiveness. |
| (4) |
For cash flow hedges, ineffectiveness is only recognized in the Consolidated Statement of Income when the cumulative change in the hedging instrument exceeds the cumulative change in the hypothetical derivative. |
|
2025 Scotiabank Annual Report
Consolidated Financial Statements
For cash flow hedges and net investment hedges, the following table contains information regarding the impacts on the Consolidated Statement of Other Comprehensive Income on a
pre-tax
basis.
|
|
|
|
|
|
|
|
|
|
|
|
|
|
|
|
|
|
|
|
|
|
|
|
|
| |
|
AOCI gains/
(losses) as at |
|
|
Net gains/
(losses)
recognized in
OCI |
|
|
Amount reclassified to net income as the hedged item affects net income (1)
|
|
|
AOCI gains/
(losses) as at |
|
|
Balance in cash flow hedge reserve/unrealized foreign currency translation account |
|
| For the year ended October 31, 2025 ($ millions) |
|
Active
hedges |
|
|
Discontinued
hedges |
|
| |
|
|
|
|
|
|
|
|
|
|
|
|
|
|
|
|
|
|
|
|
|
|
|
|
| Interest rate risk |
|
|
|
|
|
|
|
|
|
|
|
|
|
|
|
|
|
|
|
|
|
|
|
|
| Foreign currency/interest rate risk |
|
|
|
|
|
|
|
|
|
|
|
|
|
|
|
|
|
|
|
|
|
|
|
|
| Foreign currency risk |
|
|
|
|
|
|
|
|
|
|
|
|
|
|
|
|
|
|
|
|
|
|
|
|
| Equity risk |
|
|
|
|
|
|
|
|
|
|
|
|
|
|
|
|
|
|
|
|
|
|
|
|
|
|
|
|
|
|
|
|
|
|
|
|
|
|
|
|
|
|
|
|
|
|
|
|
|
| |
|
|
|
|
|
|
|
|
|
|
|
|
|
|
|
|
|
|
|
|
|
|
|
|
| Foreign currency risk |
|
|
|
|
|
|
|
|
|
|
|
|
|
|
|
|
|
|
|
|
|
|
|
|
| Total |
|
|
|
|
|
|
|
|
|
|
|
|
|
|
|
|
|
|
|
|
|
|
|
|
| (1) |
Amounts reclassified from the cash flow hedge and net investment hedge reserves to net income are recorded in non-interest income-other except for amortization, which is recorded in interest income. |
|
|
|
|
|
|
|
|
|
|
|
|
|
|
|
|
|
|
|
|
|
|
|
|
|
| |
|
AOCI gains/
(losses) as at |
|
|
Net gains/
(losses)
recognized in
OCI |
|
|
Amount reclassified to net income as the hedged item affects net income (1)
|
|
|
AOCI gains/
(losses) as at |
|
|
Balance in cash flow hedge reserve/unrealized foreign currency translation account |
|
| For the year ended October 31, 2024 ($ millions) |
|
Active
hedges |
|
|
Discontinued
hedges |
|
| |
|
|
|
|
|
|
|
|
|
|
|
|
|
|
|
|
|
|
|
|
|
|
|
|
| Interest rate risk |
|
$ |
(3,480 |
) |
|
$ |
1,746 |
|
|
$ |
558 |
|
|
$ |
(1,176 |
) |
|
$ |
(490 |
) |
|
$ |
(686 |
) |
| Foreign currency/interest rate risk |
|
|
(2,007 |
) |
|
|
1,356 |
|
|
|
(48) |
|
|
|
(699 |
) |
|
|
(733 |
) |
|
|
34 |
|
| Foreign currency risk |
|
|
(703 |
) |
|
|
1,830 |
|
|
|
(2,324 |
) |
|
|
(1,197 |
) |
|
|
(1,158 |
) |
|
|
(39 |
) |
| Equity risk |
|
|
(20 |
) |
|
|
263 |
|
|
|
(186 |
) |
|
|
57 |
|
|
|
57 |
|
|
|
– |
|
|
|
|
(6,210 |
) |
|
|
5,195 |
|
|
|
(2,000 |
) |
|
|
(3,015 |
) |
|
|
(2,324 |
) |
|
|
(691 |
) |
| |
|
|
|
|
|
|
|
|
|
|
|
|
|
|
|
|
|
|
|
|
|
|
|
|
| Foreign currency risk |
|
|
(4,061 |
) |
|
|
116 |
|
|
|
770 |
|
|
|
(3,175 |
) |
|
|
(3,102 |
) |
|
|
(73 |
) |
| Total |
|
$ |
(10,271 |
) |
|
$ |
5,311 |
|
|
$ |
(1,230 |
) |
|
$ |
(6,190 |
) |
|
$ |
(5,426 |
) |
|
$ |
(764 |
) |
| (1) |
Amounts reclassified from the cash flow hedge and net investment hedge reserves to net income are recorded in non-interest income-other except for amortization, which is recorded in interest income. |
2025 Scotiabank Annual Report
|
Consolidated Financial Statements
|
Offsetting Financial Assets and Financial Liabilities |
The Bank is eligible to present certain financial assets and financial liabilities as listed in the table below on a net basis on the Consolidated Statement of Financial Position pursuant to criteria described in Note 3 – Material accounting policies.
The following tables provide information on the impact of offsetting on the Bank’s Consolidated Statement of Financial Position, as well as the financial impact of netting for instruments that are subject to enforceable master netting arrangements or similar agreements, but do not qualify for offsetting in the Consolidated Statement of Financial Position, as well as available cash and financial instrument collateral.
|
|
|
|
|
|
|
|
|
|
|
|
|
|
|
|
|
|
|
|
|
|
|
|
|
| As at October 31, 2025 ($ millions) |
|
|
|
|
|
|
|
|
|
|
|
|
|
|
|
|
|
|
| Types of financial assets |
|
Gross amounts
of recognized
financial instruments |
|
|
recognized financial
instruments offset in
the Consolidated
Statement of
Financial Position |
|
|
Net amounts of
financial instruments
presented in the
Consolidated
Statement of
Financial Position |
|
|
Related amounts not offset
in the Consolidated Statement
of Financial Position |
|
|
|
|
| |
Impact of master netting arrangements or similar agreements (1)
|
|
|
|
|
|
|
|
Derivative financial instruments |
|
|
|
|
|
|
|
|
|
|
|
|
|
|
|
|
|
|
|
|
|
|
|
|
Securities purchased under resale agreements and securities borrowed |
|
|
|
|
|
|
|
|
|
|
|
|
|
|
|
|
|
|
|
|
|
|
|
|
Total |
|
|
|
|
|
|
|
|
|
|
|
|
|
|
|
|
|
|
|
|
|
|
|
|
|
|
|
|
|
|
|
| Types of financial liabilities |
|
|
|
|
|
|
|
|
|
|
|
|
|
|
|
|
|
|
Derivative financial instruments |
|
|
|
|
|
|
|
|
|
|
|
|
|
|
|
|
|
|
|
|
|
|
|
|
Obligations related to securities sold under repurchase agreements and securities lent |
|
|
|
|
|
|
|
|
|
|
|
|
|
|
|
|
|
|
|
|
|
|
|
|
Total |
|
|
|
|
|
|
|
|
|
|
|
|
|
|
|
|
|
|
|
|
|
|
|
|
|
|
|
|
|
|
|
| As at October 31, 2024 ($ millions) |
|
|
|
|
|
|
|
|
|
|
|
|
|
|
|
|
|
|
| Types of financial assets |
|
Gross amounts
of recognized
financial instruments |
|
|
recognized financial
instruments offset in
the Consolidated
Statement of
Financial Position |
|
|
Net amounts of
financial instruments
presented in the
Consolidated
Statement of
Financial Position |
|
|
Related amounts not offset
in the Consolidated statement
of Financial Position |
|
|
|
|
| |
Impact of master netting arrangements or similar agreements (1)
|
|
|
|
|
|
|
|
Derivative financial instruments |
|
$ |
44,379 |
|
|
$ |
– |
|
|
$ |
44,379 |
|
|
$ |
(29,949 |
) |
|
$ |
(5,559 |
) |
|
$ |
8,871 |
|
Securities purchased under resale agreements and securities borrowed |
|
|
318,531 |
|
|
|
(117,988 |
) |
|
|
200,543 |
|
|
|
(19,551 |
) |
|
|
(178,816 |
) |
|
|
2,176 |
|
Total |
|
$ |
362,910 |
|
|
$ |
(117,988 |
) |
|
$ |
244,922 |
|
|
$ |
(49,500 |
) |
|
$ |
(184,375 |
) |
|
$ |
11,047 |
|
|
|
|
|
|
|
|
| Types of financial liabilities |
|
|
|
|
|
|
|
|
|
|
|
|
|
|
|
|
|
|
Derivative financial instruments |
|
$ |
51,260 |
|
|
$ |
– |
|
|
$ |
51,260 |
|
|
$ |
(29,949 |
) |
|
$ |
(11,565 |
) |
|
$ |
9,746 |
|
Obligations related to securities sold under repurchase agreements and securities lent |
|
|
308,437 |
|
|
|
(117,988 |
) |
|
|
190,449 |
|
|
|
(19,551 |
) |
|
|
(166,734 |
) |
|
|
4,164 |
|
Total |
|
$ |
359,697 |
|
|
$ |
(117,988 |
) |
|
$ |
241,709 |
|
|
$ |
(49,500 |
) |
|
$ |
(178,299 |
) |
|
$ |
13,910 |
|
| (1) |
Amounts that are subject to master netting arrangements or similar agreements but were not offset in the Consolidated Statement of Financial Position because they did not meet the net settlement/simultaneous settlement criteria; or because the rights of set off are conditional upon the default of the counterparty only. |
| (2) |
Cash and financial instrument collateral amounts received or pledged in relation to the total amounts of financial assets and financial liabilities, including those that were not offset in the Consolidated Statement of Financial Position. These amounts are disclosed at fair value and the rights of set off are conditional upon the default of the counterparty. |
| (3) |
Not intended to represent the Bank’s actual exposure to credit risk, as a variety of credit mitigation strategies are employed in addition to offsetting and collateral arrangements. |
| (4) |
Derivative financial instruments assets include cash collateral of $4,774 million (2024 – $4,505 million) and non-cash collateral of $1,009 million (2024 – $1,054 million). Derivative financial instruments liabilities include cash collateral of $11,750 million (2024 – $10,847 million) and non-cash collateral of $2,226 million (2024 – $718 million). |
|
2025 Scotiabank Annual Report
Consolidated Financial Statements
The following table presents the carrying amounts of the Bank’s investment securities per measurement category.
|
|
|
|
|
|
|
|
|
| As at October 31 ($ millions) |
|
|
|
|
2024 |
|
Debt investment securities measured at FVOCI |
|
|
|
|
|
$ |
118,226 |
|
Debt investment securities measured at amortized cost |
|
|
|
|
|
|
29,412 |
|
Equity investment securities designated at FVOCI |
|
|
|
|
|
|
3,162 |
|
Equity investment securities measured at FVTPL |
|
|
|
|
|
|
2,004 |
|
Debt investment securities measured at FVTPL |
|
|
|
|
|
|
28 |
|
Total investment securities |
|
|
|
|
|
$ |
152,832 |
|
(a) |
Debt investment securities measured at fair value through other comprehensive income (FVOCI) |
|
|
|
|
|
|
|
|
|
|
|
|
|
|
|
|
|
|
|
|
|
|
|
|
|
|
|
|
|
|
|
|
|
| |
|
|
|
|
2024 |
|
| As at October 31 ($ millions) |
|
Cost |
|
|
Gross
unrealized
gains |
|
|
Gross
unrealized
losses |
|
|
Fair value |
|
|
Cost |
|
|
Gross
unrealized
gains |
|
|
Gross
unrealized
losses |
|
|
Fair value |
|
Canadian federal government issued or guaranteed debt |
|
|
|
|
|
|
|
|
|
|
|
|
|
|
|
|
|
$ |
21,473 |
|
|
$ |
219 |
|
|
$ |
152 |
|
|
$ |
21,540 |
|
Canadian provincial and municipal debt |
|
|
|
|
|
|
|
|
|
|
|
|
|
|
|
|
|
|
17,500 |
|
|
|
234 |
|
|
|
209 |
|
|
|
17,525 |
|
U.S. treasury and other U.S. agency debt |
|
|
|
|
|
|
|
|
|
|
|
|
|
|
|
|
|
|
47,156 |
|
|
|
214 |
|
|
|
994 |
|
|
|
46,376 |
|
Other foreign government debt |
|
|
|
|
|
|
|
|
|
|
|
|
|
|
|
|
|
|
29,505 |
|
|
|
181 |
|
|
|
400 |
|
|
|
29,286 |
|
Other debt |
|
|
|
|
|
|
|
|
|
|
|
|
|
|
|
|
|
|
3,514 |
|
|
|
22 |
|
|
|
37 |
|
|
|
3,499 |
|
Total |
|
|
|
|
|
|
|
|
|
|
|
|
|
|
|
|
|
$ |
119,148 |
|
|
$ |
870 |
|
|
$ |
1,792 |
|
|
$ |
118,226 |
|
(b) |
Debt investment securities measured at amortized cost |
|
|
|
|
|
|
|
|
|
|
|
|
|
|
|
|
|
| |
|
|
|
|
2024 |
|
| As at October 31 ($ millions) |
|
Fair Value |
|
|
|
|
|
Fair Value |
|
|
|
|
Canadian federal and provincial government issued or guaranteed debt |
|
|
|
|
|
|
|
|
|
$ |
8,722 |
|
|
$ |
8,721 |
|
U.S. treasury and other U.S. agency debt |
|
|
|
|
|
|
|
|
|
|
17,440 |
|
|
|
18,440 |
|
Other foreign government debt |
|
|
|
|
|
|
|
|
|
|
2,044 |
|
|
|
2,041 |
|
Corporate debt |
|
|
|
|
|
|
|
|
|
|
216 |
|
|
|
210 |
|
Total |
|
|
|
|
|
|
|
|
|
$ |
28,422 |
|
|
$ |
29,412 |
|
| (1) |
Balances are net of allowances, which are $1 (2024 – $1). |
(c) |
Equity investment securities designated at fair value through other comprehensive income (FVOCI) |
The Bank has designated certain equity securities at FVOCI shown in the following table as these investments are held for strategic purposes.
|
|
|
|
|
|
|
|
|
|
|
|
|
|
|
|
|
| As at October 31, 2025 ($ millions) |
|
Cost |
|
|
Gross
unrealized
gains |
|
|
Gross
unrealized
losses |
|
|
Fair value |
|
Common shares |
|
|
|
|
|
|
|
|
|
|
|
|
|
|
|
|
Total |
|
|
|
|
|
|
|
|
|
|
|
|
|
|
|
|
|
|
|
|
|
| As at October 31, 2024 ($ millions) |
|
Cost |
|
|
Gross
unrealized
gains |
|
|
Gross
unrealized
losses |
|
|
Fair value |
|
Common shares |
|
$ |
2,522 |
|
|
$ |
713 |
|
|
$ |
73 |
|
|
$ |
3,162 |
|
Total |
|
$ |
2,522 |
|
|
$ |
713 |
|
|
$ |
73 |
|
|
$ |
3,162 |
|
Dividend income on equity securities designated at FVOCI of $47 million for the year ended October 31, 2025 (2024 – $122 million) has been recognized in interest income.
During the year ended October 31, 2025, the Bank has disposed of certain equity securities designated at FVOCI with a fair value of $1,839 million (2024 – $938 million) for economic reasons and according to its investment strategy. These dispositions have resulted in a cumulative gain of $512 million (2024 – cumulative gain of $21 million) that remains in OCI.
2025 Scotiabank Annual Report
|
Consolidated Financial Statements
(d) |
An analysis of the carrying value of investment securities is as follows: |
|
|
|
|
|
|
|
|
|
|
|
|
|
|
|
|
|
|
|
|
|
|
|
|
|
|
|
|
|
| |
|
Remaining term to maturity |
|
|
|
|
| As at October 31, 2025 ($ millions) |
|
Within
three
months |
|
|
Three to
twelve
months |
|
|
One to
five years |
|
|
Five to
ten years |
|
|
Over ten
years |
|
|
No specific
maturity |
|
|
Carrying
value |
|
Fair value through other comprehensive income |
|
|
|
|
|
|
|
|
|
|
|
|
|
|
|
|
|
|
|
|
|
|
|
|
|
|
|
|
Debt instruments |
|
|
|
|
|
|
|
|
|
|
|
|
|
|
|
|
|
|
|
|
|
|
|
|
|
|
|
|
Canadian federal government issued or guaranteed debt |
|
|
|
|
|
|
|
|
|
|
|
|
|
|
|
|
|
|
|
|
|
|
|
|
|
|
|
|
|
|
|
|
|
|
|
|
|
|
|
|
|
|
|
|
|
|
|
|
|
|
|
|
|
|
|
|
|
Canadian provincial and municipal debt |
|
|
|
|
|
|
|
|
|
|
|
|
|
|
|
|
|
|
|
|
|
|
|
|
|
|
|
|
|
|
|
|
|
|
|
|
|
|
|
|
|
|
|
|
|
|
|
|
|
|
|
|
|
|
|
|
|
U.S. treasury and other U.S. agency debt |
|
|
|
|
|
|
|
|
|
|
|
|
|
|
|
|
|
|
|
|
|
|
|
|
|
|
|
|
|
|
|
|
|
|
|
|
|
|
|
|
|
|
|
|
|
|
|
|
|
|
|
|
|
|
|
|
|
Other foreign government debt |
|
|
|
|
|
|
|
|
|
|
|
|
|
|
|
|
|
|
|
|
|
|
|
|
|
|
|
|
|
|
|
|
|
|
|
|
|
|
|
|
|
|
|
|
|
|
|
|
|
|
|
|
|
|
|
|
|
Other debt |
|
|
|
|
|
|
|
|
|
|
|
|
|
|
|
|
|
|
|
|
|
|
|
|
|
|
|
|
|
|
|
|
|
|
|
|
|
|
|
|
|
|
|
|
|
|
|
|
|
|
|
|
|
|
|
|
|
|
|
|
|
|
|
|
|
|
|
|
|
|
|
|
|
|
|
|
|
|
|
|
|
|
|
|
|
|
Equity instruments |
|
|
|
|
|
|
|
|
|
|
|
|
|
|
|
|
|
|
|
|
|
|
|
|
|
|
|
|
Common shares |
|
|
|
|
|
|
|
|
|
|
|
|
|
|
|
|
|
|
|
|
|
|
|
|
|
|
|
|
Total FVOCI |
|
|
|
|
|
|
|
|
|
|
|
|
|
|
|
|
|
|
|
|
|
|
|
|
|
|
|
|
|
|
|
|
|
|
|
|
|
|
|
|
|
|
|
|
|
|
|
|
|
|
|
|
|
|
|
|
|
Canadian federal and provincial government issued or guaranteed debt |
|
|
|
|
|
|
|
|
|
|
|
|
|
|
|
|
|
|
|
|
|
|
|
|
|
|
|
|
|
|
|
|
|
|
|
|
|
|
|
|
|
|
|
|
|
|
|
|
|
|
|
|
|
|
|
|
|
U.S. treasury and other U.S. agency debt |
|
|
|
|
|
|
|
|
|
|
|
|
|
|
|
|
|
|
|
|
|
|
|
|
|
|
|
|
|
|
|
|
|
|
|
|
|
|
|
|
|
|
|
|
|
|
|
|
|
|
|
|
|
|
|
|
|
Other foreign government debt |
|
|
|
|
|
|
|
|
|
|
|
|
|
|
|
|
|
|
|
|
|
|
|
|
|
|
|
|
|
|
|
|
|
|
|
|
|
|
|
|
|
|
|
|
|
|
|
|
|
|
|
|
|
|
|
|
|
Corporate debt |
|
|
|
|
|
|
|
|
|
|
|
|
|
|
|
|
|
|
|
|
|
|
|
|
|
|
|
|
|
|
|
|
|
|
|
|
|
|
|
|
|
|
|
|
|
|
|
|
|
|
|
|
|
|
|
|
|
|
|
|
|
|
|
|
|
|
|
|
|
|
|
|
|
|
|
|
|
|
|
|
|
|
|
|
|
|
Fair value through profit or loss |
|
|
|
|
|
|
|
|
|
|
|
|
|
|
|
|
|
|
|
|
|
|
|
|
|
|
|
|
Equity instruments |
|
|
|
|
|
|
|
|
|
|
|
|
|
|
|
|
|
|
|
|
|
|
|
|
|
|
|
|
Debt instruments |
|
|
|
|
|
|
|
|
|
|
|
|
|
|
|
|
|
|
|
|
|
|
|
|
|
|
|
|
Total investment securities |
|
|
|
|
|
|
|
|
|
|
|
|
|
|
|
|
|
|
|
|
|
|
|
|
|
|
|
|
Total by currency (in Canadian equivalent): |
|
|
|
|
|
|
|
|
|
|
|
|
|
|
|
|
|
|
|
|
|
|
|
|
|
|
|
|
Canadian dollar |
|
|
|
|
|
|
|
|
|
|
|
|
|
|
|
|
|
|
|
|
|
|
|
|
|
|
|
|
U.S. dollar |
|
|
|
|
|
|
|
|
|
|
|
|
|
|
|
|
|
|
|
|
|
|
|
|
|
|
|
|
Mexican peso |
|
|
|
|
|
|
|
|
|
|
|
|
|
|
|
|
|
|
|
|
|
|
|
|
|
|
|
|
Other currencies |
|
|
|
|
|
|
|
|
|
|
|
|
|
|
|
|
|
|
|
|
|
|
|
|
|
|
|
|
Total investment securities |
|
|
|
|
|
|
|
|
|
|
|
|
|
|
|
|
|
|
|
|
|
|
|
|
|
|
|
|
| (1) |
Represents the weighted-average yield of fixed income securities. |
|
2025 Scotiabank Annual Report
Consolidated Financial Statements
|
|
|
|
|
|
|
|
|
|
|
|
|
|
|
|
|
|
|
|
|
|
|
|
|
|
|
|
|
| |
|
Remaining term to maturity |
|
|
|
|
| As at October 31, 2024 ($ millions) |
|
|
|
|
Three to
twelve
months |
|
|
One to
five years |
|
|
Five to
ten years |
|
|
Over ten
years |
|
|
No specific
maturity |
|
|
Carrying
value |
|
Fair value through other comprehensive income |
|
|
|
|
|
|
|
|
|
|
|
|
|
|
|
|
|
|
|
|
|
|
|
|
|
|
|
|
Debt instruments |
|
|
|
|
|
|
|
|
|
|
|
|
|
|
|
|
|
|
|
|
|
|
|
|
|
|
|
|
Canadian federal government issued or guaranteed debt |
|
$ |
1,873 |
|
|
$ |
4,054 |
|
|
$ |
11,699 |
|
|
$ |
3,072 |
|
|
$ |
842 |
|
|
$ |
– |
|
|
$ |
21,540 |
|
|
|
|
|
|
|
|
|
|
|
|
|
|
|
|
|
|
|
|
|
|
|
|
– |
|
|
|
|
|
Canadian provincial and municipal debt |
|
|
213 |
|
|
|
1,882 |
|
|
|
8,190 |
|
|
|
6,811 |
|
|
|
429 |
|
|
|
– |
|
|
|
17,525 |
|
|
|
|
|
|
|
|
|
|
|
|
|
|
|
|
|
|
|
|
|
|
|
|
– |
|
|
|
|
|
U.S. treasury and other U.S. agency debt |
|
|
2,308 |
|
|
|
2,209 |
|
|
|
30,098 |
|
|
|
5,387 |
|
|
|
6,374 |
|
|
|
– |
|
|
|
46,376 |
|
|
|
|
2.3 |
|
|
|
|
|
|
|
|
|
|
|
|
|
|
|
|
|
|
|
– |
|
|
|
|
|
Other foreign government debt |
|
|
6,203 |
|
|
|
6,069 |
|
|
|
12,969 |
|
|
|
3,715 |
|
|
|
330 |
|
|
|
– |
|
|
|
29,286 |
|
|
|
|
|
|
|
|
|
|
|
|
|
|
|
|
|
|
|
|
|
|
|
|
– |
|
|
|
|
|
Other debt |
|
|
1 |
|
|
|
452 |
|
|
|
2,768 |
|
|
|
268 |
|
|
|
10 |
|
|
|
– |
|
|
|
3,499 |
|
|
|
|
|
|
|
|
|
|
|
|
|
|
|
|
|
|
|
|
|
|
|
|
|
|
|
|
|
|
|
|
|
10,598 |
|
|
|
14,666 |
|
|
|
65,724 |
|
|
|
19,253 |
|
|
|
7,985 |
|
|
|
– |
|
|
|
118,226 |
|
Equity instruments |
|
|
|
|
|
|
|
|
|
|
|
|
|
|
|
|
|
|
|
|
|
|
|
|
|
|
|
|
Common shares |
|
|
– |
|
|
|
– |
|
|
|
– |
|
|
|
– |
|
|
|
– |
|
|
|
3,162 |
|
|
|
3,162 |
|
Total FVOCI |
|
|
10,598 |
|
|
|
14,666 |
|
|
|
65,724 |
|
|
|
19,253 |
|
|
|
7,985 |
|
|
|
3,162 |
|
|
|
121,388 |
|
|
|
|
|
|
|
|
|
|
|
|
|
|
|
|
|
|
|
|
|
|
|
|
|
|
|
|
|
|
Canadian federal and provincial government issued or guaranteed debt |
|
|
610 |
|
|
|
2,099 |
|
|
|
5,740 |
|
|
|
272 |
|
|
|
– |
|
|
|
– |
|
|
|
8,721 |
|
|
|
|
|
|
|
|
|
|
|
|
|
|
|
|
|
|
|
|
|
|
|
|
– |
|
|
|
|
|
U.S. treasury and other U.S. agency debt |
|
|
1 |
|
|
|
48 |
|
|
|
116 |
|
|
|
13 |
|
|
|
18,262 |
|
|
|
– |
|
|
|
18,440 |
|
|
|
|
|
|
|
|
|
|
|
|
|
|
|
|
|
|
|
|
|
|
|
|
– |
|
|
|
|
|
Other foreign government debt |
|
|
324 |
|
|
|
689 |
|
|
|
858 |
|
|
|
139 |
|
|
|
31 |
|
|
|
– |
|
|
|
2,041 |
|
|
|
|
|
|
|
|
|
|
|
|
|
|
|
|
|
|
|
|
|
|
|
|
– |
|
|
|
|
|
Corporate debt |
|
|
– |
|
|
|
– |
|
|
|
81 |
|
|
|
– |
|
|
|
129 |
|
|
|
– |
|
|
|
210 |
|
|
|
|
|
|
|
|
|
|
|
|
|
|
|
|
|
|
|
|
|
|
|
|
|
|
|
|
|
|
|
|
|
935 |
|
|
|
2,836 |
|
|
|
6,795 |
|
|
|
424 |
|
|
|
18,422 |
|
|
|
– |
|
|
|
29,412 |
|
Fair value through profit or loss |
|
|
|
|
|
|
|
|
|
|
|
|
|
|
|
|
|
|
|
|
|
|
|
|
|
|
|
|
Equity instruments |
|
|
– |
|
|
|
– |
|
|
|
– |
|
|
|
– |
|
|
|
– |
|
|
|
2,004 |
|
|
|
2,004 |
|
Debt instruments |
|
|
2 |
|
|
|
– |
|
|
|
26 |
|
|
|
– |
|
|
|
– |
|
|
|
– |
|
|
|
28 |
|
Total investment securities |
|
$ |
11,535 |
|
|
$ |
17,502 |
|
|
$ |
72,545 |
|
|
$ |
19,677 |
|
|
$ |
26,407 |
|
|
$ |
5,166 |
|
|
$ |
152,832 |
|
Total by currency (in Canadian equivalent): |
|
|
|
|
|
|
|
|
|
|
|
|
|
|
|
|
|
|
|
|
|
|
|
|
|
|
|
|
Canadian dollar |
|
$ |
2,725 |
|
|
$ |
6,799 |
|
|
$ |
23,034 |
|
|
$ |
8,491 |
|
|
$ |
1,409 |
|
|
$ |
1,464 |
|
|
$ |
43,922 |
|
U.S. dollar |
|
|
2,696 |
|
|
|
3,894 |
|
|
|
40,362 |
|
|
|
8,471 |
|
|
|
24,636 |
|
|
|
3,333 |
|
|
|
83,392 |
|
Mexican peso |
|
|
948 |
|
|
|
1,215 |
|
|
|
3,139 |
|
|
|
332 |
|
|
|
– |
|
|
|
44 |
|
|
|
5,678 |
|
Other currencies |
|
|
5,166 |
|
|
|
5,594 |
|
|
|
6,010 |
|
|
|
2,383 |
|
|
|
362 |
|
|
|
325 |
|
|
|
19,840 |
|
Total investment securities |
|
$ |
11,535 |
|
|
$ |
17,502 |
|
|
$ |
72,545 |
|
|
$ |
19,677 |
|
|
$ |
26,407 |
|
|
$ |
5,166 |
|
|
$ |
152,832 |
|
| (1) |
Represents the weighted-average yield of fixed income securities. |
(e) |
Net gain on sale of investment securities |
The following table presents the net gain on sale of investment securities:
|
|
|
|
|
|
|
|
|
| For the year ended October 31 ($ millions) |
|
|
|
|
2024 |
|
Debt investment securities measured at amortized cost |
|
|
|
|
|
$ |
1 |
|
Debt investment securities measured at FVOCI |
|
|
|
|
|
|
47 |
|
Net gain on sale of investment securities |
|
|
|
|
|
$ |
48 |
|
2025 Scotiabank Annual Report
|
Consolidated Financial Statements
|
Loans, Impaired Loans and Allowance for Credit Losses |
|
|
|
|
|
|
|
|
|
|
|
|
|
|
|
|
|
|
|
|
|
|
|
|
|
| |
|
|
|
|
2024 |
|
| As at October 31 ($ millions) |
|
|
|
|
Allowance
for credit
losses |
|
|
Net
carrying
amount |
|
|
|
|
|
Allowance
for credit
losses |
|
|
|
|
Residential mortgages |
|
|
|
|
|
|
|
|
|
|
|
|
|
$ |
350,941 |
|
|
$ |
1,208 |
|
|
$ |
349,733 |
|
Personal loans |
|
|
|
|
|
|
|
|
|
|
|
|
|
|
106,379 |
|
|
|
2,319 |
|
|
|
104,060 |
|
Credit cards |
|
|
|
|
|
|
|
|
|
|
|
|
|
|
17,374 |
|
|
|
1,160 |
|
|
|
16,214 |
|
Business and government |
|
|
|
|
|
|
|
|
|
|
|
|
|
|
292,671 |
|
|
|
1,849 |
|
|
|
290,822 |
|
Total |
|
|
|
|
|
|
|
|
|
|
|
|
|
$ |
767,365 |
|
|
$ |
6,536 |
|
|
$ |
760,829 |
|
(b) |
Loans and acceptances outstanding by geography (1) |
|
|
|
|
|
|
|
|
|
| As at October 31 ($ millions) |
|
|
|
|
2024 |
|
|
|
|
|
|
|
|
|
|
Residential mortgages |
|
|
|
|
|
$ |
297,677 |
|
Personal loans |
|
|
|
|
|
|
82,892 |
|
Credit cards |
|
|
|
|
|
|
8,982 |
|
Business and government |
|
|
|
|
|
|
133,810 |
|
|
|
|
|
|
|
|
523,361 |
|
|
|
|
|
|
|
|
|
|
Personal loans |
|
|
|
|
|
|
4,009 |
|
Business and government |
|
|
|
|
|
|
55,237 |
|
|
|
|
|
|
|
|
59,246 |
|
|
|
|
|
|
|
|
|
|
Residential mortgages |
|
|
|
|
|
|
16,749 |
|
Personal loans |
|
|
|
|
|
|
2,615 |
|
Credit cards |
|
|
|
|
|
|
832 |
|
Business and government |
|
|
|
|
|
|
23,994 |
|
|
|
|
|
|
|
|
44,190 |
|
|
|
|
|
|
|
|
|
|
Residential mortgages |
|
|
|
|
|
|
20,410 |
|
Personal loans |
|
|
|
|
|
|
4,868 |
|
Credit cards |
|
|
|
|
|
|
3,551 |
|
Business and government |
|
|
|
|
|
|
20,330 |
|
|
|
|
|
|
|
|
49,159 |
|
|
|
|
|
|
|
|
|
|
Residential mortgages |
|
|
|
|
|
|
4,113 |
|
Personal loans |
|
|
|
|
|
|
5,623 |
|
Credit cards |
|
|
|
|
|
|
757 |
|
Business and government |
|
|
|
|
|
|
10,545 |
|
|
|
|
|
|
|
|
21,038 |
|
|
|
|
|
|
|
|
|
|
Residential mortgages |
|
|
|
|
|
|
2,196 |
|
Personal loans |
|
|
|
|
|
|
2,186 |
|
Credit cards |
|
|
|
|
|
|
1,446 |
|
Business and government |
|
|
|
|
|
|
5,518 |
|
|
|
|
|
|
|
|
11,346 |
|
|
|
|
|
|
|
|
|
|
Residential mortgages |
|
|
|
|
|
|
9,796 |
|
Personal loans |
|
|
|
|
|
|
4,186 |
|
Credit cards |
|
|
|
|
|
|
1,806 |
|
Business and government |
|
|
|
|
|
|
43,237 |
|
|
|
|
|
|
|
|
59,025 |
|
Total loans |
|
|
|
|
|
|
767,365 |
|
|
|
|
|
|
|
|
148 |
|
Total loans and acceptances (3)
|
|
|
|
|
|
|
767,513 |
|
Allowance for credit losses |
|
|
|
|
|
|
(6,537 |
) |
Total loans and acceptances net of allowance for credit losses |
|
|
|
|
|
$ |
760,976 |
|
| (1) |
Geographic segmentation is based on the location of the property for residential mortgages; otherwise, the residence of the borrower. |
| (2) |
98.8% of acceptances reside outside Canada (October 31, 2024 – 96.5 %). |
| (3) |
Loans and acceptances denominated in U.S. dollars were $119,788 (2024 – $137,804), in Chilean pesos $10,885 (2024 – $39,425), Mexican pesos $12,754 (2024 – $31,522), and in other foreign currencies $24,665 (2024 – $54,549). |
|
2025 Scotiabank Annual Report
Consolidated Financial Statements
|
|
|
|
|
|
|
|
|
|
|
|
|
|
|
|
|
|
|
|
|
|
|
|
|
|
|
|
|
|
|
|
|
|
|
|
|
|
|
|
|
| As at October 31, 2025 |
|
Remaining term to maturity |
|
|
Rate sensitivity |
|
| ($ millions) |
|
Within
one year |
|
|
One to
five years |
|
|
Five to
ten years |
|
|
Over
ten years |
|
|
No specific
maturity |
|
|
Total |
|
|
Floating |
|
|
Fixed rate |
|
|
|
|
|
Total |
|
Residential mortgages |
|
|
|
|
|
|
|
|
|
|
|
|
|
|
|
|
|
|
|
|
|
|
|
|
|
|
|
|
|
|
|
|
|
|
|
|
|
|
|
|
Personal loans |
|
|
|
|
|
|
|
|
|
|
|
|
|
|
|
|
|
|
|
|
|
|
|
|
|
|
|
|
|
|
|
|
|
|
|
|
|
|
|
|
Credit cards |
|
|
|
|
|
|
|
|
|
|
|
|
|
|
|
|
|
|
|
|
|
|
|
|
|
|
|
|
|
|
|
|
|
|
|
|
|
|
|
|
Business and government |
|
|
|
|
|
|
|
|
|
|
|
|
|
|
|
|
|
|
|
|
|
|
|
|
|
|
|
|
|
|
|
|
|
|
|
|
|
|
|
|
Total |
|
|
|
|
|
|
|
|
|
|
|
|
|
|
|
|
|
|
|
|
|
|
|
|
|
|
|
|
|
|
|
|
|
|
|
|
|
|
|
|
Allowance for credit losses |
|
|
|
|
|
|
|
|
|
|
|
|
|
|
|
|
|
|
|
|
|
|
|
|
|
|
|
|
|
|
|
|
|
|
|
|
|
|
|
|
Total loans net of allowance for credit losses |
|
|
|
|
|
|
|
|
|
|
|
|
|
|
|
|
|
|
|
|
|
|
|
|
|
|
|
|
|
|
|
|
|
|
|
|
|
|
|
|
|
|
|
| As at October 31, 2024 |
|
Remaining term to maturity |
|
|
Rate sensitivity |
|
| ($ millions) |
|
Within
one year |
|
|
One to
five years |
|
|
Five to
ten years |
|
|
Over
ten years |
|
|
No specific
maturity |
|
|
Total |
|
|
Floating |
|
|
Fixed rate |
|
|
|
|
|
Total |
|
Residential mortgages |
|
$ |
72,883 |
|
|
$ |
233,469 |
|
|
$ |
15,456 |
|
|
$ |
25,264 |
|
|
$ |
3,869 |
|
|
$ |
350,941 |
|
|
$ |
93,626 |
|
|
$ |
253,954 |
|
|
$ |
3,361 |
|
|
$ |
350,941 |
|
Personal loans |
|
|
18,753 |
|
|
|
37,707 |
|
|
|
5,411 |
|
|
|
1,171 |
|
|
|
43,337 |
|
|
|
106,379 |
|
|
|
47,790 |
|
|
|
57,219 |
|
|
|
1,370 |
|
|
|
106,379 |
|
Credit cards |
|
|
– |
|
|
|
– |
|
|
|
– |
|
|
|
– |
|
|
|
17,374 |
|
|
|
17,374 |
|
|
|
– |
|
|
|
17,374 |
|
|
|
– |
|
|
|
17,374 |
|
Business and government |
|
|
142,536 |
|
|
|
135,474 |
|
|
|
7,340 |
|
|
|
405 |
|
|
|
6,916 |
|
|
|
292,671 |
|
|
|
216,334 |
|
|
|
73,596 |
|
|
|
2,741 |
|
|
|
292,671 |
|
Total |
|
$ |
234,172 |
|
|
$ |
406,650 |
|
|
$ |
28,207 |
|
|
$ |
26,840 |
|
|
$ |
71,496 |
|
|
$ |
767,365 |
|
|
$ |
357,750 |
|
|
$ |
402,143 |
|
|
$ |
7,472 |
|
|
$ |
767,365 |
|
Allowance for credit losses |
|
|
– |
|
|
|
– |
|
|
|
– |
|
|
|
– |
|
|
|
(6,536 |
) |
|
|
(6,536 |
) |
|
|
– |
|
|
|
– |
|
|
|
(6,536 |
) |
|
|
(6,536 |
) |
Total loans net of allowance for credit losses |
|
$ |
234,172 |
|
|
$ |
406,650 |
|
|
$ |
28,207 |
|
|
$ |
26,840 |
|
|
$ |
64,960 |
|
|
$ |
760,829 |
|
|
$ |
357,750 |
|
|
$ |
402,143 |
|
|
$ |
936 |
|
|
$ |
760,829 |
|
|
|
|
|
|
|
|
|
|
|
|
|
|
|
|
|
|
|
|
|
|
|
|
|
|
| |
|
|
|
|
2024 |
|
| As at October 31 ($ millions) |
|
|
|
|
Allowance
for credit
losses |
|
|
Net |
|
|
|
|
|
Allowance
for credit
losses |
|
|
Net |
|
Residential mortgages |
|
|
|
|
|
|
|
|
|
|
|
|
|
$ |
2,372 |
|
|
$ |
645 |
|
|
$ |
1,727 |
|
Personal loans |
|
|
|
|
|
|
|
|
|
|
|
|
|
|
1,117 |
|
|
|
621 |
|
|
|
496 |
|
Credit cards |
|
|
|
|
|
|
|
|
|
|
|
|
|
|
– |
|
|
|
– |
|
|
|
– |
|
Business and government |
|
|
|
|
|
|
|
|
|
|
|
|
|
|
3,250 |
|
|
|
788 |
|
|
|
2,462 |
|
Total |
|
|
|
|
|
|
|
|
|
|
|
|
|
$ |
6,739 |
|
|
$ |
2,054 |
|
|
$ |
4,685 |
|
|
|
|
|
|
|
|
|
|
|
|
|
|
|
|
|
|
|
|
|
|
|
|
|
|
Canada |
|
|
|
|
|
|
|
|
|
|
|
|
|
$ |
2,158 |
|
|
$ |
569 |
|
|
$ |
1,589 |
|
United States |
|
|
|
|
|
|
|
|
|
|
|
|
|
|
109 |
|
|
|
22 |
|
|
|
87 |
|
Mexico |
|
|
|
|
|
|
|
|
|
|
|
|
|
|
1,343 |
|
|
|
424 |
|
|
|
919 |
|
Peru |
|
|
|
|
|
|
|
|
|
|
|
|
|
|
715 |
|
|
|
385 |
|
|
|
330 |
|
Chile |
|
|
|
|
|
|
|
|
|
|
|
|
|
|
1,249 |
|
|
|
281 |
|
|
|
968 |
|
Colombia |
|
|
|
|
|
|
|
|
|
|
|
|
|
|
322 |
|
|
|
109 |
|
|
|
213 |
|
Other International |
|
|
|
|
|
|
|
|
|
|
|
|
|
|
843 |
|
|
|
264 |
|
|
|
579 |
|
Total |
|
|
|
|
|
|
|
|
|
|
|
|
|
$ |
6,739 |
|
|
$ |
2,054 |
|
|
$ |
4,685 |
|
| (1) |
Interest income recognized on impaired loans during the year ended October 31, 2025 was $95 (2024 – $84). |
2025 Scotiabank Annual Report
|
Consolidated Financial Statements
(e) |
Allowance for credit losses |
(i) |
Key inputs and assumptions |
The Bank’s allowance for credit losses is measured using a three-stage approach based on the extent of credit deterioration since origination. The calculation of the Bank’s allowance for credit losses is an output of a set of complex models with a number of underlying assumptions regarding the choice of variable inputs and their interdependencies. Some of the key drivers include the following:
| |
• |
|
Changes in risk ratings of the borrower or instrument reflecting changes in their credit quality; |
| |
• |
|
Changes in the volumes of transactions; |
| |
• |
|
Changes in the forward-looking macroeconomic environment reflected in the variables used in the models such as GDP growth, unemployment rates, commodity prices, interest rates and house price indices, which are closely related with credit losses in the relevant portfolio; |
| |
• |
|
Changes in macroeconomic scenarios and the probability weights assigned to each scenario; and |
| |
• |
|
Borrower migration between the three stages. |
The Bank determines its allowance for credit losses using four probability-weighted forward-looking scenarios (base case, optimistic, pessimistic and very pessimistic).
The Bank considers both internal and external sources of information and data to achieve unbiased projections and forecasts in determining the allowance for credit losses. The Bank prepares the scenarios using forecasts generated by Scotiabank Economics (SE). The forecasts are generated using models whose outputs are modified by SE as necessary to formulate a ‘base case’ view of the most probable future direction of economic developments. The development of the base case and alternative scenarios is overseen by a governance committee that consists of internal stakeholders from across the Bank. The final base case and alternative scenarios reflect significant review and oversight, and incorporate judgment both in the determination of the scenarios’ forecasts and the probability weights that are assigned to them.
(ii) |
Key macroeconomic variables |
The inputs and models used for calculating expected credit losses may not always capture all characteristics of the market at the date of the financial statements. Qualitative adjustments or overlays may be made for certain portfolios or geographies as temporary adjustments in circumstances where, in the Bank’s view, the inputs, assumptions, and/or modelling techniques do not capture all relevant risk factors, including the emergence of economic or geopolitical events, up to the date of the financial statements. As required under IFRS 9, the allowance for credit losses at each reporting period must be based on inputs, assumptions and information available up to that date.
The Bank has generated a forward-looking base case scenario and three alternate forward-looking scenarios (one optimistic and two pessimistic) as key inputs into the expected credit loss provisioning models. Given the uncertainty surrounding U.S. trade policies and the direction of tariffs, the scenarios as at October 31, 2025 have varying assumptions of imposed tariffs. The base case scenario assumes tariffs announced and implemented, avoiding speculation on future announcements, including potential trade deals and tariff pauses. Differing assumptions are reflected in the alternate scenarios described below. As new information comes to light in the future, the scenarios and assumptions will be updated accordingly.
U.S. trade policies and related uncertainty have shaped the economic environment over the past year and weighed on the outlook. The Canadian and U.S. forecasts have been adjusted frequently as new developments emerged. In Canada, tariff-sensitive sectors and regions are showing earlier-than-expected weakness, resulting in a softer 2025 growth profile than expected last year. In contrast, the U.S. has shown surprising resilience, supported by strong AI-related activity despite signs of weakness elsewhere in the economy. As a result, the U.S. growth profile for 2025 is slightly stronger than forecast last year. Persistent upside surprises to U.S. growth, combined with stubborn inflation, delayed the start of monetary easing relative to last year’s expectations. With inflation in both countries now closer to target and economic activity softening, the Bank of Canada and the U.S. Federal Reserve have shifted their focus from inflation control toward supporting growth, though upside inflation risks remain. Economic activity in both countries is expected to improve somewhat in 2026 as tariff impacts fade and, in Canada, as stimulus measures and infrastructure plans from the federal budget take effect.
The optimistic scenario features somewhat stronger economic activity relative to the base case. The pessimistic scenario features a negative demand-type shock with globally tighter financial conditions, weaker growth and inflation, and lower monetary policy rates than in the base case scenario. It also assumes a combination of U.S. imposed tariffs on world economies, including an effective tariff of 7.5% on imports from Canada and Mexico, while facing no retaliation from these countries. The very pessimistic scenario features a strong stagflationary impulse that leads to a protracted period of financial market uncertainty. It also assumes U.S. imposed tariffs with a magnitude about three times that of the pessimistic scenario. Under this scenario, all countries retaliate. This results in higher inflation, requiring central banks to raise their policy rates to higher levels than in the base case in order to bring inflation under control, which is dampening economic activity.
|
2025 Scotiabank Annual Report
Consolidated Financial Statements
The following tables show certain key macroeconomic variables used to calculate the modelled estimate for the allowance for credit losses. Further changes in these variables up to the date of the financial statements are incorporated through expert credit judgment. For the base case, optimistic and pessimistic scenarios, the projections are provided for the next 12 months and for the remaining forecast period, which represents a medium-term view.
|
|
|
|
|
|
|
|
|
|
|
|
|
|
|
|
|
|
|
|
|
|
|
|
|
|
|
|
|
|
|
|
|
|
|
|
|
|
|
|
|
|
|
|
|
|
|
|
|
|
|
|
|
|
|
|
|
|
|
|
|
| |
|
Base Case Scenario |
|
|
|
|
|
Alternative Scenario – Optimistic |
|
|
|
|
|
Alternative Scenario – Pessimistic |
|
|
|
|
|
Alternative Scenario – Very
Pessimistic |
|
| October 31, 2025 |
|
Next
12 Months |
|
|
|
|
|
Remaining
Forecast Period |
|
|
|
|
|
Next
12 Months |
|
|
|
|
|
Remaining
Forecast Period |
|
|
|
|
|
Next
12 Months |
|
|
|
|
|
Remaining
Forecast Period |
|
|
|
|
|
Next
12 Months |
|
|
|
|
|
Remaining
Forecast Period |
|
|
|
|
|
|
|
|
|
|
|
|
|
|
|
|
|
| |
|
|
|
|
|
|
|
|
|
|
|
|
|
|
|
|
|
|
|
|
|
|
|
|
|
|
|
|
|
|
|
|
|
|
|
|
|
|
|
|
|
|
|
|
|
|
|
|
|
|
|
|
|
|
|
|
|
|
|
|
| Real GDP growth, y/y % change |
|
|
|
|
|
|
|
|
|
|
|
|
|
|
|
|
|
|
|
|
|
|
|
|
|
|
|
|
|
|
|
|
|
|
|
|
|
|
|
|
|
|
|
|
|
|
|
|
|
|
|
|
|
|
|
|
|
|
|
|
| Consumer price index, y/y % |
|
|
|
|
|
|
|
|
|
|
|
|
|
|
|
|
|
|
|
|
|
|
|
|
|
|
|
|
|
|
|
|
|
|
|
|
|
|
|
|
|
|
|
|
|
|
|
|
|
|
|
|
|
|
|
|
|
|
|
|
| Unemployment rate, average % |
|
|
|
|
|
|
|
|
|
|
|
|
|
|
|
|
|
|
|
|
|
|
|
|
|
|
|
|
|
|
|
|
|
|
|
|
|
|
|
|
|
|
|
|
|
|
|
|
|
|
|
|
|
|
|
|
|
|
|
|
| Bank of Canada overnight rate target, average % |
|
|
|
|
|
|
|
|
|
|
|
|
|
|
|
|
|
|
|
|
|
|
|
|
|
|
|
|
|
|
|
|
|
|
|
|
|
|
|
|
|
|
|
|
|
|
|
|
|
|
|
|
|
|
|
|
|
|
|
|
| HPI – Housing Price Index, y/y % change |
|
|
|
|
|
|
|
|
|
|
|
|
|
|
|
|
|
|
|
|
|
|
|
|
|
|
|
|
|
|
|
|
|
|
|
|
|
|
|
|
|
|
|
|
|
|
|
|
|
|
|
|
|
|
|
|
|
|
|
|
| USD/CAD exchange rate, average |
|
|
|
|
|
|
|
|
|
|
|
|
|
|
|
|
|
|
|
|
|
|
|
|
|
|
|
|
|
|
|
|
|
|
|
|
|
|
|
|
|
|
|
|
|
|
|
|
|
|
|
|
|
|
|
|
|
|
|
|
|
|
|
|
|
|
|
|
|
|
|
|
|
|
|
|
| |
|
|
|
|
|
|
|
|
|
|
|
|
|
|
|
|
|
|
|
|
|
|
|
|
|
|
|
|
|
|
|
|
|
|
|
|
|
|
|
|
|
|
|
|
|
|
|
|
|
|
|
|
|
|
|
|
|
|
|
|
| Real GDP growth, y/y % change |
|
|
|
|
|
|
|
|
|
|
|
|
|
|
|
|
|
|
|
|
|
|
|
|
|
|
|
|
|
|
|
|
|
|
|
|
|
|
|
|
|
|
|
|
|
|
|
|
|
|
|
|
|
|
|
|
|
|
|
|
| Consumer price index, y/y % |
|
|
|
|
|
|
|
|
|
|
|
|
|
|
|
|
|
|
|
|
|
|
|
|
|
|
|
|
|
|
|
|
|
|
|
|
|
|
|
|
|
|
|
|
|
|
|
|
|
|
|
|
|
|
|
|
|
|
|
|
| Target federal funds rate, upper limit, average % |
|
|
|
|
|
|
|
|
|
|
|
|
|
|
|
|
|
|
|
|
|
|
|
|
|
|
|
|
|
|
|
|
|
|
|
|
|
|
|
|
|
|
|
|
|
|
|
|
|
|
|
|
|
|
|
|
|
|
|
|
| Unemployment rate, average % |
|
|
|
|
|
|
|
|
|
|
|
|
|
|
|
|
|
|
|
|
|
|
|
|
|
|
|
|
|
|
|
|
|
|
|
|
|
|
|
|
|
|
|
|
|
|
|
|
|
|
|
|
|
|
|
|
|
|
|
|
|
|
|
|
|
|
|
|
|
|
|
|
|
|
|
|
| |
|
|
|
|
|
|
|
|
|
|
|
|
|
|
|
|
|
|
|
|
|
|
|
|
|
|
|
|
|
|
|
|
|
|
|
|
|
|
|
|
|
|
|
|
|
|
|
|
|
|
|
|
|
|
|
|
|
|
|
|
| Real GDP growth, y/y % change |
|
|
|
|
|
|
|
|
|
|
|
|
|
|
|
|
|
|
|
|
|
|
|
|
|
|
|
|
|
|
|
|
|
|
|
|
|
|
|
|
|
|
|
|
|
|
|
|
|
|
|
|
|
|
|
|
|
|
|
|
|
|
|
|
|
|
|
|
|
|
|
|
|
|
|
|
| |
|
|
|
|
|
|
|
|
|
|
|
|
|
|
|
|
|
|
|
|
|
|
|
|
|
|
|
|
|
|
|
|
|
|
|
|
|
|
|
|
|
|
|
|
|
|
|
|
|
|
|
|
|
|
|
|
|
|
|
|
| WTI oil price, average USD/bbl |
|
|
|
|
|
|
|
|
|
|
|
|
|
|
|
|
|
|
|
|
|
|
|
|
|
|
|
|
|
|
|
|
|
|
|
|
|
|
|
|
|
|
|
|
|
|
|
|
|
|
|
|
|
|
|
|
|
|
|
|
| Copper price, average USD/lb |
|
|
|
|
|
|
|
|
|
|
|
|
|
|
|
|
|
|
|
|
|
|
|
|
|
|
|
|
|
|
|
|
|
|
|
|
|
|
|
|
|
|
|
|
|
|
|
|
|
|
|
|
|
|
|
|
|
|
|
|
| Global GDP, y/y % change |
|
|
|
|
|
|
|
|
|
|
|
|
|
|
|
|
|
|
|
|
|
|
|
|
|
|
|
|
|
|
|
|
|
|
|
|
|
|
|
|
|
|
|
|
|
|
|
|
|
|
|
|
|
|
|
|
|
|
|
|
2025 Scotiabank Annual Report
|
Consolidated Financial Statements
|
|
|
|
|
|
|
|
|
|
|
|
|
|
|
|
|
|
|
|
|
|
|
|
|
|
|
|
|
|
|
|
|
|
|
|
|
|
|
|
|
|
|
|
|
|
|
|
|
|
|
|
|
|
|
|
|
|
|
|
|
| |
|
Base Case Scenario |
|
|
|
|
|
Alternative Scenario – Optimistic |
|
|
|
|
|
Alternative Scenario – Pessimistic |
|
|
|
|
|
Alternative Scenario – Very
Pessimistic |
|
| October 31, 2024 |
|
Next
12 Months |
|
|
|
|
|
Remaining
Forecast Period |
|
|
|
|
|
Next
12 Months |
|
|
|
|
|
Remaining
Forecast Period |
|
|
|
|
|
Next
12 Months |
|
|
|
|
|
Remaining
Forecast Period |
|
|
|
|
|
Next
12 Months |
|
|
|
|
|
Remaining
Forecast Period |
|
|
|
|
|
|
|
|
|
|
|
|
|
|
|
|
|
| |
|
|
|
|
|
|
|
|
|
|
|
|
|
|
|
|
|
|
|
|
|
|
|
|
|
|
|
|
|
|
|
|
|
|
|
|
|
|
|
|
|
|
|
|
|
|
|
|
|
|
|
|
|
|
|
|
|
|
|
|
| Real GDP growth, y/y % change |
|
|
1.8 |
|
|
|
|
|
|
|
2.2 |
|
|
|
|
|
|
|
2.8 |
|
|
|
|
|
|
|
3.1 |
|
|
|
|
|
|
|
-1.6 |
|
|
|
|
|
|
|
2.9 |
|
|
|
|
|
|
|
-4.4 |
|
|
|
|
|
|
|
3.4 |
|
| Consumer price index, y/y % |
|
|
2.2 |
|
|
|
|
|
|
|
2.0 |
|
|
|
|
|
|
|
2.4 |
|
|
|
|
|
|
|
2.5 |
|
|
|
|
|
|
|
1.6 |
|
|
|
|
|
|
|
1.7 |
|
|
|
|
|
|
|
5.8 |
|
|
|
|
|
|
|
2.2 |
|
| Unemployment rate, average % |
|
|
6.7 |
|
|
|
|
|
|
|
6.0 |
|
|
|
|
|
|
|
6.3 |
|
|
|
|
|
|
|
5.0 |
|
|
|
|
|
|
|
8.4 |
|
|
|
|
|
|
|
6.9 |
|
|
|
|
|
|
|
11.1 |
|
|
|
|
|
|
|
7.3 |
|
| Bank of Canada overnight rate target, average % |
|
|
3.3 |
|
|
|
|
|
|
|
2.6 |
|
|
|
|
|
|
|
3.5 |
|
|
|
|
|
|
|
3.6 |
|
|
|
|
|
|
|
2.9 |
|
|
|
|
|
|
|
2.0 |
|
|
|
|
|
|
|
4.0 |
|
|
|
|
|
|
|
3.2 |
|
| HPI – Housing Price Index, y/y % change |
|
|
1.6 |
|
|
|
|
|
|
|
4.2 |
|
|
|
|
|
|
|
2.4 |
|
|
|
|
|
|
|
5.5 |
|
|
|
|
|
|
|
-3.7 |
|
|
|
|
|
|
|
4.8 |
|
|
|
|
|
|
|
-5.8 |
|
|
|
|
|
|
|
4.1 |
|
| USD/CAD exchange rate, average |
|
|
1.34 |
|
|
|
|
|
|
|
1.30 |
|
|
|
|
|
|
|
1.33 |
|
|
|
|
|
|
|
1.28 |
|
|
|
|
|
|
|
1.43 |
|
|
|
|
|
|
|
1.28 |
|
|
|
|
|
|
|
1.49 |
|
|
|
|
|
|
|
1.30 |
|
|
|
|
|
|
|
|
|
|
|
|
|
|
|
|
|
| |
|
|
|
|
|
|
|
|
|
|
|
|
|
|
|
|
|
|
|
|
|
|
|
|
|
|
|
|
|
|
|
|
|
|
|
|
|
|
|
|
|
|
|
|
|
|
|
|
|
|
|
|
|
|
|
|
|
|
|
|
| Real GDP growth, y/y % change |
|
|
1.6 |
|
|
|
|
|
|
|
2.2 |
|
|
|
|
|
|
|
2.3 |
|
|
|
|
|
|
|
3.1 |
|
|
|
|
|
|
|
-1.6 |
|
|
|
|
|
|
|
3.0 |
|
|
|
|
|
|
|
-4.0 |
|
|
|
|
|
|
|
3.4 |
|
| Consumer price index, y/y % |
|
|
2.4 |
|
|
|
|
|
|
|
2.3 |
|
|
|
|
|
|
|
2.6 |
|
|
|
|
|
|
|
2.7 |
|
|
|
|
|
|
|
1.3 |
|
|
|
|
|
|
|
2.0 |
|
|
|
|
|
|
|
6.2 |
|
|
|
|
|
|
|
2.5 |
|
| Target federal funds rate, upper limit, average % |
|
|
4.1 |
|
|
|
|
|
|
|
2.9 |
|
|
|
|
|
|
|
4.1 |
|
|
|
|
|
|
|
3.4 |
|
|
|
|
|
|
|
3.6 |
|
|
|
|
|
|
|
1.8 |
|
|
|
|
|
|
|
4.8 |
|
|
|
|
|
|
|
3.4 |
|
| Unemployment rate, average % |
|
|
4.3 |
|
|
|
|
|
|
|
4.3 |
|
|
|
|
|
|
|
4.2 |
|
|
|
|
|
|
|
3.9 |
|
|
|
|
|
|
|
6.0 |
|
|
|
|
|
|
|
4.9 |
|
|
|
|
|
|
|
8.1 |
|
|
|
|
|
|
|
5.2 |
|
|
|
|
|
|
|
|
|
|
|
|
|
|
|
|
|
| |
|
|
|
|
|
|
|
|
|
|
|
|
|
|
|
|
|
|
|
|
|
|
|
|
|
|
|
|
|
|
|
|
|
|
|
|
|
|
|
|
|
|
|
|
|
|
|
|
|
|
|
|
|
|
|
|
|
|
|
|
| Real GDP growth, y/y % change |
|
|
1.3 |
|
|
|
|
|
|
|
2.1 |
|
|
|
|
|
|
|
2.6 |
|
|
|
|
|
|
|
2.9 |
|
|
|
|
|
|
|
-0.8 |
|
|
|
|
|
|
|
2.6 |
|
|
|
|
|
|
|
-2.9 |
|
|
|
|
|
|
|
3.2 |
|
| Unemployment rate, average % |
|
|
3.3 |
|
|
|
|
|
|
|
3.9 |
|
|
|
|
|
|
|
3.0 |
|
|
|
|
|
|
|
3.1 |
|
|
|
|
|
|
|
4.1 |
|
|
|
|
|
|
|
4.0 |
|
|
|
|
|
|
|
6.3 |
|
|
|
|
|
|
|
4.9 |
|
|
|
|
|
|
|
|
|
|
|
|
|
|
|
|
|
| |
|
|
|
|
|
|
|
|
|
|
|
|
|
|
|
|
|
|
|
|
|
|
|
|
|
|
|
|
|
|
|
|
|
|
|
|
|
|
|
|
|
|
|
|
|
|
|
|
|
|
|
|
|
|
|
|
|
|
|
|
| Real GDP growth, y/y % change |
|
|
3.0 |
|
|
|
|
|
|
|
2.2 |
|
|
|
|
|
|
|
4.6 |
|
|
|
|
|
|
|
3.2 |
|
|
|
|
|
|
|
0.1 |
|
|
|
|
|
|
|
3.0 |
|
|
|
|
|
|
|
-3.6 |
|
|
|
|
|
|
|
3.8 |
|
| Unemployment rate, average % |
|
|
7.9 |
|
|
|
|
|
|
|
6.7 |
|
|
|
|
|
|
|
7.6 |
|
|
|
|
|
|
|
6.0 |
|
|
|
|
|
|
|
9.5 |
|
|
|
|
|
|
|
7.0 |
|
|
|
|
|
|
|
11.5 |
|
|
|
|
|
|
|
7.4 |
|
|
|
|
|
|
|
|
|
|
|
|
|
|
|
|
|
| |
|
|
|
|
|
|
|
|
|
|
|
|
|
|
|
|
|
|
|
|
|
|
|
|
|
|
|
|
|
|
|
|
|
|
|
|
|
|
|
|
|
|
|
|
|
|
|
|
|
|
|
|
|
|
|
|
|
|
|
|
| Real GDP growth, y/y % change |
|
|
2.6 |
|
|
|
|
|
|
|
3.4 |
|
|
|
|
|
|
|
3.6 |
|
|
|
|
|
|
|
4.5 |
|
|
|
|
|
|
|
1.5 |
|
|
|
|
|
|
|
3.7 |
|
|
|
|
|
|
|
-0.5 |
|
|
|
|
|
|
|
4.3 |
|
| Unemployment rate, average % |
|
|
6.7 |
|
|
|
|
|
|
|
6.2 |
|
|
|
|
|
|
|
6.2 |
|
|
|
|
|
|
|
5.2 |
|
|
|
|
|
|
|
8.1 |
|
|
|
|
|
|
|
6.5 |
|
|
|
|
|
|
|
11.8 |
|
|
|
|
|
|
|
8.0 |
|
|
|
|
|
|
|
|
|
|
|
|
|
|
|
|
|
| |
|
|
|
|
|
|
|
|
|
|
|
|
|
|
|
|
|
|
|
|
|
|
|
|
|
|
|
|
|
|
|
|
|
|
|
|
|
|
|
|
|
|
|
|
|
|
|
|
|
|
|
|
|
|
|
|
|
|
|
|
| Real GDP growth, y/y % change |
|
|
2.6 |
|
|
|
|
|
|
|
2.7 |
|
|
|
|
|
|
|
3.7 |
|
|
|
|
|
|
|
3.8 |
|
|
|
|
|
|
|
1.4 |
|
|
|
|
|
|
|
3.1 |
|
|
|
|
|
|
|
-0.5 |
|
|
|
|
|
|
|
3.6 |
|
| Unemployment rate, average % |
|
|
11.1 |
|
|
|
|
|
|
|
10.1 |
|
|
|
|
|
|
|
10.7 |
|
|
|
|
|
|
|
9.1 |
|
|
|
|
|
|
|
13.5 |
|
|
|
|
|
|
|
10.6 |
|
|
|
|
|
|
|
19.8 |
|
|
|
|
|
|
|
13.0 |
|
|
|
|
|
|
|
|
|
|
|
|
|
|
|
|
|
| |
|
|
|
|
|
|
|
|
|
|
|
|
|
|
|
|
|
|
|
|
|
|
|
|
|
|
|
|
|
|
|
|
|
|
|
|
|
|
|
|
|
|
|
|
|
|
|
|
|
|
|
|
|
|
|
|
|
|
|
|
| Real GDP growth, y/y % change |
|
|
3.6 |
|
|
|
|
|
|
|
3.8 |
|
|
|
|
|
|
|
4.2 |
|
|
|
|
|
|
|
4.5 |
|
|
|
|
|
|
|
2.5 |
|
|
|
|
|
|
|
4.2 |
|
|
|
|
|
|
|
0.6 |
|
|
|
|
|
|
|
4.7 |
|
|
|
|
|
|
|
|
|
|
|
|
|
|
|
|
|
| |
|
|
|
|
|
|
|
|
|
|
|
|
|
|
|
|
|
|
|
|
|
|
|
|
|
|
|
|
|
|
|
|
|
|
|
|
|
|
|
|
|
|
|
|
|
|
|
|
|
|
|
|
|
|
|
|
|
|
|
|
| WTI oil price, average USD/bbl |
|
|
73 |
|
|
|
|
|
|
|
69 |
|
|
|
|
|
|
|
78 |
|
|
|
|
|
|
|
83 |
|
|
|
|
|
|
|
60 |
|
|
|
|
|
|
|
60 |
|
|
|
|
|
|
|
53 |
|
|
|
|
|
|
|
58 |
|
| Copper price, average USD/lb |
|
|
4.99 |
|
|
|
|
|
|
|
5.29 |
|
|
|
|
|
|
|
5.16 |
|
|
|
|
|
|
|
5.86 |
|
|
|
|
|
|
|
4.50 |
|
|
|
|
|
|
|
5.13 |
|
|
|
|
|
|
|
4.32 |
|
|
|
|
|
|
|
5.02 |
|
| Global GDP, y/y % change |
|
|
3.4 |
|
|
|
|
|
|
|
2.4 |
|
|
|
|
|
|
|
4.3 |
|
|
|
|
|
|
|
3.3 |
|
|
|
|
|
|
|
0.6 |
|
|
|
|
|
|
|
3.1 |
|
|
|
|
|
|
|
-1.5 |
|
|
|
|
|
|
|
3.5 |
|
Relative to the base case scenario, the weighting of these multiple scenarios increased the reported allowance for credit losses for financial assets in Stage 1 and Stage 2 to $5,313 million (2024 – $4,682 million) from $5,018 million (2024 – $4,316 million).
The Bank enhanced certain of its IFRS 9 models in the current year, with the enhanced models exhibiting higher sensitivity to changes in the macroeconomic outlook. If the Bank was to apply a probability weighted average of its two pessimistic scenarios for the measurement of allowance for credit losses for such assets, the allowance for credit losses on performing financial instruments would be $786 million higher than the reported allowance for credit losses as at October 31, 2025 (October 31, 2024 – $942 million), excluding the consideration of changes in qualitative overlays or expert credit judgement. Actual results will differ as this does not consider the migration of exposures or incorporate changes that would occur in the portfolio due to risk mitigation actions and other factors.
Under our current probability-weighted scenarios, if all of our performing financial assets were in Stage 1, reflecting a 12 month expected loss period, the allowance for credit losses would be $801 million (2024 – $693 million) lower than the reported allowance for credit losses on performing financial assets.
|
2025 Scotiabank Annual Report
Consolidated Financial Statements
(iv) |
Allowance for credit losses |
|
|
|
|
|
|
|
|
|
|
|
|
|
|
|
|
|
|
|
|
|
| ($ millions) |
|
|
|
|
Provision for credit losses (1)
|
|
|
|
|
|
Other, including
foreign
currency
adjustment |
|
|
|
|
| Residential mortgages |
|
|
|
|
|
|
|
|
|
|
|
|
|
|
|
|
|
|
|
|
| Personal loans |
|
|
|
|
|
|
|
|
|
|
|
|
|
|
|
|
|
|
|
|
| Credit cards |
|
|
|
|
|
|
|
|
|
|
|
|
|
|
|
|
|
|
|
|
| Business and government |
|
|
|
|
|
|
|
|
|
|
|
|
|
|
|
|
|
|
|
|
|
|
|
|
|
|
|
|
|
|
|
|
|
|
|
|
|
|
|
|
|
| Presented as: |
|
|
|
|
|
|
|
|
|
|
|
|
|
|
|
|
|
|
|
|
| Allowance for credit losses on loans |
|
|
|
|
|
|
|
|
|
|
|
|
|
|
|
|
|
|
|
|
Allowance for credit losses on acceptances (2)
|
|
|
|
|
|
|
|
|
|
|
|
|
|
|
|
|
|
|
|
|
Allowance for credit losses on off-balance sheet exposures (3)
|
|
|
|
|
|
|
|
|
|
|
|
|
|
|
|
|
|
|
|
|
| (1) |
Excludes amounts associated with other assets of $(12). The provision for credit losses, net of these amounts, is $4,714. |
| (2) |
Allowance for credit losses on acceptances is recorded against the financial asset in the Consolidated Statement of Financial Position. |
| (3) |
Allowance for credit losses on off-balance sheet exposures is recorded in other liabilities in the Consolidated Statement of Financial Position. |
|
|
|
|
|
|
|
|
|
|
|
|
|
|
|
|
|
|
|
|
|
| ($ millions) |
|
|
|
|
Provision for credit losses (1)
|
|
|
|
|
|
Other, including
foreign
currency
adjustment |
|
|
|
|
| Residential mortgages |
|
$ |
1,084 |
|
|
$ |
257 |
|
|
$ |
(76 |
) |
|
$ |
(57 |
) |
|
$ |
1,208 |
|
| Personal loans |
|
|
2,414 |
|
|
|
1,893 |
|
|
|
(1,857 |
) |
|
|
(131 |
) |
|
|
2,319 |
|
| Credit cards |
|
|
1,237 |
|
|
|
1,122 |
|
|
|
(1,166 |
) |
|
|
(33 |
) |
|
|
1,160 |
|
| Business and government |
|
|
1,876 |
|
|
|
790 |
|
|
|
(424 |
) |
|
|
(206 |
) |
|
|
2,036 |
|
|
|
$ |
6,611 |
|
|
$ |
4,062 |
|
|
$ |
(3,523 |
) |
|
$ |
(427 |
) |
|
$ |
6,723 |
|
| Presented as: |
|
|
|
|
|
|
|
|
|
|
|
|
|
|
|
|
|
|
|
|
| Allowance for credit losses on loans |
|
$ |
6,372 |
|
|
|
|
|
|
|
|
|
|
|
|
|
|
$ |
6,536 |
|
Allowance for credit losses on acceptances (2)
|
|
|
90 |
|
|
|
|
|
|
|
|
|
|
|
|
|
|
|
1 |
|
Allowance for credit losses on off-balance sheet exposures (3)
|
|
|
149 |
|
|
|
|
|
|
|
|
|
|
|
|
|
|
|
186 |
|
| (1) |
Excludes amounts associated with other assets and reversal of impairment losses of $(11). The provision for credit losses, net of these amounts, is $4,051. |
| (2) |
Allowance for credit losses on acceptances is recorded against the financial asset in the Consolidated Statement of Financial Position. |
| (3) |
Allowance for credit losses on off-balance sheet exposures is recorded in other liabilities in the Consolidated Statement of Financial Position. |
Allowance for credit losses on loans
|
|
|
|
|
|
|
|
|
|
|
|
|
|
|
|
|
| As at October 31, 2025 ($ millions) |
|
Stage 1 |
|
|
Stage 2 |
|
|
Stage 3 |
|
|
Total |
|
| Residential mortgages |
|
|
|
|
|
|
|
|
|
|
|
|
|
|
|
|
| Personal loans |
|
|
|
|
|
|
|
|
|
|
|
|
|
|
|
|
| Credit cards |
|
|
|
|
|
|
|
|
|
|
|
|
|
|
|
|
| Business and government |
|
|
|
|
|
|
|
|
|
|
|
|
|
|
|
|
| |
|
|
|
|
|
|
|
|
|
|
|
|
|
|
|
|
| (1) |
Excludes allowance for credit losses for other financial assets including acceptances, investment securities, deposits with banks, off-balance sheet credit risks and reverse repos which amounted to $191. |
|
|
|
|
|
|
|
|
|
|
|
|
|
|
|
|
|
| As at October 31, 2024 ($ millions) |
|
Stage 1 |
|
|
Stage 2 |
|
|
Stage 3 |
|
|
Total |
|
| Residential mortgages |
|
$ |
165 |
|
|
$ |
398 |
|
|
$ |
645 |
|
|
$ |
1,208 |
|
| Personal loans |
|
|
544 |
|
|
|
1,154 |
|
|
|
621 |
|
|
|
2,319 |
|
| Credit cards |
|
|
288 |
|
|
|
872 |
|
|
|
– |
|
|
|
1,160 |
|
| Business and government |
|
|
586 |
|
|
|
475 |
|
|
|
788 |
|
|
|
1,849 |
|
| |
|
$ |
1,583 |
|
|
$ |
2,899 |
|
|
$ |
2,054 |
|
|
$ |
6,536 |
|
| (1) |
Excludes allowance for credit losses for other financial assets including acceptances, investment securities, deposits with banks, off-balance sheet credit risks and reverse repos which amounted to $200. |
2025 Scotiabank Annual Report
|
Consolidated Financial Statements
The following table presents the changes to the allowance for credit losses on loans.
|
|
|
|
|
|
|
|
|
|
|
|
|
|
|
|
|
|
|
|
|
|
|
|
|
|
|
|
|
|
|
|
|
| |
|
|
|
|
As at October 31, 2024 |
|
| ($ millions) |
|
Stage 1 |
|
|
Stage 2 |
|
|
Stage 3 |
|
|
Total |
|
|
Stage 1 |
|
|
Stage 2 |
|
|
Stage 3 |
|
|
Total |
|
Residential mortgages |
|
|
|
|
|
|
|
|
|
|
|
|
|
|
|
|
|
|
|
|
|
|
|
|
|
|
|
|
|
|
|
|
Balance at beginning of the year |
|
|
|
|
|
|
|
|
|
|
|
|
|
|
|
|
|
$ |
265 |
|
|
$ |
321 |
|
|
$ |
498 |
|
|
$ |
1,084 |
|
Provision for credit losses |
|
|
|
|
|
|
|
|
|
|
|
|
|
|
|
|
|
|
|
|
|
|
|
|
|
|
|
|
|
|
|
|
|
|
|
|
|
|
|
|
|
|
|
|
|
|
|
|
|
|
|
(271 |
) |
|
|
164 |
|
|
|
373 |
|
|
|
266 |
|
Newly originated or purchased financial assets |
|
|
|
|
|
|
|
|
|
|
|
|
|
|
|
|
|
|
41 |
|
|
|
– |
|
|
|
– |
|
|
|
41 |
|
Derecognition of financial assets and maturities |
|
|
|
|
|
|
|
|
|
|
|
|
|
|
|
|
|
|
(9 |
) |
|
|
(22 |
) |
|
|
– |
|
|
|
(31 |
) |
Changes in models and methodologies (7)
|
|
|
|
|
|
|
|
|
|
|
|
|
|
|
|
|
|
|
(22 |
) |
|
|
3 |
|
|
|
– |
|
|
|
(19 |
) |
Transfer to (from): |
|
|
|
|
|
|
|
|
|
|
|
|
|
|
|
|
|
|
|
|
|
|
|
|
|
|
|
|
|
|
|
|
Stage 1 |
|
|
|
|
|
|
|
|
|
|
|
|
|
|
|
|
|
|
215 |
|
|
|
(165 |
) |
|
|
(50 |
) |
|
|
– |
|
Stage 2 |
|
|
|
|
|
|
|
|
|
|
|
|
|
|
|
|
|
|
(40 |
) |
|
|
197 |
|
|
|
(157 |
) |
|
|
– |
|
Stage 3 |
|
|
|
|
|
|
|
|
|
|
|
|
|
|
|
|
|
|
– |
|
|
|
(84 |
) |
|
|
84 |
|
|
|
– |
|
| Gross write-offs |
|
|
|
|
|
|
|
|
|
|
|
|
|
|
|
|
|
|
– |
|
|
|
– |
|
|
|
(100 |
) |
|
|
(100 |
) |
| Recoveries |
|
|
|
|
|
|
|
|
|
|
|
|
|
|
|
|
|
|
– |
|
|
|
– |
|
|
|
24 |
|
|
|
24 |
|
Foreign exchange and other movements (6)
|
|
|
|
|
|
|
|
|
|
|
|
|
|
|
|
|
|
|
(14 |
) |
|
|
(16 |
) |
|
|
(27 |
) |
|
|
(57 |
) |
Balance at end of year (2)
|
|
|
|
|
|
|
|
|
|
|
|
|
|
|
|
|
|
$ |
165 |
|
|
$ |
398 |
|
|
$ |
645 |
|
|
$ |
1,208 |
|
Personal loans |
|
|
|
|
|
|
|
|
|
|
|
|
|
|
|
|
|
|
|
|
|
|
|
|
|
|
|
|
|
|
|
|
Balance at beginning of the year |
|
|
|
|
|
|
|
|
|
|
|
|
|
|
|
|
|
$ |
647 |
|
|
$ |
1,103 |
|
|
$ |
664 |
|
|
$ |
2,414 |
|
Provision for credit losses |
|
|
|
|
|
|
|
|
|
|
|
|
|
|
|
|
|
|
|
|
|
|
|
|
|
|
|
|
|
|
|
|
|
|
|
|
|
|
|
|
|
|
|
|
|
|
|
|
|
|
|
(686 |
) |
|
|
976 |
|
|
|
1,497 |
|
|
|
1,787 |
|
Newly originated or purchased financial assets |
|
|
|
|
|
|
|
|
|
|
|
|
|
|
|
|
|
|
365 |
|
|
|
– |
|
|
|
– |
|
|
|
365 |
|
Derecognition of financial assets and maturities |
|
|
|
|
|
|
|
|
|
|
|
|
|
|
|
|
|
|
(97 |
) |
|
|
(190 |
) |
|
|
– |
|
|
|
(287 |
) |
Changes in models and methodologies (7)
|
|
|
|
|
|
|
|
|
|
|
|
|
|
|
|
|
|
|
(68 |
) |
|
|
96 |
|
|
|
– |
|
|
|
28 |
|
Transfer to (from): |
|
|
|
|
|
|
|
|
|
|
|
|
|
|
|
|
|
|
|
|
|
|
|
|
|
|
|
|
|
|
|
|
Stage 1 |
|
|
|
|
|
|
|
|
|
|
|
|
|
|
|
|
|
|
658 |
|
|
|
(642 |
) |
|
|
(16 |
) |
|
|
– |
|
Stage 2 |
|
|
|
|
|
|
|
|
|
|
|
|
|
|
|
|
|
|
(231 |
) |
|
|
344 |
|
|
|
(113 |
) |
|
|
– |
|
Stage 3 |
|
|
|
|
|
|
|
|
|
|
|
|
|
|
|
|
|
|
(13 |
) |
|
|
(504 |
) |
|
|
517 |
|
|
|
– |
|
| Gross write-offs |
|
|
|
|
|
|
|
|
|
|
|
|
|
|
|
|
|
|
– |
|
|
|
– |
|
|
|
(2,145 |
) |
|
|
(2,145 |
) |
| Recoveries |
|
|
|
|
|
|
|
|
|
|
|
|
|
|
|
|
|
|
– |
|
|
|
– |
|
|
|
288 |
|
|
|
288 |
|
Foreign exchange and other movements (6)
|
|
|
|
|
|
|
|
|
|
|
|
|
|
|
|
|
|
|
(31 |
) |
|
|
(29 |
) |
|
|
(71 |
) |
|
|
(131 |
) |
Balance at end of year (2)
|
|
|
|
|
|
|
|
|
|
|
|
|
|
|
|
|
|
$ |
544 |
|
|
$ |
1,154 |
|
|
$ |
621 |
|
|
$ |
2,319 |
|
Credit cards |
|
|
|
|
|
|
|
|
|
|
|
|
|
|
|
|
|
|
|
|
|
|
|
|
|
|
|
|
|
|
|
|
Balance at beginning of the year |
|
|
|
|
|
|
|
|
|
|
|
|
|
|
|
|
|
$ |
414 |
|
|
$ |
823 |
|
|
$ |
– |
|
|
$ |
1,237 |
|
Provision for credit losses |
|
|
|
|
|
|
|
|
|
|
|
|
|
|
|
|
|
|
|
|
|
|
|
|
|
|
|
|
|
|
|
|
|
|
|
|
|
|
|
|
|
|
|
|
|
|
|
|
|
|
|
(361 |
) |
|
|
643 |
|
|
|
835 |
|
|
|
1,117 |
|
Newly originated or purchased financial assets |
|
|
|
|
|
|
|
|
|
|
|
|
|
|
|
|
|
|
136 |
|
|
|
– |
|
|
|
– |
|
|
|
136 |
|
Derecognition of financial assets and maturities |
|
|
|
|
|
|
|
|
|
|
|
|
|
|
|
|
|
|
(53 |
) |
|
|
(61 |
) |
|
|
– |
|
|
|
(114 |
) |
Changes in models and methodologies (7)
|
|
|
|
|
|
|
|
|
|
|
|
|
|
|
|
|
|
|
(38 |
) |
|
|
21 |
|
|
|
– |
|
|
|
(17 |
) |
Transfer to (from): |
|
|
|
|
|
|
|
|
|
|
|
|
|
|
|
|
|
|
|
|
|
|
|
|
|
|
|
|
|
|
|
|
Stage 1 |
|
|
|
|
|
|
|
|
|
|
|
|
|
|
|
|
|
|
335 |
|
|
|
(335 |
) |
|
|
– |
|
|
|
– |
|
Stage 2 |
|
|
|
|
|
|
|
|
|
|
|
|
|
|
|
|
|
|
(135 |
) |
|
|
135 |
|
|
|
– |
|
|
|
– |
|
Stage 3 |
|
|
|
|
|
|
|
|
|
|
|
|
|
|
|
|
|
|
– |
|
|
|
(330 |
) |
|
|
330 |
|
|
|
– |
|
Gross write-offs |
|
|
|
|
|
|
|
|
|
|
|
|
|
|
|
|
|
|
– |
|
|
|
– |
|
|
|
(1,356 |
) |
|
|
(1,356 |
) |
Recoveries |
|
|
|
|
|
|
|
|
|
|
|
|
|
|
|
|
|
|
– |
|
|
|
– |
|
|
|
190 |
|
|
|
190 |
|
Foreign exchange and other movements (6)
|
|
|
|
|
|
|
|
|
|
|
|
|
|
|
|
|
|
|
(10 |
) |
|
|
(24 |
) |
|
|
1 |
|
|
|
(33 |
) |
Balance at end of year (2)
|
|
|
|
|
|
|
|
|
|
|
|
|
|
|
|
|
|
$ |
288 |
|
|
$ |
872 |
|
|
$ |
– |
|
|
$ |
1,160 |
|
Total retail loans |
|
|
|
|
|
|
|
|
|
|
|
|
|
|
|
|
|
|
|
|
|
|
|
|
|
|
|
|
|
|
|
|
Balance at beginning of the year |
|
|
|
|
|
|
|
|
|
|
|
|
|
|
|
|
|
$ |
1,326 |
|
|
$ |
2,247 |
|
|
$ |
1,162 |
|
|
$ |
4,735 |
|
Provision for credit losses |
|
|
|
|
|
|
|
|
|
|
|
|
|
|
|
|
|
|
|
|
|
|
|
|
|
|
|
|
|
|
|
|
|
|
|
|
|
|
|
|
|
|
|
|
|
|
|
|
|
|
|
(1,318 |
) |
|
|
1,783 |
|
|
|
2,705 |
|
|
|
3,170 |
|
Newly originated or purchased financial assets |
|
|
|
|
|
|
|
|
|
|
|
|
|
|
|
|
|
|
542 |
|
|
|
– |
|
|
|
– |
|
|
|
542 |
|
Derecognition of financial assets and maturities |
|
|
|
|
|
|
|
|
|
|
|
|
|
|
|
|
|
|
(159 |
) |
|
|
(273 |
) |
|
|
– |
|
|
|
(432 |
) |
Changes in models and methodologies (7)
|
|
|
|
|
|
|
|
|
|
|
|
|
|
|
|
|
|
|
(128 |
) |
|
|
120 |
|
|
|
– |
|
|
|
(8 |
) |
Transfer to (from): |
|
|
– |
|
|
|
– |
|
|
|
– |
|
|
|
– |
|
|
|
– |
|
|
|
– |
|
|
|
– |
|
|
|
– |
|
Stage 1 |
|
|
|
|
|
|
|
|
|
|
|
|
|
|
|
|
|
|
1,208 |
|
|
|
(1,142 |
) |
|
|
(66 |
) |
|
|
– |
|
Stage 2 |
|
|
|
|
|
|
|
|
|
|
|
|
|
|
|
|
|
|
(406 |
) |
|
|
676 |
|
|
|
(270 |
) |
|
|
– |
|
Stage 3 |
|
|
|
|
|
|
|
|
|
|
|
|
|
|
|
|
|
|
(13 |
) |
|
|
(918 |
) |
|
|
931 |
|
|
|
– |
|
Gross write-offs |
|
|
|
|
|
|
|
|
|
|
|
|
|
|
|
|
|
|
– |
|
|
|
– |
|
|
|
(3,601 |
) |
|
|
(3,601 |
) |
Recoveries |
|
|
|
|
|
|
|
|
|
|
|
|
|
|
|
|
|
|
– |
|
|
|
– |
|
|
|
502 |
|
|
|
502 |
|
Foreign exchange and other movements (6)
|
|
|
|
|
|
|
|
|
|
|
|
|
|
|
|
|
|
|
(55 |
) |
|
|
(69 |
) |
|
|
(97 |
) |
|
|
(221 |
) |
Balance at end of year (2)
|
|
|
|
|
|
|
|
|
|
|
|
|
|
|
|
|
|
$ |
997 |
|
|
$ |
2,424 |
|
|
$ |
1,266 |
|
|
$ |
4,687 |
|
Business and government |
|
|
|
|
|
|
|
|
|
|
|
|
|
|
|
|
|
|
|
|
|
|
|
|
|
|
|
|
|
|
|
|
Balance at beginning of the year |
|
|
|
|
|
|
|
|
|
|
|
|
|
|
|
|
|
$ |
635 |
|
|
$ |
403 |
|
|
$ |
748 |
|
|
$ |
1,786 |
|
Provision for credit losses |
|
|
|
|
|
|
|
|
|
|
|
|
|
|
|
|
|
|
|
|
|
|
|
|
|
|
|
|
|
|
|
|
|
|
|
|
|
|
|
|
|
|
|
|
|
|
|
|
|
|
|
(210 |
) |
|
|
288 |
|
|
|
622 |
|
|
|
700 |
|
Newly originated or purchased financial assets |
|
|
|
|
|
|
|
|
|
|
|
|
|
|
|
|
|
|
936 |
|
|
|
– |
|
|
|
– |
|
|
|
936 |
|
Derecognition of financial assets and maturities |
|
|
|
|
|
|
|
|
|
|
|
|
|
|
|
|
|
|
(860 |
) |
|
|
(126 |
) |
|
|
(9 |
) |
|
|
(995 |
) |
Changes in models and methodologies (7)
|
|
|
|
|
|
|
|
|
|
|
|
|
|
|
|
|
|
|
200 |
|
|
|
37 |
|
|
|
– |
|
|
|
237 |
|
Transfer to (from): |
|
|
|
|
|
|
|
|
|
|
|
|
|
|
|
|
|
|
|
|
|
|
|
|
|
|
|
|
|
|
|
|
Stage 1 |
|
|
|
|
|
|
|
|
|
|
|
|
|
|
|
|
|
|
154 |
|
|
|
(154 |
) |
|
|
– |
|
|
|
– |
|
Stage 2 |
|
|
|
|
|
|
|
|
|
|
|
|
|
|
|
|
|
|
(110 |
) |
|
|
114 |
|
|
|
(4 |
) |
|
|
– |
|
Stage 3 |
|
|
|
|
|
|
|
|
|
|
|
|
|
|
|
|
|
|
– |
|
|
|
(21 |
) |
|
|
21 |
|
|
|
– |
|
Gross write-offs |
|
|
|
|
|
|
|
|
|
|
|
|
|
|
|
|
|
|
– |
|
|
|
– |
|
|
|
(484 |
) |
|
|
(484 |
) |
Recoveries |
|
|
|
|
|
|
|
|
|
|
|
|
|
|
|
|
|
|
– |
|
|
|
– |
|
|
|
60 |
|
|
|
60 |
|
Foreign exchange and other movements |
|
|
|
|
|
|
|
|
|
|
|
|
|
|
|
|
|
|
(6 |
) |
|
|
(33 |
) |
|
|
(166 |
) |
|
|
(205 |
) |
Balance at end of period including off-balance sheet exposures (2)
|
|
|
|
|
|
|
|
|
|
|
|
|
|
|
|
|
|
$ |
739 |
|
|
$ |
508 |
|
|
$ |
788 |
|
|
$ |
2,035 |
|
Less: Allowance for credits losses on off-balance sheet exposures (2)(3)
|
|
|
|
|
|
|
|
|
|
|
|
|
|
|
|
|
|
|
(153 |
) |
|
|
(33 |
) |
|
|
– |
|
|
|
(186 |
) |
Balance at end of year (2)
|
|
|
|
|
|
|
|
|
|
|
|
|
|
|
|
|
|
$ |
586 |
|
|
$ |
475 |
|
|
$ |
788 |
|
|
$ |
1,849 |
|
| (1) |
Includes credit risk changes as a result of significant increases in credit risk, changes in credit risk that did not result in a transfer between stages, changes in model inputs and assumptions and changes due to drawdowns of undrawn commitments. |
| (2) |
Interest income on impaired loans for residential mortgages, personal loans, credit cards, and business and government loans totaled $439 (2024 – $443). |
| (3) |
Allowance for credit losses on off-balance sheet exposures is recorded in other liabilities in the Consolidated Statement of Financial Position. |
| (4) |
Allowance for credit losses on acceptances are recorded against the financial asset in the Consolidated Statement of Financial Position. |
| (5) |
During the year ended October 31, 2025, the contractual terms of certain financial assets were modified where the modification did not result in derecognition. The carrying value of such loans that were modified in Stage 2 and Stage 3 was $2,833 (2024 – $3,504) and $899 (2024 – $ 726) respectively, before the modification. |
| (6) |
Divestitures are included in the foreign exchange and other movements. |
| (7) |
Comprises changes due to enhanced IFRS 9 models, including changes to reflect previously established expert credit judgment overlays that are now incorporated in the model. |
|
2025 Scotiabank Annual Report
Consolidated Financial Statements
(f) |
Carrying value of exposures by risk rating |
|
|
|
|
|
|
|
|
|
|
|
|
|
|
|
|
|
|
|
|
|
|
|
|
|
|
|
|
|
|
|
|
|
Residential mortgages |
|
|
|
|
As at October 31, 2024 |
|
| Category of PD grades ($ millions) |
|
Stage 1 |
|
|
Stage 2 |
|
|
|
|
|
Total |
|
|
Stage 1 |
|
|
Stage 2 |
|
|
|
|
|
Total |
|
Very low |
|
|
|
|
|
|
|
|
|
|
|
|
|
|
|
|
|
$ |
211,165 |
|
|
$ |
3,262 |
|
|
$ |
– |
|
|
$ |
214,427 |
|
Low |
|
|
|
|
|
|
|
|
|
|
|
|
|
|
|
|
|
|
78,344 |
|
|
|
3,625 |
|
|
|
– |
|
|
|
81,969 |
|
Medium |
|
|
|
|
|
|
|
|
|
|
|
|
|
|
|
|
|
|
19,205 |
|
|
|
2,072 |
|
|
|
– |
|
|
|
21,277 |
|
High |
|
|
|
|
|
|
|
|
|
|
|
|
|
|
|
|
|
|
2,561 |
|
|
|
5,280 |
|
|
|
– |
|
|
|
7,841 |
|
Very high |
|
|
|
|
|
|
|
|
|
|
|
|
|
|
|
|
|
|
13 |
|
|
|
2,814 |
|
|
|
– |
|
|
|
2,827 |
|
|
|
|
|
|
|
|
|
|
|
|
|
|
|
|
|
|
|
|
18,614 |
|
|
|
1,614 |
|
|
|
– |
|
|
|
20,228 |
|
Default |
|
|
|
|
|
|
|
|
|
|
|
|
|
|
|
|
|
|
– |
|
|
|
– |
|
|
|
2,372 |
|
|
|
2,372 |
|
Total |
|
|
|
|
|
|
|
|
|
|
|
|
|
|
|
|
|
|
329,902 |
|
|
|
18,667 |
|
|
|
2,372 |
|
|
|
350,941 |
|
Allowance for credit losses |
|
|
|
|
|
|
|
|
|
|
|
|
|
|
|
|
|
|
165 |
|
|
|
398 |
|
|
|
645 |
|
|
|
1,208 |
|
Carrying value |
|
|
|
|
|
|
|
|
|
|
|
|
|
|
|
|
|
$ |
329,737 |
|
|
$ |
18,269 |
|
|
$ |
1,727 |
|
|
$ |
349,733 |
|
| (1) |
Stage 3 includes purchased or originated credit-impaired loans. |
| (2) |
Portfolios where the customer account level ‘Probability of Default’ has not been determined have been included in the ‘Loans not graded’ category. |
|
|
|
|
|
|
|
|
|
|
|
|
|
|
|
|
|
|
|
|
|
|
|
|
|
|
|
|
|
|
|
|
|
Personal loans |
|
|
|
|
As at October 31, 2024 |
|
| Category of PD grades ($ millions) |
|
Stage 1 |
|
|
Stage 2 |
|
|
|
|
|
Total |
|
|
Stage 1 |
|
|
Stage 2 |
|
|
|
|
|
Total |
|
Very low |
|
|
|
|
|
|
|
|
|
|
|
|
|
|
|
|
|
$ |
30,865 |
|
|
$ |
– |
|
|
$ |
– |
|
|
$ |
30,865 |
|
Low |
|
|
|
|
|
|
|
|
|
|
|
|
|
|
|
|
|
|
20,686 |
|
|
|
12 |
|
|
|
– |
|
|
|
20,698 |
|
Medium |
|
|
|
|
|
|
|
|
|
|
|
|
|
|
|
|
|
|
13,053 |
|
|
|
38 |
|
|
|
– |
|
|
|
13,091 |
|
High |
|
|
|
|
|
|
|
|
|
|
|
|
|
|
|
|
|
|
10,535 |
|
|
|
4,843 |
|
|
|
– |
|
|
|
15,378 |
|
Very high |
|
|
|
|
|
|
|
|
|
|
|
|
|
|
|
|
|
|
76 |
|
|
|
2,743 |
|
|
|
– |
|
|
|
2,819 |
|
|
|
|
|
|
|
|
|
|
|
|
|
|
|
|
|
|
|
|
20,482 |
|
|
|
1,929 |
|
|
|
– |
|
|
|
22,411 |
|
Default |
|
|
|
|
|
|
|
|
|
|
|
|
|
|
|
|
|
|
– |
|
|
|
– |
|
|
|
1,117 |
|
|
|
1,117 |
|
Total |
|
|
|
|
|
|
|
|
|
|
|
|
|
|
|
|
|
|
95,697 |
|
|
|
9,565 |
|
|
|
1,117 |
|
|
|
106,379 |
|
Allowance for credit losses |
|
|
|
|
|
|
|
|
|
|
|
|
|
|
|
|
|
|
544 |
|
|
|
1,154 |
|
|
|
621 |
|
|
|
2,319 |
|
Carrying value |
|
|
|
|
|
|
|
|
|
|
|
|
|
|
|
|
|
$ |
95,153 |
|
|
$ |
8,411 |
|
|
$ |
496 |
|
|
$ |
104,060 |
|
| (1) |
Stage 3 includes purchased or originated credit-impaired loans. |
| (2) |
Portfolios where the customer account level ‘Probability of Default’ has not been determined have been included in the ‘Loans not graded’ category. |
|
|
|
|
|
|
|
|
|
|
|
|
|
|
|
|
|
|
|
|
|
|
|
|
|
|
|
|
|
|
|
|
|
Credit cards |
|
|
|
|
As at October 31, 2024 |
|
| Category of PD grades ($ millions) |
|
Stage 1 |
|
|
Stage 2 |
|
|
Stage 3 |
|
|
Total |
|
|
Stage 1 |
|
|
Stage 2 |
|
|
Stage 3 |
|
|
Total |
|
Very low |
|
|
|
|
|
|
|
|
|
|
|
|
|
|
|
|
|
$ |
2,382 |
|
|
$ |
3 |
|
|
$ |
– |
|
|
$ |
2,385 |
|
Low |
|
|
|
|
|
|
|
|
|
|
|
|
|
|
|
|
|
|
2,872 |
|
|
|
25 |
|
|
|
– |
|
|
|
2,897 |
|
Medium |
|
|
|
|
|
|
|
|
|
|
|
|
|
|
|
|
|
|
4,631 |
|
|
|
55 |
|
|
|
– |
|
|
|
4,686 |
|
High |
|
|
|
|
|
|
|
|
|
|
|
|
|
|
|
|
|
|
3,069 |
|
|
|
1,880 |
|
|
|
– |
|
|
|
4,949 |
|
Very high |
|
|
|
|
|
|
|
|
|
|
|
|
|
|
|
|
|
|
16 |
|
|
|
1,028 |
|
|
|
– |
|
|
|
1,044 |
|
|
|
|
|
|
|
|
|
|
|
|
|
|
|
|
|
|
|
|
895 |
|
|
|
518 |
|
|
|
– |
|
|
|
1,413 |
|
Default |
|
|
|
|
|
|
|
|
|
|
|
|
|
|
|
|
|
|
– |
|
|
|
– |
|
|
|
– |
|
|
|
– |
|
Total |
|
|
|
|
|
|
|
|
|
|
|
|
|
|
|
|
|
|
13,865 |
|
|
|
3,509 |
|
|
|
– |
|
|
|
17,374 |
|
Allowance for credit losses |
|
|
|
|
|
|
|
|
|
|
|
|
|
|
|
|
|
|
288 |
|
|
|
872 |
|
|
|
– |
|
|
|
1,160 |
|
Carrying value |
|
|
|
|
|
|
|
|
|
|
|
|
|
|
|
|
|
$ |
13,577 |
|
|
$ |
2,637 |
|
|
$ |
– |
|
|
$ |
16,214 |
|
| (1) |
Portfolios where the customer account level ‘Probability of Default’ has not been determined have been included in the ‘Loans not graded’ category. |
|
|
|
|
|
|
|
|
|
|
|
|
|
|
|
|
|
|
|
|
|
|
|
|
|
|
|
|
|
|
|
|
|
Undrawn loan commitments –
Retail |
|
|
|
|
As at October 31, 2024 |
|
| Category of PD grades ($ millions) |
|
Stage 1 |
|
|
Stage 2 |
|
|
Stage 3 |
|
|
Total |
|
|
Stage 1 |
|
|
Stage 2 |
|
|
Stage 3 |
|
|
Total |
|
Very low |
|
|
|
|
|
|
|
|
|
|
|
|
|
|
|
|
|
$ |
115,396 |
|
|
$ |
2 |
|
|
$ |
– |
|
|
$ |
115,398 |
|
Low |
|
|
|
|
|
|
|
|
|
|
|
|
|
|
|
|
|
|
17,947 |
|
|
|
26 |
|
|
|
– |
|
|
|
17,973 |
|
Medium |
|
|
|
|
|
|
|
|
|
|
|
|
|
|
|
|
|
|
8,128 |
|
|
|
22 |
|
|
|
– |
|
|
|
8,150 |
|
High |
|
|
|
|
|
|
|
|
|
|
|
|
|
|
|
|
|
|
3,490 |
|
|
|
505 |
|
|
|
– |
|
|
|
3,995 |
|
Very high |
|
|
|
|
|
|
|
|
|
|
|
|
|
|
|
|
|
|
10 |
|
|
|
305 |
|
|
|
– |
|
|
|
315 |
|
|
|
|
|
|
|
|
|
|
|
|
|
|
|
|
|
|
|
|
12,634 |
|
|
|
2,749 |
|
|
|
– |
|
|
|
15,383 |
|
Default |
|
|
|
|
|
|
|
|
|
|
|
|
|
|
|
|
|
|
– |
|
|
|
– |
|
|
|
– |
|
|
|
– |
|
Carrying value |
|
|
|
|
|
|
|
|
|
|
|
|
|
|
|
|
|
$ |
157,605 |
|
|
$ |
3,609 |
|
|
$ |
– |
|
|
$ |
161,214 |
|
| (1) |
Portfolios where the customer account level ‘Probability of Default’ has not been determined have been included in the ‘Loans not graded’ category. |
2025 Scotiabank Annual Report
|
Consolidated Financial Statements
|
|
|
|
|
|
|
|
|
|
|
|
|
|
|
|
|
|
|
|
|
|
|
|
|
|
|
|
|
|
|
|
|
Total retail loans |
|
|
|
|
As at October 31, 2024 |
|
| Category of PD grades ($ millions) |
|
Stage 1 |
|
|
Stage 2 |
|
|
|
|
|
Total |
|
|
Stage 1 |
|
|
Stage 2 |
|
|
|
|
|
Total |
|
Very low |
|
|
|
|
|
|
|
|
|
|
|
|
|
|
|
|
|
$ |
359,808 |
|
|
$ |
3,267 |
|
|
$ |
– |
|
|
$ |
363,075 |
|
Low |
|
|
|
|
|
|
|
|
|
|
|
|
|
|
|
|
|
|
119,849 |
|
|
|
3,688 |
|
|
|
– |
|
|
|
123,537 |
|
Medium |
|
|
|
|
|
|
|
|
|
|
|
|
|
|
|
|
|
|
45,017 |
|
|
|
2,187 |
|
|
|
– |
|
|
|
47,204 |
|
High |
|
|
|
|
|
|
|
|
|
|
|
|
|
|
|
|
|
|
19,655 |
|
|
|
12,508 |
|
|
|
– |
|
|
|
32,163 |
|
Very high |
|
|
|
|
|
|
|
|
|
|
|
|
|
|
|
|
|
|
115 |
|
|
|
6,890 |
|
|
|
– |
|
|
|
7,005 |
|
|
|
|
|
|
|
|
|
|
|
|
|
|
|
|
|
|
|
|
52,625 |
|
|
|
6,810 |
|
|
|
– |
|
|
|
59,435 |
|
Default |
|
|
|
|
|
|
|
|
|
|
|
|
|
|
|
|
|
|
– |
|
|
|
– |
|
|
|
3,489 |
|
|
|
3,489 |
|
Total |
|
|
|
|
|
|
|
|
|
|
|
|
|
|
|
|
|
|
597,069 |
|
|
|
35,350 |
|
|
|
3,489 |
|
|
|
635,908 |
|
Allowance for credit losses |
|
|
|
|
|
|
|
|
|
|
|
|
|
|
|
|
|
|
997 |
|
|
|
2,424 |
|
|
|
1,266 |
|
|
|
4,687 |
|
Carrying value |
|
|
|
|
|
|
|
|
|
|
|
|
|
|
|
|
|
$ |
596,072 |
|
|
$ |
32,926 |
|
|
$ |
2,223 |
|
|
$ |
631,221 |
|
| (1) |
Stage 3 includes purchased or originated credit-impaired loans. |
| (2) |
Portfolios where the customer account level ‘Probability of Default’ has not been determined have been included in the ‘Loans not graded’ category. |
|
|
|
|
|
|
|
|
|
|
|
|
|
|
|
|
|
|
|
|
|
|
|
|
|
|
|
|
|
|
|
|
|
Business and government loans |
|
|
|
|
As at October 31, 2024 |
|
| Category of PD grades ($ millions) |
|
Stage 1 |
|
|
Stage 2 |
|
|
|
|
|
Total |
|
|
Stage 1 |
|
|
Stage 2 |
|
|
|
|
|
Total |
|
Investment grade |
|
|
|
|
|
|
|
|
|
|
|
|
|
|
|
|
|
$ |
146,999 |
|
|
$ |
1,829 |
|
|
$ |
– |
|
|
$ |
148,828 |
|
|
|
|
|
|
|
|
|
|
|
|
|
|
|
|
|
|
|
|
124,749 |
|
|
|
8,800 |
|
|
|
– |
|
|
|
133,549 |
|
Watch list |
|
|
|
|
|
|
|
|
|
|
|
|
|
|
|
|
|
|
10 |
|
|
|
4,819 |
|
|
|
– |
|
|
|
4,829 |
|
|
|
|
|
|
|
|
|
|
|
|
|
|
|
|
|
|
|
|
2,190 |
|
|
|
25 |
|
|
|
– |
|
|
|
2,215 |
|
Default |
|
|
|
|
|
|
|
|
|
|
|
|
|
|
|
|
|
|
– |
|
|
|
– |
|
|
|
3,250 |
|
|
|
3,250 |
|
Total |
|
|
|
|
|
|
|
|
|
|
|
|
|
|
|
|
|
|
273,948 |
|
|
|
15,473 |
|
|
|
3,250 |
|
|
|
292,671 |
|
Allowance for credit losses |
|
|
|
|
|
|
|
|
|
|
|
|
|
|
|
|
|
|
586 |
|
|
|
475 |
|
|
|
788 |
|
|
|
1,849 |
|
Carrying value |
|
|
|
|
|
|
|
|
|
|
|
|
|
|
|
|
|
$ |
273,362 |
|
|
$ |
14,998 |
|
|
$ |
2,462 |
|
|
$ |
290,822 |
|
| (1) |
Stage 3 includes purchased or originated credit-impaired loans. |
| (2) |
Portfolios where the customer account level ‘Probability of Default’ has not been determined have been included in the ‘Loans not graded’ category. |
|
|
|
|
|
|
|
|
|
|
|
|
|
|
|
|
|
|
|
|
|
|
|
|
|
|
|
|
|
|
|
|
|
Undrawn loan commitments –
Business and government |
|
|
|
|
As at October 31, 2024 |
|
| Category of PD grades ($ millions) |
|
Stage 1 |
|
|
Stage 2 |
|
|
|
|
|
Total |
|
|
Stage 1 |
|
|
Stage 2 |
|
|
|
|
|
Total |
|
Investment grade |
|
|
|
|
|
|
|
|
|
|
|
|
|
|
|
|
|
$ |
243,635 |
|
|
$ |
1,124 |
|
|
$ |
– |
|
|
$ |
244,759 |
|
|
|
|
|
|
|
|
|
|
|
|
|
|
|
|
|
|
|
|
59,572 |
|
|
|
2,894 |
|
|
|
– |
|
|
|
62,466 |
|
Watch list |
|
|
|
|
|
|
|
|
|
|
|
|
|
|
|
|
|
|
– |
|
|
|
1,142 |
|
|
|
– |
|
|
|
1,142 |
|
|
|
|
|
|
|
|
|
|
|
|
|
|
|
|
|
|
|
|
3,921 |
|
|
|
– |
|
|
|
– |
|
|
|
3,921 |
|
Default |
|
|
|
|
|
|
|
|
|
|
|
|
|
|
|
|
|
|
– |
|
|
|
– |
|
|
|
32 |
|
|
|
32 |
|
Total |
|
|
|
|
|
|
|
|
|
|
|
|
|
|
|
|
|
|
307,128 |
|
|
|
5,160 |
|
|
|
32 |
|
|
|
312,320 |
|
Allowance for credit losses |
|
|
|
|
|
|
|
|
|
|
|
|
|
|
|
|
|
|
153 |
|
|
|
33 |
|
|
|
– |
|
|
|
186 |
|
Carrying value |
|
|
|
|
|
|
|
|
|
|
|
|
|
|
|
|
|
$ |
306,975 |
|
|
$ |
5,127 |
|
|
$ |
32 |
|
|
$ |
312,134 |
|
| (1) |
Stage 3 includes purchased or originated credit-impaired loans. |
| (2) |
Portfolios where the customer account level ‘Probability of Default’ has not been determined have been included in the ‘Loans not graded’ category. |
|
|
|
|
|
|
|
|
|
|
|
|
|
|
|
|
|
|
|
|
|
|
|
|
|
|
|
|
|
|
|
|
|
|
|
|
|
|
As at October 31, 2024 |
|
| Category of PD grades ($ millions) |
|
Stage 1 |
|
|
Stage 2 |
|
|
|
|
|
Total |
|
|
Stage 1 |
|
|
Stage 2 |
|
|
|
|
|
Total |
|
Investment grade |
|
|
|
|
|
|
|
|
|
|
|
|
|
|
|
|
|
$ |
390,634 |
|
|
$ |
2,953 |
|
|
$ |
– |
|
|
$ |
393,587 |
|
|
|
|
|
|
|
|
|
|
|
|
|
|
|
|
|
|
|
|
184,321 |
|
|
|
11,694 |
|
|
|
– |
|
|
|
196,015 |
|
Watch list |
|
|
|
|
|
|
|
|
|
|
|
|
|
|
|
|
|
|
10 |
|
|
|
5,961 |
|
|
|
– |
|
|
|
5,971 |
|
|
|
|
|
|
|
|
|
|
|
|
|
|
|
|
|
|
|
|
6,111 |
|
|
|
25 |
|
|
|
– |
|
|
|
6,136 |
|
Default |
|
|
|
|
|
|
|
|
|
|
|
|
|
|
|
|
|
|
– |
|
|
|
– |
|
|
|
3,282 |
|
|
|
3,282 |
|
Total |
|
|
|
|
|
|
|
|
|
|
|
|
|
|
|
|
|
|
581,076 |
|
|
|
20,633 |
|
|
|
3,282 |
|
|
|
604,991 |
|
Allowance for credit losses |
|
|
|
|
|
|
|
|
|
|
|
|
|
|
|
|
|
|
739 |
|
|
|
508 |
|
|
|
788 |
|
|
|
2,035 |
|
Carrying value |
|
|
|
|
|
|
|
|
|
|
|
|
|
|
|
|
|
$ |
580,337 |
|
|
$ |
20,125 |
|
|
$ |
2,494 |
|
|
$ |
602,956 |
|
| (1) |
Stage 3 includes purchased or originated credit-impaired loans. |
| (2) |
Portfolios where the customer account level ‘Probability of Default’ has not been determined have been included in the ‘Loans not graded’ category. |
|
2025 Scotiabank Annual Report
Consolidated Financial Statements
(g) |
Loans past due but not impaired (1) |
A loan is considered past due when a counterparty has not made a payment by the contractual due date. The following table presents the carrying value of loans that are contractually past due but not classified as impaired. In cases where borrowers have opted to participate in payment deferral programs, deferral of payments is not considered past due and such loans are not aged further during the deferral period.
|
|
|
|
|
|
|
|
|
|
|
|
|
|
|
|
|
|
|
|
|
|
|
|
|
|
|
|
|
|
|
|
|
| |
|
|
|
|
|
|
| As at October 31 ($ millions) |
|
31 - 60
days |
|
|
61 - 90
days |
|
|
|
|
|
Total |
|
|
31 - 60
days |
|
|
61 - 90
days |
|
|
|
|
|
Total |
|
Residential mortgages |
|
|
|
|
|
|
|
|
|
|
|
|
|
|
|
|
|
$ |
1,418 |
|
|
$ |
718 |
|
|
$ |
– |
|
|
$ |
2,136 |
|
Personal loans |
|
|
|
|
|
|
|
|
|
|
|
|
|
|
|
|
|
|
647 |
|
|
|
343 |
|
|
|
– |
|
|
|
990 |
|
Credit cards |
|
|
|
|
|
|
|
|
|
|
|
|
|
|
|
|
|
|
242 |
|
|
|
172 |
|
|
|
398 |
|
|
|
812 |
|
Business and government |
|
|
|
|
|
|
|
|
|
|
|
|
|
|
|
|
|
|
192 |
|
|
|
48 |
|
|
|
– |
|
|
|
240 |
|
Total |
|
|
|
|
|
|
|
|
|
|
|
|
|
|
|
|
|
$ |
2,499 |
|
|
$ |
1,281 |
|
|
$ |
398 |
|
|
$ |
4,178 |
|
| (1) |
Loans past due 30 days or less are not presented in this analysis as they are not administratively considered past due. |
| (2) |
For loans where payment deferrals were granted, deferred payments are not considered past due and such loans are not aged further during the deferral period. Regular aging of the loans resumes, after the end of the deferral period. |
| (3) |
All loans that are over 90 days past due are considered impaired with the exception of credit card receivables which are considered impaired when 180 days past due. |
(h) |
Purchased credit-impaired loans |
Certain financial assets including loans are credit-impaired on initial recognition either through acquisition or origination. The following table provides details of such assets:
|
|
|
|
|
|
|
|
|
| As at October 31 ($ millions) |
|
|
|
|
2024 |
|
Unpaid principal balance (1)
|
|
|
|
|
|
$ |
243 |
|
Credit-related fair value adjustments |
|
|
|
|
|
|
(29 |
) |
Carrying value |
|
|
|
|
|
|
214 |
|
Stage 3 allowance |
|
|
|
|
|
|
(1 |
) |
Carrying value net of related allowance |
|
|
|
|
|
$ |
213 |
|
| (1) |
Represents principal amount owed net of write-offs. |
|
Derecognition of Financial Assets |
Securitization of residential mortgage loans
The Bank securitizes fully insured residential mortgage loans, Bank originated and others, through the creation of mortgage-backed securities (MBS) under the National Housing Act (NHA) MBS program, sponsored by Canada Mortgage and Housing Corporation (CMHC). MBS created under the program are primarily sold to Canada Housing Trust (the Trust), a government sponsored entity, under the Canada Mortgage Bond (CMB) program, and/or third-party investors. The Trust issues securities to third-party investors.
Under the mortgage sale programs described above, certain transactions did not meet the derecognition requirements, as the Bank retains the
pre-payment
and interest rate risk associated with the mortgages. These risks represent substantially all of the risks and rewards associated with the transferred assets, and accordingly, the mortgages continue to be recognized on the Bank’s balance sheet.
However, certain mortgage transactions qualified for derecognition, as substantially all risks and rewards of ownership were transferred to third parties. During the year ended October 31, 2025, the Bank sold and derecognized $4,550 million (2024 – $8,486 million) of these mortgages. The Bank retains residual interests in the derecognized mortgages, representing its continuing involvement. As at October 31, 2025, the carrying value of these retained interests was $365 million (2024 – $491 million).
The transferred mortgages continue to be recognized on the Consolidated Statement of Financial Position as residential mortgage loans. Cash proceeds received from the transfer are treated as secured borrowings and included in Deposits – Business and government on the Consolidated Statement of Financial Position.
The following table provides the carrying amount of transferred assets that do not qualify for derecognition and the associated liabilities:
|
|
|
|
|
|
|
|
|
| As at October 31 ($ millions) |
|
|
|
|
|
|
|
|
|
|
|
|
|
|
|
Carrying value of residential mortgage loans |
|
|
|
|
|
$ |
11,190 |
|
|
|
|
|
|
|
|
7,202 |
|
|
|
|
|
|
|
|
|
|
Carrying value of associated liabilities |
|
|
|
|
|
|
17,923 |
|
| (1) |
The fair value of the transferred assets is $15,298 (2024 – $18,092) and the fair value of the associated liabilities is $15,593 (2024 – $17,692), for a net position of $(295) (2024 – $400). |
| (2) |
These include cash held in trust and trust permitted investment assets, including repurchase style transactions of mortgage-backed securities, acquired as part of principal reinvestment account that the Bank is required to maintain in order to participate in the programs. |
Securitization of credit card receivables and auto loans
The Bank securitizes a portion of its unsecured credit card and auto loan receivables through consolidated structured entities. These receivables continue to be recognized on the Consolidated Statement of Financial Position as credit card loans and personal loans. For further details, refer to Note 14.
2025 Scotiabank Annual Report
|
Consolidated Financial Statements
Securities sold under repurchase agreements and securities lent
The Bank enters into transactions, such as repurchase agreements and securities lending agreements, where the Bank transfers assets under agreements to repurchase them on a future date and retains all the substantial risks and rewards associated with the assets. The transferred assets remain on the Consolidated Statement of Financial Position.
The following table provides the carrying amount of the transferred assets and the associated liabilities:
|
|
|
|
|
|
|
|
|
| As at October 31 ($ millions) |
|
|
|
|
|
|
| Carrying value of assets associated with: |
|
|
|
|
|
|
|
|
| |
|
|
|
|
|
$ |
174,334 |
|
| Securities lending agreements |
|
|
|
|
|
|
58,477 |
|
| Total |
|
|
|
|
|
|
232,811 |
|
Carrying value of associated liabilities (3)
|
|
|
|
|
|
$ |
190,449 |
|
| (1) |
The fair value of transferred assets is $252,558 (2024 – $232,811) and the fair value of the associated liabilities is $189,144 (2024 – $190,449), for a net position of $63,414 (2024 – $42,362). |
| (2) |
Does not include over-collateralization of assets pledged. |
| (3) |
Liabilities for securities lending arrangements only include amounts related to cash collateral received. For securities received as collateral, refer to Note 34(a)(iv). |
Other
off-balance
sheet arrangements
The Bank uses a capital vehicle to transfer credit exposure to security holders of the vehicle. While credit exposures are transferred, the related assets are not derecognized from the balance sheet. For further details, refer to Note 14.
(a) |
Consolidated structured entities |
U.S. multi-seller conduit
The Bank-sponsored U.S. multi-seller conduit purchases high-quality financial assets from independent third parties (the sellers) funded by the issuance of highly rated asset-backed commercial paper. The sellers continue to service the financial assets and provide credit enhancements through overcollateralization protection and cash reserves.
Each asset purchased by the conduit has a deal-specific liquidity facility provided by the Bank in the form of a Liquidity Asset Purchase Agreement (LAPA). The primary purpose of the LAPA is to provide an alternative source of financing in the event the conduit is unable to access the asset-backed commercial paper market. The administration agent can require the Bank in its capacity as liquidity provider to purchase an interest in the related assets owned by the conduit. The Bank is not obligated to perform under the LAPA agreements in the event the conduit itself is insolvent.
The Bank’s liquidity agreements with the conduit call for the Bank to fund full par value of the assets, including defaulted assets, if any, of the conduit. This facility is available to absorb the losses on defaulted assets, if any, in excess of losses absorbed by deal-specific seller credit enhancements. Further, the Bank holds the subordinated note issued by the conduit.
The Bank’s exposure from the U.S. conduit through the LAPA, including the obligation to purchase defaulted assets and investment in the conduit’s subordinated note, give the Bank the obligation to absorb losses that could potentially be significant to the conduit, which in conjunction with power to direct the conduit’s activities, result in the Bank consolidating the U.S. multi-seller conduit.
The conduit’s assets of $14 billion (2024 – $11 billion) are primarily included in Business and government loans on the Bank’s Consolidated Statement of Financial Position.
There are contractual restrictions on the ability of the Bank’s consolidated U.S. multi-seller conduit to transfer funds to the Bank. The Bank is restricted from accessing the conduit’s assets under the relevant arrangements. The Bank has no rights to the assets owned by the conduit. In the normal course of business, the assets of the conduit can only be used to settle the obligations of the conduit.
Bank funding vehicles and capital vehicles
The Bank uses funding and capital vehicles to facilitate cost-efficient financing of its own operations, including the issuance of covered bonds and notes. Activities of funding structured entities are generally limited to holding an interest in a pool of assets or receivables generated by the Bank. Capital vehicles include Scotiabank LRCN Trust which was established in connection with the Bank’s issuance of qualifying regulatory capital instruments. These structured entities are consolidated due to the Bank’s decision-making power and ability to use that power to affect the returns.
Covered bonds
The Bank has a registered covered bond program through which it issues debt that is guaranteed by Scotiabank Covered Bond Guarantor Limited Partnership (the “LP”). Under this program, the LP purchases uninsured residential mortgages from the Bank, which it acquires with funding provided by the Bank.
As at October 31, 2025, $46.7 billion (2024 – $47.0 billion) covered bonds were outstanding and included in Deposits – Business and government on the Consolidated Statement of Financial Position. The Bank’s outstanding covered bonds are denominated in U.S. dollars, British pounds, Swiss francs, Euros, Canadian Dollars, and Norwegian Kroner. As at October 31, 2025, assets pledged in relation to these covered bonds were uninsured residential mortgages denominated in Canadian dollars of $44.8 billion (2024 – $48.0 billion). These figures exclude activities in connection with covered bonds held by the Bank and that are eliminated upon consolidation.
Credit card receivables securitization trust
The Bank securitizes a portion of its Canadian credit card receivables through a Bank-sponsored structured entity. This entity issues senior and subordinated notes to third-party investors and the proceeds of such issuance are used to purchase
co-ownership
interests in credit card receivables originated by the Bank. Recourse of the note holders is limited to the purchased interest.
The Bank is responsible for servicing the transferred credit card receivables as well as performing administrative functions for this entity. As at October 31, 2025, U.S.$2.3 billion ($3.2 billion Canadian dollar equivalent) (2024 – U.S.$2.4 billion, $3.3 billion Canadian dollar equivalent) Class A notes; and U.S.$196 million ($274 million Canadian dollar equivalent) (2024 – U.S.$209 million, $291 million Canadian dollar equivalent) subordinated Class B and Class C notes were outstanding and included in Deposits – Business and government on the Consolidated Statement of Financial Position.
|
2025 Scotiabank Annual Report
Consolidated Financial Statements
As at October 31, 2025, assets pledged in relation to the offered and retained notes were credit card receivables, denominated in Canadian dollars, of $ 3.6 billion (2024 – $3.8 billion).
Auto loan receivables securitization trusts
The Bank securitizes a portion of its Canadian auto loan receivables through its Securitized Term Auto Receivables Trust program (SSTRT) and Securitized Term Auto Loan Receivables Trust
2025-A
(START
2025-
A), Bank sponsored consolidated structured entities. The structured entities issue offered notes to third-party investors and retained notes to the Bank. Recourse of the noteholders is limited to the receivables and a cash reserve account.
As at October 31, 2025, U.S. $301 million ($423 million Canadian dollar equivalent) (
October 31, 2024 – nil)
offered notes that were issued to third party investors were outstanding and included in Deposits – Business and government on the Consolidated Statement of Financial Position.
The sale of such receivables does not qualify for derecognition, and the receivables continue to be recognized on the Bank’s Consolidated Statement of Financial Position. As at October 31, 2025, assets pledged in relation to the offered and retained notes were Canadian auto loan receivables, denominated in Canadian dollars of $
4,488 million (2024 – nil).
Scotiabank LRCN Trust
The Bank sponsors the Scotiabank LRCN Trust established in connection with the issuance of limited recourse capital notes. As at October 31, 2025, $8.4 billion (2024 – $5.5 billion)
of externally-issued limited recourse capital notes were outstanding and included in Preferred shares and other equity instruments on the Consolidated Statement of Financial Position. Refer to Note 23(b) – Preferred shares and other equity instruments for further information.
Assets of other consolidated structured entities are comprised of securities, deposits with banks and other assets to meet the Bank’s and customer needs.
(b) |
Unconsolidated structured entities |
The following table provides information about other structured entities which the Bank does not control and therefore does not consolidate.
|
|
|
|
|
|
|
|
|
|
|
|
|
|
|
|
|
|
|
|
|
($ millions) |
|
Canadian multi-seller
conduits that the Bank administers |
|
|
Structured
finance
entities |
|
|
|
|
|
|
|
| Total assets on structured entity’s financial statements |
|
|
|
|
|
|
|
|
|
|
|
|
|
|
|
|
| Assets recognized on the Bank’s financial statements: |
|
|
|
|
|
|
|
|
|
|
|
|
|
|
|
|
| Trading assets |
|
|
|
|
|
|
|
|
|
|
|
|
|
|
|
|
| Investment securities |
|
|
|
|
|
|
|
|
|
|
|
|
|
|
|
|
| |
|
|
|
|
|
|
|
|
|
|
|
|
|
|
|
|
| Other |
|
|
|
|
|
|
|
|
|
|
|
|
|
|
|
|
|
|
|
|
|
|
|
|
|
|
|
|
|
|
|
|
|
| Liabilities recognized on the Bank’s financial statements: |
|
|
|
|
|
|
|
|
|
|
|
|
|
|
|
|
| Deposits – Business and government |
|
|
|
|
|
|
|
|
|
|
|
|
|
|
|
|
| Other |
|
|
|
|
|
|
|
|
|
|
|
|
|
|
|
|
|
|
|
|
|
|
|
|
|
|
|
|
|
|
|
|
|
| Bank’s maximum exposure to loss |
|
|
|
|
|
|
|
|
|
|
|
|
|
|
|
|
|
|
| |
|
As at October 31, 2024 |
|
| ($ millions) |
|
Canadian multi-seller
conduits that the
Bank administers |
|
|
Structured
finance
entities |
|
|
Other
funding
vehicles |
|
|
Total |
|
| Total assets (on structured entity’s financial statements) |
|
$ |
6,299 |
|
|
$ |
13,695 |
|
|
$ |
1,870 |
|
|
$ |
21,864 |
|
| Assets recognized on the Bank’s financial statements: |
|
|
|
|
|
|
|
|
|
|
|
|
|
|
|
|
| Trading assets |
|
|
8 |
|
|
|
306 |
|
|
|
– |
|
|
|
314 |
|
| Investment securities |
|
|
– |
|
|
|
842 |
|
|
|
– |
|
|
|
842 |
|
| |
|
|
– |
|
|
|
4,757 |
|
|
|
– |
|
|
|
4,757 |
|
| Other |
|
|
– |
|
|
|
35 |
|
|
|
93 |
|
|
|
128 |
|
|
|
|
8 |
|
|
|
5,940 |
|
|
|
93 |
|
|
|
6,041 |
|
| Liabilities recognized on the Bank’s financial statements: |
|
|
|
|
|
|
|
|
|
|
|
|
|
|
|
|
| Deposits – Business and government |
|
|
– |
|
|
|
– |
|
|
|
1,842 |
|
|
|
1,842 |
|
| Derivative financial instruments |
|
|
– |
|
|
|
– |
|
|
|
28 |
|
|
|
28 |
|
|
|
|
– |
|
|
|
– |
|
|
|
1,870 |
|
|
|
1,870 |
|
| Bank’s maximum exposure to loss |
|
$ |
6,307 |
(2) |
|
$ |
11,469 |
|
|
$ |
76 |
|
|
$ |
17,852 |
|
(1) |
Loan balances are presented net of allowance for credit losses. |
(2) |
Excludes up to a maximum amount of $1.6 billion (2024 – $1.4 billion) relating to backstop liquidity facilities provided by the Bank to these multi-seller conduits based on future asset purchases by these conduits. |
2025 Scotiabank Annual Report
|
Consolidated Financial Statements
The Bank’s maximum exposure to loss represents the notional amounts of guarantees, liquidity facilities, and other credit support relationships with the structured entities, the credit risk amount for certain derivative contracts with the entities and the amount invested where the Bank holds an ownership interest in the structured entities. Of the aggregate amount of maximum exposure to loss as at October 31, 2025, the Bank has recorded $10.2 billion (2024 – $6.1 billion), primarily loans issued to structured entities, on the Consolidated Statement of Financial Position.
Canadian multi-seller conduits that the Bank administers
In 2025, the Bank established Temperance Street Funding Trust, a Canadian multi-seller conduit. The Bank sponsors a total of three Canadian multi-seller conduits. The conduits purchase assets from independent third parties (the sellers) funded by the issuance of asset-backed commercial paper. The sellers continue to service the assets and provide credit enhancements through overcollateralization protection and cash reserves. The Bank has no rights to these assets as they are available to support the obligations of the respective programs but manages the commercial paper selling programs for a fee. To ensure timely repayment of the commercial paper, each asset pool financed by the multi-seller conduits has a deal-specific LAPA or liquidity agreement (LA) with the Bank. Pursuant to the terms of the LAPA or LA, the Bank as the liquidity provider is obligated to purchase
non-defaulted
assets, transferred by the conduit at the conduit’s original cost as reflected in the table above. In most cases, the liquidity agreements do not require the Bank to purchase defaulted assets. Additionally, the Bank has not provided any program-wide credit enhancement to these conduits.
Although the Bank has power over the relevant activities of the conduits, it has limited exposure to variability in returns, which results in the Bank not consolidating the three Canadian conduits.
Structured finance entities
The Bank has interests in structured entities used to assist corporate clients in accessing cost-efficient financing through their securitization structures. The Bank may act as an administrator, an investor or a combination of both in these types of structures.
The Bank provides senior credit facilities to unaffiliated structured entities that are established by third parties to acquire and/or originate loans for the purposes of issuing collateralized loan obligations (CLOs). These credit facilities benefit from subordinated capital provided by either the collateral manager or third-party investors via subordinated financing, capital injection or asset contribution. Subordinated capital represents the first loss tranche which absorbs losses prior to the Bank’s senior exposure. The Bank’s broker-dealer affiliate acts as the arranger and placement agent for the CLOs. Proceeds from the sale of the CLOs are used to repay the senior credit facilities. The Bank does not consolidate these entities as it does not have decision making power over their relevant activities, which include the acquisition and/or origination of loans and overall management of the underlying portfolio. As at October 31, 2025, the Bank has funded $8,114 million of the credit facilities provided to these structured entities (October 31, 2024 – $4,243 million).
Other
off-balance
sheet arrangements
The Bank uses a funding vehicle to transfer credit exposure on certain loan assets and purchases credit protection against eligible credit events from this vehicle. The vehicle collateralizes its obligation using cash proceeds received through the issuance of guarantee-linked notes. Loan assets are not sold or assigned to the vehicle and remain on the Bank’s Consolidated Statement of Financial Position. The total principal balance of guarantee-linked notes issued by this vehicle and outstanding was $1,697 million as at October 31, 2025 (October 31, 2024 – $1,002 million). These are included in Deposits – Business and government on the Bank’s Consolidated Statement of Financial Position.
Although the Bank has power over the relevant activities of these vehicles, it has limited exposure to variability in returns, which results in the Bank not consolidating these vehicles.
(c) |
Other unconsolidated Bank-sponsored entities |
The Bank sponsors unconsolidated structured entities including mutual funds, in which it has insignificant or no interest at the reporting date. The Bank is a sponsor when it is significantly involved in the design and formation at inception of the structured entities, and the Bank’s name is used by the structured entities to create an awareness of the instruments being backed by the Bank’s reputation and obligation. The Bank also considers other factors, such as its continuing involvement and obligations to determine if, in substance, the Bank is a sponsor.
As at October 31, 2025, the Bank earned $2,851 million (2024 – $2,547 million) in revenue from unconsolidated Bank-sponsored mutual fund entities.
|
2025 Scotiabank Annual Report
Consolidated Financial Statements
|
|
|
|
|
|
|
|
|
|
|
|
|
|
|
|
|
|
|
|
|
|
|
|
|
| ($ millions) |
|
Land &
Building |
|
|
Equipment |
|
|
Technology
Assets |
|
|
Leasehold
Improvements |
|
|
|
|
|
Total |
|
| Cost |
|
|
|
|
|
|
|
|
|
|
|
|
|
|
|
|
|
|
|
|
|
|
|
|
| Balance as at October 31, 2023 |
|
$ |
1,813 |
|
|
$ |
1,809 |
|
|
$ |
705 |
|
|
$ |
1,854 |
|
|
$ |
4,336 |
|
|
$ |
10,517 |
|
| Additions |
|
|
120 |
|
|
|
232 |
|
|
|
73 |
|
|
|
134 |
|
|
|
125 |
|
|
|
684 |
|
| Disposals/Retirements |
|
|
(149 |
) |
|
|
(183 |
) |
|
|
(155 |
) |
|
|
(67 |
) |
|
|
(77 |
) |
|
|
(631 |
) |
| Foreign currency adjustments and other |
|
|
(48 |
) |
|
|
(78 |
) |
|
|
10 |
|
|
|
(44 |
) |
|
|
(43 |
) |
|
|
(203 |
) |
| Balance as at October 31, 2024 |
|
|
|
|
|
|
|
|
|
|
|
|
|
|
|
|
|
|
|
|
|
|
|
|
| Additions |
|
|
|
|
|
|
|
|
|
|
|
|
|
|
|
|
|
|
|
|
|
|
|
|
| |
|
|
|
|
|
|
|
|
|
|
|
|
|
|
|
|
|
|
|
|
|
|
|
|
| Foreign currency adjustments and other |
|
|
|
|
|
|
|
|
|
|
|
|
|
|
|
|
|
|
|
|
|
|
|
|
| Balance as at October 31, 2025 |
|
|
|
|
|
|
|
|
|
|
|
|
|
|
|
|
|
|
|
|
|
|
|
|
|
|
|
|
|
|
|
| Accumulated depreciation |
|
|
|
|
|
|
|
|
|
|
|
|
|
|
|
|
|
|
|
|
|
|
|
|
| Balance as at October 31, 2023 |
|
$ |
686 |
|
|
$ |
1,268 |
|
|
$ |
381 |
|
|
$ |
1,152 |
|
|
$ |
1,388 |
|
|
$ |
4,875 |
|
| Depreciation |
|
|
49 |
|
|
|
94 |
|
|
|
140 |
|
|
|
116 |
|
|
|
331 |
|
|
|
730 |
|
| Disposals/Retirements |
|
|
(50 |
) |
|
|
(75 |
) |
|
|
(145 |
) |
|
|
(40 |
) |
|
|
(62 |
) |
|
|
(372 |
) |
| Foreign currency adjustments and other |
|
|
(22 |
) |
|
|
(26 |
) |
|
|
(14 |
) |
|
|
(40 |
) |
|
|
(16 |
) |
|
|
(118 |
) |
| Balance as at October 31, 2024 |
|
|
|
|
|
|
|
|
|
|
|
|
|
|
|
|
|
|
|
|
|
|
|
|
| Depreciation |
|
|
|
|
|
|
|
|
|
|
|
|
|
|
|
|
|
|
|
|
|
|
|
|
| Disposals/Retirements |
|
|
|
|
|
|
|
|
|
|
|
|
|
|
|
|
|
|
|
|
|
|
|
|
| Foreign currency adjustments and other |
|
|
|
|
|
|
|
|
|
|
|
|
|
|
|
|
|
|
|
|
|
|
|
|
| Balance as at October 31, 2025 |
|
|
|
|
|
|
|
|
|
|
|
|
|
|
|
|
|
|
|
|
|
|
|
|
|
|
|
|
|
|
|
| Net book value |
|
|
|
|
|
|
|
|
|
|
|
|
|
|
|
|
|
|
|
|
|
|
|
|
| Balance as at October 31, 2024 |
|
$ |
1,073 |
|
|
$ |
519 |
|
|
$ |
271 |
|
|
$ |
689 |
|
|
$ |
2,700 |
|
|
$ |
5,252 |
(2) |
| Balance as at October 31, 2025 |
|
|
|
|
|
|
|
|
|
|
|
|
|
|
|
|
|
|
|
|
|
|
|
|
(1) |
Includes a net impairment loss recorded in Q1 2025 related to the agreement to sell the banking operations in Colombia, Costa Rica and Panama. Refer to Note 35 for details. |
(2) |
Includes $39 (2024 – $36) of investment property. |
|
Investments in Associates |
The Bank had significant investments in the following associates:
|
|
|
|
|
|
|
|
|
|
|
|
|
|
|
|
|
|
|
|
|
|
|
|
|
| |
|
|
|
|
|
|
|
|
|
|
|
|
|
2024 |
|
| As at October 31 ($ millions) |
|
Country of
incorporation |
|
|
Nature of
business |
|
|
Ownership
percentage |
|
|
Date of financial statements (1)
|
|
|
Carrying
value |
|
|
Carrying
value |
|
| |
|
|
|
|
|
|
|
|
|
|
|
|
|
|
|
|
|
|
|
|
|
$ |
– |
|
Bank of Xi’an Co. Ltd. (3)
|
|
|
|
|
|
|
|
|
|
|
|
|
|
|
|
|
|
|
|
|
|
|
658 |
|
Maduro & Curiel’s Bank N.V. (4)
|
|
|
|
|
|
|
|
|
|
|
|
|
|
|
|
|
|
|
|
|
|
|
527 |
|
| (1) |
Represents the date of the most recent financial statements. |
| (2) |
On December 27, 2024, the Bank completed the acquisition of an additional 10% ownership interest, bringing the total ownership interest in KeyCorp to 14.9% (refer to Note 35 for further details). The Bank has significant influence over KeyCorp through a combination of its ownership interest and board representation. Based on the quoted price on the New York Stock Exchange, the market value of the Bank’s investment in KeyCorp was $ 4,018 as at Oct 31, 2025. During the year, dividends received from KeyCorp of $140 were recognized as a reduction in the carrying value of the investment in associate. |
| (3) |
Based on the quoted price on the Shanghai Stock Exchange, the market value of the Bank’s Investment in Bank of Xi’an Co. Ltd. was $617 (October 31, 2024 – $570). The Bank has significant influence over the Bank of Xi’an Co. Ltd. through a combination of its ownership interest and board representation. |
| (4) |
The local regulator requires financial institutions to set aside reserves for general banking risks. These reserves are not required under IFRS, and represent undistributed retained earnings related to a foreign associated corporation, which are subject to local regulatory restrictions. As of October 31, 2025 , these reserves amounted to $76 (2024 – $74). |
Impairment testing of Bank of Xi’an Co. Ltd.
As at October 31, 2025, the market value of the Bank’s investment in Bank of Xi’an Co. Ltd. based on the quoted price on the Shanghai Stock Exchange continues to be below its carrying value. The Bank has been performing quarterly impairment testing on this investment due to the prolonged period in which its market value has remained below the carrying amount. The impairment test involves comparing the carrying value of the investment to its recoverable amount based on value in use (VIU). In estimating VIU, the Bank uses a discounted cash flows valuation model which incorporates key assumptions, including a
5-year
forecast of
after-tax
cash flows for the underlying entity, the estimated terminal growth rate beyond 5 years, and the applicable discount rate. As at October 31, 2025, the estimate of VIU was determined using a terminal growth rate of 2% (2024 – 2%) and an
after-tax
discount rate of 11% (2024 –12%).
Based on impairment testing performed using the VIU methodology, no impairment was determined to exist as at October 31, 2025. In the prior year, an impairment charge of $343 million ($309 million after-tax) was recorded in non-interest expenses – other in the Other operating segment, driven primarily by the continued weakening of the economic outlook in China.
2025 Scotiabank Annual Report
|
Consolidated Financial Statements
Summarized financial information
Summarized financial information of the Bank’s significant associates are as follows.
|
|
|
|
|
|
|
|
|
|
|
|
|
|
|
|
|
| |
|
For the twelve months ended (1)
|
|
|
As at October 31, 2025 |
|
| ($ millions) |
|
Revenue |
|
|
Net
income |
|
|
Total assets |
|
|
Total liabilities |
|
KeyCorp |
|
|
|
|
|
|
|
|
|
|
|
|
|
|
|
|
Bank of Xi’an Co. Ltd. |
|
|
|
|
|
|
|
|
|
|
|
|
|
|
|
|
Maduro & Curiel’s Bank N.V. |
|
|
|
|
|
|
|
|
|
|
|
|
|
|
|
|
|
|
|
| |
|
For the twelve months ended (1)
|
|
|
As at October 31, 2024 |
|
| ($ millions) |
|
Revenue |
|
|
Net
income |
|
|
Total assets |
|
|
Total liabilities |
|
Bank of Xi’an Co. Ltd. |
|
$ |
1,457 |
|
|
$ |
471 |
|
|
$ |
87,974 |
|
|
$ |
81,577 |
|
Maduro & Curiel’s Bank N.V. |
|
|
457 |
|
|
|
170 |
|
|
|
8,057 |
|
|
|
6,959 |
|
| (1) |
Based on the most recent available financial statements. |
|
Goodwill and Other Intangible Assets |
The changes in the carrying amounts of goodwill by groups of cash-generating units (CGU) are as follows:
|
|
|
|
|
|
|
|
|
|
|
|
|
|
|
|
|
|
|
|
|
|
|
|
|
| ($ millions) |
|
Canadian
Banking |
|
|
Global
Wealth
Management |
|
|
Global
Banking and
Markets |
|
|
Latin
America |
|
|
Caribbean
and
Central
America |
|
|
Total |
|
Balance as at October 31, 2023 |
|
$ |
1,690 |
|
|
$ |
3,610 |
|
|
$ |
246 |
|
|
$ |
2,630 |
|
|
$ |
1,005 |
|
|
$ |
9,181 |
|
Acquisitions |
|
|
– |
|
|
|
– |
|
|
|
– |
|
|
|
– |
|
|
|
– |
|
|
|
– |
|
|
|
|
– |
|
|
|
– |
|
|
|
– |
|
|
|
(92 |
) |
|
|
– |
|
|
|
(92 |
) |
Foreign currency adjustments and other |
|
|
– |
|
|
|
4 |
|
|
|
– |
|
|
|
(138 |
) |
|
|
6 |
|
|
|
(128 |
) |
Balance as at October 31, 2024 |
|
|
1,690 |
|
|
|
3,614 |
|
|
|
246 |
|
|
|
2,400 |
|
|
|
1,011 |
|
|
|
8,961 |
|
Acquisitions |
|
|
|
|
|
|
|
|
|
|
|
|
|
|
|
|
|
|
|
|
|
|
|
|
|
|
|
|
|
|
|
|
|
|
|
|
|
|
|
|
|
|
|
|
|
|
|
|
|
Foreign currency adjustments and other |
|
|
|
|
|
|
|
|
|
|
|
|
|
|
|
|
|
|
|
|
|
|
|
|
Balance as at October 31, 2025 |
|
|
|
|
|
|
|
|
|
|
|
|
|
|
|
|
|
|
|
|
|
|
|
|
(1) |
In fiscal 2024, the Bank recorded a goodwill write-down of $92 million pre-tax within the Latin America CGU in relation to its agreement to sell CrediScotia Financiera, a subsidiary in Peru. Refer to Note 35 for details. |
(2) |
In the current year, the Bank recorded a goodwill write-down of $589 million pre-tax within the Latin America and Caribbean & Central America CGUs in relation to its agreement to sell banking operations in Colombia, Costa Rica and Panama. Refer to Note 35 for details. |
Impairment testing of goodwill
Goodwill acquired in business combinations is allocated to each of the Bank’s groups of CGUs that are expected to benefit from the synergies of the particular acquisition. Goodwill is assessed for impairment annually or more frequently if events or circumstances occur that may indicate impairment.
The Bank determines the carrying values of its CGUs using a regulatory capital approach based on credit, market, operational risks and leverage, consistent with the Bank’s capital attribution for business line performance measurement. Corporate capital that is not directly attributable is allocated to each CGU on a proportional basis, based on the relative attributed capital prior to the corporate capital allocation. The resulting carrying amount determined for the CGU is then compared to its respective recoverable amount to identify any impairment.
Annual impairment testing for goodwill was performed as at July 31, 2025 and 2024, and no impairment was determined to exist. As of October 31, 2025 and 2024, there were no significant changes to this assessment.
Fair value less costs of disposal
For all CGUs, the recoverable amount was determined using the fair value less costs of disposal (FVLCD) method. In arriving at FVLCD, the Bank estimates the fair value of the CGU using price earnings (P/E) multiples applied to normalized net income for the last four quarters as of the test date, applies a control premium based on a weighted average of acquisition premiums paid globally in the banking industry over the past five years for comparable companies, and deducts the estimated costs of disposal. The fair value measurement is categorized as Level 3 due to significant inputs being unobservable. For the 2025 annual impairment test, P/E multiples ranging from 9.5 to 13 times (2024 – 11 to 11.5 times) were used.
The Bank has performed sensitivity analysis on the key assumptions used in estimating FVLCD. The estimate of reasonably possible changes to the key assumptions are based on available evidence in respect of each input, such as risks associated with the normalized net income projections, and range of P/E multiples observed externally. Reasonable negative changes in the net income outlook (decrease of 5%) or P/E multiples (decrease of 1x), each in isolation, holding other factors constant, would not result in impairment for all CGUs using the FVLCD method.
In the prior year, the Latin America CGU’s recoverable amount was determined using the value in use (VIU) method. In estimating VIU, the Bank used a discounted cash flow valuation model based on a
5-year
forecast of
after-tax
cash flows, the estimated terminal growth rate beyond 5 years, and the applicable discount rate. The
5-year
cash flow forecast was based on management approved budgets and plans which consider market trends, macroeconomic conditions, forecasted earnings and the business strategy for the CGU. The terminal growth rate was based on long-term growth expectations in Latin America, and the discount rate was based on the cost of capital of comparable companies. For the 2024 annual impairment test, a terminal growth rate of 3% and a discount rate of 12% were used.
|
2025 Scotiabank Annual Report
Consolidated Financial Statements
The Bank performed sensitivity analysis on the key assumptions used in estimating the Latin America CGU’s VIU in the prior year. The estimate of reasonably possible changes to the key assumptions was based on available evidence in respect of each input such as historical performance against forecasts, risks associated with the underlying cash flow projections, and range of discount rates observed externally. Reasonable negative changes in any one key assumption, holding other factors constant, would not result in impairment for the Latin America CGU.
Intangible assets consist of assets with indefinite and finite useful lives. Indefinite life intangible assets consist substantially of fund management contracts. The fund management contracts are for the management of open-ended funds. Finite life intangible assets include assets such as computer software, customer relationships and core deposit intangibles.
|
|
|
|
|
|
|
|
|
|
|
|
|
|
|
|
|
|
|
|
|
|
|
| |
|
Finite life |
|
|
|
|
Indefinite life |
|
|
|
|
| ($ millions) |
|
Computer
software |
|
|
Other
intangibles |
|
|
|
|
Fund management contracts (1)
|
|
|
Other
intangibles |
|
|
Total |
|
Cost |
|
|
|
|
|
|
|
|
|
|
|
|
|
|
|
|
|
|
|
|
|
|
Balance as at October 31, 2023 |
|
$ |
5,639 |
|
|
$ |
1,815 |
|
|
|
|
$ |
4,415 |
|
|
$ |
163 |
|
|
$ |
12,032 |
|
Acquisitions |
|
|
– |
|
|
|
– |
|
|
|
|
|
– |
|
|
|
– |
|
|
|
– |
|
Additions |
|
|
840 |
|
|
|
1 |
|
|
|
|
|
– |
|
|
|
– |
|
|
|
841 |
|
Impairment |
|
|
(188 |
) |
|
|
– |
|
|
|
|
|
– |
|
|
|
– |
|
|
|
(188 |
) |
Disposals/Retirements |
|
|
(538 |
) |
|
|
– |
|
|
|
|
|
– |
|
|
|
– |
|
|
|
(538 |
) |
Foreign currency adjustments and other |
|
|
24 |
|
|
|
(22 |
) |
|
|
|
|
– |
|
|
|
– |
|
|
|
2 |
|
Balance as at October 31, 2024 |
|
$ |
5,777 |
|
|
$ |
1,794 |
|
|
|
|
$ |
4,415 |
|
|
$ |
163 |
|
|
$ |
12,149 |
|
Acquisitions |
|
|
|
|
|
|
|
|
|
|
|
|
|
|
|
|
|
|
|
|
|
|
Additions |
|
|
|
|
|
|
|
|
|
|
|
|
|
|
|
|
|
|
|
|
|
|
|
|
|
|
|
|
|
|
|
|
|
|
|
|
|
|
|
|
|
|
|
|
|
Disposals/Retirements |
|
|
|
|
|
|
|
|
|
|
|
|
|
|
|
|
|
|
|
|
|
|
Foreign currency adjustments and other |
|
|
|
|
|
|
|
|
|
|
|
|
|
|
|
|
|
|
|
|
|
|
Balance as at October 31, 2025 |
|
|
|
|
|
|
|
|
|
|
|
|
|
|
|
|
|
|
|
|
|
|
Accumulated amortization |
|
|
|
|
|
|
|
|
|
|
|
|
|
|
|
|
|
|
|
|
|
|
Balance as at October 31, 2023 |
|
$ |
2,566 |
|
|
$ |
1,454 |
|
|
|
|
$ |
– |
|
|
$ |
– |
|
|
$ |
4,020 |
|
Amortization |
|
|
958 |
|
|
|
72 |
|
|
|
|
|
– |
|
|
|
– |
|
|
|
1,030 |
|
Impairment |
|
|
(91 |
) |
|
|
– |
|
|
|
|
|
– |
|
|
|
– |
|
|
|
(91 |
) |
Disposals/Retirements |
|
|
(614 |
) |
|
|
– |
|
|
|
|
|
– |
|
|
|
– |
|
|
|
(614 |
) |
Foreign currency adjustments and other |
|
|
(75 |
) |
|
|
(13 |
) |
|
|
|
|
– |
|
|
|
– |
|
|
|
(88 |
) |
Balance as at October 31, 2024 |
|
$ |
2,744 |
|
|
$ |
1,513 |
|
|
|
|
$ |
– |
|
|
$ |
– |
|
|
$ |
4,257 |
|
Amortization |
|
|
|
|
|
|
|
|
|
|
|
|
|
|
|
|
|
|
|
|
|
|
|
|
|
|
|
|
|
|
|
|
|
|
|
|
|
|
|
|
|
|
|
|
|
Disposals/Retirements |
|
|
|
|
|
|
|
|
|
|
|
|
|
|
|
|
|
|
|
|
|
|
Foreign currency adjustments and other |
|
|
|
|
|
|
|
|
|
|
|
|
|
|
|
|
|
|
|
|
|
|
Balance as at October 31, 2025 |
|
|
|
|
|
|
|
|
|
|
|
|
|
|
|
|
|
|
|
|
|
|
Net book value |
|
|
|
|
|
|
|
|
|
|
|
|
|
|
|
|
|
|
|
|
|
|
As at October 31, 2024 |
|
$ |
3,033 |
(3) |
|
$ |
281 |
|
|
|
|
$ |
4,415 |
|
|
$ |
163 |
|
|
$ |
7,892 |
|
As at October 31, 2025 |
|
|
|
|
|
|
|
|
|
|
|
|
|
|
|
|
|
|
|
|
|
|
| (1) |
Fund management contracts are attributable to the previously acquired Dynamic Funds business (formerly DundeeWealth Inc.), MD Financial Management Inc., and Jarislowsky Fraser Limited. |
| (2) |
In the current year, the Bank recognized an impairment loss of $ 165
million pre-tax in relation to its agreement to sell banking operations in Colombia, Costa Rica and Panama. Refer to Note 35 for details. |
(3) |
Computer software comprises purchased software of $262 (2024 – $194), internally generated software of $1,633 (2024 – $1,939), and in process software not subject to amortization of $896 (2024 – $900). |
Impairment testing of intangible assets
Indefinite life intangible assets are not amortized and are assessed for impairment annually or more frequently if events or changes in circumstances indicate that the asset may be impaired. Impairment is assessed by comparing the carrying value of the indefinite life intangible asset to its recoverable amount. The recoverable amount of fund management contracts is based on a VIU approach using the multi-period excess earnings method. This approach uses cash flow projections from management-approved financial budgets, which include key assumptions related to market appreciation, net sales of funds, and operating margins, taking into consideration past experience and market expectations. The forecast cash flows cover a
5-year
period, with a terminal growth rate of 4.5% (2024 – 4.5%) applied thereafter. These cash flows have been discounted at 10% (2024 – 10%). Fund management contracts were assessed for annual impairment using data as at July 31, 2025 and 2024, and no impairment was determined to exist. As of October 31, 2025 and 2024, there were no significant changes to this assessment. In addition, reasonable negative changes in any one key assumption, holding other factors constant, would not result in impairment.
Finite life intangible assets are only assessed for impairment if events or circumstances indicate that the asset may be impaired. When required, impairment is assessed by comparing the carrying value of the finite life intangible asset to its recoverable amount, which is generally determined using a VIU approach. In fiscal 2024, computer software with a net book value of $97 million was assessed as impaired.
2025 Scotiabank Annual Report
|
Consolidated Financial Statements
|
|
|
|
|
|
|
|
|
| As at October 31 ($ millions) |
|
|
|
|
2024 |
|
Accrued interest |
|
|
|
|
|
$ |
5,352 |
|
Accounts receivable and prepaids |
|
|
|
|
|
|
2,118 |
|
Current tax assets |
|
|
|
|
|
|
2,374 |
|
Margin deposits on derivatives |
|
|
|
|
|
|
9,976 |
|
Segregated fund assets |
|
|
|
|
|
|
1,231 |
|
Pension assets (Note 27) |
|
|
|
|
|
|
684 |
|
Receivable from brokers, dealers and clients |
|
|
|
|
|
|
3,244 |
|
Other |
|
|
|
|
|
|
5,322 |
|
Total |
|
|
|
|
|
$ |
30,301 |
|
|
|
|
|
|
|
|
|
|
|
|
|
|
|
|
|
|
|
|
|
|
|
|
|
|
| |
|
|
|
|
2024 |
|
| |
|
|
|
|
|
|
|
|
|
|
|
|
|
|
|
| As at October 31 ($ millions) |
|
Interest-
bearing |
|
|
|
|
|
|
|
|
Payable on a fixed date (3)
|
|
|
Total |
|
|
|
|
Personal |
|
|
|
|
|
|
|
|
|
|
|
|
|
|
|
|
|
|
|
|
|
$ |
298,821 |
|
Business and government |
|
|
|
|
|
|
|
|
|
|
|
|
|
|
|
|
|
|
|
|
|
|
600,114 |
|
Financial institutions |
|
|
|
|
|
|
|
|
|
|
|
|
|
|
|
|
|
|
|
|
|
|
44,914 |
|
Total |
|
|
|
|
|
|
|
|
|
|
|
|
|
|
|
|
|
|
|
|
|
$ |
943,849 |
|
Recorded in: |
|
|
|
|
|
|
|
|
|
|
|
|
|
|
|
|
|
|
|
|
|
|
|
|
Canada |
|
|
|
|
|
|
|
|
|
|
|
|
|
|
|
|
|
|
|
|
|
$ |
686,817 |
|
United States |
|
|
|
|
|
|
|
|
|
|
|
|
|
|
|
|
|
|
|
|
|
|
90,442 |
|
United Kingdom |
|
|
|
|
|
|
|
|
|
|
|
|
|
|
|
|
|
|
|
|
|
|
27,091 |
|
Mexico |
|
|
|
|
|
|
|
|
|
|
|
|
|
|
|
|
|
|
|
|
|
|
36,751 |
|
Peru |
|
|
|
|
|
|
|
|
|
|
|
|
|
|
|
|
|
|
|
|
|
|
17,710 |
|
Chile |
|
|
|
|
|
|
|
|
|
|
|
|
|
|
|
|
|
|
|
|
|
|
23,232 |
|
Colombia |
|
|
|
|
|
|
|
|
|
|
|
|
|
|
|
|
|
|
|
|
|
|
8,102 |
|
Other International |
|
|
|
|
|
|
|
|
|
|
|
|
|
|
|
|
|
|
|
|
|
|
53,704 |
|
|
|
|
|
|
|
|
|
|
|
|
|
|
|
|
|
|
|
|
|
|
|
$ |
943,849 |
|
| (1) |
Deposits payable on demand include deposits for which the Bank may not have the right to notice of withdrawal, generally chequing accounts. |
| (2) |
Deposits payable after notice include deposits for which the Bank may require notice of withdrawal, generally savings accounts. |
| (3) |
All deposits that mature on a specified date, generally term deposits, guaranteed investments certificates and similar instruments. |
| (4) |
Deposits denominated in U.S. dollars amount to $297,065 (2024 – $295,316), deposits denominated in Chilean pesos amount to $20,053 (2024 – $19,271), deposits denominated in Mexican pesos amount to $35,941 (2024 – $34,416) and deposits denominated in other foreign currencies amount to $117,530 (2024 – $109,683). |
The following table presents the maturity schedule for term deposits in Canada greater than $100,000
(1)
.
|
|
|
|
|
|
|
|
|
|
|
|
|
|
|
|
|
|
|
|
|
|
|
|
|
| ($ millions) |
|
Within three
months |
|
|
Three to six
months |
|
|
Six to
twelve months |
|
|
One to
five years |
|
|
Over
five years |
|
|
Total |
|
As at October 31, 2025 |
|
|
|
|
|
|
|
|
|
|
|
|
|
|
|
|
|
|
|
|
|
|
|
|
As at October 31, 2024 |
|
$ |
64,521 |
|
|
$ |
37,062 |
|
|
$ |
59,273 |
|
|
$ |
115,757 |
|
|
$ |
18,820 |
|
|
$ |
295,433 |
|
| (1) |
The majority of foreign term deposits are in excess of $100,000. |
These debentures are direct, unsecured obligations of the Bank and are subordinate to the claims of the Bank’s depositors and other creditors. The Bank, where appropriate, enters into interest rate and cross-currency swaps to hedge the related risks.
|
|
|
|
|
|
|
|
|
|
|
|
|
|
|
| As at October 31 ($ millions) |
|
|
|
|
2024 |
|
| Maturity date |
|
Interest
rate (%) |
|
|
|
|
|
|
|
|
|
June 2025 |
|
|
8.900 |
|
|
On June 20, 2025, all $250 million of outstanding 8.900% subordinated debentures matured. The principal plus accrued interest were paid to noteholders on the maturity date. |
|
|
|
|
|
$ |
251 |
|
|
|
|
4.500 |
|
|
U.S.$1,250 million. Interest will be payable semi-annually in arrears on June 16 and December 16 of each year, until maturity in December 2025 . |
|
|
|
|
|
|
1,740 |
|
|
|
|
3.934 |
|
|
Redeemable on or after May 3, 2027. After May 3, 2027, interest will be payable quarterly at the then prevailing three-month bankers’ acceptance rate plus 1.520 % subject to applicable benchmark fallback considerations.
|
|
|
|
|
|
|
1,713 |
|
|
|
|
1.800 |
|
|
JPY 33,000 million. Redeemable on December 20, 2027. After December 20, 2027, interest will be payable semi-annually at the reference Japanese Government Bond rate plus 1.681% on the reset date. |
|
|
|
|
|
|
301 |
|
|
|
|
5.679 |
|
|
Redeemable on or after August 2, 2028. After August 2, 2028, interest will be payable at an annual rate equal to Daily Compounded CORRA plus 2.100%. |
|
|
|
|
|
|
1,016 |
|
|
|
|
1.830 |
|
|
JPY 12,000 million. Redeemable on December 1, 2028. After December 1, 2028, interest rate on the debentures will be reset to the prevailing yield of Japanese Government Bond rate plus 1.477% on the reset date. |
|
|
|
|
|
|
110 |
|
|
|
|
4.959 |
|
|
Redeemable on or after August 1, 2029. After August 1, 2029, interest will be payable at Daily Compounded CORRA plus 1.550%. |
|
|
|
|
|
|
998 |
|
|
|
|
4.588 |
|
|
U.S.$1,250 million. Redeemable between April 12, 2027, and May 4, 2032. On May 4, 2032, interest will reset at the then prevailing 5-year U.S. treasury rate plus 2.050%. |
|
|
|
|
|
|
1,704 |
|
|
|
|
|
|
|
|
|
|
|
|
|
$ |
7,833 |
|
| (1) |
In accordance with the provisions of the Capital Adequacy Guideline of the Superintendent, all redemptions are subject to regulatory approval and subject to the terms in the relevant prospectus. |
| (2) |
The carrying value of subordinated debentures may differ from par value due to the impact of fair value hedges used for managing interest rate risk and subordinated debentures held for market-making purposes. |
| (3) |
These debentures contain non-viability contingent capital (NVCC) provisions. Under such NVCC provisions, outstanding debentures are convertible into a variable number of common shares if OSFI announces that the Bank has ceased, or is about to cease, to be viable, or if a federal or provincial government in Canada publicly announces that the Bank has accepted or agreed to accept a capital injection, or equivalent support, from the federal government or any provincial government or political subdivision or agent thereof without which the Bank would have been determined by OSFI to be non-viable. If such a conversion were to occur, the debentures would be converted into common shares pursuant to an automatic conversion formula defined as 150% of the par value plus accrued and unpaid interest divided by the conversion price and, where applicable, subject to translation at foreign exchange rates in effect at the time of conversion. The conversion price is based on the greater of: (i) a floor price of $5.00 (subject to adjustments in certain events as set out in the respective prospectus supplements), and (ii) the current market price of the Bank’s common shares at the time of the trigger event (10-day weighted average). |
|
2025 Scotiabank Annual Report
Consolidated Financial Statements
|
|
|
|
|
|
|
|
|
| As at October 31 ($ millions) |
|
|
|
|
2024 |
|
Accrued interest |
|
|
|
|
|
$ |
7,840 |
|
|
|
|
|
|
|
|
2,982 |
|
Accounts payable and accrued expenses |
|
|
|
|
|
|
8,133 |
|
Current tax liabilities |
|
|
|
|
|
|
1,070 |
|
Deferred tax liabilities (Note 26) |
|
|
|
|
|
|
1,397 |
|
Gold and silver certificates and bullion |
|
|
|
|
|
|
578 |
|
Margin and collateral accounts |
|
|
|
|
|
|
8,186 |
|
Segregated fund liabilities |
|
|
|
|
|
|
1,231 |
|
Payables to brokers, dealers and clients |
|
|
|
|
|
|
798 |
|
Provisions (Note 22) |
|
|
|
|
|
|
411 |
|
Allowance for credit losses on off-balance sheet exposures (Note 12) |
|
|
|
|
|
|
186 |
|
Pension liabilities (Note 27) |
|
|
|
|
|
|
523 |
|
Other liabilities of subsidiaries and structured entities |
|
|
|
|
|
|
22,104 |
|
Other |
|
|
|
|
|
|
7,589 |
|
Total |
|
|
|
|
|
$ |
63,028 |
|
| (1) |
Represents discounted value of lease liabilities. |
The table below sets out a maturity analysis of undiscounted lease liabilities showing the lease payments to be made after the reporting date:
|
|
|
|
|
|
|
|
|
| As at October 31 ($ millions) |
|
|
|
|
2024 |
|
Within 1 year |
|
|
|
|
|
$ |
410 |
|
1 to 2 years |
|
|
|
|
|
|
404 |
|
2 to 3 years |
|
|
|
|
|
|
401 |
|
3 to 4 years |
|
|
|
|
|
|
381 |
|
4 to 5 years |
|
|
|
|
|
|
358 |
|
After 5 years |
|
|
|
|
|
|
1,677 |
|
Total |
|
|
|
|
|
$ |
3,631 |
|
|
|
|
|
|
| ($ millions) |
|
|
|
As at November 1, 2023 |
|
$ |
573 |
|
Provisions made during the year |
|
|
203 |
|
Provisions utilized / released during the year |
|
|
(365 |
) |
Balance as at October 31, 2024 |
|
$ |
411 |
|
Provisions made during the year |
|
|
|
|
Provisions utilized / released during the year |
|
|
|
|
Balance as at October 31, 2025 |
|
|
|
|
Restructuring Charge
In Q4 2025, the Bank recorded a restructuring charge and severance provisions as well as other related charges of $
373 million ($270 million after-tax) primarily related to workforce reductions across its global operations. These amounts reflect actions taken by the Bank to simplify its organizational structure in Canadian Banking, restructure and right-size Asia operations in Global Banking and Markets and regionalize activities across its international footprint. Of these amounts, which were all recorded in the Other operating segment, $272 million was included in other liabilities – provisions as at October 31, 2025.
Legal
In the ordinary course of business, the Bank and its subsidiaries are and have been subject to a variety of pending and threatened legal proceedings, including civil claims and lawsuits, regulatory examinations, investigations, audits, and requests for information by various governmental regulatory agencies and law enforcement authorities in various jurisdictions. Some of these matters may involve novel legal theories and interpretations and may be advanced under criminal as well as civil statutes, and some proceedings could result in the imposition of civil, regulatory enforcement or criminal penalties. The Bank reviews the status of all proceedings on an ongoing basis and will exercise judgment in resolving them in such manner as the Bank believes to be in its best interest. In view of the inherent difficulty of predicting the outcome of such matters, the Bank cannot state what the eventual outcome of such matters will be. However, based on current knowledge, management does not believe that liabilities, if any, arising from pending litigation or regulatory proceedings will have a material adverse effect on the consolidated financial statements for the year ended October 31, 2025 or results of operations of the Bank.
Legal provisions are established when it becomes probable that the Bank will incur an expense related to a legal action or regulatory proceeding and the amount can be reliably estimated. Such provisions are recorded at the best estimate of the amount required to settle any obligation related to these legal actions as at the balance sheet date, taking into account the risks and uncertainties surrounding the obligation. Management and internal and external experts are involved in estimating any amounts that may be required. The actual costs of resolving these claims may vary significantly from the amount of the legal provisions. The Bank’s estimate involves significant judgement, given the varying stages of the proceedings, the fact that the Bank’s liability, if any, has yet to be determined and the fact that the underlying matters will change from time to time.
2025 Scotiabank Annual Report
|
Consolidated Financial Statements
As such, there is a possibility that the ultimate resolution of those legal actions may be material to the Bank’s consolidated results of operations for any particular reporting period.
The Bank, through its Peruvian subsidiary, is engaged in a legal action related to certain value-added tax assessed amounts and associated interest totaling $176 million, which arose from certain client transactions that occurred prior to the Bank’s acquisition of the subsidiary. The legal action in Peru relating to the original assessed amount was concluded in favour of the Government of Peru in May 2024. Accordingly, the Bank paid $34 million representing the principal and associated reasonable interest, which was recorded in
non-interest
expenses – other. In November 2021, the Peruvian Constitutional Court dismissed the matter relating to the accrued default interest for procedural reasons. With respect to this default interest component, and in relation to the Constitutional Court of Peru’s treatment of Scotiabank Peru, in October 2022, the Bank filed a request for arbitration against the Republic of Peru before the International Centre for the Settlement of Investment Disputes (ICSID), pursuant to the provisions of the Canada-Peru Free Trade Agreement. This case is currently proceeding through the arbitration process. In Q3 2024, the Bank recorded a legal provision of $142 million in other liabilities – provisions, representing the amount at issue in the arbitration. The Bank intends to continue to vigorously advance its position.
|
Common shares, preferred shares and other equity instruments |
Authorized:
An unlimited number of common shares without nominal or par value.
Issued and fully paid:
|
|
|
|
|
|
|
|
|
|
|
|
|
|
|
|
|
| |
|
|
|
|
2024 |
|
| As at October 31 ($ millions) |
|
Number of shares |
|
|
Amount |
|
|
Number of shares |
|
|
Amount |
|
Outstanding at beginning of year |
|
|
|
|
|
|
|
|
|
|
1,214,044,420 |
|
|
$ |
20,109 |
|
Issued in relation to share-based payments, net (Note 25) |
|
|
|
|
|
|
|
|
|
|
497,930 |
|
|
|
37 |
|
Issued in relation to the Shareholder Dividend and Share Purchase Plan (1)
|
|
|
|
|
|
|
|
|
|
|
29,893,336 |
|
|
|
1,908 |
|
Repurchased for cancellation under the Normal Course Issuer Bid |
|
|
|
|
|
|
|
|
|
|
– |
|
|
|
– |
|
Outstanding at end of year |
|
|
|
|
|
|
|
|
|
|
1,244,435,686 |
(2) |
|
$ |
22,054 |
|
| (1) |
Effective November 1, 2024, and until such time as the Bank elects otherwise, the Bank has suspended the discount to the Average Market Price (as defined in the Plan) for dividend reinvestments and stock dividends under the Plan and has discontinued issuances of common shares from treasury under the Plan. Additionally, effective November 1, 2024, and until such time as the Bank elects otherwise, purchases of common shares under the Plan will be made in the secondary market in accordance with the provisions of the Plan. |
| (2) |
In the normal course of business, the Bank’s regulated Dealer subsidiary purchases and sells the Bank’s common shares to facilitate trading/institutional client activity. During fiscal 2025, the number of such shares bought was 30,855,084 and sold was 30,855,333 (2024 – 26,564,849 bought and 26,566,901 sold). |
The dividends paid on common shares in fiscal 2025 and 2024 were $5,369 million ($4.32 per share) and $5,198 million ($4.24 per share), respectively. The Board of Directors approved a quarterly dividend of $1.10 per common share at its meeting on December 1, 2025. This quarterly dividend applies to shareholders of record at the close of business on January 6, 2026, and is payable January 28, 2026. Refer to Note 23(c) – Restriction on payment of dividends and retirement of shares.
On May 28, 2025, the Bank announced that OSFI and the Toronto Stock Exchange approved a normal course issuer bid (the “2025 NCIB”)
pursuant to which it may repurchase for cancellation up to 20 million of the Bank’s common shares. Purchases under the 2025 NCIB commenced on May 30, 2025, and will terminate upon the earlier of: (i) the Bank purchasing the maximum number of common shares under the 2025 NCIB, (ii) the Bank providing a notice of termination, or (iii) May 29, 2026.
During the year ended October 31, 2025, the
B
ank repurchased and cancelled approximately 10.8 million common shares at an average price of $82.57 per share for a total amount of $913 million, including
t
ax.
Non-viability
Contingent Capital
The maximum number of common shares issuable on conversion of NVCC subordinated debentures, NVCC subordinated additional tier 1 capital notes, including those issued to Scotiabank LRCN Trust as recourse assets in respect of NVCC limited recourse capital notes, and NVCC preferred shares as at October 31, 2025 would be 4,863 million common shares (2024 – 4,582 million common shares) based on the floor price and excluding the impact of any accrued and unpaid interest and any declared but unpaid dividends (refer to Note 20 – Subordinated debentures and Note 23(b) – Preferred shares and other equity instruments for further details).
(b) |
Preferred shares and other equity instruments |
Authorized:
An unlimited number of preferred shares without nominal or par value. There are currently no preferred shares outstanding.
|
2025 Scotiabank Annual Report
Consolidated Financial Statements
Other equity instruments are comprised of NVCC additional Tier 1 qualifying regulatory capital notes:
|
|
|
|
|
|
|
|
|
|
|
|
|
|
|
|
|
|
|
|
|
|
|
|
|
|
|
|
|
|
|
|
|
|
|
|
|
|
|
|
|
| |
|
|
|
|
|
|
|
|
|
|
|
|
|
|
|
|
|
|
|
|
|
|
2024 |
|
|
First issue date/
Series number
|
|
Notional
Amount
(millions) |
|
|
Next reset
date |
|
|
|
|
|
Interest
rate after
reset |
|
|
Next
redemption
date |
|
|
Redemption frequency after reset (1)
|
|
|
|
|
|
Distributions paid per Note (2)
|
|
|
|
|
|
Distributions paid per Note (2)
|
|
Subordinated Additional Tier 1 Capital Notes (3)(4)
|
|
|
|
|
|
|
|
|
|
|
|
|
|
|
|
|
|
|
|
|
|
|
|
|
|
|
|
|
|
| October 12, 2017 (5)
|
|
U.S.$ |
1,250 |
|
|
|
January 12, |
|
|
|
6.821 |
% |
|
|
SOFR +2.90961 |
(5) % |
|
|
January 12, |
|
|
|
Quarterly |
|
|
|
|
|
|
|
|
|
|
$ |
1,560 |
|
|
U.S.$ |
83.86 |
|
| June 4, 2020 (6)
|
|
|
– |
|
|
|
|
|
|
|
4.900 |
% |
|
|
|
|
|
|
|
|
|
|
|
|
|
|
|
|
|
|
|
|
|
$ |
1,689 |
|
|
U.S.$ |
49.00 |
|
|
|
|
|
|
|
|
|
Limited Recourse Capital Notes (3)(7)
|
|
|
|
|
|
|
|
|
|
|
|
|
|
|
|
|
|
|
|
|
|
|
|
|
|
|
|
|
|
| Series 1 (8)
|
|
$ |
1,250 |
|
|
|
July 27, 2026 |
|
|
|
3.700 |
% |
|
|
GOC +2.761 |
(9) % |
|
|
June 27, 2026 |
|
|
|
Every five years |
|
|
|
|
|
|
|
|
|
|
$ |
1,250 |
|
|
$ |
37.00 |
|
| Series 2 (10)
|
|
U.S.$ |
600 |
|
|
|
October 27, 2026 |
|
|
|
3.625 |
% |
|
|
UST +2.613 |
(11) % |
|
|
October 27, 2026 |
|
|
|
Quarterly |
|
|
|
|
|
|
|
|
|
|
$ |
753 |
|
|
U.S.$ |
36.25 |
|
| Series 3 (12)
|
|
$ |
1,500 |
|
|
|
July 27, 2027 |
|
|
|
7.023 |
% |
|
|
GOC +3.950 |
(9) % |
|
|
June 27, 2027 |
|
|
|
Every five years |
|
|
|
|
|
|
|
|
|
|
$ |
1,500 |
|
|
$ |
70.23 |
|
| Series 4 (13)
|
|
U.S.$ |
750 |
|
|
|
October 27, 2027 |
|
|
|
8.625 |
% |
|
|
UST +4.389 |
(11) % |
|
|
October 27, 2027 |
|
|
|
Quarterly |
|
|
|
|
|
|
|
|
|
|
$ |
1,023 |
|
|
U.S.$ |
86.25 |
|
| Series 5 (14)
|
|
U.S.$ |
750 |
|
|
|
January 27,
2029 |
|
|
|
8.000 |
% |
|
|
UST +4.017 |
(11) % |
|
|
January 27,
2029 |
|
|
|
Quarterly |
|
|
|
|
|
|
|
|
|
|
$ |
1,004 |
|
|
U.S.$ |
63.33 |
|
| Series 6 (15)
|
|
U.S.$ |
1,000 |
|
|
|
April 27, 2030 |
|
|
|
7.350 |
% |
|
|
UST +2.903 |
(11) % |
|
|
April 27, 2030 |
|
|
|
Quarterly |
|
|
|
|
|
|
|
|
|
|
$ |
– |
|
|
$ |
– |
|
| Series 7 (16)
|
|
U.S.$ |
1,000 |
|
|
|
October 27,
2035 |
|
|
|
6.875 |
% |
|
|
UST +2.734 |
(11) % |
|
|
October 27,
2035 |
|
|
|
Quarterly |
|
|
|
|
|
|
|
|
|
|
$ |
– |
|
|
$ |
– |
|
Total other equity instruments |
|
|
|
|
|
|
|
|
|
|
|
|
|
|
|
|
|
|
|
|
|
|
$ |
8,779 |
|
|
|
|
|
| (1) |
Each security is redeemable at the sole discretion of the Bank on the first reset date and every quarter or five years, as applicable, thereafter. Limited Recourse Capital Notes (LRCN) Series 1 and Series 3 are also redeemable in the one month period preceding each reset date. The securities are also redeemable following a regulatory or tax event, as described in the offering documents. All redemptions are subject to regulatory consent and occur at a redemption price of par plus accrued and unpaid interest (unless canceled, where applicable). |
| (2) |
Distributions paid from November 1 to October 31 in the relevant fiscal year per face amount of $1,000 or U.S.$1,000, as applicable. |
| (3) |
The securities rank pari passu to each other and are the Bank’s direct unsecured obligations, ranking subordinate to Bank’s other subordinated indebtedness. |
| (4) |
While interest is payable on the securities when it becomes due, the Bank may, at its sole discretion and with notice, cancel interest payments. Refer to Note 23(c) – Restriction on payment of dividends and retirement of shares. |
| (6) |
On June 4, 2025, the Bank redeemed US $1,250 million 4.900% Fixed Rate Resetting Perpetual Subordinated Additional Tier 1 Capital Notes at 100% of their principal amount plus accrued and unpaid interest. The redemption of these AT1 Notes resulted in a foreign currency loss of $22 million recorded in Retained Earnings. |
| (7) |
Interest on LRCN is non-deferrable, however, non-payment of interest that is not cured within five business days results in a Recourse Event. A Recourse Event of the respective Series occurs if (a) there is non-payment in cash by the Bank of the principal amount, together with any accrued and unpaid interest, on the maturity date, (b) there is non-payment in cash of interest which is not cured within 5 business days, (c) there is non-payment in cash of the redemption price in connection with the redemption of the LRCNs, (d) an event of default occurs (i.e. bankruptcy, insolvency, or liquidation of the Bank), or (e) there is an NVCC Trigger Event. Upon the occurrence of a Recourse Event, the noteholder’s sole recourse will be limited to their proportionate share of the Series’ respective assets held in Scotiabank LRCN Trust, a consolidated entity, which consist initially of the respective AT1 Notes or, following an NVCC Trigger Event, common shares. Refer to Note 23(c) – Restriction on payment of dividends and retirement of shares. |
| (8) |
On June 15, 2021, the Bank issued $1,250 million 3.70% Fixed Rate Resetting Limited Recourse Capital Notes Series 1 (NVCC) (“LRCN Series 1”). In connection with the issuance of LRCN Series 1, the Bank issued $1,250 million of Fixed Rate Resetting Perpetual Subordinated Additional Tier 1 Capital Notes (NVCC) (“the Series 1 AT1 Notes”) to Scotiabank LRCN Trust to be held as trust assets in connection with the LRCN structure. |
| (9) |
The then-prevailing five-year Government of Canada yield. |
| (10) |
On October 7, 2021, the Bank issued U.S.$600 million 3.625% Fixed Rate Resetting Limited Recourse Capital Notes Series 2 (NVCC) (“LRCN Series 2”). In connection with the issuance of LRCN Series 2, the Bank issued U.S.$600 million of Fixed Rate Resetting Perpetual Subordinated Additional Tier 1 Capital Notes (NVCC) (“the Series 2 AT1 Notes”) to Scotiabank LRCN Trust to be held as trust assets in connection with the LRCN structure. |
(11) |
The then-prevailing five-year U.S. Treasury Rate. |
| (12) |
On June 16, 2022, the Bank issued $1,500 million 7.023% Fixed Rate Resetting Limited Recourse Capital Notes Series 3 (NVCC) (“LRCN Series 3”). In connection with the issuance of LRCN Series 3, the Bank issued $1,500 million of Fixed Rate Resetting Perpetual Subordinated Additional Tier 1 Capital Notes (NVCC) (“the Series 3 AT1 Notes”) to Scotiabank LRCN Trust to be held as trust assets in connection with the LRCN structure. |
| (13) |
On October 25, 2022, the Bank issued U.S.$750 million 8.625% Fixed Rate Resetting Limited Recourse Capital Notes Series 4 (NVCC) (“LRCN Series 4”). In connection with the issuance of LRCN Series 4, the Bank issued U.S.$750 million of Fixed Rate Resetting Perpetual Subordinated Additional Tier 1 Capital Notes (NVCC) (“the Series 4 AT1 Notes”) to Scotiabank LRCN Trust to be held as trust assets in connection with the LRCN structure. |
| (14) |
On January 12, 2024, the Bank issued U.S.$750 million 8.000% Fixed Rate Resetting Limited Recourse Capital Notes Series 5 (NVCC) (“LRCN Series 5”). In connection with the issuance of LRCN Series 5, the Bank issued U.S.$750 million of Fixed Rate Resetting Perpetual Subordinated Additional Tier 1 Capital Notes (NVCC) (“the Series 5 AT1 Notes”) to Scotiabank LRCN Trust to be held as trust assets in connection with the LRCN structure. |
| (15) |
On January 31, 2025, the Bank issued USD$1,000 million of 7.350% Fixed Rate Resetting Limited Recourse Capital Notes Series 6 (NVCC) (“LRCN Series 6”). In connection with the issuance of LRCN Series 6, the Bank issued U.S.$1,000 million of Fixed Rate Resetting Perpetual Subordinated Additional Tier 1 Capital Notes (NVCC) (“the Series 6 AT1 Notes”) to Scotiabank LRCN Trust to be held as trust assets in connection with the LRCN structure. |
| (16) |
On September 29, 2025, the Bank issued USD$1,000 million of 6.875% Fixed Rate Resetting Limited Recourse Capital Notes Series 7 (NVCC) (“LRCN Series 7”). In connection with the issuance of LRCN Series 7, the Bank issued U.S.$1,000 million of Fixed Rate Resetting Perpetual Subordinated Additional Tier 1 Capital Notes (NVCC) (“the Series 7 AT1 Notes”) to Scotiabank LRCN Trust to be held as trust assets in connection with the LRCN structure. |
Contractual NVCC provisions contained in the Bank’s Subordinated Additional Tier 1 Capital Notes, including those issued to Scotiabank LRCN Trust as recourse assets in respect of the LRCNs, trigger conversion of these securities into a variable number of common shares if OSFI announces that the Bank has ceased, or is about to cease, to be viable, or if a federal or provincial government in Canada publicly announces that the Bank has accepted or agreed to accept a capital injection, or equivalent support, from the federal government or any provincial government or political subdivision or agent thereof without which the Bank would have been determined by OSFI to be
non-viable.
If such a conversion were to occur, outstanding Subordinated Additional Tier 1 Capital Notes (NVCC), would be converted into common shares pursuant to an automatic conversion formula defined as 125% of the par value plus accrued and unpaid interest divided by the conversion price. The conversion price is based on the greater of: (i) $5.00 (subject to adjustments in certain events and converted to U.S. dollar-equivalent, where applicable, each as set out in their respective prospectus supplements), and (ii) the current market price of the Bank’s common shares at the time of the trigger event
(10-day
weighted average and converted to U.S. dollar-equivalent, where applicable). U.S. dollar equivalents of the floor price and the current market price, where applicable, are based on the CAD/USD exchange rate on the day prior to the trigger event.
The notes above have been determined to be compound instruments that have both equity and liability features. At inception, the fair value of the liability component is initially measured with any residual amount assigned to the equity component. On the respective dates of issuance, the Bank has assigned an insignificant value to each liability component of the notes and, as a result, the proceeds received upon issuance of the notes have been presented as equity.
2025 Scotiabank Annual Report
|
Consolidated Financial Statements
The Bank will continue to monitor events that could impact the value of the liability component.
During the year ended October 31, 2025, the Bank paid aggregate distributions on these notes of $506 million (2024 – $469 million), net of income taxes of $120 million (2024 – $93 million), based on exchange rates in effect on the payment dates, where applicable.
(c) |
Restrictions on payment of dividends and retirement of shares |
Under the Bank Act, the Bank is prohibited from declaring or paying any dividends on its common or preferred shares or redeeming, purchasing or otherwise retiring such shares when the Bank is, or would be placed by such a declaration or retirement, in contravention of the capital adequacy, liquidity or any other regulatory directives issued under the Bank Act.
In the event that applicable cash distributions on any of the Scotiabank Trust Securities are not paid on a regular distribution date, the Bank has undertaken not to pay dividends of any kind on its preferred or common shares until such distributions are made in full or the twelfth month following the
non-payment
of such distributions. Similarly, should the Bank fail to declare regular dividends on any of its directly issued and outstanding preferred or common shares, cash distributions will also not be made on any of the Scotiabank Trust Securities.
In the event that distributions are not paid in full on the Bank’s Subordinated Additional Tier 1 Capital Notes (NVCC), including those issued as recourse assets in respect of LRCNs to Scotiabank LRCN Trust where the trustee has not waived such distributions or no longer holds the respective AT1 Notes, the Bank has undertaken not to declare dividends on its common or preferred shares or redeem, purchase or otherwise retire such shares until the month commencing after such distributions have been made in full.
In the event that dividends to which preferred shareholders are then entitled have not been paid or sufficient funds have not been set aside to do so, the Bank has undertaken not to declare dividends on its common shares or redeem, purchase or otherwise retire its common shares.
Currently, the above limitations do not restrict the payment of dividends on or retirement of preferred or common shares.
The primary regulator over the Bank’s consolidated capital adequacy is the Office of the Superintendent of Financial Institutions, Canada (OSFI). The capital adequacy regulations in Canada are largely consistent with international standards set by the Basel Committee on Banking Supervision (BCBS). OSFI requires Canadian deposit-taking institutions to fully implement the Basel III reforms and achieve minimums of 7%, 8.5% and 10.5% for CET1, Tier 1 and Total Capital, respectively. OSFI has also designated the Bank as a domestic systemically important bank
(D-SIB),
increasing its minimum capital ratio requirements by 1% across all tiers of capital, in line with the requirements for global systemically important banks.
In addition, OSFI expects
D-SIBs
to hold a Domestic Stability Buffer (DSB). In December 2022
,
OSFI announced that the DSB will increase to 3.0% of total risk-weighted assets (RWA), effective February 1, 2023, and has increased the DSB’s range from 0% to 4.0%. In June 2023, OSFI announced that the DSB will increase to 3.5% of total RWA, effective November 1, 2023. In addition, in June 2025, OSFI maintained the DSB at 3.5% of RWA. OSFI’s minimum regulatory capital ratio requirements, including the
D-SIB
1.0% surcharge and its DSB are: 11.5%, 13.0% and 15.0% for Common Equity Tier 1 (CET1), Tier 1 and Total capital ratios, respectively. In addition, the Bank is presently subject to a BCBS countercyclical buffer requirement of approximately eight basis points.
In addition to risk-based capital requirements, the Basel III reforms introduced a simpler, non risk-based Leverage ratio requirement to act as a supplementary measure to its risk-based capital requirements. Institutions are expected to maintain an operating buffer above the 3.5% minimum, including the
D-SIB
surcharge of 0.5%, effective Q2 2023.
The Bank’s regulatory capital ratios were as follows:
|
|
|
|
|
|
|
|
|
| As at October 31 ($ millions) |
|
|
|
|
2024 |
|
| |
|
|
|
|
|
|
|
|
| Common Equity Tier 1 capital |
|
|
|
|
|
$ |
60,631 |
|
| Net Tier 1 capital |
|
|
|
|
|
|
69,499 |
|
| Total regulatory capital |
|
|
|
|
|
|
77,708 |
|
Total loss absorbing capacity (TLAC) (2)
|
|
|
|
|
|
|
137,752 |
|
| Risk-weighted assets/exposures used in calculation of capital ratios |
|
|
|
|
|
|
|
|
| |
|
|
|
|
|
$ |
463,992 |
|
| |
|
|
|
|
|
|
1,563,140 |
|
| |
|
|
|
|
|
|
|
|
| Common Equity Tier 1 capital ratio |
|
|
|
|
|
|
13.1 |
% |
| Tier 1 capital ratio |
|
|
|
|
|
|
15.0 |
% |
| Total capital ratio |
|
|
|
|
|
|
16.7 |
% |
Total loss absorbing capacity ratio (2)
|
|
|
|
|
|
|
29.7 |
% |
| |
|
|
|
|
|
|
4.4 |
% |
Total loss absorbing capacity leverage ratio (2)
|
|
|
|
|
|
|
8.8 |
% |
| (1) |
The regulatory capital ratios are based on Basel III requirements as determined in accordance with OSFI Guideline – Capital Adequacy Requirements (November 2023). |
| (2) |
This measure has been disclosed in this document in accordance with OSFI Guideline – Total Loss Absorbing Capacity (September 2018). |
| (3) |
The leverage ratios are based on Basel III requirements as determined in accordance with OSFI Guideline – Leverage Requirements (February 2023). |
The Bank exceeded the OSFI regulatory minimum capital ratios as at October 31, 2025.
The Bank grants stock options as part of the Employee Stock Option Plan as well as stand-alone stock appreciation rights (SARs). Options to purchase common shares and/or to receive an equivalent cash payment, as applicable, may be granted to select employees at an exercise price of the higher of the closing price of the Bank’s common shares on the TSX on the trading day prior to the grant date or the volume weighted average trading price for the five trading days immediately preceding the grant date.
|
2025 Scotiabank Annual Report
Consolidated Financial Statements
Stock options granted vest 50% at the end of the third year and 50% at the end of the fourth year. Stock options are exercisable no later than 10 years after the grant date. In the event that the expiry date falls within an insider trading blackout period, the expiry date will be extended for 10 business days after the end of the blackout period. There is a total of 141 million common shares which have been reserved for issuance under the Bank’s Employee Stock Option Plan of which 120 million common shares have been issued as a result of the exercise of options and 11 million common shares are committed under outstanding options, leaving 11 million common shares available for issuance as options. Outstanding options expire on dates ranging from December 3, 2025 to December 12, 2034.
The cost of these options is recognized on a graded vesting basis except where the employee is eligible to retire prior to a tranche’s vesting date, in which case the cost is recognized between the grant date and the date the employee is eligible to retire.
The Stock Option Plan includes:
Employee stock options granted are equity-classified stock options which call for settlement in shares.
The amount recorded in equity – other reserves for vested stock options as at October 31, 2025 was $124 million (2024 – $124 million).
In 2025, an expense of $15 million (2024 – $13 million) was recorded in salaries and employee benefits in the Consolidated Statement of Income. As at October 31, 2025, future unrecognized compensation cost for
non-vested
stock options was $8 million (2024 – $10 million) which is to be recognized over a weighted-average period of 1.84 years (2024 – 2.03 years).
• |
Stock appreciation rights |
Stand-alone SARs are granted instead of stock options to select employees in countries where local laws may restrict the Bank from issuing shares. When a SAR is exercised, the Bank pays the appreciation amount in cash equal to the rise in the market price of the Bank’s common shares since the grant date.
During fiscal 2025, 119,316 SARs were granted (2024 – 81,414) and as at October 31, 2025, 485,684 SARs were outstanding (2024 – 570,156), of which 481,880 SARs were vested (2024 – 566,349).
The impact to the Bank’s consolidated financial statements of vested and outstanding SARs was not material.
Determination of fair values
The share-based payment expense for stock options was quantified using the Black-Scholes option pricing model on the date of grant. The fiscal 2025 and 2024 stock option grants were fair valued using the following weighted-average assumptions and resulting fair value per award:
|
|
|
|
|
|
|
|
|
| |
|
|
|
|
2024 Grant |
|
| Assumptions |
|
|
|
|
|
|
|
|
| Risk-free interest rate % |
|
|
|
|
|
|
3.26% |
|
| Expected dividend yield |
|
|
|
|
|
|
4.47% |
|
| Expected price volatility |
|
|
|
|
|
|
19.76% |
|
| Expected life of option |
|
|
|
|
|
|
6.90 Years |
|
| Fair value |
|
|
|
|
|
|
|
|
| Weighted-average fair value |
|
|
|
|
|
$ |
7.68 |
|
The risk-free rate is based on Canadian treasury bond rates interpolated for the maturity equal to the expected life until exercise of the options. Expected dividend yield is based on historical dividend payout. Expected price volatility is determined based on the historical volatility for compensation. For accounting purposes, an average of the market consensus implied volatility for traded options on our common shares and the historical volatility is used.
Details of the Bank’s Employee Stock Option Plan are as follows
(1)
:
|
|
|
|
|
|
|
|
|
|
|
|
|
|
|
|
|
| |
|
|
|
|
2024 |
|
| As at October 31 |
|
Number of stock
options (000’s) |
|
|
Weighted average
exercise price |
|
|
Number of stock
options (000’s) |
|
|
Weighted average
exercise price |
|
| Outstanding at beginning of year |
|
|
|
|
|
|
|
|
|
|
11,558 |
|
|
$ |
72.74 |
|
| Granted |
|
|
|
|
|
|
|
|
|
|
2,676 |
|
|
|
59.99 |
|
| Exercised as options |
|
|
|
|
|
|
|
|
|
|
(498 |
) |
|
|
66.04 |
|
| Forfeited |
|
|
|
|
|
|
|
|
|
|
(600 |
) |
|
|
70.34 |
|
| Expired |
|
|
|
|
|
|
|
|
|
|
(1,680 |
) |
|
|
68.84 |
|
| Outstanding at end of year |
|
|
|
|
|
|
|
|
|
|
11,456 |
|
|
$ |
70.75 |
|
| Exercisable at end of year |
|
|
|
|
|
|
|
|
|
|
4,737 |
|
|
$ |
73.10 |
|
| Available for grant |
|
|
|
|
|
|
|
|
|
|
11,902 |
|
|
|
|
|
|
|
|
|
|
|
|
|
|
|
|
|
|
|
|
|
|
|
|
|
|
| |
|
Options Outstanding |
|
|
|
|
|
Options Exercisable |
|
| As at October 31, 2025 |
|
|
|
|
|
|
|
|
|
|
|
|
|
|
|
| Range of exercise prices |
|
|
|
|
|
|
|
|
|
|
|
|
|
|
|
|
|
|
|
|
| $55.63 to $68.32 |
|
|
|
|
|
|
|
|
|
|
|
|
|
|
|
|
|
|
|
|
| $68.33 to $74.34 |
|
|
|
|
|
|
|
|
|
|
|
|
|
|
|
|
|
|
|
|
| $74.35 to $85.46 |
|
|
|
|
|
|
|
|
|
|
|
|
|
|
|
|
|
|
|
|
|
|
|
|
|
|
|
|
|
|
|
|
|
|
|
|
|
|
|
|
|
2025 Scotiabank Annual Report
|
Consolidated Financial Statements
(b) |
Employee share ownership plans |
Eligible employees can contribute up to a specified percentage of salary towards the purchase of common shares of the Bank. In general, the Bank matches
50-60%
of eligible contributions, depending on the region, up to a maximum dollar amount, which is expensed in salaries and employee benefits. During 2025, the Bank’s contributions totalled $94 million (2024 – $94 million). Contributions, which are used to purchase common shares in the open market, do not result in a subsequent expense to the Bank from share price appreciation.
As at October 31, 2025, an aggregate of 21 million common shares were held under the employee share ownership plans (2024 – 21 million). The shares in the employee share ownership plans are considered outstanding for computing the Bank’s basic and diluted earnings per share.
(c) |
Other share-based payment plans |
Other share-based payment plans use notional units that are valued based on the Bank’s common share price on the TSX. Most grants of units accumulate dividend equivalents in the form of additional units based on the dividends paid on the Bank’s common shares. These plans are settled in cash and, as a result, are liability-classified. Fluctuations in the Bank’s share price change the value of the units, which affects the Bank’s share-based payment expense. As described below, the value of the Performance Share Units also varies based on Bank performance. Upon exercise or redemption, payments are made to the employees with a corresponding reduction in the accrued liability.
In 2025, an aggregate expense of $394 million (2024 – $357 million) was recorded in salaries and employee benefits in the Consolidated Statement of Income for these plans. This expense includes gains from derivatives used to manage the volatility of share-based payments of $345 million (2024 – $196 million
gains
).
As at October 31, 2025, the share-based payment liability recognized for vested awards under these plans was $1,446 million (2024 – $1,010 million).
Details of these other share-based payment plans are as follows:
Deferred Stock Unit Plan (DSU)
Under the DSU Plan, senior executives may elect to receive all or a portion of their cash bonus under the Annual Incentive Plan (which is expensed for the year awarded in salaries and employee benefits in the Consolidated Statement of Income) in the form of deferred stock units which vest immediately. In addition the DSU plan allows for eligible executives of the Bank to participate in grants that are not allocated from the Annual Incentive Plan election. These grants are subject to specific vesting schedules. Units are redeemable in cash only when an executive ceases to be a Bank employee, and must be redeemed by December 31 of the year following that event. As at October 31, 2025, there were 3,040,333 units (2024 – 2,732,877) awarded and outstanding of which 2,179,058 units were vested (2024 – 1,893,903).
Directors’ Deferred Stock Unit Plan (DDSU)
Under the DDSU Plan,
non-officer
directors of the Bank may elect to receive all or a portion of their fee for that fiscal year (which is expensed by the Bank in other expenses in the Consolidated Statement of Income) in the form of deferred stock units which vest immediately. Units are redeemable in cash, only following resignation or retirement, and must be redeemed by December 31 of the year following that event. As at October 31, 2025, there were 436,880 units outstanding (2024 – 420,889).
Restricted Share Unit Plan (RSU)
Under the RSU Plan, select employees receive an award of restricted share units which, for the majority of grants, vest at the end of three years. There are certain grants that provide for a graduated vesting schedule. Upon vesting, all RSU units are paid in cash to the employee. The share-based payment expense is recognized evenly over the vesting period except where the employee is eligible to retire prior to the vesting date in which case, the expense is recognized between the grant date and the date the employee is eligible to retire. As at October 31, 2025, there were 9,438,970 units (2024 – 8,478,453) awarded and outstanding of which 6,888,296 units were vested (2024 – 5,665,778).
Performance Share Unit Plan (PSU)
Eligible executives receive an award of performance share units which, for the majority of grants, vest at the end of three years. Certain grants provide for a graduated vesting schedule which includes a specific performance factor calculation. PSU awards are subject to performance criteria measured over a three-year period whereby a multiplier factor is applied which impacts the incremental number of units due to employees. The three-year performance measures include return on equity compared to target and total shareholder return relative to a comparator group selected prior to the granting of the award. The Bank uses a probability-weighted-average of potential outcomes to estimate the multiplier impact. The share-based payment expense is recognized over the vesting period except where the employee is eligible to retire prior to the vesting date; in which case, the expense is recognized between the grant date and the date the employee is eligible to retire. This expense varies based on changes in the Bank’s share price and the Bank’s performance compared to the performance measures. Upon vesting, the units are paid in cash to the employee. As at October 31, 2025, there were 7,026,302 units (2024 – 6,766,501) outstanding subject to performance criteria, of which 6,010,837 units were vested (2024 – 4,843,892).
|
2025 Scotiabank Annual Report
Consolidated Financial Statements
Corporate income taxes recorded in the Bank’s consolidated financial statements for the years ended October 31 are as follows:
(a) |
Components of income tax provision |
|
|
|
|
|
|
|
|
|
| For the year ended October 31 ($ millions) |
|
|
|
|
2024 |
|
Provision for income taxes in the Consolidated Statement of Income: |
|
|
|
|
|
|
|
|
|
|
|
|
|
|
|
|
|
|
|
|
Domestic: |
|
|
|
|
|
|
|
|
Federal |
|
|
|
|
|
$ |
138 |
|
Provincial |
|
|
|
|
|
|
275 |
|
Adjustments related to prior periods |
|
|
|
|
|
|
(40 |
) |
Foreign |
|
|
|
|
|
|
1,219 |
|
Adjustments related to prior periods |
|
|
|
|
|
|
2 |
|
|
|
|
|
|
|
|
1,594 |
|
|
|
|
|
|
|
|
|
|
Domestic: |
|
|
|
|
|
|
|
|
Federal |
|
|
|
|
|
|
388 |
|
Provincial |
|
|
|
|
|
|
181 |
|
Foreign |
|
|
|
|
|
|
(131 |
) |
|
|
|
|
|
|
|
438 |
|
Total provision for income taxes in the Consolidated Statement of Income |
|
|
|
|
|
$ |
2,032 |
|
Provision for income taxes in the Consolidated Statement of Changes in Equity: |
|
|
|
|
|
|
|
|
Current income taxes |
|
|
|
|
|
$ |
1,019 |
|
Deferred income taxes |
|
|
|
|
|
|
41 |
|
|
|
|
|
|
|
|
1,060 |
|
Reported in: |
|
|
|
|
|
|
|
|
Other Comprehensive Income |
|
|
|
|
|
|
1,156 |
|
Retained earnings |
|
|
|
|
|
|
(96 |
) |
Other reserves |
|
|
|
|
|
|
– |
|
Total provision for income taxes in the Consolidated Statement of Changes in Equity |
|
|
|
|
|
|
1,060 |
|
Total provision for income taxes |
|
|
|
|
|
$ |
3,092 |
|
Provision for income taxes in the Consolidated Statement of Income includes: |
|
|
|
|
|
|
|
|
Deferred tax expense (benefit) relating to origination/reversal of temporary differences |
|
|
|
|
|
$ |
438 |
|
Deferred tax expense (benefit) of tax rate changes |
|
|
|
|
|
|
– |
|
|
|
|
|
|
|
$ |
438 |
|
(b) |
Reconciliation to statutory rate |
Income taxes in the Consolidated Statement of Income vary from the amounts that would be computed by applying the composite federal and provincial statutory income tax rate for the following reasons:
|
|
|
|
|
|
|
|
|
|
|
|
|
|
|
|
|
| |
|
|
|
|
2024 |
|
| For the year ended October 31 ($ millions) |
|
Amount |
|
|
Percent of pre-tax
income |
|
|
Amount |
|
|
Percent of pre-tax
income |
|
Income taxes at Canadian statutory rate |
|
|
|
|
|
|
|
|
|
$ |
2,755 |
|
|
|
27.8 |
% |
Increase (decrease) in income taxes resulting from: |
|
|
|
|
|
|
|
|
|
|
|
|
|
|
|
|
Lower average tax rate applicable to subsidiaries and foreign branches (1)
|
|
|
|
|
|
|
|
|
|
|
(746 |
) |
|
|
(7.5 |
) |
Tax-exempt income from securities |
|
|
|
|
|
|
|
|
|
|
(28 |
) |
|
|
(0.3 |
) |
Other, net |
|
|
|
|
|
|
|
|
|
|
51 |
|
|
|
0.5 |
|
Total income taxes and effective tax rate |
|
|
|
|
|
|
|
|
|
$ |
2,032 |
|
|
|
20.5 |
% |
| (1) |
Lower average tax rate applicable to subsidiaries and foreign branches includes the impact of the GMT which increased the effective tax rate by 0.8%. |
2025 Scotiabank Annual Report
|
Consolidated Financial Statements
Significant components of the Bank’s deferred tax assets and liabilities are as follows:
|
|
|
|
|
|
|
|
|
|
|
|
|
|
|
|
|
| |
|
Statement of Income |
|
|
Statement of Financial Position |
|
| |
|
For the year ended |
|
|
As at |
|
| October 31 ($ millions) |
|
|
|
|
2024 |
|
|
|
|
|
2024 |
|
Deferred tax assets: |
|
|
|
|
|
|
|
|
|
|
|
|
|
|
|
|
Loss carryforwards |
|
|
|
|
|
$ |
29 |
|
|
|
|
|
|
$ |
930 |
|
Allowance for credit losses |
|
|
|
|
|
|
54 |
|
|
|
|
|
|
|
1,076 |
|
Deferred compensation |
|
|
|
|
|
|
(100 |
) |
|
|
|
|
|
|
317 |
|
Deferred income |
|
|
|
|
|
|
(137 |
) |
|
|
|
|
|
|
255 |
|
Property and equipment |
|
|
|
|
|
|
(10 |
) |
|
|
|
|
|
|
262 |
|
Pension and other post-retirement benefits |
|
|
|
|
|
|
(48 |
) |
|
|
|
|
|
|
387 |
|
Securities |
|
|
|
|
|
|
(17 |
) |
|
|
|
|
|
|
260 |
|
Lease liabilities |
|
|
|
|
|
|
28 |
|
|
|
|
|
|
|
891 |
|
Own credit risk |
|
|
|
|
|
|
– |
|
|
|
|
|
|
|
250 |
|
Other |
|
|
|
|
|
|
(57 |
) |
|
|
|
|
|
|
673 |
|
Total deferred tax assets |
|
|
|
|
|
$ |
(258 |
) |
|
|
|
|
|
$ |
5,301 |
|
Deferred tax liabilities: |
|
|
|
|
|
|
|
|
|
|
|
|
|
|
|
|
Cash flow hedges |
|
|
|
|
|
$ |
– |
|
|
|
|
|
|
$ |
57 |
|
Deferred compensation |
|
|
|
|
|
|
(24 |
) |
|
|
|
|
|
|
187 |
|
Deferred income |
|
|
|
|
|
|
(20 |
) |
|
|
|
|
|
|
50 |
|
Property and equipment |
|
|
|
|
|
|
(243 |
) |
|
|
|
|
|
|
684 |
|
Pension and other post-retirement benefits |
|
|
|
|
|
|
1 |
|
|
|
|
|
|
|
82 |
|
Securities |
|
|
|
|
|
|
(14 |
) |
|
|
|
|
|
|
354 |
|
Investment in subsidiaries and associates |
|
|
|
|
|
|
52 |
|
|
|
|
|
|
|
29 |
|
Intangible assets |
|
|
|
|
|
|
(344 |
) |
|
|
|
|
|
|
1,809 |
|
Other |
|
|
|
|
|
|
(104 |
) |
|
|
|
|
|
|
504 |
|
Total deferred tax liabilities |
|
|
|
|
|
$ |
(696 |
) |
|
|
|
|
|
$ |
3,756 |
|
Net deferred tax assets (liabilities) (1)
|
|
|
|
|
|
$ |
438 |
|
|
|
|
|
|
$ |
1,545 |
|
| (1) |
For Consolidated Statement of Financial Position presentation, deferred tax assets and liabilities are assessed by legal entity. As a result, the net deferred tax assets of $1,839 (2024 – $1,545) are represented by deferred tax assets of $3,253 (2024 – $2,942), and deferred tax liabilities of $1,414 (2024 – $1,397) on the Consolidated Statement of Financial Position. |
The major changes to net deferred taxes were as follows:
|
|
|
|
|
|
|
|
|
For the year ended October 31 ($ millions) |
|
|
|
|
|
|
Balance at beginning of year |
|
|
|
|
|
$ |
2,095 |
|
Deferred tax benefit (expense) for the year recorded in income |
|
|
|
|
|
|
(438 |
) |
Deferred tax benefit (expense) for the year recorded in equity |
|
|
|
|
|
|
(41 |
) |
Disposed in divestitures |
|
|
|
|
|
|
– |
|
Other |
|
|
|
|
|
|
(71 |
) |
Balance at end of year |
|
|
|
|
|
$
|
1,545 |
|
The tax related to temporary differences, unused tax losses and unused tax credits for which no deferred tax asset is recognized in the Consolidated Statement of Financial Position amounts to $10 million (October 31, 2024 – $18 million). The amount related to unrecognized losses is $10 million, which have no expiry.
Included in the net deferred tax asset are tax benefits of $56 million (2024 – $73 million) that have been recognized in the Canadian bank and certain Canadian and foreign subsidiaries that have incurred losses in either the current or the preceding year. In determining if it is appropriate to recognize these tax benefits, the Bank relied on projections of future taxable profits which are expected to generate sufficient taxable income to utilize the deferred tax assets.
The amount of taxable temporary differences associated with investments in subsidiaries, associates and interests in joint ventures for which deferred tax liabilities have not been recognized at October 31, 2025 is approximately $59 billion (2024 – $57 billion).
The Bank received reassessments totaling $1,808
million of tax and interest as a result of the Canada Revenue Agency (CRA) denying the tax deductibility of certain Canadian dividends received during the 2011-2020 taxation years. The dividends subject to these reassessments are similar to those prospectively addressed by tax rules introduced in 2015 and 2018. The Bank has filed Notices of Appeal with the Tax Court of Canada against the federal reassessment in respect of its 2011 and 2012 taxation years. In addition, a subsidiary of the Bank received reassessments on the same matter in respect of its 2018-2020 taxation years totaling $
4 million of tax and interest.
A subsidiary of the Bank received withholding tax assessments from the CRA in respect of certain of its securities lending transactions for its
2014-2019
taxation years totaling $637 million of tax, penalties and interest. The subsidiary has filed a Notice of Appeal with the Tax Court of Canada against the federal assessment in respect of its 2014-2019 taxation years.
|
2025 Scotiabank Annual Report
Consolidated Financial Statements
In respect of both matters, the Bank is confident that its tax filing position was appropriate and in accordance with the relevant provisions of the Income Tax Act (Canada) and intends to vigorously defend its position.
The Organisation for Economic
Co-operation
and Development published Pillar Two model rules in December 2021 as part of its efforts toward international tax reform. The rules aim to have large multinational enterprises, with consolidated revenues in excess of
€
750 million, pay a minimum effective tax of 15%. These rules apply to the Bank effective November 1, 2024, and have been enacted or substantively enacted in certain jurisdictions in which the Bank operates, including Canada, whose Global Minimum Tax (GMT) Act was enacted in June 2024.
The IASB previously issued amendments to IAS 12 Income Taxes for a temporary mandatory exception from the recognition and disclosure of deferred taxes related to the implementation of Pillar Two GMT rules, which the Bank has applied.
For the
months ended October 31, 2025, the impact of the GMT on the Bank’s effective tax rate was approximately 0.8%, and was primarily related to its operations in certain Caribbean jurisdictions and Ireland.
The Bank sponsors a number of employee benefit plans, including pensions (defined benefit and defined contribution) and other benefit plans (post-retirement benefits and other long-term employee benefits) for most of its employees globally. The information presented below relates to the Bank’s principal plans; other plans operated by certain subsidiaries of the Bank are not considered material and are not included in these disclosures.
The principal pension plans include plans in Canada, U.S., Mexico, UK, Ireland, Jamaica, Trinidad & Tobago and other countries in the Caribbean in which the Bank operates. The most significant pension plans provided by the Bank are in Canada. The Bank has a strong and well-defined governance structure to manage these global obligations. The investment policy for each principal plan is reviewed periodically and all plans are in good standing with respect to legislation and local regulations.
Actuarial valuations for funding purposes for the Bank’s funded pension plans are conducted as required by applicable legislation. The purpose of the actuarial valuation is to determine the funded status of the plans on a going-concern and statutory basis and to determine the required contributions. The plans are funded in accordance with applicable pension legislation and the Bank’s funding policies such that future benefit promises based on plan provisions are well secured. The assumptions used for the funding valuations are set by independent plan actuaries on the basis of the requirements of the local actuarial standards of practice and statutes.
Scotiabank Pension Plan (Canada)
The most significant pension plan is the Scotiabank Pension Plan (SPP), which includes a closed defined benefit (DB) component. Employees hired in Canada on or after May 1, 2018, participate in a defined contribution (DC) component only. As the administrator of the SPP, the Bank has established a well-defined governance structure and policies to maintain compliance with legislative and regulatory requirements under OSFI and the Canada Revenue Agency. The Bank appoints a number of committees to oversee and make decisions related to the administration of the SPP. Certain committees are also responsible for the investment of the assets of the SPP Fund and for monitoring the investment managers and performance.
| |
• |
|
The Human Capital and Compensation Committee (HCOB) of the Board approves the charter of the Pension Administration and Investment Committee (PAIC), reviews reports, and approves the investment policy. The HCOB also reviews and recommends any amendments to the SPP to the Board of Directors. |
| |
• |
|
PAIC is responsible for recommending the investment policy to the HCOB, for appointing and monitoring investment managers, and for reviewing auditor and actuary reports. PAIC also monitors the administration of member pension benefits. |
| |
• |
|
The Scotiabank Master Trust Committee (MTC) invests assets in accordance with the investment policy and all applicable legislation. The MTC assigns specific mandates to investment managers. |
| |
• |
|
The Capital Accumulation Plans (CAP) Committee is responsible for the administration and investment of the DC component of the SPP including the selection and monitoring of investment options available to DC participants. |
Actuarial valuations for funding purposes for the SPP are conducted on an annual basis. The most recent funding valuation was conducted as of November 1, 2024. Contributions are being made to the SPP in accordance with this valuation and are shown in the table in b) below. The assumptions used for the funding valuation are set by independent plan actuaries on the basis of the requirements of the Canadian Institute of Actuaries and applicable regulation.
The principal other benefit plans include plans in Canada, U.S., Mexico, Uruguay, UK, Jamaica, Trinidad & Tobago, Colombia and other countries in the Caribbean in which the Bank operates. The most significant other benefit plans provided by the Bank are in Canada.
The financial information reported below in respect of pension and other benefit plans is based on a number of assumptions. The most significant assumption is the discount rate used to determine the defined benefit obligation, which is set by reference to the yields on high quality corporate bonds that have durations that match the terms of the Bank’s obligations. Separate discount rates are used to determine the annual benefit expense in Canada and the U.S. These rates are determined with reference to the yields on high quality corporate bonds with durations that match the various components of the annual benefit expense. The discount rate used to determine the annual benefit expense for all other plans continues to be the same as the rate used to determine the defined benefit obligation. Other assumptions set by management are determined in reference to market conditions, plan-level experience, best practices and future expectations. The key weighted-average assumptions used by the Bank for the measurement of the benefit obligation and benefit expense for all of the Bank’s principal plans are summarized in the table in f) below.
2025 Scotiabank Annual Report
|
Consolidated Financial Statements
The Bank’s defined benefit pension plans and other benefit plans expose the Bank to a number of risks. Some of the more significant risks include interest rate risk, investment risk, longevity risk and health care cost increases, among others. These risks could result in higher defined benefit expense and a higher defined benefit obligation to the extent that:
| |
• |
|
there is a decline in discount rates; and/or |
| |
• |
|
plan assets returns are less than expected; and/or |
| |
• |
|
plan members live longer than expected; and/or |
| |
• |
|
health care costs are higher than assumed. |
In addition to the governance structure and policies in place, the Bank manages risks by regularly monitoring market developments and asset investment performance. The Bank also monitors regulatory and legislative changes along with demographic trends and revisits the investment strategy and/or plan design as warranted.
a) |
Relative size of plan obligations and assets |
|
|
|
|
|
|
|
|
|
|
|
|
|
|
|
|
|
|
|
|
|
| |
|
Pension plans |
|
|
Other benefit plans |
|
| |
|
Canada |
|
|
|
|
|
|
|
|
|
|
| For the year ended October 31, 2025 |
|
SPP |
|
|
Other |
|
|
International |
|
|
Canada |
|
|
International |
|
Percentage of total benefit obligations |
|
|
|
|
|
|
|
|
|
|
|
|
|
|
|
|
|
|
|
|
Percentage of total plan assets |
|
|
|
|
|
|
|
|
|
|
|
|
|
|
|
|
|
|
|
|
Percentage of total benefit expense (1)
|
|
|
|
|
|
|
|
|
|
|
|
|
|
|
|
|
|
|
|
|
|
|
|
|
|
|
|
|
|
|
|
|
|
|
|
|
|
|
|
|
|
| |
|
Pension plans |
|
|
Other benefit plans |
|
| |
|
Canada |
|
|
|
|
|
|
|
|
|
|
| For the year ended October 31, 2024 |
|
SPP |
|
|
Other |
|
|
International |
|
|
Canada |
|
|
International |
|
Percentage of total benefit obligations |
|
|
72 |
% |
|
|
15 |
% |
|
|
13 |
% |
|
|
50 |
% |
|
|
50 |
% |
Percentage of total plan assets |
|
|
74 |
% |
|
|
11 |
% |
|
|
15 |
% |
|
|
– |
|
|
|
100 |
% |
Percentage of total benefit expense (1)
|
|
|
73 |
% |
|
|
27 |
% |
|
|
– |
|
|
|
46 |
% |
|
|
54 |
% |
| (1) |
Excludes non-routine benefit expense items such as past service costs, curtailment charges and settlement charges. |
b) |
Cash contributions and payments |
The table below shows the cash contributions and payments made by the Bank to its principal plans in 2025, and the prior year.
| Contributions to the principal plans for the year ended October 31 ($ millions) |
|
|
|
|
2024 |
|
Defined benefit pension plans (cash contributions to fund the plans, including paying beneficiaries under the unfunded pension arrangements) |
|
|
|
|
|
|
|
|
SPP (excluding defined contribution provision) |
|
|
|
|
|
$ |
69 |
|
All other plans |
|
|
|
|
|
|
47 |
|
Other benefit plans (cash contributions mainly in the form of benefit payments to beneficiaries) |
|
|
|
|
|
|
62 |
|
Defined contribution pension and other benefit plans (cash contributions) |
|
|
|
|
|
|
184 |
|
Defined contribution pension contributions funded from pension plan surplus |
|
|
|
|
|
|
(54 |
) |
|
|
|
|
|
|
$ |
308 |
|
| (1) |
Based on preliminary estimates, the Bank expects to make contributions of $158 million to the SPP (excluding the defined contribution provision), $79 million to all other defined benefit pension plans, $66 million to other benefit plans and $217 million to all defined contribution plans for the year ending October 31, 2026. |
c) |
Funded and unfunded plans |
The excess (deficit) of the fair value of assets over the benefit obligation at the end of the year includes the following amounts for plans that are wholly unfunded and plans that are wholly or partly funded.
|
|
|
|
|
|
|
|
|
|
|
|
|
|
|
|
|
| |
|
Pension plans |
|
|
Other benefit plans |
|
| As at October 31 ($ millions) |
|
|
|
|
2024 |
|
|
|
|
|
2024 |
|
|
|
|
|
|
|
|
|
|
|
|
|
|
|
|
|
|
Benefit obligation of plans that are wholly unfunded |
|
|
|
|
|
$ |
362 |
|
|
|
|
|
|
$ |
930 |
|
Benefit obligation of plans that are wholly or partly funded |
|
|
|
|
|
|
8,529 |
|
|
|
|
|
|
|
217 |
|
|
|
|
|
|
|
|
|
|
|
|
|
|
|
|
|
|
|
|
|
|
|
Benefit obligation of plans that are wholly or partly funded |
|
|
|
|
|
$ |
8,529 |
|
|
|
|
|
|
$ |
217 |
|
Fair value of assets |
|
|
|
|
|
|
9,260 |
|
|
|
|
|
|
|
84 |
|
Excess (deficit) of fair value of assets over benefit obligation of wholly or partly funded plans |
|
|
|
|
|
$ |
731 |
|
|
|
|
|
|
$ |
(133 |
) |
Benefit obligation of plans that are wholly unfunded |
|
|
|
|
|
|
362 |
|
|
|
|
|
|
|
930 |
|
Excess (deficit) of fair value of assets over total benefit obligation |
|
|
|
|
|
$ |
369 |
|
|
|
|
|
|
$ |
(1,063 |
) |
Effect of asset limitation and minimum funding requirement |
|
|
|
|
|
|
(208 |
) |
|
|
|
|
|
|
– |
|
Net asset (liability) at end of year |
|
|
|
|
|
$ |
161 |
|
|
|
|
|
|
$ |
(1,063 |
) |
|
2025 Scotiabank Annual Report
Consolidated Financial Statements
The following tables present financial information related to the Bank’s principal plans.
|
|
|
|
|
|
|
|
|
|
|
|
|
|
|
|
|
| |
|
Pension plans |
|
|
Other benefit plans |
|
| For the year ended October 31 ($ millions) |
|
|
|
|
2024 |
|
|
|
|
|
2024 |
|
Change in benefit obligation |
|
|
|
|
|
|
|
|
|
|
|
|
|
|
|
|
Benefit obligation at beginning of year |
|
|
|
|
|
$ |
7,669 |
|
|
|
|
|
|
$ |
1,114 |
|
Current service cost |
|
|
|
|
|
|
205 |
|
|
|
|
|
|
|
20 |
|
Interest cost on benefit obligation |
|
|
|
|
|
|
456 |
|
|
|
|
|
|
|
77 |
|
Employee contributions |
|
|
|
|
|
|
27 |
|
|
|
|
|
|
|
– |
|
Benefits paid |
|
|
|
|
|
|
(404 |
) |
|
|
|
|
|
|
(101 |
) |
Actuarial loss (gain) |
|
|
|
|
|
|
959 |
|
|
|
|
|
|
|
59 |
|
|
|
|
|
|
|
|
– |
|
|
|
|
|
|
|
(1 |
) |
Business acquisition |
|
|
|
|
|
|
– |
|
|
|
|
|
|
|
– |
|
Settlements |
|
|
|
|
|
|
(2 |
) |
|
|
|
|
|
|
– |
|
Foreign exchange |
|
|
|
|
|
|
(19 |
) |
|
|
|
|
|
|
(21 |
) |
Benefit obligation at end of year |
|
|
|
|
|
$ |
8,891 |
|
|
|
|
|
|
$ |
1,147 |
|
|
|
|
|
|
Change in fair value of assets |
|
|
|
|
|
|
|
|
|
|
|
|
|
|
|
|
Fair value of assets at beginning of year |
|
|
|
|
|
|
8,139 |
|
|
|
|
|
|
|
113 |
|
Interest income on fair value of assets |
|
|
|
|
|
|
494 |
|
|
|
|
|
|
|
9 |
|
Return on plan assets in excess of (less than) interest income on fair value of assets |
|
|
|
|
|
|
955 |
|
|
|
|
|
|
|
8 |
|
Employer contributions |
|
|
|
|
|
|
62 |
|
|
|
|
|
|
|
62 |
|
Employee contributions |
|
|
|
|
|
|
27 |
|
|
|
|
|
|
|
– |
|
Benefits paid |
|
|
|
|
|
|
(404 |
) |
|
|
|
|
|
|
(101 |
) |
Administrative expenses |
|
|
|
|
|
|
(13 |
) |
|
|
|
|
|
|
– |
|
Business acquisition |
|
|
|
|
|
|
– |
|
|
|
|
|
|
|
– |
|
Settlements |
|
|
|
|
|
|
(3 |
) |
|
|
|
|
|
|
– |
|
Foreign exchange |
|
|
|
|
|
|
3 |
|
|
|
|
|
|
|
(7 |
) |
Fair value of assets at end of year |
|
|
|
|
|
$ |
9,260 |
|
|
|
|
|
|
$ |
84 |
|
|
|
|
|
|
|
|
|
|
|
|
|
|
|
|
|
|
|
|
|
|
|
Excess (deficit) of fair value of assets over benefit obligation at end of year |
|
|
|
|
|
|
369 |
|
|
|
|
|
|
|
(1,063 |
) |
Effect of asset limitation and minimum funding requirement (2)
|
|
|
|
|
|
|
(208 |
) |
|
|
|
|
|
|
– |
|
Net asset (liability) at end of year |
|
|
|
|
|
$ |
161 |
|
|
|
|
|
|
$ |
(1,063 |
) |
Recorded in: |
|
|
|
|
|
|
|
|
|
|
|
|
|
|
|
|
Other assets in the Bank’s Consolidated Statement of Financial Position |
|
|
|
|
|
|
684 |
|
|
|
|
|
|
|
1 |
|
Other liabilities in the Bank’s Consolidated Statement of Financial Position |
|
|
|
|
|
|
(523 |
) |
|
|
|
|
|
|
(1,064 |
) |
Net asset (liability) at end of year |
|
|
|
|
|
$ |
161 |
|
|
|
|
|
|
$ |
(1,063 |
) |
|
|
|
|
|
|
|
|
|
|
|
|
|
|
|
|
|
|
|
|
|
|
Current service cost |
|
|
|
|
|
|
205 |
|
|
|
|
|
|
|
20 |
|
Net interest expense (income) |
|
|
|
|
|
|
(32 |
) |
|
|
|
|
|
|
68 |
|
Administrative expenses |
|
|
|
|
|
|
12 |
|
|
|
|
|
|
|
– |
|
|
|
|
|
|
|
|
– |
|
|
|
|
|
|
|
(1 |
) |
Amount of settlement (gain) loss recognized |
|
|
|
|
|
|
1 |
|
|
|
|
|
|
|
– |
|
Remeasurement of other long-term benefits |
|
|
|
|
|
|
– |
|
|
|
|
|
|
|
6 |
|
Benefit expense (income) recorded in the Consolidated Statement of Income (A) |
|
|
|
|
|
$ |
186 |
|
|
|
|
|
|
$ |
93 |
|
Defined contribution benefit expense (B) |
|
|
|
|
|
$ |
183 |
|
|
|
|
|
|
$ |
1 |
|
|
|
|
|
|
|
|
|
|
|
|
|
|
|
|
|
|
|
|
|
|
|
Return on plan assets in excess of interest income on fair value of assets |
|
|
|
|
|
|
955 |
|
|
|
|
|
|
|
8 |
|
Actuarial (loss) gain on benefit obligation |
|
|
|
|
|
|
(959 |
) |
|
|
|
|
|
|
(53 |
) |
Change in the asset limitation |
|
|
|
|
|
|
(146 |
) |
|
|
|
|
|
|
– |
|
Gains (losses) recorded in OCI (C) |
|
|
|
|
|
$ |
(150 |
) |
|
|
|
|
|
$ |
(45 |
) |
Total benefit cost (A + B - C) |
|
|
|
|
|
$ |
519 |
|
|
|
|
|
|
$ |
139 |
|
Additional details on actual return on assets and actuarial gains and (losses) |
|
|
|
|
|
|
|
|
|
|
|
|
|
|
|
|
Actual (return) on assets (net of administrative expenses) |
|
|
|
|
|
$ |
(1,436 |
) |
|
|
|
|
|
$ |
(19 |
) |
Actuarial gains and (losses) from changes in demographic assumptions |
|
|
|
|
|
|
7 |
|
|
|
|
|
|
|
– |
|
Actuarial gains and (losses) from changes in financial assumptions |
|
|
|
|
|
|
(952 |
) |
|
|
|
|
|
|
(53 |
) |
Actuarial gains and (losses) from changes in experience |
|
|
|
|
|
|
(14 |
) |
|
|
|
|
|
|
(6 |
) |
|
|
|
|
|
Additional details on fair value of pension plan assets invested |
|
|
|
|
|
|
|
|
|
|
|
|
|
|
|
|
In Scotiabank securities (stock, bonds) |
|
|
|
|
|
|
67 |
|
|
|
|
|
|
|
– |
|
In property occupied by Scotiabank |
|
|
|
|
|
|
4 |
|
|
|
|
|
|
|
– |
|
|
|
|
|
|
Change in asset ceiling/(onerous liability) |
|
|
|
|
|
|
|
|
|
|
|
|
|
|
|
|
Asset ceiling /onerous liability at end of prior year |
|
|
|
|
|
|
55 |
|
|
|
|
|
|
|
– |
|
Interest expense |
|
|
|
|
|
|
6 |
|
|
|
|
|
|
|
– |
|
Remeasurements |
|
|
|
|
|
|
146 |
|
|
|
|
|
|
|
– |
|
Foreign exchange |
|
|
|
|
|
|
1 |
|
|
|
|
|
|
|
– |
|
Asset ceiling /onerous liability at end of year |
|
|
|
|
|
$ |
208 |
|
|
|
|
|
|
$ |
– |
|
| (1) |
Other benefit plans past service costs relate to certain post-retirement plan amendments. |
| (2) |
The recognized asset is limited by the present value of economic benefits available from a reduction in future contributions to a plan and from the ability to pay plan expenses from the fund. |
2025 Scotiabank Annual Report
|
Consolidated Financial Statements
e) |
Maturity profile of the defined benefit obligation |
The weighted average duration of the total benefit obligation at October 31, 2025 is 13.4 years (2024 – 13.6 years).
|
|
|
|
|
|
|
|
|
|
|
|
|
|
|
|
|
| |
|
Pension plans |
|
|
Other benefit plans |
|
| For the year ended October 31 |
|
|
|
|
2024 |
|
|
|
|
|
2024 |
|
Disaggregation of the benefit obligation (%) |
|
|
|
|
|
|
|
|
|
|
|
|
|
|
|
|
Canada |
|
|
|
|
|
|
|
|
|
|
|
|
|
|
|
|
Active members |
|
|
|
|
|
|
51 |
% |
|
|
|
|
|
|
3 |
% |
Inactive and retired members |
|
|
|
|
|
|
49 |
% |
|
|
|
|
|
|
97 |
% |
Total |
|
|
|
|
|
|
100 |
% |
|
|
|
|
|
|
100 |
% |
Mexico |
|
|
|
|
|
|
|
|
|
|
|
|
|
|
|
|
Active members |
|
|
|
|
|
|
28 |
% |
|
|
|
|
|
|
32 |
% |
Inactive and retired members |
|
|
|
|
|
|
72 |
% |
|
|
|
|
|
|
68 |
% |
Total |
|
|
|
|
|
|
100 |
% |
|
|
|
|
|
|
100 |
% |
United States |
|
|
|
|
|
|
|
|
|
|
|
|
|
|
|
|
Active members |
|
|
|
|
|
|
31 |
% |
|
|
|
|
|
|
43 |
% |
Inactive and retired members |
|
|
|
|
|
|
69 |
% |
|
|
|
|
|
|
57 |
% |
Total |
|
|
|
|
|
|
100 |
% |
|
|
|
|
|
|
100 |
% |
The key weighted-average assumptions used by the Bank for the measurement of the benefit obligation and benefit expense for all of the Bank’s principal plans are summarized as follows:
|
|
|
|
|
|
|
|
|
|
|
|
|
|
|
|
|
| |
|
Pension plans |
|
|
Other benefit plans |
|
| For the year ended October 31 |
|
|
|
|
2024 |
|
|
|
|
|
2024 |
|
Benefit obligation at end of year |
|
|
|
|
|
|
|
|
|
|
|
|
|
|
|
|
Discount rate – all plans |
|
|
|
|
|
|
5.22 |
% |
|
|
|
|
|
|
6.51 |
% |
Discount rate – Canadian plans only |
|
|
|
|
|
|
4.80 |
% |
|
|
|
|
|
|
4.69 |
% |
Rate of increase in future compensation (1)
|
|
|
|
|
|
|
3.85 |
% |
|
|
|
|
|
|
4.37 |
% |
Benefit expense (income) for the year |
|
|
|
|
|
|
|
|
|
|
|
|
|
|
|
|
Discount rate – All plans |
|
|
|
|
|
|
|
|
|
|
|
|
|
|
|
|
Discount rate for defined benefit obligations |
|
|
|
|
|
|
6.13 |
% |
|
|
|
|
|
|
7.36 |
% |
Discount rate for net interest cost |
|
|
|
|
|
|
6.13 |
% |
|
|
|
|
|
|
7.36 |
% |
Discount rate for service cost |
|
|
|
|
|
|
6.06 |
% |
|
|
|
|
|
|
7.31 |
% |
Discount rate for interest on service cost |
|
|
|
|
|
|
6.07 |
% |
|
|
|
|
|
|
7.27 |
% |
Discount rate – Canadian plans only |
|
|
|
|
|
|
|
|
|
|
|
|
|
|
|
|
Discount rate for defined benefit obligations |
|
|
|
|
|
|
5.70 |
% |
|
|
|
|
|
|
5.80 |
% |
Discount rate for net interest cost |
|
|
|
|
|
|
5.70 |
% |
|
|
|
|
|
|
5.80 |
% |
Discount rate for service cost |
|
|
|
|
|
|
5.60 |
% |
|
|
|
|
|
|
5.62 |
% |
Discount rate for interest on service cost |
|
|
|
|
|
|
5.61 |
% |
|
|
|
|
|
|
5.53 |
% |
Rate of increase in future compensation (1)
|
|
|
|
|
|
|
3.96 |
% |
|
|
|
|
|
|
4.61 |
% |
Health care cost trend rates at end of year |
|
|
|
|
|
|
|
|
|
|
|
|
|
|
|
|
Initial rate |
|
|
|
|
|
|
n/a |
|
|
|
|
|
|
|
5.72 |
% |
Ultimate rate |
|
|
|
|
|
|
n/a |
|
|
|
|
|
|
|
4.71 |
% |
Year ultimate rate reached |
|
|
|
|
|
|
n/a |
|
|
|
|
|
|
|
2041 |
|
Assumed life expectancy in Canada (years) |
|
|
|
|
|
|
|
|
|
|
|
|
|
|
|
|
Life expectancy at 65 for current pensioners – male |
|
|
|
|
|
|
23.6 |
|
|
|
|
|
|
|
23.6 |
|
Life expectancy at 65 for current pensioners – female |
|
|
|
|
|
|
24.7 |
|
|
|
|
|
|
|
24.7 |
|
Life expectancy at 65, for future pensioners currently aged 45 – male |
|
|
|
|
|
|
24.5 |
|
|
|
|
|
|
|
24.5 |
|
Life expectancy at 65, for future pensioners currently aged 45 – female |
|
|
|
|
|
|
25.6 |
|
|
|
|
|
|
|
25.6 |
|
Assumed life expectancy in Mexico (years) |
|
|
|
|
|
|
|
|
|
|
|
|
|
|
|
|
Life expectancy at 65 for current pensioners – male |
|
|
|
|
|
|
21.6 |
|
|
|
|
|
|
|
21.6 |
|
Life expectancy at 65 for current pensioners – female |
|
|
|
|
|
|
24.0 |
|
|
|
|
|
|
|
24.0 |
|
Life expectancy at 65, for future pensioners currently aged 45 – male |
|
|
|
|
|
|
21.7 |
|
|
|
|
|
|
|
21.7 |
|
Life expectancy at 65, for future pensioners currently aged 45 – female |
|
|
|
|
|
|
24.0 |
|
|
|
|
|
|
|
24.0 |
|
Assumed life expectancy in United States (years) |
|
|
|
|
|
|
|
|
|
|
|
|
|
|
|
|
Life expectancy at 65 for current pensioners – male |
|
|
|
|
|
|
22.0 |
|
|
|
|
|
|
|
22.0 |
|
Life expectancy at 65 for current pensioners – female |
|
|
|
|
|
|
23.5 |
|
|
|
|
|
|
|
23.5 |
|
Life expectancy at 65, for future pensioners currently aged 45 – male |
|
|
|
|
|
|
23.4 |
|
|
|
|
|
|
|
23.4 |
|
Life expectancy at 65, for future pensioners currently aged 45 – female |
|
|
|
|
|
|
24.8 |
|
|
|
|
|
|
|
24.8 |
|
| (1) |
The weighted-average rates of increase in future compensation shown for other benefit plans do not include Canadian flexible post-retirement benefits plans established in fiscal 2005, as they are not impacted by future compensation increases. |
|
2025 Scotiabank Annual Report
Consolidated Financial Statements
The sensitivity analysis represents the impact of a change in a single assumption with other assumptions left unchanged. For purposes of the sensitivity analysis, the present value of the defined benefit obligation has been calculated using the projected unit credit method at the end of the reporting period, which is the same as that applied in calculating the defined benefit obligation recognized in the statement of financial position.
|
|
|
|
|
|
|
|
|
|
|
|
|
|
|
|
|
| |
|
Pension plans |
|
|
Other benefit plans |
|
| For the year ended October 31, 2025 ($ millions) |
|
Benefit
obligation |
|
|
Benefit
expense |
|
|
Benefit
obligation |
|
|
Benefit
expense |
|
Impact of the following changes: |
|
|
|
|
|
|
|
|
|
|
|
|
|
|
|
|
1% decrease in discount rate |
|
|
|
|
|
|
|
|
|
|
|
|
|
|
|
|
0.25% increase in rate of increase in future compensation |
|
|
|
|
|
|
|
|
|
|
|
|
|
|
|
|
1% increase in health care cost trend rate |
|
|
|
|
|
|
|
|
|
|
|
|
|
|
|
|
1% decrease in health care cost trend rate |
|
|
|
|
|
|
|
|
|
|
|
|
|
|
|
|
1 year increase in Canadian life expectancy |
|
|
|
|
|
|
|
|
|
|
|
|
|
|
|
|
1 year increase in Mexican life expectancy |
|
|
|
|
|
|
|
|
|
|
|
|
|
|
|
|
1 year increase in the United States life expectancy |
|
|
|
|
|
|
|
|
|
|
|
|
|
|
|
|
The Bank’s principal pension plans’ assets are generally invested with the long-term objective of maximizing overall expected returns, at an acceptable level of risk relative to the benefit obligation. A key factor in managing long-term investment risk is asset mix. Investing the pension assets across different asset classes and geographic regions helps to mitigate risk and to minimize the impact of declines in any single asset class, particular region or type of investment. Investment managers – including related-party managers – are typically hired and assigned specific mandates within each asset class.
Pension plan asset mix guidelines are set for the long term and are documented in each plan’s investment policy. Asset mix policy typically also reflects the nature of the plan’s benefit obligations. Legislation places certain restrictions on asset mix – for example, there are usually limits on concentration in any one investment. Other concentration and quality limits are also set forth in the investment policies. Derivatives cannot be used without specific authorization; currently, the main uses of derivatives are for duration management and currency hedging. Asset mix guidelines are reviewed at least once each year, and adjusted, where appropriate, based on market conditions and opportunities. However, large asset class shifts are not common, and typically reflect a change in the pension plan’s situation (e.g. plan amendments) and/or in the investment strategy. Actual asset mix is reviewed regularly and rebalancing back to target asset mix is considered – as needed – generally on a quarterly basis. The Bank’s other benefit plans are generally not funded, with the exception of certain programs in Mexico.
The tables below show the weighted-average actual and target asset allocations for the Bank’s principal plans at October 31, by asset category.
|
|
|
|
|
|
|
|
|
|
|
|
|
|
|
|
|
| |
|
Pension plans |
|
|
Other benefit plans |
|
| Asset category % |
|
|
|
|
Actual
2024 |
|
|
|
|
|
Actual
2024 |
|
Cash and cash equivalents |
|
|
|
|
|
|
2 |
% |
|
|
|
|
|
|
– |
% |
Equity investments |
|
|
|
|
|
|
|
|
|
|
|
|
|
|
|
|
Quoted in an active market |
|
|
|
|
|
|
43 |
% |
|
|
|
|
|
|
12 |
% |
Non quoted |
|
|
|
|
|
|
5 |
% |
|
|
|
|
|
|
– |
% |
|
|
|
|
|
|
|
48 |
% |
|
|
|
|
|
|
12 |
% |
Fixed income investments |
|
|
|
|
|
|
|
|
|
|
|
|
|
|
|
|
Quoted in an active market |
|
|
|
|
|
|
10 |
% |
|
|
|
|
|
|
87 |
% |
Non quoted |
|
|
|
|
|
|
29 |
% |
|
|
|
|
|
|
– |
% |
|
|
|
|
|
|
|
39 |
% |
|
|
|
|
|
|
87 |
% |
Property |
|
|
|
|
|
|
|
|
|
|
|
|
|
|
|
|
Quoted in an active market |
|
|
|
|
|
|
– |
% |
|
|
|
|
|
|
1 |
% |
Non quoted |
|
|
|
|
|
|
1 |
% |
|
|
|
|
|
|
– |
% |
|
|
|
|
|
|
|
1 |
% |
|
|
|
|
|
|
1 |
% |
Other |
|
|
|
|
|
|
|
|
|
|
|
|
|
|
|
|
Quoted in an active market |
|
|
|
|
|
|
– |
% |
|
|
|
|
|
|
– |
% |
Non quoted |
|
|
|
|
|
|
10 |
% |
|
|
|
|
|
|
– |
% |
|
|
|
|
|
|
|
10 |
% |
|
|
|
|
|
|
– |
% |
Total |
|
|
|
|
|
|
100 |
% |
|
|
|
|
|
|
100 |
% |
|
|
|
|
|
|
|
|
|
|
Target asset allocation at October 31, 2025
Asset category %
|
|
Pension plans |
|
|
Other benefit plans |
|
Cash and cash equivalents |
|
|
|
|
|
|
|
|
Equity investments |
|
|
|
|
|
|
|
|
Fixed income investments |
|
|
|
|
|
|
|
|
Property |
|
|
|
|
|
|
|
|
Other |
|
|
|
|
|
|
|
|
Total |
|
|
|
|
|
|
|
|
2025 Scotiabank Annual Report
|
Consolidated Financial Statements
The Bank’s businesses are grouped into four business lines: Canadian Banking, International Banking, Global Wealth Management and Global Banking and Markets. The Bank’s other smaller business segments and corporate adjustments are included in the Other segment. The accounting policies used in these segments are generally consistent with those followed in the preparation of the consolidated financial statements as disclosed in Note 3.
The Bank analyzes revenue on a taxable equivalent basis (TEB) for business lines. This methodology grosses up
tax-exempt
income earned on certain securities reported in either net interest income or
non-interest
income to an equivalent before tax basis. It also grosses up net income from associated corporations to normalize the effective tax rate in the business lines. Corresponding increases are made to the income tax expense; hence, there is no impact on the segment’s net income. The elimination of the TEB
gross-up
is recorded in the Other segment; hence, there is no impact on the consolidated results.
Effective January 1, 2024, in line with the provisions of Bill C-59, the Bank no longer claims the dividend received deduction on Canadian shares that are mark-to-market property, which resulted in a lower TEB gross-up.
Changes in business line allocation methodology
Effective the first quarter of 2025, the Bank made voluntary changes to its allocation methodology impacting business segment presentation. The new methodology includes updates related to the Bank’s funds transfer pricing, head office expense allocations, and allocations between business segments. Prior period results for each segment have been revised to conform with the current period’s methodology. Further details on the changes are as follows:
| 1. |
Funds transfer pricing methodology was updated, primarily related to the allocation of substantially all liquidity costs to the business lines, reflecting the Bank’s strategic objective to maintain higher liquidity ratios. |
| 2. |
Periodically, the Bank updates its allocation methodologies. This includes a comprehensive update to the allocation of head office expenses across countries within International Banking, updates to the allocation of clients and associated revenue, expenses, and balances between International Banking, Global Banking and Markets, and Global Wealth Management to align with the strategy, as well as updates to the allocation of head office expenses and income taxes from the Other segment to the business segments. |
| 3. |
To be consistent with the reporting of Scotiabank’s recent minority investment in KeyCorp, the Bank has also made changes to the reporting of certain minority investments in International Banking (Bank of Xi’an) and Global Wealth Management (Bank of Beijing Scotia Asset Management) which are now reported in the Other segment. |
Scotiabank’s results, and average assets and liabilities, allocated by these operating segments, are as follows:
|
|
|
|
|
|
|
|
|
|
|
|
|
|
|
|
|
|
|
|
|
|
|
|
|
| For the year ended October 31, 2025 |
|
|
|
|
|
|
|
|
|
|
|
|
|
|
|
|
|
|
| Taxable equivalent basis ($ millions) |
|
Canadian
Banking |
|
|
International
Banking |
|
|
Global Wealth
Management |
|
|
Global Banking
and Markets |
|
|
|
|
|
Total |
|
| |
|
|
|
|
|
|
|
|
|
|
|
|
|
|
|
|
|
|
|
|
|
|
|
|
| |
|
|
|
|
|
|
|
|
|
|
|
|
|
|
|
|
|
|
|
|
|
|
|
|
| Total revenues |
|
|
|
|
|
|
|
|
|
|
|
|
|
|
|
|
|
|
|
|
|
|
|
|
| Provision for credit losses |
|
|
|
|
|
|
|
|
|
|
|
|
|
|
|
|
|
|
|
|
|
|
|
|
| Depreciation and amortization |
|
|
|
|
|
|
|
|
|
|
|
|
|
|
|
|
|
|
|
|
|
|
|
|
Other non-interest expenses |
|
|
|
|
|
|
|
|
|
|
|
|
|
|
|
|
|
|
|
|
|
|
|
|
| Income tax expense |
|
|
|
|
|
|
|
|
|
|
|
|
|
|
|
|
|
|
|
|
|
|
|
|
| Net income |
|
|
|
|
|
|
|
|
|
|
|
|
|
|
|
|
|
|
|
|
|
|
|
|
Net income attributable to non-controlling interests in subsidiaries |
|
|
|
|
|
|
|
|
|
|
|
|
|
|
|
|
|
|
|
|
|
|
|
|
| Net income attributable to equity holders of the Bank |
|
|
|
|
|
|
|
|
|
|
|
|
|
|
|
|
|
|
|
|
|
|
|
|
Average assets ($ billions) |
|
|
|
|
|
|
|
|
|
|
|
|
|
|
|
|
|
|
|
|
|
|
|
|
Average liabilities ($ billions) |
|
|
|
|
|
|
|
|
|
|
|
|
|
|
|
|
|
|
|
|
|
|
|
|
(1) |
Includes all other smaller operating segments and corporate adjustments. |
(2) |
Interest income is reported net of interest expense as management relies primarily on net interest income as a performance measure. |
(3) |
Card revenues and Banking services fees are mainly earned in Canadian and International Banking. Mutual fund, Brokerage fees and Investment management and trust fees are primarily earned in Global Wealth Management. Underwriting and other advisory fees are predominantly earned in Global Banking and Markets. |
| ( 4 ) |
Includes net income (on a taxable equivalent basis) from investments in associated corporations for Canadian Banking – $19; International Banking – $152; Global Banking and Markets – $1; and Other – $436. |
|
2025 Scotiabank Annual Report
Consolidated Financial Statements
|
|
|
|
|
|
|
|
|
|
|
|
|
|
|
|
|
|
|
|
|
|
|
|
|
| For the year ended October 31, 2024 |
|
|
|
|
|
|
|
|
|
|
|
|
|
|
|
|
|
|
| Taxable equivalent basis ($ millions) |
|
|
|
|
|
|
|
Global Wealth Management (1)
|
|
|
Global Banking and Markets (1)
|
|
|
|
|
|
Total |
|
| |
|
$ |
10,185 |
|
|
$ |
8,867 |
|
|
$ |
786 |
|
|
$ |
1,102 |
|
|
$ |
(1,688 |
) |
|
$ |
19,252 |
|
Non-interest income (4)(5)
|
|
|
2,848 |
|
|
|
2,999 |
|
|
|
4,803 |
|
|
|
3,959 |
|
|
|
(191 |
) |
|
|
14,418 |
|
| Total revenues |
|
|
13,033 |
|
|
|
11,866 |
|
|
|
5,589 |
|
|
|
5,061 |
|
|
|
(1,879 |
) |
|
|
33,670 |
|
| Provision for credit losses |
|
|
1,691 |
|
|
|
2,285 |
|
|
|
27 |
|
|
|
47 |
|
|
|
1 |
|
|
|
4,051 |
|
Depreciation and amortization (6)
|
|
|
568 |
|
|
|
568 |
|
|
|
187 |
|
|
|
258 |
|
|
|
179 |
|
|
|
1,760 |
|
Other non-interest expenses |
|
|
5,557 |
|
|
|
5,602 |
|
|
|
3,468 |
|
|
|
2,864 |
|
|
|
444 |
|
|
|
17,935 |
|
| Income tax expense |
|
|
1,440 |
|
|
|
705 |
|
|
|
479 |
|
|
|
414 |
|
|
|
(1,006 |
) |
|
|
2,032 |
|
| Net income |
|
$ |
3,777 |
|
|
$ |
2,706 |
|
|
$ |
1,428 |
|
|
$ |
1,478 |
|
|
$ |
(1,497 |
) |
|
$ |
7,892 |
|
Net income attributable to non-controlling interests in subsidiaries |
|
|
– |
|
|
|
125 |
|
|
|
10 |
|
|
|
– |
|
|
|
(1 |
) |
|
|
134 |
|
| Net income attributable to equity holders of the Bank |
|
$ |
3,777 |
|
|
$ |
2,581 |
|
|
$ |
1,418 |
|
|
$ |
1,478 |
|
|
$ |
(1,496 |
) |
|
$ |
7,758 |
|
Average assets ($ billions) |
|
|
449 |
|
|
|
231 |
|
|
|
35 |
|
|
|
495 |
|
|
|
209 |
|
|
|
1,419 |
|
Average liabilities ($ billions) |
|
|
389 |
|
|
|
179 |
|
|
|
41 |
|
|
|
475 |
|
|
|
254 |
|
|
|
1,338 |
|
| (1) |
Effective Q1 2025, changes were made to the methodology used to allocate certain income, expenses and balance sheet items between business segments. Prior period results for each segment have been reclassified to conform with the current period’s methodology. |
| (2) |
Includes all other smaller operating segments and corporate adjustments, such as the elimination of the tax-exempt income gross-up reported in net interest income and non-interest income and provision for income taxes for the year ended October 31, 2024 amounting to $55 to arrive at the amounts reported in the Consolidated Statement of Income, differences in the actual amount of costs incurred and charged to the operating segments. |
| ( 3 ) |
Interest income is reported net of interest expense as management relies primarily on net interest income as a performance measure. |
| ( 4 ) |
Card revenues and Banking services fees are mainly earned in Canadian and International Banking. Mutual fund, Brokerage fees and Investment management and trust fees are primarily earned in Global Wealth Management. Underwriting and other advisory fees are predominantly earned in Global Banking and Markets. |
| ( 5 ) |
Includes net income (on a taxable equivalent basis) from investments in associated corporations for Canadian Banking – $(9); International Banking – $130; and Other – $77. |
| ( 6 ) |
Includes impairment charge on software and other intangible assets in the Other segment. |
Geographical segmentation
The following table summarizes the Bank’s financial results by geographic region.
|
|
|
|
|
|
|
|
|
|
|
|
|
|
|
|
|
|
|
|
|
|
|
|
|
|
|
|
|
|
|
|
|
|
|
|
|
For the year ended October 31, 2025
($ millions) |
|
Canada |
|
|
United
States |
|
|
Mexico |
|
|
Peru |
|
|
Chile |
|
|
Colombia |
|
|
Caribbean and
Central America |
|
|
Other
International |
|
|
Total |
|
| Net interest income |
|
|
|
|
|
|
|
|
|
|
|
|
|
|
|
|
|
|
|
|
|
|
|
|
|
|
|
|
|
|
|
|
|
|
|
|
| |
|
|
|
|
|
|
|
|
|
|
|
|
|
|
|
|
|
|
|
|
|
|
|
|
|
|
|
|
|
|
|
|
|
|
|
|
| |
|
|
|
|
|
|
|
|
|
|
|
|
|
|
|
|
|
|
|
|
|
|
|
|
|
|
|
|
|
|
|
|
|
|
|
|
| Provision for credit losses |
|
|
|
|
|
|
|
|
|
|
|
|
|
|
|
|
|
|
|
|
|
|
|
|
|
|
|
|
|
|
|
|
|
|
|
|
| |
|
|
|
|
|
|
|
|
|
|
|
|
|
|
|
|
|
|
|
|
|
|
|
|
|
|
|
|
|
|
|
|
|
|
|
|
| Income tax expense |
|
|
|
|
|
|
|
|
|
|
|
|
|
|
|
|
|
|
|
|
|
|
|
|
|
|
|
|
|
|
|
|
|
|
|
|
| Net income |
|
|
|
|
|
|
|
|
|
|
|
|
|
|
|
|
|
|
|
|
|
|
|
|
|
|
|
|
|
|
|
|
|
|
|
|
Net income attributable to non-controlling interests in subsidiaries |
|
|
|
|
|
|
|
|
|
|
|
|
|
|
|
|
|
|
|
|
|
|
|
|
|
|
|
|
|
|
|
|
|
|
|
|
| Net income attributable to equity holders of the Bank |
|
|
|
|
|
|
|
|
|
|
|
|
|
|
|
|
|
|
|
|
|
|
|
|
|
|
|
|
|
|
|
|
|
|
|
|
Total average assets ($ billions) |
|
|
|
|
|
|
|
|
|
|
|
|
|
|
|
|
|
|
|
|
|
|
|
|
|
|
|
|
|
|
|
|
|
|
|
|
Total average liabilities ($billions) |
|
|
|
|
|
|
|
|
|
|
|
|
|
|
|
|
|
|
|
|
|
|
|
|
|
|
|
|
|
|
|
|
|
|
|
|
| (1) |
Includes net income from investments in associated corporations for Canada – $(12), United States – $362, Mexico – $9, Peru – $4, Chile – $7, Caribbean and Central America – $132, and Other International – $106. |
| (2) |
Revenues are attributed to countries based on where services are performed or assets are recorded. |
2025 Scotiabank Annual Report
|
Consolidated Financial Statements
|
|
|
|
|
|
|
|
|
|
|
|
|
|
|
|
|
|
|
|
|
|
|
|
|
|
|
|
|
|
|
|
|
|
|
|
|
| For the year ended October 31, 2024 (1)
($ millions) |
|
Canada |
|
|
United
States |
|
|
Mexico |
|
|
Peru |
|
|
Chile |
|
|
Colombia |
|
|
Caribbean and
Central America |
|
|
Other
International |
|
|
Total |
|
| Net interest income |
|
$ |
9,207 |
|
|
$ |
664 |
|
|
$ |
2,397 |
|
|
$ |
1,422 |
|
|
$ |
2,020 |
|
|
$ |
690 |
|
|
$ |
1,842 |
|
|
$ |
1,010 |
|
|
$ |
19,252 |
|
| |
|
|
8,535 |
|
|
|
1,578 |
|
|
|
1,032 |
|
|
|
546 |
|
|
|
455 |
|
|
|
486 |
|
|
|
1,180 |
|
|
|
606 |
|
|
|
14,418 |
|
| |
|
|
17,742 |
|
|
|
2,242 |
|
|
|
3,429 |
|
|
|
1,968 |
|
|
|
2,475 |
|
|
|
1,176 |
|
|
|
3,022 |
|
|
|
1,616 |
|
|
|
33,670 |
|
| Provision for credit losses |
|
|
1,701 |
|
|
|
28 |
|
|
|
380 |
|
|
|
501 |
|
|
|
626 |
|
|
|
561 |
|
|
|
150 |
|
|
|
104 |
|
|
|
4,051 |
|
| |
|
|
11,207 |
|
|
|
1,309 |
|
|
|
1,867 |
|
|
|
869 |
|
|
|
1,143 |
|
|
|
794 |
|
|
|
1,454 |
|
|
|
1,052 |
|
|
|
19,695 |
|
| Income tax expense |
|
|
1,002 |
|
|
|
146 |
|
|
|
280 |
|
|
|
140 |
|
|
|
119 |
|
|
|
(49 |
) |
|
|
303 |
|
|
|
91 |
|
|
|
2,032 |
|
| Net income |
|
|
3,832 |
|
|
|
759 |
|
|
|
902 |
|
|
|
458 |
|
|
|
587 |
|
|
|
(130 |
) |
|
|
1,115 |
|
|
|
369 |
|
|
|
7,892 |
|
Net income attributable to non-controlling interests in subsidiaries |
|
|
– |
|
|
|
– |
|
|
|
24 |
|
|
|
3 |
|
|
|
42 |
|
|
|
(50 |
) |
|
|
115 |
|
|
|
– |
|
|
|
134 |
|
| Net income attributable to equity holders of the Bank |
|
$ |
3,832 |
|
|
$ |
759 |
|
|
$ |
878 |
|
|
$ |
455 |
|
|
$ |
545 |
|
|
$ |
(80 |
) |
|
$ |
1,000 |
|
|
$ |
369 |
|
|
$ |
7,758 |
|
Total average assets ($ billions) |
|
$ |
874 |
|
|
$ |
218 |
|
|
$ |
64 |
|
|
$ |
27 |
|
|
$ |
56 |
|
|
$ |
14 |
|
|
$ |
35 |
|
|
$ |
131 |
|
|
$ |
1,419 |
|
Total average liabilities ($billions) |
|
$ |
854 |
|
|
$ |
189 |
|
|
$ |
59 |
|
|
$ |
21 |
|
|
$ |
53 |
|
|
$ |
14 |
|
|
$ |
32 |
|
|
$ |
116 |
|
|
$ |
1,338 |
|
| (1) |
Effective Q1 2025, changes were made to the methodology used to allocate certain income, expenses and balance sheet items between business segments. Prior period results for each segment have been reclassified to conform with the current period’s methodology. |
| (2) |
Includes net income from investments in associated corporations for Canada – $(68), Mexico – $11, Peru – $4, Chile – $6, Caribbean and Central America – $109, and Other International – $136. |
| (3) |
Revenues are attributed to countries based on where services are performed or assets are recorded. |
|
Related Party Transactions |
Compensation of key management personnel of the Bank
Key management personnel are those persons having authority and responsibility for planning, directing and controlling the activities of the Bank, directly or indirectly, and comprise the directors of the Bank, the President and Chief Executive Officer, certain direct reports of the President and Chief Executive Officer and Group Heads.
|
|
|
|
|
|
|
|
|
| For the year ended October 31 ($ millions) |
|
|
|
|
2024 |
|
Salaries and cash incentives (1)
|
|
|
|
|
|
$ |
25 |
|
| |
|
|
|
|
|
|
29 |
|
Pension and other benefits (1)
|
|
|
|
|
|
|
2 |
|
| Total |
|
|
|
|
|
$ |
56 |
|
| (1) |
Represents amounts expensed during the year. |
| (2) |
Represents equity-based awards granted during the year. |
Directors can use some or all of their director fees earned to buy common shares of the Bank at market rates through the Director’s Share Purchase Plan.
Non-officer
directors may elect to receive all or a portion of their fees in the form of deferred stock units which vest immediately. Refer to Note 25 for further details of these plans.
Loans and deposits of key management personnel
Loans are currently granted to key management personnel at market terms and conditions.
|
|
|
|
|
|
|
|
|
| As at October 31 ($ millions) |
|
|
|
|
2024 |
|
| Loans |
|
|
|
|
|
$ |
10 |
|
| Deposits |
|
|
|
|
|
|
5 |
|
The Bank’s committed credit exposure to companies controlled by directors totaled $263 million as at October 31, 2025 (October 31, 2024 – $267 million), while actual utilized amounts were $186 million (October 31, 2024 – $199 million).
Transactions with associates and joint ventures
In the ordinary course of business, the Bank provides normal banking services and enters into transactions with its associated and other related corporations on terms similar to those offered to
non-related
parties. If these transactions are eliminated on consolidation, they are not disclosed as related party transactions. Transactions between the Bank and its associated companies and joint ventures also qualify as related party transactions and were recorded as follows:
|
|
|
|
|
|
|
|
|
| As at and for the year ended October 31 ($ millions) |
|
|
|
|
2024 |
|
| Net income / (loss) |
|
|
|
|
|
$ |
(15 |
) |
| Loans |
|
|
|
|
|
|
209 |
|
| Deposits |
|
|
|
|
|
|
253 |
|
| Guarantees and commitments |
|
|
|
|
|
|
46 |
|
Scotiabank principal pension plan
The Bank manages assets of $6.4 billion (October 31, 2024 – $6.0 billion) which is a portion of the Scotiabank principal pension plan assets and earned $7.0 million in fees (October 31, 2024 – $6.7 million).
|
2025 Scotiabank Annual Report
Consolidated Financial Statements
|
Principal Subsidiaries and Non-Controlling Interests in Subsidiaries |
(a) |
Principal subsidiaries (1) |
The following table presents certain operating subsidiaries the Bank owns, directly or indirectly. All of these subsidiaries are included in the Bank’s consolidated financial statements.
|
|
|
|
|
|
|
|
|
|
|
| |
|
|
|
Carrying value of shares |
|
| As at October 31 ($ millions) |
|
Principal office |
|
|
|
|
2024 |
|
| |
|
|
|
|
|
|
|
|
|
|
|
|
|
|
| Scotia Capital Inc. |
|
Toronto, Ontario |
|
|
|
|
|
$ |
4,160 |
|
| BNS Investments Inc. |
|
Toronto, Ontario |
|
|
|
|
|
|
23,860 |
|
| 1832 Asset Management L.P. |
|
Toronto, Ontario |
|
|
|
|
|
|
|
|
| Montreal Trust Company of Canada |
|
Montreal, Quebec |
|
|
|
|
|
|
|
|
| MD Financial Management Inc. |
|
Ottawa, Ontario |
|
|
|
|
|
|
2,826 |
|
| Jarislowsky, Fraser Limited |
|
Montreal, Quebec |
|
|
|
|
|
|
956 |
|
| Scotia Securities Inc. |
|
Toronto, Ontario |
|
|
|
|
|
|
73 |
|
| Tangerine Bank |
|
Toronto, Ontario |
|
|
|
|
|
|
4,154 |
|
| The Bank of Nova Scotia Trust Company |
|
Toronto, Ontario |
|
|
|
|
|
|
704 |
|
| Scotia Mortgage Corporation |
|
Toronto, Ontario |
|
|
|
|
|
|
843 |
|
| National Trust Company |
|
Stratford, Ontario |
|
|
|
|
|
|
408 |
|
| Roynat Inc. |
|
Calgary, Alberta |
|
|
|
|
|
|
741 |
|
| Scotia Dealer Advantage Inc. |
|
Hamilton, Ontario |
|
|
|
|
|
|
924 |
|
|
|
|
|
| |
|
|
|
|
|
|
|
|
|
|
| Scotia Holdings (USA) LLC |
|
New York, New York |
|
|
|
|
|
|
7,654 |
|
| Scotia Capital (USA) Inc. |
|
New York, New York |
|
|
|
|
|
|
|
|
| Scotia Financing (USA) LLC |
|
New York, New York |
|
|
|
|
|
|
|
|
| Nova Scotia Inversiones Limitada |
|
Santiago, Chile |
|
|
|
|
|
|
7,489 |
|
| Scotiabank Chile S.A. (99.79%) |
|
Santiago, Chile |
|
|
|
|
|
|
|
|
| Grupo Financiero Scotiabank Inverlat, S.A. de C.V. (97.39%) |
|
Mexico City, Mexico |
|
|
|
|
|
|
6,966 |
|
| Scotiabank Inverlat, S.A. |
|
Mexico City, Mexico |
|
|
|
|
|
|
|
|
| Scotia Peru Holdings S.A. |
|
Lima, Peru |
|
|
|
|
|
|
5,779 |
|
| Scotiabank Peru S.A.A. (99.31%) |
|
Lima, Peru |
|
|
|
|
|
|
|
|
| |
|
Bogota, Colombia |
|
|
|
|
|
|
973 |
|
Scotiabank Colpatria, S.A. (56.00%) (2)(3)
|
|
Bogota, Colombia |
|
|
|
|
|
|
|
|
| Scotiabank Brasil S.A. Banco Multiplo |
|
Sao Paulo, Brazil |
|
|
|
|
|
|
796 |
|
| Scotia Uruguay Holdings S.A. |
|
Montevideo, Uruguay |
|
|
|
|
|
|
681 |
|
| Scotiabank Uruguay S.A. |
|
Montevideo, Uruguay |
|
|
|
|
|
|
|
|
| Scotiabank Republica Dominicana, S.A. – Banco Multiple (99.80%) |
|
Santo Domingo, Dominican Republic |
|
|
|
|
|
|
943 |
|
| Scotiabank Caribbean Holdings Ltd. |
|
Bridgetown, Barbados |
|
|
|
|
|
|
1,608 |
|
| Scotia Group Jamaica Limited (71.78%) |
|
Kingston, Jamaica |
|
|
|
|
|
|
|
|
| Scotiabank Trinidad and Tobago Limited (50.90%) |
|
Port of Spain, Trinidad and Tobago |
|
|
|
|
|
|
|
|
| Scotiabank (Barbados) Limited |
|
Bridgetown, Barbados |
|
|
|
|
|
|
237 |
|
| BNS International (Bahamas) Limited |
|
Nassau, Bahamas |
|
|
|
|
|
|
11,180 |
|
| The Bank of Nova Scotia Trust Company (Bahamas) Limited |
|
Nassau, Bahamas |
|
|
|
|
|
|
|
|
| Scotiabank (Bahamas) Limited |
|
Nassau, Bahamas |
|
|
|
|
|
|
|
|
| Scotiabank & Trust (Cayman) Ltd. |
|
Grand Cayman, Cayman Islands |
|
|
|
|
|
|
|
|
Grupo BNS de Costa Rica, S.A. (2)
|
|
San Jose, Costa Rica |
|
|
|
|
|
|
|
|
| Scotiabank (Ireland) Designated Activity Company |
|
Dublin, Ireland |
|
|
|
|
|
|
|
|
| (1) |
The Bank (or immediate parent of an entity) owns 100% of the outstanding voting shares of each subsidiary unless otherwise noted. |
(2) |
In Q1 2025, the Bank entered into an agreement to sell its banking operations in Colombia, Costa Rica and Panama to Davivienda. The transaction was completed on December 1, 2025. Refer to Note 35 for details. |
| (3) |
The Bank made a capital contribution to Scotiabank Colpatria S.A. in May 2025 which increased its ownership interest to 56.00% following the subsequent issuance of additional shares. |
Subsidiaries may have a different reporting date from that of the Bank of October 31. Dates may differ for a variety of reasons including local reporting requirements or tax laws. In accordance with the Bank’s accounting policies, for the purpose of inclusion in the consolidated financial statements of the Bank, adjustments are made where significant for subsidiaries with different reporting dates.
2025 Scotiabank Annual Report
|
Consolidated Financial Statements
(b) |
Non-controlling interests in subsidiaries |
The Bank’s significant
non-controlling
interests in subsidiaries are comprised of the following entities:
|
|
|
|
|
|
|
|
|
|
|
|
|
|
|
|
|
|
|
|
|
| |
|
As at and for the year ended |
|
| |
|
|
|
|
|
|
|
2024 |
|
| |
|
Non-controlling
interest % |
|
|
Non-controlling
interests in subsidiaries |
|
|
Dividends paid to non-controlling
interest |
|
|
Non-controlling
interests in subsidiaries |
|
|
Dividends paid to non-controlling
interest |
|
| Scotiabank Chile S.A. |
|
|
|
|
|
|
|
|
|
|
|
|
|
$ |
256 |
|
|
$ |
24 |
|
Scotiabank Colpatria S.A. (1)
|
|
|
|
|
|
|
|
|
|
|
|
|
|
|
405 |
|
|
|
– |
|
| Scotia Group Jamaica Limited |
|
|
|
|
|
|
|
|
|
|
|
|
|
|
350 |
|
|
|
13 |
|
| Scotiabank Trinidad and Tobago Limited |
|
|
|
|
|
|
|
|
|
|
|
|
|
|
464 |
|
|
|
49 |
|
| Other |
|
|
|
|
|
|
|
|
|
|
|
|
|
|
232 |
|
|
|
2 |
|
| Total |
|
|
|
|
|
|
|
|
|
|
|
|
|
$ |
1,707 |
|
|
$ |
88 |
|
| (1) |
Non-controlling interest holders for Scotiabank Colpatria S.A. have a right to sell their holding to the Bank after the end of the 7th anniversary (January 17, 2019) and at subsequent pre-agreed intervals, into the future, at fair market value that can be settled at the Bank’s discretion, by issuance of common shares or cash. |
| (2) |
Range of non-controlling interest % for other subsidiaries. |
Summarized financial information of the Bank’s subsidiaries with significant
non-controlling
interests are as follows:
|
|
|
|
|
|
|
|
|
|
|
|
|
|
|
|
|
|
|
|
|
|
|
|
|
|
|
|
|
|
|
|
|
| |
|
As at and for the year ended October 31, 2025 |
|
|
As at and for the year ended October 31, 2024 |
|
| ($ millions) |
|
Revenue |
|
|
Total
comprehensive
income (loss) |
|
|
Total assets |
|
|
Total
liabilities |
|
|
Revenue |
|
|
Total
comprehensive
income (loss) |
|
|
Total assets |
|
|
Total
liabilities |
|
| Total |
|
|
|
|
|
|
|
|
|
|
|
|
|
|
|
|
|
$ |
4,455 |
|
|
$ |
226 |
|
|
$ |
93,051 |
|
|
$ |
82,223 |
|
|
Interest Income and Expense |
|
|
|
|
|
|
|
|
|
|
|
|
|
|
|
|
|
| For the year ended October 31 ($ millions) |
|
|
|
|
2024 |
|
| |
|
Interest
income |
|
|
Interest
expense |
|
|
Interest
income |
|
|
Interest
expense |
|
Measured at amortized cost (1)
|
|
|
|
|
|
|
|
|
|
$ |
53,966 |
|
|
$ |
42,177 |
|
| |
|
|
|
|
|
|
|
|
|
|
5,905 |
|
|
|
– |
|
|
|
|
|
|
|
|
|
|
|
|
59,871 |
|
|
|
42,177 |
|
| Other |
|
|
|
|
|
|
|
|
|
|
1,788 |
(2) |
|
|
230 |
(3) |
| Total |
|
|
|
|
|
|
|
|
|
$ |
61,659 |
|
|
$ |
42,407 |
|
| (1) |
The interest income/expense on financial assets/liabilities are calculated using the effective interest method. |
| (2) |
Includes dividend income on equity securities. |
| (3) |
Includes interest on lease liabilities of $125 (2024 – $119) and insurance finance expense of $33 (2024 – $30). |
|
|
|
|
|
|
|
|
|
| For the year ended October 31 ($ millions) |
|
|
|
|
2024 |
|
| Basic earnings per common share |
|
|
|
|
|
|
|
|
| Net income attributable to common shareholders |
|
|
|
|
|
$
|
7,286 |
|
Foreign currency loss on redemption of Subordinated Additional Tier 1 Capital Notes (1)
|
|
|
|
|
|
|
– |
|
| Net income attributable to common shareholders used to calculate basic earnings per common share |
|
|
|
|
|
|
7,286 |
|
| Weighted average number of common shares outstanding (millions) |
|
|
|
|
|
|
1,226 |
|
Basic earnings per common share (2) (in dollars) |
|
|
|
|
|
$ |
5.94 |
|
| Diluted earnings per common share |
|
|
|
|
|
|
|
|
| Net income attributable to common shareholders used to calculate basic earnings per common share |
|
|
|
|
|
$ |
7,286 |
|
Dilutive impact of share-based payment options and others (3)
|
|
|
|
|
|
|
(49 |
) |
| Net income attributable to common shareholders (diluted) |
|
|
|
|
|
$ |
7,237 |
|
| Weighted average number of common shares outstanding (millions) |
|
|
|
|
|
|
1,226 |
|
Dilutive impact of share-based payment options and others (3) (millions) |
|
|
|
|
|
|
6 |
|
| Weighted average number of diluted common shares outstanding (millions) |
|
|
|
|
|
|
1,232 |
|
Diluted earnings per common share (2) (in dollars) |
|
|
|
|
|
$ |
5.87 |
|
| (1) |
Refer to Note 23 (b) for further details on the redemption of the equity instrument. |
| (2) |
Earnings per share calculations are based on full dollar and share amounts. |
| (3) |
Certain options were not included in the calculation of diluted earnings per share as they were anti-dilutive. |
|
2025 Scotiabank Annual Report
Consolidated Financial Statements
|
Guarantees, Commitments and Pledged Assets |
The Bank enters into various types of guarantees and indemnifications in the normal course of business. Guarantees represent an undertaking to another party to make a payment to that party when certain specified events occur. The various guarantees and indemnifications that the Bank provides with respect to its customers and other third parties are presented below:
|
|
|
|
|
|
|
|
|
| |
|
|
|
|
2024 |
|
| As at October 31 ($ millions) |
|
Maximum potential amount of future payments (1)
|
|
|
Maximum potential amount of future payments (1)
|
|
| Standby letters of credit and letters of guarantee |
|
|
|
|
|
$ |
62,966 |
|
| Liquidity facilities |
|
|
|
|
|
|
7,665 |
|
| Indemnifications |
|
|
|
|
|
|
791 |
|
| (1) |
The maximum potential amount of future payments represents those guarantees that can be quantified and excludes other guarantees that cannot be quantified. As many of these guarantees will not be drawn upon and the maximum potential amount of future payments listed above does not consider the possibility of recovery under recourse or collateral provisions, the above amounts are not indicative of future cash requirements, credit risk, or the Bank’s expected losses from these arrangements. |
(i) |
Standby letters of credit and letters of guarantee |
Standby letters of credit and letters of guarantee are irrevocable undertakings by the Bank on behalf of a customer, to make payments to a third party in the event that the customer is unable to meet its obligations to the third party. Generally, the term of these guarantees does not exceed four years. The types and amounts of collateral security held by the Bank for these guarantees are generally the same as for loans.
The Bank’s backstop liquidity facilities are committed liquidity and provided to asset-backed commercial paper conduits, administered by the Bank. These facilities generally provide an alternative source of financing in the event market disruption prevents the conduit from issuing commercial paper or, in some cases, when certain specified conditions or performance measures are not met. These facilities generally have a term of up to three years.
In the ordinary course of business, the Bank enters into many contracts which contain indemnification provisions, such as purchase contracts, service agreements, trademark licensing agreements, director / officer contracts, escrow arrangements, sales of assets or businesses, outsourcing agreements, leasing arrangements, clearing system arrangements, securities lending agency agreements and structured transactions. The Bank cannot estimate the maximum potential future amount that may be payable. The Bank has not made any significant payments under such indemnifications.
(b) |
Other indirect commitments |
In the normal course of business, various other indirect commitments are outstanding which are not reflected on the Consolidated Statement of Financial Position. These may include:
| |
• |
|
Commercial letters of credit which require the Bank to honour drafts presented by a third-party when specific activities are completed; |
| |
• |
|
Commitments to extend credit which represent undertakings to make credit available in the form of loans or other financings for specific amounts and maturities, subject to specific conditions; |
| |
• |
|
Securities lending transactions under which the Bank, acting as principal or agent, agrees to lend securities to a borrower. The borrower must fully collateralize the security loan at all times. The market value of the collateral is monitored relative to the amounts due under the agreements, and where necessary, additional collateral is obtained; and |
| |
• |
|
Security purchase commitments which require the Bank to fund future investments. |
These financial instruments are subject to normal credit standards, financial controls and monitoring procedures.
The table below provides a detailed breakdown of the Bank’s other indirect commitments expressed in terms of the contractual amounts of the related commitment or contract which are not reflected on the Consolidated Statement of Financial Position.
|
|
|
|
|
|
|
|
|
| As at October 31 ($ millions) |
|
|
|
|
2024 |
|
| Commercial letters of credit |
|
|
|
|
|
$ |
1,049 |
|
Commitments to extend credit (1)
|
|
|
|
|
|
|
272,793 |
|
| Securities lending |
|
|
|
|
|
|
58,477 |
|
| Securities purchase and other commitments |
|
|
|
|
|
|
844 |
|
| Total |
|
|
|
|
|
$ |
333,163 |
|
| (1) |
Includes liquidity facilities, and excludes commitments which are unconditionally cancellable at the Bank’s discretion at any time. |
2025 Scotiabank Annual Report
|
Consolidated Financial Statements
(c) |
Assets pledged and repurchase agreements |
In the ordinary course of business, securities and other assets are pledged against liabilities. As well, securities are sold under repurchase agreements. The carrying value of pledged assets and details of related activities are shown below.
|
|
|
|
|
|
|
|
|
| As at October 31 ($ millions) |
|
|
|
|
2024 |
|
|
|
|
|
|
|
|
|
|
|
|
|
|
|
|
$ |
229 |
|
Foreign governments and central banks (1)
|
|
|
|
|
|
|
2,020 |
|
Clearing systems, payment systems and depositories (1)
|
|
|
|
|
|
|
2,460 |
|
Assets pledged in relation to exchange-traded derivative transactions |
|
|
|
|
|
|
5,334 |
|
Assets pledged in relation to derivative transactions |
|
|
|
|
|
|
25,487 |
|
Assets pledged as collateral related to securities borrowing and lending |
|
|
|
|
|
|
149,669 |
|
Assets pledged in relation to covered bond program (Note 14) (2)
|
|
|
|
|
|
|
47,560 |
|
Assets pledged in relation to other securitization programs (Note 14) |
|
|
|
|
|
|
4,022 |
|
Assets pledged under CMHC programs (Note 13) |
|
|
|
|
|
|
18,392 |
|
Other |
|
|
|
|
|
|
228 |
|
Total assets pledged |
|
|
|
|
|
$ |
255,401 |
|
Obligations related to securities sold under repurchase agreements |
|
|
|
|
|
|
174,335 |
|
|
|
|
|
|
|
$ |
429,736 |
|
| (1) |
Includes assets pledged in order to participate in clearing and payment systems and depositories, or pledged to have access to the facilities of central banks in foreign jurisdictions. |
| (2) |
Excludes mortgages related to covered bonds held by the Bank or used for securities lending transactions. |
| (3) |
Includes assets that have been received from counterparties through normal course of business in securities financing and derivative transactions. |
(d) |
Other executory contracts |
Effective July 2018, the Bank has entered into an $800 million contract for naming rights of an arena for 20 years.
The Bank and its subsidiaries have also entered into other long-term executory contracts, relating to outsourced services. The significant outsourcing arrangements have variable pricing based on utilization and are cancellable with notice.
|
Financial Instruments – Risk Management |
The Bank’s risk management framework to monitor, evaluate, measure and manage risks is disclosed in Management’s Discussion and Analysis (MD&A). These disclosures are incorporated by cross-reference in the Consolidated Financial Statements as permitted under IFRS 7, Financial Instruments: Disclosures. The grey shaded text and tables marked with an asterisk (*) in the “Group Financial Condition” and “Risk Management” sections of the MD&A form an integral part of the 2025 Consolidated Financial Statements.
The Bank’s principal business activities result in a balance sheet that consists primarily of financial instruments. In addition, the Bank uses derivative financial instruments for both trading and hedging purposes. The principal financial risks that arise from transacting financial instruments include credit risk, liquidity risk and market risk. The Bank’s framework to monitor, evaluate and manage these risks is consistent with that in place as at October 31, 2025:
| |
• |
|
extensive risk management policies define the Bank’s risk appetite, set the limits and controls within which the Bank and its subsidiaries can operate, and reflect the requirements of regulatory authorities. Risk appetite is approved by the Bank’s Board of Directors, either directly or through the Risk Committee of the Board (the Board); |
| |
• |
|
guidelines are developed to clarify risk limits and conditions under which the Bank’s risk policies are implemented; |
| |
• |
|
processes are implemented to identify, evaluate, document, report and control risk. Standards define the breadth and quality of information required to make a decision; and |
| |
• |
|
compliance with risk policies, limits and guidelines is measured, monitored and reported to ensure consistency against defined goals. |
Further details on the fair value of financial instruments and how these amounts were determined are provided in Note 6. Note 9 provides details on the terms and conditions of the Bank’s derivative financial instruments including notional amounts, remaining term to maturity, credit risk, and fair values of derivatives used in trading and hedging activities.
Credit risk is the risk of loss resulting from the failure of a borrower or counterparty to honour its financial or contractual obligations to the Bank. The Bank’s Credit Risk Appetite and Credit Risk Policy are developed by its Global Risk Management (GRM) department and limits are reviewed and approved by the Board on an annual and biennial basis, respectively. The Credit Risk Appetite defines target markets and risk tolerances that are developed at an
all-Bank
level, and then further refined at the business line level. The objectives of the Credit Risk Appetite are to ensure that, for the Bank, including the individual business lines:
| |
• |
|
target markets and product offerings are well defined; |
| |
• |
|
the risk parameters for new underwritings and for the portfolios as a whole are clearly specified; and |
| |
• |
|
transactions, including origination, syndication, loan sales and hedging, are managed in a manner to ensure the goals for the overall portfolio are met. |
The Credit Risk Policy sets out, among other things, the credit risk rating systems and associated parameter estimates, the delegation of authority for granting credit, and the calculation of allowance for credit losses. It forms an integral part of enterprise-wide policies and procedures that encompass governance, risk management and control structure.
The Bank’s credit risk rating systems are designed to support the determination of key credit risk parameter estimates which measure credit and transaction risk. For
non-retail
exposures, parameters are associated with each credit facility through the assignment of borrower and facility ratings. Borrower risk is evaluated using methodologies that are specific to particular industry sectors and/or business lines. The risk associated with facilities of a given borrower is assessed by considering the facilities’ structural and collateral-related elements. For retail portfolios, product specific models assign accounts into homogeneous segments using internal and external borrower/facility-level credit experience. This process provides for a meaningful differentiation of risk and allows for appropriate and consistent estimation of loss characteristics at the model and segment level. Further details on credit risk relating to derivatives are provided in Note 9(c).
|
2025 Scotiabank Annual Report
Consolidated Financial Statements
Credit risk exposures disclosed below are presented based on the Basel framework utilized by the Bank i.e., exposures subject to credit risk capital. The Bank uses the Internal Ratings Based approach (IRB) for all material Canadian, U.S., European portfolios, and for a significant portion of all international corporate and commercial portfolios. Under the Advanced Internal Ratings Based (AIRB) approach, the Bank uses internal risk parameter estimates, based on historical experience and appropriate margin of conservatism, for probability of default (PD), loss given default (LGD) and exposure at default (EAD). Under Basel III rules, there are IRB requirements for internally developed model parameters under AIRB, including scope restrictions which limit certain asset classes to only the Foundation Internal Ratings Based (FIRB) approach. For those asset classes (e.g. Large Corporates, Banks, etc.) the FIRB approach utilizes the Bank’s internally modeled PD parameters combined with internationally prescribed LGD and EAD parameters. The remaining portfolios, including other individual portfolios, are treated under the standardized approach.
Under the standardized approach, credit risk is estimated using the risk weights as prescribed by the Basel framework either based on credit assessments by external rating agencies or based on the counterparty/exposure type for
non-retail
exposures and product type for retail exposures. The external ratings the Bank uses are issued by S&P, Fitch and/or DBRS specifically for the Bank’s exposures (i.e. issue specific ratings) if available, otherwise issuer ratings are used following OSFI’s CAR guidelines requirements. Standardized risk weights also take into account other factors such as specific provisions for defaulted exposures, eligible collateral, and
for real estate secured retail exposures.
|
|
|
|
|
|
|
|
|
|
|
|
|
|
|
|
|
|
|
|
|
| As at October 31 ($ millions) |
|
|
|
|
2024 |
|
| |
|
|
|
| Category |
|
|
|
|
Undrawn
commitments |
|
|
|
|
|
Total |
|
|
Total |
|
|
|
|
|
|
|
|
|
|
|
|
|
|
|
|
|
|
|
|
|
|
|
|
|
|
|
|
|
|
|
|
|
|
|
|
|
|
|
|
|
|
|
IRB portfolio |
|
|
|
|
|
|
|
|
|
|
|
|
|
|
|
|
|
|
|
|
Corporate |
|
|
|
|
|
|
|
|
|
|
|
|
|
|
|
|
|
$ |
357,600 |
|
Bank |
|
|
|
|
|
|
|
|
|
|
|
|
|
|
|
|
|
|
56,648 |
|
Sovereign |
|
|
|
|
|
|
|
|
|
|
|
|
|
|
|
|
|
|
258,858 |
|
|
|
|
|
|
|
|
|
|
|
|
|
|
|
|
|
|
|
|
673,106 |
|
Standardized portfolio |
|
|
|
|
|
|
|
|
|
|
|
|
|
|
|
|
|
|
|
|
Corporate |
|
|
|
|
|
|
|
|
|
|
|
|
|
|
|
|
|
|
65,375 |
|
Bank |
|
|
|
|
|
|
|
|
|
|
|
|
|
|
|
|
|
|
3,213 |
|
Sovereign |
|
|
|
|
|
|
|
|
|
|
|
|
|
|
|
|
|
|
24,320 |
|
|
|
|
|
|
|
|
|
|
|
|
|
|
|
|
|
|
|
|
92,908 |
|
|
|
|
|
|
|
|
|
|
|
|
|
|
|
|
|
|
|
$ |
766,014 |
|
Retail |
|
|
|
|
|
|
|
|
|
|
|
|
|
|
|
|
|
|
|
|
IRB portfolio |
|
|
|
|
|
|
|
|
|
|
|
|
|
|
|
|
|
|
|
|
Real estate secured |
|
|
|
|
|
|
|
|
|
|
|
|
|
|
|
|
|
$ |
306,395 |
|
Qualifying revolving |
|
|
|
|
|
|
|
|
|
|
|
|
|
|
|
|
|
|
67,585 |
|
Other retail |
|
|
|
|
|
|
|
|
|
|
|
|
|
|
|
|
|
|
38,665 |
|
|
|
|
|
|
|
|
|
|
|
|
|
|
|
|
|
|
|
|
412,645 |
|
Standardized portfolio |
|
|
|
|
|
|
|
|
|
|
|
|
|
|
|
|
|
|
|
|
Real estate secured |
|
|
|
|
|
|
|
|
|
|
|
|
|
|
|
|
|
|
63,572 |
|
Other retail |
|
|
|
|
|
|
|
|
|
|
|
|
|
|
|
|
|
|
63,214 |
|
|
|
|
|
|
|
|
|
|
|
|
|
|
|
|
|
|
|
|
126,786 |
|
Total retail |
|
|
|
|
|
|
|
|
|
|
|
|
|
|
|
|
|
$ |
539,431 |
|
Total |
|
|
|
|
|
|
|
|
|
|
|
|
|
|
|
|
|
$ |
1,305,445 |
|
|
|
|
|
|
|
|
|
|
|
|
|
|
|
|
|
|
|
|
|
|
Canada |
|
|
|
|
|
|
|
|
|
|
|
|
|
|
|
|
|
$ |
783,178 |
|
United States |
|
|
|
|
|
|
|
|
|
|
|
|
|
|
|
|
|
|
238,201 |
|
Chile |
|
|
|
|
|
|
|
|
|
|
|
|
|
|
|
|
|
|
60,179 |
|
Mexico |
|
|
|
|
|
|
|
|
|
|
|
|
|
|
|
|
|
|
58,439 |
|
Peru |
|
|
|
|
|
|
|
|
|
|
|
|
|
|
|
|
|
|
32,609 |
|
Colombia |
|
|
|
|
|
|
|
|
|
|
|
|
|
|
|
|
|
|
15,015 |
|
Other International |
|
|
|
|
|
|
|
|
|
|
|
|
|
|
|
|
|
|
|
|
Europe |
|
|
|
|
|
|
|
|
|
|
|
|
|
|
|
|
|
|
38,776 |
|
Caribbean |
|
|
|
|
|
|
|
|
|
|
|
|
|
|
|
|
|
|
36,170 |
|
Latin America (other) |
|
|
|
|
|
|
|
|
|
|
|
|
|
|
|
|
|
|
17,742 |
|
All other |
|
|
|
|
|
|
|
|
|
|
|
|
|
|
|
|
|
|
25,136 |
|
Total |
|
|
|
|
|
|
|
|
|
|
|
|
|
|
|
|
|
$ |
1,305,445 |
|
| (1) |
Exposure at default is presented after credit risk mitigation. Exposures exclude equity securities and other assets. Portfolios under the Standardized Approach are reported net of specific allowances for credit losses and net of collateral amounts treated under the Comprehensive Approach. |
| (2) |
Non-retail drawn includes loans, acceptances, deposits with financial institutions and FVOCI debt securities. Retail drawn includes residential mortgages, credit cards, lines of credit, other personal loans and small business treated as other regulatory retail. |
| (3) |
Other exposures include off-balance sheet lending instruments such as letters of credit, letters of guarantees, securitizations, derivatives and repo-style transactions (reverse repurchase agreements, repurchase agreements, securities lending and securities borrowing), net of related collateral. |
| (4) |
Geographic segmentation is based upon the location of the ultimate risk of the credit exposure. |
2025 Scotiabank Annual Report
|
Consolidated Financial Statements
Consolidated Statement of Financial Position asset categories cross-referenced to credit risk exposures
The table below provides mapping of
on-balance
sheet asset categories that are included in the various Basel III exposure categories as presented in the credit ris
k
exposure summary table of these consolidated financial statements. In addition, it also provides other exposures which are subject to market risk and/or other assets which are not subject to market and credit risk with a reconciliation to the Consolidated Statement of Financial Position. The Bank calculates market risk capital based on the Standardized Approach under the Fundamental Review of the Trading Book (FRTB) framework, including its Trading vs. Banking boundary requirements. The credit risk exposures on certain assets such as cash, precious metals, investment securities (equities) and other assets are not included in the credit risk exposure summary table. Also excluded from the credit risk exposures are certain trading assets and all assets of the Bank’s insurance subsidiaries.
|
|
|
|
|
|
|
|
|
|
|
|
|
|
|
|
|
|
|
|
|
|
|
|
|
|
|
|
|
|
|
|
|
|
|
|
|
|
|
|
|
|
|
|
|
|
|
|
|
| |
|
Credit Risk Exposures |
|
|
|
|
|
Other Exposures |
|
|
|
|
| |
|
Drawn |
|
|
|
|
|
Other Exposures |
|
|
|
|
|
Market Risk Exposures |
|
|
|
|
|
|
|
| As at October 31, 2025 ($ millions) |
|
|
|
|
Retail |
|
|
|
|
|
Securitization |
|
|
Repo-style
Transactions |
|
|
Derivative
Financial
Instruments |
|
|
Equity |
|
|
|
|
|
Also
subject to
Credit Risk |
|
|
|
|
|
|
|
|
Total |
|
Cash and deposits with financial institutions |
|
|
|
|
|
|
|
|
|
|
|
|
|
|
|
|
|
|
|
|
|
|
|
|
|
|
|
|
|
|
|
|
|
|
|
|
|
|
|
|
|
|
|
|
|
|
|
|
Precious metals |
|
|
|
|
|
|
|
|
|
|
|
|
|
|
|
|
|
|
|
|
|
|
|
|
|
|
|
|
|
|
|
|
|
|
|
|
|
|
|
|
|
|
|
|
|
|
|
|
Trading assets |
|
|
|
|
|
|
|
|
|
|
|
|
|
|
|
|
|
|
|
|
|
|
|
|
|
|
|
|
|
|
|
|
|
|
|
|
|
|
|
|
|
|
|
|
|
|
|
|
Securities |
|
|
|
|
|
|
|
|
|
|
|
|
|
|
|
|
|
|
|
|
|
|
|
|
|
|
|
|
|
|
|
|
|
|
|
|
|
|
|
|
|
|
|
|
|
|
|
|
Loans |
|
|
|
|
|
|
|
|
|
|
|
|
|
|
|
|
|
|
|
|
|
|
|
|
|
|
|
|
|
|
|
|
|
|
|
|
|
|
|
|
|
|
|
|
|
|
|
|
Other |
|
|
|
|
|
|
|
|
|
|
|
|
|
|
|
|
|
|
|
|
|
|
|
|
|
|
|
|
|
|
|
|
|
|
|
|
|
|
|
|
|
|
|
|
|
|
|
|
Financial assets designated at fair value through profit or loss |
|
|
|
|
|
|
|
|
|
|
|
|
|
|
|
|
|
|
|
|
|
|
|
|
|
|
|
|
|
|
|
|
|
|
|
|
|
|
|
|
|
|
|
|
|
|
|
|
Securities purchased under resale agreements and securities borrowed |
|
|
|
|
|
|
|
|
|
|
|
|
|
|
|
|
|
|
|
|
|
|
|
|
|
|
|
|
|
|
|
|
|
|
|
|
|
|
|
|
|
|
|
|
|
|
|
|
Derivative financial instruments |
|
|
|
|
|
|
|
|
|
|
|
|
|
|
|
|
|
|
|
|
|
|
|
|
|
|
|
|
|
|
|
|
|
|
|
|
|
|
|
|
|
|
|
|
|
|
|
|
Investment securities |
|
|
|
|
|
|
|
|
|
|
|
|
|
|
|
|
|
|
|
|
|
|
|
|
|
|
|
|
|
|
|
|
|
|
|
|
|
|
|
|
|
|
|
|
|
|
|
|
Loans: |
|
|
|
|
|
|
|
|
|
|
|
|
|
|
|
|
|
|
|
|
|
|
|
|
|
|
|
|
|
|
|
|
|
|
|
|
|
|
|
|
|
|
|
|
|
|
|
|
|
|
|
|
|
|
|
|
|
|
|
|
|
|
|
|
|
|
|
|
|
|
|
|
|
|
|
|
|
|
|
|
|
|
|
|
|
|
|
|
|
|
|
|
|
|
|
|
|
Personal loans |
|
|
|
|
|
|
|
|
|
|
|
|
|
|
|
|
|
|
|
|
|
|
|
|
|
|
|
|
|
|
|
|
|
|
|
|
|
|
|
|
|
|
|
|
|
|
|
|
Credit cards |
|
|
|
|
|
|
|
|
|
|
|
|
|
|
|
|
|
|
|
|
|
|
|
|
|
|
|
|
|
|
|
|
|
|
|
|
|
|
|
|
|
|
|
|
|
|
|
|
Business & government |
|
|
|
|
|
|
|
|
|
|
|
|
|
|
|
|
|
|
|
|
|
|
|
|
|
|
|
|
|
|
|
|
|
|
|
|
|
|
|
|
|
|
|
|
|
|
|
|
Allowances for credit losses (3)
|
|
|
|
|
|
|
|
|
|
|
|
|
|
|
|
|
|
|
|
|
|
|
|
|
|
|
|
|
|
|
|
|
|
|
|
|
|
|
|
|
|
|
|
|
|
|
|
|
Customers’ liability under acceptances |
|
|
|
|
|
|
|
|
|
|
|
|
|
|
|
|
|
|
|
|
|
|
|
|
|
|
|
|
|
|
|
|
|
|
|
|
|
|
|
|
|
|
|
|
|
|
|
|
Property and equipment |
|
|
|
|
|
|
|
|
|
|
|
|
|
|
|
|
|
|
|
|
|
|
|
|
|
|
|
|
|
|
|
|
|
|
|
|
|
|
|
|
|
|
|
|
|
|
|
|
Investment in associates |
|
|
|
|
|
|
|
|
|
|
|
|
|
|
|
|
|
|
|
|
|
|
|
|
|
|
|
|
|
|
|
|
|
|
|
|
|
|
|
|
|
|
|
|
|
|
|
|
Goodwill and other intangibles assets |
|
|
|
|
|
|
|
|
|
|
|
|
|
|
|
|
|
|
|
|
|
|
|
|
|
|
|
|
|
|
|
|
|
|
|
|
|
|
|
|
|
|
|
|
|
|
|
|
Other (including Deferred tax assets) |
|
|
|
|
|
|
|
|
|
|
|
|
|
|
|
|
|
|
|
|
|
|
|
|
|
|
|
|
|
|
|
|
|
|
|
|
|
|
|
|
|
|
|
|
|
|
|
|
|
|
|
|
|
|
|
|
|
|
|
|
|
Total |
|
|
|
|
|
|
|
|
|
|
|
|
|
|
|
|
|
|
|
|
|
|
|
|
|
|
|
|
|
|
|
|
|
|
|
|
|
|
|
|
|
|
|
|
|
|
|
|
| (1) |
Includes the Bank’s insurance subsidiaries’ assets and all other assets which are not subject to credit and market risks. |
| (2) |
Includes $52.8 billion in mortgages guaranteed by Canada Mortgage Housing Corporation and federally backed privately insured mortgages. |
| (3) |
Amounts for IRB exposures are reported gross of allowances and amounts for standardized exposures are reported net of allowances. |
|
|
|
|
|
|
|
|
|
|
|
|
|
|
|
|
|
|
|
|
|
|
|
|
|
|
|
|
|
|
|
|
|
|
|
|
|
|
|
|
|
|
|
|
|
|
|
|
|
| |
|
Credit Risk Exposures |
|
|
|
|
|
Other Exposures |
|
|
|
|
| |
|
Drawn |
|
|
|
|
|
Other Exposures |
|
|
|
|
|
Market Risk Exposures |
|
|
|
|
|
|
|
| As at October 31, 2024 ($ millions) |
|
|
|
|
Retail |
|
|
|
|
|
Securitization |
|
|
Repo-style
Transactions |
|
|
Derivative
Financial
Instruments |
|
|
Equity |
|
|
|
|
|
Also
subject to
Credit Risk |
|
|
|
|
|
|
|
|
Total |
|
Cash and deposits with financial institutions |
|
$ |
60,501 |
|
|
$ |
– |
|
|
|
|
|
|
$ |
– |
|
|
$ |
– |
|
|
$ |
– |
|
|
$ |
– |
|
|
|
|
|
|
$ |
– |
|
|
$ |
– |
|
|
$ |
3,359 |
|
|
$ |
63,860 |
|
Precious metals |
|
|
– |
|
|
|
– |
|
|
|
|
|
|
|
– |
|
|
|
– |
|
|
|
– |
|
|
|
– |
|
|
|
|
|
|
|
– |
|
|
|
2,540 |
|
|
|
– |
|
|
|
2,540 |
|
Trading assets |
|
|
|
|
|
|
|
|
|
|
|
|
|
|
|
|
|
|
|
|
|
|
|
|
|
|
|
|
|
|
|
|
|
|
|
|
|
|
|
|
|
|
|
|
|
|
|
|
Securities |
|
|
331 |
|
|
|
– |
|
|
|
|
|
|
|
– |
|
|
|
– |
|
|
|
– |
|
|
|
– |
|
|
|
|
|
|
|
– |
|
|
|
119,581 |
|
|
|
– |
|
|
|
119,912 |
|
Loans |
|
|
933 |
|
|
|
– |
|
|
|
|
|
|
|
– |
|
|
|
– |
|
|
|
– |
|
|
|
– |
|
|
|
|
|
|
|
569 |
|
|
|
6,716 |
|
|
|
– |
|
|
|
7,649 |
|
Other |
|
|
– |
|
|
|
– |
|
|
|
|
|
|
|
– |
|
|
|
– |
|
|
|
– |
|
|
|
– |
|
|
|
|
|
|
|
– |
|
|
|
2,166 |
|
|
|
– |
|
|
|
2,166 |
|
Financial assets designated at fair value through profit or loss |
|
|
– |
|
|
|
– |
|
|
|
|
|
|
|
– |
|
|
|
– |
|
|
|
– |
|
|
|
– |
|
|
|
|
|
|
|
– |
|
|
|
– |
|
|
|
– |
|
|
|
– |
|
Securities purchased under resale agreements and securities borrowed |
|
|
– |
|
|
|
– |
|
|
|
|
|
|
|
– |
|
|
|
200,543 |
|
|
|
– |
|
|
|
– |
|
|
|
|
|
|
|
– |
|
|
|
– |
|
|
|
– |
|
|
|
200,543 |
|
Derivative financial instruments |
|
|
– |
|
|
|
– |
|
|
|
|
|
|
|
– |
|
|
|
– |
|
|
|
44,379 |
|
|
|
– |
|
|
|
|
|
|
|
39,736 |
|
|
|
– |
|
|
|
– |
|
|
|
44,379 |
|
Investment securities |
|
|
147,607 |
|
|
|
– |
|
|
|
|
|
|
|
– |
|
|
|
– |
|
|
|
– |
|
|
|
5,008 |
|
|
|
|
|
|
|
– |
|
|
|
– |
|
|
|
217 |
|
|
|
152,832 |
|
Loans: |
|
|
|
|
|
|
|
|
|
|
|
|
|
|
|
|
|
|
|
|
|
|
|
|
|
|
|
|
|
|
|
|
|
|
|
|
|
|
|
|
|
|
|
|
|
|
|
|
|
|
|
61,467 |
|
|
|
289,358 |
|
|
|
|
|
|
|
– |
|
|
|
– |
|
|
|
– |
|
|
|
– |
|
|
|
|
|
|
|
– |
|
|
|
– |
|
|
|
116 |
|
|
|
350,941 |
|
Personal loans |
|
|
711 |
|
|
|
101,821 |
|
|
|
|
|
|
|
3,847 |
|
|
|
– |
|
|
|
– |
|
|
|
– |
|
|
|
|
|
|
|
– |
|
|
|
– |
|
|
|
– |
|
|
|
106,379 |
|
Credit cards |
|
|
– |
|
|
|
13,892 |
|
|
|
|
|
|
|
162 |
|
|
|
– |
|
|
|
– |
|
|
|
– |
|
|
|
|
|
|
|
– |
|
|
|
– |
|
|
|
3,320 |
|
|
|
17,374 |
|
Business & government |
|
|
261,903 |
|
|
|
12,904 |
|
|
|
|
|
|
|
17,627 |
|
|
|
– |
|
|
|
– |
|
|
|
– |
|
|
|
|
|
|
|
– |
|
|
|
– |
|
|
|
237 |
|
|
|
292,671 |
|
Allowances for credit losses (3)
|
|
|
(363 |
) |
|
|
(1,170 |
) |
|
|
|
|
|
|
– |
|
|
|
– |
|
|
|
– |
|
|
|
– |
|
|
|
|
|
|
|
– |
|
|
|
– |
|
|
|
(5,003 |
) |
|
|
(6,536 |
) |
Customers’ liability under acceptances |
|
|
149 |
|
|
|
– |
|
|
|
|
|
|
|
– |
|
|
|
– |
|
|
|
– |
|
|
|
– |
|
|
|
|
|
|
|
– |
|
|
|
– |
|
|
|
(1 |
) |
|
|
148 |
|
Property and equipment |
|
|
– |
|
|
|
– |
|
|
|
|
|
|
|
– |
|
|
|
– |
|
|
|
– |
|
|
|
– |
|
|
|
|
|
|
|
– |
|
|
|
– |
|
|
|
5,252 |
|
|
|
5,252 |
|
Investment in associates |
|
|
– |
|
|
|
– |
|
|
|
|
|
|
|
– |
|
|
|
– |
|
|
|
– |
|
|
|
62 |
|
|
|
|
|
|
|
– |
|
|
|
– |
|
|
|
1,759 |
|
|
|
1,821 |
|
Goodwill and other intangibles assets |
|
|
– |
|
|
|
– |
|
|
|
|
|
|
|
– |
|
|
|
– |
|
|
|
– |
|
|
|
– |
|
|
|
|
|
|
|
– |
|
|
|
– |
|
|
|
16,853 |
|
|
|
16,853 |
|
Other (including Deferred tax assets) |
|
|
5,968 |
|
|
|
1,220 |
|
|
|
|
|
|
|
– |
|
|
|
343 |
|
|
|
– |
|
|
|
– |
|
|
|
|
|
|
|
– |
|
|
|
448 |
|
|
|
25,264 |
|
|
|
33,243 |
|
|
|
|
|
|
|
|
|
|
|
|
|
|
Total |
|
$ |
539,207 |
|
|
$ |
418,025 |
|
|
|
|
|
|
$ |
21,636 |
|
|
$ |
200,886 |
|
|
$ |
44,379 |
|
|
$ |
5,070 |
|
|
|
|
|
|
$ |
40,305 |
|
|
$ |
131,451 |
|
|
$ |
51,373 |
|
|
$ |
1,412,027 |
|
| (1) |
Includes the Bank’s insurance subsidiaries’ assets and all other assets which are not subject to credit and market risks. |
| (2) |
Includes $56.3 billion in mortgages guaranteed by Canada Mortgage Housing Corporation and federally backed privately insured mortgages. |
| (3) |
Amounts for IRB exposures are reported gross of allowances and amounts for standardized exposures are reported net of allowances. |
|
2025 Scotiabank Annual Report
Consolidated Financial Statements
(ii) |
Credit quality of non-retail exposures |
Credit decisions are made based upon an assessment of the credit risk of the individual borrower or counterparty. Key factors considered in the assessment include: the borrower’s management; the borrower’s current and projected financial results and credit statistics; the industry in which the borrower operates; economic trends; and geopolitical risk. Banking units and Global Risk Management also review the credit quality of the credit portfolio across the organization on a regular basis to assess whether economic trends or specific events may affect the performance of the portfolio.
The Bank’s
non-retail
portfolio is well diversified by industry. As at October 31, 2025, and October 31, 2024, a significant portion of the authorized corporate and commercial lending portfolio was internally assessed at a grade that would generally equate to an investment grade rating by external rating agencies. There has not been a significant change in concentrations of credit risk since October 31, 2024.
Internal grades (IG) are used to differentiate the risk of default of a borrower. The following table cross references the Bank’s internal borrower grades with equivalent ratings categories utilized by external rating agencies:
|
|
|
|
|
|
|
|
|
|
|
|
|
| Cross referencing of internal ratings to external ratings (1)
|
Equivalent External Rating |
|
|
|
|
|
|
|
S&P and Fitch |
|
Moody’s |
|
Morningstar DBRS |
|
Internal Grade |
|
Internal Grade Code |
|
|
|
| AAA to AA+ |
|
Aaa to Aa1 |
|
AAA to AA (high) |
|
|
|
|
99 – 98
|
|
|
0.0000 % – 0.0565 % |
| AA to A+ |
|
Aa2 to A1 |
|
AA to A (high) |
|
|
|
|
95 |
|
|
|
| A to A- |
|
A2 to A3 |
|
A to A (low) |
|
Investment grade |
|
|
90 |
|
|
|
| BBB+ |
|
Baa1 |
|
BBB (high) |
|
|
|
|
87 |
|
|
|
| BBB |
|
Baa2 |
|
BBB |
|
|
|
|
85 |
|
|
|
| BBB- |
|
Baa3 |
|
BBB (low) |
|
|
|
|
83 |
|
|
|
| BB+ |
|
Ba1 |
|
BB (high) |
|
|
|
|
80 |
|
|
|
| BB |
|
Ba2 |
|
BB |
|
|
|
|
77 |
|
|
|
| BB- |
|
Ba3 |
|
BB (low) |
|
Non-Investment grade |
|
|
75 |
|
|
|
| B+ |
|
B1 |
|
B (high) |
|
|
|
|
73 |
|
|
|
| B to B- |
|
B2 to B3 |
|
B to B (low) |
|
|
|
|
70 |
|
|
|
| CCC+ |
|
Caa1 |
|
– |
|
|
|
|
65 |
|
|
|
| CCC |
|
Caa2 |
|
– |
|
Watch list |
|
|
60 |
|
|
|
| |
|
Caa3 to Ca |
|
– |
|
|
|
|
40 |
|
|
|
– |
|
– |
|
– |
|
|
|
|
30 |
|
|
|
| Default |
|
|
|
|
|
Default |
|
|
21 |
|
|
100% |
| (1) |
Applies to non-retail portfolio. |
| (2) |
PD Ranges as at October 31, 2025. The Range does not include the upper boundary for the row. |
The credit quality of the
non-retail
IRB portfolio, expressed in terms of risk categories of borrower internal grades is shown in the table below:
|
|
|
|
|
|
|
|
|
|
|
|
|
|
|
|
|
|
|
|
|
|
|
|
|
| |
|
|
|
|
|
|
|
2024 |
|
| |
|
|
|
|
|
|
| As at October 31 ($ millions) Category of internal grades |
|
IG Code |
|
|
Drawn |
|
|
Undrawn
commitments |
|
|
|
|
|
Total |
|
|
Total |
|
Investment grade |
|
|
|
|
|
|
|
|
|
|
|
|
|
|
|
|
|
|
|
|
|
$ |
174,122 |
|
|
|
|
|
|
|
|
|
|
|
|
|
|
|
|
|
|
|
|
|
|
|
|
71,282 |
|
|
|
|
|
|
|
|
|
|
|
|
|
|
|
|
|
|
|
|
|
|
|
|
49,596 |
|
|
|
|
|
|
|
|
|
|
|
|
|
|
|
|
|
|
|
|
|
|
|
|
63,699 |
|
|
|
|
|
|
|
|
|
|
|
|
|
|
|
|
|
|
|
|
|
|
|
|
49,980 |
|
|
|
|
|
|
|
|
|
|
|
|
|
|
|
|
|
|
|
|
|
|
|
|
69,342 |
|
|
|
|
|
|
|
|
|
|
|
|
|
|
|
|
|
|
|
|
|
|
|
|
54,770 |
|
|
|
|
|
|
|
|
|
|
|
|
|
|
|
|
|
|
|
|
|
|
|
|
40,729 |
|
|
|
|
|
|
|
|
|
|
|
|
|
|
|
|
|
|
|
|
|
|
|
|
27,324 |
|
|
|
|
|
|
|
|
|
|
|
|
|
|
|
|
|
|
|
|
|
|
|
|
10,140 |
|
|
|
|
|
|
|
|
|
|
|
|
|
|
|
|
|
|
|
|
|
|
|
|
3,791 |
|
Watch list |
|
|
|
|
|
|
|
|
|
|
|
|
|
|
|
|
|
|
|
|
|
|
1,592 |
|
|
|
|
|
|
|
|
|
|
|
|
|
|
|
|
|
|
|
|
|
|
|
|
986 |
|
|
|
|
|
|
|
|
|
|
|
|
|
|
|
|
|
|
|
|
|
|
|
|
889 |
|
|
|
|
|
|
|
|
|
|
|
|
|
|
|
|
|
|
|
|
|
|
|
|
232 |
|
Default |
|
|
|
|
|
|
|
|
|
|
|
|
|
|
|
|
|
|
|
|
|
|
1,313 |
|
Total |
|
|
|
|
|
|
|
|
|
|
|
|
|
|
|
|
|
|
|
|
|
$ |
619,787 |
|
Government guaranteed residential mortgages (3)
|
|
|
|
|
|
|
|
|
|
|
|
|
|
|
|
|
|
|
|
|
|
|
53,319 |
|
Total |
|
|
|
|
|
|
|
|
|
|
|
|
|
|
|
|
|
|
|
|
|
$ |
673,106 |
|
| (1) |
After credit risk mitigation. |
| (2) |
Includes off-balance sheet lending instruments such as letters of credit, letters of guarantees, securitizations, derivatives and repo-style transactions (reverse repurchase agreements, repurchase agreements and securities lending and borrowing), net of related collateral. |
| (3) |
These exposures are classified as sovereign exposures and are included in the non-retail category. |
2025 Scotiabank Annual Report
|
Consolidated Financial Statements
Non-retail
standardized portfolio
The
non-retail
standardized portfolio relies on external credit ratings (e.g. S&P, Fitch, Morningstar DBRS, etc.) of the borrower, if available, to compute regulatory capital for credit risk. Exposures are risk weighted based on prescribed percentages and a mapping process as defined within OSFI’s Capital Adequacy Requirements Guideline.
Non-retail
standardized portfolio as at October 31, 2025 comprised of drawn, undrawn and other exposures to corporate, bank and sovereign counterparties amounted to $105 billion (October 31, 2024 – $93 billion). Within this portfolio, the majority of Corporate/Commercial exposures are to unrated counterparties, mainly in Canada, U.S., Mexico, Chile, Peru and Colombia.
(iii) |
Credit quality of retail exposures |
The Bank’s retail portfolios consist of a number of relatively small loans to a large number of borrowers. The portfolios are distributed across Canada and a wide range of countries. As such, the portfolios inherently have a high degree of diversification. In addition, as of October 31, 2025, 23% of the Canadian banking residential mortgage portfolio is insured and the average
ratio of the uninsured portion of the portfolio is 54%.
The data in the table below provides a distribution of the retail AIRB exposures within each PD range by asset class:
|
|
|
|
|
|
|
|
|
|
|
|
|
|
|
|
|
|
|
|
|
|
|
|
|
|
|
|
|
| As at October 31 ($ millions) |
|
|
|
|
2024 |
|
| |
|
|
|
| |
|
|
|
|
Real estate secured |
|
|
|
|
|
|
|
|
|
|
|
|
|
| Category of (PD) grades |
|
PD range |
|
|
Mortgages |
|
|
HELOC |
|
|
Qualifying
revolving |
|
|
Other retail |
|
|
Total |
|
|
Total |
|
| Exceptionally Low |
|
|
|
|
|
|
|
|
|
|
|
|
|
|
|
|
|
|
|
|
|
|
|
|
|
$ |
145,243 |
|
| Very Low |
|
|
|
|
|
|
|
|
|
|
|
|
|
|
|
|
|
|
|
|
|
|
|
|
|
|
148,919 |
|
| Low |
|
|
|
|
|
|
|
|
|
|
|
|
|
|
|
|
|
|
|
|
|
|
|
|
|
|
79,011 |
|
| Medium Low |
|
|
|
|
|
|
|
|
|
|
|
|
|
|
|
|
|
|
|
|
|
|
|
|
|
|
25,478 |
|
| Medium |
|
|
|
|
|
|
|
|
|
|
|
|
|
|
|
|
|
|
|
|
|
|
|
|
|
|
7,524 |
|
| High |
|
|
|
|
|
|
|
|
|
|
|
|
|
|
|
|
|
|
|
|
|
|
|
|
|
|
3,232 |
|
| Extremely High |
|
|
|
|
|
|
|
|
|
|
|
|
|
|
|
|
|
|
|
|
|
|
|
|
|
|
2,263 |
|
| Default |
|
|
|
|
|
|
|
|
|
|
|
|
|
|
|
|
|
|
|
|
|
|
|
|
|
|
975 |
|
| Total |
|
|
|
|
|
|
|
|
|
|
|
|
|
|
|
|
|
|
|
|
|
|
|
|
|
$ |
412,645 |
|
| (1) |
After credit risk mitigation. |
Retail standardized portfolio
The retail standardized portfolio of $130 billion as at October 31, 2025 (2024 – $127 billion) was comprised of residential mortgages, personal loans, credit cards and lines of credit to individuals, mainly in the Latin American and Caribbean region. Of the total retail standardized exposures, $67 billion (2024 – $64 billion) was represented by mortgages and loans secured by residential real estate, mostly with a
ratio of below 80%.
In the normal course of business, to reduce its exposure to counterparty credit risk, the Bank receives collateral for capital markets related activities. The following are examples of the terms and conditions customary to collateral for these types of transactions:
| |
• |
|
The risks and rewards of the pledged assets reside with the pledgor. |
| |
• |
|
Additional collateral is required when the market value of the transaction exceeds thresholds agreed upon with the pledgor. |
| |
• |
|
The Bank is normally permitted to sell or repledge the collateral it receives, although this right is specific to each agreement under which the collateral is pledged. |
| |
• |
|
Upon satisfaction of the obligation, the Bank must return the pledged assets, unless the Bank has the right to sell or repledge the collateral it receives, in which case the Bank must return comparable collateral to the pledgor. |
As at October 31, 2025, the approximate market value of cash and securities collateral accepted that may be sold or repledged by the Bank was $409 billion (2024 – $359 billion). This collateral is held primarily in connection with reverse repurchase agreements, margin loans, securities lending and derivative transactions. The Bank also borrows securities under standard securities borrowing agreements that it is able to
re-pledge.
Including these borrowed securities, the approximate market value of securities collateral accepted that may be sold or
re-pledged
was $350 billion (2024 – $300 billion), of which approximately $67 billion was not sold or
re-pledged
(2024 – $60 billion).
In the normal course of business, securities and other assets are pledged to secure an obligation, participate in clearing or settlement systems, or operate in a foreign jurisdiction. Note 33(c) details the nature and extent of the Bank’s asset pledging activities. Asset pledging transactions are conducted under terms that are common and customary to standard derivative, securities financing, and other borrowing activities. Standard risk management controls are applied with respect to asset pledging.
Assets acquired in exchange for loans
The carrying value of assets acquired in exchange for loans as at October 31, 2025 was $221 million (2024 – $312 million) mainly comprised of real estate and was classified as either held for sale or held for use as appropriate.
|
2025 Scotiabank Annual Report
Consolidated Financial Statements
Liquidity risk is the risk that the Bank is unable to meet its financial obligations in a timely manner at reasonable prices. Our liquidity risk management framework and key risk measures are disclosed in the gray-shaded text and tables marked with an asterisk (*) in the “Risk Management” section of the MD&A.
Market risk arises from changes in market prices and rates (including interest rates, credit spreads, equity prices, foreign exchange rates and commodity prices), the correlations between them, and their levels of volatility. Our market risk management framework and
k
ey risk measures are disclosed in the gray-shaded text and tables marked with an asterisk (*) in the “Risk Management” section of the MD&A.
|
Acquisitions and Divestitures |
Acquisition completed impacting the current year
On December 27, 2024, the Bank completed its acquisition of an approximate ownership interest of 14.9% or 163 million shares in KeyCorp. The acquisition was completed in two stages – an initial investment of 4.9% (Initial Investment) on August 30, 2024, and an additional investment of approximately 10% (Additional Investment) on December 27, 2024. The acquisition was completed through
all-cash
purchases of newly issued voting common shares, at a fixed price of U.S.$17.17 per share, resulting in total cash consideration paid of approximately U.S.$2.8 billion
($4.1 billion). Following completion of the Additional Investment, the Bank designated two individuals to serve on KeyCorp’s Board of Directors.
Effective December 27, 2024, the combined 14.9% investment was accounted for as an investment in associate as the Bank has significant influence over KeyCorp as defined under IFRS, given its board representation and ownership interest. The Initial Investment of 4.9% previously accounted for at fair value through other comprehensive income was derecognized and included in the cost base of the investment in associate. The difference between the fixed transaction price and the quoted share price of KeyCorp on the date of Additional Investment (U.S.$17.20) was recognized as a gain in
non-interest
income – other, with a corresponding increase in the carrying value of the investment in associate. The carrying amount of the investment in associate upon closing was U.S.$2.8 billion ($4.1 billion), and represents the Bank’s share of KeyCorp’s net assets, adjusted for goodwill and other intangibles. The total impact to the Bank’s common equity Tier 1 (CET1) ratio from the transaction was a decrease of approximately 49 basis points.
For the three and twelve months ended October 31, 2025, $117 million ($111 million
after-tax)
and $362 million ($338 million
after-tax),
respectively, was recorded in net income from investments in associated corporations, representing the Bank’s share of KeyCorp’s financial results.
Divestiture announced that is expected to close in a future period
Sale of banking operations in Colombia, Costa Rica and Panama
On January 6, 2025, the Bank entered into an agreement with Davivienda to sell
it
s banking operations in Colombia, Costa Rica and Panama in exchange for an approximately 20% ownership stake in the newly combined entity of Davivienda. The Bank’s ownership will consist of 14.99% voting common shares and the remainder in
non-voting
preferred shares. At the closing date, the Bank will have the right to designate individuals to serve on the Board of Directors of Davivienda’s combined operations commensurate with its ownership stake. This investment will be accounted for as an investment in associate, as the Bank will have significant influence.
On the date of the agreement, the Bank’s operations that are part of this transaction were classified as held for sale in accordance with IFRS 5 and an impairment loss of $1,362 million ($1,355 million
was recorded in
non-interest
expenses – other within the Other operating segment, representing the write-down of goodwill ($589 million), intangibles ($151 million), property and equipment ($290 million) and the remaining in other assets.
As of October 31, 2025, the Bank has recognized a total impairment loss of $1,422 million in non-interest expense and a credit of $45 million in non-interest income (collectively $1,342
million after-tax). The loss was recorded in Other operating segment. The held for sale operations included total assets of $
24 billion and total liabilities of $22 billion, consisting primarily of loans and deposits, and the
total
cumulative foreign currency translation losses, net of hedges was $249 million. Upon closing, total assets and liabilities will be derecognized. Any resulting gains/loss and the total cumulative foreign currency translation reserve, net of hedges at the closing date related to these operations will be recorded in the
C
onsolidated
S
tatement of
I
ncome.
The total impact of the transaction to the Bank’s CET1 capital ratio was a decrease of approximately 13 basis points as of October 31, 2025.
Closed divestitures impacting the current fiscal year
On February 28, 2025, the Bank completed the sale of CrediScotia Financiera S.A. (CrediScotia), a wholly-owned consumer finance subsidiary in Peru, to Banco Santander S.A. (Espana), upon receiving regulatory approvals and satisfying closing conditions.
Upon closing, assets and liabilities of $985 million and $726 million, respectively, in relation to this business were derecognized. A total loss of $102 million
after-tax
has been recognized and recorded in the Other Segment for this transaction, of which $12 million
after-tax
was recorded in 2025 and $90 million was recorded in 2024. The amount recognized in 2025 was recognized in
non-interest
income – other. The closing of the transaction increased the Bank’s CET1 capital ratio by approximately three basis points.
2025 Scotiabank Annual Report
|
Consolidated Financial Statements
|
Event s after the Consolidated Statement of Financial Position date |
Sale of banking operations in Colombia, Costa Rica and Panama
On December 1, 2025, the Bank completed the sale of
it
s banking operations in Colombia, Costa Rica and Panama to Davivienda Group in exchange for an approximately 20% ownership stake in the newly combined entity of Davivienda, upon receiving all regulatory approvals and satisfying all customary closing conditions.
Following this date, the investment in Davivienda Group will be accounted for as an investment in associate as the Bank has significant influence. Additionally, all assets and liabilities in relation to the Bank’s operations will be
derecognized
and the Bank is expected to record a loss in Q1 2026 of approximately $300 million after-tax in the Other segment, primarily relating to the release of cumulative foreign currency translation losses, net of hedges.
|
2025 Scotiabank Annual Report
EX-99.4
6
d936350dex994.htm
EX-99.4
EX-99.4
Exhibit 99.4

KPMG LLP
Bay Adelaide Centre
333 Bay Street, Suite 4600
Toronto, ON M5H 2S5
Canada
Tel 416-777-8500
Fax 416-777-8818
www.kpmg.ca
CONSENT OF INDEPENDENT
REGISTERED PUBLIC ACCOUNTING FIRM
To the Board of Directors of The Bank of Nova Scotia (the “Bank”)
We consent to the use of our reports of independent registered public accounting firm dated December 2, 2025 on:
| i) |
the consolidated financial statements of the Bank, which comprise the consolidated statements of financial
position as of October 31, 2025 and 2024, the consolidated statements of income, comprehensive income, changes in equity and cash flows for the years then ended, and the related notes; and
|
| ii) |
the effectiveness of the Bank’s internal control over financial reporting as of October 31, 2025,
|
each of which is included in the Annual Report on Form 40-F of the Bank for the fiscal year
ended October 31, 2025.
We also consent to the incorporation by reference of such reports in the Registration Statement on Form S-8 (No. 333-199099) of the Bank.
We also consent to the incorporation by
reference of such reports and to the reference to our firm under the heading “Experts” in the Registration Statement on Form F-3 (No. 333-282565) of the
Bank.
/s/ KPMG LLP
Chartered Professional
Accountants, Licensed Public Accountants
December 2, 2025
Toronto, Canada
© 2025 KPMG LLP, an Ontario limited liability partnership and a member firm of the KPMG global
organization of independent member firms affiliated with KPMG International Limited, a private English company limited by guarantee. All rights reserved.
EX-99.5
7
d936350dex995.htm
EX-99.5
EX-99.5
Exhibit 99.5
CERTIFICATIONS
I, L. SCOTT THOMSON,
certify that:
| 1. |
I have reviewed the annual report on Form 40-F of The Bank of Nova
Scotia;
|
| 2. |
Based on my knowledge, this report does not contain any untrue statement of a material fact or omit to state a
material fact necessary to make the statements made, in light of the circumstances under which such statements were made, not misleading with respect to the period covered by this report;
|
| 3. |
Based on my knowledge, the financial statements, and other financial information included in this report,
fairly present in all material respects the financial condition, results of operations and cash flows of the issuer as of, and for, the periods presented in this report;
|
| 4. |
The issuer’s other certifying officer(s) and I are responsible for establishing and maintaining
disclosure controls and procedures (as defined in Exchange Act Rules 13a-15(e) and 15d-15(e)) and internal control over financial reporting (as defined in Exchange Act
Rules 13a-15(f) and 15d-15(f)) for the issuer and have:
|
| |
a) |
Designed such disclosure controls and procedures, or caused such disclosure controls and procedures to be
designed under our supervision, to ensure that material information relating to the issuer, including its consolidated subsidiaries, is made known to us by others within those entities, particularly during the period in which this report is being
prepared;
|
| |
b) |
Designed such internal control over financial reporting, or caused such internal control over financial
reporting to be designed under our supervision, to provide reasonable assurance regarding the reliability of financial reporting and the preparation of financial statements for external purposes in accordance with generally accepted accounting
principles;
|
| |
c) |
Evaluated the effectiveness of the issuer’s disclosure controls and procedures and presented in this
report our conclusions about the effectiveness of the disclosure controls and procedures, as of the end of the period covered by this report based on such evaluation; and
|
| |
d) |
Disclosed in this report any change in the issuer’s internal control over financial reporting that
occurred during the period covered by the annual report that has materially affected, or is reasonably likely to materially affect, the issuer’s internal control over financial reporting; and
|
| 5. |
The issuer’s other certifying officer(s) and I have disclosed, based on our most recent evaluation of
internal control over financial reporting, to the issuer’s auditors and the audit committee of the issuer’s board of directors (or persons performing the equivalent functions):
|
| |
a) |
All significant deficiencies and material weaknesses in the design or operation of internal control over
financial reporting which are reasonably likely to adversely affect the issuer’s ability to record, process, summarize and report financial information; and
|
| |
b) |
Any fraud, whether or not material, that involves management or other employees who have a significant role in
the issuer’s internal control over financial reporting.
|
Date: December 2, 2025
|
| /s/ L. Scott Thomson |
| L. Scott Thomson |
| President and Chief Executive Officer |
CERTIFICATIONS
I, RAJAGOPAL VISWANATHAN, certify that:
| 1. |
I have reviewed the annual report on Form 40-F of The Bank of Nova
Scotia;
|
| 2. |
Based on my knowledge, this report does not contain any untrue statement of a material fact or omit to state a
material fact necessary to make the statements made, in light of the circumstances under which such statements were made, not misleading with respect to the period covered by this report;
|
| 3. |
Based on my knowledge, the financial statements, and other financial information included in this report,
fairly present in all material respects the financial condition, results of operations and cash flows of the issuer as of, and for, the periods presented in this report;
|
| 4. |
The issuer’s other certifying officer(s) and I are responsible for establishing and maintaining
disclosure controls and procedures (as defined in Exchange Act Rules 13a-15(e) and 15d-15(e)) and internal control over financial reporting (as defined in Exchange Act
Rules 13a-15(f) and 15d-15(f)) for the issuer and have:
|
| |
a) |
Designed such disclosure controls and procedures, or caused such disclosure controls and procedures to be
designed under our supervision, to ensure that material information relating to the issuer, including its consolidated subsidiaries, is made known to us by others within those entities, particularly during the period in which this report is being
prepared;
|
| |
b) |
Designed such internal control over financial reporting, or caused such internal control over financial
reporting to be designed under our supervision, to provide reasonable assurance regarding the reliability of financial reporting and the preparation of financial statements for external purposes in accordance with generally accepted accounting
principles;
|
| |
c) |
Evaluated the effectiveness of the issuer’s disclosure controls and procedures and presented in this
report our conclusions about the effectiveness of the disclosure controls and procedures, as of the end of the period covered by this report based on such evaluation; and
|
| |
d) |
Disclosed in this report any change in the issuer’s internal control over financial reporting that
occurred during the period covered by the annual report that has materially affected, or is reasonably likely to materially affect, the issuer’s internal control over financial reporting; and
|
| 5. |
The issuer’s other certifying officer(s) and I have disclosed, based on our most recent evaluation of
internal control over financial reporting, to the issuer’s auditors and the audit committee of the issuer’s board of directors (or persons performing the equivalent functions):
|
| |
a) |
All significant deficiencies and material weaknesses in the design or operation of internal control over
financial reporting which are reasonably likely to adversely affect the issuer’s ability to record, process, summarize and report financial information; and
|
| |
b) |
Any fraud, whether or not material, that involves management or other employees who have a significant role in
the issuer’s internal control over financial reporting.
|
Date: December 2, 2025
|
| /s/ Rajagopal Viswanathan |
| Rajagopal Viswanathan
|
| Group Head and Chief Financial Officer
|
EX-99.6
8
d936350dex996.htm
EX-99.6
EX-99.6
Exhibit 99.6
CERTIFICATION PURSUANT TO 18 U.S.C. SECTION 1350,
AS ENACTED PURSUANT TO
SECTION 906
OF THE U.S. SARBANES-OXLEY ACT OF 2002
In connection with the annual report of The Bank of Nova Scotia (the “Bank”) on Form 40-F for the year ended October 31, 2025 (the “Report”) as filed with the U.S. Securities and Exchange Commission,
I, L. Scott Thomson, President and Chief Executive Officer of the Bank, certify, pursuant to 18 U.S.C. section 1350, as enacted pursuant to section 906 of the
U.S. Sarbanes-Oxley Act of 2002, that to my knowledge:
| |
(i) |
the Report fully complies with the requirements of section 13(a) or 15(d) of the U.S. Securities Exchange Act
of 1934; and
|
| |
(ii) |
the information contained in the Report fairly presents, in all material respects, the financial condition and
results of operations of the Bank.
|
|
|
|
| December 2, 2025 |
|
/s/ L. Scott Thomson
|
|
|
L. Scott Thomson |
|
|
President and Chief Executive Officer |
CERTIFICATION PURSUANT TO 18 U.S.C. SECTION 1350,
AS ENACTED PURSUANT TO
SECTION 906
OF THE U.S. SARBANES-OXLEY ACT OF 2002
In connection with the annual report of The Bank of Nova Scotia (the “Bank”) on Form 40-F for the year ended October 31, 2025 (the “Report”) as filed with the U.S. Securities and Exchange Commission,
I, Rajagopal Viswanathan, Group Head and Chief Financial Officer of the Bank, certify, pursuant to 18 U.S.C. section 1350, as enacted pursuant to section 906
of the U.S. Sarbanes-Oxley Act of 2002, that to my knowledge:
(i) the Report fully complies with
the requirements of section 13(a) or 15(d) of the U.S. Securities Exchange Act of 1934; and
(ii) the information contained in the Report
fairly presents, in all material respects, the financial condition and results of operations of the Bank.
|
|
|
| December 2, 2025
|
|
/s/ Rajagopal Viswanathan
|
|
|
|
|
|
Rajagopal Viswanathan
|
|
|
Group Head and Chief Financial Officer
|