UNITED STATES
SECURITIES AND EXCHANGE COMMISSION
WASHINGTON, D.C. 20549
FORM 8-K
CURRENT REPORT
PURSUANT TO SECTION 13 OR 15(D)
OF THE SECURITIES EXCHANGE ACT OF 1934
Date of Report (Date of earliest event reported): November 19, 2025
SR BANCORP, INC.
(Exact Name of Registrant as Specified in Charter)
| Maryland | 001-41808 | 92-2601722 | ||
| (State or Other Jurisdiction of Incorporation) |
(Commission File No.) |
(I.R.S. Employer Identification No.) |
| 220 West Union Avenue, Bound Brook, New Jersey | 08805 | |
| (Address of Principal Executive Offices) | (Zip Code) |
Registrant’s telephone number, including area code: (732) 560-1700
Not Applicable
(Former name or former address, if changed since last report)
Check the appropriate box below if the Form 8-K filing is intended to simultaneously satisfy the filing obligation of the registrant under any of the following provisions (see General Instruction A.2. below):
| ☐ | Written communications pursuant to Rule 425 under the Securities Act (17 CFR 230.425) |
| ☐ | Soliciting material pursuant to Rule 14a-12 under the Exchange Act (17 CFR 240.14a-12) |
| ☐ | Pre-commencement communications pursuant to Rule 14d-2(b) under the Exchange Act (17 CFR 240.14d-2(b)) |
| ☐ | Pre-commencement communications pursuant to Rule 13e-4(c) under the Exchange Act (17 CFR 240.13e-4(c)) |
Securities registered pursuant to Section 12(b) of the Act:
| Title of each class |
Trading |
Name of each exchange |
||
| Common Stock, $0.01 par value | SRBK | The NASDAQ Stock Market, LLC |
Indicate by check mark whether the registrant is an emerging growth company as defined in Rule 405 of the Securities Act of 1933 (§230.405 of this chapter) or Rule 12b-2 of the Securities Exchange Act of 1934 (§240.12b-2 of this chapter).
Emerging growth company ☒
If an emerging growth company, indicate by check mark if the registrant has elected not to use the extended transition period for complying with any new or revised financial accounting standards provided pursuant to Section 13(a) of the Exchange Act. ☐
| Item 5.07 | Submission of Matters to a Vote of Security Holders. |
The Annual Meeting of Stockholders of SR Bancorp, Inc. (the “Company”) was held on November 19, 2025. The final results of the vote on each matter submitted to a vote of stockholders are as follows:
| 1. | The following individual was elected as directors of the Company for a one-year term or until his successor is duly elected and qualified, by the following vote: |
| For | Withhold | Broker Non-Votes |
||||||||||
| Robert Mustard |
4,596,661 | 290,328 | 2,230,197 | |||||||||
The following individuals were elected as directors of the Company for a three-year term or until his successors are duly elected and qualified, by the following vote:
| For | Withhold | Broker Non-Votes |
||||||||||
| Marc Lebovitz |
4,531,816 | 355,173 | 2,230,197 | |||||||||
| Douglas M. Sonier |
3,963,150 | 923,839 | 2,230,197 | |||||||||
| William P. Taylor |
4,651,483 | 235,506 | 2,230,197 | |||||||||
| 2. | The appointment of Baker Tilly US, LLP to serve as the Company’s independent registered public accounting firm for the fiscal year ending June 30, 2026 was ratified by the following vote: |
| For |
Against |
Abstentions |
||
| 6,975,091 | 90,382 | 51,713 |
| Item 7.01 | Regulation FD Disclosure |
The Company is furnishing the presentation materials presented at the 2025 Annual Meeting of Stockholders as Exhibit 99.1 to this report. The Company is not undertaking to update this presentation. The information in this report (including Exhibit 99.1) is being furnished pursuant to Item 7.01 and shall not be deemed to be “filed” for purposes of Section 18 of the Securities Exchange Act of 1934, as amended, or otherwise subject to the liabilities of that section. This report will not be deemed an admission as to the materiality of any information herein (including Exhibit 99.1).
| Item 9.01 | Financial Statements and Exhibits |
(d) Exhibits.
| Exhibit |
Description |
|
| 99.1 | Slides used by the Company at the 2025 Annual Meeting of Stockholders | |
| 104 | Cover Page Interactive Data File (embedded in the cover page formatted in Inline XBRL). | |
SIGNATURES
Pursuant to the requirements of the Securities Exchange Act of 1934, the registrant has duly caused this report to be signed on its behalf by the undersigned, hereunto duly authorized.
| SR Bancorp, Inc. | ||||||
| DATE: November 19, 2025 | By: | /s/ William P. Taylor |
||||
| William P. Taylor Chief Executive Officer |
||||||

Exhibit 99.1 Annual Shareholders’ Meeting November 19, 2025

Agenda Call to Order – David M. Orbach, Executive Chairman Introduction of Directors and Senior Officers Inspector of Elections’ Report Presentation of Proposals Report to Shareholders Vote Report Adjournment Page 2

Business of Annual Shareholders Meeting 1. Election of Directors – Elect one director to serve until the 2026 annual meeting and three directors to serve until the 2028 annual meeting • Marc Lebovitz • Robert Mustard • Douglas M. Sonier • William P. Taylor 2. The ratification of the appointment of Baker Tilly US, LLP to serve as the independent registered public accounting firm for the fiscal year ending June 30, 2026 Page 3

Disclaimer Forward-Looking Statements Certain statements contained herein are forward-looking statements within the meaning of Section 27A of the Securities Act of 1933, as amended, and Section 21E of the Securities Exchange Act of 1934, as amended (the “Exchange Act”) and are intended to be covered by the safe harbor provisions of the Private Securities Litigation Reform Act of 1995. These statements, which are based on certain current assumptions and describe our future plans, strategies and expectations, can generally be identified by the use of the words “may,” “will,” “should,” “could,” “would,” “plan,” “potential,” “estimate,” “project,” “believe,” “intend,” “anticipate,” “expect,” “target” and similar expressions. Forward-looking statements are based on current beliefs and expectations of management and are inherently subject to significant business, economic and competitive uncertainties and contingencies, many of which are beyond our control. Certain factors that could cause actual results to differ materially from expected results include increased competitive pressures, changes in the interest rate environment, inflation, general economic conditions or conditions within the securities markets, including potential recessionary conditions, the impact of the current federal government shutdown, real estate market values in the Bank’s lending area changes in the quality of our loan and security portfolios, increases in non-performing and classified loans, economic assumptions or changes in our methodology that may impact our allowance for credit losses calculation, changes in liquidity, including the size and composition of our deposit portfolio and the percentage of uninsured deposits in the portfolio, the availability of low-cost funding, monetary and fiscal policies of the U.S. Government including policies of the U.S. Treasury and the Board of Governors of the Federal Reserve System, the imposition of tariffs or other domestic or international governmental policies and retaliatory responses, a failure in or breach of the Company’s operational or security systems or infrastructure, including cyber attacks, the failure to maintain current technologies, failure to retain or attract employees and legislative, accounting and regulatory changes that could adversely affect the business in which the Company and the Bank are engaged. Our actual future results may be materially different from the results indicated by these forward-looking statements. Except as required by applicable law or regulation, we do not undertake, and we specifically disclaim any obligation, to release publicly the results of any revisions that may be made to any forward-looking statement. Non-GAAP Financial Measures This presentation contains financial information determined by methods other than in accordance with accounting principles generally accepted in the United States of America (“GAAP”). These non-GAAP measures include core net income, core return on average assets, tangible book value to assets, and tangible book value per share. Management uses these “non-GAAP” measures in its analysis of the Company’s performance. Management believes these non-GAAP financial measures allow for better comparability of period to period operating performance. Additionally, the Company believes this information is utilized by regulators and market analysts to evaluate a company’s financial condition and therefore, such information is useful to investors. These disclosures should not be viewed as a substitute for operating results determined in accordance with GAAP, nor are they necessarily comparable to non-GAAP performance measures that may be presented by other companies. Page 4
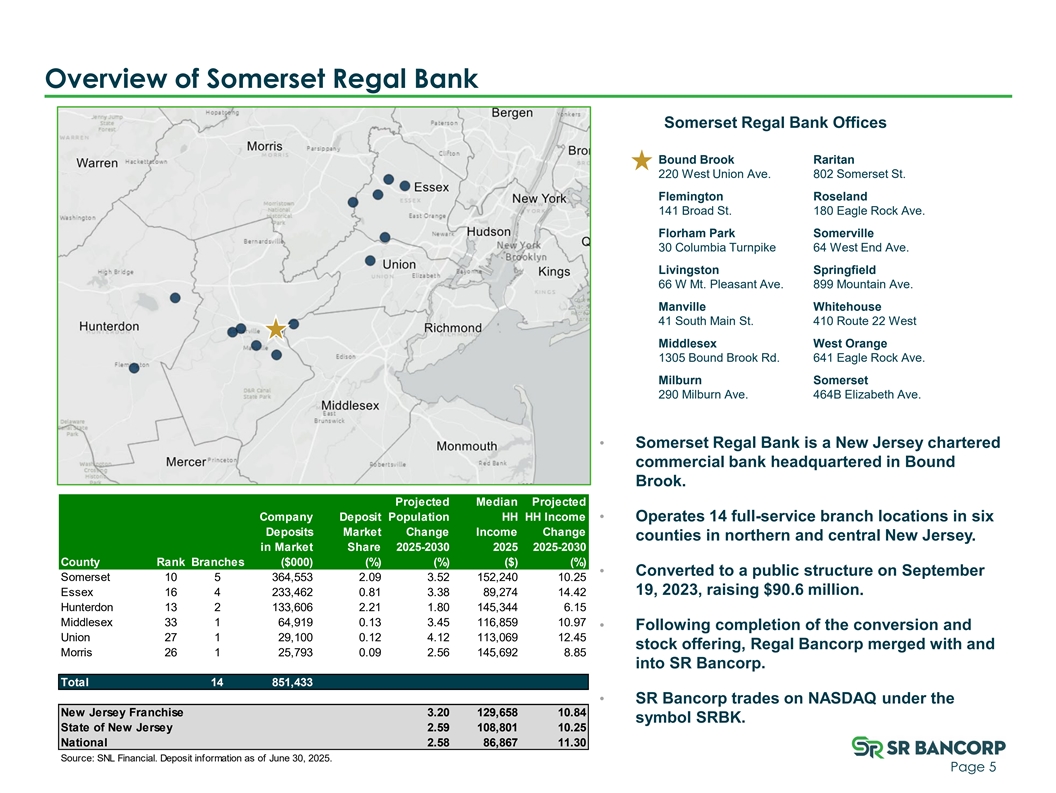
Overview of Somerset Regal Bank Somerset Regal Bank Offices Bound Brook Raritan 220 West Union Ave. 802 Somerset St. Flemington Roseland 141 Broad St. 180 Eagle Rock Ave. Florham Park Somerville 30 Columbia Turnpike 64 West End Ave. Livingston Springfield 66 W Mt. Pleasant Ave. 899 Mountain Ave. Manville Whitehouse 41 South Main St. 410 Route 22 West Middlesex West Orange 1305 Bound Brook Rd. 641 Eagle Rock Ave. Milburn Somerset 290 Milburn Ave. 464B Elizabeth Ave. • Somerset Regal Bank is a New Jersey chartered commercial bank headquartered in Bound Brook. Projected Median Projected Company Deposit Population HH HH Income • Operates 14 full-service branch locations in six Deposits Market Change Income Change counties in northern and central New Jersey. in Market Share 2025-2030 2025 2025-2030 County Rank Branches ($000) (%) (%) ($) (%) • Converted to a public structure on September Somerset 10 5 364,553 2.09 3.52 152,240 10.25 19, 2023, raising $90.6 million. Essex 16 4 233,462 0.81 3.38 89,274 14.42 Hunterdon 13 2 133,606 2.21 1.80 145,344 6.15 Middlesex 33 1 64,919 0.13 3.45 116,859 10.97 • Following completion of the conversion and Union 27 1 29,100 0.12 4.12 113,069 12.45 stock offering, Regal Bancorp merged with and Morris 26 1 25,793 0.09 2.56 145,692 8.85 into SR Bancorp. Total 14 851,433 • SR Bancorp trades on NASDAQ under the New Jersey Franchise 3.20 129,658 10.84 symbol SRBK. State of New Jersey 2.59 108,801 10.25 National 2.58 86,867 11.30 Source: SNL Financial. Deposit information as of June 30, 2025. Page 5

Financial Highlights Dollars in Thousands FY 2024 FY 2025 Q1 2026 (except per share amounts) Assets $1,020,844 $1,084,405 $1,110,096 Net Loans $731,859 $797,166 $826,371 Deposits $807,100 $846,022 $869,612 GAAP Net Income ($10,860) $5,136 $693 1 $950 $3,106 $475 Core Net Income GAAP EPS ($1.59) $0.61 $0.09 1 $0.14 $0.37 $0.06 Core EPS GAAP ROAA (1.10%) 0.49% 0.06% 1 Core ROAA 0.10% 0.29% 0.04% Book Value Per Share $20.98 $21.83 $22.12 2 $18.02 $18.83 $19.08 Tangible Book Value Per Share Noninterest Exp / Avg Assets 3.51% 2.56% 2.60% Non-Performing Assets $50 $0 $0 Financial data for SR Bancorp’s Fiscal Year Ended June 30 or for the quarter ended September 30, 2025. 1) Core net income for fiscal year ended June 30, 2024 is net income less $4.4 million in one-time merger related expenses, $4.2 million provision for credit losses on acquired loan portfolio, $5.4 million charitable contribution to the foundation, $4.1 million net accretion income related to fair value adjustments and $4.5 million loss on the sale of AFS securities, tax affected. Core net income for fiscal year ended June 30, 2025 is net income less $2.8 million net accretion income related to fair value adjustments. Core net income for quarter ended September 30, 2025 is net income less $303,000 net accretion income related to fair value adjustments. 2) Tangible book value per share is calculated based on total stockholders’ equity, excluding intangible assets (goodwill and core deposit intangibles), divided by total shares outstanding as of the periods indicated. Goodwill and core deposit intangibles were $28,141, $26,708 and $26,393 at FY 2024, FY 2025 and Q1 2026, respectively. Page 6

Financial Highlights – Total Assets • Assets grew since the merger with Regal Bank in September 2023 st • Strong loan growth fueled 1 quarter 2026 asset growth $1,110.1M $1,084.4M $1,020.8M $651.5M $648.6M $639.4M 2021 2022 2023 2024 2025 Q1 2026 Loans Receivable, Net Securities - AFS Cash and Cash Equivalents Securities - HTM Premises and Equipment, Net Other Assets Bank Owned Life Insurance Financial data for Somerset Savings Bank, SLA for 2021, 2022 and 2023 fiscal years and for SR Bancorp’s for fiscal 2024 and 2025 and for the quarter ended September 30, 2025. Page 7

Financial Highlights – Total Loans At September 30, Dollars in Thousands 2023 2024 2025 Owner occupied commercial real estate loans $ 60,850 $ 59,229 $ 52, 385 Other commercial real estate loans 75,357 75,415 80,969 Multi-family loans 171,427 205,929 224, 867 Commercial and industrial loans 12,789 12,092 17,646 Total commercial loans 320,423 352,665 375,867 Residential mortgage loans 362,704 406,258 439, 851 Consumer and other loans 12,371 11,706 13,786 Total loans 695,498 770,629 829,504 Allowance for credit losses (5,325) ( 5,075) (5,533) Deferred loan costs, net 2,230 2,163 2,400 Loans receivable, net $ 692,403 $ 767,717 $ 826,371 Page 8
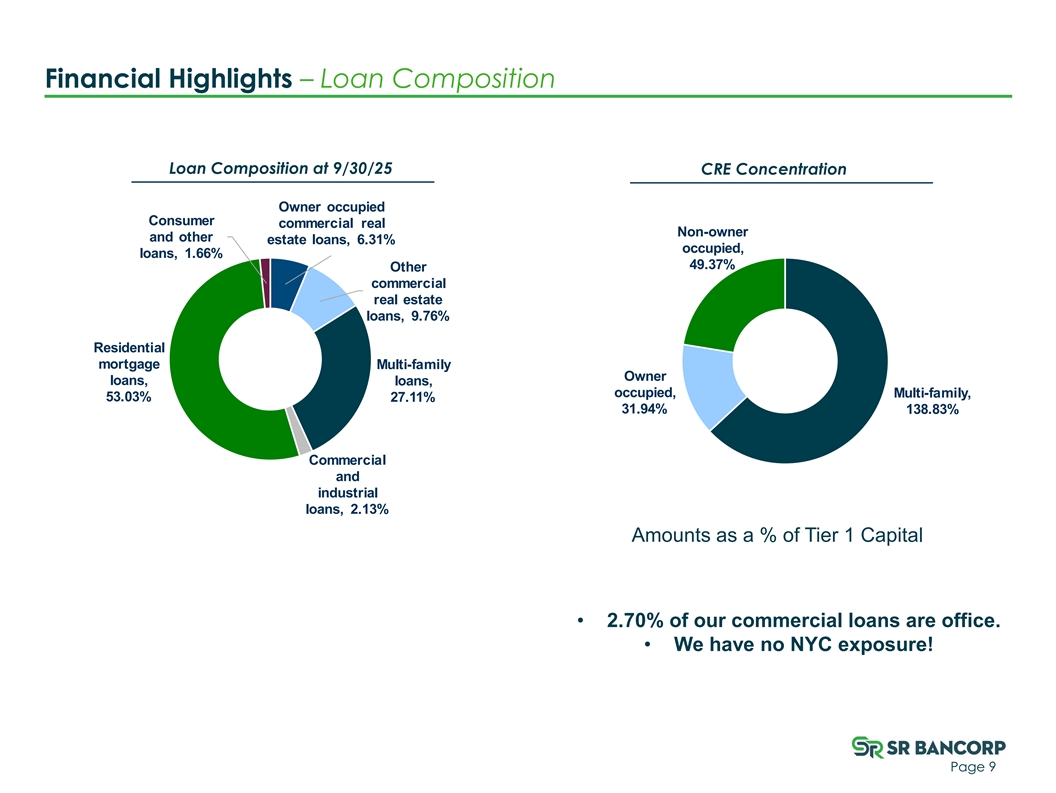
Financial Highlights – Loan Composition Loan Composition at 9/30/25 CRE Concentration Owner occupied Consumer commercial real Non-owner and other estate loans, 6.31% occupied, loans, 1.66% 49.37% Other commercial real estate loans, 9.76% Residential mortgage Multi-family Owner loans, loans, occupied, Multi-family, 53.03% 27.11% 31.94% 138.83% Commercial and industrial loans, 2.13% Amounts as a % of Tier 1 Capital • 2.70% of our commercial loans are office. • We have no NYC exposure! Page 9
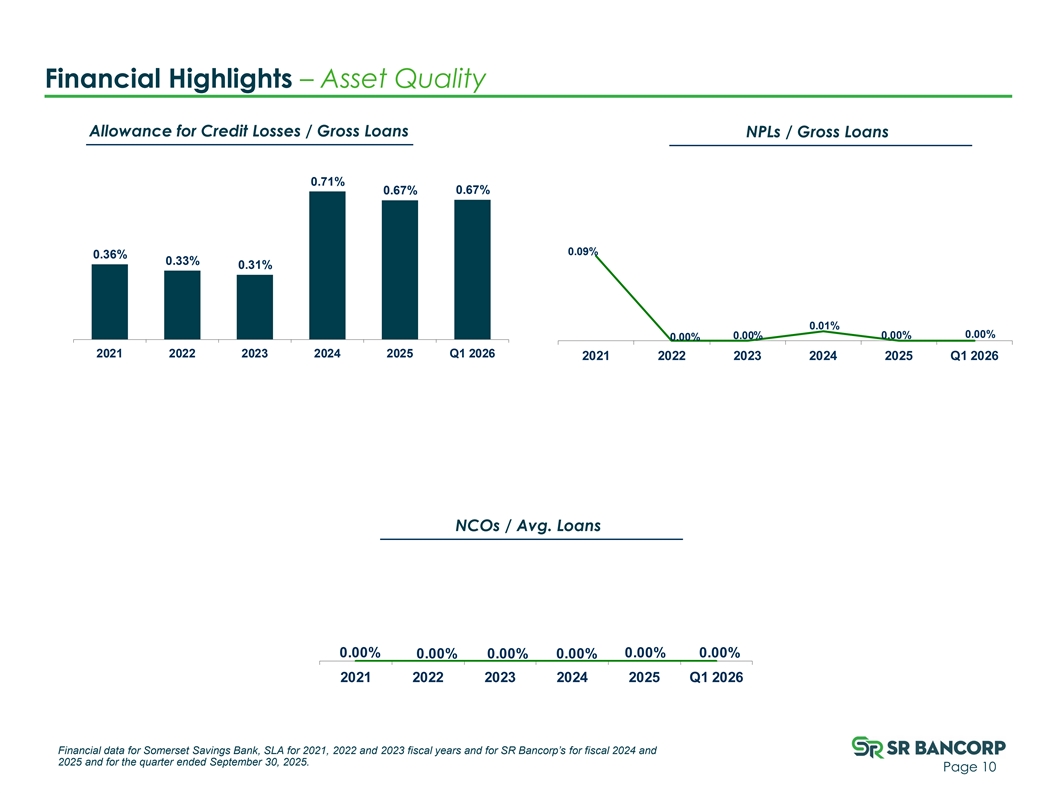
Financial Highlights – Asset Quality Allowance for Credit Losses / Gross Loans NPLs / Gross Loans 0.71% 0.67% 0.67% 0.09% 0.36% 0.33% 0.31% 0.01% 0.00% 0.00% 0.00% 0.00% 2021 2022 2023 2024 2025 Q1 2026 2021 2022 2023 2024 2025 Q1 2026 NCOs / Avg. Loans 0.00% 0.00% 0.00% 0.00% 0.00% 0.00% 2021 2022 2023 2024 2025 Q1 2026 Financial data for Somerset Savings Bank, SLA for 2021, 2022 and 2023 fiscal years and for SR Bancorp’s for fiscal 2024 and 2025 and for the quarter ended September 30, 2025. Page 10

Financial Highlights – Deposits Deposit Trends Cost of Gross Loans / Deposits Deposits 0.53% 1.63% 2.13% 0.32% 0.46% 2.15% 95.66% 94.86% $869.6M 91.33% $819.4M $807.1M $522.1M $510.0M $503.9M 72.11% 64.30% 60.38% 2021 2022 2023 2024 2025 Q1 2026 2021 2022 2023 2024 2025 Q1 2026 Non-Interest Demand Deposits Interest-Bearing Demand Deposits Savings and Club Accounts Time Deposits Financial data for Somerset Savings Bank, SLA for 2021, 2022 and 2023 fiscal years and for SR Bancorp’s for fiscal 2024 and 2025 and for the quarter ended September 30, 2025. Page 11

Financial Highlights - Profitability Core ROAA* Core Net Income* $3,106 0.31% 0.29% 0.29% $1,995 $1,871 0.20% $1,229 $950 0.10% $475 0.04% 2021 2022 2023 2024 2025 Q1 2026 2021 2022 2023 2024 2025 Q1 2026 Net Interest Margin Non Interest Expense / Avg. Assets 3.51% 3.19% 3.05% 2.93% 2.60% 2.56% 2.25% 2.03% 1.95% 1.70% 1.70% 1.85% 2021 2022 2023 2024 2025 Q1 2026 2021 2022 2023 2024 2025 Q1 2026 Financial data for Somerset Savings Bank, SLA for 2021, 2022 and 2023 fiscal years and for SR Bancorp’s for fiscal 2024 and 2025 and for the quarter ended September 30, 2025. Noninterest expenses for the fiscal year ended June 30, 2024 include $4.4 million in one-time merger expenses. *GAAP net income ($10,860), $5,136 and $693 for the periods ending June 30, 2024, June 30, 2025 and September 30, 2025, respectively. GAAP ROAA was Page 12 (1.10%), 0.49% and 0.25% for the periods ending June 30, 2024, June 30, 2025 and September 30, 2025, respectively.

Creating Shareholder Value • On September 19, 2024, we adopted our initial stock repurchase program since becoming a public company. We completed this share repurchase on August 4, 2025 at an average price of $12.09. • On July 8, 2025, we approved the repurchase of an additional 886,137 shares, or approximately 10% of our then outstanding shares. We repurchased 198,310 shares at an average price of $14.71 during the three months ended September 30, 2025. 2021 2022 2023 2024 2025 Q1 2026 Tier 1 Capital (to average total assets) 19.9% 19.4% 19.6% 16.8% 15.5% 15.5% Equity / Total Assets 19.1% 18.2% 18.7% 19.5% 17.9% 17.3% 1 19.1% 18.2% 18.7% 17.3% 15.8% 15.3% Tangible Equity / Tangible Assets 2 - - - 9,507,930 8,875,170 8,676,860 Common Shares Outstanding Financial data for Somerset Savings Bank SLA for 2021, 2022 and 2023 fiscal years and for SR Bancorp’s fiscal years 2024 and 2025 and for the quarter ended September 30, 2025. 1) Tangible book value per share is calculated based on total stockholders’ equity, excluding intangible assets (goodwill and core deposit intangibles), divided by total shares outstanding as of the periods indicated. Goodwill and core deposit intangibles were $28,141, $26,708 and $26,393 at FY 2024, FY 2025 and Q1 2026, respectively. Page 13

Overview of SR Bancorp, Inc. Stockholder Information (NASDAQ: SRBK) Ownership Market Information as of 11/14/25 Institutional 29.0% Total Market Cap (mm) $131.5 1 Insider* 17.6% Tangible Book Value $165,540 Tangible Book Value / Share $19.08 Dividend Yield 1.32% Price / Tangible Book 79% LTM Dividend Payout 27.78% Price / LTM EPS 28.1x Ownership information based on Proxy Statement and S&P Global Market Intelligence as of 9/30/25. Market information as of 11/14/25. *Includes 9.78% of the shares of common stock outstanding owned by the ESOP and the 401(k) Plan. 1) Tangible book value per share is calculated based on total stockholders’ equity, excluding intangible assets (goodwill and core deposit intangibles), divided by total shares outstanding as of the periods indicated. Goodwill and core deposit intangibles were $26,393 at Q1 2026. Book value and book value per share at Q1 2026 were $191,933 and $22.12, respectively. Dollars in thousands. Page 14

Tangible Book Value Growth 50.0% 53.5% 52.6% 51.3% 61.4% 64.6% 65.2% 72.3% 79.1% P/TBV $16.00 $19.50 $15.00 $19.00 $14.00 $13.00 $18.50 $12.00 $18.00 $11.00 $10.00 $17.50 $9.00 $8.00 $17.00 9/30/23 12/31/23 3/31/24 6/30/24 9/30/24 12/31/24 3/31/25 6/30/25 9/30/25 TBV Stock Price Source: S&P Global Market Intelligence. Page 15 Stock Price TBV
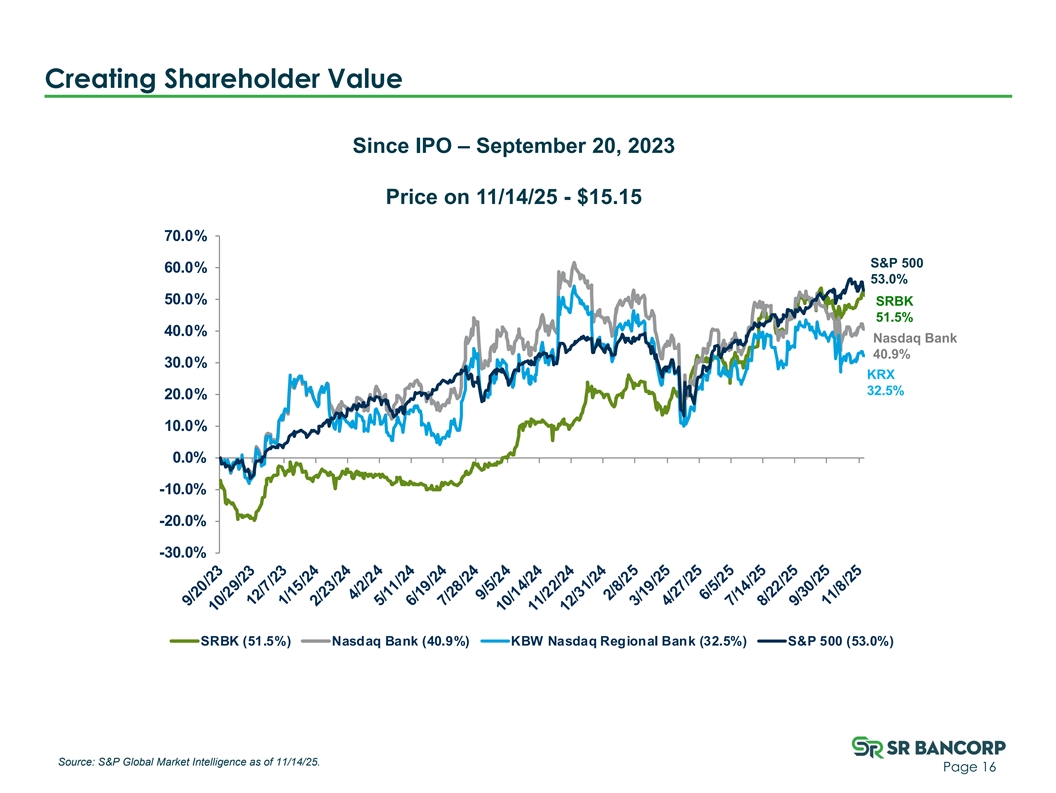
Creating Shareholder Value Since IPO – September 20, 2023 Price on 11/14/25 - $15.15 70.0% S&P 500 60.0% 53.0% 50.0% SRBK 51.5% 40.0% Nasdaq Bank 40.9% 30.0% KRX 32.5% 20.0% 10.0% 0.0% -10.0% -20.0% -30.0% SRBK (51.5%) Nasdaq Bank (40.9%) KBW Nasdaq Regional Bank (32.5%) S&P 500 (53.0%) Source: S&P Global Market Intelligence as of 11/14/25. Page 16
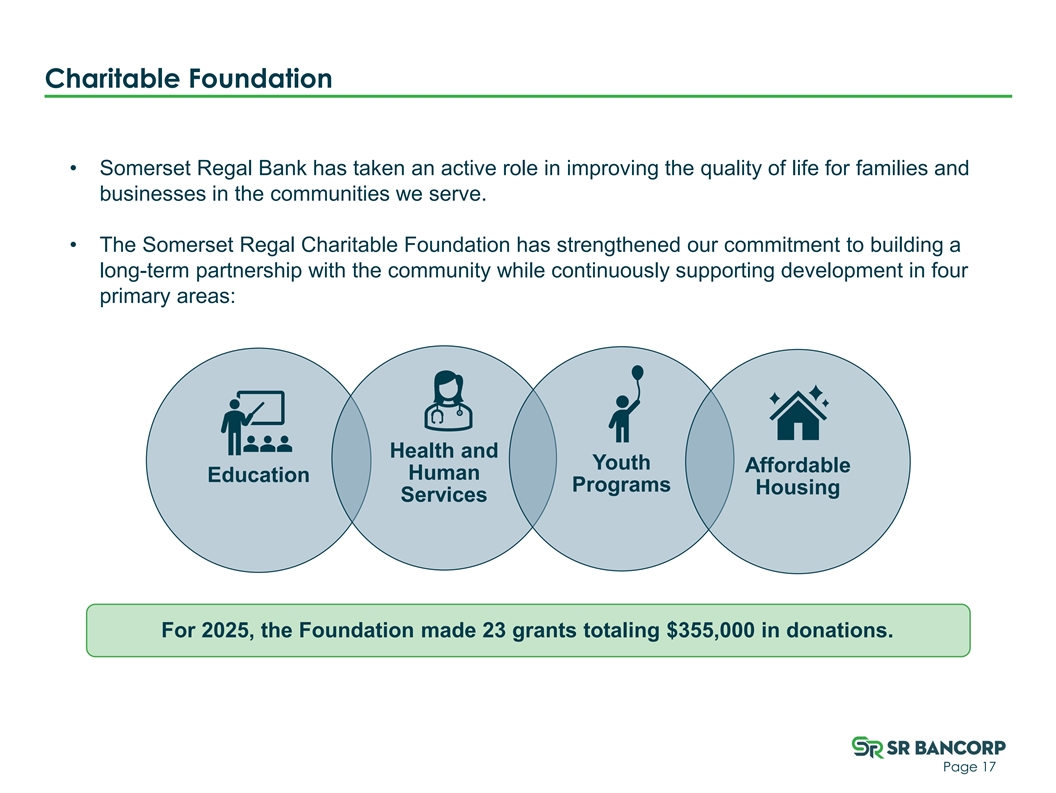
Charitable Foundation • Somerset Regal Bank has taken an active role in improving the quality of life for families and businesses in the communities we serve. • The Somerset Regal Charitable Foundation has strengthened our commitment to building a long-term partnership with the community while continuously supporting development in four primary areas: Health and Youth Affordable Human Education Programs Housing Services For 2025, the Foundation made 23 grants totaling $355,000 in donations. Page 17

Questions and Answers

220 W. Union Avenue Bound Brook, NJ 08805 somersetregalbank.com