UNITED STATES
SECURITIES AND EXCHANGE COMMISSION
WASHINGTON, DC 20509
FORM 8-K
CURRENT REPORT
PURSUANT TO SECTION 13 OR 15(d)
OF THE SECURITIES EXCHANGE ACT OF 1934
Date of Report (Date of earliest event reported) November 14, 2025
Tejon Ranch Co.
(Exact Name of Registrant as Specified in its Charter)
| Delaware | 1-07183 | 77-0196136 | ||
| (State or Other Jurisdiction of Incorporation) |
(Commission File Number) |
(IRS Employer Identification No.) |
||
| P. O. Box 1000, Lebec, California | 93243 | |||
| (Address of Principal Executive Offices) | (Zip Code) | |||
Registrant’s telephone number, including area code 661-248-3000
Not applicable
(Former Name or Former Address, if Changed Since Last Report)
Check the appropriate box below if the Form 8-K filing is intended to simultaneously satisfy the filing obligation of the registrant under any of the following provisions (see General Instruction A.2. below):
| ☐ | Written communications pursuant to Rule 425 under the Securities Act (17 CFR 230.425) |
| ☐ | Soliciting material pursuant to Rule 14a-12 under the Exchange Act (17 CFR 240.14a-12) |
| ☐ | Pre-commencement communications pursuant to Rule 14d-2(b) under the Exchange Act (17 CFR 240.14d-2(b)) |
| ☐ | Pre-commencement communications pursuant to Rule 13e-4(c) under the Exchange Act (17 CFR 240.13e-4(c)) |
Securities registered pursuant to Section 12(b) of the Act:
| Title of each class |
Trading |
Name of each exchange on which registered |
||
| Common Stock | TRC | New York Stock Exchange |
Indicate by check mark whether the registrant is an emerging growth company as defined in Rule 405 of the Securities Act of 1933 (§230.405 of this chapter) or Rule 12b-2 of the Securities Exchange Act of 1934 (§240.12b-2 of this chapter).
Emerging growth company ☐
If an emerging growth company, indicate by check mark if the registrant has elected not to use the extended transition period for complying with any new or revised financial accounting standards provided pursuant to Section 13(a) of the Exchange Act. ☐
| Item 7.01 | Regulation FD Disclosure. |
On November 14, 2025, Tejon Ranch Co. (the “Company”) is hosting an Investor Engagement Event at the New York Stock Exchange (the “Investor Engagement Event”) to discuss the strategic vision of the Company. A copy of the presentation materials that is being provided to and discussed with attendees at the Investor Engagement Event is furnished as Exhibit 99.1 to this Current Report on Form 8-K.
The information in this Current Report on Form 8-K (including the exhibit attached as Exhibit 99.1 hereto) is being furnished pursuant to Item 7.01 of Form 8-K and shall not be deemed to be “filed” for the purposes of Section 18 of the Securities Exchange Act of 1934, as amended (the “Exchange Act”), or otherwise subject to the liabilities of that section, nor shall it be deemed to be incorporated by reference in any filing under the Securities Act (including the exhibit attached as Exhibit 99.1 hereto).
| Item 9.01 | Financial Statements and Exhibits. |
For the exhibits that are furnished herewith, see the Index to Exhibits immediately following.
INDEX TO EXHIBITS
| 99.1 | Investor Engagement Event November 14, 2025 Slide Presentation. | |
| 104 | Cover Page Interactive Data File (formatted as Inline XBRL and contained in Exhibit 101). | |
SIGNATURES
Pursuant to the requirements of the Securities Exchange Act of 1934, the Registrant has duly caused this report to be signed on its behalf by the undersigned hereunto duly authorized.
| Date: November 14, 2025 | TEJON RANCH CO. | |||||
| By: | /S/ MICHAEL R.W. HOUSTON |
|||||
| Name: | Michael R.W. Houston | |||||
| Title: | Senior Vice President, General Counsel & Secretary | |||||
Exhibit 99.1 Tejon Ranch Company Investor Engagement Day NOVEMBER 14, 2025
Disclaimer Safe Harbor Statement This presentation contains forward-looking statements within the meaning of the federal securities laws. Generally speaking, any statement not based upon historical fact is a forward-looking statement. In particular, statements regarding the Company’s business plans, strategies, prospects, objectives, milestones, future operating results, financial condition, expectations regarding capital allocation, cost savings, share repurchases, entitlement and development timelines, partnerships, regulatory reforms, and other future events or circumstances are forward-looking statements. These statements reflect the Company’s current expectations and beliefs about future developments and their potential effects on the Company. Forward-looking statements are not guarantees of performance and speak only as of the date of this letter. Words such as “anticipate,” “believe,” “estimate,” “expect,” “intend,” “plan,” “project,” “target,” “can,” “could,” “may,” “will,” “should,” “would,” “likely,” “improve,” “commit,” and similar expressions, as well as discussions of strategy, objectives, and intentions, are intended to identify forward-looking statements. These statements are based on current assumptions and involve known and unknown risks, uncertainties, and other factors—many of which are beyond the Company’s control—that could cause actual results to differ materially from those expressed or implied. Such factors include, but are not limited to, market, economic, geopolitical and weather conditions; the availability and cost of financing for land development and other activities; competition; commodity prices and agricultural yields; success in obtaining and maintaining governmental entitlements and permits; the timing and outcome of regulatory or litigation processes; demand for commercial, industrial, residential, and retail real estate; and other risks inherent in real estate and agricultural operations. No assurance can be given that actual results will not differ materially from those expressed or implied by these forward-looking statements. Except as required by law, the Company undertakes no obligation to update or revise any forward- looking statement as a result of new information, future events, or otherwise. Investors are cautioned not to place undue reliance on these forward-looking statements. For a discussion of risks and uncertainties that could cause actual results to differ, please refer to the Company’s Annual Report on Form 10-K for the fiscal year ended December 31, 2024, and subsequent filings with the U.S. Securities and Exchange Commission. Non-GAAP Financial Measures Adjusted EBITDA: We use Adjusted EBITDA to assess the performance of our core operations, for financial and operational decision making, and as a supplemental or additional means of evaluating period-to-period comparisons on a consistent basis. Adjusted EBITDA is calculated as EBITDA (earnings before interest, taxes, depreciation, and amortization), excluding stock compensation expense. We believe Adjusted EBITDA provides investors relevant and useful information because it permits investors to view income from our operations on an unleveraged basis, before the effects of taxes, depreciation and amortization, and stock compensation expense. By excluding interest expense and income, EBITDA and Adjusted EBITDA allow investors to measure our performance independent of our capital structure and indebtedness and, therefore, allow for a more meaningful comparison of our performance to that of other companies, both in the real estate industry and in other industries. We believe that excluding charges related to share-based compensation facilitates a comparison of our operations across periods and among other companies without the variances caused by different valuation methodologies, the volatility of the expense (which depends on market forces outside our control), and the assumptions and the variety of award types that a company can use. Quantitative reconciliation of historical measures of Adjusted EBITDA to net income, which is the most directly comparable GAAP measure, is provided on a previous slide. TRCC Net Asset Value (NAV) Per Share: The inputs used in calculating NAV are derived from publicly available disclosures and third-party market data. Tejon Ranch Co.’s share of depreciation and interest expense for unconsolidated joint ventures, as disclosed in the Company’s SEC filings, was used to estimate Net Operating Income (“NOI”) attributable to its 50/50 joint ventures, excluding the TA/Petro investments. Cap rates applied to the NOI are based on average market rates for industrial and retail assets published in the most recent PwC Real Estate Investor Survey. Land value assumptions, including the $1,500 per acre estimate, reflect legacy benchmarks historically applied to quality grazing land. Due to the aggregation of NOI for outlet and industrial assets in the disclosures, a uniform cap rate was applied across both asset types for valuation purposes. We believe TTRCC NAV Per Share is useful to shareholders because it illustrates the current value of our strategic assets, and management uses this measure to evaluate contribution of TRCC relative to overall company NAV. Other companies may calculate NAV and measures associated with it differently. We do not believe there is a directly comparable GAAP measure to TRCC NAV Per Share. Net Debt / Adjusted EBITDA: We use Net Debt / Adjusted EBITDA as a non-GAAP financial measure to evaluate our capital structure and ability to service our debt. Management believes this ratio provides useful insight into leverage trends and capital efficiency. Net debt includes TRC debt and the company’s pro rata share of debt held at unconsolidated joint ventures, offset by consolidated and pro rata cash. Adjusted EBITDA is used as a proxy for core operating performance. There is no directly comparable GAAP measure to Net Debt; a reconciliation is provided above. Reconciliation of Adjusted Farming EBITDA before Fixed Water Obligations The Company evaluates the performance of its farming operations using Adjusted Farming EBITDA before fixed water obligations, a non-GAAP financial measure. Management believes this measure provides a meaningful representation of the underlying profitability and cash flow potential of its agricultural operations by excluding both non-operating items and the fixed water obligation, which represents a non-controllable infrastructure cost incurred regardless of the level of farming activity in this segment. The fixed water obligations reflects the Company’s allocated share of infrastructure and financing costs associated with the transmission and delivery of water to the Company’s property. These obligations primarily consist of annual assessments levied to repay bonds issued by the State of California to finance the construction and on-going maintenance of the state water project system and local water districts water systems. The landowners who hold water rights, including the Company, are responsible for repaying these bonds through fixed annual payments. Unlike variable water costs which are included in farming expenses, management views the fixed water obligation as an infrastructure cost that supports long-term access to water resources, rather than an essential operating cost of farming. Accordingly, Adjusted Farming EBITDA before fixed water obligations allows management and investors to evaluate the operating performance of the Company’s farming segment independent of the fixed costs associated with water infrastructure. 2
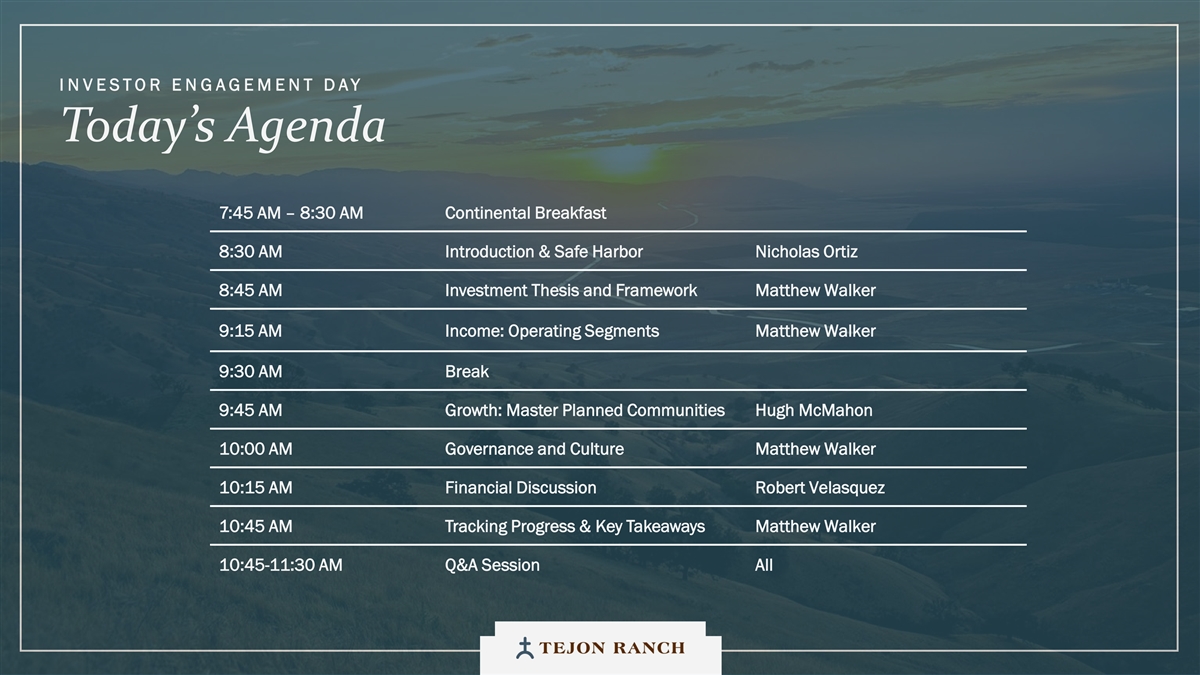
I N VESTOR E N G AGEMENT DAY Today’s Agenda 7:45 AM – 8:30 AM Continental Breakfast 8:30 AM Introduction & Safe Harbor Nicholas Ortiz 8:45 AM Investment Thesis and Framework Matthew Walker 9:15 AM Income: Operating Segments Matthew Walker 9:30 AM Break 9:45 AM Growth: Master Planned Communities Hugh McMahon 10:00 AM Governance and Culture Matthew Walker 10:15 AM Financial Discussion Robert Velasquez 10:45 AM Tracking Progress & Key Takeaways Matthew Walker 10:45-11:30 AM Q&A Session All
Introduction & Safe Harbor

Strategic Review & Update
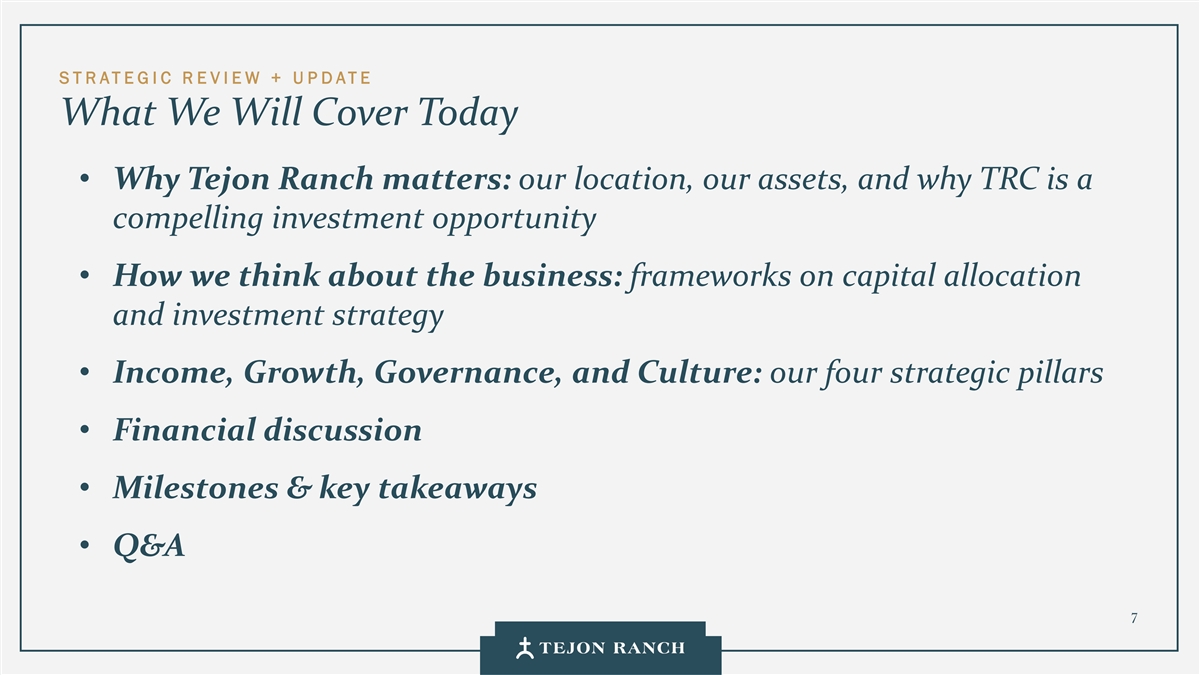
STRATEGIC R EVIEW + U PDATE What We Will Cover Today • Why Tejon Ranch matters: our location, our assets, and why TRC is a compelling investment opportunity • How we think about the business: frameworks on capital allocation and investment strategy • Income, Growth, Governance, and Culture: our four strategic pillars • Financial discussion • Milestones & key takeaways • Q&A 7

Investment Thesis
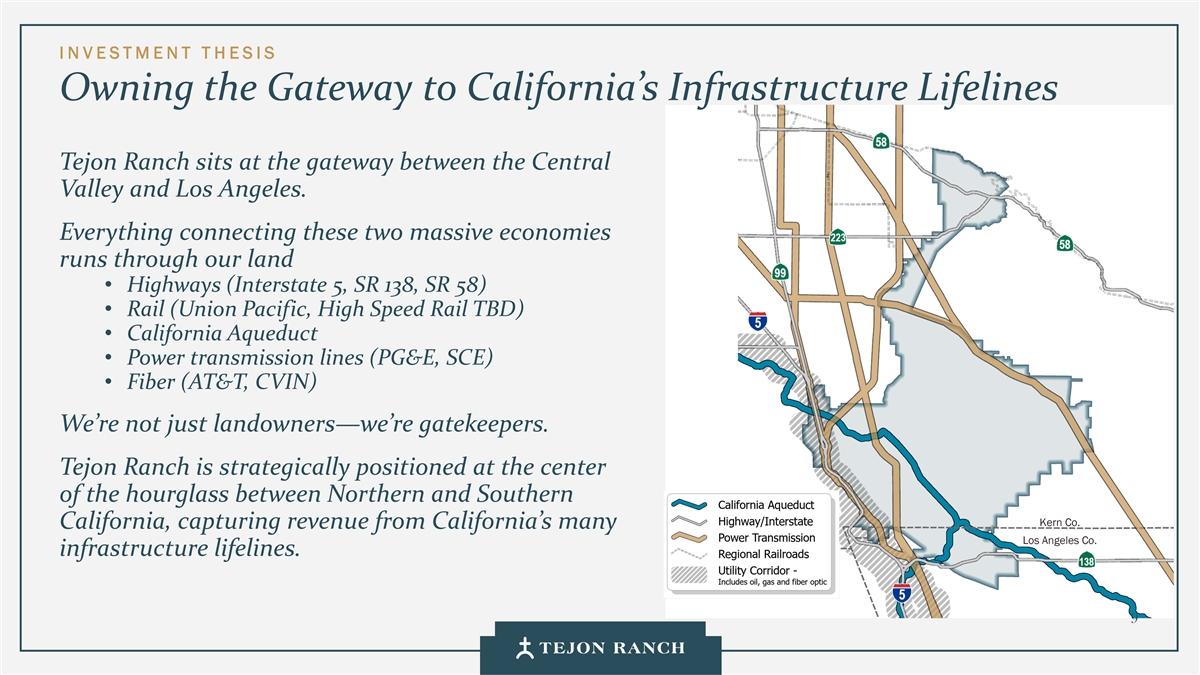
I N VESTMENT T H ESIS Owning the Gateway to California’s Infrastructure Lifelines Tejon Ranch sits at the gateway between the Central Valley and Los Angeles. Everything connecting these two massive economies runs through our land • Highways (Interstate 5, SR 138, SR 58) • Rail (Union Pacific, High Speed Rail TBD) • California Aqueduct • Power transmission lines (PG&E, SCE) • Fiber (AT&T, CVIN) We’re not just landowners—we’re gatekeepers. Tejon Ranch is strategically positioned at the center of the hourglass between Northern and Southern Kern Co. California, capturing revenue from California’s many Los Angeles Co. infrastructure lifelines. 9
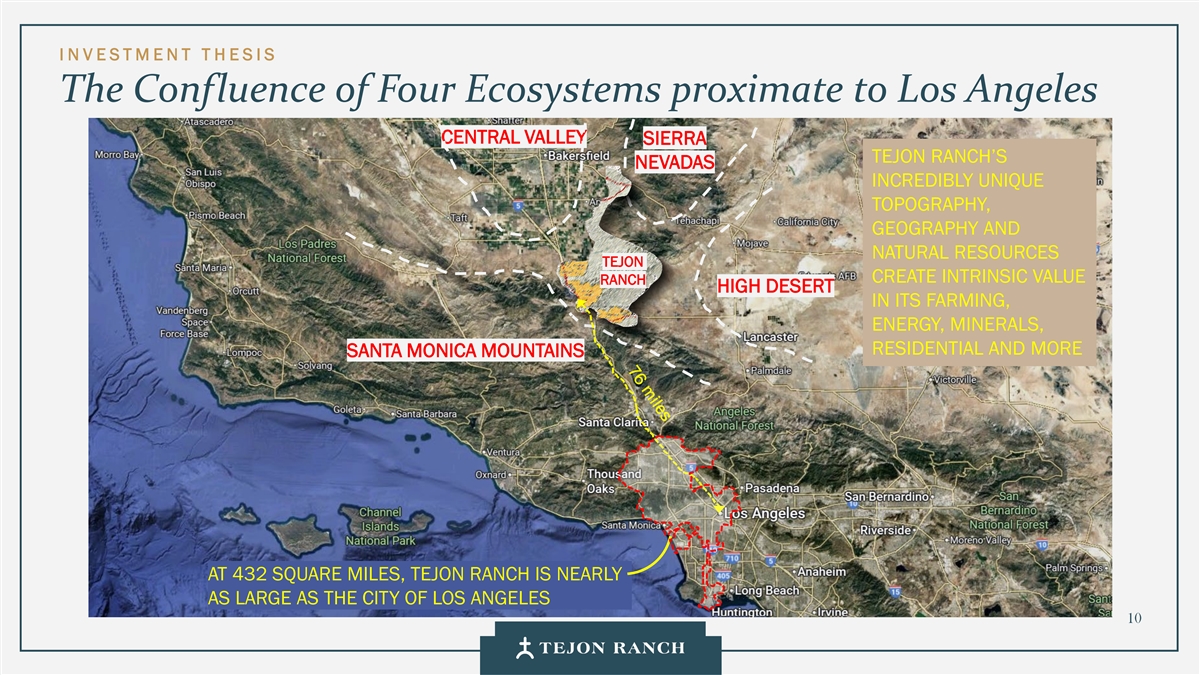
I N VESTMENT T H ESIS The Confluence of Four Ecosystems proximate to Los Angeles CENTRAL VALLEY SIERRA TEJON RANCH’S NEVADAS INCREDIBLY UNIQUE TOPOGRAPHY, GEOGRAPHY AND NATURAL RESOURCES TEJON CREATE INTRINSIC VALUE RANCH HIGH DESERT IN ITS FARMING, ENERGY, MINERALS, RESIDENTIAL AND MORE SANTA MONICA MOUNTAINS AT 432 SQUARE MILES, TEJON RANCH IS NEARLY AS LARGE AS THE CITY OF LOS ANGELES 10
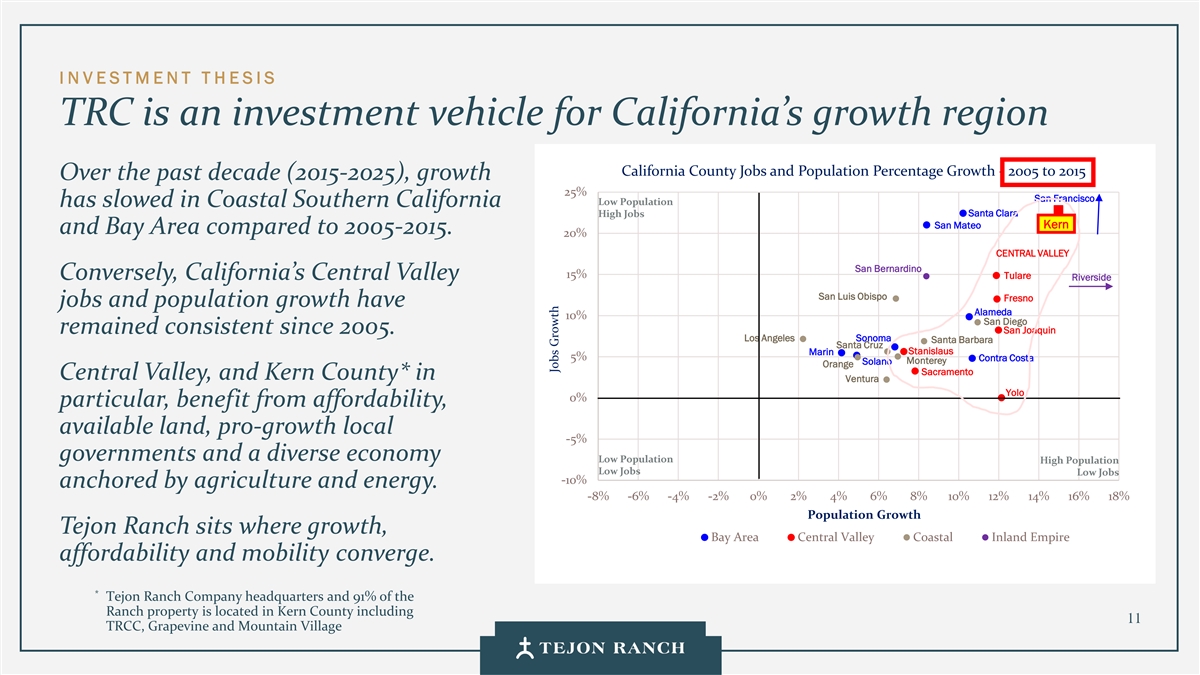
I N VESTMENT T H ESIS TRC is an investment vehicle for California’s growth region California County Jobs and Population Percentage Growth - 2005 to 2015 Over the past decade (2015-2025), growth 25% San Francisco Low Population has slowed in Coastal Southern California Santa Clara High Jobs Kern San Mateo Kern and Bay Area compared to 2005-2015. 20% CENTRAL VALLEY San Bernardino 15% Tulare Conversely, California’s Central Valley Riverside San Luis Obispo Fresno jobs and population growth have Alameda 10% San Diego remained consistent since 2005. San Joaquin Los Angeles Sonoma Santa Barbara Santa Cruz Marin Stanislaus 5% Contra Costa Monterey Solano Orange Sacramento Central Valley, and Kern County* in Ventura Yolo 0% particular, benefit from affordability, available land, pro-growth local -5% governments and a diverse economy Low Population High Population Low Jobs Low Jobs -10% anchored by agriculture and energy. -8% -6% -4% -2% 0% 2% 4% 6% 8% 10% 12% 14% 16% 18% Population Growth Tejon Ranch sits where growth, Bay Area Central Valley Coastal Inland Empire affordability and mobility converge. * Tejon Ranch Company headquarters and 91% of the Ranch property is located in Kern County including 11 TRCC, Grapevine and Mountain Village Jobs Growth
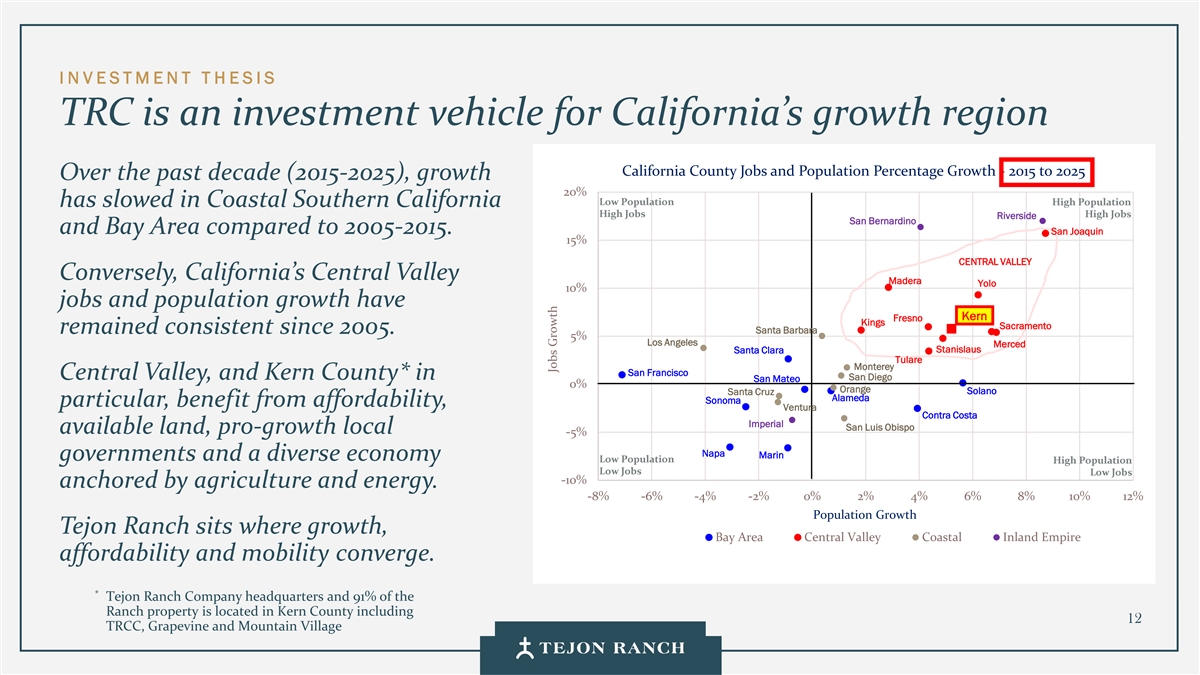
I N VESTMENT T H ESIS TRC is an investment vehicle for California’s growth region California County Jobs and Population Percentage Growth - 2015 to 2025 Over the past decade (2015-2025), growth 20% Low Population High Population has slowed in Coastal Southern California High Jobs High Jobs Riverside San Bernardino and Bay Area compared to 2005-2015. San Joaquin 15% CENTRAL VALLEY Conversely, California’s Central Valley Madera Yolo 10% jobs and population growth have K Kee rn rn Fresno Kings Sacramento remained consistent since 2005. Santa Barbara 5% Los Angeles Merced Stanislaus Santa Clara Tulare Monterey San Francisco Central Valley, and Kern County* in San Diego San Mateo 0% Orange Santa Cruz Solano Alameda Sonoma particular, benefit from affordability, Ventura Contra Costa Imperial San Luis Obispo available land, pro-growth local -5% Napa Marin governments and a diverse economy Low Population High Population Low Jobs Low Jobs -10% anchored by agriculture and energy. -8% -6% -4% -2% 0% 2% 4% 6% 8% 10% 12% Population Growth Tejon Ranch sits where growth, Bay Area Central Valley Coastal Inland Empire affordability and mobility converge. * Tejon Ranch Company headquarters and 91% of the Ranch property is located in Kern County including 12 TRCC, Grapevine and Mountain Village Jobs Growth

I N VESTMENT T H ESIS A Place Where Californians Can Still Afford California’s housing market has priced out the middle class. Bakersfield 110 mi 23.4% 1 The median home price falls $35,000 per mile heading north on Interstate 5. Home ownership costs don’t drop below 30% of household income until Santa Clarita, and drop to 23.4% in Kern County/Bakersfield. 12,000 units Grapevine Tejon Ranch’s two primary residential communities, Grapevine and 82 mi 2 Mountain Village Centennial, are well positioned to capture demand for affordable homes 68 mi 62 mi Centennial Grapevine and Centennial Located within Affordable Residential Corridor 19,000 units with Housing Cost (PITI) less than 30% of Household Income Miles Home Median from Owner- Home Median PITI % Santa Clarita City Ocean ship % Price HHI PITI of HHI 40 mi 29.3% Bakersfield 110 mi 60.2% $410,000 $77,397 $18,108 23.4% Santa Clarita 40 mi 72.0% $795,000 $119,926 $35,113 29.3% Encino 72.5% Encino 15 mi 64.0% $1,700,000 $103,498 $75,083 72.5% 15 mi Santa Monica Santa Monica 0 mi 73.8% $4,222,500 $182,688 $186,494 102.1% 0 mi 102.1% 1 Based on difference between median home prices of coastal Santa Monica ($4.2M), and Bakersfield ($410K) divided by 110 miles Miles from PITI % 1 Mountain Village is positioned as a premium community which is not subject to the same Ocean of HHI primary housing affordability factors as Grapevine and Centennial 13
Investment Framework
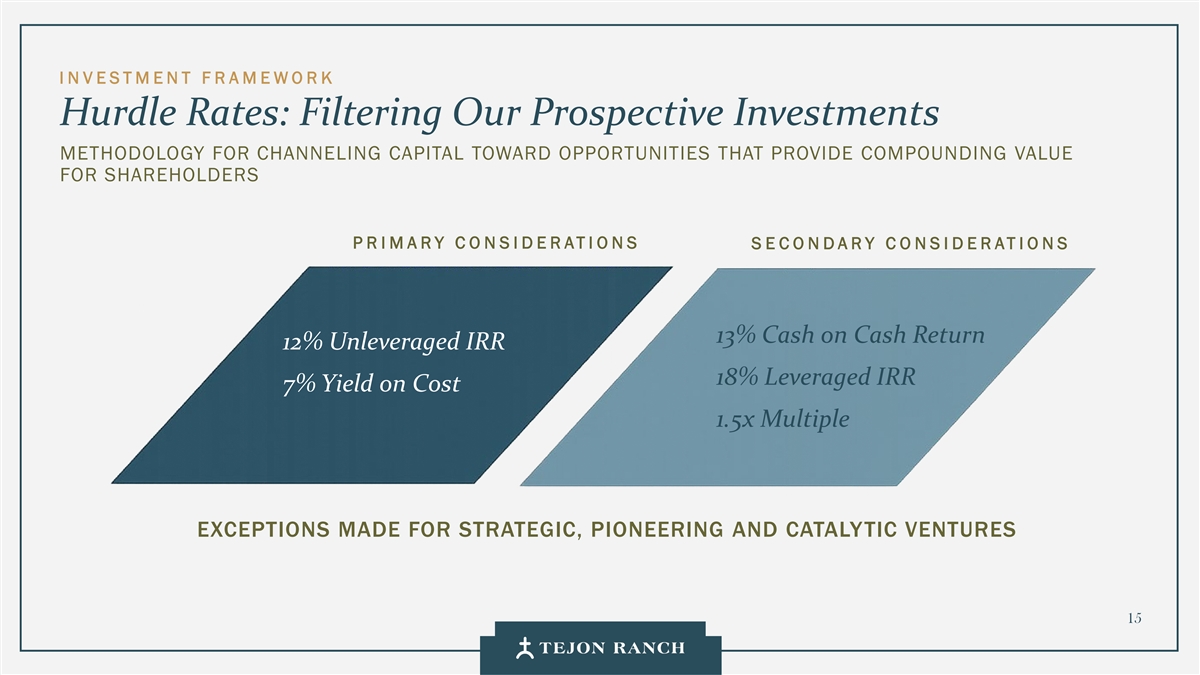
I N VESTMENT F R AMEWORK Hurdle Rates: Filtering Our Prospective Investments METHODOLOGY FOR CHANNELING CAPITAL TOWARD OPPORTUNITIES THAT PROVIDE COMPOUNDING VALUE FOR SHAREHOLDERS P R I MARY C O N SIDERATI ONS S E CONDARY C O NSIDERATIONS 13% Cash on Cash Return 12% Unleveraged IRR 18% Leveraged IRR 7% Yield on Cost 1.5x Multiple EXCEPTIONS MADE FOR STRATEGIC, PIONEERING AND CATALYTIC VENTURES 15
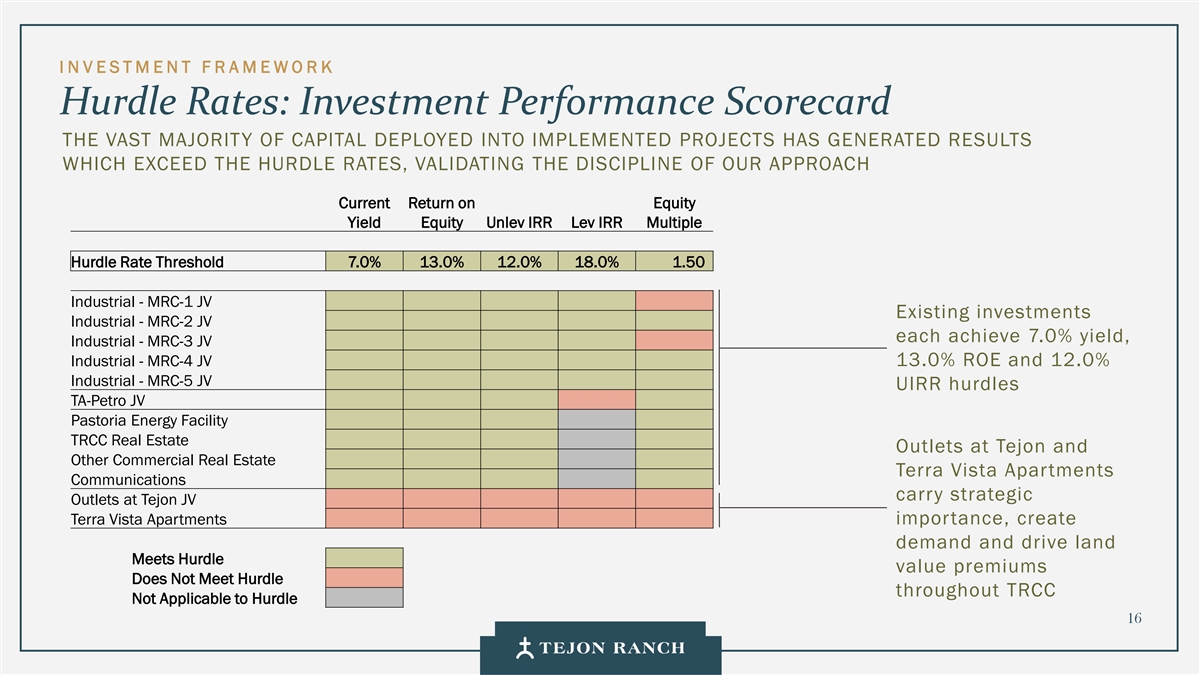
I N VESTMENT F R AMEWORK Hurdle Rates: Investment Performance Scorecard THE VAST MAJORITY OF CAPITAL DEPLOYED INTO IMPLEMENTED PROJECTS HAS GENERATED RESULTS WHICH EXCEED THE HURDLE RATES, VALIDATING THE DISCIPLINE OF OUR APPROACH Current Return on Equity Yield Equity Unlev IRR Lev IRR Multiple Hurdle Rate Threshold 7.0% 13.0% 12.0% 18.0% 1.50 Industrial - MRC-1 JV Existing investments Industrial - MRC-2 JV each achieve 7.0% yield, Industrial - MRC-3 JV Industrial - MRC-4 JV 13.0% ROE and 12.0% Industrial - MRC-5 JV UIRR hurdles TA-Petro JV Pastoria Energy Facility TRCC Real Estate Outlets at Tejon and Other Commercial Real Estate Terra Vista Apartments Communications carry strategic Outlets at Tejon JV Terra Vista Apartments importance, create demand and drive land Meets Hurdle value premiums Does Not Meet Hurdle throughout TRCC Not Applicable to Hurdle 16
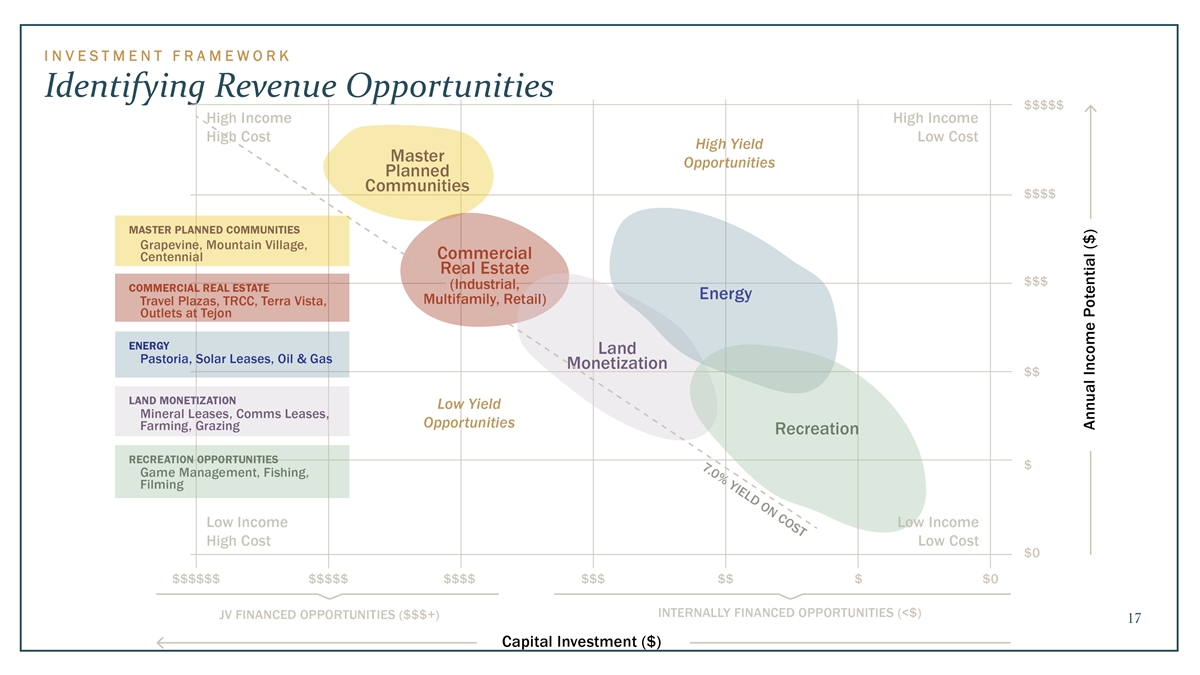
I N V EST M EN T F R A M EW O R K Identifying Revenue Opportunities 17
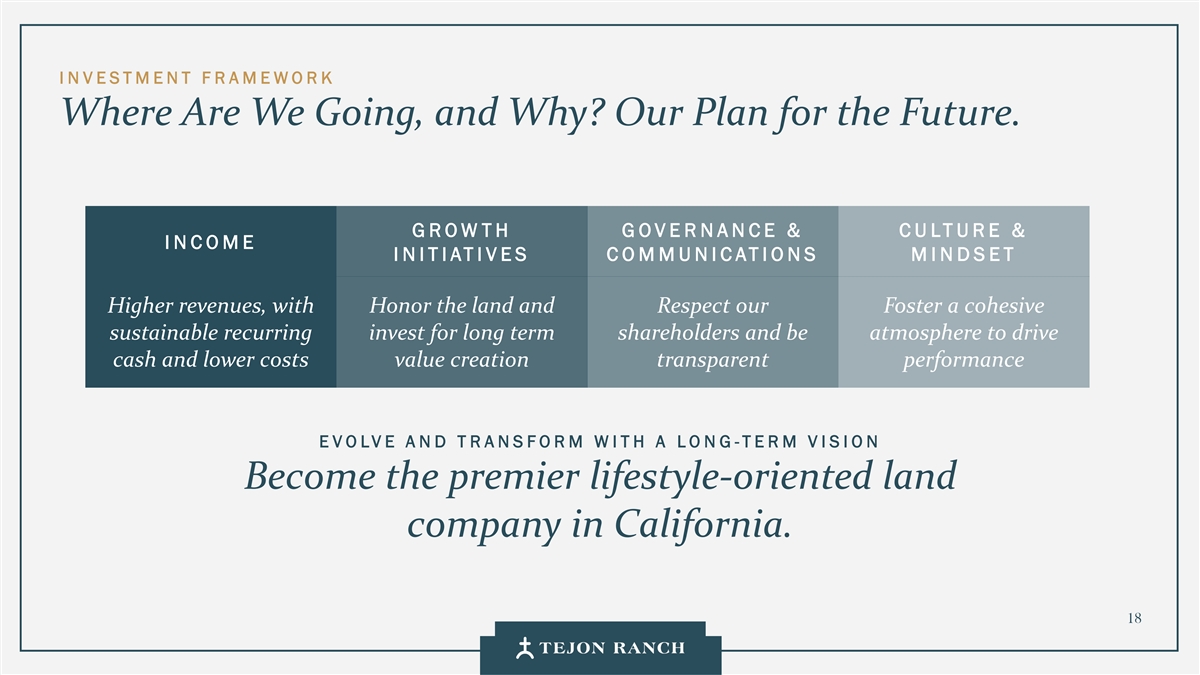
I N VESTMENT F R AMEWORK Where Are We Going, and Why? Our Plan for the Future. G R OW T H GOVERNANCE & CULTURE & I N C O M E IN IT I AT IV E S C O M M U N IC A T IO N S M I N D SE T Higher revenues, with Honor the land and Respect our Foster a cohesive sustainable recurring invest for long term shareholders and be atmosphere to drive cash and lower costs value creation transparent performance E VOLVE AN D T RANSFORM W I TH A LO N G -TERM V I SION Become the premier lifestyle-oriented land company in California. 18
Income: Operating Segments
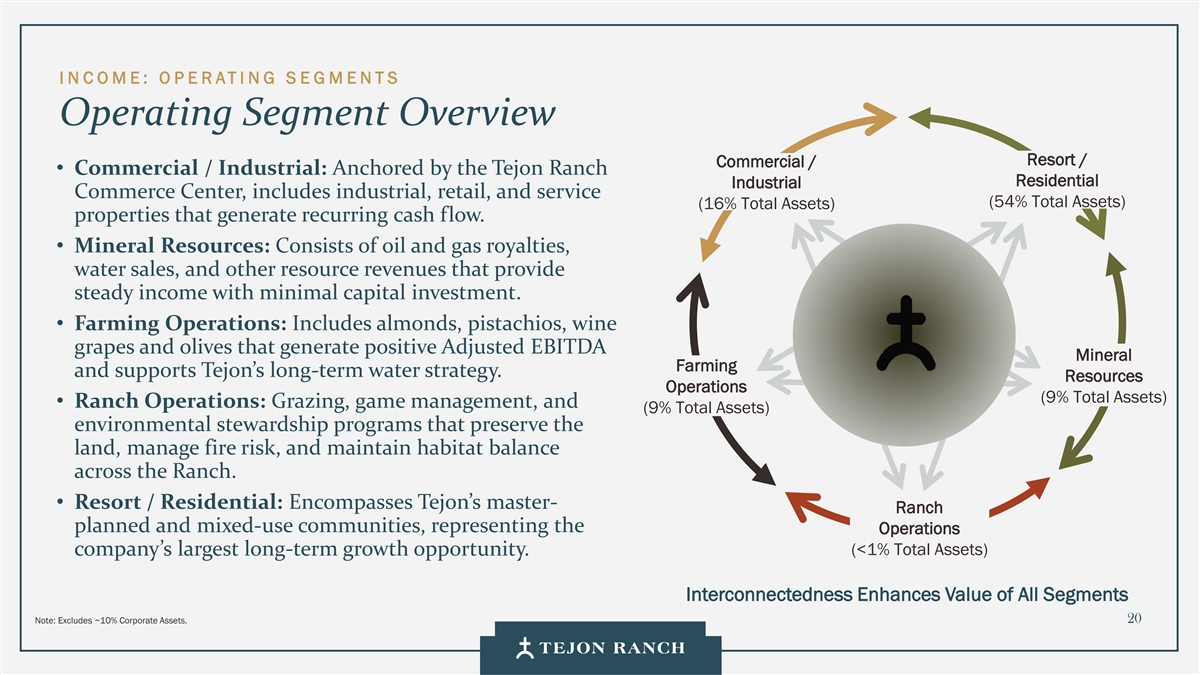
I N C OME: O P E RATI NG S E GMENTS Operating Segment Overview Resort / Commercial / • Commercial / Industrial: Anchored by the Tejon Ranch Residential Industrial Commerce Center, includes industrial, retail, and service (54% Total Assets) (16% Total Assets) properties that generate recurring cash flow. • Mineral Resources: Consists of oil and gas royalties, water sales, and other resource revenues that provide steady income with minimal capital investment. • Farming Operations: Includes almonds, pistachios, wine grapes and olives that generate positive Adjusted EBITDA Mineral Farming and supports Tejon’s long-term water strategy. Resources Operations (9% Total Assets) • Ranch Operations: Grazing, game management, and (9% Total Assets) environmental stewardship programs that preserve the land, manage fire risk, and maintain habitat balance across the Ranch. • Resort / Residential: Encompasses Tejon’s master- Ranch planned and mixed-use communities, representing the Operations (<1% Total Assets) company’s largest long-term growth opportunity. Interconnectedness Enhances Value of All Segments Note: Excludes ~10% Corporate Assets. 20
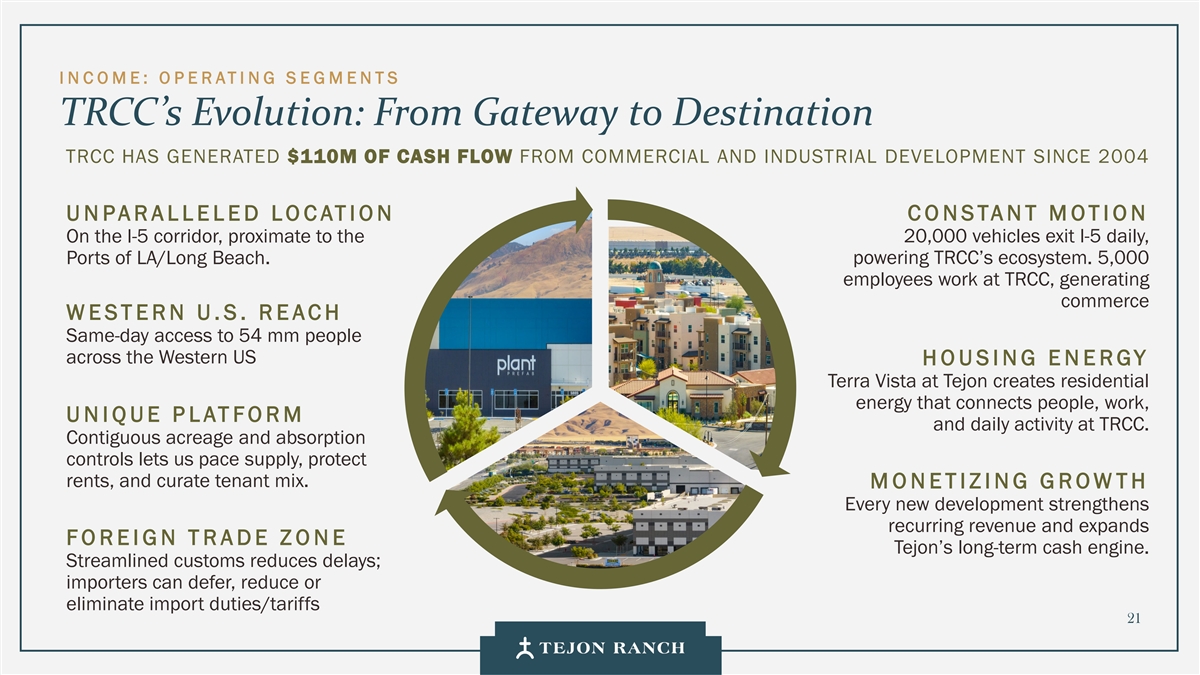
I N C OME: O P E RATI NG S E GMENTS TRCC’s Evolution: From Gateway to Destination TRCC HAS GENERATED $110M OF CASH FLOW FROM COMMERCIAL AND INDUSTRIAL DEVELOPMENT SINCE 2004 CONSTANT MOTION UNPARALLELED LOCATION On the I-5 corridor, proximate to the 20,000 vehicles exit I-5 daily, Ports of LA/Long Beach. powering TRCC’s ecosystem. 5,000 employees work at TRCC, generating commerce WESTERN U.S. REACH Same-day access to 54 mm people across the Western US HOUSING ENERGY Terra Vista at Tejon creates residential energy that connects people, work, UNIQUE PLATFORM and daily activity at TRCC. Contiguous acreage and absorption controls lets us pace supply, protect rents, and curate tenant mix. MONETIZING GROWTH Every new development strengthens recurring revenue and expands FOREIGN TRADE ZONE Tejon’s long-term cash engine. Streamlined customs reduces delays; importers can defer, reduce or eliminate import duties/tariffs 21
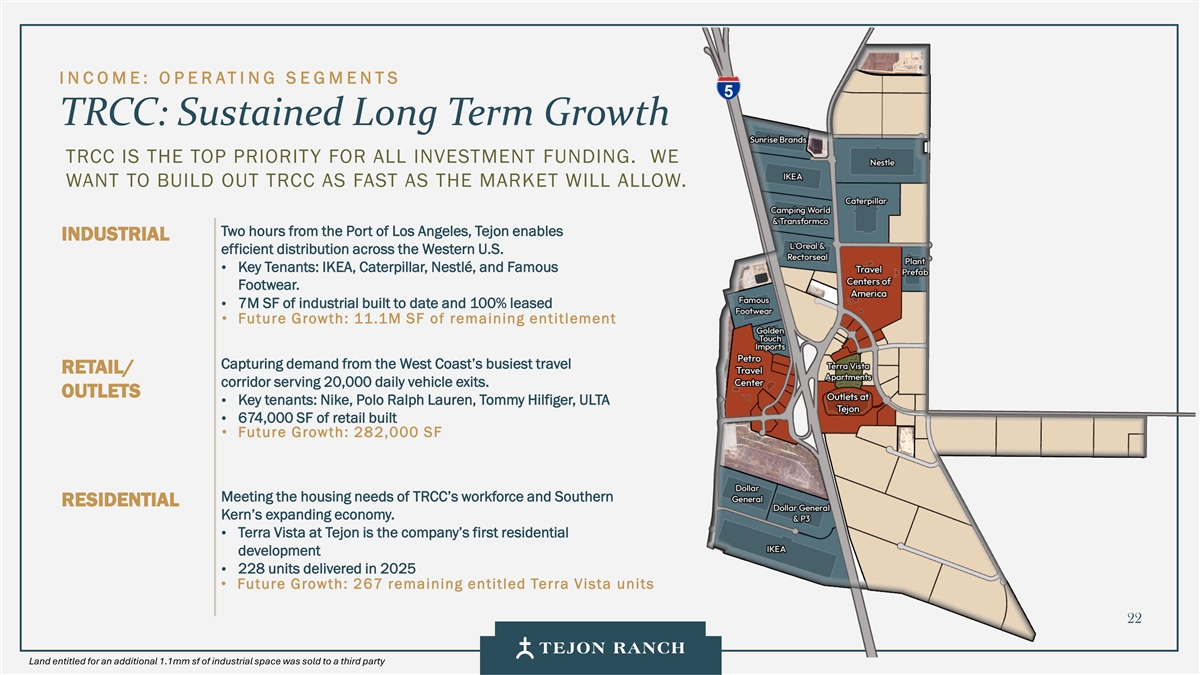
I N C OME: O P E RATI NG S E GMENTS TRCC: Sustained Long Term Growth TRCC IS THE TOP PRIORITY FOR ALL INVESTMENT FUNDING. WE WANT TO BUILD OUT TRCC AS FAST AS THE MARKET WILL ALLOW. Two hours from the Port of Los Angeles, Tejon enables INDUSTRIAL efficient distribution across the Western U.S. • Key Tenants: IKEA, Caterpillar, Nestlé, and Famous Footwear. • 7M SF of industrial built to date and 100% leased • Future Growth: 11.1M SF of remaining entitlement Capturing demand from the West Coast’s busiest travel RETAIL/ corridor serving 20,000 daily vehicle exits. OUTLETS Key tenants: Nike, Polo Ralph Lauren, Tommy Hilfiger, ULTA • 674,000 SF of retail built • • Future Growth: 282,000 SF Meeting the housing needs of TRCC’s workforce and Southern RESIDENTIAL Kern’s expanding economy. Terra Vista at Tejon is the company’s first residential • development 228 units delivered in 2025 • • Future Growth: 267 remaining entitled Terra Vista units 22 Land entitled for an additional 1.1mm sf of industrial space was sold to a third party
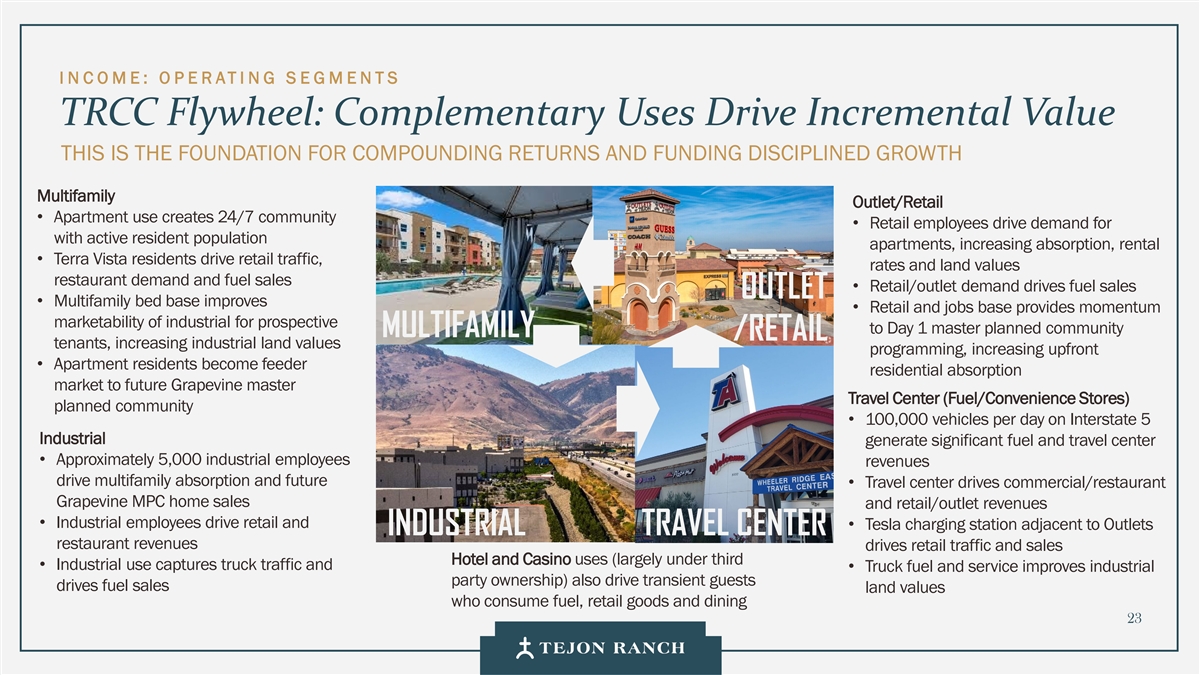
I N C OME: O P E RATI NG S E GMENTS TRCC Flywheel: Complementary Uses Drive Incremental Value THIS IS THE FOUNDATION FOR COMPOUNDING RETURNS AND FUNDING DISCIPLINED GROWTH Multifamily Outlet/Retail • Apartment use creates 24/7 community • Retail employees drive demand for with active resident population apartments, increasing absorption, rental • Terra Vista residents drive retail traffic, rates and land values restaurant demand and fuel sales • Retail/outlet demand drives fuel sales OUTLET • Multifamily bed base improves • Retail and jobs base provides momentum marketability of industrial for prospective to Day 1 master planned community MULTIFAMILY /RETAIL tenants, increasing industrial land values programming, increasing upfront • Apartment residents become feeder residential absorption market to future Grapevine master Travel Center (Fuel/Convenience Stores) planned community • 100,000 vehicles per day on Interstate 5 Industrial generate significant fuel and travel center • Approximately 5,000 industrial employees revenues drive multifamily absorption and future • Travel center drives commercial/restaurant Grapevine MPC home sales and retail/outlet revenues • Industrial employees drive retail and • Tesla charging station adjacent to Outlets INDUSTRIAL TRAVEL CENTER restaurant revenues drives retail traffic and sales Hotel and Casino uses (largely under third • Industrial use captures truck traffic and • Truck fuel and service improves industrial party ownership) also drive transient guests drives fuel sales land values who consume fuel, retail goods and dining 23
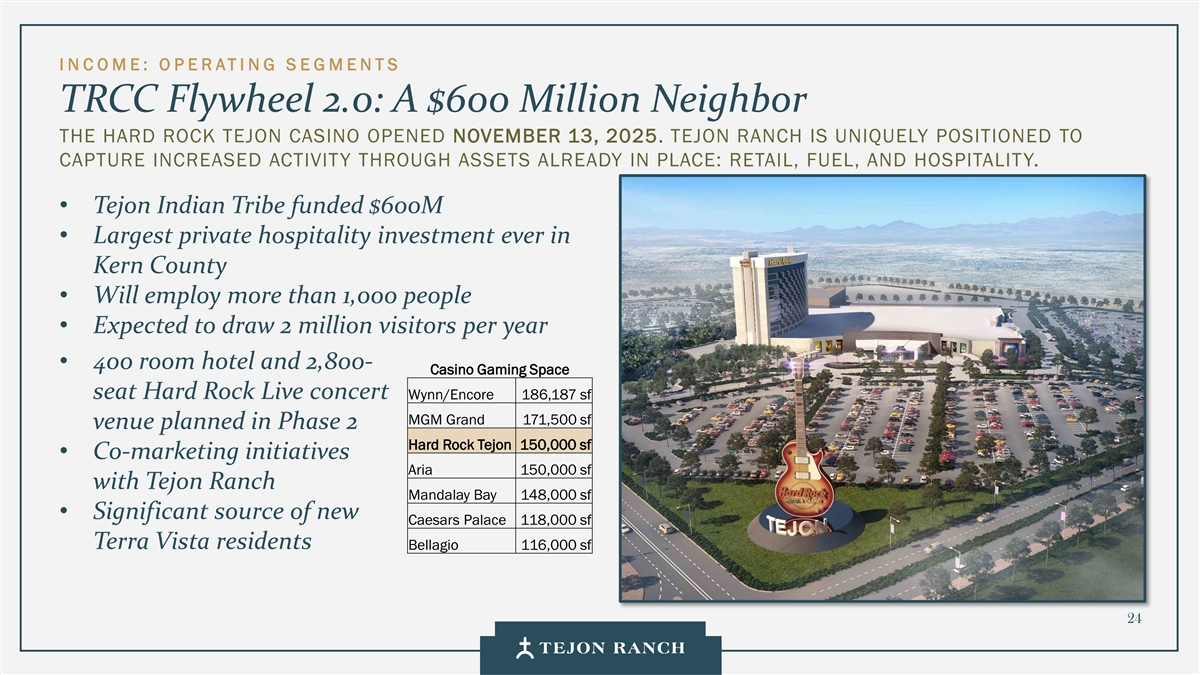
I N C OME: O P E RATI NG S E GMENTS TRCC Flywheel 2.0: A $600 Million Neighbor THE HARD ROCK TEJON CASINO OPENED NOVEMBER 13, 2025. TEJON RANCH IS UNIQUELY POSITIONED TO CAPTURE INCREASED ACTIVITY THROUGH ASSETS ALREADY IN PLACE: RETAIL, FUEL, AND HOSPITALITY. • Tejon Indian Tribe funded $600M • Largest private hospitality investment ever in Kern County • Will employ more than 1,000 people • Expected to draw 2 million visitors per year • 400 room hotel and 2,800- Casino Gaming Space seat Hard Rock Live concert Wynn/Encore 186,187 sf MGM Grand 171,500 sf venue planned in Phase 2 Hard Rock Tejon 150,000 sf • Co-marketing initiatives Aria 150,000 sf with Tejon Ranch Mandalay Bay 148,000 sf • Significant source of new Caesars Palace 118,000 sf Terra Vista residents Bellagio 116,000 sf 24
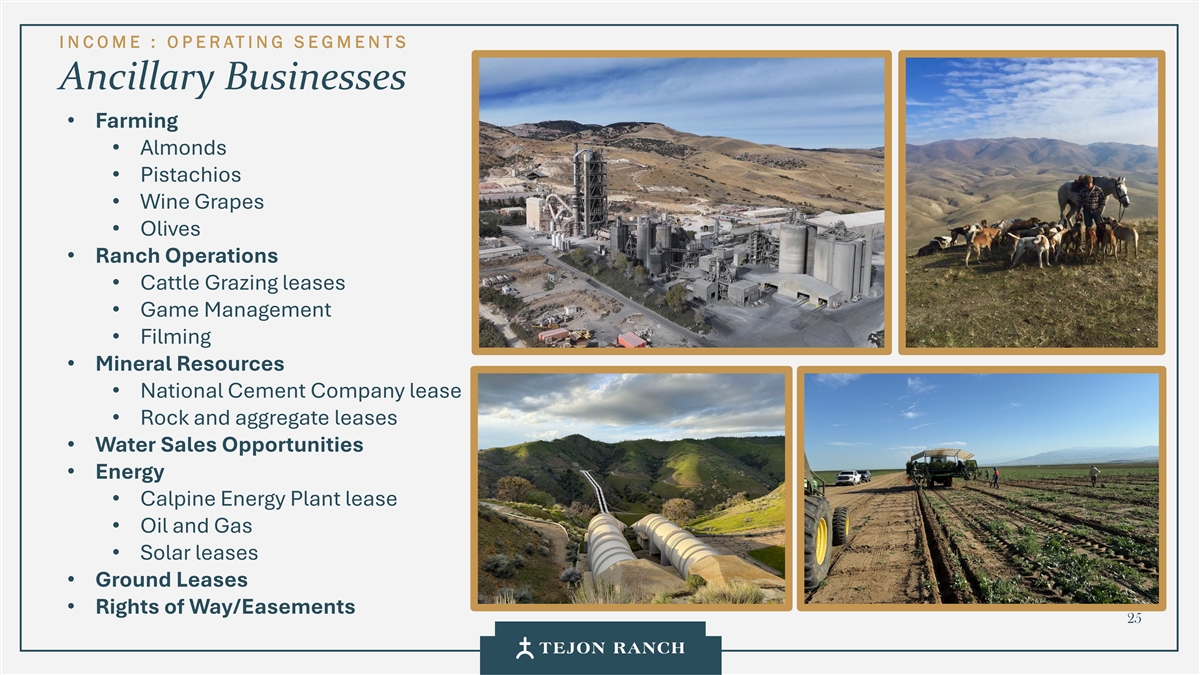
I N C OME : O P E RATING S E GMENTS Ancillary Businesses • Farming • Almonds • Pistachios • Wine Grapes • Olives • Ranch Operations • Cattle Grazing leases • Game Management • Filming • Mineral Resources • National Cement Company lease • Rock and aggregate leases • Water Sales Opportunities • Energy • Calpine Energy Plant lease • Oil and Gas • Solar leases • Ground Leases • Rights of Way/Easements 25
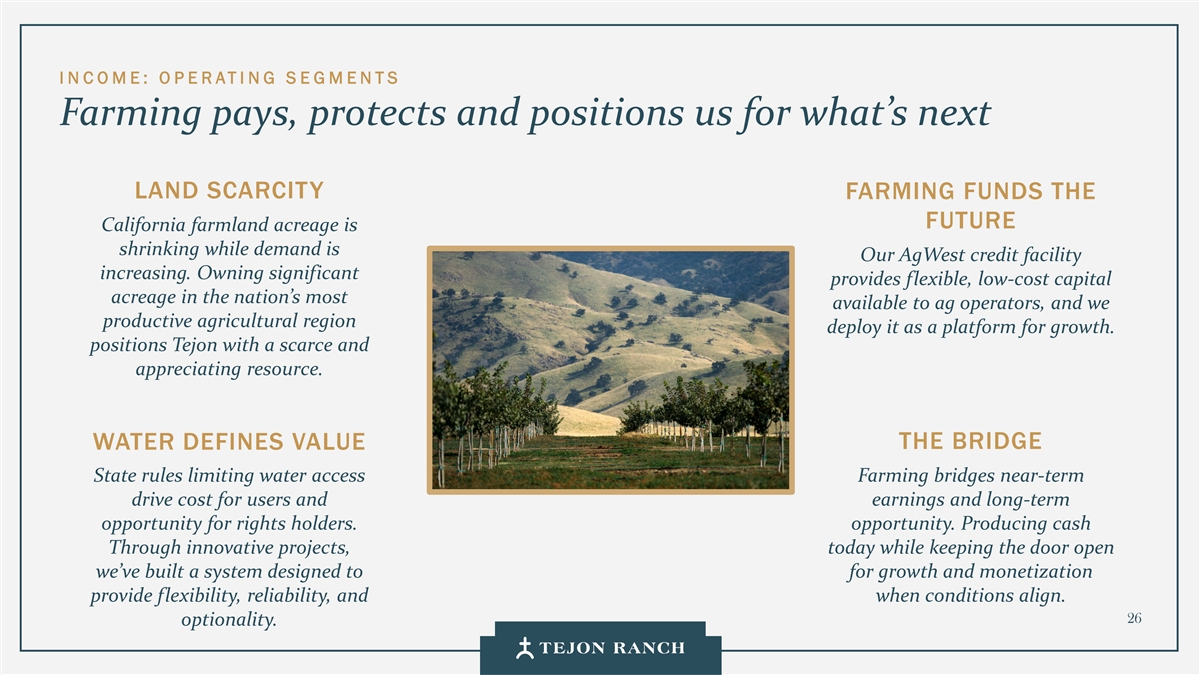
I N C OME: O P E RATI NG S E GMENTS Farming pays, protects and positions us for what’s next LAND SCARCITY FARMING FUNDS THE FUTURE California farmland acreage is shrinking while demand is Our AgWest credit facility increasing. Owning significant provides flexible, low-cost capital acreage in the nation’s most available to ag operators, and we productive agricultural region deploy it as a platform for growth. positions Tejon with a scarce and appreciating resource. THE BRIDGE WATER DEFINES VALUE State rules limiting water access Farming bridges near-term drive cost for users and earnings and long-term opportunity for rights holders. opportunity. Producing cash Through innovative projects, today while keeping the door open we’ve built a system designed to for growth and monetization provide flexibility, reliability, and when conditions align. 26 optionality.
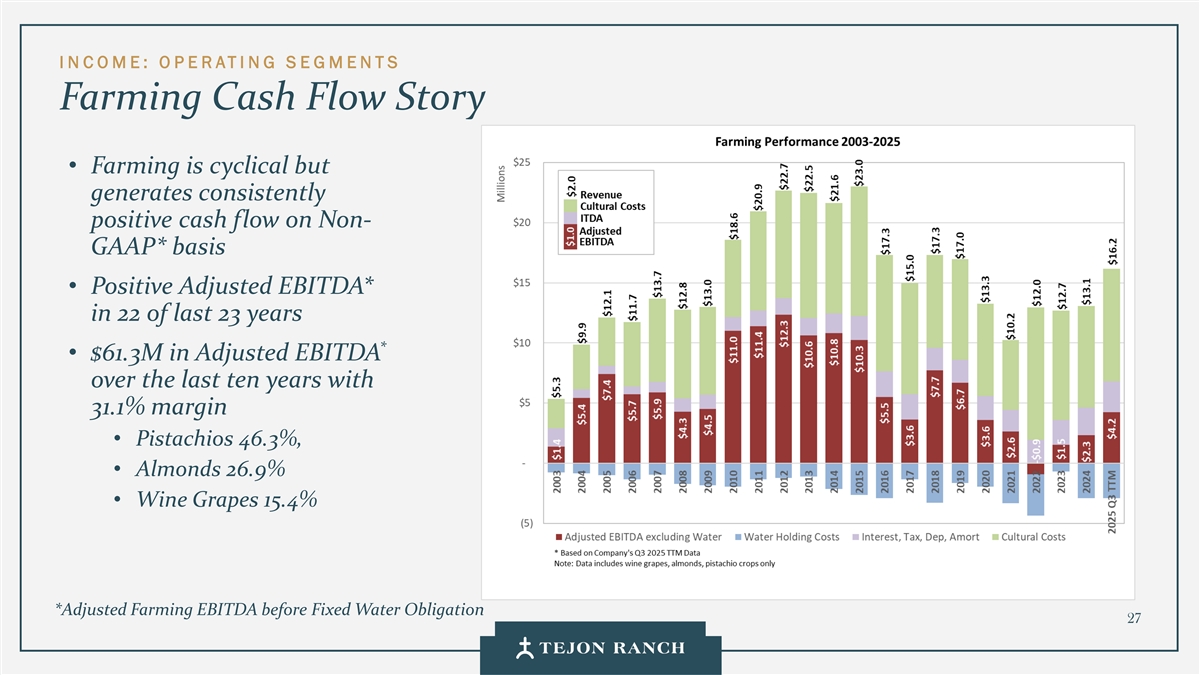
I N C OME: O P E RATI NG S E GMENTS Farming Cash Flow Story • Farming is cyclical but generates consistently positive cash flow on Non- GAAP* basis • Positive Adjusted EBITDA* in 22 of last 23 years * • $61.3M in Adjusted EBITDA over the last ten years with 31.1% margin • Pistachios 46.3%, • Almonds 26.9% • Wine Grapes 15.4% *Adjusted Farming EBITDA before Fixed Water Obligation 27
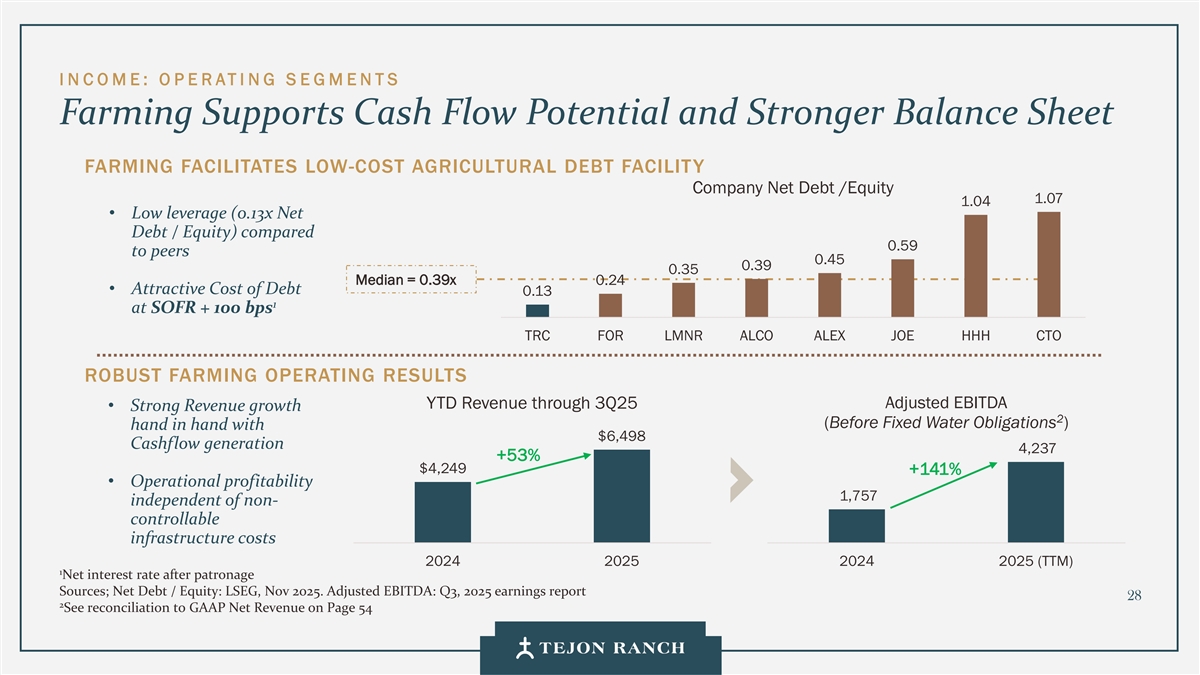
I N C OME: O P E RATI NG S E GMENTS Farming Supports Cash Flow Potential and Stronger Balance Sheet FARMING FACILITATES LOW-COST AGRICULTURAL DEBT FACILITY Company Net Debt /Equity 1.07 1.04 • Low leverage (0.13x Net Debt / Equity) compared 0.59 to peers 0.45 0.39 0.35 Median = 0.39x 0.24 • Attractive Cost of Debt 0.13 1 at SOFR + 100 bps TRC FOR LMNR ALCO ALEX JOE HHH CTO ROBUST FARMING OPERATING RESULTS YTD Revenue through 3Q25 Adjusted EBITDA • Strong Revenue growth 2 (Before Fixed Water Obligations ) hand in hand with $6,498 Cashflow generation 4,237 +53% $4,249 +141% • Operational profitability 1,757 independent of non- controllable infrastructure costs 2024 2025 2024 2025 (TTM) 1 Net interest rate after patronage Sources; Net Debt / Equity: LSEG, Nov 2025. Adjusted EBITDA: Q3, 2025 earnings report 28 2 See reconciliation to GAAP Net Revenue on Page 54
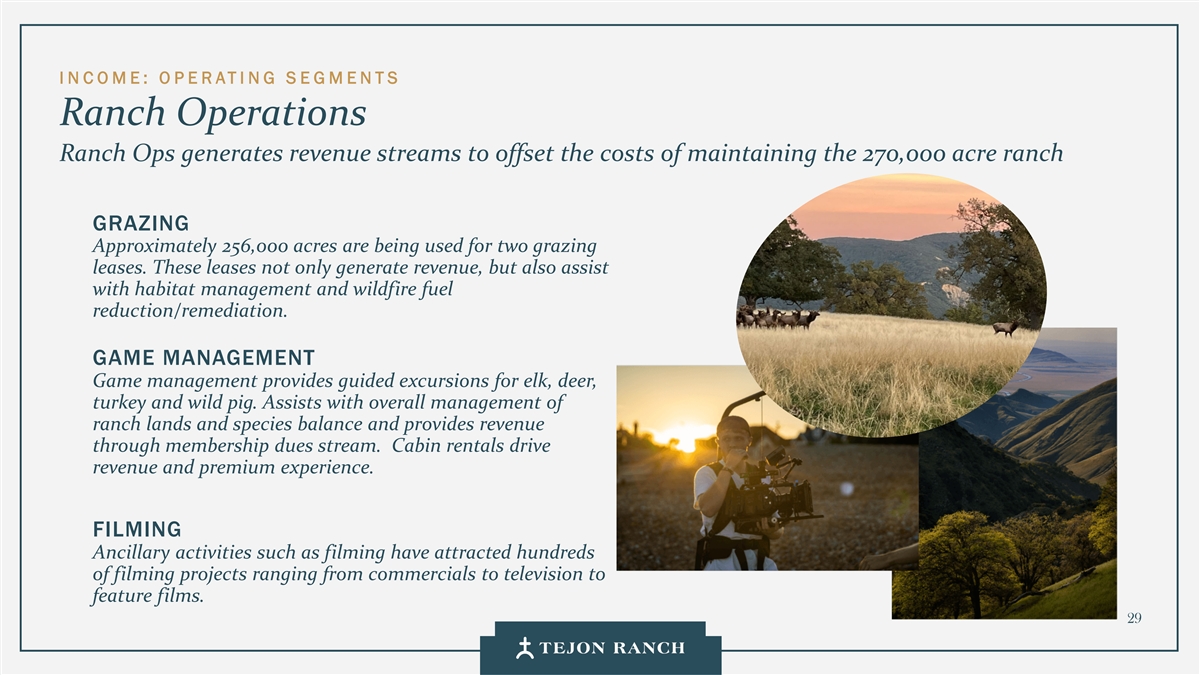
I N C OME: O P E RATI NG S E GMENTS Ranch Operations Ranch Ops generates revenue streams to offset the costs of maintaining the 270,000 acre ranch GRAZING Approximately 256,000 acres are being used for two grazing leases. These leases not only generate revenue, but also assist with habitat management and wildfire fuel reduction/remediation. GAME MANAGEMENT Game management provides guided excursions for elk, deer, turkey and wild pig. Assists with overall management of ranch lands and species balance and provides revenue through membership dues stream. Cabin rentals drive revenue and premium experience. FILMING Ancillary activities such as filming have attracted hundreds of filming projects ranging from commercials to television to feature films. 29

I N C OME: O P E RATI NG S E GMENTS Mineral Resources MINERAL RESOURCES LEASES PROVIDE STEADY AND DIVERSIFIED INCOME WITH MINIMAL CAPITAL INVESTMENT OIL / GAS 12,015 acres currently under lease We continue to look for opportunities to grow our mineral 295 active wells (117 producing) resource revenues through expansion of leasing and encouraging new exploration MINERALS Mineral Resources Revenues 2,000 acres under lease to National Cement (Excluding Water Sales & Exploration Leases) Griffith aggregate lease totaling 244 acres $7M Royalties on 703 acre Solari mine site $6M WATER $5M 154,399 total acre-feet of water held for future use and $4M purchased water contracts $3M Total Water Held for Future Use at Cost $2M (Thousands) $45,861 +27% $1M $36,083 $0M 2016 2017 2018 2019 2020 2021 2022 2023 2024 Oil and gas Rock Aggregate Cement Reimbursables and other 2024 2025 30 Source: Company SEC Filings
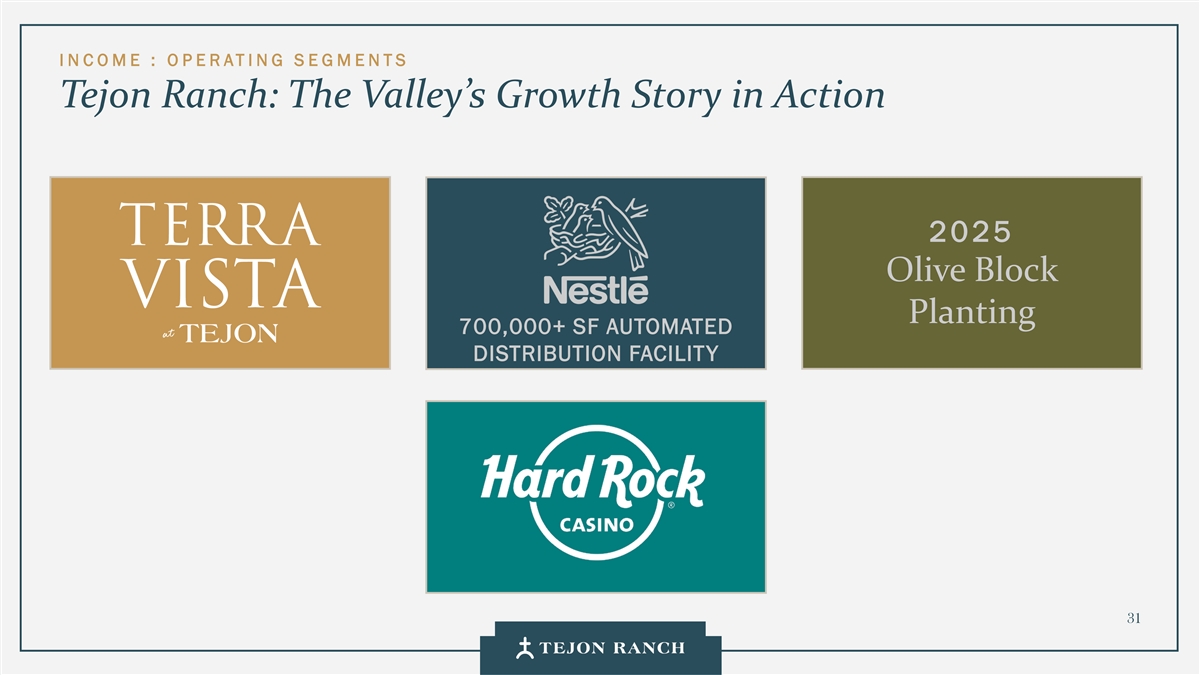
I N C OME : O P E RATING S E GMENTS Tejon Ranch: The Valley’s Growth Story in Action 2025 Olive Block Planting 700,000+ SF AUTOMATED DISTRIBUTION FACILITY 31

Break
Growth: Master Planned Communities
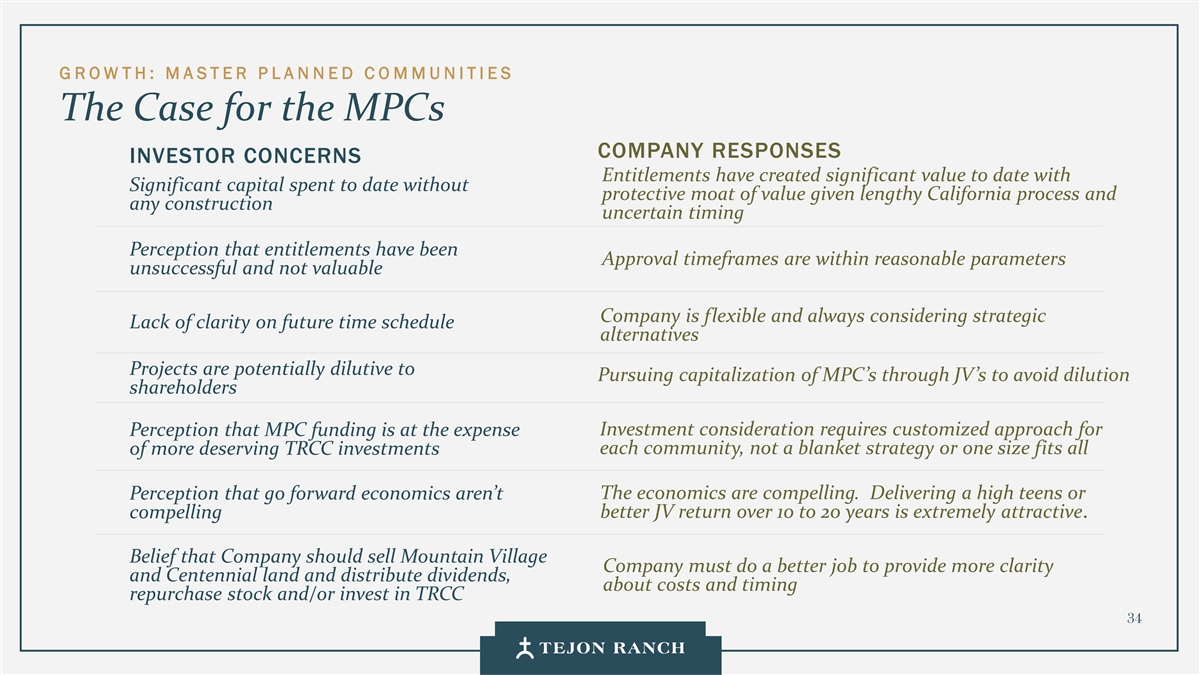
G ROW TH: M A STER P L A N NED C O MMUNITIES The Case for the MPCs COMPANY RESPONSES INVESTOR CONCERNS Entitlements have created significant value to date with Significant capital spent to date without protective moat of value given lengthy California process and any construction uncertain timing Perception that entitlements have been Approval timeframes are within reasonable parameters unsuccessful and not valuable Company is flexible and always considering strategic Lack of clarity on future time schedule alternatives Projects are potentially dilutive to Pursuing capitalization of MPC’s through JV’s to avoid dilution shareholders Investment consideration requires customized approach for Perception that MPC funding is at the expense each community, not a blanket strategy or one size fits all of more deserving TRCC investments The economics are compelling. Delivering a high teens or Perception that go forward economics aren’t better JV return over 10 to 20 years is extremely attractive. compelling Belief that Company should sell Mountain Village Company must do a better job to provide more clarity and Centennial land and distribute dividends, about costs and timing repurchase stock and/or invest in TRCC 34

G ROW TH: M A STER P L A N NED C O MMUNITIES Master Planned Community Overview • 35,000 new homes (of which 15,000+ are fully entitled) and millions of square feet of commercial provide decades of runway for future cash flow generation • Clustered along I-5, forming a unified growth corridor • Among California’s last large-scale greenfield communities with protective moat and premium value due to challenging California land use entitlements • Leverage TRCC’s infrastructure and flywheel of existing GRAPEVINE industrial/retail/multifamily uses which provide demand and employment generators to drive future residential absorption • Three distinct market positionings allow for simultaneous MOUNTAIN development of three unique master planned communities VILLAGE CENTENNIAL • Joint-venture approach to unlock value without dilution 35
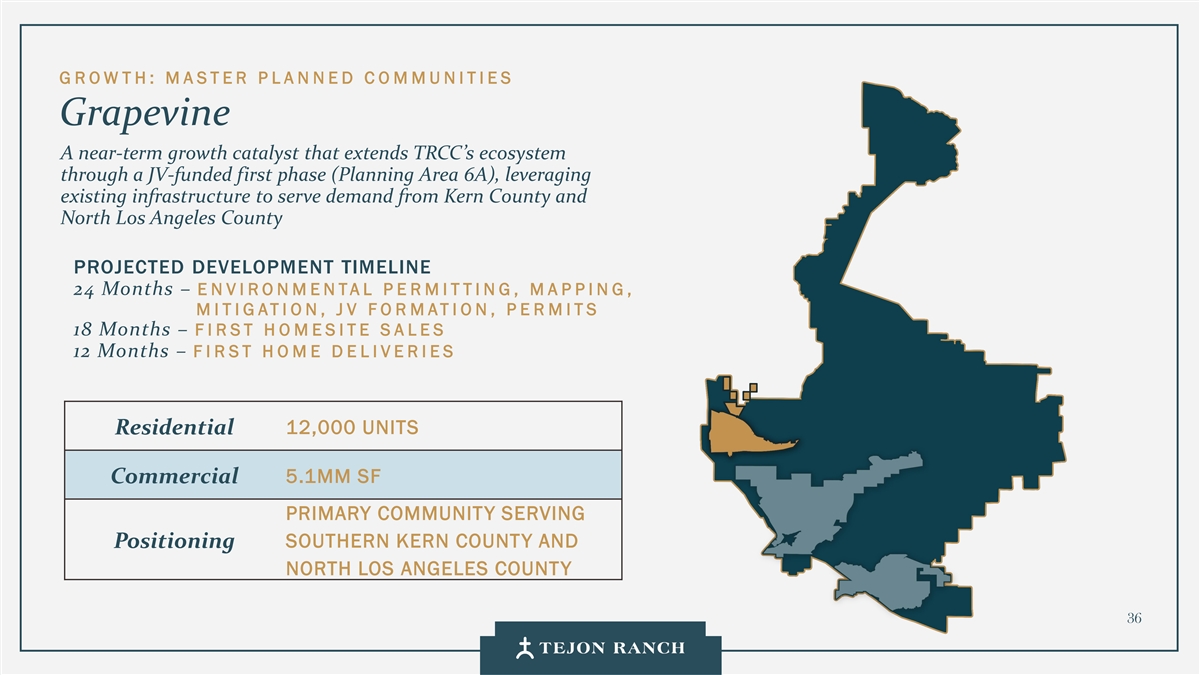
G ROW TH: M A STER P L A N NED C O MMUNITIES Grapevine A near-term growth catalyst that extends TRCC’s ecosystem through a JV-funded first phase (Planning Area 6A), leveraging existing infrastructure to serve demand from Kern County and North Los Angeles County PROJECTED DEVELOPMENT TIMELINE 24 Months – ENVIRONMENTAL PERMITTING, MAPPING, M I TIG ATI ON, J V FO R MATION, P E R MITS 18 Months – F I RST H O MESITE S A LES 12 Months – F I R ST H O M E D E L IVERIES 12,000 UNITS Residential 5.1MM SF Commercial PRIMARY COMMUNITY SERVING SOUTHERN KERN COUNTY AND Positioning NORTH LOS ANGELES COUNTY 36

G ROW TH: M A STER P L A N NED C O MMUNITIES Mountain Village We intend to raise capital for Mountain Village, seeking a joint venture partner who would fund the go-forward equity PROJECTED DEVELOPMENT TIMELINE 24 Months – JV FOR MATION 36 Months – FIR ST HO MESITE S A LES 12 Months – F I R ST H O M E D E L IVERIES 3,450 UNITS + 750 HOTEL ROOMS Residential 160,000 SF Commercial SECOND HOME LUXURY COMMUNITY + PRIMARY HOME Positioning COMMUNITY 37
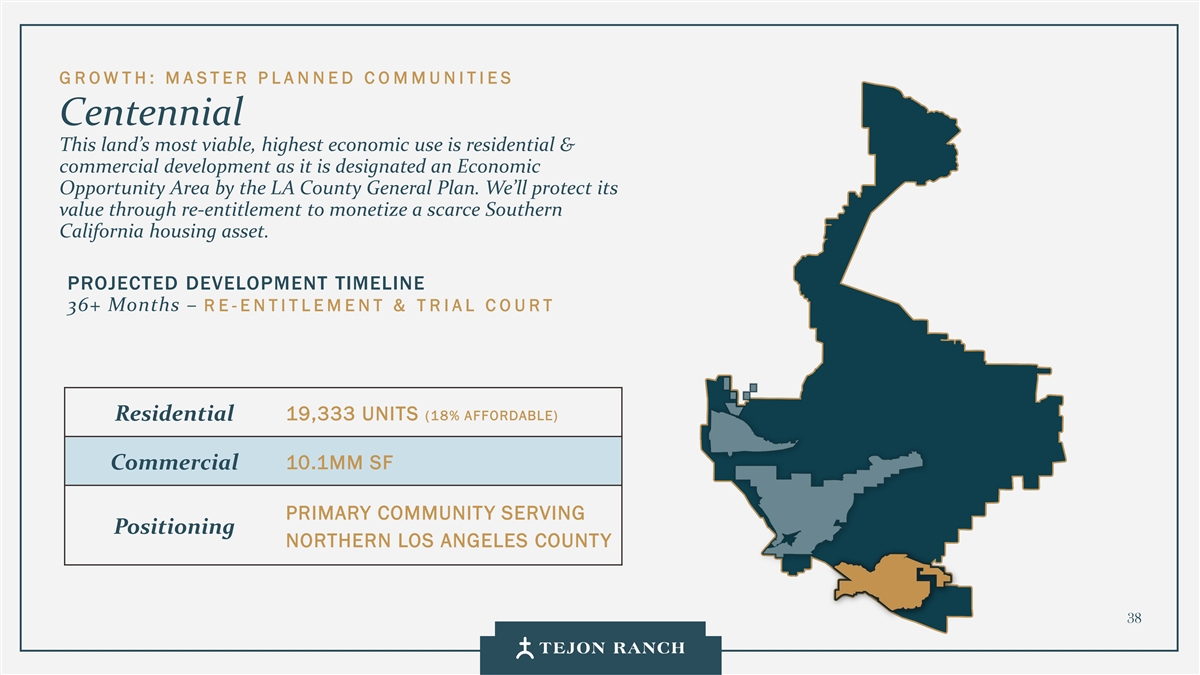
G ROW TH: M A STER P L A N NED C O MMUNITIES Centennial This land’s most viable, highest economic use is residential & commercial development as it is designated an Economic Opportunity Area by the LA County General Plan. We’ll protect its value through re-entitlement to monetize a scarce Southern California housing asset. PROJECTED DEVELOPMENT TIMELINE 36+ Months – RE -ENTITLEMENT & T R IAL C O URT 19,333 UNITS (18% AFFORDABLE) Residential 10.1MM SF Commercial PRIMARY COMMUNITY SERVING Positioning NORTHERN LOS ANGELES COUNTY 38
Governance: Communication + Transparency
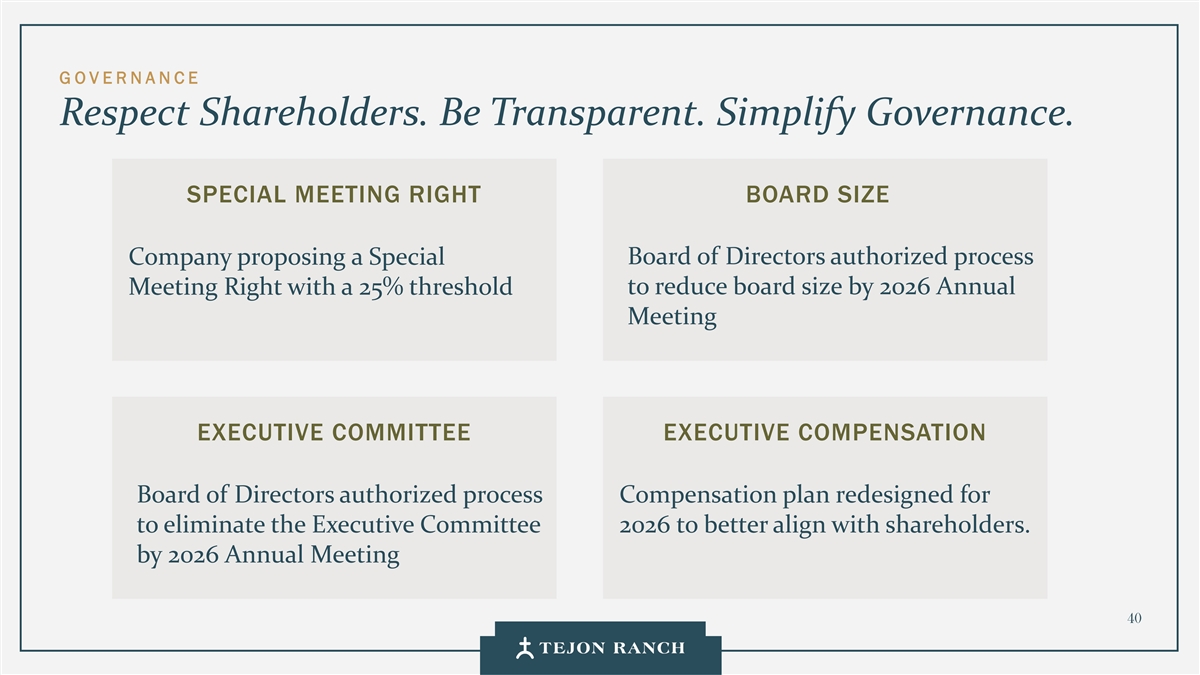
G O VE R NA NC E Respect Shareholders. Be Transparent. Simplify Governance. SPECIAL MEETING RIGHT BOARD SIZE Company proposing a Special Board of Directors authorized process Meeting Right with a 25% threshold to reduce board size by 2026 Annual Meeting EXECUTIVE COMMITTEE EXECUTIVE COMPENSATION Board of Directors authorized process Compensation plan redesigned for to eliminate the Executive Committee 2026 to better align with shareholders. by 2026 Annual Meeting 40
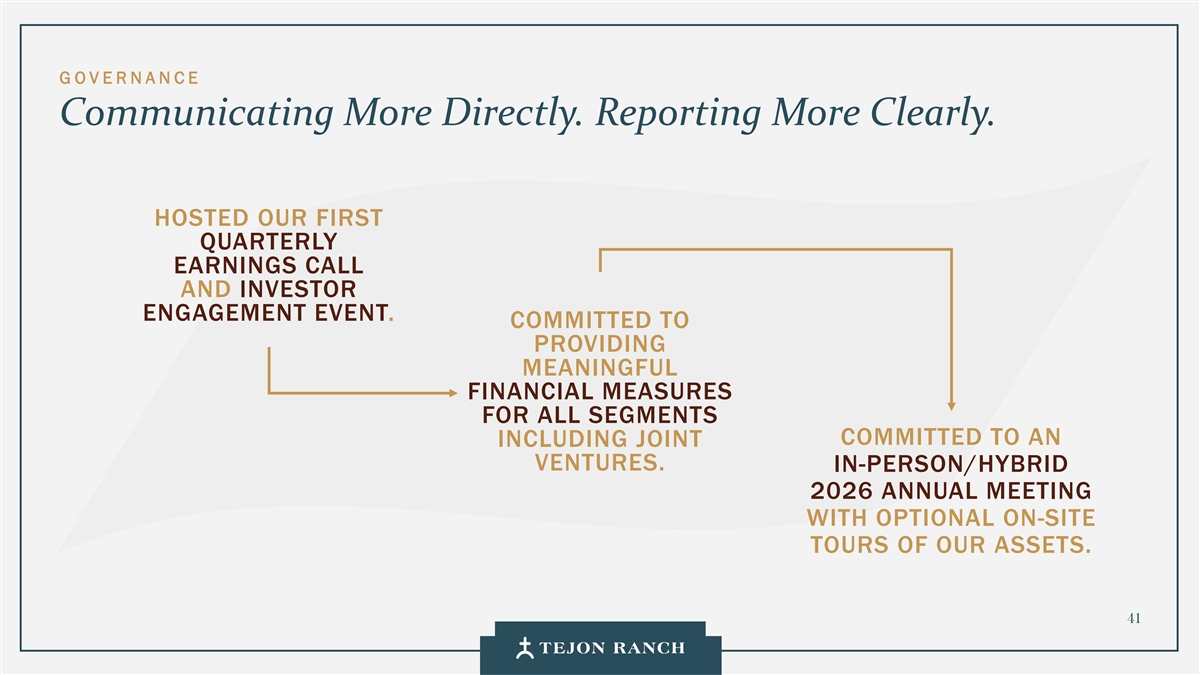
G O VE R NA NC E Communicating More Directly. Reporting More Clearly. HOSTED OUR FIRST QUARTERLY EARNINGS CALL AND INVESTOR ENGAGEMENT EVENT. COMMITTED TO PROVIDING MEANINGFUL FINANCIAL MEASURES FOR ALL SEGMENTS COMMITTED TO AN INCLUDING JOINT VENTURES. IN-PERSON/HYBRID 2026 ANNUAL MEETING WITH OPTIONAL ON-SITE TOURS OF OUR ASSETS. 41

Culture: Cohesion + Performance
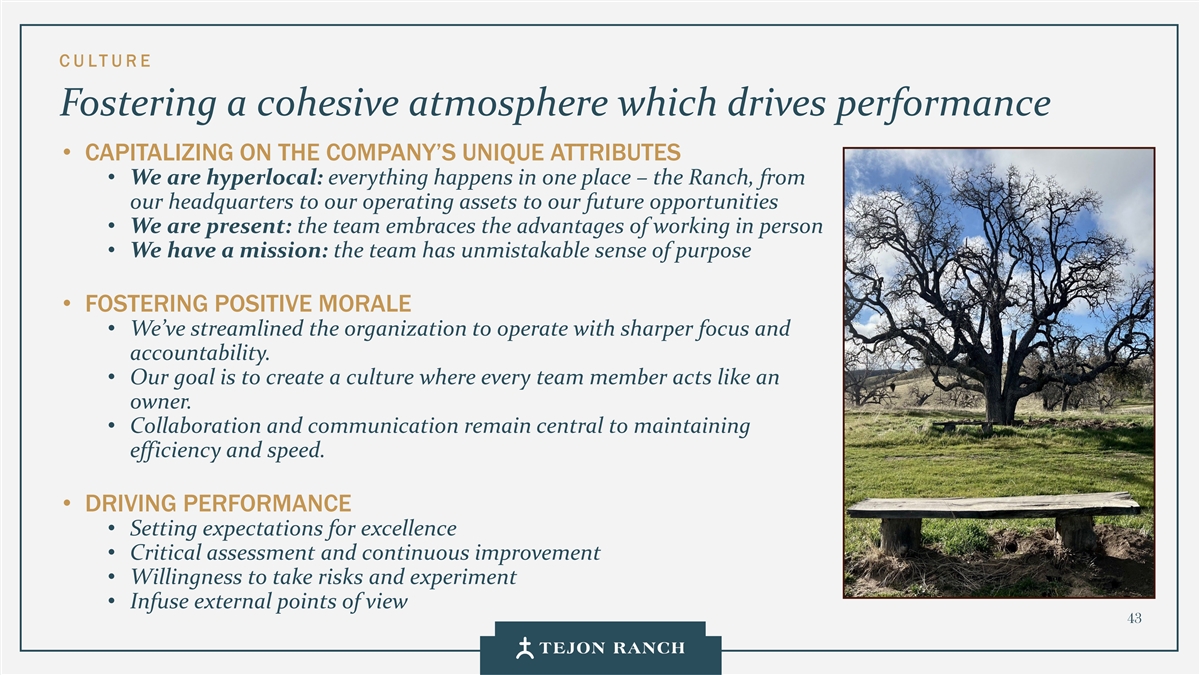
C U L TU RE Fostering a cohesive atmosphere which drives performance • CAPITALIZING ON THE COMPANY’S UNIQUE ATTRIBUTES • We are hyperlocal: everything happens in one place – the Ranch, from our headquarters to our operating assets to our future opportunities • We are present: the team embraces the advantages of working in person • We have a mission: the team has unmistakable sense of purpose • FOSTERING POSITIVE MORALE • We’ve streamlined the organization to operate with sharper focus and accountability. • Our goal is to create a culture where every team member acts like an owner. • Collaboration and communication remain central to maintaining efficiency and speed. • DRIVING PERFORMANCE • Setting expectations for excellence • Critical assessment and continuous improvement • Willingness to take risks and experiment • Infuse external points of view 43

Financial Discussion
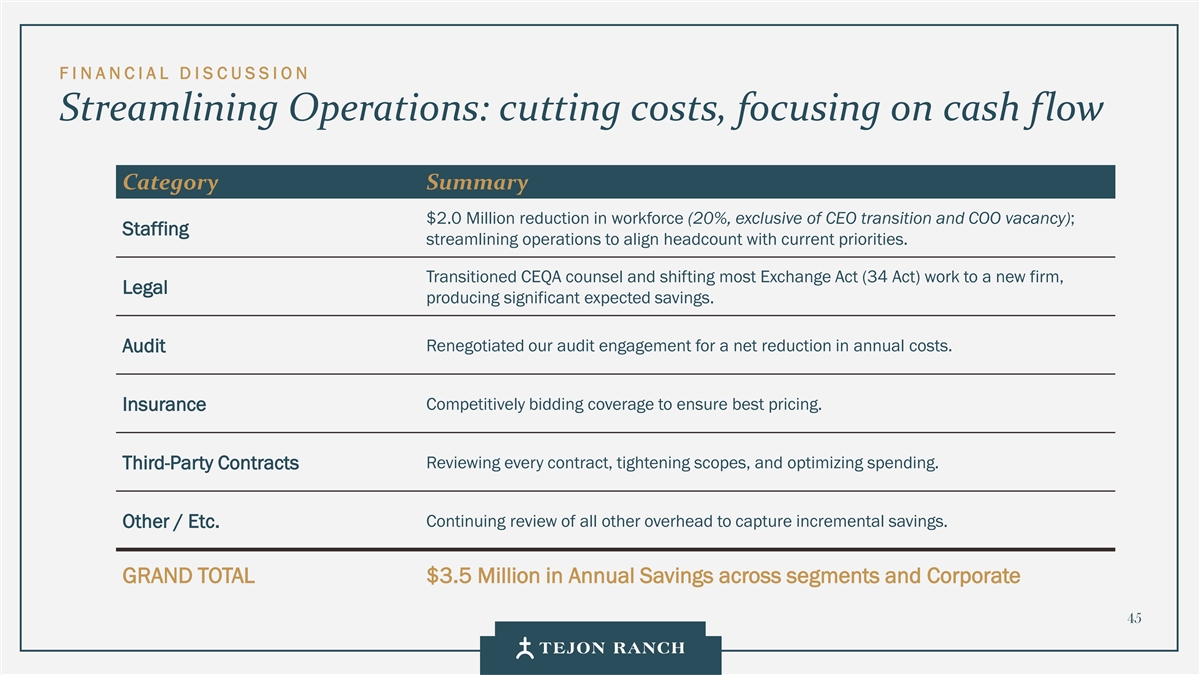
F I N ANCIAL D I S CUSSION Streamlining Operations: cutting costs, focusing on cash flow Category Summary $2.0 Million reduction in workforce (20%, exclusive of CEO transition and COO vacancy); Staffing streamlining operations to align headcount with current priorities. Transitioned CEQA counsel and shifting most Exchange Act (34 Act) work to a new firm, Legal producing significant expected savings. Renegotiated our audit engagement for a net reduction in annual costs. Audit Competitively bidding coverage to ensure best pricing. Insurance Reviewing every contract, tightening scopes, and optimizing spending. Third-Party Contracts Other / Etc. Continuing review of all other overhead to capture incremental savings. GRAND TOTAL $3.5 Million in Annual Savings across segments and Corporate 45
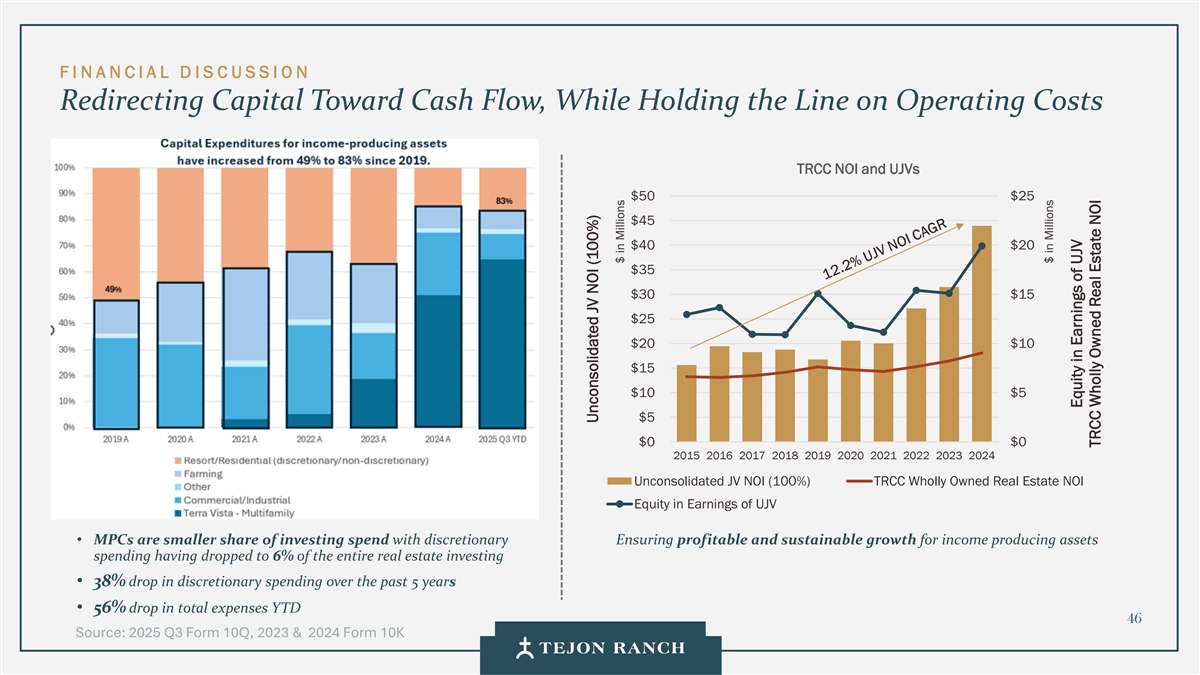
F I N A N C I A L D I S C U SSI O N Redirecting Capital Toward Cash Flow, While Holding the Line on Operating Costs TRCC NOI and UJVs $50 $25 $45 $40 $20 $35 $30 $15 $25 $20 $10 $15 $10 $5 $5 $0 $0 2015 2016 2017 2018 2019 2020 2021 2022 2023 2024 Unconsolidated JV NOI (100%) TRCC Wholly Owned Real Estate NOI Equity in Earnings of UJV • MPCs are smaller share of investing spend with discretionary Ensuring profitable and sustainable growth for income producing assets spending having dropped to 6% of the entire real estate investing • 38% drop in discretionary spending over the past 5 years • 56% drop in total expenses YTD 46 Source: 2025 Q3 Form 10Q, 2023 & 2024 Form 10K Unconsolidated JV NOI (100%) $ in Millions $ in Millions Equity in Earnings of UJV TRCC Wholly Owned Real Estate NOI

F I N ANCIAL D I S CUSSION Translating Discipline Into Profitable Growth Adjusted EBITDA Reconciliation Adjusted EBITDA YTD Growing in Lockstep with Revenue $35.4M 7% Revenue $13.9M Growth 8% Adjusted $33.2M EBITDA Growth $12.9M Growth in Distributions of Earnings from Unconsolidated JVs YTD $2.8M 158% $1.1M Robust Segment Level Growth YTD Farming Revenue Commercial/Industrial +53% +29% Sources: 2025 Form 10Q and Reconciliations 47 (1) Adjusted EBITDA is a non-GAAP financial measure. Please refer to Appendix for additional information
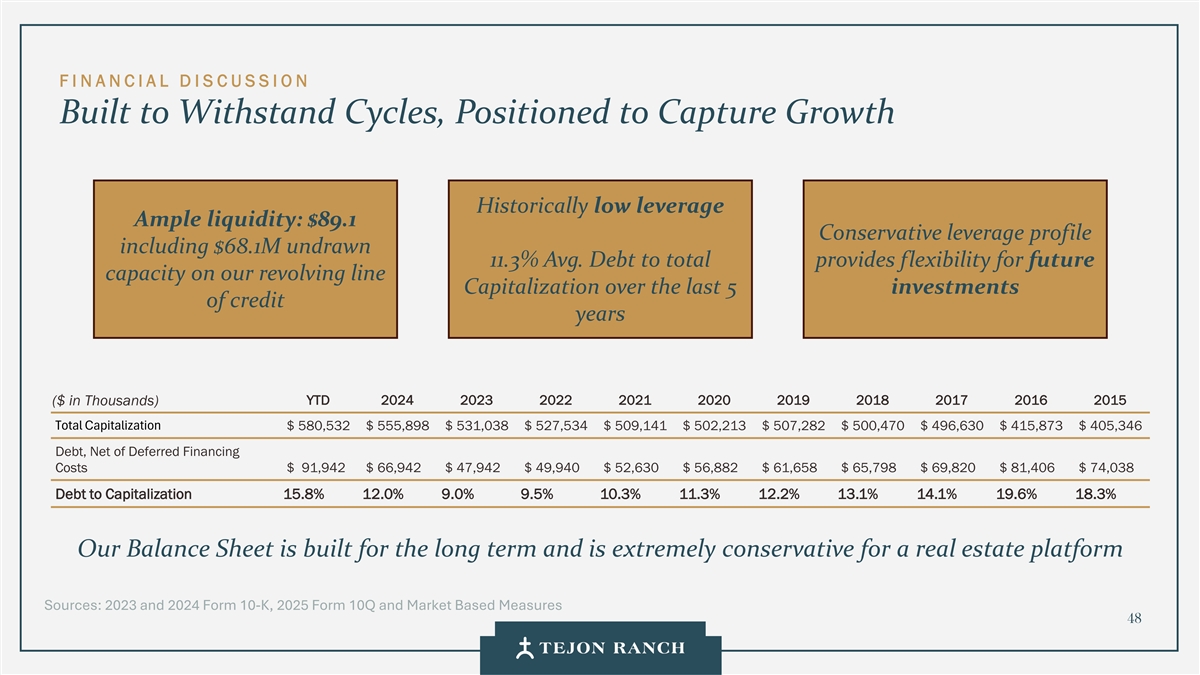
F I N ANCIAL D I S CUSSION Built to Withstand Cycles, Positioned to Capture Growth Historically low leverage Ample liquidity: $89.1 Conservative leverage profile including $68.1M undrawn 11.3% Avg. Debt to total provides flexibility for future capacity on our revolving line Capitalization over the last 5 investments of credit years ($ in Thousands) YTD 2024 2023 2022 2021 2020 2019 2018 2017 2016 2015 Total Capitalization $ 580,532 $ 555,898 $ 531,038 $ 527,534 $ 509,141 $ 502,213 $ 507,282 $ 500,470 $ 496,630 $ 415,873 $ 405,346 Debt, Net of Deferred Financing Costs $ 91,942 $ 66,942 $ 47,942 $ 49,940 $ 52,630 $ 56,882 $ 61,658 $ 65,798 $ 69,820 $ 81,406 $ 74,038 Debt to Capitalization 15.8% 12.0% 9.0% 9.5% 10.3% 11.3% 12.2% 13.1% 14.1% 19.6% 18.3% Our Balance Sheet is built for the long term and is extremely conservative for a real estate platform Sources: 2023 and 2024 Form 10-K, 2025 Form 10Q and Market Based Measures 48
Key Takeaways & Highlights
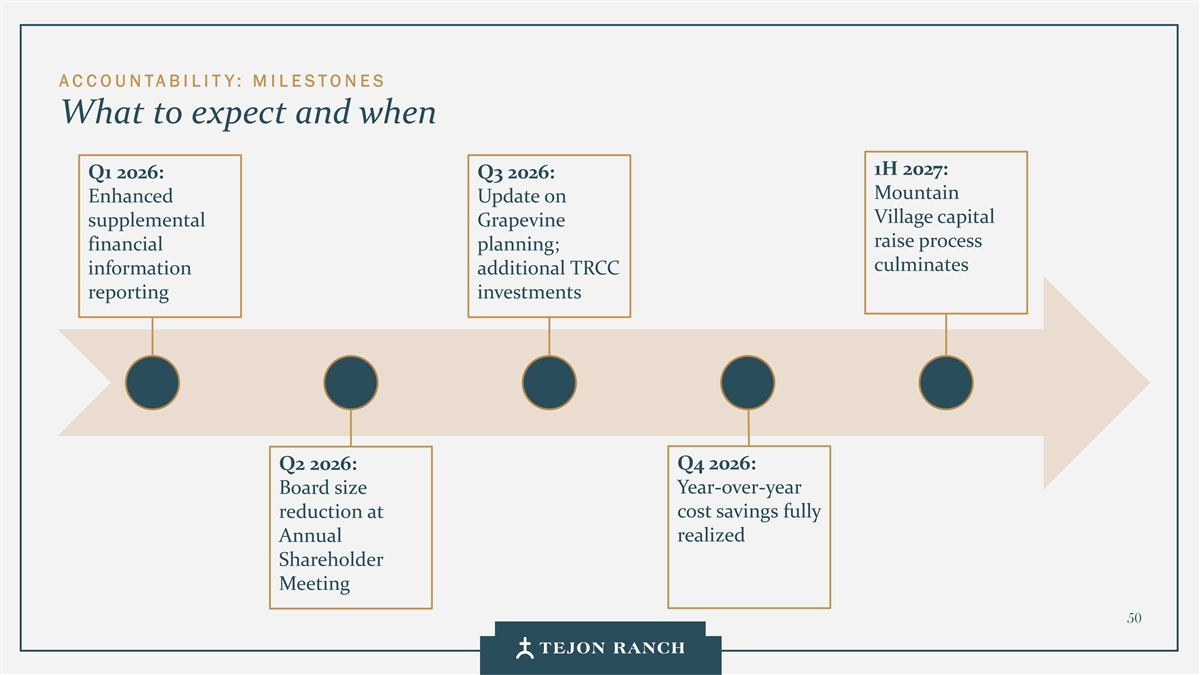
AC COUNTABI LIT Y: M I L ESTONES What to expect and when 1H 2027: Q1 2026: Q3 2026: Mountain Enhanced Update on Village capital supplemental Grapevine raise process financial planning; culminates information additional TRCC reporting investments Q2 2026: Q4 2026: Board size Year-over-year reduction at cost savings fully realized Annual Shareholder Meeting 50
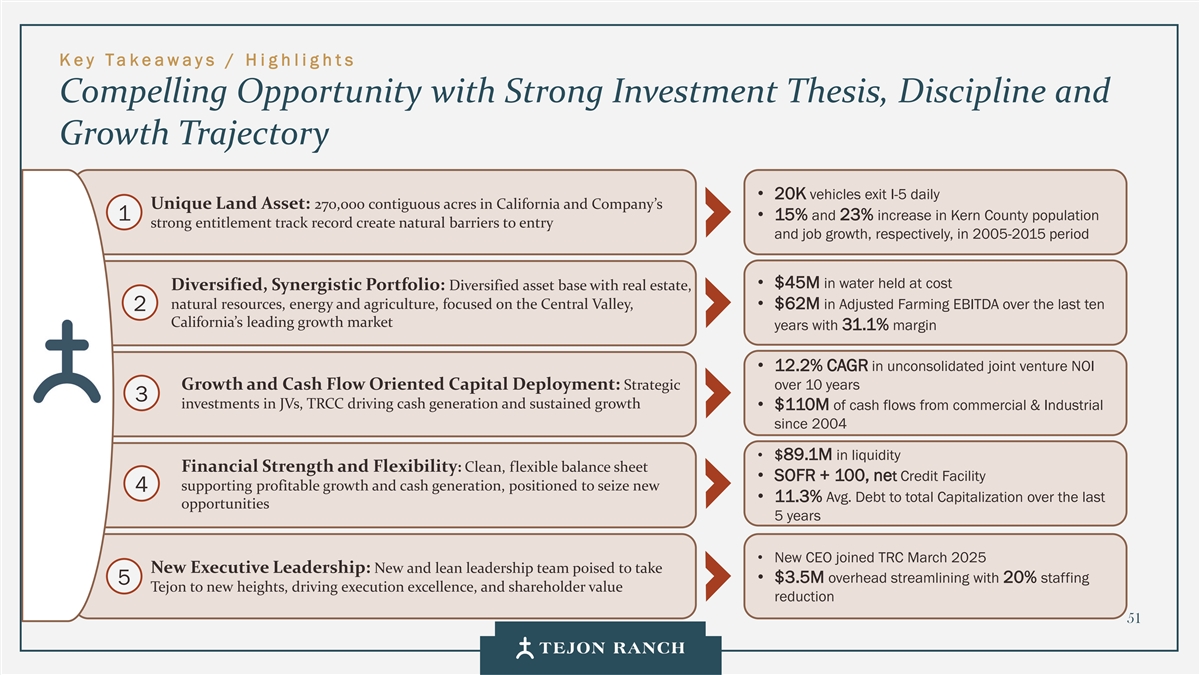
Key Takeaways / H i g h lig ht s Compelling Opportunity with Strong Investment Thesis, Discipline and Growth Trajectory • 20K vehicles exit I-5 daily Unique Land Asset: 270,000 contiguous acres in California and Company’s • 15% and 23% increase in Kern County population 1 strong entitlement track record create natural barriers to entry and job growth, respectively, in 2005-2015 period • $45M in water held at cost Diversified, Synergistic Portfolio: Diversified asset base with real estate, natural resources, energy and agriculture, focused on the Central Valley, • $62M in Adjusted Farming EBITDA over the last ten 2 California’s leading growth market years with 31.1% margin • 12.2% CAGR in unconsolidated joint venture NOI Growth and Cash Flow Oriented Capital Deployment: Strategic over 10 years 3 investments in JVs, TRCC driving cash generation and sustained growth • $110M of cash flows from commercial & Industrial since 2004 • $89.1M in liquidity Financial Strength and Flexibility: Clean, flexible balance sheet • SOFR + 100, net Credit Facility supporting profitable growth and cash generation, positioned to seize new 4 • 11.3% Avg. Debt to total Capitalization over the last opportunities 5 years • New CEO joined TRC March 2025 New Executive Leadership: New and lean leadership team poised to take • $3.5M overhead streamlining with 20% staffing 5 Tejon to new heights, driving execution excellence, and shareholder value reduction 51

Questions & Answers
Reconciliations and Additional Information
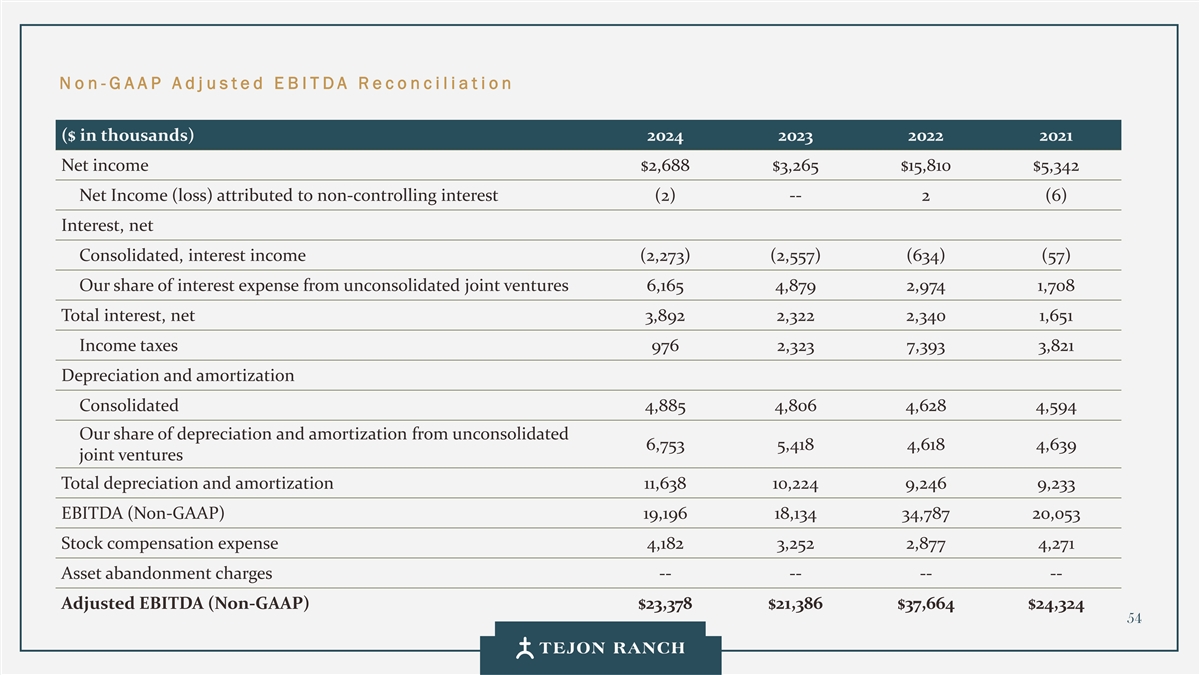
No n -G AAP Adj usted E B ITDA Reconciliat ion ($ in thousands) 2024 2023 2022 2021 Net income $2,688 $3,265 $15,810 $5,342 Net Income (loss) attributed to non-controlling interest (2) -- 2 (6) Interest, net Consolidated, interest income (2,273) (2,557) (634) (57) Our share of interest expense from unconsolidated joint ventures 6,165 4,879 2,974 1,708 Total interest, net 3,892 2,322 2,340 1,651 Income taxes 976 2,323 7,393 3,821 Depreciation and amortization Consolidated 4,885 4,806 4,628 4,594 Our share of depreciation and amortization from unconsolidated 6,753 5,418 4,618 4,639 joint ventures Total depreciation and amortization 11,638 10,224 9,246 9,233 EBITDA (Non-GAAP) 19,196 18,134 34,787 20,053 Stock compensation expense 4,182 3,252 2,877 4,271 Asset abandonment charges -- -- -- -- Adjusted EBITDA (Non-GAAP) $23,378 $21,386 $37,664 $24,324 54
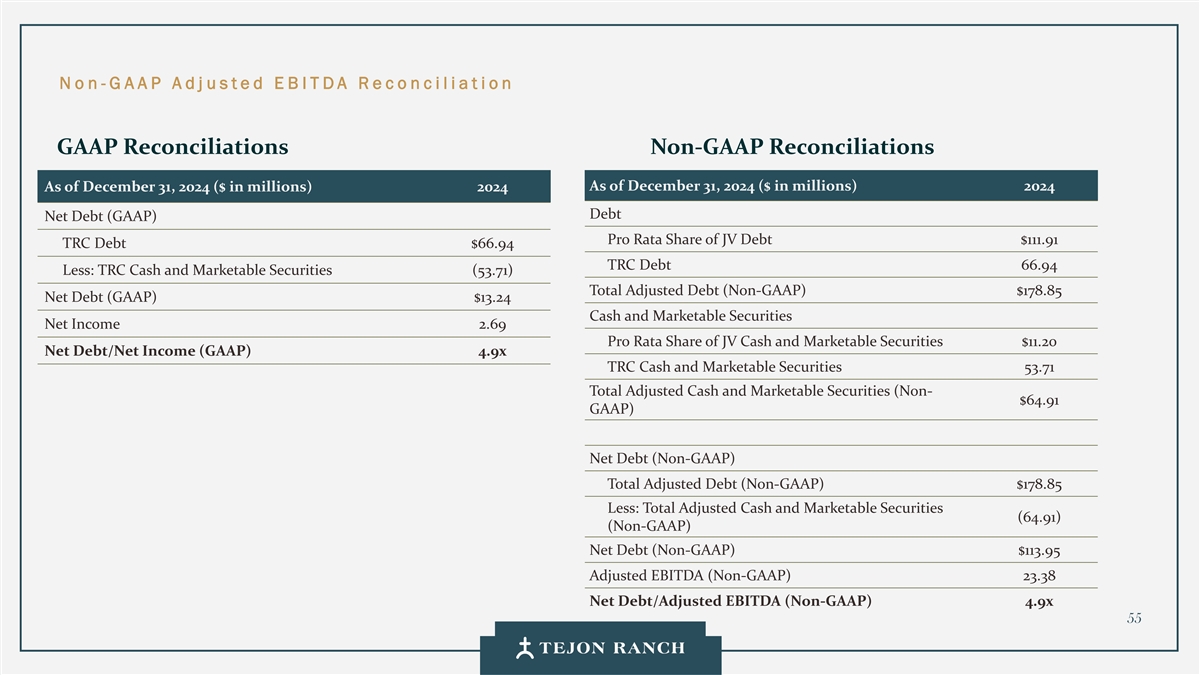
No n -G AAP Adj usted E B ITDA Reconciliat ion GAAP Reconciliations Non-GAAP Reconciliations As of December 31, 2024 ($ in millions) 2024 As of December 31, 2024 ($ in millions) 2024 Debt Net Debt (GAAP) Pro Rata Share of JV Debt $111.91 TRC Debt $66.94 TRC Debt 66.94 Less: TRC Cash and Marketable Securities (53.71) Total Adjusted Debt (Non-GAAP) $178.85 Net Debt (GAAP) $13.24 Cash and Marketable Securities Net Income 2.69 Pro Rata Share of JV Cash and Marketable Securities $11.20 Net Debt/Net Income (GAAP) 4.9x TRC Cash and Marketable Securities 53.71 Total Adjusted Cash and Marketable Securities (Non- $64.91 GAAP) Net Debt (Non-GAAP) Total Adjusted Debt (Non-GAAP) $178.85 Less: Total Adjusted Cash and Marketable Securities (64.91) (Non-GAAP) Net Debt (Non-GAAP) $113.95 Adjusted EBITDA (Non-GAAP) 23.38 Net Debt/Adjusted EBITDA (Non-GAAP) 4.9x 55
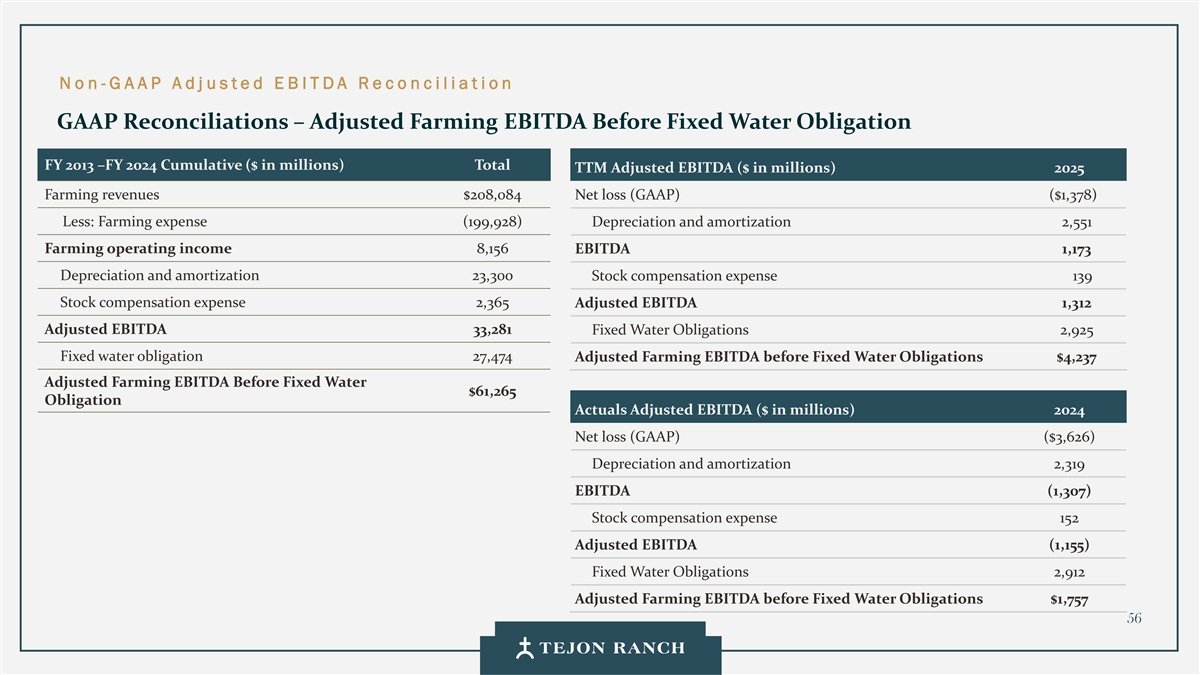
No n -G AAP Adj usted E B ITDA Reconciliat ion GAAP Reconciliations – Adjusted Farming EBITDA Before Fixed Water Obligation FY 2013 –FY 2024 Cumulative ($ in millions) Total TTM Adjusted EBITDA ($ in millions) 2025 Farming revenues $208,084 Net loss (GAAP) ($1,378) Less: Farming expense (199,928) Depreciation and amortization 2,551 Farming operating income 8,156 EBITDA 1,173 Depreciation and amortization 23,300 Stock compensation expense 139 Stock compensation expense 2,365 Adjusted EBITDA 1,312 Adjusted EBITDA 33,281 Fixed Water Obligations 2,925 Fixed water obligation 27,474 Adjusted Farming EBITDA before Fixed Water Obligations $4,237 Adjusted Farming EBITDA Before Fixed Water $61,265 Obligation Actuals Adjusted EBITDA ($ in millions) 2024 Net loss (GAAP) ($3,626) Depreciation and amortization 2,319 EBITDA (1,307) Stock compensation expense 152 Adjusted EBITDA (1,155) Fixed Water Obligations 2,912 Adjusted Farming EBITDA before Fixed Water Obligations $1,757 56

A D D ITIONAL I N FO RMATION Board of Directors STEVEN A. BETTS NORMAN METCALFE, Chairman GREGORY S. BIELLI ANDREW DAKOS DENISE GAMMON ANTHONY LEGGIO JEFF MCCALL ERIC SPERON DANIEL TISCH KENNETH YEE 57
A D D ITIONAL I N FO RMATION Senior Executive Team MATTHEW WALKER HUGH F. MCMAHON ROBERT D. VELASQUEZ MICHAEL R.W. HOUSTON Executive Vice President, Senior Vice President & Senior Vice President, President & CEO Real Estate Chief Financial Officer General Counsel 58