UNITED STATES
SECURITIES AND EXCHANGE COMMISSION
Washington, D.C. 20549
FORM 8-K
CURRENT REPORT
Pursuant to Section 13 or 15(d)
of the Securities Exchange Act of 1934
November 12, 2025
Date of Report (Date of earliest event reported)

TRUSTMARK CORPORATION
(Exact name of registrant as specified in its charter)
| Mississippi | 000-03683 | 64-0471500 | ||
| (State or other jurisdiction of incorporation) |
(Commission File Number) |
(IRS Employer Identification No.) |
| 248 East Capitol Street, Jackson, Mississippi | 39201 | |
| (Address of principal executive offices) | (Zip Code) |
Registrant’s telephone number, including area code: (601) 208-5111
Check the appropriate box below if the Form 8-K filing is intended to simultaneously satisfy the filing obligation of the registrant under any of the following provisions:
| ☐ | Written communications pursuant to Rule 425 under the Securities Act (17 CFR 230.425) |
| ☐ | Soliciting material pursuant to Rule 14a-12 under the Exchange Act (17 CFR 240.14a-12) |
| ☐ | Pre-commencement communications pursuant to Rule 14d-2(b) under the Exchange Act (17 CFR 240.14d-2(b)) |
| ☐ | Pre-commencement communications pursuant to Rule 13e-4(c) under the Exchange Act (17 CFR 240.13e-4(c)) |
Securities registered Pursuant to Section 12(b) of the Act:
| Title of each class |
Trading |
Name of each exchange |
||
| Common Stock, no par value | TRMK | Nasdaq Global Select Market |
Indicate by check mark whether the registrant is an emerging growth company as defined in Rule 405 of the Securities Act of 1933 (17 CFR §230.405) or Rule 12b-2 of the Securities Exchange Act of 1934 (17 CFR §240.12b-2).
Emerging growth company ☐
If an emerging growth company, indicate by check mark if the registrant has elected not to use the extended transition period for complying with any new or revised financial accounting standards provided pursuant to Section 13(a) of the Exchange Act. ☐
| Item 7.01. | Regulation FD Disclosure. |
The attached presentation materials contain updated information that the members of Trustmark Corporation (the “Company”) management will use during visits with investors, analysts, and other interested parties to assist their understanding of the Company from time to time throughout the fourth quarter of 2025.
As provided in General Instruction B.2 to Form 8-K, the information furnished in Item 7.01 and Exhibit 99.1 of this Current Report on Form 8-K shall not be deemed “filed” for purposes of Section 18 of the Securities Exchange Act of 1934, as amended (the “Exchange Act”), or otherwise subject to the liabilities of that section, and such information shall not be deemed incorporated by reference in any filing under the Securities Act of 1933, as amended, or the Exchange Act, except as shall be expressly set forth by specific reference in such filing.
| Item 9.01. | Financial Statements and Exhibits. |
(d) Exhibits
| Exhibit |
Description of Exhibits |
|
| 99.1 | Investor slide presentation, dated November 12, 2025 | |
| 104 | Cover Page Interactive Data File (embedded within the Inline XBRL document) | |
SIGNATURES
Pursuant to the requirements of the Securities Exchange Act of 1934, the registrant has duly caused this report to be signed on its behalf by the undersigned hereunto duly authorized.
TRUSTMARK CORPORATION
| BY: | /s/ Thomas C. Owens |
|
| Thomas C. Owens | ||
| Treasurer and Principal Financial Officer | ||
| DATE: | November 12, 2025 | |
Exhibit 99.1 Fixed Income Investor Presentation November 2025

Safe Harbor Statement and Disclaimers Certain statements contained in this presentation constitute forward-looking statements within the meaning of the Private Securities Litigation Reform Act of 1995. You can identify forward-looking statements by words such as “may,” “hope,” “will,” “should,” “expect,” “plan,” “anticipate,” “intend,” “believe,” “estimate,” “predict,” “project,” “potential,” “seek,” “continue,” “could,” “would,” “future” or the negative of those terms or other words of similar meaning. You should read statements that contain these words carefully because they discuss our future expectations or state other “forward-looking” information. These forward-looking statements include, but are not limited to, statements relating to anticipated future operating and financial performance measures, including net interest margin, credit quality, business initiatives, growth opportunities and growth rates, among other things, and encompass any estimate, prediction, expectation, projection, opinion, anticipation, outlook or statement of belief included therein as well as the management assumptions underlying these forward-looking statements. You should be aware that the occurrence of the events described under the caption “Risk Factors” in Trustmark’s filings with the Securities and Exchange Commission (SEC) could have an adverse effect on our business, results of operations or financial condition. Should one or more of these risks materialize, or should any such underlying assumptions prove to be significantly different, actual results may vary significantly from those anticipated, estimated, projected or expected. Risks that could cause actual results to differ materially from current expectations of Management include, but are not limited to, actions by the Board of Governors of the Federal Reserve System (FRB) that impact the level of market interest rates, local, state, national and international economic and market conditions, conditions in the housing and real estate markets in the regions in which Trustmark operates, conditions and changes, including volatility, in the credit and financial markets, changes in the level of nonperforming assets and charge-offs, an increase in unemployment levels, a slowdown in economic growth, changes in our ability to measure the fair value of assets in our portfolio, changes in the level and/or volatility of market interest rates, the impacts related to or resulting from bank failures and other economic and industry volatility, including potential increased regulatory requirements, the demand for the products and services we offer, potential unexpected adverse outcomes in pending litigation matters, our ability to attract and retain noninterest-bearing deposits and other low-cost funds, competition in loan and deposit pricing, as well as the entry of new competitors into our markets through de novo expansion and acquisitions, changes in accounting standards and practices, including changes in the interpretation of existing standards, that affect our consolidated financial statements, changes in consumer spending, borrowings and savings habits, technological changes, changes in the financial performance or condition of our borrowers, greater than expected costs or difficulties related to the integration of acquisitions or new products and lines of business, cyber-attacks and other breaches which could affect our information system security, natural disasters, environmental disasters, pandemics or other health crises, acts of war or terrorism, potential market or regulatory effects of the current United States presidential administration’s policies, changes to the credit rating of U.S. Government securities and other risks described in our filings with the SEC. Although we believe that the expectations reflected in such forward-looking statements are reasonable, we can give no assurance that such expectations will prove to be correct. Except as required by law, we undertake no obligation to update or revise any of this information, whether as the result of new information, future events or developments or otherwise. This presentation is not an offer to sell securities and Trustmark Corporation (Trustmark) is not soliciting an offer to buy securities in any jurisdiction where such offer or sale is not permitted. Neither the SEC nor any state securities commission has approved or disapproved of the securities of Trustmark or passed upon the accuracy or adequacy of this presentation. Any representation to the contrary is a criminal offence. Except as otherwise indicated, this presentation speaks as of the date hereof. This presentation includes statistical and other industry and market data that we obtained from government reports and other third-party sources. Our internal data, estimates, and forecasts are based on information obtained from government reports, trade, and business organizations and other contacts in the markets in which we operate and our management’s understanding of industry conditions. Although we believe that this information (including the industry publications and third-party research, surveys, and studies) is accurate and reliable, we have not independently verified such information. In addition, estimates, forecasts, and assumptions are necessarily subject to a high degree of uncertainty and risk due to a variety of factors. Finally, forward-looking information obtained from these sources is subject to the same qualifications and the additional uncertainties regarding the other forward-looking statements in this presentation. Numbers contained in this presentation for the quarter ended September 30, 2025 and for other quarterly periods are unaudited. Additionally, all figures presented as year-to-date and for periods that represent a full fiscal year ended December 31 represent unaudited results. As a result, subsequent information may cause a change in certain accounting estimates and other financial information, including Trustmark’s allowance for credit losses, fair values, and income taxes. This presentation includes financial information in its analysis of Trustmark’s performance that is not in conformity with accounting principles generally accepted in the United States of America (“GAAP”). The reconciliations of these measures to their most directly comparable GAAP equivalents are provided in the Appendix to this presentation. These disclosures should not be viewed as a substitute for operating results determined in accordance with GAAP, nor are they necessarily comparable to non-GAAP performance measures that may be presented by other companies. 2
Table of Contents 1. Company Overview 4-6 2. Q3 ’25 Results 7 3. Historical Growth 8-9 4. Capital Position 10-11 5. Net Interest Income 12 6. Deposit Portfolio 13 7. Loan Portfolio 14-18 8. Asset Quality 19-20 9. Liquidity Profile 21-22 10. Noninterest Income & Expense 23-24 11. Appendix 25-32 3
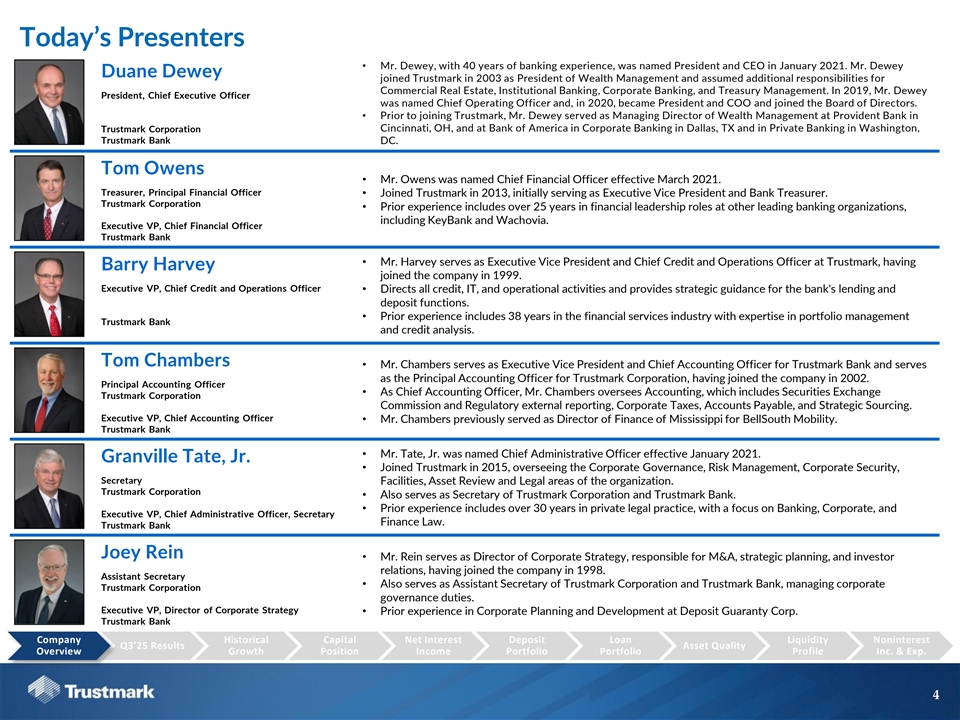
Today’s Presenters v• Mr. Dewey, with 40 years of banking experience, was named President and CEO in January 2021. Mr. Dewey Duane Dewey joined Trustmark in 2003 as President of Wealth Management and assumed additional responsibilities for Commercial Real Estate, Institutional Banking, Corporate Banking, and Treasury Management. In 2019, Mr. Dewey President, Chief Executive Officer was named Chief Operating Officer and, in 2020, became President and COO and joined the Board of Directors. • Prior to joining Trustmark, Mr. Dewey served as Managing Director of Wealth Management at Provident Bank in Trustmark Corporation Cincinnati, OH, and at Bank of America in Corporate Banking in Dallas, TX and in Private Banking in Washington, Trustmark Bank DC. Tom Owens • Mr. Owens was named Chief Financial Officer effective March 2021. Treasurer, Principal Financial Officer • Joined Trustmark in 2013, initially serving as Executive Vice President and Bank Treasurer. Trustmark Corporation • Prior experience includes over 25 years in financial leadership roles at other leading banking organizations, including KeyBank and Wachovia. Executive VP, Chief Financial Officer Trustmark Bank • Mr. Harvey serves as Executive Vice President and Chief Credit and Operations Officer at Trustmark, having Barry Harvey joined the company in 1999. Executive VP, Chief Credit and Operations Officer • Directs all credit, IT, and operational activities and provides strategic guidance for the bank's lending and deposit functions. • Prior experience includes 38 years in the financial services industry with expertise in portfolio management Trustmark Bank and credit analysis. Tom Chambers • Mr. Chambers serves as Executive Vice President and Chief Accounting Officer for Trustmark Bank and serves as the Principal Accounting Officer for Trustmark Corporation, having joined the company in 2002. Principal Accounting Officer • As Chief Accounting Officer, Mr. Chambers oversees Accounting, which includes Securities Exchange Trustmark Corporation Commission and Regulatory external reporting, Corporate Taxes, Accounts Payable, and Strategic Sourcing. Executive VP, Chief Accounting Officer • Mr. Chambers previously served as Director of Finance of Mississippi for BellSouth Mobility. Trustmark Bank • Mr. Tate, Jr. was named Chief Administrative Officer effective January 2021. Granville Tate, Jr. • Joined Trustmark in 2015, overseeing the Corporate Governance, Risk Management, Corporate Security, Secretary Facilities, Asset Review and Legal areas of the organization. Trustmark Corporation • Also serves as Secretary of Trustmark Corporation and Trustmark Bank. • Prior experience includes over 30 years in private legal practice, with a focus on Banking, Corporate, and Executive VP, Chief Administrative Officer, Secretary Finance Law. Trustmark Bank Joey Rein • Mr. Rein serves as Director of Corporate Strategy, responsible for M&A, strategic planning, and investor relations, having joined the company in 1998. Assistant Secretary • Also serves as Assistant Secretary of Trustmark Corporation and Trustmark Bank, managing corporate Trustmark Corporation governance duties. Executive VP, Director of Corporate Strategy • Prior experience in Corporate Planning and Development at Deposit Guaranty Corp. Trustmark Bank C Co om mp pa an ny y Historical Capital Net Interest Deposit Loan Liquidity Noninterest Q3’25 Results Asset Quality O Ov ve er rv vi ie ew w Growth Position Income Portfolio Portfolio Profile Inc. & Exp. 4
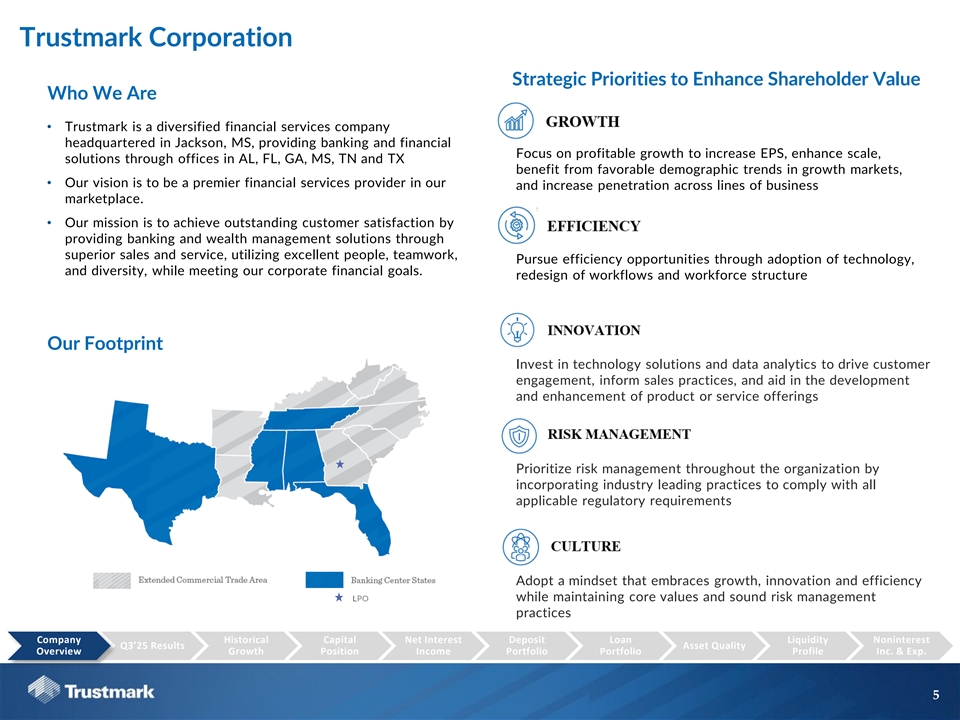
Trustmark Corporation Strategic Priorities to Enhance Shareholder Value Who We Are • Trustmark is a diversified financial services company headquartered in Jackson, MS, providing banking and financial Focus on profitable growth to increase EPS, enhance scale, solutions through offices in AL, FL, GA, MS, TN and TX benefit from favorable demographic trends in growth markets, • Our vision is to be a premier financial services provider in our and increase penetration across lines of business marketplace. • Our mission is to achieve outstanding customer satisfaction by providing banking and wealth management solutions through superior sales and service, utilizing excellent people, teamwork, Pursue efficiency opportunities through adoption of technology, and diversity, while meeting our corporate financial goals. redesign of workflows and workforce structure Our Footprint Invest in technology solutions and data analytics to drive customer engagement, inform sales practices, and aid in the development and enhancement of product or service offerings Prioritize risk management throughout the organization by incorporating industry leading practices to comply with all applicable regulatory requirements Adopt a mindset that embraces growth, innovation and efficiency LPO while maintaining core values and sound risk management practices C Co om mp pa an ny y Historical Capital Net Interest Deposit Loan Liquidity Noninterest Q3’25 Results Asset Quality O Ov ve er rv vi ie ew w Growth Position Income Portfolio Portfolio Profile Inc. & Exp. 5

Our Company Franchise Overview Company Highlights Balance Sheet TRMK (167) $18.8B $13.5B $15.6B $10.1B LPO (1) Total Gross Loans Total Wealth (1) Assets HFI Deposits AUM Company Info TN Memphis 1889 #2 Outstanding Year Mississippi CRA (2) (3) Founded Market Share Rating MS Birmingham Profitability Atlanta Jackson 1.21% 12.84% 20% 1.84% ROAA ROATCE* Fee Income / Cost of GA Total Revenue Deposits TX AL Capital & Asset Quality LA Houston 9.6% 10.3% 11.9% 14.3% Tallahassee TCE / Leverage CET1 TRBC FL TA* Ratio Ratio Ratio 249% 60% 0.13% 0.49% CRE / C&D / NCOs / NPAs / (4) (4) TRBC TRBC Avg Loans Assets Ratings * A reconciliation of this non-GAAP measure is set forth in appendix BBB BBB Note: Unless otherwise stated, financial data as of or for the 3 months ended 9/30/25 S&P Issuer Fitch Issuer Note: TRMK’s Loan Production Office is responsible for the nationwide equipment finance business (1) AUM as of 9/30/2025 per TRMK 10-Q filing Rating Rating (2) Deposit market share data as of 6/30/25 (3) TRMK formally upgraded to “outstanding” status in February 2025 (4) Financial data per bank level regulatory filings; CRE ratio excludes owner-occupied CRE per regulatory definition C Co om mp pa an ny y Historical Capital Net Interest Deposit Loan Liquidity Noninterest Q3’25 Results Asset Quality O Ov ve er rv vi ie ew w Growth Position Income Portfolio Portfolio Profile Inc. & Exp. 6
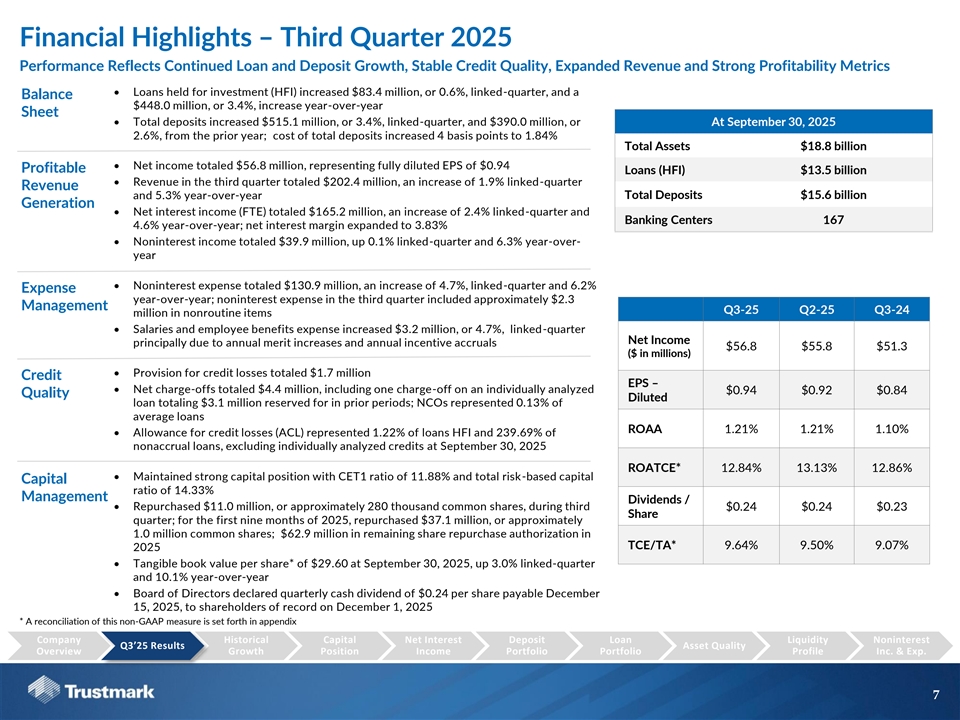
Financial Highlights – Third Quarter 2025 Performance Reflects Continued Loan and Deposit Growth, Stable Credit Quality, Expanded Revenue and Strong Profitability Metrics • Loans held for investment (HFI) increased $83.4 million, or 0.6%, linked-quarter, and a Balance $448.0 million, or 3.4%, increase year-over-year Sheet • Total deposits increased $515.1 million, or 3.4%, linked-quarter, and $390.0 million, or At September 30, 2025 2.6%, from the prior year; cost of total deposits increased 4 basis points to 1.84% Total Assets $18.8 billion • Net income totaled $56.8 million, representing fully diluted EPS of $0.94 Profitable Loans (HFI) $13.5 billion • Revenue in the third quarter totaled $202.4 million, an increase of 1.9% linked-quarter Revenue Total Deposits $15.6 billion and 5.3% year-over-year Generation • Net interest income (FTE) totaled $165.2 million, an increase of 2.4% linked-quarter and Banking Centers 167 4.6% year-over-year; net interest margin expanded to 3.83% • Noninterest income totaled $39.9 million, up 0.1% linked-quarter and 6.3% year-over- year • Noninterest expense totaled $130.9 million, an increase of 4.7%, linked-quarter and 6.2% Expense year-over-year; noninterest expense in the third quarter included approximately $2.3 Management Q3-25 Q2-25 Q3-24 million in nonroutine items • Salaries and employee benefits expense increased $3.2 million, or 4.7%, linked-quarter Net Income principally due to annual merit increases and annual incentive accruals $56.8 $55.8 $51.3 ($ in millions) • Provision for credit losses totaled $1.7 million Credit EPS – • Net charge-offs totaled $4.4 million, including one charge-off on an individually analyzed $0.94 $0.92 $0.84 Quality Diluted loan totaling $3.1 million reserved for in prior periods; NCOs represented 0.13% of average loans ROAA 1.21% 1.21% 1.10% • Allowance for credit losses (ACL) represented 1.22% of loans HFI and 239.69% of nonaccrual loans, excluding individually analyzed credits at September 30, 2025 ROATCE* 12.84% 13.13% 12.86% • Maintained strong capital position with CET1 ratio of 11.88% and total risk-based capital Capital ratio of 14.33% Management Dividends / • Repurchased $11.0 million, or approximately 280 thousand common shares, during third $0.24 $0.24 $0.23 Share quarter; for the first nine months of 2025, repurchased $37.1 million, or approximately 1.0 million common shares; $62.9 million in remaining share repurchase authorization in TCE/TA* 9.64% 9.50% 9.07% 2025 • Tangible book value per share* of $29.60 at September 30, 2025, up 3.0% linked-quarter and 10.1% year-over-year • Board of Directors declared quarterly cash dividend of $0.24 per share payable December 15, 2025, to shareholders of record on December 1, 2025 * A reconciliation of this non-GAAP measure is set forth in appendix Company Historical Capital Net Interest Deposit Loan Liquidity Noninterest Q Q3 3’ ’2 25 5 R Re es su ul lt ts s Asset Quality Overview Growth Position Income Portfolio Portfolio Profile Inc. & Exp. 7

Enhanced Financial Positioning Loans HFI NIM - FTE ($ in billions) 3.80% $13.5 3.51% $13.1 $13.0 3.32% $12.2 3.17% 2022 2023 2024 9/30/2025 YTD 2022 2023 2024 9/30/2025 YTD Total Deposits Tangible Book Value Per Share* ($ in billions) $29.60 $26.68 $15.6 $15.6 $15.1 $21.73 $18.98 $14.4 2022 2023 2024 9/30/2025 YTD 2022 2023 2024 9/30/2025 YTD * A reconciliation of this non-GAAP measure is set forth in appendix Company H Hi is st to or ri ic ca al l Capital Net Interest Deposit Loan Liquidity Noninterest Q3’25 Results Asset Quality Overview G Gr ro ow wt th h Position Income Portfolio Portfolio Profile Inc. & Exp. 8
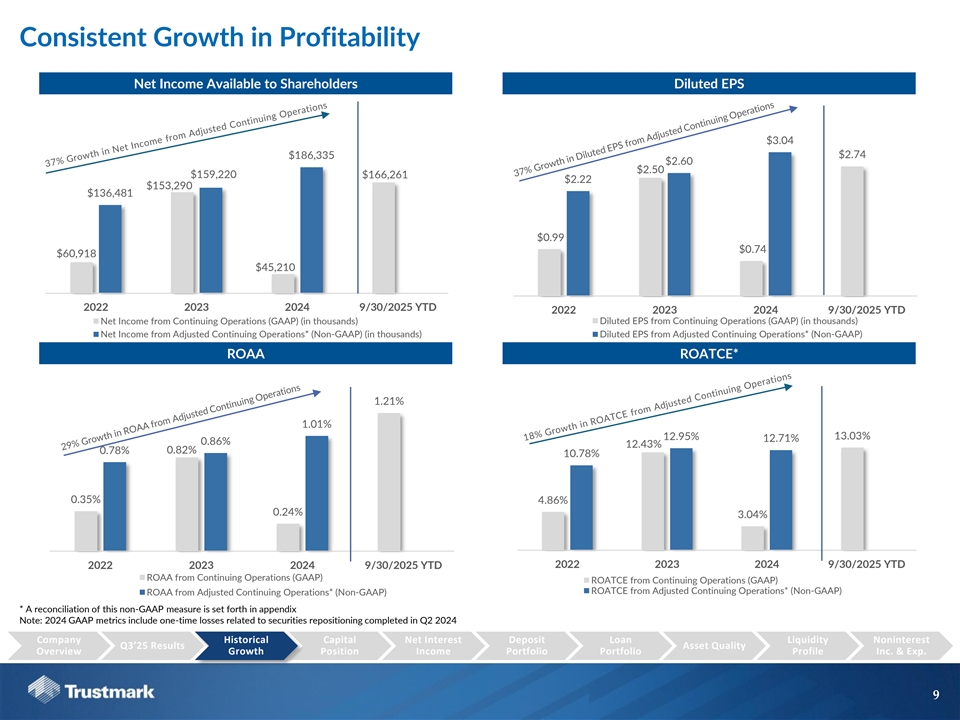
Consistent Growth in Profitability Net Income Available to Shareholders Diluted EPS $3.04 $186,335 $2.74 $2.60 $2.50 $159,220 $166,261 $2.22 $153,290 $136,481 $0.99 $0.74 $60,918 $45,210 2022 2023 2024 9/30/2025 YTD 2022 2023 2024 9/30/2025 YTD Net Income from Continuing Operations (GAAP) (in thousands) Diluted EPS from Continuing Operations (GAAP) (in thousands) Net Income from Adjusted Continuing Operations* (Non-GAAP) (in thousands) Diluted EPS from Adjusted Continuing Operations* (Non-GAAP) ROAA ROATCE* 1.21% 1.01% 12.95% 13.03% 12.71% 0.86% 12.43% 0.82% 0.78% 10.78% 0.35% 4.86% 0.24% 3.04% 2022 2023 2024 9/30/2025 YTD 2022 2023 2024 9/30/2025 YTD ROAA from Continuing Operations (GAAP) ROATCE from Continuing Operations (GAAP) ROATCE from Adjusted Continuing Operations* (Non-GAAP) ROAA from Adjusted Continuing Operations* (Non-GAAP) * A reconciliation of this non-GAAP measure is set forth in appendix Note: 2024 GAAP metrics include one-time losses related to securities repositioning completed in Q2 2024 Company H Hi is st to or ri ic ca al l Capital Net Interest Deposit Loan Liquidity Noninterest Q3’25 Results Asset Quality Overview G Gr ro ow wt th h Position Income Portfolio Portfolio Profile Inc. & Exp. 9

Current Capital Position Regulatory Capital as of September 30, 2025 Capital Highlights $ in millions Subordinated Notes 9.6% 10.3% 11.9% $124 Tier 2 TCE / Leverage CET1 $315 ACL $191 TA* Ratio Ratio Trust Preferred $60 12.3% 14.3% Tier 1 Total Capital Ratio Ratio ▪ Subordinated Notes Approaching Call Phase: The $125.0 million subordinated notes remain outstanding. They will begin to phase out of Tier Common Equity Tier 1 Tier 1 2 capital on a 20% annual basis starting $1,873 $1,813 December 1, 2025. ▪ Legacy Tier 1 Capital: The company continues to utilize $60.0 million in trust preferred securities as Tier 1 capital under regulatory grandfathering provisions. 1 * A reconciliation of this non-GAAP measure is set forth in appendix Company Historical C Ca ap pi it ta al l Net Interest Deposit Loan Liquidity Noninterest Q3’25 Results Asset Quality Overview Growth P Po os si it ti io on n Income Portfolio Portfolio Profile Inc. & Exp. 10

Strong Capital Position Relative to Peers Tangible Common Equity / Tangible Assets* Common Equity Tier 1 Ratio* 11.9% 9.6% 11.6% 9.3% TRMK Peer Median TRMK Peer Median TCE/TA, including After-Tax HTM Losses* Common Equity Tier 1, including AOCI & HTM* 11.6% 9.5% 11.4% 8.9% TRMK Peer Median TRMK Peer Median Source: S&P Global Market Intelligence * A reconciliation of this non-GAAP measure is set forth in appendix Note: Financial data as of 9/30/2025 Note: Peers include major-exchange traded banks headquartered in the Southeast with assets between $10bn and $50bn; Excludes merger targets and mutual holding companies Note: Assumes a tax rate of 21.0% for peer after-tax HTM losses; Assumes a tax rate of 25.0% for TRMK after-tax HTM losses Company Historical C Ca ap pi it ta al l Net Interest Deposit Loan Liquidity Noninterest Q3’25 Results Asset Quality Overview Growth P Po os si it ti io on n Income Portfolio Portfolio Profile Inc. & Exp. 11

Income Statement Highlights – Net Interest Income (1) Net Interest Income – FTE Yields and Costs ($ in millions) 6.55% $165 6.32% $161 $158 6.19% 6.21% $158 6.15% $155 3.83% 3.75% 3.76% 3.81% 3.69% 3.46% 3.46% 3.50% 3.44% 3.41% 2.94% 2.61% 2.43% 2.44% 2.42% Q3-24 Q4-24 Q1-25 Q2-25 Q3-25 Q3-24 Q4-24 Q1-25 Q2-25 Q3-25 Loan Yield NIM Securities Yield Cost of IBL Net Interest Income Net Interest Margin • Net interest income (FTE) totaled $165.2 million in the third 0.09% 3.83% 3.81% quarter, resulting in a net interest margin of 3.83%, up 2 basis -0.03% -0.04% points from the prior quarter Liability # of Days in Asset Rate/Volume Qtr Rate/Volume • Securities yield during Q3-25 was 3.50%, up 4 basis points linked-quarter and an increase of 6 basis points year-over- year Q2-25 NIM Q3-25 NIM (1) Loan Yield includes LHFI & LHFS Company Historical Capital N Ne et t I In nt te er re es st t Deposit Loan Liquidity Noninterest Q3’25 Results Asset Quality Overview Growth Position I In nc co om me e Portfolio Portfolio Profile Inc. & Exp. 12
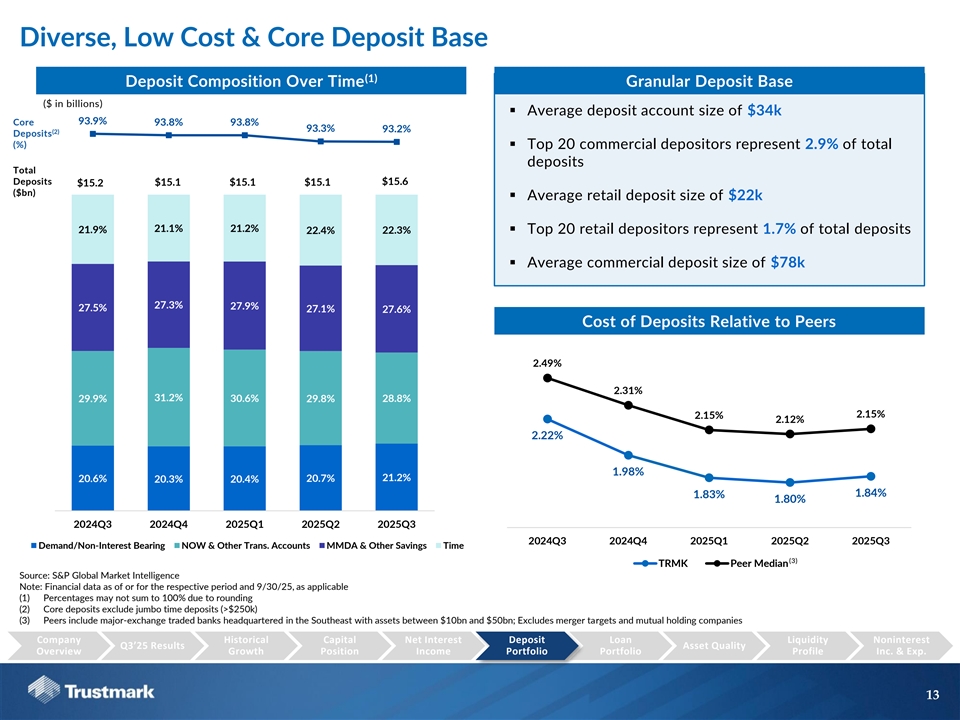
Diverse, Low Cost & Core Deposit Base (1) Deposit Composition Over Time Granular Deposit Base ($ in billions) ▪ Average deposit account size of $34k 93.9% Core 93.8% 93.8% 93.3% 93.2% (2) Deposits (%) ▪ Top 20 commercial depositors represent 2.9% of total deposits Total Deposits $15.6 $15.2 $15.1 $15.1 $15.1 ($bn) ▪ Average retail deposit size of $22k 21.1% 21.2% 21.9% 22.4% 22.3% ▪ Top 20 retail depositors represent 1.7% of total deposits ▪ Average commercial deposit size of $78k 27.3% 27.9% 27.5% 27.1% 27.6% Cost of Deposits Relative to Peers 2.49% 2.31% 31.2% 29.9% 30.6% 29.8% 28.8% 2.15% 2.15% 2.12% 2.22% 1.98% 21.2% 20.6% 20.3% 20.4% 20.7% 1.84% 1.83% 1.80% 2024Q3 2024Q4 2025Q1 2025Q2 2025Q3 2024Q3 2024Q4 2025Q1 2025Q2 2025Q3 Demand/Non-Interest Bearing NOW & Other Trans. Accounts MMDA & Other Savings Time (3) TRMK Peer Median Source: S&P Global Market Intelligence Note: Financial data as of or for the respective period and 9/30/25, as applicable (1) Percentages may not sum to 100% due to rounding (2) Core deposits exclude jumbo time deposits (>$250k) (3) Peers include major-exchange traded banks headquartered in the Southeast with assets between $10bn and $50bn; Excludes merger targets and mutual holding companies Company Historical Capital Net Interest D De ep po os si it t Loan Liquidity Noninterest Q3’25 Results Asset Quality Overview Growth Position Income P Po or rt tf fo ol li io o Portfolio Profile Inc. & Exp. 13
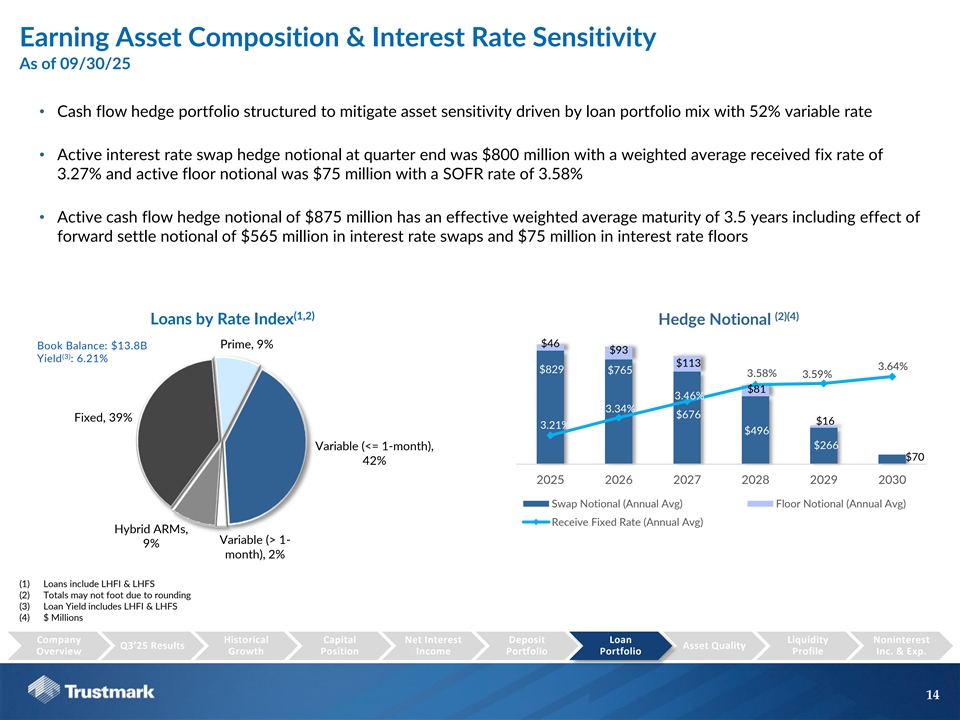
Earning Asset Composition & Interest Rate Sensitivity As of 09/30/25 • Cash flow hedge portfolio structured to mitigate asset sensitivity driven by loan portfolio mix with 52% variable rate • Active interest rate swap hedge notional at quarter end was $800 million with a weighted average received fix rate of 3.27% and active floor notional was $75 million with a SOFR rate of 3.58% • Active cash flow hedge notional of $875 million has an effective weighted average maturity of 3.5 years including effect of forward settle notional of $565 million in interest rate swaps and $75 million in interest rate floors (1,2) (2)(4) Loans by Rate Index Hedge Notional $1,000 4.00% $900 3.90% $46 Prime, 9% Book Balance: $13.8B $93 $800 3.80% (3) Yield : 6.21% $113 $700 3.70% 3.64% $829 $765 3.58% 3.59% $600 3.60% $81 $500 3.50% 3.46% $400 3.40% 3.34% $676 Fixed, 39% $300 3.30% $16 3.21% $496 $200 3.20% $266 Variable (<= 1-month), $100 3.10% $70 42% $- 3.00% 2025 2026 2027 2028 2029 2030 Swap Notional (Annual Avg) Floor Notional (Annual Avg) Receive Fixed Rate (Annual Avg) Hybrid ARMs, Variable (> 1- 9% month), 2% (1) Loans include LHFI & LHFS (2) Totals may not foot due to rounding (3) Loan Yield includes LHFI & LHFS (4) $ Millions Company Historical Capital Net Interest Deposit L Lo oa an n Liquidity Noninterest Q3’25 Results Asset Quality Overview Growth Position Income Portfolio P Po or rt tf fo ol li io o Profile Inc. & Exp. 14

Loans Held for Investment (HFI) Portfolio Focus on profitable, credit-disciplined loan growth continued (1) Loans HFI Lo an Po rtfolio Composition 09/30/25 Change (1) ($ in millions) Other RE, 9/30/2025 LQ Y-o-Y 15% Nonfarm,Nonres, Loans secured by real estate: 24% Const., land dev. and other land loans $ 1,242 $ (113) $ (346) Secured by 1-4 family residential prop. 3,055 (2) 160 C&I, 14% Secured by nonfarm, nonresidential prop. 3 ,300 (179) (283) Other real estate secured 2,056 137 580 Commercial and industrial loans 1,904 71 137 Consumer, 1% Consumer loans 151 2 2 1-4 Residential, State & Other Political 23% Sub. , 8% State and other political subdivision loans 1,028 67 32 Other, 6% Other Loans & Leases 813 101 167 Construction, Land Dev, 9% Total LHFI $ 13,548 $ 83 $ 448 • Portfolio exhibits diversity by product type, geography, and industry Loans HFI by Quarter • Total loans to NDFIs of $292 million (2% of total loans): $13,548 $13,465 • $96 million to mortgage credit intermediaries (2) • $93 million to business credit intermediaries $13,241 • $52 million to consumer credit intermediaries $13,100 $13,090 • $51 million to other non-depository financial institutions $223 $83 $151 Dollar Change: $(10) • Minimal lending to private credit with total exposure of $137 million to six long term relationships, of which only $55 million Q3-24 Q4-24 Q1-25 Q2-25 Q3-25 (3) is funded and outstanding (<0.5% of total loans) (1) Totals and percentages may not foot due to rounding (2) This figure includes the referenced private credit in the last bullet below (3) Defined as direct loans made to mid-market businesses typically by non-bank vehicles such as private debt and Business Development Companies. Company Historical Capital Net Interest Deposit L Lo oa an n Liquidity Noninterest Q3’25 Results Asset Quality Overview Growth Position Income Portfolio P Po or rt tf fo ol li io o Profile Inc. & Exp. 15
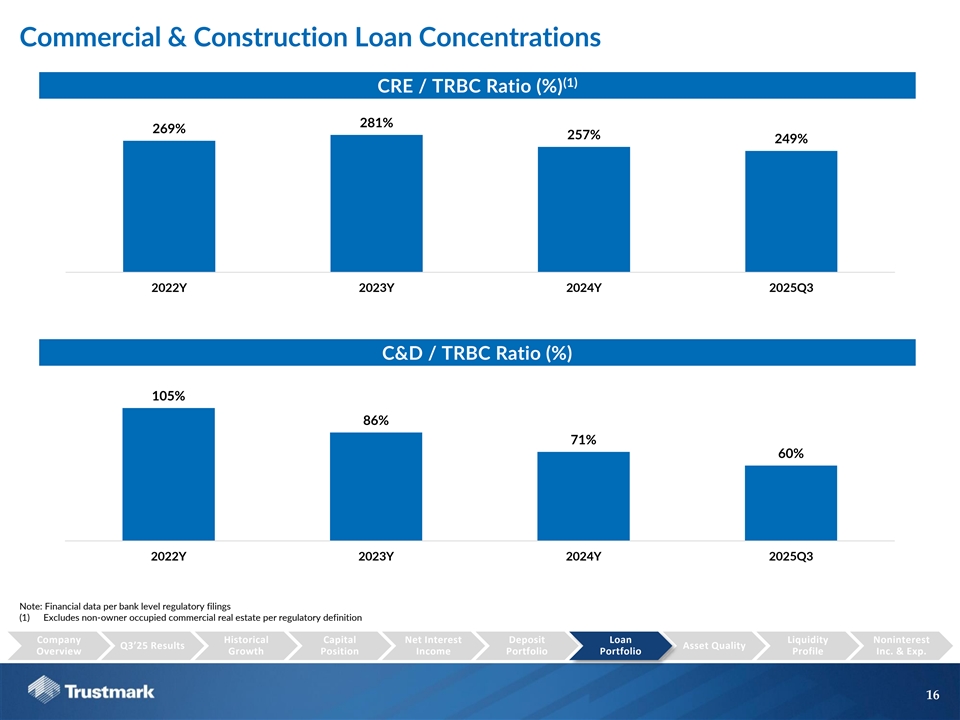
Commercial & Construction Loan Concentrations (1) CRE / TRBC Ratio (%) 281% 269% 257% 249% 2022Y 2023Y 2024Y 2025Q3 C&D / TRBC Ratio (%) 105% 86% 71% 60% 2022Y 2023Y 2024Y 2025Q3 Note: Financial data per bank level regulatory filings (1) Excludes non-owner occupied commercial real estate per regulatory definition Company Historical Capital Net Interest Deposit L Lo oa an n Liquidity Noninterest Q3’25 Results Asset Quality Overview Growth Position Income Portfolio P Po or rt tf fo ol li io o Profile Inc. & Exp. 16

Commercial Real Estate and Offices (CRE) Portfolio Detail (1)(2) (1)(2) Offices (CRE) Portfolio % of Offices CRE Portfolio % of CRE ($ in millions) ($ in millions) 09/30/25 Portfolio 09/30/25 Portfolio Construction $ 1 0% Lots, Development and Unimproved Land $ 254 5% Existing 228 100% 1-4 Family Construction 310 6% Total Offices $ 229 100% Other Construction 678 13% Total Construction, Land Development and $ 1,242 24% Other Land Loans Offices (CRE) as % of LHFI 1.7% Retail 262 5% Average Loan Balance $1.6 million Offices 228 4% YTD Office NCOs/Average Loans 0.84% Hotels/Motels 252 5% Office Delinquencies/Total Offices 0.00% Industrial 464 9% Office NPL/Total Offices 0.06% Senior Living 283 5% Other 446 9% Total Non-owner Occupied & REITs $ 1,935 37% Offices (CRE) Portfolio (3) Multi-Family 1,987 38% • Existing (credits of $5 million or more) Total CRE $ 5,164 100% * Weighted average occupancy of investment grade tenants is 44% CRE Portfolio * Less than 10% lease turnover in each year from 2025-2028 • Focused on vertical construction with limited exposure to unimproved land and development * Weighted average vacancies of 3% • Well-diversified product and geographical mix * Weighted average LTV of 67% (1) All information provided above reflects outstanding balances (2) Totals and percentages may not foot due to rounding (3) Multi-Family is included in Other Real Estate Secured Loans in Financials Company Historical Capital Net Interest Deposit L Lo oa an n Liquidity Noninterest Q3’25 Results Asset Quality Overview Growth Position Income Portfolio P Po or rt tf fo ol li io o Profile Inc. & Exp. 17

Commercial Loan Portfolio Detail % of • Portfolio includes commercial, financial (1)(2) Commercial Portfolio Commercial intermediaries, agriculture production, equipment ($ in millions) 09/30/25 Portfolio finance, non-profits, and leases Manufacturing $ 417 15% • Credits originated by the Equipment Finance line of Wholesale Trade 350 13% business comprise $652 million of the commercial Real Estate & Rental & Leasing 348 13% portfolio Finance & Insurance 287 11% • Well-diversified portfolio with no single category Construction 279 10% exceeding 15% Transportation & Warehousing 169 6% Administrative & Support & Waste Mgmt 129 5% & Remediation Services Retail Trade 128 5% Professional, Scientific & Technical 117 4% Services Health Care & Social Assistance 105 4% Information 92 3% Other 278 10% Total $ 2,699 100% (1) All information provided above reflects outstanding balances (2) Totals and percentages may not foot due to rounding Company Historical Capital Net Interest Deposit L Lo oa an n Liquidity Noninterest Q3’25 Results Asset Quality Overview Growth Position Income Portfolio P Po or rt tf fo ol li io o Profile Inc. & Exp. 18
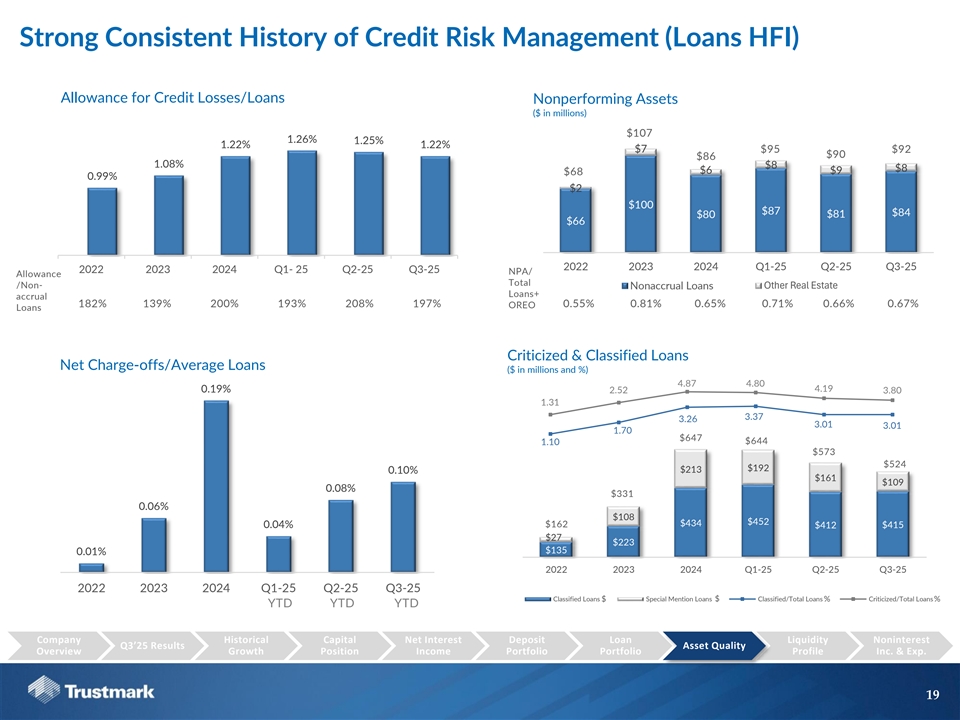
Strong Consistent History of Credit Risk Management (Loans HFI) Allowance for Credit Losses/Loans Nonperforming Assets ($ in millions) $107 1.26% 1.25% 1.22% 1.22% $7 $95 $92 $90 $86 1.08% $8 $8 $6 $9 $68 0.99% $2 $100 $87 $84 $81 $80 $66 2022 2023 2024 Q1-25 Q2-25 Q3-25 2022 2023 2024 Q1- 25 Q2-25 Q3-25 NPA/ Allowance Total /Non- Nonaccrual Loans Other Real Estate Loans+ accrual 182% 139% 200% 193% 208% 197% OREO 0.55% 0.81% 0.65% 0.71% 0.66% 0.67% Loans Criticized & Classified Loans Net Charge-offs/Average Loans ($ in millions and %) 4.87 4.80 4.19 0.19% 2.52 3.80 1.31 5.0 0 850 3.37 3.0 0 3.26 3.01 3.01 1.70 750 1.0 0 $647 $644 1.10 -1.00 650 $573 -3.00 $524 550 $192 $213 0.10% $161 -5.00 $109 450 0.08% $331 -7.00 350 0.06% -9.00 $108 250 $452 $434 0.04% $162 $415 -11.00 $412 $27 150 -13.00 $223 $135 0.01% -15.00 50 2022 2023 2024 Q1-25 Q2-25 Q3-25 2022 2023 2024 Q1-25 Q2-25 Q3-25 Classified Loans Special Mention Loans $ Classified/Total Loans Criticized/Total Loans $ % % YTD YTD YTD Company Historical Capital Net Interest Deposit Loan Liquidity Noninterest Q3’25 Results A As ss se et t Q Qu ua al li it ty y Overview Growth Position Income Portfolio Portfolio Profile Inc. & Exp. 19 Axis Title

Strong Historical Credit Culture Net Charge-Offs / Average Loans 2.56% 2.56% 1.57% 1.41% 1.10% 1.01% (3) 0.69% 0.95% 0.68% 0.64% 0.87% 0.51% 0.51% 0.49% 0.50% 0.50% 0.48% 0.47% 0.44% 0.56% 0.27% 0.25% 0.19% 0.19% 0.15% 0.10% 0.11% 0.30% 0.10% 0.06% 0.06% 0.02% 0.01% (0.03%) (0.02%) (0.04%) 2008 2009 2010 2011 2012 2013 2014 2015 2016 2017 2018 2019 2020 2021 2022 2023 2024 YTD (1) (2) TRMK National Average (1) Performance is based upon credits underwritten and approved by Trustmark (2) Sourced from Federal Reserve Economic Data; Includes all Commercial Banks (3) Data as of 6/30/25 YTD per Federal Reserve Economic Data Company Historical Capital Net Interest Deposit Loan Liquidity Noninterest Q3’25 Results A As ss se et t Q Qu ua al li it ty y Overview Growth Position Income Portfolio Portfolio Profile Inc. & Exp. 20

Liquidity Profile Loans Held for Investment / Deposits (%) Calculation of Available Liquidity (Dollars in millions) 89.1% 87.8% 86.6% 86.7% 86.0% Liquidity Available to TRMK 9/30/2025 On-Balance Sheet Liquidity FRBA Interest-Bearing Balance $454 (1) 1,329 Unencumbered Securities 2024Q3 2024Q4 2025Q1 2025Q2 2025Q3 Total Liquidity Available on BS $1,783 Available Lines of Credit Cash & AFS Securities / Total Assets (%) (2) $2,020 FHLB of Dallas Line 13.8% 13.5% (2) 13.0% 1,235 Discount Window Line 12.7% 12.4% Upstream Federal Funds Line 280 Total Borrowing Capacity $3,535 Total Immediate Liquidity $5,318 2024Q3 2024Q4 2025Q1 2025Q2 2025Q3 (1) Includes cash on deposit with the Federal Reserve Bank. (2) In 2025, Trustmark reallocated a substantial portion of its external credit facilities from the Federal Home Loan Bank (FHLB) to the Federal Reserve under its Borrower-In-Custody (BIC) program. This collateral represents an estimated incremental borrowing capacity of approximately $6 billion. Company Historical Capital Net Interest Deposit Loan L Li iq qu ui id di it ty y Noninterest Q3’25 Results Asset Quality Overview Growth Position Income Portfolio Portfolio P Pr ro of fi il le e Inc. & Exp. 21
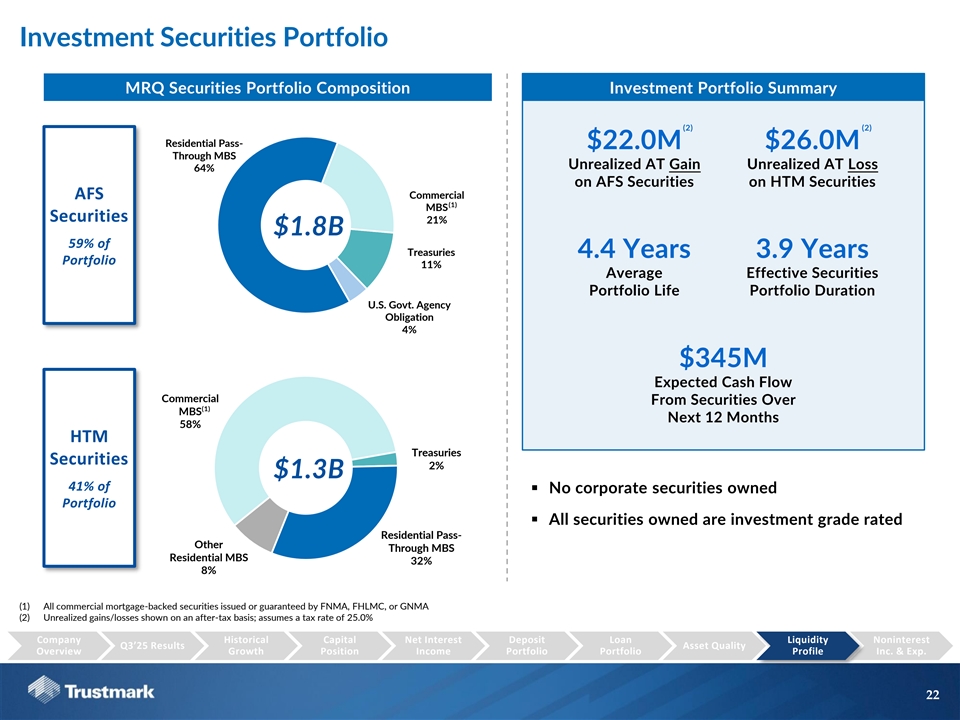
Investment Securities Portfolio MRQ Securities Portfolio Composition Investment Portfolio Summary (2) (2) Residential Pass- $22.0M $26.0M Through MBS Unrealized AT Gain Unrealized AT Loss 64% on AFS Securities on HTM Securities Commercial AFS (1) MBS Securities 21% $1.8B 59% of Treasuries 4.4 Years 3.9 Years Portfolio 11% Average Effective Securities Portfolio Life Portfolio Duration U.S. Govt. Agency Obligation 4% $345M Expected Cash Flow Commercial From Securities Over (1) MBS Next 12 Months 58% HTM Treasuries Securities 2% $1.3B 41% of ▪ No corporate securities owned Portfolio ▪ All securities owned are investment grade rated Residential Pass- Other Through MBS Residential MBS 32% 8% (1) All commercial mortgage-backed securities issued or guaranteed by FNMA, FHLMC, or GNMA (2) Unrealized gains/losses shown on an after-tax basis; assumes a tax rate of 25.0% Company Historical Capital Net Interest Deposit Loan L Li iq qu ui id di it ty y Noninterest Q3’25 Results Asset Quality Overview Growth Position Income Portfolio Portfolio P Pr ro of fi il le e Inc. & Exp. 22

Attractive Diversified Fee Income Business (1) Noninterest Income – Q3-25 (1) (2) (1) Noninterest Income (2) (2) Other, net, 6% Change Wealth ($ in millions) Management, Q3-25 LQ Y-o-Y 25% Service Charges Service Charges on Deposit Accounts on Deposit $ 11.3 $ 0.7 $ (0.0) Accounts, 28% Bank Card and Other Fees 8.3 (0.4) 0.4 Mortgage Banking, net 8.2 (0.4) 2.1 Wealth Management 9.8 0.2 0.5 Other, net 2.4 0.1 (0.6) Total Noninterest Income $ 3 9.9 $ 0.0 $ 2.4 Mortgage Banking, net, Bank Card and 21% Other Fees, 21% (1) Noninterest Income ($ in millions) $43 $41 $39 $39 $38 • Noninterest income in the third quarter totaled $39.9 million, up $41 $11 thousand linked-quarter and $2.4 million year-over-year. $11 $11 $11 $11 • Mortgage banking, net totaled $8.2 million in the third quarter, a decrease $8 $9 $9 $8 of $420 thousand linked-quarter and an increase of $2.1 million year- $8 over-year. The linked-quarter decrease was principally due to lower gain $9 $7 $9 $8 on sales of loans, net and increased net negative hedge ineffectiveness, $6 which was partly offset by increased mortgage servicing income, net. $10 $9 $9 $10 $10 • Wealth Management revenue in the third quarter totaled $9.8 million, an $6 $4 $3 $2 $2 increase of $160 thousand from the prior quarter and a $510 thousand (1) increase from the previous year. Q3-24 Q4-24 Q1-25 Q2-25 Q3-25 Service Charges on Deposit Accounts Bank Card and Other Fees Mortgage Banking, net Wealth Management Other, net (1) Totals may not foot due to rounding Company Historical Capital Net Interest Deposit Loan Liquidity N No on ni in nt te er re es st t Q3’25 Results Asset Quality Overview Growth Position Income Portfolio Portfolio Profile I In nc c. . & & E Ex xp p. . 23
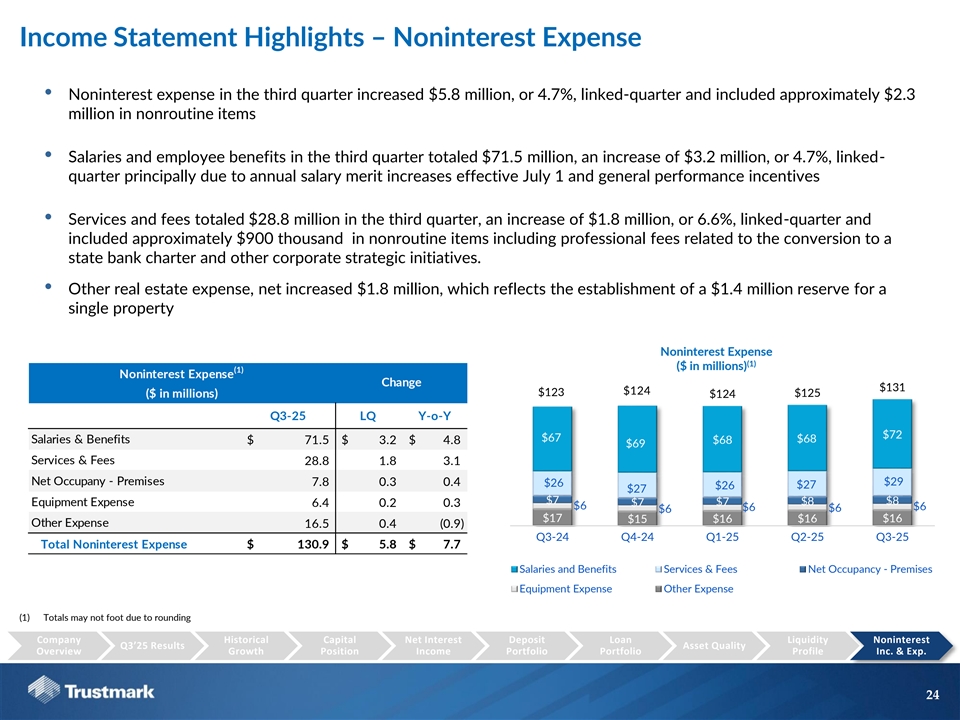
Income Statement Highlights – Noninterest Expense • Noninterest expense in the third quarter increased $5.8 million, or 4.7%, linked-quarter and included approximately $2.3 million in nonroutine items • Salaries and employee benefits in the third quarter totaled $71.5 million, an increase of $3.2 million, or 4.7%, linked- quarter principally due to annual salary merit increases effective July 1 and general performance incentives • Services and fees totaled $28.8 million in the third quarter, an increase of $1.8 million, or 6.6%, linked-quarter and included approximately $900 thousand in nonroutine items including professional fees related to the conversion to a state bank charter and other corporate strategic initiatives. • Other real estate expense, net increased $1.8 million, which reflects the establishment of a $1.4 million reserve for a single property (2) Noninterest Expense (1) ($ in millions) (1) Noninterest Expense Change $131 $124 $123 ($ in millions) $125 $124 Q3-25 LQ Y-o-Y $72 $67 $68 Salaries & Benefits $ 71.5 $ 3.2 $ 4.8 $68 $69 Services & Fees 28.8 1.8 3.1 Net Occupany - Premises $29 7.8 0.3 0.4 $26 $26 $27 $27 $7 $7 $8 $8 Equipment Expense 6.4 0.2 0.3 $7 $6 $6 $6 $6 $6 $17 $15 $16 $16 $16 Other Expense 1 6.5 0.4 (0.9) Q3-24 Q4-24 Q1-25 Q2-25 Q3-25 Total Noninterest Expense $ 130.9 $ 5.8 $ 7.7 Salaries and Benefits Services & Fees Net Occupancy - Premises Equipment Expense Other Expense (1) Totals may not foot due to rounding Company Historical Capital Net Interest Deposit Loan Liquidity N No on ni in nt te er re es st t Q3’25 Results Asset Quality Overview Growth Position Income Portfolio Portfolio Profile I In nc c. . & & E Ex xp p. . 24
Appendix
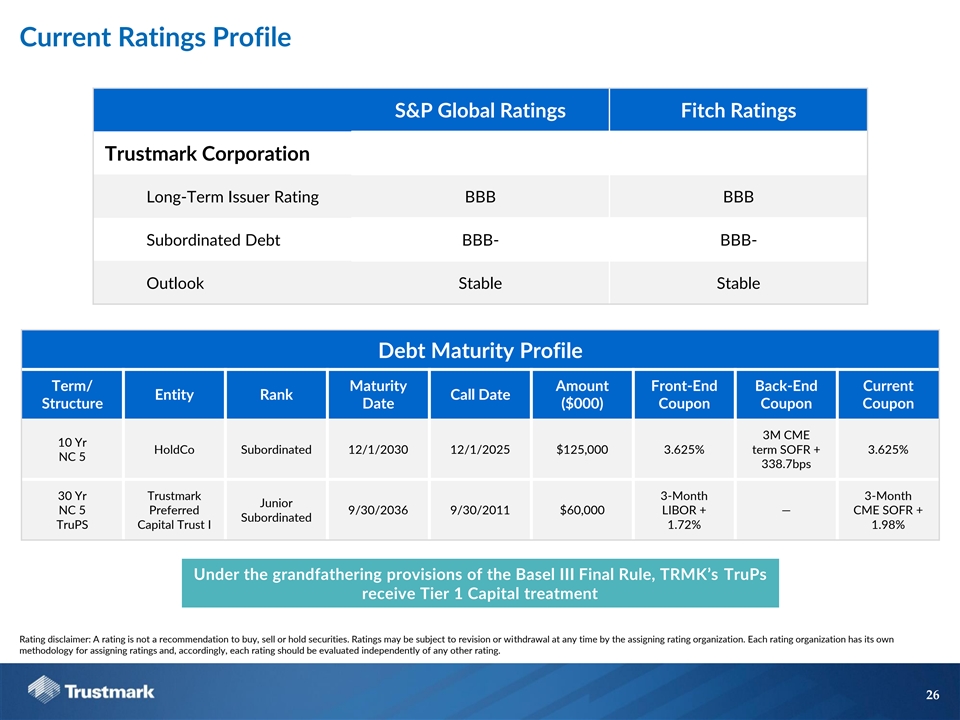
Current Ratings Profile S&P Global Ratings Fitch Ratings Trustmark Corporation Long-Term Issuer Rating BBB BBB Subordinated Debt BBB- BBB- Outlook Stable Stable Debt Maturity Profile Term/ Maturity Amount Front-End Back-End Current Entity Rank Call Date Structure Date ($000) Coupon Coupon Coupon 3M CME 10 Yr HoldCo Subordinated 12/1/2030 12/1/2025 $125,000 3.625% term SOFR + 3.625% NC 5 338.7bps 30 Yr Trustmark 3-Month 3-Month Junior NC 5 Preferred 9/30/2036 9/30/2011 $60,000 LIBOR + — CME SOFR + Subordinated TruPS Capital Trust I 1.72% 1.98% Under the grandfathering provisions of the Basel III Final Rule, TRMK’s TruPs receive Tier 1 Capital treatment Rating disclaimer: A rating is not a recommendation to buy, sell or hold securities. Ratings may be subject to revision or withdrawal at any time by the assigning rating organization. Each rating organization has its own methodology for assigning ratings and, accordingly, each rating should be evaluated independently of any other rating. 26
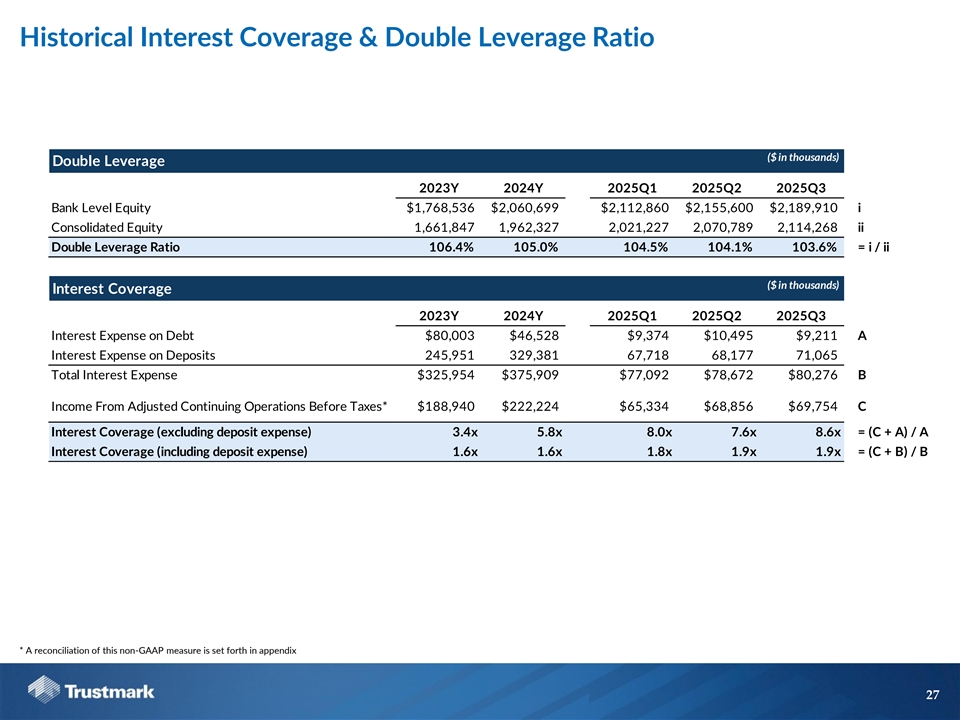
Historical Interest Coverage & Double Leverage Ratio ($ in thousands) Double Leverage 2023Y 2024Y 2025Q1 2025Q2 2025Q3 Bank Level Equity $1,768,536 $2,060,699 $2,112,860 $2,155,600 $2,189,910 i Consolidated Equity 1,661,847 1,962,327 2,021,227 2,070,789 2,114,268 ii Double Leverage Ratio 106.4% 105.0% 104.5% 104.1% 103.6% = i / ii ($ in thousands) Interest Coverage 2023Y 2024Y 2025Q1 2025Q2 2025Q3 Interest Expense on Debt $80,003 $46,528 $9,374 $10,495 $9,211 A Interest Expense on Deposits 245,951 329,381 67,718 68,177 71,065 Total Interest Expense $325,954 $375,909 $77,092 $78,672 $80,276 B Income From Adjusted Continuing Operations Before Taxes* $188,940 $222,224 $65,334 $68,856 $69,754 C Interest Coverage (excluding deposit expense) 3.4x 5.8x 8.0x 7.6x 8.6x = (C + A) / A Interest Coverage (including deposit expense) 1.6x 1.6x 1.8x 1.9x 1.9x = (C + B) / B * A reconciliation of this non-GAAP measure is set forth in appendix 27
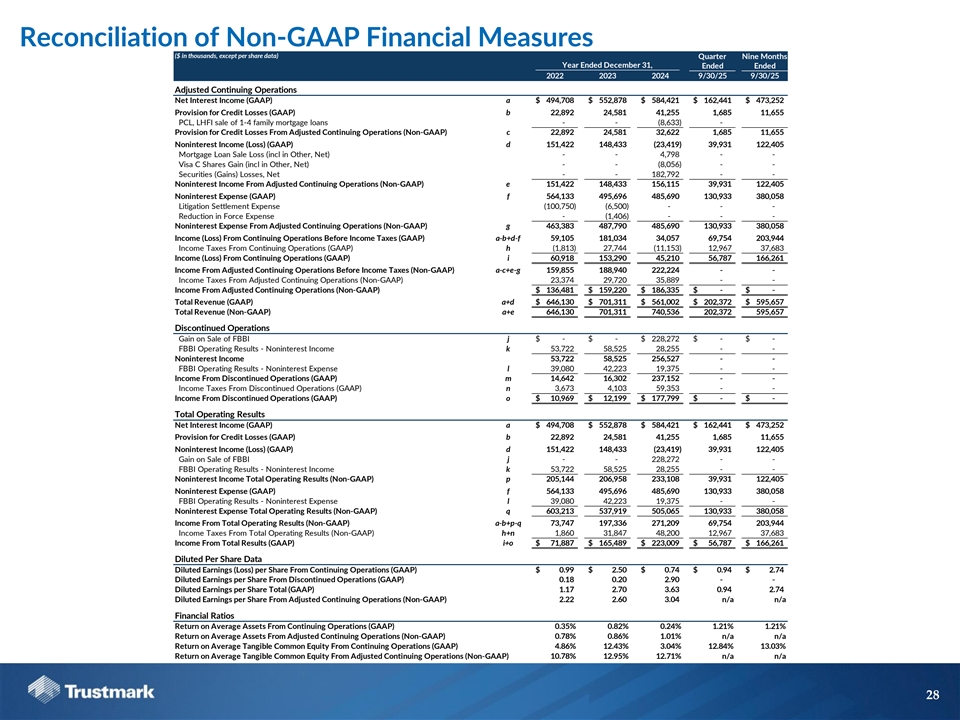
Reconciliation of Non-GAAP Financial Measures ($ in thousands, except per share data) Quarter Nine Months Year Ended December 31, Ended Ended 2022 2023 2024 9/30/25 9/30/25 Adjusted Continuing Operations Net Interest Income (GAAP) a $ 494,708 $ 552,878 $ 584,421 $ 162,441 $ 473,252 Provision for Credit Losses (GAAP) b 22,892 24,581 41,255 1,685 11,655 PCL, LHFI sale of 1-4 family mortgage loans - - ( 8,633) - Provision for Credit Losses From Adjusted Continuing Operations (Non-GAAP) c 22,892 24,581 32,622 1,685 11,655 Noninterest Income (Loss) (GAAP) d 151,422 148,433 (23,419) 39,931 122,405 Mortgage Loan Sale Loss (incl in Other, Net) - - 4,798 - - Visa C Shares Gain (incl in Other, Net) - - ( 8,056) - - Securities (Gains) Losses, Net - - 1 82,792 - - Noninterest Income From Adjusted Continuing Operations (Non-GAAP) e 151,422 148,433 156,115 39,931 122,405 Noninterest Expense (GAAP) f 564,133 495,696 485,690 130,933 380,058 Litigation Settlement Expense ( 100,750) ( 6,500) - - - Reduction in Force Expense - ( 1,406) - - - Noninterest Expense From Adjusted Continuing Operations (Non-GAAP) g 463,383 487,790 485,690 130,933 380,058 Income (Loss) From Continuing Operations Before Income Taxes (GAAP) a-b+d-f 59,105 181,034 34,057 69,754 203,944 Income Taxes From Continuing Operations (GAAP) h ( 1,813) 27,744 ( 11,153) 12,967 37,683 Income (Loss) From Continuing Operations (GAAP) i 60,918 153,290 45,210 56,787 166,261 Income From Adjusted Continuing Operations Before Income Taxes (Non-GAAP) a-c+e-g 159,855 188,940 222,224 - - Income Taxes From Adjusted Continuing Operations (Non-GAAP) 23,374 29,720 3 5,889 - - Income From Adjusted Continuing Operations (Non-GAAP) $ 136,481 $ 159,220 $ 186,335 $ - $ - Total Revenue (GAAP) a+d $ 646,130 $ 701,311 $ 561,002 $ 202,372 $ 595,657 Total Revenue (Non-GAAP) a+e 646,130 701,311 740,536 202,372 595,657 Discontinued Operations Gain on Sale of FBBI j $ - $ - $ 2 28,272 $ - $ - FBBI Operating Results - Noninterest Income k 53,722 5 8,525 28,255 - - Noninterest Income 53,722 58,525 256,527 - - FBBI Operating Results - Noninterest Expense l 3 9,080 42,223 1 9,375 - - Income From Discontinued Operations (GAAP) m 14,642 16,302 237,152 - - Income Taxes From Discontinued Operations (GAAP) n 3 ,673 4,103 59,353 - - Income From Discontinued Operations (GAAP) o $ 10,969 $ 12,199 $ 177,799 $ - $ - Total Operating Results Net Interest Income (GAAP) a $ 494,708 $ 552,878 $ 584,421 $ 162,441 $ 473,252 Provision for Credit Losses (GAAP) b 22,892 24,581 41,255 1,685 11,655 Noninterest Income (Loss) (GAAP) d 151,422 148,433 (23,419) 39,931 122,405 Gain on Sale of FBBI j - - 2 28,272 - - FBBI Operating Results - Noninterest Income k 53,722 5 8,525 2 8,255 - - Noninterest Income Total Operating Results (Non-GAAP) p 205,144 206,958 233,108 39,931 122,405 Noninterest Expense (GAAP) f 564,133 495,696 485,690 130,933 380,058 FBBI Operating Results - Noninterest Expense l 3 9,080 4 2,223 19,375 - - Noninterest Expense Total Operating Results (Non-GAAP) q 603,213 537,919 505,065 130,933 380,058 Income From Total Operating Results (Non-GAAP) a-b+p-q 73,747 197,336 271,209 69,754 203,944 Income Taxes From Total Operating Results (Non-GAAP) h+n 1,860 3 1,847 48,200 1 2,967 3 7,683 Income From Total Results (GAAP) i+o $ 71,887 $ 165,489 $ 223,009 $ 56,787 $ 166,261 Diluted Per Share Data Diluted Earnings (Loss) per Share From Continuing Operations (GAAP) $ 0.99 $ 2.50 $ 0.74 $ 0.94 $ 2.74 Diluted Earnings per Share From Discontinued Operations (GAAP) 0.18 0.20 2.90 - - Diluted Earnings per Share Total (GAAP) 1.17 2.70 3.63 0.94 2.74 Diluted Earnings per Share From Adjusted Continuing Operations (Non-GAAP) 2.22 2.60 3.04 n/a n/a Financial Ratios Return on Average Assets From Continuing Operations (GAAP) 0.35% 0.82% 0.24% 1.21% 1.21% Return on Average Assets From Adjusted Continuing Operations (Non-GAAP) 0.78% 0.86% 1.01% n/a n/a Return on Average Tangible Common Equity From Continuing Operations (GAAP) 4.86% 12.43% 3.04% 12.84% 13.03% Return on Average Tangible Common Equity From Adjusted Continuing Operations (Non-GAAP) 10.78% 12.95% 12.71% n/a n/a 28

Reconciliation of Non-GAAP Financial Measures Return on Average Tangible Common Equity Quarter Nine Months ($ in thousands) Year Ended December 31, Ended Ended 2022 2023 2024 9/30/25 9/30/25 Average Tangible Common Equity Average Total Shareholders' Equity $ 1,608,299 $ 1,565,740 $ 1,801,797 $ 2,090,373 $ 2,041,407 Less: Average Goodwill 334,605 334,605 334,605 334,605 334,605 Less: Average Identifiable Intangible Assets 971 325 182 49 80 Total Average Tangible Common Equity $ 1,272,723 $ 1,230,810 $ 1,467,010 $ 1,755,719 $ 1,706,722 Net Income From Continuing Operations Adjusted For Intangible Amorization Net Income From Adjusted Continuing Operations $ 136,481 $ 159,220 $ 186,335 $ 56,787 $ 166,261 Plus: Intangible Amortization Net of Tax 740 217 81 24 72 Net Income From Adjusted Continuing Operations $ 137,221 $ 159,437 $ 186,416 $ 56,811 $ 166,333 Adjusted For Intangible Amortization (1) 10.78% 12.95% 12.71% 12.84% 13.03% ROATCE From Adjusted Continuing Operations (1) Calculation = ((Net Income From Adjusted Continuing Operations Adjusted For Intangible Amortization/Number of Days in Period)*Number Of Days in Year)/Total Average Tangible Common Equity. 29
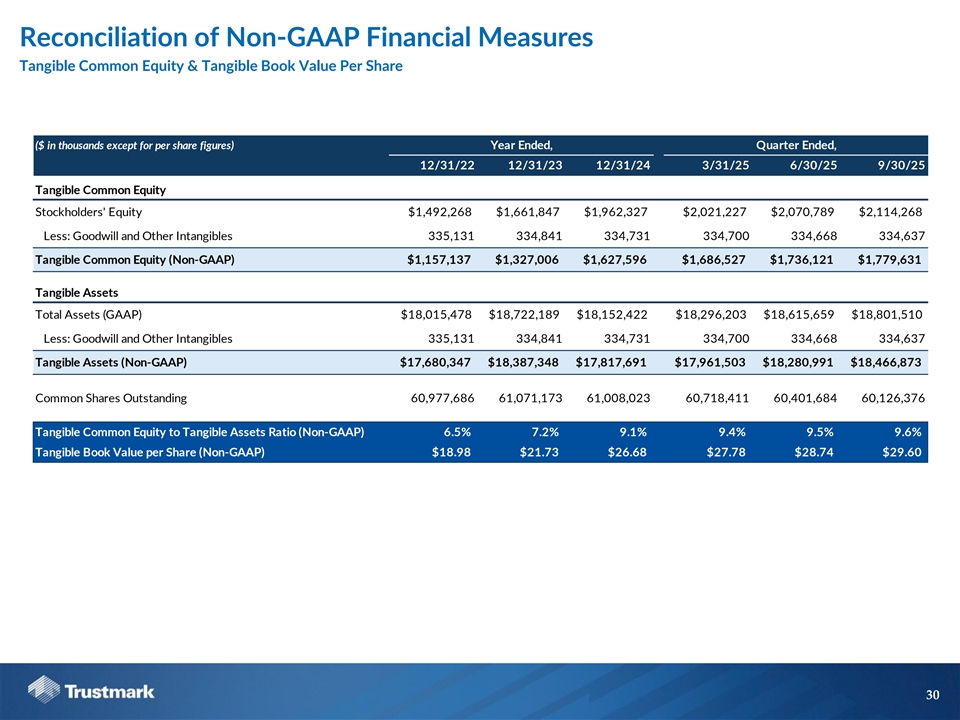
Reconciliation of Non-GAAP Financial Measures Tangible Common Equity & Tangible Book Value Per Share ($ in thousands except for per share figures) Year Ended, Quarter Ended, 12/31/22 12/31/23 12/31/24 3/31/25 6/30/25 9/30/25 Tangible Common Equity Stockholders' Equity $1,492,268 $1,661,847 $1,962,327 $2,021,227 $2,070,789 $2,114,268 Less: Goodwill and Other Intangibles 335,131 334,841 334,731 334,700 334,668 334,637 Tangible Common Equity (Non-GAAP) $1,157,137 $1,327,006 $1,627,596 $1,686,527 $1,736,121 $1,779,631 Tangible Assets Total Assets (GAAP) $18,015,478 $18,722,189 $18,152,422 $18,296,203 $18,615,659 $18,801,510 Less: Goodwill and Other Intangibles 335,131 334,841 334,731 334,700 334,668 334,637 Tangible Assets (Non-GAAP) $17,680,347 $18,387,348 $17,817,691 $17,961,503 $18,280,991 $18,466,873 Common Shares Outstanding 60,977,686 61,071,173 61,008,023 60,718,411 60,401,684 60,126,376 Tangible Common Equity to Tangible Assets Ratio (Non-GAAP) 6.5% 7.2% 9.1% 9.4% 9.5% 9.6% Tangible Book Value per Share (Non-GAAP) $18.98 $21.73 $26.68 $27.78 $28.74 $29.60 30
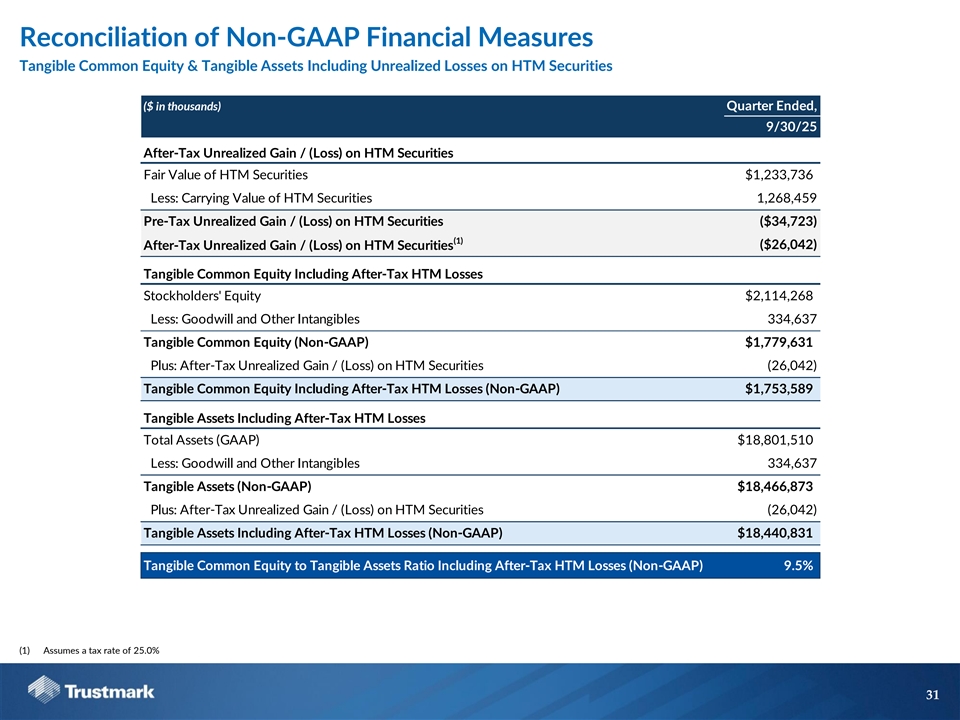
Reconciliation of Non-GAAP Financial Measures Tangible Common Equity & Tangible Assets Including Unrealized Losses on HTM Securities ($ in thousands) Quarter Ended, 9/30/25 After-Tax Unrealized Gain / (Loss) on HTM Securities Fair Value of HTM Securities $1,233,736 Less: Carrying Value of HTM Securities 1,268,459 Pre-Tax Unrealized Gain / (Loss) on HTM Securities ($34,723) (1) ($26,042) After-Tax Unrealized Gain / (Loss) on HTM Securities Tangible Common Equity Including After-Tax HTM Losses Stockholders' Equity $2,114,268 Less: Goodwill and Other Intangibles 334,637 Tangible Common Equity (Non-GAAP) $1,779,631 Plus: After-Tax Unrealized Gain / (Loss) on HTM Securities (26,042) Tangible Common Equity Including After-Tax HTM Losses (Non-GAAP) $1,753,589 Tangible Assets Including After-Tax HTM Losses Total Assets (GAAP) $18,801,510 Less: Goodwill and Other Intangibles 334,637 Tangible Assets (Non-GAAP) $18,466,873 Plus: After-Tax Unrealized Gain / (Loss) on HTM Securities (26,042) Tangible Assets Including After-Tax HTM Losses (Non-GAAP) $18,440,831 Tangible Common Equity to Tangible Assets Ratio Including After-Tax HTM Losses (Non-GAAP) 9.5% (1) Assumes a tax rate of 25.0% 31

Reconciliation of Non-GAAP Financial Measures Common Equity Tier 1 and Common Equity Tier 1 Including AOCI & After-Tax HTM Losses ($ in thousands) Quarter Ended, 9/30/25 After-Tax Unrealized Gain / (Loss) on HTM Securities Fair Value of HTM Securities $1,233,736 Less: Carrying Value of HTM Securities 1,268,459 Pre-Tax Unrealized Gain / (Loss) on HTM Securities ($34,723) (1) ($26,042) After-Tax Unrealized Gain / (Loss) on HTM Securities Common Equity Tier 1 Capital (CET1) Stockholders' Equity $2,114,268 Less: Accumulated Other Comprehensive Income (AOCI) (19,380) Less: Goodwill Net of Associated Deferred Tax Liabilities 320,754 (2) Less: Other Adjustments and Deductions for CET1 111 Common Equity Tier 1 Capital (Non-GAAP) $1,812,783 A CET1 Including AOCI & After-Tax HTM Losses Plus: Accumulated Other Comprehensive Income (AOCI) (19,380) Plus: After-Tax Unrealized Gain / (Loss) on HTM Securities (26,042) CET1 Including AOCI & After-Tax HTM Losses (Non-GAAP) $1,767,361 B Risk Weighted Assets $15,263,314 C CET1 Capital Ratio 11.9% = A / C CET1 Capital Ratio Including AOCI & After-Tax HTM Losses (Non-GAAP) 11.6% = B / C (1) Assumes a tax rate of 25.0% (2) Includes other intangible assets, net of DTLs, disallowed deferred tax assets (DTAs), threshold deductions and transition adjustments, as applicable. 32