UNITED STATES
SECURITIES AND EXCHANGE COMMISSION
Washington, D.C. 20549
FORM 6-K
REPORT OF FOREIGN PRIVATE ISSUER
PURSUANT TO RULE 13a-16 OR 15d-16
OF THE SECURITIES EXCHANGE ACT OF 1934
FOR THE MONTH OF NOVEMBER 2025
COMMISSION FILE NUMBER 001-38976
Genmab A/S
(Exact name of Registrant as specified in its charter)
Carl Jacobsens Vej 30
2500 Valby
Denmark
+45 70 20 27 28
(Address of principal executive offices)
Indicate by check mark whether the registrant files or will file annual reports under cover Form 20-F or Form 40-F.
Form 20-F ☒ Form 40-F ☐
EXHIBIT INDEX
SIGNATURE
Pursuant to the requirements of the Securities Exchange Act of 1934, the registrant has duly caused this report to be signed on its behalf by the undersigned, thereunto duly authorized.
| GENMAB A/S | ||
| BY: | /s/ Anthony Pagano |
|
| Name: Anthony Pagano | ||
| Title: Executive Vice President & Chief Financial Officer | ||
DATE: NOVEMBER 12, 2025
Exhibit 99.1

Genmab Announces Proposed Private Offering of Senior Secured Notes and Senior Unsecured Notes and Syndication of New Senior Secured Term Loan Facility
Media Release
COPENHAGEN, Denmark; November 10, 2025
Genmab A/S (Nasdaq: GMAB) (“Genmab”) announced today that it and its wholly owned subsidiary Genmab Finance LLC (“Genmab Finance”) intend to offer, subject to market and other conditions, $1.5 billion of senior secured notes due 2032 (the “Secured Notes”) and $1.0 billion of senior unsecured notes due 2033 (the “Unsecured Notes,” and together with the Secured Notes, the “Notes”).
Genmab also launched the syndication of a new $2.0 billion senior secured term loan “B” facility, which term loan “B” facility is in addition to a $1.0 billion senior secured term loan “A” facility and $500 million senior secured revolving credit facility (collectively, the “New Credit Facilities”) that Genmab previously syndicated to certain lenders as part of the financing for the pending acquisition (the “Acquisition”) of Merus N.V. (“Merus”).
Genmab intends to use the net proceeds from this offering of the Notes, together with borrowings under the New Credit Facilities and cash on hand, to fund the consideration payable in connection with the Acquisition of Merus and related fees and expenses in connection with the Acquisition, the borrowings under the New Credit Facilities and the issuance of the Notes.
Prior to the Acquisition closing, the Notes and the related guarantees from Genmab subsidiaries will be secured solely by segregated securities accounts of Genmab in which the gross proceeds of the Notes will be held. Following the purchase of all Merus common shares tendered in the previously announced tender offer by Genmab, the Secured Notes will be secured by a first priority security interest in certain assets of Genmab and its subsidiaries that will guarantee the obligations under the New Credit Facilities, in accordance with certain customary practices in the relevant jurisdictions, and subject to certain thresholds, exceptions and permitted liens. The Secured Notes will be unconditionally guaranteed on a senior secured basis and the Unsecured Notes will be unconditionally guaranteed on a senior unsecured basis by certain subsidiaries of Genmab that will guarantee the obligations under the New Credit Facilities.
The indentures governing the Notes are expected to contain customary covenants that, among other things, restrict, with certain exceptions, the ability of each of Genmab and its subsidiaries to incur additional debt, pay dividends, make certain other restricted payments, incur debt secured by liens, dispose of assets, engage in consolidations and mergers or sell or transfer all or substantially all of its assets.
The Notes will not be registered under the Securities Act of 1933, as amended (the “Securities Act”), or any state or other securities laws and may not be offered or sold in the United States absent an effective registration statement or an applicable exemption from the registration requirements of or in a transaction not subject to the Securities Act and any state or other applicable securities laws. Accordingly, the offering of the Notes is available only to persons who are either (1) reasonably believed to be “qualified institutional buyers” as defined in Rule 144A under the Securities Act or (2) non-U.S. persons outside the United States pursuant to Regulation S under the Securities Act. The Notes will be subject to restrictions on transferability and resale and may not be transferred or resold except in compliance with the registration requirements of the Securities Act or pursuant to an exemption therefrom and in compliance with any state or other applicable securities laws.
| Genmab A/S Carl Jacobsens Vej 30 2500 Valby, Denmark |
Tel: +45 7020 2728 www.genmab.com |
Media Release no. 22 Page 1 CVR no. 2102 3884 LEI Code 529900MTJPDPE4MHJ122 |
Genmab Announces Proposed Private Offering of Senior Secured Notes and Senior Unsecured Notes and Syndication of New Senior Secured Term Loan Facility
This announcement shall not constitute an offer to sell or a solicitation of an offer to purchase any securities and shall not constitute an offer, solicitation or sale in any state or jurisdiction in which such an offer, solicitation or sale would be unlawful. The offering of the Notes may be made only by means of an offering memorandum.
Contact:
Marisol Peron, Senior Vice President, Global Communications & Corporate Affairs
T: +1 609 524 0065; E:mmp@genmab.com
Andrew Carlsen, Vice President, Head of Investor Relations
T: +45 3377 9558; E:acn@genmab.com
Forward-looking Statements
In this announcement, we make statements concerning our expectations, beliefs, plans, objectives, goals, strategies, and future events or performance, including, but not limited to, the statements about the proposed offering of Notes, our intention to issue the Notes and the expected use of proceeds. Genmab cautions investors that any forward-looking statements or projections made by Genmab, including those made in this announcement, are subject to risks and uncertainties that may cause actual results to differ materially from those projected. Such factors include, but are not limited to, those described in Genmab’s filings with the SEC, including those included in Genmab’s most recent Annual Report on Form 20-F, which is available at www.genmab.com and www.sec.gov. Genmab is providing the information in this announcement as of this date, and Genmab does not undertake any obligation to update any forward-looking statements as a result of new information, future events or otherwise.
Genmab A/S and/or its subsidiaries own the following trademarks: Genmab®; the Y-shaped Genmab logo®; Genmab in combination with the Y-shaped Genmab logo®; HuMax®; DuoBody®; HexaBody®; DuoHexaBody®, HexElect® and KYSO®.
| Genmab A/S Carl Jacobsens Vej 30 2500 Valby, Denmark |
Tel: +45 7020 2728 www.genmab.com |
Media Release no. 22 Page 2 CVR no. 2102 3884 LEI Code 529900MTJPDPE4MHJ122 |
Exhibit 99.2

Genmab Provides Certain Information Disclosed in Connection with Proposed Private Offering of Senior Secured Notes and Senior Unsecured Notes
Media Release
COPENHAGEN, Denmark; November 10, 2025
Genmab A/S (“Genmab”) announced on November 10, 2025, that it and its wholly owned subsidiary Genmab Finance LLC intend to offer, subject to market and other conditions, $1.5 billion of senior secured notes due 2032 (the “Secured Notes”) and $1.0 billion of senior unsecured notes due 2033 (the “Unsecured Notes,” and together with the Secured Notes, the “Notes”). Genmab also launched the syndication of a new $2.0 billion senior secured term loan “B” facility, which term loan “B” facility is in addition to a $1.0 billion senior secured term loan “A” facility and $500 million senior secured revolving credit facility (collectively, the “New Credit Facilities”) that Genmab previously syndicated to certain lenders as part of the financing for the pending acquisition (the “Acquisition”) of Merus N.V. (“Merus”).
In connection with the proposed offering of the Notes, Genmab is providing potential investors with a preliminary offering memorandum, dated November 10, 2025 (the “Preliminary Offering Memorandum”). The Preliminary Offering Memorandum contains (i) certain information not previously disclosed by Genmab, attached as Exhibit A to this Company Announcement; (ii) unaudited pro forma condensed combined financial information giving effect to the Acquisition of Merus, the borrowings under the New Credit Facilities and the issuance of the Notes as of and for the nine months ended September 30, 2025 and for the year ended December 31, 2024, attached as Exhibit B to this Company Announcement; and (iii) the audited consolidated financial statements of Genmab as of and for the years ended December 31, 2024, 2023 and 2022 and the related notes thereto, originally prepared in Danish Kroner and retranslated into United States Dollars for all periods presented, attached as Exhibit C to this Company Announcement.
This Company Announcement, including Exhibit A, Exhibit B and Exhibit C, does not constitute an offer to sell, or a solicitation of an offer to buy, any security. No offer, solicitation, or sale will be made in any jurisdiction in which such an offer, solicitation, or sale would be unlawful. The Notes will not be registered under the Securities Act of 1933, as amended, or the securities laws of any state or other jurisdiction, and, unless so registered, may not be offered or sold in the United States absent registration or an applicable exemption from registration requirements.
Contact:
Marisol Peron, Senior Vice President, Global Communications & Corporate Affairs
T: +1 609 524 0065; E:mmp@genmab.com
Andrew Carlsen, Vice President, Head of Investor Relations
T: +45 3377 9558; E:acn@genmab.com
Forward-looking Statements
In this announcement, we make statements concerning our expectations, beliefs, plans, objectives, goals, strategies, and future events or performance, including, but not limited to, the statements about the proposed offering of Notes and our intention to issue the Notes. Genmab cautions investors that any forward-looking statements or projections made by Genmab, including those made in this announcement, are subject to risks and uncertainties that may cause actual results to differ materially from those projected. Such factors include, but are not limited to, those described in Genmab’s filings with the SEC, including those included in Genmab’s most recent Annual Report on Form 20-F, which is available at www.genmab.com and www.sec.gov. Genmab is providing the information in this Company Announcement as of this date, and Genmab does not undertake any obligation to update any forward- looking statements as a result of new information, future events or otherwise.
| Genmab A/S Carl Jacobsens Vej 30 2500 Valby, Denmark |
Tel: +45 7020 2728 www.genmab.com |
Media Release no. 23 Page 1 CVR no. 2102 3884 LEI Code 529900MTJPDPE4MHJ122 |
Genmab Provides Certain Information Disclosed in Connection with Proposed Private Offering of Senior Secured Notes and Senior Unsecured Notes
Genmab A/S and/or its subsidiaries own the following trademarks: Genmab®; the Y-shaped Genmab logo®; Genmab in combination with the Y-shaped Genmab logo®; HuMax®; DuoBody®; HexaBody®; DuoHexaBody®, HexElect® and KYSO®.
| Genmab A/S Carl Jacobsens Vej 30 2500 Valby, Denmark |
Tel: +45 7020 2728 www.genmab.com |
Media Release no. 23 Page 2 CVR no. 2102 3884 LEI Code 529900MTJPDPE4MHJ122 |
Exhibit 99.3
EXHIBIT A
EXCERPTS FROM THE PRELIMINARY OFFERING MEMORANDUM
SUMMARY
The following summary highlights certain information contained elsewhere in this offering memorandum and is qualified in its entirety by the more detailed information and historical financial statements included herein. Because this is a summary, it is not complete and may not contain all of the information that may be important to you in making a decision to invest in the Notes. Before making an investment decision, you should carefully read this entire offering memorandum, including the information presented under “Risk Factors,” “—Summary Historical Financial Information,” “Unaudited Pro Forma Condensed Combined Financial Information” and the historical financial statements included in this offering memorandum.
Our Company
Genmab is an international biotechnology company with a core purpose of improving the lives of patients with innovative and differentiated antibody therapeutics. For more than 25 years, its passionate, innovative and collaborative team has invented next-generation antibody technology platforms and leveraged translational, quantitative and data sciences, resulting in a proprietary pipeline including bispecific T-cell engagers, antibody-drug conjugates, next-generation immune checkpoint modulators and effector function-enhanced antibodies. Genmab’s antibody technology platforms have given rise to eight commercialised products and a pipeline of novel antibody-based products and product candidates designed to address medical needs and improve treatment outcomes for patients with cancer and other serious diseases. Our pipeline includes both wholly owned and partnered programs, with several compounds in late-stage clinical development. Our goal in building our pipeline is to bring medicines to market ourselves in geographic areas where we believe we will be able to maximize their value. By 2030, our vision is to transform the lives of people with cancer and other serious diseases with knock-your-socks-off antibody medicines®.
Since Genmab’s founding in 1999 we have been dedicated to creating innovative and differentiated antibody therapeutics, initially as a research and development (“R&D”) innovation powerhouse out-licensing novel candidates to large cap pharma partners, including Janssen Biotech, Inc (“Janssen”), F. Hoffmann-La Roche AG (“Roche”), GlaxoSmithKline (“GSK”) and Novo Nordisk A/S (“Novo Nordisk”), for upfront, milestone and royalty payments. Early partnerships yielded six U.S. Food and Drug Administration (“FDA”) approved, commercialized, royalty-bearing products: DARZALEX, Kesimpta, TEPEZZA, RYBREVANT, TALVEY, and TECVAYLI. In full-year 2024, these products generated approximately $18 billion in aggregate partner net sales, providing a strong, recurring royalty revenue foundation for Genmab. Given the constantly evolving oncology landscape, our antibody platforms and our expertise and know-how in antibody development, we have shifted our model into a fully integrated biotech company through commercialization and co-commercialization of proprietary products such as EPKINLY and Tivdak in certain geographies, allowing Genmab to retain a greater share of the economic potential of these products. We are focused on the development of our proprietary, wholly owned pipeline, including through high potential growth opportunities such as our acquisition of ProfoundBio, Inc. (“ProfoundBio”) in 2024 and the Acquisition, which has resulted in a significant portfolio that incorporates the next wave of innovation in oncology indications with high medical needs.
Our current priorities are the commercial or late-stage programs epcoritamab and wholly owned rinatabart sesutecan (“Rina-S”) and acasunlimab. Epcoritamab, marketed as EPKINLY in the U.S. and Japan and as TEPKINLY outside of those territories, is being developed and commercialized in collaboration with AbbVie Inc. (“AbbVie”).
Epcoritamab is the only bispecific antibody approved with a dual indication for the treatment of certain B-cell malignancies in the U.S., Europe and Japan. Rina-S entered Phase III clinical development for platinum-resistant ovarian cancer (“PROC”) in 2024 and Endometrial Cancer (“EC”) in 2025, and acasunlimab entered Phase III clinical development for Non-Small Cell Lung Cancer (“NSCLC”) in 2024.
8
The table below summarizes key data points on our six approved royalty products and our two approved proprietary products, respectively.
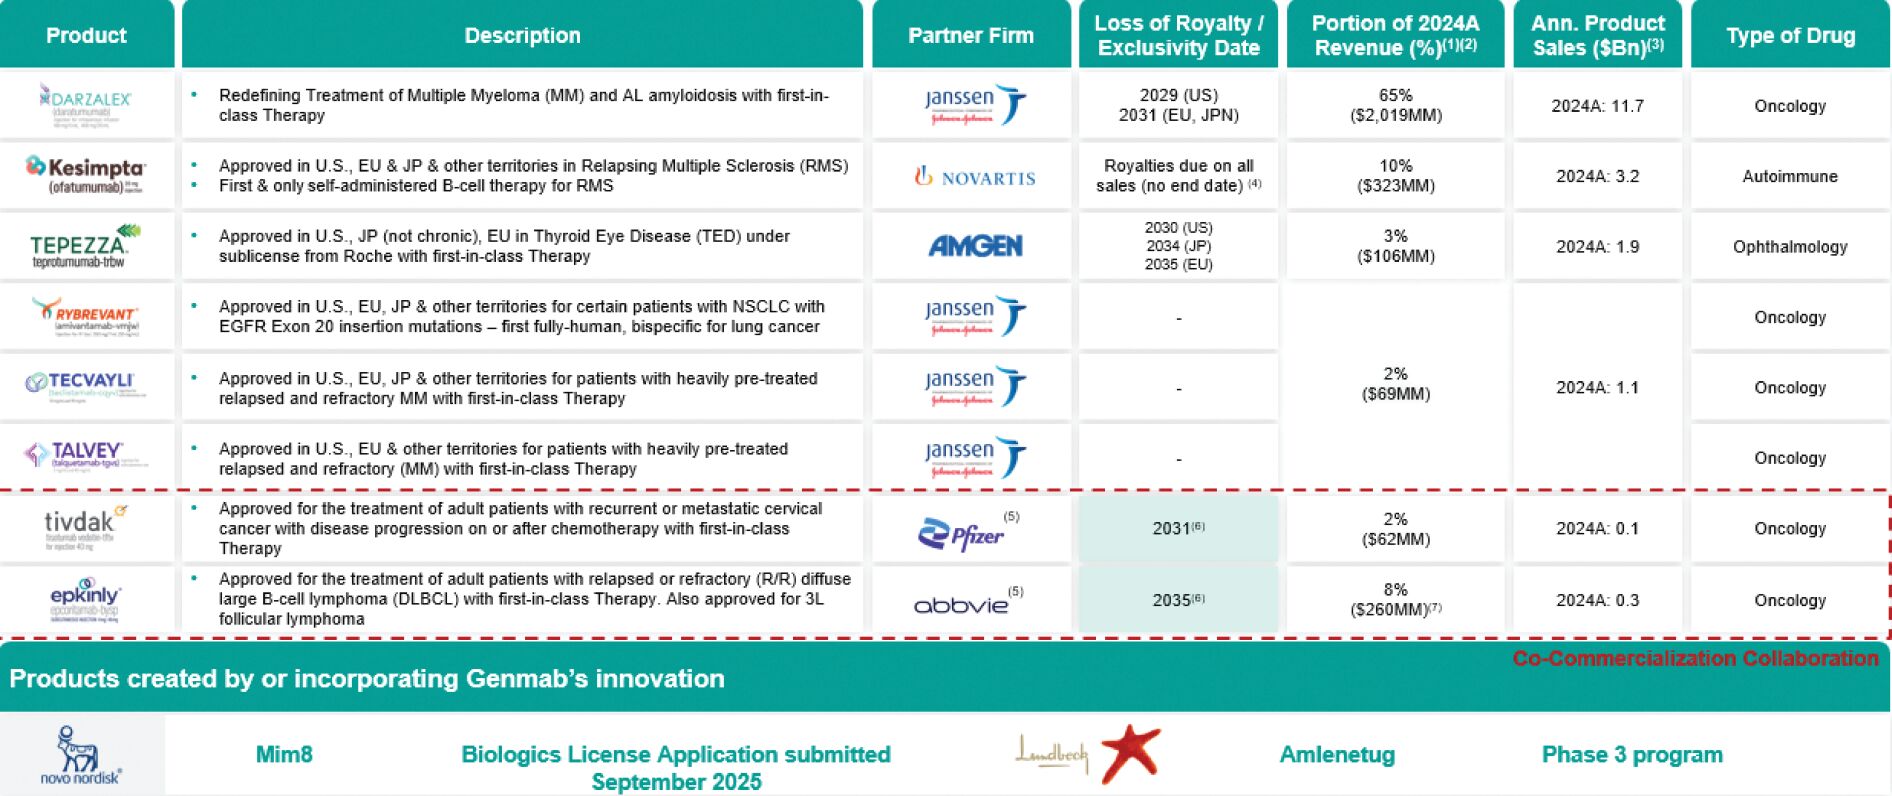
| (1) | To the extent available and reported; RYBREVANT®, TECVAYLI® and TALVEY® are not owned products. |
| (2) | Remaining 10% of revenue attributable to milestones and reimbursements and licensing. |
| (3) | Source: For DARZALEX® and TECVAYLI® 2024 sales, Johnson & Johnson (“J&J”) FY 2024 financial results; for KESIMPTA® 2024 sales, Novartis AG (“Novartis”) FY 2024 financial results; for TEPEZZA® 2024 sales, Amgen Inc. (“Amgen”) FY 2024 results; for TIVDAK® and EPKINLY® 2024 sales, GMAB FY 2024 presentation. |
| (4) | Exclusivity protection provided by Genmab patents (exp. 2031) and Novartis owned patents (exp. 2037). Royalties continue to be paid on all sales after patent expirations. |
| (5) | Co-commercialization collaboration. |
| (6) | U.S., European and Japanese patents for EPKINLY® and TIVDAK® do not begin to expire until the dates shown, however requests for patent term extensions have been filed for both which, if approved, would provide protection beyond the displayed end dates. |
| (7) | Includes $253M in EPKINLY® net product sales and $7M in TEPKINLY® royalties. |
Innovation and Proprietary Technology Platform
Our portfolio includes five proprietary antibody technology platforms: (i) our DuoBody platform, which can be used for the creation and development of bispecific antibodies; (ii) our HexaBody platform, which can be used to increase the potential potency of antibodies through hexamerization; (iii) our DuoHexaBody platform, which enhances the potential potency of bispecific antibodies through hexamerization; (iv) our HexElect platform, which combines two HexaBody molecules to maximize potential potency while minimizing potential toxicity by more selective binding to desired target cells; and (v) our antibody drug conjugate (“ADC”) platforms, acquired through the purchase of ProfoundBio in May 2024. Antibody products created with these technologies may be used in a wide variety of indications including cancer as well as autoimmune, central nervous system and infectious diseases. These platforms play a key role in building our product pipeline, enhancing our collaborations and generating revenue. We selectively enter into collaborations with other biotechnology and pharmaceutical companies that build our network in the biotechnology space and give us access to complementary novel technologies or products that move us closer to achieving our vision and fulfilling our core purpose.
9
Our innovation and proprietary technology platforms are used in the pipelines of global pharmaceutical and biotechnology companies. These companies are running clinical development programs with antibodies created by Genmab or created using Genmab’s proprietary DuoBody bispecific antibody technology platform. The six approved medicines created by Genmab or that incorporate Genmab’s innovation or technology platforms are: daratumumab, marketed by J&J as DARZALEX (intravenous (“IV”) formulation) and DARZALEX FASPRO or DARZALEX SC (SC formulation), approved in the U.S., Europe, Japan and other territories for the treatment of certain indications of MM and AL amyloidosis; amivantamab, marketed in the U.S., Europe, Japan and other territories by J&J as RYBREVANT for the treatment of certain adult patients with locally-advanced or metastatic NSCLC with epidermal growth factor receptor (“EGFR”) exon 20 insertion mutations; teclistamab, marketed in the U.S., Europe, Japan and other territories by J&J as TECVAYLI for certain indications of MM; talquetamab, marketed in the U.S., Europe, Japan and other territories by J&J as TALVEY for certain indications of MM; SC ofatumumab, marketed in the U.S., Europe, Japan and other territories as Kesimpta by Novartis for the treatment of relapsing multiple sclerosis (“RMS”); and teprotumumab, marketed in the U.S. and Japan as TEPEZZA by Amgen for the treatment of thyroid eye disease (“TED”). Under the agreements for these products we are entitled to certain royalties based on net sales and potential milestone payments.
Our proprietary commercial products are EPKINLY and Tivdak. Net Sales from these products continue to grow and strengthen.
For the twelve months ended September 30, 2025, Genmab generated approximately $3.6 billion of revenue, of which $2.9 billion were royalty revenues, $1.5 billion of net income (loss), and $1.5 billion of Adjusted EBITDA. Adjusted EBITDA is a non-IFRS measure. See “Use of Non-IFRS and Non-GAAP Financial Information” and “Summary Historical Financial Information—Company Summary Financial Information—Company Adjusted EBITDA” for a discussion of the limitations of Adjusted EBITDA and a reconciliation to Net Profit.
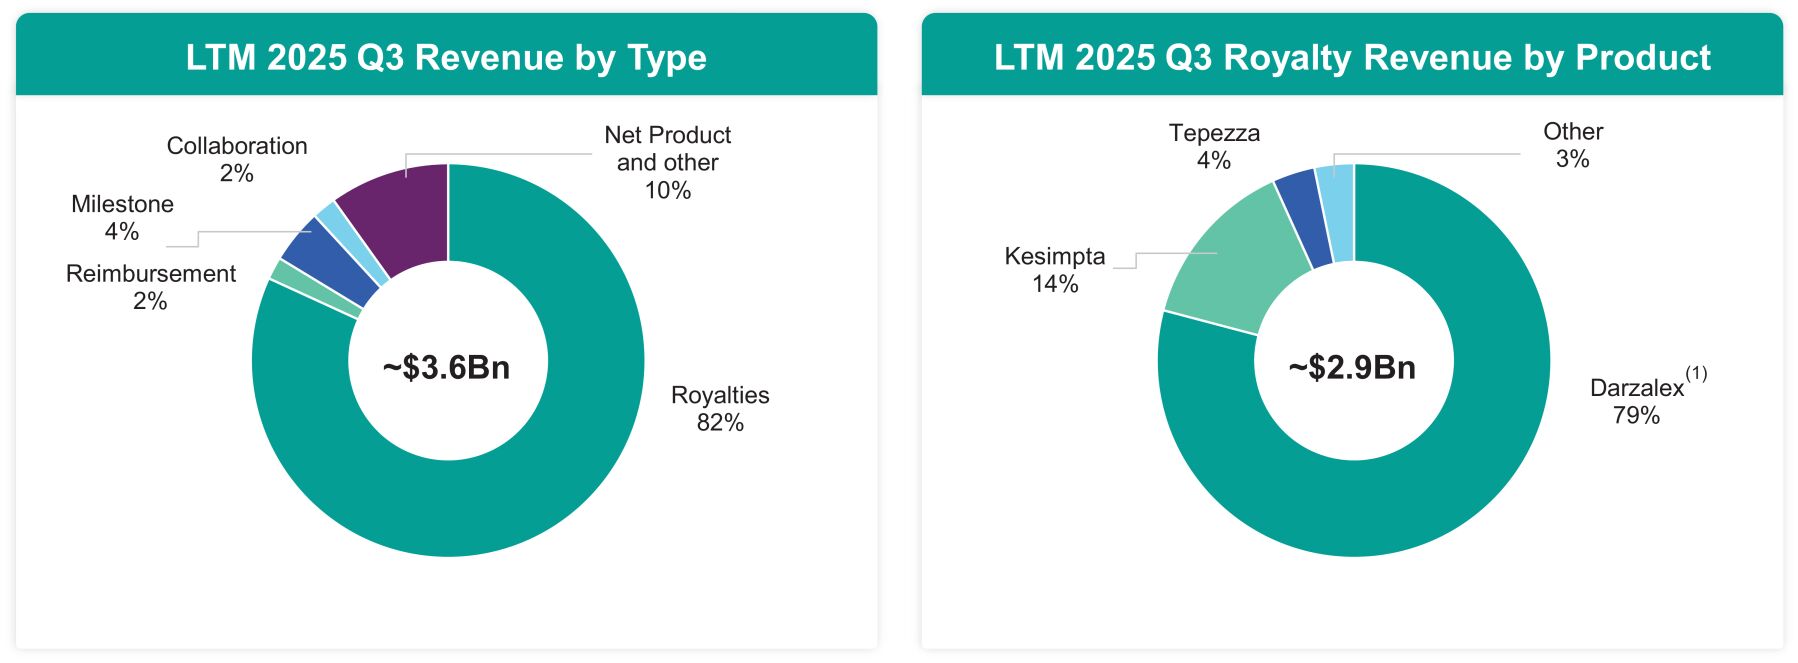
| (1) | “DARZALEX®” refers to both DARZALEX® and DARZALEX FASPRO® (trade name in the U.S.)/DARZALEX SC (trade name in Europe). |
Business Strategy
Key elements of our strategy to achieve our vision and fulfill our core purpose include:
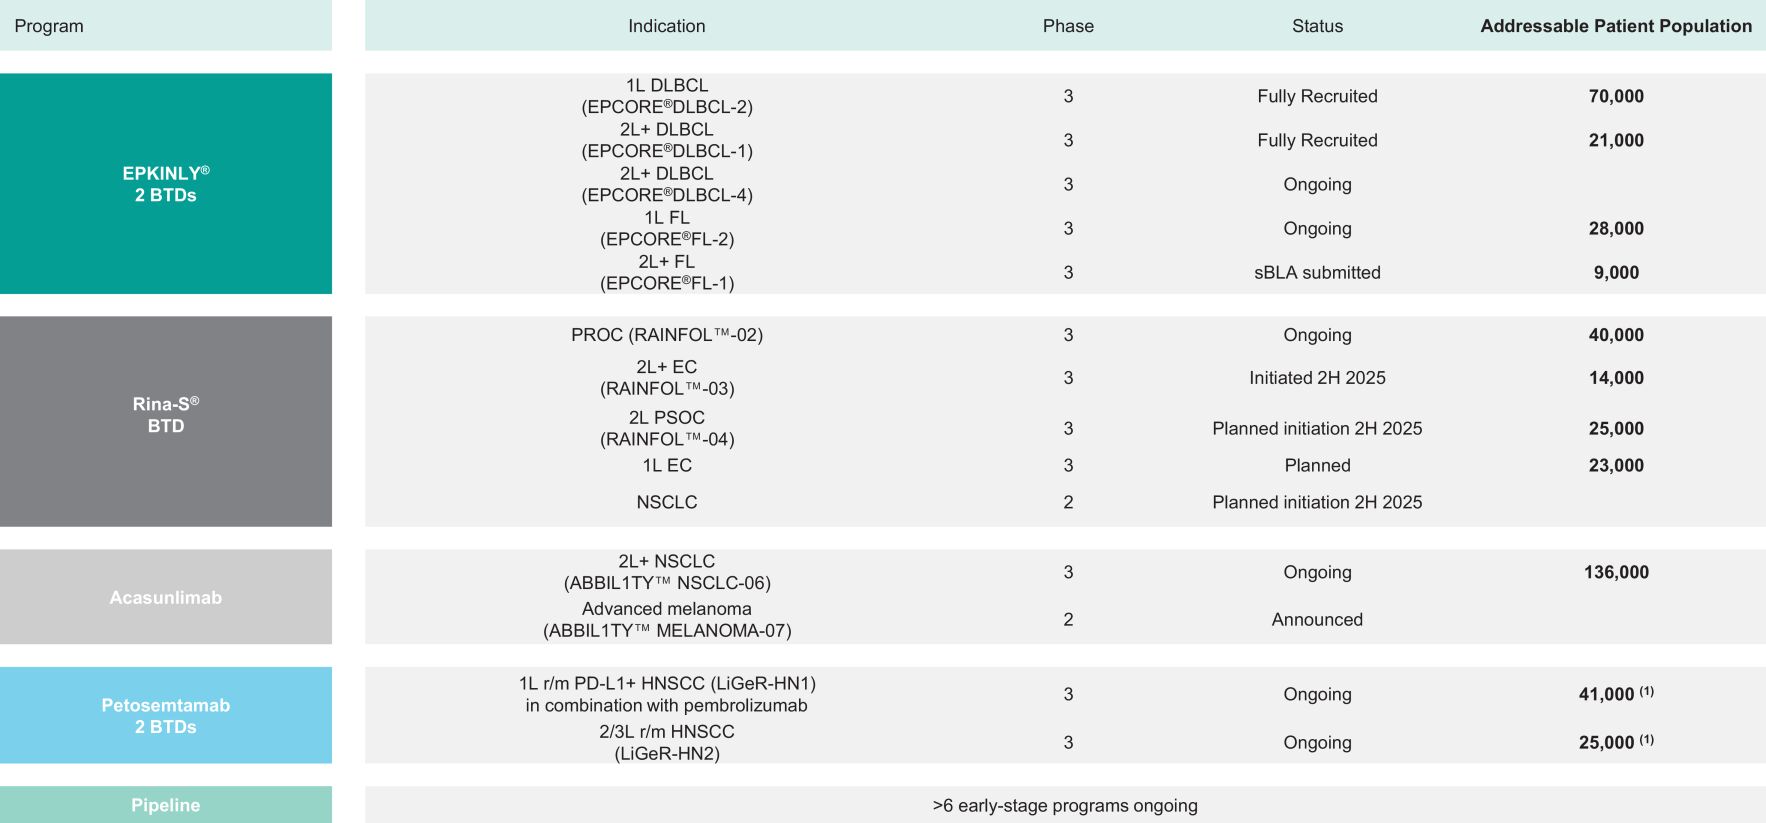
| • | Actively advance and expand our proprietary product pipeline. We are actively advancing our promising proprietary product candidates, and specifically our commercial or late-stage programs epcoritamab, Rina-S and acasunlimab, through development and commercialization. |
10
| • | Grow our commercialization capabilities. We are continuing to develop and expand our commercialization capabilities to enable us to bring our own products to market for the indications and in the geographies that we determine are most likely to create value for patients and our investors. Our primary focus for commercialization has been in the U.S. and in Japan, with the commercialization of Tivdak and EPKINLY. More recently, we have expanded our commercial footprint to the EU. |
| • | Strengthen our product portfolio with strategic collaborations and acquisitions. We enter into strategic product and technology collaborations to build our network in the biotechnology space and to strengthen our portfolio with complementary technologies and products, and we seek to expand our proprietary product pipeline by developing new products in-house and through selective collaborations. We monitor for potential collaborations and acquisitions that would advance our overall strategy, such as the Acquisition and our 2024 acquisition of ProfoundBio. |
| • | Leverage our proprietary technology platforms. Our leading proprietary antibody technology platforms play a key role in building our product pipeline, enhancing our collaborations and generating revenue. Multiple new product candidates are currently being developed by us using our technology platforms, including proprietary product candidates created with our DuoBody and ADC technologies. We actively seek collaboration partners interested in developing potential antibody therapeutics using our technologies. |
| • | Leverage recurring revenue streams from collaborations. There are six medicines on the market, developed and commercialized by partners, that were created by Genmab or created using our DuoBody technology. Under the agreements for these medicines, Genmab is entitled to certain royalties and potential milestone payments. Originally, this strategy allowed us to bring our innovative products to the market and create a stable revenue stream. Over time, it has allowed us to build and expand our own proprietary pipeline. |
Transaction Overview
On September 29, 2025, we agreed to acquire Merus pursuant to a Transaction Agreement (as defined herein) among Merus, the Purchaser (as defined herein), and us. Pursuant to the Transaction Agreement, on October 21, 2025, the Purchaser commenced the Offer (as defined herein) to purchase any and all of the issued and outstanding common shares of Merus at a purchase price of $97.00 per share, payable in cash, less any applicable withholding taxes and without interest. The Offer will expire at 5:00 p.m. New York City time on December 11, 2025, unless earlier terminated or extended in accordance with the Transaction Agreement.
Merus is a clinical-stage biotechnology company with a late-stage breakthrough therapy asset, petosemtamab, which is in Phase III development. The Acquisition, if consummated, will further strengthen our late-stage product pipeline with the addition of petosemtamab where we believe our expertise and leadership in antibody-based innovations will assist in unlocking petosemtamab’s full potential.
Merus N. V.
Merus is an oncology company developing innovative antibody therapeutics. Merus’ lead product candidate is MCLA-158 (petosemtamab), in clinical development for the potential treatment of solid tumors, including first line (“1L”) programmed death-ligand 1 positive (“PD-L1+”) recurrent/metastatic (“r/m”) head and neck squamous cell carcinoma (“HNSCC”) in combination with pembrolizumab, and second line (“2L”) or third line (“3L”) r/m HNSCC as monotherapy; and in metastatic colorectal cancer (“mCRC”) in 1L and 2L in combination with standard chemotherapy and 3L+ mCRC as monotherapy. Merus has also developed BIZENGRI® (zenocutuzumab-zbco), the first and only FDA-approved treatment indicated for adults with pancreatic adenocarcinoma or NSCLC that are advanced, unresectable or metastatic and harbor a neuregulin 1 (“NRG1”)
11
gene fusion who have disease progression on or after prior systemic therapy. Merus has a pipeline of full-length human multispecific antibody candidates generated from its proprietary technology platforms, Biclonics and Triclonics.
Strategic Rationale for the Acquisition
We believe that the Acquisition further strengthens our position as a leader in the biotechnology space, and is underpinned by the following four strategic rationales:
| • | Enhancing Genmab’s late-stage pipeline with a high-potential asset. Acquiring Merus adds its lead asset, petosemtamab, to Genmab’s late-stage pipeline, an EGFRxLGR5 bispecific antibody with the potential to become the first and best-in-class therapy for head and neck cancer. There are two petosemtamab Phase III trials ongoing, one in 1L and one in 2L and 3L head and neck. The product candidate has demonstrated meaningful clinical benefits in 1L and later line settings with the FDA granting BTD (as defined herein) for both the 1L PD-L1+ and 2L+ recurrent or metastatic head and neck cancer. |
| • | Meaningfully accelerating Genmab’s shift to a 100% owned model. The Acquisition is in line with and advances our long-term strategy of transitioning from a royalty-based business to an end-to-end biotech company that fully owns, develops, and commercializes medicines. With the addition of petosemtamab to EPKINLY and Rina-S, Genmab strengthens its position as an antibody-driven biotechnology powerhouse, supported by a robust, diverse, wholly owned late-stage portfolio. |
| • | Driving sustainable and profitable growth. As launch revenues build and investment levels stabilize, we expect meaningful growth for petosemtamab in the medium term, subject to clinical results and regulatory approvals. We expect the Acquisition to provide a high-potential wholly owned revenue stream that supports continued investment in our innovative R&D pipeline. We believe this strategic positioning will enable us to build a robust foundation for sustainable growth and profitability into the next decade and beyond. |
| • | Leveraging Genmab’s expertise in antibody innovation and clinical development. We believe our established leadership in antibody-based therapeutics and proven track record in rapid, broad clinical development are central to unlocking the full value of petosemtamab. Our strong commercial infrastructure in the U.S., Japan and Europe provides a robust platform for the launch and expansion of petosemtamab and positions us to maximize the impact of this high-potential asset, supporting both patient outcomes and long-term value creation. |
Industry Overview
The biotechnology and pharmaceutical industries generally, and the cancer drug sector specifically, are characterized by evolving understanding of causes of disease, rapidly advancing technologies, intense competition and a strong emphasis on intellectual property. Both sectors are subject to significant regulatory oversight and substantial investment in R&D. Within this landscape, oncology remains one of the most dynamic and innovative therapeutic areas, driven by unmet medical needs, scientific breakthroughs, and robust market growth.
The Oncology Biopharmaceuticals Industry
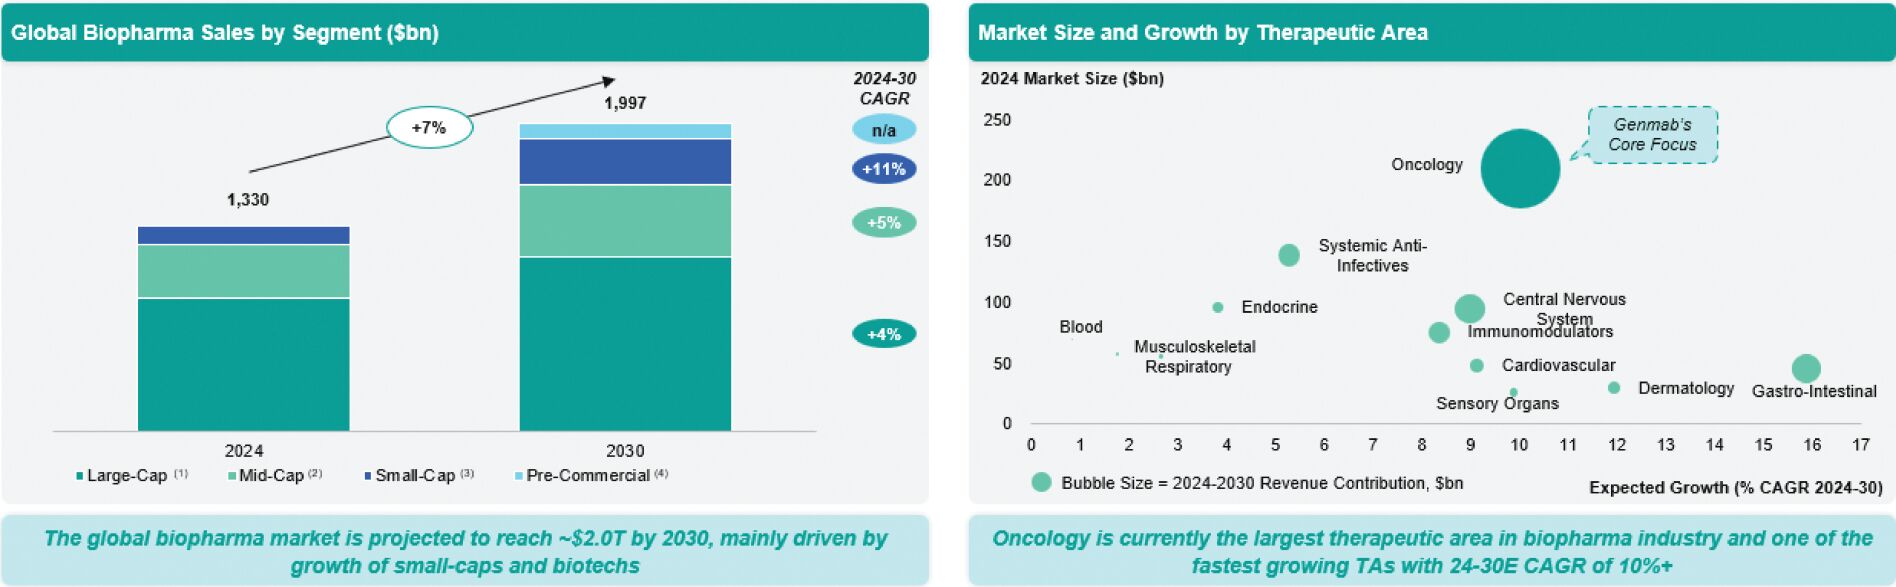
We operate within the global oncology biopharmaceutical sector, which is one of the largest and fastest-growing segments of the pharmaceutical industry. The oncology market is driven by several secular trends, including an aging population, increased cancer incidence, and ongoing innovation in targeted therapies, immuno-oncology, and antibody-based treatments. According to Evaluate Pharma, the global biopharma market is projected to reach $1.8 trillion by 2030, driven largely by innovation from small-cap and biotech companies.
12
Per Evaluate Pharma, oncology remains the largest therapeutic area, expected to grow at a compound annual growth rate of over 10% through 2030 to $350 billion driven by the launch of novel therapies and expanded indications for existing drugs.
Generally, the sector is marked by:
| • | Rapid innovation. Advances in antibody engineering, bispecifics, cell therapy, and precision medicine are transforming the treatment paradigm for many cancers. |
| • | Regulatory complexity. Oncology drugs often benefit from expedited regulatory pathways, such as breakthrough therapy or fast track designation and accelerated approval, but must demonstrate meaningful clinical benefit above available therapy and a tolerable safety profile. |
| • | Intense competition. Large multinational pharmaceutical companies and innovative biotechs compete for leadership in key indications, with significant investment in R&D and business development. |
Merus’ Industry: Head and Neck Squamous Carcinoma and Colorectal Cancer
Merus’ lead asset petosemtamab is being evaluated in two Phase III trials for head and neck squamous cell carcinoma, with expansion opportunities for colorectal cancer in three Phase II trials.
Key characteristics of Merus’ target market include:
| • | The addressable market for head and neck squamous cell cancer has a significant unmet need. HNSCC remains an area of high unmet medical need. Despite advances in standard of care, prognosis for recurrent or metastatic HNSCC remains poor, with limited effective treatment options and high rates of disease progression. According to results from the KEYNOTE-048 trial, pembrolizumab, the 1L standard of care, achieved median progression free survival of 3.2 months and overall survival of approximately one year. Based on internal market research, we believe there are nearly 70,000 patients with locally advanced or metastatic head and neck cancer in the U.S., the European Union (“EU”) and Japan combined. We believe there are approximately 41,000 patients in the U.S., EU and Japan eligible for 1L treatment. For 2L treatment and beyond, we believe there are an approximate additional 25,000 patients in the U.S., EU and Japan. In the Phase II trial in the 1L setting, petosemtamab demonstrated an overall response rate and median progression free survival of approximately three times better than pembrolizumab monotherapy. |
| • | Innovation in bispecifics. EGFRxLGR5 bispecific antibodies, such as petosemtamab, offer the potential for enhanced efficacy by simultaneously targeting multiple pathways. Petosemtamab has demonstrated a significant clinical benefit in both 1L and 2L+ HNSCC, with a 63% overall response rate and nine months median progression-free survival in combination with pembrolizumab, and a 36% overall response rate as monotherapy in later lines. |
| • | Regulatory momentum. Therapies addressing high unmet need in head and neck cancer, such as petosemtamab, may benefit from expedited regulatory review. Petosemtamab has received BTD from the FDA for both 1L and 2L+ HNSCC indications, reflecting the promise of its clinical data and the urgency of the need. |
| • | Competitive landscape. The late-stage development landscape in HNSCC includes programmes with limited clinical evidence or focus on subpopulations, providing an opportunity for differentiation for bispecific antibodies like petosemtamab. Success in this field depends on clinical differentiation, safety, and the ability to demonstrate meaningful benefit over existing therapies. |
13
| • | Expansion into colorectal cancer. Petosemtamab is also being developed for colorectal cancer, with ongoing Phase II studies in 1L, 2L and 3L settings, representing further expansion opportunities in solid tumours with significant unmet need. |
Our Competitive Strengths
We are a leader in antibody innovation, with a portfolio of wholly owned and partnered assets addressing high unmet medical needs in hematological malignancies and solid tumours. Our focus on proprietary, differentiated antibody platforms and our track record of successful product launches positions us to capture value in a market that rewards innovation, clinical differentiation, and commercial execution.
Top Player in Oncology, One of the Fastest Growing Segments Within Pharma
Genmab is a leading antibody company and one of the largest European biotechs. It stands out as a strong player in oncology, one of the most dynamic and fastest-growing segments within the pharmaceutical industry; and has established itself as a leader in antibody innovation, with a portfolio of wholly owned and partnered assets addressing high unmet needs in hematological malignancies and solid tumors. Genmab’s focus on proprietary, differentiated antibody platforms and its track record of successful product launches position it to capture value in a market that rewards innovation, clinical differentiation, and commercial execution. We believe we are uniquely positioned to capitalize on the momentum of the industry, leveraging our deep expertise in B-cell lymphomas and multiple myeloma, diseases that primarily affect older populations. Our leadership in antibody engineering and bispecific platforms has yielded four late-stage assets, collectively earning three BTDs.
| (1) | Companies with 2024 sales >$10bn. |
| (2) | Companies with 2024 sales $10bn-$1bn. |
| (3) | Companies with 2024 sales $1-$0bn. |
| (4) | Companies with no sales in 2024. |
World-Class R&D Powerhouse with an Innovation Track-Record
We are a world-class leader with antibody R&D and commercialization expertise, distinguished by our consistent track record of innovation and successful delivery of transformative antibody-based therapies. With approximately 1,840 of our 2,681 employees dedicated to R&D as of September 30, 2025, we offer a fully integrated value chain—from early-stage discovery to global commercialization—designed to maximize innovation, ensure product quality, and optimize market reach. We have built a streamlined enterprise that coordinates antibody discovery, preclinical testing, clinical development, contractual manufacturing, and regulatory submissions across our international footprint. We continue to expand our scientific capabilities by integrating data science and artificial intelligence to identify novel targets and biomarkers, enhancing our precision medicine and translational research efforts.
14
Our suite of pioneering antibody platforms, including DuoBody, enables the creation of differentiated, potentially first- or best-in-class investigational medicines with the potential to significantly improve patient outcomes.
With the successful launches of Tivdak (2021, with Pfizer Inc. (“Pfizer”)) and EPKINLY/TEPKINLY (2023, with AbbVie) and two wholly owned Phase III programs (Rina-S and acasunlimab), we continue to transform into a fully integrated biotech innovator.
Strong and Differentiated Pipeline of Potential Best-in-Class and First-in-Class Therapies
Our full pipeline includes bispecific T-cell engagers, next-generation immune checkpoint modulators, effector function enhanced antibodies and ADCs. We currently have nine proprietary products or product candidates in clinical development, which comprise programs where we retain at least 50% of product rights in collaboration with partners. Our key, late-stage clinical programs are EPKINLY, Rina-S and acasunlimab.
Substantial Cash Flow Generation from Royalty Income
Genmab continues to demonstrate substantial cash flow generation, underpinned by a long-standing track record of profitable growth and revenue diversification. For the twelve months ended September 30, 2025, Genmab had revenues of approximately $3.6 billion and Adjusted EBITDA of $1.5 billion, reflecting a strong Adjusted EBITDA margin of 42.2%. Genmab also achieved Free Cash Flow of $1.2 billion. Adjusted EBITDA, Adjusted EBITDA margin and Free Cash Flow are non-IFRS measures. See “Use of Non-IFRS and Non-GAAP Financial Information” and “Summary Historical Financial Information—Company Summary Financial Information—Company Adjusted EBITDA” and “Summary Historical Financial Information—Company Summary Financial Information—Company Free Cash Flow” for discussions of the limitations of Adjusted EBITDA, Adjusted EBITDA Margin and Free Cash Flow and a reconciliation to Net Profit and Net Cash Provided by Operating Activities. We expect this robust financial performance to enable Genmab to service and reduce its debt obligations while continuing to invest significantly in R&D to drive innovation. Importantly, our growth is de-risked by recurring royalty income from DARZALEX, which is currently the second-largest oncology drug worldwide by net sales, providing a stable and high-margin income stream that supports long-term strategic initiatives.
15
Founder-led and Experienced Management Team with Significant Tenure in Biotech
Our management team is led by our visionary founder and Chief Executive Officer, Jan van de Winkel, whose leadership has been instrumental in shaping Genmab’s strategic direction and global success. The team brings deep industry expertise, having held senior roles across leading biotech and pharmaceutical organizations, and has successfully executed large-scale M&A transactions while building a high-performing, innovation-driven organization. To maintain its competitive edge, we have consistently recruited and retained top talent, forming a deep bench of experienced leaders. This includes Anthony Pagano, Chief Financial Officer; Judith Klimovsky, Chief Development Officer; Martine J. van Vugt, Chief Strategy Officer; Bradley Bailey, Chief Commercial Officer; Tahamtan Ahmadi, Chief Medical Officer; Greg Mueller, General Counsel & Chief Legal Officer; Rayne Waller, Chief Technical Operations Officer and Christopher Cozic, Chief People Officer—each contributing to our continued growth and operational excellence. Their collective expertise enables us to remain at the forefront of antibody therapeutics and global biotech innovation.
The Transactions
The Acquisition
The Tender Offer
On September 29, 2025, Genmab agreed to acquire (the “Acquisition”) Merus pursuant to a Transaction Agreement (the “Transaction Agreement”) among Merus, Genmab Holding II B.V., a private limited liability company organized under the laws of the Netherlands and a wholly owned subsidiary of Genmab (the “Purchaser”), and us. Pursuant to the Transaction Agreement, on October 21, 2025, the Purchaser commenced a tender offer (the “Offer”) to purchase any and all of the issued and outstanding common shares of Merus at a purchase price of $97.00 per share, payable in cash, less any applicable withholding taxes and without interest. The Offer will expire at 5:00 p.m. New York City time on December 11, 2025, unless earlier terminated or extended in accordance with the Transaction Agreement.
The Offer is subject to the satisfaction or waiver of various customary conditions for similar transactions, including the valid tendering in accordance with the terms of the Offer, and not properly withdrawing, of a number of Merus common shares that, together with the common shares then owned by us, the Purchaser and our respective affiliates, and any common shares irrevocably and unconditionally (or conditionally only on the closing of the Offer having occurred) sold and committed to be transferred, but not yet transferred, to the Purchaser in writing, representing at least 80% of Merus’ issued and outstanding share capital immediately prior to the expiration of the Offer. Under certain circumstances, the Purchaser may reduce this condition to 75% of the Merus issued and outstanding share capital. The conditions also include receipt of required approvals relating to U.S. and foreign competition filings, or the expiration or termination of their respective waiting periods (including under the Hart-Scott-Rodino Antitrust Improvements Act of 1976). Finally, the conditions include, among other matters, the adoption of resolutions by shareholders of Merus at an extraordinary meeting convened for this purpose approving certain transactions relating to the Offer, including the Back-End Transactions described below.
If all of the conditions to the completion of the Offer have been satisfied or waived, the Purchaser expects to purchase all Merus common shares tendered in the Offer prior to the expiration time promptly following the expiration time. We refer to this as the “Acquisition Closing” and the date of purchase as the “Acquisition Closing Date”.
Following the Acquisition Closing, the Purchaser will commence a subsequent offering period for a period of at least ten business days to purchase additional Merus common shares at the same price as during the initial offer period.
16
The Back-End Transactions
We expect that, promptly following completion of the subsequent offering period, Merus will become an indirect wholly owned subsidiary of Genmab through certain back-end reorganization transactions involving Genmab, the Purchaser, Merus and their subsidiaries. The form that such back-end reorganization transactions take will depend on the receipt of a certain tax ruling as set forth in the Transaction Agreement. Assuming receipt of such tax ruling by the completion of the subsequent offer period described above, the back-end mechanics will be implemented by means of a Dutch legal merger of Merus with and into a newly formed wholly owned Dutch subsidiary of Merus, followed by the cancellation of all outstanding class A shares of such subsidiary to be issued to the remaining minority shareholders other than Genmab in such merger in exchange for a cancellation consideration in cash equal to the price per share paid in the Offer, less any applicable withholding taxes and without interest. If such tax ruling is not obtained prior to the completion of the subsequent offer period described above, Merus will, if necessary, issue such number of additional common shares to the Purchaser at an issue price per share equal to the price paid in the Offer in order to permit the Purchaser to commence statutory buy-out proceedings under Dutch law and obtain ownership of all Merus common shares not tendered pursuant to the Offer (including during the subsequent offering period). In that case, holders of those Merus common shares will receive an amount per share determined in court proceedings under Dutch law. We refer to the foregoing merger and cancellation transactions or share issuance and buy-out proceedings, as applicable, as the “Back-End Transactions” and to the completion of those transactions as the “Back-End Closing.”
Financing Transactions
In connection with the Acquisition Closing, we intend to enter into new senior secured credit facilities consisting of (i) a $1 billion senior secured term loan “A” facility (the “Term Loan A Facility”), (ii) a $2 billion senior secured term loan “B” facility (the “Term Loan B Facility” and, together with the Term Loan A Facility, the “Term Facilities”), and (iii) a $500 million senior secured revolving credit facility (the “New Revolving Facility” and, together with the Term Facilities, the “New Senior Secured Credit Facilities”).
There can be no assurance that these financing transactions will be completed on the terms we anticipate, or at all. The terms and conditions of these financing transactions described herein have not been finalized and are therefore subject to change. Investors are encouraged not to place undue reliance on the descriptions in deciding to invest in the Notes offered hereby, as changes may be made after the date of this offering memorandum.
For further details regarding the New Senior Secured Credit Facilities, see “Description of Certain Other Indebtedness.”
We plan to fund the total consideration payable in the Acquisition and related fees and expenses through a combination of cash on hand, including from the liquidation of substantially all of our marketable securities portfolio, from borrowings under the Term Facilities and from the proceeds of the Notes offered hereby. See “Use of Proceeds.” We refer to the Acquisition, including the Back-End Transactions, the borrowings under the Term Facilities and the issuance of the Notes offered hereby and the use of the proceeds therefrom, together with cash on hand as described above, to fund the consideration payable in the Acquisition and related fees and expenses collectively as the “Transactions.”
We are currently party to that certain facility agreement, dated as of October 24, 2024, by and among Genmab, the Arrangers (as defined therein), the Coordinator (as defined therein), the Original Lenders (as defined therein) and Dansk Bank A/S as the Agent (the “Existing Credit Agreement”), which provides for $300 million in commitments of revolving borrowings. We are seeking consent under the Existing Credit Agreement to permit the consummation of this offering. If this consent is obtained, we expect to terminate the Existing Credit Agreement at the Acquisition Closing Date. If this consent is not obtained, we will terminate the Existing Credit Agreement on the date of the settlement of this offering.
17
The table below sets forth the estimated sources and uses of funds in connection with the Acquisition. Actual amounts will vary from the estimated amounts shown below. You should read the following in conjunction with the information included under the sections entitled “Capitalization” and “Summary—Summary Historical Financial Information” included elsewhere in this offering memorandum. See “Use of Proceeds” for further details on the table below, including additional notes to each source and use.
| Sources of funds |
Uses of funds |
|||||||||
| ($ in millions) | ||||||||||
| Term Loan A Facility(1) |
$ | 1,000 | Acquisition Consideration(5) | $ | 8,014 | |||||
| Term Loan B Facility(1) |
2,000 | Acquisition Fees and Expenses(6) | 381 | |||||||
| Secured Notes Offered Hereby(2) |
1,500 | |||||||||
| Unsecured Notes Offered Hereby(3) |
1,000 | |||||||||
| Cash from Balance Sheet(4) |
2,895 | |||||||||
|
|
|
|
|
|||||||
| Total Sources of Funds |
8,395 | Total uses of funds | 8,395 | |||||||
|
|
|
|
|
|||||||
| (1) | Concurrently with the closing of the Acquisition, the Issuers expect to enter into the Term Loan A Facility and the Term Loan B Facility, as further described in “Summary—The Transactions—Financing Transactions”, each of which will be fully drawn at the closing of the Acquisition. |
| (2) | Represents the aggregate principal amount of Secured Notes offered hereby. Assumes the Secured Notes are issued at par. If we do not consummate the Acquisition, the Secured Notes will be subject to a special mandatory redemption. See “Description of the Secured Notes—Segregation of Proceeds; Special Mandatory Redemption.” |
| (3) | Represents the aggregate principal amount of Unsecured Notes offered hereby. Assumes the Unsecured Notes are issued at par. If we do not consummate the Acquisition, the Unsecured Notes will be subject to a special mandatory redemption. See “Description of the Unsecured Notes—Segregation of Proceeds; Special Mandatory Redemption.” |
| (4) | Represents estimated cash on our balance sheet immediately prior to the closing of the Acquisition, including from the liquidation of substantially all of our marketable securities. The actual amount of cash and cash equivalents and marketable securities that will be used as a source of funds in connection with the Acquisition will vary depending on, among other things, our cash balance on the Acquisition Closing Date, transaction fees and expenses and the timing of the Acquisition Closing Date. |
| (5) | Represents the estimated aggregate consideration payable to equity holders of Merus pursuant to the Acquisition, calculated based on Genmab’s offer of $97.00 per Merus common share pursuant to the tender offer. |
| (6) | Represents estimated fees and expenses associated with the Acquisition, including financing fees, advisory fees and other costs and legal, accounting and other professional fees relating to the Acquisition. Actual fees and expenses may vary. To the extent any fees and expenses exceed the estimated amounts, we expect to fund such amounts with cash on our balance sheet at the closing of the Acquisition. |
18
SUMMARY HISTORICAL FINANCIAL INFORMATION
Company Summary Financial Information
The following tables summarize certain of our consolidated financial data for the periods ended on and as of the dates indicated below and are presented in U.S. dollars.
We have extracted our summary financial information (i) as of January 1, 2023, December 31, 2023 and December 31, 2024 and for the years ended December 31, 2022, 2023 and 2024 from the audited consolidated financial statements (the “Genmab Consolidated Financial Statements”) which have been updated as described in notes 1.1, 1.4, 4.2 and 4.5 in the Genmab Consolidated Financial Statements, which are included in this offering memorandum, and reissued compared to the previously announced consolidated financial statements as of the end of and for such years and (ii) as of and for the nine months ended September 30, 2024 and 2025 from the unaudited interim condensed consolidated financial statements (the “Genmab Unaudited Interim Condensed Consolidated Financial Statements”), which are included in this offering memorandum, each prepared in accordance with International Financial Reporting Standards (“IFRS”), as issued by the International Accounting Standards Board (“IASB”) and as endorsed by the EU (“IFRS Accounting Standards”) and IAS 34 Financial Information, respectively.
Our historical results are not necessarily indicative of our future results, and our results for any interim period are not necessarily indicative of the results to be expected for a full year.
The summary financial information below includes Adjusted EBITDA, Adjusted EBITDA Margin and Free Cash Flow, which are non-IFRS measures that we believe are widely used by investors as supplemental measures of performance or, in the case of Free Cash Flow, liquidity. Adjusted EBITDA, Adjusted EBITDA Margin, Free Cash Flow and our unaudited historical financial information for the twelve months ended September 30, 2025 are not an accounting measures presented in accordance with IFRS and therefore should not be considered a substitute for, or superior to, measures of our operating performance and liquidity presented in accordance with IFRS. Our unaudited historical financial information for the twelve months ended September 30, 2025 has been calculated by adding together (i) the audited financial information for the year ended December 31, 2024 and (ii) the unaudited interim condensed consolidated financial information for the nine months ended September 30, 2025 and then subtracting the unaudited interim condensed consolidated financial information for the nine months ended September 30, 2024. See “Presentation of Financial and Other Information—Use of Non-IFRS And Non-GAAP Financial Information”.
Prospective investors should read the summary financial information presented below in conjunction with “Presentation of Financial and Other Information,” “Use of Proceeds,” “Capitalization,” “Management’s Discussion and Analysis of Financial Condition and Results of Operations” and the Genmab Consolidated Financial Statements and the Genmab Unaudited Interim Condensed Consolidated Financial Statements, included elsewhere in this offering memorandum.
28
Select Consolidated Income Statement Data of the Company
| Year Ended December 31, | Nine Months Ended September 30, |
Last Twelve Months Ended September 30, |
||||||||||||||||||||||
| ($ million) | 2022* Restated |
2023* Restated |
2024* Restated |
2024* Restated |
2025 | 2025 | ||||||||||||||||||
| Revenue |
$ | 2,031 | $ | 2,390 | $ | 3,121 | $ | 2,198 | $ | 2,662 | 3,585 | |||||||||||||
| Cost of product sales |
— | (33 | ) | (143 | ) | (95 | ) | (157 | ) | (205 | ) | |||||||||||||
| Research and development expenses |
(787 | ) | (1,107 | ) | (1,414 | ) | (1,032 | ) | (1,080 | ) | (1,462 | ) | ||||||||||||
| Selling, general and administrative expenses |
(379 | ) | (478 | ) | (549 | ) | (370 | ) | (418 | ) | (597 | ) | ||||||||||||
| Acquisition and integration related charges |
— | — | (43 | ) | (39 | ) | — | (4 | ) | |||||||||||||||
|
|
|
|
|
|
|
|
|
|
|
|
|
|||||||||||||
| Total costs and operating expenses |
$ | (1,166 | ) | $ | (1,618 | ) | $ | (2,149 | ) | $ | (1,536 | ) | $ | (1,655 | ) | $ | (2,268 | ) | ||||||
|
|
|
|
|
|
|
|
|
|
|
|
|
|||||||||||||
| Operating profit |
$ | 865 | $ | 772 | $ | 972 | $ | 662 | $ | 1,007 | $ | 1,317 | ||||||||||||
|
|
|
|
|
|
|
|
|
|
|
|
|
|||||||||||||
| Financial income |
443 | 299 | 645 | 328 | 312 | 629 | ||||||||||||||||||
| Financial expenses |
(347 | ) | (254 | ) | (291 | ) | (181 | ) | (170 | ) | (280 | ) | ||||||||||||
|
|
|
|
|
|
|
|
|
|
|
|
|
|||||||||||||
| Net profit before tax |
961 | 817 | 1,326 | 809 | 1,149 | 1,666 | ||||||||||||||||||
|
|
|
|
|
|
|
|
|
|
|
|
|
|||||||||||||
| Corporate tax |
(211 | ) | (186 | ) | (193 | ) | (228 | ) | (217 | ) | (182 | ) | ||||||||||||
|
|
|
|
|
|
|
|
|
|
|
|
|
|||||||||||||
| Net profit |
$ | 750 | $ | 631 | $ | 1,133 | $ | 581 | $ | 932 | $ | 1,484 | ||||||||||||
|
|
|
|
|
|
|
|
|
|
|
|
|
|||||||||||||
| * | Genmab changed its presentation currency from DKK to USD effective January 1, 2025. Accordingly, management has translated the consolidated financial statements and related notes into USD for all periods presented. Refer to the Genmab Consolidated Financial Statements for more information. |
Select Consolidated Balance Sheet Data of the Company
| As of January 1, |
As of December 31, | As of September 30, | ||||||||||||||||||
| ($ million) | 2023* Restated |
2023* Restated |
2024* Restated |
2024 | 2025 | |||||||||||||||
| Marketable securities |
$ | 1,783 | $ | 1,967 | $ | 1,574 | $ | 1,648 | $ | 1,650 | ||||||||||
| Cash and cash equivalents |
1,419 | 2,204 | 1,380 | 952 | 1,761 | |||||||||||||||
| Total non-current assets |
273 | 320 | 2,514 | 2,397 | 2,550 | |||||||||||||||
| Shareholders’ equity |
3,915 | 4,687 | 5,137 | 4,793 | 5,751 | |||||||||||||||
| Share capital |
10 | 10 | 10 | 10 | 10 | |||||||||||||||
| * | Genmab changed its presentation currency from DKK to USD effective January 1, 2025. Accordingly, management has translated the consolidated financial statements and related notes into USD for all periods presented. Refer to the Genmab Consolidated Financial Statements for more information. |
29
Company Adjusted EBITDA
| Year Ended December 31, | Nine Months Ended September 30, |
Last Twelve Months Ended September 30, |
||||||||||||||||||||||
| ($ million) | 2022 | 2023 | 2024 | 2024 | 2025 | 2025 | ||||||||||||||||||
| Adjusted EBITDA(1) |
$ | 978 | $ | 900 | $ | 1,197 | $ | 833 | $ | 1,150 | $ | 1,514 | ||||||||||||
| (1) | We present Adjusted EBITDA because we believe that it is widely used by investors as a supplemental measure of performance. We believe that Adjusted EBITDA provides useful information to investors about our results of operations because it allows a comparison of our results across periods on a consistent basis by removing the effects on our operating performance of our asset base and capital investment cycle (such as depreciation and amortization) and items largely outside the control of management (such as corporate taxes). We calculate Adjusted EBITDA as net profit for the period as adjusted for corporate tax, depreciation, amortization, share-based compensation expense, impairment charges, acquisition and integration related charges, financial income and financial expense. In addition, you should be aware that we may incur expenses similar to the adjustments in this presentation in the future and that certain of these items could be considered recurring in nature. Our presentation of Adjusted EBITDA should not be construed as an implication that our future results will be unaffected by unusual or non-recurring items. Adjusted EBITDA should not be considered in isolation or as a substitute for measures of our operating performance presented in accordance with IFRS. For a description of the limitations of Adjusted EBITDA, see “Presentation of Financial and Other Information—Use of Non-IFRS and Non-GAAP Financial Information.” The following table reconciles our Net Profit to Adjusted EBITDA for the periods indicated below: |
| Year Ended December 31, | Nine Months Ended September 30, |
Last Twelve Months Ended September 30, |
||||||||||||||||||||||
| ($ million) | 2022 | 2023 | 2024 | 2024 | 2025 | 2025 | ||||||||||||||||||
| Net profit |
$ | 750 | $ | 631 | $ | 1,133 | $ | 581 | $ | 932 | $ | 1,484 | ||||||||||||
| Plus: Corporate tax |
211 | 186 | 193 | 228 | 217 | 182 | ||||||||||||||||||
| Plus: Depreciation |
30 | 40 | 49 | 36 | 39 | 52 | ||||||||||||||||||
| Plus: Amortization |
20 | 3 | 11 | 7 | 11 | 15 | ||||||||||||||||||
| Plus: Share-based-compensation expense |
63 | 85 | 105 | 78 | 92 | 119 | ||||||||||||||||||
| Plus: Impairment charges |
— | — | 17 | 11 | 1 | 7 | ||||||||||||||||||
| Plus: Acquisition and integration related charges |
— | — | 43 | 39 | — | 4 | ||||||||||||||||||
| Less: Financial income |
(443 | ) | (299 | ) | (645 | ) | (328 | ) | (312 | ) | (629 | ) | ||||||||||||
| Plus: Financial expense |
347 | 254 | 291 | 181 | 170 | 280 | ||||||||||||||||||
| Adjusted EBITDA |
$ | 978 | $ | 900 | $ | 1,197 | $ | 833 | $ | 1,150 | $ | 1,514 | ||||||||||||
| Divided by: Revenue |
$ | 2,031 | $ | 2,390 | $ | 3,121 | $ | 2,198 | $ | 2,662 | 3,585 | |||||||||||||
| Adjusted EBITDA Margin |
48 | % | 38 | % | 38 | % | 38 | % | 43 | % | 42 | % | ||||||||||||
30
Company Free Cash Flow
| Year Ended December 31, | Nine Months Ended September 30, |
Last Twelve Months Ended September 30, |
||||||||||||||||||
| ($ million) | 2022 | 2023 | 2024 | 2025 | 2025 | |||||||||||||||
| Cash from Operating Activities |
$ | 555 | $ | 1,071 | $ | 1,126 | $ | 885 | $ | 1,274 | ||||||||||
|
|
|
|
|
|
|
|
|
|
|
|||||||||||
| Less: Tangible Capital Expenditures |
(45 | ) | (53 | ) | (27 | ) | (24 | ) | (38 | ) | ||||||||||
|
|
|
|
|
|
|
|
|
|
|
|||||||||||
| Free Cash Flow(2) |
510 | 1,018 | 1,099 | 861 | 1,236 | |||||||||||||||
| (2) | We present Free Cash Flow because we believe that it is widely used by investors as a supplemental measure of performance. We also believe Free Cash Flow is a meaningful measure as it is utilized by management and investors to assess our ability to generate cash flow from business operations to repay debt and return capital to our shareholders. We believe Free Cash Flow provides useful information to investors about our results of operations. We calculate Free Cash Flow as cash from operating activities minus tangible capital expenditures. Free Cash Flow should not be considered in isolation or as a substitute for measures of our operating performance presented in accordance with IFRS. For a description of the limitations of Free Cash Flow, see “Presentation of Financial and Other Information—Use of Non-IFRS and Non-GAAP Financial Information.” |
Merus Summary Financial Information
The following tables summarize certain financial information of Merus for the periods indicated below and are presented in U.S. dollars. We have extracted Merus’ summary financial information (i) as of and for the years ended December 31, 2023 and 2024 from Merus’ audited consolidated financial statements (“Merus’ Consolidated Financial Statements”) and (ii) as of and for the nine months ended September 30, 2024 and 2025 from Merus’ unaudited interim condensed consolidated financial statements (“Merus’ Unaudited Interim Condensed Consolidated Financial Statements”), each prepared in accordance with accounting principles generally accepted in the United States (“U.S. GAAP”) and set forth elsewhere in this offering memorandum.
The unaudited historical financial information for Merus for the twelve months ended September 30, 2025 has been calculated by adding together (i) the financial information for the year ended December 31, 2024 and (ii) the unaudited interim condensed consolidated financial information for the nine months ended September 30, 2025 and then subtracting the unaudited interim condensed consolidated financial information for the nine months ended September 30, 2024 from Merus’ Unaudited Interim Condensed Consolidated Financial Statements.
The summary financial information below includes Adjusted EBITDA, which is a non-GAAP measure that we believe is widely used by investors as a supplemental measure of performance. Adjusted EBITDA is not an accounting measure presented in accordance with U.S. GAAP and therefore should not be considered a substitute for, or superior to, measures of Merus’ operating performance presented in accordance with U.S. GAAP. See “Presentation of Financial and Other Information—Use of Non-IFRS and Non-GAAP Financial Information.”
Prospective investors should read the summary financial information of Merus presented below in conjunction with Merus’ Consolidated Financial Statements included elsewhere in this Offering Memorandum.
31
Select Consolidated Income Statement Data of Merus
| Year Ended December 31, | Nine Months Ended September 30, |
Last Twelve Months Ended September 30, |
||||||||||||||||||
| ($ thousands) | 2023 | 2024 | 2024 | 2025 | 2025 | |||||||||||||||
| Commercial material revenue |
$ | — | $ | — | $ | — | $ | 13,331 | $ | 13,331 | ||||||||||
| Collaboration revenue |
43,947 | 36,133 | 26,993 | 33,843 | 42,983 | |||||||||||||||
| Royalty revenue |
— | — | — | 292 | 292 | |||||||||||||||
|
|
|
|
|
|
|
|
|
|
|
|||||||||||
| Total revenue |
$ | 43,947 | $ | 36,133 | $ | 26,993 | $ | 47,466 | $ | 56,606 | ||||||||||
|
|
|
|
|
|
|
|
|
|
|
|||||||||||
| Operating expenses: |
||||||||||||||||||||
| Research and development |
140,658 | 225,368 | 150,942 | 254,059 | 328,485 | |||||||||||||||
| General and administrative |
59,836 | 82,832 | 59,466 | 75,975 | 99,341 | |||||||||||||||
|
|
|
|
|
|
|
|
|
|
|
|||||||||||
| Total operating expenses |
$ | 200,494 | $ | 308,200 | $ | 210,408 | $ | 330,034 | $ | 427,826 | ||||||||||
|
|
|
|
|
|
|
|
|
|
|
|||||||||||
| Operating loss |
$ | (156,547 | ) | $ | (272,067 | ) | $ | (183,415 | ) | $ | (282,568 | ) | $ | (371,220 | ) | |||||
|
|
|
|
|
|
|
|
|
|
|
|||||||||||
| Other income (loss), net: |
||||||||||||||||||||
| Interest income, net |
14,510 | 30,789 | 22,301 | 23,152 | 31,640 | |||||||||||||||
| Foreign exchange (losses) gains, net |
(9,710 | ) | 34,103 | (16,897 | ) | (78,342 | ) | (27,342 | ) | |||||||||||
| Other (losses) gains, net |
— | — | — | (2,912 | ) | (2,912 | ) | |||||||||||||
|
|
|
|
|
|
|
|
|
|
|
|||||||||||
| Total other income (loss), net |
$ | 4,800 | $ | 64,892 | $ | 5,404 | $ | (58,102 | ) | $ | 1,386 | |||||||||
|
|
|
|
|
|
|
|
|
|
|
|||||||||||
| Loss before income tax expense |
$ | (151,747 | ) | $ | (207,175 | ) | $ | (178,011 | ) | $ | (340,670 | ) | $ | (369,834 | ) | |||||
|
|
|
|
|
|
|
|
|
|
|
|||||||||||
| Income tax expense |
3,192 | 8,151 | 6,392 | 9,542 | 11,301 | |||||||||||||||
|
|
|
|
|
|
|
|
|
|
|
|||||||||||
| Net loss |
$ | (154,939 | ) | $ | (215,326 | ) | $ | (184,403 | ) | $ | (350,212 | ) | $ | (381,135 | ) | |||||
|
|
|
|
|
|
|
|
|
|
|
|||||||||||
Select Consolidated Balance Sheet Data of Merus
| As of December 31, | As of September 30, | |||||||||||
| ($ thousands) | 2023 | 2024 | 2025 | |||||||||
| Cash and cash equivalents |
$ | 204,246 | $ | 293,294 | $ | 367,491 | ||||||
| Marketable securities |
150,130 | 243,733 | 268,441 | |||||||||
| Total current assets |
368,814 | 569,072 | 691,929 | |||||||||
| Total non-current assets |
86,680 | 213,621 | 212,267 | |||||||||
| Total assets |
455,494 | 782,693 | 904,196 | |||||||||
| Total liabilities |
99,151 | 134,766 | 129,264 | |||||||||
| Total shareholders’ equity |
356,343 | 647,927 | 774,932 | |||||||||
32
Merus Adjusted EBITDA
| Year Ended December 31, | Nine Months Ended September 30, |
Last Twelve Months Ended September 30, |
||||||||||||||||||
| ($ thousands) | 2023 | 2024 | 2024 | 2025 | 2025 | |||||||||||||||
| Adjusted EBITDA(1) |
(127,781 | ) | (223,762 | ) | (151,562 | ) | (224,566 | ) | (296,766 | ) | ||||||||||
| (1) | Merus does not report Adjusted EBITDA in its public disclosures and it is calculated differently than Adjusted EBITDA of Genmab. Genmab is presenting this measure using U.S. GAAP measures reported in Merus’ public disclosures and based on corresponding adjustments that Genmab applies to its own Adjusted EBITDA. We present Adjusted EBITDA because we believe that it is widely used by investors as a supplemental measure of performance. We believe that Adjusted EBITDA provides useful information to investors about Merus’ results of operations because it allows a comparison of Merus’ results across periods on a consistent basis by removing the effects on Merus’ operating performance of its asset base and capital investment cycle (such as depreciation and amortization) and items largely outside the control of management (such as income taxes). We calculate Merus Adjusted EBITDA as net loss for the period as adjusted for income tax expense, depreciation of property and equipment, amortization of intangible assets, share-based compensation expense and total other income (loss), net. Adjusted EBITDA is not an accounting measure presented in accordance with U.S. GAAP and therefore should not be considered in isolation or as a substitute for measures of Merus’ operating performance presented in accordance with U.S. GAAP. For a description of the limitations of Adjusted EBITDA, see “Presentation of Financial and Other Information—Use of Non-IFRS and Non-GAAP Financial Information.” The following table reconciles Merus’ net loss to Adjusted EBITDA for the periods indicated below: |
| Year Ended December 31, |
Nine Months Ended September 30, |
Last Twelve Months Ended September 30, |
||||||||||||||||||
| ($ thousands) | 2023 | 2024 | 2024 | 2025 | 2025 | |||||||||||||||
| Net loss |
$ | (154,939 | ) | $ | (215,326 | ) | $ | (184,403 | ) | $ | (350,212 | ) | $ | (381,135 | ) | |||||
| Plus: Income tax expense |
3,192 | 8,151 | 6,392 | 9,542 | 11,301 | |||||||||||||||
| Plus: Depreciation of property and equipment |
2,325 | 2,294 | 1,749 | 1,720 | 2,265 | |||||||||||||||
| Plus: Amortization of intangible assets |
215 | 177 | 133 | 139 | 183 | |||||||||||||||
| Plus: Share-based compensation expense |
26,226 | 45,834 | 29,971 | 56,143 | 72,006 | |||||||||||||||
| Plus/(Less): Total other income (loss), net(1) |
(4,800 | ) | (64,892 | ) | (5,404 | ) | 58,102 | (1,386 | ) | |||||||||||
|
|
|
|
|
|
|
|
|
|
|
|||||||||||
| Adjusted EBITDA |
$ | (127,781 | ) | $ | (223,762 | ) | $ | (151,562 | ) | $ | (224,566 | ) | $ | (296,766 | ) | |||||
|
|
|
|
|
|
|
|
|
|
|
|||||||||||
| (1) | Total other income (loss), net includes net interest income and foreign exchange loss. |
33
Risks Related to the Acquisition
The pending Acquisition may not be completed on the currently contemplated timeline or terms, or at all.
The consummation of the Acquisition is subject to the satisfaction or waiver of certain conditions. Satisfaction of a number of the conditions is not within our control, and it is possible that such conditions may prevent or delay or otherwise materially adversely affect our ability to complete the Acquisition. These conditions include (i) the expiration or termination of the relevant waiting period (as it may be extended) under the Hart-Scott-Rodino Antitrust Improvements Act of 1976 and the rules and regulations promulgated thereunder, (ii) a ‘no further questions’ response following submission of a briefing paper to the UK Competition and Markets Authority (the “UK CMA”), if this is the most recent response from the UK CMA as at the date all other conditions to the Offer are satisfied or, alternatively, clearance from the UK CMA following the submission of a notice to the CMA in the prescribed form as contemplated by Section 96 of the Enterprise Act 2002 in relation to the Offer, (iii) the valid tendering of a sufficient number of Merus common shares and (iv) adoption of resolutions by shareholders of Merus at an extraordinary meeting convened for the purpose of approving certain transactions related to the Offer, including the Back-End Transactions. Neither we nor Merus can provide assurance that the conditions to completing the Acquisition will be satisfied or waived, and accordingly, that the Acquisition will be completed on the timeline that the parties anticipate or at all. If any condition to the Acquisition is not satisfied, it could delay or prevent the Acquisition from occurring, which could negatively impact us and our growth prospects.
63
We may not realize the anticipated benefits from the pending Acquisition.
The Acquisition involves the combination of two companies that currently operate as independent companies. While we and Merus will continue to operate independently until the Acquisition Closing Date, the success of the Acquisition will depend, in part, on our ability to realize the anticipated benefits from successfully combining our and Merus’ businesses after closing. We plan on devoting substantial management attention and resources to integrating our and Merus’ businesses so that we can fully realize the anticipated benefits of the Acquisition. Nonetheless, the acquired Merus business, including petosemtamab, may not be successful, may require greater resources and investments than originally anticipated or may result in the assumption of unknown or contingent liabilities, which could have an adverse effect on us or our results of operations.
Potential difficulties we may encounter following closing include the following:
| • | the inability to successfully combine our and Merus’ businesses in a manner that permits us to realize the anticipated benefits of the Acquisition in the timeframe currently anticipated, or at all; |
| • | the failure to integrate internal systems, programs and internal controls, or applying different accounting policies, assumptions or judgments to Merus’ operational results than Merus applied in the past; |
| • | effectively and efficiently integrating information technology and other systems; |
| • | issues not discovered as part of the transactional due diligence process or unanticipated liabilities or contingencies of Merus, including employment or severance-related obligations under applicable law or other benefits arrangements, claims by or amounts owed to vendors or other commercial disputes, cyber incidents and information technology failures or delays, matters related to data privacy, data localization and the handling of personally identifiable information, and other unknown or contingent liabilities; |
| • | preserving the important licensing, marketing, and other commercial relationships of Merus; |
| • | the complexities associated with managing the combined company; |
| • | the failure to retain key employees of either of the two companies who may be difficult to replace; |
| • | the disruption of each company’s ongoing businesses or inconsistencies in services, standards, controls, procedures and policies; |
| • | potential unknown liabilities and unforeseen increased expenses, delays or regulatory conditions associated with the Acquisition; and |
| • | performance shortfalls at one or both of the two companies as a result of the diversion of management’s attention caused by completing the Acquisition and integrating our and Merus’ operations. |
Any of these risks could adversely affect our ability to maintain relationships with collaboration partners, vendors, employees and other commercial relationships or adversely affect our or Merus’ future operational results. As a result, the anticipated benefits of the Acquisition may not be realized or at all or may take longer to realize or cost more than expected, which could adversely affect our business, financial condition, results of operations and growth prospects. In addition, changes in laws and regulations could adversely impact our business, financial condition, results of operations and growth prospects after the Acquisition.
The pendency of the Acquisition could adversely affect our and/or Merus’ businesses and operations.
In connection with the pending Acquisition, some collaboration partners, vendors or other parties with commercial relationships with either of us or Merus may delay or defer decisions, which could adversely affect the revenues, earnings, cash flows and expenses of us or Merus, regardless of whether the Acquisition is completed.
64
In addition, due to operating covenants in the Transaction Agreement, Merus may be unable (without our prior written consent), during the pendency of the Acquisition, to pursue strategic transactions, undertake significant capital projects or otherwise pursue other actions outside the ordinary course, even if such actions would prove beneficial.
We expect to incur material expenses related to the Acquisition.
We expect to incur material expenses in connection with the Acquisition and the subsequent integration of the business, operations, practices, policies and procedures of Merus. These additional expenses could have an adverse effect on us or our results of operations. While we have assumed that a certain level of transaction and integration expenses would be incurred, there are a number of factors beyond our control that could affect the total amount or the timing of integration expenses. Many of the expenses that will be incurred, by their nature, are difficult to estimate accurately at the present time.
The Transaction Agreement and related documents may be amended or modified without your consent.
Between the time of the issuance of the notes and the consummation of the Acquisition, the parties to the Transaction Agreement may agree to modify or waive the terms or conditions of such documents without noteholder consent. The terms of the notes will not preclude the parties to the Transaction Agreement from making certain changes to the terms of the Acquisition or from waiving certain conditions to the Acquisition, which may adversely affect your investment in the notes.
Genmab’s ability to realize the anticipated benefits of the Acquisition will depend on its ability to effectively conduct clinical development of, obtain regulatory approvals for, and profitably commercialize, petosemtamab.
We may fail to realize the anticipated benefits of the Acquisition if we are unable to successfully develop, obtain regulatory approval for, and commercialize petosemtamab on the currently anticipated timeline, for all of the currently anticipated therapeutic indications, or at all.
While petosemtamab delivered positive data in certain HNSCC indications in prior Phase I/II trials, there is no assurance that the currently ongoing Phase III trials will ultimately demonstrate the efficacy of petosemtamab in those indications at a level that will be sufficient to obtain regulatory approval. A number of companies in the pharmaceutical, biopharmaceutical and biotechnology industries have suffered significant setbacks in advanced clinical trials even after obtaining promising results in earlier trials, and we cannot be certain that we will not face similar setbacks with petosemtamab.
In addition, while petosemtamab has received BTD from the FDA with respect to two HNSCC indications, this designation does not assure ultimate approval by the FDA. BTD is a process designed to expedite the development and review of drugs that are intended to treat a serious condition and preliminary clinical evidence indicates that the drug may demonstrate substantial improvement over available therapy on a clinically significant endpoint. Drugs that receive BTD are eligible for certain procedural benefits as part of the FDA review process, including more frequent meetings with FDA staff to discuss the drug’s development plan and ensure collection of appropriate data needed to support drug approval, more frequent written communication from FDA staff, rolling review of BLA or NDA submissions, intensive guidance on an efficient drug development program, and organizational commitment involving senior managers. BTD does not, however, change the scientific and medical standard for approval or the quality of evidence necessary to support approval. As a result, applications for product candidates granted expedited review or BTD designation may be ultimately denied based on trial data, trial design or other factors.
Furthermore, even though the available data from petosemtamab Phase I/II trials in certain HNSCC indications may seem stronger in certain respects than data for certain alternative therapies, there is no completed head-to-head trial that actually compared the safety and efficacy of petosemtamab with any alternative therapy as part of the same investigational setting.
65
Separate clinical trials for alternative therapies may differ in trial design and duration, patient population, treatment protocols and investigators and other important factors, making it difficult to compare data across trials or to draw reliable conclusions from such cross-trial comparisons. It is possible that petosemtamab may turn out not to be superior to alternative therapies in the currently ongoing Phase III trials in HNSCC.
Even if we can successfully progress the clinical development of petosemtamab and obtain the anticipated marketing approvals, we may not be able to commercialize it on the currently anticipated timeline or at all, or to realize its expected revenue potential. For more information about the risks involved in clinical development, regulatory approval and commercialization of new products generally, please see “—Risks Related to Product Development.” Our ability to realize petosemtamab’s potential is also subject to all of the other risks affecting our business described in this “Risk Factors” section.
Genmab’s and Merus’ actual financial positions and results of operations may differ materially from the unaudited pro forma condensed combined financial information included in this offering memorandum.
The unaudited pro forma condensed combined financial information contained in this offering memorandum is presented for illustrative purposes only and may differ materially from what Genmab’s actual financial position or results of operations would have been had the Acquisition been completed on the dates indicated. The unaudited pro forma condensed combined financial information has been derived from the audited and unaudited historical financial statements of Genmab and Merus and certain adjustments and assumptions have been made regarding the combined company after giving effect to the Transactions. The assets and liabilities of Merus have been measured at fair value based on various preliminary estimates using assumptions that Genmab management believes are reasonable utilizing information currently available. The process for estimating the fair value of acquired assets and assumed liabilities requires the use of judgment in determining the appropriate assumptions and estimates. These estimates may be revised as additional information becomes available and as additional analyses are performed. Differences between preliminary estimates in the unaudited pro forma condensed combined financial information and the final acquisition accounting will occur and could have a material impact on the unaudited pro forma condensed combined financial information and the combined company’s financial position and future results of operations.
In addition, the assumptions used in preparing the unaudited pro forma condensed combined financial information may not prove to be accurate, and other factors may affect Genmab’s financial condition or results of operations following the completion of the Acquisition. Furthermore, while Genmab’s financial statements are prepared in accordance with IFRS, Merus’ financial statements have historically been prepared in accordance with U.S. GAAP. We have provided adjustments to present these reported results on a basis consistent with Genmab’s accounting policies under IFRS; however, there may be additional differences in the accounting standards that were not captured in such adjustments which would have altered the results.
66
CAPITALIZATION
The following table sets forth our cash and cash equivalents and marketable securities and capitalization as of September 30, 2025 on (i) an actual basis and (ii) on an as adjusted basis after giving effect to the Transactions. The information in this table should be read in conjunction with “Use of Proceeds,” “Unaudited Pro Forma Condensed Combined Financial Information” and “Management’s Discussion and Analysis of Financial Condition and Results of Operations,” as well as the historical consolidated financial statements included in this offering memorandum. For purposes of this presentation, the as adjusted debt amounts are presented at their full principal amounts, without giving effect to any capitalization of debt issuance costs under IFRS.
| As of September 30, 2025 | ||||||||
| Actual | As Adjusted | |||||||
| ($ in millions) | ||||||||
| Cash and cash equivalents and marketable securities(1) |
$ | 3,411 | $ | 1,153 | ||||
|
|
|
|
|
|||||
| Total long-term debt: |
||||||||
| New Revolving Facility(2) |
— | — | ||||||
| Existing Revolving Facility(3) |
— | — | ||||||
| Term Loan A Facility(4) |
— | 1,000 | ||||||
| Term Loan B Facility(4) |
— | 2,000 | ||||||
| Secured Notes offered hereby(5) |
— | 1,500 | ||||||
| Unsecured Notes offered hereby(5) |
— | 1,000 | ||||||
|
|
|
|
|
|||||
| Total long-term debt, including current portion |
— | 5,500 | ||||||
| Total shareholders’ equity |
5,751 | 5,751 | ||||||
|
|
|
|
|
|||||
| Total capitalization |
$ | 5,751 | $ | 11,251 | ||||
|
|
|
|
|
|||||
| (1) | Approximately $2,895 million of cash and cash equivalents and marketable securities is expected to be used as a source of funds in connection with the Acquisition. The actual amount of cash and cash equivalents and marketable securities that will be used as a source of funds in connection with the Acquisition will vary depending on, among other things, our cash balance on the Acquisition Closing Date, transaction fees and expenses and the Acquisition Closing Date. The as adjusted column reflects Merus cash and cash equivalents and marketable securities of $637 million as of September 30, 2025 as presented under IFRS, which involved a reclassification of $181 million of Merus non-current marketable securities under U.S. GAAP to other investments under IFRS. See Note 2 in “Unaudited Pro Forma Condensed Combined Financial Information” for further information. Assumes the Notes are issued at par. |
| (2) | The New Revolving Facility is expected to provide for commitments for $500 million of revolving borrowings, which would constitute secured indebtedness when drawn. The Issuers expect the New Revolving Facility to be undrawn at the closing of the Acquisition. See “Description of Certain Other Indebtedness.” |
| (3) | Our Existing Credit Agreement provides for $300 million in commitments of revolving borrowings. As of September 30, 2025, there were $0 million in borrowings under our Existing Credit Agreement. We expect to terminate the existing revolving credit facility prior to or concurrently with the closing of the Acquisition. See “Description of Certain Other Indebtedness.” |
| (4) | Concurrently with the closing of the Acquisition, the Issuers expect to enter into the Term Loan A Facility and the Term Loan B Facility, as further described in “Summary—The Transactions—Financing Transactions”, each of which will be fully drawn at the closing of the Acquisition. “Description of Certain Other Indebtedness.” |
| (5) | Assumes the Notes are issued at par. |
90
MANAGEMENT’S DISCUSSION AND ANALYSIS OF FINANCIAL CONDITION AND RESULTS OF OPERATIONS
The following discussion and analysis of Genmab’s financial condition and results of operations covers periods prior to the consummation of the Acquisition, except for the subsections “Acquisition of Merus,” “Key Components of Our Results and Related Trends—Impact of the Acquisition of Merus” and “Liquidity and Capital Resources—Liquidity and Capital Resources Following the Acquisition”. Accordingly, the discussion and analysis of historical periods do not reflect the impact that the Acquisition will have on us. You should read the following discussion of Genmab’s financial condition and results of operations in conjunction with the Genmab Consolidated Financial Statements and the Genmab Unaudited Interim Condensed Consolidated Financial Statements included in this offering memorandum. This discussion contains forward-looking statements and involves numerous risks and uncertainties, including, but not limited to, those described in the “Forward-Looking Statements” ands “Risk Factors” sections of this offering memorandum. Actual results may differ materially from those contained in any forward-looking statements. Unless otherwise indicated or the context otherwise requires, references in this management’s discussion and analysis of financial condition and results of operations to “we,” “us,” “our,” “Genmab” and the “Company” refer to Genmab and its consolidated subsidiaries over which Genmab has control before giving effect to the consummation of the Acquisition.
Overview
Genmab is an international biotechnology company with a core purpose of improving the lives of patients with innovative and differentiated antibody therapeutics. For more than 25 years, its passionate, innovative and collaborative team has invented next-generation antibody technology platforms and leveraged translational, quantitative and data sciences, resulting in a proprietary pipeline including bispecific T-cell engagers, antibody-drug conjugates, next-generation immune checkpoint modulators and effector function-enhanced antibodies. Genmab’s antibody technology platforms have given rise to eight commercialised products and a pipeline of novel antibody-based products and product candidates designed to address medical needs and improve treatment outcomes for patients with cancer and other serious diseases. Our pipeline includes both wholly owned and partnered programs, with several compounds in late-stage clinical development. Our goal in building our pipeline is to bring medicines to market ourselves in geographic areas where we believe we will be able to maximize their value. By 2030, our vision is to transform the lives of people with cancer and other serious diseases with knock-your-socks-off antibody medicines®.
Since Genmab’s founding in 1999 we have been dedicated to creating innovative and differentiated antibody therapeutics, initially as a R&D innovation powerhouse out-licensing novel candidates to large cap pharma partners, including Janssen, Roche, GSK and Novo Nordisk, for upfront, milestone and royalty payments. Early partnerships yielded six FDA-approved, commercialized, royalty-bearing products: DARZALEX, Kesimpta, TEPEZZA, RYBREVANT, TALVEY, and TECVAYLI. In full-year 2024, these products generated approximately $18 billion in aggregate partner net sales, providing a strong, recurring royalty revenue foundation for Genmab. Given the constantly evolving oncology landscape, our antibody platforms and our expertise and know-how in antibody development, we have shifted our model into a fully integrated biotech company through commercialization and co-commercialization of proprietary products such as EPKINLY and Tivdak in certain geographies, allowing Genmab to retain a greater share of the economic potential of these products. We are focused on the development of our proprietary, wholly owned pipeline, including through high potential growth opportunities such as our acquisition of ProfoundBio in 2024 and the Acquisition, which has resulted in a significant portfolio that incorporates the next wave of innovation in oncology indications with high medical needs.
Our current priorities are the commercial or late-stage programs epcoritamab and wholly owned Rina-S and acasunlimab. Epcoritamab, marketed as EPKINLY in the U.S. and Japan and as TEPKINLY outside of those territories, is being developed and commercialized in collaboration with AbbVie.
109
Epcoritamab is the only bispecific antibody approved with a dual indication for the treatment of certain B-cell malignancies in the U.S., Europe and Japan. Rina-S entered Phase III clinical development for PROC in 2024 and EC in 2025, and acasunlimab entered Phase III clinical development for NSCLC in 2024.
The table below summarizes key data points on our six approved royalty products and our two approved proprietary products, respectively.
| (1) | To the extent available and reported; RYBREVANT®, TECVAYLI® and TALVEY® are not owned products. |
| (2) | Remaining 10% of revenue attributable to milestones and reimbursements and licensing. |
| (3) | Source: For DARZALEX® and TECVAYLI® 2024 sales, J&J FY 2024 financial results; for KESIMPTA® 2024 sales, Novartis FY 2024 financial results; for TEPEZZA® 2024 sales, Amgen FY 2024 results; for TIVDAK® and EPKINLY® 2024 sales, GMAB FY 2024 presentation. |
| (4) | Exclusivity protection provided by Genmab patents (exp. 2031) and Novartis owned patents (exp. 2037). Royalties continue to be paid on all sales after patent expirations. |
| (5) | Co-commercialization collaboration. |
| (6) | U.S., European and Japanese patents for EPKINLY® and TIVDAK® do not begin to expire until the dates shown, however requests for patent term extensions have been filed for both which, if approved, would provide protection beyond the displayed end dates. |
| (7) | Includes $253M in EPKINLY® net product sales and $7M in TEPKINLY® royalties. |
Innovation and Proprietary Technology Platform
Our portfolio includes five proprietary antibody technology platforms: (i) our DuoBody platform, which can be used for the creation and development of bispecific antibodies; (ii) our HexaBody platform, which can be used to increase the potential potency of antibodies through hexamerization; (iii) our DuoHexaBody platform, which enhances the potential potency of bispecific antibodies through hexamerization; (iv) our HexElect platform, which combines two HexaBody molecules to maximize potential potency while minimizing potential toxicity by more selective binding to desired target cells; and (v) our ADC platforms, acquired through the purchase of ProfoundBio in May 2024. Antibody products created with these technologies may be used in a wide variety of indications including cancer as well as autoimmune, central nervous system and infectious diseases. These platforms play a key role in building our product pipeline, enhancing our collaborations and generating revenue. We selectively enter into collaborations with other biotechnology and pharmaceutical companies that build our network in the biotechnology space and give us access to complementary novel technologies or products that move us closer to achieving our vision and fulfilling our core purpose.
110
Our innovation and proprietary technology platforms are used in the pipelines of global pharmaceutical and biotechnology companies. These companies are running clinical development programs with antibodies created by Genmab or created using Genmab’s proprietary DuoBody bispecific antibody technology platform. The six approved medicines created by Genmab or that incorporate Genmab’s innovation or technology platforms are: daratumumab, marketed by J&J as DARZALEX (IV formulation) and DARZALEX FASPRO or DARZALEX SC (SC formulation), approved in the U.S., Europe, Japan and other territories for the treatment of certain indications of MM and AL amyloidosis; amivantamab, marketed in the U.S., Europe, Japan and other territories by J&J as RYBREVANT for the treatment of certain adult patients with locally-advanced or metastatic NSCLC with EGFR exon 20 insertion mutations; teclistamab, marketed in the U.S., Europe, Japan and other territories by J&J as TECVAYLI for certain indications of MM; talquetamab, marketed in the U.S., Europe, Japan and other territories by J&J as TALVEY for certain indications of MM; SC ofatumumab, marketed in the U.S., Europe, Japan and other territories as Kesimpta by Novartis for the treatment of RMS; and teprotumumab, marketed in the U.S. and Japan as TEPEZZA by Amgen for the treatment of TED. Under the agreements for these products we are entitled to certain royalties based on net sales and potential milestone payments.
For our proprietary commercial products EPKINLY and Tivdak, our commercialization rights and related revenues and expenses vary by jurisdiction as further described below:
| • | EPKINLY collaboration with AbbVie. Genmab shares commercial responsibilities for epcoritamab, marketed as EPKINLY, with AbbVie in the U.S. and Japan, while AbbVie is responsible for global commercialization outside of the U.S. and Japan. We are the principal for net sales of epcoritamab in the U.S. and Japan and receive tiered royalties on remaining global sales outside these territories. We are entitled to tiered royalties between 22% and 26% on net sales for epcoritamab outside the U.S. and Japan, subject to certain royalty reductions. Except for these royalty-bearing sales, we share with AbbVie profits from the sale of epcoritamab on a 50:50 basis. We and AbbVie split 50:50 the development costs related to epcoritamab, while we will be responsible for 100% of the costs for the discovery research programs up to the stage at which AbbVie elects whether to participate in co-development and co-commercialization of a compound or licensed product. |
| • | Tivdak collaboration with Pfizer. Genmab is co-promoting tisotumab vedotin, marketed as Tivdak, in the U.S. with Pfizer, with Pfizer recording U.S. sales and Genmab receiving a 50% share of profit on such sales. Genmab is co-promoting tisotumab vedotin, marketed as Tivdak, in the U.S., and we lead commercial operational activities and record sales in Japan, where the product has been approved. Effective January 1, 2025, Genmab and Pfizer agreed to amend the Pfizer License and Collaboration Agreement (as defined herein) and the Tivdak Joint Commercialization Agreement (as defined herein), assigning Genmab sole responsibility for the development and commercialization of Tivdak for second line plus recurrent or metastatic cervical cancer in Europe and all other regions globally, excluding the U.S. and the China region. Pfizer will lead operational commercial activities in China, if and when approved in connection with the sublicense of its right to develop and commercialize Tivdak in China to Zai Lab, with a 50:50 profit split. |
Our results of operations have been, and we expect them to continue to be, affected by our collaboration with J&J for the development and commercialization of daratumumab. Since inception, we have funded our operating requirements primarily through proceeds from equity financing and milestone payments and royalties from our collaboration partners. We expect to continue to fund a significant portion of our development expenses for our proprietary product candidates as well as our planned commercialization activities with funds received from royalties and milestone payments from our collaboration partners.
For a description of certain of our product and technology collaborations including relevant royalty tiers, milestones and expense sharing provisions, please refer to “Business of Genmab—Product and Technology Collaborations”.
111
Acquisition of Merus
We announced the proposed Acquisition of Merus on September 29, 2025. Following the Back-End Closing Date, Merus will become our wholly owned subsidiary. The Acquisition, if consummated, will give us worldwide rights to Merus’ approved product, BIZENGRI (zenocutuzumab), as well as to its candidates in clinical development, including its lead product candidate, petosemtamab. In addition, we will acquire Merus’ Biclonics and Triclonics technology platforms. Petosemtamab is an investigational antibody-dependent cell-mediated cytotoxicity (ADCC)-enhanced Biclonics® for the potential treatment of solid tumors that is designed to bind to cancer stem cells expressing EGFR and LGR5.
We intend to continue the clinical development of petosemtamab in the LiGeR-HN1 Phase III clinical trial for the treatment of 1L PD-L1+ r/m HNSCC with pembrolizumab; the LiGeR-HN2 Phase III clinical trial for the treatment of 2/3L r/m HNSCC and the ongoing Phase I/II clinical trial in mCRC. We also intend to commence a Phase III clinical trial of petosemtamab in locally advanced HNSCC.
The FDA granted petosemtamab BTD in combination with pembrolizumab for the first-line treatment of adult patients with r/m PD-L1 positive HNSCC with CPS ≥ 1 in February 2025, and for the treatment of patients with r/m HNSCC whose disease has progressed following treatment with platinum based chemotherapy and an anti-PD-1 or anti-PD-L1 antibody. This designation followed receipt of FTD for petosemtamab for the treatment of patients with r/m HNSCC whose disease has progressed following treatment with platinum-based chemotherapy and an anti-programmed cell death protein 1 antibody announced in August 2023.
See “Summary—The Transactions—The Acquisition” for more information about the Acquisition, and “Business of Merus” for more information about Merus and petosemtamab.
Acquisition of ProfoundBio Inc.
On May 21, 2024, we completed the acquisition of all of the outstanding shares of ProfoundBio, resulting in ProfoundBio becoming a wholly owned subsidiary of Genmab. The acquisition of ProfoundBio gave us worldwide rights to three candidates in clinical development, including ProfoundBio’s lead drug candidate, Rina-S. In addition, we acquired ProfoundBio’s novel ADC technology platforms. Rina-S is a clinical-stage, FRa-targeted, TOPO1 ADC, currently in a Phase III clinical trial for the treatment of PROC. Based on the data from the ongoing Phase I/II clinical trial we intend to continue to broaden the development plans for Rina-S within ovarian cancer and other FRa-expressing solid tumors. In January 2024, the U.S. FDA granted FTD to Rina-S for the treatment of patients with FRa-expressing high-grade serous or endometrioid platinum-resistant ovarian cancer. In August 2025, the FDA granted BTD to Rina-S for the treatment of adult patients with recurrent or progressive endometrial cancer who have disease progression on or following prior treatment with a platinum-containing regimen and a PD-L1 therapy. A Phase III trial in endometrial cancer, RAINFOL-03, has been initiated.
See Note 5.5 in the Genmab Consolidated Financial Statements and Note 2 to the Genmab Unaudited Interim Condensed Consolidated Financial Statements included in this offering memorandum for additional details regarding our acquisition of ProfoundBio.
Key Components of Our Results and Related Trends
Impact of the Acquisition of Merus
We expect that, after consummation of the Acquisition, our research and development expenses, as well as our selling, general and administrative expenses, will increase in the short to medium term as compared to our own recent historical levels, and as compared to such historical expenses pro forma for the Acquisition as presented in our unaudited pro forma financial statements included elsewhere in this offering memorandum. We expect an increase in these expenses primarily as a result of our planned development and commercialization activities for petosemtamab.
112
Following the Acquisition, we intend to expand Merus’ current development plan for petosemtamab in additional HNSCC settings and other potential tumor types. Such expanded development will involve increased research and development and selling, general and administrative expenses as we support related manufacturing, clinical trial activities, and commercialization activities. See “—Liquidity and Capital Resources—Liquidity.”
While we expect to record additional royalty revenues following the Acquisition because we will acquire zenocutuzumab from Merus, we do not expect such revenues to be material. Considering the costs of development of petosemtamab and other Merus product candidates, we expect to maintain positive operating earnings and positive cash flow generation driven by our royalty business and proprietary products.
In addition, we recorded acquisition-related costs in the nine months ended September 30, 2025 and expect to record acquisition-related costs in the year ending December 31, 2025 related to the Acquisition. We also expect to record integration-related charges related to the Acquisition in the years ending December 31, 2025 and December 31, 2026. Such acquisition and integration-related charges may be significant.
Revenues
Our revenues are currently comprised of royalties, milestone revenue, reimbursement revenue, collaboration revenue, license fees, and net product sales. Royalty revenue from licenses is based on third-party sales of licensed products. Milestone revenue is typically related to reaching particular stages in product development, regulatory approval or a certain level of net sales. Reimbursement revenue is mainly comprised of the reimbursement of certain research and development expenses related to the development work under our collaboration agreements. Collaboration revenue reflects profit sharing arrangements for the sale of commercial products by our collaboration partners. License fees are non-refundable, upfront fees for our intellectual property received from our collaboration partners. Net product sales represent sales of products when Genmab is determined to be the principal in sales to the end customers.
The majority of our revenue is recognized from our collaboration partners under our collaboration agreements. In particular, our ability to generate revenue significantly depends on the success of J&J’s continued ability to effectively maintain and grow sales of DARZALEX for its approved indications, expand its indications, and successfully compete with existing and potential new investigational agents and technologies that are currently being marketed or studied for the same indications as DARZALEX. In addition, the royalties payable by J&J are limited in time. Pursuant to the terms of the agreement, J&J’s obligation to pay royalties to us will expire on a country-by-country basis on the later of the date that is 13 years after the first sale of daratumumab in such country or upon the expiration or invalidation of the last-to-expire relevant Genmab patent covering daratumumab in such country. The first U.S., European and Japanese sales of daratumumab occurred in 2015, 2016 and 2017, respectively. We have issued patents and pending patent applications covering daratumumab in numerous jurisdictions, including patents issued in the U.S., Europe and Japan. J&J owns a separate patent portfolio related to the subcutaneous formulation of daratumumab used in DARZALEX FASPRO/DARZALEX SC, but a binding arbitration determined that we are not entitled to royalties based on these separate patents. Our issued U.S., European and Japanese patents covering daratumumab, after giving effect to issued U.S., European and Japanese PTEs and SPCs, expire in 2029, 2031 and begin to expire in 2030, respectively. Assuming constant underlying sales of DARZALEX, we expect that our royalties from sales of DARZALEX will begin to decline materially in 2029 following expiration of our U.S. patent rights on daratumumab. We have also received, and in the future may from time to time receive, revenues from milestones and other payments relating to our collaborations.
In addition to revenue recognized from our collaboration partners, we also record revenue for sales of our proprietary commercial products. Epcoritamab was approved by the FDA and Japan MHLW in May 2023 and September 2023, respectively, and is marketed in the U.S. and Japan under the tradename EPKINLY. Our net product sales are currently almost exclusively derived from EPKINLY.
113
Tisotumab vedotin was approved by the FDA in September 2021, and is currently marketed in the U.S. as Tivdak. Pfizer records net product sales in the U.S. and shares 50% of the profit of such sales with us, and we record this profit share as collaboration revenue. Our ability to generate revenue from our proprietary commercial products, including EPKINLY and Tivdak, depends on the commercial potential of such products as well as our ability to successfully commercialize them.
Our ability to generate revenue from our proprietary and partnered product candidates depends on our and our collaboration partners’ ability to successfully complete clinical trials for our product candidates receive regulatory approvals, and effectively commercialize, all of which could impact the commercial potential of such products and our potential to receive milestone payments, royalties, net sales and other revenues for these products in the future.
For more information on our revenues, including for the breakdown of our revenues by type, collaboration partner and product, see Note 2.1 of the Genmab Consolidated Financial Statements and Note 3 of the Genmab Unaudited Interim Condensed Consolidated Financial Statements included in this offering memorandum.
Cost of Product Sales
Cost of product sales includes direct and indirect costs relating to the manufacture of inventory mainly from third-party providers of manufacturing as well as costs related to internal resources and distribution and logistics. Cost of product sales also includes product costs, royalty expense and profit-sharing amounts owed to collaboration partners for the sale of commercial products when Genmab is determined to be the principal in sales to end customers. For the year ended December 31, 2024 and the nine months ended September 30, 2025, the only profit-sharing amounts recorded as cost of product sales relate to 50:50 sharing of sales and related cost of product sales of EPKINLY in the U.S. and Japan pursuant to the collaboration agreement with AbbVie.
Research and Development Expenses
We are currently advancing our proprietary product candidates through clinical development and are conducting pre-clinical trials with respect to other programs. Developing product candidates is expensive, time-intensive and risky, and we expect our research and development expenses to increase over the next few years, particularly as we seek to advance our proprietary product candidates toward commercialization. Our research and development expenses include internal costs relating to our research and development departments, as well as external costs relating to trials performed by external suppliers and collaboration partners. Internal research and development expenses consist primarily of salaries and benefits for our research and development staff and related expenses, including expenses related to cash bonuses, warrant and restricted stock unit (“RSU”) programs as applicable to such personnel, costs of related facilities, equipment and other overhead expenses that have been determined to be directly attributable to research and development, costs associated with obtaining and maintaining patents for intellectual property, amortization of licenses and rights, amortization and impairment of intangible assets and depreciation and impairment of property and capital assets used to develop our product candidates.
Major components of the external costs are fees and other costs paid to CROs in conjunction with preclinical trials and the performance of clinical trials, milestone payments for in-licensed technology, as well as fees paid to CMOs in conjunction with the production of clinical compounds, drug substances and drugs. This includes (i) antibody clinical material for use in clinical trials and (ii) preparation for production of process validation batches for potential future regulatory submissions and related activities. These costs are expensed as incurred, because they do not qualify to be capitalized as inventory under IFRS Accounting Standards since the technical feasibility of the materials is not proven and no alternative use for them exists in the absence of marketing approval. Research and development expenses include amortization of intangible assets only in connection with licenses and rights we have acquired and capitalized. We do not capitalize intellectual property generated through our internal development activities. We expect to incur higher research and development expenses in future periods, including increasing costs for clinical trials and manufacturing as our proprietary product candidates advance in clinical development and we increase the number of product candidates under active clinical development.
114
Our research and development expenses may vary substantially from period to period based on the timing of our research and development activities, including timing due to regulatory approvals and enrollment of patients in clinical trials. See “Liquidity and Capital Resources—Liquidity and Capital Resources Following the Acquisition” below.
Selling, General and Administrative Expenses
Our selling, general and administrative expenses consist primarily of wages and salaries for personnel other than research and development staff. Also included are expenses related to pre-launch commercialization activities, depreciation, amortization and impairment of property and equipment, to the extent such expenses are related to the administrative functions, and co-promotion expenses related to commercial sales of Tivdak in the U.S. in accordance with our Tivdak Joint Commercialization Agreement with Pfizer. Lastly, selling, general and administrative expenses include our 50% share of the aggregate costs incurred by us and AbbVie in relation to sales and commercialization of EPKINLY in the U.S. and Japan. We expect our selling, general and administrative expenses to increase over the next few years as we continue to expand our commercialization capabilities in a number of jurisdictions. Such expenses may also increase over time as a result of inflation and other factors.
Overhead expenses are allocated to research and development expenses or selling, general and administrative expenses based on the number of employees and their relevant functions. The Dutch Research and Development Act (“WBSO”) provides compensation for a part of research and development wages and other costs at our Utrecht facility through a reduction in payroll taxes in the Netherlands. WBSO grant amounts are offset against wages and salaries included in research and development expenses.
Our ongoing research and development and, increasingly, commercialization activities will require substantial amounts of capital and may not ultimately be successful. Over the next several years, we expect that we will continue to incur substantial selling, general and administrative expenses, primarily as a result of activities related to the continued development of our proprietary pipeline and developing our commercial capabilities. Our proprietary product candidates will require significant further development, financial resources and personnel to pursue and obtain regulatory approval and develop them into commercially viable products, if they are approved and commercialized at all. Our commitment of resources to the research and continued development of our product candidates and expansion of our proprietary pipeline will likely result in our selling, general and administrative expenses increasing and/or fluctuating as a result of such activities in future periods. We may also incur significant milestone payment obligations to certain of our licensors as our product candidates progress through clinical trials towards potential commercialization.
Acquisition and Integration Related Charges
In the year ended December 31, 2024, acquisition related charges comprised payments to holders of outstanding ProfoundBio equity awards related to post-combination services. The remaining expenses are integration related charges, which comprise professional fees incurred to assist with the integration of ProfoundBio into our operations post-acquisition. See Note 5.5 in the Genmab Consolidated Financial Statements and Note 2 in the Genmab Unaudited Interim Condensed Consolidated Financial Statements included in this offering memorandum for additional details regarding our acquisition of ProfoundBio.
115
Results of Operations
Results of Operations for the Nine Months Ended September 30, 2025 and 2024
The following table sets forth our results of operations for the periods presented.
| Nine Months Ended September 30, | ||||||||
| ($ million) | 2025 | 2024 | ||||||
| Revenue |
$ | 2,662 | $ | 2,198 | ||||
| Cost of product sales |
(157 | ) | (95 | ) | ||||
| Research and development expenses |
(1,080 | ) | (1,032 | ) | ||||
| Selling, general and administrative expenses |
(418 | ) | (370 | ) | ||||
| Acquisition and integration related charges |
— | (39 | ) | |||||
|
|
|
|
|
|||||
| Total costs and operating expenses |
$ | (1,655 | ) | $ | (1,536 | ) | ||
|
|
|
|
|
|||||
| Operating profit |
$ | 1,007 | $ | 662 | ||||
|
|
|
|
|
|||||
| Financial income |
312 | 328 | ||||||
| Financial expenses |
(170 | ) | (181 | ) | ||||
|
|
|
|
|
|||||
| Net profit before tax |
$ | 1,149 | $ | 809 | ||||
|
|
|
|
|
|||||
| Corporate tax |
(217 | ) | (228 | ) | ||||
|
|
|
|
|
|||||
| Net profit |
$ | 932 | $ | 581 | ||||
|
|
|
|
|
|||||
Revenue
Genmab’s revenue was $2,662 million for the nine months ended September 30, 2025 compared to $2,198 million for the same period in 2024. The increase of $464 million, or 21%, was primarily driven by higher DARZALEX and Kesimpta royalties achieved under our collaborations with J&J and Novartis, respectively, and increased EPKINLY net product sales. This increase was partly offset by reduced reimbursement revenue associated with Genmab assuming full control of development, as well as future commercialization, of the acasunlimab program, effective in the second half of 2024.
| Nine Months Ended September 30, | ||||||||||||||||
| ($ million) | 2025 | 2024 | ||||||||||||||
| Royalties |
$ | 2,219 | 83 | % | $ | 1,802 | 82 | % | ||||||||
| Reimbursement Revenue |
43 | 2 | % | 121 | 6 | % | ||||||||||
| Milestone Revenue |
66 | 2 | % | 51 | 2 | % | ||||||||||
| Collaboration Revenue |
54 | 2 | % | 45 | 2 | % | ||||||||||
| Net Product Sales |
280 | 11 | % | 179 | 8 | % | ||||||||||
|
|
|
|
|
|
|
|
|
|||||||||
| Total revenue |
$ | 2,662 | 100 | % | $ | 2,198 | 100 | % | ||||||||
|
|
|
|
|
|
|
|
|
|||||||||
116
Royalty revenue amounted to $2,219 million for the nine months ended September 30, 2025 compared to $1,802 million for the same period in 2024. The increase of $417 million, or 23%, was primarily driven by higher DARZALEX and Kesimpta royalties achieved under our daratumumab collaboration with J&J and ofatumumab collaboration with Novartis. The table below summarizes Genmab’s royalty revenue by product.
| Nine Months Ended September 30, | ||||||||
| ($ million) | 2025 | 2024 | ||||||
| DARZALEX |
$ | 1,744 | $ | 1,442 | ||||
| Kesimpta |
320 | 228 | ||||||
| TEPEZZA |
75 | 78 | ||||||
| Other |
80 | 54 | ||||||
|
|
|
|
|
|||||
| Total royalties |
$ | 2,219 | $ | 1,802 | ||||
|
|
|
|
|
|||||
DARZALEX
J&J’s net sales of DARZALEX were $10,448 million for the nine months ended September 30, 2025 compared to $8,586 million for the same period in 2024. The increase of $1,862 million, or 22%, was driven by market share gains in all regions.
Royalty revenue on net sales of DARZALEX was $1,744 million for the nine months ended September 30, 2025 compared to $1,442 million for the same period in 2024, an increase of $302 million. The percentage increase in royalties of 21% is in line with the percentage increase in the underlying net sales.
Kesimpta
Novartis’ net sales of Kesimpta were $3,198 million for the nine months ended September 30, 2025 compared to $2,274 million for the same period in 2024. The increase of $924 million, or 41%, was primarily driven by increased demand and strong access.
Royalty revenue on net sales of Kesimpta was $320 million for the nine months ended September 30, 2025 compared to $228 million for the same 2024, an increase of $92 million, or 40%, which is in line with the percentage increase in net sales.
TEPEZZA
Amgen’s net sales of TEPEZZA were $1,446 million for the nine months ended September 30, 2025 and $1,391 million for the same period in 2024. Royalty revenue on net sales of TEPEZZA was $75 million for the nine months ended September 30, 2025 compared to $78 million for the same period in 2024, a decrease of $3 million, or 4% which is in line with the slight reduction of net sales.
Other royalties
Other royalties consist of royalties from net sales of RYBREVANT, TECVAYLI, TALVEY and TEPKINLY.
J&J was granted U.S. FDA approval for RYBREVANT during the second quarter of 2021, and Genmab subsequently started recognizing royalties on net sales of RYBREVANT. Royalties were not material for the nine months ended September 30, 2025 or the nine months ended September 30, 2024.
J&J was granted conditional approval for TECVAYLI for the treatment of R/R multiple myeloma during the third quarter of 2022 in Europe and approval in the fourth quarter of 2022 in the U.S. Royalties were not material for the nine months ended September 30, 2025 or the nine months ended September 30, 2024.
117
During the third quarter of 2023, J&J was granted approval in the U.S. and conditional approval in Europe for TALVEY for the treatment of relapsed or refractory multiple myeloma. Royalties were not material for the nine months ended September 30, 2025 or the nine months ended September 30, 2024.
The EC granted conditional marketing authorization for TEPKINLY as a monotherapy for the treatment of adult patients with relapsed or refractory DLBCL after two or more lines of systemic therapy during the third quarter of 2023. Royalties from AbbVie were not material for the nine months ended September 30, 2025 or the nine months ended September 30, 2024.
Royalty revenue fluctuations from period to period are driven by the level of product net sales and more specifically to DARZALEX, the contractual arrangement related to the annual currency hedge rate under our agreement with J&J, at which sales of DARZALEX for non-U.S. dollar denominated currencies are translated to U.S. dollars, Genmab’s share of J&J’s royalty payments to Halozyme in connection with SC product net sales and royalty deductions on net sales in countries and territories where there is no patent protection.
Reimbursement Revenue
Reimbursement revenue, mainly comprised of the reimbursement of certain research and development costs related to the development work under Genmab’s collaboration agreements, amounted to $43 million for the nine months ended September 30, 2025 and $121 million for the same period in 2024. The decrease of $78 million, or 64%, was primarily driven by Genmab assuming full control of development, as well as future commercialization, of the acasunlimab program, effective in the second half of 2024.
Milestone Revenue
Milestone revenue was $66 million for the nine months ended September 30, 2025 compared to $51 million for the same period in 2024, an increase of $15 million, or 29%, primarily driven by the following:
Nine Months Ended September 30, 2025 milestones:
| • | AbbVie milestone of $30 million due to the acceptance for filing of a BLA by the FDA in the third indication of epcoritamab in the U.S. |
| • | Janssen milestones of $10 million due to the BLA approval for Talvey in China and $10 million due to the European Commission’s approval of a new indication of DARZALEX formulation as a monotherapy for the treatment of patients with smoldering multiple myeloma (“SMM”), and |
| • | Novo Nordisk milestone of $13 million due to the filing of a BLA in the U.S. for Mim8. |
Nine Months Ended September 30, 2024 milestones:
| • | AbbVie milestone of $50 million due to the acceptance for filing of a BLA by the FDA in the second indication of epcoritamab in the U.S. |
Milestone revenue may fluctuate significantly from period to period due to both the timing of achievements and the varying amount of each individual milestone under our license and collaboration agreements.
Collaboration Revenue
Collaboration revenue, which reflects 50% of gross profit from net sales of Tivdak in the U.S. by Pfizer, was $54 million for the nine months ended September 30, 2025 compared to $45 million for the same period in 2024. The increase of $9 million, or 20%, primarily driven by an increase in net sales by Pfizer in the U.S. of Tivdak, which was approved in April 2024.
118
Net Product Sales
Genmab’s net product sales include sales of EPKINLY in the U.S. and Japan and Tivdak in Japan and Germany. Global net product sales of EPKINLY/TEPKINLY were $333 million in the first nine months ended September 30, 2025 compared to $203 million for the same period in 2024, an increase of $130 million or 64%, driven by strong growth in 3L+ DLBCL and the expansion to address a second indication, 3L+ FL, which was approved in the U.S. in June 2024. Net product sales of EPKINLY in the U.S. and Japan recorded by Genmab were $272 million in the first nine months of 2025 compared to $179 million in the first nine months of 2024. EPKINLY was approved in the U.S. in May 2023 and in Japan in September 2023.
Net sales of TEPKINLY in territories where Genmab receives royalty revenue were $61 million in the first nine months ended September 30, 2025 compared to $24 million for the same period in 2024.
Net product sales of Tivdak by Genmab were $8 million in the first nine months ended September 30, 2025 with no net product sales for the same period in 2024. Tivdak was approved in Japan in May 2025 and became available for prescribing in Germany in September 2025.
Refer to Note 3 of the Genmab Unaudited Interim Condensed Consolidated Financial Statements included in this offering memorandum for further details about revenue.
Cost of Product Sales
Genmab recognized cost of product sales of $157 million for the nine months ended September 30, 2025 compared to $95 million for the same period in 2024. Cost of product sales includes product costs, royalty expense and profit-sharing amounts payable to AbbVie. The profit-sharing amount paid to AbbVie related to EPKINLY was $128 million for the nine months ended September 30, 2025 compared to $86 million for the same period in 2024.
Research and Development Expenses
Research and development expenses amounted to $1,080 million in the first nine months of 2025 compared to $1,032 million in the first nine months of 2024. The increase of $48 million, or 5%, was driven by the addition of ProfoundBio related research and development expenses, primarily Rina-S, and the increase in team members to support the continued expansion of our product portfolio. The acquisition of ProfoundBio occurred in the second quarter of 2024 and therefore there were minimal ProfoundBio related research and development expenses during the first nine months of 2024. These increases were partly offset by decreased research and development expenses related to Epcoritamab under our collaboration with AbbVie, primarily due to lower chemistry, manufacturing and controls (“CMC”) costs in the first nine months of 2025 compared to the first nine months of 2024.
Research and development expenses accounted for 72% of total research and development expenses & selling, general and administrative expenses in the first nine months of 2025 compared to 74% in the first nine months of 2024.
Selling, General and Administrative Expenses
Selling, general and administrative expenses were $418 million for the nine months ended September 30, 2025 compared to $370 million in the same period in 2024. The increase from the nine months ended September 30, 2024 to the same period in 2025 of $48 million, or 13%, was driven primarily by the expansion of Genmab’s global commercialization capabilities, primarily associated with the expansion of epcoritamab and investment in commercialization related activities related to the anticipated launch of Rina-S.
119
Selling, general and administrative expenses accounted for 28% of total research and development expenses and selling, general and administration expenses for the nine months ended September 30, 2025 compared to 26% in the same period in 2024.
Acquisition and Integration Related Charges
Acquisition and integration related charges for the acquisition of ProfoundBio were $39 million in the first nine months of 2024. There were $0 million acquisition and integration related charges in the first nine months of 2025.
Refer to Note 5.5 of the Genmab Consolidated Financial Statements and Note 2 to the Genmab Unaudited Interim Condensed Consolidated Financial Statements included in this offering memorandum for further details about the acquisition of ProfoundBio.
Operating Profit
Operating profit was $1,007 million for the nine months ended September 30, 2025 compared to $662 million for the same period in 2024, an increase of $345 million, or 52%.
Financial Income and Expense
Financial income and expense was comprised of the following:
| Nine Months Ended September 30, | ||||||||
| ($ million) | 2025 | 2024 | ||||||
| Financial income: |
||||||||
| Interest and other financial income |
$ | 90 | $ | 112 | ||||
| Gain on marketable securities |
87 | 139 | ||||||
| Gain on other investments, net |
— | 5 | ||||||
| Foreign exchange rate gain |
135 | 72 | ||||||
|
|
|
|
|
|||||
| Total financial income |
$ | 312 | $ | 328 | ||||
|
|
|
|
|
|||||
| Financial expenses: |
||||||||
| Interest and other financial expenses |
$ | (17 | ) | $ | (10 | ) | ||
| Loss on marketable securities |
(24 | ) | (131 | ) | ||||
| Loss on other investments, net |
(1 | ) | — | |||||
| Foreign exchange rate loss |
(128 | ) | (40 | ) | ||||
|
|
|
|
|
|||||
| Total financial expenses |
$ | (170 | ) | $ | (181 | ) | ||
|
|
|
|
|
|||||
| Net Financial Items |
$ | 142 | $ | 147 | ||||
Interest and Other Financial Income
Interest and other financial income was $90 million for the nine months ended September 30, 2025 compared to $112 million for the same period in 2024. The decrease of $22 million, or 20%, from the nine months ended September 2024 to the same period in 2025 was primarily driven by lower average cash and cash equivalents and marketable securities as a result of the ProfoundBio acquisition in the second quarter of 2024, as well as lower interest rates on USD denominated marketable securities in the first nine months of 2025 compared to the first nine months of 2024.
120
Foreign Exchange Rate Gains and Losses
Foreign exchange rate gain, net, which excludes foreign exchange rate movements on marketable securities, was $7 million in the first nine months of 2025 compared to foreign exchange rate gain, net of $32 million in the first nine months of 2024. The decrease in foreign exchange rate gain, net is primarily driven by a lower foreign exchange rate impact due to the change in functional currency of Genmab from DKK to USD on January 1, 2025.
Marketable Securities Gains and Losses
Gain on marketable securities, net was $63 million for the nine months ended September 30, 2025 compared to $8 million for the same period in 2024. The increase was primarily driven by the change in the functional currency of Genmab A/S effective January 1, 2025. As the majority of Genmab’s investment portfolio is denominated in U.S. dollars, these securities were adversely affected by the weakening of the USD against the DKK during the first nine months of 2024. In contrast, during the first nine months of 2025, Genmab’s DKK and EUR denominated securities benefited from the strengthening of those currencies against the USD, resulting in a higher overall gain on marketable securities.
Refer to Note 6 of the Genmab Unaudited Interim Condensed Consolidated Financial Statements included in this offering memorandum for further details regarding net financial items.
Corporate Tax
Corporate tax expense was $217 million for the nine months ended September 30, 2025 compared to $228 million for the same period in 2024. The decrease in corporate tax expense is primarily the result of Genmab’s lower estimated annual effective tax rate in the first nine months of 2025 of 18.9% compared to 28.1% in the first nine months of 2024.
Net Profit
Net profit for nine months ended September 30, 2025 was $932 million compared to $581 million for the same period in 2024. The changes in net profit between the periods were driven by the items described above.
Results of Operations for the Year Ended December 31, 2024 and 2023
The following table sets forth our results of operations for the periods presented.
| Year Ended December 31, | ||||||||
| ($ million) | 2024 | 2023 | ||||||
| Revenue |
$ | 3,121 | $ | 2,390 | ||||
| Cost of product sales |
(143 | ) | (33 | ) | ||||
| Research and development expenses |
(1,414 | ) | (1,107 | ) | ||||
| Selling, general and administrative expenses |
(549 | ) | (478 | ) | ||||
| Acquisition and integration related charges |
(43 | ) | — | |||||
|
|
|
|
|
|||||
| Total costs and operating expenses |
$ | (2,149 | ) | $ | (1,618 | ) | ||
|
|
|
|
|
|||||
| Operating profit |
$ | 972 | $ | 772 | ||||
|
|
|
|
|
|||||
| Financial income |
645 | 299 | ||||||
| Financial expense |
(291 | ) | (254 | ) | ||||
|
|
|
|
|
|||||
| Net profit before tax |
$ | 1,326 | $ | 817 | ||||
|
|
|
|
|
|||||
| Corporate Tax |
(193 | ) | (186 | ) | ||||
|
|
|
|
|
|||||
| Net Profit |
$ | 1,133 | $ | 631 | ||||
121
Revenue
Genmab’s revenue was $3,121 million in 2024 compared to $2,390 million in 2023. The increase of $731 million, or 31%, was primarily driven by higher DARZALEX and Kesimpta royalties achieved under our collaborations with J&J and Novartis, respectively. Increased EPKINLY net product sales, driven by a strong product launch in 2023 with a full year of net sales in 2024, also contributed to increased revenue in 2024.
| Year Ended December 31, | ||||||||||||||||
| ($ million) | 2024 | 2023 | ||||||||||||||
| Royalties |
$ | 2,517 | 80 | % | $ | 1,989 | 83 | % | ||||||||
| Reimbursement Revenue |
144 | 5 | % | 124 | 5 | % | ||||||||||
| Milestone Revenue |
145 | 5 | % | 171 | 7 | % | ||||||||||
| Collaboration Revenue |
62 | 2 | % | 45 | 2 | % | ||||||||||
| Net Product Sales |
253 | 8 | % | 61 | 3 | % | ||||||||||
| License Revenue |
— | — | % | — | — | % | ||||||||||
|
|
|
|
|
|
|
|
|
|||||||||
| Total revenue |
$ | 3,121 | 100 | % | $ | 2,390 | 100 | % | ||||||||
|
|
|
|
|
|
|
|
|
|||||||||
Royalties
Royalty revenue amounted to $2,517 million in 2024 compared to $1,989 million in 2023. The increase of $528 million, or 27%, was primarily driven by higher DARZALEX and Kesimpta royalties achieved under our daratumumab collaboration with J&J and ofatumumab collaboration with Novartis, respectively. The table below summarizes Genmab’s royalty revenue by product.
| Year Ended December 31, | ||||||||
| ($ million) | 2024 | 2023 | ||||||
| DARZALEX |
2,019 | 1,635 | ||||||
| Kesimpta |
323 | 217 | ||||||
| TEPEZZA |
106 | 102 | ||||||
| Other |
69 | 35 | ||||||
|
|
|
|
|
|||||
| Total royalties |
$ | 2,517 | $ | 1,989 | ||||
|
|
|
|
|
|||||
DARZALEX
J&J’s net sales of DARZALEX were $11,670 million in 2024 compared to $9,744 million in 2023. The increase from 2023 to 2024 of $1,926 million, or 20%, was driven by share gains in all regions.
Royalty revenue on net sales of DARZALEX was $2,019 million in 2024 compared to $1,635 million in 2023, an increase of $384 million.
The percentage increase in royalties of 23% from 2023 to 2024 is higher than the percentage increase in the underlying net sales of 20% primarily due to a higher effective royalty rate for 2024 and other positive foreign exchange rate impacts, partially offset by the increase in Genmab’s Halozyme royalty reductions in connection with the increase in SC product net sales and an increase in royalty reductions on net sales in countries and territories where there is no Genmab patent coverage as well as lower average exchange rate between the USD and DKK in 2024. Under our license agreement with Janssen for DARZALEX, for purposes of calculating royalties due to Genmab, DARZALEX net sales for non-U.S. dollar denominated currencies are translated to U.S. dollars at a specified annual Currency Hedge Rate. This contractual arrangement is the driver for the other foreign exchange impacts discussed elsewhere in this offering memorandum.
122
Kesimpta
Novartis’ net sales of Kesimpta were $3,224 million in 2024 compared to $2,171 million in 2023. The increase of $1,053 million from 2023 to 2024, or 49%, was primarily driven by increased demand and strong access.
Royalty revenue on net sales of Kesimpta was $323 million in 2024 compared to $217 million in 2023, an increase of $106 million, or 49%.
TEPEZZA
Amgen’s net sales of TEPEZZA were $1,851 million in 2024 compared to $1,771 million in 2023. Royalty revenue on net sales of TEPEZZA was $106 million in 2024 compared to $102 million in 2023, an increase of $4 million, or 4%.
Other royalties
Other royalties consist of royalties from net sales of RYBREVANT, TECVAYLI, TALVEY and TEPKINLY.
J&J was granted FDA approval for RYBREVANT during the second quarter of 2021, and Genmab subsequently started recognizing royalties on net sales of RYBREVANT. Royalties were not material for 2024 or 2023.
J&J was granted conditional approval for TECVAYLI for the treatment of relapsed or refractory multiple myeloma during the third quarter of 2022 in Europe and approval in the fourth quarter of 2022 in the U.S. Royalties were not material for 2024 or 2023.
During the third quarter of 2023, J&J was granted approval in the U.S. and conditional approval in Europe for TALVEY for the treatment of relapsed or refractory multiple myeloma. Royalties were not material for 2024 or 2023.
The EC granted conditional marketing authorization for TEPKINLY as a monotherapy for the treatment of adult patients with relapsed or refractory DLBCL after two or more lines of systemic therapy during the third quarter of 2023. Royalties from AbbVie, related to European net sales, were not material for 2024 or 2023.
Royalty revenue fluctuations from period to period are driven by the level of product net sales, foreign currency exchange rate movements and more specifically to DARZALEX, the contractual arrangement related to annual Currency Hedge Rate, Genmab’s share of J&J’s royalty payments to Halozyme in connection with SC product net sales and royalty deductions on net sales in countries and territories where there is no patent protection.
Reimbursement Revenue
Reimbursement revenue, mainly comprised of the reimbursement of certain research and development costs related to the development work under Genmab’s collaboration agreements, amounted to $144 million in 2024 compared to $124 million in 2023. The increase of $20 million, or 16%, from 2023 to 2024 was primarily driven by higher activities under our collaboration agreements with BioNTech for DuoBody-CD40x4-1BB and acasunlimab, prior to Genmab assuming full ownership, as well as by higher activities under our collaboration agreement with Pfizer for Tivdak.
123
Milestone Revenue
Milestone revenue was $145 million in 2024 compared to $171 million in 2023, a decrease of $26 million, or 15%, primarily driven by the following:
2024 milestones:
| • | Novartis milestone of $84 million (DKK 582 million) driven by worldwide net sales for Kesimpta, first exceeding $2.5 billion (DKK 17.4 billion) in 2024, and |
| • | AbbVie milestone of $50 million due to the acceptance for filing of a BLA by the U.S. FDA in the second indication of epcoritamab in the U.S. |
2023 milestones:
| • | AbbVie milestone of $50 million driven by the first commercial sale of EPKINLY in the U.S., |
| • | AbbVie milestone of $30 million due to the acceptance of the marketing authorization application (MAA) filing by the EMA of the type II variation for marketing authorization of TEPKINLY, |
| • | AbbVie milestone of $25 million due to the first commercial sale of TEPKINLY in Europe, and |
| • | J&J milestone of $25 million related to the BLA approval in the U.S. for talquetamab. |
Milestone revenue may fluctuate significantly from period to period due to both the timing of achievements and the varying amount of each individual milestone under our license and collaboration agreements.
Collaboration Revenue
Collaboration revenue, which reflects 50% of gross profit from net sales of Tivdak in the U.S. by Pfizer, was $62 million in 2024 compared to $45 million in 2023. The increase of $17 million, or 38%, from 2023 to 2024 was primarily driven by increased sales of Tivdak.
Net Product Sales
Global net sales of EPKINLY/TEPKINLY were $281 million in 2024. Net product sales in the U.S. and Japan by Genmab were $253 million in 2024 compared to $61 million in 2023. EPKINLY was approved in the U.S. in May 2023 and in Japan in September 2023.
Net sales of TEPKINLY in territories where Genmab receives royalty revenue were $28 million in 2024, with immaterial net sales in 2023 due to regulatory approvals in such territories not occurring until late 2023.
Refer to Note 2.1 of the Genmab Consolidated Financial Statements included in this offering memorandum for further details about revenue.
Cost of Product Sales
Genmab recognized cost of product sales of $143 million in 2024 compared to $33 million in 2023. Cost of product sales related to EPKINLY sales is primarily comprised of profit-sharing amounts payable to AbbVie of $122 million in 2024 compared to $28 million in 2023, as well as product costs. Aside from these items, there are no other costs included within cost of product sales.
Refer to Notes 2.3, 3.5 and 5.6 of the Genmab Consolidated Financial Statements in this offering memorandum for further details about cost of product sales.
124
Research and Development Expenses
Research and development expenses amounted to $1,414 million in 2024 compared to $1,107 million in 2023. The increase from 2023 to 2024 of $307 million, or 28%, was driven by the increased and accelerated advancement of epcoritamab under our collaboration with AbbVie, the addition of ProfoundBio related research and development expenses, primarily Rina-S, advancement of acasunlimab and DuoBody- CD40x4-1BB under our collaboration with BioNTech, further progression of pipeline products, and the increase in team members to support the continued expansion of our product portfolio.
Research and development costs accounted for 72% of total research and development expenses and selling, general and administration expenses in 2024 compared to 70% in 2023.
The following table provides information regarding our research and development expenses for 2024 as compared to 2023.
| December 31, | Percentage Change |
|||||||||||
| ($ million) | 2024 | 2023 | ||||||||||
| Research(1) |
$ | 310 | $ | 219 | 42 | % | ||||||
| Development and contract manufacturing(2) |
516 | 337 | 53 | % | ||||||||
| Clinical(3) |
478 | 476 | — | % | ||||||||
| Other(4) |
110 | 75 | 47 | % | ||||||||
|
|
|
|
|
|
|
|||||||
| Total research and development expenses |
$ | 1,414 | $ | 1,107 | 28 | % | ||||||
|
|
|
|||||||||||
| (1) | Research expenses include, among other things, personnel, occupancy and laboratory expenses, technology access fees associated with identification of new monoclonal antibodies (mAbs), expenses associated with the development of new proprietary technologies and research activities associated with our product candidates, such as in vitro and in vivo studies, translational research, and IND enabling toxicology studies. |
| (2) | Development and contract manufacturing expenses include personnel and occupancy expenses, external contract manufacturing costs for the scaleup and pre-approval manufacturing of drug product used in research and our clinical trials, costs for drug product supplied to our collaborators, costs related to preparation for the production of process validation batches to be used in potential future regulatory submissions, quality control and assurance activities, and storage and shipment of our product candidates. |
| (3) | Clinical expenses include personnel, travel, occupancy costs, and external clinical trial costs including contract research organizations (CROs), investigator fees, clinical site fees, contractors and regulatory activities associated with conducting human clinical trials. |
| (4) | Other research and development expenses primarily include share-based compensation, depreciation, amortization and impairment expenses. |
125
The following table shows third-party costs incurred for research, contract manufacturing of our product candidates and clinical and regulatory services for 2024 as compared to 2023. The table also presents unallocated costs and overhead consisting of third-party costs for our preclinical stage programs, personnel, facilities, and other indirect costs not directly charged to development programs.
| December 31, | Percentage Change |
|||||||||||
| ($ million) | 2024 | 2023 | ||||||||||
| Epcoritamab |
$ | 414 | $ | 192 | 116 | % | ||||||
| Rina-S |
46 | — | N/A | |||||||||
| Tisotumab vedotin |
38 | 41 | (7 | )% | ||||||||
| Acasunlimab |
102 | 80 | 28 | % | ||||||||
| DuoBody-CD40x4-1BB |
75 | 59 | 27 | % | ||||||||
| Other clinical stage programs |
73 | 109 | (33 | )% | ||||||||
|
|
|
|
|
|
|
|||||||
| Total third-party costs for clinical stage programs |
$ | 748 | $ | 481 | 56 | % | ||||||
|
|
|
|
|
|
|
|||||||
| Preclinical projects |
216 | 164 | 32 | % | ||||||||
| Personnel, unallocated costs and overhead |
450 | 462 | (3 | )% | ||||||||
|
|
|
|
|
|
|
|||||||
| Total research and development expenses |
$ | 1,414 | $ | 1,107 | 28 | % | ||||||
|
|
|
|
|
|
|
|||||||
Third-party costs for epcoritamab increased by $222 million, or 116%, in 2024 as compared to 2023, primarily due to the advancement and acceleration of the epcoritamab program under Genmab’s collaboration with AbbVie.
Third-party costs for Rina-S were $46 million in 2024. Rina-S was acquired through the acquisition of ProfoundBio in the second quarter of 2024.
Third-party costs for tisotumab vedotin decreased by $3 million, or 7%, in 2024 as compared to 2023, primarily due to the completion of certain clinical study activities in 2024.
Third-party costs for acasunlimab increased by $22 million, or 28%, in 2024 as compared to 2023, primarily due to the continued advancement of the program, which Genmab obtained sole ownership during the third quarter of 2024.
Third-party costs for DuoBody-CD40x4-1BB increased by $16 million, or 27%, in 2024 as compared to 2023, primarily due to the continued advancement and expansion of the program under Genmab’s collaboration with BioNTech.
Third-party costs for Genmab’s other clinical stage programs decreased by $36 million, or 33%, in 2024 as compared to 2023, primarily related to advancements of DuoBody-CD3xB7H4 and DuoBody-CD3xCD30 in 2024.
Research and development expenses related to our preclinical projects increased by $52 million, or 32%, in 2024 as compared to 2023, driven by the continued investment in new and existing preclinical programs. An IND was submitted for DuoBody-FAPaxDR4 and a CTA was submitted for GEN1078.
Personnel, unallocated costs and overhead decreased by $12 million, or 3%, in 2024 as compared to 2023, primarily due to travel costs, which were higher in 2023 due to the upcoming launch of EPKINLY in 2023. Our research and development full time equivalents increased from 1,541 at the end of 2023 to 1,886 at the end of 2024.
Refer to Note 2.3, 3.1, 3.2 and 5.5 of the Genmab Consolidated Financial Statements included in this offering memorandum for further details about staff costs, intangible assets, property and equipment and the acquisition of ProfoundBio.
126
Selling, General and Administrative Expenses
Selling, general and administrative expenses were $549 million in 2024 compared to $478 million in 2023. The increase from 2023 to 2024 of $71 million, or 15%, was driven by the continued expansion of Genmab’s commercialization capabilities through the increase in team members to support the continued launch of EPKINLY in the U.S. and Japan in 2023, and the investment in Genmab’s broader organizational capabilities. Selling, general and administration expense growth has been moderating during 2024 reflecting a focus on driving efficiency. We continue to increase team members and commercial support in a strategic manner.
$263 million, or 48% of selling, general and administrative expenses in 2024 was related to compensation of Genmab team members associated with selling, general and administrative activities, as compared to $224 million, or 47% in 2023.
Refer to Note 2.3 and 3.2 for further details about staff costs and property and equipment.
Selling, general and administrative expenses accounted for 28% of total research and development expenses and selling, general and administration expenses in 2024 compared to 30% in 2023.
Acquisition and Integration Related Charges
Acquisition and integration related charges for the acquisition of ProfoundBio were $43 million in 2024 compared to $0 million acquisition and integration related charges for 2023 as there were no acquisitions during 2023.
Refer to Note 5.5 of the Genmab Consolidated Financial Statements included in this offering memorandum for further details about the acquisition of ProfoundBio.
Operating Profit
Operating profit was $972 million in 2024 compared to $772 million in 2023, an increase of $200 million, or 26%.
Financial Income and Expense
Financial income and expense was comprised of the following:
| ($ million) | 2024 | 2023 | ||||||
| Financial income: |
||||||||
| Interest and other financial income |
144 | 142 | ||||||
| Gain on marketable securities |
237 | 157 | ||||||
| Gain on other investments |
6 | — | ||||||
| Foreign exchange rate gain |
258 | — | ||||||
|
|
|
|
|
|||||
| Total financial income |
645 | 299 | ||||||
|
|
|
|
|
|||||
| Financial expenses: |
||||||||
| Interest and other financial expenses |
(18 | ) | (10 | ) | ||||
| Loss on marketable securities |
(107 | ) | (174 | ) | ||||
| Loss on other investments |
— | (4 | ) | |||||
| Foreign exchange rate loss |
(166 | ) | (66 | ) | ||||
|
|
|
|
|
|||||
| Total financial expenses |
(291 | ) | (254 | ) | ||||
|
|
|
|
|
|||||
| Net financial items |
354 | 45 | ||||||
|
|
|
|
|
|||||
127
Interest and Other Financial Income
Interest and other financial income was $144 million in 2024 compared to $142 million in 2023. The increase of $2 million, or 1% from 2023 to 2024, was primarily driven by the higher cash and cash equivalents and marketable securities in the first half of 2024 compared to 2023, almost entirely offset by lower cash and cash equivalents and marketable securities in the second half of 2024 compared to 2023 as a result of liquidating marketable securities and using cash to purchase ProfoundBio.
Foreign Exchange Rate Gains and Losses
Foreign exchange rate gain, net of $92 million in 2024 compared to the foreign exchange rate loss, net of $66 million in 2023 were primarily driven by foreign exchange movements impacting Genmab’s USD denominated assets (excluding marketable securities) and liabilities; in particular, the USD/DKK foreign exchange rates were as follows for each period:
| December 31, 2024 |
December 31, 2023 |
|||||||
| USD/DKK Foreign Exchange Rates |
7.1429 | 6.7447 | ||||||
| % Increase/(Decrease) |
6 | % | (3 | )% | ||||
Marketable Securities Gains and Losses
Gain on marketable securities, net was $130 million in 2024 compared to loss on marketable securities, net of $17 million in 2023. The net change is a function of increase in marketable securities balances as well as the position of the portfolio in the changing interest rates environment, primarily in the U.S.
Other Investments
Gains on other investments, net were $6 million in 2024, and losses on other investments, net were $4 million in 2023. The net gains and losses in 2024 and 2023 were primarily driven by changes in fair value of Genmab’s investments in certain strategic investment funds.
Refer to Notes 4.2 and 4.5 of the Genmab Consolidated Financial Statements included in this offering memorandum for further details regarding foreign currency risk and net financial items, respectively.
Corporate Tax
Corporate tax expense was $193 million in 2024 compared to $186 million in 2023. Genmab’s estimated annual effective tax rate was 14.6% in 2024 compared to 22.8% in 2023. The decrease from 2023 to 2024 in Genmab’s effective tax rate was primarily due to the integration of ProfoundBio which allowed for the deduction of previously unrecognized deferred tax assets in 2024.
Refer to Note 2.4 of the Genmab Consolidated Financial Statements included in this offering memorandum for additional information regarding the corporate tax, deferred tax assets and deferred tax liabilities including management’s significant judgments and estimates.
Net Profit
Net profit for 2024 was $1,133 million compared to $631 million in 2023. The changes in net profit for the periods were driven by the items described above.
128
Liquidity and Capital Resources
Cash Flows
Cash Flows for the Nine Months Ended September 30, 2025 and 2024
The following table provides information regarding Genmab’s cash flow for the nine months ended September 30, 2025 and 2024.
| Nine Months Ended September 30, | ||||||||
| Cash Flow ($ million) |
2025 | 2024 | ||||||
| Net cash provided by operating activities |
$ | 885 | $ | 737 | ||||
| Net cash (used in) investing activities |
(71 | ) | (1,459 | ) | ||||
| Net cash (used in) financing activities |
(440 | ) | (564 | ) | ||||
|
|
|
|
|
|||||
| Increase (decrease) in cash and cash equivalents |
$ | 374 | $ | (1,286 | ) | |||
| Exchange rate adjustments |
$ | 7 | $ | 34 | ||||
Net cash provided by operating activities is primarily related to our operating profit, changes in operating assets and liabilities, reversal of net financial items, and adjustments related to non-cash transactions. The $148 million increase in net cash provided by operating activities is primarily driven by a $340 million increase in net profit before tax and a $69 million increase related to changes in receivables and other current assets, partly offset by an increase in corporate taxes paid of $268 million.
Net cash used in investing activities primarily reflects differences between the proceeds received from the sale and maturity of our investments and amounts invested, and the cash paid for investments in tangible and intangible assets. The $1,388 million decrease in net cash used in investing activities is primarily driven by the acquisition of ProfoundBio during the second quarter of 2024.
Net cash used in financing activities is primarily related to the purchase of treasury shares, exercise of warrants, lease payments, and payment of withholding taxes on behalf of employees on net settled RSUs. The $124 million decrease in net cash used in financing activities between the periods is primarily driven by $130 million decreased cash paid for the purchase of treasury shares during the first nine months of 2025 compared to the first nine months of 2024 due to the timing of share repurchases. This decrease was partly offset by lower proceeds from the exercise of warrants of $2 million, with $16 million received in the first nine months of 2025 as compared to $18 million in the first nine months of 2024.
Exchange rate adjustments represent foreign currency gains or losses on Genmab’s cash and cash equivalents.
Cash Flows for the Years ended December 31, 2024 and 2023
The following table provides information regarding Genmab’s cash flow for the year ended December 31, 2024 and 2023.
| Cash Flow ($ million) |
2024 | 2023 | ||||||
| Net cash provided by operating activities |
$ | 1,126 | $ | 1,071 | ||||
| Net cash (used in) investing activities |
(1,447 | ) | (185 | ) | ||||
| Net cash (used in) financing activities |
(566 | ) | (89 | ) | ||||
|
|
|
|
|
|||||
| Increase in cash and cash equivalents |
$ | (887 | ) | $ | 797 | |||
| Exchange rate adjustments |
$ | 63 | $ | (12 | ) | |||
129
Net cash provided by operating activities is primarily related to our operating profit, changes in operating assets and liabilities, reversal of net financial items, and adjustments related to non-cash transactions. Net cash provided by operating activities increased in 2024 compared to 2023 primarily driven by an increase in net profit before tax of $509 million, an increase in non-cash transactions of $54 million, and a decrease in taxes paid of $105 million in 2024 compared to 2023, partly offset by significant AbbVie milestones achieved during the fourth quarter of 2022 with related cash received during 2023 and an increase in DARZALEX royalty receivables in the fourth quarter of 2024 compared to the fourth quarter of 2023.
Net cash (used in) investing activities primarily reflects cash used in making acquisitions, differences between the proceeds received from the sale and maturity of our investments and amounts invested, and the cash paid for investments in tangible and intangible assets. The increase from 2023 to 2024 in net cash (used in) investing activities is primarily driven by the acquisition of ProfoundBio.
Net cash (used in) financing activities is primarily related to the purchase of treasury shares, exercise of warrants, lease payments, and payment of withholding taxes on behalf of employees on net settled RSUs. The increase from 2023 to 2024 in net cash (used in) financing activities is primarily driven by cash payments for the purchase of treasury shares of $560 million in 2024 compared to $81 million in 2023.
Exchange rate adjustments represent foreign currency gains or losses on Genmab’s cash and cash equivalents, primarily driven by our cash and cash equivalents holdings denominated in USD. The USD/DKK foreign exchange rate increased 6% in 2024, decreased 3% in 2023.
Cash, Cash Equivalents and Marketable Securities
| September 30, | ||||||||
| ($ million) |
2025 | 2024 | ||||||
| Marketable securities |
$ | 1,650 | $ | 1,648 | ||||
| Cash and cash equivalents |
1,761 | 952 | ||||||
As of September 30, 2025, cash and cash equivalents and marketable securities denominated in USD represented 87% of Genmab’s total cash and cash equivalents and marketable securities compared to 80% of September 30, 2024.
Marketable securities are invested in highly secure and liquid investments with short effective maturities. As of September 30, 2025, 70% of Genmab’s marketable securities were long-term A rated or higher, or short-term rated A-1 / P-1 by S&P, Moody’s or Fitch compared to 70% as of September 30, 2024.
As of September 30, 2025, $1,761 million was held as cash and cash equivalents, and $1,650 million was held as liquid investments in short-term government and other debt instruments compared to $952 million held as cash and cash equivalents and $1,648 million held as liquid investments in short-term government and other debt instruments as of September 30, 2024.
Cash and cash equivalents included short-term marketable securities of $140 million at the end of September 2025. In accordance with Genmab’s accounting policy, securities purchased with a maturity of less than 90 days at the date of acquisition are classified as cash and cash equivalents.
Liquidity and Capital Resources Following the Acquisition
Funding of the Acquisition
We expect that the Transactions will require total cash in U.S dollars of approximately $8,395 million, which will be used to fund the Acquisition and to pay fees and expenses associated with the Transactions. We expect the cash requirements of the Transactions to be financed through the net proceeds from the issuance of the notes offered hereby, together with borrowings under the Term Credit Facilities, as well as our cash on hand, including cash from the sale of substantially all of our marketable securities.
130
See “Use of Proceeds” for more information.
Debt
Currently, we have $0 million in debt as of September 30, 2025. Following consummation of the Transactions, our long-term debt will consist of the notes and indebtedness under the Term Credit Facilities. In connection with this offering, we will also enter into the New Revolving Facility, which we do not expect to draw in connection with the Transactions.
We are seeking consent under the Existing Credit Agreement to permit the consummation of this offering. If this consent is obtained, we expect to terminate the Existing Credit Agreement at the Acquisition Closing Date. If this consent is not obtained, we will terminate the Existing Credit Agreement on the date of the settlement of this offering.
On a pro forma basis giving effect to the Transactions, as of September 30, 2025, we would have had outstanding $5,263 million in aggregate indebtedness for borrowed money, including the Term Credit Facilities and the Notes offered hereby. On a pro forma basis giving effect to the Transactions, assuming the blended interest rate used in the presentation of our pro forma financial statements included elsewhere in this offering memorandum, our cash interest expense would have been $423 million for the twelve months ended December 31, 2024 and $321 million for the nine months ended September 30, 2025.
From time to time, depending upon market and other conditions, as well as upon our cash balances and liquidity, we may acquire our outstanding debt securities or our other indebtedness through open market purchases, privately negotiated transactions, tender offers, redemption or otherwise, upon such terms and at such prices as we may determine, for cash or other consideration.
For additional information regarding our material indebtedness upon the completion of the Transactions, see “Summary—The Transactions,” “Description of Other Indebtedness”, “Description of the Unsecured Notes” and “Description of the Secured Notes”
Liquidity
Prior to consummation of the Transactions, we will require cash to meet our operating expenses and capital expenditures. We have funded our cash requirements since inception, including through September 30, 2025, primarily with royalty and milestone payments from our partners, upfront payments, and equity financing. We expect to continue to fund a significant portion of our development costs for proprietary product candidates as well as commercialization activities prior to consummation of the Transactions with cash received from royalties and milestone payments from partners, and net sales of Genmab products.
After the consummation of the Transactions, our primary sources of liquidity will be cash received from royalties and milestone payments from partners and net sales of our products, our remaining cash, cash equivalents and marketable securities, and our New Revolving Facility, which will permit aggregate borrowings of up to $500 million. Our primary uses of cash after the consummation of the Transactions will be our development costs for our proprietary product candidates, commercialization activities, capital expenditures and debt service obligations.
Based on our current level of operations, our available cash, cash equivalents and marketable securities, we believe our cash flows from operating activities, combined with availability under the New Revolving Facility, will provide sufficient liquidity to fund our development and commercialization activities, current obligations, projected working capital requirements, debt service requirements and capital spending requirements over the next twelve months and the foreseeable future.
131
Our expenditures on current and future preclinical and clinical development programs are subject to numerous uncertainties in timing and cost to completion. In order to advance our product candidates toward commercialization, the product candidates are tested in numerous preclinical safety, toxicology and efficacy studies. Genmab then conducts clinical trials for those product candidates that take several years or more to complete. The length of time varies substantially based upon the type, complexity, novelty and intended use of a product candidate. The cost of clinical trials may vary significantly over the life of a project as a result of a variety of factors, including: the number of patients required in the clinical trials; the length of time required to enroll trial participants; the number and location of sites included in the trials; the costs of producing supplies of the product candidates needed for clinical trials and regulatory submissions; the safety and efficacy profile of the product candidate; the use of CROs to assist with the management of the trials; and the costs and timing of, and the ability to secure, regulatory approvals.
Our expenses also fluctuate from period to period based on the degree of activities with collaborative partners, timing of manufacturing campaigns, numbers of patients enrolled in clinical trials and the outcome of each clinical trial event. As a result, we are unable to determine with any degree of certainty the anticipated completion dates, duration and completion costs of research and development projects, or when and to what extent we will receive cash inflows from the commercialization and sale of any product candidates. We also cannot predict the actual amount or timing of future royalties and milestone payments, and these may differ from estimates.
We expect to increase operating expenditures and make additional capital outlays over the next several years as we support preclinical development, manufacturing, clinical trial activities, product collaborations, commercialization activities and additional hiring of staff. The adequacy of our available funds will depend on many factors, including the level of DARZALEX and other royalty streams, progress in our research and development programs, the magnitude of those programs, our commitments to existing and new clinical collaborators, our ability to establish commercial and licensing arrangements, our capital expenditures, market developments, and any future acquisitions. Accordingly, Genmab may require additional funds and may attempt to raise additional funds through equity or debt financings, collaborative agreements with partners, or from other sources. During the fourth quarter of 2024, Genmab entered into the Existing Credit Agreement. The Existing Credit Agreement is an unsecured three-year revolving credit facility of up to $300 million with a syndicate of lenders. Genmab intends to use the Existing Credit Agreement to finance working capital needs, and for general corporate purposes, of Genmab and its subsidiaries. The Existing Credit Agreement includes options to increase the size of the facility up to $500 million as well as the ability to extend for an additional two years. The Existing Credit Agreement contains certain customary financial covenants. As of December 31, 2024, there were no outstanding amounts due on, nor any usage of, the Existing Credit Agreement and Genmab was in compliance with all financial covenants. We expect to terminate the Existing Credit Agreement prior to or concurrently with the closing of the Acquisition
For a discussion on the impact of the Acquisition, please see “—Key Components of Our Results and Related Trends—Impact of the Acquisition of Merus.”
Please also see Note 9 of the Genmab Unaudited Interim Condensed Consolidated Financial Statements included in this offering memorandum for a description of our lease obligations; and Note 5.6 of the Genmab Consolidated Financial Statements for a description of our contractual obligations related to a number of agreements, primarily related to research and development activities, as well as a description of our contingent commitments under our license and collaboration agreements that may become due for future payments.
In addition to the above obligations, we enter into a variety of agreements and financial commitments in the normal course of business. The terms generally allow us the option to cancel, reschedule and adjust our requirements based on our business needs prior to the delivery of goods or performance of services.
132
It is not possible to predict the maximum potential amount of future payments under these agreements due to the conditional nature of our obligations and the unique facts and circumstances involved in each particular agreement.
Significant Accounting Policies
Refer to Note 1.1 of the Genmab Consolidated Financial Statements and Note 1 of the Genmab Unaudited Interim Condensed Consolidated Financial Statements included in this offering memorandum for information about our significant accounting policies and how estimates are involved in the preparation of our financial statements.
Implementation of New and Revised Standards and Interpretations
For information related to new and revised standards and interpretations, see Note 1.2 to the Genmab Consolidated Financial Statements and Note 1 to the Genmab Unaudited Interim Condensed Consolidated Financial Statements included in this offering memorandum.
Standards and Interpretations Not Yet in Effect
For information related to standards and interpretations not yet in effect, see Note 1.2 to the Genmab Consolidated Financial Statements and Note 1 to the Genmab Unaudited Interim Condensed Consolidated Financial Statements included in this offering memorandum.
Qualitative and Quantitative Disclosures about Market Risks
For information related to qualitative and quantitative disclosures about market risks including foreign currency risk, interest rate risk, and credit risk, see Note 4.2 to the Genmab Consolidated Financial Statements.
133
DESCRIPTION OF CERTAIN OTHER INDEBTEDNESS
The following is a summary of certain provisions of the expected terms of the New Senior Secured Credit Facilities in which the Issuers intend to enter in connection with the Acquisition Closing. The terms and conditions of the New Senior Secured Credit Facilities described herein have not been finalized, and are therefore subject to change. Investors are encouraged not to place undue reliance on such descriptions in deciding to invest in the Notes offered hereby, as changes may be made after the date of this offering memorandum.
In connection with the Acquisition, the Issuers expect to enter into a credit agreement governing the New Senior Secured Credit Facilities with Morgan Stanley Senior Funding Inc., as administrative agent and collateral agent and various financial institutions as lenders thereunder. Merus and its wholly owned subsidiaries are expected to become guarantors under the New Senior Secured Credit Facilities and provide applicable collateral which will be required under the New Senior Secured Credit Facilities after the Back-End Closing.
Maturity and Amortization
The Term Loan A Facility will mature on the fifth anniversary of the Acquisition Closing and amortize in equal quarterly installments in aggregate annual amounts equal to 5.0% of the original principal amount of the Term Loan A Facility, with the balance of the original principal amount of the Term Loan A Facility payable at maturity. The Term Loan B Facility will mature on the seventh anniversary of the Acquisition Closing and amortize in equal quarterly installments in aggregate annual amounts equal to 10% in 2026, 15% in 2027 and 2028, 10% in 2029, and 5% in 2030, 2031, and 2032, in each case, of the original principal amount of the Term Loan B Facility, with the balance of the original principal amount of the Term Loan B Facility payable at maturity. The Revolving Facility will mature, and the commitments thereunder will terminate, on the fifth anniversary of the Acquisition Closing.
Interest
The interest rate on each of the Term Loan A Facility and the Revolving Facility is expected to be based on, at the option of the Issuers, either Term SOFR (as will be defined in New Senior Secured Credit Facilities and subject to a 0% floor) or alternate base rate (subject to a 1% floor), in each case, plus an applicable margin that will initially be fixed and, after the delivery of financial statements for the first full fiscal quarter completed after the Acquisition Closing, will vary based on our first lien secured net leverage ratio. The interest rate on the Term Loan B Facility is expected to be based on, at the option of the Issuers, either Term SOFR (subject to a 0% floor) or alternate base rate (subject to a 1% floor), in each case, plus an applicable margin.
Mandatory Prepayments
Subject to certain important exceptions and thresholds, it is expected that the Issuers will be required to make mandatory prepayments under certain circumstances, with excess cash flow, the net proceeds of asset sales and casualty events (subject to customary reinvestment rights) and the incurrence of indebtedness that is not permitted under the New Senior Secured Credit Facilities.
Voluntary Prepayments
The Issuers may voluntarily repay outstanding loans under the Term Loan A Facility and Term Loan B Facility at any time without prepayment premium or penalty, except in connection with a repricing event in respect of the term loans under the Term Loan B Facility as described below, subject to customary “breakage” costs with respect to loans bearing interest at Term SOFR.
187
It is expected that any refinancing through the issuance of certain debt or any repricing amendment, in either case, that constitutes a “repricing event” applicable to the term loans under the Term Loan B Facility resulting in a lower yield occurring at any time during the first six months after the closing date of the Term Loan B Facility will be accompanied by a 1.00% prepayment premium or fee, as applicable.
Guarantees and Security
The obligations of the Issuers under the New Senior Secured Credit Facilities will be guaranteed, on a joint and several basis, by the Guarantors. The obligations of the Issuers under the New Senior Secured Credit Facilities will be secured, on a joint and several basis, by first-priority liens (subject to permitted liens) on certain of the Issuers’ and the Guarantors’ existing and future assets (subject to certain exclusions and agreed guarantee and security principles in line with customary practices in the relevant jurisdiction), which will rank pari passu with the liens securing the Secured Notes offered hereby pursuant to a customary intercreditor agreement governing relative priority and creditor rights. See “Description of the Secured Notes—Equal Priority Intercreditor Agreement.” On the Acquisition Closing, security jurisdictions will be limited to the U.S., Denmark and the Netherlands.
Representations, Warranties and Covenants
The New Senior Secured Credit Facilities will contain representations and warranties and affirmative covenants that are usual and customary for facilities of this nature and subject to important limitations and exceptions. The New Senior Secured Credit Facilities will also contain customary negative covenants (subject to important limitations and exceptions) that include limitations on indebtedness, liens, asset sales, investments, restricted payments, restricted debt prepayments, affiliate transactions, fundamental changes, material changes in nature of business, negative pledge clauses, and changes to fiscal year. Solely with respect to the Term Loan A Facility and the Revolving Facility, the Issuers will be subject to quarterly-tested maintenance financial covenants that require compliance with a maximum First Lien Secured Net Leverage Ratio (as will be defined in the New Senior Secured Credit Facilities) and a minimum Interest Coverage Ratio (as will be defined in the New Senior Secured Credit Facilities).
Events of Default
The New Senior Secured Credit Facilities will contain customary events of default (subject to important limitations and exceptions), including with respect to non-payment of principal, non-payment of interest and fees subject to a grace period, covenant breaches subject to a grace period for certain covenants, material misrepresentations subject to a grace period for certain representations, cross-defaults to material indebtedness above a materiality threshold, monetary judgments above a materiality threshold, insolvency or bankruptcy events, change of control, certain ERISA (as defined herein) events, and invalidity of a material portion of guarantees or security. If an event of default occurs, the lenders under the New Senior Secured Credit Facilities will be entitled to take various actions, including the acceleration of amounts due under the New Senior Secured Credit Facilities and all actions permitted to be taken by secured creditors.
188
Exhibit 99.4
EXHIBIT B
UNAUDITED PRO FORMA CONDENSED COMBINED FINANCIAL INFORMATION
UNAUDITED PRO FORMA CONDENSED COMBINED FINANCIAL INFORMATION
Introduction
On September 29, 2025, Genmab entered into the Acquisition, to which Genmab intends to acquire all the shares of Merus for $97.00 per share in an all-cash transaction. The following unaudited pro forma condensed combined financial information gives effect to the Acquisition and the related financing transactions, as further described below.
The accompanying unaudited pro forma condensed combined statement of financial position as of September 30, 2025 gives effect to the Acquisition, including the related financing transactions, as if it had been consummated on September 30, 2025; and the accompanying unaudited pro forma condensed combined statements of operations for the year ended December 31, 2024 and the nine months ended September 30, 2025 give effect to the Acquisition, including the related financing transactions, as if it had been consummated on January 1, 2024.
These unaudited pro forma condensed combined financial statements should be read in conjunction with:
| • | The accompanying notes to these unaudited pro forma condensed combined financial statements, |
| • | The historical audited consolidated financial statements of Genmab for the year ended December 31, 2024, as reissued, |
| • | The historical unaudited interim condensed consolidated financial statements of Genmab for the nine months ended September 30, 2025, |
| • | The historical audited consolidated financial statements of Merus for the year ended December 31, 2024, |
| • | The historical unaudited interim condensed consolidated financial statements of Merus for the nine months ended September 30, 2025, |
| • | The section of this offering memorandum entitled “Management’s Discussion and Analysis of Financial Condition and Results of Operations.” |
See the section of this offering memorandum entitled “Notes to Unaudited Pro Forma Consolidated Combined Financial Information.”
The historical audited consolidated financial statements and historical unaudited interim condensed consolidated financial statements of Genmab have been prepared in accordance with IFRS Accounting Standards, and IAS 34 Financial Information, respectively. The historical audited consolidated financial statements and historical unaudited interim condensed consolidated financial statements of Merus have been prepared in accordance with U.S. GAAP and with Regulation S-X promulgated under the Securities Exchange Act of 1933, as amended.
The unaudited pro forma adjustments are based upon available information and certain assumptions that management believes are reasonable. All adjustments are preliminary and subject to change.
These unaudited pro forma condensed combined financial statements are for illustrative purposes only and are not intended to represent or be indicative of:
| • | The actual results of operations or financial position of the combined company that would have been achieved if the Acquisition had been completed as of the dates indicated, or |
| • | The results of operations or financial position of the combined company as of any future date or for any future period. |
91
Description of the Transaction
On September 29, 2025, Merus entered into the Transaction Agreement with Genmab and the Purchaser. Pursuant to the Transaction Agreement, the Purchaser commenced a tender offer for all the outstanding common shares of Merus on October 21, 2025. The closing of the tender offer is subject to the satisfaction or waiver of customary conditions as described elsewhere in this offering memorandum. Following the closing of the tender offer, Merus and Genmab will effect the Back-End Transactions resulting in Genmab owning 100% of the common shares of Merus (or a successor entity). Depending on the structure of these Back-End Transactions, Merus shareholders that do not tender their shares into the tender offer will either receive the same consideration for their common shares as the common shares tendered into the tender offer (subject to applicable withholding taxes) or a fair price for their common shares determined by a Dutch court in statutory buy-out proceedings. For purposes of this unaudited pro forma condensed combined financial information, we have assumed that the purchase of Genmab’s majority interest in Merus through the tender offer and the acquisition of any remaining Merus shares through the Back-End Transactions will occur during the same reporting period and at the same per share purchase price.
Merus Equity awards
In connection with the transaction Merus equity awards will be treated as follows:
Merus Stock Options: each outstanding and unexercised option that is outstanding immediately prior to the closing of the transaction, whether or not fully vested, and whether or not subject to any performance or other conditions, will vest in full. “In-the-money” options will be converted automatically into the right to receive cash equal to the merger consideration less the strike price for each in the money award.
Merus Restricted Stock Award: each outstanding and unvested restricted stock award outstanding immediately prior to the closing of the transaction, whether or not fully vested, and whether or not subject to any performance or other conditions, will vest in full and be converted automatically into the right to receive cash equal to the merger consideration available to holders of common shares.
Description of the Financing
To finance the Transactions, Genmab has obtained committed financing from several financial institutions in the aggregate amount of $6,000 million, of which $5,500 million is intended to be used to finance, in part, the aggregate consideration for the Acquisition and $500 million is committed pursuant to a revolving credit facility that is expected to be undrawn at the closing of the Acquisition. In connection with the Transactions, the Company intends to enter into the following debt financing transactions:
| • | the entry into New Senior Secured Credit Facilities consisting of (i) the Term Loan A Facility, (ii) the Term Loan B Facility, and (iii) the New Revolving Facility; and |
| • | the issuance of (i) $1,500 million in aggregate principal amount of the senior secured notes offered hereby and (ii) $1,000 million in aggregate principal amount of the senior unsecured notes offered hereby. |
Accounting for the Acquisition
The transaction will be accounted for in accordance with IFRS Accounting Standards. It is anticipated to be treated as the acquisition of a group of assets that do not constitute a business, as outlined in the scoping guidance in IFRS 3.2 and the related IFRS Interpretations Committee Update in November 2017 (“IU 11-17”). This is because it is anticipated that substantially all the fair value of the gross assets acquired will be concentrated into a single asset. Following the guidance provided by the IU 11-17 meeting and set forth in IFRS 3.2(b), Genmab will measure any identifiable assets or assumed liabilities that are initially measured at an amount other than cost in accordance with the applicable accounting standards, and allocate the residual cost of the asset acquisition to the remaining identifiable assets based on their preliminary estimates of fair value.
92
The transaction will not result in the recognition of any goodwill, gain or loss. Further, the transaction will not result in the recognition of any deferred tax asset or liability as IFRS Accounting Standards do not permit the recognition of deferred taxes that arise from initial recognition of an asset or liability in a transaction that is an asset acquisition, does not give rise to an accounting or tax profit, and does not give rise to equal taxable and deductible temporary differences. Directly attributable transaction costs necessary to execute the transaction are capitalizable and form part of the cost basis of the net assets acquired. The detailed valuation studies necessary to arrive at required estimates of fair values of the assets acquired and liabilities assumed from Merus in the transaction have not been completed. The actual fair values will be determined upon the completion of the Transaction and the dependent allocations may vary materially from these preliminary estimates.
While following the initial tender offer, but prior to the completion of the Back-End Transactions, Genmab may own less than 100% of the outstanding shares of Merus, the transaction is presented here as if Genmab has achieved 100% ownership upon closing of the tender offer because the remaining shares will eventually be acquired by Genmab during the subsequent offering period or through the successful completion of the Back-End Transactions. All Back-End Transactions are expected to be completed in the same reporting period, and the unaudited pro forma condensed combined financial information presented herein has been prepared on this basis. If the Back-End Transactions are not completed within the same reporting period, there may be recognition of a mandatorily redeemable financial instrument. The accounting for this transaction is preliminary and has not yet been finalized.
Pro forma Adjustments
The following unaudited pro forma condensed combined statement of operations for the nine months ended September 30, 2025 and the year ended December 31, 2024 and unaudited pro forma condensed combined statement of financial position as of September 30, 2025 are based on the historical consolidated financial statements of Genmab and Merus, and have been prepared to reflect the Acquisition and the financing arrangements contemplated at the date of this offering memorandum. The pro forma adjustments related to the transaction include:
| • | The purchase consideration of $97.00 per share transferred to holders of shares, options, and restricted stock awards outstanding as of September 26, 2025, resulting in an estimated consideration paid to such holders of $8,014 million. |
| • | The conversion of Merus financial statements from U.S. GAAP and Merus accounting policies to Genmab accounting policies in accordance with IFRS Accounting Standards and reclassifications to conform to Genmab financial statement presentation. |
| • | The recognition of Merus’ net assets acquired and liabilities assumed in the Acquisition, measured at their allocated transaction price, as described above. |
| • | The borrowings under the term loan facilities and the issuance of the secured and unsecured notes offered hereby, each further described in Note 4—Adjustments for Financing of the unaudited pro forma condensed combined financial information, and the planned liquidation of marketable securities to fund a portion of the purchase price of the Acquisition. |
| • | The recognition of certain one time transaction related expenses and the recognition of incremental share based compensation expense attributable to the acceleration of share based payment awards in conjunction with the transaction, as if the transaction had occurred on January 1, 2024, each described in Note 5—Other Transaction Accounting Adjustments of the unaudited pro forma condensed combined financial information. |
The unaudited pro forma condensed combined financial statements have been prepared in accordance with Article 11 of Regulation S-X as amended by the final rule, Release No. 33-10786 “Amendments to Financial Disclosures about Acquired and Disposed Businesses.” Release No.
93
33-10786 established simplified requirements to depict the accounting for the transaction (“Transaction Accounting Adjustments”). These pro forma adjustments were presented in separate columns after the presentation of the combined historical information of the Company and its subsidiaries and Merus and its subsidiaries. The Company has elected not to present management’s adjustments and is only presenting Transaction Accounting Adjustments in the unaudited pro forma condensed combined financial information. The pro forma adjustments are subject to material change and are based upon currently available information and certain assumptions that the Company believes are reasonable.
This information has been prepared assuming (1) that Genmab irrevocably accepts for payment all Merus shares, tendered during the initial tender offer period, on a fully diluted basis and (2) that the Back-End Transactions, including the back-end merger, the back-end loan and the back-end cancellation, to the extent applicable, occur within the same reporting period; resulting in Genmab acquiring 100% of outstanding shares of Merus. The unaudited pro forma condensed combined financial information does not reflect any anticipated synergies or dis-synergies, operating efficiencies or cost savings, or integration costs that may result from the Acquisition. No assurance can be given that synergies, operating efficiencies or cost savings will be realized. Income taxes do not reflect the amounts that would have resulted had Genmab and Merus filed consolidated income tax returns during the periods presented.
94
Unaudited Pro Forma Condensed Combined Statement of Financial Position
As at September 30, 2025
| Transaction Accounting Adjustments | ||||||||||||||||||||||||||||||||||||
| ($ in millions, except per share data) | Genmab Historical (IFRS) |
Merus (IFRS) |
Acquisition | Financing | Others | Pro Forma Combined |
||||||||||||||||||||||||||||||
| Note 2 | Note 3 | Note 4 | Note 5 | |||||||||||||||||||||||||||||||||
| Assets | ||||||||||||||||||||||||||||||||||||
| Goodwill |
$ | 355 | $ | — | $ | — | $ | — | $ | — | $ | 355 | ||||||||||||||||||||||||
| Other intangible assets |
1,748 | 2 | 7,316 | (ii) | — | — | 9,066 | |||||||||||||||||||||||||||||
| Property and equipment |
145 | 11 | — | (iii) | — | — | 156 | |||||||||||||||||||||||||||||
| Right-of-use assets |
121 | 12 | — | (v) | — | — | 133 | |||||||||||||||||||||||||||||
| Receivables |
9 | — | — | — | — | 9 | ||||||||||||||||||||||||||||||
| Deferred tax assets |
127 | 1 | (1 | ) | (vi) | — | — | 127 | ||||||||||||||||||||||||||||
| Prepaid expenses and other non-current assets |
9 | 2 | — | — | — | 11 | ||||||||||||||||||||||||||||||
| Other investments |
36 | 183 | — | (iv) | — | — | 219 | |||||||||||||||||||||||||||||
|
|
|
|
|
|
|
|
|
|
|
|
|
|||||||||||||||||||||||||
| Total non-current assets |
$ | 2,550 | $ | 211 | $ | 7,315 | $ | — | $ | — | $ | 10,076 | ||||||||||||||||||||||||
| Corporate tax receivable |
— | — | — | — | — | — | ||||||||||||||||||||||||||||||
| Inventories |
14 | — | — | — | — | 14 | ||||||||||||||||||||||||||||||
| Receivables |
1,046 | 19 | — | — | — | 1,065 | ||||||||||||||||||||||||||||||
| Prepaid expenses and other current assets |
— | 37 | — | — | — | 37 | ||||||||||||||||||||||||||||||
| Marketable securities |
1,650 | 268 | — | — | (1,650 | ) | (ii) | 268 | ||||||||||||||||||||||||||||
| Cash and cash equivalents |
1,761 | 369 | (8,158 | ) | (i) | 5,263 | (i) | 1,650 | (ii) | 885 | ||||||||||||||||||||||||||
|
|
|
|
|
|
|
|
|
|
|
|
|
|||||||||||||||||||||||||
| Total current assets |
$ | 4,471 | $ | 693 | $ | (8,158 | ) | $ | 5,263 | $ | — | $ | 2,269 | |||||||||||||||||||||||
|
|
|
|
|
|
|
|
|
|
|
|
|
|||||||||||||||||||||||||
| Total assets |
$ | 7,021 | $ | 904 | $ | (843 | ) | $ | 5,263 | — | $ | 12,345 | ||||||||||||||||||||||||
| Shareholders’ Equity and Liabilities |
||||||||||||||||||||||||||||||||||||
| Share capital |
10 | 8 | (8 | ) | (vii) | — | — | 10 | ||||||||||||||||||||||||||||
| Share premium |
1,913 | 2,066 | (2,066 | ) | (vii) | — | — | 1,913 | ||||||||||||||||||||||||||||
| Other reserves |
(204 | ) | 19 | (19 | ) | (vii) | — | — | (204 | ) | ||||||||||||||||||||||||||
| Retained earnings |
4,032 | (1,318 | ) | 1,250 | (vii) | — | — | 3,964 | ||||||||||||||||||||||||||||
|
|
|
|
|
|
|
|
|
|
|
|
|
|||||||||||||||||||||||||
| Total shareholders’ equity |
$ | 5,751 | $ | 775 | $ | (843 | ) | — | — | $ | 5,683 | |||||||||||||||||||||||||
| Lease liabilities |
126 | 9 | — | — | 135 | |||||||||||||||||||||||||||||||
| Contract liabilities |
67 | 33 | — | — | 100 | |||||||||||||||||||||||||||||||
| Borrowings—non-current |
— | — | — | 5,013 | (i) | — | 5,013 | |||||||||||||||||||||||||||||
| Deferred tax liabilities |
330 | — | — | — | — | 330 | ||||||||||||||||||||||||||||||
| Other payables |
6 | — | — | — | — | 6 | ||||||||||||||||||||||||||||||
|
|
|
|
|
|
|
|
|
|
|
|
|
|||||||||||||||||||||||||
| Total non-current liabilities |
$ | 529 | $ | 42 | $ | — | $ | 5,013 | $ | — | $ | 5,584 | ||||||||||||||||||||||||
| Corporate tax payable |
120 | 7 | — | — | — | 127 | ||||||||||||||||||||||||||||||
| Lease liabilities |
16 | 3 | — | — | — | 19 | ||||||||||||||||||||||||||||||
| Borrowings—current |
— | — | — | 250 | (i) | — | 250 | |||||||||||||||||||||||||||||
| Contract liabilities |
3 | 24 | — | — | — | 27 | ||||||||||||||||||||||||||||||
| Other payables |
602 | 53 | — | — | — | 655 | ||||||||||||||||||||||||||||||
|
|
|
|
|
|
|
|
|
|
|
|
|
|||||||||||||||||||||||||
| Total current liabilities |
$ | 741 | $ | 87 | $ | — | $ | 250 | — | $ | 1,078 | |||||||||||||||||||||||||
|
|
|
|
|
|
|
|
|
|
|
|
|
|||||||||||||||||||||||||
| Total liabilities |
$ | 1,270 | $ | 129 | — | 5,263 | — | $ | 6,662 | |||||||||||||||||||||||||||
|
|
|
|
|
|
|
|
|
|
|
|
|
|||||||||||||||||||||||||
| Total shareholders’ equity and liabilities |
$ | 7,021 | $ | 904 | $ | (843 | ) | $ | 5,263 | — | $ | 12,345 | ||||||||||||||||||||||||
|
|
|
|
|
|
|
|
|
|
|
|
|
|||||||||||||||||||||||||
95
Unaudited Pro Forma Condensed Combined Statement of Operations
For the nine months ended September 30, 2025
| Transaction Accounting Adjustments | ||||||||||||||||||||||||||||||||||||
| ($ in millions, except per share data) | Genmab Historical (IFRS) |
Merus (IFRS) |
Acquisition | Financing | Others | Pro Forma Combined |
||||||||||||||||||||||||||||||
| Note 2 | Note 3 | Note 4 | Note 5 | |||||||||||||||||||||||||||||||||
| Revenue |
$ | 2,662 | $ | 47 | $ | — | $ | — | $ | — | $ | 2,709 | ||||||||||||||||||||||||
| Cost of product sales |
(157 | ) | — | — | — | — | (157 | ) | ||||||||||||||||||||||||||||
| Research and development expenses |
(1,080 | ) | (254 | ) | (24 | ) | (viii) | — | — | (1,358 | ) | |||||||||||||||||||||||||
| Selling, general and administrative expenses |
(418 | ) | (70 | ) | — | — | — | (488 | ) | |||||||||||||||||||||||||||
| Acquisition and integration related charges |
— | — | — | — | — | — | ||||||||||||||||||||||||||||||
|
|
|
|
|
|
|
|
|
|
|
|
|
|||||||||||||||||||||||||
| Total costs and operating expenses |
$ | (1,655 | ) | $ | (324 | ) | $ | (24 | ) | $ | — | $ | — | $ | (2,003 | ) | ||||||||||||||||||||
|
|
|
|
|
|
|
|
|
|
|
|
|
|||||||||||||||||||||||||
| Operating profit |
$ | 1,007 | $ | (277 | ) | $ | (24 | ) | $ | — | $ | — | $ | 706 | ||||||||||||||||||||||
|
|
|
|
|
|
|
|
|
|
|
|
|
|||||||||||||||||||||||||
| Financial income |
312 | 23 | — | — | — | 335 | ||||||||||||||||||||||||||||||
| Financial expenses |
(170 | ) | (81 | ) | — | (321 | ) | (ii) | — | (572 | ) | |||||||||||||||||||||||||
|
|
|
|
|
|
|
|
|
|
|
|
|
|||||||||||||||||||||||||
| Net profit before tax |
$ | 1,149 | $ | (335 | ) | $ | (24 | ) | $ | (321 | ) | $ | — | $ | 469 | |||||||||||||||||||||
|
|
|
|
|
|
|
|
|
|
|
|
|
|||||||||||||||||||||||||
| Corporate tax |
(217 | ) | (10 | ) | 5 | (viii) | 71 | (iii) | — | (151 | ) | |||||||||||||||||||||||||
|
|
|
|
|
|
|
|
|
|
|
|
|
|||||||||||||||||||||||||
| Net profit |
$ | 932 | $ | (345 | ) | $ | (19 | ) | $ | (250 | ) | $ | — | $ | 318 | |||||||||||||||||||||
|
|
|
|
|
|
|
|
|
|
|
|
|
|||||||||||||||||||||||||
| Other comprehensive income: |
||||||||||||||||||||||||||||||||||||
| Amounts which may be re-classified to the income statement |
||||||||||||||||||||||||||||||||||||
| Exchange differences on translation of foreign operations |
22 | 75 | — | — | — | 97 | ||||||||||||||||||||||||||||||
|
|
|
|
|
|
|
|
|
|
|
|
|
|||||||||||||||||||||||||
| Total comprehensive income |
$ | 954 | $ | (270 | ) | $ | (19 | ) | $ | (250 | ) | $ | — | $ | 415 | |||||||||||||||||||||
|
|
|
|
|
|
|
|
|
|
|
|
|
|||||||||||||||||||||||||
| Basic net profit per share |
$ | 14.95 | $ | 5.10 | ||||||||||||||||||||||||||||||||
| Diluted net profit per share |
$ | 14.90 | $ | 5.08 | ||||||||||||||||||||||||||||||||
96
Unaudited Pro Forma Condensed Combined Statement of Operations
For the year ended December 31, 2024
| Transaction Accounting Adjustments | ||||||||||||||||||||||||||||||||||||
| ($ in millions, except per share data) | Genmab Historical (IFRS) |
Merus (IFRS) |
Acquisition | Financing | Others | Pro Forma Combined |
||||||||||||||||||||||||||||||
| Note 2 | Note 3 | Note 4 | Note 5 | |||||||||||||||||||||||||||||||||
| Revenue |
$ | 3,121 | $ | 36 | $ | — | $ | — | $ | — | $ | 3,157 | ||||||||||||||||||||||||
| Cost of product sales |
(143 | ) | — | — | — | — | (143 | ) | ||||||||||||||||||||||||||||
| Research and development expenses |
(1,414 | ) | (225 | ) | (32 | ) | (viii) | — | (33 | ) | (i) | (1,704 | ) | |||||||||||||||||||||||
| Selling, general and administrative expenses |
(549 | ) | (86 | ) | — | — | (35 | ) | (i) | (670 | ) | |||||||||||||||||||||||||
| Acquisition and integration related charges |
(43 | ) | — | — | — | — | (43 | ) | ||||||||||||||||||||||||||||
|
|
|
|
|
|
|
|
|
|
|
|
|
|||||||||||||||||||||||||
| Total costs and operating expenses |
$ | (2,149 | ) | $ | (311 | ) | $ | (32 | ) | $ | — | $ | (68 | ) | $ | (2,560 | ) | |||||||||||||||||||
|
|
|
|
|
|
|
|
|
|
|
|
|
|||||||||||||||||||||||||
| Operating profit |
$ | 972 | $ | (275 | ) | $ | (32 | ) | $ | — | $ | (68 | ) | $ | 597 | |||||||||||||||||||||
|
|
|
|
|
|
|
|
|
|
|
|
|
|||||||||||||||||||||||||
| Financial income |
645 | 65 | — | — | — | 710 | ||||||||||||||||||||||||||||||
| Financial expenses |
(291 | ) | (1 | ) | — | (423 | ) | (ii) | — | (715 | ) | |||||||||||||||||||||||||
|
|
|
|
|
|
|
|
|
|
|
|
|
|||||||||||||||||||||||||
| Net profit before tax |
$ | 1,326 | $ | (211 | ) | $ | (32 | ) | $ | (423 | ) | $ | (68 | ) | $ | 592 | ||||||||||||||||||||
|
|
|
|
|
|
|
|
|
|
|
|
|
|||||||||||||||||||||||||
| Corporate tax |
(193 | ) | (8 | ) | 7 | (viii) | 93 | (iii) | 15 | (i) | (86 | ) | ||||||||||||||||||||||||
|
|
|
|
|
|
|
|
|
|
|
|
|
|||||||||||||||||||||||||
| Net profit |
$ | 1,133 | $ | (219 | ) | $ | (25 | ) | $ | (330 | ) | $ | (53 | ) | $ | 506 | ||||||||||||||||||||
|
|
|
|
|
|
|
|
|
|
|
|
|
|||||||||||||||||||||||||
| Other comprehensive income: |
||||||||||||||||||||||||||||||||||||
| Amounts which may be re-classified to the income statement |
||||||||||||||||||||||||||||||||||||
| Exchange differences on translation of foreign operations |
(224 | ) | (33 | ) | — | — | — | (257 | ) | |||||||||||||||||||||||||||
|
|
|
|
|
|
|
|
|
|
|
|
|
|||||||||||||||||||||||||
| Total comprehensive income |
$ | 909 | $ | (252 | ) | $ | (25 | ) | $ | (330 | ) | $ | (53 | ) | $ | 249 | ||||||||||||||||||||
|
|
|
|
|
|
|
|
|
|
|
|
|
|||||||||||||||||||||||||
| Basic net profit per share |
$ | 17.66 | $ | 7.88 | ||||||||||||||||||||||||||||||||
| Diluted net profit per share |
$ | 17.53 | $ | 7.83 | ||||||||||||||||||||||||||||||||
97
NOTES TO UNAUDITED PRO FORMA CONDENSED COMBINED FINANCIAL INFORMATION
Note 1—Basis of Presentation
Basis of Presentation
The unaudited pro forma condensed combined financial information have been prepared in accordance with Article 11 of Regulation S-X as amended by the final rule, Release No. 33-10786 “Amendments to Financial Disclosures about Acquired and Disposed Businesses.” Release No. 33-10786 replaced the then-existing pro forma adjustment criteria with simplified requirements to depict the accounting for the Transaction Accounting Adjustments.
Genmab’s historical audited consolidated financial statements for the year ended December 31, 2024 and nine months ended September 30, 2025, were prepared in accordance with IFRS Accounting Standards, and IAS 34 Financial Information, respectively. Merus’ historical audited consolidated financial statements for the year ended December 31, 2024 and nine months ended September 30, 2025, were prepared in accordance with US GAAP. Refer to Note 2—Adjustments to Merus’ Consolidated Financial Statements for the IFRS Adjustments made to Merus’ historical unaudited income statement for the nine months ended September 30, 2025 to conform with the Company’s December 31, 2024 fiscal year end. Additional adjustments have been made to Merus’ historical financial statement presentation to present amounts in millions in order to align with Genmab’s financial statement presentation.
The unaudited pro forma condensed combined financial information is presented for informational purposes only and is not necessarily indicative of the combined company’s financial position or results of operations that would have been realized had the Acquisition and related financing transactions occurred as of the dates indicated, nor is it meant to be indicative of any anticipated combined financial position or future results of operations that the combined company will experience after the completion of the Acquisition.
The unaudited pro forma condensed combined financial information does not reflect any anticipated synergies or dis-synergies, operating efficiencies or cost savings, or integration costs that may result from the Acquisition. No assurance can be given that synergies, operating efficiencies or cost savings will be realized. Income taxes do not reflect the amounts that would have resulted had Genmab and Merus filed consolidated income tax returns during the periods presented.
Note 2—Adjustments to Merus’ Consolidated Financial Statements
The tables below illustrate the impact of adjustments made to Merus’ consolidated financial statements in order to present them on a basis consistent with Genmab’s accounting policies under IFRS Accounting Standards. These adjustments reflect Genmab’s best estimates based upon the information currently available to Genmab and could be subject to change once more detailed information is obtained.
98
Unaudited adjusted Merus consolidated statement of operations for the year ended December 31, 2024
| Reclassifications and US GAAP to IFRS adjustments |
||||||||||||||||||||
| ($ in millions) | Merus (US GAAP) |
Reclassifications | Leases | Share based Compensation |
Adjusted Merus (IFRS) |
|||||||||||||||
| (I) | (II) | (III) | ||||||||||||||||||
| Revenue |
$ | — | $ | 36 | $ | — | $ | — | $ | 36 | ||||||||||
| Collaboration revenue |
36 | (36 | ) | — | — | — | ||||||||||||||
| Cost of product sales |
— | — | — | — | — | |||||||||||||||
| Research and development expenses |
(225 | ) | — | — | — | (225 | ) | |||||||||||||
| Selling, general and administrative expenses |
(83 | ) | — | — | (3 | ) | (86 | ) | ||||||||||||
|
|
|
|
|
|
|
|
|
|
|
|||||||||||
| Total costs and operating expenses |
$ | (308 | ) | $ | — | $ | — | $ | (3 | ) | $ | (311 | ) | |||||||
|
|
|
|
|
|
|
|
|
|
|
|||||||||||
| Operating profit |
$ | (272 | ) | $ | — | $ | — | $ | (3 | ) | $ | (275 | ) | |||||||
| Interest (expense) income, net |
31 | (31 | ) | — | — | — | ||||||||||||||
| Foreign exchange (losses) gains, net |
34 | (34 | ) | — | — | — | ||||||||||||||
| Other (losses) gains, net |
— | — | — | — | — | |||||||||||||||
| Financial income |
— | 65 | — | — | 65 | |||||||||||||||
| Financial expenses |
— | — | (1 | ) | — | (1 | ) | |||||||||||||
|
|
|
|
|
|
|
|
|
|
|
|||||||||||
| Net loss before tax |
$ | (207 | ) | $ | — | $ | (1 | ) | $ | (3 | ) | $ | (211 | ) | ||||||
| Corporate tax |
(8 | ) | — | — | — | (8 | ) | |||||||||||||
|
|
|
|
|
|
|
|
|
|
|
|||||||||||
| Net loss |
$ | (215 | ) | $ | — | $ | (1 | ) | $ | (3 | ) | $ | (219 | ) | ||||||
|
|
|
|
|
|
|
|
|
|
|
|||||||||||
| Other comprehensive loss: |
||||||||||||||||||||
| Exchange differences on translation of foreign operations |
(33 | ) | — | — | — | (33 | ) | |||||||||||||
|
|
|
|
|
|
|
|
|
|
|
|||||||||||
| Total comprehensive loss |
$ | (248 | ) | $ | — | $ | (1 | ) | $ | (3 | ) | $ | (252 | ) | ||||||
|
|
|
|
|
|
|
|
|
|
|
|||||||||||
The Reclassifications and US GAAP to IFRS adjustments reflect rounded figures in millions above. Refer to the applicable note below for more information.
99
Unaudited adjusted Merus consolidated statement of operations for the nine months ended September 30, 2025
| Reclassifications and US GAAP to IFRS adjustments |
||||||||||||||||||||
| ($ in millions) | Merus (US GAAP) |
Reclassifications | Leases | Share based Compensation |
Adjusted Merus (IFRS) |
|||||||||||||||
| (I) | (II) | (III) | ||||||||||||||||||
| Revenue |
$ | — | $ | 47 | $ | — | $ | — | $ | 47 | ||||||||||
| Commercial material revenue |
13 | (13 | ) | — | — | — | ||||||||||||||
| Collaboration revenue |
34 | (34 | ) | — | — | — | ||||||||||||||
| Royalty revenue |
— | — | — | — | — | |||||||||||||||
| Research and development expenses |
(254 | ) | — | — | — | (254 | ) | |||||||||||||
| Selling, general and administrative expenses |
(76 | ) | — | 1 | 5 | (70 | ) | |||||||||||||
| Total costs and operating expenses |
$ | (330 | ) | $ | — | $ | 1 | $ | 5 | $ | (324 | ) | ||||||||
| Operating loss |
$ | (283 | ) | $ | — | $ | 1 | $ | 5 | $ | (277 | ) | ||||||||
|
|
|
|
|
|
|
|
|
|
|
|||||||||||
| Interest (expense) income, net |
23 | (23 | ) | — | — | — | ||||||||||||||
| Foreign exchange (losses) gains, net |
(78 | ) | 78 | — | — | — | ||||||||||||||
| Other (losses) gains, net |
(3 | ) | 3 | — | — | — | ||||||||||||||
| Finance income |
— | 23 | — | — | 23 | |||||||||||||||
| Financial expenses |
— | (81 | ) | — | — | (81 | ) | |||||||||||||
|
|
|
|
|
|
|
|
|
|
|
|||||||||||
| Net loss before tax |
$ | (341 | ) | $ | — | $ | 1 | $ | 5 | $ | (335 | ) | ||||||||
| Corporate tax |
(10 | ) | — | — | — | (10 | ) | |||||||||||||
|
|
|
|
|
|
|
|
|
|
|
|||||||||||
| Net profit |
$ | (351 | ) | $ | — | $ | 1 | $ | 5 | $ | (345 | ) | ||||||||
| Other comprehensive loss: |
||||||||||||||||||||
| Exchange differences on translation of foreign operations |
75 | — | — | — | 75 | |||||||||||||||
|
|
|
|
|
|
|
|
|
|
|
|||||||||||
| Total comprehensive loss |
$ | (276 | ) | $ | — | $ | 1 | $ | 5 | $ | (270 | ) | ||||||||
|
|
|
|
|
|
|
|
|
|
|
|||||||||||
The Reclassifications and US GAAP to IFRS adjustments reflect rounded figures in millions above. Refer to the applicable note below for more information.
100
Unaudited adjusted Merus consolidated statement of financial position as at September 30, 2025
| Reclassifications and US GAAP to IFRS adjustments |
||||||||||||||||||||
| ($ in millions) | Merus (US GAAP) |
Reclassifications | Leases | Share based Compensation |
Adjusted Merus (IFRS) |
|||||||||||||||
| I | II | III | ||||||||||||||||||
| Assets | ||||||||||||||||||||
| Goodwill |
$ | — | $ | — | $ | — | $ | — | $ | — | ||||||||||
| Other intangible assets |
2 | — | — | — | 2 | |||||||||||||||
| Property and equipment |
11 | — | — | — | 11 | |||||||||||||||
| Right-of-use assets |
12 | — | — | — | 12 | |||||||||||||||
| Receivables |
— | — | — | — | — | |||||||||||||||
| Deferred tax assets |
1 | — | — | — | 1 | |||||||||||||||
| Marketable securities—non-current |
181 | (181 | ) | — | — | — | ||||||||||||||
| Other investments |
— | 183 | — | — | 183 | |||||||||||||||
| Equity investment |
2 | (2 | ) | — | — | — | ||||||||||||||
| Prepaid expenses and other noncurrent assets |
— | 2 | — | — | 2 | |||||||||||||||
| Other assets |
3 | (3 | ) | — | — | — | ||||||||||||||
|
|
|
|
|
|
|
|
|
|
|
|||||||||||
| Total non-current assets |
$ | 212 | $ | (1 | ) | $ | — | $ | — | $ | 211 | |||||||||
|
|
|
|
|
|
|
|
|
|
|
|||||||||||
| Inventories |
— | — | — | — | — | |||||||||||||||
| Receivables |
19 | — | — | — | 19 | |||||||||||||||
| Marketable securities—current |
268 | — | — | — | 268 | |||||||||||||||
| Cash and cash equivalents |
368 | 1 | — | — | 369 | |||||||||||||||
| Prepaid expenses and other current assets |
37 | — | — | — | 37 | |||||||||||||||
|
|
|
|
|
|
|
|
|
|
|
|||||||||||
| Total current assets |
$ | 692 | $ | 1 | $ | — | $ | — | $ | 693 | ||||||||||
|
|
|
|
|
|
|
|
|
|
|
|||||||||||
| Total assets |
$ | 904 | $ | — | $ | — | $ | — | $ | 904 | ||||||||||
|
|
|
|
|
|
|
|
|
|
|
|||||||||||
| Shareholders’ Equity and Liabilities |
||||||||||||||||||||
| Common shares |
8 | $ | (8 | ) | $ | — | $ | — | $ | — | ||||||||||
| Additional paid-in capital |
2,066 | (2,066 | ) | — | — | — | ||||||||||||||
| Accumulated other comprehensive income |
19 | (19 | ) | — | — | — | ||||||||||||||
| Accumulated deficit |
(1,319 | ) | 1,319 | — | — | — | ||||||||||||||
| Share capital |
— | 8 | — | — | 8 | |||||||||||||||
| Share premium |
— | 2,066 | — | — | 2,066 | |||||||||||||||
| Other reserves |
— | 19 | — | — | 19 | |||||||||||||||
| Retained earnings |
— | (1,319 | ) | 1 | — | (1,318 | ) | |||||||||||||
|
|
|
|
|
|
|
|
|
|
|
|||||||||||
| Total shareholders’ equity |
$ | 774 | $ | — | $ | 1 | $ | — | $ | 775 | ||||||||||
|
|
|
|
|
|
|
|
|
|
|
|||||||||||
| Lease liabilities—non-current |
10 | — | (1 | ) | — | 9 | ||||||||||||||
| Contract liabilities—non-current |
— | 33 | — | — | 33 | |||||||||||||||
| Borrowings—noncurrent |
— | — | — | — | ||||||||||||||||
| Deferred tax liabilities |
— | — | — | — | — | |||||||||||||||
| Other payables |
— | — | — | — | — | |||||||||||||||
| Deferred revenue, net of current portion |
33 | (33 | ) | — | — | — | ||||||||||||||
|
|
|
|
|
|
|
|
|
|
|
|||||||||||
| Total non-current liabilities |
$ | 43 | $ | — | $ | (1 | ) | $ | — | $ | 42 | |||||||||
|
|
|
|
|
|
|
|
|
|
|
|||||||||||
| Corporate tax payable |
7 | — | — | — | 7 | |||||||||||||||
| Lease liabilities—current |
3 | — | — | — | 3 | |||||||||||||||
| Borrowings—current |
— | — | — | — | — | |||||||||||||||
| Accounts payable |
8 | (8 | ) | — | — | — | ||||||||||||||
| Contract liabilities—current |
— | 24 | — | — | 24 | |||||||||||||||
| Accrued expenses and other liabilities |
45 | (45 | ) | — | — | — | ||||||||||||||
| Other payables |
— | 53 | — | — | 53 | |||||||||||||||
| Current portion of deferred revenue |
24 | (24 | ) | — | — | — | ||||||||||||||
|
|
|
|
|
|
|
|
|
|
|
|||||||||||
| Total current liabilities |
$ | 87 | $ | — | $ | — | $ | — | $ | 87 | ||||||||||
|
|
|
|
|
|
|
|
|
|
|
|||||||||||
| Total liabilities |
$ | 130 | $ | — | $ | (1 | ) | $ | — | $ | 129 | |||||||||
|
|
|
|
|
|
|
|
|
|
|
|||||||||||
| Total shareholders’ equity and liabilities |
$ | 904 | $ | — | $ | — | $ | — | $ | 904 | ||||||||||
|
|
|
|
|
|
|
|
|
|
|
|||||||||||
The Reclassifications and US GAAP to IFRS adjustments reflect rounded figures in millions above. Refer to the applicable note below for more information.
101
The classification of certain items presented by Merus under US GAAP has been modified in order to align with the presentation used by Genmab under IFRS Accounting Standards; all amounts are rounded to the nearest million. Merus historical financial statements were presented in thousands of U.S. Dollars.
I. Presentational Alignment
Modifications to Merus’ historical consolidated statement of operations presentation include:
| • | Presentation of “Collaboration revenue” in “Revenue” of $36 million for the year ended December 31, 2024 and $34 million for the nine months ended September 30, 2025; |
| • | Presentation of “Commercial material revenue” in “Revenue” of nil for the year ended December 31, 2024 and $13 million for the nine months ended September 30, 2025; |
| • | Presentation of “Interest (expense) income, net” in “Financial Income” of $31 million for the year ended December 31, 2024 and $23 million for the nine months ended September 30, 2025; |
| • | Presentation of “Foreign exchange (losses) gains, net” in “Financial income” and “Financial expenses” of $34 million for the year ended December 31, 2024 and $78 million for the nine months ended September 30, 2025; |
| • | Presentation of “Other (losses) gains, net” in “Financial expenses” of nil for the year ended December 31, 2024 and $3 million for the nine months ended September 30, 2025; |
Modifications to Merus’ historical consolidated statement of financial position presentation include:
Assets
| • | Presentation of “Marketable securities—non-current” of $181 million and “Equity investment” of $2 million to align with Genmab’s aggregate presentation of “Other Investments”; |
| • | Presentation of “Other assets” reclassified into “Cash and cash equivalents” to present the restricted cash portion $1 million of other assets and the remainder of the account balance $2 million in “Prepaid expenses and other noncurrent assets”; |
Shareholder’s Equity and Liabilities
| • | Presentation of “Common Shares” of $8 million in “Share Capital”; |
| • | Presentation of “Additional paid-in capital” of $2,066 million in “Share premium”; |
| • | Presentation of “Accumulated other comprehensive income” of $19 million in “Other reserves” ; |
| • | Presentation of “Accumulated deficit” of $1,319 million in “Retained earnings”; |
| • | Presentation of “Deferred revenue, net of current portion” of $33 million in “Contract liabilities—noncurrent”; |
| • | Presentation of “Accounts payable” of $8 million and “Accrued Expenses and other liabilities” of $45 million in “Other payables”; |
| • | Presentation of “Current portion of deferred revenue” of $24 million in “Contract liabilities—current”. |
II. Leases
Under U.S. GAAP, lessees are permitted to allocate variable consideration not dependent on an index or rate, such as performance- or usage-based payments, between lease and non-lease components of a contract. Conversely, IFRS variable consideration that is not dependent on an index or rate is not included in the measurement of lease liability. In addition, there are differences in the subsequent measurement of right-of-use assets (“ROU assets”).
102
Under IFRS Accounting Standards, ROU assets are depreciated using a straight-line method, with depreciation and interest on lease liabilities separated. U.S. GAAP recognizes operating lease expense on a straight-line basis. These differences influence the presentation and measurement of leases on financial statements.
As a result, “Right-of-use assets” increased by $0.3 million, “Lease liabilities—current” decreased by $0.1 million, “Lease liabilities—non-current” decreased by $0.9 million, and “Retained Earnings” increased by $0.9 million in the unaudited adjusted consolidated statement of financial position at September 30, 2025. The unaudited adjusted consolidated statement of operations reflects a $0.4 million decrease in “Selling, general and administrative expenses” for the year ended December 31, 2024 and a $0.5 million decrease in “Selling, general and administrative expenses” for the nine months ended September 30, 2025, a $0.6 million increase to “Financial expense” for the year ended December 31, 2024 and a $0.3 million increase to “Financial expense” for the nine months ended September 30, 2025.
III. Share-based Compensation
Under U.S. GAAP, there are differences related to the grant date for awards granted to non-executive directors. According to U.S. GAAP, the service inception date may be the grant date if all key terms and conditions are understood and necessary approvals are obtained. This can lead to recognizing compensation expense earlier than under IFRS Accounting Standards where the grant date is based solely on when the initial grant terms are understood and agreed upon. Additionally, Merus’ accounting policy under U.S. GAAP is to recognize forfeitures of share-based compensation awards when the forfeiture occurs; under IFRS Accounting Standards, the forfeitures are estimated as of the grant date.
As a result, “Selling, general and administrative costs” was increased by $3 million for the year ended December 31, 2024 and decreased by $5 million for the nine months ended September 30, 2025.
Note 3—Preliminary Purchase Consideration and Allocation
Estimated Aggregate Acquisition Consideration
The following table summarizes the preliminary estimated aggregate acquisition consideration for Merus with reference to Genmab’s tender offer price of $97 per common share.
| ($ in millions, except per share data) | Note | |||||||
| Offer Price per share |
$ | 97.00 | (i) | |||||
| Shares outstanding |
75,784,442 | |||||||
| Options outstanding |
10,248,022 | |||||||
| Aggregate exercise price of options outstanding |
331 | (iii) | ||||||
| Net shares repurchased with exercise proceeds |
(3,417,367 | ) | ||||||
| Estimated shares outstanding -fully diluted |
82,615,097 | (ii) | ||||||
|
|
|
|||||||
| Estimated transaction consideration |
$ | 8,014 | ||||||
|
|
|
|||||||
| Plus: Estimated directly attributable acquisition cost |
144 | (iv) | ||||||
| Plus: Liabilities assumed |
129 | (vi) | ||||||
| Less: Portion attributable to modified share based payment awards |
68 | (v) | ||||||
|
|
|
|||||||
| Total cost allocated to net assets acquired |
$ | 8,219 | ||||||
|
|
|
|||||||
| (i) | The offering price per share represents the tender offer consideration offered to holders of Merus’ common shares pursuant to the Transaction Agreement. |
| (ii) | The shares outstanding and options outstanding represent the sum of all common shares and outstanding options, regardless of vesting status as computed under the treasury stock method, as reported on Merus’ capitalization table as of September 26, 2025. |
103
| (iii) | The aggregate exercise price outstanding represents the sum of the exercise prices sourced from Merus’ capitalization table as of September 26, 2025. |
| (iv) | The allocated cost of net assets acquired includes $144 million of costs directly attributable to the transaction such as professional fees, filing fees, and non-refundable purchase taxes. |
| (v) | The unvested share-based payment awards were accelerated to the closing date of the transaction with no future service requirements of the holder of an unvested award and the awards do not contain pre-existing acceleration clauses. This acceleration of vesting represents a modification of share-based payment awards under IFRS 2. The company identified the unrecognized grant date fair value of $68 million for the modified awards as an acquirer compensation expense for the year ended December 31, 2024, recognized in note 5, that is not part of the cost of net assets acquired. |
| (vi) | The liabilities assumed of $129 million will be included as part of the purchase price and are sourced from Merus’ balance sheet as of September 30, 2025. |
Preliminary Allocation of Cost of Net Assets Acquired
The assumed accounting for the transaction followed “Approach 2” as provided by IFRS 3.2(b) and IU 11-17 as follows: measure any identifiable asset or assumed liability initially measured at an amount other than cost in accordance with the applicable accounting standards, deduct from the cost of the group of assets the amounts allocated to these assets and liabilities, and then allocate the residual cost of acquisition to the remaining identifiable assets and liabilities based on their relative fair values at the date of acquisition.
The allocated cost of net assets acquired includes $144 million of costs directly attributable to the transaction such as financial advisory fees, professional fees, filing fees, and non-refundable purchase taxes.
The provisional fair value amounts used to allocate the acquisition consideration is not final. For the preliminary estimate of recognition and measurement of the net assets of Merus, management used publicly available benchmarking information as well as a variety of other assumptions, including market participant assumptions. Management is expected to use widely accepted income-based, market-based, and cost-based valuation approaches upon finalization of purchase accounting for the recognition and measurement of net assets acquired. Actual results may differ materially from the assumptions within the accompanying unaudited pro forma condensed combined financial information. The unaudited pro forma adjustments are based upon available information and certain assumptions that management believes are reasonable under the circumstances but may be subject to change as additional information becomes available and as additional analyses are performed.
104
The following table summarizes the preliminary allocation of net assets acquired, as if the Acquisition had been completed on September 30, 2025:
| ($ in millions, except per share data) | Amount | |||||||
| As of September 30, 2025 |
||||||||
| Total cost allocated to net assets acquired |
$ | 8,219 | (i) | |||||
| Assets and Liabilities recognized at historical carrying value |
||||||||
| Prepaid expenses and other non-current assets |
2 | |||||||
| Other investments |
181 | |||||||
|
|
|
|||||||
| Total non-current assets recognized at historical carrying value |
$ | 183 | ||||||
|
|
|
|||||||
| Prepaid expenses and other current assets |
37 | |||||||
| Receivables |
19 | |||||||
| Marketable securities |
268 | |||||||
| Cash and cash equivalents |
369 | |||||||
|
|
|
|||||||
| Total Assets recognized at historical carrying value |
$ | 876 | ||||||
|
|
|
|||||||
| Corporate tax payable |
7 | |||||||
| Other payables |
53 | |||||||
| Lease liabilities—Current |
3 | |||||||
| Lease liabilities—Non Current |
9 | |||||||
| Contract Liabilities—Current |
24 | |||||||
| Contract Liabilities—Non Current |
33 | |||||||
|
|
|
|||||||
| Total Liabilities recognized at historical carrying value |
$ | 129 | ||||||
|
|
|
|||||||
| Assets recognized at residual cost |
||||||||
| Other intangible assets |
$ | 7,318 | (ii) | |||||
| Property and equipment |
11 | (iii) | ||||||
| Other investments |
2 | (iv) | ||||||
| Right-of-use assets |
12 | (v) | ||||||
| (i.) | Represents the cash paid for the acquired assets. |
| (ii.) | The cost allocated to identified intangible assets represents primarily a group of IPR&D assets related to Merus’ petosemtamab programs, Licenses and Patents for the Bizengri royalty asset, and Technology Platform. The result is an incremental recognition of $7,316 million to the cost of other intangible assets compared to Merus’ historical carrying value of $2 million. |
The allocated cost and weighted average estimated useful life of identifiable intangible assets are estimated as follows:
| Fair Value | Weighted— average estimated useful life |
Annual amortization |
||||||||||
| (In $ millions) | (in years) | (In $ millions) | ||||||||||
| Licenses and Patents |
$ | 57 | 18 | $ | 3 | |||||||
| Technology Platform |
371 | 13 | 29 | |||||||||
| Acquired IPR&D |
6,890 | Not in use | — | |||||||||
|
|
|
|
|
|||||||||
| Total acquired identifiable intangible assets* |
$ | 7,318 | $ | 32 | ||||||||
|
|
|
|
|
|||||||||
| * | The subsequent measurement of increases to fair value of tangible assets is not expected to have a material impact on the continuing financial statements |
| (iii.) | The cost allocated to identified tangible assets at the relative fair value results in de minimis incremental recognition to the cost basis of property and equipment compared to Merus’ historical carrying value of $11 million. |
105
| (iv.) | The cost allocated to other investments represents the portion of Merus’ equity method investment. A de minimis incremental cost adjustment is recognized in the allocation of acquisition cost compared to Merus’ historical carrying value of $2 million. |
| (v.) | The cost allocated to right of use assets represents intangible asset associated with the assumed lease, accounted for under the single lease model under IFRS 16. A de minimis incremental cost adjustment is recognized in the allocation of acquisition cost compared to Merus’ historical carrying value of $12 million. |
| (vi.) | The adjustment to deferred tax asset represents the derecognition of Merus’ historical deferred tax asset which meets the recognition exemption under IAS 12.15. |
| (vii.) | As part of the purchase price allocation, Merus’ historical equity of $775 is eliminated and replaced with the acquisition consideration. Retained earnings is also adjusted for the $68 million of modified share based payment awards recorded as compensation expense for the year ended December 31, 2024. |
| (viii.) | Based on the estimated cost allocation to the identified intangible assets and the weighted average estimated useful lives, an adjustment to amortization expense of $32 million and $24 million has been included in the unaudited pro forma condensed combined statement of operations for the year ended December 31, 2024 and the nine months ended September 30, 2025, respectively. The related estimated net decrease to income tax expense for the unaudited pro forma condensed combined statement of operations, calculated using the Danish statutory tax rate of 22%, is $7 million and $5 million for the year ended December 31, 2024 and the nine months ended September 30, 2025, respectively. This adjustment will recur for the life of the underlying assets. |
Note 4—Adjustments for Financing
In connection with the Transactions, Genmab has secured committed financing of $6,000 million, of which $5,500 million is intended to be used to finance, in part, the aggregate consideration for the Acquisition and $500 million is committed pursuant to a revolving credit facility that is expected to be undrawn at the closing of the Acquisition.
The following pro forma financing adjustments relate to the effects of the financing transaction:
| (i) | The following adjustments have been made the unaudited pro forma condensed combined statement of financial position as of September 30, 2025 to recognize current and non-current borrowings: |
| (in $ millions) | Financing adjustments | |||||||
| Proceeds from Term Loan A Facility |
$ | 1,000 | ||||||
| Proceeds from Term Loan B Facility |
2,000 | |||||||
| Proceeds from Revolving Facility |
— | (i)(d) | ||||||
| Proceeds from Senior Secured Notes |
1,500 | |||||||
| Proceeds from Senior Unsecured Notes |
1,000 | |||||||
|
|
|
|||||||
| Total sources of funding |
$ | 5,500 | ||||||
| Debt issuance costs |
(237 | ) | (i)(a) | |||||
|
|
|
|||||||
| Total sources of funding, net of debt issuance costs |
$ | 5,263 | ||||||
|
|
|
|||||||
| Presented as: |
||||||||
| Current portion of debt adjustment |
$ | 250 | (i)(b) | |||||
| Non-current portion of debt adjustment |
$ | 5,013 | (i)(c) | |||||
| (i)(a) | The debt issuance costs represent total estimated costs in relation to the Term Loan A Facility, Term Loan B Facility, Senior Secured Notes, and Senior Unsecured Notes. |
| (i)(b) | The current portion of the debt adjustment is comprised of the proceeds from the Senior Secured Notes and Senior Unsecured Notes, net of debt issuance costs of $50.0 million related to the first year of annual amortization on the Term Loan A Facility, and $200.0 million related to the first year of annual amortization on the Term Loan B Facility. |
106
| (i)(c) | The non-current portion of the debt adjustment is comprised of the proceeds from the Term Loan A Facility, Term Loan B Facility, the Senior Secured Notes and the Senior Unsecured Notes, net of debt issuance costs. |
| (i)(d) | The Company does not expect to utilize any proceeds from the $500 million Revolving Facility to finance the Acquisition and incurred $5.7 million in fees related to the Revolving Facility. As the facility is not expected to be drawn down, the fees are capitalized as a prepayment for liquidity services. The fees will be presented under “Prepaid expenses and other non-current assets” in the unaudited pro forma condensed combined statement of financial position. The capitalized costs will be amortized over the Revolving Facility, and this amortization will be recognized in the unaudited pro forma condensed combined statement of operations as “Financial expenses”. |
| (ii) | Reflects the pro forma interest expense and amortized debt issuance costs adjustment for the nine months ended September 30, 2025 and year ended December 31, 2024, respectively, calculated as follows. |
| Finance expense | ||||||||
| ($ in millions) | For the year ended December 31, 2024 |
For the nine months ended September 30, 2025 |
||||||
| Interest Expense (6.66% rate) |
$ | 398 | $ | 299 | ||||
| Amortized debt issuance cost |
25 | 22 | ||||||
|
|
|
|
|
|||||
| Total finance expense adjustment |
$ | 423 | $ | 321 | ||||
|
|
|
|
|
|||||
For the purposes of calculating the above pro forma interest expense, a blended interest rate of 6.66% has been assumed across the debt financing instruments, which may differ from the actual blended interest rate when the debt financing is finalized. A hypothetical increase in interest rates of 0.125% would increase total finance expense for the unaudited pro forma condensed combined statement of operations by approximately $7.2 million in the year ended December 31, 2024 and $3.8 million in the nine months ended September 30, 2025. A hypothetical decrease in interest rates of 0.125% would decrease total finance expense for the unaudited pro forma condensed combined statement of operations by approximately $6.3 million in the year ended December 31, 2024 and $6.4 million in the nine months ended September 30, 2025.
In addition to incremental interest charges, Genmab has also recorded a pro forma adjustment for debt issuance cost amortization for each facility, which will be deferred and amortized over the duration of the borrowings.
The related estimated net decrease to income tax expense for the unaudited pro forma condensed combined statement of operations is $93.1 million and $70.6 million in the year ended December 31, 2024 and the nine months ended September 30, 2025, respectively. The pro forma income tax adjustments were estimated using the Danish statutory tax rate of 22%.
Note 5—Other Transaction Accounting Adjustments
| (i) | The unvested share-based payment awards are accelerated to the closing date of the transaction with no future service requirements of the holder of an unvested award and the awards do not contain pre-existing acceleration clauses. This acceleration of vesting represents a modification of share-based payment awards under IFRS 2. The company identified the unrecognized grant date fair value of the modified as an acquirer compensation expense. The modification resulted in additional compensation expense of $68 million. In the unaudited pro forma condensed combined statement of operations, this expense consists of both research and development expense and selling, general and administrative expense of $35 million and $33 million, respectively, for the year ended December 31, 2024. The related tax impact of $7.2 million and $7.8 million calculated at the Danish statutory tax rate of 22%, for research and |
107
| development expenses, selling, general and administrative expenses, respectively, is removed from corporate tax for the year ended December 31, 2024. As there is no ongoing service requirement, all of the compensation charge would have been recognized as of the date of acquisition therefore no adjustment is made to the unaudited pro forma condensed combined statement of operations as of September 30, 2025. This adjustment will not have a continuing impact on the combined company. |
| (ii) | Adjustment to present the effect of the planned liquidation of Genmab marketable securities of $1,650 million to fund a portion of the purchase price of the transaction. |
Note 6—Earnings per Share
For the year ended December 31, 2024, the Genmab pro forma basic earnings per share was calculated using 64,186,647 weighted average number of shares excluding. treasury shares and 64,655,986 weighted average shares, diluted for the period. For the nine months ended September 30, 2025, the Genmab pro forma basic earnings per share was calculated using 62,337,740 weighted average shares outstanding—basic and 62,552,176 weighted average shares, diluted for the period. The EPS information is presented as follows:
| Earnings Per Share Data | ||||||||
| ($ in millions, except per share data) | For the year ended December 31, 2024 |
For the nine months ended September 30, 2025 |
||||||
| Net Profit |
$ | 506 | $ | 318 | ||||
|
|
|
|
|
|||||
| Weighted average number of shares excl. treasury shares |
64,186,647 | 62,337,740 | ||||||
| Weighted average number of shares, diluted |
64,655,986 | 62,552,176 | ||||||
| Basic EPS |
$ | 7.88 | $ | 5.10 | ||||
| Diluted EPS |
$ | 7.83 | $ | 5.08 | ||||
108
Exhibit 99.5
EXHIBIT C
AUDITED CONSOLIDATED FINANCIAL STATEMENTS AS OF AND FOR THE YEARS ENDED
DECEMBER 31, 2024, 2023 AND 2022

REPORT OF INDEPENDENT REGISTERED PUBLIC ACCOUNTING FIRM
To the Shareholders and the Board of Directors of Genmab A/S
Opinions on the Financial Statements and Internal Control over Financial Reporting
We have audited the accompanying consolidated balance sheet of Genmab A/S and its subsidiaries (the “Company”) as of December 31, 2024, the related Consolidated Statement of Comprehensive Income, Consolidated Statement of Cash Flows and the Consolidated Statement of Changes in Equity, for the year then ended, and the related notes (collectively referred to as the “financial statements”). We also have audited the Company’s internal control over financial reporting as of December 31, 2024, based on criteria established in Internal Control—Integrated Framework (2013) issued by the Committee of Sponsoring Organizations of the Treadway Commission (COSO).
In our opinion, the financial statements referred to above present fairly, in all material respects, the financial position of the Company as of December 31, 2024, and the results of its operations and its cash flows for the year then ended, in conformity with IFRS Accounting Standards as issued by the International Accounting Standards Board (IASB) and IFRS as endorsed by the EU. Also, in our opinion, the Company maintained, in all material respects, effective internal control over financial reporting as of December 31, 2024, based on criteria established in Internal Control—Integrated Framework (2013) issued by COSO.
Change in Accounting Principle
As described in Note 1.1, sub-section Presentation Currency, to the financial statements, the Company has changed its presentation currency from Danish Kroner (DKK) to U.S. Dollars (USD).
Basis for Opinions
The Company’s management is responsible for these financial statements, for maintaining effective internal control over financial reporting, and for its assessment of the effectiveness of internal control over financial reporting, included in the Report of Genmab Management on Internal Control over Financial Reporting (not presented herein). Our responsibility is to express an opinion on these financial statements and an opinion on the Company’s internal control over financial reporting based on our audit. We are a public accounting firm registered with the Public Company Accounting Oversight Board (United States) (PCAOB) and are required to be independent with respect to the Company in accordance with the U.S. federal securities laws and the applicable rules and regulations of the Securities and Exchange Commission and the PCAOB.
We conducted our audit in accordance with the standards of the PCAOB. Those standards require that we plan and perform the audit to obtain reasonable assurance about whether the financial statements are free of material misstatement, whether due to error or fraud, and whether effective internal control over financial reporting was maintained in all material respects.
Our audit of the financial statements included performing procedures to assess the risks of material misstatement of the financial statements, whether due to error or fraud, and performing procedures to respond to those risks. Such procedures included examining, on a test basis, evidence regarding the amounts and disclosures in the financial statements. Our audit also included evaluating the accounting principles used and significant estimates made by management, as well as evaluating the overall presentation of the financial statements. Our audit of internal control over financial reporting included obtaining an understanding of internal control over financial reporting, assessing the risk that a material weakness exists, and testing and evaluating the design and operating effectiveness of internal control based on the assessed risk. Our audit also included performing such other procedures as we considered necessary in the circumstances. We believe that our audit provides a reasonable basis for our opinions.
F-2
Definition and Limitations of Internal Control over Financial Reporting
A company’s internal control over financial reporting is a process designed to provide reasonable assurance regarding the reliability of financial reporting and the preparation of financial statements for external purposes in accordance with generally accepted accounting principles. A company’s internal control over financial reporting includes those policies and procedures that (1) pertain to the maintenance of records that, in reasonable detail, accurately and fairly reflect the transactions and dispositions of the assets of the company; (2) provide reasonable assurance that transactions are recorded as necessary to permit preparation of financial statements in accordance with generally accepted accounting principles, and that receipts and expenditures of the company are being made only in accordance with authorizations of management and directors of the company; and (3) provide reasonable assurance regarding prevention or timely detection of unauthorized acquisition, use, or disposition of the company’s assets that could have a material effect on the financial statements.
Because of its inherent limitations, internal control over financial reporting may not prevent or detect misstatements. Also, projections of any evaluation of effectiveness to future periods are subject to the risk that controls may become inadequate because of changes in conditions, or that the degree of compliance with the policies or procedures may deteriorate.
Critical Audit Matters
The critical audit matters communicated below are matters arising from the current-period audit of the financial statements that were communicated or required to be communicated to the audit committee and that (1) relate to accounts or disclosures that are material to the financial statements and (2) involved our especially challenging, subjective, or complex judgments. The communication of critical audit matters does not alter in any way our opinion on the financial statements, taken as a whole, and we are not, by communicating the critical audit matters below, providing separate opinions on the critical audit matters or on the accounts or disclosures to which they relate.
Valuation of Acquired IPR&D Assets in the ProfoundBio, Inc. Acquisition—Refer to Notes 3.1 and 5.5 to the financial statements
Critical Audit Matter Description
The Company completed the acquisition of ProfoundBio, Inc. (“ProfoundBio”) for USD 1.72 billion (DKK 11.8 billion) on May 21, 2024. The Company accounted for the acquisition as a business combination and, accordingly, has performed procedures to identify all assets and liabilities and allocated the purchase price to the assets acquired and liabilities assumed based on their respective estimated fair values as of the date of acquisition.
Intangible assets acquired primarily included the in-process research and development intangible assets (“Acquired IPR&D assets”). The Company estimated the fair value of the Acquired IPR&D assets using an income approach. The fair value determination of the Acquired IPR&D assets required the Company to make significant estimates and assumptions related to the forecasted future cash flows, such as probabilities of technical and regulatory success, and the determination of the discount rates.
We identified the valuation of Acquired IPR&D assets for the ProfoundBio acquisition as a critical audit matter because of the high level of complexity and management judgement involved in determining the above outlined significant estimates and assumptions used by the Company to determine the fair value of these assets. This required a high degree of auditor judgement and an increased extent of effort when performing audit procedures to evaluate the reasonableness of management’s estimates and assumptions.
F-3
How the Critical Audit Matter Was Addressed in the Audit
Our audit procedures related to the valuation of the Acquired IPR&D assets in the ProfoundBio acquisition included the following, among others:
| • | We tested the effectiveness of controls over the valuation of the Acquired IPR&D assets, including the Company’s controls over the significant estimates and assumptions related to the forecasted future cash flows, such as probabilities of technical and regulatory success, and the determination of the discount rates. |
| • | We assessed the reasonableness of the Company’s probabilities of technical and regulatory success used in determination of the fair value of the Acquired IPR&D assets by comparing to internal and external market studies and certain peer companies/products in the industry. |
| • | We assessed the reasonableness of the Company’s forecasts of future cash flows used in determination of the fair value of the Acquired IPR&D assets by comparing the forecasts to historical results of operations, certain peer companies within comparable industries, and internal and external market studies. |
| • | With the assistance of our valuation specialists, we evaluated the reasonableness of the discount rates by testing the source information and inputs underlying the determination of the discount rates, including in relation to publicly available information for comparable companies and testing the mathematical accuracy of the calculation. |
Revenue recognition of royalty revenue—Refer to Note 2.1 to the financial statements
Critical Audit Matter Description
The Company recognized royalty revenue, where revenue is recognized based on net sales by collaboration partners. The Company uses net sales provided by its collaboration partners as an input to their calculation of the amount of royalty revenue to recognize in each period. The preliminary net sales data provided by the collaboration partner may change once final net sales data is available.
We identified the revenue recognition of royalty contracts as a critical audit matter because of the significant estimation uncertainty related to the net sales data provided by collaboration partners. Specifically, the collaboration partner’s estimate of net sales could change based on the final net sales impacting the royalty revenue recognized in each period. This required a high degree of auditor judgement and an increased extent of effort when performing audit procedures to evaluate the reasonableness of management’s estimates of the net sales.
How the Critical Audit Matter Was Addressed in the Audit
Our audit procedures related to the royalty revenue recognized based on the significant assumption of estimated net sales provided by the collaboration partners included the following, among others:
| • | We tested the effectiveness of controls relating to the evaluation for reasonableness of the estimated net sales used in the determination of royalty revenue recognition. |
| • | We tested the overall reasonableness of the estimated net sales reported by the collaboration partners by assessing the historical accuracy of the estimates. |
| • | We obtained external confirmations from selected collaboration partners on the estimated and actual net sales amounts reported. |
F-4
/s/ Deloitte Statsautoriseret Revisionspartnerselskab
Copenhagen, Denmark
February 12, 2025 (November 7, 2025 as to the effects on the financial statements for the change in presentation currency disclosed within note 1.1, sub-section Presentation Currency, note 4.2 and the reclassifications made to financial income and expenses as disclosed in notes 1.4 and 4.5)
We have served as the Company’s auditor since 2024.
F-5

REPORT OF INDEPENDENT REGISTERED PUBLIC ACCOUNTING FIRM
To the Board of Directors and Shareholders of Genmab A/S
Opinion on the Financial Statements
We have audited the consolidated balance sheet of Genmab A/S and its subsidiaries (the “Company”) as of December 31, 2023, and the related consolidated statements of comprehensive income, statements of changes in equity and statements of cash flows for each of the two years in the period ended December 31, 2023, including the related notes, (collectively referred to as the “consolidated financial statements”).
In our opinion, the consolidated financial statements present fairly, in all material respects, the financial position of the Company as of December 31, 2023, and the results of its operations and its cash flows for each of the two years in the period ended December 31, 2023 in conformity with IFRS Accounting Standards as issued by the International Accounting Standards Board and IFRS Accounting Standards as adopted by the European Union.
Basis for Opinion
These consolidated financial statements are the responsibility of the Company’s management. Our responsibility is to express an opinion on the Company’s consolidated financial statements based on our audits. We are a public accounting firm registered with the Public Company Accounting Oversight Board (United States) (PCAOB) and are required to be independent with respect to the Company in accordance with the U.S. federal securities laws and the applicable rules and regulations of the Securities and Exchange Commission and the PCAOB.
We conducted our audits of these consolidated financial statements in accordance with the standards of the PCAOB. Those standards require that we plan and perform the audit to obtain reasonable assurance about whether the consolidated financial statements are free of material misstatement, whether due to error or fraud.
Our audits included performing procedures to assess the risks of material misstatement of the consolidated financial statements, whether due to error or fraud, and performing procedures that respond to those risks. Such procedures included examining, on a test basis, evidence regarding the amounts and disclosures in the consolidated financial statements. Our audits also included evaluating the accounting principles used and significant estimates made by management, as well as evaluating the overall presentation of the consolidated financial statements. We believe that our audits provide a reasonable basis for our opinion.
/s/ PricewaterhouseCoopers
Statsautoriseret Revisionspartnerselskab
Hellerup, Denmark
February 14, 2024, except for the revisions in Notes 1.4 and 4.5, as to which the date is February 12, 2025, and the changes in presentation currency and reclassification in Notes 1.1, 1.4, 4.2 and 4.5, as to which the date is November 7, 2025.
We served as the Company’s auditor from 2001 to 2024.
F-6
CONSOLIDATED STATEMENTS OF COMPREHENSIVE INCOME
| (USD million) |
Note | 2024* Restated |
2023* Restated |
2022* Restated |
||||||||||
| Revenue |
2.1, 2.2 | 3,121 | 2,390 | 2,031 | ||||||||||
| Cost of product sales |
2.3 | (143 | ) | (33 | ) | — | ||||||||
| Research and development expenses |
2.3, 3.1, 3.2 | (1,414 | ) | (1,107 | ) | (787 | ) | |||||||
| Selling, general and administrative expenses |
2.3, 3.2 | (549 | ) | (478 | ) | (379 | ) | |||||||
| Acquisition and integration related charges |
5.5 | (43 | ) | — | — | |||||||||
|
|
|
|
|
|
|
|||||||||
| Total costs and operating expenses |
(2,149 | ) | (1,618 | ) | (1,166 | ) | ||||||||
|
|
|
|
|
|
|
|||||||||
| Operating profit |
972 | 772 | 865 | |||||||||||
| Financial income |
4.5 | 645 | 299 | 443 | ||||||||||
| Financial expenses |
4.5 | (291 | ) | (254 | ) | (347 | ) | |||||||
|
|
|
|
|
|
|
|||||||||
| Net profit before tax |
1,326 | 817 | 961 | |||||||||||
| Corporate tax |
2.4 | (193 | ) | (186 | ) | (211 | ) | |||||||
|
|
|
|
|
|
|
|||||||||
| Net profit |
1,133 | 631 | 750 | |||||||||||
|
|
|
|
|
|
|
|||||||||
| Other comprehensive income: |
||||||||||||||
| Amounts which may be re-classified to the income statement: |
||||||||||||||
| Exchange differences on translation of foreign operations |
(224 | ) | 139 | (201 | ) | |||||||||
|
|
|
|
|
|
|
|||||||||
| Total comprehensive income |
909 | 770 | 549 | |||||||||||
|
|
|
|
|
|
|
|||||||||
| Basic net profit per share |
2.5 | 17.66 | 9.67 | 11.47 | ||||||||||
| Diluted net profit per share |
2.5 | 17.53 | 9.58 | 11.36 | ||||||||||
| * | Genmab changed its presentation currency from DKK to USD effective January 1, 2025. Accordingly, management has translated the consolidated financial statements and related notes into USD for all periods presented. Additionally, certain reclassification adjustments have been made between financial income and financial expenses for all periods presented. Refer to Note 1.1 and Note 1.4, respectively, for more information. |
F-7
CONSOLIDATED BALANCE SHEETS
| (USD million) |
Note | December 31, | January 1, | |||||||||||||
| 2024* Restated |
2023* Restated |
2023* Restated |
||||||||||||||
| ASSETS |
||||||||||||||||
| Goodwill |
3.1, 5.5 | 355 | — | — | ||||||||||||
| Other intangible assets |
3.1, 5.5 | 1,728 | 15 | 21 | ||||||||||||
| Property and equipment |
2.2, 3.2 | 137 | 142 | 115 | ||||||||||||
| Right-of-use assets |
2.2, 3.3 | 128 | 102 | 75 | ||||||||||||
| Receivables |
2.2, 3.6 | 7 | 10 | 7 | ||||||||||||
| Deferred tax assets |
2.4 | 127 | 31 | 36 | ||||||||||||
| Other investments |
3.4 | 32 | 20 | 19 | ||||||||||||
|
|
|
|
|
|
|
|||||||||||
| Total non-current assets |
2,514 | 320 | 273 | |||||||||||||
|
|
|
|
|
|
|
|||||||||||
| Corporate tax receivable |
2.4 | 14 | — | 26 | ||||||||||||
| Inventories |
3.5 | 9 | 8 | — | ||||||||||||
| Receivables |
3.6 | 923 | 733 | 820 | ||||||||||||
| Marketable securities |
4.2, 4.4 | 1,574 | 1,967 | 1,783 | ||||||||||||
| Cash and cash equivalents |
1,380 | 2,204 | 1,419 | |||||||||||||
|
|
|
|
|
|
|
|||||||||||
| Total current assets |
3,900 | 4,912 | 4,048 | |||||||||||||
|
|
|
|
|
|
|
|||||||||||
| Total assets |
6,414 | 5,232 | 4,321 | |||||||||||||
|
|
|
|
|
|
|
|||||||||||
| SHAREHOLDERS’ EQUITY AND LIABILITIES |
||||||||||||||||
| Share capital |
4.7 | 10 | 10 | 10 | ||||||||||||
| Share premium |
4.7 | 1,961 | 1,942 | 1,921 | ||||||||||||
| Other reserves |
(226 | ) | (2 | ) | (141 | ) | ||||||||||
| Retained earnings |
3,392 | 2,737 | 2,125 | |||||||||||||
|
|
|
|
|
|
|
|||||||||||
| Total shareholders’ equity |
5,137 | 4,687 | 3,915 | |||||||||||||
|
|
|
|
|
|
|
|||||||||||
| Lease liabilities |
3.3 | 131 | 101 | 75 | ||||||||||||
| Contract liabilities |
3.7 | 67 | 71 | 69 | ||||||||||||
| Deferred tax liabilities |
2.4 | 330 | — | — | ||||||||||||
| Other payables |
3.8 | 5 | 5 | 2 | ||||||||||||
|
|
|
|
|
|
|
|||||||||||
| Total non-current liabilities |
533 | 177 | 146 | |||||||||||||
|
|
|
|
|
|
|
|||||||||||
| Corporate tax payable |
2.4 | 239 | 8 | — | ||||||||||||
| Lease liabilities |
3.3 | 13 | 13 | 11 | ||||||||||||
| Contract liabilities |
3.7 | 3 | 5 | 5 | ||||||||||||
| Other payables |
3.8 | 489 | 342 | 244 | ||||||||||||
|
|
|
|
|
|
|
|||||||||||
| Total current liabilities |
744 | 368 | 260 | |||||||||||||
|
|
|
|
|
|
|
|||||||||||
| Total liabilities |
1,277 | 545 | 406 | |||||||||||||
|
|
|
|
|
|
|
|||||||||||
| Total shareholders’ equity and liabilities |
6,414 | 5,232 | 4,321 | |||||||||||||
|
|
|
|
|
|
|
|||||||||||
| * | Genmab changed its presentation currency from DKK to USD effective January 1, 2025. Accordingly, management has translated the consolidated financial statements and related notes into USD for all periods presented. Refer to Note 1.1 for more information. |
F-8
CONSOLIDATED STATEMENTS OF CASH FLOWS
| (USD million) |
Note | 2024* Restated |
2023* Restated |
2022* Restated |
||||||||||
| Cash flows from operating activities: |
||||||||||||||
| Net profit before tax |
1,326 | 817 | 961 | |||||||||||
| Financial income |
4.5 | (645 | ) | (299 | ) | (443 | ) | |||||||
| Financial expenses |
4.5 | 291 | 254 | 347 | ||||||||||
| Adjustment for non-cash transactions |
||||||||||||||
| Share-based compensation expense |
2.3, 4.6 | 105 | 85 | 63 | ||||||||||
| Depreciation |
3.2, 3.3 | 49 | 40 | 30 | ||||||||||
| Amortization |
3.1 | 11 | 3 | 20 | ||||||||||
| Impairment charges |
3.1 | 17 | — | — | ||||||||||
| Change in operating assets and liabilities |
||||||||||||||
| Receivables |
3.6 | (230 | ) | 116 | (277 | ) | ||||||||
| Inventories |
3.5 | (1 | ) | (8 | ) | — | ||||||||
| Other payables |
3.8 | 122 | 90 | 40 | ||||||||||
|
|
|
|
|
|
|
|||||||||
| Cash flows from operating activities before financial items |
1,045 | 1,098 | 741 | |||||||||||
| Interest received |
136 | 131 | 40 | |||||||||||
| Interest elements of lease payments |
3.3 | (5 | ) | (3 | ) | (2 | ) | |||||||
| Interest paid |
— | — | — | |||||||||||
| Corporate taxes paid |
(50 | ) | (155 | ) | (224 | ) | ||||||||
|
|
|
|
|
|
|
|||||||||
| Net cash provided by operating activities |
1,126 | 1,071 | 555 | |||||||||||
|
|
|
|
|
|
|
|||||||||
| Cash flows from investing activities: |
||||||||||||||
| Acquisition of business, net of cash acquired |
5.5 | (1,783 | ) | — | — | |||||||||
| Investment in intangible assets |
3.1 | (17 | ) | (1 | ) | — | ||||||||
| Investment in tangible assets |
3.2 | (27 | ) | (53 | ) | (45 | ) | |||||||
| Marketable securities bought |
4.3, 4.4 | (1,248 | ) | (1,578 | ) | (1,367 | ) | |||||||
| Marketable securities sold |
4.3, 4.4 | 1,636 | 1,451 | 1,026 | ||||||||||
| Other investments bought |
3.4 | (8 | ) | (4 | ) | (6 | ) | |||||||
|
|
|
|
|
|
|
|||||||||
| Net cash (used in) investing activities |
(1,447 | ) | (185 | ) | (392 | ) | ||||||||
|
|
|
|
|
|
|
|||||||||
| Cash flows from financing activities: |
||||||||||||||
| Warrants exercised |
4.6, 4.7 | 19 | 21 | 40 | ||||||||||
| Principal elements of lease payments |
3.3 | (9 | ) | (14 | ) | (10 | ) | |||||||
| Purchase of treasury shares |
4.7 | (560 | ) | (81 | ) | (128 | ) | |||||||
| Payment of withholding taxes on behalf of employees on net settled RSUs |
(16 | ) | (15 | ) | (12 | ) | ||||||||
|
|
|
|
|
|
|
|||||||||
| Net cash (used in) financing activities |
(566 | ) | (89 | ) | (110 | ) | ||||||||
|
|
|
|
|
|
|
|||||||||
| Changes in cash and cash equivalents |
(887 | ) | 797 | 53 | ||||||||||
| Cash and cash equivalents at the beginning of the period |
2,204 | 1,419 | 1,365 | |||||||||||
| Exchange rate adjustments |
63 | (12 | ) | 1 | ||||||||||
|
|
|
|
|
|
|
|||||||||
| Cash and cash equivalents at the end of the period |
1,380 | 2,204 | 1,419 | |||||||||||
|
|
|
|
|
|
|
|||||||||
| Cash and cash equivalents include: |
||||||||||||||
| Bank deposits |
1,369 | 2,004 | 1,334 | |||||||||||
| Short-term marketable securities |
11 | 200 | 85 | |||||||||||
|
|
|
|
|
|
|
|||||||||
| Cash and cash equivalents at the end of the period |
1,380 | 2,204 | 1,419 | |||||||||||
|
|
|
|
|
|
|
|||||||||
| * | Genmab changed its presentation currency from DKK to USD effective January 1, 2025. Accordingly, management has translated the consolidated financial statements and related notes into USD for all periods presented. Refer to Note 1.1 for more information. |
F-9
CONSOLIDATED STATEMENTS OF CHANGES IN EQUITY
| (USD million) |
Share capital | Share premium |
Translation reserves |
Retained earnings |
Shareholders’ equity |
|||||||||||||||
| Balance at December 31, 2021* Restated |
10 | 1,881 | 60 | 1,454 | 3,405 | |||||||||||||||
|
|
|
|
|
|
|
|
|
|
|
|||||||||||
| Net profit |
— | — | — | 750 | 750 | |||||||||||||||
| Other comprehensive income |
— | — | (201 | ) | — | (201 | ) | |||||||||||||
|
|
|
|
|
|
|
|
|
|
|
|||||||||||
| Total comprehensive income |
— | — | (201 | ) | 750 | 549 | ||||||||||||||
| Transactions with owners: |
||||||||||||||||||||
| Exercise of warrants |
— | 40 | — | — | 40 | |||||||||||||||
| Shares issued for cash |
— | — | — | — | — | |||||||||||||||
| Expenses related to capital increases |
— | — | — | — | — | |||||||||||||||
| Purchase of treasury shares |
— | — | — | (128 | ) | (128 | ) | |||||||||||||
| Share-based compensation expenses |
— | — | — | 63 | 63 | |||||||||||||||
| Withholding taxes on behalf of employees on net settled RSUs |
— | — | — | (12 | ) | (12 | ) | |||||||||||||
| Tax on items recognized directly in equity |
— | — | — | (2 | ) | (2 | ) | |||||||||||||
|
|
|
|
|
|
|
|
|
|
|
|||||||||||
| Balance at December 31, 2022* Restated |
10 | 1,921 | (141 | ) | 2,125 | 3,915 | ||||||||||||||
|
|
|
|
|
|
|
|
|
|
|
|||||||||||
| Net profit |
— | — | — | 631 | 631 | |||||||||||||||
| Other comprehensive income |
— | — | 139 | — | 139 | |||||||||||||||
|
|
|
|
|
|
|
|
|
|
|
|||||||||||
| Total comprehensive income |
— | — | 139 | 631 | 770 | |||||||||||||||
| Transactions with owners: |
||||||||||||||||||||
| Exercise of warrants |
— | 21 | — | — | 21 | |||||||||||||||
| Purchase of treasury shares |
— | — | — | (81 | ) | (81 | ) | |||||||||||||
| Share-based compensation expenses |
— | — | — | 85 | 85 | |||||||||||||||
| Withholding taxes on behalf of employees on net settled RSUs |
— | — | — | (15 | ) | (15 | ) | |||||||||||||
| Tax on items recognized directly in equity |
— | — | — | (8 | ) | (8 | ) | |||||||||||||
|
|
|
|
|
|
|
|
|
|
|
|||||||||||
| Balance at December 31, 2023* Restated |
10 | 1,942 | (2 | ) | 2,737 | 4,687 | ||||||||||||||
|
|
|
|
|
|
|
|
|
|
|
|||||||||||
| Net profit |
— | — | — | 1,133 | 1,133 | |||||||||||||||
| Other comprehensive income |
— | — | (224 | ) | — | (224 | ) | |||||||||||||
|
|
|
|
|
|
|
|
|
|
|
|||||||||||
| Total comprehensive income |
— | — | (224 | ) | 1,133 | 909 | ||||||||||||||
| Transactions with owners: |
||||||||||||||||||||
| Exercise of warrants |
— | 19 | — | — | 19 | |||||||||||||||
| Purchase of treasury shares |
— | — | — | (560 | ) | (560 | ) | |||||||||||||
| Share-based compensation expenses |
— | — | — | 105 | 105 | |||||||||||||||
| Withholding taxes on behalf of employees on net settled RSUs |
— | — | — | (16 | ) | (16 | ) | |||||||||||||
| Tax on items recognized directly in equity |
— | — | — | (7 | ) | (7 | ) | |||||||||||||
|
|
|
|
|
|
|
|
|
|
|
|||||||||||
| Balance at December 31, 2024* Restated |
10 | 1,961 | (226 | ) | 3,392 | 5,137 | ||||||||||||||
|
|
|
|
|
|
|
|
|
|
|
|||||||||||
| * | Genmab changed its presentation currency from DKK to USD effective January 1, 2025. Accordingly, management has translated the consolidated financial statements and related notes into USD for all periods presented. Refer to Note 1.1 for more information. |
F-10
NOTES TO THE CONSOLIDATED FINANCIAL STATEMENTS
Section 1—Basis of Presentation
These consolidated financial statements include Genmab A/S (parent company) and subsidiaries over which the parent company has control. The Genmab consolidated Group is referenced herein as “Genmab” or the “Company.”
This section describes Genmab’s general accounting policies including management’s judgements and estimates under IFRS Accounting Standards as issued by the International Accounting Standards Board (IASB) and endorsed by the EU (IFRS Accounting Standards). The specific accounting policies are described in each note in conjunction with supplementary disclosures of the specific item with the aim to provide a more understandable description of each accounting area.
1.1—Nature of the Business and Material Accounting Policies
Genmab A/S is a publicly traded, international biotechnology company that was founded in 1999 and specializes in the creation and development of differentiated antibody therapeutics for the treatment of cancer and other diseases. Genmab has six approved products commercialized by third parties, two approved products that are jointly commercialized with a collaboration partner, a broad clinical and preclinical product pipeline and proprietary next-generation antibody technologies.
The consolidated financial statements have been prepared in accordance with IFRS Accounting Standards as issued by the International Accounting Standards Board (IASB) and in accordance with IFRS as endorsed by the EU and further disclosure requirements for listed companies in Denmark. The consolidated financial statements were approved by the Board of Directors and authorized for issue on February 12, 2025, with the changes outlined in Note 1.1 and Note 1.4 being approved by the Board of Directors on November 6, 2025. Except as outlined in this Note 1.1 and Note 1.4, the 2024 consolidated financial statements have been prepared using the same accounting principles and accounting policies as 2023 and 2022.
Please refer to the overview below to see in which note/section the detailed accounting policy is included.
| Section 2—Results for the Year |
3.5 Inventories |
|
| 2.1 Revenue |
3.6 Receivables |
|
| 2.2 Information about Geographical Areas |
3.7 Contract Liabilities |
|
| 2.3 Staff Costs |
3.8 Other Payables |
|
| 2.4 Corporate and Deferred Tax |
Section 4—Capital Structure, Financial Risk and Related Items |
|
| 2.5 Profit per Share |
4.3 Financial Assets and Liabilities |
|
| Section 3—Operating Assets and Liabilities |
4.4 Marketable Securities |
|
| 3.1 Intangible Assets and Goodwill |
4.5 Financial Income and Expenses |
|
| 3.2 Property and Equipment |
4.6 Share-Based Instruments |
|
| 3.3 Leases |
Section 5—Other Disclosures |
|
| 3.4 Other Investments | 5.5 Acquisition of Businesses |
|
Materiality
Genmab’s consolidated financial statements are based on the concept of materiality and the Company focuses on information that is considered material and relevant to the users of the consolidated financial statements. The consolidated financial statements consist of a large number of transactions. These transactions are aggregated into classes according to their nature or function and presented in classes of similar items in the consolidated financial statements as required by IFRS and the Danish Financial Statements Act.
F-11
NOTES TO THE CONSOLIDATED FINANCIAL STATEMENTS—(CONTINUED)
If items are individually immaterial, they are aggregated with other items of similar nature in the consolidated financial statements or in the notes.
Genmab provides these specific required disclosures unless the information is considered immaterial to the economic decision-making of the readers of the consolidated financial statements or not applicable.
Consolidated Financial Statements
The consolidated financial statements include Genmab A/S and subsidiaries over which the parent company has control. The parent controls a subsidiary when the parent is exposed to, or has rights to, variable returns from its involvement with the subsidiary and has the ability to affect those returns through its power to direct the activities of the subsidiary. Genmab A/S (parent company) holds investments either directly or indirectly in the following subsidiaries:
| Name |
Domicile |
Ownership and votes 2024 |
Ownership and votes 2023 |
|||
| Genmab B.V. |
Utrecht, the Netherlands | 100% | 100% | |||
| Genmab Holding B.V. |
Utrecht, the Netherlands | 100% | 100% | |||
| Genmab US, Inc. |
New Jersey, USA | 100% | 100% | |||
| Genmab K.K. |
Tokyo, Japan | 100% | 100% | |||
| ProfoundBio, Inc. |
Delaware, USA | 100% | N/A* | |||
| ProfoundBio, US Co |
Delaware, USA | 100% | N/A* | |||
| Profound Limited |
Hong Kong, China | 100% | N/A* | |||
| ProfoundBio co., Ltd. |
Suzhou, China | 100% | N/A* | |||
| ProfoundBio Shanghai Branch, Co., Ltd. |
Shanghai, China | 100% | N/A* | |||
| Beijing Puyifang Biotechnology Co., Ltd. |
Beijing, China | 100% | N/A* |
| * | These subsidiaries were added as a result of the acquisition of ProfoundBio during the second quarter of 2024. |
Genmab’s consolidated financial statements have been prepared on the basis of the financial statements of the parent company and subsidiaries—prepared under Genmab’s accounting policies—by combining similar accounting items on a line-by-line basis. On consolidation, intercompany income and expenses, intercompany receivables and payables, and unrealized gains and losses on transactions between the consolidated companies are eliminated.
The recorded value of the equity interests in the consolidated subsidiaries is eliminated with the proportionate share of the subsidiaries’ equity. Subsidiaries are consolidated from the date when control is transferred to the Group.
Items included in the financial statements of Genmab’s entities are measured using the currency of the primary economic environment in which the entity operates (functional currency). The income statements for subsidiaries with a different functional currency than Genmab’s presentation currency are translated into Genmab’s presentation currency at average exchange rates, and the balance sheets are translated at the exchange rate in effect at the balance sheet date.
Exchange rate differences arising from the translation of foreign subsidiaries shareholders’ equity at the beginning of the year and exchange rate differences arising as a result of foreign subsidiaries’ income statements being translated at average exchange rates are recorded in translation reserves in shareholders’ equity.
F-12
NOTES TO THE CONSOLIDATED FINANCIAL STATEMENTS—(CONTINUED)
Presentation Currency
The consolidated financial statements were originally presented in Danish Kroner (DKK). Genmab changed its presentation currency from DKK to USD effective January 1, 2025. The change was made to better reflect the Company’s financial position. For purposes of reissuance of Genmab’s consolidated financial statements as of and for the years ended December 31, 2024, 2023 and 2022 (the “consolidated financial statements”), management has translated the consolidated financial statements and related notes into United States Dollar (USD) for all periods presented. Excluding royalty revenues related to DARZALEX and milestone revenues, which have been translated using historical rates in effect on the date of the transactions, the consolidated statements of comprehensive income and the consolidated statements of cash flows, and related notes, have been translated into the presentation currency using the average exchange rates prevailing during each reporting period. In the consolidated balance sheets, and related notes, all assets and liabilities have been translated using the period-end exchange rates, and all resulting exchange differences have been recognized in accumulated other comprehensive income. Shareholders’ equity balances, and related notes, have been translated using historical rates in effect on the date of the transactions and all resulting exchange differences have been recognized in accumulated other comprehensive income. The DKK/USD exchange rates used to reflect the change in presentation currency were as follows:
| 2020 | 2021 | 2022 | 2023 | |||||||||||||
| Average rate |
0.153 | NA | 0.1415 | 0.1451 | ||||||||||||
| Closing rate |
N/A | 0.1524 | 0.1434 | 0.1483 | ||||||||||||
| Q1 2024 | Q2 2024 | Q3 2024 | Q4 2024 | YTD 2024 | ||||||||||||||||
| Average rate |
0.1456 | 0.1443 | 0.1472 | 0.1433 | 0.1452 | |||||||||||||||
| Closing rate |
0.1450 | 0.1435 | 0.1502 | 0.1400 | 0.1400 | |||||||||||||||
The change in presentation currency resulted in the following impact on the December 31, 2024 consolidated balance sheet:
| Previously reported in DKK |
Reported in USD | |||||||||||
| December 31, 2024 | Presentation currency change |
December 31, 2024 | ||||||||||
| Total assets |
45,811 | (39,397 | ) | 6,414 | ||||||||
| Total liabilities |
9,114 | (7,837 | ) | 1,277 | ||||||||
| Total shareholders’ equity |
36,697 | (31,560 | ) | 5,137 | ||||||||
The change in presentation currency resulted in the following impact on the December 31, 2023 consolidated balance sheet:
| Previously reported in DKK |
Reported in USD | |||||||||||
| December 31, 2023 | Presentation currency change |
December 31, 2023 | ||||||||||
| Total assets |
35,289 | (30,057 | ) | 5,232 | ||||||||
| Total liabilities |
3,679 | (3,134 | ) | 545 | ||||||||
| Total shareholders’ equity |
31,610 | (26,923 | ) | 4,687 | ||||||||
F-13
NOTES TO THE CONSOLIDATED FINANCIAL STATEMENTS—(CONTINUED)
The change in presentation currency resulted in the following impact on the January 1, 2023 consolidated balance sheet:
| Previously reported in DKK |
Reported in USD | |||||||||||
| January 1, 2023 | Presentation currency change |
January 1, 2023 | ||||||||||
| Total assets |
30,119 | (25,798 | ) | 4,321 | ||||||||
| Total liabilities |
2,837 | (2,431 | ) | 406 | ||||||||
| Total shareholders’ equity |
27,282 | (23,367 | ) | 3,915 | ||||||||
The change in presentation currency resulted in the following impact on the twelve months ended December 31, 2024 consolidated statements of comprehensive income:
| Previously reported in DKK |
Reported in USD | |||||||||||
| December 31, 2024 | Presentation currency change |
December 31, 2024 | ||||||||||
| Net profit |
7,844 | (6,711 | ) | 1,133 | ||||||||
| Comprehensive income |
8,274 | (7,365 | ) | 909 | ||||||||
The change in presentation currency resulted in the following impact on the twelve months ended December 31, 2023 consolidated statements of comprehensive income:
| Previously reported in DKK |
Reported in USD | |||||||||||
| December 31, 2023 | Presentation currency change |
December 31, 2023 | ||||||||||
| Net profit |
4,352 | (3,721 | ) | 631 | ||||||||
| Comprehensive income |
4,314 | (3,544 | ) | 770 | ||||||||
The change in presentation currency resulted in the following impact on the twelve months ended December 31, 2022 consolidated statements of comprehensive income:
| Previously reported in DKK |
Reported in USD | |||||||||||
| December 31, 2022 | Presentation currency change |
December 31, 2022 | ||||||||||
| Net profit |
5,452 | (4,702 | ) | 750 | ||||||||
| Comprehensive income |
5,469 | (4,920 | ) | 549 | ||||||||
The change in presentation currency resulted in the following impact on the twelve months ended December 31, 2024 consolidated statements of cash flows:
| Previously reported in DKK |
Reported in USD | |||||||||||
| December 31, 2024 | Presentation currency change |
December 31, 2024 | ||||||||||
| Cash provided by (used in): |
||||||||||||
| Operating activities |
7,771 | (6,645 | ) | 1,126 | ||||||||
| Investing activities |
(9,907 | ) | 8,460 | (1,447 | ) | |||||||
| Financing activities |
(3,919 | ) | 3,353 | (566 | ) | |||||||
F-14
NOTES TO THE CONSOLIDATED FINANCIAL STATEMENTS—(CONTINUED)
The change in presentation currency resulted in the following impact on the twelve months ended December 31, 2023 consolidated statements of cash flows:
| Previously reported in DKK |
Reported in USD | |||||||||||
| December 31, 2023 | Presentation currency change |
December 31, 2023 | ||||||||||
| Cash provided by (used in): |
||||||||||||
| Operating activities |
7,380 | (6,309 | ) | 1,071 | ||||||||
| Investing activities |
(1,282 | ) | 1,097 | (185 | ) | |||||||
| Financing activities |
(606 | ) | 517 | (89 | ) | |||||||
The change in presentation currency resulted in the following impact on the twelve months ended December 31, 2022 consolidated statements of cash flows:
| Previously reported in DKK |
Reported in USD | |||||||||||
| December 31, 2022 | Presentation currency change |
December 31, 2022 | ||||||||||
| Cash provided by (used in): |
||||||||||||
| Operating activities |
3,912 | (3,357 | ) | 555 | ||||||||
| Investing activities |
(2,761 | ) | 2,369 | (392 | ) | |||||||
| Financing activities |
(789 | ) | 679 | (110 | ) | |||||||
The change in presentation currency resulted in the following impact on the twelve months ended December 31, 2024 basic and diluted earnings per share:
| Previously reported in DKK |
Reported in USD | |||||||||||
| December 31, 2024 | Presentation currency change |
December 31, 2024 | ||||||||||
| Earnings per share—basic |
122.21 | (104.55 | ) | 17.66 | ||||||||
| Earnings per share—diluted |
121.36 | (103.83 | ) | 17.53 | ||||||||
The change in presentation currency resulted in the following impact on the twelve months ended December 31, 2023 basic and diluted earnings per share:
| Previously reported in DKK |
Reported in USD | |||||||||||
| December 31, 2023 | Presentation currency change |
December 31, 2023 | ||||||||||
| Earnings per share—basic |
66.64 | (56.97 | ) | 9.67 | ||||||||
| Earnings per share—diluted |
66.02 | (56.44 | ) | 9.58 | ||||||||
The change in presentation currency resulted in the following impact on the twelve months ended December 31, 2022 basic and diluted earnings per share:
| Previously reported in DKK |
Reported in USD | |||||||||||
| December 31, 2022 | Presentation currency change |
December 31, 2022 | ||||||||||
| Earnings per share—basic |
83.38 | (71.91 | ) | 11.47 | ||||||||
| Earnings per share—diluted |
82.59 | (71.23 | ) | 11.36 | ||||||||
F-15
NOTES TO THE CONSOLIDATED FINANCIAL STATEMENTS—(CONTINUED)
Foreign Currency
As stated above, the consolidated financial statements were originally prepared in DKK, which was the presentation currency of Genmab. As such, foreign currency transactions reflect the original impacts of the DKK presentation currency. See Note 4.2 for further details of foreign currency risks.
Transactions in foreign currencies are translated at the exchange rates in effect at the date of the transaction.
Exchange rate gains and losses arising between the transaction date and the settlement date are recognized in the Consolidated Statements of Comprehensive Income as financial income or expense.
Unsettled monetary assets and liabilities in foreign currencies are translated at the exchange rates in effect at the balance sheet date. Exchange rate gains and losses arising between the transaction date and the balance sheet date are recognized in the Consolidated Statements of Comprehensive Income as financial income or expense.
Classification of Costs and Operating Expenses in the Income Statement
Cost of Product Sales
Cost of product sales includes direct and indirect costs relating to the manufacturing of inventory mainly from third-party providers of manufacturing as well as costs related to internal resources and distribution and logistics. Inventory amounts written down as a result of excess or obsolescence are charged to cost of product sales. Also included in Cost of Product Sales are royalty payments on commercialized products. Aside from these items, there are no other costs included within cost of product sales.
Additionally, cost of product sales includes profit-sharing amounts owed to collaboration partners for the sale of commercial products when Genmab is determined to be the principal in sales to end customers. The only profit-sharing amounts owed to collaboration partners that are recorded as cost of product sales relate to sales of EPKINLY in the U.S. and Japan pursuant to the Collaboration Agreement with AbbVie.
Refer to Note 5.6 for detailed information regarding Genmab’s Collaboration Agreement with AbbVie.
Research and Development Expenses
Research and development expenses primarily include salaries, benefits and other employee-related costs of Genmab’s research and development staff, license costs, manufacturing costs, preclinical costs, clinical trials, contractors and outside service fees, amortization and impairment of licenses and rights related to intangible assets, depreciation of property and equipment, and depreciation of right-of-use assets, to the extent that such costs are related to the Group’s research and development activities.
Refer to Note 3.1 for a more detailed description on the treatment of Genmab’s research and development expenses.
Selling, General and Administrative Expenses
Selling, general and administrative expenses relate to the management and administration of Genmab, including commercialization activities. This primarily includes salaries, benefits and other employee costs related to management and support functions including human resources, information technology and the finance departments. In addition, depreciation of property and equipment and depreciation of right-of-use assets, to the extent such expenses are related to administrative functions, are also included. Selling, general and administrative expenses are recognized in the Consolidated Statements of Comprehensive Income in the period to which they relate.
F-16
NOTES TO THE CONSOLIDATED FINANCIAL STATEMENTS—(CONTINUED)
Acquisition and Integration Related Charges
Acquisition and integration related charges for the acquisition of ProfoundBio which occurred during the second quarter of 2024.
Refer to Note 5.5 for more information regarding Genmab’s Acquisition and Integration costs related to the acquisition of ProfoundBio.
Government Grants
Government grants are recognized at their fair value where there is reasonable assurance that the grant will be received and that Genmab will comply with all attaching conditions. When the grant relates to an expense item, it is recognized as a reduction of that expense on a systematic basis over the periods that the costs for which it is intended to compensate are incurred. Where the grant relates to an asset, the fair value is credited to a contract liability account and is released to the statement of comprehensive income as other operating income over the expected useful life of the relevant asset by equal annual installments.
Statements of Cash Flows
The cash flow statement is presented using the indirect method with basis in the net profit before tax.
Cash flows from operating activities are stated as the net profit before tax adjusted for financial income and expense, non-cash operating items including depreciation, amortization, impairment losses, share-based compensation expenses, and for changes in operating assets and liabilities, interest paid and received, interest elements of lease payments and corporate taxes paid or received. Operating assets and liabilities are mainly comprised of changes in receivables, inventories and other payables excluding the items included in cash and cash equivalents. Changes in non-current assets and liabilities are included in operating assets and liabilities, if related to the main revenue-producing activities of Genmab.
Cash flows from investing activities consist of acquisitions of businesses, net of cash acquired, purchases and sales of marketable securities and other investments, as well as purchases of intangible assets and property and equipment.
Cash flows from financing activities relate to the purchase of treasury shares, exercise of warrants, payments of withholding taxes on behalf of employees on net settled RSUs and payments of long-term loans including installments on lease liabilities.
Cash and cash equivalents are comprised of cash, bank deposits, and marketable securities with a maturity of less than 90 days on the date of acquisition.
The statements of cash flows cannot be derived solely from the consolidated financial statements.
Treasury Shares
The total amount paid to acquire treasury shares including directly attributable costs and the proceeds from the sale of treasury shares is recognized in retained earnings.
Collaborations, License Agreements and Collaborative Agreements
Collaborations and License Agreements
Genmab continues to pursue the establishment of research collaborations and licensing agreements. These arrangements often include upfront payments, expense reimbursements or payments to the collaboration partner, and milestone and royalty arrangements, contingent upon the occurrence of certain future events linked to the success of the asset in development.
F-17
NOTES TO THE CONSOLIDATED FINANCIAL STATEMENTS—(CONTINUED)
In regard to Genmab’s license agreements with J&J, Novartis and Roche, each of these parties retain final decision-making authority over the relevant activities and as such no joint control exists.
Refer to Note 2.1 for additional information related to revenue from these parties.
Collaborative Agreements
Genmab has entered into a number of joint collaborative agreements. These agreements often include upfront payments, expense reimbursements or payments to the collaboration partner, and milestone and royalty arrangements, contingent upon the occurrence of certain future events linked to the success of the asset in development.
These agreements also provide Genmab with varying rights to develop, produce and market products together with its collaborative partners. Both parties in these arrangements share in the decision-making and therefore have joint control of the arrangement. In 2024, Genmab’s more significant collaboration agreements are with AbbVie (epcoritamab), Pfizer (tisotumab vedotin) and BioNTech.
Refer to Note 2.1 for additional information related to revenue from our joint collaborative agreements.
Refer to Note 5.6 for detailed information regarding Genmab’s significant Research Collaborations, License Agreements and Collaborative Agreements.
1.2—New Accounting Policies and Disclosures
NEW ACCOUNTING POLICIES AND DISCLOSURES FOR 2024
Genmab has, with effect from January 1, 2024, implemented the following standards and amendments:
| • | Amendments to IFRS 16 Leases: Lease Liability in a Sale and Leaseback |
| • | Amendments to IAS 1 Presentation of Financial Statements: Classification of Liabilities as Current or Non-current, Classification of Liabilities as Current or Non-current – Deferral of Effective Date, and Non-current Liabilities with Covenants, and |
| • | Amendments to IAS 7 Statement of Cash Flows and IFRS 7 Financial Instruments: Disclosures: Supplier Finance Arrangements |
The implementation of these amendments did not have a material impact on the consolidated financial statements for the current or prior reporting periods and is not expected to have a significant impact in future reporting periods.
NEW ACCOUNTING POLICIES AND DISCLOSURES EFFECTIVE IN 2025 OR LATER
Furthermore, as it relates to new or amended accounting standards and interpretations (IFRSs) issued by the IASB, management does not anticipate any significant impact on the Consolidated Financial Statements in the period of initial application from the adoption of these new standards and amendments, apart from IFRS 18 ‘Presentation and Disclosure in Financial Statements’ which replaces IAS 1 effective from 1 January 2027. The new IFRS 18 is expected to change the presentation of the financial statements, requiring items of income and expense to be classified into five categories: operating, investing, finance, income taxes and discontinued operations along with two new mandatory sub-totals, operating profit or loss and profit or loss before financing and income taxes. IFRS 18 will not impact the recognition or measurement of items in the financial statements.
F-18
NOTES TO THE CONSOLIDATED FINANCIAL STATEMENTS—(CONTINUED)
1.3—Management’s Judgements and Estimates under IFRS
In preparing financial statements under IFRS, certain provisions in the standards require management’s judgements, including various accounting estimates and assumptions. These judgements and estimates affect the application of accounting policies, as well as reported amounts within the consolidated financial statements and disclosures.
Determining the carrying amount of certain assets and liabilities requires judgements, estimates and assumptions concerning future events that are based on historical experience and other factors, which by their very nature are associated with uncertainty and unpredictability.
Accounting estimates are based on historical experience and various other factors relative to the circumstances in which they are applied. Estimates are generally made based on information available at the time.
Accounting judgements are made in the process of applying accounting policies. These judgements are typically made based on the guidance and information available at the time of application.
These estimates and judgements may prove incomplete or incorrect, and unexpected events or circumstances may arise. Genmab is also subject to risks and uncertainties which may lead actual results to differ from these estimates, both positively and negatively. Specific risks for Genmab are discussed in the relevant section of these consolidated financial statements and in the notes to the consolidated financial statements.
The areas involving a high degree of judgement and estimation that are significant to the consolidated financial statements are summarized below. Refer to the identified notes for further information on the key accounting estimates and judgements utilized in the preparation of the consolidated financial statements.
| Accounting |
Key accounting estimates and judgements |
Note reference |
Risk |
|||
| Revenue recognition | Judgement in assessing whether a collaboration partner is a customer
Estimation of partner net sales amounts in the calculation of royalties
Estimation of variable consideration
Judgement in assessing the nature of combined performance obligations within contracts |
Note 2.1 | High | |||
| Share-based compensation | Judgement in selecting assumptions required for valuation of warrant grants
Estimation in developing forfeiture rate
RSUs/warrants and probability of achievement for PSUs |
Note 4.6 | Moderate | |||
| Current and deferred income taxes | Judgement and estimation regarding valuation of deferred income taxes | Note 2.4 | Moderate | |||
| Fair value and impairment assessment of other intangible assets and goodwill | Estimation of the fair value of other intangible assets and assessment of impairment of other intangible assets
Estimation regarding the valuation of goodwill and assessment of impairment of goodwill |
Notes 3.1 and 5.5 | High | |||
F-19
NOTES TO THE CONSOLIDATED FINANCIAL STATEMENTS—(CONTINUED)
1.4—Revision of Prior Period Financial Statements
Reclassifications
In order to conform to the current period gross presentation for 2025, a reclassification of net $100 million gain, $63 million loss and $97 million gain have been made to the gross amounts presented for 2024, 2023 and 2022 respectively, to move foreign exchange rate gains and losses related to marketable securities from gains and losses on foreign exchange rates to gains and losses on marketable securities. These reclassifications have no impact on the net amounts of financial items as presented in Note 4.5—Financial Income and Expenses.
| (USD million) |
December 31, 2024 |
Reclass | December 31, 2024 |
|||||||||
| Financial income: |
||||||||||||
| Gain on marketable securities |
53 | 184 | 237 | |||||||||
| Foreign exchange rate gain |
431 | (173 | ) | 258 | ||||||||
| Gain on other investments, net |
21 | (15 | ) | 6 | ||||||||
|
|
|
|
|
|
|
|||||||
| Total financial income |
505 | (4 | ) | 501 | ||||||||
|
|
|
|
|
|
|
|||||||
| Financial expenses: |
||||||||||||
| Loss on marketable securities |
(23 | ) | (84 | ) | (107 | ) | ||||||
| Foreign exchange rate loss |
(239 | ) | 73 | (166 | ) | |||||||
| Loss on other investments, net |
(15 | ) | 15 | — | ||||||||
|
|
|
|
|
|
|
|||||||
| Total financial expenses |
(277 | ) | 4 | (273 | ) | |||||||
|
|
|
|
|
|
|
|||||||
| Net financial items |
228 | — | 228 | |||||||||
|
|
|
|
|
|
|
|||||||
| December 31, 2023 |
Reclass | December 31, 2023 |
||||||||||
| Financial income: |
||||||||||||
| Gain on marketable securities |
72 | 85 | 157 | |||||||||
| Foreign exchange rate gain |
57 | (57 | ) | — | ||||||||
| Gain on other investments, net |
10 | (10 | ) | — | ||||||||
|
|
|
|
|
|
|
|||||||
| Total financial income |
139 | 18 | 157 | |||||||||
|
|
|
|
|
|
|
|||||||
| Financial expenses: |
||||||||||||
| Loss on marketable securities |
(26 | ) | (148 | ) | (174 | ) | ||||||
| Foreign exchange rate loss |
(186 | ) | 120 | (66 | ) | |||||||
| Loss on other investments, net |
(14 | ) | 10 | (4 | ) | |||||||
|
|
|
|
|
|
|
|||||||
| Total financial expenses |
(226 | ) | (18 | ) | (244 | ) | ||||||
|
|
|
|
|
|
|
|||||||
| Net financial items |
(87 | ) | — | (87 | ) | |||||||
|
|
|
|
|
|
|
|||||||
| December 31, 2022 |
Reclass | December 31, 2022 |
||||||||||
| Financial income: |
||||||||||||
| Gain on marketable securities |
13 | 180 | 193 | |||||||||
| Foreign exchange rate gain |
384 | (180 | ) | 204 | ||||||||
| Gain on other investments, net |
8 | (8 | ) | — | ||||||||
|
|
|
|
|
|
|
|||||||
| Total financial income |
405 | (8 | ) | 397 | ||||||||
|
|
|
|
|
|
|
|||||||
F-20
NOTES TO THE CONSOLIDATED FINANCIAL STATEMENTS—(CONTINUED)
| December 31, 2022 |
Reclass | December 31, 2022 |
||||||||||
| Financial expenses: |
||||||||||||
| Loss on marketable securities |
(64 | ) | (83 | ) | (147 | ) | ||||||
| Foreign exchange rate loss |
(235 | ) | 83 | (152 | ) | |||||||
| Loss on other investments, net |
(50 | ) | 8 | (42 | ) | |||||||
|
|
|
|
|
|
|
|||||||
| Total financial expenses |
(349 | ) | 8 | (341 | ) | |||||||
|
|
|
|
|
|
|
|||||||
| Net financial items |
56 | — | 56 | |||||||||
|
|
|
|
|
|
|
|||||||
Refer to Note 4.5 for additional information relating to financial income and expenses of the Group.
Section 2—Results for the Year
This section includes disclosures related to revenue, information about geographical areas, staff costs, corporate and deferred tax, and profit per share.
2.1—Revenue
| (USD million) |
2024 | 2023 | 2022 | |||||||||
| Revenue by type: |
||||||||||||
| Royalties |
2,517 | 1,989 | 1,625 | |||||||||
| Reimbursement revenue |
144 | 124 | 115 | |||||||||
| Milestone revenue |
145 | 171 | 243 | |||||||||
| Collaboration revenue |
62 | 45 | 47 | |||||||||
| Net product sales |
253 | 61 | — | |||||||||
| License revenue |
— | — | 1 | |||||||||
|
|
|
|
|
|
|
|||||||
| Total |
3,121 | 2,390 | 2,031 | |||||||||
|
|
|
|
|
|
|
|||||||
| Revenue by collaboration partner: |
||||||||||||
| Janssen |
2,091 | 1,734 | 1,475 | |||||||||
| AbbVie |
58 | 106 | 160 | |||||||||
| Roche |
107 | 102 | 113 | |||||||||
| Novartis |
408 | 219 | 115 | |||||||||
| BioNTech |
127 | 114 | 100 | |||||||||
| Pfizer1 |
77 | 54 | 58 | |||||||||
| Other |
— | — | 10 | |||||||||
|
|
|
|
|
|
|
|||||||
| Total2 |
2,868 | 2,329 | 2,031 | |||||||||
|
|
|
|
|
|
|
|||||||
| Royalties by product: |
||||||||||||
| DARZALEX |
2,019 | 1,635 | 1,396 | |||||||||
| Kesimpta |
323 | 217 | 110 | |||||||||
| TEPEZZA |
106 | 102 | 113 | |||||||||
| Other3 |
69 | 35 | 6 | |||||||||
|
|
|
|
|
|
|
|||||||
| Total |
2,517 | 1,989 | 1,625 | |||||||||
|
|
|
|
|
|
|
|||||||
| 1 | Pzifer acquired Seagen in December 2023 |
| 2 | Excludes Genmab’s Net product sales |
| 3 | Other consists of royalties from net sales of RYBREVANT, TECVAYLI, TALVEY and TEPKINLY |
F-21
NOTES TO THE CONSOLIDATED FINANCIAL STATEMENTS—(CONTINUED)
ACCOUNTING POLICIES
Genmab recognizes revenue when its customer obtains control of promised goods or services, in an amount that reflects the consideration that it expects to receive in exchange for those goods or services. To determine revenue recognition for arrangements that Genmab determines are within the scope of IFRS 15, Genmab performs the following five steps: (i) identify the contract(s) with a customer; (ii) identify the performance obligations in the contract; (iii) determine the transaction price; (iv) allocate the transaction price to the performance obligations in the contract; and (v) recognize revenue when (or as) the entity satisfies a performance obligation. Genmab only applies the five-step model to contracts when it is probable that the Company will collect the consideration it is entitled to in exchange for the goods or services it transfers to the customer. At contract inception, once the contract is determined to be within the scope of IFRS 15, Genmab assesses the goods and services promised within each contract and identifies as a performance obligation each good or service that is distinct. Revenue is recognized in the amount of the transaction price that is allocated to the respective performance obligation when (or as) the performance obligation is satisfied.
Royalties: Certain of Genmab’s license and collaboration agreements include sales-based royalties based on the level of sales. The license has been deemed to be the predominant item to which the royalties relate under Genmab’s license and collaboration agreements. As a result, Genmab recognizes revenue when the related sales occur.
Reimbursement Revenue for R&D Services: Genmab’s research collaboration agreements include provisions for reimbursement or cost sharing for R&D services and payment for full time equivalents (“FTEs”) at contractual rates. R&D services are performed and satisfied over time given that the customer simultaneously receives and consumes the benefits provided by Genmab and revenue for research services is recognized over time rather than at a point in time.
Milestone Revenue: Certain of Genmab’s license and collaboration agreements include development, regulatory and commercial milestone payments based on the level of sales. At the inception of each arrangement that includes milestone payments, Genmab evaluates whether the achievement of milestones is considered highly probable and estimates the amount to be included in the transaction price using the most likely amount method. If it is highly probable that a significant revenue reversal would not occur, the associated milestone value is included in the transaction price. Milestone payments that are not within the control of Genmab or the license and collaboration partner, such as regulatory approvals, are not considered probable of being achieved until those approvals are received. The transaction price is then allocated to each performance obligation on a relative stand-alone selling price basis, for which Genmab recognizes revenue as or when the performance obligations under the contract are satisfied. At the end of each subsequent reporting period, Genmab re-evaluates the probability of achievement of such development milestones and commercial milestones and any related constraint, and if necessary, adjusts its estimate of the overall transaction price. Any such adjustments are recorded on a cumulative catch-up basis, which would affect revenue and earnings in the period of adjustment. Under all of Genmab’s existing license and collaboration agreements, milestone payments have been allocated to the license transfer performance obligation.
License Revenue for Intellectual Property: If the license to Genmab’s functional intellectual property is determined to be distinct from the other performance obligations identified in the arrangement, Genmab recognizes revenues from non-refundable upfront fees allocated to the license at the point in time the license is transferred to the licensee and the licensee is able to use and benefit from the license. For licenses that are bundled with other promises, Genmab utilizes judgement to assess the nature of the combined performance obligation to determine whether the combined performance obligation is satisfied over time or at a point in time and, if over time, the appropriate method of measuring progress for purposes of recognizing revenue from non-refundable, upfront fees. Under all of Genmab’s existing license and collaboration agreements the license to functional intellectual property has been determined to be distinct from other performance obligations identified in the agreement.
F-22
NOTES TO THE CONSOLIDATED FINANCIAL STATEMENTS—(CONTINUED)
Collaboration Revenue: Collaboration revenue includes the result of profit sharing arrangements for the sale of commercial products by our collaboration partners. When Genmab’s collaboration partner is determined to be the principal in sales to end customers, Genmab’s share of profits for the sale of commercial products is included in collaboration revenue.
Net Product Sales: Revenue from the sale of goods is recognized when control is transferred to the customer and it is probable that Genmab will collect the consideration to which it is entitled for transferring the products. Control of the products is transferred at a single point in time which occurs upon delivery to the customer. The amount of sales to be recognized is based on the consideration Genmab expects to receive in exchange for its goods. When sales are recognized, an estimate for a variety of sales deductions is also recorded such as cash discounts, government rebates, chargebacks, wholesaler fees, other rebates and administrative fees, sales returns and allowances and other sales discounts. Sales deductions are estimated and recognized as a reduction of gross product sales to arrive at net product sales, by assessing the expected value of the sales deductions (variable consideration). Sales deductions are estimated and provided for at the time the related sales are recorded. Genmab’s estimates related to sales deductions require significant use of estimates as not all conditions are known at the time of sale. The estimates are based on analyses of existing contractual obligations, historical experience, drug product analogs and payer channel mix. Genmab considers the provisions established for sales deductions to be reasonable and appropriate based on currently available information; however, the actual amount of deductions may differ from the amounts estimated by management as more information becomes available. Estimates will be assessed each period and adjusted as required based on updated information and actual experience.
When Genmab is determined to be the principal in sales to end customers, all product sales are included in net product sales in the Consolidated Statements of Comprehensive Income. As of December 31, 2024, all net product sales relate to sales of EPKINLY in the U.S. and Japan pursuant to the Collaboration Agreement with AbbVie.
Refer to Note 5.6 for detailed information regarding Genmab’s significant Research Collaborations, License Agreements and Collaborative Agreements.
| • | Refer to Note 1.3 for management’s judgements and estimates related to revenue recognition. |
2.2—Information about Geographical Areas
Genmab is managed and operated as one business unit, which is reflected in the organizational structure and internal reporting. No separate lines of business or separate business entities have been identified with respect to any licensed products, marketed products, product candidates or geographical markets and no segment information is currently prepared for internal reporting.
Accordingly, it has been concluded that it is not relevant to include segment disclosures in the financial statements as Genmab’s business activities are not organized on the basis of differences in related product and geographical areas.
| Revenue | Non- current |
Revenue | Non- current |
Revenue | Non- current |
|||||||||||||||||||
| (USD million) |
2024 | 2023 | 2022 | |||||||||||||||||||||
| Denmark |
2,868 | 1,779 | 2,329 | 75 | 2,031 | 30 | ||||||||||||||||||
| Netherlands |
— | 108 | — | 130 | — | 114 | ||||||||||||||||||
| United States |
131 | 447 | 55 | 56 | — | 63 | ||||||||||||||||||
| Japan |
122 | 14 | 6 | 8 | — | 10 | ||||||||||||||||||
| China |
— | 7 | — | — | — | — | ||||||||||||||||||
|
|
|
|
|
|
|
|
|
|
|
|
|
|||||||||||||
| Total |
3,121 | 2,355 | 2,390 | 269 | 2,031 | 217 | ||||||||||||||||||
|
|
|
|
|
|
|
|
|
|
|
|
|
|||||||||||||
F-23
NOTES TO THE CONSOLIDATED FINANCIAL STATEMENTS—(CONTINUED)
Out of total non-current assets of $2,355 million, $1,728 million relates to intangible assets in Denmark and $355 million relates to goodwill in the United States acquired as a part of the acquisition of ProfoundBio.
ACCOUNTING POLICIES
Geographical information is presented for Genmab’s revenue and non-current assets. Revenue is attributed to countries on the basis of the location of the legal entity holding the contract with the counterparty. Non-current assets comprise intangible assets, goodwill, property and equipment, right-of-use assets, and receivables.
2.3—Staff Costs
| (USD million) |
2024 | 2023 | 2022 | |||||||||
| Wages and salaries |
460 | 381 | 271 | |||||||||
| Share-based compensation |
105 | 85 | 63 | |||||||||
| Defined contribution plans |
30 | 25 | 16 | |||||||||
| Other social security costs |
58 | 49 | 36 | |||||||||
| Government grants related to research and development expenses |
(22 | ) | (25 | ) | (20 | ) | ||||||
|
|
|
|
|
|
|
|||||||
| Total |
631 | 515 | 366 | |||||||||
|
|
|
|
|
|
|
|||||||
| Staff costs are included in the Consolidated Statements of Comprehensive Income as follows: |
||||||||||||
| Cost of product sales |
2 | — | — | |||||||||
| Research and development expenses |
366 | 291 | 215 | |||||||||
| Selling, general and administrative expenses |
263 | 224 | 151 | |||||||||
|
|
|
|
|
|
|
|||||||
| Total |
631 | 515 | 366 | |||||||||
|
|
|
|
|
|
|
|||||||
| Average number of FTE |
2,535 | 2,011 | 1,460 | |||||||||
|
|
|
|
|
|
|
|||||||
| Number of FTE at year-end |
2,682 | 2,204 | 1,660 | |||||||||
|
|
|
|
|
|
|
|||||||
Refer to Note 4.6 for additional information regarding share-based instruments and Note 5.1 for additional information regarding the remuneration of the Board and Executive Management.
ACCOUNTING POLICIES
STAFF COSTS
Wages and salaries, other social security costs, paid leave and bonuses, and other employee benefits are recognized in the financial year in which the employee performs the associated work.
Genmab’s pension plans are classified as defined contribution plans and, accordingly, no pension obligations are recognized in the balance sheet. Costs relating to defined contribution plans are included in the income statement in the period in which they are accrued, and outstanding contributions are included in other payables.
Termination benefits are recognized as an expense, when Genmab is committed demonstrably, without realistic possibility of withdrawal, to a formal detailed plan to terminate employment.
F-24
NOTES TO THE CONSOLIDATED FINANCIAL STATEMENTS—(CONTINUED)
2.4—Corporate and Deferred Tax
TAXATION—INCOME STATEMENT & SHAREHOLDERS’ EQUITY
| (USD million) |
2024 | 2023 | 2022 | |||||||||
| Current tax on profit |
261 | 189 | 209 | |||||||||
| Adjustment to deferred tax |
14 | (9 | ) | 15 | ||||||||
| Net Increase (decrease) of unrecognized deferred tax assets for the year |
(84 | ) | 6 | (13 | ) | |||||||
| Effect of exchange rate adjustment |
2 | — | — | |||||||||
|
|
|
|
|
|
|
|||||||
| Total tax for the period in the income statement |
193 | 186 | 211 | |||||||||
|
|
|
|
|
|
|
|||||||
| (USD million) |
2024 | 2023 | 2022 | |||||||||
| Net profit before tax |
1,326 | 817 | 961 | |||||||||
|
|
|
|
|
|
|
|||||||
| Tax at the Danish corporation tax rate of 22% for all periods |
292 | 180 | 211 | |||||||||
|
|
|
|
|
|
|
|||||||
| Tax effect of: |
||||||||||||
| Net Increase (decrease) of unrecognized deferred tax assets for the year |
(84 | ) | 6 | (13 | ) | |||||||
| Net of non-taxable income over non-deductible expenses |
13 | 1 | 10 | |||||||||
| Other current and deferred tax adjustments |
(30 | ) | (1 | ) | (2 | ) | ||||||
| Effect of exchange rate adjustment |
2 | — | 5 | |||||||||
|
|
|
|
|
|
|
|||||||
| Total tax effect |
(99 | ) | 6 | — | ||||||||
|
|
|
|
|
|
|
|||||||
| Total tax for the period in the income statement |
193 | 186 | 211 | |||||||||
|
|
|
|
|
|
|
|||||||
| Total tax for the period in shareholders’ equity |
7 | 8 | (2 | ) | ||||||||
|
|
|
|
|
|
|
|||||||
| Effective Tax Rate |
14.6 | % | 22.8 | % | 22.0 | % | ||||||
|
|
|
|
|
|
|
|||||||
Corporate tax consists of current tax and the adjustment of deferred taxes during the year. The corporate tax expense was $193 million in 2024, $186 million in 2023 and $211 million in 2022. Tax benefits of $7 million in 2024, $8 million in 2023 and tax expenses of $2 million in 2022, related to excess tax benefits for share-based compensation were recorded directly in shareholders’ equity.
As a result of the ProfoundBio integration activities, Genmab utilized approximately $319 million of previously unrecognized tax losses during 2024.
Genmab operates in multiple jurisdictions which have enacted new legislation to implement the global minimum top-up tax, which became effective on January 1, 2024. Under this legislation, the Company is liable to pay a top-up tax for the difference between its GloBE Effective Tax Rate per jurisdiction and the minimum rate of 15 percent. The rules have no impact on the tax position of Genmab in 2024.
TAXATION—BALANCE SHEET
Significant components of the deferred tax (liabilities) assets are as follows:
| (USD million) |
2024 | 2023 | ||||||
| Share-based instruments |
38 | 6 | ||||||
| Deferred revenue |
17 | 17 | ||||||
| Intangible assets |
(347 | ) | — | |||||
| Other temporary differences |
89 | 8 | ||||||
|
|
|
|
|
|||||
| Total at December 31 |
(203 | ) | 31 | |||||
|
|
|
|
|
|||||
F-25
NOTES TO THE CONSOLIDATED FINANCIAL STATEMENTS—(CONTINUED)
Genmab recognizes deferred tax assets if it is probable that sufficient taxable income will be available in the future. Management has considered future taxable income and applied its judgement in assessing whether deferred tax assets should be recognized.
The difference between the deferred tax liability as of December 31, 2024 and the deferred tax liability acquired as part of the acquisition of ProfoundBio relates to the reestablishment of the deferred tax liability as a result of the transfer of intangible assets from ProfoundBio US to Genmab A/S during the fourth quarter of 2024.
As of December 31, 2024, Genmab had estimated gross unrecognized tax loss carryforwards in the Netherlands of $0.1 billion to reduce future taxable income. As of December 31, 2023, Genmab had estimated gross unrecognized tax loss carryforwards in the U.S. and in the Netherlands of $0.3 billion and $0.1 billion, respectively. The tax losses in the Netherlands available as of December 31, 2024, can be carried forward indefinitely.
ACCOUNTING POLICIES
CORPORATE TAX
Corporate tax, which consists of current tax and deferred taxes for the year, is recognized in the income statement, except to the extent that the tax is attributable to items which directly relate to shareholders’ equity or other comprehensive income.
Current tax assets and liabilities for current and prior periods are measured at the amounts expected to be recovered from or paid to the tax authorities.
DEFERRED TAX
Deferred tax accounting requires recognition of deferred tax on all temporary differences between the carrying amount of assets and liabilities and the tax base of such assets and liabilities. This includes the tax value of certain tax losses carried forward.
Deferred tax is calculated in accordance with the tax regulations in the local countries and the tax rates expected to be in force at the time the deferred tax is utilized. Changes in deferred tax as a result of changes in tax rates are recognized in the income statement.
Deferred tax assets resulting from temporary differences, including the tax value of losses to be carried forward, are recognized only to the extent that it is probable that future taxable profit will be available against which the differences can be utilized.
Deferred tax liabilities are recognized for taxable temporary differences that arise when the carrying amount of an asset exceeds its tax basis or the carrying amount of a liability is less than its tax base.
MANAGEMENT’S JUDGEMENTS AND ESTIMATES
DEFERRED TAX
Genmab recognizes deferred tax assets if management assesses that these tax assets can be offset against positive taxable income within the foreseeable future. This judgement is made on an ongoing basis and is based on numerous factors, including actual results, budgets, and business plans for the coming years.
Realization of deferred tax assets is dependent upon a number of factors, including estimated future taxable earnings, the timing and amount of which are highly uncertain.
F-26
NOTES TO THE CONSOLIDATED FINANCIAL STATEMENTS—(CONTINUED)
A significant portion of Genmab’s future taxable income will be driven by future events that are highly susceptible to factors outside the control of Genmab including overall commercial growth, specific clinical outcomes, regulatory approvals, advancement of Genmab’s product pipeline and other matters. As such, changes in estimates of future taxable income could impact Genmab’s future taxable income in a positive or negative manner.
As a result of the ProfoundBio integration activities, Genmab, based on current business plans and estimates of future taxable income, recognized a significant portion of previously unrecognized deferred tax assets during 2024.
2.5—Profit Per Share
| (USD million) |
2024 | 2023 | 2022 | |||||||||
| Net profit |
1,133 | 631 | 750 | |||||||||
|
|
|
|
|
|
|
|||||||
| (Shares) |
||||||||||||
| Weighted average number of shares outstanding |
66,139,029 | 66,023,437 | 65,783,130 | |||||||||
| Weighted average number of treasury shares |
(1,952,382 | ) | (713,693 | ) | (395,829 | ) | ||||||
|
|
|
|
|
|
|
|||||||
| Weighted average number of shares excl. treasury shares |
64,186,647 | 65,309,744 | 65,387,301 | |||||||||
| Adjustments for share-based instruments, dilution |
469,339 | 587,833 | 613,460 | |||||||||
|
|
|
|
|
|
|
|||||||
| Weighted average number of shares, diluted |
64,655,986 | 65,897,577 | 66,000,761 | |||||||||
|
|
|
|
|
|
|
|||||||
| Basic net profit per share |
17.66 | 9.67 | 11.47 | |||||||||
| Diluted net profit per share |
17.53 | 9.58 | 11.36 | |||||||||
In the calculation of the diluted net profit per share for 2024, 788,967 potential ordinary shares related to share-based instruments have been excluded as they are anti-dilutive, compared to 248,649 and 68,728 for 2023 and 2022, respectively.
ACCOUNTING POLICIES
BASIC NET PROFIT PER SHARE
Basic net profit per share is calculated as the net profit for the period divided by the weighted average number of outstanding ordinary shares, excluding treasury shares.
DILUTED NET PROFIT PER SHARE
Diluted net profit per share is calculated as the net profit for the period divided by the weighted average number of outstanding ordinary shares, excluding treasury shares and adjusted for the dilutive effect of share equivalents.
Section 3—Operating Assets and Liabilities
This section covers the operating assets and related liabilities that form the basis for Genmab’s activities. Deferred tax assets and liabilities are included in Note 2.4. Assets related to Genmab’s financing activities are shown in section 4.
3.1—Other Intangible Assets and Goodwill
Intangible Assets
The increase in the gross carrying value of other intangible assets during 2024 was primarily due to the addition of $1,536 million of in-process research and development (IPR&D) and $180 million of a technology platform asset from the ProfoundBio acquisition.
F-27
NOTES TO THE CONSOLIDATED FINANCIAL STATEMENTS—(CONTINUED)
The technology platform asset is being amortized over its estimated useful life of 15 years. Refer to Note 5.5 for additional details.
| (USD million) |
Goodwill | Licenses and Patents |
Technology Platform |
Acquired IPR&D |
Total Intangible Assets |
|||||||||||||||
| 2024 |
||||||||||||||||||||
| Cost at the beginning of the year |
— | 134 | — | — | 134 | |||||||||||||||
| Additions during the year |
354 | 24 | 180 | 1,536 | 2,094 | |||||||||||||||
| Effect of exchange rate adjustment |
1 | (9 | ) | — | (4 | ) | (12 | ) | ||||||||||||
|
|
|
|
|
|
|
|
|
|
|
|||||||||||
| Cost at the end of the year |
355 | 149 | 180 | 1,532 | 2,216 | |||||||||||||||
|
|
|
|
|
|
|
|
|
|
|
|||||||||||
| Amortization and impairment losses at the beginning of the year |
— | 119 | — | — | 119 | |||||||||||||||
| Amortization for the year |
— | 3 | 8 | — | 11 | |||||||||||||||
| Impairment losses for the year |
— | 11 | — | — | 11 | |||||||||||||||
| Effect of exchange rate adjustment |
— | (7 | ) | (1 | ) | — | (8 | ) | ||||||||||||
|
|
|
|
|
|
|
|
|
|
|
|||||||||||
| Amortization and impairment losses at the end of the year |
— | 126 | 7 | — | 133 | |||||||||||||||
|
|
|
|
|
|
|
|
|
|
|
|||||||||||
| Carrying amount at the end of the year |
355 | 23 | 173 | 1,532 | 2,083 | |||||||||||||||
|
|
|
|
|
|
|
|
|
|
|
|||||||||||
| 2023 |
||||||||||||||||||||
| Cost at the beginning of the year |
— | 128 | — | — | 128 | |||||||||||||||
| Additions during the year |
— | 1 | — | — | 1 | |||||||||||||||
| Effect of exchange rate adjustment |
— | 5 | — | — | 5 | |||||||||||||||
|
|
|
|
|
|
|
|
|
|
|
|||||||||||
| Cost at the end of the year |
— | 134 | — | — | 134 | |||||||||||||||
|
|
|
|
|
|
|
|
|
|
|
|||||||||||
| Amortization and impairment losses at the beginning of the year |
— | 107 | — | — | 107 | |||||||||||||||
| Amortization for the year |
— | 8 | — | — | 8 | |||||||||||||||
| Effect of exchange rate adjustment |
— | 4 | — | — | 4 | |||||||||||||||
|
|
|
|
|
|
|
|
|
|
|
|||||||||||
| Amortization and impairment losses at the end of the year |
— | 119 | — | — | 119 | |||||||||||||||
|
|
|
|
|
|
|
|
|
|
|
|||||||||||
| Carrying amount at the end of the year |
— | 15 | — | — | 15 | |||||||||||||||
|
|
|
|
|
|
|
|
|
|
|
|||||||||||
Impairment losses for the year related to licenses and patents, which were not material, were recorded in Research and development expenses in the Consolidated Statements of Comprehensive Income.
Amortization expense was $11 million, $8 million, and $15 million for 2024, 2023 and 2022, respectively, which was recorded in Research and development expenses in the Consolidated Statements of Comprehensive Income.
Goodwill
The carrying amount of goodwill was $355 million as of December 31, 2024, due to the acquisition of ProfoundBio (refer to Note 5.5). No impairment of goodwill was recognized in 2024 as the annual impairment test showed that the estimated recoverable amount exceeded the carrying amount of the single cash-generating unit (CGU) to which all of Genmab’s goodwill was allocated. There was no goodwill balance as of December 31, 2023.
F-28
NOTES TO THE CONSOLIDATED FINANCIAL STATEMENTS—(CONTINUED)
ACCOUNTING POLICIES
RESEARCH AND DEVELOPMENT PROJECTS
Internal and subcontracted research costs are charged in full to research and development expenses in the Consolidated Statements of Comprehensive Income in the period in which they are incurred. Development costs are also expensed until regulatory approval is obtained or is probable. Genmab has no internally generated intangible assets from development, as the criteria for recognition of an intangible asset are not met.
Genmab acquires licenses and rights primarily to gain access to targets and technologies identified by third parties. Payments to third parties under collaboration and license agreements are assessed to determine whether such payments should be expensed as incurred as research and development expenses or capitalized as an intangible asset. Licenses and rights that meet the criteria for capitalization as intangible assets are measured at cost less accumulated amortization and any impairment losses. Milestone payments related to capitalized licenses and rights are accounted for as an increase in the cost to acquire licenses and rights.
For acquired research and development projects, and intellectual property rights, including acquisition in a business combination, the likelihood of obtaining future commercial sales is reflected in the cost of the asset, and thus the probability recognition criteria is always considered to be satisfied. As the cost of acquired research and development projects can often be measured reliably, these projects fulfil the capitalization criteria as intangible assets on acquisition. Development costs incurred subsequent to acquisition are treated consistently with internal project development costs.
GOODWILL
Goodwill represents the excess of purchase price over the fair value of net identifiable assets acquired and liabilities assumed in a business combination accounted for by the acquisition method of accounting. Goodwill is allocated to each of the group’s CGU (or groups of CGUs) expected to benefit from the synergies of the combination. Genmab consists of one single CGU which represents its single operating segment.
RECOGNITION AND MEASUREMENT
Intangible assets are initially measured at cost and are subsequently measured at cost less any accumulated amortization and any impairment loss. Goodwill is not amortized but is subject to impairment testing.
For intellectual property rights acquired for research and development projects, upfront fees and acquisition costs are capitalized as the historical cost. Subsequent milestone payments payable on achievement of a contingent event will be capitalized when the contingent event being achieved is probable. Intangible assets acquired in a business combination are recognized at fair value at the acquisition date.
Amortization
Intangible assets with definite useful lives are amortized based on the straight-line method over their estimated useful lives. This corresponds to the legal duration or the economic useful life depending on which is shorter. The amortization of intellectual property rights, including IPR&D, commences after regulatory approval has been obtained or when assets are put in use.
Impairment
Goodwill and intangible assets not yet available for use (IPR&D) are tested for impairment when indicators of impairment exist. However, they are tested at least annually, irrespective of whether there is any indication that they may be impaired.
F-29
NOTES TO THE CONSOLIDATED FINANCIAL STATEMENTS—(CONTINUED)
If circumstances or changes in Genmab’s operations indicate that the carrying amount of Goodwill, IPR&D or definite-lived intangible assets may not be recoverable, management performs an impairment test of the asset for impairment.
Amortization, impairment losses, and gains or losses on the disposal of other intangible assets related to licenses and rights are recognized in Consolidated Statements of Comprehensive Income as research and development expenses.
MANAGEMENT’S JUDGMENTS AND ESTIMATES
Impairment Assessment of Goodwill and Other Intangible Assets
CGUs to which goodwill has been allocated are tested for impairment at least annually, or more frequently when there is an indication that the unit may be impaired by assessing qualitative factors or performing a quantitative analysis. Goodwill is monitored for impairment at the operating segment level, which is the lowest level CGU to which goodwill is allocated and monitored by Management. Goodwill impairment tests are based on management’s estimate of recoverable amount determined as the greater of the fair value less cost to sell, or its value in use. Value in use is calculated based on a multiple applied on steady earnings from operations before tax generated from the CGU. If the carrying amount of goodwill exceeds the recoverable amount, any impairment is measured as the difference between the recoverable amount and the carrying amount. Any impairment is first allocated to reduce the carrying amount of goodwill and any exceeding amount is allocated pro-rata to Genmab’s other assets in the CGU in the scope of IAS 36 but not less than their recoverable amount. An impairment loss is recognized in the Consolidated Statements of Comprehensive Income when the impairment is identified. Impairments of goodwill are prohibited from future reversals.
As permitted under IAS 36 (Impairment of Assets), use of a short-cut quantitative impairment test may be relied on if conservative assumptions are utilized which would result in an underestimation of the recoverable amount. By applying a multiple of four on the previous twelve consecutive months operating profit before tax the estimated recoverable amount is higher than the carrying amount of the CGU. It is management’s assessment that a multiple of four is a conservative assumption compared to market observations. The operating profit before tax for the previous twelve consecutive months is based on recurring earnings and is considered a conservative measure of earnings for the next four years compared to the budget and forecast prepared by the Group. Thus, management has concluded that there is no impairment on goodwill. As Genmab has a single CGU with a quoted market price of the entire Group (level 1 observable input), a high-level comparison between Genmab’s market capitalization and the recoverable amount was also performed to reaffirm the reasonableness of the short-cut approach to estimate recoverable amount. The carrying amount of the single CGU includes Genmab’s net assets, less cash and marketable securities as returns on such balances are not included in operating profit before tax and therefore are not included in the recoverable amount either.
The basis for the review of IPR&D impairment is also the recoverable amount. If the carrying amount of an intangible asset is greater than the recoverable amount, the intangible asset is written down to the recoverable amount. An impairment loss is recognized in the Consolidated Statements of Comprehensive Income when the impairment is identified. Impairments on intangible assets are reviewed at each reporting date for possible reversal.
Factors considered material that could trigger an impairment test include the following:
| • | Development of a competing drug |
| • | Realized sales trending below predicted sales |
| • | Inconsistent or unfavorable clinical readouts |
F-30
NOTES TO THE CONSOLIDATED FINANCIAL STATEMENTS—(CONTINUED)
| • | Changes in the legal framework covering patents, rights, and licenses |
| • | Advances in medicine and/or technology that affect the medical treatments |
| • | Adverse impact on reputation and/or brand names |
3.2—Property and Equipment
| (USD million) |
Leasehold improvements |
Equipment, furniture and fixtures |
Assets under construction |
Total property and equipment |
||||||||||||
| 2024 |
||||||||||||||||
| Cost at January 1 |
101 | 135 | 6 | 242 | ||||||||||||
| Additions for the year |
1 | 12 | 17 | 30 | ||||||||||||
| Acquisitions through business combinations |
2 | 6 | — | 8 | ||||||||||||
| Transfers between the classes |
1 | 6 | (7 | ) | — | |||||||||||
| Disposals for the year |
(1 | ) | (12 | ) | (1 | ) | (14 | ) | ||||||||
| Exchange rate adjustment |
(3 | ) | (8 | ) | (1 | ) | (12 | ) | ||||||||
|
|
|
|
|
|
|
|
|
|||||||||
| Cost at December 31 |
101 | 139 | 14 | 254 | ||||||||||||
|
|
|
|
|
|
|
|
|
|||||||||
| Accumulated depreciation and impairment at January 1 |
(29 | ) | (71 | ) | — | (100 | ) | |||||||||
| Depreciation for the year |
(11 | ) | (23 | ) | — | (34 | ) | |||||||||
| Exchange rate adjustment |
1 | 4 | — | 5 | ||||||||||||
| Accumulated depreciation on disposals |
1 | 11 | — | 12 | ||||||||||||
|
|
|
|
|
|
|
|
|
|||||||||
| Accumulated depreciation and impairment at December 31 |
(38 | ) | (79 | ) | — | (117 | ) | |||||||||
|
|
|
|
|
|
|
|
|
|||||||||
| Carrying amount at December 31 |
63 | 60 | 14 | 137 | ||||||||||||
|
|
|
|
|
|
|
|
|
|||||||||
| (USD million) |
Leasehold improvements |
Equipment, furniture and fixtures |
Assets under construction |
Total property and equipment |
||||||||||||
| 2023 |
||||||||||||||||
| Cost at January 1 |
59 | 93 | 33 | 185 | ||||||||||||
| Additions for the year |
1 | 19 | 32 | 52 | ||||||||||||
| Acquisitions through business combinations |
— | — | — | — | ||||||||||||
| Transfers between the classes |
40 | 19 | (59 | ) | — | |||||||||||
| Disposals for the year |
— | — | (1 | ) | (1 | ) | ||||||||||
| Exchange rate adjustment |
1 | 4 | 1 | 6 | ||||||||||||
|
|
|
|
|
|
|
|
|
|||||||||
| Cost at December 31 |
101 | 135 | 6 | 242 | ||||||||||||
|
|
|
|
|
|
|
|
|
|||||||||
| Accumulated depreciation and impairment at January 1 |
(19 | ) | (52 | ) | — | (71 | ) | |||||||||
| Depreciation for the year |
(9 | ) | (18 | ) | — | (27 | ) | |||||||||
| Exchange rate adjustment |
(1 | ) | (1 | ) | — | (2 | ) | |||||||||
| Accumulated depreciation on disposals |
— | — | — | — | ||||||||||||
|
|
|
|
|
|
|
|
|
|||||||||
| Accumulated depreciation and impairment at December 31 |
(29 | ) | (71 | ) | — | (100 | ) | |||||||||
|
|
|
|
|
|
|
|
|
|||||||||
| Carrying amount at December 31 |
72 | 64 | 6 | 142 | ||||||||||||
|
|
|
|
|
|
|
|
|
|||||||||
F-31
NOTES TO THE CONSOLIDATED FINANCIAL STATEMENTS—(CONTINUED)
| (USD million) |
2024 | 2023 | 2022 | |||||||||
| Depreciation and impairment included in the income statement as follows: |
||||||||||||
| Research and development expenses |
29 | 20 | 15 | |||||||||
| Selling, general and administrative expenses |
5 | 7 | 5 | |||||||||
|
|
|
|
|
|
|
|||||||
| Total |
34 | 27 | 20 | |||||||||
|
|
|
|
|
|
|
|||||||
Capital expenditures in 2024 were primarily related to the expansion Genmab’s facilities in the United States and Japan. Capital expenditures in 2023 were primarily related to the expansion of our facilities in the Netherlands and our new headquarters in Denmark.
ACCOUNTING POLICIES
Property and equipment is comprised of leasehold improvements, assets under construction, and equipment, furniture, and fixtures, which are measured at cost less accumulated depreciation and any impairment losses.
The cost is comprised of the acquisition price and direct costs related to the acquisition until the asset is ready for use. Costs include direct costs and costs to subcontractors.
DEPRECIATION
Depreciation is calculated on a straight-line basis to allocate the cost of the assets, net of any residual value, over the estimated useful lives, which are as follows:
| Equipment, furniture, and fixtures | 3-5 years | |
| Leasehold improvements | 15 years or the lease term, if shorter |
Depreciation commences when the asset is available for use, including when it is in the location and condition necessary for it to be capable of operating in the manner intended by management. The useful lives and residual values are reviewed and adjusted if appropriate on a yearly basis. Assets under construction are not depreciated.
IMPAIRMENT
If circumstances or changes in Genmab’s operations indicate that the carrying amount of property and equipment may not be recoverable, management performs an impairment test of the asset.
The basis for the performance of an impairment test is the recoverable amount of the asset, determined as the greater of the fair value less cost to sell or its value in use. Value in use is calculated as the net present value of future cash inflow expected to be generated from the asset.
If the carrying amount of an asset is greater than the recoverable amount, the asset is written down to the recoverable amount. An impairment loss is recognized in the Consolidated Statements of Comprehensive Income when the impairment is identified.
F-32
NOTES TO THE CONSOLIDATED FINANCIAL STATEMENTS—(CONTINUED)
3.3—Leases
Genmab has entered into lease agreements with respect to office and laboratory space, vehicles, and IT equipment. The expense, lease liability, and right-of-use assets balances related to vehicles and IT equipment are immaterial. The leases are non-cancellable over various periods through 2038.
| (USD million) |
2024 | 2023 | 2022 | |||||||||
| Right-of-use assets |
||||||||||||
| Balance at January 1 |
102 | 75 | 54 | |||||||||
| Additions to right-of-use assets1 |
48 | 36 | 34 | |||||||||
| Depreciation charge for the year |
(15 | ) | (13 | ) | (10 | ) | ||||||
| Exchange rate adjustment |
(7 | ) | 4 | (3 | ) | |||||||
|
|
|
|
|
|
|
|||||||
| Balance at December 31 |
128 | 102 | 75 | |||||||||
|
|
|
|
|
|
|
|||||||
| Lease liabilities |
||||||||||||
| Current |
13 | 13 | 11 | |||||||||
| Non-current |
131 | 101 | 75 | |||||||||
|
|
|
|
|
|
|
|||||||
| Total at December 31 |
144 | 114 | 86 | |||||||||
|
|
|
|
|
|
|
|||||||
| 1 | Additions to right-of-use assets also includes modifications to existing leases and adjustments to the provisions for contractual restoration obligations related to leases of Genmab offices. |
| Cash outflow for lease payments |
14 | 17 | 12 | |||||||||
|
|
|
|
|
|
|
Variable lease payments, short-term lease expense, lease interest expense, low-value assets, and sublease income are immaterial.
Future minimum payments under leases are as follows:
| (USD million) |
2024 | 2023 | 2022 | |||||||||
| Payment due |
||||||||||||
| Less than 1 year |
18 | 16 | 13 | |||||||||
| 1 to 3 years |
40 | 30 | 24 | |||||||||
| More than 3 years but less than 5 years |
39 | 27 | 20 | |||||||||
| More than 5 years |
77 | 61 | 39 | |||||||||
|
|
|
|
|
|
|
|||||||
| Total at December 31 |
174 | 134 | 96 | |||||||||
|
|
|
|
|
|
|
|||||||
ACCOUNTING POLICIES
All leases are recognized in the Consolidated Balance Sheets as a right-of-use (ROU) asset with a corresponding lease liability, except for short-term leases in which the term is 12 months or less, or low-value leases.
ROU assets represent Genmab’s right to use an underlying asset for the lease term and lease liabilities represent Genmab’s obligation to make lease payments arising from the lease. The ROU asset is depreciated over the shorter of the asset’s useful life or the lease term on a straight-line basis. In the Consolidated Statements of Comprehensive Income, depreciation of the ROU asset is recognized over the lease term in operating expenses and interest expenses related to the lease liability are classified in financial items.
Genmab determines if an arrangement is a lease at inception. Genmab leases various properties, vehicles, and IT equipment. Rental contracts are typically made for fixed periods. Lease terms are negotiated on an individual basis and contain a wide range of terms and conditions.
F-33
NOTES TO THE CONSOLIDATED FINANCIAL STATEMENTS—(CONTINUED)
Assets and liabilities arising from a lease are initially measured on a present value basis. Lease liabilities include the net present value of fixed payments, less any lease incentives receivable. As Genmab’s leases generally do not provide an implicit interest rate, Genmab uses an incremental borrowing rate based on the information available at the commencement date of the lease in determining the present value of lease payments. Lease terms utilized by Genmab may include options to extend or terminate the lease when it is reasonably certain that Genmab will exercise that option. In determining the lease term, management considers all facts and circumstances that create an economic incentive to exercise an extension option, or not exercise a termination option. Extension options (or periods after termination options) are only included in the lease term if the lease is reasonably certain to be extended.
ROU assets are measured at cost and include the amount of the initial measurement of the lease liability, any lease payments made at or before the commencement date less any lease incentives received, any initial direct costs, and restoration costs.
Payments associated with short-term leases and leases of low-value assets are recognized on a straight-line basis as an expense in the Consolidated Statements of Comprehensive Income.
3.4—Other Investments
| (USD million) |
2024 | 2023 | ||||||
| Publicly traded equity securities |
5 | 7 | ||||||
| Fund investments |
25 | 13 | ||||||
| Privately held equity securities |
2 | — | ||||||
|
|
|
|
|
|||||
| Total at December 31 |
32 | 20 | ||||||
|
|
|
|
|
|||||
Other investments includes strategic investments in publicly traded common stock of companies, including common stock of companies with whom Genmab has entered into collaboration arrangements, investments in certain investment funds, as well as investments in shares of privately held companies.
ACCOUNTING POLICIES
Other investments are measured on initial recognition at fair value, and subsequently at fair value. Changes in fair value are recognized in the Consolidated Statements of Comprehensive Income within financial income or expense.
Other investments primarily consist of investments in certain strategic investment funds. Genmab’s share of the fair value of these fund investments is determined based on the valuation of the underlying investments included in the fund. Investments in publicly traded equity securities included in these strategic investment funds are valued based at the most recent sale price or official closing price reported on the exchange or over-the-counter market on which they trade, while investments in non-publicly traded equity securities are based on other factors, including but not limited to, type of the security, the size of the holding, the initial cost of the security, the price and extent of public trading in similar securities of the comparable companies, an analysis of the company’s or issuer’s financial statements and with respect to debt securities, the maturity and creditworthiness. As such, these fund investments have been characterized as Level 3 investments as fair values are based on significant unobservable inputs.
F-34
NOTES TO THE CONSOLIDATED FINANCIAL STATEMENTS—(CONTINUED)
3.5—Inventories
| (USD million) |
2024 | 2023 | ||||||
| Raw materials |
1 | 2 | ||||||
| Work in progress |
— | — | ||||||
| Finished goods |
11 | 9 | ||||||
|
|
|
|
|
|||||
| Total inventories (gross) at December 31 |
12 | 11 | ||||||
|
|
|
|
|
|||||
| Allowances at year end |
(3 | ) | (3 | ) | ||||
|
|
|
|
|
|||||
| Total inventories (net) at December 31 |
9 | 8 | ||||||
|
|
|
|
|
|||||
In 2024 and 2023, allowances related to write downs of excess and obsolete inventories were immaterial and recognized as expense within cost of product sales in the Consolidated Statements of Comprehensive Income.
Inventory write down in 2023 pertaining to pre-launch inventories of EPKINLY was also immaterial. The write down was recorded as research and development expense in Genmab’s Consolidated Statements of Comprehensive Income and was subsequently reversed upon receiving U.S. FDA approval during the second quarter of 2023.
ACCOUNTING POLICIES
Inventories are measured at the lower of cost and net realizable value with costs determined on a first-in, first-out basis. Costs comprise direct and indirect costs relating to the manufacture of inventory mainly from third-party providers of manufacturing as well as costs related to internal resources and distribution and logistics. Genmab assesses the recoverability of capitalized inventories during each reporting period and will write down excess or obsolete inventories to their net realizable value in the period in which the impairment is identified. Write downs of inventory are included within Cost of product sales in the Consolidated Statements of Comprehensive Income.
Included in inventories are materials with the intended purpose of being made available for sale. If the materials are later used in the production of clinical products, the materials are charged to research and development expense when shipped to the clinical packaging site. Materials ordered exclusively to be used in Genmab’s research and development process (e.g., early research/clinical trials) are immediately expensed to research and development based on the relevant shipping terms (FOB destination/shipping point).
Inventory manufactured prior to regulatory approval of a product (prelaunch inventory) is written down to its net realizable value (that is the probable amount expected to be realized from its sale or use at the time of production). The amount of this write down is recognized in the Consolidated Statements of Comprehensive Income as research and development expenses. Once there is a high probability of regulatory approval being obtained for the product, inventory costs begin to be capitalized. Additionally, the write-down is reversed, up to no more than the original cost. The reversal of the write-down is recognized as a reduction to research and development expenses in the Consolidated Statements of Comprehensive Income.
F-35
NOTES TO THE CONSOLIDATED FINANCIAL STATEMENTS—(CONTINUED)
3.6—Receivables
| (USD million) |
2024 | 2023 | ||||||
| Receivables related to collaboration agreements |
761 | 615 | ||||||
| Prepayments |
36 | 36 | ||||||
| Trade receivables related to product sales |
65 | 27 | ||||||
| Interest receivables |
19 | 22 | ||||||
| Other receivables |
49 | 43 | ||||||
|
|
|
|
|
|||||
| Total at December 31 |
930 | 743 | ||||||
|
|
|
|
|
|||||
| Non-current receivables |
7 | 10 | ||||||
| Current receivables |
923 | 733 | ||||||
|
|
|
|
|
|||||
| Total at December 31 |
930 | 743 | ||||||
|
|
|
|
|
|||||
During 2024 and 2023, there were no losses related to receivables and the credit risk on receivables is considered to be limited. The provision for expected credit losses was zero given that there have been no credit losses over the last three years and the limited credit risk due to high-quality nature with high credit ratings (top tier life science companies and major distributors) of Genmab’s customers are not likely to result in future default risk.
The receivables are mainly comprised of royalties, trade receivables, milestones and amounts due under collaboration agreements and are non-interest bearing receivables which are due less than one year from the balance sheet date.
Refer to Note 4.2 for additional information about interest receivables and related credit risk.
ACCOUNTING POLICIES
Initially, trade receivables are designated as financial assets measured at transaction price and other receivables are measured at fair value. Subsequently receivables are measured in the balance sheet at amortized cost, which generally corresponds to nominal value less expected credit losses.
Accounts receivable arising from product sales consists of amounts due from customers, net of customer allowances for chargebacks, cash and other discounts and estimated credit losses. Genmab’s contracts with customers have initial payment terms that range from 30 to 180 days.
Genmab utilizes a simplified approach to measuring expected credit losses and uses a lifetime expected loss allowance for all receivables. To measure the expected credit losses, receivables have been grouped based on credit risk characteristics and the days past due.
Prepayments include expenditures related to a future financial period. Prepayments are measured at nominal value.
F-36
NOTES TO THE CONSOLIDATED FINANCIAL STATEMENTS—(CONTINUED)
3.7—Contract Liabilities
Genmab has recognized the following liabilities related to the AbbVie collaboration agreement.
| (USD million) |
2024 | 2023 | ||||||
| Contract liabilities at January 1 |
76 | 74 | ||||||
| Payment received |
— | — | ||||||
| Revenue recognized during the year |
(1 | ) | — | |||||
| Exchange rate adjustment |
(5 | ) | 2 | |||||
|
|
|
|
|
|||||
| Total at December 31 |
70 | 76 | ||||||
|
|
|
|
|
|||||
| Non-current contract liabilities |
67 | 71 | ||||||
| Current contract liabilities |
3 | 5 | ||||||
|
|
|
|
|
|||||
| Total at December 31 |
70 | 76 | ||||||
|
|
|
|
|
|||||
Contract liabilities were recognized in connection with the AbbVie collaboration agreement. An upfront payment of $750 million was received in July 2020 of which $673 million was recognized as license revenue during 2020.
The revenue deferred at the initiation of the AbbVie agreement in June 2020 related to four product concepts to be identified and subject to a research agreement to be negotiated between Genmab and AbbVie.
During the first quarter of 2022, Genmab and AbbVie entered into the aforementioned research agreement that governs the research and development activities in regard to the product concepts.
As part of the continued evaluation of contract liabilities related to the AbbVie collaboration agreement, Genmab’s classification of contract liabilities reflects the current estimate of co-development activities as of December 31, 2024. Contract liabilities have been recognized as reimbursement revenue during the second half of 2024.
Refer to Note 5.6 for additional information related to the AbbVie collaboration.
3.8—Other Payables
| (USD million) |
2024 | 2023 | ||||||
| Liabilities related to collaboration agreements |
39 | 22 | ||||||
| Staff cost liabilities |
102 | 94 | ||||||
| Accounts payable |
90 | 49 | ||||||
| Other liabilities |
263 | 182 | ||||||
|
|
|
|
|
|||||
| Total at December 31 |
494 | 347 | ||||||
|
|
|
|
|
|||||
| Non-current other payables |
5 | 5 | ||||||
| Current other payables |
489 | 342 | ||||||
|
|
|
|
|
|||||
| Total at December 31 |
494 | 347 | ||||||
|
|
|
|
|
|||||
ACCOUNTING POLICIES
Other payables, excluding provisions, are initially measured at fair value and subsequently measured in the balance sheet at amortized cost.
F-37
NOTES TO THE CONSOLIDATED FINANCIAL STATEMENTS—(CONTINUED)
The current other payables are comprised of liabilities that are due less than one year from the balance sheet date and are in general not interest bearing and settled on an ongoing basis during the next financial year.
Non-current payables are measured at the present value of the expenditures expected to be required to settle the obligation using a pre-tax discount rate that reflects current market assessments of the time value of money and the risks specific to the obligation. The increase in the liability due to passage of time is recognized as interest expense.
ACCOUNTS PAYABLE
Accounts payable are measured in the Consolidated Balance Sheets at amortized cost.
OTHER LIABILITIES
Other liabilities primarily include accrued expenses related to our research and development project costs and are measured in the Consolidated Balance Sheets at amortized cost.
Refer to Note 2.3 for accounting policies related to staff costs.
Section 4—Capital Structure, Financial Risk and Related Items
This section includes disclosures related to how Genmab manages its capital structure, cash position and related risks and items. Genmab is primarily financed through partnership collaborations.
4.1—Capital Management
Genmab’s goal is to maintain a strong capital base so as to maintain investor, creditor and market confidence, and to have adequate liquidity to support the continuous advancement of Genmab’s product pipeline and business in general. To achieve this goal Genmab invests in different liquidity tiers. To meet operational goals, Genmab invests in cash and cash equivalents (marketable securities). To ensure sufficient reserves, Genmab invests in short-term securities with an average duration of about six months, which serves as back-up liquidity for the operating tier. For strategic purposes, Genmab has short term investments to support the Company’s growth over the longer term. Most of Genmab’s cash and marketable securities are in USD due to having a larger USD expenditure base than DKK which provides better matching of investment balances with actual expenditures. Genmab is primarily financed through revenues under various collaboration agreements and had, as of December 31, 2024, cash, and cash equivalents of $1,380 million and marketable securities of $1,574 million compared to $2,204 million and $1,967 million, respectively, as of December 31, 2023. Genmab’s cash and cash equivalents and marketable securities support the advancement of our product pipeline and operations.
The adequacy of our available funds will depend on many factors, including the level of DARZALEX and other royalty streams, progress in our research and development programs, the magnitude of those programs, our commitments to existing and new clinical collaborators, our ability to establish commercial and licensing arrangements, our capital expenditures, market developments, and any future acquisitions. Accordingly, Genmab may require additional funds and may attempt to raise additional funds through equity or debt financings, collaborative agreements with partners, or from other sources.
During the fourth quarter of 2024, Genmab entered into an unsecured three-year revolving credit facility (“Credit Facility”) of up to $300 million with a syndicate of lenders. Genmab intends to use the Credit Facility to finance working capital needs, and for general corporate purposes, of Genmab A/S and its subsidiaries. The Credit Facility includes options to increase the size of the facility up to $500 million as well as the ability to extend for an additional two years.
F-38
NOTES TO THE CONSOLIDATED FINANCIAL STATEMENTS—(CONTINUED)
The Credit Facility contains certain customary financial covenants. As of December 31, 2024, there were no outstanding amounts due on, nor any usage of, the Credit Facility and Genmab was in compliance with all financial covenants.
The Board monitors the share and capital structure to ensure that Genmab’s capital resources support its strategic goals.
Neither Genmab A/S nor any of its subsidiaries are subject to externally imposed capital requirements.
4.2—Financial Risk
The financial risks of Genmab are managed centrally.
The overall risk management guidelines have been approved by the Board of Directors and include the Group’s investment policy related to our marketable securities. The Group’s risk management guidelines are established to identify and analyze the risks faced by the Genmab Group, to set the appropriate risk limits and controls and to monitor the risks and adherence to limits. It is Genmab’s policy not to actively speculate in financial risks. The Group’s financial risk management is directed solely towards monitoring and reducing financial risks which are directly related to Genmab’s operations.
The primary objective of Genmab’s investment activities is to preserve capital and ensure liquidity with a secondary objective of maximizing the return derived from security investments without significantly increasing risk. Therefore, our investment policy includes among other items, guidelines and ranges for which investments (which are primarily shorter-term in nature) are considered to be eligible investments for Genmab and which investment parameters are to be applied, including maturity limitations and credit ratings. In addition, the policy includes specific diversification criteria and investment limits to minimize the risk of loss resulting from over-concentration of assets in a specific class, issuer, currency, country, or economic sector.
Genmab’s marketable securities are administered by external investment managers. The investment guidelines and managers are reviewed regularly to reflect changes in market conditions, Genmab’s activities and financial position. Genmab’s investment policy allows investments in debt rated BBB- or greater by S&P or Fitch and in debt rated Baa3 or greater by Moody’s. The policy also includes additional allowable investment types such as corporate debt, commercial paper, certificates of deposit, and certain types of AAA rated asset-backed securities.
In addition to the capital management and financing risk mentioned in Note 4.1, Genmab has identified the following key financial risk areas, which are mainly related to our marketable securities portfolio:
| • | credit risk; |
| • | foreign currency risk; and |
| • | interest rate risk |
All of Genmab’s marketable securities are traded in established markets. Given the current market conditions, all future cash inflows, including re-investments of proceeds from the disposal of marketable securities, are invested in highly liquid, investment grade securities. Refer to Note 4.4 for additional information regarding marketable securities.
F-39
NOTES TO THE CONSOLIDATED FINANCIAL STATEMENTS—(CONTINUED)
CREDIT RISK
Genmab is exposed to credit risk and losses on marketable securities, bank deposits and receivables. The maximum credit exposure related to Genmab’s cash and cash equivalents and marketable securities was $2,954 million as of December 31, 2024, compared to $4,171 million as of December 31, 2023. The maximum credit exposure to Genmab’s receivables was $930 million as of December 31, 2024 compared to $743 million as of December 31, 2023.
Marketable Securities
To manage and reduce credit risks on our securities, Genmab’s policy is to ensure only securities from investment grade issuers are eligible for our portfolios. No issuer of marketable securities can be accepted if the issuer, at the time of purchase, does not have the credit quality equal to or better than the rating shown in the table below from at least one of the rating agencies. If an issuer is rated by more than one of the rating agencies listed below, the credit assessment is made against the lowest rating available for the issuer.
| Category |
S&P | Moody’s | Fitch | |||||||||
| Short-term |
A-2 | P-2 | F-2 | |||||||||
| Long-term |
BBB- | Baa3 | BBB- | |||||||||
Genmab’s current portfolio is spread over a number of different securities with a focus on liquidity and security. As of December 31, 2024, 71% of Genmab’s marketable securities were long-term A rated or higher, or short-term A-1 / P-1 rated by S&P, Moody’s or Fitch compared to 72% as of December 31, 2023. The total value of marketable securities amounted to $1,574 million at the end of 2024 compared to $1,967 million at the end of 2023.
Cash and Cash Equivalents
To reduce the credit risk on our bank deposits, Genmab’s policy is only to invest its cash deposits with highly rated financial institutions. Currently, these financial institutions have a short-term Fitch and S&P rating of at least F-1 and A-1, respectively. In addition, Genmab maintains bank deposits at a level necessary to support the short-term funding requirements of Genmab. The total value of bank deposits including AAA rated money market funds and short-term marketable securities classified as cash equivalents amounted to $1,380 million as of December 31, 2024 compared to $2,204 million at the end of 2023. The decrease was primarily the result of cash used to acquire ProfoundBio in the second half of 2024.
Receivables
The credit risk related to our receivables is not significant based on the high-quality nature of Genmab’s collaboration partners. As disclosed in Note 2.1, J&J, Novartis, Roche, AbbVie and BioNTech are Genmab’s primary partners in which receivables are established for royalties, milestone revenue and reimbursement revenue. These are long-standing relationships and Genmab does not have a history of writing off receivables from collaboration partners.
FOREIGN CURRENCY RISK
As stated in Note 1.1, the consolidated financial statements were originally prepared in DKK, which was the presentation currency of Genmab. As such, the foreign currency risk reflects the original impacts of the DKK presentation currency.
Genmab’s revenues and expenses are in a number of different currencies. Consequently, there is a substantial risk of exchange rate fluctuations having an impact on Genmab’s cash flows, profit (loss) and/or financial position.
F-40
NOTES TO THE CONSOLIDATED FINANCIAL STATEMENTS—(CONTINUED)
The majority of Genmab’s revenue is generated in USD. Exchange rate changes to the USD will result in changes to the translated value of future net profit before tax and cash flows. Genmab’s revenue in USD was 79% of total revenue in 2024 as compared to 86% in 2023 and 89% in 2022.
Under our license agreement with J&J for DARZALEX, for purposes of calculating royalties due to Genmab, DARZALEX net sales for non-U.S. dollar denominated currencies are translated to U.S. dollars at a specified annual Currency Hedge Rate. Movements in foreign exchanges against the annual Currency Hedge Rate will result in changes to royalties due to Genmab impacting net profit before tax and cash flows.
There is also exposure that exchange rate fluctuations may impact equity as part of the currency translation adjustments required to convert the investments in foreign subsidiaries from their respective functional currencies to the presentation currency during consolidation, however any such fluctuations would be immaterial. The foreign subsidiaries are not significantly affected by currency risks as both revenues and expenses are primarily settled in the foreign subsidiaries’ functional currencies.
Foreign currency risk is primarily concentrated at the Genmab A/S level as transactions with subsidiaries are primarily in the functional currency of the subsidiary. To manage and reduce this foreign currency risk, Genmab maintains a large portion of its investment portfolio in marketable securities in USD (approximately 76%) as well as a portion of our investment portfolio in DKK, EUR, and GBP denominated securities as a natural partial hedge of Genmab A/S’ liability exposures in these currencies.
Assets and Liabilities in Foreign Currency
Genmab’s marketable securities denominated in USD, DKK, EUR, and GBP as a percentage of total marketable securities were as follows:
| Percent |
2024 | 2023 | ||||||
| USD |
76 | % | 81 | % | ||||
| DKK |
15 | % | 12 | % | ||||
| EUR |
8 | % | 6 | % | ||||
| GBP |
1 | % | 1 | % | ||||
|
|
|
|
|
|||||
| Total at December 31 |
100 | % | 100 | % | ||||
|
|
|
|
|
|||||
Genmab’s USD currency exposure is mainly related to cash and cash equivalents, marketable securities, and receivables related to our collaborations with J&J, AbbVie, and Roche. Significant changes in the exchange rate of USD to DKK could cause net profit before tax to change materially as gains and losses are recognized in the Consolidated Statements of Comprehensive Income. Based on the amount of assets and liabilities denominated in USD as of December 31, 2024 and 2023, a 10% increase/decrease in the USD to DKK exchange rate is estimated to impact Genmab’s net profit before tax by approximately $266 million and $400 million, respectively. The analysis assumes that all other variables, in particular interest rates, remain constant. The movements in the income statement and equity arise from monetary items (cash and cash equivalents, marketable securities, receivables, and liabilities) where the functional currency of the entity differs from the currency that the monetary items are denominated in.
Genmab’s EUR exposure is mainly related to our marketable securities, receivables under our collaboration with BioNTech, and other costs denominated in EUR. Since the introduction of the EUR in 1999, Denmark has committed to maintaining a central rate of 7.46 DKK to the EUR. This rate may fluctuate within a +/- 2.25% band. Should Denmark’s policy toward the EUR change, the DKK values of our EUR denominated assets and costs could be materially different compared to what is calculated and reported under the existing Danish policy toward the DKK/EUR. As of December 31, 2024 and 2023, Genmab’s EUR exposure is not material.
F-41
NOTES TO THE CONSOLIDATED FINANCIAL STATEMENTS—(CONTINUED)
Genmab’s GBP currency exposure is mainly related to contracts and marketable securities denominated in GBP. As of December 31, 2024 and 2023, Genmab’s GBP exposure is not material.
INTEREST RATE RISK
Genmab’s exposure to interest rate risk is primarily related to marketable securities, as Genmab currently does not have significant interest-bearing debts.
Marketable Securities
The securities in which the Group has invested bear interest rate risk, as a change in market-derived interest rates may cause fluctuations in the fair value of the investments. In accordance with the objective of the investment activities, the portfolio of securities is monitored on a total return basis.
To control and minimize the interest rate risk, Genmab maintains an investment portfolio in a variety of securities with a relatively short effective duration with both fixed and variable interest rates.
A sensitivity analysis was performed on Genmab’s marketable securities, and based on exposures in 2023 and 2024, a hypothetical +/- 1% interest rate change would not have resulted in a material change in the fair values of these financial instruments. Due to the short-term nature of the current investments and to the extent that Genmab is able to hold the investments to maturity, the current exposure to changes in fair value due to interest rate changes is considered to be insignificant compared to the fair value of the portfolio.
| (USD million) |
2024 | 2023 | ||||||
| Year of Maturity |
||||||||
| 2024 |
— | 1,000 | ||||||
| 2025 |
700 | 551 | ||||||
| 2026 |
449 | 322 | ||||||
| 2027 |
324 | 34 | ||||||
| 2028 |
46 | 21 | ||||||
| 2029+ |
55 | 39 | ||||||
|
|
|
|
|
|||||
| Total at December 31 |
1,574 | 1,967 | ||||||
|
|
|
|
|
|||||
4.3—Financial Assets and Liabilities
CATEGORIES OF FINANCIAL ASSETS AND LIABILITIES
| December 31, | ||||||||||||
| (USD million) |
Note | 2024 | 2023 | |||||||||
| Financial assets measured at fair value through profit or loss |
||||||||||||
| Marketable securities |
4.4 | 1,574 | 1,967 | |||||||||
| Other investments |
3.4 | 32 | 20 | |||||||||
| Financial assets measured at amortized cost |
||||||||||||
| Receivables excluding prepayments |
3.6 | 894 | 707 | |||||||||
| Cash and cash equivalents |
1,380 | 2,204 | ||||||||||
| Financial liabilities measured at amortized cost |
||||||||||||
| Lease liabilities |
3.3 | (144 | ) | (114 | ) | |||||||
| Other payables excluding provisions |
3.8 | (490 | ) | (343 | ) | |||||||
F-42
NOTES TO THE CONSOLIDATED FINANCIAL STATEMENTS—(CONTINUED)
FAIR VALUE MEASUREMENT
| December 31, | ||||||||||||||||||||||||||||||||||||
| 2024 | 2023 | |||||||||||||||||||||||||||||||||||
| (USD million) |
Note | Level 1 | Level 2 | Level 3 | Total | Level 1 | Level 2 | Level 3 | Total | |||||||||||||||||||||||||||
| Assets Measured at Fair Value |
||||||||||||||||||||||||||||||||||||
| Marketable securities |
4.4 | 1,574 | — | — | 1,574 | 1,967 | — | — | 1,967 | |||||||||||||||||||||||||||
| Other investments |
3.4 | 5 | 2 | 25 | 32 | 7 | — | 13 | 20 | |||||||||||||||||||||||||||
Marketable Securities
Substantially all fair market values are determined by reference to external sources using unadjusted quoted prices in established markets for our marketable securities (Level 1).
Other Investments
Other investments primarily consist of investments in certain strategic investment funds. Genmab’s share of the fair value of these fund investments is determined based on the valuation of the underlying investments included in the fund. Investments in publicly traded equity securities included in these strategic investment funds are valued based at the most recent sale price or official closing price reported on the exchange or over-the-counter market on which they trade, while investments in non-publicly traded equity securities are based on other factors, including but not limited to, type of the security, the size of the holding, the initial cost of the security, the price and extent of public trading in similar securities of the comparable companies, an analysis of the company’s or issuer’s financial statements and with respect to debt securities, the maturity and creditworthiness. As such, these fund investments have been characterized as Level 3 investments as fair values are not entirely based on observable market data.
There were no transfers into or out of Level 3 during 2024 or 2023. Acquisitions (capital calls), fair value changes and foreign currency changes on Level 3 investments in 2024 and 2023 were as follows:
| (USD million) |
Other Investments | |||
| Fair value at January 1, 2023 |
9 | |||
| Acquisitions |
4 | |||
| Fair value changes |
(1 | ) | ||
| Foreign currency changes |
1 | |||
| Fair value at December 31, 2023 |
13 | |||
| Acquisitions |
6 | |||
| Fair value changes |
6 | |||
| Foreign currency changes |
— | |||
| Fair value at December 31, 2024 |
25 | |||
ACCOUNTING POLICIES
CLASSIFICATION OF CATEGORIES OF FINANCIAL ASSETS AND LIABILITIES
Genmab classifies its financial assets held into the following measurement categories:
| • | those to be measured subsequently at fair value (either through other comprehensive income, or through profit or loss), and |
| • | those to be measured at amortized cost. |
F-43
NOTES TO THE CONSOLIDATED FINANCIAL STATEMENTS—(CONTINUED)
The classification depends on the business model for managing the financial assets and the contractual terms of the cash flows.
For assets measured at fair value, gains and losses will either be recorded in profit or loss or other comprehensive income.
Genmab reclassifies debt investments only when its business model for managing those assets changes.
Further details about the accounting policy for each of the categories are outlined in the respective notes.
FAIR VALUE MEASUREMENT
Genmab measures financial instruments, such as marketable securities, at fair value at each balance sheet date. Management assessed that the fair value of financial assets and liabilities measured at amortized cost such as bank deposits, receivables and other payables approximate their carrying amounts largely due to the short-term maturities of these instruments.
Fair value is the price that would be received to sell an asset or paid to transfer a liability in an orderly transaction between market participants at the measurement date. The fair value measurement is based on the presumption that the transaction to sell the asset or transfer the liability takes place either:
| • | In the principal market for the asset or liability, or |
| • | In the absence of a principal market, in the most advantageous market for the asset or liability. |
The principal or the most advantageous market must be accessible by Genmab.
The fair value of an asset or a liability is measured using the assumptions that market participants would use when pricing the asset or liability, assuming that market participants act in their economic best interest.
Genmab uses valuation techniques that are appropriate in the circumstances and for which sufficient data are available to measure fair value, maximizing the use of relevant observable inputs and minimizing the use of unobservable inputs.
For financial instruments that are measured in the balance sheet at fair value, IFRS 13 requires disclosure of fair value measurements by level of the following fair value measurement hierarchy:
| • | Level 1 - Quoted prices (unadjusted) in active markets for identical assets or liabilities |
| • | Level 2 - Inputs other than quoted prices included within level 1 that are observable for the asset or liability, either directly (that is, as prices) or indirectly (that is, derived from prices) |
| • | Level 3 - Inputs for the asset or liability that are not based on observable market data (that is, unobservable inputs). |
For assets and liabilities that are recognized in the financial statements at fair value on a recurring basis, Genmab determines whether transfers have occurred between levels in the hierarchy by re-assessing categorization (based on the lowest level input that is significant to the fair value measurement as a whole) at the end of each reporting period. Any transfers between the different levels are carried out at the end of the reporting period.
F-44
NOTES TO THE CONSOLIDATED FINANCIAL STATEMENTS—(CONTINUED)
4.4 —Marketable Securities
| Market value |
Share | Market value |
Share | |||||||||||||
| (USD million) |
2024 | % | 2023 | % | ||||||||||||
| USD portfolio |
||||||||||||||||
| Corporate bonds |
711 | 45 | % | 895 | 46 | % | ||||||||||
| US government bonds and treasury bills |
355 | 22 | % | 481 | 24 | % | ||||||||||
| Commercial paper |
27 | 2 | % | 67 | 3 | % | ||||||||||
| Other |
114 | 7 | % | 149 | 8 | % | ||||||||||
|
|
|
|
|
|
|
|
|
|||||||||
| Total USD portfolio |
1,207 | 76 | % | 1,592 | 81 | % | ||||||||||
|
|
|
|
|
|
|
|
|
|||||||||
| DKK portfolio |
||||||||||||||||
| Kingdom of Denmark bonds and treasury bills |
60 | 4 | % | 62 | 3 | % | ||||||||||
| Danish mortgage-backed securities |
170 | 11 | % | 174 | 9 | % | ||||||||||
|
|
|
|
|
|
|
|
|
|||||||||
| Total DKK portfolio |
230 | 15 | % | 236 | 12 | % | ||||||||||
|
|
|
|
|
|
|
|
|
|||||||||
| EUR portfolio |
||||||||||||||||
| European government bonds and treasury bills |
124 | 8 | % | 127 | 6 | % | ||||||||||
| GBP portfolio |
||||||||||||||||
| UK government bonds and treasury bills |
13 | 1 | % | 12 | 1 | % | ||||||||||
|
|
|
|
|
|
|
|
|
|||||||||
| Total portfolio at December 31 |
1,574 | 100 | % | 1,967 | 100 | % | ||||||||||
|
|
|
|
|
|||||||||||||
| Marketable securities at December 31 |
1,574 | 1,967 | ||||||||||||||
|
|
|
|
|
|||||||||||||
Refer to Note 4.2 for additional information regarding the risks related to our marketable securities.
ACCOUNTING POLICIES
Marketable securities are debt instruments that consist of investments in securities with a maturity of 90 days or greater at the time of acquisition. Measurement of marketable securities depends on the business model for managing the asset and the cash flow characteristics of the asset. Genmab assesses its debt instruments to determine classification based on the following measurement categories:
| • | Amortized cost: Assets that are held for collection of contractual cash flows, where those cash flows represent solely payments of principal and interest, are measured at amortized cost. Interest income from these financial assets is included in finance income using the effective interest rate method. Any gain or loss arising on derecognition is recognized directly in profit or loss and presented in other financial income or expenses, together with foreign exchange gains and losses. Impairment losses, when material, are presented as a separate line item in the Consolidated Statements of Comprehensive Income. |
| • | Fair value through other comprehensive income (FVOCI): Assets that are held to achieve an objective by both collecting contractual cash flows as well as selling financial assets and where those cash flows represent solely payments of principal and interest, are measured at FVOCI. Changes in fair value on a debt investment that is subsequently measured at FVOCI are recognized in other comprehensive income. Impairment gains and losses, interest income and foreign exchange gains and losses are recognized in the Consolidated Statements of Comprehensive Income and presented within financial income or expenses in the period in which they arise. |
| • | Fair value through profit and loss (FVPL): Assets that do not meet the criteria for amortized cost or FVOCI are measured at FVPL. A gain or loss on a debt investment that is subsequently measured at |
F-45
NOTES TO THE CONSOLIDATED FINANCIAL STATEMENTS—(CONTINUED)
| FVPL is recognized in the Consolidated Statements of Comprehensive Income and presented net within financial income or expenses in the period in which it arises. |
Genmab’s portfolio is managed and evaluated on a fair value basis in accordance with its stated investment guidelines and the information provided internally to management. This business model does not meet the criteria for amortized cost or FVOCI and as a result marketable securities are measured at FVPL. This classification is consistent with the prior year’s classification.
Genmab invests its cash in deposits with major financial institutions, in AAA rated money market funds, Danish mortgage bonds, investment grade rated corporate debt, commercial paper, certificates of deposit, certain types of AAA rated asset backed securities, U.S. Agency bonds, and notes issued by the Danish, European and U.S. governments. The securities can be purchased and sold using established markets.
Transactions are recognized at the trade date.
4.5—Financial Income and Expenses
| (USD million) |
2024* Restated |
2023* Restated |
2022* Restated |
|||||||||
| Financial income: |
||||||||||||
| Interest and other financial income |
144 | 142 | 46 | |||||||||
| Gain on marketable securities |
237 | 157 | 193 | |||||||||
| Gain on other investments |
6 | — | — | |||||||||
| Foreign exchange rate gain |
258 | — | 204 | |||||||||
|
|
|
|
|
|
|
|||||||
| Total financial income |
645 | 299 | 443 | |||||||||
|
|
|
|
|
|
|
|||||||
| Financial expenses: |
||||||||||||
| Interest and other financial expenses |
(18 | ) | (10 | ) | (6 | ) | ||||||
| Loss on marketable securities |
(107 | ) | (174 | ) | (147 | ) | ||||||
| Loss on other investments |
— | (4 | ) | (42 | ) | |||||||
| Foreign exchange rate loss |
(166 | ) | (66 | ) | (152 | ) | ||||||
|
|
|
|
|
|
|
|||||||
| Total financial expenses |
(291 | ) | (254 | ) | (347 | ) | ||||||
|
|
|
|
|
|
|
|||||||
| Net financial items |
354 | 45 | 96 | |||||||||
|
|
|
|
|
|
|
|||||||
| * | Certain reclassification adjustments have been made between financial income and financial expenses for all periods presented. Refer to Note 1.4 for more information. |
INTEREST INCOME
Interest income was $144 million in 2024 compared to $142 million in 2023 and $46 million in 2022. The increase of $2 million, or 1% from 2023 to 2024, was primarily driven by the higher cash and cash equivalents and marketable securities in the first half of 2024 compared to 2023, almost entirely offset by lower cash and cash equivalents and marketable securities in the second half of 2024 compared to 2023 as a result of liquidating marketable securities and using cash to purchase ProfoundBio. The increase of $96 million, or 209% from 2022 to 2023 was primarily driven by higher effective interest rates in the U.S., Europe, and Denmark.
F-46
NOTES TO THE CONSOLIDATED FINANCIAL STATEMENTS—(CONTINUED)
FOREIGN EXCHANGE RATE GAINS AND LOSSES
Foreign exchange rate gain, net of $92 million in 2024 compared to the foreign exchange rate loss, net of $66 million in 2023 and foreign exchange rate gain, net of $52 million in 2022 were primarily driven by foreign exchange movements impacting Genmab’s USD denominated assets (excluding marketable securities) and liabilities; in particular, the USD/DKK foreign exchange rates were as follows for each period:
| December 31, 2024 |
December 31, 2023 |
December 31, 2022 |
||||||||||
| USD/DKK Foreign Exchange Rates |
7.1429 | 6.7447 | 6.9722 | |||||||||
| % Increase/(Decrease) |
6 | % | (3 | )% | 6 | % | ||||||
Refer to Note 4.2 for additional information on foreign currency risk.
MARKETABLE SECURITIES GAINS AND LOSSES
Gain on marketable securities, net was $130 million in 2024 compared to loss on marketable securities, net of $17 million in 2023 and gain on marketable securities, net of $46 million in 2022. The increase in gain, net of $147 million, from 2023 to 2024 and the decrease in gain, net of $63 million from 2022 to 2023, were primarily driven by foreign exchange rate movements impacting Genmab’s USD denominated marketable securities. Refer to the table above for the exchange rate movements for each period.
OTHER INVESTMENTS
Gains on other investments, net were $6 million in 2024, losses on other investments, net were $4 million in 2023 and $42 million in 2022. The net gains and losses in 2024 and 2023 were primarily driven by changes in fair value of Genmab’s investments in certain strategic investment funds. The losses in 2022 were primarily driven by the change in fair value of Genmab’s investment in common shares of CureVac.
ACCOUNTING POLICIES
Financial income and expenses include interest as well as foreign exchange rate adjustments and gains and losses on marketable securities (designated as FVPL) and realized gains and losses and write-downs of other securities and equity interests.
Interest income is shown separately from gains and losses on marketable securities and other securities and equity interests.
4.6—Share-Based Instruments
Restricted Stock Unit Program
Genmab A/S has established an RSU program (equity-settled share-based payment transactions) as an incentive for Genmab’s employees, members of the Executive Management, and members of the Board of Directors. RSUs granted to Executive Management are performance-based (PSUs).
RSUs are granted by the Board of Directors. RSU grants to members of the Board of Directors and members of the registered Executive Management are subject to the Remuneration Policy adopted at the Annual General Meeting.
F-47
NOTES TO THE CONSOLIDATED FINANCIAL STATEMENTS—(CONTINUED)
See the table below for a summary of key terms of Genmab’s RSU programs:
| RSUs Granted in Periods | ||||
| Key Terms | December 2019 – February 2021 | From February 2021 | ||
|
Grants |
RSUs are granted at no cost to employees. Number of shares granted is determined based on closing share price on the grant date. | |||
|
Vesting (Settlement) |
Cliff vesting – RSUs become fully-vested on the first banking day of the month following a period of three years from the grant date. The three year cliff vesting also applies to PSUs, while also subject to the degree of fulfillment of the applicable performance criteria.
After RSUs vest, the holder receives one share in Genmab A/S for each RSU granted. In jurisdictions in which Genmab as an employer is required to withhold tax and settle with the tax authority on behalf of the employee, Genmab withholds the number of RSUs that are equal to the monetary value of the employee’s tax obligation from the total number of RSUs that otherwise would have been issued to the employee upon vesting (“net settlement”). Genmab A/S may at its sole discretion in extraordinary circumstances choose to make a cash settlement instead of delivering shares. |
|||
|
Leaver |
Leavers – Forfeit all unvested RSUs except when due to retirement, death, serious sickness, or serious injury, in which case granted but not yet vested RSUs shall remain outstanding and will be settled in accordance with their terms.
Notwithstanding the above, the December 2020 RSU grant to members of the Board was made subject to pro-rata vesting upon termination of board services.
Employees and Executive Management – RSUs remain outstanding and vest accordingly when the employment relationship is terminated by Genmab without cause. |
Good-Leavers1- May maintain a pro-rata portion of unvested RSUs.
Bad-Leavers2 – Forfeit all unvested RSUs. Death – Forfeit all unvested RSUs.
Voluntary leavers forfeit unvested RSUs. |
||
| 1 | “Good-Leaver” – Dismissal without cause or termination of employment due to Genmab’s material breach of the RSU or Warrant holder’s employment terms, or if the participant is a member of the Board, if the membership of the Board ceases for any other reason than as a result of the participant’s death. |
| 2 | “Bad-leaver” – Dismissed for cause or during the employment probationary period. |
The RSU program contains anti-dilution provisions if changes occur in Genmab’s share capital prior to the vesting date and provisions to accelerate vesting of RSUs in the event of change of control as defined in the RSU program.
F-48
NOTES TO THE CONSOLIDATED FINANCIAL STATEMENTS—(CONTINUED)
RSU Activity in 2024, 2023 and 2022
| Number of RSUs held by the Board of Directors |
Number of RSUs held by the Executive Management |
Number of RSUs held by employees |
Number of RSUs held by former members of the Executive Management, Board of Directors and employees |
Total RSUs |
Weighted Average Fair Value —RSUs Granted— DKK |
Total Fair Value of RSUs Granted— DKK million |
||||||||||||||||||||||
| Outstanding at January 1, 2022 |
10,965 | 89,043 | 293,031 | 12,952 | 405,991 | |||||||||||||||||||||||
| Granted* |
4,295 | 40,453 | 221,000 | 6,383 | 272,131 | 2,250.18 | 612 | |||||||||||||||||||||
| Settled |
(3,420 | ) | (17,165 | ) | (67,945 | ) | (12,847 | ) | (101,377 | ) | ||||||||||||||||||
| Transferred |
(2,368 | ) | — | (13,749 | ) | 16,117 | — | |||||||||||||||||||||
| Forfeited |
(653 | ) | — | (9,195 | ) | (18,759 | ) | (28,607 | ) | |||||||||||||||||||
|
|
|
|
|
|
|
|
|
|
|
|||||||||||||||||||
| Outstanding at December 31, 2022 |
8,819 | 112,331 | 423,142 | 3,846 | 548,138 | |||||||||||||||||||||||
|
|
|
|
|
|
|
|
|
|
|
|||||||||||||||||||
| Outstanding at January 1, 2023 |
8,819 | 112,331 | 423,142 | 3,846 | 548,138 | |||||||||||||||||||||||
| Granted* |
3,361 | 75,854 | 208,353 | 11,643 | 299,211 | 2,619.35 | 784 | |||||||||||||||||||||
| Settled |
(1,880 | ) | (35,773 | ) | (54,871 | ) | (9,805 | ) | (102,329 | ) | ||||||||||||||||||
| Transferred |
— | 12,918 | (55,103 | ) | 42,185 | — | ||||||||||||||||||||||
| Forfeited |
— | (4,357 | ) | (35 | ) | (37,984 | ) | (42,376 | ) | |||||||||||||||||||
|
|
|
|
|
|
|
|
|
|
|
|||||||||||||||||||
| Outstanding at December 31, 2023 |
10,300 | 160,973 | 521,486 | 9,885 | 702,644 | |||||||||||||||||||||||
|
|
|
|
|
|
|
|
|
|
|
|||||||||||||||||||
| Outstanding at January 1, 2024 |
10,300 | 160,973 | 521,486 | 9,885 | 702,644 | |||||||||||||||||||||||
|
|
|
|
|
|
|
|
|
|
|
|||||||||||||||||||
| Granted* |
7,097 | 121,063 | 344,068 | 14,484 | 486,712 | 1,977.87 | 963 | |||||||||||||||||||||
| Settled |
(3,367 | ) | (35,320 | ) | (112,663 | ) | (12,465 | ) | (163,815 | ) | ||||||||||||||||||
| Transferred |
— | (19,924 | ) | (37,348 | ) | 57,272 | — | |||||||||||||||||||||
| Forfeited |
— | (11,667 | ) | (71 | ) | (38,178 | ) | (49,916 | ) | |||||||||||||||||||
|
|
|
|
|
|
|
|
|
|
|
|||||||||||||||||||
| Outstanding at December 31, 2024 |
14,030 | 215,125 | 715,472 | 30,998 | 975,625 | |||||||||||||||||||||||
|
|
|
|
|
|
|
|
|
|
|
|||||||||||||||||||
| * | RSUs held by the Board of Directors include RSUs granted to employee-elected Board Members as employees of Genmab A/S or its subsidiaries. |
Refer to Note 5.1 for additional information regarding compensation of the Executive Management and the Board of Directors.
Warrant Program
Genmab A/S has established a warrant program (equity-settled share-based payment transactions) as an incentive for all the Genmab Group’s employees.
Warrants are granted by the Board of Directors in accordance with authorizations given to it by Genmab A/S’ shareholders.
Following Genmab’s Annual General Meeting on March 29, 2023, members of the registered Executive Management and members of the Board may only be granted RSUs.
F-49
NOTES TO THE CONSOLIDATED FINANCIAL STATEMENTS—(CONTINUED)
See the table below for a summary of key terms of Genmab’s warrant programs:
| Warrants Granted in Periods | ||||||
| Key Terms | April 2012—March 2017 | March 2017—February 2021 | From February 2021 | |||
|
Grants |
Warrants are granted at no cost to employees. Granted at an exercise price equal to the closing share price on the grant date. | |||||
|
Vesting (Exercisable) |
Annually over 4-year period (25% per year) | Cliff vesting over 3-year period (100% after 3 years) | ||||
|
Leaver |
Leavers—Forfeit all unvested warrants; however, will be able to exercise pro-rata portion of warrants on a regular schedule in instances where the employment relationship is terminated by Genmab without cause. |
Good-Leavers—Maintain a pro-rata portion of unvested warrants.
Bad-Leavers—Forfeit all unvested warrants.
Death—Forfeit all unvested warrants.
Voluntary leavers forfeit all unvested warrants. |
||||
|
Lapse |
7th anniversary of grant date | |||||
The warrant program contains anti-dilution provisions if changes occur in Genmab’s share capital prior to the warrants being exercised and provisions to accelerate vesting of warrants in the event of change of control or certain other extraordinary transactions as defined in the warrant program.
Warrant Activity in 2024, 2023 and 2022
| Number of warrants held by the Board of Directors |
Number of warrants held by the Executive Management |
Number of warrants held by employees |
Number of warrants held by former members of the Executive Management, Board of Directors and employees |
Total warrants |
Weighted average exercise price— DKK |
Weighted average share price at exercise date— DKK |
Outstanding Warrants— % of Share Capital |
|||||||||||||||||||||||||
| Outstanding at January 1, 2022 |
10,658 | 159,634 | 739,000 | 59,159 | 968,451 | 1,501.49 | ||||||||||||||||||||||||||
| Granted* |
1,541 | — | 250,005 | 7,412 | 258,958 | 2,244.22 | ||||||||||||||||||||||||||
| Exercised |
(1,558 | ) | (29,836 | ) | (176,948 | ) | (34,775 | ) | (243,117 | ) | 1,154.95 | 2,815.33 | ||||||||||||||||||||
| Expired |
— | — | — | — | — | — | ||||||||||||||||||||||||||
| Forfeited |
— | — | (13,670 | ) | (32,654 | ) | (46,324 | ) | 2,029.00 | |||||||||||||||||||||||
| Transfers |
(8,721 | ) | — | (25,373 | ) | 34,094 | — | — | ||||||||||||||||||||||||
|
|
|
|
|
|
|
|
|
|
|
|
|
|||||||||||||||||||||
| Outstanding at December 31, 2022 |
1,920 | 129,798 | 773,014 | 33,236 | 937,968 | 1,770.31 | 1 | % | ||||||||||||||||||||||||
|
|
|
|
|
|
|
|
|
|
|
|
|
|||||||||||||||||||||
| Exercisable at year end |
617 | 118,571 | 282,296 | 32,695 | 434,179 | 1,265.68 | ||||||||||||||||||||||||||
| Exercisable warrants in the money at year end |
617 | 118,571 | 282,296 | 32,695 | 434,179 | 1,265.68 | ||||||||||||||||||||||||||
F-50
NOTES TO THE CONSOLIDATED FINANCIAL STATEMENTS—(CONTINUED)
| Number of warrants held by the Board of Directors |
Number of warrants held by the Executive Management |
Number of warrants held by employees |
Number of warrants held by former members of the Executive Management, Board of Directors and employees |
Total warrants |
Weighted average exercise price— DKK |
Weighted average share price at exercise date— DKK |
Outstanding Warrants— % of Share Capital |
|||||||||||||||||||||||||
| Outstanding at January 1, 2023 |
1,920 | 129,798 | 773,014 | 33,236 | 937,968 | 1,770.31 | ||||||||||||||||||||||||||
| Granted* |
403 | — | 198,001 | 10,973 | 209,377 | 2,632.02 | ||||||||||||||||||||||||||
| Exercised |
— | (11,900 | ) | (74,672 | ) | (26,390 | ) | (112,962 | ) | 1,341.40 | 2,657.76 | |||||||||||||||||||||
| Expired |
— | — | (1,200 | ) | (117 | ) | (1,317 | ) | 1,225.18 | |||||||||||||||||||||||
| Forfeited |
— | — | (32 | ) | (43,143 | ) | (43,175 | ) | 2,274.50 | |||||||||||||||||||||||
| Transfers |
— | 21,295 | (103,396 | ) | 82,101 | — | — | |||||||||||||||||||||||||
|
|
|
|
|
|
|
|
|
|
|
|
|
|||||||||||||||||||||
| Outstanding at December 31, 2023 |
2,323 | 139,193 | 791,715 | 56,660 | 989,891 | 1,980.25 | 1 | % | ||||||||||||||||||||||||
|
|
|
|
|
|
|
|
|
|
|
|
|
|||||||||||||||||||||
| Exercisable at year end |
875 | 123,345 | 246,635 | 45,686 | 416,541 | 1,416.25 | ||||||||||||||||||||||||||
| Exercisable warrants in the money at year end |
617 | 123,345 | 192,945 | 43,632 | 360,539 | 1,272.37 | ||||||||||||||||||||||||||
| Outstanding at January 1, 2024 |
2,323 | 139,193 | 791,715 | 56,660 | 989,891 | 1,980.25 | ||||||||||||||||||||||||||
| Granted* |
694 | — | 354,255 | 14,898 | 369,847 | 1,974.71 | ||||||||||||||||||||||||||
| Exercised |
— | (63,811 | ) | (31,721 | ) | (17,119 | ) | (112,651 | ) | 1,143.29 | 1,877.19 | |||||||||||||||||||||
| Expired |
— | — | (155 | ) | (132 | ) | (287 | ) | 1,032.00 | |||||||||||||||||||||||
| Forfeited |
— | — | (73 | ) | (39,564 | ) | (39,637 | ) | 2,300.10 | |||||||||||||||||||||||
| Transfers |
— | 555 | (53,903 | ) | 53,348 | — | — | |||||||||||||||||||||||||
|
|
|
|
|
|
|
|
|
|
|
|
|
|||||||||||||||||||||
| Outstanding at December 31, 2024 |
3,017 | 75,937 | 1,060,118 | 68,091 | 1,207,163 | 2,046.38 | 2 | % | ||||||||||||||||||||||||
|
|
|
|
|
|
|
|
|
|
|
|
|
|||||||||||||||||||||
| Exercisable at year end |
1,226 | 63,405 | 321,099 | 60,686 | 446,416 | 1,759.86 | ||||||||||||||||||||||||||
| Exercisable warrants in the money at year end |
— | 46,166 | 77,669 | 25,477 | 149,312 | 1,131.68 | ||||||||||||||||||||||||||
| * | Warrants held by the Board include warrants granted to employee-elected Board Members as employees of Genmab A/S or its subsidiaries. |
Refer to Note 5.1 for additional information regarding compensation of the Executive Management and the Board of Directors.
Weighted Average Outstanding Warrants at December 31, 2024
As of December 31, 2024, the range of exercise prices for outstanding warrants was DKK 962 to DKK 3,172 with a weighted average remaining contractual life of 4.24 years. As of December 31, 2023, the range of exercise prices for outstanding warrants was DKK 962 to DKK 3,172 with a weighted average remaining contractual life of 4.11 years.
F-51
NOTES TO THE CONSOLIDATED FINANCIAL STATEMENTS—(CONTINUED)
ACCOUNTING POLICIES
SHARE-BASED COMPENSATION EXPENSES
Share-based compensation expense is recognized in the Consolidated Statements of Comprehensive Income based on the estimated fair value of the awards at grant date. Subsequently, the fair value is not remeasured. The expense recognized reflects an estimate of the number of awards expected to vest after taking into consideration an estimate of award forfeitures based on historical experience and is recognized on a straight-line basis over the requisite service period, which is the vesting period. Genmab reassesses its estimate of the number of shares expected to vest periodically.
Management expectations related to the achievement of performance goals associated with performance-based RSU grants are assessed periodically, and that assessment is used to determine whether such grants are expected to vest or if any revision to the current estimate is required. Genmab recognizes the impact of the revised estimate of the number of awards expected to vest, if any, as an adjustment to the income statement over the remaining vesting period. If performance-based milestones related to performance-based RSU grants are not met or not expected to be met, any share-based compensation expense recognized to date associated with grants that are not expected to vest will be reversed.
Share-based compensation expenses represent calculated values of warrants, RSUs and performance-based RSUs granted and do not represent actual cash expenditures. A corresponding amount is recognized in shareholders’ equity as the warrant, RSU and performance-based RSU programs are designated as equity-settled share-based payment transactions.
The fair value of each RSU and performance-based RSU granted during the year are calculated using the closing share price on the grant date. Below is a description on how the fair value of warrants is measured and the estimates involved.
MANAGEMENT’S JUDGEMENTS AND ESTIMATES
SHARE-BASED COMPENSATION EXPENSES
The fair value of each warrant granted during the year is calculated using the Black-Scholes pricing model. This pricing model requires the input of subjective assumptions such as:
| • | The expected stock price volatility, which is based upon the historical volatility of Genmab’s stock price; |
| • | The risk-free interest rate, which is determined as the interest rate on Danish government bonds (bullet issues) with an average maturity of five years; |
| • | The expected life of warrants, which is based on vesting terms, expected rate of exercise and life terms in the current warrant program. |
These assumptions can vary over time and can change the fair value of future warrants granted.
F-52
NOTES TO THE CONSOLIDATED FINANCIAL STATEMENTS—(CONTINUED)
Valuation Assumptions for Warrants Granted in 2024, 2023 and 2022
The fair value of each warrant granted during the year is calculated using the Black-Scholes pricing model with the following assumptions:
| Weighted average |
2024 | 2023 | 2022 | |||||||||
| Fair value per warrant on grant date (DKK) |
639.67 | 924.10 | 664.08 | |||||||||
| Share price (DKK) |
1,974.71 | 2,632.02 | 2,244.22 | |||||||||
| Exercise price (DKK) |
1,974.71 | 2,632.02 | 2,244.22 | |||||||||
| Expected dividend yield |
— | % | — | % | — | % | ||||||
| Expected stock price volatility |
32.3 | % | 35.3 | % | 33.5 | % | ||||||
| Risk-free interest rate |
2.26 | % | 2.48 | % | 0.15 | % | ||||||
| Expected life of warrants |
5 years | 5 years | 5 years | |||||||||
| Total Fair Value of Amounts Granted |
2024 | 2023 | 2022 | |||||||||
| Total fair value of warrants granted |
DKK 237 million | DKK 193 million | DKK 172 million | |||||||||
4.7—Share Capital
SHARE CAPITAL
The share capital comprises the nominal amount of Genmab A/S ordinary shares, each at a nominal value of DKK 1. All shares are fully paid.
As of December 31, 2024, the share capital of Genmab A/S comprised 66,187,186 shares of DKK 1 each with one vote. There are no restrictions related to the transferability of the shares. All shares are regarded as negotiable instruments and do not confer any special rights upon the holder, and no shareholder shall be under an obligation to allow his/her shares to be redeemed.
Genmab’s Board is authorized to increase the share capital by subscription of new shares, issue warrants to subscribe for shares and raise loans against bonds as well as other financial instruments of Genmab A/S as set out in articles 4A-5B of Genmab A/S’ articles of association. Further, Genmab’s share capital is in compliance with the capital requirements of the Danish Companies Act and the rules of Nasdaq Copenhagen.
See table below for warrants issued and reissued and warrants available for reissue under active authorizations as of December 31, 2024:
| March 13, 2024 Authorization |
April 13, 2021 Authorization |
March 29, 2019 Authorization |
||||||||||
| Warrants issued |
— | 585,692 | 500,000 | |||||||||
| Warrants reissued |
— | 41,143 | 81,684 | |||||||||
| Warrants available for issue |
750,000 | 164,308 | — | |||||||||
| Warrants available for reissue |
— | 4,550 | — | |||||||||
SHARE PREMIUM
The share premium reserve is comprised of the amount received, attributable to shareholders’ equity, in excess of the nominal amount of the shares issued at the parent company’s offerings, reduced by any external expenses directly attributable to the offerings. The share premium reserve can be distributed.
F-53
NOTES TO THE CONSOLIDATED FINANCIAL STATEMENTS—(CONTINUED)
CHANGES IN SHARE CAPITAL DURING 2022 TO 2024
The share capital of DKK 66.2 million at December 31, 2024, is divided into 66,187,186 shares at a nominal value of DKK 1 each.
| Number of shares |
Share capital | Share capital | Share Price Ranges1 |
|||||||||||
| (DKK million) | (USD million) | |||||||||||||
| December 31, 2021 |
65,718,456 | 65.7 | 10.2 | |||||||||||
|
|
|
|
|
|
|
|||||||||
| Exercise of warrants |
243,117 | 0.3 | — | DKK 466.20 to DKK 1,615.00 |
||||||||||
|
|
|
|
|
|
|
|||||||||
| December 31, 2022 |
65,961,573 | 66.0 | 10.2 | |||||||||||
|
|
|
|
|
|
|
|||||||||
| Exercise of warrants |
112,962 | 0.1 | — | DKK 815.50 to DKK 1,948.00 |
||||||||||
|
|
|
|
|
|
|
|||||||||
| December 31, 2023 |
66,074,535 | 66.1 | 10.2 | |||||||||||
|
|
|
|
|
|
|
|||||||||
| Exercise of warrants |
112,651 | 0.1 | — | DKK 962.00 to DKK 1,615.00 |
||||||||||
|
|
|
|
|
|
|
|||||||||
| December 31, 2024 |
66,187,186 | 66.2 | 10.2 | |||||||||||
|
|
|
|
|
|
|
|||||||||
| 1 | New shares were subscribed at share prices in connection with the exercise of warrants under Genmab’s warrant program. |
TREASURY SHARES
| Number of shares |
Share capital | Proportion of share capital |
Cost | |||||||||||||
| (USD million) | % | (USD million) | ||||||||||||||
| Shareholding at December 31, 2021 |
288,325 | — | 0.4 | 84 | ||||||||||||
|
|
|
|
|
|
|
|
|
|||||||||
| Purchase of treasury shares |
370,000 | 0.1 | 0.6 | 128 | ||||||||||||
| Shares used for funding RSU program |
(68,377 | ) | — | (0.1 | ) | (11 | ) | |||||||||
|
|
|
|
|
|
|
|
|
|||||||||
| Shareholding at December 31, 2022 |
589,948 | 0.1 | 0.9 | 201 | ||||||||||||
|
|
|
|
|
|
|
|
|
|||||||||
| Purchase of treasury shares |
220,000 | — | 0.3 | 81 | ||||||||||||
| Shares used for funding RSU program |
(65,778 | ) | — | (0.1 | ) | (18 | ) | |||||||||
|
|
|
|
|
|
|
|
|
|||||||||
| Shareholding at December 31, 2023 |
744,170 | 0.1 | 1.1 | 263 | ||||||||||||
|
|
|
|
|
|
|
|
|
|||||||||
| Purchase of treasury shares |
2,011,853 | 0.3 | 3.0 | 560 | ||||||||||||
| Shares used for funding RSU program |
(109,016 | ) | — | (0.1 | ) | (36 | ) | |||||||||
|
|
|
|
|
|
|
|
|
|||||||||
| Shareholding at December 31, 2024 |
2,647,007 | 0.4 | 4.0 | 787 | ||||||||||||
|
|
|
|
|
|
|
|
|
|||||||||
F-54
NOTES TO THE CONSOLIDATED FINANCIAL STATEMENTS—(CONTINUED)
SHARE REPURCHASES
As of December 31, 2024, Genmab’s 2021 and 2023 authorizations have shares available for repurchase, whereas Genmab’s 2019 authorization has expired. In addition, at Genmab’s Annual General Meeting on March 13, 2024, a new authorization to acquire treasury shares up to a nominal amount of DKK 3,500,000 was granted.
| 2024 Authorization |
2023 Authorization |
2021 Authorization |
||||||||||
| Number of shares authorized for repurchase1 |
3,500,000 | 500,000 | 500,000 | |||||||||
| Actual shares repurchased under authorization |
1,821,853 | — | 450,000 | |||||||||
| Shares available for repurchase as of December 31, 2024 |
1,678,147 | 500,000 | 50,000 | |||||||||
| 1 | Nominal value of DKK 3,500,000 for 2024, and DKK 500,000 for 2023 and 2021 Authorizations. |
As announced on February 14, 2024, and March 15, 2024, Genmab initiated two share buy-back programs. The purpose of the share buy-back program announced on February 14, 2024, was to honor Genmab’s commitments under the RSU program. The share buy-back program announced on March 15, 2024, was in support of Genmab’s capital allocation strategy. During 2024, Genmab acquired 2,011,853 of its own shares, representing approximately 3.0% of share capital as of December 31, 2023. The total amount paid to acquire the shares, including directly attributable costs, was $560 million and was recognized as a deduction to shareholders’ equity. During 2023, Genmab acquired 220,000 of its own shares, representing approximately 0.3% of share capital as of December 31, 2022. The total amount paid to acquire the shares, including directly attributable costs, was $81 million and was recognized as a deduction to shareholders’ equity. These shares are classified as treasury shares and are presented within retained earnings on the Consolidated Balance Sheets as of December 31, 2024.
As of December 31, 2024, 2,647,007 treasury shares were held by Genmab.
Section 5—Other Disclosures
This section is comprised of various statutory disclosures or notes that are of secondary importance for the understanding of Genmab’s financials.
5.1—Remuneration of the Board of Directors and Executive Management
The total remuneration of the Board and Executive Management is as follows:
| (USD million) |
2024 | 2023 | 2022 | |||||||||
| Wages and salaries |
15 | 10 | 8 | |||||||||
| Share-based compensation expenses |
23 | 15 | 10 | |||||||||
| Defined contribution plans |
1 | — | — | |||||||||
|
|
|
|
|
|
|
|||||||
| Total |
39 | 25 | 18 | |||||||||
|
|
|
|
|
|
|
|||||||
The remuneration packages for the Board and Executive Management are described in further detail in Genmab’s 2024 Compensation Report. The remuneration packages are denominated in DKK, EUR, or USD. The Compensation Committee of the Board performs an annual review of the remuneration packages. All incentive and variable remuneration is considered and adopted at the Company’s Annual General Meeting.
Share-based compensation is included in the Consolidated Statements of Comprehensive Income and reported in the table above. Share-based compensation expense represents the estimated fair value of the awards at grant date and does not represent actual cash compensation received by the Board Members or Executive Management. Refer to Note 4.6 for additional information regarding Genmab’s share-based compensation programs and accounting policies.
F-55
NOTES TO THE CONSOLIDATED FINANCIAL STATEMENTS—(CONTINUED)
REMUNERATION TO THE BOARD OF DIRECTORS
| Base Board Fee | Committee Fees | Share-Based Compensation Expenses |
Total | |||||||||||||||||||||||||||||||||||||||||||||
| (USD million) |
2024 | 2023 | 2022 | 2024 | 2023 | 2022 | 2024 | 2023 | 2022 | 2024 | 2023 | 2022 | ||||||||||||||||||||||||||||||||||||
| Deirdre P. Connelly |
0.2 | 0.2 | 0.2 | 0.1 | 0.1 | 0.1 | 0.2 | 0.2 | 0.1 | 0.5 | 0.5 | 0.4 | ||||||||||||||||||||||||||||||||||||
| Pernille Erenbjerg |
0.1 | 0.1 | 0.1 | 0.1 | 0.1 | 0.1 | 0.2 | 0.1 | 0.1 | 0.4 | 0.3 | 0.3 | ||||||||||||||||||||||||||||||||||||
| Anders Gersel Pedersen |
0.1 | 0.1 | 0.1 | 0.1 | 0.1 | 0.1 | 0.1 | 0.1 | 0.1 | 0.3 | 0.3 | 0.3 | ||||||||||||||||||||||||||||||||||||
| Paolo Paoletti |
0.1 | 0.1 | 0.1 | — | — | — | 0.1 | 0.1 | 0.1 | 0.2 | 0.2 | 0.2 | ||||||||||||||||||||||||||||||||||||
| Rolf Hoffmann |
0.1 | 0.1 | 0.1 | 0.1 | — | — | 0.1 | 0.1 | 0.1 | 0.3 | 0.2 | 0.2 | ||||||||||||||||||||||||||||||||||||
| Elizabeth O’Farrell1 |
0.1 | 0.1 | 0.1 | 0.1 | — | — | 0.2 | 0.1 | 0.1 | 0.4 | 0.2 | 0.2 | ||||||||||||||||||||||||||||||||||||
| Mijke Zachariasse2 |
0.1 | 0.1 | 0.1 | — | — | — | 0.1 | 0.1 | 0.1 | 0.2 | 0.2 | 0.2 | ||||||||||||||||||||||||||||||||||||
| Martin Schultz2 |
0.1 | 0.1 | 0.1 | — | — | — | 0.1 | — | — | 0.2 | 0.1 | 0.1 | ||||||||||||||||||||||||||||||||||||
| Takahiro Hamatani2 |
0.1 | 0.1 | 0.1 | — | — | — | 0.1 | — | — | 0.2 | 0.1 | 0.1 | ||||||||||||||||||||||||||||||||||||
| Peter Storm Kristensen3 |
— | — | — | — | — | — | — | — | — | — | — | — | ||||||||||||||||||||||||||||||||||||
| Rima Bawarshi Nassar3 |
— | — | — | — | — | — | — | — | — | — | — | — | ||||||||||||||||||||||||||||||||||||
|
|
|
|
|
|
|
|
|
|
|
|
|
|
|
|
|
|
|
|
|
|
|
|
|
|||||||||||||||||||||||||
| Total |
1.0 | 1.0 | 1.0 | 0.5 | 0.3 | 0.3 | 1.2 | 0.8 | 0.7 | 2.7 | 2.1 | 2.0 | ||||||||||||||||||||||||||||||||||||
|
|
|
|
|
|
|
|
|
|
|
|
|
|
|
|
|
|
|
|
|
|
|
|
|
|||||||||||||||||||||||||
| 1 | Elizabeth O’Farrell was newly elected to the Board at the Annual General Meeting in March 2022. |
| 2 | Employee elected board members were elected at the Annual General Meeting in March 2022. |
| 3 | Peter Storm Kristensen and Rima Bawarshi Nassar stepped down from the Board as employee elected board members at the Annual General Meeting in March 2022. |
Refer to the section “Board of Directors” in Management’s Review for additional information regarding the Board.
REMUNERATION TO THE EXECUTIVE MANAGEMENT
| Base Salary | Defined Contribution Plans |
Other Benefits | Annual Cash Bonus | Share-Based Compensation Expenses |
Total | |||||||||||||||||||||||||||||||||||||||||||||||||||||||||||||||||||
| (USD million) |
2024 | 2023 | 2022 | 2024 | 2023 | 2022 | 2024 | 2023 | 2022 | 2024 | 2023 | 2022 | 2024 | 2023 | 2022 | 2024 | 2023 | 2022 | ||||||||||||||||||||||||||||||||||||||||||||||||||||||
| Jan van de Winkel |
1.4 | 1.3 | 1.2 | 0.2 | 0.2 | 0.2 | — | — | — | 1.3 | 1.3 | 1.2 | 5.0 | 3.5 | 3.2 | 7.9 | 6.3 | 5.8 | ||||||||||||||||||||||||||||||||||||||||||||||||||||||
| Anthony Pagano |
0.7 | 0.6 | 0.6 | — | — | — | — | — | — | 0.4 | 0.4 | 0.4 | 2.4 | 1.8 | 1.3 | 3.5 | 2.8 | 2.3 | ||||||||||||||||||||||||||||||||||||||||||||||||||||||
| Anthony Mancini3 |
0.4 | 0.7 | 0.7 | — | — | — | 2.4 | — | — | 0.4 | 0.4 | 0.4 | 4.2 | 2.0 | 1.6 | 7.4 | 3.1 | 2.7 | ||||||||||||||||||||||||||||||||||||||||||||||||||||||
| Judith Klimovsky |
0.8 | 0.7 | 0.7 | — | — | — | — | — | — | 0.4 | 0.4 | 0.4 | 2.8 | 2.0 | 2.0 | 4.0 | 3.1 | 3.1 | ||||||||||||||||||||||||||||||||||||||||||||||||||||||
| Tahamtan Ahmadi |
0.7 | 0.7 | 0.7 | — | — | — | — | — | — | 0.4 | 0.4 | 0.4 | 2.6 | 1.8 | 1.1 | 3.7 | 2.9 | 2.2 | ||||||||||||||||||||||||||||||||||||||||||||||||||||||
| Birgitte Stephensen1 |
0.4 | 0.4 | — | — | — | — | — | — | — | 0.2 | 0.2 | — | 1.2 | 0.8 | — | 1.8 | 1.4 | — | ||||||||||||||||||||||||||||||||||||||||||||||||||||||
| Christopher Cozic1 |
0.5 | 0.5 | — | — | — | — | — | — | — | 0.3 | 0.3 | — | 1.6 | 1.1 | — | 2.4 | 1.9 | — | ||||||||||||||||||||||||||||||||||||||||||||||||||||||
| Martine van Vugt2 |
0.4 | 0.4 | — | 0.1 | 0.1 | — | — | — | — | 0.2 | 0.2 | — | 0.8 | 0.6 | — | 1.5 | 1.3 | — | ||||||||||||||||||||||||||||||||||||||||||||||||||||||
| Brad Bailey4 |
0.6 | — | — | — | — | — | 0.1 | — | — | 0.3 | — | — | 0.6 | — | — | 1.6 | — | — | ||||||||||||||||||||||||||||||||||||||||||||||||||||||
| Rayne Waller4 |
0.2 | — | — | — | — | — | 0.6 | — | — | 0.1 | — | — | 0.1 | — | — | 1.0 | — | — | ||||||||||||||||||||||||||||||||||||||||||||||||||||||
|
|
|
|
|
|
|
|
|
|
|
|
|
|
|
|
|
|
|
|
|
|
|
|
|
|
|
|
|
|
|
|
|
|
|
|
|
|||||||||||||||||||||||||||||||||||||
| Total |
6.1 | 5.3 | 3.9 | 0.3 | 0.3 | 0.2 | 3.1 | — | — | 4.0 | 3.6 | 2.8 | 21.3 | 13.6 | 9.2 | 34.8 | 22.8 | 16.1 | ||||||||||||||||||||||||||||||||||||||||||||||||||||||
|
|
|
|
|
|
|
|
|
|
|
|
|
|
|
|
|
|
|
|
|
|
|
|
|
|
|
|
|
|
|
|
|
|
|
|
|
|||||||||||||||||||||||||||||||||||||
| 1 | Birgitte Stephensen and Christopher Cozic were appointed Chief Legal Officer and Chief People Officer, respectively, and members of the Executive Management in March 2022. |
| 2 | Martine van Vugt was appointed Chief Strategy Officer and member of the Executive Management in March 2023. |
| 3 | Anthony Mancini stepped down as Executive Vice President and Chief Operating Officer in September 2024. |
F-56
NOTES TO THE CONSOLIDATED FINANCIAL STATEMENTS—(CONTINUED)
| 4 | Brad Bailey and Rayne Waller were appointed Executive Vice President and Chief Commercial Officer, and Executive Vice President and Chief Technical Operations Officer, respectively, and members of the Executive Management in August 2024. |
Jan van de Winkel, President and Chief Executive Officer, and Anthony Pagano, Executive Vice President and Chief Financial Officer, are formally registered as executive managers with the Danish Business Authority.
Refer to the section “Executive Management” in Management’s Review for additional information regarding the Executive Management.
Severance Payments
In the event Genmab terminates the service agreements with any member of the Executive Management team without cause, Genmab is obliged to pay his/her existing salary for one or two years after the end of the one-year notice period. However, in the event of termination by Genmab (unless for cause) or by any member of Executive Management as a result of a change of control of Genmab, Genmab is obliged to pay compensation equal to his/her existing total salary (including benefits) for up to two years in addition to the notice period. The total value of remuneration relating to the notice period for new members of Executive Management cannot exceed two years of remuneration, including all components of the remuneration. In case of the termination of the service agreements of the Executive Management without cause, the total impact on Genmab’s financial position is estimated to be approximately $17 million as of December 31, 2024 (2023: $15 million, 2022: $12 million).
5.2—Related Party Disclosures
Genmab’s related parties are its Board, Executive Management, and close members of the family of these persons.
Genmab has not granted any loans, guarantees or other commitments to or on behalf of any of the members of the Board or members of the Executive Management.
Other than the remuneration and other transactions relating to the Board and the Executive Management described in Note 5.1, there were no material related party transactions during 2024, 2023 or 2022.
5.3—Commitments
PURCHASE OBLIGATIONS
Genmab has entered into a number of agreements related to research and development activities that contain various obligations. These contractual obligations amounted to approximately $403 million as of December 31, 2024 (2023: approximately $476 million).
Genmab also has certain contingent commitments under license and collaboration agreements that may become due in the future. As of December 31, 2024, these contingent commitments amounted to approximately $2.2 billion in potential future development, regulatory and commercial milestone payments to third parties under license and collaboration agreements for our preclinical and clinical stage development programs as compared to approximately $2.3 billion as of December 31, 2023. These milestone payments generally become due and payable only upon the achievement of certain development, clinical, regulatory or commercial milestones. The events triggering such payments or obligations have not yet occurred.
F-57
NOTES TO THE CONSOLIDATED FINANCIAL STATEMENTS—(CONTINUED)
In addition to the above obligations, Genmab enters into a variety of agreements and financial commitments in the normal course of business. The terms generally allow Genmab the option to cancel, reschedule and adjust our requirements based on our business needs prior to the delivery of goods or performance of services. It is not possible to predict the maximum potential amount of future payments under these agreements due to the conditional nature of our obligations and the unique facts and circumstances involved in each particular agreement.
5.4—Fees to Auditors Appointed at the Annual General Meeting
| (USD million) |
2024 | 2023 | 2022 | |||||||||
| Audit fees |
1.5 | 0.9 | 0.8 | |||||||||
| Audit-related fees |
0.3 | 0.5 | 0.3 | |||||||||
| All other fees |
— | — | — | |||||||||
|
|
|
|
|
|
|
|||||||
| Total |
1.8 | 1.4 | 1.1 | |||||||||
|
|
|
|
|
|
|
|||||||
Genmab changed auditors from PricewaterhouseCoopers Statsautoriseret Revisionspartnerselskab (PwC) to Deloitte Statsautoriseret Revisionspartnerselskab (Deloitte) as Genmab’s new statutory auditor and independent registered public accounting firm for the fiscal year beginning January 1, 2024, replacing PwC. As such, fees in the table above reflect those incurred by Deloitte in 2024 and by PwC in 2023 and 2022.
Fees for other services than statutory audit of the financial statements provided by Deloitte amounted to $0.3 million in 2024 ($0.5 million and $0.3 million in 2023 and 2022, respectively provided by PwC). These services primarily include agreed-upon procedures, other assurance assessments and reports, and accounting advice.
5.5—Acquisition of Businesses
On May 21, 2024 (“Acquisition Date”), Genmab completed the previously announced acquisition of all of the outstanding shares of ProfoundBio, resulting in ProfoundBio becoming a wholly owned subsidiary of Genmab. The acquisition of ProfoundBio gave Genmab worldwide rights to three candidates in clinical development, including ProfoundBio’s lead drug candidate, rinatabart sesutecan (Rina-S). In addition, Genmab acquired ProfoundBio’s novel ADC technology platforms. Rina-S is a clinical-stage, FRatargeted, TOPO1 ADC, which was in Phase 2 of a Phase 1/2 clinical trial at the time of the acquisition, for the treatment of ovarian cancer and other FRa-expressing solid tumors. Based on the data from the ongoing Phase 1/2 clinical trial Genmab intends to broaden the development plans for Rina-S within ovarian cancer and other FRaexpressing solid tumors. In January 2024, the U.S. FDA granted Fast Track designation to Rina-S for the treatment of patients with FRa-expressing high-grade serous or endometrioid platinum-resistant ovarian cancer.
In addition to payment of $1.72 billion for all of the outstanding shares of ProfoundBio, Genmab also made a $199 million payment to holders of outstanding ProfoundBio equity awards for settlement of such vested and non-vested awards. Of the $199 million payment, $187 million related to the portion of awards where the vesting period was completed prior to the Acquisition Date. This portion of the payment was therefore determined to be attributable to the pre-combination period and included in purchase consideration. The remaining $11 million payment related to the portion of awards with future vesting conditions, and therefore is attributable to post-combination services. The amount attributable to the post-combination service does not form part of the consideration and was therefore instead recognized as Acquisition and integration related charges in Genmab’s Consolidated Statements of Comprehensive Income.
The acquisition has been accounted for using the acquisition method of accounting which requires that assets acquired and liabilities assumed be recognized at their fair values as of the Acquisition Date and consolidated into Genmab’s Consolidated Balance Sheets.
F-58
NOTES TO THE CONSOLIDATED FINANCIAL STATEMENTS—(CONTINUED)
The results of operations for ProfoundBio have been included in Genmab’s consolidated financial statements from the Acquisition Date. A fair value measurement has been performed and the purchase price has been allocated to intangible assets, associated deferred tax liabilities, other assets and liabilities, as well as goodwill being the excess value of the purchase price over the fair value of assets acquired and liabilities assumed (the purchase price allocation). Adjustments may be applied to the purchase price allocation for a period of up to 12 months from the Acquisition Date. During the fourth quarter of 2024, the Company recorded a measurement period adjustment impacting non-current deferred tax liabilities and goodwill that was not material. The total consideration for the acquisition of ProfoundBio is summarized as follows:
| Total Consideration | ||||
| Cash paid for outstanding shares |
$ | 1,718 | ||
| Cash for equity compensation attributable to pre-combination service |
187 | |||
|
|
|
|||
| Total consideration |
$ | 1,905 | ||
| Cash acquired |
(122 | ) | ||
|
|
|
|||
| Cash used for acquisition of business |
$ | 1,783 | ||
|
|
|
|||
The purchase price allocation resulted in the following amounts being allocated to the assets acquired and liabilities assumed at the Acquisition Date based upon their respective fair values summarized below:
| Amounts Recognized as of the Acquisition Date |
||||
| Cash and cash equivalents |
$ | 122 | ||
| Other current assets* |
4 | |||
| Property and equipment |
6 | |||
| IPR&D |
1,540 | |||
| Technology platform intangible asset |
181 | |||
| Other non-current assets** |
3 | |||
| Deferred tax liability |
(292 | ) | ||
| Other current liabilities*** |
(13 | ) | ||
|
|
|
|||
| Total identifiable net assets |
$ | 1,551 | ||
| Goodwill |
354 | |||
|
|
|
|||
| Total consideration |
$ | 1,905 | ||
|
|
|
|||
| * | Includes receivables and other investments |
| ** | Includes other investments and right-of-use assets |
| *** | Includes other payables, contract liabilities, lease and other liabilities |
The carrying values of other current assets, property and equipment, other non-current assets and other current liabilities were determined to approximate their fair values.
The fair value assigned to acquired IPR&D, which was calculated using the multi-period excess earnings method of the income approach, was based on the present value of expected after-tax cash flows attributable to Rina-S, which was in Phase 1/2 testing. The present value of expected after-tax cash flows obtainable from Rina-S and assigned to IPR&D was determined by estimating the after-tax costs to complete development of Rina-S into a commercially viable product, estimating future revenue and ongoing expenses to produce, support and sell Rina-S, on an after-tax basis, and discounting the resulting net cash flows to present value. The revenue and costs projections used were reduced based on the probability that compounds at similar stages of development will become commercially viable products. The rate utilized to discount the net cash flows to their present value reflects the risk associated with the future earnings attributable to the intangible asset.
F-59
NOTES TO THE CONSOLIDATED FINANCIAL STATEMENTS—(CONTINUED)
Acquired IPR&D will be accounted for as an intangible asset not yet available for use until regulatory approval in a major market is received or development is discontinued.
The fair value of the technology platform intangible asset was calculated using the relief from royalty method of the income approach. This method includes assigning value based on the economic savings from owning, rather than in-licensing, the technology platform intangible asset supported by observable market data for peer companies, then discounting the resulting probability adjusted net post-tax cash flows using a discount rate commensurate with the risk associated with the future income or cost savings attributable to the intangible asset.
The significant assumptions used to estimate the value of the acquired intangible assets include discount rates and certain assumptions that form the basis of future cash flows (such as probabilities of technical and regulatory success, revenue growth rates, operating margins, and royalty rates).
The excess of purchase price over the fair value amounts assigned to identifiable assets acquired and liabilities assumed represents the goodwill amount resulting from the acquisition. The goodwill recorded as part of the acquisition is attributable to the intangible assets that do not qualify for separate recognition at the time of the acquisition, assembled workforce and deferred tax consequences of the IPR&D and technology platform intangible asset recorded for financial statement purposes. Genmab does not expect any portion of this goodwill to be deductible for tax purposes. The goodwill attributable to the acquisition has been recorded as a non-current asset in Genmab’s Consolidated Balance Sheets and is not amortized, but is subject to review for impairment annually. Refer to Note 3.1 for further details related to the accounting for goodwill.
From the Acquisition Date through December 31, 2024, Genmab’s Consolidated Statements of Comprehensive Income include no revenue and the following expenses associated with the acquisition and operations of ProfoundBio:
| Consolidated Statements of Comprehensive Income (USD million): |
Acquisition Date through December 31, 2024 |
|||
| Research and development expenses |
58 | |||
| Selling, general and administrative expenses |
4 | |||
| Acquisition and integration related charges* |
27 | |||
|
|
|
|||
| Total |
89 | |||
|
|
|
|||
| * | Acquisition related charges incurred from the Acquisition Date through December 31, 2024, are comprised of payments to holders of outstanding ProfoundBio equity awards related to post-combination services ($11 million). The remaining expenses are integration related charges incurred from the Acquisition Date through December 31, 2024, which are comprised of professional fees incurred to assist with the integration of ProfoundBio into Genmab’s operations post-acquisition. Additionally, prior to the Acquisition Date, Genmab recorded $16 million in Acquisition and integration related charges in Genmab’s Consolidated Statements of Comprehensive Income related to professional due diligence procedures in connection with the acquisition of ProfoundBio. The $16 million of Acquisition and integration related charges incurred prior to the Acquisition Date and the $27 million of Acquisition and integration charges incurred from the Acquisition Date through December 31, 2024 total $43 million through the fourth quarter of 2024. |
F-60
NOTES TO THE CONSOLIDATED FINANCIAL STATEMENTS—(CONTINUED)
The following table provides Genmab’s consolidated revenue and net profit for 2024 as if the acquisition of ProfoundBio had occurred on January 1, 2024:
| (USD million) |
Twelve Month Period Ended December 31, 2024 |
|||
| Revenue |
3,121 | |||
| Net Profit |
1,102 | |||
The unaudited pro forma information does not necessarily reflect the actual results of operations of the combined entities that would have been achieved, nor are they necessarily indicative of future results of operations. The unaudited pro forma information reflects certain adjustments that were directly attributable to the acquisition of ProfoundBio, including additional amortization adjustments for the fair value of the technology platform intangible asset acquired.
As of December 31, 2024, Cash and cash equivalents in Genmab’s Consolidated Balance Sheets includes $30 million of restricted cash balances for funds held in escrow related to the acquisition of ProfoundBio.
ACCOUNTING POLICIES
BUSINESS COMBINATIONS
The acquisition method of accounting is used to account for all acquisitions where the target company meets the definition of a business in accordance with IFRS 3 (Business Combinations). The purchase price for a business is comprised of the fair value of the assets transferred and liabilities owned to the former owners, including option holders, of the acquired business and the fair value of any asset or liability resulting from a contingent consideration arrangement. Any amount of the purchase price which effectively comprises a settlement of a pre-existing relationship is not part of the exchange for the acquiree and is therefore not included in the consideration for the purpose of applying the acquisition method. Settlements of pre-existing relationships are accounted for as separate transactions in accordance with the relevant IFRS standards.
Identifiable assets and liabilities and contingent liabilities assumed are measured at fair value on the date of acquisition by applying relevant valuation methods. Goodwill is recognized as the excess of purchase price over the fair value of net identifiable assets acquired and liabilities assumed. Acquisition-related charges are expensed as incurred and included within Acquisition and integration related charges in the Consolidated Statements of Comprehensive Income.
MANAGEMENT’S JUDGMENTS AND ESTIMATES – OTHER INTANGIBLE ASSETS AND GOODWILL
Fair Value and Impairment Assessment of Other Intangible Assets and Goodwill
The application of the acquisition method involves the use of significant estimates because the identifiable net assets of the acquiree are recognized at their fair values for which observable market prices are typically not available. This is particularly relevant for intangible assets which require use of valuation techniques typically based on estimates of present value of future uncertain cash flows. The significant assumptions used to estimate the value of the acquired intangible assets include discount rates and certain assumptions that form the basis of future cash flows (such as probabilities of technical and regulatory success, revenue growth rates, operating margins, and royalty rates).
F-61
NOTES TO THE CONSOLIDATED FINANCIAL STATEMENTS—(CONTINUED)
5.6—Collaborations and Licenses
Collaborations
Genmab enters into collaborations with biotechnology and pharmaceutical companies to advance the development and commercialization of Genmab’s product candidates and to supplement its internal pipeline. Genmab seeks collaborations that will allow Genmab to retain significant future participation in product sales through either profit-sharing or royalties paid on net sales. Below is an overview of certain of Genmab’s collaborations that have had, or are expected in the near term to have, a significant impact on financial results.
J&J (Daratumumab/DARZALEX)
In 2012, Genmab entered into a global license, development and commercialization agreement with J&J for daratumumab (marketed for the treatment of certain multiple myeloma indications as DARZALEX for IV administration and as DARZALEX FASPRO in the U.S. and DARZALEX SC in Europe for SC administration). Under this agreement, J&J is fully responsible for developing and commercializing daratumumab, and all costs associated therewith. Genmab receives tiered royalty payments between 12% and 20% based on J&J’s annual net product sales with J&J reducing such royalty payments for Genmab’s share of J&J’s royalty payments made to Halozyme. In addition, the royalties payable by J&J are limited in time and subject to reduction on a country-by-country basis for customary reduction events, including for lack of Genmab patent coverage or upon patent expiration or invalidation in the relevant country and upon the first commercial sale of a biosimilar product in the relevant country (for as long as the biosimilar product remains for sale in that country). Pursuant to the terms of the agreement, J&J’s obligation to pay royalties to us will expire on a country-by-country basis on the later of the date that is 13 years after the first commercial sale of daratumumab in such country or upon the expiration or invalidation of the last-to-expire relevant Genmab patent covering daratumumab in such country. The first U.S., European and Japanese sales of daratumumab occurred in 2015, 2016 and 2017, respectively. We have issued patents and pending patent applications covering daratumumab in numerous jurisdictions, including patents issued in the U.S., Europe and Japan. J&J owns a separate patent portfolio related to the subcutaneous formulation of daratumumab used in DARZALEX FASPRO/DARZALEX SC, but a binding arbitration determined that we are not entitled to royalties based on these separate patents.
Our issued U.S., European and Japanese patents covering daratumumab, after giving effect to issued U.S., European and Japanese patent term extensions and supplementary protection certificates, expire in 2029, 2031 and begin to expire in 2030, respectively. Assuming constant underlying sales of DARZALEX, we expect that our royalties from sales of DARZALEX will begin to decline materially in 2029 following expiration of our U.S. patent rights on daratumumab. Genmab is also eligible to receive certain additional payments in connection with development, regulatory and sales milestones.
In September 2020, Genmab commenced arbitration against J&J with respect to two different provisions of our license agreement for daratumumab, both relating to royalties payable to Genmab on net sales of daratumumab (marketed as DARZALEX for IV administration and as DARZALEX FASPRO in the U.S. and as DARZALEX SC in Europe for SC administration). In April 2022, the arbitral tribunal issued an award in that arbitration denying both of Genmab’s claims. Genmab did not seek review of the award.
On June 9, 2022, Genmab announced the commencement of a second arbitration under the daratumumab license agreement with Janssen with claims for milestone payments for daratumumab SC of $405 million and a separate 13-year royalty term for daratumumab SC on a country-by-country basis, from the date of the first commercial sale of daratumumab SC in each such country. This second arbitration followed from the award in the prior arbitration, where the tribunal ruled in favor of Janssen on the question as to whether Genmab is required to share in Janssen’s royalty payments to Halozyme for its technology used in the daratumumab SC product. The tribunal based its ruling on the finding that DARZALEX FASPRO constitutes a new licensed product under the license agreement.
F-62
NOTES TO THE CONSOLIDATED FINANCIAL STATEMENTS—(CONTINUED)
On April 21, 2023, the arbitral tribunal dismissed Genmab’s claims regarding the second arbitration, on the basis that these claims should have been brought in the first arbitration. One arbitrator dissented Genmab filed a request for review of the award, which was denied on January 23, 2024. As a result, the dismissal of Genmab’s claims in the second arbitration is now final.
Novartis (Ofatumumab/Kesimpta)
Genmab and GlaxoSmithKline (GSK) entered a co-development and collaboration agreement for ofatumumab in 2006. The full rights to ofatumumab were transferred from GSK to Novartis in 2015. Novartis is now fully responsible for the development and commercialization of ofatumumab in all potential indications, including autoimmune diseases. Genmab is entitled to a 10% royalty payment on net sales for non-cancer treatments. Genmab pays a royalty to Medarex based on Kesimpta net sales. Novartis’s obligation to pay royalties to Genmab under this agreement expire on a country-by-country basis only in the event Novartis is no longer selling such product in a given country. The royalties are on a country-by-country basis subject to reduction in case of significant competition by competing products (as defined in the agreement) or a joint committee determination that a license of intellectual property owned by a third-party is necessary for commercialization.
Roche (Teprotumumab/TEPEZZA)
In May 2001, Genmab entered a research collaboration with Roche to develop human antibodies to disease targets identified by Roche. In 2002, this alliance was expanded. Under the agreement, Genmab will receive milestones as well as royalty payments on successful products.
Teprotumumab was initially developed in collaboration between Genmab and Roche, and later investigated under license from Roche by River Vision Development Corporation and subsequently Horizon Therapeutics for ophthalmic use. The product was approved under the brand name TEPEZZA in 2020 by the U.S. FDA for the treatment of TED and in 2024 by Japan’s MHLW for the treatment of active or high clinical activity score (CAS) TED. In October 2023, Amgen completed its acquisition of Horizon Therapeutics, including all rights to the development and commercialization of teprotumumab. Under the terms of Genmab’s agreement with Roche, Genmab receives a mid-single digit royalty on net sales of TEPEZZA, on a country-by-country basis, for 10 years following the first commercial sale in such country.
Pfizer (Tisotumab vedotin/Tivdak)
In September 2010, Genmab and Pfizer entered into an ADC collaboration, and a commercial license and collaboration agreement was executed in October 2011. In October 2020, Genmab and Pfizer entered into a Joint Commercialization Agreement where Genmab would co-promote tisotumab vedotin, marketed as Tivdak, in the U.S., and lead commercial operational activities and record sales in Japan, while Pfizer would lead operational commercial activities in the U.S., Europe and China with a 50:50 profit split in those markets. In all other markets, if any, Pfizer would be responsible for commercializing tisotumab vedotin and Genmab would receive royalties based on a percentage of aggregate net sales ranging from the mid-teens to the mid-twenties. Effective January 1, 2025, Genmab and Pfizer agreed to amend the License and Collaboration Agreement and the Joint Commercialization Agreement for Tivdak, assigning Genmab sole responsibility for the development and commercialization of Tivdak for second line plus recurrent or metastatic cervical cancer in Europe and all other regions globally, excluding the United States and the China region. With this amendment, Genmab will continue to co-promote Tivdak with Pfizer in the U.S. and will record sales for Europe, Japan and rest of world markets (excluding the United States and China regions), once commercialized, and will provide royalties to Pfizer on net sales in the low teens. Pfizer will continue to lead commercialization activities in China, when approved. The companies will continue the practice of joint decision-making on the worldwide development and commercialization strategy for tisotumab vedotin.
F-63
NOTES TO THE CONSOLIDATED FINANCIAL STATEMENTS—(CONTINUED)
AbbVie (Epcoritamab/EPKINLY/TEPKINLY)
On June 10, 2020, Genmab entered into a broad oncology collaboration agreement with AbbVie to jointly develop and commercialize products including epcoritamab, and subsequently into a discovery research collaboration for up to four future differentiated antibody therapeutics for cancer. The companies will share commercial responsibilities for epcoritamab in the U.S. and Japan, with AbbVie responsible for further global commercialization. Genmab is the principal for net sales in the U.S. and Japan and receives tiered royalties between 22% and 26% on remaining net sales outside of these territories, subject to certain royalty reductions. For any product candidates developed as a result of the companies’ discovery research collaboration, Genmab and AbbVie will share responsibilities for global development and commercialization in the U.S. and Japan. Genmab retains the right to co-commercialize these products, along with AbbVie, outside of the U.S. and Japan.
Under the terms of the agreement, Genmab received a $750 million upfront payment in June 2020 and was initially entitled to receive an aggregate of up to $3.15 billion in additional development, regulatory and sales milestone payments for all programs. Included in these potential milestones were up to $1.15 billion in payments related to clinical development and commercial success across the three bispecific antibody programs originally included in the agreement.
As a result of two programs being stopped, Genmab is instead contractually entitled to receive an aggregate of up to $2.55 billion in additional development, regulatory and sales milestone payments for all programs including an aggregate of up to $550 million in payments related to clinical development and commercial success for the one remaining bispecific antibody program, epcoritamab, included in the original agreement. In addition, and also included in these potential milestones, if all four next-generation antibody product candidates developed as a result of the discovery research collaboration are successful, Genmab is eligible to receive up to $2.0 billion in option exercise and success-based milestones.
In May 2023, epcoritamab received initial approval from the U.S. FDA and is marketed under the tradename EPKINLY. In September 2023, epcoritamab received initial approval from the EC and the Japan MHLW and is marketed under the tradenames TEPKINLY and EPKINLY, respectively. Genmab is entitled to tiered royalties between 22% and 26% on net sales for epcoritamab outside the U.S. and Japan. Except for these royalty-bearing sales, Genmab will share with AbbVie profits from the sale of licensed products on a 50:50 basis. Genmab and AbbVie split 50:50 the development costs related to epcoritamab, while Genmab will be responsible for 100% of the costs of the discovery research programs up to opt-in.
The total transaction price of $750 million was allocated to the four performance obligations based on the best estimate of relative stand-alone selling prices. The allocation of the transaction price to the performance obligations is summarized below:
| • | Delivery of licenses for the three programs: $672 million |
| • | Co-development activities for the product concepts: $78 million |
For the license grants, Genmab based the stand-alone selling price on a discounted cash flow approach and considered several factors including, but not limited to, discount rate, development timeline, regulatory risks, estimated market demand and future revenue potential. For co-development activities related to up to four product concepts, a cost-plus margin approach was utilized.
The performance obligations related to the delivery of licenses were completed at a point in time (June 2020) and Genmab recognized $672 million as license fee revenue in June 2020. After delivery of the licenses, Genmab shares further development and commercial costs equally with AbbVie. AbbVie is not assessed as a customer but as a collaboration partner, and as such this part of the collaboration is not in scope of IFRS 15.
F-64
NOTES TO THE CONSOLIDATED FINANCIAL STATEMENTS—(CONTINUED)
Refer to Note 3.7 for information pertaining to the remaining performance obligation related to co-development activities for the product concepts.
BioNTech
In May 2015, Genmab entered into an agreement with BioNTech to jointly research, develop and commercialize bispecific antibody products using Genmab’s DuoBody technology platform. Under the terms of the agreement, BioNTech will provide proprietary antibodies against key immunomodulatory targets, while Genmab provides proprietary antibodies and access to its DuoBody technology platform. Genmab paid an upfront fee of $10 million to BioNTech and an additional fee as certain BioNTech assets were selected for further development. If the companies jointly select any product candidates for clinical development, development costs and product ownership will be shared equally going forward. If one of the companies does not wish to move a product candidate forward, the other company is entitled to continue developing the product on predetermined licensing terms. The agreement also includes provisions which will allow the parties to opt out of joint development at key points. During July 2022, Genmab and BioNTech expanded this collaboration to include the joint research, development and commercialization of monospecific antibody candidates using Genmab’s HexaBody technology platform.
Genmab and BioNTech have three investigational medicines currently in clinical development: DuoBody-CD40x4-1BB (GEN1042/BNT312), HexaBody-OX40 (GEN1055/BNT315) and DuoBody-EpCAMx4-1BB (GEN1059/BNT314). In August 2024, BioNTech opted not to participate in the further development of the acasunlimab (GEN1046) program under the parties’ existing License and Collaboration Agreement for reasons related to BioNTech’s portfolio strategy. Genmab assumed sole responsibility for the continued development and potential commercialization of acasunlimab and the program will be subject to payment of certain milestones and a tiered single-digit royalty on net sales by Genmab to BioNTech.
J&J (DuoBody)
In July 2012, and as amended in December 2013, Genmab entered into a collaboration with J&J to create and develop bispecific antibodies using our DuoBody technology platform.
As of December 31, 2024, three DuoBody-based products created under this collaboration were in active clinical development and had been approved by regulatory authorities: RYBREVANT, TECVAYLI and TALVEY. Under our agreement with J&J, Genmab is eligible to receive milestones and receives royalties between 8% and 10% on net sales of RYBREVANT, a mid-single digit royalty on net sales of TECVAYLI, and a mid-single digit royalty on net sales of TALVEY, all of which are subject to a reduction of such royalty payment in countries and territories where there are no relevant patents (as defined in the agreement), among other reductions. Pursuant to the terms of the DuoBody agreement, J&J’s obligation to pay these royalties will expire on a country-by-country and licensed product-by-licensed product basis on the later of the date that is 10 years after the first sale of each licensed product in such country or upon the expiration of the last-to-expire relevant patent (as defined in the agreement) covering the licensed product in such country. Genmab pays a royalty to Medarex based on RYBREVANT net sales.
5.7—Contingencies
Legal Contingency
In 2024, Chugai filed a lawsuit in the Tokyo District Court, Japan against AbbVie’s and Genmab’s subsidiaries in Japan asserting that their activities with EPKINLY (epcoritamab) in Japan infringe two Japanese patents held by Chugai, JP6278598 and JP6773929. Chugai is claiming damages and injunctive relief.
F-65
NOTES TO THE CONSOLIDATED FINANCIAL STATEMENTS—(CONTINUED)
Genmab and AbbVie believe that the two Japanese patents are invalid and not infringed and intend to vigorously defend against the lawsuit, and thus no provision has been recognized related to this matter.
Financial Guarantees
As of December 31, 2024 and December 31, 2023, Genmab has financial bank guarantees of $2 million issued as security for lease obligations under certain lease agreements. The likelihood of a claim under the guarantees has been assessed to be remote due to Genmab’ strong financial position and history of fulfilling lease payments. Accordingly, no provision has been recognized related to this matter.
5.8—Subsequent Events
Management has determined it is appropriate to change the functional currency of the Genmab A/S legal entity from DKK to USD effective January 1, 2025. This determination was made based on the growing number and significance of the underlying USD transactions, triggered by the commercialization of EPKINLY. Effective for the first quarter of 2025, the consolidated financial statements will also be presented in USD, which will be both the functional and presentation currency of the parent company.
No other events have occurred subsequent to the balance sheet date that could significantly affect the financial statements as of December 31, 2024.
F-66
Directors’ and Management’s Statement on the Consolidated Financial Statements
The Board of Directors and the Executive Management have today considered and approved the Consolidated Financial Statements of Genmab A/S for the financial years January 1 to December 31, 2024, 2023 and 2022. The Consolidated Financial Statements have been prepared in accordance with IFRS Accounting Standards as issued by the International Accounting Standards Board (IASB) and in accordance with IFRS as endorsed by the EU and further disclosure requirements for listed companies in Denmark.
The Consolidated Financial Statements have been updated regarding the change in accounting policy relating to presentation currency from Danish Kroner to U.S. Dollars and foreign currency as disclosed within note 1.1, and the revisions made to notes 1.4, 4.2 and 4.5.
In our opinion, the Consolidated Financial Statements give a true and fair view of the Group’s financial position as at December 31, 2024 and 2023 and January 1, 2023 as well as of the results of its operations and cash flows for the financial years January 1 to December 31, 2024, 2023 and 2022.
Copenhagen, November 6, 2025
EXECUTIVE MANAGEMENT
|

|
|||
| Jan van de Winkel | Anthony Pagano | |||
| (President & CEO) | (Executive Vice President & CFO) |
BOARD OF DIRECTORS

|

|

|
||
| Deirdre P. Connelly | Pernille Erenbjerg | Anders Gersel Pedersen | ||
| (Chair) | (Deputy Chair) | |||
|

|

|
||
| Rolf Hoffmann | Paolo Paoletti | Elizabeth O’Farrell | ||

|

|

|
||
| Mijke Zachariasse | Michael Kavanagh | Martin Schultz | ||
| (Employee elected) | (Employee elected) | (Employee elected) | ||
F-67