UNITED STATES
SECURITIES AND EXCHANGE COMMISSION
WASHINGTON, D.C. 20549
Form 6-K
REPORT OF FOREIGN PRIVATE ISSUER
PURSUANT TO RULE 13a-16 OR 15d-16
UNDER THE SECURITIES EXCHANGE ACT OF 1934
For the month of November 2025
Commission File Number: 1-9059
Barrick Mining Corporation
(Registrant’s name)
| Brookfield Place, TD Canada Trust Tower, Suite 3700 161 Bay Street, P.O. Box 212 Toronto, Ontario M5J 2S1 Canada (800) 720-7415 |
310 South Main Street Suite 1150 Salt Lake City, Utah 84101 (801) 990-3745 |
|
| (Address of principal executive offices) |
Indicate by check mark whether the registrant files or will file annual reports under cover of Form 20-F or Form 40-F.
Form 20-F ☐ Form 40-F ☒
INCORPORATION BY REFERENCE
Exhibit 99.1 to this report on Form 6-K is furnished, not filed, and will not be incorporated by reference into any registration statement.
Exhibit 99.2 to this report on Form 6-K is hereby incorporated by reference into the Registration Statements on Form F-3 (File No. 333-206417), Form S-8 (File Nos. 333-121500, 333-131715, 333-135769, 333-224560) and Form F-10 (File No. 333- 287021).
SIGNATURES
Pursuant to the requirements of the Securities Exchange Act of 1934, the registrant has duly caused this report to be signed on its behalf by the undersigned, thereunto duly authorized.
| Date: November 10, 2025 | BARRICK MINING CORPORATION | |||||
| By: | /s/ Joseph Heckendorn |
|||||
| Name: | Joseph Heckendorn | |||||
| Title: | Senior Vice President, Corporate Secretary & Associate General Counsel | |||||
EXHIBIT INDEX
| Exhibits |
Description |
|
| 99.1 | 2025 Q3 Report Press Release dated November 10, 2025 | |
| 99.2 | Barrick Mining Corporation’s Comparative Unaudited Financial Statements prepared in accordance with International Financial Reporting Standards and the notes thereto for the three and nine months ended September 30, 2025 and Management’s Discussion and Analysis for the same periods | |
Exhibit 99.1
|
|
Barrick Reports Third Quarter 2025 Results
Delivering record adjusted net earnings, operating and free cash flow
| ∎ |
Q3 gold production 4% higher than Q2 at 829,000 ounces, copper production in line with plan at 55,000 tonnes | |
| ∎ |
Record quarterly operating cash flow and free cash flow1 of $2.4 billion and $1.5 billion—up 82% and 274%, respectively, over Q2 | |
| ∎ |
$0.76 net earnings per share, $0.58 adjusted net earnings per share1 | |
| ∎ |
Increased base quarterly dividend 25% to $0.125 per share plus a performance dividend of $0.05 per share to total $0.175 per share dividend for current quarter | |
| ∎ |
Repurchased $1 billion of shares YTD, with existing buyback program expanded by $500 million to up to $1.5 billion | |
| ∎ |
On track to deliver full year gold and copper production and AISC1 guidance | |
| ∎ |
Updated preliminary economic assessment (“PEA”) confirms Fourmile as one of this century’s most significant gold discoveries2 | |
All amounts expressed in U.S. dollars
Toronto, November 10, 2025 – Barrick Mining Corporation (NYSE:B)(TSX:ABX) (“Barrick” or the “Company”) today reported third quarter operating and financial results for the period ending September 30, 2025. Barrick produced 829,000 ounces of gold and 55,000 tonnes of copper in the quarter and the Company generated $4.1 billion in revenue, as well as a record $2.4 billion in operating cash flow and $1.5 billion in free cash flow.1 Net earnings per share of $0.76 and adjusted net earnings per share1 of $0.58 increased 62% and 23%, respectively, from Q2.
“Higher gold production combined with lower costs and strong commodity prices drove record cash flow for Barrick in Q3,” said Mark Hill, Group Chief Operating Officer and Interim President and Chief Executive Officer. “This allowed us to significantly increase share repurchases while also making progress on our key growth projects, maintaining our industry-leading balance sheet. Given the confidence in ongoing cash flow generation and shareholder focus, the Board has approved a 25% increase in the base quarterly dividend. Our portfolio of world-class assets continues to grow, as demonstrated by the generational gold discovery at Fourmile in Nevada.”
Mark Hill continued, “Since assuming interim CEO responsibilities at the end of September, I have met with our teams across the globe to review performance and assess what we can do differently at Barrick, putting a stronger emphasis on safety and operational performance. The quality of our portfolio is undeniable and the opportunity in front of the Barrick team is significant. We are singularly focused on driving improved performance and shareholder value, particularly at our Tier One6 gold assets in Nevada and the Dominican Republic. To this end, we have begun an operational review from the bottom up to ensure we are completely focused on delivering results safely and consistently going forward and we will provide an update with our year-end results.”
Operational Highlights
Gold production in Q3 was 4% higher than Q2 at 829,000 ounces, with cost of sales (“COS”)3 of $1,562 per ounce, total cash costs (“TCC”)1 of $1,137 per ounce and all-in sustaining costs (“AISC”)1 of $1,538 per ounce. Gold COS3 and AISC1 were 6% and 9% lower than Q2, respectively, with AISC margins4 19% higher. Cortez and Turquoise Ridge performed well, increasing production 15% and 13% over Q2, respectively. Pueblo Viejo achieved record-high throughput in Q3 with the highest quarterly production since 2022. Unplanned downtime at the Goldstrike roaster near the end of the quarter delayed some of Carlin’s processing volume and production from Q3 into Q4.
Copper production in Q3 was 7% lower than Q2 at 55,000 tonnes, in-line with plan, with COS5 of $2.68 per pound, C1 cash costs1 of $1.96 per pound and AISC1 of $3.14 per pound. Copper production year-to-date is 21% higher than the first nine months of 2024, driven by a 42% increase at Lumwana. Copper COS5 and AISC1 were 14% and 16% lower year-to-date than the first nine months of 2024, respectively, with AISC margins4 128% higher.
After nearly twelve months fatality free, unfortunately three of our colleagues lost their lives in recent months. A previously recorded lost-time injury at Kibali was reclassified as a fatality after an employee sadly succumbed to injuries. On September 29th an employee at the Goldrush Underground mine in Nevada sustained fatal injuries. On October 21st an employee sustained fatal injuries at the Bulyanhulu mine in Tanzania. Our thoughts are with the families, friends and colleagues of these team members who passed away. Safety remains Barrick’s highest priority, and we are conducting full investigations into these incidents in cooperation with the relevant authorities. We remain unequivocally committed to our safety vision of ‘Every person going home safe and healthy every day.’
Financial Highlights
Barrick achieved record quarterly operating cash flow and free cash flow1 of $2.4 billion and $1.5 billion—up 82% and 274%, respectively—compared to operating cash flow of $1.3 billion and free cash flow1 of $0.4 billion in the prior quarter. This significant increase was primarily due to higher realized gold prices1, increased gold sales volume and lower total cash costs1 per ounce. In Q3 2025, Barrick achieved net earnings of $1.3 billion ($0.76 per share and adjusted net earnings1 of $982 million ($0.58 per share—another record) compared to net earnings of $483 million ($0.28 per share) and adjusted net earnings1 of $529 million ($0.30 per share) in the same prior-year period. Notably, our Q3 net earnings and adjusted net earnings include a $0.04 per share after tax share-based compensation expense due to our higher share price. Revenues of $4.1 billion in Q3 2025 increased 23% from $3.4 billion in Q3 2024.
Non-core asset sales also continued during the quarter, underscoring our disciplined focus on our Tier One6 gold and copper portfolio. On September 10, Barrick announced an agreement to sell the Hemlo gold mine in Canada to Carcetti Capital Corp. for gross proceeds of up to $1.09 billion. Subsequently, on October 6, Barrick announced an agreement to sell its interests in the Tongon gold mine and certain exploration properties in Côte d’lvoire to the Atlantic Group for total consideration of up to $305 million. Both transactions are expected to close in the fourth quarter of 2025. Together with the sales of Donlin and Alturas, total gross proceeds from non-core assets divested this year are expected to generate approximately $2.6 billion in value.
Key Growth Projects
Updated studies completed during the quarter reaffirm the 100%-owned Fourmile project in Nevada as one of this century’s most significant gold discoveries.2 A new PEA, supported by the 2024 mineral resource estimate and ongoing 2025 evaluation results, underscores Fourmile’s rare combination of
| BARRICK THIRD QUARTER 2025 | 2 | PRESS RELEASE |
grade, scale, and exploration upside, confirming its potential to become one of the world’s most valuable gold mines. The current drilling program—the largest undertaken to date—supports a potential doubling of the existing resource in 2025. Meanwhile, planned access via the Bullion Hill Decline is progressing as expected, with permitting and engineering activities on track.
The Reko Diq project remains on schedule, with onsite construction activities accelerating and project financing approaching completion. The Lumwana expansion has advanced in both procurement and construction and continues to track slightly ahead of schedule. There was also significant progress at Pueblo Viejo, where more than 180 families have now moved into the new community Nuevos Horizontes (‘New Horizons’), and the tailings storage facility construction is on track to support the expansion.
Quarterly Dividend and Share Buybacks
Given confidence in ongoing cash flow generation and shareholder focus, the Board approved a 25% increase in the quarterly base dividend to $0.125 per share. For the current quarter, the Board approved a $0.175 per share dividend, consisting of the higher $0.125 per share base dividend and including a further $0.05 performance dividend. The enhancement to Barrick’s dividend for the current quarter is aligned with Barrick’s intention to provide shareholders with an attractive cash yield over time.
During the quarter, the Company repurchased $589 million of its shares, with year-to-date buybacks now totaling $1 billion. In light of exceptionally strong cash flow, the Board authorized a $500 million increase to the previously approved $1 billion share buyback program, expiring in February 2026. Total capital returned to shareholders in the first nine months of 2025 amounts to $1.6 billion.
Full Year 2025 Guidance
Full-year 2025 guidance remains unchanged. We continue to expect gold production of 3.15–3.50 million ounces, tracking in the lower half of the range, with quarterly production highest in Q4. Following the agreed sales of Hemlo and Tongon, we expect a portion of the production for the fourth quarter from these assets will be excluded. Gold cost guidance, including COS3 of $1,460–$1,560 per ounce, TCC1 of $1,050–$1,130 per ounce and ASIC1 of $1,460–$1,560 per ounce, is based on a gold price assumption of $2,400 per ounce. Adjusting for the current gold price and the impact on royalties on our costs of approximately $50 per ounce, we are on track to achieve our 2025 gold cost guidance, with the impact as follows: COS/oz 3 of $1,510–$1,610, TCC/oz 1 of $1,100–$1,180 and AISC/oz 1 of $1,510–$1,610.
Full-year copper production guidance remains 200,000–230,000 tonnes at copper COS5 of $2.50–$2.80 per pound, C1 cash costs1 of $1.80–$2.10 per pound and AISC1 of $2.80–$3.10 per pound.
Interim CEO Appointment
On September 29, Mark Hill was appointed Group COO and Interim President and CEO following the departure of Mark Bristow. Mr. Hill was previously COO of Barrick’s LATAM and Asia Pacific region and is a seasoned mining executive with 30 years of experience in strategy, corporate development and leading major projects across the world.
The Search Committee of the Board, chaired by Brett Harvey, is working with a leading executive search firm to identify a permanent President and CEO.
“The Board is committed to conducting a thorough and deliberate process to ensure we assess world-class talent and identify the right leader for Barrick,” said Mr. Harvey. “Our ideal candidate will possess deep industry expertise, a clear vision for innovation and the ability to grow the business while delivering
| BARRICK THIRD QUARTER 2025 | 3 | PRESS RELEASE |
sustainable returns for our stakeholders. Throughout this transition, our experienced management team remains focused on executing our strategic priorities and maintaining the momentum of the business.”
Presentation and Webcast
The management team will host a webcast to discuss the results today at 11:00 AM ET followed by a question-and-answer session with analysts. The presentation materials will be available on Barrick’s website and a recording of the webcast will be available for replay later in the day.
About Barrick Mining Corporation
Barrick is a leading global mining, exploration and development company. With one of the largest portfolios of world-class and long-life gold and copper assets in the industry—including six of the world’s Tier One gold mines—Barrick’s operations and projects span 18 countries and five continents. Barrick is also the largest gold producer in the United States. We create real, long-term value for all stakeholders through responsible mining, strong partnerships and a disciplined approach to growth. Barrick shares trade on the New York Stock Exchange under the symbol ‘B’ and on the Toronto Stock Exchange under the symbol ‘ABX’.
| BARRICK THIRD QUARTER 2025 | 4 | PRESS RELEASE |
Financial and Operating Highlights
| For the three months ended | For the nine months ended | |||||||||||||||||||||||||||||||
| 9/30/25 | 6/30/25 | % Change | 9/30/24 | % Change | 9/30/25 | 9/30/24 | % Change | |||||||||||||||||||||||||
| Financial Results ($ millions) |
||||||||||||||||||||||||||||||||
| Revenues |
4,148 | 3,681 | 13 % | 3,368 | 23 % | 10,959 | 9,277 | 18 % | ||||||||||||||||||||||||
| Cost of sales |
1,890 | 1,878 | 1 % | 2,051 | (8)% | 5,553 | 5,966 | (7)% | ||||||||||||||||||||||||
| Net earningsa |
1,302 | 811 | 61 % | 483 | 170 % | 2,587 | 1,148 | 125 % | ||||||||||||||||||||||||
| Adjusted net earningsb |
982 | 800 | 23 % | 529 | 86 % | 2,385 | 1,419 | 68 % | ||||||||||||||||||||||||
| Attributable EBITDAb |
2,022 | 1,690 | 20 % | 1,292 | 57 % | 5,073 | 3,488 | 45 % | ||||||||||||||||||||||||
| Attributable EBITDA marginb |
59 % | 55 % | 7 % | 46 % | 28 % | 56 % | 45 % | 24 % | ||||||||||||||||||||||||
| Minesite sustaining capital expendituresb,c |
395 | 479 | (18)% | 511 | (23)% | 1,438 | 1,692 | (15)% | ||||||||||||||||||||||||
| Project capital expendituresb,c |
532 | 439 | 21 % | 221 | 141 % | 1,240 | 562 | 121 % | ||||||||||||||||||||||||
| Total consolidated capital expendituresc,d |
943 | 934 | 1 % | 736 | 28 % | 2,714 | 2,283 | 19 % | ||||||||||||||||||||||||
| Total attributable capital expenditurese |
757 | 717 | 6 % | 583 | 30 % | 2,105 | 1,849 | 14 % | ||||||||||||||||||||||||
| Net cash provided by operating activities |
2,422 | 1,329 | 82 % | 1,180 | 105 % | 4,963 | 3,099 | 60 % | ||||||||||||||||||||||||
| Net cash provided by operating activities marginf |
58 % | 36 % | 61 % | 35 % | 66 % | 45 % | 33 % | 36 % | ||||||||||||||||||||||||
| Free cash flowb |
1,479 | 395 | 274 % | 444 | 233 % | 2,249 | 816 | 176 % | ||||||||||||||||||||||||
| Net earnings per share (basic and diluted) |
0.76 | 0.47 | 62 % | 0.28 | 171 % | 1.51 | 0.65 | 132 % | ||||||||||||||||||||||||
| Adjusted net earnings (basic)b per share |
0.58 | 0.47 | 23 % | 0.30 | 93 % | 1.39 | 0.81 | 72 % | ||||||||||||||||||||||||
| Weighted average diluted common shares (millions of shares) |
1,703 | 1,716 | (1)% | 1,752 | (3)% | 1,715 | 1,754 | (2)% | ||||||||||||||||||||||||
| Debt (current and long-term) |
4,714 | 4,729 | 0 % | 4,725 | 0 % | 4,714 | 4,725 | 0 % | ||||||||||||||||||||||||
| Cash and equivalents |
5,037 | 4,802 | 5 % | 4,225 | 19 % | 5,037 | 4,225 | 19 % | ||||||||||||||||||||||||
| Debt, net of cash |
(323) | (73) | 342 % | 500 | (165)% | (323) | 500 | (165)% | ||||||||||||||||||||||||
| a. | Net earnings represents net earnings attributable to the equity holders of the Company. |
| b. | Further information on these non-GAAP financial measures, including detailed reconciliations, is included in the endnotes to this press release. |
| c. | Amounts presented on a consolidated cash basis. Project capital expenditures are not included in our calculation of all-in sustaining costs. |
| d. | Total consolidated capital expenditures also includes capitalized interest of $16 million and $36 million for Q3 2025 and YTD 2025, respectively (Q2 2025: $16 million; Q3 2024: $4 million; YTD 2024: $29 million). |
| e. | These amounts are presented on the same basis as our guidance. |
| f. | Represents net cash provided by operating activities divided by revenue. |
| For the three months ended | For the nine months ended | |||||||||||||||||||||||||||||||
| 9/30/25 | 6/30/25 | % Change | 9/30/24 | % Change | 9/30/25 | 9/30/24 | % Change | |||||||||||||||||||||||||
| Operating Results |
||||||||||||||||||||||||||||||||
| Gold |
||||||||||||||||||||||||||||||||
| Gold production (thousands of ounces)a |
829 | 797 | 4 % | 943 | (12)% | 2,384 | 2,831 | (16)% | ||||||||||||||||||||||||
| Gold sold (thousands of ounces)a |
837 | 770 | 9 % | 967 | (13)% | 2,358 | 2,833 | (17)% | ||||||||||||||||||||||||
| Market gold price ($/oz) |
3,457 | 3,280 | 5 % | 2,474 | 40 % | 3,201 | 2,296 | 39 % | ||||||||||||||||||||||||
| Realized gold pricea,b ($/oz) |
3,457 | 3,295 | 5 % | 2,494 | 39 % | 3,226 | 2,309 | 40 % | ||||||||||||||||||||||||
| Gold COS (Barrick’s share)a,c ($/oz) |
1,562 | 1,654 | (6)% | 1,472 | 6 % | 1,613 | 1,447 | 11 % | ||||||||||||||||||||||||
| Gold TCCa,b ($/oz) |
1,137 | 1,239 | (8)% | 1,104 | 3 % | 1,197 | 1,072 | 12 % | ||||||||||||||||||||||||
| Gold AISCa,b ($/oz) |
1,538 | 1,684 | (9)% | 1,507 | 2 % | 1,660 | 1,495 | 11 % | ||||||||||||||||||||||||
| Revenue ($ millions)a |
2,943 | 2,575 | 14 % | 2,453 | 20 % | 7,733 | 6,673 | 16 % | ||||||||||||||||||||||||
| Attributable EBITDA ($ millions)b |
1,777 | 1,424 | 25 % | 1,169 | 52 % | 4,333 | 3,155 | 37 % | ||||||||||||||||||||||||
| Copper |
||||||||||||||||||||||||||||||||
| Copper production (thousands of tonnes)a |
55 | 59 | (7)% | 48 | 15 % | 158 | 131 | 21 % | ||||||||||||||||||||||||
| Copper sold (thousands of tonnes)a |
52 | 54 | (4)% | 42 | 24 % | 157 | 123 | 28 % | ||||||||||||||||||||||||
| Market copper price ($/lb) |
4.44 | 4.32 | 3 % | 4.18 | 6 % | 4.33 | 4.14 | 5 % | ||||||||||||||||||||||||
| Realized copper pricea,b ($/lb) |
4.39 | 4.36 | 1 % | 4.27 | 3 % | 4.42 | 4.23 | 4 % | ||||||||||||||||||||||||
| Copper COS (Barrick’s share)a,d ($/lb) |
2.68 | 2.56 | 5 % | 3.23 | (17)% | 2.72 | 3.16 | (14)% | ||||||||||||||||||||||||
| Copper C1 cash costsa,b ($/lb) |
1.96 | 1.80 | 9 % | 2.49 | (21)% | 2.00 | 2.35 | (15)% | ||||||||||||||||||||||||
| Copper AISCa,b ($/lb) |
3.14 | 2.90 | 8 % | 3.57 | (12)% | 3.03 | 3.62 | (16)% | ||||||||||||||||||||||||
| Revenue ($ millions)a |
472 | 484 | (2)% | 357 | 32 % | 1,430 | 1,048 | 36 % | ||||||||||||||||||||||||
| Attributable EBITDA ($ millions)b |
245 | 266 | (8)% | 123 | 99 % | 740 | 333 | 122 % | ||||||||||||||||||||||||
| a. | On an attributable basis. |
| b. | Further information on these non-GAAP financial measures, including detailed reconciliations, is included in the endnotes to this press release. |
| c. | Gold COS/oz is calculated as cost of sales across our gold operations (excluding sites in closure or care and maintenance) divided by ounces sold (both on an attributable basis using Barrick’s ownership share). |
| d. | Copper COS/lb is calculated as cost of sales across our copper operations divided by pounds sold (both on an attributable basis using Barrick’s ownership share). |
| BARRICK THIRD QUARTER 2025 | 5 | PRESS RELEASE |
Regional Summarya and 2025 Guidanceb
| For the three months ended
|
For the nine months ended
|
2025 Guidance |
||||||||||||||||||||||
|
9/30/25
|
6/30/25 | 9/30/24 | 9/30/25 | 9/30/24 | ||||||||||||||||||||
| Gold |
||||||||||||||||||||||||
| North America |
||||||||||||||||||||||||
| Gold produced (000s oz) |
429 | 413 | 415 | 1,222 | 1,310 | 1,680 - 1,860 | ||||||||||||||||||
| Gold sold (000s oz) |
435 | 408 | 415 | 1,227 | 1,316 | |||||||||||||||||||
| COS ($/oz)d |
1,596 | 1,697 | 1,579 | 1,647 | 1,503 | 1,470 - 1,570 | ||||||||||||||||||
| TCC ($/oz)c |
1,204 | 1,334 | 1,234 | 1,274 | 1,157 | 1,080 - 1,160 | ||||||||||||||||||
| AISC ($/oz)c |
1,512 | 1,751 | 1,661 | 1,706 | 1,616 | 1,480 - 1,580 | ||||||||||||||||||
| Revenue ($ millions) |
1,516 | 1,365 | 1,060 | 4,007 | 3,106 | |||||||||||||||||||
| Attributable EBITDA ($ millions)c |
834 | 700 | 425 | 2,077 | 1,292 | |||||||||||||||||||
| Latin America & Asia Pacific |
||||||||||||||||||||||||
| Gold produced (000s oz) |
180 | 180 | 173 | 526 | 462 | 630 - 730 | ||||||||||||||||||
| Gold sold (000s oz) |
176 | 184 | 193 | 525 | 467 | |||||||||||||||||||
| COS ($/oz)d |
1,446 | 1,494 | 1,375 | 1,492 | 1,424 | 1,490 - 1,590 | ||||||||||||||||||
| TCC ($/oz)c |
930 | 990 | 959 | 982 | 975 | 940 - 1,020 | ||||||||||||||||||
| AISC ($/oz)c |
1,327 | 1,440 | 1,286 | 1,423 | 1,345 | 1,430 - 1,530 | ||||||||||||||||||
| Revenue ($ millions) |
620 | 611 | 487 | 1,723 | 1,115 | |||||||||||||||||||
| Attributable EBITDA ($ millions)c |
441 | 420 | 290 | 1,144 | 620 | |||||||||||||||||||
| Africa & Middle East |
||||||||||||||||||||||||
| Gold produced (000s oz) |
220 | 204 | 355 | 636 | 1,059 | 820 - 910 | ||||||||||||||||||
| Gold sold (000s oz) |
226 | 178 | 359 | 606 | 1,050 | |||||||||||||||||||
| COS ($/oz)d |
1,587 | 1,718 | 1,404 | 1,643 | 1,386 | 1,420 - 1,520 | ||||||||||||||||||
| TCC ($/oz)c |
1,170 | 1,277 | 1,037 | 1,226 | 1,016 | 1,060 - 1,140 | ||||||||||||||||||
| AISC ($/oz)c |
1,424 | 1,577 | 1,328 | 1,528 | 1,317 | 1,360 - 1,460 | ||||||||||||||||||
| Revenue ($ millions) |
807 | 599 | 906 | 2,003 | 2,452 | |||||||||||||||||||
| Attributable EBITDA ($ millions)c |
502 | 304 | 454 | 1,112 | 1,243 | |||||||||||||||||||
| Total Gold |
||||||||||||||||||||||||
| Gold produced (000s oz) |
829 | 797 | 943 | 2,384 | 2,831 | 3,150 - 3,500 | ||||||||||||||||||
| Gold sold (000s oz) |
837 | 770 | 967 | 2,358 | 2,833 | |||||||||||||||||||
| COS ($/oz)d |
1,562 | 1,654 | 1,472 | 1,613 | 1,447 | 1,460 - 1,560 | ||||||||||||||||||
| TCC ($/oz)c |
1,137 | 1,239 | 1,104 | 1,197 | 1,072 | 1,050 - 1,130 | ||||||||||||||||||
| AISC ($/oz)c |
1,538 | 1,684 | 1,507 | 1,660 | 1,495 | 1,460 - 1,560 | ||||||||||||||||||
| Revenue ($ millions) |
2,943 | 2,575 | 2,453 | 7,733 | 6,673 | |||||||||||||||||||
| Attributable EBITDA ($ millions)c |
1,777 | 1,424 | 1,169 | 4,333 | 3,155 | |||||||||||||||||||
| Total Copper |
||||||||||||||||||||||||
| Copper produced (kt) |
55 | 59 | 48 | 158 | 131 | 200 - 230 | ||||||||||||||||||
| Copper sold (kt) |
52 | 54 | 42 | 157 | 123 | |||||||||||||||||||
| COS ($/lb)e |
2.68 | 2.56 | 3.23 | 2.72 | 3.16 | 2.50 - 2.80 | ||||||||||||||||||
| C1 cash costs ($/lb)c |
1.96 | 1.80 | 2.49 | 2.00 | 2.35 | 1.80 - 2.10 | ||||||||||||||||||
| AISC ($/lb)c |
3.14 | 2.90 | 3.57 | 3.03 | 3.62 | 2.80 - 3.10 | ||||||||||||||||||
| Revenue ($ millions) |
472 | 484 | 357 | 1,430 | 1,048 | |||||||||||||||||||
| Attributable EBITDA ($ millions)c |
245 | 266 | 123 | 740 | 333 | |||||||||||||||||||
| a. | All figures in this table are on an attributable basis. |
| b. | See “Outlook Assumptions and Economic Sensitivity Analysis” in endnote 7 of this press release. |
| c. | Further information on these non-GAAP financial measures, including detailed reconciliations, is included in endnote 1 of this press release. |
| d. | Gold COS/oz is calculated as cost of sales across our gold operations (excluding sites in closure or care and maintenance) divided by ounces sold (both on an attributable basis using Barrick’s ownership share). |
| e. | Copper COS/lb is calculated as cost of sales across our copper operations divided by pounds sold (both on an attributable basis using Barrick’s ownership share). |
| BARRICK THIRD QUARTER 2025 | 6 | PRESS RELEASE |
| Investor Relations Contact | Media Contact | |
| Barrick Mining Corporation |
Brunswick Group |
|
| Cleve Rueckert, +1 775 397 5443 |
Carole Cable, +44 (0) 7974 982 458 |
|
| cleveland.rueckert@barrick.com |
barrick@brunswickgroup.com |
|
Technical Information
The scientific and technical information contained in this press release has been reviewed and approved by Tricia Evans, BSc, SMERM, Mineral Resource Manager: North America; Mark Roux, BSc (Hons), P. Grad. Cert. (Geostatistics), Pr. Sci. Nat, Resource Geology Lead – North America; Richard Peattie, MPhil, FAusIMM, Mineral Resources Manager: Africa and Middle East; Peter Jones, MAIG, Manager Resource Geology – Latin America & Asia Pacific; and Joel Holliday, FAusIMM, Executive Vice-President, Exploration – each a “Qualified Person” as defined in National Instrument 43-101 – Standards of Disclosure for Mineral Projects.
All mineral reserve and mineral resource estimates are estimated in accordance with National Instrument 43-101 – Standards of Disclosure for Mineral Projects. Unless otherwise noted, such mineral reserve and mineral resource estimates are as of December 31, 2024.
Endnotes
Endnote 1 – Non-GAAP Financial Measures
Adjusted Net Earnings and Adjusted Net Earnings per Share
“Adjusted net earnings” and “adjusted net earnings per share” are non-GAAP financial performance measures. Adjusted net earnings excludes the following from net earnings: impairment charges (reversals) related to intangibles, goodwill, property, plant and equipment, and investments; acquisition/disposition gains/losses; foreign currency translation gains/losses; significant tax adjustments; other items that are not indicative of the underlying operating performance of our core mining business; and tax effect and non-controlling interest of the above items. Management uses this measure internally to evaluate our underlying operating performance for the reporting periods presented and to assist with the planning and forecasting of future operating results. Management believes that adjusted net earnings is a useful measure of our performance because impairment charges, acquisition/disposition gains/losses and significant tax adjustments do not reflect the underlying operating performance of our core mining business and are not necessarily indicative of future operating results. Adjusted net earnings and adjusted net earnings per share are intended to provide additional information only and does not have any standardized definition under IFRS Accounting Standards as issued by the International Accounting Standards Board (“IFRS”) and should not be considered in isolation or as a substitute for measures of performance prepared in accordance with IFRS. The measures are not necessarily indicative of operating profit or cash flow from operations as determined under IFRS. Other companies may calculate these measures differently. The following table reconciles these non-GAAP financial measures to the most directly comparable IFRS measure. Further details on these non-GAAP financial performance measures are provided in the MD&A accompanying Barrick’s financial statements filed from time to time on SEDAR+ at www.sedarplus.ca and on EDGAR at www.sec.gov.
Reconciliation of Net Earnings to Net Earnings per Share, Adjusted Net Earnings and Adjusted Net Earnings per Share
| ($ millions, except per share amounts in dollars) |
For the three months ended | For the nine months ended | ||||||||||||||||||
| 9/30/25 | 6/30/25 | 9/30/24 | 9/30/25 | 9/30/24 | ||||||||||||||||
| Net earnings attributable to equity holders of the Company |
1,302 | 811 | 483 | 2,587 | 1,148 | |||||||||||||||
| Impairment charges related to intangibles, goodwill, property, plant and equipment, and investmentsa |
3 | 0 | 2 | 7 | 20 | |||||||||||||||
| Acquisition/disposition (gains) lossesb |
(250 | ) | 289 | (1 | ) | 39 | (7 | ) | ||||||||||||
| (Gain) loss on currency translation |
(3 | ) | (2 | ) | 4 | (3 | ) | 21 | ||||||||||||
| Significant tax adjustmentsc |
(119 | ) | (35 | ) | (30 | ) | (169 | ) | 136 | |||||||||||
| Other expense adjustmentsd |
47 | 44 | 97 | 264 | 136 | |||||||||||||||
| Non-controlling interest |
0 | (4 | ) | (7 | ) | (15 | ) | (11 | ) | |||||||||||
| Tax effecte |
2 | (303 | ) | (19 | ) | (325 | ) | (24 | ) | |||||||||||
| Adjusted net earnings |
982 | 800 | 529 | 2,385 | 1,419 | |||||||||||||||
| Net earnings per sharef |
0.76 | 0.47 | 0.28 | 1.51 | 0.65 | |||||||||||||||
| Adjusted net earnings per sharef |
0.58 | 0.47 | 0.30 | 1.39 | 0.81 | |||||||||||||||
| a. | There were no significant impairment charges or reversals in the current period or prior periods. |
| b. | Acquisition/disposition (gains) losses for Q3 2025 mainly related to the $250 million revaluation of our 80% equity investment in Loulo-Gounkoto, as it was deconsolidated and an investment at fair value was recognized in Q2 2025 (resulting in a Q2 2025 net loss of $1,035 million) following the change of control after it was placed under a temporary provisional administration on June 16, 2025. This loss in Q2 2025 and YTD 2025 was partially offset by a gain of $745 million on the sale of our 50% interest in the Donlin Gold project. |
| c. | For Q3 2025, significant tax adjustments include the re-measurement of deferred tax balances and the recognition of deferred tax assets. Significant tax adjustments for YTD 2025 also include the adjustments in respect of prior years. For Q3 2024, significant tax adjustments include the re-measurement of |
| BARRICK THIRD QUARTER 2025 | 7 | PRESS RELEASE |
| deferred tax balances and the recognition of deferred tax assets. Significant tax adjustments for YTD 2024 also include the adjustments in respect of prior years and the proposed settlement of the Zaldívar Tax Assessments in Chile. |
| d. | Other expense adjustments for the 2025 periods mainly relate to reduced operation costs at Loulo-Gounkoto. Q3 2025 also includes severance costs and YTD 2025 was further impacted by the signing of agreements to settle legacy legal matters in the Philippines related to Placer Dome Inc. Other adjustments in Q3 2024 mainly relate to the $40 million accrual relating to the road construction in Tanzania per our community investment obligations under the Twiga partnership, and changes in the discount rate assumptions on our closed mine rehabilitation provision, combined with a provision made relating to a legacy mine site operated by Homestake Mining Company that was closed prior to the 2001 acquisition by Barrick. YTD 2024 was further impacted by the interest and penalties recognized following the settlement of the Zaldívar Tax Assessments in Chile. |
| e. | Tax effect for Q2 2025 and YTD 2025 primarily relates to acquisition/disposition losses (gains). |
| f. | Calculated using weighted average number of shares outstanding under the basic method of earnings per share. |
Free Cash Flow
“Free cash flow” is a non-GAAP financial measure that deducts capital expenditures from net cash provided by operating activities. Management believes this to be a useful indicator of our ability to operate without reliance on additional borrowing or usage of existing cash. Free cash flow is intended to provide additional information only and does not have any standardized definition under IFRS, and should not be considered in isolation or as a substitute for measures of performance prepared in accordance with IFRS. The measure is not necessarily indicative of operating profit or cash flow from operations as determined under IFRS. Other companies may calculate this measure differently. Further details on this non-GAAP financial performance measure are provided in the MD&A accompanying Barrick’s financial statements filed from time to time on SEDAR+ at www.sedarplus.ca and on EDGAR at www.sec.gov. The following table reconciles this non-GAAP financial measure to the most directly comparable IFRS measure.
Reconciliation of Net Cash Provided by Operating Activities to Free Cash Flow
| ($ millions) |
For the three months ended | For the nine months ended | ||||||||||||||||||
| 9/30/25 | 6/30/25 | 9/30/24 | 9/30/25 | 9/30/24 | ||||||||||||||||
| Net cash provided by operating activities |
2,422 | 1,329 | 1,180 | 4,963 | 3,099 | |||||||||||||||
| Capital expenditures |
(943 | ) | (934 | ) | (736 | ) | (2,714 | ) | (2,283 | ) | ||||||||||
| Consolidated free cash flow |
1,479 | 395 | 444 | 2,249 | 816 | |||||||||||||||
| Free cash flow applicable to equity investees |
191 | 66 | 71 | 413 | 247 | |||||||||||||||
|
Non-controlling interests |
(516 | ) | (249 | ) | (210 | ) | (885 | ) | (475 | ) | ||||||||||
| Attributable free cash flow |
1,154 | 212 | 305 | 1,777 | 588 | |||||||||||||||
Capital Expenditures
These amounts are presented on the same basis as our guidance. Minesite sustaining capital expenditures and project capital expenditures are non-GAAP financial measures. Capital expenditures are classified into minesite sustaining capital expenditures or project capital expenditures depending on the nature of the expenditure. Minesite sustaining capital expenditures is the capital spending required to support current production levels. Project capital expenditures represent the capital spending at new projects and major, discrete projects at existing operations intended to increase net present value through higher production or longer mine life. Management believes this to be a useful indicator of the purpose of capital expenditures and this distinction is an input into the calculation of all-in sustaining costs per ounce. Classifying capital expenditures is intended to provide additional information only and does not have any standardized definition under IFRS, and should not be considered in isolation or as a substitute for measures of performance prepared in accordance with IFRS. Other companies may calculate these measures differently. The following table reconciles these non-GAAP financial performance measures to the most directly comparable IFRS measure.
Reconciliation of the Classification of Capital Expenditures
| ($ millions) |
For the three months ended | For the nine months ended | ||||||||||||||||||
| 9/30/25 | 6/30/25 | 9/30/24 | 9/30/25 | 9/30/24 | ||||||||||||||||
| Minesite sustaining capital expenditures |
395 | 479 | 511 | 1,438 | 1,692 | |||||||||||||||
| Project capital expenditures |
532 | 439 | 221 | 1,240 | 562 | |||||||||||||||
| Capitalized interest |
16 | 16 | 4 | 36 | 29 | |||||||||||||||
| Total consolidated capital expenditures |
943 | 934 | 736 | 2,714 | 2,283 | |||||||||||||||
Total cash costs per ounce and All-in sustaining costs per ounce
“Total cash costs” per ounce and “All-in sustaining costs” per ounce are non-GAAP financial performance measures which are calculated based on the definition published by the World Gold Council (a market development organization for the gold industry comprised of and funded by gold mining companies from around the world, including Barrick, the “WGC”). The WGC is not a regulatory organization. Management uses these measures to monitor the performance of our gold mining operations and their ability to generate positive cash flow, both on an individual site basis and an overall company basis. “Total cash costs” per ounce start with our cost of sales related to gold production and removes depreciation, the noncontrolling interest of cost of sales and includes by-product credits. “All-in sustaining costs” per ounce start with “Total cash costs” per ounce and includes sustaining capital expenditures, sustaining leases, general and administrative costs, minesite exploration and evaluation costs and reclamation cost accretion and amortization. These additional costs reflect the expenditures made to maintain current production
| BARRICK THIRD QUARTER 2025 | 8 | PRESS RELEASE |
levels. These definitions recognize that there are different costs associated with the life-cycle of a mine, and that it is therefore appropriate to distinguish between sustaining and non-sustaining costs. Barrick believes that the use of “Total cash costs” per ounce and “All-in sustaining costs” per ounce will assist analysts, investors and other stakeholders of Barrick in understanding the costs associated with producing gold, understanding the economics of gold mining, assessing our operating performance and also our ability to generate free cash flow from current operations and to generate free cash flow on an overall company basis. “Total cash costs” per ounce and “All-in sustaining costs” per ounce are intended to provide additional information only and do not have standardized definitions under IFRS and should not be considered in isolation or as a substitute for measures of performance prepared in accordance with IFRS. These measures are not equivalent to net income or cash flow from operations as determined under IFRS. Although the WGC has published a standardized definition, other companies may calculate these measures differently. Further details on these non-GAAP financial performance measures are provided in the MD&A accompanying Barrick’s financial statements filed from time to time on SEDAR+ at www.sedarplus.ca and on EDGAR at www.sec.gov. The following table reconciles these non-GAAP financial measures to the most directly comparable IFRS measure.
Reconciliation of Gold Cost of Sales to Total cash costs and All-in sustaining costs, including on a per ounce basis
| ($ millions, except per oz information in dollars) |
For the three months ended | For the nine months ended | ||||||||||||||||||||
| Footnote | 9/30/25 | 6/30/25 | 9/30/24 | 9/30/25 | 9/30/24 | |||||||||||||||||
| COS applicable to gold production |
1,690 | 1,676 | 1,856 | 4,934 | 5,416 | |||||||||||||||||
| Depreciation |
(384 | ) | (359 | ) | (409 | ) | (1,085 | ) | (1,217 | ) | ||||||||||||
| Total cash costs applicable to equity method investments |
114 | 101 | 93 | 324 | 226 | |||||||||||||||||
| By-product credits |
(80 | ) | (64 | ) | (58 | ) | (204 | ) | (189 | ) | ||||||||||||
| Non-recurring items |
a | 0 | 0 | 0 | 0 | 0 | ||||||||||||||||
| Other |
b | 5 | 11 | 3 | 21 | 10 | ||||||||||||||||
|
Non-controlling interests |
c | (393 | ) | (411 | ) | (417 | ) | (1,168 | ) | (1,210 | ) | |||||||||||
| Total cash costs |
952 | 954 | 1,068 | 2,822 | 3,036 | |||||||||||||||||
| General & administrative costs |
77 | 39 | 46 | 158 | 106 | |||||||||||||||||
| Minesite exploration and evaluation costs |
d | 7 | 7 | 10 | 19 | 29 | ||||||||||||||||
| Minesite sustaining capital expenditures |
e | 395 | 479 | 511 | 1,438 | 1,692 | ||||||||||||||||
| Sustaining leases |
7 | 7 | 8 | 22 | 23 | |||||||||||||||||
| Rehabilitation - accretion and amortization (operating sites) |
f | 17 | 16 | 14 | 50 | 51 | ||||||||||||||||
|
Non-controlling interest, copper operations and other |
g | (171 | ) | (208 | ) | (199 | ) | (596 | ) | (701 | ) | |||||||||||
|
All-in sustaining costs |
1,284 | 1,294 | 1,458 | 3,913 | 4,236 | |||||||||||||||||
| Ounces sold - attributable basis (koz) |
h | 837 | 770 | 967 | 2,358 | 2,833 | ||||||||||||||||
| COS/oz |
i,j | 1,562 | 1,654 | 1,472 | 1,613 | 1,447 | ||||||||||||||||
| TCC/oz |
j | 1,137 | 1,239 | 1,104 | 1,197 | 1,072 | ||||||||||||||||
| TCC/oz (on a co-product basis) |
j,k | 1,199 | 1,292 | 1,145 | 1,253 | 1,117 | ||||||||||||||||
| AISC/oz |
j | 1,538 | 1,684 | 1,507 | 1,660 | 1,495 | ||||||||||||||||
| AISC/oz (on a co-product basis) |
j,k | 1,600 | 1,737 | 1,548 | 1,716 | 1,540 | ||||||||||||||||
| a. | Non-recurring items - These costs are not indicative of our cost of production and have been excluded from the calculation of TCC. |
| b. | Other - Other adjustments mainly relate to treatment and refinement charges. |
| c. | Non-controlling interests - Non-controlling interests include non-controlling interests related to gold production of $540 million and $1,567 million for Q3 2025 and YTD 2025, respectively, (Q2 2025: $540 million; Q3 2024: $556 million; YTD 2024: $1,630 million). Non-controlling interests include NGM, Pueblo Viejo, Loulo-Gounkoto, Tongon, North Mara and Bulyanhulu. Refer to Note 5 to the Financial Statements for further information. |
| d. | Exploration and evaluation costs - Exploration, evaluation and project expenses are presented as minesite sustaining if they support current mine operations and project if they relate to future projects. Refer to page 36 of Barrick’s Q3 2025 MD&A. |
| e. | Capital expenditures - Capital expenditures are related to our gold sites only and are split between minesite sustaining and project capital expenditures. |
| f. | Rehabilitation—accretion and amortization - Includes depreciation on the assets related to rehabilitation provisions of our gold operations and accretion on the rehabilitation provision of our gold operations, split between operating and non-operating sites. |
| g. | Non-controlling interest and copper operations - Removes general and administrative costs related to non-controlling interests and copper based on a percentage allocation of revenue. Also removes exploration, evaluation and project expenses, rehabilitation costs and capital expenditures incurred by our copper sites and the non-controlling interest of NGM, Pueblo Viejo, Loulo-Gounkoto, Tongon, North Mara and Bulyanhulu operating segments. It also includes capital expenditures applicable to our equity method investment in Kibali. The impact is summarized as the following: |
| ($ millions) |
For the three months ended | For the nine months ended | ||||||||||||||||||
|
Non-controlling interest, copper operations and other |
9/30/25 | 6/30/25 | 9/30/24 | 9/30/25 | 9/30/24 | |||||||||||||||
| General & administrative costs |
(13 | ) | (6 | ) | (7 | ) | (25 | ) | (17 | ) | ||||||||||
| Minesite exploration and evaluation expenses |
(1 | ) | (3 | ) | (2 | ) | (4 | ) | (8 | ) | ||||||||||
| Rehabilitation - accretion and amortization (operating sites) |
(5 | ) | (6 | ) | (5 | ) | (16 | ) | (16 | ) | ||||||||||
| Minesite sustaining capital expenditures |
(152 | ) | (193 | ) | (185 | ) | (551 | ) | (660 | ) | ||||||||||
|
All-in sustaining costs total |
(171 | ) | (208 | ) | (199 | ) | (596 | ) | (701 | ) | ||||||||||
| h. | Ounces sold - attributable basis - Excludes Long Canyon which is producing residual ounces from the leach pad while in care and maintenance. |
| BARRICK THIRD QUARTER 2025 | 9 | PRESS RELEASE |
| i. | COS/oz - Gold COS/oz is calculated as cost of sales across our gold operations (excluding sites in closure or care and maintenance) divided by ounces sold (both on an attributable basis using Barrick’s ownership share). |
| j. | Per ounce figures - COS/oz, TCC/oz and AISC/oz may not calculate based on amounts presented in this table due to rounding. |
| k. | Co-product costs/oz |
| TCC/oz and AISC/oz presented on a co-product basis removes the impact of by-product credits of our gold production (net of non-controlling interest) calculated as: |
| ($ millions) |
For the three months ended | For the nine months ended | ||||||||||||||||||
| 9/30/25 | 6/30/25 | 9/30/24 | 9/30/25 | 9/30/24 | ||||||||||||||||
| By-product credits |
80 | 64 | 58 | 204 | 189 | |||||||||||||||
|
Non-controlling interest |
(28 | ) | (23 | ) | (18 | ) | (71 | ) | (60 | ) | ||||||||||
|
By-product credits (net of non-controlling interest) |
52 | 41 | 40 | 133 | 129 | |||||||||||||||
C1 cash costs per pound and All-in sustaining costs per pound
“C1 cash costs” per pound and “All-in sustaining costs” per pound are non-GAAP financial performance measures related to our copper mine operations. We believe that “C1 cash costs” per pound enables investors to better understand the performance of our copper operations in comparison to other copper producers who present results on a similar basis. “C1 cash costs” per pound excludes royalties and non-routine charges as they are not direct production costs. “All-in sustaining costs” per pound is similar to the gold all-in sustaining costs metric and management uses this to better evaluate the costs of copper production. We believe this measure enables investors to better understand the operating performance of our copper mines as this measure reflects all of the sustaining expenditures incurred in order to produce copper. “All-in sustaining costs” per pound includes C1 cash costs, sustaining capital expenditures, sustaining leases, general and administrative costs, minesite exploration and evaluation costs, royalties, reclamation cost accretion and amortization and writedowns taken on inventory to net realizable value. Further details on these non-GAAP financial performance measures are provided in the MD&A accompanying Barrick’s financial statements filed from time to time on SEDAR+ at www.sedarplus.ca and on EDGAR at www.sec.gov. The following table reconciles these non-GAAP financial measures to the most directly comparable IFRS measure.
Reconciliation of Copper Cost of Sales to C1 cash costs and All-in sustaining costs, including on a per pound basis
| ($ millions, except per lb information in dollars) |
For the three months ended | For the nine months ended | ||||||||||||||||||
| 9/30/25 | 6/30/25 | 9/30/24 | 9/30/25 | 9/30/24 | ||||||||||||||||
| Cost of sales |
193 | 193 | 187 | 594 | 527 | |||||||||||||||
| Depreciation/amortization |
(69 | ) | (68 | ) | (60 | ) | (197 | ) | (191 | ) | ||||||||||
| Treatment and refinement charges |
44 | 40 | 39 | 126 | 111 | |||||||||||||||
| C1 cash costs applicable to equity method investments |
91 | 84 | 83 | 265 | 249 | |||||||||||||||
| Less: royalties |
(25 | ) | (25 | ) | (17 | ) | (71 | ) | (45 | ) | ||||||||||
|
By-product credits |
(7 | ) | (12 | ) | (3 | ) | (24 | ) | (14 | ) | ||||||||||
| C1 cash costs |
227 | 212 | 229 | 693 | 637 | |||||||||||||||
| General & administrative costs |
12 | 8 | 6 | 28 | 15 | |||||||||||||||
| Rehabilitation - accretion and amortization |
1 | 3 | 2 | 5 | 6 | |||||||||||||||
| Royalties |
25 | 25 | 17 | 71 | 45 | |||||||||||||||
| Minesite exploration and evaluation costs |
1 | 1 | 1 | 4 | 2 | |||||||||||||||
| Minesite sustaining capital expenditures |
93 | 90 | 71 | 240 | 265 | |||||||||||||||
| Sustaining leases |
2 | 2 | 2 | 7 | 7 | |||||||||||||||
|
All-in sustaining costs |
361 | 341 | 328 | 1,048 | 977 | |||||||||||||||
| Tonnes sold - attributable basis (Kt) |
52 | 54 | 42 | 157 | 123 | |||||||||||||||
| Pounds sold - attributable basis (Mlb) |
116 | 118 | 91 | 347 | 270 | |||||||||||||||
| COS/lba,b |
2.68 | 2.56 | 3.23 | 2.72 | 3.16 | |||||||||||||||
| C1 cash costs/lba |
1.96 | 1.80 | 2.49 | 2.00 | 2.35 | |||||||||||||||
| AISC/lba |
3.14 | 2.90 | 3.57 | 3.03 | 3.62 | |||||||||||||||
| a. | COS/lb, C1 cash costs/lb and AISC/lb may not calculate based on amounts presented in this table due to rounding. |
| b. | Copper COS/lb is calculated as cost of sales across our copper operations divided by pounds sold (both on an attributable basis using Barrick’s ownership share). |
EBITDA, Adjusted EBITDA, Attributable EBITDA, Attributable EBITDA Margin and Net Leverage
EBITDA is a non-GAAP financial performance measure, which excludes the following from net earnings: income tax expense; finance costs; finance income; and depreciation. Management believes that EBITDA is a valuable indicator of our ability to generate liquidity by producing operating cash flow to fund working capital needs, service debt obligations, and fund capital expenditures. Management uses EBITDA for this purpose. Adjusted EBITDA removes the effect of impairment charges; acquisition/disposition gains/losses; foreign currency translation gains/losses; and other expense adjustments. We also remove the impact of the income tax expense, finance costs, finance income and depreciation incurred in our equity method accounted investments. We believe these items provide a greater level of consistency with the adjusting items included in our adjusted net earnings reconciliation, with the exception that these amounts are adjusted to remove any impact on finance costs/income,
| BARRICK THIRD QUARTER 2025 | 10 | PRESS RELEASE |
income tax expense and/or depreciation as they do not affect EBITDA. We believe this additional information will assist analysts, investors and other stakeholders of Barrick in better understanding our ability to generate liquidity from our full business, including equity method investments, by excluding these amounts from the calculation as they are not indicative of the performance of our core mining business and not necessarily reflective of the underlying operating results for the periods presented. We believe this additional information will assist analysts, investors and other stakeholders of Barrick in better understanding our ability to generate liquidity from our attributable business and which is aligned with how we present our forward looking guidance on gold ounces and copper pounds produced. Attributable EBITDA margin is calculated as attributable EBITDA divided by revenues - as adjusted. We believe this ratio will assist analysts, investors and other stakeholders of Barrick to better understand the relationship between revenues and EBITDA or operating profit. Starting with the Q2 2024 MD&A, we are presenting net leverage as a non-GAAP ratio and is calculated as debt, net of cash divided by the sum of adjusted EBITDA of the last four consecutive quarters. We believe this ratio will assist analysts, investors and other stakeholders of Barrick in monitoring our leverage and evaluating our balance sheet. EBITDA, adjusted EBITDA, attributable EBITDA, EBITDA margin and net leverage are intended to provide additional information to investors and analysts and do not have any standardized definition under IFRS, and should not be considered in isolation or as a substitute for measures of performance prepared in accordance with IFRS. EBITDA, adjusted EBITDA and attributable EBITDA exclude the impact of cash costs of financing activities and taxes, and the effects of changes in operating working capital balances, and therefore are not necessarily indicative of operating profit or cash flow from operations as determined under IFRS. Other companies may calculate EBITDA, adjusted EBITDA, attributable EBITDA, EBITDA margin and net leverage differently. Further details on these non-GAAP financial performance measures are provided in the MD&A accompanying Barrick’s financial statements filed from time to time on SEDAR+ at www.sedarplus.ca and on EDGAR at www.sec.gov. The following table reconciles these non-GAAP financial measures to the most directly comparable IFRS measure.
Reconciliation of Net Earnings to EBITDA, Adjusted EBITDA and Attributable EBITDA
| ($ millions) |
For the three months ended | For the nine months ended | ||||||||||||||||||
| 9/30/25 | 6/30/25 | 9/30/24 | 9/30/25 | 9/30/24 | ||||||||||||||||
| Net earnings |
1,904 | 1,256 | 780 | 3,941 | 1,901 | |||||||||||||||
| Income tax expense |
477 | 102 | 245 | 857 | 826 | |||||||||||||||
| Finance costs, neta |
21 | 36 | 59 | 96 | 97 | |||||||||||||||
| Depreciation |
460 | 436 | 477 | 1,307 | 1,431 | |||||||||||||||
| EBITDA |
2,862 | 1,830 | 1,561 | 6,201 | 4,255 | |||||||||||||||
| Impairment charges of non-current assetsb |
3 | 0 | 2 | 7 | 20 | |||||||||||||||
| Acquisition/disposition losses (gains)c |
(250 | ) | 289 | (1 | ) | 39 | (7 | ) | ||||||||||||
| (Gain) loss on currency translation |
(3 | ) | (2 | ) | 4 | (3 | ) | 21 | ||||||||||||
| Other expense adjustmentsd |
47 | 44 | 97 | 264 | 136 | |||||||||||||||
| Income tax expense, net finance costsa and depreciation from equity investees |
197 | 156 | 110 | 494 | 331 | |||||||||||||||
| Adjusted EBITDA |
2,856 | 2,317 | 1,773 | 7,002 | 4,756 | |||||||||||||||
|
Non-controlling Interests |
(834 | ) | (627 | ) | (481 | ) | (1,929 | ) | (1,268 | ) | ||||||||||
| Attributable EBITDA |
2,022 | 1,690 | 1,292 | 5,073 | 3,488 | |||||||||||||||
| Revenues - as adjustede |
3,405 | 3,050 | 2,806 | 9,140 | 7,686 | |||||||||||||||
| Attributable EBITDA marginf |
59 | % | 55 | % | 46 | % | 56 | % | 45 | % | ||||||||||
| As at 9/30/25 | As at 12/31/24 | As at 9/30/24 | As at 9/30/25 | As at 12/31/24 | ||||||||||||||||
| Net leverageg |
0.0:1 | 0.1:1 | 0.1:1 | 0.0:1 | 0.0:1 | |||||||||||||||
| a. | Finance costs exclude accretion. |
| b. | There were no significant impairment charges or reversals in the current period or prior periods. |
| c. | Acquisition/disposition (gains) losses for Q3 2025 mainly related to the $250 million revaluation of our 80% equity investment in Loulo-Gounkoto, as it was deconsolidated and an investment at fair value was recognized in Q2 2025 (resulting in a Q2 2025 net loss of $1,035 million) following the change of control after it was placed under a temporary provisional administration on June 16, 2025. This loss in Q2 2025 and YTD 2025 was partially offset by a gain of $745 million on the sale of our 50% interest in the Donlin Gold project. |
| d. | Other expense adjustments for the 2025 periods mainly relate to reduced operation costs at Loulo-Gounkoto. Q3 2025 also includes severance costs and YTD 2025 was further impacted by the signing of agreements to settle legacy legal matters in the Philippines related to Placer Dome Inc. Other adjustments in Q3 2024 mainly relate to the $40 million accrual relating to the road construction in Tanzania per our community investment obligations under the Twiga partnership, and changes in the discount rate assumptions on our closed mine rehabilitation provision, combined with a provision made relating to a legacy mine site operated by Homestake Mining Company that was closed prior to the 2001 acquisition by Barrick. YTD 2024 was further impacted by the interest and penalties recognized following the settlement of the Zaldívar Tax Assessments in Chile. |
| e. | Refer to Reconciliation of Sales to Realized Price per oz/pound on page 58 of Barrick’s Q3 2025 MD&A. |
| f. | Represents attributable EBITDA divided by revenues - as adjusted. |
| g. | Represents debt, net of cash divided by adjusted EBITDA of the last four consecutive quarters. |
Realized Price
“Realized price” is a non-GAAP financial performance measure which excludes from sales: treatment and refining charges; and cumulative catch-up adjustment to revenue relating to our streaming arrangements. We believe this provides investors and analysts with a more accurate measure with which to compare to market gold and copper prices and to assess our gold and copper sales performance. For those reasons, management believes that this measure provides a more accurate reflection of our company’s past performance and is a better indicator of its expected performance in future periods. The realized price measure is intended to provide additional information, and does not have any standardized definition under IFRS and should not be considered in isolation or as a substitute for measures of performance prepared in accordance with IFRS. The measure is not
| BARRICK THIRD QUARTER 2025 | 11 | PRESS RELEASE |
necessarily indicative of sales as determined under IFRS. Other companies may calculate this measure differently. The following table reconciles realized prices to the most directly comparable IFRS measure. Further details on these non-GAAP financial performance measures are provided in the MD&A accompanying Barrick’s financial statements filed from time to time on SEDAR+ at www.sedarplus.ca and on EDGAR at www.sec.gov.
Reconciliation of Sales to Realized Price per ounce/pound
| ($ millions, except per oz/lb information in dollars) |
Gold | Copper | Gold | Copper | ||||||||||||||||||||||||||||||||||||
| For the three months ended | For the nine months ended | |||||||||||||||||||||||||||||||||||||||
| 9/30/25 | 6/30/25 | 9/30/24 | 9/30/25 | 6/30/25 | 9/30/24 | 9/30/25 | 9/30/24 | 9/30/25 | 9/30/24 | |||||||||||||||||||||||||||||||
| Sales |
3,748 | 3,280 | 3,097 | 320 | 337 | 213 | 9,794 | 8,493 | 961 | 595 | ||||||||||||||||||||||||||||||
| Sales applicable to non-controlling interests |
(1,237) | (1,054) | (930) | 0 | 0 | 0 | (3,139) | (2,575) | 0 | 0 | ||||||||||||||||||||||||||||||
| Sales applicable to equity method investmentsa,b |
377 | 306 | 241 | 147 | 135 | 141 | 935 | 609 | 446 | 438 | ||||||||||||||||||||||||||||||
| Sales applicable to sites in closure or care and maintenancec |
(1) | (1) | (2) | 0 | 0 | 0 | (3) | (7) | 0 | 0 | ||||||||||||||||||||||||||||||
| Treatment and refinement charges |
7 | 7 | 7 | 44 | 40 | 39 | 20 | 22 | 126 | 111 | ||||||||||||||||||||||||||||||
| Revenues – as adjusted |
2,894 | 2,538 | 2,413 | 511 | 512 | 393 | 7,607 | 6,542 | 1,533 | 1,144 | ||||||||||||||||||||||||||||||
| Ounces/pounds sold (koz/Mlb)c |
837 | 770 | 967 | 116 | 118 | 91 | 2,358 | 2,833 | 347 | 270 | ||||||||||||||||||||||||||||||
| Realized gold/copper price per oz/lbd |
3,457 | 3,295 | 2,494 | 4.39 | 4.36 | 4.27 | 3,226 | 2,309 | 4.42 | 4.23 | ||||||||||||||||||||||||||||||
| a. | Represents sales of $294 million and $711 million, respectively, for Q3 2025 and YTD 2025 (Q2 2025: $226 million; Q3 2024: $193 million; YTD 2024: $533 million) applicable to our 45% equity method investment in Kibali and $83 million and $224 million, respectively (Q2 2025: $80 million; Q3 2024: $48 million; YTD 2024: $76 million) applicable to our 24.5% equity method investment in Porgera for gold. Represents sales of $77 million and $243 million, respectively, for Q3 2025 and YTD 2025 (Q2 2025: $71 million; Q3 2024: $91 million; YTD 2024: $260 million) applicable to our 50% equity method investment in Zaldívar and $71 million and $208 million, respectively (Q2 2025: $65 million; Q3 2024: $55 million; YTD 2024: $196 million), applicable to our 50% equity method investment in Jabal Sayid for copper. |
| b. | Sales applicable to equity method investments are net of treatment and refinement charges. |
| c. | On an attributable basis. Excludes Long Canyon which is producing residual ounces from the leach pad while in care and maintenance. |
| d. | Realized price per oz/lb may not calculate based on amounts presented in this table due to rounding. |
Endnote 2 – Fourmile 2025 Preliminary Economic Assessment Summary of Results
Potential quantities and grades in these Fourmile preliminary results are conceptual in nature and there has been insufficient exploration to define a mineral resource at this time and it is uncertain that further exploration will result in the target being delineated as a mineral resource.
|
Fourmile 2025 PEA Results Summary: |
||
| 2024 Mineral Resourceiii |
M&I: 3.6Mt @ 11.8g/t for 1.4Moz INF: 14Mt @ 14.1g/t for 6.4Moz + Exploration Upside:ii 32-34Mt @ 15–16g/t
|
|
| Mine Life (yrs)ii | >25 | |
| Ore tonnes (ktpa)i | Approx. 1.5–1.8Mtpaiv | |
| Avg annual production (Au koz)i |
Approx. 600–750 | |
| Project Capital ($Bn)i | Approx. 1.5–1.7 | |
| Cost of Sales ($/oz)i | Approx. 850–900 | |
| LOM AISC1 ($/oz)i | Approx. 650–750 | |
| i. | Fourmile production and economic metrics are based upon a preliminary economic assessment, using 2024 mineral resources only and August 2025 Long Term Consensus Gold Price of $2,585/oz. These metrics are conceptual in nature because they include inferred mineral resources that are considered too speculative to have the considerations applied to them that would enable them to be categorized as mineral reserves, and there is no certainty that the preliminary economic assessment will be realized. |
| ii. | Fourmile mine life is based upon combined 2024 mineral resource and exploration upside and is conceptual in nature with no certainty that this will be realized. Potential quantities and grades in these Fourmile preliminary results are conceptual in nature and there has been insufficient exploration to define a mineral resource at this time and it is uncertain that further exploration will result in the target being delineated as a mineral resource. |
| iii. | Estimates are as of December 31, 2024, unless otherwise noted. Complete mineral reserve and mineral resource data for all mines and projects referenced in this presentation, including tonnes, grades, and ounces, can be found in the Mineral Reserves and Mineral Resources Tables included on pages 36-45 of Barrick’s 2024 Annual Information Form/Form 40-F filed on SEDAR+ at www.sedarplus.ca and on EDGAR at www.sec.gov. |
| iv. | Fourmile exploration potential tonnage and grade ranges are based upon a preliminary economic assessment which is preliminary in nature because it includes inferred mineral resources that are considered too speculative geologically to have the economic considerations applied to them that would enable them to be categorized as mineral reserves, and there is no certainty that the preliminary economic assessment |
| BARRICK THIRD QUARTER 2025 | 12 | PRESS RELEASE |
| will be realized. The preliminary economic assessment for Fourmile is based upon $1,900/oz mineable stope optimizer. The assumptions outlined within the preliminary economic assessment have formed the basis for the ongoing study and are made by the Qualified Person. Fourmile is currently 100% owned by Barrick. Barrick anticipates Fourmile being contributed to the Nevada Gold Mines joint venture, at fair market value, if certain criteria are met. |
Endnote 3
On an attributable basis. Gold COS/oz is calculated as cost of sales across our gold operations (excluding sites in closure or care and maintenance) divided by ounces sold (both on an attributable basis using Barrick’s ownership share).
Endnote 4
“AISC Margin” is a non-GAAP financial measure calculated as the difference between the realized gold price per ounce and “All-in sustaining costs” (AISC) per ounce for the relevant period. Management uses this metric to assess the efficiency of our gold mining operations and to evaluate the ability of our assets to generate cash flow in excess of sustaining expenditures. This measure does not have a standardized meaning under IFRS and should not be considered in isolation or as a substitute for measures prepared in accordance with IFRS. Other companies may calculate AISC Margin differently and therefore it may not be comparable to similar measures presented by other companies.
Endnote 5
Copper COS/lb is calculated as cost of sales across our copper operations divided by pounds sold (both on an attributable basis using Barrick’s ownership share).
Endnote 6
A Tier One Gold Asset is an asset with a $1,400/oz reserve with potential to deliver a minimum 10-year life, annual production of at least 500,000 ounces of gold and with costs per ounce in the lower half of the industry cost curve. A Tier One Copper Asset/ Project is an asset with a $3.00/lb reserve with potential for +5Mt contained copper in support at least 20 years life, annual production of at least 200ktpa, with costs per pound in the lower half of the industry cost curve. Tier One Assets must be located in a world-class geological district with potential for organic reserve growth and long-term geologically driven addition.
Endnote 7 – 2025 Outlook Assumptions and Economic Sensitivity Analysis
Reflects the impact of the full year
| 2025 guidance assumption |
Hypothetical change | Consolidated impact on EBITDA (millions) |
Attributable impact on EBITDA (millions) |
Attributable impact on TCC and AISC |
||||||
| Gold price sensitivity |
$2,400/oz | ‘+ $100/oz | ‘+ $440 | ‘+ $310 | ‘+ $4.00/oz | |||||
|
Copper price sensitivity |
$4.00/lb | ‘+/- $0.25/lb | ‘+/- $120 | ‘+/- $120 | ‘+/- $0.01/lb | |||||
| BARRICK THIRD QUARTER 2025 | 13 | PRESS RELEASE |
Cautionary Statement on Forward-Looking Information
Certain information contained or incorporated by reference in this press release, including any information as to our strategy, projects, plans or future financial or operating performance, constitutes “forward-looking statements”. All statements, other than statements of historical fact, are forward-looking statements. The words “believe”, “expect”, “plan”, “committed”, “guidance”, “project”, “progress”, “invest”, “continue”, “progress”, “develop”, “on track”, “ongoing”, “estimate”, “growth”, “potential”, “future”, “extend”, “will”, “could”, “would”, “should”, “may” and similar expressions identify forward-looking statements. In particular, this press release contains forward-looking statements including, without limitation, with respect to: Barrick’s forward-looking production guidance; projected capital, operating and exploration expenditures; our ability to convert resources into reserves and replace reserves net of depletion from production; the ability for Fourmile to be one of this century’s most significant gold discoveries and its ability to double its mineral resource in 2025; expected benefits from the sale of Barrick’s interests in the Hemlo gold mine, Tongon gold mine, Alturas project and its 50% interest in Donlin; timing and progress of the Bullion Hill Decline; mine life and production rates, including anticipated production growth from Barrick’s organic project pipeline; Barrick’s global exploration strategy and planned exploration activities; Barrick’s copper strategy; our plans, and expected timing, completion and benefits of our growth projects, including the progress at Pueblo Viejo, Lumwana and Reko Diq; the timing for completion of the Reko Diq project financing; potential mineralization and metal or mineral recoveries; Barrick’s strategy, plans, targets and goals in respect of environmental and social governance issues, including local community relations, planned resettlement activities at Pueblo Viejo, and health and safety initiatives; Barrick’s performance dividend policy and share buyback program; Barrick’s search for a permanent President and Chief Executive Officer; and expectations regarding future price assumptions, financial performance and other outlook or guidance.
Forward-looking statements are necessarily based upon a number of estimates and assumptions including material estimates and assumptions related to the factors set forth below that, while considered reasonable by the Company as at the date of this press release in light of management’s experience and perception of current conditions and expected developments, are inherently subject to significant business, economic and competitive uncertainties and contingencies. Known and unknown factors could cause actual results to differ materially from those projected in the forward-looking statements and undue reliance should not be placed on such statements and information. Such factors include, but are not limited to: fluctuations in the spot and forward price of gold, copper or certain other commodities (such as silver, diesel fuel, natural gas and electricity); risks associated with projects in the early stages of evaluation and for which additional engineering and other analysis is required; risks related to the possibility that future exploration results will not be consistent with the Company’s expectations, that quantities or grades of reserves will be diminished, and that resources may not be converted to reserves; risks associated with the fact that certain of the initiatives described in this press release are still in the early stages and may not materialize; changes in mineral production performance, exploitation and exploration successes; risks that exploration data may be incomplete and considerable additional work may be required to complete further evaluation, including but not limited to drilling, engineering and socioeconomic studies and investment; the speculative nature of mineral exploration and development; lack of certainty with respect to foreign legal systems, corruption and other factors that are inconsistent with the rule of law; changes in national and local government legislation, taxation, controls or regulations and/or changes in the administration of laws, policies and practices, including the status of value added tax refunds received in Chile in connection with the Pascua-Lama Project; expropriation or nationalization of property and political or economic developments in Canada, the United States, Mali or other countries in which Barrick does or may carry on business in the future; risks relating to political instability in certain of the jurisdictions in which Barrick operates; timing of receipt of, or failure to comply with, necessary permits and approvals; non-renewal of key licenses by governmental authorities; failure to comply with environmental and health and safety laws and regulations; increased costs and physical and transition risks related to climate change, including extreme weather events, resource shortages, emerging policies and increased regulations related to greenhouse gas (“GHG”) emission levels, energy efficiency and reporting of risks; the Company’s ability to achieve its sustainability goals, including its climate-related goals and GHG emissions reduction targets, in particular its ability to achieve its Scope 3 emissions targets which require reliance on entities within Barrick’s value chain, but outside of the Company’s direct control, to achieve such targets within the specified timeframes; contests over title to properties, particularly title to undeveloped properties, or over access to water, power and other required infrastructure; the liability associated with risks and hazards in the mining industry, and the ability to maintain insurance to cover such losses; damage to the Company’s reputation due to the actual or perceived occurrence of any number of events, including negative publicity with respect to the Company’s handling of environmental matters or dealings with community groups, whether true or not; risks related to operations near communities that may regard Barrick’s operations as being detrimental to them; litigation and legal and administrative proceedings; operating or technical difficulties in connection with mining or development activities, including geotechnical challenges, tailings dam and storage facilities failures, and disruptions in the maintenance or provision of required infrastructure and information technology systems; increased costs, delays, suspensions and technical challenges associated with the construction of capital projects; risks associated with working with partners in jointly controlled assets; risks related to disruption of supply routes which may cause delays in construction and mining activities, including disruptions in the supply of key mining inputs due to the invasion of Ukraine by Russia and conflicts in the Middle East; risk of loss due to acts of war, terrorism, sabotage and civil disturbances; risks associated with artisanal and illegal mining; risks associated with Barrick’s infrastructure, information technology systems and the implementation of Barrick’s technological initiatives, including risks related cybersecurity incidents, including those caused by computer viruses, malware, ransomware and other cyberattacks, or similar information technology system failures, delays and/or disruptions; the impact of global liquidity and credit availability on the timing of cash flows and the values of assets and liabilities based on projected future cash flows; the impact of inflation, including global inflationary pressures driven by ongoing global supply chain disruptions, global energy cost increases following the invasion of Ukraine by Russia and country-specific political and economic factors in Argentina; adverse changes in our credit
| BARRICK THIRD QUARTER 2025 | 14 | PRESS RELEASE |
ratings; fluctuations in the currency markets; changes in U.S. dollar interest rates; changes in U.S. trade, tariff and other controls on imports and exports, tax, immigration or other policies that may impact relations with foreign countries, result in retaliatory policies, lead to increased costs for raw materials and components, or impact Barrick’s existing operations and material growth projects; risks arising from holding derivative instruments (such as credit risk, market liquidity risk and mark-to-market risk); risks related to the demands placed on the Company’s management, the ability of management to implement its business strategy and enhanced political risk in certain jurisdictions; uncertainty whether some or all of Barrick’s targeted investments and projects will meet the Company’s capital allocation objectives and internal hurdle rate; whether benefits expected from recent transactions are realized; business opportunities that may be presented to, or pursued by, the Company; our ability to successfully integrate acquisitions or complete divestitures; risks related to competition in the mining industry; employee relations including loss of key employees; availability and increased costs associated with mining inputs and labor; risks associated with diseases, epidemics and pandemics; risks related to the failure of internal controls; and risks related to the impairment of the Company’s goodwill and assets.
In addition, there are risks and hazards associated with the business of mineral exploration, development and mining, including environmental hazards, industrial accidents, unusual or unexpected formations, pressures, cave-ins, flooding and gold bullion, copper cathode or gold or copper concentrate losses (and the risk of inadequate insurance, or inability to obtain insurance, to cover these risks).
Many of these uncertainties and contingencies can affect our actual results and could cause actual results to differ materially from those expressed or implied in any forward-looking statements made by, or on behalf of, us. Readers are cautioned that forward-looking statements are not guarantees of future performance. All of the forward-looking statements made in this press release are qualified by these cautionary statements. Specific reference is made to the most recent Form 40-F/ Annual Information Form on file with the SEC and Canadian provincial securities regulatory authorities for a more detailed discussion of some of the factors underlying forward-looking statements and the risks that may affect Barrick’s ability to achieve the expectations set forth in the forward-looking statements contained in this press release. We disclaim any intention or obligation to update or revise any forward-looking statements whether as a result of new information, future events or otherwise, except as required by applicable law.
| BARRICK THIRD QUARTER 2025 | 15 | PRESS RELEASE |
Exhibit 99.2

Management’s Discussion and Analysis (“MD&A”)
Quarterly Report on the Third Quarter of 2025
This portion of the Quarterly Report provides management’s discussion and analysis (“MD&A”) of the financial condition and results of operations, to enable a reader to assess material changes in financial condition and results of operations as at, and for the three and nine month periods ended September 30, 2025, in comparison to the corresponding prior-year periods. The MD&A is intended to help the reader understand Barrick Mining Corporation (formerly Barrick Gold Corporation) (“Barrick”, “we”, “our”, the “Company” or the “Group”), our operations, financial performance as well as our present and future business environment. This MD&A, which has been prepared as of November 7, 2025, is intended to supplement and complement the condensed unaudited interim consolidated financial statements and notes thereto, prepared in accordance with IFRS Accounting Standards as issued by the International Accounting Standards Board applicable to the preparation of interim financial statements, under International Accounting Standard 34, Interim Financial Reporting, for the three and nine month periods ended September 30, 2025 (collectively, the “Financial Statements”), which are included in this Quarterly Report on pages 60 to 64. You are encouraged to review the Financial Statements in conjunction with your review of this MD&A. This MD&A should be read in conjunction with both the
annual audited consolidated financial statements for the two years ended December 31, 2024, the related annual MD&A included in the 2024 Annual Report, and the most recent Form 40–F/Annual Information Form on file with the U.S. Securities and Exchange Commission (“SEC”) and Canadian provincial securities regulatory authorities. These documents and additional information relating to the Company are available on SEDAR+ at www.sedarplus.ca and EDGAR at www.sec.gov. Certain notes to the Financial Statements are specifically referred to in this MD&A and such notes are incorporated by reference herein. All dollar amounts in this MD&A are in millions of United States dollars (“$” or “US$”), unless otherwise specified.
For the purposes of preparing our MD&A, we consider the materiality of information. Information is considered material if: (i) such information results in, or would reasonably be expected to result in, a significant change in the market price or value of our shares; (ii) there is a substantial likelihood that a reasonable investor would consider it important in making an investment decision; or (iii) it would significantly alter the total mix of information available to investors. We evaluate materiality with reference to all relevant circumstances, including potential market sensitivity.
Abbreviations
| AISC |
All-in Sustaining Costs | |
| BNL |
Barrick Niugini Limited | |
| CCV |
Critical Control Verifications | |
| CEO |
Chief Executive Officer | |
| COS |
Cost of Sales | |
| DRC |
Democratic Republic of Congo | |
| G&A |
General and administrative | |
| GHG |
Greenhouse Gas | |
| GoT |
Government of Tanzania | |
| IASB |
International Accounting Standards Board | |
| ICMM |
International Council on Mining and Metals | |
| ICSID |
International Centre for the Settlement of Investment Disputes | |
| IFRS |
IFRS Accounting Standards as issued by the International Accounting Standards Board | |
| Ktpa |
Thousand tonnes per annum | |
| Lb |
Pound | |
| LME |
London Metal Exchange | |
| LTI |
Lost Time Injury | |
| LTIFR |
Lost Time Injury Frequency Rate |
| Mtpa |
Million tonnes per annum | |
| MW |
Megawatt | |
| NGM |
Nevada Gold Mines | |
| OECD |
Organisation for Economic Co-operation and Development | |
| Oz |
Ounce | |
| PJL |
Porgera Jersey Limited | |
| PNG |
Papua New Guinea | |
| Randgold |
Randgold Resources Limited | |
| SOKIMO |
Société Minière de Kilo-Moto | |
| TCC |
Total Cash Costs | |
| TRIFR |
Total Recordable Injury Frequency Rate | |
| TSF |
Tailings Storage Facilities | |
| UN SDG |
United Nations Sustainable Development Goals | |
| VAT |
Value-Added Tax | |
| WGC |
World Gold Council | |
| WTI |
West Texas Intermediate | |
| YTD |
Year to date September 30 |
| BARRICK THIRD QUARTER 2025 | 1 | MANAGEMENT’S DISCUSSION AND ANALYSIS |
Cautionary Statement on Forward-Looking Information
Certain information contained or incorporated by reference in this MD&A, including any information as to our strategy, projects, plans or future financial or operating performance, constitutes “forward-looking statements”. All statements, other than statements of historical fact, are forward-looking statements. The words “believe”, “expect”, “anticipated”, “aim”, “strategy”, “ramp up”, “target”, “plan”, “opportunities”, “guidance”, “forecast”, “outlook”, “project”, “develop”, “progress”, “continue”, “temporary”, “committed”, “estimate”, “potential”, “prospective”, “future”, “focus”, “ongoing”, “following”, “subject to”, “scheduled”, “may”, “will”, “can”, “could”, “would”, “should” and similar expressions identify forward-looking statements. In particular, this MD&A contains forward-looking statements including, without limitation, with respect to: Barrick’s forward-looking production and cost guidance, including our ability to meet our 2025 guidance; anticipated production growth from Barrick’s organic project pipeline and reserve replacement; estimates of future cost of sales per ounce for gold and per pound for copper, total cash costs per ounce and C1 cash costs per pound, and all-in sustaining costs per ounce/ pound; cash flow forecasts; projected capital, operating and exploration expenditures; the share buyback program and performance dividend policy; mine life and production rates; anticipated benefits from the sale of the Donlin Gold project, the Hemlo gold mine, the Tongon gold mine, and the Alturas project; anticipated timing for development of the Goldrush Project; our plans, timelines, and expected completion and benefits of our growth projects, including the Goldrush Project, Fourmile, Ren, Pueblo Viejo Expansion project, Veladero Phase 8 Leach Pad, Reko Diq, solar power project at Kibali, and the Lumwana Super Pit Expansion; anticipated production at Goldrush, Ren, Reko Diq and Lumwana; timing for first production from the Lumwana Super Pit Expansion; timing for first ore delivery from the Gokona open pit; capital expenditures related to upgrades and ongoing management initiatives; Barrick’s global exploration strategy and planned exploration activities; Barrick’s copper strategy; the status of negotiations with the Government of Mali in respect of ongoing disputes regarding the Loulo-Gounkoto Complex, including the outcome of dispute resolution through arbitration; the resumption of operations and the temporary nature of the provisional administration and transfer of operational control to an external administrator at Loulo-Gounkoto; our pipeline of high confidence projects at or near existing operations; our ability to identify new Tier One assets and the potential for existing assets to attain Tier One status, including Fourmile; the incorporation of Fourmile into the NGM joint venture at fair market value; potential mineralization and metal or mineral recoveries; our ability to convert resources into reserves and future reserve replacement; asset sales, joint ventures and partnerships; Barrick’s strategy, plans, targets and goals in respect of sustainability issues, including climate change, greenhouse gas (“GHG”) emissions reduction targets, safety performance, community development and resettlement, and responsible water use; Barrick’s search for a permanent President and Chief Executive Officer; and expectations regarding future price assumptions, financial performance and other outlook or guidance.
Forward-looking statements are necessarily based upon a number of estimates and assumptions including material estimates and assumptions related to the factors set forth below that, while considered reasonable by the Company as at the date of this MD&A in light of management’s experience and perception of current conditions and expected developments, are inherently
subject to significant business, economic and competitive uncertainties and contingencies. Known and unknown factors could cause actual results to differ materially from those projected in the forward-looking statements and undue reliance should not be placed on such statements and information. Such factors include, but are not limited to: fluctuations in the spot and forward price of gold, copper or certain other commodities (such as silver, diesel fuel, natural gas and electricity); risks associated with projects in the early stages of evaluation and for which additional engineering and other analysis is required; risks related to the possibility that future exploration results will not be consistent with the Company’s expectations, that quantities or grades of reserves will be diminished, and that resources may not be converted to reserves; risks associated with the fact that certain of the initiatives described in this MD&A are still in the early stages and may not materialize; changes in mineral production performance, exploitation and exploration successes; risks that exploration data may be incomplete and considerable additional work may be required to complete further evaluation, including but not limited to drilling, engineering and socioeconomic studies and investment; the speculative nature of mineral exploration and development; lack of certainty with respect to foreign legal systems, corruption and other factors that are inconsistent with the rule of law; changes in national and local government legislation, taxation, controls or regulations and/or changes in the administration of laws, policies and practices, including the expropriation or nationalization of property and political or economic developments in Canada, the United States, Mali or other countries in which Barrick does or may carry on business in the future; risks relating to political instability in certain of the jurisdictions in which Barrick operates; timing of receipt of, or failure to comply with, necessary permits and approvals; non-renewal of key licenses by governmental authorities; failure to comply with environmental and health and safety laws and regulations; increased costs and physical and transition risks related to climate change, including extreme weather events, resource shortages, emerging policies and increased regulations relating to related to GHG emission levels, energy efficiency and reporting of risks; the Company’s ability to achieve its sustainability goals, including its climate-related goals and GHG emissions reduction targets, in particular its ability to achieve its Scope 3 emissions targets which require reliance on entities within Barrick’s value chain, but outside of the Company’s direct control, to achieve such targets within the specified time frames; contests over title to properties, particularly title to undeveloped properties, or over access to water, power and other required infrastructure; the liability associated with risks and hazards in the mining industry, and the ability to maintain insurance to cover such losses; damage to the Company’s reputation due to the actual or perceived occurrence of any number of events, including negative publicity with respect to the Company’s handling of environmental matters or dealings with community groups, whether true or not; risks related to operations near communities that may regard Barrick’s operations as being detrimental to them; litigation and legal and administrative proceedings; operating or technical difficulties in connection with mining or development activities, including geotechnical challenges, tailings dam and storage facilities failures, and disruptions in the maintenance or provision of required infrastructure and information technology systems; increased costs, delays, suspensions and technical challenges associated with the construction of capital projects; risks associated with
| BARRICK THIRD QUARTER 2025 | 2 | MANAGEMENT’S DISCUSSION AND ANALYSIS |
working with partners in jointly controlled assets; risks related to disruption of supply routes which may cause delays in construction and mining activities, including disruptions in the supply of key mining inputs due to the invasion of Ukraine by Russia and conflicts in the Middle East; risk of loss due to acts of war, terrorism, sabotage and civil disturbances; risks associated with artisanal and illegal mining; risks associated with Barrick’s infrastructure, information technology systems and the implementation of Barrick’s technological initiatives, including risks related to cybersecurity incidents, including those caused by computer viruses, malware, ransomware and other cyberattacks, or similar information technology system failures, delays and/or disruptions; the impact of global liquidity and credit availability on the timing of cash flows and the values of assets and liabilities based on projected future cash flows; the impact of inflation, including global inflationary pressures driven by ongoing global supply chain disruptions, global energy cost increases following the invasion of Ukraine by Russia and country-specific political and economic factors in Argentina; adverse changes in our credit ratings; fluctuations in the currency markets; changes in U.S. dollar interest rates; changes in U.S. trade, tariff and other controls on imports and exports, tax, immigration or other policies that may impact relations with foreign countries, result in retaliatory policies, lead to increased costs for raw materials and components, or impact Barrick’s existing operations and material growth projects; risks arising from holding derivative instruments (such as credit risk, market liquidity risk and mark-to-market risk); risks related to the demands placed on the Company’s management, the ability of management to implement its business strategy and enhanced political risk in certain jurisdictions; uncertainty whether some or all of Barrick’s targeted investments and projects will meet the Company’s capital allocation objectives and internal hurdle rate;
whether benefits expected from recent transactions are realized; business opportunities that may be presented to, or pursued by, the Company; our ability to successfully integrate acquisitions or complete divestitures; risks related to competition in the mining industry; employee relations including loss of key employees; availability and increased costs associated with mining inputs and labor; risks associated with diseases, epidemics and pandemics; risks related to the failure of internal controls; and risks related to the impairment of the Company’s goodwill and assets. In addition, there are risks and hazards associated with the business of mineral exploration, development and mining, including environmental hazards, industrial accidents, unusual or unexpected formations, pressures, cave-ins, flooding and gold bullion, copper cathode or gold or copper concentrate losses (and the risk of inadequate insurance, or inability to obtain insurance, to cover these risks).
Many of these uncertainties and contingencies can affect our actual results and could cause actual results to differ materially from those expressed or implied in any forward-looking statements made by, or on behalf of, us. Readers are cautioned that forward-looking statements are not guarantees of future performance. All of the forward-looking statements made in this MD&A are qualified by these cautionary statements. Specific reference is made to the most recent Form 40-F/Annual Information Form on file with the SEC and Canadian provincial securities regulatory authorities for a more detailed discussion of some of the factors underlying forward-looking statements and the risks that may affect Barrick’s ability to achieve the expectations set forth in the forward-looking statements contained in this MD&A. We disclaim any intention or obligation to update or revise any forward-looking statements whether as a result of new information, future events or otherwise, except as required by applicable law.
| BARRICK THIRD QUARTER 2025 | 3 | MANAGEMENT’S DISCUSSION AND ANALYSIS |
Use of Non-GAAP Financial Measures
We use the following non-GAAP financial measures and ratios in our MD&A:
| ∎ | “adjusted net earnings” |
| ∎ | “free cash flow” |
| ∎ | “EBITDA” |
| ∎ | “adjusted EBITDA” |
| ∎ | “attributable EBITDA” |
| ∎ | “attributable EBITDA margin” |
| ∎ | “net leverage” |
| ∎ | “minesite sustaining capital expenditures” |
| ∎ | “project capital expenditures” |
| ∎ | “TCC/oz” |
| ∎ | “C1 cash costs/lb” |
| ∎ | “AISC per oz/lb” and |
| ∎ | “realized price per oz/lb” |
For a detailed description of each of the non-GAAP financial measures used in this MD&A and a detailed reconciliation to the most directly comparable measure under IFRS, please refer to the Non-GAAP Financial Measures section of this MD&A on pages 43 to 58. Each non-GAAP financial measure has been annotated with a reference to an endnote on page 59. The non-GAAP financial measures set out in this MD&A are intended to provide additional information to investors and do not have any standardized meaning under IFRS, and therefore may not be comparable to other issuers, and should not be considered in isolation or as a substitute for measures of performance prepared in accordance with IFRS.
Index
|
5 Overview |
|
5 Financial and Operating Highlights |
|
8 Key Business Developments |
|
10 Sustainability |
|
11 Outlook |
|
13 Operating Performance |
|
13 Nevada Gold Mines |
|
14 Carlin |
|
16 Cortez |
|
18 Turquoise Ridge |
|
20 Pueblo Viejo |
|
22 Kibali |
|
24 North Mara |
|
26 Bulyanhulu |
|
28 Other Mines - Gold |
|
29 Lumwana |
|
30 Other Mines - Copper |
|
31 Future Growth |
|
34 Review of Financial Results |
|
34 Revenue |
|
35 Production Costs |
|
36 General and Administrative Expenses |
|
36 Exploration, Evaluation and Project Expenses |
|
37 Finance Costs, Net |
|
37 Additional Statement of Income Items |
|
37 Income Tax Expense |
|
38 Financial Condition Review |
|
38 Balance Sheet Review |
|
38 Financial Position and Liquidity |
|
39 Summary of Cash Inflow (Outflow) |
|
41 Commitments and Contingencies |
|
42 Review of Quarterly Results |
|
42 Internal Control over Financial Reporting and Disclosure Controls and Procedures |
|
43 IFRS Critical Accounting Policies and Accounting Estimates |
|
43 Non-GAAP Financial Measures |
|
59 Technical Information |
|
59 Endnotes |
|
60 Financial Statements |
|
65 Notes to Consolidated Financial Statements |
| BARRICK THIRD QUARTER 2025 | 4 | MANAGEMENT’S DISCUSSION AND ANALYSIS |
| OVERVIEW | OPERATING PERFORMANCE
|
FUTURE GROWTH
|
REVIEW OF FINANCIAL RESULTS
|
OTHER INFORMATION & NON-GAAP RECONCILIATIONS |
FINANCIAL STATEMENTS |
|||||
Overview
Financial and Operating Highlights
| For the three months ended | For the nine months ended | |||||||||||||||||||||||||||||||
| 9/30/25 | 6/30/25 | % Change | 9/30/24 | % Change | 9/30/25 | 9/30/24 | % Change | |||||||||||||||||||||||||
| Financial Results ($ millions) |
||||||||||||||||||||||||||||||||
| Revenues |
4,148 | 3,681 | 13 % | 3,368 | 23 % | 10,959 | 9,277 | 18 % | ||||||||||||||||||||||||
| Cost of sales |
1,890 | 1,878 | 1 % | 2,051 | (8)% | 5,553 | 5,966 | (7)% | ||||||||||||||||||||||||
| Net earningsa |
1,302 | 811 | 61 % | 483 | 170 % | 2,587 | 1,148 | 125 % | ||||||||||||||||||||||||
| Adjusted net earningsb |
982 | 800 | 23 % | 529 | 86 % | 2,385 | 1,419 | 68 % | ||||||||||||||||||||||||
| Attributable EBITDAb |
2,022 | 1,690 | 20 % | 1,292 | 57 % | 5,073 | 3,488 | 45 % | ||||||||||||||||||||||||
| Attributable EBITDA marginb |
59 % | 55 % | 7 % | 46 % | 28 % | 56 % | 45 % | 24 % | ||||||||||||||||||||||||
| Minesite sustaining capital expendituresb,c |
395 | 479 | (18)% | 511 | (23)% | 1,438 | 1,692 | (15)% | ||||||||||||||||||||||||
| Project capital expendituresb,c |
532 | 439 | 21 % | 221 | 141 % | 1,240 | 562 | 121 % | ||||||||||||||||||||||||
| Total consolidated capital expendituresc,d |
943 | 934 | 1 % | 736 | 28 % | 2,714 | 2,283 | 19 % | ||||||||||||||||||||||||
| Total attributable capital expenditurese |
757 | 717 | 6 % | 583 | 30 % | 2,105 | 1,849 | 14 % | ||||||||||||||||||||||||
| Net cash provided by operating activities |
2,422 | 1,329 | 82 % | 1,180 | 105 % | 4,963 | 3,099 | 60 % | ||||||||||||||||||||||||
| Net cash provided by operating activities marginf |
58 % | 36 % | 61 % | 35 % | 66 % | 45 % | 33 % | 36 % | ||||||||||||||||||||||||
| Free cash flowb |
1,479 | 395 | 274 % | 444 | 233 % | 2,249 | 816 | 176 % | ||||||||||||||||||||||||
| Net earnings per share (basic and diluted) |
0.76 | 0.47 | 62 % | 0.28 | 171 % | 1.51 | 0.65 | 132 % | ||||||||||||||||||||||||
| Adjusted net earnings (basic)b per share |
0.58 | 0.47 | 23 % | 0.30 | 93 % | 1.39 | 0.81 | 72 % | ||||||||||||||||||||||||
| Weighted average diluted common shares (millions of shares) |
1,703 | 1,716 | (1)% | 1,752 | (3)% | 1,715 | 1,754 | (2)% | ||||||||||||||||||||||||
| Operating Results |
||||||||||||||||||||||||||||||||
| Gold production (thousands of ounces)g |
829 | 797 | 4 % | 943 | (12)% | 2,384 | 2,831 | (16)% | ||||||||||||||||||||||||
| Gold sold (thousands of ounces)g |
837 | 770 | 9 % | 967 | (13)% | 2,358 | 2,833 | (17)% | ||||||||||||||||||||||||
| Market gold price ($/oz) |
3,457 | 3,280 | 5 % | 2,474 | 40 % | 3,201 | 2,296 | 39 % | ||||||||||||||||||||||||
| Realized gold priceb,g ($/oz) |
3,457 | 3,295 | 5 % | 2,494 | 39 % | 3,226 | 2,309 | 40 % | ||||||||||||||||||||||||
| Gold COS (Barrick’s share)g,h ($/oz) |
1,562 | 1,654 | (6)% | 1,472 | 6 % | 1,613 | 1,447 | 11 % | ||||||||||||||||||||||||
| Gold TCCb,g ($/oz) |
1,137 | 1,239 | (8)% | 1,104 | 3 % | 1,197 | 1,072 | 12 % | ||||||||||||||||||||||||
| Gold AISCb,g ($/oz) |
1,538 | 1,684 | (9)% | 1,507 | 2 % | 1,660 | 1,495 | 11 % | ||||||||||||||||||||||||
| Copper production (thousands of tonnes)g |
55 | 59 | (7)% | 48 | 15 % | 158 | 131 | 21 % | ||||||||||||||||||||||||
| Copper sold (thousands of tonnes)g |
52 | 54 | (4)% | 42 | 24 % | 157 | 123 | 28 % | ||||||||||||||||||||||||
| Market copper price ($/lb) |
4.44 | 4.32 | 3 % | 4.18 | 6 % | 4.33 | 4.14 | 5 % | ||||||||||||||||||||||||
| Realized copper priceb,g ($/lb) |
4.39 | 4.36 | 1 % | 4.27 | 3 % | 4.42 | 4.23 | 4 % | ||||||||||||||||||||||||
| Copper COS (Barrick’s share)g,i ($/lb) |
2.68 | 2.56 | 5 % | 3.23 | (17)% | 2.72 | 3.16 | (14)% | ||||||||||||||||||||||||
| Copper C1 cash costsb,g ($/lb) |
1.96 | 1.80 | 9 % | 2.49 | (21)% | 2.00 | 2.35 | (15)% | ||||||||||||||||||||||||
| Copper AISCb,g ($/lb) |
3.14 | 2.90 | 8 % | 3.57 | (12)% | 3.03 | 3.62 | (16)% | ||||||||||||||||||||||||
| |
As at 9/30/25 |
|
|
As at 6/30/25 |
|
% Change | |
As at 9/30/24 |
|
% Change | ||||||||||||||||||||||
| Financial Position ($ millions) |
||||||||||||||||||||||||||||||||
| Debt (current and long-term) |
4,714 | 4,729 | 0 % | 4,725 | 0 % | |||||||||||||||||||||||||||
| Cash and equivalents |
5,037 | 4,802 | 5 % | 4,225 | 19 % | |||||||||||||||||||||||||||
| Debt, net of cash |
(323) | (73) | 342 % | 500 | (165)% | |||||||||||||||||||||||||||
| a. | Net earnings represents net earnings attributable to the equity holders of the Company. |
| b. | Further information on these non-GAAP financial measures, including detailed reconciliations, is included on pages 43 to 58 of this MD&A. |
| c. | Amounts presented on a consolidated cash basis. Project capital expenditures are not included in our calculation of AISC. |
| d. | Total consolidated capital expenditures also includes capitalized interest of $16 million and $36 million for Q3 2025 and YTD 2025, respectively (Q2 2025: $16 million; Q3 2024: $4 million; YTD 2024: $29 million). |
| e. | These amounts are presented on the same basis as our guidance. |
| f. | Represents net cash provided by operating activities divided by revenue. |
| g. | On an attributable basis. |
| h. | Gold COS/oz is calculated as cost of sales across our gold operations (excluding sites in closure or care and maintenance) divided by ounces sold (both on an attributable basis using Barrick’s ownership share). |
| i. | Copper COS/lb is calculated as cost of sales across our copper operations divided by pounds sold (both on an attributable basis using Barrick’s ownership share). |
| BARRICK THIRD QUARTER 2025 | 5 | MANAGEMENT’S DISCUSSION AND ANALYSIS |
| OVERVIEW | OPERATING PERFORMANCE
|
FUTURE GROWTH
|
REVIEW OF FINANCIAL RESULTS
|
OTHER INFORMATION & NON-GAAP RECONCILIATIONS |
FINANCIAL STATEMENTS |
|||||
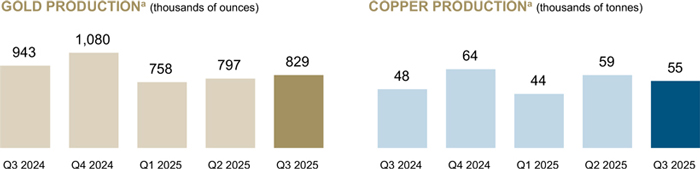


| a. | On an attributable basis. |
| b. | Gold COS/oz is calculated as cost of sales across our gold operations (excluding sites in closure or care and maintenance) divided by ounces sold (both on an attributable basis using Barrick’s ownership share). Copper COS/lb is calculated as cost of sales across our copper operations divided by pounds sold (both on an attributable basis using Barrick’s ownership share). Refer to endnote 2 for further details. |
| c. | Further information on these non-GAAP financial measures, including detailed reconciliations, is included on pages 43 to 58 of this MD&A. |
| d. | Capital expenditures also includes capitalized interest. |
| e. | Dividends declared are inclusive of performance dividends. |
| BARRICK THIRD QUARTER 2025 | 6 | MANAGEMENT’S DISCUSSION AND ANALYSIS |
| OVERVIEW | OPERATING PERFORMANCE
|
FUTURE GROWTH
|
REVIEW OF FINANCIAL RESULTS
|
OTHER INFORMATION & NON-GAAP RECONCILIATIONS |
FINANCIAL STATEMENTS |
|||||
Factors affecting net earnings and adjusted net earnings1 - Q3 2025 versus Q2 2025
The higher realized gold price1 combined with an increase in gold ounces sold were the primary drivers of our Q3 2025 results performance relative to Q2 2025. Unit costs were lower although this was partially offset by higher royalties as a result of the higher gold price. This result ensured that the majority of the benefit of the higher price was delivered to the bottom line.
Net earnings and adjusted net earnings1 attributable to equity holders of Barrick (“net earnings”) for Q3 2025 were $1,302 million and $982 million, respectively, compared to $811 million and $800 million, respectively in Q2 2025. The primary drivers of the increase were higher realized gold prices1, increased gold sales volumes, and lower gold COS/oz2.
After adjusting for items that are not indicative of future operating earnings, adjusted net earnings1 of $982 million for Q3 2025 was $182 million higher than Q2 2025. Q3 2025 realized gold prices1 were 5% higher when compared to Q2 2025. The increase in gold sales volumes was mainly as a result of the ongoing ramp up of Goldrush (part of Cortez) combined with higher grades processed at Pueblo Viejo and Kibali and higher throughput at Turquoise Ridge, partially offset by lower production at Veladero as a result of fewer recoverable ounces placed on the leach pad which is per the mine plan as previously guided. Lower gold COS/oz2 was mainly driven by higher fixed cost dilution driven by higher sales volume, combined with lower maintenance costs at Turquoise Ridge related to the planned autoclave shutdown in Q2 2025. This was partially offset by higher share based compensation and higher royalties associated with the higher realized gold price1.
Factors affecting net earnings and adjusted net earnings1 - Q3 2025 versus Q3 2024
Net earnings and adjusted net earnings1 for Q3 2025 were $1,302 million and $982 million, respectively, compared to $483 million and $529 million, respectively in Q3 2024. The primary drivers of the increase were higher realized gold prices1 and lower copper COS/lb2, partially offset by lower gold sales volumes and higher gold COS/oz2. Q3 2025 realized gold prices1 were 39% higher when compared to Q3 2024. Lower copper COS/lb2 resulted from higher grades processed at Lumwana. The decrease in gold sales volume was primarily as a result of the temporary suspension of operations at Loulo-Gounkoto, which was subsequently placed under a temporary provisional administration on June 16, 2025. This was partially offset by increased ounces from Cortez driven by the ongoing ramp up of Goldrush. The increase in gold COS/oz2 was mainly due to the impact of less fixed cost dilution driven by lower sales volumes, combined with higher share-based compensation and higher royalties (impact approximately $50/oz) associated with the higher realized gold price1.
Factors affecting net earnings and adjusted net earnings1 - YTD 2025 versus YTD 2024
Net earnings and adjusted net earnings1 for YTD 2025 were $2,587 million and $2,385 million, respectively, up from $1,148 million and $1,419 million in YTD 2024. The primary drivers of the increase were higher realized gold prices1 and lower copper COS/lb2, partially offset by lower
gold sales volumes, and higher gold COS/oz2. YTD 2025 realized gold prices1 were 40% higher when compared to YTD 2024. The decrease in copper COS/lb2 was mainly due to higher grades processed and higher recovery rates at Lumwana. The lower gold sales volume was primarily driven by the temporary suspension of operations at Loulo-Gounkoto on January 14, 2025, which was subsequently placed under a temporary provisional administration on June 16, 2025. This was combined with lower production at Carlin as a result of a decrease in tonnes processed at lower grades, and lower recoveries at the autoclave. The increase in gold COS/oz2 compared to YTD 2024 was primarily due to the impact of lower throughput and to a lesser extent lower grades processed at a number of operations, combined with higher share-based compensation and higher royalties (impact approximately $45/oz) associated with the higher realized gold price1.
Significant adjusting items for both Q3 2025 and YTD 2025 include:
| ∎ | acquisition/disposition gains of $250 million for Q3 2025 and losses of $39 million for YTD 2025. The gains in Q3 2025 mainly related to the $250 million revaluation of our 80% equity investment in Loulo- Gounkoto, as it was deconsolidated and an investment at fair value was recognized in Q2 2025 (resulting in a Q2 2025 net loss of $1,035 million) following the change of control after it was placed under a temporary provisional administration on June 16, 2025 (refer to page 8 for further details). For YTD 2025, the deconsolidation and recognition of our 80% equity investment in Loulo-Gounkoto resulted in a total net loss of $785 million. This loss in Q2 2025 and YTD 2025 was partially offset by a gain of $745 million on the sale of our 50% interest in the Donlin Gold project; and |
| ∎ | other expense adjustments of $47 million and $264 million, respectively, which mainly related to reduced operations costs at Loulo-Gounkoto prior to June 16, 2025. Q3 2025 also included severance costs and YTD 2025 was further impacted by the signing of agreements to settle legacy legal matters in the Philippines related to Placer Dome Inc. (refer to note 17 of the Financial Statements for further details). |
Refer to page 43 for a full list of reconciling items between net earnings and adjusted net earnings1 for the current and previous periods.
Factors affecting Operating Cash Flow and Free Cash Flow1 - Q3 2025 versus Q2 2025
The cash flow outcomes for Q3 2025 reflect the strong earnings delivery and improved working capital position as discussed below. We also accelerated our share buy back program with $589 million for the quarter and have purchased $1 billion year-to-date, which was the previously authorized limit. Finally, we ended Q3 2025 in a net cash position for the second consecutive quarter. A performance dividend in relation to Q2 2025 was paid in the third quarter, further enhancing our returns to shareholders.
In Q3 2025, we generated $2,422 million in operating cash flow, compared to $1,329 million in Q2 2025. The increase of $1,093 million was primarily due to higher realized gold prices1, increased gold sales volumes,
Numerical annotations throughout the text of this document refer to the endnotes found starting on page 59.
| BARRICK THIRD QUARTER 2025 | 7 | MANAGEMENT’S DISCUSSION AND ANALYSIS |
| OVERVIEW | OPERATING PERFORMANCE
|
FUTURE GROWTH
|
REVIEW OF FINANCIAL RESULTS
|
OTHER INFORMATION & NON-GAAP RECONCILIATIONS |
FINANCIAL STATEMENTS |
|||||
and lower gold TCC/oz1. Operating cash flow was further impacted by a favorable movement in working capital, mainly in accounts receivable, partially offset by an unfavorable movement in accounts payable and inventory. The decrease in accounts receivable mainly relates to our mines in Tanzania and Zambia where sales occurred at the end of Q2 2025 with the receipt of the cash early in Q3 2025. These results were also positively impacted by a decrease in cash taxes paid and lower interest paid as a result of the timing of semi-annual interest payments on our bonds, which primarily occur in the second and fourth quarters.
In Q3 2025, we recorded free cash flow1 of $1,479 million, compared to $395 million in Q2 2025, mainly reflecting higher operating cash flows as explained above, with capital expenditures largely in line with Q2 2025. In Q3 2025, capital expenditures on a cash basis were $943 million compared to $934 million in Q2 2025, as discussed on page 39.
Factors affecting Operating Cash Flow and Free Cash Flow1 - Q3 2025 versus Q3 2024
In Q3 2025, we generated $2,422 million in operating cash flow, compared to $1,180 million in Q3 2024. The increase of $1,242 million was primarily due to higher realized gold prices1, partially offset by lower gold sales volumes and higher gold TCC/oz1. This was combined with a favorable movement in working capital, mainly in accounts receivable. The decrease in accounts receivable mainly relates to our mines in Tanzania and Zambia where sales were delayed to the end of Q2 2025 with the receipt of the cash occurring early in Q3. These results were partially offset by higher cash taxes paid.
In Q3 2025, we generated free cash flow1 of $1,479 million compared to $444 million in Q3 2024. The increase primarily reflects higher operating cash flows as explained above, partially offset by higher capital expenditures. In Q3 2025, capital expenditures on a cash basis were $943 million compared to $736 million in Q3 2024, as discussed on page 40.
Factors affecting Operating Cash Flow and Free Cash Flow1 - YTD 2025 versus YTD 2024
For YTD 2025, we generated $4,963 million in operating cash flow, compared to $3,099 million in YTD 2024. The increase of $1,864 million was primarily due to higher realized gold prices1 and lower C1 cash costs/lb1, partially offset by lower gold sales volumes and higher TCC/oz1. This was combined with a favorable change in working capital mainly in other current liabilities and accounts receivable. These impacts were partially offset by higher cash taxes paid.
For YTD 2025, we generated free cash flow1 of $2,249 million compared to $816 million in YTD 2024. The increase of $1,433 million primarily reflects higher operating cash flows as explained above, partially offset by higher capital expenditures. In YTD 2025, capital expenditures on a cash basis were $2,714 million compared to $2,283 million in YTD 2024, as discussed on page 40.
Key Business Developments
Leadership transition
On September 29, 2025, Mark Hill was appointed as Group Chief Operating Officer and Interim President and Chief Executive Officer, following the departure of Mark Bristow.
Mark Hill, who was previously responsible for Barrick’s LATAM and Asia Pacific regions, is a seasoned mining executive with 30 years of experience. He joined Barrick in 2006 and has experience in strategy, corporate development and leading major projects across the world, and was also integral in the initial decision to undertake exploration at the Fourmile gold project in Nevada. The Search Committee of the Board of Directors, chaired by Brett Harvey, has embarked on a process with the support of a leading executive search firm to identify a permanent President and CEO.
Mark Bristow stepped down as President and CEO after nearly seven years having joined Barrick following Barrick’s merger with Randgold in 2019. Mark Bristow led the successful integration of the two companies, and during his tenure made significant investments in Barrick’s world-class assets to better position Barrick to maintain profitable gold and copper growth.
Fourmile
In September 2025, we presented an update on the 100% owned Fourmile project in Nevada, further establishing its status as one of the most important discoveries this century. Refer to page 31 for more information.
Hemlo sale
On September 11, 2025, Barrick announced that it reached an agreement to sell the Hemlo Gold Mine (“Hemlo”) in Canada to Carcetti Capital Corp., which is to be renamed to Hemlo Mining Corp. (“HMC”). The sale agreement provides for gross proceeds of up to $1.09 billion, consisting of $875 million of cash proceeds due on closing, HMC shares with an aggregate value of $50 million, and a production and tiered gold price-linked cash payment structure of up to $165 million starting in January 2027 for a five-year term. The transaction is expected to be completed within Q4 2025 subject to the satisfaction of customary closing conditions and obtaining required regulatory approvals.
Tongon sale
On October 6, 2025, Barrick announced that it reached an agreement to sell its interests in the Tongon gold mine (“Tongon”) and certain of its exploration properties in Côte d’lvoire to the Atlantic Group for total consideration of up to $305 million. The consideration is composed of cash consideration of $192 million, inclusive of a $23 million shareholder loan repayment within six months of closing, and contingent cash payments totalling up to $113 million payable based on the price of gold over 2.5 years and resource conversions over 5 years. The transaction is expected to be completed within Q4 2025 subject to the satisfaction of customary closing conditions.
| BARRICK THIRD QUARTER 2025 | 8 | MANAGEMENT’S DISCUSSION AND ANALYSIS |
| OVERVIEW | OPERATING PERFORMANCE
|
FUTURE GROWTH
|
REVIEW OF FINANCIAL RESULTS
|
OTHER INFORMATION & NON-GAAP RECONCILIATIONS |
FINANCIAL STATEMENTS |
|||||
Loulo-Gounkoto Mining Conventions Dispute
The Company and the Government of Mali have been engaged in an ongoing dispute in connection with the existing mining conventions of Société des Mines de Loulo SA (“Somilo”) and Société des Mines de Gounkoto (“Gounkoto”) (together, the “Conventions”).
On December 18, 2024, after multiple good faith attempts to resolve the dispute, Somilo and Gounkoto submitted a request for arbitration to ICSID in accordance with the provisions of their respective Conventions. On January 14, 2025, due to the restrictions imposed by the Government of Mali on gold shipments, the Company announced that the Loulo-Gounkoto complex would temporarily suspend operations.
On June 16, 2025, the Bamako Commercial Tribunal placed Loulo-Gounkoto under a temporary provisional administration. While Barrick retains its 80% legal ownership of the mine, operational control has been transferred to an external administrator. As a result of this loss of control event, the assets, liabilities and non-controlling interest of Loulo-Gounkoto were deconsolidated and derecognized and a retained investment was recognized at fair value.
For more information, refer to notes 17 and 18 of the Financial Statements.
Donlin Sale
On April 22, 2025, Barrick announced it had entered into an agreement to sell its 50% interest in the Donlin Gold project located in Alaska, USA to affiliates of Paulson Advisers LLC and NOVAGOLD Resources Inc. (“NOVAGOLD”) for total cash consideration of $1 billion. In addition, Barrick has granted NOVAGOLD an option to purchase the outstanding debt owed to Barrick (value of $164 million as at September 30, 2025 and presented in Other Assets) in connection with the Donlin Gold project for $90 million if purchased prior to closing (which was not exercised), or for $100 million if purchased within 18 months from closing, when the option expires. If that option is not exercised, the debt will remain outstanding, substantially in accordance with its existing terms which would largely defer repayment to the commencement of production.
The transaction closed on June 3, 2025 and we recognized a gain on sale of $745 million in Q2 2025. In addition, NOVAGOLD retains the option to purchase the outstanding debt for $100 million within 18 months from closing.
Alturas Sale
On August 8, 2025, Barrick announced that it has reached an agreement to sell the Alturas Project in Chile to a subsidiary of Boroo Pte Ltd (Singapore) (“Boroo”) for an up-front cash payment of $50 million. In addition, Barrick will be granted a 0.5% net smelter return royalty on gold and silver produced from the Project, which will terminate once 2 million ounces of gold and gold-equivalent have been produced. Boroo may repurchase the royalty within four years from closing for $10 million. The transaction closed on November 7, 2025.
Name and Ticker Change
At the Company’s Annual and Special Meeting of Shareholders on May 6, 2025, Barrick’s shareholders approved the change of the Company’s corporate name from Barrick Gold Corporation to Barrick Mining
Corporation, which was made effective on that date. In addition, as of May 9, 2025, Barrick’s ticker on the New York Stock Exchange changed to “B” from “GOLD”, better reflecting Barrick’s current business and our mission to achieve sustainable and profitable gold and copper growth. Barrick’s ticker on the TSX remains unchanged.
Board of Directors Changes
Also at the Company’s Annual and Special Meeting of Shareholders on May 6, 2025, two new independent directors were elected to the Board of Directors: Ben van Beurden and Pekka Vauramo. They replace Christopher Coleman and Andrew Quinn who have retired from the Board.
At the August 8, 2025 meeting, the Board of Directors appointed Ben van Beurden as Lead Director, succeeding Brett Harvey who continues to serve on the Board as an independent director. Mr. van Beurden, former CEO of Shell, brings nearly four decades of global leadership in the energy and natural resource sectors.
Increased Dividend
On November 7, 2025 the Board of Directors approved a 25% increase in the quarterly base dividend to $0.125 per share, effective for the Q3 2025 dividend that will be paid on December 15, 2025 to shareholders of record at the close of business on November 28, 2025.Refer to page 38 for further details of our dividend policy, including our performance dividend.
Share Buyback Program
At the February 11, 2025 meeting, the Board of Directors authorized a new share buyback program for the purchase of up to $1.0 billion of Barrick’s outstanding common shares over the next 12 months. Barrick repurchased $589 million of shares in Q3 2025, following repurchases of $268 million and $143 million of shares in Q2 2025 and Q1 2025, respectively, bringing the YTD 2025 to $1.0 billion purchased under this share buyback program. At the November 7, 2025 meeting, the Board of Directors authorized an increase in the share buyback program for the repurchase of up to an additional $500 million of the Company’s outstanding common shares before the program expires in February 2026.
The actual number of common shares that may be purchased, and the timing of any such purchases, will be determined by Barrick based on a number of factors, including the Company’s financial performance, the availability of cash flows, and the consideration of other uses of cash, including capital investment opportunities, overall returns to shareholders, and debt reduction.
The repurchase program does not obligate the Company to acquire any particular number of common shares, and the repurchase program may be suspended or discontinued at any time at the Company’s discretion.
| BARRICK THIRD QUARTER 2025 | 9 | MANAGEMENT’S DISCUSSION AND ANALYSIS |
| OVERVIEW | OPERATING PERFORMANCE
|
FUTURE GROWTH
|
REVIEW OF FINANCIAL RESULTS
|
OTHER INFORMATION & NON-GAAP RECONCILIATIONS |
FINANCIAL STATEMENTS |
|||||
Sustainability
Sustainability, including our license to operate, is entrenched in our DNA: our sustainability strategy is our business plan. Please refer to page 13 of our fourth quarter and full year 2024 MD&A for a full description of governance, strategy, risk management and targets. Key updates for 2025 are summarized below:
After nearly twelve months of fatality free operations throughout the group there were unfortunately three fatalities in the later part of the year.
A previously recorded LTI at Kibali in Q2 has unfortunately been reclassified as a fatality after an employee sadly succumbed to their injuries after nearly two months of treatment in hospital. During Q3, on September 29, an employee at the Goldrush Underground mine in NGM sustained fatal injuries while operating a loader in a stope. The investigation into this incident is ongoing. In October, we had a fatality at Bulyanhulu in Tanzania in the underground. The investigation is currently underway.
These tragic events have deepened our commitment to the Journey to Zero, reminding us of the critical importance of safety and the power of our shared responsibility. We reiterate our steadfast dedication to the health and safety of our employees and contractors, their families, and the communities in which we operate, encapsulating our safety vision of “Every person going home safe and healthy every day.”
The ongoing efforts of our “Journey to Zero” initiative continues to make progress. The group recorded a Q3 TRIFR3 of 0.76 and an LTIFR3 of 0.11.
During Q3, we undertook over 36,000 CCVs across the group. The tracking and reporting on leading indicators continues at all sites focused on the completion of CCVs before tasks and implementing corrective actions where identified. These serve as proactive measures, quantifying prevention efforts and anticipating incidents before they occur.
Barrick continues to roll out its climate risk assessments, the Barrick Biodiversity Residual Impact Assessment tool, and development of community based socio-economic metrics aligned to the UN SDGs across all sites, as published in our annual Sustainability Report for 2024, available on Barrick’s website and is not incorporated by reference into, and is not a part of, this MD&A. The report included the forecasting of Barrick’s GHG emissions in line with its expansion projects and increased production outlook towards the end of the decade, along with associated revised GHG targets.
During Q3 2025, the Group’s total Scope 1 and 2 (location-based) GHG emissions were 2,001 kt CO2-e. Absolute emissions are trending 3% higher than 2024, however emissions have increased on a relative basis compared to 2024 as 2024 emissions included the continued operation of Loulo-Gounkoto.
The TSF disclosures as per the Global Industry Standard on Tailings Management are available on Barrick’s website and are not incorporated by reference into, and are not a part of, this MD&A.
| For the three months ended | ||||||||||||
| 9/30/2025a | 6/30/2025 | a | 9/30/24 | |||||||||
| LTIFR3 |
0.11 | 0.05 | 0.00 | |||||||||
| TRIFR3 |
0.76 | 0.57 | 0.71 | |||||||||
| Community Development Spend ($ millions) |
17 | 15 | 12 | |||||||||
| Class 14 Environmental Incidents |
0 | 0 | 0 | |||||||||
| GHG Scope 1 and 2 emissions (kt CO2-e) (location based) |
2,001 | 1,898 | 1,852 | |||||||||
| Water Recycling and Reuse Rate |
81 % | 81 % | 84 % | |||||||||
| a. | Data presented is provisional data and is subject to change as a result of external assurance during annual reporting. |
| BARRICK THIRD QUARTER 2025 | 10 | MANAGEMENT’S DISCUSSION AND ANALYSIS |
| OVERVIEW | OPERATING PERFORMANCE
|
FUTURE GROWTH
|
REVIEW OF FINANCIAL RESULTS
|
OTHER INFORMATION & NON-GAAP RECONCILIATIONS |
FINANCIAL STATEMENTS |
|||||
Full Year 2025 Outlook
We continue to expect our 2025 gold production to be in the range of 3.15 to 3.50 million ounces albeit in the lower half. Furthermore, we continue to expect Q4 to be the highest quarter of the year. This is driven by the timing of shutdowns that occurred earlier in the year, the Goldrush ramp-up and mine sequencing across the NGM sites, the 35 day shutdown at Pueblo Viejo in Q1, and grade variability across the other mines. Offsetting this, the divestiture of both Hemlo and Tongon will impact the production outcome for the year with both transactions expected to close during Q4 2025.
Our 2025 gold cost guidance remains unchanged noting the ranges in the table to the right are based on a gold price assumption of $2,400/oz. Given the expectation is that the average gold price for the year is likely to be around $3,400/oz, applying our previously disclosed sensitivity would result in all our cost guidance ranges increasing by $50/oz, with the impact as follows: COS/oz2 of $1,510 to $1,610, TCC/oz1 of $1,100 to $1,180 and AISC/oz1 of $1,510 to $1,610. This cost sensitivity of $5/oz for every $100/oz change in the gold price is driven by the higher royalties that flow through from the higher gold price. Taking this impact into account, we are on track to achieve our 2025 gold cost guidance metrics adjusted for the gold price, albeit at the higher end of the gold price adjusted range.
We continue to expect 2025 copper production to be in the range of 200 to 230 thousand tonnes and close to the midpoint of the range. Copper production for Q4 is expected to be similar to the result for Q2 and Q3 whereas Q1 was the lowest quarter of the year mainly driven by grade at Lumwana as per the mine plan. We are on track to achieve our copper cost guidance metrics for 2025, which are based on a LME copper price assumption of $4.00/lb. With a cost sensitivity of $0.01/lb per $0.25/lb change in the copper price, we do not expect the impact of higher copper royalties to be as significant as the impact of higher gold royalties as discussed above.
Further detail on our 2025 company guidance is provided below and on the next page, inclusive of the key assumptions that were used as the basis for this guidance as released on February 11, 2025 and as qualified by the comments above.
| Company Guidance |
2025 | |||
| ($ millions, except per oz/lb data) |
Estimate | |||
| Gold production (millions of ounces) |
3.15 - 3.50 | |||
| Gold cost metrics |
||||
| COS - gold ($/oz) |
1,460 - 1,560 | |||
| TCC ($/oz)a |
1,050 - 1,130 | |||
| Depreciation ($/oz) |
370 - 400 | |||
| AISC ($/oz)a |
1,460 - 1,560 | |||
| Copper production (thousands of tonnes) |
200 - 230 | |||
| Copper cost metrics |
||||
| COS - copper ($/lb) |
2.50 - 2.80 | |||
| C1 cash costs ($/lb)a |
1.80 - 2.10 | |||
| Depreciation ($/lb) |
0.75 - 0.85 | |||
| AISC ($/lb)a |
2.80 - 3.10 | |||
| Exploration and project expenses |
330 - 370 | |||
| Exploration and evaluation |
220 - 240 | |||
| Project expenses |
110 - 130 | |||
| General and administrative expenses |
~160 | |||
| Corporate administration |
~120 | |||
| Share-based compensationb |
~40 | |||
| Other expense |
70 - 90 | |||
| Finance costs, net |
270 - 310 | |||
| Attributable capital expenditures: |
||||
| Attributable minesite sustaininga |
1,400 - 1,650 | |||
| Attributable projecta |
1,700 - 1,950 | |||
| Total attributable capital expenditures |
3,100 - 3,600 | |||
| Effective income tax ratec |
26% - 30% | |||
| Key assumptions (used for guidance) |
||||
| Gold Price ($/oz) |
2,400 | |||
| Copper Price ($/lb) |
4.00 | |||
| Oil Price (WTI) ($/barrel) |
80 | |||
| AUD Exchange Rate (AUD:USD) |
0.75 | |||
| ARS Exchange Rate (USD:ARS) |
1,000 | |||
| CAD Exchange Rate (USD:CAD) |
1.30 | |||
| CLP Exchange Rate (USD:CLP) |
900 | |||
| EUR Exchange Rate (EUR:USD) |
1.10 | |||
| a. | Further information on these non-GAAP financial measures, including detailed reconciliations, is included on pages 43 to 58 of this MD&A. |
| b. | Based on a one-month trailing average ending December 31, 2024 of US$16.39 per share. |
| c. | Based on key assumptions included in this table. |
| BARRICK THIRD QUARTER 2025 | 11 | MANAGEMENT’S DISCUSSION AND ANALYSIS |
| OVERVIEW | OPERATING PERFORMANCE
|
FUTURE GROWTH
|
REVIEW OF FINANCIAL RESULTS
|
OTHER INFORMATION & NON-GAAP RECONCILIATIONS |
FINANCIAL STATEMENTS |
|||||
Operating Division Guidance
Our 2025 forecast gold and copper production, COSa, TCCb, AISCb, and C1 cash costsb ranges by operating division were originally released on February 12, 2025 as follows:
| Operating Division | 2025 forecast attributable production (koz) |
2025 forecast COSa ($/oz) |
2025 forecast TCCb ($/oz) |
2025 forecast AISCb ($/oz) |
||||||||||||
| Gold | ||||||||||||||||
| Carlin (61.5%) |
705 - 785 | 1,470 - 1,570 | 1,140 - 1,220 | 1,630 - 1,730 | ||||||||||||
| Cortez (61.5%)c |
420 - 470 | 1,420 - 1,520 | 1,050 - 1,130 | 1,370 - 1,470 | ||||||||||||
| Turquoise Ridge (61.5%) |
310 - 345 | 1,370 - 1,470 | 1,000 - 1,080 | 1,260 - 1,360 | ||||||||||||
| Phoenix (61.5%) |
85 - 105 | 2,070 - 2,170 | 890 - 970 | 1,240 - 1,340 | ||||||||||||
| Nevada Gold Mines (61.5%) |
1,540 - 1,700 | 1,470 - 1,570 | 1,070 - 1,150 | 1,460 - 1,560 | ||||||||||||
| Hemlo |
140 - 160 | 1,500 - 1,600 | 1,200 - 1,280 | 1,600 - 1,700 | ||||||||||||
| Pueblo Viejo (60%) |
370 - 410 | 1,540 - 1,640 | 910 - 990 | 1,280 - 1,380 | ||||||||||||
| Veladero (50%) |
190 - 220 | 1,390 - 1,490 | 890 - 970 | 1,570 - 1,670 | ||||||||||||
| Porgera (24.5%) |
70 - 95 | 1,510 - 1,610 | 1,210 - 1,290 | 1,770 - 1,870 | ||||||||||||
| Loulo-Gounkoto (80%)d |
— | — | — | — | ||||||||||||
| Kibali (45%) |
310 - 340 | 1,280 - 1,380 | 940 - 1,020 | 1,130 - 1,230 | ||||||||||||
| North Mara (84%) |
230 - 260 | 1,370 - 1,470 | 1,020 - 1,100 | 1,400 - 1,500 | ||||||||||||
| Bulyanhulu (84%) |
150 - 180 | 1,470 - 1,570 | 1,010 - 1,090 | 1,540 - 1,640 | ||||||||||||
| Tongon (89.7%) |
110 - 140 | 1,790 - 1,890 | 1,570 - 1,650 | 1,660 - 1,760 | ||||||||||||
| Total Attributable to Barricke,f,g | 3,150 - 3,500 | 1,460 - 1,560 | 1,050 - 1,130 | 1,460 - 1,560 | ||||||||||||
| 2025 forecast attributable production (kt) |
2025 forecast COSa ($/lb) |
2025 forecast C1 cash costsb ($/lb) |
2025 forecast AISCb ($/lb) |
|||||||||||||
| Copper | ||||||||||||||||
| Lumwana |
125 - 155 | 2.30 - 2.60 | 1.60 - 1.90 | 2.80 - 3.10 | ||||||||||||
| Zaldívar (50%) |
40 - 45 | 3.60 - 3.90 | 2.70 - 3.00 | 3.50 - 3.80 | ||||||||||||
| Jabal Sayid (50%) |
25 - 35 | 2.00 - 2.30 | 1.60 - 1.90 | 1.80 - 2.10 | ||||||||||||
| Total Copperg | 200 - 230 | 2.50 - 2.80 | 1.80 - 2.10 | 2.80 - 3.10 | ||||||||||||
| a. | Gold COS/oz is calculated as cost of sales across our gold operations (excluding sites in closure or care and maintenance) divided by ounces sold (both on an attributable basis using Barrick’s ownership share). Copper COS/lb is calculated as cost of sales across our copper operations divided by pounds sold (both on an attributable basis using Barrick’s ownership share). |
| b. | Further information on these non-GAAP financial measures, including detailed reconciliations, is included on pages 43 to 58 of this MD&A. |
| c. | Includes Goldrush. |
| d. | As a result of the temporary suspension of operations at Loulo-Gounkoto in January, Loulo-Gounkoto was excluded from our 2025 production guidance at the time it was issued in February (refer to page 8 for more information). |
| e. | TCC/oz and AISC/oz include costs allocated to non-operating sites. |
| f. | Operating division guidance ranges reflect expectations at each individual operating division and may not add up to the company-wide guidance range total. |
| g. | Includes corporate administration costs. |
| BARRICK THIRD QUARTER 2025 | 12 | MANAGEMENT’S DISCUSSION AND ANALYSIS |
| OVERVIEW | OPERATING PERFORMANCE
|
FUTURE GROWTH
|
REVIEW OF FINANCIAL RESULTS
|
OTHER INFORMATION & NON-GAAP RECONCILIATIONS |
FINANCIAL STATEMENTS |
|||||
Operating Performance
Our presentation of reportable operating segments consists of eight gold mines (Carlin, Cortez, Turquoise Ridge, Pueblo Viejo, Loulo-Gounkoto, Kibali, North Mara and Bulyanhulu) and one copper mine (Lumwana). Starting with the Q2 2025 MD&A, the discussion on Loulo-Gounkoto is presented in the “Other Mines - Gold” section as no operating or per ounce data is provided as a result of the temporary suspension of operations starting January 14, 2025, and subsequent loss of control on June 16, 2025.
The remaining operating segments, including our remaining gold and copper mines, have been grouped into an “Other Mines” category and will not be reported on individually. Segment performance is evaluated based on a number of measures including operating income before tax, production levels and unit production costs. Certain costs are managed on a consolidated basis and are therefore not reflected in segment income.
Nevada Gold Mines (61.5%)a, Nevada, USA
Summary of Operating and Financial Data
| For the three months ended | For the nine months ended | |||||||||||||||||||||||||||
| 9/30/25 | 6/30/25 | % Change | 9/30/24 | % Change | 9/30/25 | 9/30/24 | % Change | |||||||||||||||||||||
| Total tonnes mined (000s) |
34,963 | 37,304 | (6)% | 38,111 | (8)% | 109,228 | 119,603 | (9)% | ||||||||||||||||||||
| Open pit ore |
5,080 | 3,988 | 27 % | 5,002 | 2 % | 13,042 | 15,113 | (14)% | ||||||||||||||||||||
| Open pit waste |
28,239 | 31,724 | (11)% | 31,639 | (11)% | 91,497 | 100,078 | (9)% | ||||||||||||||||||||
| Underground |
1,644 | 1,592 | 3 % | 1,470 | 12 % | 4,689 | 4,412 | 6 % | ||||||||||||||||||||
| Average grade (grams/tonne) |
||||||||||||||||||||||||||||
| Open pit mined |
0.96 | 0.96 | 0 % | 1.17 | (18)% | 0.97 | 1.01 | (4)% | ||||||||||||||||||||
| Underground mined |
8.46 | 8.16 | 4 % | 8.46 | 0 % | 8.10 | 8.45 | (4)% | ||||||||||||||||||||
| Processed |
2.75 | 2.97 | (7)% | 2.91 | (5)% | 2.74 | 2.67 | 3 % | ||||||||||||||||||||
| Ore tonnes processed (000s) |
6,247 | 5,941 | 5 % | 5,125 | 22 % | 18,331 | 18,350 | 0 % | ||||||||||||||||||||
| Oxide mill |
1,906 | 1,847 | 3 % | 1,970 | (3)% | 5,633 | 6,260 | (10)% | ||||||||||||||||||||
| Roaster |
1,329 | 1,362 | (2)% | 1,191 | 12 % | 3,817 | 3,886 | (2)% | ||||||||||||||||||||
| Autoclave |
1,126 | 929 | 21 % | 945 | 19 % | 3,153 | 3,179 | (1)% | ||||||||||||||||||||
| Heap leach |
1,886 | 1,803 | 5 % | 1,019 | 85 % | 5,728 | 5,025 | 14% | ||||||||||||||||||||
| Recovery rate |
83 % | 82 % | 1 % | 83 % | 0 % | 82 % | 83 % | (1)% | ||||||||||||||||||||
| Oxide Mill |
82 % | 79 % | 4 % | 78 % | 5 % | 79 % | 78 % | 1 % | ||||||||||||||||||||
| Roaster |
86 % | 86 % | 0 % | 86 % | 0 % | 86 % | 86 % | 0 % | ||||||||||||||||||||
| Autoclave |
78 % | 77 % | 1 % | 82 % | (5)% | 79 % | 81 % | (2)% | ||||||||||||||||||||
| Gold produced (000s oz) |
402 | 381 | 6 % | 385 | 4 % | 1,125 | 1,206 | (7)% | ||||||||||||||||||||
| Oxide mill |
71 | 77 | (8)% | 75 | (5)% | 220 | 232 | (5)% | ||||||||||||||||||||
| Roaster |
222 | 212 | 5 % | 198 | 12 % | 606 | 622 | (3)% | ||||||||||||||||||||
| Autoclave |
100 | 82 | 22 % | 91 | 10 % | 268 | 270 | (1)% | ||||||||||||||||||||
| Heap leach |
9 | 10 | (10)% | 21 | (57)% | 31 | 82 | (62)% | ||||||||||||||||||||
| Gold sold (000s oz) |
406 | 376 | 8 % | 387 | 5 % | 1,127 | 1,211 | (7)% | ||||||||||||||||||||
| Revenue ($ millions) |
1,467 | 1,272 | 15 % | 1,008 | 46 % | 3,769 | 2,892 | 30 % | ||||||||||||||||||||
| Cost of sales ($ millions) |
633 | 637 | (1)% | 612 | 3 % | 1,840 | 1,816 | 1 % | ||||||||||||||||||||
| Income ($ millions) |
828 | 624 | 33 % | 383 | 116 % | 1,905 | 1,042 | 83 % | ||||||||||||||||||||
| EBITDA ($ millions)b,c |
962 | 742 | 30 % | 500 | 92 % | 2,270 | 1,412 | 61 % | ||||||||||||||||||||
| EBITDA margind |
66 % | 58 % | 14 % | 50 % | 32 % | 60 % | 49 % | 22 % | ||||||||||||||||||||
| Capital expenditures ($ millions)e |
168 | 201 | (16)% | 193 | (13)% | 626 | 647 | (3)% | ||||||||||||||||||||
| Minesite sustainingb |
107 | 151 | (29)% | 154 | (31)% | 467 | 537 | (13)% | ||||||||||||||||||||
| Projectb |
60 | 48 | 25 % | 38 | 58 % | 156 | 106 | 47 % | ||||||||||||||||||||
| COS ($/oz) |
1,557 | 1,685 | (8)% | 1,553 | 0 % | 1,626 | 1,481 | 10 % | ||||||||||||||||||||
| TCC ($/oz)b |
1,156 | 1,319 | (12)% | 1,205 | (4)% | 1,245 | 1,128 | 10 % | ||||||||||||||||||||
| AISC ($/oz)b |
1,448 | 1,749 | (17)% | 1,633 | (11)% | 1,687 | 1,600 | 5 % | ||||||||||||||||||||
| a. | Barrick is the operator of NGM and owns 61.5%, with Newmont Corporation owning the remaining 38.5%. NGM is accounted for as a subsidiary with a 38.5% non-controlling interest. These results represent our 61.5% interest in Carlin, Cortez, Turquoise Ridge and Phoenix. |
| b. | Further information on these non-GAAP financial measures, including detailed reconciliations, is included on pages 43 to 58 of this MD&A. |
| c. | EBITDA represents income less depreciation. Depreciation expense is $134 million and $365 million for Q3 2025 and YTD 2025, respectively (Q2 2025: $118 million, Q3 2024: $117 million, YTD 2024: $370 million). |
| d. | Represents EBITDA divided by revenue. |
| e. | Includes capitalized interest. |
NGM includes Carlin, Cortez, Turquoise Ridge, Phoenix and non-mine site related activity. Barrick is the operator of the joint venture and owns 61.5%, with Newmont owning the remaining 38.5%. Refer to pages 14 to 19 and 28 for a detailed discussion of each minesite’s results.
| BARRICK THIRD QUARTER 2025 | 13 | MANAGEMENT’S DISCUSSION AND ANALYSIS |
| OVERVIEW |
OPERATING PERFORMANCE |
FUTURE GROWTH |
REVIEW OF FINANCIAL RESULTS |
OTHER INFORMATION & NON-GAAP RECONCILIATIONS |
FINANCIAL STATEMENTS |
|||||
Carlin (61.5%), Nevada, USA
Summary of Operating and Financial Data
| For the three months ended | For the nine months ended | |||||||||||||||||||||||||||
| 9/30/25 | 6/30/25 | % Change | 9/30/24 | % Change | 9/30/25 | 9/30/24 | % Change | |||||||||||||||||||||
| Total tonnes mined (000s) |
14,692 | 16,042 | (8)% | 14,469 | 2 % | 47,444 | 45,779 | 4 % | ||||||||||||||||||||
| Open pit ore |
1,062 | 378 | 181 % | 1,013 | 5 % | 1,568 | 2,230 | (30)% | ||||||||||||||||||||
| Open pit waste |
12,760 | 14,814 | (14)% | 12,613 | 1 % | 43,360 | 41,006 | 6 % | ||||||||||||||||||||
| Underground |
870 | 850 | 2 % | 843 | 3 % | 2,516 | 2,543 | (1)% | ||||||||||||||||||||
| Average grade (grams/tonne) |
||||||||||||||||||||||||||||
| Open pit mined |
2.21 | 1.38 | 60 % | 1.65 | 34 % | 1.93 | 1.73 | 12 % | ||||||||||||||||||||
| Underground mined |
7.29 | 7.28 | 0 % | 7.63 | (4)% | 7.28 | 7.69 | (5)% | ||||||||||||||||||||
| Processed |
4.41 | 4.50 | (2)% | 4.47 | (1)% | 4.30 | 4.21 | 2 % | ||||||||||||||||||||
| Ore tonnes processed (000s) |
1,430 | 1,432 | 0 % | 1,505 | (5)% | 4,239 | 5,113 | (17)% | ||||||||||||||||||||
| Roasters |
926 | 1,049 | (12)% | 994 | (7)% | 2,835 | 3,345 | (15)% | ||||||||||||||||||||
| Autoclave |
504 | 305 | 65 % | 511 | (1)% | 1,308 | 1,768 | (26)% | ||||||||||||||||||||
| Heap leach |
0 | 78 | (100)% | 0 | 0 % | 96 | 0 | 100 % | ||||||||||||||||||||
| Recovery rate |
80 % | 81 % | (1)% | 84 % | (5)% | 81 % | 83 % | (2)% | ||||||||||||||||||||
| Roasters |
85 % | 85 % | 0 % | 86 % | (1)% | 84 % | 84 % | 0 % | ||||||||||||||||||||
| Autoclave |
54 % | 43 % | 26 % | 72 % | (25)% | 55 % | 71 % | (23)% | ||||||||||||||||||||
| Gold produced (000s oz) |
165 | 170 | (3)% | 182 | (9)% | 480 | 589 | (19)% | ||||||||||||||||||||
| Roasters |
149 | 157 | (5)% | 160 | (7)% | 431 | 502 | (14)% | ||||||||||||||||||||
| Autoclave |
13 | 10 | 30 % | 18 | (28)% | 39 | 71 | (45)% | ||||||||||||||||||||
| Heap leach |
3 | 3 | 0 % | 4 | (25)% | 10 | 16 | (38)% | ||||||||||||||||||||
| Gold sold (000s oz) |
170 | 166 | 2 % | 183 | (7)% | 478 | 592 | (19)% | ||||||||||||||||||||
| Revenue ($ millions) |
602 | 552 | 9 % | 466 | 29 % | 1,571 | 1,378 | 14 % | ||||||||||||||||||||
| Cost of sales ($ millions) |
254 | 264 | (4)% | 277 | (8)% | 764 | 848 | (10)% | ||||||||||||||||||||
| Income ($ millions) |
345 | 285 | 21 % | 186 | 85 % | 798 | 520 | 53 % | ||||||||||||||||||||
| EBITDA ($ millions)a,b |
394 | 327 | 20 % | 229 | 72 % | 927 | 663 | 40 % | ||||||||||||||||||||
| EBITDA marginc |
65 % | 59 % | 10 % | 49 % | 33 % | 59 % | 48 % | 23 % | ||||||||||||||||||||
| Capital expenditures ($ millions)d |
90 | 98 | (8)% | 104 | (13)% | 362 | 359 | 1 % | ||||||||||||||||||||
| Minesite sustaininga |
71 | 78 | (9)% | 91 | (22)% | 305 | 334 | (9)% | ||||||||||||||||||||
| Projecta |
18 | 18 | 0 % | 13 | 38 % | 54 | 25 | 116 % | ||||||||||||||||||||
| COS ($/oz) |
1,493 | 1,589 | (6)% | 1,478 | 1 % | 1,594 | 1,410 | 13 % | ||||||||||||||||||||
| TCC ($/oz)a |
1,201 | 1,330 | (10)% | 1,249 | (4)% | 1,323 | 1,171 | 13 % | ||||||||||||||||||||
| AISC ($/oz)a |
1,643 | 1,826 | (10)% | 1,771 | (7)% | 1,982 | 1,753 | 13 % | ||||||||||||||||||||
| a. | Further information on these non-GAAP financial measures, including detailed reconciliations, is included on pages 43 to 58 of this MD&A. |
| b. | EBITDA represents income less depreciation. Depreciation expense is $49 million and $129 million for Q3 2025 and YTD 2025, respectively (Q2 2025: $42 million, Q3 2024: $43 million, YTD 2024: $143 million). |
| c. | Represents EBITDA divided by revenue. |
| d. | Includes capitalized interest. |
Safety and Environment
| For the three months ended | ||||||||
| 9/30/25 | 6/30/25 | |||||||
| LTI |
0 | 0 | ||||||
| LTIFR3 |
0.00 | 0.00 | ||||||
| TRIFR3 |
2.11 | 0.80 | ||||||
| Class 14 environmental incidents |
0 | 0 | ||||||
Financial Results
Q3 2025 compared to Q2 2025
Underground mining across the Carlin operations continued its progressive improvement journey delivering higher tonnes versus Q2 2025 and open pit mining continued to track well on both costs and tonnes. On the processing side, the Goldstrike roaster experienced a failure of one of the gas emissions circuits resulting in the loss of seven days of production at the end of the quarter. This circuit
has now been rectified. In addition, there was unplanned downtime at the Gold Quarry roaster earlier in Q3 2025 due to excessive scaling. We now expect that Carlin’s production will be just below the low end of the guidance range for 2025.
Gold production in Q3 2025 was 3% lower compared to Q2 2025 primarily due to the unplanned downtime at the Goldstrike roaster referred to above. This was partially offset by higher autoclave throughput which was driven by higher ore tonnes processed from the open pit operations and higher Gold Quarry Roaster production following the shut down in Q2 2025. Recovery at the autoclave also saw a marked improvement in Q3 2025 due to transitioning back to an acid feed.
COS/oz2 and TCC/oz1 in Q3 2025 were 6% and 10% lower, respectively, than Q2 2025, which mainly reflected higher fixed cost dilution driven by the higher sales volumes combined with improved contained ounces mined
| BARRICK THIRD QUARTER 2025 | 14 | MANAGEMENT’S DISCUSSION AND ANALYSIS |
| OVERVIEW |
OPERATING PERFORMANCE |
FUTURE GROWTH |
REVIEW OF FINANCIAL RESULTS |
OTHER INFORMATION & NON-GAAP RECONCILIATIONS |
FINANCIAL STATEMENTS |
|||||
for the quarter. In Q3 2025, AISC/oz1 was 10% lower than Q2 2025, driven by lower TCC/oz1, combined with lower minesite sustaining capital expenditures1.
Capital expenditures decreased by 8% compared to Q2 2025 mainly due to lower minesite sustaining capital expenditures1 from lower open pit waste stripping.
Q3 2025 compared to Q3 2024
Gold production for Q3 2025 was 9% lower than Q3 2024, primarily due to lower tonnes processed at the roasters (as explained above), combined with lower grades processed resulting from lower grades mined from the underground operations. Production was also lower at the autoclave due to lower recoveries owing to a lower acid blend compared to the prior year quarter.
COS/oz2 for Q3 2025 was in line with Q3 2024, as higher depreciation expense was offset by lower TCC/oz1. TCC/oz1 was 4% lower, primarily due to lower open pit mining costs resulting from the operation of the new Komatsu-930 truck fleet which delivered higher availability and lower fleet maintenance costs, partially offset by lower fixed cost dilution driven by the lower sales volumes. For Q3 2025, AISC/oz1 was 7% lower than Q3 2024 owing to lower TCC/oz1 combined with lower minesite sustaining capital expenditures1.
Capital expenditures were 13% lower than Q3 2024, mainly due to lower minesite sustaining capital expenditures1 driven by purchases of the Komatsu-930 truck fleet occurring in Q3 2024, partially offset by higher open pit waste stripping in Q3 2025. Project capital expenditures1 increased due to the advancement and continuation of the Ren project.
YTD 2025 compared to YTD 2024
Gold production for YTD 2025 was 19% lower than YTD 2024, mainly due to a decrease in tonnes processed at the autoclave driven by proactive maintenance and less Carlin material processed at the autoclave as Cortez refractory ore was processed instead to the overall benefit of NGM. This was combined with lower recoveries at the autoclave owing to a lower acid blend compared to the prior year period. This was further impacted by a higher proportion of higher grade Cortez refractory ore processed at the Carlin roasters compared to YTD 2024 which displaced lower-grade Carlin feed (noting that overall production for NGM was maximized as a result of these ore movements between the two sites).
COS/oz2 and TCC/oz1 for YTD 2025 were both 13% higher than YTD 2024, primarily due to lower tonnes processed and lower recoveries at the autoclave, and lower fixed cost dilution as a result. This was partially offset by lower open pit mining costs resulting from the operation of the new Komatsu-930 truck fleet which has delivered higher availability and lower fleet maintenance costs. For YTD 2025, AISC/oz1 was 13% higher than YTD 2024, mainly due to higher TCC/oz1, partially offset by lower minesite sustaining capital expenditures1.
Capital expenditures were in line with YTD 2024 driven by lower minesite sustaining capital expenditures1 primarily due to the purchase of the Komatsu-930 truck fleet occurring in YTD 2024 and lower open pit waste stripping, offset by higher project capital expenditures1 relating to the continuation of the Ren project.
| BARRICK THIRD QUARTER 2025 | 15 | MANAGEMENT’S DISCUSSION AND ANALYSIS |
| OVERVIEW |
OPERATING PERFORMANCE |
FUTURE GROWTH |
REVIEW OF FINANCIAL RESULTS |
OTHER INFORMATION & NON-GAAP RECONCILIATIONS |
FINANCIAL STATEMENTS |
|||||
Cortez (61.5%), Nevada, USA
Summary of Operating and Financial Data
| For the three months ended | For the nine months ended | |||||||||||||||||||||||||||
| 9/30/25 | 6/30/25 | % Change | 9/30/24 | % Change | 9/30/25 | 9/30/24 | % Change | |||||||||||||||||||||
| Total tonnes mined (000s) |
13,699 | 14,639 | (6)% | 17,292 | (21)% | 42,735 | 53,521 | (20)% | ||||||||||||||||||||
| Open pit ore |
1,777 | 1,092 | 63 % | 1,421 | 25 % | 4,260 | 4,497 | (5)% | ||||||||||||||||||||
| Open pit waste |
11,372 | 13,019 | (13)% | 15,445 | (26)% | 36,941 | 47,755 | (23)% | ||||||||||||||||||||
| Underground |
550 | 528 | 4 % | 426 | 29 % | 1,534 | 1,269 | 21 % | ||||||||||||||||||||
| Average grade (grams/tonne) |
||||||||||||||||||||||||||||
| Open pit mined |
1.16 | 0.99 | 17 % | 1.60 | (28)% | 1.11 | 1.06 | 5 % | ||||||||||||||||||||
| Underground mined |
8.06 | 7.88 | 2 % | 7.13 | 13 % | 7.51 | 8.11 | (7)% | ||||||||||||||||||||
| Processed |
2.26 | 2.69 | (16)% | 2.25 | 0 % | 2.26 | 2.03 | 11 % | ||||||||||||||||||||
| Ore tonnes processed (000s) |
2,028 | 1,553 | 31 % | 1,542 | 32 % | 5,363 | 5,320 | 1 % | ||||||||||||||||||||
| Oxide mill |
538 | 455 | 18 % | 567 | (5)% | 1,519 | 1,837 | (17)% | ||||||||||||||||||||
| Roasters |
403 | 313 | 29 % | 197 | 105 % | 982 | 541 | 82 % | ||||||||||||||||||||
| Autoclave |
44 | 128 | (66)% | n/a | 100 % | 185 | n/a | 100 % | ||||||||||||||||||||
| Heap leach |
1,043 | 657 | 59 % | 778 | 34 % | 2,677 | 2,942 | (9)% | ||||||||||||||||||||
| Recovery rate |
83 % | 82 % | 1 % | 82 % | 1 % | 83 % | 83 % | 0 % | ||||||||||||||||||||
| Oxide Mill |
79 % | 82 % | (4)% | 79 % | 0 % | 81 % | 79 % | 3 % | ||||||||||||||||||||
| Roasters |
88 % | 89 % | (1)% | 87 % | 1 % | 88 % | 88 % | 0 % | ||||||||||||||||||||
| Autoclave |
45 % | 46 % | (2)% | n/a | n/a | 46 % | n/a | n/a | ||||||||||||||||||||
| Gold produced (000s oz) |
124 | 108 | 15 % | 98 | 27 % | 324 | 319 | 2 % | ||||||||||||||||||||
| Oxide Mill |
40 | 45 | (11)% | 44 | (9)% | 122 | 138 | (12)% | ||||||||||||||||||||
| Roasters |
73 | 55 | 33 % | 37 | 97 % | 174 | 117 | 49 % | ||||||||||||||||||||
| Autoclave |
5 | 1 | 400 % | n/a | 100 % | 7 | n/a | 100 % | ||||||||||||||||||||
| Heap leach |
6 | 7 | (14)% | 17 | (65)% | 21 | 64 | (67)% | ||||||||||||||||||||
| Gold sold (000s oz) |
123 | 107 | 15 % | 99 | 24 % | 326 | 321 | 2 % | ||||||||||||||||||||
| Revenue ($ millions) |
438 | 356 | 23 % | 252 | 74 % | 1,075 | 743 | 45 % | ||||||||||||||||||||
| Cost of sales ($ millions) |
198 | 181 | 9 % | 152 | 30 % | 527 | 450 | 17 % | ||||||||||||||||||||
| Income ($ millions) |
238 | 173 | 38 % | 98 | 143 % | 542 | 286 | 90 % | ||||||||||||||||||||
| EBITDA ($ millions)a,b |
283 | 211 | 34 % | 132 | 114 % | 660 | 401 | 65 % | ||||||||||||||||||||
| EBITDA marginc |
65 % | 59 % | 10 % | 52 % | 25 % | 61 % | 54 % | 13 % | ||||||||||||||||||||
| Capital expenditures ($ millions) |
56 | 75 | (25)% | 59 | (5)% | 191 | 185 | 3 % | ||||||||||||||||||||
| Minesite sustaininga |
15 | 45 | (67)% | 35 | (57)% | 92 | 119 | (23)% | ||||||||||||||||||||
| Projecta |
41 | 30 | 37 % | 24 | 71 % | 99 | 66 | 50 % | ||||||||||||||||||||
| COS ($/oz) |
1,612 | 1,687 | (4)% | 1,526 | 6 % | 1,616 | 1,401 | 15 % | ||||||||||||||||||||
| TCC ($/oz)a |
1,242 | 1,326 | (6)% | 1,180 | 5 % | 1,249 | 1,039 | 20 % | ||||||||||||||||||||
| AISC ($/oz)a |
1,407 | 1,774 | (21)% | 1,570 | (10)% | 1,566 | 1,445 | 8 % | ||||||||||||||||||||
| a. | Further information on these non-GAAP financial measures, including detailed reconciliations, is included on pages 43 to 58 of this MD&A. |
| b. | EBITDA represents income less depreciation. Depreciation expense is $45 million and $118 million for Q3 2025 and YTD 2025, respectively (Q2 2025: $38 million, Q3 2024: $34 million, YTD 2024: $115 million). |
| c. | Represents EBITDA divided by revenue. |
Safety and Environment
| For the three months ended | ||||||||
| 9/30/25 | 6/30/25 | |||||||
| LTI |
0 | 0 | ||||||
| LTIFR3 |
0.00 | 0.00 | ||||||
| TRIFR3 |
5.29 | 0.88 | ||||||
| Class 14 environmental incidents |
0 | 0 | ||||||
On September 29, 2025, a fatal tragedy at the Goldrush underground mine resulted in the loss of an employee. Please refer to page 9 for further details on our safety initiatives.
Financial Results
Q3 2025 compared to Q2 2025
Underground delivery at Cortez continued its steady increase in Q3 as the Goldrush ramp-up further progressed. We continue to expect a strong Q4 from Cortez driven by the ongoing ramp-up of the Goldrush underground and high-grade ore from Cortez Pits Phase 1 before mining ends in Q4. Cortez is now expecting to end the year in the top half of the production guidance range for 2025.
Gold production in Q3 2025 was 15% higher than Q2 2025, primarily driven by an increase in underground ore processed at the Carlin roasters and at the oxide mill combined with higher underground grades mined. This was also combined with a 63% increase in open pit ore and a
| BARRICK THIRD QUARTER 2025 | 16 | MANAGEMENT’S DISCUSSION AND ANALYSIS |
| OVERVIEW |
OPERATING PERFORMANCE |
FUTURE GROWTH |
REVIEW OF FINANCIAL RESULTS |
OTHER INFORMATION & NON-GAAP RECONCILIATIONS |
FINANCIAL STATEMENTS |
|||||
17% increase in open pit grade mined, consistent with the planned mining sequence.
COS/oz2 and TCC/oz1 in Q3 2025 were 4% and 6% lower, respectively, than Q2 2025, primarily reflecting higher fixed cost dilution driven by higher sales volume, partially offset by less capitalized stripping at Crossroads phase 6. In Q3 2025, AISC/oz1 was 21% lower than Q2 2025, driven by lower TCC/oz1, combined with lower minesite sustaining capital expenditures1.
Capital expenditures in Q3 2025 were 25% lower than Q2 2025 due to lower minesite sustaining capital expenditures1 primarily related to the end of waste stripping at Crossroads Phase 6 and timing of equipment deliveries. This was partially offset by project capital expenditures1 that increased by 37% in Q3 2025 with the start of the autonomous haul truck project and ongoing ramp-up at Goldrush.
Q3 2025 compared to Q3 2024
Gold production for Q3 2025 was 27% higher than Q3 2024, primarily driven by increased underground ore shipped and processed at the Carlin roasters, combined with higher underground grades mined, driven in large part by the ramp-up at Goldrush. This was combined with a 25% increase in open pit ore mined, consistent with the planned mining sequence.
COS/oz2 and TCC/oz1 for Q3 2025 were 6% and 5% higher, respectively, than Q3 2024, reflecting an increased proportion of higher cost refractory ounces processed at the Carlin roasters and autoclave. For Q3 2025, AISC/oz1 was 10% lower than Q3 2024 as higher TCC/oz1 were more than offset by lower minesite sustaining capital expenditures1.
Capital expenditures in Q3 2025 were 5% lower than Q3 2024, largely due to lower sustaining capital expenditures1 due to the end of waste stripping at Crossroads Phase 6, partially offset by higher project capital expenditures1 with the start of the autonomous haul truck project and ongoing ramp-up at Goldrush.
YTD 2025 compared to YTD 2024
Gold production for YTD 2025 was 2% higher than YTD 2024 resulting from an increase in refractory ore shipped and processed at the Carlin roasters and autoclave, partially offset by lower underground grades mined in line with the mine sequence. This resulted in lower grade oxide ore processed at the oxide mill and a decrease in tonnes placed on the leach pad.
COS/oz2 and TCC/oz1 for YTD 2025 were 15% and 20% higher, respectively, than YTD 2024, reflecting an increased proportion of higher-cost refractory ounces processed at Carlin in the sales mix. For YTD 2025, AISC/oz1 increased by 8% compared to YTD 2024, due to higher TCC/oz1, partially offset by lower minesite sustaining capital expenditures1.
Capital expenditures for YTD 2025 were 3% higher than YTD 2024, due to an increase in project capital expenditures1 driven by the ongoing ramp-up at Goldrush and start of the autonomous haul truck project, partially offset by lower minesite sustaining capital expenditures1 due to lower waste stripping in Crossroads Phase 6.
| BARRICK THIRD QUARTER 2025 | 17 | MANAGEMENT’S DISCUSSION AND ANALYSIS |
| OVERVIEW |
OPERATING PERFORMANCE |
FUTURE GROWTH |
REVIEW OF FINANCIAL RESULTS |
OTHER INFORMATION & NON-GAAP RECONCILIATIONS |
FINANCIAL STATEMENTS |
|||||
Turquoise Ridge (61.5%), Nevada, USA
Summary of Operating and Financial Data
| For the three months ended | For the nine months ended | |||||||||||||||||||||||||||||||||
| 9/30/25 | 6/30/25 | % Change | 9/30/24 | % Change | 9/30/25 | 9/30/24 | % Change | |||||||||||||||||||||||||||
| Total tonnes mined (000s) |
430 | 221 | 95 % | 758 | (43)% | 852 | 2,057 | (59)% | ||||||||||||||||||||||||||
| Open pit ore |
54 | 0 | 100 % | 82 | (34)% | 54 | 82 | (34)% | ||||||||||||||||||||||||||
| Open pit waste |
152 | 7 | 2,071 % | 475 | (68)% | 159 | 1,375 | (88)% | ||||||||||||||||||||||||||
| Underground |
224 | 214 | 5 % | 201 | 11 % | 639 | 600 | 7 % | ||||||||||||||||||||||||||
| Average grade (grams/tonne) |
||||||||||||||||||||||||||||||||||
| Open pit mined |
1.51 | n/a | n/a | 1.36 | 11 % | 1.51 | 1.36 | 11 % | ||||||||||||||||||||||||||
| Underground mined |
13.02 | 11.93 | 9 % | 13.89 | (6)% | 11.91 | 11.96 | 0 % | ||||||||||||||||||||||||||
| Processed |
4.61 | 4.74 | (3)% | 5.69 | (19)% | 4.46 | 4.71 | (5)% | ||||||||||||||||||||||||||
| Ore tonnes processed (000s) |
650 | 570 | 14 % | 503 | 29 % | 1,875 | 1,617 | 16 % | ||||||||||||||||||||||||||
| Oxide Mill |
72 | 74 | (3)% | 69 | 4 % | 215 | 206 | 4 % | ||||||||||||||||||||||||||
| Autoclave |
578 | 496 | 17 % | 434 | 33 % | 1,660 | 1,411 | 18 % | ||||||||||||||||||||||||||
| Recovery rate |
87 % | 89 % | (2)% | 84 % | 4 % | 87 % | 85 % | 2 % | ||||||||||||||||||||||||||
| Oxide Mill |
86 % | 85 % | 1 % | 82 % | 5 % | 85 % | 84 % | 1 % | ||||||||||||||||||||||||||
| Autoclave |
87 % | 89 % | (2)% | 84 % | 4 % | 87 % | 85 % | 2 % | ||||||||||||||||||||||||||
| Gold produced (000s oz) |
86 | 76 | 13 % | 76 | 13 % | 236 | 210 | 12 % | ||||||||||||||||||||||||||
| Oxide Mill |
4 | 5 | (20)% | 3 | 33 % | 14 | 9 | 56 % | ||||||||||||||||||||||||||
| Autoclave |
82 | 71 | 15 % | 73 | 12 % | 222 | 199 | 12 % | ||||||||||||||||||||||||||
| Heap leach |
0 | 0 | 0 % | 0 | 0 % | 0 | 2 | (100)% | ||||||||||||||||||||||||||
| Gold sold (000s oz) |
85 | 75 | 13 % | 77 | 10 % | 238 | 209 | 14 % | ||||||||||||||||||||||||||
| Revenue ($ millions) |
301 | 252 | 19 % | 192 | 57 % | 777 | 487 | 60 % | ||||||||||||||||||||||||||
| Cost of sales ($ millions) |
123 | 133 | (8)% | 129 | (5)% | 381 | 349 | 9 % | ||||||||||||||||||||||||||
| Income ($ millions) |
180 | 122 | 48 % | 61 | 195 % | 401 | 134 | 199 % | ||||||||||||||||||||||||||
| EBITDA ($ millions)a,b |
209 | 149 | 40 % | 90 | 132 % | 486 | 211 | 130 % | ||||||||||||||||||||||||||
| EBITDA marginc |
69 % | 59 % | 17 % | 47 % | 47 % | 63 % | 43 % | 47 % | ||||||||||||||||||||||||||
| Capital expenditures ($ millions) |
14 | 16 | (13)% | 16 | (13)% | 44 | 51 | (14)% | ||||||||||||||||||||||||||
| Minesite sustaininga |
13 | 16 | (19)% | 16 | (19)% | 42 | 50 | (16)% | ||||||||||||||||||||||||||
| Projecta |
1 | 0 | 100 % | 0 | 100 % | 2 | 1 | 100 % | ||||||||||||||||||||||||||
| COS ($/oz) |
1,452 | 1,761 | (18)% | 1,674 | (13)% | 1,600 | 1,668 | (4)% | ||||||||||||||||||||||||||
| TCC ($/oz)a |
1,099 | 1,394 | (21)% | 1,295 | (15)% | 1,234 | 1,294 | (5)% | ||||||||||||||||||||||||||
| AISC ($/oz)a |
1,244 | 1,621 | (23)% | 1,516 | (18)% | 1,417 | 1,554 | (9)% | ||||||||||||||||||||||||||
| a. | Further information on these non-GAAP financial measures, including detailed reconciliations, is included on pages 43 to 58 of this MD&A. |
| b. | EBITDA represents income less depreciation. Depreciation expense is $29 million and $85 million for Q3 2025 and YTD 2025, respectively (Q2 2025: $27 million, Q3 2024: $29 million, YTD 2024: $77 million). |
| c. | Represents EBITDA divided by revenue. |
Safety and Environment
| For the three months ended | ||||||||
| 9/30/25 | 6/30/25 | |||||||
| LTI |
0 | 0 | ||||||
| LTIFR3 |
0.00 | 0.00 | ||||||
| TRIFR3 |
0.00 | 0.00 | ||||||
| Class 14 environmental incidents |
0 | 0 | ||||||
Financial Results
Q3 2025 compared to Q2 2025
Turquoise Ridge underground continued to deliver on the ore tonnes mined and higher grades as the mining moved into the high-grade zone in the quarter. The focus remains on the ramp up of the underground along with continuing to build on the reliability improvements to the Sage autoclave. We continue to expect that Turquoise Ridge will end the year comfortably within the 2025 production guidance, driven by the combination of the higher ore tonnes and grades mined from the underground.
Gold production in Q3 2025 was 13% higher than Q2 2025, mainly due to higher throughput at the Sage autoclave as a result of the planned shutdown that occurred early in Q2 2025.
COS/oz2 and TCC/oz1 in Q3 2025 were 18% and 21% lower, respectively, than Q2 2025, primarily due to higher maintenance costs in Q2 2025 related to the planned autoclave shutdown. AISC/oz1 was 23% lower than Q2 2025, primarily reflecting lower TCC/oz1, combined with decreased minesite sustaining capital expenditures1 due to lower process improvement and tailings dam capital.
Q3 2025 compared to Q3 2024
Gold production for Q3 2025 was 13% higher than Q3 2024, primarily driven by higher ore tonnes mined from the Turquoise Ridge underground operations. The increase also reflects higher tonnes processed at the Sage autoclave, which had a planned shutdown during Q3 2024.
COS/oz2 and TCC/oz1 for Q3 2025 were 13% and 15% lower, respectively, than Q3 2024, primarily owing to
| BARRICK THIRD QUARTER 2025 | 18 | MANAGEMENT’S DISCUSSION AND ANALYSIS |
| OVERVIEW |
OPERATING PERFORMANCE |
FUTURE GROWTH |
REVIEW OF FINANCIAL RESULTS |
OTHER INFORMATION & NON-GAAP RECONCILIATIONS |
FINANCIAL STATEMENTS |
|||||
higher sales volume and lower processing costs driven by the Q3 2024 shutdown. AISC/oz1 was 18% lower than Q3 2024, reflecting lower TCC/oz1, combined with lower minesite sustaining capital expenditures1 due to lower process improvement and mobile equipment capital.
YTD 2025 compared to YTD 2024
Gold production for YTD 2025 was 12% higher compared to YTD 2024, primarily due to higher ore tonnes mined from Turquoise Ridge underground as the first half of 2024 was primarily focused on backfill and development. Tonnes processed were 16% higher in YTD 2025 compared to YTD 2024 as we are starting to realize the benefits of the investments made in the Sage autoclave during 2024.
COS/oz2 and TCC/oz1 for YTD 2025 were 4% and 5% lower, respectively, compared to YTD 2024 driven by increased underground ore mined combined with higher tonnes processed at the Sage autoclave. AISC/oz1 decreased by 9% compared to YTD 2024, due to both lower minesite sustaining capital expenditures1 and decreased TCC/oz1.
Capital expenditures for YTD 2025 were 14% lower than YTD 2024 driven by lower mine site sustaining capital expenditures due to lower process improvement, mobile equipment, and underground development capital.
| BARRICK THIRD QUARTER 2025 | 19 | MANAGEMENT’S DISCUSSION AND ANALYSIS |
| OVERVIEW |
OPERATING PERFORMANCE |
FUTURE GROWTH |
REVIEW OF FINANCIAL RESULTS |
OTHER INFORMATION & NON-GAAP RECONCILIATIONS |
FINANCIAL STATEMENTS |
|||||
Pueblo Viejo (60%)a, Dominican Republic
Summary of Operating and Financial Data
| For the three months ended | For the nine months ended | |||||||||||||||||||||||||||
| 9/30/25 | 6/30/25 | % Change | 9/30/24 | % Change | 9/30/25 | 9/30/24 | % Change | |||||||||||||||||||||
| Open pit tonnes mined (000s) |
6,303 | 3,876 | 63 % |
3,021 | 109 % |
11,561 | 9,466 | 22 % |
||||||||||||||||||||
| Open pit ore |
1,682 | 673 | 150 % | 2,029 | (17)% | 2,444 | 4,751 | (49)% | ||||||||||||||||||||
| Open pit waste |
4,621 | 3,203 | 44 % | 992 | 366 % | 9,117 | 4,715 | 93 % | ||||||||||||||||||||
| Average grade (grams/tonne) |
||||||||||||||||||||||||||||
| Open pit mined |
2.12 | 2.22 | (5)% |
2.21 | (4)% |
2.15 | 2.17 | (1)% |
||||||||||||||||||||
| Processed |
2.59 | 2.34 | 11 % | 2.58 | 0 % | 2.39 | 2.51 | (5)% | ||||||||||||||||||||
| Autoclave ore tonnes processed (000s) |
1,717 | 1,611 | 7 % | 1,605 | 7 % | 4,622 | 4,353 | 6 % | ||||||||||||||||||||
| Recovery rate |
77 % | 77 % | 0 % | 78 % | (1)% | 78 % | 79 % | (1)% | ||||||||||||||||||||
| Gold produced (000s oz) |
107 | 95 | 13 % |
98 | 9 % |
276 | 259 | 7 % |
||||||||||||||||||||
| Gold sold (000s oz) |
108 | 93 | 16 % | 96 | 13 % | 277 | 257 | 8 % | ||||||||||||||||||||
| Revenue ($ millions) |
378 | 306 | 24 % | 241 | 57 % | 912 | 600 | 52 % | ||||||||||||||||||||
| Cost of sales ($ millions) |
157 | 160 | (2)% | 140 | 12 % | 458 | 395 | 16 % | ||||||||||||||||||||
| Income ($ millions) |
216 | 142 | 52 % | 98 | 120 % | 442 | 196 | 126 % | ||||||||||||||||||||
| EBITDA ($ millions)b,c |
263 | 188 | 40 % | 144 | 83 % | 579 | 318 | 82 % | ||||||||||||||||||||
| EBITDA margind |
70 % | 61 % | 15 % | 60 % | 17 % | 63 % | 53 % | 19 % | ||||||||||||||||||||
| Capital expenditures ($ millions)e |
47 | 56 | (16)% | 38 | 24 % | 149 | 155 | (4)% | ||||||||||||||||||||
| Minesite sustainingb |
27 | 37 | (27)% | 24 | 13 % | 100 | 81 | 23 % | ||||||||||||||||||||
| Projectb |
18 | 16 | 13 % | 12 | 50 % | 42 | 52 | (19)% | ||||||||||||||||||||
| COS ($/oz) |
1,451 | 1,715 | (15)% | 1,470 | (1)% | 1,653 | 1,538 | 7 % | ||||||||||||||||||||
| TCC ($/oz)b |
929 | 1,147 | (19)% | 957 | (3)% | 1,074 | 995 | 8 % | ||||||||||||||||||||
| AISC ($/oz)b |
1,198 | 1,552 | (23)% | 1,221 | (2)% | 1,446 | 1,322 | 9 % | ||||||||||||||||||||
| a. | Barrick is the operator of Pueblo Viejo and owns 60%, with Newmont Corporation owning the remaining 40%. Pueblo Viejo is accounted for as a subsidiary with a 40% non-controlling interest. The results in the table and the discussion that follows are based on our 60% share only. |
| b. | Further information on these non-GAAP financial measures, including detailed reconciliations, is included on pages 43 to 58 of this MD&A. |
| c. | EBITDA represents income less depreciation. Depreciation expense is $47 million and $137 million for Q3 2025 and YTD 2025, respectively (Q2 2025: $46 million, Q3 2024: $46 million, YTD 2024: $122 million). |
| d. | Represents EBITDA divided by revenue. |
| e. | Includes capitalized interest. |
Safety and Environment
| For the three months ended | ||||||||
| 9/30/25 | 6/30/25 | |||||||
| LTI |
0 | 0 | ||||||
| LTIFR3 |
0.00 | 0.00 | ||||||
| TRIFR3 |
0.44 | 0.22 | ||||||
| Class 14 environmental incidents |
0 | 0 | ||||||
Financial Results
Q3 2025 compared to Q2 2025
Q3 marked record quarterly throughput with continued benefits from targeted plant improvement initiatives, supporting a 7% increase in throughput compared to the previous quarter. Strong throughput is expected to continue in Q4, supported by further improvements in performance and reliability and the site remains on track to meet full-year guidance.
Gold production in Q3 2025 was 13% higher than Q2 2025, primarily due to higher grade and higher throughput as detailed above.
COS/oz2 and TCC/oz1 for Q3 2025 were 15% and 19% lower respectively, compared to Q2 2025, primarily reflecting higher production. For Q3 2025, AISC/oz1 was 23% lower than Q2 2025, driven by lower TCC/oz1 and lower minesite sustaining capital expenditures1.
Capital expenditures for Q3 2025 decreased by 16% compared to Q2 2025, mainly due to lower sustaining
capital expenditures1 relating to the construction of the Llagal TSF.
Q3 2025 compared to Q3 2024
Gold production for Q3 2025 was 9% higher than Q3 2024, driven by higher tonnes processed following the successfully executed throughput improvement initiatives.
COS/oz2 and TCC/oz1 for Q3 2025 were 1% and 3% lower, respectively, compared to Q3 2024, primarily reflecting higher production, with TCC/oz1 was also aided by higher silver by-product credits. For Q3 2025, AISC/oz1 was 2% lower than Q3 2024, driven by lower TCC/oz1, partially offset by higher minesite sustaining capital expenditures1.
Capital expenditures for Q3 2025 increased by 24% compared to Q3 2024, primarily due to increased project capital expenditures1 related to the Naranjo TSF and higher minesite sustaining capital expenditures1 due to increased activities at the Llagal TSF and the execution of process optimization projects.
YTD 2025 compared to YTD 2024
Gold production for YTD 2025 was 7% higher than YTD 2024, driven by higher throughput resulting from the plant expansion, partially offset by a lower average grade processed driven by the mine and stockpile feed sequence.
COS/oz2 and TCC/oz1 for YTD 2025 were 7% and 8% higher, respectively, than YTD 2024, primarily due to
| BARRICK THIRD QUARTER 2025 | 20 | MANAGEMENT’S DISCUSSION AND ANALYSIS |
| OVERVIEW |
OPERATING PERFORMANCE |
FUTURE GROWTH |
REVIEW OF FINANCIAL RESULTS |
OTHER INFORMATION & NON-GAAP RECONCILIATIONS |
FINANCIAL STATEMENTS |
|||||
higher royalties resulting from the higher realized gold price1 and increased processing costs. For YTD 2025, AISC/oz1 increased by 9% compared to YTD 2024, primarily reflecting higher TCC/oz1, and higher minesite sustaining capital expenditures1.
Capital expenditures for YTD 2025 decreased by 4% compared to YTD 2024, primarily due to lower project capital expenditures1, partially offset by higher sustaining capital expenditures1 from the execution of process plant optimization projects.
| BARRICK THIRD QUARTER 2025 | 21 | MANAGEMENT’S DISCUSSION AND ANALYSIS |
| OVERVIEW |
OPERATING PERFORMANCE |
FUTURE GROWTH |
REVIEW OF FINANCIAL RESULTS |
OTHER INFORMATION & NON-GAAP RECONCILIATIONS |
FINANCIAL STATEMENTS |
|||||
Kibali (45%)a, Democratic Republic of Congo
Summary of Operating and Financial Data
| For the three months ended | For the nine months ended | |||||||||||||||||||||||||||
| 9/30/25 | 6/30/25 | % Change | 9/30/24 | % Change | 9/30/25 | 9/30/24 | % Change | |||||||||||||||||||||
| Total tonnes mined (000s) |
6,089 | 5,421 | 12 % |
4,615 | 32 % |
16,756 | 14,577 | 15 % |
||||||||||||||||||||
| Open pit ore |
959 | 624 | 54 % | 412 | 133 % | 1,975 | 1,414 | 40 % | ||||||||||||||||||||
| Open pit waste |
4,723 | 4,393 | 8 % | 3,763 | 26 % | 13,588 | 11,798 | 15 % | ||||||||||||||||||||
| Underground |
407 | 404 | 1 % | 440 | (8)% | 1,193 | 1,365 | (13)% | ||||||||||||||||||||
| Average grade (grams/tonne) |
||||||||||||||||||||||||||||
| Open pit mined |
1.49 | 1.45 | 3 % | 1.58 | (6)% | 1.48 | 1.42 | 4 % | ||||||||||||||||||||
| Underground mined |
4.96 | 5.36 | (7)% | 4.92 | 1 % | 5.11 | 5.20 | (2)% | ||||||||||||||||||||
| Processed |
3.15 | 2.73 | 15 % | 2.58 | 22 % | 2.75 | 2.79 | (1)% | ||||||||||||||||||||
| Ore tonnes processed (000s) |
935 | 946 | (1)% |
965 | (3)% |
2,812 | 2,856 | (2)% |
||||||||||||||||||||
| Recovery rate |
90 % | 90 % | 0 % | 89 % | 1 % | 90 % | 89 % | 1 % | ||||||||||||||||||||
| Gold produced (000s oz) |
86 | 75 | 15 % | 71 | 21 % | 224 | 229 | (2)% | ||||||||||||||||||||
| Gold sold (000s oz) |
84 | 69 | 22 % | 77 | 9 % | 220 | 230 | (4)% | ||||||||||||||||||||
| Revenue ($ millions) |
294 | 226 | 30 % | 193 | 52 % | 712 | 534 | 33 % | ||||||||||||||||||||
| Cost of sales ($ millions) |
124 | 108 | 15 % | 111 | 12 % | 345 | 304 | 13 % | ||||||||||||||||||||
| Income ($ millions) |
161 | 89 | 81 % | 73 | 121 % | 322 | 221 | 46 % | ||||||||||||||||||||
| EBITDA ($ millions)b,c |
199 | 121 | 64 % | 108 | 84 % | 424 | 320 | 33 % | ||||||||||||||||||||
| EBITDA margind |
68 % | 54 % | 26 % | 56 % | 21 % | 60 % | 60 % | 0 % | ||||||||||||||||||||
| Capital expenditures ($ millions) |
39 | 30 | 30 % | 26 | 50 % | 101 | 84 | 20 % | ||||||||||||||||||||
| Minesite sustainingb |
19 | 10 | 90 % | 12 | 58 % | 41 | 43 | (5)% | ||||||||||||||||||||
| Projectb |
20 | 20 | 0 % | 14 | 43 % | 60 | 41 | 46 % | ||||||||||||||||||||
| COS ($/oz) |
1,482 | 1,565 | (5)% | 1,441 | 3 % | 1,572 | 1,320 | 19 % | ||||||||||||||||||||
| TCC ($/oz)b |
1,019 | 1,094 | (7)% | 978 | 4 % | 1,101 | 884 | 25 % | ||||||||||||||||||||
| AISC ($/oz)b |
1,286 | 1,273 | 1 % | 1,172 | 10 % | 1,325 | 1,103 | 20 % | ||||||||||||||||||||
| a. | Barrick owns 45% of Kibali Goldmines SA with the Government of DRC and our joint venture partner, AngloGold Ashanti, owning 10% and 45%, respectively. The figures presented in this table and the discussion that follows are based on our 45% effective interest in Kibali Goldmines SA held through our 50% interest in Kibali (Jersey) Limited and its other subsidiaries (collectively “Kibali”), inclusive of the impact of the purchase price allocation resulting from the merger with Randgold. Kibali is accounted for as an equity method investment on the basis that the joint venture partners that have joint control have rights to the net assets of the joint venture. |
| b. | Further information on these non-GAAP financial measures, including detailed reconciliations, is included on pages 43 to 58 of this MD&A. |
| c. | EBITDA represents income less depreciation. Depreciation expense is $38 million and $102 million for Q3 2025 and YTD 2025, respectively (Q2 2025: $32 million, Q3 2024: $35 million, YTD 2024: $99 million). |
| d. | Represents EBITDA divided by revenue. |
Safety and Environment
| For the three months ended | ||||||||
| 9/30/25 | 6/30/25 | |||||||
| LTI |
2 | 2 | ||||||
| LTIFR3 |
0.37 | 0.39 | ||||||
| TRIFR3 |
0.75 | 1.77 | ||||||
| Class 14 environmental incidents |
0 | 0 | ||||||
A previously recorded LTI in Q2 2025 has unfortunately been reclassified as a fatality after an employee sadly succumbed to their injuries after nearly two months of treatment in hospital. Please refer to page 9 for further details on our safety initiatives.
Financial Results
Q3 2025 compared to Q2 2025
Kibali had an improved quarter compared to Q2 2025 following a successful ramp-up on open pit mining providing flexibility to the underground where we have seen an improvement on the Q2 2025 performance. We continue to focus on improving equipment utilization and commissioning additional underground trucking capacity as we expect to deliver more underground ounces in Q4 2025
as compared to Q3 2025. As a result and as previously guided, we continue to expect production to be higher in Q4 2025 from both the underground and open pit. Our expectation continues to be that Kibali will end the year within the 2025 production guidance.
Gold production in Q3 2025 was 15% higher than Q2 2025, mainly due to higher grades processed resulting from more ore tonnes mined from the open pit driving the higher feed grade blend.
COS/oz2 and TCC/oz1 for Q3 2025 were 5% and 7% lower, respectively, mainly due to a higher average grade processed and increased volume from the open pits reducing the unit rates, partially offset by higher royalties driven by a higher realized gold price1. For Q3 2025, AISC/ oz1 was in line with Q2 2025, as lower TCC/oz1 was offset by higher minesite sustaining capital expenditures1 resulting from down-payments to secure 2026 underground equipment.
Q3 2025 compared to Q3 2024
Gold production for Q3 2025 was 21% higher than Q3 2024, mainly due to the ramp-up in the open pits delivering 133% more ore tonnes, providing flexibility and a higher
| BARRICK THIRD QUARTER 2025 | 22 | MANAGEMENT’S DISCUSSION AND ANALYSIS |
| OVERVIEW |
OPERATING PERFORMANCE |
FUTURE GROWTH |
REVIEW OF FINANCIAL RESULTS |
OTHER INFORMATION & NON-GAAP RECONCILIATIONS |
FINANCIAL STATEMENTS |
|||||
grade processed underpinned by a steady performance from the underground.
COS/oz2 and TCC/oz1 for Q3 2025 were 3% and 4% higher, respectively, compared to Q3 2024 mainly resulting from lower ore delivery from the underground driving up the unit costs coupled with higher royalties resulting from a higher realized gold price1. For Q3 2025, AISC/oz1 was 10% higher than Q3 2024, driven by higher TCC/oz1 and higher minesite sustaining capital expenditures1.
Capital expenditures for Q3 2025 were 50% higher than Q3 2024, predominantly driven by higher minesite sustaining capital expenditures1 linked to higher capitalized waste stripping and equipment purchases, combined with increased project capital expenditures1 driven by the Pamao TSF project.
YTD 2025 compared to YTD 2024
Gold production for YTD 2025 was 2% lower compared to YTD 2024, mainly due to lower grades processed driven by fewer ore tonnes from the underground relating to a
planned shaft shutdown during Q1 2025, coupled with an unplanned rope change out in Q2 2025 that resulted in a delay in processing higher grade tonnes.
COS/oz2 and TCC/oz1 for YTD 2025 were 19% and 25% higher, respectively, than YTD 2024, mainly due to lower grades processed, higher unit rates from the underground and higher royalties resulting from the higher realized gold price1 and the 3% export duty that was in place during Q1 2025.
For YTD 2025, AISC/oz1 was 20% higher compared to YTD 2024, mainly due to the higher TCC/oz1, slightly offset by lower minesite sustaining capital expenditures1.
Capital expenditures in YTD 2025 were 20% higher than YTD 2024, mainly due to an increase in project capital expenditures1 related to the completion of the solar project, the construction of the Cyanide Tailings Storage Facility 3 in Q2 2025 and the ongoing Pamao TSF project, partially offset by lower minesite sustaining capital expenditures1 due to decreased capitalized waste stripping.
| BARRICK THIRD QUARTER 2025 | 23 | MANAGEMENT’S DISCUSSION AND ANALYSIS |
| OVERVIEW |
OPERATING PERFORMANCE |
FUTURE GROWTH |
REVIEW OF FINANCIAL RESULTS |
OTHER INFORMATION & NON-GAAP RECONCILIATIONS |
FINANCIAL STATEMENTS |
|||||
North Mara (84%)a, Tanzania
Summary of Operating and Financial Data
| For the three months ended | For the nine months ended | |||||||||||||||||||||||||||
| 9/30/25 | 6/30/25 | % Change | 9/30/24 | % Change | 9/30/25 | 9/30/24 | % Change | |||||||||||||||||||||
| Total tonnes mined (000s) |
4,189 | 3,271 | 28 % |
4,792 | (13)% |
11,303 | 12,107 | (7)% |
||||||||||||||||||||
| Open pit ore |
0 | 488 | (100)% | 1,061 | (100)% | 1,545 | 1,935 | (20)% | ||||||||||||||||||||
| Open pit waste |
3,721 | 2,398 | 55 % | 3,328 | 12 % | 8,517 | 8,993 | (5)% | ||||||||||||||||||||
| Underground |
468 | 385 | 22 % | 403 | 16 % | 1,241 | 1,179 | 5 % | ||||||||||||||||||||
| Average grade (grams/tonne) |
||||||||||||||||||||||||||||
| Open pit mined |
n/a | 1.90 | n/a | 1.89 | n/a | 2.00 | 1.79 | 12 % | ||||||||||||||||||||
| Underground mined |
4.09 | 3.73 | 10 % | 4.86 | (16)% | 3.87 | 3.69 | 5 % | ||||||||||||||||||||
| Processed |
2.99 | 3.16 | (5)% | 3.84 | (22)% | 3.23 | 2.96 | 9 % | ||||||||||||||||||||
| Ore tonnes processed (000s) |
729 | 698 | 4 % |
682 | 7 % |
2,099 | 2,048 | 2 % |
||||||||||||||||||||
| Recovery rate |
89 % | 88 % | 1 % | 90 % | (1)% | 88 % | 90 % | (2)% | ||||||||||||||||||||
| Gold produced (000s oz) |
64 | 62 | 3 % | 75 | (15)% | 193 | 175 | 10 % | ||||||||||||||||||||
| Gold sold (000s oz) |
72 | 50 | 44 % | 78 | (8)% | 190 | 174 | 9 % | ||||||||||||||||||||
| Revenue ($ millions) |
260 | 168 | 55 % | 197 | 32 % | 626 | 410 | 53 % | ||||||||||||||||||||
| Cost of sales ($ millions) |
108 | 71 | 52 % | 86 | 26 % | 265 | 242 | 10 % | ||||||||||||||||||||
| Income ($ millions) |
149 | 88 | 69 % | 74 | 101 % | 346 | 124 | 179 % | ||||||||||||||||||||
| EBITDA ($ millions)b,c |
178 | 104 | 71 % | 93 | 91 % | 409 | 173 | 136 % | ||||||||||||||||||||
| EBITDA margind |
68 % | 62 % | 10 % | 47 % | 45 % | 65 % | 42 % | 55 % | ||||||||||||||||||||
| Capital expenditures ($ millions) |
41 | 43 | (5)% | 28 | 46 % | 118 | 82 | 44 % | ||||||||||||||||||||
| Minesite sustainingb |
13 | 10 | 30 % | 15 | (13)% | 40 | 43 | (7)% | ||||||||||||||||||||
| Projectb |
28 | 33 | (15)% | 13 | 115 % | 78 | 39 | 100 % | ||||||||||||||||||||
| COS ($/oz) |
1,497 | 1,430 | 5 % | 1,108 | 35 % | 1,393 | 1,393 | 0 % | ||||||||||||||||||||
| TCC ($/oz)b |
1,069 | 1,073 | 0 % | 850 | 26 % | 1,040 | 1,100 | (5)% | ||||||||||||||||||||
| AISC ($/oz)b |
1,268 | 1,292 | (2)% | 1,052 | 21 % | 1,270 | 1,365 | (7)% | ||||||||||||||||||||
| a. | Barrick owns 84% of North Mara, with the GoT owning 16%. North Mara is accounted for as a subsidiary with a 16% non-controlling interest on the basis that Barrick controls the asset. The results in the table and the discussion that follows are based on our 84% share. |
| b. | Further information on these non-GAAP financial measures, including detailed reconciliations, is included on pages 43 to 58 of this MD&A. |
| c. | EBITDA represents income less depreciation. Depreciation expense is $29 million and $63 million for Q3 2025 and YTD 2025, respectively (Q2 2025: $16 million, Q3 2024: $19 million, YTD 2024: $49 million). |
| d. | Represents EBITDA divided by revenue. |
Safety and Environment
| For the three months ended | ||||||||
| 9/30/25 | 6/30/25 | |||||||
| LTI |
0 | 0 | ||||||
| LTIFR3 |
0.00 | 0.00 | ||||||
| TRIFR3 |
0.00 | 0.00 | ||||||
| Class 14 environmental incidents |
0 | 0 | ||||||
Financial Results
Q3 2025 compared to Q2 2025
North Mara transitioned into a more underground dependent quarter with the open pit mining activity focused on waste material in the Gokona pit. Both underground and open pit delivered above expectations for the quarter. North Mara is still expected to end the year comfortably within the 2025 production guidance.
In Q3 2025, gold production was 3% higher than Q2 2025 mainly driven by higher throughput and higher recoveries as we continue the current blending strategy of lower grade Gena open pit material through the plant. Gold sales were higher than gold production during Q3 2025 as we successfully concluded an agreement with the Bank of Tanzania, following recent updates to the Mining Act, which requires us to sell 20% of our gold production in country, at a reduced royalty rate.
COS/oz2 for Q3 2025 were 5% higher compared to Q2 2025 mainly due to the impact of higher depreciation, while TCC/oz1 remained in line with Q2 2025. AISC/oz1 in Q3 2025 was 2% lower than Q2 2025, mainly due to lower minesite sustaining capital expenditures1 on a per ounce basis.
Capital expenditures for Q3 2025 were 5% lower compared to Q2 2025 due to decreased project capital expenditures1 driven by lower spending on the second crushing line. Project capital expenditures were steady quarter on quarter at the Gokona open pit pre-stripping project, which is on track to deliver its first ore by Q3 2026.
Q3 2025 compared to Q3 2024
Gold production for Q3 2025 was 15% lower mainly due to lower grades processed, slightly offset by higher throughput.
COS/oz2 and TCC/oz1 for Q3 2025 were 35% and 26% higher, respectively, compared to Q3 2024, mainly due to the lower grade processed, combined with higher royalties associated with the higher realized gold price1. AISC/oz1 in Q3 2025 was 21% higher than Q3 2024, mainly due to higher TCC/oz1, while minesite sustaining capital expenditures1 on a per ounce basis were marginally lower than Q3 2024.
| BARRICK THIRD QUARTER 2025 | 24 | MANAGEMENT’S DISCUSSION AND ANALYSIS |
| OVERVIEW |
OPERATING PERFORMANCE |
FUTURE GROWTH |
REVIEW OF FINANCIAL RESULTS |
OTHER INFORMATION & NON-GAAP RECONCILIATIONS |
FINANCIAL STATEMENTS |
|||||
For Q3 2025, capital expenditures increased by 46% compared to Q3 2024, mainly due to higher project capital expenditures1 relating to the Gokona pre-stripping project and the powerhouse to further support the underground mining operations.
YTD 2025 compared to YTD 2024
For YTD 2025, gold production was 10% higher than YTD 2024, mainly due to a higher average grade processed driven by higher grades mined.
COS/oz2 for YTD 2025 was in line with YTD 2024, as higher depreciation expense was offset by lower TCC/oz1. TCC/oz1 was 5% lower due to the impact of higher grades processed, partially offset by higher royalties associated with the higher realized gold price1. AISC/oz1 for YTD 2025 was 7% lower than YTD 2024 reflecting the decrease in TCC/oz1, combined with lower minesite sustaining capital expenditures1.
For YTD 2025, capital expenditures increased by 44% compared to YTD 2024, mainly driven by higher project capital expenditures1 reflecting the ramp-up of the Gokona open pit and second crushing line.
| BARRICK THIRD QUARTER 2025 | 25 | MANAGEMENT’S DISCUSSION AND ANALYSIS |
| OVERVIEW |
OPERATING PERFORMANCE |
FUTURE GROWTH |
REVIEW OF FINANCIAL RESULTS |
OTHER INFORMATION & NON-GAAP RECONCILIATIONS |
FINANCIAL STATEMENTS |
|||||
Bulyanhulu (84%)a, Tanzania
Summary of Operating and Financial Data
| For the three months ended | For the nine months ended | |||||||||||||||||||||||||||
| 9/30/25 | 6/30/25 | % Change | 9/30/24 | % Change | 9/30/25 | 9/30/24 | % Change | |||||||||||||||||||||
| Underground tonnes mined (000s) |
416 | 377 | 10 % | 303 | 37 % | 1,097 | 921 | 19 % | ||||||||||||||||||||
| Average grade (grams/tonne) |
||||||||||||||||||||||||||||
| Underground mined |
4.95 | 5.29 | (6)% | 5.62 | (12)% | 5.16 | 5.79 | (11)% | ||||||||||||||||||||
| Processed |
4.87 | 5.37 | (9)% | 5.48 | (11)% | 5.16 | 5.72 | (10)% | ||||||||||||||||||||
| Ore tonnes processed (000s) |
255 | 231 | 10 % | 228 | 12 % | 723 | 716 | 1 % | ||||||||||||||||||||
| Recovery rate |
94 % | 95 % | (1)% | 92 % | 2 % | 94 % | 94 % | 0 % | ||||||||||||||||||||
| Gold produced (000s oz) |
38 | 38 | 0 % | 37 | 3 % | 113 | 124 | (9)% | ||||||||||||||||||||
| Gold sold (000s oz) |
40 | 31 | 29 % | 37 | 8 % | 109 | 121 | (10)% | ||||||||||||||||||||
| Revenue ($ millions) |
144 | 112 | 29 % | 99 | 45 % | 379 | 296 | 28 % | ||||||||||||||||||||
| Cost of sales ($ millions) |
73 | 53 | 38 % | 62 | 18 % | 191 | 184 | 4 % | ||||||||||||||||||||
| Income ($ millions) |
69 | 58 | 19 % | 36 | 92 % | 183 | 109 | 68 % | ||||||||||||||||||||
| EBITDA ($ millions)b,c |
84 | 69 | 22 % | 49 | 71 % | 223 | 148 | 51 % | ||||||||||||||||||||
| EBITDA margind |
58 % | 62 % | (6)% | 49 % | 18 % | 59 % | 50 % | 18 % | ||||||||||||||||||||
| Capital expenditures ($ millions) |
32 | 36 | (11)% | 30 | 7 % | 103 | 79 | 30 % | ||||||||||||||||||||
| Minesite sustainingb |
18 | 22 | (18)% | 10 | 80 % | 63 | 39 | 62 % | ||||||||||||||||||||
| Projectb |
14 | 14 | 0 % | 20 | (30)% | 40 | 40 | 0 % | ||||||||||||||||||||
| COS ($/oz) |
1,817 | 1,722 | 6 % | 1,628 | 12 % | 1,754 | 1,511 | 16 % | ||||||||||||||||||||
| TCC ($/oz)b |
1,334 | 1,189 | 12 % | 1,191 | 12 % | 1,250 | 1,069 | 17 % | ||||||||||||||||||||
| AISC ($/oz)b |
1,790 | 1,885 | (5)% | 1,470 | 22 % | 1,831 | 1,394 | 31 % | ||||||||||||||||||||
| a. | Barrick owns 84% of Bulyanhulu, with the GoT owning 16%. Bulyanhulu is accounted for as a subsidiary with a 16% non-controlling interest on the basis that Barrick controls the asset. The results in the table and the discussion that follows are based on our 84% share. |
| b. | Further information on these non-GAAP financial measures, including detailed reconciliations, is included on pages 43 to 58 of this MD&A. |
| c. | EBITDA represents income less depreciation. Depreciation expense is $15 million and $40 million for Q3 2025 and YTD 2025, respectively (Q2 2025: $11 million, Q3 2024: $13 million, YTD 2024: $39 million). |
| d. | Represents EBITDA divided by revenue. |
Safety and Environment
| For the three months ended | ||||||||
| 9/30/25 | 6/30/25 | |||||||
| LTI |
0 | 0 | ||||||
| LTIFR3 |
0.00 | 0.00 | ||||||
| TRIFR3 |
0.48 | 1.51 | ||||||
| Class 14 environmental incidents |
0 | 0 | ||||||
In October 2025, there was a fatality in the Bulyanhulu underground. Please refer to page 9 for further details on our safety initiatives.
Financial Results
Q3 2025 compared to Q2 2025
At Bulyanhulu, Q3 production was in line with Q2 as higher processed tonnes were offset by lower mined grades driven by the type of mineralization of the current mining zones in the plan. The Upper West project continues to advance well and at improved advance rates following the success of the dewatering project and mining improvement initiatives. Our expectation continues to be that Bulyanhulu will end the year within the 2025 production guidance.
Gold sales were higher than gold production during Q3 2025 as we successfully concluded an agreement with the Bank of Tanzania, following recent updates to the Mining Act, which requires us to sell 20% of our gold production in country, at a reduced royalty rate.
COS/oz2 and TCC/oz1 in Q3 2025 were 6% and 12% higher, respectively, due to the impact of the lower average grade processed, partially offset by higher fixed
cost dilution to higher sales volumes. AISC/oz1 in Q3 2025 was 5% lower than Q2 2025, due to lower minesite sustaining capital expenditures1, partially offset by higher TCC/oz1.
Capital expenditures in Q3 2025 were 11% lower compared to Q2 2025, reflecting lower minesite sustaining capital expenditures1 driven by the timing of underground equipment procurement, with project capital expenditures1 remaining consistent quarter on quarter as we continue to develop the Upper West decline.
Q3 2025 compared to Q3 2024
For Q3 2025, gold production was 3% higher than Q3 2024 mainly driven by higher throughput partially offset by a lower average grade processed, in line with the mine plan and with the focus on development.
COS/oz2 and TCC/oz1 for Q3 2025 were both 12% higher compared to Q3 2024, due to the lower grade processed and higher royalties associated with the higher realized gold price1, slightly offset by improved underground unit rates associated with the increased tonnes mined. AISC/oz1 in Q3 2025 was 22% higher than Q3 2024, mainly due to higher TCC/oz1 and higher minesite sustaining capital expenditures1.
For Q3 2025, capital expenditures were 7% higher than Q3 2024, mainly due to higher minesite sustaining capital expenditures1 related to the purchase of underground equipment, partially offset by lower project capital expenditures1 with the transition to the development of Upper West project.
| BARRICK THIRD QUARTER 2025 | 26 | MANAGEMENT’S DISCUSSION AND ANALYSIS |
| OVERVIEW |
OPERATING PERFORMANCE |
FUTURE GROWTH |
REVIEW OF FINANCIAL RESULTS |
OTHER INFORMATION & NON-GAAP RECONCILIATIONS |
FINANCIAL STATEMENTS |
|||||
YTD 2025 compared to YTD 2024
For YTD 2025, gold production was 9% lower than YTD 2024, due to a lower average grade processed, slightly offset by higher throughput, in line with our mine plan.
COS/oz2 and TCC/oz1 in YTD 2025 were 16% and 17% higher, respectively, than YTD 2024, largely reflecting the lower grades processed and higher royalties associated with the higher realized gold price1. AISC/oz1 for YTD 2025 was 31% higher than YTD 2024, mainly due to higher TCC/oz1 and higher minesite sustaining capital expenditures1.
For YTD 2025, capital expenditures increased by 30% compared to YTD 2024, mainly due to higher minesite sustaining capital expenditures1 related to underground equipment.
| BARRICK THIRD QUARTER 2025 | 27 | MANAGEMENT’S DISCUSSION AND ANALYSIS |
| OVERVIEW |
OPERATING PERFORMANCE |
FUTURE GROWTH |
REVIEW OF FINANCIAL RESULTS |
OTHER INFORMATION & NON-GAAP RECONCILIATIONS |
FINANCIAL STATEMENTS |
|||||
Other Mines - Gold
Summary of Operating and Financial Data
| For the three months ended | ||||||||||||||||||||||||||||||||||||||||
| 9/30/25 | 6/30/25 | |||||||||||||||||||||||||||||||||||||||
| Gold produced (000s oz) |
COS ($/oz) |
TCC ($/oz)a |
AISC ($/oz)a |
Capital Expend- ituresb |
Gold produced (000s oz) |
COS ($/oz) |
TCC ($/oz)a |
AISC ($/oz)a |
Capital Expend- ituresb |
|||||||||||||||||||||||||||||||
| Phoenix (61.5%) |
27 | 2,010 | 664 | 935 | 6 | 27 | 2,033 | 1,010 | 1,376 | 8 | ||||||||||||||||||||||||||||||
| Veladero (50%) |
49 | 1,352 | 787 | 1,498 | 35 | 62 | 1,234 | 751 | 1,295 | 41 | ||||||||||||||||||||||||||||||
| Tongon (89.7%)c |
32 | 1,787 | 1,605 | 1,692 | 9 | 29 | 2,397 | 2,204 | 2,390 | 4 | ||||||||||||||||||||||||||||||
| Hemlod |
27 | 2,145 | 1,874 | 2,417 | 14 | 32 | 1,837 | 1,512 | 1,766 | 8 | ||||||||||||||||||||||||||||||
| Porgera (24.5%) |
24 | 1,599 | 1,200 | 1,594 | 9 | 23 | 1,354 | 1,041 | 1,406 | 10 | ||||||||||||||||||||||||||||||
| Loulo-Gounkoto (80%)e |
— | — | — | — | — | — | — | — | — | 4 | ||||||||||||||||||||||||||||||
| a. | Further information on these non-GAAP financial measures, including detailed reconciliations, is included on pages 43 to 58 of this MD&A. |
| b. | Includes both minesite sustaining and project capital expenditures1. |
| c. | On October 6, 2025, we reached an agreement to sell our interest in the Tongon gold mine and certain of its exploration properties to the Atlantic Group for total consideration of up to $305 million. The transaction is expected to close in Q4 2025. |
| d. | On September 10, 2025, we reached an agreement to sell the Hemlo gold mine to Carcetti Capital Corp. for gross proceeds of up to $1.09 billion. The transaction is expected to close in Q4 2025. |
| e. | As a result of temporary suspension of operations at Loulo-Gounkoto starting January 14, 2025, and subsequent loss of control on June 16, 2025, no operating or per ounce data is provided. |
Phoenix (61.5%), Nevada, USA
Gold production for Phoenix in Q3 2025 was in line with the prior quarter as lower grades mined and processed were offset by higher recoveries. COS/oz2 was largely in line with Q2 2025 while TCC/oz1 in Q3 2025 was 34% lower, mainly due to higher by-product credits. In Q3 2025, AISC/oz1 decreased by 32% compared to Q2 2025 due to lower TCC/oz1 combined with lower minesite sustaining capital expenditures1.
Veladero (50%), Argentina
Gold production for Veladero in Q3 2025 was 21% lower compared to Q2 2025 driven by the planned mining sequence. COS/oz2 and TCC/oz1 in Q3 2025 were 10% and 5% higher, respectively, driven by lower production. AISC/oz1 increased by 16% due to higher minesite sustaining capital expenditures1 on a per ounce basis, combined with increased TCC/oz1.
Tongon (89.7%), Côte d’Ivoire
Gold production for Tongon in Q3 2025 was 10% higher than Q2 2025, primarily due to increased throughput and higher grades processed. COS/oz2 and TCC/oz1 in Q3 2025 were 25% and 27% lower, respectively, compared to Q2 2025, primarily driven by higher production as explained above, partially offset by increased royalty costs as a result of the higher realized gold price1. AISC/oz1 in Q3 2025 decreased by 29% compared to Q2 2025, primarily reflecting lower TCC/oz1 and lower minesite sustaining capital expenditures1.
Hemlo (100%), Ontario, Canada
Gold production in Q3 2025 was 16% lower than Q2 2025 resulting from lower ore tonnes mined and processed due to the failure of a hoist transformer early in the quarter impacting production for several weeks. COS/oz2 and TCC/oz1 were 17% and 24% higher, respectively, resulting from lower fixed cost dilution related to lower sales volumes. AISC/oz1 increased by 37% mainly due to higher minesite sustaining capital expenditures1, combined with increased TCC/oz1.
Porgera (24.5%), Papua New Guinea
Gold production in Q3 2025 was 4% higher than Q2 2025 driven by the ongoing ramp-up of operations. COS/oz2 TCC/oz1 and AISC/oz1 were 18%, 15% and 13%, higher respectively, than Q2 2025 driven by higher royalties from the higher gold price and increased maintenance costs, with AISC/oz1 partially offset by lower minesite sustaining capital expenditures.
Loulo-Gounkoto (80%), Mali
On January 14, 2025, Loulo-Gounkoto temporarily suspended operations following an ongoing dispute over the existing mining Conventions. On June 16, 2025 the Bamako Commercial Tribunal placed Loulo-Gounkoto under a temporary provisional administration. While Barrick retains its 80% legal ownership of the mine, operational control has been transferred to an external administrator. As a result of this loss of control event, in Q2 2025 the assets, liabilities and non-controlling interest of Loulo-Gounkoto were deconsolidated and derecognized and an investment recognized at fair value. Refer to notes 17 and 18 of the Financial Statements for further information.
| BARRICK THIRD QUARTER 2025 | 28 | MANAGEMENT’S DISCUSSION AND ANALYSIS |
| OVERVIEW |
OPERATING PERFORMANCE |
FUTURE GROWTH |
REVIEW OF FINANCIAL RESULTS |
OTHER INFORMATION & NON-GAAP RECONCILIATIONS |
FINANCIAL STATEMENTS |
|||||
Lumwana (100%), Zambia
Summary of Operating and Financial Data
| For the three months ended | For the nine months ended | |||||||||||||||||||||||||||
| 9/30/25 | 6/30/25 | % Change | 9/30/24 | % Change | 9/30/25 | 9/30/24 | % Change | |||||||||||||||||||||
| Open pit tonnes mined (000s) |
41,678 | 37,481 | 11 % | 36,809 | 13 % | 109,469 | 105,512 | 4 % | ||||||||||||||||||||
| Open pit ore |
10,505 | 7,667 | 37 % | 6,178 | 70 % | 24,176 | 15,468 | 56 % | ||||||||||||||||||||
| Open pit waste |
31,173 | 29,814 | 5 % | 30,631 | 2 % | 85,293 | 90,044 | (5)% | ||||||||||||||||||||
| Average grade |
||||||||||||||||||||||||||||
| Open pit mined |
0.58 % | 0.63 % | (8)% | 0.55 % | 5 % | 0.60 % | 0.52 % | 15 % | ||||||||||||||||||||
| Processed |
0.66 % | 0.67 % | (1)% | 0.53 % | 25 % | 0.64 % | 0.47 % | 36 % | ||||||||||||||||||||
| Tonnes processed (000s) |
6,392 | 7,082 | (10)% | 6,380 | 0 % | 18,711 | 18,925 | (1)% | ||||||||||||||||||||
| Recovery rate |
92 % | 92 % | 0 % | 91 % | 1 % | 92 % | 88 % | 4 % | ||||||||||||||||||||
| Copper produced (kt) |
38 | 44 | (14)% | 30 | 27 % | 109 | 77 | 42 % | ||||||||||||||||||||
| Copper sold (kt) |
37 | 39 | (5)% | 26 | 42 % | 110 | 73 | 51 % | ||||||||||||||||||||
| Revenue ($ millions) |
322 | 340 | (5)% | 213 | 51 % | 967 | 595 | 63 % | ||||||||||||||||||||
| Cost of sales ($ millions) |
193 | 194 | (1)% | 187 | 3 % | 595 | 527 | 13 % | ||||||||||||||||||||
| Income ($ millions) |
124 | 144 | (14)% | 26 | 377 % | 363 | 56 | 548 % | ||||||||||||||||||||
| EBITDA ($ millions)a,b |
192 | 213 | (10)% | 86 | 123 % | 560 | 246 | 128 % | ||||||||||||||||||||
| EBITDA marginc |
60 % | 63 % | (5)% | 40 % | 50 % | 58 % | 41 % | 41 % | ||||||||||||||||||||
| Capital expenditures ($ millions)d |
200 | 151 | 32 % | 79 | 153 % | 421 | 283 | 49 % | ||||||||||||||||||||
| Minesite sustaininga |
78 | 78 | 0 % | 62 | 26 % | 206 | 239 | (14)% | ||||||||||||||||||||
| Projecta |
119 | 72 | 65 % | 17 | 600 % | 211 | 44 | 380 % | ||||||||||||||||||||
| COS ($/lb) |
2.32 | 2.25 | 3 % | 3.27 | (29)% | 2.44 | 3.27 | (25)% | ||||||||||||||||||||
| C1 cash costs ($/lb)a |
1.68 | 1.58 | 6 % | 2.53 | (34)% | 1.81 | 2.39 | (24)% | ||||||||||||||||||||
| AISC ($/lb)a |
2.93 | 2.79 | 5 % | 3.94 | (26)% | 2.97 | 4.20 | (29)% | ||||||||||||||||||||
| a. | Further information on these non-GAAP financial measures, including detailed reconciliations, is included on pages 43 to 58 of this MD&A. |
| b. | EBITDA represents income less depreciation. Depreciation expense is $68 million and $197 million for Q3 2025 and YTD 2025, respectively (Q2 2025: $69 million, Q3 2024: $60 million, YTD 2024: $190 million). |
| c. | Represents EBITDA divided by revenue. |
| d. | Includes capitalized interest. |
Safety and Environment
| For the three months ended | ||||||||
| 9/30/25 | 6/30/25 | |||||||
| LTI |
0 | 0 | ||||||
| LTIFR3 |
0.00 | 0.00 | ||||||
| TRIFR3 |
0.00 | 0.00 | ||||||
| Class 14 environmental incidents |
0 | 0 | ||||||
Financial Results
Q3 2025 compared to Q2 2025
Q3 2025 operational performance continued to improve on Q2 2025 with higher mining volumes through improved productivities and execution of defined maintenance plans. As such, our expectation continues to be that Lumwana will end the year comfortably within the 2025 production guidance range.
Copper production in Q3 2025 was 14% lower than in Q2 2025 due to lower than planned throughput driven by a prolonged September shut and crusher down time, combined with lower grades processed. We have also built up stockpiles to ensure Q4 2025 production remains on track.
COS/lb2 and C1 cash costs/lb1 were 3% and 6% higher, respectively, than Q2 2025, mainly reflecting increased mining fleet maintenance costs and lower fixed cost dilution. In Q3 2025, AISC/lb1 increased by 5% compared to Q2 2025, primarily driven by the increase in C1 cash costs/lb1.
Capital expenditures for Q3 2025 were 32% higher than Q2 2025, due to higher project capital expenditures1, primarily relating to further milestone payments on long lead items, mobile equipment and civil earth works contracts related to the Lumwana Super Pit Expansion project. Refer to the Future Growth section on page 32 for more details.
Q3 2025 compared to Q3 2024
Copper production for Q3 2025 was 27% higher than Q3 2024, mainly due to higher grades processed, as well as higher recoveries.
COS/lb2 and C1 cash costs/lb1 for Q3 2025 decreased by 29% and 34%, respectively, compared to Q3 2024, mainly due to the higher grades processed and higher fixed cost dilution. For Q3 2025, AISC/lb1 was 26% lower than Q3 2024 mainly due to lower C1 cash cost/lb1, partially offset by higher royalties due to the higher realized copper price1 and increased minesite sustaining capital expenditures1.
Capital expenditures for Q3 2025 were 153% higher than Q3 2024, mainly due to increased project capital expenditures1 on the Super Pit Expansion project, including long lead items, mobile equipment, housing, engineering procurement and construction management, earthworks and owners team costs. This was combined with higher minesite sustaining capital expenditures1, primarily on mobile equipment rebuilds.
| BARRICK THIRD QUARTER 2025 | 29 | MANAGEMENT’S DISCUSSION AND ANALYSIS |
| OVERVIEW |
OPERATING PERFORMANCE |
FUTURE GROWTH |
REVIEW OF FINANCIAL RESULTS |
OTHER INFORMATION & NON-GAAP RECONCILIATIONS |
FINANCIAL STATEMENTS |
|||||
YTD 2025 compared to YTD 2024
Copper production for YTD 2025 was 42% higher than YTD 2024, primarily due to higher grades processed and higher recovery rates.
COS/lb2 and C1 cash costs/lb1 for YTD 2025 decreased by 25% and 24%, respectively, compared to YTD 2024, mainly as a result of higher grades processed, partially offset by higher mining maintenance and energy costs. For YTD 2025, AISC/lb1 decreased by 29%
compared to YTD 2024, mainly due to lower C1 cash costs/lb1 and lower minesite sustaining capital expenditures1, partially offset by higher royalty costs driven by the higher realized copper price1.
Capital expenditures for YTD 2025 were 49% higher than YTD 2024 due to higher project capital expenditures1 on the Super Pit Expansion project, as described above.
Other Mines - Copper
Summary of Operating and Financial Data
| For the three months ended | ||||||||||||||||||||||||||||||||||||||||
| 9/30/25 | 6/30/25 | |||||||||||||||||||||||||||||||||||||||
| Copper production (kt) |
COS ($/lb) |
C1 cash costs ($/lb)a |
AISC ($/lb)a |
Capital Expend- ituresb |
Copper production (kt) |
COS ($/lb) |
C1 cash costs ($/lb)a |
AISC ($/lb)a |
Capital Expend- ituresb |
|||||||||||||||||||||||||||||||
| Zaldívar (50%) |
9 | 5.02 | 3.80 | 4.82 | 16 | 7 | 4.59 | 3.46 | 4.34 | 13 | ||||||||||||||||||||||||||||||
| Jabal Sayid (50%) |
8 | 2.08 | 1.47 | 1.65 | 6 | 8 | 2.11 | 1.29 | 1.46 | 4 | ||||||||||||||||||||||||||||||
| a. | Further information on these non-GAAP financial measures, including detailed reconciliations, is included on pages 43 to 58 of this MD&A. |
| b. | Includes both minesite sustaining and project capital expenditures1. |
Zaldívar (50%), Chile
Copper production for Zaldívar in Q3 2025 was 29% higher than Q2 2025 driven by higher throughput and recovery. COS/lb2 and C1 cash costs/lb1 were 9% and 10% higher, respectively, than Q2 2025, driven by higher labor costs and consumable pricing. AISC/lb1 in Q3 2025 was 11% higher compared to Q2 2025, driven by higher C1 cash costs/lb1 and higher minesite sustaining capital expenditures1.
Our investment in this asset, of which we are not the operator, continues to be a non-core part of our portfolio.
Jabal Sayid (50%), Saudi Arabia
Jabal Sayid’s copper production in Q3 2025 was consistent with Q2 2025. COS/lb2 for Q3 2025 was 1% lower than Q2 2025 due to lower depreciation expense. C1 cash costs/lb1 increased by 14% due to lower by-product credits resulting from lower gold and silver volumes despite the higher commodity prices, partially offset by processing cost efficiencies. AISC/lb1 in Q3 2025 increased by 13% compared to Q2 2025, mainly due to higher C1 cash costs/lb1.
| BARRICK THIRD QUARTER 2025 | 30 | MANAGEMENT’S DISCUSSION AND ANALYSIS |
| OVERVIEW | OPERATING PERFORMANCE |
FUTURE GROWTH |
REVIEW OF FINANCIAL RESULTS |
OTHER INFORMATION & NON-GAAP RECONCILIATIONS |
FINANCIAL STATEMENTS |
|||||
Future Growth
Fourmile, Nevada, USA
Fourmile is a 100% owned Barrick asset in Nevada, located adjacent to Goldrush, and has the potential to be a standalone Tier One Gold Asset5. Ongoing PFS studies point to the potential for significant resource growth. In Q3 2025, an updated preliminary economic assessment outlined the potential to produce 600-750koz per annum over multiple decades which would make Fourmile one of the most important discoveries this century.
The current focus is on exploration drilling from surface with results supporting the potential to double the declared mineral resource and at higher grades by year end. Drilling activity intensified over 2025, peaking at 16 active rigs, representing the largest drill campaign to date at Fourmile for a total of 23.2km drilled in Q3. Drilling results in 2025 are consistently confirming the geological model and are successfully converting high-grade inferred resources at Rose and Blanche along the known ore controls. Looking ahead, drilling will continue through Q4 and beyond, although the level of activity will likely decline slightly with the onset of winter conditions.
The dedicated Barrick project team is also progressing an independent surface portal access from Bullion Hill and the development of twin exploration declines to facilitate underground drilling. Footwall development along the strike of the Fourmile orebodies would initially be used for underground exploration drilling and then later be re-purposed for ore haulage. The Bullion Hill access would decouple Fourmile evaluation from the existing Goldrush development and ultimately complement Goldrush in the future.
To support the PFS, the Bullion Hill Decline disturbance plan that was submitted to the relevant authorities in Q1 2025 continues to progress on schedule. Development is on track to begin in late 2026.
As previously disclosed, Barrick anticipates Fourmile will be incorporated into the NGM joint venture, at fair market value, if certain criteria are met following the completion of drilling and the requisite feasibility work. In Q3 2025, we spent $29 million, with a YTD spend of $60 million. Based on the successful ramp up of drilling activity, the expected spend for 2025 is now estimated to be $90 to $95 million (previously $75 to $85 million).
Goldrush Project, Nevada, USA6
Goldrush, which is included within Cortez, is expected to be a long-life underground mine with anticipated annual production in excess of 400,000 ounces of gold per year (100% basis) once in full production by 2028.
In Q3 2025, execution planning continued for key infrastructure projects. Construction contracts for the second surface ventilation raise are in progress and site preparation is expected to begin in Q4 ahead of shaft sinking activities in Q1 2026. Life of mine ventilation modeling is under evaluation to optimize future ventilation raises. Additional material handling trade-off studies were completed for ore and backfill aggregate transport options. Material testing continues with a focus on optimizing the paste backfill makeup; specifically the paste pumping capability and cement content necessary to satisfy the backfill strength requirements. A summary test report was
completed in Q3 2025 to finalize paste backfill conceptual designs and inform remaining trade-off studies.
Surface dewatering continued in Horse Canyon as the second of three wells planned in 2025 was commissioned. The third well is expected to be commissioned in Q4 2025. Mine dewatering is on track, with the next wells planned for 2027. The surface shotcrete plant design was finalized and construction is expected to begin in Q4 2025.
As of September 30, 2025, project spend was $473 million on a 100% basis (including $16 million in Q3 2025) inclusive of the exploration declines. This capital spent to date, together with the remaining expected preproduction capital, is still anticipated to be near the approximate $1 billion initial capital estimate for the Goldrush project (100% basis).
Ren, Nevada, USA7
Ren is a new ore deposit at Goldstrike Underground and a key expansion project at Carlin. Located north of Goldstrike Underground’s Meikle and Banshee deposits, Ren is anticipated to produce an average of 140,000 ounces per year (contained ounces, 100% basis) once in full production in 2027.
To develop the deposit, the existing exploration drift will be duplicated, allowing for increased ventilation and secondary egress into the working area. Once completed, additional exploration drilling platforms will be constructed to support further drilling on the project allowing for both the conversion of the existing resource and further growth of the deposit.
To support production mining of the deposit, an additional set of twin declines will be driven from the Betze-Post open pit to the north with the intent to provide life of mine ventilation to the deposit as well as a direct path for material to be hauled and hoisted out via the existing Meikle Headframe. To complete the project, a ventilation shaft will be sunk 550 meters to serve as an exhaust raise and utility conduit for mining the orebody.
During Q3 2025, secondary drift development was completed with breakthrough to the existing exploration drift. Remaining exploration drift rehabilitation and utility installation will be completed in Q4 2025. Infill conversion drilling continued with a total of 1,992 meters drilled with 73% of those samples being assayed. An additional 1,034 meters is planned for Q4 2025. The Ren ventilation shaft contract was executed and contractor mobilized to begin pre-sinking activity. Surface infrastructure to support the Betze-Post twin declines development will be completed in Q4 2025.
As of September 30, 2025, project spend was $138 million (including $23 million in Q3 2025) out of an estimated capital cost of $410 to $470 million (100% basis).
| BARRICK THIRD QUARTER 2025 | 31 | MANAGEMENT’S DISCUSSION AND ANALYSIS |
| OVERVIEW | OPERATING PERFORMANCE |
FUTURE GROWTH |
REVIEW OF FINANCIAL RESULTS |
OTHER INFORMATION & NON-GAAP RECONCILIATIONS |
FINANCIAL STATEMENTS |
|||||
Pueblo Viejo Expansion, Dominican Republic8
The Pueblo Viejo Life of Mine Expansion continues to focus on housing, resettlement, and the Naranjo TSF. Engineering has advanced significantly on the new water treatment plant, tailings and reclaim system as well as the Naranjo dam and related earth structures. The permit application for the temporary water management structures has now been submitted, while the overall starter dam permit remains on track for submission in 2025. The dam access road and diorite access road continue to advance on track for completion this year, while the diorite filter crushing operation is now in full production and stockpiling dam filter material.
The housing project at Pueblo Viejo continues with over 500 homes constructed and more than 180 families now resettled. The east side of the project is now complete and an elementary school was opened in October, while the west side will begin hosting families during Q4 2025.
The overall resettlement process continues to progress well. As the movement of families continues, the livelihood programs continue to support the successful integration of families into their new homes.
As at September 30, 2025, total project spend was $1,186 million (including $21 million in Q3 2025) on a 100% basis. The estimated capital cost of the plant expansion and mine life extension project remains approximately $2.6 billion (100% basis).
Veladero Phase 8 Leach Pad, Argentina
The construction of the Phase 8 leach pad will be executed in three phases which are named 8A, 8B and 8C. In December 2024, the Phase 8A leach pad construction project was approved, and it has now been completed. Phase 8B was approved in Q3 2025, mobilization has started and construction expected to be completed during H1 2026. Construction of the project includes cutting, filling, sub-drainage and monitoring, leak collection and recirculation, impermeabilization, as well as pregnant leaching solution collection.
Overall, the total Phase 8 leach pad project spend at September 30, 2025 was $68 million ($15 million in Q3 2025) out of an estimated capital cost of $250-$270 million (100% basis).
Reko Diq Project, Pakistan9
At the end of 2024, Barrick completed a full update of the project’s 2010 feasibility study and 2011 expansion prefeasibility study and added 7.3 million tonnes of copper and 13 million ounces of attributable gold in probable reserves as at December 31, 202410. Once fully commissioned, the Reko Diq project is projected to deliver 240,000 tonnes of copper production and 297,000 ounces of gold per year during Phase 1 increasing to 460,000 tonnes of copper and 520,000 ounces of gold during the first ten years (2034-2043) of Phase 2 (100% basis). This is based on an increased 45Mtpa process plant throughput in Phase 1 (from the original 40Mtpa) and 90Mtpa (from the original 80Mtpa) in Phase 2, following the grind size optimization work undertaken as part of the feasibility study. The total estimated capital cost of Phase 1 is $5.6-6.0 billion (100% basis, exclusive of capitalization of financing costs) to be spent between 2025-2029. On February 11, 2025, the Board of Directors conditionally approved the development of Phase 1 subject to the closing of
approximately $3 billion of limited recourse project financing. Assuming $3 billion of project financing, Barrick’s share of the total partner equity contribution required to fund the construction of Phase 1 is expected to be $1.4-1.7 billion (exclusive of capitalization of financing costs). The total estimated capital cost of Phase 2 is $3.3-3.6 billion (100% basis, exclusive of capitalization of financing costs) to be spent between 2029-2033.
During Q3 2025 the project focused on supply contracts with key manufacturing and construction partners, with the majority of these to be finalized in Q4 2025. Long-lead procurement continued with the existing key partners of Metso, Weir and Komatsu and early works progressed on site infrastructure. The project obtained a number of key regulatory approvals which were required to advance the project financing including those relating to rail and port infrastructure and water access, and their associated agreements.
Capital expenditures commenced in Q2 2024, with total capitalized spend to date of $636 million (including $215 million in Q3 2025) (100% basis).
For 2025, the spend profile has been optimized with suppliers and is expected to be approximately $700 million (100% basis) with the balance resequenced over the remaining years of Phase 1 construction. The overall project schedule remains on track.
Kibali Solar Project, DRC
This project entails the design, supply and installation of a 16 MW photovoltaic solar farm with a 15 MW battery energy storage system to complement the existing hydroelectric power stations raising the renewable component of the mine’s energy mix from 81% to 85%. The completion of this project is projected to deliver a 53% reduction in fuel consumption in the power plant. During Q3 2025, we continued with the power management system integration which enabled the solar photovoltaic field to inject 4,213MWh into the Kibali grid. Power management system optimization will continue during the next quarter ensuring that the supply and system integration remains stable and the full utilization of the benefits provided by the solar project is realized. As at September 30, 2025, project spend was $44 million (including $4 million in Q3 2025) out of an estimated capital cost of $55 million (100% basis).
Lumwana Super Pit Expansion, Zambia11
The Lumwana Super Pit Expansion is projected to deliver 240,000 tonnes of copper production per year, from a 52Mtpa process plant expansion, with a mine life of more than 30 years.
The project is tracking slightly ahead of schedule with the target of first copper production during Q1 2028. The main critical path for the process plant expansion is the mill building, where good progress was made during Q3 2025 with the completion of the bulk excavation and associated back fill as part of soil remediation. Long lead equipment manufacturing is continuing to make progress and procurement of future packages is tracking on schedule with the award of key packages during the quarter, including the civil package for the dry plant and crushed ore stockpile tunnel. The building of the second phase of accommodation units for the construction camp has been completed and was handed over to operations during Q3 2025. The TSF design and reviews have been completed and the construction of the first diversion channel for the
| BARRICK THIRD QUARTER 2025 | 32 | MANAGEMENT’S DISCUSSION AND ANALYSIS |
| OVERVIEW | OPERATING PERFORMANCE |
FUTURE GROWTH |
REVIEW OF FINANCIAL RESULTS |
OTHER INFORMATION & NON-GAAP RECONCILIATIONS |
FINANCIAL STATEMENTS |
|||||
expanded facility is currently in progress. All orders for the 2026 mining fleet expansion have been completed and deliveries are scheduled to commence towards the end of the year.
This positive progress on the detailed engineering, procurement and construction ensured that the total project remains slightly ahead of schedule. Through the successful integration with the engineering, procurement, and construction partner, we maintain the focus on delivery of critical milestones in line with the execution schedule. Following this updated execution schedule, an updated forecast of the project cash flow for 2025 has been completed to ensure it is fully aligned. The spend profile has been optimized with suppliers and is now expected to be approximately $325 million in 2025 with no impact on the project schedule. As at Q3 2025, we have spent $148 million, (including $88 million in Q3 2025). As at September 30, 2025, the total spend on the expansion project was $310 million. The total project capital cost (exclusive of capitalized stripping) is expected to be $2 billion based on the approved feasibility study.
Exploration
The foundation of our exploration strategy is a deep organizational understanding that discovery through exploration is a long-term investment and the main value driver for the business. Our exploration strategy has multiple elements that all need to be in balance to deliver on Barrick’s business plan for growth and long-term
sustainability.
First, we seek to deliver projects of a short- to medium-term nature that will drive improvements in mine plans. Second, we seek to make new discoveries that add to Barrick’s Tier One Gold Asset5 portfolio. Third, we work to optimize the value of our major undeveloped projects and finally, we seek to identify emerging third party opportunities early in their value chain and secure them, where appropriate.
This quarter, Barrick’s exploration teams have been active around all our operations, with strong results returned from drilling across NGM in Nevada, at the Agbarabo-Rhino-Kombokolo target in Kibali, and on the recently discovered Bukit Pasir porphyry at Reko Diq. In early-stage work, framework drilling continues at the Norris property in Canada as we simultaneously expand our Canadian exploration portfolio further. We are advancing multiple regional targets within the portfolio with drilling and geophysical surveys returning encouraging early results from targets across the western United States, Dominican Republic, Peru and Tanzania. At the same time, we are prioritizing new, highly prospective areas for consolidation and are progressing with the delivery and evaluation of early-stage exploration opportunities in Ecuador, Saudi Arabia and in the Copper Belt in Zambia and DRC, demonstrating our commitment to organic growth with a strong pipeline of high-quality targets.
| BARRICK THIRD QUARTER 2025 | 33 | MANAGEMENT’S DISCUSSION AND ANALYSIS |
| OVERVIEW | OPERATING PERFORMANCE |
FUTURE GROWTH |
REVIEW OF FINANCIAL RESULTS |
OTHER INFORMATION & NON-GAAP RECONCILIATIONS |
FINANCIAL STATEMENTS |
|||||
Review of Financial Results
Revenue
| ($ millions, except per oz/lb data in dollars) |
For the three months ended |
For the nine months ended |
||||||||||||||||||
| 9/30/25 | 6/30/25 | 9/30/24 | 9/30/25 | 9/30/24 | ||||||||||||||||
| Gold |
||||||||||||||||||||
| 000s oz solda |
837 | 770 | 967 | 2,358 | 2,833 | |||||||||||||||
| 000s oz produceda |
829 | 797 | 943 | 2,384 | 2,831 | |||||||||||||||
| Market price ($/oz) |
3,457 | 3,280 | 2,474 | 3,201 | 2,296 | |||||||||||||||
| Realized price ($/oz)b |
3,457 | 3,295 | 2,494 | 3,226 | 2,309 | |||||||||||||||
| Revenue |
3,748 | 3,280 | 3,097 | 9,794 | 8,493 | |||||||||||||||
| Copper |
||||||||||||||||||||
| 000s tonnes solda |
52 | 54 | 42 | 157 | 123 | |||||||||||||||
| 000s tonnes produceda |
55 | 59 | 48 | 158 | 131 | |||||||||||||||
| Market price ($/lb) |
4.44 | 4.32 | 4.18 | 4.33 | 4.14 | |||||||||||||||
| Realized price ($/lb)b |
4.39 | 4.36 | 4.27 | 4.42 | 4.23 | |||||||||||||||
| Revenue |
320 | 337 | 213 | 961 | 595 | |||||||||||||||
| Other sales |
80 | 64 | 58 | 204 | 189 | |||||||||||||||
| Total revenue |
4,148 | 3,681 | 3,368 | 10,959 | 9,277 | |||||||||||||||
| a. | On an attributable basis. |
| b. | Further information on these non-GAAP financial measures, including detailed reconciliations, is included on pages 43 to 58 of this MD&A. |
Q3 2025 compared to Q2 2025
In Q3 2025, gold revenues on a consolidated basis increased by 14% compared to Q2 2025, driven by higher sales volumes and a higher realized gold price1. The average market price for Q3 2025 was $3,457/oz, representing an all-time high quarterly average and a 5% increase versus the $3,280/oz average in Q2 2025. During Q3 2025, the gold price ranged from $3,268/oz to an all-time nominal high of $3,872/oz, and closed the quarter at $3,825/oz. Gold price strength in Q3 2025 was driven by economic and geopolitical concerns and a decline in the value of the trade-weighted US dollar.
In Q3 2025, gold production on an attributable basis increased by 4% compared to Q2 2025 mainly as a result of the ongoing ramp up of Goldrush (part of Cortez) combined with higher grades processed at Pueblo Viejo and Kibali and higher throughput at Turquoise Ridge. This was partially offset by lower production at Veladero (included in the “Other” category) as a result of fewer recoverable ounces placed on the leach pad which is per the mine plan as previously guided.
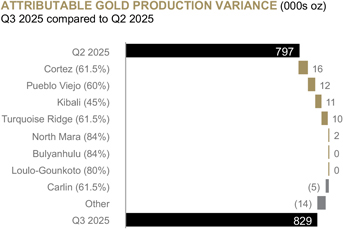
In Q3 2025, copper revenues on a consolidated basis decreased by 5% compared to Q2 2025, primarily due to lower sales volumes compared to Q2 2025, partially offset by a higher realized copper price1. The average market price in Q3 2025 was $4.44/lb, representing an increase of 3% from the $4.32/lb average in Q2 2025. The realized copper price1 in Q3 2025 was slightly lower than the market copper price due to the impact of negative provisional pricing adjustments, whereas the realized copper price1 was higher than the market copper price in Q2 due to the timing of sales. During Q3 2025, the copper price traded in a range of $4.33/lb to $4.76/lb, and closed the quarter at $4.67/lb. Copper prices in Q3 2025 were impacted by a decline in the trade-weighted US dollar, concerns about the global economy resulting from global trade disputes, supply disruptions, and demand forecasts in China, which is the world’s largest consumer of copper.
Attributable copper production in Q3 2025 was 4 thousand tonnes lower compared to Q2 2025 mainly driven by lower than planned throughput caused by a prolonged September shut and crusher down time, combined with lower grades processed at Lumwana.
Q3 2025 compared to Q3 2024
For Q3 2025, gold revenues on a consolidated basis increased by 21% compared to Q3 2024, primarily due to a higher realized gold price1, partially offset by lower sales volumes. The average market price for Q3 2025 was $3,457/oz versus $2,474/oz for Q3 2024.
| BARRICK THIRD QUARTER 2025 | 34 | MANAGEMENT’S DISCUSSION AND ANALYSIS |
| OVERVIEW | OPERATING PERFORMANCE |
FUTURE GROWTH |
REVIEW OF FINANCIAL RESULTS |
OTHER INFORMATION & NON-GAAP RECONCILIATIONS |
FINANCIAL STATEMENTS |
|||||
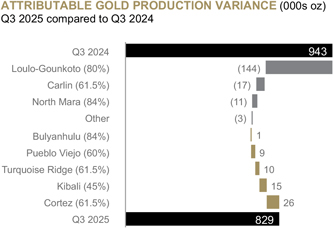
For Q3 2025, attributable gold production was 12% lower than Q3 2024, primarily as a result of the temporary suspension of operations at Loulo-Gounkoto, which was subsequently placed under a temporary provisional administration on June 16, 2025. This was partially offset by increased ounces from Cortez driven by the ongoing ramp up of Goldrush.
For Q3 2025, copper revenues on a consolidated basis increased by 50% compared to Q3 2024, due to increased sales volumes, combined with a higher realized copper price1. In Q3 2025, the realized copper price1 was lower than the market copper price, as discussed above, whereas the realized copper price1 was higher than the market copper price in Q3 2024 due to the impact of positive provisional pricing adjustments.
Attributable copper production for Q3 2025 was 7 thousand tonnes higher than Q3 2024, mainly due to higher grades processed and higher recoveries at Lumwana.
YTD 2025 compared to YTD 2024
For YTD 2025, gold revenues increased by 15% compared to YTD 2024, primarily due to an increase in the realized gold price1, partially offset by a decrease in sales volumes. The average market price for YTD 2025 was $3,201/oz versus $2,296/oz for YTD 2024.
For YTD 2025, attributable gold production was 16% lower than YTD 2024, primarily driven by the temporary suspension of operations at Loulo-Gounkoto on January 14, 2025, which was subsequently placed under a temporary provisional administration on June 16, 2025. This was combined with lower production at Carlin as a result of a decrease in tonnes processed at lower grades, and lower recoveries at the autoclave.
Copper revenues for YTD 2025 increased by 62% compared to YTD 2024, as a result of higher sales volumes, combined with a higher realized copper price1. For YTD 2025, the realized copper price1 was higher than the market copper price due to the impact of positive provisional pricing adjustments, consistent with YTD 2024.
Attributable copper production for YTD 2025, increased by 27 thousand tonnes compared to YTD 2024, mainly due to higher grades processed and higher recovery rates at Lumwana.
Production Costs
| ($ millions, except per oz/lb data in dollars) |
For the three months ended |
For the nine months ended |
||||||||||||||||||
| 9/30/25 | 6/30/25 | 9/30/24 | 9/30/25 | 9/30/24 | ||||||||||||||||
| Gold |
||||||||||||||||||||
| Site operating costs |
1,157 | 1,179 | 1,313 | 3,433 | 3,822 | |||||||||||||||
| Depreciation |
384 | 359 | 409 | 1,085 | 1,217 | |||||||||||||||
| Royalty expense |
113 | 103 | 106 | 311 | 293 | |||||||||||||||
| Mining and production taxes |
29 | 25 | 19 | 77 | 56 | |||||||||||||||
| Community relations |
7 | 10 | 9 | 28 | 28 | |||||||||||||||
| Cost of sales |
1,690 | 1,676 | 1,856 | 4,934 | 5,416 | |||||||||||||||
| COS ($/oz)a |
1,562 | 1,654 | 1,472 | 1,613 | 1,447 | |||||||||||||||
| TCC ($/oz)b |
1,137 | 1,239 | 1,104 | 1,197 | 1,072 | |||||||||||||||
| AISC ($/oz)b |
1,538 | 1,684 | 1,507 | 1,660 | 1,495 | |||||||||||||||
| Copper |
||||||||||||||||||||
| Site operating costs |
98 | 99 | 109 | 323 | 288 | |||||||||||||||
| Depreciation |
69 | 68 | 60 | 197 | 191 | |||||||||||||||
| Royalty expense |
25 | 25 | 17 | 71 | 45 | |||||||||||||||
| Community relations |
1 | 1 | 1 | 3 | 3 | |||||||||||||||
| Cost of sales |
193 | 193 | 187 | 594 | 527 | |||||||||||||||
| COS ($/lb)a |
2.68 | 2.56 | 3.23 | 2.72 | 3.16 | |||||||||||||||
| C1 cash costs ($/lb)b |
1.96 | 1.80 | 2.49 | 2.00 | 2.35 | |||||||||||||||
| AISC ($/lb)b |
3.14 | 2.90 | 3.57 | 3.03 | 3.62 | |||||||||||||||
| a. | Gold COS/oz is calculated as cost of sales across our gold operations (excluding sites in closure or care and maintenance) divided by ounces sold (both on an attributable basis using Barrick’s ownership share). Copper COS/lb is calculated as cost of sales across our copper operations divided by pounds sold (both on an attributable basis using Barrick’s ownership share). |
| b. | Further information on these non-GAAP financial measures, including detailed reconciliations, is included on pages 43 to 58 of this MD&A. |
Q3 2025 compared to Q2 2025
In Q3 2025, gold cost of sales on a consolidated basis was 1% higher than Q2 2025, mainly due to higher sales and production volumes, combined with higher share-based compensation as a result of the significant increase in our share price during the current period and higher royalties as a result of a higher realized gold price1. Our 45% interest in Kibali and 24.5% interest in Porgera are equity accounted, and therefore each mine’s cost of sales is excluded from our consolidated gold cost of sales. Our per ounce metrics, gold COS/oz2 and TCC/oz1, includes our proportionate share of cost of sales at our equity method investees, and were 6% and 8% lower than Q2 2025, mainly driven by higher fixed cost dilution driven by higher sales volume, combined with lower maintenance costs at Turquoise Ridge related to the planned autoclave shutdown in Q2 2025. This was partially offset by higher share based compensation and higher royalties associated with the higher realized gold price1.
In Q3 2025, gold AISC/oz1, which also includes our proportionate share of equity method investees, decreased by 9% compared to Q2 2025. This was primarily due to lower TCC/oz1 as explained above and lower minesite sustaining capital expenditures1.
In Q3 2025, copper cost of sales on a consolidated basis was in line with Q2 2025. Our 50% interests in Zaldívar and Jabal Sayid are equity accounted and
| BARRICK THIRD QUARTER 2025 | 35 | MANAGEMENT’S DISCUSSION AND ANALYSIS |
| OVERVIEW | OPERATING PERFORMANCE |
FUTURE GROWTH |
REVIEW OF FINANCIAL RESULTS |
OTHER INFORMATION & NON-GAAP RECONCILIATIONS |
FINANCIAL STATEMENTS |
|||||
therefore, we do not include their cost of sales in our consolidated copper cost of sales. Our per pound metrics, copper COS/lb2 and C1 cash costs/lb1, include our proportionate share of cost of sales at our equity method investees. Copper COS/lb2 and C1 cash costs/lb1 were 5% and 9% higher, respectively, compared to Q2 2025, primarily at Lumwana due to increased mining fleet maintenance costs and lower fixed cost dilution.
In Q3 2025, copper AISC/lb1, which also includes our proportionate share of equity method investees, was 8% higher compared to Q2 2025, mainly due to an increase in C1 cash costs/lb1, combined with slightly higher minesite sustaining capital expenditures1.
Q3 2025 compared to Q3 2024
For Q3 2025, gold cost of sales on a consolidated basis was 9% lower than Q3 2024, mainly due to lower sales volumes, partially offset by higher share-based compensation as a result of the significant increase in our share price during the current period and higher royalties associated with the higher realized gold price1. As described above, our per ounce metrics, gold COS/oz2 and TCC/oz1, include our proportionate share of cost of sales at our equity method investees, and were 6% and 3% higher, respectively, compared to Q3 2024. This was mainly due to the impact of less fixed cost dilution driven by lower sales volumes, combined with higher share-based compensation and higher royalties (impact approximately $50/oz) associated with the higher realized gold price1.
For Q3 2025, gold AISC/oz1 was 2% higher than Q3 2024, primarily due to higher TCC/oz1, as described above, partially offset by lower minesite sustaining capital expenditures1.
For Q3 2025, copper cost of sales on a consolidated basis was 3% higher than Q3 2024, primarily due to the impact of higher sales volumes. As described above, our per pound metrics, copper COS/lb2 and C1 cash costs/lb1, include our proportionate share of cost of sales at our equity method investees. Copper COS/lb2 and C1 cash costs/lb1 were 17% and 21% lower, respectively, compared to Q3 2024, mainly due to higher grades processed at Lumwana.
For Q3 2025, copper AISC/lb1 was 12% lower than Q3 2024, primarily reflecting lower C1 cash costs/lb1, as per above, partially offset by higher minesite sustaining capital expenditures1.
YTD 2025 compared to YTD 2024
For YTD 2025, gold cost of sales on a consolidated basis was 9% lower than YTD 2024, mainly due to lower sales volumes, partially offset by higher share-based compensation as a result of the significant increase in our share price during the current period and higher royalties associated with the higher realized gold price1. On a per ounce basis, gold COS2 and TCC1, after including our proportionate share of COS at our equity method investees (refer to explanation above), were 11% and 12% higher, respectively, than YTD 2024. This was primarily due to the impact of lower throughput and to a lesser extent lower grades processed at a number of operations, combined with higher share-based compensation and higher royalties (impact approximately $45/oz) associated with the higher realized gold price1.
For YTD 2025, gold AISC/oz1 increased by 11% compared to YTD 2024, primarily due to an increase in
TCC/oz1, combined with higher minesite sustaining capital expenditures1 on a per ounce basis.
For YTD 2025, copper cost of sales on a consolidated basis was 13% higher than YTD 2024, primarily due to the impact of higher sales volumes. Our per pound metrics, copper COS2 and C1 cash costs1, include our proportionate share of COS at our equity method investees (refer to explanation above). Copper COS/lb2 and C1 cash costs/lb1 were 14% and 15% lower, respectively, compared to YTD 2024, due to higher grades processed at Lumwana.
For YTD 2025, copper AISC/lb1 was 16% lower than YTD 2024, primarily due to a lower C1 cash costs/lb1, as discussed above, combined with lower minesite sustaining capital expenditures1 which was mainly driven by the decrease in waste stripping at Lumwana.
General and Administrative Expenses
| ($ millions) | For the three months ended |
For the nine months ended |
||||||||||||||||||
| 9/30/25 | 6/30/25 | 9/30/24 | 9/30/25 | 9/30/24 | ||||||||||||||||
| Corporate administration |
25 | 30 | 25 | 78 | 76 | |||||||||||||||
| Share-based compensationa |
52 | 9 | 21 | 80 | 30 | |||||||||||||||
| General & administrative expenses |
77 | 39 | 46 | 158 | 106 | |||||||||||||||
| a. | Based on a US$34.12 share price as at September 30, 2025 (June 30, 2025: US$20.91 and September 30, 2024: US$20.45). |
General and administrative expenses for Q3 2025 and YTD 2025 increased compared to the prior periods primarily as a result of higher share-based compensation expenses due to a significant increase in our share price during the current periods compared to prior periods.
Exploration, Evaluation and Project Expenses
| ($ millions) | For the three months ended |
For the nine months ended |
||||||||||||||||||
| 9/30/25 | 6/30/25 | 9/30/24 | 9/30/25 | 9/30/24 | ||||||||||||||||
| Global exploration and evaluation |
58 | 53 | 45 | 138 | 116 | |||||||||||||||
| Project costs: |
||||||||||||||||||||
| Reko Diq |
4 | 0 | 30 | 7 | 94 | |||||||||||||||
| Other |
23 | 22 | 19 | 64 | 57 | |||||||||||||||
| Global exploration and evaluation and project expense |
85 | 75 | 94 | 209 | 267 | |||||||||||||||
| Minesite exploration and evaluation |
7 | 7 | 10 | 19 | 29 | |||||||||||||||
| Total exploration, evaluation and project expenses |
92 | 82 | 104 | 228 | 296 | |||||||||||||||
Exploration, evaluation and project expenses for Q3 2025 and YTD 2025 decreased compared to Q3 2024 and YTD 2024, respectively, driven by lower project costs at Reko Diq as the feasibility study was completed at the end of 2024 which resulted in the conversion of resources to mineral reserves and consequently project development costs are now capitalized consistent with our accounting policy.
| BARRICK THIRD QUARTER 2025 | 36 | MANAGEMENT’S DISCUSSION AND ANALYSIS |
| OVERVIEW | OPERATING PERFORMANCE |
FUTURE GROWTH |
REVIEW OF FINANCIAL RESULTS |
OTHER INFORMATION & NON-GAAP RECONCILIATIONS |
FINANCIAL STATEMENTS |
|||||
Finance Costs, Net
| ($ millions) | For the three months ended |
For the nine months ended |
||||||||||||||||||
| 9/30/25 | 6/30/25 | 9/30/24 | 9/30/25 | 9/30/24 | ||||||||||||||||
| Interest expensea |
93 | 99 | 137 | 290 | 339 | |||||||||||||||
| Accretion |
22 | 22 | 23 | 67 | 67 | |||||||||||||||
| Interest capitalized |
(16 | ) | (16 | ) | (4 | ) | (36 | ) | (29 | ) | ||||||||||
| Other finance costs |
4 | 0 | 2 | 5 | 4 | |||||||||||||||
| Finance income |
(60 | ) | (47 | ) | (76 | ) | (163 | ) | (217 | ) | ||||||||||
| Finance costs, net |
43 | 58 | 82 | 163 | 164 | |||||||||||||||
| a. | For Q3 2025 and YTD 2025, interest expense includes $8 million and $24 million, respectively, of non-cash interest expense relating to the Pueblo Viejo streaming agreement with Royal Gold Inc. (Q2 2025: $8 million; Q3 2024: $8 million; YTD 2024: $24 million). Interest expense also includes $1 million and $10 million, respectively, relating to finance costs in Argentina (Q2 2025: $4 million; Q3 2024: $44 million; YTD 2024: $60 million). |
In Q3 2025, finance costs, net decreased compared to Q2 2025 mainly due to higher finance income resulting from the increased cash balance.
For Q3 2025, finance costs, net decreased by $39 million compared to Q3 2024, primarily due to lower interest expense as Q3 2024 experienced increased finance costs in Argentina associated with cash repatriation, partially offset by lower finance income.
Additional Statement of Income Items
| ($ millions) | For the three months ended |
For the nine months ended |
||||||||||||||||||
| 9/30/25 | 6/30/25 | 9/30/24 | 9/30/25 | 9/30/24 | ||||||||||||||||
| Impairment charges |
3 | 0 | 2 | 7 | 20 | |||||||||||||||
| (Gain) loss on currency translation |
(3 | ) | (2 | ) | 4 | (3 | ) | 21 | ||||||||||||
| Closed mine rehabilitation |
4 | (8 | ) | 59 | 15 | 48 | ||||||||||||||
| Other (income) expense |
(193 | ) | 353 | 46 | 330 | 143 | ||||||||||||||
Other (Income) Expense
Other income in Q3 2025 of $193 million mainly related to the $250 million revaluation of our 80% equity investment in Loulo-Gounkoto, as it was deconsolidated and an investment at fair value was recognized in Q2 2025 (resulting in a Q2 2025 net loss of $1,035 million) following the change of control after it was placed under a temporary provisional administration on June 16, 2025. For YTD 2025, the deconsolidation and recognition of our 80% equity investment in Loulo-Gounkoto resulted in a total net loss of $785 million. This loss in Q2 2025 and YTD 2025 was partially offset by a gain of $745 million on the sale of our 50% interest in the Donlin Gold project. For both Q3 2024 and YTD 2024, other expense mainly related to the $40 million accrual relating to the road construction in Tanzania per our community investment obligations under the Twiga partnership. Other expense in YTD 2024 was further impacted by the interest and penalties recognized following the settlement of the Zaldívar Tax Assessments in Chile.
For a further breakdown of other expense, refer to note 9 to the Financial Statements.
Income Tax Expense
Income tax expense was $477 million in Q3 2025. The unadjusted effective income tax rate in Q3 2025 was 20% of income before income taxes.
The underlying effective income tax rate on ordinary income in Q3 2025 was 27% after adjusting for the impact of foreign currency translation losses on deferred tax balances; the impact of the recognition of deferred tax assets; the impact of Loulo-Gounkoto’s loss of control; the impact of Loulo-Gounkoto’s reduced operations costs; and the impact of other expense adjustments.
We record deferred tax charges or credits if changes in facts or circumstances affect the estimated tax basis of assets and therefore, the expectations of our ability to realize deferred tax assets. The interpretation of tax regulations and legislation as well as their application to our business is complex and subject to change.
We have significant amounts of deferred tax assets, including tax loss carry forwards, and also deferred tax liabilities. In Q3 2025, we recognized previously unrecognized deferred tax assets in Canada following the announced sale of our Canadian mine, Hemlo. The expected taxable gain on this transaction provides sufficient Canadian taxable income to support the recognition of a portion of the previously unrecognized tax losses, resulting in an income tax recovery of $129 million. This recognition partially reverses the deferred tax asset derecognition recorded in 2018 and reflects a one-time event linked to the sale. We continue to carry significant amounts of unrecognized deferred tax assets (e.g. for additional tax losses in Canada). Potential changes in any of these amounts, as well as our ability to realize deferred tax assets, could significantly affect net income or cash flow in future periods. For further details on income tax expense, refer to note 10 of the Financial Statements.
Withholding Taxes
In Q3 2025, we recorded $66 million of dividend withholding taxes related to the undistributed and distributed earnings of our subsidiaries in Argentina, Côte d’lvoire and Saudi Arabia, and the undistributed earnings of our subsidiaries in the United States.
OECD Pillar Two model rules
We have applied the exception available under the amendments to IAS 12 published by the IASB in May 2023 and are not recognizing or disclosing information about deferred tax assets and liabilities related to Pillar Two income taxes. Our review of Pillar Two for the current year, based on the OECD’s Transitional Safe Harbour rules as implemented in the Global Minimum Tax Act in Canada, has not identified any material amounts to be accrued for Q3 2025. As the law is evolving, both in Canada and elsewhere, we will continue to monitor the impact of this legislation.
| BARRICK THIRD QUARTER 2025 | 37 | MANAGEMENT’S DISCUSSION AND ANALYSIS |
| OVERVIEW | OPERATING PERFORMANCE |
FUTURE GROWTH |
REVIEW OF FINANCIAL RESULTS |
OTHER INFORMATION & NON-GAAP RECONCILIATIONS |
FINANCIAL STATEMENTS |
|||||
Financial Condition Review
Summary Balance Sheet and Key Financial Ratios
| ($ millions, except ratios and share amounts) |
As at 9/30/25 | As at 12/31/24 | ||||||
| Total cash and equivalents |
5,037 | 4,074 | ||||||
| Current assets |
3,912 | 3,558 | ||||||
| Non-current assets |
39,408 | 39,994 | ||||||
| Total Assets |
48,357 | 47,626 | ||||||
| Current liabilities excluding short-term debt |
2,969 | 2,618 | ||||||
| Non-current liabilities excluding long-term debta |
6,758 | 7,023 | ||||||
| Debt (current and long-term) |
4,714 | 4,729 | ||||||
| Total Liabilities |
14,441 | 14,370 | ||||||
| Total shareholders’ equity |
25,150 | 24,290 | ||||||
| Non-controlling interests |
8,766 | 8,966 | ||||||
| Total Equity |
33,916 | 33,256 | ||||||
| Total common shares outstanding (millions of shares)b |
1,687 | 1,727 | ||||||
| Debt, net of cash |
(323) | 655 | ||||||
| Key Financial Ratios: |
||||||||
| Current ratioc |
2.94:1 | 2.89:1 | ||||||
| Debt-to-equityd |
0.14:1 | 0.14:1 | ||||||
| Net leveragee |
0.0:1 | 0.1:1 | ||||||
| a. | Non-current financial liabilities as at September 30, 2025 were $5,303 million (December 31, 2024: $5,215 million). |
| b. | As of October 28, 2025, the number of common shares outstanding is 1,687,433,930. |
| c. | Represents current assets divided by current liabilities (including short-term debt) as at September 30, 2025 and December 31, 2024. |
| d. | Represents debt divided by total shareholders’ equity (including minority interest) as at September 30, 2025 and December 31, 2024. |
| e. | Further information on these non-GAAP financial measures, including detailed reconciliations, is included on pages 43 to 58 of this MD&A. |
Balance Sheet Review
Total assets were $48.4 billion as at September 30, 2025, slightly higher than total assets as at December 31, 2024, driven by the cash proceeds received from the sale of our 50% interest in the Donlin project, partially offset by the net impact of the deconsolidation and derecognition of the assets, liabilities and non-controlling interests of Loulo-Gounkoto and recognition of an investment at fair value following the loss of control event as it was placed on temporary provisional administration on June 16, 2025.
Our asset base is primarily comprised of non-current assets such as property, plant and equipment and equity method investments, reflecting the capital-intensive nature of the mining business and our history of growing through acquisitions and creation of joint ventures with other mining companies. Other significant assets include our investment in Loulo-Gounkoto, production inventories, indirect taxes recoverable and receivable, concentrate sales receivable, other government and joint venture related receivables, as well as cash and equivalents.
Total liabilities as at September 30, 2025 were $14.4 billion, in line with total liabilities at December 31, 2024. Our liabilities are primarily comprised of debt, other non-current liabilities (such as provisions and deferred income tax liabilities), and accounts payable.
Financial Position and Liquidity
We believe we have sufficient financial resources to meet our business requirements for the foreseeable future, including capital expenditures, working capital requirements, interest payments, environmental rehabilitation, securities buybacks and dividends.
Total cash and cash equivalents as at September 30, 2025 were $5.0 billion. Our capital structure comprises a mix of debt, non-controlling interest (primarily
at NGM) and shareholders’ equity. As at September 30, 2025, our total debt was $4.7 billion (cash and equivalents, net of debt was $323 million) and our debt-to-equity ratio was 0.14:1. This compares to total debt as at December 31, 2024 of $4.7 billion (debt, net of cash and equivalents was $655 million), and a debt-to-equity ratio of 0.14:1.
Uses of cash for the remainder of 2025 include capital commitments of $1,244 million, and we expect to incur attributable minesite sustaining1 and project capital expenditures1 of approximately $1,000 million during the remainder of the year, based on our annual guidance range on page 11. For the remainder of 2025, we have contractual obligations and commitments of $670 million for supplies and consumables. In addition, we have $124 million in interest payments and other amounts as detailed in the table on page 41. We expect to fund these commitments through operating cash flow, which is our primary source of liquidity, as well as our existing cash balances as necessary. As at September 30, 2025, we have purchased $1 billion of Barrick shares under our share repurchase program for the year-to-date, which was the previously authorized limit. On November 7, 2025 the Board of Directors approved a $500 million increase to the authorized limit of the current program that expires in February 2026.
Also on November 7, 2025 the Board of Directors approved a 25% increase in the quarterly base dividend to $0.125 per share. We also have a performance dividend policy that enhances shareholder returns when the Company’s liquidity is strong. In addition to our base dividend, the amount of the performance dividend on a quarterly basis will be based on the amount of cash, net of debt, on our balance sheet at the end of each quarter as per the schedule below.
| BARRICK THIRD QUARTER 2025 | 38 | MANAGEMENT’S DISCUSSION AND ANALYSIS |
| OVERVIEW | OPERATING PERFORMANCE |
FUTURE GROWTH |
REVIEW OF FINANCIAL RESULTS |
OTHER INFORMATION & NON-GAAP RECONCILIATIONS |
FINANCIAL STATEMENTS |
|||||
| Performance Dividend Level |
Threshold Level |
Quarterly Base Dividend |
Quarterly Performance Dividend |
Quarterly Total Dividend |
||||
| Level I |
Net cash <$0 | $0.125 per share | $0.00 per share | $0.125 per share | ||||
| Level II |
Net cash >$0 and <$0.5B | $0.125 per share | $0.05 per share | $0.175 per share | ||||
| Level III |
Net cash >$0.5B and <$1B | $0.125 per share | $0.10 per share | $0.225 per share | ||||
| Level IV |
Net cash >$1B | $0.125 per share | $0.15 per share | $0.275 per share | ||||
The declaration and payment of dividends is at the discretion of the Board of Directors, and will depend on the company’s financial results, cash requirements, future prospects, the number of outstanding common shares, and other factors deemed relevant by the Board.
Our operating cash flow is dependent on the ability of our operations to deliver projected future cash flows. The market price of gold and to a lesser extent, copper, are the primary drivers of our operating cash flow. Other options to enhance liquidity include portfolio optimization; issuance of equity or long-term debt securities in the public markets or to private investors (Moody’s and S&P currently rate Barrick’s outstanding long-term debt as investment grade, with ratings of A3 and BBB+, respectively); and drawing on the $3.0 billion available under our undrawn Credit Facility (subject to compliance with covenants and the making of certain representations and warranties, this facility is available for drawdown as a source of financing). In May 2025, we completed an update to our undrawn $3.0 billion revolving credit facility, including an extension of the termination date by one year to May 2030. The revolving Credit Facility incorporates sustainability-linked metrics and are made up of annual environmental and social performance targets directly influenced by Barrick’s actions, rather than based on external ratings. The performance targets include Scope 1 and Scope 2 GHG emissions intensity, water use efficiency (reuse and recycling rates), and TRIFR3. Barrick may incur positive or negative pricing adjustments on drawn credit spreads and standby fees based on its sustainability performance versus the targets that have been set. The key financial covenant in our undrawn Credit Facility requires Barrick to maintain a net debt to total capitalization ratio of less than 0.60:1. Barrick’s net debt to total capitalization ratio was negative 0.01:1 as at September 30, 2025 (0.02:1 as at December 31, 2024).
Summary of Cash Inflow (Outflow)
| ($ millions) |
For the three months ended |
For the nine months ended |
||||||||||||||||||
| 9/30/25 | 6/30/25 | 9/30/24 | 9/30/25 | 9/30/24 | ||||||||||||||||
| Net cash provided by operating activities |
2,422 | 1,329 | 1,180 | 4,963 | 3,099 | |||||||||||||||
| Investing activities |
||||||||||||||||||||
| Capital expenditures |
(943 | ) | (934 | ) | (736 | ) | (2,714 | ) | (2,283 | ) | ||||||||||
| Divestitures |
0 | 999 | 0 | 999 | 0 | |||||||||||||||
| Income taxes paid on divestitures |
(44 | ) | (87 | ) | 0 | (131 | ) | 0 | ||||||||||||
| Funding of equity method investments |
(1 | ) | 0 | 0 | (1 | ) | (55 | ) | ||||||||||||
| Dividends received from equity method investments |
63 | 53 | 38 | 154 | 127 | |||||||||||||||
| Shareholder loan repayments from equity method investments |
64 | 53 | 49 | 177 | 139 | |||||||||||||||
| Investment sales |
0 | 0 | 44 | 0 | 77 | |||||||||||||||
| Other |
0 | 2 | 2 | 2 | 9 | |||||||||||||||
| Total investing inflows/(outflows) |
(861 | ) | 86 | (603 | ) | (1,514 | ) | (1,986 | ) | |||||||||||
| Net change in debta |
(3 | ) | (16 | ) | (4 | ) | (22 | ) | (11 | ) | ||||||||||
| Dividendsb |
(254 | ) | (170 | ) | (174 | ) | (596 | ) | (524 | ) | ||||||||||
| Net disbursements to non-controlling interests |
(423 | ) | (280 | ) | (110 | ) | (828 | ) | (348 | ) | ||||||||||
| Share buyback program |
(589 | ) | (268 | ) | (95 | ) | (1,000 | ) | (144 | ) | ||||||||||
| Other |
(26 | ) | 13 | (4 | ) | (9 | ) | (6 | ) | |||||||||||
| Total financing outflows |
(1,295 | ) | (721 | ) | (387 | ) | (2,455 | ) | (1,033 | ) | ||||||||||
| Effect of exchange rate |
1 | 0 | (1 | ) | 1 | (3 | ) | |||||||||||||
| Increase (decrease) in cash and equivalents |
267 | 694 | 189 | 995 | 77 | |||||||||||||||
| a. | The difference between the net change in debt on a cash basis and the net change on the balance sheet is due to changes in non-cash charges, specifically the unwinding of discounts and amortization of debt issue costs. |
| b. | For Q3 2025 and YTD 2025, we declared and paid dividends per share in US dollars totaling $0.15 and $0.35, respectively (Q2 2025: declared and paid $0.10; Q3 2024: declared and paid $0.10; YTD 2024: declared and paid $0.30). |
Q3 2025 compared to Q2 2025
In Q3 2025, we generated $2,422 million in operating cash flow, compared to $1,329 million in Q2 2025. The increase of $1,093 million was primarily due to higher realized gold prices1, increased gold sales volumes, and lower gold TCC/ oz1. Operating cash flow was further impacted by a favorable movement in working capital, mainly in accounts receivable, partially offset by an unfavorable movement in accounts payable and inventory. The decrease in accounts receivable mainly relates to our mines in Tanzania and Zambia where sales occurred at the end of Q2 2025 with the receipt of the cash early in Q3 2025. These results were also positively impacted by a decrease in cash taxes paid and lower interest paid as a result of the timing of semi-annual interest payments on our bonds, which primarily occur in the second and fourth quarters.
Cash outflows from investing activities in Q3 2025 were $861 million, compared to cash inflows of $86 million in Q2 2025. The increased outflow of $947 million was
| BARRICK THIRD QUARTER 2025 | 39 | MANAGEMENT’S DISCUSSION AND ANALYSIS |
| OVERVIEW | OPERATING PERFORMANCE |
FUTURE GROWTH |
REVIEW OF FINANCIAL RESULTS |
OTHER INFORMATION & NON-GAAP RECONCILIATIONS |
FINANCIAL STATEMENTS |
|||||
primarily due to proceeds from the sale of our 50% interest in the Donlin project in Q2 2025. Capital expenditures in Q3 2025 were largely in line with Q2 2025, as increased project capital expenditures1 relating to Reko Diq site infrastructure and the Lumwana Super Pit Expansion project were largely offset by lower minesite sustaining capital expenditures1 mainly due to the end of waste stripping at Crossroads Phase 6 at Cortez.
Net financing cash outflows for Q3 2025 amounted to $1,295 million, compared to $721 million in Q2 2025. The increase of $574 million is primarily due to increased repurchases of shares under our share buyback program compared to Q2 2025. This was combined with higher net disbursements paid to non-controlling interests, primarily to Newmont in relation to their interest in NGM, and higher dividends paid as Q3 2025 included a $0.05 performance dividend reflecting our increased cash position.
Q3 2025 compared to Q3 2024
In Q3 2025, we generated $2,422 million in operating cash flow, compared to $1,180 million in Q3 2024. The increase of $1,242 million was primarily due to higher realized gold prices1, partially offset by lower gold sales volumes and higher gold TCC/oz1. This was combined with a favorable movement in working capital, mainly in accounts receivable. The decrease in accounts receivable mainly relates to our mines in Tanzania and Zambia where sales were delayed to the end of Q2 2025 with the receipt of the cash occurring early in Q3. These results were partially offset by higher cash taxes paid.
Cash outflows from investing activities in Q3 2025 were $861 million compared to $603 million in Q3 2024. The increase of $258 million was primarily due to higher capital expenditures driven by increased project capital expenditures1, mainly related to costs being capitalized at Reko Diq as the feasibility study was completed in Q4 2024 and at Lumwana on the Super Pit Expansion project, partially offset by decreased minesite sustaining capital expenditures1 mainly at Carlin driven by purchases of the Komatsu-930 truck fleet occurring in Q3 2024 and lower open pit waste stripping, and at Loulo-Gounkoto as operations were temporarily suspended and the mine was subsequently placed under a temporary provisional administration on June 16, 2025.
Net financing cash outflows for Q3 2025 amounted to $1,295 million compared to $387 million in Q3 2024. The
increase of $908 million is primarily due to increased repurchases of shares under our share buyback program in Q3 2025. This was combined with higher net disbursements paid to non-controlling interests, primarily to Newmont in relation to their interest in NGM, and higher dividends paid as Q3 2025 included a $0.05 performance dividend reflecting our increased cash position.
YTD 2025 compared to YTD 2024
For YTD 2025, we generated $4,963 million in operating cash flow, compared to $3,099 million in YTD 2024. The increase of $1,864 million was primarily due to higher realized gold prices1 and lower C1 cash costs/lb1, partially offset by lower gold sales volumes and higher TCC/oz1. This was combined with a favorable change in working capital mainly in other current liabilities and accounts receivable. These impacts were partially offset by higher cash taxes paid.
Cash outflows from investing activities for YTD 2025 were $1,514 million compared to $1,986 million in YTD 2024. The decrease of $472 million was primarily due to proceeds from the sale of our 50% interest in the Donlin project. This was partially offset by higher capital expenditures as a result of higher project capital expenditures1 mainly related to costs being capitalized at Reko Diq as the feasibility study was completed in Q4 2024 and at Lumwana on the Super Pit Expansion project, partially offset by lower minesite sustaining capital expenditures1 mainly at Carlin driven by purchases of the Komatsu-930 truck fleet occurring in YTD 2024 and lower open pit waste stripping, and at Loulo-Gounkoto as operations were temporarily suspended and the mine was subsequently placed under a temporary provisional administration on June 16, 2025.
Net financing cash outflows for YTD 2025 amounted to $2,455 million, compared to $1,033 million in YTD 2024. The increased outflow of $1,422 million is primarily due to increased repurchases of shares under our share buyback program in the current year. This was combined with higher net disbursements paid to non-controlling interests, primarily to Newmont in relation to their interest in NGM, and higher dividends paid as Q3 2025 included a $0.05 performance dividend reflecting our increased cash position.
| BARRICK THIRD QUARTER 2025 | 40 | MANAGEMENT’S DISCUSSION AND ANALYSIS |
| OVERVIEW | OPERATING PERFORMANCE |
FUTURE GROWTH |
REVIEW OF FINANCIAL RESULTS |
OTHER INFORMATION & NON-GAAP RECONCILIATIONS |
FINANCIAL STATEMENTS |
|||||
Commitments and Contingencies
Litigation and Claims
We are currently subject to various litigation proceedings as disclosed in note 18 to the Financial Statements, and we may be involved in disputes with other parties in the future that may result in litigation. If we are unable to resolve these disputes favorably, it may have a material adverse impact on our financial condition, cash flow and results of operations.
Contractual Obligations and Commitments
In the normal course of business, we enter into contracts that give rise to commitments for future minimum payments. The following table summarizes the remaining contractual maturities of our financial liabilities and operating and capital commitments shown on an undiscounted basis:
| ($ millions) |
Payments due as at 9/30/25 | |||||||||||||||||||||||||||
| 2025 | 2026 | 2027 | 2028 | 2029 | 2030 and thereafter |
Total | ||||||||||||||||||||||
| Debta |
||||||||||||||||||||||||||||
| Repayment of principal |
12 | 47 | 0 | 0 | 0 | 4,630 | 4,689 | |||||||||||||||||||||
| Capital leases |
2 | 13 | 14 | 12 | 1 | 3 | 45 | |||||||||||||||||||||
| Interest |
124 | 283 | 279 | 278 | 277 | 2,658 | 3,899 | |||||||||||||||||||||
| Provisions for environmental rehabilitationb |
58 | 148 | 119 | 165 | 135 | 1,931 | 2,556 | |||||||||||||||||||||
| Restricted share units |
22 | 56 | 13 | 0 | 0 | 0 | 91 | |||||||||||||||||||||
| Pension benefits and other post-retirement benefits |
1 | 5 | 4 | 4 | 4 | 62 | 80 | |||||||||||||||||||||
| Purchase obligations for supplies and consumablesc |
670 | 307 | 251 | 164 | 149 | 56 | 1,597 | |||||||||||||||||||||
| Capital commitmentsd |
1,244 | 612 | 224 | 171 | 30 | 0 | 2,281 | |||||||||||||||||||||
| Social development costse |
41 | 58 | 9 | 5 | 5 | 65 | 183 | |||||||||||||||||||||
| Other obligationsf |
10 | 64 | 66 | 61 | 59 | 544 | 804 | |||||||||||||||||||||
| Total |
2,184 | 1,593 | 979 | 860 | 660 | 9,949 | 16,225 | |||||||||||||||||||||
| a. | Debt and Interest: Our debt obligations do not include any subjective acceleration clauses or other clauses that enable the holder of the debt to call for early repayment, except in the event that we breach any of the terms and conditions of the debt or for other customary events of default. We are not required to post any collateral under any debt obligations. Projected interest payments on variable rate debt were based on interest rates in effect at September 30, 2025. Interest is calculated on our long-term debt obligations using both fixed and variable rates. |
| b. | Provisions for environmental rehabilitation: Amounts presented in the table represent the undiscounted uninflated future payments for the expected cost of environmental rehabilitation. |
| c. | Purchase obligations for supplies and consumables: Includes commitments related to new purchase obligations to secure a supply of acid, tires and cyanide for our production process. |
| d. | Capital commitments: Purchase obligations for capital expenditures include only those items where binding commitments have been entered into. |
| e. | Social development costs: Includes a commitment of $14 million in 2030 and thereafter, related to the funding of a power transmission line in Argentina. |
| f. | Other obligations includes the Pueblo Viejo joint venture partner shareholder loan, the deposit on the Pascua-Lama silver sale agreement with Wheaton Precious Metals Corp. due in 2039, and minimum royalty payments. |
| BARRICK THIRD QUARTER 2025 | 41 | MANAGEMENT’S DISCUSSION AND ANALYSIS |
| OVERVIEW | OPERATING PERFORMANCE |
FUTURE GROWTH |
REVIEW OF FINANCIAL RESULTS |
OTHER INFORMATION & NON-GAAP RECONCILIATIONS |
FINANCIAL STATEMENTS |
|||||
Review of Quarterly Results
Quarterly Informationa
| ($ millions, except where indicated) |
2025 | 2025 | 2025 | 2024 | 2024 | 2024 | 2024 | 2023 | ||||||||||||||||||||||||
| Q3 | Q2 | Q1 | Q4 | Q3 | Q2 | Q1 | Q4 | |||||||||||||||||||||||||
| Revenues |
4,148 | 3,681 | 3,130 | 3,645 | 3,368 | 3,162 | 2,747 | 3,059 | ||||||||||||||||||||||||
| Realized price/oz – goldb |
3,457 | 3,295 | 2,898 | 2,657 | 2,494 | 2,344 | 2,075 | 1,986 | ||||||||||||||||||||||||
| Realized price/lb – copperb |
4.39 | 4.36 | 4.51 | 3.96 | 4.27 | 4.53 | 3.86 | 3.78 | ||||||||||||||||||||||||
| Cost of sales |
1,890 | 1,878 | 1,785 | 1,995 | 2,051 | 1,979 | 1,936 | 2,139 | ||||||||||||||||||||||||
| Net earnings |
1,302 | 811 | 474 | 996 | 483 | 370 | 295 | 479 | ||||||||||||||||||||||||
| Per share (dollars)c |
0.76 | 0.47 | 0.27 | 0.57 | 0.28 | 0.21 | 0.17 | 0.27 | ||||||||||||||||||||||||
| Adjusted net earningsb |
982 | 800 | 603 | 794 | 529 | 557 | 333 | 466 | ||||||||||||||||||||||||
| Per share (dollars)b,c |
0.58 | 0.47 | 0.35 | 0.46 | 0.30 | 0.32 | 0.19 | 0.27 | ||||||||||||||||||||||||
| Operating cash flow |
2,422 | 1,329 | 1,212 | 1,392 | 1,180 | 1,159 | 760 | 997 | ||||||||||||||||||||||||
| Consolidated capital expendituresd |
943 | 934 | 837 | 891 | 736 | 819 | 728 | 861 | ||||||||||||||||||||||||
| Free cash flowb |
1,479 | 395 | 375 | 501 | 444 | 340 | 32 | 136 | ||||||||||||||||||||||||
| a. | Sum of all the quarters may not add up to the annual total due to rounding. |
| b. | Further information on these non-GAAP financial measures, including detailed reconciliations, is included on pages 43 to 58 of this MD&A. |
| c. | Calculated using weighted average number of shares outstanding under the basic method of earnings per share. |
| d. | Amounts presented on a consolidated cash basis. |
Our recent financial results reflect our emphasis on cost discipline, an agile management structure that empowers our site based leadership teams and a portfolio of Tier One Gold Assets5. This, combined with significant increase in the gold price and ongoing strength in the copper price, has resulted in strong operating cash flows over the past several quarters and record high free cash flow for Q3 2025. The positive operating cash flow generated has allowed us to continue to reinvest in our business including our key growth projects, maintain a strong balance sheet and increase returns to shareholders.
In addition to the strength in metal prices, net earnings has also been impacted by the following items in each quarter, which have been excluded from adjusted net earnings1. In Q2 2025, we recorded a net loss of $1,035 million on the deconsolidation of Loulo-Gounkoto following the change of control after it was placed under a temporary
provisional administration on June 16, 2025 (refer to note 17 of the Financial Statements for further details), which was partially offset by the recognition of our 80% equity investment in Loulo-Gounkoto. In addition, we recorded a gain of $745 million on the sale of our 50% interest in the Donlin Gold project. In Q4 2024, we recorded non-current asset impairment reversals of $655 million at Lumwana and $437 million at Veladero. In addition, we recorded a goodwill impairment of $484 million related to Loulo-Gounkoto. In Q2 2024, we recorded a provision following the settlement of the Zaldívar Tax Assessments in Chile (refer to note 18 of the Financial Statements). In Q4 2023, we recorded a gain of $352 million as the conditions for the reopening of the Porgera mine were completed on December 22, 2023. In addition, we recorded a long-lived asset impairment of $280 million at Long Canyon.
Internal Control Over Financial Reporting and Disclosure Controls and Procedures
Management is responsible for establishing and maintaining adequate internal control over financial reporting and disclosure controls and procedures as defined in our 2024 annual MD&A.
Together, the internal control frameworks provide internal control over financial reporting and disclosure. Due to its inherent limitations, internal control over financial reporting and disclosure may not prevent or detect all misstatements. Further, the effectiveness of internal control is subject to the risk that controls may become inadequate because of changes in conditions, or that the degree of compliance with policies or procedures may change.
There were no changes in our internal controls over financial reporting during the three months ended September 30, 2025 that have materially affected, or are reasonably likely to materially affect, our internal controls over financial reporting.
Under the supervision and with the participation of management, including the Group Chief Operating Officer and Interim President and Chief Executive Officer, and Senior Executive Vice-President and Chief Financial Officer, management will continue to monitor and evaluate the design and effectiveness of its internal control over financial reporting and disclosure controls and procedures, and may make modifications from time to time as considered necessary.
| BARRICK THIRD QUARTER 2025 | 42 | MANAGEMENT’S DISCUSSION AND ANALYSIS |
| OVERVIEW | OPERATING PERFORMANCE |
FUTURE GROWTH |
REVIEW OF FINANCIAL RESULTS |
OTHER INFORMATION & NON-GAAP RECONCILIATIONS |
FINANCIAL STATEMENTS |
|||||
IFRS Critical Accounting Policies and Accounting Estimates
Management has discussed the development and selection of our critical accounting estimates with the Audit & Risk Committee of the Board of Directors, and the Audit & Risk Committee has reviewed the disclosure relating to such estimates in conjunction with its review of this MD&A. The accounting policies and methods we utilize determine how we report our financial condition and results of operations, and they may require management to make estimates or rely on assumptions about matters that are inherently uncertain. The consolidated financial statements have been prepared in accordance with IFRS. Our material accounting policies are disclosed in note 2 of the Financial Statements, including a summary of current and future changes in accounting policies.
Critical Accounting Estimates and Judgments
Certain accounting estimates have been identified as being “critical” to the presentation of our financial condition and results of operations because they require us to make subjective and/or complex judgments about matters that are inherently uncertain; or there is a reasonable likelihood that materially different amounts could be reported under different conditions or using different assumptions and estimates. Our significant accounting judgments, estimates and assumptions, including our assessment of the impacts following the loss of control of our Loulo-Gounkoto mine, are disclosed in note 3 of the accompanying Financial Statements.
Non-GAAP Financial Measures
Adjusted Net Earnings and Adjusted Net Earnings per Share
Adjusted net earnings is a non-GAAP financial measure which excludes the following from net earnings:
| ∎ | Impairment charges (reversals) related to intangibles, goodwill, property, plant and equipment, and investments; |
| ∎ | Acquisition/disposition gains/losses; |
| ∎ | Foreign currency translation gains/losses; |
| ∎ | Significant tax adjustments; |
| ∎ | Other items that are not indicative of the underlying operating performance of our core mining business; and |
| ∎ | Tax effect and non-controlling interest of the above items. |
Management uses this measure internally to evaluate our underlying operating performance for the reporting periods presented and to assist with the planning and forecasting of future operating results. Management believes that adjusted net earnings is a useful measure of our performance because impairment charges, acquisition/ disposition gains/losses and significant tax adjustments do not reflect the underlying operating performance of our core mining business and are not necessarily indicative of future operating results. Furthermore, foreign currency translation gains/losses are not necessarily reflective of the underlying operating results for the reporting periods presented. The tax effect and non-controlling interest of the adjusting items are also excluded to reconcile the amounts to Barrick’s share on a post-tax basis, consistent with net earnings.
As noted, we use this measure for internal purposes. Management’s internal budgets and forecasts and public guidance do not reflect the types of items we adjust for. Consequently, the presentation of adjusted net earnings enables investors and analysts to better understand the underlying operating performance of our core mining business through the eyes of management. Management periodically evaluates the components of adjusted net earnings based on an internal assessment of performance measures that are useful for evaluating the operating performance of our business segments and a review of the non-GAAP financial measures used by mining industry analysts and other mining companies.
Adjusted net earnings is intended to provide additional information only and does not have any standardized definition under IFRS and should not be considered in isolation or as a substitute for measures of performance prepared in accordance with IFRS. The measures are not necessarily indicative of operating profit or cash flow from operations as determined under IFRS. Other companies may calculate these measures differently. The following table reconciles these non-GAAP financial measures to the most directly comparable IFRS measure.
| BARRICK THIRD QUARTER 2025 | 43 | MANAGEMENT’S DISCUSSION AND ANALYSIS |
| OVERVIEW | OPERATING PERFORMANCE |
FUTURE GROWTH |
REVIEW OF FINANCIAL RESULTS |
OTHER INFORMATION & NON-GAAP RECONCILIATIONS |
FINANCIAL STATEMENTS |
|||||
Reconciliation of Net Earnings to Net Earnings per Share, Adjusted Net Earnings and Adjusted Net Earnings per Share
| ($ millions, except per share amounts in dollars) |
For the three months ended | For the nine months ended | ||||||||||||||||||
| 9/30/25 | 6/30/25 | 9/30/24 | 9/30/25 | 9/30/24 | ||||||||||||||||
| Net earnings attributable to equity holders of the Company |
1,302 | 811 | 483 | 2,587 | 1,148 | |||||||||||||||
| Impairment charges related to intangibles, goodwill, property, plant and equipment, and investmentsa |
3 | 0 | 2 | 7 | 20 | |||||||||||||||
| Acquisition/disposition (gains) lossesb |
(250 | ) | 289 | (1 | ) | 39 | (7 | ) | ||||||||||||
| (Gain) loss on currency translation |
(3 | ) | (2 | ) | 4 | (3 | ) | 21 | ||||||||||||
| Significant tax adjustmentsc |
(119 | ) | (35 | ) | (30 | ) | (169 | ) | 136 | |||||||||||
| Other expense adjustmentsd |
47 | 44 | 97 | 264 | 136 | |||||||||||||||
| Non-controlling interest |
0 | (4 | ) | (7 | ) | (15 | ) | (11 | ) | |||||||||||
| Tax effecte |
2 | (303 | ) | (19 | ) | (325 | ) | (24 | ) | |||||||||||
| Adjusted net earnings |
982 | 800 | 529 | 2,385 | 1,419 | |||||||||||||||
| Net earnings per sharef |
0.76 | 0.47 | 0.28 | 1.51 | 0.65 | |||||||||||||||
| Adjusted net earnings per sharef |
0.58 | 0.47 | 0.30 | 1.39 | 0.81 | |||||||||||||||
| a. | There were no significant impairment charges or reversals in the current period or prior periods. |
| b. | Acquisition/disposition (gains) losses for Q3 2025 mainly related to the $250 million revaluation of our 80% equity investment in Loulo-Gounkoto, as it was deconsolidated and an investment at fair value was recognized in Q2 2025 (resulting in a Q2 2025 net loss of $1,035 million) following the change of control after it was placed under a temporary provisional administration on June 16, 2025. This loss in Q2 2025 and YTD 2025 was partially offset by a gain of $745 million on the sale of our 50% interest in the Donlin Gold project. |
| c. | For Q3 2025, significant tax adjustments include the re-measurement of deferred tax balances and the recognition of deferred tax assets. Significant tax adjustments for YTD 2025 also include the adjustments in respect of prior years. For Q3 2024, significant tax adjustments include the re-measurement of deferred tax balances and the recognition of deferred tax assets. Significant tax adjustments for YTD 2024 also include the adjustments in respect of prior years and the proposed settlement of the Zaldívar Tax Assessments in Chile. |
| d. | Other expense adjustments for the 2025 periods mainly relate to reduced operation costs at Loulo-Gounkoto. Q3 2025 also includes severance costs and YTD 2025 was further impacted by the signing of agreements to settle legacy legal matters in the Philippines related to Placer Dome Inc. Other adjustments in Q3 2024 mainly relate to the $40 million accrual relating to the road construction in Tanzania per our community investment obligations under the Twiga partnership, and changes in the discount rate assumptions on our closed mine rehabilitation provision, combined with a provision made relating to a legacy mine site operated by Homestake Mining Company that was closed prior to the 2001 acquisition by Barrick. YTD 2024 was further impacted by the interest and penalties recognized following the settlement of the Zaldívar Tax Assessments in Chile. |
| e. | Tax effect for Q2 2025 and YTD 2025 primarily relates to acquisition/disposition losses (gains). |
| f. | Calculated using weighted average number of shares outstanding under the basic method of earnings per share. |
Free Cash Flow
Free cash flow is a non-GAAP financial measure that deducts capital expenditures from net cash provided by operating activities. Management believes this to be a useful indicator of our ability to operate without reliance on additional borrowing or usage of existing cash.
Free cash flow is intended to provide additional information only and does not have any standardized definition under IFRS and should not be considered in
isolation or as a substitute for measures of performance prepared in accordance with IFRS. The measure is not necessarily indicative of operating profit or cash flow from operations as determined under IFRS. Other companies may calculate this measure differently. The following table reconciles this non-GAAP financial measure to the most directly comparable IFRS measure.
Reconciliation of Net Cash Provided by Operating Activities to Free Cash Flow
| ($ millions) |
For the three months ended | For the nine months ended | ||||||||||||||||||
| 9/30/25 | 6/30/25 | 9/30/24 | 9/30/25 | 9/30/24 | ||||||||||||||||
| Net cash provided by operating activities |
2,422 | 1,329 | 1,180 | 4,963 | 3,099 | |||||||||||||||
| Capital expenditures |
(943 | ) | (934 | ) | (736 | ) | (2,714 | ) | (2,283 | ) | ||||||||||
| Consolidated free cash flow |
1,479 | 395 | 444 | 2,249 | 816 | |||||||||||||||
| Free cash flow applicable to equity investees |
191 | 66 | 71 | 413 | 247 | |||||||||||||||
| Non-controlling interests |
(516 | ) | (249 | ) | (210 | ) | (885 | ) | (475 | ) | ||||||||||
| Attributable free cash flow |
1,154 | 212 | 305 | 1,777 | 588 | |||||||||||||||
Capital Expenditures
Capital expenditures are classified into minesite sustaining capital expenditures or project capital expenditures depending on the nature of the expenditure. Minesite sustaining capital expenditures is the capital spending required to support current production levels. Project capital expenditures represent the capital spending at new projects and major, discrete projects at existing operations intended to increase net present value through higher production or longer mine life. Management believes this to be a useful indicator of the purpose of capital expenditures
and this distinction is an input into the calculation of all-in sustaining costs per ounce/pound.
Classifying capital expenditures is intended to provide additional information only and does not have any standardized definition under IFRS, and should not be considered in isolation or as a substitute for measures of performance prepared in accordance with IFRS. Other companies may calculate these measures differently. The following table reconciles these non-GAAP financial measures to the most directly comparable IFRS measure.
| BARRICK THIRD QUARTER 2025 | 44 | MANAGEMENT’S DISCUSSION AND ANALYSIS |
| OVERVIEW | OPERATING PERFORMANCE |
FUTURE GROWTH |
REVIEW OF FINANCIAL RESULTS |
OTHER INFORMATION & NON-GAAP RECONCILIATIONS |
FINANCIAL STATEMENTS |
|||||
Reconciliation of the Classification of Capital Expenditures
| ($ millions) |
For the three months ended | For the nine months ended | ||||||||||||||||||
| 9/30/25 | 6/30/25 | 9/30/24 | 9/30/25 | 9/30/24 | ||||||||||||||||
| Minesite sustaining capital expenditures |
395 | 479 | 511 | 1,438 | 1,692 | |||||||||||||||
| Project capital expenditures |
532 | 439 | 221 | 1,240 | 562 | |||||||||||||||
| Capitalized interest |
16 | 16 | 4 | 36 | 29 | |||||||||||||||
| Total consolidated capital expenditures |
943 | 934 | 736 | 2,714 | 2,283 | |||||||||||||||
Total cash costs per ounce, All-in sustaining costs per ounce, C1 cash costs per pound and All-in sustaining costs per pound
TCC/oz and AISC/oz are non-GAAP financial measures which are calculated based on the definition published by the WGC (a market development organization for the gold industry comprised of and funded by gold mining companies from around the world, including Barrick). The WGC is not a regulatory organization. Management uses these measures to monitor the performance of our gold mining operations and their ability to generate positive cash flow, both on an individual site basis and an overall company basis.
TCC start with our cost of sales related to gold production and removes depreciation, the non-controlling interest of cost of sales and includes by-product credits. AISC start with TCC and includes sustaining capital expenditures, sustaining leases, general and administrative costs, minesite exploration and evaluation costs and reclamation cost accretion and amortization. These additional costs reflect the expenditures made to maintain current production levels.
We believe that our use of TCC and AISC will assist analysts, investors and other stakeholders of Barrick in understanding the costs associated with producing gold, understanding the economics of gold mining, assessing our operating performance and also our ability to generate free cash flow from current operations and to generate free cash flow on an overall company basis. Due to the capital-intensive nature of the industry and the long useful lives over which these items are depreciated, there can be a significant timing difference between net earnings calculated in accordance with IFRS and the amount of free cash flow that is being generated by a mine and therefore we believe these measures are useful non-GAAP operating metrics and supplement our IFRS disclosures. These measures are not representative of all of our cash expenditures as they do not include income tax payments, interest costs or dividend payments. These measures do not include depreciation or amortization.
TCC/oz and AISC/oz are intended to provide additional information only and do not have standardized definitions under IFRS and should not be considered in isolation or as a substitute for measures of performance prepared in accordance with IFRS. These measures are not equivalent to net income or cash flow from operations as determined under IFRS. Although the WGC has published a standardized definition, other companies may calculate these measures differently.
In addition to presenting these metrics on a by-product basis, we have calculated these metrics on a co-product basis. Our co-product metrics remove the impact of other metal sales that are produced as a by-product of our gold production from cost per ounce calculations but does not reflect a reduction in costs for costs associated with other metal sales.
C1 cash costs/lb and AISC/lb are non-GAAP financial measures related to our copper mine operations. We believe that C1 cash costs/lb enables investors to better understand the performance of our copper operations in comparison to other copper producers who present results on a similar basis. C1 cash costs/lb excludes royalties and non-routine charges as they are not direct production costs. AISC/lb is similar to the gold AISC metric and management uses this to better evaluate the costs of copper production. We believe this measure enables investors to better understand the operating performance of our copper mines as this measure reflects all of the sustaining expenditures incurred in order to produce copper. AISC/lb includes C1 cash costs, sustaining capital expenditures, sustaining leases, general and administrative costs, minesite exploration and evaluation costs, royalties, reclamation cost accretion and amortization and write-downs taken on inventory to net realizable value.
| BARRICK THIRD QUARTER 2025 | 45 | MANAGEMENT’S DISCUSSION AND ANALYSIS |
| OVERVIEW | OPERATING PERFORMANCE |
FUTURE GROWTH |
REVIEW OF FINANCIAL RESULTS |
OTHER INFORMATION & NON-GAAP RECONCILIATIONS |
FINANCIAL STATEMENTS |
|||||
Reconciliation of Gold Cost of Sales to Total cash costs and All-in sustaining costs, including on a per ounce basis
| ($ millions, except per oz information in dollars) |
For the three months ended | For the nine months ended | ||||||||||||||||||||
| Footnote | 9/30/25 | 6/30/25 | 9/30/24 | 9/30/25 | 9/30/24 | |||||||||||||||||
| COS applicable to gold production |
1,690 | 1,676 | 1,856 | 4,934 | 5,416 | |||||||||||||||||
| Depreciation |
(384 | ) | (359 | ) | (409 | ) | (1,085 | ) | (1,217 | ) | ||||||||||||
| Total cash costs applicable to equity method investments |
114 | 101 | 93 | 324 | 226 | |||||||||||||||||
| By-product credits |
(80 | ) | (64 | ) | (58 | ) | (204 | ) | (189 | ) | ||||||||||||
| Non-recurring items |
a | 0 | 0 | 0 | 0 | 0 | ||||||||||||||||
| Other |
b | 5 | 11 | 3 | 21 | 10 | ||||||||||||||||
| Non-controlling interests |
c | (393 | ) | (411 | ) | (417 | ) | (1,168 | ) | (1,210 | ) | |||||||||||
| Total cash costs |
952 | 954 | 1,068 | 2,822 | 3,036 | |||||||||||||||||
| General & administrative costs |
77 | 39 | 46 | 158 | 106 | |||||||||||||||||
| Minesite exploration and evaluation costs |
d | 7 | 7 | 10 | 19 | 29 | ||||||||||||||||
| Minesite sustaining capital expenditures |
e | 395 | 479 | 511 | 1,438 | 1,692 | ||||||||||||||||
| Sustaining leases |
7 | 7 | 8 | 22 | 23 | |||||||||||||||||
| Rehabilitation - accretion and amortization (operating sites) |
f | 17 | 16 | 14 | 50 | 51 | ||||||||||||||||
| Non-controlling interest, copper operations and other |
g | (171 | ) | (208 | ) | (199 | ) | (596 | ) | (701 | ) | |||||||||||
| All-in sustaining costs |
1,284 | 1,294 | 1,458 | 3,913 | 4,236 | |||||||||||||||||
| Ounces sold - attributable basis (koz) |
h | 837 | 770 | 967 | 2,358 | 2,833 | ||||||||||||||||
| COS/oz |
i,j | 1,562 | 1,654 | 1,472 | 1,613 | 1,447 | ||||||||||||||||
| TCC/oz |
j | 1,137 | 1,239 | 1,104 | 1,197 | 1,072 | ||||||||||||||||
| TCC/oz (on a co-product basis) |
j,k | 1,199 | 1,292 | 1,145 | 1,253 | 1,117 | ||||||||||||||||
| AISC/oz |
j | 1,538 | 1,684 | 1,507 | 1,660 | 1,495 | ||||||||||||||||
| AISC/oz (on a co-product basis) |
j,k | 1,600 | 1,737 | 1,548 | 1,716 | 1,540 | ||||||||||||||||
| a. | Non-recurring items - These costs are not indicative of our cost of production and have been excluded from the calculation of TCC. |
| b. | Other - Other adjustments mainly relate to treatment and refinement charges. |
| c. | Non-controlling interests - Non-controlling interests include non-controlling interests related to gold production of $540 million and $1,567 million for Q3 2025 and YTD 2025, respectively, (Q2 2025: $540 million; Q3 2024: $556 million; YTD 2024: $1,630 million). Non-controlling interests include NGM, Pueblo Viejo, Loulo-Gounkoto, Tongon, North Mara and Bulyanhulu. Refer to Note 5 to the Financial Statements for further information. |
| d. | Exploration and evaluation costs - Exploration, evaluation and project expenses are presented as minesite sustaining if they support current mine operations and project if they relate to future projects. Refer to page 36 of this MD&A. |
| e. | Capital expenditures - Capital expenditures are related to our gold sites only and are split between minesite sustaining and project capital expenditures. |
| f. | Rehabilitation—accretion and amortization - Includes depreciation on the assets related to rehabilitation provisions of our gold operations and accretion on the rehabilitation provision of our gold operations, split between operating and non-operating sites. |
| g. | Non-controlling interest and copper operations - Removes general and administrative costs related to non-controlling interests and copper based on a percentage allocation of revenue. Also removes exploration, evaluation and project expenses, rehabilitation costs and capital expenditures incurred by our copper sites and the non-controlling interest of NGM, Pueblo Viejo, Loulo-Gounkoto, Tongon, North Mara and Bulyanhulu operating segments. It also includes capital expenditures applicable to our equity method investment in Kibali. The impact is summarized as the following: |
| ($ millions) |
For the three months ended | For the nine months ended | ||||||||||||||||||
| Non-controlling interest, copper operations and other |
9/30/25 | 6/30/25 | 9/30/24 | 9/30/25 | 9/30/24 | |||||||||||||||
| General & administrative costs |
(13 | ) | (6 | ) | (7 | ) | (25 | ) | (17 | ) | ||||||||||
| Minesite exploration and evaluation expenses |
(1 | ) | (3 | ) | (2 | ) | (4 | ) | (8 | ) | ||||||||||
| Rehabilitation - accretion and amortization (operating sites) |
(5 | ) | (6 | ) | (5 | ) | (16 | ) | (16 | ) | ||||||||||
| Minesite sustaining capital expenditures |
(152 | ) | (193 | ) | (185 | ) | (551 | ) | (660 | ) | ||||||||||
| All-in sustaining costs total |
(171 | ) | (208 | ) | (199 | ) | (596 | ) | (701 | ) | ||||||||||
| h. | Ounces sold - attributable basis - Excludes Long Canyon which is producing residual ounces from the leach pad while in care and maintenance. |
| i. | COS/oz - Gold COS/oz is calculated as cost of sales across our gold operations (excluding sites in closure or care and maintenance) divided by ounces sold (both on an attributable basis using Barrick’s ownership share). |
| j. | Per ounce figures - COS/oz, TCC/oz and AISC/oz may not calculate based on amounts presented in this table due to rounding. |
| k. | Co-product costs/oz |
| TCC/oz and AISC/oz presented on a co-product basis removes the impact of by-product credits of our gold production (net of non-controlling interest) calculated as: |
| ($ millions) |
For the three months ended | For the nine months ended | ||||||||||||||||||
| 9/30/25 | 6/30/25 | 9/30/24 | 9/30/25 | 9/30/24 | ||||||||||||||||
| By-product credits |
80 | 64 | 58 | 204 | 189 | |||||||||||||||
| Non-controlling interest |
(28 | ) | (23 | ) | (18 | ) | (71 | ) | (60 | ) | ||||||||||
| By-product credits (net of non-controlling interest) |
52 | 41 | 40 | 133 | 129 | |||||||||||||||
| BARRICK THIRD QUARTER 2025 | 46 | MANAGEMENT’S DISCUSSION AND ANALYSIS |
| OVERVIEW | OPERATING PERFORMANCE |
FUTURE GROWTH |
REVIEW OF FINANCIAL RESULTS |
OTHER INFORMATION & NON-GAAP RECONCILIATIONS |
FINANCIAL STATEMENTS |
|||||
Reconciliation of Gold Cost of Sales to Total cash costs and All-in sustaining costs, including on a per ounce basis, by operating segment
| ($ millions, except per oz information in dollars) |
For the three months ended 9/30/25 | |||||||||||||||||||||||||
| Footnote | Carlin | Cortez | Turquoise Ridge |
Phoenix | Nevada Gold Minesa |
Hemlob | ||||||||||||||||||||
| COS applicable to gold production |
413 | 322 | 201 | 91 | 1,029 | 63 | ||||||||||||||||||||
| Depreciation |
(80 | ) | (73 | ) | (48 | ) | (18 | ) | (220 | ) | (7 | ) | ||||||||||||||
| By-product credits |
(1 | ) | (1 | ) | (1 | ) | (49 | ) | (52 | ) | (1 | ) | ||||||||||||||
| Non-recurring items |
c | 0 | 0 | 0 | 0 | 0 | 0 | |||||||||||||||||||
| Other |
d | 0 | 0 | 0 | 6 | 6 | 0 | |||||||||||||||||||
| Non-controlling interests |
(129 | ) | (95 | ) | (58 | ) | (12 | ) | (294 | ) | 0 | |||||||||||||||
| Total cash costs |
203 | 153 | 94 | 18 | 469 | 55 | ||||||||||||||||||||
| General & administrative costs |
0 | 0 | 0 | 0 | 0 | 0 | ||||||||||||||||||||
| Minesite exploration and evaluation costs |
e | 3 | 1 | 0 | 1 | 5 | 0 | |||||||||||||||||||
| Minesite sustaining capital expenditures |
f | 116 | 26 | 20 | 10 | 176 | 14 | |||||||||||||||||||
| Sustaining capital leases |
0 | 0 | 0 | 1 | 1 | 0 | ||||||||||||||||||||
| Rehabilitation - accretion and amortization (operating sites) |
g | 3 | 5 | 1 | 1 | 10 | 0 | |||||||||||||||||||
| Non-controlling interests |
(46 | ) | (12 | ) | (9 | ) | (5 | ) | (74 | ) | 0 | |||||||||||||||
| All-in sustaining costs |
279 | 173 | 106 | 26 | 587 | 69 | ||||||||||||||||||||
| Ounces sold - attributable basis (koz) |
170 | 123 | 85 | 28 | 406 | 29 | ||||||||||||||||||||
| COS/oz |
h,i | 1,493 | 1,612 | 1,452 | 2,010 | 1,557 | 2,145 | |||||||||||||||||||
| TCC/oz |
i | 1,201 | 1,242 | 1,099 | 664 | 1,156 | 1,874 | |||||||||||||||||||
| TCC/oz (on a co-product basis) |
i,j | 1,206 | 1,247 | 1,106 | 1,618 | 1,226 | 1,885 | |||||||||||||||||||
| AISC/oz |
i | 1,643 | 1,407 | 1,244 | 935 | 1,448 | 2,417 | |||||||||||||||||||
| AISC/oz (on a co-product basis) |
i,j | 1,648 | 1,412 | 1,251 | 1,889 | 1,518 | 2,428 | |||||||||||||||||||
| ($ millions, except per oz information in dollars) |
For the three months ended 9/30/25 | |||||||||||||
| Footnote | Pueblo Viejo | Veladero | Porgera | |||||||||||
| COS applicable to gold production |
260 | 60 | 38 | |||||||||||
| Depreciation |
(77 | ) | (23 | ) | (9 | ) | ||||||||
| By-product credits |
(16 | ) | (2 | ) | (1 | ) | ||||||||
| Non-recurring items |
c | 0 | 0 | 0 | ||||||||||
| Other |
d | 0 | 0 | 0 | ||||||||||
| Non-controlling interests |
(66 | ) | 0 | 0 | ||||||||||
| Total cash costs |
101 | 35 | 28 | |||||||||||
| General & administrative costs |
0 | 0 | 0 | |||||||||||
| Minesite exploration and evaluation costs |
e | 0 | 0 | 0 | ||||||||||
| Minesite sustaining capital expenditures |
f | 47 | 30 | 8 | ||||||||||
| Sustaining capital leases |
0 | 0 | 0 | |||||||||||
| Rehabilitation - accretion and amortization (operating sites) |
g | 2 | 1 | 1 | ||||||||||
| Non-controlling interests |
(21 | ) | 0 | 0 | ||||||||||
| All-in sustaining costs |
129 | 66 | 37 | |||||||||||
| Ounces sold - attributable basis (koz) |
108 | 44 | 24 | |||||||||||
| COS/oz |
h,i | 1,451 | 1,352 | 1,599 | ||||||||||
| TCC/oz |
i | 929 | 787 | 1,200 | ||||||||||
| TCC/oz (on a co-product basis) |
i,j | 1,022 | 831 | 1,209 | ||||||||||
| AISC/oz |
i | 1,198 | 1,498 | 1,594 | ||||||||||
| AISC/oz (on a co-product basis) |
i,j | 1,291 | 1,542 | 1,604 | ||||||||||
| BARRICK THIRD QUARTER 2025 | 47 | MANAGEMENT’S DISCUSSION AND ANALYSIS |
| OVERVIEW | OPERATING PERFORMANCE |
FUTURE GROWTH |
REVIEW OF FINANCIAL RESULTS |
OTHER INFORMATION & NON-GAAP RECONCILIATIONS |
FINANCIAL STATEMENTS |
|||||
| ($ millions, except per oz information in dollars) |
For the three months ended 9/30/25 | |||||||||||||||||||||
| Footnote | Loulo- Gounkotok |
Kibali | North Mara | Tongonl | Bulyanhulu | |||||||||||||||||
| COS applicable to gold production |
— | 124 | 130 | 60 | 87 | |||||||||||||||||
| Depreciation |
— | (38) | (35) | (6) | (18) | |||||||||||||||||
| By-product credits |
— | 0 | (2) | 0 | (6) | |||||||||||||||||
| Non-recurring items |
c | — | 0 | 0 | 0 | 0 | ||||||||||||||||
| Other |
d | — | 0 | 0 | 0 | 0 | ||||||||||||||||
| Non-controlling interests |
— | 0 | (16) | (5) | (10) | |||||||||||||||||
| Total cash costs |
— | 86 | 77 | 49 | 53 | |||||||||||||||||
| General & administrative costs |
— | 0 | 0 | 0 | 0 | |||||||||||||||||
| Minesite exploration and evaluation costs |
e | — | 0 | 0 | 0 | 0 | ||||||||||||||||
| Minesite sustaining capital expenditures |
f | — | 19 | 16 | 1 | 21 | ||||||||||||||||
| Sustaining capital leases |
— | 2 | 0 | 1 | 0 | |||||||||||||||||
| Rehabilitation - accretion and amortization (operating sites) |
g | — | 1 | 2 | 1 | 0 | ||||||||||||||||
| Non-controlling interests |
— | 0 | (3) | 0 | (3) | |||||||||||||||||
| All-in sustaining costs |
— | 108 | 92 | 52 | 71 | |||||||||||||||||
| Ounces sold - attributable basis (koz) |
— | 84 | 72 | 30 | 40 | |||||||||||||||||
| COS/oz |
h,i | — | 1,482 | 1,497 | 1,787 | 1,817 | ||||||||||||||||
| TCC/oz |
i | — | 1,019 | 1,069 | 1,605 | 1,334 | ||||||||||||||||
| TCC/oz (on a co-product basis) |
i,j | — | 1,026 | 1,095 | 1,612 | 1,445 | ||||||||||||||||
| AISC/oz |
i | — | 1,286 | 1,268 | 1,692 | 1,790 | ||||||||||||||||
| AISC/oz (on a co-product basis) |
i,j | — | 1,293 | 1,294 | 1,699 | 1,901 | ||||||||||||||||
| ($ millions, except per oz information in dollars) |
For the three months ended 6/30/25 | |||||||||||||||||||||||||
| Footnote | Carlin | Cortez | Turquoise Ridge |
Phoenix | Nevada Gold Minesa |
Hemlob | ||||||||||||||||||||
| COS applicable to gold production |
429 | 294 | 216 | 92 | 1,031 | 58 | ||||||||||||||||||||
| Depreciation |
(68 | ) | (62 | ) | (44 | ) | (18 | ) | (192 | ) | (10 | ) | ||||||||||||||
| By-product credits |
(1 | ) | (1 | ) | (1 | ) | (34 | ) | (37 | ) | 0 | |||||||||||||||
| Non-recurring items |
c | 0 | 0 | 0 | 0 | 0 | 0 | |||||||||||||||||||
| Other |
d | 0 | 0 | 0 | 6 | 6 | 0 | |||||||||||||||||||
| Non-controlling interests |
(138 | ) | (89 | ) | (66 | ) | (18 | ) | (312 | ) | 0 | |||||||||||||||
| Total cash costs |
222 | 142 | 105 | 28 | 496 | 48 | ||||||||||||||||||||
| General & administrative costs |
0 | 0 | 0 | 0 | 0 | 0 | ||||||||||||||||||||
| Minesite exploration and evaluation costs |
e | 4 | 2 | 0 | 1 | 7 | 0 | |||||||||||||||||||
| Minesite sustaining capital expenditures |
f | 128 | 72 | 26 | 13 | 246 | 7 | |||||||||||||||||||
| Sustaining capital leases |
0 | 0 | 0 | 0 | 1 | 1 | ||||||||||||||||||||
| Rehabilitation - accretion and amortization (operating sites) |
g | 2 | 4 | 1 | 2 | 9 | 1 | |||||||||||||||||||
| Non-controlling interests |
(52 | ) | (30 | ) | (9 | ) | (6 | ) | (100 | ) | 0 | |||||||||||||||
| All-in sustaining costs |
304 | 190 | 123 | 38 | 659 | 57 | ||||||||||||||||||||
| Ounces sold - attributable basis (koz) |
166 | 107 | 75 | 28 | 376 | 32 | ||||||||||||||||||||
| COS/oz |
h,i | 1,589 | 1,687 | 1,761 | 2,033 | 1,685 | 1,837 | |||||||||||||||||||
| TCC/oz |
i | 1,330 | 1,326 | 1,394 | 1,010 | 1,319 | 1,512 | |||||||||||||||||||
| TCC/oz (on a co-product basis) |
i,j | 1,335 | 1,331 | 1,403 | 1,634 | 1,370 | 1,524 | |||||||||||||||||||
| AISC/oz |
i | 1,826 | 1,774 | 1,621 | 1,376 | 1,749 | 1,766 | |||||||||||||||||||
| AISC/oz (on a co-product basis) |
i,j | 1,831 | 1,779 | 1,630 | 2,000 | 1,800 | 1,778 | |||||||||||||||||||
| BARRICK THIRD QUARTER 2025 | 48 | MANAGEMENT’S DISCUSSION AND ANALYSIS |
| OVERVIEW | OPERATING PERFORMANCE |
FUTURE GROWTH |
REVIEW OF FINANCIAL RESULTS |
OTHER INFORMATION & NON-GAAP RECONCILIATIONS |
FINANCIAL STATEMENTS |
|||||
| ($ millions, except per oz information in dollars) |
For the three months ended 6/30/25 | |||||||||||||
| Footnote | Pueblo Viejo | Veladero | Porgera | |||||||||||
| COS applicable to gold production |
267 | 82 | 32 | |||||||||||
| Depreciation |
(77 | ) | (31 | ) | (7 | ) | ||||||||
| By-product credits |
(11 | ) | (2 | ) | 0 | |||||||||
| Non-recurring items |
c | 0 | 0 | 0 | ||||||||||
| Other |
d | 0 | 0 | 0 | ||||||||||
| Non-controlling interests |
(72 | ) | 0 | 0 | ||||||||||
| Total cash costs |
107 | 49 | 25 | |||||||||||
| General & administrative costs |
0 | 0 | 0 | |||||||||||
| Minesite exploration and evaluation costs |
e | 0 | 2 | 1 | ||||||||||
| Minesite sustaining capital expenditures |
f | 61 | 34 | 8 | ||||||||||
| Sustaining capital leases |
0 | 1 | 1 | |||||||||||
| Rehabilitation - accretion and amortization (operating sites) |
g | 2 | 0 | 0 | ||||||||||
| Non-controlling interests |
(25 | ) | 0 | 0 | ||||||||||
| All-in sustaining costs |
145 | 86 | 35 | |||||||||||
| Ounces sold - attributable basis (koz) |
93 | 67 | 24 | |||||||||||
| COS/oz |
h,i | 1,715 | 1,234 | 1,354 | ||||||||||
| TCC/oz |
i | 1,147 | 751 | 1,041 | ||||||||||
| TCC/oz (on a co-product basis) |
i,j | 1,219 | 775 | 1,051 | ||||||||||
| AISC/oz |
i | 1,552 | 1,295 | 1,406 | ||||||||||
| AISC/oz (on a co-product basis) |
i,j | 1,624 | 1,319 | 1,416 | ||||||||||
| ($ millions, except per oz information in dollars) |
For the three months ended 6/30/25 | |||||||||||||||||||||
| Footnote |
Loulo- Gounkotok |
Kibali | North Mara | Tongonl | Bulyanhulu | |||||||||||||||||
| COS applicable to gold production |
— | 108 | 84 | 74 | 64 | |||||||||||||||||
| Depreciation |
— | (32) | (19) | (6) | (14) | |||||||||||||||||
| By-product credits |
— | (1) | (2) | 0 | (7) | |||||||||||||||||
| Non-recurring items |
c | — | 0 | 0 | 0 | 0 | ||||||||||||||||
| Other |
d | — | 0 | 0 | 0 | 1 | ||||||||||||||||
| Non-controlling interests |
— | 0 | (9) | (7) | (7) | |||||||||||||||||
| Total cash costs |
— | 75 | 54 | 61 | 37 | |||||||||||||||||
| General & administrative costs |
— | 0 | 0 | 0 | 0 | |||||||||||||||||
| Minesite exploration and evaluation costs |
e | — | 0 | 0 | 0 | 0 | ||||||||||||||||
| Minesite sustaining capital expenditures |
f | — | 10 | 11 | 4 | 25 | ||||||||||||||||
| Sustaining capital leases |
— | 3 | 0 | 0 | 0 | |||||||||||||||||
| Rehabilitation - accretion and amortization (operating sites) |
g | — | 0 | 1 | 2 | 1 | ||||||||||||||||
| Non-controlling interests |
— | 0 | (2) | (1) | (4) | |||||||||||||||||
| All-in sustaining costs |
— | 88 | 64 | 66 | 59 | |||||||||||||||||
| Ounces sold - attributable basis (koz) |
— | 69 | 50 | 28 | 31 | |||||||||||||||||
| COS/oz |
h,i | — | 1,565 | 1,430 | 2,397 | 1,722 | ||||||||||||||||
| TCC/oz |
i | — | 1,094 | 1,073 | 2,204 | 1,189 | ||||||||||||||||
| TCC/oz (on a co-product basis) |
i,j | — | 1,099 | 1,100 | 2,207 | 1,353 | ||||||||||||||||
| AISC/oz |
i | — | 1,273 | 1,292 | 2,390 | 1,885 | ||||||||||||||||
| AISC/oz (on a co-product basis) |
i,j | — | 1,278 | 1,319 | 2,393 | 2,049 | ||||||||||||||||
| BARRICK THIRD QUARTER 2025 | 49 | MANAGEMENT’S DISCUSSION AND ANALYSIS |
| OVERVIEW | OPERATING PERFORMANCE |
FUTURE GROWTH |
REVIEW OF FINANCIAL RESULTS |
OTHER INFORMATION & NON-GAAP RECONCILIATIONS |
FINANCIAL STATEMENTS |
|||||
| ($ millions, except per oz information in dollars) |
For the three months ended 9/30/24 | |||||||||||||||||||||||||
| Footnote | Carlin | Cortez | Turquoise Ridge |
Phoenix | Nevada Gold Minesa |
Hemlob | ||||||||||||||||||||
| COS applicable to gold production |
449 | 246 | 208 | 83 | 987 | 55 | ||||||||||||||||||||
| Depreciation |
(69 | ) | (55 | ) | (46 | ) | (15 | ) | (185 | ) | (8 | ) | ||||||||||||||
| By-product credits |
(1 | ) | 0 | (1 | ) | (39 | ) | (41 | ) | 0 | ||||||||||||||||
| Non-recurring items |
c | 0 | 0 | 0 | 0 | 0 | 0 | |||||||||||||||||||
| Other |
d | (8 | ) | 0 | 0 | 7 | (1 | ) | 0 | |||||||||||||||||
| Non-controlling interests |
(143 | ) | (73 | ) | (62 | ) | (14 | ) | (293 | ) | 0 | |||||||||||||||
| Total cash costs |
228 | 118 | 99 | 22 | 467 | 47 | ||||||||||||||||||||
| General & administrative costs |
0 | 0 | 0 | 0 | 0 | 0 | ||||||||||||||||||||
| Minesite exploration and evaluation costs |
e | 3 | 3 | 2 | 1 | 9 | 0 | |||||||||||||||||||
| Minesite sustaining capital expenditures |
f | 150 | 57 | 25 | 13 | 251 | 11 | |||||||||||||||||||
| Sustaining capital leases |
0 | 0 | 0 | 0 | 0 | 1 | ||||||||||||||||||||
| Rehabilitation - accretion and amortization (operating sites) |
g | 4 | 4 | 1 | 2 | 11 | 0 | |||||||||||||||||||
| Non-controlling interests |
(60 | ) | (26 | ) | (11 | ) | (6 | ) | (106 | ) | 0 | |||||||||||||||
| All-in sustaining costs |
325 | 156 | 116 | 32 | 632 | 59 | ||||||||||||||||||||
| Ounces sold - attributable basis (koz) |
183 | 99 | 77 | 28 | 387 | 28 | ||||||||||||||||||||
| COS/oz |
h,i | 1,478 | 1,526 | 1,674 | 1,789 | 1,553 | 1,929 | |||||||||||||||||||
| TCC/oz |
i | 1,249 | 1,180 | 1,295 | 764 | 1,205 | 1,623 | |||||||||||||||||||
| TCC/oz (on a co-product basis) |
i,j | 1,252 | 1,183 | 1,305 | 1,465 | 1,260 | 1,633 | |||||||||||||||||||
| AISC/oz |
i | 1,771 | 1,570 | 1,516 | 1,113 | 1,633 | 2,044 | |||||||||||||||||||
| AISC/oz (on a co-product basis) |
i,j | 1,774 | 1,573 | 1,526 | 1,814 | 1,688 | 2,054 | |||||||||||||||||||
| ($ millions, except per oz information in dollars) |
For the three months ended 9/30/24 | |||||||||||||||
| Footnote | Pueblo Viejo | Veladero | Porgera | |||||||||||||
| COS applicable to gold production |
235 | 102 | 22 | |||||||||||||
| Depreciation |
(78 | ) | (24 | ) | (3 | ) | ||||||||||
| By-product credits |
(5 | ) | (3 | ) | 0 | |||||||||||
| Non-recurring items |
c | 0 | 0 | 0 | ||||||||||||
| Other |
d | 0 | 0 | 0 | ||||||||||||
| Non-controlling interests |
(61 | ) | 0 | 0 | ||||||||||||
| Total cash costs |
91 | 75 | 19 | |||||||||||||
| General & administrative costs |
0 | 0 | 0 | |||||||||||||
| Minesite exploration and evaluation costs |
e | 0 | 0 | 1 | ||||||||||||
| Minesite sustaining capital expenditures |
f | 41 | 33 | 3 | ||||||||||||
| Sustaining capital leases |
0 | 0 | 0 | |||||||||||||
| Rehabilitation - accretion and amortization (operating sites) |
g | 2 | 0 | 0 | ||||||||||||
| Non-controlling interests |
(18 | ) | 0 | 0 | ||||||||||||
| All-in sustaining costs |
116 | 108 | 23 | |||||||||||||
| Ounces sold - attributable basis (koz) |
96 | 78 | 19 | |||||||||||||
| COS/oz |
h,i | 1,470 | 1,311 | 1,163 | ||||||||||||
| TCC/oz |
i | 957 | 951 | 999 | ||||||||||||
| TCC/oz (on a co-product basis) |
i,j | 985 | 995 | 1,016 | ||||||||||||
| AISC/oz |
i | 1,221 | 1,385 | 1,214 | ||||||||||||
| AISC/oz (on a co-product basis) |
i,j | 1,249 | 1,429 | 1,231 | ||||||||||||
| BARRICK THIRD QUARTER 2025 | 50 | MANAGEMENT’S DISCUSSION AND ANALYSIS |
| OVERVIEW | OPERATING PERFORMANCE |
FUTURE GROWTH |
REVIEW OF FINANCIAL RESULTS |
OTHER INFORMATION & NON-GAAP RECONCILIATIONS |
FINANCIAL STATEMENTS |
|||||
| ($ millions, except per oz information in dollars) |
For the three months ended 9/30/24 | |||||||||||||||||||||||
| Footnote | Loulo- Gounkotok |
Kibali | North Mara | Tongonl | Bulyanhulu | |||||||||||||||||||
| COS applicable to gold production |
212 | 111 | 102 | 85 | 74 | |||||||||||||||||||
| Depreciation |
(66) | (35) | (23) | (8) | (16) | |||||||||||||||||||
| By-product credits |
0 | 0 | (1) | 0 | (6) | |||||||||||||||||||
| Non-recurring items |
c | 0 | 0 | 0 | 0 | 0 | ||||||||||||||||||
| Other |
d | 0 | 0 | 0 | 0 | 2 | ||||||||||||||||||
| Non-controlling interests |
(29) | 0 | (12) | (8) | (9) | |||||||||||||||||||
| Total cash costs |
117 | 76 | 66 | 69 | 45 | |||||||||||||||||||
| General & administrative costs |
0 | 0 | 0 | 0 | 0 | |||||||||||||||||||
| Minesite exploration and evaluation costs |
e | 0 | 0 | 0 | 0 | 0 | ||||||||||||||||||
| Minesite sustaining capital expenditures |
f | 70 | 12 | 17 | 8 | 12 | ||||||||||||||||||
| Sustaining capital leases |
0 | 1 | 0 | 0 | 0 | |||||||||||||||||||
| Rehabilitation - accretion and amortization (operating sites) |
g | 1 | 0 | 2 | 0 | 0 | ||||||||||||||||||
| Non-controlling interests |
(14) | 0 | (3) | (1) | (1) | |||||||||||||||||||
| All-in sustaining costs |
174 | 89 | 82 | 76 | 56 | |||||||||||||||||||
| Ounces sold - attributable basis (koz) |
135 | 77 | 78 | 32 | 37 | |||||||||||||||||||
| COS/oz |
h,i | 1,257 | 1,441 | 1,108 | 2,403 | 1,628 | ||||||||||||||||||
| TCC/oz |
i | 865 | 978 | 850 | 2,184 | 1,191 | ||||||||||||||||||
| TCC/oz (on a co-product basis) |
i,j | 866 | 983 | 863 | 2,188 | 1,288 | ||||||||||||||||||
| AISC/oz |
i | 1,288 | 1,172 | 1,052 | 2,388 | 1,470 | ||||||||||||||||||
| AISC/oz (on a co-product basis) |
i,j | 1,289 | 1,177 | 1,065 | 2,392 | 1,567 | ||||||||||||||||||
| ($ millions, except per oz information in dollars) |
For the nine months ended 9/30/25 | |||||||||||||||||||||||||||
| Footnote | Carlin | Cortez | Turquoise Ridge |
Phoenix |
Nevada Gold Minesa |
Hemlob | ||||||||||||||||||||||
| COS applicable to gold production |
1,243 | 857 | 620 | 262 | 2,985 | 188 | ||||||||||||||||||||||
| Depreciation |
(210 | ) | (192 | ) | (139 | ) | (53 | ) | (595 | ) | (27 | ) | ||||||||||||||||
| By-product credits |
(4 | ) | (3 | ) | (3 | ) | (116 | ) | (126 | ) | (1 | ) | ||||||||||||||||
| Non-recurring items |
c | 0 | 0 | 0 | 0 | 0 | 0 | |||||||||||||||||||||
| Other |
d | 0 | 0 | 0 | 18 | 18 | 0 | |||||||||||||||||||||
| Non-controlling interests |
(397 | ) | (254 | ) | (184 | ) | (43 | ) | (879 | ) | 0 | |||||||||||||||||
| Total cash costs |
632 | 408 | 294 | 68 | 1,403 | 160 | ||||||||||||||||||||||
| General & administrative costs |
0 | 0 | 0 | 0 | 0 | 0 | ||||||||||||||||||||||
| Minesite exploration and evaluation costs |
e | 8 | 4 | 0 | 2 | 15 | 0 | |||||||||||||||||||||
| Minesite sustaining capital expenditures |
f | 497 | 150 | 68 | 33 | 762 | 29 | |||||||||||||||||||||
| Sustaining capital leases |
0 | 0 | 0 | 1 | 2 | 2 | ||||||||||||||||||||||
| Rehabilitation - accretion and amortization (operating sites) |
g | 8 | 13 | 3 | 5 | 29 | 1 | |||||||||||||||||||||
| Non-controlling interests |
(197 | ) | (64 | ) | (27 | ) | (16 | ) | (310 | ) | 0 | |||||||||||||||||
| All-in sustaining costs |
948 | 511 | 338 | 93 | 1,901 | 192 | ||||||||||||||||||||||
| Ounces sold - attributable basis (koz) |
478 | 326 | 238 | 85 | 1,127 | 100 | ||||||||||||||||||||||
| COS/oz |
h,i | 1,594 | 1,616 | 1,600 | 1,907 | 1,626 | 1,884 | |||||||||||||||||||||
| TCC/oz |
i | 1,323 | 1,249 | 1,234 | 807 | 1,245 | 1,596 | |||||||||||||||||||||
| TCC/oz (on a co-product basis) |
i,j | 1,329 | 1,254 | 1,242 | 1,525 | 1,304 | 1,607 | |||||||||||||||||||||
| AISC/oz |
i | 1,982 | 1,566 | 1,417 | 1,107 | 1,687 | 1,925 | |||||||||||||||||||||
| AISC/oz (on a co-product basis) |
i,j | 1,988 | 1,571 | 1,425 | 1,825 | 1,746 | 1,936 | |||||||||||||||||||||
| BARRICK THIRD QUARTER 2025 | 51 | MANAGEMENT’S DISCUSSION AND ANALYSIS |
| OVERVIEW | OPERATING PERFORMANCE |
FUTURE GROWTH |
REVIEW OF FINANCIAL RESULTS |
OTHER INFORMATION & NON-GAAP RECONCILIATIONS |
FINANCIAL STATEMENTS |
|||||
| ($ millions, except per oz information in dollars) |
For the nine months ended 9/30/25 | |||||||||||||||
| Footnote | Pueblo Viejo | Veladero | Porgera | |||||||||||||
| COS applicable to gold production |
764 | 221 | 106 | |||||||||||||
| Depreciation |
(229 | ) | (79 | ) | (23 | ) | ||||||||||
| By-product credits |
(39 | ) | (5 | ) | (1 | ) | ||||||||||
| Non-recurring items |
c | 0 | 0 | 0 | ||||||||||||
| Other |
d | 0 | 0 | 0 | ||||||||||||
| Non-controlling interests |
(198 | ) | 0 | 0 | ||||||||||||
| Total cash costs |
298 | 137 | 82 | |||||||||||||
| General & administrative costs |
0 | 0 | 0 | |||||||||||||
| Minesite exploration and evaluation costs |
e | 0 | 3 | 1 | ||||||||||||
| Minesite sustaining capital expenditures |
f | 167 | 97 | 22 | ||||||||||||
| Sustaining capital leases |
0 | 1 | 1 | |||||||||||||
| Rehabilitation - accretion and amortization (operating sites) |
g | 5 | 2 | 1 | ||||||||||||
| Non-controlling interests |
(69 | ) | 0 | 0 | ||||||||||||
| All-in sustaining costs |
401 | 240 | 107 | |||||||||||||
| Ounces sold - attributable basis (koz) |
277 | 179 | 69 | |||||||||||||
| COS/oz |
h,i | 1,653 | 1,227 | 1,536 | ||||||||||||
| TCC/oz |
i | 1,074 | 761 | 1,186 | ||||||||||||
| TCC/oz (on a co-product basis) |
i,j | 1,160 | 788 | 1,195 | ||||||||||||
| AISC/oz |
i | 1,446 | 1,336 | 1,555 | ||||||||||||
| AISC/oz (on a co-product basis) |
i,j | 1,532 | 1,363 | 1,564 | ||||||||||||
| ($ millions, except per oz information in dollars) |
For the nine months ended 9/30/25 | |||||||||||||||||||||
| Footnote |
Loulo- Gounkotok |
Kibali | North Mara | Tongonl | Bulyanhulu | |||||||||||||||||
| COS applicable to gold production |
— | 345 | 316 | 204 | 228 | |||||||||||||||||
| Depreciation |
— | (102 | ) | (75 | ) | (18 | ) | (48 | ) | |||||||||||||
| By-product credits |
— | (1 | ) | (5 | ) | 0 | (20 | ) | ||||||||||||||
| Non-recurring items |
c | — | 0 | 0 | 0 | 0 | ||||||||||||||||
| Other |
d | — | 0 | 0 | 0 | 2 | ||||||||||||||||
| Non-controlling interests |
— | 0 | (38 | ) | (19 | ) | (26 | ) | ||||||||||||||
| Total cash costs |
— | 242 | 198 | 167 | 136 | |||||||||||||||||
| General & administrative costs |
— | 0 | 0 | 0 | 0 | |||||||||||||||||
| Minesite exploration and evaluation costs |
e | — | 0 | 0 | 0 | 0 | ||||||||||||||||
| Minesite sustaining capital expenditures |
f | — | 41 | 48 | 8 | 74 | ||||||||||||||||
| Sustaining capital leases |
— | 7 | 0 | 1 | 0 | |||||||||||||||||
| Rehabilitation - accretion and amortization (operating sites) |
g | — | 1 | 4 | 5 | 1 | ||||||||||||||||
| Non-controlling interests |
— | 0 | (8 | ) | (1 | ) | (12 | ) | ||||||||||||||
| All-in sustaining costs |
— | 291 | 242 | 180 | 199 | |||||||||||||||||
| Ounces sold - attributable basis (koz) |
— | 220 | 190 | 87 | 109 | |||||||||||||||||
| COS/oz |
h,i | — | 1,572 | 1,393 | 2,101 | 1,754 | ||||||||||||||||
| TCC/oz |
i | — | 1,101 | 1,040 | 1,916 | 1,250 | ||||||||||||||||
| TCC/oz (on a co-product basis) |
i,j | — | 1,107 | 1,062 | 1,921 | 1,385 | ||||||||||||||||
| AISC/oz |
i | — | 1,325 | 1,270 | 2,063 | 1,831 | ||||||||||||||||
| AISC/oz (on a co-product basis) |
i,j | — | 1,331 | 1,292 | 2,068 | 1,966 | ||||||||||||||||
| BARRICK THIRD QUARTER 2025 | 52 | MANAGEMENT’S DISCUSSION AND ANALYSIS |
| OVERVIEW | OPERATING PERFORMANCE |
FUTURE GROWTH |
REVIEW OF FINANCIAL RESULTS |
OTHER INFORMATION & NON-GAAP RECONCILIATIONS |
FINANCIAL STATEMENTS |
|||||
| ($ millions, except per oz information in dollars) |
For the nine months ended 9/30/24 | |||||||||||||||||||||||||||
| Footnote | Carlin | Cortez | Turquoise Ridge |
Phoenix | Nevada Gold Minesa |
Hemlob | ||||||||||||||||||||||
| COS applicable to gold production |
1,378 | 731 | 567 | 259 | 2,938 | 184 | ||||||||||||||||||||||
| Depreciation |
(232) | (187) | (125) | (50) | (595) | (27) | ||||||||||||||||||||||
| By-product credits |
(2) | (2) | (2) | (117) | (123) | 0 | ||||||||||||||||||||||
| Non-recurring items |
c | 0 | 0 | 0 | 0 | 0 | 0 | |||||||||||||||||||||
| Other |
d | (17) | 0 | 0 | 20 | 3 | 0 | |||||||||||||||||||||
| Non-controlling interests |
(434) | (208) | (170) | (43) | (856) | 0 | ||||||||||||||||||||||
| Total cash costs |
693 | 334 | 270 | 69 | 1,367 | 157 | ||||||||||||||||||||||
| General & administrative costs |
0 | 0 | 0 | 0 | 0 | 0 | ||||||||||||||||||||||
| Minesite exploration and evaluation costs |
e | 9 | 6 | 5 | 4 | 25 | 0 | |||||||||||||||||||||
| Minesite sustaining capital expenditures |
f | 544 | 194 | 81 | 32 | 874 | 30 | |||||||||||||||||||||
| Sustaining capital leases |
0 | 0 | 0 | 1 | 2 | 3 | ||||||||||||||||||||||
| Rehabilitation - accretion and amortization (operating sites) |
g | 11 | 12 | 3 | 5 | 31 | 0 | |||||||||||||||||||||
| Non-controlling interests |
(218) | (82) | (34) | (16) | (360) | 0 | ||||||||||||||||||||||
| All-in sustaining costs |
1,039 | 464 | 325 | 95 | 1,939 | 190 | ||||||||||||||||||||||
| Ounces sold - attributable basis (koz) |
592 | 321 | 209 | 89 | 1,211 | 105 | ||||||||||||||||||||||
| COS/oz |
h,i | 1,410 | 1,401 | 1,668 | 1,784 | 1,481 | 1,754 | |||||||||||||||||||||
| TCC/oz |
i | 1,171 | 1,039 | 1,294 | 770 | 1,128 | 1,486 | |||||||||||||||||||||
| TCC/oz (on a co-product basis) |
i,j | 1,173 | 1,042 | 1,301 | 1,444 | 1,180 | 1,495 | |||||||||||||||||||||
| AISC/oz |
i | 1,753 | 1,445 | 1,554 | 1,065 | 1,600 | 1,798 | |||||||||||||||||||||
| AISC/oz (on a co-product basis) |
i,j | 1,755 | 1,448 | 1,561 | 1,739 | 1,652 | 1,807 | |||||||||||||||||||||
| ($ millions, except per oz information in dollars) |
For the nine months ended 9/30/24 | |||||||||||||||
| Footnote | Pueblo Viejo | Veladero | Porgera | |||||||||||||
| COS applicable to gold production |
658 | 235 | 36 | |||||||||||||
| Depreciation |
(203 | ) | (57 | ) | (5 | ) | ||||||||||
| By-product credits |
(29 | ) | (7 | ) | (1 | ) | ||||||||||
| Non-recurring items |
c | 0 | 0 | 0 | ||||||||||||
| Other |
d | 0 | 0 | 0 | ||||||||||||
| Non-controlling interests |
(171 | ) | 0 | 0 | ||||||||||||
| Total cash costs |
255 | 171 | 30 | |||||||||||||
| General & administrative costs |
0 | 0 | 0 | |||||||||||||
| Minesite exploration and evaluation costs |
e | 0 | 3 | 1 | ||||||||||||
| Minesite sustaining capital expenditures |
f | 135 | 79 | 3 | ||||||||||||
| Sustaining capital leases |
0 | 0 | 1 | |||||||||||||
| Rehabilitation - accretion and amortization (operating sites) |
g | 5 | 0 | 1 | ||||||||||||
| Non-controlling interests |
(56 | ) | 0 | 0 | ||||||||||||
| All-in sustaining costs |
339 | 253 | 36 | |||||||||||||
| Ounces sold - attributable basis (koz) |
257 | 179 | 31 | |||||||||||||
| COS/oz |
h,i | 1,538 | 1,308 | 1,151 | ||||||||||||
| TCC/oz |
i | 995 | 945 | 977 | ||||||||||||
| TCC/oz (on a co-product basis) |
i,j | 1,063 | 989 | 1,002 | ||||||||||||
| AISC/oz |
i | 1,322 | 1,409 | 1,162 | ||||||||||||
| AISC/oz (on a co-product basis) |
i,j | 1,390 | 1,453 | 1,187 | ||||||||||||
| BARRICK THIRD QUARTER 2025 | 53 | MANAGEMENT’S DISCUSSION AND ANALYSIS |
| OVERVIEW | OPERATING PERFORMANCE |
FUTURE GROWTH |
REVIEW OF FINANCIAL RESULTS |
OTHER INFORMATION & NON-GAAP RECONCILIATIONS |
FINANCIAL STATEMENTS |
|||||
| ($ millions, except per oz information in dollars) |
For the nine months ended 9/30/24 | |||||||||||||||||||||
| Footnote | Loulo- Gounkotok |
Kibali | North Mara | Tongonl | Bulyanhulu | |||||||||||||||||
| COS applicable to gold production |
616 | 304 | 288 | 259 | 219 | |||||||||||||||||
| Depreciation |
(195) | (99) | (59) | (30) | (47) | |||||||||||||||||
| By-product credits |
0 | (1) | (2) | 0 | (19) | |||||||||||||||||
| Non-recurring items |
c | 0 | 0 | 0 | 0 | 0 | ||||||||||||||||
| Other |
d | 0 | 0 | 0 | 0 | 2 | ||||||||||||||||
| Non-controlling interests |
(84) | 0 | (36) | (24) | (25) | |||||||||||||||||
| Total cash costs |
337 | 204 | 191 | 205 | 130 | |||||||||||||||||
| General & administrative costs |
0 | 0 | 0 | 0 | 0 | |||||||||||||||||
| Minesite exploration and evaluation costs |
e | 0 | 0 | 0 | 0 | 0 | ||||||||||||||||
| Minesite sustaining capital expenditures |
f | 196 | 43 | 51 | 15 | 46 | ||||||||||||||||
| Sustaining capital leases |
1 | 5 | 0 | 1 | 0 | |||||||||||||||||
| Rehabilitation - accretion and amortization (operating sites) |
g | 4 | 1 | 4 | 7 | 1 | ||||||||||||||||
| Non-controlling interests |
(40) | 0 | (9) | (3) | (7) | |||||||||||||||||
| All-in sustaining costs |
498 | 253 | 237 | 225 | 170 | |||||||||||||||||
| Ounces sold - attributable basis (koz) |
412 | 230 | 174 | 113 | 121 | |||||||||||||||||
| COS/oz |
h,i | 1,197 | 1,320 | 1,393 | 2,062 | 1,511 | ||||||||||||||||
| TCC/oz |
i | 818 | 884 | 1,100 | 1,821 | 1,069 | ||||||||||||||||
| TCC/oz (on a co-product basis) |
i,j | 819 | 889 | 1,110 | 1,827 | 1,189 | ||||||||||||||||
| AISC/oz |
i | 1,209 | 1,103 | 1,365 | 1,997 | 1,394 | ||||||||||||||||
| AISC/oz (on a co-product basis) |
i,j | 1,210 | 1,108 | 1,375 | 2,003 | 1,514 | ||||||||||||||||
| a. |
These results represent our 61.5% interest in Carlin, Cortez, Turquoise Ridge and Phoenix. |
|
| b. |
On September 10, 2025, we reached an agreement to sell the Hemlo gold mine to Carcetti Capital Corp. for gross proceeds of up to $1.09 billion. The transaction is expected to close in Q4 2025. |
|
| c. |
Non-recurring items - These costs are not indicative of our cost of production and have been excluded from the calculation of TCC. |
|
| d. |
Other - Other adjustments at Carlin include the removal of TCC and by-product credits associated with Emigrant, which is producing incidental ounces. |
|
| e. |
Exploration and evaluation costs - Exploration, evaluation and project expenses are presented as minesite sustaining if it supports current mine operations and project if it relates to future projects. Refer to page 36 of this MD&A. |
|
| f. |
Capital expenditures - Capital expenditures are related to our gold sites only and are split between minesite sustaining and project capital expenditures. |
|
| g. |
Rehabilitation - accretion and amortization - Includes depreciation on the assets related to rehabilitation provisions of our gold operations and accretion on the rehabilitation provision of our gold operations, split between operating and non-operating sites. |
|
| h. |
COS/oz - Gold COS/oz is calculated as cost of sales across our gold operations (excluding sites in closure or care and maintenance) divided by ounces sold (both on an attributable basis using Barrick’s ownership share). |
|
| i. |
Per ounce figures - COS/oz, TCC/oz and AISC/oz may not calculate based on amounts presented in this table due to rounding. |
|
| j. |
Co-product costs/oz - TCC/oz and AISC/oz presented on a co-product basis removes the impact of by-product credits of our gold production (net of non-controlling interest) calculated as: |
|
| ($ millions) |
For the three months ended 9/30/25 | |||||||||||||||||||||||||||
| Carlin | Cortez | Turquoise Ridge |
Phoenix |
Nevada Gold Minesa |
Hemlob |
Pueblo Viejo |
||||||||||||||||||||||
| By-product credits |
1 | 1 | 1 | 49 | 52 | 1 | 16 | |||||||||||||||||||||
| Non-controlling interest |
(1 | ) | 0 | 0 | (19 | ) | (20 | ) | 0 | (7 | ) | |||||||||||||||||
| By-product credits (net of non-controlling interest) |
0 | 1 | 1 | 30 | 32 | 1 | 9 | |||||||||||||||||||||
| ($ millions) |
For the three months ended 9/30/25 | |||||||||||||||||||||||||||
| Veladero | Porgera | Loulo- Gounkotok |
Kibali | North Mara | Tongonl | Bulyanhulu | ||||||||||||||||||||||
| By-product credits |
2 | 1 | — | 0 | 2 | 0 | 6 | |||||||||||||||||||||
| Non-controlling interest |
0 | 0 | — | 0 | (1 | ) | 0 | (1 | ) | |||||||||||||||||||
| By-product credits (net of non-controlling interest) |
2 | 1 | — | 0 | 1 | 0 | 5 | |||||||||||||||||||||
| ($ millions) |
For the three months ended 6/30/25 | |||||||||||||||||||||||||||
| Carlin | Cortez | Turquoise Ridge |
Phoenix | Nevada Gold Minesa |
Hemlob | Pueblo Viejo | ||||||||||||||||||||||
| By-product credits |
1 | 1 | 1 | 34 | 37 | 0 | 11 | |||||||||||||||||||||
| Non-controlling interest |
0 | 0 | (1 | ) | (13 | ) | (14 | ) | 0 | (4 | ) | |||||||||||||||||
| By-product credits (net of non-controlling interest) |
1 | 1 | 0 | 21 | 23 | 0 | 7 | |||||||||||||||||||||
| BARRICK THIRD QUARTER 2025 | 54 | MANAGEMENT’S DISCUSSION AND ANALYSIS |
| OVERVIEW | OPERATING PERFORMANCE |
FUTURE GROWTH |
REVIEW OF FINANCIAL RESULTS |
OTHER INFORMATION & NON-GAAP RECONCILIATIONS |
FINANCIAL STATEMENTS |
|||||
| ($ millions) |
For the three months ended 6/30/25 | |||||||||||||||||||||||||||
| Veladero | Porgera | Loulo- Gounkotok |
Kibali | North Mara | Tongonl | Bulyanhulu | ||||||||||||||||||||||
| By-product credits |
2 | 0 | — | 1 | 2 | 0 | 7 | |||||||||||||||||||||
| Non-controlling interest |
0 | 0 | — | 0 | 0 | 0 | (1 | ) | ||||||||||||||||||||
| By-product credits (net of non-controlling interest) |
2 | 0 | — | 1 | 2 | 0 | 6 | |||||||||||||||||||||
| ($ millions) |
For the three months ended 9/30/24 | |||||||||||||||||||||||||||
| Carlin | Cortez | Turquoise Ridge |
Phoenix | Nevada Gold Minesa |
Hemlob | Pueblo Viejo | ||||||||||||||||||||||
| By-product credits |
1 | 0 | 1 | 39 | 41 | 0 | 5 | |||||||||||||||||||||
| Non-controlling interest |
(1 | ) | 0 | (1 | ) | (15 | ) | (17 | ) | 0 | (2 | ) | ||||||||||||||||
| By-product credits (net of non-controlling interest) |
0 | 0 | 0 | 24 | 24 | 0 | 3 | |||||||||||||||||||||
| ($ millions) |
For the three months ended 9/30/24 | |||||||||||||||||||||||||||
| Veladero | Porgera | Loulo- Gounkotok |
Kibali | North Mara | Tongonl | Bulyanhulu | ||||||||||||||||||||||
| By-product credits |
3 | 0 | 0 | 0 | 1 | 0 | 6 | |||||||||||||||||||||
| Non-controlling interest |
0 | 0 | 0 | 0 | 0 | 0 | (1 | ) | ||||||||||||||||||||
| By-product credits (net of non-controlling interest) |
3 | 0 | 0 | 0 | 1 | 0 | 5 | |||||||||||||||||||||
| ($ millions) |
For the nine months ended 9/30/25 | |||||||||||||||||||||||||||
| Carlin | Cortez | Turquoise Ridge |
Phoenix | Nevada Gold Minesa |
Hemlob | Pueblo Viejo |
||||||||||||||||||||||
| By-product credits |
4 | 3 | 3 | 116 | 126 | 1 | 39 | |||||||||||||||||||||
| Non-controlling interest |
(2 | ) | (1 | ) | (1 | ) | (45 | ) | (49 | ) | 0 | (16 | ) | |||||||||||||||
| By-product credits (net of non-controlling interest) |
2 | 2 | 2 | 71 | 77 | 1 | 23 | |||||||||||||||||||||
| ($ millions) |
For the nine months ended 9/30/25 | |||||||||||||||||||||||||||
| Veladero | Porgera | Loulo- Gounkotok |
Kibali | North Mara | Tongonl | Bulyanhulu | ||||||||||||||||||||||
| By-product credits |
5 | 1 | — | 1 | 5 | 0 | 20 | |||||||||||||||||||||
| Non-controlling interest |
0 | 0 | — | 0 | (1 | ) | 0 | (3 | ) | |||||||||||||||||||
| By-product credits (net of non-controlling interest) |
5 | 1 | — | 1 | 4 | 0 | 17 | |||||||||||||||||||||
| ($ millions) |
For the nine months ended 9/30/24 | |||||||||||||||||||||||||||
| Carlin | Cortez | Turquoise Ridge |
Phoenix | Nevada Gold Minesa |
Hemlob | Pueblo Viejo | ||||||||||||||||||||||
| By-product credits |
2 | 2 | 2 | 117 | 123 | 0 | 29 | |||||||||||||||||||||
| Non-controlling interest |
(1 | ) | (1 | ) | (1 | ) | (45 | ) | (48 | ) | 0 | (12 | ) | |||||||||||||||
| By-product credits (net of non-controlling interest) |
1 | 1 | 1 | 72 | 75 | 0 | 17 | |||||||||||||||||||||
| ($ millions) |
For the nine months ended 9/30/24 | |||||||||||||||||||||||||||
| Veladero | Porgera | Loulo- Gounkotok |
Kibali | North Mara | Tongonl | Bulyanhulu | ||||||||||||||||||||||
| By-product credits |
7 | 1 | 0 | 1 | 2 | 0 | 19 | |||||||||||||||||||||
| Non-controlling interest |
0 | 0 | 0 | 0 | 0 | 0 | (3 | ) | ||||||||||||||||||||
| By-product credits (net of non-controlling interest) |
7 | 1 | 0 | 1 | 2 | 0 | 16 | |||||||||||||||||||||
| k. | As a result of temporary suspension of operations at Loulo-Gounkoto starting January 14, 2025, and subsequent loss of control on June 16, 2025, no operating or per ounce data is provided. |
| l. | On October 6, 2025, we reached an agreement to sell our interest in the Tongon gold mine and certain of its exploration properties to the Atlantic Group for total consideration of up to $305 million. The transaction is expected to close in Q4 2025. |
| BARRICK THIRD QUARTER 2025 | 55 | MANAGEMENT’S DISCUSSION AND ANALYSIS |
| OVERVIEW | OPERATING PERFORMANCE |
FUTURE GROWTH |
REVIEW OF FINANCIAL RESULTS |
OTHER INFORMATION & NON-GAAP RECONCILIATIONS |
FINANCIAL STATEMENTS |
|||||
Reconciliation of Copper Cost of Sales to C1 cash costs and All-in sustaining costs, including on a per pound basis
| ($ millions, except per lb information in dollars) |
For the three months ended | For the nine months ended | ||||||||||||||||||
| 9/30/25 | 6/30/25 | 9/30/24 | 9/30/25 | 9/30/24 | ||||||||||||||||
| Cost of sales |
193 | 193 | 187 | 594 | 527 | |||||||||||||||
| Depreciation/amortization |
(69 | ) | (68 | ) | (60 | ) | (197 | ) | (191 | ) | ||||||||||
| Treatment and refinement charges |
44 | 40 | 39 | 126 | 111 | |||||||||||||||
| C1 cash costs applicable to equity method investments |
91 | 84 | 83 | 265 | 249 | |||||||||||||||
| Less: royalties |
(25 | ) | (25 | ) | (17 | ) | (71 | ) | (45 | ) | ||||||||||
| By-product credits |
(7 | ) | (12 | ) | (3 | ) | (24 | ) | (14 | ) | ||||||||||
| C1 cash costs |
227 | 212 | 229 | 693 | 637 | |||||||||||||||
| General & administrative costs |
12 | 8 | 6 | 28 | 15 | |||||||||||||||
| Rehabilitation - accretion and amortization |
1 | 3 | 2 | 5 | 6 | |||||||||||||||
| Royalties |
25 | 25 | 17 | 71 | 45 | |||||||||||||||
| Minesite exploration and evaluation costs |
1 | 1 | 1 | 4 | 2 | |||||||||||||||
| Minesite sustaining capital expenditures |
93 | 90 | 71 | 240 | 265 | |||||||||||||||
| Sustaining leases |
2 | 2 | 2 | 7 | 7 | |||||||||||||||
| All-in sustaining costs |
361 | 341 | 328 | 1,048 | 977 | |||||||||||||||
| Tonnes sold - attributable basis (Kt) |
52 | 54 | 42 | 157 | 123 | |||||||||||||||
| Pounds sold - attributable basis (Mlb) |
116 | 118 | 91 | 347 | 270 | |||||||||||||||
|
COS/lba,b |
2.68 | 2.56 | 3.23 | 2.72 | 3.16 | |||||||||||||||
| C1 cash costs/lba |
1.96 | 1.80 | 2.49 | 2.00 | 2.35 | |||||||||||||||
|
AISC/lba |
3.14 | 2.90 | 3.57 | 3.03 | 3.62 | |||||||||||||||
| a. | COS/lb, C1 cash costs/lb and AISC/lb may not calculate based on amounts presented in this table due to rounding. |
| b. | Copper COS/lb is calculated as cost of sales across our copper operations divided by pounds sold (both on an attributable basis using Barrick’s ownership share). |
Reconciliation of Copper Cost of Sales to C1 cash costs and All-in sustaining costs, including on a per pound basis, by operating segment
| ($ millions, except per lb information in dollars) |
For the three months ended | |||||||||||||||||||||||||||||||||||
| 9/30/25 | 6/30/25 | 9/30/24 | ||||||||||||||||||||||||||||||||||
| Zaldívar | Lumwana | Jabal Sayid |
Zaldívar | Lumwana | Jabal Sayid |
Zaldívar | Lumwana | Jabal Sayid |
||||||||||||||||||||||||||||
| Cost of sales |
85 | 193 | 33 | 75 | 194 | 33 | 86 | 187 | 23 | |||||||||||||||||||||||||||
| Depreciation/amortization |
(20 | ) | (68 | ) | (7 | ) | (18 | ) | (69 | ) | (6 | ) | (22 | ) | (60 | ) | (4 | ) | ||||||||||||||||||
| Treatment and refinement charges |
0 | 42 | 2 | 0 | 39 | 1 | 0 | 34 | 5 | |||||||||||||||||||||||||||
| Less: royalties |
0 | (25 | ) | 0 | 0 | (25 | ) | 0 | 0 | (17 | ) | 0 | ||||||||||||||||||||||||
| By-product credits |
(1 | ) | (2 | ) | (4 | ) | 0 | (4 | ) | (8 | ) | 0 | 0 | (3 | ) | |||||||||||||||||||||
| C1 cash costs |
64 | 140 | 24 | 57 | 135 | 20 | 64 | 144 | 21 | |||||||||||||||||||||||||||
| Rehabilitation - accretion and amortization |
0 | 1 | 0 | 1 | 1 | 0 | 0 | 2 | 0 | |||||||||||||||||||||||||||
| Royalties |
0 | 25 | 0 | 0 | 25 | 0 | 0 | 17 | 0 | |||||||||||||||||||||||||||
| Minesite exploration and evaluation costs |
1 | 0 | 0 | 1 | 0 | 0 | 1 | 0 | 0 | |||||||||||||||||||||||||||
| Minesite sustaining capital expenditures |
13 | 78 | 2 | 10 | 78 | 2 | 7 | 62 | 2 | |||||||||||||||||||||||||||
| Sustaining leases |
2 | 0 | 0 | 1 | 0 | 1 | 2 | 0 | 0 | |||||||||||||||||||||||||||
| All-in sustaining costs |
80 | 244 | 26 | 70 | 239 | 23 | 74 | 225 | 23 | |||||||||||||||||||||||||||
| Tonnes sold - attributable basis (Kt) |
8 | 37 | 7 | 7 | 39 | 8 | 10 | 26 | 6 | |||||||||||||||||||||||||||
| Pounds sold - attributable basis (Mlb) |
17 | 83 | 16 | 17 | 85 | 16 | 21 | 57 | 13 | |||||||||||||||||||||||||||
|
COS/lba,b |
5.02 | 2.32 | 2.08 | 4.59 | 2.25 | 2.11 | 4.04 | 3.27 | 1.76 | |||||||||||||||||||||||||||
| C1 cash costs/lba |
3.80 | 1.68 | 1.47 | 3.46 | 1.58 | 1.29 | 2.99 | 2.53 | 1.54 | |||||||||||||||||||||||||||
|
AISC/lba |
4.82 | 2.93 | 1.65 | 4.34 | 2.79 | 1.46 | 3.45 | 3.94 | 1.76 | |||||||||||||||||||||||||||
| BARRICK THIRD QUARTER 2025 | 56 | MANAGEMENT’S DISCUSSION AND ANALYSIS |
| OVERVIEW | OPERATING PERFORMANCE |
FUTURE GROWTH |
REVIEW OF FINANCIAL RESULTS |
OTHER INFORMATION & NON-GAAP RECONCILIATIONS |
FINANCIAL STATEMENTS |
|||||
| ($ millions, except per lb information in dollars) |
For the nine months ended | |||||||||||||||||||||||
| 9/30/25 | 9/30/24 | |||||||||||||||||||||||
| Zaldívar | Lumwana | Jabal Sayid | Zaldívar | Lumwana | Jabal Sayid | |||||||||||||||||||
| Cost of sales |
248 | 595 | 99 | 246 | 527 | 81 | ||||||||||||||||||
| Depreciation/amortization |
(62 | ) | (197 | ) | (20 | ) | (62 | ) | (190 | ) | (16 | ) | ||||||||||||
| Treatment and refinement charges |
0 | 120 | 6 | 0 | 93 | 18 | ||||||||||||||||||
| Less: royalties |
0 | (71 | ) | 0 | 0 | (45 | ) | 0 | ||||||||||||||||
| By-product credits |
(1 | ) | (6 | ) | (17 | ) | 0 | 0 | (14 | ) | ||||||||||||||
| Other |
0 | 0 | 0 | 0 | 0 | 0 | ||||||||||||||||||
| C1 cash costs |
185 | 441 | 68 | 184 | 385 | 69 | ||||||||||||||||||
| Rehabilitation - accretion and amortization |
1 | 3 | 0 | 0 | 6 | 0 | ||||||||||||||||||
| Royalties |
0 | 71 | 0 | 0 | 45 | 0 | ||||||||||||||||||
| Minesite exploration and evaluation costs |
4 | 0 | 0 | 2 | 0 | 0 | ||||||||||||||||||
| Minesite sustaining capital expenditures |
28 | 206 | 6 | 18 | 239 | 8 | ||||||||||||||||||
| Sustaining leases |
5 | 1 | 1 | 5 | 1 | 1 | ||||||||||||||||||
| All-in sustaining costs |
223 | 722 | 75 | 209 | 676 | 78 | ||||||||||||||||||
| Tonnes sold - attributable basis (thousands of tonnes) |
25 | 110 | 22 | 28 | 73 | 22 | ||||||||||||||||||
| Pounds sold -attributable basis (millions pounds) |
55 | 243 | 49 | 61 | 161 | 48 | ||||||||||||||||||
|
COS/lba,b |
4.53 | 2.44 | 2.05 | 4.04 | 3.27 | 1.68 | ||||||||||||||||||
| C1 cash cost/lba |
3.38 | 1.81 | 1.40 | 3.02 | 2.39 | 1.40 | ||||||||||||||||||
|
AISC/lba |
4.11 | 2.97 | 1.55 | 3.42 | 4.20 | 1.60 | ||||||||||||||||||
| a. | COS/lb, C1 cash costs/lb and AISC/lb may not calculate based on amounts presented in this table due to rounding. |
| b. | Copper COS/lb is calculated as cost of sales across our copper operations divided by pounds sold (both on an attributable basis using Barrick’s ownership share). |
EBITDA, Adjusted EBITDA, Attributable EBITDA, Attributable EBITDA Margin and Net Leverage
EBITDA is a non-GAAP financial measure, which excludes the following from net earnings:
| ∎ | Income tax expense; |
| ∎ | Finance costs; |
| ∎ | Finance income; and |
| ∎ | Depreciation. |
Management believes that EBITDA is a valuable indicator of our ability to generate liquidity by producing operating cash flow to fund working capital needs, service debt obligations, and fund capital expenditures. Management uses EBITDA for this purpose. EBITDA is also frequently used by investors and analysts for valuation purposes whereby EBITDA is multiplied by a factor or “EBITDA multiple” that is based on an observed or inferred relationship between EBITDA and market values to determine the approximate total enterprise value of a company.
Adjusted EBITDA removes the effect of impairment charges; acquisition/disposition gains/losses; foreign currency translation gains/losses; and other expense adjustments. We also remove the impact of income tax expense, finance costs, finance income and depreciation incurred in our equity method accounted investments. Attributable EBITDA further removes the non-controlling interest portion. We believe these items provide a greater level of consistency with the adjusting items included in our adjusted net earnings reconciliation, with the exception that these amounts are adjusted to remove any impact on finance costs/income, income tax expense and/or depreciation as they do not affect EBITDA. We believe this additional information will assist analysts, investors and other stakeholders of Barrick in better understanding our
ability to generate liquidity from our attributable business, including equity method investments, by excluding these amounts from the calculation as they are not indicative of the performance of our core mining business and do not necessarily reflect the underlying operating results for the periods presented. Additionally, it is aligned with how we present our forward-looking guidance on gold ounces and copper pounds produced.
Attributable EBITDA margin is calculated as attributable EBITDA divided by revenues - as adjusted. We believe this ratio will assist analysts, investors and other stakeholders of Barrick to better understand the relationship between revenues and EBITDA or operating profit.
Net leverage is calculated as debt, net of cash divided by the sum of adjusted EBITDA of the last four consecutive quarters. We believe this ratio will assist analysts, investors and other stakeholders of Barrick in monitoring our leverage and evaluating our balance sheet.
EBITDA, adjusted EBITDA, attributable EBITDA, EBITDA margin and net leverage are intended to provide additional information to investors and analysts and do not have any standardized definition under IFRS, and should not be considered in isolation or as a substitute for measures of performance prepared in accordance with IFRS. EBITDA, adjusted EBITDA and attributable EBITDA exclude the impact of cash costs of financing activities and taxes, and the effects of changes in operating working capital balances, and therefore are not necessarily indicative of operating profit or cash flow from operations as determined under IFRS. Other companies may calculate EBITDA, adjusted EBITDA, attributable EBITDA, EBITDA margin and net leverage differently.
| BARRICK THIRD QUARTER 2025 | 57 | MANAGEMENT’S DISCUSSION AND ANALYSIS |
| OVERVIEW | OPERATING PERFORMANCE |
FUTURE GROWTH |
REVIEW OF FINANCIAL RESULTS |
OTHER INFORMATION & NON-GAAP RECONCILIATIONS |
FINANCIAL STATEMENTS |
|||||
Reconciliation of Net Earnings to EBITDA, Adjusted EBITDA and Attributable EBITDA
| ($ millions) |
For the three months ended | For the nine months ended | ||||||||||||||||||
| 9/30/25 | 6/30/25 | 9/30/24 | 9/30/25 | 9/30/24 | ||||||||||||||||
| Net earnings |
1,904 | 1,256 | 780 | 3,941 | 1,901 | |||||||||||||||
| Income tax expense |
477 | 102 | 245 | 857 | 826 | |||||||||||||||
| Finance costs, neta |
21 | 36 | 59 | 96 | 97 | |||||||||||||||
| Depreciation |
460 | 436 | 477 | 1,307 | 1,431 | |||||||||||||||
| EBITDA |
2,862 | 1,830 | 1,561 | 6,201 | 4,255 | |||||||||||||||
| Impairment charges of non-current assetsb |
3 | 0 | 2 | 7 | 20 | |||||||||||||||
| Acquisition/disposition losses (gains)c |
(250) | 289 | (1) | 39 | (7) | |||||||||||||||
| (Gain) loss on currency translation |
(3) | (2) | 4 | (3) | 21 | |||||||||||||||
| Other expense adjustmentsd |
47 | 44 | 97 | 264 | 136 | |||||||||||||||
| Income tax expense, net finance costsa and depreciation from equity investees |
197 | 156 | 110 | 494 | 331 | |||||||||||||||
| Adjusted EBITDA |
2,856 | 2,317 | 1,773 | 7,002 | 4,756 | |||||||||||||||
| Non-controlling Interests |
(834) | (627) | (481) | (1,929) | (1,268) | |||||||||||||||
| Attributable EBITDA |
2,022 | 1,690 | 1,292 | 5,073 | 3,488 | |||||||||||||||
| Revenues - as adjustede |
3,405 | 3,050 | 2,806 | 9,140 | 7,686 | |||||||||||||||
| Attributable EBITDA marginf |
59 % | 55 % | 46 % | 56 % | 45 % | |||||||||||||||
| As at 9/30/25 | As at 12/31/24 | As at 9/30/24 | As at 9/30/25 | As at 12/31/24 | ||||||||||||||||
| Net leverageg |
0.0:1 | 0.1:1 | 0.1:1 | 0.0:1 | 0.0:1 | |||||||||||||||
| a. | Finance costs exclude accretion. |
| b. | There were no significant impairment charges or reversals in the current period or prior periods. |
| c. | Acquisition/disposition (gains) losses for Q3 2025 mainly related to the $250 million revaluation of our 80% equity investment in Loulo-Gounkoto, as it was deconsolidated and an investment at fair value was recognized in Q2 2025 (resulting in a Q2 2025 net loss of $1,035 million) following the change of control after it was placed under a temporary provisional administration on June 16, 2025. This loss in Q2 2025 and YTD 2025 was partially offset by a gain of $745 million on the sale of our 50% interest in the Donlin Gold project. |
| d. | Other expense adjustments for the 2025 periods mainly relate to reduced operation costs at Loulo-Gounkoto. Q3 2025 also includes severance costs and YTD 2025 was further impacted by the signing of agreements to settle legacy legal matters in the Philippines related to Placer Dome Inc. Other adjustments in Q3 2024 mainly relate to the $40 million accrual relating to the road construction in Tanzania per our community investment obligations under the Twiga partnership, and changes in the discount rate assumptions on our closed mine rehabilitation provision, combined with a provision made relating to a legacy mine site operated by Homestake Mining Company that was closed prior to the 2001 acquisition by Barrick. YTD 2024 was further impacted by the interest and penalties recognized following the settlement of the Zaldívar Tax Assessments in Chile. |
| e. | Refer to Reconciliation of Sales to Realized Price per oz/pound on page 58 of this MD&A. |
| f. | Represents attributable EBITDA divided by revenues - as adjusted. |
| g. | Represents debt, net of cash divided by adjusted EBITDA of the last four consecutive quarters. |
Realized Price
Realized price is a non-GAAP financial measure which excludes from sales:
| ∎ | Treatment and refining charges; and |
| ∎ | Cumulative catch-up adjustment to revenue relating to our streaming arrangements. |
We believe this provides investors and analysts with a more accurate measure with which to compare to market gold and copper prices and to assess our gold and copper sales performance. For those reasons, management believes that this measure provides a more accurate reflection of our
Company’s past performance and is a better indicator of its expected performance in future periods.
The realized price measure is intended to provide additional information, and does not have any standardized definition under IFRS and should not be considered in isolation or as a substitute for measures of performance prepared in accordance with IFRS. The measure is not necessarily indicative of sales as determined under IFRS. Other companies may calculate this measure differently. The following table reconciles realized prices to the most directly comparable IFRS measure.
Reconciliation of Sales to Realized Price per ounce/pound
| ($ millions, except per oz/lb information in dollars) |
Gold | Copper | Gold | Copper | ||||||||||||||||||||||||||||||||||||
| For the three months ended | For the nine months ended | |||||||||||||||||||||||||||||||||||||||
| 9/30/25 | 6/30/25 | 9/30/24 | 9/30/25 | 6/30/25 | 9/30/24 | 9/30/25 | 9/30/24 | 9/30/25 | 9/30/24 | |||||||||||||||||||||||||||||||
| Sales |
3,748 | 3,280 | 3,097 | 320 | 337 | 213 | 9,794 | 8,493 | 961 | 595 | ||||||||||||||||||||||||||||||
| Sales applicable to non-controlling interests |
(1,237 | ) | (1,054 | ) | (930 | ) | 0 | 0 | 0 | (3,139 | ) | (2,575 | ) | 0 | 0 | |||||||||||||||||||||||||
| Sales applicable to equity method investmentsa,b |
377 | 306 | 241 | 147 | 135 | 141 | 935 | 609 | 446 | 438 | ||||||||||||||||||||||||||||||
| Sales applicable to sites in closure or care and maintenancec |
(1 | ) | (1 | ) | (2 | ) | 0 | 0 | 0 | (3 | ) | (7 | ) | 0 | 0 | |||||||||||||||||||||||||
| Treatment and refinement charges |
7 | 7 | 7 | 44 | 40 | 39 | 20 | 22 | 126 | 111 | ||||||||||||||||||||||||||||||
| Revenues – as adjusted |
2,894 | 2,538 | 2,413 | 511 | 512 | 393 | 7,607 | 6,542 | 1,533 | 1,144 | ||||||||||||||||||||||||||||||
| Ounces/pounds sold (koz/Mlb)c |
837 | 770 | 967 | 116 | 118 | 91 | 2,358 | 2,833 | 347 | 270 | ||||||||||||||||||||||||||||||
| Realized gold/copper price per oz/lbd |
3,457 | 3,295 | 2,494 | 4.39 | 4.36 | 4.27 | 3,226 | 2,309 | 4.42 | 4.23 | ||||||||||||||||||||||||||||||
| a. | Represents sales of $294 million and $711 million, respectively, for Q3 2025 and YTD 2025 (Q2 2025: $226 million; Q3 2024: $193 million; YTD 2024: $533 million) applicable to our 45% equity method investment in Kibali and $83 million and $224 million, respectively (Q2 2025: $80 million; Q3 2024: $48 million; YTD 2024: $76 million) applicable to our 24.5% equity method investment in Porgera for gold. Represents sales of $77 million and $243 million, respectively, for Q3 2025 and YTD 2025 (Q2 2025: $71 million; Q3 2024: $91 million; YTD 2024: $260 million) applicable to our 50% equity method investment in Zaldívar and $71 million and $208 million, respectively (Q2 2025: $65 million; Q3 2024: $55 million; YTD 2024: $196 million), applicable to our 50% equity method investment in Jabal Sayid for copper. |
| b. | Sales applicable to equity method investments are net of treatment and refinement charges. |
| c. | On an attributable basis. Excludes Long Canyon which is producing residual ounces from the leach pad while in care and maintenance. |
| d. | Realized price per oz/lb may not calculate based on amounts presented in this table due to rounding. |
| BARRICK THIRD QUARTER 2025 | 58 | MANAGEMENT’S DISCUSSION AND ANALYSIS |
| OVERVIEW | OPERATING PERFORMANCE |
FUTURE GROWTH |
REVIEW OF FINANCIAL RESULTS |
OTHER INFORMATION & NON-GAAP RECONCILIATIONS |
FINANCIAL STATEMENTS |
|||||
Technical Information
The scientific and technical information contained in this MD&A has been reviewed and approved by Tricia Evans, BSc, SMERM, Mineral Resource Manager: North America; Mark Roux, BSc (Hons), P. Grad. Cert. (Geostatistics), Pr. Sci. Nat, Resource Geology Lead – North America; Richard Peattie, MPhil, FAusIMM, Mineral Resources Manager: Africa and Middle East; Peter Jones, MAIG, Manager Resource Geology – Latin America & Asia Pacific; and Joel Holliday, FAusIMM, Executive Vice-President, Exploration – each a “Qualified Person” as defined in National Instrument 43-101 – Standards of Disclosure for Mineral Projects.
All mineral reserve and mineral resource estimates are estimated in accordance with National Instrument 43-101 – Standards of Disclosure for Mineral Projects. Unless otherwise noted, such mineral reserve and mineral resource estimates are as of December 31, 2024.
Endnotes
| 1 | Further information on these non-GAAP financial measures, including detailed reconciliations, is included on pages 43 to 58 of this MD&A. |
| 2 | Gold COS/oz is calculated as cost of sales across our gold operations (excluding sites in closure or care and maintenance) divided by ounces sold (both on an attributable basis using Barrick’s ownership share). Copper COS/lb is calculated as cost of sales across our copper operations divided by pounds sold (both on an attributable basis using Barrick’s ownership share). References to attributable basis means our 100% share of Hemlo and Lumwana, our 61.5% share of NGM, our 60% share of Pueblo Viejo, our 80% share of Loulo-Gounkoto, our 89.7% share of Tongon, our 84% share of North Mara, and Bulyanhulu, our 50% share of Veladero, Zaldívar and Jabal Sayid, our 24.5% share of Porgera and our 45% share of Kibali. |
| 3 | Total reportable incident frequency rate (“TRIFR”) is a ratio calculated as follows: number of reportable injuries x 1,000,000 hours divided by the total number of hours worked. Reportable injuries include fatalities, lost time injuries, restricted duty injuries, and medically treated injuries. Lost time injury frequency rate (“LTIFR”) is a ratio calculated as follows: number of lost time injuries x 1,000,000 hours divided by the total number of hours worked. |
| 4 | Class 1 - High Significance is defined as an incident that causes significant negative impacts on human health or the environment or an incident that extends onto publicly accessible land and has the potential to cause significant adverse impact to surrounding communities, livestock or wildlife. |
| 5 | A Tier One Gold Asset is an asset with a $1,400/oz reserve with potential to deliver a minimum 10-year life, annual production of at least 500,000 ounces of gold and with costs per ounce in the lower half of the industry cost curve. A Tier One Copper Asset/Project is an asset with a $3.00/lb reserve with potential for +5Mt contained copper in support at least 20 years life, annual production of at least 200ktpa, with costs per pound in the lower half of the industry cost curve. Tier One Assets must be located in a world-class geological district with potential for organic reserve growth and long-term geologically driven addition. |
| 6 | Refer to the Technical Report on the Cortez Complex, Lander and Eureka Counties, State of Nevada, USA, dated December 31, 2021, and filed on SEDAR+ at www.sedarplus.ca and EDGAR at www.sec.gov on March 18, 2022. |
| 7 | Refer to the Technical Report on the Carlin Complex, Eureka and Elko County, Nevada, USA, dated March 14, 2025, and filed on SEDAR+ at www.sedarplus.ca and EDGAR at www.sec.gov on March 14, 2025. |
| 8 | Refer to the Technical Report on the Pueblo Viejo mine, Dominican Republic, dated March 17, 2023, and filed on SEDAR+ at www.sedarplus.ca and EDGAR at www.sec.gov on March 17, 2023. |
| 9 | Refer to the Technical Report on the Reko Diq Project, Balochistan, Pakistan, dated February 19, 2025, and filed on SEDAR+ at www.sedarplus.ca and EDGAR at www.sec.gov on February 19, 2025. |
| 10 | Reko Diq probable reserves of 1,400 million tonnes grading 0.28 g/t representing 13 million ounces of gold, probable reserves of 1,500 million tonnes grading 0.48% representing 7.3 million tonnes of copper, indicated resources of 1,800 million tonnes grading 0.25 g/t representing 15 million ounces of gold, inferred resources of 640 million tonnes grading 0.2 g/t representing 3.9 million ounces of gold, indicated resources of 2,000 million tonnes grading 0.43% representing 8.4 million tonnes of copper, and inferred resources of 690 million tonnes grading 0.3% representing 2.2 million tonnes of copper. Complete mineral reserve and mineral resource data for all mines and projects referenced in this MD&A, including tonnes, grades, and ounces, can be found on pages 83-92 of Barrick’s Fourth Quarter and Year-End 2024 Report. |
| 11 | Refer to the Technical Report on the Lumwana Expansion Project, Republic of Zambia, dated February 19, 2025, and filed on SEDAR+ at www.sedarplus.ca and EDGAR at www.sec.gov on February 19, 2025. |
| BARRICK THIRD QUARTER 2025 | 59 | MANAGEMENT’S DISCUSSION AND ANALYSIS |
| OVERVIEW | OPERATING PERFORMANCE |
FUTURE GROWTH |
REVIEW OF FINANCIAL RESULTS |
OTHER INFORMATION & NON-GAAP RECONCILIATIONS |
FINANCIAL STATEMENTS |
|||||
Consolidated Statements of Income
| Barrick Mining Corporation (formerly Barrick Gold Corporation) (in millions of United States dollars, except per share data) (Unaudited) |
Three months ended September 30, |
Nine months ended September 30, |
||||||||||||||
| 2025 | 2024 | 2025 | 2024 | |||||||||||||
| Revenue (notes 5 and 6) |
$4,148 | $3,368 | $10,959 | $9,277 | ||||||||||||
| Costs and expenses (income) |
||||||||||||||||
| Cost of sales (notes 5 and 7) |
1,890 | 2,051 | 5,553 | 5,966 | ||||||||||||
| General and administrative expenses |
77 | 46 | 158 | 106 | ||||||||||||
| Exploration, evaluation and project expenses |
92 | 104 | 228 | 296 | ||||||||||||
| Impairment charges (note 9b) |
3 | 2 | 7 | 20 | ||||||||||||
| (Gain) loss on currency translation |
(3 | ) | 4 | (3 | ) | 21 | ||||||||||
| Closed mine rehabilitation |
4 | 59 | 15 | 48 | ||||||||||||
| Income from equity investees (note 12) |
(146 | ) | (51 | ) | (290 | ) | (214 | ) | ||||||||
| Other (income) expense (note 9a) |
(193 | ) | 46 | 330 | 143 | |||||||||||
| Income before finance costs and income taxes |
$2,424 | $1,107 | $4,961 | $2,891 | ||||||||||||
| Finance costs, net |
(43 | ) | (82 | ) | (163 | ) | (164 | ) | ||||||||
| Income before income taxes |
$2,381 | $1,025 | $4,798 | $2,727 | ||||||||||||
| Income tax expense (note 10) |
(477 | ) | (245 | ) | (857 | ) | (826 | ) | ||||||||
| Net income |
$1,904 | $780 | $3,941 | $1,901 | ||||||||||||
| Attributable to: |
||||||||||||||||
| Equity holders of Barrick Mining Corporation |
$1,302 | $483 | $2,587 | $1,148 | ||||||||||||
| Non-controlling interests (note 16) |
$602 | $297 | $1,354 | $753 | ||||||||||||
| Earnings per share attributable to the equity holders of Barrick Mining Corporation |
||||||||||||||||
| Net income |
||||||||||||||||
| Basic |
$0.76 | $0.28 | $1.51 | $0.65 | ||||||||||||
| Diluted |
$0.76 | $0.28 | $1.51 | $0.65 | ||||||||||||
The accompanying notes are an integral part of these condensed interim consolidated financial statements.
| BARRICK THIRD QUARTER 2025 | 60 | FINANCIAL STATEMENTS (UNAUDITED) |
| OVERVIEW | OPERATING PERFORMANCE |
FUTURE GROWTH |
REVIEW OF FINANCIAL RESULTS |
OTHER INFORMATION & NON-GAAP RECONCILIATIONS |
FINANCIAL STATEMENTS |
|||||
Consolidated Statements
of Comprehensive Income
| Barrick Mining Corporation (formerly Barrick Gold Corporation) (in millions of United States dollars) (Unaudited) |
Three months ended September 30, |
Nine months ended September 30, |
||||||||||||||
| 2025 | 2024 | 2025 | 2024 | |||||||||||||
| Net income |
$1,904 | $780 | $3,941 | $1,901 | ||||||||||||
| Other comprehensive income (loss), net of taxes |
||||||||||||||||
| Items that may be reclassified subsequently to profit or loss: |
||||||||||||||||
| Unrealized gains (losses) on derivatives designated as cash flow hedges, net of tax $nil, $nil, $nil and $nil |
(150 | ) | — | (150 | ) | 1 | ||||||||||
| Items that will not be reclassified to profit or loss: |
||||||||||||||||
| Actuarial gain (loss) on post employment benefit obligations, net of tax $nil, $nil, $nil and $nil |
1 | — | (1 | ) | — | |||||||||||
| Net change on equity investments, net of tax $(2), $(1), $(3) and $nil |
24 | 3 | 41 | 12 | ||||||||||||
| Total other comprehensive (loss) income |
(125 | ) | 3 | (110 | ) | 13 | ||||||||||
| Total comprehensive income |
$1,779 | $783 | $3,831 | $1,914 | ||||||||||||
| Attributable to: |
||||||||||||||||
| Equity holders of Barrick Mining Corporation |
$1,177 | $486 | $2,477 | $1,161 | ||||||||||||
| Non-controlling interests |
$602 | $297 | $1,354 | $753 | ||||||||||||
The accompanying notes are an integral part of these condensed interim consolidated financial statements.
| BARRICK THIRD QUARTER 2025 | 61 | FINANCIAL STATEMENTS (UNAUDITED) |
| OVERVIEW | OPERATING PERFORMANCE |
FUTURE GROWTH |
REVIEW OF FINANCIAL RESULTS |
OTHER INFORMATION & NON-GAAP RECONCILIATIONS |
FINANCIAL STATEMENTS |
|||||
Consolidated Statements of Cash Flow
| Barrick Mining Corporation (formerly Barrick Gold Corporation) (in millions of United States dollars) (Unaudited) |
Three months ended September 30, |
Nine months ended September 30, |
||||||||||||||
| 2025 | 2024 | 2025 | 2024 | |||||||||||||
| OPERATING ACTIVITIES |
||||||||||||||||
| Net income |
$1,904 | $780 | $3,941 | $1,901 | ||||||||||||
| Adjustments for the following items: |
||||||||||||||||
| Depreciation |
460 | 477 | 1,307 | 1,431 | ||||||||||||
| Finance costs, net |
43 | 82 | 163 | 164 | ||||||||||||
| Impairment charges (note 9b) |
3 | 2 | 7 | 20 | ||||||||||||
| Income tax expense (note 10) |
477 | 245 | 857 | 826 | ||||||||||||
| Income from equity investees (note 12) |
(146 | ) | (51 | ) | (290 | ) | (214 | ) | ||||||||
| Gain on sale of non-current assets (note 9a) |
— | (1 | ) | (745 | ) | (7 | ) | |||||||||
| Loulo-Gounkoto (note 9a and 17) |
(250 | ) | — | 785 | — | |||||||||||
| (Gain) loss on currency translation |
(3 | ) | 4 | (3 | ) | 21 | ||||||||||
| Change in working capital (note 11) |
184 | (251 | ) | (50 | ) | (380 | ) | |||||||||
| Other operating activities (note 11) |
(24 | ) | 45 | (136 | ) | (54 | ) | |||||||||
| Operating cash flows before interest and income taxes |
2,648 | 1,332 | 5,836 | 3,708 | ||||||||||||
| Interest paid |
(18 | ) | (76 | ) | (157 | ) | (234 | ) | ||||||||
| Interest received |
53 | 66 | 136 | 184 | ||||||||||||
| Income taxes paid1 |
(261 | ) | (142 | ) | (852 | ) | (559 | ) | ||||||||
| Net cash provided by operating activities |
2,422 | 1,180 | 4,963 | 3,099 | ||||||||||||
| INVESTING ACTIVITIES |
||||||||||||||||
| Property, plant and equipment |
||||||||||||||||
| Capital expenditures (note 5) |
(943 | ) | (736 | ) | (2,714 | ) | (2,283 | ) | ||||||||
| Sales proceeds |
— | 2 | 2 | 9 | ||||||||||||
| Divestitures (note 4) |
— | — | 999 | — | ||||||||||||
| Income taxes paid on divestitures |
(44 | ) | — | (131 | ) | — | ||||||||||
| Investment sales |
— | 44 | — | 77 | ||||||||||||
| Funding of equity method investments (note 12) |
(1 | ) | — | (1 | ) | (55 | ) | |||||||||
| Dividends received from equity method investments (note 12) |
63 | 38 | 154 | 127 | ||||||||||||
| Shareholder loan repayments from equity method investments |
64 | 49 | 177 | 139 | ||||||||||||
| Net cash used in investing activities |
(861 | ) | (603 | ) | (1,514 | ) | (1,986 | ) | ||||||||
| FINANCING ACTIVITIES |
||||||||||||||||
| Lease repayments |
(3 | ) | (4 | ) | (20 | ) | (11 | ) | ||||||||
| Debt repayments |
— | — | (2 | ) | — | |||||||||||
| Dividends |
(254 | ) | (174 | ) | (596 | ) | (524 | ) | ||||||||
| Share buyback program (note 15) |
(589 | ) | (95 | ) | (1,000 | ) | (144 | ) | ||||||||
| Funding from Reko Diq non-controlling interests (note 16) |
101 | 32 | 228 | 84 | ||||||||||||
| Disbursements to non-controlling interests (note 16) |
(524 | ) | (142 | ) | (1,056 | ) | (432 | ) | ||||||||
| Pueblo Viejo JV partner shareholder loan |
(26 | ) | (4 | ) | (9 | ) | (6 | ) | ||||||||
| Net cash used in financing activities |
(1,295 | ) | (387 | ) | (2,455 | ) | (1,033 | ) | ||||||||
| Effect of exchange rate changes on cash and equivalents |
1 | (1 | ) | 1 | (3 | ) | ||||||||||
| Net increase in cash and equivalents |
267 | 189 | 995 | 77 | ||||||||||||
| Cash and equivalents at the beginning of period |
4,802 | 4,036 | 4,074 | 4,148 | ||||||||||||
| Cash and equivalents at the end of period |
$5,069 | $4,225 | 5,069 | 4,225 | ||||||||||||
| Less: cash and equivalents classified as held for sale at the end of period |
32 | — | 32 | — | ||||||||||||
| Cash and equivalents excluding assets classified as held for sale at the end of period |
$5,037 | $4,225 | $5,037 | $4,225 | ||||||||||||
| 1 | Income taxes paid excludes $53 million (Q3 2024: $36 million) for Q3 2025 and $128 million (YTD 2024: $65 million) for YTD 2025 of income taxes payable that were settled against offsetting value added tax (“VAT”) receivables. |
The accompanying notes are an integral part of these condensed interim consolidated financial statements.
| BARRICK THIRD QUARTER 2025 | 62 | FINANCIAL STATEMENTS (UNAUDITED) |
| OVERVIEW | OPERATING PERFORMANCE |
FUTURE GROWTH |
REVIEW OF FINANCIAL RESULTS |
OTHER INFORMATION & NON-GAAP RECONCILIATIONS |
FINANCIAL STATEMENTS |
|||||
Consolidated Balance Sheets
| Barrick Mining Corporation (formerly Barrick Gold Corporation) (in millions of United States dollars) (Unaudited) |
As at September 30, 2025 |
As at December 31, 2024 |
||||||
| ASSETS |
||||||||
| Current assets |
||||||||
| Cash and equivalents |
$5,037 | $4,074 | ||||||
| Accounts receivable |
551 | 763 | ||||||
| Inventories |
1,870 | 1,942 | ||||||
| Other current assets |
676 | 853 | ||||||
| Total current assets (excluding assets classified as held for sale) |
$8,134 | $7,632 | ||||||
| Assets classified as held for sale (note 4) |
815 | — | ||||||
| Total current assets |
$8,949 | $7,632 | ||||||
| Non-current assets |
||||||||
| Non-current portion of inventory |
2,650 | 2,783 | ||||||
| Equity in investees (note 12) |
4,186 | 4,112 | ||||||
| Property, plant and equipment |
25,849 | 28,559 | ||||||
| Intangible assets |
148 | 148 | ||||||
| Goodwill |
3,034 | 3,097 | ||||||
| Deferred income tax assets |
129 | — | ||||||
| Other assets |
3,412 | 1,295 | ||||||
| Total assets |
$48,357 | $47,626 | ||||||
| LIABILITIES AND EQUITY |
||||||||
| Current liabilities |
||||||||
| Accounts payable |
$1,423 | $1,613 | ||||||
| Debt |
71 | 24 | ||||||
| Current income tax liabilities |
675 | 545 | ||||||
| Other current liabilities |
585 | 460 | ||||||
| Total current liabilities (excluding liabilities classified as held for sale) |
$2,754 | $2,642 | ||||||
| Liabilities classified as held for sale (note 4) |
286 | — | ||||||
| Total current liabilities |
$3,040 | $2,642 | ||||||
| Non-current liabilities |
||||||||
| Debt |
4,643 | 4,705 | ||||||
| Provisions |
1,887 | 1,962 | ||||||
| Deferred income tax liabilities |
3,562 | 3,887 | ||||||
| Other liabilities |
1,309 | 1,174 | ||||||
| Total liabilities |
$14,441 | $14,370 | ||||||
| Equity |
||||||||
| Capital stock (note 15) |
$27,026 | $27,661 | ||||||
| Deficit |
(3,281 | ) | (5,269 | ) | ||||
| Accumulated other comprehensive income (loss) |
(77 | ) | 33 | |||||
| Other |
1,482 | 1,865 | ||||||
| Total equity attributable to Barrick Mining Corporation shareholders |
$25,150 | $24,290 | ||||||
| Non-controlling interests (note 16) |
8,766 | 8,966 | ||||||
| Total equity |
$33,916 | $33,256 | ||||||
| Contingencies and commitments (notes 5 and 18) |
||||||||
| Total liabilities and equity |
$48,357 | $47,626 | ||||||
The accompanying notes are an integral part of these condensed interim consolidated financial statements.
| BARRICK THIRD QUARTER 2025 | 63 | FINANCIAL STATEMENTS (UNAUDITED) |
| OVERVIEW | OPERATING PERFORMANCE |
FUTURE GROWTH |
REVIEW OF FINANCIAL RESULTS |
OTHER INFORMATION & NON-GAAP RECONCILIATIONS |
FINANCIAL STATEMENTS |
|||||
Consolidated Statements of Changes in Equity
| Barrick Mining Corporation (formerly Barrick Gold Corporation) |
Attributable to equity holders of the company | |||||||||||||||||||||||||||||||
| (in millions of United States dollars) (Unaudited) |
Common Shares (in thousands) |
Capital stock |
Retained earnings (deficit) |
Accumulated income (loss)1 |
Other2 | Total equity attributable to shareholders |
Non- controlling interests |
Total equity |
||||||||||||||||||||||||
| At January 1, 2025 |
1,727,100 | $27,661 | ($5,269 | ) | $33 | $1,865 | $24,290 | $8,966 | $33,256 | |||||||||||||||||||||||
| Net income |
— | — | 2,587 | — | — | 2,587 | 1,354 | 3,941 | ||||||||||||||||||||||||
| Total other comprehensive loss |
— | — | — | (110 | ) | — | (110 | ) | — | (110 | ) | |||||||||||||||||||||
| Total comprehensive income (loss) |
— | — | 2,587 | (110 | ) | — | 2,477 | 1,354 | 3,831 | |||||||||||||||||||||||
| Transactions with owners |
||||||||||||||||||||||||||||||||
| Dividends |
— | — | (596 | ) | — | — | (596 | ) | — | (596 | ) | |||||||||||||||||||||
| Loulo-Gounkoto loss of control (note 17) |
— | — | — | — | — | — | (686 | ) | (686 | ) | ||||||||||||||||||||||
| Funding from non-controlling interests (note 16) |
— | — | — | — | — | — | 228 | 228 | ||||||||||||||||||||||||
| Disbursements to non-controlling interests (note 16) |
— | — | — | — | — | — | (1,096 | ) | (1,096 | ) | ||||||||||||||||||||||
| Dividend reinvestment plan (note 15) |
125 | 3 | (3 | ) | — | — | — | — | — | |||||||||||||||||||||||
| Share buyback program (note 15) |
(39,791 | ) | (638 | ) | — | — | (383 | ) | (1,021 | ) | — | (1,021 | ) | |||||||||||||||||||
| Total transactions with owners |
(39,666 | ) | (635 | ) | (599 | ) | — | (383 | ) | (1,617 | ) | (1,554 | ) | (3,171 | ) | |||||||||||||||||
| At September 30, 2025 |
1,687,434 | $27,026 | ($3,281 | ) | ($77 | ) | $1,482 | $25,150 | $8,766 | $33,916 | ||||||||||||||||||||||
| At January 1, 2024 |
1,755,570 | $28,117 | ($6,713 | ) | $24 | $1,913 | $23,341 | $8,661 | $32,002 | |||||||||||||||||||||||
| Net income |
— | — | 1,148 | — | — | 1,148 | 753 | 1,901 | ||||||||||||||||||||||||
| Total other comprehensive income |
— | — | — | 13 | — | 13 | — | 13 | ||||||||||||||||||||||||
| Total comprehensive income |
— | — | 1,148 | 13 | — | 1,161 | 753 | 1,914 | ||||||||||||||||||||||||
| Transactions with owners |
||||||||||||||||||||||||||||||||
| Dividends |
— | — | (524 | ) | — | — | (524 | ) | — | (524 | ) | |||||||||||||||||||||
| Funding from non-controlling interests |
— | — | — | — | — | — | 84 | 84 | ||||||||||||||||||||||||
| Disbursements to non-controlling interests |
— | — | — | — | — | — | (432 | ) | (432 | ) | ||||||||||||||||||||||
| Dividend reinvestment plan |
154 | 3 | (3 | ) | — | — | — | — | — | |||||||||||||||||||||||
| Share buyback program |
(7,675 | ) | (124 | ) | — | — | (23 | ) | (147 | ) | — | (147 | ) | |||||||||||||||||||
| Total transactions with owners |
(7,521 | ) | (121 | ) | (527 | ) | — | (23 | ) | (671 | ) | (348 | ) | (1,019 | ) | |||||||||||||||||
| At September 30, 2024 |
1,748,049 | $27,996 | ($6,092 | ) | $37 | $1,890 | $23,831 | $9,066 | $32,897 | |||||||||||||||||||||||
| 1 | Includes cumulative translation losses at September 30, 2025: $95 million (December 31, 2024: $95 million; September 30, 2024: $95 million). |
| 2 | Includes additional paid-in capital as at September 30, 2025: $1,444 million (December 31, 2024: $1,827 million; September 30, 2024: $1,852 million). |
The accompanying notes are an integral part of these condensed interim consolidated financial statements.
| BARRICK THIRD QUARTER 2025 | 64 | FINANCIAL STATEMENTS (UNAUDITED) |
| OVERVIEW | OPERATING PERFORMANCE |
FUTURE GROWTH |
REVIEW OF FINANCIAL RESULTS |
OTHER INFORMATION & NON-GAAP RECONCILIATIONS |
FINANCIAL STATEMENTS |
|||||
Notes to Consolidated Financial Statements
Barrick Mining Corporation. Tabular dollar amounts in millions of United States dollars, unless otherwise shown.
1 ∎ Corporate Information
Barrick Mining Corporation (formerly Barrick Gold Corporation) (“Barrick”, “we” or the “Company”) is a corporation governed by the Business Corporations Act (British Columbia). The Company’s corporate office is located at Brookfield Place, TD Canada Trust Tower, 161 Bay Street, Suite 3700, Toronto, Ontario, M5J 2S1. The Company’s registered office is 925 West Georgia Street, Suite 1600, Vancouver, British Columbia, V6C 3L2. Barrick shares trade on the New York Stock Exchange under the symbol B (formerly GOLD) and the Toronto Stock Exchange under the symbol ABX. We are principally engaged in the production and sale of gold and copper, as well as related activities such as exploration and mine development. We sell our gold and copper into the world market.
We have ownership interests in producing gold mines that are located in Argentina, Canada, Côte d’Ivoire, the Democratic Republic of the Congo, the Dominican Republic, Mali, Papua New Guinea, Tanzania and the United States. Our mine in Mali was placed on temporary suspension in January 2025 and on June 16, 2025, the Bamako Commercial Tribunal placed the mine under a temporary provisional administration (refer to note 17 for further details). We have ownership interests in producing copper mines in Chile, Saudi Arabia and Zambia. We also have various projects located throughout the Americas, Asia and Africa.
2 ∎ Material Accounting Policy Information
a) Statement of Compliance
These condensed interim consolidated financial statements have been prepared in accordance with IFRS Accounting Standards as issued by the International Accounting Standards Board (“IASB”) applicable to the preparation of interim financial statements, under International Accounting Standard 34, Interim Financial Reporting. These interim financial statements should be read in conjunction with Barrick’s most recently issued Annual Report, which includes information necessary or useful to understanding the Company’s business and financial statement presentation. In particular, the Company’s material accounting policy information was presented in Note 2 of the Annual Consolidated Financial Statements for the year ended December 31, 2024 (“2024 Annual Financial Statements”), and have been consistently applied in the preparation of these interim financial statements. These condensed interim consolidated financial statements were authorized for issuance by the Board of Directors on November 7, 2025.
b) New Accounting Standards Issued
Certain new accounting standards and interpretations have been published that are either applicable in the current year or not mandatory for the current period. We have assessed these standards and determined they do not have a material impact on Barrick in the current reporting period. In addition, the following standards have been issued by the IASB and we are currently assessing the impact on our consolidated financial statements.
| ∎ | Amendments to the Classification and Measurement of Financial Instruments (IFRS 9 and IFRS 7) with mandatory application of the standard in annual reporting periods beginning on or after January 1, 2026. |
| ∎ | IFRS 18 Presentation and Disclosure in Financial Statements with mandatory application of the standard in annual reporting periods beginning on or after January 1, 2027. |
No standards have been early adopted in the current period.
3 ∎ Critical Judgements, Estimates, Assumptions and Risks
The judgments, estimates, assumptions and risks discussed here reflect updates from the 2024 Annual Financial Statements. For judgments, estimates, assumptions and risks related to other areas not discussed in these interim consolidated financial statements, please refer to Notes 3 and 28 of the 2024 Annual Financial Statements.
a) Provision for Environmental Rehabilitation (“PER”)
Provisions are updated each reporting period for changes to expected cash flows and for the effect of changes in the discount rate and foreign exchange rates. The change in estimate is added or deducted from the related asset and depreciated over the expected economic life of the operation to which it relates. In the case of closed sites, changes in estimates and assumptions are recognized immediately in the consolidated statements of income. For Q3 2025, we recorded a net decrease of $68 million (Q3 2024: $71 million net increase) to the PER at our minesites and for YTD 2025, a net decrease of $150 million (YTD 2024: $29 million net decrease) primarily due to spending incurred during the year, combined with the deconsolidation of Loulo-Gounkoto upon loss of control (refer to note 17 for further details) and the classification of Hemlo and Tongon as assets held-for-sale (refer to note 4 for further details), partially offset by changes in cost estimates at our Carlin property and accretion.
Adjustments to the estimated amount and timing of future closure and rehabilitation cash flows are a normal occurrence in light of the significant judgments and estimates involved. Rehabilitation provisions are adjusted as a result of changes in estimates and assumptions and are accounted for prospectively. In Q4 of each year, our life of mine plans are updated and that typically results in an update to the rehabilitation provision.
b) Contingencies
Contingencies can be either possible assets or possible liabilities arising from past events which, by their nature, will be resolved only when one or more future events, not wholly within our control, occur or fail to occur. The assessment of such contingencies inherently involves the exercise of significant judgment and estimates of the outcome of future events. Refer to Note 18 for further details on contingencies.
c) Loulo-Gounkoto
On June 16, 2025, we lost control of the subsidiaries that hold our 80% interest in the Loulo-Gounkoto mine in Mali when they were placed under a temporary provisional administration. As a result of this event in Q2 2025, we determined that we no longer had control of the mine and stopped consolidating it. As we retain legal ownership of 80% of the companies that hold the mine, we have recognized an investment at fair value to reflect our retained interest. Refer to note 17 for further details.
| BARRICK THIRD QUARTER 2025 | 65 | NOTES TO FINANCIAL STATEMENTS (UNAUDITED) |
| OVERVIEW | OPERATING PERFORMANCE |
FUTURE GROWTH |
REVIEW OF FINANCIAL RESULTS |
OTHER INFORMATION & NON-GAAP RECONCILIATIONS |
FINANCIAL STATEMENTS |
|||||
4 ∎ Acquisitions and Divestitures
a) Tongon
On October 6, 2025, Barrick announced that it reached an agreement to sell its interests in the Tongon gold mine (“Tongon”) and certain of its exploration properties in Côte d’lvoire to the Atlantic Group for total consideration of up to $305 million. The consideration is composed of cash consideration of $192 million, inclusive of a $23 million shareholder loan repayment within six months of closing, and contingent cash payments totalling up to $113 million payable based on the price of gold over 2.5 years and resource conversions over 5 years. The transaction is expected to be completed within Q4 2025 subject to the satisfaction of customary closing conditions. As at September 30, 2025, the assets and liabilities of our interest in Tongon were classified as held-for-sale.
b) Hemlo
On September 11, 2025, Barrick announced that it reached an agreement to sell the Hemlo Gold Mine (“Hemlo”) in Canada to Carcetti Capital Corp., which is to be renamed to Hemlo Mining Corp. (“HMC”). The sale agreement provides for gross proceeds of up to $1.09 billion, consisting of $875 million of cash proceeds due on closing, HMC shares with an aggregate value of $50 million, and a production and tiered gold price-linked cash payment structure of up to $165 million starting in January 2027 for a five-year term. The transaction is expected to be completed within Q4 2025 subject to the satisfaction of customary closing conditions and obtaining required regulatory approvals. As at September 30, 2025, the assets and liabilities of our interest in Hemlo were classified as held-for-sale.
c) Alturas
On August 8, 2025, Barrick announced that it reached an agreement to sell the Alturas Project in Chile to a subsidiary of Boroo Pte Ltd (Singapore) (“Boroo”) for an up-front cash payment of $50 million. In addition, Barrick will be granted a 0.5% net smelter return royalty on gold and silver produced from the Project, which will terminate once 2 million ounces of gold and gold-equivalent have been produced. Boroo may repurchase the royalty within four years from closing for $10 million. The transaction closed on November 7, 2025. As at September 30, 2025, the assets and liabilities of our interest in the Alturas Project were classified as held-for-sale.
d) Donlin Gold
On April 22, 2025, Barrick announced it entered into an agreement to sell its 50% interest in the Donlin Gold project located in Alaska, USA to affiliates of Paulson Advisers LLC and NOVAGOLD Resources Inc. (“NOVAGOLD”) for total cash consideration of $1 billion. In addition, Barrick has granted NOVAGOLD an option to purchase the outstanding debt owed to Barrick (value of $164 million as at September 30, 2025, classified as fair value through profit or loss (“FVPL”) and presented in Other Assets) in connection with the Donlin Gold project for $90 million if purchased prior to closing, or for $100 million if purchased within 18 months from closing, when the option expires. If that option is not exercised, the debt will remain outstanding, substantially in accordance with its existing terms which would largely defer repayment to the commencement of production.
The transaction closed on June 3, 2025 and we recognized a gain on sale of $745 million in Q2 2025. In addition, NOVAGOLD did not exercise the option to purchase the outstanding debt owed to Barrick at closing, but retains the option to purchase the outstanding debt for $100 million within 18 months from closing.
| BARRICK THIRD QUARTER 2025 | 66 | NOTES TO FINANCIAL STATEMENTS (UNAUDITED) |
| OVERVIEW | OPERATING PERFORMANCE |
FUTURE GROWTH |
REVIEW OF FINANCIAL RESULTS |
OTHER INFORMATION & NON-GAAP RECONCILIATIONS |
FINANCIAL STATEMENTS |
|||||
5 ∎ Segment Information
Barrick’s business is organized into sixteen minesites. Barrick’s Chief Operating Decision Maker (“CODM”) (Mark Bristow, President and Chief Executive Officer until September 29, 2025 and Mark Hill, Group Chief Operating Officer and Interim President and Chief Executive Officer thereafter) reviews the operating results, assesses performance and makes capital allocation decisions at the minesite level. Our presentation of our reportable operating segments consists of eight gold mines (Carlin, Cortez, Turquoise Ridge, Pueblo Viejo, Loulo-Gounkoto, Kibali, North Mara and Bulyanhulu) and one copper mine (Lumwana). The remaining operating segments, including our remaining gold mines, have been grouped into an “Other Mines” category and will not be reported on individually. Segment performance is evaluated based on a number of measures including operating income before tax, production levels and unit production costs. Certain costs are managed on a consolidated basis and are therefore not reflected in segment income.
Consolidated Statement of Income Information
| Cost of Sales | ||||||||||||||||||||||||
| For the three months ended September 30, 2025 |
Revenue | Site operating costs, royalties and community relations |
Depreciation | Exploration, evaluation and project expenses |
Other expenses (income)1 |
Segment income (loss) |
||||||||||||||||||
| Carlin2 |
$979 | $333 | $80 | $3 | $3 | $560 | ||||||||||||||||||
| Cortez2 |
712 | 249 | 73 | 2 | 1 | 387 | ||||||||||||||||||
| Turquoise Ridge2 |
490 | 153 | 48 | — | (4 | ) | 293 | |||||||||||||||||
| Pueblo Viejo2 |
631 | 183 | 77 | 1 | 4 | 366 | ||||||||||||||||||
| Loulo-Gounkoto2 |
— | — | — | — | — | — | ||||||||||||||||||
| Kibali |
294 | 86 | 38 | — | 9 | 161 | ||||||||||||||||||
| Lumwana |
322 | 125 | 68 | — | 5 | 124 | ||||||||||||||||||
| North Mara2 |
309 | 95 | 35 | — | 4 | 175 | ||||||||||||||||||
| Bulyanhulu2 |
173 | 69 | 18 | — | 2 | 84 | ||||||||||||||||||
| Other Mines2 |
582 | 219 | 54 | 2 | 6 | 301 | ||||||||||||||||||
| Reportable segment total |
$4,492 | $1,512 | $491 | $8 | $30 | $2,451 | ||||||||||||||||||
| Share of equity investees |
(294 | ) | (86 | ) | (38 | ) | — | (9 | ) | (161 | ) | |||||||||||||
| Segment total |
$4,198 | $1,426 | $453 | $8 | $21 | $2,290 | ||||||||||||||||||
Consolidated Statement of Income Information
| Cost of Sales | ||||||||||||||||||||||||
| For the three months ended September 30, 2024 |
Revenue | Site operating costs, royalties and community relations |
Depreciation | Exploration, project expenses |
Other expenses (income)1 |
Segment income (loss) |
||||||||||||||||||
| Carlin2 |
$759 | $380 | $69 | $3 | $1 | $306 | ||||||||||||||||||
| Cortez2 |
411 | 191 | 55 | 3 | 1 | 161 | ||||||||||||||||||
| Turquoise Ridge2 |
313 | 162 | 46 | 2 | 1 | 102 | ||||||||||||||||||
| Pueblo Viejo2 |
404 | 157 | 78 | 1 | 2 | 166 | ||||||||||||||||||
| Loulo-Gounkoto2 |
422 | 146 | 66 | 1 | 6 | 203 | ||||||||||||||||||
| Kibali |
193 | 76 | 35 | — | 9 | 73 | ||||||||||||||||||
| Lumwana |
213 | 127 | 60 | — | — | 26 | ||||||||||||||||||
| North Mara2 |
234 | 79 | 23 | — | 44 | 88 | ||||||||||||||||||
| Bulyanhulu2 |
118 | 58 | 16 | — | 1 | 43 | ||||||||||||||||||
| Other Mines2 |
515 | 270 | 57 | 2 | (4 | ) | 190 | |||||||||||||||||
| Reportable segment total |
$3,582 | $1,646 | $505 | $12 | $61 | $1,358 | ||||||||||||||||||
| Share of equity investees |
(193 | ) | (76 | ) | (35 | ) | — | (9 | ) | (73 | ) | |||||||||||||
| Segment total |
$3,389 | $1,570 | $470 | $12 | $52 | $1,285 | ||||||||||||||||||
| BARRICK THIRD QUARTER 2025 | 67 | NOTES TO FINANCIAL STATEMENTS (UNAUDITED) |
| OVERVIEW | OPERATING PERFORMANCE |
FUTURE GROWTH |
REVIEW OF FINANCIAL RESULTS |
OTHER INFORMATION & NON-GAAP RECONCILIATIONS |
FINANCIAL STATEMENTS |
|||||
Consolidated Statement of Income Information
| Cost of Sales | ||||||||||||||||||||||||
| For the nine months ended September 30, 2025 |
Revenue | Site operating costs, royalties and |
Depreciation | Exploration, evaluation and project expenses |
Other expenses (income)1 |
Segment income (loss) |
||||||||||||||||||
| Carlin2 |
$2,555 | $1,033 | $210 | $8 | $7 | $1,297 | ||||||||||||||||||
| Cortez2 |
1,747 | 665 | 192 | 5 | 5 | 880 | ||||||||||||||||||
| Turquoise Ridge2 |
1,264 | 481 | 139 | — | (8 | ) | 652 | |||||||||||||||||
| Pueblo Viejo2 |
1,525 | 535 | 229 | 2 | 10 | 749 | ||||||||||||||||||
| Loulo-Gounkoto2 |
— | — | 14 | 1 | 142 | (157 | ) | |||||||||||||||||
| Kibali |
712 | 243 | 102 | — | 45 | 322 | ||||||||||||||||||
| Lumwana |
967 | 398 | 197 | — | 9 | 363 | ||||||||||||||||||
| North Mara2 |
745 | 241 | 75 | — | 18 | 411 | ||||||||||||||||||
| Bulyanhulu2 |
452 | 180 | 48 | — | 6 | 218 | ||||||||||||||||||
| Other Mines2 |
1,775 | 698 | 177 | 5 | 18 | 877 | ||||||||||||||||||
| Reportable segment total |
$11,742 | $4,474 | $1,383 | $21 | $252 | $5,612 | ||||||||||||||||||
| Share of equity investees |
(712 | ) | (243 | ) | (102 | ) | — | (45 | ) | (322 | ) | |||||||||||||
| Segment total |
$11,030 | $4,231 | $1,281 | $21 | $207 | $5,290 | ||||||||||||||||||
Consolidated Statement of Income Information
| Cost of Sales | ||||||||||||||||||||||||
| For the nine months ended September 30, 2024 |
Revenue | Site operating costs, royalties and |
Depreciation | Exploration, evaluation and project expenses |
Other expenses (income)1 |
Segment income (loss) |
||||||||||||||||||
| Carlin2 |
$2,241 | $1,146 | $232 | $9 | $7 | $847 | ||||||||||||||||||
| Cortez2 |
1,209 | 544 | 187 | 7 | 4 | 467 | ||||||||||||||||||
| Turquoise Ridge2 |
792 | 442 | 125 | 5 | 1 | 219 | ||||||||||||||||||
| Pueblo Viejo2 |
1,008 | 455 | 203 | 3 | 6 | 341 | ||||||||||||||||||
| Loulo-Gounkoto2 |
1,187 | 421 | 195 | 1 | 28 | 542 | ||||||||||||||||||
| Kibali |
534 | 205 | 99 | — | 9 | 221 | ||||||||||||||||||
| Lumwana |
595 | 337 | 190 | — | 12 | 56 | ||||||||||||||||||
| North Mara2 |
488 | 229 | 59 | — | 52 | 148 | ||||||||||||||||||
| Bulyanhulu2 |
353 | 172 | 47 | — | 4 | 130 | ||||||||||||||||||
| Other Mines2 |
1,427 | 781 | 169 | 8 | 7 | 462 | ||||||||||||||||||
| Reportable segment total |
$9,834 | $4,732 | $1,506 | $33 | $130 | $3,433 | ||||||||||||||||||
| Share of equity investees |
(534 | ) | (205 | ) | (99 | ) | — | (9 | ) | (221 | ) | |||||||||||||
| Segment total |
$9,300 | $4,527 | $1,407 | $33 | $121 | $3,212 | ||||||||||||||||||
| 1 | Includes accretion expense, which is included within finance costs in the consolidated statement of income. For Q3 2025, accretion expense was $13 million (Q3 2024: $14 million) and for YTD 2025, accretion expense was $39 million (YTD 2024: $41 million). |
| 2 | Includes non-controlling interest portion of revenues, cost of sales and segment income for Q3 2025 for Nevada Gold Mines $918 million, $395 million, $519 million (Q3 2024: $631 million, $380 million, $246 million), Pueblo Viejo $254 million, $104 million, $150 million (Q3 2024: $162 million, $95 million, $68 million), Loulo-Gounkoto $nil, $nil, $nil (Q3 2024: $84 million, $42 million, $41 million), North Mara and Bulyanhulu $77 million, $35 million, $41 million (Q3 2024: $56 million, $28 million, $20 million), and Tongon $13 million, $6 million, $6 million (Q3 2024: $9 million, $9 million, $nil) and for YTD 2025 for Nevada Gold Mines $2,357 million, $1,148 million, $1,199 million (YTD 2024: $1,806 million, $1,130 million, $660 million), Pueblo Viejo $613 million, $307 million, $306 million (YTD 2024: $407 million, $263 million, $144 million), Loulo-Gounkoto $nil, $3 million, $(29) million (YTD 2024: $237 million, $123 million, $110 million), North Mara and Bulyanhulu $191 million, $87 million, $102 million (YTD 2024: $134 million, $81 million, $44 million) and Tongon $33 million, $21 million, $11 million (YTD 2024: $30 million, $27 million, $3 million), respectively. |
| BARRICK THIRD QUARTER 2025 | 68 | NOTES TO FINANCIAL STATEMENTS (UNAUDITED) |
| OVERVIEW | OPERATING PERFORMANCE |
FUTURE GROWTH |
REVIEW OF FINANCIAL RESULTS |
OTHER INFORMATION & NON-GAAP RECONCILIATIONS |
FINANCIAL STATEMENTS |
|||||
Reconciliation of Segment Income to Income Before Income Taxes
|
For the three months ended September 30 |
For the nine months ended September 30 |
|||||||||||||||
| 2025 | 2024 | 2025 | 2024 | |||||||||||||
| Segment income |
$2,290 | $1,285 | $5,290 | $3,212 | ||||||||||||
| Other revenue |
(50 | ) | (21 | ) | (71 | ) | (23 | ) | ||||||||
| Other cost of sales/amortization |
(11 | ) | (11 | ) | (41 | ) | (32 | ) | ||||||||
| Exploration, evaluation and project expenses not attributable to segments |
(84 | ) | (92 | ) | (207 | ) | (263 | ) | ||||||||
| General and administrative expenses |
(77 | ) | (46 | ) | (158 | ) | (106 | ) | ||||||||
| Other income (expense) not attributable to segments |
201 | (7 | ) | (161 | ) | (62 | ) | |||||||||
| Impairment charges |
(3 | ) | (2 | ) | (7 | ) | (20 | ) | ||||||||
| Gain (loss) on currency translation |
3 | (4 | ) | 3 | (21 | ) | ||||||||||
| Closed mine rehabilitation |
(4 | ) | (59 | ) | (15 | ) | (48 | ) | ||||||||
| Income from equity investees |
146 | 51 | 290 | 214 | ||||||||||||
| Finance costs, net (includes non-segment accretion) |
(30 | ) | (68 | ) | (124 | ) | (123 | ) | ||||||||
| Loss on non-hedge derivatives |
— | (1 | ) | (1 | ) | (1 | ) | |||||||||
| Income before income taxes |
$2,381 | $1,025 | $4,798 | $2,727 | ||||||||||||
|
Capital Expenditures Information |
Segment capital expenditures1 | |||||||||||||||
|
For the three months ended September 30 |
For the nine months ended September 30 |
|||||||||||||||
| 2025 | 2024 | 2025 | 2024 | |||||||||||||
| Carlin |
$150 | $185 | $510 | $614 | ||||||||||||
| Cortez |
92 | 96 | 311 | 289 | ||||||||||||
| Turquoise Ridge |
23 | 28 | 71 | 84 | ||||||||||||
| Pueblo Viejo |
87 | 63 | 258 | 213 | ||||||||||||
| Loulo-Gounkoto |
— | 102 | 23 | 276 | ||||||||||||
| Kibali |
44 | 29 | 111 | 90 | ||||||||||||
| Lumwana |
199 | 79 | 452 | 272 | ||||||||||||
| North Mara |
46 | 38 | 139 | 109 | ||||||||||||
| Bulyanhulu |
42 | 39 | 116 | 100 | ||||||||||||
| Other Mines |
71 | 67 | 213 | 181 | ||||||||||||
| Reportable segment total |
$754 | $726 | $2,204 | $2,228 | ||||||||||||
| Other items not allocated to segments |
254 | 66 | 622 | 144 | ||||||||||||
| Total |
$1,008 | $792 | $2,826 | $2,372 | ||||||||||||
| Share of equity investees |
(44 | ) | (29 | ) | (111 | ) | (90 | ) | ||||||||
| Total |
$964 | $763 | $2,715 | $2,282 | ||||||||||||
| 1 | Segment capital expenditures are presented for internal management reporting purposes on an accrual basis. Capital expenditures in the Consolidated Statements of Cash Flow are presented on a cash basis. For Q3 2025, cash expenditures were $943 million (Q3 2024: $736 million) and the increase in accrued expenditures was $21 million (2024: $27 million increase). For YTD 2025, cash expenditures were $2,714 million (2024: $2,283 million) and the increase in accrued expenditures was $1 million (YTD 2024: $1 million decrease). |
Purchase Commitments
At September 30, 2025, we had purchase obligations for supplies and consumables of $1,597 million (December 31, 2024: $1,621 million).
Capital Commitments
In addition to entering into various operational commitments in the normal course of business, we had capital commitments of $2,281 million at September 30, 2025 (December 31, 2024: $605 million).
| BARRICK THIRD QUARTER 2025 | 69 | NOTES TO FINANCIAL STATEMENTS (UNAUDITED) |
| OVERVIEW | OPERATING PERFORMANCE |
FUTURE GROWTH |
REVIEW OF FINANCIAL RESULTS |
OTHER INFORMATION & NON-GAAP RECONCILIATIONS |
FINANCIAL STATEMENTS |
|||||
6 ∎ Revenue
| For the three months ended September 30 |
For the nine months ended September 30 |
|||||||||||||||
| 2025 | 2024 | 2025 | 2024 | |||||||||||||
| Gold sales |
||||||||||||||||
| Spot market sales |
$3,577 | $2,965 | $9,295 | $8,135 | ||||||||||||
| Concentrate sales |
173 | 127 | 477 | 339 | ||||||||||||
| Provisional pricing adjustments |
(2 | ) | 5 | 22 | 19 | |||||||||||
| $3,748 | $3,097 | $9,794 | $8,493 | |||||||||||||
| Copper sales |
||||||||||||||||
| Concentrate sales |
$328 | $204 | $940 | $586 | ||||||||||||
| Provisional pricing adjustments |
(8 | ) | 9 | 21 | 9 | |||||||||||
| $320 | $213 | $961 | $595 | |||||||||||||
| Other sales1 |
80 | 58 | 204 | 189 | ||||||||||||
| Total |
$4,148 | $3,368 | $10,959 | $9,277 | ||||||||||||
| 1 | Revenues include the sale of by-products for our gold and copper mines. |
7 ∎ Cost of Sales
| Gold | Copper | Other3 | Total | |||||||||||||||||||||||||||||
| For the three months ended September 30 |
2025 | 2024 | 2025 | 2024 | 2025 | 2024 | 2025 | 2024 | ||||||||||||||||||||||||
| Site operating costs1,2 |
$1,157 | $1,313 | $98 | $109 | $— | $— | $1,255 | $1,422 | ||||||||||||||||||||||||
| Depreciation1 |
384 | 409 | 69 | 60 | 7 | 8 | 460 | 477 | ||||||||||||||||||||||||
| Royalty expense |
113 | 106 | 25 | 17 | — | — | 138 | 123 | ||||||||||||||||||||||||
| Mining and production taxes4 |
29 | 19 | — | — | — | — | 29 | 19 | ||||||||||||||||||||||||
| Community relations |
7 | 9 | 1 | 1 | — | — | 8 | 10 | ||||||||||||||||||||||||
| $1,690 | $1,856 | $193 | $187 | $7 | $8 | $1,890 | $2,051 | |||||||||||||||||||||||||
| Gold | Copper | Other3 | Total | |||||||||||||||||||||||||||||
| For the nine months ended September 30 |
2025 | 2024 | 2025 | 2024 | 2025 | 2024 | 2025 | 2024 | ||||||||||||||||||||||||
| Site operating costs1,2 |
$3,433 | $3,822 | $323 | $288 | $— | $— | $3,756 | $4,110 | ||||||||||||||||||||||||
| Depreciation1 |
1,085 | 1,217 | 197 | 191 | 25 | 23 | 1,307 | 1,431 | ||||||||||||||||||||||||
| Royalty expense |
311 | 293 | 71 | 45 | — | — | 382 | 338 | ||||||||||||||||||||||||
| Mining and production taxes4 |
77 | 56 | — | — | — | — | 77 | 56 | ||||||||||||||||||||||||
| Community relations |
28 | 28 | 3 | 3 | — | — | 31 | 31 | ||||||||||||||||||||||||
| $4,934 | $5,416 | $594 | $527 | $25 | $23 | $5,553 | $5,966 | |||||||||||||||||||||||||
| 1 | Site operating costs and depreciation include charges to reduce the cost of inventory to net realizable value as follows: $nil for Q3 2025 (Q3 2024: $5 million) and $1 million for YTD 2025 (YTD 2024: $38 million). |
| 2 | Site operating costs includes the costs of extracting by-products. |
| 3 | Other includes corporate amortization. |
| 4 | 2024 figures have been changed to present mining and production taxes separately from site operating costs. |
8 ∎ Earnings Per Share
| For the three months ended September 30 | For the nine months ended September 30 | |||||||||||||||||||||||||||||||
| 2025 | 2024 | 2025 | 2024 | |||||||||||||||||||||||||||||
| Basic | Diluted | Basic | Diluted | Basic | Diluted | Basic | Diluted | |||||||||||||||||||||||||
| Net income |
$1,904 | $1,904 | $780 | $780 | $3,941 | $3,941 | $1,901 | $1,901 | ||||||||||||||||||||||||
| Net income attributable to non-controlling interests |
(602 | ) | (602 | ) | (297 | ) | (297 | ) | (1,354 | ) | (1,354 | ) | (753 | ) | (753 | ) | ||||||||||||||||
| Net income attributable to equity holders of Barrick Mining Corporation |
$1,302 | $1,302 | $483 | $483 | $2,587 | $2,587 | $1,148 | $1,148 | ||||||||||||||||||||||||
| Weighted average shares outstanding |
1,703 | 1,703 | 1,752 | 1,752 | 1,715 | 1,715 | 1,754 | 1,754 | ||||||||||||||||||||||||
| Basic and diluted earnings per share attributable to the equity holders of Barrick Mining Corporation |
$0.76 | $0.76 | $0.28 | $0.28 | $1.51 | $1.51 | $0.65 | $0.65 | ||||||||||||||||||||||||
| BARRICK THIRD QUARTER 2025 | 70 | NOTES TO FINANCIAL STATEMENTS (UNAUDITED) |
| OVERVIEW | OPERATING PERFORMANCE |
FUTURE GROWTH |
REVIEW OF FINANCIAL RESULTS |
OTHER INFORMATION & NON-GAAP RECONCILIATIONS |
FINANCIAL STATEMENTS |
|||||
9 ∎ Other Expense (Income)
a) Other Expense (Income)
| For the three months ended September 30 |
For the nine months ended September 30 |
|||||||||||||||
| 2025 | 2024 | 2025 | 2024 | |||||||||||||
| Other expense: |
||||||||||||||||
| Bank charges |
$2 | $1 | $5 | $4 | ||||||||||||
| Severance costs |
29 | — | 29 | — | ||||||||||||
| Loulo-Gounkoto1 |
(250 | ) | — | 785 | — | |||||||||||
| Loss on non-hedge derivatives |
— | 1 | 1 | 1 | ||||||||||||
| Litigation legal expenses |
9 | 3 | 29 | 14 | ||||||||||||
| Loss (gain) on warrant investments at FVPL |
— | — | (1 | ) | 3 | |||||||||||
| Loulo-Gounkoto reduced operations costs |
15 | — | 140 | — | ||||||||||||
| Litigation settlement accruals |
— | — | 91 | — | ||||||||||||
| Tanzania community relations projects2 |
— | 40 | — | 40 | ||||||||||||
| Tax interest and penalties |
— | 1 | — | 62 | ||||||||||||
| Other |
13 | 7 | 30 | 41 | ||||||||||||
| Total other expense (income) |
($182 | ) | $53 | $1,109 | $165 | |||||||||||
| Other income: |
||||||||||||||||
| Gain on sale of non-current assets3 |
$— | ($1 | ) | ($745 | ) | ($7 | ) | |||||||||
| Interest income on other assets |
(11 | ) | (6 | ) | (34 | ) | (15 | ) | ||||||||
| Total other income |
($11 | ) | ($7 | ) | ($779 | ) | ($22 | ) | ||||||||
| Total |
($193 | ) | $46 | $330 | $143 | |||||||||||
| 1 | Refer to note 17 for further details. |
| 2 | 2024 amounts relate to commitment for road construction under the Twiga partnership. |
| 3 | 2025 includes a gain of $745 million related to the sale of the Donlin Gold project. Refer to note 4 for further details. |
b) Impairment Charges
| For the three months ended |
For the nine months ended September 30 |
|||||||||||||||
| 2025 | 2024 | 2025 | 2024 | |||||||||||||
| Impairment charges of non-current assets |
$3 | $2 | $7 | $20 | ||||||||||||
| Total |
$3 | $2 | $7 | $20 | ||||||||||||
10 ∎ Income Tax Expense
| For the three months ended September 30 |
For the nine months ended September 30 |
|||||||||||||||
| 2025 | 2024 | 2025 | 2024 | |||||||||||||
| Current |
$521 | $236 | $1,273 | $788 | ||||||||||||
| Deferred |
(44 | ) | 9 | (416 | ) | 38 | ||||||||||
| Total |
$477 | $245 | $857 | $826 | ||||||||||||
Income tax expense was $857 million for YTD 2025 (YTD 2024: $826 million). The unadjusted effective income tax rate for YTD 2025 was 18% of income before income taxes.
The underlying effective income tax rate on ordinary income for YTD 2025 was 26% after adjusting for the impact of foreign currency translation losses on deferred tax balances; the impact of the recognition of deferred tax assets; the impact of the sale of the Donlin Gold project; the impact of the signing of agreements to
settle legacy legal matters in the Philippines related to Placer Dome Inc.; the impact of Loulo-Gounkoto’s loss of control (derecognition of $437 million in current and deferred tax balances); the impact of Loulo-Gounkoto’s reduced operations costs; and the impact of other expense adjustments.
Currency Translation
Current and deferred tax balances are subject to remeasurement for changes in foreign currency exchange rates each period. This is required in countries where tax is paid in local currency and the subsidiary has a different functional currency (typically US dollars). The most significant balances relate to Argentine and Malian tax balances.
In YTD 2025, a tax recovery of $31 million (YTD 2024: $26 million tax expense) arose primarily from net translation gains on deferred tax balances in Mali (prior to their deconsolidation) and Argentina due to the strengthening of the West African CFA, partially offset by the weakening of the Argentine peso against the US dollar. These net translation gains are included within income tax expense.
Withholding Taxes
For YTD 2025, we have recorded $116 million (YTD 2024: $36 million related to Peru and the United States) of dividend withholding taxes related to the distributed earnings of our subsidiaries in Argentina, Côte d’lvoire, Tanzania and Saudi Arabia, and undistributed earnings of our subsidiaries in Argentina, Saudi Arabia and the United States.
Recognition of Deferred Tax Assets
In Q3 2025, we recognized previously unrecognized deferred tax assets in Canada in connection with the agreement to sell Hemlo (refer to note 4). The transaction is expected to give rise to a taxable gain that will provide sufficient Canadian taxable profit to support the recognition of a portion of previously unrecognized Canadian tax loss carryforwards. As a result, we recorded an income tax recovery of $129 million.
This recognition partially reverses the derecognition recorded in 2018 of deferred tax assets in Canada. The recognition represents a discrete, non-recurring event arising from the future Hemlo disposition. Outside of this transaction, it remains not probable that sufficient future taxable profits will be available in Canada to utilize the remaining deferred tax assets. Accordingly, no additional deferred tax assets are expected to be recognized in Canada in the foreseeable future.
United States Tax Reform
Under the Inflation Reduction Act signed in August 2022, the United States implemented a 15% corporate alternative minimum tax (“CAMT”) on applicable financial statement income, effective for tax years beginning after December 31, 2022, with CAMT credit carryforwards having an indefinite life. Barrick is subject to CAMT as it meets the requisite income thresholds for a foreign-parented multi-national group.
While final regulations are still awaited, since its introduction, Barrick has recognized a deferred tax asset from the CAMT credit carryforwards anticipating recovery against future US Federal Income Tax liabilities. No
| BARRICK THIRD QUARTER 2025 | 71 | NOTES TO FINANCIAL STATEMENTS (UNAUDITED) |
| OVERVIEW | OPERATING PERFORMANCE |
FUTURE GROWTH |
REVIEW OF FINANCIAL RESULTS |
OTHER INFORMATION & NON-GAAP RECONCILIATIONS |
FINANCIAL STATEMENTS |
|||||
additional deferred tax asset related to CAMT has been recognized for YTD 2025 due to the anticipated application of a portion of the existing balance to our federal income tax payable; however, the timing and amount of such offset may be subject to change pending issuance of final regulations.
Organization for Economic Co-operation and Development (“OECD”) Pillar Two model rules
These rules apply to multi-national enterprises with annual consolidated revenues of at least €750 million in at least two of the prior four fiscal years immediately preceding the relevant fiscal year, which is reflective of our status.
Canada enacted Pillar Two legislation in Q2 2024, effective for fiscal years commencing on or after December
31, 2023. Other jurisdictions in which the group operates have either enacted or are in the process of enacting similar legislation.
In terms of the income tax accounting, we have applied the exception available under the amendments to IAS 12 published by the IASB in May 2023 and are not recognizing or disclosing information about deferred tax assets and liabilities related to Pillar Two income taxes. Our review of Pillar Two for the current year, based on the OECD’s Transitional Safe Harbour rules as implemented in the Global Minimum Tax Act in Canada, has not identified any material amounts to be accrued for Q3 2025. As the law is evolving, both in Canada and elsewhere, we will continue to monitor the impact of this legislation.
11 ∎ Cash Flow - Other Items
| Operating Cash Flows – Other Items |
For the three months ended September 30 |
For the nine months ended September 30 |
||||||||||||||
| 2025 | 2024 | 2025 | 2024 | |||||||||||||
| Adjustments for non-cash income statement items: |
||||||||||||||||
| Loss on non-hedge derivatives |
$— | $1 | $1 | $1 | ||||||||||||
| Loss (gain) on warrant investments at FVPL |
— | — | ($1 | ) | $3 | |||||||||||
| Litigation settlement accruals |
— | — | 91 | — | ||||||||||||
| Tax interest and penalties |
— | 1 | — | 62 | ||||||||||||
| Share-based compensation expense |
98 | 50 | 167 | 68 | ||||||||||||
| Change in estimate of rehabilitation costs at closed mines |
(3 | ) | 44 | (10 | ) | 17 | ||||||||||
| Tanzania community relations projects1 |
— | 37 | — | 37 | ||||||||||||
| Inventory impairment charges |
— | 4 | 1 | 26 | ||||||||||||
| Non-cash revenue recognized on Pueblo Viejo gold and silver streaming agreement |
(10 | ) | (6 | ) | (25 | ) | (22 | ) | ||||||||
| Change in other assets and liabilities |
(60 | ) | (33 | ) | (168 | ) | (76 | ) | ||||||||
| Settlement of share-based compensation |
(9 | ) | (4 | ) | (62 | ) | (50 | ) | ||||||||
| Settlement of rehabilitation obligations |
(40 | ) | (49 | ) | (130 | ) | (120 | ) | ||||||||
| Other operating activities |
($24 | ) | $45 | ($136 | ) | ($54 | ) | |||||||||
| Cash flow arising from changes in: |
||||||||||||||||
| Accounts receivable |
$316 | ($107 | ) | $112 | ($26 | ) | ||||||||||
| Inventory |
(68 | ) | (69 | ) | (133 | ) | (57 | ) | ||||||||
| Value added taxes receivable2 |
(37 | ) | (66 | ) | (133 | ) | (217 | ) | ||||||||
| Other current assets |
(1 | ) | 6 | (18 | ) | (7 | ) | |||||||||
| Accounts payable |
(53 | ) | (11 | ) | (13 | ) | (61 | ) | ||||||||
| Other current liabilities |
27 | (4 | ) | 135 | (12 | ) | ||||||||||
| Change in working capital |
$184 | ($251 | ) | ($50 | ) | ($380 | ) | |||||||||
| 1 | 2024 amounts relate to commitment for road construction under the Twiga partnership. |
| 2 | Excludes $53 million (Q3 2024: $36 million) for Q3 2025 and $128 million (YTD 2024: $65 million) for YTD 2025 of VAT receivables that were settled against offsetting of income taxes payable and $6 million (Q3 2024: $21 million) for Q3 2025 and $54 million (YTD 2024: $29 million) for YTD 2025 of VAT receivables that were settled against offsetting of other duties and liabilities. |
| BARRICK THIRD QUARTER 2025 | 72 | NOTES TO FINANCIAL STATEMENTS (UNAUDITED) |
| OVERVIEW | OPERATING PERFORMANCE |
FUTURE GROWTH |
REVIEW OF FINANCIAL RESULTS |
OTHER INFORMATION & NON-GAAP RECONCILIATIONS |
FINANCIAL STATEMENTS |
|||||
12 ∎ Equity Accounting Method Investment Continuity
| Kibali | Jabal Sayid | Zaldívar | Porgera | Other | Total | |||||||||||||||||||
| At January 1, 2024 |
$2,119 | $391 | $874 | $703 | $46 | $4,133 | ||||||||||||||||||
| Investment in equity accounting method investment |
— | — | — | 7 | — | 7 | ||||||||||||||||||
| Equity pick-up (loss) from equity investees |
108 | 119 | 1 | 22 | (2 | ) | 248 | |||||||||||||||||
| Funds invested |
— | — | — | 55 | 4 | 59 | ||||||||||||||||||
| Dividends received from equity investees |
(88 | ) | (109 | ) | — | — | (1 | ) | (198 | ) | ||||||||||||||
| Non-cash dividends received from equity investees |
(124 | ) | — | — | — | — | (124 | ) | ||||||||||||||||
| Equity earnings adjustment |
— | — | — | (7 | ) | — | (7 | ) | ||||||||||||||||
| Shareholder loan repayment |
— | — | — | — | (6 | ) | (6 | ) | ||||||||||||||||
| At December 31, 2024 |
$2,015 | $401 | $875 | $780 | $41 | $4,112 | ||||||||||||||||||
| Equity earnings adjustment |
— | — | — | 16 | — | 16 | ||||||||||||||||||
| Equity pick-up (loss) from equity investees |
107 | 93 | — | 75 | (1 | ) | 274 | |||||||||||||||||
| Funds invested |
— | — | — | — | 1 | 1 | ||||||||||||||||||
| Dividends received from equity investees |
— | (98 | ) | — | — | (1 | ) | (99 | ) | |||||||||||||||
| Non-cash dividends received from equity investees |
(18 | ) | — | — | — | — | (18 | ) | ||||||||||||||||
| Shareholder loan repayment |
— | — | — | (96 | ) | (4 | ) | (100 | ) | |||||||||||||||
| At September 30, 2025 |
$2,104 | $396 | $875 | $775 | $36 | $4,186 | ||||||||||||||||||
13 ∎ Financial Instruments
Financial instruments include cash; evidence of ownership in an entity; or a contract that imposes an obligation on one party and conveys a right to a second party to deliver/receive cash or another financial instrument.
Gold Contracts
In Q3 2025, we entered into 25,000 ounces of zero cost gold collars that mature every month between September 2025 and August 2028 for a total of 900,000 ounces. These contracts contain purchased put and sold call options with strike prices of $3,100/oz and $4,310/oz, respectively. These contracts are designated as cash flow hedges, with the effective portion of the hedge recognized in other comprehensive income and the ineffective portion recognized as loss (gain) on non-hedge derivatives. The realized loss (gain) related to these positions is $nil for Q3 2025 (Q3 2024: $nil) and $nil for YTD 2025 (YTD 2024: $nil). As at September 30, 2025, the fair value of the remaining derivatives is a loss of $150 million (December 31, 2024: $nil), with $15 million recorded as other current liabilities and $135 million recorded as other non-current liabilities (December 31, 2024: $nil and $nil, respectively).
| BARRICK THIRD QUARTER 2025 | 73 | NOTES TO FINANCIAL STATEMENTS (UNAUDITED) |
| OVERVIEW | OPERATING PERFORMANCE |
FUTURE GROWTH |
REVIEW OF FINANCIAL RESULTS |
OTHER INFORMATION & NON-GAAP RECONCILIATIONS |
FINANCIAL STATEMENTS |
|||||
14 ∎ Fair Value Measurements
a) Assets and Liabilities Measured at Fair Value on a Recurring Basis
| As at September 30, 2025 |
Quoted prices in active markets for identical assets
(Level 1) |
Significant other observable inputs
(Level 2) |
Significant unobservable inputs
(Level 3) |
Aggregate fair value
|
||||||||||||
| Other investments1 |
$86 | $— | $— | $86 | ||||||||||||
| Derivatives2 |
— | (150 | ) | — | (150 | ) | ||||||||||
| Receivables from provisional copper and gold sales |
— | 180 | — | 180 | ||||||||||||
| Receivable from NOVAGOLD3 |
— | — | 164 | 164 | ||||||||||||
| Investment in Loulo- Gounkoto4 |
— | — | 1,950 | 1,950 | ||||||||||||
| $86 | $30 | $2,114 | $2,230 | |||||||||||||
| 1 | Includes equity investments in other mining companies. |
| 2 | Refer to note 13 for further details. |
| 3 | Refer to note 4 for further details. |
| 4 | Refer to note 17 for further details. |
b) Fair Values of Financial Assets and Liabilities
| As at September 30, 2025 |
As at December 31, 2024 |
|||||||||||||||
| Carrying amount |
Estimated fair value |
Carrying amount |
Estimated fair value |
|||||||||||||
| Financial assets |
||||||||||||||||
| Other assets1 |
$751 | $751 | $776 | $776 | ||||||||||||
| Other investments2 |
86 | 86 | 42 | 42 | ||||||||||||
| Investment in Loulo-Gounkoto3 |
1,950 | 1,950 | — | — | ||||||||||||
| $2,787 | $2,787 | $818 | $818 | |||||||||||||
| Financial liabilities |
||||||||||||||||
| Debt4 |
$4,714 | $5,025 | $4,729 | $4,821 | ||||||||||||
| Derivative liabilities5 |
150 | 150 | — | — | ||||||||||||
| Other liabilities |
574 | 574 | 595 | 595 | ||||||||||||
| $5,438 | $5,749 | $5,324 | $5,416 | |||||||||||||
| 1 | Includes restricted cash and amounts due from our partners. |
| 2 | Includes equity investments in other mining companies. Recorded at fair value. Quoted market prices are used to determine fair value. |
| 3 | Refer to note 17 for further details. |
| 4 | Debt is generally recorded at amortized cost. The fair value of debt is primarily determined using quoted market prices. Balance includes both current and long-term portions of debt. |
| 5 | Refer to note 13 for further details. |
Derivative Instruments
The fair value of derivative instruments is determined using option pricing models that utilize a variety of inputs that are a combination of quoted prices and market-corroborated inputs. As a result, the derivative instruments are classified within Level 2 of the fair value hierarchy.
The Company’s valuation techniques for our remaining financial assets and liabilities were presented in Note 26 of the 2024 Annual Financial Statements and have been consistently applied in these interim financial statements.
15 ∎ Capital Stock
a) Authorized Capital Stock
Our authorized capital stock is composed of an unlimited number of common shares (issued 1,687,433,930 common shares as at September 30, 2025). Our common shares have no par value.
b) Dividends
The Company’s practice has been to declare dividends after a quarter as part of the announcement of the results for the quarter. Dividends declared are paid in the same quarter.
The Company’s dividend reinvestment plan resulted in 124,983 common shares being issued to shareholders for YTD 2025.
c) Share Buyback Program
At the February 11, 2025 meeting, the Board of Directors authorized a share buyback program for the repurchase of up to $1.0 billion of the Company’s outstanding common shares over the next 12 months. During YTD 2025, Barrick purchased 39.79 million common shares for a total cash amount of $1.0 billion under this program and accrued $21 million in related taxes. At the November 7, 2025 meeting, the Board of Directors authorized an increase in the share buyback program for the repurchase of up to an additional $500 million of the Company’s outstanding common shares before the program expires in February 2026.
The actual number of common shares that may be purchased, and the timing of any such purchases, will be determined by Barrick based on a number of factors, including the Company’s financial performance, the availability of cash flows, and the consideration of other uses of cash, including capital investment opportunities, returns to shareholders, and debt reduction.
The repurchase program does not obligate the Company to acquire any particular number of common shares, and the repurchase program may be suspended or discontinued at any time at the Company’s discretion.
| BARRICK THIRD QUARTER 2025 | 74 | NOTES TO FINANCIAL STATEMENTS (UNAUDITED) |
| OVERVIEW | OPERATING PERFORMANCE |
FUTURE GROWTH |
REVIEW OF FINANCIAL RESULTS |
OTHER INFORMATION & NON-GAAP RECONCILIATIONS |
FINANCIAL STATEMENTS |
|||||
16 ∎ Non-controlling Interests Continuity
| Nevada Gold Mines |
Pueblo Viejo |
Tanzania Mines1 |
Loulo- Gounkoto |
Tongon | Reko Diq | Other | Total | |||||||||||||||||||||||||||||||||
| NCI in subsidiary at September 30, 2025 |
38.5 | % | 40 | % | 16 | % | 20 | % | 10.3 | % | 50 | % | Various | |||||||||||||||||||||||||||
| At January 1, 2024 |
$6,162 | $1,143 | $322 | $760 | $16 | $338 | ($80 | ) | $8,661 | |||||||||||||||||||||||||||||||
| Share of income (loss) |
884 | 101 | 53 | (31 | ) | — | (63 | ) | — | 944 | ||||||||||||||||||||||||||||||
| Cash contributed |
— | — | — | — | — | 146 | — | 146 | ||||||||||||||||||||||||||||||||
| Disbursements |
(667 | ) | (84 | ) | — | (34 | ) | — | — | — | (785 | ) | ||||||||||||||||||||||||||||
| At December 31, 2024 |
$6,379 | $1,160 | $375 | $695 | $16 | $421 | ($80 | ) | $8,966 | |||||||||||||||||||||||||||||||
| Share of income (loss) |
1,122 | 167 | 67 | (9 | ) | 9 | (3 | ) | 1 | 1,354 | ||||||||||||||||||||||||||||||
| Cash contributed |
— | — | — | — | — | 228 | — | 228 | ||||||||||||||||||||||||||||||||
| Loss of control2 |
— | — | — | (686 | ) | — | — | — | (686 | ) | ||||||||||||||||||||||||||||||
| Disbursements |
(966 | ) | (88 | ) | (35 | ) | — | (7 | ) | — | — | (1,096 | ) | |||||||||||||||||||||||||||
| At September 30, 2025 |
$6,535 | $1,239 | $407 | $— | $18 | $646 | ($79 | ) | $8,766 | |||||||||||||||||||||||||||||||
| 1 | Tanzania mines consist of the two operating mines, North Mara and Bulyanhulu. |
| 2 | Refer to note 17 for further details. |
17 ∎ Loulo-Gounkoto
Barrick owns 80% of Société des Mines de Loulo SA (“Somilo”) and Société des Mines de Gounkoto (“Gounkoto”) with the Republic of Mali owning the other 20%. As previously disclosed, the Company and the Government of Mali (“GoM”) have been engaged in an ongoing dispute over the existing mining conventions of these two companies (together, the “Conventions”).
The Loulo and Gounkoto permits each have a 30 year term from their date of grant, after which they are renewable if production is still taking place. The Loulo permit renewal date is February 2026 and a renewal application was submitted on February 13, 2025.
On December 18, 2024, after multiple good faith attempts to resolve the dispute, Somilo and Gounkoto submitted a request for arbitration to the International Centre for the Settlement of Investment Disputes (“ICSID”) in accordance with the provisions of their respective Conventions. On January 14, 2025, due to the restrictions imposed by the GoM on gold shipments, the Company announced that the Loulo-Gounkoto complex would temporarily suspend operations.
On June 16, 2025, the Bamako Commercial Tribunal placed Loulo-Gounkoto under temporary provisional administration. While Barrick retains its 80% legal ownership of the mine, control over operations has been transferred to an external administrator. Following this action by the Malian courts, we concluded that Barrick had lost control of the subsidiaries that hold our interest in Loulo-Gounkoto because we cannot effectively exercise power over the relevant activities related to the mine, nor can we affect the returns of the mine through managerial involvement. As a result of the loss of control event in Q2 2025, we deconsolidated the subsidiaries, and derecognized the assets, liabilities and non-controlling interest of Loulo-Gounkoto at their carrying amounts at the date when control was lost.
Upon deconsolidation, IFRS Accounting Standards require the retained interest in the former subsidiaries to be recognized at fair value. Barrick will account for the retained interest in Somilo and Gounkoto in accordance with IFRS 9. Fair value is the price that would be received to sell an asset in an orderly transaction between market participants. Barrick’s estimate of the initial fair value of the retained interest was $1.7 billion. This fair value was calculated
using our life of mine plan with updates to reflect the situation as at June 30, 2025 inclusive of the adverse measures taken by the GoM against the subsidiaries. This included an increase in the weighted average cost of capital (“WACC”) from the 9% applied as at December 31, 2024 to 18% as at June 30, 2025. We also lowered the Net Asset Value (“NAV”) multiple to 1.1 and used a long-term gold price of $2,000/oz. Finally, the fiscal terms were amended to be in line with 2023 Mining Code, primarily increased royalties and duties; and certain adjustments were made to reflect a period of disruption to the steady state operations. This fair value calculation includes a high level of uncertainty and is subject to change based on further developments that may require an update of these assumptions. Under certain scenarios the fair value could be materially higher or lower. The calculation does not include any value for Barrick’s or its subsidiaries arbitration claims, which are now before the arbitration tribunal.
A loss on the change of control of $1,035 million, equal to the carrying value of the net assets and non-controlling interest of Loulo-Gounkoto at the date when control was lost, partially offset by the value of the retained investment in Loulo-Gounkoto, was recognized in Q2 2025.
The details are summarized in the following table:
| Carrying value of net assets derecognized |
$(3,421 | ) | ||
| Carrying value of non-controlling interest derecognized |
686 | |||
| Investment in Loulo-Gounkoto recognized |
1,700 | |||
| Loss of control |
$ (1,035 | ) | ||
We reviewed the fair value of the investment as at September 30, 2025 and, primarily as a result of an increase in our gold price assumptions including a long-term price of $2,300/oz, we now estimate the fair value of our retained interest to be $1.95 billion. As a result, income of $250 million was recognized in Other Expense (Income) in Q3 2025, bringing the full year net impact to an expense of $785 million, as summarized in the table below:
| Loss of control recognized in Q2 2025 |
$ (1,035 | ) | ||
| Increase in fair value of investment in Q3 2025 |
250 | |||
| Net expense recognized in Other Expense (Income) |
$ (785 | ) | ||
| BARRICK THIRD QUARTER 2025 | 75 | NOTES TO FINANCIAL STATEMENTS (UNAUDITED) |
| OVERVIEW | OPERATING PERFORMANCE |
FUTURE GROWTH |
REVIEW OF FINANCIAL RESULTS |
OTHER INFORMATION & NON-GAAP RECONCILIATIONS |
FINANCIAL STATEMENTS |
|||||
We performed a sensitivity analysis on the September 30, 2025 fair value calculation where we flexed the gold prices, WACC and NAV multiple, which are the most significant assumptions that impact the fair value calculations. We first assumed a +/- $100 per ounce change in our gold price assumptions, while holding all other assumptions constant. We then assumed a +/-1% change in our WACC, independent from the change in gold prices, while holding all other assumptions constant. Finally, we assumed a +/- 0.1 change in the NAV multiple, while holding all other assumptions constant. These sensitivities help to determine the theoretical change in fair value that would be recorded with these changes in gold prices, WACC and NAV multiple.
| Change in fair value based on: |
||||
| Increase in gold price of $100/oz |
158 | |||
| Decrease in gold price of $100/oz |
(163 | ) | ||
| Increase in WACC of 1% |
(83 | ) | ||
| Decrease in WACC of 1% |
88 | |||
| Increase in NAV multiple of 0.1 |
193 | |||
| Decrease in NAV multiple of 0.1 |
(193 | ) | ||
Refer to note 18 for further details of the legal matters related to this topic.
18 ∎ Contingencies
Certain conditions may exist as of the date the financial statements are issued that may result in a loss to the Company, but which will only be resolved when one or more future events occur or fail to occur. The impact of any resulting loss from such matters affecting these financial statements and noted below may be material.
Except as noted below, no material changes have occurred with respect to the matters disclosed in Note 35 “Contingencies” to the 2024 Annual Financial Statements, and no new contingencies have occurred that are material to the Company since the issuance of the 2024 Annual Financial Statements.
The description set out below should be read in conjunction with Note 35 “Contingencies” to the 2024 Annual Financial Statements.
Litigation and Claims Update
Pascua-Lama — Proposed Canadian Securities Class Actions
In the Quebec proceeding, Barrick filed its Statement of Defence on February 12, 2025. No trial date has been set as of this time. In the Ontario proceeding, a hearing on the Plaintiffs’ motion for class certification has been scheduled for January 2026.
Legacy Philippines Matters
On April 4, 2025, Barrick and the Provincial Government of Marinduque (the “PGM”) signed agreements to settle, without admission of liability by Barrick, all proceedings and claims related to alleged environmental issues associated with the Marcopper mine in the Province of Marinduque, Philippines. On October 3, 2025, the Court of Appeals in the Philippines issued a decision approving the settlement agreement and dismissing the Writ of Kalikasan proceedings against Barrick and Placer Dome with prejudice. The settlement is subject to various other conditions precedent, including the issuance of certain
confirmations by the Department of Environment and Natural Resources, the Philippines agency in charge of mining and the environment. Once all conditions are satisfied, Barrick will pay a settlement amount of $100 million to the PGM over a period of three years. This amount was recorded as part of Other Expense in Q1 2025.
Loulo-Gounkoto Mining Conventions Dispute
On January 2, 2025, an interim attachment order was issued by the Senior Investigating Judges of the Pôle National Économique et Financier (“Pôle Économique”) against the existing gold stock on the site of the Loulo-Gounkoto mining complex, which was executed on January 11, 2025, when the gold was removed from the site to a custodial bank. On January 14, 2025, due to the restrictions imposed by the Government of Mali on gold shipments, the Company temporarily suspended operations at the Loulo-Gounkoto complex.
On April 15, 2025, the Government of Mali closed the administrative office of Somilo and Gounkoto in Bamako due to unpaid taxes. The companies had previously explained to the authorities that those taxes could not be timely paid due to the Government’s restrictions on exporting gold
On May 8, 2025, the Government of Mali filed an application with the Bamako Commercial Tribunal to appoint a judicial administrator to manage Somilo and Gounkoto due to the company’s decision to temporarily suspend operations.
On June 16, 2025, the Bamako Commercial Tribunal placed Somilo and Gounkoto under a temporary provisional administration and appointed a Provisional Administrator. On June 17 2025, Somilo and Gounkoto filed an appeal against this decision.
Following the appointment of the Provisional Administrator, on June 23, 2025, the authorities lifted the closure order over the Bamako offices. This was immediately followed by the Provisional Administrator taking over day-to-day management of the operations of the Loulo-Gounkoto complex.
The ICSID arbitration process initiated on December 18, 2024 is ongoing and the Tribunal is now fully constituted. On July 21, 2025, the Tribunal held its first session, along with a hearing on a request filed by Somilo and Gounkoto for provisional measures to prevent further escalation and to safeguard their rights under the Mining Conventions during the pendency of the arbitration. On October 29, 2025, the ICSID Tribunal issued a decision recommending several provisional measures against Mali aimed at restoring Somilo’s and Gounkoto’s ability to operate the mines and denying certain other measures. The decision to grant provisional measures is an interim decision and is not a decision on the merits.
Barrick remains committed to engage with the Government of Mali in parallel to resolve the dispute.
Abuse of Criminal Proceedings
After several appeals were filed seeking the release of the employees, on September 9, 2025, the Investigating Judge at the Pôle Économique issued rulings allowing for the release of the four detained employees on bail. On September 15, 2025, the Public Prosecutor filed an appeal against the release orders, which have been stayed while the appeal is pending.
The Company continues to vigorously defend its rights, as well as those of its Malian subsidiaries and the affected employees, in connection with these proceedings.
| BARRICK THIRD QUARTER 2025 | 76 | NOTES TO FINANCIAL STATEMENTS (UNAUDITED) |
| OVERVIEW | OPERATING PERFORMANCE |
FUTURE GROWTH |
REVIEW OF FINANCIAL RESULTS |
OTHER INFORMATION & NON-GAAP RECONCILIATIONS |
FINANCIAL STATEMENTS |
|||||
North Mara — Ontario Litigation
On November 26, 2024, the court granted Barrick’s motion to dismiss both actions on the grounds that the Ontario Superior Court of Justice lacks jurisdiction and that Tanzania is a more appropriate forum in which to litigate this matter. On December 27, 2024, the plaintiffs’ appealed this decision to the Ontario Court of Appeal. The hearing of this appeal has been scheduled for November 27, 2025.
Pueblo Viejo - Amparo Actions
In May 2025, two constitutional actions were filed in an administrative court in the Dominican Republic against Pueblo Viejo Dominicana Jersey 2 Limited (“PV”), the joint venture company that operates the Pueblo Viejo mine, and the Dominican Ministry of Environment and Natural Resources. The actions, which are styled as “amparo” remedies, were brought by local individuals and environmental non-governmental organizations seeking to suspend construction of Pueblo Viejo’s new Naranjo tailings storage facility and revoke the underlying environmental license for such facility on the basis of alleged environmental and human rights concerns.
Following a hearing on September 2, 2025, the administrative court dismissed one of the two amparo actions on procedural grounds. The plaintiffs filed an appeal of this decision with the Constitutional Court on October 6, 2025.
The administrative court has not yet scheduled a hearing for the other amparo action.
The Company believes that there is no merit to these actions and intends to defend its position vigorously. No amounts have been recorded for any potential liability arising from these actions as the Company cannot reasonably predict the outcome.
| BARRICK THIRD QUARTER 2025 | 77 | NOTES TO FINANCIAL STATEMENTS (UNAUDITED) |
Shares Listed
| B | The New York Stock Exchange [1] |
| ABX | The Toronto Stock Exchange |
Transfer Agents and Registrars
TSX Trust Company
301 – 100 Adelaide Street West
Toronto, Ontario M5H 4H1
or
Equiniti Trust Company, LLC
48 Wall Street
New York, New York 10043
Telephone: 1 800 387 0825
Fax: 1 888 249 6189
Email: shareholderinquiries@tmx.com
Website: www.tsxtrust.com
Barrick Mining Corporation
Telephone: +1 416 861 9911
Email: investor@barrick.com
Website: www.barrick.com
161 Bay Street, Suite 3700
Toronto, Ontario M5J 2S1
310 South Main Street, Suite 1150
Salt Lake City, Utah 84101
Enquiries
Investor Relations Contact
Cleve Rueckert, +1 775 397 5443
Email: cleveland.rueckert@barrick.com
Media Contact
Brunswick Group
Carole Cable, +44 (0) 7974 982 458
Email: barrick@brunswickgroup.com
[1] As of May 9, 2025, Barrick’s ticker on the New York Stock Exchange changed to “B” from “GOLD”
Cautionary Statement on Forward-Looking Information
Certain information contained or incorporated by reference in this MD&A, including any information as to our strategy, projects, plans or future financial or operating performance, constitutes “forward-looking statements”. All statements, other than statements of historical fact, are forward-looking statements. The words “believe”, “expect”, “anticipated”, “aim”, “strategy”, “ramp up”, “target”, “plan”, “opportunities”, “guidance”, “forecast”, “outlook”, “project”, “develop”, “progress”, “continue”, “temporary”, “committed”, “estimate”, “potential”, “prospective”, “future”, “focus”, “ongoing”, “following”, “subject to”, “scheduled”, “may”, “will”, “can”, “could”, “would”, “should” and similar expressions identify forward-looking statements. In particular, this MD&A contains forward-looking statements including, without limitation, with respect to: Barrick’s forward-looking production and cost guidance, including our ability to meet our 2025 guidance; anticipated production growth from Barrick’s organic project pipeline and reserve replacement; estimates of future cost of sales per ounce for gold and per pound for copper, total cash costs per ounce and C1 cash costs per pound, and all-in sustaining costs per ounce/ pound; cash flow forecasts; projected capital, operating and exploration expenditures; the share buyback program and performance dividend policy; mine life and production rates; anticipated benefits from the sale of the Donlin Gold project, the Hemlo gold mine, the Tongon gold mine, and the Alturas project; anticipated timing for development of the Goldrush Project; our plans, timelines, and expected completion and benefits of our growth projects, including the Goldrush Project, Fourmile, Ren, Pueblo Viejo Expansion project, Veladero Phase 8 Leach Pad, Reko Diq, solar power project at Kibali, and the Lumwana Super Pit Expansion; anticipated production at Goldrush, Ren, Reko Diq and Lumwana; timing for first production from the Lumwana Super Pit Expansion; timing for first ore delivery from the
Gokona open pit; capital expenditures related to upgrades and ongoing management initiatives; Barrick’s global exploration strategy and planned exploration activities; Barrick’s copper strategy; the status of negotiations with the Government of Mali in respect of ongoing disputes regarding the Loulo-Gounkoto Complex, including the outcome of dispute resolution through arbitration; the resumption of operations and the temporary nature of the provisional administration and transfer of operational control to an external administrator at Loulo-Gounkoto; our pipeline of high confidence projects at or near existing operations; our ability to identify new Tier One assets and the potential for existing assets to attain Tier One status, including Fourmile; the incorporation of Fourmile into the NGM joint venture at fair market value; potential mineralization and metal or mineral recoveries; our ability to convert resources into reserves and future reserve replacement; asset sales, joint ventures and partnerships; Barrick’s strategy, plans, targets and goals in respect of sustainability issues, including climate change, greenhouse gas (“GHG”) emissions reduction targets, safety performance, community development and resettlement, and responsible water use; Barrick’s search for a permanent President and Chief Executive Officer; and expectations regarding future price assumptions, financial performance and other outlook or guidance.
Forward-looking statements are necessarily based upon a number of estimates and assumptions including material estimates and assumptions related to the factors set forth below that, while considered reasonable by the Company as at the date of this MD&A in light of management’s experience and perception of current conditions and expected developments, are inherently subject to significant business, economic and competitive uncertainties and contingencies. Known and unknown factors could cause actual results to differ materially from those projected in the forward-looking statements and undue reliance should not be placed on such statements and information.
Such factors include, but are not limited to: fluctuations in the spot and forward price of gold, copper or certain other commodities (such as silver, diesel fuel, natural gas and electricity); risks associated with projects in the early stages of evaluation and for which additional engineering and other analysis is required; risks related to the possibility that future exploration results will not be consistent with the Company’s expectations, that quantities or grades of reserves will be diminished, and that resources may not be converted to reserves; risks associated with the fact that certain of the initiatives described in this MD&A are still in the early stages and may not materialize; changes in mineral production performance, exploitation and exploration successes; risks that exploration data may be incomplete and considerable additional work may be required to complete further evaluation, including but not limited to drilling, engineering and socioeconomic studies and investment; the speculative nature of mineral exploration and development; lack of certainty with respect to foreign legal systems, corruption and other factors that are inconsistent with the rule of law; changes in national and local government legislation, taxation, controls or regulations and/or changes in the administration of laws, policies and practices, including the expropriation or nationalization of property and political or economic developments in Canada, the United States, Mali or other countries in which Barrick does or may carry on business in the future; risks relating to political instability in certain of the jurisdictions in which Barrick operates; timing of receipt of, or failure to comply with, necessary permits and approvals; non-renewal of key licenses by governmental authorities; failure to comply with environmental and health and safety laws and regulations; increased costs and physical and transition risks related to climate change, including extreme weather events, resource shortages, emerging policies and increased regulations relating to related to GHG emission levels, energy efficiency and reporting of risks; the Company’s ability to achieve its sustainability goals, including its climate-related goals and GHG emissions reduction targets, in particular its ability to achieve its Scope 3 emissions targets which require reliance on entities within Barrick’s value chain, but outside of the Company’s direct control, to achieve such targets within the specified time frames; contests over title to properties, particularly title to undeveloped properties, or over access to water, power and other required infrastructure; the liability associated with risks and hazards in the mining industry, and the ability to maintain insurance to cover such losses; damage to the Company’s reputation due to the actual or perceived occurrence of any number of events, including negative publicity with respect to the Company’s handling of environmental matters or dealings with community groups, whether true or not; risks related to operations near communities that may regard Barrick’s operations as being detrimental to them; litigation and legal and administrative proceedings; operating or technical difficulties in connection with mining or development activities, including geotechnical challenges, tailings dam and storage facilities failures, and disruptions in the maintenance or provision of required infrastructure and information technology systems; increased costs, delays, suspensions and technical challenges associated with the construction of capital projects; risks associated with working with partners in jointly controlled assets; risks related to disruption of supply routes which may cause delays in construction and mining activities, including disruptions in the supply of key mining inputs due to the
invasion of Ukraine by Russia and conflicts in the Middle East; risk of loss due to acts of war, terrorism, sabotage and civil disturbances; risks associated with artisanal and illegal mining; risks associated with Barrick’s infrastructure, information technology systems and the implementation of Barrick’s technological initiatives, including risks related to cybersecurity incidents, including those caused by computer viruses, malware, ransomware and other cyberattacks, or similar information technology system failures, delays and/or disruptions; the impact of global liquidity and credit availability on the timing of cash flows and the values of assets and liabilities based on projected future cash flows; the impact of inflation, including global inflationary pressures driven by ongoing global supply chain disruptions, global energy cost increases following the invasion of Ukraine by Russia and country-specific political and economic factors in Argentina; adverse changes in our credit ratings; fluctuations in the currency markets; changes in U.S. dollar interest rates; changes in U.S. trade, tariff and other controls on imports and exports, tax, immigration or other policies that may impact relations with foreign countries, result in retaliatory policies, lead to increased costs for raw materials and components, or impact Barrick’s existing operations and material growth projects; risks arising from holding derivative instruments (such as credit risk, market liquidity risk and mark-to-market risk); risks related to the demands placed on the Company’s management, the ability of management to implement its business strategy and enhanced political risk in certain jurisdictions; uncertainty whether some or all of Barrick’s targeted investments and projects will meet the Company’s capital allocation objectives and internal hurdle rate; whether benefits expected from recent transactions are realized; business opportunities that may be presented to, or pursued by, the Company; our ability to successfully integrate acquisitions or complete divestitures; risks related to competition in the mining industry; employee relations including loss of key employees; availability and increased costs associated with mining inputs and labor; risks associated with diseases, epidemics and pandemics; risks related to the failure of internal controls; and risks related to the impairment of the Company’s goodwill and assets. In addition, there are risks and hazards associated with the business of mineral exploration, development and mining, including environmental hazards, industrial accidents, unusual or unexpected formations, pressures, cave-ins, flooding and gold bullion, copper cathode or gold or copper concentrate losses (and the risk of inadequate insurance, or inability to obtain insurance, to cover these risks).
Many of these uncertainties and contingencies can affect our actual results and could cause actual results to differ materially from those expressed or implied in any forward-looking statements made by, or on behalf of, us. Readers are cautioned that forward-looking statements are not guarantees of future performance. All of the forward-looking statements made in this MD&A are qualified by these cautionary statements. Specific reference is made to the most recent Form 40-F/Annual Information Form on file with the SEC and Canadian provincial securities regulatory authorities for a more detailed discussion of some of the factors underlying forward-looking statements and the risks that may affect Barrick’s ability to achieve the expectations set forth in the forward-looking statements contained in this MD&A. We disclaim any intention or obligation to update or revise any forward-looking statements whether as a result of new information, future events or otherwise, except as required by applicable law.
