UNITED STATES
SECURITIES AND EXCHANGE COMMISSION
Washington, D.C. 20549
FORM 6-K
REPORT OF FOREIGN PRIVATE ISSUER
PURSUANT TO RULE 13a-16 OR 15d-16
UNDER THE SECURITIES EXCHANGE ACT OF 1934
For the month of November 2025
Commission File Number: 001-41404
Woodside Energy Group Ltd
(ABN 55 004 898 962)
(Registrant’s name)
Woodside Energy Group Ltd
Mia Yellagonga, 11 Mount Street
Perth, Western Australia 6000
Australia
(Address of principal executive offices)
Indicate by check mark whether the registrant files or will file annual reports under cover of Form 20-F or Form 40-F.
Form 20-F ☒ Form 40-F ☐
Indicate by check mark if the registrant is submitting the Form 6-K in paper as permitted by Regulation S-T Rule 101(b)(1): ☐
Indicate by check mark if the registrant is submitting the Form 6-K in paper as permitted by Regulation S-T Rule 101(b)(7): ☐
EXHIBIT INDEX
| Exhibit No. |
Description |
|
| 99.1 | A copy of the registrant’s ASX Announcement, dated November 5, 2025, entitled “2025 Capital Markets Day”. | |
SIGNATURES
Pursuant to the requirements of the Securities Exchange Act of 1934, the registrant has duly caused this report to be signed on its behalf by the undersigned, thereunto duly authorized.
Dated: November 5, 2025
| WOODSIDE ENERGY GROUP LTD | ||
| By: | /s/ Damien Gare |
|
| Damien Gare Corporate Secretary |
||
Exhibit 99.1
| Announcement
Wednesday, 5 November 2025 |
Woodside Energy Group Ltd. ACN 004 898 962 Mia Yellagonga 11 Mount Street Perth WA 6000 Australia T +61 8 9348 4000 www.woodside.com
ASX: WDS NYSE: WDS |
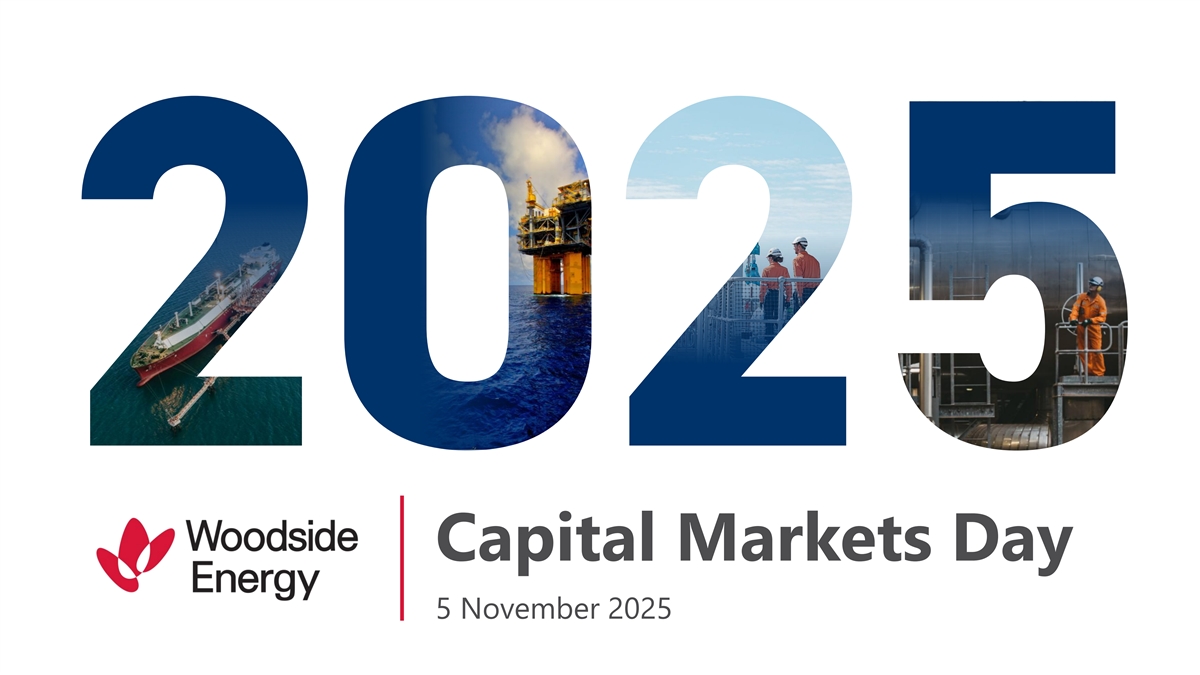
2025 CAPITAL MARKETS DAY
At its 2025 Capital Markets Day today, Woodside outlined its strategy to thrive through the energy transition and deliver long-term shareholder value by meeting rising global demand for affordable, reliable, lower-carbon energy.
Chief Executive Officer Meg O’Neill said she is excited by the opportunities ahead of Woodside.
“Woodside is a compelling investment opportunity supported by world-class assets, an integrated value chain, long-term customer relationships and a strong balance sheet. Woodside generates durable cash flows and has rewarded shareholders with approximately US$11 billion in dividends since 2022.
“Over the next decade, with disciplined capital management, we will execute our strategy by maximising performance from our base business, delivering cash-generative projects to sustain and grow the business and creating the next wave of future opportunities for long-term returns for our shareholders.
“Woodside is extracting full value from every asset through safe, reliable operations and a focus on innovation to reduce operating costs and increase efficiencies.
“We are applying the same disciplined approach to our next phase of growth, aiming to realise a step-change in net operating cash flow. By the early 2030s, net operating cash is expected to rise to around US$9 billion, representing a more than 6% compound annual growth rate in sales and cash flow from 2024 and providing a pathway to a 50% increase in dividend per share from 2032.1
“Our strategy is supported by ongoing robust global demand for our products. Woodside’s major growth projects will capitalise on this demand, with the Beaumont New Ammonia project expecting first ammonia this year, the Scarborough Energy Project on track to begin LNG shipments in the second half of next year, the offshore Mexico Trion field targeting first oil in 2028, and Louisiana LNG targeting start-up in 2029.
“With global LNG demand forecast to grow 60% by 2035, Woodside’s increasing scale across the Atlantic and Pacific basins, combined with our marketing and trading business, optimises our capability to meet customer needs.2
“Our confidence in Woodside’s future is founded on our long track record of sustainably growing and returning value to shareholders through the investment cycle. We have a clear strategy to continue delivering value in years to come.
| 1 | In the attached Capital Markets Day 2025 presentation, refer to slides 18, 87, 88 and the ‘Disclaimer, important notes and assumptions’ for further details on underlying assumptions. |
| 2 | Source: Wood Mackenzie LNG Tool (September 2025), relative to a 2024 baseline. |
Page 1 of 2
Webcast
To access the live webcast of the Capital Markets Day, please follow the link at https://meetings.lumiconnect.com/300-031-281-118.
The webcast will commence at 09:30 AEDT / 06:30 AWST (16:30PM CT on Tuesday, 4 November 2025).
A copy of Woodside’s Capital Markets Day 2025 slide pack is attached.
| INVESTORS
|
MEDIA
|
|
| Vanessa Martin | Christine Abbott | |
| M: +61 477 397 961 |
M: +61 484 112 469 |
|
| E: investor@woodside.com |
E: christine.forster@woodside.com |
This announcement was approved and authorised for release by Woodside’s Disclosure Committee.
Forward-looking statements
This announcement contains forward-looking statements with respect to Woodside’s business and operations, market conditions, results of operations and financial condition, including, for example, but not limited to, outcomes of transactions, statements regarding long-term demand for Woodside’s products and services, development, completion and execution of Woodside’s projects, expectations regarding future capital expenditures and cash flow, the payment of future dividends and the amount thereof, future results of projects, operating activities and new energy products, expectations and plans for new energy products and lower-carbon services and investments in, and development of, new energy products and lower-carbon services, expectations and guidance with respect to production, capital and exploration expenditure and gas hub exposure, and expectations regarding the achievement of Woodside’s net equity Scope 1 and 2 greenhouse gas emissions reduction and Scope 3 investment and abatement targets and other climate and sustainability goals. All forward-looking statements contained in this announcement reflect Woodside’s views held as at the date of this announcement. All statements, other than statements of historical or present facts, are forward-looking statements and generally may be identified by the use of forward-looking words such as ‘guidance’, ‘foresee’, ‘likely’, ‘potential’, ‘anticipate’, ‘believe’, ‘aim’, ‘aspire’, ‘estimate’, ‘expect’, ‘intend’, ‘may’, ‘target’, ‘enable’, ‘plan’, ‘strategy’, ‘forecast’, ‘outlook’, ‘project’, ‘schedule’, ‘will’, ‘should’, ‘seek’ and other similar words or expressions.
Forward-looking statements in this announcement are not guidance, forecasts, guarantees or predictions of future events or performance, but are in the nature of aspirational targets that Woodside has set for itself and its management of the business. Those statements and any assumptions on which they are based are only opinions, are subject to change without notice and are subject to inherent known and unknown risks, uncertainties, assumptions and other factors, many of which are beyond the control of Woodside, its related bodies corporate and their respective officers, directors, employees, advisers or representatives.
Details of the key risks relating to Woodside and its business can be found in the “Risk” section of Woodside’s most recent Annual Report released to the Australian Securities Exchange and Woodside’s most recent Annual Report on Form 20-F filed with the United States Securities and Exchange Commission and available on the Woodside website at https://www.woodside.com/investors/reports-investor-briefings. You should review and have regard to these risks when considering the information contained in this announcement.
Investors are strongly cautioned not to place undue reliance on any forward-looking statements. Actual results or performance may vary materially from those expressed in, or implied by, any forward-looking statements.
All information included in this announcement, including any forward-looking statements, speak only as of the date of this announcement and, except as required by law or regulation, Woodside does not undertake to update or revise any information or forward-looking statements contained in this announcement, whether as a result of new information, future events, or otherwise.
Page 2 of 2
Capital Markets Day 5 November 2025 1 2025 Capital Markets Day
Disclaimer, important notes and assumptions Information ‘forecast’, ‘outlook’, ‘project’, ‘schedule’, ‘will’, ‘should’, ‘seek’ and other similar words or expressions. Similarly, statements that describe the objectives, plans, goals or expectations of Woodside are forward-looking statements. • This presentation has been prepared by Woodside Energy Group Ltd (“Woodside”). Forward-looking statements in this presentation are not guidance, forecasts, guarantees or predictions of future events • All information included in this presentation, including any forward-looking statements, reflects Woodside’s views held or performance, but are in the nature of future expectations that are based on management’s current expectations and as at the date of this presentation and, except as required by applicable law, neither Woodside, its related bodies contingencies. Those statements and any assumptions on which they are based are subject to change without notice corporate, nor any of their respective officers, directors, employees, advisers or representatives (“Beneficiaries”) intends and are subject to inherent known and unknown risks, uncertainties, assumptions and other factors, many of which are to, undertakes to, or assumes any obligation to, provide any additional information or update or revise any information beyond the control of Woodside, its related bodies corporate and their respective officers, directors, employees, advisers or forward-looking statements in this presentation after the date of this presentation, either to make them conform to or representatives. actual results or as a result of new information, future events, changes in Woodside’s expectations or otherwise. • Important factors that could cause actual results to differ materially from those in the forward-looking statements and • This presentation may contain industry, market and competitive position data that is based on industry publications and assumptions on which they are based include, but are not limited to, fluctuations in commodity prices, actual demand studies conducted by third parties as well as Woodside’s internal estimates and research. While Woodside believes that for Woodside’s products, currency fluctuations, geotechnical factors, drilling and production results, gas each of these publications and third-party studies is reliable and has been prepared by a reputable source, Woodside commercialisation, development progress, operating results, engineering estimates, reserve and resource estimates, loss has not independently verified the market and industry data obtained from these third-party sources and cannot of market, industry competition, sustainability and environmental risks, climate related transition and physical risks, guarantee the accuracy or completeness of such data. Accordingly, undue reliance should not be placed on any of the changes in accounting standards, political risks, the actions of third parties, project delay or advancement, regulatory industry, market and competitive position data contained in this presentation. approvals, the impact of armed conflict and political instability (such as the ongoing conflicts in Ukraine and in the • To the maximum extent permitted by law, neither Woodside, its related bodies corporate, nor any of their respective Middle East) on economic activity and oil and gas supply and demand, cost estimates, legislative, fiscal and regulatory Beneficiaries, assume any liability (including liability for equitable, statutory or other damages) in connection with, any developments, including but not limited to those related to the imposition of tariffs and other trade restrictions, the responsibility for, or make any representation or warranty (express or implied) as to, the fairness, currency, accuracy, effect of future regulatory or legislative actions on Woodside or the industries in which it operates, including potential adequacy, reliability or completeness of the information or any opinions expressed in this presentation or the changes to tax laws, the impact of general economic and financial market conditions, inflationary conditions, prevailing reasonableness of any underlying assumptions. exchange rates and interest rates and conditions in financial markets, and risks associated with acquisitions, mergers and joint ventures, including difficulties integrating or separating businesses, uncertainty associated with financial No offer or advice projections, restructuring, increased costs and adverse tax consequences, and uncertainties and liabilities associated with • This presentation is not intended to and does not constitute, form part of, or contain an offer or invitation to sell to acquired and divested properties and businesses. Woodside shareholders (or any other person), or a solicitation of an offer from Woodside shareholders (or any other • A detailed summary of the key risks relating to Woodside and its business can be found in the “Risk” section of person) or a solicitation of any vote or approval from Woodside shareholders (or any other person) in any jurisdiction. Woodside’s most recent Annual Report released to the Australian Securities Exchange and in Woodside’s most recent • This presentation has been prepared without reference to the investment objectives, financial and taxation situation or Annual Report on Form 20-F filed with the United States Securities and Exchange Commission and available on the particular needs of any Woodside shareholder or any other person. The information contained in this presentation does Woodside website at https://www.woodside.com/investors/reports-investor-briefings. You should review and have not constitute, and should not be taken as, financial product or investment advice. Woodside encourages you to seek regard to these risks when considering the information contained in this presentation. independent legal, financial, taxation and other professional advice before making any investment decision. • If any of the assumptions on which a forward-looking statement is based were to change or be found to be incorrect, Forward-looking statements this would likely cause outcomes to differ from the statements made in this presentation. Investors are strongly • This presentation contains forward-looking statements with respect to Woodside’s business and operations, market cautioned not to place undue reliance on any forward-looking statements. Actual results or performance may vary conditions, results of operations and financial condition, including, for example, but not limited to, outcomes of materially from those expressed in, or implied by, any forward-looking statements. transactions, statements regarding long-term demand for Woodside’s products and services, development, completion • All forward-looking statements contained in this presentation reflect Woodside’s views held as at the date of this and execution of Woodside’s projects, expectations regarding future capital expenditures and cash flow, the payment of presentation and, except as required by applicable law, Woodside does not intend to, undertake to, or assume any future dividends and the amount thereof, future results of projects, operating activities and new energy products, obligation to, provide any additional information or update or revise any of these statements after the date of this expectations and plans for new energy products and lower-carbon services and investments in, and development of, presentation, either to make them conform to actual results or as a result of new information, future events, changes in new energy products and lower-carbon services, expectations and guidance with respect to production, capital and Woodside’s expectations or otherwise. exploration expenditure and gas hub exposure, and expectations regarding the achievement of Woodside’s net equity Scope 1 and 2 greenhouse gas emissions reduction and Scope 3 investment and abatement targets and other climate and sustainability goals. All statements, other than statements of historical or present facts, are forward-looking statements and generally may be identified by the use of forward-looking words such as ‘guidance’, ‘foresee’, ‘likely’, ‘potential’, ‘anticipate’, ‘believe’, ‘aim’ ,’aspire’, ‘estimate, ‘expect’, ‘intend’, ‘may’, ‘target’, ‘enable’, ‘plan’, ‘strategy’, 2 2025 Capital Markets Day
Disclaimer, important notes and assumptions (continued) Disclosure of reserve information and cautionary note to US investors Climate strategy and emissions data • Woodside is an Australian company with securities listed on the Australian Securities Exchange and the New York Stock • All greenhouse gas emissions data in this presentation are estimates, due to the inherent uncertainty and limitations in Exchange. Woodside reports its Proved (1P) Reserves in accordance with SEC regulations, which are also compliant with measuring or quantifying greenhouse gas emissions, and our methodologies for measuring or quantifying greenhouse SPE-PRMS guidelines, and reports its Proved plus Probable (2P) Reserves and Best Estimate (2C) Contingent Resources in gas emissions may evolve as best practices continue to develop and data quality and quantity continue to improve. accordance with SPE-PRMS guidelines. Woodside reports all of its petroleum resource estimates using definitions • Woodside “greenhouse gas” or “emissions” information reported are net equity Scope 1 greenhouse gas emissions, consistent with the 2018 Society of Petroleum Engineers (SPE)/World Petroleum Council (WPC)/American Association of Scope 2 greenhouse gas emissions, and/or Scope 3 greenhouse gas emissions, unless otherwise stated. Petroleum Geologists (AAPG)/Society of Petroleum Evaluation Engineers (SPEE) Petroleum Resources Management • For more information on Woodside's climate strategy and performance, including further details regarding Woodside’s System (PRMS). targets, aspirations and goals and the underlying methodology, judgements, assumptions and contingencies, refer to • The SEC prohibits oil and gas companies, in their filings with the SEC, from disclosing estimates of oil or gas resources Woodside's Climate Transition Action Plan 2023 (CTAP) and the 2024 Climate Update, each available on the Woodside other than ‘reserves’ (as that term is defined by the SEC). In this announcement, Woodside includes estimates of website at https://www.woodside.com/sustainability/climate-change and section 3.85 of Woodside’s 2024 Annual quantities of oil and gas using certain terms, such as ‘proved plus probable (2P) reserves’, ‘best estimate (2C) contingent Report. The glossary and footnotes to this presentation provide clarification regarding the use of terms such as lower- resources’, ‘reserves and contingent resources’, ‘proved plus probable’, ‘developed and undeveloped’, ‘probable carbon“ under Woodside's climate strategy. A full glossary of terms used in connection with Woodside's climate strategy developed’, ‘probable undeveloped’, ‘contingent resources’ or other descriptions of volumes of reserves, which terms is contained in the CTAP. include quantities of oil and gas that may not meet the SEC’s definitions of proved, probable and possible reserves, and Non-IFRS Financial Measures which the SEC’s guidelines strictly prohibit Woodside from including in filings with the SEC. These types of estimates do • Throughout this presentation, a range of financial and non-financial measures are used to assess Woodside’s not represent, and are not intended to represent, any category of reserves based on SEC definitions, and may differ from and may not be comparable to the same or similarly-named measures used by other companies. These estimates are by performance, including a number of financial measures that are not defined in, and have not been prepared in accordance with, International Financial Reporting Standards (IFRS) and are not recognised measures of financial their nature more speculative than estimates of proved reserves and would require substantial capital spending over a significant number of years to implement recovery, and accordingly are subject to substantially greater risk of not being performance or liquidity under IFRS (Non-IFRS Financial Measures). These measures include EBIT, EBITDA, EBITDA excluding impairment, EBITDA margin, Gearing, Underlying NPAT, Average realised price, Unit production cost, Net debt, recovered by Woodside. In addition, actual locations drilled and quantities that may be ultimately recovered from Liquidity, Free cash flow, Capital expenditure, Capital expenditure excluding Louisiana LNG, Exploration expenditure, Woodside’s properties may differ substantially. Woodside has made no commitment to drill, and likely will not drill, all drilling locations that have been attributable to these quantities. The Reserves Statement presenting Woodside’s proved Return on Equity, Cash margin, Production cost margin, and Other cash cost margin. These Non-IFRS Financial Measures are defined in the glossary section of this presentation. A quantitative reconciliation of these measures to the most oil and gas reserves in accordance with the regulations of the SEC is filed with the SEC as part of Woodside’s annual report on Form 20-F. US investors are urged to consider closely the disclosures in Woodside’s most recent Annual directly comparable financial measure calculated and presented in accordance with IFRS can be found in the Alternative Performance Measures section of Woodside’s Half-Year Report for the period ended 30 June 2025. Report on Form 20-F filed with the SEC and available on the Woodside website at https://www.woodside.com/investors/reports-investor-briefings and its other filings with the SEC, which are available • Woodside’s management uses these measures to monitor Woodside’s financial performance alongside IFRS measures to from Woodside at https://www.woodside.com. These reports can also be obtained from the SEC at www.sec.gov. improve the comparability of information between reporting periods and business units and Woodside believes that the Non-IFRS Financial Measures it presents provide a useful means through which to examine the underlying performance Assumptions of its business. • Unless otherwise indicated, the targets set out in this presentation have been estimated on the basis of a variety of • Undue reliance should not be placed on the Non-IFRS Financial Measures contained in this presentation and these Non- economic assumptions including: (1) US$70/bbl Brent long-term oil price, US$10/MMBtu long term JKM price, IFRS Financial Measures should be considered in addition to, and not as a substitute for, or as superior to, measures of US$9/MMBtu long-term TTF price, US$3.50 long-term Henry Hub price (2024 real terms) and a long-term inflation rate of 2.0%; (2) currently sanctioned projects being delivered in accordance with their current project schedules; and (3) financial performance, financial position or cash flows reported in accordance with IFRS. Non-IFRS Financial Measures are not uniformly defined by all companies, including those in Woodside’s industry. Accordingly, they may not be applicable growth opportunities being sanctioned and delivered in accordance with the target schedules provided in this presentation. These growth opportunities are subject to relevant project participant approvals, commercial comparable with similarly titled measures and disclosures by other companies. arrangements with third parties and regulatory approvals being obtained in the timeframe contemplated or at all. Other important information Woodside expresses no view as to whether project participants will agree with and support Woodside’s current position • All references to dollars, cents or $ in this presentation are to US currency, unless otherwise stated. in relation to these opportunities, or such commercial arrangements and regulatory approvals will be obtained. • References to “Woodside” may be references to Woodside Energy Group Ltd and/or its applicable subsidiaries (as the Additional assumptions relevant to particular targets or other statements in this presentation may be set out in the context requires). relevant slides and slides 87-88. Any such additional assumptions are in addition to the assumptions and qualifications applicable to the presentation as a whole. • This presentation does not include any express or implied prices at which Woodside will buy or sell financial products. • A securities rating is not a recommendation to buy, sell or hold securities and may be subject to revision or withdrawal at any time. 3 2025 Capital Markets Day
Notes to petroleum reserves and resources 1. Unless otherwise stated, all petroleum resource estimates are quoted as at the effective date of 31 December 2024, net government regulations. Proved reserves are estimated and reported on a net interest basis in accordance with the SEC Woodside share. For details of Woodside’s year end 2024 reserves position, see the Reserves and Resources Statement regulations and have been determined in accordance with SEC Rule 4-10(a) of Regulation S-X. included in the 2024 Annual Report. US Investors should refer to “Additional information for US investors concerning 11. ‘Undeveloped reserves’ are those reserves for which wells and facilities have not been installed or executed but are reserves and resources estimates” above. expected to be recovered through future significant investments. 2. All numbers are internal estimates produced by Woodside. Estimates of reserves and contingent resources should be 12. ‘Probable reserves’ are those reserves which analysis of geological and engineering data suggests are more likely than regarded only as estimates that may change over time as additional information becomes available. not to be recoverable. Proved plus probable reserves represent the best estimate of recoverable quantities. Where 3. For offshore oil projects, the reference point is defined as the outlet of the floating production storage and offloading probabilistic methods are used, there is at least a 50% probability that the actual quantities recovered will equal or facility (FPSO) or platform, while for the onshore gas projects the reference point is defined as the outlet of the exceed the sum of estimated proved plus probable reserves. Proved plus probable reserves are estimated and reported downstream (onshore) gas processing facility. in accordance with SPE-PRMS guidelines and are not compliant with SEC regulations. 4. ‘Reserves’ are estimated quantities of petroleum that have been demonstrated to be producible from known 13. The estimates of petroleum reserves and contingent resources are based on and fairly represent information and accumulations in which the company has a material interest from a given date forward, at commercial rates, under supporting documentation prepared by, or under the supervision of, Mr Benjamin Ziker, Woodside’s Vice President presently anticipated production methods, operating conditions, prices, and costs. Woodside reports reserves inclusive Reserves and Subsurface, who is a full-time employee of the company and a member of the Society of Petroleum of all fuel consumed in operations. Woodside estimates and reports its proved reserves in accordance with SEC Engineers. The reserves and resources estimates included in this announcement are issued with the prior written consent regulations which are also compliant with the 2018 Society of Petroleum Engineers (SPE)/World Petroleum Council of Mr Ziker. Mr Ziker’s qualifications include a Bachelor of Science (Chemical Engineering) from Rice University (WPC)/American Association of Petroleum Geologists (AAPG)/Society of Petroleum Evaluation Engineers (SPEE) (Houston, Texas, USA) and 27 years of relevant experience. Petroleum Resources Management System (PRMS) (SPE-PRMS) guidelines. SEC-compliant proved reserves estimates use a more restrictive, rules-based approach and are generally lower than estimates prepared solely in accordance with SPE- PRMS guidelines due to, among other things, the requirement to use commodity prices based on the average of first of month prices during the 12-month period in the reporting company’s fiscal year. Woodside estimates and reports its proved plus probable reserves in accordance with SPE-PRMS guidelines which are not compliant with SEC regulations. 5. Assessment of the economic value in support of an SPE-PRMS (2018) reserves and resources classification, uses Woodside Portfolio Economic Assumptions (Woodside PEAs). The Woodside PEAs are reviewed on an annual basis, or more often if required. The review is based on historical data and forecast estimates for economic variables such as product prices and exchange rates. The Woodside PEAs are approved by the Woodside Board. Specific contractual arrangements for individual projects are also taken into account. 6. Woodside is not aware of any new information or data that materially affects the information included in the Reserves and Resources Update. All the material assumptions and technical parameters underpinning the estimates in the Reserves and Resources Update continue to apply and have not materially changed. 7. Woodside reports its petroleum resource estimates inclusive of all fuel consumed in operations. 8. Woodside uses both deterministic and probabilistic methods for the estimation of reserves and contingent resources at the field and project levels. All proved reserves estimates have been estimated using deterministic methods and reported on a net interest basis in accordance with the SEC regulations and have been determined in accordance with SEC Rule 4-10(a) of Regulation S-X. 6 9. ‘MMboe’ means millions (10 ) of barrels of oil equivalent. Natural gas volumes are converted to oil equivalent volumes via a constant conversion factor, which for Woodside is 5.7 Bcf of dry gas per 1 MMboe. All volumes are reported at standard oilfield conditions of 14.696 psi (101.325 kPa) and 60 degrees Fahrenheit (15.56 degrees Celsius). 10. ‘Proved reserves’ are those quantities of crude oil, condensate, natural gas and NGLs that, by analysis of geoscience and engineering data, can be estimated with reasonable certainty to be economically producible from a given date forward from known reservoirs and under existing economic conditions, operating methods, operating contracts, and 4 2025 Capital Markets Day
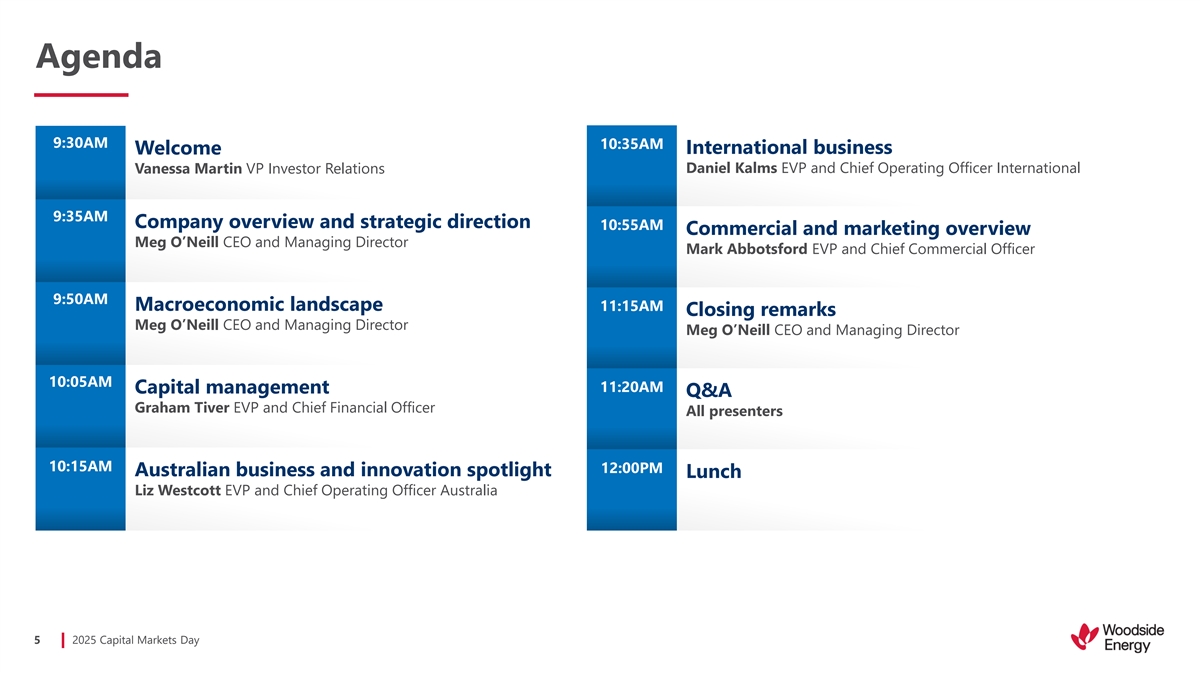
Agenda 9:30AM 10:35AM International business Welcome Vanessa Martin VP Investor Relations Daniel Kalms EVP and Chief Operating Officer International 9:35AM Company overview and strategic direction 10:55AM Commercial and marketing overview Meg O’Neill CEO and Managing Director Mark Abbotsford EVP and Chief Commercial Officer 9:50AM Macroeconomic landscape 11:15AM Closing remarks Meg O’Neill CEO and Managing Director Meg O’Neill CEO and Managing Director 10:05AM 11:20AM Capital management Q&A Graham Tiver EVP and Chief Financial Officer All presenters 10:15AM 12:00PM Australian business and innovation spotlight Lunch Liz Westcott EVP and Chief Operating Officer Australia 5 2025 Capital Markets Day

Company overview and strategic direction Maximise, deliver, create Meg O’Neill CEO and Managing Director
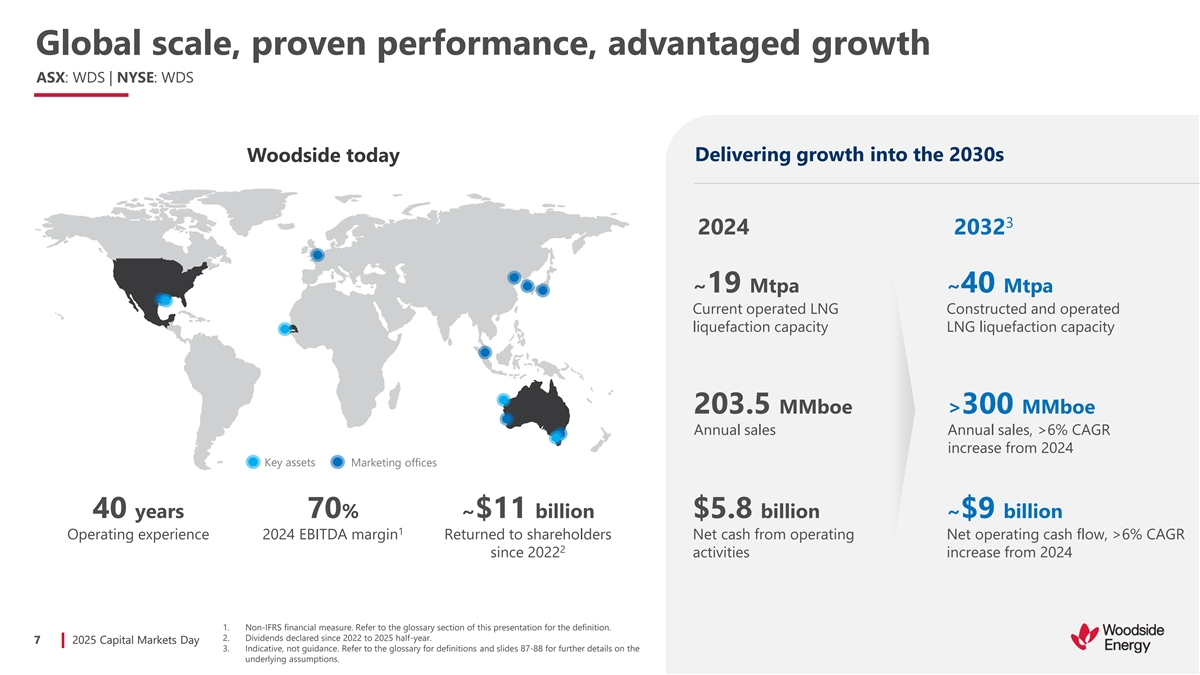
Global scale, proven performance, advantaged growth ASX: WDS | NYSE: WDS Delivering growth into the 2030s Woodside today 3 2024 2032 ~19 Mtpa ~40 Mtpa Current operated LNG Constructed and operated liquefaction capacity LNG liquefaction capacity 203.5 MMboe >300 MMboe Annual sales Annual sales, >6% CAGR increase from 2024 Key assets Marketing offices 40 years 70% ~$11 billion $5.8 billion ~$9 billion 1 Operating experience 2024 EBITDA margin Returned to shareholders Net cash from operating Net operating cash flow, >6% CAGR 2 since 2022 activities increase from 2024 1. Non-IFRS financial measure. Refer to the glossary section of this presentation for the definition. 2. Dividends declared since 2022 to 2025 half-year. 7 7 2 20 02 25 5 C Cap apit ital al M Mar ark ke et ts s D Day ay 3. Indicative, not guidance. Refer to the glossary for definitions and slides 87-88 for further details on the underlying assumptions.
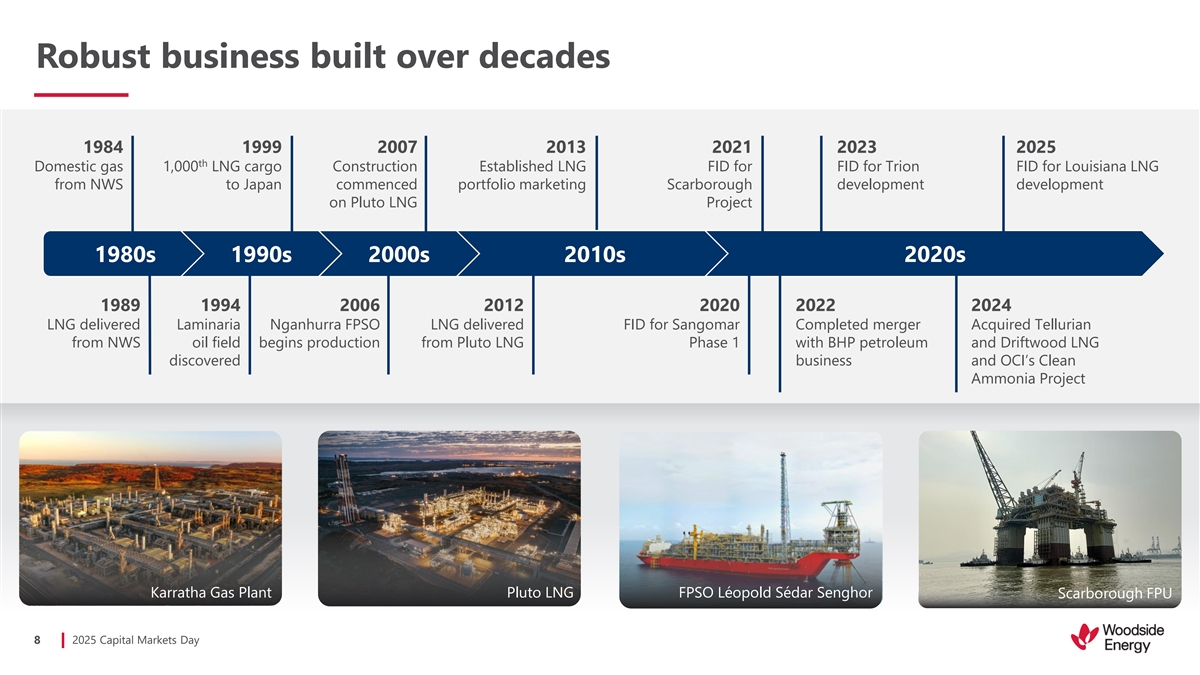
Robust business built over decades 1984 1999 2007 2013 2021 2023 2025 th Domestic gas 1,000 LNG cargo Construction Established LNG FID for FID for Trion FID for Louisiana LNG from NWS to Japan commenced portfolio marketing Scarborough development development on Pluto LNG Project 1980s 1990s 2000s 2010s 2020s 1989 1994 2006 2012 2020 2022 2024 LNG delivered Laminaria Nganhurra FPSO LNG delivered FID for Sangomar Completed merger Acquired Tellurian from NWS oil field begins production from Pluto LNG Phase 1 with BHP petroleum and Driftwood LNG discovered business and OCI’s Clean Ammonia Project Karratha Gas Plant Pluto LNG FPSO Léopold Sédar Senghor Scarborough FPU 8 2025 Capital Markets Day
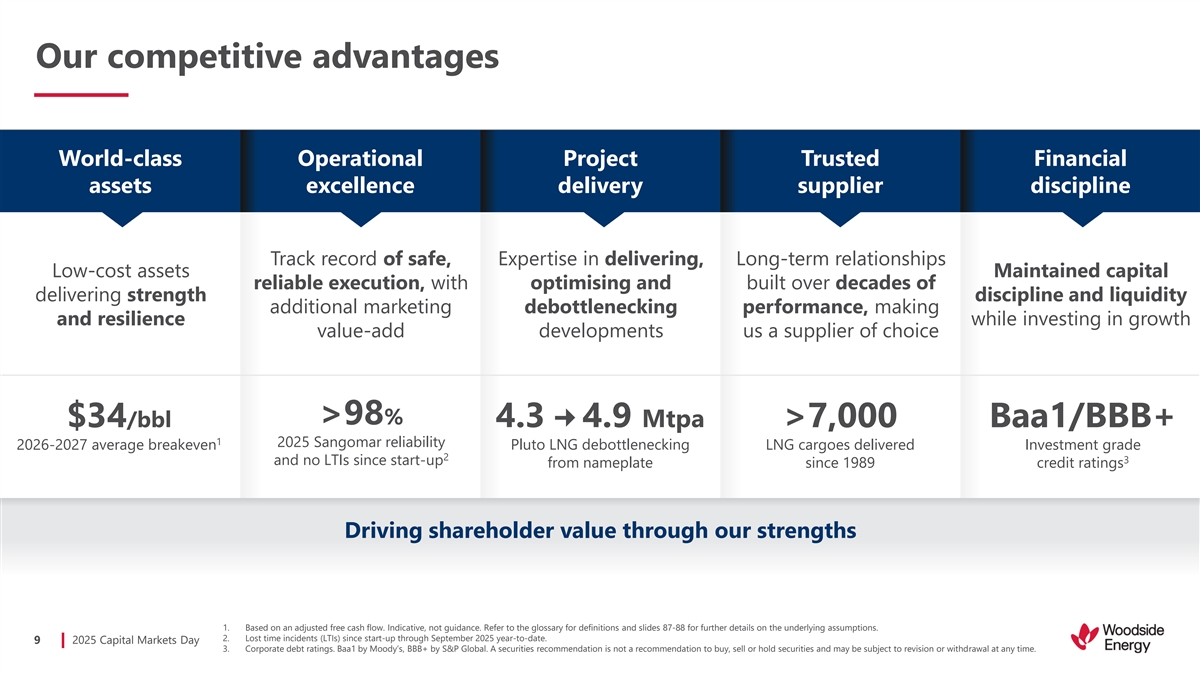
Our competitive advantages World-class Operational Project Trusted Financial assets excellence delivery supplier discipline Track record of safe, Expertise in delivering, Long-term relationships Low-cost assets Maintained capital reliable execution, with optimising and built over decades of delivering strength discipline and liquidity additional marketing debottlenecking performance, making and resilience while investing in growth value-add developments us a supplier of choice >98% $34/bbl 4.3 – 4.9 Mtpa >7,000 Baa1/BBB+ 1 2025 Sangomar reliability 2026-2027 average breakeven Pluto LNG debottlenecking LNG cargoes delivered Investment grade 2 3 and no LTIs since start-up from nameplate since 1989 credit ratings Driving shareholder value through our strengths 1. Based on an adjusted free cash flow. Indicative, not guidance. Refer to the glossary for definitions and slides 87-88 for further details on the underlying assumptions. 2. Lost time incidents (LTIs) since start-up through September 2025 year-to-date. 9 2025 Capital Markets Day 3. Corporate debt ratings. Baa1 by Moody’s, BBB+ by S&P Global. A securities recommendation is not a recommendation to buy, sell or hold securities and may be subject to revision or withdrawal at any time.
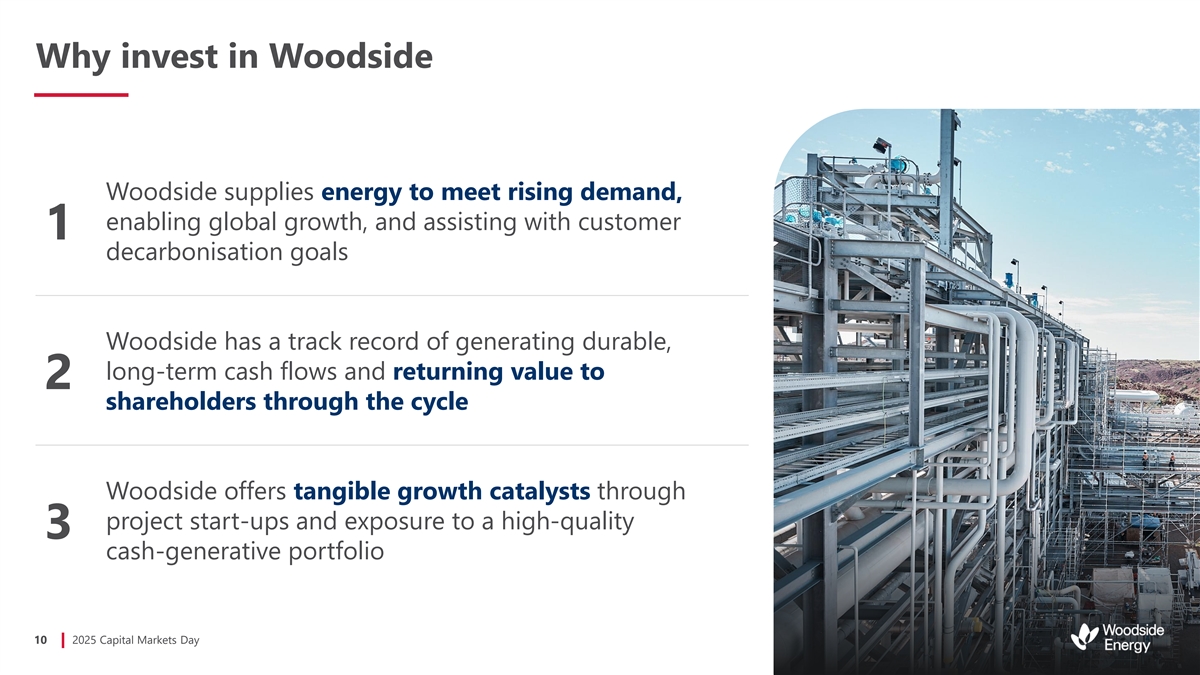
Why invest in Woodside Woodside supplies energy to meet rising demand, enabling global growth, and assisting with customer 1 decarbonisation goals Woodside has a track record of generating durable, long-term cash flows and returning value to 2 shareholders through the cycle Woodside offers tangible growth catalysts through project start-ups and exposure to a high-quality 3 cash-generative portfolio 10 2025 Capital Markets Day
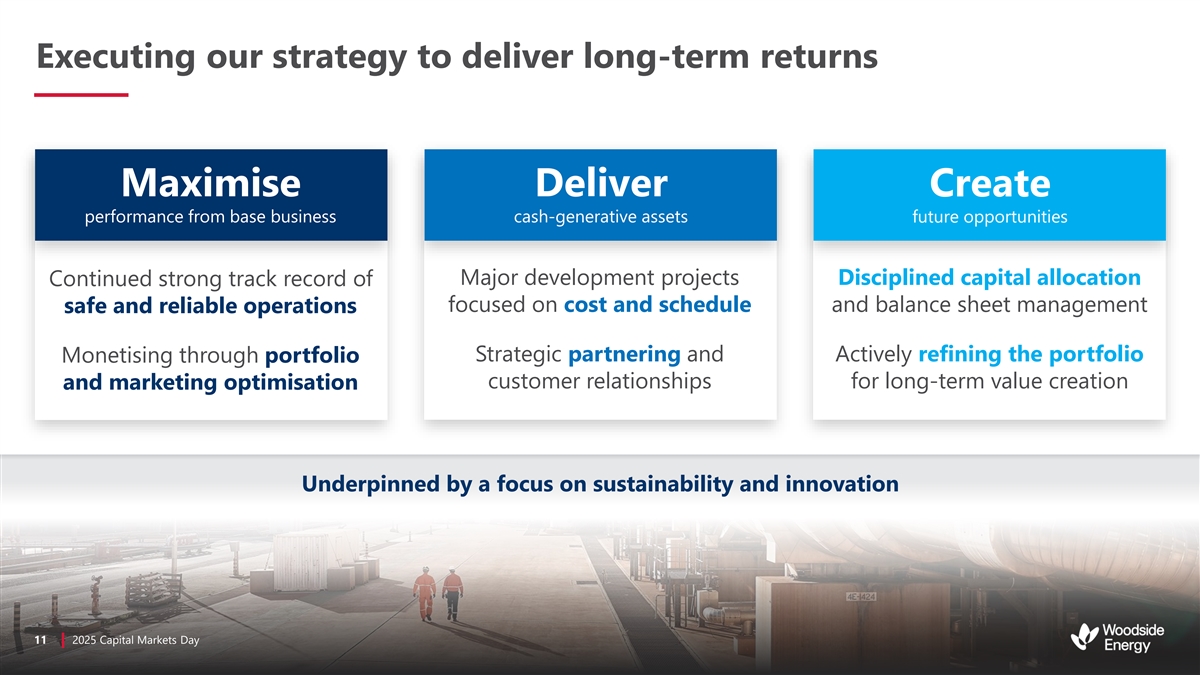
Executing our strategy to deliver long-term returns Maximise Deliver Create performance from base business cash-generative assets future opportunities Major development projects Disciplined capital allocation Continued strong track record of focused on cost and schedule and balance sheet management safe and reliable operations Strategic partnering and Actively refining the portfolio Monetising through portfolio customer relationships for long-term value creation and marketing optimisation Underpinned by a focus on sustainability and innovation 11 11 2 20 02 25 5 C Cap apit ital al M Mar ark ke et ts s D Day ay
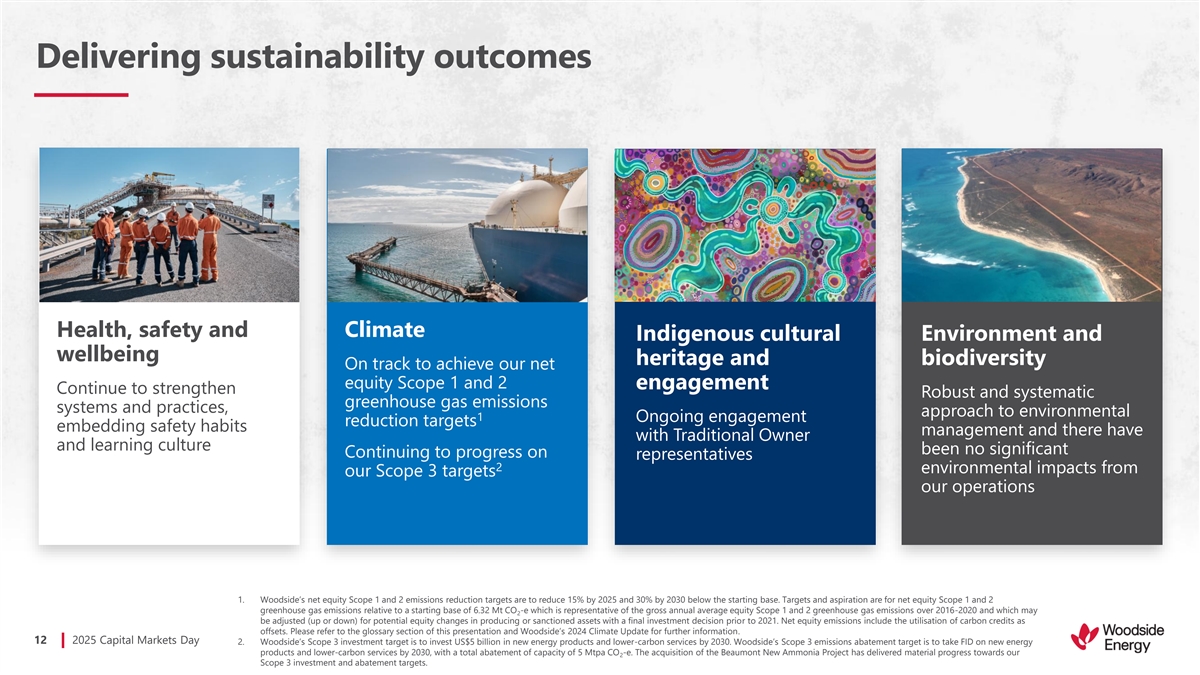
Deliv Delive er riing ng s sus usttainabil ainabiliit ty y o and utco innov mes ation outcomes FPSO Léopold Sédar Senghor North Rankin B Platform Pluto LNG Health, safety and Climate Indigenous cultural Environment and wellbeing heritage and biodiversity On track to achieve our net equity Scope 1 and 2 engagement Continue to strengthen Robust and systematic greenhouse gas emissions systems and practices, approach to environmental 1 Ongoing engagement reduction targets embedding safety habits management and there have with Traditional Owner and learning culture been no significant Continuing to progress on representatives 2 environmental impacts from our Scope 3 targets our operations 1. Woodside’s net equity Scope 1 and 2 emissions reduction targets are to reduce 15% by 2025 and 30% by 2030 below the starting base. Targets and aspiration are for net equity Scope 1 and 2 greenhouse gas emissions relative to a starting base of 6.32 Mt CO -e which is representative of the gross annual average equity Scope 1 and 2 greenhouse gas emissions over 2016-2020 and which may 2 be adjusted (up or down) for potential equity changes in producing or sanctioned assets with a final investment decision prior to 2021. Net equity emissions include the utilisation of carbon credits as offsets. Please refer to the glossary section of this presentation and Woodside’s 2024 Climate Update for further information. 12 2025 Capital Markets Day 2. Woodside’s Scope 3 investment target is to invest US$5 billion in new energy products and lower-carbon services by 2030. Woodside’s Scope 3 emissions abatement target is to take FID on new energy products and lower-carbon services by 2030, with a total abatement of capacity of 5 Mtpa CO -e. The acquisition of the Beaumont New Ammonia Project has delivered material progress towards our 2 Scope 3 investment and abatement targets.
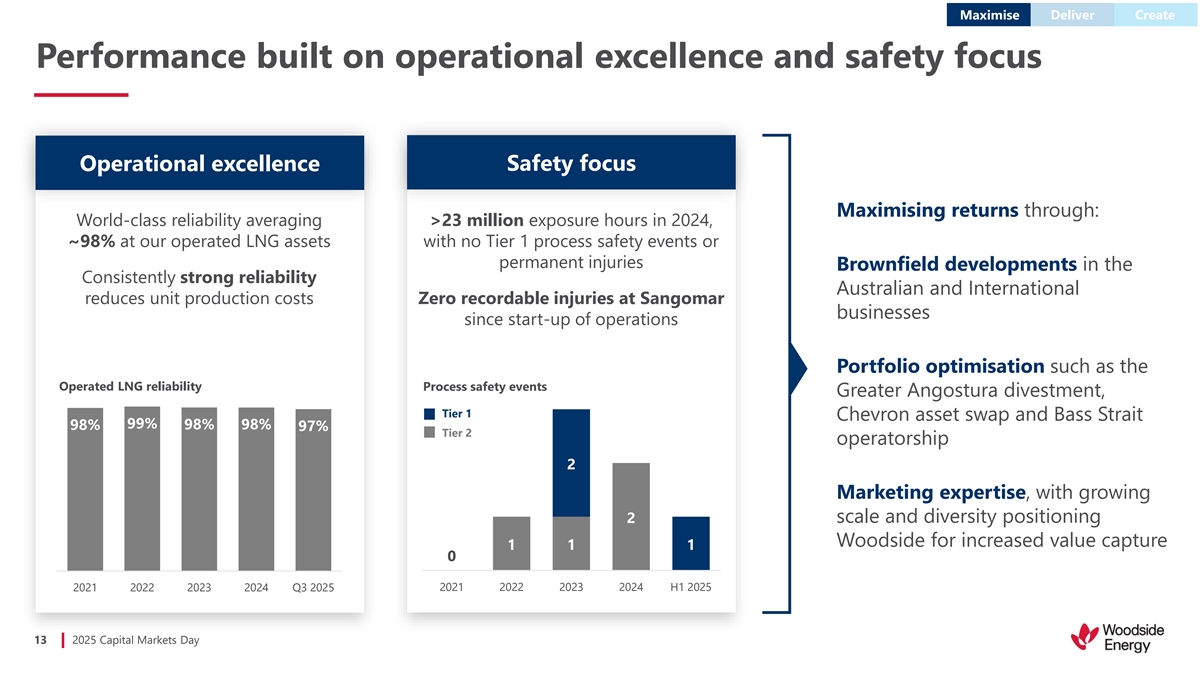
Maximise Deliver Create Performance built on operational excellence and safety focus Operational excellence Safety focus Maximising returns through: World-class reliability averaging >23 million exposure hours in 2024, ~98% at our operated LNG assets with no Tier 1 process safety events or permanent injuries Brownfield developments in the Consistently strong reliability Australian and International reduces unit production costs Zero recordable injuries at Sangomar businesses since start-up of operations Portfolio optimisation such as the Operated LNG reliability Process safety events Greater Angostura divestment, Tier 1 Chevron asset swap and Bass Strait 99% 98% 98% 98% 97% Tier 2 operatorship 2 Marketing expertise, with growing scale and diversity positioning 2 Woodside for increased value capture 1 1 1 0 2021 2022 2023 2024 Q3 2025 2021 2022 2023 2024 H1 2025 13 2025 Capital Markets Day
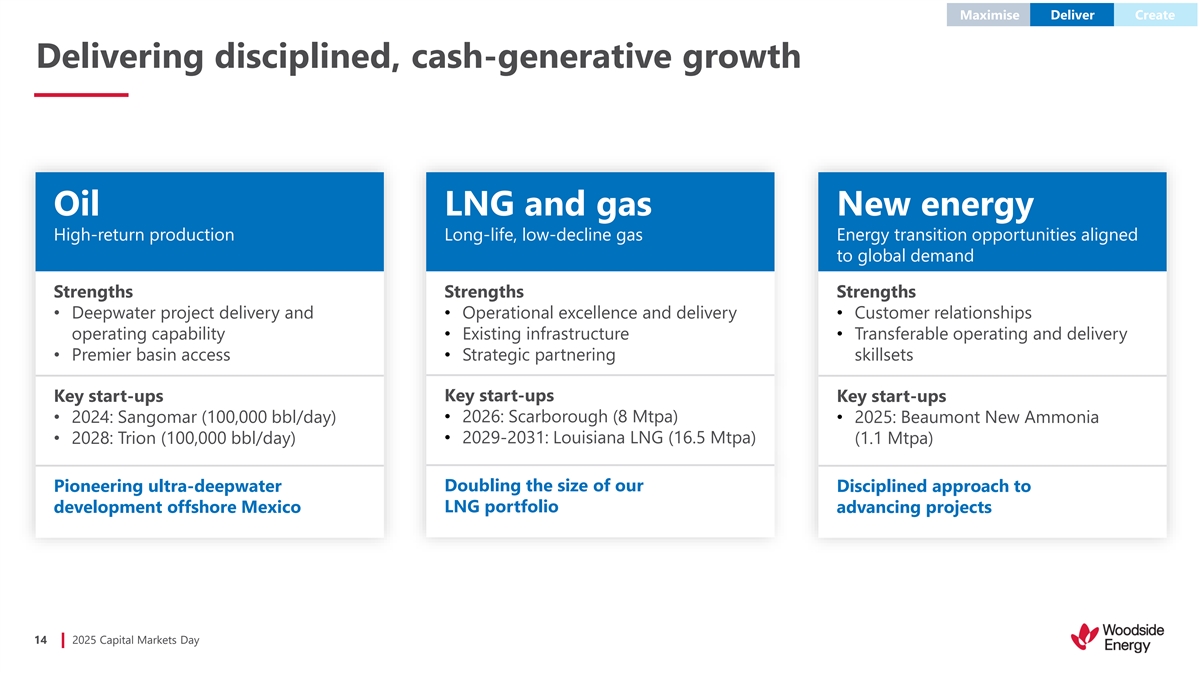
Maximise Deliver Create Delivering disciplined, cash-generative growth Oil LNG and gas New energy High-return production Long-life, low-decline gas Energy transition opportunities aligned to global demand Strengths Strengths Strengths • Deepwater project delivery and • Operational excellence and delivery• Customer relationships operating capability• Existing infrastructure• Transferable operating and delivery • Premier basin access• Strategic partnering skillsets Key start-ups Key start-ups Key start-ups • 2024: Sangomar (100,000 bbl/day)• 2026: Scarborough (8 Mtpa) • 2025: Beaumont New Ammonia • 2028: Trion (100,000 bbl/day)• 2029-2031: Louisiana LNG (16.5 Mtpa) (1.1 Mtpa) Doubling the size of our Pioneering ultra-deepwater Disciplined approach to development offshore Mexico LNG portfolio advancing projects 14 2025 Capital Markets Day
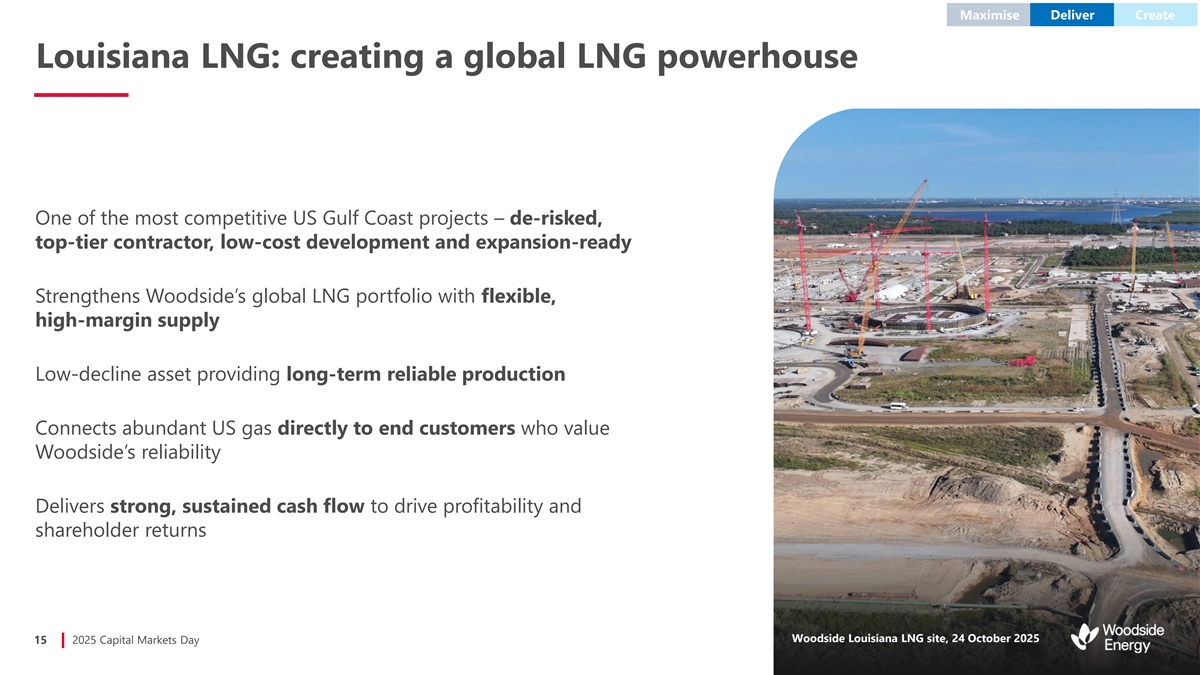
Maximise Deliver Create Louisiana LNG: creating a global LNG powerhouse One of the most competitive US Gulf Coast projects – de-risked, top-tier contractor, low-cost development and expansion-ready Strengthens Woodside’s global LNG portfolio with flexible, high-margin supply Low-decline asset providing long-term reliable production Connects abundant US gas directly to end customers who value Woodside’s reliability Delivers strong, sustained cash flow to drive profitability and shareholder returns Woodside Louisiana LNG site, 24 October 2025 15 2025 Capital Markets Day
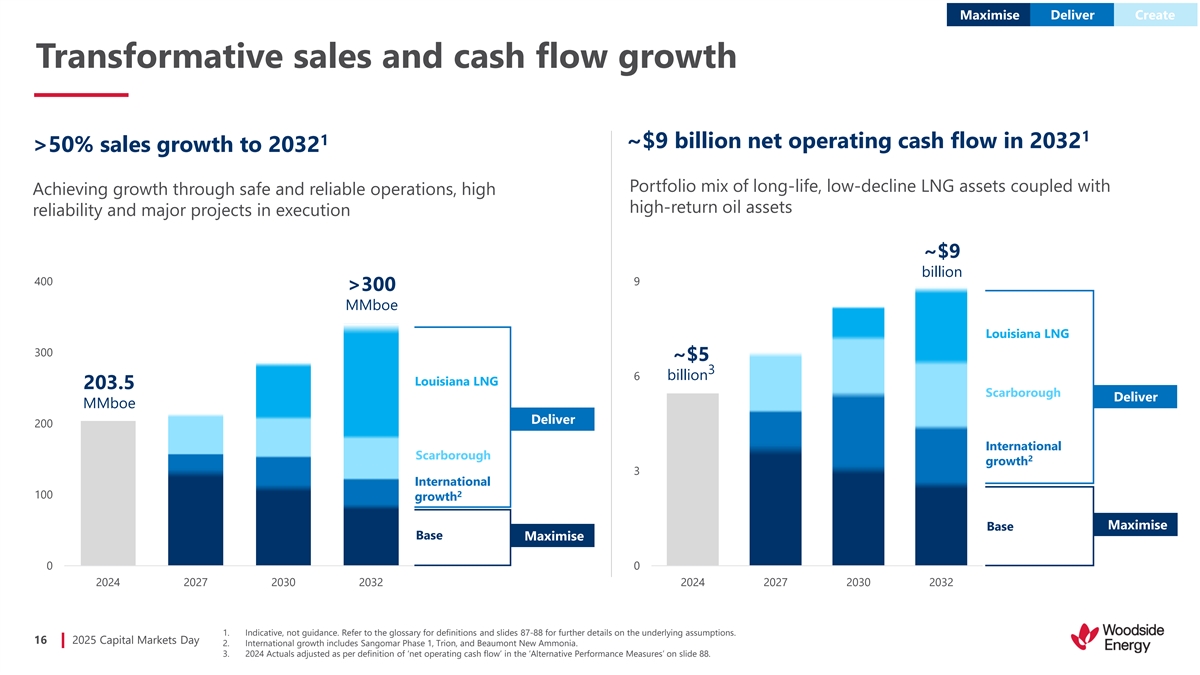
Maximise Deliver Create Transformative sales and cash flow growth 1 1 ~$9 billion net operating cash flow in 2032 >50% sales growth to 2032 Portfolio mix of long-life, low-decline LNG assets coupled with Achieving growth through safe and reliable operations, high high-return oil assets reliability and major projects in execution ~$9 billion 400 9 >300 MMboe Louisiana LNG 300 ~$5 3 6 billion Louisiana LNG 203.5 Scarborough Deliver MMboe Deliver 200 International Scarborough 2 growth 3 International 2 100 growth Maximise Base Base Maximise 0 0 2024 2027 2030 2032 2024 2027 2030 2032 1. Indicative, not guidance. Refer to the glossary for definitions and slides 87-88 for further details on the underlying assumptions. 16 2025 Capital Markets Day 2. International growth includes Sangomar Phase 1, Trion, and Beaumont New Ammonia. 3. 2024 Actuals adjusted as per definition of ‘net operating cash flow’ in the ‘Alternative Performance Measures’ on slide 88.
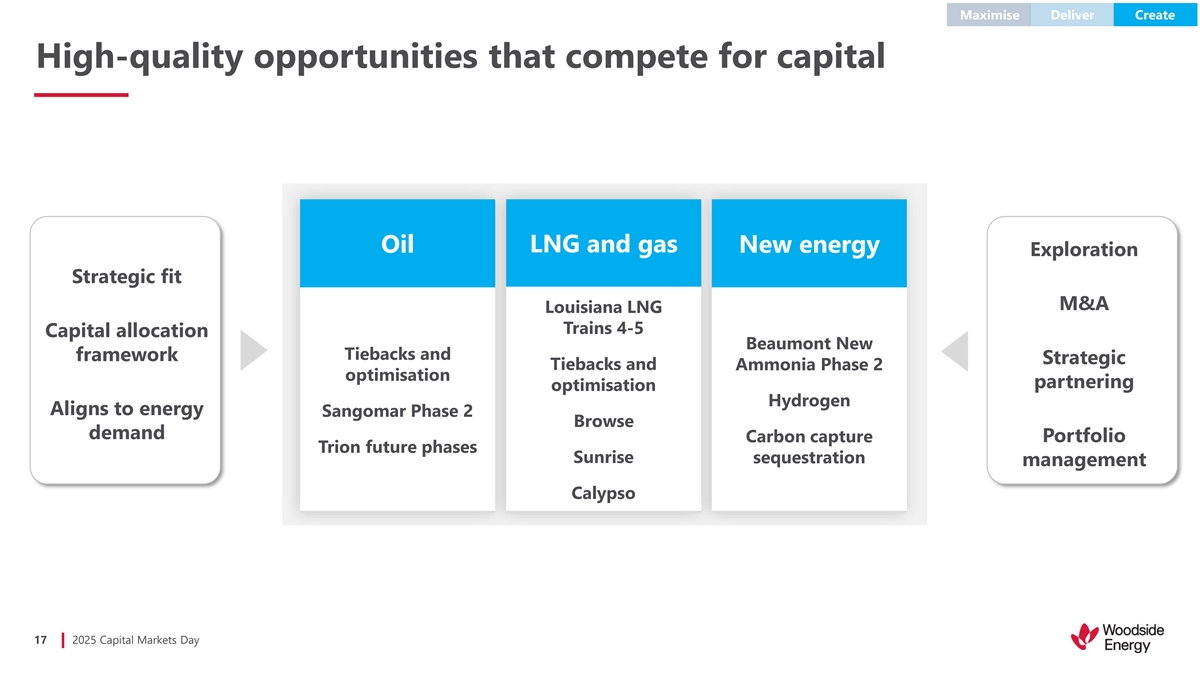
Maximise Deliver Create High-quality opportunities that compete for capital Oil LNG and gas New energy Exploration Strategic fit M&A Louisiana LNG Trains 4-5 Capital allocation Beaumont New Tiebacks and framework Strategic Tiebacks and Ammonia Phase 2 optimisation partnering optimisation Hydrogen Aligns to energy Sangomar Phase 2 Browse demand Carbon capture Portfolio Trion future phases Sunrise sequestration management Calypso 17 2025 Capital Markets Day
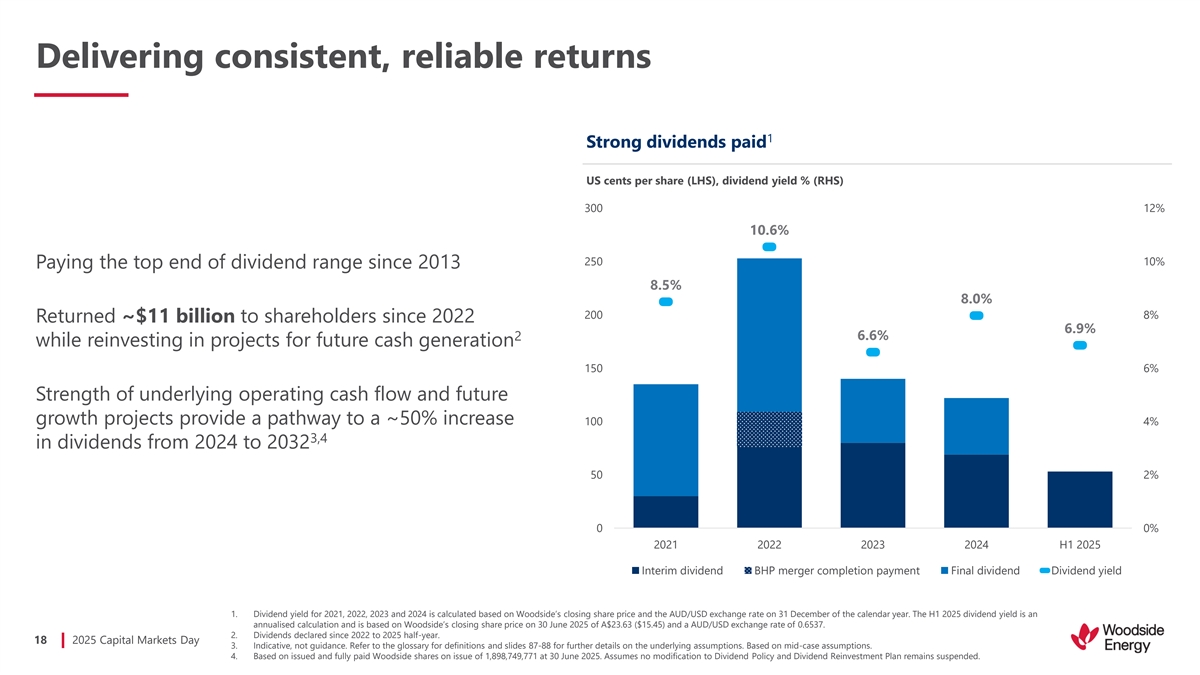
Delivering consistent, reliable returns 1 Strong dividends paid US cents per share (LHS), dividend yield % (RHS) 300 12% 10.6% 250 10% Paying the top end of dividend range since 2013 8.5% 8.0% 200 8% Returned ~$11 billion to shareholders since 2022 6.9% 6.6% 2 while reinvesting in projects for future cash generation 150 6% Strength of underlying operating cash flow and future growth projects provide a pathway to a ~50% increase 100 4% 3,4 in dividends from 2024 to 2032 50 2% 0 0% 2021 2022 2023 2024 H1 2025 Interim dividend BHP merger completion payment Final dividend Dividend yield 1. Dividend yield for 2021, 2022, 2023 and 2024 is calculated based on Woodside’s closing share price and the AUD/USD exchange rate on 31 December of the calendar year. The H1 2025 dividend yield is an annualised calculation and is based on Woodside’s closing share price on 30 June 2025 of A$23.63 ($15.45) and a AUD/USD exchange rate of 0.6537. 2. Dividends declared since 2022 to 2025 half-year. 18 2025 Capital Markets Day 3. Indicative, not guidance. Refer to the glossary for definitions and slides 87-88 for further details on the underlying assumptions. Based on mid-case assumptions. 4. Based on issued and fully paid Woodside shares on issue of 1,898,749,771 at 30 June 2025. Assumes no modification to Dividend Policy and Dividend Reinvestment Plan remains suspended.
Macroeconomic landscape Growing global energy demand supports strong fundamentals across products Meg O’Neill CEO and Managing Director
Key messages Oil is anticipated to continue playing a significant role in 1 the global energy mix Gas demand is expected to grow, with LNG playing an increasing role in the global energy mix, supporting 2 energy security while helping customers to achieve lower 1 overall emissions Growing role for ammonia across a wide variety of use cases with broad regulatory support from European and 3 Asia Pacific countries 1. One example of helping customers achieve lower overall emissions is through coal-to-gas switching. Refer to Woodside’s 20 2025 Capital Markets Day Climate Report 2024 or slide 24 of this presentation for further information.

Global energy demand is expected to rise Driving increased energy Increasing standards of consumption primarily in 1 Growing population 1 1 living for ~7 billion people developing nations Energy priorities include affordability, Population (billion) GDP (US$ trillion, RT2015) Primary energy (boe/person) 35 reliability and decarbonisation 90 9 80 8 30 Developed nations continue to see trends 70 7 of increased power demand from uses 25 60 6 such as AI 20 50 5 Rapid non-OECD growth presents an 40 4 15 opportunity for Woodside to supply 30 3 10 reliable, lower-carbon energy 20 2 5 10 1 Efforts continue to decarbonise energy mix in a complex energy transition 0 0 0 2000 2010 2020 2030 2040 2000 2010 2020 2030 2040 2000 2010 2020 2030 2040 OECD Non-OECD 21 2025 Capital Markets Day 1. Wood Mackenzie Energy Transition Outlook (November 2024).
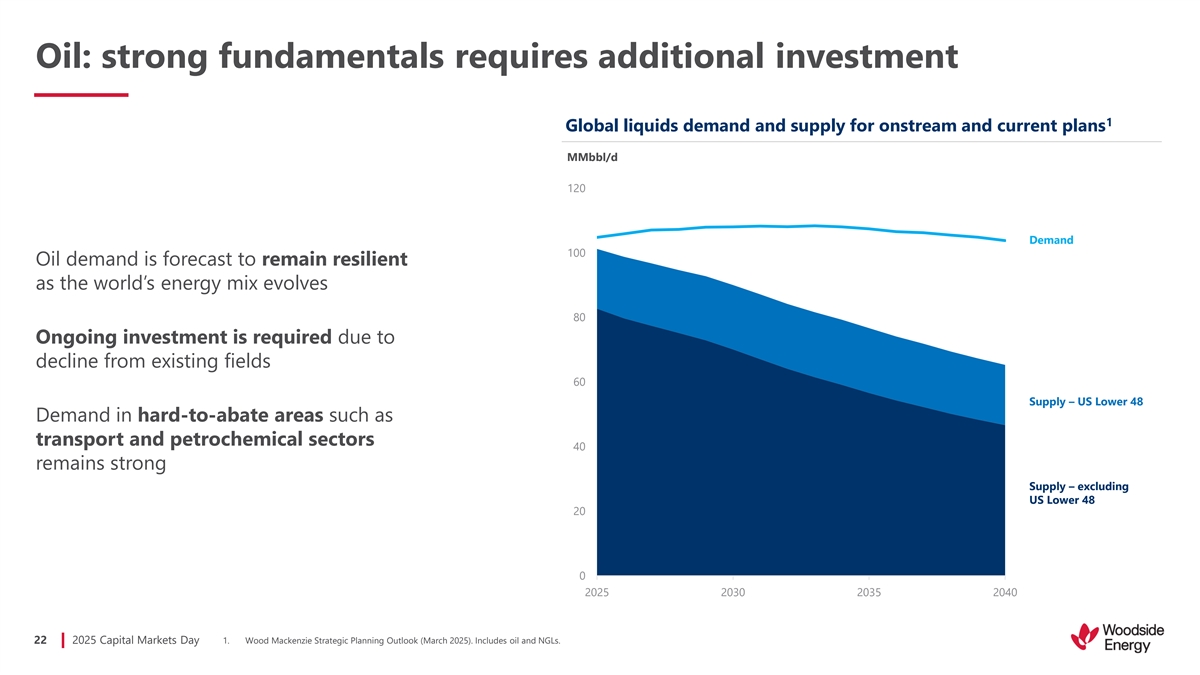
Oil: strong fundamentals requires additional investment 1 Global liquids demand and supply for onstream and current plans MMbbl/d 120 Demand 100 Oil demand is forecast to remain resilient as the world’s energy mix evolves 80 Ongoing investment is required due to decline from existing fields 60 Supply – US Lower 48 Demand in hard-to-abate areas such as transport and petrochemical sectors 40 remains strong Supply – excluding US Lower 48 20 0 2025 2030 2035 2040 22 2025 Capital Markets Day 1. Wood Mackenzie Strategic Planning Outlook (March 2025). Includes oil and NGLs.
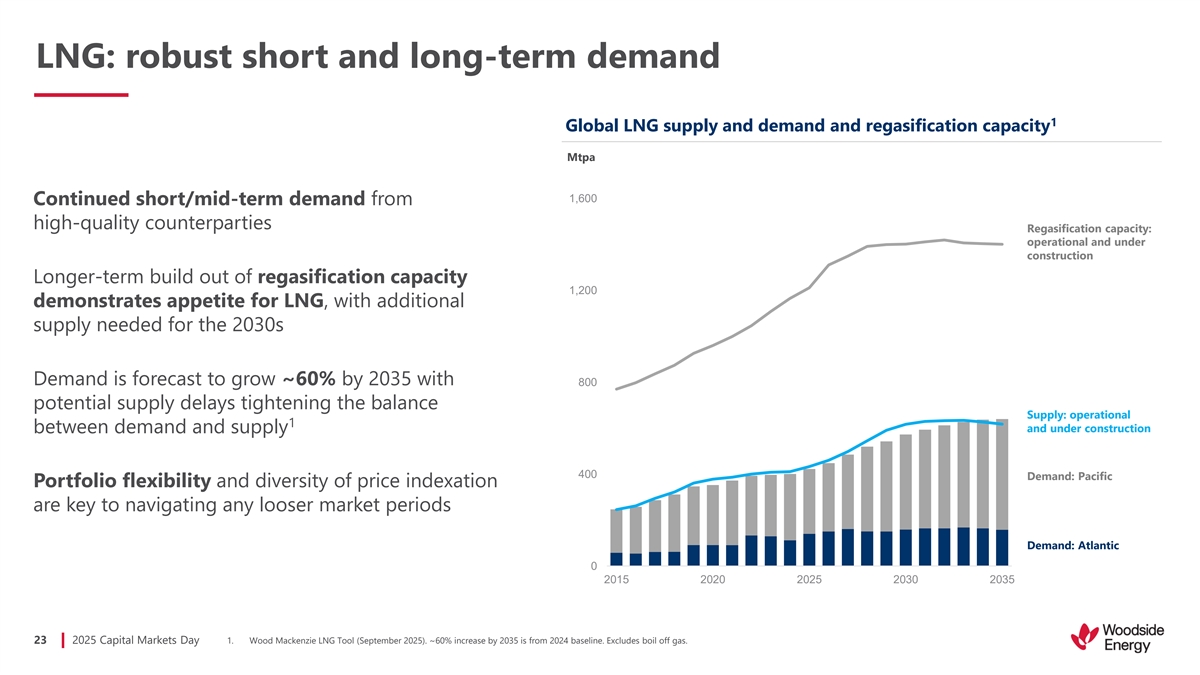
LNG: robust short and long-term demand 1 Global LNG supply and demand and regasification capacity Mtpa 1,600 Continued short/mid-term demand from high-quality counterparties Regasification capacity: operational and under construction Longer-term build out of regasification capacity 1,200 demonstrates appetite for LNG, with additional supply needed for the 2030s Demand is forecast to grow ~60% by 2035 with 800 potential supply delays tightening the balance Supply: operational 1 and under construction between demand and supply 400 Demand: Pacific Portfolio flexibility and diversity of price indexation are key to navigating any looser market periods Demand: Atlantic 0 2015 2020 2025 2030 2035 23 2025 Capital Markets Day 1. Wood Mackenzie LNG Tool (September 2025). ~60% increase by 2035 is from 2024 baseline. Excludes boil off gas.
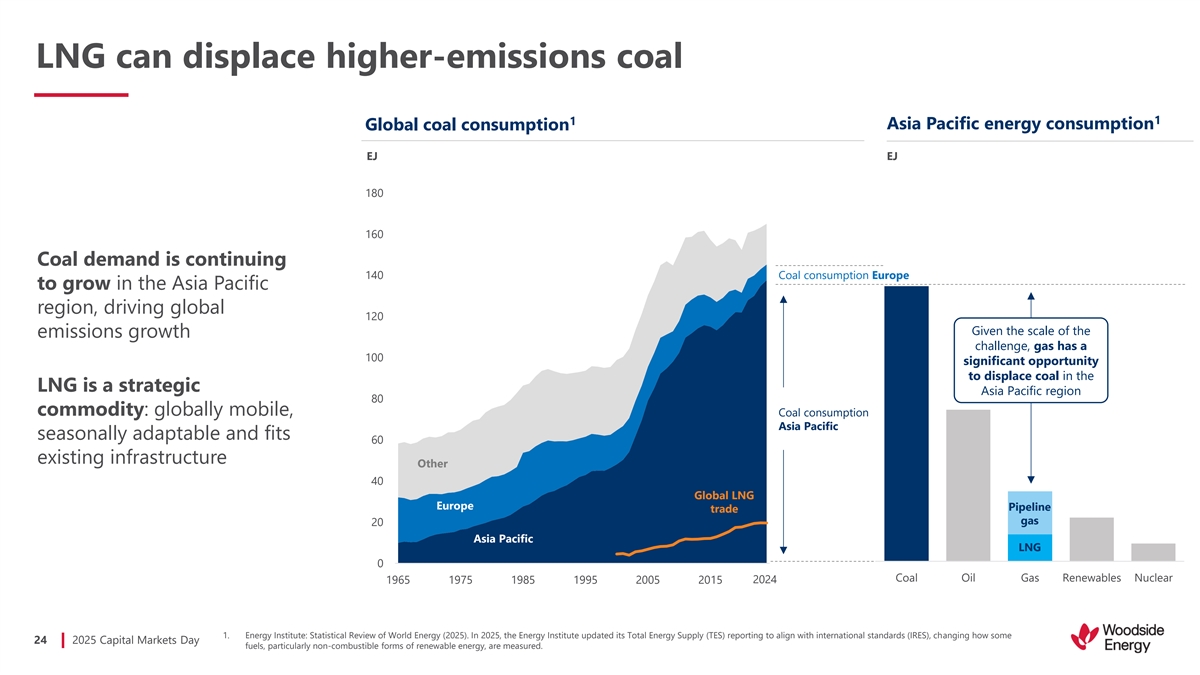
LNG can displace higher-emissions coal 1 1 Asia Pacific energy consumption Global coal consumption EJ EJ 180 160 Coal demand is continuing 140 Coal consumption Europe to grow in the Asia Pacific region, driving global 120 Given the scale of the emissions growth challenge, gas has a 100 significant opportunity to displace coal in the LNG is a strategic Asia Pacific region 80 commodity: globally mobile, Coal consumption Asia Pacific seasonally adaptable and fits 60 existing infrastructure Other 40 Global LNG Europe Pipeline trade gas 20 Asia Pacific LNG 0 Coal Oil Gas Renewables Nuclear 1965 1975 1985 1995 2005 2015 2024 1. Energy Institute: Statistical Review of World Energy (2025). In 2025, the Energy Institute updated its Total Energy Supply (TES) reporting to align with international standards (IRES), changing how some 24 2025 Capital Markets Day fuels, particularly non-combustible forms of renewable energy, are measured.
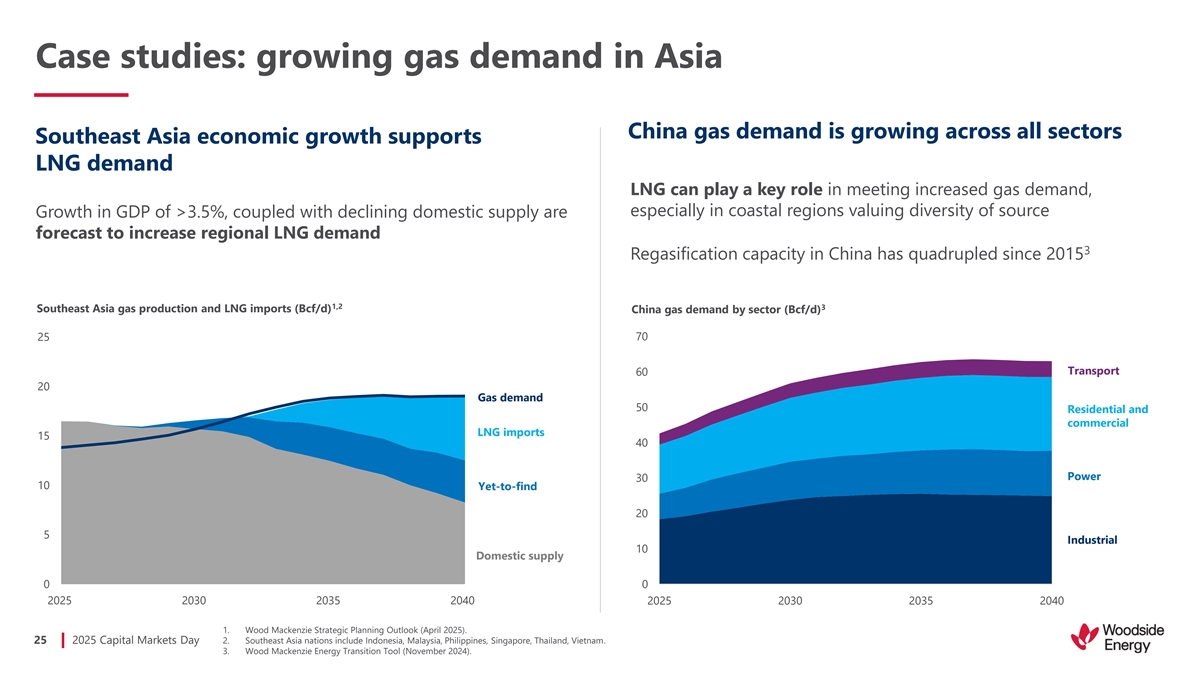
Case studies: growing gas demand in Asia China gas demand is growing across all sectors Southeast Asia economic growth supports LNG demand LNG can play a key role in meeting increased gas demand, especially in coastal regions valuing diversity of source Growth in GDP of >3.5%, coupled with declining domestic supply are forecast to increase regional LNG demand 3 Regasification capacity in China has quadrupled since 2015 1,2 3 Southeast Asia gas production and LNG imports (Bcf/d) China gas demand by sector (Bcf/d) 70 25 Transport 60 20 Gas demand 50 Residential and commercial LNG imports 15 40 Power 30 10 Yet-to-find 20 5 Industrial 10 Domestic supply 0 0 2025 2030 2035 2040 2025 2030 2035 2040 1. Wood Mackenzie Strategic Planning Outlook (April 2025). 25 2025 Capital Markets Day 2. Southeast Asia nations include Indonesia, Malaysia, Philippines, Singapore, Thailand, Vietnam. 3. Wood Mackenzie Energy Transition Tool (November 2024).
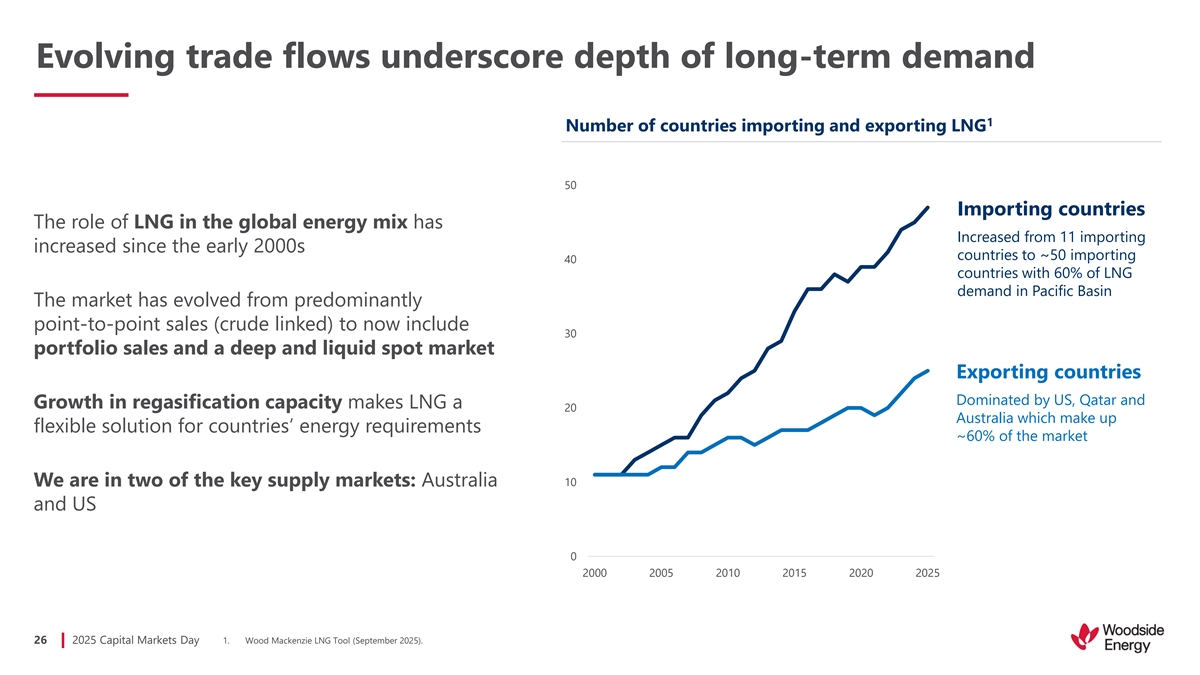
Evolving trade flows underscore depth of long-term demand 1 Number of countries importing and exporting LNG 50 Importing countries The role of LNG in the global energy mix has Increased from 11 importing increased since the early 2000s countries to ~50 importing 40 countries with 60% of LNG demand in Pacific Basin The market has evolved from predominantly point-to-point sales (crude linked) to now include 30 portfolio sales and a deep and liquid spot market Exporting countries Dominated by US, Qatar and Growth in regasification capacity makes LNG a 20 Australia which make up flexible solution for countries’ energy requirements ~60% of the market We are in two of the key supply markets: Australia 10 and US 0 2000 2005 2010 2015 2020 2025 26 2025 Capital Markets Day 1. Wood Mackenzie LNG Tool (September 2025).
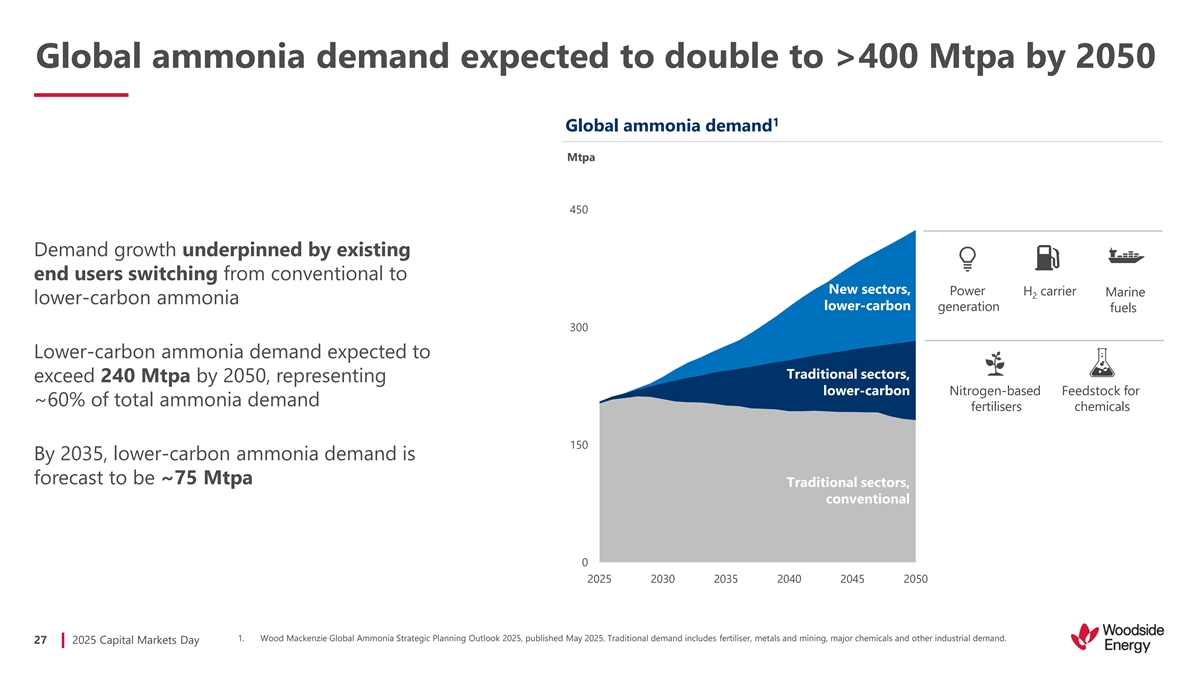
Global ammonia demand expected to double to >400 Mtpa by 2050 1 Global ammonia demand Mtpa 450 Demand growth underpinned by existing end users switching from conventional to H 2 New sectors, Power H carrier Marine 2 lower-carbon ammonia lower-carbon generation fuels 300 Lower-carbon ammonia demand expected to Traditional sectors, exceed 240 Mtpa by 2050, representing lower-carbon Nitrogen-based Feedstock for ~60% of total ammonia demand fertilisers chemicals 150 By 2035, lower-carbon ammonia demand is forecast to be ~75 Mtpa Traditional sectors, conventional 0 2025 2030 2035 2040 2045 2050 1. Wood Mackenzie Global Ammonia Strategic Planning Outlook 2025, published May 2025. Traditional demand includes fertiliser, metals and mining, major chemicals and other industrial demand. 27 2025 Capital Markets Day
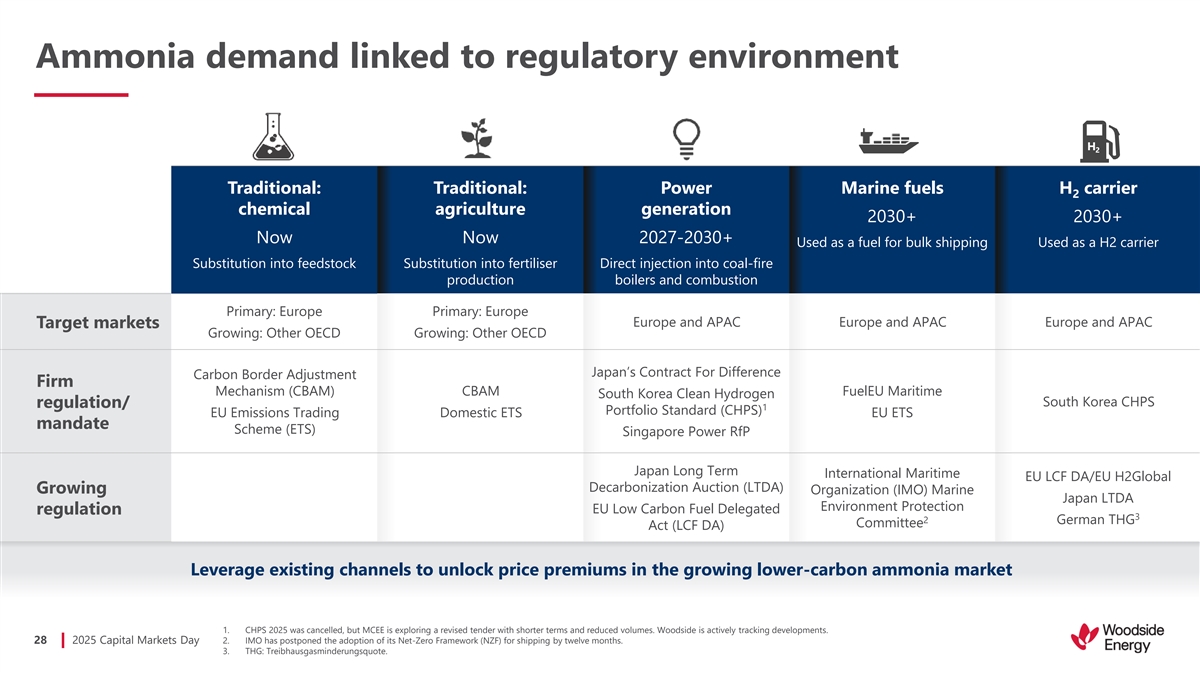
Ammonia demand linked to regulatory environment H 2 Traditional: Traditional: Power Marine fuels H carrier 2 chemical agriculture generation 2030+ 2030+ Now Now 2027-2030+ Used as a fuel for bulk shipping Used as a H2 carrier Substitution into feedstock Substitution into fertiliser Direct injection into coal-fire production boilers and combustion Primary: Europe Primary: Europe Europe and APAC Europe and APAC Europe and APAC Target markets Growing: Other OECD Growing: Other OECD Japan’s Contract For Difference Carbon Border Adjustment Firm Mechanism (CBAM) CBAM FuelEU Maritime South Korea Clean Hydrogen South Korea CHPS regulation/ 1 Portfolio Standard (CHPS) EU Emissions Trading Domestic ETS EU ETS mandate Scheme (ETS) Singapore Power RfP Japan Long Term International Maritime EU LCF DA/EU H2Global Decarbonization Auction (LTDA) Growing Organization (IMO) Marine Japan LTDA Environment Protection EU Low Carbon Fuel Delegated regulation 3 2 German THG Committee Act (LCF DA) Leverage existing channels to unlock price premiums in the growing lower-carbon ammonia market 1. CHPS 2025 was cancelled, but MCEE is exploring a revised tender with shorter terms and reduced volumes. Woodside is actively tracking developments. 28 2025 Capital Markets Day 2. IMO has postponed the adoption of its Net-Zero Framework (NZF) for shipping by twelve months. 3. THG: Treibhausgasminderungsquote.
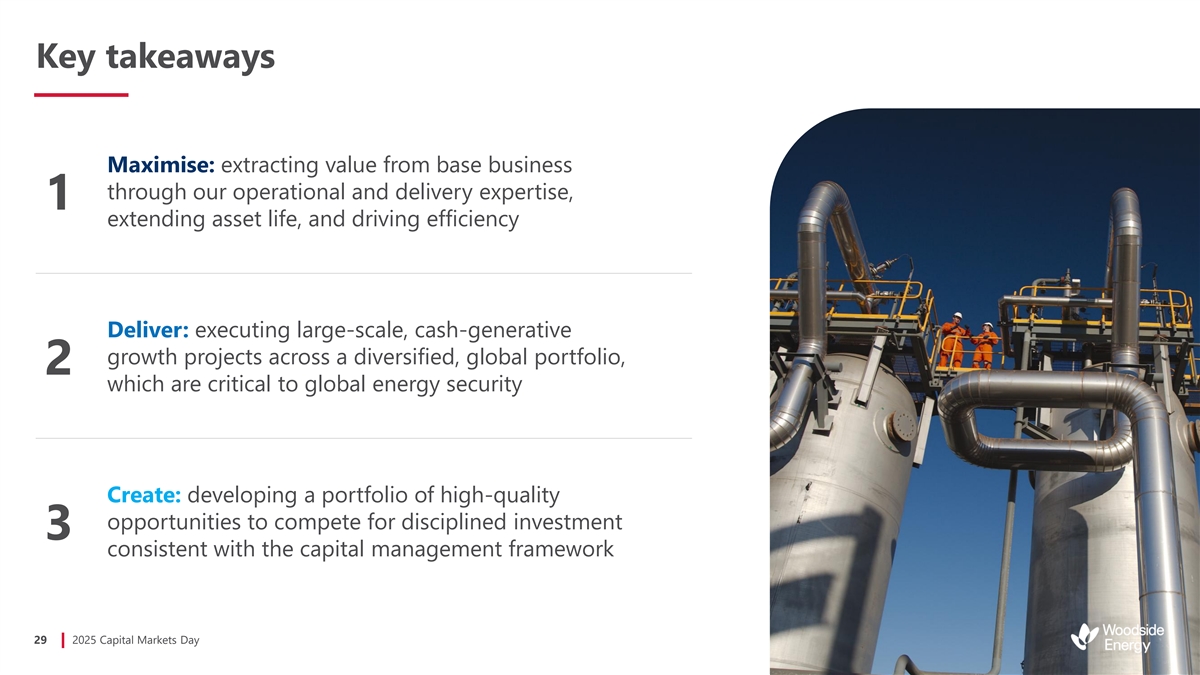
Key takeaways Maximise: extracting value from base business through our operational and delivery expertise, 1 extending asset life, and driving efficiency Deliver: executing large-scale, cash-generative growth projects across a diversified, global portfolio, 2 which are critical to global energy security Create: developing a portfolio of high-quality opportunities to compete for disciplined investment 3 consistent with the capital management framework 29 2025 Capital Markets Day
Capital management Generating robust cash flow and taking disciplined approach to capital allocation Graham Tiver EVP and Chief Financial Officer
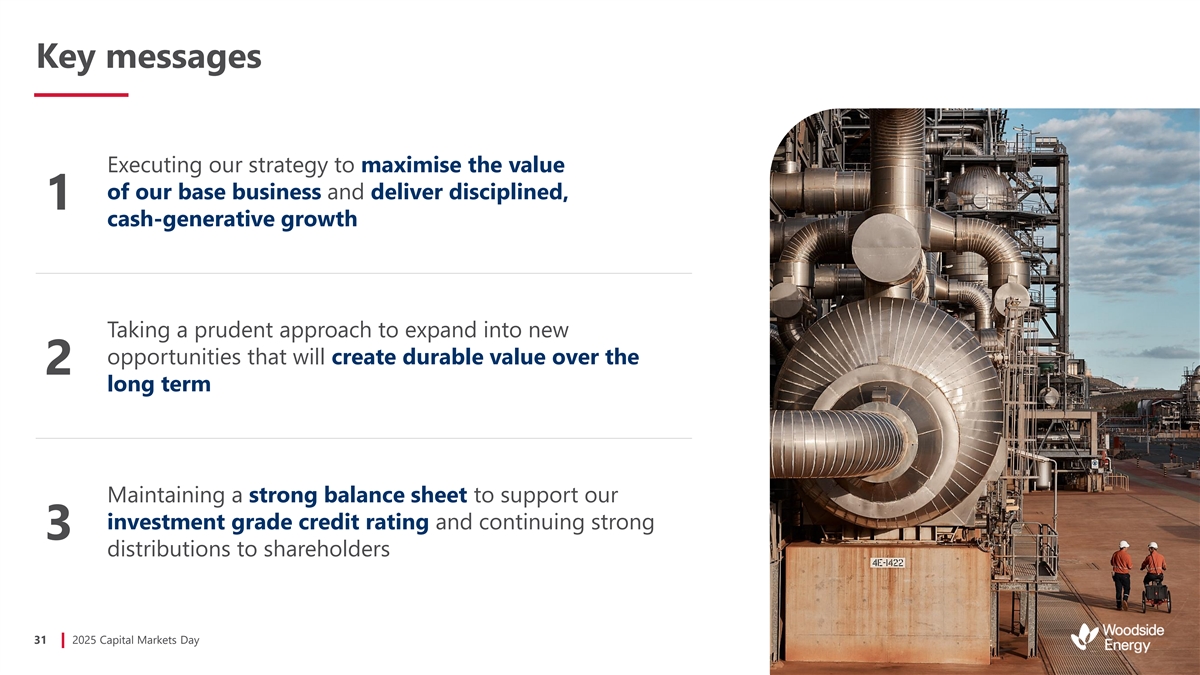
Key messages Executing our strategy to maximise the value of our base business and deliver disciplined, 1 cash-generative growth Taking a prudent approach to expand into new opportunities that will create durable value over the 2 long term Maintaining a strong balance sheet to support our investment grade credit rating and continuing strong 3 distributions to shareholders 31 2025 Capital Markets Day

Strategic and disciplined capital management Consistent unit cost focus Disciplined investment Actively managed decisions balance sheet Managing inflationary pressure, unit 1 production cost <$8/boe Opportunities must meet capital Investment grade credit rating of 2 allocation targets Baa1/BBB+ Rationalised exploration and new energy expenditure De-risking through lump sum turn-key Committed to shareholder returns with EPC contracting strategy (e.g. Bechtel) a track record of 80% payout ratio for Delivering maintenance campaigns on over 10 years (policy is minimum 50%), schedule and budget Strategic partnering, asset sell-downs and 3 ~$11 billion returned since 2022 divestments (e.g. Stonepeak, Williams) 1. September 2025 year-to-date. 2. Corporate debt ratings Baa1 by Moody’s, BBB+ by S&P Global. A securities recommendation is not a recommendation to buy, sell or hold securities and may be subject to revision or withdrawal at any time. 32 2025 Capital Markets Day 3. Dividends declared since 2022 to 2025 half-year.
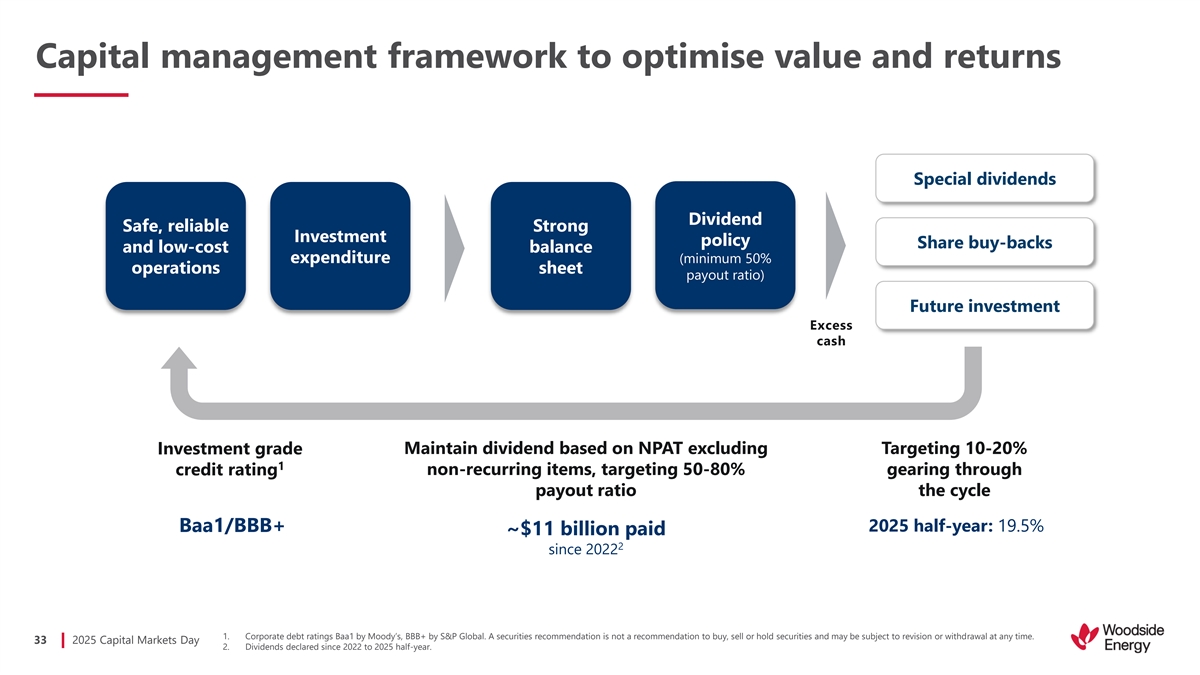
Capital management framework to optimise value and returns Special dividends Dividend Safe, reliable Strong Investment policy Share buy-backs and low-cost balance expenditure (minimum 50% operations sheet payout ratio) Future investment Excess cash Maintain dividend based on NPAT excluding Targeting 10-20% Investment grade 1 credit rating non-recurring items, targeting 50-80% gearing through payout ratio the cycle 2025 half-year: 19.5% Baa1/BBB+ ~$11 billion paid 2 since 2022 1. Corporate debt ratings Baa1 by Moody’s, BBB+ by S&P Global. A securities recommendation is not a recommendation to buy, sell or hold securities and may be subject to revision or withdrawal at any time. 33 2025 Capital Markets Day 2. Dividends declared since 2022 to 2025 half-year.
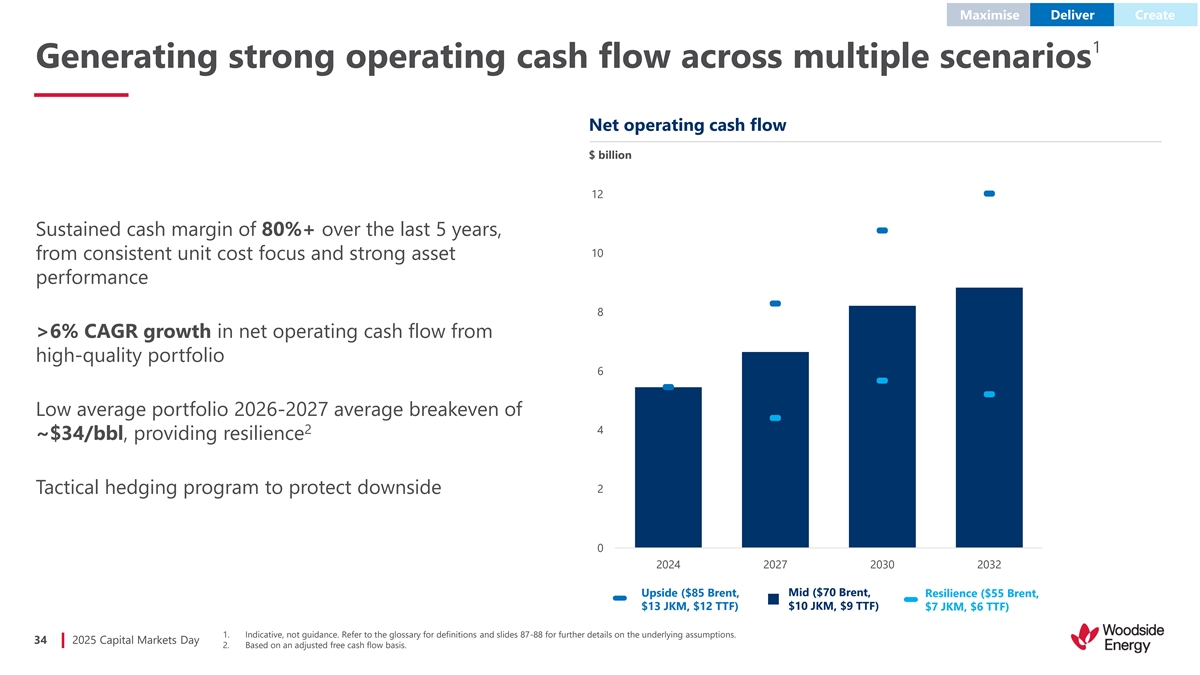
Maximise Deliver Create 1 Generating strong operating cash flow across multiple scenarios Net operating cash flow $ billion 12 Sustained cash margin of 80%+ over the last 5 years, 10 from consistent unit cost focus and strong asset performance 8 >6% CAGR growth in net operating cash flow from high-quality portfolio 6 Low average portfolio 2026-2027 average breakeven of 2 4 ~$34/bbl, providing resilience 2 Tactical hedging program to protect downside 0 2024 2027 2030 2032 Upside ($85 Brent, Mid ($70 Brent, Resilience ($55 Brent, $13 JKM, $12 TTF) $10 JKM, $9 TTF) $7 JKM, $6 TTF) 1. Indicative, not guidance. Refer to the glossary for definitions and slides 87-88 for further details on the underlying assumptions. 34 2025 Capital Markets Day 2. Based on an adjusted free cash flow basis.
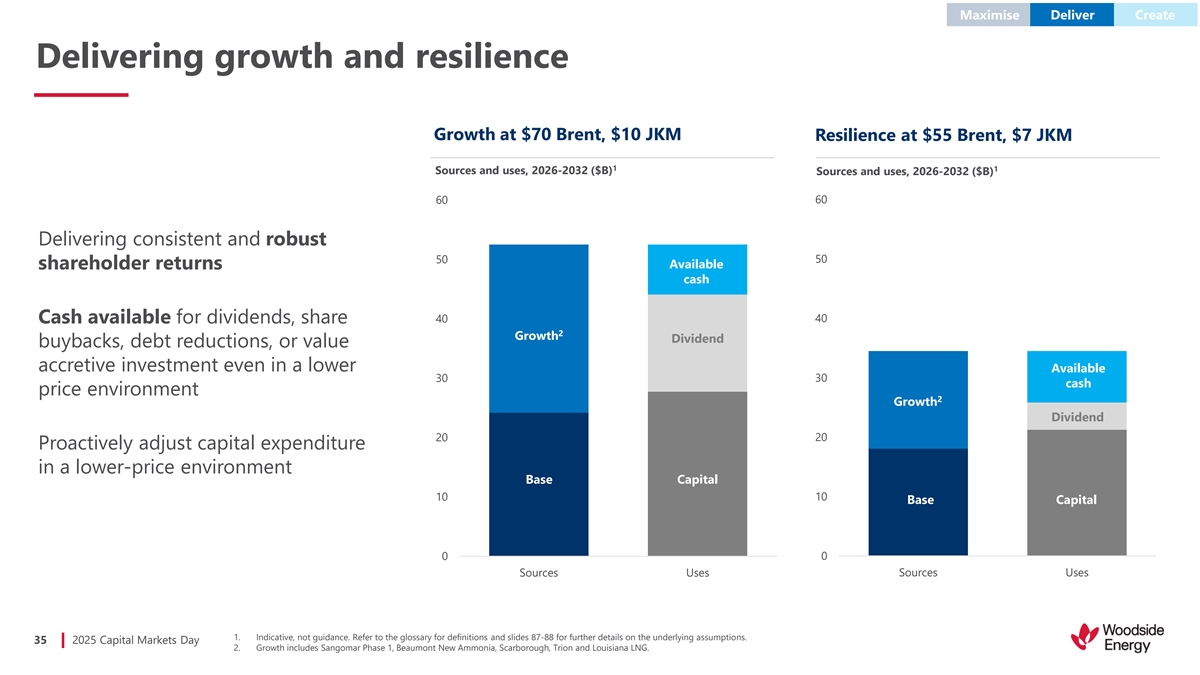
Maximise Deliver Create Delivering growth and resilience Growth at $70 Brent, $10 JKM Resilience at $55 Brent, $7 JKM 1 1 Sources and uses, 2026-2032 ($B) Sources and uses, 2026-2032 ($B) 60 60 Delivering consistent and robust 50 50 Available shareholder returns cash 40 40 Cash available for dividends, share 2 Growth Dividend buybacks, debt reductions, or value accretive investment even in a lower Available 30 30 cash price environment 2 Growth Dividend 20 20 Proactively adjust capital expenditure in a lower-price environment Base Capital 10 10 Base Capital 0 0 Sources Uses Sources Uses 1. Indicative, not guidance. Refer to the glossary for definitions and slides 87-88 for further details on the underlying assumptions. 35 2025 Capital Markets Day 2. Growth includes Sangomar Phase 1, Beaumont New Ammonia, Scarborough, Trion and Louisiana LNG.
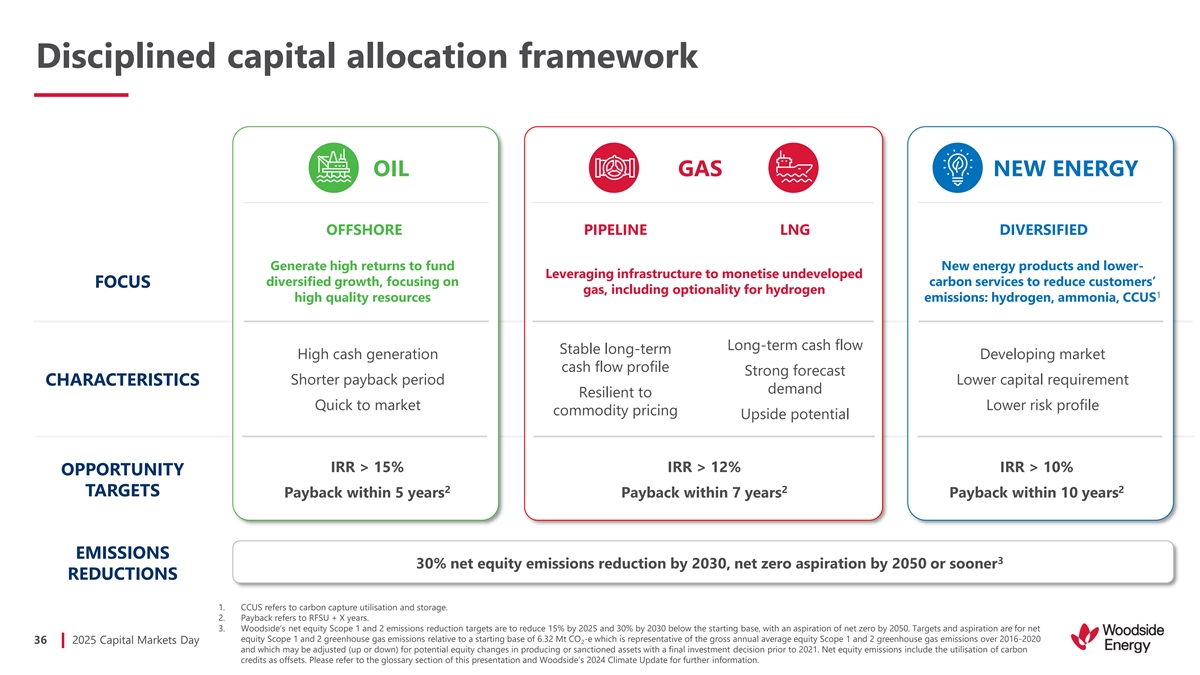
Disciplined capital allocation framework OIL GAS NEW ENERGY OFFSHORE PIPELINE LNG DIVERSIFIED Generate high returns to fund New energy products and lower- Leveraging infrastructure to monetise undeveloped diversified growth, focusing on carbon services to reduce customers’ FOCUS gas, including optionality for hydrogen 1 high quality resources emissions: hydrogen, ammonia, CCUS Long-term cash flow Stable long-term High cash generation Developing market cash flow profile Strong forecast Shorter payback period Lower capital requirement CHARACTERISTICS demand Resilient to Quick to market Lower risk profile commodity pricing Upside potential IRR > 15% IRR > 12% IRR > 10% OPPORTUNITY 2 2 2 TARGETS Payback within 5 years Payback within 7 years Payback within 10 years EMISSIONS 3 30% net equity emissions reduction by 2030, net zero aspiration by 2050 or sooner REDUCTIONS 1. CCUS refers to carbon capture utilisation and storage. 2. Payback refers to RFSU + X years. 3. Woodside’s net equity Scope 1 and 2 emissions reduction targets are to reduce 15% by 2025 and 30% by 2030 below the starting base, with an aspiration of net zero by 2050. Targets and aspiration are for net equity Scope 1 and 2 greenhouse gas emissions relative to a starting base of 6.32 Mt CO -e which is representative of the gross annual average equity Scope 1 and 2 greenhouse gas emissions over 2016-2020 36 2025 Capital Markets Day 2 and which may be adjusted (up or down) for potential equity changes in producing or sanctioned assets with a final investment decision prior to 2021. Net equity emissions include the utilisation of carbon credits as offsets. Please refer to the glossary section of this presentation and Woodside’s 2024 Climate Update for further information.
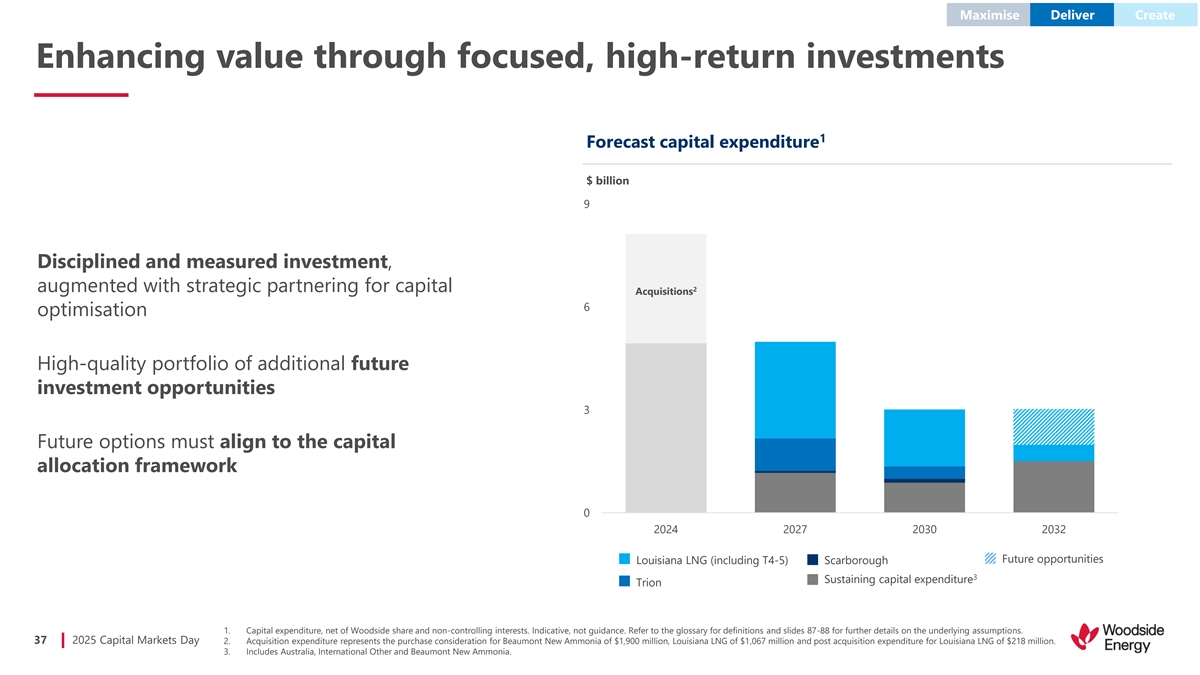
Maximise Deliver Create Enhancing value through focused, high-return investments 1 Forecast capital expenditure $ billion 9 Disciplined and measured investment, augmented with strategic partnering for capital 2 Acquisitions 6 optimisation High-quality portfolio of additional future investment opportunities 3 Future options must align to the capital allocation framework 0 2024 2027 2030 2032 Future opportunities Louisiana LNG (including T4-5) Scarborough 3 Sustaining capital expenditure Trion 1. Capital expenditure, net of Woodside share and non-controlling interests. Indicative, not guidance. Refer to the glossary for definitions and slides 87-88 for further details on the underlying assumptions. 37 2025 Capital Markets Day 2. Acquisition expenditure represents the purchase consideration for Beaumont New Ammonia of $1,900 million, Louisiana LNG of $1,067 million and post acquisition expenditure for Louisiana LNG of $218 million. 3. Includes Australia, International Other and Beaumont New Ammonia.

Maximise Deliver Create Actively managing balance sheet for growth and returns 1 Net debt and gearing $ billion (LHS), % (RHS) 10 30% Targeted gearing range of 10-20% through the cycle 8 Reducing debt levels following projects coming 20% online creating opportunity to enhance returns 6 Continued strong support from US debt markets; 2 liquidity of $8.3 billion 4 10% Weighted average term to maturity increased to 2 2 6.6 years from 3.6 years over the last two years 0 0% 2024 2027 2030 2032 Gearing (%) Net debt 1. Indicative, not guidance. Refer to the glossary for definitions and slides 87-88 for further details on the underlying assumptions. 38 2025 Capital Markets Day 2. As at 30 September 2025.
Key takeaways We are executing our strategy to maximise the value of our base business and deliver disciplined, 1 cash-generative growth We are taking a strategic approach to opportunities 2 that will create significant value over the long term During our disciplined reinvestment, we are maintaining our investment grade rating while 3 generating returns for shareholders 39 2025 Capital Markets Day
Australian business and innovation spotlight Capturing premium value through proven processes and capabilities Liz Westcott EVP and Chief Operating Officer Australia
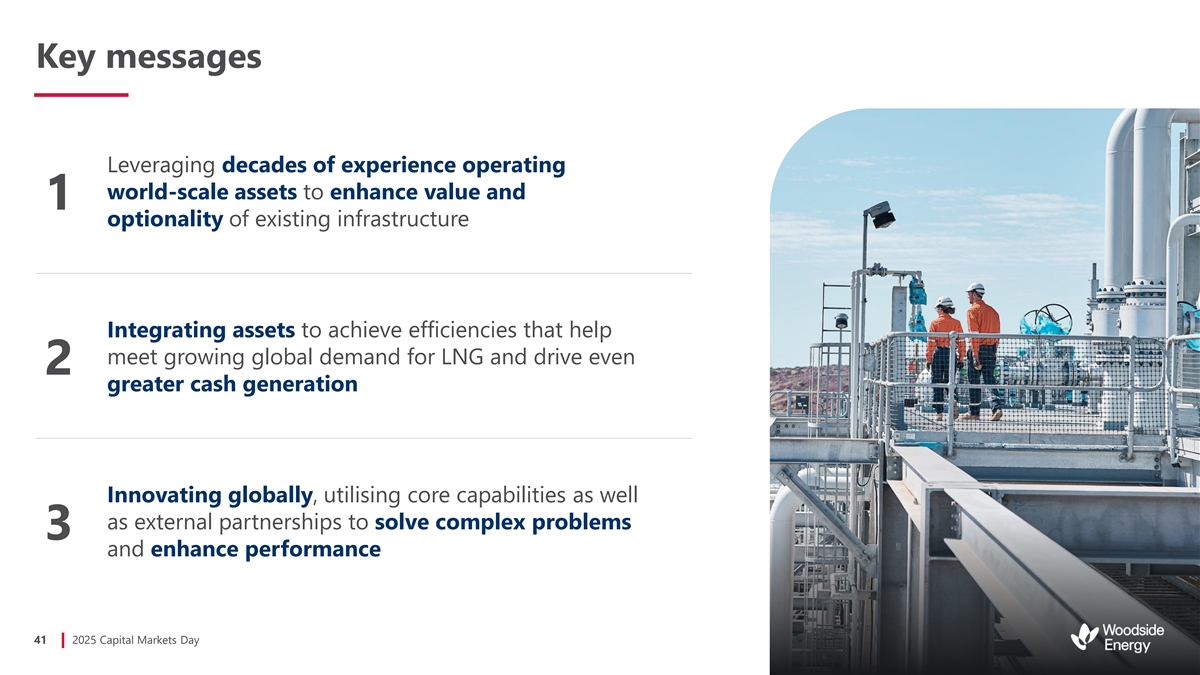
Key messages Leveraging decades of experience operating world-scale assets to enhance value and 1 optionality of existing infrastructure Integrating assets to achieve efficiencies that help meet growing global demand for LNG and drive even 2 greater cash generation Innovating globally, utilising core capabilities as well as external partnerships to solve complex problems 3 and enhance performance 41 2025 Capital Markets Day
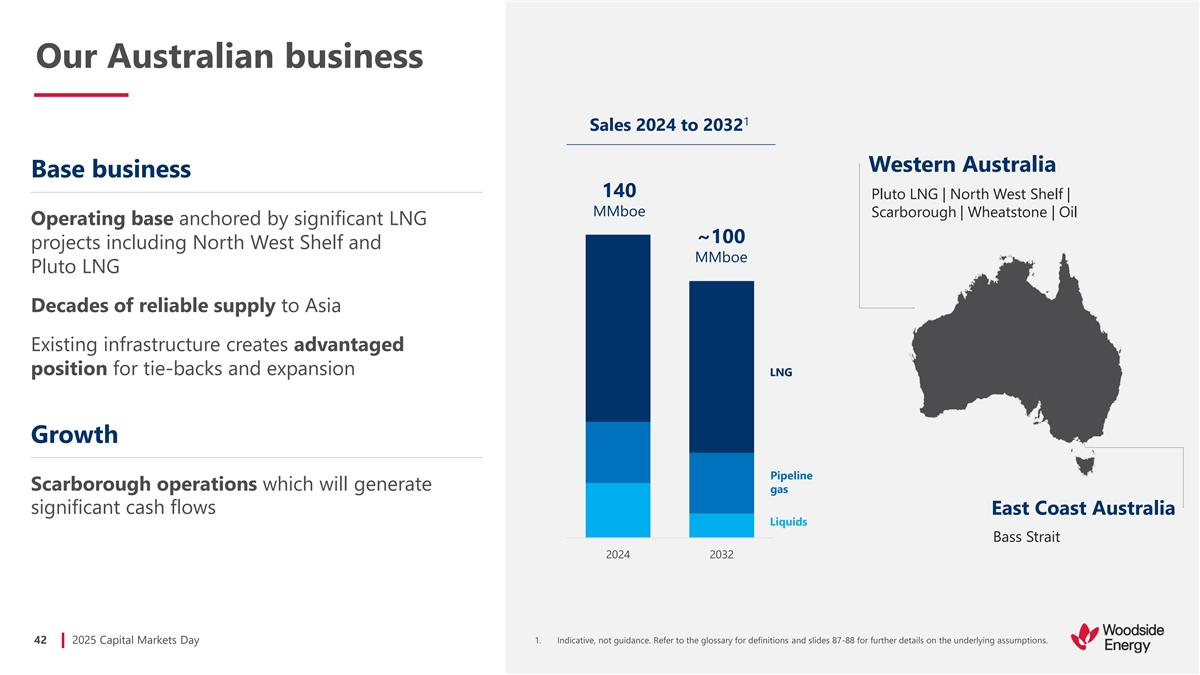
Our Australian business 1 Sales 2024 to 2032 Western Australia Base business 140 Pluto LNG | North West Shelf | MMboe Scarborough | Wheatstone | Oil Operating base anchored by significant LNG ~100 projects including North West Shelf and MMboe Pluto LNG Decades of reliable supply to Asia Existing infrastructure creates advantaged position for tie-backs and expansion LNG Growth Pipeline Scarborough operations which will generate gas significant cash flows East Coast Australia Liquids Bass Strait 2024 2032 42 2025 Capital Markets Day 1. Indicative, not guidance. Refer to the glossary for definitions and slides 87-88 for further details on the underlying assumptions.
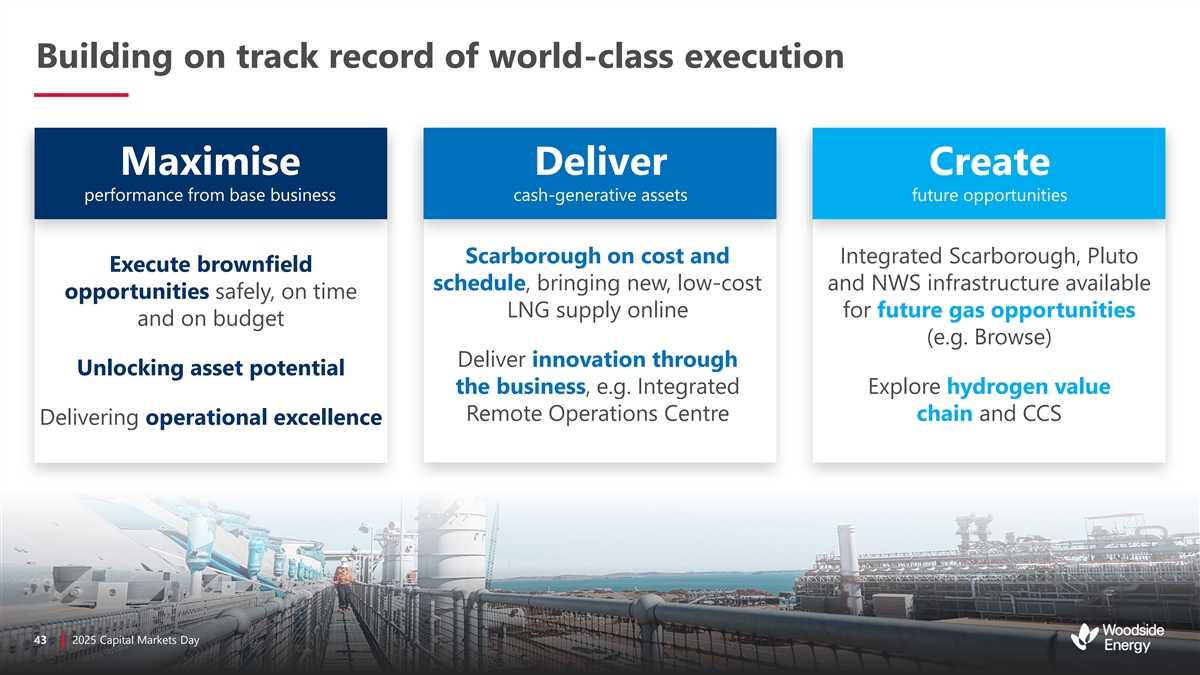
Building on track record of world-class execution Maximise Deliver Create performance from base business cash-generative assets future opportunities Scarborough on cost and Integrated Scarborough, Pluto Execute brownfield schedule, bringing new, low-cost and NWS infrastructure available opportunities safely, on time LNG supply online for future gas opportunities and on budget (e.g. Browse) Deliver innovation through Unlocking asset potential the business, e.g. Integrated Explore hydrogen value Remote Operations Centre chain and CCS Delivering operational excellence 43 43 2 20 02 25 5 C Cap apit ital al M Mar ark ke et ts s D Day ay
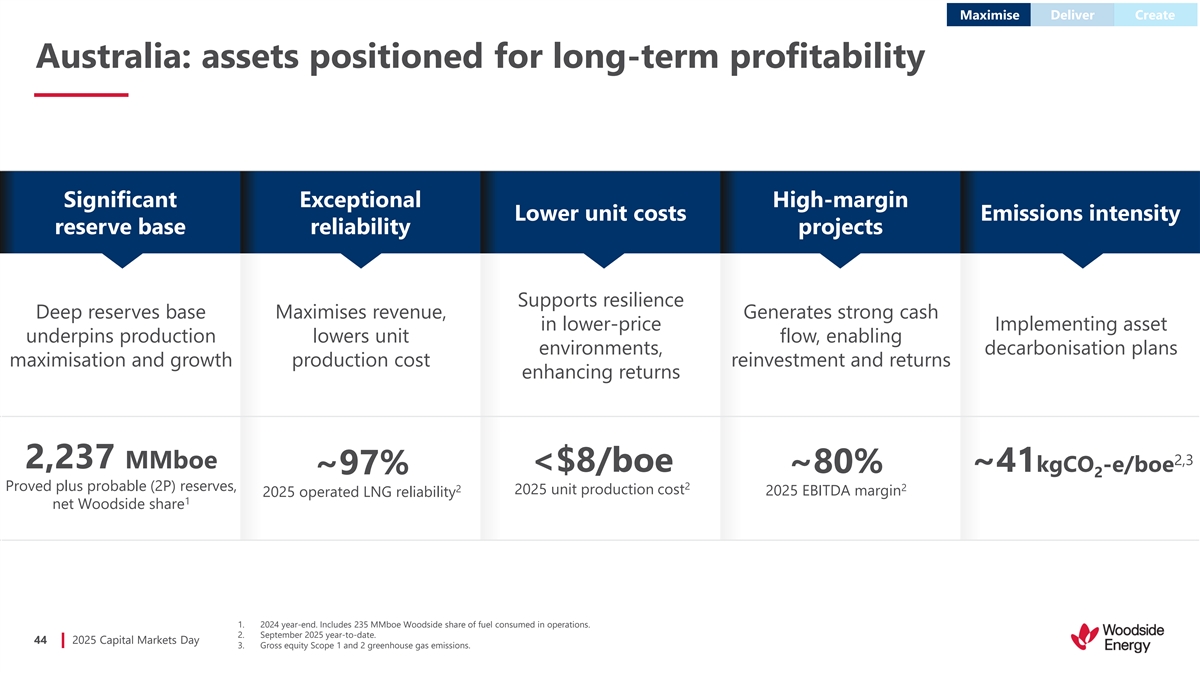
Maximise Deliver Create Australia: assets positioned for long-term profitability Significant Exceptional High-margin Lower unit costs Emissions intensity reserve base reliability projects Supports resilience Deep reserves base Maximises revenue, Generates strong cash in lower-price Implementing asset underpins production lowers unit flow, enabling environments, decarbonisation plans maximisation and growth production cost reinvestment and returns enhancing returns 2,3 2,237 MMboe <$8/boe ~41kgCO -e/boe ~80% ~97% 2 2 Proved plus probable (2P) reserves, 2 2 2025 unit production cost 2025 EBITDA margin 2025 operated LNG reliability 1 net Woodside share 1. 2024 year-end. Includes 235 MMboe Woodside share of fuel consumed in operations. 2. September 2025 year-to-date. 44 2025 Capital Markets Day 3. Gross equity Scope 1 and 2 greenhouse gas emissions.
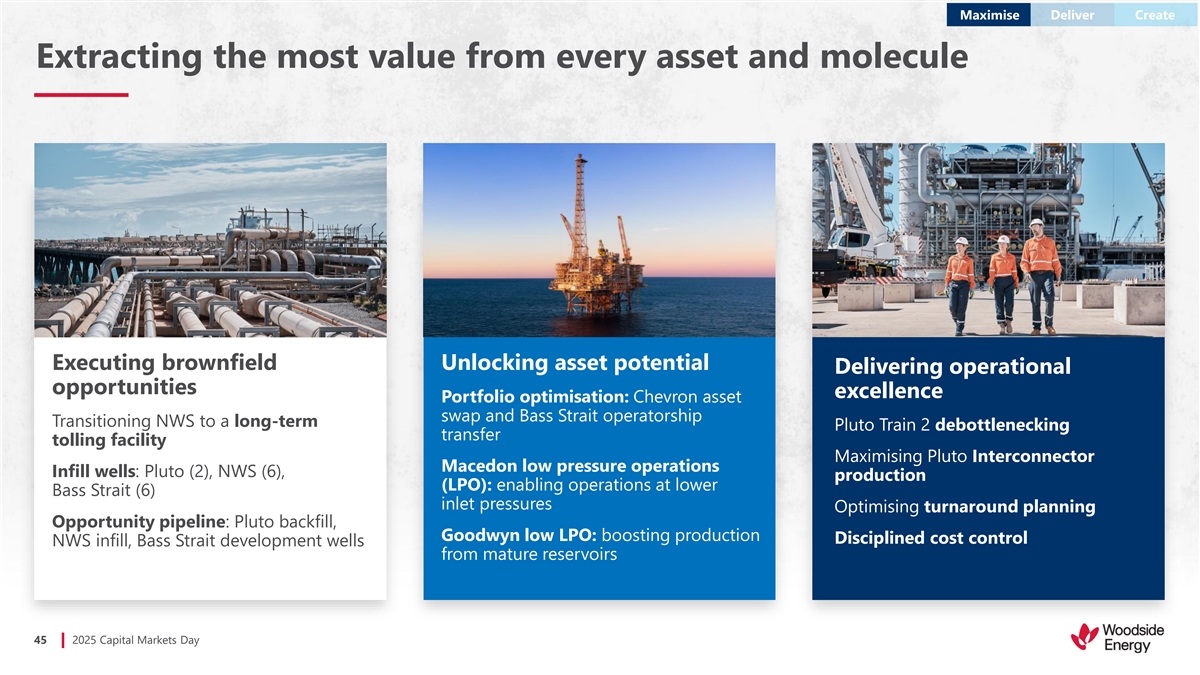
Maximise Deliver Create Extracting the most value from every asset and molecule Replace image Replace image Executing brownfield Unlocking asset potential Delivering operational opportunities excellence Portfolio optimisation: Chevron asset swap and Bass Strait operatorship Transitioning NWS to a long-term Pluto Train 2 debottlenecking transfer tolling facility Maximising Pluto Interconnector Macedon low pressure operations Infill wells: Pluto (2), NWS (6), production (LPO): enabling operations at lower Bass Strait (6) inlet pressures Optimising turnaround planning Opportunity pipeline: Pluto backfill, Goodwyn low LPO: boosting production Disciplined cost control NWS infill, Bass Strait development wells from mature reservoirs 45 2025 Capital Markets Day
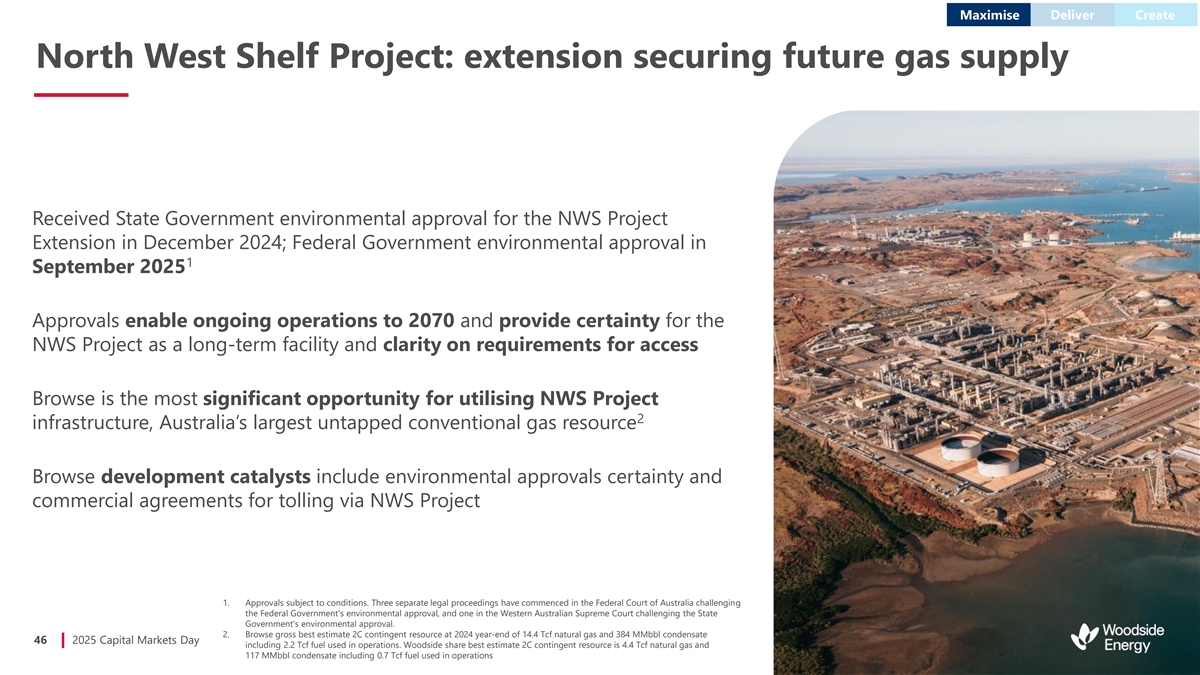
Maximise Deliver Create North West Shelf Project: extension securing future gas supply Received State Government environmental approval for the NWS Project Extension in December 2024; Federal Government environmental approval in 1 September 2025 Approvals enable ongoing operations to 2070 and provide certainty for the NWS Project as a long-term facility and clarity on requirements for access Browse is the most significant opportunity for utilising NWS Project 2 infrastructure, Australia’s largest untapped conventional gas resource Browse development catalysts include environmental approvals certainty and commercial agreements for tolling via NWS Project 1. Approvals subject to conditions. Three separate legal proceedings have commenced in the Federal Court of Australia challenging the Federal Government's environmental approval, and one in the Western Australian Supreme Court challenging the State Government's environmental approval. 2. Browse gross best estimate 2C contingent resource at 2024 year-end of 14.4 Tcf natural gas and 384 MMbbl condensate 46 2025 Capital Markets Day including 2.2 Tcf fuel used in operations. Woodside share best estimate 2C contingent resource is 4.4 Tcf natural gas and 117 MMbbl condensate including 0.7 Tcf fuel used in operations
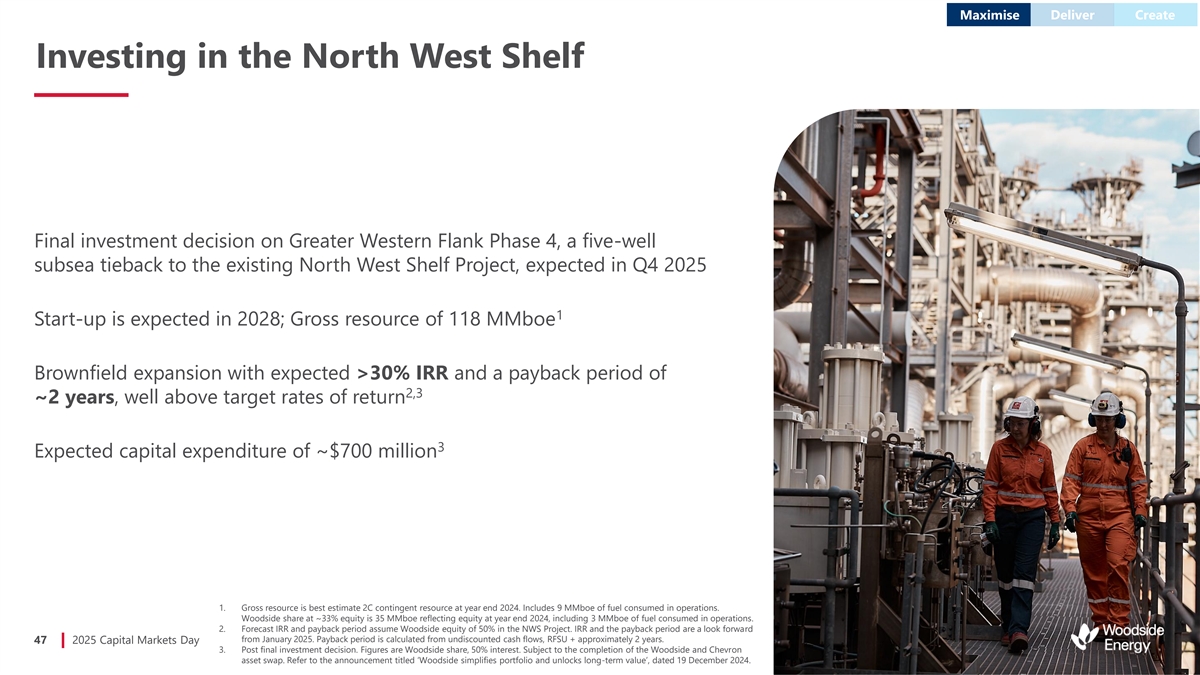
Maximise Deliver Create Investing in the North West Shelf Final investment decision on Greater Western Flank Phase 4, a five-well subsea tieback to the existing North West Shelf Project, expected in Q4 2025 1 Start-up is expected in 2028; Gross resource of 118 MMboe Brownfield expansion with expected >30% IRR and a payback period of 2,3 ~2 years, well above target rates of return 3 Expected capital expenditure of ~$700 million 1. Gross resource is best estimate 2C contingent resource at year end 2024. Includes 9 MMboe of fuel consumed in operations. Woodside share at ~33% equity is 35 MMboe reflecting equity at year end 2024, including 3 MMboe of fuel consumed in operations. 2. Forecast IRR and payback period assume Woodside equity of 50% in the NWS Project. IRR and the payback period are a look forward from January 2025. Payback period is calculated from undiscounted cash flows, RFSU + approximately 2 years. 47 2025 Capital Markets Day 3. Post final investment decision. Figures are Woodside share, 50% interest. Subject to the completion of the Woodside and Chevron asset swap. Refer to the announcement titled ‘Woodside simplifies portfolio and unlocks long-term value’, dated 19 December 2024.
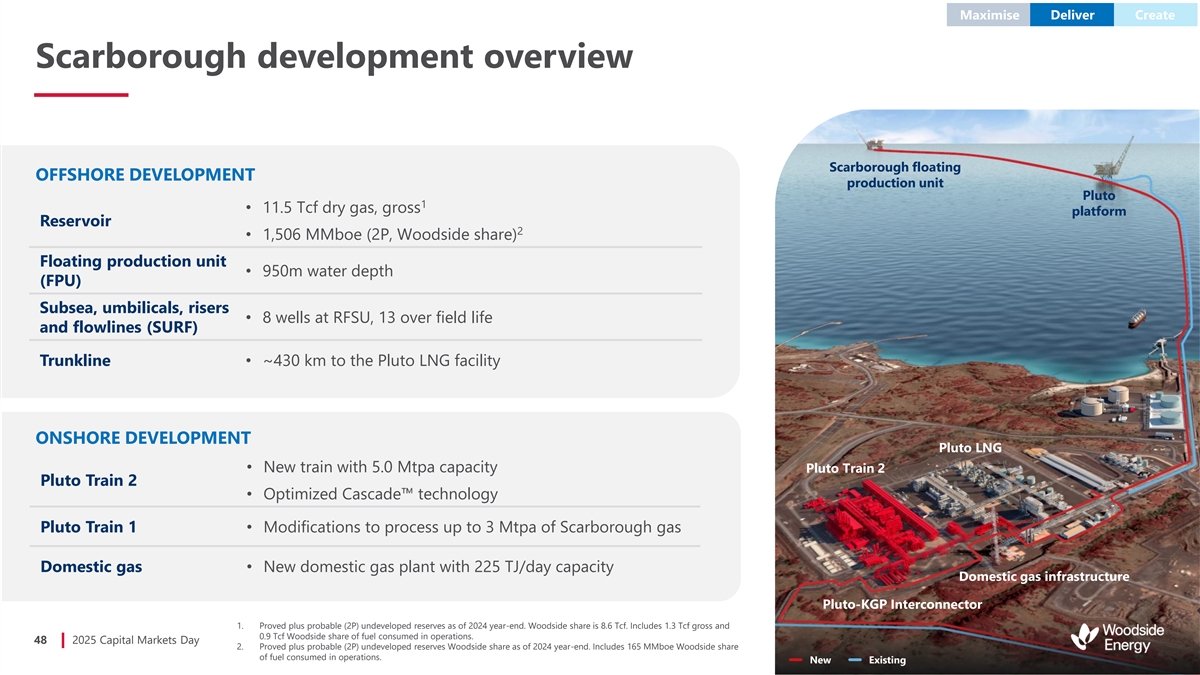
Maximise Deliver Create Scarborough development overview Scarborough floating OFFSHORE DEVELOPMENT production unit Pluto 1 • 11.5 Tcf dry gas, gross platform Reservoir 2 • 1,506 MMboe (2P, Woodside share) Floating production unit • 950m water depth (FPU) Subsea, umbilicals, risers • 8 wells at RFSU, 13 over field life and flowlines (SURF) Trunkline• ~430 km to the Pluto LNG facility ONSHORE DEVELOPMENT Pluto LNG • New train with 5.0 Mtpa capacity Pluto Train 2 Pluto Train 2 • Optimized Cascade technology Pluto Train 1• Modifications to process up to 3 Mtpa of Scarborough gas Domestic gas• New domestic gas plant with 225 TJ/day capacity Domestic gas infrastructure Pluto-KGP Interconnector 1. Proved plus probable (2P) undeveloped reserves as of 2024 year-end. Woodside share is 8.6 Tcf. Includes 1.3 Tcf gross and 0.9 Tcf Woodside share of fuel consumed in operations. 48 2025 Capital Markets Day 2. Proved plus probable (2P) undeveloped reserves Woodside share as of 2024 year-end. Includes 165 MMboe Woodside share of fuel consumed in operations. New Existing
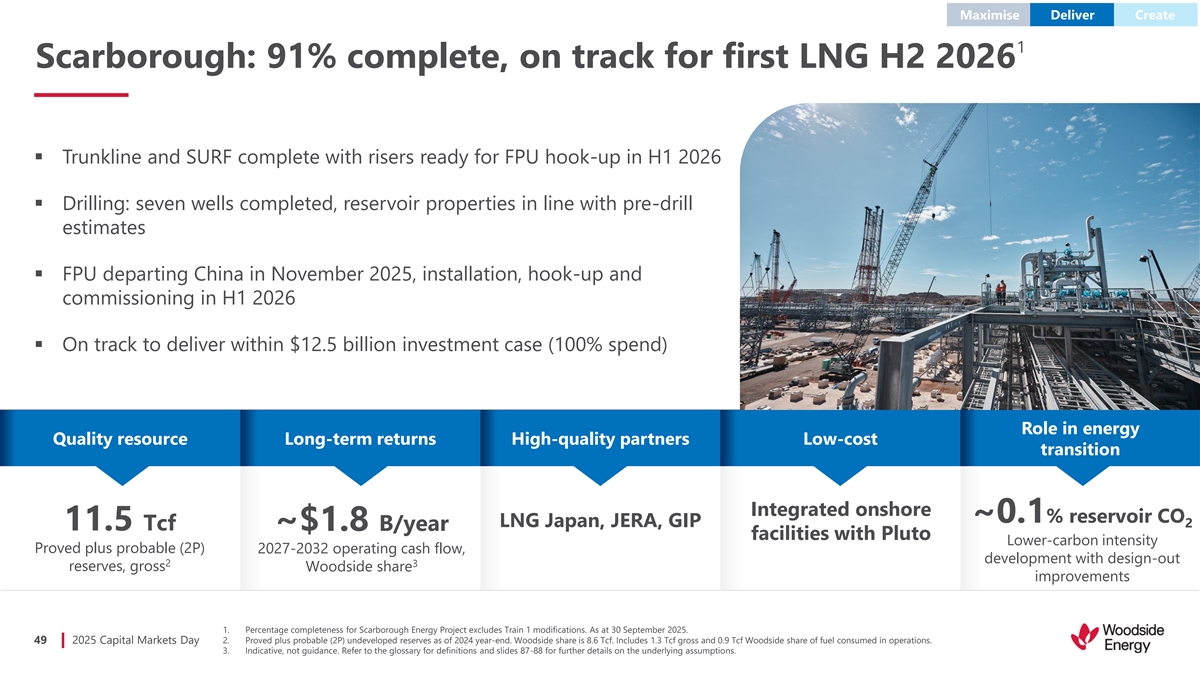
Maximise Deliver Create 1 Scarborough: 91% complete, on track for first LNG H2 2026 ▪ Trunkline and SURF complete with risers ready for FPU hook-up in H1 2026 ▪ Drilling: seven wells completed, reservoir properties in line with pre-drill estimates ▪ FPU departing China in November 2025, installation, hook-up and commissioning in H1 2026 ▪ On track to deliver within $12.5 billion investment case (100% spend) Role in energy Quality resource Long-term returns High-quality partners Low-cost transition Integrated onshore ~0.1% reservoir CO LNG Japan, JERA, GIP 2 11.5 Tcf ~$1.8 B/year facilities with Pluto Lower-carbon intensity Proved plus probable (2P) 2027-2032 operating cash flow, development with design-out 2 3 reserves, gross Woodside share improvements 1. Percentage completeness for Scarborough Energy Project excludes Train 1 modifications. As at 30 September 2025. 49 2025 Capital Markets Day 2. Proved plus probable (2P) undeveloped reserves as of 2024 year-end. Woodside share is 8.6 Tcf. Includes 1.3 Tcf gross and 0.9 Tcf Woodside share of fuel consumed in operations. 3. Indicative, not guidance. Refer to the glossary for definitions and slides 87-88 for further details on the underlying assumptions.
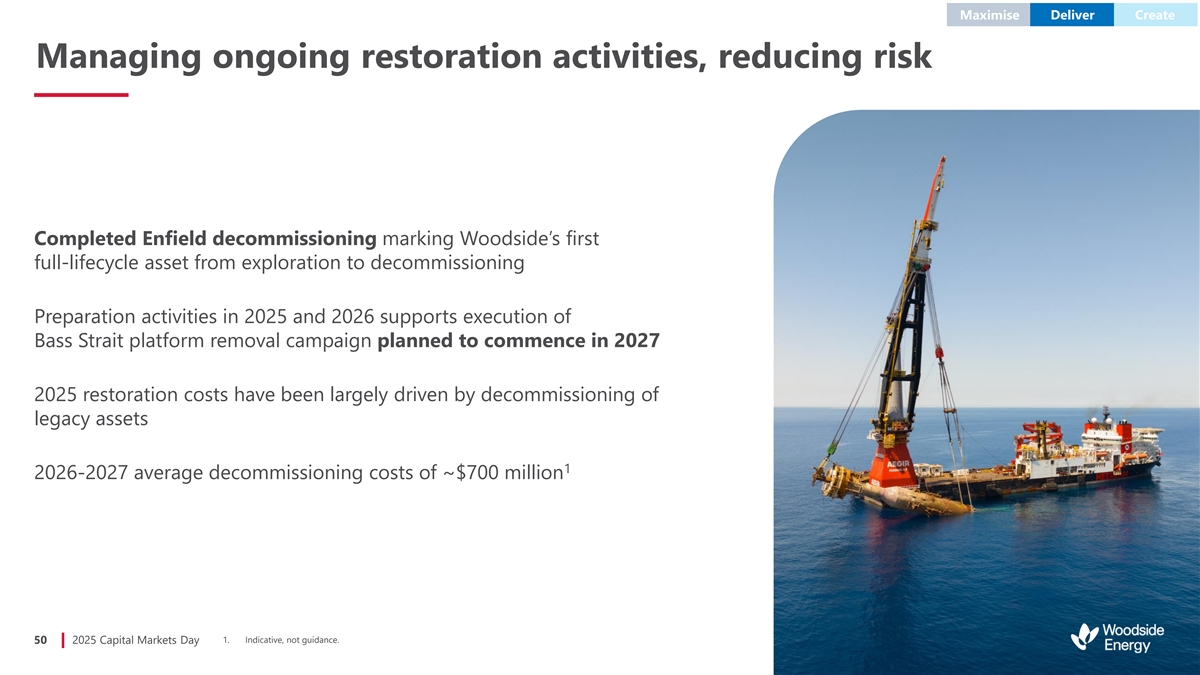
Maximise Deliver Create Managing ongoing restoration activities, reducing risk Completed Enfield decommissioning marking Woodside’s first full-lifecycle asset from exploration to decommissioning Preparation activities in 2025 and 2026 supports execution of Bass Strait platform removal campaign planned to commence in 2027 2025 restoration costs have been largely driven by decommissioning of legacy assets 1 2026-2027 average decommissioning costs of ~$700 million 1. Indicative, not guidance. 50 2025 Capital Markets Day
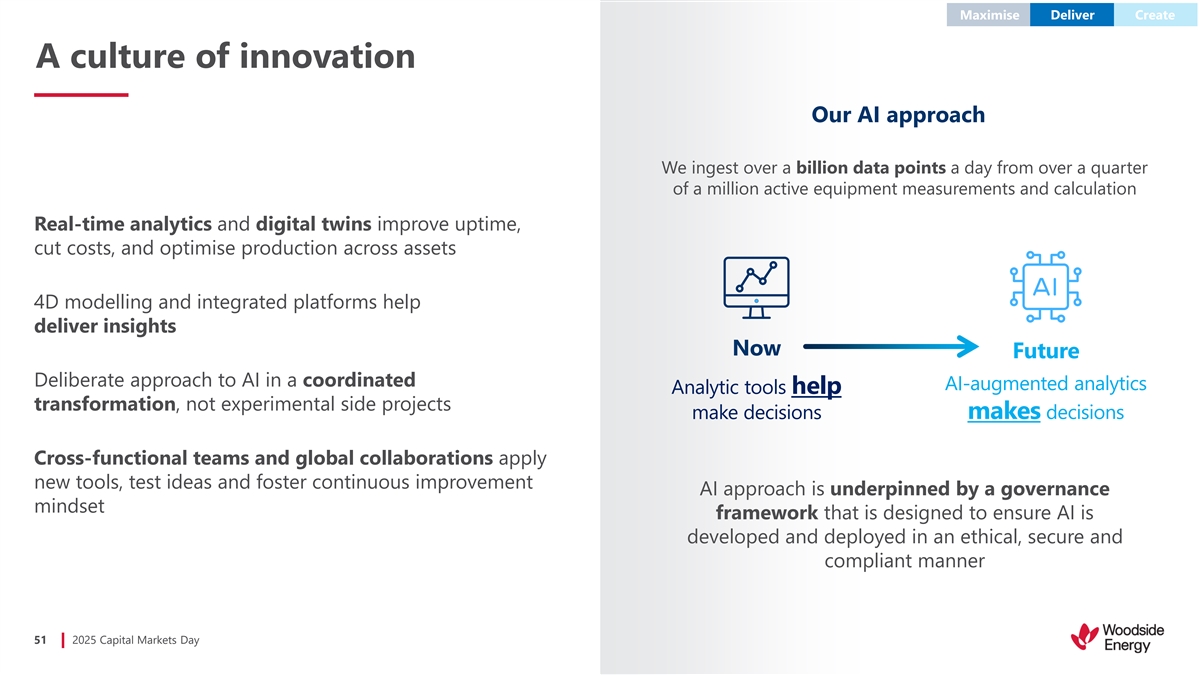
Maximise Deliver Create A culture of innovation Our AI approach We ingest over a billion data points a day from over a quarter of a million active equipment measurements and calculation Real-time analytics and digital twins improve uptime, cut costs, and optimise production across assets 4D modelling and integrated platforms help deliver insights Now Future Deliberate approach to AI in a coordinated AI-augmented analytics Analytic tools help transformation, not experimental side projects make decisions makes decisions Cross-functional teams and global collaborations apply new tools, test ideas and foster continuous improvement AI approach is underpinned by a governance mindset framework that is designed to ensure AI is developed and deployed in an ethical, secure and compliant manner 51 2025 Capital Markets Day
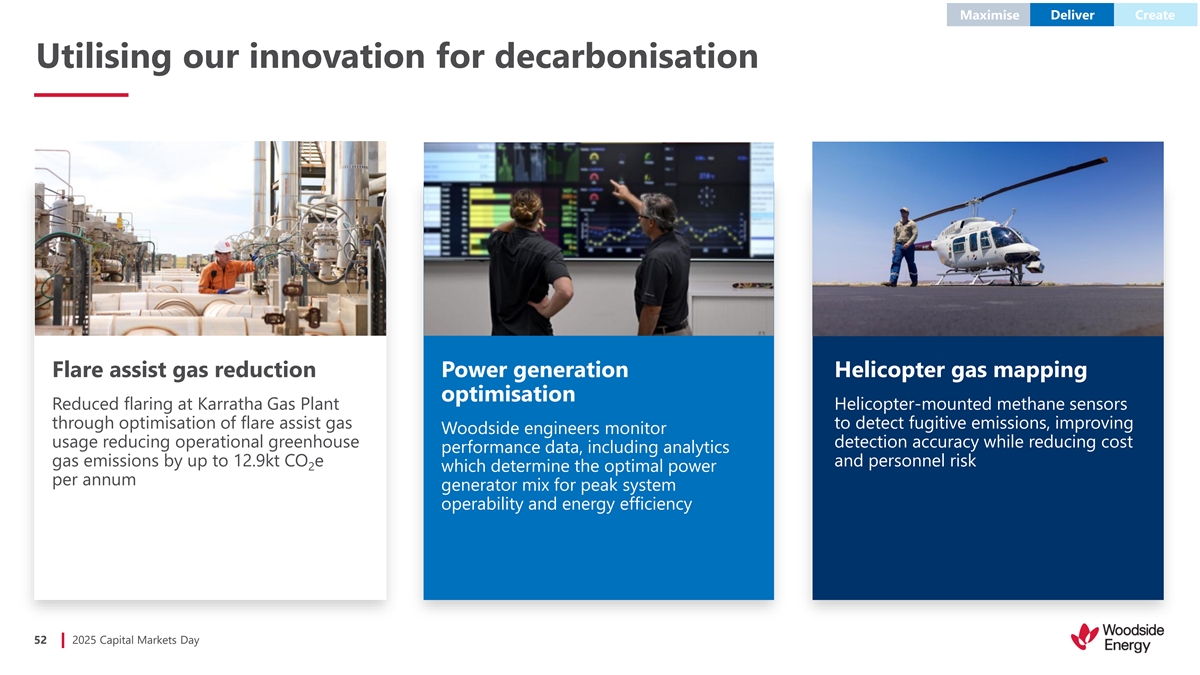
Maximise Deliver Create Utilising our innovation for decarbonisation Flare assist gas reduction Power generation Helicopter gas mapping optimisation Reduced flaring at Karratha Gas Plant Helicopter-mounted methane sensors through optimisation of flare assist gas to detect fugitive emissions, improving Woodside engineers monitor usage reducing operational greenhouse detection accuracy while reducing cost performance data, including analytics gas emissions by up to 12.9kt CO e and personnel risk 2 which determine the optimal power per annum generator mix for peak system operability and energy efficiency 52 2025 Capital Markets Day
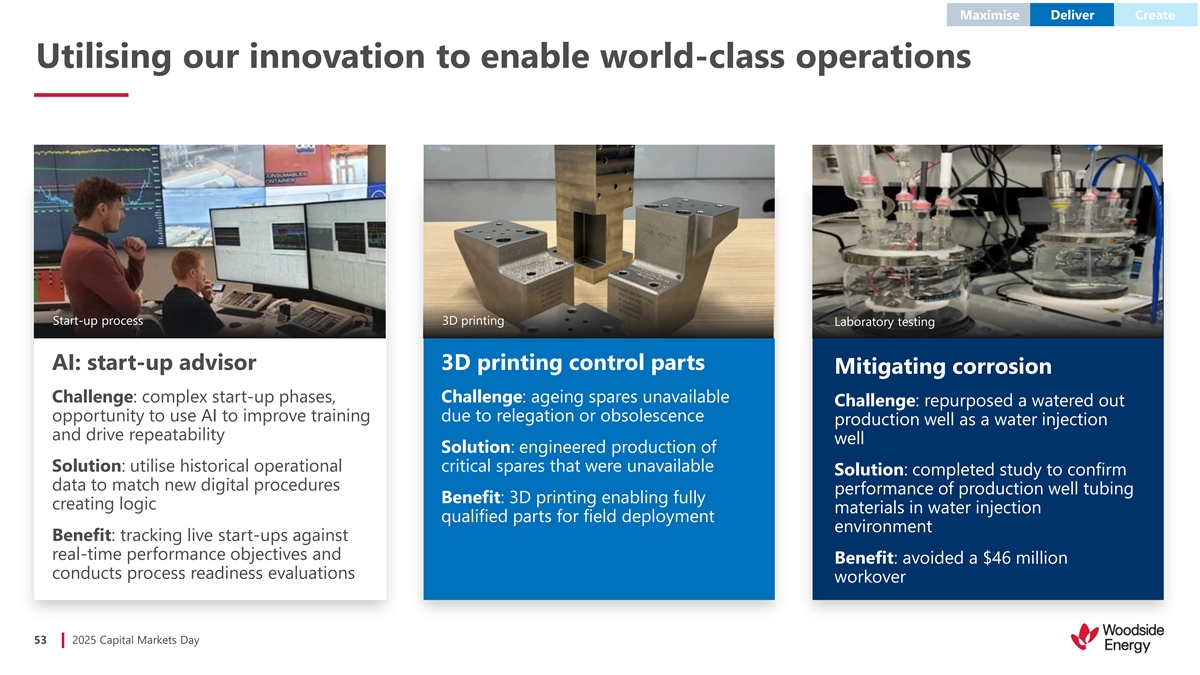
Maximise Deliver Create Utilising our innovation to enable world-class operations Start-up process 3D printing Laboratory testing AI: start-up advisor 3D printing control parts Mitigating corrosion Challenge: complex start-up phases, Challenge: ageing spares unavailable Challenge: repurposed a watered out opportunity to use AI to improve training due to relegation or obsolescence production well as a water injection and drive repeatability well Solution: engineered production of Solution: utilise historical operational critical spares that were unavailable Solution: completed study to confirm data to match new digital procedures performance of production well tubing Benefit: 3D printing enabling fully creating logic materials in water injection qualified parts for field deployment environment Benefit: tracking live start-ups against real-time performance objectives and Benefit: avoided a $46 million conducts process readiness evaluations workover 53 2025 Capital Markets Day
International business Building on core strengths to diversify portfolio and drive long-term growth Daniel Kalms EVP and Chief Operating Officer International
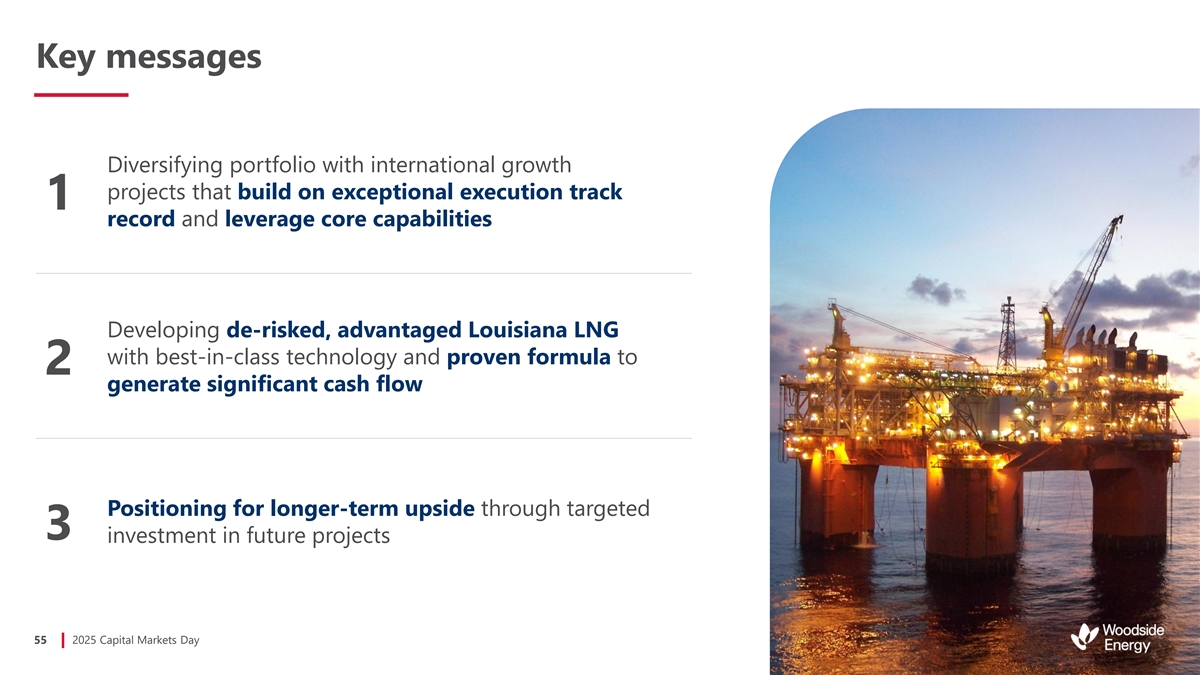
Key messages Diversifying portfolio with international growth projects that build on exceptional execution track 1 record and leverage core capabilities Developing de-risked, advantaged Louisiana LNG with best-in-class technology and proven formula to 2 generate significant cash flow Positioning for longer-term upside through targeted 3 investment in future projects 55 2025 Capital Markets Day
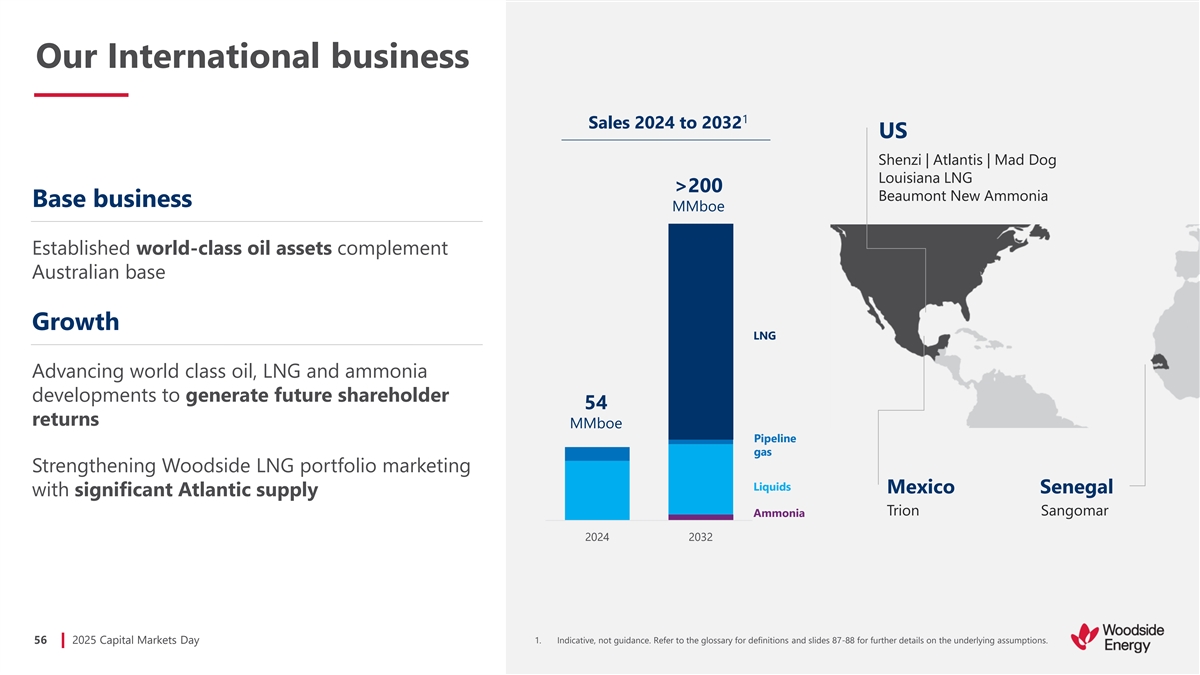
Our International business 1 Sales 2024 to 2032 US Shenzi | Atlantis | Mad Dog Louisiana LNG >200 Beaumont New Ammonia Base business MMboe Established world-class oil assets complement Australian base Growth LNG Advancing world class oil, LNG and ammonia developments to generate future shareholder 54 returns MMboe Pipeline gas Strengthening Woodside LNG portfolio marketing Liquids Mexico Senegal with significant Atlantic supply Trion Sangomar Ammonia 2024 2032 56 2025 Capital Markets Day 1. Indicative, not guidance. Refer to the glossary for definitions and slides 87-88 for further details on the underlying assumptions.
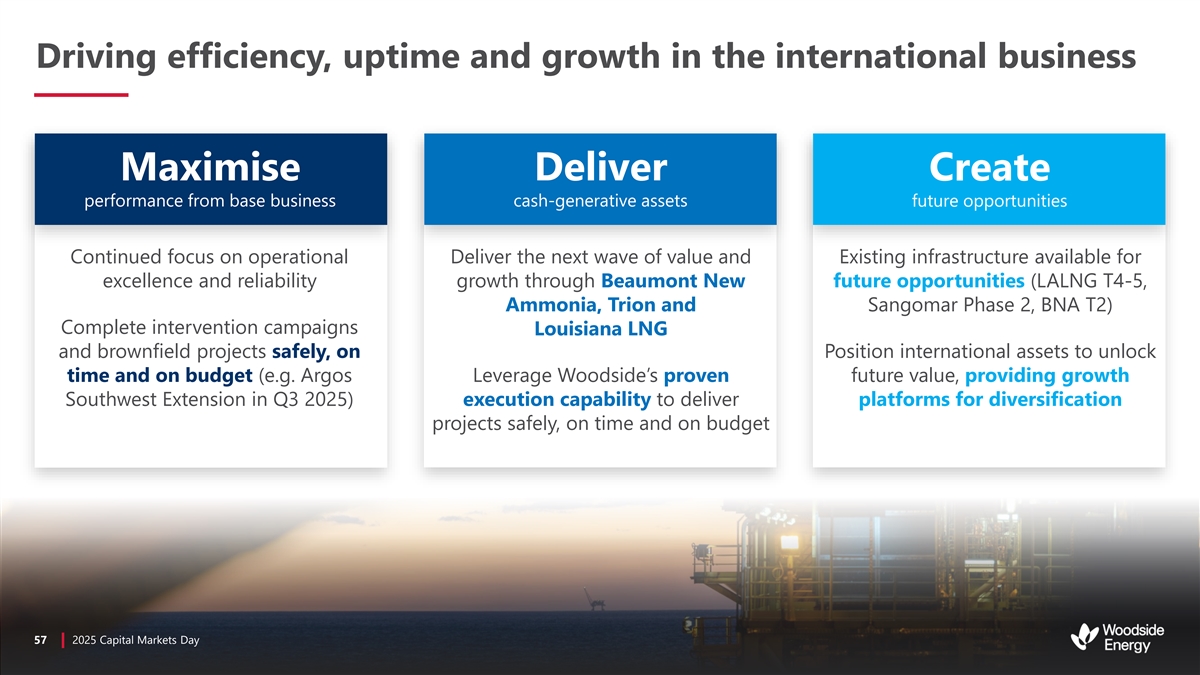
Driving efficiency, uptime and growth in the international business Maximise Deliver Create performance from base business cash-generative assets future opportunities Continued focus on operational Deliver the next wave of value and Existing infrastructure available for excellence and reliability growth through Beaumont New future opportunities (LALNG T4-5, Ammonia, Trion and Sangomar Phase 2, BNA T2) Complete intervention campaigns Louisiana LNG and brownfield projects safely, on Position international assets to unlock time and on budget (e.g. Argos Leverage Woodside’s proven future value, providing growth Southwest Extension in Q3 2025) execution capability to deliver platforms for diversification projects safely, on time and on budget 57 57 2 20 02 25 5 C Cap apit ital al M Mar ark ke et ts s D Day ay
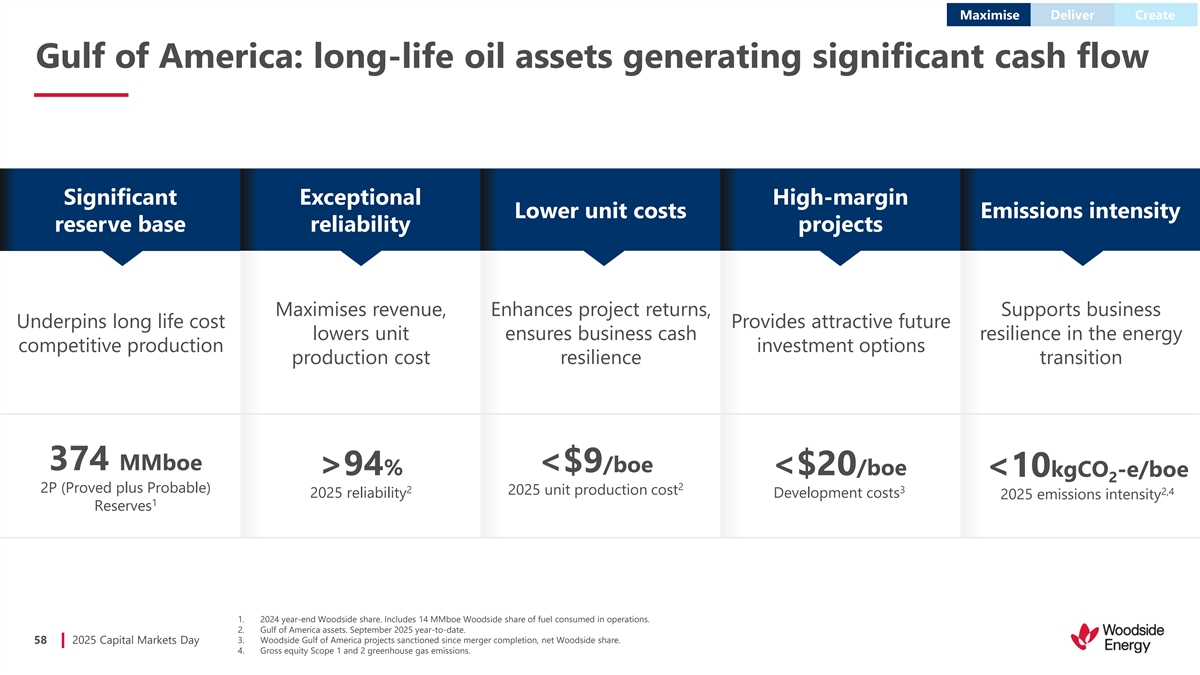
Maximise Deliver Create Gulf of America: long-life oil assets generating significant cash flow Significant Exceptional High-margin Lower unit costs Emissions intensity reserve base reliability projects Maximises revenue, Enhances project returns, Supports business Underpins long life cost Provides attractive future lowers unit ensures business cash resilience in the energy competitive production investment options production cost resilience transition 374 MMboe <$9/boe >94% <$20/boe <10kgCO -e/boe 2 2 2P (Proved plus Probable) 2 3 2025 unit production cost 2,4 2025 reliability Development costs 2025 emissions intensity 1 Reserves 1. 2024 year-end Woodside share. Includes 14 MMboe Woodside share of fuel consumed in operations. 2. Gulf of America assets. September 2025 year-to-date. 58 2025 Capital Markets Day 3. Woodside Gulf of America projects sanctioned since merger completion, net Woodside share. 4. Gross equity Scope 1 and 2 greenhouse gas emissions.
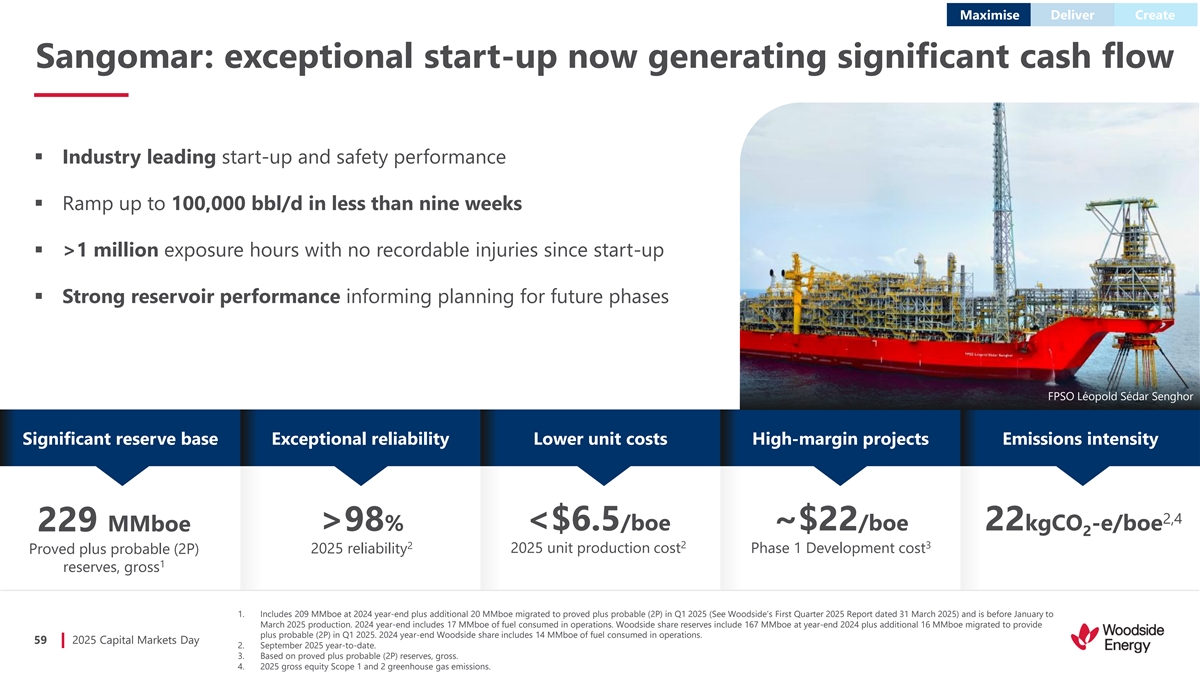
Maximise Deliver Create Sangomar: exceptional start-up now generating significant cash flow ▪ Industry leading start-up and safety performance ▪ Ramp up to 100,000 bbl/d in less than nine weeks ▪ >1 million exposure hours with no recordable injuries since start-up ▪ Strong reservoir performance informing planning for future phases FPSO Léopold Sédar Senghor Significant reserve base Exceptional reliability Lower unit costs High-margin projects Emissions intensity 2,4 229 MMboe >98% <$6.5/boe ~$22/boe 22kgCO -e/boe 2 2 2 3 Proved plus probable (2P) 2025 reliability 2025 unit production cost Phase 1 Development cost 1 reserves, gross 1. Includes 209 MMboe at 2024 year-end plus additional 20 MMboe migrated to proved plus probable (2P) in Q1 2025 (See Woodside’s First Quarter 2025 Report dated 31 March 2025) and is before January to March 2025 production. 2024 year-end includes 17 MMboe of fuel consumed in operations. Woodside share reserves include 167 MMboe at year-end 2024 plus additional 16 MMboe migrated to provide plus probable (2P) in Q1 2025. 2024 year-end Woodside share includes 14 MMboe of fuel consumed in operations. 59 2025 Capital Markets Day 2. September 2025 year-to-date. 3. Based on proved plus probable (2P) reserves, gross. 4. 2025 gross equity Scope 1 and 2 greenhouse gas emissions.
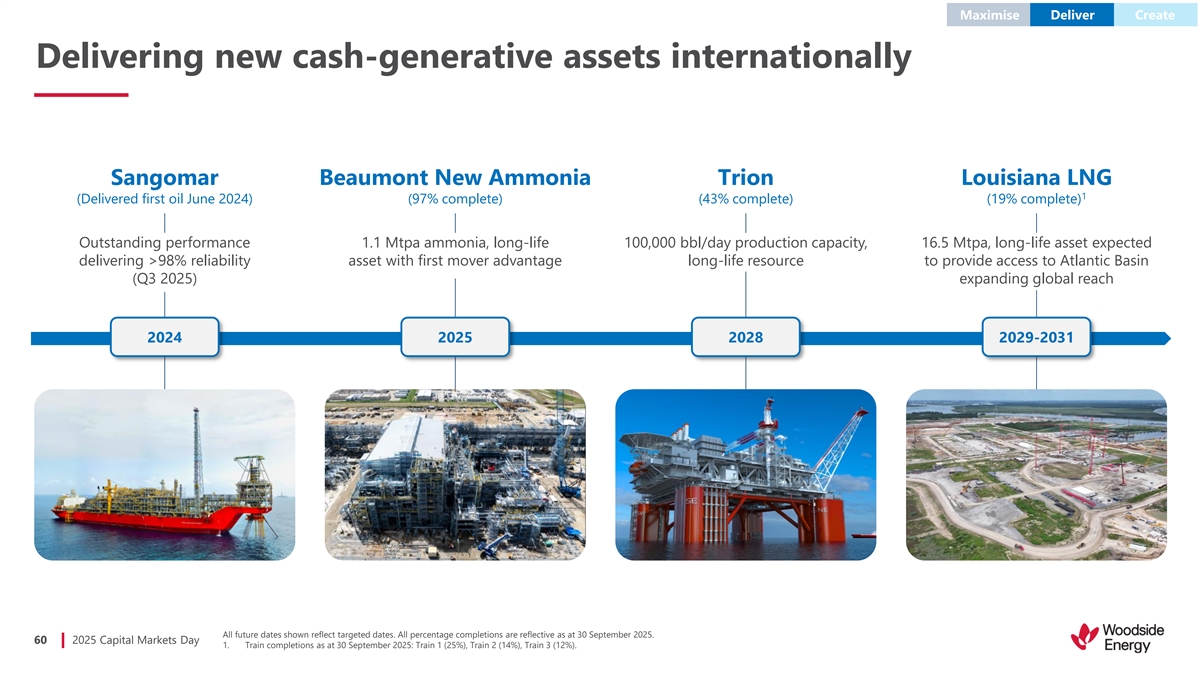
Maximise Deliver Create Delivering new cash-generative assets internationally Sangomar Beaumont New Ammonia Trion Louisiana LNG 1 (Delivered first oil June 2024) (97% complete) (43% complete) (19% complete) Outstanding performance 1.1 Mtpa ammonia, long-life 100,000 bbl/day production capacity, 16.5 Mtpa, long-life asset expected delivering >98% reliability asset with first mover advantage long-life resource to provide access to Atlantic Basin (Q3 2025) expanding global reach 2024 2025 2028 2029-2031 All future dates shown reflect targeted dates. All percentage completions are reflective as at 30 September 2025. 60 2025 Capital Markets Day 1. Train completions as at 30 September 2025: Train 1 (25%), Train 2 (14%), Train 3 (12%).
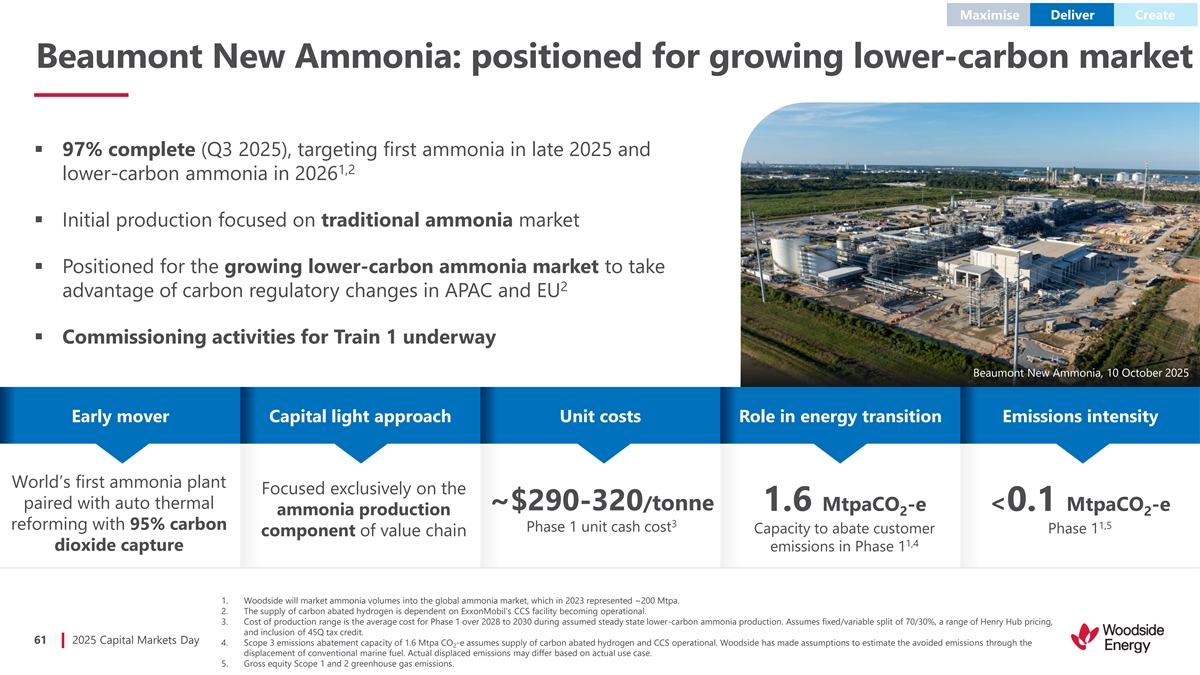
Maximise Deliver Create Beaumont New Ammonia: positioned for growing lower-carbon market ▪ 97% complete (Q3 2025), targeting first ammonia in late 2025 and 1,2 lower-carbon ammonia in 2026 ▪ Initial production focused on traditional ammonia market ▪ Positioned for the growing lower-carbon ammonia market to take 2 advantage of carbon regulatory changes in APAC and EU ▪ Commissioning activities for Train 1 underway Beaumont New Ammonia, 10 October 2025 Early mover Capital light approach Unit costs Role in energy transition Emissions intensity World’s first ammonia plant Focused exclusively on the paired with auto thermal ~$290-320/tonne 1.6 MtpaCO -e <0.1 MtpaCO -e ammonia production 2 2 3 1,5 reforming with 95% carbon Phase 1 unit cash cost Capacity to abate customer Phase 1 component of value chain 1,4 dioxide capture emissions in Phase 1 1. Woodside will market ammonia volumes into the global ammonia market, which in 2023 represented ~200 Mtpa. 2. The supply of carbon abated hydrogen is dependent on ExxonMobil’s CCS facility becoming operational. 3. Cost of production range is the average cost for Phase 1 over 2028 to 2030 during assumed steady state lower-carbon ammonia production. Assumes fixed/variable split of 70/30%, a range of Henry Hub pricing, and inclusion of 45Q tax credit. 61 2025 Capital Markets Day 4. Scope 3 emissions abatement capacity of 1.6 Mtpa CO -e assumes supply of carbon abated hydrogen and CCS operational. Woodside has made assumptions to estimate the avoided emissions through the 2 displacement of conventional marine fuel. Actual displaced emissions may differ based on actual use case. 5. Gross equity Scope 1 and 2 greenhouse gas emissions.
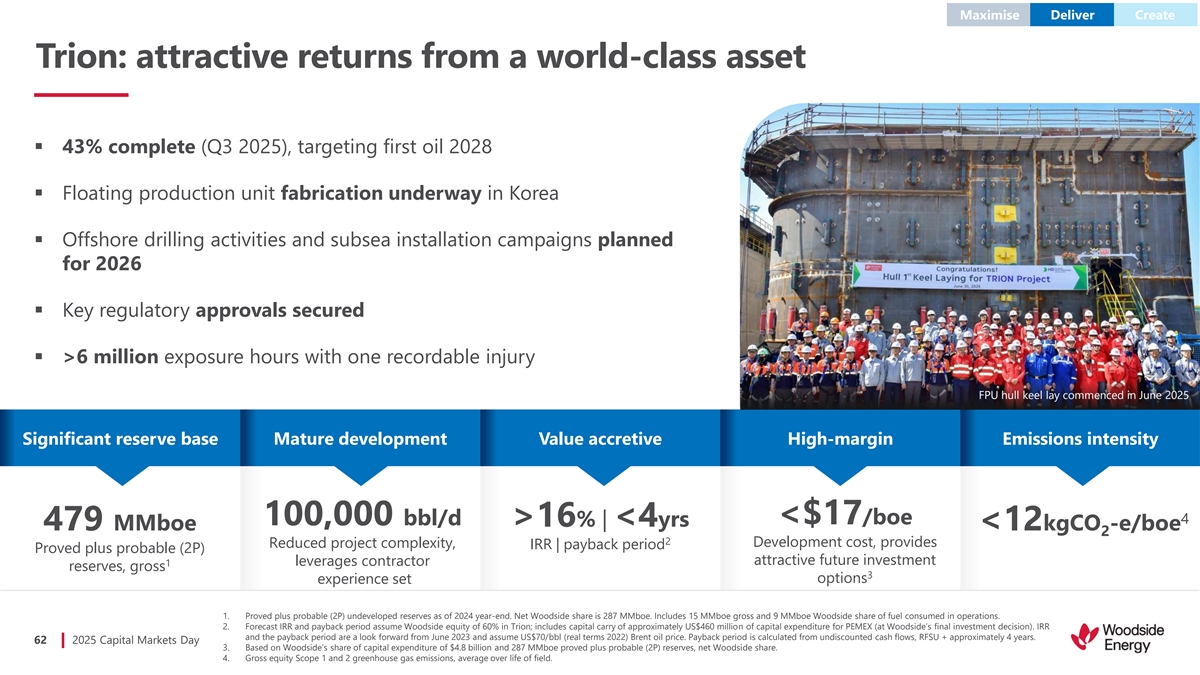
Maximise Deliver Create Trion: attractive returns from a world-class asset ▪ 43% complete (Q3 2025), targeting first oil 2028 ▪ Floating production unit fabrication underway in Korea ▪ Offshore drilling activities and subsea installation campaigns planned for 2026 ▪ Key regulatory approvals secured ▪ >6 million exposure hours with one recordable injury FPU hull keel lay commenced in June 2025 Significant reserve base Mature development Value accretive High-margin Emissions intensity 4 100,000 bbl/d <$17/boe >16% | <4yrs 479 MMboe <12kgCO -e/boe 2 2 Reduced project complexity, Development cost, provides IRR | payback period Proved plus probable (2P) attractive future investment 1 leverages contractor reserves, gross 3 options experience set 1. Proved plus probable (2P) undeveloped reserves as of 2024 year-end. Net Woodside share is 287 MMboe. Includes 15 MMboe gross and 9 MMboe Woodside share of fuel consumed in operations. 2. Forecast IRR and payback period assume Woodside equity of 60% in Trion; includes capital carry of approximately US$460 million of capital expenditure for PEMEX (at Woodside’s final investment decision). IRR and the payback period are a look forward from June 2023 and assume US$70/bbl (real terms 2022) Brent oil price. Payback period is calculated from undiscounted cash flows, RFSU + approximately 4 years. 62 2025 Capital Markets Day 3. Based on Woodside’s share of capital expenditure of $4.8 billion and 287 MMboe proved plus probable (2P) reserves, net Woodside share. 4. Gross equity Scope 1 and 2 greenhouse gas emissions, average over life of field.
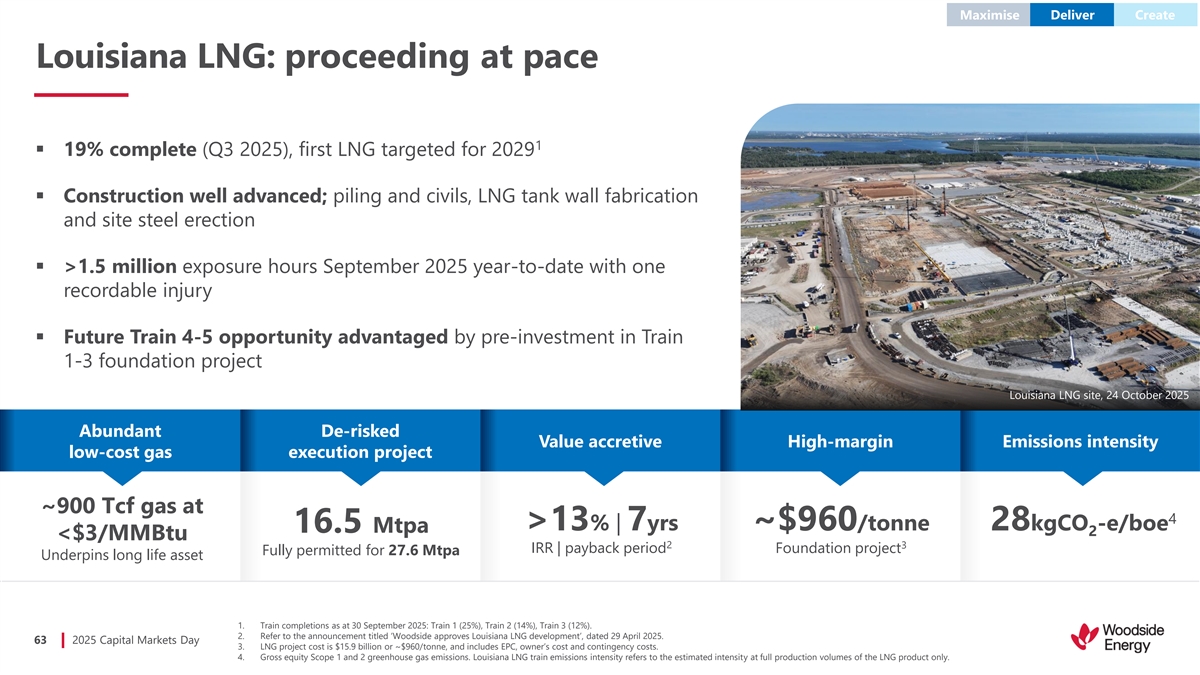
Maximise Deliver Create Louisiana LNG: proceeding at pace 1 ▪ 19% complete (Q3 2025), first LNG targeted for 2029 ▪ Construction well advanced; piling and civils, LNG tank wall fabrication and site steel erection ▪ >1.5 million exposure hours September 2025 year-to-date with one recordable injury ▪ Future Train 4-5 opportunity advantaged by pre-investment in Train 1-3 foundation project Louisiana LNG site, 24 October 2025 Abundant De-risked Value accretive High-margin Emissions intensity low-cost gas execution project ~900 Tcf gas at 4 >13% | 7yrs ~$960/tonne 28kgCO -e/boe 16.5 Mtpa 2 <$3/MMBtu 2 3 IRR | payback period Foundation project Fully permitted for 27.6 Mtpa Underpins long life asset 1. Train completions as at 30 September 2025: Train 1 (25%), Train 2 (14%), Train 3 (12%). 2. Refer to the announcement titled ‘Woodside approves Louisiana LNG development’, dated 29 April 2025. 63 2025 Capital Markets Day 3. LNG project cost is $15.9 billion or ~$960/tonne, and includes EPC, owner’s cost and contingency costs. 4. Gross equity Scope 1 and 2 greenhouse gas emissions. Louisiana LNG train emissions intensity refers to the estimated intensity at full production volumes of the LNG product only.
Maximise Deliver Create Louisiana LNG: delivering end-to-end value Advantaged US-based location Woodside competitive differentiators LNG value Transportation Liquefaction End customers Gas sourcing Shipping Portfolio sales 1 Abundant low-cost gas supply Established network Three-train, 16.5 Mtpa, ~$960/tonne >35 years of delivery chain Costs: Henry Hub, feedgas, fuel Costs: opex, capex, toll World-class leader in US natural gas Leading global investment Strategic infrastructure with complementary firm specialising in partnerships gas sourcing platform, Sequent infrastructure and real assets Henry Hub plus ~$4.90 to Europe 100% Henry Hub plus ~$3.40/MMBtu or Strong Henry Hub plus ~$5.80 to Asia 115% Henry Hub plus ~$2.90/MMBtu 2 returns 2 For 12% return US Gulf Coast netback for 12% return 3 Delivering >13% IRR at Louisiana LNG through integrated, end-to-end value chain participation and strategic partnerships 1. LNG project cost is $15.9 billion or ~$960/tonne, and includes EPC, owner’s cost and contingency costs. 2. Real terms 2024. Pre-tax. Presented on industry equivalent basis for comparison (e.g. 10% return for breakeven). Internal economics with Woodside pricing, carbon pricing, tax, and portfolio 64 2025 Capital Markets Day optimisation generate >13% return. 3. Refer to the announcement titled ‘Woodside approves Louisiana LNG development’, dated 29 April 2025.
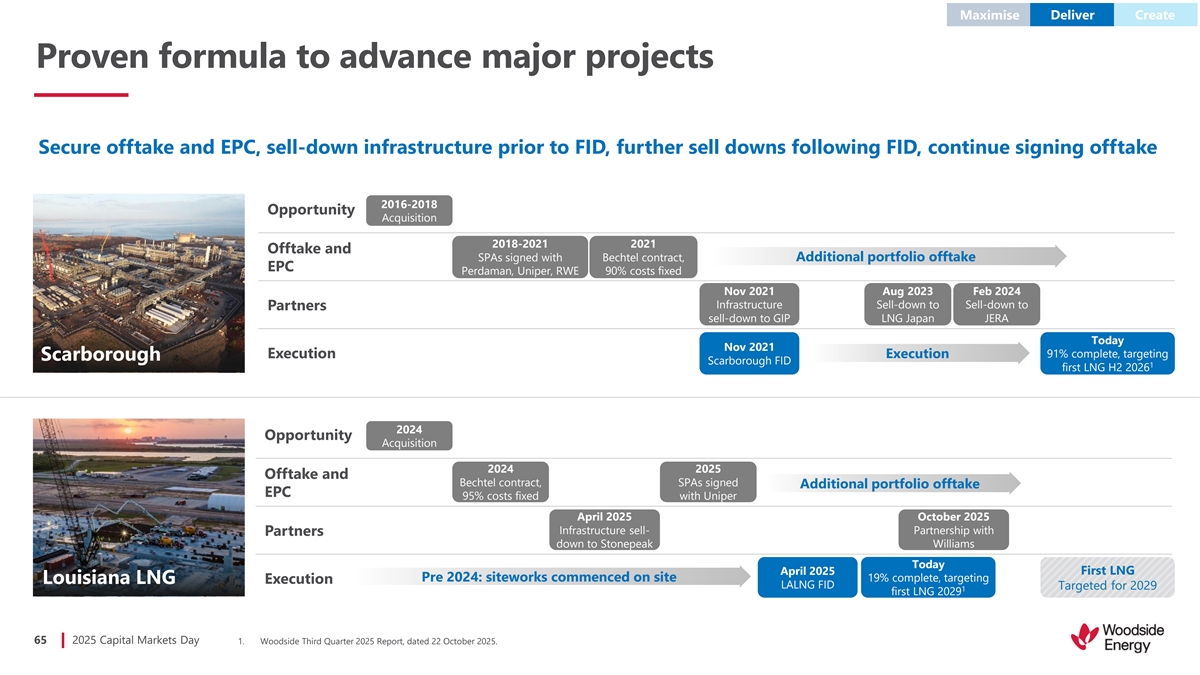
Maximise Deliver Create Proven formula to advance major projects Secure offtake and EPC, sell-down infrastructure prior to FID, further sell downs following FID, continue signing offtake 2016-2018 Opportunity Acquisition 2018-2021 2021 Offtake and SPAs signed with Bechtel contract, Additional portfolio offtake EPC Perdaman, Uniper, RWE 90% costs fixed Nov 2021 Aug 2023 Feb 2024 Infrastructure Sell-down to Sell-down to Partners sell-down to GIP LNG Japan JERA Today Nov 2021 91% complete, targeting Execution Execution Scarborough Scarborough FID 1 first LNG H2 2026 2024 Opportunity Acquisition 2024 2025 Offtake and Bechtel contract, SPAs signed Additional portfolio offtake EPC 95% costs fixed with Uniper April 2025 October 2025 Infrastructure sell- Partnership with Partners down to Stonepeak Williams Today April 2025 First LNG Pre 2024: siteworks commenced on site 19% complete, targeting Louisiana LNG Execution LALNG FID Targeted for 2029 1 first LNG 2029 65 2025 Capital Markets Day 1. Woodside Third Quarter 2025 Report, dated 22 October 2025.
Commercial and marketing overview Evolving our approach to provide flexibility and meet customer needs Mark Abbotsford EVP and Chief Commercial Officer
Key messages Capturing value through competitively advantaged global marketing and trading platform with clear 1 strategy and risk management Generating incremental earnings through integration across shipping, operations, marketing 2 and trading activities Providing meaningful flexibility through portfolio approach and shipping capabilities to optimise 3 outcomes, serve growing global energy demand and meet customer needs 67 2025 Capital Markets Day
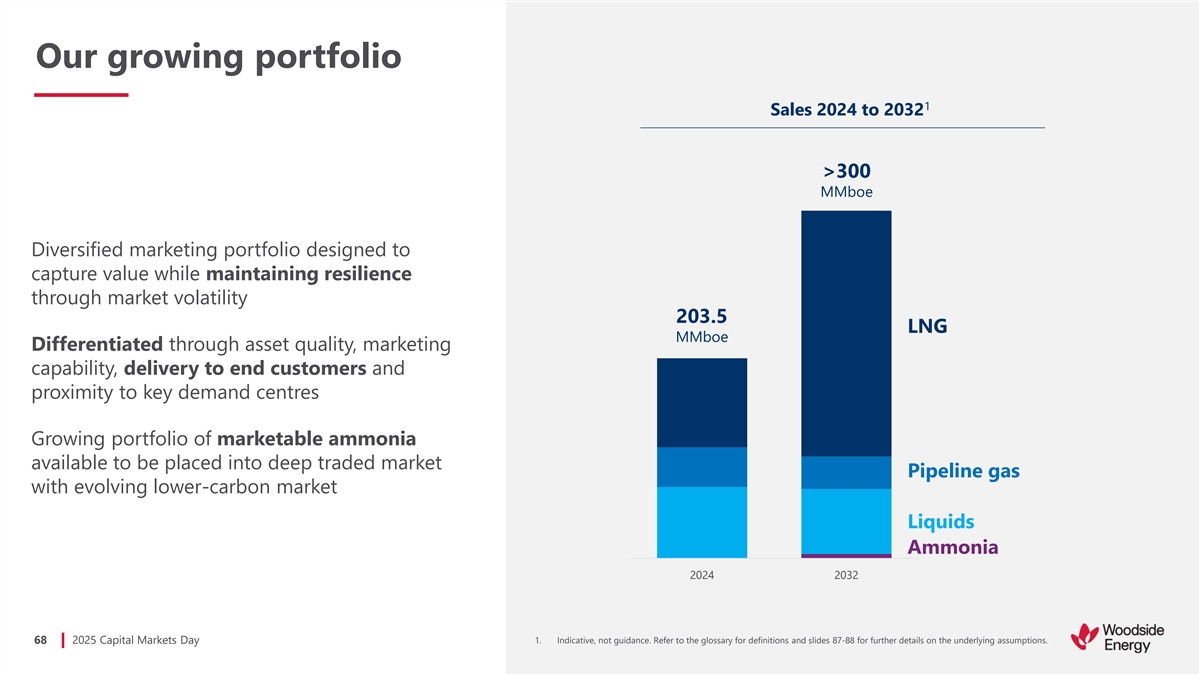
Our growing portfolio 1 Sales 2024 to 2032 >300 MMboe Diversified marketing portfolio designed to capture value while maintaining resilience through market volatility 203.5 LNG MMboe Differentiated through asset quality, marketing capability, delivery to end customers and proximity to key demand centres Growing portfolio of marketable ammonia available to be placed into deep traded market Pipeline gas with evolving lower-carbon market Liquids Ammonia 2024 2032 68 2025 Capital Markets Day 1. Indicative, not guidance. Refer to the glossary for definitions and slides 87-88 for further details on the underlying assumptions.
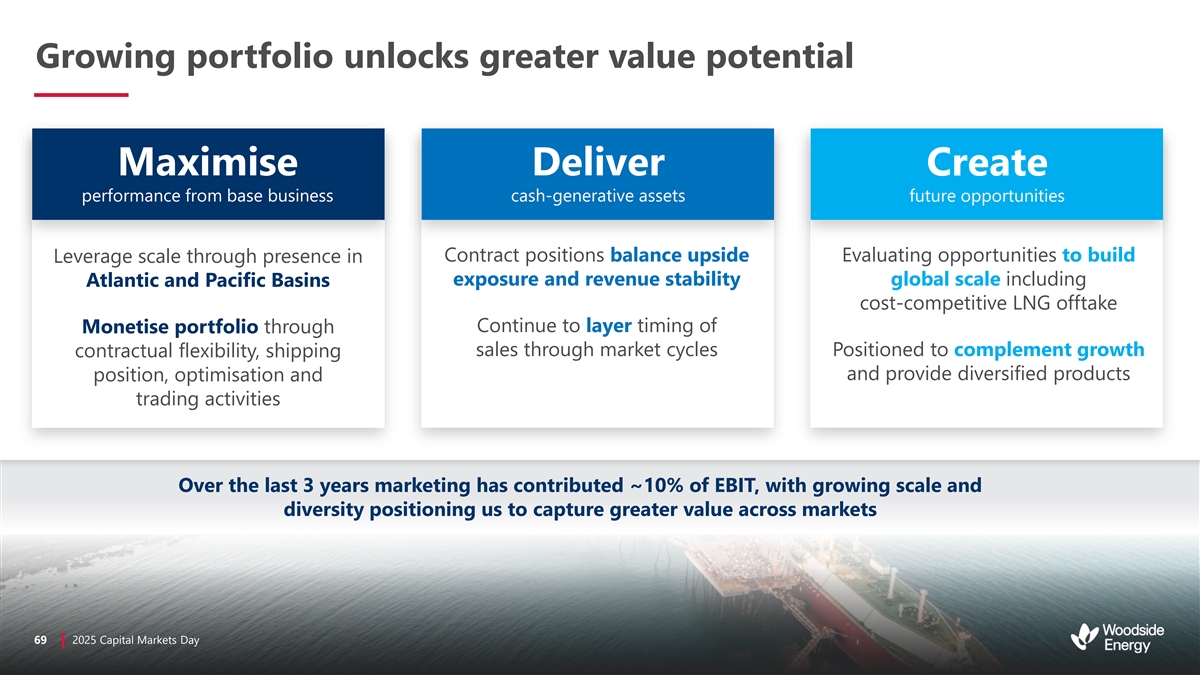
Growing portfolio unlocks greater value potential Maximise Deliver Create performance from base business cash-generative assets future opportunities Contract positions balance upside Evaluating opportunities to build Leverage scale through presence in exposure and revenue stability global scale including Atlantic and Pacific Basins cost-competitive LNG offtake Continue to layer timing of Monetise portfolio through sales through market cycles Positioned to complement growth contractual flexibility, shipping and provide diversified products position, optimisation and trading activities Over the last 3 years marketing has contributed ~10% of EBIT, with growing scale and diversity positioning us to capture greater value across markets 69 69 2 20 02 25 5 C Cap apit ital al M Mar ark ke et ts s D Day ay
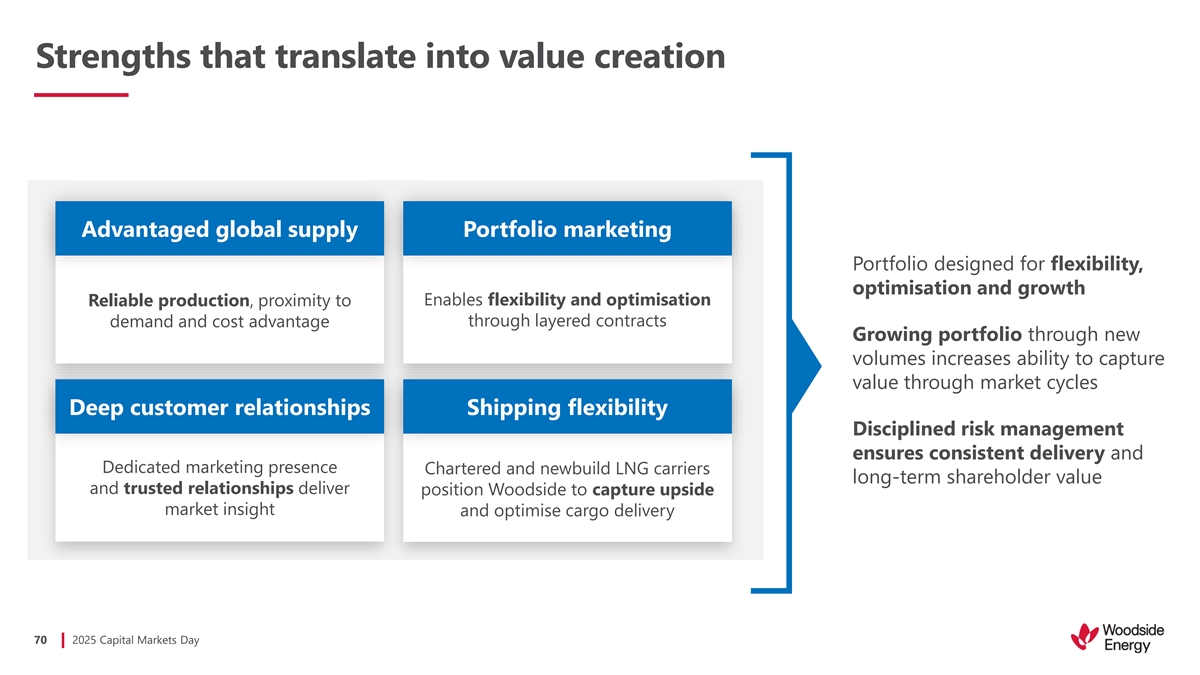
Strengths that translate into value creation Advantaged global supply Portfolio marketing Portfolio designed for flexibility, optimisation and growth Reliable production, proximity to Enables flexibility and optimisation through layered contracts demand and cost advantage Growing portfolio through new volumes increases ability to capture value through market cycles Deep customer relationships Shipping flexibility Disciplined risk management ensures consistent delivery and Dedicated marketing presence Chartered and newbuild LNG carriers long-term shareholder value and trusted relationships deliver position Woodside to capture upside market insight and optimise cargo delivery 70 2025 Capital Markets Day
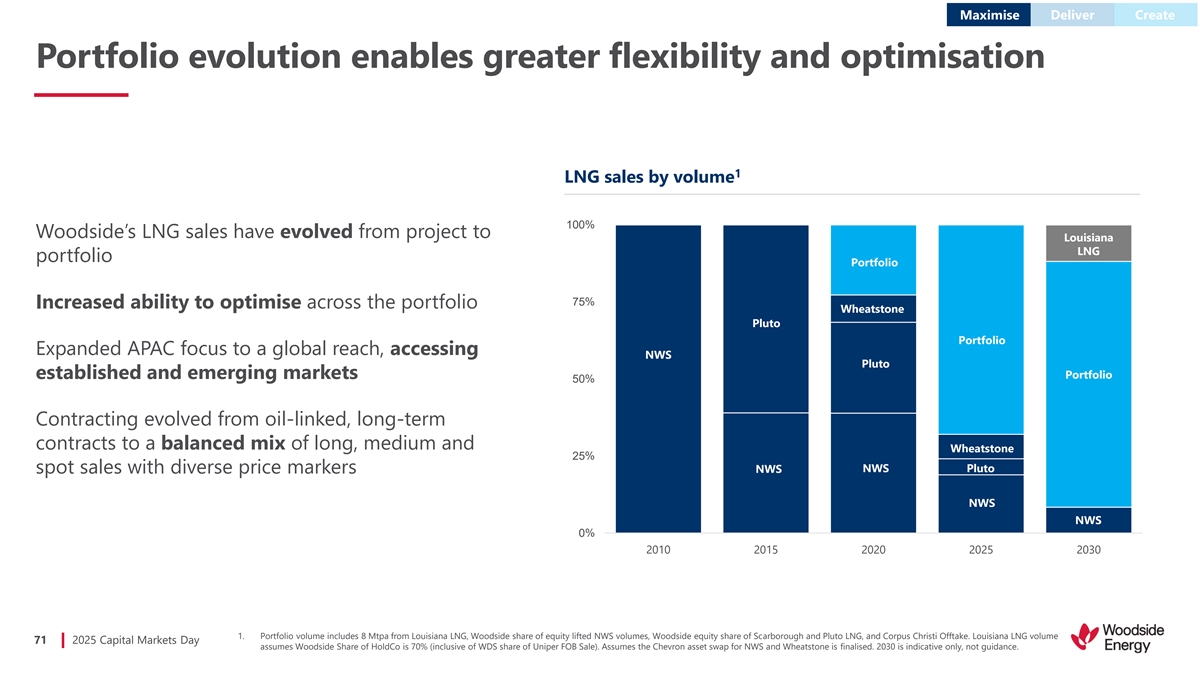
Maximise Deliver Create Portfolio evolution enables greater flexibility and optimisation 1 LNG sales by volume 100% Woodside’s LNG sales have evolved from project to Louisiana LNG portfolio Portfolio 75% Increased ability to optimise across the portfolio Wheatstone Pluto Portfolio Expanded APAC focus to a global reach, accessing NWS Pluto established and emerging markets Portfolio 50% Contracting evolved from oil-linked, long-term contracts to a balanced mix of long, medium and Wheatstone 25% NWS Pluto spot sales with diverse price markers NWS NWS NWS 0% 2010 2015 2020 2025 2030 1. Portfolio volume includes 8 Mtpa from Louisiana LNG, Woodside share of equity lifted NWS volumes, Woodside equity share of Scarborough and Pluto LNG, and Corpus Christi Offtake. Louisiana LNG volume 71 2025 Capital Markets Day assumes Woodside Share of HoldCo is 70% (inclusive of WDS share of Uniper FOB Sale). Assumes the Chevron asset swap for NWS and Wheatstone is finalised. 2030 is indicative only, not guidance.
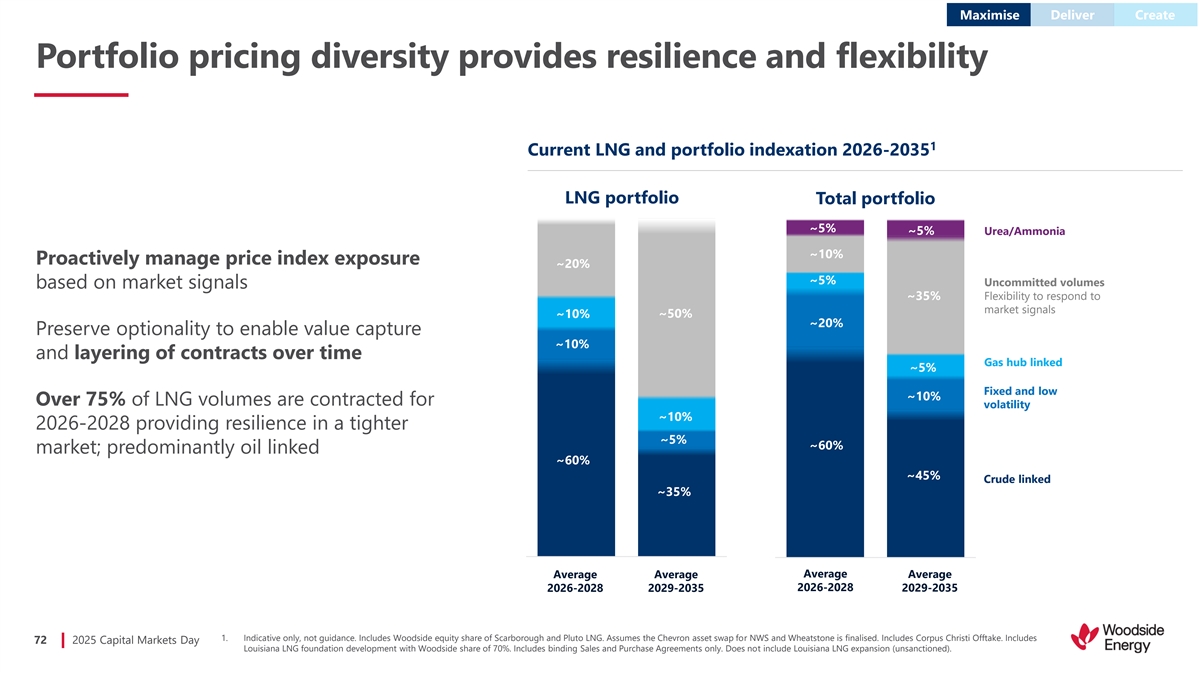
Maximise Deliver Create Portfolio pricing diversity provides resilience and flexibility 1 Current LNG and portfolio indexation 2026-2035 LNG portfolio Total portfolio ~5% ~5% Urea/Ammonia ~10% Proactively manage price index exposure ~20% ~5% Uncommitted volumes based on market signals ~35% Flexibility to respond to market signals ~50% ~10% ~20% Preserve optionality to enable value capture ~10% and layering of contracts over time Gas hub linked ~5% Fixed and low ~10% Over 75% of LNG volumes are contracted for volatility ~10% 2026-2028 providing resilience in a tighter ~5% ~60% market; predominantly oil linked ~60% ~45% Crude linked ~35% LNG Portfolio 2026-LNG Portfolio 2029- Total portfolio 2026 Total portfolio 2029- Average Average Average Average 2028 2035 - 2028 2035 2026-2028 2029-2035 2026-2028 2029-2035 1. Indicative only, not guidance. Includes Woodside equity share of Scarborough and Pluto LNG. Assumes the Chevron asset swap for NWS and Wheatstone is finalised. Includes Corpus Christi Offtake. Includes 72 2025 Capital Markets Day Louisiana LNG foundation development with Woodside share of 70%. Includes binding Sales and Purchase Agreements only. Does not include Louisiana LNG expansion (unsanctioned).
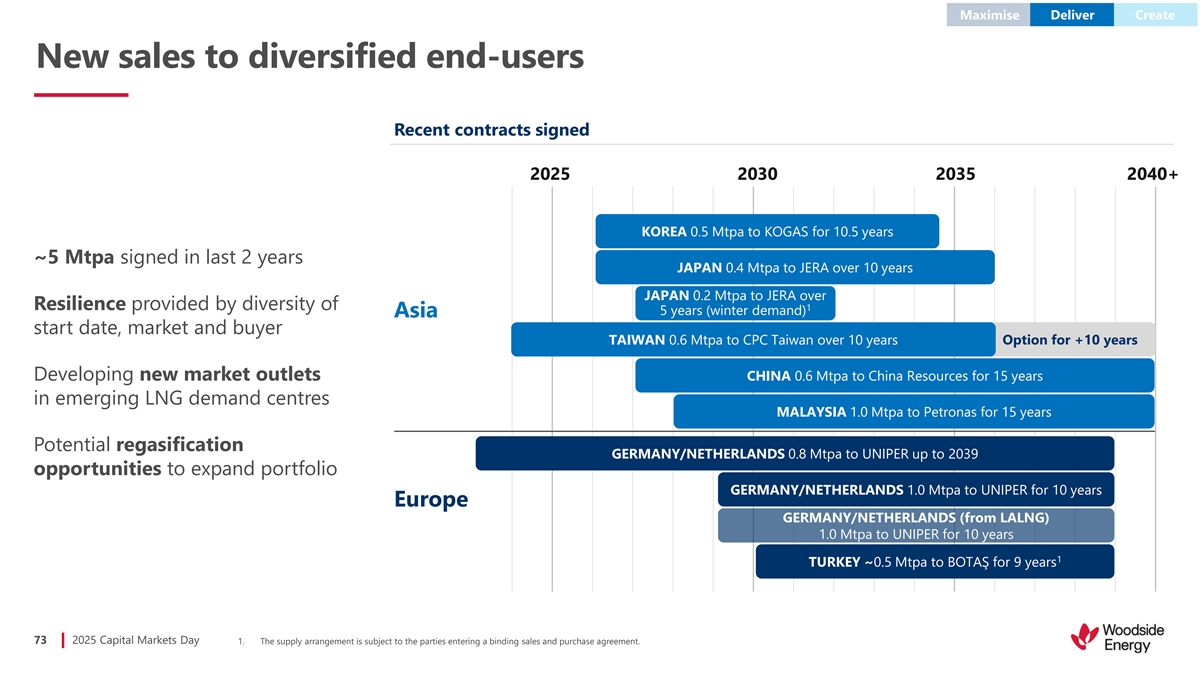
Maximise Deliver Create New sales to diversified end-users Recent contracts signed 2025 2030 2035 2040+ KOREA 0.5 Mtpa to KOGAS for 10.5 years ~5 Mtpa signed in last 2 years JAPAN 0.4 Mtpa to JERA over 10 years JAPAN 0.2 Mtpa to JERA over Resilience provided by diversity of 1 5 years (winter demand) Asia start date, market and buyer TAIWAN 0.6 Mtpa to CPC Taiwan over 10 years Option for +10 years Developing new market outlets CHINA 0.6 Mtpa to China Resources for 15 years in emerging LNG demand centres MALAYSIA 1.0 Mtpa to Petronas for 15 years Potential regasification GERMANY/NETHERLANDS 0.8 Mtpa to UNIPER up to 2039 opportunities to expand portfolio GERMANY/NETHERLANDS 1.0 Mtpa to UNIPER for 10 years Europe GERMANY/NETHERLANDS (from LALNG) 1.0 Mtpa to UNIPER for 10 years 1 TURKEY ~0.5 Mtpa to BOTAŞ for 9 years 73 2025 Capital Markets Day 1. The supply arrangement is subject to the parties entering a binding sales and purchase agreement.

Maximise Deliver Create Shipping capacity provides flexibility to the portfolio Shifting from regional delivery to global trade Eight ships in fleet, an additional three new long-term charters delivering through ~13 days to end 2026 and multiple vessels on short and mid-term charter as required ~23 days Suez Canal Fleet supports reliable, efficient delivery of LNG and diversion optionality ~10 days ~23 days Access to cost-competitive shipping is Panama Canal essential Growing shipping fleet in line with expanding portfolio Cape of Good Hope to Asia ~39 days Supply US Gulf of America to Asia Traditional trade routes Existing demand Potential demand 74 2025 Capital Markets Day
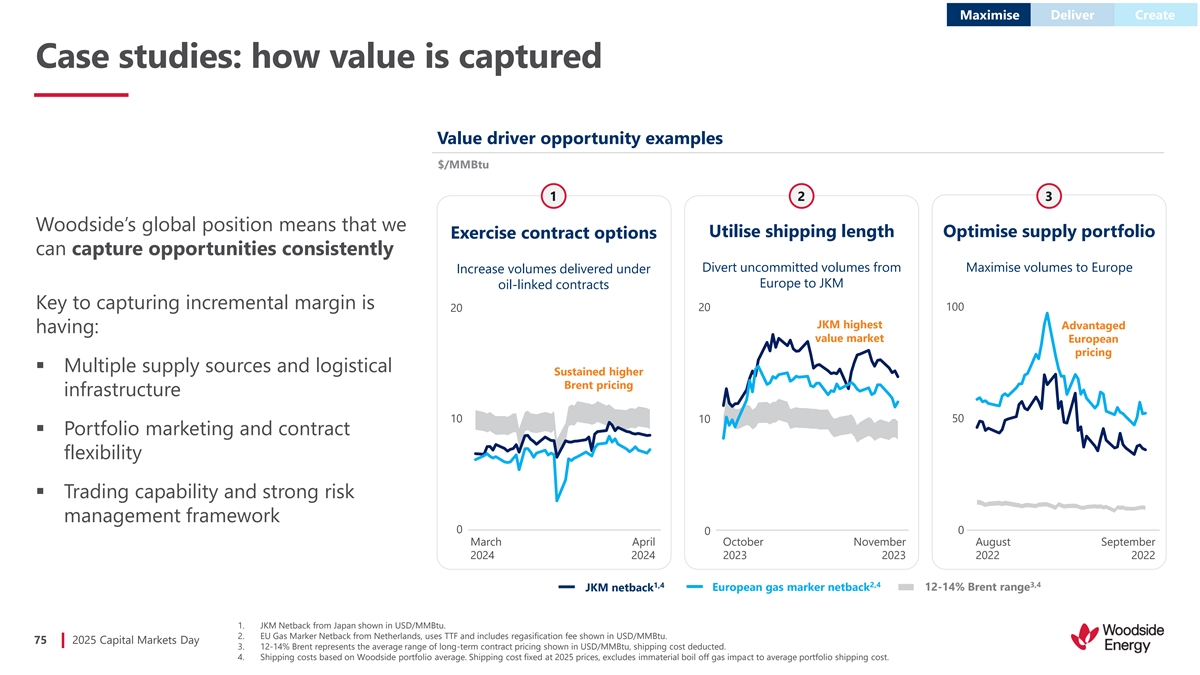
Maximise Deliver Create Case studies: how value is captured Value driver opportunity examples $/MMBtu 1 2 3 Woodside’s global position means that we Utilise shipping length Optimise supply portfolio Exercise contract options can capture opportunities consistently Divert uncommitted volumes from Maximise volumes to Europe Increase volumes delivered under Europe to JKM oil-linked contracts Key to capturing incremental margin is 20 100 20 JKM highest Advantaged having: value market European pricing ▪ Multiple supply sources and logistical Sustained higher Brent pricing infrastructure 10 50 10 ▪ Portfolio marketing and contract flexibility ▪ Trading capability and strong risk management framework 0 0 0 March April October November August September 2024 2024 2023 2023 2022 2022 1,4 2,4 3,4 JKM netback European gas marker netback 12-14% Brent range 1. JKM Netback from Japan shown in USD/MMBtu. 2. EU Gas Marker Netback from Netherlands, uses TTF and includes regasification fee shown in USD/MMBtu. 75 2025 Capital Markets Day 3. 12-14% Brent represents the average range of long-term contract pricing shown in USD/MMBtu, shipping cost deducted. 4. Shipping costs based on Woodside portfolio average. Shipping cost fixed at 2025 prices, excludes immaterial boil off gas impact to average portfolio shipping cost.
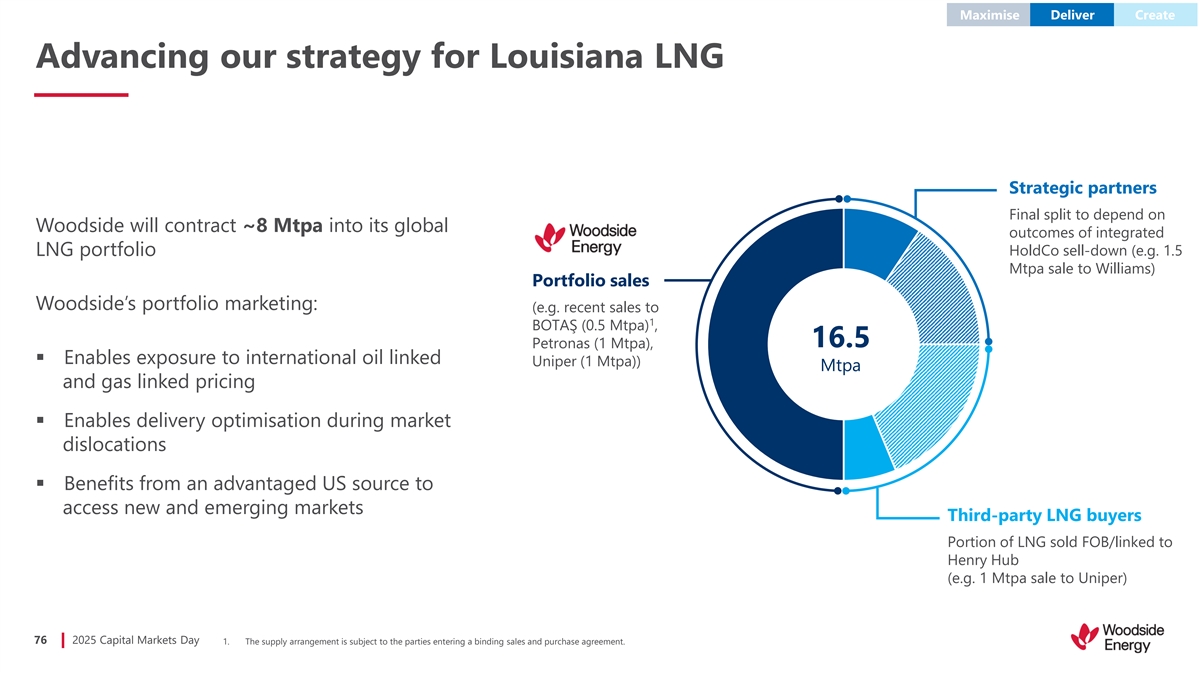
Maximise Deliver Create Advancing our strategy for Louisiana LNG Strategic partners Final split to depend on Woodside will contract ~8 Mtpa into its global outcomes of integrated LNG portfolio HoldCo sell-down (e.g. 1.5 Mtpa sale to Williams) Portfolio sales Woodside’s portfolio marketing: (e.g. recent sales to 1 BOTAŞ (0.5 Mtpa) , 16.5 Petronas (1 Mtpa), ▪ Enables exposure to international oil linked Uniper (1 Mtpa)) Mtpa and gas linked pricing ▪ Enables delivery optimisation during market dislocations ▪ Benefits from an advantaged US source to access new and emerging markets Third-party LNG buyers Portion of LNG sold FOB/linked to Henry Hub (e.g. 1 Mtpa sale to Uniper) 76 2025 Capital Markets Day 1. The supply arrangement is subject to the parties entering a binding sales and purchase agreement.
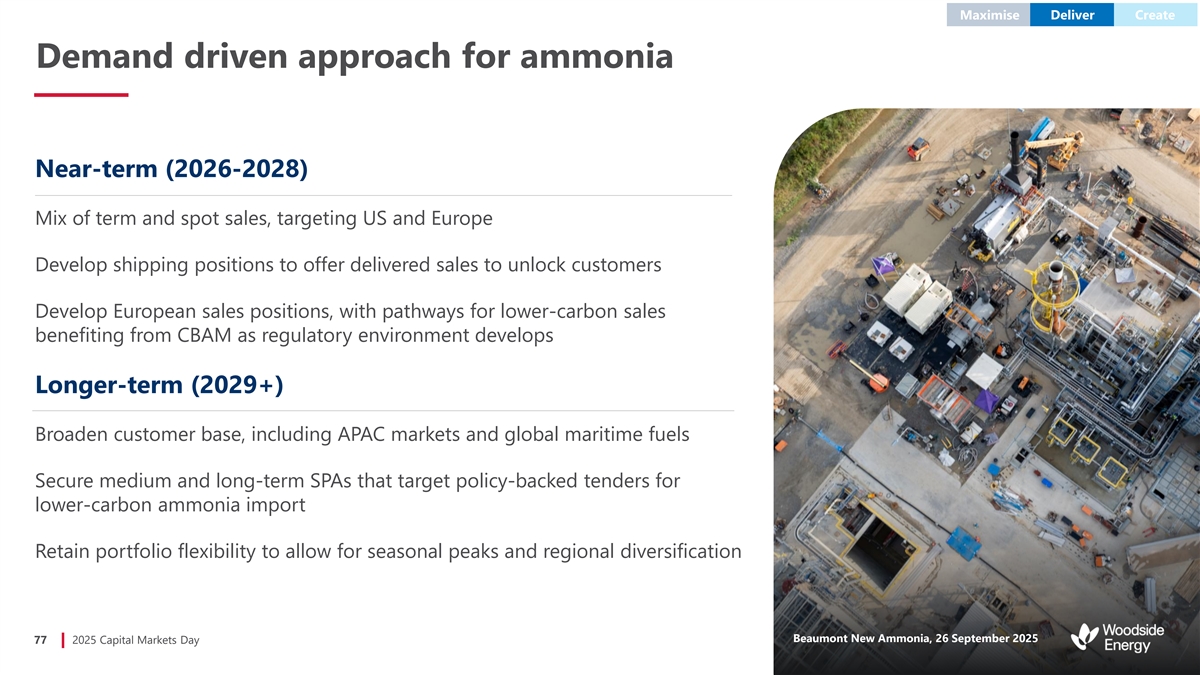
Maximise Deliver Create Demand driven approach for ammonia Near-term (2026-2028) Mix of term and spot sales, targeting US and Europe Develop shipping positions to offer delivered sales to unlock customers Develop European sales positions, with pathways for lower-carbon sales benefiting from CBAM as regulatory environment develops Longer-term (2029+) Broaden customer base, including APAC markets and global maritime fuels Secure medium and long-term SPAs that target policy-backed tenders for lower-carbon ammonia import Retain portfolio flexibility to allow for seasonal peaks and regional diversification Beaumont New Ammonia, 26 September 2025 77 2025 Capital Markets Day

Closing remarks
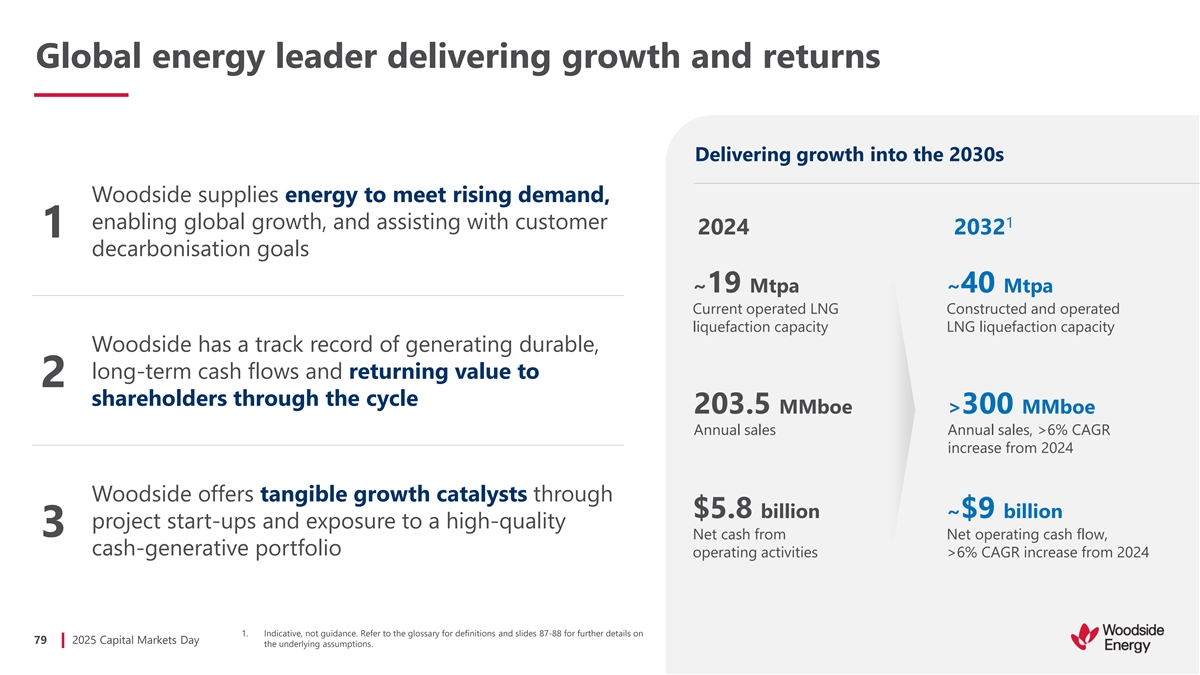
Global energy leader delivering growth and returns Delivering growth into the 2030s Woodside supplies energy to meet rising demand, 1 enabling global growth, and assisting with customer 2024 2032 1 decarbonisation goals ~19 Mtpa ~40 Mtpa Current operated LNG Constructed and operated liquefaction capacity LNG liquefaction capacity Woodside has a track record of generating durable, long-term cash flows and returning value to 2 shareholders through the cycle 203.5 MMboe >300 MMboe Annual sales Annual sales, >6% CAGR increase from 2024 Woodside offers tangible growth catalysts through $5.8 billion ~$9 billion project start-ups and exposure to a high-quality 3 Net cash from Net operating cash flow, cash-generative portfolio operating activities >6% CAGR increase from 2024 1. Indicative, not guidance. Refer to the glossary for definitions and slides 87-88 for further details on 79 2025 Capital Markets Day the underlying assumptions.

Break

Q&A

Annexure
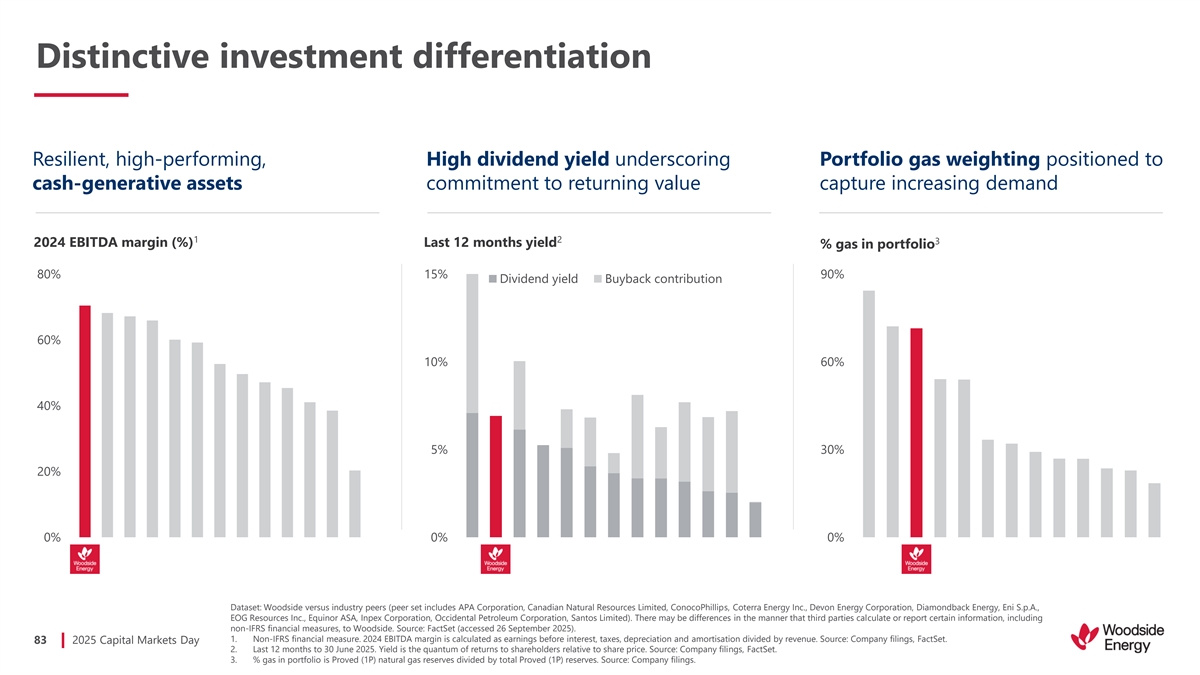
Distinctive investment differentiation Resilient, high-performing, High dividend yield underscoring Portfolio gas weighting positioned to cash-generative assets commitment to returning value capture increasing demand 1 2 3 2024 EBITDA margin (%) Last 12 months yield % gas in portfolio 80% 15% 90% Dividend yield Buyback contribution 60% 10% 60% 40% 5% 30% 20% 0% 0% 0% Dataset: Woodside versus industry peers (peer set includes APA Corporation, Canadian Natural Resources Limited, ConocoPhillips, Coterra Energy Inc., Devon Energy Corporation, Diamondback Energy, Eni S.p.A., EOG Resources Inc., Equinor ASA, Inpex Corporation, Occidental Petroleum Corporation, Santos Limited). There may be differences in the manner that third parties calculate or report certain information, including non-IFRS financial measures, to Woodside. Source: FactSet (accessed 26 September 2025). 1. Non-IFRS financial measure. 2024 EBITDA margin is calculated as earnings before interest, taxes, depreciation and amortisation divided by revenue. Source: Company filings, FactSet. 83 2025 Capital Markets Day 2. Last 12 months to 30 June 2025. Yield is the quantum of returns to shareholders relative to share price. Source: Company filings, FactSet. 3. % gas in portfolio is Proved (1P) natural gas reserves divided by total Proved (1P) reserves. Source: Company filings.
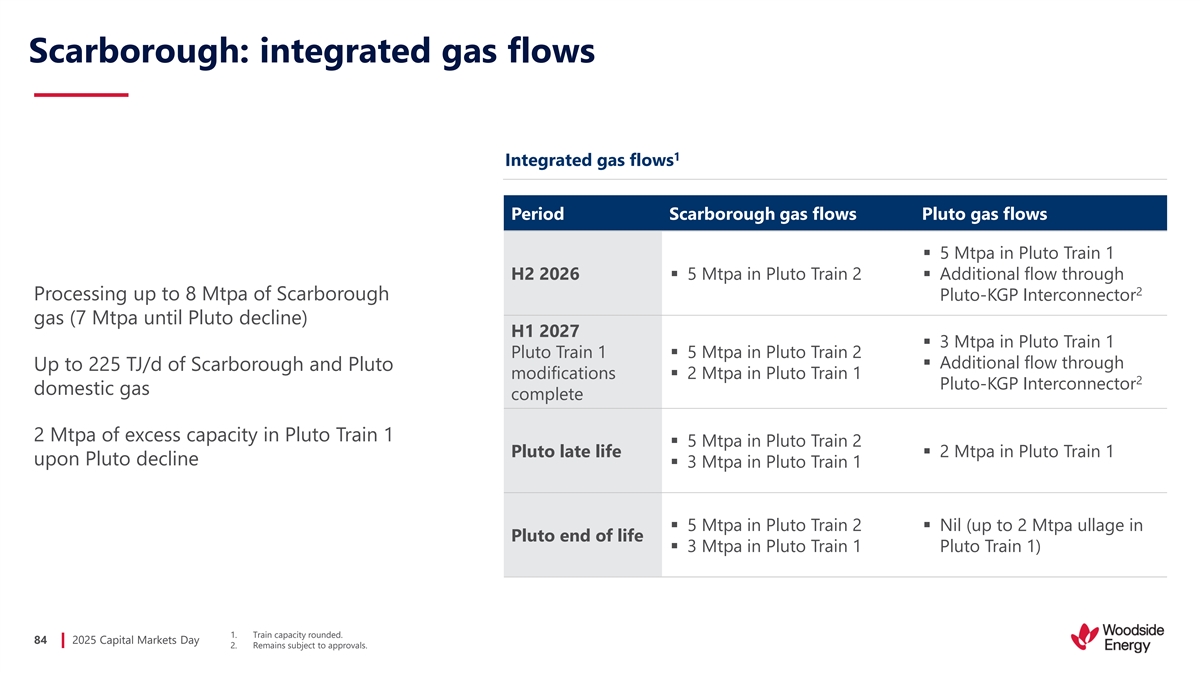
Scarborough: integrated gas flows 1 Integrated gas flows Period Scarborough gas flows Pluto gas flows ▪ 5 Mtpa in Pluto Train 1 H2 2026▪ 5 Mtpa in Pluto Train 2▪ Additional flow through 2 Processing up to 8 Mtpa of Scarborough Pluto-KGP Interconnector gas (7 Mtpa until Pluto decline) H1 2027 ▪ 3 Mtpa in Pluto Train 1 Pluto Train 1 ▪ 5 Mtpa in Pluto Train 2 ▪ Additional flow through Up to 225 TJ/d of Scarborough and Pluto modifications ▪ 2 Mtpa in Pluto Train 1 2 Pluto-KGP Interconnector domestic gas complete 2 Mtpa of excess capacity in Pluto Train 1 ▪ 5 Mtpa in Pluto Train 2 Pluto late life▪ 2 Mtpa in Pluto Train 1 upon Pluto decline ▪ 3 Mtpa in Pluto Train 1 ▪ 5 Mtpa in Pluto Train 2▪ Nil (up to 2 Mtpa ullage in Pluto end of life ▪ 3 Mtpa in Pluto Train 1 Pluto Train 1) 1. Train capacity rounded. 84 2025 Capital Markets Day 2. Remains subject to approvals.
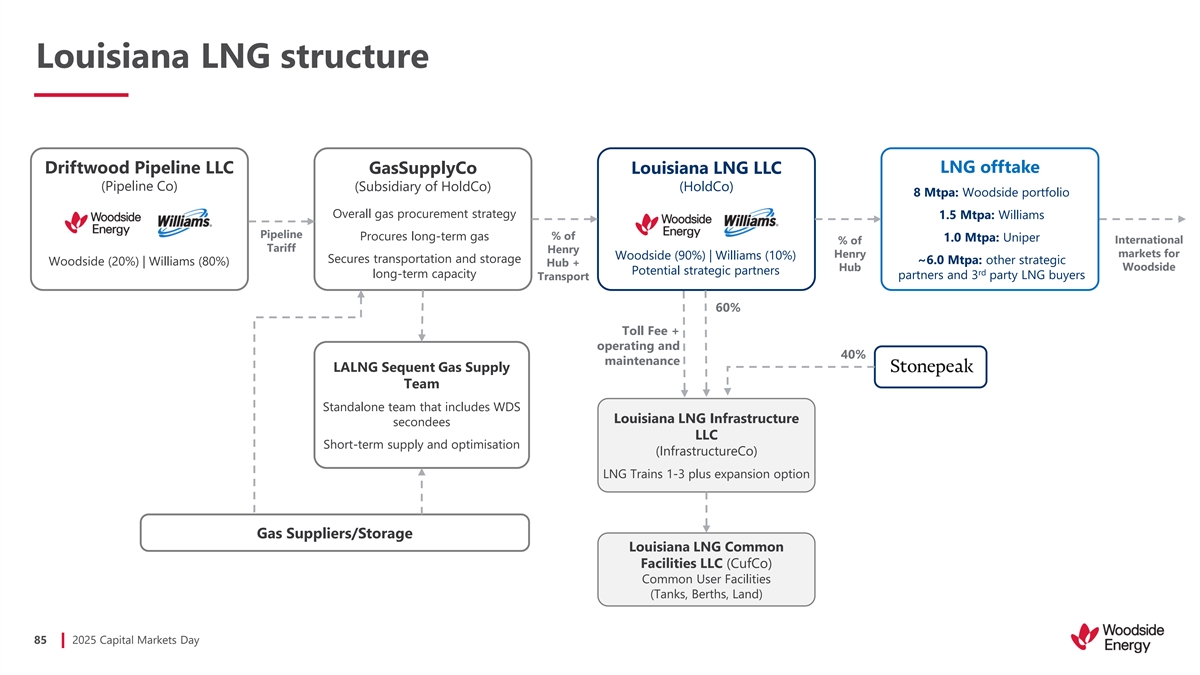
Louisiana LNG structure LNG offtake Driftwood Pipeline LLC GasSupplyCo Louisiana LNG LLC (Pipeline Co) (Subsidiary of HoldCo) (HoldCo) 8 Mtpa: Woodside portfolio Overall gas procurement strategy 1.5 Mtpa: Williams Pipeline Procures long-term gas % of 1.0 Mtpa: Uniper International % of Tariff Henry Henry markets for Woodside (90%) | Williams (10%) Secures transportation and storage ~6.0 Mtpa: other strategic Woodside (20%) | Williams (80%) Hub + Hub Woodside Potential strategic partners rd long-term capacity partners and 3 party LNG buyers Transport 60% Toll Fee + operating and 40% maintenance LALNG Sequent Gas Supply Team Standalone team that includes WDS Louisiana LNG Infrastructure secondees LLC Short-term supply and optimisation (InfrastructureCo) LNG Trains 1-3 plus expansion option Gas Suppliers/Storage Louisiana LNG Common Facilities LLC (CufCo) Common User Facilities (Tanks, Berths, Land) 85 2025 Capital Markets Day
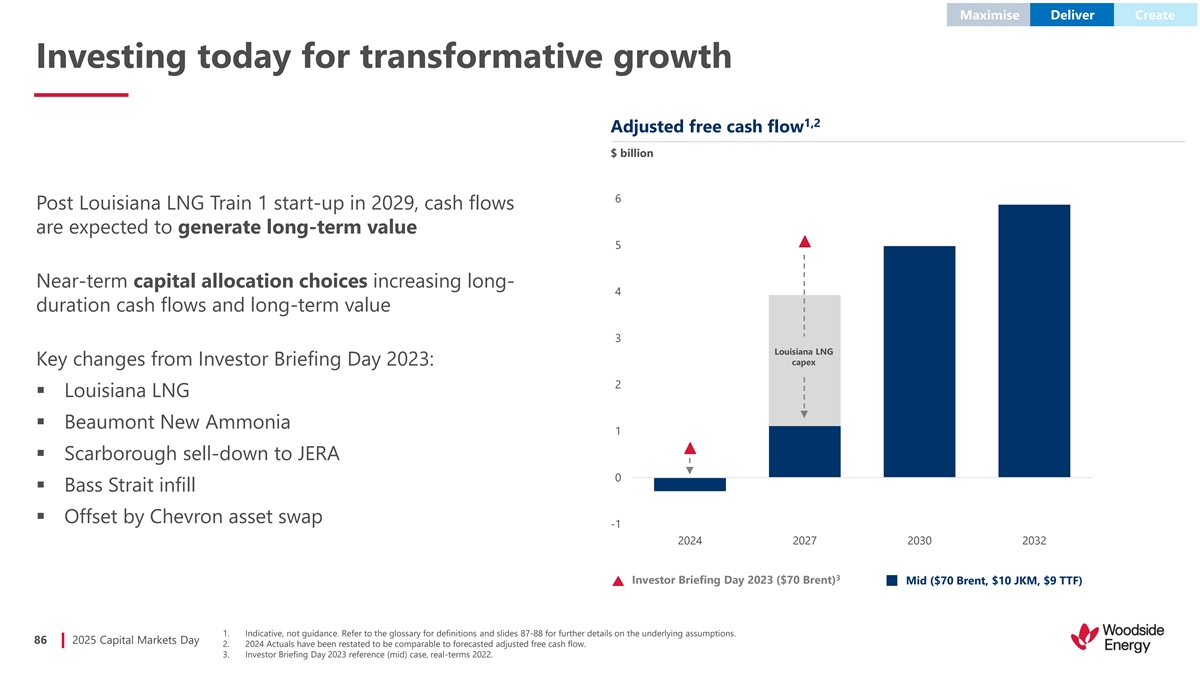
Maximise Deliver Create Investing today for transformative growth 1,2 Adjusted free cash flow $ billion 6 Post Louisiana LNG Train 1 start-up in 2029, cash flows are expected to generate long-term value 5 Near-term capital allocation choices increasing long- 4 duration cash flows and long-term value 3 Louisiana LNG capex Key changes from Investor Briefing Day 2023: 2 ▪ Louisiana LNG ▪ Beaumont New Ammonia 1 ▪ Scarborough sell-down to JERA 0 ▪ Bass Strait infill ▪ Offset by Chevron asset swap -1 2024 2027 2030 2032 3 Investor Briefing Day 2023 ($70 Brent) Mid ($70 Brent, $10 JKM, $9 TTF) 1. Indicative, not guidance. Refer to the glossary for definitions and slides 87-88 for further details on the underlying assumptions. 86 2025 Capital Markets Day 2. 2024 Actuals have been restated to be comparable to forecasted adjusted free cash flow. 3. Investor Briefing Day 2023 reference (mid) case, real-terms 2022.
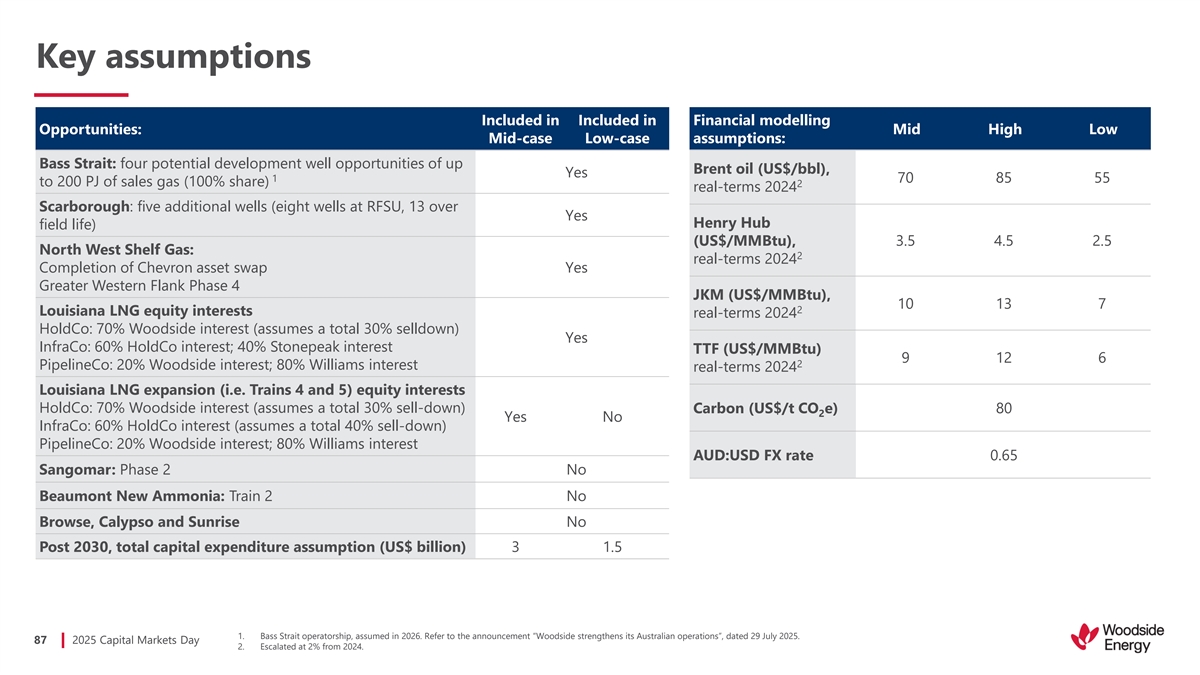
Key assumptions Included in Included in Financial modelling Opportunities: Mid High Low Mid-case Low-case assumptions: Bass Strait: four potential development well opportunities of up Brent oil (US$/bbl), Yes 1 70 85 55 to 200 PJ of sales gas (100% share) 2 real-terms 2024 Scarborough: five additional wells (eight wells at RFSU, 13 over Yes Henry Hub field life) (US$/MMBtu), 3.5 4.5 2.5 North West Shelf Gas: 2 real-terms 2024 Completion of Chevron asset swap Yes Greater Western Flank Phase 4 JKM (US$/MMBtu), 10 13 7 2 Louisiana LNG equity interests real-terms 2024 HoldCo: 70% Woodside interest (assumes a total 30% selldown) Yes InfraCo: 60% HoldCo interest; 40% Stonepeak interest TTF (US$/MMBtu) 9 12 6 2 PipelineCo: 20% Woodside interest; 80% Williams interest real-terms 2024 Louisiana LNG expansion (i.e. Trains 4 and 5) equity interests HoldCo: 70% Woodside interest (assumes a total 30% sell-down) Carbon (US$/t CO e) 80 2 Yes No InfraCo: 60% HoldCo interest (assumes a total 40% sell-down) PipelineCo: 20% Woodside interest; 80% Williams interest AUD:USD FX rate 0.65 Sangomar: Phase 2 No Beaumont New Ammonia: Train 2 No Browse, Calypso and Sunrise No Post 2030, total capital expenditure assumption (US$ billion) 3 1.5 1. Bass Strait operatorship, assumed in 2026. Refer to the announcement “Woodside strengthens its Australian operations”, dated 29 July 2025. 87 2025 Capital Markets Day 2. Escalated at 2% from 2024.
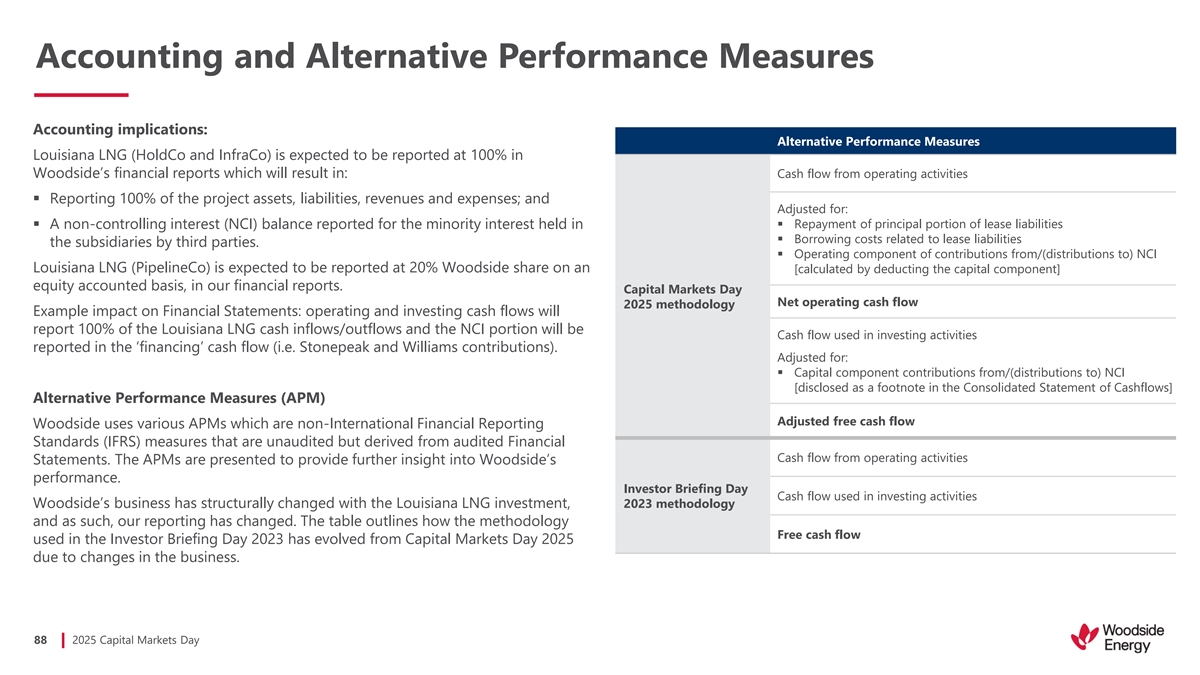
Accounting and Alternative Performance Measures Accounting implications: Alternative Performance Measures Louisiana LNG (HoldCo and InfraCo) is expected to be reported at 100% in Woodside’s financial reports which will result in: Cash flow from operating activities ▪ Reporting 100% of the project assets, liabilities, revenues and expenses; and Adjusted for: ▪ A non-controlling interest (NCI) balance reported for the minority interest held in ▪ Repayment of principal portion of lease liabilities ▪ Borrowing costs related to lease liabilities the subsidiaries by third parties. ▪ Operating component of contributions from/(distributions to) NCI Louisiana LNG (PipelineCo) is expected to be reported at 20% Woodside share on an [calculated by deducting the capital component] equity accounted basis, in our financial reports. Capital Markets Day Net operating cash flow 2025 methodology Example impact on Financial Statements: operating and investing cash flows will report 100% of the Louisiana LNG cash inflows/outflows and the NCI portion will be Cash flow used in investing activities reported in the ‘financing’ cash flow (i.e. Stonepeak and Williams contributions). Adjusted for: ▪ Capital component contributions from/(distributions to) NCI [disclosed as a footnote in the Consolidated Statement of Cashflows] Alternative Performance Measures (APM) Adjusted free cash flow Woodside uses various APMs which are non-International Financial Reporting Standards (IFRS) measures that are unaudited but derived from audited Financial Cash flow from operating activities Statements. The APMs are presented to provide further insight into Woodside’s performance. Investor Briefing Day Cash flow used in investing activities 2023 methodology Woodside’s business has structurally changed with the Louisiana LNG investment, and as such, our reporting has changed. The table outlines how the methodology Free cash flow used in the Investor Briefing Day 2023 has evolved from Capital Markets Day 2025 due to changes in the business. 88 2025 Capital Markets Day
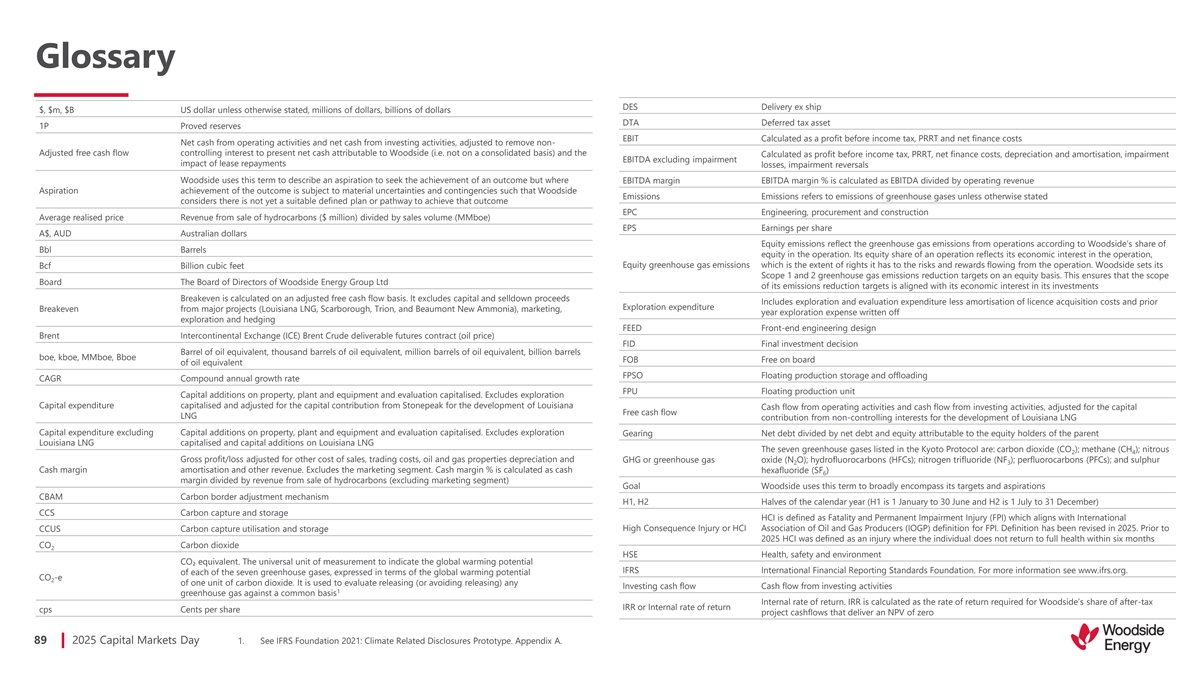
Glossary DES Delivery ex ship $, $m, $B US dollar unless otherwise stated, millions of dollars, billions of dollars DTA Deferred tax asset 1P Proved reserves EBIT Calculated as a profit before income tax, PRRT and net finance costs Net cash from operating activities and net cash from investing activities, adjusted to remove non- Adjusted free cash flow controlling interest to present net cash attributable to Woodside (i.e. not on a consolidated basis) and the Calculated as profit before income tax, PRRT, net finance costs, depreciation and amortisation, impairment EBITDA excluding impairment impact of lease repayments losses, impairment reversals Woodside uses this term to describe an aspiration to seek the achievement of an outcome but where EBITDA margin EBITDA margin % is calculated as EBITDA divided by operating revenue Aspiration achievement of the outcome is subject to material uncertainties and contingencies such that Woodside Emissions Emissions refers to emissions of greenhouse gases unless otherwise stated considers there is not yet a suitable defined plan or pathway to achieve that outcome EPC Engineering, procurement and construction Average realised price Revenue from sale of hydrocarbons ($ million) divided by sales volume (MMboe) EPS Earnings per share A$, AUD Australian dollars Equity emissions reflect the greenhouse gas emissions from operations according to Woodside’s share of Bbl Barrels equity in the operation. Its equity share of an operation reflects its economic interest in the operation, Equity greenhouse gas emissions which is the extent of rights it has to the risks and rewards flowing from the operation. Woodside sets its Bcf Billion cubic feet Scope 1 and 2 greenhouse gas emissions reduction targets on an equity basis. This ensures that the scope Board The Board of Directors of Woodside Energy Group Ltd of its emissions reduction targets is aligned with its economic interest in its investments Breakeven is calculated on an adjusted free cash flow basis. It excludes capital and selldown proceeds Includes exploration and evaluation expenditure less amortisation of licence acquisition costs and prior Exploration expenditure Breakeven from major projects (Louisiana LNG, Scarborough, Trion, and Beaumont New Ammonia), marketing, year exploration expense written off exploration and hedging FEED Front-end engineering design Brent Intercontinental Exchange (ICE) Brent Crude deliverable futures contract (oil price) FID Final investment decision Barrel of oil equivalent, thousand barrels of oil equivalent, million barrels of oil equivalent, billion barrels boe, kboe, MMboe, Bboe FOB Free on board of oil equivalent FPSO Floating production storage and offloading CAGR Compound annual growth rate FPU Floating production unit Capital additions on property, plant and equipment and evaluation capitalised. Excludes exploration Capital expenditure capitalised and adjusted for the capital contribution from Stonepeak for the development of Louisiana Cash flow from operating activities and cash flow from investing activities, adjusted for the capital Free cash flow LNG contribution from non-controlling interests for the development of Louisiana LNG Capital expenditure excluding Capital additions on property, plant and equipment and evaluation capitalised. Excludes exploration Gearing Net debt divided by net debt and equity attributable to the equity holders of the parent Louisiana LNG capitalised and capital additions on Louisiana LNG The seven greenhouse gases listed in the Kyoto Protocol are: carbon dioxide (CO ); methane (CH ); nitrous 2 4 Gross profit/loss adjusted for other cost of sales, trading costs, oil and gas properties depreciation and GHG or greenhouse gas oxide (N O); hydrofluorocarbons (HFCs); nitrogen trifluoride (NF ); perfluorocarbons (PFCs); and sulphur 2 3 Cash margin amortisation and other revenue. Excludes the marketing segment. Cash margin % is calculated as cash hexafluoride (SF ) 6 margin divided by revenue from sale of hydrocarbons (excluding marketing segment) Goal Woodside uses this term to broadly encompass its targets and aspirations CBAM Carbon border adjustment mechanism H1, H2 Halves of the calendar year (H1 is 1 January to 30 June and H2 is 1 July to 31 December) CCS Carbon capture and storage HCI is defined as Fatality and Permanent Impairment Injury (FPI) which aligns with International High Consequence Injury or HCI Association of Oil and Gas Producers (IOGP) definition for FPI. Definition has been revised in 2025. Prior to CCUS Carbon capture utilisation and storage 2025 HCI was defined as an injury where the individual does not return to full health within six months CO Carbon dioxide 2 HSE Health, safety and environment CO₂ equivalent. The universal unit of measurement to indicate the global warming potential IFRS International Financial Reporting Standards Foundation. For more information see www.ifrs.org. of each of the seven greenhouse gases, expressed in terms of the global warming potential CO -e 2 of one unit of carbon dioxide. It is used to evaluate releasing (or avoiding releasing) any Investing cash flow Cash flow from investing activities 1 greenhouse gas against a common basis Internal rate of return. IRR is calculated as the rate of return required for Woodside’s share of after-tax IRR or Internal rate of return cps Cents per share project cashflows that deliver an NPV of zero 89 2025 Capital Markets Day 1. See IFRS Foundation 2021: Climate Related Disclosures Prototype. Appendix A.
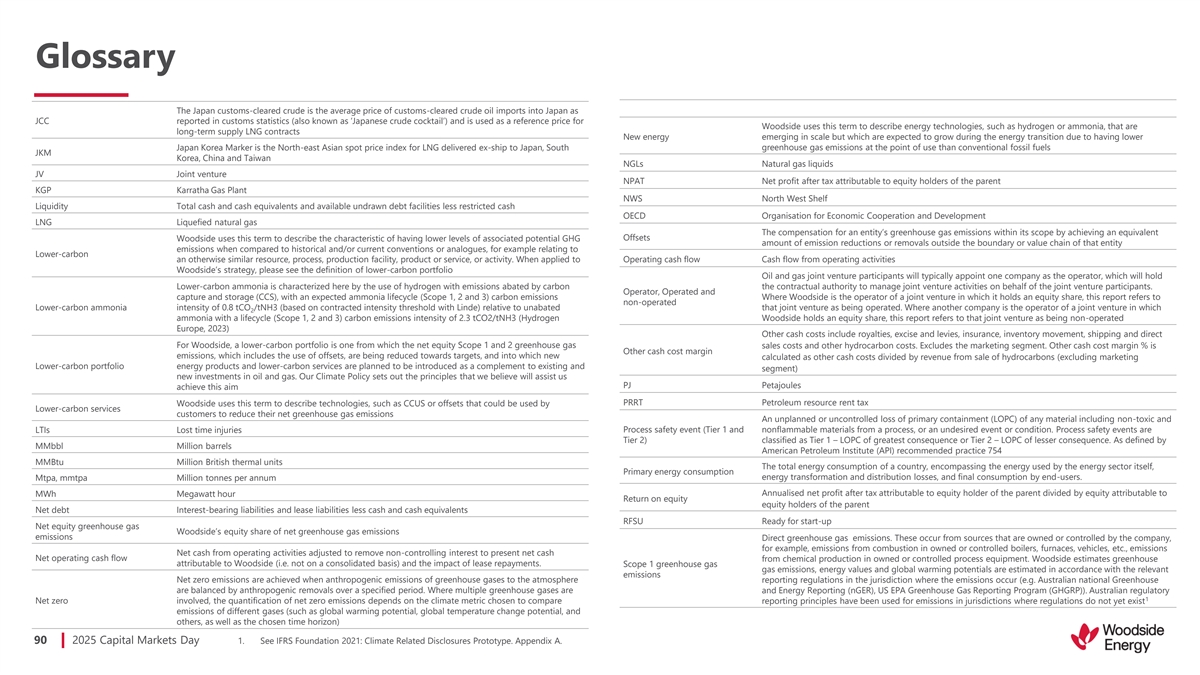
Glossary The Japan customs-cleared crude is the average price of customs-cleared crude oil imports into Japan as JCC reported in customs statistics (also known as ‘Japanese crude cocktail’) and is used as a reference price for Woodside uses this term to describe energy technologies, such as hydrogen or ammonia, that are long-term supply LNG contracts New energy emerging in scale but which are expected to grow during the energy transition due to having lower greenhouse gas emissions at the point of use than conventional fossil fuels Japan Korea Marker is the North-east Asian spot price index for LNG delivered ex-ship to Japan, South JKM Korea, China and Taiwan NGLs Natural gas liquids JV Joint venture NPAT Net profit after tax attributable to equity holders of the parent KGP Karratha Gas Plant NWS North West Shelf Liquidity Total cash and cash equivalents and available undrawn debt facilities less restricted cash OECD Organisation for Economic Cooperation and Development LNG Liquefied natural gas The compensation for an entity’s greenhouse gas emissions within its scope by achieving an equivalent Woodside uses this term to describe the characteristic of having lower levels of associated potential GHG Offsets amount of emission reductions or removals outside the boundary or value chain of that entity emissions when compared to historical and/or current conventions or analogues, for example relating to Lower-carbon an otherwise similar resource, process, production facility, product or service, or activity. When applied to Operating cash flow Cash flow from operating activities Woodside’s strategy, please see the definition of lower-carbon portfolio Oil and gas joint venture participants will typically appoint one company as the operator, which will hold Lower-carbon ammonia is characterized here by the use of hydrogen with emissions abated by carbon the contractual authority to manage joint venture activities on behalf of the joint venture participants. Operator, Operated and capture and storage (CCS), with an expected ammonia lifecycle (Scope 1, 2 and 3) carbon emissions Where Woodside is the operator of a joint venture in which it holds an equity share, this report refers to non-operated Lower-carbon ammonia intensity of 0.8 tCO /tNH3 (based on contracted intensity threshold with Linde) relative to unabated that joint venture as being operated. Where another company is the operator of a joint venture in which 2 ammonia with a lifecycle (Scope 1, 2 and 3) carbon emissions intensity of 2.3 tCO2/tNH3 (Hydrogen Woodside holds an equity share, this report refers to that joint venture as being non-operated Europe, 2023) Other cash costs include royalties, excise and levies, insurance, inventory movement, shipping and direct For Woodside, a lower-carbon portfolio is one from which the net equity Scope 1 and 2 greenhouse gas sales costs and other hydrocarbon costs. Excludes the marketing segment. Other cash cost margin % is Other cash cost margin emissions, which includes the use of offsets, are being reduced towards targets, and into which new calculated as other cash costs divided by revenue from sale of hydrocarbons (excluding marketing Lower-carbon portfolio energy products and lower-carbon services are planned to be introduced as a complement to existing and segment) new investments in oil and gas. Our Climate Policy sets out the principles that we believe will assist us PJ Petajoules achieve this aim PRRT Petroleum resource rent tax Woodside uses this term to describe technologies, such as CCUS or offsets that could be used by Lower-carbon services customers to reduce their net greenhouse gas emissions An unplanned or uncontrolled loss of primary containment (LOPC) of any material including non-toxic and LTIs Lost time injuries Process safety event (Tier 1 and nonflammable materials from a process, or an undesired event or condition. Process safety events are Tier 2) classified as Tier 1 – LOPC of greatest consequence or Tier 2 – LOPC of lesser consequence. As defined by MMbbl Million barrels American Petroleum Institute (API) recommended practice 754 MMBtu Million British thermal units The total energy consumption of a country, encompassing the energy used by the energy sector itself, Primary energy consumption energy transformation and distribution losses, and final consumption by end-users. Mtpa, mmtpa Million tonnes per annum Annualised net profit after tax attributable to equity holder of the parent divided by equity attributable to MWh Megawatt hour Return on equity equity holders of the parent Net debt Interest-bearing liabilities and lease liabilities less cash and cash equivalents RFSU Ready for start-up Net equity greenhouse gas Woodside’s equity share of net greenhouse gas emissions emissions Direct greenhouse gas emissions. These occur from sources that are owned or controlled by the company, for example, emissions from combustion in owned or controlled boilers, furnaces, vehicles, etc., emissions Net cash from operating activities adjusted to remove non-controlling interest to present net cash Net operating cash flow from chemical production in owned or controlled process equipment. Woodside estimates greenhouse attributable to Woodside (i.e. not on a consolidated basis) and the impact of lease repayments. Scope 1 greenhouse gas gas emissions, energy values and global warming potentials are estimated in accordance with the relevant emissions Net zero emissions are achieved when anthropogenic emissions of greenhouse gases to the atmosphere reporting regulations in the jurisdiction where the emissions occur (e.g. Australian national Greenhouse are balanced by anthropogenic removals over a specified period. Where multiple greenhouse gases are and Energy Reporting (nGER), US EPA Greenhouse Gas Reporting Program (GHGRP)). Australian regulatory 1 Net zero involved, the quantification of net zero emissions depends on the climate metric chosen to compare reporting principles have been used for emissions in jurisdictions where regulations do not yet exist emissions of different gases (such as global warming potential, global temperature change potential, and others, as well as the chosen time horizon) 90 2025 Capital Markets Day 1. See IFRS Foundation 2021: Climate Related Disclosures Prototype. Appendix A.
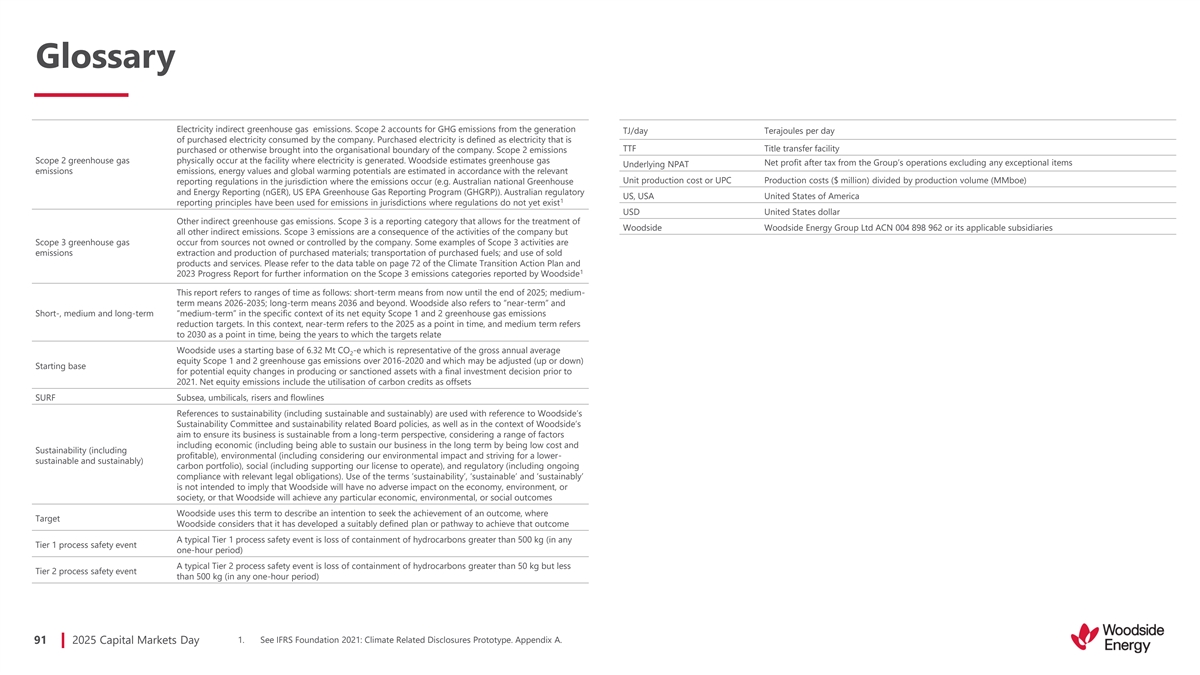
Glossary Electricity indirect greenhouse gas emissions. Scope 2 accounts for GHG emissions from the generation TJ/day Terajoules per day of purchased electricity consumed by the company. Purchased electricity is defined as electricity that is TTF Title transfer facility purchased or otherwise brought into the organisational boundary of the company. Scope 2 emissions Scope 2 greenhouse gas physically occur at the facility where electricity is generated. Woodside estimates greenhouse gas Net profit after tax from the Group’s operations excluding any exceptional items Underlying NPAT emissions emissions, energy values and global warming potentials are estimated in accordance with the relevant Unit production cost or UPC Production costs ($ million) divided by production volume (MMboe) reporting regulations in the jurisdiction where the emissions occur (e.g. Australian national Greenhouse and Energy Reporting (nGER), US EPA Greenhouse Gas Reporting Program (GHGRP)). Australian regulatory US, USA United States of America 1 reporting principles have been used for emissions in jurisdictions where regulations do not yet exist USD United States dollar Other indirect greenhouse gas emissions. Scope 3 is a reporting category that allows for the treatment of Woodside Woodside Energy Group Ltd ACN 004 898 962 or its applicable subsidiaries all other indirect emissions. Scope 3 emissions are a consequence of the activities of the company but Scope 3 greenhouse gas occur from sources not owned or controlled by the company. Some examples of Scope 3 activities are emissions extraction and production of purchased materials; transportation of purchased fuels; and use of sold products and services. Please refer to the data table on page 72 of the Climate Transition Action Plan and 1 2023 Progress Report for further information on the Scope 3 emissions categories reported by Woodside This report refers to ranges of time as follows: short-term means from now until the end of 2025; medium- term means 2026-2035; long-term means 2036 and beyond. Woodside also refers to “near-term” and Short-, medium and long-term “medium-term” in the specific context of its net equity Scope 1 and 2 greenhouse gas emissions reduction targets. In this context, near-term refers to the 2025 as a point in time, and medium term refers to 2030 as a point in time, being the years to which the targets relate Woodside uses a starting base of 6.32 Mt CO -e which is representative of the gross annual average 2 equity Scope 1 and 2 greenhouse gas emissions over 2016-2020 and which may be adjusted (up or down) Starting base for potential equity changes in producing or sanctioned assets with a final investment decision prior to 2021. Net equity emissions include the utilisation of carbon credits as offsets SURF Subsea, umbilicals, risers and flowlines References to sustainability (including sustainable and sustainably) are used with reference to Woodside’s Sustainability Committee and sustainability related Board policies, as well as in the context of Woodside’s aim to ensure its business is sustainable from a long-term perspective, considering a range of factors including economic (including being able to sustain our business in the long term by being low cost and Sustainability (including profitable), environmental (including considering our environmental impact and striving for a lower- sustainable and sustainably) carbon portfolio), social (including supporting our license to operate), and regulatory (including ongoing compliance with relevant legal obligations). Use of the terms ‘sustainability’, ‘sustainable’ and ‘sustainably’ is not intended to imply that Woodside will have no adverse impact on the economy, environment, or society, or that Woodside will achieve any particular economic, environmental, or social outcomes Woodside uses this term to describe an intention to seek the achievement of an outcome, where Target Woodside considers that it has developed a suitably defined plan or pathway to achieve that outcome A typical Tier 1 process safety event is loss of containment of hydrocarbons greater than 500 kg (in any Tier 1 process safety event one-hour period) A typical Tier 2 process safety event is loss of containment of hydrocarbons greater than 50 kg but less Tier 2 process safety event than 500 kg (in any one-hour period) 91 2025 Capital Markets Day 1. See IFRS Foundation 2021: Climate Related Disclosures Prototype. Appendix A.

Head Office: Woodside Energy Mia Yellagonga 11 Mount Street Perth WA 6000 Australia Postal Address: GPO Box D188 Perth WA 6840 Australia T: +61 8 9348 4000 F: +61 8 9214 2777 E: companyinfo@woodside.com Woodside Energy Group Ltd ABN 55 004 898 962 woodside.com 92 2025 Capital Markets Day