FORM 6-K
U.S. SECURITIES AND EXCHANGE COMMISSION
Washington, D.C. 20549
Report of Foreign Private Issuer
Pursuant to Rule 13a-16 or 15d-16 of
the Securities Exchange Act of 1934
Commission File Number: 1-15270
For the month of October 2025
NOMURA HOLDINGS, INC.
(Translation of registrant’s name into English)
13-1, Nihonbashi 1-chome
Chuo-ku, Tokyo 103-8645
Japan
(Address of principal executive offices)
Indicate by check mark whether the registrant files or will file annual reports under cover Form 20-F or Form 40-F.
Form 20-F X Form 40-F
Indicate by check mark if the registrant is submitting the Form 6-K in paper as permitted by Regulation S-T Rule 101(b)(1):
Indicate by check mark if the registrant is submitting the Form 6-K in paper as permitted by Regulation S-T Rule 101(b)(7): Information furnished on this form:
EXHIBIT
Exhibit Number
| 1. Consolidated Results of Operations (US GAAP), Second quarter, year ending March 2026 |
SIGNATURES
Pursuant to the requirements of the Securities Exchange Act of 1934, the registrant has duly caused this report to be signed on its behalf by the undersigned, thereunto duly authorized.
| NOMURA HOLDINGS, INC. | ||||
| Date: October 31, 2025 |
By: | /s/ Yoshifumi Kishida |
||
| Yoshifumi Kishida | ||||
| Senior Managing Director | ||||
2-3) Trend in stable revenue (p. 4) Overview of results (p. 5) Business segment results (p. 6) Wealth Management (p. 7-9) Investment Management (p. 10-11) Wholesale (p. 12-14) Banking (p. 15) Non-interest expenses (p. 16) Robust financial position (p. 17) Consolidated balance sheet (p. 18) Value at risk (p. 19) Consolidated financial highlights (p. 20) Consolidated income (p. 21) Main revenue items (p. 22) Consolidated results: Income (loss) before income taxes by segment and region (p. 23) Segment “Other” (p. 24) Wealth Management related data (p. 25-28) Investment Management related data (p. 29-30) Wholesale related data (p. 31) Number of employees (p.
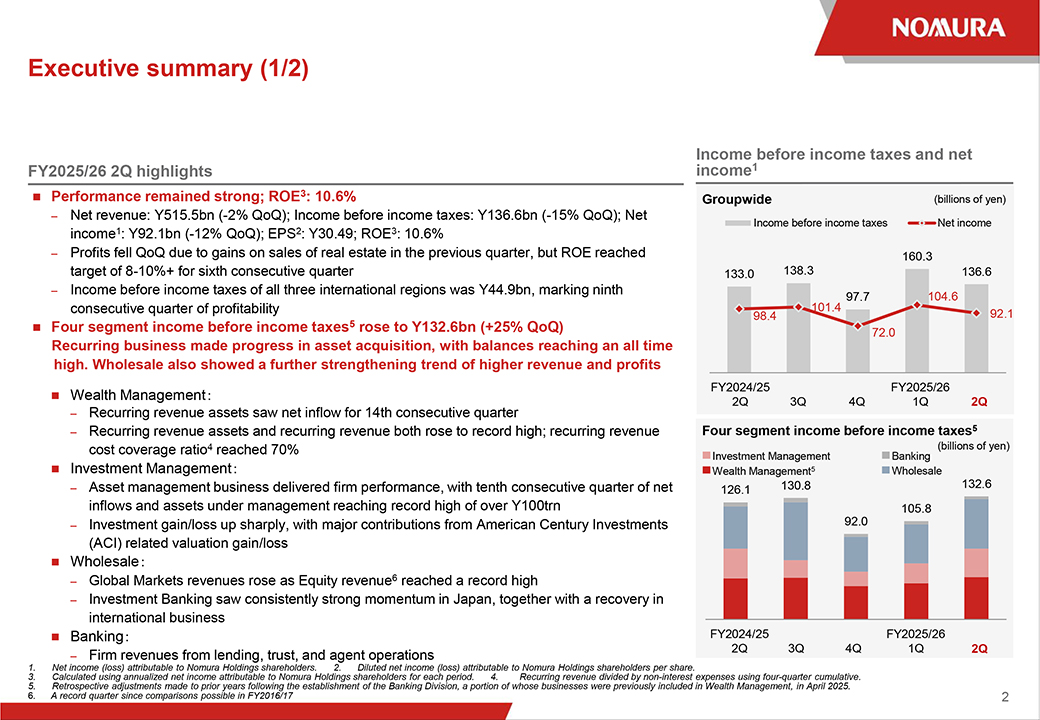
32) 1 Executive summary (1/2) FY2025/26 2Q highlights Performance remained strong; ROE3: 10.6% – Net revenue: Y515.5bn (-2% QoQ); Income before income taxes: Y136.6bn (-15% QoQ); Net income1: Y92.1bn (-12% QoQ); EPS2: Y30.49; ROE3: 10.6% – Profits fell QoQ due to gains on sales of real estate in the previous quarter, but ROE reached target of 8-10%+ for sixth consecutive quarter – Income before income taxes of all three international regions was Y44.9bn, marking ninth consecutive quarter of profitability Four segment income before income taxes5 rose to Y132.6bn (+25% QoQ) Recurring business made progress in asset acquisition, with balances reaching an all time high. Wholesale also showed a further strengthening trend of higher revenue and profits Wealth Management – Recurring revenue assets saw net inflow for 14th consecutive quarter – Recurring revenue assets and recurring revenue both rose to record high; recurring revenue cost coverage ratio4 reached 70% Investment Management – Asset management business delivered firm performance, with tenth consecutive quarter of net inflows and assets under management reaching record high of over Y100trn – Investment gain/loss up sharply, with major contributions from American Century Investments (ACI) related valuation gain/loss Wholesale – Global Markets revenues rose as Equity revenue6 reached a record high – Investment Banking saw consistently strong momentum in Japan, together with a recovery in international business Banking – Firm revenues from lending, trust, and agent operations Income before income taxes and net income1 Groupwide (billions of yen) Income before income taxes Net income 160.3 133.0 138.3 136.6 101.4 97.7 104.6 98.4 92.1 72.0 FY2024/25 FY2025/26 2Q 3Q 4Q 1Q 2Q Four segment income before income taxes5 (billions of yen) Investment Management Banking Wealth Management5 Wholesale 130.8 132.6 126.1 105.8 92.0 FY2024/25 FY2025/26 2Q 3Q 4Q 1Q 2Q 1. Net income (loss) attributable to Nomura Holdings shareholders. 2. Diluted net income (loss) attributable to Nomura Holdings shareholders per share. 3. Calculated using annualized net income attributable to Nomura Holdings shareholders for each period. 4. Recurring revenue divided by non-interest expenses using four-quarter cumulative. 5. Retrospective adjustments made to prior years following the establishment of the Banking Division, a portion of whose businesses were previously included in Wealth Management, in April 2025. 6.
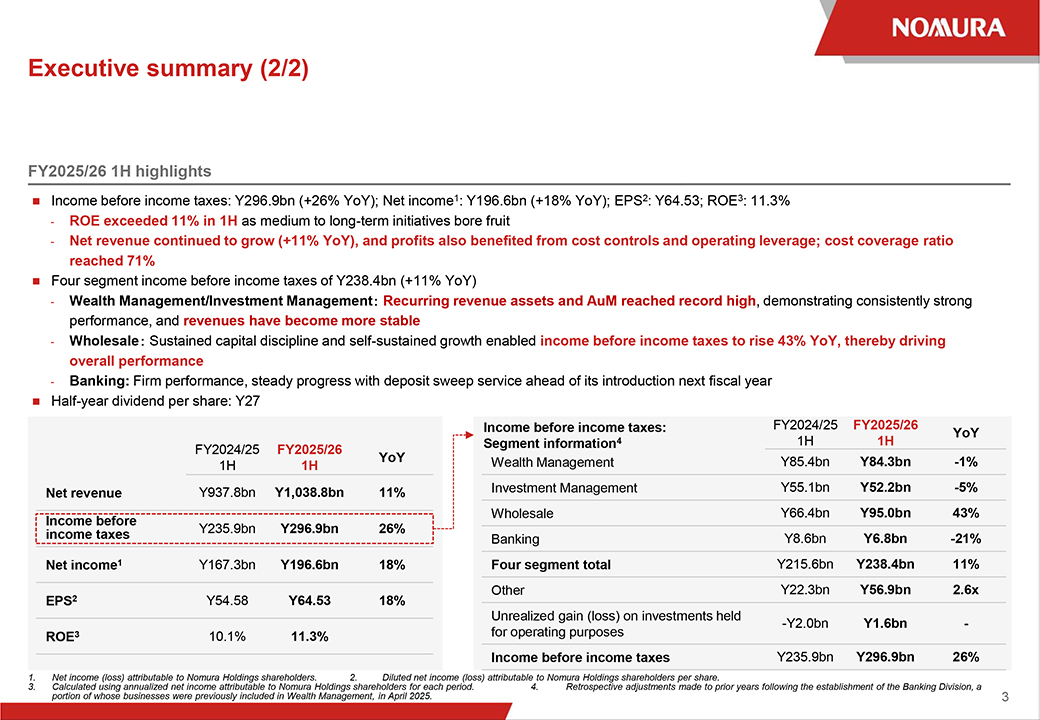
A record quarter since comparisons possible in FY2016/17 2 Executive summary (2/2) FY2025/26 1H highlights Income before income taxes: Y296.9bn (+26% YoY); Net income1: Y196.6bn (+18% YoY); EPS2: Y64.53; ROE3: 11.3% - ROE exceeded 11% in 1H as medium to long-term initiatives bore fruit - Net revenue continued to grow (+11% YoY), and profits also benefited from cost controls and operating leverage; cost coverage ratio reached 71% Four segment income before income taxes of Y238.4bn (+11% YoY) - Wealth Management/Investment Management Recurring revenue assets and AuM reached record high, demonstrating consistently strong performance, and revenues have become more stable - Wholesale Sustained capital discipline and self-sustained growth enabled income before income taxes to rise 43% YoY, thereby driving overall performance - Banking: Firm performance, steady progress with deposit sweep service ahead of its introduction next fiscal year Half-year dividend per share: Y27 Income before income taxes: FY2024/25 FY2025/26 YoY FY2024/25 FY2025/26 Segment information4 1H 1H 1H 1H YoY Wealth Management Y85.4bn Y84.3bn -1% Net revenue Y937.8bn Y1,038.8bn 11% Investment Management Y55.1bn Y52.2bn -5% Income before Wholesale Y66.4bn Y95.0bn 43% Y235.9bn Y296.9bn 26% income taxes Banking Y8.6bn Y6.8bn -21% Net income1 Y167.3bn Y196.6bn 18% Four segment total Y215.6bn Y238.4bn 11% Other Y22.3bn Y56.9bn 2.6x EPS2 Y54.58 Y64.53 18% Unrealized gain (loss) on investments held -Y2.0bn Y1.6bn— ROE3 10.1% 11.3% for operating purposes Income before income taxes Y235.9bn Y296.9bn 26% 1. Net income (loss) attributable to Nomura Holdings shareholders. 2. Diluted net income (loss) attributable to Nomura Holdings shareholders per share. 3. Calculated using annualized net income attributable to Nomura Holdings shareholders for each period. 4.
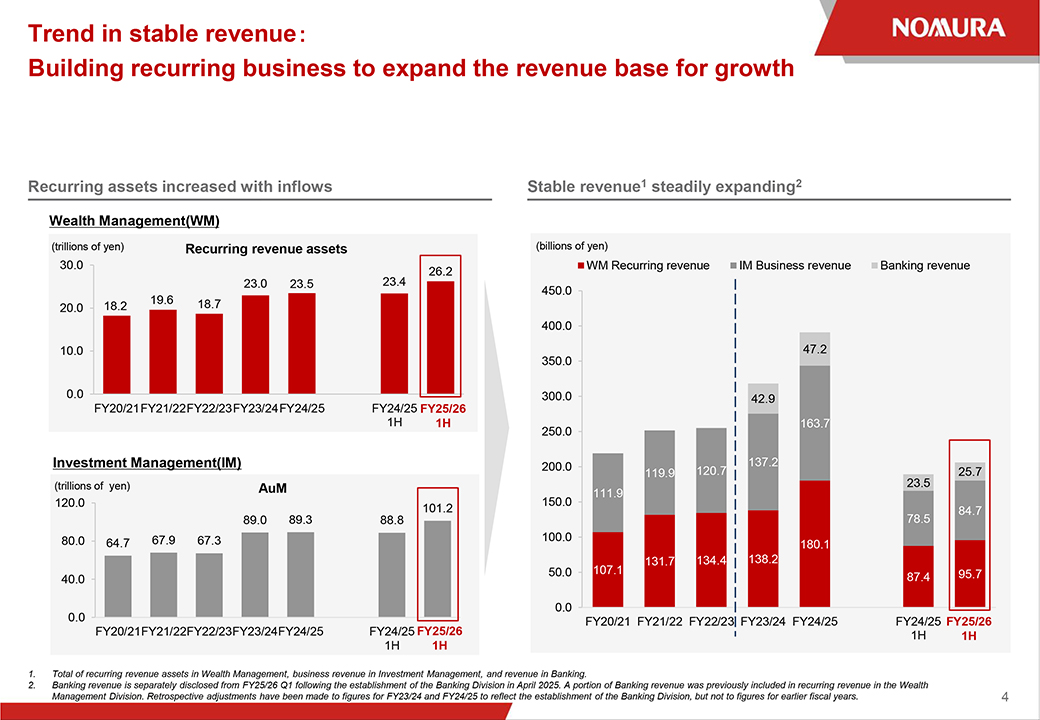
Retrospective adjustments made to prior years following the establishment of the Banking Division, a portion of whose businesses were previously included in Wealth Management, in April 2025. 3 Trend in stable revenue Building recurring business to expand the revenue base for growth Recurring assets increased with inflows Stable revenue1 steadily expanding2 Wealth Management(WM) (trillions of yen) Recurring revenue assets (billions of yen) 30.0 WM Recurring revenue IM Business revenue Banking revenue 23.4 26.2 23.0 23.5 450.0 19.6 18.7 20.0 18.2 400.0 10.0 47.2 350.0 0.0 300.0 42.9 FY20/21FY21/22FY22/23FY23/24FY24/25 FY24/25 FY25/26 1H 1H 163.7 250.0 Investment Management(IM) 200.0 137.2 119.9 120.7 25.7 (trillions of yen) AuM 111.9 23.5 120.0 150.0 101.2 78.5 84.7 89.0 89.3 88.8 80.0 67.9 67.3 100.0 64.7 180.1 107.1 131.7 134.4 138.2 50.0 87.4 95.7 40.0 0.0 0.0 FY20/21 FY21/22 FY22/23 FY23/24 FY24/25 FY24/25 FY25/26 FY20/21FY21/22FY22/23FY23/24FY24/25 FY24/25 FY25/26 1H 1H 1H 1H 1. Total of recurring revenue assets in Wealth Management, business revenue in Investment Management, and revenue in Banking. 2. Banking revenue is separately disclosed from FY25/26 Q1 following the establishment of the Banking Division in April 2025. A portion of Banking revenue was previously included in recurring revenue in the Wealth Management Division. Retrospective adjustments have been made to figures for FY23/24 and FY24/25 to reflect the establishment of the Banking Division, but not to figures for earlier fiscal years. 4 Overview of results Highlights (billions of yen, excluding EPS, BPS and ROE) FY24/25 FY25/26 FY24/25 FY25/26 QoQ YoY YoY 2Q 3Q 4Q 1Q 2Q 1H 1H Net revenue 483.3 502.0 452.7 523.3 515.5 -2% 7% 937.8 1,038.8 11% Non-interest expenses 350.3 363.7 355.0 363.0 378.8 4% 8% 701.8 741.9 6% Income before income taxes 133.0 138.3 97.7 160.3 136.6 -15% 3% 235.9 296.9 26% Net income1 98.4 101.4 72.0 104.6 92.1 -12% -6% 167.3 196.6 18% Effective tax rate 26.5% 24.7% 24.3% 32.9% 29.9% 28.3% 31.5% EPS2 Y32.26 Y33.08 Y23.39 Y34.04 Y30.49 -10% 5% Y54.58 Y64.53 18% BPS3 Y1,117.00 Y1,207.81 Y1,174.10 Y1,177.31 Y1,188.05 1% 6% Y1,117.00 Y1,188.05 6% ROE4 11.6% 11.8% 8.2% 12.0% 10.6% 10.1% 11.3% Income before income taxes from three international 39.8 51.8 28.5 27.5 44.9 63% 13% 56.7 72.3 28% regions5,6 1.
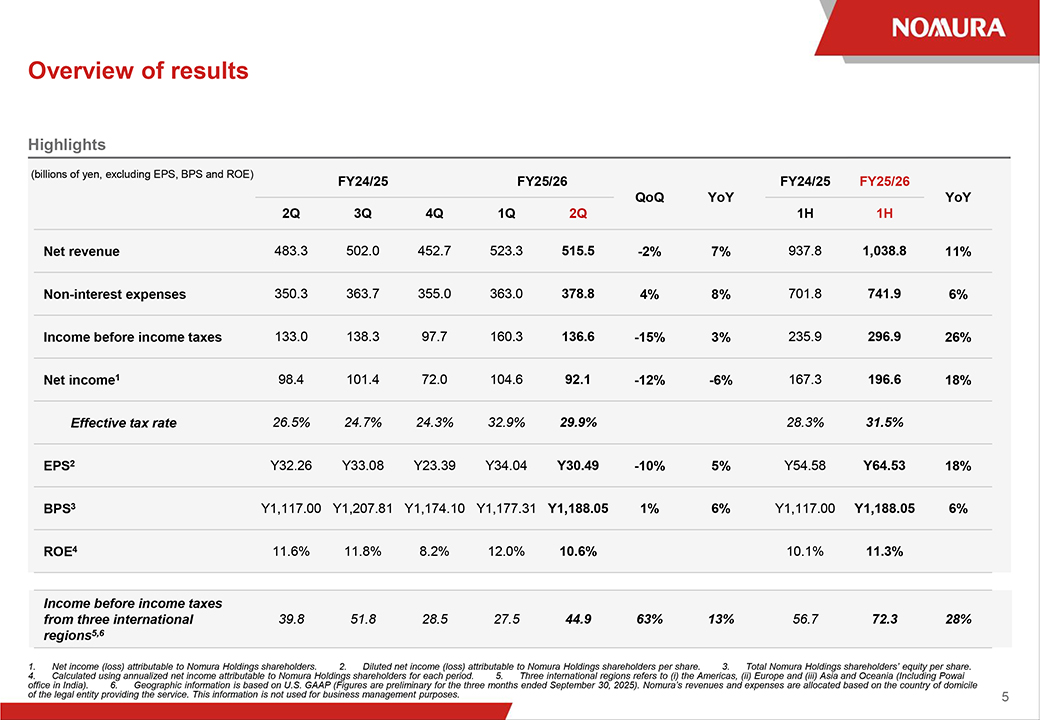
Net income (loss) attributable to Nomura Holdings shareholders. 2. Diluted net income (loss) attributable to Nomura Holdings shareholders per share. 3. Total Nomura Holdings shareholders’ equity per share. 4. Calculated using annualized net income attributable to Nomura Holdings shareholders for each period. 5. Three international regions refers to (i) the Americas, (ii) Europe and (iii) Asia and Oceania (Including Powai office in India). 6. Geographic information is based on U.S. GAAP (Figures are preliminary for the three months ended September 30, 2025). Nomura’s revenues and expenses are allocated based on the country of domicile of the legal entity providing the service.
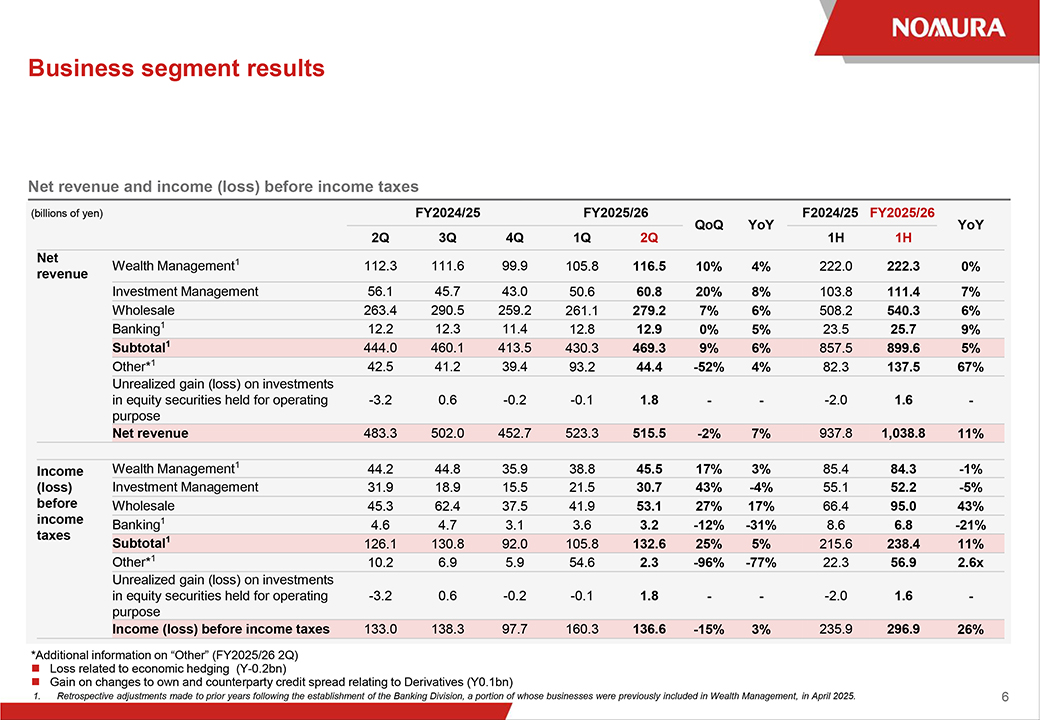
This information is not used for business management purposes. 5 Business segment results Net revenue and income (loss) before income taxes (billions of yen) FY2024/25 FY2025/26 F2024/25 FY2025/26 QoQ YoY YoY 2Q 3Q 4Q 1Q 2Q 1H 1H Net Wealth Management1 112.3 111.6 99.9 105.8 116.5 10% 4% 222.0 222.3 0% revenue Investment Management 56.1 45.7 43.0 50.6 60.8 20% 8% 103.8 111.4 7% Wholesale 263.4 290.5 259.2 261.1 279.2 7% 6% 508.2 540.3 6% Banking1 12.2 12.3 11.4 12.8 12.9 0% 5% 23.5 25.7 9% Subtotal1 444.0 460.1 413.5 430.3 469.3 9% 6% 857.5 899.6 5% Other*1 42.5 41.2 39.4 93.2 44.4 -52% 4% 82.3 137.5 67% Unrealized gain (loss) on investments in equity securities held for operating -3.2 0.6 -0.2 -0.1 1.8 — -2.0 1.6— purpose Net revenue 483.3 502.0 452.7 523.3 515.5 -2% 7% 937.8 1,038.8 11% Income Wealth Management1 44.2 44.8 35.9 38.8 45.5 17% 3% 85.4 84.3 -1% (loss) Investment Management 31.9 18.9 15.5 21.5 30.7 43% -4% 55.1 52.2 -5% before Wholesale 45.3 62.4 37.5 41.9 53.1 27% 17% 66.4 95.0 43% income Banking1 4.6 4.7 3.1 3.6 3.2 -12% -31% 8.6 6.8 -21% taxes Subtotal1 126.1 130.8 92.0 105.8 132.6 25% 5% 215.6 238.4 11% Other*1 10.2 6.9 5.9 54.6 2.3 -96% -77% 22.3 56.9 2.6x Unrealized gain (loss) on investments in equity securities held for operating -3.2 0.6 -0.2 -0.1 1.8 — -2.0 1.6— purpose Income (loss) before income taxes 133.0 138.3 97.7 160.3 136.6 -15% 3% 235.9 296.9 26% *Additional information on “Other” (FY2025/26 2Q) Loss related to economic hedging (Y-0.2bn) Gain on changes to own and counterparty credit spread relating to Derivatives (Y0.1bn) 1.
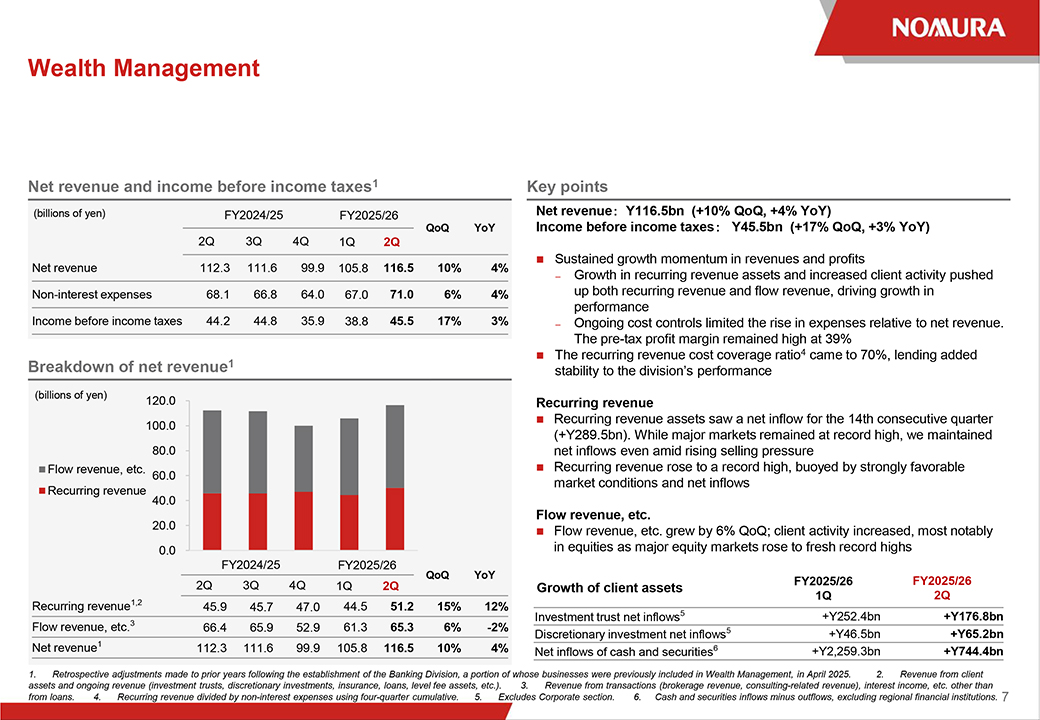
Retrospective adjustments made to prior years following the establishment of the Banking Division, a portion of whose businesses were previously included in Wealth Management, in April 2025. 6 Wealth Management Net revenue and income before income taxes1 (billions of yen) FY2024/25 FY2025/26 QoQ YoY 2Q 3Q 4Q 1Q 2Q Net revenue 112.3 111.6 99.9 105.8 116.5 10% 4% Non-interest expenses 68.1 66.8 64.0 67.0 71.0 6% 4% Income before income taxes 44.2 44.8 35.9 38.8 45.5 17% 3% Breakdown of net revenue1 (billions of yen) 120.0 100.0 80.0 Flow revenue, etc. 60.0 Recurring revenue 40.0 20.0 0.0 2Q FY2024/25 3Q 4Q FY2025/26 1Q 2Q 2Q 3Q 4Q QoQ YoY 1Q 2Q Recurring revenue1,2 45.9 45.7 47.0 44.5 51.2 15% 12% Flow revenue, etc.3 66.4 65.9 52.9 61.3 65.3 6% -2% Net revenue1 112.3 111.6 99.9 105.8 116.5 10% 4% Key points Net revenue Y116.5bn (+10% QoQ, +4% YoY) Income before income taxes Y45.5bn (+17% QoQ, +3% YoY) Sustained growth momentum in revenues and profits – Growth in recurring revenue assets and increased client activity pushed up both recurring revenue and flow revenue, driving growth in performance – Ongoing cost controls limited the rise in expenses relative to net revenue. The pre-tax profit margin remained high at 39% The recurring revenue cost coverage ratio4 came to 70%, lending added stability to the division’s performance Recurring revenue Recurring revenue assets saw a net inflow for the 14th consecutive quarter (+Y289.5bn). While major markets remained at record high, we maintained net inflows even amid rising selling pressure Recurring revenue rose to a record high, buoyed by strongly favorable market conditions and net inflows Flow revenue, etc. Flow revenue, etc. grew by 6% QoQ; client activity increased, most notably in equities as major equity markets rose to fresh record highs Growth of client assets FY2025/26 FY2025/26 1Q 2Q Investment trust net inflows5 +Y252.4bn +Y176.8bn Discretionary investment net inflows5 +Y46.5bn +Y65.2bn Net inflows of cash and securities6 +Y2,259.3bn +Y744.4bn 1. Retrospective adjustments made to prior years following the establishment of the Banking Division, a portion of whose businesses were previously included in Wealth Management, in April 2025. 2. Revenue from client assets and ongoing revenue (investment trusts, discretionary investments, insurance, loans, level fee assets, etc.). 3. Revenue from transactions (brokerage revenue, consulting-related revenue), interest income, etc. other than from loans. 4. Recurring revenue divided by non-interest expenses using four-quarter cumulative. 5. Excludes Corporate section. 6. Cash and securities inflows minus outflows, excluding regional financial institutions. 7 Wealth Management: Purchase of assets based on long-term diversified investments increased Total sales1 (billions of yen) Discretionary 7,000.0 investments, Insurance 6,000.0 products Investment trusts 5,000.0 4,000.0 Bonds 3,000.0 2,000.0 Stocks 1,000.0 0.0 FY2024/25 FY2025/26 2Q 3Q 4Q 1Q 2Q Stocks 4,149.9 3,644.4 3,870.6 4,967.5 4,539.9 Bonds 610.8 399.8 462.7 655.6 630.4 Investment trusts 793.7 863.4 791.0 754.7 815.2 Discretionary Investments 180.9 174.4 149.5 140.2 187.0 Insurance 115.7 109.4 87.1 137.3 185.5 Total sales1 5,851.0 5,191.4 5,360.9 6,655.3 6,358.0 1.
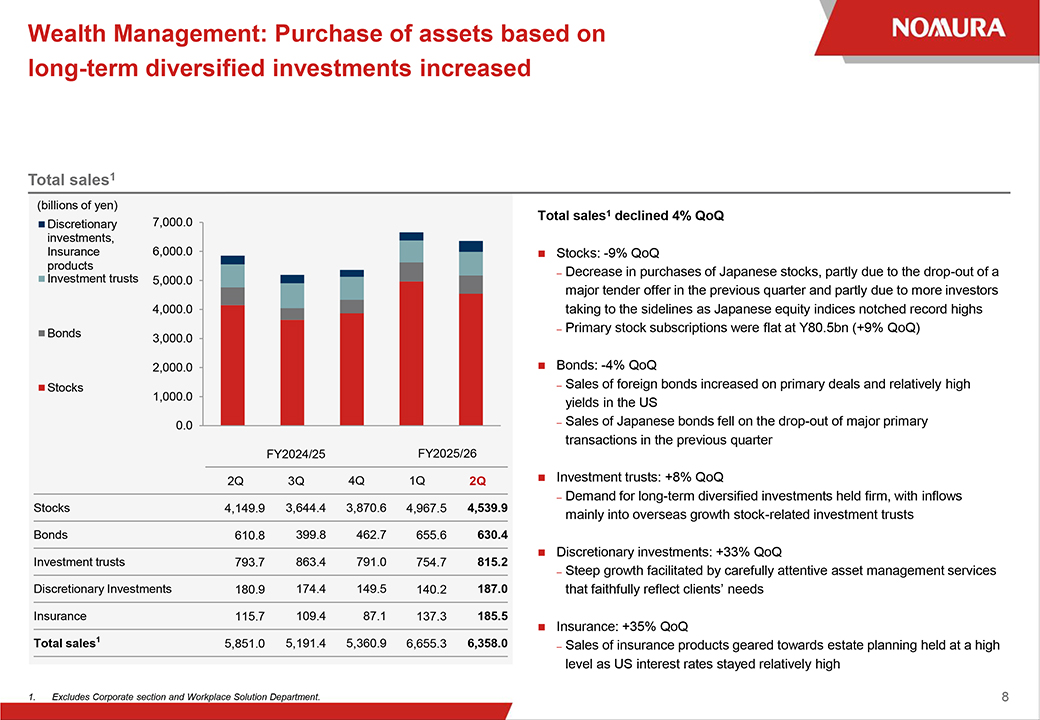
Excludes Corporate section and Workplace Solution Department.
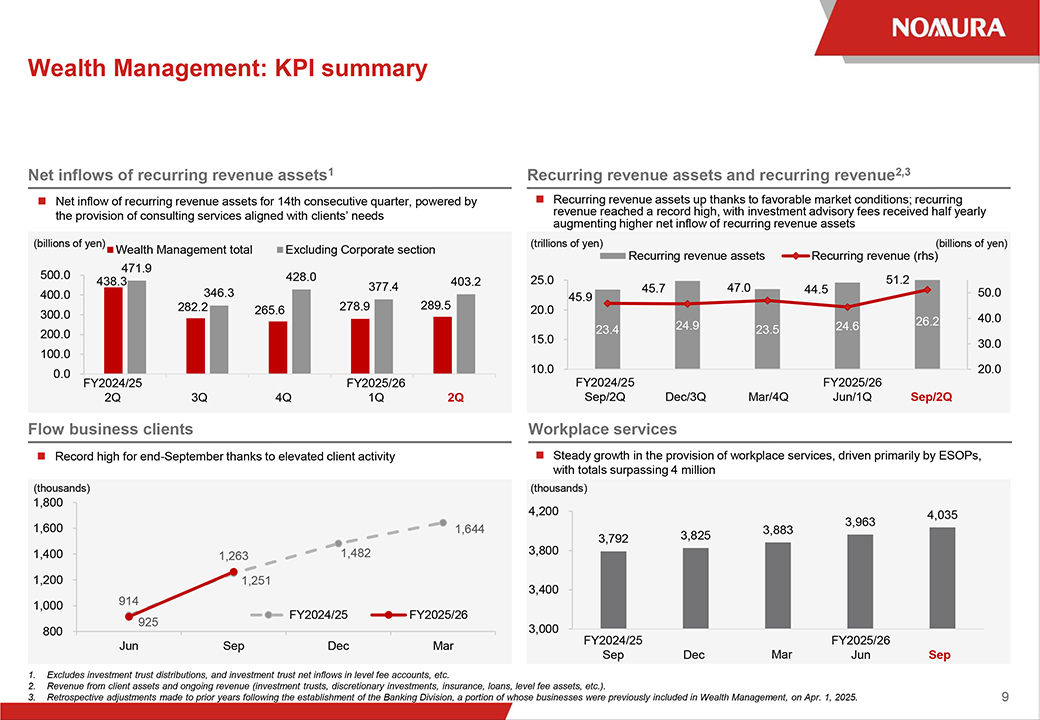
Total sales1 declined 4% QoQ Stocks: -9% QoQ – Decrease in purchases of Japanese stocks, partly due to the drop-out of a major tender offer in the previous quarter and partly due to more investors taking to the sidelines as Japanese equity indices notched record highs – Primary stock subscriptions were flat at Y80.5bn (+9% QoQ) Bonds: -4% QoQ – Sales of foreign bonds increased on primary deals and relatively high yields in the US – Sales of Japanese bonds fell on the drop-out of major primary transactions in the previous quarter Investment trusts: +8% QoQ – Demand for long-term diversified investments held firm, with inflows mainly into overseas growth stock-related investment trusts Discretionary investments: +33% QoQ – Steep growth facilitated by carefully attentive asset management services that faithfully reflect clients’ needs Insurance: +35% QoQ – Sales of insurance products geared towards estate planning held at a high level as US interest rates stayed relatively high 8 Wealth Management: KPI summary Net inflows of recurring revenue assets1 Net inflow of recurring revenue assets for 14th consecutive quarter, powered by the provision of consulting services aligned with clients’ needs (billions of yen) Wealth Management total Excluding Corporate section 471.9 500.0 428.0 438.3 403.2 377.4 400.0 346.3 282.2 265.6 278.9 289.5 300.0 200.0 100.0 0.0 FY2024/25 FY2025/26 2Q 3Q 4Q 1Q 2Q Flow business clients Record high for end-September thanks to elevated client activity (thousands) 1,800 1,600 1,644 1,400 1,263 1,482 1,200 1,251 1,000 914 FY2024/25 FY2025/26 925 800 Jun Sep Dec Mar Recurring revenue assets and recurring revenue2,3 Recurring revenue assets up thanks to favorable market conditions; recurring revenue reached a record high, with investment advisory fees received half yearly augmenting higher net inflow of recurring revenue assets (trillions of yen) (billions of yen) Recurring revenue assets Recurring revenue (rhs) 25.0 51.2 45.9 45.7 47.0 44.5 50.0 20.0 24.9 26.2 40.0 23.4 23.5 24.6 15.0 30.0 10.0 20.0 FY2024/251 2 3 FY2025/264 5 Sep/2Q Dec/3Q Mar/4Q Jun/1Q Sep/2Q Workplace services Steady growth in the provision of workplace services, driven primarily by ESOPs, with totals surpassing 4 million (thousands) 4,200 4,035 3,963 3,792 3,825 3,883 3,800 3,400 3,000 FY2024/25 9 12 3 FY2025/26 6 9 Sep Dec Mar Jun Sep 1. Excludes investment trust distributions, and investment trust net inflows in level fee accounts, etc. 2. Revenue from client assets and ongoing revenue (investment trusts, discretionary investments, insurance, loans, level fee assets, etc.). 3. Retrospective adjustments made to prior years following the establishment of the Banking Division, a portion of whose businesses were previously included in Wealth Management, on Apr. 1, 2025. 9 Investment Management Net revenue and income before income taxes1 (billions of yen) FY2024/25 FY2025/26 QoQ YoY 2Q 3Q 4Q 1Q 2Q Net revenue 56.1 45.7 43.0 50.6 60.8 20% 8% Non-interest expenses 24.2 26.8 27.5 29.0 30.1 4% 25% Income before income taxes 31.9 18.9 15.5 21.5 30.7 43% -4% Breakdown of net revenue (billions of yen) 70.0 50.0 Investment gain/loss 30.0 Business revenue 10.0 -10.0 FY2024/25 FY2025/26 QoQ YoY 2Q 3Q 4Q 1Q 2Q Business revenue1,2 39.4 42.0 43.3 40.6 44.1 8% 12% Investment gain/loss3 16.7 3.7 -0.2 9.9 16.8 69% 0.4% Net revenue 56.1 45.7 43.0 50.6 60.8 20% 8% Key points Net revenue: Y60.8bn (+20% QoQ, +8% YoY) Income before income taxes: Y30.7bn (+43% QoQ, -4% YoY) Solid growth in stable business revenue - Assets under management reached all-time high of Y101.2trn on net inflows as well as market factors Investment gain/loss up sharply QoQ, with major contributions from American Century Investments (ACI) related valuation gain/loss Business revenue Net revenue: Y44.1bn (+8% QoQ, +12% YoY) - Asset management business continued to deliver strong performance.
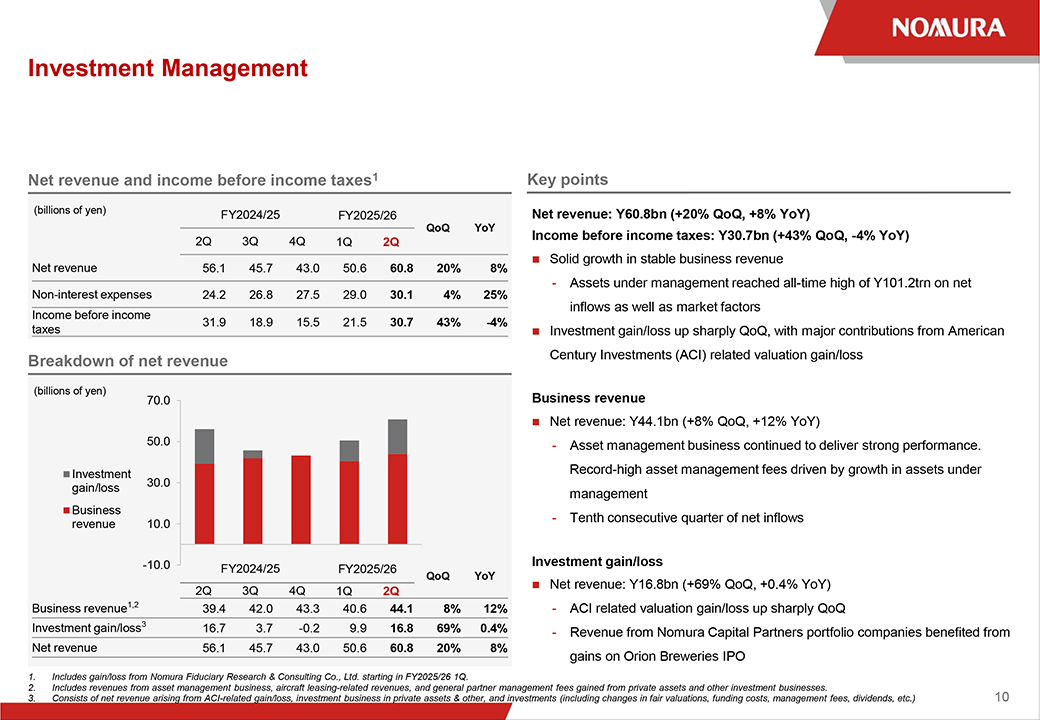
Record-high asset management fees driven by growth in assets under management - Tenth consecutive quarter of net inflows Investment gain/loss Net revenue: Y16.8bn (+69% QoQ, +0.4% YoY) - ACI related valuation gain/loss up sharply QoQ - Revenue from Nomura Capital Partners portfolio companies benefited from gains on Orion Breweries IPO 1. Includes gain/loss from Nomura Fiduciary Research & Consulting Co., Ltd. starting in FY2025/26 1Q. 2. Includes revenues from asset management business, aircraft leasing-related revenues, and general partner management fees gained from private assets and other investment businesses. 3.
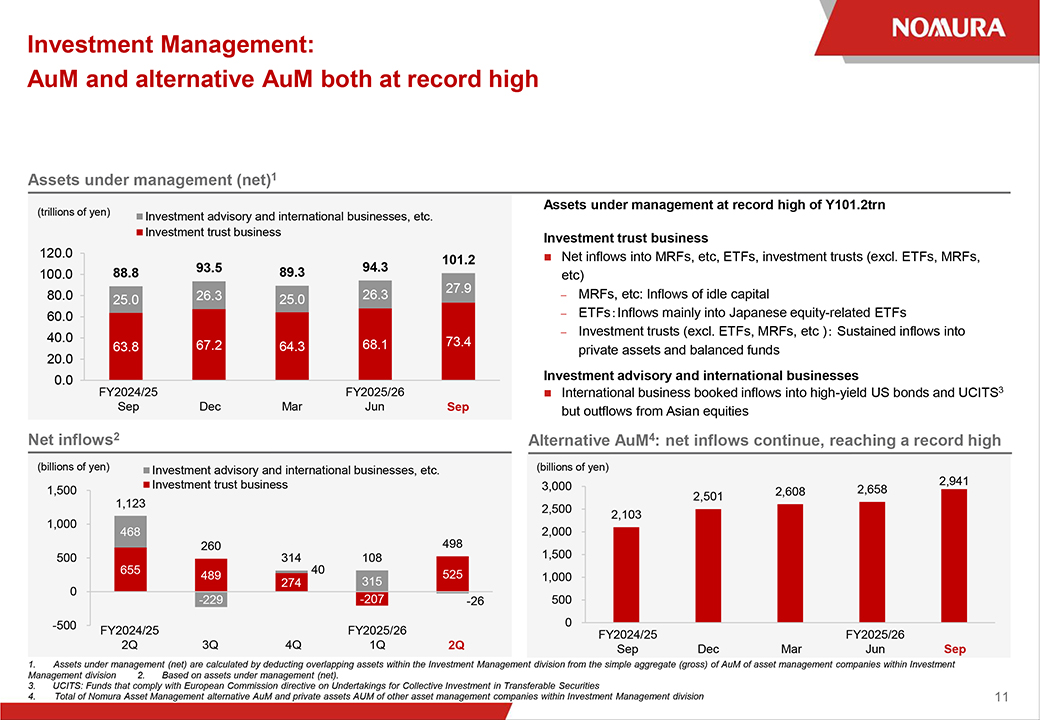
Consists of net revenue arising from ACI-related gain/loss, investment business in private assets & other, and investments (including changes in fair valuations, funding costs, management fees, dividends, etc.) 10 Investment Management: AuM and alternative AuM both at record high Assets under management (net)1 (trillions of yen) Investment advisory and international businesses, etc. Investment trust business 120.0 101.2 93.5 89.3 94.3 100.0 88.8 27.9 80.0 25.0 26.3 25.0 26.3 60.0 40.0 73.4 63.8 67.2 64.3 68.1 20.0 0.0 FY2024/25 FY2025/26 Sep Dec Mar Jun Sep Net inflows2 (billions of yen) Investment advisory and international businesses, etc. Investment trust business 1,500 1,123 1,000 468 260 498 500 314 108 655 40 525 489 0 274 315 -229 -207 -26 -500 FY2024/25 FY2025/26 2Q 3Q 4Q 1Q 2Q Assets under management at record high of Y101.2trn Investment trust business Net inflows into MRFs, etc, ETFs, investment trusts (excl. ETFs, MRFs, etc) MRFs, etc: Inflows of idle capital ETFsInflows mainly into Japanese equity-related ETFs Investment trusts (excl. ETFs, MRFs, etc ) Sustained inflows into private assets and balanced funds Investment advisory and international businesses International business booked inflows into high-yield US bonds and UCITS3 but outflows from Asian equities Alternative AuM4: net inflows continue, reaching a record high (billions of yen) 3,000 2,941 2,608 2,658 2,501 2,500 2,103 2,000 1,500 1,000 500 0 FY2024/25 FY2025/26 Sep Dec Mar Jun Sep 1. Assets under management (net) are calculated by deducting overlapping assets within the Investment Management division from the simple aggregate (gross) of AuM of asset management companies within Investment Management division 2. Based on assets under management (net). 3. UCITS: Funds that comply with European Commission directive on Undertakings for Collective Investment in Transferable Securities 4.
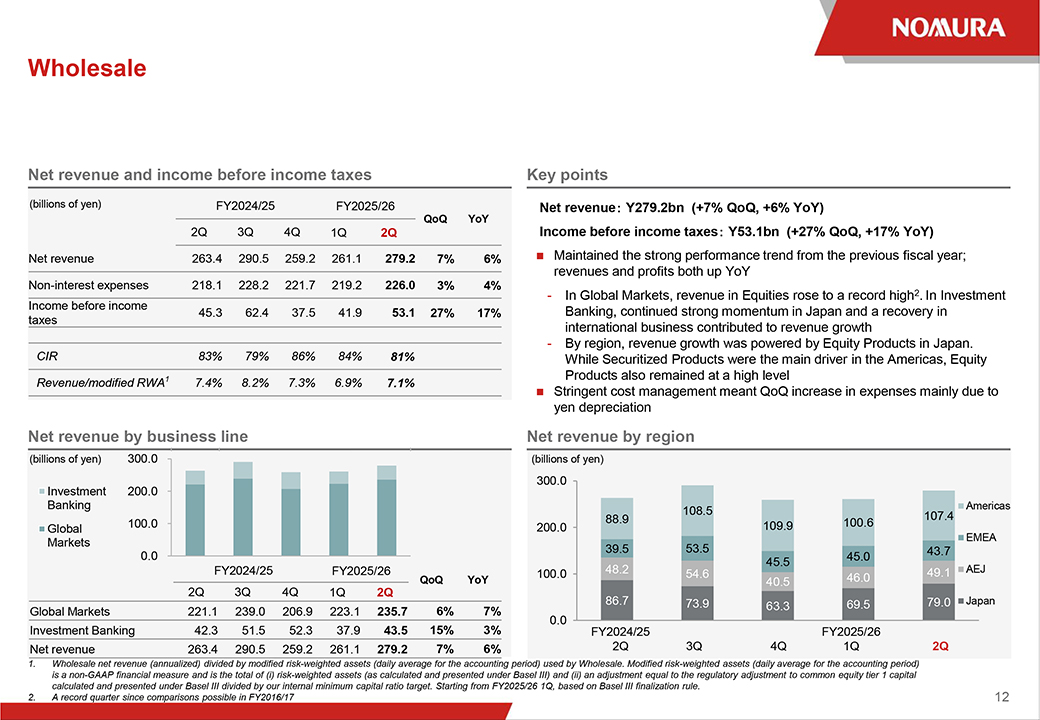
Total of Nomura Asset Management alternative AuM and private assets AUM of other asset management companies within Investment Management division 11 Wholesale Net revenue and income before income taxes (billions of yen) FY2024/25 FY2025/26 QoQ YoY 2Q 3Q 4Q 1Q 2Q Net revenue 263.4 290.5 259.2 261.1 279.2 7% 6% Non-interest expenses 218.1 228.2 221.7 219.2 226.0 3% 4% Income before income 45.3 62.4 37.5 41.9 53.1 27% 17% taxes CIR 83% 79% 86% 84% 81% Revenue/modified RWA1 7.4% 8.2% 7.3% 6.9% 7.1% Net revenue by business line (billions of yen) 300.0 Investment 200.0 Banking 100.0 Global Markets 0.0 FY2024/25 FY2025/26 QoQ YoY 2Q 3Q 4Q 1Q 2Q Global Markets 221.1 239.0 206.9 223.1 235.7 6% 7% Investment Banking 42.3 51.5 52.3 37.9 43.5 15% 3% Net revenue 263.4 290.5 259.2 261.1 279.2 7% 6% Key points Net revenue Y279.2bn (+7% QoQ, +6% YoY) Income before income taxes Y53.1bn (+27% QoQ, +17% YoY) Maintained the strong performance trend from the previous fiscal year; revenues and profits both up YoY - In Global Markets, revenue in Equities rose to a record high2. In Investment Banking, continued strong momentum in Japan and a recovery in international business contributed to revenue growth - By region, revenue growth was powered by Equity Products in Japan. While Securitized Products were the main driver in the Americas, Equity Products also remained at a high level Stringent cost management meant QoQ increase in expenses mainly due to yen depreciation Net revenue by region (billions of yen) 300.0 108.5 107.4 Americas 88.9 100.6 200.0 109.9 EMEA 39.5 53.5 43.7 45.0 45.5 100.0 48.2 54.6 49.1 AEJ 40.5 46.0 86.7 73.9 63.3 69.5 79.0 Japan 0.0 FY2024/25 FY2025/26 2Q 3Q 4Q 1Q 2Q 1. Wholesale net revenue (annualized) divided by modified risk-weighted assets (daily average for the accounting period) used by Wholesale. Modified risk-weighted assets (daily average for the accounting period) is a non-GAAP financial measure and is the total of (i) risk-weighted assets (as calculated and presented under Basel III) and (ii) an adjustment equal to the regulatory adjustment to common equity tier 1 capital calculated and presented under Basel III divided by our internal minimum capital ratio target. Starting from FY2025/26 1Q, based on Basel III finalization rule. 2.

A record quarter since comparisons possible in FY2016/17 12 Wholesale: Global Markets Net revenue (billions of yen) 250.0 FI: Others1 200.0 FI: Macro Products2 150.0 FI: Spread Products3 EQ: Others4 100.0 EQ: Equity Products5 50.0 EQ: Execution Services6 0.0 FY2024/25 FY2025/26 QoQ YoY 2Q 3Q 4Q 1Q 2Q Fixed 127.8 139.9 105.8 124.8 121.9 -2% -5% Income (FI) Equities 93.2 99.1 101.1 98.3 113.8 16% 22% (EQ) Global 221.1 239.0 206.9 223.1 235.7 6% 7% Markets Key points Net revenue Y235.7bn (+6% QoQ, +7% YoY) Fixed Income revenue in line with the previous quarter; slowdown in FX/EM partially offset by Securitized Products and Credit Equities revenue climbing to a record high7 driven by strength in Equity Products Fixed Income Net revenue: Y121.9bn (-2% QoQ, -5% YoY) - Macro Products: Rates revenue down in EMEA, following a strong previous quarter. FX/EM revenue down in AEJ - Spread Products: Credit revenues up in AEJ and Japan on continued robust demand for high-yield bonds. Steep rise in Securitized Products revenue in the Americas amid lessened uncertainty over interest rates Equities Net revenue: Y113.8bn (+16% QoQ, +22% YoY) - Equity Products: Strong revenue growth in Japan and AEJ, where increased client activity drove strength in Derivatives - Execution Services: Sustained strong revenues from the previous quarter 1. International Wealth Management, businesses run together with Investment Banking, and other revenue not attributed to a particular desk. 2. Rates, FX/EM. 3. Credit, Securitized Products. 4. Businesses run together with Investment Banking, Other gains and losses not attributable to a particular desk. 5.
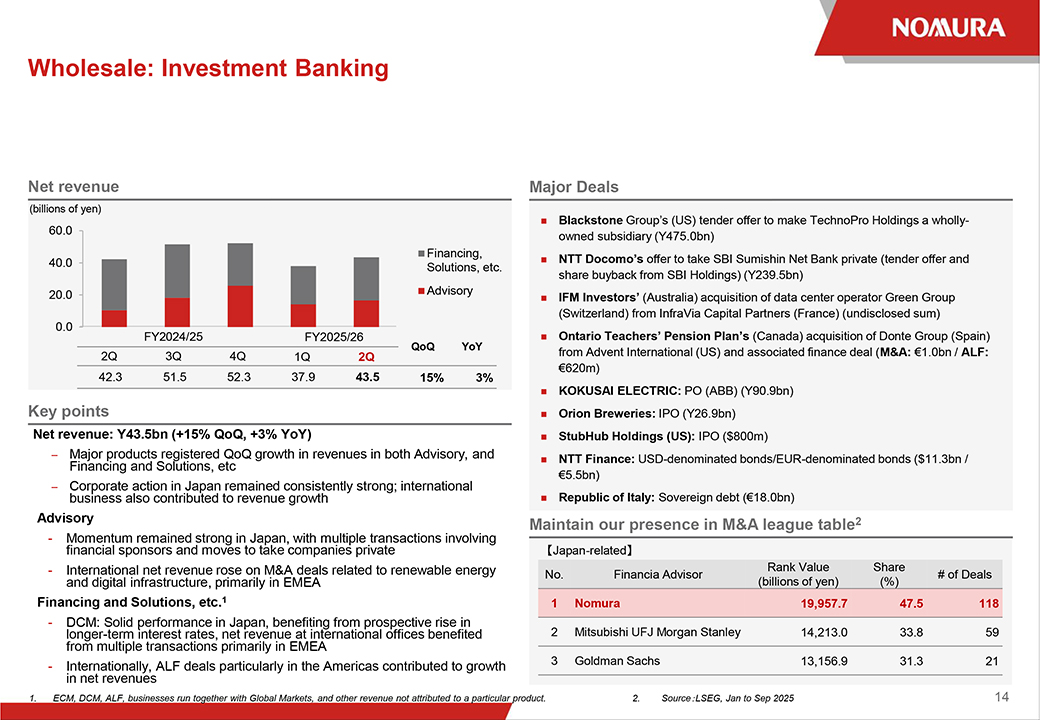
Cash and derivatives trading and Prime Services. 6. Equities execution business 7 A record quarter since comparisons possible in FY2016/17 13 Wholesale: Investment Banking Net revenue (billions of yen) 60.0 Financing, 40.0 Solutions, etc. 20.0 Advisory 0.0 FY2024/25 FY2025/26 2Q 3Q 4Q 1Q 2Q QoQ YoY 42.3 51.5 52.3 37.9 43.5 15% 3% Key points Net revenue: Y43.5bn (+15% QoQ, +3% YoY) – Financing Major products and Solutions, registered etc QoQ growth in revenues in both Advisory, and – business Corporate also action contributed in Japan to remained revenue consistently growth strong; international Advisory - Momentum financial sponsors remained and strong moves in to Japan, take companies with multiple private transactions involving - International and digital infrastructure, net revenue primarily rose on M&A in EMEA deals related to renewable energy Financing and Solutions, etc.1 - longer-term DCM: Solid performance interest rates, in net Japan, revenue benefiting at international from prospective offices benefited rise in from multiple transactions primarily in EMEA - Internationally, in net revenues ALF deals particularly in the Americas contributed to growth Major Deals Blackstone Group’s (US) tender offer to make TechnoPro Holdings a wholly- owned subsidiary (Y475.0bn) NTT Docomo’s offer to take SBI Sumishin Net Bank private (tender offer and share buyback from SBI Holdings) (Y239.5bn) IFM Investors’ (Australia) acquisition of data center operator Green Group (Switzerland) from InfraVia Capital Partners (France) (undisclosed sum) Ontario Teachers’ Pension Plan’s (Canada) acquisition of Donte Group (Spain) from Advent International (US) and associated finance deal (M&A: €1.0bn / ALF: €620m) KOKUSAI ELECTRIC: PO (ABB) (Y90.9bn) Orion Breweries: IPO (Y26.9bn) StubHub Holdings (US): IPO ($800m) NTT Finance: USD-denominated bonds/EUR-denominated bonds ($11.3bn / €5.5bn) Republic of Italy: Sovereign debt (€18.0bn) Maintain our presence in M&A league table2 Japan-related Rank Value Share No. Financia Advisor # of Deals (billions of yen) (%) 1 Nomura 19,957.7 47.5 118 2 Mitsubishi UFJ Morgan Stanley 14,213.0 33.8 59 3 Goldman Sachs 13,156.9 31.3 21 1. ECM, DCM, ALF, businesses run together with Global Markets, and other revenue not attributed to a particular product.
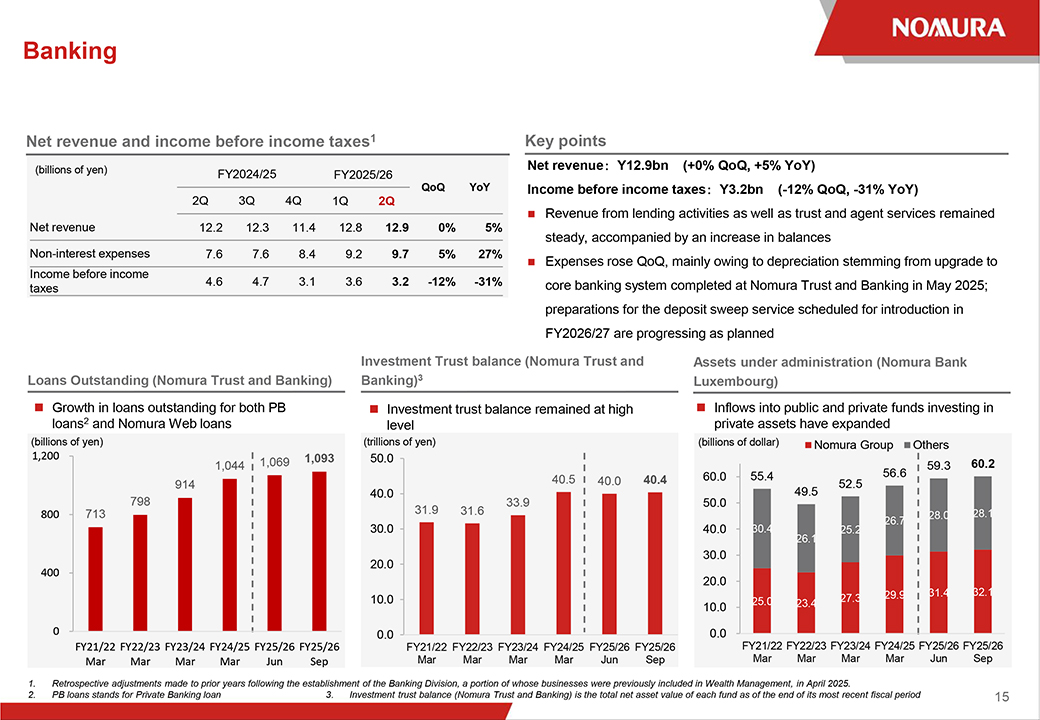
2. SourceLSEG, Jan to Sep 2025 14 Banking Net revenue and income before income taxes1 Key points (billions of yen) Net revenue Y12.9bn (+0% QoQ, +5% YoY) FY2024/25 FY2025/26 QoQ YoY Income before income taxes Y3.2bn (-12% QoQ, -31% YoY) 2Q 3Q 4Q 1Q 2Q Revenue from lending activities as well as trust and agent services remained Net revenue 12.2 12.3 11.4 12.8 12.9 0% 5% steady, accompanied by an increase in balances Non-interest expenses 7.6 7.6 8.4 9.2 9.7 5% 27% Expenses rose QoQ, mainly owing to depreciation stemming from upgrade to Income before income 4.6 4.7 3.1 3.6 3.2 -12% -31% core banking system completed at Nomura Trust and Banking in May 2025; taxes preparations for the deposit sweep service scheduled for introduction in FY2026/27 are progressing as planned Investment Trust balance (Nomura Trust and Assets under administration (Nomura Bank Loans Outstanding (Nomura Trust and Banking) Banking)3 Luxembourg) Growth in loans outstanding for both PB Investment trust balance remained at high Inflows into public and private funds investing in loans2 and Nomura Web loans level private assets have expanded (billions of yen) (trillions of yen) (billions of dollar) Nomura Group Others 1,200 1,093 50.0 1,044 1,069 56.6 59.3 60.2 40.5 40.0 40.4 60.0 55.4 914 52.5 798 40.0 33.9 50.0 49.5 800 713 31.9 31.6 28.1 28.0 26.7 30.0 40.0 30.4 26.1 25.2 30.0 400 20.0 20.0 29.9 31.4 32.1 10.0 25.0 27.3 10.0 23.4 0 0.0 0.0 FY21/22 FY22/23 FY23/24 FY24/25 FY25/26 FY25/26 FY21/22 FY22/23 FY23/24 FY24/25 FY25/26 FY25/26 FY21/22 FY22/23 FY23/24 FY24/25 FY25/26 FY25/26 Mar Mar Mar Mar Jun Sep Mar Mar Mar Mar Jun Sep Mar Mar Mar Mar Jun Sep 1. Retrospective adjustments made to prior years following the establishment of the Banking Division, a portion of whose businesses were previously included in Wealth Management, in April 2025. 2.
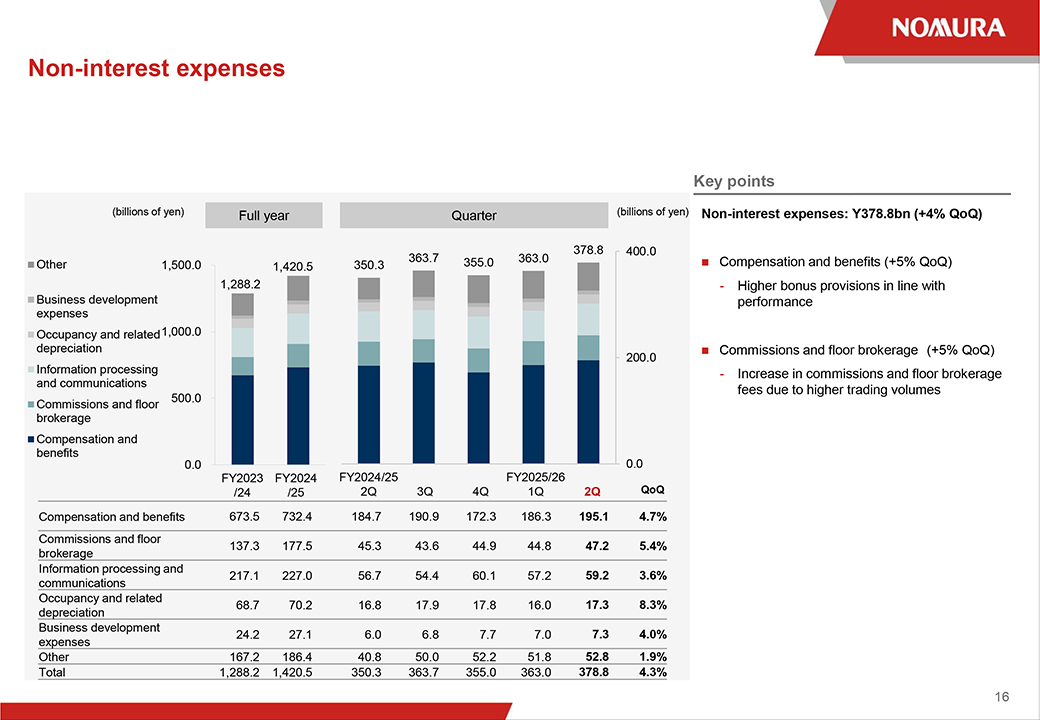
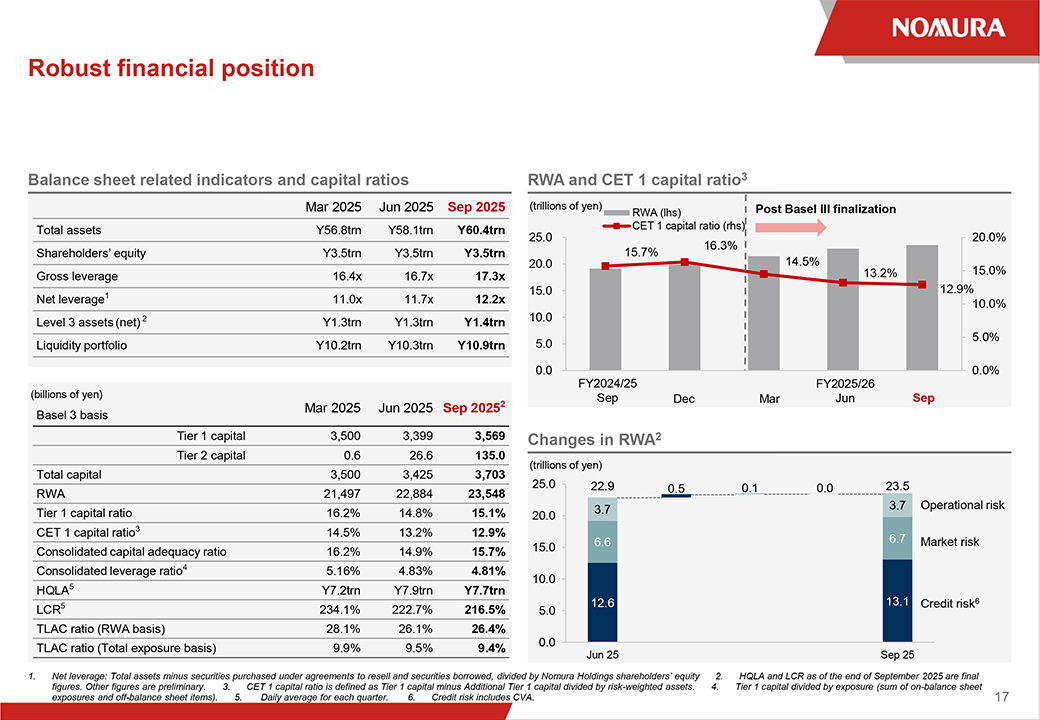
PB loans stands for Private Banking loan 3 Investment trust balance (Nomura Trust and Banking) is the total net asset value of each fund as of the end of its most recent fiscal period 15 Non-interest expenses (billions of yen) Full year Quarter (billions of yen) 378.8 400.0 363.7 355.0 363.0 Other 1,500.0 1,420.5 350.3 1,288.2 Business development expenses Occupancy and related 1,000.0 depreciation 200.0 Information processing and communications 500.0 Commissions and floor brokerage Compensation and benefits 0.0 0.0 FY2023 FY2024 FY2024/25 FY2025/26 /24 /25 2Q 3Q 4Q 1Q 2Q QoQ Compensation and benefits 673.5 732.4 184.7 190.9 172.3 186.3 195.1 4.7% Commissions and floor 137.3 177.5 45.3 43.6 44.9 44.8 47.2 5.4% brokerage Information processing and 217.1 227.0 56.7 54.4 60.1 57.2 59.2 3.6% communications Occupancy and related 68.7 70.2 16.8 17.9 17.8 16.0 17.3 8.3% depreciation Business development 24.2 27.1 6.0 6.8 7.7 7.0 7.3 4.0% expenses Other 167.2 186.4 40.8 50.0 52.2 51.8 52.8 1.9% Total 1,288.2 1,420.5 350.3 363.7 355.0 363.0 378.8 4.3% Key points Non-interest expenses: Y378.8bn (+4% QoQ) Compensation and benefits (+5% QoQ) - Higher bonus provisions in line with performance Commissions and floor brokerage (+5% QoQ) - Increase in commissions and floor brokerage fees due to higher trading volumes 16 Robust financial position Balance sheet related indicators and capital ratios Mar 2025 Jun 2025 Sep 2025 Total assets Y56.8trn Y58.1trn Y60.4trn Shareholders’ equity Y3.5trn Y3.5trn Y3.5trn Gross leverage 16.4x 16.7x 17.3x Net leverage1 11.0x 11.7x 12.2x Level 3 assets (net) 2 Y1.3trn Y1.3trn Y1.4trn Liquidity portfolio Y10.2trn Y10.3trn Y10.9trn (billions of yen) Mar 2025 Jun 2025 Sep 20252 Basel 3 basis Tier 1 capital 3,500 3,399 3,569 Tier 2 capital 0.6 26.6 135.0 Total capital 3,500 3,425 3,703 RWA 21,497 22,884 23,548 Tier 1 capital ratio 16.2% 14.8% 15.1% CET 1 capital ratio3 14.5% 13.2% 12.9% Consolidated capital adequacy ratio 16.2% 14.9% 15.7% Consolidated leverage ratio4 5.16% 4.83% 4.81% HQLA5 Y7.2trn Y7.9trn Y7.7trn LCR5 234.1% 222.7% 216.5% TLAC ratio (RWA basis) 28.1% 26.1% 26.4% TLAC ratio (Total exposure basis) 9.9% 9.5% 9.4% RWA and CET 1 capital ratio3 (trillions of yen) Post Basel III finalization RWA (lhs) CET 1 capital ratio (rhs) 25.0 20.0% 16.3% 15.7% 20.0 14.5% 13.2% 15.0% 15.0 12.9% 10.0% 10.0 5.0% 5.0 0.0 0.0% FY2024/25 FY2025/26 Sep Dec Mar Jun Sep Changes in RWA2 (trillions of yen) 25.0 22.9 0.5 0.1 0.0 23.5 20.0 3.7 3.7 Operational risk 6.6 6.7 Market risk 15.0 10.0 5.0 12.6 13.1 Credit risk6 0.0 Jun 25 Sep 25 1.

Financial Supplement
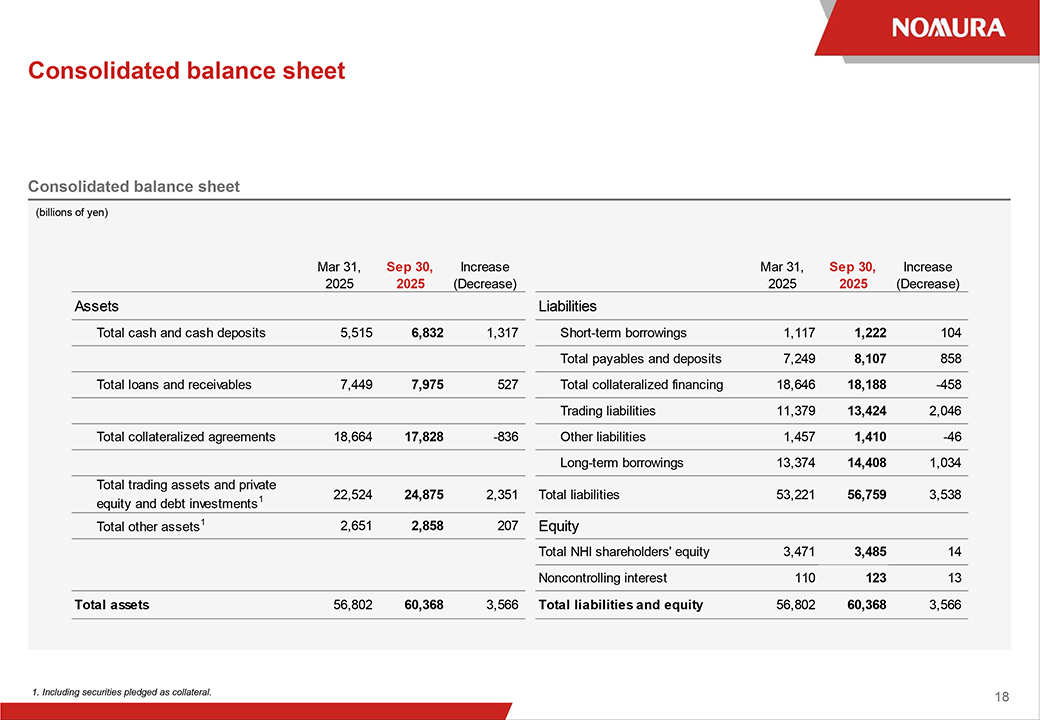
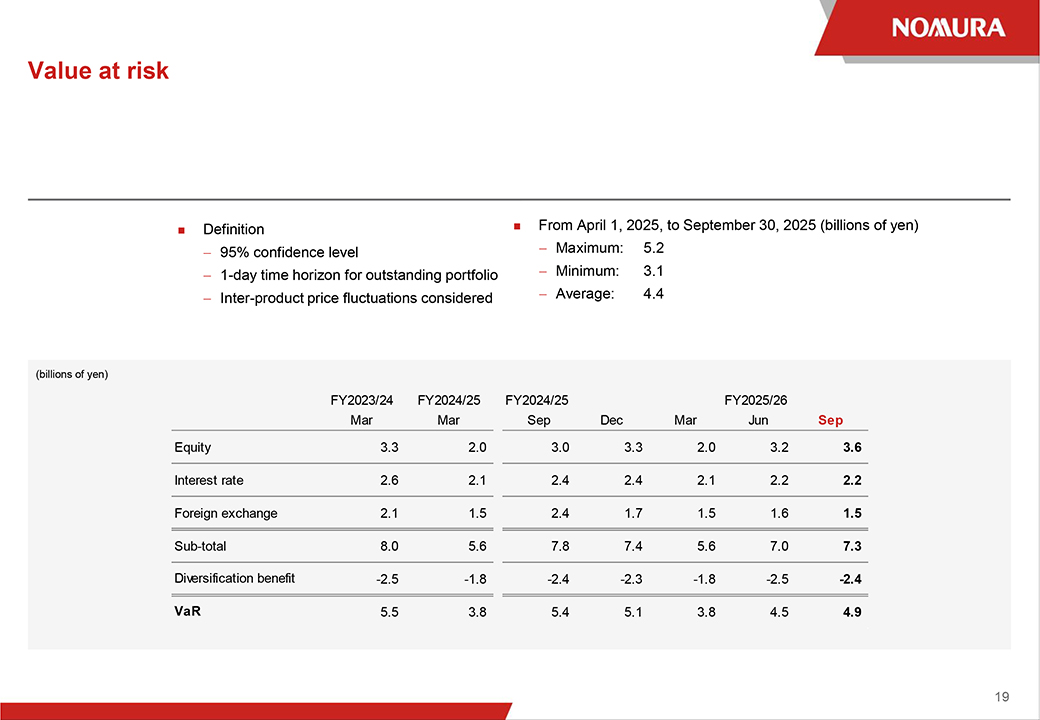
Net leverage: Total assets minus securities purchased under agreements to resell and securities borrowed, divided by Nomura Holdings shareholders’ equity 2. HQLA and LCR as of the end of September 2025 are final figures. Other figures are preliminary. 3. CET 1 capital ratio is defined as Tier 1 capital minus Additional Tier 1 capital divided by risk-weighted assets. 4. Tier 1 capital divided by exposure (sum of on-balance sheet exposures and off-balance sheet items). 5. Daily average for each quarter. 6. Credit risk includes CVA. 17 Consolidated balance sheet Consolidated balance sheet (billions of yen) Mar 31, Sep 30, Increase Mar 31, Sep 30, Increase 2025 2025 (Decrease) 2025 2025 (Decrease) Assets Liabilities Total cash and cash deposits 5,515 6,832 1,317 Short-term borrowings 1,117 1,222 104 Total payables and deposits 7,249 8,107 858 Total loans and receivables 7,449 7,975 527 Total collateralized financing 18,646 18,188 -458 Trading liabilities 11,379 13,424 2,046 Total collateralized agreements 18,664 17,828 -836 Other liabilities 1,457 1,410 -46 Long-term borrowings 13,374 14,408 1,034 Total trading assets and private 1 22,524 24,875 2,351 Total liabilities 53,221 56,759 3,538 equity and debt investments Total other assets1 2,651 2,858 207 Equity Total NHI shareholders’ equity 3,471 3,485 14 Noncontrolling interest 110 123 13 Total assets 56,802 60,368 3,566 Total liabilities and equity 56,802 60,368 3,566 1. Including securities pledged as collateral. 18 Value at risk Definition From April 1, 2025, to September 30, 2025 (billions of yen) 95% confidence level Maximum: 5.2 1-day time horizon for outstanding portfolio Minimum: 3.1 Inter-product price fluctuations considered Average: 4.4 (billions of yen) FY2023/24 FY2024/25 FY2024/25 FY2025/26 Mar Mar Sep Dec Mar Jun Sep Equity 3.3 2.0 3.0 3.3 2.0 3.2 3.6 Interest rate 2.6 2.1 2.4 2.4 2.1 2.2 2.2 Foreign exchange 2.1 1.5 2.4 1.7 1.5 1.6 1.5 Sub-total 8.0 5.6 7.8 7.4 5.6 7.0 7.3 Diversification benefit -2.5 -1.8 -2.4 -2.3 -1.8 -2.5 -2.4 VaR 5.5 3.8 5.4 5.1 3.8 4.5 4.9 19
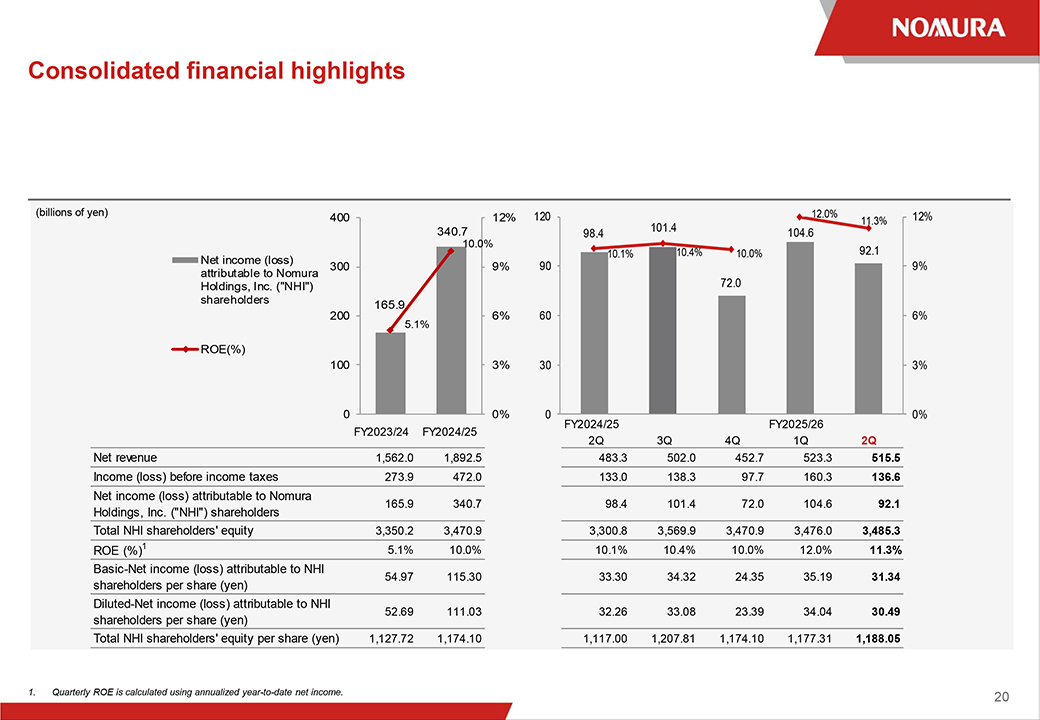
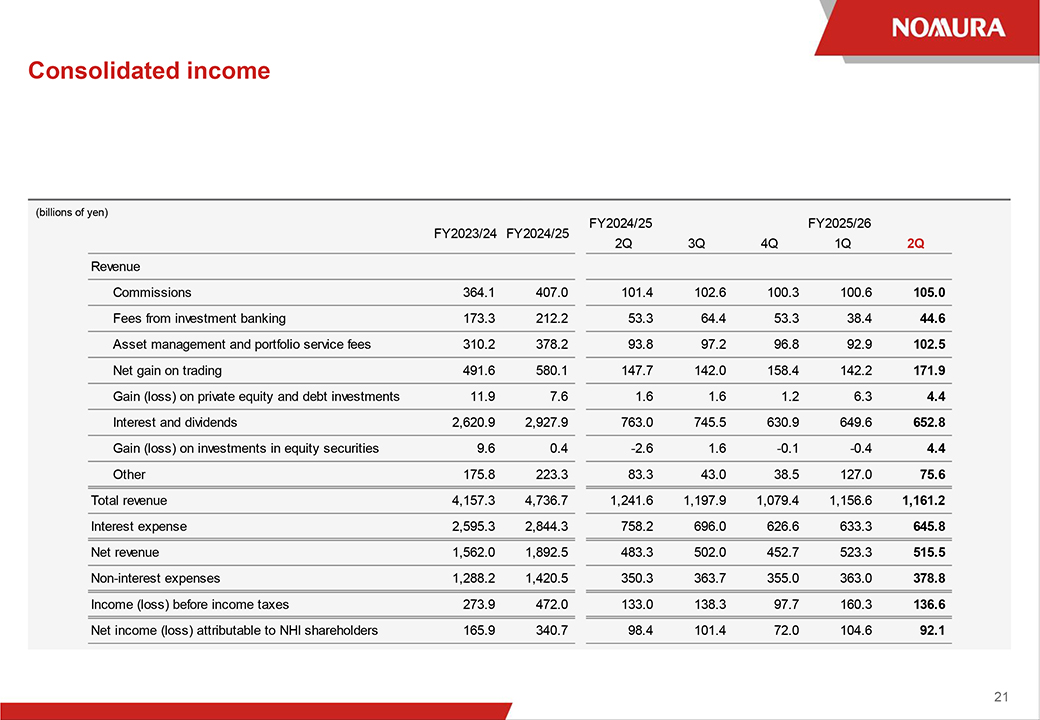
Consolidated financial highlights (billions of yen) 400 12% 120 12.0% 12% 11.3% 340.7 101.4 104.6 10.0% 98.4 10.1% 10.4% 10.0% 92.1 Net income (loss) 300 9% 90 9% attributable to Nomura Holdings, Inc. (“NHI”) 72.0 shareholders 165.9 60 6% 200 6% 5.1% ROE(%) 100 3% 30 3% 0 0% 0 FY2024/25 FY2025/26 0% FY2023/24 FY2024/25 2Q 3Q 4Q 1Q 2Q Net revenue 1,562.0 1,892.5 483.3 502.0 452.7 523.3 515.5 Income (loss) before income taxes 273.9 472.0 133.0 138.3 97.7 160.3 136.6 Net income (loss) attributable to Nomura 165.9 340.7 98.4 101.4 72.0 104.6 92.1 Holdings, Inc. (“NHI”) shareholders Total NHI shareholders’ equity 3,350.2 3,470.9 3,300.8 3,569.9 3,470.9 3,476.0 3,485.3 ROE (%)1 5.1% 10.0% 10.1% 10.4% 10.0% 12.0% 11.3% Basic-Net income (loss) attributable to NHI 54.97 115.30 33.30 34.32 24.35 35.19 31.34 shareholders per share (yen) Diluted-Net income (loss) attributable to NHI 52.69 111.03 32.26 33.08 23.39 34.04 30.49 shareholders per share (yen) Total NHI shareholders’ equity per share (yen) 1,127.72 1,174.10 1,117.00 1,207.81 1,174.10 1,177.31 1,188.05 1. Quarterly ROE is calculated using annualized year-to-date net income. 20 Consolidated income (billions of yen) FY2024/25 FY2025/26 FY2023/24 FY2024/25 2Q 3Q 4Q 1Q 2Q Revenue Commissions 364.1 407.0 101.4 102.6 100.3 100.6 105.0 Fees from investment banking 173.3 212.2 53.3 64.4 53.3 38.4 44.6 Asset management and portfolio service fees 310.2 378.2 93.8 97.2 96.8 92.9 102.5 Net gain on trading 491.6 580.1 147.7 142.0 158.4 142.2 171.9 Gain (loss) on private equity and debt investments 11.9 7.6 1.6 1.6 1.2 6.3 4.4 Interest and dividends 2,620.9 2,927.9 763.0 745.5 630.9 649.6 652.8 Gain (loss) on investments in equity securities 9.6 0.4 -2.6 1.6 -0.1 -0.4 4.4 Other 175.8 223.3 83.3 43.0 38.5 127.0 75.6 Total revenue 4,157.3 4,736.7 1,241.6 1,197.9 1,079.4 1,156.6 1,161.2 Interest expense 2,595.3 2,844.3 758.2 696.0 626.6 633.3 645.8 Net revenue 1,562.0 1,892.5 483.3 502.0 452.7 523.3 515.5 Non-interest expenses 1,288.2 1,420.5 350.3 363.7 355.0 363.0 378.8 Income (loss) before income taxes 273.9 472.0 133.0 138.3 97.7 160.3 136.6 Net income (loss) attributable to NHI shareholders 165.9 340.7 98.4 101.4 72.0 104.6 92.1 21
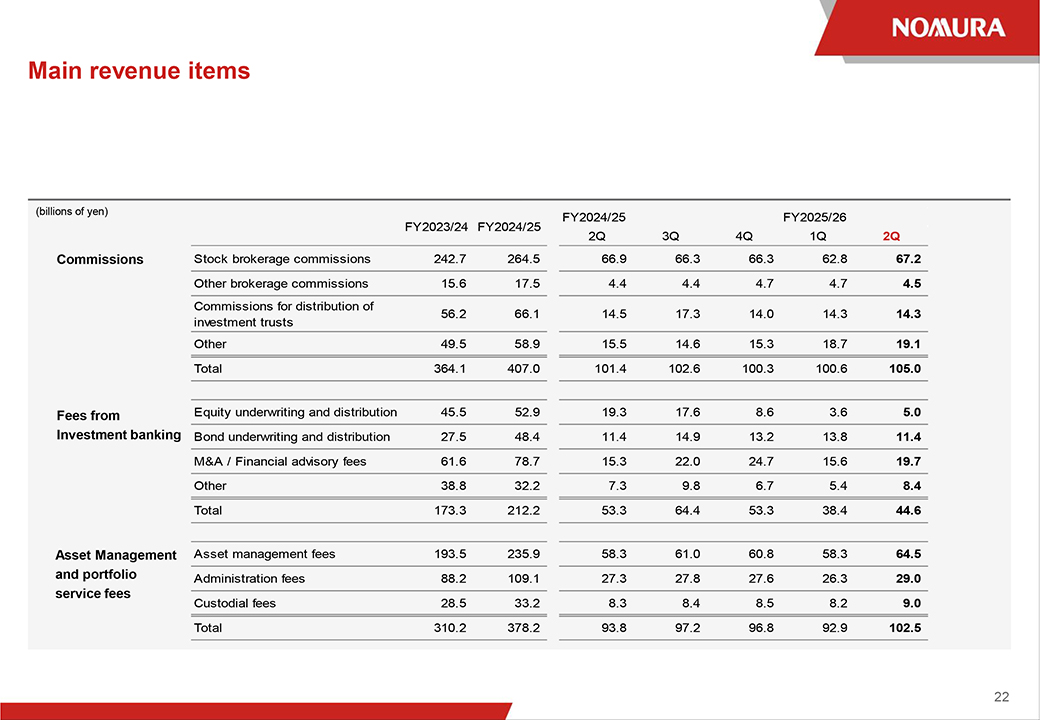
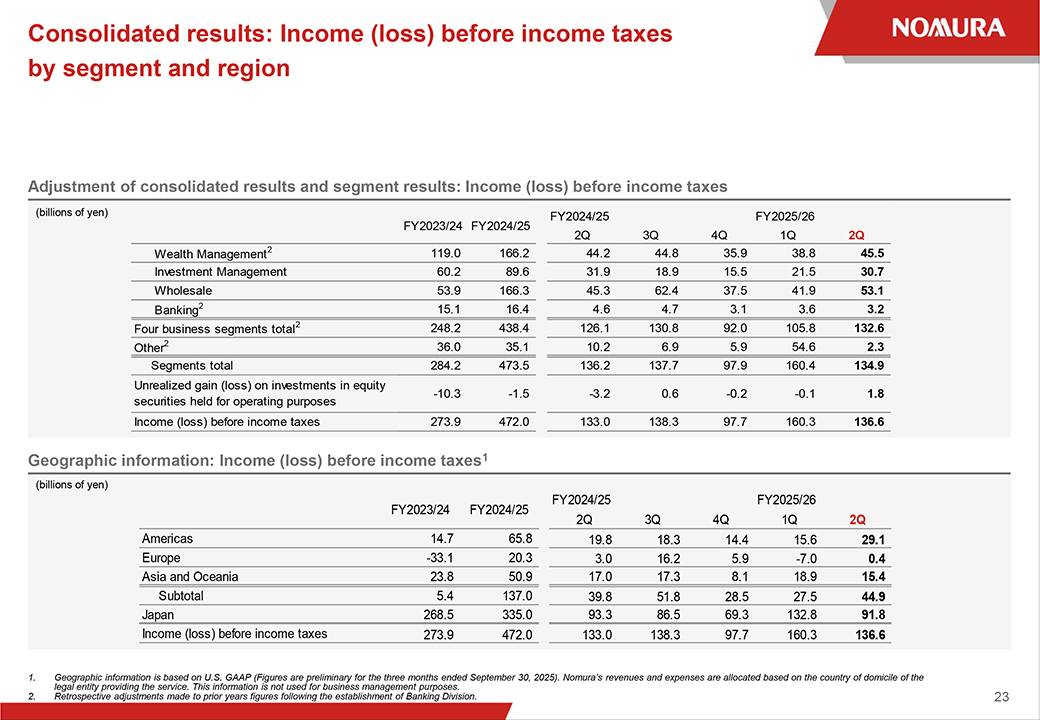
Main revenue items (billions of yen) FY2024/25 FY2025/26 FY2023/24 FY2024/25 2Q 3Q 4Q 1Q 2Q Commissions Stock brokerage commissions 242.7 264.5 66.9 66.3 66.3 62.8 67.2 Other brokerage commissions 15.6 17.5 4.4 4.4 4.7 4.7 4.5 Commissions for distribution of 56.2 66.1 14.5 17.3 14.0 14.3 14.3 investment trusts Other 49.5 58.9 15.5 14.6 15.3 18.7 19.1 Total 364.1 407.0 101.4 102.6 100.3 100.6 105.0 Fees from Equity underwriting and distribution 45.5 52.9 19.3 17.6 8.6 3.6 5.0 Investment banking Bond underwriting and distribution 27.5 48.4 11.4 14.9 13.2 13.8 11.4 M&A / Financial advisory fees 61.6 78.7 15.3 22.0 24.7 15.6 19.7 Other 38.8 32.2 7.3 9.8 6.7 5.4 8.4 Total 173.3 212.2 53.3 64.4 53.3 38.4 44.6 Asset Management Asset management fees 193.5 235.9 58.3 61.0 60.8 58.3 64.5 and portfolio Administration fees 88.2 109.1 27.3 27.8 27.6 26.3 29.0 service fees Custodial fees 28.5 33.2 8.3 8.4 8.5 8.2 9.0 Total 310.2 378.2 93.8 97.2 96.8 92.9 102.5 22 Consolidated results: Income (loss) before income taxes by segment and region Adjustment of consolidated results and segment results: Income (loss) before income taxes (billions of yen) FY2024/25 FY2025/26 FY2023/24 FY2024/25 2Q 3Q 4Q 1Q 2Q Wealth Management2 119.0 166.2 44.2 44.8 35.9 38.8 45.5 Investment Management 60.2 89.6 31.9 18.9 15.5 21.5 30.7 Wholesale 53.9 166.3 45.3 62.4 37.5 41.9 53.1 Banking2 15.1 16.4 4.6 4.7 3.1 3.6 3.2 Four business segments total2 248.2 438.4 126.1 130.8 92.0 105.8 132.6 Other2 36.0 35.1 10.2 6.9 5.9 54.6 2.3 Segments total 284.2 473.5 136.2 137.7 97.9 160.4 134.9 Unrealized gain (loss) on investments in equity -10.3 -1.5 -3.2 0.6 -0.2 -0.1 1.8 securities held for operating purposes Income (loss) before income taxes 273.9 472.0 133.0 138.3 97.7 160.3 136.6 Geographic information: Income (loss) before income taxes1 (billions of yen) FY2024/25 FY2025/26 FY2023/24 FY2024/25 2Q 3Q 4Q 1Q 2Q Americas 14.7 65.8 19.8 18.3 14.4 15.6 29.1 Europe -33.1 20.3 3.0 16.2 5.9 -7.0 0.4 Asia and Oceania 23.8 50.9 17.0 17.3 8.1 18.9 15.4 Subtotal 5.4 137.0 39.8 51.8 28.5 27.5 44.9 Japan 268.5 335.0 93.3 86.5 69.3 132.8 91.8 Income (loss) before income taxes 273.9 472.0 133.0 138.3 97.7 160.3 136.6 1. Geographic information is based on U.S. GAAP (Figures are preliminary for the three months ended September 30, 2025). Nomura’s revenues and expenses are allocated based on the country of domicile of the legal entity providing the service. This information is not used for business management purposes. 2. Retrospective adjustments made to prior years figures following the establishment of Banking Division. 23 Segment “Other” Income (loss) before income taxes (billions of yen) 60 54.6 50 40 36.0 35.1 30 20 10 10.2 6.9 5.9 2.3 0 1 2 FY2024/25 FY2025/26 FY2023/24 FY2024/25 1 2 3 4 5 2Q 3Q 4Q 1Q 2Q Net gain (loss) related to economic 2.0 -5.8 1.8 -7.0 2.2 1.1 -0.2 hedging transactions Realized gain (loss) on investments in equity 21.0 1.5 0.5 0.6 0.3 0.0 2.2 securities held for operating purposes Equity in earnings of affiliates 46.4 51.2 11.6 15.2 9.7 12.3 12.4 Corporate items -12.0 -5.9 -5.3 -1.0 -5.1 -11.6 -15.2 Others1 -21.5 -5.9 1.6 -1.0 -1.2 52.9 3.0 Income (loss) before income taxes1 36.0 35.1 10.2 6.9 5.9 54.6 2.3 1.
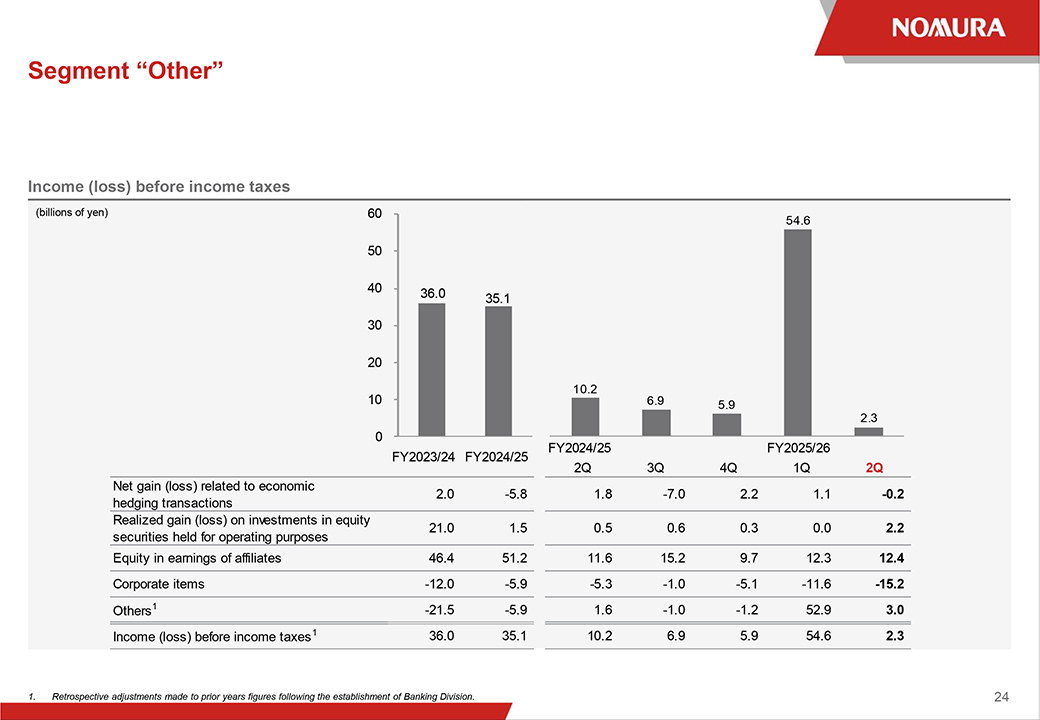

Retrospective adjustments made to prior years figures following the establishment of Banking Division. 24 Wealth Management related data (1) (billions of yen) FY2024/25 FY2025/26 FY2023/24 FY2024/25 2Q 3Q 4Q 1Q 2Q QoQ YoY Commissions 173.5 183.6 43.3 47.1 43.3 46.2 52.1 12.8% 20.1% Of which, stock brokerage commission 80.2 72.2 17.7 18.1 17.4 18.3 22.7 23.9% 27.9% Of which, commissions for distribution of 54.9 65.9 14.1 17.3 14.3 14.2 14.3 0.2% 1.3% investment trusts Sales credit 55.9 52.5 15.6 11.5 10.8 11.6 12.6 8.5% -19.1% Fees from investment banking and other 23.1 27.3 10.5 8.7 3.7 5.2 3.9 -24.7% -62.5% Investment trust administration fees and other 124.4 156.7 39.0 40.1 40.2 38.7 42.9 10.7% 10.0% Net interest revenue1 10.1 13.4 3.8 4.3 1.9 4.0 5.0 23.5% 30.0% Net revenue1 387.0 433.6 112.3 111.6 99.9 105.8 116.5 10.1% 3.7% Non-interest expenses1 268.0 267.4 68.1 66.8 64.0 67.0 71.0 5.8% 4.2% Income before income taxes1 119.0 166.2 44.2 44.8 35.9 38.8 45.5 17.5% 2.9% Domestic distribution volume of investment trusts 3,271.8 3,882.8 899.0 942.0 838.3 827.1 854.6 3.3% -4.9% Stock investment trusts 2,525.9 3,107.2 719.8 719.5 712.3 724.1 708.5 -2.2% -1.6% Foreign investment trusts 745.9 775.6 179.2 222.5 126.0 102.9 146.0 41.8% -18.5% Other Sales of JGBs for individual investors (transaction 398.9 317.9 38.6 89.0 76.8 82.0 33.5 -59.2% -13.3% base) 1. Retrospective adjustments made to prior years figures following the establishment of Banking Division. 25 Wealth Management related data (2) Wealth Management client assets (trillions of yen) 200 Other 162.3 Foreign investment 153.5 143.8 146.1 152.2 153.2 trusts 150 143.8 Bond investment trusts Stock investment 100 trusts Domestic bonds 50 Foreign currency bonds Equities 0 FY2023/24 FY2024/25 FY2024/25 FY2025/26 Mar Mar Sep Dec Mar Jun Sep Equities 102.5 92.2 94.6 98.9 92.2 99.7 106.2 Foreign currency bonds 6.4 6.5 6.5 6.5 6.5 6.5 6.8 Domestic bonds1 13.7 14.2 14.0 14.0 14.2 14.7 14.8 Stock investment trusts 13.3 13.3 13.5 14.4 13.3 14.2 15.2 Bond investment trusts 7.3 6.7 7.0 7.2 6.7 6.8 7.2 Foreign investment trusts 1.8 2.0 1.8 2.0 2.0 2.0 2.1 Other2 8.6 8.8 8.7 9.2 8.8 9.3 10.0 Total 153.5 143.8 146.1 152.2 143.8 153.2 162.3 1.
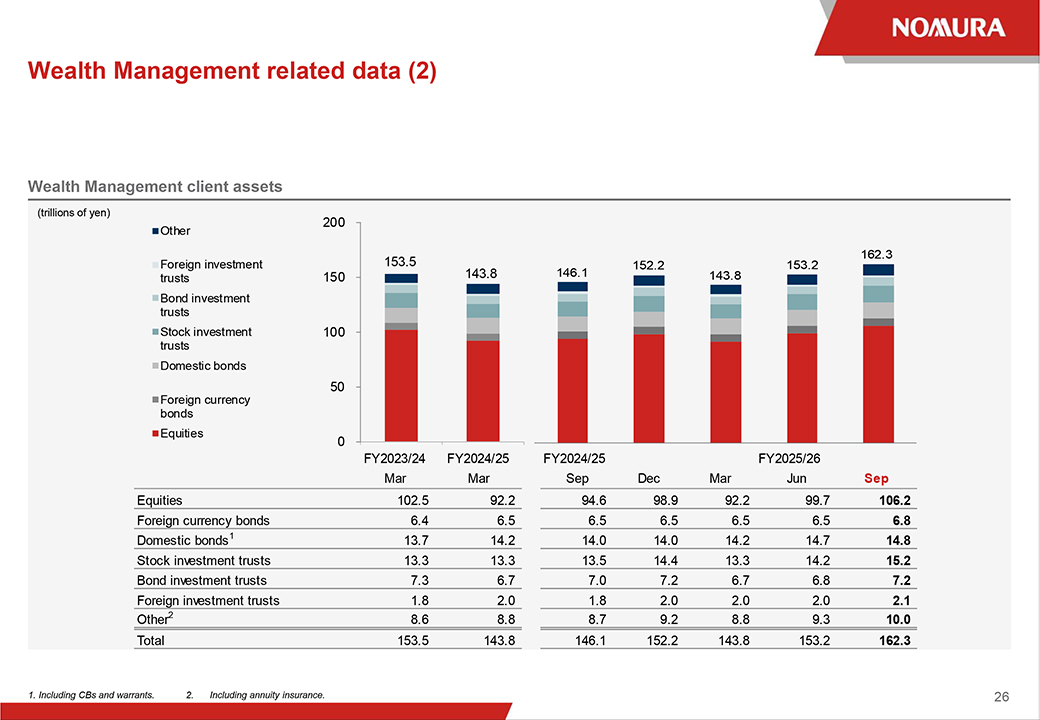
Including CBs and warrants. 2. Including annuity insurance. 26
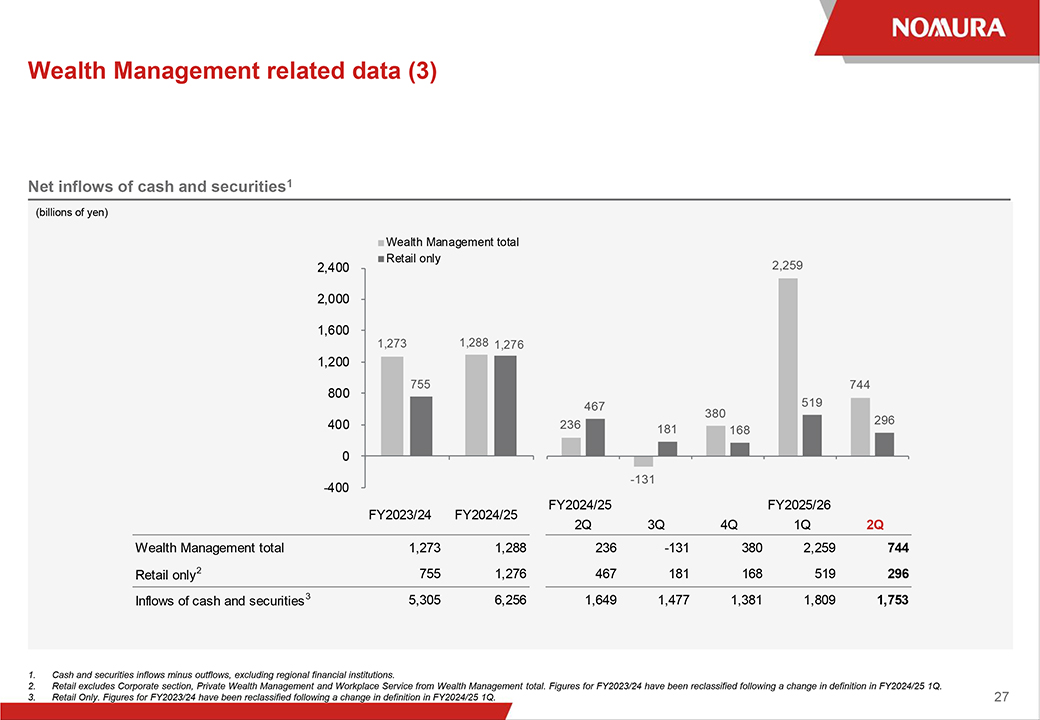
Wealth Management related data (3) Net inflows of cash and securities1 (billions of yen) Wealth Management total Retail only 2,400 2,259 2,000 1,600 1,273 1,288 1,276 1,200 755 744 800 467 380 519 400 236 296 181 168 0 -131 -400 FY2024/25 FY2025/26 FY2023/24 FY2024/25 2Q 3Q 4Q 1Q 2Q Wealth Management total 1,273 1,288 236 -131 380 2,259 744 Retail only2 755 1,276 467 181 168 519 296 Inflows of cash and securities3 5,305 6,256 1,649 1,477 1,381 1,809 1,753 1. Cash and securities inflows minus outflows, excluding regional financial institutions. 2. Retail excludes Corporate section, Private Wealth Management and Workplace Service from Wealth Management total. Figures for FY2023/24 have been reclassified following a change in definition in FY2024/25 1Q. 3. Retail Only. Figures for FY2023/24 have been reclassified following a change in definition in FY2024/25 1Q. 27 Wealth Management related data (4) Number of accounts (thousands) FY2023/24 FY2024/25 FY2024/25 FY2025/26 Mar Mar Sep Dec Mar Jun Sep Accounts with balance 5,496 5,934 5,888 5,925 5,934 5,965 5,998 Equity holding accounts 2,972 3,285 3,265 3,275 3,285 3,292 3,292 NISA accounts opened1 1,780 1,779 1,763 1,771 1,779 1,800 1,816 Online service accounts 5,582 5,974 5,796 5,881 5,974 6,053 6,140 New individual accounts / IT share2 (thousands) FY2024/25 FY2025/26 FY2023/24 FY2024/25 2Q 3Q 4Q 1Q 2Q New individual accounts 334 372 81 99 109 103 103 IT share2 No.
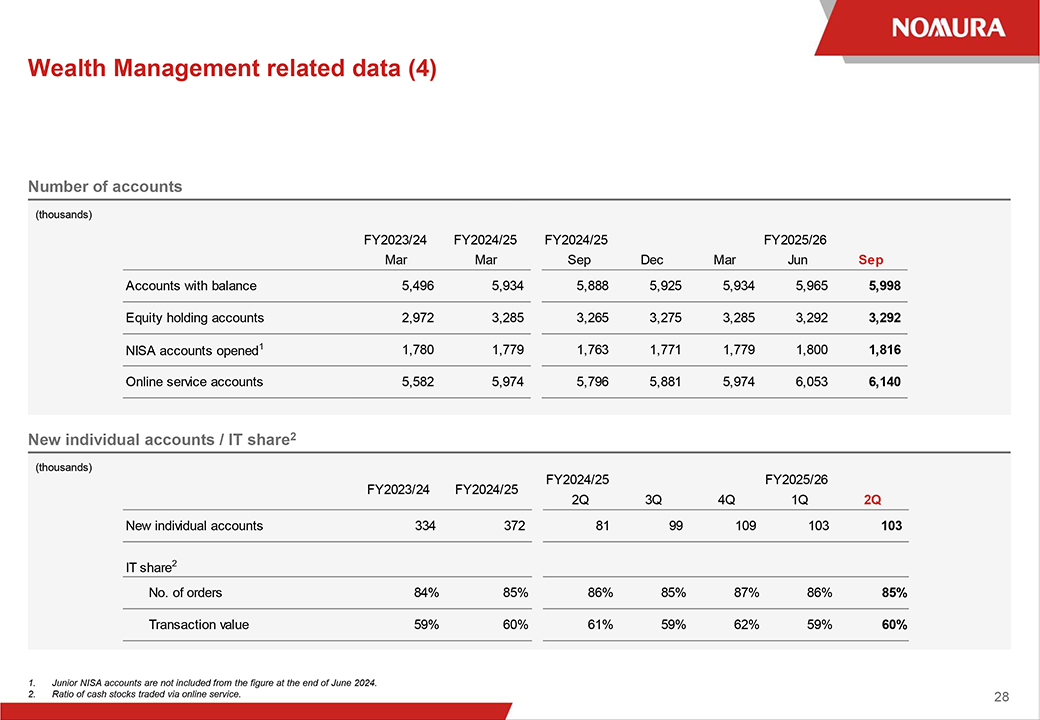
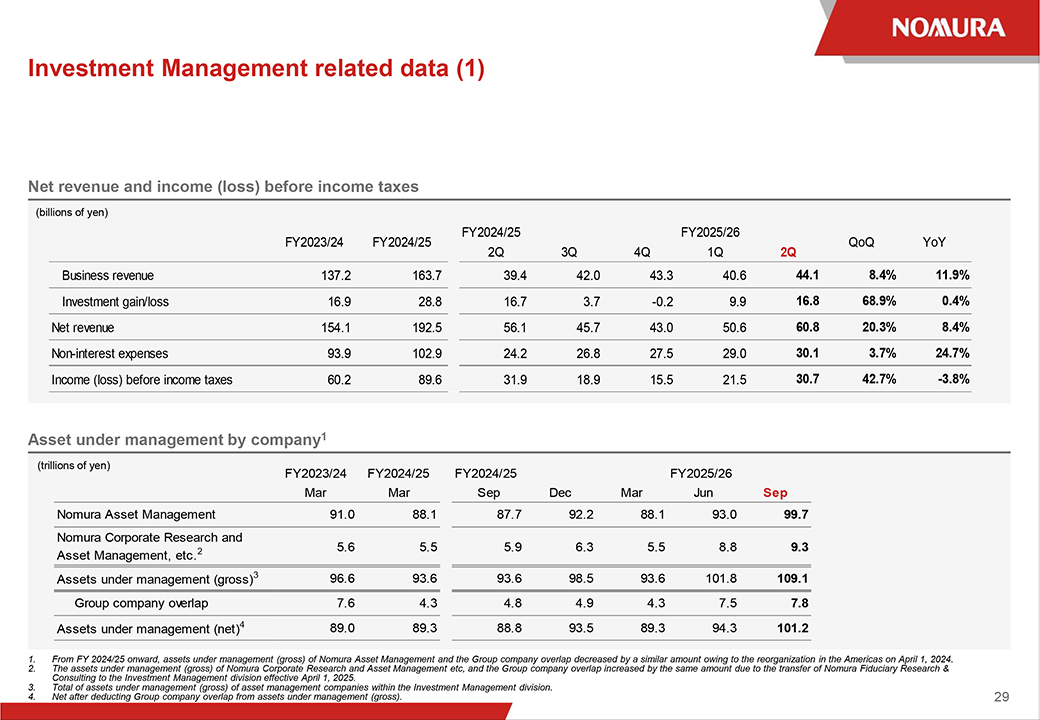
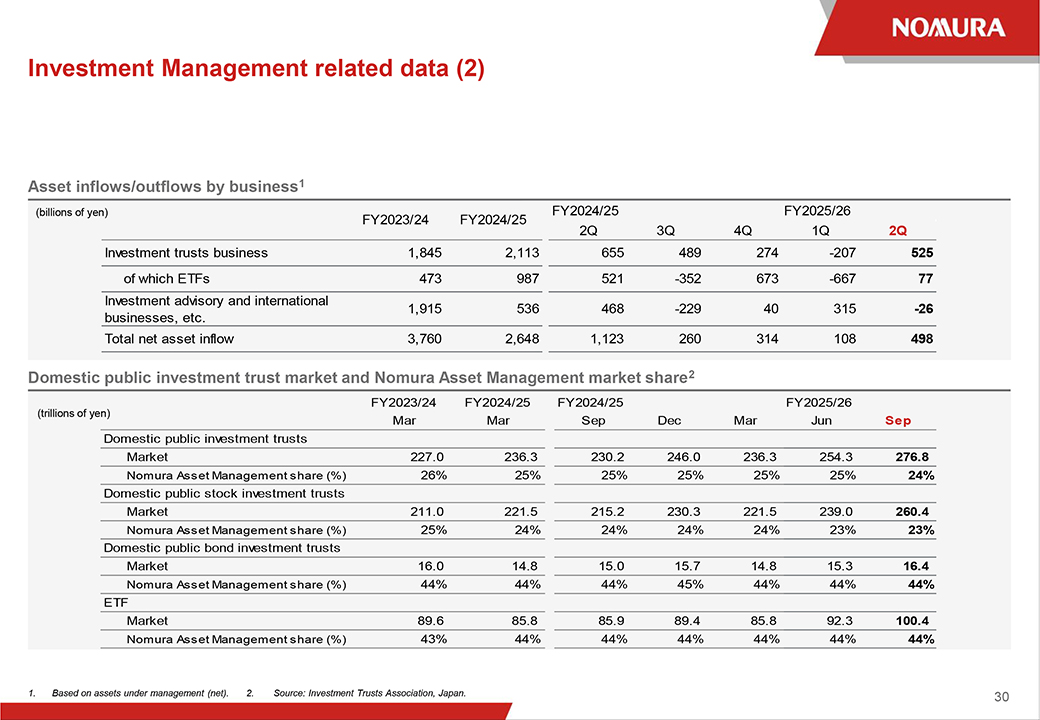
of orders 84% 85% 86% 85% 87% 86% 85% Transaction value 59% 60% 61% 59% 62% 59% 60% 1. Junior NISA accounts are not included from the figure at the end of June 2024. 2. Ratio of cash stocks traded via online service. 28 Investment Management related data (1) Net revenue and income (loss) before income taxes (billions of yen) FY2024/25 FY2025/26 FY2023/24 FY2024/25 QoQ YoY 2Q 3Q 4Q 1Q 2Q Business revenue 137.2 163.7 39.4 42.0 43.3 40.6 44.1 8.4% 11.9% Investment gain/loss 16.9 28.8 16.7 3.7 -0.2 9.9 16.8 68.9% 0.4% Net revenue 154.1 192.5 56.1 45.7 43.0 50.6 60.8 20.3% 8.4% Non-interest expenses 93.9 102.9 24.2 26.8 27.5 29.0 30.1 3.7% 24.7% Income (loss) before income taxes 60.2 89.6 31.9 18.9 15.5 21.5 30.7 42.7% -3.8% Asset under management by company1 (trillions of yen) FY2023/24 FY2024/25 FY2024/25 FY2025/26 Mar Mar Sep Dec Mar Jun Sep Nomura Asset Management 91.0 88.1 87.7 92.2 88.1 93.0 99.7 Nomura Corporate Research and 2 5.6 5.5 5.9 6.3 5.5 8.8 9.3 Asset Management, etc. Assets under management (gross)3 96.6 93.6 93.6 98.5 93.6 101.8 109.1 Group company overlap 7.6 4.3 4.8 4.9 4.3 7.5 7.8 Assets under management (net)4 89.0 89.3 88.8 93.5 89.3 94.3 101.2 1. From FY 2024/25 onward, assets under management (gross) of Nomura Asset Management and the Group company overlap decreased by a similar amount owing to the reorganization in the Americas on April 1, 2024. 2. The assets under management (gross) of Nomura Corporate Research and Asset Management etc, and the Group company overlap increased by the same amount due to the transfer of Nomura Fiduciary Research & Consulting to the Investment Management division effective April 1, 2025. 3. Total of assets under management (gross) of asset management companies within the Investment Management division. 4. Net after deducting Group company overlap from assets under management (gross). 29 Investment Management related data (2) Asset inflows/outflows by business1 (billions of yen) FY2024/25 FY2025/26 FY2023/24 FY2024/25 2Q 3Q 4Q 1Q 2Q Investment trusts business 1,845 2,113 655 489 274 -207 525 of which ETFs 473 987 521 -352 673 -667 77 Investment advisory and international 1,915 536 468 -229 40 315 -26 businesses, etc. Total net asset inflow 3,760 2,648 1,123 260 314 108 498 Domestic public investment trust market and Nomura Asset Management market share2 FY2023/24 FY2024/25 FY2024/25 FY2025/26 (trillions of yen) Mar Mar Sep Dec Mar Jun Sep Domestic public investment trusts Market 227.0 236.3 230.2 246.0 236.3 254.3 276.8 Nomura Asset Management share (%) 26% 25% 25% 25% 25% 25% 24% Domestic public stock investment trusts Market 211.0 221.5 215.2 230.3 221.5 239.0 260.4 Nomura Asset Management share (%) 25% 24% 24% 24% 24% 23% 23% Domestic public bond investment trusts Market 16.0 14.8 15.0 15.7 14.8 15.3 16.4 Nomura Asset Management share (%) 44% 44% 44% 45% 44% 44% 44% ETF Market 89.6 85.8 85.9 89.4 85.8 92.3 100.4 Nomura Asset Management share (%) 43% 44% 44% 44% 44% 44% 44% 1. Based on assets under management (net). 2. Source: Investment Trusts Association, Japan. 30
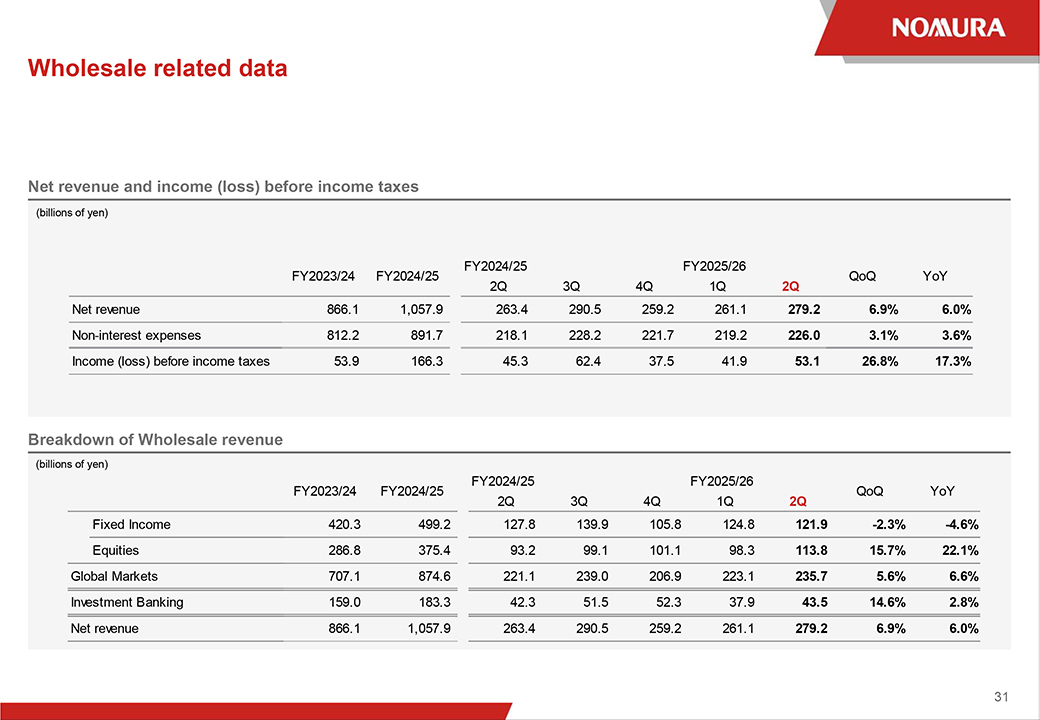
Wholesale related data Net revenue and income (loss) before income taxes (billions of yen) FY2024/25 FY2025/26 FY2023/24 FY2024/25 QoQ YoY 2Q 3Q 4Q 1Q 2Q Net revenue 866.1 1,057.9 263.4 290.5 259.2 261.1 279.2 6.9% 6.0% Non-interest expenses 812.2 891.7 218.1 228.2 221.7 219.2 226.0 3.1% 3.6% Income (loss) before income taxes 53.9 166.3 45.3 62.4 37.5 41.9 53.1 26.8% 17.3% Breakdown of Wholesale revenue (billions of yen) FY2024/25 FY2025/26 FY2023/24 FY2024/25 QoQ YoY 2Q 3Q 4Q 1Q 2Q Fixed Income 420.3 499.2 127.8 139.9 105.8 124.8 121.9 -2.3% -4.6% Equities 286.8 375.4 93.2 99.1 101.1 98.3 113.8 15.7% 22.1% Global Markets 707.1 874.6 221.1 239.0 206.9 223.1 235.7 5.6% 6.6% Investment Banking 159.0 183.3 42.3 51.5 52.3 37.9 43.5 14.6% 2.8% Net revenue 866.1 1,057.9 263.4 290.5 259.2 261.1 279.2 6.9% 6.0% 31 Number of employees FY2023/24 FY2024/25 FY2024/25 FY2025/26 Mar Mar Sep Dec Mar Jun Sep Japan 14,870 14,877 15,045 14,977 14,877 15,317 15,144 Europe 3,053 3,133 3,111 3,114 3,133 3,155 3,173 Americas 2,440 2,417 2,502 2,433 2,417 2,476 2,450 Asia and Oceania1 6,487 6,815 6,724 6,736 6,815 6,960 7,109 Total 26,850 27,242 27,382 27,260 27,242 27,908 27,876 1.

Includes Powai office in India. 32
Disclaimer
This document
is produced by Nomura Holdings, Inc. (“Nomura”).
Nothing in this document shall be considered as an offer to sell or solicitation of an offer to buy
any security, commodity or other instrument, including securities issued by Nomura or any affiliate thereof. Offers to sell, sales, solicitations to buy, or purchases of any securities issued by Nomura or any affiliate thereof may only be made or
entered into pursuant to appropriate offering materials or a prospectus prepared and distributed according to the laws, regulations, rules and market practices of the jurisdictions in which such offers or sales may be made.
The information and opinions contained in this document have been obtained from sources believed to be reliable, but no representations or warranty, express or implied, are made
that such information is accurate or complete and no responsibility or liability can be accepted by Nomura for errors or omissions or for any losses arising from the use of this information.
All rights regarding this document are reserved by Nomura unless otherwise indicated. No part of this document shall be reproduced, stored in a retrieval system or transmitted in
any form or by any means, electronic, mechanical, photocopying, recording or otherwise, without the prior written permission of Nomura.
This document contains
statements that may constitute, and from time to time our management may make “forward-looking statements” within the meaning of the safe harbor provisions of The Private Securities Litigation Reform Act of 1995. Any such statements must
be read in the context of the offering materials pursuant to which any securities may be offered or sold in the United States. These forward-looking statements are not historical facts but instead represent only our belief regarding future events,
many of which, by their nature, are inherently uncertain and outside our control. Actual results and financial condition may differ, possibly materially, from what is indicated in those forward-looking statements. You should not place undue reliance
on any forward-looking statement and should consider all of the following uncertainties and risk factors, as well as those more fully discussed under Nomura’s most recent Annual Report on Form 20-F and
other reports filed with the U.S. Securities and Exchange Commission (“SEC”) that are available on Nomura’s website (https://www.nomura.com) and on the SEC‘s website (https://www.sec.gov); Important risk factors that could
cause actual results to differ from those in specific forward-looking statements include, without limitation, economic and market conditions, political events and investor sentiments, liquidity of secondary markets, level and volatility of interest
rates, currency exchange rates, security valuations, competitive conditions and size, and the number and timing of transactions.
Forward-looking statements speak
only as of the date they are made, and Nomura undertakes no obligation to update any forward-looking statement to reflect the impact of circumstances or events that arise after the date the forward-looking statement was made.
The consolidated financial information in this document is unaudited.

Nomura Holdings, Inc.
www.nomura.com