UNITED STATES
SECURITIES AND EXCHANGE COMMISSION
Washington, D.C. 20549
FORM 8-K
CURRENT REPORT
Pursuant to Section 13 or 15(d)
of The Securities Exchange Act of 1934
Date of Report (Date of earliest event reported): October 30, 2025
Apollo Commercial Real Estate Finance, Inc.
(Exact name of registrant as specified in its charter)
| Maryland | 001-34452 | 27-0467113 | ||
| (State or other jurisdiction of incorporation) |
(Commission File Number) |
(IRS Employer Identification No.) |
| c/o Apollo Global Management, Inc. | ||
| 9 West 57th Street, 42nd Floor | ||
| New York, New York | 10019 | |
| (Address of principal executive offices) | (Zip Code) |
Registrant’s telephone number, including area code: (212) 515-3200
n/a
(Former name or former address, if changed since last report.)
Check the appropriate box below if the Form 8-K filing is intended to simultaneously satisfy the filing obligation of the registrant under any of the following provisions (see General Instruction A.2. below):
| ☐ | Written communications pursuant to Rule 425 under the Securities Act (17 CFR 230.425) |
| ☐ | Soliciting material pursuant to Rule 14a-12 under the Exchange Act (17 CFR 240.14a-12) |
| ☐ | Pre-commencement communications pursuant to Rule 14d-2(b) under the Exchange Act (17 CFR 240.14d-2(b)) |
| ☐ | Pre-commencement communications pursuant to Rule 13e-4(c) under the Exchange Act (17 CFR 240.13e-4(c)) |
Securities registered pursuant to Section 12(b) of the Act:
| Title of each class |
Trading Symbol(s) |
Name of each exchange on which registered |
||
| Common Stock, $0.01 par value | ARI | New York Stock Exchange |
Indicate by check mark whether the registrant is an emerging growth company as defined in Rule 405 of the Securities Act of 1933 (§230.405 of this chapter) or Rule 12b-2 of the Securities Exchange Act of 1934 (§240.12b-2 of this chapter).
Emerging Growth Company ☐
If an emerging growth company, indicate by check mark if the registrant has elected not to use the extended transition period for complying with any new or revised financial accounting standards provided pursuant to Section 13(a) of the Exchange Act. ☐
| Item 2.02 | Results of Operations and Financial Condition. |
On October 30, 2025, Apollo Commercial Real Estate Finance, Inc. (the “Company”) issued a summary press release and a detailed presentation announcing its financial results for the quarter ended September 30, 2025. A copy of the summary press release and the detailed presentation are attached as Exhibit 99.1 and Exhibit 99.2, respectively, hereto and incorporated herein by reference.
The information in Item 2.02 of this Current Report, including Exhibits 99.1 and 99.2, is being furnished and shall not be deemed “filed” for purposes of Section 18 of the Securities Exchange Act of 1934, as amended, or otherwise subject to the liabilities of that Section. The information in this Current Report shall not be incorporated by reference into any registration statement or other document pursuant to the Securities Act of 1933, as amended, unless it is specifically incorporated by reference therein.
| Item 9.01 | Financial Statements and Exhibits. |
(d) Exhibits.
| Exhibit |
Description |
|
| 99.1 | Summary press release dated October 30, 2025 | |
| 99.2 | Financial results presentation dated October 30, 2025 | |
| 104 | Cover Page Interactive Data File (embedded within the Inline XBRL document) | |
SIGNATURES
Pursuant to the requirements of the Securities Exchange Act of 1934, the registrant has duly caused this report to be signed on its behalf by the undersigned hereunto duly authorized.
| Apollo Commercial Real Estate Finance, Inc. | ||
| By: | /s/ Stuart A. Rothstein |
|
| Name: | Stuart A. Rothstein | |
| Title: | President and Chief Executive Officer | |
Date: October 30, 2025
Exhibit 99.1

| CONTACT: | Hilary Ginsberg | |
| Investor Relations | ||
| (212) 822-0767 |
APOLLO COMMERCIAL REAL ESTATE FINANCE, INC.
REPORTS THIRD QUARTER 2025 RESULTS
New York, NY, October 30, 2025 – Apollo Commercial Real Estate Finance, Inc. (the “Company” or “ARI”) (NYSE: ARI) today reported results for the quarter and nine months ended September 30, 2025.
Net income attributable to common stockholders per diluted share of common stock was $0.34 for the quarter ended September 30, 2025. Distributable Earnings (a non-GAAP financial measure defined below), and Distributable Earnings prior to realized loss on investments and realized gain on litigation settlement per diluted share of common stock was $0.30 and $0.23 for the quarter ended September 30, 2025, respectively.
Commenting on third quarter 2025 performance, Stuart Rothstein, Chief Executive Officer and President of the Company, said: “With $1.0 billion of new loan originations during the quarter ARI continued to benefit from the strength of the Apollo real estate credit platform. There was also continued progress in freeing up non-performing capital for redeployment and we expect the resulting benefit to earnings to begin materializing in the fourth quarter”
ARI issued a detailed presentation of the Company’s quarter ended September 30, 2025 results, which can be viewed at www.apollocref.com.
Conference Call and Webcast
The Company will hold a conference call to review third quarter results on October 31, 2025 at 10am ET. To register for the call, please use the following link:
https://register-conf.media-server.com/register/BIfd7586302b66496f949a42c77ef14a7e
After you register, you will receive a dial-in number and unique pin. The Company will also post a link in the Stockholders’ section on ARI’s website for a live webcast. For those unable to listen to the live call or webcast, there will be a webcast replay link posted in the Stockholders’ section on ARI’s website approximately two hours after the call.
Distributable Earnings
“Distributable Earnings,” a non-GAAP financial measure, is defined as net income available to common stockholders, computed in accordance with GAAP, adjusted for (i) equity-based compensation expense (a portion of which may become cash-based upon final vesting and settlement of awards should the holder elect net share settlement to satisfy income tax withholding), (ii) any unrealized gains or losses or other non-cash items (including depreciation and amortization related to real estate owned) included in net income available to common stockholders, (iii) unrealized income from unconsolidated joint ventures, (iv) foreign currency gains (losses), other than (a) realized gains/(losses) related to interest income, and (b) forward point gains/(losses) realized on the Company’s foreign currency hedges, and (v) provision for current expected credit losses.
As a REIT, U.S. federal income tax law generally requires the Company to distribute annually at least 90% of its REIT taxable income, without regard to the deduction for dividends paid and excluding net capital gains, and that the Company pay tax at regular corporate rates to the extent that it annually distributes less than 100% of its net taxable income.
Given these requirements and the Company’s belief that dividends are generally one of the principal reasons shareholders invest in a REIT, the Company generally intends over time to pay dividends to its stockholders in an amount equal to its net taxable income, if and to the extent authorized by the Company’s board of directors. Distributable Earnings is a key factor considered by the Company’s board of directors in setting the dividend and as such the Company believes Distributable Earnings is useful to investors.
The Company believes it is useful to its investors to also present Distributable Earnings prior to realized loss on investments and realized gain from litigation settlement, in applicable periods, to reflect its operating results because (i) the Company’s operating results are primarily comprised of earning interest income on its investments net of borrowing and administrative costs, which comprise the Company’s ongoing operations and (ii) it has been a useful factor related to the Company’s dividend per share because it is one of the considerations when a dividend is determined. The Company believes that its investors use Distributable Earnings and Distributable Earnings prior to realized loss on investments and realized gain from litigation settlement or a comparable supplemental performance measure, to evaluate and compare the performance of the Company and its peers.
During the nine months ended September 30, 2025, the Company recorded realized losses related to the discounted payoff of a subordinate loan secured by a pledge of equity interest in the entity owning an office, and the discounted sale of a promissory note previously recorded as Note receivable, held for sale. In addition, the Company recorded a realized gain related to a litigation settlement of a hospital property taken by eminent domain.
A significant limitation associated with Distributable Earnings as a measure of the Company’s financial performance over any period is that it excludes unrealized gains (losses) from investments. In addition, the Company’s presentation of Distributable Earnings may not be comparable to similarly titled measures of other companies, that use different calculations. As a result, Distributable Earnings should not be considered as a substitute for the Company’s GAAP net income as a measure of its financial performance or any measure of its liquidity under GAAP. Distributable Earnings are reduced for realized losses on loans which include losses that management believes are near certain to be realized.
A reconciliation of Distributable Earnings to GAAP net income (loss) available to common stockholders is included in the detailed presentation of the Company’s quarter ended September 30, 2025 results, which can be viewed at www.apollocref.com.
About Apollo Commercial Real Estate Finance, Inc.
Apollo Commercial Real Estate Finance, Inc. (NYSE: ARI) is a real estate investment trust that primarily originates, acquires, invests in and manages performing commercial first mortgage loans, subordinate financings and other commercial real estate-related debt investments. The Company is externally managed and advised by ACREFI Management, LLC, a Delaware limited liability company and an indirect subsidiary of Apollo Global Management, Inc., a high-growth, global alternative asset manager with approximately $840 billion of assets under management at June 30, 2025.
Additional information can be found on the Company’s website at www.apollocref.com.
Forward-Looking Statements
Certain statements contained in this press release constitute forward-looking statements as such term is defined in Section 27A of the Securities Act of 1933, as amended, and Section 21E of the Securities Exchange Act of 1934, as amended, and such statements are intended to be covered by the safe harbor provided by the same. Forward-looking statements are subject to substantial risks and uncertainties, many of which are difficult to predict and are generally beyond the Company’s control. These forward-looking statements include information about possible or assumed future results of the Company’s business, financial condition, liquidity, results of operations, plans and objectives. When used in this release, the words believe, expect, anticipate, estimate, plan, continue, intend, should, may or similar expressions, are intended to identify forward-looking statements. Statements regarding the following subjects, among others, may be forward-looking: higher interest rates and inflation; market trends in the Company’s industry, real estate values, the debt securities markets or the general economy; the timing and amounts of expected future fundings of unfunded commitments; the return on equity; the yield on investments; the ability to borrow to finance assets; the Company’s ability to deploy the proceeds of its capital raises or acquire its target assets; and risks associated with investing in real estate assets, including changes in business conditions and the general economy. For a further list and description of such risks and uncertainties, see the reports filed by the Company with the Securities and Exchange Commission. The forward-looking statements, and other risks, uncertainties and factors are based on the Company’s beliefs, assumptions and expectations of its future performance, taking into account all information currently available to the Company. Forward-looking statements are not predictions of future events. The Company disclaims any intention or obligation to update or revise any forward-looking statements, whether as a result of new information, future events or otherwise, except as required by law.
Exhibit 99.2 Q3 2025 Financial Results Apollo Commercial Real Estate Finance, Inc. October 30, 2025 Unless otherwise noted, information as of September 30, 2025 It should not be assumed that investments made in the future will be profitable or will equal the performance of the investments shown in this document.

Forward Looking Statements and Other Disclosures This presentation may contain forward-looking statements that are within the meaning of Section 27A of the Securities Act of 1933, as amended, and Section 21E of the Securities Exchange Act of 1934, as amended, and such statements are intended to be covered by the safe harbor provided by the same. Forward-looking statements are subject to substantial risks and uncertainties, many of which are difficult to predict and are generally beyond management’s control. These forward-looking statements may include information about possible or assumed future results of Apollo Commercial Real Estate Finance, Inc.’s (the “Company,” “ARI,” “we,” “us” and “our”) business, financial condition, liquidity, results of operations, plans and objectives. When used in this presentation, the words “believe,” “expect,” “anticipate,” “estimate,” “plan,” “continue,” “intend,” “should,” “may” or similar expressions, are intended to identify forward-looking statements. Statements regarding the following subjects, among others, may be forward-looking: higher interest rates and inflation; market trends in our industry, real estate values, the debt securities markets or the general economy; ARI’s business and investment strategy; ARI’s operating results; ARI’s ability to obtain and maintain financing arrangements; the timing and amounts of expected future fundings of unfunded commitments; and the return on equity, the yield on investments and risks associated with investing in real estate assets including changes in business conditions and the general economy. The forward-looking statements are based on management’s beliefs, assumptions and expectations of future performance, taking into account all information currently available to ARI. Forward-looking statements are not predictions of future events. These beliefs, assumptions and expectations can change as a result of many possible events or factors, not all of which are known to ARI. Some of these factors are described under “Risk Factors,” and “Management’s Discussion and Analysis of Financial Condition and Results of Operations” included in ARI’s Annual Report on Form 10-K for the year ended December 31, 2024 and other filings with the Securities and Exchange Commission (“SEC”), which are accessible on the SEC’s website at www.sec.gov. If a change occurs, ARI’s business, financial condition, liquidity and results of operations may vary materially from those expressed in ARI’s forward-looking statements. Any forward-looking statement speaks only as of the date on which it is made. New risks and uncertainties arise over time, and it is not possible for management to predict those events or how they may affect ARI. Except as required by law, ARI is not obligated to, and does not intend to, update or revise any forward-looking statements, whether as a result of new information, future events or otherwise. This presentation contains information regarding ARI’s financial results that is calculated and presented on the basis of methodologies other than in accordance with accounting principles generally accepted in the United States (“GAAP”), including Distributable Earnings and Distributable Earnings per share. Please refer to page 22 for a definition of “Distributable Earnings” and the reconciliation of the applicable GAAP financial measures to non-GAAP financial measures set forth on page 21. This presentation may contain statistics and other data that in some cases has been obtained from or compiled from information made available by third-party service providers. ARI makes no representation or warranty, expressed or implied, with respect to the accuracy, reasonableness or completeness of such information. Past performance is not indicative nor a guarantee of future returns. Index performance and yield data are shown for illustrative purposes only and have limitations when used for comparison or for other purposes due to, among other matters, volatility, credit or other factors (such as number and types of securities). Indices are unmanaged, do not charge any fees or expenses, assume reinvestment of income and do not employ special investment techniques such as leveraging or short selling. No such index is indicative of the future results of any investment by ARI. Unless the context requires otherwise, references in this presentation to “Apollo” refer to Apollo Global Management, Inc., together with its subsidiaries, and references in this presentation to the “Manager” refer to ACREFI Management, LLC, an indirect subsidiary of Apollo Global Management, Inc. 2

Q3 Summary Results Ø Net income available to common stockholders of $48 million, or $0.34 per diluted share of common stock 1 Ø Distributable Earnings prior to realized loss on investments and realized gain on litigation settlement of $32 million, or $0.23 per diluted share of common stock Financial Results 1 Ø Distributable Earnings of $42 million, or $0.30 per diluted share of common stock 2 Ø Declared common stock dividends of $0.25 per share, which implies a dividend yield of 9.9% 3 Ø Total loan portfolio of $8.3 billion with weighted-average (“w/a”) unlevered all-in yield of 7.7% – 98% first mortgages – 98% floating rate Ø W/A risk rating of 3.0 Loan Portfolio (a) (a) (a) (a) Ø Committed $3.0 billion ($2.2 billion funded at close) to new loans year-to-date, $1.0 billion ($807 million funded at close) in Q3 Ø Loan repayments and sales of $2.1 billion year-to date, $1.3 billion in Q3 5 Ø Gross add-on fundings of $702 million year-to date, $234 million in Q3 (b) Ø Ended the quarter with total common equity book value of $1.8 billion (c) Capitalization Ø Ended the quarter with $312 million of total liquidity, including $259 million of cash and $53 million available leverage on our secured debt arrangements & Ø Closed one new secured credit facility which provided an additional $280 million of borrowing capacity Liquidity Ø Increased the borrowing capacity under our revolving credit facility by $115 million to $275 million and extended the maturity date through August 2028 (a) (a) Ø Committed $388 million ($324 million funded at close) to two floating-rate first mortgages Subsequent Events th Ø Three units at 111 West 57 Street closed, resulting in ~$54 million net sales proceeds which further reduced ARI’s loan basis a) Represents USD equivalent based on foreign exchange rates as of date funded or commitment closed b) Reflects book value per share (excluding General CECL Allowance and depreciation) of $12.73 multiplied by shares of common stock outstanding (see page 4 for book value per share overview) c) Includes loan proceeds held by servicer 3 See footnotes on page 22
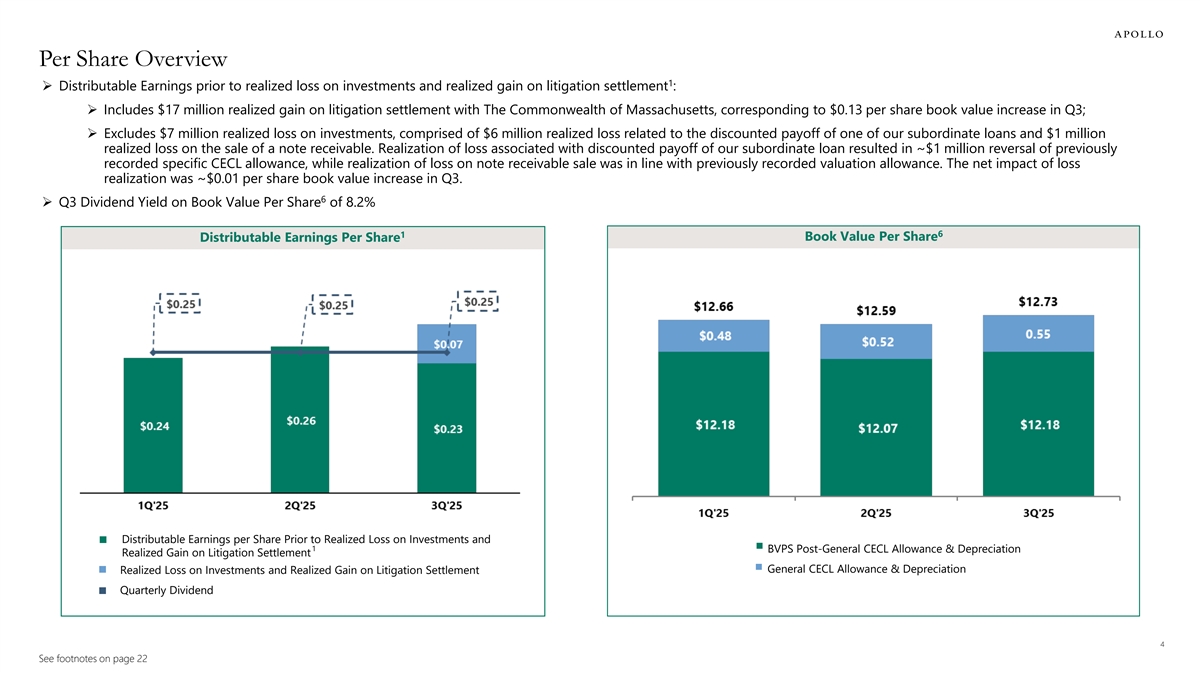
Per Share Overview 1 Ø Distributable Earnings prior to realized loss on investments and realized gain on litigation settlement : Ø Includes $17 million realized gain on litigation settlement with The Commonwealth of Massachusetts, corresponding to $0.13 per share book value increase in Q3; Ø Excludes $7 million realized loss on investments, comprised of $6 million realized loss related to the discounted payoff of one of our subordinate loans and $1 million realized loss on the sale of a note receivable. Realization of loss associated with discounted payoff of our subordinate loan resulted in ~$1 million reversal of previously recorded specific CECL allowance, while realization of loss on note receivable sale was in line with previously recorded valuation allowance. The net impact of loss realization was ~$0.01 per share book value increase in Q3. 6 Ø Q3 Dividend Yield on Book Value Per Share of 8.2% 1 6 Book Value Per Share Distributable Earnings Per Share Distributable Earnings per Share Prior to Realized Loss on Investments and § 1 BVPS Post-General CECL Allowance & Depreciation § Realized Gain on Litigation Settlement General CECL Allowance & Depreciation Realized Loss on Investments and Realized Gain on Litigation Settlement§ § Quarterly Dividend § 4 See footnotes on page 22
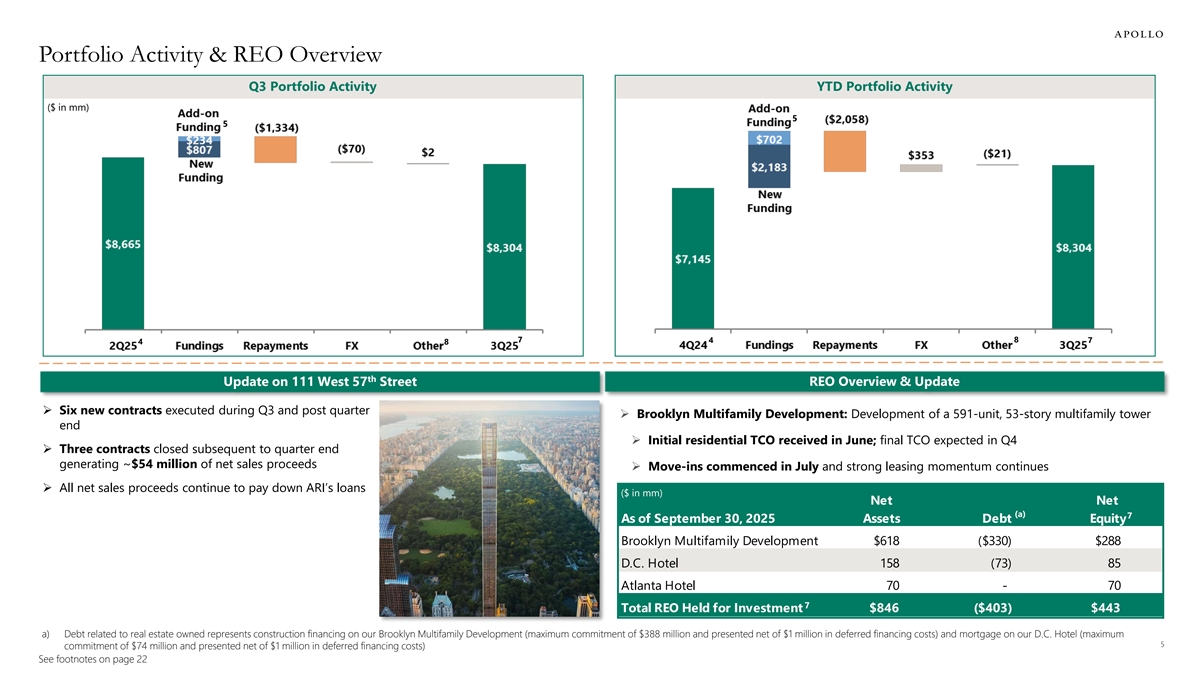
Portfolio Activity & REO Overview Q3 Portfolio Activity YTD Portfolio Activity ($ in mm) 5 5 7 8 7 4 4 8 th Update on 111 West 57 Street REO Overview & Update Ø Six new contracts executed during Q3 and post quarter Ø Brooklyn Multifamily Development: Development of a 591-unit, 53-story multifamily tower end Ø Initial residential TCO received in June; final TCO expected in Q4 Ø Three contracts closed subsequent to quarter end generating ~$54 million of net sales proceeds Ø Move-ins commenced in July and strong leasing momentum continues Ø All net sales proceeds continue to pay down ARI’s loans ($ in mm) Net Net (a) 7 As of September 30, 2025 Assets Debt Equity Brooklyn Multifamily Development $618 ($330) $288 D.C. Hotel 158 (73) 85 Atlanta Hotel 70 - 70 7 Total REO Held for Investment $846 ($403) $443 a) Debt related to real estate owned represents construction financing on our Brooklyn Multifamily Development (maximum commitment of $388 million and presented net of $1 million in deferred financing costs) and mortgage on our D.C. Hotel (maximum 5 commitment of $74 million and presented net of $1 million in deferred financing costs) See footnotes on page 22
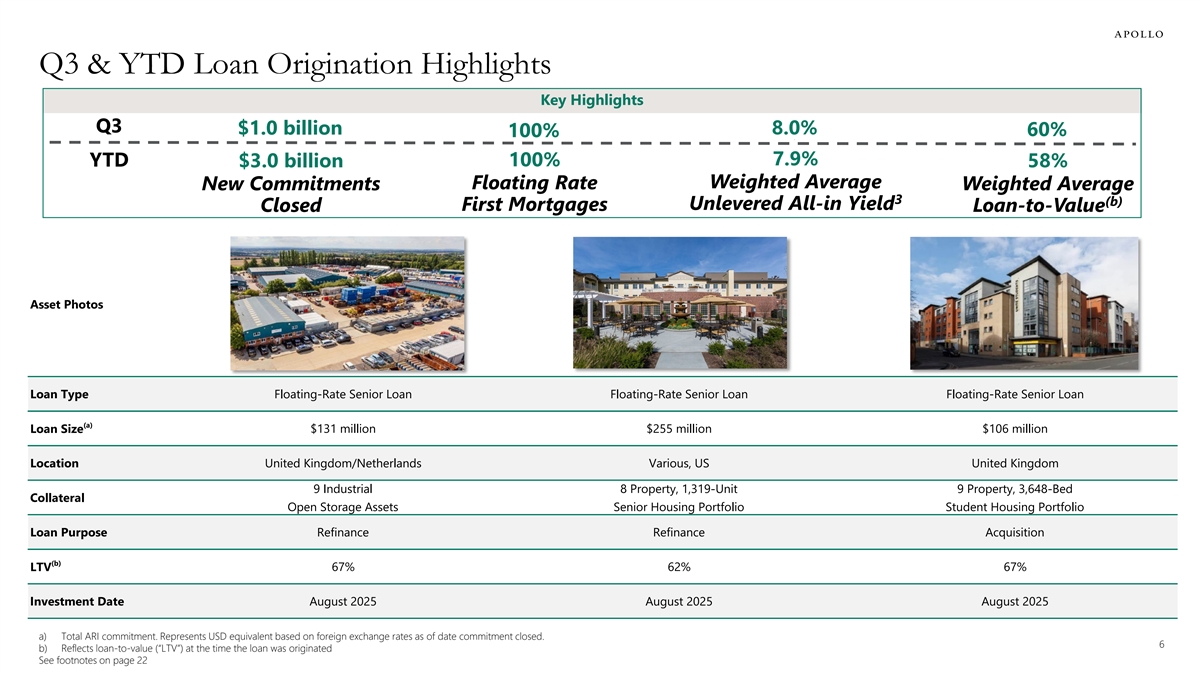
Q3 & YTD Loan Origination Highlights Key Highlights Q3 $1.0 billion 8.0% 60% 100% ] 7.9% YTD 100% $3.0 billion 58% ] Weighted Average New Commitments Floating Rate Weighted Average 3 (b) Unlevered All-in Yield First Mortgages Closed Loan-to-Value Asset Photos Loan Type Floating-Rate Senior Loan Floating-Rate Senior Loan Floating-Rate Senior Loan (a) $131 million $255 million $106 million Loan Size Location United Kingdom/Netherlands Various, US United Kingdom 9 Industrial 8 Property, 1,319-Unit 9 Property, 3,648-Bed Collateral Open Storage Assets Senior Housing Portfolio Student Housing Portfolio Loan Purpose Refinance Refinance Acquisition (b) LTV 67% 62% 67% Investment Date August 2025 August 2025 August 2025 a) Total ARI commitment. Represents USD equivalent based on foreign exchange rates as of date commitment closed. 6 b) Reflects loan-to-value (“LTV”) at the time the loan was originated See footnotes on page 22

Q3 & YTD’25 Loan Origination Highlights (cont.) Asset Photos Loan Type Floating-Rate Senior Loan Floating-Rate Senior Loan Floating-Rate Senior Loan (a) Loan Size $128 million $185 million $150 million Location West Southeast New York City 671-Key, Full Service Collateral 42-Story Residential Tower 374-Key Upscale Hotel Upscale Hotel Loan Purpose Refinance Refinance Acquisition (b) LTV 51% 51% 58% Investment Date August 2025 September 2025 September 2025 a) Total ARI commitment. Total ARI commitment. Represents USD equivalent based on foreign exchange rates as of date commitment closed. 7 b) Reflects LTV at the time the loan was originated See footnotes on page 22

Loan Portfolio Overview Carrying Value/ W/A Unlevered All-in Yield 9 Loan Position 3,9,(a) Number of Loans on Loan Portfolio 98% First Mortgage $8.3 billion/54 Loans 7.7% W/A Remaining Fully-Extended 9 (b) W/A Portfolio Risk Rating W/A Portfolio Loan-to-Value 9,10 Term 3.0 57% 3.0 Years 9 9 Collateral Diversification Origination Vintage (c) $2,258 Other 54% of Mixed Use (e) Retail 4% portfolio originated 4% 4% post-2022 (d) Residential $1,633 Data Centers 31% $1,508 5% $1,052 Industrial 10% $716 $459 $283 $265 Hotel 17% $96 $73 $0 $0 Office 25% 2014 2015 2016 2017 2018 2019 2020 2021 2022 2023 2024 2025 a) Excludes benefit of forward points on currency hedges related to loans denominated in currencies other than USD b) W/A LTV reflects the LTV at the time the loan was originated; based on amortized cost and excludes risk-rated 5 loans c) Other property types include pubs (3%) and urban predevelopment (1%) d) Residential property types include senior housing (11%), multifamily (9%), student housing (5%), residential-for-sale (4%) and vacation rentals (2%) 8 e) Retail property types include urban retail (2%) and lifestyle center (2%) See footnotes on page 22
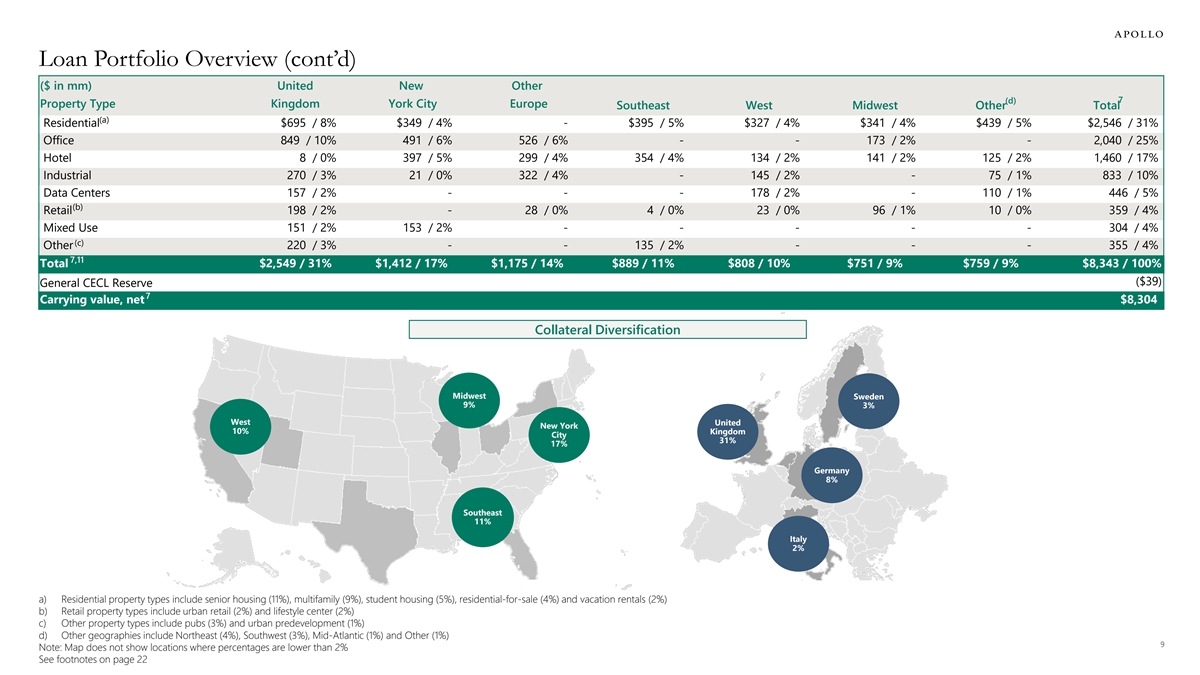
Loan Portfolio Overview (cont’d) ($ in mm) United New Other 7 (d) Property Type Kingdom York City Europe Southeast West Midwest Other Total (a) Residential $695 / 8% $349 / 4% - $395 / 5% $327 / 4% $341 / 4% $439 / 5% $2,546 / 31% Office 849 / 10% 491 / 6% 526 / 6% - - 173 / 2% - 2,040 / 25% Hotel 8 / 0% 397 / 5% 299 / 4% 354 / 4% 134 / 2% 141 / 2% 125 / 2% 1,460 / 17% Industrial 270 / 3% 21 / 0% 322 / 4% - 145 / 2% - 75 / 1% 833 / 10% Data Centers 157 / 2% - - - 178 / 2% - 110 / 1% 446 / 5% (b) Retail 198 / 2% - 28 / 0% 4 / 0% 23 / 0% 96 / 1% 10 / 0% 359 / 4% Mixed Use 151 / 2% 153 / 2% - - - - - 304 / 4% (c) Other 220 / 3% - - 135 / 2% - - - 355 / 4% 7,11 Total $2,549 / 31% $1,412 / 17% $1,175 / 14% $889 / 11% $808 / 10% $751 / 9% $759 / 9% $8,343 / 100% ($39) General CECL Reserve 7 Carrying value, net $8,304 Collateral Diversification Midwest Sweden 9% 3% West United New York 10% Kingdom City 31% 17% Germany 8% Southeast 11% Italy 2% a) Residential property types include senior housing (11%), multifamily (9%), student housing (5%), residential-for-sale (4%) and vacation rentals (2%) b) Retail property types include urban retail (2%) and lifestyle center (2%) c) Other property types include pubs (3%) and urban predevelopment (1%) d) Other geographies include Northeast (4%), Southwest (3%), Mid-Atlantic (1%) and Other (1%) 9 Note: Map does not show locations where percentages are lower than 2% See footnotes on page 22
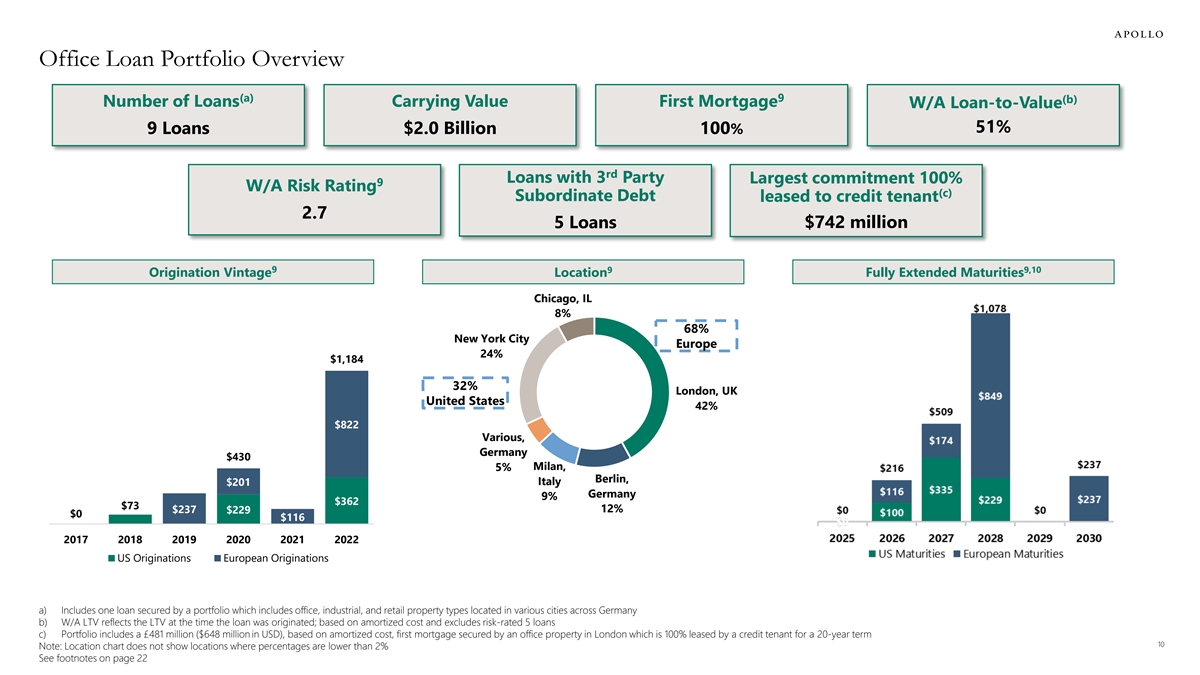
Office Loan Portfolio Overview (a) 9 (b) Number of Loans Carrying Value First Mortgage W/A Loan-to-Value 51% 9 Loans $2.0 Billion 100% rd Loans with 3 Party Largest commitment 100% 9 W/A Risk Rating (c) Subordinate Debt leased to credit tenant 2.7 5 Loans $742 million 9 9 9,10 Origination Vintage Location Fully Extended Maturities Chicago, IL 8% 68% New York City Europe 24% $1,184 32% London, UK United States 42% $822 Various, Germany $430 Milan, 5% Berlin, Italy $201 Germany 9% $362 $73 12% $237 $229 $0 $116 2017 2018 2019 2020 2021 2022 US Originations European Originations a) Includes one loan secured by a portfolio which includes office, industrial, and retail property types located in various cities across Germany b) W/A LTV reflects the LTV at the time the loan was originated; based on amortized cost and excludes risk-rated 5 loans c) Portfolio includes a £481 million ($648 million in USD), based on amortized cost, first mortgage secured by an office property in London which is 100% leased by a credit tenant for a 20-year term 10 Note: Location chart does not show locations where percentages are lower than 2% See footnotes on page 22
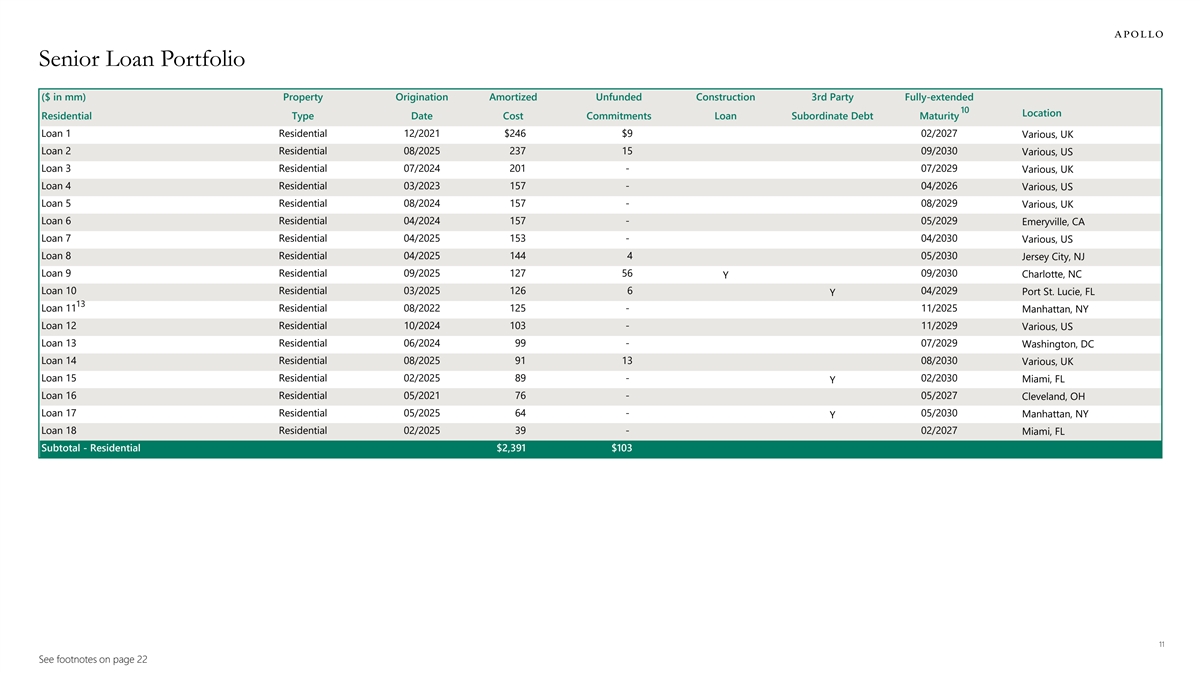
Senior Loan Portfolio ($ in mm) Property Origination Amortized Unfunded Construction 3rd Party Fully-extended 10 Location Residential Type Date Cost Commitments Loan Subordinate Debt Maturity Loan 1 Residential 12/2021 $246 $9 02/2027 Various, UK Loan 2 Residential 08/2025 237 15 09/2030 Various, US Loan 3 Residential 07/2024 201 - 07/2029 Various, UK Loan 4 Residential 03/2023 157 - 04/2026 Various, US Loan 5 Residential 08/2024 157 - 08/2029 Various, UK Loan 6 Residential 04/2024 157 - 05/2029 Emeryville, CA Loan 7 Residential 04/2025 153 - 04/2030 Various, US Loan 8 Residential 04/2025 144 4 05/2030 Jersey City, NJ Loan 9 Residential 09/2025 127 56 09/2030 Charlotte, NC Y Loan 10 Residential 03/2025 126 6 04/2029 Port St. Lucie, FL Y 13 Loan 11 Residential 08/2022 125 - 11/2025 Manhattan, NY Loan 12 Residential 10/2024 103 - 11/2029 Various, US Loan 13 Residential 06/2024 99 - 07/2029 Washington, DC Loan 14 Residential 08/2025 91 13 08/2030 Various, UK Loan 15 Residential 02/2025 89 - 02/2030 Miami, FL Y Loan 16 Residential 05/2021 76 - 05/2027 Cleveland, OH Loan 17 Residential 05/2025 64 - 05/2030 Manhattan, NY Y Loan 18 Residential 02/2025 39 - 02/2027 Miami, FL Subtotal - Residential $2,391 $103 11 See footnotes on page 22
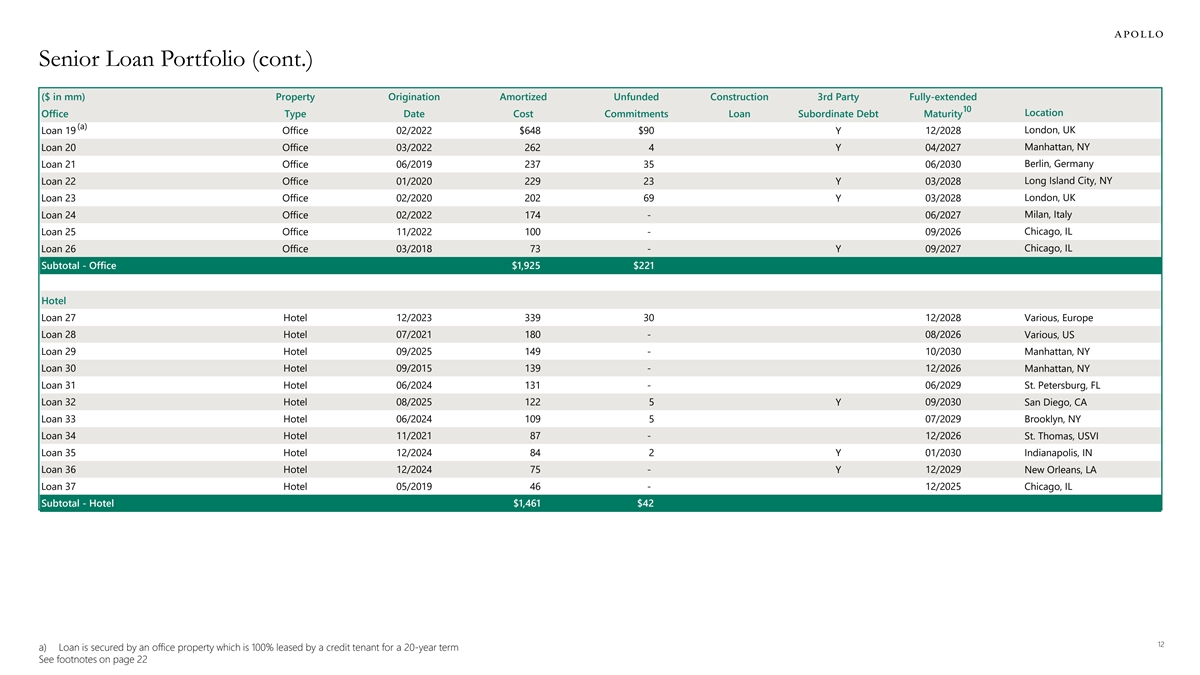
Senior Loan Portfolio (cont.) ($ in mm) Property Origination Amortized Unfunded Construction 3rd Party Fully-extended 10 Location Office Type Date Cost Commitments Loan Subordinate Debt Maturity (a) Loan 19 Office 02/2022 $648 $90 Y 12/2028 London, UK Manhattan, NY Loan 20 Office 03/2022 262 4 Y 04/2027 Loan 21 Office 06/2019 237 35 06/2030 Berlin, Germany Long Island City, NY Loan 22 Office 01/2020 229 23 Y 03/2028 Loan 23 Office 02/2020 202 69 03/2028 London, UK Y Milan, Italy Loan 24 Office 02/2022 174 - 06/2027 Loan 25 Office 11/2022 100 - 09/2026 Chicago, IL Chicago, IL Loan 26 Office 03/2018 73 - Y 09/2027 Subtotal - Office $1,925 $221 Hotel Loan 27 Hotel 12/2023 339 30 12/2028 Various, Europe Loan 28 Hotel 07/2021 180 - 08/2026 Various, US Loan 29 Hotel 09/2025 149 - 10/2030 Manhattan, NY Loan 30 Hotel 09/2015 139 - 12/2026 Manhattan, NY Loan 31 Hotel 06/2024 131 - 06/2029 St. Petersburg, FL Loan 32 Hotel 08/2025 122 5 Y 09/2030 San Diego, CA Loan 33 Hotel 06/2024 109 5 07/2029 Brooklyn, NY Loan 34 Hotel 11/2021 87 - 12/2026 St. Thomas, USVI Loan 35 Hotel 12/2024 84 2 Y 01/2030 Indianapolis, IN Loan 36 Hotel 12/2024 75 - Y 12/2029 New Orleans, LA Loan 37 Hotel 05/2019 46 - 12/2025 Chicago, IL Subtotal - Hotel $1,461 $42 12 a) Loan is secured by an office property which is 100% leased by a credit tenant for a 20-year term See footnotes on page 22
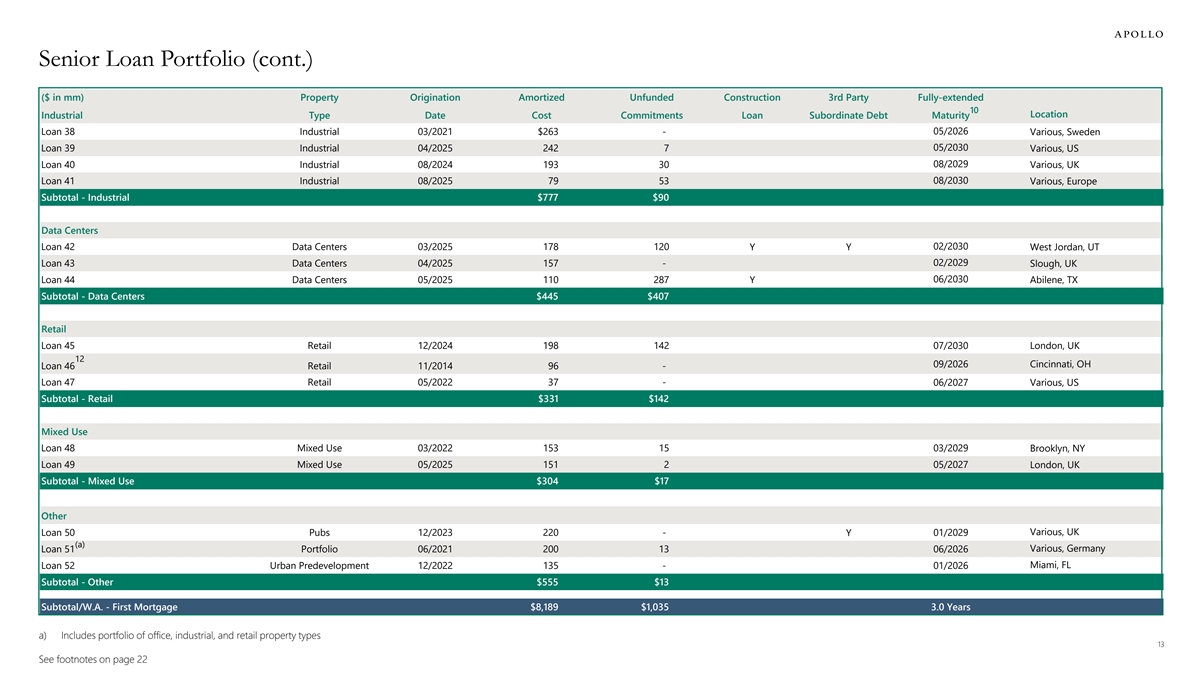
Senior Loan Portfolio (cont.) ($ in mm) Property Origination Amortized Unfunded Construction 3rd Party Fully-extended 10 Location Industrial Type Date Cost Commitments Loan Subordinate Debt Maturity Loan 38 Industrial 03/2021 $263 - 05/2026 Various, Sweden Loan 39 Industrial 04/2025 242 7 05/2030 Various, US Loan 40 Industrial 08/2024 193 30 08/2029 Various, UK 08/2030 Loan 41 Industrial 08/2025 79 53 Various, Europe Subtotal - Industrial $777 $90 Data Centers Loan 42 Data Centers 03/2025 178 120 Y Y 02/2030 West Jordan, UT Loan 43 Data Centers 04/2025 157 - 02/2029 Slough, UK 06/2030 Loan 44 Data Centers 05/2025 110 287 Y Abilene, TX Subtotal - Data Centers $445 $407 Retail Loan 45 Retail 12/2024 198 142 07/2030 London, UK 12 09/2026 Cincinnati, OH Loan 46 Retail 11/2014 96 - Loan 47 Retail 05/2022 37 - 06/2027 Various, US Subtotal - Retail $331 $142 Mixed Use Loan 48 Mixed Use 03/2022 153 15 03/2029 Brooklyn, NY Loan 49 Mixed Use 05/2025 151 2 05/2027 London, UK Subtotal - Mixed Use $304 $17 Other Various, UK Loan 50 Pubs 12/2023 220 - Y 01/2029 (a) Loan 51 Portfolio 06/2021 200 13 06/2026 Various, Germany Loan 52 Urban Predevelopment 12/2022 135 - 01/2026 Miami, FL Subtotal - Other $555 $13 Subtotal/W.A. - First Mortgage $8,189 $1,035 3.0 Years a) Includes portfolio of office, industrial, and retail property types 13 See footnotes on page 22
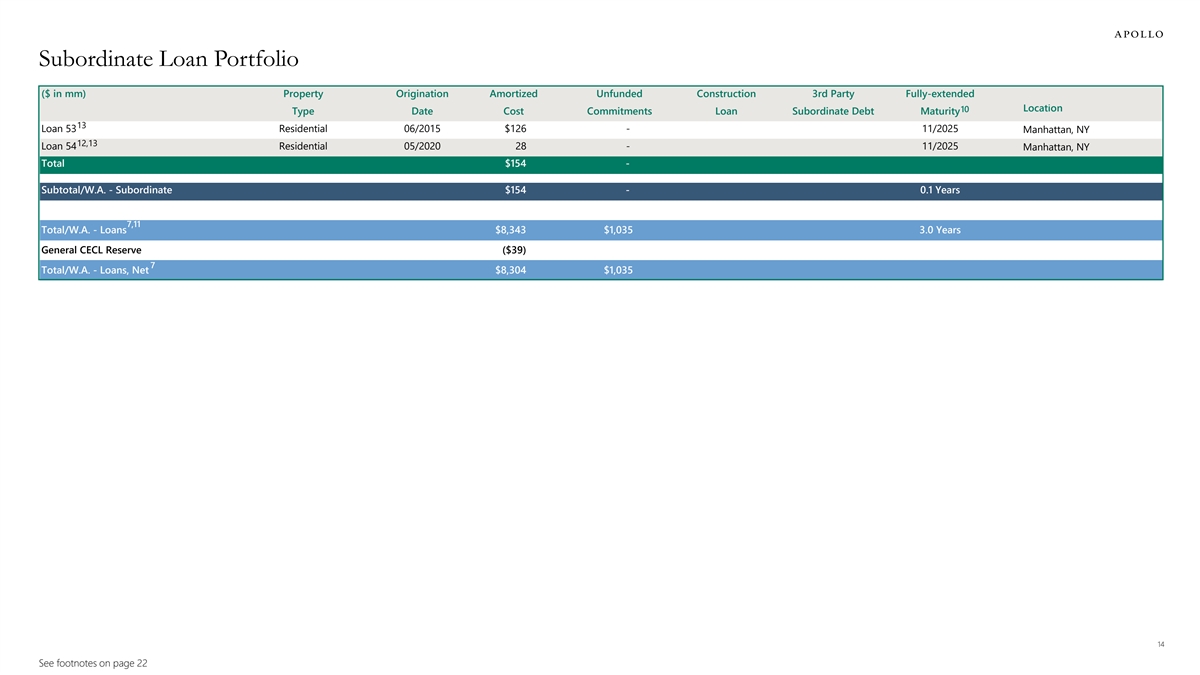
Subordinate Loan Portfolio ($ in mm) Property Origination Amortized Unfunded Construction 3rd Party Fully-extended Location 10 Type Date Cost Commitments Loan Subordinate Debt Maturity 13 Loan 53 Residential 06/2015 $126 - 11/2025 Manhattan, NY 12,13 Loan 54 Residential 05/2020 28 - 11/2025 Manhattan, NY Total $154 - Subtotal/W.A. - Subordinate $154 - 0.1 Years 7,11 Total/W.A. - Loans $8,343 $1,035 3.0 Years General CECL Reserve ($39) 7 Total/W.A. - Loans, Net $8,304 $1,035 14 See footnotes on page 22
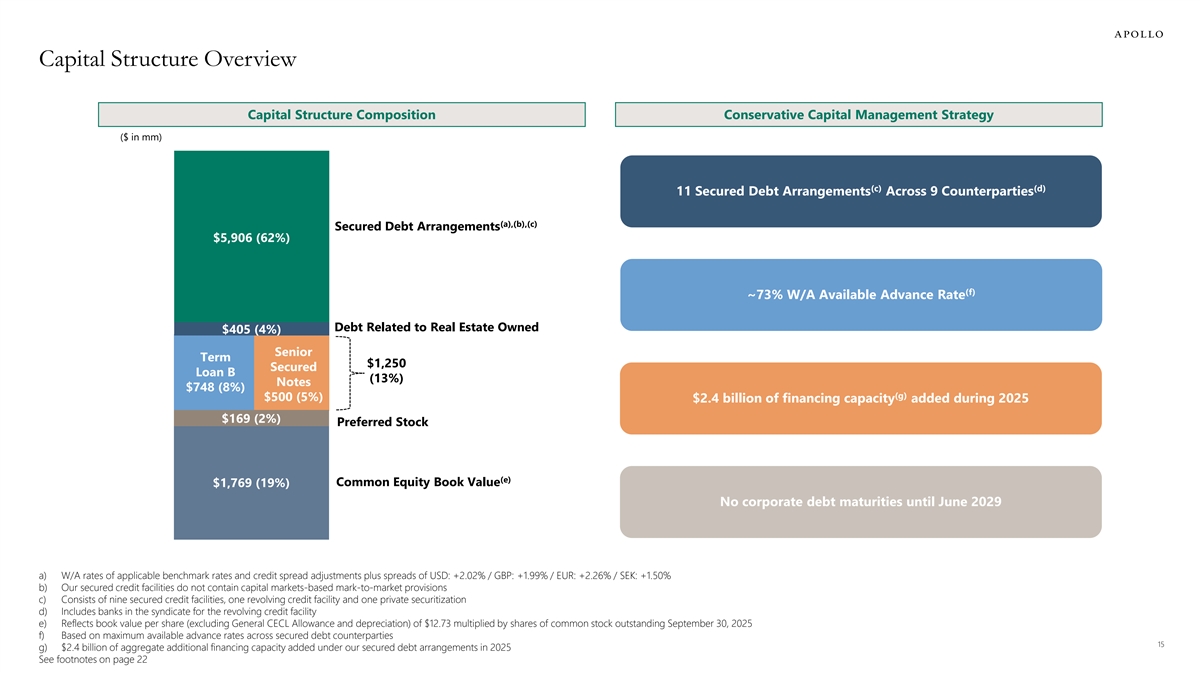
Capital Structure Overview Capital Structure Composition Conservative Capital Management Strategy ($ in mm) (c) (d) 11 Secured Debt Arrangements Across 9 Counterparties (a),(b),(c) Secured Debt Arrangements $5,906 (62%) (f) ~73% W/A Available Advance Rate Debt Related to Real Estate Owned $405 (4%) Senior Term $1,250 Secured Loan B (13%) Notes $748 (8%) (g) $500 (5%) $2.4 billion of financing capacity added during 2025 $169 (2%) Preferred Stock (e) Common Equity Book Value $1,769 (19%) No corporate debt maturities until June 2029 a) W/A rates of applicable benchmark rates and credit spread adjustments plus spreads of USD: +2.02% / GBP: +1.99% / EUR: +2.26% / SEK: +1.50% b) Our secured credit facilities do not contain capital markets-based mark-to-market provisions c) Consists of nine secured credit facilities, one revolving credit facility and one private securitization d) Includes banks in the syndicate for the revolving credit facility e) Reflects book value per share (excluding General CECL Allowance and depreciation) of $12.73 multiplied by shares of common stock outstanding September 30, 2025 f) Based on maximum available advance rates across secured debt counterparties 15 g) $2.4 billion of aggregate additional financing capacity added under our secured debt arrangements in 2025 See footnotes on page 22
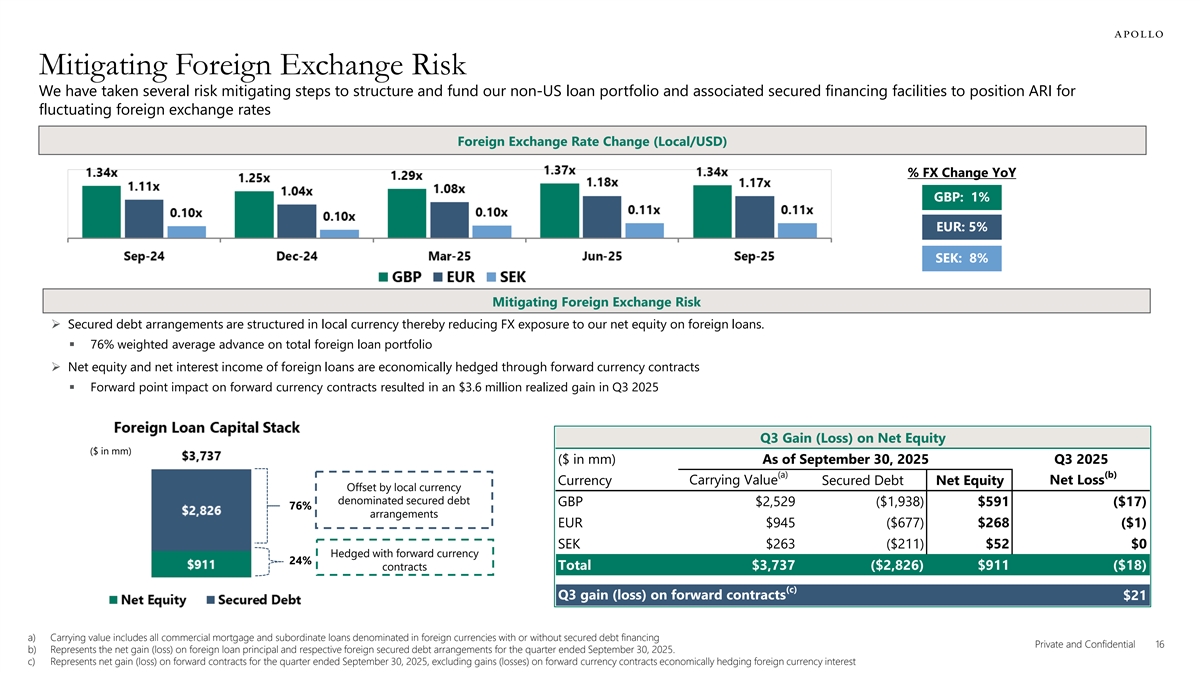
Mitigating Foreign Exchange Risk We have taken several risk mitigating steps to structure and fund our non-US loan portfolio and associated secured financing facilities to position ARI for fluctuating foreign exchange rates Foreign Exchange Rate Change (Local/USD) % FX Change YoY GBP: 1% EUR: 5% SEK: 8% Mitigating Foreign Exchange Risk Ø Secured debt arrangements are structured in local currency thereby reducing FX exposure to our net equity on foreign loans. § 76% weighted average advance on total foreign loan portfolio Ø Net equity and net interest income of foreign loans are economically hedged through forward currency contracts § Forward point impact on forward currency contracts resulted in an $3.6 million realized gain in Q3 2025 Q3 Gain (Loss) on Net Equity ($ in mm) ($ in mm) As of September 30, 2025 Q3 2025 (a) (b) Currency Carrying Value Secured Debt Net Equity Net Loss Offset by local currency denominated secured debt GBP $2,529 ($1,938) $591 ($17) 76% arrangements EUR $945 ($677) $268 ($1) SEK $263 ($211) $52 $0 Hedged with forward currency 24% Total $3,737 ($2,826) $911 ($18) contracts (c) Q3 gain (loss) on forward contracts $21 a) Carrying value includes all commercial mortgage and subordinate loans denominated in foreign currencies with or without secured debt financing Private and Confidential 16 b) Represents the net gain (loss) on foreign loan principal and respective foreign secured debt arrangements for the quarter ended September 30, 2025. c) Represents net gain (loss) on forward contracts for the quarter ended September 30, 2025, excluding gains (losses) on forward currency contracts economically hedging foreign currency interest
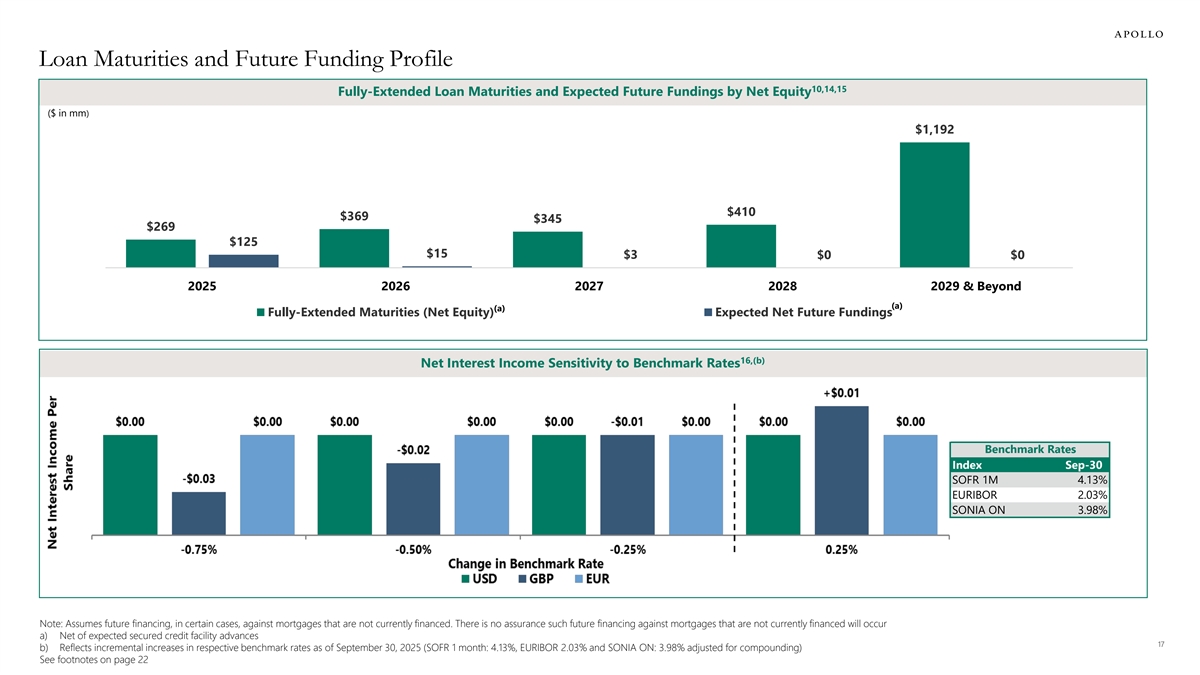
Loan Maturities and Future Funding Profile 10,14,15 Fully-Extended Loan Maturities and Expected Future Fundings by Net Equity ($ in mm) $1,192 $410 $369 $345 $269 $125 $15 $3 $0 $0 2025 2026 2027 2028 2029 & Beyond (a) (a) Fully-Extended Maturities (Net Equity) Expected Net Future Fundings 16,(b) Net Interest Income Sensitivity to Benchmark Rates Benchmark Rates Index Sep-30 SOFR 1M 4.13% EURIBOR 2.03% SONIA ON 3.98% Note: Assumes future financing, in certain cases, against mortgages that are not currently financed. There is no assurance such future financing against mortgages that are not currently financed will occur a) Net of expected secured credit facility advances 17 b) Reflects incremental increases in respective benchmark rates as of September 30, 2025 (SOFR 1 month: 4.13%, EURIBOR 2.03% and SONIA ON: 3.98% adjusted for compounding) See footnotes on page 22
Appendix Consolidated Balance Sheets Consolidated Statement of Operations Reconciliation of GAAP Net Income to Distributable Earnings 18
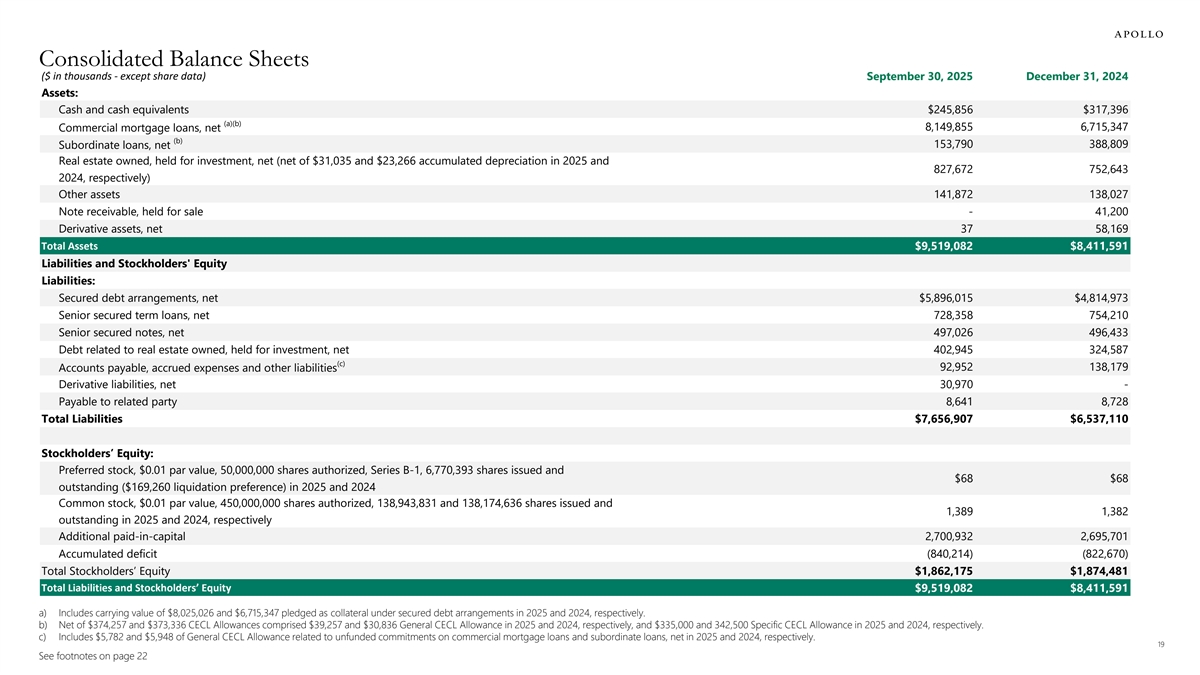
Consolidated Balance Sheets ($ in thousands - except share data) September 30, 2025 December 31, 2024 Assets: Cash and cash equivalents $245,856 $317,396 (a)(b) Commercial mortgage loans, net 8,149,855 6,715,347 (b) 153,790 388,809 Subordinate loans, net Real estate owned, held for investment, net (net of $31,035 and $23,266 accumulated depreciation in 2025 and 827,672 752,643 2024, respectively) Other assets 141,872 138,027 Note receivable, held for sale - 41,200 Derivative assets, net 37 58,169 Total Assets $9,519,082 $8,411,591 Liabilities and Stockholders' Equity Liabilities: Secured debt arrangements, net $5,896,015 $4,814,973 Senior secured term loans, net 728,358 754,210 Senior secured notes, net 497,026 496,433 Debt related to real estate owned, held for investment, net 402,945 324,587 (c) 92,952 138,179 Accounts payable, accrued expenses and other liabilities Derivative liabilities, net 30,970 - Payable to related party 8,641 8,728 Total Liabilities $7,656,907 $6,537,110 Stockholders’ Equity: Preferred stock, $0.01 par value, 50,000,000 shares authorized, Series B-1, 6,770,393 shares issued and $68 $68 outstanding ($169,260 liquidation preference) in 2025 and 2024 Common stock, $0.01 par value, 450,000,000 shares authorized, 138,943,831 and 138,174,636 shares issued and 1,389 1,382 outstanding in 2025 and 2024, respectively Additional paid-in-capital 2,700,932 2,695,701 Accumulated deficit (840,214) (822,670) Total Stockholders’ Equity $1,862,175 $1,874,481 Total Liabilities and Stockholders’ Equity $9,519,082 $8,411,591 a) Includes carrying value of $8,025,026 and $6,715,347 pledged as collateral under secured debt arrangements in 2025 and 2024, respectively. b) Net of $374,257 and $373,336 CECL Allowances comprised $39,257 and $30,836 General CECL Allowance in 2025 and 2024, respectively, and $335,000 and 342,500 Specific CECL Allowance in 2025 and 2024, respectively. c) Includes $5,782 and $5,948 of General CECL Allowance related to unfunded commitments on commercial mortgage loans and subordinate loans, net in 2025 and 2024, respectively. 19 See footnotes on page 22
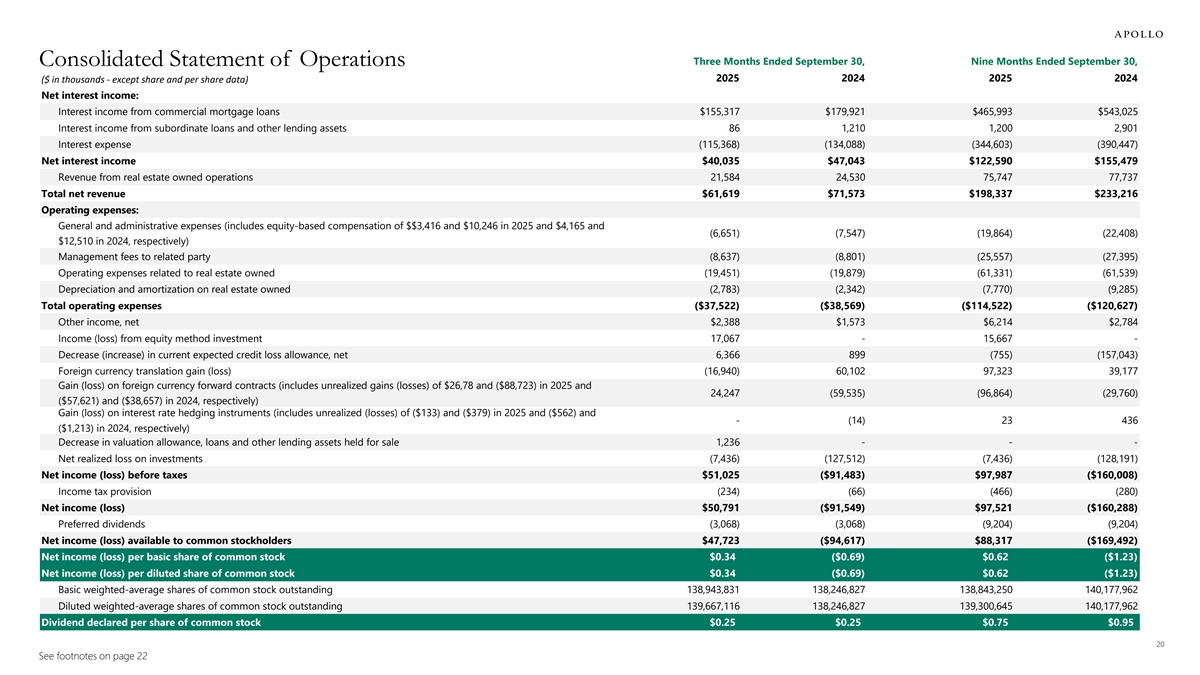
Three Months Ended September 30, Nine Months Ended September 30, Consolidated Statement of Operations 2025 2024 2025 2024 ($ in thousands - except share and per share data) Net interest income: Interest income from commercial mortgage loans $155,317 $179,921 $465,993 $543,025 Interest income from subordinate loans and other lending assets 86 1,210 1,200 2,901 Interest expense (115,368) (134,088) (344,603) (390,447) Net interest income $40,035 $47,043 $122,590 $155,479 Revenue from real estate owned operations 21,584 24,530 75,747 77,737 Total net revenue $61,619 $71,573 $198,337 $233,216 Operating expenses: General and administrative expenses (includes equity-based compensation of $$3,416 and $10,246 in 2025 and $4,165 and (6,651) (7,547) (19,864) (22,408) $12,510 in 2024, respectively) Management fees to related party (8,637) (8,801) (25,557) (27,395) Operating expenses related to real estate owned (19,451) (19,879) (61,331) (61,539) Depreciation and amortization on real estate owned (2,783) (2,342) (7,770) (9,285) Total operating expenses ($37,522) ($38,569) ($114,522) ($120,627) Other income, net $2,388 $1,573 $6,214 $2,784 Income (loss) from equity method investment 17,067 - 15,667 - Decrease (increase) in current expected credit loss allowance, net 6,366 899 (755) (157,043) Foreign currency translation gain (loss) (16,940) 60,102 97,323 39,177 Gain (loss) on foreign currency forward contracts (includes unrealized gains (losses) of $26,78 and ($88,723) in 2025 and 24,247 (59,535) (96,864) (29,760) ($57,621) and ($38,657) in 2024, respectively) Gain (loss) on interest rate hedging instruments (includes unrealized (losses) of ($133) and ($379) in 2025 and ($562) and - (14) 23 436 ($1,213) in 2024, respectively) Decrease in valuation allowance, loans and other lending assets held for sale 1,236 - - - Net realized loss on investments (7,436) (127,512) (7,436) (128,191) Net income (loss) before taxes $51,025 ($91,483) $97,987 ($160,008) Income tax provision (234) (66) (466) (280) Net income (loss) $50,791 ($91,549) $97,521 ($160,288) Preferred dividends (3,068) (3,068) (9,204) (9,204) Net income (loss) available to common stockholders $47,723 ($94,617) $88,317 ($169,492) Net income (loss) per basic share of common stock $0.34 ($0.69) $0.62 ($1.23) Net income (loss) per diluted share of common stock $0.34 ($0.69) $0.62 ($1.23) Basic weighted-average shares of common stock outstanding 138,943,831 138,246,827 138,843,250 140,177,962 Diluted weighted-average shares of common stock outstanding 139,667,116 138,246,827 139,300,645 140,177,962 Dividend declared per share of common stock $0.25 $0.25 $0.75 $0.95 20 See footnotes on page 22
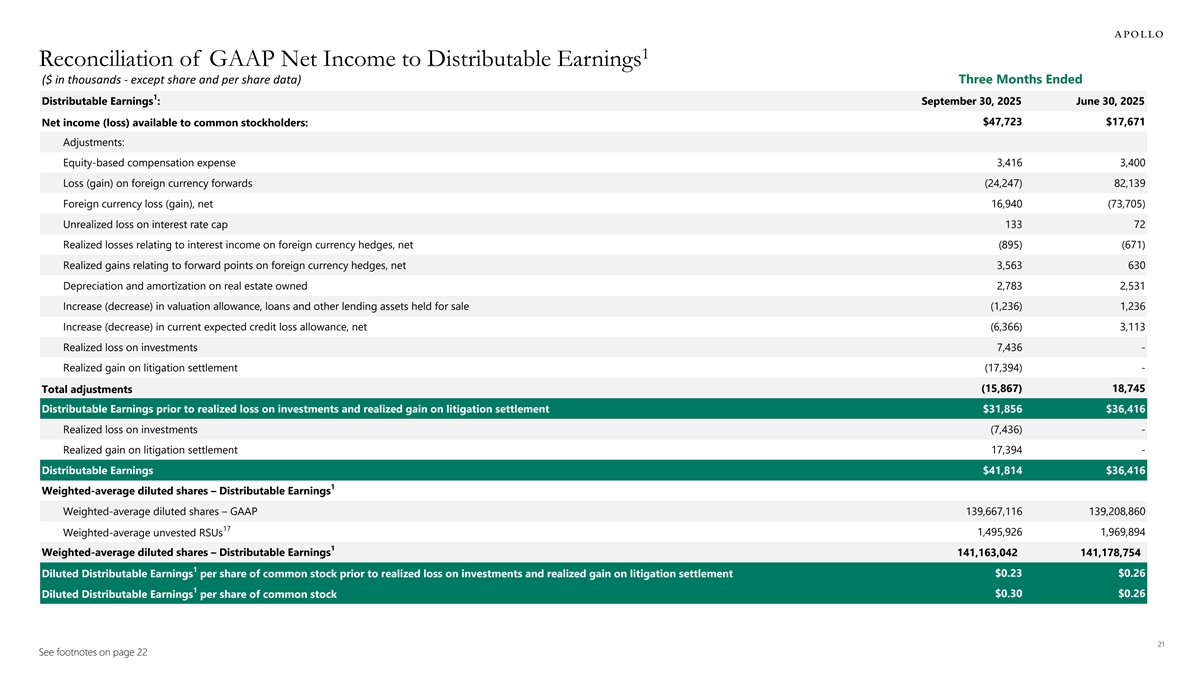
1 Reconciliation of GAAP Net Income to Distributable Earnings ($ in thousands - except share and per share data) Three Months Ended 1 Distributable Earnings : September 30, 2025 June 30, 2025 $47,723 $17,671 Net income (loss) available to common stockholders: Adjustments: Equity-based compensation expense 3,416 3,400 Loss (gain) on foreign currency forwards (24,247) 82,139 Foreign currency loss (gain), net 16,940 (73,705) Unrealized loss on interest rate cap 133 72 Realized losses relating to interest income on foreign currency hedges, net (895) (671) Realized gains relating to forward points on foreign currency hedges, net 3,563 630 Depreciation and amortization on real estate owned 2,783 2,531 Increase (decrease) in valuation allowance, loans and other lending assets held for sale (1,236) 1,236 Increase (decrease) in current expected credit loss allowance, net (6,366) 3,113 Realized loss on investments 7,436 - Realized gain on litigation settlement (17,394) - Total adjustments (15,867) 18,745 Distributable Earnings prior to realized loss on investments and realized gain on litigation settlement $31,856 $36,416 Realized loss on investments (7,436) - Realized gain on litigation settlement 17,394 - Distributable Earnings $41,814 $36,416 1 Weighted-average diluted shares – Distributable Earnings Weighted-average diluted shares – GAAP 139,667,116 139,208,860 17 Weighted-average unvested RSUs 1,495,926 1,969,894 1 Weighted-average diluted shares – Distributable Earnings 141, 163,042 141, 178,754 1 Diluted Distributable Earnings per share of common stock prior to realized loss on investments and realized gain on litigation settlement $0.23 $0.26 1 Diluted Distributable Earnings per share of common stock $0.30 $0.26 21 See footnotes on page 22
Footnotes 1. Distributable Earnings: Distributable Earnings is a non-GAAP financial measure that we define as net income available to common stockholders, computed in accordance with GAAP, adjusted for (i) equity-based compensation expense (a portion of which may become cash-based upon final vesting and settlement of awards should the holder elect net share settlement to satisfy income tax withholding), (ii) any unrealized gains or losses or other non-cash items (including depreciation and amortization on real estate owned) included in net income available to common stockholders, (iii) unrealized income from unconsolidated joint ventures, (iv) foreign currency gains (losses), other than (a) realized gains/(losses) related to interest income, and (b) forward point gains/(losses) realized on our foreign currency hedges, and (v) provision for current expected credit losses. Please see page 21 for a reconciliation of GAAP net income to Distributable Earnings. Distributable Earnings Prior to Realized Loss on Investments and Realized Gain from Litigation Settlement: We believe it is useful to our investors to present Distributable Earnings prior to realized loss on investments and realized gain from litigation settlement to reflect our operating results because (i) our operating results are primarily comprised of earning interest income on our investments net of borrowing and administrative costs, which comprise our ongoing operations and (ii) it has been a useful factor related to our dividend per share because it is one of the considerations when a dividend is determined. We believe that our investors use Distributable Earnings and Distributable Earnings prior to realized loss on investments and realized gain from litigation settlement, or a comparable supplemental performance measure, to evaluate and compare the performance of our company and our peers. 2. Reflects closing share price on October 29, 2025. 3. Weighted Average Unlevered All-in Yield on the loan portfolio is based on the applicable benchmark rates as of period end on the floating rate loans and includes accrual of origination, extension, and exit fees. For non-US deals, yield excludes incremental forward points impact from currency hedging. 4. Includes a $41 million held-for-sale corporate note. The note was sold during the third quarter of 2025. 5. Add-on fundings represent fundings subsequent to loan closing. 6. Book value per share, or “BVPS”, of common stock is common stockholders’ equity divided by shares of common stock outstanding. 7. Amounts and percentages may not foot due to rounding. 8. Other includes changes in General CECL Allowance, cost recovery interest, realized loss on investments, and the accretion of loan costs and fees. 9. Based on loan amortized cost, net of Specific CECL Allowance. 10. Assumes exercise of all extension options. There is no assurance that all or any extension options will be exercised. 11. Gross of $39 million of General CECL Allowance. 12. Amortized cost for these loans is net of the recorded Specific CECL Allowances. 13. Loans are secured by the same property. 14. Future funding dates and amounts are based upon the Manager’s estimates, which are derived from the best information available to the Manager at the time. There is no assurance that the payments will occur in accordance with these estimates or at all, which could affect our operating results. 15. Excludes risk-rated 5 loans. 16. Any such hypothetical impact on interest rates on our variable rate borrowings does not consider the effect of any change in overall economic activity that could occur in a rising interest rate environment. Further, in the event of a change in interest rates of that magnitude, we may take actions to further mitigate our exposure to such a change. However, due to the uncertainty of the specific actions that would be taken and their possible effects, this analysis assumes no changes in our financial structure. There is no assurance that there will be no changes in our financial structure. The analysis incorporates movements in USD, GBP and EUR benchmark rates only. 17. Unvested RSUs are net of incremental shares assumed repurchased under the treasury stock method, if dilutive. For the three months ended September 30, 2025 and June 30, 2025, there were 723,285 and 265,295 incremental shares included, respectively. 22