UNITED STATES
SECURITIES AND EXCHANGE COMMISSION
WASHINGTON, D.C. 20549
FORM 8-K
CURRENT REPORT
Pursuant to Section 13 or 15(d)
of the Securities Exchange Act of 1934
Date of report (Date of earliest event reported): October 29, 2025
ALLISON TRANSMISSION HOLDINGS, INC.
(Exact Name of Registrant as Specified in its Charter)
| Delaware | 001-35456 | 26-0414014 | ||
| (State or other jurisdiction of incorporation) |
(Commission File Number) |
(IRS Employer Identification No.) |
||
| One Allison Way, Indianapolis, Indiana | 46222 | |||
| (Address of principal executive offices) | (Zip Code) | |||
Registrant’s telephone number, including area code: (317) 242-5000
Not Applicable
(Former name or former address, if changed since last report)
Check the appropriate box below if the Form 8-K filing is intended to simultaneously satisfy the filing obligation of the registrant under any of the following provisions (see General Instructions A.2. below):
| ☐ | Written communications pursuant to Rule 425 under the Securities Act (17 CFR 230.425) |
| ☐ | Soliciting material pursuant to Rule 14a-12 under the Exchange Act (17 CFR 240.14a-12) |
| ☐ | Pre-commencement communications pursuant to Rule 14d-2(b) under the Exchange Act (17 CFR 240.14d-2(b)) |
| ☐ | Pre-commencement communications pursuant to Rule 13e-4(c) under the Exchange Act (17 CFR 240.13e-4(c)) |
Securities registered pursuant to Section 12(b) of the Act:
| Title of each class |
Trading Symbol(s) |
Name of each exchange on which registered |
||
| Common Stock, $0.01 par value | ALSN | New York Stock Exchange |
Indicate by check mark whether the registrant is an emerging growth company as defined in Rule 405 of the Securities Act of 1933 (§ 230.405 of this chapter) or Rule 12b-2 of the Securities Exchange Act of 1934 (§ 240.12b-2 of this chapter).
Emerging growth company ☐
If an emerging growth company, indicate by check mark if the registrant has elected not to use the extended transition period for complying with any new or revised financial accounting standards provided pursuant to Section 13(a) of the Exchange Act. ☐
| Item 2.02 | Results of Operations and Financial Condition. |
On October 29, 2025, Allison Transmission Holdings, Inc. (“Allison”) published an earnings release reporting its financial results for the three months ended September 30, 2025. A copy of the earnings release is attached as Exhibit 99.1 hereto. Following the publication of the earnings release, Allison will host an earnings call on October 29, 2025 at 5:00 p.m. ET on which its financial results for the three months ended September 30, 2025 will be discussed. The investor presentation materials that will be used for the call are attached as Exhibit 99.2 hereto.
On October 29, 2025, Allison posted the materials attached as Exhibits 99.1 and 99.2 on its website (www.allisontransmission.com).
As discussed on page 2 of Exhibit 99.2, the investor presentation contains forward-looking statements within the meaning of the federal securities laws. These statements are present expectations and are subject to the limitations listed therein and in Allison’s other Securities and Exchange Commission filings, including that actual events or results may differ materially from those in the forward-looking statements.
The foregoing information (including the exhibits hereto) is being furnished and shall not be deemed “filed” for purposes of Section 18 of the Securities Exchange Act of 1934, as amended, or otherwise subject to the liabilities of that section, nor shall it be deemed incorporated by reference in any filing under the Securities Act of 1933, as amended, except as expressly set forth by specific reference in such filing.
| Item 9.01 | Financial Statements and Exhibits. |
| (d) | Exhibits: |
| Exhibit |
Description |
|
| 99.1 | Earnings release dated October 29, 2025. | |
| 99.2 | Investor presentation materials dated October 29, 2025. | |
| 104 | Cover Page Interactive Data File (embedded within the Inline XBRL document). | |
SIGNATURES
Pursuant to the requirements of the Securities Exchange Act of 1934, the registrant has duly caused this report to be signed on its behalf by the undersigned hereunto duly authorized.
| Allison Transmission Holdings, Inc. | ||||||
| Date: October 29, 2025 | By: | /s/ Eric C. Scroggins |
||||
| Name: | Eric C. Scroggins | |||||
| Title: | Vice President, General Counsel and Assistant Secretary | |||||
Exhibit 99.1

|
|
Allison Transmission Announces Third Quarter 2025 Results
| • | Net Sales of $78 million in the Defense end market, up over 47% year over year |
| • | Net Income of $137 million, 19.8% of Net Sales |
| • | Achieved Adjusted EBITDA margin of 37% despite challenging demand environment |
| • | Net Cash Provided by Operating Activities of $228 million |
| • | Adjusted Free Cash Flow of $184 million |
INDIANAPOLIS, October 29, 2025 – Allison Transmission Holdings Inc. (NYSE: ALSN), today reported third quarter net sales of $693 million, driven by continued growth in the Defense end market.
David S. Graziosi, Chair and Chief Executive Officer of Allison Transmission commented, “Throughout 2025, our largest end market, North America On-Highway, has been negatively affected by global macroeconomic factors leading to demand uncertainty and shifting customer behaviors. During this period, we are fully focused on the things we can control, including our commitment to operational excellence, quality, customer service and maintaining strong execution across our business. We also continue to work diligently on closing the acquisition of Dana’s Off-Highway business and are pleased with the progress to date.”
Graziosi continued, “Allison remains agile and responsive to evolving market dynamics, ensuring we can quickly adapt as conditions change. Importantly, even in this challenging operating environment, we continue to generate strong cash flow, enabling continued investment in our strategic initiatives and capital allocation priorities, including the repurchase of $27 million of our common stock and $23 million of dividend payments during the third quarter.”
Third Quarter Financial Highlights
Net sales for the quarter were $693 million. Year over year results by end market include:
| • | A $25 million increase in net sales in the Defense end market principally driven by increased demand for Tracked vehicle applications, price increases on certain products and the continued execution of our growth initiatives |
| • | A $4 million decrease in net sales in the Outside North America On-Highway end market principally driven by lower demand in Asia, partially offset by higher demand in Europe |
| • | A $9 million decrease in net sales in the Service Parts, Support Equipment and Other end market principally driven by lower demand for aluminum die cast components and support equipment, partially offset by price increases on certain products |
| • | A $13 million decrease in net sales in the Global Off-Highway end market principally driven by lower demand from the energy, mining and construction sectors outside of North America |
| • | A $130 million decrease in net sales in the North America On-Highway end market principally driven by lower demand for Class 8 vocational and medium-duty trucks, partially offset by price increases on certain products and market share gains for hybrid propulsion systems for transit buses. |
Net income for the quarter was $137 million. Diluted EPS for the quarter was $1.63. Adjusted EBITDA, a non-GAAP financial measure, for the quarter was $256 million. Net cash provided by operating activities for the quarter was $228 million. Adjusted free cash flow, a non-GAAP financial measure, for the quarter was $184 million.
1
Third Quarter Net Sales by End Market
| End Market |
Q3 2025 Net Sales ($M) |
Q3 2024 Net Sales ($M) |
Variance ($M) | |||||||||
| North America On-Highway |
$ | 327 | $ | 457 | ($ | 130 | ) | |||||
| Outside North America On-Highway |
$ | 122 | $ | 126 | ($ | 4 | ) | |||||
| Global Off-Highway |
$ | 7 | $ | 20 | ($ | 13 | ) | |||||
| Defense |
$ | 78 | $ | 53 | $ | 25 | ||||||
| Service Parts, Support Equipment & Other |
$ | 159 | $ | 168 | ($ | 9 | ) | |||||
| Total Net Sales |
$ | 693 | $ | 824 | ($ | 131 | ) | |||||
Third Quarter Financial Results
Gross profit for the quarter was $329 million, a decrease of $67 million from $396 million for the same period in 2024. The decrease was principally driven by lower volumes and unfavorable direct material costs, partially offset by price increases on certain products and lower manufacturing expense.
Selling, general and administrative expenses for the quarter were $82 million, a decrease of $3 million from $85 million for the same period in 2024. The decrease was principally driven by lower incentive compensation expense and lower commercial activities spending to align costs and programs across our business with end markets demand conditions, partially offset by acquisition-related expenses of approximately $14 million.
Engineering – research and development expenses for the quarter were $43 million, a decrease of $8 million from $51 million for the same period in 2024. The decrease was principally driven by reduced product initiatives spending to align costs and programs across our business with end markets demand conditions.
Net income for the quarter was $137 million, a decrease of $63 million from $200 million for the same period in 2024. The decrease was principally driven by lower gross profit and acquisition-related expenses.
Net cash provided by operating activities was $228 million, a decrease of $18 million from $246 million for the same period in 2024. The decrease was principally driven by lower gross profit and $13 million of payments for acquisition-related expenses, partially offset by lower cash income taxes and lower operating working capital funding requirements.
2025 Guidance Update
Given third quarter results and current end markets conditions, we are revising our full year 2025 guidance provided to the market on August 4th.
Allison now expects 2025 net sales in the range of $2,975 to $3,025 million, Net income in the range of $620 to $650 million, Adjusted EBITDA in the range of $1,090 to $1,125 million, Net cash provided by operating activities in the range of $765 to $795 million, capital expenditures in the range of $165 to $175 million, and Adjusted free cash flow in the range of $600 to $620 million. We are maintaining the midpoint of the implied Adjusted EBITDA margin guidance.
2
Conference Call and Webcast
The Company will host a conference call at 5:00 p.m. EDT on Wednesday, October 29, 2025 to discuss its third quarter 2025 results. The dial-in phone number for the conference call is +1-877-425-9470 and the international dial-in number is +1-201-389-0878. A live webcast of the conference call will also be available online at https://ir.allisontransmission.com.
For those unable to participate in the conference call, a replay will be available from 9:00 p.m. EDT on October 29 until 11:59 p.m. EDT on November 12. The replay dial-in phone number is +1-844-512-2921 and the international replay dial-in number is +1-412-317-6671. The replay passcode is 13756515.
About Allison Transmission
Allison Transmission (NYSE: ALSN) is a leading designer and manufacturer of propulsion solutions for commercial and defense vehicles and the largest global manufacturer of medium- and heavy-duty fully automatic transmissions that Improve the Way the World Works. Allison products are used in a wide variety of applications, including on-highway vehicles (distribution, refuse, construction, fire and emergency), buses (school, transit and coach), motorhomes, off-highway vehicles and equipment (energy, mining, construction and agriculture) and defense vehicles (tactical wheeled and tracked). Founded in 1915, the company is headquartered in Indianapolis, Indiana, USA. With a presence in more than 150 countries, Allison has regional headquarters in the Netherlands, China and Brazil, manufacturing facilities in the USA, Hungary and India, as well as global engineering resources, including electrification engineering centers in Indianapolis, Indiana, Auburn Hills, Michigan and London in the United Kingdom. Allison also has more than 1,600 independent distributor and dealer locations worldwide. For more information, visit https://allisontransmission.com.
Forward-Looking Statements
This press release contains forward-looking statements. The words “believe,” “expect,” “anticipate,” “intend,” “estimate” and other expressions that are predictions of or indicate future events and trends and that do not relate to historical matters identify forward-looking statements. You should not place undue reliance on these forward-looking statements. Although forward-looking statements reflect management’s good faith beliefs, reliance should not be placed on forward-looking statements because they involve known and unknown risks, uncertainties and other factors, which may cause actual results, performance or achievements to differ materially from anticipated future results, performance or achievements expressed or implied by such forward-looking statements. Forward-looking statements speak only as of the date the statements are made. We undertake no obligation to publicly update or revise any forward-looking statement, whether as a result of new information, future events, changed circumstances or otherwise. These forward-looking statements are subject to numerous risks and uncertainties, including, but not limited to: risks relating to the pending acquisition of the Off-Highway business of Dana Incorporated, including: the acquisition may not be completed in a timely manner or at all; we may experience delays, unanticipated costs or restrictions resulting from regulatory review of the acquisition, including the risk that Allison may be unable to obtain governmental and regulatory approvals required for the acquisition or that such approvals may result in the imposition of conditions that could adversely affect the combined company or the expected benefits of the acquisition; the financing intended to fund the acquisition may not be obtained; uncertainties associated with the acquisition may cause a loss of both companies’ management personnel and other key employees, and cause disruptions to both companies’ business relationships; the purchase agreement subjects Allison and Dana to restrictions on business activities prior to the effective time of the acquisition; Allison is expected to incur significant costs in connection with the acquisition and integration; litigation risks relating to the acquisition; the off-highway business of Dana and its operations may not be integrated successfully in the expected time frame; the acquisition may result in a loss of customers, vendors, and other business counterparties; the combined company may fail to realize all of the anticipated benefits of the acquisition or fail to effectively manage its expanded operations; our participation in markets that are competitive; our ability to prepare for, respond to and successfully achieve our objectives relating to technological and market developments, competitive threats and changing customer needs, including with respect to electric hybrid and fully electric commercial vehicles; increases in cost, disruption of supply or shortage of labor, freight, raw materials, energy or components used to manufacture or transport our products or those of our customers or suppliers, including as a result of geopolitical risks, natural disasters, extreme weather events, wars and public health crises such as pandemics; global economic volatility; general economic and industry conditions, including the risk of prolonged inflation and recession; labor strikes, work stoppages or similar labor disputes, which could significantly disrupt our operations or those of our principal customers or suppliers; the highly cyclical industries in which certain of our end users operate; uncertainty in the global regulatory and business environments in which we operate; the concentration of our net sales in our top five customers and the loss of any one of these; cybersecurity risks to our operational systems, security systems or infrastructure owned by us or our third-party vendors and suppliers; the failure of markets outside North America to increase adoption of fully automatic transmissions; the success of our research and development efforts, the outcome of which is uncertain; U.S. and foreign defense spending; risks associated with our international operations, including acts of war and increased trade protectionism and tariffs; the discovery of defects in our products, resulting in delays in new model launches, recall campaigns and/or increased warranty costs and reduction in future sales or damage to our brand and reputation; our ability to identify, consummate and effectively integrate acquisitions and collaborations; and risks related to our indebtedness.
3
Use of Non-GAAP Financial Measures
This press release contains information about Allison’s financial results and forward-looking estimates of financial results which are not presented in accordance with accounting principles generally accepted in the United States (“GAAP”). Such non-GAAP financial measures are reconciled to their closest GAAP financial measures at the end of this press release. Non-GAAP financial measures should not be considered in isolation or as a substitute for our reported results prepared in accordance with GAAP and, as calculated, may not be comparable to other similarly titled measures of other companies.
We use Adjusted EBITDA and Adjusted EBITDA as a percent of net sales to measure our operating profitability. We believe that Adjusted EBITDA and Adjusted EBITDA as a percent of net sales provide management, investors and creditors with useful measures of the operational results of our business and increase the period-to-period comparability of our operating profitability and comparability with other companies. Adjusted EBITDA as a percent of net sales is also used in the calculation of management’s incentive compensation program. The most directly comparable GAAP measure to Adjusted EBITDA is Net income. The most directly comparable GAAP measure to Adjusted EBITDA as a percent of net sales is Net income as a percent of net sales. Adjusted EBITDA is calculated as the earnings before interest expense, net, income tax expense, amortization of intangible assets, depreciation of property, plant and equipment and other adjustments as defined by Allison Transmission, Inc.’s, the Company’s wholly-owned subsidiary, Second Amended and Restated Credit Agreement. Adjusted EBITDA as a percent of net sales is calculated as Adjusted EBITDA divided by net sales.
We use Adjusted Free Cash Flow to evaluate the amount of cash generated by our business that, after the capital investment needed to maintain and grow our business and certain mandatory debt service requirements, can be used for repayment of debt, stockholder distributions and strategic opportunities, including investing in our business. We believe that Adjusted Free Cash Flow enhances the understanding of the cash flows of our business for management, investors and creditors. Adjusted Free Cash Flow is also used in the calculation of management’s incentive compensation program. The most directly comparable GAAP measure to Adjusted Free Cash Flow is Net cash provided by operating activities. Adjusted Free Cash Flow is calculated as Net cash provided by operating activities, after additions of long-lived assets.
Attachments
| • | Condensed Consolidated Statements of Operations |
| • | Condensed Consolidated Balance Sheets |
| • | Condensed Consolidated Statements of Cash Flows |
| • | Reconciliation of GAAP to Non-GAAP Financial Measures |
| • | Reconciliation of GAAP to Non-GAAP Financial Measures for Full Year Guidance |
Contacts
Jackie Bolles
Executive Director, Treasury and Investor Relations Condensed Consolidated Statements of Operations
jacalyn.bolles@allisontransmission.com
(317) 242-7073
Media Relations
media@allisontransmission.com
(317) 694-2065
4
Allison Transmission Holdings, Inc.
(Unaudited, dollars in millions, except per share data)
| Three months ended September 30, | Nine months ended September 30, | |||||||||||||||
| 2025 | 2024 | 2025 | 2024 | |||||||||||||
| Net sales |
$ | 693 | $ | 824 | $ | 2,273 | $ | 2,429 | ||||||||
| Cost of sales |
364 | 428 | 1,164 | 1,273 | ||||||||||||
|
|
|
|
|
|
|
|
|
|||||||||
| Gross profit |
329 | 396 | 1,109 | 1,156 | ||||||||||||
| Selling, general and administrative |
82 | 85 | 270 | 253 | ||||||||||||
| Engineering - research and development |
43 | 51 | 130 | 146 | ||||||||||||
|
|
|
|
|
|
|
|
|
|||||||||
| Operating income |
204 | 260 | 709 | 757 | ||||||||||||
| Interest expense, net |
(24 | ) | (21 | ) | (67 | ) | (68 | ) | ||||||||
| Other income (expense), net |
2 | 10 | 15 | (2 | ) | |||||||||||
|
|
|
|
|
|
|
|
|
|||||||||
| Income before income taxes |
182 | 249 | 657 | 687 | ||||||||||||
| Income tax expense |
(45 | ) | (49 | ) | (133 | ) | (131 | ) | ||||||||
|
|
|
|
|
|
|
|
|
|||||||||
| Net income |
$ | 137 | $ | 200 | $ | 524 | $ | 556 | ||||||||
|
|
|
|
|
|
|
|
|
|||||||||
| Basic earnings per share attributable to common stockholders |
$ | 1.63 | $ | 2.30 | $ | 6.24 | $ | 6.39 | ||||||||
|
|
|
|
|
|
|
|
|
|||||||||
| Diluted earnings per share attributable to common stockholders |
$ | 1.63 | $ | 2.27 | $ | 6.16 | $ | 6.32 | ||||||||
|
|
|
|
|
|
|
|
|
|||||||||
5
Allison Transmission Holdings, Inc.
Condensed Consolidated Balance Sheets
(Unaudited, dollars in millions)
| September 30, | December 31, | |||||||
| 2025 | 2024 | |||||||
| ASSETS |
||||||||
| Current Assets |
||||||||
| Cash and cash equivalents |
$ | 902 | $ | 781 | ||||
| Accounts receivable, net |
329 | 360 | ||||||
| Inventories |
331 | 315 | ||||||
| Other current assets |
109 | 82 | ||||||
|
|
|
|
|
|||||
| Total Current Assets |
1,671 | 1,538 | ||||||
| Property, plant and equipment, net |
834 | 803 | ||||||
| Intangible assets, net |
816 | 822 | ||||||
| Goodwill |
2,075 | 2,075 | ||||||
| Other non-current assets |
121 | 98 | ||||||
|
|
|
|
|
|||||
| TOTAL ASSETS |
$ | 5,517 | $ | 5,336 | ||||
|
|
|
|
|
|||||
| LIABILITIES |
||||||||
| Current Liabilities |
||||||||
| Accounts payable |
$ | 192 | $ | 212 | ||||
| Product warranty liability |
34 | 31 | ||||||
| Current portion of long-term debt |
5 | 5 | ||||||
| Deferred revenue |
35 | 41 | ||||||
| Other current liabilities |
172 | 217 | ||||||
|
|
|
|
|
|||||
| Total Current Liabilities |
438 | 506 | ||||||
| Product warranty liability |
47 | 36 | ||||||
| Deferred revenue |
101 | 95 | ||||||
| Long-term debt |
2,393 | 2,395 | ||||||
| Deferred income taxes |
545 | 501 | ||||||
| Other non-current liabilities |
152 | 152 | ||||||
|
|
|
|
|
|||||
| TOTAL LIABILITIES |
3,676 | 3,685 | ||||||
| TOTAL STOCKHOLDERS’ EQUITY |
1,841 | 1,651 | ||||||
|
|
|
|
|
|||||
| TOTAL LIABILITIES & STOCKHOLDERS’ EQUITY |
$ | 5,517 | $ | 5,336 | ||||
|
|
|
|
|
|||||
6
Allison Transmission Holdings, Inc.
Condensed Consolidated Statements of Cash Flows
(Unaudited, dollars in millions)
| Three months ended September 30, | Nine months ended September 30, | |||||||||||||||
| 2025 | 2024 | 2025 | 2024 | |||||||||||||
| Net cash provided by operating activities |
$ | 228 | $ | 246 | $ | 593 | $ | 590 | ||||||||
| Net cash used for investing activities (a) |
(49 | ) | (38 | ) | (108 | ) | (70 | ) | ||||||||
| Net cash used for financing activities |
(52 | ) | (69 | ) | (368 | ) | (287 | ) | ||||||||
| Effect of exchange rate changes on cash |
(3 | ) | 1 | 4 | — | |||||||||||
|
|
|
|
|
|
|
|
|
|||||||||
| Net increase in cash and cash equivalents |
124 | 140 | 121 | 233 | ||||||||||||
| Cash and cash equivalents at beginning of period |
778 | 648 | 781 | 555 | ||||||||||||
|
|
|
|
|
|
|
|
|
|||||||||
| Cash and cash equivalents at end of period |
$ | 902 | $ | 788 | $ | 902 | $ | 788 | ||||||||
|
|
|
|
|
|
|
|
|
|||||||||
| Supplemental disclosures: |
||||||||||||||||
| Income taxes paid |
$ | (6 | ) | $ | (51 | ) | $ | (101 | ) | $ | (150 | ) | ||||
| Interest paid |
$ | (27 | ) | $ | (29 | ) | $ | (87 | ) | $ | (91 | ) | ||||
| Interest received from interest rate swaps |
$ | 2 | $ | 3 | $ | 6 | $ | 10 | ||||||||
| (a) Additions of long-lived assets |
$ | (44 | ) | $ | (36 | ) | $ | (101 | ) | $ | (68 | ) | ||||
7
Allison Transmission Holdings, Inc.
Reconciliation of GAAP to Non-GAAP Financial Measures
(Unaudited, dollars in millions)
| Three months ended | Nine months ended | |||||||||||||||
| September 30, | September 30, | |||||||||||||||
| 2025 | 2024 | 2025 | 2024 | |||||||||||||
| Net income (GAAP) |
$ | 137 | $ | 200 | $ | 524 | $ | 556 | ||||||||
| plus: |
||||||||||||||||
| Income tax expense |
45 | 49 | 133 | 131 | ||||||||||||
| Depreciation of property, plant and equipment |
30 | 28 | 87 | 82 | ||||||||||||
| Interest expense, net |
24 | 21 | 67 | 68 | ||||||||||||
| Amortization of intangible assets |
2 | 1 | 5 | 8 | ||||||||||||
| Acquisition-related expenses (a) |
14 | — | 38 | — | ||||||||||||
| Stock-based compensation expense (b) |
6 | 6 | 20 | 20 | ||||||||||||
| Unrealized (gain) loss on marketable securities (c) |
(3 | ) | (2 | ) | (11 | ) | 8 | |||||||||
| UAW Local 933 contract signing incentives (d) |
— | — | — | 14 | ||||||||||||
| Pension plan settlement loss (e) |
— | — | — | 4 | ||||||||||||
| Other (f) |
1 | 2 | 2 | 4 | ||||||||||||
|
|
|
|
|
|
|
|
|
|||||||||
| Adjusted EBITDA (Non-GAAP) |
$ | 256 | $ | 305 | $ | 865 | $ | 895 | ||||||||
|
|
|
|
|
|
|
|
|
|||||||||
| Net sales (GAAP) |
$ | 693 | $ | 824 | $ | 2,273 | $ | 2,429 | ||||||||
| Net income as a percent of Net sales (GAAP) |
19.8 | % | 24.3 | % | 23.1 | % | 22.9 | % | ||||||||
| Adjusted EBITDA as a percent of Net sales (Non-GAAP) |
36.9 | % | 37.0 | % | 38.1 | % | 36.8 | % | ||||||||
| Net cash provided by operating activities (GAAP) (g) |
$ | 228 | $ | 246 | $ | 593 | $ | 590 | ||||||||
| Deductions to reconcile to Adjusted free cash flow: |
||||||||||||||||
| Additions of long-lived assets |
(44 | ) | (36 | ) | (101 | ) | (68 | ) | ||||||||
|
|
|
|
|
|
|
|
|
|||||||||
| Adjusted free cash flow (Non-GAAP) (g) |
$ | 184 | $ | 210 | $ | 492 | $ | 522 | ||||||||
|
|
|
|
|
|
|
|
|
|||||||||
| (a) | Represents acquisition-related expenses (recorded in Selling, general and administrative), primarily consulting and legal fees, related to our pending acquisition of the Dana Off -Highw ay business (the “Acquisition”). |
| (b) | Represents stock-based compensation expense (recorded in Cost of sales, Selling, general and administrative, and Engineering — research and development). |
| (c) | Represents unrealized (gains) losses (recorded in Other income (expense), net) related to an investment in the common stock of Jing-Jin Electric Technologies Co. Ltd. |
| (d) | Represents non-recurring incentives (recorded in Cost of sales, Selling, general and administrative, and Engineering — research and development) to eligible employees as a result of International Union, United Automobile, Aerospace and Agricultural Implement Workers of America Local 933 represented employees ratifying a four-year collective bargaining agreement effective through November 2027. |
| (e) | Represents a non-cash settlement charge (recorded in Other income (expense), net) for a pro rata portion of previously unrecognized pension plan actuarial net losses associated w ith the pension risk transfer of a portion of our salaried defined benefit pension plan obligations to a third-party insurance company. |
| (f) | Represents other adjustments as defined by the Second Amended and Restated Credit Agreement dated as of March 29, 2019 as amended. |
| (g) | Net cash provided by operating activities (GAAP) and Adjusted free cash flow (Non-GAAP) include $13 million and $30 million of payments for expenses related to the Acquisition for the three and nine months ended September 30, 2025, respectively. There w ere no payments for expenses related to the Acquisition in either of the three or nine months ended September 30, 2024. |
8
Allison Transmission Holdings, Inc.
Reconciliation of GAAP to Non-GAAP Financial Measures for Full Year Guidance
(Unaudited, dollars in millions)
| Guidance | ||||||||
| Year Ending December 31, 2025 | ||||||||
| Low | High | |||||||
| Net income (GAAP) |
$ | 620 | $ | 650 | ||||
| plus: |
||||||||
| Income tax expense |
166 | 171 | ||||||
| Depreciation of property, plant and equipment |
117 | 117 | ||||||
| Interest expense, net |
99 | 99 | ||||||
| Amortization of intangible assets |
7 | 7 | ||||||
| Acquisition-related expenses (a) |
63 | 63 | ||||||
| Stock-based compensation expense (b) |
27 | 27 | ||||||
| Other unrealized gains (c) |
(9 | ) | (9 | ) | ||||
|
|
|
|
|
|||||
| Adjusted EBITDA (Non-GAAP) |
$ | 1,090 | $ | 1,125 | ||||
|
|
|
|
|
|||||
| Net cash provided by operating activities (GAAP) |
$ | 765 | $ | 795 | ||||
| Deductions to reconcile to Adjusted free cash flow: |
||||||||
| Additions of long-lived assets |
$ | (165 | ) | $ | (175 | ) | ||
|
|
|
|
|
|||||
| Adjusted free cash flow (Non-GAAP) |
$ | 600 | $ | 620 | ||||
|
|
|
|
|
|||||
| (a) | Represents acquisition-related expenses (recorded in Selling, general and administrative), primarily consulting and legal fees, related to our pending acquisition of the Dana Off-Highway business (the “Acquisition”). |
| (b) | Represents stock-based compensation expense (recorded in Cost of sales, Selling, general and administrative, and Engineering — research and development). |
| (c) | Represents other unrealized gains recorded in Other income (expense), net |
9
Exhibit 99.2
Q3 2025 Earnings Release October 29th, 2025 [Graphic Appears Here] Dave Graziosi, Chair & CEO Fred Bohley, COO Scott Mell, CFO & Treasurer
Safe Harbor Statement The following information contains forward-looking statements. The words “believe,” “expect,” “anticipate,” “intend,” “estimate” and other expressions that are predictions of or indicate future events and trends and that do not relate to historical matters identify forward-looking statements. You should not place undue reliance on these forward-looking statements. Although forward-looking statements reflect management’s good faith beliefs, reliance should not be placed on forward-looking statements because they involve known and unknown risks, uncertainties and other factors, which may cause actual results, performance or achievements to differ materially from anticipated future results, performance or achievements expressed or implied by such forward-looking statements. Forward-looking statements speak only as of the date the statements are made. We undertake no obligation to publicly update or revise any forward-looking statement, whether as a result of new information, future events, changed circumstances or otherwise. These forward-looking statements are subject to numerous risks and uncertainties, including, but not limited to: risks relating to the pending acquisition of the Off-Highway business of Dana Incorporated, including: the acquisition may not be completed in a timely manner or at all; we may experience delays, unanticipated costs or restrictions resulting from regulatory review of the acquisition, including the risk that Allison may be unable to obtain governmental and regulatory approvals required for the acquisition or that such approvals may result in the imposition of conditions that could adversely affect the combined company or the expected benefits of the acquisition; the financing intended to fund the acquisition may not be obtained; uncertainties associated with the acquisition may cause a loss of both companies’ management personnel and other key employees, and cause disruptions to both companies’ business relationships; the purchase agreement subjects Allison and Dana to restrictions on business activities prior to the effective time of the acquisition; Allison is expected to incur significant costs in connection with the acquisition and integration; litigation risks relating to the acquisition; the off-highway business of Dana and its operations may not be integrated successfully in the expected time frame; the acquisition may result in a loss of customers, vendors, and other business counterparties; the combined company may fail to realize all of the anticipated benefits of the acquisition or fail to effectively manage its expanded operations; our participation in markets that are competitive; our ability to prepare for, respond to and successfully achieve our objectives relating to technological and market developments, competitive threats and changing customer needs, including with respect to electric hybrid and fully electric commercial vehicles; increases in cost, disruption of supply or shortage of labor, freight, raw materials, energy or components used to manufacture or transport our products or those of our customers or suppliers, including as a result of geopolitical risks, natural disasters, extreme weather events, wars and public health crises such as pandemics; global economic volatility; general economic and industry conditions, including the risk of prolonged inflation and recession; labor strikes, work stoppages or similar labor disputes, which could significantly disrupt our operations or those of our principal customers or suppliers; the highly cyclical industries in which certain of our end users operate; uncertainty in the global regulatory and business environments in which we operate; the concentration of our net sales in our top five customers and the loss of any one of these; cybersecurity risks to our operational systems, security systems or infrastructure owned by us or our third-party vendors and suppliers; the failure of markets outside North America to increase adoption of fully automatic transmissions; the success of our research and development efforts, the outcome of which is uncertain; U.S. and foreign defense spending; risks associated with our international operations, including acts of war and increased trade protectionism and tariffs; the discovery of defects in our products, resulting in delays in new model launches, recall campaigns and/or increased warranty costs and reduction in future sales or damage to our brand and reputation; our ability to identify, consummate and effectively integrate acquisitions and collaborations; and risks related to our indebtedness. Allison Transmission cannot assure you that the assumptions made in preparing any of the forward-looking statements will prove accurate or that any long-term financial goals will be realized. All forward-looking statements included in this presentation speak only as of the date made, and Allison Transmission undertakes no obligation to update or revise publicly any such forward-looking statements, whether as a result of new information, future events, or otherwise. In particular, Allison Transmission cautions you not to place undue weight on certain forward-looking statements pertaining to potential growth opportunities or long-term financial goals set forth herein. Actual results may vary significantly from these statements. Allison Transmission’s business is subject to numerous risks and uncertainties, which may cause future results of operations to vary significantly from those presented herein. Important factors that could cause actual results to differ materially are discussed in Allison Transmission’s Annual Report on Form 10-K for the year ended December 31, 2024 and Quarterly Report on Form 10-Q for the quarter ended June 30, 2025. 2
Non-GAAP Financial Information We use Adjusted EBITDA and Adjusted EBITDA as a percent of net sales to measure our operating profitability. We believe that Adjusted EBITDA and Adjusted EBITDA as a percent of net sales provide management, investors and creditors with useful measures of the operational results of our business and increase the period-to-period comparability of our operating profitability and comparability with other companies. Adjusted EBITDA as a percent of net sales is also used in the calculation of management’s incentive compensation program. The most directly comparable GAAP measure to Adjusted EBITDA is Net income. The most directly comparable GAAP measure to Adjusted EBITDA as a percent of net sales is Net income as a percent of net sales. Adjusted EBITDA is calculated as the earnings before interest expense, net, income tax expense, amortization of intangible assets, depreciation of property, plant and equipment and other adjustments as defined by Allison Transmission, Inc.’s, the Company’s wholly-owned subsidiary, Second Amended and Restated Credit Agreement. Adjusted EBITDA as a percent of net sales is calculated as Adjusted EBITDA divided by net sales. We use Adjusted Free Cash Flow to evaluate the amount of cash generated by our business that, after the capital investment needed to maintain and grow our business and certain mandatory debt service requirements, can be used for repayment of debt, stockholder distributions and strategic opportunities, including investing in our business. We believe that Adjusted Free Cash Flow enhances the understanding of the cash flows of our business for management, investors and creditors. Adjusted Free Cash Flow is also used in the calculation of management’s incentive compensation program. The most directly comparable GAAP measure to Adjusted Free Cash Flow is Net cash provided by operating activities. Adjusted Free Cash Flow is calculated as Net cash provided by operating activities, after additions of long-lived assets.

[Graphic Appears Here] 3 Call Agenda Business Update Recent Announcements Q3 2025 Performance 2025 Guidance Update
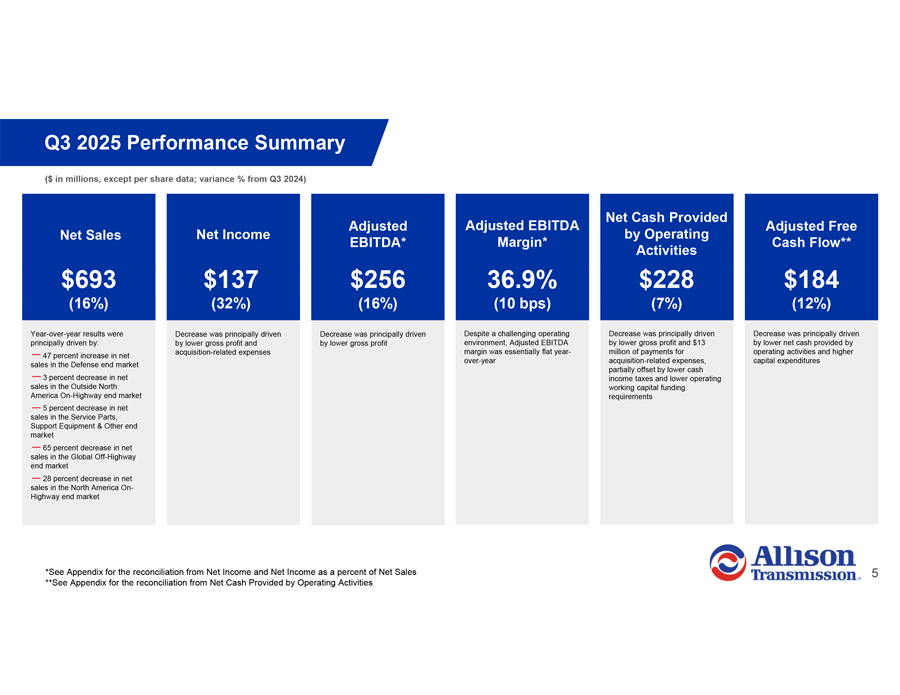
Q3 2025 Performance Summary ($ in millions, except per share data; variance % from Q3 2024) Net Cash Provided Adjusted Adjusted EBITDA Adjusted Free Net Sales Net Income by Operating EBITDA* Margin* Cash Flow** Activities $693 $137 $256 36.9% $228 $184 (16%) (32%) (16%) (10 bps) (7%) (12%) Year-over-year results were Decrease was principally driven Decrease was principally driven Despite a challenging operating Decrease was principally driven Decrease was principally driven principally driven by: by lower gross profit and by lower gross profit environment, Adjusted EBITDA by lower gross profit and $13 by lower net cash provided by acquisition-related expenses margin was essentially flat year- million of payments for operating activities and higher 47 percent increase in net over-year acquisition-related expenses, capital expenditures sales in the Defense end market partially offset by lower cash 3 percent decrease in net income taxes and lower operating sales in the Outside North working capital funding America On-Highway end market requirements 5 percent decrease in net sales in the Service Parts, Support Equipment & Other end market 65 percent decrease in net sales in the Global Off-Highway end market 28 percent decrease in net sales in the North America On-Highway end market *See Appendix for the reconciliation from Net Income and Net Income as a percent of Net Sales **See Appendix for the reconciliation from Net Cash Provided by Operating Activities
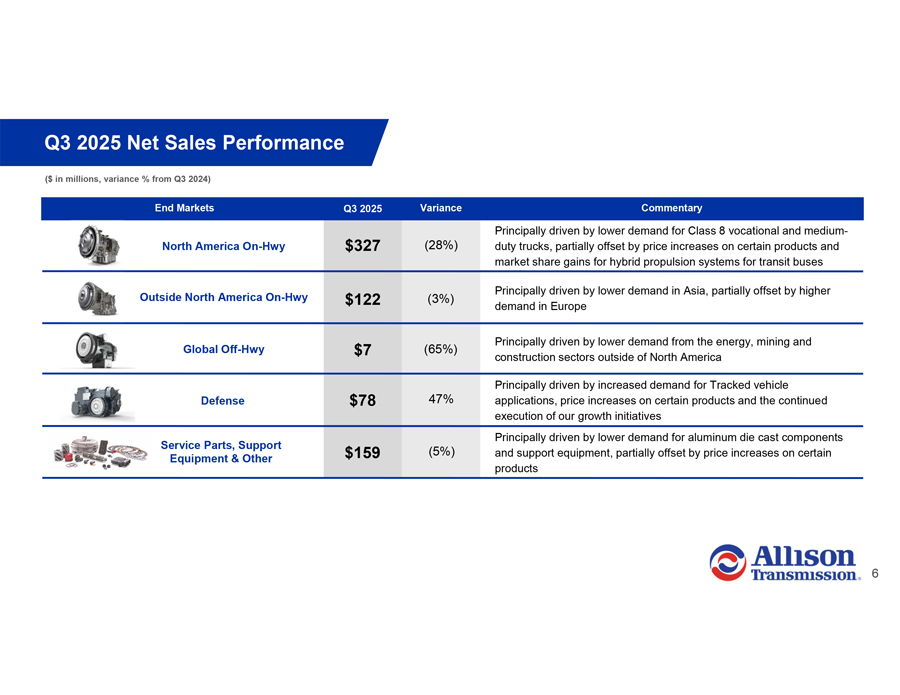
Q3 2025 Net Sales Performance ($ in millions, variance % from Q3 2024) End Markets Q3 2025 Variance Commentary Principally driven by lower demand for Class 8 vocational and medium-North America On-Hwy $327 (28%) duty trucks, partially offset by price increases on certain products and market share gains for hybrid propulsion systems for transit buses Principally driven by lower demand in Asia, partially offset by higher Outside North America On-Hwy $122 (3%) demand in Europe Principally driven by lower demand from the energy, mining and Global Off-Hwy $7 (65%) construction sectors outside of North America Principally driven by increased demand for Tracked vehicle Defense $78 47% applications, price increases on certain products and the continued execution of our growth initiatives Principally driven by lower demand for aluminum die cast components Service Parts, Support $159 (5%) and support equipment, partially offset by price increases on certain Equipment & Other products
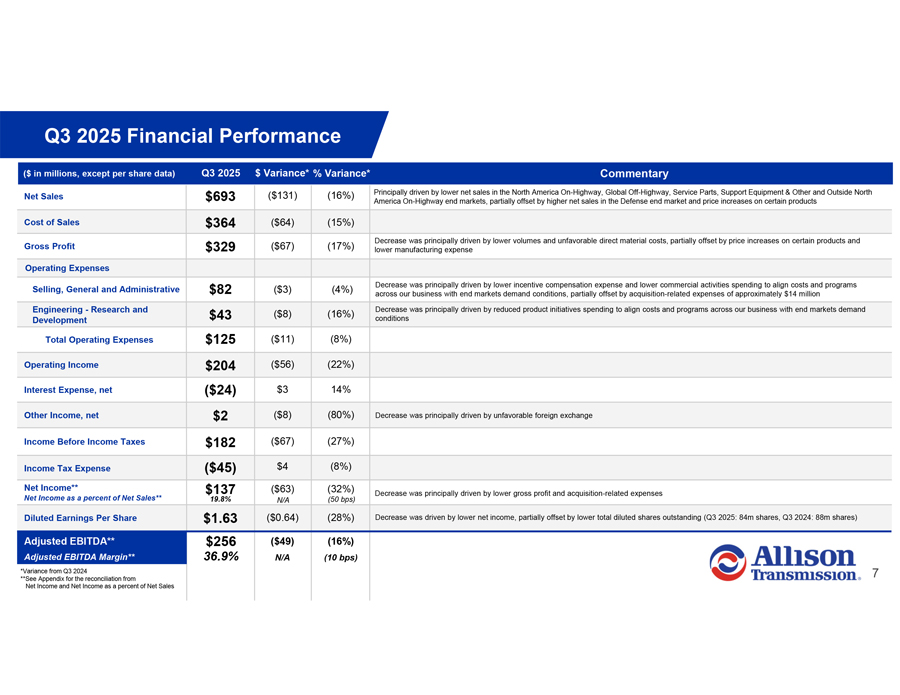
Q3 2025 Financial Performance ($ in millions, except per share data) Q3 2025 $ Variance* % Variance* Commentary Net Sales $693 ($131) (16%) Principally driven by lower net sales in the North America On-Highway, Global Off-Highway, Service Parts, Support Equipment & Other and Outside North America On-Highway end markets, partially offset by higher net sales in the Defense end market and price increases on certain products Cost of Sales $364 ($64) (15%) Decrease was principally driven by lower volumes and unfavorable direct material costs, partially offset by price increases on certain products and Gross Profit $329 ($67) (17%) lower manufacturing expense Operating Expenses Decrease was principally driven by lower incentive compensation expense and lower commercial activities spending to align costs and programs Selling, General and Administrative $82 ($3) (4%) across our business with end markets demand conditions, partially offset by acquisition-related expenses of approximately $14 million Engineering—Research and $43 ($8) (16%) Decrease was principally driven by reduced product initiatives spending to align costs and programs across our business with end markets demand Development conditions Total Operating Expenses $125 ($11) (8%) Operating Income $204 ($56) (22%) Interest Expense, net ($24) $3 14% Other Income, net $2 ($8) (80%) Decrease was principally driven by unfavorable foreign exchange Income Before Income Taxes $182 ($67) (27%) Income Tax Expense ($45) $4 (8%) Net Income** $137 ($63) (32%) Decrease was principally driven by lower gross profit and acquisition-related expenses Net Income as a percent of Net Sales** 19.8% N/A (50 bps) Diluted Earnings Per Share $1.63 ($0.64) (28%) Decrease was driven by lower net income, partially offset by lower total diluted shares outstanding (Q3 2025: 84m shares, Q3 2024: 88m shares) Adjusted EBITDA** $256 ($49) (16%) Adjusted EBITDA Margin** 36.9% N/A (10 bps) *Variance from Q3 2024 7 **See Appendix for the reconciliation from Net Income and Net Income as a percent of Net Sales
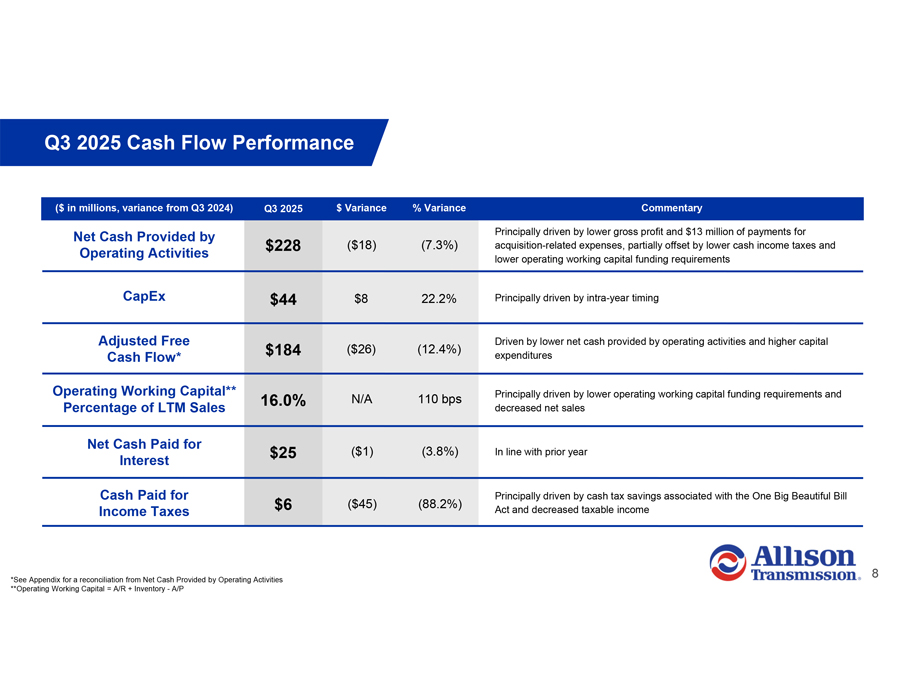
Q3 2025 Cash Flow Performance ($ in millions, variance from Q3 2024) Q3 2025 $ Variance % Variance Commentary Net Cash Provided by Principally driven by lower gross profit and $13 million of payments for $228 ($18) (7.3%) acquisition-related expenses, partially offset by lower cash income taxes and Operating Activities lower operating working capital funding requirements CapEx $44 $8 22.2% Principally driven by intra-year timing Adjusted Free Driven by lower net cash provided by operating activities and higher capital $184 ($26) (12.4%) Cash Flow* expenditures Operating Working Capital** Principally driven by lower operating working capital funding requirements and 16.0% N/A 110 bps Percentage of LTM Sales decreased net sales Net Cash Paid for $25 ($1) (3.8%) In line with prior year Interest Cash Paid for Principally driven by cash tax savings associated with the One Big Beautiful Bill $6 ($45) (88.2%) Income Taxes Act and decreased taxable income *See Appendix for a reconciliation from Net Cash Provided by Operating Activities **Operating Working Capital = A/R + Inventory—A/P
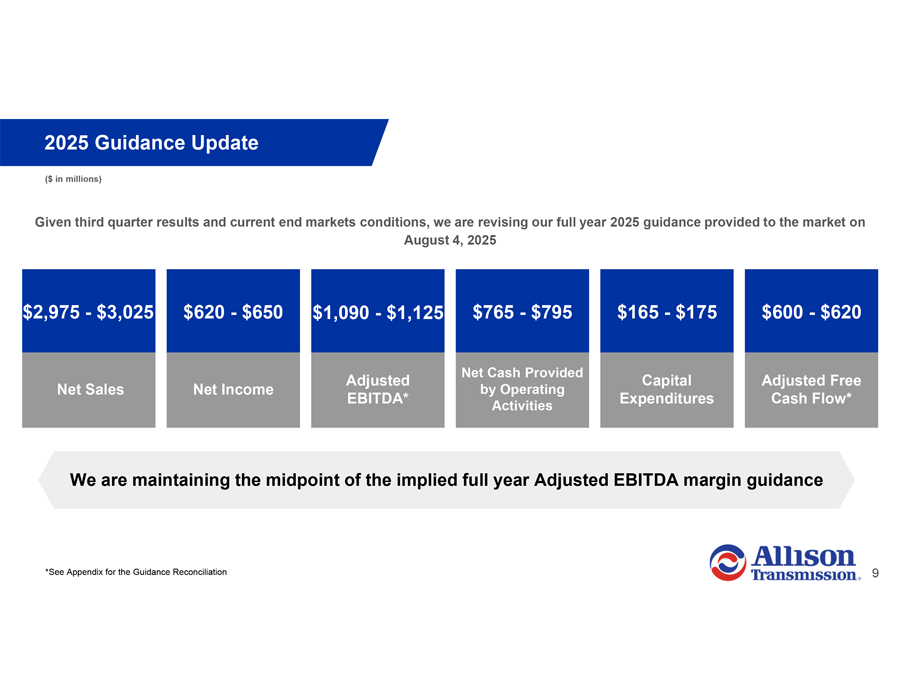
2025 Guidance Update ($ in millions) Given third quarter results and current end markets conditions, we are revising our full year 2025 guidance provided to the market on August 4, 2025 $2,975—$3,025 $620—$650 $1,090—$1,125 $765—$795 $165—$175 $600—$620 Net Cash Provided Adjusted Capital Adjusted Free Net Sales Net Income by Operating EBITDA* Expenditures Cash Flow* Activities We are maintaining the midpoint of the implied full year Adjusted EBITDA margin guidance *See Appendix for the Guidance Reconciliation

Appendix Non-GAAP Financial Information
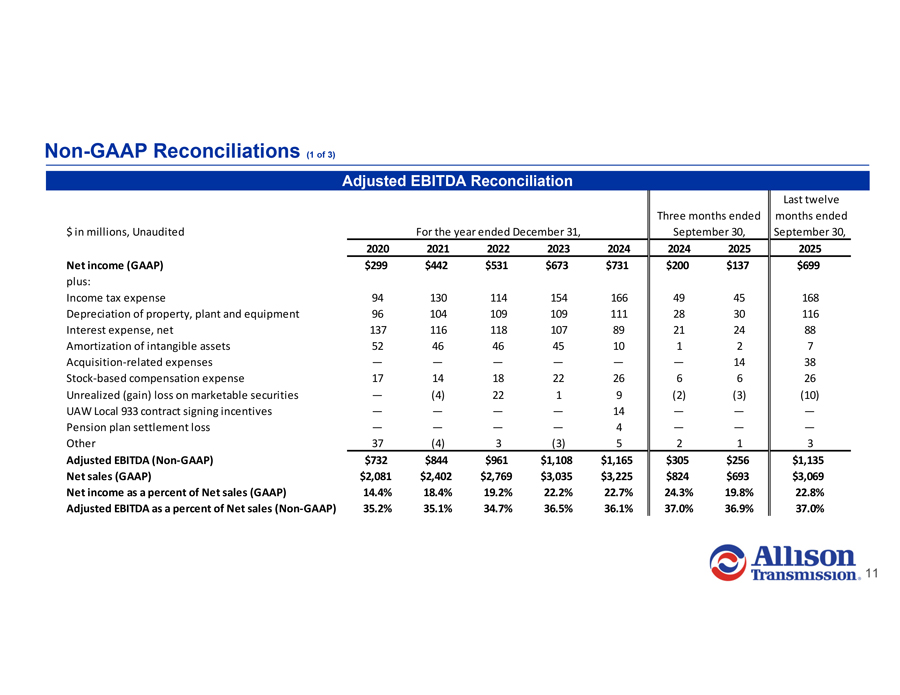
Non-GAAP Reconciliations (1 of 3) Adjusted EBITDA Reconciliation Last twelve Three months ended months ended $ in millions, Unaudited For the year ended December 31, September 30, September 30, 2020 2021 2022 2023 2024 2024 2025 2025 Net income (GAAP) $299 $442 $531 $673 $731 $200 $137 $699 plus: Income tax expense 94 130 114 154 166 49 45 168 Depreciation of property, plant and equipment 96 104 109 109 111 28 30 116 Interest expense, net 137 116 118 107 89 21 24 88 Amortization of intangible assets 52 46 46 45 10 1 2 7 Acquisition-related expenses — — — — — — 14 38 Stock-based compensation expense 17 14 18 22 26 6 6 26 Unrealized (gain) loss on marketable securities — (4) 22 1 9 (2) (3) (10) UAW Local 933 contract signing incentives — — — — 14 — — —Pension plan settlement loss — — — — 4 — — —Other 37 (4) 3 (3) 5 2 1 3 Adjusted EBITDA (Non-GAAP) $732 $844 $961 $1,108 $1,165 $305 $256 $1,135 Net sales (GAAP) $2,081 $2,402 $2,769 $3,035 $3,225 $824 $693 $3,069 Net income as a percent of Net sales (GAAP) 14.4% 18.4% 19.2% 22.2% 22.7% 24.3% 19.8% 22.8% Adjusted EBITDA as a percent of Net sales (Non-GAAP) 35.2% 35.1% 34.7% 36.5% 36.1% 37.0% 36.9% 37.0%
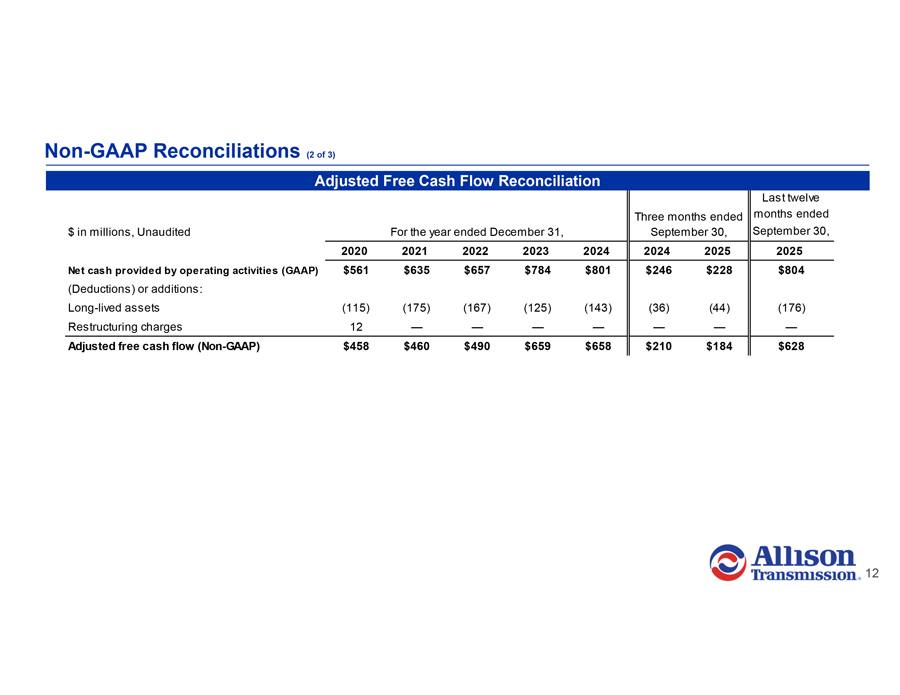
Non-GAAP Reconciliations (2 of 3) Adjusted Free Cash Flow Reconciliation Last twelve Three months ended months ended $ in millions, Unaudited For the year ended December 31, September 30, September 30, 2020 2021 2022 2023 2024 2024 2025 2025 Net cash provided by operating activities (GAAP) $561 $635 $657 $784 $801 $246 $228 $804 (Deductions) or additions: Long-lived assets (115) (175) (167) (125) (143) (36) (44) (176) Restructuring charges 12 — — — — — — — Adjusted free cash flow (Non-GAAP) $458 $460 $490 $659 $658 $210 $184 $628
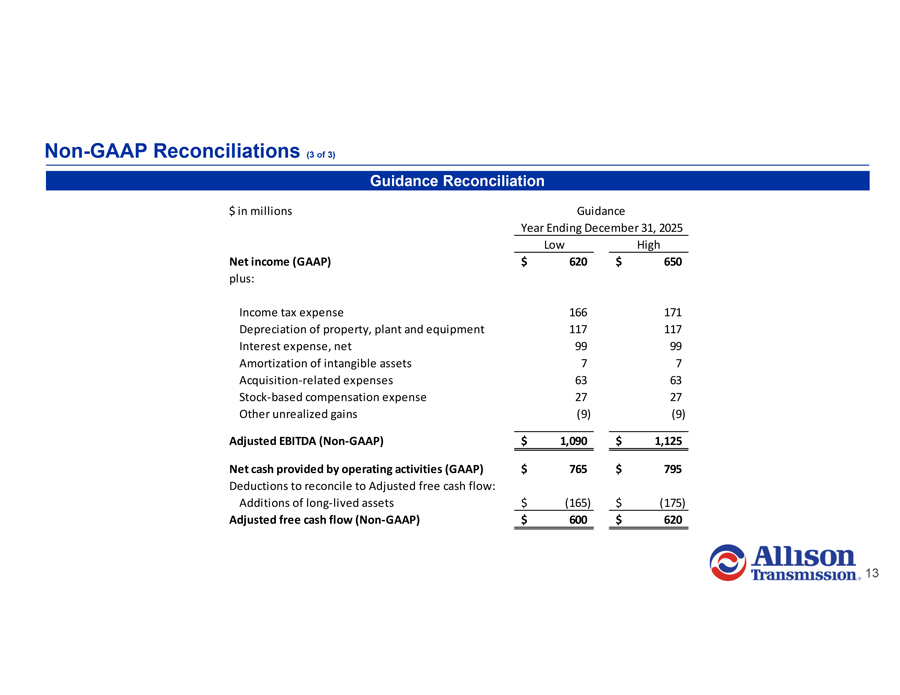
Non-GAAP Reconciliations (3 of 3) Guidance Reconciliation $ in millions Guidance Year Ending December 31, 2025 Low High Net income (GAAP) $ 620 $ 650 plus: Income tax expense 166 171 Depreciation of property, plant and equipment 117 117 Interest expense, net 99 99 Amortization of intangible assets 7 7 Acquisition-related expenses 63 63 Stock-based compensation expense 27 27 Other unrealized gains (9) (9) Adjusted EBITDA (Non-GAAP) $ 1,090 $ 1,125 Net cash provided by operating activities (GAAP) $ 765 $ 795 Deductions to reconcile to Adjusted free cash flow: Additions of long-lived assets $ (165) $ (175) Adjusted free cash flow (Non-GAAP) $ 600 $ 620 2