UNITED STATES
SECURITIES AND EXCHANGE COMMISSION
Washington, D.C. 20549
Form 8-K
CURRENT REPORT
Pursuant to Section 13 OR 15(d)
of the Securities Exchange Act of 1934
Date of Report (Date of earliest event reported): October 23, 2025
POPULAR, INC.
(Exact name of registrant as specified in its charter)
| Puerto Rico | 001-34084 | 66-0667416 | ||
| (State or other jurisdiction of incorporation or organization) |
(Commission File Number) |
(IRS Employer Identification Number) |
| 209 Muñoz Rivera Avenue | ||
| Hato Rey, Puerto Rico | 00918 | |
| (Address of principal executive offices) | (Zip code) |
(787) 765-9800
(Registrant’s telephone number, including area code)
NOT APPLICABLE
(Former name, former address and former fiscal year, if changed since last report)
Check the appropriate box below if the Form 8-K filing is intended to simultaneously satisfy the filing obligation of the registrant under any of the following provisions (see General Instruction A.2. below):
| ☐ | Written communication pursuant to Rule 425 under the Securities Act (17 CFR 230.425) |
| ☐ | Soliciting material pursuant to Rule 14a-12 under the Exchange Act (17 CFR 240.14a-12) |
| ☐ | Pre-commencement communication pursuant to Rule 14d-2(b) under the Exchange Act (17 CFR 240.14d-2(b)) |
| ☐ | Pre-commencement communication pursuant to Rule 13e-4(c) under the Exchange Act (17 CFR 240.13e-4(c)) |
Securities registered pursuant to Section 12(b) of the Act:
| Title of each class |
Trading |
Name of each exchange |
||
| Common Stock ($0.01 par value) | BPOP | The NASDAQ Stock Market | ||
| 6.125% Cumulative Monthly Income Trust Preferred Securities | BPOPM | The NASDAQ Stock Market |
Indicate by check mark whether the registrant is an emerging growth company as defined in Rule 405 of the Securities Act of 1933 (§230.405 of this chapter) or Rule 12b-2 of the Securities Exchange Act of 1934 (§240.12b-2 of this chapter).
Emerging growth company ☐
If an emerging growth company, indicate by check mark if the registrant has elected not to use the extended transition period for complying with any new or revised financial accounting standards provided pursuant to Section 13(a) of the Exchange Act. ☐
| Item 2.02. | Results of Operations and Financial Condition. |
On October 23, 2025, Popular, Inc. (the “Corporation”) issued a press release announcing its unaudited financial results for the quarter ended September 30, 2025, a copy of which is attached as Exhibit 99.1 to this Current Report on Form 8-K.
The information furnished pursuant to this Item 2.02 of this Current Report on Form 8-K, including Exhibit 99.1, shall not be deemed “filed” for purposes of the Securities Exchange Act of 1934, as amended, nor shall it be incorporated by reference into any of the Corporation’s filings under the Securities Act of 1933, as amended, unless otherwise expressly stated in such filing.
| Item 7.01. | Regulation FD Disclosure. |
The Corporation is furnishing information regarding its conference call to discuss its financial results for the quarter ended September 30, 2025. A copy of the presentation to be used by the Corporation on the conference call is attached hereto as Exhibit 99.2.
The information furnished pursuant to this Item 7.01 of this Current Report on Form 8-K, including Exhibit 99.2, shall not be deemed “filed” for purposes of the Securities Exchange Act of 1934, as amended, nor shall it be incorporated by reference into any of the Corporation’s filings under the Securities Act of 1933, as amended, unless otherwise expressly stated in such filing.
| Item 9.01. | Financial Statements and Exhibits. |
Exhibits 99.1 and 99.2 shall not be deemed to be “filed” for purposes of the Securities Exchange Act of 1934, as amended.
| 99.1 | Press Release dated October 23, 2025 – Third Quarter 2025 Financial Results. | |
| 99.2 | Popular, Inc. Conference Call Presentation – Third Quarter 2025 Financial Results. | |
| 101 | Pursuant to Rule 406 of Regulation S-T, the cover page is formatted in Inline XBRL (Inline eXtensible Business Reporting Language). | |
| 104 | Cover Page Interactive Data File (embedded within the Inline XBRL document and included in Exhibit 101). | |
SIGNATURE
Pursuant to the requirements of the Securities Exchange Act of 1934, as amended, the registrant has duly caused this report to be signed on its behalf by the undersigned hereunto duly authorized.
| POPULAR, INC. (Registrant) |
||||||
| Date: October 23, 2025 | By: | /s/ Denissa M. Rodríguez |
||||
| Denissa M. Rodríguez | ||||||
| Senior Vice President and Corporate Comptroller | ||||||
Exhibit 99.1

Popular, Inc. Announces Third Quarter 2025 Financial Results
| • | Net income of $211.3 million in Q3 2025, compared to net income of $210.4 million in Q2 2025. |
| • | Earnings per share (“EPS”) of $3.15 in Q3 2025 vs. $3.09 in Q2 2025. |
| • | Net interest income of $646.5 million in Q3 2025, an increase of $15.0 million compared to Q2 2025: |
| • | Net interest margin of 3.51% in Q3 2025, compared to 3.49% in Q2 2025; net interest margin on a taxable equivalent basis of 3.90% in Q3 2025, compared to 3.85% in Q2 2025. |
| • | Non-interest income of $171.2 million in Q3 2025, compared to $168.5 million in Q2 2025. |
| • | Operating expenses amounted to $495.3 million, compared to $492.8 million in Q2 2025. |
| • | Credit quality metrics: |
| • | Non-performing loans held-in-portfolio (“NPLs”) increased by $190.6 million from Q2 2025, primarily due to two unrelated large commercial loans with book values of $158.3 million and $30.1 million; the NPLs to loans ratio increased to 1.30% from 0.82% in Q2 2025. |
| • | Net charge-offs (“NCOs”) increased by $15.6 million from Q2 2025, mainly due to a $13.5 million commercial loan charge-off on the $30.1 million commercial NPL inflow; annualized NCOs to average loans held-in-portfolio at 0.60% vs. 0.45% in Q2 2025. |
| • | Allowance for credit losses (“ACL”) to loans held-in-portfolio at 2.03% vs. 2.02% in Q2 2025; and |
| • | ACL to NPLs at 156.6% vs. 246.9% in Q2 2025. |
| • | Loans held-in-portfolio, excluding loans held-for-sale, amounted to $38.7 billion, an increase of $502.0 million from Q2 2025; average quarterly loan balances higher by $859.2 million. |
| • | Money market and investment securities decreased by $1.5 billion from Q2 2025; average quarterly balances decreased by $111.6 million. |
| • | Deposits at $66.5 billion, decreased $704.1 million from Q2 2025, including a decrease of $841.9 million in P.R. public deposits; average quarterly deposits higher by $793.2 million, including an increase of $433.2 million in P.R. public deposits. |
| • | Common Equity Tier 1 ratio of 15.79%, Common Equity per share of $91.00 and Tangible Book Value per share increased $3.71 to $79.12. |
| • | Capital actions for the third quarter of 2025 included the repurchase of 1,000,862 shares of common stock for $119.4 million, at an average price of $119.33 per share and the declaration of a common stock dividend of $0.75 per share, an increase from $0.70 per share. As of September 30, 2025, a total of $429.0 million remained available for stock repurchases under the active repurchase authorization. |
1
SAN JUAN, Puerto Rico – (BUSINESS WIRE) – Popular, Inc. (the “Corporation,” “Popular,” “we,” “us,” “our”) (NASDAQ:BPOP) reported net income of $211.3 million for the quarter ended September 30, 2025, compared to net income of $210.4 million for the quarter ended June 30, 2025.
“We are very pleased with our strong results in the third quarter, which were driven by higher revenues, continued expansion of our net interest margin, and discipline in expense management,” said Javier D. Ferrer, President and Chief Executive Officer of Popular, Inc. “We are also encouraged by strong loan growth in both markets, stable customer deposit balances, and solid performance across most fee-generating segments, including robust transaction activity supported by continued customer growth.
We are focused on executing on our new strategic framework, which has three objectives: be the #1 bank for our customers, be simple and efficient, and be a top-performing bank with first-rate talent and which delivers sustainable returns to our shareholders. This framework guides our Transformation, which continues to show steady and notable progress.
Our team is clear about our priorities and energized about the opportunities that lie ahead. I want to thank all our colleagues for their dedication and outstanding work—their commitment continues to drive our success.”
2
Earnings Highlights
| (Unaudited) |
Quarters ended | Nine months ended | ||||||||||||||||||
| (Dollars in thousands, except per share information) |
30-Sep-25 | 30-Jun-25 | 30-Sep-24 | 30-Sep-25 | 30-Sep-24 | |||||||||||||||
| Net interest income |
$ | 646,505 | $ | 631,549 | $ | 572,473 | $ | 1,883,651 | $ | 1,691,529 | ||||||||||
| Provision for credit losses |
75,125 | 48,941 | 71,448 | 188,147 | 190,840 | |||||||||||||||
|
|
|
|
|
|
|
|
|
|
|
|||||||||||
| Net interest income after provision for credit losses |
571,380 | 582,608 | 501,025 | 1,695,504 | 1,500,689 | |||||||||||||||
| Other non-interest income |
171,195 | 168,477 | 164,082 | 491,733 | 494,206 | |||||||||||||||
| Operating expenses |
495,287 | 492,761 | 467,321 | 1,459,060 | 1,420,010 | |||||||||||||||
|
|
|
|
|
|
|
|
|
|
|
|||||||||||
| Income before income tax |
247,288 | 258,324 | 197,786 | 728,177 | 574,885 | |||||||||||||||
| Income tax expense |
35,971 | 47,884 | 42,463 | 128,918 | 138,490 | |||||||||||||||
|
|
|
|
|
|
|
|
|
|
|
|||||||||||
| Net income |
$ | 211,317 | $ | 210,440 | $ | 155,323 | $ | 599,259 | $ | 436,395 | ||||||||||
|
|
|
|
|
|
|
|
|
|
|
|||||||||||
| Net income applicable to common stock |
$ | 210,964 | $ | 210,087 | $ | 154,970 | $ | 598,200 | $ | 435,336 | ||||||||||
|
|
|
|
|
|
|
|
|
|
|
|||||||||||
| Net income per common share-basic |
$ | 3.15 | $ | 3.09 | $ | 2.16 | $ | 8.78 | $ | 6.06 | ||||||||||
|
|
|
|
|
|
|
|
|
|
|
|||||||||||
| Net income per common share-diluted |
$ | 3.14 | $ | 3.09 | $ | 2.16 | $ | 8.78 | $ | 6.05 | ||||||||||
|
|
|
|
|
|
|
|
|
|
|
|||||||||||
3
Non-GAAP Financial Measures
This press release contains financial information prepared under accounting principles generally accepted in the United States (“U.S. GAAP”) and non-GAAP financial measures. Management uses non-GAAP financial measures when it determines that these measures provide more meaningful information of the underlying performance of the ongoing operations. Non-GAAP financial measures used by the Corporation may not be comparable to similarly named non-GAAP financial measures used by other companies.
Net interest income on a taxable equivalent basis
Net interest income, on a taxable equivalent basis, is presented with its different components in Tables D, E and F for the quarter ended September 30, 2025. Net interest income, on a taxable equivalent basis, is a non-GAAP financial measure. Management believes that this presentation provides meaningful information since it facilitates the comparison of revenues arising from taxable and tax-exempt sources.
Tangible Common Equity
Tangible common equity, the tangible common equity ratio, tangible assets and tangible book value per common share are non-GAAP financial measures. The tangible common equity ratio and tangible book value per common share are commonly used by banks and analysts in conjunction with more traditional bank capital ratios to compare the capital adequacy of banking organizations with significant amounts of goodwill or other intangible assets, typically stemming from the use of the purchase accounting method for mergers and acquisitions. Neither tangible common equity nor tangible assets or related measures should be used in isolation or as a substitute for stockholders’ equity, total assets or any other measure calculated in accordance with GAAP.
Refer to Table R for a reconciliation of total stockholders’ equity to tangible common equity and total assets to tangible assets.
Net Interest Income and Net Interest Margin
Net interest income (“NII”) for the third quarter of 2025 of $646.5 million, an increase of $15.0 million when compared to the previous quarter. These results continue to reflect the favorable impact of asset repricing, and the Corporation’s focus on deposit retention. During the period, the investments in U.S. Treasury securities with higher yields contributed positively to the period’s net interest income, supported by an increase of $793.2 million in average deposits compared to the second quarter of 2025, primarily in P.R. public deposits and high-cost deposits in our U.S. operations, offset in part by a reduction in overnight Fed funds balances. Conversely, total interest expense on deposits increased by $8.4 million when compared with the second quarter of 2025, driven by higher average deposits during the quarter. The additional day in the quarter, when compared to the previous quarter, resulted in higher NII by $5.1 million.
Net interest margin (“NIM”) for the quarter was 3.51%, compared to 3.49% in the second quarter of 2025, an increase of two basis points. NIM expansion for the period was driven by earning assets mix, including higher yielding U.S. Treasury securities by approximately 10 basis points, partially offset by changes in the loan portfolios composition, which resulted in lower loan yields by four basis points. Total deposit costs of 1.79% increased by one basis point when compared to the second quarter of 2025. P.R. public deposit costs, which are market-linked, decreased by three basis points to 3.19%. Excluding P.R. public deposits, average deposits increased by $359.9 million and total deposit costs increased two basis points to 1.17% when compared to the second quarter of 2025.
Net Interest Income and Net Interest Margin Taxable Equivalent (Non-GAAP)
Net interest income on a taxable equivalent basis for the third quarter of 2025 was $720.8 million, an increase of $23.6 million. Net interest margin on a taxable equivalent basis for the third quarter of 2025 was 3.90%, an increase of five basis points.
4
The main drivers of net interest income on a taxable equivalent basis were:
| • | higher income from investment securities by $12.7 million or 13 basis points, due to higher investments in U.S. Treasury securities, which are tax-exempt in Puerto Rico, by $290.4 million and higher yields by 17 basis points. During the quarter we purchased approximately $2.5 billion of U.S. Treasury notes with an average duration of 1.4 years and a yield of approximately 3.65%, through a combination of approximately $1.0 billion in maturing U.S. Treasuries and a reduction of approximately $1.5 billion in overnight Fed funds. This further supports a reduction in the portfolio’s sensitivity to future rate decreases; and |
| • | higher interest income from loans by $21.4 million, primarily as a result of higher average loan balances by $859.7 million due to growth in the loan portfolios, most notably in the commercial and mortgage loan portfolios which in Banco Popular de Puerto Rico (“BPPR”) include certain loans that are tax- exempt; |
partially offset by:
| • | higher interest expense on deposits by $8.4 million or one basis point, primarily as result of higher average balance of P.R. public deposits, which increased by $433.2 million, and high-cost deposits in Popular Bank (“PB” or “Popular U.S.”), partially offset by the lower repricing of market linked P.R. public deposits; and |
| • | lower income from money market investments by $2.7 million mainly due to the use of funds to support loan growth and U.S. Treasury securities purchases, as previously noted. |
Net Interest Income and Net Interest Margin (Banco Popular de Puerto Rico Segment)
For the BPPR segment, net interest income for the third quarter of 2025 was $550.7 million, an increase of $12.2 million over the previous quarter. Net interest margin increased by three basis points to 3.71%. Total deposits cost in BPPR increased by one basis point to 1.53%.
The main drivers of higher net interest income for the BPPR segment include:
| • | higher income from investment securities by $8.0 million, or an eight basis points increase, driven by higher yields by 10 basis points and higher average balances of U.S. Treasury securities by $255.0 million, driven by higher average deposits and a reduction in overnight Fed funds; and |
| • | higher income from loans by $11.8 million primarily attributable to growth in all portfolios, mainly in the commercial and mortgage portfolios which on average grew balances by $382.4 million and $144.8 million, respectively, partially offset by lower yields in commercial loan portfolio by 15 basis points, driven by the impact of certain large commercial loan originations at lower yields that have occurred during the second and third quarter of 2025 and the impact of 6 basis points due to the reversal of accrued interest income receivable on a large commercial loan classified as non-accrual during the period; |
partially offset by:
| • | higher average deposits by $389.2 million, driven by higher P.R. public deposits by $433.2 million, resulting in higher interest expense by $3.7 million; and |
| • | lower income from money market investments by $3.3 million mainly due to the use of funds to support loan growth and U.S. Treasury securities purchases. |
5
Net Interest Income and Net Interest Margin (Popular Bank Segment)
In the Popular Bank segment, net interest income was $105.2 million, $3.0 million higher when compared to the previous quarter. Net interest margin in the PB segment increased by one basis point to 2.94%. Total cost of deposits increased by one basis point during the quarter to 2.96%.
The main drivers for the higher net interest income for the Popular Bank segment include:
| • | an increase in interest income on loan portfolios by $5.7 million, or two basis points, compared to the previous quarter, driven by growth in the commercial and construction loan portfolios; and |
partially offset by:
| • | higher interest expense on deposits by $3.2 million, or one basis point, attributed to higher average deposits, mainly in high-cost deposits including online deposits and time deposits. |
Refer to tables D and E for more details on the components of net interest income and net interest margin on a taxable equivalent basis.
Non-interest income
Non-interest income amounted to $171.2 million for the quarter ended September 30, 2025, an increase of $2.7 million when compared to $168.5 million for the previous quarter. Our diverse fee-generating segments, together with robust customer transaction activity, have contributed to solid performance in the third quarter of 2025.
The main variances in non-interest income include:
| • | higher other operating income by $3.6 million mainly due to income of $5.3 million related to a retroactive charge billed to a tenant for energy supplied in prior years and higher income from investments accounted under the equity method by $2.7 million, partially offset by the impact of $3.5 million related to certain transactions recognized during the second quarter of 2025 which included income on a tax-related reimbursement and a cash distribution from a legacy equity investment; |
partially offset by:
| • | lower income from mortgage banking activities by $2.1, million mainly due to an unfavorable variance in the fair value adjustment of Mortgage Servicing Rights (“MSRs”) driven by a reduction in market rates that impacted interest earned on escrowed accounts and net portfolio runoff. |
Refer to Table B for further details.
6
Operating expenses
Operating expenses for the third quarter of 2025 totaled $495.3 million, an increase of $2.5 million when compared to the second quarter of 2025. The variance in operating expenses was driven primarily by:
| • | a non-cash goodwill impairment of $13.0 million in our U.S. based equipment leasing subsidiary due to lower projected earnings for the forecasted period, driven by lower lending activity; |
| • | higher personnel costs by $3.6 million mainly as a result of higher salary expense by $6.6 million due in part to annual salary and merit increases effective in the third quarter of 2025, and the impact of an additional day in the quarter, and higher other personnel costs by $2.0 million, driven by employee termination benefits resulting from ongoing efforts to improve our profitability, including the decision to exit the U.S. Residential Mortgage origination business and close four underperforming branches in the New York metro area at Popular U.S.; partially offset by lower incentive expenses by $6.5 million related to restricted stock grants and performance shares awarded in the second quarter of 2025; |
| • | higher technology and software expenses by $2.4 million, including software cost amortization, related to investments in the Corporation’s cloud infrastructure, among other continuing investments in technology and transformation initiatives, partially offset by a decrease in network management services expenses; and |
| • | higher FDIC deposit insurance expense by $1.5 million, mainly driven by Popular U.S., due to changes in the assessment impacted by its wholesale funding composition and an increase in construction loans; |
partially offset by:
| • | lower other operating expenses by $13.5 million, driven by a reversal in the third quarter of a $4.8 million claim reserve established during the second quarter of 2025 and the release of several sundry loss reserves by $4.6 million mainly related to the mortgage servicing business; |
| • | lower net occupancy expenses by $3.1 million, driven by a favorable reassessment of the real property tax estimate for certain properties in Puerto Rico by $3.0 million; and |
| • | lower professional fees by $2.3 million, mainly due to lower costs associated with regulatory compliance activities. |
Full-time equivalent employees were 9,263 as of September 30, 2025, compared to 9,303 as of June 30, 2025.
For a breakdown of operating expenses by category refer to Table B.
Income taxes
For the third quarter of 2025, the Corporation recorded an income tax expense of $36.0 million, compared to an income tax expense of $47.9 million for the previous quarter. The lower income tax expense of $11.9 million is mainly driven by lower income before tax and higher income that is exempt or subject to a preferential tax rate.
The effective tax rate (“ETR”) for the third quarter of 2025 was 14.5%, compared to 18.5% for the previous quarter. The ETR of the Corporation is impacted by the composition source of its taxable income and tax credit activities.
Upon an amendment to the Puerto Rico internal revenue code during the third quarter of 2025, the Corporation elected to treat certain single members LLCs as disregarded entities, as allowed by this amendment, on its 2024 corporate income tax return filed subsequent to the quarter end in October. It is expected that this election will lower our income tax expense by approximately $7.7 million during the fourth quarter of 2025, essentially reversing the year’s income tax expense related to this matter. We expect the ETR for the fourth quarter of 2025 to be within a range of 14% - 16% and within a range from 16% - 18% for the year 2025.
7
Credit Quality
During the third quarter of 2025, the Corporation’s credit quality metrics were affected by two significant unrelated commercial exposures, resulting in a $188.4 million increase in NPLs and $13.5 million in NCOs tied to these borrowers. These impacts stemmed from issues specific to the individual borrowers and are not indicative of a broader decline in portfolio credit quality.
The first loan classified as NPL is a $158.3 million commercial and industrial facility issued to a telecommunications company in Puerto Rico experiencing reduced revenue due to operational challenges following a business acquisition and client attrition. The second loan classified as NPL is a $30.1 million commercial real estate facility, following a $13.5 million charge-off during the quarter, and is secured by a hotel property in Florida.
Excluding these cases, credit quality metrics were stable. The Corporation continues to closely monitor the economic landscape and borrower performance, as economic uncertainty remains a key consideration. Management believes that the improvements in risk management practices over recent years and the overall credit risk profile of the loan portfolio position the Corporation to continue to operate successfully in the current environment.
The following presents credit quality results for the third quarter of 2025:
Non-Performing Loans and Net Charge Offs
Total NPLs increased by $190.6 million to $502.2 million compared to the previous quarter. Excluding consumer loans, inflows of NPLs held-in-portfolio increased by $205.4 million in the third quarter of 2025. The ratio of NPLs to total loans held in the portfolio was 1.30% for the third quarter of 2025, compared to 0.82% for the previous quarter. NPLs variances per reporting segment include:
| • | In the BPPR segment, NPLs increased by $195.7 million, primarily due to the classification of two significant commercial exposures with book values of $158.3 million and $30.1 million as NPLs. These classifications are attributable to borrower specific circumstances and management believes they are not a reflection of the broader credit quality within the portfolio. Excluding consumer loans, inflows to NPLs in the BPPR segment increased by $209.5 million compared to the previous quarter, largely driven by the previously mentioned commercial exposures. |
| • | In the PB segment, NPLs decreased by $5.1 million driven by lower commercial NPLs by $4.9 million. Inflows to NPLs, excluding consumer loans, decreased by $4.1 million quarter-over-quarter, mainly related to commercial loans. |
Total NCOs of $57.8 million increased by $15.6 million when compared to the second quarter of 2025. The Corporation’s ratio of annualized NCOs to average loans held-in-portfolio for the third quarter was 0.60%, compared to 0.45% in the second quarter of 2025.
NCOs variances per reporting segment include:
| • | In the BPPR segment, NCOs increased by $16.4 million, mostly due to a $13.5 million charge-off related to the $30.1 million commercial NPL inflow referenced above. Consumer NCOs increased by $3.7 million, mostly due to higher auto loans NCOs by $5.5 million, while the credit cards NCOs decreased by $2.0 million. |
| • | In the PB segment, NCOs decreased by $0.8 million, mostly due to lower consumer NCOs. |
Including other real estate owned (“OREO”) assets of $43.0 million, non-performing assets (“NPAs”) for the Corporation amounted to $545.2 million, an increase of $187.4 million during the period, driven by the increase in NPLs, as previously discussed, partially offset by a net reduction of $3.2 million in OREO assets, mainly due to the sale of residential properties at the BPPR segment, at a net gain.
8
Allowance for Credit Losses and Provision for Credit Losses
The ACL as of September 30, 2025 amounted to $786.2 million, an increase of $16.7 million when compared to the second quarter of 2025. The increase in ACL was primarily due to a specific reserve recognized for the $158.3 million commercial NPL inflow, partially offset by improvements in the credit quality of the consumer portfolio, as further described below.
In the BPPR segment, the ACL increased by $16.1 million when compared to the previous quarter, mostly due to a $25.6 million increase in the reserves for commercial loans driven by the aforementioned NPL inflow, higher loan balances, and changes in macroeconomic scenarios. The ACL for mortgage loans increased by $2.6 million mostly due to changes in the macroeconomic scenarios. These increases were partially offset by a $11.6 million reduction in the reserves for consumer loans, mainly in the auto loans and credit card portfolios, reflecting improvements in credit quality. In the Popular U.S. segment, the ACL remained stable, increasing by $0.6 million from the previous quarter.
The Corporation’s ratio of the ACL to loans held-in-portfolio was 2.03% in the third quarter of 2025, compared to 2.02% in the previous quarter. The ratio of the ACL to NPLs held-in-portfolio decreased to 156.6%, from 246.9% in the previous quarter, mainly due to the impact of the two commercial exposures previously mentioned.
The provision for loan losses for the loan and lease portfolios for the third quarter of 2025 was $74.5 million, an increase of $25.0 million when compared to $49.5 million in the previous quarter. The provision for loan losses for the BPPR segment amounted to $72.6 million, compared to $43.2 million in the previous quarter. This increase was mainly driven by higher provision expenses for commercial loans, due to the impact of the above-mentioned large commercial exposures entering NPL status, partially offset by a lower provision for the consumer loan portfolio. The provision for loan losses for the PB segment amounted to $1.9 million, compared to $6.4 million in the prior quarter. The reduction in provision expense occurred mainly within the commercial loan portfolio.
The provision for credit losses for the third quarter of $75.1 million includes the provision for loan and lease losses, along with the $0.8 million reserve related to unfunded loan commitments and the $0.2 million reserve release for the Corporation’s investment portfolio.
Refer to Table L for breakdown of non-performing assets and related ratios and to Table N for allowance for credit losses, net charge-offs and related ratios.
9
Non-Performing Assets
| (Unaudited) |
||||||||||||
| (In thousands) |
30-Sep-25 | 30-Jun-25 | 30-Sep-24 | |||||||||
| Non-performing loans held-in-portfolio |
$ | 502,202 | $ | 311,625 | $ | 361,398 | ||||||
| Other real estate owned |
42,950 | 46,126 | 63,028 | |||||||||
|
|
|
|
|
|
|
|||||||
| Total non-performing assets |
$ | 545,152 | $ | 357,751 | $ | 424,426 | ||||||
|
|
|
|
|
|
|
|||||||
| Net charge-offs for the quarter |
$ | 57,788 | $ | 42,202 | $ | 58,529 | ||||||
|
|
|
|
|
|
|
|||||||
| Ratios: |
||||||||||||
| Loans held-in-portfolio |
$ | 38,687,158 | $ | 38,185,178 | $ | 36,194,967 | ||||||
| Non-performing loans held-in-portfolio to loans held-in-portfolio |
1.30 | % | 0.82 | % | 1.00 | % | ||||||
| Allowance for credit losses to loans held-in-portfolio |
2.03 | 2.02 | 2.06 | |||||||||
| Allowance for credit losses to non-performing loans, excluding loans held-for-sale |
156.55 | 246.93 | 205.96 | |||||||||
Refer to Table L for additional information.
Provision for Credit Losses (Benefit)- Loan Portfolios
| (Unaudited) |
Quarters ended | Nine months ended | ||||||||||||||||||
| (In thousands) |
30-Sep-25 | 30-Jun-25 | 30-Sep-24 | 30-Sep-25 | 30-Sep-24 | |||||||||||||||
| Provision for credit losses (benefit) - loan portfolios: |
||||||||||||||||||||
| BPPR |
$ | 72,639 | $ | 43,150 | $ | 77,147 | $ | 168,479 | $ | 186,740 | ||||||||||
| Popular U.S. |
1,878 | 6,389 | (4,378 | ) | 20,795 | 2,572 | ||||||||||||||
|
|
|
|
|
|
|
|
|
|
|
|||||||||||
| Total provision for credit losses (benefit) - loan portfolios |
$ | 74,517 | $ | 49,539 | $ | 72,769 | $ | 189,274 | $ | 189,312 | ||||||||||
|
|
|
|
|
|
|
|
|
|
|
|||||||||||
Credit Quality by Segment
| (Unaudited) | ||||||||||||
| (Dollars in thousands) |
Quarters ended | |||||||||||
| BPPR |
30-Sep-25 | 30-Jun-25 | 30-Sep-24 | |||||||||
| Provision for credit losses - loan portfolios |
$ | 72,639 | $ | 43,150 | $ | 77,147 | ||||||
| Net charge-offs |
56,539 | 40,164 | 54,581 | |||||||||
| Total non-performing loans held-in-portfolio |
453,369 | 257,648 | 288,815 | |||||||||
| Annualized net charge-offs to average loans held-in-portfolio |
0.84 | % | 0.61 | % | 0.86 | % | ||||||
| Allowance / loans held-in-portfolio |
2.56 | % | 2.53 | % | 2.59 | % | ||||||
| Allowance / non-performing loans held-in-portfolio |
153.38 | % | 263.63 | % | 230.66 | % | ||||||
| Quarters ended | ||||||||||||
| Popular U.S. |
30-Sep-25 | 30-Jun-25 | 30-Sep-24 | |||||||||
| Provision for credit losses (benefit) - loan portfolios |
$ | 1,878 | $ | 6,389 | $ | (4,378 | ) | |||||
| Net charge-offs |
1,249 | 2,038 | 3,948 | |||||||||
| Total non-performing loans held-in-portfolio |
48,833 | 53,977 | 72,583 | |||||||||
| Annualized net charge-offs to average loans held-in-portfolio |
0.04 | % | 0.07 | % | 0.15 | % | ||||||
| Allowance / loans held-in-portfolio |
0.79 | % | 0.79 | % | 0.75 | % | ||||||
| Allowance / non-performing loans held-in-portfolio |
186.07 | % | 167.17 | % | 107.66 | % | ||||||
10
Financial Condition Highlights
| (Unaudited) |
||||||||||||
| (In thousands) |
30-Sep-25 | 30-Jun-25 | 30-Sep-24 | |||||||||
| Cash and money market investments |
$ | 5,131,470 | $ | 6,741,417 | $ | 6,958,382 | ||||||
| Investment securities |
28,371,673 | 28,283,970 | 25,280,451 | |||||||||
| Loans |
38,687,158 | 38,185,178 | 36,194,967 | |||||||||
| Total assets |
75,065,798 | 76,065,090 | 71,323,074 | |||||||||
| Deposits |
66,513,404 | 67,217,491 | 63,668,501 | |||||||||
| Borrowings |
1,246,807 | 1,414,494 | 973,736 | |||||||||
| Total liabilities |
68,950,126 | 70,111,072 | 65,532,560 | |||||||||
| Stockholders’ equity |
6,115,672 | 5,954,018 | 5,790,514 | |||||||||
11
Total assets amounted to $75.1 billion at September 30, 2025, a decrease of $1.0 billion from the second quarter of 2025, driven by:
| • | a decrease in money market investments of $1.6 billion, mainly driven by lower deposits, loan origination activity and the purchase of investments in U.S. Treasury securities; and |
| • | a decrease in securities held-to-maturity (“HTM”) of $108.6 million, driven by maturities and principal paydowns, partially offset by the amortization of $47.2 million of the discount related to U.S. Treasury securities previously reclassified from available-for-sale (“AFS”) to HTM; |
partially offset by:
| • | an increase in loans held-in-portfolio by $502.0 million, driven by an increase of $356.8 million in the BPPR segment across most portfolios, particularly commercial, and mortgage loans, coupled with an increase of $145.2 million in the PB segment, mainly due to commercial and construction loans; and |
| • | an increase in AFS securities of $196.2 million, driven by an increase in investments in U.S. Treasury securities and a decrease in the unrealized losses of $105.9 million, partially offset by maturities and principal paydowns, mainly in mortgage-backed securities. |
Total liabilities decreased by $1.2 billion from the second quarter of 2025, driven by:
| • | a decrease of $704.1 million in deposits, primarily driven by a decrease in P.R. public deposits of approximately $841.9 million, mainly due to annual contributions to the government’s pension reserve and debt service payments, and lower demand deposits by $240.6 million, mainly commercial deposits, partially offset by an increase in retail deposits of $185.4 million, primarily at BPPR, and an increase in high-cost deposits of $193.0 million, mainly at PB; P.R. public deposits totaled $20.1 billion and represented 30% of the Corporation’s total deposit portfolio at September 30, 2025; |
| • | a decrease in other liabilities of $289.2 million, mainly due to lower unsettled U.S. Treasury securities purchases; and |
| • | a decrease in other short-term borrowings of $150.0 million due to lower FHLB advances in PB. |
Stockholders’ equity increased by $161.7 million when compared to the second quarter of 2025 mainly due to the quarter’s net income of $211.3 million, a decrease in net unrealized losses in the portfolio of AFS securities of $94.7 million and the amortization of unrealized losses from securities previously reclassified to HTM of $37.8 million, net of tax, partially offset by an increase in Treasury Stock of $119.1 million, mainly due to common stock repurchases during the quarter, common and preferred dividends declared during the quarter of $50.7 million, and an unfavorable variance in foreign currency translation adjustments of $14.5 million from investments accounted for under the equity method.
During the quarter and nine months ended September 30, 2025, Popular repurchased 1,000,862 shares of common stock for $119.4 million at an average price of $119.33, per share, and 3,407,821 shares of common stock for $353.7 million at an average price of $103.78, per share, respectively, as part of the 2024 and 2025 common stock repurchase programs previously announced. As of September 30, 2025, $429.0 million remained available for stock repurchase under the active repurchase authorization.
The Corporation is in the process of completing its annual goodwill impairment test, using July 31, 2025, as the evaluation date. During the third quarter of 2025, an impairment charge of $13.0 million related to our U.S. based equipment leasing subsidiary was recognized. The Corporation expects to finalize its goodwill evaluation prior to the filing of its Form 10-Q for the quarter ended September 30, 2025, with the Securities and Exchange Commission. Any further impairment of goodwill would result in a non-cash expense, net of tax impact. A charge to earnings related to goodwill impairment would not materially impact regulatory capital and tangible capital calculations.
12
Common Equity Tier 1 ratio (“CET1”), common equity per share and tangible book value per share were 15.79%, $91.00 and $79.12, respectively, at September 30, 2025, compared to 15.91%, $87.31 and $75.41, respectively, at June 30, 2025.
Refer to Table A for capital ratios.
Cautionary Note Regarding Forward-Looking Statements
This press release contains “forward-looking statements” within the meaning of the U.S. Private Securities Litigation Reform Act of 1995, including without limitation those regarding Popular’s business, financial condition, results of operations, plans, objectives and future performance. These statements are not guarantees of future performance, are based on management’s current expectations and, by their nature, involve risks, uncertainties, estimates and assumptions. Potential factors, some of which are beyond the Corporation’s control, could cause actual results to differ materially from those expressed in, or implied by, such forward-looking statements. Risks and uncertainties include, without limitation, the effect of competitive and economic factors, and our reaction to those factors, the adequacy of the allowance for loan losses, delinquency trends, market risk and the impact of interest rate changes (including on our cost of deposits), our ability to attract deposits and grow our loan portfolio, capital market conditions, capital adequacy and liquidity, the effect of legal and regulatory proceedings, new regulatory requirements or accounting standards on the Corporation’s financial condition and results of operations, the occurrence of unforeseen or catastrophic events, such as extreme weather events, pandemics, man-made disasters or acts of violence or war, as well as actions taken by governmental authorities in response thereto, and the direct and indirect impact of such events on Popular, our customers, service providers and third parties. Other potential factors include Popular’s ability to successfully execute its transformation initiative, including, but not limited to, achieving projected earnings, efficiencies and return on tangible common equity and accurately anticipating costs and expenses associated therewith, imposition of additional or special FDIC assessments, or increases thereto, changes to regulatory capital, liquidity and resolution-related requirements applicable to financial institutions in response to recent developments affecting the banking sector, the impact of bank failures or adverse developments at other banks and related negative media coverage of the banking industry in general on investor and depositor sentiment regarding the stability and liquidity of banks, the impact of the current or any future U.S. government shutdown and changes in and uncertainty regarding federal funding, tax and trade policies, and rulemaking, supervision, examination and enforcement priorities of the federal administration. All statements contained herein that are not clearly historical in nature, are forward-looking, and the words “anticipate,” “believe,” “continues,” “expect,” “estimate,” “intend,” “project” and similar expressions, and future or conditional verbs such as “will,” “would,” “should,” “could,” “might,” “can,” “may” or similar expressions, are generally intended to identify forward-looking statements.
More information on the risks and important factors that could affect the Corporation’s future results and financial condition is included in our Form 10-K for the year ended December 31, 2024, our Form 10-Q for the quarters ended March 31, 2025 and June 30, 2025, and our Form 10-Q for the quarter ended September 30, 2025 to be filed with the Securities and Exchange Commission. Our filings are available on the Corporation’s website (www.popular.com) and on the Securities and Exchange Commission website (www.sec.gov). The Corporation assumes no obligation to update or revise any forward-looking statements or information which speak as of their respective dates.
About Popular, Inc.
Popular, Inc. (NASDAQ: BPOP) is the leading financial institution in Puerto Rico, by both assets and deposits, and ranks among the top 50 U.S. bank holding companies by assets. Founded in 1893, Banco Popular de Puerto Rico, Popular’s principal subsidiary, provides retail, mortgage and commercial banking services in Puerto Rico and the U.S. and British Virgin Islands, as well as auto and equipment leasing and financing in Puerto Rico. Popular also offers broker-dealer and insurance services in Puerto Rico through specialized subsidiaries. In the mainland United States, Popular provides retail, mortgage and commercial banking services through its New York-chartered banking subsidiary, Popular Bank, which has branches located in New York, New Jersey and Florida.
13
Conference Call
Popular will hold a conference call to discuss its financial results today, Thursday, October 23, 2025 at 11:00 a.m. Eastern Time. The call will be broadcast live over the Internet and can be accessed through the Investor Relations section of the Corporation’s website: www.popular.com.
Listeners are recommended to go to the website at least 15 minutes prior to the call to download and install any necessary audio software. The call may also be accessed through a dial-in telephone number 1-833-470-1428 (Toll Free) or 1-646-844-6383 (Local). The dial-in access code is 828640.
A replay of the webcast will be archived in Popular’s website. A telephone replay will be available one hour after the end of the conference call through Saturday, November 22, 2025, 11:59 p.m. Eastern Time. The replay dial in is: 1-866-813-9403 or 1-929-458-6194. The replay passcode is 785813.
An electronic version of this press release can be found at the Corporation’s website: www.popular.com.
14
Popular, Inc.
Financial Supplement to Third Quarter 2025 Earnings Release
Table A - Selected Ratios and Other Information
Table B - Consolidated Statement of Operations
Table C - Consolidated Statement of Financial Condition
Table D - Analysis of Levels and Yields on a Taxable Equivalent Basis (Non-GAAP) - QUARTER
Table E - Analysis of Levels and Yields on a Taxable Equivalent Basis (Non-GAAP) - QUARTER
Table F - Analysis of Levels and Yields on a Taxable Equivalent Basis (Non-GAAP) - YEAR-TO-DATE
Table G - Mortgage Banking Activities and Other Service Fees
Table H - Consolidated Loans and Deposits
Table I - Loan Delinquency - BPPR Operations
Table J - Loan Delinquency - Popular U.S. Operations
Table K - Loan Delinquency - Consolidated
Table L - Non-Performing Assets
Table M - Activity in Non-Performing Loans
Table N - Allowance for Credit Losses, Net Charge-offs and Related Ratios
Table O - Allowance for Credit Losses “ACL” - Loan Portfolios - BPPR Operations
Table P - Allowance for Credit Losses “ACL” - Loan Portfolios - Popular U.S. Operations
Table Q - Allowance for Credit Losses “ACL” - Loan Portfolios - Consolidated
Table R - Reconciliation to GAAP Financial Measures
15
POPULAR, INC.
Financial Supplement to Third Quarter 2025 Earnings Release
Table A - Selected Ratios and Other Information
(Unaudited)
| Quarters ended | Nine months ended | |||||||||||||||||||
| 30-Sep-25 | 30-Jun-25 | 30-Sep-24 | 30-Sep-25 | 30-Sep-24 | ||||||||||||||||
| Basic EPS |
$ | 3.15 | $ | 3.09 | $ | 2.16 | $ | 8.78 | $ | 6.06 | ||||||||||
| Diluted EPS |
$ | 3.14 | $ | 3.09 | $ | 2.16 | $ | 8.78 | $ | 6.05 | ||||||||||
| Average common shares outstanding |
67,058,260 | 68,050,361 | 71,807,136 | 68,121,447 | 71,882,273 | |||||||||||||||
| Average common shares outstanding - assuming dilution |
67,095,421 | 68,079,649 | 71,828,402 | 68,143,888 | 71,912,153 | |||||||||||||||
| Common shares outstanding at end of period |
66,959,866 | 67,937,468 | 71,787,349 | 66,959,866 | 71,787,349 | |||||||||||||||
| Market value per common share |
$ | 129.10 | $ | 110.21 | $ | 100.27 | $ | 129.10 | $ | 100.27 | ||||||||||
| Market capitalization - (In millions) |
$ | 8,645 | $ | 7,487 | $ | 7,198 | $ | 8,645 | $ | 7,198 | ||||||||||
| Return on average assets |
1.09 | % | 1.11 | % | 0.84 | % | 1.06 | % | 0.79 | % | ||||||||||
| Return on average common equity |
11.60 | % | 11.77 | % | 8.82 | % | 11.15 | % | 8.43 | % | ||||||||||
| Net interest margin (non-taxable equivalent basis) |
3.51 | % | 3.49 | % | 3.24 | % | 3.46 | % | 3.20 | % | ||||||||||
| Net interest margin (taxable equivalent basis) -non-GAAP |
3.90 | % | 3.85 | % | 3.47 | % | 3.83 | % | 3.44 | % | ||||||||||
| Common equity per share |
$ | 91.00 | $ | 87.31 | $ | 80.35 | $ | 91.00 | $ | 80.35 | ||||||||||
| Tangible common book value per common share (non-GAAP) [1] |
$ | 79.12 | $ | 75.41 | $ | 69.04 | $ | 79.12 | $ | 69.04 | ||||||||||
| Tangible common equity to tangible assets (non-GAAP) [1] |
7.13 | % | 6.81 | % | 7.03 | % | 7.13 | % | 7.03 | % | ||||||||||
| Return on average tangible common equity [1] |
13.06 | % | 13.26 | % | 9.98 | % | 12.57 | % | 9.56 | % | ||||||||||
| Tier 1 capital |
15.84 | % | 15.96 | % | 16.48 | % | 15.84 | % | 16.48 | % | ||||||||||
| Total capital |
17.58 | % | 17.70 | % | 18.24 | % | 17.58 | % | 18.24 | % | ||||||||||
| Tier 1 leverage |
8.48 | % | 8.51 | % | 8.67 | % | 8.48 | % | 8.67 | % | ||||||||||
| Common Equity Tier 1 capital |
15.79 | % | 15.91 | % | 16.42 | % | 15.79 | % | 16.42 | % | ||||||||||
| [1] | Refer to Table R for reconciliation to GAAP financial measures. |
16
POPULAR, INC.
Financial Supplement to Third Quarter 2025 Earnings Release
Table B - Consolidated Statement of Operations
(Unaudited)
| Quarters ended | Variance | Quarter ended | Variance | Nine months ended | ||||||||||||||||||||||||
| Q3 2025 | Q3 2025 | |||||||||||||||||||||||||||
| (In thousands, except per share information) |
30-Sep-25 | 30-Jun-25 | vs. Q2 2025 | 30-Sep-24 | vs. Q3 2024 | 30-Sep-25 | 30-Sep-24 | |||||||||||||||||||||
| Interest income: |
||||||||||||||||||||||||||||
| Loans |
$ | 702,039 | $ | 684,587 | $ | 17,452 | $ | 664,731 | $ | 37,308 | $ | 2,053,299 | $ | 1,952,200 | ||||||||||||||
| Money market investments |
66,867 | 69,532 | (2,665 | ) | 96,061 | (29,194 | ) | 206,565 | 272,893 | |||||||||||||||||||
| Investment securities |
197,743 | 189,753 | 7,990 | 176,656 | 21,087 | 567,655 | 528,403 | |||||||||||||||||||||
|
|
|
|
|
|
|
|
|
|
|
|
|
|
|
|||||||||||||||
| Total interest income |
966,649 | 943,872 | 22,777 | 937,448 | 29,201 | 2,827,519 | 2,753,496 | |||||||||||||||||||||
|
|
|
|
|
|
|
|
|
|
|
|
|
|
|
|||||||||||||||
| Interest expense: |
||||||||||||||||||||||||||||
| Deposits |
303,432 | 295,058 | 8,374 | 350,985 | (47,553 | ) | 896,353 | 1,020,420 | ||||||||||||||||||||
| Short-term borrowings |
4,616 | 5,300 | (684 | ) | 1,430 | 3,186 | 11,342 | 3,748 | ||||||||||||||||||||
| Long-term debt |
12,096 | 11,965 | 131 | 12,560 | (464 | ) | 36,173 | 37,799 | ||||||||||||||||||||
|
|
|
|
|
|
|
|
|
|
|
|
|
|
|
|||||||||||||||
| Total interest expense |
320,144 | 312,323 | 7,821 | 364,975 | (44,831 | ) | 943,868 | 1,061,967 | ||||||||||||||||||||
|
|
|
|
|
|
|
|
|
|
|
|
|
|
|
|||||||||||||||
| Net interest income |
646,505 | 631,549 | 14,956 | 572,473 | 74,032 | 1,883,651 | 1,691,529 | |||||||||||||||||||||
| Provision for credit losses |
75,125 | 48,941 | 26,184 | 71,448 | 3,677 | 188,147 | 190,840 | |||||||||||||||||||||
|
|
|
|
|
|
|
|
|
|
|
|
|
|
|
|||||||||||||||
| Net interest income after provision for credit losses |
571,380 | 582,608 | (11,228 | ) | 501,025 | 70,355 | 1,695,504 | 1,500,689 | ||||||||||||||||||||
|
|
|
|
|
|
|
|
|
|
|
|
|
|
|
|||||||||||||||
| Service charges on deposit accounts |
39,077 | 38,826 | 251 | 38,315 | 762 | 116,957 | 113,283 | |||||||||||||||||||||
| Other service fees |
101,376 | 100,522 | 854 | 98,748 | 2,628 | 296,406 | 289,883 | |||||||||||||||||||||
| Mortgage banking activities |
2,771 | 4,872 | (2,101 | ) | 2,670 | 101 | 11,332 | 12,753 | ||||||||||||||||||||
| Net gain (loss), including impairment, on equity securities |
2,197 | 1,862 | 335 | (546 | ) | 2,743 | 3,645 | 876 | ||||||||||||||||||||
| Net gain on trading account debt securities |
398 | 538 | (140 | ) | 817 | (419 | ) | 1,456 | 1,455 | |||||||||||||||||||
| Adjustments to indemnity reserves on loans sold |
36 | 120 | (84 | ) | 808 | (772 | ) | 329 | 783 | |||||||||||||||||||
| Other operating income |
25,340 | 21,737 | 3,603 | 23,270 | 2,070 | 61,608 | 75,173 | |||||||||||||||||||||
|
|
|
|
|
|
|
|
|
|
|
|
|
|
|
|||||||||||||||
| Total non-interest income |
171,195 | 168,477 | 2,718 | 164,082 | 7,113 | 491,733 | 494,206 | |||||||||||||||||||||
|
|
|
|
|
|
|
|
|
|
|
|
|
|
|
|||||||||||||||
| Operating expenses: |
||||||||||||||||||||||||||||
| Personnel costs |
||||||||||||||||||||||||||||
| Salaries |
139,350 | 132,752 | 6,598 | 135,983 | 3,367 | 403,052 | 394,001 | |||||||||||||||||||||
| Commissions, incentives and other bonuses |
35,309 | 40,551 | (5,242 | ) | 26,350 | 8,959 | 113,846 | 95,587 | ||||||||||||||||||||
| Profit sharing |
13,000 | 13,000 | — | — | 13,000 | 26,000 | — | |||||||||||||||||||||
| Pension, postretirement and medical insurance |
18,749 | 18,458 | 291 | 16,387 | 2,362 | 51,773 | 50,391 | |||||||||||||||||||||
| Other personnel costs, including payroll taxes |
26,580 | 24,594 | 1,986 | 23,136 | 3,444 | 80,385 | 74,678 | |||||||||||||||||||||
|
|
|
|
|
|
|
|
|
|
|
|
|
|
|
|||||||||||||||
| Total personnel costs |
232,988 | 229,355 | 3,633 | 201,856 | 31,132 | 675,056 | 614,657 | |||||||||||||||||||||
| Net occupancy expenses |
26,083 | 29,140 | (3,057 | ) | 28,031 | (1,948 | ) | 82,441 | 83,764 | |||||||||||||||||||
| Equipment expenses |
5,313 | 5,789 | (476 | ) | 9,349 | (4,036 | ) | 16,404 | 28,578 | |||||||||||||||||||
| Other taxes |
17,967 | 18,632 | (665 | ) | 17,757 | 210 | 55,324 | 47,465 | ||||||||||||||||||||
| Professional fees |
25,808 | 28,108 | (2,300 | ) | 26,708 | (900 | ) | 80,741 | 93,370 | |||||||||||||||||||
| Technology and software expenses |
87,117 | 84,696 | 2,421 | 88,452 | (1,335 | ) | 255,481 | 247,666 | ||||||||||||||||||||
| Processing and transactional services |
||||||||||||||||||||||||||||
| Credit and debit cards |
14,728 | 13,044 | 1,684 | 11,761 | 2,967 | 40,698 | 37,644 | |||||||||||||||||||||
| Other processing and transactional services |
23,680 | 24,817 | (1,137 | ) | 22,559 | 1,121 | 73,352 | 69,966 | ||||||||||||||||||||
|
|
|
|
|
|
|
|
|
|
|
|
|
|
|
|||||||||||||||
| Total processing and transactional services |
38,408 | 37,861 | 547 | 34,320 | 4,088 | 114,050 | 107,610 | |||||||||||||||||||||
| Communications |
4,836 | 5,010 | (174 | ) | 5,229 | (393 | ) | 14,750 | 14,143 | |||||||||||||||||||
| Business promotion |
||||||||||||||||||||||||||||
| Rewards and customer loyalty programs |
17,656 | 18,047 | (391 | ) | 16,533 | 1,123 | 52,068 | 46,995 | ||||||||||||||||||||
| Other business promotion |
9,648 | 8,338 | 1,310 | 9,104 | 544 | 25,296 | 25,080 | |||||||||||||||||||||
|
|
|
|
|
|
|
|
|
|
|
|
|
|
|
|||||||||||||||
| Total business promotion |
27,304 | 26,385 | 919 | 25,637 | 1,667 | 77,364 | 72,075 | |||||||||||||||||||||
| Deposit insurance |
10,873 | 9,407 | 1,466 | 10,433 | 440 | 30,315 | 44,901 | |||||||||||||||||||||
| Other real estate owned (OREO) expense (income) |
(3,408 | ) | (4,124 | ) | 716 | (2,674 | ) | (734 | ) | (10,862 | ) | (13,745 | ) | |||||||||||||||
| Other operating expenses |
||||||||||||||||||||||||||||
| Operational losses |
1,634 | 6,185 | (4,551 | ) | 5,769 | (4,135 | ) | 13,957 | 21,153 | |||||||||||||||||||
| All other |
6,980 | 15,932 | (8,952 | ) | 15,750 | (8,770 | ) | 39,673 | 56,140 | |||||||||||||||||||
|
|
|
|
|
|
|
|
|
|
|
|
|
|
|
|||||||||||||||
| Total other operating expenses |
8,614 | 22,117 | (13,503 | ) | 21,519 | (12,905 | ) | 53,630 | 77,293 | |||||||||||||||||||
| Amortization of intangibles |
384 | 385 | (1 | ) | 704 | (320 | ) | 1,366 | 2,233 | |||||||||||||||||||
| Goodwill impairment |
13,000 | — | 13,000 | — | 13,000 | 13,000 | — | |||||||||||||||||||||
|
|
|
|
|
|
|
|
|
|
|
|
|
|
|
|||||||||||||||
| Total operating expenses |
495,287 | 492,761 | 2,526 | 467,321 | 27,966 | 1,459,060 | 1,420,010 | |||||||||||||||||||||
|
|
|
|
|
|
|
|
|
|
|
|
|
|
|
|||||||||||||||
| Income before income tax |
247,288 | 258,324 | (11,036 | ) | 197,786 | 49,502 | 728,177 | 574,885 | ||||||||||||||||||||
| Income tax expense |
35,971 | 47,884 | (11,913 | ) | 42,463 | (6,492 | ) | 128,918 | 138,490 | |||||||||||||||||||
|
|
|
|
|
|
|
|
|
|
|
|
|
|
|
|||||||||||||||
| Net income |
$ | 211,317 | $ | 210,440 | $ | 877 | $ | 155,323 | $ | 55,994 | $ | 599,259 | $ | 436,395 | ||||||||||||||
|
|
|
|
|
|
|
|
|
|
|
|
|
|
|
|||||||||||||||
| Net income applicable to common stock |
$ | 210,964 | $ | 210,087 | $ | 877 | $ | 154,970 | $ | 55,994 | $ | 598,200 | $ | 435,336 | ||||||||||||||
|
|
|
|
|
|
|
|
|
|
|
|
|
|
|
|||||||||||||||
| Net income per common share - basic |
$ | 3.15 | $ | 3.09 | $ | 0.06 | $ | 2.16 | $ | 0.99 | $ | 8.78 | $ | 6.06 | ||||||||||||||
|
|
|
|
|
|
|
|
|
|
|
|
|
|
|
|||||||||||||||
| Net income per common share - diluted |
$ | 3.14 | $ | 3.09 | $ | 0.05 | $ | 2.16 | $ | 0.98 | $ | 8.78 | $ | 6.05 | ||||||||||||||
|
|
|
|
|
|
|
|
|
|
|
|
|
|
|
|||||||||||||||
| Dividends Declared per Common Share |
$ | 0.75 | $ | 0.70 | $ | 0.05 | $ | 0.62 | $ | 0.13 | $ | 2.15 | $ | 1.86 | ||||||||||||||
|
|
|
|
|
|
|
|
|
|
|
|
|
|
|
|||||||||||||||
17
Popular, Inc.
Financial Supplement to Third Quarter 2025 Earnings Release
Table C - Consolidated Statement of Financial Condition
(Unaudited)
| Variance | ||||||||||||||||
| Q3 2025 vs. | ||||||||||||||||
| (In thousands) |
30-Sep-25 | 30-Jun-25 | 30-Sep-24 | Q2 2025 | ||||||||||||
| Assets: |
||||||||||||||||
| Cash and due from banks |
$ | 377,079 | $ | 400,631 | $ | 427,594 | $ | (23,552 | ) | |||||||
| Money market investments |
4,754,391 | 6,340,786 | 6,530,788 | (1,586,395 | ) | |||||||||||
| Trading account debt securities, at fair value |
33,122 | 29,643 | 30,843 | 3,479 | ||||||||||||
| Debt securities available-for-sale, at fair value |
20,686,423 | 20,490,212 | 17,186,123 | 196,211 | ||||||||||||
| Debt securities held-to-maturity, at amortized cost |
7,433,135 | 7,541,724 | 7,865,294 | (108,589 | ) | |||||||||||
| Less: Allowance for credit losses |
5,837 | 5,999 | 5,430 | (162 | ) | |||||||||||
|
|
|
|
|
|
|
|
|
|||||||||
| Debt securities held-to-maturity, net |
7,427,298 | 7,535,725 | 7,859,864 | (108,427 | ) | |||||||||||
|
|
|
|
|
|
|
|
|
|||||||||
| Equity securities |
218,993 | 222,391 | 198,191 | (3,398 | ) | |||||||||||
| Loans held-for-sale, at lower of cost or fair value |
7,783 | 2,898 | 5,509 | 4,885 | ||||||||||||
| Loans held-in-portfolio |
39,111,956 | 38,611,834 | 36,599,612 | 500,122 | ||||||||||||
| Less: Unearned income |
424,798 | 426,656 | 404,645 | (1,858 | ) | |||||||||||
| Allowance for credit losses |
786,220 | 769,485 | 744,320 | 16,735 | ||||||||||||
|
|
|
|
|
|
|
|
|
|||||||||
| Total loans held-in-portfolio, net |
37,900,938 | 37,415,693 | 35,450,647 | 485,245 | ||||||||||||
|
|
|
|
|
|
|
|
|
|||||||||
| Premises and equipment, net |
679,651 | 649,191 | 624,376 | 30,460 | ||||||||||||
| Other real estate |
42,950 | 46,126 | 63,028 | (3,176 | ) | |||||||||||
| Accrued income receivable |
297,347 | 274,867 | 257,406 | 22,480 | ||||||||||||
| Mortgage servicing rights, at fair value |
99,523 | 103,077 | 108,827 | (3,554 | ) | |||||||||||
| Other assets |
1,744,886 | 1,745,052 | 1,767,919 | (166 | ) | |||||||||||
| Goodwill |
789,954 | 802,954 | 804,428 | (13,000 | ) | |||||||||||
| Other intangible assets |
5,460 | 5,844 | 7,531 | (384 | ) | |||||||||||
|
|
|
|
|
|
|
|
|
|||||||||
| Total assets |
$ | 75,065,798 | $ | 76,065,090 | $ | 71,323,074 | $ | (999,292 | ) | |||||||
|
|
|
|
|
|
|
|
|
|||||||||
| Liabilities and Stockholders’ Equity: |
||||||||||||||||
| Liabilities: |
||||||||||||||||
| Deposits: |
||||||||||||||||
| Non-interest bearing |
$ | 14,874,026 | $ | 15,114,614 | $ | 15,276,071 | $ | (240,588 | ) | |||||||
| Interest bearing |
51,639,378 | 52,102,877 | 48,392,430 | (463,499 | ) | |||||||||||
|
|
|
|
|
|
|
|
|
|||||||||
| Total deposits |
66,513,404 | 67,217,491 | 63,668,501 | (704,087 | ) | |||||||||||
|
|
|
|
|
|
|
|
|
|||||||||
| Assets sold under agreements to repurchase |
56,853 | 56,043 | 55,360 | 810 | ||||||||||||
| Other short-term borrowings |
400,000 | 550,000 | — | (150,000 | ) | |||||||||||
| Notes payable |
789,954 | 808,451 | 918,376 | (18,497 | ) | |||||||||||
| Other liabilities |
1,189,915 | 1,479,087 | 890,323 | (289,172 | ) | |||||||||||
|
|
|
|
|
|
|
|
|
|||||||||
| Total liabilities |
68,950,126 | 70,111,072 | 65,532,560 | (1,160,946 | ) | |||||||||||
|
|
|
|
|
|
|
|
|
|||||||||
| Stockholders’ equity: |
||||||||||||||||
| Preferred stock |
22,143 | 22,143 | 22,143 | — | ||||||||||||
| Common stock |
1,049 | 1,049 | 1,048 | — | ||||||||||||
| Surplus |
4,920,767 | 4,919,950 | 4,853,869 | 817 | ||||||||||||
| Retained earnings |
5,022,546 | 4,861,958 | 4,495,878 | 160,588 | ||||||||||||
| Treasury stock |
(2,574,573 | ) | (2,455,425 | ) | (2,069,430 | ) | (119,148 | ) | ||||||||
| Accumulated other comprehensive loss, net of tax |
(1,276,260 | ) | (1,395,657 | ) | (1,512,994 | ) | 119,397 | |||||||||
|
|
|
|
|
|
|
|
|
|||||||||
| Total stockholders’ equity |
6,115,672 | 5,954,018 | 5,790,514 | 161,654 | ||||||||||||
|
|
|
|
|
|
|
|
|
|||||||||
| Total liabilities and stockholders’ equity |
$ | 75,065,798 | $ | 76,065,090 | $ | 71,323,074 | $ | (999,292 | ) | |||||||
|
|
|
|
|
|
|
|
|
|||||||||
18
Popular, Inc.
Financial Supplement to Third Quarter 2025 Earnings Release
Table D - Analysis of Levels and Yields on a Taxable Equivalent Basis (Non-GAAP)
For the quarters ended September 30, 2025 and June 30, 2025
(Unaudited)
| Variance | ||||||||||||||||||||||||||||||||||||||||||||
| Average Volume | Average Yields / Costs | Interest | Attributable to | |||||||||||||||||||||||||||||||||||||||||
| 30-Sep-25 |
30-Jun-25 | Variance | 30-Sep-25 | 30-Jun-25 | Variance | 30-Sep-25 | 30-Jun-25 | Variance | Rate | Volume | ||||||||||||||||||||||||||||||||||
| (In millions) | (In thousands) | |||||||||||||||||||||||||||||||||||||||||||
| $ | 5,990 | $ | 6,251 | $ | (261 | ) | 4.43 | % | 4.46 | % | (0.03 | )% | Money market investments |
$ | 66,867 | $ | 69,532 | $ | (2,665 | ) | $ | 246 | $ | (2,911 | ) | |||||||||||||||||||
| 28,957 | 28,809 | 148 | 3.42 | 3.29 | 0.13 | Investment securities [1] |
249,071 | 236,372 | 12,699 | 10,895 | 1,804 | |||||||||||||||||||||||||||||||||
| 28 | 27 | 1 | 5.43 | 5.99 | (0.56 | ) | Trading securities |
391 | 407 | (16 | ) | (35 | ) | 19 | ||||||||||||||||||||||||||||||
|
|
|
|
|
|
|
|
|
|
|
|
|
|
|
|
|
|
|
|
|
|
|
|||||||||||||||||||||||
| 34,975 | 35,087 | (112 | ) | 3.59 | 3.50 | 0.09 | Total money market, investment and trading securities |
316,329 | 306,311 | 10,018 | 11,106 | (1,088 | ) | |||||||||||||||||||||||||||||||
|
|
|
|
|
|
|
|
|
|
|
|
|
|
|
|
|
|
|
|
|
|
|
|||||||||||||||||||||||
| Loans: |
||||||||||||||||||||||||||||||||||||||||||||
| 19,229 | 18,676 | 553 | 6.72 | 6.73 | (0.01 | ) | Commercial |
325,869 | 313,493 | 12,376 | 3,031 | 9,345 | ||||||||||||||||||||||||||||||||
| 1,549 | 1,459 | 90 | 8.24 | 8.19 | 0.05 | Construction |
32,184 | 29,806 | 2,378 | 526 | 1,852 | |||||||||||||||||||||||||||||||||
| 1,981 | 1,963 | 18 | 7.26 | 7.18 | 0.08 | Leasing |
35,957 | 35,249 | 708 | 378 | 330 | |||||||||||||||||||||||||||||||||
| 8,484 | 8,339 | 145 | 5.96 | 5.89 | 0.07 | Mortgage |
126,352 | 122,873 | 3,479 | 1,324 | 2,155 | |||||||||||||||||||||||||||||||||
| 3,257 | 3,211 | 46 | 13.80 | 14.00 | (0.20 | ) | Consumer |
113,280 | 112,083 | 1,197 | (476 | ) | 1,673 | |||||||||||||||||||||||||||||||
| 3,945 | 3,937 | 8 | 9.15 | 9.14 | 0.01 | Auto |
91,006 | 89,706 | 1,300 | 1,138 | 162 | |||||||||||||||||||||||||||||||||
|
|
|
|
|
|
|
|
|
|
|
|
|
|
|
|
|
|
|
|
|
|
|
|||||||||||||||||||||||
| 38,445 | 37,585 | 860 | 7.49 | 7.50 | (0.01 | ) | Total loans |
724,648 | 703,210 | 21,438 | 5,921 | 15,517 | ||||||||||||||||||||||||||||||||
|
|
|
|
|
|
|
|
|
|
|
|
|
|
|
|
|
|
|
|
|
|
|
|||||||||||||||||||||||
| $ | 73,420 | $ | 72,672 | $ | 748 | 5.63 | % | 5.57 | % | 0.06 | % | Total earning assets |
$ | 1,040,977 | $ | 1,009,521 | $ | 31,456 | $ | 17,027 | $ | 14,429 | ||||||||||||||||||||||
|
|
|
|
|
|
|
|
|
|
|
|
|
|
|
|
|
|
|
|
|
|
|
|||||||||||||||||||||||
| Interest bearing deposits: |
||||||||||||||||||||||||||||||||||||||||||||
| $ | 8,184 | $ | 8,062 | $ | 122 | 1.77 | % | 1.71 | % | 0.06 | % | NOW and money market |
$ | 36,421 | $ | 34,288 | $ | 2,133 | $ | 967 | $ | 1,166 | ||||||||||||||||||||||
| 14,529 | 14,605 | (76 | ) | 0.81 | 0.83 | (0.02 | ) | Savings |
29,772 | 30,378 | (606 | ) | (351 | ) | (255 | ) | ||||||||||||||||||||||||||||
| 8,825 | 8,532 | 293 | 3.16 | 3.15 | 0.01 | Time deposits |
70,196 | 67,032 | 3,164 | 728 | 2,436 | |||||||||||||||||||||||||||||||||
| 20,766 | 20,333 | 433 | 3.19 | 3.22 | (0.03 | ) | P.R. public deposits |
167,043 | 163,360 | 3,683 | 139 | 3,544 | ||||||||||||||||||||||||||||||||
|
|
|
|
|
|
|
|
|
|
|
|
|
|
|
|
|
|
|
|
|
|
|
|||||||||||||||||||||||
| 52,304 | 51,532 | 772 | 2.30 | 2.29 | 0.01 | Total interest bearing deposits |
303,432 | 295,058 | 8,374 | 1,483 | 6,891 | |||||||||||||||||||||||||||||||||
|
|
|
|
|
|
|
|
|
|
|
|
|
|
|
|
|
|
|
|
|
|
|
|||||||||||||||||||||||
| 14,846 | 14,825 | 21 | Non-interest bearing demand deposits |
|||||||||||||||||||||||||||||||||||||||||
|
|
|
|
|
|
|
|||||||||||||||||||||||||||||||||||||||
| 67,150 | 66,357 | 793 | 1.79 | 1.78 | 0.01 | Total deposits |
303,432 | 295,058 | 8,374 | 1,483 | 6,891 | |||||||||||||||||||||||||||||||||
|
|
|
|
|
|
|
|
|
|
|
|
|
|
|
|
|
|
|
|
|
|
|
|||||||||||||||||||||||
| 405 | 470 | (65 | ) | 4.52 | 4.52 | — | Short-term borrowings |
4,616 | 5,300 | (684 | ) | 62 | (746 | ) | ||||||||||||||||||||||||||||||
| 812 | 832 | (20 | ) | 5.98 | 5.79 | 0.19 | Other medium and long-term debt |
12,096 | 11,965 | 131 | 198 | (67 | ) | |||||||||||||||||||||||||||||||
|
|
|
|
|
|
|
|
|
|
|
|
|
|
|
|
|
|
|
|
|
|
|
|||||||||||||||||||||||
| 53,521 | 52,834 | 687 | 2.37 | 2.36 | 0.01 | Total interest bearing liabilities (excluding demand deposits) |
320,144 | 312,323 | 7,821 | 1,743 | 6,078 | |||||||||||||||||||||||||||||||||
|
|
|
|
|
|
|
|
|
|
|
|
|
|
|
|
|
|
|
|
|
|
|
|||||||||||||||||||||||
| 5,053 | 5,013 | 40 | Other sources of funds |
|||||||||||||||||||||||||||||||||||||||||
|
|
|
|
|
|
|
|||||||||||||||||||||||||||||||||||||||
| $ | 73,420 | $ | 72,672 | $ | 748 | 1.73 | % | 1.72 | % | 0.01 | % | Total source of funds |
320,144 | 312,323 | 7,821 | 1,743 | 6,078 | |||||||||||||||||||||||||||
|
|
|
|
|
|
|
|
|
|
|
|
|
|||||||||||||||||||||||||||||||||
| 3.90 | % | 3.85 | % | 0.05 | % | Net interest margin/income on a taxable equivalent basis (Non-GAAP) |
720,833 | 697,198 | 23,635 | $ | 15,284 | $ | 8,351 | |||||||||||||||||||||||||||||||
|
|
|
|
|
|
|
|
|
|
|
|
|
|
|
|
|
|||||||||||||||||||||||||||||
| 3.26 | % | 3.21 | % | 0.05 | % | Net interest spread |
||||||||||||||||||||||||||||||||||||||
|
|
|
|
|
|
|
|||||||||||||||||||||||||||||||||||||||
| Taxable equivalent adjustment |
74,328 | 65,649 | 8,679 | |||||||||||||||||||||||||||||||||||||||||
|
|
|
|
|
|
|
|||||||||||||||||||||||||||||||||||||||
| 3.51 | % | 3.49 | % | 0.02 | % | Net interest margin/income non-taxable equivalent basis (GAAP) |
$ | 646,505 | $ | 631,549 | $ | 14,956 | ||||||||||||||||||||||||||||||||
|
|
|
|
|
|
|
|
|
|
|
|
|
|||||||||||||||||||||||||||||||||
Note: The changes that are not due solely to volume or rate are allocated to volume and rate based on the proportion of the change in each category.
| [1] | Average balances exclude unrealized gains or losses on debt securities available-for-sale and the unrealized loss related to certain securities transferred from available-for-sale to held-to-maturity. |
19
Popular, Inc.
Financial Supplement to Third Quarter 2025 Earnings Release
Table E - Analysis of Levels and Yields on a Taxable Equivalent Basis (Non-GAAP)
For the quarters ended September 30, 2025 and September 30, 2024
(Unaudited)
| Variance | ||||||||||||||||||||||||||||||||||||||||||||
| Average Volume | Average Yields / Costs | Interest | Attributable to | |||||||||||||||||||||||||||||||||||||||||
| 30-Sep-25 |
30-Sep-24 | Variance | 30-Sep-25 | 30-Sep-24 | Variance | 30-Sep-25 | 30-Sep-24 | Variance | Rate | Volume | ||||||||||||||||||||||||||||||||||
| (In millions) | (In thousands) | |||||||||||||||||||||||||||||||||||||||||||
| $ | 5,990 | $ | 7,033 | $ | (1,043 | ) | 4.43 | % | 5.43 | % | (1.00 | )% | Money market investments |
$ | 66,867 | $ | 96,061 | $ | (29,194 | ) | $ | (16,107 | ) | $ | (13,087 | ) | ||||||||||||||||||
| 28,957 | 27,569 | 1,388 | 3.42 | 2.92 | 0.50 | Investment securities [1] |
249,071 | 202,317 | 46,754 | 32,970 | 13,784 | |||||||||||||||||||||||||||||||||
| 28 | 30 | (2 | ) | 5.43 | 5.87 | (0.44 | ) | Trading securities |
391 | 436 | (45 | ) | (31 | ) | (14 | ) | ||||||||||||||||||||||||||||
|
|
|
|
|
|
|
|
|
|
|
|
|
|
|
|
|
|
|
|
|
|
|
|||||||||||||||||||||||
| 34,975 | 34,632 | 343 | 3.59 | 3.43 | 0.16 | Total money market, investment and trading securities |
316,329 | 298,814 | 17,515 | 16,832 | 683 | |||||||||||||||||||||||||||||||||
|
|
|
|
|
|
|
|
|
|
|
|
|
|
|
|
|
|
|
|
|
|
|
|||||||||||||||||||||||
| Loans: |
||||||||||||||||||||||||||||||||||||||||||||
| 19,229 | 17,798 | 1,431 | 6.72 | 6.90 | (0.18 | ) | Commercial |
325,869 | 308,734 | 17,135 | (7,239 | ) | 24,374 | |||||||||||||||||||||||||||||||
| 1,549 | 1,129 | 420 | 8.24 | 8.85 | (0.61 | ) | Construction |
32,184 | 25,102 | 7,082 | (1,732 | ) | 8,814 | |||||||||||||||||||||||||||||||
| 1,981 | 1,851 | 130 | 7.26 | 6.97 | 0.29 | Leasing |
35,957 | 32,241 | 3,716 | 1,378 | 2,338 | |||||||||||||||||||||||||||||||||
| 8,484 | 7,911 | 573 | 5.96 | 5.73 | 0.23 | Mortgage |
126,352 | 113,409 | 12,943 | 4,523 | 8,420 | |||||||||||||||||||||||||||||||||
| 3,257 | 3,211 | 46 | 13.80 | 14.08 | (0.28 | ) | Consumer |
113,280 | 112,423 | 857 | (787 | ) | 1,644 | |||||||||||||||||||||||||||||||
| 3,945 | 3,879 | 66 | 9.15 | 8.94 | 0.21 | Auto |
91,006 | 87,189 | 3,817 | 2,338 | 1,479 | |||||||||||||||||||||||||||||||||
|
|
|
|
|
|
|
|
|
|
|
|
|
|
|
|
|
|
|
|
|
|
|
|||||||||||||||||||||||
| 38,445 | 35,779 | 2,666 | 7.49 | 7.56 | (0.07 | ) | Total loans |
724,648 | 679,098 | 45,550 | (1,519 | ) | 47,069 | |||||||||||||||||||||||||||||||
|
|
|
|
|
|
|
|
|
|
|
|
|
|
|
|
|
|
|
|
|
|
|
|||||||||||||||||||||||
| $ | 73,420 | $ | 70,411 | $ | 3,009 | 5.63 | % | 5.53 | % | 0.10 | % | Total earning assets |
$ | 1,040,977 | $ | 977,912 | $ | 63,065 | $ | 15,313 | $ | 47,752 | ||||||||||||||||||||||
|
|
|
|
|
|
|
|
|
|
|
|
|
|
|
|
|
|
|
|
|
|
|
|||||||||||||||||||||||
| Interest bearing deposits: |
||||||||||||||||||||||||||||||||||||||||||||
| $ | 8,184 | $ | 7,387 | $ | 797 | 1.77 | % | 2.04 | % | (0.27 | )% | NOW and money market |
$ | 36,421 | $ | 37,857 | $ | (1,436 | ) | $ | (4,891 | ) | $ | 3,455 | ||||||||||||||||||||
| 14,529 | 14,318 | 211 | 0.81 | 0.92 | (0.11 | ) | Savings |
29,772 | 33,134 | (3,362 | ) | (3,981 | ) | 619 | ||||||||||||||||||||||||||||||
| 8,825 | 8,366 | 459 | 3.16 | 3.45 | (0.29 | ) | Time deposits |
70,196 | 72,503 | (2,307 | ) | (6,096 | ) | 3,789 | ||||||||||||||||||||||||||||||
| 20,766 | 19,468 | 1,298 | 3.19 | 4.24 | (1.05 | ) | P.R. public deposits |
167,043 | 207,491 | (40,448 | ) | (52,899 | ) | 12,451 | ||||||||||||||||||||||||||||||
|
|
|
|
|
|
|
|
|
|
|
|
|
|
|
|
|
|
|
|
|
|
|
|||||||||||||||||||||||
| 52,304 | 49,539 | 2,765 | 2.30 | 2.82 | (0.52 | ) | Total interest bearing deposits |
303,432 | 350,985 | (47,553 | ) | (67,867 | ) | 20,314 | ||||||||||||||||||||||||||||||
|
|
|
|
|
|
|
|
|
|
|
|
|
|
|
|
|
|
|
|
|
|
|
|||||||||||||||||||||||
| 14,846 | 14,968 | (122 | ) | Non-interest bearing demand deposits |
||||||||||||||||||||||||||||||||||||||||
|
|
|
|
|
|
|
|||||||||||||||||||||||||||||||||||||||
| 67,150 | 64,507 | 2,643 | 1.79 | 2.16 | (0.37 | ) | Total deposits |
303,432 | 350,985 | (47,553 | ) | (67,867 | ) | 20,314 | ||||||||||||||||||||||||||||||
|
|
|
|
|
|
|
|
|
|
|
|
|
|
|
|
|
|
|
|
|
|
|
|||||||||||||||||||||||
| 405 | 101 | 304 | 4.52 | 5.62 | (1.10 | ) | Short-term borrowings |
4,616 | 1,431 | 3,185 | (267 | ) | 3,452 | |||||||||||||||||||||||||||||||
| 812 | 950 | (138 | ) | 5.98 | 5.32 | 0.66 | Other medium and long-term debt |
12,096 | 12,560 | (464 | ) | 226 | (690 | ) | ||||||||||||||||||||||||||||||
|
|
|
|
|
|
|
|
|
|
|
|
|
|
|
|
|
|
|
|
|
|
|
|||||||||||||||||||||||
| 53,521 | 50,590 | 2,931 | 2.37 | 2.87 | (0.50 | ) | Total interest bearing liabilities (excluding demand deposits) |
320,144 | 364,976 | (44,832 | ) | (67,908 | ) | 23,076 | ||||||||||||||||||||||||||||||
|
|
|
|
|
|
|
|
|
|
|
|
|
|
|
|
|
|
|
|
|
|
|
|||||||||||||||||||||||
| 5,053 | 4,853 | 200 | Other sources of funds |
|||||||||||||||||||||||||||||||||||||||||
|
|
|
|
|
|
|
|||||||||||||||||||||||||||||||||||||||
| $ | 73,420 | $ | 70,411 | $ | 3,009 | 1.73 | % | 2.06 | % | (0.33 | )% | Total source of funds |
320,144 | 364,976 | (44,832 | ) | (67,908 | ) | 23,076 | |||||||||||||||||||||||||
|
|
|
|
|
|
|
|
|
|
|
|
|
|||||||||||||||||||||||||||||||||
| 3.90 | % | 3.47 | % | 0.43 | % | Net interest margin/income on a taxable equivalent basis (Non-GAAP) |
720,833 | 612,936 | 107,897 | $ | 83,221 | $ | 24,676 | |||||||||||||||||||||||||||||||
|
|
|
|
|
|
|
|
|
|
|
|
|
|
|
|
|
|||||||||||||||||||||||||||||
| 3.26 | % | 2.66 | % | 0.60 | % | Net interest spread |
||||||||||||||||||||||||||||||||||||||
|
|
|
|
|
|
|
|||||||||||||||||||||||||||||||||||||||
| Taxable equivalent adjustment |
74,328 | 40,464 | 33,864 | |||||||||||||||||||||||||||||||||||||||||
|
|
|
|
|
|
|
|||||||||||||||||||||||||||||||||||||||
| 3.51 | % | 3.24 | % | 0.27 | % | Net interest margin/income non-taxable equivalent basis (GAAP) |
$ | 646,505 | $ | 572,472 | $ | 74,033 | ||||||||||||||||||||||||||||||||
|
|
|
|
|
|
|
|
|
|
|
|
|
|||||||||||||||||||||||||||||||||
Note: The changes that are not due solely to volume or rate are allocated to volume and rate based on the proportion of the change in each category.
| [1] | Average balances exclude unrealized gains or losses on debt securities available-for-sale and the unrealized loss related to certain securities transferred from available-for-sale to held-to-maturity. |
20
Popular, Inc.
Financial Supplement to Third Quarter 2025 Earnings Release
Table F - Analysis of Levels and Yields on a Taxable Equivalent Basis (Non-GAAP) - YEAR-TO-DATE
(Unaudited)
| Variance | ||||||||||||||||||||||||||||||||||||||||||||
| Average Volume | Average Yields / Costs | Interest | Attributable to | |||||||||||||||||||||||||||||||||||||||||
| 30-Sep-25 |
30-Sep-24 | Variance | 30-Sep-25 | 30-Sep-24 | Variance | 30-Sep-25 | 30-Sep-24 | Variance | Rate | Volume | ||||||||||||||||||||||||||||||||||
| (In millions) | (In thousands) | |||||||||||||||||||||||||||||||||||||||||||
| $ | 6,205 | $ | 6,664 | $ | (459 | ) | 4.45 | % | 5.47 | % | (1.02 | )% | Money market investments |
$ | 206,565 | $ | 272,893 | $ | (66,328 | ) | $ | (48,483 | ) | $ | (17,845 | ) | ||||||||||||||||||
| 28,729 | 28,271 | 458 | 3.28 | 2.88 | 0.40 | Investment securities [1] |
705,879 | 610,342 | 95,537 | 79,280 | 16,257 | |||||||||||||||||||||||||||||||||
| 29 | 30 | (1 | ) | 5.74 | 5.02 | 0.72 | Trading securities |
1,237 | 1,114 | 123 | 155 | (32 | ) | |||||||||||||||||||||||||||||||
|
|
|
|
|
|
|
|
|
|
|
|
|
|
|
|
|
|
|
|
|
|
|
|||||||||||||||||||||||
| 34,963 | 34,965 | (2 | ) | 3.49 | 3.38 | 0.11 | Total money market, investment and trading securities |
913,681 | 884,349 | 29,332 | 30,952 | (1,620 | ) | |||||||||||||||||||||||||||||||
|
|
|
|
|
|
|
|
|
|
|
|
|
|
|
|
|
|
|
|
|
|
|
|||||||||||||||||||||||
| Loans: |
||||||||||||||||||||||||||||||||||||||||||||
| 18,802 | 17,707 | 1,095 | 6.72 | 6.87 | (0.15 | ) | Commercial |
945,330 | 910,241 | 35,089 | (20,306 | ) | 55,395 | |||||||||||||||||||||||||||||||
| 1,440 | 1,064 | 376 | 8.19 | 8.97 | (0.78 | ) | Construction |
88,179 | 71,426 | 16,753 | (6,722 | ) | 23,475 | |||||||||||||||||||||||||||||||
| 1,961 | 1,794 | 167 | 7.18 | 6.86 | 0.32 | Leasing |
105,650 | 92,292 | 13,358 | 4,501 | 8,857 | |||||||||||||||||||||||||||||||||
| 8,331 | 7,818 | 513 | 5.89 | 5.67 | 0.22 | Mortgage |
368,141 | 332,626 | 35,515 | 13,125 | 22,390 | |||||||||||||||||||||||||||||||||
| 3,224 | 3,209 | 15 | 14.10 | 13.94 | 0.16 | Consumer |
339,880 | 334,818 | 5,062 | 3,058 | 2,004 | |||||||||||||||||||||||||||||||||
| 3,935 | 3,820 | 115 | 9.00 | 8.86 | 0.14 | Auto |
264,905 | 253,511 | 11,394 | 3,760 | 7,634 | |||||||||||||||||||||||||||||||||
|
|
|
|
|
|
|
|
|
|
|
|
|
|
|
|
|
|
|
|
|
|
|
|||||||||||||||||||||||
| 37,693 | 35,412 | 2,281 | 7.49 | 7.52 | (0.03 | ) | Total loans |
2,112,085 | 1,994,914 | 117,171 | (2,584 | ) | 119,755 | |||||||||||||||||||||||||||||||
|
|
|
|
|
|
|
|
|
|
|
|
|
|
|
|
|
|
|
|
|
|
|
|||||||||||||||||||||||
| $ | 72,656 | $ | 70,377 | $ | 2,279 | 5.57 | % | 5.46 | % | 0.11 | % | Total earning assets |
$ | 3,025,766 | $ | 2,879,263 | $ | 146,503 | $ | 28,368 | $ | 118,135 | ||||||||||||||||||||||
|
|
|
|
|
|
|
|
|
|
|
|
|
|
|
|
|
|
|
|
|
|
|
|||||||||||||||||||||||
| Interest bearing deposits: |
||||||||||||||||||||||||||||||||||||||||||||
| $ | 8,077 | $ | 7,558 | $ | 519 | 1.73 | % | 2.00 | % | (0.27 | )% | NOW and money market |
$ | 104,711 | $ | 113,405 | $ | (8,694 | ) | $ | (14,883 | ) | $ | 6,189 | ||||||||||||||||||||
| 14,547 | 14,579 | (32 | ) | 0.84 | 0.93 | (0.09 | ) | Savings |
91,430 | 101,008 | (9,578 | ) | (9,213 | ) | (365 | ) | ||||||||||||||||||||||||||||
| 8,587 | 8,142 | 445 | 3.17 | 3.35 | (0.18 | ) | Time deposits |
203,909 | 204,014 | (105 | ) | (11,631 | ) | 11,526 | ||||||||||||||||||||||||||||||
| 20,464 | 19,168 | 1,296 | 3.24 | 4.20 | (0.96 | ) | P.R public deposits |
496,303 | 601,993 | (105,690 | ) | (144,853 | ) | 39,163 | ||||||||||||||||||||||||||||||
|
|
|
|
|
|
|
|
|
|
|
|
|
|
|
|
|
|
|
|
|
|
|
|||||||||||||||||||||||
| 51,675 | 49,447 | 2,228 | 2.32 | 2.76 | (0.44 | ) | Total interest bearing deposits |
896,353 | 1,020,420 | (124,067 | ) | (180,580 | ) | 56,513 | ||||||||||||||||||||||||||||||
|
|
|
|
|
|
|
|
|
|
|
|
|
|
|
|
|
|
|
|
|
|
|
|||||||||||||||||||||||
| 14,778 | 15,075 | (297 | ) | Non-interest bearing demand deposits |
||||||||||||||||||||||||||||||||||||||||
|
|
|
|
|
|
|
|||||||||||||||||||||||||||||||||||||||
| 66,453 | 64,522 | 1,931 | 1.80 | 2.11 | (0.31 | ) | Total deposits |
896,353 | 1,020,420 | (124,067 | ) | (180,580 | ) | 56,513 | ||||||||||||||||||||||||||||||
|
|
|
|
|
|
|
|
|
|
|
|
|
|
|
|
|
|
|
|
|
|
|
|||||||||||||||||||||||
| 333 | 89 | 244 | 4.55 | 5.65 | (1.10 | ) | Short-term borrowings |
11,342 | 3,749 | 7,593 | (669 | ) | 8,262 | |||||||||||||||||||||||||||||||
| 835 | 975 | (140 | ) | 5.79 | 5.18 | 0.61 | Other medium and long-term debt |
36,173 | 37,799 | (1,626 | ) | 3,875 | (5,501 | ) | ||||||||||||||||||||||||||||||
|
|
|
|
|
|
|
|
|
|
|
|
|
|
|
|
|
|
|
|
|
|
|
|||||||||||||||||||||||
| 52,843 | 50,511 | 2,332 | 2.39 | 2.81 | (0.42 | ) | Total interest bearing liabilities (excluding demand deposits) |
943,868 | 1,061,968 | (118,100 | ) | (177,374 | ) | 59,274 | ||||||||||||||||||||||||||||||
|
|
|
|
|
|
|
|
|
|
|
|
|
|
|
|
|
|
|
|
|
|
|
|||||||||||||||||||||||
| 5,035 | 4,791 | 244 | Other sources of funds |
|||||||||||||||||||||||||||||||||||||||||
|
|
|
|
|
|||||||||||||||||||||||||||||||||||||||||
| $ | 72,656 | $ | 70,377 | $ | 2,279 | 1.74 | % | 2.02 | % | (0.28 | )% | Total source of funds |
943,868 | 1,061,968 | (118,100 | ) | (177,374 | ) | 59,274 | |||||||||||||||||||||||||
|
|
|
|
|
|
|
|
|
|
|
|
|
|||||||||||||||||||||||||||||||||
| 3.83 | % | 3.44 | % | 0.39 | % | Net interest margin/income on a taxable equivalent basis (Non-GAAP) |
2,081,898 | 1,817,295 | 264,603 | $ | 205,742 | $ | 58,861 | |||||||||||||||||||||||||||||||
|
|
|
|
|
|
|
|
|
|
|
|
|
|
|
|
|
|||||||||||||||||||||||||||||
| 3.18 | % | 2.65 | % | 0.53 | % | Net interest spread |
||||||||||||||||||||||||||||||||||||||
|
|
|
|
|
|
|
|||||||||||||||||||||||||||||||||||||||
| Taxable equivalent adjustment |
198,247 | 125,766 | 72,481 | |||||||||||||||||||||||||||||||||||||||||
|
|
|
|
|
|
|
|||||||||||||||||||||||||||||||||||||||
| 3.46 | % | 3.20 | % | 0.26 | % | Net interest margin/income non-taxable equivalent basis (GAAP) |
$ | 1,883,651 | $ | 1,691,529 | $ | 192,122 | ||||||||||||||||||||||||||||||||
|
|
|
|
|
|
|
|
|
|
|
|
|
|||||||||||||||||||||||||||||||||
Note: The changes that are not due solely to volume or rate are allocated to volume and rate based on the proportion of the change in each category.
| [1] | Average balances exclude unrealized gains or losses on debt securities available-for-sale and the unrealized loss related to certain securities transferred from available-for-sale to held-to-maturity. |
21
Popular, Inc.
Financial Supplement to Third Quarter 2025 Earnings Release
Table G - Mortgage Banking Activities and Other Service Fees
(Unaudited)
Mortgage Banking Activities
| Quarters ended | Variance | Nine months ended | Variance | |||||||||||||||||||||||||||||
| (In thousands) |
30-Sep-25 | 30-Jun-25 | 30-Sep-24 | Q3 2025 vs.Q2 2025 |
Q3 2025 vs.Q3 2024 |
30-Sep-25 | 30-Sep-24 | 2025 vs. 2024 |
||||||||||||||||||||||||
| Mortgage servicing fees, net of fair value adjustments: |
||||||||||||||||||||||||||||||||
| Mortgage servicing fees |
$ | 6,744 | $ | 6,912 | $ | 7,559 | $ | (168 | ) | $ | (815 | ) | $ | 20,824 | $ | 22,912 | $ | (2,088 | ) | |||||||||||||
| Mortgage servicing rights fair value adjustments |
(3,835 | ) | (1,954 | ) | (4,896 | ) | (1,881 | ) | 1,061 | (9,359 | ) | (10,280 | ) | 921 | ||||||||||||||||||
|
|
|
|
|
|
|
|
|
|
|
|
|
|
|
|
|
|||||||||||||||||
| Total mortgage servicing fees, net of fair value adjustments |
2,909 | 4,958 | 2,663 | (2,049 | ) | 246 | 11,465 | 12,632 | (1,167 | ) | ||||||||||||||||||||||
|
|
|
|
|
|
|
|
|
|
|
|
|
|
|
|
|
|||||||||||||||||
| Net (loss) gain on sale of loans, including valuation on loans held-for-sale |
(53 | ) | (37 | ) | 320 | (16 | ) | (373 | ) | 103 | 396 | (293 | ) | |||||||||||||||||||
|
|
|
|
|
|
|
|
|
|
|
|
|
|
|
|
|
|||||||||||||||||
| Trading account loss: |
||||||||||||||||||||||||||||||||
| Unrealized gains (losses) on outstanding derivative positions |
51 | (8 | ) | (44 | ) | 59 | 95 | (44 | ) | 113 | (157 | ) | ||||||||||||||||||||
| Realized losses on closed derivative positions |
(122 | ) | (10 | ) | (261 | ) | (112 | ) | 139 | (131 | ) | (249 | ) | 118 | ||||||||||||||||||
|
|
|
|
|
|
|
|
|
|
|
|
|
|
|
|
|
|||||||||||||||||
| Total trading account loss |
(71 | ) | (18 | ) | (305 | ) | (53 | ) | 234 | (175 | ) | (136 | ) | (39 | ) | |||||||||||||||||
|
|
|
|
|
|
|
|
|
|
|
|
|
|
|
|
|
|||||||||||||||||
| Losses on repurchased loans, including interest advances |
(14 | ) | (31 | ) | (8 | ) | 17 | (6 | ) | (61 | ) | (139 | ) | 78 | ||||||||||||||||||
|
|
|
|
|
|
|
|
|
|
|
|
|
|
|
|
|
|||||||||||||||||
| Total mortgage banking activities |
$ | 2,771 | $ | 4,872 | $ | 2,670 | $ | (2,101 | ) | $ | 101 | $ | 11,332 | $ | 12,753 | $ | (1,421 | ) | ||||||||||||||
|
|
|
|
|
|
|
|
|
|
|
|
|
|
|
|
|
|||||||||||||||||
Other Service Fees
| Quarters ended | Variance | Nine months ended | Variance | |||||||||||||||||||||||||||||
| (In thousands) |
30-Sep-25 | 30-Jun-25 | 30-Sep-24 | Q3 2025 vs.Q2 2025 |
Q3 2025 vs.Q3 2024 |
30-Sep-25 | 30-Sep-24 | 2025 vs. 2024 |
||||||||||||||||||||||||
| Other service fees: |
||||||||||||||||||||||||||||||||
| Debit card fees |
$ | 28,084 | $ | 27,918 | $ | 26,197 | $ | 166 | $ | 1,887 | $ | 82,434 | $ | 78,907 | $ | 3,527 | ||||||||||||||||
| Insurance fees |
12,995 | 12,695 | 15,422 | 300 | (2,427 | ) | 36,999 | 43,479 | (6,480 | ) | ||||||||||||||||||||||
| Credit card fees |
32,668 | 32,502 | 31,262 | 166 | 1,406 | 95,300 | 91,577 | 3,723 | ||||||||||||||||||||||||
| Sale and administration of investment products |
9,459 | 9,058 | 8,387 | 401 | 1,072 | 27,490 | 23,664 | 3,826 | ||||||||||||||||||||||||
| Trust fees |
6,998 | 6,626 | 6,715 | 372 | 283 | 19,924 | 20,044 | (120 | ) | |||||||||||||||||||||||
| Other fees |
11,172 | 11,723 | 10,765 | (551 | ) | 407 | 34,259 | 32,212 | 2,047 | |||||||||||||||||||||||
|
|
|
|
|
|
|
|
|
|
|
|
|
|
|
|
|
|||||||||||||||||
| Total other service fees |
$ | 101,376 | $ | 100,522 | $ | 98,748 | $ | 854 | $ | 2,628 | $ | 296,406 | $ | 289,883 | $ | 6,523 | ||||||||||||||||
|
|
|
|
|
|
|
|
|
|
|
|
|
|
|
|
|
|||||||||||||||||
22
Popular, Inc.
Financial Supplement to Third Quarter 2025 Earnings Release
Table H - Consolidated Loans and Deposits
(Unaudited)
Loans - Ending Balances
| Variance | ||||||||||||||||||||||||||||
| (Dollars in thousands) |
30-Sep-25 | 30-Jun-25 | 30-Sep-24 | Q3 2025 vs.Q2 2025 |
% of Change | Q3 2025 vs.Q3 2024 |
% of Change | |||||||||||||||||||||
| Loans held-in-portfolio: |
|
|||||||||||||||||||||||||||
| Commercial |
||||||||||||||||||||||||||||
| Commercial multi-family |
$ | 2,489,589 | $ | 2,520,789 | $ | 2,405,302 | $ | (31,200 | ) | (1.24 | %) | $ | 84,287 | 3.50 | % | |||||||||||||
| Commercial real estate non-owner occupied |
5,462,580 | 5,521,374 | 5,185,381 | (58,794 | ) | (1.06 | %) | 277,199 | 5.35 | % | ||||||||||||||||||
| Commercial real estate owner occupied |
3,090,724 | 3,003,855 | 3,092,393 | 86,869 | 2.89 | % | (1,669 | ) | (0.05 | %) | ||||||||||||||||||
| Commercial and industrial |
8,245,639 | 8,043,752 | 7,400,553 | 201,887 | 2.51 | % | 845,086 | 11.42 | % | |||||||||||||||||||
| Total Commercial |
19,288,532 | 19,089,770 | 18,083,629 | 198,762 | 1.04 | % | 1,204,903 | 6.66 | % | |||||||||||||||||||
| Construction |
1,604,612 | 1,468,201 | 1,113,307 | 136,411 | 9.29 | % | 491,305 | 44.13 | % | |||||||||||||||||||
| Mortgage |
8,558,408 | 8,444,427 | 7,993,348 | 113,981 | 1.35 | % | 565,060 | 7.07 | % | |||||||||||||||||||
| Leasing |
1,998,651 | 1,983,068 | 1,887,052 | 15,583 | 0.79 | % | 111,599 | 5.91 | % | |||||||||||||||||||
| Consumer |
||||||||||||||||||||||||||||
| Credit cards |
1,225,567 | 1,215,293 | 1,186,893 | 10,274 | 0.85 | % | 38,674 | 3.26 | % | |||||||||||||||||||
| Home equity lines of credit |
78,890 | 77,479 | 69,691 | 1,411 | 1.82 | % | 9,199 | 13.20 | % | |||||||||||||||||||
| Personal |
1,900,325 | 1,876,463 | 1,873,175 | 23,862 | 1.27 | % | 27,150 | 1.45 | % | |||||||||||||||||||
| Auto |
3,850,953 | 3,861,702 | 3,818,607 | (10,749 | ) | (0.28 | %) | 32,346 | 0.85 | % | ||||||||||||||||||
| Other |
181,220 | 168,775 | 169,265 | 12,445 | 7.37 | % | 11,955 | 7.06 | % | |||||||||||||||||||
| Total Consumer |
7,236,955 | 7,199,712 | 7,117,631 | 37,243 | 0.52 | % | 119,324 | 1.68 | % | |||||||||||||||||||
|
|
|
|
|
|
|
|
|
|
|
|
|
|
|
|||||||||||||||
| Total loans held-in-portfolio |
$ | 38,687,158 | $ | 38,185,178 | $ | 36,194,967 | $ | 501,980 | 1.31 | % | $ | 2,492,191 | 6.89 | % | ||||||||||||||
|
|
|
|
|
|
|
|
|
|
|
|
|
|
|
|||||||||||||||
| Loans held-for-sale: |
||||||||||||||||||||||||||||
| Mortgage |
$ | 7,783 | $ | 2,898 | $ | 5,509 | $ | 4,885 | 168.56 | % | $ | 2,274 | 41.28 | % | ||||||||||||||
|
|
|
|
|
|
|
|
|
|
|
|
|
|
|
|||||||||||||||
| Total loans held-for-sale |
$ | 7,783 | $ | 2,898 | $ | 5,509 | $ | 4,885 | 168.56 | % | $ | 2,274 | 41.28 | % | ||||||||||||||
|
|
|
|
|
|
|
|
|
|
|
|
|
|
|
|||||||||||||||
| Total loans |
$ | 38,694,941 | $ | 38,188,076 | $ | 36,200,476 | $ | 506,865 | 1.33 | % | $ | 2,494,465 | 6.89 | % | ||||||||||||||
|
|
|
|
|
|
|
|
|
|
|
|
|
|
|
|||||||||||||||
Deposits - Ending Balances
| Variance | ||||||||||||||||||||||||||||
| (In thousands) |
30-Sep-25 | 30-Jun-25 | 30-Sep-24 | Q3 2025 vs. Q2 2025 |
% of Change | Q3 2025 vs.Q3 2024 |
% of Change | |||||||||||||||||||||
| Deposits excluding P.R. public deposits: |
||||||||||||||||||||||||||||
| Demand deposits |
$ | 14,874,026 | $ | 15,114,614 | $ | 15,276,071 | $ | (240,588 | ) | (1.59 | %) | $ | (402,045 | ) | (2.63 | %) | ||||||||||||
| Savings, NOW and money market deposits (non-brokered) |
21,739,958 | 21,554,606 | 20,584,328 | 185,352 | 0.86 | % | 1,155,630 | 5.61 | % | |||||||||||||||||||
| Savings, NOW and money market deposits (brokered) |
883,471 | 829,506 | 735,231 | 53,965 | 6.51 | % | 148,240 | 20.16 | % | |||||||||||||||||||
| Time deposits (non-brokered) |
8,014,080 | 7,938,858 | 7,363,477 | 75,222 | 0.95 | % | 650,603 | 8.84 | % | |||||||||||||||||||
| Time deposits (brokered CDs) |
925,761 | 861,947 | 993,522 | 63,814 | 7.40 | % | (67,761 | ) | (6.82 | %) | ||||||||||||||||||
|
|
|
|
|
|
|
|
|
|
|
|
|
|
|
|||||||||||||||
| Sub-total deposits excluding P.R. public deposits |
46,437,296 | 46,299,531 | 44,952,629 | 137,765 | 0.30 | % | 1,484,667 | 3.30 | % | |||||||||||||||||||
|
|
|
|
|
|
|
|
|
|
|
|
|
|
|
|||||||||||||||
| P.R. public deposits: |
||||||||||||||||||||||||||||
| Demand deposits [1] |
12,487,246 | 12,376,316 | 11,088,511 | 110,930 | 0.90 | % | 1,398,735 | 12.61 | % | |||||||||||||||||||
| Savings, NOW and money market deposits (non-brokered) |
6,907,309 | 7,743,663 | 6,903,370 | (836,354 | ) | (10.80 | %) | 3,939 | 0.06 | % | ||||||||||||||||||
| Time deposits (non-brokered) |
681,553 | 797,981 | 723,991 | (116,428 | ) | (14.59 | %) | (42,438 | ) | (5.86 | %) | |||||||||||||||||
|
|
|
|
|
|
|
|
|
|
|
|
|
|
|
|||||||||||||||
| Sub-total P.R. public deposits |
20,076,108 | 20,917,960 | 18,715,872 | (841,852 | ) | (4.02 | %) | 1,360,236 | 7.27 | % | ||||||||||||||||||
|
|
|
|
|
|
|
|
|
|
|
|
|
|
|
|||||||||||||||
| Total deposits |
$ | 66,513,404 | $ | 67,217,491 | $ | 63,668,501 | $ | (704,087 | ) | (1.05 | %) | $ | 2,844,903 | 4.47 | % | |||||||||||||
|
|
|
|
|
|
|
|
|
|
|
|
|
|
|
|||||||||||||||
| [1] | Includes interest bearing demand deposits. |
23
Popular, Inc.
Financial Supplement to Third Quarter 2025 Earnings Release
Table I - Loan Delinquency -BPPR Operations
(Unaudited)
| 30-Sep-25 |
||||||||||||||||||||||||||||||||
| BPPR |
||||||||||||||||||||||||||||||||
| Past due | Past due 90 days or more | |||||||||||||||||||||||||||||||
| 30-59 | 60-89 | 90 days | Total | Non-accrual | Accruing | |||||||||||||||||||||||||||
| (In thousands) |
days | days | or more | past due | Current | Loans HIP | loans | loans | ||||||||||||||||||||||||
| Commercial multi-family |
$ | 1,357 | $ | 1 | $ | 174 | $ | 1,532 | $ | 300,834 | $ | 302,366 | $ | 174 | $ | — | ||||||||||||||||
| Commercial real estate: |
||||||||||||||||||||||||||||||||
| Non-owner occupied |
17,422 | 292 | 37,043 | 54,757 | 3,247,988 | 3,302,745 | 37,043 | — | ||||||||||||||||||||||||
| Owner occupied |
2,004 | 152 | 25,619 | 27,775 | 1,167,509 | 1,195,284 | 25,619 | — | ||||||||||||||||||||||||
| Commercial and industrial |
4,237 | 2,032 | 178,224 | 184,493 | 5,567,505 | 5,751,998 | 173,245 | 4,979 | ||||||||||||||||||||||||
| Construction |
2,898 | 1,691 | — | 4,589 | 299,364 | 303,953 | — | — | ||||||||||||||||||||||||
| Mortgage |
252,650 | 118,092 | 314,103 | 684,845 | 6,548,261 | 7,233,106 | 139,958 | 174,145 | ||||||||||||||||||||||||
| Leasing |
23,537 | 5,372 | 7,747 | 36,656 | 1,961,995 | 1,998,651 | 7,747 | — | ||||||||||||||||||||||||
| Consumer: |
||||||||||||||||||||||||||||||||
| Credit cards |
13,556 | 9,917 | 25,625 | 49,098 | 1,176,469 | 1,225,567 | — | 25,625 | ||||||||||||||||||||||||
| Home equity lines of credit |
— | — | — | — | 1,693 | 1,693 | — | — | ||||||||||||||||||||||||
| Personal |
19,826 | 11,353 | 18,375 | 49,554 | 1,773,594 | 1,823,148 | 18,375 | — | ||||||||||||||||||||||||
| Auto |
107,907 | 21,874 | 49,432 | 179,213 | 3,671,740 | 3,850,953 | 49,432 | — | ||||||||||||||||||||||||
| Other |
2,907 | 245 | 2,195 | 5,347 | 166,980 | 172,327 | 1,776 | 419 | ||||||||||||||||||||||||
|
|
|
|
|
|
|
|
|
|
|
|
|
|
|
|
|
|||||||||||||||||
| Total |
$ | 448,301 | $ | 171,021 | $ | 658,537 | $ | 1,277,859 | $ | 25,883,932 | $ | 27,161,791 | $ | 453,369 | $ | 205,168 | ||||||||||||||||
|
|
|
|
|
|
|
|
|
|
|
|
|
|
|
|
|
|||||||||||||||||
| 30-Jun-25 |
||||||||||||||||||||||||||||||||
| BPPR |
||||||||||||||||||||||||||||||||
| Past due | Past due 90 days or more | |||||||||||||||||||||||||||||||
| 30-59 | 60-89 | 90 days | Total | Non-accrual | Accruing | |||||||||||||||||||||||||||
| (In thousands) |
days | days | or more | past due | Current | Loans HIP | loans | loans | ||||||||||||||||||||||||
| Commercial multi-family |
$ | 6,337 | $ | — | $ | 174 | $ | 6,511 | $ | 299,852 | $ | 306,363 | $ | 174 | $ | — | ||||||||||||||||
| Commercial real estate: |
||||||||||||||||||||||||||||||||
| Non-owner occupied |
113 | 1,679 | 6,084 | 7,876 | 3,322,108 | 3,329,984 | 6,084 | — | ||||||||||||||||||||||||
| Owner occupied |
1,087 | 2,098 | 27,320 | 30,505 | 1,171,601 | 1,202,106 | 27,320 | — | ||||||||||||||||||||||||
| Commercial and industrial |
4,657 | 2,449 | 12,652 | 19,758 | 5,574,966 | 5,594,724 | 8,588 | 4,064 | ||||||||||||||||||||||||
| Construction |
3,720 | — | — | 3,720 | 249,579 | 253,299 | — | — | ||||||||||||||||||||||||
| Mortgage |
262,525 | 109,530 | 324,140 | 696,195 | 6,407,811 | 7,104,006 | 147,464 | 176,676 | ||||||||||||||||||||||||
| Leasing |
23,109 | 5,629 | 7,976 | 36,714 | 1,946,354 | 1,983,068 | 7,976 | — | ||||||||||||||||||||||||
| Consumer: |
||||||||||||||||||||||||||||||||
| Credit cards |
14,184 | 9,360 | 25,201 | 48,745 | 1,166,545 | 1,215,290 | — | 25,201 | ||||||||||||||||||||||||
| Home equity lines of credit |
— | — | — | — | 1,809 | 1,809 | — | — | ||||||||||||||||||||||||
| Personal |
19,022 | 11,917 | 17,499 | 48,438 | 1,743,772 | 1,792,210 | 17,499 | — | ||||||||||||||||||||||||
| Auto |
102,643 | 22,404 | 40,595 | 165,642 | 3,696,060 | 3,861,702 | 40,595 | — | ||||||||||||||||||||||||
| Other |
2,500 | 160 | 2,212 | 4,872 | 155,550 | 160,422 | 1,948 | 264 | ||||||||||||||||||||||||
|
|
|
|
|
|
|
|
|
|
|
|
|
|
|
|
|
|||||||||||||||||
| Total |
$ | 439,897 | $ | 165,226 | $ | 463,853 | $ | 1,068,976 | $ | 25,736,007 | $ | 26,804,983 | $ | 257,648 | $ | 206,205 | ||||||||||||||||
|
|
|
|
|
|
|
|
|
|
|
|
|
|
|
|
|
|||||||||||||||||
24
| Variance |
||||||||||||||||||||||||||||||||
| Past due | Past due 90 days or more | |||||||||||||||||||||||||||||||
| 30-59 | 60-89 | 90 days | Total | Non-accrual | Accruing | |||||||||||||||||||||||||||
| (In thousands) |
days | days | or more | past due | Current | Loans HIP | loans | loans | ||||||||||||||||||||||||
| Commercial multi-family |
$ | (4,980 | ) | $ | 1 | $ | — | $ | (4,979 | ) | $ | 982 | $ | (3,997 | ) | $ | — | $ | — | |||||||||||||
| Commercial real estate: |
||||||||||||||||||||||||||||||||
| Non-owner occupied |
17,309 | (1,387 | ) | 30,959 | 46,881 | (74,120 | ) | (27,239 | ) | 30,959 | — | |||||||||||||||||||||
| Owner occupied |
917 | (1,946 | ) | (1,701 | ) | (2,730 | ) | (4,092 | ) | (6,822 | ) | (1,701 | ) | — | ||||||||||||||||||
| Commercial and industrial |
(420 | ) | (417 | ) | 165,572 | 164,735 | (7,461 | ) | 157,274 | 164,657 | 915 | |||||||||||||||||||||
| Construction |
(822 | ) | 1,691 | — | 869 | 49,785 | 50,654 | — | — | |||||||||||||||||||||||
| Mortgage |
(9,875 | ) | 8,562 | (10,037 | ) | (11,350 | ) | 140,450 | 129,100 | (7,506 | ) | (2,531 | ) | |||||||||||||||||||
| Leasing |
428 | (257 | ) | (229 | ) | (58 | ) | 15,641 | 15,583 | (229 | ) | — | ||||||||||||||||||||
| Consumer: |
||||||||||||||||||||||||||||||||
| Credit cards |
(628 | ) | 557 | 424 | 353 | 9,924 | 10,277 | — | 424 | |||||||||||||||||||||||
| Home equity lines of credit |
— | — | — | — | (116 | ) | (116 | ) | — | — | ||||||||||||||||||||||
| Personal |
804 | (564 | ) | 876 | 1,116 | 29,822 | 30,938 | 876 | — | |||||||||||||||||||||||
| Auto |
5,264 | (530 | ) | 8,837 | 13,571 | (24,320 | ) | (10,749 | ) | 8,837 | — | |||||||||||||||||||||
| Other |
407 | 85 | (17 | ) | 475 | 11,430 | 11,905 | (172 | ) | 155 | ||||||||||||||||||||||
|
|
|
|
|
|
|
|
|
|
|
|
|
|
|
|
|
|||||||||||||||||
| Total |
$ | 8,404 | $ | 5,795 | $ | 194,684 | $ | 208,883 | $ | 147,925 | $ | 356,808 | $ | 195,721 | $ | (1,037 | ) | |||||||||||||||
|
|
|
|
|
|
|
|
|
|
|
|
|
|
|
|
|
|||||||||||||||||
25
Popular, Inc.
Financial Supplement to Third Quarter 2025 Earnings Release
Table J - Loan Delinquency - Popular U.S. Operations
(Unaudited)
| 30-Sep-25 |
||||||||||||||||||||||||||||||||
| Popular U.S. |
||||||||||||||||||||||||||||||||
| Past due | Past due 90 days or more | |||||||||||||||||||||||||||||||
| 30-59 | 60-89 | 90 days | Total | Non-accrual | Accruing | |||||||||||||||||||||||||||
| (In thousands) |
days | days | or more | past due | Current | Loans HIP | loans | loans | ||||||||||||||||||||||||
| Commercial multi-family |
$ | — | $ | 2,638 | $ | 8,467 | $ | 11,105 | $ | 2,176,118 | $ | 2,187,223 | $ | 8,467 | $ | — | ||||||||||||||||
| Commercial real estate: |
||||||||||||||||||||||||||||||||
| Non-owner occupied |
84 | — | 7,083 | 7,167 | 2,152,668 | 2,159,835 | 7,083 | — | ||||||||||||||||||||||||
| Owner occupied |
15,171 | 217 | — | 15,388 | 1,880,052 | 1,895,440 | — | — | ||||||||||||||||||||||||
| Commercial and industrial |
14,949 | — | 1,434 | 16,383 | 2,477,258 | 2,493,641 | 1,246 | 188 | ||||||||||||||||||||||||
| Construction |
— | — | — | — | 1,300,659 | 1,300,659 | — | — | ||||||||||||||||||||||||
| Mortgage |
1,298 | 4,988 | 27,809 | 34,095 | 1,291,207 | 1,325,302 | 27,809 | — | ||||||||||||||||||||||||
| Consumer: |
||||||||||||||||||||||||||||||||
| Home equity lines of credit |
395 | 335 | 3,257 | 3,987 | 73,210 | 77,197 | 3,257 | — | ||||||||||||||||||||||||
| Personal |
1,006 | 990 | 941 | 2,937 | 74,240 | 77,177 | 941 | — | ||||||||||||||||||||||||
| Other |
— | — | 30 | 30 | 8,863 | 8,893 | 30 | — | ||||||||||||||||||||||||
|
|
|
|
|
|
|
|
|
|
|
|
|
|
|
|
|
|||||||||||||||||
| Total |
$ | 32,903 | $ | 9,168 | $ | 49,021 | $ | 91,092 | $ | 11,434,275 | $ | 11,525,367 | $ | 48,833 | $ | 188 | ||||||||||||||||
|
|
|
|
|
|
|
|
|
|
|
|
|
|
|
|
|
|||||||||||||||||
| 30-Jun-25 |
||||||||||||||||||||||||||||||||
| Popular U.S. |
||||||||||||||||||||||||||||||||
| Past due | Past due 90 days or more | |||||||||||||||||||||||||||||||
| 30-59 | 60-89 | 90 days | Total | Non-accrual | Accruing | |||||||||||||||||||||||||||
| (In thousands) |
days | days | or more | past due | Current | Loans HIP | loans | loans | ||||||||||||||||||||||||
| Commercial multi-family |
$ | — | $ | 4,675 | $ | 10,751 | $ | 15,426 | $ | 2,199,000 | $ | 2,214,426 | $ | 10,751 | $ | — | ||||||||||||||||
| Commercial real estate: |
||||||||||||||||||||||||||||||||
| Non-owner occupied |
1,503 | — | 7,893 | 9,396 | 2,181,994 | 2,191,390 | 7,893 | — | ||||||||||||||||||||||||
| Owner occupied |
10,677 | — | 231 | 10,908 | 1,790,841 | 1,801,749 | 231 | — | ||||||||||||||||||||||||
| Commercial and industrial |
9,235 | 5,195 | 3,025 | 17,455 | 2,431,573 | 2,449,028 | 2,836 | 189 | ||||||||||||||||||||||||
| Construction |
— | — | — | — | 1,214,902 | 1,214,902 | — | — | ||||||||||||||||||||||||
| Mortgage |
677 | 3,329 | 28,052 | 32,058 | 1,308,363 | 1,340,421 | 28,052 | — | ||||||||||||||||||||||||
| Consumer: |
||||||||||||||||||||||||||||||||
| Credit cards |
— | — | — | — | 3 | 3 | — | — | ||||||||||||||||||||||||
| Home equity lines of credit |
845 | 717 | 3,120 | 4,682 | 70,988 | 75,670 | 3,120 | — | ||||||||||||||||||||||||
| Personal |
1,045 | 532 | 1,094 | 2,671 | 81,582 | 84,253 | 1,094 | — | ||||||||||||||||||||||||
| Other |
694 | 1 | — | 695 | 7,658 | 8,353 | — | — | ||||||||||||||||||||||||
|
|
|
|
|
|
|
|
|
|
|
|
|
|
|
|
|
|||||||||||||||||
| Total |
$ | 24,676 | $ | 14,449 | $ | 54,166 | $ | 93,291 | $ | 11,286,904 | $ | 11,380,195 | $ | 53,977 | $ | 189 | ||||||||||||||||
|
|
|
|
|
|
|
|
|
|
|
|
|
|
|
|
|
|||||||||||||||||
26
| Variance |
||||||||||||||||||||||||||||||||
|
|
||||||||||||||||||||||||||||||||
| Past due | Past due 90 days or more | |||||||||||||||||||||||||||||||
| 30-59 | 60-89 | 90 days | Total | Non-accrual | Accruing | |||||||||||||||||||||||||||
| (In thousands) |
days | days | or more | past due | Current | Loans HIP | loans | loans | ||||||||||||||||||||||||
| Commercial multi-family |
$ | — | $ | (2,037 | ) | $ | (2,284 | ) | $ | (4,321 | ) | $ | (22,882 | ) | $ | (27,203 | ) | $ | (2,284 | ) | $ | — | ||||||||||
| Commercial real estate: |
||||||||||||||||||||||||||||||||
| Non-owner occupied |
(1,419 | ) | — | (810 | ) | (2,229 | ) | (29,326 | ) | (31,555 | ) | (810 | ) | — | ||||||||||||||||||
| Owner occupied |
4,494 | 217 | (231 | ) | 4,480 | 89,211 | 93,691 | (231 | ) | — | ||||||||||||||||||||||
| Commercial and industrial |
5,714 | (5,195 | ) | (1,591 | ) | (1,072 | ) | 45,685 | 44,613 | (1,590 | ) | (1 | ) | |||||||||||||||||||
| Construction |
— | — | — | — | 85,757 | 85,757 | — | — | ||||||||||||||||||||||||
| Mortgage |
621 | 1,659 | (243 | ) | 2,037 | (17,156 | ) | (15,119 | ) | (243 | ) | — | ||||||||||||||||||||
| Consumer: |
||||||||||||||||||||||||||||||||
| Credit cards |
— | — | — | — | (3 | ) | (3 | ) | — | — | ||||||||||||||||||||||
| Home equity lines of credit |
(450 | ) | (382 | ) | 137 | (695 | ) | 2,222 | 1,527 | 137 | — | |||||||||||||||||||||
| Personal |
(39 | ) | 458 | (153 | ) | 266 | (7,342 | ) | (7,076 | ) | (153 | ) | — | |||||||||||||||||||
| Other |
(694 | ) | (1 | ) | 30 | (665 | ) | 1,205 | 540 | 30 | — | |||||||||||||||||||||
|
|
|
|
|
|
|
|
|
|
|
|
|
|
|
|
|
|||||||||||||||||
| Total |
$ | 8,227 | $ | (5,281 | ) | $ | (5,145 | ) | $ | (2,199 | ) | $ | 147,371 | $ | 145,172 | $ | (5,144 | ) | $ | (1 | ) | |||||||||||
|
|
|
|
|
|
|
|
|
|
|
|
|
|
|
|
|
|||||||||||||||||
27
Popular, Inc.
Financial Supplement to Third Quarter 2025 Earnings Release
Table K - Loan Delinquency - Consolidated
(Unaudited)
| 30-Sep-25 |
||||||||||||||||||||||||||||||||
| Popular, Inc. |
||||||||||||||||||||||||||||||||
| Past due | Past due 90 days or more | |||||||||||||||||||||||||||||||
| 30-59 | 60-89 | 90 days | Total | Non-accrual | Accruing | |||||||||||||||||||||||||||
| (In thousands) |
days | days | or more | past due | Current | Loans HIP | loans | loans | ||||||||||||||||||||||||
| Commercial multi-family |
$ | 1,357 | $ | 2,639 | $ | 8,641 | $ | 12,637 | $ | 2,476,952 | $ | 2,489,589 | $ | 8,641 | $ | — | ||||||||||||||||
| Commercial real estate: |
||||||||||||||||||||||||||||||||
| Non-owner occupied |
17,506 | 292 | 44,126 | 61,924 | 5,400,656 | 5,462,580 | 44,126 | — | ||||||||||||||||||||||||
| Owner occupied |
17,175 | 369 | 25,619 | 43,163 | 3,047,561 | 3,090,724 | 25,619 | — | ||||||||||||||||||||||||
| Commercial and industrial |
19,186 | 2,032 | 179,658 | 200,876 | 8,044,763 | 8,245,639 | 174,491 | 5,167 | ||||||||||||||||||||||||
| Construction |
2,898 | 1,691 | — | 4,589 | 1,600,023 | 1,604,612 | — | — | ||||||||||||||||||||||||
| Mortgage |
253,948 | 123,080 | 341,912 | 718,940 | 7,839,468 | 8,558,408 | 167,767 | 174,145 | ||||||||||||||||||||||||
| Leasing |
23,537 | 5,372 | 7,747 | 36,656 | 1,961,995 | 1,998,651 | 7,747 | — | ||||||||||||||||||||||||
| Consumer: |
||||||||||||||||||||||||||||||||
| Credit cards |
13,556 | 9,917 | 25,625 | 49,098 | 1,176,469 | 1,225,567 | — | 25,625 | ||||||||||||||||||||||||
| Home equity lines of credit |
395 | 335 | 3,257 | 3,987 | 74,903 | 78,890 | 3,257 | — | ||||||||||||||||||||||||
| Personal |
20,832 | 12,343 | 19,316 | 52,491 | 1,847,834 | 1,900,325 | 19,316 | — | ||||||||||||||||||||||||
| Auto |
107,907 | 21,874 | 49,432 | 179,213 | 3,671,740 | 3,850,953 | 49,432 | — | ||||||||||||||||||||||||
| Other |
2,907 | 245 | 2,225 | 5,377 | 175,843 | 181,220 | 1,806 | 419 | ||||||||||||||||||||||||
|
|
|
|
|
|
|
|
|
|
|
|
|
|
|
|
|
|||||||||||||||||
| Total |
$ | 481,204 | $ | 180,189 | $ | 707,558 | $ | 1,368,951 | $ | 37,318,207 | $ | 38,687,158 | $ | 502,202 | $ | 205,356 | ||||||||||||||||
|
|
|
|
|
|
|
|
|
|
|
|
|
|
|
|
|
|||||||||||||||||
| 30-Jun-25 |
||||||||||||||||||||||||||||||||
| Popular, Inc. |
||||||||||||||||||||||||||||||||
| Past due | Past due 90 days or more | |||||||||||||||||||||||||||||||
| 30-59 | 60-89 | 90 days | Total | Non-accrual | Accruing | |||||||||||||||||||||||||||
| (In thousands) |
days | days | or more | past due | Current | Loans HIP | loans | loans | ||||||||||||||||||||||||
| Commercial multi-family |
$ | 6,337 | $ | 4,675 | $ | 10,925 | $ | 21,937 | $ | 2,498,852 | $ | 2,520,789 | $ | 10,925 | $ | — | ||||||||||||||||
| Commercial real estate: |
||||||||||||||||||||||||||||||||
| Non-owner occupied |
1,616 | 1,679 | 13,977 | 17,272 | 5,504,102 | 5,521,374 | 13,977 | — | ||||||||||||||||||||||||
| Owner occupied |
11,764 | 2,098 | 27,551 | 41,413 | 2,962,442 | 3,003,855 | 27,551 | — | ||||||||||||||||||||||||
| Commercial and industrial |
13,892 | 7,644 | 15,677 | 37,213 | 8,006,539 | 8,043,752 | 11,424 | 4,253 | ||||||||||||||||||||||||
| Construction |
3,720 | — | — | 3,720 | 1,464,481 | 1,468,201 | — | — | ||||||||||||||||||||||||
| Mortgage |
263,202 | 112,859 | 352,192 | 728,253 | 7,716,174 | 8,444,427 | 175,516 | 176,676 | ||||||||||||||||||||||||
| Leasing |
23,109 | 5,629 | 7,976 | 36,714 | 1,946,354 | 1,983,068 | 7,976 | — | ||||||||||||||||||||||||
| Consumer: |
||||||||||||||||||||||||||||||||
| Credit cards |
14,184 | 9,360 | 25,201 | 48,745 | 1,166,548 | 1,215,293 | — | 25,201 | ||||||||||||||||||||||||
| Home equity lines of credit |
845 | 717 | 3,120 | 4,682 | 72,797 | 77,479 | 3,120 | — | ||||||||||||||||||||||||
| Personal |
20,067 | 12,449 | 18,593 | 51,109 | 1,825,354 | 1,876,463 | 18,593 | — | ||||||||||||||||||||||||
| Auto |
102,643 | 22,404 | 40,595 | 165,642 | 3,696,060 | 3,861,702 | 40,595 | — | ||||||||||||||||||||||||
| Other |
3,194 | 161 | 2,212 | 5,567 | 163,208 | 168,775 | 1,948 | 264 | ||||||||||||||||||||||||
|
|
|
|
|
|
|
|
|
|
|
|
|
|
|
|
|
|||||||||||||||||
| Total |
$ | 464,573 | $ | 179,675 | $ | 518,019 | $ | 1,162,267 | $ | 37,022,911 | $ | 38,185,178 | $ | 311,625 | $ | 206,394 | ||||||||||||||||
|
|
|
|
|
|
|
|
|
|
|
|
|
|
|
|
|
|||||||||||||||||
28
| Variance |
||||||||||||||||||||||||||||||||
| Past due | Past due 90 days or more | |||||||||||||||||||||||||||||||
| 30-59 | 60-89 | 90 days | Total | Non-accrual | Accruing | |||||||||||||||||||||||||||
| (In thousands) |
days | days | or more | past due | Current | Loans HIP | loans | loans | ||||||||||||||||||||||||
| Commercial multi-family |
$ | (4,980 | ) | $ | (2,036 | ) | $ | (2,284 | ) | $ | (9,300 | ) | $ | (21,900 | ) | $ | (31,200 | ) | $ | (2,284 | ) | $ | — | |||||||||
| Commercial real estate: |
||||||||||||||||||||||||||||||||
| Non-owner occupied |
15,890 | (1,387 | ) | 30,149 | 44,652 | (103,446 | ) | (58,794 | ) | 30,149 | — | |||||||||||||||||||||
| Owner occupied |
5,411 | (1,729 | ) | (1,932 | ) | 1,750 | 85,119 | 86,869 | (1,932 | ) | — | |||||||||||||||||||||
| Commercial and industrial |
5,294 | (5,612 | ) | 163,981 | 163,663 | 38,224 | 201,887 | 163,067 | 914 | |||||||||||||||||||||||
| Construction |
(822 | ) | 1,691 | — | 869 | 135,542 | 136,411 | — | — | |||||||||||||||||||||||
| Mortgage |
(9,254 | ) | 10,221 | (10,280 | ) | (9,313 | ) | 123,294 | 113,981 | (7,749 | ) | (2,531 | ) | |||||||||||||||||||
| Leasing |
428 | (257 | ) | (229 | ) | (58 | ) | 15,641 | 15,583 | (229 | ) | — | ||||||||||||||||||||
| Consumer: |
||||||||||||||||||||||||||||||||
| Credit cards |
(628 | ) | 557 | 424 | 353 | 9,921 | 10,274 | — | 424 | |||||||||||||||||||||||
| Home equity lines of credit |
(450 | ) | (382 | ) | 137 | (695 | ) | 2,106 | 1,411 | 137 | — | |||||||||||||||||||||
| Personal |
765 | (106 | ) | 723 | 1,382 | 22,480 | 23,862 | 723 | — | |||||||||||||||||||||||
| Auto |
5,264 | (530 | ) | 8,837 | 13,571 | (24,320 | ) | (10,749 | ) | 8,837 | — | |||||||||||||||||||||
| Other |
(287 | ) | 84 | 13 | (190 | ) | 12,635 | 12,445 | (142 | ) | 155 | |||||||||||||||||||||
|
|
|
|
|
|
|
|
|
|
|
|
|
|
|
|
|
|||||||||||||||||
| Total |
$ | 16,631 | $ | 514 | $ | 189,539 | $ | 206,684 | $ | 295,296 | $ | 501,980 | $ | 190,577 | $ | (1,038 | ) | |||||||||||||||
|
|
|
|
|
|
|
|
|
|
|
|
|
|
|
|
|
|||||||||||||||||
29
Popular, Inc.
Financial Supplement to Third Quarter 2025 Earnings Release
Table L - Non-Performing Assets
(Unaudited)
| Variance | ||||||||||||||||||||||||||||||||
| (Dollars in thousands) |
30-Sep-25 | As a % of loans HIP by category |
30-Jun-25 | As a % of loans HIP by category |
30-Sep-24 | As a % of loans HIP by category |
Q3 2025 vs. Q2 2025 |
Q3 2025 vs. Q3 2024 |
||||||||||||||||||||||||
| Non-accrual loans: |
||||||||||||||||||||||||||||||||
| Commercial |
||||||||||||||||||||||||||||||||
| Commercial multi-family |
$ | 8,641 | 0.3 | % | $ | 10,925 | 0.4 | % | $ | 8,787 | 0.4 | % | $ | (2,284 | ) | $ | (146 | ) | ||||||||||||||
| Commercial real estate non-owner occupied |
44,126 | 0.8 | 13,977 | 0.3 | 9,775 | 0.2 | 30,149 | 34,351 | ||||||||||||||||||||||||
| Commercial real estate owner occupied |
25,619 | 0.8 | 27,551 | 0.9 | 48,848 | 1.6 | (1,932 | ) | (23,229 | ) | ||||||||||||||||||||||
| Commercial and industrial |
174,491 | 2.1 | 11,424 | 0.1 | 24,885 | 0.3 | 163,067 | 149,606 | ||||||||||||||||||||||||
| Total Commercial |
252,877 | 1.3 | 63,877 | 0.3 | 92,295 | 0.5 | 189,000 | 160,582 | ||||||||||||||||||||||||
| Mortgage |
167,767 | 2.0 | 175,516 | 2.1 | 186,354 | 2.3 | (7,749 | ) | (18,587 | ) | ||||||||||||||||||||||
| Leasing |
7,747 | 0.4 | 7,976 | 0.4 | 7,367 | 0.4 | (229 | ) | 380 | |||||||||||||||||||||||
| Consumer |
||||||||||||||||||||||||||||||||
| Home equity lines of credit |
3,257 | 4.1 | 3,120 | 4.0 | 3,834 | 5.5 | 137 | (577 | ) | |||||||||||||||||||||||
| Personal |
19,316 | 1.0 | 18,593 | 1.0 | 22,829 | 1.2 | 723 | (3,513 | ) | |||||||||||||||||||||||
| Auto |
49,432 | 1.3 | 40,595 | 1.1 | 47,828 | 1.3 | 8,837 | 1,604 | ||||||||||||||||||||||||
| Other |
1,806 | 1.0 | 1,948 | 1.2 | 891 | 0.5 | (142 | ) | 915 | |||||||||||||||||||||||
| Total Consumer |
73,811 | 1.0 | 64,256 | 0.9 | 75,382 | 1.1 | 9,555 | (1,571 | ) | |||||||||||||||||||||||
|
|
|
|
|
|
|
|
|
|
|
|
|
|
|
|
|
|||||||||||||||||
| Total non-performing loans held-in-portfolio |
502,202 | 1.3 | % | 311,625 | 0.8 | % | 361,398 | 1.0 | % | 190,577 | 140,804 | |||||||||||||||||||||
| Other real estate owned (“OREO”) |
42,950 | 46,126 | 63,028 | (3,176 | ) | (20,078 | ) | |||||||||||||||||||||||||
|
|
|
|
|
|
|
|
|
|
|
|||||||||||||||||||||||
| Total non-performing assets [1] |
545,152 | 357,751 | 424,426 | 187,401 | 120,726 | |||||||||||||||||||||||||||
|
|
|
|
|
|
|
|
|
|
|
|||||||||||||||||||||||
| Accruing loans past due 90 days or more [2] |
$ | 205,356 | $ | 206,394 | $ | 233,971 | $ | (1,038 | ) | $ | (28,615 | ) | ||||||||||||||||||||
|
|
|
|
|
|
|
|
|
|
|
|||||||||||||||||||||||
| Ratios: |
||||||||||||||||||||||||||||||||
| Non-performing assets to total assets |
0.73 | % | 0.47 | % | 0.60 | % | ||||||||||||||||||||||||||
| Non-performing loans held-in-portfolio to loans held-in-portfolio |
1.30 | 0.82 | 1.00 | |||||||||||||||||||||||||||||
| Allowance for credit losses to loans held-in-portfolio |
2.03 | 2.02 | 2.06 | |||||||||||||||||||||||||||||
| Allowance for credit losses to non-performing loans, excluding loans held-for-sale |
156.55 | 246.93 | 205.96 | |||||||||||||||||||||||||||||
|
|
|
|
|
|
|
|||||||||||||||||||||||||||
| [1] | There were no non-performing loans held-for-sale as of September 30, 2025, June 30, 2025 and September 30, 2024. |
| [2] | It is the Corporation’s policy to report delinquent residential mortgage loans insured by FHA or guaranteed by the VA as accruing loans past due 90 days or more as opposed to non-performing since the principal repayment is insured. The balance of these loans includes $9 million at September 30, 2025, related to the rebooking of loans previously pooled into GNMA securities, in which the Corporation had a buy-back option as further described below (June 30, 2025 - $8 million; September 30, 2024 - $9 million). Under the GNMA program, issuers such as BPPR have the option but not the obligation to repurchase loans that are 90 days or more past due. For accounting purposes, these loans subject to the repurchase option are required to be reflected (rebooked) on the financial statements of BPPR with an offsetting liability. These balances include $49 million of residential mortgage loans insured by FHA or guaranteed by the VA that are no longer accruing interest as of September 30, 2025 (June 30, 2025 - $52 million; September 30, 2024 - $70 million). Furthermore, the Corporation has approximately $29 million reverse mortgage loans which are guaranteed by FHA, as of September 30, 2025. Due to the guaranteed nature of the loans, it is the Corporation’s policy to exclude these balances from non-performing assets (June 30, 2025 - $29 million; September 30, 2024 - $32 million). |
30
Popular, Inc.
Financial Supplement to Third Quarter 2025 Earnings Release
Table M - Activity in Non-Performing Loans
(Unaudited)
| Commercial loans held-in-portfolio: |
||||||||||||||||||||||||
| Quarter ended | Quarter ended | |||||||||||||||||||||||
| 30-Sep-25 | 30-Jun-25 | |||||||||||||||||||||||
| (In thousands) |
BPPR | Popular U.S. | Popular, Inc. | BPPR | Popular U.S. | Popular, Inc. | ||||||||||||||||||
| Beginning balance NPLs |
$ | 42,166 | $ | 21,711 | $ | 63,877 | $ | 42,597 | $ | 17,507 | $ | 60,104 | ||||||||||||
| Plus: |
||||||||||||||||||||||||
| New non-performing loans |
211,193 | 1,775 | 212,968 | 1,768 | 5,632 | 7,400 | ||||||||||||||||||
| Advances on existing non-performing loans |
— | 48 | 48 | — | 20 | 20 | ||||||||||||||||||
| Less: |
||||||||||||||||||||||||
| Non-performing loans transferred to OREO |
— | — | — | (140 | ) | — | (140 | ) | ||||||||||||||||
| Non-performing loans charged-off |
(13,779 | ) | — | (13,779 | ) | (403 | ) | (583 | ) | (986 | ) | |||||||||||||
| Loans returned to accrual status / loan collections |
(3,499 | ) | (6,738 | ) | (10,237 | ) | (1,656 | ) | (865 | ) | (2,521 | ) | ||||||||||||
|
|
|
|
|
|
|
|
|
|
|
|
|
|||||||||||||
| Ending balance NPLs |
$ | 236,081 | $ | 16,796 | $ | 252,877 | $ | 42,166 | $ | 21,711 | $ | 63,877 | ||||||||||||
|
|
|
|
|
|
|
|
|
|
|
|
|
|||||||||||||
| Mortgage loans held-in-portfolio: |
||||||||||||||||||||||||
| Quarter ended | Quarter ended | |||||||||||||||||||||||
| 30-Sep-25 | 30-Jun-25 | |||||||||||||||||||||||
| (In thousands) |
BPPR | Popular U.S. | Popular, Inc. | BPPR | Popular U.S. | Popular, Inc. | ||||||||||||||||||
| Beginning balance NPLs |
$ | 147,464 | $ | 28,052 | $ | 175,516 | $ | 148,506 | $ | 29,087 | $ | 177,593 | ||||||||||||
| Plus: |
||||||||||||||||||||||||
| New non-performing loans |
30,552 | 3,011 | 33,563 | 30,437 | 3,277 | 33,714 | ||||||||||||||||||
| Less: |
||||||||||||||||||||||||
| Non-performing loans transferred to OREO |
(2,333 | ) | — | (2,333 | ) | (2,245 | ) | (433 | ) | (2,678 | ) | |||||||||||||
| Non-performing loans charged-off |
(75 | ) | — | (75 | ) | (387 | ) | — | (387 | ) | ||||||||||||||
| Loans returned to accrual status / loan collections |
(35,650 | ) | (3,254 | ) | (38,904 | ) | (28,847 | ) | (3,879 | ) | (32,726 | ) | ||||||||||||
|
|
|
|
|
|
|
|
|
|
|
|
|
|||||||||||||
| Ending balance NPLs |
$ | 139,958 | $ | 27,809 | $ | 167,767 | $ | 147,464 | $ | 28,052 | $ | 175,516 | ||||||||||||
|
|
|
|
|
|
|
|
|
|
|
|
|
|||||||||||||
| Total non-performing loans held-in-portfolio (excluding consumer): |
||||||||||||||||||||||||
| Quarter ended | Quarter ended | |||||||||||||||||||||||
| 30-Sep-25 | 30-Jun-25 | |||||||||||||||||||||||
| (In thousands) |
BPPR | Popular U.S. | Popular, Inc. | BPPR | Popular U.S. | Popular, Inc. | ||||||||||||||||||
| Beginning balance NPLs |
$ | 189,630 | $ | 49,763 | $ | 239,393 | $ | 191,103 | $ | 46,594 | $ | 237,697 | ||||||||||||
| Plus: |
||||||||||||||||||||||||
| New non-performing loans |
241,745 | 4,786 | 246,531 | 32,205 | 8,909 | 41,114 | ||||||||||||||||||
| Advances on existing non-performing loans |
— | 48 | 48 | — | 20 | 20 | ||||||||||||||||||
| Less: |
||||||||||||||||||||||||
| Non-performing loans transferred to OREO |
(2,333 | ) | — | (2,333 | ) | (2,385 | ) | (433 | ) | (2,818 | ) | |||||||||||||
| Non-performing loans charged-off |
(13,854 | ) | — | (13,854 | ) | (790 | ) | (583 | ) | (1,373 | ) | |||||||||||||
| Loans returned to accrual status / loan collections |
(39,149 | ) | (9,992 | ) | (49,141 | ) | (30,503 | ) | (4,744 | ) | (35,247 | ) | ||||||||||||
|
|
|
|
|
|
|
|
|
|
|
|
|
|||||||||||||
| Ending balance NPLs |
$ | 376,039 | $ | 44,605 | $ | 420,644 | $ | 189,630 | $ | 49,763 | $ | 239,393 | ||||||||||||
|
|
|
|
|
|
|
|
|
|
|
|
|
|||||||||||||
31
Popular, Inc.
Financial Supplement to Third Quarter 2025 Earnings Release
Table N - Allowance for Credit Losses, Net Charge-offs and Related Ratios
(Unaudited)
| Quarters ended | ||||||||||||
| (In thousands) |
30-Sep-25 | 30-Jun-25 | 30-Sep-24 | |||||||||
| Balance at beginning of period - loans held-in-portfolio |
$ | 769,485 | $ | 762,148 | $ | 730,077 | ||||||
| Provision for credit losses |
74,517 | 49,539 | 72,769 | |||||||||
| Initial allowance for credit losses - PCD Loans |
6 | — | 3 | |||||||||
|
|
|
|
|
|
|
|||||||
| 844,008 | 811,687 | 802,849 | ||||||||||
|
|
|
|
|
|
|
|||||||
| Net loans charge-off (recovered)- BPPR |
||||||||||||
| Commercial: |
||||||||||||
| Commercial multi-family |
(2 | ) | (6 | ) | — | |||||||
| Commercial real estate non-owner occupied |
12,614 | (451 | ) | 10 | ||||||||
| Commercial real estate owner occupied |
(947 | ) | (1,005 | ) | (1,554 | ) | ||||||
| Commercial and industrial |
1,467 | 1,436 | 4,729 | |||||||||
| Total Commercial |
13,132 | (26 | ) | 3,185 | ||||||||
| Construction |
— | — | (1,036 | ) | ||||||||
| Mortgage |
(2,216 | ) | (2,429 | ) | (3,894 | ) | ||||||
| Leasing |
2,054 | 2,736 | 2,256 | |||||||||
| Consumer: |
||||||||||||
| Credit cards |
15,310 | 17,311 | 14,857 | |||||||||
| Home equity lines of credit |
(89 | ) | (307 | ) | (76 | ) | ||||||
| Personal |
15,685 | 15,776 | 22,186 | |||||||||
| Auto |
12,036 | 6,557 | 16,901 | |||||||||
| Other Consumer |
627 | 546 | 202 | |||||||||
| Total Consumer |
43,569 | 39,883 | 54,070 | |||||||||
|
|
|
|
|
|
|
|||||||
| Total net charged-off BPPR |
$ | 56,539 | $ | 40,164 | $ | 54,581 | ||||||
|
|
|
|
|
|
|
|||||||
| Net loans charge-off (recovered) - Popular U.S. |
||||||||||||
| Commercial: |
||||||||||||
| Commercial multi-family |
(60 | ) | 563 | (5 | ) | |||||||
| Commercial real estate non-owner occupied |
— | — | (8 | ) | ||||||||
| Commercial real estate owner occupied |
(16 | ) | (26 | ) | (19 | ) | ||||||
| Commercial and industrial |
660 | (205 | ) | 372 | ||||||||
| Total Commercial |
584 | 332 | 340 | |||||||||
| Mortgage |
(36 | ) | (32 | ) | (46 | ) | ||||||
| Consumer: |
||||||||||||
| Home equity lines of credit |
(423 | ) | (579 | ) | (120 | ) | ||||||
| Personal |
1,109 | 2,305 | 3,751 | |||||||||
| Other Consumer |
15 | 12 | 23 | |||||||||
| Total Consumer |
701 | 1,738 | 3,654 | |||||||||
|
|
|
|
|
|
|
|||||||
| Total net charged-off Popular U.S. |
$ | 1,249 | $ | 2,038 | $ | 3,948 | ||||||
|
|
|
|
|
|
|
|||||||
| Total loans net charged-off - Popular, Inc. |
$ | 57,788 | $ | 42,202 | $ | 58,529 | ||||||
|
|
|
|
|
|
|
|||||||
| Balance at end of period - loans held-in-portfolio |
$ | 786,220 | $ | 769,485 | $ | 744,320 | ||||||
|
|
|
|
|
|
|
|||||||
| Balance at beginning of period - unfunded commitments |
$ | 13,053 | $ | 14,169 | $ | 18,884 | ||||||
| Provision for credit losses (benefit) |
770 | (1,116 | ) | (500 | ) | |||||||
|
|
|
|
|
|
|
|||||||
| Balance at end of period - unfunded commitments [1] |
$ | 13,823 | $ | 13,053 | $ | 18,384 | ||||||
|
|
|
|
|
|
|
|||||||
| POPULAR, INC. |
||||||||||||
| Annualized net charge-offs (recoveries) to average loans held-in-portfolio |
0.60 | % | 0.45 | % | 0.65 | % | ||||||
| Provision for credit losses (benefit) - loan portfolios to net charge-offs |
128.95 | % | 117.39 | % | 124.33 | % | ||||||
| BPPR |
||||||||||||
| Annualized net charge-offs (recoveries) to average loans held-in-portfolio |
0.84 | % | 0.61 | % | 0.86 | % | ||||||
| Provision for credit losses (benefit) - loan portfolios to net charge-offs |
128.48 | % | 107.43 | % | 141.34 | % | ||||||
| Popular U.S. |
||||||||||||
| Annualized net charge-offs (recoveries) to average loans held-in-portfolio |
0.04 | % | 0.07 | % | 0.15 | % | ||||||
| Provision for credit losses (benefit) - loan portfolios to net charge-offs |
150.36 | % | 313.49 | % | (110.89 | )% | ||||||
| [1] | Allowance for credit losses of unfunded commitments is presented as part of Other Liabilities in the Consolidated Statements of Financial Condition. |
32
Popular, Inc.
Financial Supplement to Third Quarter 2025 Earnings Release
Table O - Allowance for Credit Losses “ACL”- Loan Portfolios - BPPR Operations
(Unaudited)
| 30-Sep-25 |
||||||||||||
| BPPR |
||||||||||||
| (Dollars in thousands) |
Total ACL | Total loans held-in-portfolio | ACL to loans held-in-portfolio | |||||||||
| Commercial: |
||||||||||||
| Commercial multi-family |
$ | 3,521 | $ | 302,366 | 1.16 | % | ||||||
| Commercial real estate - non-owner occupied |
41,456 | 3,302,745 | 1.26 | % | ||||||||
| Commercial real estate - owner occupied |
34,584 | 1,195,284 | 2.89 | % | ||||||||
| Commercial and industrial |
151,955 | 5,751,998 | 2.64 | % | ||||||||
|
|
|
|
|
|
|
|||||||
| Total commercial |
$ | 231,516 | $ | 10,552,393 | 2.19 | % | ||||||
|
|
|
|
|
|
|
|||||||
| Construction |
3,445 | 303,953 | 1.13 | % | ||||||||
| Mortgage |
77,525 | 7,233,106 | 1.07 | % | ||||||||
| Leasing |
19,220 | 1,998,651 | 0.96 | % | ||||||||
| Consumer: |
||||||||||||
| Credit cards |
87,208 | 1,225,567 | 7.12 | % | ||||||||
| Home equity lines of credit |
48 | 1,693 | 2.84 | % | ||||||||
| Personal |
90,401 | 1,823,148 | 4.96 | % | ||||||||
| Auto |
177,819 | 3,850,953 | 4.62 | % | ||||||||
| Other |
8,173 | 172,327 | 4.74 | % | ||||||||
|
|
|
|
|
|
|
|||||||
| Total consumer |
$ | 363,649 | $ | 7,073,688 | 5.14 | % | ||||||
|
|
|
|
|
|
|
|||||||
| Total |
$ | 695,355 | $ | 27,161,791 | 2.56 | % | ||||||
|
|
|
|
|
|
|
|||||||
| 30-Jun-25 |
||||||||||||
| BPPR |
||||||||||||
| (Dollars in thousands) |
Total ACL | Total loans held-in-portfolio | ACL to loans held-in-portfolio | |||||||||
| Commercial: |
||||||||||||
| Commercial multi-family |
$ | 3,696 | $ | 306,363 | 1.21 | % | ||||||
| Commercial real estate - non-owner occupied |
43,139 | 3,329,984 | 1.30 | % | ||||||||
| Commercial real estate - owner occupied |
35,848 | 1,202,106 | 2.98 | % | ||||||||
| Commercial and industrial |
123,202 | 5,594,724 | 2.20 | % | ||||||||
|
|
|
|
|
|
|
|||||||
| Total commercial |
$ | 205,885 | $ | 10,433,177 | 1.97 | % | ||||||
|
|
|
|
|
|
|
|||||||
| Construction |
3,075 | 253,299 | 1.21 | % | ||||||||
| Mortgage |
74,966 | 7,104,006 | 1.06 | % | ||||||||
| Leasing |
20,040 | 1,983,068 | 1.01 | % | ||||||||
| Consumer: |
||||||||||||
| Credit cards |
92,306 | 1,215,290 | 7.60 | % | ||||||||
| Home equity lines of credit |
54 | 1,809 | 2.99 | % | ||||||||
| Personal |
92,891 | 1,792,210 | 5.18 | % | ||||||||
| Auto |
182,274 | 3,861,702 | 4.72 | % | ||||||||
| Other |
7,758 | 160,422 | 4.84 | % | ||||||||
|
|
|
|
|
|
|
|||||||
| Total consumer |
$ | 375,283 | $ | 7,031,433 | 5.34 | % | ||||||
|
|
|
|
|
|
|
|||||||
| Total |
$ | 679,249 | $ | 26,804,983 | 2.53 | % | ||||||
|
|
|
|
|
|
|
|||||||
33
| Variance |
||||||||||||
| (Dollars in thousands) |
Total ACL | Total loans held-in-portfolio | ACL to loans held-in-portfolio | |||||||||
| Commercial: |
||||||||||||
| Commercial multi-family |
$ | (175 | ) | $ | (3,997 | ) | (0.05 | )% | ||||
| Commercial real estate - non-owner occupied |
(1,683 | ) | (27,239 | ) | (0.04 | )% | ||||||
| Commercial real estate - owner occupied |
(1,264 | ) | (6,822 | ) | (0.09 | )% | ||||||
| Commercial and industrial |
28,753 | 157,274 | 0.44 | % | ||||||||
|
|
|
|
|
|
|
|||||||
| Total commercial |
$ | 25,631 | $ | 119,216 | 0.22 | % | ||||||
|
|
|
|
|
|
|
|||||||
| Construction |
370 | 50,654 | (0.08 | )% | ||||||||
| Mortgage |
2,559 | 129,100 | 0.01 | % | ||||||||
| Leasing |
(820 | ) | 15,583 | (0.05 | )% | |||||||
| Consumer: |
||||||||||||
| Credit cards |
(5,098 | ) | 10,277 | (0.48 | )% | |||||||
| Home equity lines of credit |
(6 | ) | (116 | ) | (0.15 | )% | ||||||
| Personal |
(2,490 | ) | 30,938 | (0.22 | )% | |||||||
| Auto |
(4,455 | ) | (10,749 | ) | (0.10 | )% | ||||||
| Other |
415 | 11,905 | (0.10 | )% | ||||||||
|
|
|
|
|
|
|
|||||||
| Total consumer |
$ | (11,634 | ) | $ | 42,255 | (0.20 | )% | |||||
|
|
|
|
|
|
|
|||||||
| Total |
$ | 16,106 | $ | 356,808 | 0.03 | % | ||||||
|
|
|
|
|
|
|
|||||||
34
Popular, Inc.
Financial Supplement to Third Quarter 2025 Earnings Release
Table P - Allowance for Credit Losses “ACL”- Loan Portfolios - POPULAR U.S. Operations
(Unaudited)
| 30-Sep-25 |
||||||||||||
| Popular U.S. |
||||||||||||
| (Dollars in thousands) |
Total ACL | Total loans held-in-portfolio | ACL to loans held-in-portfolio | |||||||||
| Commercial: |
||||||||||||
| Commercial multi-family |
$ | 13,061 | $ | 2,187,223 | 0.60 | % | ||||||
| Commercial real estate - non-owner occupied |
17,389 | 2,159,835 | 0.81 | % | ||||||||
| Commercial real estate - owner occupied |
14,607 | 1,895,440 | 0.77 | % | ||||||||
| Commercial and industrial |
17,352 | 2,493,641 | 0.70 | % | ||||||||
|
|
|
|
|
|
|
|||||||
| Total commercial |
$ | 62,409 | $ | 8,736,139 | 0.71 | % | ||||||
|
|
|
|
|
|
|
|||||||
| Construction |
7,659 | 1,300,659 | 0.59 | % | ||||||||
| Mortgage |
9,456 | 1,325,302 | 0.71 | % | ||||||||
| Consumer: |
||||||||||||
| Home equity lines of credit |
1,500 | 77,197 | 1.94 | % | ||||||||
| Personal |
9,837 | 77,177 | 12.75 | % | ||||||||
| Other |
4 | 8,893 | 0.04 | % | ||||||||
|
|
|
|
|
|
|
|||||||
| Total consumer |
$ | 11,341 | $ | 163,267 | 6.95 | % | ||||||
|
|
|
|
|
|
|
|||||||
| Total |
$ | 90,865 | $ | 11,525,367 | 0.79 | % | ||||||
|
|
|
|
|
|
|
|||||||
| 30-Jun-25 |
||||||||||||
| Popular U.S. |
||||||||||||
| (Dollars in thousands) |
Total ACL | Total loans held-in-portfolio | ACL to loans held-in-portfolio | |||||||||
| Commercial: |
||||||||||||
| Commercial multi-family |
$ | 13,085 | $ | 2,214,426 | 0.59 | % | ||||||
| Commercial real estate - non-owner occupied |
15,978 | 2,191,390 | 0.73 | % | ||||||||
| Commercial real estate - owner occupied |
13,203 | 1,801,749 | 0.73 | % | ||||||||
| Commercial and industrial |
18,160 | 2,449,028 | 0.74 | % | ||||||||
|
|
|
|
|
|
|
|||||||
| Total commercial |
$ | 60,426 | $ | 8,656,593 | 0.70 | % | ||||||
|
|
|
|
|
|
|
|||||||
| Construction |
7,504 | 1,214,902 | 0.62 | % | ||||||||
| Mortgage |
10,209 | 1,340,421 | 0.76 | % | ||||||||
| Consumer: |
||||||||||||
| Credit cards |
— | 3 | - | % | ||||||||
| Home equity lines of credit |
1,330 | 75,670 | 1.76 | % | ||||||||
| Personal |
10,763 | 84,253 | 12.77 | % | ||||||||
| Other |
4 | 8,353 | 0.05 | % | ||||||||
|
|
|
|
|
|
|
|||||||
| Total consumer |
$ | 12,097 | $ | 168,279 | 7.19 | % | ||||||
|
|
|
|
|
|
|
|||||||
| Total |
$ | 90,236 | $ | 11,380,195 | 0.79 | % | ||||||
|
|
|
|
|
|
|
|||||||
35
| Variance |
||||||||||||
| (Dollars in thousands) |
Total ACL | Total loans held-in-portfolio | ACL to loans held-in-portfolio | |||||||||
| Commercial: |
||||||||||||
| Commercial multi-family |
$ | (24 | ) | $ | (27,203 | ) | 0.01 | % | ||||
| Commercial real estate - non-owner occupied |
1,411 | (31,555 | ) | 0.08 | % | |||||||
| Commercial real estate - owner occupied |
1,404 | 93,691 | 0.04 | % | ||||||||
| Commercial and industrial |
(808 | ) | 44,613 | (0.04 | )% | |||||||
|
|
|
|
|
|
|
|||||||
| Total commercial |
$ | 1,983 | $ | 79,546 | 0.01 | % | ||||||
|
|
|
|
|
|
|
|||||||
| Construction |
155 | 85,757 | (0.03 | )% | ||||||||
| Mortgage |
(753 | ) | (15,119 | ) | (0.05 | )% | ||||||
| Consumer: |
||||||||||||
| Credit cards |
— | (3 | ) | - | % | |||||||
| Home equity lines of credit |
170 | 1,527 | 0.18 | % | ||||||||
| Personal |
(926 | ) | (7,076 | ) | (0.02 | )% | ||||||
| Other |
— | 540 | (0.01 | )% | ||||||||
|
|
|
|
|
|
|
|||||||
| Total consumer |
$ | (756 | ) | $ | (5,012 | ) | (0.24 | )% | ||||
|
|
|
|
|
|
|
|||||||
| Total |
$ | 629 | $ | 145,172 | - | % | ||||||
|
|
|
|
|
|
|
|||||||
36
Popular, Inc.
Financial Supplement to Third Quarter 2025 Earnings Release
Table Q - Allowance for Credit Losses “ACL”- Loan Portfolios - Consolidated
(Unaudited)
| 30-Sep-25 |
||||||||||||
| (Dollars in thousands) |
Total ACL | Total loans held-in-portfolio | ACL to loans held-in-portfolio | |||||||||
| Commercial: |
||||||||||||
| Commercial multi-family |
$ | 16,582 | $ | 2,489,589 | 0.67 | % | ||||||
| Commercial real estate - non-owner occupied |
58,845 | 5,462,580 | 1.08 | % | ||||||||
| Commercial real estate - owner occupied |
49,191 | 3,090,724 | 1.59 | % | ||||||||
| Commercial and industrial |
169,307 | 8,245,639 | 2.05 | % | ||||||||
|
|
|
|
|
|
|
|||||||
| Total commercial |
$ | 293,925 | $ | 19,288,532 | 1.52 | % | ||||||
|
|
|
|
|
|
|
|||||||
| Construction |
11,104 | 1,604,612 | 0.69 | % | ||||||||
| Mortgage |
86,981 | 8,558,408 | 1.02 | % | ||||||||
| Leasing |
19,220 | 1,998,651 | 0.96 | % | ||||||||
| Consumer: |
||||||||||||
| Credit cards |
87,208 | 1,225,567 | 7.12 | % | ||||||||
| Home equity lines of credit |
1,548 | 78,890 | 1.96 | % | ||||||||
| Personal |
100,238 | 1,900,325 | 5.27 | % | ||||||||
| Auto |
177,819 | 3,850,953 | 4.62 | % | ||||||||
| Other |
8,177 | 181,220 | 4.51 | % | ||||||||
|
|
|
|
|
|
|
|||||||
| Total consumer |
$ | 374,990 | $ | 7,236,955 | 5.18 | % | ||||||
|
|
|
|
|
|
|
|||||||
| Total |
$ | 786,220 | $ | 38,687,158 | 2.03 | % | ||||||
|
|
|
|
|
|
|
|||||||
| 30-Jun-25 |
||||||||||||
| (Dollars in thousands) |
Total ACL | Total loans held-in-portfolio | ACL to loans held-in-portfolio | |||||||||
| Commercial: |
||||||||||||
| Commercial multi-family |
$ | 16,781 | $ | 2,520,789 | 0.67 | % | ||||||
| Commercial real estate - non-owner occupied |
59,117 | 5,521,374 | 1.07 | % | ||||||||
| Commercial real estate - owner occupied |
49,051 | 3,003,855 | 1.63 | % | ||||||||
| Commercial and industrial |
141,362 | 8,043,752 | 1.76 | % | ||||||||
|
|
|
|
|
|
|
|||||||
| Total commercial |
$ | 266,311 | $ | 19,089,770 | 1.40 | % | ||||||
|
|
|
|
|
|
|
|||||||
| Construction |
10,579 | 1,468,201 | 0.72 | % | ||||||||
| Mortgage |
85,175 | 8,444,427 | 1.01 | % | ||||||||
| Leasing |
20,040 | 1,983,068 | 1.01 | % | ||||||||
| Consumer: |
||||||||||||
| Credit cards |
92,306 | 1,215,293 | 7.60 | % | ||||||||
| Home equity lines of credit |
1,384 | 77,479 | 1.79 | % | ||||||||
| Personal |
103,654 | 1,876,463 | 5.52 | % | ||||||||
| Auto |
182,274 | 3,861,702 | 4.72 | % | ||||||||
| Other |
7,762 | 168,775 | 4.60 | % | ||||||||
|
|
|
|
|
|
|
|||||||
| Total consumer |
$ | 387,380 | $ | 7,199,712 | 5.38 | % | ||||||
|
|
|
|
|
|
|
|||||||
| Total |
$ | 769,485 | $ | 38,185,178 | 2.02 | % | ||||||
|
|
|
|
|
|
|
|||||||
37
| Variance |
||||||||||||
| (Dollars in thousands) |
Total ACL | Total loans held-in-portfolio | ACL to loans held-in-portfolio | |||||||||
| Commercial: |
||||||||||||
| Commercial multi-family |
$ | (199 | ) | $ | (31,200 | ) | - | % | ||||
| Commercial real estate - non-owner occupied |
(272 | ) | (58,794 | ) | 0.01 | % | ||||||
| Commercial real estate - owner occupied |
140 | 86,869 | (0.04 | )% | ||||||||
| Commercial and industrial |
27,945 | 201,887 | 0.29 | % | ||||||||
|
|
|
|
|
|
|
|||||||
| Total commercial |
$ | 27,614 | $ | 198,762 | 0.12 | % | ||||||
|
|
|
|
|
|
|
|||||||
| Construction |
525 | 136,411 | (0.03 | )% | ||||||||
| Mortgage |
1,806 | 113,981 | 0.01 | % | ||||||||
| Leasing |
(820 | ) | 15,583 | (0.05 | )% | |||||||
| Consumer: |
||||||||||||
| Credit cards |
(5,098 | ) | 10,274 | (0.48 | )% | |||||||
| Home equity lines of credit |
164 | 1,411 | 0.17 | % | ||||||||
| Personal |
(3,416 | ) | 23,862 | (0.25 | )% | |||||||
| Auto |
(4,455 | ) | (10,749 | ) | (0.10 | )% | ||||||
| Other |
415 | 12,445 | (0.09 | )% | ||||||||
|
|
|
|
|
|
|
|||||||
| Total consumer |
$ | (12,390 | ) | $ | 37,243 | (0.20 | )% | |||||
|
|
|
|
|
|
|
|||||||
| Total |
$ | 16,735 | $ | 501,980 | 0.01 | % | ||||||
|
|
|
|
|
|
|
|||||||
38
Popular, Inc.
Financial Supplement to Third Quarter 2025 Earnings Release
Table R - Reconciliation to GAAP Financial Measures
(Unaudited)
| (In thousands, except share or per share information) |
30-Sep-25 | 30-Jun-25 | 30-Sep-24 | |||||||||
| Total stockholders’ equity |
$ | 6,115,672 | $ | 5,954,018 | $ | 5,790,514 | ||||||
| Less: Preferred stock |
(22,143 | ) | (22,143 | ) | (22,143 | ) | ||||||
| Less: Goodwill |
(789,954 | ) | (802,954 | ) | (804,428 | ) | ||||||
| Less: Other intangibles |
(5,460 | ) | (5,844 | ) | (7,531 | ) | ||||||
|
|
|
|
|
|
|
|||||||
| Total tangible common equity |
$ | 5,298,115 | $ | 5,123,077 | $ | 4,956,412 | ||||||
|
|
|
|
|
|
|
|||||||
| Total assets |
$ | 75,065,798 | $ | 76,065,090 | $ | 71,323,074 | ||||||
| Less: Goodwill |
(789,954 | ) | (802,954 | ) | (804,428 | ) | ||||||
| Less: Other intangibles |
(5,460 | ) | (5,844 | ) | (7,531 | ) | ||||||
|
|
|
|
|
|
|
|||||||
| Total tangible assets |
$ | 74,270,384 | $ | 75,256,292 | $ | 70,511,115 | ||||||
|
|
|
|
|
|
|
|||||||
| Tangible common equity to tangible assets |
7.13 | % | 6.81 | % | 7.03 | % | ||||||
| Common shares outstanding at end of period |
66,959,866 | 67,937,468 | 71,787,349 | |||||||||
| Tangible book value per common share |
$ | 79.12 | $ | 75.41 | $ | 69.04 | ||||||
|
|
|
|
|
|
|
|||||||
| Quarterly average | ||||||||||||
| Total stockholders’ equity [1] |
$ | 6,943,541 | $ | 6,849,789 | $ | 6,460,517 | ||||||
| Average unrealized (gains) losses on AFS securities transferred to HTM |
296,934 | 334,183 | 550,971 | |||||||||
|
|
|
|
|
|
|
|||||||
| Adjusted total stockholder’s equity |
7,240,475 | 7,183,972 | 7,011,488 | |||||||||
|
|
|
|
|
|
|
|||||||
| Less: Preferred Stock |
(22,143 | ) | (22,143 | ) | (22,143 | ) | ||||||
| Less: Goodwill |
(802,812 | ) | (802,953 | ) | (804,427 | ) | ||||||
| Less: Other intangibles |
(5,714 | ) | (6,096 | ) | (7,995 | ) | ||||||
|
|
|
|
|
|
|
|||||||
| Total tangible equity |
$ | 6,409,806 | $ | 6,352,780 | $ | 6,176,923 | ||||||
| Return on average tangible common equity |
13.06 | % | 13.26 | % | 9.98 | % | ||||||
|
|
|
|
|
|
|
|||||||
| [1] | Average balances exclude unrealized gains or losses on debt securities available-for-sale. |
39
CONTACTS:
Popular, Inc.
Investor Relations:
Paul J. Cardillo, 212-417-6721
Senior Vice President and Investor Relations Officer
pcardillo@popular.com
or
Media Relations:
MC González Noguera, 917-804-5253
Executive Vice President and Chief Communications & Public Affairs Officer
mc.gonzalez@popular.com
40

Exhibit 99.2 Investor Presentation Third Quarter 2025
Cautionary Note Regarding Forward-Looking Statements This presentation contains “forward-looking statements” within the meaning of the U.S. Private Securities Litigation Reform Act of 1995, including without limitation those regarding Popular’s business, financial condition, results of operations and objectives, performance, earnings and expenses. These statements are not guarantees of future performance, are based on the current expectations of Popular, Inc.’s management and, by their nature, involve risks, uncertainties, estimates and assumptions. Potential factors, some of which are beyond our control, could cause actual results to differ materially from those expressed in, or implied by, such forward-looking statements. More information on the risks and important factors that could affect our future results and financial condition is included in our Form 10-K for the year ended December 31, 2024, our Form 10-Q for the quarter ended June 30, 2025 and our Form 10-Q for the quarter ended September 30, 2025, to be filed with the Securities and Exchange Commission. Our filings are available on our website (www.popular.com) and on the Securities and Exchange Commission website (www.sec.gov). We assume no obligation to update or revise any forward-looking statements which speak as of their respective dates. 2
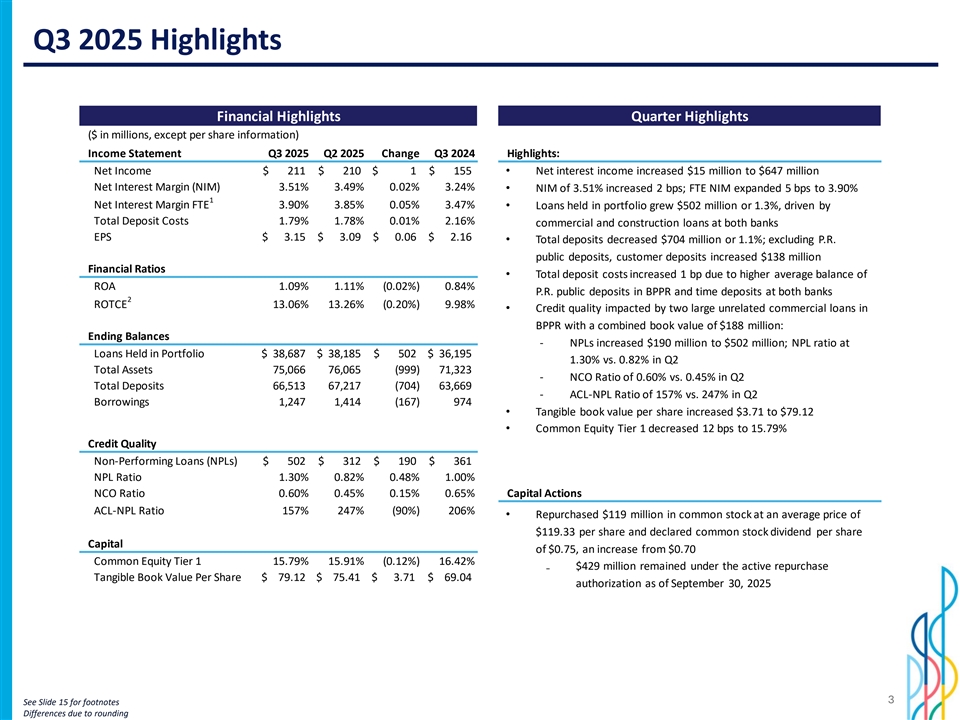
Q3 2025 Highlights Financial Highlights Quarter Highlights ($ in millions, except per share information) Income Statement Q3 2025 Q2 2025 Change Q3 2024 Highlights: Net Income $ 211 $ 210 $ 1 $ 155 • Net interest income increased $15 million to $647 million Net Interest Margin (NIM) 3.51% 3.49% 0.02% 3.24% • NIM of 3.51% increased 2 bps; FTE NIM expanded 5 bps to 3.90% 1 Net Interest Margin FTE 3.90% 3.85% 0.05% 3.47%• Loans held in portfolio grew $502 million or 1.3%, driven by Total Deposit Costs 1.79% 1.78% 0.01% 2.16% commercial and construction loans at both banks EPS $ 3 .15 $ 3.09 $ 0 .06 $ 2.16 • Total deposits decreased $704 million or 1.1%; excluding P.R. public deposits, customer deposits increased $138 million Financial Ratios • Total deposit costs increased 1 bp due to higher average balance of ROA 1.09% 1.11% (0.02%) 0.84% P.R. public deposits in BPPR and time deposits at both banks 2 ROTCE 13.06% 13.26% (0.20%) 9.98% • Credit quality impacted by two large unrelated commercial loans in BPPR with a combined book value of $188 million: Ending Balances ‐ NPLs increased $190 million to $502 million; NPL ratio at Loans Held in Portfolio $ 3 8,687 $ 38,185 $ 502 $ 3 6,195 1.30% vs. 0.82% in Q2 Total Assets 75,066 76,065 ( 999) 7 1,323 ‐ NCO Ratio of 0.60% vs. 0.45% in Q2 Total Deposits 6 6,513 6 7,217 (704) 63,669 ‐ ACL-NPL Ratio of 157% vs. 247% in Q2 Borrowings 1,247 1,414 (167) 974 • Tangible book value per share increased $3.71 to $79.12 • Common Equity Tier 1 decreased 12 bps to 15.79% Credit Quality Non-Performing Loans (NPLs) $ 502 $ 312 $ 190 $ 361 NPL Ratio 1.30% 0.82% 0.48% 1.00% NCO Ratio 0.60% 0.45% 0.15% 0.65% Capital Actions ACL-NPL Ratio 157% 247% (90%) 206% • Repurchased $119 million in common stock at an average price of $119.33 per share and declared common stock dividend per share Capital of $0.75, an increase from $0.70 Common Equity Tier 1 15.79% 15.91% (0.12%) 16.42% ₋ $429 million remained under the active repurchase Tangible Book Value Per Share $ 7 9.12 $ 75.41 $ 3.71 $ 69.04 authorization as of September 30, 2025 3 See Slide 15 for footnotes Differences due to rounding
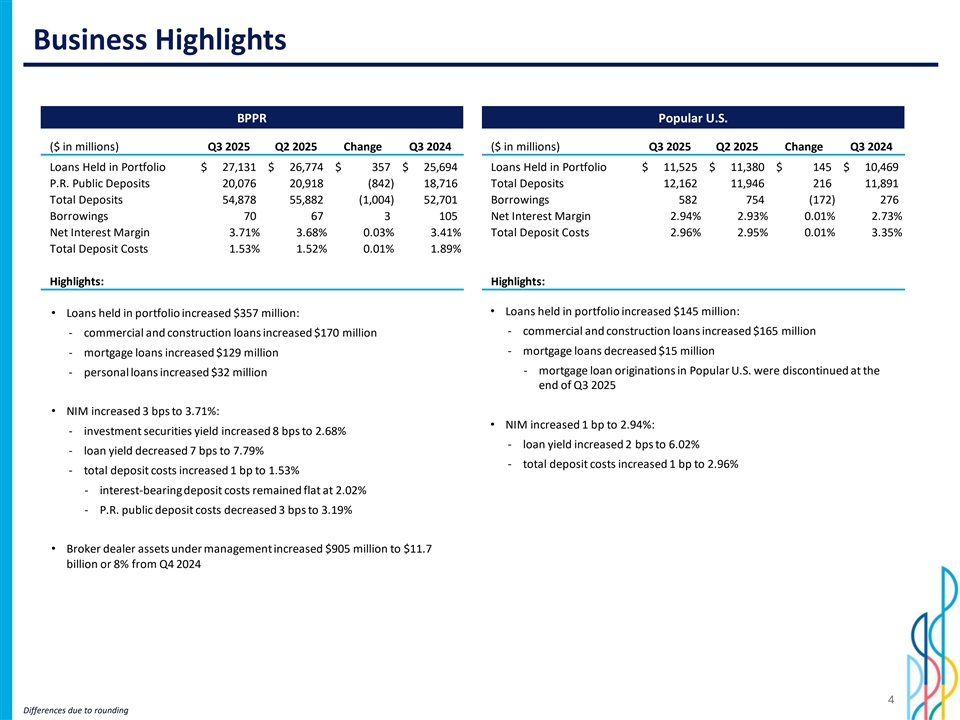
Business Highlights BPPR Popular U.S. ($ in millions) Q3 2025 Q2 2025 Change Q3 2024 ($ in millions) Q3 2025 Q2 2025 Change Q3 2024 Loans Held in Portfolio $ 27,131 $ 26,774 $ 357 $ 25,694 Loans Held in Portfolio $ 11,525 $ 11,380 $ 145 $ 10,469 P.R. Public Deposits 20,076 20,918 (842) 18,716 Total Deposits 12,162 11,946 216 11,891 Total Deposits 54,878 55,882 (1,004) 52,701 Borrowings 582 754 (172) 276 Borrowings 70 67 3 105 Net Interest Margin 2.94% 2.93% 0.01% 2.73% Net Interest Margin 3.71% 3.68% 0.03% 3.41% Total Deposit Costs 2.96% 2.95% 0.01% 3.35% Total Deposit Costs 1.53% 1.52% 0.01% 1.89% Highlights: Highlights: • Loans held in portfolio increased $145 million: • Loans held in portfolio increased $357 million: ‐ commercial and construction loans increased $165 million ‐ commercial and construction loans increased $170 million ‐ mortgage loans decreased $15 million ‐ mortgage loans increased $129 million ‐ mortgage loan originations in Popular U.S. were discontinued at the ‐ personal loans increased $32 million end of Q3 2025 • NIM increased 3 bps to 3.71%: • NIM increased 1 bp to 2.94%: ‐ investment securities yield increased 8 bps to 2.68% ‐ loan yield increased 2 bps to 6.02% ‐ loan yield decreased 7 bps to 7.79% ‐ total deposit costs increased 1 bp to 2.96% ‐ total deposit costs increased 1 bp to 1.53% ‐ interest-bearing deposit costs remained flat at 2.02% ‐ P.R. public deposit costs decreased 3 bps to 3.19% • Broker dealer assets under management increased $905 million to $11.7 billion or 8% from Q4 2024 4 Differences due to rounding

New Strategic Framework BE THE #1 BANK FOR OUR CUSTOMERS Meet customers where they are. We are their first choice, always one step ahead, fostering loyalty and deepening relationships at every stage of their lives, to drive growth BE SIMPLE AND EFFICIENT Deliver solutions faster, improve productivity, and reduce costs BE A TOP PERFORMING BANK Become a performance-driven organization with top talent, delivering sustainable, profitable growth and long-term value to our shareholders 5
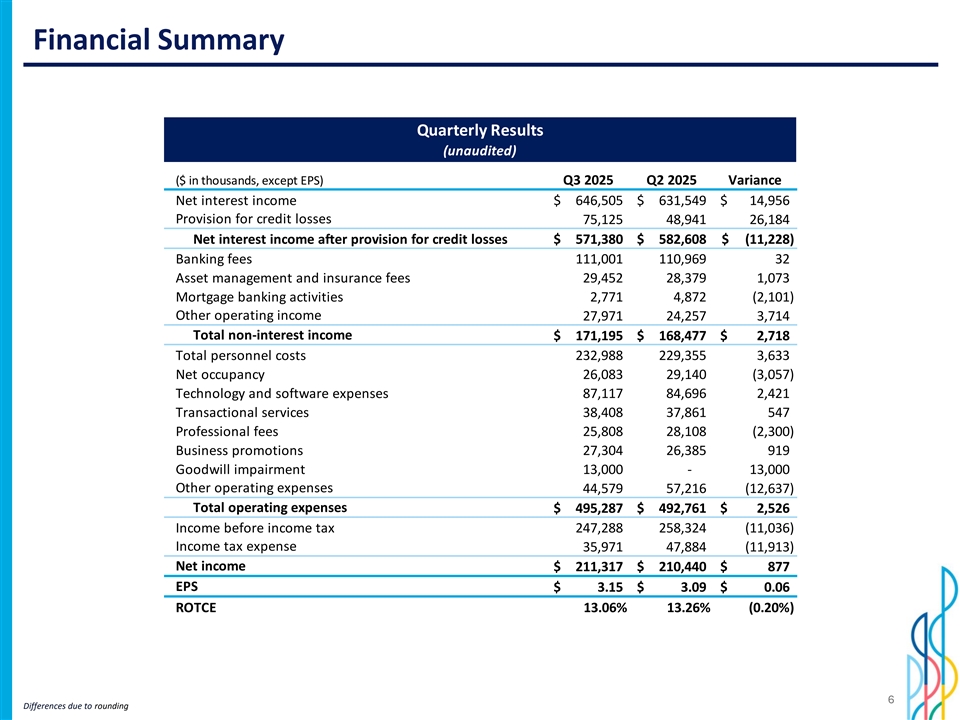
Financial Summary Quarterly Results (unaudited) ($ in thousands, except EPS) Q3 2025 Q2 2025 Variance Net interest income $ 646,505 $ 6 31,549 $ 1 4,956 Provision for credit losses 7 5,125 48,941 2 6,184 Net interest income after provision for credit losses $ 571,380 $ 582,608 $ (11,228) Banking fees 1 11,001 110,969 32 Asset management and insurance fees 29,452 2 8,379 1 ,073 Mortgage banking activities 2 ,771 4 ,872 (2,101) Other operating income 2 7,971 24,257 3,714 Total non-interest income $ 171,195 $ 168,477 $ 2,718 Total personnel costs 2 32,988 229,355 3 ,633 Net occupancy 2 6,083 29,140 (3,057) Technology and software expenses 87,117 84,696 2 ,421 Transactional services 38,408 37,861 547 Professional fees 25,808 2 8,108 (2,300) Business promotions 2 7,304 26,385 919 Goodwill impairment 13,000 - 1 3,000 Other operating expenses 4 4,579 57,216 (12,637) Total operating expenses $ 495,287 $ 492,761 $ 2,526 Income before income tax 247,288 2 58,324 (11,036) Income tax expense 35,971 47,884 (11,913) Net income $ 211,317 $ 210,440 $ 877 EPS $ 3 .15 $ 3.09 $ 0 .06 ROTCE 13.06% 13.26% (0.20%) 6 Differences due to rounding

Net Interest Income and NIM Dynamics Quarter Highlights: Earning Assets 1 (ending balances, $ in billions) • Net interest income increased by $15 million to $647 million $72.8 $71.8 $70.8 $69.7 $68.0 • Net interest margin increased 2 bps to 3.51% 0.1 4 70.0 0 $38.2 $38.7 $37.3 ₋ Primarily driven by improved earning asset mix 0.1 2 $37.1 $36.2 60.0 0 0.1 • Net interest margin FTE of 3.90% increased 5 bps driven by fixed 50.0 0 7.56% 7.51% 7.50% 7.49% 7.48% rate asset repricing 0.0 8 40.0 0 ‐ Money market and investment securities yield increased 9 bps 0.0 6 30.0 0 $34.6 $33.6 $33.1 $32.6 $31.8 0.0 4 • Money market and investment securities decreased $1.5 billion; 20.0 0 represent 46% of earning assets 10.0 0 0.0 2 3.59% 3.50% 3.43% 3.38% 3.29% • Average deposits increased $793 million. Excluding P.R. public - 0 deposits, average customer deposits increased $360 million Q3 2024 Q4 2024 Q1 2025 Q2 2025 Q3 2025 Money market and investment securities Loan balances Loan yield (FTE) Money market and investment securities yield Net Interest Income and NIM Sources of Funds ($ in millions) 1 (ending balances, $ in billions) $647 $68.6 $67.8 $632 $66.9 $66.1 $64.7 $606 0.06 00 $591 0.0 7 $572 600 $20.9 60.0 0 $20.1 $19.6 $19.5 0.0 6 $18.7 0.05 00 500 50.0 0 0.0 5 5.63% 5.57% 0.04 00 5.53% 5.49% 5.49% 400 4.24% 40.0 0 0.0 4 3.70% 0.03 00 300 3.90% 30.0 0 3.32% 3.85% 0.0 3 3.22% 3.19% 3.73% 3.62% 3.47% 0.02 00 $46.2 $46.3 $46.4 $45.0 $45.4 200 20.0 0 0.0 2 2.06% 0.01 00 100 1.87% 0.0 1 10.0 0 1.76% 1.72% 1.73% 1.27% 1.21% 1.17% 1.17% 1.15% - 0 - - Q3 2024 Q4 2024 Q1 2025 Q2 2025 Q3 2025 Q3 2024 Q4 2024 Q1 2025 Q2 2025 Q3 2025 Net interest income NIM (FTE) Earning assets yield (FTE) Cost of funds Deposits, excl P.R. public deposits P.R. public deposits Borrowings P.R. public deposit costs Deposit Costs, excl P.R. public deposit costs See Slide 15 for footnotes 7 Differences due to rounding
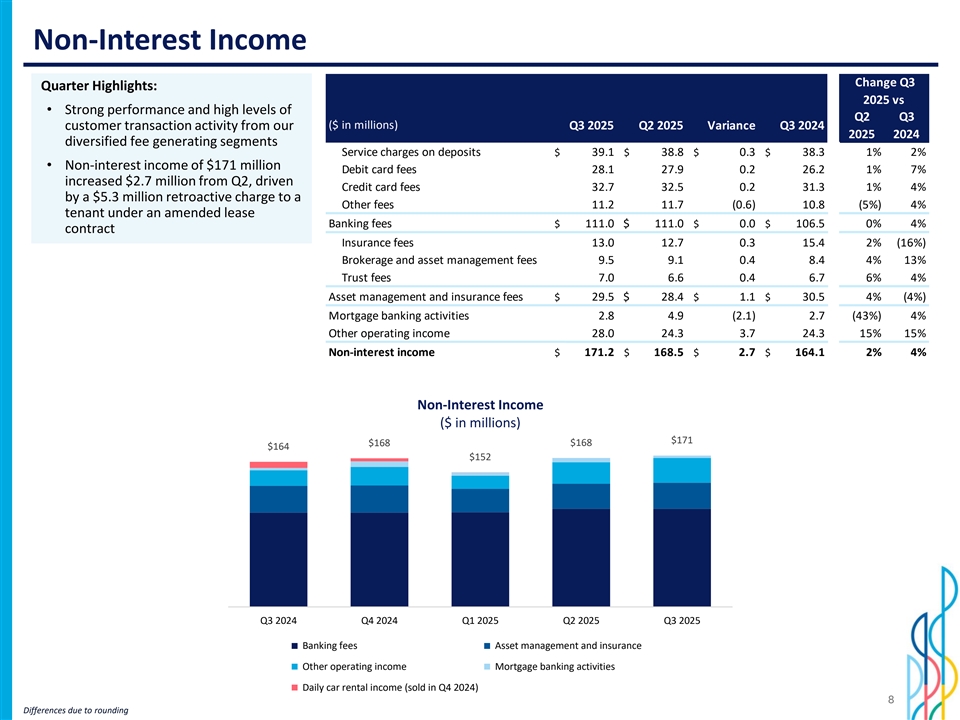
Non-Interest Income Change Q3 Quarter Highlights: 2025 vs • Strong performance and high levels of Q2 Q3 ($ in millions) Q3 2025 Q2 2025 Variance Q3 2024 customer transaction activity from our 2025 2024 diversified fee generating segments Service charges on deposits $ 39.1 $ 38.8 $ 0.3 $ 38.3 1% 2% • Non-interest income of $171 million Debit card fees 28.1 27.9 0.2 26.2 1% 7% increased $2.7 million from Q2, driven Credit card fees 32.7 32.5 0.2 31.3 1% 4% by a $5.3 million retroactive charge to a Other fees 11.2 11.7 (0.6) 10.8 (5%) 4% tenant under an amended lease Banking fees $ 111.0 $ 111.0 $ 0.0 $ 106.5 0% 4% contract Insurance fees 13.0 12.7 0.3 15.4 2% (16%) Brokerage and asset management fees 9.5 9.1 0.4 8.4 4% 13% Trust fees 7.0 6.6 0.4 6.7 6% 4% Asset management and insurance fees $ 29.5 $ 28.4 $ 1.1 $ 30.5 4% (4%) Mortgage banking activities 2.8 4.9 (2.1) 2.7 (43%) 4% Other operating income 28.0 24.3 3.7 24.3 15% 15% Non-interest income $ 171.2 $ 168.5 $ 2.7 $ 164.1 2% 4% Non-Interest Income ($ in millions) $171 $168 $168 180 .00 180 .00 $164 $152 160 .00 160 .00 140 .00 140 .00 120 .00 120 .00 100 .00 100 .00 80.0 0 80.0 0 60.0 0 60.0 0 40.0 0 40.0 0 20.0 0 20.0 0 - - Q3 2024 Q4 2024 Q1 2025 Q2 2025 Q3 2025 Banking fees Asset management and insurance Other operating income Mortgage banking activities Daily car rental income (sold in Q4 2024) 8 Differences due to rounding
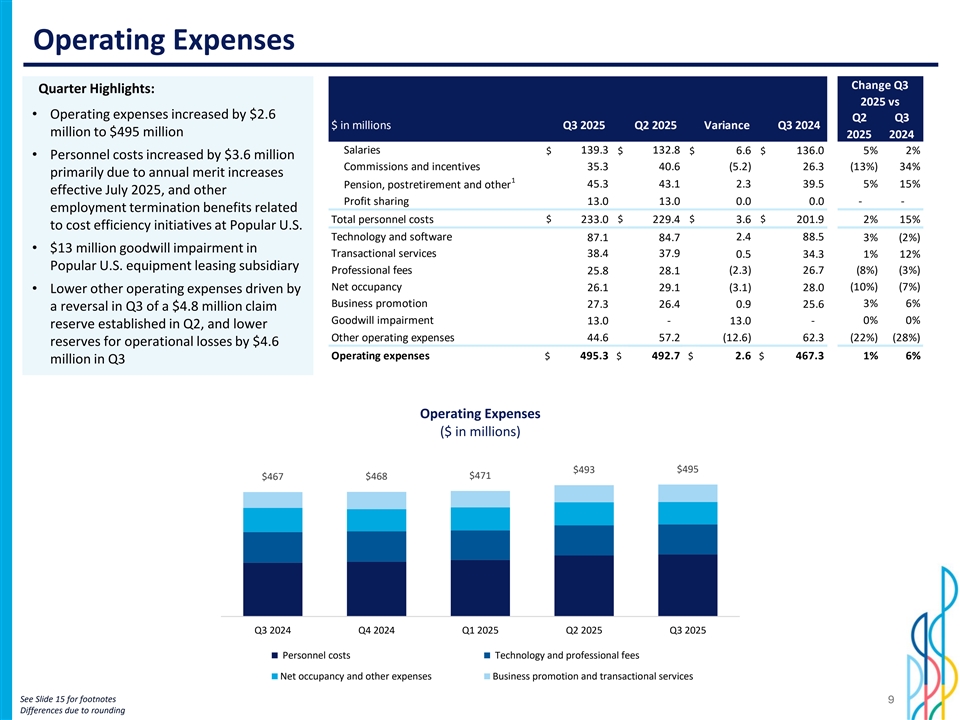
Operating Expenses Change Q3 Quarter Highlights: 2025 vs • Operating expenses increased by $2.6 Q2 Q3 $ in millions Q3 2025 Q2 2025 Variance Q3 2024 million to $495 million 2025 2024 Salaries 139.3 132.8 $ $ $ 6.6 $ 136.0 5% 2% • Personnel costs increased by $3.6 million Commissions and incentives 35.3 40.6 (5.2) 26.3 (13%) 34% primarily due to annual merit increases 1 Pension, postretirement and other 45.3 43.1 2.3 39.5 5% 15% effective July 2025, and other Profit sharing 13.0 13.0 0.0 0.0 - - employment termination benefits related Total personnel costs $ 233.0 $ 229.4 $ 3.6 $ 201.9 2% 15% to cost efficiency initiatives at Popular U.S. Technology and software 87.1 84.7 2.4 88.5 3% (2%) • $13 million goodwill impairment in Transactional services 38.4 37.9 0.5 34.3 1% 12% Popular U.S. equipment leasing subsidiary Professional fees 25.8 28.1 (2.3) 26.7 (8%) (3%) Net occupancy (10%) (7%) 26.1 29.1 (3.1) 28.0 • Lower other operating expenses driven by Business promotion 27.3 26.4 0.9 25.6 3% 6% a reversal in Q3 of a $4.8 million claim Goodwill impairment 0% 0% 13.0 - 13.0 - reserve established in Q2, and lower Other operating expenses 44.6 57.2 (12.6) 62.3 (22%) (28%) reserves for operational losses by $4.6 Operating expenses $ 495.3 $ 492.7 $ 2.6 $ 467.3 1% 6% million in Q3 Operating Expenses ($ in millions) 600 .00 600 .00 $495 $493 $471 $467 $468 500 .00 500 .00 400 .00 400 .00 300 .00 300 .00 200 .00 200 .00 100 .00 100 .00 - - Q3 2024 Q4 2024 Q1 2025 Q2 2025 Q3 2025 Personnel costs Technology and professional fees Net occupancy and other expenses Business promotion and transactional services See Slide 15 for footnotes 9 Differences due to rounding
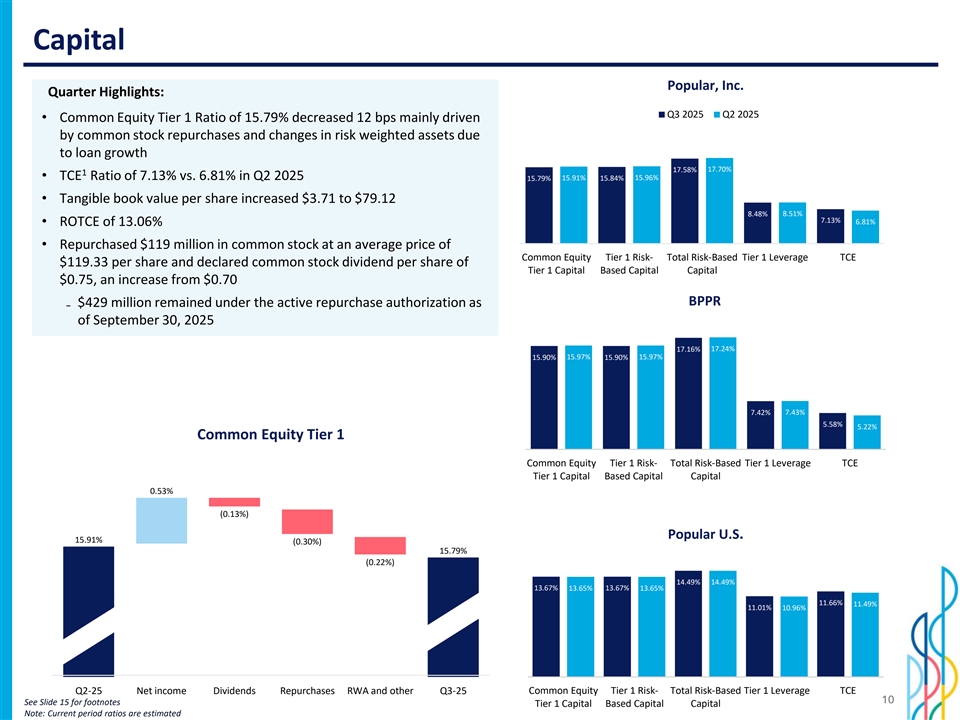
Capital Popular, Inc. Quarter Highlights: Q3 2025 Q2 2025 • Common Equity Tier 1 Ratio of 15.79% decreased 12 bps mainly driven by common stock repurchases and changes in risk weighted assets due 0.2 to loan growth 0.1 8 0.1 6 17.58% 17.70% 1 0.1 4 • TCE Ratio of 7.13% vs. 6.81% in Q2 2025 15.91% 15.96% 15.79% 15.84% 0.1 2 0.1 • Tangible book value per share increased $3.71 to $79.12 0.0 8 0.0 6 8.48% 8.51% 7.13% 6.81% 0.0 4 • ROTCE of 13.06% 0.0 2 0 • Repurchased $119 million in common stock at an average price of Common Equity Tier 1 Risk- Total Risk-Based Tier 1 Leverage TCE $119.33 per share and declared common stock dividend per share of Tier 1 Capital Based Capital Capital $0.75, an increase from $0.70 BPPR ₋ $429 million remained under the active repurchase authorization as 0.2 of September 30, 2025 0.1 8 0.1 6 17.16% 17.24% 0.1 4 15.90% 15.97% 15.90% 15.97% 0.1 2 0.1 0.0 8 0.0 6 7.42% 7.43% 0.0 4 5.58% 5.22% 0.0 2 Common Equity Tier 1 0 Common Equity Tier 1 Risk- Total Risk-Based Tier 1 Leverage TCE Tier 1 Capital Based Capital Capital 0.53% (0.13%) Popular U.S. 15.91% (0.30%) 15.79% 0.1 6 (0.22%) 0.1 4 14.49% 14.49% 0.1 2 13.67% 13.65% 13.67% 13.65% 0.1 11.66% 11.49% 11.01% 10.96% 0.0 8 0.0 6 0.0 4 0.0 2 0 Q2-25 Net income Dividends Repurchases RWA and other Q3-25 Common Equity Tier 1 Risk- Total Risk-Based Tier 1 Leverage TCE 10 See Slide 15 for footnotes Tier 1 Capital Based Capital Capital Note: Current period ratios are estimated

Non-Performing Assets Quarter Highlights: Non-Performing Assets • Non-Performing Assets increased $187 million ($ in millions) • Non-Performing Loans increased $190 million 600 0.04 $545 ₋ BPPR NPLs increased $196 million to $453 million 0.035 500 $444 $438 $435 $424 $412 $408 0.03 ₋ Popular U.S. NPLs decreased $5 million to $49 million $366 $358 400 0.025 • NPL inflows increased $205 million 300 0.02 ‐ BPPR increased $210 million, driven by two large unrelated 0.015 commercial loans with a combined book value of $188 200 0.7% 0.01 0.6% 0.6% 0.6% 0.6% million 0.6% 0.6% 0.5% 0.5% 100 0.005 ‐ Popular U.S. decreased $5 million, mainly related to 0 0 commercial loans Q3 2023 Q4 2023 Q1 2024 Q2 2024 Q3 2024 Q4 2024 Q1 2025 Q2 2025 Q3 2025 NPLs OREO NPAs/Total Assets Non-Performing Loans NPL Inflows ($ in millions) ($ in millions) 600 0.04 $502 0.035 300 500 $242 0.03 $362 $361 $358 $354 $351 400 $342 0.025 $314 $312 200 300 0.02 1.3% 0.015 1.1% 1.0% 1.0% 1.0% 200 1.0% 0.9% 0.8% 100 0.8% $41 $34 0.01 $48 $52 $37 $37 $37 $32 100 0.005 0 0 0 Q3 2023 Q4 2023 Q1 2024 Q2 2024 Q3 2024 Q4 2024 Q1 2025 Q2 2025 Q3 2025 Q3 2023 Q4 2023 Q1 2024 Q2 2024 Q3 2024 Q4 2024 Q1 2025 Q2 2025 Q3 2025 Popular U.S. BPPR Commercial and Construction Mortgage Other NPLs/Loans 11 Differences due to rounding
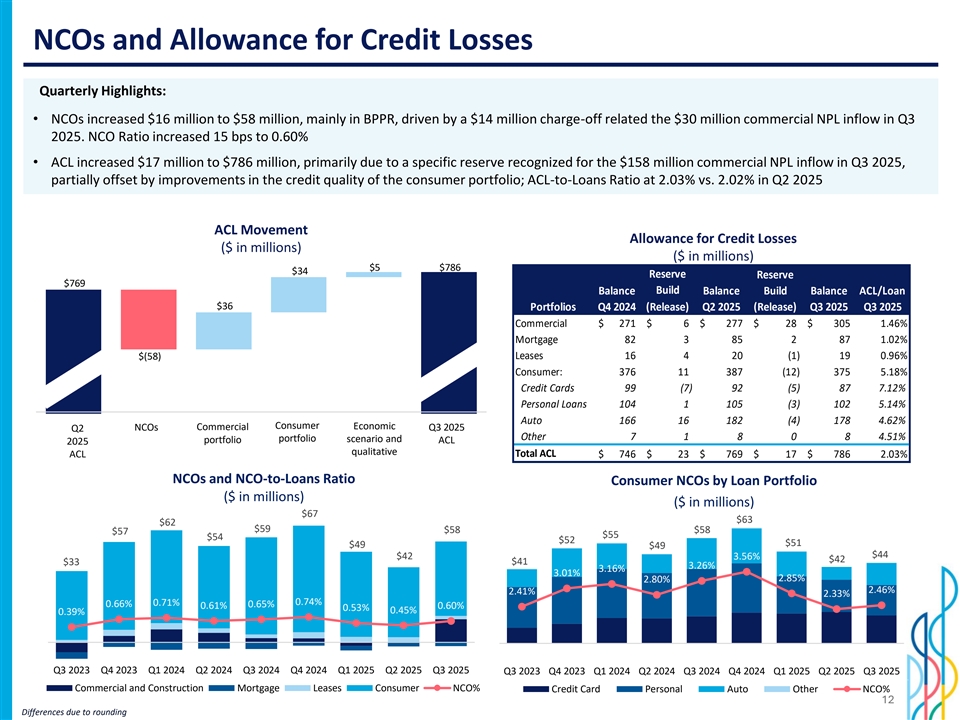
NCOs and Allowance for Credit Losses Quarterly Highlights: • NCOs increased $16 million to $58 million, mainly in BPPR, driven by a $14 million charge-off related the $30 million commercial NPL inflow in Q3 2025. NCO Ratio increased 15 bps to 0.60% • ACL increased $17 million to $786 million, primarily due to a specific reserve recognized for the $158 million commercial NPL inflow in Q3 2025, partially offset by improvements in the credit quality of the consumer portfolio; ACL-to-Loans Ratio at 2.03% vs. 2.02% in Q2 2025 ACL Movement Allowance for Credit Losses ($ in millions) ($ in millions) $5 $786 $34 Reserve Reserve $769 Balance Build Balance Build Balance ACL/Loan $36 Portfolios Q4 2024 (Release) Q2 2025 (Release) Q3 2025 Q3 2025 Commercial $ 271 $ 6 $ 277 $ 28 $ 305 1.46% Mortgage 82 3 85 2 87 1.02% $(58) Leases 16 4 20 (1) 19 0.96% Consumer: 376 11 387 (12) 375 5.18% Credit Cards 99 (7) 92 (5) 87 7.12% Personal Loans 104 1 105 (3) 102 5.14% Auto 166 16 182 (4) 178 4.62% NCOs Consumer Changes Q3 2025 ACL Consumer Economic NCOs Commercial Q3 2025 Q2 Q2 2025 ACL Commercial Changes Economic Scenarios and… Other 7 1 8 0 8 4.51% portfolio portfolio scenario and ACL 2025 qualitative ACL Total ACL $ 746 $ 23 $ 769 $ 17 $ 786 2.03% NCOs and NCO-to-Loans Ratio Consumer NCOs by Loan Portfolio ($ in millions) ($ in millions) 75 $67 70 4.0 0% $63 $62 5.0 0% $59 65 $58 $58 $57 60 $55 $54 $52 $51 $49 $49 55 3.0 0% 50 $44 4.0 0% $42 3.56% $42 $33 $41 45 3.26% 3.16% 40 3.01% 2.0 0% 2.85% 2.80% 35 3.0 0% 30 2.46% 2.41% 2.33% 25 0.71% 0.74% 0.66% 0.65% 0.61% 0.60% 0.53% 20 1.0 0% 0.45% 0.39% 15 2.0 0% 10 5 0.0 0% - 1.0 0% (5 ) (10) (1 5) -1.00% Q3 2023 Q4 2023 Q1 2024 Q2 2024 Q3 2024 Q4 2024 Q1 2025 Q2 2025 Q3 2025 Q3 2023 Q4 2023 Q1 2024 Q2 2024 Q3 2024 Q4 2024 Q1 2025 Q2 2025 Q3 2025 0.0 0% (20) Commercial and Construction Mortgage Leases Consumer NCO% Credit Card Personal Auto Other NCO% 12 Differences due to rounding
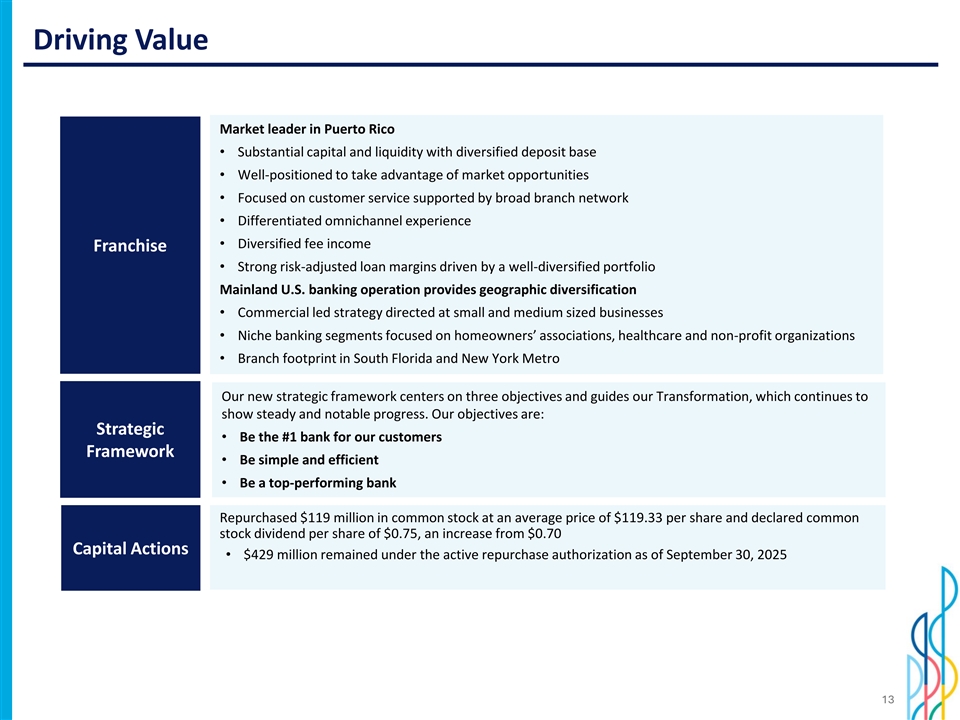
Driving Value Market leader in Puerto Rico • Substantial capital and liquidity with diversified deposit base • Well-positioned to take advantage of market opportunities • Focused on customer service supported by broad branch network • Differentiated omnichannel experience • Diversified fee income Franchise • Strong risk-adjusted loan margins driven by a well-diversified portfolio Mainland U.S. banking operation provides geographic diversification • Commercial led strategy directed at small and medium sized businesses • Niche banking segments focused on homeowners’ associations, healthcare and non-profit organizations • Branch footprint in South Florida and New York Metro Our new strategic framework centers on three objectives and guides our Transformation, which continues to show steady and notable progress. Our objectives are: Strategic • Be the #1 bank for our customers Framework • Be simple and efficient • Be a top-performing bank Repurchased $119 million in common stock at an average price of $119.33 per share and declared common stock dividend per share of $0.75, an increase from $0.70 Capital Actions • $429 million remained under the active repurchase authorization as of September 30, 2025 13

Guidance 2025 Guidance Q2 2025 Q3 Update Q3 2025 Commentary 10%-11% YoY growth driven by fixed asset Net Interest Income Unchanged Reaffirm Q2 guidance repricing, loan growth and deposit balances Higher end of guidance for the year based on Now expect $160 million-$165 million in Q4 and Non-Interest Income Updated YTD results and seasonal activity in Q4 $650 million- $655 million for the year 45bps-65 bps annualized due to credit Now expect 50bps-65 bps annualized due to YTD NCOs performance YTD and stable outlook for Updated credit performance and NPLs inflows in Q3 remainder of the year 4%-5% for the year due to profit sharing and Operating Expenses Unchanged Reaffirm Q2 guidance performance-based incentives Now expect 14%-16% in Q4 and 16-18% for the Effective Tax Rate 18%-20% due to higher tax exempt income Updated year, due to higher proportion of exempt income, and impact of changes to the P.R. tax code Reaffirm original guidance range of 3%-5% Now expect 4%-5% based on YTD growth and Loan Growth based on YTD growth and expected Updated expected repayments in Popular U.S. repayments in Popular U.S. 14

Footnotes Slide 3: 1- Fully taxable equivalent (“FTE”) net interest margin represents a non-GAAP financial measure. See the Corporation's earnings press release, Form 10-Q and Form 10-K filed with the U.S. Securities and Exchange Commission for the applicable periods for the GAAP to non- GAAP reconciliation. 2- Return on average tangible common equity (“ROTCE”) represents a non-GAAP financial measure. See table R in the Corporation's earnings press release for the reconciliation of GAAP to non-GAAP financial measures. Slide 7: 1- Balances are as of end of period. Slide 9: 1- Pension, postretirement and other combines “pension, postretirement and medical insurance” and “other personnel costs, including payroll taxes” as presented in the Consolidated Statement of Operations. Slide 10: 1- TCE ratio is defined as the ratio of tangible common equity to tangible assets. 15

Investor Presentation Third Quarter 2025 Appendix
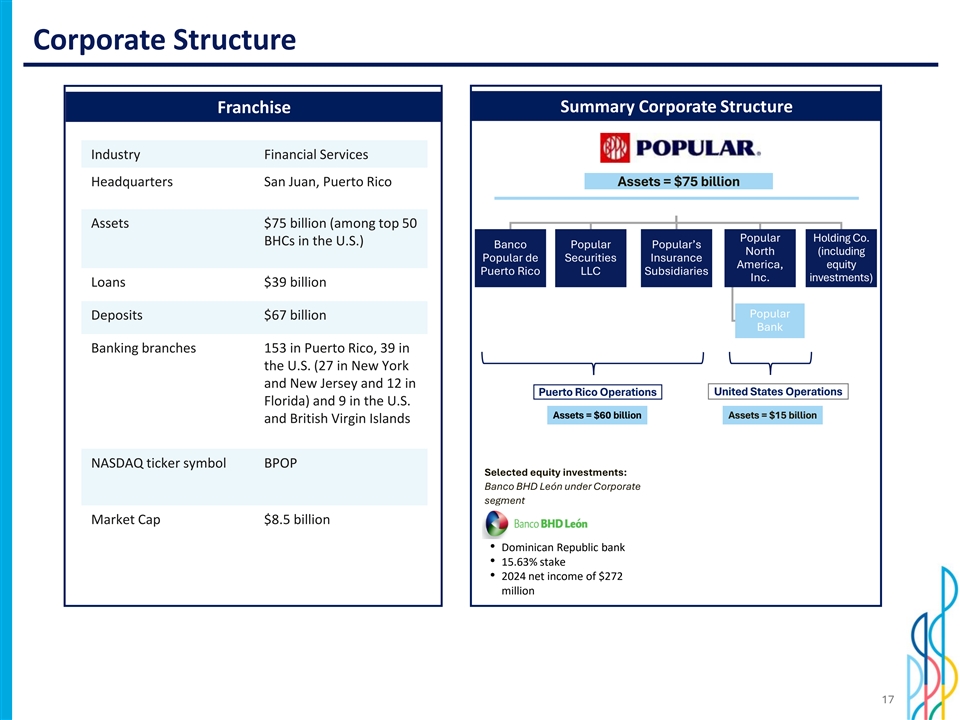
Corporate Structure Summary Corporate Structure Franchise Industry Financial Services Headquarters San Juan, Puerto Rico Assets = $75 billion Assets $75 billion (among top 50 Popular Holding Co. BHCs in the U.S.) Banco Popular Popular’s North (including Popular de Securities Insurance America, equity Puerto Rico LLC Subsidiaries Inc. investments) Loans $39 billion Popular Deposits $67 billion Bank Earnings Earnings Banking branches 153 in Puerto Rico, 39 in the U.S. (27 in New York and New Jersey and 12 in Puerto Rico Operations United States Operations Florida) and 9 in the U.S. Assets = $60 billion Assets = $15 billion and British Virgin Islands NASDAQ ticker symbol BPOP Selected equity investments: Banco BHD León under Corporate segment Market Cap $8.5 billion • Dominican Republic bank • 15.63% stake • 2024 net income of $272 million 17
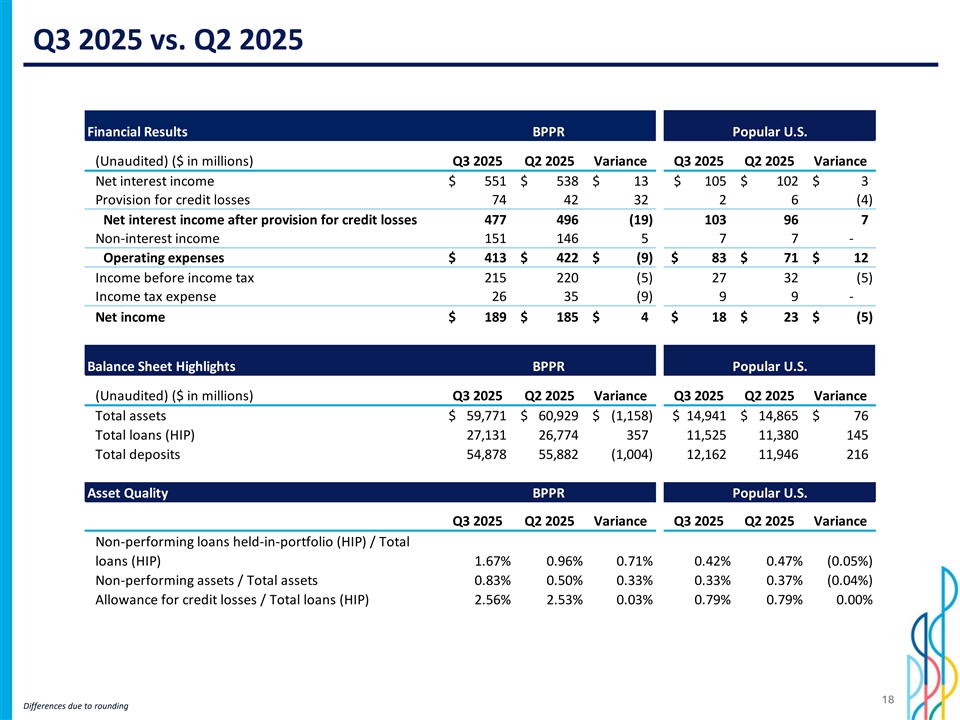
Q3 2025 vs. Q2 2025 Financial Results BPPR Popular U.S. (Unaudited) ($ in millions) Q3 2025 Q2 2025 Variance Q3 2025 Q2 2025 Variance Net interest income $ 551 $ 538 $ 13 $ 105 $ 102 $ 3 Provision for credit losses 74 42 32 2 6 (4) Net interest income after provision for credit losses 477 496 ( 19) 103 96 7 Non-interest income 151 146 5 7 7 - Operating expenses $ 413 $ 422 $ ( 9) $ 83 $ 71 $ 12 Income before income tax 215 220 (5) 27 32 (5) Income tax expense 26 35 (9) 9 9 - Net income $ 189 $ 185 $ 4 $ 18 $ 23 $ (5) Balance Sheet Highlights BPPR Popular U.S. (Unaudited) ($ in millions) Q3 2025 Q2 2025 Variance Q3 2025 Q2 2025 Variance Total assets $ 59,771 $ 60,929 $ (1,158) $ 14,941 $ 14,865 $ 76 Total loans (HIP) 27,131 26,774 357 1 1,525 11,380 145 Total deposits 54,878 55,882 (1,004) 1 2,162 11,946 216 Asset Quality BPPR Popular U.S. Q3 2025 Q2 2025 Variance Q3 2025 Q2 2025 Variance Non-performing loans held-in-portfolio (HIP) / Total loans (HIP) 1.67% 0.96% 0.71% 0.42% 0.47% (0.05%) Non-performing assets / Total assets 0.83% 0.50% 0.33% 0.33% 0.37% (0.04%) Allowance for credit losses / Total loans (HIP) 2.56% 2.53% 0.03% 0.79% 0.79% 0.00% 18 Differences due to rounding

Loan Composition and Yields Highlights: Loans Held-in-Portfolio Average Yield • Loans held in portfolio increased $502 (ending balances, million or 1.3%, compared to Q2 2025 $ in millions) Q3 2025 Q2 2025 Variance Q3 2025 (FTE) $ $ $ $ Commercial 19,289 19,090 199 19,229 6.72% ‐ The increase was primarily driven by the commercial and construction Construction 1,605 1,468 136 1,549 8.24% portfolios in BPPR and in Popular U.S., 8,558 8,444 114 5.96% Mortgage 8,484 and by the mortgage portfolio in BPPR 5,859 5,854 5 8.52% Auto loans and leases 5,926 • Average loan yield FTE at 7.49% Consumer 3,377 3,329 48 3,258 13.80% Total Loans $ 38,687 $ 38,185 $ 502 $ 38,445 7.49% Loan Composition (ending balances, $ in billions) 45.0 0 $38.7 $38.2 40.0 0 $37.3 $37.1 $37.1 $35.1 $3.4 $3.3 35.0 0 $3.3 $3.3 $3.3 $32.1 $3.3 $29.3 $8.6 30.0 0 $3.1 $8.4 $8.1 $8.1 $8.3 $2.6 $7.7 25.0 0 $7.4 $5.9 $5.9 $7.5 $5.8 $5.8 $5.8 $5.4 20.0 0 $1.6 $1.5 $1.3 $1.3 $1.4 $5.1 $1.0 $4.8 $0.8 15.0 0 $0.7 10.0 0 $19.1 $19.3 $18.7 $18.7 $18.6 $17.7 $15.7 $13.7 5.00 - 2021 2022 2023 2024 Q4 2024 Q1 2025 Q2 2025 Q3 2025 Commercial Construction Auto loans and Leases Mortgage Consumer 19 Differences due to rounding
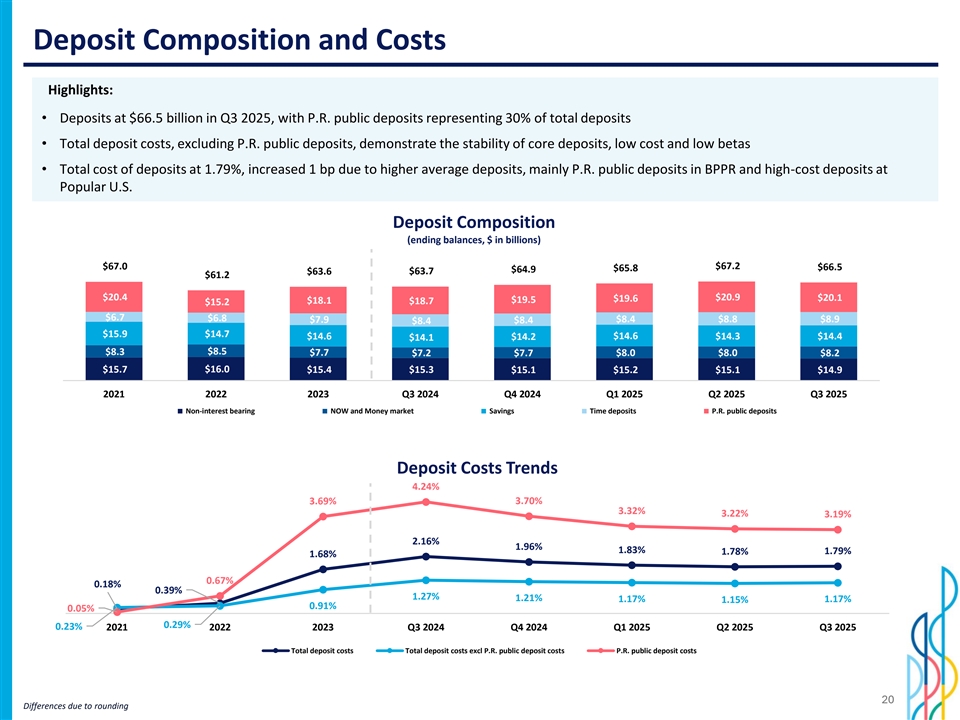
Deposit Composition and Costs Highlights: • Deposits at $66.5 billion in Q3 2025, with P.R. public deposits representing 30% of total deposits • Total deposit costs, excluding P.R. public deposits, demonstrate the stability of core deposits, low cost and low betas • Total cost of deposits at 1.79%, increased 1 bp due to higher average deposits, mainly P.R. public deposits in BPPR and high-cost deposits at Popular U.S. Deposit Composition (ending balances, $ in billions) 80.0 0 $67.0 $67.2 $66.5 $65.8 $64.9 $63.6 $63.7 70.0 0 $61.2 60.0 0 $20.4 $19.6 $20.9 $20.1 $19.5 $18.1 $18.7 $15.2 50.0 0 $6.7 $6.8 40.0 0 $7.9 $8.4 $8.8 $8.9 $8.4 $8.4 30.0 0 $15.9 $14.7 $14.6 $14.2 $14.6 $14.3 $14.4 $14.1 20.0 0 $8.3 $8.5 $7.7 $7.2 $7.7 $8.0 $8.0 $8.2 10.0 0 $15.7 $16.0 $15.4 $15.3 $15.1 $15.2 $15.1 $14.9 - 2021 2022 2023 Q3 2024 Q4 2024 Q1 2025 Q2 2025 Q3 2025 Non-interest bearing NOW and Money market Savings Time deposits P.R. public deposits Deposit Costs Trends 4.24% 0.045 3.69% 3.70% 0.04 3.32% 3.22% 3.19% 0.035 0.03 2.16% 0.025 1.96% 1.83% 1.78% 1.79% 1.68% 0.02 0.015 0.67% 0.01 0.18% 0.39% 1.27% 0.005 1.21% 1.17% 1.15% 1.17% 0.91% 0.05% 0 0.29% 0.23% 2021 2022 2023 Q3 2024 Q4 2024 Q1 2025 Q2 2025 Q3 2025 Total deposit costs Total deposit costs excl P.R. public deposit costs P.R. public deposit costs 20 Differences due to rounding
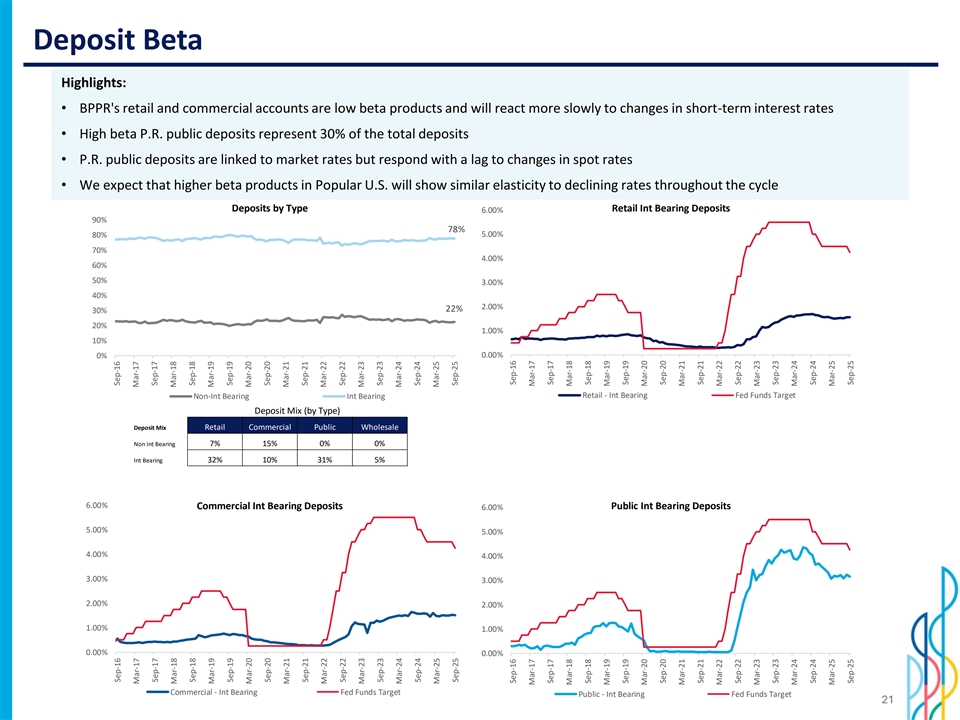
Deposit Beta Highlights: • BPPR's retail and commercial accounts are low beta products and will react more slowly to changes in short-term interest rates • High beta P.R. public deposits represent 30% of the total deposits • P.R. public deposits are linked to market rates but respond with a lag to changes in spot rates • We expect that higher beta products in Popular U.S. will show similar elasticity to declining rates throughout the cycle Deposits by Type Retail Int Bearing Deposits 6.00% 90% 78% 80% 5.00% 70% 4.00% 60% 50% 3.00% 40% 2.00% 22% 30% 20% 1.00% 10% 0.00% 0% Non-Int Bearing Int Bearing Retail - Int Bearing Fed Funds Target Deposit Mix (by Type) Deposit Mix Retail Commercial Public Wholesale Non Int Bearing 7% 15% 0% 0% Int Bearing 32% 10% 31% 5% 6.00% Commercial Int Bearing Deposits Public Int Bearing Deposits 6.00% 5.00% 5.00% 4.00% 4.00% 3.00% 3.00% 2.00% 2.00% 1.00% 1.00% 0.00% 0.00% Commercial - Int Bearing Fed Funds Target Public - Int Bearing Fed Funds Target 21 Sep-16 Sep-16 Mar-17 Mar-17 Sep-17 Sep-17 Mar-18 Mar-18 Sep-18 Sep-18 Mar-19 Mar-19 Sep-19 Sep-19 Mar-20 Mar-20 Sep-20 Sep-20 Mar-21 Mar-21 Sep-21 Sep-21 Mar-22 Mar-22 Sep-22 Sep-22 Mar-23 Mar-23 Sep-23 Sep-23 Mar-24 Mar-24 Sep-24 Sep-24 Mar-25 Mar-25 Sep-25 Sep-25 Sep-16 Sep-16 Mar-17 Mar-17 Sep-17 Sep-17 Mar-18 Mar-18 Sep-18 Sep-18 Mar-19 Mar-19 Sep-19 Sep-19 Mar-20 Mar-20 Sep-20 Sep-20 Mar-21 Mar-21 Sep-21 Sep-21 Mar-22 Mar-22 Sep-22 Sep-22 Mar-23 Mar-23 Sep-23 Sep-23 Mar-24 Mar-24 Sep-24 Sep-24 Mar-25 Mar-25 Sep-25 Sep-25
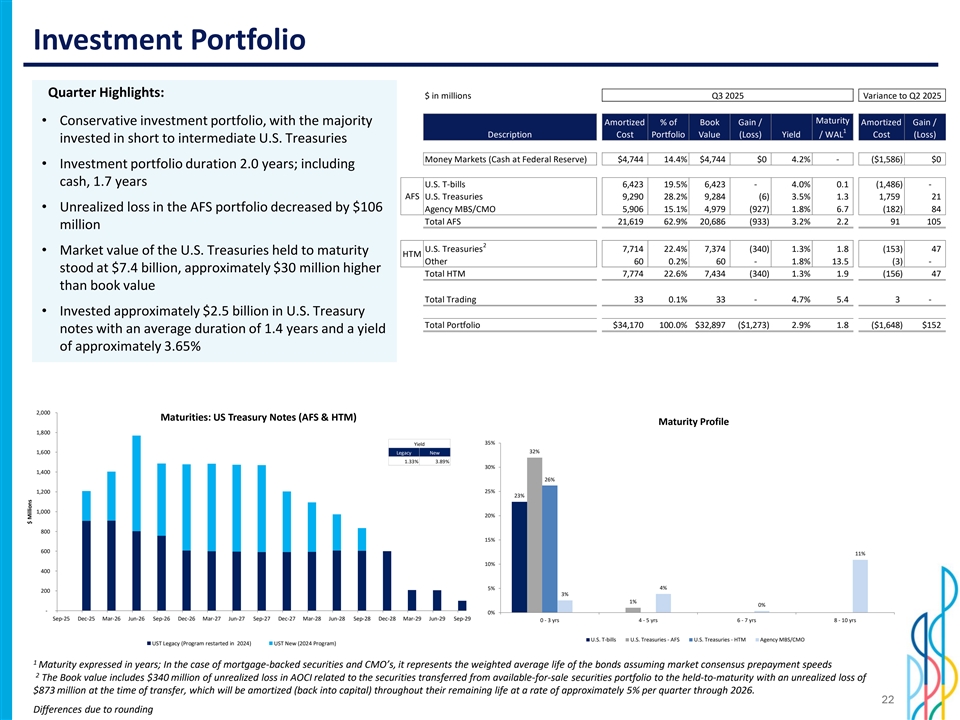
Investment Portfolio Quarter Highlights: $ in millions Q3 2025 Variance to Q2 2025 Maturity • Conservative investment portfolio, with the majority Amortized % of Book Gain / Amortized Gain / 1 Description Cost Portfolio Value (Loss) Yield / WAL Cost (Loss) invested in short to intermediate U.S. Treasuries Money Markets (Cash at Federal Reserve) $4,744 14.4% $4,744 $0 4.2% - ($1,586) $0 • Investment portfolio duration 2.0 years; including cash, 1.7 years U.S. T-bills 6,423 19.5% 6,423 - 4.0% 0.1 ( 1,486) - AFS U.S. Treasuries 9,290 28.2% 9,284 (6) 3.5% 1.3 1,759 21 • Unrealized loss in the AFS portfolio decreased by $106 Agency MBS/CMO 5,906 15.1% 4,979 ( 927) 1.8% 6.7 (182) 84 Total AFS 21,619 62.9% 20,686 (933) 3.2% 2.2 91 105 million 2 U.S. Treasuries 7,714 22.4% 7,374 ( 340) 1.3% 1.8 (153) 47 • Market value of the U.S. Treasuries held to maturity HTM Other 60 0.2% 60 - 1.8% 13.5 (3) - stood at $7.4 billion, approximately $30 million higher Total HTM 7,774 22.6% 7,434 ( 340) 1.3% 1.9 (156) 47 than book value Total Trading 33 0.1% 33 - 4.7% 5.4 3 - • Invested approximately $2.5 billion in U.S. Treasury Total Portfolio $34,170 100.0% $32,897 ($1,273) 2.9% 1.8 ($1,648) $152 notes with an average duration of 1.4 years and a yield of approximately 3.65% 2,000 Maturities: US Treasury Notes (AFS & HTM) Maturity Profile 1,800 35% Yield 32% 1,600 Legacy New 1.33% 3.89% 30% 1,400 26% 25% 1,200 23% 1,000 20% 800 15% 600 11% 10% 400 4% 5% 200 3% 1% 0% 0% 0% 0% 0% 0% 0% 0% 0% 0% 0% 0% 0% - 0% Sep-25 Dec-25 Mar-26 Jun-26 Sep-26 Dec-26 Mar-27 Jun-27 Sep-27 Dec-27 Mar-28 Jun-28 Sep-28 Dec-28 Mar-29 Jun-29 Sep-29 0 - 3 yrs 4 - 5 yrs 6 - 7 yrs 8 - 10 yrs U.S. T-bills U.S. Treasuries - AFS U.S. Treasuries - HTM Agency MBS/CMO UST Legacy (Program restarted in 2024) UST New (2024 Program) 1 Maturity expressed in years; In the case of mortgage-backed securities and CMO’s, it represents the weighted average life of the bonds assuming market consensus prepayment speeds 2 The Book value includes $340 million of unrealized loss in AOCI related to the securities transferred from available-for-sale securities portfolio to the held-to-maturity with an unrealized loss of $873 million at the time of transfer, which will be amortized (back into capital) throughout their remaining life at a rate of approximately 5% per quarter through 2026. 22 Differences due to rounding $ Millions

Allowance for Credit Losses – Q3 2025 ACL Movement: • Moody’s baseline forecast continues to assume a slowdown in economic activity for the U.S. in 2025 and 2026 • Changes in the forecast of certain employment variables contributed to higher reserves • Higher reserves related to the commercial portfolio due to Q3 commercial NPL inflows, mainly of two large unrelated commercial loans with a combined book value of $188 million and higher loan balances. Economic Scenarios: • Baseline scenario assigned the highest probability, followed by the S3 (pessimistic) scenario • The probability assigned to the S3 (pessimistic) scenario remains at elevated levels due to current uncertainty in the markets • 2025 annualized GDP growth (baseline): ‐ P.R consistent with previous period at 0.34% ‐ U.S. increased to 1.64% from 1.28% • 2025 forecasted average unemployment rate (baseline): ‐ P.R. remains near historically low levels at 5.59% ‐ U.S. consistent with previous period at 4.24% 23
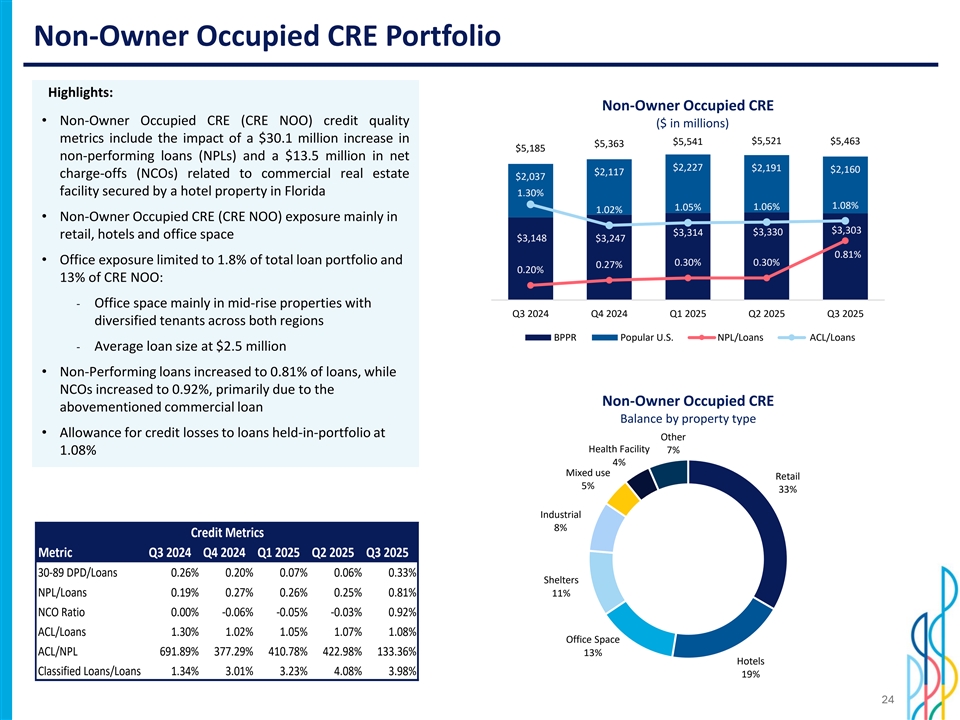
Non-Owner Occupied CRE Portfolio Highlights: Non-Owner Occupied CRE • Non-Owner Occupied CRE (CRE NOO) credit quality ($ in millions) metrics include the impact of a $30.1 million increase in $5,521 $5,463 $5,541 $5,363 $5,185 non-performing loans (NPLs) and a $13.5 million in net 5,000 $2,227 $2,191 $2,160 $2,117 charge-offs (NCOs) related to commercial real estate $2,037 facility secured by a hotel property in Florida 4,000 1.30% 1.08% 1.05% 1.06% 1.02% • Non-Owner Occupied CRE (CRE NOO) exposure mainly in 3,000 $3,303 $3,314 $3,330 retail, hotels and office space $3,148 $3,247 2,000 0.81% • Office exposure limited to 1.8% of total loan portfolio and 0.30% 0.30% 0.27% 0.20% 1,000 13% of CRE NOO: 0 0.0% ‐ Office space mainly in mid-rise properties with Q3 2024 Q4 2024 Q1 2025 Q2 2025 Q3 2025 diversified tenants across both regions BPPR Popular U.S. NPL/Loans ACL/Loans ‐ Average loan size at $2.5 million • Non-Performing loans increased to 0.81% of loans, while NCOs increased to 0.92%, primarily due to the Non-Owner Occupied CRE abovementioned commercial loan Balance by property type • Allowance for credit losses to loans held-in-portfolio at Other Health Facility 7% 1.08% 4% Mixed use Retail 5% 33% Industrial 8% Credit Metrics Metric Q3 2024 Q4 2024 Q1 2025 Q2 2025 Q3 2025 30-89 DPD/Loans 0.26% 0.20% 0.07% 0.06% 0.33% Shelters NPL/Loans 0.19% 0.27% 0.26% 0.25% 0.81% 11% NCO Ratio 0.00% -0.06% -0.05% -0.03% 0.92% ACL/Loans 1.30% 1.02% 1.05% 1.07% 1.08% Office Space ACL/NPL 691.89% 377.29% 410.78% 422.98% 133.36% 13% Hotels Classified Loans/Loans 1.34% 3.01% 3.23% 4.08% 3.98% 19% 24

Multifamily Loan Portfolio Highlights: Multifamily Loans • 88% of the portfolio concentrated in Popular U.S. ($ in millions) $2,521 $2,521 • Strong credit risk profile with low levels of delinquency, $2,406 $2,400 $2,375 2,500 NCOs and classified loans: 1.4% $2,214 $2,187 $2,100 $2,092 $2,067 2,000 1.2% ‐ 30-89 DPD/Loans at 0.16% 0.60% 0.67% 0.57% 1.0% ‐ Classified loans at 1.20% 0.40% 1,500 0.38% 0.8% ‐ NCO Ratio 0.00% 1,000 0.6% 0.43% 0.40% 0.37% 0.37% 0.35% • Allowance for credit losses (“ACL”) to loans held-in- 0.4% 500 portfolio at 0.67% 0.2% $306 $308 $308 $306 • New York portfolio: $302 0 0.0% Q3 2024 Q4 2024 Q1 2025 Q2 2025 Q3 2025 ‐ $1.5 billion or 3.9% of our total loan portfolio BPPR Popular U.S. NPL/Loans ACL/Loans ‐ Underwritten based on current rental income at origination ‐ No exposure to rent controlled buildings Multifamily Loans ‐ Rent stabilized units represent less than 40% of the Balance by state total units in the loan portfolio with the majority Other originated after 2019 NJ 1% 3% PR 8% Credit Metrics Metric Q3 2024 Q4 2024 Q1 2025 Q2 2025 Q3 2025 30-89 DPD/Loans 0.12% 0.29% 0.23% 0.44% 0.16% FL NPL/Loans 0.37% 0.37% 0.37% 0.43% 0.35% 27% NCO Ratio 0.00% 0.00% 0.00% 0.00% 0.00% NY ACL/Loans 0.40% 0.38% 0.57% 0.67% 0.67% 61% ACL/NPL 109.72% 105.20% 153.90% 153.60% 191.90% Classified Loans/Loans 1.30% 1.10% 0.97% 1.27% 1.20% 25
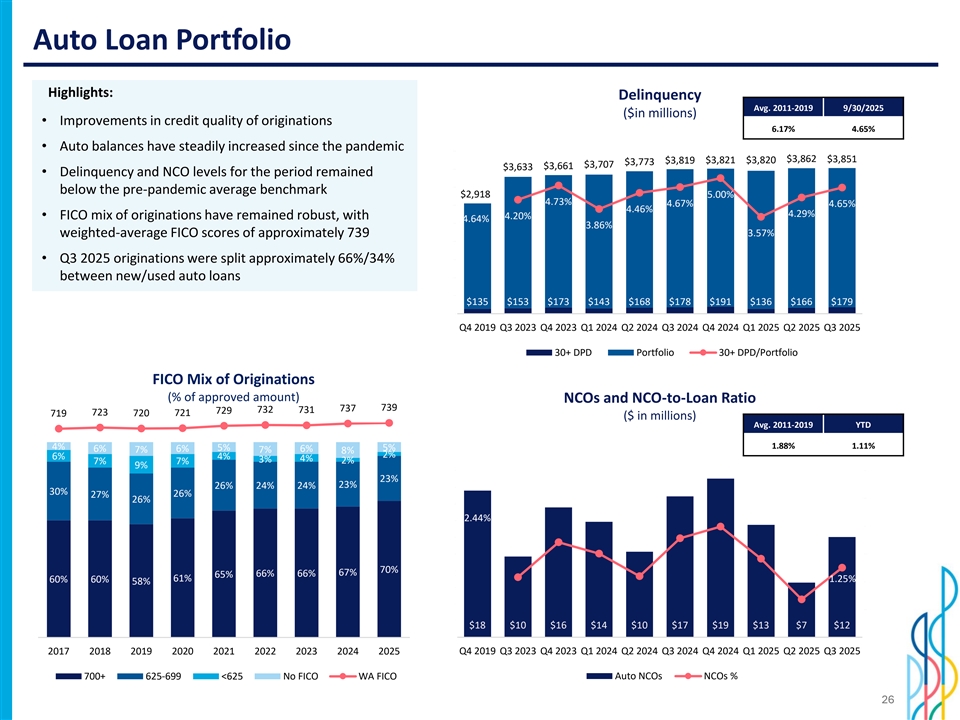
Auto Loan Portfolio Highlights: Delinquency Avg. 2011-2019 9/30/2025 ($in millions) • Improvements in credit quality of originations 6.17% 4.65% • Auto balances have steadily increased since the pandemic 4500 0.06 $3,862 $3,851 $3,819 $3,821 $3,820 $3,773 $3,707 4000 $3,661 $3,633 • Delinquency and NCO levels for the period remained 0.05 3500 below the pre-pandemic average benchmark $2,918 5.00% 4.73% 3000 4.67% 4.65% 0.04 4.46% 4.29% • FICO mix of originations have remained robust, with 4.20% 4.64% 2500 3.86% 0.03 3.57% weighted-average FICO scores of approximately 739 2000 1500 0.02 • Q3 2025 originations were split approximately 66%/34% 1000 between new/used auto loans 0.01 500 $135 $153 $173 $143 $168 $178 $191 $136 $166 $179 0 0 Q4 2019 Q3 2023 Q4 2023 Q1 2024 Q2 2024 Q3 2024 Q4 2024 Q1 2025 Q2 2025 Q3 2025 30+ DPD Portfolio 30+ DPD/Portfolio FICO Mix of Originations (% of approved amount) NCOs and NCO-to-Loan Ratio 739 737 729 732 731 723 720 721 719 ($ in millions) Avg. 2011-2019 YTD 700 100% 1.88% 1.11% 4% 5% 5% 6% 6% 6% 7% 7% 8% 2% 6% 4% 4% 3% 2% 600 7% 7% 9% 20 0.03 80% 23% 23% 18 26% 24% 24% 500 30% 27% 26% 0.025 26% 16 60% 14 2.44% 400 0.02 12 300 10 0.015 40% 8 70% 67% 65% 66% 66% 200 61% 60% 60% 1.25% 0.01 58% 6 20% 4 100 0.005 2 $18 $10 $16 $14 $10 $17 $19 $13 $7 $12 0% 0 0 0 2017 2018 2019 2020 2021 2022 2023 2024 2025 Q4 2019 Q3 2023 Q4 2023 Q1 2024 Q2 2024 Q3 2024 Q4 2024 Q1 2025 Q2 2025 Q3 2025 700+ 625-699 <625 No FICO WA FICO Auto NCOs NCOs % 26
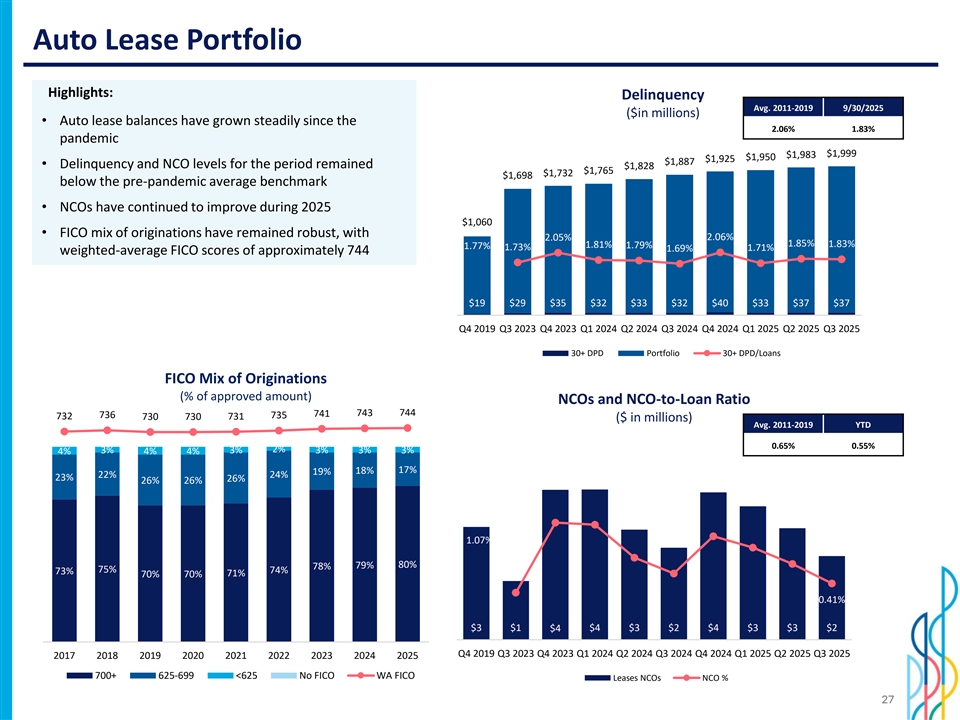
Auto Lease Portfolio Highlights: Delinquency Avg. 2011-2019 9/30/2025 ($in millions) • Auto lease balances have grown steadily since the 2.06% 1.83% 2500 0.06 pandemic $1,999 $1,983 $1,950 $1,925 0.05 $1,887 • Delinquency and NCO levels for the period remained 2000 $1,828 $1,765 $1,732 $1,698 below the pre-pandemic average benchmark 0.04 1500 • NCOs have continued to improve during 2025 0.03 $1,060 • FICO mix of originations have remained robust, with 2.06% 2.05% 1000 1.85% 1.81% 1.79% 1.83% 1.77% 1.73% 1.71% 1.69% weighted-average FICO scores of approximately 744 0.02 500 0.01 $19 $29 $35 $32 $33 $32 $40 $33 $37 $37 0 0 Q4 2019 Q3 2023 Q4 2023 Q1 2024 Q2 2024 Q3 2024 Q4 2024 Q1 2025 Q2 2025 Q3 2025 30+ DPD Portfolio 30+ DPD/Loans FICO Mix of Originations (% of approved amount) NCOs and NCO-to-Loan Ratio 743 744 741 736 735 732 730 730 731 ($ in millions) Avg. 2011-2019 YTD 700 100% 0.65% 0.55% 2% 3% 3% 3% 3% 3% 4% 4% 4% 600 17% 19% 18% 4 0.012 22% 24% 23% 26% 26% 26% 80% 3.5 500 0.01 3 60% 400 0.008 2.5 1.07% 300 2 0.006 40% 80% 78% 79% 75% 74% 73% 71% 70% 70% 1.5 200 0.004 1 0.41% 20% 0.002 100 0.5 $3 $1 $4 $3 $2 $4 $3 $3 $2 $4 0 0 0% 0 Q4 2019 Q3 2023 Q4 2023 Q1 2024 Q2 2024 Q3 2024 Q4 2024 Q1 2025 Q2 2025 Q3 2025 2017 2018 2019 2020 2021 2022 2023 2024 2025 700+ 625-699 <625 No FICO WA FICO Leases NCOs NCO % 27
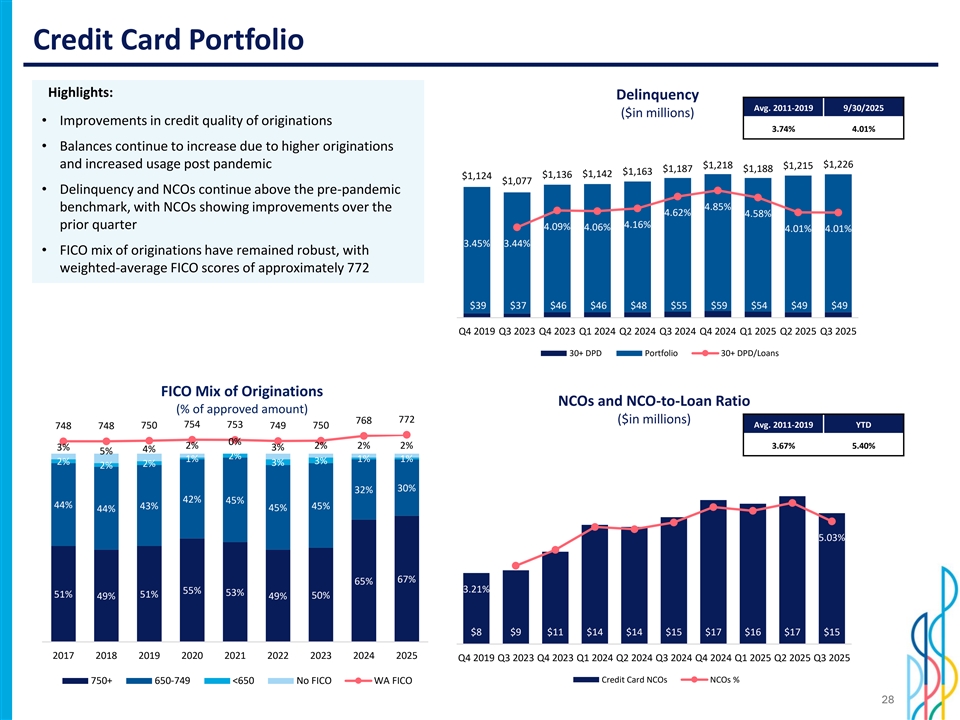
Credit Card Portfolio Highlights: Delinquency Avg. 2011-2019 9/30/2025 ($in millions) • Improvements in credit quality of originations 3.74% 4.01% • Balances continue to increase due to higher originations 1400 0.06 and increased usage post pandemic $1,226 $1,218 $1,215 $1,187 $1,188 $1,163 0.055 $1,142 $1,136 $1,124 1200 $1,077 0.05 • Delinquency and NCOs continue above the pre-pandemic 0.045 1000 4.85% benchmark, with NCOs showing improvements over the 0.04 4.62% 4.58% 0.035 800 4.16% prior quarter 4.09% 4.06% 4.01% 4.01% 0.03 3.45% 3.44% 600 0.025 • FICO mix of originations have remained robust, with 0.02 weighted-average FICO scores of approximately 772 400 0.015 0.01 200 0.005 $39 $37 $46 $46 $48 $55 $59 $54 $49 $49 0 0 Q4 2019 Q3 2023 Q4 2023 Q1 2024 Q2 2024 Q3 2024 Q4 2024 Q1 2025 Q2 2025 Q3 2025 30+ DPD Portfolio 30+ DPD/Loans FICO Mix of Originations NCOs and NCO-to-Loan Ratio (% of approved amount) 772 768 ($in millions) 754 753 Avg. 2011-2019 YTD 748 748 750 749 750 0% 2% 2% 2% 2% 3.67% 5.40% 3% 3% 4% 100% 5% 700 2% 1% 1% 1% 3% 2% 2% 3% 2% 20 0.07 600 18 80% 30% 32% 0.06 42% 45% 44% 500 16 43% 45% 45% 44% 0.05 14 60% 400 5.03% 12 0.04 10 300 40% 0.03 8 67% 65% 200 6 3.21% 55% 53% 0.02 51% 51% 50% 49% 49% 20% 4 100 0.01 2 $8 $9 $11 $14 $14 $15 $17 $16 $17 $15 0% 0 0 0 2017 2018 2019 2020 2021 2022 2023 2024 2025 Q4 2019 Q3 2023 Q4 2023 Q1 2024 Q2 2024 Q3 2024 Q4 2024 Q1 2025 Q2 2025 Q3 2025 Credit Card NCOs NCOs % 750+ 650-749 <650 No FICO WA FICO 28
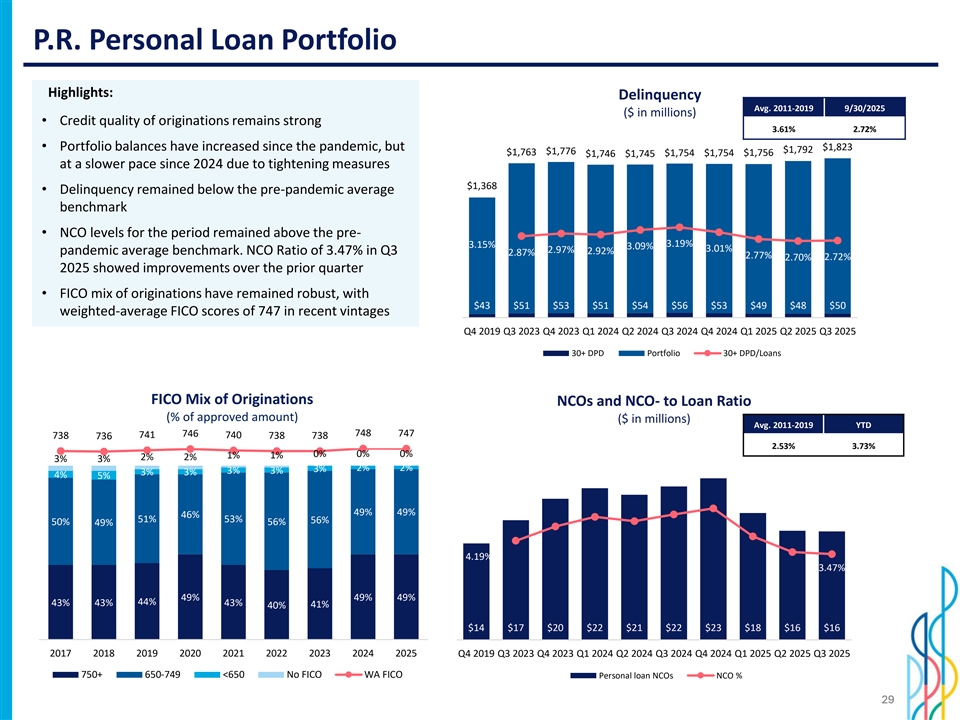
P.R. Personal Loan Portfolio Highlights: Delinquency Avg. 2011-2019 9/30/2025 ($ in millions) • Credit quality of originations remains strong 3.61% 2.72% 200 0 0.06 • Portfolio balances have increased since the pandemic, but $1,823 $1,792 $1,776 $1,763 $1,754 $1,754 $1,756 $1,746 $1,745 180 0 at a slower pace since 2024 due to tightening measures 0.05 160 0 $1,368 • Delinquency remained below the pre-pandemic average 140 0 0.04 benchmark 120 0 100 0 0.03 • NCO levels for the period remained above the pre- 3.19% 3.15% 3.09% 800 3.01% 2.97% pandemic average benchmark. NCO Ratio of 3.47% in Q3 2.92% 2.87% 2.77% 2.72% 2.70% 0.02 600 2025 showed improvements over the prior quarter 400 0.01 • FICO mix of originations have remained robust, with 200 $43 $51 $53 $51 $54 $56 $53 $49 $48 $50 weighted-average FICO scores of 747 in recent vintages 0 0 Q4 2019 Q3 2023 Q4 2023 Q1 2024 Q2 2024 Q3 2024 Q4 2024 Q1 2025 Q2 2025 Q3 2025 30+ DPD Portfolio 30+ DPD/Loans FICO Mix of Originations NCOs and NCO- to Loan Ratio (% of approved amount) ($ in millions) Avg. 2011-2019 YTD 748 746 747 738 741 740 738 738 736 2.53% 3.73% 0% 0% 0% 1% 1% 2% 2% 700 3% 3% 100% 25 0.07 2% 2% 3% 3% 3% 3% 3% 4% 5% 600 0.06 80% 20 500 49% 49% 0.05 46% 51% 53% 56% 50% 56% 49% 60% 15 400 0.04 4.19% 300 0.03 40% 3.47% 10 200 0.02 49% 49% 49% 20% 44% 43% 43% 43% 5 41% 40% 100 0.01 $14 $17 $20 $22 $21 $22 $23 $18 $16 $16 0% 0 0 0 2017 2018 2019 2020 2021 2022 2023 2024 2025 Q4 2019 Q3 2023 Q4 2023 Q1 2024 Q2 2024 Q3 2024 Q4 2024 Q1 2025 Q2 2025 Q3 2025 750+ 650-749 <650 No FICO WA FICO Personal loan NCOs NCO % 29
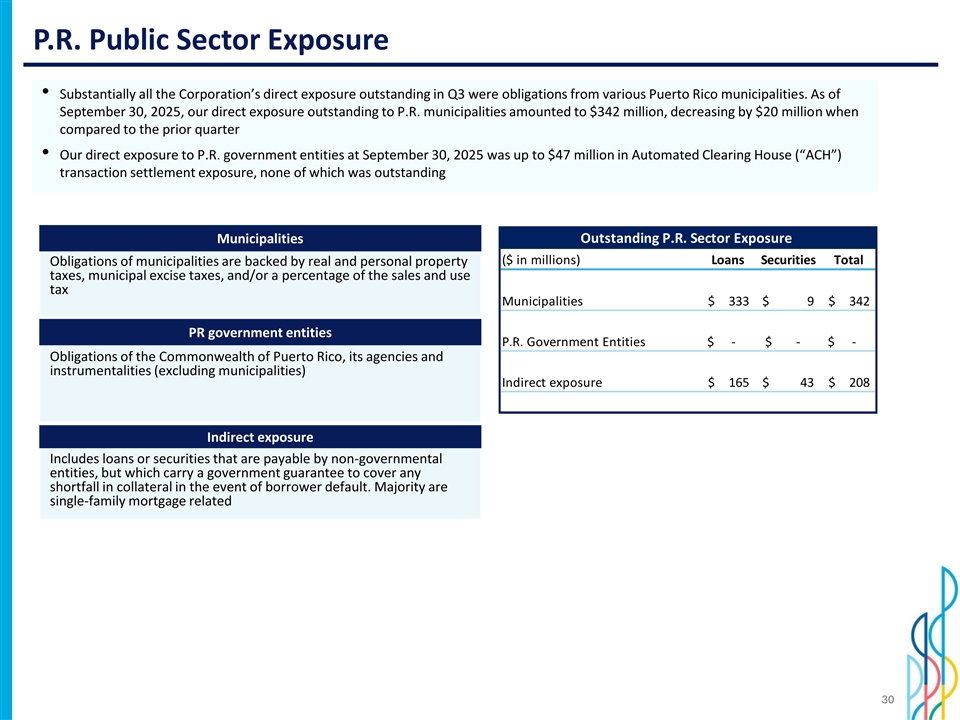
P.R. Public Sector Exposure • Substantially all the Corporation’s direct exposure outstanding in Q3 were obligations from various Puerto Rico municipalities. As of September 30, 2025, our direct exposure outstanding to P.R. municipalities amounted to $342 million, decreasing by $20 million when compared to the prior quarter • Our direct exposure to P.R. government entities at September 30, 2025 was up to $47 million in Automated Clearing House (“ACH”) transaction settlement exposure, none of which was outstanding Outstanding P.R. Sector Exposure Municipalities ($ in millions) Loans Securities Total Obligations of municipalities are backed by real and personal property taxes, municipal excise taxes, and/or a percentage of the sales and use tax Municipalities $ 333 $ 9 $ 342 PR government entities P.R. Government Entities $ - $ - $ - Obligations of the Commonwealth of Puerto Rico, its agencies and instrumentalities (excluding municipalities) Indirect exposure $ 165 $ 43 $ 208 Indirect exposure Includes loans or securities that are payable by non-governmental entities, but which carry a government guarantee to cover any shortfall in collateral in the event of borrower default. Majority are single-family mortgage related 30

Popular’s Credit Ratings Senior Uns Senior Unsec ecur ured ed Ratings Ratings Fitch BBB- Stable Outlook S&P BB+ Stable Outlook Moody’s Ba1 Positive Outlook 2018 2019 2020 2021 2022 2025 April April June Moody’s Moody's Fitch upgrades upgrades to upgrades to B1 to BBB- from April September Ba3 from B1 September from B2 May March BB, revised S&P upgrades to Moody’s upgrades Moody’s Fitch Moody’s Fitch and S&P May S&P revised outlook to BB+ from BB-, to Ba1 from Ba3, upgrades upgrades to revised outlook revised outlook Fitch revised outlook to Stable revised outlook revised outlook to outlook to BB from BB- to Positive to Positive outlook to Positive Positive to Stable Stable Positive March S&P lowers outlook to Stable 31

Investor Presentation Third Quarter 2025