UNITED STATES SECURITIES AND EXCHANGE COMMISSION
Washington, D.C. 20549
Form 8-K
|
|
CURRENT REPORT PURSUANT TO SECTION 13 or 15(d) OF THE SECURITIES EXCHANGE ACT OF 1934 |
|
| Date of Report (Date of earliest event reported): October 14, 2025 |
||
The Goldman Sachs Group, Inc.
(Exact name of registrant as specified in its charter)
Commission File Number: 001-14965
| Delaware | 13-4019460 | |
| (State or other jurisdiction of incorporation) |
(IRS Employer Identification No.) |
|
| 200 West Street, New York, N.Y. | 10282 | |
| (Address of principal executive offices) | (Zip Code) | |
(212) 902-1000
(Registrant’s telephone number, including area code)
Check the appropriate box below if the Form 8-K filing is intended to simultaneously satisfy the filing obligation of the registrant under any of the following provisions:
☐ Written communications pursuant to Rule 425 under the Securities Act (17 CFR 230.425)
☐ Soliciting material pursuant to Rule 14a-12 under the Exchange Act (17 CFR 240.14a-12)
☐ Pre-commencement communications pursuant to Rule 14d-2(b) under the Exchange Act (17 CFR 240.14d-2(b))
☐ Pre-commencement communications pursuant to Rule 13e-4(c) under the Exchange Act (17 CFR 240.13e-4(c))
Securities registered pursuant to Section 12(b) of the Act:
| Title of each class |
Trading Symbol |
Exchange on which registered |
||
| Common stock, par value $.01 per share | GS | NYSE | ||
| Depositary Shares, Each Representing 1/1,000th Interest in a Share of Floating Rate Non-Cumulative Preferred Stock, Series A | GS PrA | NYSE | ||
| Depositary Shares, Each Representing 1/1,000th Interest in a Share of Floating Rate Non-Cumulative Preferred Stock, Series C | GS PrC | NYSE | ||
| Depositary Shares, Each Representing 1/1,000th Interest in a Share of Floating Rate Non-Cumulative Preferred Stock, Series D | GS PrD | NYSE | ||
| 5.793% Fixed-to-Floating Rate Normal Automatic Preferred Enhanced Capital Securities of Goldman Sachs Capital II | GS/43PE | NYSE | ||
| Floating Rate Normal Automatic Preferred Enhanced Capital Securities of Goldman Sachs Capital III | GS/43PF | NYSE | ||
| Medium-Term Notes, Series F, Callable Fixed and Floating Rate Notes due March 2031 of GS Finance Corp. | GS/31B | NYSE | ||
| Medium-Term Notes, Series F, Callable Fixed and Floating Rate Notes due May 2031 of GS Finance Corp. | GS/31X | NYSE | ||
Indicate by check mark whether the registrant is an emerging growth company as defined in Rule 405 of the Securities Act of 1933 (17 CFR 230.405) or Rule 12b-2 of the Securities Exchange Act of 1934 (17 CFR 240.12b-2).
Emerging growth company ☐
If an emerging growth company, indicate by check mark if the registrant has elected not to use the extended transition period for complying with any new or revised financial accounting standards provided pursuant to Section 13(a) of the Exchange Act. ☐
Item 2.02 Results of Operations and Financial Condition.
On October 14, 2025, The Goldman Sachs Group, Inc. (Group Inc. and, together with its consolidated subsidiaries, the firm) reported its earnings for the third quarter ended September 30, 2025. A copy of Group Inc.’s press release containing this information is attached as Exhibit 99.1 to this Report on Form 8-K and is incorporated herein by reference.
Item 7.01 Regulation FD Disclosure.
On October 14, 2025, at 9:30 a.m. (ET), the firm will hold a conference call to discuss the firm’s financial results, outlook and related matters. A copy of the presentation for the conference call is attached as Exhibit 99.2 to this Report on Form 8-K.
Item 9.01 Financial Statements and Exhibits.
(d) Exhibits.
| 99.1 |
Exhibit 99.1 shall be deemed “filed” for purposes of Section 18 of the Securities Exchange Act of 1934 (Exchange Act).
| 99.2 | Presentation of Group Inc. dated October 14, 2025, for the conference call on October 14, 2025. |
Exhibit 99.2 is being furnished pursuant to Item 7.01 of Form 8-K and the information included therein shall not be deemed “filed” for purposes of Section 18 of the Exchange Act or otherwise subject to the liabilities under that Section and shall not be deemed to be incorporated by reference into any filing of Group Inc. under the Securities Act of 1933 or the Exchange Act.
| 101 | Pursuant to Rule 406 of Regulation S-T, the cover page information is formatted in iXBRL (Inline eXtensible Business Reporting Language). |
| 104 | Cover Page Interactive Data File (formatted in iXBRL in Exhibit 101). |
SIGNATURE
Pursuant to the requirements of the Securities Exchange Act of 1934, the Registrant has duly caused this report to be signed on its behalf by the undersigned hereunto duly authorized.
| THE GOLDMAN SACHS GROUP, INC. |
||||||||||
| (Registrant) |
||||||||||
| Date: October 14, 2025 |
By: |
/s/ Denis P. Coleman III |
||||||||
| Name: Denis P. Coleman III |
||||||||||
| Title: Chief Financial Officer |
||||||||||
Exhibit 99.1

|
Third Quarter 2025
Earnings Results
Media Relations: Tony Fratto 212-902-5400 Investor Relations: Jehan Ilahi 212-902-0300
|
||
|
The Goldman Sachs Group, Inc. 200 West Street | New York, NY 10282
|
Third Quarter 2025 Earnings Results
Goldman Sachs Reports Third Quarter Earnings Per Common Share of $12.25
|
Financial Summary
|
|
|
|
|
|
|||||||||
|
Net Revenues
|
Net Earnings
|
EPS
|
||||||||||
|
3Q25 $15.18 billion
|
3Q25 $ 4.10 billion
|
3Q25 $12.25
|
||||||||||
|
3Q25 YTD $44.83 billion
|
3Q25 YTD $12.56 billion
|
3Q25 YTD $37.33
|
|
Annualized ROE1
|
Book Value Per Share
|
|||||||
|
3Q25 14.2%
|
3Q25 $353.79
|
|||||||
|
3Q25 YTD 14.6%
|
YTD Growth 5.1%
|
|||||||
NEW YORK, October 14, 2025 – The Goldman Sachs Group, Inc. (NYSE: GS) today reported net revenues of $15.18 billion and net earnings of $4.10 billion for the third quarter ended September 30, 2025. Net revenues were $44.83 billion and net earnings were $12.56 billion for the first nine months of 2025.
Diluted earnings per common share (EPS) was $12.25 for the third quarter of 2025 compared with $8.40 for the third quarter of 2024 and $10.91 for the second quarter of 2025, and was $37.33 for the first nine months of 2025 compared with $28.64 for the first nine months of 2024.
Annualized return on average common shareholders’ equity (ROE)1 was 14.2% for the third quarter of 2025 and 14.6% for the first nine months of 2025.
Book value per common share increased by 1.2% during the third quarter of 2025 and by 5.1% during the first nine months of 2025 to $353.79.
1
Goldman Sachs Reports
Third Quarter 2025 Earnings Results
Net Revenues
| Net revenues were $15.18 billion for the third quarter of 2025, 20% higher than the third quarter of 2024 and 4% higher than the second quarter of 2025. The increase compared with the third quarter of 2024 reflected higher net revenues across all segments. |
Net Revenues
|
|||
|
$15.18 billion
|
||||
| Global Banking & Markets |
| Net revenues in Global Banking & Markets were $10.12 billion for the third quarter of 2025, 18% higher than the third quarter of 2024 and essentially unchanged compared with the second quarter of 2025.
Investment banking fees were $2.66 billion, 42% higher than the third quarter of 2024, primarily due to significantly higher net revenues in Advisory, reflecting a significant increase in completed mergers and acquisitions volumes, and in Debt underwriting, primarily driven by an increase in leveraged finance activity. Net revenues in Equity underwriting were higher, primarily driven by initial public offerings. The firm’s Investment banking fees backlog2 was essentially unchanged compared with the end of the second quarter of 2025 and higher compared with the end of 2024.
Net revenues in Fixed Income, Currency and Commodities (FICC) were $3.47 billion, 17% higher than the third quarter of 2024, primarily reflecting significantly higher net revenues in FICC intermediation, due to significantly higher net revenues in interest rate products and higher net revenues in mortgages and commodities, partially offset by significantly lower net revenues in currencies and lower net revenues in credit products. Net revenues in FICC financing were higher, primarily driven by mortgages and structured lending.
Net revenues in Equities were $3.74 billion, 7% higher than the third quarter of 2024, due to significantly higher net revenues in Equities financing, primarily driven by prime financing, partially offset by lower net revenues in Equities intermediation, driven by cash products.
Net revenues in Other were $250 million, compared with $227 million for the third quarter of 2024. |
Global Banking & Markets
|
|||
|
$10.12 billion
|
||||
| Advisory |
$ 1.40 billion |
|||
| Equity underwriting |
$ 465 million |
|||
| Debt underwriting |
$ 788 million |
|||
| Investment banking fees |
$ 2.66 billion |
|||
|
FICC intermediation |
$ 2.44 billion |
|||
| FICC financing |
$ 1.04 billion |
|||
| FICC |
$ 3.47 billion |
|||
|
Equities intermediation |
$ 2.02 billion |
|||
| Equities financing |
$ 1.72 billion |
|||
| Equities |
$ 3.74 billion |
|||
|
Other |
$ 250 million |
|||
2
Goldman Sachs Reports
Third Quarter 2025 Earnings Results
| Asset & Wealth Management |
| Net revenues in Asset & Wealth Management were $4.40 billion for the third quarter of 2025, 17% higher than the third quarter of 2024 and 16% higher than the second quarter of 2025. The increase compared with the third quarter of 2024 primarily reflected higher Management and other fees and significantly higher net revenues in Private banking and lending.
The increase in Management and other fees primarily reflected the impact of higher average assets under supervision. The increase in Private banking and lending net revenues were primarily driven by the payment of interest on a previously impaired loan. Net revenues in Debt investments were higher, reflecting net mark-ups compared with net mark-downs in the prior year period, partially offset by lower net interest income due to a reduction in the debt investments balance sheet. |
Asset & Wealth Management
|
|||
|
$4.40 billion
|
||||
|
Management and other fees |
$ 2.95 billion |
|||
| Incentive fees |
$ 77 million |
|||
| Private banking and lending |
$ 1.06 billion |
|||
| Equity investments |
$ 116 million |
|||
| Debt investments |
$ 204 million |
|||
| Platform Solutions |
| Net revenues in Platform Solutions were $670 million for the third quarter of 2025, 71% higher than the third quarter of 2024 and 2% lower than the second quarter of 2025.
Consumer platforms net revenues were significantly higher, primarily reflecting a net loss in the prior year period related to the General Motors credit card program that was transferred to held for sale. Transaction banking and other net revenues were higher, primarily reflecting mark-downs in the prior year period related to the seller financing loan portfolio that was transferred to held for sale. |
Platform Solutions
|
|||
|
$670 million
|
||||
|
Consumer platforms |
$599 million | |||
| Transaction banking and other
|
$ 71 million
|
|||
Provision for Credit Losses
| Provision for credit losses was $339 million for the third quarter of 2025, compared with $397 million for the third quarter of 2024 and $384 million for the second quarter of 2025. Provisions for the third quarter of 2025 primarily reflected net provisions related to the credit card portfolio (driven by net charge-offs). Provisions for the third quarter of 2024 reflected net provisions related to the credit card portfolio (primarily driven by net charge-offs), partially offset by a net benefit related to the wholesale portfolio (driven by recoveries on previously impaired loans). |
Provision for Credit Losses
|
|||
|
$339 million
|
||||
3
Goldman Sachs Reports
Third Quarter 2025 Earnings Results
Operating Expenses
| Operating expenses were $9.45 billion for the third quarter of 2025, 14% higher than the third quarter of 2024 and 2% higher than the second quarter of 2025. The firm’s efficiency ratio2 was 62.1% for the first nine months of 2025, compared with 64.3% for the first nine months of 2024.
The increase in operating expenses compared with the third quarter of 2024 primarily reflected increases in compensation and benefits expenses (reflecting improved operating performance), transaction based expenses, charitable contributions to Goldman Sachs Gives (in other expenses) and net provisions for litigation and regulatory proceedings (in other expenses).
Net provisions for litigation and regulatory proceedings were $131 million for the third quarter of 2025, compared with $41 million for the third quarter of 2024.
Headcount increased 5% compared with the end of the second quarter of 2025, reflecting the timing of campus hires.
|
Operating Expenses
|
|||||
|
$9.45 billion
|
||||||
|
YTD Efficiency Ratio |
||||||
|
62.1%
|
||||||
Provision for Taxes
| The effective income tax rate for the first nine months of 2025 was 21.5%, up from 20.2% for the first half of 2025, primarily due to a decrease in the impact of tax benefits on the settlement of employee share-based awards.3 |
YTD Effective Tax Rate
|
|||
|
21.5%
|
||||
Other Matters
| ◾ On October 13, 2025, the Board of Directors of The Goldman Sachs Group, Inc. declared a dividend of $4.00 per common share to be paid on December 30, 2025 to common shareholders of record on December 2, 2025.
◾ During the quarter, the firm returned $3.25 billion of capital to common shareholders, including $2.00 billion of common share repurchases (2.8 million shares at an average cost of $718.60) and $1.25 billion of common stock dividends.2
◾ Global core liquid assets2 averaged $481 billion for the third quarter of 2025, compared with an average of $462 billion for the second quarter of 2025. |
Declared Quarterly Dividend Per Common Share
|
|||
|
$4.00
|
||||
|
Common Share Repurchases
|
||||
|
2.8 million shares for $2.00 billion
|
||||
|
Average GCLA
|
||||
|
$481 billion
|
||||
4
Goldman Sachs Reports
Third Quarter 2025 Earnings Results
The Goldman Sachs Group, Inc. is a leading global financial institution that delivers a broad range of financial services to a large and diversified client base that includes corporations, financial institutions, governments and individuals. Founded in 1869, the firm is headquartered in New York and maintains offices in all major financial centers around the world.
| Cautionary Note Regarding Forward-Looking Statements |
This press release contains “forward-looking statements” within the meaning of the safe harbor provisions of the U.S. Private Securities Litigation Reform Act of 1995. Forward-looking statements are not historical facts or statements of current conditions, but instead represent only the firm’s beliefs regarding future events, many of which, by their nature, are inherently uncertain and outside of the firm’s control. It is possible that the firm’s actual results, financial condition and liquidity may differ, possibly materially, from the anticipated results, financial condition and liquidity in these forward-looking statements. For information about some of the risks and important factors that could affect the firm’s future results, financial condition and liquidity, see “Risk Factors” in Part I, Item 1A of the firm’s Annual Report on Form 10-K for the year ended December 31, 2024.
Information regarding the firm’s assets under supervision, capital ratios, risk-weighted assets, supplementary leverage ratio, balance sheet data, global core liquid assets and VaR consists of preliminary estimates. These estimates are forward-looking statements and are subject to change, possibly materially, as the firm completes its financial statements.
Statements about the firm’s Investment banking fees backlog and future results also may constitute forward-looking statements. Such statements are subject to the risk that transactions may be modified or may not be completed at all, and related net revenues may not be realized or may be materially less than expected. Important factors that could have such a result include, for underwriting transactions, a decline or weakness in general economic conditions, changes in international trade policies, including the imposition of tariffs, an outbreak or worsening of hostilities, volatility in the securities markets or an adverse development with respect to the issuer of the securities and, for financial advisory transactions, a decline in the securities markets, an inability to obtain adequate financing, an adverse development with respect to a party to the transaction or a failure to obtain a required regulatory approval. For information about other important factors that could adversely affect the firm’s Investment banking fees, see “Risk Factors” in Part I, Item 1A of the firm’s Annual Report on Form 10-K for the year ended December 31, 2024.
| Conference Call |
A conference call to discuss the firm’s financial results, outlook and related matters will be held at 9:30 am (ET). The call will be open to the public. Members of the public who would like to listen to the conference call should dial 1-800-289-0459 (in the U.S.) or 1-323-794-2095 (outside the U.S.) passcode number 7042022. The number should be dialed at least 10 minutes prior to the start of the conference call. The conference call will also be accessible as an audio webcast through the Investor Relations section of the firm’s website, www.goldmansachs.com/investor-relations. There is no charge to access the call. For those unable to listen to the live broadcast, a replay will be available on the firm’s website beginning approximately three hours after the event. Please direct any questions regarding obtaining access to the conference call to Goldman Sachs Investor Relations, via e-mail, at gs-investor-relations@gs.com.
5
Goldman Sachs Reports
Third Quarter 2025 Earnings Results
The Goldman Sachs Group, Inc. and Subsidiaries
Segment Net Revenues (unaudited)
$ in millions
| THREE MONTHS ENDED | % CHANGE FROM | |||||||||||||||||||||||
| SEPTEMBER 30, 2025 |
JUNE 30, 2025 |
SEPTEMBER 30, 2024 |
JUNE 30, 2025 |
SEPTEMBER 30, 2024 |
||||||||||||||||||||
|
GLOBAL BANKING & MARKETS
|
||||||||||||||||||||||||
|
Advisory
|
|
$ 1,404 |
|
|
$ 1,174 |
|
|
$ 875 |
|
|
20 % |
|
|
60 % |
|
|||||||||
| Equity underwriting
|
|
465
|
|
|
428
|
|
|
385
|
|
|
9
|
|
|
21
|
|
|||||||||
| Debt underwriting
|
|
788
|
|
|
589
|
|
|
605
|
|
|
34
|
|
|
30
|
|
|||||||||
| Investment banking fees |
2,657 | 2,191 | 1,865 | 21 | 42 | |||||||||||||||||||
| FICC intermediation
|
|
2,437
|
|
|
2,423
|
|
|
2,013
|
|
|
1
|
|
|
21
|
|
|||||||||
| FICC financing
|
|
1,035
|
|
|
1,044
|
|
|
949
|
|
|
(1)
|
|
|
9
|
|
|||||||||
| FICC |
3,472 | 3,467 | 2,962 | – | 17 | |||||||||||||||||||
| Equities intermediation
|
|
2,020
|
|
|
2,595
|
|
|
2,209
|
|
|
(22)
|
|
|
(9)
|
|
|||||||||
| Equities financing
|
|
1,716
|
|
|
1,706
|
|
|
1,291
|
|
|
1
|
|
|
33
|
|
|||||||||
| Equities |
3,736 | 4,301 | 3,500 | (13) | 7 | |||||||||||||||||||
| Other |
|
250
|
|
|
161
|
|
|
227
|
|
|
55
|
|
|
10
|
|
|||||||||
|
Net revenues
|
|
10,115
|
|
|
10,120
|
|
|
8,554
|
|
|
–
|
|
|
18
|
|
|||||||||
|
ASSET & WEALTH MANAGEMENT
|
||||||||||||||||||||||||
|
Management and other fees
|
|
2,945
|
|
|
2,805
|
|
|
2,619
|
|
|
5
|
|
|
12
|
|
|||||||||
| Incentive fees
|
|
77
|
|
|
102
|
|
|
85
|
|
|
(25)
|
|
|
(9)
|
|
|||||||||
| Private banking and lending
|
|
1,057
|
|
|
789
|
|
|
756
|
|
|
34
|
|
40 | |||||||||||
| Equity investments
|
|
116
|
|
|
(1)
|
|
|
116
|
|
|
N.M.
|
|
|
–
|
|
|||||||||
| Debt investments
|
|
204
|
|
|
83
|
|
|
178
|
|
|
146
|
|
|
15
|
|
|||||||||
|
Net revenues
|
|
4,399
|
|
|
3,778
|
|
|
3,754
|
|
|
16
|
|
|
17
|
|
|||||||||
|
PLATFORM SOLUTIONS
|
||||||||||||||||||||||||
|
Consumer platforms
|
|
599
|
|
|
623
|
|
|
333
|
|
|
(4)
|
|
|
80
|
|
|||||||||
| Transaction banking and other
|
|
71
|
|
|
62
|
|
|
58
|
|
|
15
|
|
|
22
|
|
|||||||||
|
Net revenues
|
|
670
|
|
|
685
|
|
|
391
|
|
|
(2)
|
|
|
71
|
|
|||||||||
|
Total net revenues
|
|
$ 15,184
|
|
|
$ 14,583
|
|
|
$ 12,699
|
|
|
4
|
|
|
20
|
|
|||||||||
|
Geographic Net Revenues (unaudited)2 |
|
|||||||||||||||||||||||
| $ in millions | ||||||||||||||||||||||||
| THREE MONTHS ENDED | ||||||||||||||||||||||||
| SEPTEMBER 30, 2025 |
JUNE 30, 2025 |
SEPTEMBER 30, 2024 |
||||||||||||||||||||||
|
Americas |
$ 10,020 | $ 8,982 | $ 8,045 | |||||||||||||||||||||
|
EMEA |
|
3,163 |
|
|
3,811 |
|
|
3,076 |
|
|||||||||||||||
|
Asia |
|
2,001 |
|
|
1,790 |
|
|
1,578 |
|
|||||||||||||||
|
Total net revenues
|
|
$ 15,184
|
|
|
$ 14,583
|
|
|
$ 12,699
|
|
|||||||||||||||
| Americas |
66% | 62% | 63% | |||||||||||||||||||||
|
EMEA |
|
21% |
|
|
26% |
|
|
24% |
|
|||||||||||||||
|
Asia
|
|
13%
|
|
|
12%
|
|
|
13%
|
|
|||||||||||||||
|
Total
|
|
100%
|
|
|
100%
|
|
|
100%
|
|
|||||||||||||||
6
Goldman Sachs Reports
Third Quarter 2025 Earnings Results
The Goldman Sachs Group, Inc. and Subsidiaries
Segment Net Revenues (unaudited)
$ in millions
| NINE MONTHS ENDED | % CHANGE FROM | |||||||||||||||
| SEPTEMBER 30, 2025 |
SEPTEMBER 30, 2024 |
SEPTEMBER 30, 2024 |
||||||||||||||
|
GLOBAL BANKING & MARKETS
|
||||||||||||||||
| Advisory |
$ 3,370 | $ 2,574 | 31 % | |||||||||||||
|
Equity underwriting
|
|
1,263
|
|
|
1,178
|
|
|
7
|
|
|||||||
| Debt underwriting
|
|
2,129
|
|
|
1,926
|
|
11 | |||||||||
| Investment banking fees |
6,762 | 5,678 | 19 | |||||||||||||
| FICC intermediation
|
|
8,250
|
|
|
7,814
|
|
|
6
|
|
|||||||
| FICC financing
|
|
3,093
|
|
|
2,651
|
|
|
17
|
|
|||||||
| FICC |
11,343 | 10,465 | 8 | |||||||||||||
| Equities intermediation
|
|
7,162
|
|
|
5,984
|
|
|
20
|
|
|||||||
| Equities financing
|
|
5,067
|
|
|
3,996
|
|
|
27
|
|
|||||||
| Equities |
12,229 | 9,980 | 23 | |||||||||||||
| Other
|
|
608
|
|
|
341
|
|
|
78
|
|
|||||||
|
Net revenues
|
|
30,942
|
|
|
26,464
|
|
|
17
|
|
|||||||
|
ASSET & WEALTH MANAGEMENT
|
||||||||||||||||
| Management and other fees
|
|
8,453
|
|
|
7,607
|
|
|
11
|
|
|||||||
| Incentive fees
|
|
308
|
|
|
219
|
|
|
41
|
|
|||||||
| Private banking and lending
|
|
2,571
|
|
|
2,145
|
|
|
20
|
|
|||||||
| Equity investments
|
|
110
|
|
|
630
|
|
|
(83)
|
|
|||||||
| Debt investments
|
|
414
|
|
|
820
|
|
|
(50)
|
|
|||||||
|
Net revenues
|
|
11,856
|
|
|
11,421
|
|
|
4
|
|
|||||||
|
PLATFORM SOLUTIONS
|
||||||||||||||||
| Consumer platforms |
1,833 | 1,550 | 18 | |||||||||||||
|
Transaction banking and other
|
|
198
|
|
|
208
|
|
|
(5)
|
|
|||||||
|
Net revenues
|
|
2,031
|
|
|
1,758
|
|
|
16
|
|
|||||||
|
Total net revenues
|
|
$ 44,829
|
|
|
$ 39,643
|
|
|
13
|
|
|||||||
|
Geographic Net Revenues (unaudited)2 |
|
|||||||||||||||
| $ in millions | ||||||||||||||||
| NINE MONTHS ENDED | ||||||||||||||||
| SEPTEMBER 30, 2025 |
SEPTEMBER 30, 2024 |
|||||||||||||||
|
Americas
|
$ 28,868 | $ 25,351 | ||||||||||||||
| EMEA
|
|
10,465 |
|
|
9,477 |
|
||||||||||
| Asia
|
|
5,496
|
|
|
4,815
|
|
||||||||||
|
Total net revenues
|
|
$ 44,829
|
|
|
$ 39,643
|
|
||||||||||
| Americas
|
65% | 64% | ||||||||||||||
| EMEA
|
|
23% |
|
|
24% |
|
||||||||||
| Asia
|
|
12%
|
|
|
12%
|
|
||||||||||
|
Total
|
|
100%
|
|
|
100%
|
|
||||||||||
7
Goldman Sachs Reports
Third Quarter 2025 Earnings Results
The Goldman Sachs Group, Inc. and Subsidiaries
Consolidated Statements of Earnings (unaudited)2
In millions, except per share amounts and headcount
| THREE MONTHS ENDED | % CHANGE FROM | |||||||||||||||||||||||
| SEPTEMBER 30, 2025 |
JUNE 30, 2025 |
SEPTEMBER 30, 2024 |
JUNE 30, 2025 |
SEPTEMBER 30, 2024 |
||||||||||||||||||||
|
REVENUES |
||||||||||||||||||||||||
|
Investment banking |
$ 2,659 | $ 2,194 | $ 1,864 | 21 % | 43 % | |||||||||||||||||||
|
Investment management |
2,952 | 2,837 | 2,649 | 4 | 11 | |||||||||||||||||||
|
Commissions and fees |
1,110 | 1,201 | 873 | (8) | 27 | |||||||||||||||||||
|
Market making |
3,868 | 4,733 | 4,127 | (18) | (6) | |||||||||||||||||||
|
Other principal transactions |
743 | 514 | 839 | 45 | (11) | |||||||||||||||||||
|
Total non-interest revenues |
11,332 | 11,479 | 10,352 | (1) | 9 | |||||||||||||||||||
| Interest income |
20,822 | 19,789 | 21,448 | 5 | (3) | |||||||||||||||||||
|
Interest expense |
16,970 | 16,685 | 19,101 | 2 | (11) | |||||||||||||||||||
|
Net interest income |
3,852 | 3,104 | 2,347 | 24 | 64 | |||||||||||||||||||
|
Total net revenues |
15,184 | 14,583 | 12,699 | 4 | 20 | |||||||||||||||||||
|
Provision for credit losses |
339 | 384 | 397 | (12) | (15) | |||||||||||||||||||
|
OPERATING EXPENSES |
||||||||||||||||||||||||
|
Compensation and benefits |
4,680 | 4,685 | 4,122 | - | 14 | |||||||||||||||||||
|
Transaction based |
1,968 | 1,955 | 1,701 | 1 | 16 | |||||||||||||||||||
|
Market development |
171 | 167 | 159 | 2 | 8 | |||||||||||||||||||
|
Communications and technology |
545 | 530 | 498 | 3 | 9 | |||||||||||||||||||
|
Depreciation and amortization |
531 | 618 | 621 | (14) | (14) | |||||||||||||||||||
|
Occupancy |
242 | 234 | 242 | 3 | - | |||||||||||||||||||
|
Professional fees |
432 | 440 | 400 | (2) | 8 | |||||||||||||||||||
|
Other expenses |
884 | 612 | 572 | 44 | 55 | |||||||||||||||||||
|
Total operating expenses |
9,453 | 9,241 | 8,315 | 2 | 14 | |||||||||||||||||||
| Pre-tax earnings |
5,392 | 4,958 | 3,987 | 9 | 35 | |||||||||||||||||||
|
Provision for taxes |
1,294 | 1,235 | 997 | 5 | 30 | |||||||||||||||||||
|
Net earnings |
4,098 | 3,723 | 2,990 | 10 | 37 | |||||||||||||||||||
|
Preferred stock dividends |
238 | 250 | 210 | (5) | 13 | |||||||||||||||||||
|
Net earnings applicable to common shareholders |
$ 3,860 | $ 3,473 | $ 2,780 | 11 | 39 | |||||||||||||||||||
|
EARNINGS PER COMMON SHARE |
||||||||||||||||||||||||
|
Basic2 |
$ 12.42 | $ 11.03 | $ 8.52 | 13 % | 46 % | |||||||||||||||||||
|
Diluted |
$ 12.25 | $ 10.91 | $ 8.40 | 12 | 46 | |||||||||||||||||||
|
AVERAGE COMMON SHARES |
||||||||||||||||||||||||
|
Basic |
309.6 | 313.7 | 324.8 | (1) | (5) | |||||||||||||||||||
|
Diluted |
315.0 | 318.3 | 330.8 | (1) | (5) | |||||||||||||||||||
|
SELECTED DATA AT PERIOD-END |
||||||||||||||||||||||||
|
Common shareholders’ equity |
$ 109,249 | $ 108,943 | $ 107,947 | - | 1 | |||||||||||||||||||
|
Basic shares2
|
|
308.8
|
|
|
311.5
|
|
|
324.2
|
|
|
(1)
|
|
|
(5)
|
|
|||||||||
| Book value per common share |
$ 353.79 | $ 349.74 | $ 332.96 | 1 | 6 | |||||||||||||||||||
| Headcount |
|
48,300
|
|
|
45,900
|
|
|
46,400
|
|
|
5
|
|
|
4
|
|
|||||||||
8
Goldman Sachs Reports
Third Quarter 2025 Earnings Results
The Goldman Sachs Group, Inc. and Subsidiaries
Consolidated Statements of Earnings (unaudited)2
In millions, except per share amounts
| NINE MONTHS ENDED | % CHANGE FROM | |||||||||||||||||||
| SEPTEMBER 30, 2025 |
SEPTEMBER 30, 2024 |
SEPTEMBER 30, 2024 |
||||||||||||||||||
|
REVENUES
|
||||||||||||||||||||
| Investment banking |
$ | 6,769 | $ | 5,682 | 19 | % | ||||||||||||||
| Investment management |
8,548 | 7,673 | 11 | |||||||||||||||||
| Commissions and fees |
3,537 | 3,001 | 18 | |||||||||||||||||
| Market making |
14,324 | 14,557 | (2) | |||||||||||||||||
| Other principal transactions |
1,800 | 3,019 | (40) | |||||||||||||||||
|
Total non-interest revenues |
34,978 | 33,932 | 3 | |||||||||||||||||
| Interest income |
59,994 | 61,443 | (2) | |||||||||||||||||
| Interest expense |
50,143 | 55,732 | (10) | |||||||||||||||||
|
Net interest income |
9,851 | 5,711 | 72 | |||||||||||||||||
|
Total net revenues |
44,829 | 39,643 | 13 | |||||||||||||||||
|
Provision for credit losses |
1,010 | 997 | 1 | |||||||||||||||||
|
OPERATING EXPENSES |
||||||||||||||||||||
| Compensation and benefits |
14,241 | 12,947 | 10 | |||||||||||||||||
| Transaction based |
5,773 | 4,852 | 19 | |||||||||||||||||
| Market development |
494 | 465 | 6 | |||||||||||||||||
| Communications and technology |
1,581 | 1,468 | 8 | |||||||||||||||||
| Depreciation and amortization |
1,655 | 1,894 | (13) | |||||||||||||||||
| Occupancy |
709 | 733 | (3) | |||||||||||||||||
| Professional fees |
1,296 | 1,177 | 10 | |||||||||||||||||
| Other expenses |
2,073 | 1,970 | 5 | |||||||||||||||||
|
Total operating expenses |
27,822 | 25,506 | 9 | |||||||||||||||||
|
Pre-tax earnings |
15,997 | 13,140 | 22 | |||||||||||||||||
| Provision for taxes |
3,438 | 2,975 | 16 | |||||||||||||||||
|
Net earnings |
12,559 | 10,165 | 24 | |||||||||||||||||
| Preferred stock dividends |
643 | 563 | 14 | |||||||||||||||||
|
Net earnings applicable to common shareholders |
$ | 11,916 | $ | 9,602 | 24 | |||||||||||||||
|
EARNINGS PER COMMON SHARE |
||||||||||||||||||||
| Basic2 |
$ | 37.75 | $ | 28.98 | 30 | % | ||||||||||||||
| Diluted |
$ | 37.33 | $ | 28.64 | 30 | |||||||||||||||
|
AVERAGE COMMON SHARES |
||||||||||||||||||||
| Basic |
314.6 | 330.0 | (5) | |||||||||||||||||
|
Diluted |
319.2 | 335.3 | (5) | |||||||||||||||||
9
Goldman Sachs Reports
Third Quarter 2025 Earnings Results
The Goldman Sachs Group, Inc. and Subsidiaries
Condensed Consolidated Balance Sheets (unaudited)2
$ in billions
| AS OF | ||||||||||||||||||||||
| SEPTEMBER 30, 2025 |
JUNE 30, 2025 |
|||||||||||||||||||||
|
ASSETS
|
||||||||||||||||||||||
| Cash and cash equivalents |
$ 169 | $ 153 | ||||||||||||||||||||
| Collateralized agreements |
347 | 367 | ||||||||||||||||||||
| Customer and other receivables |
177 | 182 | ||||||||||||||||||||
| Trading assets |
653 | 628 | ||||||||||||||||||||
| Investments |
204 | 202 | ||||||||||||||||||||
| Loans |
222 | 217 | ||||||||||||||||||||
| Other assets |
36 | 36 | ||||||||||||||||||||
|
Total assets |
$ 1,808 | $ 1,785 | ||||||||||||||||||||
|
LIABILITIES AND SHAREHOLDERS’ EQUITY |
||||||||||||||||||||||
| Deposits |
$ 490 | $ 466 | ||||||||||||||||||||
| Collateralized financings |
300 | 311 | ||||||||||||||||||||
| Customer and other payables |
257 | 259 | ||||||||||||||||||||
| Trading liabilities |
262 | 253 | ||||||||||||||||||||
| Unsecured short-term borrowings |
73 | 69 | ||||||||||||||||||||
| Unsecured long-term borrowings |
277 | 280 | ||||||||||||||||||||
| Other liabilities |
25 | 23 | ||||||||||||||||||||
|
Total liabilities |
1,684 | 1,661 | ||||||||||||||||||||
| Shareholders’ equity
|
|
124
|
|
|
124
|
|
||||||||||||||||
|
Total liabilities and shareholders’ equity
|
|
$ 1,808
|
|
|
$ 1,785
|
|
||||||||||||||||
|
Capital Ratios and Supplementary Leverage Ratio (unaudited)2 $ in billions
|
|
|||||||||||||||||||||
| AS OF | ||||||||||||||||||||||
| SEPTEMBER 30, 2025 |
JUNE 30, 2025 |
|||||||||||||||||||||
| Common equity tier 1 capital |
$ 103.7 | $ 102.6 | ||||||||||||||||||||
|
STANDARDIZED CAPITAL RULES |
||||||||||||||||||||||
| Risk-weighted assets |
$ 722 | $ 709 | ||||||||||||||||||||
| Common equity tier 1 capital ratio |
14.4% | 14.5% | ||||||||||||||||||||
|
ADVANCED CAPITAL RULES |
||||||||||||||||||||||
| Risk-weighted assets |
$ 682 | $ 672 | ||||||||||||||||||||
| Common equity tier 1 capital ratio |
15.2% | 15.3% | ||||||||||||||||||||
|
SUPPLEMENTARY LEVERAGE RATIO |
||||||||||||||||||||||
| Supplementary leverage ratio
|
|
5.2%
|
|
|
5.3%
|
|
||||||||||||||||
|
Average Daily VaR (unaudited)2 $ in millions
|
|
|||||||||||||||||||||
| THREE MONTHS ENDED | ||||||||||||||||||||||
| SEPTEMBER 30, 2025 |
JUNE 30, 2025 |
|||||||||||||||||||||
|
RISK CATEGORIES |
||||||||||||||||||||||
| Interest rates |
$ 72 | $ 79 | ||||||||||||||||||||
| Equity prices |
51 | 48 | ||||||||||||||||||||
| Currency rates |
19 | 23 | ||||||||||||||||||||
| Commodity prices |
20 | 15 | ||||||||||||||||||||
| Diversification effect |
(71) | (67) | ||||||||||||||||||||
|
Total |
$ 91 | $ 98 | ||||||||||||||||||||
10
Goldman Sachs Reports
Third Quarter 2025 Earnings Results
The Goldman Sachs Group, Inc. and Subsidiaries
Assets Under Supervision (unaudited)2
$ in billions
| AS OF | ||||||||||||||||||||||||
| SEPTEMBER 30, 2025 |
JUNE 30, 2025 |
SEPTEMBER 30, 2024 |
||||||||||||||||||||||
|
ASSET CLASS
|
||||||||||||||||||||||||
| Alternative investments
|
$ 374 | $ 355 | $ 328 | |||||||||||||||||||||
| Equity
|
914 | 857 | 780 | |||||||||||||||||||||
| Fixed income
|
|
1,313
|
|
|
1,253
|
|
|
1,220
|
|
|||||||||||||||
|
Total long-term AUS
|
|
2,601
|
|
|
2,465
|
|
|
2,328
|
|
|||||||||||||||
| Liquidity products
|
|
851
|
|
|
828
|
|
|
775
|
|
|||||||||||||||
|
Total AUS
|
|
$ 3,452
|
|
|
$ 3,293
|
|
|
$ 3,103
|
|
|||||||||||||||
| THREE MONTHS ENDED | ||||||||||||||||||||||||
| SEPTEMBER 30, 2025 |
JUNE 30, 2025 |
SEPTEMBER 30, 2024 |
||||||||||||||||||||||
|
Beginning balance
|
|
$ 3,293
|
|
|
$ 3,173
|
|
|
$ 2,934
|
|
|||||||||||||||
| Net inflows / (outflows):
|
||||||||||||||||||||||||
| Alternative investments
|
12 | 9 | 9 | |||||||||||||||||||||
| Equity
|
5 | 8 | 4 | |||||||||||||||||||||
| Fixed income
|
39 | – | 16 | |||||||||||||||||||||
|
Total long-term AUS net inflows / (outflows)
|
|
56
|
|
|
17
|
|
|
29
|
|
|||||||||||||||
| Liquidity products
|
|
23
|
|
|
(12)
|
|
|
37
|
|
|||||||||||||||
|
Total AUS net inflows / (outflows)
|
|
79
|
|
|
5
|
|
|
66
|
|
|||||||||||||||
| Net market appreciation / (depreciation)
|
|
80
|
|
|
115
|
|
|
103
|
|
|||||||||||||||
|
Ending balance
|
|
$ 3,452
|
|
|
$ 3,293
|
|
|
$ 3,103
|
|
|||||||||||||||
11
Goldman Sachs Reports
Third Quarter 2025 Earnings Results
|
Footnotes |
|
|
| 1. | Annualized ROE is calculated by dividing annualized net earnings applicable to common shareholders by average monthly common shareholders’ equity. |
| The table below presents average common shareholders’ equity: |
| AVERAGE FOR THE | ||||||||||||
| Unaudited, $ in millions
|
THREE MONTHS ENDED SEPTEMBER 30, 2025 |
NINE MONTHS ENDED SEPTEMBER 30, 2025 |
||||||||||
| Total shareholders’ equity
|
$ 123,507 | $ 123,444 | ||||||||||
| Preferred stock
|
|
(15,153)
|
|
|
(14,963)
|
|
||||||
|
Common shareholders’ equity
|
|
$ 108,354
|
|
|
$ 108,481
|
|
||||||
| 2. | For information about the following items, see the referenced sections in Part I, Item 2 “Management’s Discussion and Analysis of Financial Condition and Results of Operations” in the firm’s Quarterly Report on Form 10-Q for the period ended June 30, 2025: (i) Investment banking fees backlog – see “Results of Operations – Global Banking & Markets,” (ii) assets under supervision – see “Results of Operations – Asset & Wealth Management – Assets Under Supervision,” (iii) efficiency ratio – see “Results of Operations – Operating Expenses,” (iv) share repurchase program – see “Capital Management and Regulatory Capital – Capital Management,” (v) global core liquid assets – see “Risk Management – Liquidity Risk Management,” (vi) basic shares – see “Balance Sheet and Funding Sources – Balance Sheet Analysis and Metrics” and (vii) VaR – see “Risk Management – Market Risk Management.” |
| For information about the following items, see the referenced sections in Part I, Item 1 “Financial Statements (Unaudited)” in the firm’s Quarterly Report on Form 10-Q for the period ended June 30, 2025: (i) risk-based capital ratios and the supplementary leverage ratio – see Note 20 “Regulation and Capital Adequacy,” (ii) geographic net revenues – see Note 25 “Business Segments” and (iii) unvested share-based awards that have non-forfeitable rights to dividends or dividend equivalents in calculating basic EPS – see Note 21 “Earnings Per Common Share.” |
| For information about net interest income and total non-interest revenues, see the firm’s Form 8-K dated January 15, 2025. |
| Represents a preliminary estimate for the third quarter of 2025 for the firm’s assets under supervision, capital ratios, risk-weighted assets, supplementary leverage ratio, balance sheet data, global core liquid assets and VaR. These may be revised in the firm’s Quarterly Report on Form 10-Q for the period ended September 30, 2025. |
| 3. | The impact of tax benefits related to employee share-based awards was a reduction to provision for taxes for the first nine months of 2025 of approximately $610 million, which increased diluted EPS by $1.91 and annualized ROE by 0.7 percentage points. |
12

Exhibit 99.2 Third Quarter 2025 Earnings Results Presentation October 14, 2025
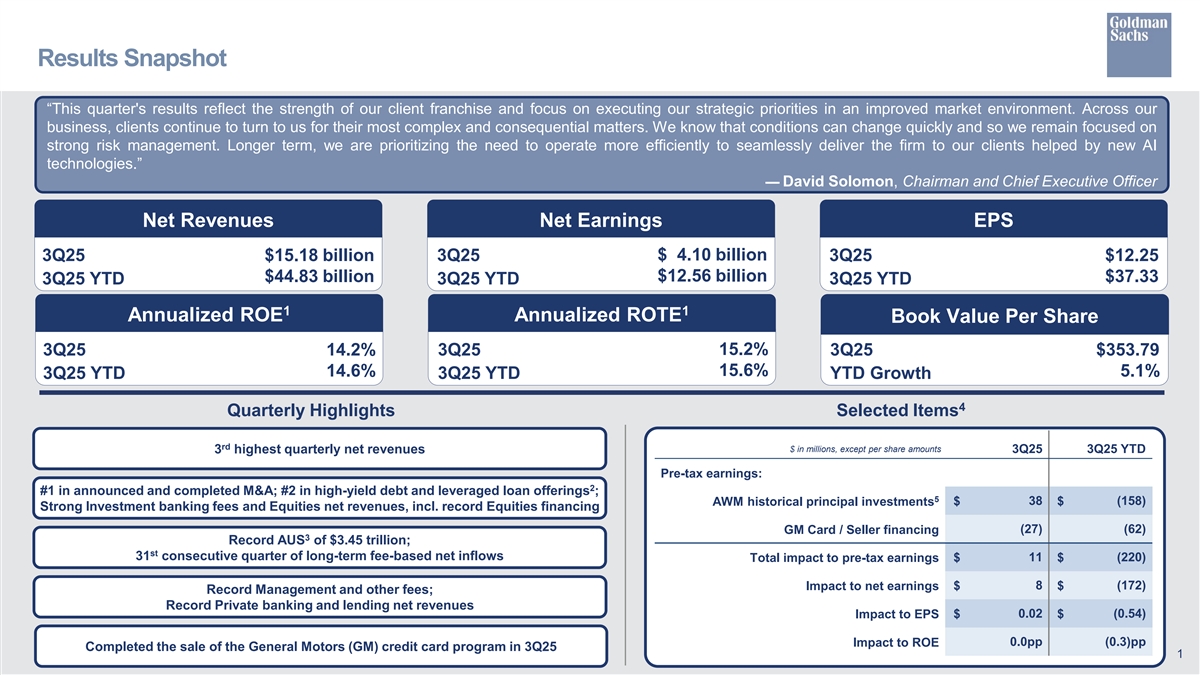
Results Snapshot “This quarter's results reflect the strength of our client franchise and focus on executing our strategic priorities in an improved market environment. Across our business, clients continue to turn to us for their most complex and consequential matters. We know that conditions can change quickly and so we remain focused on strong risk management. Longer term, we are prioritizing the need to operate more efficiently to seamlessly deliver the firm to our clients helped by new AI technologies.” — David Solomon, Chairman and Chief Executive Officer Net Revenues Net Earnings EPS 3Q25 $15.18 billion 3Q25 $ 4.10 billion 3Q25 $12.25 $12.56 billion $44.83 billion $37.33 3Q25 YTD 3Q25 YTD 3Q25 YTD 1 1 Annualized ROE Annualized ROTE Book Value Per Share 15.2% 3Q25 14.2% 3Q25 3Q25 $353.79 14.6% 15.6% 5.1% 3Q25 YTD 3Q25 YTD YTD Growth 4 Quarterly Highlights Selected Items rd $ in millions, except per share amounts 3 highest quarterly net revenues 3Q25 3Q25 YTD Pre-tax earnings: 2 #1 in announced and completed M&A; #2 in high-yield debt and leveraged loan offerings ; 5 $ 38 $ (158) AWM historical principal investments Strong Investment banking fees and Equities net revenues, incl. record Equities financing GM Card / Seller financing (27) (62) 3 Record AUS of $3.45 trillion; st 31 consecutive quarter of long-term fee-based net inflows 11 (220) Total impact to pre-tax earnings $ $ Impact to net earnings $ 8 $ (172) Record Management and other fees; Record Private banking and lending net revenues 0.02 (0.54) Impact to EPS $ $ 0.0pp (0.3)pp Impact to ROE Completed the sale of the General Motors (GM) credit card program in 3Q25 1
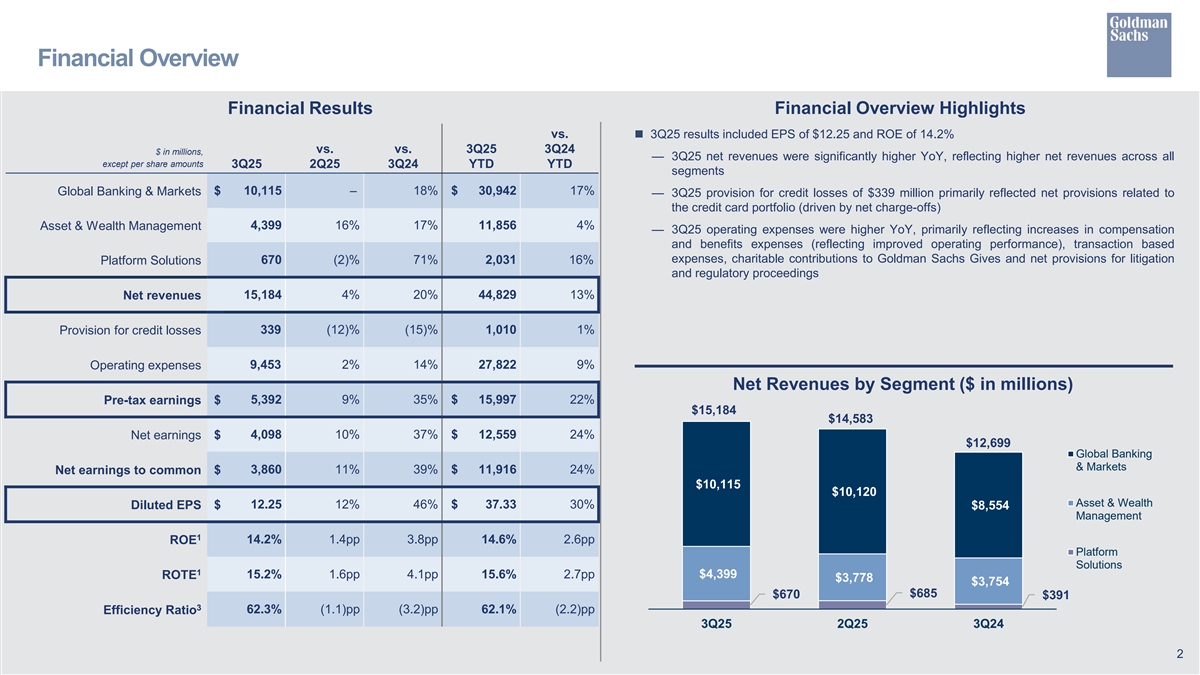
Financial Overview Financial Results Financial Overview Highlights vs.n 3Q25 results included EPS of $12.25 and ROE of 14.2% vs. vs. 3Q25 3Q24 $ in millions, — 3Q25 net revenues were significantly higher YoY, reflecting higher net revenues across all except per share amounts 3Q25 2Q25 3Q24 YTD YTD segments $ 10,115 – 18% $ 30,942 17% Global Banking & Markets — 3Q25 provision for credit losses of $339 million primarily reflected net provisions related to the credit card portfolio (driven by net charge-offs) Asset & Wealth Management 4,399 16% 17% 11,856 4% — 3Q25 operating expenses were higher YoY, primarily reflecting increases in compensation and benefits expenses (reflecting improved operating performance), transaction based expenses, charitable contributions to Goldman Sachs Gives and net provisions for litigation 670 (2)% 71% 2,031 16% Platform Solutions and regulatory proceedings 15,184 4% 20% 44,829 13% Net revenues 339 (12)% (15)% 1,010 1% Provision for credit losses 9,453 2% 14% 27,822 9% Operating expenses Net Revenues by Segment ($ in millions) 5,392 9% 35% $ 15,997 22% Pre-tax earnings $ $15,184 $14,583 $ 4,098 10% 37% $ 12,559 24% Net earnings $12,699 Global Banking & Markets $ 3,860 11% 39% $ 11,916 24% Net earnings to common $10,115 $10,120 Asset & Wealth $ 12.25 12% 46% $ 37.33 30% Diluted EPS $8,554 Management 1 ROE 14.2% 1.4pp 3.8pp 14.6% 2.6pp Platform Solutions 1 ROTE 15.2% 1.6pp 4.1pp 15.6% 2.7pp $4,399 $3,778 $3,754 $685 $670 $391 3 62.3% (1.1)pp (3.2)pp 62.1% (2.2)pp Efficiency Ratio 3Q25 2Q25 3Q24 2
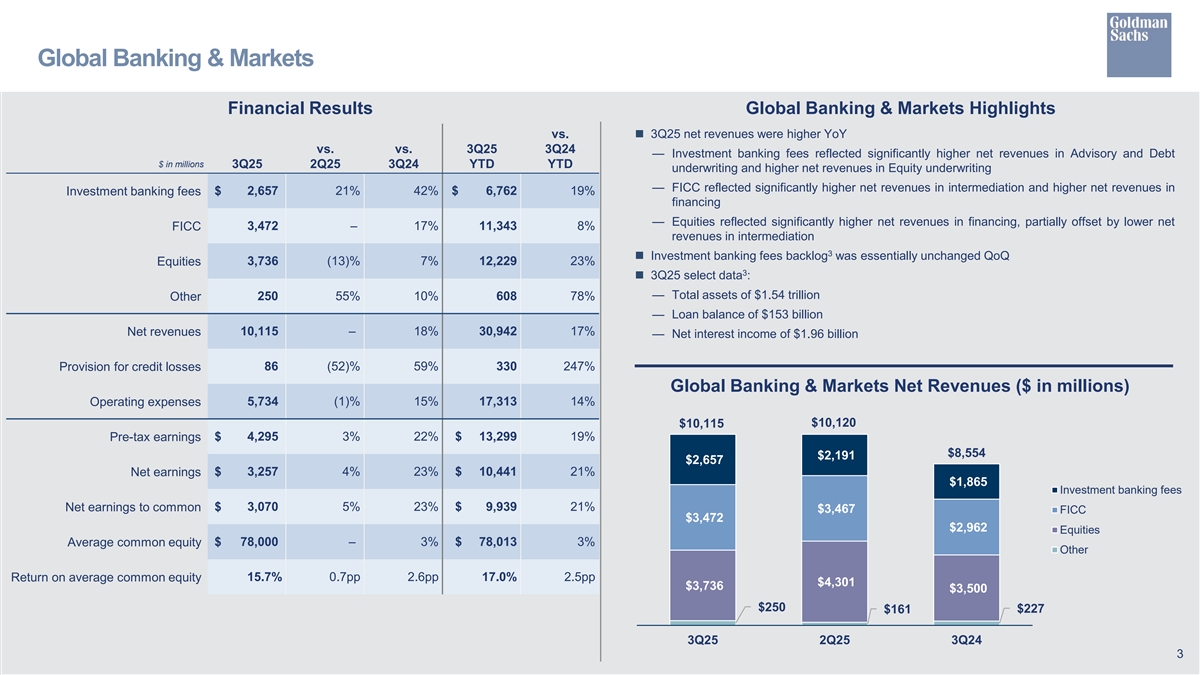
Global Banking & Markets Financial Results Global Banking & Markets Highlights vs.n 3Q25 net revenues were higher YoY vs. vs. 3Q25 3Q24 — Investment banking fees reflected significantly higher net revenues in Advisory and Debt $ in millions 3Q25 2Q25 3Q24 YTD YTD underwriting and higher net revenues in Equity underwriting — FICC reflected significantly higher net revenues in intermediation and higher net revenues in $ 2,657 21% 42% $ 6,762 19% Investment banking fees financing — Equities reflected significantly higher net revenues in financing, partially offset by lower net 3,472 – 17% 11,343 8% FICC revenues in intermediation 3 n Investment banking fees backlog was essentially unchanged QoQ 3,736 (13)% 7% 12,229 23% Equities 3 n 3Q25 select data : — Total assets of $1.54 trillion 250 55% 10% 608 78% Other — Loan balance of $153 billion 10,115 – 18% 30,942 17% Net revenues — Net interest income of $1.96 billion Provision for credit losses 86 (52)% 59% 330 247% Global Banking & Markets Net Revenues ($ in millions) Operating expenses 5,734 (1)% 15% 17,313 14% $10,115 $10,120 Pre-tax earnings $ 4,295 3% 22% $ 13,299 19% $8,554 $2,191 $2,657 Net earnings $ 3,257 4% 23% $ 10,441 21% $1,865 Investment banking fees Net earnings to common $ 3,070 5% 23% $ 9,939 21% $3,467 FICC $3,472 $2,962 Equities Average common equity $ 78,000 – 3% $ 78,013 3% Other Return on average common equity 15.7% 0.7pp 2.6pp 17.0% 2.5pp $4,301 $3,736 $3,500 $250 $227 $161 3Q25 2Q25 3Q24 3
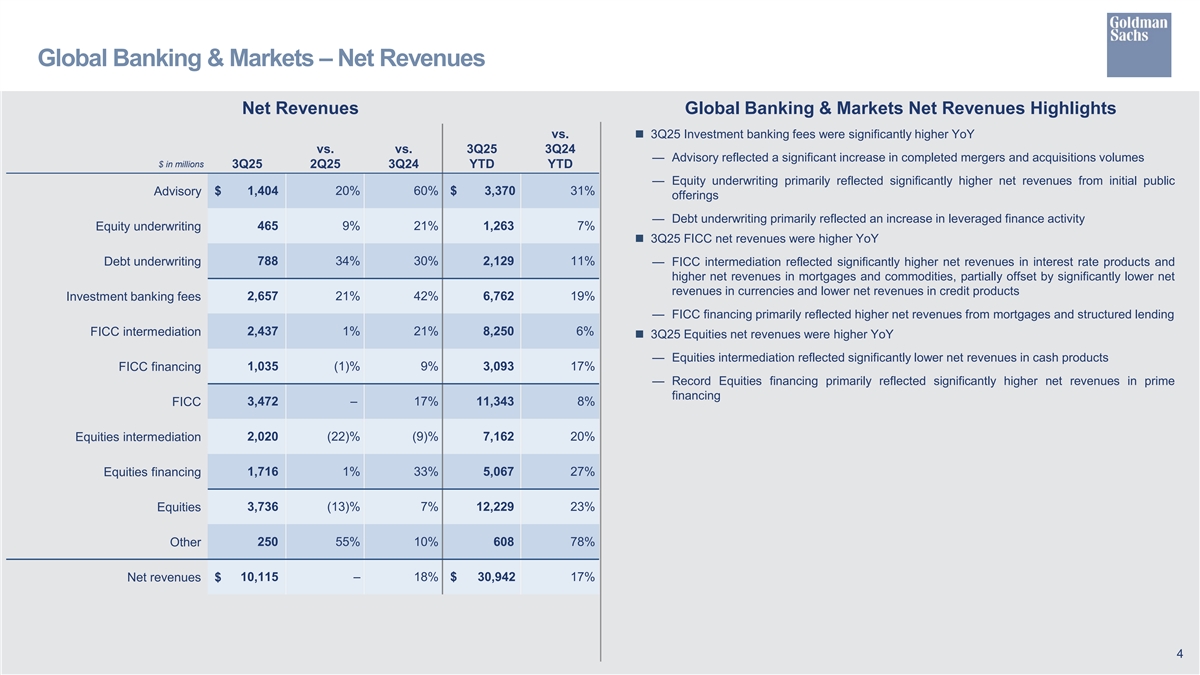
Global Banking & Markets – Net Revenues Net Revenues Global Banking & Markets Net Revenues Highlights vs.n 3Q25 Investment banking fees were significantly higher YoY vs. vs. 3Q25 3Q24 — Advisory reflected a significant increase in completed mergers and acquisitions volumes $ in millions 3Q25 2Q25 3Q24 YTD YTD — Equity underwriting primarily reflected significantly higher net revenues from initial public $ 1,404 20% 60% $ 3,370 31% Advisory offerings — Debt underwriting primarily reflected an increase in leveraged finance activity 465 9% 21% 1,263 7% Equity underwriting n 3Q25 FICC net revenues were higher YoY 788 34% 30% 2,129 11% Debt underwriting — FICC intermediation reflected significantly higher net revenues in interest rate products and higher net revenues in mortgages and commodities, partially offset by significantly lower net revenues in currencies and lower net revenues in credit products 2,657 21% 42% 6,762 19% Investment banking fees — FICC financing primarily reflected higher net revenues from mortgages and structured lending 2,437 1% 21% 8,250 6% FICC intermediation n 3Q25 Equities net revenues were higher YoY — Equities intermediation reflected significantly lower net revenues in cash products FICC financing 1,035 (1)% 9% 3,093 17% — Record Equities financing primarily reflected significantly higher net revenues in prime financing FICC 3,472 – 17% 11,343 8% Equities intermediation 2,020 (22)% (9)% 7,162 20% Equities financing 1,716 1% 33% 5,067 27% Equities 3,736 (13)% 7% 12,229 23% Other 250 55% 10% 608 78% Net revenues $ 10,115 – 18% $ 30,942 17% 4
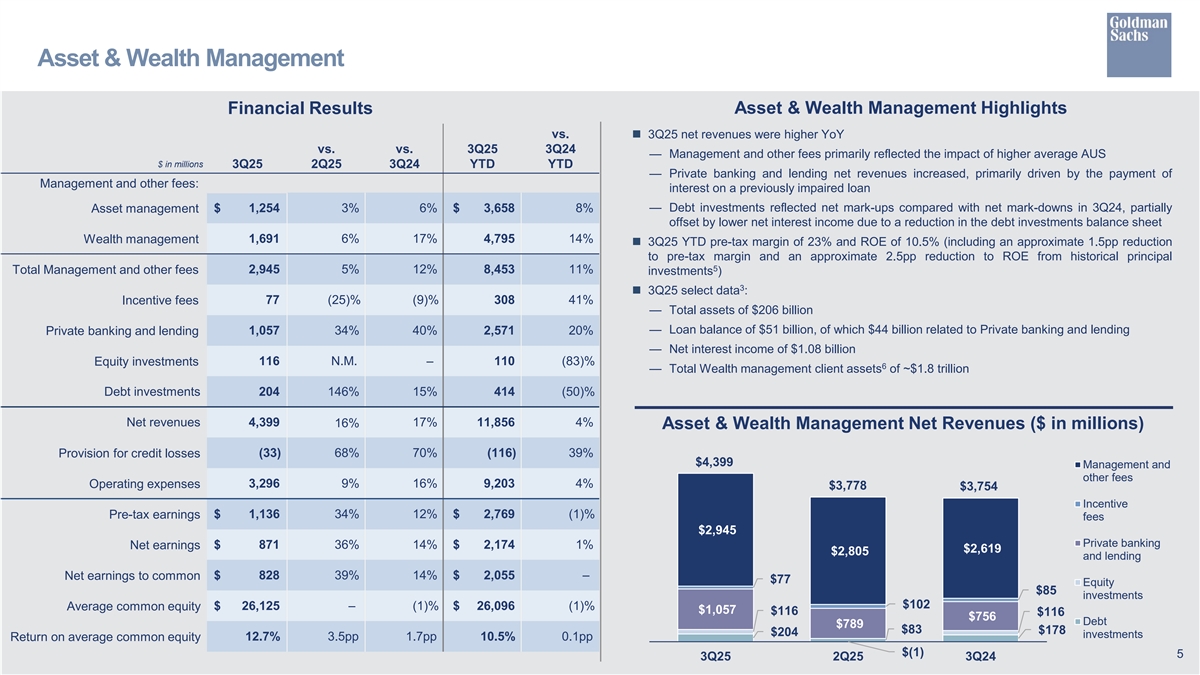
Asset & Wealth Management Financial Results Asset & Wealth Management Highlights vs.n 3Q25 net revenues were higher YoY vs. vs. 3Q25 3Q24 — Management and other fees primarily reflected the impact of higher average AUS $ in millions 3Q25 2Q25 3Q24 YTD YTD — Private banking and lending net revenues increased, primarily driven by the payment of Management and other fees: interest on a previously impaired loan — Debt investments reflected net mark-ups compared with net mark-downs in 3Q24, partially Asset management $ 1,254 3% 6% $ 3,658 8% offset by lower net interest income due to a reduction in the debt investments balance sheet 1,691 6% 17% 4,795 14% Wealth management n 3Q25 YTD pre-tax margin of 23% and ROE of 10.5% (including an approximate 1.5pp reduction to pre-tax margin and an approximate 2.5pp reduction to ROE from historical principal 5 Total Management and other fees 2,945 5% 12% 8,453 11% investments ) 3 n 3Q25 select data : 77 (25)% (9)% 308 41% Incentive fees — Total assets of $206 billion — Loan balance of $51 billion, of which $44 billion related to Private banking and lending Private banking and lending 1,057 34% 40% 2,571 20% — Net interest income of $1.08 billion 116 N.M. – 110 (83)% Equity investments 6 — Total Wealth management client assets of ~$1.8 trillion Debt investments 204 146% 15% 414 (50)% Net revenues 4,399 17% 11,856 4% 16% Asset & Wealth Management Net Revenues ($ in millions) Provision for credit losses (33) 68% 70% (116) 39% $4,399 Management and other fees 3,296 9% 16% 9,203 4% Operating expenses $3,778 $3,754 Incentive Pre-tax earnings $ 1,136 34% 12% $ 2,769 (1)% fees $2,945 Private banking $ 871 36% 14% $ 2,174 1% Net earnings $2,619 $2,805 and lending Net earnings to common $ 828 39% 14% $ 2,055 – $77 Equity $85 investments $102 $ 26,125 – (1)% $ 26,096 (1)% Average common equity $1,057 $116 $116 $756 Debt $789 $83 $178 $204 investments Return on average common equity 12.7% 3.5pp 1.7pp 10.5% 0.1pp $(1) 5 3Q25 2Q25 3Q24
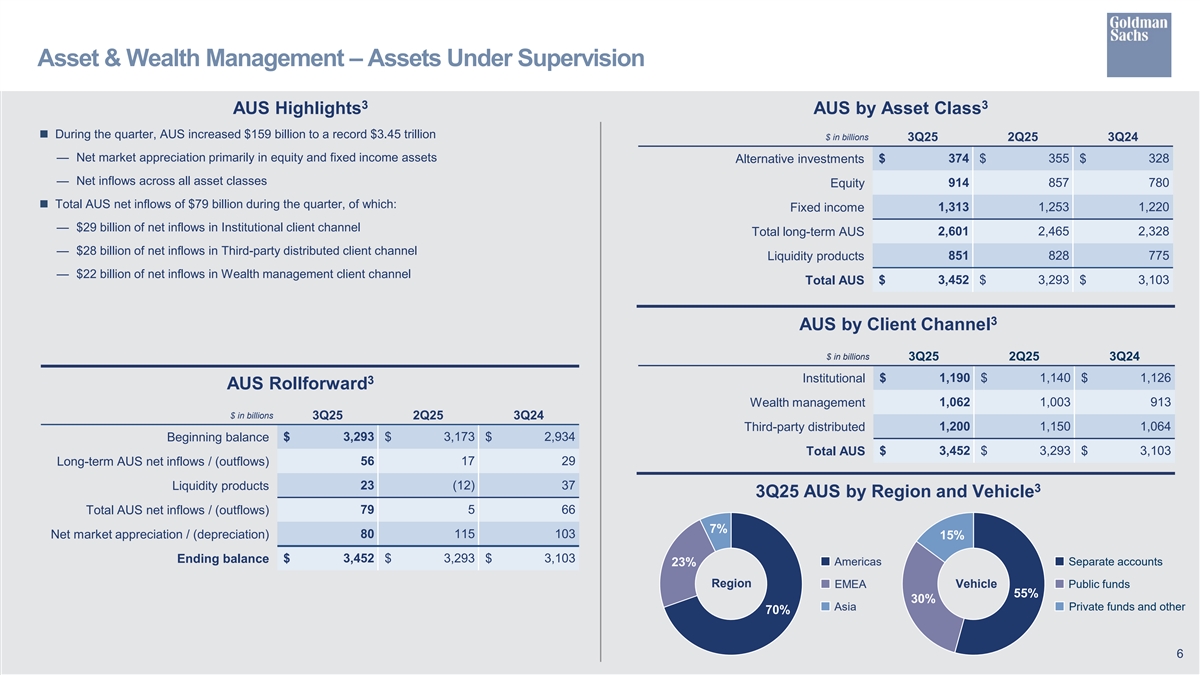
Asset & Wealth Management – Assets Under Supervision 3 3 AUS Highlights AUS by Asset Class n During the quarter, AUS increased $159 billion to a record $3.45 trillion $ in billions 3Q25 2Q25 3Q24 — Net market appreciation primarily in equity and fixed income assets $ 374 $ 355 $ 328 Alternative investments — Net inflows across all asset classes Equity 914 857 780 n Total AUS net inflows of $79 billion during the quarter, of which: Fixed income 1,313 1,253 1,220 — $29 billion of net inflows in Institutional client channel Total long-term AUS 2,601 2,465 2,328 — $28 billion of net inflows in Third-party distributed client channel Liquidity products 851 828 775 — $22 billion of net inflows in Wealth management client channel 3,452 3,293 3,103 Total AUS $ $ $ 3 AUS by Client Channel $ in billions 3Q25 2Q25 3Q24 Institutional $ 1,190 $ 1,140 $ 1,126 3 AUS Rollforward 1,062 1,003 913 Wealth management $ in billions 3Q25 2Q25 3Q24 Third-party distributed 1,200 1,150 1,064 Beginning balance $ 3,293 $ 3,173 $ 2,934 Total AUS $ 3,452 $ 3,293 $ 3,103 56 17 29 Long-term AUS net inflows / (outflows) Liquidity products 23 (12) 37 3 3Q25 AUS by Region and Vehicle 79 5 66 Total AUS net inflows / (outflows) 7% Net market appreciation / (depreciation) 80 115 103 15% Ending balance $ 3,452 $ 3,293 $ 3,103 23% Americas Separate accounts Region Vehicle EMEA Public funds 55% 30% Asia Private funds and other 70% 6
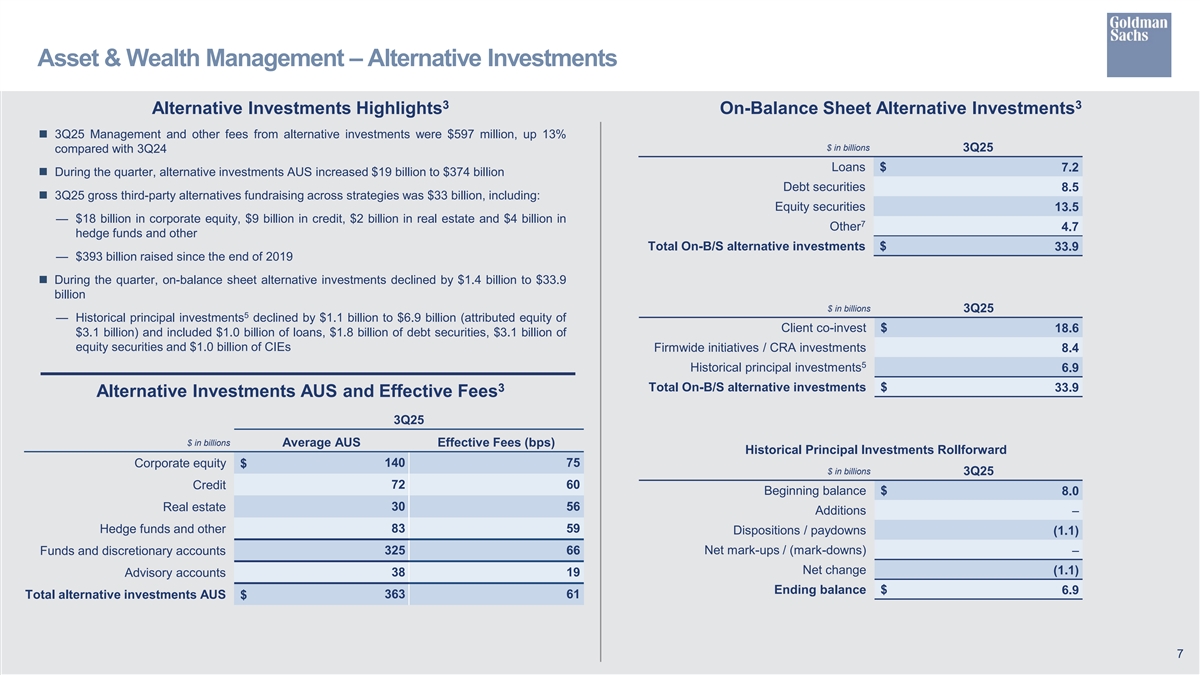
Asset & Wealth Management – Alternative Investments 3 3 Alternative Investments Highlights On-Balance Sheet Alternative Investments n 3Q25 Management and other fees from alternative investments were $597 million, up 13% $ in billions 3Q25 compared with 3Q24 Loans $ 7.2 n During the quarter, alternative investments AUS increased $19 billion to $374 billion Debt securities 8.5 n 3Q25 gross third-party alternatives fundraising across strategies was $33 billion, including: Equity securities 13.5 — $18 billion in corporate equity, $9 billion in credit, $2 billion in real estate and $4 billion in 7 Other 4.7 hedge funds and other Total On-B/S alternative investments $ 33.9 — $393 billion raised since the end of 2019 n During the quarter, on-balance sheet alternative investments declined by $1.4 billion to $33.9 billion $ in billions 3Q25 5 — Historical principal investments declined by $1.1 billion to $6.9 billion (attributed equity of Client co-invest $ 18.6 $3.1 billion) and included $1.0 billion of loans, $1.8 billion of debt securities, $3.1 billion of equity securities and $1.0 billion of CIEs Firmwide initiatives / CRA investments 8.4 5 Historical principal investments 6.9 Total On-B/S alternative investments $ 3 33.9 Alternative Investments AUS and Effective Fees 3Q25 $ in billions Average AUS Effective Fees (bps) Historical Principal Investments Rollforward Corporate equity $ 140 75 $ in billions 3Q25 72 60 Credit Beginning balance $ 8.0 Real estate 30 56 Additions – 83 59 Hedge funds and other Dispositions / paydowns (1.1) Funds and discretionary accounts 325 66 Net mark-ups / (mark-downs) – Net change (1.1) 38 19 Advisory accounts Ending balance $ 6.9 Total alternative investments AUS $ 363 61 7
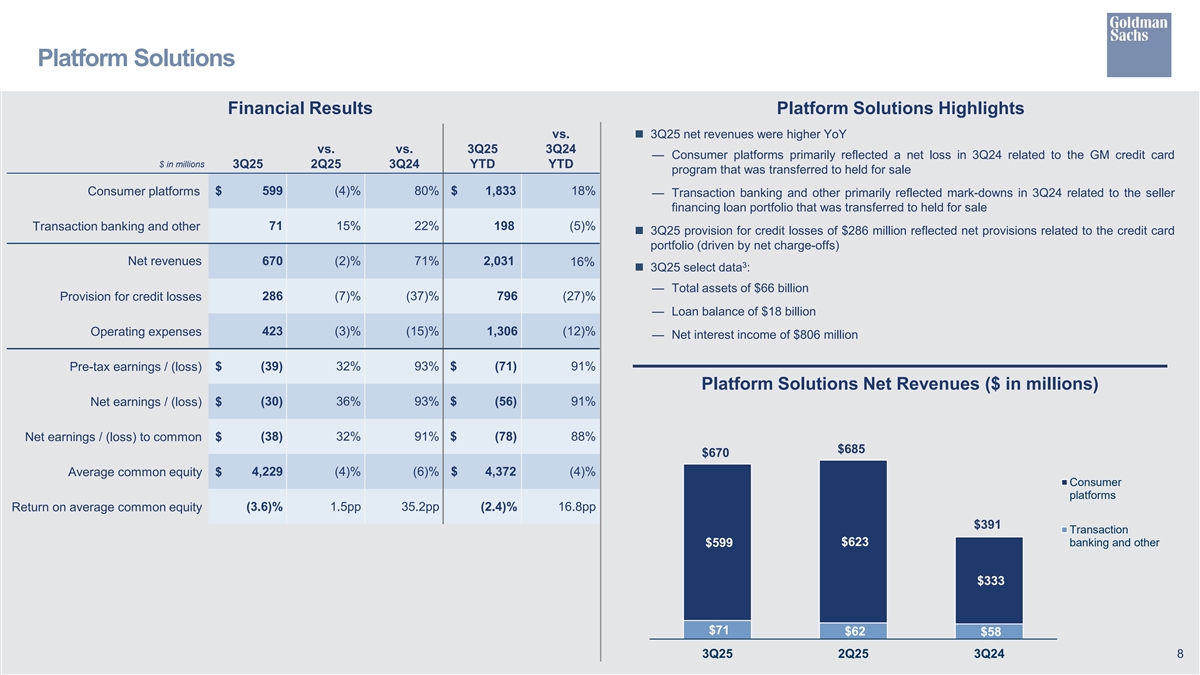
Platform Solutions Financial Results Platform Solutions Highlights vs.n 3Q25 net revenues were higher YoY vs. vs. 3Q25 3Q24 — Consumer platforms primarily reflected a net loss in 3Q24 related to the GM credit card $ in millions 3Q25 2Q25 3Q24 YTD YTD program that was transferred to held for sale $ 599 (4)% 80% $ 1,833 18% Consumer platforms — Transaction banking and other primarily reflected mark-downs in 3Q24 related to the seller financing loan portfolio that was transferred to held for sale 71 15% 22% 198 (5)% Transaction banking and other n 3Q25 provision for credit losses of $286 million reflected net provisions related to the credit card portfolio (driven by net charge-offs) Net revenues 670 (2)% 71% 2,031 16% 3 n 3Q25 select data : — Total assets of $66 billion 286 (7)% (37)% 796 (27)% Provision for credit losses — Loan balance of $18 billion 423 (3)% (15)% 1,306 (12)% Operating expenses — Net interest income of $806 million Pre-tax earnings / (loss) $ (39) 32% 93% $ (71) 91% Platform Solutions Net Revenues ($ in millions) Net earnings / (loss) $ (30) 36% 93% $ (56) 91% Net earnings / (loss) to common $ (38) 32% 91% $ (78) 88% $685 $670 Average common equity $ 4,229 (4)% (6)% $ 4,372 (4)% Consumer platforms Return on average common equity (3.6)% 1.5pp 35.2pp (2.4)% 16.8pp $391 Transaction $623 banking and other $599 $333 $71 $62 $58 3Q25 2Q25 3Q24 8
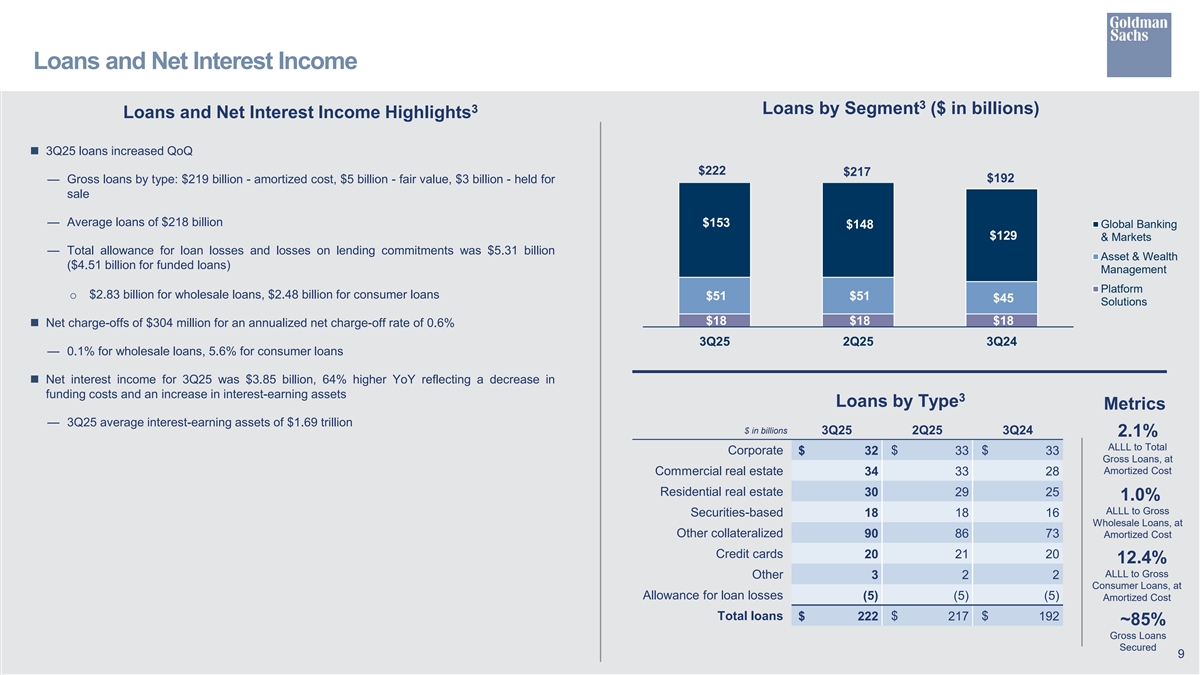
Loans and Net Interest Income 3 3 Loans by Segment ($ in billions) Loans and Net Interest Income Highlights n 3Q25 loans increased QoQ $222 $217 $192 — Gross loans by type: $219 billion - amortized cost, $5 billion - fair value, $3 billion - held for sale — Average loans of $218 billion $153 $148 Global Banking $129 & Markets — Total allowance for loan losses and losses on lending commitments was $5.31 billion Asset & Wealth ($4.51 billion for funded loans) Management Platform o $2.83 billion for wholesale loans, $2.48 billion for consumer loans $51 $51 $45 Solutions $18 $18 $18 n Net charge-offs of $304 million for an annualized net charge-off rate of 0.6% 3Q25 2Q25 3Q24 — 0.1% for wholesale loans, 5.6% for consumer loans n Net interest income for 3Q25 was $3.85 billion, 64% higher YoY reflecting a decrease in funding costs and an increase in interest-earning assets 3 Loans by Type Metrics — 3Q25 average interest-earning assets of $1.69 trillion $ in billions 3Q25 2Q25 3Q24 2.1% ALLL to Total Corporate $ 32 $ 33 $ 33 Gross Loans, at Commercial real estate Amortized Cost 34 33 28 Residential real estate 30 29 25 1.0% ALLL to Gross Securities-based 18 18 16 Wholesale Loans, at Other collateralized 90 86 73 Amortized Cost Credit cards 20 21 20 12.4% ALLL to Gross Other 3 2 2 Consumer Loans, at Allowance for loan losses (5) (5) (5) Amortized Cost Total loans $ $ $ 222 217 192 ~85% Gross Loans Secured 9
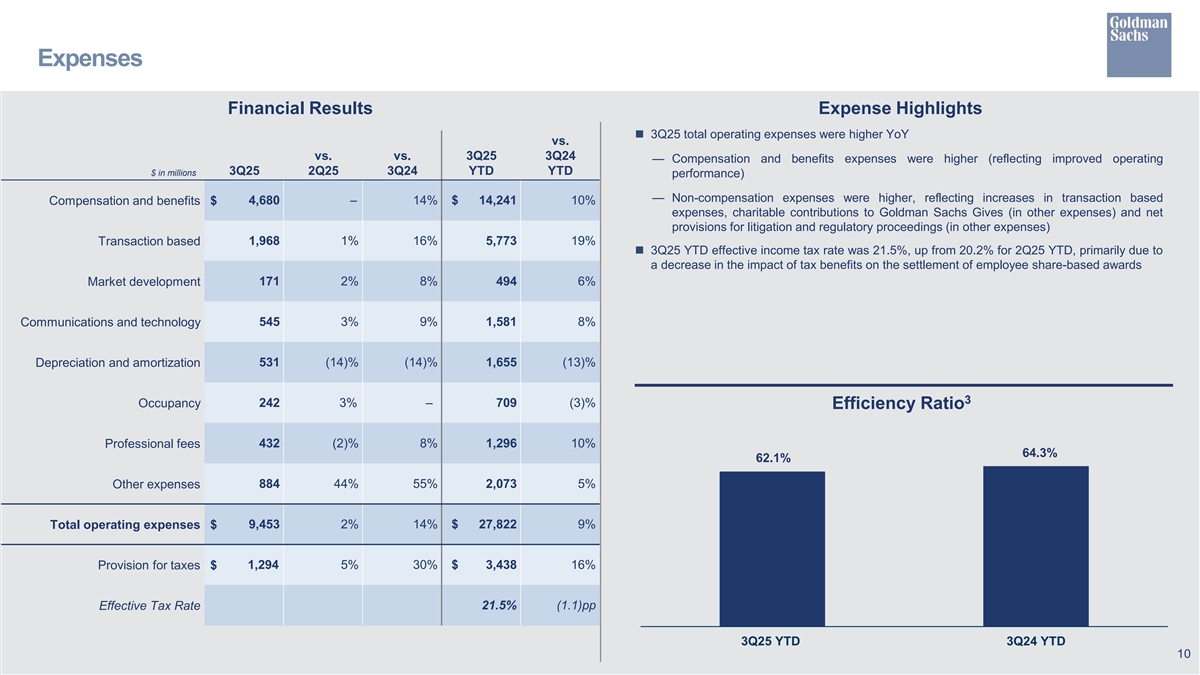
Expenses Financial Results Expense Highlights n 3Q25 total operating expenses were higher YoY vs. vs. vs. 3Q25 3Q24 — Compensation and benefits expenses were higher (reflecting improved operating 3Q25 2Q25 3Q24 YTD YTD $ in millions performance) — Non-compensation expenses were higher, reflecting increases in transaction based Compensation and benefits $ 4,680 – 14% $ 14,241 10% expenses, charitable contributions to Goldman Sachs Gives (in other expenses) and net provisions for litigation and regulatory proceedings (in other expenses) Transaction based 1,968 1% 16% 5,773 19% n 3Q25 YTD effective income tax rate was 21.5%, up from 20.2% for 2Q25 YTD, primarily due to a decrease in the impact of tax benefits on the settlement of employee share-based awards Market development 171 2% 8% 494 6% Communications and technology 545 3% 9% 1,581 8% 531 (14)% (14)% 1,655 (13)% Depreciation and amortization 3 Occupancy 242 3% – 709 (3)% Efficiency Ratio Professional fees 432 (2)% 8% 1,296 10% 64.3% 62.1% Other expenses 884 44% 55% 2,073 5% Total operating expenses $ 9,453 2% 14% $ 27,822 9% 1,294 5% 30% $ 3,438 16% Provision for taxes $ Effective Tax Rate 21.5% (1.1)pp 3Q25 YTD 3Q24 YTD 10
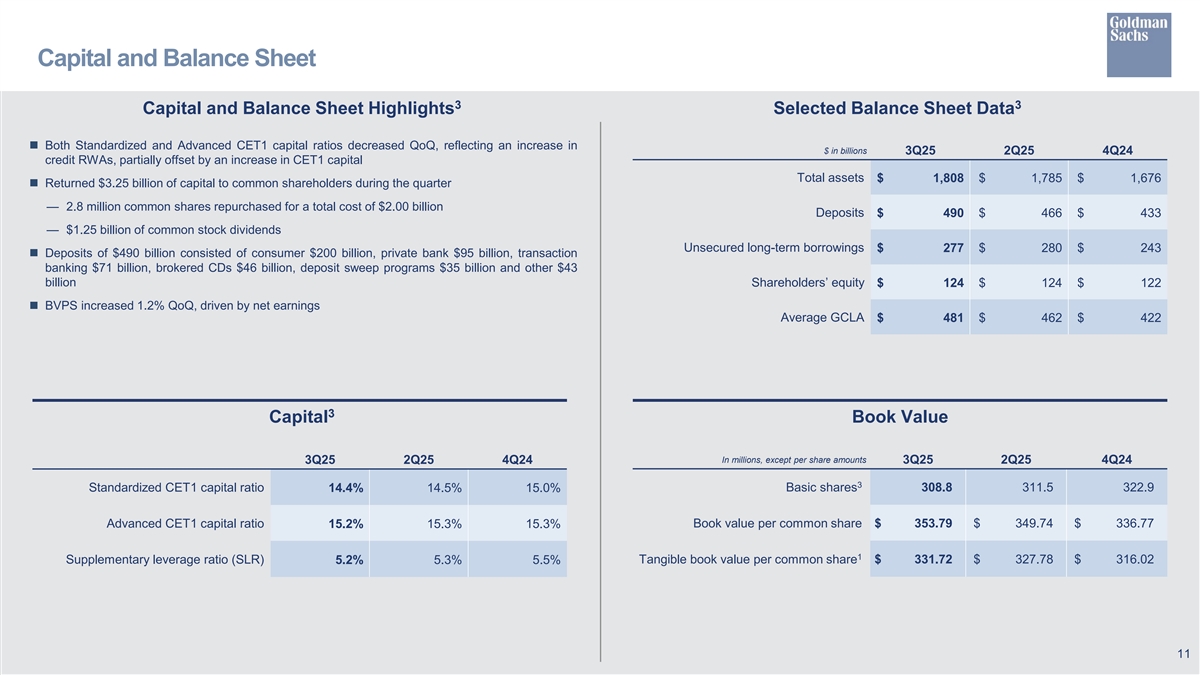
Capital and Balance Sheet 3 3 Capital and Balance Sheet Highlights Selected Balance Sheet Data n Both Standardized and Advanced CET1 capital ratios decreased QoQ, reflecting an increase in $ in billions 3Q25 2Q25 4Q24 credit RWAs, partially offset by an increase in CET1 capital Total assets $ 1,808 $ 1,785 $ 1, 676 n Returned $3.25 billion of capital to common shareholders during the quarter — 2.8 million common shares repurchased for a total cost of $2.00 billion Deposits $ 490 $ 466 $ 433 — $1.25 billion of common stock dividends Unsecured long-term borrowings $ 277 $ 280 $ 243 n Deposits of $490 billion consisted of consumer $200 billion, private bank $95 billion, transaction banking $71 billion, brokered CDs $46 billion, deposit sweep programs $35 billion and other $43 billion Shareholders’ equity $ 124 $ 124 $ 122 n BVPS increased 1.2% QoQ, driven by net earnings Average GCLA $ 481 $ 462 $ 422 3 Capital Book Value In millions, except per share amounts 3Q25 2Q25 4Q24 3Q25 2Q25 4Q24 3 Standardized CET1 capital ratio Basic shares 308.8 311.5 322.9 14.4% 14.5% 15.0% Advanced CET1 capital ratio Book value per common share $ 353.79 $ 349.74 $ 336.77 15.2% 15.3% 15.3% 1 Supplementary leverage ratio (SLR) 5.2% 5.3% 5.5% Tangible book value per common share $ 331.72 $ 327.78 $ 316.02 11
Cautionary Note Regarding Forward-Looking Statements This presentation contains “forward-looking statements” within the meaning of the safe harbor provisions of the U.S. Private Securities Litigation Reform Act of 1995. Forward-looking statements are not historical facts or statements of current conditions, but instead represent only the firm’s beliefs regarding future events, many of which, by their nature, are inherently uncertain and outside of the firm’s control. It is possible that the firm’s actual results, financial condition and liquidity may differ, possibly materially, from the anticipated results, financial condition and liquidity in these forward-looking statements. For information about some of the risks and important factors that could affect the firm’s future results, financial condition and liquidity and the forward-looking statements below, see “Risk Factors” in Part I, Item 1A of the firm’s Annual Report on Form 10-K for the year ended December 31, 2024. Information regarding the firm’s assets under supervision, capital ratios, risk-weighted assets, supplementary leverage ratio, balance sheet data and global core liquid assets (GCLA) consists of preliminary estimates. These estimates are forward-looking statements and are subject to change, possibly materially, as the firm completes its financial statements. Statements regarding (i) forward catalysts, estimated GDP growth or contraction, interest rate and inflation trends and volatility, (ii) the timing, profitability, benefits and other prospective aspects of business initiatives (including via acquisitions and partnerships) and the achievability of targets and goals, (iii) the firm’s expense savings, productivity (including the opportunities presented by artificial intelligence (AI)) and strategic location initiatives, (iv) the future state of the firm’s liquidity and regulatory capital ratios (including the firm’s stress capital buffer (SCB) requirement and G-SIB buffer, and the potential impact of changes to U.S. regulatory capital rules), (v) the firm’s prospective capital distributions (including dividends and repurchases), (vi) the firm’s future effective income tax rate, (vii) the firm’s Investment banking fees backlog and future results, (viii) the firm’s planned benchmark debt issuances, and (ix) the firm’s ability to sell, and the terms of any proposed or pending sale of, Asset & Wealth Management historical principal investments are forward-looking statements. Statements regarding forward catalysts are subject to the risk that the actual operating environment may differ, possibly materially, due to, among other things, changes or the absence of changes in general economic and market conditions, CEO confidence, sponsor activity, productivity gains, and the regulatory backdrop. Statements regarding estimated GDP growth or contraction, interest rate and inflation trends and volatility are subject to the risk that actual GDP growth or contraction, interest rate and inflation trends and volatility may differ, possibly materially, due to, among other things, changes in general economic conditions and monetary, fiscal and trade policy, including tariffs. Statements about the timing, profitability, benefits and other prospective aspects of business (including via acquisitions and partnerships), expense savings and productivity initiatives (including the opportunities presented by AI) and the achievability of targets and goals are based on the firm’s current expectations regarding the firm’s ability to effectively implement these initiatives and achieve these targets and goals and may change, possibly materially, from what is currently expected. Statements about the future state of the firm’s liquidity and regulatory capital ratios (including the firm’s SCB requirement and G-SIB buffer), as well as its prospective capital distributions (including dividends and repurchases), are subject to the risk that the firm’s actual liquidity, regulatory capital ratios and capital distributions may differ, possibly materially, from what is currently expected, including due to, among other things, the results of supervisory stress tests, the finalization of the outstanding proposal on SCB averaging and other potential future changes to regulatory capital rules, which may not be what the firm expects. Statements about the firm’s future effective income tax rate are subject to the risk that the firm’s future effective income tax rate may differ from the anticipated rate indicated, possibly materially, due to, among other things, changes in the tax rates applicable to the firm, the firm’s earnings mix or profitability, the entities in which the firm generates profits and the assumptions made in forecasting the firm’s expected tax rate, and potential future guidance from tax authorities. Statements about the firm’s Investment banking fees backlog and future advisory and capital market results are subject to the risk that advisory and capital market activity may not increase as the firm expects or that transactions may be modified or may not be completed at all, and related net revenues may not be realized or may be materially less than expected. Important factors that could have such a result include, for underwriting transactions, a decline or weakness in general economic conditions, changes in international trade policies, including the imposition of tariffs, an outbreak or worsening of hostilities, volatility in the securities markets or an adverse development with respect to the issuer of the securities and, for financial advisory transactions, a decline in the securities markets, an inability to obtain adequate financing, an adverse development with respect to a party to the transaction or a failure to obtain a required regulatory approval. Statements regarding the firm’s planned benchmark debt issuances are subject to the risk that actual issuances may differ, possibly materially, due to changes in market conditions, business opportunities or the firm’s funding needs. Statements about the proposed sales of Asset & Wealth Management historical principal investments are subject to the risks that buyers may not bid on these assets or bid at levels, or with terms, that are unacceptable to the firm, and that the performance of these investments may deteriorate as a result of the proposed sales. 12
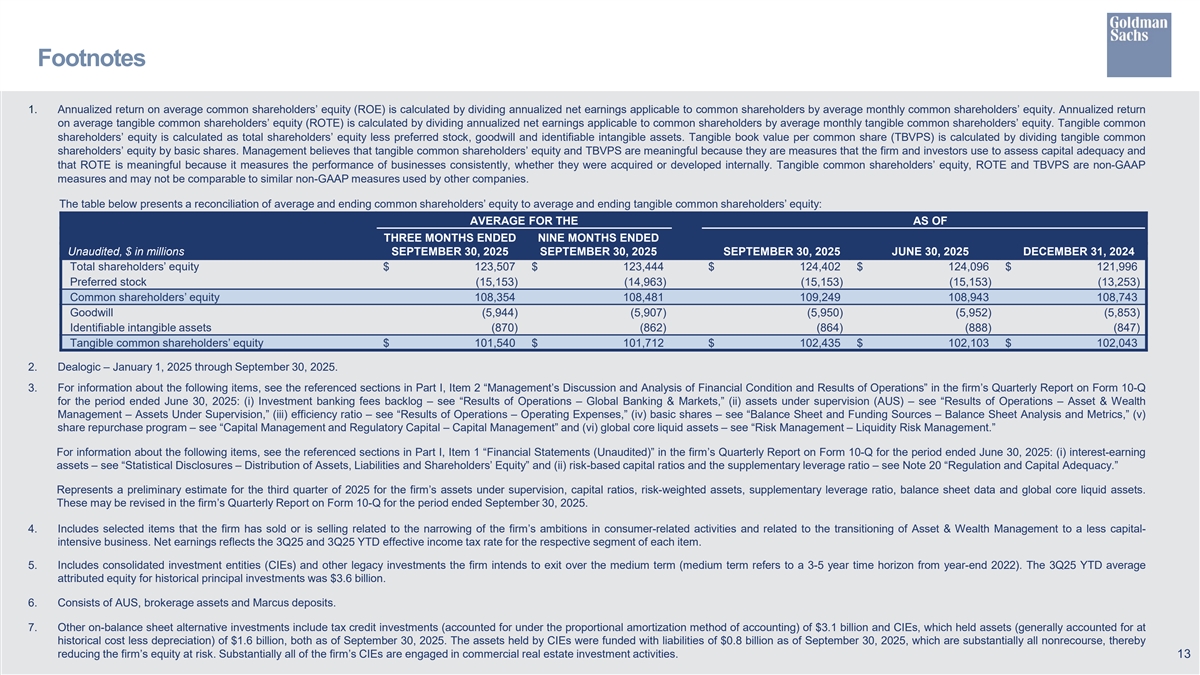
Footnotes 1. Annualized return on average common shareholders’ equity (ROE) is calculated by dividing annualized net earnings applicable to common shareholders by average monthly common shareholders’ equity. Annualized return on average tangible common shareholders’ equity (ROTE) is calculated by dividing annualized net earnings applicable to common shareholders by average monthly tangible common shareholders’ equity. Tangible common shareholders’ equity is calculated as total shareholders’ equity less preferred stock, goodwill and identifiable intangible assets. Tangible book value per common share (TBVPS) is calculated by dividing tangible common shareholders’ equity by basic shares. Management believes that tangible common shareholders’ equity and TBVPS are meaningful because they are measures that the firm and investors use to assess capital adequacy and that ROTE is meaningful because it measures the performance of businesses consistently, whether they were acquired or developed internally. Tangible common shareholders’ equity, ROTE and TBVPS are non-GAAP measures and may not be comparable to similar non-GAAP measures used by other companies. The table below presents a reconciliation of average and ending common shareholders’ equity to average and ending tangible common shareholders’ equity: AVERAGE FOR THE AS OF THREE MONTHS ENDED NINE MONTHS ENDED Unaudited, $ in millions SEPTEMBER 30, 2025 SEPTEMBER 30, 2025 SEPTEMBER 30, 2025 JUNE 30, 2025 DECEMBER 31, 2024 Total shareholders’ equity $ 123,507 $ 123,444 $ 124,402 $ 124,096 $ 121,996 Preferred stock (15,153) (14,963) (15,153) (15,153) (13,253) Common shareholders’ equity 108,354 108,481 109,249 108,943 108,743 Goodwill (5,944) (5,907) (5,950) (5,952) (5,853) Identifiable intangible assets (870) (862) (864) (888) (847) Tangible common shareholders’ equity $ 101,540 $ 101,712 $ 102,435 $ 102,103 $ 102,043 2. Dealogic – January 1, 2025 through September 30, 2025. 3. For information about the following items, see the referenced sections in Part I, Item 2 “Management’s Discussion and Analysis of Financial Condition and Results of Operations” in the firm’s Quarterly Report on Form 10-Q for the period ended June 30, 2025: (i) Investment banking fees backlog – see “Results of Operations – Global Banking & Markets,” (ii) assets under supervision (AUS) – see “Results of Operations – Asset & Wealth Management – Assets Under Supervision,” (iii) efficiency ratio – see “Results of Operations – Operating Expenses,” (iv) basic shares – see “Balance Sheet and Funding Sources – Balance Sheet Analysis and Metrics,” (v) share repurchase program – see “Capital Management and Regulatory Capital – Capital Management” and (vi) global core liquid assets – see “Risk Management – Liquidity Risk Management.” For information about the following items, see the referenced sections in Part I, Item 1 “Financial Statements (Unaudited)” in the firm’s Quarterly Report on Form 10-Q for the period ended June 30, 2025: (i) interest-earning assets – see “Statistical Disclosures – Distribution of Assets, Liabilities and Shareholders’ Equity” and (ii) risk-based capital ratios and the supplementary leverage ratio – see Note 20 “Regulation and Capital Adequacy.” Represents a preliminary estimate for the third quarter of 2025 for the firm’s assets under supervision, capital ratios, risk-weighted assets, supplementary leverage ratio, balance sheet data and global core liquid assets. These may be revised in the firm’s Quarterly Report on Form 10-Q for the period ended September 30, 2025. 4. Includes selected items that the firm has sold or is selling related to the narrowing of the firm’s ambitions in consumer-related activities and related to the transitioning of Asset & Wealth Management to a less capital- intensive business. Net earnings reflects the 3Q25 and 3Q25 YTD effective income tax rate for the respective segment of each item. 5. Includes consolidated investment entities (CIEs) and other legacy investments the firm intends to exit over the medium term (medium term refers to a 3-5 year time horizon from year-end 2022). The 3Q25 YTD average attributed equity for historical principal investments was $3.6 billion. 6. Consists of AUS, brokerage assets and Marcus deposits. 7. Other on-balance sheet alternative investments include tax credit investments (accounted for under the proportional amortization method of accounting) of $3.1 billion and CIEs, which held assets (generally accounted for at historical cost less depreciation) of $1.6 billion, both as of September 30, 2025. The assets held by CIEs were funded with liabilities of $0.8 billion as of September 30, 2025, which are substantially all nonrecourse, thereby reducing the firm’s equity at risk. Substantially all of the firm’s CIEs are engaged in commercial real estate investment activities. 13