UNITED STATES
SECURITIES AND EXCHANGE COMMISSION
Washington, D.C. 20549
FORM 8-K
CURRENT REPORT
Pursuant to Section 13 or 15(d)
of the Securities Exchange Act of 1934
Date of Report (Date of earliest event reported): September 30, 2025

CRH public limited company
(Exact name of registrant as specified in its charter)
Ireland |
001-32846 |
98-0366809 |
||
|
(State or other jurisdiction of incorporation) |
(Commission File Number) |
(I.R.S. Employer Identification No.) |
Stonemason’s Way, Rathfarnham,
Dublin 16, D16 KH51, Ireland
(Address of principal executive offices)
+353 1 404 1000
(Registrant’s telephone number, including area code)
Not Applicable
(Former name or former address, if changed since last report)
Check the appropriate box below if the Form 8-K filing is intended to simultaneously satisfy the filing obligation of the registrant under any of the following provisions:
| ☐ | Written communications pursuant to Rule 425 under the Securities Act (17 CFR 230.425) |
| ☐ | Soliciting material pursuant to Rule 14a-12 under the Exchange Act (17 CFR 240.14a-12) |
| ☐ | Pre-commencement communications pursuant to Rule 14d-2(b) under the Exchange Act (17 CFR 240.14d 2(b)) |
| ☐ | Pre-commencement communications pursuant to Rule 13e-4(c) under the Exchange Act (17 CFR 240.13e-4(c)) |
Securities registered pursuant to Section 12(b) of the Act:
Title of each class |
Trading Symbol(s) |
Name of each exchange on which registered |
||
| Ordinary Shares of €0.32 each | CRH | New York Stock Exchange | ||
| 5.200% Guaranteed Notes due 2029 | CRH/29 | New York Stock Exchange | ||
| 5.125% Guaranteed Notes due 2030 | CRH/30 | New York Stock Exchange | ||
| 6.400% Notes due 2033 | CRH/33A | New York Stock Exchange | ||
| 5.400% Guaranteed Notes due 2034 | CRH/34 | New York Stock Exchange | ||
| 5.500% Guaranteed Notes due 2035 | CRH/35 | New York Stock Exchange | ||
| 5.875% Guaranteed Notes due 2055 | CRH/55 | New York Stock Exchange |
Indicate by check mark whether the registrant is an emerging growth company as defined in Rule 405 of the Securities Act of 1933 (§230.405 of this chapter) or Rule 12b-2 of the Securities Exchange Act of 1934 (§240.12b-2 of this chapter)
| ☐ | Emerging Growth Company |
If an emerging growth company, indicate by check mark if the registrant has elected not to use the extended transition period for complying with any new or revised financial accounting standards provided pursuant to Section 13(e) of the Exchange Act ☐
| Item 7.01 | Regulation FD Disclosure. |
As previously announced, CRH plc (the ‘Company’) is hosting an Investor Day at 9:00 a.m. Eastern time on September 30, 2025. On September 30, 2025, in advance of its Investor Day, the Company issued a press release setting forth, among other things, certain financial targets. A copy of the press release is attached hereto as Exhibit 99.1 and incorporated herein by reference.
In addition, the Company is furnishing certain presentation slides that will be used in conjunction with the Investor Day, copies of which are attached hereto as Exhibits 99.2, 99.3, 99.4, 99.5 and 99.6 and incorporated herein by reference.
The information in this Item 7.01, including Exhibits 99.1, 99.2, 99.3., 99.4, 99.5 and 99.6 attached hereto, shall not be deemed to be “filed” for purposes of Section 18 of the Securities Exchange Act of 1934, as amended (the ‘Exchange Act’), or otherwise subject to the liabilities of that section, nor shall it be deemed incorporated by reference in any filing made by the Company under the Securities Act of 1933, as amended, or the Exchange Act, regardless of any general incorporation language in such filing, except as shall be expressly set forth by specific reference in such a filing. This Current Report on Form 8-K will not be deemed an admission as to the materiality of any information contained herein.
| Item 9.01 | Financial Statements and Exhibits. |
(d) Exhibits.
| Exhibit No. | Description |
|
| 99.1 | Press Release, dated September 30, 2025 | |
| 99.2 | Investor Day 2025 Presentation, dated September 30, 2025 | |
| 99.3 | Investor Day Presentation (Growth), dated September 30, 2025 | |
| 99.4 | Investor Day Presentation (Performance), dated September 30, 2025 | |
| 99.5 | Investor Day Presentation (Roads), dated September 30, 2025 | |
| 99.6 | Investor Day Presentation (Water), dated September 30, 2025 | |
| 104 | Cover Page Interactive Data File (formatted in Inline XBRL) | |
SIGNATURES
Pursuant to the requirements of the Securities Exchange Act of 1934, as amended, the registrant has duly caused this report to be signed on its behalf by the undersigned hereunto duly authorized.
Date: September 30, 2025
|
CRH public limited company
|
||
/s/ Nancy Buese |
||
| By: | Nancy Buese | |
| Chief Financial Officer | ||
Exhibit 99.1
|
|
1350 Avenue of the Americas
New York, NY 10019 |
|
Press Release
CRH sets out next era of growth and five-year targets at Investor Day
|
NEW YORK – Sept. 30, 2025 – CRH (NYSE: CRH), the leading global provider of building materials, will host its Investor Day today in New York City at 9:00 a.m. EDT, led by CEO Jim Mintern and the executive leadership team.
Jim Mintern, CEO, said: “As the global leader in building materials and the number one infrastructure play in North America, our Investor Day will showcase how we are raising our ambition to 2030 to deliver the next era of growth and why we are the leading compounder of capital and shareholder value in our industry. With $40 billion of financial capacity1 over the next five years, our superior strategy, enabled by our unmatched scale and connected portfolio, positions us to execute on unrivaled growth opportunities.”
At the event, CRH will set out its financial targets over the next five years (2026-2030):
| • | Average annual Revenue growth between 7% and 9%2 |
| • | Adjusted EBITDA margin3 between 22% and 24% by 2030 |
| • | Average annual Adjusted Free Cash Flow Conversion3 of >100% |
CRH has today also reaffirmed its financial guidance for 20254, including Adjusted EBITDA3 of $7.5 billion - $7.7 billion.
The event will be broadcast via live webcast and registration details are available on www.crh.com/investors. Upon registration, a link to join the webcast will be made available. The presentation materials will be available on the Investors section of the CRH website. A replay of the webcast will be available after the event.
****
| 1 | Financial capacity is defined as the anticipated cash and debt financing available (after maintenance capex) for growth investments and cash returns to shareholders. The information is indicative only and any capital deployment will be dependent on the value creation opportunities arising over the period. |
| 2 | Revenue growth is presented on a total basis, including organic and inorganic growth. |
| 3 | Represents a non-GAAP measure. See “Non-GAAP Reconciliation and Supplementary Information” below. |
| 4 | As published on August 6, 2025 (including Net income of $3.8 billion - $3.9 billion) and reflecting the same underlying assumptions. 2025 guidance does not reflect any financial impacts from the recent acquisition of Eco Material Technologies. |
Contacts
| Tom Holmes |
Lauren Schulz |
|
| Head of Investor Relations |
Chief Communications Officer |
|
| tholmes@crh.com |
lschulz@crh.com |
About CRH
CRH (NYSE: CRH) is the leading global provider of building materials solutions that build, connect and improve our world. Employing 80,000 people at 4,000 operating locations in 28 countries, CRH has market leadership positions in North America and Europe. As the essential partner for transportation and critical infrastructure projects, complex non-residential construction and outdoor living solutions, CRH’s unique offering of materials, products and value-added services helps to deliver a more resilient and sustainable built environment. The company is ranked among sector leaders by Environmental, Social and Governance (ESG) rating agencies. A Fortune Global 500 company, CRH’s shares are listed on the NYSE and LSE.
For more information visit: www.crh.com In order to utilize the “Safe Harbor” provisions of the United States Private Securities Litigation Reform Act of 1995, CRH is providing the following cautionary statement.
Appendix 1 - Disclaimer/Forward-Looking Statements
This press release contains statements that are, or may be deemed to be, forward-looking statements. These forward-looking statements may generally, but not always, be identified by the use of words such as “will”, “anticipates”, “should”, “could”, “would”, “targets”, “aims”, “may”, “continues”, “expects”, “is expected to”, “estimates”, “believes”, “intends” or similar expressions. These forward-looking statements include all matters that are not historical facts or matters of fact at the date of this press release.
In particular, the following, among other statements, are all forward-looking in nature: statements regarding CRH’s 2025 financial guidance and related assumptions and 2030 financial targets; statements regarding CRH’s growth and value creation prospects and its expected financial capacity and resulting optionality; and statements regarding advantages afforded to CRH as a result of its scale and connected portfolio.
By their nature, forward-looking statements involve risk and uncertainty because they relate to events and depend on circumstances that may or may not occur in the future and reflect our current expectations and assumptions as to such future events and circumstances that may not prove accurate. You are cautioned not to place undue reliance on any forward-looking statements. These forward-looking statements are made as of the date of this press release. We expressly disclaim any obligation or undertaking to publicly update or revise these forward-looking statements other than as required by applicable law.
A number of material factors could cause actual results and developments to differ materially from those expressed or implied by these forward-looking statements, certain of which are beyond our control, and which include, among other factors, the risks and uncertainties described under “Risk Factors” in CRH’s 2024 Form 10-K and in its other filings with the SEC.
Appendix 2 - Non-GAAP Reconciliation and Supplementary Information
CRH uses a number of non-GAAP performance measures to monitor financial performance. These measures are regularly reviewed by CRH management. These measures may not be uniformly defined by all companies and accordingly may not be directly comparable with similarly titled measures and disclosures by other companies.
The non-GAAP performance measures as summarized below should not be viewed in isolation or as an alternative to the equivalent GAAP measure.
Adjusted EBITDA: Adjusted EBITDA is defined as earnings from continuing operations before interest, taxes, depreciation, depletion, amortization, loss on impairments, gain/loss on divestitures and investments, income/loss from equity method investments, substantial acquisition-related costs and pension expense/income excluding current service cost component. It is quoted by management in conjunction with other GAAP and non-GAAP financial measures to aid investors in their analysis of the performance of the Company. Adjusted EBITDA margin is calculated by expressing Adjusted EBITDA as a percentage of total revenues.
Please refer to CRH’s earnings release, dated August 6, 2025, for a reconciliation of the mid-point of the 2025 Adjusted EBITDA guidance to its nearest GAAP measure.
Adjusted Free Cash Flow: Adjusted Free Cash Flow is a liquidity measure and is defined as net cash provided by operating activities adjusted for proceeds from disposal of long-lived assets less maintenance capital expenditures. Adjusted Free Cash Flow Conversion is defined as Adjusted Free Cash Flow divided by Net income. Management believes that Adjusted Free Cash Flow and Adjusted Free Cash Flow Conversion are useful metrics for both management and investors in evaluating the Company’s ability to generate cash flow from operations after making investments in maintaining its asset base. As is the case with the other non-GAAP measures presented, users should consider the limitations of using Adjusted Free Cash Flow and Adjusted Free Cash Flow conversion, including the fact that those measures do not provide a complete measure of our cash flows for any period. In particular, Adjusted Free Cash Flow and Adjusted Free Cash Flow conversion are not intended to be a measure of cash flow available for management’s discretionary use, as these measures do not reflect certain cash requirements, such as debt service requirements and other contractual commitments.
Adjusted EBITDA Margin and Adjusted Free Cash Conversion are non-GAAP financial measures. We cannot predict with certainty certain items that would be included in the most directly comparable GAAP measure for the relevant future periods. Due to these uncertainties, we cannot provide a quantitative reconciliation of Adjusted EBITDA Margin or Adjusted Free Cash Flow Conversion to the most directly comparable GAAP financial measure, respectively, without unreasonable effort.

Exhibit 99.2 Built for Growth Investor Day 2025 Powered by Performance
Disclaimer Unless the context otherwise provides, “we,” “us,” “our,” “CRH”, the “Company” and like terms refer to CRH plc and its consolidated subsidiaries. Forward-Looking Statements In order to utilize the “Safe Harbor” provisions of the United States Private Securities Litigation Reform Act of 1995, CRH is providing the following cautionary statement. This presentation contains statements that are, or may be deemed to be, forward-looking statements with respect to the financial condition, results of operations, business, viability and future performance of CRH and certain of the plans and objectives of CRH. These forward-looking statements may generally, but not always, be identified by the use of words such as “will”, “anticipates”, “should”, “could”, “would”, “targets”, “aims”, “may”, “continues”, “expects”, “is expected to”, “estimates”, “believes”, “intends” or similar expressions. These forward-looking statements include all matters that are not historical facts or matters of fact at the date of this presentation. In particular, the following, among other statements, are all forward-looking in nature: plans and expectations regarding megatrends and growth with respect to each, including infrastructure, transportation, water and reindustrialization; CRH’s 2030 financial targets and long-term leverage comfort levels; statements regarding CRH’s position as a beneficiary of infrastructure tailwinds; plans and expectations regarding government funding initiatives and the amounts related thereto, including IIJA highway funding; statements regarding CRH’s capital allocation, including optionality thereof, and expected benefits of the capital allocation strategy; statements regarding the impact of sustainability and circularity on CRH’s future growth and profits, statements regarding the cementitious market and benefits for CRH relating to the Eco Material acquisition; statements regarding the benefits of emerging technologies, including robotics, autonomy and artificial intelligence; and plans and expectations regarding CRH’s M&A and growth capital expenditure activity. By their nature, forward-looking statements involve risk and uncertainty because they relate to events and depend on circumstances that may or may not occur in the future and reflect the Company’s current expectations and assumptions as to such future events and circumstances that may not prove accurate. You are cautioned not to place undue reliance on any forward-looking statements. These forward-looking statements are made as of the date of this presentation. The Company expressly disclaims any obligation or undertaking to publicly update or revise these forward-looking statements other than as required by applicable law. A number of material factors could cause actual results and developments to differ materially from those expressed or implied by these forward-looking statements, certain of which are beyond our control, and which include, among other factors: economic and financial conditions, including changes in interest rates, inflation, price volatility and/or labor and materials shortages; industry cyclicality and the demand for infrastructure, residential and non-residential construction and our products in geographic markets in which we operate; increased competition and its impact on prices and market position; increases in energy, labor and/or other raw materials costs; adverse changes to laws and regulations, including in relation to climate change; the impact of unfavorable weather; investor and/or consumer sentiment regarding the importance of sustainable practices and products; availability of, or reductions or delays to, public sector funding for infrastructure programs; political uncertainty, including as a result of political and social conditions in the jurisdictions CRH operates in, or adverse public policy, economic, social and political developments, including the ongoing geopolitical conflicts in Ukraine and the Middle East; failure to complete or successfully integrate acquisitions or make timely divestitures; cyberattacks and exposure of associates, contractors, customers, suppliers and other individuals to health and safety risks, including due to product failures. Additional factors, risks and uncertainties that could cause actual outcomes and results to be materially different from those expressed by the forward-looking statements in this presentation including, but not limited to, the risks and uncertainties described herein and under “Risk Factors” in our 2024 Form 10-K and in our other filings with the SEC. Non-GAAP Measure Disclosure This presentation includes discussion of Adjusted EBITDA, Adjusted EBITDA Margin, Net Debt, Adjusted Free Cash Flow, Adjusted Return on Invested Capital, and Adjusted Free Cash Flow Conversion, each of which is a financial measure that is not calculated in accordance with U.S. generally accepted accounting principles (“GAAP”). This presentation also includes discussion of Adjusted EBITDA generated by CRH’s operations in Texas and certain operating companies’ cash gross profit per ton, each of which is also financial information that is not calculated in accordance with GAAP. Non-GAAP measures should not be considered a replacement for GAAP measures. Non-GAAP financial measures are denoted in this presentation with an '*' with corresponding discussion and reconciliations to the most directly comparable GAAP measures included on pages 49 to 52. Investor Day 2025 1

Key Messages ü The #1 Infrastructure play in North America ü Leading positions in high-growth markets … unmatched scale & connected portfolio ü Superior strategy & leading performance … more consistent long-term delivery Built for Growth, ü Proven stewards of capital … disciplined & value-focused Powered by Performance ü 2030 financial targets … raising our ambition & maximizing value creation Investor Day 2025 2
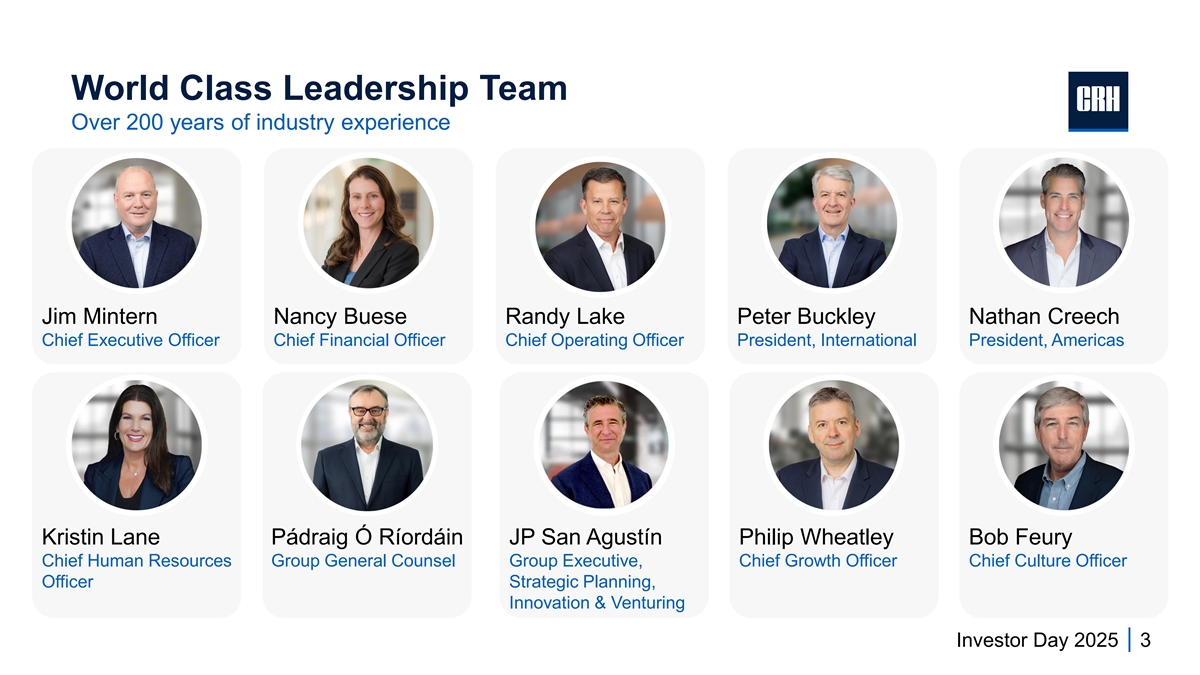
World Class Leadership Team Over 200 years of industry experience Jim Mintern Nancy Buese Randy Lake Peter Buckley Nathan Creech Chief Executive Officer Chief Financial Officer Chief Operating Officer President, International President, Americas Kristin Lane Pádraig Ó Ríordáin JP San Agustín Philip Wheatley Bob Feury Chief Human Resources Group General Counsel Group Executive, Chief Growth Officer Chief Culture Officer Officer Strategic Planning, Innovation & Venturing Investor Day 2025 3
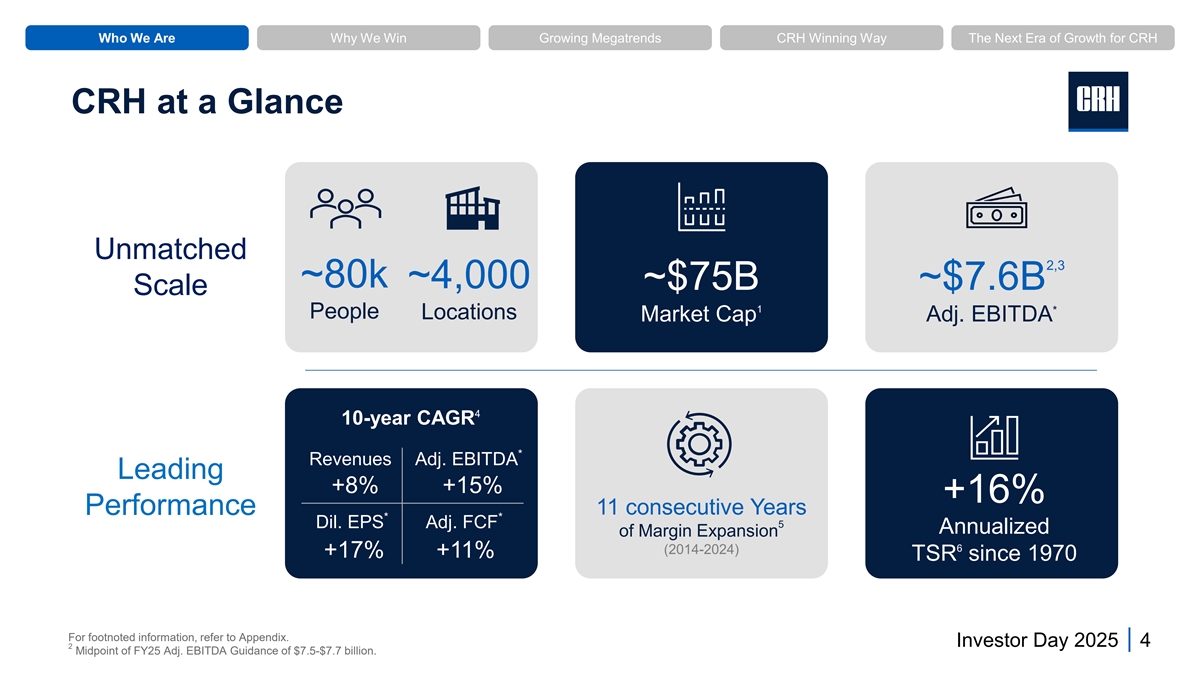
Who We Are Why We Win Growing Megatrends CRH Winning Way The Next Era of Growth for CRH CRH at a Glance Unmatched 2,3 ~80k ~4,000 ~$75B ~$7.6B Scale 1 * People Locations Market Cap Adj. EBITDA 4 10-year CAGR * Revenues Adj. EBITDA Leading +8% +15% +16% Performance 11 consecutive Years * * 5 Dil. EPS Adj. FCF Annualized of Margin Expansion 6 (2014-2024) +17% +11% TSR since 1970 For footnoted information, refer to Appendix. Investor Day 2025 4 2 Midpoint of FY25 Adj. EBITDA Guidance of $7.5-$7.7 billion.

Who We Are Why We Win Growing Megatrends CRH Winning Way The Next Era of Growth for CRH Leadership Positions in High-Growth Markets 1 1 #1 in North America #1 in International $23.3B $12.3B Revenues Revenues ~2k ~2k Locations Locations 2 2 $5.1B $1.8B * * Adj. EBITDA Adj. EBITDA ~50k ~30k People People For footnoted information, refer to Appendix. Investor Day 2025 5

Who We Are Why We Win Growing Megatrends CRH Winning Way The Next Era of Growth for CRH 1 Our Business Americas Materials Solutions $7.1B $1.4B #1 Aggregates #1 Cementitious $16.2B $6.9B $35.6B #1 Roads * Adj. EBITDA Revenues $3.7B (2024) (2024) Americas Building Solutions $1.8B $12.3B #1 Critical Infrastructure (Water, Energy, Data) #1 Outdoor Living Americas Materials Solutions Americas Building Solutions International Solutions International Solutions #1 Regional Leadership positions For footnoted information, refer to Appendix. Investor Day 2025 6

Who We Are Why We Win Growing Megatrends CRH Winning Way The Next Era of Growth for CRH The #1 Infrastructure Play in North America Connected growth platforms Aggregates Cementitious Roads Water 1 … ~95% of revenues connected to aggregates For footnoted information, refer to Appendix. Investor Day 2025 7
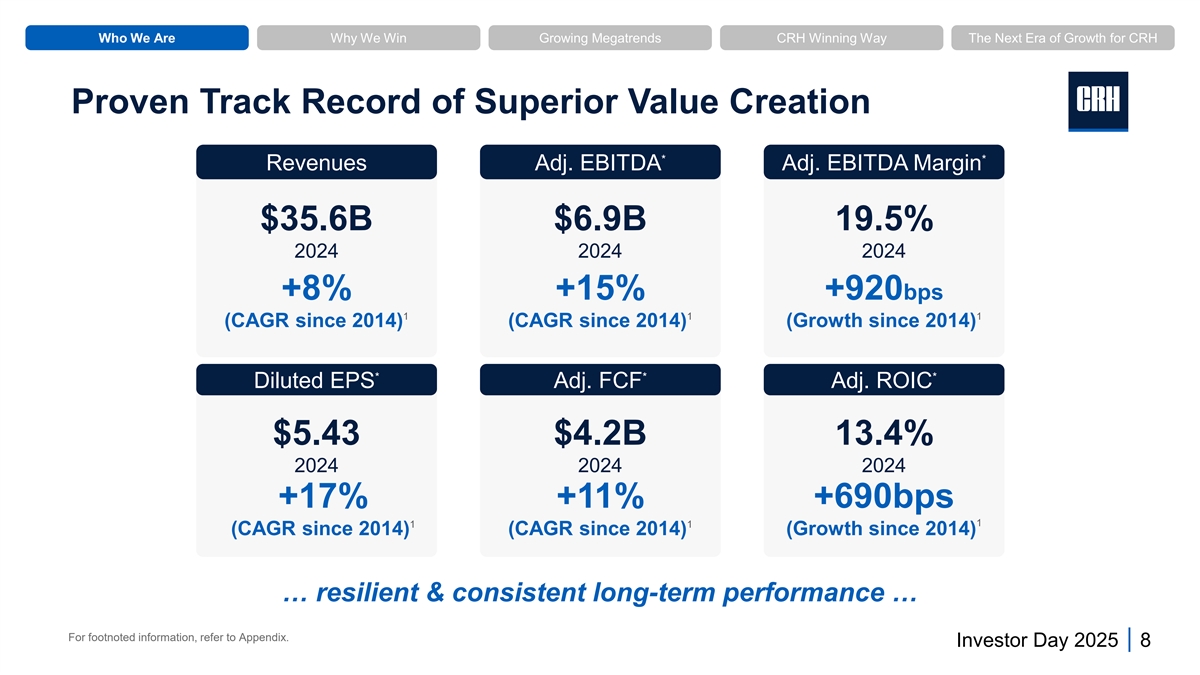
Who We Are Why We Win Growing Megatrends CRH Winning Way The Next Era of Growth for CRH Proven Track Record of Superior Value Creation * * Revenues Adj. EBITDA Adj. EBITDA Margin $35.6B $6.9B 19.5% 2024 2024 2024 1 2 3 +8% +15% +920bps 1 1 1 (CAGR since 2014) (CAGR since 2014) (Growth since 2014) * * * Diluted EPS Adj. FCF Adj. ROIC $5.43 $4.2B 13.4% 2024 2024 2024 +17% +11% +690bps 1 1 1 (CAGR since 2014) (CAGR since 2014) (Growth since 2014) … resilient & consistent long-term performance … For footnoted information, refer to Appendix. Investor Day 2025 8

Who We Are Why We Win Growing Megatrends CRH Winning Way The Next Era of Growth for CRH The Leading Compounder of Capital in our Industry Over the Last Year Over the Last 10 Years Since 1970 1 1 1 2023-2024 Annualized TSR 2014-2024 Annualized TSR 1970-2024 Annualized TSR 35.9% 17.5% 16.2% 13.1% 25.0% 9.3% 9.6% 13.9% Peer Peer S&P 500 S&P 500 S&P 500 2 2 Avg. Avg. For footnoted information, refer to Appendix. Investor Day 2025 9

Who We Are Why We Win Growing Megatrends CRH Winning Way The Next Era of Growth for CRH Why We Win Investor Day 2025 10

Who We Are Why We Win Growing Megatrends CRH Winning Way The Next Era of Growth for CRH Our Growth Algorithm Growing CRH Leading Megatrends Winning Way Compounder of Capital Infrastructure Transportation x = Water Proven long-term delivery 1 Double-digit earnings growth Reindustrialization For footnoted information, refer to Appendix. Investor Day 2025 11

Who We Are Why We Win Growing Megatrends CRH Winning Way The Next Era of Growth for CRH Our Growth Algorithm Growing CRH Proven Long- Megatrends Winning Way Term Delivery Growth & Performance +8% +920bps Infrastructure Revenues Adj. EBITDA * Margin CAGR 1 1 (2014-2024) (2014-2024) Transportation Industry-Leading Profitability x $6.9B = Water * 2024 Adj. EBITDA Attractive Returns Reindustrialization 13.4% * 2024 Adj. ROIC For footnoted information, refer to Appendix. Investor Day 2025 12

Who We Are Why We Win Growing Megatrends CRH Winning Way The Next Era of Growth for CRH Growing Megatrends Investor Day 2025 13
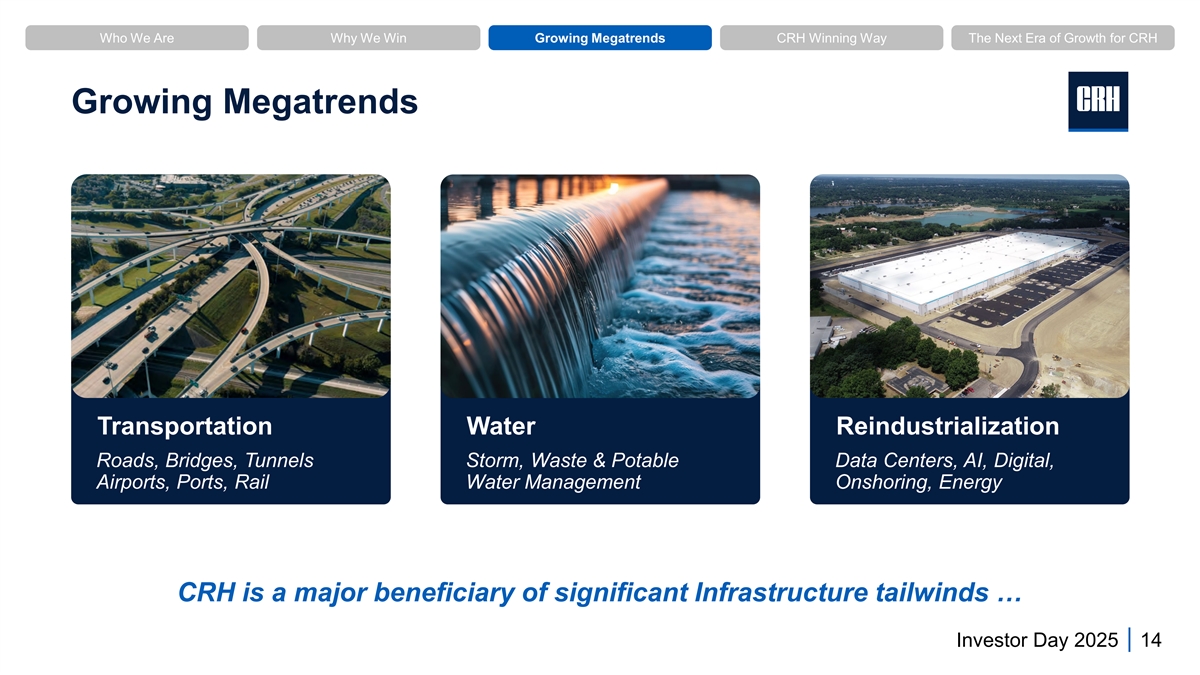
Who We Are Why We Win Growing Megatrends CRH Winning Way The Next Era of Growth for CRH Growing Megatrends Transportation Water Reindustrialization Roads, Bridges, Tunnels Storm, Waste & Potable Data Centers, AI, Digital, Airports, Ports, Rail Water Management Onshoring, Energy CRH is a major beneficiary of significant Infrastructure tailwinds … Investor Day 2025 14
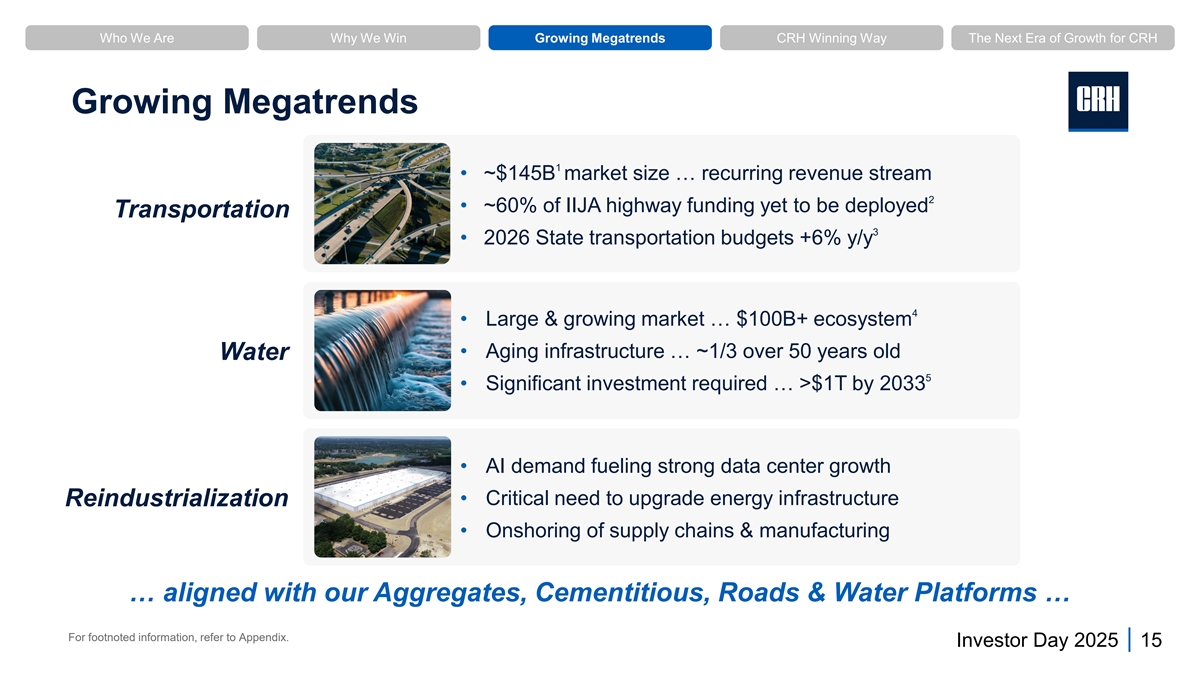
Who We Are Why We Win Growing Megatrends CRH Winning Way The Next Era of Growth for CRH Growing Megatrends 1 • ~$145B market size … recurring revenue stream 2 • ~60% of IIJA highway funding yet to be deployed Transportation 3 • 2026 State transportation budgets +6% y/y 4 • Large & growing market … $100B+ ecosystem • Aging infrastructure … ~1/3 over 50 years old Water 5 • Significant investment required … >$1T by 2033 • AI demand fueling strong data center growth • Critical need to upgrade energy infrastructure Reindustrialization • Onshoring of supply chains & manufacturing … aligned with our Aggregates, Cementitious, Roads & Water Platforms … For footnoted information, refer to Appendix. Investor Day 2025 15
Who We Are Why We Win Growing Megatrends CRH Winning Way The Next Era of Growth for CRH CRH Winning Way Investor Day 2025 16

Who We Are Why We Win Growing Megatrends CRH Winning Way The Next Era of Growth for CRH CRH Winning Way SUPERIOR STRATEGY PROVEN LEADING GROWTH PERFORMANCE CAPABILITIES VALUE-CREATING CAPITAL ALLOCATION … driven by our unique entrepreneurial culture … Investor Day 2025 17

Who We Are Why We Win Growing Megatrends CRH Winning Way The Next Era of Growth for CRH Customer Centric & Empowered Teams Leveraging the power of local relationships … • Customer Centric: Leveraging the power of 200+ local brands in North America & ~90 across our International division • Empowered Teams: Ownership mindset & unique entrepreneurial spirit • Local Relationships: Critical to maintaining unrivaled acquisition pipeline … the acquirer of choice … replicated at scale across our portfolio Investor Day 2025 18
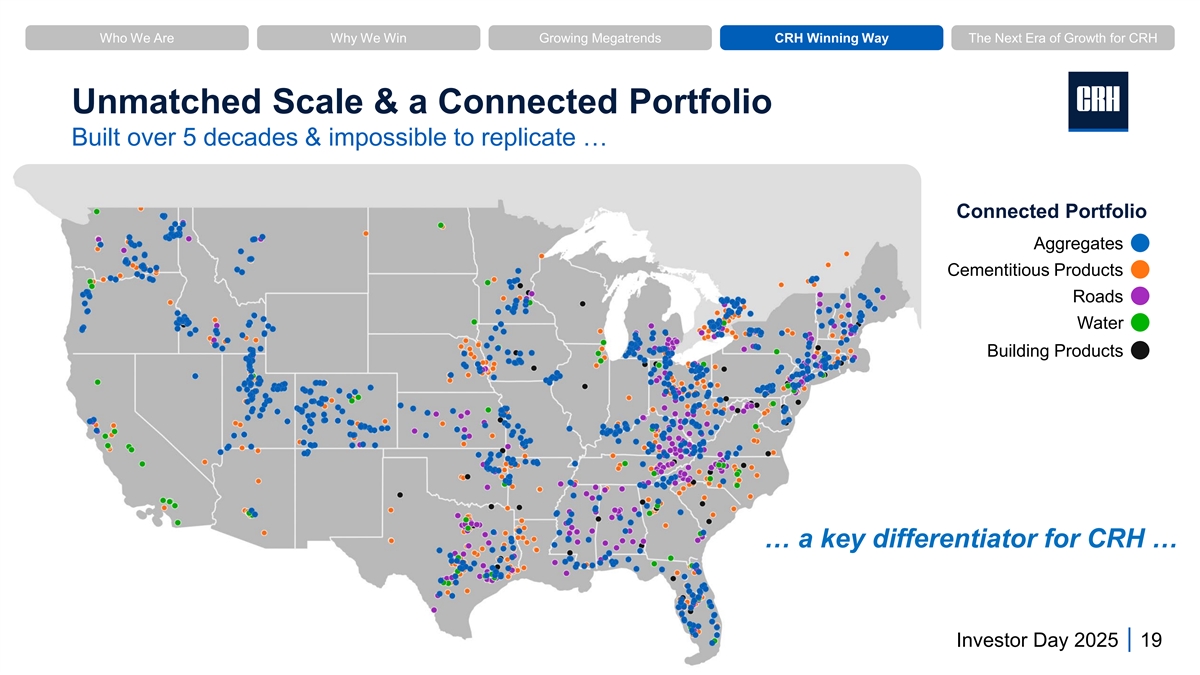
Who We Are Why We Win Growing Megatrends CRH Winning Way The Next Era of Growth for CRH Unmatched Scale & a Connected Portfolio Built over 5 decades & impossible to replicate … Connected Portfolio Aggregates Cementitious Products Roads Water Building Products … a key differentiator for CRH … Investor Day 2025 19
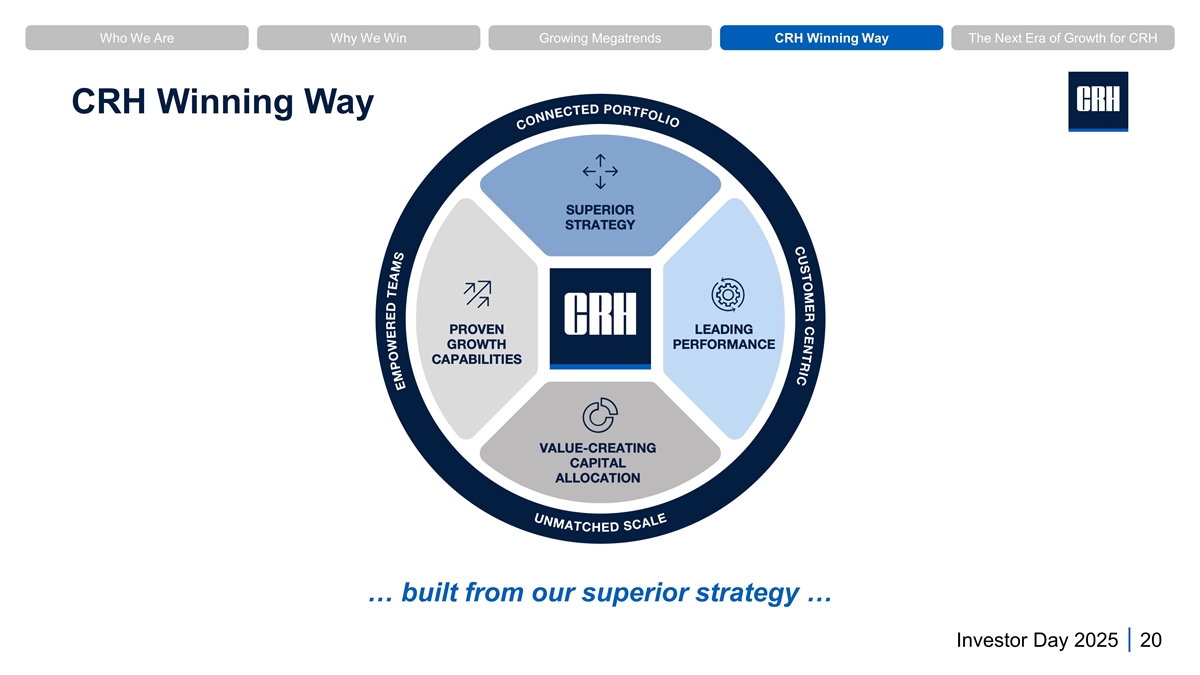
Who We Are Why We Win Growing Megatrends CRH Winning Way The Next Era of Growth for CRH CRH Winning Way … built from our superior strategy … Investor Day 2025 20

Who We Are Why We Win Growing Megatrends CRH Winning Way The Next Era of Growth for CRH Superior Strategy Aggregates Cementitious Roads Water Lower capital intensity Customer-centric approach Aligning with Infrastructure megatrends Delivering Greater optionality for capital deployment Unmatched scale & connected portfolio Compounding growth & value creation … a more consistent & predictable portfolio … Investor Day 2025 21

Who We Are Why We Win Growing Megatrends CRH Winning Way The Next Era of Growth for CRH Superior Strategy in Action Customer Centric & Connected Portfolio… ~6x 1 more profitable ~300bps 2 Adj. ROIC accretive Aggregates Liquid Asphalt Asphalt Paving Finished Road ~$10 CGP/t ~$60 CGP/t … a multiplier for profits, cash & returns Illustrative example. Investor Day 2025 22 For footnoted information, refer to Appendix.
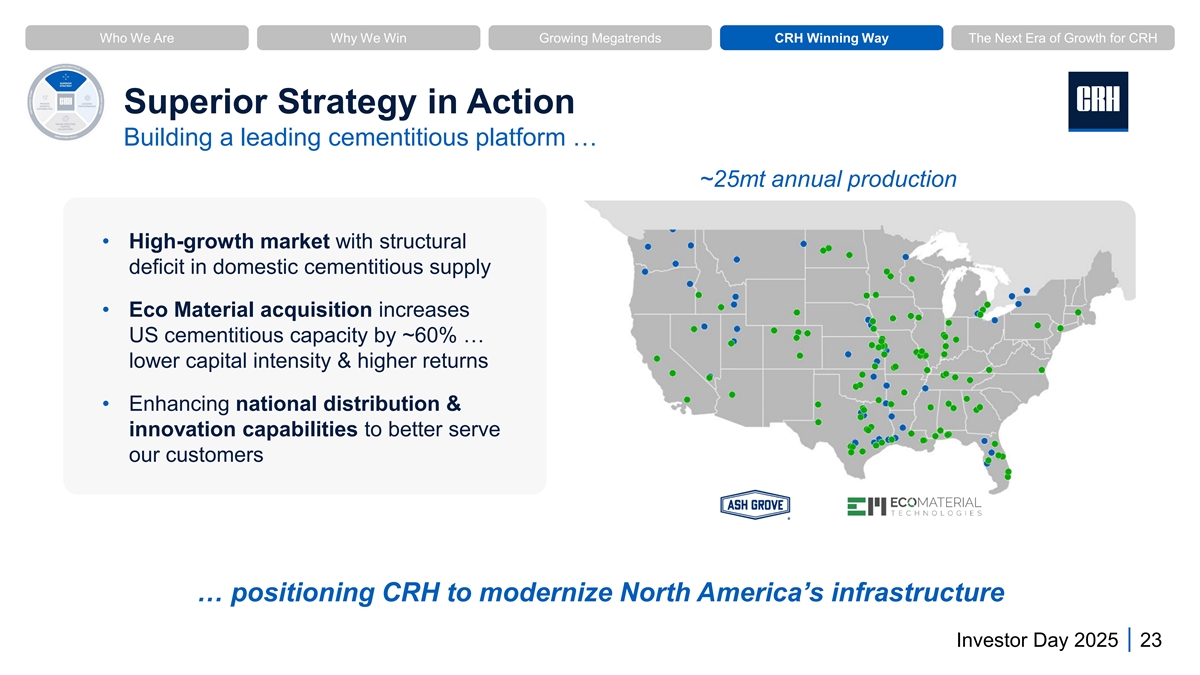
Who We Are Why We Win Growing Megatrends CRH Winning Way The Next Era of Growth for CRH Superior Strategy in Action Building a leading cementitious platform … ~25mt annual production • High-growth market with structural deficit in domestic cementitious supply • Eco Material acquisition increases US cementitious capacity by ~60% … lower capital intensity & higher returns • Enhancing national distribution & innovation capabilities to better serve our customers … positioning CRH to modernize North America’s infrastructure Investor Day 2025 23

Who We Are Why We Win Growing Megatrends CRH Winning Way The Next Era of Growth for CRH Leading Performance • Safety at the core of everything we do • Part of our culture … relentless focus on making businesses better • Global capabilities driving performance Locally Globally Leading excellence across ~4,000 locations Owned Performance Enabled • Replicated at scale … integrated & innovative approach 1 … delivering 11 consecutive years of margin expansion For footnoted information, refer to Appendix. Investor Day 2025 24
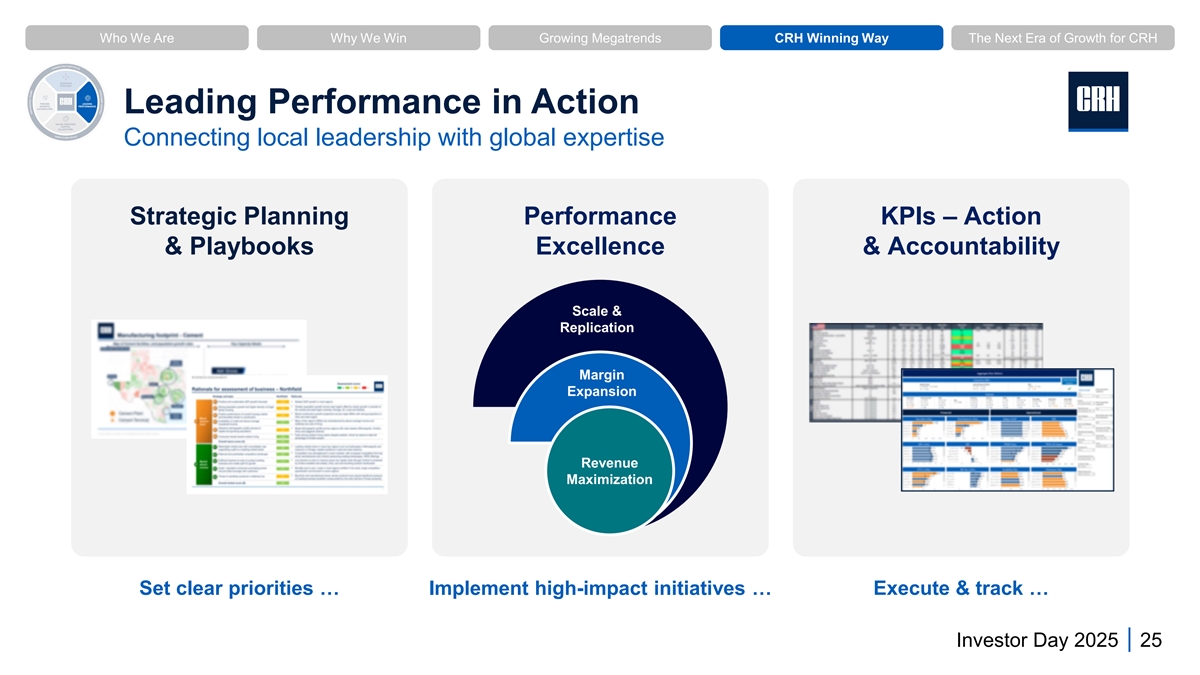
Who We Are Why We Win Growing Megatrends CRH Winning Way The Next Era of Growth for CRH Leading Performance in Action Connecting local leadership with global expertise Strategic Planning Performance KPIs – Action & Playbooks Excellence & Accountability Scale & Replication Margin Expansion Revenue Maximization Set clear priorities … Implement high-impact initiatives … Execute & track … Investor Day 2025 25

Who We Are Why We Win Growing Megatrends CRH Winning Way The Next Era of Growth for CRH Leading Performance in Action Innovation & Technology … ~200 ongoing projects & >2,000 patents Proprietary Pricing Energy Optimization Artificial Intelligence Decarbonized heat use in Identifying hidden water leaks Tools asphalt production using artificial intelligence Data driven pricing & sales insights … reducing costs, accelerating growth & driving margin expansion Investor Day 2025 26

Who We Are Why We Win Growing Megatrends CRH Winning Way The Next Era of Growth for CRH Leading Performance in Action Circularity & Sustainability 49mt 10mt 36% #1 recycler of waste and increase in SCMs alternative of any material by-products through acquisition fuels substitution in North America recycled in 2024 of Eco Material in cement in 2024 2030 industry-leading decarbonization roadmap … driving higher growth & profitability Investor Day 2025 27

Who We Are Why We Win Growing Megatrends CRH Winning Way The Next Era of Growth for CRH Value-Creating Capital Allocation • A relentless focus on shareholder value creation ~$5B Dividends • Prioritized Growth investments ... ~55% ~45% ~55% over the past 5 years ~$11B ~$27B Growth Shareholder M&A Investments Deployed Returns 2020-2024 ~$7B • 50+ years of dividend delivery and Buybacks shareholder returns ~$4B Growth • Consistent strong cash generation 1 Capex … optionality for capital deployment … unrivaled financial capacity & proven growth capabilities … For footnoted information, refer to Appendix. Investor Day 2025 28

Who We Are Why We Win Growing Megatrends CRH Winning Way The Next Era of Growth for CRH Value-Creating Capital Allocation in Action Robust Balance Sheet • Financial strength & discipline 1 … investment grade credit rating for 20+ years 4 Agency Rating Outlook *2 • >10x net interest cover ; 3 S&P BBB+ Stable ~8 years average debt maturity • Long-term comfort level ~2x Moody’s Baa1 Stable * * Net Debt /Adj. EBITDA Fitch BBB+ Stable • Strong liquidity underpinned by cash generation capabilities … financial strength, flexibility & optionality to maximize shareholder value … For footnoted information, refer to Appendix. Investor Day 2025 29
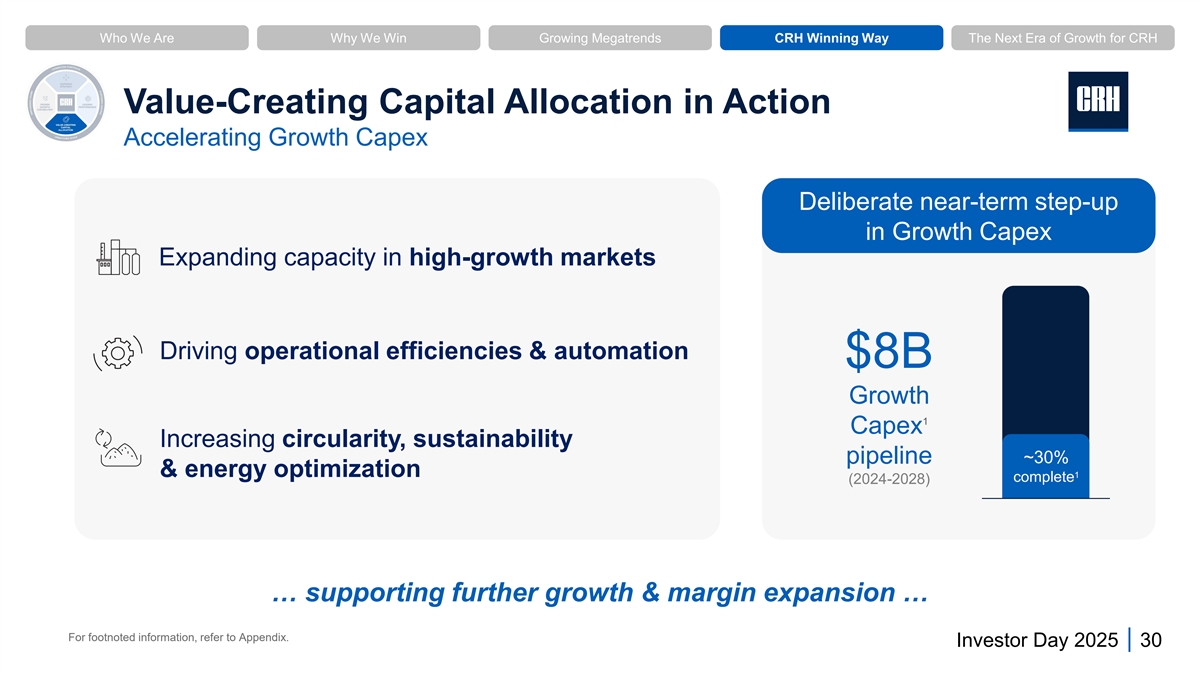
Who We Are Why We Win Growing Megatrends CRH Winning Way The Next Era of Growth for CRH Value-Creating Capital Allocation in Action Accelerating Growth Capex Deliberate near-term step-up in Growth Capex Expanding capacity in high-growth markets Driving operational efficiencies & automation $8B Growth 1 Capex Increasing circularity, sustainability pipeline ~30% & energy optimization 1 complete (2024-2028) … supporting further growth & margin expansion … For footnoted information, refer to Appendix. Investor Day 2025 30
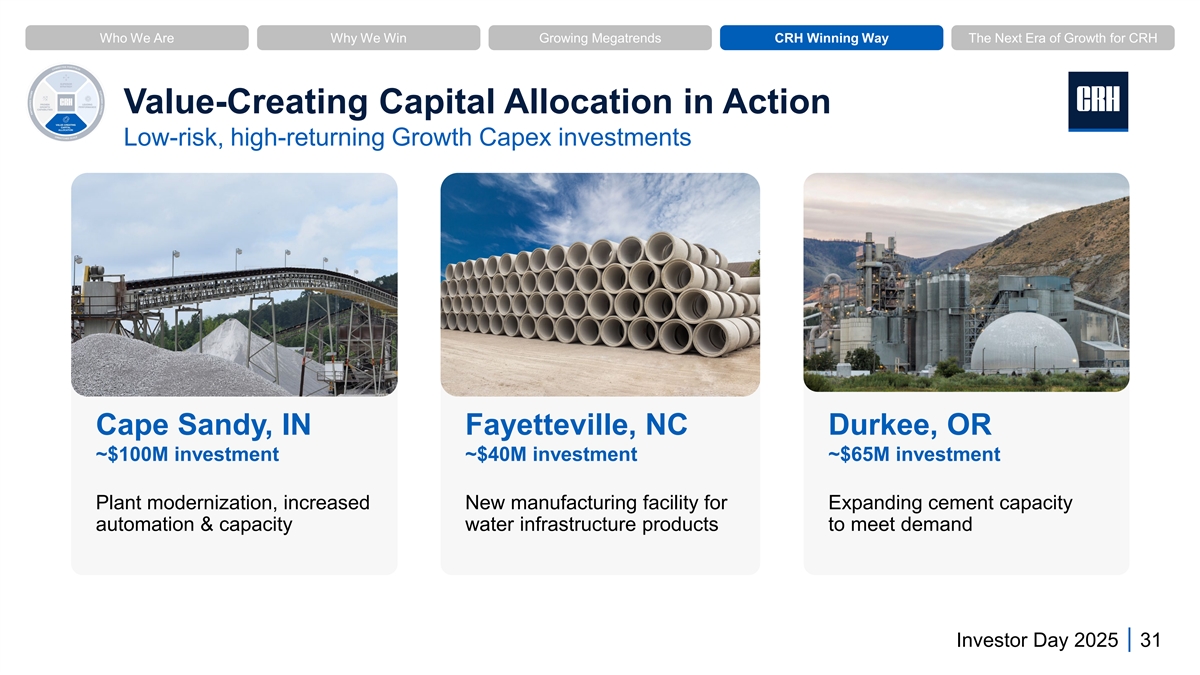
Who We Are Why We Win Growing Megatrends CRH Winning Way The Next Era of Growth for CRH Value-Creating Capital Allocation in Action Low-risk, high-returning Growth Capex investments Cape Sandy, IN Fayetteville, NC Durkee, OR ~$100M investment ~$40M investment ~$65M investment Plant modernization, increased New manufacturing facility for Expanding cement capacity automation & capacity water infrastructure products to meet demand Investor Day 2025 31

Who We Are Why We Win Growing Megatrends CRH Winning Way The Next Era of Growth for CRH Proven Growth Capabilities M&A Track Record Disciplined & value-focused approach The acquirer of choice in our industry … ü Rigorous investment appraisal processes 88% ü Strict strategic & financial performance criteria 1 Bolt-ons Proven track record of value creation >320 Acquisitions ü Acquisitions predominantly bolt-on; complementing existing assets 2015 - 2025 ü Leading performance delivering enhanced synergies Active portfolio management ü Narrower & deeper strategic focus ü Reallocating capital to connected businesses in higher-growth markets 10% 2% 1 1 Mid-sized Platform-sized … a deeply embedded mindset throughout our organization … For footnoted information, refer to Appendix. Investor Day 2025 32

Who We Are Why We Win Growing Megatrends CRH Winning Way The Next Era of Growth for CRH Proven Growth Capabilities in Action Building growth platforms of scale Attractive growth markets … South & West U.S., Central & Eastern Europe, Australia Aggregates Cementitious … disciplined & value-accretive capital deployment Roads Water … leveraging benefits of scale & our uniquely connected portfolio Investor Day 2025 33
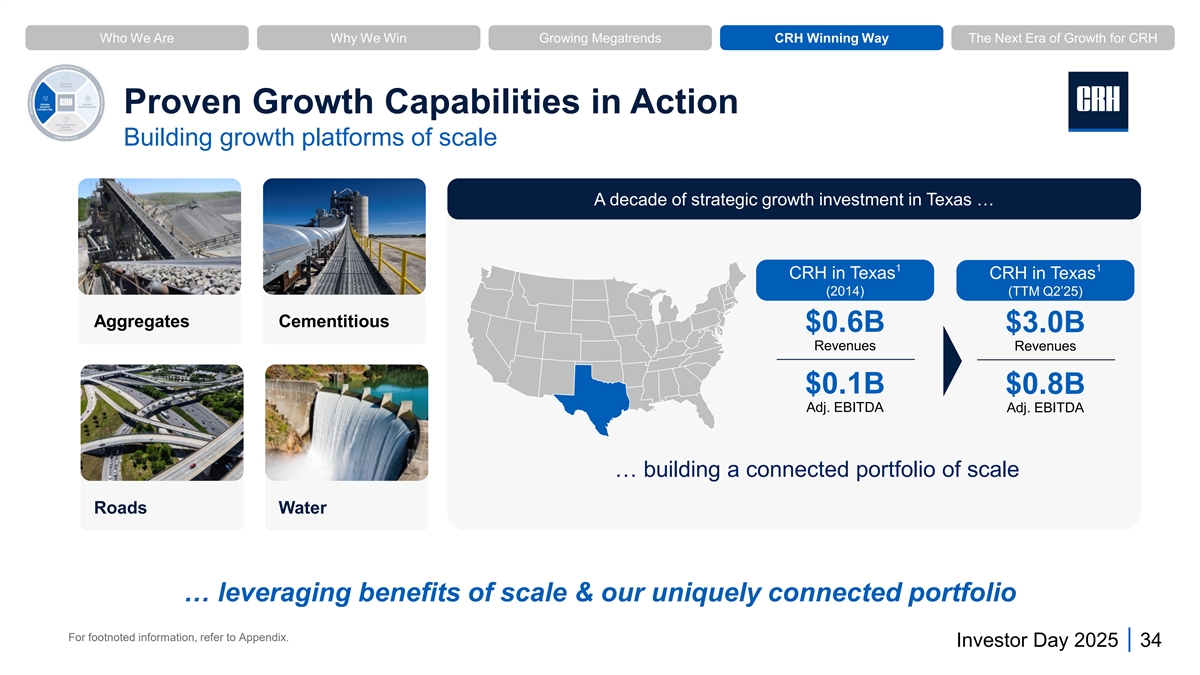
Who We Are Why We Win Growing Megatrends CRH Winning Way The Next Era of Growth for CRH Proven Growth Capabilities in Action Building growth platforms of scale A decade of strategic growth investment in Texas … 1 1 CRH in Texas CRH in Texas (2014) (TTM Q2’25) Aggregates Cementitious $0.6B $3.0B Revenues Revenues $0.1B $0.8B Adj. EBITDA Adj. EBITDA … building a connected portfolio of scale Roads Water … leveraging benefits of scale & our uniquely connected portfolio For footnoted information, refer to Appendix. Investor Day 2025 34

Who We Are Why We Win Growing Megatrends CRH Winning Way The Next Era of Growth for CRH CRH Winning Way • Superior Strategy: Unmatched scale & connected portfolio in high-growth markets • Leading Performance: Locally owned & globally enabled 1 • Value-Creating Capital Allocation: Relentless focus on shareholder value • Proven Growth Capabilities: Deeply embedded mindset … enabled by our unique entrepreneurial culture … Investor Day 2025 35

Who We Are Why We Win Growing Megatrends CRH Winning Way The Next Era of Growth for CRH The Next Era of Growth for CRH Investor Day 2025 36
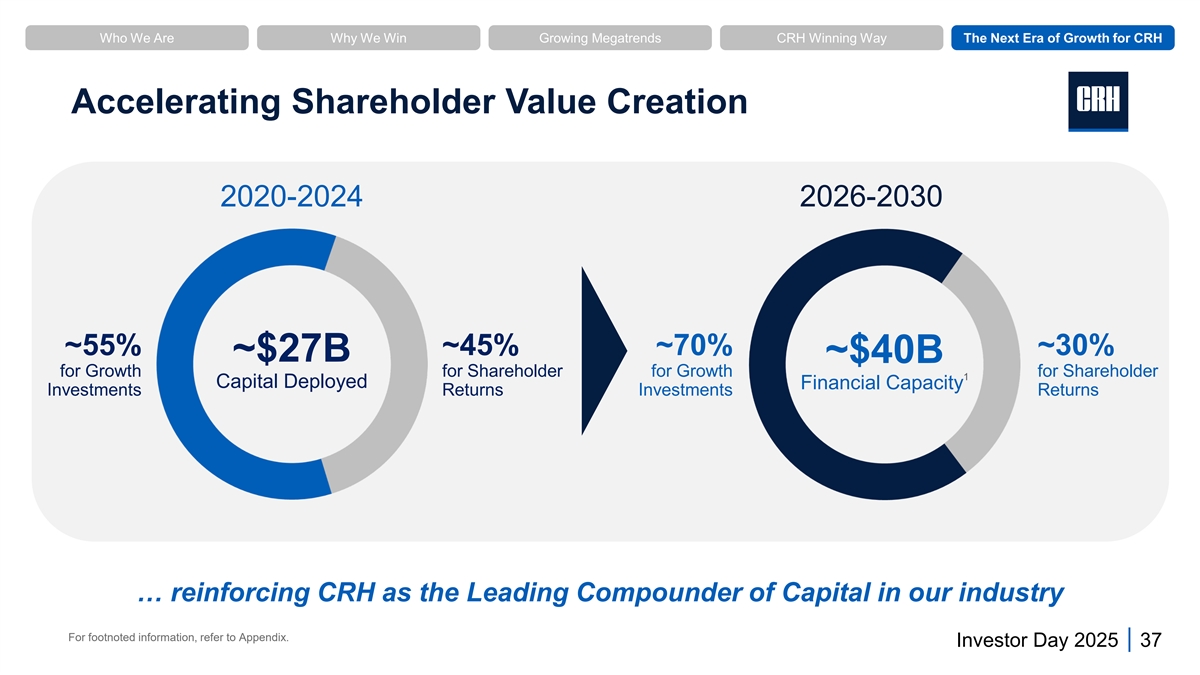
Who We Are Why We Win Growing Megatrends CRH Winning Way The Next Era of Growth for CRH Accelerating Shareholder Value Creation 2020-2024 2026-2030 ~55% ~45% ~70% ~30% ~$27B ~$40B for Growth for Shareholder for Growth for Shareholder 1 Capital Deployed Financial Capacity Investments Returns Investments Returns … reinforcing CRH as the Leading Compounder of Capital in our industry For footnoted information, refer to Appendix. Investor Day 2025 37

Who We Are Why We Win Growing Megatrends CRH Winning Way The Next Era of Growth for CRH Accelerating Shareholder Value Creation • Driving organic growth … low-risk, high-returning investments • Executing on a strong pipeline of ~70% ~30% ~$40B M&A opportunities … disciplined & 1 for Growth for Shareholder Financial Capacity value-focused Investments Returns 2026-2030 • Continuing track record of value-accretive returns to shareholders … reinforcing CRH as the Leading Compounder of Capital in our industry For footnoted information, refer to Appendix. Investor Day 2025 38

Who We Are Why We Win Growing Megatrends CRH Winning Way The Next Era of Growth for CRH Unrivaled Growth Opportunities ~$28B Aggregates Cementitious ~$40B Growth Investments Financial Capacity to 2030 Value-accretive Growth Capex and M&A in fragmented markets Roads Water … greater optionality for capital deployment Investor Day 2025 39

Who We Are Why We Win Growing Megatrends CRH Winning Way The Next Era of Growth for CRH 1 2030 Financial Targets Revenue Adj. EBITDA Adj. FCF 2 * * Growth Margin Conversion 7% to 9% 22% to 24% >100% … Built for Growth … Powered by Performance 2 Revenue growth is presented on a total basis, including organic and inorganic growth. Investor Day 2025 40 For footnoted information, refer to Appendix.

Who We Are Why We Win Growing Megatrends CRH Winning Way The Next Era of Growth for CRH Our Growth Algorithm Growing CRH 2030 Financial 1 Megatrends Winning Way Targets Revenue Growth Infrastructure 7% to 9% Transportation * Adj. EBITDA Margin 22% to 24% x = Water * Adj. FCF Conversion Reindustrialization >100% For footnoted information, refer to Appendix. Investor Day 2025 41
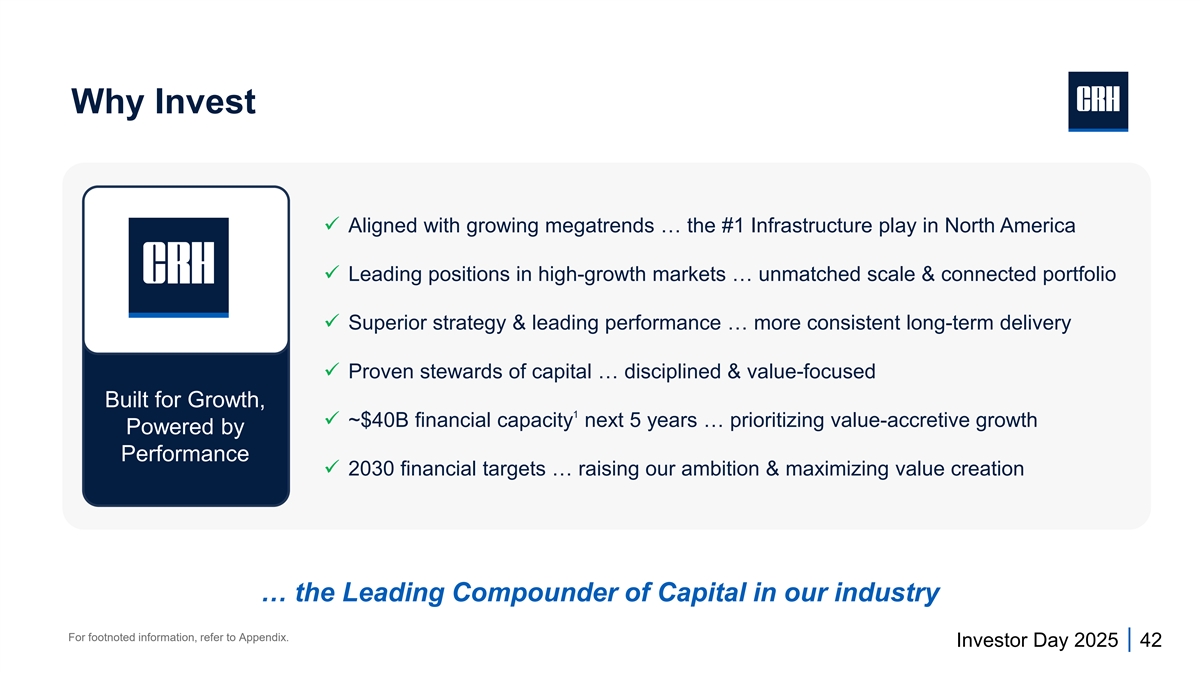
Why Invest ü Aligned with growing megatrends … the #1 Infrastructure play in North America ü Leading positions in high-growth markets … unmatched scale & connected portfolio ü Superior strategy & leading performance … more consistent long-term delivery ü Proven stewards of capital … disciplined & value-focused Built for Growth, 1 ü ~$40B financial capacity next 5 years … prioritizing value-accretive growth Powered by Performance ü 2030 financial targets … raising our ambition & maximizing value creation … the Leading Compounder of Capital in our industry For footnoted information, refer to Appendix. Investor Day 2025 42
Appendix Investor Day 2025 43 43
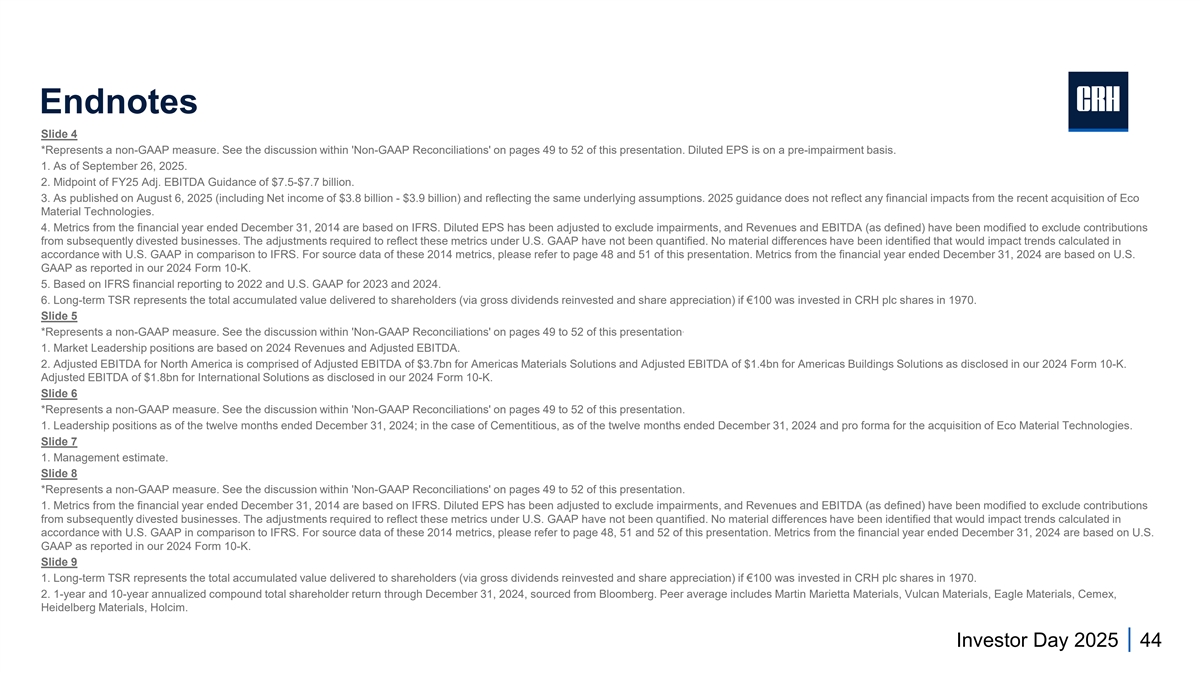
Endnotes Slide 4 *Represents a non-GAAP measure. See the discussion within 'Non-GAAP Reconciliations' on pages 49 to 52 of this presentation. Diluted EPS is on a pre-impairment basis. 1. As of September 26, 2025. 2. Midpoint of FY25 Adj. EBITDA Guidance of $7.5-$7.7 billion. 3. As published on August 6, 2025 (including Net income of $3.8 billion - $3.9 billion) and reflecting the same underlying assumptions. 2025 guidance does not reflect any financial impacts from the recent acquisition of Eco Material Technologies. 4. Metrics from the financial year ended December 31, 2014 are based on IFRS. Diluted EPS has been adjusted to exclude impairments, and Revenues and EBITDA (as defined) have been modified to exclude contributions from subsequently divested businesses. The adjustments required to reflect these metrics under U.S. GAAP have not been quantified. No material differences have been identified that would impact trends calculated in accordance with U.S. GAAP in comparison to IFRS. For source data of these 2014 metrics, please refer to page 48 and 51 of this presentation. Metrics from the financial year ended December 31, 2024 are based on U.S. GAAP as reported in our 2024 Form 10-K. 5. Based on IFRS financial reporting to 2022 and U.S. GAAP for 2023 and 2024. 6. Long-term TSR represents the total accumulated value delivered to shareholders (via gross dividends reinvested and share appreciation) if €100 was invested in CRH plc shares in 1970. Slide 5 . *Represents a non-GAAP measure. See the discussion within 'Non-GAAP Reconciliations' on pages 49 to 52 of this presentation 1. Market Leadership positions are based on 2024 Revenues and Adjusted EBITDA. 2. Adjusted EBITDA for North America is comprised of Adjusted EBITDA of $3.7bn for Americas Materials Solutions and Adjusted EBITDA of $1.4bn for Americas Buildings Solutions as disclosed in our 2024 Form 10-K. Adjusted EBITDA of $1.8bn for International Solutions as disclosed in our 2024 Form 10-K. Slide 6 *Represents a non-GAAP measure. See the discussion within 'Non-GAAP Reconciliations' on pages 49 to 52 of this presentation. 1. Leadership positions as of the twelve months ended December 31, 2024; in the case of Cementitious, as of the twelve months ended December 31, 2024 and pro forma for the acquisition of Eco Material Technologies. Slide 7 1. Management estimate. Slide 8 *Represents a non-GAAP measure. See the discussion within 'Non-GAAP Reconciliations' on pages 49 to 52 of this presentation. 1. Metrics from the financial year ended December 31, 2014 are based on IFRS. Diluted EPS has been adjusted to exclude impairments, and Revenues and EBITDA (as defined) have been modified to exclude contributions from subsequently divested businesses. The adjustments required to reflect these metrics under U.S. GAAP have not been quantified. No material differences have been identified that would impact trends calculated in accordance with U.S. GAAP in comparison to IFRS. For source data of these 2014 metrics, please refer to page 48, 51 and 52 of this presentation. Metrics from the financial year ended December 31, 2024 are based on U.S. GAAP as reported in our 2024 Form 10-K. Slide 9 1. Long-term TSR represents the total accumulated value delivered to shareholders (via gross dividends reinvested and share appreciation) if €100 was invested in CRH plc shares in 1970. 2. 1-year and 10-year annualized compound total shareholder return through December 31, 2024, sourced from Bloomberg. Peer average includes Martin Marietta Materials, Vulcan Materials, Eagle Materials, Cemex, Heidelberg Materials, Holcim. Investor Day 2025 44
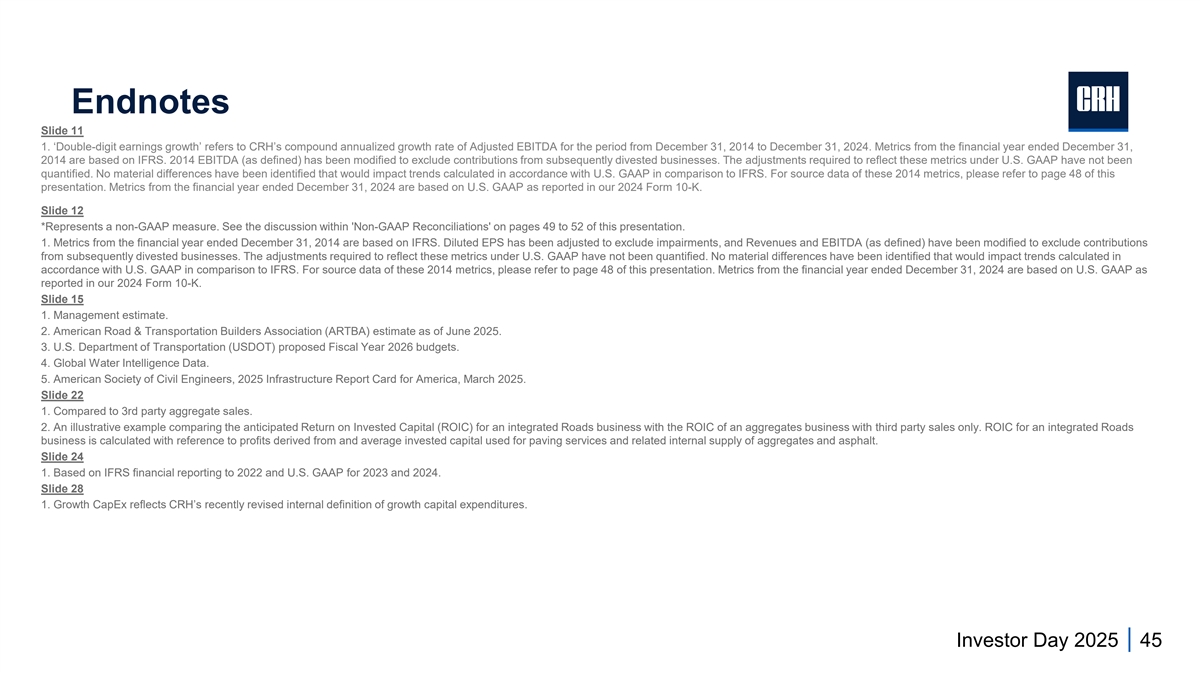
Endnotes Slide 11 1. ‘Double-digit earnings growth’ refers to CRH’s compound annualized growth rate of Adjusted EBITDA for the period from December 31, 2014 to December 31, 2024. Metrics from the financial year ended December 31, 2014 are based on IFRS. 2014 EBITDA (as defined) has been modified to exclude contributions from subsequently divested businesses. The adjustments required to reflect these metrics under U.S. GAAP have not been quantified. No material differences have been identified that would impact trends calculated in accordance with U.S. GAAP in comparison to IFRS. For source data of these 2014 metrics, please refer to page 48 of this presentation. Metrics from the financial year ended December 31, 2024 are based on U.S. GAAP as reported in our 2024 Form 10-K. Slide 12 *Represents a non-GAAP measure. See the discussion within 'Non-GAAP Reconciliations' on pages 49 to 52 of this presentation. 1. Metrics from the financial year ended December 31, 2014 are based on IFRS. Diluted EPS has been adjusted to exclude impairments, and Revenues and EBITDA (as defined) have been modified to exclude contributions from subsequently divested businesses. The adjustments required to reflect these metrics under U.S. GAAP have not been quantified. No material differences have been identified that would impact trends calculated in accordance with U.S. GAAP in comparison to IFRS. For source data of these 2014 metrics, please refer to page 48 of this presentation. Metrics from the financial year ended December 31, 2024 are based on U.S. GAAP as reported in our 2024 Form 10-K. Slide 15 1. Management estimate. 2. American Road & Transportation Builders Association (ARTBA) estimate as of June 2025. 3. U.S. Department of Transportation (USDOT) proposed Fiscal Year 2026 budgets. 4. Global Water Intelligence Data. 5. American Society of Civil Engineers, 2025 Infrastructure Report Card for America, March 2025. Slide 22 1. Compared to 3rd party aggregate sales. 2. An illustrative example comparing the anticipated Return on Invested Capital (ROIC) for an integrated Roads business with the ROIC of an aggregates business with third party sales only. ROIC for an integrated Roads business is calculated with reference to profits derived from and average invested capital used for paving services and related internal supply of aggregates and asphalt. Slide 24 1. Based on IFRS financial reporting to 2022 and U.S. GAAP for 2023 and 2024. Slide 28 1. Growth CapEx reflects CRH’s recently revised internal definition of growth capital expenditures. Investor Day 2025 45

Endnotes Slide 29 *Represents a non-GAAP measure. See the discussion within 'Non-GAAP Reconciliations' on pages 49 to 52 of this presentation. Net Debt comprises short and long-term debt, finance lease liabilities, cash and cash equivalents and current and noncurrent derivative financial instruments (net). Net Debt/Adjusted EBITDA is a non-GAAP financial measure. We cannot predict with certainty certain items that would be included in the most directly comparable GAAP measure for the relevant future periods. Due to these uncertainties, we cannot provide a quantitative reconciliation of Net Debt / Adjusted EBITDA or its components, respectively, to the most directly comparable GAAP financial measure, respectively, without unreasonable effort. 1. Bloomberg 2. Net interest cover is calculated by expressing Adjusted EBITDA as a ratio of net interest. 3. Weighted average maturity of the term debt (net of cash and cash equivalents) as at June 30, 2025. 4. A security rating is not a recommendation to buy, sell or hold securities and may be subject to revision or withdrawal at any time by the assigning rating organization. Each rating should be evaluated independently of any other rating. Slide 30 1. Growth CapEx reflects CRH’s recently revised internal definition of growth capital expenditures.30% of $8B Growth Capex pipeline spent to date as of June, 30 2025. Slide 32 1. Bolt-on deal classified as <$0.1B, mid-sized deal classified as $0.1B-$1B, platform deal classified as >$1.0B. Slide 34 1. Management estimates derived from financial information relating to the State of Texas as a destination for the trailing twelve months ended June 30, 2025, which was based on U.S. GAAP financial reporting, compared with the fiscal year ended December 31, 2014, which was based on IFRS financial reporting. The nature of the adjustments for purposes of Adjusted EBITDA is consistent with CRH’s consolidated presentation. No material differences have been identified that would impact trends calculated between the relevant periods. Slide 37 1. Financial capacity is defined as the anticipated cash and debt financing available (after maintenance capex) for growth investments and cash returns to shareholders. The information is indicative only and any capital deployment will be dependent on the value creation opportunities arising over the period. The Company’s ability to deliver on these capital allocation priorities may be negatively impacted by the factors set out in the disclaimer on slide 1. Slide 38 1. Financial capacity is defined as the anticipated cash and debt financing available (after maintenance capex) for growth investments and cash returns to shareholders. The information is indicative only and any capital deployment will be dependent on the value creation opportunities arising over the period. The Company’s ability to deliver on these capital allocation priorities may be negatively impacted by the factors set out in the disclaimer on slide 1. Slide 40 *Represents a non-GAAP measure. See the discussion within 'Non-GAAP Reconciliations' on pages 49 to 52 of this presentation. 1. 2030 Financial Targets represent average annual Revenue growth between 7% and 9% from 2026-2030, Adjusted EBITDA Margin between 22% and 24% by 2030, and average annual Adjusted Free Cash Flow Conversion of more than 100% from 2026-2030. Adjusted EBITDA Margin and Adjusted Free Cash Flow Conversion are non-GAAP financial measures. We cannot predict with certainty certain items that would be included in the most directly comparable GAAP measure for the relevant future periods. Due to these uncertainties, we cannot provide a quantitative reconciliation of Adjusted EBITDA Margin or Adjusted Free Cash Flow Conversion, respectively, to the most directly comparable GAAP financial measure, respectively, without unreasonable effort. However, we expect to calculate Adjusted EBITDA Margin and Adjusted Free Cash Flow Conversion for future periods in the same manner as provided herein. Investor Day 2025 46

Endnotes Slide 41 *Represents a non-GAAP measure. See the discussion within 'Non-GAAP Reconciliations' on pages 49 to 52 of this presentation. 1. 2030 Financial Targets represent average annual Revenue growth between 7% and 9% from 2026-2030, Adjusted EBITDA Margin between 22% and 24% by 2030, and average annual Adjusted Free Cash Flow Conversion of more than 100% from 2026-2030. Adjusted EBITDA Margin and Adjusted Free Cash Flow Conversion are non-GAAP financial measures. We cannot predict with certainty certain items that would be included in the most directly comparable GAAP measure for the relevant future periods. Due to these uncertainties, we cannot provide a quantitative reconciliation of Adjusted EBITDA Margin or Adjusted Free Cash Flow Conversion, respectively, to the most directly comparable GAAP financial measure, respectively, without unreasonable effort. However, we expect to calculate Adjusted EBITDA Margin and Adjusted Free Cash Flow Conversion for future periods in the same manner as provided herein. Slide 42 1. Financial capacity is defined as the anticipated cash and debt financing available (after maintenance capex) for growth investments and cash returns to shareholders. The information is indicative only and any capital deployment will be dependent on the value creation opportunities arising over the period. The Company’s ability to deliver on these capital allocation priorities may be negatively impacted by the factors set out in the disclaimer on slide 1. Slide 43 *Represents a non-GAAP measure. See the discussion within 'Non-GAAP Reconciliations' on pages 49 to 52 of this presentation. 1. 2030 Financial Targets represent average annual Revenue growth between 7% and 9% from 2026-2030, Adjusted EBITDA Margin between 22% and 24% by 2030, and average annual Adjusted Free Cash Flow Conversion of more than 100% from 2026-2030. Adjusted EBITDA Margin and Adjusted Free Cash Flow Conversion are non-GAAP financial measures. We cannot predict with certainty certain items that would be included in the most directly comparable GAAP measure for the relevant future periods. Due to these uncertainties, we cannot provide a quantitative reconciliation of Adjusted EBITDA Margin or Adjusted Free Cash Flow Conversion, respectively, to the most directly comparable GAAP financial measure, respectively, without unreasonable effort. However, we expect to calculate Adjusted EBITDA Margin and Adjusted Free Cash Flow Conversion for future periods in the same manner as provided herein. Investor Day 2025 47

Source Data - Proven Track Record of Superior Value Creation € $ in millions, except per share data 2014 Revenue (i) 18,912 Less: Revenue from divested businesses Europe Distribution (i) (3,999) Americas Distribution (i) (1,776) Building Envelope (ii) (739) 12,398 2014 IFRS Revenue adjusted for divested businesses (iii) (iv) A 16,477 2024 U.S. GAAP Revenues per the Annual Report on Form 10-K B 35,572 10-Year CAGR 8% 2014 EBITDA (as defined) (i) 1,641 Less: EBITDA (as defined) from divested businesses Europe Distribution (i) (190) Americas Distribution (i) (105) Building Envelope (ii) (64) 1,282 2014 IFRS based EBITDA (as defined) (iii) (iv) C 1,704 2024 U.S. GAAP based Adjusted EBITDA* per the Annual Report on Form 10-K D 6,930 10-Year CAGR 15% 2014 IFRS based EBITDA (as defined) Margin (C divided by A) 10.3% 2024 U.S. GAAP based Adjusted EBITDA* Margin (D divided by B) 19.5% 10-Year Change 920bps 2014 Diluted EPS (i) €0.79 Impairment (net of tax) (i) €0.07 €0.86 2014 IFRS diluted EPS (pre-impairment) (iii) (iv) $1.14 2024 U.S. GAAP diluted EPS (pre-impairment)* $5.43 10-Year CAGR 17% (i) As reported under IFRS in the Annual Report on Form 20-F for 2014. (ii) The results for Building Envelope stated are under IFRS and were not previously separately reported in external filings. (iii) Effective from January 1, 2020, CRH changed its reporting currency from euro to U.S. Dollar. Reported results for 2014 have been translated from euro to U.S. Dollar using the 2014 average exchange rate of $1.329 to €1. (iv) The adjustments required to reflect these metrics under U.S. GAAP have not been quantified. No material differences have been identified that would impact trends calculated in accordance with Investor Day 2025 48 U.S. GAAP in comparison to IFRS. * Represents a non-GAAP measure. See the discussion within 'Non-GAAP Reconciliations' on pages 49 to 52.

Non-GAAP Reconciliations CRH uses a number of non-GAAP performance measures to monitor financial performance. These measures are referred to throughout the discussion of our reported financial position and operating performance on a continuing operations basis unless otherwise defined and are measures which are regularly reviewed by CRH management. These performance measures may not be uniformly defined by all companies and accordingly may not be directly comparable with similarly titled measures and disclosures by other companies. Certain information presented is derived from amounts calculated in accordance with U.S. GAAP but is not itself an expressly permitted GAAP measure. The non-GAAP performance measures as summarized below should not be viewed in isolation or as an alternative to the equivalent GAAP measure. Adjusted EBITDA: Adjusted EBITDA is defined as earnings from continuing operations before interest, taxes, depreciation, depletion, amortization, loss on impairments, gain/loss on divestitures and unrealized gain/loss on investments, income/loss from equity method investments, substantial acquisition-related costs and pension expense/income excluding current service cost component. It is quoted by management in conjunction with other GAAP and non-GAAP financial measures to aid investors in their analysis of the performance of the Company. Adjusted EBITDA by segment is monitored by management in order to allocate resources between segments and to assess performance. Adjusted EBITDA margin is calculated by expressing Adjusted EBITDA as a percentage of total revenues. Net interest is calculated as a sum of Interest expense and Interest income. Net interest cover is calculated by expressing Adjusted EBITDA as a ratio of net interest. Net interest cover is used by management as a measure which matches the earnings and cash generated by the business to the underlying funding costs. Net interest cover is presented to provide investors with a greater understanding of the impact of CRH’s debt and financing arrangements. Reconciliation to the nearest GAAP measure is presented below: in $ millions FY2024 Net income 3,521 Loss from equity method investments (i) 108 Income tax expense 1,085 Gain on divestitures and on investments (ii) (250) Pension income excluding current service cost component (ii) (7) Other interest, net (ii) (1) Interest expense 612 Interest income (143) Depreciation, depletion and amortization 1,798 Loss on impairments (i) 161 Substantial acquisition-related costs (iii) 46 Adjusted EBITDA 6,930 Total revenues 35,572 Net income margin 9.9% Adjusted EBITDA margin 19.5% Interest expense 612 Interest income (143) Net interest 469 Net income divided by net interest 7.5x Net interest cover (Adjusted EBITDA divided by net interest) 14.8x (i) For the year ended December 31, 2024, the total impairment loss comprised $0.35 billion, principally related to the Architectural Products reporting unit within International Solutions and the equity method investment in China. (ii) Gain on divestitures and investments, pension income excluding current service cost component and other interest, net have been included in Other nonoperating (expense) income, net in the Consolidated Statements of Income in Item 8. “Financial Statements and Supplementary Data” in the Annual Report on Form 10-K. (iii) Represents expenses associated with non-routine substantial acquisitions, which meet the criteria for being separately reported in Note 4 “Acquisitions” in Item 8. “Financial Statements and Investor Day 2025 49 Supplementary Data” in the Annual Report on Form 10-K. Expenses in 2024 primarily include legal and consulting expenses related to these non-routine substantial acquisitions.

Non-GAAP Reconciliations Diluted EPS pre-impairment: Diluted EPS pre-impairment is a measure of the Company's profitability per share from continuing operations excluding any loss on impairments (which is non-cash) and the related tax impact of such impairments. It is used by management to evaluate the Company's underlying profit performance and its own past performance. Diluted EPS information presented on a pre-impairment basis is useful to investors as it provides an insight into the Company's underlying performance and profitability. Diluted EPS pre- impairment is calculated as income from continuing operations adjusted for (i) net (income) attributable to redeemable noncontrolling interests (ii) net loss (income) attributable to noncontrolling interests (iii) adjustment of redeemable noncontrolling interests to redemption value and excluding any loss on impairments (and the related tax impact of such impairments) divided by the diluted weighted average number of common shares outstanding for the year. Reconciliation to its nearest GAAP measure is presented below: in $ millions, except share and per share data FY 2024 Per Share - diluted Weighted average common shares outstanding - Diluted 689.5 Net income 3,521 $5.11 Net (income) attributable to redeemable noncontrolling interests (28) ($0.04) Net loss (income) attributable to noncontrolling interests (1) — Adjustment of redeemable noncontrolling interests to redemption value (34) ($0.05) Net Income for EPS 3,458 $5.02 Impairment of property, plant and equipment and intangible assets 161 $0.23 Tax related to impairment charges (26) ($0.04) Impairment of equity method investments (net of tax) 151 $0.22 Net income for EPS – pre-impairment (i) 3,744 $5.43 (i) Reflective of CRH’s share of impairment of property, plant and equipment and intangible assets (2024: $161 million), an impairment of equity method investments (2024: $190 million) and related tax effect. Investor Day 2025 50

Non-GAAP Reconciliations Adjusted Free Cash Flow: Adjusted Free Cash Flow is a liquidity measure and is defined as net cash provided by operating activities adjusted for proceeds from disposal of long-lived assets less maintenance capital expenditures. Adjusted Free Cash Flow conversion is defined as Adjusted Free Cash Flow divided by Net income. Management believes that Adjusted Free Cash Flow and Adjusted Free Cash Flow Conversion are useful metrics for both management and investors in evaluating the Company’s ability to generate cash flow from operations after making investments in maintaining its asset base. As is the case with the other non-GAAP measures presented, users should consider the limitations of using Adjusted Free Cash Flow and Adjusted Free Cash Flow conversion, including the fact that those measures do not provide a complete measure of our cash flows for any period. In particular, Adjusted Free Cash Flow and Adjusted Free Cash Flow conversion are not intended to be a measure of cash flow available for management’s discretionary use, as these measures do not reflect certain cash requirements, such as debt service requirements and other contractual commitments. Reconciliation to its nearest GAAP measure is presented below: FY 2024 FY 2014 FY 2014 in millions $ € (ii) $ (iii) Net cash provided by operating activities 4,989 1,237 1,644 Proceeds from disposal of long-lived assets 272 121 161 Maintenance capital expenditure (i) (1,036) (261) (347) Adjusted Free Cash Flow 4,225 1,097 1,458 10-year CAGR 11% (i) Maintenance capital expenditure refers to capital expenditure that is routine, essential, and part of day-to-day operations, focusing on preserving the value, functionality, and profitability of existing assets. Maintenance capital expenditure does not include growth capital expenditure, which is intended to increase profitability by expanding capacity, improving efficiency or fulfilling strategic objectives. A reconciliation of total capital expenditure to maintenance capital expenditure is provided below: FY 2024 FY 2014 FY 2014 in millions $ € (ii) $ (iii) (2,578) (435) (578) Total capital expenditure (1,542) (174) (231) Growth capital expenditure (iv) (1,036) (261) (347) Maintenance capital expenditure (ii) Based on net cash inflow from operating activities and other figures published under IFRS in the Annual Report on Form 20-F for 2014. Adjusted Free cash flow figure under IFRS not previously reported in external filings. The adjustments required to reflect this metric under U.S. GAAP have not been quantified. No material differences have been identified that would impact trends calculated in accordance with U.S. GAAP in comparison to IFRS. (iii) Effective from January 1, 2020, CRH changed its reporting currency from euro to U.S. Dollar. Reported results for 2014 have been translated from euro to U.S. Dollar using the 2014 average exchange rate of $1.329 to €1. (iv) Reflects CRH’s recently revised internal definitions of ‘growth capital expenditures’. Investor Day 2025 51

Non-GAAP Reconciliations Adjusted Return on Invested Capital (Adj. ROIC): Adjusted ROIC is an after-tax measure of operating performance and can be used by management and investors to assess how efficiently we use capital to generate operating income. The metric measures management’s ability to generate after-tax adjusted operating income from the capital invested in the business, focusing on both after-tax operating income maximization and the maintenance of an efficient asset base. It is meaningful in order to evaluate fixed asset maintenance programs, decision-making with respect to expenditures on property, plant and equipment and timeliness of disposal of surplus assets. It also supports the evaluation of management of the Company’s working capital base. Adjusted ROIC is calculated by expressing Adjusted Net Operating Profit After Tax (Adjusted NOPAT) being net operating income after tax from continuing operations and net operating income after tax from discontinued operations adjusted for certain items affecting comparability because they are of a non-recurring or extraordinary nature as a percentage of the average of current year and prior year invested capital. The items affecting comparability because they are of a non-recurring or extraordinary nature for the periods presented below are loss on impairments and substantial acquisition-related costs. Invested capital comprises total equity, redeemable noncontrolling interest, short and long-term debt, finance leases and derivatives and excludes cash and cash equivalents, and equity method investments as disclosed in our 2024 Form 10-K. The average invested capital for the year is the simple average of the opening and closing balance sheet figures. Reconciliation to its nearest GAAP measure is presented below: 2024 2014 2024 2014 in millions in millions $ € (i) $ € (i) 4,925 917 Operating income Prior year Impairment (ii) 161 49 Total equity 21,288 9,686 46 Substantial acquisition-related costs (iii) — Redeemable noncontrolling interest 333 — 5,132 966 Adjusted operating income 11,642 5,540 Short and long-term debt (1,180) (224) Income tax adjustment (iv) 117 — Finance leases 3,952 742 Numerator for Adjusted ROIC computation – adjusted NOPAT 37 27 Derivatives (6,390) (2,540) Cash and cash equivalents Current year Adjusted for 22,466 10,198 Total equity Equity method investments (620) (1,340) 384 — Redeemable noncontrolling interest Invested capital 26,407 11,373 13,968 5,866 Short and long-term debt 257 — 29,526 11,446 Finance leases Denominator for Adjusted ROIC computation - average invested capital 27 79 Derivatives (3,720) (3,295) 16.7% 8.0% Cash and cash equivalents Operating income/average invested capital Adjusted for (737) (1,329) Equity method investments Adjusted ROIC 13.4% 6.5% 32,645 11,519 690 bps Invested capital 10-year change (i) Based on Group operating profit and other figures published under IFRS in the Annual Report on Form 20-F for 2014. ROIC figure under IFRS not previously reported in external filings. The adjustments required to reflect this metric under U.S. GAAP have not been quantified. No material differences have been identified that would impact trends calculated in accordance with U.S. GAAP in comparison to IFRS. Effective from January 1, 2020, CRH changed its reporting currency from euro to U.S. Dollar. Reported results for 2014 are shown in euro. (ii) For the year ended December 31, 2024, the total impairment loss comprised $161 million within International Solutions. iii) Represents expenses associated with non-routine substantial acquisitions, which meet the criteria for being separately reported in Note 4 “Acquisitions” of the audited financial statements. Expenses in 2024 primarily include legal and consulting expenses related to these non-routine substantial acquisitions. Investor Day 2025 52 (iv) Income tax adjustment is defined as adjusted operating income multiplied by the Company’s effective tax rate of 23% (2014: 23%).

Exhibit 99.3 Investor Day 2025 New York Proven Growth Capabilities Built for Growth Powered by Performance

Disclaimer Unless the context otherwise provides, “we,” “us,” “our,” “CRH”, the “Company” and like terms refer to CRH plc and its consolidated subsidiaries. Forward-Looking Statements In order to utilize the “Safe Harbor” provisions of the United States Private Securities Litigation Reform Act of 1995, CRH is providing the following cautionary statement. This presentation contains statements that are, or may be deemed to be, forward-looking statements with respect to the financial condition, results of operations, business, viability and future performance of CRH and certain of the plans and objectives of CRH. These forward-looking statements may generally, but not always, be identified by the use of words such as “will”, “anticipates”, “should”, “could”, “would”, “targets”, “aims”, “may”, “continues”, “expects”, “is expected to”, “estimates”, “believes”, “intends” or similar expressions. These forward-looking statements include all matters that are not historical facts or matters of fact at the date of this presentation. In particular, the following, among other statements, are all forward-looking in nature: plans and expectations regarding megatrends and growth with respect to each, including infrastructure, transportation, water and reindustrialization; statements regarding the expected impacts of CRH’s capital allocation; statements regarding anticipated financial capacity and optionality for, and results of, capital deployment; expectations regarding economic and population growth, public funding and secular tailwinds; statements regarding growth opportunities as a result of replicating at scale; statements regarding CRH's long-term return prospects and capital compounding; statements regarding CRH’s prioritization of high-growth markets and ability to build market-leading positions; and statements regarding CRH’s pipeline of growth opportunities. By their nature, forward-looking statements involve risk and uncertainty because they relate to events and depend on circumstances that may or may not occur in the future and reflect the Company’s current expectations and assumptions as to such future events and circumstances that may not prove accurate. You are cautioned not to place undue reliance on any forward-looking statements. These forward-looking statements are made as of the date of this presentation. The Company expressly disclaims any obligation or undertaking to publicly update or revise these forward-looking statements other than as required by applicable law. A number of material factors could cause actual results and developments to differ materially from those expressed or implied by these forward-looking statements, certain of which are beyond our control, and which include, among other factors, the risks and uncertainties described herein and under “Risk Factors” in our 2024 Form 10-K and in our other filings with the SEC. Non-GAAP Financial Information This presentation includes discussion of Adjusted EBITDA and Adjusted EBITDA margin generated by CRH’s operations in Texas and by certain operating companies, assets and quarries, each of which is financial information that is not calculated in accordance with U.S. generally accepted accounting principles (‘GAAP’). Non-GAAP financial information should not be considered a replacement for GAAP measures. Investor Day 2025 1

Today’s Speakers JP San Agustín Tim Ortman Group Executive, Strategic Planning, President, CRH Americas Innovation and Venturing Building Products Investor Day 2025 2

Our Growth Algorithm Growing CRH Leading Megatrends Winning Way Compounder of Capital Infrastructure Transportation x = Water Proven long-term delivery 1 Double-digit earnings growth Reindustrialization Investor Day 2025 3 For footnoted information, refer to Appendix.

Proven Growth Capabilities A deeply embedded mindset throughout our organization • Empowered teams & local relationships … the acquirer of choice >1,250 Acquisitions since 1970 • Disciplined & value-focused approach • Unmatched acquisition, integration & synergy delivery capabilities 30 transactions on average every year • Greater optionality for capital deployment … over last decade underpinned by a connected portfolio … building platforms of scale in attractive markets … Investor Day 2025 4

Building Growth Platforms of Scale A deliberate & strategic customer centric approach Attractive growth markets … South & West U.S., Central & Eastern Europe, Australia Aggregates Cementitious Roads Water Leveraging benefits of scale & our uniquely connected portfolio Inv Inves estor tor Day Day 2025 2025 5 5

Building a Growth Platform in a High Growth Region (Texas) Investor Day 2025 6

Superior Strategy Deliberate approach to capital allocation CRH identified Texas as a key growth opportunity Strong fundamentals … … with megatrend drivers Robust Growing Strong Public Significant Water Re- Economy Population Funding Road Infra Needs industrialization Demand Inv Inves estor tor Day Day 2025 2025 7 7

1 CRH in Texas Strengthening our connected portfolio through acquisition … Since 2014 Certain assets Eco of Capitol Ash Grove Angel East Texas Aggregates Cement Brothers Asphalt Material May-14 Jun-18 Mar-21 Dec-22 Sep-25 >25 acquisitions Oct-15 Dec-20 Apr-22 Feb-24 >1,000bps Asphalt Martin Certain assets Hunter assets of Enterprises of Rinker Cement plant Adj. EBITDA 2 Martin Materials & margin expansion Marietta 20 RMC plants … maintaining & leveraging strong local brands & leadership teams Inv Inves estor tor Day Day 2025 2025 8 8 For footnoted information, refer to Appendix.

Building from Aggregates … 7.5m Tons annual production Aggregates Cementitious ~3x Revenue growth 1 since acquisition Marble Falls Quarry Roads Water 2014 Acquisition ~7x Adj. EBITDA growth 1 since acquisition Inv Inves estor tor Day Day 2025 2025 9 9 For footnoted information, refer to Appendix.

Increasing our Cementitious Supply … Aggregates Cementitious Ash Grove Hunter cement Eco cement & RMC Material acquisition acquisition acquisition (2018) (2024) (2025) Roads Water Including 1mt 2mt cement plant, Market leader cement plant in 20 RMC plants, in SCMs in Midlothian, Texas network of North America; 19 terminals locations in Texas Inv Inves estor tor Day Day 2025 2025 10 10

Connected to Roads … 2021 2022 Roads acquisition with Roads acquisition with Aggregates Cementitious operations in Houston, operations in East Texas San Antonio & Austin & Louisiana +350bps +730bps Adj. EBITDA margin Adj. EBITDA margin 1 2 expansion since acquisition expansion since acquisition Roads Water Aggregates, Aggregates, Asphalt & Paving Asphalt & Paving Inv Inves estor tor Day Day 2025 2025 11 11 For footnoted information, refer to Appendix.

Connected to Water … >300k Tons of products manufactured p.a. Aggregates Cementitious ~1.5x Revenue growth 1 since acquisition Roads Water Rinker Assets, Houston ~2x 2022 Acquisition Adj. EBITDA growth 1 since acquisition Inv Inves estor tor Day Day 2025 2025 12 12 For footnoted information, refer to Appendix.

Creating a Connected Platform in Texas … The Leading Building Materials Business in Texas Connected Portfolio Aggregates Cementitious Products Roads Aggregates Cementitious Water Building Products Roads Water Inv Inves estor tor Day Day 2025 2025 13 13

… With Significant Growth Over the Last Decade CRH Texas in 2014 CRH Texas in 2025 1 1 (FY14) (TTM Q2’25) $0.6B +16% $3.0B Revenues CAGR Revenues $0.1B +24% $0.8B Adj. EBITDA CAGR Adj. EBITDA 60 181 2 Locations Locations Inv Inves estor tor Day Day 2025 2025 14 14 For footnoted information, refer to Appendix.

The Growth Opportunity: Replicating at Scale Investor Day 2025 15
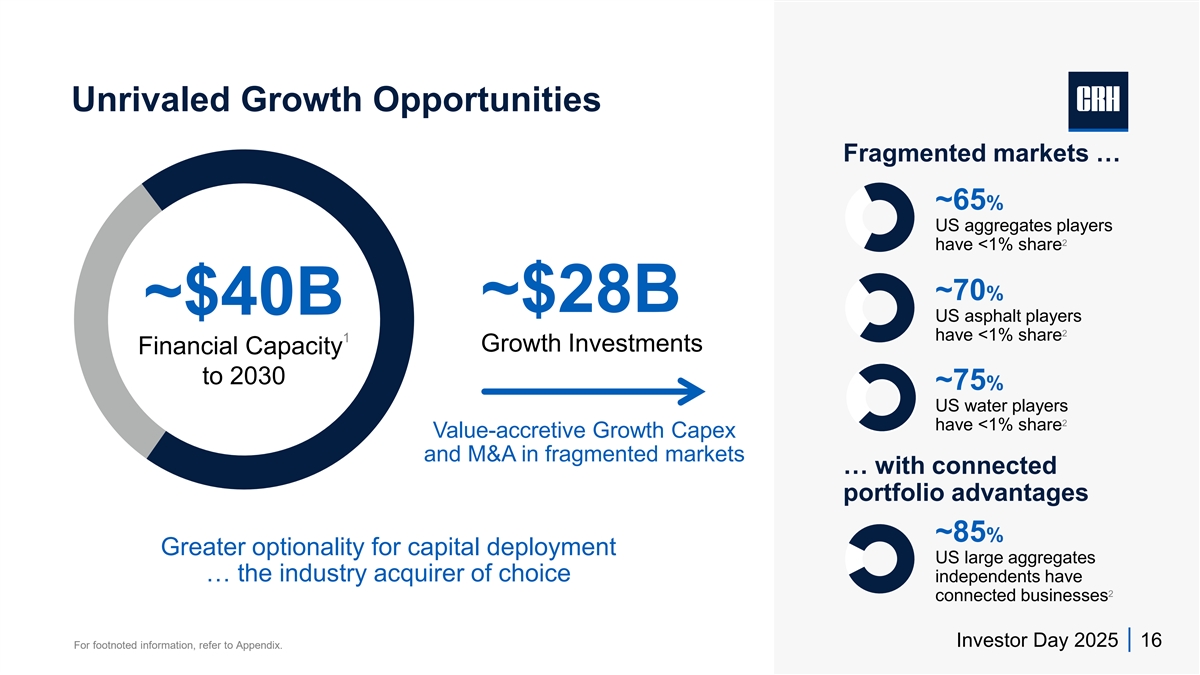
Unrivaled Growth Opportunities Fragmented markets … ~65% US aggregates players 2 have <1% share ~70% ~$28B ~$40B US asphalt players 2 have <1% share 1 Growth Investments Financial Capacity to 2030 ~75% US water players 2 have <1% share Value-accretive Growth Capex and M&A in fragmented markets … with connected portfolio advantages ~85% Greater optionality for capital deployment US large aggregates … the industry acquirer of choice independents have 2 connected businesses Investor Day 2025 16 For footnoted information, refer to Appendix.

Building CRH’s Future Growth Platforms Deliberate & strategic approach … Strong Market Dynamics Attractive Target Companies Driving Superior Value #1 + x Secular Growth Tailwinds Market-Leading Positions Leading Performance Attractive Markets Strong Local Brands Connected Portfolio Synergies … superior long-term returns & compounding of capital Inv Inves estor tor Day Day 2025 2025 17 17
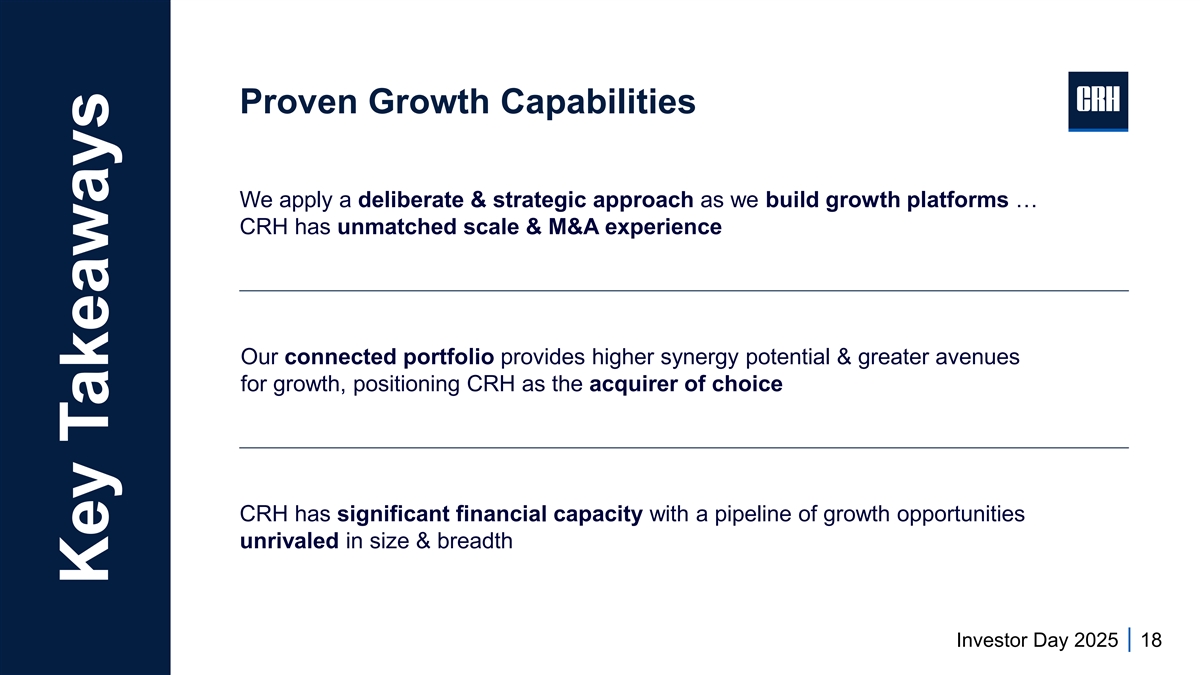
Proven Growth Capabilities We apply a deliberate & strategic approach as we build growth platforms … CRH has unmatched scale & M&A experience Our connected portfolio provides higher synergy potential & greater avenues for growth, positioning CRH as the acquirer of choice CRH has significant financial capacity with a pipeline of growth opportunities unrivaled in size & breadth Investor Day 2025 18 Key Takeaways

Appendix: Endnotes Slide 3 1. ‘Double-digit earnings growth’ refers to CRH’s compound annualized growth rate of Adjusted EBITDA for the period from December 31, 2014 to December 31, 2024. Metrics from the financial year ended December 31, 2014 are based on IFRS. 2014 EBITDA (as defined) has been modified to exclude contributions from subsequently divested businesses. The adjustments required to reflect these metrics under U.S. GAAP have not been quantified. No material differences have been identified that would impact trends calculated in accordance with U.S. GAAP in comparison to IFRS. For source data of this 2014 metric, please refer to the Appendix of the main September 2025 Investor Day presentation. Metrics from the financial year ended December 31, 2024 are based on U.S. GAAP as reported in our 2024 Form 10-K Slide 8 1. Through September 2025; includes acquired entities with operations within the State of Texas. 2. Management estimates derived from financial information relating to the State of Texas as a destination for the trailing twelve months ended June 30, 2025, which was based on U.S. GAAP financial reporting, compared with the financial year ended December 31, 2014, which was based on IFRS financial reporting. The nature of the adjustments for purposes of Adjusted EBITDA is consistent with CRH’s consolidated presentation. No material differences have been identified that would impact trends calculated between the relevant periods. Slide 9 1. Management estimates derived from financial information comparing results from materials produced at the Marble Falls Quarry from the twelve months ended December 31, 2024, which was based on U.S. GAAP financial reporting, with the pre-acquisition results prepared in accordance with the acquiree’s accounting policies for the twelve months ended December 31, 2014. This comparison is intended to illustrate directional performance improvement and should not be interpreted as an audited historical financial comparison. Slide 11 1. Management estimates derived from operating company-level financial information comparing results from Angel Brothers for the twelve months ended December 31, 2024 which was based on U.S. GAAP financial reporting, with the pre-acquisition results prepared in accordance with the acquiree’s accounting policies for the twelve months ended December 31, 2020. This comparison is intended to illustrate directional performance improvement and should not be interpreted as an audited historical financial comparison. 2. Management estimates derived from operating company-level financial information comparing results from East Texas Asphalt for the twelve months ended December 31, 2024, which was based on U.S. GAAP financial reporting, with the pre-acquisition results prepared in accordance with the acquiree’s accounting policies for the twelve months ended December 31, 2021. This comparison is intended to illustrate directional performance improvement and should not be interpreted as an audited historical financial comparison. Slide 12 1. Management estimates derived from financial information comparing results from materials produced by the Rinker Assets operations for the twelve months ended December 31, 2024, which was based on U.S. GAAP financial reporting, with the pre-acquisition results prepared in accordance with the acquiree’s accounting policies for the twelve months ended December 31, 2021. This comparison is intended to illustrate directional performance improvement and should not be interpreted as an audited historical financial comparison. Slide 14 1. Management estimates derived from financial information relating to the State of Texas as a destination for the trailing twelve months ended June 30, 2025, which was based on U.S. GAAP financial reporting, compared with the financial year ended December 31, 2014, which was based on IFRS financial reporting. The nature of the adjustments for purposes of Adjusted EBITDA is consistent with CRH’s consolidated presentation. No material differences have been identified that would impact trends calculated between the relevant periods. 2. Locations shown are pro forma for the completion of the Eco Material Technologies transaction which closed on September 15, 2025. Financial results do not include Eco Material Technologies. Slide 16 1. Financial capacity is defined as the anticipated cash and debt financing available (after maintenance capex) for growth investments and cash returns to shareholders. The information is indicative only and any capital deployment will be dependent on the value creation opportunities arising over the period. The Company’s ability to deliver on these capital allocation priorities may be negatively impacted by the factors set out in the disclaimer on slide 1. 2. Management estimates. Investor Day 2025 19

Exhibit 99.4 Investor Day 2025 New York Leading Performance Built for Growth Powered by Performance

Disclaimer Unless the context otherwise provides, “we,” “us,” “our,” “CRH”, the “Company” and like terms refer to CRH plc and its consolidated subsidiaries. Forward-Looking Statements In order to utilize the “Safe Harbor” provisions of the United States Private Securities Litigation Reform Act of 1995, CRH is providing the following cautionary statement. This presentation contains statements that are, or may be deemed to be, forward-looking statements with respect to the financial condition, results of operations, business, viability and future performance of CRH and certain of the plans and objectives of CRH. These forward-looking statements may generally, but not always, be identified by the use of words such as “will”, “anticipates”, “should”, “could”, “would”, “targets”, “aims”, “may”, “continues”, “expects”, “is expected to”, “estimates”, “believes”, “intends” or similar expressions. These forward-looking statements include all matters that are not historical facts or matters of fact at the date of this presentation. In particular, the following, among other statements, are all forward-looking in nature: plans and expectations regarding megatrends and growth with respect to each, including infrastructure, transportation, water and reindustrialization; statements regarding the expected impacts of CRH’s capital allocation; statements regarding the impact of certain enablers on CRH’s growth and financial delivery; statements regarding CRH’s integration process and impact on financial results and growth opportunities; and statements regarding CRH’s ability to repeat and scale its model and to deliver synergies. By their nature, forward-looking statements involve risk and uncertainty because they relate to events and depend on circumstances that may or may not occur in the future and reflect the Company’s current expectations and assumptions as to such future events and circumstances that may not prove accurate. You are cautioned not to place undue reliance on any forward-looking statements. These forward-looking statements are made as of the date of this presentation. The Company expressly disclaims any obligation or undertaking to publicly update or revise these forward-looking statements other than as required by applicable law. A number of material factors could cause actual results and developments to differ materially from those expressed or implied by these forward-looking statements, certain of which are beyond our control, and which include, among other factors, the risks and uncertainties described herein and under “Risk Factors” in our 2024 Form 10-K and in our other filings with the SEC. Non-GAAP Financial Information This presentation includes discussion of certain operating companies’ Adjusted EBITDA, cash gross profit per ton and Adjusted EBITDA margin, each of which is financial information that is not calculated in accordance with U.S. generally accepted accounting principles (‘GAAP’). Non-GAAP financial information should not be considered a replacement for GAAP measures. Investor Day 2025 1

Today’s Speakers Peter Buckley Liz Haggerty President, CRH International Executive Vice President, CRH Americas Investor Day 2025 2

Our Growth Algorithm Growing CRH Leading Megatrends Winning Way Compounder of Capital Infrastructure Transportation x = Water Proven long-term delivery 1 Double-digit earnings growth Reindustrialization Investor Day 2025 3 For footnoted information, refer to Appendix.
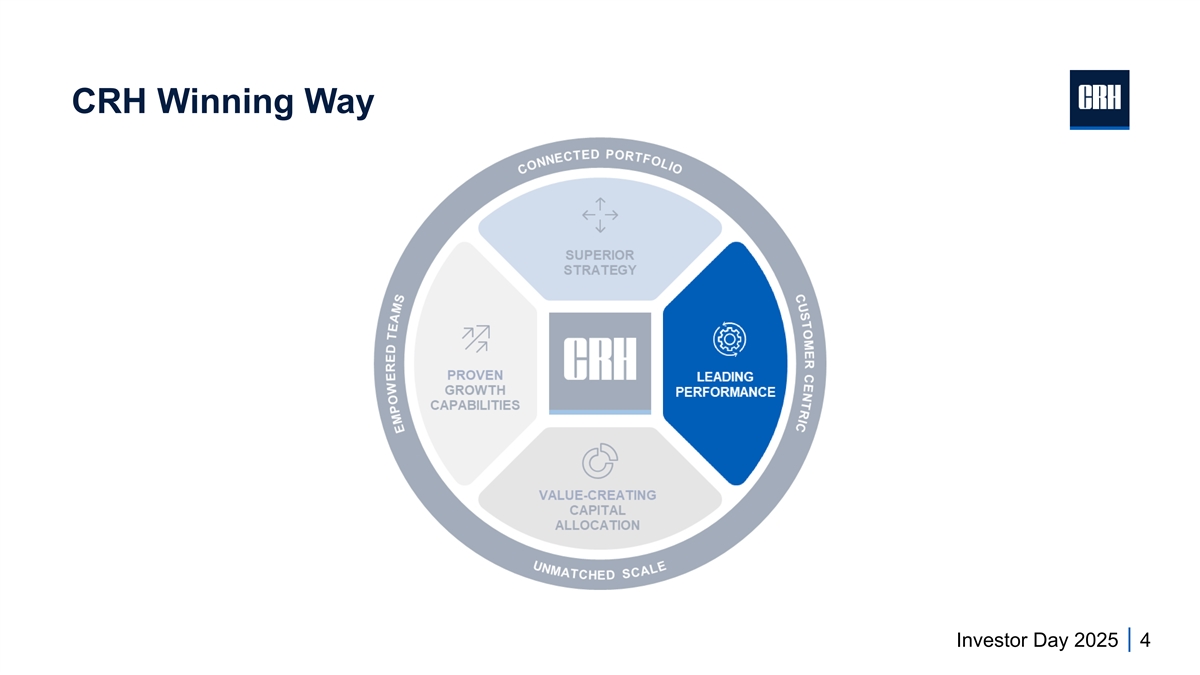
CRH Winning Way Investor Day 2025 4

Leading Performance Safety Culture Locally Globally Leading Owned Performance Enabled ‘Best-in-class’ performance teams A key enabler to our growth and financial delivery … Investor Day 2025 5

Leading Performance Strategic Planning Performance KPIs — Action & Playbooks Excellence & Accountability Scale & Replication Margin Expansion Revenue Maximization Set clear priorities … Implement high-impact initiatives … Execute & track … Investor Day 2025 6

Performance Excellence Unrivaled scale & resources Scale & to further accelerate Replication Margin Expansion Benchmarking globally to deliver best-in-class Revenue Maximization Utilizing the power of our local brands to develop deep customer relationships Investor Day 2025 7

Scale and Replication Expanding Revenue Maximization Margin Revenue Maximizatio Developing deep customer relationships n Harnessing our Leveraging our Unrivaled local brands connected portfolio commercial excellence Right Route to People Market Subsurface At Grade Building Finishing Volume Price Customer Sales Acquisition Execution & Loyalty Trusted customer relationships Increased share of wallet Execute high-impact initiatives Investor Day 2025 8
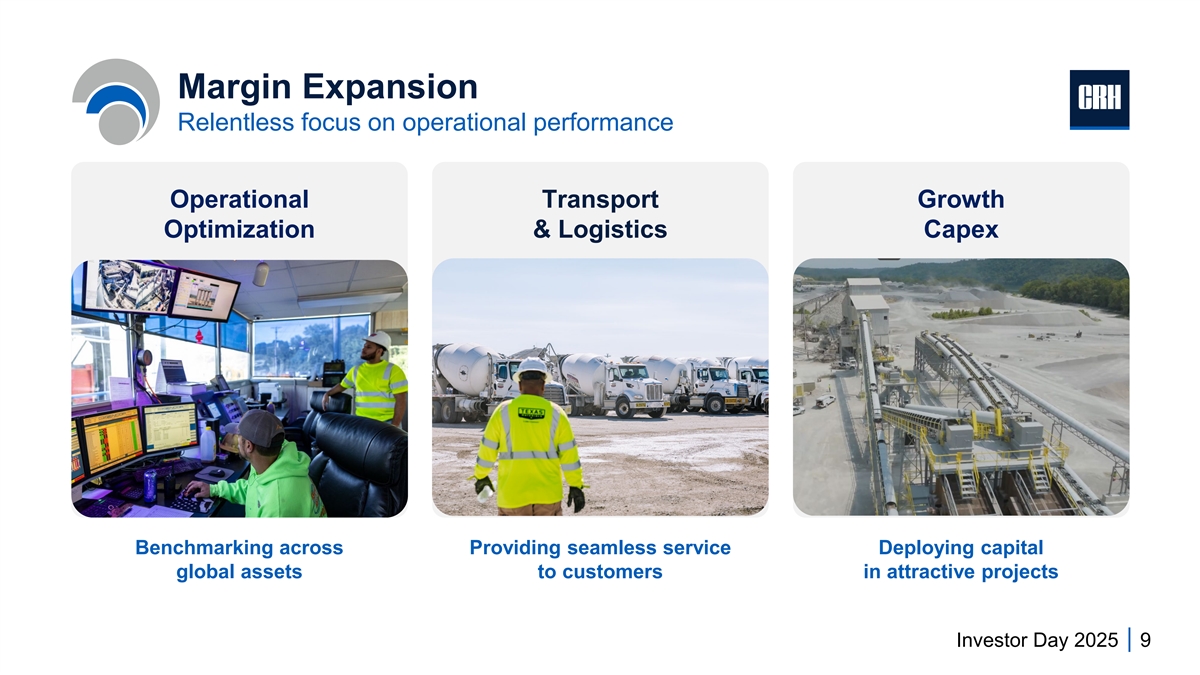
Margin Expansion Relentless focus on operational performance Operational Transport Growth Optimization & Logistics Capex Benchmarking across Providing seamless service Deploying capital global assets to customers in attractive projects Investor Day 2025 9

Scale & Replication Best-in-class support for local teams to unlock full potential Performance Teams Global Procurement Innovation Cementitious Global Technical Services Benchmarking, best practice sharing and support with Aggregates strategic capital investments • Plant performance optimization Asphalt • Portfolio development and capex • Strategic planning Ready Mix Concrete Investor Day 2025 10

Leading Performance in Action: Mulzer Crushed Stone Investor Day 11
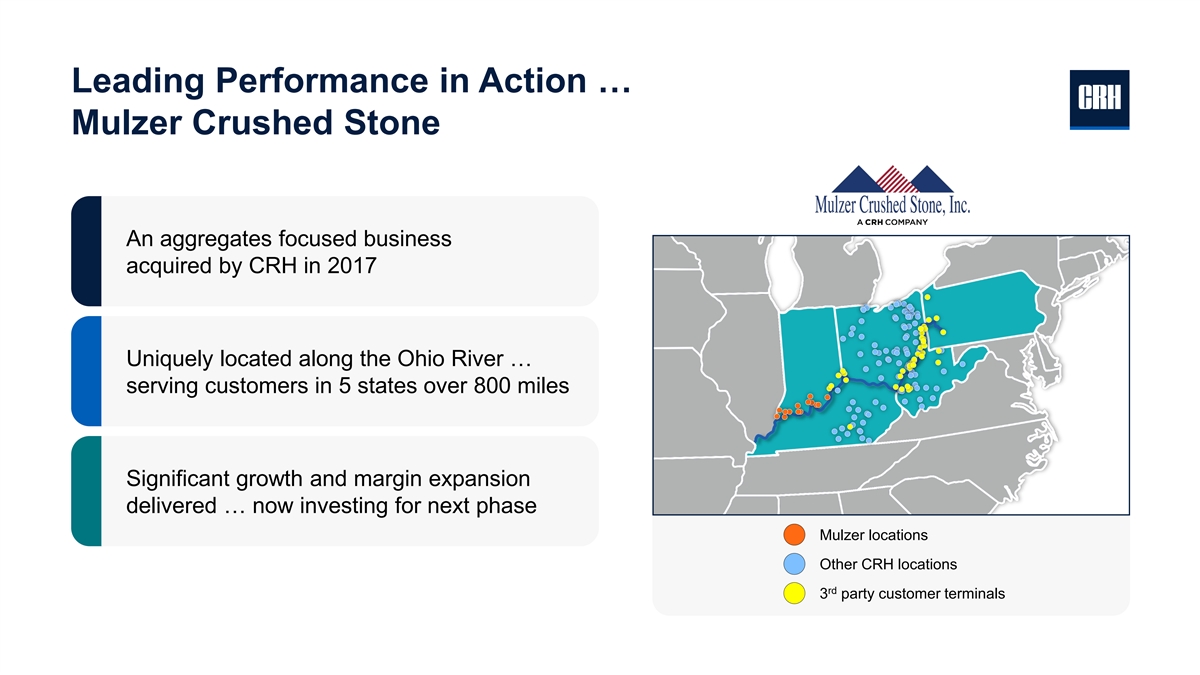
Leading Performance in Action … Mulzer Crushed Stone An aggregates focused business acquired by CRH in 2017 Uniquely located along the Ohio River … serving customers in 5 states over 800 miles Significant growth and margin expansion delivered … now investing for next phase Mulzer locations Other CRH locations rd 3 party customer terminals Investor Day 2025 12

Leading Performance in Action: Ash Grove Investor Day 2025 13

Unmatched Performance Excellence Capabilities Dedicated resources enable local teams to accelerate best-in-class performance … Global capabilities Embedded performance Value Successful integration & to capitalize on growth excellence initiatives & Creation synergy delivery opportunities local accountability Delivering continued margin expansion & ensuring a clear runway for growth Investor Day 2025 14

Relentless Focus on Value Creation since Acquisition … ~2x 1 Revenues • Unrivaled capabilities to make businesses better • Connected portfolio driving financial ~3x performance 1 Adj. EBITDA • Full potential mindset to continuously deliver ~1,500bps 1 Margin … superior performance across key financial metrics Investor Day 2025 15 For footnoted information, refer to Appendix.

Investing to Unlock the Next Phase of Growth … Hunter cement Eco Material Durkee, Oregon acquisition (2024) growth capex (2025) acquisition (2025) 2mt cement plant & Increasing cement capacity Market leader in SCMs in network of terminals to meet demand North America … increasing our cementitious supply to deliver continued value creation Investor Day 2025 16

Leading Performance Our Leading Performance system is locally owned & globally enabled Deployed at unmatched scale across ~4,000 locations, leveraging the power of our ~300 local brands Allows us to relentlessly drive and compound organic & inorganic growth 1 A key enabler to achieving 11 years of margin expansion & to executing on our Financial Targets Investor Day 2025 17 For footnoted information, refer to Appendix. Key Takeaways

Appendix: Endnotes Slide 3 1. ‘Double-digit earnings growth’ refers to CRH’s compound annualized growth rate of Adjusted EBITDA for the period from December 31, 2014 to December 31, 2024. Metrics from the financial year ended December 31, 2014 are based on IFRS. 2014 EBITDA (as defined) has been modified to exclude contributions from subsequently divested businesses. The adjustments required to reflect these metrics under U.S. GAAP have not been quantified. No material differences have been identified that would impact trends calculated in accordance with U.S. GAAP in comparison to IFRS. For source data of this 2014 metric, please refer to the Appendix of the main September 2025 Investor Day presentation. Metrics from the financial year ended December 31, 2024 are based on U.S. GAAP as reported in our 2024 Form 10-K. Slide 15 1. Management estimates derived from operating company-level financial information comparing results from our U.S. cement operations for the twelve months ended December 31, 2024, which was based on U.S. GAAP financial reporting, with the pre-acquisition results prepared in accordance with the acquiree’s accounting policies for the twelve months ended December 31, 2017. This comparison is intended to illustrate directional performance improvement and should not be interpreted as an audited historical financial comparison. Slide 17 1. Based on IFRS financial reporting to 2022 and U.S. GAAP for 2023 and 2024. Investor Day 2025 18

Exhibit 99.5 Investor Day 2025 New York Why We Win in Roads Built for Growth Powered by Performance

Disclaimer Unless the context otherwise provides, “we,” “us,” “our,” “CRH”, the “Company” and like terms refer to CRH plc and its consolidated subsidiaries. Forward-Looking Statements In order to utilize the “Safe Harbor” provisions of the United States Private Securities Litigation Reform Act of 1995, CRH is providing the following cautionary statement. This presentation contains statements that are, or may be deemed to be, forward-looking statements with respect to the financial condition, results of operations, business, viability and future performance of CRH and certain of the plans and objectives of CRH. These forward-looking statements may generally, but not always, be identified by the use of words such as “will”, “anticipates”, “should”, “could”, “would”, “targets”, “aims”, “may”, “continues”, “expects”, “is expected to”, “estimates”, “believes”, “intends” or similar expressions. These forward-looking statements include all matters that are not historical facts or matters of fact at the date of this presentation. In particular, the following, among other statements, are all forward-looking in nature: plans and expectations regarding megatrends and growth with respect to each, including infrastructure, transportation, water and reindustrialization; statements regarding margin, return, cash generation and growth prospects for CRH’s roads’ business; statements relating to CRH’s total addressable market; expectations regarding public funding; and statements regarding the opportunities for further expansion. By their nature, forward-looking statements involve risk and uncertainty because they relate to events and depend on circumstances that may or may not occur in the future and reflect the Company’s current expectations and assumptions as to such future events and circumstances that may not prove accurate. You are cautioned not to place undue reliance on any forward-looking statements. These forward-looking statements are made as of the date of this presentation. The Company expressly disclaims any obligation or undertaking to publicly update or revise these forward-looking statements other than as required by applicable law. A number of material factors could cause actual results and developments to differ materially from those expressed or implied by these forward-looking statements, certain of which are beyond our control, and which include, among other factors, the risks and uncertainties described herein and under “Risk Factors” in our 2024 Form 10-K and in our other filings with the SEC. Non-GAAP Financial Information This presentation includes discussion of Return on Invested Capital and cash gross profit per ton for CRH’s roads businesses, each of which is financial information that is not calculated in accordance with U.S. generally accepted accounting principles (‘GAAP’). Non-GAAP financial information should not be considered a replacement for GAAP measures. Investor Day 2025 2

Today’s Speakers Nathan Creech Jake Parson President, President, CRH Americas CRH Americas Materials Northeast Investor Day 2025 3
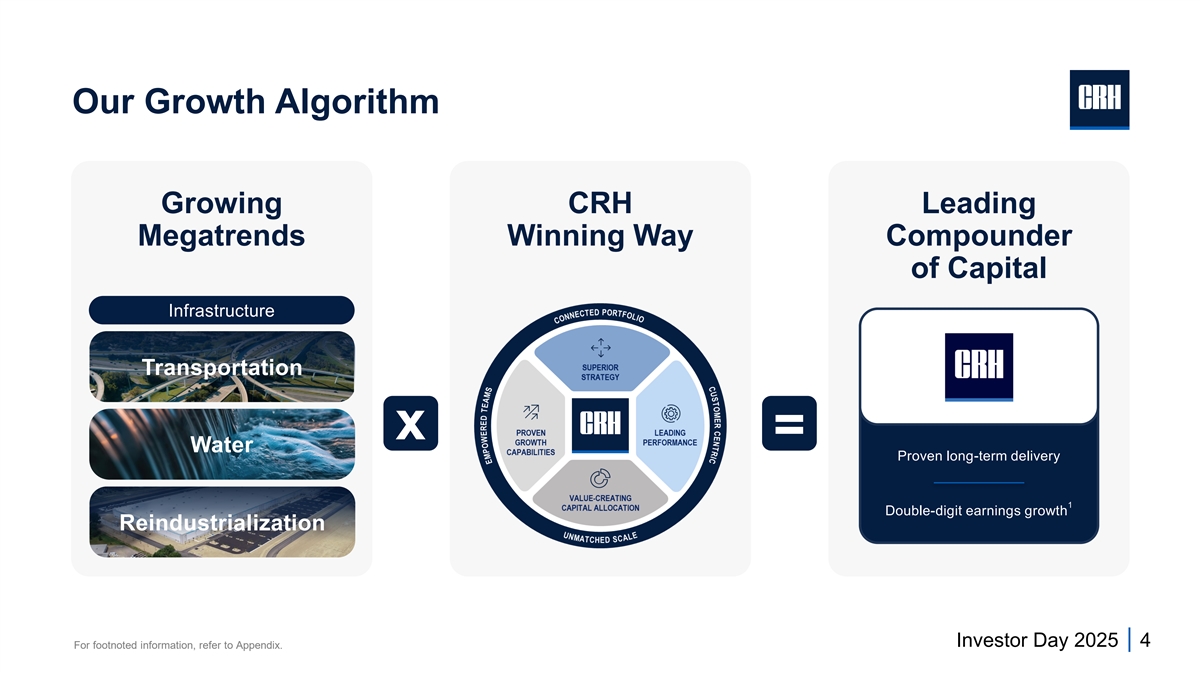
Our Growth Algorithm Growing CRH Leading Megatrends Winning Way Compounder of Capital Infrastructure Transportation x = Water Proven long-term delivery 1 Double-digit earnings growth Reindustrialization Investor Day 2025 4 For footnoted information, refer to Appendix.

Driving Value at Scale in our US Roads platform Investor Day 2025 5

Driving Value at Scale in our US Roads Platform CRH wins with Roads is a lower capital unmatched scale … Roads is an intensity business ... With a long a structural advantage attractive business runway for growth generating higher that cannot profits, cash & returns be replicated Investor Day 2025 6

Roads is a Highly Attractive Business Low & Distributed Risk 4,000+ paving jobs 90 – 120 days on-site 90% of projects are <$2M ~60% of projects are repair & maintenance CRH is best positioned to capitalize on strong fundamentals Investor Day 2025 7 For footnoted information, refer to Appendix. CRH Annual Roads Activities

CRH is the Undisputed Leader in Roads 1 $6.4B revenues Leading positions across 43 states 2/3rds of US population live within 50 miles of a CRH asphalt plant Investor Day 2025 8 For footnoted information, refer to Appendix.

CRH is the Undisputed Leader in Roads 1 US Asphalt Volumes 51M tons CRH has unmatched scale as the clear industry leader … Investor Day 2025 9 For footnoted information, refer to Appendix.

CRH is the Undisputed Leader in Roads 1 US Asphalt Volumes 51M tons 51M tons c D CRH has unmatched scale as the clear industry leader … equal to the next 5 largest players combined Investor Day 2025 10 For footnoted information, refer to Appendix.

CRH is the Undisputed Leader in Roads 800+ 23 ~450 800+ 1 Aggregate Sites (230M tons) Liquid Asphalt Terminals Hot Mix Asphalt Plants Paving & Related Services Crews … a fully connected roads offering with unmatched scale … Investor Day 2025 11 For footnoted information, refer to Appendix.

Video not running on version he sent us? 1 CRH is the Undisputed Leader in Roads ~20% of US cementitious v 1olume 1 is used in Road right-of-way ~85% of water, energy & communications infrastructure products are installed in Road right-of-way Investor Day 2025 12 For footnoted information, refer to Appendix.

CRH is the Undisputed Leader in Roads Best-in-class Performance Leveraging Scale to drive: Best practices Technical expertise Quality Investor Day 2025 13

CRH is the Undisputed Leader in Roads Driving Value Through Circularity & Innovation ~90 State-of-the-art laboratories ~25% of asphalt produced is recycled content Investor Day 2025 14
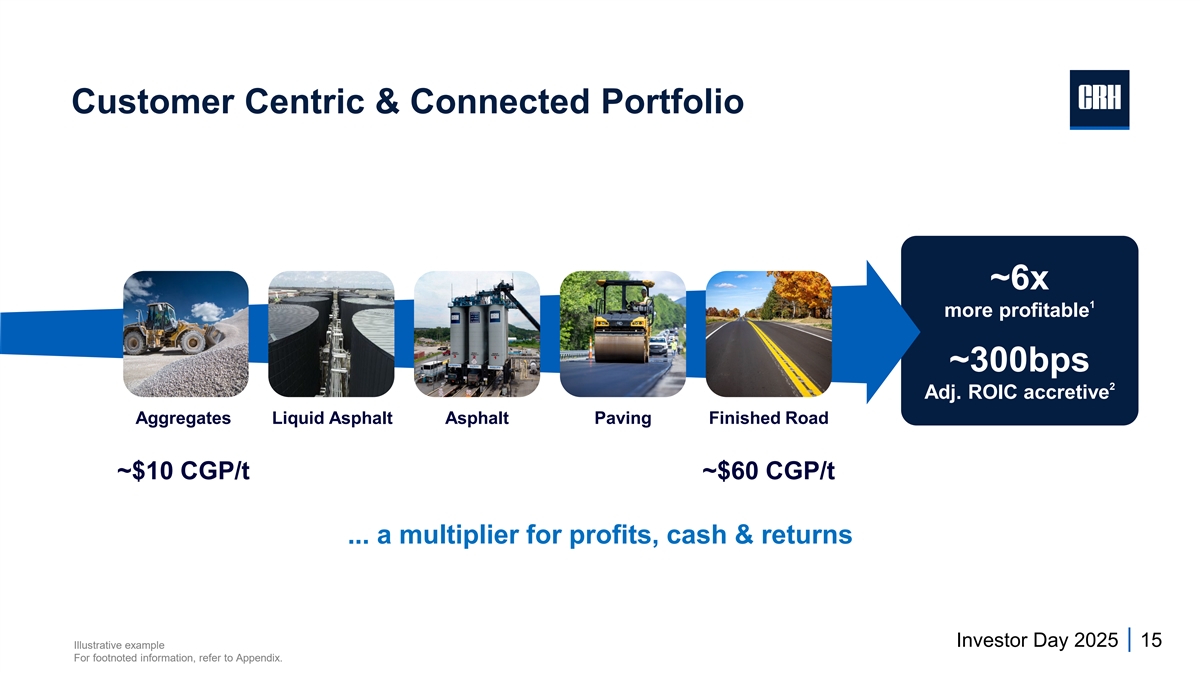
Customer Centric & Connected Portfolio ~6x 1 more profitable ~300bps 2 Adj. ROIC accretive Aggregates Liquid Asphalt Asphalt Paving Finished Road ~$10 CGP/t ~$60 CGP/t ... a multiplier for profits, cash & returns Investor Day 2025 15 Illustrative example For footnoted information, refer to Appendix.
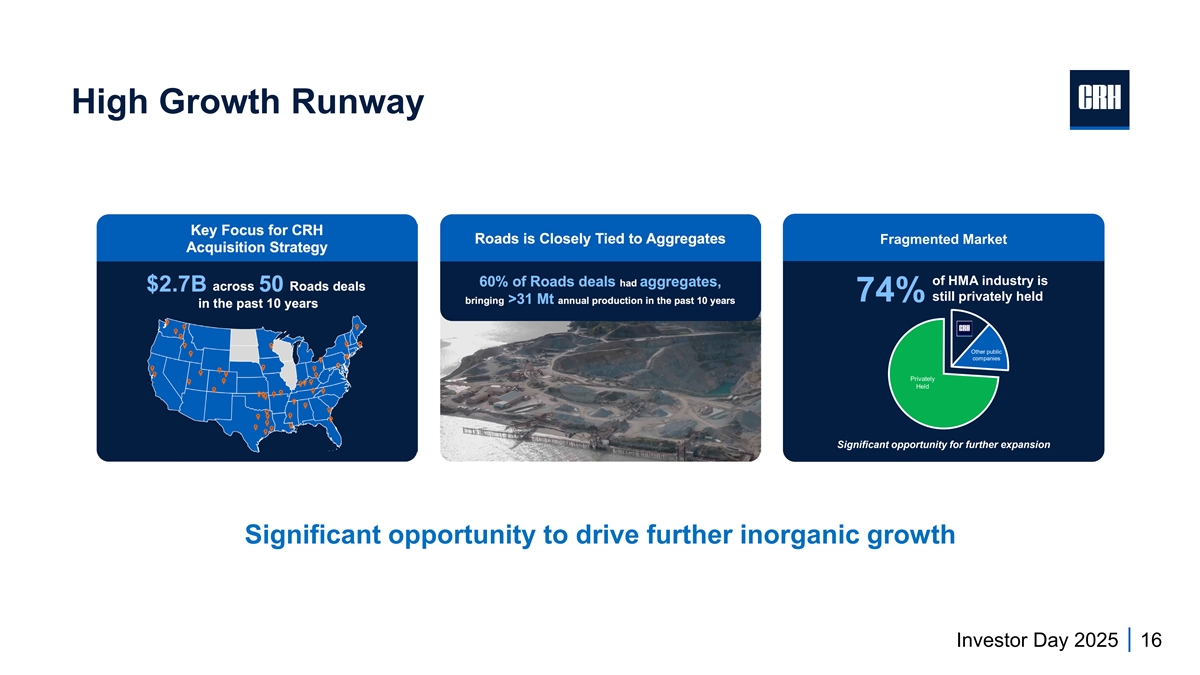
High Growth Runway Fragmented Market of HMA industry is 74% still privately held Other public companies Privately Held Significant opportunity for further expansion Significant opportunity to drive further inorganic growth Investor Day 2025 16
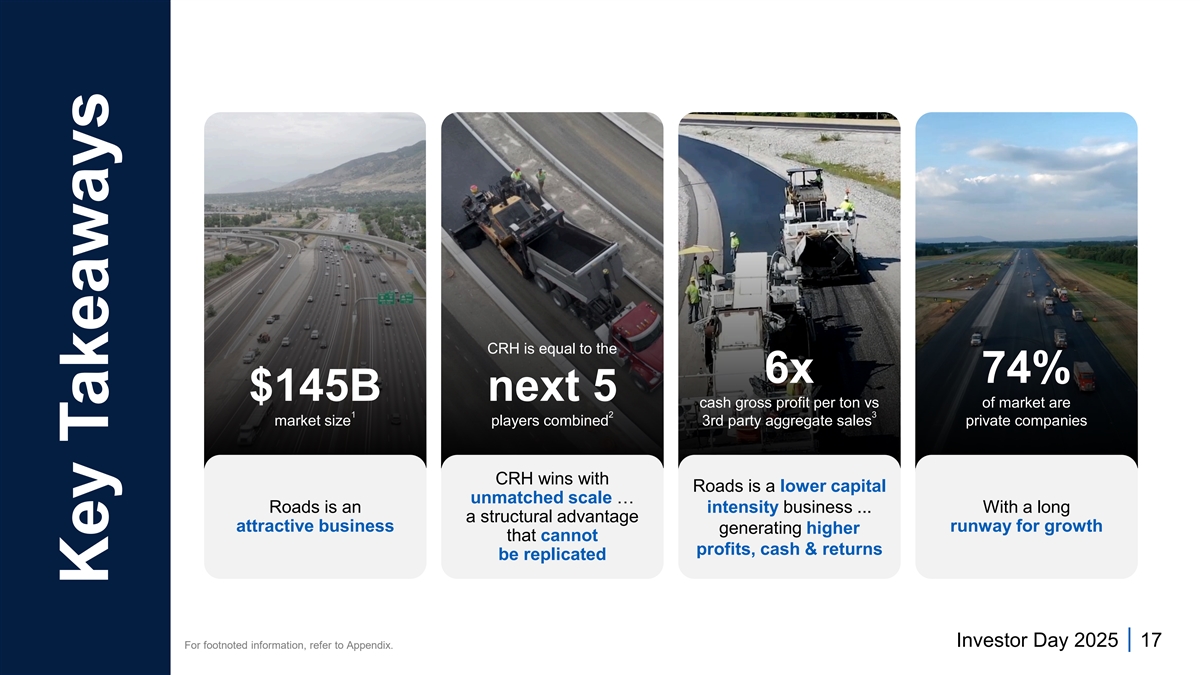
CRH is equal to the 6x 74% $145B next 5 cash gross profit per ton vs of market are 1 2 3 market size players combined 3rd party aggregate sales private companies CRH wins with Roads is a lower capital unmatched scale … Roads is an intensity business ... With a long a structural advantage attractive business runway for growth generating higher that cannot profits, cash & returns be replicated Investor Day 2025 17 For footnoted information, refer to Appendix. Key Takeaways

Appendix: Endnotes Slide 4 1. ‘Double-digit earnings growth’ refers to CRH’s compound annualized growth rate of Adjusted EBITDA for the period from December 31, 2014 to December 31, 2024. Metrics from the financial year ended December 31, 2014 are based on IFRS. 2014 EBITDA (as defined) has been modified to exclude contributions from subsequently divested businesses. The adjustments required to reflect these metrics under U.S. GAAP have not been quantified. No material differences have been identified that would impact trends calculated in accordance with U.S. GAAP in comparison to IFRS. For source data of this 2014 metric, please refer to the Appendix of the main September 2025 Investor Day presentation. Metrics from the financial year ended December 31, 2024 are based on U.S. GAAP as reported in our 2024 Form 10-K. Slide 7 1. Management estimate. 2. U.S. Census Bureau, Total Construction Spending: Highway and Street in the United States, 2005-2024. 3. American Society of Civil Engineers, 2025 Infrastructure Report Card for America, March 2025. Slide 8 1. Refers to revenues derived from paving and contracting services in the Americas Materials Solutions segment for the financial year ended December 31, 2024 which is disclosed as Revenue in Road Solutions recognized over time in our 2024 Form 10-K. Slide 9 & 10 1. 2024 asphalt volumes. Sourced from each company’s 2024 filings and management estimates, respectively. Slide 11 1. 2024 annualized sales volumes reflecting the full-year impact of acquisitions and divestitures during the year and may vary from actual volumes sold. This includes volumes which are used internally (e.g., aggregates supplied internally for cement production). Slide 12 1. Management estimate. Slide 15 1. Compared to 3rd party aggregate sales. 2. Illustrative example comparing the anticipated Return on Invested Capital (ROIC) for an integrated Roads business with the ROIC of an aggregates business with third party sales only. ROIC for an integrated Roads business is calculated with reference to profits derived from average invested capital used for paving services and related internal supply of aggregates and asphalt. Slide 17 1. Management estimate. 2. 2024 annual asphalt volumes. Sourced from 2024 company’s public filings. 3. Illustrative example, compared to 3rd party aggregate sales. Investor Day 2025 18
Exhibit 99.6 Investor Day 2025 Water: New York Connected and Built for Growth Scaled to Win Powered by Performance
Disclaimer Unless the context otherwise provides, “we,” “us,” “our,” “CRH”, the “Company” and like terms refer to CRH plc and its consolidated subsidiaries. Forward-Looking Statements In order to utilize the “Safe Harbor” provisions of the United States Private Securities Litigation Reform Act of 1995, CRH is providing the following cautionary statement. This presentation contains statements that are, or may be deemed to be, forward-looking statements with respect to the financial condition, results of operations, business, viability and future performance of CRH and certain of the plans and objectives of CRH. These forward-looking statements may generally, but not always, be identified by the use of words such as “will”, “anticipates”, “should”, “could”, “would”, “targets”, “aims”, “may”, “continues”, “expects”, “is expected to”, “estimates”, “believes”, “intends” or similar expressions. These forward-looking statements include all matters that are not historical facts or matters of fact at the date of this presentation. In particular, the following, among other statements, are all forward-looking in nature: plans and expectations regarding megatrends and growth with respect to each, including infrastructure, transportation, water and reindustrialization; statements regarding the long-term tailwinds in critical water infrastructure; information relating to U.S. funding needs; statements relating to CRH’s strategic position in large and growing markets; statements relating to CRH’s total addressable market; and statements relating to CRH’s water infrastructure growth prospects. By their nature, forward-looking statements involve risk and uncertainty because they relate to events and depend on circumstances that may or may not occur in the future and reflect the Company’s current expectations and assumptions as to such future events and circumstances that may not prove accurate. You are cautioned not to place undue reliance on any forward-looking statements. These forward-looking statements are made as of the date of this presentation. The Company expressly disclaims any obligation or undertaking to publicly update or revise these forward-looking statements other than as required by applicable law. A number of material factors could cause actual results and developments to differ materially from those expressed or implied by these forward-looking statements, certain of which are beyond our control, and which include, among other factors, the risks and uncertainties described herein and under “Risk Factors” in our 2024 Form 10-K and in our other filings with the SEC. Non-GAAP Financial Information This presentation includes discussion of Adjusted EBITDA generated by CRH’s water infrastructure business which is financial information that is not calculated in accordance with U.S. generally accepted accounting principles (‘GAAP’). Non-GAAP financial information should not be considered a replacement for GAAP measures. Investor Day 2025 1

T To od day ay’’s s S Sp peakers eakers Jason Jackson Marie Glenn President, Chief Operating Officer, Americas Materials Preferred Materials Investor Day 2025 2

Our Growth Algorithm Growing CRH Leading Megatrends Winning Way Compounder of Capital Infrastructure Transportation x = Water Proven long-term delivery 1 Double-digit earnings growth Reindustrialization Investor Day 2025 3 For footnoted information, refer to Appendix.
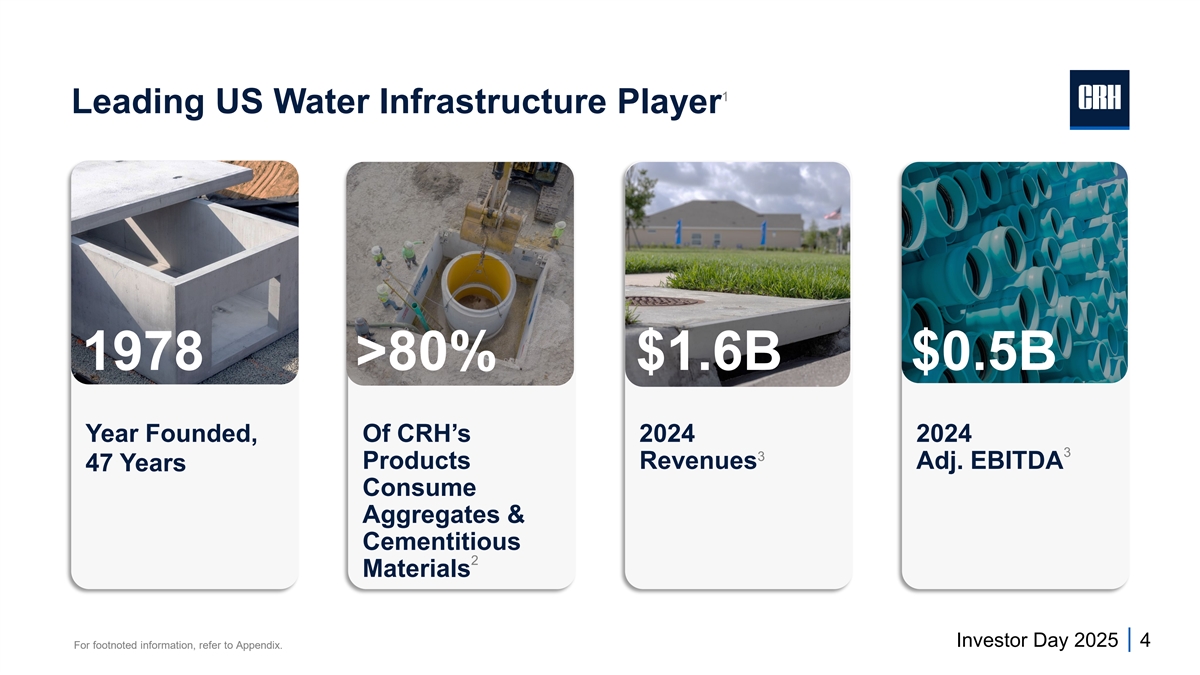
1 Leading US Water Infrastructure Player 1978 >80% $1.6B $0.5B Year Founded, Of CRH’s 2024 2024 3 3 Products Revenues Adj. EBITDA 47 Years Consume Aggregates & Cementitious 2 Materials Investor Day 2025 4 For footnoted information, refer to Appendix.

Where We Play in Water Water Infrastructure … … & water quality conveyance, flow control … Hydro Separation Pipes Culverts Manholes Bio Filtration Inlets Chambers Media Filtration Mechanical Separation Investor Day 2025 5
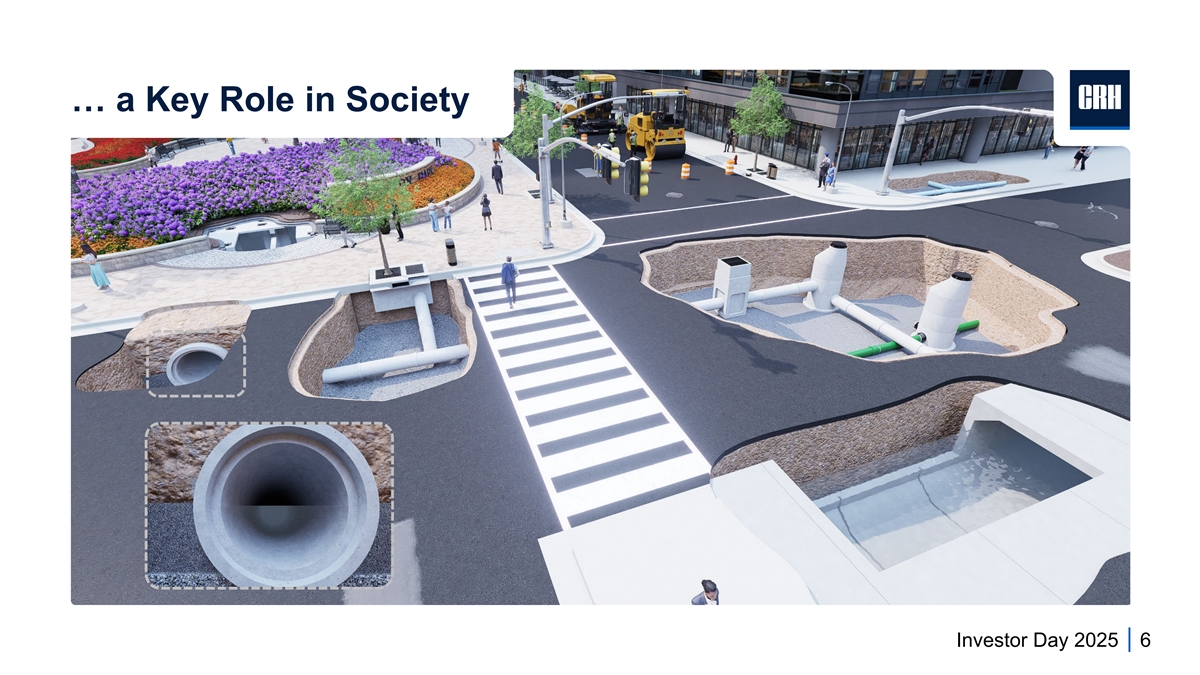
… a Key Role in Society Investor Day 2025 6

Scale: Our Unrivalled Advantage National Reach, Local Impact Efficient Scale, Cost Leadership CRH Powered Capabilities … 79 Facilities … Reaching all 50 states … Investor Day 2025 7

Connected Platform with Best-in-Class Expertise Customer-Driven Design, Specification Accessing Product Breadth & Regulatory Expertise CRH Aggregates, Cementitious Materials & Roads Capabilities Investor Day 2025 8

Growth Opportunity Needed for Water 1 >$1T Infrastructure ASCE 2025 Scorecard Stormwater Drinking Water Roads Wastewater D C- D+ D+ • Aging assets + climate resilience • Water = essential, non-discretionary • 152K water systems, highly fragmented Investor Day 2025 9 For footnoted information, refer to Appendix.

Strategically Positioned in Large & Growing Markets 1 Focused on the highest-growth segments of the $100B+ U.S. water ecosystem 2 5-year Projected CAGR Across Our Select Segments (’25-’30) 9.7% 8.4% 6.8% 5.9% 4.9% Capture Conveyance Storage Treatment Separation Water Quality Flow Control 3 … today, CRH has a $41B total addressable market in water infrastructure … Investor Day 2025 10 For footnoted information, refer to Appendix.

Strategically Positioned, Proven Value Creator 1 Leading Revenues US Water $1.6B Infrastructure 2024 Player 1 Adj. EBITDA +32% $0.5B CAGR ('19 - '24) 2024 … delivering growth through performance & a connected portfolio at scale … Investor Day 2025 11 For footnoted information, refer to Appendix.

Leading Superior Strategy, US Water Proven Results Infrastructure Player ü 47-year track record $1.6B ü Industry-leading results 1 2024 Revenue Strong Growth Why we Win in Water Opportunities Ahead ü Scale ü >$1T … non-discretionary ü Connected platform 2 water funding needs ü Exposed to highest-growth ü A large fragmented market … Water segments runway for continued growth Investor Day 2025 12 For footnoted information, refer to Appendix. Key Takeaways

Appendix: Endnotes Slide 3 1. ‘Double-digit earnings growth’ refers to CRH’s compound annualized growth rate of Adjusted EBITDA for the period from December 31, 2014 to December 31, 2024. Metrics from the financial year ended December 31, 2014 are based on IFRS. 2014 EBITDA (as defined) has been modified to exclude contributions from subsequently divested businesses. The adjustments required to reflect these metrics under U.S. GAAP have not been quantified. No material differences have been identified that would impact trends calculated in accordance with U.S. GAAP in comparison to IFRS. For source data of this 2014 metric, please refer to the Appendix of the main September 2025 Investor Day presentation. Metrics from the financial year ended December 31, 2024 are based on U.S. GAAP as reported in our 2024 Form 10-K. Slide 4 1. Market leadership positions are based on 2024 Revenue figures for CRH’s water infrastructure business and are derived from management estimates. 2. Management estimate. 3. Management estimate derived from financial information relating to CRH’s water infrastructure business for the financial year ended December 31, 2024. The nature of the adjustments for purposes of Adjusted EBITDA is consistent with CRH’s consolidated presentation. Slide 9 1. American Society of Civil Engineers, 2025 Infrastructure Report Card for America, March 2025. Slide 10 1. Global Water Intelligence Data, July 2025. 2. Bluefield research, Data Navigator, November 2024 and Global Water Intelligence Data, July 2025. 3. Management estimate. Slide 11 1. Management estimate derived from financial information relating to CRH’s water infrastructure business for the financial year ended December 31, 2024. The nature of the adjustments for purposes of Adjusted EBITDA is consistent with CRH’s consolidated presentation. Adjusted EBITDA CAGR: Management estimate comparing financial information relating to Adjusted EBITDA derived from CRH’s water infrastructure business for the financial year ended December 31, 2024, which was based on U.S. GAAP financial reporting, with the financial year ended December 31, 2019, which was based on IFRS financial reporting. The nature of the adjustments for purposes of Adjusted EBITDA is consistent with CRH’s consolidated presentation. No material differences have been identified that would impact trends calculated between the relevant periods. Slide 12 1. Management estimate derived from financial information relating to CRH’s water infrastructure business for the fiscal year ended December 31, 2024. 2. American Society of Civil Engineers, 2025 Infrastructure Report Card for America, March 2025. Investor Day 2025 13