UNITED STATES
SECURITIES AND EXCHANGE COMMISSION
Washington, D.C. 20549
Form 8-K
Current Report
Pursuant to Section 13 or 15(d)
of the Securities Exchange Act of 1934
Date of Report (Date of earliest event reported): September 24, 2025
SmartStop Self Storage REIT, Inc.
(Exact name of registrant as specified in its charter)
| Maryland | 001-42584 | 46-1722812 | ||
| (State or other jurisdiction of incorporation) |
(Commission File Number) |
(IRS Employer Identification No.) |
10 Terrace Road, Ladera Ranch, California 92694
(Address of principal executive offices, including zip code)
(866) 418-5144
(Registrant’s telephone number, including area code)
Not Applicable
(Former name or former address, if changed since last report)
Check the appropriate box below if the Form 8-K filing is intended to simultaneously satisfy the filing obligation of the registrant under any of the following provisions:
| ☐ | Written communications pursuant to Rule 425 under the Securities Act (17 CFR 230.425) |
| ☐ | Soliciting material pursuant to Rule 14a-12 under the Exchange Act (17 CFR 240.14a-12) |
| ☐ | Pre-commencement communications pursuant to Rule 14d-2(b) under the Exchange Act (17 CFR 240.14d-2(b)) |
| ☐ | Pre-commencement communications pursuant to Rule 13e-4(c) under the Exchange Act (17 CFR 240.13e-4(c)) |
Securities registered pursuant to Section 12(b) of the Act:
| Title of Each Class |
Trading |
Name of Each Exchange |
||
| Common Stock, $0.001 par value | SMA | New York Stock Exchange |
Indicate by check mark whether the registrant is an emerging growth company as defined in Rule 405 of the Securities Act of 1933 (§ 230.405 of this chapter) or Rule 12b-2 of the Securities Exchange Act of 1934 (§ 240.12b-2 of this chapter).
Emerging growth company ☐
If an emerging growth company, indicate by check mark if the registrant has elected not to use the extended transition period for complying with any new or revised financial accounting standards provided pursuant to Section 13(a) of the Exchange Act. ☐
| Item 7.01. | Regulation FD Disclosure. |
SmartStop Self Storage REIT, Inc. (the “Company”) is furnishing this Current Report to attach material that may be used in presentations to investors from time to time. A copy of such material is attached as Exhibit 99.1 to this Current Report and is incorporated herein solely for purposes of this Item 7.01 disclosure.
Pursuant to the rules and regulations of the Securities and Exchange Commission, the information in this Item 7.01 disclosure, including Exhibit 99.1 and information set forth therein, is deemed to have been furnished and shall not be deemed to be “filed” for purposes of Section 18 of the Securities Exchange Act of 1934, as amended, or otherwise subject to the liabilities of that section. Such information shall not be incorporated by reference into any filing of the Company, whether made before or after the date hereof, regardless of any general incorporation language in such filing.
| Item 9.01 | Financial Statements and Exhibits. |
| (d) Exhibits. |
||
| 99.1 | Investor Presentation Materials of SmartStop Self Storage REIT, Inc. | |
| 104 | Cover Page Interactive Data File (embedded within the Inline XBRL document). | |
Signature(s)
Pursuant to the requirements of the Securities Exchange Act of 1934, the registrant has duly caused this report to be signed on its behalf by the undersigned hereunto duly authorized.
| SMARTSTOP SELF STORAGE REIT, INC. | ||||||
| Date: September 24, 2025 |
By: | /s/ James R. Barry |
||||
| James R. Barry | ||||||
| Chief Financial Officer and Treasurer | ||||||
/Admin/ADVANCED GRAPHICS FILES/Cover and Template/2024/2024_03/4211467-001_Cover_Trevor McMillin Exhibit 99.1 Investor Presentation September 2025 Location: 60 Taunton Road E., Whitby, ONT

/Admin/ADVANCED GRAPHICS FILES/Cover and Template/2024/2024_01/4159141-001_Trevor McMillin_SmartStop_Cover & Template C O N F I D E N T I A L COLOR PALETTE Text Disclaimer & Forward-Looking Disclosure 50 56 62 Title bar/Bullets Certain of the matters discussed in this investor presentation, other than historical facts, constitute forward-looking statements within the meaning of the federal securities laws, and we intend for all such forward-looking statements to be covered by the applicable safe harbor 1 124 186 provisions for forward-looking statements contained in such federal securities laws. Such forward-looking statements can generally be identified by our use of forward-looking terminology such as “may,” “will,” “expect,” “intend,” “anticipate,” “estimate,” “believe,” “continue,” or other similar words, or the negative of such terms or other comparable terminology, or by discussions of strategy or the outlook for Argus Professional Storage Management, LLC (“Argus”)’s, SmartStop’s or the combined company’s future businesses and financial performance and/or the ACCENTS performance of the self-storage industry and economy in general. All such subsequent forward-looking statements, whether written or oral, by us or on our behalf, are also expressly qualified by these cautionary statements. Such statements include, but are not limited to statements concerning our plans, strategies, initiatives, prospects, objectives, goals, future events, future revenues or performance, capital expenditures, financing needs, plans or intentions relating to acquisitions (including the pending acquisition of Argus and its potential effects upon 1 126 SmartStop) and other information that is not historical information. Such statements are subject to known and unknown risks and uncertainties, which could cause actual results to differ materially from those projected or anticipated, including, without limitation: 124 211 1 186 254 • disruptions in the economy, including debt and banking markets and foreign currency, including changes in the Canadian Dollar ( CAD )/U.S. Dollar ( USD ) exchange rate; 127 212 188 253 2 • significant transaction costs, including financing costs, and unknown liabilities; 3 129 • whether we will be successful in the pursuit of our business plan and investment objectives; 32 140 56 168 3 • changes in the political and economic climate, economic conditions and fiscal imbalances in the United States, and other major developments, including tariffs, wars, natural disasters, epidemics and pandemics, military actions, and terrorist attacks; 100 218 • changes in tax and other laws and regulations, including tenant protection programs and other aspects of our business; 0 141 157 220 4 • difficulties in our ability to attract and retain qualified personnel and management; 226 255 166 219 • conflicts of interest relating to the purchase of properties, including conflicts with the Managed REITs—such conflicts may not be resolved in our favor, which could adversely affect our investment opportunities; 166 219 5 166 219 • the effect of competition at our self-storage properties or from other storage alternatives, which could cause rents and occupancy rates to decline; 1 126 • failure to close on pending or future acquisitions (including the potential Argus transaction) on favorable terms or at all; Hyperlink 124 211 186 254 • the risk that the cost savings and synergies from proposed acquisitions may not be fully or timely realized, that proposed acquisitions may be disruptive to our businesses and that integration of acquisitions will be materially delayed or will be more costly or difficult than expected, as 127 212 well as potential reputational risk associated with potential acquisitions and the reaction of each company’s customers, suppliers, employees or other business partners Followed 188 253 Hyperlink 3 129 • our reliance on information technologies, which are vulnerable to, among other things, attack from computer viruses and malware, hacking, cyberattacks and other unauthorized access or misuse; TABLE • increases in interest rates; and 50 • failure to maintain our REIT status. 56 Lines 62 All forward-looking statements, including without limitation, management’s examination of historical operating trends and estimates of future earnings, are based upon our current expectations and various assumptions. Our expectations, beliefs and projections are expressed in good faith, and we believe there is a reasonable basis for them, but there can be no assurance that management’s expectations, beliefs and projections will result or be achieved. Readers are cautioned not to place undue reliance on these forward-looking statements, which speak only as 1 of the date of this presentation and are not intended to be a guarantee of our performance in future periods. We cannot guarantee the accuracy of any such forward-looking statements contained in this investor presentation, and we do not intend to publicly update or revise any 124 Highlights forward-looking statements, whether as a result of new information, future events, or otherwise. For further information regarding risks and uncertainties associated with our business, and important factors that could cause our actual results to vary materially from those expressed or 186 implied in such forward-looking statements, please refer to the factors listed and described under “Management’s Discussion and Analysis of Financial Condition and Results of Operations” and the “Risk Factors” sections of the documents we file from time to time with the Securities and Exchange Commission (the “SEC”), including, but not limited to, our Annual Report on Form 10-K for the year ended December 31, 2024, and our Quarterly Report on Form 10-Q for the quarter ended June 30, 2025, copies of which may be obtained from our website at investors.smartstopselfstorage.com. We use market data throughout this presentation that has generally been obtained from publicly available information and industry publications. We have also obtained certain information, where indicated, from the 2024 Self Storage Almanac and the January 2024 Colliers Report. These sources generally state that the information they provide has been obtained from sources believed to be reliable, but the accuracy and completeness of the information are not guaranteed. The market data includes forecasts and projections that are based on industry surveys and the preparers’ experiences in the industry, and there is no assurance that any of the projections or forecasts will be achieved. We believe that the surveys and market research others have performed are reliable, but we have not independently verified this information. This presentation may contain trade names, trademarks or service marks of other companies. We do not intend the use or display of other parties’ trade names, trademarks or service marks to imply a relationship with, or endorsement or sponsorship of, these other parties. This presentation includes certain financial information that is not presented in accordance with generally accepted accounting principles in the United States (“GAAP”). Such non-GAAP financial measures should not be considered alternatives to net income as a performance measure or cash flows from operations as reported on our statement of cash flows as a liquidity measure and should be considered in addition to, and not in lieu of, GAAP financial measures. Please refer to the Appendix of this presentation for a reconciliation of the non- GAAP financial measures included in this presentation to the most directly comparable financial measures prepared in accordance with GAAP. You should be aware that our presentation of these and other non-GAAP financial measures in this presentation may not be comparable to similarly-titled measures used by other companies. Non-GAAP financial information is presented for supplemental informational purposes only, has limitations as an analytical tool, and should not be considered in isolation or as a substitute for financial information presented in accordance with GAAP. We seek to compensate such limitations by providing a detailed reconciliation for the non-GAAP financial measures to the most directly comparable financial measures stated in accordance with GAAP in this presentation. You are encouraged to review the related GAAP financial measures to their most directly comparable GAAP financial measures and not rely on any single financial measure to evaluate our business. 2
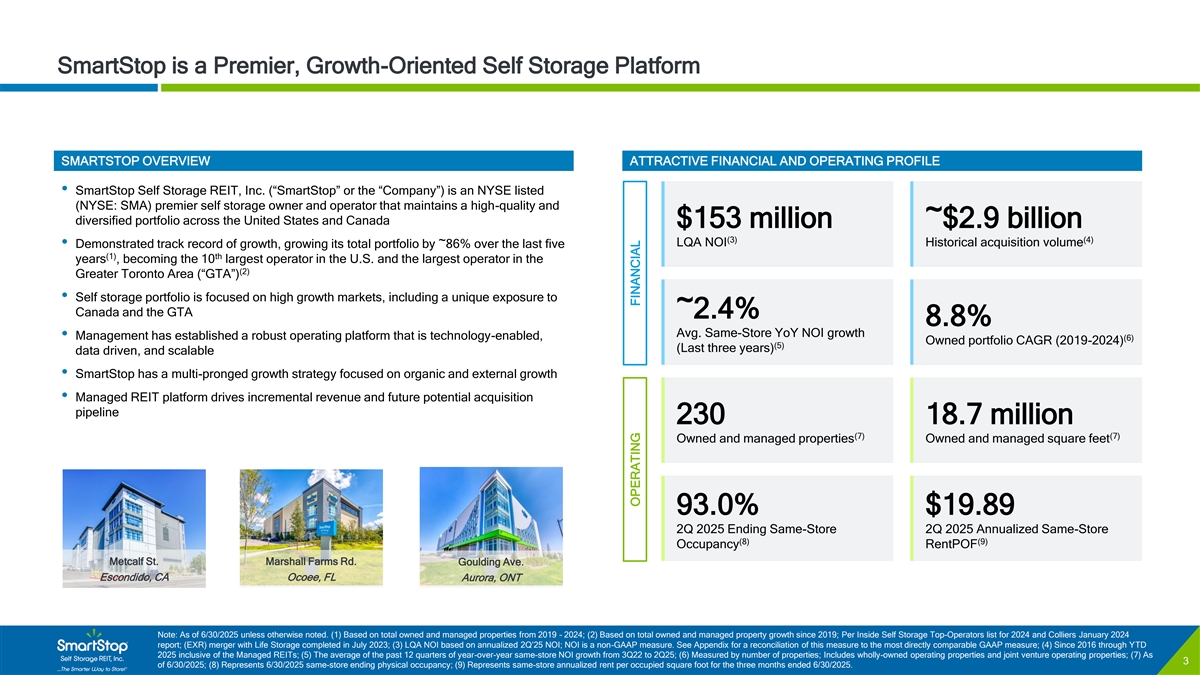
/Admin/ADVANCED GRAPHICS FILES/Cover and Template/2024/2024_01/4159141-001_Trevor McMillin_SmartStop_Cover & Template C O N F I D E N T I A L COLOR PALETTE Text SmartStop is a Premier, Growth-Oriented Self Storage Platform 50 56 62 Title bar/Bullets 1 124 186 ACCENTS 1 126 124 211 SMARTSTOP OVERVIEW ATTRACTIVE FINANCIAL AND OPERATING PROFILE 1 186 254 127 212 • SmartStop Self Storage REIT, Inc. (“SmartStop” or the “Company”) is an NYSE listed 188 253 2 (NYSE: SMA) premier self storage owner and operator that maintains a high-quality and 3 129 diversified portfolio across the United States and Canada $153 million ~$2.9 billion 32 140 56 168 3 (3) (4) LQA NOI Historical acquisition volume • Demonstrated track record of growth, growing its total portfolio by ~86% over the last five 100 218 (1) th years , becoming the 10 largest operator in the U.S. and the largest operator in the 0 141 (2) 157 220 Greater Toronto Area (“GTA”) 4 226 255 • Self storage portfolio is focused on high growth markets, including a unique exposure to 166 219 166 219 5 Canada and the GTA ~2.4% 166 219 8.8% Avg. Same-Store YoY NOI growth • Management has established a robust operating platform that is technology-enabled, (6) 1 126 Owned portfolio CAGR (2019-2024) (5) Hyperlink 124 211 (Last three years) data driven, and scalable 186 254 127 212• SmartStop has a multi-pronged growth strategy focused on organic and external growth Followed 188 253 Hyperlink 3 129 • Managed REIT platform drives incremental revenue and future potential acquisition TABLE pipeline 230 18.7 million 50 (7) (7) 56 Lines Owned and managed properties Owned and managed square feet 62 1 124 Highlights 186 93.0% $19.89 2Q 2025 Ending Same-Store 2Q 2025 Annualized Same-Store (8) (9) Occupancy RentPOF Metcalf St. Marshall Farms Rd. Goulding Ave. Escondido, CA Ocoee, FL Aurora, ONT Note: As of 6/30/2025 unless otherwise noted. (1) Based on total owned and managed properties from 2019 – 2024; (2) Based on total owned and managed property growth since 2019; Per Inside Self Storage Top-Operators list for 2024 and Colliers January 2024 report; (EXR) merger with Life Storage completed in July 2023; (3) LQA NOI based on annualized 2Q’25 NOI; NOI is a non-GAAP measure. See Appendix for a reconciliation of this measure to the most directly comparable GAAP measure; (4) Since 2016 through YTD 2025 inclusive of the Managed REITs; (5) The average of the past 12 quarters of year-over-year same-store NOI growth from 3Q22 to 2Q25; (6) Measured by number of properties; Includes wholly-owned operating properties and joint venture operating properties; (7) As 3 of 6/30/2025; (8) Represents 6/30/2025 same-store ending physical occupancy; (9) Represents same-store annualized rent per occupied square foot for the three months ended 6/30/2025. OPERATING FINANCIAL
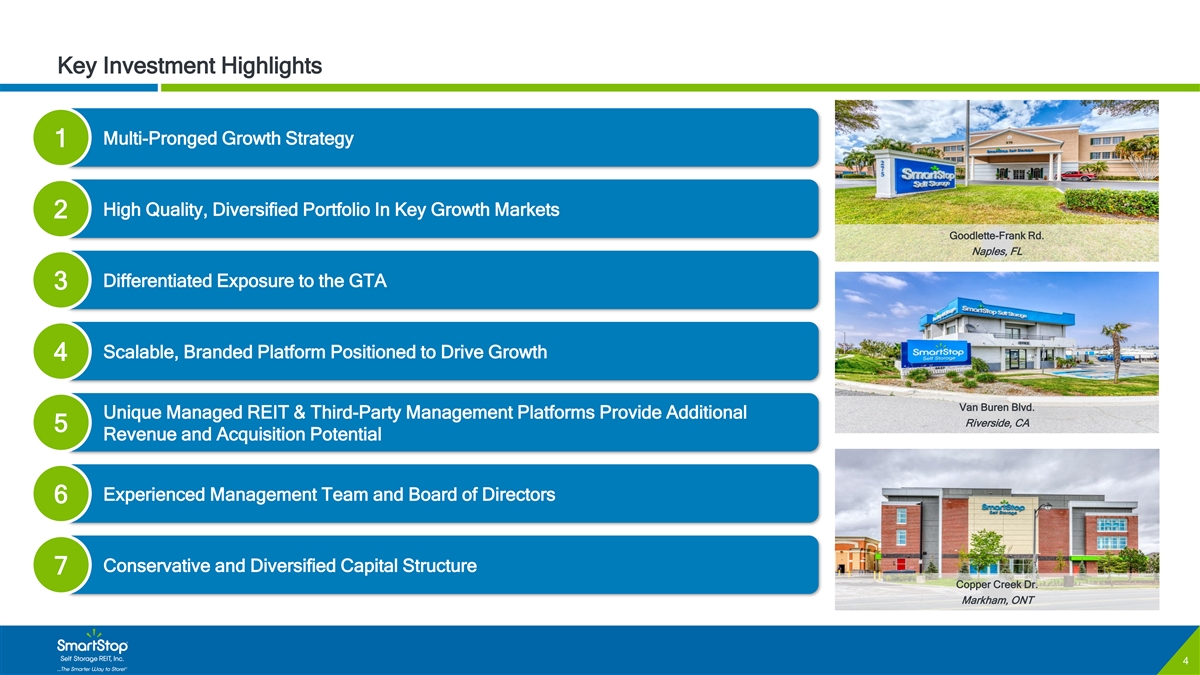
/Admin/ADVANCED GRAPHICS FILES/Cover and Template/2024/2024_01/4159141-001_Trevor McMillin_SmartStop_Cover & Template C O N F I D E N T I A L COLOR PALETTE Text Key Investment Highlights 50 56 62 Title bar/Bullets 1 124 186 ACCENTS Multi-Pronged Growth Strategy 1 1 126 124 211 1 186 254 127 212 188 253 2 3 129 High Quality, Diversified Portfolio In Key Growth Markets 2 32 140 Goodlette-Frank Rd. 56 168 3 100 218 Naples, FL 0 141 157 220 4 226 255 Differentiated Exposure to the GTA 3 166 219 166 219 5 166 219 1 126 Hyperlink 124 211 Scalable, Branded Platform Positioned to Drive Growth 186 254 4 127 212 Followed 188 253 Hyperlink 3 129 Van Buren Blvd. TABLE Unique Managed REIT & Third-Party Management Platforms Provide Additional Riverside, CA 50 5 Revenue and Acquisition Potential 56 Lines 62 1 124 Highlights 186 Experienced Management Team and Board of Directors 6 Conservative and Diversified Capital Structure 7 Copper Creek Dr. Markham, ONT 4

/Admin/ADVANCED GRAPHICS FILES/Cover and Template/2024/2024_01/4159141-001_Trevor McMillin_SmartStop_Cover & Template C O N F I D E N T I A L COLOR PALETTE Text 1 Successful Track Record of Growing the SmartStop Platform 50 56 62 Title bar/Bullets 1 124 186 ACCENTS JUNE 2022 DECEMBER 2024 1 126 JUNE 2019 SmartStop Completed 124 211 1 SST II completes MAY 2025 186 254 completes 100% MARCH 2022 ~$240mm of JULY 2025 JANUARY 2014 Self Administration Receives 127 212 SmartStop stock-for-stock acquisitions in Upgrade to SST II declared Transaction; 188 253 2 NOVEMBER 2005 BBB Credit merger with SSGT receives BBB- FY 2024 with BBB from 3 129 effective and renames company Rating from H. Michael Schwartz II, acquiring Investment ~$110mm closed KBRA with a 32 140 JULY 2009 begins offering to SmartStop Self Morrningstar acquires first ten self ~$262mm of Grade Rating or under contract 56 168 Stable trend 3 SMARTSTOP shares at $10.00 Storage REIT, Inc. DBRS with 100 218 storage properties in storage assets from KBRA as of March 2025 brand launched Stable trends a DST 0 141 157 220 4 226 255 2023 166 219 2021 2022 2024 2025 2013 2014 2015 2019 2010 2005 2008 2009 166 219 5 166 219 1 126 JUNE 2025 APRIL 2025 NOVEMBER MARCH 2021 JUNE 2024 JULY 2025 MARCH 2008 SEPTEMBER SEPTEMBER 2015 APRIL 2022 Hyperlink 124 211 SmartStop REIT SmartStop 186 254 2010 SST, first public non- SmartStop closes SmartStop SmartStop 2013 SST closes a $1.4 SmartStop files closes prices IPO at SST acquires first traded REIT entirely 100% stock-for- surpasses announces 127 212 SST II is billion all-cash Form S-11 with SEC Followed 188 253 Maple Bond $30.00 per property in the stock merger with new board focused on self $750mm in AUM in established merger with Extra to list its shares on Hyperlink 3 129 share raising for CAD Greater Toronto storage, declared SST IV; acquiring its Managed REIT member, Space Storage the NYSE (1) TABLE $500 $932mm and Area ~$375mm in Platform Lora effective and begins (NYSE: EXR) for 50 starts trading on million at a offering shares at storage assets Gotcheva $13.75 / share, 56 Lines 3.91% the NYSE under $10.00 62 returning over coupon. SMA $800mm of equity 1 124 Highlights to shareholders 186 2018 2019 2020 2021 2022 2023 2024 6/30/2025 (2) Owned operating properties 83 112 112 144 160 162 171 181 Managed operating properties - - 41 18 19 32 37 49 Note: Strategic Storage Trust, Inc. (SST); Strategic Storage Trust II, Inc (SST II); Strategic Storage Trust IV, Inc (SST IV); Strategic Storage Growth Trust II, Inc (SSGT II). Gray shading represents events that occurred prior to the formation of SmartStop Self Storage REIT, Inc.; Blue shading represents events that occurred after the formation of SmartStop. (1) Based on 31.05mm shares issued post-greenshoe; (2) Includes wholly-owned and joint venture stores 5

/Admin/ADVANCED GRAPHICS FILES/Cover and Template/2024/2024_01/4159141-001_Trevor McMillin_SmartStop_Cover & Template C O N F I D E N T I A L COLOR PALETTE Text 1 The SmartStop Opportunity 50 56 62 Title bar/Bullets 1 124 186 ACCENTS 1 126 124 211 1 Scalable platform positioned to 186 254 Highly fragmented sector that is going generate outsized returns with 127 212 through a wave of consolidation 188 253 2 3 129 improved cost of capital 32 140 56 168 3 100 218 0 141 ⚫ Over 52,000 self storage facilities in the US with 157 220 4 226 255 only 22.5% penetration from public self storage (1) 166 219 companies ⚫ Significant investments made in SmartStop 166 219 5 166 219 ⚫ The top 10 operators in Canada account for only technology, infrastructure and human capital to 1 126 (2) 20% of all self storage facilities prepare for future growth Hyperlink 124 211 186 254 127 212 Followed 188 253 Hyperlink 3 129 TABLE 50 SmartStop is a high-growth Accelerate our growth in target 56 Lines 62 alternative to large-cap self storage markets, including building a premier 1 companies platform in Canada 124 Highlights 186 (3) ⚫ ~$1.7 billion of acquisitions over the last ~4 years ⚫ Continued expansion of footprint in top markets including the Mid-Atlantic, Southern California, ⚫ Attractive relative scale to existing REITs drives Houston, and Canada greater impact to FFO growth from acquisitions (1) 2024 Self-Storage Almanac; (2) Colliers January 2024 report (3) Includes acquisitions by Managed REITs. Represents 2021 – YTD 2025 6

/Admin/ADVANCED GRAPHICS FILES/Cover and Template/2024/2024_01/4159141-001_Trevor McMillin_SmartStop_Cover & Template C O N F I D E N T I A L COLOR PALETTE Text 1 Multi-Pronged North American Growth Strategy 50 56 62 Title bar/Bullets 1 124 186 ACCENTS 1 126 124 211 1 186 254 127 212 188 253 2 3 129 32 140 56 168 3 100 218 ORGANIC ADDITIONAL 0 141 ACQUISITIONS 157 220 4 GROWTH DRIVERS GROWTH DRIVERS 226 255 166 219 166 219 5 166 219 Joint Ventures Acquisitions on Balance Sheet 1 126 Property Revenue Maximization Hyperlink 124 211 186 254 ⚫ Accretive development opportunities within ⚫ Leverage institutional operating platform to ⚫ Utilize technology-enabled platform to 127 212 Canadian JV SmartCentres Followed accretively acquire stabilized and non- continue growing rental rates and occupancy 188 253 Hyperlink 3 129 stabilized assets Margin Expansion Managed REIT Platform TABLE ⚫ Leverage existing Canadian footprint to 50 ⚫ NOI and EBITDA margin continue to expand acquire under-managed Canadian properties⚫ Opportunity to scale managed portfolio and 56 Lines 62 but are still below public peers brand presence 1 Strategic Combination with ⚫ Solar initiative presents opportunity to further 124 Highlights ⚫ High ROE revenue streams 186 Managed REITs reduce utility costs Third-Party Management Platform ⚫ Track record of successful integration of Ancillary Revenues Managed REITs ⚫ Large opportunity to grow managed assets in ⚫ Expand ancillary revenues (tenant protection, Canada and US storage supplies, etc.) within existing assets ⚫ Build shadow M&A pipeline 7
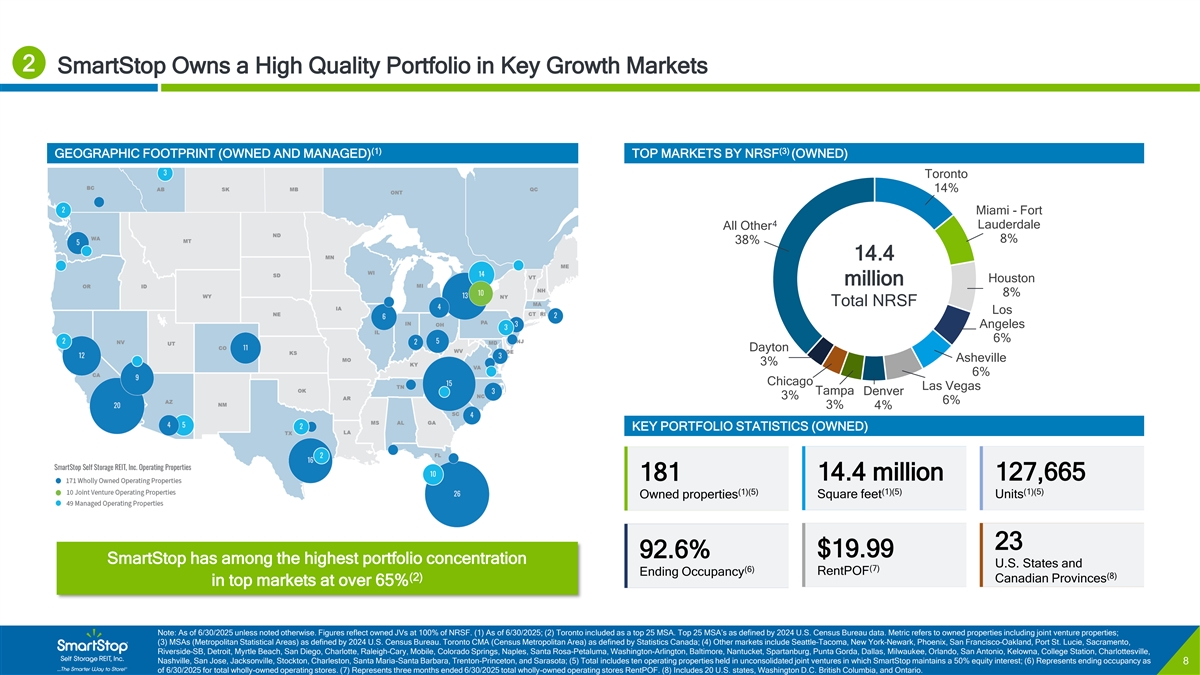
/Admin/ADVANCED GRAPHICS FILES/Cover and Template/2024/2024_01/4159141-001_Trevor McMillin_SmartStop_Cover & Template C O N F I D E N T I A L COLOR PALETTE Text 2 SmartStop Owns a High Quality Portfolio in Key Growth Markets 50 56 62 Title bar/Bullets 1 124 186 ACCENTS (1) (3) 1 126 GEOGRAPHIC FOOTPRINT (OWNED AND MANAGED) TOP MARKETS BY NRSF (OWNED) 124 211 1 186 254 Toronto 127 212 14% 188 253 2 3 129 Miami - Fort 4 Lauderdale All Other 32 140 56 168 3 8% 38% 100 218 14.4 0 141 157 220 4 Houston million 226 255 8% 166 219 Total NRSF Los 166 219 5 166 219 Angeles 1 126 6% Hyperlink 124 211 Dayton 186 254 Asheville 3% 6% 127 212 Followed Chicago 188 253 Las Vegas Hyperlink Tampa Denver 3 129 3% 6% 3% 4% TABLE KEY PORTFOLIO STATISTICS (OWNED) 50 56 Lines 62 1 181 14.4 million 127,665 124 Highlights 186 (1)(5) (1)(5) (1)(5) Square feet Units Owned properties 23 $19.99 92.6% SmartStop has among the highest portfolio concentration Toronto Tampa U.S. States and (7) (6) RentPOF Ending Occupancy (8) (2) Canadian Provinces in top markets at over 65% Miami/Fort Lauderdale Denver Las Vegas Chicago Note: As of 6/30/2025 unless noted otherwise. Figures reflect owned JVs at 100% of NRSF. (1) As of 6/30/2025; (2) Toronto included as a top 25 MSA. Top 25 MSA’s as defined by 2024 U.S. Census Bureau data. Metric refers to owned properties including joint venture properties; (3) MSAs (Metropolitan Statistical Areas) as defined by 2024 U.S. Census Bureau. Toronto CMA (Census Metropolitan Area) as defined by Statistics Canada; (4) Other markets include Seattle–Tacoma, New York–Newark, Phoenix, San Francisco–Oakland, Port St. Lucie, Sacramento, Riverside–SB, Detroit, Myrtle Beach, San Diego, Charlotte, Raleigh–Cary, Mobile, Colorado Springs, Naples, Santa Rosa–Petaluma, Washington-Arlington, Baltimore, Nantucket, Spartanburg, Punta Gorda, Dallas, Milwaukee, Orlando, San Antonio, Kelowna, College Station, Charlottesville, Asheville Dayton Nashville, San Jose, Jacksonville, Stockton, Charleston, Santa Maria-Santa Barbara, Trenton-Princeton, and Sarasota; (5) Total includes ten operating properties held in unconsolidated joint ventures in which SmartStop maintains a 50% equity interest; (6) Represents ending occupancy as 8 of 6/30/2025 for total wholly-owned operating stores. (7) Represents three months ended 6/30/2025 total wholly-owned operating stores RentPOF. (8) Includes 20 U.S. states, Washington D.C. British Columbia, and Ontario. (3) Houston All other Los Angeles
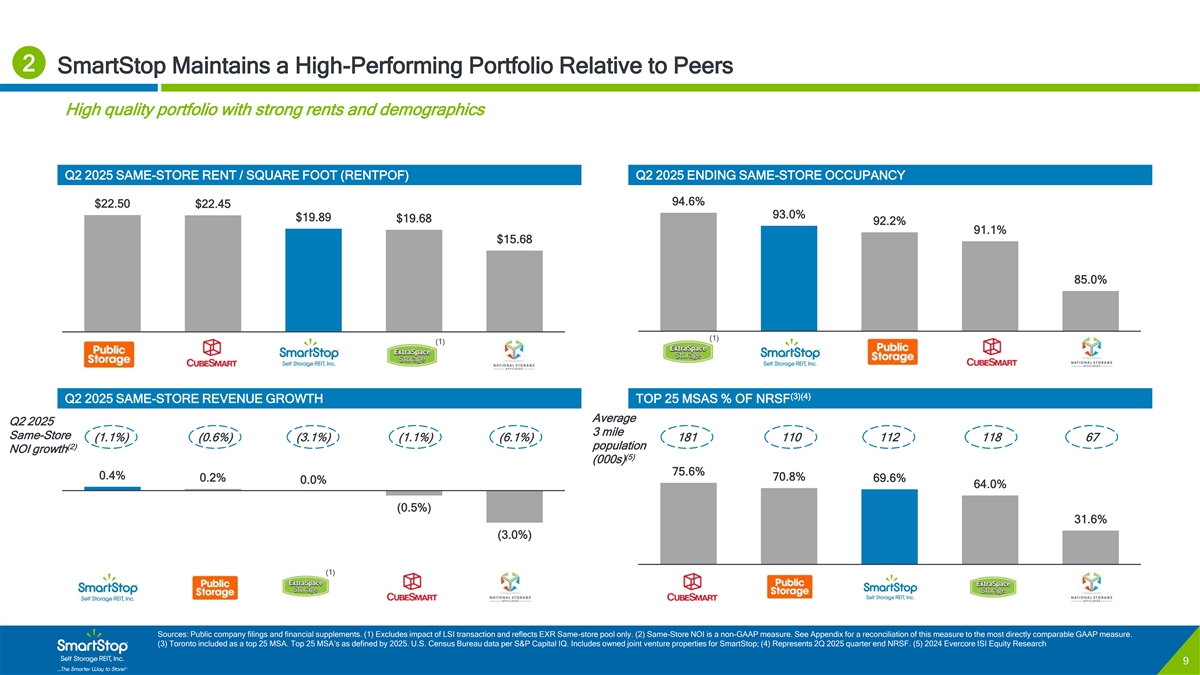
/Admin/ADVANCED GRAPHICS FILES/Cover and Template/2024/2024_01/4159141-001_Trevor McMillin_SmartStop_Cover & Template C O N F I D E N T I A L COLOR PALETTE Text 2 SmartStop Maintains a High-Performing Portfolio Relative to Peers 50 56 62 Title bar/Bullets High quality portfolio with strong rents and demographics 1 124 186 ACCENTS 1 126 124 211 1 186 254 Q2 2025 SAME-STORE RENT / SQUARE FOOT (RENTPOF) Q2 2025 ENDING SAME-STORE OCCUPANCY 127 212 188 253 2 94.6% $22.50 $22.45 3 129 93.0% $19.89 $19.68 92.2% 32 140 91.1% 56 168 3 $15.68 100 218 0 141 157 220 4 85.0% 226 255 166 219 166 219 5 166 219 (1) 1 126 (1) Hyperlink 124 211 186 254 127 212 Followed 188 253 Hyperlink 3 129 (3)(4) Q2 2025 SAME-STORE REVENUE GROWTH TOP 25 MSAS % OF NRSF TABLE Average Q2 2025 50 3 mile Same-Store 56 (1.1%) (0.6%) (3.1%) (1.1%) (6.1%) 181 110 112 118 67 Lines (2) population 62 NOI growth (5) (000s) 1 75.6% 0.4% 70.8% 0.2% 124 69.6% Highlights 0.0% 64.0% 186 (0.5%) 31.6% (3.0%) (1) Sources: Public company filings and financial supplements. (1) Excludes impact of LSI transaction and reflects EXR Same-store pool only. (2) Same-Store NOI is a non-GAAP measure. See Appendix for a reconciliation of this measure to the most directly comparable GAAP measure. (3) Toronto included as a top 25 MSA. Top 25 MSA’s as defined by 2025. U.S. Census Bureau data per S&P Capital IQ. Includes owned joint venture properties for SmartStop; (4) Represents 2Q 2025 quarter end NRSF. (5) 2024 Evercore ISI Equity Research 9
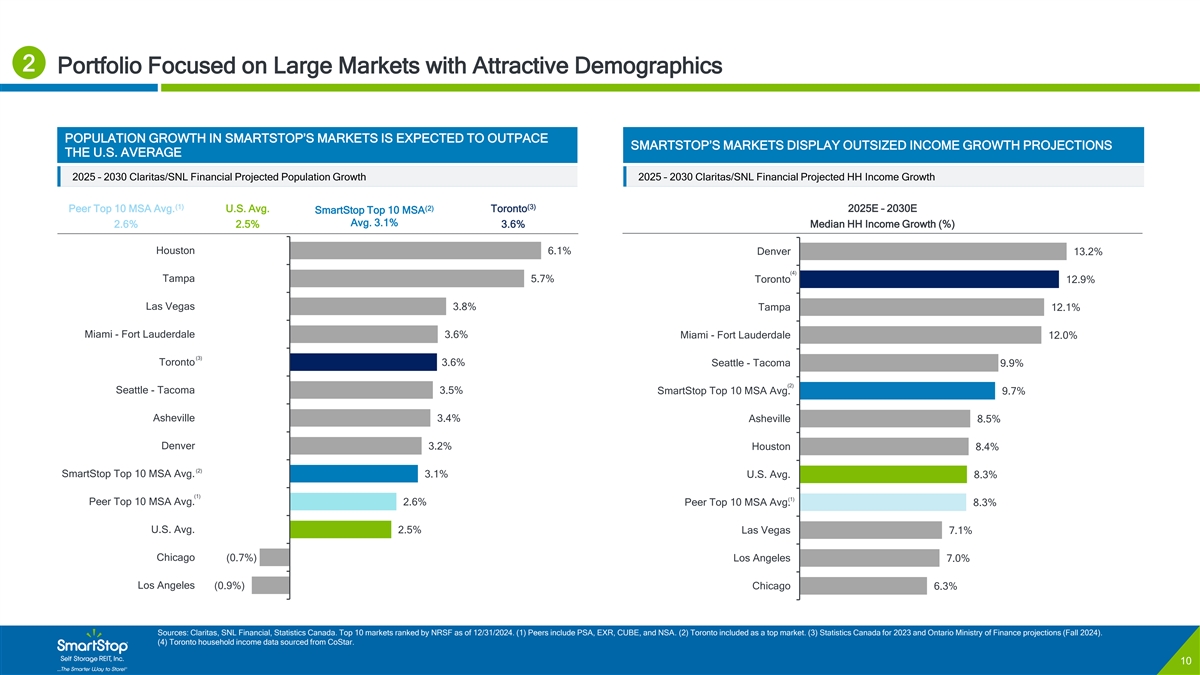
/Admin/ADVANCED GRAPHICS FILES/Cover and Template/2024/2024_01/4159141-001_Trevor McMillin_SmartStop_Cover & Template C O N F I D E N T I A L COLOR PALETTE Text 2 Portfolio Focused on Large Markets with Attractive Demographics 50 56 62 Title bar/Bullets 1 124 186 ACCENTS POPULATION GROWTH IN SMARTSTOP’S MARKETS IS EXPECTED TO OUTPACE SMARTSTOP’S MARKETS DISPLAY OUTSIZED INCOME GROWTH PROJECTIONS 1 126 THE U.S. AVERAGE 124 211 1 186 254 2025 – 2030 Claritas/SNL Financial Projected Population Growth 2025 – 2030 Claritas/SNL Financial Projected HH Income Growth 127 212 188 253 2 (1) (3) (2) 2025E – 2030E 3 129 Peer Top 10 MSA Avg. U.S. Avg. Toronto SmartStop Top 10 MSA Avg. 3.1% 2.6% 2.5% 3.6% Median HH Income Growth (%) 32 140 56 168 3 100 218 Houston 6.1% Denver 13.2% 0 141 (4) 157 220 4 Tampa 5.7% Toronto 12.9% 226 255 166 219 Las Vegas 3.8% Tampa 12.1% 166 219 5 166 219 Miami - Fort Lauderdale 3.6% Miami - Fort Lauderdale 12.0% 1 126 Hyperlink 124 211 186 254 (3) Toronto 3.6% Seattle - Tacoma 9.9% 127 212 Followed 188 253 (2) Hyperlink Seattle - Tacoma 3.5% SmartStop Top 10 MSA Avg. 9.7% 3 129 TABLE Asheville 3.4% Asheville 8.5% 50 56 Lines Denver 3.2% Houston 8.4% 62 1 (2) SmartStop Top 10 MSA Avg. 3.1% U.S. Avg. 8.3% 124 Highlights 186 (1) (1) Peer Top 10 MSA Avg. 2.6% Peer Top 10 MSA Avg. 8.3% U.S. Avg. 2.5% Las Vegas 7.1% Chicago (0.7%) Los Angeles 7.0% Los Angeles (0.9%) Chicago 6.3% Sources: Claritas, SNL Financial, Statistics Canada. Top 10 markets ranked by NRSF as of 12/31/2024. (1) Peers include PSA, EXR, CUBE, and NSA. (2) Toronto included as a top market. (3) Statistics Canada for 2023 and Ontario Ministry of Finance projections (Fall 2024). (4) Toronto household income data sourced from CoStar. 10
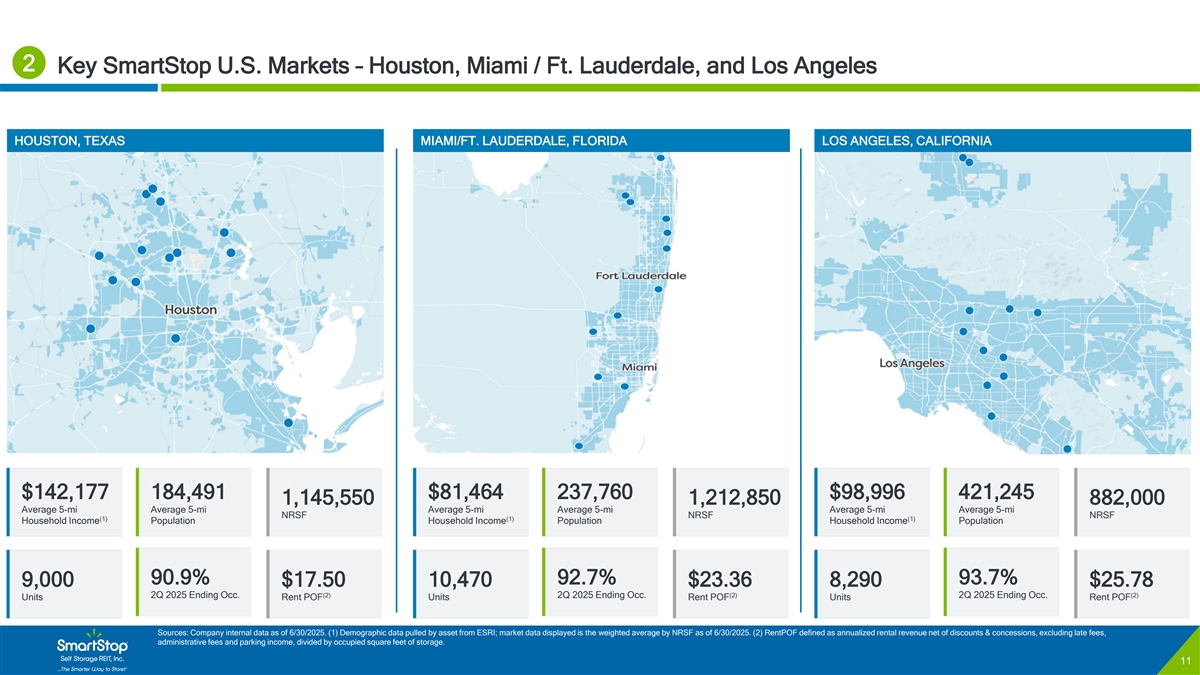
/Admin/ADVANCED GRAPHICS FILES/Cover and Template/2024/2024_01/4159141-001_Trevor McMillin_SmartStop_Cover & Template C O N F I D E N T I A L COLOR PALETTE Text 2 Key SmartStop U.S. Markets – Houston, Miami / Ft. Lauderdale, and Los Angeles 50 56 62 Title bar/Bullets 1 124 186 ACCENTS HOUSTON, TEXAS MIAMI/FT. LAUDERDALE, FLORIDA LOS ANGELES, CALIFORNIA 1 126 *P *PL LE EA AS SE E D DO O N NOT OT D DE EL LE ET TE E 124 211 1 186 254 T TH HIIS S T TE EX XT T B BO OX X* * 127 212 188 253 2 T This his map map w was as created created 3 129 us usiing ng A ArcG rcGIIS S P Pro. ro. 32 140 T Thi his s ttag ag iide dentif ntifiies es tthe he m map ap 56 168 3 al alllow owiing ng ad addi dittiion onal al up upda da 100 ttes es 218 an and d ed ediitts s usi using ng prev previiou ousl sly y 0 141 sub subm miitttted ed m mater ateriial als s an and dat d dat 157 a. a. 220 4 226 255 C Con onttact act G GC CFO FO- -P Pr rese esentat ntatiion ons s an and d use use tthe he w work orkffllow ow 166 219 166 219 r ref eference erence nu num mbe ber r be bellow ow tto o 5 166 219 m mak ake e ed ediitts. s. 1 126 A ArcG rcGIIS S P Pro ro Hyperlink 124 211 W Workf orkfllow ow r ref eference erence nu num mbe ber r 186 254 iis: s: 42 4209 0909 095 5- -003 003 127 212 Followed 188 253 Hyperlink 3 129 TABLE 50 56 Lines 62 1 124 Highlights 186 $142,177 184,491 $81,464 237,760 $98,996 421,245 1,145,550 1,212,850 882,000 Average 5-mi Average 5-mi Average 5-mi Average 5-mi Average 5-mi Average 5-mi NRSF NRSF NRSF (1) (1) (1) Household Income Population Household Income Population Household Income Population 90.9% 92.7% 93.7% 9,000 $17.50 10,470 $23.36 8,290 $25.78 2Q 2025 Ending Occ. (2) 2Q 2025 Ending Occ. (2) 2Q 2025 Ending Occ. (2) Units Rent POF Units Rent POF Units Rent POF Sources: Company internal data as of 6/30/2025. (1) Demographic data pulled by asset from ESRI; market data displayed is the weighted average by NRSF as of 6/30/2025. (2) RentPOF defined as annualized rental revenue net of discounts & concessions, excluding late fees, administrative fees and parking income, divided by occupied square feet of storage. 11

/Admin/ADVANCED GRAPHICS FILES/Cover and Template/2024/2024_01/4159141-001_Trevor McMillin_SmartStop_Cover & Template C O N F I D E N T I A L COLOR PALETTE Text 3 Toronto and Greater Canada Represent an Untapped Growth Opportunity 50 56 62 Title bar/Bullets 1 124 186 POPULATION GROWTH VS. SUPPLY RATIO – SELECT LARGE CITIES OPPORTUNITY TO EXPAND IN SEVERAL UNDERPENETRATED CANADIAN MARKETS ACCENTS 1 126 14% 124 211 1 186 254 Supply Ratio 127 212 Edmonton 188 253 2 12% 3 129 Alberta Toronto vs. Top 25 U.S. MSA Avg. Delta 32 140 Vanouver 5 56 168 3 3 100 218 10% (1) ✓ Manitoba Population growth: vs. U. +127bps⚫ Largest Self Storage Owners in the GTA: Edmonton Saskatchewan 0 141 157 220 4 Storage supply ratio: (3.8x) ✓ British 2.8x 226 255 8% Ontario Québec Columbia 166 219 Dallas 166 219 5 Houston 2.3x 166 219 Montreal 1 2.5x 6% Calgary 1 126 Atlanta 2 Hyperlink 124 211 186 254 Vancouver 127 212 14 Followed 2.0x 4% 10 2.2x 188 253 Hyperlink 3 129 (1) 13 SmartStop Self Storage REIT, Inc. Operating Properties 1 Top 25 U.S. MSA Avg. Seattle - Tacoma Toronto TABLE Wholly-Owned Operating Properties (19) Montreal Toronto 2% Philadelphia Joint Venture Operating Properties (10) 50 2.3x 56 Lines Boston Managed Properties (20) NYC 62 Chicago 1 0% -- LA 124 Highlights Supply Per Capita Ratio 186 U.S. National Average >6x Below U.S. Average Above U.S. Average (2%) U.S. National Avg. 6.3x 1.0x 2.0x 3.0x 4.0x 5.0x 6.0x 7.0x 8.0x 9.0x 10.0x Sq. Ft. / Capita Top 25 U.S. MSA Avg. 6.1x Canadian markets maintain attractive demographics with room to (2) Select Canadian CMAs Avg. 2.4x meaningfully expand storage market penetration Sources: Claritas, Colliers, CoStar, Green Street, SNL Financial, Statistics Canada, and The 2024 Self-Storage Almanac. (1) As of 8/31/2025: inclusive of subsequent property additions after period end. (2) Includes Toronto, Vancouver, Montreal, and Edmonton. 12 % Population Growth
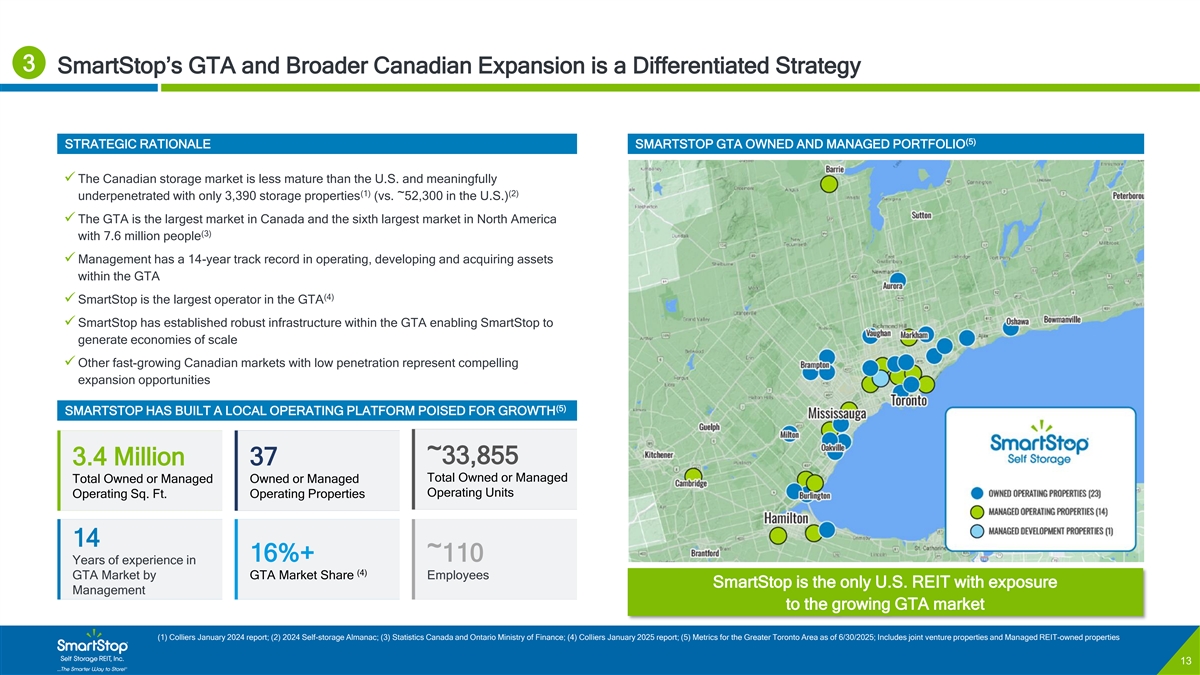
/Admin/ADVANCED GRAPHICS FILES/Cover and Template/2024/2024_01/4159141-001_Trevor McMillin_SmartStop_Cover & Template C O N F I D E N T I A L COLOR PALETTE Text 3 SmartStop’s GTA and Broader Canadian Expansion is a Differentiated Strategy 50 56 62 Title bar/Bullets 1 124 186 ACCENTS (5) STRATEGIC RATIONALE SMARTSTOP GTA OWNED AND MANAGED PORTFOLIO 1 126 *PLEASE DO NOT DELETE 124 211 1 186 254 THIS TEXT BOX* ✓ The Canadian storage market is less mature than the U.S. and meaningfully 127 212 (1) (2) underpenetrated with only 3,390 storage properties (vs. ~52,300 in the U.S.) 188 253 2 This map was created 3 129 https://www.bamsec.com/filing/1 ✓ The GTA is the largest market in Canada and the sixth largest market in North America using ArcGIS Pro. 19312524016641/1?cik=158538 32 140 (3) This tag identifies the map 56 168 with 7.6 million people 3 9&hl=32971:35136&hl_id=vkw9 allowing additional upda 100 tes 218 kr-ayg and edits using previously ✓ Management has a 14-year track record in operating, developing and acquiring assets 0 141 submitted materials and dat 157 a. 220 4 within the GTA 226 255 Contact GCFO-Presentations (4) and use the workflow ✓ SmartStop is the largest operator in the GTA 166 219 166 219 reference number below to 5 166 219 ✓ SmartStop has established robust infrastructure within the GTA enabling SmartStop to make edits. 1 126 ArcGIS Pro generate economies of scale Hyperlink 124 211 Workflow reference number 186 254 ✓ Other fast-growing Canadian markets with low penetration represent compelling is: 4209095-003 127 212 Followed expansion opportunities 188 253 Hyperlink 3 129 (5) SMARTSTOP HAS BUILT A LOCAL OPERATING PLATFORM POISED FOR GROWTH TABLE 50 56 Lines 62 ~33,855 3.4 Million 37 1 124 Total Owned or Managed Highlights Total Owned or Managed Owned or Managed 186 Operating Units Operating Sq. Ft. Operating Properties 14 16%+ ~110 Years of experience in (4) GTA Market by GTA Market Share Employees SmartStop is the only U.S. REIT with exposure Management to the growing GTA market (1) Colliers January 2024 report; (2) 2024 Self-storage Almanac; (3) Statistics Canada and Ontario Ministry of Finance; (4) Colliers January 2025 report; (5) Metrics for the Greater Toronto Area as of 6/30/2025; Includes joint venture properties and Managed REIT-owned properties 13
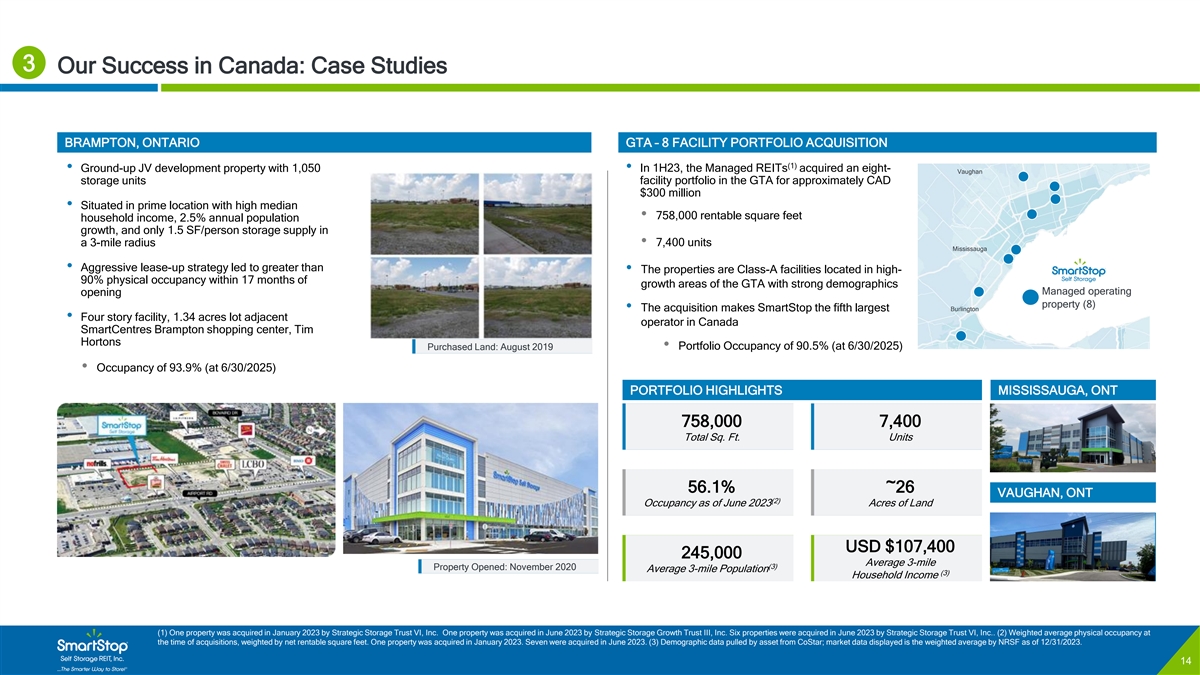
/Admin/ADVANCED GRAPHICS FILES/Cover and Template/2024/2024_01/4159141-001_Trevor McMillin_SmartStop_Cover & Template C O N F I D E N T I A L COLOR PALETTE Text 3 Our Success in Canada: Case Studies 50 56 62 Title bar/Bullets 1 124 186 ACCENTS BRAMPTON, ONTARIO GTA – 8 FACILITY PORTFOLIO ACQUISITION 1 126 *PLEASE DO NOT DELETE 124 211 1 (1) • Ground-up JV development property with 1,050 • In 1H23, the Managed REITs acquired an eight- Vaughan 186 254 THIS TEXT BOX* storage units facility portfolio in the GTA for approximately CAD 127 212 $300 million 188 253 2 • Situated in prime location with high median This map was created 3 129 • 758,000 rentable square feet household income, 2.5% annual population using ArcGIS Pro. 32 140 growth, and only 1.5 SF/person storage supply in This tag identifies the map 56 168 3 • 7,400 units a 3-mile radius allowing additional upda 100 tes 218 Mississauga and edits using previously 0 141 • Aggressive lease-up strategy led to greater than • The properties are Class-A facilities located in high- submitted materials and dat 157 a. 220 4 90% physical occupancy within 17 months of 226 255 growth areas of the GTA with strong demographics Contact GCFO-Presentations Managed operating opening and use the workflow 166 219 property (8) • The acquisition makes SmartStop the fifth largest Burlington 166 219 reference number below to 5 • Four story facility, 1.34 acres lot adjacent 166 219 operator in Canada make edits. SmartCentres Brampton shopping center, Tim 1 126 ArcGIS Pro Hortons Purchased Land: August 2019• Portfolio Occupancy of 90.5% (at 6/30/2025) Hyperlink 124 211 Workflow reference number 186 254 is: 4209095-003 • Occupancy of 93.9% (at 6/30/2025) 127 212 Followed 188 253 Hyperlink PORTFOLIO HIGHLIGHTS MISSISSAUGA, ONT 3 129 TABLE 758,000 7,400 50 Total Sq. Ft. Units 56 Lines 62 1 124 Highlights 186 56.1% ~26 VAUGHAN, ONT (2) Occupancy as of June 2023 Acres of Land USD $107,400 245,000 Average 3-mile (3) Property Opened: November 2020 Average 3-mile Population (3) Household Income (1) One property was acquired in January 2023 by Strategic Storage Trust VI, Inc. One property was acquired in June 2023 by Strategic Storage Growth Trust III, Inc. Six properties were acquired in June 2023 by Strategic Storage Trust VI, Inc.. (2) Weighted average physical occupancy at the time of acquisitions, weighted by net rentable square feet. One property was acquired in January 2023. Seven were acquired in June 2023. (3) Demographic data pulled by asset from CoStar; market data displayed is the weighted average by NRSF as of 12/31/2023. 14
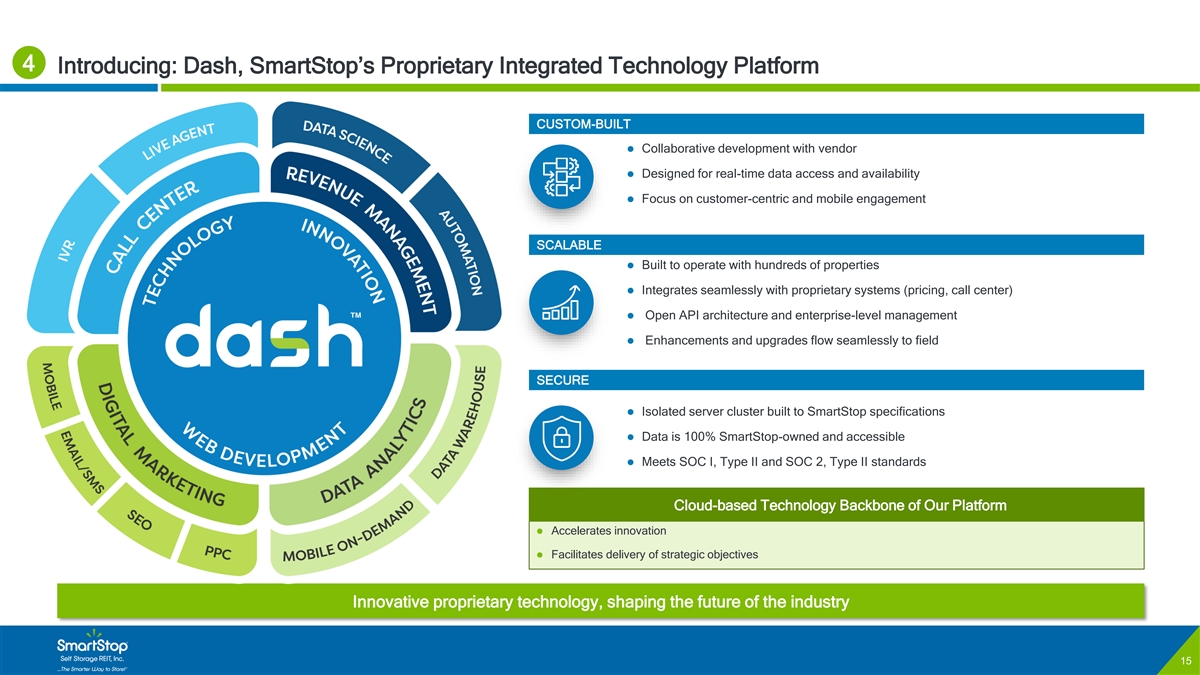
/Admin/ADVANCED GRAPHICS FILES/Cover and Template/2024/2024_01/4159141-001_Trevor McMillin_SmartStop_Cover & Template C O N F I D E N T I A L COLOR PALETTE Text 4 Introducing: Dash, SmartStop’s Proprietary Integrated Technology Platform 50 56 62 Title bar/Bullets 1 124 186 CUSTOM-BUILT ACCENTS ⚫ Collaborative development with vendor 1 126 124 211 1 186 254 ⚫ Designed for real-time data access and availability 127 212 188 253⚫ Focus on customer-centric and mobile engagement 2 3 129 32 140 56 168 3 SCALABLE 100 218 0 141 ⚫ Built to operate with hundreds of properties 157 220 4 226 255 ⚫ Integrates seamlessly with proprietary systems (pricing, call center) 166 219 166 219 5 ⚫ Open API architecture and enterprise-level management 166 219 1 126 ⚫ Enhancements and upgrades flow seamlessly to field Hyperlink 124 211 186 254 127 212 Followed SECURE 188 253 Hyperlink 3 129 TABLE⚫ Isolated server cluster built to SmartStop specifications 50 ⚫ Data is 100% SmartStop-owned and accessible 56 Lines 62 ⚫ Meets SOC I, Type II and SOC 2, Type II standards 1 124 Highlights 186 Cloud-based Technology Backbone of Our Platform ⚫ Accelerates innovation ⚫ Facilitates delivery of strategic objectives Innovative proprietary technology, shaping the future of the industry 15
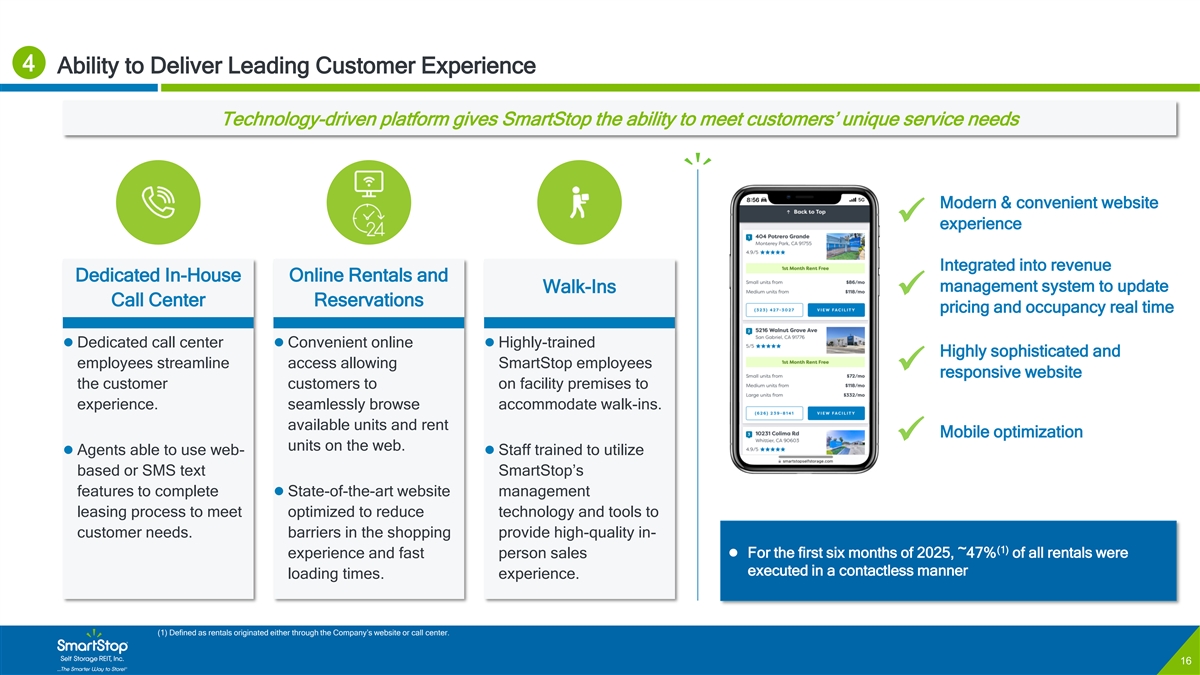
/Admin/ADVANCED GRAPHICS FILES/Cover and Template/2024/2024_01/4159141-001_Trevor McMillin_SmartStop_Cover & Template C O N F I D E N T I A L COLOR PALETTE Text 4 Ability to Deliver Leading Customer Experience 50 56 62 Title bar/Bullets 1 124 186 Technology-driven platform gives SmartStop the ability to meet customers’ unique service needs ACCENTS 1 126 124 211 1 186 254 127 212 188 253 2 Modern & convenient website 3 129 ✓ experience 32 140 56 168 3 100 218 0 141 Integrated into revenue 157 220 4 Dedicated In-House Online Rentals and 226 255 management system to update Walk-Ins ✓ 166 219 Call Center Reservations pricing and occupancy real time 166 219 5 166 219 1 126 ⚫ Dedicated call center ⚫ Convenient online ⚫ Highly-trained Hyperlink 124 211 Highly sophisticated and 186 254 employees streamline access allowing SmartStop employees ✓ 127 212 responsive website Followed 188 253 the customer customers to on facility premises to Hyperlink 3 129 experience. seamlessly browse accommodate walk-ins. TABLE available units and rent 50 Mobile optimization 56 Lines ✓ units on the web. 62 ⚫ Agents able to use web-⚫ Staff trained to utilize 1 based or SMS text SmartStop’s 124 Highlights 186 features to complete ⚫ State-of-the-art website management leasing process to meet optimized to reduce technology and tools to customer needs. barriers in the shopping provide high-quality in- (1) ⚫ For the first six months of 2025, ~47% of all rentals were experience and fast person sales executed in a contactless manner loading times. experience. (1) Defined as rentals originated either through the Company’s website or call center. 16

/Admin/ADVANCED GRAPHICS FILES/Cover and Template/2024/2024_01/4159141-001_Trevor McMillin_SmartStop_Cover & Template C O N F I D E N T I A L COLOR PALETTE Text 4 Award Winning Customer Service and Strong Brand Awareness 50 56 62 Title bar/Bullets 1 124 186 CONSISTENT BRAND STANDARDS CUSTOMER SERVICE AWARDS AND ACCOLADES ACCENTS 1 126 124 211 1 186 254 127 212 Newsweek Awards 188 253 2 3 129 Named the top-ranked self 32 140 storage company for customer 56 168 3 100 218 service by Newsweek and 0 141 157 220 4 Statista in 2021, 2023 and 2024 226 255 SMARTSTOP SPONSORSHIP 166 219 166 219 5 166 219 1 126 Hyperlink 124 211 186 254 127 212 Followed 188 253 Hyperlink 3 129 TABLE Sports / Entertainment Arrow McLaren IndyCar USC Athletics 50 56 Lines 62 CHARITABLE GIVING 1 124 Highlights 186 The Stevie Awards Reputation 800 Awards Recognized as a Silver Winner in Awarded the Reputation 800 The 21st Annual American Award from reputation.com Business Awards® for Customer for outstanding customer Breast Cancer Research Wounded Warrior Project Habitat for Humanity Service Department of the Year reviews in 2022 and 2023 Foundation 17

/Admin/ADVANCED GRAPHICS FILES/Cover and Template/2024/2024_01/4159141-001_Trevor McMillin_SmartStop_Cover & Template C O N F I D E N T I A L COLOR PALETTE Text 4 Internal Growth Strategy 50 56 62 Title bar/Bullets 1 124 186 (1) INTERNAL GROWTH STRATEGIC HIGHLIGHTS HISTORICAL SAME-STORE AVERAGE OCCUPANCY ACCENTS Average: 93.2% 1 126 124 211 95.5% 1 94.5% 186 254 93.7% 93.1% 93.3% 92.5% 92.6% 92.5% 92.4% 93.1% 93.2% 92.4% 92.3% 127 212 188 253 2 Maximize net operating income with a balanced 3 129 ✓ approach to rate and occupancy 32 140 56 168 3 100 218 0 141 157 220 4 226 255 166 219 Majority of the Company’s same-store portfolio base 166 219 5 166 219 2Q22 3Q22 4Q22 1Q23 2Q23 3Q23 4Q23 1Q24 2Q24 3Q24 4Q24 1Q25 2Q25 has been owned or managed less than five years and ✓ 1 126 Hyperlink 124 211 retains additional rate upside 186 254 (1) (2) HISTORICAL SAME-STORE RENTPOF 127 212 Average: $19.80 Followed 188 253 $20.37 $20.15 Hyperlink $20.25 $20.17 $19.99 3 129 $19.94 $19.64 $19.89 $19.84 $19.84 $19.49 $19.30 TABLE $18.47 50 SmartStop’s customer service platform drives 56 Lines 62 ✓ consumer traffic and develops a sticky customer base 1 124 Highlights 186 Asset management technology and experienced personnel all help drive expense savings and 2Q22 3Q22 4Q22 1Q23 2Q23 3Q23 4Q23 1Q24 2Q24 3Q24 4Q24 1Q25 2Q25 ✓ ultimately bottom-line growth SmartStop’s strategic internal growth initiatives have proven successful on key operational statistics (1) Q1’25 and Q2’25 figures based on SmartStop’s 149 same-store pool; Q3’24 and Q4’24 figures based on SmartStop’s 148 same-store pool; Q1’24 and Q2’24 figures based on SmartStop’s 149 same-store pool. All 2023 figures based on SmartStop’s 137 property same-store pool. All 2022 figures based on SmartStop’s 109 property same-store pool. All 2021 figures based on SmartStop’s 103 property same-store pool. (2) RentPOF defined as annualized rental revenue net of discounts & concessions, excluding late fees, administrative fees and parking income, divided by occupied square feet of storage. 18

/Admin/ADVANCED GRAPHICS FILES/Cover and Template/2024/2024_01/4159141-001_Trevor McMillin_SmartStop_Cover & Template C O N F I D E N T I A L COLOR PALETTE Text 4 Strong Track Record of Internal Growth 50 56 62 Title bar/Bullets SmartStop’s internal growth strategies have translated into successful long-term growth 1 124 186 ACCENTS 1 126 124 211 1 186 254 HISTORY OF OPERATIONAL EXCELLENCE HIGHLIGHTED BY SAME-STORE PERFORMANCE VS. PEERS EMBEDDED NOI UPSIDE FROM NON SAME-STORE ASSETS 127 212 188 253 2 3 129 (5) 2Q 2025 Ending Non Same-Store vs. Same-Store Occupancy 2Q’25 Same-Store Revenue Growth 2Q’25 Same-Store NOI Growth 32 140 56 168 3 100 218 SmartStop Peer avg. Delta SmartStop Peer avg. Delta 0 141 2Q’25 0.4% (0.8%) +123bps 2Q’25 (1.1%) (2.7%) +163bps 157 220 4 +3.3% 93.0% 226 255 166 219 166 219 5 166 219 (1) (2) (3) 3-year Avg. YoY Same-Store NOI Growth 3-year Avg. YoY Same-Store Revenue Growth 1 126 Hyperlink 124 211 186 254 89.7% 127 212 3.8% Followed 3.7% 188 253 3.5% Hyperlink 3.4% 3 129 2.8% 2.6% 2.7% TABLE 2.4% 50 56 Lines 62 0.8% 1 124 Highlights 186 PSA SMA EXR CUBE NSA (0.5%) Non Same-Store Same-Store (4) (4) Non same-store pool includes 22 properties covering ~1.9mm square feet (14% of total square feet) Sources: Public company filings and financial supplements. Note: peers may have different definitions of same-store metrics. (1) Represents the simple average of quarterly year-over-year same-store revenue growth for the most recent 12 quarters (the quarter ended 09/30/2022 through 6/30/2025). (2) Represents the simple average of quarterly year-over-year same-store NOI growth for the most recent 12 quarters (the quarter ended 09/30/2022 through 6/30/2025). (3) Same-Store NOI is a non-GAAP measure. See Appendix for a reconciliation of this measure to the most directly comparable GAAP measure. (4) Excludes impact of LSI transaction and reflects EXR SS Pool Only. (5) Represents 6/30/2025 non same-store and same-store ending physical occupancy. 19

/Admin/ADVANCED GRAPHICS FILES/Cover and Template/2024/2024_01/4159141-001_Trevor McMillin_SmartStop_Cover & Template C O N F I D E N T I A L COLOR PALETTE Text 4 Existing Embedded Internal Growth Opportunities 50 56 62 Title bar/Bullets 1 124 186 (2) ACCENTS SMARTSTOP SAME-STORE RENTAL RATE AND NOI MARGIN EXPANSION PEER COMPARISON - NOI MARGIN AND ADJ. EBITDA 1 126 (1) (3) 124 211 (4) 1 FY 2024 Same-Store NOI Margin FY 2024 Adj. EBITDA Margin Rent POF NOI Margin 186 254 127 212 71.3% 188 253 2 69.6% 73.9% 3 129 70% $25 67.8% 71.2% 66.2% 67.8% 32 140 56 168 3 100 218 59.1% 0 141 $20.04 $20.02 $19.87 157 220 4 $20 $18.79 226 255 60% 166 219 $16.51 166 219 $16.18 5 $16.01 166 219 $15 1 126 Hyperlink 124 211 186 254 50% 127 212 Followed 188 253 Hyperlink 3 129 $10 TABLE 50 56 Lines 40% 62 $5 1 124 Highlights 186 $0 30% 2019 2020 2021 2022 2023 2024 YTD '25 SmartStop Peer Avg. SmartStop Peer Avg. Source: Company data and filings. (1) Rent POF defined as annualized rental revenue net of discounts & concessions, excluding late fees, administrative fees and parking income, divided by occupied square feet of storage. (2) NOI and Adjusted EBITDA are non-GAAP measures. See the Appendix for a reconciliation of these measures to their most directly comparable GAAP measures. (3) Q1’25 and Q2 ’25 figures based on SmartStop’s 149 same-store pool; Q3’24 and Q4’24 figures based on SmartStop’s 148 same-store pool; Q1’24 and Q2’24 figures based on SmartStop’s 149 same-store pool. Rates are on a monthly per square foot basis. (4) Calculated as same-store net operating income divided by same-store revenue 20
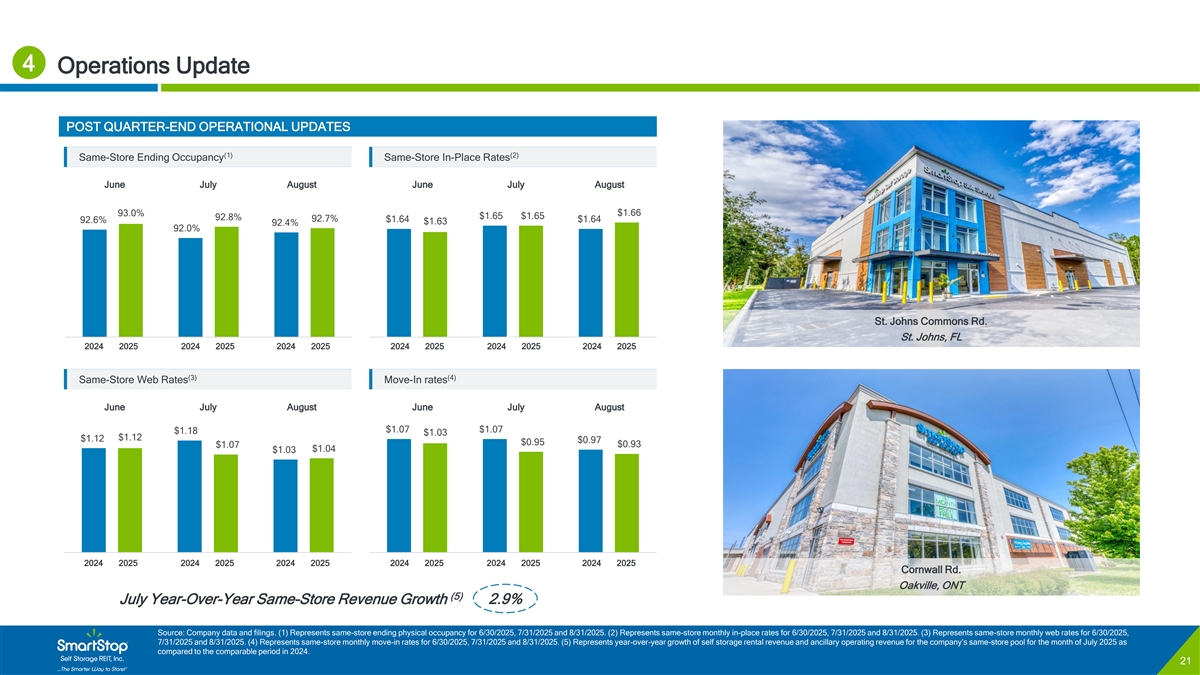
/Admin/ADVANCED GRAPHICS FILES/Cover and Template/2024/2024_01/4159141-001_Trevor McMillin_SmartStop_Cover & Template C O N F I D E N T I A L COLOR PALETTE Text 4 Operations Update 50 56 62 Title bar/Bullets 1 124 186 POST QUARTER-END OPERATIONAL UPDATES ACCENTS 1 126 (1) (2) Same-Store Ending Occupancy Same-Store In-Place Rates 124 211 1 186 254 June July August June July August 127 212 188 253 2 3 129 $1.66 93.0% $1.65 $1.65 92.8% 92.7% $1.64 $1.64 92.6% $1.63 92.4% 32 140 92.0% 56 168 3 100 218 0 141 157 220 4 226 255 166 219 166 219 5 166 219 St. Johns Commons Rd. St. Johns, FL 1 126 2024 2025 2024 2025 2024 2025 2024 2025 2024 2025 2024 2025 Hyperlink 124 211 June July August June July August 186 254 127 212 (3) (4) Followed Same-Store Web Rates Move-In rates 188 253 Hyperlink 3 129 June July August June July August TABLE 50 $1.07 $1.07 $1.18 $1.03 $1.12 56 $1.12 Lines $0.97 $0.95 $0.93 $1.07 62 $1.04 $1.03 1 124 Highlights 186 2024 2025 2024 2025 2024 2025 2024 2025 2024 2025 2024 2025 June July August June July August Cornwall Rd. Oakville, ONT (5) July Year-Over-Year Same-Store Revenue Growth 2.9% Source: Company data and filings. (1) Represents same-store ending physical occupancy for 6/30/2025, 7/31/2025 and 8/31/2025. (2) Represents same-store monthly in-place rates for 6/30/2025, 7/31/2025 and 8/31/2025. (3) Represents same-store monthly web rates for 6/30/2025, 7/31/2025 and 8/31/2025. (4) Represents same-store monthly move-in rates for 6/30/2025, 7/31/2025 and 8/31/2025. (5) Represents year-over-year growth of self storage rental revenue and ancillary operating revenue for the company’s same-store pool for the month of July 2025 as compared to the comparable period in 2024. 21
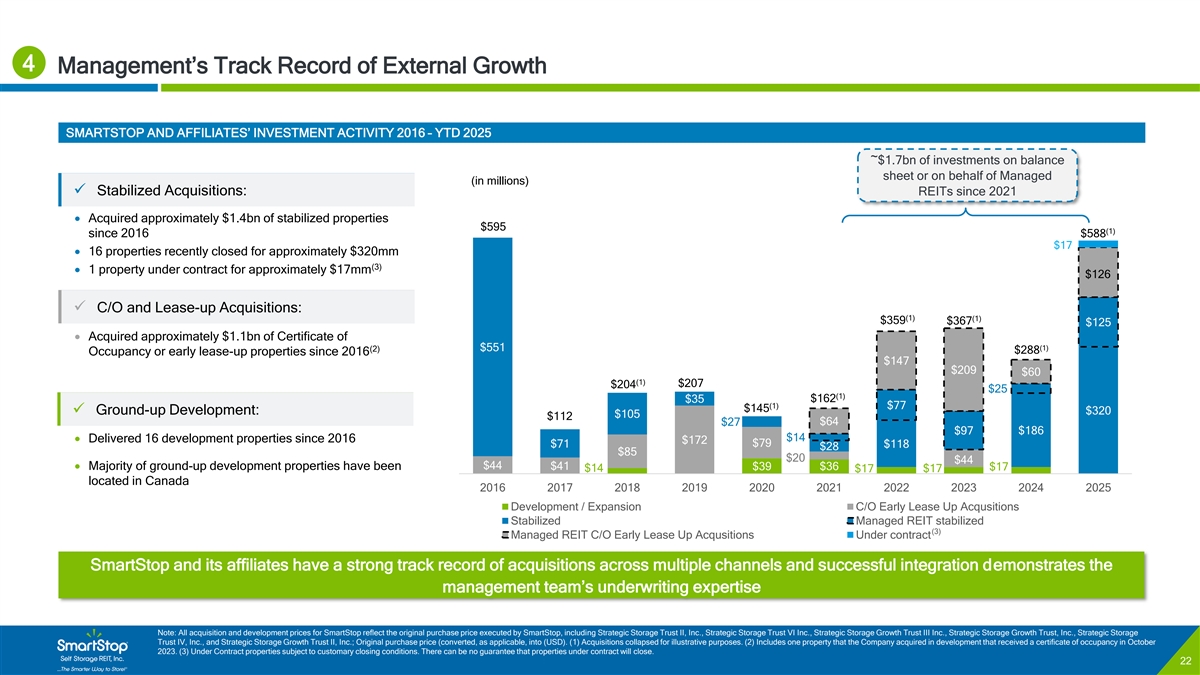
/Admin/ADVANCED GRAPHICS FILES/Cover and Template/2024/2024_01/4159141-001_Trevor McMillin_SmartStop_Cover & Template C O N F I D E N T I A L COLOR PALETTE Text 4 Management’s Track Record of External Growth 50 56 62 Title bar/Bullets 1 124 186 SMARTSTOP AND AFFILIATES’ INVESTMENT ACTIVITY 2016 – YTD 2025 ACCENTS 1 126 ~$1.7bn of investments on balance 124 211 1 186 254 sheet or on behalf of Managed (in millions) (3) 127 212 ✓ Stabilized Acquisitions: REITs since 2021 188 253 2 3 129 (3) • Acquired approximately $1.4bn of stabilized properties $595 32 140 (1) since 2016 $588 56 168 3 $17 100 218 • 16 properties recently closed for approximately $320mm 0 141 (3) • 1 property under contract for approximately $17mm 157 220 $126 4 226 255 166 219 ✓ C/O and Lease-up Acquisitions: 166 219 5 (1) (1) 166 219 $359 $367 $125 • Acquired approximately $1.1bn of Certificate of 1 126 Hyperlink 124 211 $551 (1) (2) $288 Occupancy or early lease-up properties since 2016 186 254 $147 $209 $60 127 212 Followed (1) 188 253 $207 $204 $25 Hyperlink 3 129 (1) $162 $35 (1) $77 $145 ✓ Ground-up Development: $320 TABLE $105 $112 $64 $27 50 $97 $186 56 $14 Lines• Delivered 16 development properties since 2016 $172 $79 $71 $118 $28 62 $85 $20 $44 • Majority of ground-up development properties have been $44 $41 $36 $39 $17 $14 $17 1 $17 124 Highlights located in Canada 2016 2017 2018 2019 2020 2021 2022 2023 2024 2025 186 Development / Expansion C/O Early Lease Up Acqusitions Stabilized Managed REIT stabilized (3) Managed REIT C/O Early Lease Up Acqusitions Under contract SmartStop and its affiliates have a strong track record of acquisitions across multiple channels and successful integration demonstrates the management team’s underwriting expertise Note: All acquisition and development prices for SmartStop reflect the original purchase price executed by SmartStop, including Strategic Storage Trust II, Inc., Strategic Storage Trust VI Inc., Strategic Storage Growth Trust III Inc., Strategic Storage Growth Trust, Inc., Strategic Storage Trust IV, Inc., and Strategic Storage Growth Trust II, Inc.; Original purchase price (converted, as applicable, into (USD). (1) Acquisitions collapsed for illustrative purposes. (2) Includes one property that the Company acquired in development that received a certificate of occupancy in October 2023. (3) Under Contract properties subject to customary closing conditions. There can be no guarantee that properties under contract will close. 22

/Admin/ADVANCED GRAPHICS FILES/Cover and Template/2024/2024_01/4159141-001_Trevor McMillin_SmartStop_Cover & Template C O N F I D E N T I A L COLOR PALETTE Text 4 Recent Acquisition Activity (2025 YTD) 50 56 62 Title bar/Bullets 1 124 186 ACCENTS Recently 1 126 (1) closed Under contract 124 211 1 186 254 127 212 Total Properties 16 1 188 253 2 3 129 32 140 (2) Total Purchase Price ($mm) $320 $17 56 168 3 100 218 0 141 157 220 4 Total NRSF (Storage Only) ~1,284,500 ~54,300 226 255 166 219 166 219 5 Total Units (Storage Only) ~11,560 ~500 166 219 1 126 Hyperlink 124 211 186 254 127 212 Followed 188 253 Hyperlink 3 129 TABLE PORTFOLIO STRATEGY 50 56 Lines 62 • 16 properties primarily located in Top 25 MSAs / CMAs 1 • Maximize efficiencies in top markets by leveraging 124 Highlights 186 existing assets and operations • Accretive investments with high physical occupancy and management upside Note: Acquisition pipeline represents properties acquired subsequent to 8/31/25 end and properties under contract. There can be no guarantee that properties under contract will close. (1) Represents properties acquired during 2025. (2) All dollars denominated in U.S. Dollars (USD). 23

/Admin/ADVANCED GRAPHICS FILES/Cover and Template/2024/2024_01/4159141-001_Trevor McMillin_SmartStop_Cover & Template C O N F I D E N T I A L COLOR PALETTE Text 4 Solar Initiative 50 56 62 Title bar/Bullets 1 124 186 ACCENTS 1 126 124 211 1 (1) 186 254 HIGHLIGHTS ACTUAL GWH PRODUCTION 127 212 188 253 2 3 129 $946K $1.3M $8.4M $12.0M 59 70 10.8 GWh 8.1 GWh Existing Est. Expected Est. Existing Expected Live Solar Expected Solar Cumulative Expected Annual 32 140 56 168 Annual Savings Annual Savings Investment Investment Sites Sites Production Production 3 100 218 0 141 157 220 4 226 255 KILOWATTS Live PTO Pipeline 166 219 Live PTO Pipeline 166 219 5 166 219 4,554 1 1 126 Hyperlink 124 211 186 254 Pipeline sites 127 212 Followed 188 253 Hyperlink 3 129 2,695 11 2,703 TABLE 8 50 56 Lines 1,833 30 62 1 124 Highlights Live PTO Sites 186 16 13 578 59 34 2 Western U.S. Central U.S. Eastern U.S. Canada 2020 2021 2022 2023 2024 2025 YTD (1) Includes wholly-owned and joint venture operating assets of 3/31/2024. Western U.S. includes Arizona and California. Central U.S. includes Colorado, Illinois, Indiana, Michigan and Texas. Eastern U.S. includes DC, Florida, Maryland, Massachusetts, North Carolina, South Carolina, New Jersey and Virginia. 24

/Admin/ADVANCED GRAPHICS FILES/Cover and Template/2024/2024_01/4159141-001_Trevor McMillin_SmartStop_Cover & Template C O N F I D E N T I A L COLOR PALETTE Text 5 SmartStop Managed REIT Platform Provides Additional Capital Allocation Flexibility 50 56 62 Title bar/Bullets Managed REIT and third-party platforms represent a significant expansion opportunity for SmartStop 1 124 186 ACCENTS 1 126 124 211 1 OPERATIONAL PROPERTIES 186 254 (1) STRATEGIC STORAGE TRUST VI, INC. • Acquire growth-oriented properties that broaden NRSF ALLOCATION 127 212 the platform in an accretive structure for 188 253 2 SmartStop 3 129 OR, 2% NV, 2% PA, 3% $564mm AUM BC, 2% Managed REIT AB, 2% 32 140 (3) Assets Under Management on a cost basis 56 168 DE, 3% 3• Generate fees and expense reimbursements Platform 100 218 WA, 4% 0 141 (3) Portfolio Stats QC, 4% • Create economies of scale by adding SmartStop 157 220 4 ON , 50% NRSF 226 255 locations # of Stores 28 2,535,500 166 219 States / Provinces 11 FL, 13% 166 219 5 166 219 Units 24,019 • The structure of SST VI and SSGT III provides the platform 1 126 access to raising equity capital at NAV, subsequently deploying Net Rentable SQFT 2,535,500 Hyperlink 124 211 in an accretive manner at a relatively low-cost basis 186 254 Canadian Development AZ, 17% 2 Differentiated 127 212 Properties Under Construction Followed • The managed REIT platform provides a competitive advantage 188 253 Hyperlink Access to Capital 3 129 STRATEGIC STORAGE GROWTH OPERATIONAL PROPERTIES relative to institutions and publicly traded REITs, which (2) TABLE TRUST III, INC. NRSF ALLOCATION continues to trade at a high cost of capital and discount to NAV, 50 making accretive transactions via equity capital markets 56 Lines VA, 4% BC, 3% $410mm AUM 62 challenging NC, 4% (3) Assets Under Management on a cost basis NJ, 4% 1 • Third-party management represents an expansion opportunity, 124 Highlights FL, 29% AZ, 5% 186 particularly in Canadian markets where there is relatively less (3) Portfolio Stats AB, 6% sophisticated and smaller operators Third-Party NRSF # of Stores 20 1,679,600 Management CA, 7% States / Provinces 10 • Third-party expansion efforts focused across a range of Strategy Units 14,590 Canadian and U.S. markets ON , 10% Net Rentable SQFT 1,679,600 TX, 29% Canadian Development 3 Properties Under Construction Note: All data as of 6/30/2025. (1) Represents Strategic Storage Trust VI, Inc. ( SST VI ), a non-traded REIT with a publicly-registered offering that was declared effective by the SEC on 3/17/2022. (2) Represents Strategic Storage Growth Trust III, Inc. ( SSGT III ), which was launched in May 2022. (3) Includes all rentable units and rentable square feet, consisting of storage units and parking units. 25

/Admin/ADVANCED GRAPHICS FILES/Cover and Template/2024/2024_01/4159141-001_Trevor McMillin_SmartStop_Cover & Template C O N F I D E N T I A L COLOR PALETTE Text 5 APSM – Overview and Deal Summary 50 56 62 Title bar/Bullets 1 124 186 SELF STORAGE FACILITY-MANAGEMENT OVERVIEW APSM BACKGROUND & DEAL SUMMARY ACCENTS Overview: 1 126 Top 10 Self Storage Facility- 124 211 1 (1) 186 254 Management Companies ⚫ SmartStop Self Storage REIT, Inc. (“SmartStop”) is under contract to purchase Argus 127 212 Professional Storage Management (“APSM”), a self storage third-party management 188 253 2 # of Managed # Self Storage Manager 3 129 Facilities company based in Tucson AZ. APSM is the sixth largest self storage manager in the U.S. 32 140 (1) 56 168 and the second largest private third-party self storage manager in the U.S. 3 1 1,895 100 218 0 141 Background: 157 220 4 2 802 226 255 ⚫ Founded in 1994 as the Argus Professional Storage Sales Network, the company initially 166 219 166 219 5 3 623 focused on brokering self-storage transactions. In 2012, Argus partnered with Professional 166 219 1 126 Self Storage Management to create Argus Professional Storage Management (APSM) Hyperlink 124 211 4 489 186 254 ◼ The partnership launched with 40 managed facilities, and rapidly expanded thereafter 127 212 Followed 188 253 5 375 ◼ Today, APSM serves a wide breadth of owner types and geographies, managing Hyperlink 3 129 approximately 227 facilities across 26 states TABLE (2) 227 6 50 – Serves over 90 owners that range from large, multi-facility investment firms to 56 Lines 62 individual site owners 7 146 1 – Properties located in both major metropolitan areas and secondary markets 124 Highlights 186 8 137 Deal Terms: 9 132 (2) ⚫ Up Front Consideration: $21.0 million payable in a combination of cash and OP Units ⚫ Earnout Consideration: $11.0 million due upon certain revenue thresholds being met in 10 104 year 3 (1) According to Inside Self Storage and the 2025 Self Storage Almanac, as of 12/31/2024, adjusted for APSM’s latest facility count. (2) Represents latest facilities managed count per APSM management, adjusted for recent onboards and offboards. (2) Up front consideration consists of $8.5 million of cash and approximately 328,000 OP Units. 26

/Admin/ADVANCED GRAPHICS FILES/Cover and Template/2024/2024_01/4159141-001_Trevor McMillin_SmartStop_Cover & Template C O N F I D E N T I A L COLOR PALETTE Text 5 APSM – Investment Highlights & Portfolio Overview 50 56 62 Title bar/Bullets 1 124 186 INVESTMENT HIGHLIGHTS PRO FORMA PORTFOLIO OVERVIEW ACCENTS (2) (3) APSM SMA PF SMA 1 126▪ APSM will immediately expand SmartStop’s managed portfolio, create new operational Vertically Integrated 124 211 1 infrastructure, and leverage experienced talent to support a best-in-class, fully-integrated 227 230 457 Number of Properties 186 254 Managed Portfolio third-party management strategy 127 212 83.2% 92.8% 88.3% Occupancy (by Occupied SF) 188 253 2 3 129 ▪ Immediately accretive transaction supported by scaled, managed portfolio with in-place 16,550,625 18,674,450 35,225,075 Total NRSF tenant insurance capture 32 140 Accretive 56 168 3 (1) 102,122 167,165 269,287 ▪ Going-in Adjusted EBITDA yield of 11-13% ; yield exceeds current SMA implied cap rate Total Storage Units Transaction 100 218 ▪ Ability to bolster future SMA earnings through addition of new 3PM facilities over time 0 141 (4) $79,471 $82,361 $81,003 3-Mile Median HH Income 157 220 4 ▪ Integration of shared services and centralized systems improve margin profile and 226 255 (4) 60,336 108,929 86,098 3-Mile Population streamline property-level operations Property Management 166 219 166 219 (5) 5▪ Strengthens SmartStop’s ability to deliver consistent performance across a larger, more Synergies 26 / 65 23 / 54 34 / 107 # of States / Markets 166 219 diverse portfolio 1 126 Hyperlink 124 211 ▪ Datasets from APSM legacy facilities will enhance SmartStop’s pricing and expense 186 254 optimization capabilities, enabling more precise market-level revenue management Digital Economies APSM GEOGRAPHIC DIVERSIFICATION 127 212 across both existing and new geographies Followed of Scale 188 253 Hyperlink 3 129▪ Immediate property clustering in 12 current SmartStop markets WA TABLE ▪ APSM’s national footprint and established third-party platform significantly expand MT MN NH 50 SmartStop’s geographic reach Geographic 56 Lines OR MA WI MI 62 Diversification▪ Of APSM’s top 20 markets, 12 provide new market exposure to SmartStop; pro forma WY SmartStop will have operations in 34 states CT 1 NV OH 124 Highlights ▪ Launches best-in-class capabilities of APSM and SmartStop into new geographies 186 VA CA CO including Canada, where there is a limited set of institutional 3rd party managers New Avenues for KY Pending EVS MO AZ NM OK NC AR Future Growth▪ Ability to enter new target markets for owned assets, in which APSM already has a foothold AL GA ▪ New and existing third-party management relationships provide SmartStop with direct TX access to a pipeline of potential acquisition targets Captive Pipeline for New FL ▪ Enhances SmartStop’s ability to source off-market transactions and “price to perfection” Acquisitions APSM Managed Facilities on existing 3PM properties (1) Adjusted EBITDA yield is a non-GAAP financial measure. As presented, it is derived from estimated net income yield (defined as net income from the transaction before financing costs divided by the up-front consideration of $21 million)) of 7% - 9%. Net income is adjusted for taxes to arrive at Adjusted EBITDA. Further quantification can not be made without unreasonable efforts; (2) APSM portfolio data as of 08/20/2025, unadjusted for subsequent onboard and offboards following this date; (3) SmartStop owned and managed portfolio data as of 06/30/2025, unadjusted for subsequent events; (4) Weighted based on total SF; (5) SmartStop market count includes Canadian markets 27

/Admin/ADVANCED GRAPHICS FILES/Cover and Template/2024/2024_01/4159141-001_Trevor McMillin_SmartStop_Cover & Template C O N F I D E N T I A L COLOR PALETTE Text 5 APSM – Significant Expansion of SMA’s Managed Portfolio and Capabilities 50 56 62 Title bar/Bullets 1 124 186 SmartStop has existing presence in EXPANSION & NEW MARKETS 5 15 of APSM’s 26 states: ACCENTS WA ▪ Expands SMA's presence 1 126 NH SMA # APSM Market Total Units 124 211 MT 1 2 Presence in Central Florida, Denver, 186 254 1 Colorado 19,715 MN✓ 3 Las Vegas, Phoenix, 2 Texas 15,320 127 212 2✓ OR MA 4 MI Sacramento, and San WI 2 188 253 3 Arizona 13,909 2 ✓ 3 129 4 New Mexico 9,764 3 Antonio WY 3 California 7,226 CT 5 ✓ 32 140 4 3 PA Arkansas 5,850 5 6 ▪ SMA entry into new target 56 168 3 6 3 4 100 218 OH 7 North Carolina 3,924 NV✓ NJ markets including Atlanta 2 IN 8 Oklahoma 3,612 3 IL 8 0 141 5 10 2 and Minneapolis 12 9 Georgia 2,910 DE 157 220 CO 4 10 Nevada 2,826 VA ✓ 226 255 CA 42 6 MO MD 11 Wyoming 2,550 KY 166 219 10 12 Minnesota 2,179 5 15 166 219 5 3 13 Florida 1,608 5 8✓ 166 219 NC 20 AZ TN OK 3 AR 14 Michigan 1,543 ✓ 13 3 4 1 126 SC 15 Alabama 1,476 NM✓ 10 4 Hyperlink 124 211 2 6 4 16 Oregon 1,335 5 5 ✓ (2) 186 254 # of APSM Managed Properties 17 Montana 1,274 4 6 18 11 AL 18 Massachusetts 1,022 12 127 212 (1) GA✓ # of SmartStop Managed Properties 2 Followed 5 188 253 New Hampshire 967 19 TX Hyperlink (1) 3 129 # of SmartStop Owned Properties 20 Ohio 696 ✓ FL 10 3 21 Conneticut 567 TABLE APSM Presence 22 Washington 477 11✓ 50 23 Virginia 460 10✓ SmartStop / APSM Overlap 56 26 Lines 24 Wisconsin 428 ✓ 62 SmartStop Presence 25 Missouri 250 26 Kentucky 234 1 124 Highlights 186 Update to APSM Market Real Storage – Plano, TX Buffalo Run SS – Commerce City, CO 303 SS (Monaco) – Denver, CO Ray SS – Burlington, NC Indigo SS – Las Vegas, NV (1) SmartStop portfolio includes all owned and managed properties, based in the U.S.; (2) APSM portfolio includes 227 managed properties. 28

/Admin/ADVANCED GRAPHICS FILES/Cover and Template/2024/2024_01/4159141-001_Trevor McMillin_SmartStop_Cover & Template C O N F I D E N T I A L COLOR PALETTE Text 5 APSM – SMA’s Differentiated Third-Party Offerings 50 56 62 Title bar/Bullets 1 124 186 SMARTSTOP SMARTSTOP LEGACY FULL PRIVATE LABEL ACCENTS A B C 1 126 124 211 1 186 254 127 212 A traditional SmartStop-branded A hybrid model where partners A fully white-labeled solution that 188 253 2 3 129 approach that leverages our full retain their existing brand identity preserves the partner’s brand 32 140 marketing and revenue management while operating on SmartStop identity end-to-end, while 56 168 3 100 218 strategies along with complete website and platforms, or by seamlessly operating on the 0 141 157 220 4 access to SmartStop’s proprietary integrating SmartStop SmartStop platform and maintaining 226 255 166 219 platforms and services enhancements into current systems marketing autonomy 166 219 5 166 219 1 126 Hyperlink 124 211 186 254 127 212 Followed 188 253 Hyperlink SmartStop will offer tailored solutions to meet the evolving needs of self-storage owners across North America 3 129 TABLE 50 56 Lines 62 1 124 Highlights 186 Update to APSM Market First & River SS – Tuscon, AZ Buffalo Run SS – Commerce City, CO Indigo SS – Las Vegas, NV 29
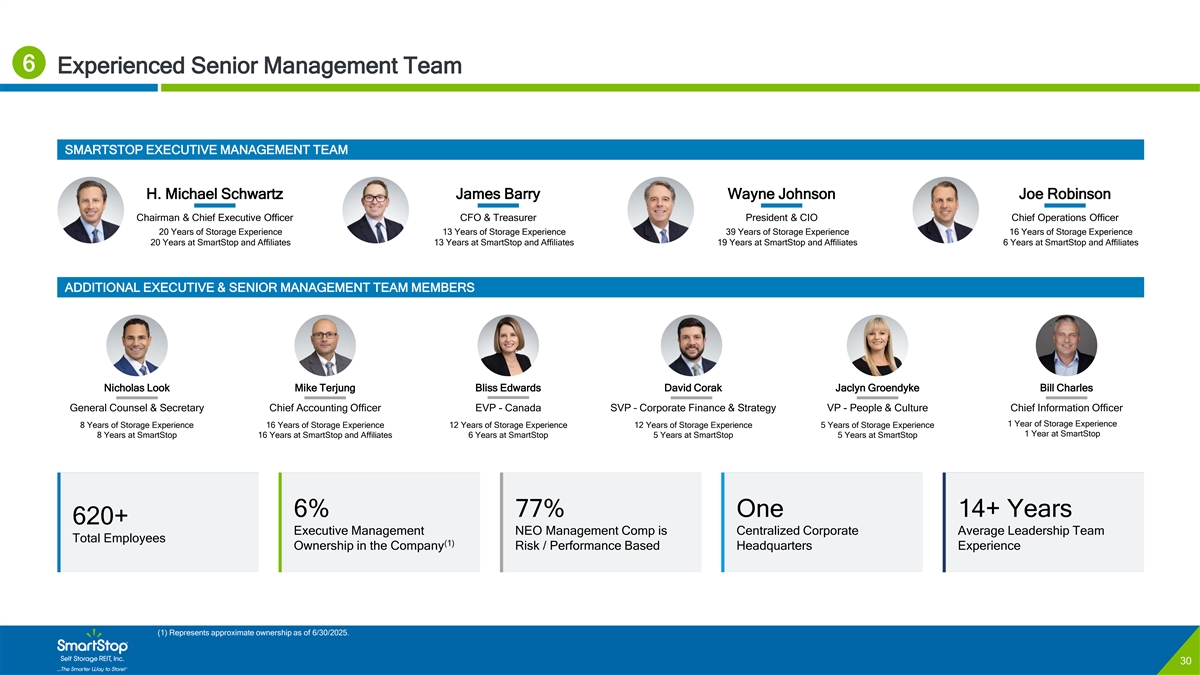
/Admin/ADVANCED GRAPHICS FILES/Cover and Template/2024/2024_01/4159141-001_Trevor McMillin_SmartStop_Cover & Template C O N F I D E N T I A L COLOR PALETTE Text 6 Experienced Senior Management Team 50 56 62 Title bar/Bullets 1 124 186 ACCENTS SMARTSTOP EXECUTIVE MANAGEMENT TEAM 1 126 124 211 1 186 254 127 212 H. Michael Schwartz James Barry Wayne Johnson Joe Robinson 188 253 2 3 129 Chairman & Chief Executive Officer CFO & Treasurer President & CIO Chief Operations Officer 32 140 20 Years of Storage Experience 13 Years of Storage Experience 39 Years of Storage Experience 16 Years of Storage Experience 56 168 3 20 Years at SmartStop and Affiliates 13 Years at SmartStop and Affiliates 19 Years at SmartStop and Affiliates 6 Years at SmartStop and Affiliates 100 218 0 141 157 220 4 226 255 ADDITIONAL EXECUTIVE & SENIOR MANAGEMENT TEAM MEMBERS 166 219 166 219 5 166 219 1 126 Hyperlink 124 211 186 254 127 212 Followed 188 253 Nicholas Look Mike Terjung Bliss Edwards David Corak Jaclyn Groendyke Bill Charles Hyperlink 3 129 General Counsel & Secretary Chief Accounting Officer EVP - Canada SVP – Corporate Finance & Strategy VP - People & Culture Chief Information Officer TABLE 1 Year of Storage Experience 8 Years of Storage Experience 16 Years of Storage Experience 12 Years of Storage Experience 12 Years of Storage Experience 5 Years of Storage Experience 50 1 Year at SmartStop 8 Years at SmartStop 16 Years at SmartStop and Affiliates 6 Years at SmartStop 5 Years at SmartStop 5 Years at SmartStop 56 Lines 62 1 124 Highlights 186 6% 77% One 14+ Years 620+ Executive Management NEO Management Comp is Centralized Corporate Average Leadership Team Total Employees (1) Ownership in the Company Risk / Performance Based Headquarters Experience (1) Represents approximate ownership as of 6/30/2025. 30
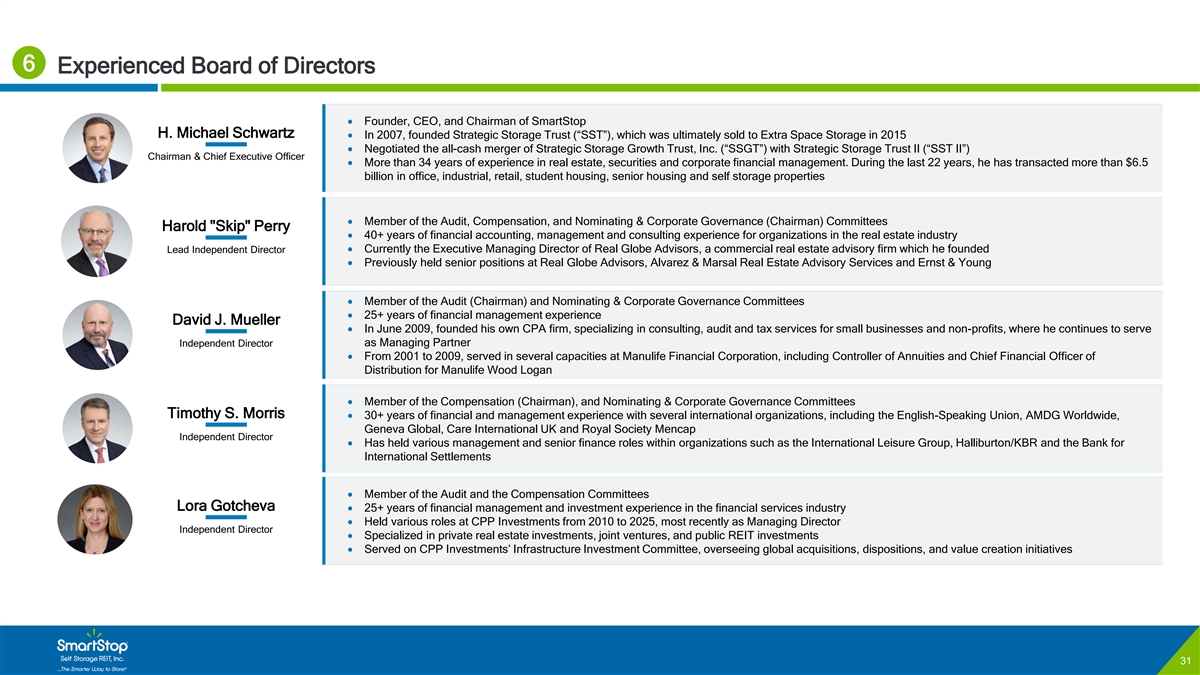
/Admin/ADVANCED GRAPHICS FILES/Cover and Template/2024/2024_01/4159141-001_Trevor McMillin_SmartStop_Cover & Template C O N F I D E N T I A L COLOR PALETTE Text 6 Experienced Board of Directors 50 56 62 Title bar/Bullets 1 124 186 • Founder, CEO, and Chairman of SmartStop H. Michael Schwartz • In 2007, founded Strategic Storage Trust (“SST”), which was ultimately sold to Extra Space Storage in 2015 ACCENTS • Negotiated the all-cash merger of Strategic Storage Growth Trust, Inc. (“SSGT”) with Strategic Storage Trust II (“SST II”) 1 126 Chairman & Chief Executive Officer 124 211 • More than 34 years of experience in real estate, securities and corporate financial management. During the last 22 years, he has transacted more than $6.5 1 186 254 billion in office, industrial, retail, student housing, senior housing and self storage properties 127 212 188 253 2 3 129 • Member of the Audit, Compensation, and Nominating & Corporate Governance (Chairman) Committees 32 140 Harold Skip Perry Harold Skip Perry • 40+ years of financial accounting, management and consulting experience for organizations in the real estate industry 56 168 3 100 218 In Led ad e p Ine dn ep de e nn dt en Dir t Di ercto ectorr• Currently the Executive Managing Director of Real Globe Advisors, a commercial real estate advisory firm which he founded • Previously held senior positions at Real Globe Advisors, Alvarez & Marsal Real Estate Advisory Services and Ernst & Young 0 141 157 220 4 226 255 166 219• Member of the Audit (Chairman) and Nominating & Corporate Governance Committees 166 219 5 • 25+ years of financial management experience 166 219 David J. Mueller • In June 2009, founded his own CPA firm, specializing in consulting, audit and tax services for small businesses and non-profits, where he continues to serve David J. Mueller 1 126 Independent Director as Managing Partner Hyperlink 124 211 Independent Director 186 254• From 2001 to 2009, served in several capacities at Manulife Financial Corporation, including Controller of Annuities and Chief Financial Officer of Distribution for Manulife Wood Logan 127 212 Followed 188 253 Hyperlink 3 129 • Member of the Compensation (Chairman), and Nominating & Corporate Governance Committees TABLE Timothy S. Morris • 30+ years of financial and management experience with several international organizations, including the English-Speaking Union, AMDG Worldwide, 50 Geneva Global, Care International UK and Royal Society Mencap Independent Director 56 Lines • Has held various management and senior finance roles within organizations such as the International Leisure Group, Halliburton/KBR and the Bank for 62 International Settlements 1 124 Highlights 186 • Member of the Audit and the Compensation Committees Lora Gotcheva • 25+ years of financial management and investment experience in the financial services industry Paula Mathews • Held various roles at CPP Investments from 2010 to 2025, most recently as Managing Director Independent Director Director• Specialized in private real estate investments, joint ventures, and public REIT investments • Served on CPP Investments’ Infrastructure Investment Committee, overseeing global acquisitions, dispositions, and value creation initiatives 31

/Admin/ADVANCED GRAPHICS FILES/Cover and Template/2024/2024_01/4159141-001_Trevor McMillin_SmartStop_Cover & Template C O N F I D E N T I A L COLOR PALETTE Text 7 Investment Grade Rated Balance Sheet Positioned for Growth 50 56 62 Title bar/Bullets 1 124 186 (3)(4) SMARTSTOP AS ADJUSTED BALANCE SHEET HIGHLIGHTS ACCENTS 1 126 124 211 1 186 254 BBB/with Stable Trends 5.6x 3.5 Years (6) 127 212 DBRS rating Normalized Net Debt to Adjusted EBITDA Wtd. Avg. Debt Maturity 188 253 2 3 129 32 140 56 168 3 100 218 3.2x BBB/Stable 0 141 $3.1 Billion 157 220 (5) 4 KBRA rating Fixed Charge Coverage (2)(4) 226 255 Total Capitalization 166 219 166 219 5 166 219 1 126 Hyperlink 124 211 186 254 (1)(2)(3) (2)(4) DEBT MATURITY SCHEDULE (MILLIONS) CAPITAL STRUCTURE 127 212 Followed 188 253 Hyperlink 3 129 $519 TABLE 50 56 Lines 62 $366 1 124 Highlights 186 $200 $54 $150 $104 $98 $92 $41 $42 $9 2026 2027 2028 2029 2030+ Term Loans Revolver CMBS Debt Private Placement (1) As of 6/30/2025. (2) Presented in US Dollars (USD) as translated at the end of the quarter. The ending USD/CAD exchange rate for the quarter ended June 30, 2025 was approximately 0.73x. (3) Excludes amortizing debt payments. Does not account for extension options. (4) Total capitalization includes debt and equity market cap based on approximately 58.8 million shares and OP Units at June 30, 2025 valued at the closing stock price on 6/30/2025 of $36.23. Debt is at face value for purposes of this calculation. (5) Fixed-charge coverage ratio is Adjusted EBITDA divided by total interest expense and principal payments and preferred stock dividends. (6) Net debt to Adjusted EBITDA ratio is total debt , less cash and restricted cash (including SmartStop's portion of joint venture net debt) divided by current quarter Adjusted EBITDA (annualized). Includes intra-quarter NOI of $1,865 (incremental net operating income and tenant protection program revenues less tenant protection program related expenses), intra-quarter interest income of $651 (incremental interest income from lending), and $225 of fees from Managed REITs over 32 and above the amount recognized during the quarter.
/Admin/ADVANCED GRAPHICS FILES/Cover and Template/2024/2024_01/4159990-001_Trevor McMillin_Cover and divider edit Appendix

/Admin/ADVANCED GRAPHICS FILES/Cover and Template/2024/2024_01/4159141-001_Trevor McMillin_SmartStop_Cover & Template C O N F I D E N T I A L COLOR PALETTE Text MSA Exposure – Total Portfolio 50 56 62 Title bar/Bullets Wholly-Owned Total Portfolio at 6/30/25 1 124 186 ACCENTS 1 126 124 211 % of Portfolio % of Portfolio Net Rentable 1 186 254 (1) MSA/CMA Units by NRSF by NOI Sq. Ft. # of Stores 127 212 Miami - Fort Lauderdale 9.0% 11.8% 1, 212,850 12 10 ,470 188 253 2 3 129 Houston 8.5% 5.4% 1,145,550 14 9,000 32 140 Toronto 8.3% 10.5% 1, 110,700 13 10 ,610 56 168 3 100 218 Los Angeles 6.6% 9.7% 88 2,000 12 8,290 0 141 157 220 Las Vegas 6.4% 6.3% 86 5,000 9 7,160 4 226 255 Asheville 5.9% 5.3% 79 2,450 13 5,680 166 219 166 219 5 Denver 4.4% 3.0% 591,650 9 5,205 166 219 Tampa 3.6% 3.0% 478,100 5 3,890 1 126 Hyperlink 124 211 Dayton 3.2% 1.9% 432,750 7 3,860 186 254 Chicago 3.2% 2.4% 43 2,450 6 3,785 127 212 Followed 188 253 Hyperlink Seattle - Tacoma 2.9% 3.2% 39 0,550 5 3,430 3 129 New York - Newark 2.9% 2.8% 386,000 3 4,385 TABLE 50 Phoenix 2.4% 2.2% 32 9,100 4 3,130 56 Lines 62 San Francisco - Oakland 2.4% 2.8% 322,600 4 2,920 1 Port St. Lucie 2.4% 2.0% 318,900 4 2,610 124 Highlights Sacramento 2.3% 1.4% 308,100 4 2,895 186 Riverside - SB 2.3% 2.6% 306,700 5 2,690 Detroit 2.0% 1.7% 266,100 4 2,220 Myrtle Beach 1.5% 1.0% 197,800 2 1,450 (2) Other 19.8% 21.0% 2, 692,700 36 24 ,545 Total Stores 100.0% 100.0% 13,462,050 171 118,225 (1) MSAs (Metropolitan Statistical Areas) as defined by the U.S. Census Bureau. Toronto CMA (Census Metropolitan Area) as defined by Statistics Canada. (2) Other markets include: Baltimore, Charleston, Charlotte, Charlottesville, College Station, Colorado Springs, Dallas, Jacksonville, Kelowna, Milwaukee, Mobile, Nantucket, Naples, Nashville, Orlando, Punta Gorda, Raleigh - Cary, San Antonio, San Diego, San Jose, Santa Maria-Santa Barbara, Santa Rosa - Petaluma, Sarasota, Spartanburg, Stockton, Trenton-Princeton and Washington-Arlington. None of these markets represent more than 1.5% of the total portfolio by NRSF. 34
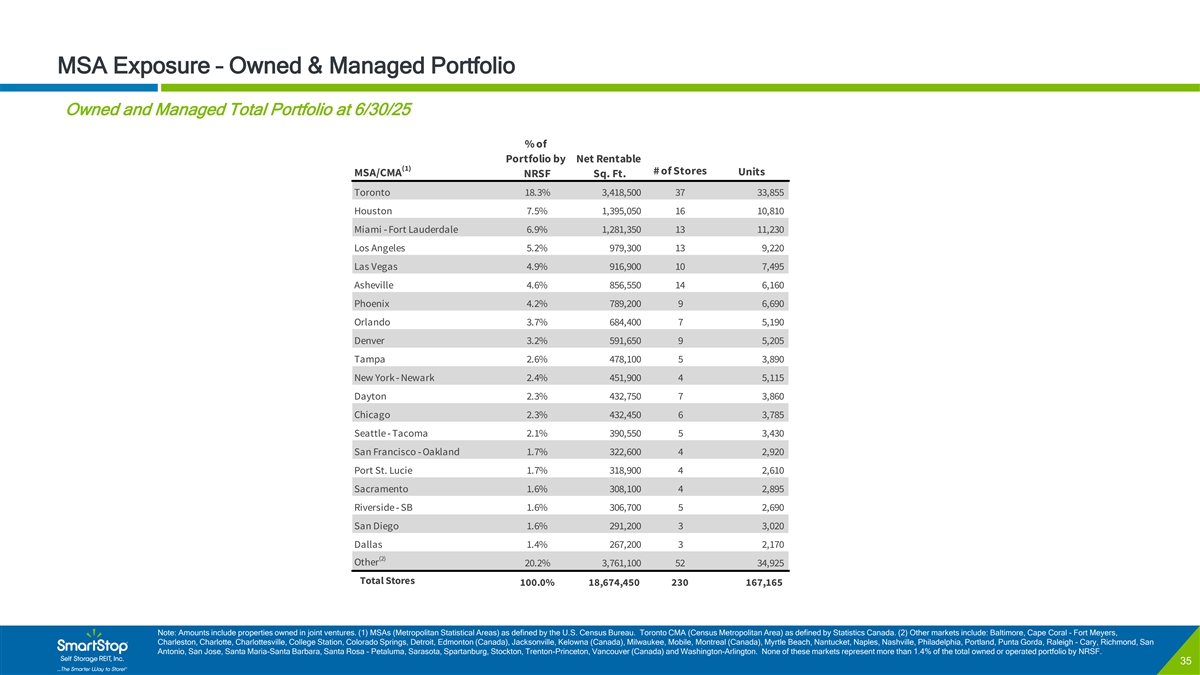
/Admin/ADVANCED GRAPHICS FILES/Cover and Template/2024/2024_01/4159141-001_Trevor McMillin_SmartStop_Cover & Template C O N F I D E N T I A L COLOR PALETTE Text MSA Exposure – Owned & Managed Portfolio 50 56 62 Title bar/Bullets Owned and Managed Total Portfolio at 6/30/25 1 124 186 ACCENTS % of 1 126 Portfolio by Net Rentable 124 211 1 (1) 186 254 # of Stores Units MSA/CMA NRSF Sq. Ft. 127 212 Toronto 18.3% 3,418,500 37 33,855 188 253 2 3 129 Houston 7.5% 1,395,050 16 1 0,810 32 140 Miami - Fort Lauderdale 6.9% 1,281,350 13 1 1,230 56 168 3 100 218 Los Angeles 5.2% 9 79,300 13 9,220 0 141 Las Vegas 4.9% 9 16,900 10 7 ,495 157 220 4 226 255 Asheville 4.6% 8 56,550 14 6,160 166 219 Phoenix 4.2% 7 89,200 9 6,690 166 219 5 166 219 Orlando 3.7% 684,400 7 5 ,190 1 126 Denver 3.2% 591,650 9 5,205 Hyperlink 124 211 186 254 Tampa 2.6% 4 78,100 5 3,890 127 212 New York - Newark 2.4% 4 51,900 4 5 ,115 Followed 188 253 Hyperlink 3 129 Dayton 2.3% 4 32,750 7 3,860 TABLE Chicago 2.3% 432,450 6 3,785 50 Seattle - Tacoma 2.1% 3 90,550 5 3,430 56 Lines 62 San Francisco - Oakland 1.7% 322,600 4 2,920 1 Port St. Lucie 1.7% 3 18,900 4 2,610 124 Highlights 186 Sacramento 1.6% 3 08,100 4 2 ,895 Riverside - SB 1.6% 3 06,700 5 2 ,690 San Diego 1.6% 2 91,200 3 3,020 Dallas 1.4% 2 67,200 3 2 ,170 (2) Other 20.2% 3 ,761,100 52 3 4,925 Total Stores 100.0% 18,674,450 230 1 67,165 Note: Amounts include properties owned in joint ventures. (1) MSAs (Metropolitan Statistical Areas) as defined by the U.S. Census Bureau. Toronto CMA (Census Metropolitan Area) as defined by Statistics Canada. (2) Other markets include: Baltimore, Cape Coral - Fort Meyers, Charleston, Charlotte, Charlottesville, College Station, Colorado Springs, Detroit, Edmonton (Canada), Jacksonville, Kelowna (Canada), Milwaukee, Mobile, Montreal (Canada), Myrtle Beach, Nantucket, Naples, Nashville, Philadelphia, Portland, Punta Gorda, Raleigh - Cary, Richmond, San Antonio, San Jose, Santa Maria-Santa Barbara, Santa Rosa - Petaluma, Sarasota, Spartanburg, Stockton, Trenton-Princeton, Vancouver (Canada) and Washington-Arlington. None of these markets represent more than 1.4% of the total owned or operated portfolio by NRSF. 35
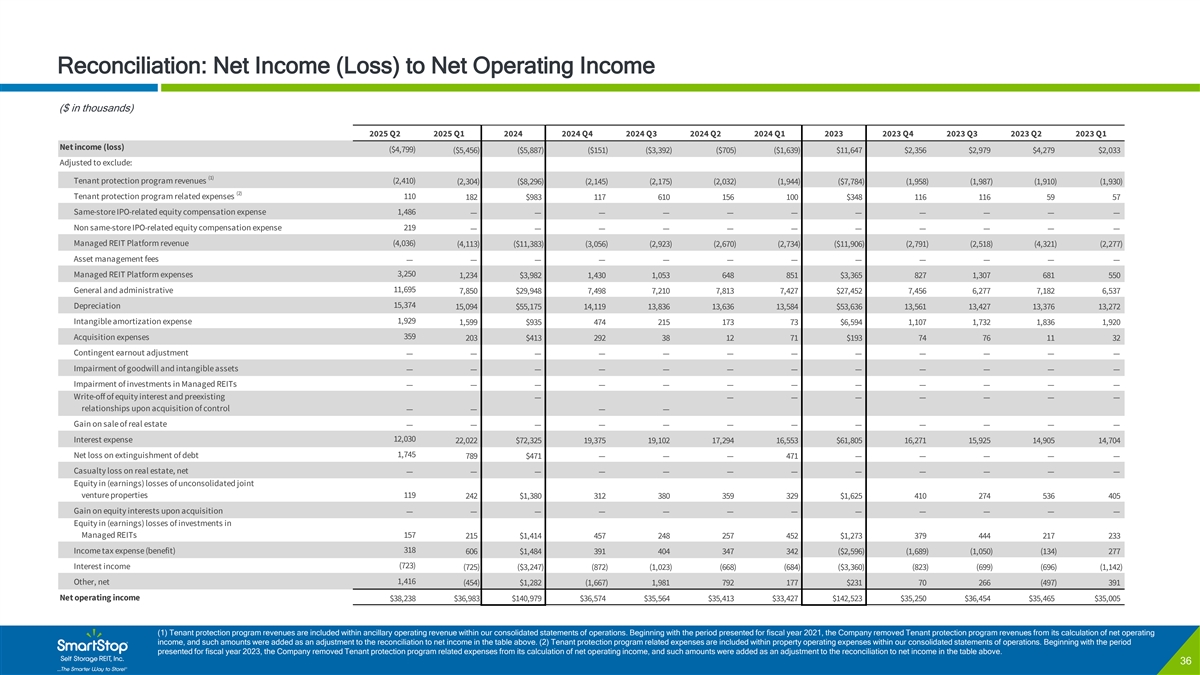
/Admin/ADVANCED GRAPHICS FILES/Cover and Template/2024/2024_01/4159141-001_Trevor McMillin_SmartStop_Cover & Template C O N F I D E N T I A L COLOR PALETTE Text Reconciliation: Net Income (Loss) to Net Operating Income 50 56 62 Title bar/Bullets ($ in thousands) 1 124 186 2025 Q2 2025 Q1 2024 2024 Q4 2024 Q3 2024 Q2 2024 Q1 2023 2023 Q4 2023 Q3 2023 Q2 2023 Q1 ACCENTS Net income (loss) ($4,799) ($5,456) ($5,887) ($151) ($3,392) ($705) ($1,639) $11,647 $2,356 $2,979 $4,279 $2,033 1 126 124 211 Adjusted to exclude: 1 186 254 (1) Tenant protection program revenues (2,410) ( 2,304) ($8,296) ( 2,145) (2,175) (2,032) ( 1,944) ($7,784) ( 1,958) (1,987) (1,910) ( 1,930) 127 212 (2) Tenant protection program related expenses 110 182 $983 117 610 156 100 $348 116 116 59 57 188 253 2 3 129 Same-store IPO-related equity compensation expense 1,486 — — — — — — — — — — — Non same-store IPO-related equity compensation expense 219 32 140 — — — — — — — — — — — 56 168 3 Managed REIT Platform revenue (4,036) ( 4,113) ($11,383) ( 3,056) (2,923) ( 2,670) (2,734) ($11,906) (2,791) ( 2,518) ( 4,321) (2,277) 100 218 Asset management fees — — — — — — — — — — — — 0 141 157 220 Managed REIT Platform expenses 3,250 1,234 $3,982 1,430 1,053 648 851 $3,365 827 1 ,307 681 550 4 226 255 General and administrative 11,695 7 ,850 $29,948 7 ,498 7,210 7,813 7,427 $27,452 7 ,456 6,277 7,182 6 ,537 166 219 Depreciation 15,374 15,094 $55,175 14,119 13,836 1 3,636 1 3,584 $53,636 13,561 13,427 1 3,376 1 3,272 166 219 5 166 219 Intangible amortization expense 1,929 1 ,599 $935 474 215 173 73 $6,594 1,107 1 ,732 1 ,836 1 ,920 Acquisition expenses 359 203 $413 292 38 12 71 $193 74 76 11 32 1 126 Hyperlink 124 211 Contingent earnout adjustment — — — — — — — — — — — — 186 254 Impairment of goodwill and intangible assets — — — — — — — — — — — — 127 212 Followed Impairment of investments in Managed REITs 188 253 — — — — — — — — — — — — Hyperlink 3 129 Write-off of equity interest and preexisting — — — — — — — — relationships upon acquisition of control — — — — TABLE Gain on sale of real estate — — — — — — — — — — — — 50 56 12,030 Lines Interest expense 2 2,022 $72,325 19,375 19,102 17,294 1 6,553 $61,805 16,271 1 5,925 1 4,905 1 4,704 62 1,745 Net loss on extinguishment of debt 789 $471 — — — 471 — — — — — 1 Casualty loss on real estate, net — — — — — — — — — — — — 124 Highlights Equity in (earnings) losses of unconsolidated joint 186 venture properties 119 242 $1,380 312 380 359 329 $1,625 410 274 536 405 Gain on equity interests upon acquisition — — — — — — — — — — — — Equity in (earnings) losses of investments in Managed REITs 157 215 $1,414 457 248 257 452 $1,273 379 444 217 233 Income tax expense (benefit) 318 606 $1,484 391 404 347 342 ($2,596) (1,689) (1,050) (134) 277 Interest income (723) (725) ($3,247) ( 872) ( 1,023) ( 668) ( 684) ($3,360) ( 823) ( 699) (696) (1,142) Other, net 1,416 ( 454) $1,282 (1,667) 1,981 792 177 $231 70 266 ( 497) 391 Net operating income $38,238 $36,983 $140,979 $36,574 $35,564 $35,413 $33,427 $142,523 $35,250 $36,454 $35,465 $35,005 (1) Tenant protection program revenues are included within ancillary operating revenue within our consolidated statements of operations. Beginning with the period presented for fiscal year 2021, the Company removed Tenant protection program revenues from its calculation of net operating income, and such amounts were added as an adjustment to the reconciliation to net income in the table above. (2) Tenant protection program related expenses are included within property operating expenses within our consolidated statements of operations. Beginning with the period presented for fiscal year 2023, the Company removed Tenant protection program related expenses from its calculation of net operating income, and such amounts were added as an adjustment to the reconciliation to net income in the table above. 36
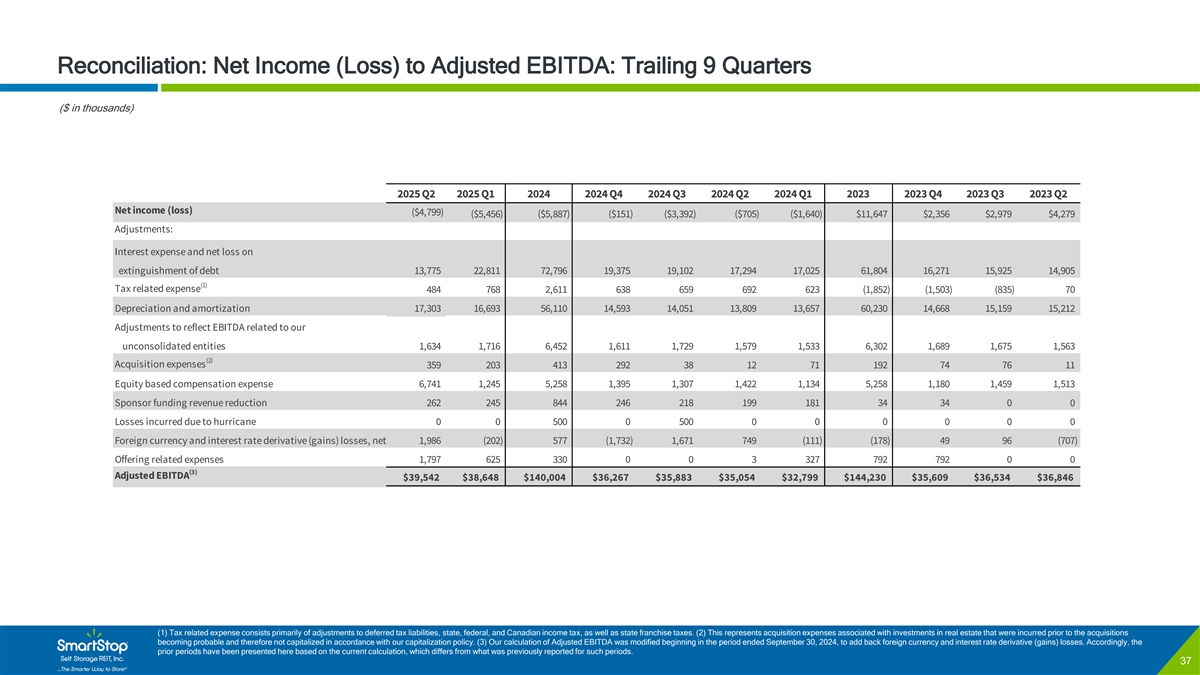
/Admin/ADVANCED GRAPHICS FILES/Cover and Template/2024/2024_01/4159141-001_Trevor McMillin_SmartStop_Cover & Template C O N F I D E N T I A L COLOR PALETTE Text Reconciliation: Net Income (Loss) to Adjusted EBITDA: Trailing 9 Quarters 50 56 62 Title bar/Bullets ($ in thousands) 1 124 186 ACCENTS 1 126 124 211 1 186 254 127 212 2025 Q2 2025 Q1 2024 2024 Q4 2024 Q3 2024 Q2 2024 Q1 2023 2023 Q4 2023 Q3 2023 Q2 188 253 2 3 129 Net income (loss) ($4,799) ($5,456) ($5,887) ($151) ($3,392) ($705) ($1,640) $11,647 $2,356 $2,979 $4,279 32 140 Adjustments: 56 168 3 100 218 Interest expense and net loss on 0 141 extinguishment of debt 13,775 22,811 72,796 19,375 19,102 17,294 17,025 61,804 16,271 15,925 14,905 157 220 4 226 255 (1) Tax related expense 484 768 2,611 638 659 692 623 (1,852) (1,503) (835) 70 166 219 Depreciation and amortization 17,303 16,693 56,110 14,593 14,051 13,809 13,657 60,230 14,668 15,159 15,212 166 219 5 166 219 Adjustments to reflect EBITDA related to our 1 126 unconsolidated entities 1,634 1,716 6,452 1,611 1,729 1,579 1,533 6,302 1,689 1,675 1,563 Hyperlink 124 211 186 254 (2) Acquisition expenses 359 203 413 292 38 12 71 192 74 76 11 127 212 Followed 188 253 Equity based compensation expense 6,741 1,245 5,258 1,395 1,307 1,422 1,134 5,258 1,180 1,459 1,513 Hyperlink 3 129 Sponsor funding revenue reduction 262 245 844 246 218 199 181 34 34 0 0 TABLE Losses incurred due to hurricane 0 0 500 0 500 0 0 0 0 0 0 50 56 Lines Foreign currency and interest rate derivative (gains) losses, net 1,986 (202) 577 (1,732) 1,671 749 (111) (178) 49 96 (707) 62 Offering related expenses 1,797 625 330 0 0 3 327 792 792 0 0 1 (3) Adjusted EBITDA $39,542 $38,648 $140,004 $36,267 $35,883 $35,054 $32,799 $144,230 $35,609 $36,534 $36,846 124 Highlights 186 (1) Tax related expense consists primarily of adjustments to deferred tax liabilities, state, federal, and Canadian income tax, as well as state franchise taxes. (2) This represents acquisition expenses associated with investments in real estate that were incurred prior to the acquisitions becoming probable and therefore not capitalized in accordance with our capitalization policy. (3) Our calculation of Adjusted EBITDA was modified beginning in the period ended September 30, 2024, to add back foreign currency and interest rate derivative (gains) losses. Accordingly, the prior periods have been presented here based on the current calculation, which differs from what was previously reported for such periods. 37

/Admin/ADVANCED GRAPHICS FILES/Cover and Template/2024/2024_01/4159141-001_Trevor McMillin_SmartStop_Cover & Template C O N F I D E N T I A L COLOR PALETTE Text Reconciliation: Same-Store Net Operating Income to Total Net Operating Income 50 56 62 Title bar/Bullets ($ in thousands) 1 124 186 ACCENTS 1 126 124 211 1 186 254 Net Rent / Occupied Sq. Expenses for the Three NOI for the Three Revenue for the Three 127 212 Ft. for the Three Months Months Ended Months Ended June 188 253 2 Ending Occupancy Months Ended 3 129 (1) (3) (4) Ended June 30, as of June 30, June 30, June 30, 30, Net # of 32 140 Rentable % % % % 56 168 Stores Units 2025 2024 2025 2024 2025 2024 2025 2024 2025 2024 3 Owned Operating Store Segment Sq. Ft. Change Change Change Change 100 218 0 141 Same-Store Wholly-Owned 149 1 1,549,600 100,070 $19.89 $20.10 93.0% 92.6% 0.4% $51,637 $51,437 0.4% $17,327 $16,744 3.5% $34,310 $34,693 -1.1% 157 220 4 (2) Non Same-Store Wholly-Owned 22 1,912,450 1 8,155 20.79 NM 89.7% NM 6,837 1,515 NM 2,908 $795 NM $3,929 $720 NM 226 255 Total Wholly-Owned Operating Stores 171 1 3,462,050 118,225 $19.99 NM 92.6% NM $58,474 $52,952 NM $20,235 $17,539 NM $38,239 $35,413 NM 166 219 166 219 5 Total Joint Venture Operating Stores 10 900,000 9,440 93.0% 166 219 Total All Owned Operating Stores 1 126 181 1 4,362,050 127,665 Hyperlink 124 211 186 254 127 212 Followed 188 253 Hyperlink 3 129 TABLE 50 56 Lines 62 1 124 Highlights 186 NM: Not meaningful comparison (1) RentPOF defined as annualized rental revenue net of discounts & concessions, excluding late fees, administrative fees and parking income, divided by occupied square feet of storage. Not in thousands. (2) The non same-store wholly-owned pool consisted of 22 properties owned at quarter end June 30, 2025. Not all of these properties were owned at or during the entirety of the quarter ending June 30, 2024 . As such, the results as measured on a year-over-year basis are not directly comparable. (3) Excludes IPO related equity compensation expense and Tenant Protection Program expenses. (4) NOI is a non-GAAP measure. See Appendix for a reconciliation of this measure to the most directly comparable GAAP measure. 38

/Admin/ADVANCED GRAPHICS FILES/Cover and Template/2024/2024_01/4159141-001_Trevor McMillin_SmartStop_Cover & Template C O N F I D E N T I A L COLOR PALETTE Text Reconciliation: Same-Store Facility Results — Years Ended December 31, 2024 and 2023 50 56 62 Title bar/Bullets ($ in thousands) 1 124 186 ACCENTS 1 126 124 211 1 186 254 127 212 188 253 2 3 129 Same-Store Facilities Non Same-Store Facilities Total 32 140 56 168 3 2024 2023 % Change 2024 2023 % Change 2024 2023 % Change 100 218 (1) 0 141 $202,523 $201,728 0.4% $8,156 $5,809 N/M $210,679 $207,537 1.5% Revenue 157 220 4 226 255 (2) $65,301 $62,115 5.1% $4,399 $2,899 N/M $69,700 $65,014 7.2% Property operating expenses 166 219 166 219 5 Net operating income $137,222 $139,613 (1.7%) $3,757 $2,910 N/M $140,979 $142,523 (1.1%) 166 219 1 126 Number of facilities 148 148 14 6 162 154 Hyperlink 124 211 186 254 (3) 11,429,100 11,404,485 1,187,800 486,700 12,616,900 11,891,185 Rentable square feet 127 212 Followed 188 253 Hyperlink (4) 3 129 92.2% 92.9% (0.7%) 82.9% N/M N/M 91.8% 92.1% (0.3%) Average physical occupancy TABLE (5) $20.02 $19.83 1.0% $16.32 N/M N/M $19.85 $19.77 0.4% Annualized rent per occupied square foot 50 56 Lines 62 1 124 Highlights 186 NM: Not meaningful comparison (1) Revenue includes rental income, certain ancillary revenue, administrative and late fees, and excludes Tenant Protection Program revenue. (2) Property operating expenses excludes Tenant Protection Program related expense. Please see the reconciliation of net operating income to net income (loss) below for the full detail of adjustments to reconcile net operating income to net income (loss). (3) Of the total rentable square feet, parking represented approximately 1,017,000 square feet as of December 31, 2024 and 2023, respectively. On a same-store basis, for the same periods, parking represented approximately 954,000 square feet. Amount not in thousands. (4) Determined by dividing the sum of the month-end occupied square feet for the applicable group of facilities for each applicable period by the sum of their month-end rentable square feet for the period. Properties are included in the respective calculations in their first full month of operations, as appropriate. In the event a property is disposed of, or becomes completely inoperable during the period, such property is excluded from the respective calculation in the first full month of non-operation. (5) Determined by dividing the aggregate realized rental income for each applicable period by the aggregate of the month-end occupied square feet for the 39 period. Properties are included in the respective calculations in their first full month of operations, as appropriate. In the event a property is disposed of, or becomes completely inoperable during the period, such property is excluded from the respective calculation in the first full month of non-operation. We have excluded the realized rental revenue and occupied square feet related to parking herein for the purpose of calculating annualized rent per occupied square foot. Amount not in thousands.
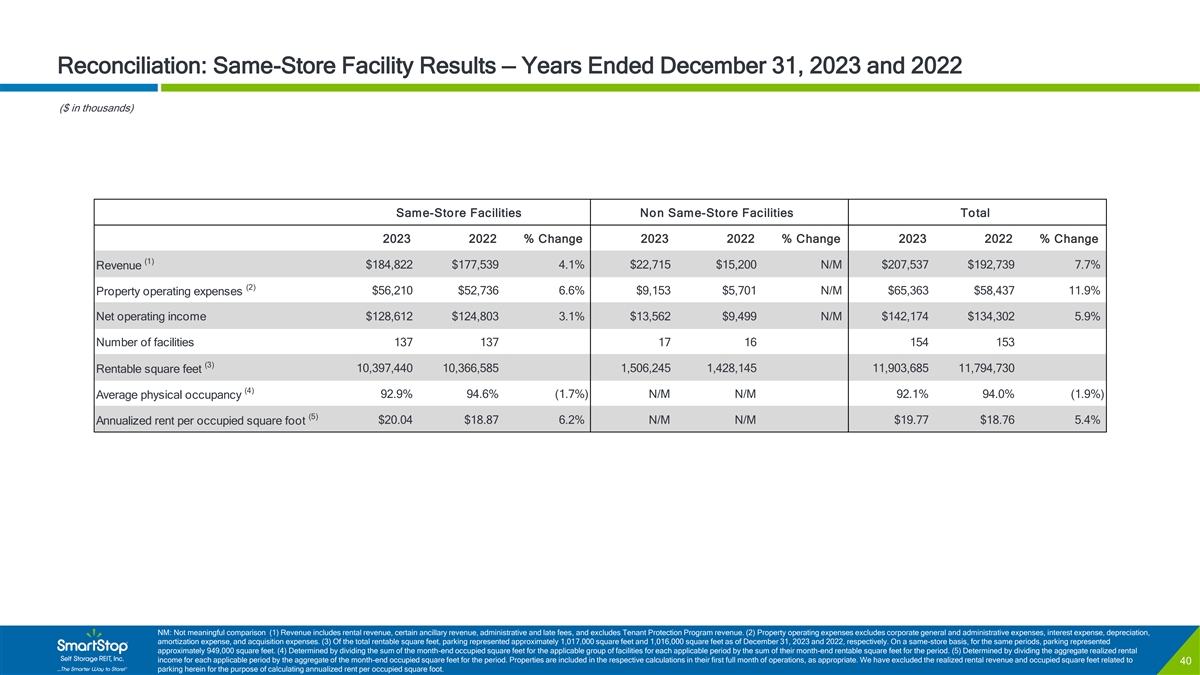
/Admin/ADVANCED GRAPHICS FILES/Cover and Template/2024/2024_01/4159141-001_Trevor McMillin_SmartStop_Cover & Template C O N F I D E N T I A L COLOR PALETTE Text Reconciliation: Same-Store Facility Results — Years Ended December 31, 2023 and 2022 50 56 62 Title bar/Bullets ($ in thousands) 1 124 186 ACCENTS 1 126 124 211 1 186 254 127 212 188 253 2 3 129 Same-Store Facilities Non Same-Store Facilities Total 32 140 56 168 3 2023 2022 % Change 2023 2022 % Change 2023 2022 % Change 100 218 (1) 0 141 $184,822 $177,539 4.1% $22,715 $15,200 N/M $207,537 $192,739 7.7% Revenue 157 220 4 226 255 (2) $56,210 $52,736 6.6% $9,153 $5,701 N/M $65,363 $58,437 11.9% Property operating expenses 166 219 166 219 5 Net operating income $128,612 $124,803 3.1% $13,562 $9,499 N/M $142,174 $134,302 5.9% 166 219 1 126 Number of facilities 137 137 17 16 154 153 Hyperlink 124 211 186 254 (3) 10,397,440 10,366,585 1,506,245 1,428,145 11,903,685 11,794,730 Rentable square feet 127 212 Followed 188 253 Hyperlink (4) 3 129 92.9% 94.6% (1.7%) N/M N/M 92.1% 94.0% (1.9%) Average physical occupancy TABLE (5) $20.04 $18.87 6.2% N/M N/M $19.77 $18.76 5.4% Annualized rent per occupied square foot 50 56 Lines 62 1 124 Highlights 186 NM: Not meaningful comparison (1) Revenue includes rental revenue, certain ancillary revenue, administrative and late fees, and excludes Tenant Protection Program revenue. (2) Property operating expenses excludes corporate general and administrative expenses, interest expense, depreciation, amortization expense, and acquisition expenses. (3) Of the total rentable square feet, parking represented approximately 1,017,000 square feet and 1,016,000 square feet as of December 31, 2023 and 2022, respectively. On a same-store basis, for the same periods, parking represented approximately 949,000 square feet. (4) Determined by dividing the sum of the month-end occupied square feet for the applicable group of facilities for each applicable period by the sum of their month-end rentable square feet for the period. (5) Determined by dividing the aggregate realized rental income for each applicable period by the aggregate of the month-end occupied square feet for the period. Properties are included in the respective calculations in their first full month of operations, as appropriate. We have excluded the realized rental revenue and occupied square feet related to 40 parking herein for the purpose of calculating annualized rent per occupied square foot.
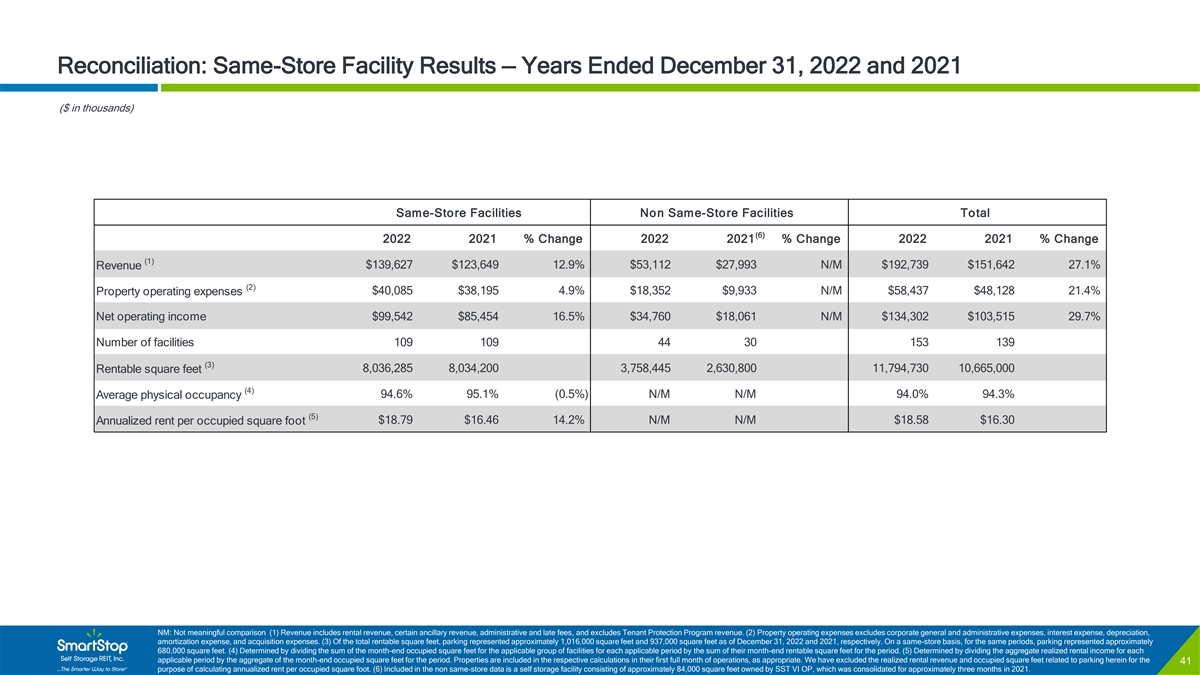
/Admin/ADVANCED GRAPHICS FILES/Cover and Template/2024/2024_01/4159141-001_Trevor McMillin_SmartStop_Cover & Template C O N F I D E N T I A L COLOR PALETTE Text Reconciliation: Same-Store Facility Results — Years Ended December 31, 2022 and 2021 50 56 62 Title bar/Bullets ($ in thousands) 1 124 186 ACCENTS 1 126 124 211 1 186 254 127 212 188 253 2 3 129 Same-Store Facilities Non Same-Store Facilities Total 32 140 (6) 56 168 3 2022 2021 % Change 2022 2021 % Change 2022 2021 % Change 100 218 (1) 0 141 $139,627 $123,649 12.9% $53,112 $27,993 N/M $192,739 $151,642 27.1% Revenue 157 220 4 226 255 (2) $40,085 $38,195 4.9% $18,352 $9,933 N/M $58,437 $48,128 21.4% Property operating expenses 166 219 166 219 5 Net operating income $99,542 $85,454 16.5% $34,760 $18,061 N/M $134,302 $103,515 29.7% 166 219 1 126 Number of facilities 109 109 44 30 153 139 Hyperlink 124 211 186 254 (3) 8,036,285 8,034,200 3,758,445 2,630,800 11,794,730 10,665,000 Rentable square feet 127 212 Followed 188 253 Hyperlink (4) 3 129 94.6% 95.1% (0.5%) N/M N/M 94.0% 94.3% Average physical occupancy TABLE (5) $18.79 $16.46 14.2% N/M N/M $18.58 $16.30 Annualized rent per occupied square foot 50 56 Lines 62 1 124 Highlights 186 NM: Not meaningful comparison (1) Revenue includes rental revenue, certain ancillary revenue, administrative and late fees, and excludes Tenant Protection Program revenue. (2) Property operating expenses excludes corporate general and administrative expenses, interest expense, depreciation, amortization expense, and acquisition expenses. (3) Of the total rentable square feet, parking represented approximately 1,016,000 square feet and 937,000 square feet as of December 31, 2022 and 2021, respectively. On a same-store basis, for the same periods, parking represented approximately 680,000 square feet. (4) Determined by dividing the sum of the month-end occupied square feet for the applicable group of facilities for each applicable period by the sum of their month-end rentable square feet for the period. (5) Determined by dividing the aggregate realized rental income for each applicable period by the aggregate of the month-end occupied square feet for the period. Properties are included in the respective calculations in their first full month of operations, as appropriate. We have excluded the realized rental revenue and occupied square feet related to parking herein for the 41 purpose of calculating annualized rent per occupied square foot. (6) Included in the non same-store data is a self storage facility consisting of approximately 84,000 square feet owned by SST VI OP, which was consolidated for approximately three months in 2021.
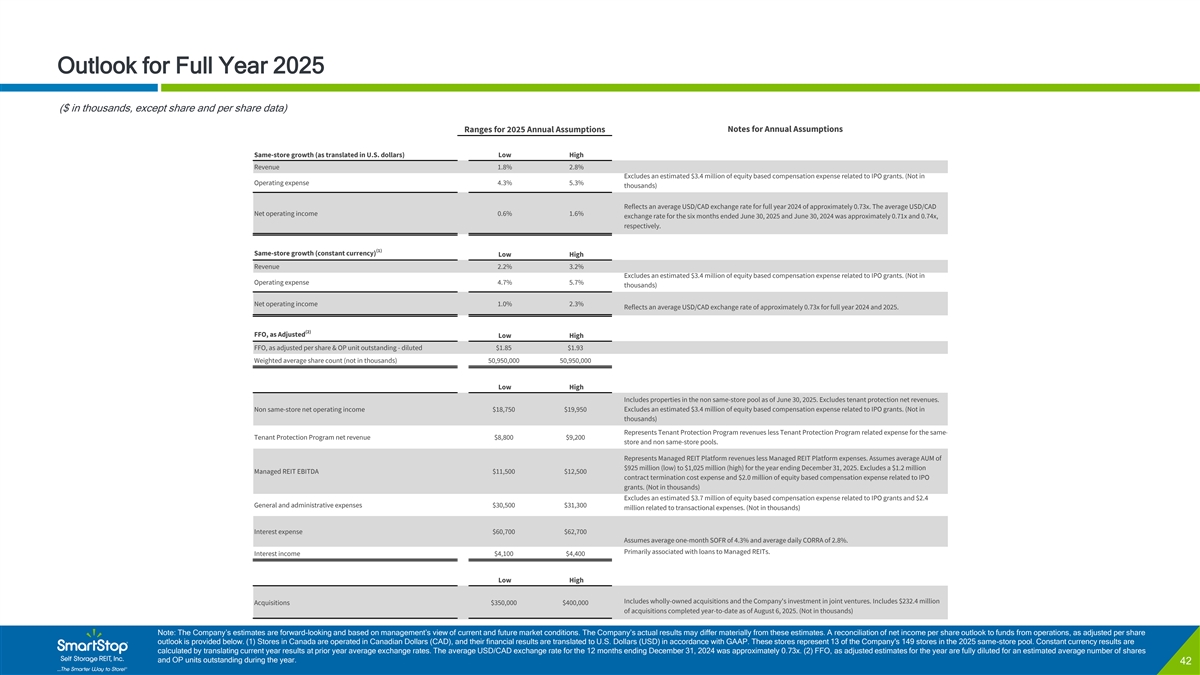
/Admin/ADVANCED GRAPHICS FILES/Cover and Template/2024/2024_01/4159141-001_Trevor McMillin_SmartStop_Cover & Template C O N F I D E N T I A L COLOR PALETTE Text Outlook for Full Year 2025 50 56 62 Title bar/Bullets ($ in thousands, except share and per share data) 1 124 186 Ranges for 2025 Annual Assumptions Notes for Annual Assumptions ACCENTS 1 126 Same-store growth (as translated in U.S. dollars) Low High 124 211 1 Revenue 1.8% 2.8% 186 254 Excludes an estimated $3.4 million of equity based compensation expense related to IPO grants. (Not in Operating expense 4.3% 5.3% thousands) 127 212 188 253 2 Reflects an average USD/CAD exchange rate for full year 2024 of approximately 0.73x. The average USD/CAD 3 129 Net operating income 0.6% 1.6% exchange rate for the six months ended June 30, 2025 and June 30, 2024 was approximately 0.71x and 0.74x, respectively. 32 140 (6) 56 168 3 100 218 (1) Same-store growth (constant currency) Low High 0 141 Revenue 2.2% 3.2% 157 220 Excludes an estimated $3.4 million of equity based compensation expense related to IPO grants. (Not in 4 Operating expense 4.7% 5.7% 226 255 thousands) 166 219 Net operating income 1.0% 2.3% Reflects an average USD/CAD exchange rate of approximately 0.73x for full year 2024 and 2025. 166 219 5 166 219 (2) FFO, as Adjusted Low High 1 126 FFO, as adjusted per share & OP unit outstanding - diluted $1.85 $1.93 Hyperlink 124 211 186 254 Weighted average share count (not in thousands) 50,950,000 50,950,000 127 212 Followed 188 253 Low High Hyperlink 3 129 Includes properties in the non same-store pool as of June 30, 2025. Excludes tenant protection net revenues. Non same-store net operating income $18,750 $19,950 Excludes an estimated $3.4 million of equity based compensation expense related to IPO grants. (Not in TABLE thousands) 50 Represents Tenant Protection Program revenues less Tenant Protection Program related expense for the same- Tenant Protection Program net revenue $8,800 $9,200 56 Lines store and non same-store pools. 62 Represents Managed REIT Platform revenues less Managed REIT Platform expenses. Assumes average AUM of $925 million (low) to $1,025 million (high) for the year ending December 31, 2025. Excludes a $1.2 million 1 Managed REIT EBITDA $11,500 $12,500 contract termination cost expense and $2.0 million of equity based compensation expense related to IPO 124 Highlights grants. (Not in thousands) 186 Excludes an estimated $3.7 million of equity based compensation expense related to IPO grants and $2.4 General and administrative expenses $30,500 $31,300 million related to transactional expenses. (Not in thousands) Interest expense $60,700 $62,700 Assumes average one-month SOFR of 4.3% and average daily CORRA of 2.8%. Primarily associated with loans to Managed REITs. Interest income $4,100 $4,400 Low High Includes wholly-owned acquisitions and the Company's investment in joint ventures. Includes $232.4 million Acquisitions $350,000 $400,000 of acquisitions completed year-to-date as of August 6, 2025. (Not in thousands) Note: The Company’s estimates are forward-looking and based on management’s view of current and future market conditions. The Company’s actual results may differ materially from these estimates. A reconciliation of net income per share outlook to funds from operations, as adjusted per share outlook is provided below. (1) Stores in Canada are operated in Canadian Dollars (CAD), and their financial results are translated to U.S. Dollars (USD) in accordance with GAAP. These stores represent 13 of the Company's 149 stores in the 2025 same-store pool. Constant currency results are calculated by translating current year results at prior year average exchange rates. The average USD/CAD exchange rate for the 12 months ending December 31, 2024 was approximately 0.73x. (2) FFO, as adjusted estimates for the year are fully diluted for an estimated average number of shares and OP units outstanding during the year. 42

/Admin/ADVANCED GRAPHICS FILES/Cover and Template/2024/2024_01/4159141-001_Trevor McMillin_SmartStop_Cover & Template C O N F I D E N T I A L COLOR PALETTE Text Outlook for Full Year 2025 50 56 62 Title bar/Bullets The following table presents a reconciliation of the range of estimated GAAP fully diluted earnings per share to estimated fully diluted FFO, as adjusted per share: 1 124 186 ACCENTS Ranges for 2025 Annual 1 126 Assumptions 124 211 1 186 254 Low High 127 212 188 253 Net income $ (0.06) $ (0.00) 2 3 129 Other noncontrolling interests ( 0.00) ( 0.00) 32 140 Distributions to preferred stockholders ( 0.07) ( 0.07) 56 168 3 Preferred equity-accretion of costs on redemption ( 0.07) ( 0.07) 100 218 Depreciation & amortization of real estate and intangible 0 141 157 220 4 assets from consolidated and unconsolidated entities 1.50 1.52 226 255 FFO per share & OP unit outstanding - diluted $ 1 .29 $ 1 .37 166 219 Preferred equity-accretion of costs on redemption 0 .07 0 .07 166 219 5 166 219 Net loss on extinguishment of debt 0 .05 0.05 Amortization of debt issuance costs 0.09 0 .09 1 126 Hyperlink 124 211 Transactional expenses 0.05 0.05 186 254 Sponsor funding revenue reduction 0 .02 0.02 127 212 Followed Equity based compensation related to IPO Grants 0.18 0 .18 188 253 Hyperlink 3 129 (1) 0 .09 0.09 Other TABLE FFO, as adjusted per share and OP unit outstanding - diluted $ 1 .85 $ 1 .93 50 56 Lines 62 1 124 Highlights 186 (1) Includes the following: Intangible amortization expense - contracts, acquisition expenses, acquisition expenses and foreign currency (gains) losses, net from unconsolidated entities, accretion of fair market value of secured debt, foreign currency and interest rate derivative (gains) losses, net, and adjustment of deferred tax liabilities. 43

/Admin/ADVANCED GRAPHICS FILES/Cover and Template/2024/2024_01/4159141-001_Trevor McMillin_SmartStop_Cover & Template C O N F I D E N T I A L COLOR PALETTE Text Additional Information Regarding NOI and Adjusted EBITDA 50 56 62 Title bar/Bullets 1 124 186 Net Operating Income or (“NOI”) ACCENTS NOI is a non-GAAP measure that SmartStop defines as net income (loss), computed in accordance with GAAP, generated from properties, excluding tenant protection plan revenue, before corporate general and administrative expenses, asset management fees, interest expense, depreciation, amortization, acquisition expenses, tenant protection economics, stock compensation related to our IPO Grant and other non-property 1 126 related income and expense. SmartStop believes that NOI is useful for investors as it provides a measure of the operating performance of its operating assets because NOI excludes certain items that are not associated 124 211 1 with the ongoing operation of the properties. Additionally, SmartStop believes that NOI is a widely accepted measure of comparative operating performance in the real estate community. However, SmartStop’s use of the 186 254 term NOI may not be comparable to that of other real estate companies as they may have different methodologies for computing this amount. In addition, NOI is not a substitute for net income (loss), cash flows from 127 212 operations, or other related financial measures, in evaluating our operating performance. 188 253 2 3 129 Adjusted EBITDA Adjusted EBITDA is a non-GAAP measure that SmartStop defines as net income (loss) computed in accordance with GAAP before: (i) interest expense and net loss on extinguishment of debt; (ii) tax related expenses; (iii) 32 140 depreciation and amortization; (iv) adjustments to reflect EBITDA related to its unconsolidated entities; (v) changes in the fair value of its contingent earn-out liability; (vi) acquisition and transaction expenses; (vii) 56 168 3 impairment charges related to goodwill, intangible assets, and equity investments; (viii) equity based compensation expense; (ix) gains or losses from disposition of depreciable property; (x) gains or losses from the 100 218 acquisition of previously unconsolidated affiliates; (xi) sponsor funding revenue reduction; (xii) offering related expenses; and (xiii) gains or losses from foreign currency and interest rate derivatives. SmartStop uses Adjusted EBITDA as an additional metric by which it measures its operational performance independent of the impact of its capital structure. Additionally, SmartStop believes Adjusted EBITDA is a useful indicator of its 0 141 ability to support its debt obligations. Presentation of Adjusted EBITDA is intended to provide useful information to investors as they compare the operating performance of different REITs. However, not all REITs calculate 157 220 4 Adjusted EBITDA or on the same basis, so comparisons with other REITs may not be meaningful. Furthermore, Adjusted EBITDA is not necessarily indicative of cash flow available to fund cash needs and should not be 226 255 considered as an alternative to net income (loss) as an indication of SmartStop’s performance, as an alternative to cash flows from operations as an indication of its liquidity or indicative of funds available to fund its cash needs, including its ability to make distributions to its stockholders or support its debt obligations. Adjusted EBITDA should be reviewed in conjunction with other measurements as an indication of SmartStop’s performance. 166 219 166 219 5 166 219 1 126 Hyperlink 124 211 186 254 127 212 Followed 188 253 Hyperlink 3 129 TABLE 50 56 Lines 62 1 124 Highlights 186 44
/Admin/ADVANCED GRAPHICS FILES/Cover and Template/2024/2024_01/4159141-001_Trevor McMillin_SmartStop_Cover & Template Thank you!