UNITED STATES
SECURITIES AND EXCHANGE COMMISSION
Washington, D.C. 20549
FORM 8-K
CURRENT REPORT
Pursuant to Section 13 or 15(d)
of the Securities Exchange Act of 1934
Date of Report (Date of earliest event reported): September 2, 2025
McGraw Hill, Inc.
(Exact name of registrant as specified in its charter)
Delaware
(State or other jurisdiction of incorporation)
001-42764
(Commission File Number)
87-1259704
(I.R.S. Employer Identification No.)
8787 Orion Place, Columbus, OH 43240
(Address of principal executive offices and zip code)
614-430-4000
(Registrant’s telephone number, including area code)
Check the appropriate box below if the Form 8-K filing is intended to simultaneously satisfy the filing obligation of the registrant under any of the following provisions:
| ☐ | Written communications pursuant to Rule 425 under the Securities Act (17 CFR 230.425) |
| ☐ | Soliciting material pursuant to Rule 14a-12 under the Exchange Act (17 CFR 240.14a-12) |
| ☐ | Pre-commencement communications pursuant to Rule 14d-2(b) under the Exchange Act (17 CFR 240.14d-2(b)) |
| ☐ | Pre-commencement communications pursuant to Rule 13e-4(c) under the Exchange Act (17 CFR 240.13e-4(c)) |
Securities registered pursuant to Section 12(b) of the Act:
| Title of each class |
Trading |
Name of each exchange |
||
| Common stock, par value $0.001 | MH | New York Stock Exchange |
Indicate by check mark whether the registrant is an emerging growth company as defined in Rule 405 of the Securities Act of 1933 (§230.405 of this chapter) or Rule 12b-2 of the Securities Exchange Act of 1934 (§240.12b-2 of this chapter).
Emerging growth company ☐
If an emerging growth company, indicate by check mark if the registrant has elected not to use the extended transition period for complying with any new or revised financial accounting standards provided pursuant to Section 13(a) of the Exchange Act. ☐
| Item 7.01 | Regulation FD Disclosure. |
McGraw-Hill Education, Inc., a Delaware corporation (the “Borrower”), an indirect wholly owned subsidiary of McGraw Hill, Inc., a Delaware corporation (the “Company”), intends to amend its existing senior secured first lien term loan facility due 2031 (the “Existing Term Loans”) to, among other items, reprice the Existing Term Loans (the “Repricing Transaction”) through an amendment to that certain credit agreement, dated as of July 30, 2021, by and among MAV Intermediate Holding II Corporation, a Delaware corporation; the Borrower; certain subsidiaries of the Borrower as guarantors from time to time; the lenders and swingline lenders party thereto from time to time; and Bank of America, N.A., as administrative agent and collateral agent (the “Credit Agreement”). The Company and the Borrower expect to have a meeting with the lenders under the Credit Agreement on September 2, 2025 to discuss the Repricing Transaction and furnish the Lender Presentation (as defined below) thereto in connection therewith. The Repricing Transaction is subject to market conditions and may not occur as described or at all.
In connection with the Repricing Transaction, the Borrower is providing today the lenders under the Credit Agreement with a presentation, which is attached to this current report on Form 8-K as Exhibit 99.1 and is incorporated by reference herein (the “Lender Presentation”).
The information in this Item 7.01 and Exhibit 99.1 hereto are furnished solely pursuant to Item 7.01 of this Form 8-K. Consequently, they shall not be deemed “filed” for purposes of Section 18 of the Securities Exchange Act of 1934, as amended (the “Exchange Act”), or otherwise subject to the liabilities under that Section and shall not be deemed to be incorporated by reference into any filing of the Company under the Securities Act of 1933, as amended, or the Exchange Act, unless such subsequent filing specifically references this Form 8-K.
- 2 -
| Item 9.01 | Financial Statements and Exhibits. |
| (d) | Exhibits |
The following exhibits are being filed with this Current Report on Form 8-K:
| 99.1 | Lender Presentation, dated as of September 2, 2025 | |
| 104 | Cover Page Interactive Data File (embedded within the Inline XBRL document) | |
- 3 -
SIGNATURE
Pursuant to the requirements of the Securities Exchange Act of 1934, the registrant has duly caused this report to be signed on its behalf by the undersigned hereunto duly authorized.
Dated: September 2, 2025
| MCGRAW HILL, INC. | ||
| By: | /s/ David Stafford |
|
| Name: | David Stafford | |
| Title: | Executive Vice President, General Counsel and Secretary | |
- 4 -

Exhibit 99.1 Lender Presentation September 2025
Disclaimer Confidentiality The presentation is confidential and is intended only for the use of the person(s) to whom it is provided and who has signed a confidentiality agreement with us or is otherwise subject to a confidentiality undertaking in favor of the Company. The presentation may not be reproduced (in whole or in part) nor may its contents be divulged to any other person without the prior written consent of the Company. If you are not the intended recipient of the presentation, please delete and destroy all copies immediately. Forward-Looking Statements This presentation contains statements that are, or may be deemed to be, “forward-looking statements” within the meaning of Section 27A of the Securities Act of 1933, as amended (the “Securities Act”), Section 21E of the Securities Exchange Act of 1934, as amended, and the Private Securities Litigation Reform Act of 1995. These forward-looking statements can be identified by the use of forward-looking terminology, including terms such as “believes,” “estimates,” “anticipates,” “expects,” “projects,” “intends,” “plans,” “may,” “will,” “should” or “seeks,” or, in each case, their negative or other variations or comparable terminology. These forward-looking statements include all matters that are not historical facts and include, but are not limited to, statements regarding the Company’s intentions, beliefs or current expectations concerning, among other things, the Company’s results of operations, financial condition, liquidity, prospects, growth, strategies, position in the market and the industry in which it operates. By their nature, forward-looking statements involve risks and uncertainties, as they relate to events and depend on circumstances that may or may not occur in the future. The Company’s expectations, beliefs and projections are expressed in good faith, and the Company believes there is a reasonable basis for them; however, the Company cautions readers that forward-looking statements are not guarantees of future performance and that the Company’s actual results of operations, financial condition and liquidity, and the developments in the industry in which the Company operates, may differ materially from those made in or suggested by the forward-looking statements contained in this presentation. There are a number of risks, uncertainties and other important factors that could cause our actual results to differ materially from the forward-looking statements contained in this presentation, including those described under the headings “Risk Factors” and “Cautionary Note Regarding Forward-Looking Statements” in the Company’s final prospectus filed pursuant to Rule 424(b) under the Securities Act, filed on July 24, 2025, the Company’s Quarterly Report on Form 10-Q, filed on August 14, 2025 and in other filings made with the U.S. Securities and Exchange Commission (“SEC”). In addition, even if our results of operations, financial condition and liquidity, and the developments in the industry in which we operate are consistent with the forward-looking statements contained in this presentation, those results or developments may not be indicative of results or developments in subsequent periods. Any forward-looking statements the Company makes in this presentation speak only as of the date of such statement. Comparisons of results for current and any prior periods are not intended to express any future trends or indications of future performance, unless expressed as such, and should only be viewed as historical data. We undertake no obligation to update or revise any forward-looking statements, whether as a result of new information, future developments or otherwise, except as may be required by any applicable securities law. Non-GAAP Financial Measures Certain financial measures included herein, including EBITDA, Adjusted EBITDA, Adjusted EBITDA Margin, Consolidated Adjusted EBITDA, Pro Forma Consolidated Adjusted EBITDA and certain ratios and other metrics derived therefrom, are not presentations made in accordance with GAAP. A “non-GAAP financial measure” is defined as a numerical measure of a company’s historical or future financial performance, financial position or cash flows that excludes amounts, or is subject to adjustments that have the effect of excluding amounts, that are included in the most directly comparable measure calculated and presented in accordance with GAAP in the statements of operations, balance sheets, or statement of cash flows of the Company. Such measures are presented for supplemental information purposes only, have limitations as analytical tools, and should not be considered in isolation or as substitute measures for our results as reported under GAAP or any other performance measures derived in accordance with GAAP as measures of operating performance, debt covenant compliance or cash flows as measures of liquidity. See slide 32 and slide 34. Because not all companies use identical calculations, our measures may not be comparable to other similarly titled measures of other companies, and our use of these measures varies from others in our industry. Such non-GAAP financial measures are included because they are a basis on which our management assesses the Company's performance. Although we believe these measures are useful for investors for the same reasons, we recommend that users of the financial statements note that these measures are not a substitute for GAAP financial measures or disclosures. We provide reconciliations of such non-GAAP measures to the corresponding most closely related GAAP measure on slide 32 and slide 34. This presentation contains forward-looking estimates of Adjusted EBITDA for fiscal year 2026. We provide this non-GAAP measure to investors on a prospective basis for the same reasons (set forth above) that we provide it to investors on a historical basis. We are unable to provide a reconciliation of our forward-looking estimate of fiscal year 2026 net income (loss) to a forward-looking estimate of fiscal year 2026 Adjusted EBITDA because certain information needed to make a reasonable forward-looking estimate of net income (loss) for fiscal year 2026 is unreasonably difficult to predict and estimate and is often dependent on future events that may be uncertain or outside of our control. In addition, we believe such reconciliations would imply a degree of precision that would be confusing or misleading to investors. The unavailable information could have a significant impact on our future financial results. Our forward-looking estimates of both GAAP and non-GAAP measures of our financial performance may differ materially from our actual results and should not be relied upon as statements of fact. 2
Disclaimer Miscellaneous We and our directors, officers, employees, advisors, and other representatives expressly disclaim any and all liability relating to or resulting from the use of this presentation, reliance on the information contained herein, omissions from this presentation, or the distribution or possession of this presentation. We do not guarantee the accuracy or completeness of information which is contained in this document. Any data on past performance, modeling or back-testing contained herein is no indication as to future performance. No person makes any representation or warranty, express or implied, with respect to the accuracy or completeness of the information contained in the attached materials or any oral or written communication made to any interested party in connection with any transactions described herein. No representation is made as to the reasonableness of the assumptions made within or the accuracy or completeness of any modeling or back-testing. All statements and estimates are given as of the date hereof and are subject to change. The information in this document is not intended to predict actual results and no assurances are given with respect thereto. The information contained in this presentation does not purport to be all‐inclusive or contain all of the information that a recipient may need or desire. In all cases, interested parties should conduct their own investigation and analysis of the Company and the data set forth in this presentation, should rely solely on their own judgment, review, and analysis in evaluating the merits of pursuing a transaction involving the Company, and should consult such party’s own professional advisors. This presentation is not intended to form the basis of a decision with respect to the transactions described herein or the basis of any other investment decision and does not constitute an offer, invitation, solicitation, or recommendation for the sale or purchase of securities. Neither the information contained in this presentation nor any further information made available by the Company in connection with the transactions described herein will form the basis of or be construed as a contract. By accepting this presentation, the recipient represents that it is sophisticated and experienced in extending credit to entities similar to the Company and that it is engaged in making, acquiring or holding commercial loans in the ordinary course. The recipient understands that the financing described herein is a commercial lending facility, and not any other type of financial instrument, and agrees not to assert a claim in contravention of the foregoing. This presentation speaks only as of the date hereof. In furnishing this presentation, the Company reserves the right to amend or replace the presentation at any time and undertakes no obligation to provide the recipient of this presentation with any additional information, or to update, or to correct any inaccuracies which may become apparent in this presentation or any other information made available in connection with the transaction or otherwise concerning the Company. The Company reserves the right to terminate, at any time, solicitation of indications of interest for the transaction or future participation in the investigation and proposal process by any party. The Company reserves the right to negotiate with one or more interested parties at any time and to enter into a definitive agreement for the transaction without prior notice to the recipient or other interested parties. Finally, the Company reserves the right to modify, at any time, any procedures relating to such process, or terminate or extend the process, without assigning any reason therefor and reject or decline any proposals at its sole discretion. The Company reserves the right to take any action, whether in or out of the ordinary course of business, including but not limited to the sale of any securities or property, which the Company deems necessary or prudent in the conduct of such business. The recipient agrees not to contact any customers, officers, employees, personnel, or shareholders of the Company, either directly or indirectly, without the prior written consent of the officers of the Company listed below, and all communications, inquiries, and requests for information relating to this presentation or to the transactions described herein should be addressed to the officers of the Company. 3
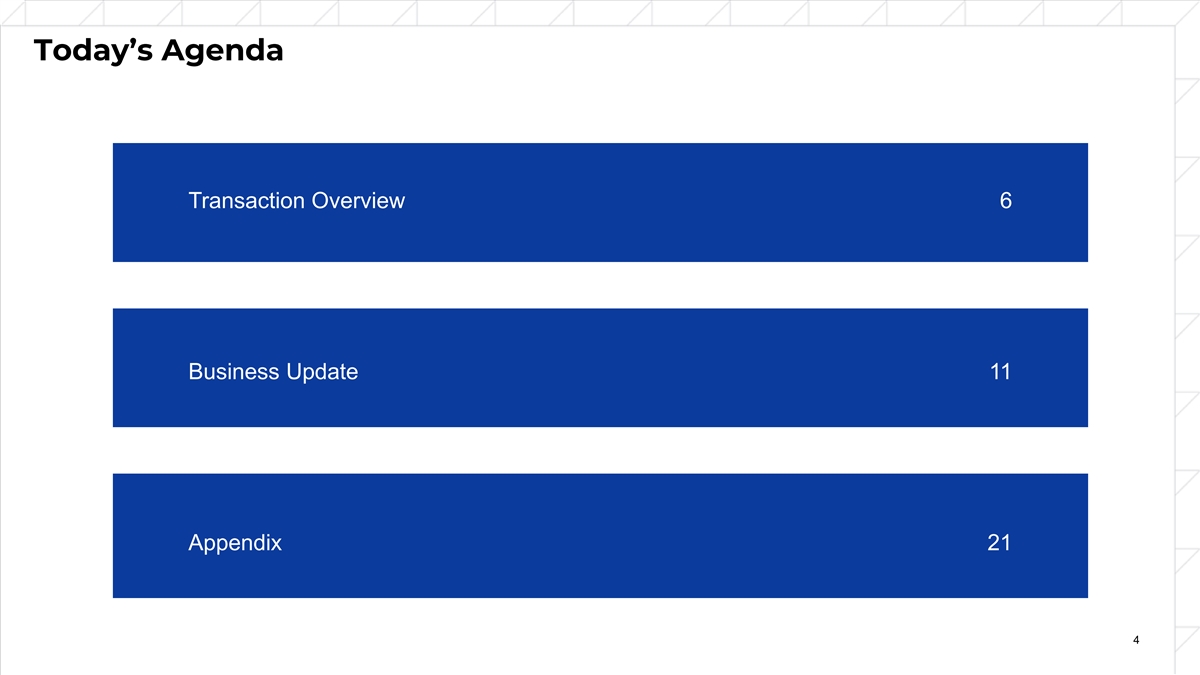
Today’s Agenda Transaction Overview 6 Business Update 11 Appendix 21 4

Today’s Presenters Bob Sallmann Kevin Smith Chief Financial Officer Head of Debt Capital Markets McGraw Hill Platinum Equity 5

Transaction Overview 1
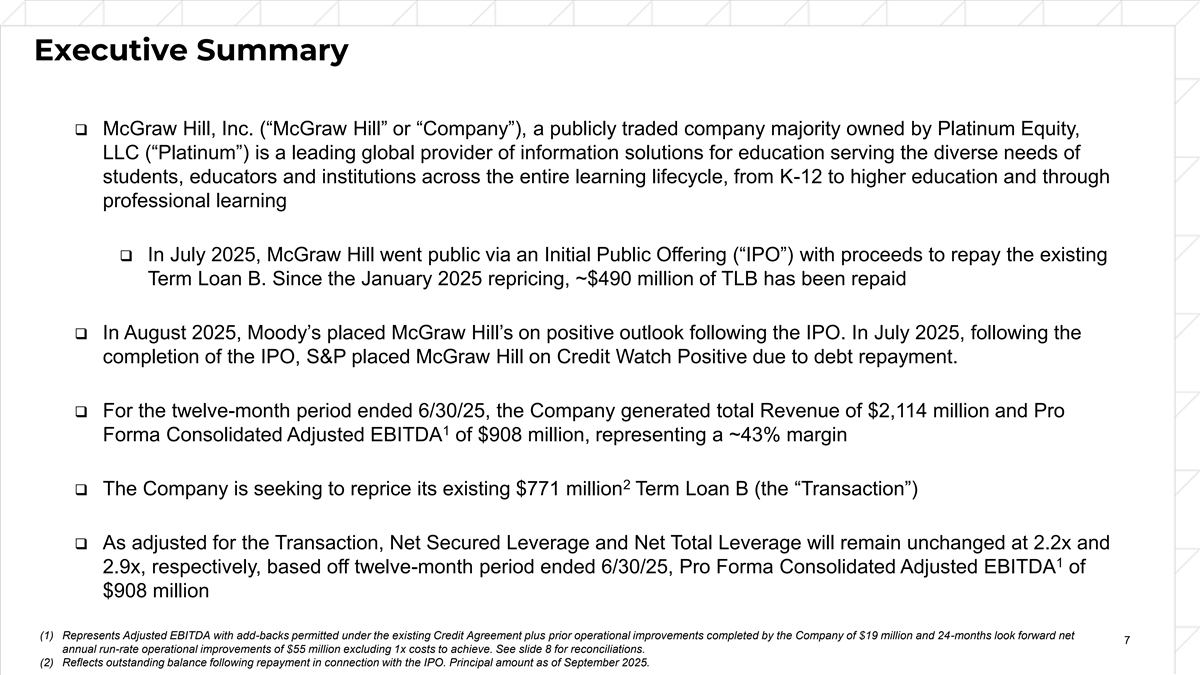
Executive Summary ❑ McGraw Hill, Inc. (“McGraw Hill” or “Company”), a publicly traded company majority owned by Platinum Equity, LLC (“Platinum”) is a leading global provider of information solutions for education serving the diverse needs of students, educators and institutions across the entire learning lifecycle, from K-12 to higher education and through professional learning ❑ In July 2025, McGraw Hill went public via an Initial Public Offering (“IPO”) with proceeds to repay the existing Term Loan B. Since the January 2025 repricing, ~$490 million of TLB has been repaid ❑ In August 2025, Moody’s placed McGraw Hill’s on positive outlook following the IPO. In July 2025, following the completion of the IPO, S&P placed McGraw Hill on Credit Watch Positive due to debt repayment. ❑ For the twelve-month period ended 6/30/25, the Company generated total Revenue of $2,114 million and Pro 1 Forma Consolidated Adjusted EBITDA of $908 million, representing a ~43% margin 2 ❑ The Company is seeking to reprice its existing $771 million Term Loan B (the “Transaction”) ❑ As adjusted for the Transaction, Net Secured Leverage and Net Total Leverage will remain unchanged at 2.2x and 1 2.9x, respectively, based off twelve-month period ended 6/30/25, Pro Forma Consolidated Adjusted EBITDA of $908 million (1) Represents Adjusted EBITDA with add-backs permitted under the existing Credit Agreement plus prior operational improvements completed by the Company of $19 million and 24-months look forward net 7 annual run-rate operational improvements of $55 million excluding 1x costs to achieve. See slide 8 for reconciliations. (2) Reflects outstanding balance following repayment in connection with the IPO. Principal amount as of September 2025.
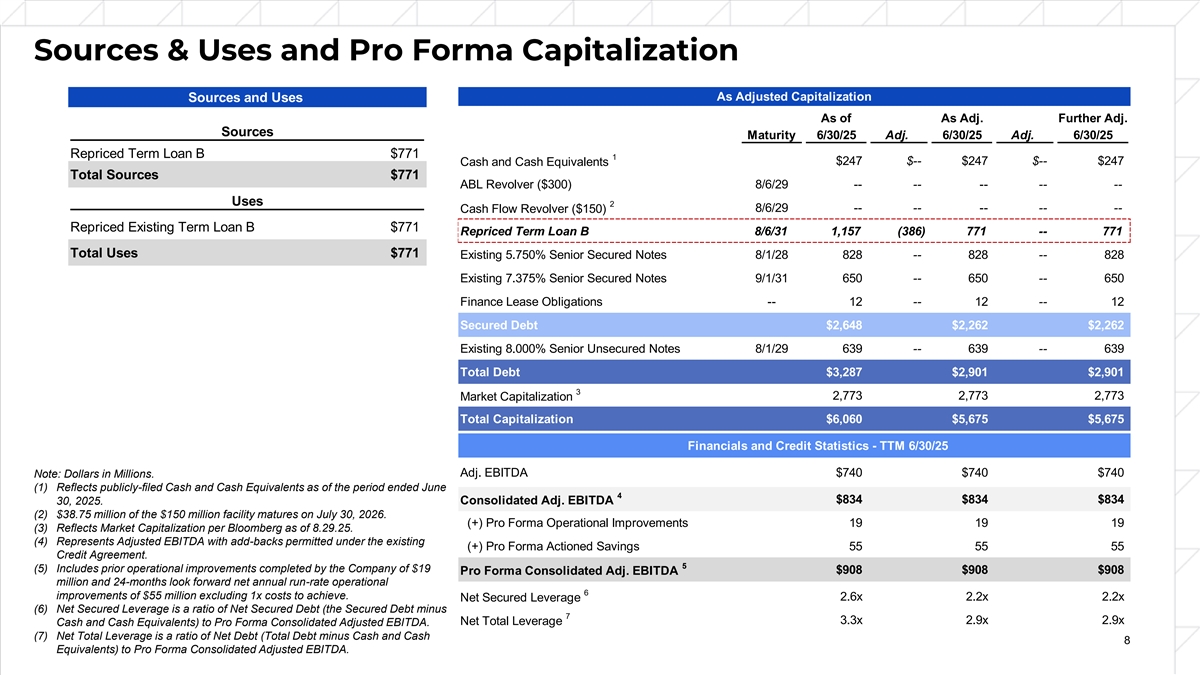
Sources & Uses and Pro Forma Capitalization ($ in millions) ($ in millions) As Adjusted Capitalization Sources and Uses As of As Adj. Further Adj. Sources Maturity 6/30/25 Adj. 6/30/25 Adj. 6/30/25 Repriced Term Loan B $771 1 $247 $-- $247 $-- $247 Cash and Cash Equivalents Total Sources $771 ABL Revolver ($300) 8/6/29 -- -- -- -- -- Uses 2 Cash Flow Revolver ($150) 8/6/29 -- -- -- -- -- Repriced Existing Term Loan B $771 Repriced Term Loan B 8/6/31 1,157 (386) 771 -- 771 Total Uses $771 Existing 5.750% Senior Secured Notes 8/1/28 828 -- 828 -- 828 Existing 7.375% Senior Secured Notes 9/1/31 650 -- 650 -- 650 Finance Lease Obligations -- 12 -- 12 -- 12 Secured Debt $2,648 $2,262 $2,262 Existing 8.000% Senior Unsecured Notes 8/1/29 639 -- 639 -- 639 Total Debt $3,287 $2,901 $2,901 3 2,773 2,773 2,773 Market Capitalization Total Capitalization $6,060 $5,675 $5,675 Financials and Credit Statistics - TTM 6/30/25 Note: Dollars in Millions. Adj. EBITDA $740 $740 $740 (1) Reflects publicly-filed Cash and Cash Equivalents as of the period ended June 4 $834 $834 $834 30, 2025. Consolidated Adj. EBITDA (2) $38.75 million of the $150 million facility matures on July 30, 2026. (+) Pro Forma Operational Improvements 19 19 19 (3) Reflects Market Capitalization per Bloomberg as of 8.29.25. (4) Represents Adjusted EBITDA with add-backs permitted under the existing (+) Pro Forma Actioned Savings 55 55 55 Credit Agreement. 5 (5) Includes prior operational improvements completed by the Company of $19 $908 $908 $908 Pro Forma Consolidated Adj. EBITDA million and 24-months look forward net annual run-rate operational 6 improvements of $55 million excluding 1x costs to achieve. Net Secured Leverage 2.6x 2.2x 2.2x (6) Net Secured Leverage is a ratio of Net Secured Debt (the Secured Debt minus 7 3.3x 2.9x 2.9x Net Total Leverage Cash and Cash Equivalents) to Pro Forma Consolidated Adjusted EBITDA. (7) Net Total Leverage is a ratio of Net Debt (Total Debt minus Cash and Cash 8 Equivalents) to Pro Forma Consolidated Adjusted EBITDA.
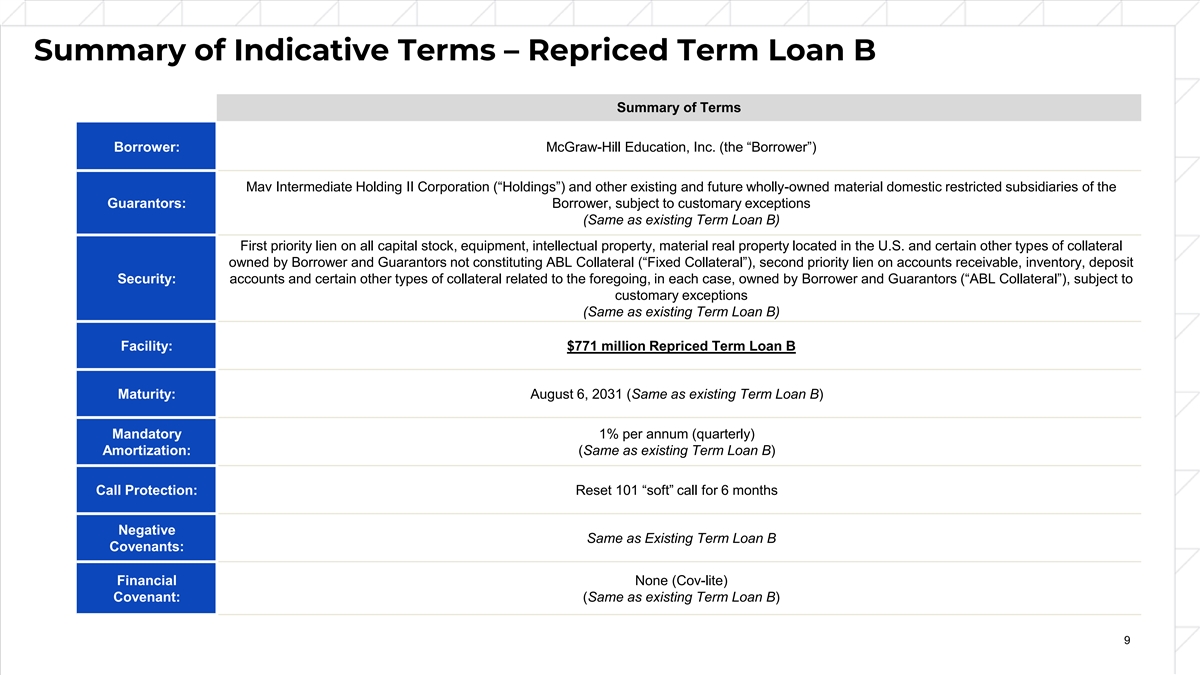
Summary of Indicative Terms – Repriced Term Loan B Summary of Terms Borrower: McGraw-Hill Education, Inc. (the “Borrower”) Mav Intermediate Holding II Corporation (“Holdings”) and other existing and future wholly-owned material domestic restricted subsidiaries of the Guarantors: Borrower, subject to customary exceptions (Same as existing Term Loan B) First priority lien on all capital stock, equipment, intellectual property, material real property located in the U.S. and certain other types of collateral owned by Borrower and Guarantors not constituting ABL Collateral (“Fixed Collateral”), second priority lien on accounts receivable, inventory, deposit Security: accounts and certain other types of collateral related to the foregoing, in each case, owned by Borrower and Guarantors (“ABL Collateral”), subject to customary exceptions (Same as existing Term Loan B) Facility: $771 million Repriced Term Loan B Maturity: August 6, 2031 (Same as existing Term Loan B) Mandatory 1% per annum (quarterly) Amortization: (Same as existing Term Loan B) Call Protection: Reset 101 “soft” call for 6 months Negative Same as Existing Term Loan B Covenants: Financial None (Cov-lite) Covenant: (Same as existing Term Loan B) 9 9
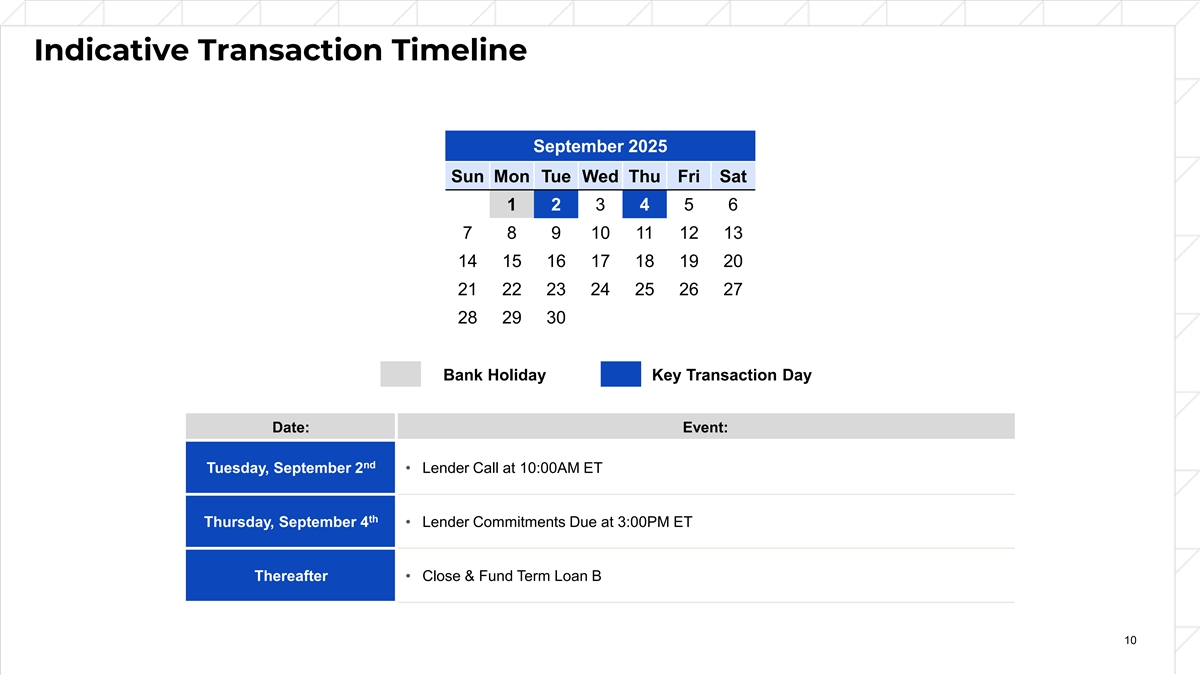
Indicative Transaction Timeline September 2025 Sun Mon Tue Wed Thu Fri Sat 1 2 3 4 5 6 7 8 9 10 11 12 13 14 15 16 17 18 19 20 21 22 23 24 25 26 27 28 29 30 Bank Holiday Key Transaction Day Date: Event: nd Tuesday, September 2 • Lender Call at 10:00AM ET th Thursday, September 4 • Lender Commitments Due at 3:00PM ET Thereafter • Close & Fund Term Loan B 10 10

Business Update 2
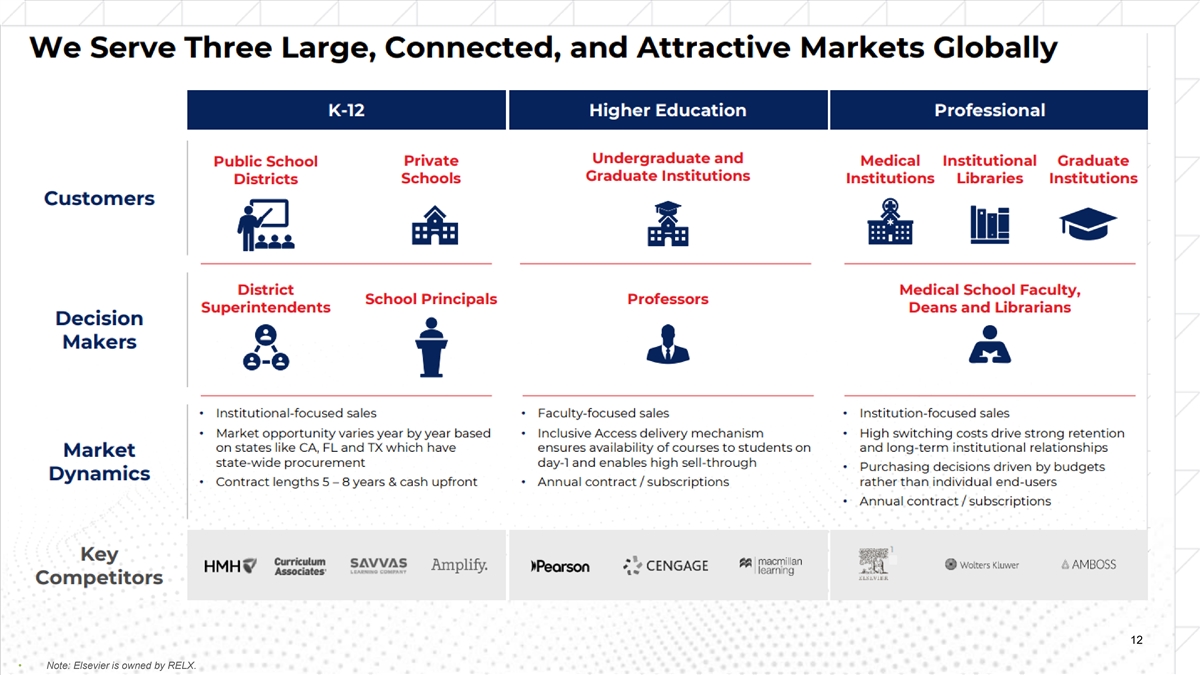
12 • Note: Elsevier is owned by RELX.
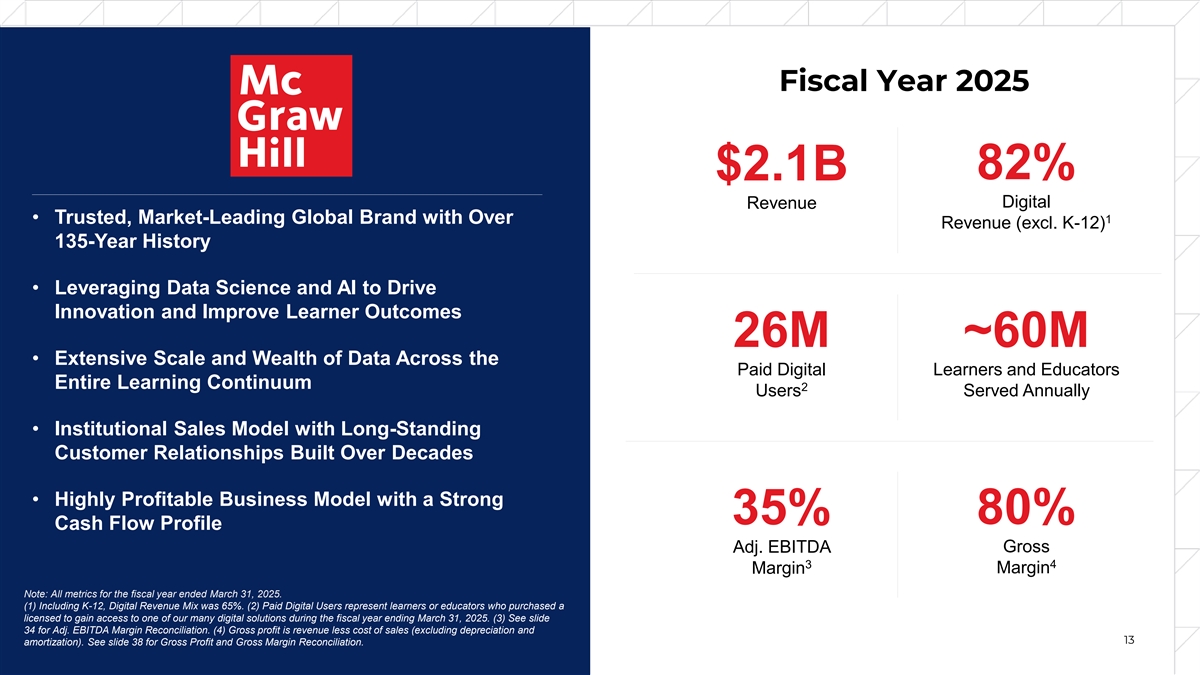
Fiscal Year 2025 82% $2.1B Digital Revenue • Trusted, Market-Leading Global Brand with Over 1 Revenue (excl. K-12) 135-Year History • Leveraging Data Science and AI to Drive Innovation and Improve Learner Outcomes 26M ~60M • Extensive Scale and Wealth of Data Across the Paid Digital Learners and Educators Entire Learning Continuum 2 Users Served Annually • Institutional Sales Model with Long-Standing Customer Relationships Built Over Decades • Highly Profitable Business Model with a Strong 80% 35% Cash Flow Profile Adj. EBITDA Gross 3 4 Margin Margin Note: All metrics for the fiscal year ended March 31, 2025. (1) Including K-12, Digital Revenue Mix was 65%. (2) Paid Digital Users represent learners or educators who purchased a licensed to gain access to one of our many digital solutions during the fiscal year ending March 31, 2025. (3) See slide 34 for Adj. EBITDA Margin Reconciliation. (4) Gross profit is revenue less cost of sales (excluding depreciation and 13 amortization). See slide 38 for Gross Profit and Gross Margin Reconciliation.
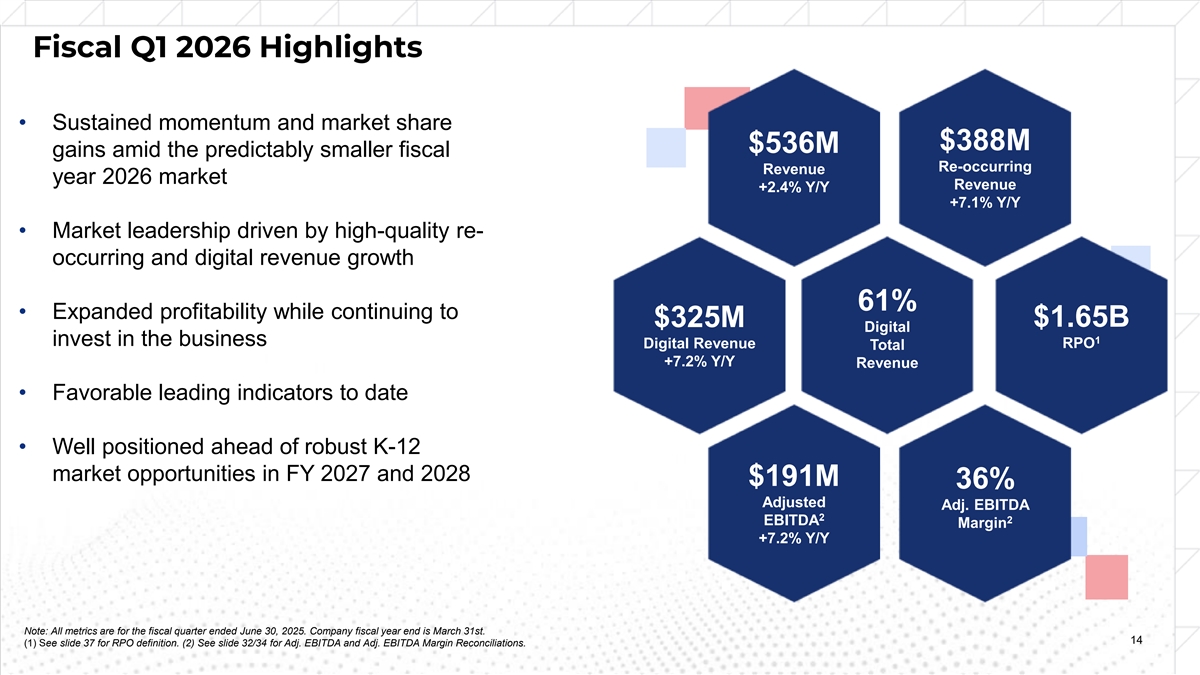
Fiscal Q1 2026 Highlights • Sustained momentum and market share $388M $536M gains amid the predictably smaller fiscal Re-occurring Revenue year 2026 market Revenue +2.4% Y/Y +7.1% Y/Y • Market leadership driven by high-quality re- occurring and digital revenue growth 61% • Expanded profitability while continuing to $325M $1.65B Digital 1 invest in the business Digital Revenue RPO Total +7.2% Y/Y Revenue • Favorable leading indicators to date • Well positioned ahead of robust K-12 market opportunities in FY 2027 and 2028 $191M 36% Adjusted Adj. EBITDA 2 2 EBITDA Margin +7.2% Y/Y Note: All metrics are for the fiscal quarter ended June 30, 2025. Company fiscal year end is March 31st. 14 (1) See slide 37 for RPO definition. (2) See slide 32/34 for Adj. EBITDA and Adj. EBITDA Margin Reconciliations.
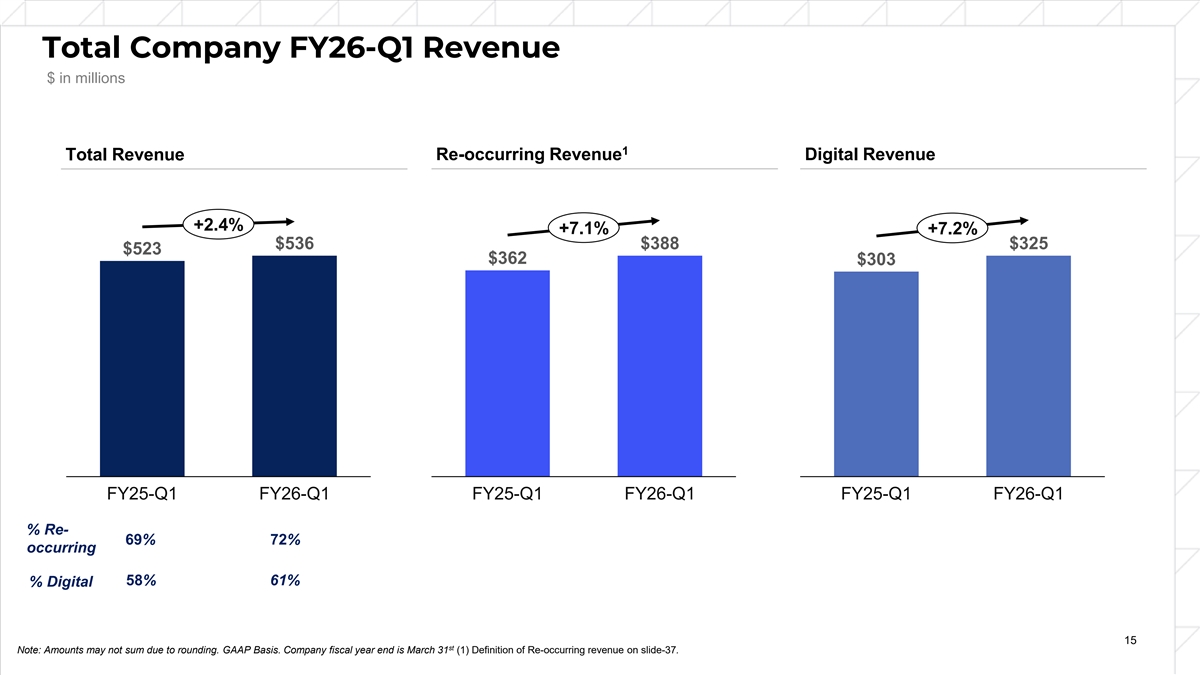
Total Company FY26-Q1 Revenue $ in millions 1 Re-occurring Revenue Digital Revenue Total Revenue +2.4% +7.1% +7.2% $536 $388 $325 $523 $362 $303 FY25-Q1 FY26-Q1 FY25-Q1 FY26-Q1 FY25-Q1 FY26-Q1 % Re- 69% 72% occurring 58% 61% % Digital 15 st Note: Amounts may not sum due to rounding. GAAP Basis. Company fiscal year end is March 31 (1) Definition of Re-occurring revenue on slide-37.
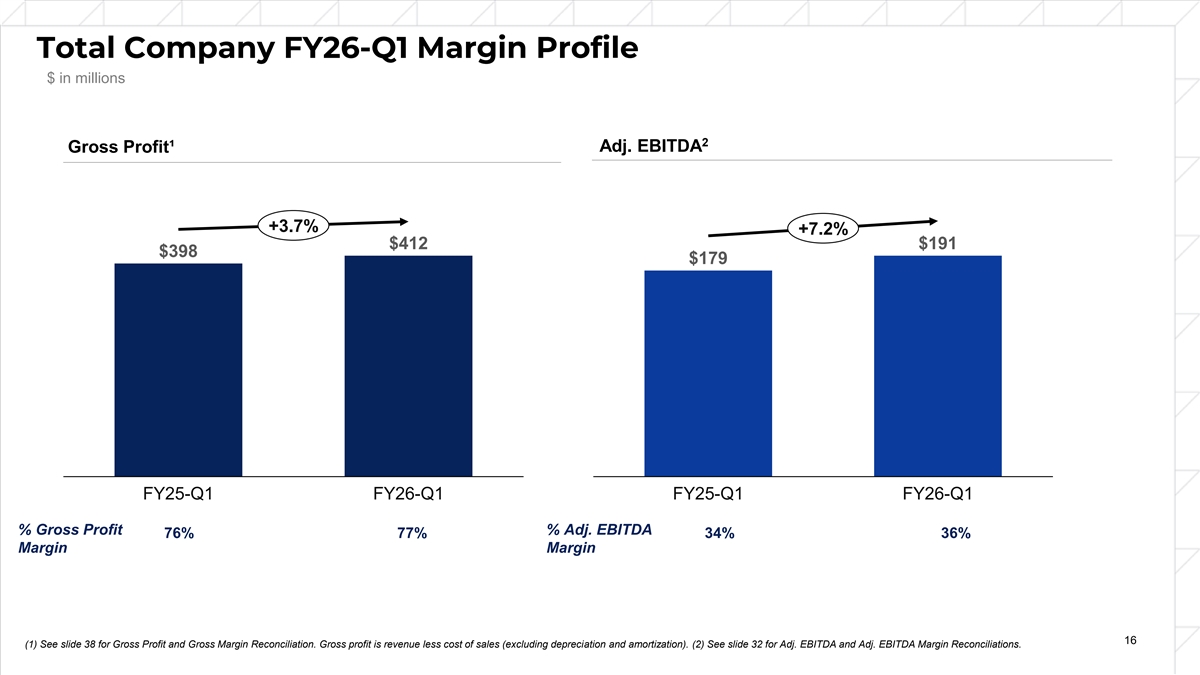
Total Company FY26-Q1 Margin Profile $ in millions 2 Gross Profit¹ Adj. EBITDA +3.7% +7.2% $412 $191 $398 $179 FY25-Q1 FY26-Q1 FY25-Q1 FY26-Q1 % Gross Profit % Adj. EBITDA 76% 77% 34% 36% Margin Margin 16 (1) See slide 38 for Gross Profit and Gross Margin Reconciliation. Gross profit is revenue less cost of sales (excluding depreciation and amortization). (2) See slide 32 for Adj. EBITDA and Adj. EBITDA Margin Reconciliations.
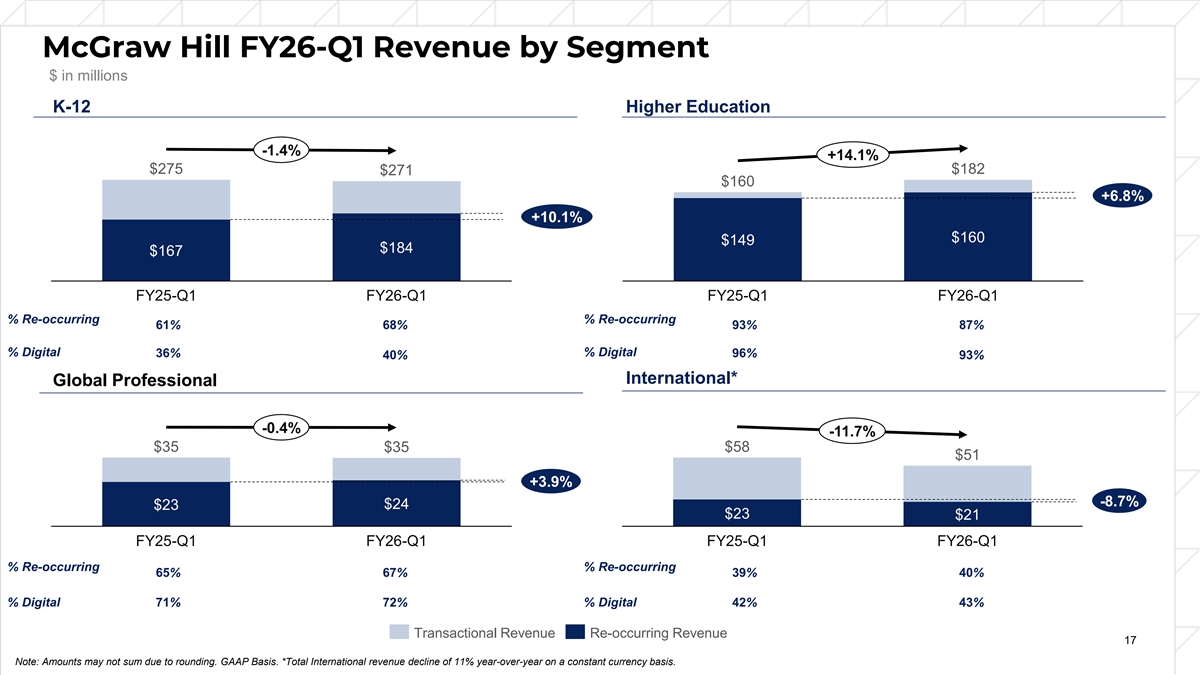
McGraw Hill FY26-Q1 Revenue by Segment $ in millions K-12 Higher Education -1.4% +14.1% $275 $182 $271 $160 +6.8% +10.1% $160 $149 $184 $167 FY25-Q1 FY26-Q1 FY25-Q1 FY26-Q1 % Re-occurring % Re-occurring 61% 68% 93% 87% % Digital % Digital 36% 96% 40% 93% % Digital % Digital International* Global Professional -0.4% -11.7% $35 $35 $58 $51 +3.9% -8.7% $24 $23 $23 $21 FY25-Q1 FY26-Q1 FY25-Q1 FY26-Q1 % Re-occurring % Re-occurring 65% 67% 39% 40% % % Dig Digit ital al 71% 72% % % Dig Digit ital al 42% 43% Transactional Revenue Re-occurring Revenue 17 Note: Amounts may not sum due to rounding. GAAP Basis. *Total International revenue decline of 11% year-over-year on a constant currency basis.

Consolidated FY26-Q1 Cash Flow Summary $ in millions Three Months Ended June 30 FY26-Q1 FY25-Q1 Variance TTM Net Income (Loss) 1 (9) 10 (76) Adjustments to reconcile net income (loss) to net cash provided by operating activities: D&A, Provisions, Impairments, and Other 137 142 (5) 523 Change in Working Capital (234) (135) (99) 105 Cash provided by (used for) operating activities (97) (3) (94) 553 Product Development Investments (23) (19) (4) (94) Capital Expenditures (16) (16) (0) (71) Cash Provided by (Used For) Investing Activities (39) (35) (4) (165) Cash Paid for Interest Expense 22 54 (31) 243 Note: Trailing Twelve Months is calculated by adding the results for the three months ended June 30, 2025, to the results of the fiscal year ended March 31, 2025, and subtracting the three months ended June 30, 2024. 18
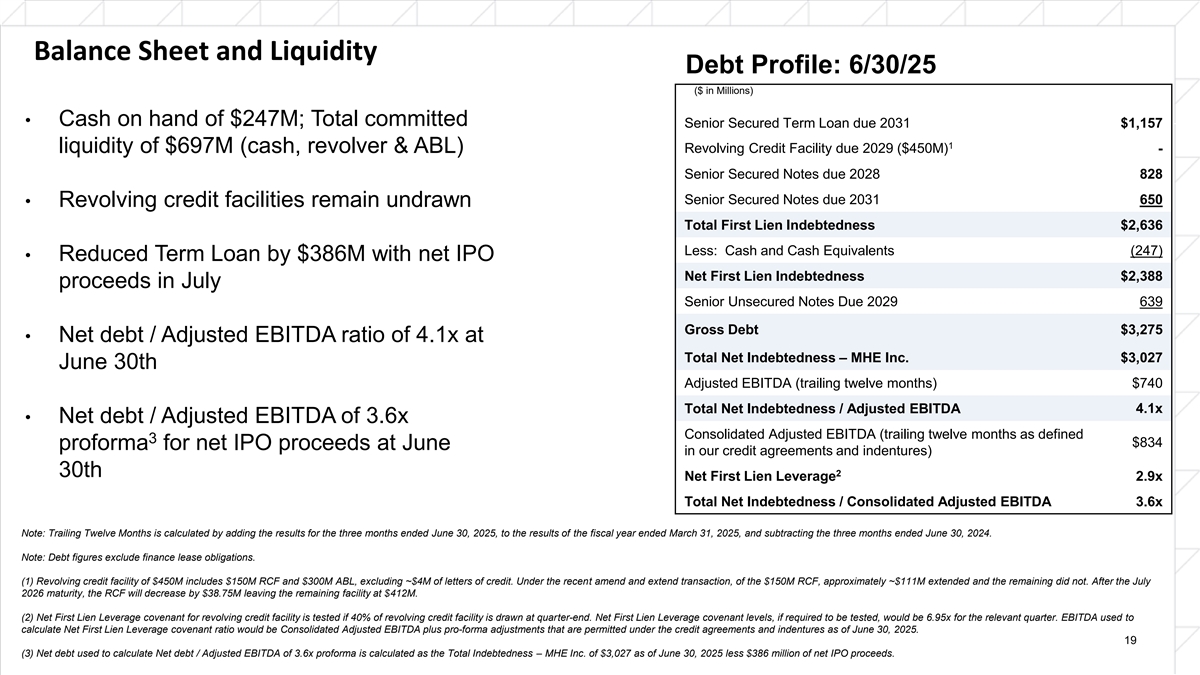
Balance Sheet and Liquidity Debt Profile: 6/30/25 ($ in Millions) • Cash on hand of $247M; Total committed Senior Secured Term Loan due 2031 $1,157 1 Revolving Credit Facility due 2029 ($450M) liquidity of $697M (cash, revolver & ABL) - Senior Secured Notes due 2028 828 Senior Secured Notes due 2031 650 • Revolving credit facilities remain undrawn Total First Lien Indebtedness $2,636 Less: Cash and Cash Equivalents (247) • Reduced Term Loan by $386M with net IPO Net First Lien Indebtedness $2,388 proceeds in July Senior Unsecured Notes Due 2029 639 Gross Debt $3,275 • Net debt / Adjusted EBITDA ratio of 4.1x at Total Net Indebtedness – MHE Inc. $3,027 June 30th Adjusted EBITDA (trailing twelve months) $740 Total Net Indebtedness / Adjusted EBITDA 4.1x • Net debt / Adjusted EBITDA of 3.6x Consolidated Adjusted EBITDA (trailing twelve months as defined 3 $834 proforma for net IPO proceeds at June in our credit agreements and indentures) 2 30th Net First Lien Leverage 2.9x Total Net Indebtedness / Consolidated Adjusted EBITDA 3.6x Note: Trailing Twelve Months is calculated by adding the results for the three months ended June 30, 2025, to the results of the fiscal year ended March 31, 2025, and subtracting the three months ended June 30, 2024. Note: Debt figures exclude finance lease obligations. (1) Revolving credit facility of $450M includes $150M RCF and $300M ABL, excluding ~$4M of letters of credit. Under the recent amend and extend transaction, of the $150M RCF, approximately ~$111M extended and the remaining did not. After the July 2026 maturity, the RCF will decrease by $38.75M leaving the remaining facility at $412M. (2) Net First Lien Leverage covenant for revolving credit facility is tested if 40% of revolving credit facility is drawn at quarter-end. Net First Lien Leverage covenant levels, if required to be tested, would be 6.95x for the relevant quarter. EBITDA used to calculate Net First Lien Leverage covenant ratio would be Consolidated Adjusted EBITDA plus pro-forma adjustments that are permitted under the credit agreements and indentures as of June 30, 2025. 19 (3) Net debt used to calculate Net debt / Adjusted EBITDA of 3.6x proforma is calculated as the Total Indebtedness – MHE Inc. of $3,027 as of June 30, 2025 less $386 million of net IPO proceeds.
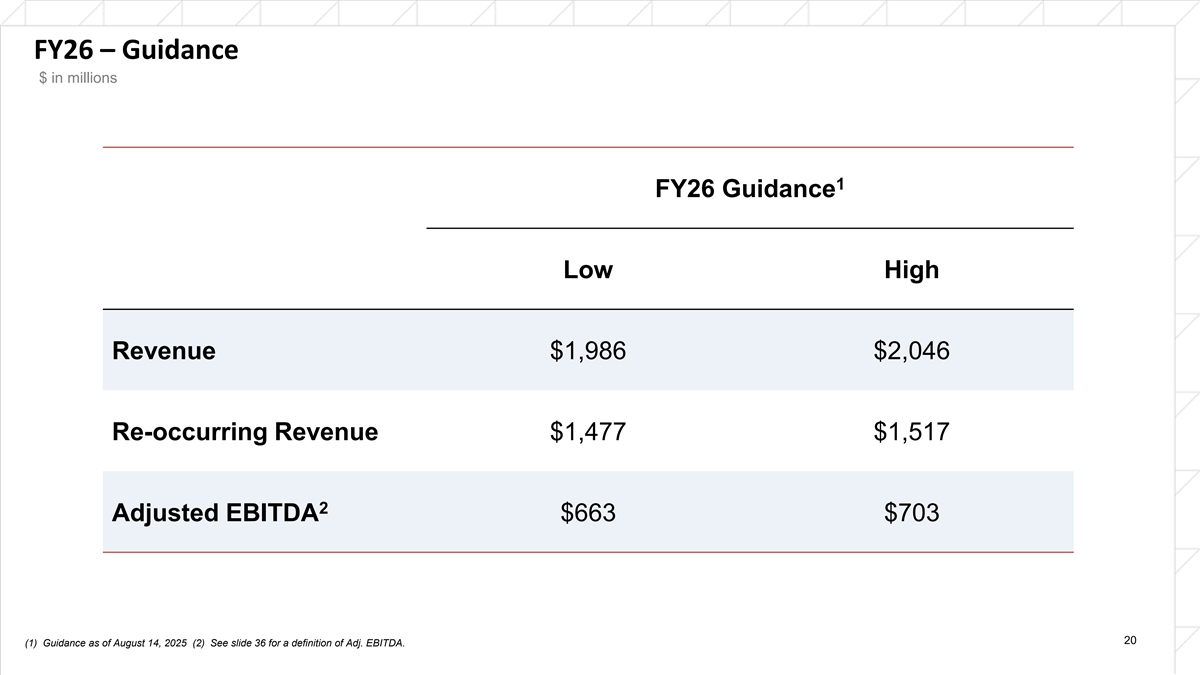
FY26 – Guidance $ in millions 1 FY26 Guidance Low High Revenue $1,986 $2,046 Re-occurring Revenue $1,477 $1,517 2 Adjusted EBITDA $663 $703 20 (1) Guidance as of August 14, 2025 (2) See slide 36 for a definition of Adj. EBITDA.

Appendix A

Investment Highlights Trusted, Market-Leading Global Brand with Deep Expertise in Learning Science 01 Leading Suite of Digital Solutions Across the Entire Learning Continuum 02 Agile Content Model Supported by High-Quality, Proprietary Digital Content 03 Leveraging Data Science, Machine Learning, and GenAI to Drive Innovation and Improve Outcomes 04 Extensive Global Go-to-Market Reach 05 Institutional Sales Model with Long-Standing Customer Relationships Built Over Decades 06 Highly Profitable Business Model with a Strong Cash Flow Profile 07 Mission-Driven Culture and Leadership Team with Track Record of Success 08 22
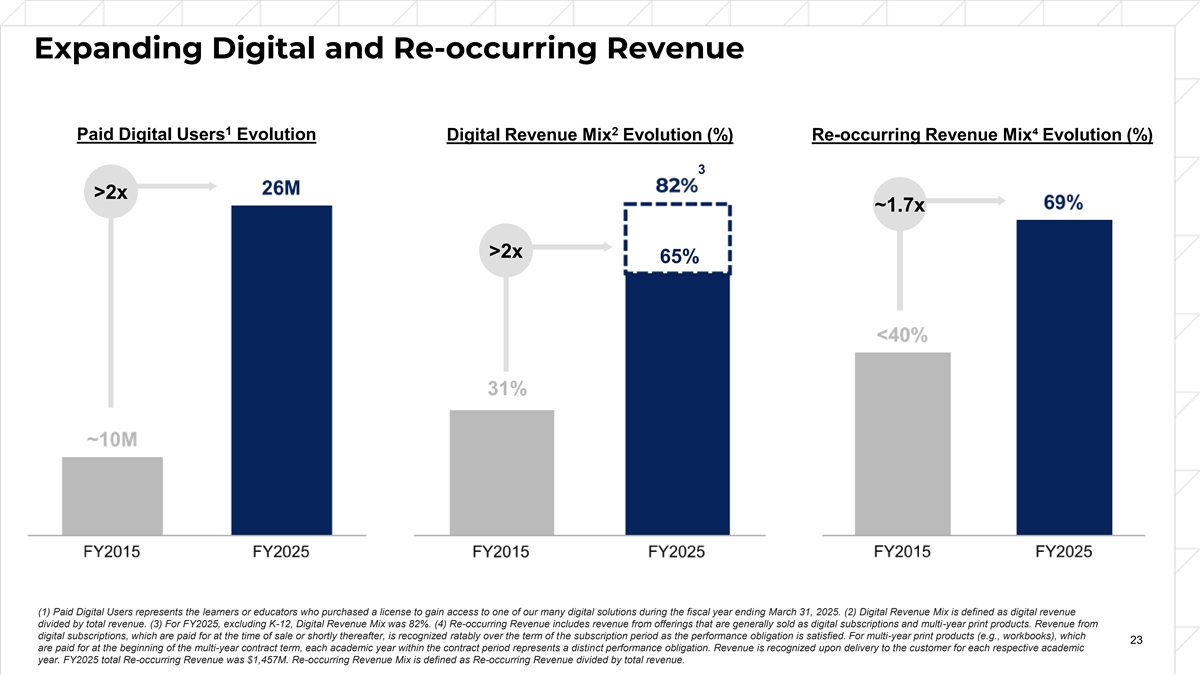
Expanding Digital and Re-occurring Revenue 1 2 Paid Digital Users Evolution Digital Revenue Mix Evolution (%) Re-occurring Revenue Mix⁴ Evolution (%) 3 >2x ~1.7x >2x 65% 31% (1) Paid Digital Users represents the learners or educators who purchased a license to gain access to one of our many digital solutions during the fiscal year ending March 31, 2025. (2) Digital Revenue Mix is defined as digital revenue divided by total revenue. (3) For FY2025, excluding K-12, Digital Revenue Mix was 82%. (4) Re-occurring Revenue includes revenue from offerings that are generally sold as digital subscriptions and multi-year print products. Revenue from digital subscriptions, which are paid for at the time of sale or shortly thereafter, is recognized ratably over the term of the subscription period as the performance obligation is satisfied. For multi-year print products (e.g., workbooks), which 23 are paid for at the beginning of the multi-year contract term, each academic year within the contract period represents a distinct performance obligation. Revenue is recognized upon delivery to the customer for each respective academic year. FY2025 total Re-occurring Revenue was $1,457M. Re-occurring Revenue Mix is defined as Re-occurring Revenue divided by total revenue.
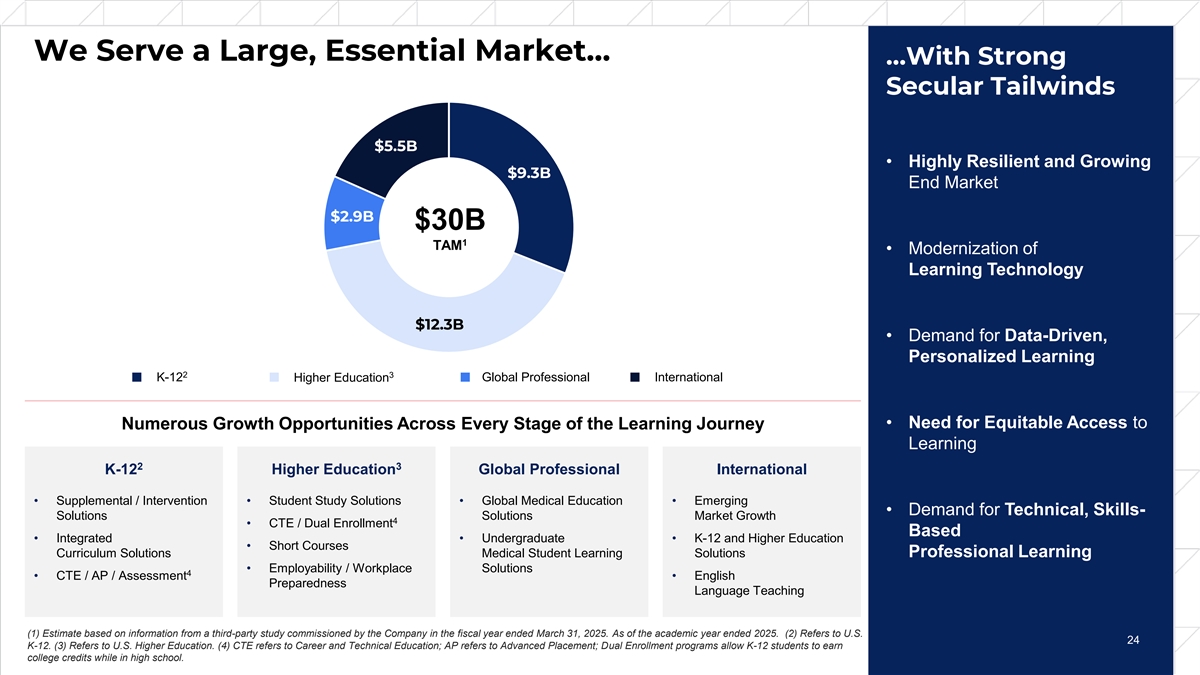
We Serve a Large, Essential Market… …With Strong Secular Tailwinds $5.5B • Highly Resilient and Growing $9.3B End Market $2.9B $30B 1 TAM • Modernization of Learning Technology $12.3B • Demand for Data-Driven, Personalized Learning 2 3 K-12 Global Professional International Higher Education • Need for Equitable Access to Numerous Growth Opportunities Across Every Stage of the Learning Journey Learning 2 3 K-12 Higher Education Global Professional International • Supplemental / Intervention • Student Study Solutions • Global Medical Education • Emerging • Demand for Technical, Skills- Solutions Solutions Market Growth 4 • CTE / Dual Enrollment Based • Integrated • Undergraduate • K-12 and Higher Education • Short Courses Curriculum Solutions Medical Student Learning Solutions Professional Learning • Employability / Workplace Solutions 4 • CTE / AP / Assessment • English Preparedness Language Teaching (1) Estimate based on information from a third-party study commissioned by the Company in the fiscal year ended March 31, 2025. As of the academic year ended 2025. (2) Refers to U.S. 24 24 K-12. (3) Refers to U.S. Higher Education. (4) CTE refers to Career and Technical Education; AP refers to Advanced Placement; Dual Enrollment programs allow K-12 students to earn college credits while in high school.

Established Market-Leading Digital Learning Solutions >64M Lifetime Learners >30M Lifetime Learners >34M Lifetime Learners In 94% of U.S. Medical Schools Personalized learning Market leading digital solution for Market leading digital learning Interactive digital solution supporting K-12 and K-12 supporting teachers with solution for Higher Ed providing subscription solution for the Higher Education markets across planning and customizing lessons custom course creation capabilities Professional market with thousands of institutions globally that are accessible by students and valuable insights on student simulation-based interactive anywhere, anytime performance learning experiences 25 Note: All metrics are as of the fiscal year ended March 31, 2025.
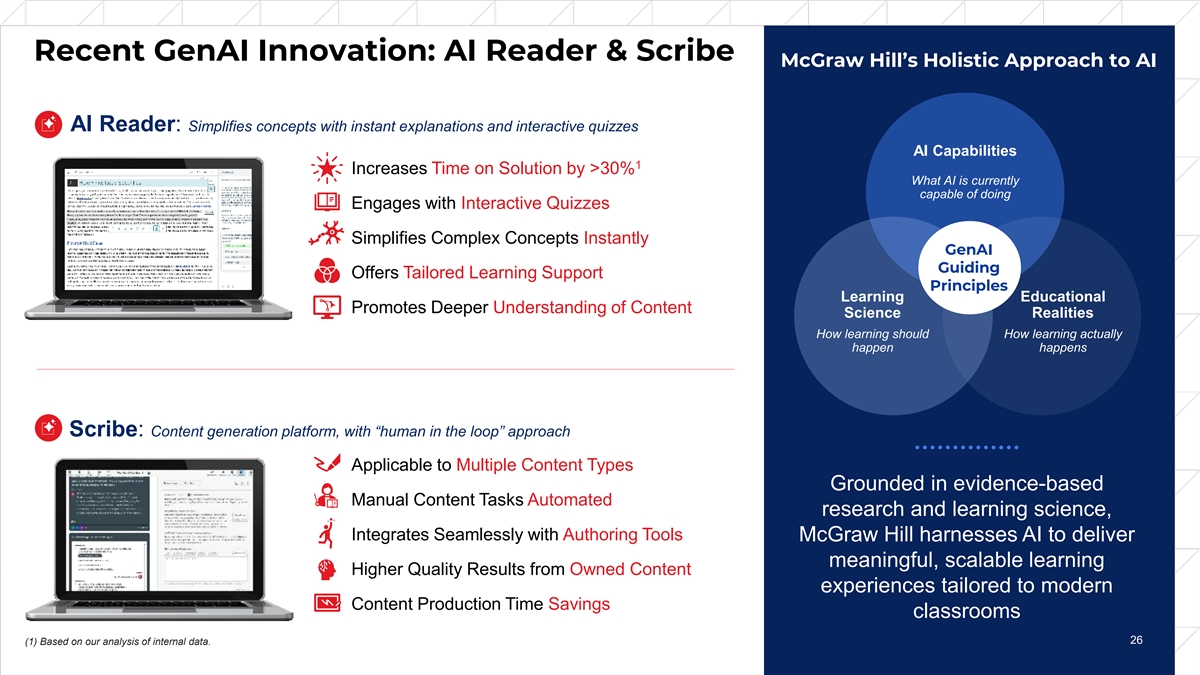
Recent GenAI Innovation: AI Reader & Scribe McGraw Hill’s Holistic Approach to AI AI Reader: Simplifies concepts with instant explanations and interactive quizzes AI Capabilities 1 Increases Time on Solution by >30% What AI is currently capable of doing Engages with Interactive Quizzes Simplifies Complex Concepts Instantly GenAI Guiding Offers Tailored Learning Support Principles Learning Educational Promotes Deeper Understanding of Content Science Realities How learning should How learning actually happen happens Scribe: Content generation platform, with “human in the loop” approach Applicable to Multiple Content Types Grounded in evidence-based Manual Content Tasks Automated research and learning science, Integrates Seamlessly with Authoring Tools McGraw Hill harnesses AI to deliver meaningful, scalable learning Higher Quality Results from Owned Content experiences tailored to modern Content Production Time Savings classrooms 26 26 (1) Based on our analysis of internal data.
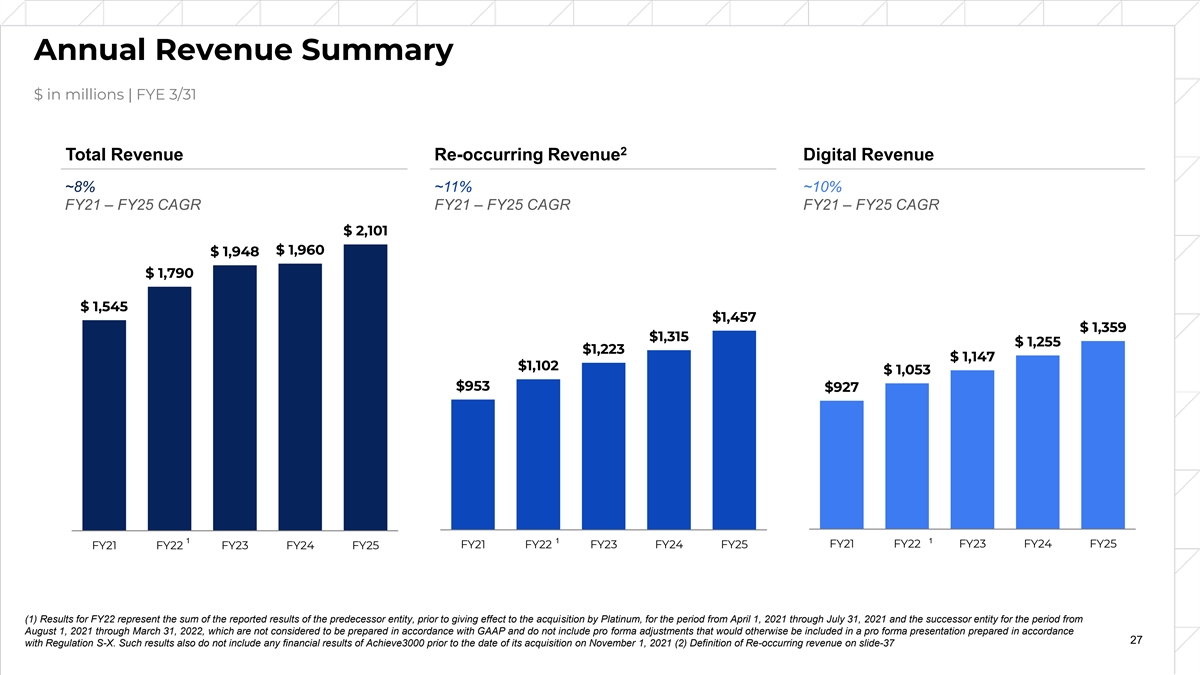
Annual Revenue Summary $ in millions | FYE 3/31 2 Total Revenue Re-occurring Revenue Digital Revenue ~8% ~11% ~10% FY21 – FY25 CAGR FY21 – FY25 CAGR FY21 – FY25 CAGR $ 2,101 $ 1,960 $ 1,948 $ 1,790 $ 1,545 $1,457 $ 1,359 $1,315 $ 1,255 $1,223 $ 1,147 $1,102 $ 1,053 $953 $927 1 1 1 FY21 FY22 FY23 FY24 FY25 FY21 FY22 FY23 FY24 FY25 FY21 FY22 FY23 FY24 FY25 (1) Results for FY22 represent the sum of the reported results of the predecessor entity, prior to giving effect to the acquisition by Platinum, for the period from April 1, 2021 through July 31, 2021 and the successor entity for the period from August 1, 2021 through March 31, 2022, which are not considered to be prepared in accordance with GAAP and do not include pro forma adjustments that would otherwise be included in a pro forma presentation prepared in accordance 27 with Regulation S-X. Such results also do not include any financial results of Achieve3000 prior to the date of its acquisition on November 1, 2021 (2) Definition of Re-occurring revenue on slide-37
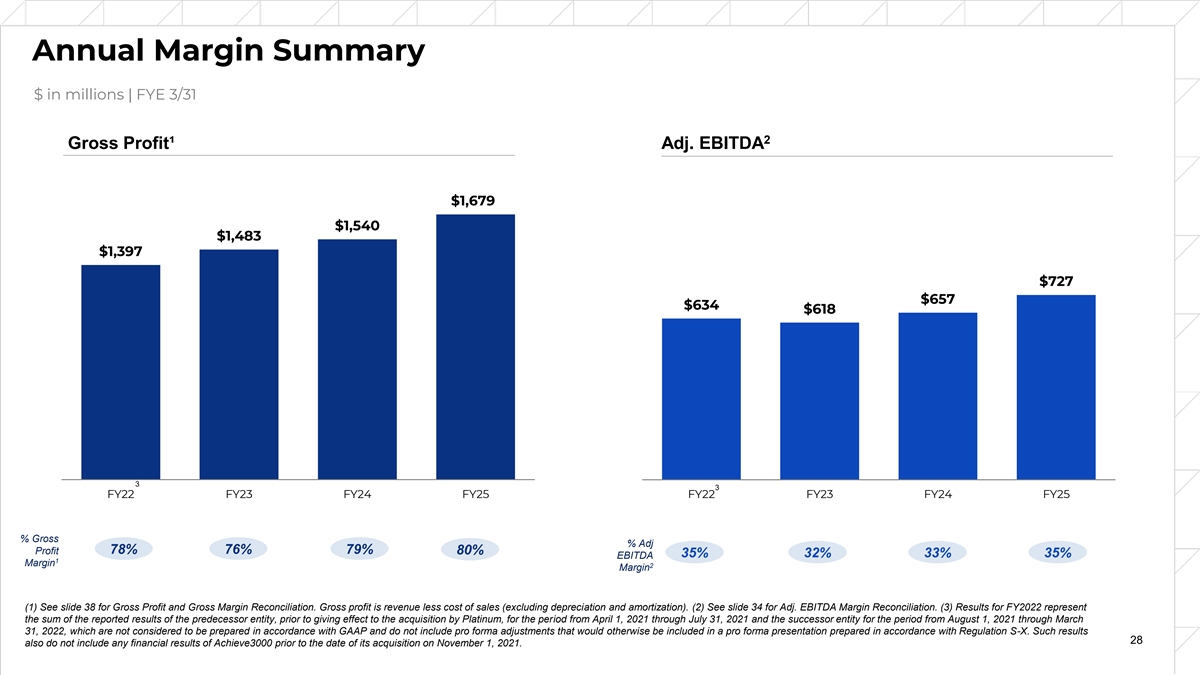
Annual Margin Summary $ in millions | FYE 3/31 2 Gross Profit¹ Adj. EBITDA $1,679 $1,540 $1,483 $1,397 $727 $657 $634 $618 3 3 FY22 FY23 FY24 FY25 FY22 FY23 FY24 FY25 % Gross % Adj 78% 76% 79% Profit 80% 35% 32% 33% 35% EBITDA 1 Margin 2 Margin (1) See slide 38 for Gross Profit and Gross Margin Reconciliation. Gross profit is revenue less cost of sales (excluding depreciation and amortization). (2) See slide 34 for Adj. EBITDA Margin Reconciliation. (3) Results for FY2022 represent the sum of the reported results of the predecessor entity, prior to giving effect to the acquisition by Platinum, for the period from April 1, 2021 through July 31, 2021 and the successor entity for the period from August 1, 2021 through March 31, 2022, which are not considered to be prepared in accordance with GAAP and do not include pro forma adjustments that would otherwise be included in a pro forma presentation prepared in accordance with Regulation S-X. Such results 28 also do not include any financial results of Achieve3000 prior to the date of its acquisition on November 1, 2021.
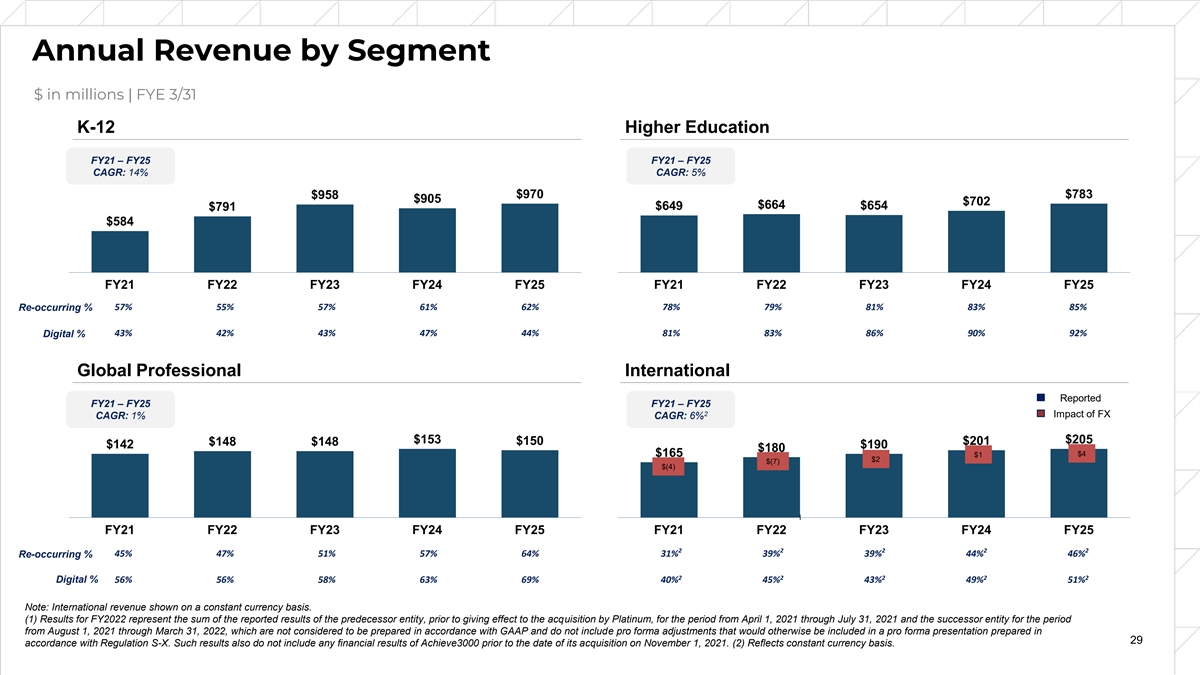
Annual Revenue by Segment $ in millions | FYE 3/31 K-12 Higher Education FY21 – FY25 FY21 – FY25 CAGR: 14% CAGR: 5% $958 $970 $783 $905 $702 $664 $649 $654 $791 $584 FY21 FY22 FY23 FY24 FY25 FY21 FY22 FY23 FY24 FY25 57% 55% 57% 61% 62% 78% 79% 81% 83% 85% Re-occurring % 43% 42% 43% 47% 44% 81% 83% 86% 90% 92% Digital % Global Professional International Reported FY21 – FY25 FY21 – FY25 2 Impact of FX CAGR: 1% CAGR: 6% $153 $205 $150 $201 $148 $148 $142 $190 $180 $4 $165 $1 $2 $(7) $(4) 1 FY21 FY22 FY23 FY24 FY25 FY21 FY22 FY23 FY24 FY25 2 2 2 2 2 Re-occurring % 45% 47% 51% 57% 64% 31% 39% 39% 44% 46% 2 2 2 2 2 Digital % 56% 56% 58% 63% 69% 40% 45% 43% 49% 51% Note: International revenue shown on a constant currency basis. (1) Results for FY2022 represent the sum of the reported results of the predecessor entity, prior to giving effect to the acquisition by Platinum, for the period from April 1, 2021 through July 31, 2021 and the successor entity for the period from August 1, 2021 through March 31, 2022, which are not considered to be prepared in accordance with GAAP and do not include pro forma adjustments that would otherwise be included in a pro forma presentation prepared in 29 accordance with Regulation S-X. Such results also do not include any financial results of Achieve3000 prior to the date of its acquisition on November 1, 2021. (2) Reflects constant currency basis.
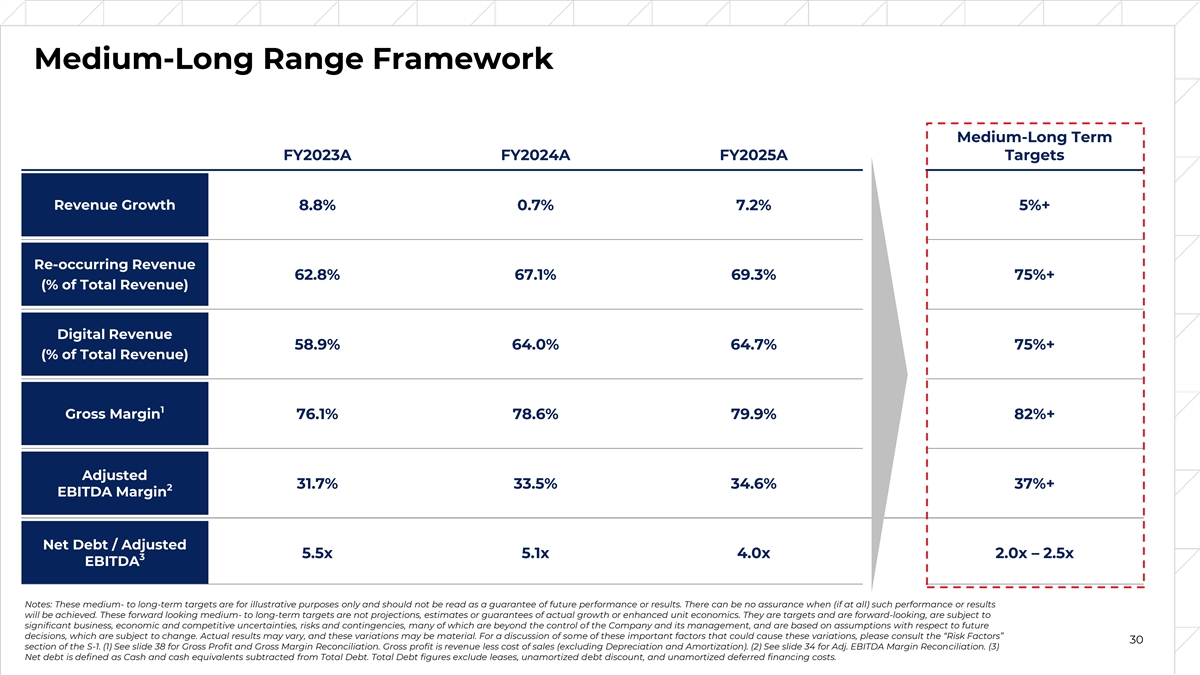
Medium-Long Range Framework Medium-Long Term FY2023A FY2024A FY2025A Targets Revenue Growth 8.8% 0.7% 7.2% 5%+ Re-occurring Revenue 62.8% 67.1% 69.3% 75%+ (% of Total Revenue) Digital Revenue 58.9% 64.0% 64.7% 75%+ (% of Total Revenue) 1 Gross Margin 76.1% 78.6% 79.9% 82%+ Adjusted 31.7% 33.5% 34.6% 37%+ 2 EBITDA Margin Net Debt / Adjusted 5.5x 5.1x 4.0x 2.0x – 2.5x 3 EBITDA Notes: These medium- to long-term targets are for illustrative purposes only and should not be read as a guarantee of future performance or results. There can be no assurance when (if at all) such performance or results will be achieved. These forward looking medium- to long-term targets are not projections, estimates or guarantees of actual growth or enhanced unit economics. They are targets and are forward-looking, are subject to significant business, economic and competitive uncertainties, risks and contingencies, many of which are beyond the control of the Company and its management, and are based on assumptions with respect to future decisions, which are subject to change. Actual results may vary, and these variations may be material. For a discussion of some of these important factors that could cause these variations, please consult the “Risk Factors” 30 section of the S-1. (1) See slide 38 for Gross Profit and Gross Margin Reconciliation. Gross profit is revenue less cost of sales (excluding Depreciation and Amortization). (2) See slide 34 for Adj. EBITDA Margin Reconciliation. (3) Net debt is defined as Cash and cash equivalents subtracted from Total Debt. Total Debt figures exclude leases, unamortized debt discount, and unamortized deferred financing costs.
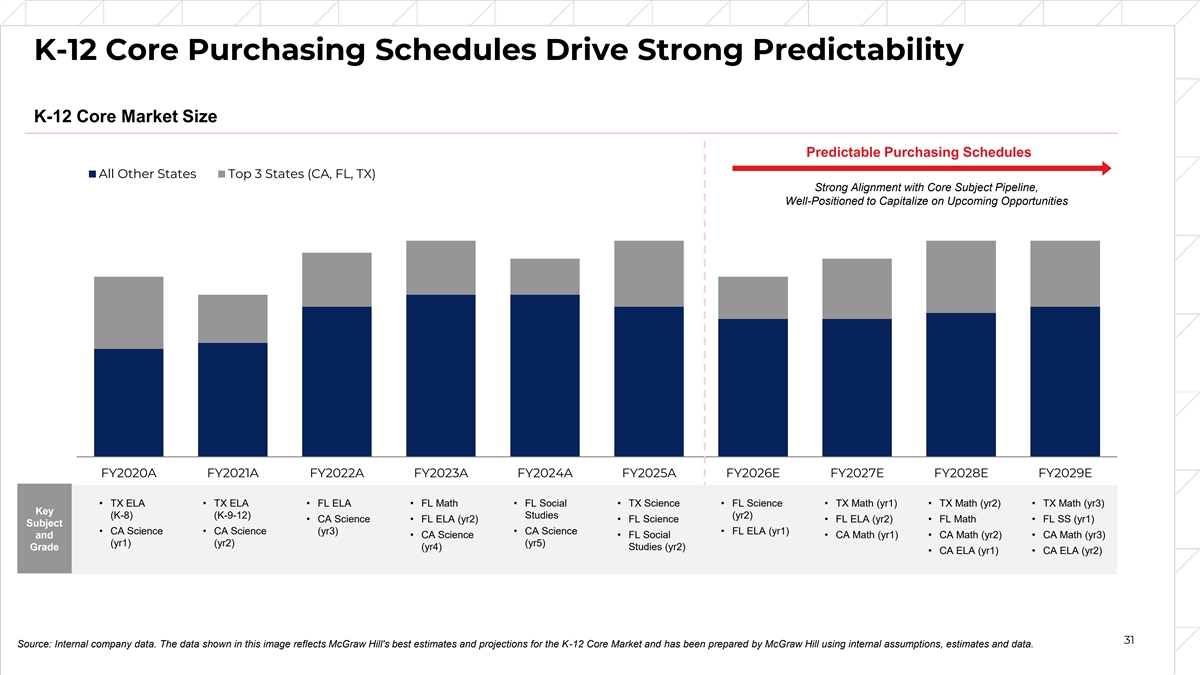
K-12 Core Purchasing Schedules Drive Strong Predictability K-12 Core Market Size Predictable Purchasing Schedules All Other States Top 3 States (CA, FL, TX) Strong Alignment with Core Subject Pipeline, Well-Positioned to Capitalize on Upcoming Opportunities FY2020A FY2021A FY2022A FY2023A FY2024A FY2025A FY2026E FY2027E FY2028E FY2029E • TX ELA • TX ELA • FL ELA • FL Math • FL Social • TX Science • FL Science • TX Math (yr1) • TX Math (yr2) • TX Math (yr3) Key (K-8) (K-9-12) Studies (yr2) • CA Science • FL ELA (yr2) • FL Science • FL ELA (yr2) • FL Math • FL SS (yr1) Subject • CA Science • CA Science (yr3) • CA Science • FL ELA (yr1) and • CA Science • FL Social • CA Math (yr1) • CA Math (yr2) • CA Math (yr3) (yr1) (yr2) (yr5) (yr4) Studies (yr2) Grade • CA ELA (yr1) • CA ELA (yr2) 31 Source: Internal company data. The data shown in this image reflects McGraw Hill's best estimates and projections for the K-12 Core Market and has been prepared by McGraw Hill using internal assumptions, estimates and data.

Adjusted EBITDA Reconciliation – Three Months Ended June 30 $ in millions Note: Amounts may not sum due to rounding. 32
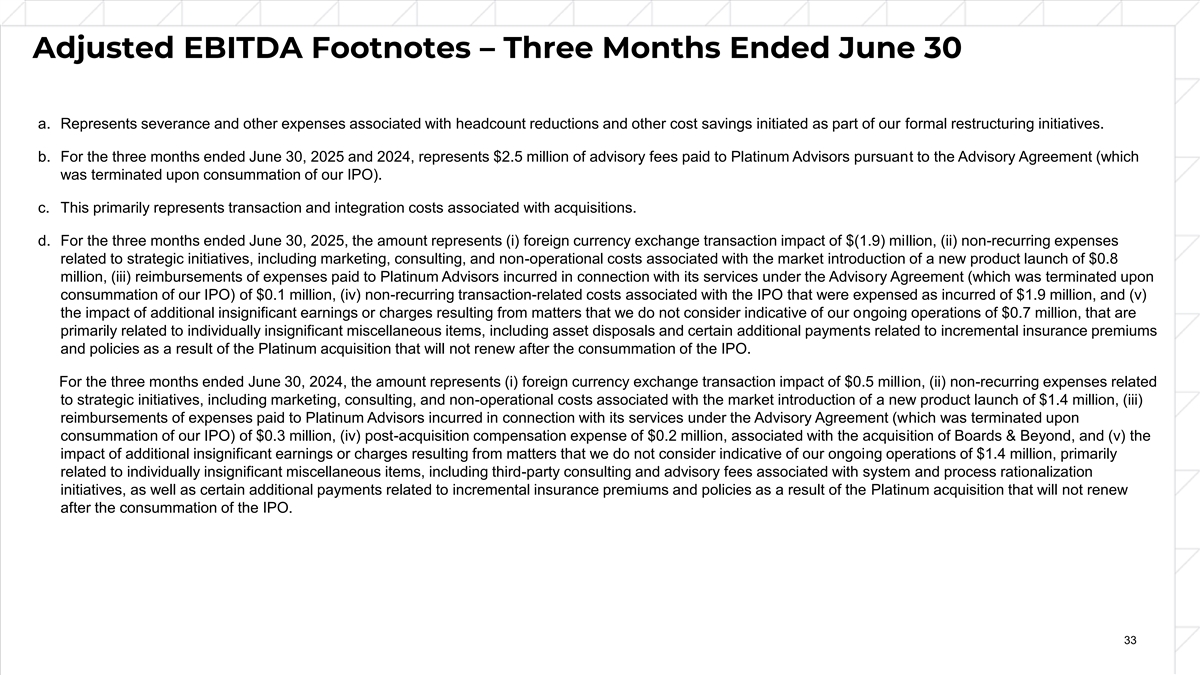
Adjusted EBITDA Footnotes – Three Months Ended June 30 a. Represents severance and other expenses associated with headcount reductions and other cost savings initiated as part of our formal restructuring initiatives. b. For the three months ended June 30, 2025 and 2024, represents $2.5 million of advisory fees paid to Platinum Advisors pursuant to the Advisory Agreement (which was terminated upon consummation of our IPO). c. This primarily represents transaction and integration costs associated with acquisitions. d. For the three months ended June 30, 2025, the amount represents (i) foreign currency exchange transaction impact of $(1.9) million, (ii) non-recurring expenses related to strategic initiatives, including marketing, consulting, and non-operational costs associated with the market introduction of a new product launch of $0.8 million, (iii) reimbursements of expenses paid to Platinum Advisors incurred in connection with its services under the Advisory Agreement (which was terminated upon consummation of our IPO) of $0.1 million, (iv) non-recurring transaction-related costs associated with the IPO that were expensed as incurred of $1.9 million, and (v) the impact of additional insignificant earnings or charges resulting from matters that we do not consider indicative of our ongoing operations of $0.7 million, that are primarily related to individually insignificant miscellaneous items, including asset disposals and certain additional payments related to incremental insurance premiums and policies as a result of the Platinum acquisition that will not renew after the consummation of the IPO. For the three months ended June 30, 2024, the amount represents (i) foreign currency exchange transaction impact of $0.5 million, (ii) non-recurring expenses related to strategic initiatives, including marketing, consulting, and non-operational costs associated with the market introduction of a new product launch of $1.4 million, (iii) reimbursements of expenses paid to Platinum Advisors incurred in connection with its services under the Advisory Agreement (which was terminated upon consummation of our IPO) of $0.3 million, (iv) post-acquisition compensation expense of $0.2 million, associated with the acquisition of Boards & Beyond, and (v) the impact of additional insignificant earnings or charges resulting from matters that we do not consider indicative of our ongoing operations of $1.4 million, primarily related to individually insignificant miscellaneous items, including third-party consulting and advisory fees associated with system and process rationalization initiatives, as well as certain additional payments related to incremental insurance premiums and policies as a result of the Platinum acquisition that will not renew after the consummation of the IPO. 33
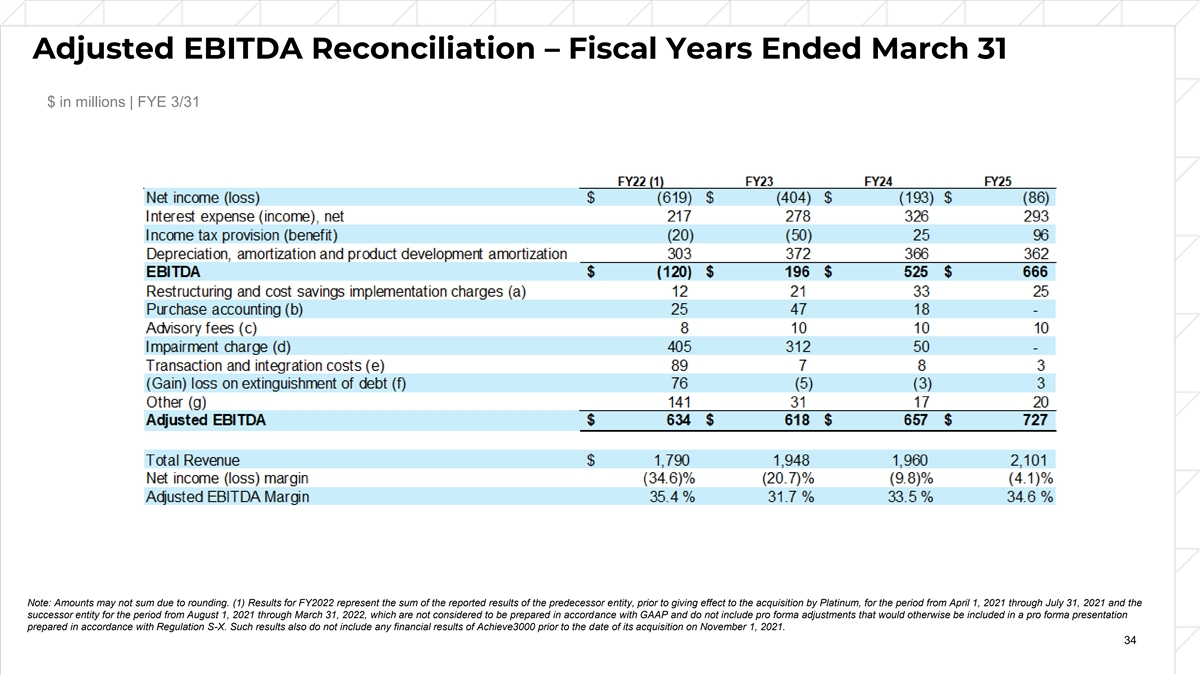
Adjusted EBITDA Reconciliation – Fiscal Years Ended March 31 $ in millions | FYE 3/31 Note: Amounts may not sum due to rounding. (1) Results for FY2022 represent the sum of the reported results of the predecessor entity, prior to giving effect to the acquisition by Platinum, for the period from April 1, 2021 through July 31, 2021 and the successor entity for the period from August 1, 2021 through March 31, 2022, which are not considered to be prepared in accordance with GAAP and do not include pro forma adjustments that would otherwise be included in a pro forma presentation prepared in accordance with Regulation S-X. Such results also do not include any financial results of Achieve3000 prior to the date of its acquisition on November 1, 2021. 34
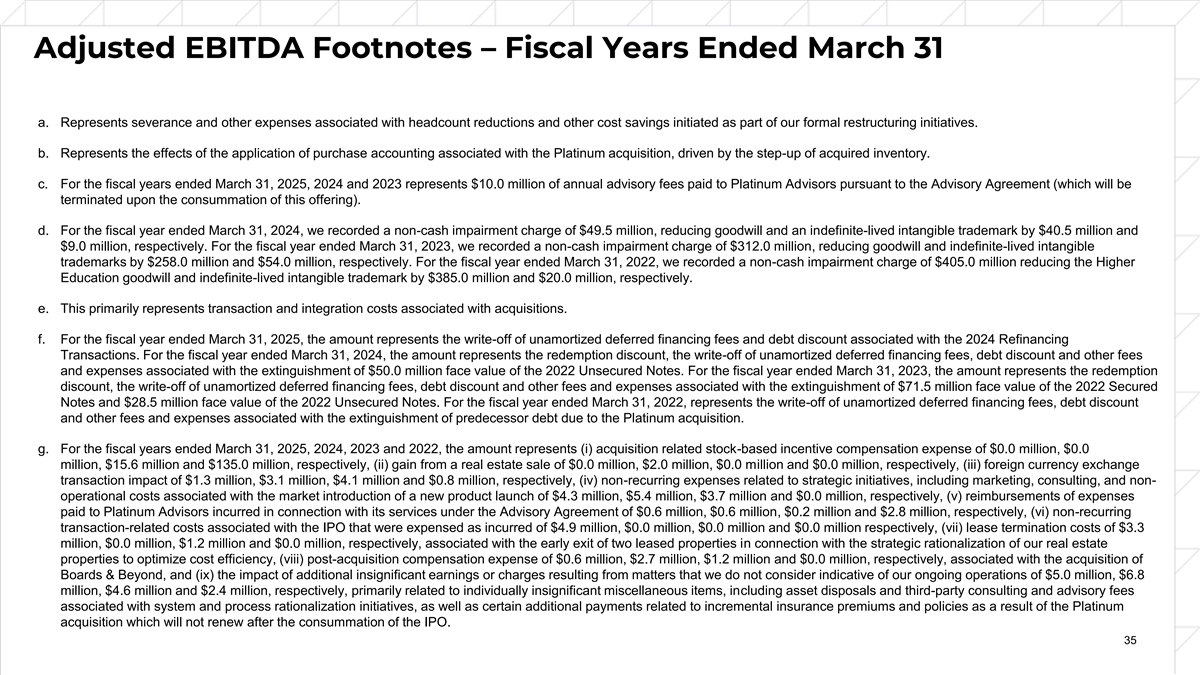
Adjusted EBITDA Footnotes – Fiscal Years Ended March 31 a. Represents severance and other expenses associated with headcount reductions and other cost savings initiated as part of our formal restructuring initiatives. b. Represents the effects of the application of purchase accounting associated with the Platinum acquisition, driven by the step-up of acquired inventory. c. For the fiscal years ended March 31, 2025, 2024 and 2023 represents $10.0 million of annual advisory fees paid to Platinum Advisors pursuant to the Advisory Agreement (which will be terminated upon the consummation of this offering). d. For the fiscal year ended March 31, 2024, we recorded a non-cash impairment charge of $49.5 million, reducing goodwill and an indefinite-lived intangible trademark by $40.5 million and $9.0 million, respectively. For the fiscal year ended March 31, 2023, we recorded a non-cash impairment charge of $312.0 million, reducing goodwill and indefinite-lived intangible trademarks by $258.0 million and $54.0 million, respectively. For the fiscal year ended March 31, 2022, we recorded a non-cash impairment charge of $405.0 million reducing the Higher Education goodwill and indefinite-lived intangible trademark by $385.0 million and $20.0 million, respectively. e. This primarily represents transaction and integration costs associated with acquisitions. f. For the fiscal year ended March 31, 2025, the amount represents the write-off of unamortized deferred financing fees and debt discount associated with the 2024 Refinancing Transactions. For the fiscal year ended March 31, 2024, the amount represents the redemption discount, the write-off of unamortized deferred financing fees, debt discount and other fees and expenses associated with the extinguishment of $50.0 million face value of the 2022 Unsecured Notes. For the fiscal year ended March 31, 2023, the amount represents the redemption discount, the write-off of unamortized deferred financing fees, debt discount and other fees and expenses associated with the extinguishment of $71.5 million face value of the 2022 Secured Notes and $28.5 million face value of the 2022 Unsecured Notes. For the fiscal year ended March 31, 2022, represents the write-off of unamortized deferred financing fees, debt discount and other fees and expenses associated with the extinguishment of predecessor debt due to the Platinum acquisition. g. For the fiscal years ended March 31, 2025, 2024, 2023 and 2022, the amount represents (i) acquisition related stock-based incentive compensation expense of $0.0 million, $0.0 million, $15.6 million and $135.0 million, respectively, (ii) gain from a real estate sale of $0.0 million, $2.0 million, $0.0 million and $0.0 million, respectively, (iii) foreign currency exchange transaction impact of $1.3 million, $3.1 million, $4.1 million and $0.8 million, respectively, (iv) non-recurring expenses related to strategic initiatives, including marketing, consulting, and non- operational costs associated with the market introduction of a new product launch of $4.3 million, $5.4 million, $3.7 million and $0.0 million, respectively, (v) reimbursements of expenses paid to Platinum Advisors incurred in connection with its services under the Advisory Agreement of $0.6 million, $0.6 million, $0.2 million and $2.8 million, respectively, (vi) non-recurring transaction-related costs associated with the IPO that were expensed as incurred of $4.9 million, $0.0 million, $0.0 million and $0.0 million respectively, (vii) lease termination costs of $3.3 million, $0.0 million, $1.2 million and $0.0 million, respectively, associated with the early exit of two leased properties in connection with the strategic rationalization of our real estate properties to optimize cost efficiency, (viii) post-acquisition compensation expense of $0.6 million, $2.7 million, $1.2 million and $0.0 million, respectively, associated with the acquisition of Boards & Beyond, and (ix) the impact of additional insignificant earnings or charges resulting from matters that we do not consider indicative of our ongoing operations of $5.0 million, $6.8 million, $4.6 million and $2.4 million, respectively, primarily related to individually insignificant miscellaneous items, including asset disposals and third-party consulting and advisory fees associated with system and process rationalization initiatives, as well as certain additional payments related to incremental insurance premiums and policies as a result of the Platinum acquisition which will not renew after the consummation of the IPO. 35
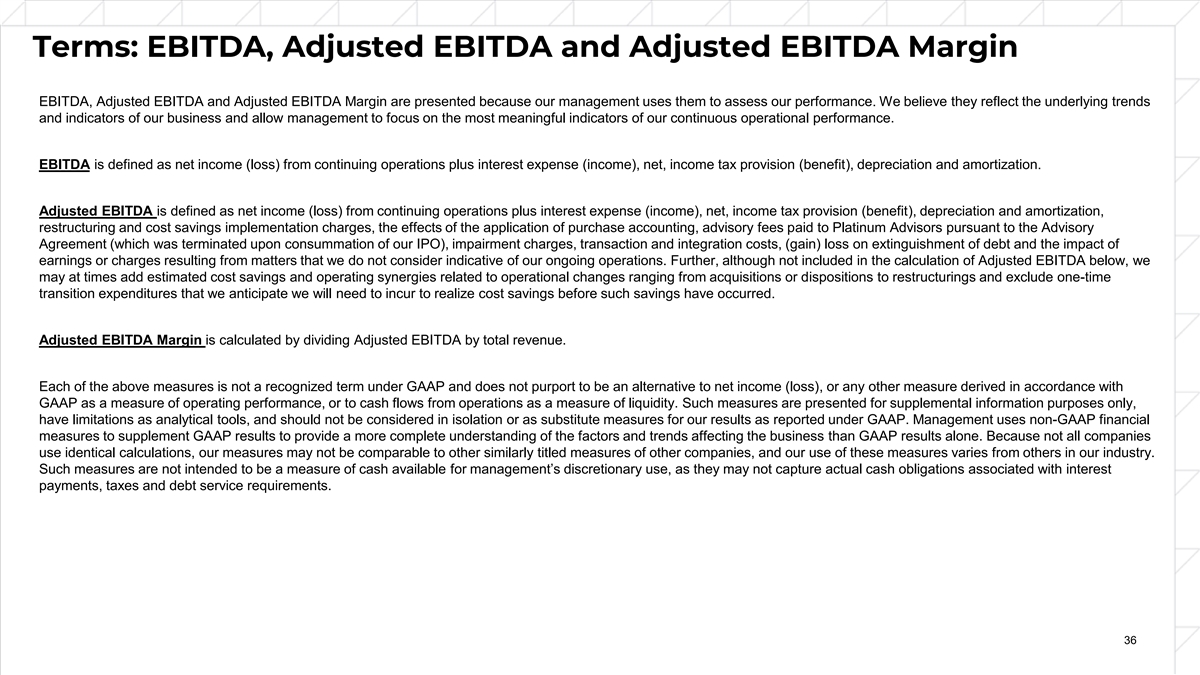
Terms: EBITDA, Adjusted EBITDA and Adjusted EBITDA Margin EBITDA, Adjusted EBITDA and Adjusted EBITDA Margin are presented because our management uses them to assess our performance. We believe they reflect the underlying trends and indicators of our business and allow management to focus on the most meaningful indicators of our continuous operational performance. EBITDA is defined as net income (loss) from continuing operations plus interest expense (income), net, income tax provision (benefit), depreciation and amortization. Adjusted EBITDA is defined as net income (loss) from continuing operations plus interest expense (income), net, income tax provision (benefit), depreciation and amortization, restructuring and cost savings implementation charges, the effects of the application of purchase accounting, advisory fees paid to Platinum Advisors pursuant to the Advisory Agreement (which was terminated upon consummation of our IPO), impairment charges, transaction and integration costs, (gain) loss on extinguishment of debt and the impact of earnings or charges resulting from matters that we do not consider indicative of our ongoing operations. Further, although not included in the calculation of Adjusted EBITDA below, we may at times add estimated cost savings and operating synergies related to operational changes ranging from acquisitions or dispositions to restructurings and exclude one-time transition expenditures that we anticipate we will need to incur to realize cost savings before such savings have occurred. Adjusted EBITDA Margin is calculated by dividing Adjusted EBITDA by total revenue. Each of the above measures is not a recognized term under GAAP and does not purport to be an alternative to net income (loss), or any other measure derived in accordance with GAAP as a measure of operating performance, or to cash flows from operations as a measure of liquidity. Such measures are presented for supplemental information purposes only, have limitations as analytical tools, and should not be considered in isolation or as substitute measures for our results as reported under GAAP. Management uses non-GAAP financial measures to supplement GAAP results to provide a more complete understanding of the factors and trends affecting the business than GAAP results alone. Because not all companies use identical calculations, our measures may not be comparable to other similarly titled measures of other companies, and our use of these measures varies from others in our industry. Such measures are not intended to be a measure of cash available for management’s discretionary use, as they may not capture actual cash obligations associated with interest payments, taxes and debt service requirements. 36
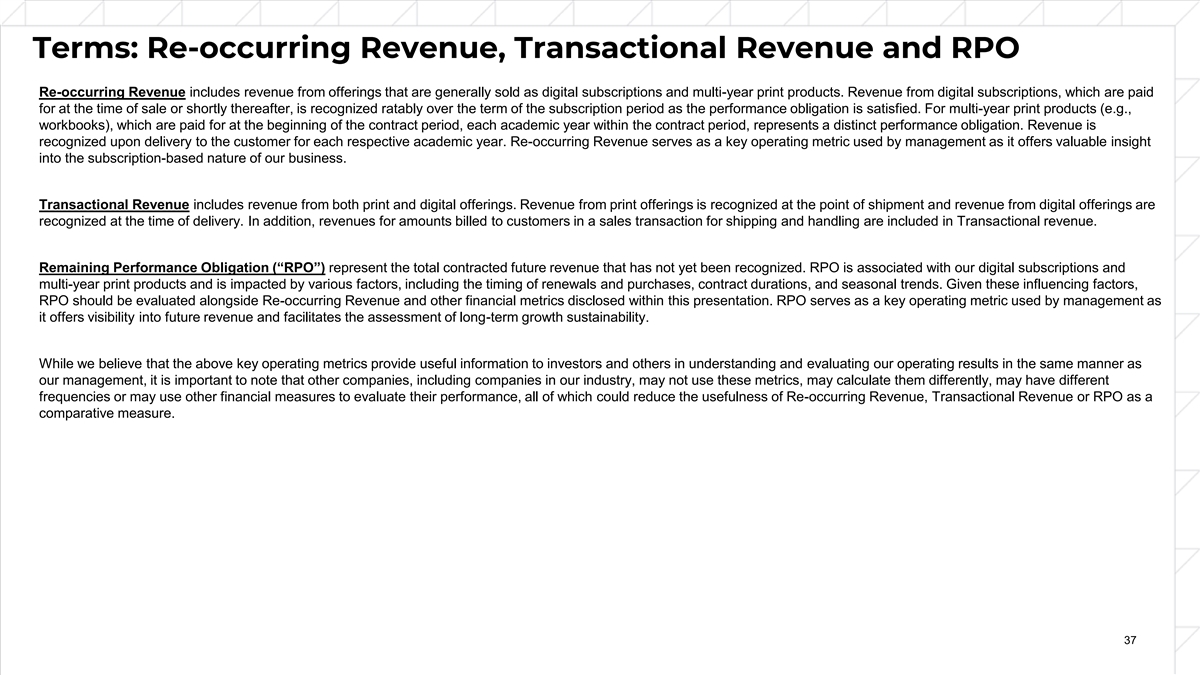
Terms: Re-occurring Revenue, Transactional Revenue and RPO Re-occurring Revenue includes revenue from offerings that are generally sold as digital subscriptions and multi-year print products. Revenue from digital subscriptions, which are paid for at the time of sale or shortly thereafter, is recognized ratably over the term of the subscription period as the performance obligation is satisfied. For multi-year print products (e.g., workbooks), which are paid for at the beginning of the contract period, each academic year within the contract period, represents a distinct performance obligation. Revenue is recognized upon delivery to the customer for each respective academic year. Re-occurring Revenue serves as a key operating metric used by management as it offers valuable insight into the subscription-based nature of our business. Transactional Revenue includes revenue from both print and digital offerings. Revenue from print offerings is recognized at the point of shipment and revenue from digital offerings are recognized at the time of delivery. In addition, revenues for amounts billed to customers in a sales transaction for shipping and handling are included in Transactional revenue. Remaining Performance Obligation (“RPO”) represent the total contracted future revenue that has not yet been recognized. RPO is associated with our digital subscriptions and multi-year print products and is impacted by various factors, including the timing of renewals and purchases, contract durations, and seasonal trends. Given these influencing factors, RPO should be evaluated alongside Re-occurring Revenue and other financial metrics disclosed within this presentation. RPO serves as a key operating metric used by management as it offers visibility into future revenue and facilitates the assessment of long-term growth sustainability. While we believe that the above key operating metrics provide useful information to investors and others in understanding and evaluating our operating results in the same manner as our management, it is important to note that other companies, including companies in our industry, may not use these metrics, may calculate them differently, may have different frequencies or may use other financial measures to evaluate their performance, all of which could reduce the usefulness of Re-occurring Revenue, Transactional Revenue or RPO as a comparative measure. 37

1 Gross Profit and Gross Margin Reconciliation $ in millions Three Months Ended June 30 Fiscal Years Ended March 31 Note: Amounts may not sum due to rounding. (1) Due to the inherent subjectivity in the classification of costs between cost of sales and operating and administrative expenses across our industry, we do not focus on gross profit or gross margin as key operating metrics for our business (2) Results for FY2022 represent the sum of the reported results of the predecessor entity, prior to giving effect to the acquisition by Platinum, for the period from April 1, 2021 through July 31, 2021 and the successor entity for the period from August 1, 2021 through March 31, 2022, which are not considered to be prepared in accordance with GAAP and do not include pro forma 38 adjustments that would otherwise be included in a pro forma presentation prepared in accordance with Regulation S-X. Such results also do not include any financial results of Achieve3000 prior to the date of its acquisition on November 1, 2021.