For the month of August, 2025 |
Commission File Number: 1-14678
|
CANADIAN IMPERIAL BANK OF COMMERCE |
||||||
Date: August 28, 2025 |
By: |
/s/ Allison Mudge |
||||
Name: |
Allison Mudge |
|||||
Title: |
Senior Vice-President |
|||||
Exhibit |
Description of Exhibit |
|
99.1 |
Report to Shareholders for the Third Quarter, 2025 |
|
101 |
Interactive Data File (formatted as Inline XBRL) |
|
104 |
Cover Page Interactive Data File (formatted as Inline XBRL and contained in Exhibit 101) |
|

|
Report to Shareholders for the Third Quarter, www.cibc.com August 28, 2025 |
Q3/25 |
Q3/24 |
Q2/25 |
YoY Variance |
QoQ Variance |
||||||||||||||||||||||||||
Revenue |
$7,254 million | $6,604 million | $7,022 million | +10% | +3% | |||||||||||||||||||||||||
Reported Net Income |
$2,096 million | $1,795 million | $2,007 million | +17% | +4% | |||||||||||||||||||||||||
Adjusted Net Income (1)
|
$2,104 million | $1,895 million | $2,016 million | +11% | +4% | |||||||||||||||||||||||||
Adjusted pre-provision, pre-tax earnings (1)
|
$3,289 million | $2,939 million | $3,214 million | +12% | +2% | |||||||||||||||||||||||||
Reported Diluted Earnings Per Share (EPS) |
$2.15 | $1.82 | $2.04 | +18% | +5% | |||||||||||||||||||||||||
Adjusted Diluted EPS (1)
|
$2.16 | $1.93 | $2.05 | +12% | +5% | |||||||||||||||||||||||||
Reported Return on Common Shareholders’ Equity (ROE) (2)
|
14.2% | 13.2% | 13.8% | |||||||||||||||||||||||||||
Adjusted ROE (1)
|
14.2% | 14.0% | 13.9% | |||||||||||||||||||||||||||
Net interest margin on average interest-earnings assets (2)(3)
|
1.58% | 1.50% | 1.54% | |||||||||||||||||||||||||||
| Net interest margin on average interest-earnings assets (excluding trading) (2)(3)
|
1.94% |
1.84% |
1.88% |
|||||||||||||||||||||||||||
Common Equity Tier 1 (CET1) Ratio (4)
|
13.4% | 13.3% | 13.4% |
| • | $11 million ($8 million after-tax) amortization of acquisition-related intangible assets. |
| (1) | This measure is a non-GAAP measure. For additional information, see the “Non-GAAP measures” section, including the quantitative reconciliations of reported GAAP measures to: adjusted non-interest expenses and adjusted net income on pages 9 to 13; and adjusted pre-provision, pre-tax earnings on page 14. |
| (2) | For additional information on the composition of these specified financial measures, see the “Glossary” section. |
| (3) | Average balances are calculated as a weighted average of daily closing balances. |
| (4) | Our capital ratios are calculated pursuant to the Office of the Superintendent of Financial Institution’s (OSFI’s) Capital Adequacy Requirements (CAR) Guideline and the leverage ratio is calculated pursuant to OSFI’s Leverage Requirements Guideline, all of which are based on the Basel Committee on Banking Supervision (BCBS) standards. For additional information, see the “Capital management” and “Liquidity risk” sections. |
| (5) | Certain prior period information has been restated. See the “External reporting changes” section for additional details. |
| • | CIBC deployed its in-house Generative AI platform, CIBC AI, enterprise-wide to help drive further productivity across the organization and enable team members to deliver on the bank’s client-focused strategy. |
| • | CIBC won the 2025 Digital CX Award for Best Use of AI for Customer Experience from The Digital Banker, recognizing the bank’s innovative AI-powered voice assistant. |
| • | CIBC received the highest ranking in customer satisfaction for both online and mobile banking among Canada’s Big 5 banks by J.D. Power and was named a 2025 Forrester Customer-Obsessed Enterprise award winner, the only retail bank in North America to receive this award. |
| • | CIBC launched the no annual fee CIBC Adapta ™ Mastercard® that automatically adapts to clients’ spending practices which supports our strategic priorities of gaining share in the credit card space, delivering seamless client experiences and best-in-class advice. |
| • | CIBC announced the launch of a new dedicated Business Banking program tailored for skilled trades professionals. This initiative builds on the success of CIBC’s first-of-its-kind skilled trades Personal Banking program. Together, these initiatives are designed to enhance support for a sector that is crucial to the Canadian economy. |
| • | CIBC Capital Markets was recognized as Global Capital’s 2024 Most Impressive Supranational, Sovereign and Agency House for the Canadian market. |
| • | CIBC was announced as national partner and Official Banking Partner of Special Olympics Team Canada. This partnership will help ensure Special Olympics Team Canada athletes receive essential training, health and mental preparation, and the dedicated coaching and support they need to achieve their ambitions. |
| • | The CIBC Foundation and the TELUS Friendly Future Foundation announced a transformative $2 million partnership to launch the TELUS Momentum Student Bursary, powered by the CIBC Foundation. With each foundation contributing $1 million, this multi-year partnership will support up to 500 young changemakers from the Black community, helping them accelerate their ambitions and impact across the globe. |
| • | Team CIBC raised $1.32 million dollars for the 29th annual Tour CIBC Charles-Bruneau, exceeding its goal. This year the event raised $3.75 million for children with cancer and marked CIBC’s 19th year as title partner of the Tour, with the bank having now raised over $14.36 million since 2006 for the Charles-Bruneau Foundation. |
| • | CIBC donated $150,000 to provide support to those affected by the wildfires and evacuation efforts across impacted areas. |
| (1) | Certain prior period information has been restated. See the “External reporting changes” section for additional details. |
| (2) | This measure is a non-GAAP measure. For additional information and a reconciliation of reported results to adjusted results, where applicable, see the “Non-GAAP measures” section. |
ii |
CIBC THIRD QUARTER 2025 |
Third quarter, 2025 |
||||||||||||||||||
Topics |
Recommendations |
Disclosures |
Management’s discussion and analysis |
Consolidated financial statements |
Pillar 3 report and Supplementary regulatory capital disclosure |
2024 Annual Report |
||||||||||||
Page references |
||||||||||||||||||
| General | 1 | Index of risk information – current page | ||||||||||||||||
| 2 | Risk terminology and measures | 47–50 | 93–95 | 100–103 | ||||||||||||||
| 3 | Top and emerging risks | 28–30 | 53–56 | |||||||||||||||
| 4 | Key future regulatory ratio requirements | 25, 38–40 | 71 | 17, 27 | |
37, 39–40, 75, 77, 164 |
|
|||||||||||
Risk governance, risk management and business model |
5 | Risk management structure | 46, 47 | |||||||||||||||
| 6 | Risk culture and appetite | 45, 48–50 | ||||||||||||||||
| 7 | Risks arising from business activities | 30 | 45–52, 56 | |||||||||||||||
| 8 | Bank-wide stress testing | 33 | |
35–36, 52, 60, 65, 71, 73 |
|
|||||||||||||
| Capital adequacy and risk-weighted assets |
9 | Minimum capital requirements | 24 | 71 | 35–37, 164 | |||||||||||||
| 10 | Components of capital and reconciliation to the consolidated regulatory balance sheet |
16–19 | 39 | |||||||||||||||
| 11 | Regulatory capital flow statement |
20 | 40 | |||||||||||||||
| 12 | Capital management and planning |
35, 37, 164 | ||||||||||||||||
| 13 | Business activities and risk-weighted assets |
30 | 5 | 41, 56 | ||||||||||||||
| 14 | Risk-weighted assets and capital requirements |
3, 5, 6–7 | 38, 41 | |||||||||||||||
| 15 | Credit risk by major portfolios | 40–54, 61–70 | 58–63 | |||||||||||||||
| 16 | Risk-weighted assets flow statement | 5, 11 | 40, 41 | |||||||||||||||
| 17 | Back-testing of models | 91, 92 | 52, 60 | |||||||||||||||
| Liquidity | 18 | Liquid assets | 37 | 74 | ||||||||||||||
| Funding | 19 | Encumbered assets | 38 | 74, 79 | ||||||||||||||
| 20 | Contractual maturities of assets, liabilities and off-balance sheet instruments |
42–43 | 78–80 | |||||||||||||||
| 21 | Funding strategy and sources | 40 | 78 | |||||||||||||||
| Market risk | 22 | Reconciliation of trading and non-trading portfolios to the consolidated balance sheet |
35 | 69 | ||||||||||||||
| 23 | Significant trading and non-trading market risk factors |
35–36 | 68–72 | |||||||||||||||
| 24 | Model assumptions, limitations and validation procedures |
52, 68–72 | ||||||||||||||||
| 25 | Stress testing and scenario analysis | 35, 51, 52, 56, 71 | ||||||||||||||||
| Credit risk | 26 | Analysis of credit risk exposures | 31–34 | |
12–13, 57–84, 87–90 |
|
|
61–67, 80 137–144, 151, 153, 154, 179, 183 |
|
|||||||||
| 27 | Impaired loan and forbearance techniques |
31, 33 | |
58, 65, 86, 119–120, 144 |
|
|||||||||||||
| 28 | Reconciliation of impaired loans and the allowance for credit losses |
33 | 64 | 65, 139 | ||||||||||||||
| 29 | Counterparty credit risk arising from derivatives |
|
71–72, 74, 90, 35 (1)
|
|
|
58, 62, 130, 132 151, 153–155 |
|
|||||||||||
| 30 | Credit risk mitigation | 31 | 31, 71, 73, 90 | 58, 62, 153–155 | ||||||||||||||
| Other risks | 31 | Other risks | 43 | 80–84 | ||||||||||||||
| 32 | Discussion of publicly known risk events |
73 | 53–56, 80, 176 | |||||||||||||||
| (1) | Included in our supplementary financial information package. |
CIBC THIRD QUARTER 2025 |
iii |
Management’s discussion and analysis (MD&A) is provided to enable readers to assess CIBC’s financial condition and results of operations as at and for the quarter ended July 31, 2025 compared with corresponding periods. The MD&A should be read in conjunction with our 2024 Annual Report and the unaudited interim consolidated financial statements included in this report. Unless otherwise indicated, all financial information in this MD&A has been prepared in accordance with International Financial Reporting Standards (IFRS or GAAP) and all amounts are expressed in Canadian dollars (CAD). Certain disclosures in the MD&A have been shaded as they form an integral part of the interim consolidated financial statements. The MD&A is current as of August 27, 2025. Additional information relating to CIBC is available on SEDAR+ at www.sedarplus.com and on the United States (U.S.) Securities and Exchange Commission’s (SEC) website at www.sec.gov. No information on CIBC’s website (www.cibc.com) should be considered incorporated herein by reference. A glossary of terms used throughout this quarterly report can be found on pages 44 to 50. |
CIBC THIRD QUARTER 2025 |
1 |
| As at or for the three months ended |
As at or for the nine months ended |
|||||||||||||||||||||||||||
Unaudited |
2025 Jul. 31 |
2025 Apr. 30 |
2024 Jul. 31 |
2025 Jul. 31 |
2024 Jul. 31 |
|||||||||||||||||||||||
Financial results |
||||||||||||||||||||||||||||
Net interest income |
$ |
4,048 |
$ | 3,788 | $ | 3,532 | $ |
11,637 |
$ | 10,062 | ||||||||||||||||||
Non-interest income |
3,206 |
3,234 | 3,072 | 9,920 |
8,927 | |||||||||||||||||||||||
Total revenue |
7,254 |
7,022 | 6,604 | 21,557 |
18,989 | |||||||||||||||||||||||
Provision for credit losses |
559 |
605 | 483 | 1,737 |
1,582 | |||||||||||||||||||||||
Non-interest expenses |
3,976 |
3,819 | 3,682 | 11,673 |
10,648 | |||||||||||||||||||||||
Income before income taxes |
2,719 |
2,598 | 2,439 | 8,147 |
6,759 | |||||||||||||||||||||||
Income taxes |
623 |
591 | 644 | 1,873 |
1,487 | |||||||||||||||||||||||
Net income |
$ |
2,096 |
$ | 2,007 | $ | 1,795 | $ |
6,274 |
$ | 5,272 | ||||||||||||||||||
Net income attributable to non-controlling interests |
$ |
2 |
$ | 9 | $ | 9 | $ |
19 |
$ | 31 | ||||||||||||||||||
Preferred shareholders and other equity instrument holders |
82 |
78 | 63 | 248 |
191 | |||||||||||||||||||||||
Common shareholders |
2,012 |
1,920 | 1,723 | 6,007 |
5,050 | |||||||||||||||||||||||
Net income attributable to equity shareholders |
$ |
2,094 |
$ | 1,998 | $ | 1,786 | $ |
6,255 |
$ | 5,241 | ||||||||||||||||||
Financial measures |
||||||||||||||||||||||||||||
Reported efficiency ratio (1)
|
54.8 |
% |
54.4 | % | 55.8 | % | 54.1 |
% |
56.1 | % | ||||||||||||||||||
Reported operating leverage (1)
|
1.9 |
% |
4.9 | % | 1.5 | % | 3.9 |
% |
11.0 | % | ||||||||||||||||||
Loan loss ratio (1)
|
0.33 |
% |
0.33 | % | 0.29 | % | 0.33 |
% |
0.33 | % | ||||||||||||||||||
Reported return on common shareholders’ equity (1)
|
14.2 |
% |
13.8 | % | 13.2 | % | 14.5 |
% |
13.5 | % | ||||||||||||||||||
Net interest margin (1)
|
1.46 |
% |
1.42 | % | 1.39 | % | 1.42 |
% |
1.35 | % | ||||||||||||||||||
Net interest margin on average interest-earning assets (1)(2)
|
1.58 |
% |
1.54 | % | 1.50 | % | 1.54 |
% |
1.46 | % | ||||||||||||||||||
Return on average assets (1)(2)
|
0.75 |
% |
0.75 | % | 0.71 | % | 0.76 |
% |
0.71 | % | ||||||||||||||||||
Return on average interest-earning assets (1)(2)
|
0.82 |
% |
0.82 | % | 0.76 | % | 0.83 |
% |
0.77 | % | ||||||||||||||||||
Reported effective tax rate |
22.9 |
% |
22.7 | % | 26.4 | % | 23.0 |
% |
22.0 | % | ||||||||||||||||||
Common share information |
||||||||||||||||||||||||||||
Per share ($) |
– basic earnings |
$ |
2.16 |
$ | 2.05 | $ | 1.83 | $ |
6.41 |
$ | 5.39 | |||||||||||||||||
– reported diluted earnings |
2.15 |
2.04 | 1.82 | 6.37 |
5.38 | |||||||||||||||||||||||
– dividends |
0.97 |
0.97 | 0.90 | 2.91 |
2.70 | |||||||||||||||||||||||
– book value (1)
|
60.18 |
59.65 | 55.66 | 60.18 |
55.66 | |||||||||||||||||||||||
Closing share price ($) |
99.03 |
86.95 | 71.40 | 99.03 |
71.40 | |||||||||||||||||||||||
Shares outstanding (thousands) |
– weighted-average basic |
932,258 |
938,495 | 943,467 | 937,588 |
937,696 | ||||||||||||||||||||||
– weighted-average diluted |
937,518 |
942,748 | 945,784 | 942,579 |
939,292 | |||||||||||||||||||||||
– end of period |
929,451 |
934,230 | 944,590 | 929,451 |
944,590 | |||||||||||||||||||||||
Market capitalization ($ millions) |
$ |
92,044 |
$ | 81,231 | $ | 67,444 | $ |
92,044 |
$ | 67,444 | ||||||||||||||||||
Value measures |
||||||||||||||||||||||||||||
Total shareholder return |
15.05 |
% |
(3.88 | )% | 12.65 | % | 17.47 |
% |
52.08 | % | ||||||||||||||||||
Dividend yield (based on closing share price) |
3.9 |
% |
4.6 | % | 5.0 | % | 3.9 |
% |
5.1 | % | ||||||||||||||||||
Reported dividend payout ratio (1)
|
44.9 |
% |
47.4 | % | 49.3 | % | 45.4 |
% |
50.1 | % | ||||||||||||||||||
Market value to book value ratio |
1.65 |
1.46 | 1.28 | 1.65 |
1.28 | |||||||||||||||||||||||
Selected financial measures – adjusted (3)
|
||||||||||||||||||||||||||||
Adjusted efficiency ratio |
54.7 |
% |
54.2 | % | 55.5 | % | 54.0 |
% |
55.3 | % | ||||||||||||||||||
Adjusted operating leverage |
1.7 |
% |
4.3 | % | 0.6 | % | 2.7 |
% |
1.0 | % | ||||||||||||||||||
Adjusted return on common shareholders’ equity |
14.2 |
% |
13.9 | % | 14.0 | % | 14.6 |
% |
13.8 | % | ||||||||||||||||||
Adjusted effective tax rate |
22.9 |
% |
22.7 | % | 22.8 | % | 23.0 |
% |
22.1 | % | ||||||||||||||||||
Adjusted diluted earnings per share (EPS) |
$ |
2.16 |
$ | 2.05 | $ | 1.93 | $ |
6.40 |
$ | 5.50 | ||||||||||||||||||
Adjusted dividend payout ratio |
44.7 |
% |
47.2 | % | 46.6 | % | 45.2 |
% |
49.1 | % | ||||||||||||||||||
On- and off-balance sheet information |
||||||||||||||||||||||||||||
Cash, deposits with banks and securities |
$ |
330,184 |
$ | 319,427 | $ | 301,771 | $ |
330,184 |
$ | 301,771 | ||||||||||||||||||
Loans and acceptances, net of allowance for credit losses |
581,644 |
571,639 | 550,149 | 581,644 |
550,149 | |||||||||||||||||||||||
Total assets |
1,102,255 |
1,090,143 | 1,021,407 | 1,102,255 |
1,021,407 | |||||||||||||||||||||||
Deposits |
792,672 |
784,627 | 743,446 | 792,672 |
743,446 | |||||||||||||||||||||||
Common shareholders’ equity (1)
|
55,930 |
55,724 | 52,580 | 55,930 |
52,580 | |||||||||||||||||||||||
Average assets (2)
|
1,103,447 |
1,096,006 | 1,012,012 | 1,098,605 |
994,820 | |||||||||||||||||||||||
Average interest-earning assets (1)(2)
|
1,015,107 |
1,009,512 | 938,914 | 1,010,140 |
919,012 | |||||||||||||||||||||||
Average common shareholders’ equity (1)(2)
|
56,289 |
56,959 | 51,916 | 55,317 |
50,107 | |||||||||||||||||||||||
Assets under administration (AUA) (1)(4)(5)
|
3,965,501 |
3,765,012 | 3,475,292 | 3,965,501 |
3,475,292 | |||||||||||||||||||||||
Assets under management (AUM) (1)(5)
|
402,901 |
376,360 | 371,950 | 402,901 |
371,950 | |||||||||||||||||||||||
Balance sheet quality and liquidity measures (6)
|
||||||||||||||||||||||||||||
Risk-weighted assets (RWA) ($ millions) |
$ |
347,712 |
$ | 341,204 | $ | 329,202 | $ |
347,712 |
$ | 329,202 | ||||||||||||||||||
Common Equity Tier 1 (CET1) ratio |
13.4 |
% |
13.4 | % | 13.3 | % | 13.4 |
% |
13.3 | % | ||||||||||||||||||
Tier 1 capital ratio |
15.3 |
% |
15.2 | % | 14.8 | % | 15.3 |
% |
14.8 | % | ||||||||||||||||||
Total capital ratio |
17.6 |
% |
17.8 | % | 17.1 | % | 17.6 |
% |
17.1 | % | ||||||||||||||||||
Leverage ratio |
4.3 |
% |
4.3 | % | 4.3 | % | 4.3 |
% |
4.3 | % | ||||||||||||||||||
Liquidity coverage ratio (LCR) |
127 |
% |
131 | % | 126 | % | n/a |
n/a | ||||||||||||||||||||
Net stable funding ratio (NSFR) |
115 |
% |
113 | % | 116 | % | 115 |
% |
116 | % | ||||||||||||||||||
Other information |
||||||||||||||||||||||||||||
Full-time equivalent employees |
49,761 |
48,726 | 48,552 | 49,761 |
48,552 | |||||||||||||||||||||||
| (1) | For additional information on the composition of these specified financial measures, see the “Glossary” section. |
| (2) | Average balances are calculated as a weighted average of daily closing balances. |
| (3) | Adjusted measures are non-GAAP measures. Adjusted measures are calculated in the same manner as reported measures, except that financial information included in the calculation of adjusted measures is adjusted to exclude the impact of items of note. For additional information and a reconciliation of reported results to adjusted results, where applicable, see the “Non-GAAP measures” section. |
| (4) | Includes the full contract amount of AUA or custody under a 50/50 joint venture between CIBC and The Bank of New York Mellon of $3,130.1 billion (April 30, 2025: $2,965.9 billion; July 31, 2024: $2,725.2 billion). |
| (5) | AUM amounts are included in the amounts reported under AUA. |
| (6) | RWA and our capital ratios are calculated pursuant to the Office of the Superintendent of Financial Institution’s (OSFI’s) Capital Adequacy Requirements (CAR) Guideline, the leverage ratio is calculated pursuant to OSFI’s Leverage Requirements Guideline, and LCR and NSFR are calculated pursuant to OSFI’s Liquidity Adequacy Requirements (LAR) Guideline, all of which are based on the Basel Committee on Banking Supervision (BCBS) standards. For additional information, see the “Capital management” and “Liquidity risk” sections. |
| n/a | Not applicable. |
2 |
CIBC THIRD QUARTER 2025 |
| • | Our Simplii Financial direct banking business and Investor’s Edge direct investing business, previously reported in Capital Markets and Direct Financial Services were realigned with Canadian Personal and Business Banking and Canadian Commercial Banking and Wealth Management, respectively; and |
| • | Our CIBC Cleary Gull U.S. mid-market investment banking business was realigned from Capital Markets to U.S. Commercial Banking and Wealth Management. |
CIBC THIRD QUARTER 2025 |
3 |
| • | $11 million ($8 million after-tax) amortization of acquisition-related intangible assets ($5 million after-tax in Canadian Personal and Business Banking, and $3 million after-tax in U.S. Commercial Banking and Wealth Management). |
|
For the three months ended |
For the nine months ended |
|||||||||||||||||||||||
$ millions |
2025 Jul. 31 |
2025 Apr. 30 |
2024 Jul. 31 |
2025 Jul. 31 |
2024 Jul. 31 |
|||||||||||||||||||
Net interest income consists of: |
||||||||||||||||||||||||
Non-trading net interest income |
$ |
4,297 |
$ | 4,010 | $ | 3,810 | $ |
12,425 |
$ | 10,712 | ||||||||||||||
Trading net interest income (2)
|
(249 |
) |
(222 | ) | (278 | ) (3) |
(788 |
) |
(650 | ) (3) |
||||||||||||||
Total net interest income |
$ |
4,048 |
$ | 3,788 | $ | 3,532 | $ |
11,637 |
$ | 10,062 | ||||||||||||||
Average interest-earning assets consists of: |
||||||||||||||||||||||||
Average trading interest-earning assets |
137,797 |
135,277 | 113,945 | 139,507 |
105,828 | |||||||||||||||||||
Average non-trading interest-earning assets |
877,310 |
874,235 | 824,969 | 870,633 |
813,184 | |||||||||||||||||||
Total average interest-earning assets |
1,015,107 |
1,009,512 | 938,914 | 1,010,140 |
919,012 | |||||||||||||||||||
Net interest margin on average interest-earning assets |
1.58 |
% |
1.54 | % | 1.50 | % | 1.54 |
% |
1.46 | % | ||||||||||||||
Net interest margin on average interest-earning assets (excluding trading) (4)
|
1.94 |
% |
1.88 | % | 1.84 | % | 1.91 |
% |
1.76 | % | ||||||||||||||
| (1) | Adjusted measures are non-GAAP measures. For additional information and a reconciliation of reported results to adjusted results, where applicable, see the “Non-GAAP measures” section. |
| (2) | See the “Glossary – Trading activities and trading net interest income” section for additional information. |
| (3) | Does not include a reversal of a taxable equivalent basis (TEB) adjustment of $123 million for the quarter ended July 31, 2024 and a TEB adjustment of $16 million for the nine months ended July 31, 2024. |
| (4) | Net interest margin on average interest-earnings assets (excluding trading) is computed using total net interest income minus trading net interest income, excluding the applicable TEB adjustment included therein, divided by total average interest-earning assets minus average trading interest-earning assets. For additional information, see the “Glossary” section. |
4 |
CIBC THIRD QUARTER 2025 |
| For the three months ended |
For the nine months ended |
|||||||||||||||||||||||
$ millions |
2025 Jul. 31 |
2025 Apr. 30 |
2024 Jul. 31 |
2025 Jul. 31 |
2024 Jul. 31 |
|||||||||||||||||||
Provision for (reversal of) credit losses – impaired |
||||||||||||||||||||||||
Canadian Personal and Business Banking (1)
|
$ |
361 |
$ | 357 | $ | 307 | $ |
1,025 |
$ | 877 | ||||||||||||||
Canadian Commercial Banking and Wealth Management (1)
|
25 |
34 | 35 | 72 |
56 | |||||||||||||||||||
U.S. Commercial Banking and Wealth Management |
57 |
64 | 15 | 228 |
365 | |||||||||||||||||||
Capital Markets (1)
|
37 |
2 | 37 | 46 |
34 | |||||||||||||||||||
Corporate and Other |
1 |
6 | 10 | 19 |
11 | |||||||||||||||||||
481 |
463 | 404 | 1,390 |
1,343 | ||||||||||||||||||||
Provision for (reversal of) credit losses – performing |
||||||||||||||||||||||||
Canadian Personal and Business Banking (1)
|
83 |
32 | 35 | 236 |
76 | |||||||||||||||||||
Canadian Commercial Banking and Wealth Management (1)
|
(4 |
) |
20 | 7 | 42 |
43 | ||||||||||||||||||
U.S. Commercial Banking and Wealth Management |
(40 |
) |
59 | 32 | (20 |
) |
112 | |||||||||||||||||
Capital Markets (1)
|
39 |
32 | 4 | 85 |
19 | |||||||||||||||||||
Corporate and Other |
– |
(1 | ) | 1 | 4 |
(11 | ) | |||||||||||||||||
78 |
142 | 79 | 347 |
239 | ||||||||||||||||||||
$ |
559 |
$ | 605 | $ | 483 | $ |
1,737 |
$ | 1,582 | |||||||||||||||
| (1) | Certain prior period information has been restated. See the “External reporting changes” section for additional details. |
CIBC THIRD QUARTER 2025 |
5 |
|
For the three
months ended
|
For the nine months ended |
|||||||||||||||
$ millions, except per share amounts |
Jul. 31, 2025
vs. Jul. 31, 2024
|
Jul. 31, 2025
vs. Apr. 30, 2025
|
Jul. 31, 2025
vs. Jul. 31, 2024
|
|||||||||||||
Estimated increase (decrease) in: |
||||||||||||||||
Total revenue |
$ | 5 | $ | (63 | ) | $ | 191 | |||||||||
Provision for (reversal of) credit losses |
– | (2 | ) | 12 | ||||||||||||
Non-interest expenses |
2 | (28 | ) | 88 | ||||||||||||
Income taxes |
1 | (7 | ) | 21 | ||||||||||||
Net income (loss) |
2 | (26 | ) | 70 | ||||||||||||
Impact on EPS: |
||||||||||||||||
Basic |
$ | – | $ | (0.03 | ) | $ | 0.07 | |||||||||
Diluted |
– | (0.03 | ) | 0.07 | ||||||||||||
Average USD appreciation (depreciation) relative to CAD |
0.3 | % | (3.3 | ) % | 3.7 | % | ||||||||||
$ millions, except per share amounts, for the three months ended |
2025 |
2024 | 2023 | |||||||||||||||||||||||||||||||
Jul. 31 |
Apr. 30 | Jan. 31 | Oct. 31 | Jul. 31 | Apr. 30 | Jan. 31 | Oct. 31 | |||||||||||||||||||||||||||
Revenue |
||||||||||||||||||||||||||||||||||
Canadian Personal and Business Banking (1)
|
$ |
3,061 |
$ | 2,859 | $ | 2,923 | $ | 2,842 | $ | 2,775 | $ | 2,646 | $ | 2,679 | $ | 2,640 | ||||||||||||||||||
Canadian Commercial Banking and Wealth Management (1)
|
1,723 |
1,640 | 1,703 | 1,602 | 1,523 | 1,456 | 1,437 | 1,424 | ||||||||||||||||||||||||||
U.S. Commercial Banking and Wealth Management (1)
|
790 |
769 | 847 | 733 | 731 | 669 | 687 | 681 | ||||||||||||||||||||||||||
Capital Markets (1)(2)
|
1,506 |
1,545 | 1,574 | 1,155 | 1,092 | 1,243 | 1,310 | 1,041 | ||||||||||||||||||||||||||
Corporate and Other (2)
|
174 |
209 | 234 | 285 | 483 | 150 | 108 | 61 | ||||||||||||||||||||||||||
Total revenue |
$ |
7,254 |
$ | 7,022 | $ | 7,281 | $ | 6,617 | $ | 6,604 | $ | 6,164 | $ | 6,221 | $ | 5,847 | ||||||||||||||||||
Net interest income |
$ |
4,048 |
$ | 3,788 | $ | 3,801 | $ | 3,633 | $ | 3,532 | $ | 3,281 | $ | 3,249 | $ | 3,197 | ||||||||||||||||||
Non-interest income |
3,206 |
3,234 | 3,480 | 2,984 | 3,072 | 2,883 | 2,972 | 2,650 | ||||||||||||||||||||||||||
Total revenue |
7,254 |
7,022 | 7,281 | 6,617 | 6,604 | 6,164 | 6,221 | 5,847 | ||||||||||||||||||||||||||
Provision for credit losses |
559 |
605 | 573 | 419 | 483 | 514 | 585 | 541 | ||||||||||||||||||||||||||
Non-interest expenses |
3,976 |
3,819 | 3,878 | 3,791 | 3,682 | 3,501 | 3,465 | 3,440 | ||||||||||||||||||||||||||
Income before income taxes |
2,719 |
2,598 | 2,830 | 2,407 | 2,439 | 2,149 | 2,171 | 1,866 | ||||||||||||||||||||||||||
Income taxes |
623 |
591 | 659 | 525 | 644 | 400 | 443 | 381 | ||||||||||||||||||||||||||
Net income |
$ |
2,096 |
$ | 2,007 | $ | 2,171 | $ | 1,882 | $ | 1,795 | $ | 1,749 | $ | 1,728 | $ | 1,485 | ||||||||||||||||||
Net income attributable to: |
||||||||||||||||||||||||||||||||||
Non-controlling interests |
$ |
2 |
$ | 9 | $ | 8 | $ | 8 | $ | 9 | $ | 10 | $ | 12 | $ | 8 | ||||||||||||||||||
Equity shareholders |
2,094 |
1,998 | 2,163 | 1,874 | 1,786 | 1,739 | 1,716 | 1,477 | ||||||||||||||||||||||||||
EPS – basic |
$ |
2.16 |
$ | 2.05 | $ | 2.20 | $ | 1.91 | $ | 1.83 | $ | 1.79 | $ | 1.77 | $ | 1.53 | ||||||||||||||||||
– diluted |
2.15 |
2.04 | 2.19 | 1.90 | 1.82 | 1.79 | 1.77 | 1.53 | ||||||||||||||||||||||||||
| (1) | Certain prior period information has been restated. See the “External reporting changes” section for additional details. |
| (2) | Commencing in the third quarter of 2024, TEB reporting is no longer applicable to certain dividends received on or after January 1, 2024. In the third quarter of 2024, the enactment of the denial of the dividends received deduction resulted in a TEB reversal for dividends received on or after January 1, 2024 that were reflected in the first and second quarters of 2024 as an item of note. Prior to the third quarter of 2024, Capital Markets revenue and income taxes were reported on a TEB with an equivalent offset in the revenue and income taxes of Corporate and Other. |
6 |
CIBC THIRD QUARTER 2025 |
CIBC THIRD QUARTER 2025 |
7 |
8 |
CIBC THIRD QUARTER 2025 |
| $ millions, for the three months ended July 31, 2025 | Canadian Personal and Business Banking |
Canadian Commercial Banking and Wealth Management |
U.S. Commercial Banking and Wealth Management |
Capital Markets |
Corporate and Other |
CIBC Total |
U.S. Commercial Banking and Wealth Management (US$ millions) |
|||||||||||||||||||||||||
Operating results – reported |
||||||||||||||||||||||||||||||||
Total revenue |
$ |
3,061 |
$ |
1,723 |
$ |
790 |
$ |
1,506 |
$ |
174 |
$ |
7,254 |
$ |
576 |
||||||||||||||||||
Provision for credit losses |
444 |
21 |
17 |
76 |
1 |
559 |
14 |
|||||||||||||||||||||||||
Non-interest expenses |
1,517 |
879 |
450 |
721 |
409 |
3,976 |
327 |
|||||||||||||||||||||||||
Income (loss) before income taxes |
1,100 |
823 |
323 |
709 |
(236 |
) |
2,719 |
235 |
||||||||||||||||||||||||
Income taxes |
288 |
225 |
69 |
169 |
(128 |
) |
623 |
49 |
||||||||||||||||||||||||
Net income (loss) |
812 |
598 |
254 |
540 |
(108 |
) |
2,096 |
186 |
||||||||||||||||||||||||
Net income attributable to non-controlling interests |
– |
– |
– |
– |
2 |
2 |
– |
|||||||||||||||||||||||||
Net income (loss) attributable to equity shareholders |
812 |
598 |
254 |
540 |
(110 |
) |
2,094 |
186 |
||||||||||||||||||||||||
Diluted EPS |
$ |
2.15 |
||||||||||||||||||||||||||||||
Impact of items of note (1)
|
||||||||||||||||||||||||||||||||
Non-interest expenses |
||||||||||||||||||||||||||||||||
Amortization of acquisition-related intangible assets |
$ |
(7 |
) |
$ |
– |
$ |
(4 |
) |
$ |
– |
$ |
– |
$ |
(11 |
) |
$ |
(3 |
) |
||||||||||||||
Impact of items of note on non-interest expenses |
(7 |
) |
– |
(4 |
) |
– |
– |
(11 |
) |
(3 |
) |
|||||||||||||||||||||
Total pre-tax impact of items of note on net income |
7 |
– |
4 |
– |
– |
11 |
3 |
|||||||||||||||||||||||||
Income taxes |
||||||||||||||||||||||||||||||||
Amortization of acquisition-related intangible assets |
2 |
– |
1 |
– |
– |
3 |
1 |
|||||||||||||||||||||||||
Impact of items of note on income taxes |
2 |
– |
1 |
– |
– |
3 |
1 |
|||||||||||||||||||||||||
Total after-tax impact of items of note on net income |
$ |
5 |
$ |
– |
$ |
3 |
$ |
– |
$ |
– |
$ |
8 |
$ |
2 |
||||||||||||||||||
Impact of items of note on diluted EPS (2)
|
$ |
0.01 |
||||||||||||||||||||||||||||||
Operating results – adjusted (3)
|
||||||||||||||||||||||||||||||||
Total revenue – adjusted (4)
|
$ |
3,061 |
$ |
1,723 |
$ |
790 |
$ |
1,506 |
$ |
174 |
$ |
7,254 |
$ |
576 |
||||||||||||||||||
Provision for credit losses – adjusted |
444 |
21 |
17 |
76 |
1 |
559 |
14 |
|||||||||||||||||||||||||
Non-interest expenses – adjusted |
1,510 |
879 |
446 |
721 |
409 |
3,965 |
324 |
|||||||||||||||||||||||||
Income (loss) before income taxes – adjusted |
1,107 |
823 |
327 |
709 |
(236 |
) |
2,730 |
238 |
||||||||||||||||||||||||
Income taxes – adjusted |
290 |
225 |
70 |
169 |
(128 |
) |
626 |
50 |
||||||||||||||||||||||||
Net income (loss) – adjusted |
817 |
598 |
257 |
540 |
(108 |
) |
2,104 |
188 |
||||||||||||||||||||||||
Net income attributable to non-controlling interests – adjusted |
– |
– |
– |
– |
2 |
2 |
– |
|||||||||||||||||||||||||
Net income (loss) attributable to equity shareholders – adjusted |
817 |
598 |
257 |
540 |
(110 |
) |
2,102 |
188 |
||||||||||||||||||||||||
Adjusted diluted EPS |
$ |
2.16 |
||||||||||||||||||||||||||||||
| (1) | Items of note are removed from reported results to calculate adjusted results. |
| (2) | Includes the impact of rounding differences between diluted EPS and adjusted diluted EPS. |
| (3) | Adjusted to exclude the impact of items of note. Adjusted measures are non-GAAP measures. |
| (4) | CIBC total results excludes a TEB adjustment of nil for the quarter ended July 31, 2025 (April 30, 2025: nil; July 31, 2024: excludes a reversal of a TEB adjustment of $123 million) and nil for the nine months ended July 31, 2025 (July 31, 2024: excludes a TEB adjustment of $16 million). |
| (5) | Certain prior period information has been restated. See the “External reporting changes” section for additional details. |
| (6) | This item of note reports the impact on consolidated income tax expense had a Federal tax proposal related to the denial of Canadian dividends been substantively enacted at that time. The corresponding impact on revenue reported on a TEB in Capital Markets and Corporate and Other is also included in this item of note with no impact on the consolidated item of note. |
CIBC THIRD QUARTER 2025 |
9 |
| $ millions, for the three months ended April 30, 2025 |
Canadian Personal and Business Banking |
Canadian Commercial Banking and Wealth Management |
U.S. Commercial Banking and Wealth Management |
Capital Markets |
Corporate and Other |
CIBC Total |
U.S. Commercial Banking and Wealth Management (US$ millions) |
|||||||||||||||||||||||||
Operating results – reported |
||||||||||||||||||||||||||||||||
Total revenue |
$ | 2,859 | $ | 1,640 | $ | 769 | $ | 1,545 | $ | 209 | $ | 7,022 | $ | 541 | ||||||||||||||||||
Provision for credit losses |
389 | 54 | 123 | 34 | 5 | 605 | 86 | |||||||||||||||||||||||||
Non-interest expenses |
1,478 | 833 | 441 | 719 | 348 | 3,819 | 310 | |||||||||||||||||||||||||
Income (loss) before income taxes |
992 | 753 | 205 | 792 | (144 | ) | 2,598 | 145 | ||||||||||||||||||||||||
Income taxes |
258 | 204 | 32 | 226 | (129 | ) | 591 | 23 | ||||||||||||||||||||||||
Net income (loss) |
734 | 549 | 173 | 566 | (15 | ) | 2,007 | 122 | ||||||||||||||||||||||||
Net income attributable to non-controlling interests |
– | – | – | – | 9 | 9 | – | |||||||||||||||||||||||||
Net income (loss) attributable to equity shareholders |
734 | 549 | 173 | 566 | (24 | ) | 1,998 | 122 | ||||||||||||||||||||||||
Diluted EPS |
$ | 2.04 | ||||||||||||||||||||||||||||||
Impact of items of note (1)
|
||||||||||||||||||||||||||||||||
Non-interest expenses |
||||||||||||||||||||||||||||||||
Amortization of acquisition-related intangible assets |
$ | (6 | ) | $ | – | $ | (5 | ) | $ | – | $ | – | $ | (11 | ) | $ | (3 | ) | ||||||||||||||
Impact of items of note on non-interest expenses |
(6 | ) | – | (5 | ) | – | – | (11 | ) | (3 | ) | |||||||||||||||||||||
Total pre-tax impact of items of note on net income |
6 | – | 5 | – | – | 11 | 3 | |||||||||||||||||||||||||
Income taxes |
||||||||||||||||||||||||||||||||
Amortization of acquisition-related intangible assets |
1 | – | 1 | – | – | 2 | – | |||||||||||||||||||||||||
Impact of items of note on income taxes |
1 | – | 1 | – | – | 2 | – | |||||||||||||||||||||||||
Total after-tax impact of items of note on net income |
$ | 5 | $ | – | $ | 4 | $ | – | $ | – | $ | 9 | $ | 3 | ||||||||||||||||||
Impact of items of note on diluted EPS (2)
|
$ | 0.01 | ||||||||||||||||||||||||||||||
Operating results – adjusted (3)
|
||||||||||||||||||||||||||||||||
Total revenue – adjusted (4)
|
$ | 2,859 | $ | 1,640 | $ | 769 | $ | 1,545 | $ | 209 | $ | 7,022 | $ | 541 | ||||||||||||||||||
Provision for credit losses – adjusted |
389 | 54 | 123 | 34 | 5 | 605 | 86 | |||||||||||||||||||||||||
Non-interest expenses – adjusted |
1,472 | 833 | 436 | 719 | 348 | 3,808 | 307 | |||||||||||||||||||||||||
Income (loss) before income taxes – adjusted |
998 | 753 | 210 | 792 | (144 | ) | 2,609 | 148 | ||||||||||||||||||||||||
Income taxes – adjusted |
259 | 204 | 33 | 226 | (129 | ) | 593 | 23 | ||||||||||||||||||||||||
Net income (loss) – adjusted |
739 | 549 | 177 | 566 | (15 | ) | 2,016 | 125 | ||||||||||||||||||||||||
Net income attributable to non-controlling interests – adjusted |
– | – | – | – | 9 | 9 | – | |||||||||||||||||||||||||
Net income (loss) attributable to equity shareholders – adjusted |
739 | 549 | 177 | 566 | (24 | ) | 2,007 | 125 | ||||||||||||||||||||||||
Adjusted diluted EPS |
$ | 2.05 | ||||||||||||||||||||||||||||||
10 |
CIBC THIRD QUARTER 2025 |
| $ millions, for the three months ended July 31, 2024 (5)
|
Canadian Personal and Business Banking |
Canadian Commercial Banking and Wealth Management |
U.S. Commercial Banking and Wealth Management |
Capital Markets |
Corporate and Other |
CIBC Total |
U.S. Commercial Banking and Wealth Management (US$ millions) |
|||||||||||||||||||||||||
Operating results – reported |
||||||||||||||||||||||||||||||||
Total revenue |
$ | 2,775 | $ | 1,523 | $ | 731 | $ | 1,092 | $ | 483 | $ | 6,604 | $ | 534 | ||||||||||||||||||
Provision for credit losses |
342 | 42 | 47 | 41 | 11 | 483 | 33 | |||||||||||||||||||||||||
Non-interest expenses |
1,472 | 793 | 420 | 651 | 346 | 3,682 | 307 | |||||||||||||||||||||||||
Income before income taxes |
961 | 688 | 264 | 400 | 126 | 2,439 | 194 | |||||||||||||||||||||||||
Income taxes |
268 | 187 | 48 | 111 | 30 | 644 | 35 | |||||||||||||||||||||||||
Net income |
693 | 501 | 216 | 289 | 96 | 1,795 | 159 | |||||||||||||||||||||||||
Net income attributable to non-controlling interests |
– | – | – | – | 9 | 9 | – | |||||||||||||||||||||||||
Net income attributable to equity shareholders |
693 | 501 | 216 | 289 | 87 | 1,786 | 159 | |||||||||||||||||||||||||
Diluted EPS |
$ | 1.82 | ||||||||||||||||||||||||||||||
Impact of items of note (1)
|
||||||||||||||||||||||||||||||||
Revenue |
||||||||||||||||||||||||||||||||
Adjustments related to the denial of dividends received deduction for Canadian banks (6)
|
$ | – | $ | – | $ | – | $ | 123 | $ | (123 | ) | $ | – | $ | – | |||||||||||||||||
Impact of items of note on revenue |
– | – | – | 123 | (123 | ) | – | – | ||||||||||||||||||||||||
Non-interest expenses |
||||||||||||||||||||||||||||||||
Amortization of acquisition-related intangible assets |
(7 | ) | – | (8 | ) | – | – | (15 | ) | (6 | ) | |||||||||||||||||||||
Charge related to the special assessment imposed by the FDIC |
– | – | (2 | ) | – | – | (2 | ) | (2 | ) | ||||||||||||||||||||||
Impact of items of note on non-interest expenses |
(7 | ) | – | (10 | ) | – | – | (17 | ) | (8 | ) | |||||||||||||||||||||
Total pre-tax impact of items of note on net income |
7 | – | 10 | 123 | (123 | ) | 17 | 8 | ||||||||||||||||||||||||
Income taxes |
||||||||||||||||||||||||||||||||
Amortization of acquisition-related intangible assets |
2 | – | 2 | – | – | 4 | 2 | |||||||||||||||||||||||||
Adjustments related to the denial of dividends received deduction for Canadian banks (6)
|
– | – | – | 35 | (123 | ) | (88 | ) | – | |||||||||||||||||||||||
Charge related to the special assessment imposed by the FDIC |
– | – | 1 | – | – | 1 | 1 | |||||||||||||||||||||||||
Impact of items of note on income taxes |
2 | – | 3 | 35 | (123 | ) | (83 | ) | 3 | |||||||||||||||||||||||
Total after-tax impact of items of note on net income |
$ | 5 | $ | – | $ | 7 | $ | 88 | $ | – | $ | 100 | $ | 5 | ||||||||||||||||||
Impact of items of note on diluted EPS (2)
|
$ | 0.11 | ||||||||||||||||||||||||||||||
Operating results – adjusted (3)
|
||||||||||||||||||||||||||||||||
Total revenue – adjusted (4)
|
$ | 2,775 | $ | 1,523 | $ | 731 | $ | 1,215 | $ | 360 | $ | 6,604 | $ | 534 | ||||||||||||||||||
Provision for credit losses – adjusted |
342 | 42 | 47 | 41 | 11 | 483 | 33 | |||||||||||||||||||||||||
Non-interest expenses – adjusted |
1,465 | 793 | 410 | 651 | 346 | 3,665 | 299 | |||||||||||||||||||||||||
Income before income taxes – adjusted |
968 | 688 | 274 | 523 | 3 | 2,456 | 202 | |||||||||||||||||||||||||
Income taxes – adjusted |
270 | 187 | 51 | 146 | (93 | ) | 561 | 38 | ||||||||||||||||||||||||
Net income – adjusted |
698 | 501 | 223 | 377 | 96 | 1,895 | 164 | |||||||||||||||||||||||||
Net income attributable to non-controlling interests – adjusted |
– | – | – | – | 9 | 9 | – | |||||||||||||||||||||||||
Net income attributable to equity shareholders – adjusted |
698 | 501 | 223 | 377 | 87 | 1,886 | 164 | |||||||||||||||||||||||||
Adjusted diluted EPS |
$ | 1.93 | ||||||||||||||||||||||||||||||
CIBC THIRD QUARTER 2025 |
11 |
| $ millions, for the nine months ended July 31, 2025 | Canadian Personal and Business Banking |
Canadian Commercial Banking and Wealth Management |
U.S. Commercial Banking and Wealth Management |
Capital Markets |
Corporate and Other |
CIBC Total |
U.S. Commercial Banking and Wealth Management (US$ millions) |
|||||||||||||||||||||||||
Operating results – reported |
||||||||||||||||||||||||||||||||
Total revenue |
$ |
8,843 |
$ |
5,066 |
$ |
2,406 |
$ |
4,625 |
$ |
617 |
$ |
21,557 |
$ |
1,709 |
||||||||||||||||||
Provision for credit losses |
1,261 |
114 |
208 |
131 |
23 |
1,737 |
148 |
|||||||||||||||||||||||||
Non-interest expenses |
4,455 |
2,565 |
1,361 |
2,145 |
1,147 |
11,673 |
966 |
|||||||||||||||||||||||||
Income (loss) before income taxes |
3,127 |
2,387 |
837 |
2,349 |
(553 |
) |
8,147 |
595 |
||||||||||||||||||||||||
Income taxes |
816 |
649 |
154 |
624 |
(370 |
) |
1,873 |
109 |
||||||||||||||||||||||||
Net income (loss) |
2,311 |
1,738 |
683 |
1,725 |
(183 |
) |
6,274 |
486 |
||||||||||||||||||||||||
Net income attributable to non-controlling interests |
– |
– |
– |
– |
19 |
19 |
– |
|||||||||||||||||||||||||
Net income (loss) attributable to equity shareholders |
2,311 |
1,738 |
683 |
1,725 |
(202 |
) |
6,255 |
486 |
||||||||||||||||||||||||
Diluted EPS |
$ |
6.37 |
||||||||||||||||||||||||||||||
Impact of items of note (1)
|
||||||||||||||||||||||||||||||||
Non-interest expenses |
||||||||||||||||||||||||||||||||
Amortization of acquisition-related intangible assets |
$ |
(20 |
) |
$ |
– |
$ |
(14 |
) |
$ |
– |
$ |
– |
$ |
(34 |
) |
$ |
(10 |
) |
||||||||||||||
Impact of items of note on non-interest expenses |
(20 |
) |
– |
(14 |
) |
– |
– |
(34 |
) |
(10 |
) |
|||||||||||||||||||||
Total pre-tax impact of items of note on net income |
20 |
– |
14 |
– |
– |
34 |
10 |
|||||||||||||||||||||||||
Income taxes |
||||||||||||||||||||||||||||||||
Amortization of acquisition-related intangible assets |
5 |
– |
4 |
– |
– |
9 |
3 |
|||||||||||||||||||||||||
Impact of items of note on income taxes |
5 |
– |
4 |
– |
– |
9 |
3 |
|||||||||||||||||||||||||
Total after-tax impact of items of note on net income |
$ |
15 |
$ |
– |
$ |
10 |
$ |
– |
$ |
– |
$ |
25 |
$ |
7 |
||||||||||||||||||
Impact of items of note on diluted EPS (2)
|
$ |
0.03 |
||||||||||||||||||||||||||||||
Operating results – adjusted (3)
|
||||||||||||||||||||||||||||||||
Total revenue – adjusted (4)
|
$ |
8,843 |
$ |
5,066 |
$ |
2,406 |
$ |
4,625 |
$ |
617 |
$ |
21,557 |
$ |
1,709 |
||||||||||||||||||
Provision for credit losses – adjusted |
1,261 |
114 |
208 |
131 |
23 |
1,737 |
148 |
|||||||||||||||||||||||||
Non-interest expenses – adjusted |
4,435 |
2,565 |
1,347 |
2,145 |
1,147 |
11,639 |
956 |
|||||||||||||||||||||||||
Income (loss) before income taxes – adjusted |
3,147 |
2,387 |
851 |
2,349 |
(553 |
) |
8,181 |
605 |
||||||||||||||||||||||||
Income taxes – adjusted |
821 |
649 |
158 |
624 |
(370 |
) |
1,882 |
112 |
||||||||||||||||||||||||
Net income (loss) – adjusted |
2,326 |
1,738 |
693 |
1,725 |
(183 |
) |
6,299 |
493 |
||||||||||||||||||||||||
Net income attributable to non-controlling interests – adjusted |
– |
– |
– |
– |
19 |
19 |
– |
|||||||||||||||||||||||||
Net income (loss) attributable to equity shareholders – adjusted |
2,326 |
1,738 |
693 |
1,725 |
(202 |
) |
6,280 |
493 |
||||||||||||||||||||||||
Adjusted diluted EPS |
$ |
6.40 |
||||||||||||||||||||||||||||||
12 |
CIBC THIRD QUARTER 2025 |
| $ millions, for the nine months ended July 31, 2024 (5)
|
Canadian Personal and Business Banking |
Canadian Commercial Banking and Wealth Management |
U.S. Commercial Banking and Wealth Management |
Capital Markets |
Corporate and Other |
CIBC Total |
U.S. Commercial Banking and Wealth Management (US$ millions) |
|||||||||||||||||||||||||
Operating results – reported |
||||||||||||||||||||||||||||||||
Total revenue |
$ | 8,100 | $ | 4,416 | $ | 2,087 | $ | 3,645 | $ | 741 | $ | 18,989 | $ | 1,536 | ||||||||||||||||||
Provision for credit losses |
953 | 99 | 477 | 53 | – | 1,582 | 351 | |||||||||||||||||||||||||
Non-interest expenses |
4,243 | 2,243 | 1,303 | 1,827 | 1,032 | 10,648 | 959 | |||||||||||||||||||||||||
Income (loss) before income taxes |
2,904 | 2,074 | 307 | 1,765 | (291 | ) | 6,759 | 226 | ||||||||||||||||||||||||
Income taxes |
791 | 562 | 7 | 482 | (355 | ) | 1,487 | 5 | ||||||||||||||||||||||||
Net income |
2,113 | 1,512 | 300 | 1,283 | 64 | 5,272 | 221 | |||||||||||||||||||||||||
Net income attributable to non-controlling interests |
– | – | – | – | 31 | 31 | – | |||||||||||||||||||||||||
Net income attributable to equity shareholders |
2,113 | 1,512 | 300 | 1,283 | 33 | 5,241 | 221 | |||||||||||||||||||||||||
Diluted EPS |
$ | 5.38 | ||||||||||||||||||||||||||||||
Impact of items of note (1)
|
||||||||||||||||||||||||||||||||
Revenue |
||||||||||||||||||||||||||||||||
Adjustments related to the denial of dividends received deduction for Canadian banks (6)
|
$ | – | $ | – | $ | – | $ | – | $ | – | $ | – | $ | – | ||||||||||||||||||
Impact of items of note on revenue |
– | – | – | – | – | – | – | |||||||||||||||||||||||||
Non-interest expenses |
||||||||||||||||||||||||||||||||
Amortization of acquisition-related intangible assets |
(20 | ) | – | (24 | ) | – | – | (44 | ) | (18 | ) | |||||||||||||||||||||
Charge related to the special assessment imposed by the FDIC |
– | – | (106 | ) | – | – | (106 | ) | (79 | ) | ||||||||||||||||||||||
Impact of items of note on non-interest expenses |
(20 | ) | – | (130 | ) | – | – | (150 | ) | (97 | ) | |||||||||||||||||||||
Total pre-tax impact of items of note on net income |
20 | – | 130 | – | – | 150 | 97 | |||||||||||||||||||||||||
Income taxes |
||||||||||||||||||||||||||||||||
Amortization of acquisition-related intangible assets |
6 | – | 6 | – | – | 12 | 5 | |||||||||||||||||||||||||
Adjustments related to the denial of dividends received deduction for Canadian banks (6)
|
– | – | – | – | – | – | – | |||||||||||||||||||||||||
Charge related to the special assessment imposed by the FDIC |
– | – | 27 | – | – | 27 | 20 | |||||||||||||||||||||||||
Impact of items of note on income taxes |
6 | – | 33 | – | – | 39 | 25 | |||||||||||||||||||||||||
Total after-tax impact of items of note on net income |
$ | 14 | $ | – | $ | 97 | $ | – | $ | – | $ | 111 | $ | 72 | ||||||||||||||||||
Impact of items of note on diluted EPS (2)
|
$ | 0.12 | ||||||||||||||||||||||||||||||
Operating results – adjusted (3)
|
||||||||||||||||||||||||||||||||
Total revenue – adjusted (4)
|
$ | 8,100 | $ | 4,416 | $ | 2,087 | $ | 3,645 | $ | 741 | $ | 18,989 | $ | 1,536 | ||||||||||||||||||
Provision for credit losses – adjusted |
953 | 99 | 477 | 53 | – | 1,582 | 351 | |||||||||||||||||||||||||
Non-interest expenses – adjusted |
4,223 | 2,243 | 1,173 | 1,827 | 1,032 | 10,498 | 862 | |||||||||||||||||||||||||
Income (loss) before income taxes – adjusted |
2,924 | 2,074 | 437 | 1,765 | (291 | ) | 6,909 | 323 | ||||||||||||||||||||||||
Income taxes – adjusted |
797 | 562 | 40 | 482 | (355 | ) | 1,526 | 30 | ||||||||||||||||||||||||
Net income – adjusted |
2,127 | 1,512 | 397 | 1,283 | 64 | 5,383 | 293 | |||||||||||||||||||||||||
Net income attributable to non-controlling interests – adjusted |
– | – | – | – | 31 | 31 | – | |||||||||||||||||||||||||
Net income attributable to equity shareholders – adjusted |
2,127 | 1,512 | 397 | 1,283 | 33 | 5,352 | 293 | |||||||||||||||||||||||||
Adjusted diluted EPS |
$ | 5.50 | ||||||||||||||||||||||||||||||
CIBC THIRD QUARTER 2025 |
13 |
| $ millions, for the three months ended | Canadian Personal and Business Banking |
Canadian Commercial Banking and Wealth Management |
U.S. Commercial Banking and Wealth Management |
Capital Markets |
Corporate and Other |
CIBC Total |
U.S. Commercial Banking and Wealth Management (US$ millions) |
|||||||||||||||||||||||||||
2025 |
Net income (loss) |
$ |
812 |
$ |
598 |
$ |
254 |
$ |
540 |
$ |
(108 |
) |
$ |
2,096 |
$ |
186 |
||||||||||||||||||
Jul. 31 |
Add: provision for credit losses |
444 |
21 |
17 |
76 |
1 |
559 |
14 |
||||||||||||||||||||||||||
Add: income taxes |
288 |
225 |
69 |
169 |
(128 |
) |
623 |
49 |
||||||||||||||||||||||||||
|
Pre-provision (reversal), pre-tax earnings (losses) (1)
|
1,544 |
844 |
340 |
785 |
(235 |
) |
3,278 |
249 |
||||||||||||||||||||||||||
|
Pre-tax impact of items of note (2)
|
7 |
– |
4 |
– |
– |
11 |
3 |
|||||||||||||||||||||||||||
|
Adjusted pre-provision (reversal), pre-tax earnings (losses) (3)
|
$ |
1,551 |
$ |
844 |
$ |
344 |
$ |
785 |
$ |
(235 |
) |
$ |
3,289 |
$ |
252 |
|||||||||||||||||||
2025 |
Net income (loss) | $ | 734 | $ | 549 | $ | 173 | $ | 566 | $ | (15 | ) | $ | 2,007 | $ | 122 | ||||||||||||||||||
Apr. 30 |
Add: provision for credit losses | 389 | 54 | 123 | 34 | 5 | 605 | 86 | ||||||||||||||||||||||||||
| Add: income taxes | 258 | 204 | 32 | 226 | (129 | ) | 591 | 23 | ||||||||||||||||||||||||||
| Pre-provision (reversal), pre-tax earnings (losses) (1)
|
1,381 | 807 | 328 | 826 | (139 | ) | 3,203 | 231 | ||||||||||||||||||||||||||
| Pre-tax impact of items of note (2)
|
6 | – | 5 | – | – | 11 | 3 | |||||||||||||||||||||||||||
| Adjusted pre-provision (reversal), pre-tax earnings (losses) (3)
|
$ | 1,387 | $ | 807 | $ | 333 | $ | 826 | $ | (139 | ) | $ | 3,214 | $ | 234 | |||||||||||||||||||
2024 |
Net income | $ | 693 | $ | 501 | $ | 216 | $ | 289 | $ | 96 | $ | 1,795 | $ | 159 | |||||||||||||||||||
Jul. 31 (4)
|
Add: provision for credit losses | 342 | 42 | 47 | 41 | 11 | 483 | 33 | ||||||||||||||||||||||||||
| Add: income taxes | 268 | 187 | 48 | 111 | 30 | 644 | 35 | |||||||||||||||||||||||||||
| Pre-provision, pre-tax earnings (1)
|
1,303 | 730 | 311 | 441 | 137 | 2,922 | 227 | |||||||||||||||||||||||||||
| Pre-tax impact of items of note (2)
|
7 | – | 10 | 123 | (123 | ) | 17 | 8 | ||||||||||||||||||||||||||
| Adjusted pre-provision, pre-tax earnings (3)
|
$ | 1,310 | $ | 730 | $ | 321 | $ | 564 | $ | 14 | $ | 2,939 | $ | 235 | ||||||||||||||||||||
| $ millions, for the nine months ended | ||||||||||||||||||||||||||||||||||
2025 |
Net income (loss) |
$ |
2,311 |
$ |
1,738 |
$ |
683 |
$ |
1,725 |
$ |
(183 |
) |
$ |
6,274 |
$ |
486 |
||||||||||||||||||
Jul. 31 |
Add: provision for credit losses |
1,261 |
114 |
208 |
131 |
23 |
1,737 |
148 |
||||||||||||||||||||||||||
Add: income taxes |
816 |
649 |
154 |
624 |
(370 |
) |
1,873 |
109 |
||||||||||||||||||||||||||
|
Pre-provision (reversal), pre-tax earnings (losses) (1)
|
4,388 |
2,501 |
1,045 |
2,480 |
(530 |
) |
9,884 |
743 |
||||||||||||||||||||||||||
|
Pre-tax impact of items of note (2)
|
20 |
– |
14 |
– |
– |
34 |
10 |
|||||||||||||||||||||||||||
|
Adjusted pre-provision (reversal), pre-tax earnings (losses) (3)
|
$ |
4,408 |
$ |
2,501 |
$ |
1,059 |
$ |
2,480 |
$ |
(530 |
) |
$ |
9,918 |
$ |
753 |
|||||||||||||||||||
2024 |
Net income | $ | 2,113 | $ | 1,512 | $ | 300 | $ | 1,283 | $ | 64 | $ | 5,272 | $ | 221 | |||||||||||||||||||
Jul. 31 (4)
|
Add: provision for credit losses | 953 | 99 | 477 | 53 | – | 1,582 | 351 | ||||||||||||||||||||||||||
| Add: income taxes | 791 | 562 | 7 | 482 | (355 | ) | 1,487 | 5 | ||||||||||||||||||||||||||
| Pre-provision (reversal), pre-tax earnings (losses) (1)
|
3,857 | 2,173 | 784 | 1,818 | (291 | ) | 8,341 | 577 | ||||||||||||||||||||||||||
| Pre-tax impact of items of note (2)
|
20 | – | 130 | – | – | 150 | 97 | |||||||||||||||||||||||||||
| Adjusted pre-provision (reversal), pre-tax earnings (losses) (3)
|
$ | 3,877 | $ | 2,173 | $ | 914 | $ | 1,818 | $ | (291 | ) | $ | 8,491 | $ | 674 | |||||||||||||||||||
| (1) | Non-GAAP measure. |
| (2) | Items of note are removed from reported results to calculate adjusted results. |
| (3) | Adjusted to exclude the impact of items of note. Adjusted measures are non-GAAP measures. |
| (4) | Certain prior period information has been restated. See the “External reporting changes” section for additional details. |
14 |
CIBC THIRD QUARTER 2025 |
| For the three months ended |
For the nine months ended |
|||||||||||||||||||||||
$ millions |
|
2025 Jul. 31 |
|
|
2025 Apr. 30 |
|
|
2024 Jul. 31 |
(2) |
2025 Jul. 31 |
|
2024 Jul. 31 |
(2) |
|||||||||||
Revenue |
$ |
3,061 |
$ | 2,859 | $ | 2,775 | $ |
8,843 |
$ | 8,100 | ||||||||||||||
Provision for credit losses |
||||||||||||||||||||||||
Impaired |
361 |
357 | 307 | 1,025 |
877 | |||||||||||||||||||
Performing |
83 |
32 | 35 | 236 |
76 | |||||||||||||||||||
Total provision for credit losses |
444 |
389 | 342 | 1,261 |
953 | |||||||||||||||||||
Non-interest expenses |
1,517 |
1,478 | 1,472 | 4,455 |
4,243 | |||||||||||||||||||
Income before income taxes |
1,100 |
992 | 961 | 3,127 |
2,904 | |||||||||||||||||||
Income taxes |
288 |
258 | 268 | 816 |
791 | |||||||||||||||||||
Net income |
$ |
812 |
$ | 734 | $ | 693 | $ |
2,311 |
$ | 2,113 | ||||||||||||||
Net income attributable to: |
||||||||||||||||||||||||
Equity shareholders |
$ |
812 |
$ | 734 | $ | 693 | $ |
2,311 |
$ | 2,113 | ||||||||||||||
Total revenue |
||||||||||||||||||||||||
Net interest income |
$ |
2,459 |
$ | 2,272 | $ | 2,183 | $ |
7,057 |
$ | 6,353 | ||||||||||||||
Non-interest income (3)
|
602 |
587 | 592 | 1,786 |
1,747 | |||||||||||||||||||
$ |
3,061 |
$ | 2,859 | $ | 2,775 | $ |
8,843 |
$ | 8,100 | |||||||||||||||
Net interest margin on average interest-earning assets (4)(5)
|
2.91 |
% |
2.80 | % | 2.64 | % | 2.83 |
% |
2.59 | % | ||||||||||||||
Efficiency ratio |
49.6 |
% |
51.7 | % | 53.0 | % | 50.4 |
% |
52.4 | % | ||||||||||||||
Operating leverage |
7.3 |
% |
2.9 | % | 1.1 | % | 4.2 |
% |
5.5 | % | ||||||||||||||
Return on equity (6)
|
25.9 |
% |
24.2 | % | 22.7 | % | 24.9 |
% |
24.1 | % | ||||||||||||||
Average allocated common equity (6)
|
$ |
12,458 |
$ | 12,419 | $ | 12,142 | $ |
12,388 |
$ | 11,720 | ||||||||||||||
Full-time equivalent employees |
13,800 |
13,679 | 13,860 | 13,800 |
13,860 | |||||||||||||||||||
| (1) | For additional segmented information, see the notes to the interim consolidated financial statements. |
| (2) | Certain prior period information has been restated. See the “External reporting changes” section for additional details. |
| (3) | Includes intersegment revenue, which represents internal sales commissions and revenue allocations under the Product Owner/Customer Segment/Distributor Channel allocation management model. |
| (4) | Average balances are calculated as a weighted average of daily closing balances. |
| (5) | For additional information on the composition, see the “Glossary” section. |
| (6) | For additional information, see the “Non-GAAP measures” section. |
CIBC THIRD QUARTER 2025 |
15 |
| For the three months ended |
For the nine months ended |
|||||||||||||||||||||||
| $ millions |
|
2025 Jul. 31 |
|
|
2025 Apr. 30 |
|
|
2024 Jul. 31 |
(2) |
2025 Jul. 31 |
|
2024 Jul. 31 |
(2) |
|||||||||||
Revenue |
||||||||||||||||||||||||
Commercial banking |
$ |
679 |
$ | 662 | $ | 618 | $ |
2,016 |
$ | 1,828 | ||||||||||||||
Wealth management |
1,044 |
978 | 905 | 3,050 |
2,588 | |||||||||||||||||||
Total revenue |
1,723 |
1,640 | 1,523 | 5,066 |
4,416 | |||||||||||||||||||
Provision for (reversal of) credit losses |
||||||||||||||||||||||||
Impaired |
25 |
34 | 35 | 72 |
56 | |||||||||||||||||||
Performing |
(4 |
) |
20 | 7 | 42 |
43 | ||||||||||||||||||
Total provision for credit losses |
21 |
54 | 42 | 114 |
99 | |||||||||||||||||||
Non-interest expenses |
879 |
833 | 793 | 2,565 |
2,243 | |||||||||||||||||||
Income before income taxes |
823 |
753 | 688 | 2,387 |
2,074 | |||||||||||||||||||
Income taxes |
225 |
204 | 187 | 649 |
562 | |||||||||||||||||||
Net income |
$ |
598 |
$ | 549 | $ | 501 | $ |
1,738 |
$ | 1,512 | ||||||||||||||
Net income attributable to: |
||||||||||||||||||||||||
Equity shareholders |
$ |
598 |
$ | 549 | $ | 501 | $ |
1,738 |
$ | 1,512 | ||||||||||||||
Total revenue |
||||||||||||||||||||||||
Net interest income |
$ |
751 |
$ | 707 | $ | 585 | $ |
2,176 |
$ | 1,556 | ||||||||||||||
Non-interest income (3)
|
972 |
933 | 938 | 2,890 |
2,860 | |||||||||||||||||||
$ |
1,723 |
$ | 1,640 | $ | 1,523 | $ |
5,066 |
$ | 4,416 | |||||||||||||||
Net interest margin on average interest-earning assets (4)(5)
|
2.89 |
% |
2.88 | % | 2.92 | % | 2.89 |
% |
3.16 | % | ||||||||||||||
Efficiency ratio |
51.0 |
% |
50.8 | % | 52.0 | % | 50.6 |
% |
50.8 | % | ||||||||||||||
Operating leverage |
2.2 |
% |
1.6 | % | (4.7 | )% | 0.3 |
% |
(2.2 | )% | ||||||||||||||
Return on equity (6)
|
23.8 |
% |
23.0 | % | 20.8 | % | 23.6 |
% |
21.3 | % | ||||||||||||||
Average allocated common equity (6)
|
$ |
9,977 |
$ | 9,792 | $ | 9,586 | $ |
9,832 |
$ | 9,484 | ||||||||||||||
Full-time equivalent employees |
6,155 |
5,968 | 5,915 | 6,155 |
5,915 | |||||||||||||||||||
| (1) | For additional segmented information, see the notes to the interim consolidated financial statements. |
| (2) | Certain prior period information has been restated. See the “External reporting changes” section for additional details. |
| (3) | Includes intersegment revenue, which represents internal sales commissions and revenue allocations under the Product Owner/Customer Segment/Distributor Channel allocation management model. |
| (4) | Average balances are calculated as a weighted average of daily closing balances. |
| (5) | For additional information on the composition, see the “Glossary” section. |
| (6) | For additional information, see the “Non-GAAP measures” section. |
16 |
CIBC THIRD QUARTER 2025 |
CIBC THIRD QUARTER 2025 |
17 |
| For the three months ended |
For the nine months ended |
|||||||||||||||||||||||
$ millions |
|
2025 Jul. 31 |
|
|
2025 Apr. 30 |
|
|
2024 Jul. 31 |
(2) |
2025 Jul. 31 |
|
2024 Jul. 31 |
(2) |
|||||||||||
Revenue |
||||||||||||||||||||||||
Commercial banking |
$ |
554 |
$ | 539 | $ | 520 | $ |
1,660 |
$ | 1,458 | ||||||||||||||
Wealth management |
236 |
230 | 211 | 746 |
629 | |||||||||||||||||||
Total revenue |
790 |
769 | 731 | 2,406 |
2,087 | |||||||||||||||||||
Provision for (reversal of) credit losses |
||||||||||||||||||||||||
Impaired |
57 |
64 | 15 | 228 |
365 | |||||||||||||||||||
Performing |
(40 |
) |
59 | 32 | (20 |
) |
112 | |||||||||||||||||
Total provision for credit losses |
17 |
123 | 47 | 208 |
477 | |||||||||||||||||||
Non-interest expenses |
450 |
441 | 420 | 1,361 |
1,303 | |||||||||||||||||||
Income before income taxes |
323 |
205 | 264 | 837 |
307 | |||||||||||||||||||
Income taxes |
69 |
32 | 48 | 154 |
7 | |||||||||||||||||||
Net income |
$ |
254 |
$ | 173 | $ | 216 | $ |
683 |
$ | 300 | ||||||||||||||
Net income attributable to: |
||||||||||||||||||||||||
Equity shareholders |
$ |
254 |
$ | 173 | $ | 216 | $ |
683 |
$ | 300 | ||||||||||||||
Total revenue |
||||||||||||||||||||||||
Net interest income |
$ |
548 |
$ | 536 | $ | 477 | $ |
1,646 |
$ | 1,400 | ||||||||||||||
Non-interest income |
242 |
233 | 254 | 760 |
687 | |||||||||||||||||||
$ |
790 |
$ | 769 | $ | 731 | $ |
2,406 |
$ | 2,087 | |||||||||||||||
Average allocated common equity (3)
|
$ |
11,200 |
$ | 11,770 | $ | 10,953 | $ |
11,441 |
$ | 11,103 | ||||||||||||||
Full-time equivalent employees |
3,196 |
3,018 | 2,974 | 3,196 |
2,974 | |||||||||||||||||||
| (1) | For additional segmented information, see the notes to the interim consolidated financial statements. |
| (2) | Certain prior period information has been restated. See the “External reporting changes” section for additional details. |
| (3) | For additional information, see the “Non-GAAP measures” section. |
| For the three months ended |
For the nine months ended |
|||||||||||||||||||||||
US$ millions |
|
2025 Jul. 31 |
|
|
2025 Apr. 30 |
|
|
2024 Jul. 31 |
(2) |
2025 Jul. 31 |
|
2024 Jul. 31 |
(2) |
|||||||||||
Revenue |
||||||||||||||||||||||||
Commercial banking |
$ |
404 |
$ | 379 | $ | 380 | $ |
1,179 |
$ | 1,073 | ||||||||||||||
Wealth management |
172 |
162 | 154 | 530 |
463 | |||||||||||||||||||
Total revenue |
576 |
541 | 534 | 1,709 |
1,536 | |||||||||||||||||||
Provision for (reversal of) credit losses |
||||||||||||||||||||||||
Impaired |
42 |
45 | 10 | 162 |
269 | |||||||||||||||||||
Performing |
(28 |
) |
41 | 23 | (14 |
) |
82 | |||||||||||||||||
Total provision for credit losses |
14 |
86 | 33 | 148 |
351 | |||||||||||||||||||
Non-interest expenses |
327 |
310 | 307 | 966 |
959 | |||||||||||||||||||
Income before income taxes |
235 |
145 | 194 | 595 |
226 | |||||||||||||||||||
Income taxes |
49 |
23 | 35 | 109 |
5 | |||||||||||||||||||
Net income |
$ |
186 |
$ | 122 | $ | 159 | $ |
486 |
$ | 221 | ||||||||||||||
Net income attributable to: |
||||||||||||||||||||||||
Equity shareholders |
$ |
186 |
$ | 122 | $ | 159 | $ |
486 |
$ | 221 | ||||||||||||||
Total revenue |
||||||||||||||||||||||||
Net interest income |
$ |
399 |
$ | 377 | $ | 349 | $ |
1,169 |
$ | 1,031 | ||||||||||||||
Non-interest income |
177 |
164 | 185 | 540 |
505 | |||||||||||||||||||
$ |
576 |
$ | 541 | $ | 534 | $ |
1,709 |
$ | 1,536 | |||||||||||||||
Net interest margin on average interest-earning assets (3)(4)
|
3.78 |
% |
3.72 | % | 3.42 | % | 3.77 |
% |
3.44 | % | ||||||||||||||
Efficiency ratio |
57.0 |
% |
57.4 | % | 57.5 | % | 56.6 |
% |
62.4 | % | ||||||||||||||
Operating leverage |
0.9 |
% |
4.6 | % | (10.8 | )% | 10.4 |
% |
(16.5 | )% | ||||||||||||||
Return on equity (5)
|
9.0 |
% |
6.0 | % | 7.8 | % | 8.0 |
% |
3.6 | % | ||||||||||||||
Average allocated common equity (5)
|
$ |
8,150 |
$ | 8,286 | $ | 7,991 | $ |
8,124 |
$ | 8,177 | ||||||||||||||
| (1) | For additional segmented information, see the notes to the interim consolidated financial statements. |
| (2) | Certain prior period information has been restated. See the “External reporting changes” section for additional details. |
| (3) | Average balances are calculated as a weighted average of daily closing balances. |
| (4) | For additional information on the composition, see the “Glossary” section. |
| (5) | For additional information, see the “Non-GAAP measures” section. |
18 |
CIBC THIRD QUARTER 2025 |
CIBC THIRD QUARTER 2025 |
19 |
| For the three months ended |
For the nine months ended |
|||||||||||||||||||||||
| $ millions | 2025 Jul. 31 |
|
2025 Apr. 30 |
|
|
2024 Jul. 31 |
(2) |
2025 Jul. 31 |
|
2024 Jul. 31 |
(2) |
|||||||||||||
Revenue |
||||||||||||||||||||||||
Global markets (2)
|
$ |
930 |
$ | 1,035 | $ | 663 | $ |
3,085 |
$ | 2,338 | ||||||||||||||
Corporate and investment banking |
576 |
510 | 429 | 1,540 |
1,307 | |||||||||||||||||||
Total revenue (3)
|
1,506 |
1,545 | 1,092 | 4,625 |
3,645 | |||||||||||||||||||
Provision for credit losses |
||||||||||||||||||||||||
Impaired |
37 |
2 | 37 | 46 |
34 | |||||||||||||||||||
Performing |
39 |
32 | 4 | 85 |
19 | |||||||||||||||||||
Total provision for credit losses |
76 |
34 | 41 | 131 |
53 | |||||||||||||||||||
Non-interest expenses |
721 |
719 | 651 | 2,145 |
1,827 | |||||||||||||||||||
Income before income taxes |
709 |
792 | 400 | 2,349 |
1,765 | |||||||||||||||||||
Income taxes (3)
|
169 |
226 | 111 | 624 |
482 | |||||||||||||||||||
Net income |
$ |
540 |
$ | 566 | $ | 289 | $ |
1,725 |
$ | 1,283 | ||||||||||||||
Net income attributable to: |
||||||||||||||||||||||||
Equity shareholders |
$ |
540 |
$ | 566 | $ | 289 | $ |
1,725 |
$ | 1,283 | ||||||||||||||
Efficiency ratio |
47.9 |
% |
46.5 | % | 59.7 | % | 46.4 |
% |
50.2 | % | ||||||||||||||
Operating leverage |
27.3 |
% |
1.5 | % | (20.1 | )% | 9.6 |
% |
(7.5 | )% | ||||||||||||||
Return on equity (4)
|
20.7 |
% |
22.9 | % | 12.3 | % | 22.8 |
% |
19.0 | % | ||||||||||||||
Average allocated common equity (4)
|
$ |
10,349 |
$ | 10,136 | $ | 9,352 | $ |
10,110 |
$ | 9,038 | ||||||||||||||
Full-time equivalent employees |
2,034 |
1,894 | 1,919 | 2,034 |
1,919 | |||||||||||||||||||
| (1) | For additional segmented information, see the notes to the interim consolidated financial statements. |
| (2) | Certain prior period information has been restated. See the “External reporting changes” section for additional details. In addition to the changes to our SBUs, our foreign exchange and payments business is now included in Global markets within Capital Markets. Previously, this business was included in Direct Financial Services within Capital Markets together with Simplii Financial and Investor’s Edge. Prior period information has been restated. |
| (3) | TEB adjustment offset is no longer applied since the third quarter of 2024 upon the enactment of Bill C-59 in June 2024, which eliminated the dividend received deduction for Canadian banks. The third quarter of 2024 includes a reversal of a TEB adjustment of $123 million, and a TEB adjustment offset of $16 million for the nine months ended July 31, 2024. |
| (4) | For additional information, see the “Non-GAAP measures” section. |
20 |
CIBC THIRD QUARTER 2025 |
|
For the three months ended |
For the nine months ended |
|||||||||||||||||||||||
| $ millions | 2025 Jul. 31 |
2025 Apr. 30 |
2024 Jul. 31 |
2025 Jul. 31 |
2024 Jul. 31 |
|||||||||||||||||||
Revenue |
||||||||||||||||||||||||
International banking |
$ |
163 |
$ | 251 | $ | 254 | $ |
663 |
$ | 741 | ||||||||||||||
Other |
11 |
(42 | ) | 229 | (46 |
) |
– | |||||||||||||||||
Total revenue (2)
|
174 |
209 | 483 | 617 |
741 | |||||||||||||||||||
Provision for (reversal of) credit losses |
||||||||||||||||||||||||
Impaired |
1 |
6 | 10 | 19 |
11 | |||||||||||||||||||
Performing |
– |
(1 | ) | 1 | 4 |
(11 | ) | |||||||||||||||||
Total provision for credit losses |
1 |
5 | 11 | 23 |
– | |||||||||||||||||||
Non-interest expenses |
409 |
348 | 346 | 1,147 |
1,032 | |||||||||||||||||||
Income (loss) before income taxes |
(236 |
) |
(144 | ) | 126 | (553 |
) |
(291 | ) | |||||||||||||||
Income taxes (2)
|
(128 |
) |
(129 | ) | 30 | (370 |
) |
(355 | ) | |||||||||||||||
Net income (loss) |
$ |
(108 |
) |
$ | (15 | ) | $ | 96 | $ |
(183 |
) |
$ | 64 | |||||||||||
Net income (loss) attributable to: |
||||||||||||||||||||||||
Non-controlling interests |
$ |
2 |
$ | 9 | $ | 9 | $ |
19 |
$ | 31 | ||||||||||||||
Equity shareholders |
(110 |
) |
(24 | ) | 87 | (202 |
) |
33 | ||||||||||||||||
Full-time equivalent employees (3)
|
24,576 |
24,167 | 23,884 | 24,576 |
23,884 | |||||||||||||||||||
| (1) | For additional segmented information, see the notes to the interim consolidated financial statements. |
| (2) | TEB adjustment offset is no longer applied since the third quarter of 2024 upon the enactment of Bill C-59 in June 2024, which eliminated the dividend received deduction for Canadian banks. The third quarter of 2024 includes a reversal of a TEB adjustment of $123 million, and a TEB adjustment offset of $16 million for the nine months ended July 31, 2024. |
| (3) | Includes full-time equivalent employees for which the expenses are allocated to the business lines within the SBUs. The majority of the full-time equivalent employees for functional and support costs of CIBC Bank USA are included in the U.S. Commercial Banking and Wealth Management SBU. |
CIBC THIRD QUARTER 2025 |
21 |
22 |
CIBC THIRD QUARTER 2025 |
$ millions, as at |
2025 Jul. 31 |
2024 Oct. 31 |
||||||
Assets |
||||||||
Cash and deposits with banks |
$ |
55,187 |
$ | 48,064 | ||||
Securities |
274,997 |
254,345 | ||||||
Securities borrowed and purchased under resale agreements |
107,900 |
100,749 | ||||||
Loans and acceptances, net of allowance for credit losses |
581,644 |
558,292 | ||||||
Derivative instruments |
34,614 |
36,435 | ||||||
Other assets |
47,913 |
44,100 | ||||||
$ |
1,102,255 |
$ | 1,041,985 | |||||
Liabilities and equity |
||||||||
Deposits |
$ |
792,672 |
$ | 764,857 | ||||
Obligations related to securities lent, sold short and under repurchase agreements |
171,790 |
139,792 | ||||||
Derivative instruments |
36,552 |
40,654 | ||||||
Other liabilities |
30,666 |
30,210 | ||||||
Subordinated indebtedness |
7,699 |
7,465 | ||||||
Equity |
62,876 |
59,007 | ||||||
$ |
1,102,255 |
$ | 1,041,985 | |||||
CIBC THIRD QUARTER 2025 |
23 |

| (1) | Excluding AOCI relating to cash flow hedges and changes to fair value option (FVO) liabilities attributable to changes in own credit risk. |
| (i) | On-balance sheet assets less Tier 1 capital regulatory adjustments; |
| (ii) | Derivative exposures; |
| (iii) | Securities financing transaction exposures; and |
| (iv) | Off-balance sheet exposures (such as commitments, direct credit substitutes, letters of credit, and securitization exposures). |
| As at July 31, 2025 | Minimum |
Capital conservation buffer |
D-SIB buffer |
|
Pillar 1 targets |
(1)
|
|
Domestic Stability Buffer |
(2)
|
|
Target including all buffer requirements |
|
||||||||||||
CET1 ratio |
4.5 |
% |
2.5 |
% |
1.0 |
% |
8.0 |
% |
3.5 |
% |
11.5 |
% |
||||||||||||
Tier 1 capital ratio |
6.0 |
% |
2.5 |
% |
1.0 |
% |
9.5 |
% |
3.5 |
% |
13.0 |
% |
||||||||||||
Total capital ratio |
8.0 |
% |
2.5 |
% |
1.0 |
% |
11.5 |
% |
3.5 |
% |
15.0 |
% |
||||||||||||
Leverage ratio |
3.0 |
% |
n/a |
0.5 |
% |
3.5 |
% |
n/a |
3.5 |
% |
||||||||||||||
TLAC ratio |
18.0 |
% |
2.5 |
% |
1.0 |
% |
21.5 |
% |
3.5 |
% |
25.0 |
% |
||||||||||||
TLAC leverage ratio |
6.75 |
% |
n/a |
0.5 |
% |
7.25 |
% |
n/a |
7.25 |
% |
| (1) | The countercyclical capital buffer applicable to CIBC is insignificant as at July 31, 2025. |
| (2) | On June 26, 2025, OSFI announced the DSB will remain at 3.5% of total RWA. This level remains unchanged since November 1, 2023. |
| n/a | Not applicable. |
24 |
CIBC THIRD QUARTER 2025 |
| $ millions, as at | 2025 Jul. 31 |
2024 Oct. 31 |
||||||
CET1 capital |
$ |
46,616 |
$ | 44,516 | ||||
Tier 1 capital |
53,303 |
49,481 | ||||||
Total capital |
61,338 |
56,809 | ||||||
RWA consisting of: |
||||||||
Credit risk |
$ |
286,754 |
$ | 274,503 | ||||
Market risk |
11,320 |
12,188 | ||||||
Operational risk |
49,638 |
46,811 | ||||||
Total RWA |
$ |
347,712 |
$ | 333,502 | ||||
CET1 ratio |
13.4 |
% |
13.3 | % | ||||
Tier 1 capital ratio |
15.3 |
% |
14.8 | % | ||||
Total capital ratio |
17.6 |
% |
17.0 | % | ||||
Leverage ratio exposure |
$ |
1,244,201 |
$ | 1,155,432 | ||||
Leverage ratio |
4.3 |
% |
4.3 | % | ||||
TLAC available |
$ |
114,311 |
$ | 101,062 | ||||
TLAC ratio |
32.9 |
% |
30.3 | % | ||||
TLAC leverage ratio |
9.2 |
% |
8.7 | % | ||||
CIBC THIRD QUARTER 2025 |
25 |
26 |
CIBC THIRD QUARTER 2025 |
Shares outstanding |
||||||||
| $ millions, except number of shares and per share amounts, as at July 31, 2025 | Number of shares |
Par value |
||||||
Common shares |
929,477,200 |
$ |
16,869 |
|||||
Treasury shares – common shares (1)
|
(26,509 |
) |
(2 |
) |
||||
Preferred shares |
||||||||
Series 47 (NVCC) |
18,000,000 |
450 |
||||||
Series 56 (NVCC) |
600,000 |
600 |
||||||
Series 57 (NVCC) |
500,000 |
500 |
||||||
Series 61 (NVCC) |
150,000 |
150 |
||||||
Treasury shares – preferred shares (1)
|
(1,232 |
) |
(1 |
) |
||||
Limited recourse capital notes |
||||||||
4.375% Limited recourse capital notes Series 1 (NVCC) |
n/a |
750 |
||||||
4.000% Limited recourse capital notes Series 2 (NVCC) |
n/a |
750 |
||||||
7.150% Limited recourse capital notes Series 3 (NVCC) |
n/a |
800 |
||||||
6.987% Limited recourse capital notes Series 4 (NVCC) |
n/a |
500 |
||||||
6.950% Limited recourse capital notes Series 5 (NVCC) (2)
|
n/a |
693 |
||||||
6.369% Limited recourse capital notes Series 6 (NVCC) |
n/a |
450 |
||||||
7.000% Limited recourse capital notes Series 7 (NVCC) (2)
|
n/a |
1,027 |
||||||
Subordinated indebtedness |
||||||||
1.96% Debentures due April 21, 2031 (NVCC) |
n/a |
1,000 |
||||||
4.20% Debentures due April 7, 2032 (NVCC) |
n/a |
1,000 |
||||||
5.33% Debentures due January 20, 2033 (NVCC) |
n/a |
1,000 |
||||||
5.35% Debentures due April 20, 2033 (NVCC) |
n/a |
750 |
||||||
5.30% Debentures due January 16, 2034 (NVCC) |
n/a |
1,250 |
||||||
4.90% Debentures due June 12, 2034 (NVCC) |
n/a |
1,000 |
||||||
4.15% Debentures due April 2, 2035 (NVCC) |
n/a |
1,250 |
||||||
Stock options outstanding |
16,154,770 |
|||||||
| (1) | A long position in our own shares is shown as a negative number, which reduces the number of shares outstanding. A short position is shown as a positive number, which adds to the number of shares outstanding. See Note 1 to the consolidated financial statements in our 2024 Annual Report for the accounting policy on treasury shares. |
| (2) | For Limited Recourse Capital Notes (LRCNs) – Series 5 and Series 7, the amount represents the Canadian dollar equivalent of the U.S. dollar notional amount. |
| n/a | Not applicable. |
CIBC THIRD QUARTER 2025 |
27 |
| • | CIBC, SBU, functional group-level and regional risk appetite statements; |
| • | Risk frameworks, policies, procedures and limits to align activities with our risk appetite; |
| • | Regular risk reports to identify and communicate risk levels; |
| • | An independent control framework to identify and test the design and operating effectiveness of our key controls; |
| • | Stress testing to consider the potential impact of changes in the business environment on capital, liquidity and earnings; |
| • | Proactive consideration of risk mitigation options in order to optimize results; and |
| • | Oversight through our risk-focused committees and governance structure. |
| (i) | As the first line of defence, CIBC’s Management, in SBUs and functional groups own the risks and are accountable and responsible for identifying and assessing risks inherent in its activities in accordance with the CIBC risk appetite. In addition, Management establishes and maintains controls to mitigate such risks. Management may include Governance Groups within the business to facilitate the Control Framework, Operational Risk Framework and other risk-related processes. A Governance Group refers to a group within Business Unit Management (first line of defence) whose focus is to support Management in meeting their governance, risk and control activities. A Governance Group is considered the first line of defence, in conjunction with Business Unit Management. Control Groups, which typically reside within centralized functions, provide subject matter expertise to Business Unit Management and/or implement/maintain enterprise-wide control programs and activities. While Control Groups collaborate with Business Unit Management in identifying and managing risk, they also challenge risk decisions and risk mitigation strategies. |
| (ii) | The second line of defence is independent from the first line of defence and provides an enterprise-wide view of specific risk types, guidance and effective challenge to risk and control activities. Risk Management is the primary second line of defence. Risk Management may leverage subject matter expertise of other groups (e.g., third parties or Control Groups) to inform their independent assessments, as appropriate. |
| (iii) | As the third line of defence, CIBC’s Internal Audit is responsible for providing reasonable assurance to senior management and the Audit Committee of the Board on the effectiveness of CIBC’s governance practices, risk management processes, and Internal Control as a part of its risk-based audit plan and in accordance with its mandate as described in the Internal Audit Charter. |
| • | Inflation, interest rates and economic growth |
| • | Technology, information and cyber security risk |
| • | Disintermediation risk |
| • | Data and Artificial Intelligence risk |
| • | Third-party risk |
| • | Anti-money laundering, anti-terrorist financing and sanctions |
| • | U.S. banking regulation |
| • | Interbank Offered Rate transition |
| • | Corporate transactions |
28 |
CIBC THIRD QUARTER 2025 |
• |
Conflict in the Middle East; |
• |
The war in Ukraine; and |
• |
Rising civil unrest and activism globally. |
CIBC THIRD QUARTER 2025 |
29 |

(1) |
Average balances are calculated as a weighted average of daily closing balances. |
(2) |
Includes counterparty credit risk (CCR) of $12 million, which comprises derivatives and repo-style transactions. |
(3) |
Includes CCR of $14,776 million, which comprises derivatives and repo-style transactions. |
(4) |
Includes CCR of $570 million, which comprises derivatives and repo-style transactions. |
(5) |
Average allocated common equity is a non-GAAP measure. For additional information on the composition of this non-GAAP measure, see the “Non-GAAP measures” section. |
(6) |
Represents average allocated common equity relating to capital deductions, such as goodwill and intangible assets, in accordance with the rules in OSFI’s CAR Guideline. |
30 |
CIBC THIRD QUARTER 2025 |
| $ millions, as at |
2025 Jul. 31 |
2024 Oct. 31 |
||||||||||||||||||||||
|
IRB approach |
(1)
|
Standardized approach |
Total |
IRB approach |
(1) |
Standardized approach |
|
Total | ||||||||||||||||
Business and government portfolios |
||||||||||||||||||||||||
Drawn |
$ |
411,940 |
$ |
16,396 |
$ |
428,336 |
$ | 386,836 | $ | 15,817 | $ | 402,653 | ||||||||||||
Undrawn commitments |
65,529 |
1,214 |
66,743 |
62,778 | 1,183 | 63,961 | ||||||||||||||||||
Repo-style transactions |
506,658 |
1 |
506,659 |
408,201 | 1 | 408,202 | ||||||||||||||||||
Other off-balance sheet |
18,990 |
490 |
19,480 |
17,078 | 487 | 17,565 | ||||||||||||||||||
OTC derivatives |
21,100 |
125 |
21,225 |
18,806 | 126 | 18,932 | ||||||||||||||||||
Gross EAD on business and government portfolios |
1,024,217 |
18,226 |
1,042,443 |
893,699 | 17,614 | 911,313 | ||||||||||||||||||
Less: Collateral held for repo-style transactions |
481,105 |
– |
481,105 |
388,767 | – | 388,767 | ||||||||||||||||||
Net EAD on business and government portfolios |
543,112 |
18,226 |
561,338 |
504,932 | 17,614 | 522,546 | ||||||||||||||||||
Retail portfolios |
||||||||||||||||||||||||
Drawn |
336,177 |
6,557 |
342,734 |
331,821 | 6,976 | 338,797 | ||||||||||||||||||
Undrawn commitments |
111,446 |
4,184 |
115,630 |
104,906 | 3,982 | 108,888 | ||||||||||||||||||
Other off-balance sheet |
471 |
123 |
594 |
444 | 114 | 558 | ||||||||||||||||||
Gross EAD on retail portfolios |
448,094 |
10,864 |
458,958 |
437,171 | 11,072 | 448,243 | ||||||||||||||||||
Securitization exposures (2)
|
38,654 |
28,785 |
67,439 |
30,901 | 21,251 | 52,152 | ||||||||||||||||||
Gross EAD (3)
|
$ |
1,510,965 |
$ |
57,875 |
$ |
1,568,840 |
$ | 1,361,771 | $ | 49,937 | $ | 1,411,708 | ||||||||||||
Net EAD (3)
|
$ |
1,029,860 |
$ |
57,875 |
$ |
1,087,735 |
$ | 973,004 | $ | 49,937 | $ | 1,022,941 | ||||||||||||
| (1) | Includes exposures subject to the supervisory slotting approach. |
| (2) | OSFI guidelines define a hierarchy of approaches for treating securitization exposures in our banking book. Depending on the underlying characteristics, exposures are eligible for either the standardized approach or the IRB approach. The external ratings-based approach (SEC-ERBA), which is inclusive of the internal assessment approach (SEC-IAA), includes exposures that qualify for the IRB approach, as well as exposures under the standardized approach. |
| (3) | Excludes exposures arising from derivative and repo-style transactions which are cleared through qualified central counterparties (QCCPs) as well as credit risk exposures arising from other assets that are subject to the credit risk framework, including other balance sheet assets which are risk-weighted at 100%, significant investments in the capital of non-financial institutions which are risk-weighted at 1250%, settlement risk, and amounts below the thresholds for deduction which are risk-weighted at 250%. Non-trading equity exposures are also excluded and are subject to a range of risk-weightings dependent on the nature of the security. |
CIBC THIRD QUARTER 2025 |
31 |
| Residential mortgages (1)
|
HELOC (2)
|
Total | ||||||||||||||||||||||||||||||||||||||||||||||
| $ billions, as at July 31, 2025 | Insured | Uninsured | Uninsured | Insured | Uninsured | |||||||||||||||||||||||||||||||||||||||||||
Ontario (3)
|
$ |
16.3 |
11 |
% |
$ |
138.1 |
89 |
% |
$ |
11.4 |
100 |
% |
$ |
16.3 |
10 |
% |
$ |
149.5 |
90 |
% |
||||||||||||||||||||||||||||
British Columbia and territories (4)
|
5.1 |
10 |
46.1 |
90 |
4.1 |
100 |
5.1 |
9 |
50.2 |
91 |
||||||||||||||||||||||||||||||||||||||
Alberta |
8.8 |
34 |
17.0 |
66 |
1.8 |
100 |
8.8 |
32 |
18.8 |
68 |
||||||||||||||||||||||||||||||||||||||
Quebec |
4.7 |
19 |
20.1 |
81 |
1.3 |
100 |
4.7 |
18 |
21.4 |
82 |
||||||||||||||||||||||||||||||||||||||
Central prairie provinces |
2.4 |
36 |
4.3 |
64 |
0.5 |
100 |
2.4 |
33 |
4.8 |
67 |
||||||||||||||||||||||||||||||||||||||
Atlantic provinces |
2.4 |
27 |
6.4 |
73 |
0.7 |
100 |
2.4 |
25 |
7.1 |
75 |
||||||||||||||||||||||||||||||||||||||
Canadian portfolio (5)(6)
|
39.7 |
15 |
232.0 |
85 |
19.8 |
100 |
39.7 |
14 |
251.8 |
86 |
||||||||||||||||||||||||||||||||||||||
U.S. portfolio (5)
|
– |
– |
2.8 |
100 |
0.1 |
100 |
– |
– |
2.9 |
100 |
||||||||||||||||||||||||||||||||||||||
Other international portfolio (5)
|
– |
– |
2.9 |
100 |
– |
– |
– |
– |
2.9 |
100 |
||||||||||||||||||||||||||||||||||||||
Total portfolio |
$ |
39.7 |
14 |
% |
$ |
237.7 |
86 |
% |
$ |
19.9 |
100 |
% |
$ |
39.7 |
13 |
% |
$ |
257.6 |
87 |
% |
||||||||||||||||||||||||||||
October 31, 2024 |
$ | 42.3 | 15 | % | $ | 231.4 | 85 | % | $ | 19.6 | 100 | % | $ | 42.3 | 14 | % | $ | 251.0 | 86 | % | ||||||||||||||||||||||||||||
| (1) | Balances reflect principal values. |
| (2) | We did not have any insured HELOCs as at July 31, 2025 and October 31, 2024. |
| (3) | Includes $7.1 billion (October 31, 2024: $7.6 billion) of insured residential mortgages, $85.4 billion (October 31, 2024: $83.2 billion) of uninsured residential mortgages, and $6.6 billion (October 31, 2024: $6.5 billion) of HELOCs in the Greater Toronto Area (GTA). |
| (4) | Includes $2.2 billion (October 31, 2024: $2.4 billion) of insured residential mortgages, $31.2 billion (October 31, 2024: $30.9 billion) of uninsured residential mortgages, and $2.6 billion (October 31, 2024: $2.5 billion) of HELOCs in the Greater Vancouver Area (GVA). |
| (5) | Geographic location is based on the address of the property. |
| (6) | 52% (October 31, 2024: 55%) of insurance on Canadian residential mortgages is provided by Canada Mortgage and Housing Corporation (CMHC) and the remaining by two private Canadian insurers, both rated at least AA (low) by DBRS Limited (Morningstar DBRS). |
|
For the three months ended |
For the nine months ended |
|||||||||||||||||||||||||||||||||||||||||||
2025 Jul. 31 |
2025 Apr. 30 |
2024 Jul. 31 |
2025 Jul. 31 |
2024 Jul. 31 |
||||||||||||||||||||||||||||||||||||||||
Residential mortgages |
HELOC |
Residential mortgages |
HELOC | Residential mortgages |
HELOC | Residential mortgages |
HELOC |
Residential mortgages |
HELOC | |||||||||||||||||||||||||||||||||||
Ontario (2)
|
64 |
% |
67 |
% |
66 | % | 67 | % | 66 | % | 66 | % | 66 |
% |
67 |
% |
67 | % | 66 | % | ||||||||||||||||||||||||
British Columbia and territories (3)
|
62 |
65 |
63 | 65 | 63 | 63 | 63 |
65 |
63 | 63 | ||||||||||||||||||||||||||||||||||
Alberta |
67 |
72 |
69 | 72 | 71 | 71 | 69 |
72 |
71 | 71 | ||||||||||||||||||||||||||||||||||
Quebec |
68 |
71 |
68 | 70 | 68 | 70 | 68 |
70 |
68 | 70 | ||||||||||||||||||||||||||||||||||
Central prairie provinces |
67 |
73 |
69 | 72 | 71 | 72 | 68 |
73 |
71 | 73 | ||||||||||||||||||||||||||||||||||
Atlantic provinces |
65 |
69 |
66 | 68 | 67 | 68 | 66 |
68 |
67 | 68 | ||||||||||||||||||||||||||||||||||
Canadian portfolio (4)
|
65 |
% |
68 |
% |
66 | % | 68 | % | 66 | % | 66 | % | 66 |
% |
68 |
% |
67 | % | 66 | % | ||||||||||||||||||||||||
U.S. portfolio (4)
|
68 |
% |
51 |
% |
71 | % | 61 | % | 66 | % | n/m | 67 |
% |
53 |
% |
67 | % | n/m | ||||||||||||||||||||||||||
Other international portfolio (4)
|
73 |
% |
n/m |
71 | % | n/m | 70 | % | n/m | 71 |
% |
n/m |
72 | % | n/m | |||||||||||||||||||||||||||||
| (1) | LTV ratios for newly originated and acquired residential mortgages and HELOCs are calculated based on weighted average. |
| (2) | Average LTV ratios for our uninsured GTA residential mortgages originated during the quarter were 65% (April 30, 2025: 66%; July 31, 2024: 67%) and 66% for the nine months ended July 31, 2025 (July 31, 2024: 67%). |
| (3) | Average LTV ratios for our uninsured GVA residential mortgages originated during the quarter were 63% (April 30, 2025: 63%; July 31, 2024: 62%) and 63% for the nine months ended July 31, 2025 (July 31, 2024: 62%). |
| (4) | Geographic location is based on the address of the property. |
| Insured | Uninsured | |||||||
July 31, 2025 (1)(2)
|
57 |
% |
54 |
% |
||||
October 31, 2024 (1)(2)
|
54 | % | 52 | % |
| (1) | LTV ratios for residential mortgages are calculated based on weighted average. The house price estimates for July 31, 2025 and October 31, 2024 are based on the Forward Sortation Area level indices from the Teranet – National Bank National Composite House Price Index (Teranet) as of June 30, 2025 and September 30, 2024, respectively. Teranet is an independent estimate of the rate of change in Canadian home prices. |
| (2) | Average LTV ratio on our uninsured GTA residential mortgage portfolio was 56% (October 31, 2024: 53%). Average LTV ratio on our uninsured GVA residential mortgage portfolio was 48% (October 31, 2024: 45%). |
32 |
CIBC THIRD QUARTER 2025 |
|
0–5 years |
>5–10 years |
>10–15 years |
>15–20 years |
>20–25 years |
>25–30 years |
>30–35 years |
>35 years |
|||||||||||||||||||||||||
Canadian portfolio |
||||||||||||||||||||||||||||||||
July 31, 2025 |
– |
% |
– |
% |
2 |
% |
13 |
% |
42 |
% |
43 |
% |
– |
% |
– |
% |
||||||||||||||||
October 31, 2024 |
– | % | – | % | 2 | % | 12 | % | 45 | % | 41 | % | – | % | – | % | ||||||||||||||||
U.S. portfolio |
||||||||||||||||||||||||||||||||
July 31, 2025 |
– |
% |
– |
% |
1 |
% |
2 |
% |
28 |
% |
69 |
% |
– |
% |
– |
% |
||||||||||||||||
October 31, 2024 |
– | % | – | % | – | % | 2 | % | 15 | % | 83 | % | – | % | – | % | ||||||||||||||||
Other international portfolio |
||||||||||||||||||||||||||||||||
July 31, 2025 |
8 |
% |
11 |
% |
19 |
% |
21 |
% |
24 |
% |
16 |
% |
1 |
% |
– |
% |
||||||||||||||||
October 31, 2024 |
7 | % | 12 | % | 20 | % | 21 | % | 23 | % | 16 | % | 1 | % | – | % | ||||||||||||||||
| |
0–5 years |
|
|
>5–10 years |
|
|
>10–15 years |
|
|
>15–20 years |
|
|
>20–25 years |
|
|
>25–30 years |
|
|
>30–35 years |
|
|
>35 years |
(1) |
|||||||||
Canadian portfolio |
||||||||||||||||||||||||||||||||
July 31, 2025 |
1 |
% |
3 |
% |
9 |
% |
19 |
% |
32 |
% |
28 |
% |
1 |
% |
7 |
% |
||||||||||||||||
October 31, 2024 |
1 | % | 3 | % | 7 | % | 17 | % | 32 | % | 26 | % | 3 | % | 11 | % | ||||||||||||||||
U.S. portfolio |
||||||||||||||||||||||||||||||||
July 31, 2025 |
1 |
% |
3 |
% |
8 |
% |
10 |
% |
23 |
% |
55 |
% |
– |
% |
– |
% |
||||||||||||||||
October 31, 2024 |
1 | % | 3 | % | 7 | % | 9 | % | 14 | % | 66 | % | – | % | – | % | ||||||||||||||||
Other international portfolio |
||||||||||||||||||||||||||||||||
July 31, 2025 |
8 |
% |
11 |
% |
19 |
% |
21 |
% |
24 |
% |
16 |
% |
1 |
% |
– |
% |
||||||||||||||||
October 31, 2024 |
7 | % | 12 | % | 20 | % | 21 | % | 23 | % | 16 | % | 1 | % | – | % |
| (1) | Includes variable rate mortgages of $18.6 billion (October 31, 2024: $28.9 billion), of which less than $0.1 billion (October 31, 2024: $17.6 billion) relates to mortgages in which all of the fixed contractual payments are currently being applied to interest based on the rates in effect at July 31, 2025 and October 31, 2024, respectively, and the terms of the mortgages, with the portion of the contractual interest requirement not met by the payments being added to the principal. Since the amortization profile reflected in this table is based on the current amount of existing contractual payments, it does not reflect that the contractual payment amount is required to be increased at the time of renewal by the amount necessary to reduce the amortization period down to the period in effect at the time the mortgage was originally provided. |
| As at or for the three months ended |
As at or for the nine months ended |
|||||||||||||||||||||||||||||||||||||||||||||||||||||||||||||||
| $ millions |
2025 Jul. 31 |
2025 Apr. 30 |
2024 Jul. 31 |
2025 Jul. 31 |
2024 Jul. 31 |
|||||||||||||||||||||||||||||||||||||||||||||||||||||||||||
Business and government loans |
Consumer loans |
Total |
Business and government loans |
Consumer loans |
Total | Business and government loans |
Consumer loans |
Total | Business and government loans |
Consumer loans |
Total |
Business and government loans |
Consumer loans |
Total | ||||||||||||||||||||||||||||||||||||||||||||||||||
Gross impaired loans |
||||||||||||||||||||||||||||||||||||||||||||||||||||||||||||||||
Balance at beginning of period |
$ |
1,830 |
$ |
1,465 |
$ |
3,295 |
$ | 1,841 | $ | 1,421 | $ | 3,262 | $ | 1,629 | $ | 1,220 | $ | 2,849 | $ |
1,628 |
$ |
1,286 |
$ |
2,914 |
$ | 1,956 | $ | 1,034 | $ | 2,990 | ||||||||||||||||||||||||||||||||||
Classified as impaired during the period |
474 |
846 |
1,320 |
396 | 829 | 1,225 | 421 | 736 | 1,157 | 1,434 |
2,519 |
3,953 |
1,276 | 2,042 | 3,318 | |||||||||||||||||||||||||||||||||||||||||||||||||
Transferred to performing during the period |
(37 |
) |
(125 |
) |
(162 |
) |
(72 | ) | (134 | ) | (206 | ) | (27 | ) | (114 | ) | (141 | ) | (130 |
) |
(398 |
) |
(528 |
) |
(124 | ) | (329 | ) | (453 | ) | ||||||||||||||||||||||||||||||||||
Net repayments (1)
|
(427 |
) |
(275 |
) |
(702 |
) |
(181 | ) | (264 | ) | (445 | ) | (461 | ) | (158 | ) | (619 | ) | (910 |
) |
(777 |
) |
(1,687 |
) |
(927 | ) | (459 | ) | (1,386 | ) | ||||||||||||||||||||||||||||||||||
Amounts written off |
(94 |
) |
(383 |
) |
(477 |
) |
(85 | ) | (372 | ) | (457 | ) | (142 | ) | (352 | ) | (494 | ) | (256 |
) |
(1,099 |
) |
(1,355 |
) |
(749 | ) | (954 | ) | (1,703 | ) | ||||||||||||||||||||||||||||||||||
Foreign exchange and other |
6 |
1 |
7 |
(69 | ) | (15 | ) | (84 | ) | 4 | 1 | 5 | (14 |
) |
(2 |
) |
(16 |
) |
(8 | ) | (1 | ) | (9 | ) | ||||||||||||||||||||||||||||||||||||||||
Balance at end of period |
$ |
1,752 |
$ |
1,529 |
$ |
3,281 |
$ | 1,830 | $ | 1,465 | $ | 3,295 | $ | 1,424 | $ | 1,333 | $ | 2,757 | $ |
1,752 |
$ |
1,529 |
$ |
3,281 |
$ | 1,424 | $ | 1,333 | $ | 2,757 | ||||||||||||||||||||||||||||||||||
Allowance for credit losses – impaired loans |
$ |
470 |
$ |
482 |
$ |
952 |
$ | 440 | $ | 464 | $ | 904 | $ | 378 | $ | 451 | $ | 829 | $ |
470 |
$ |
482 |
$ |
952 |
$ | 378 | $ | 451 | $ | 829 | ||||||||||||||||||||||||||||||||||
Net impaired loans (2)
|
||||||||||||||||||||||||||||||||||||||||||||||||||||||||||||||||
Balance at beginning of period |
$ |
1,390 |
$ |
1,001 |
$ |
2,391 |
$ | 1,378 | $ | 981 | $ | 2,359 | $ | 1,196 | $ | 768 | $ | 1,964 | $ |
1,236 |
$ |
862 |
$ |
2,098 |
$ | 1,289 | $ | 629 | $ | 1,918 | ||||||||||||||||||||||||||||||||||
Net change in gross impaired |
(78 |
) |
64 |
(14 |
) |
(11 | ) | 44 | 33 | (205 | ) | 113 | (92 | ) | 124 |
243 |
367 |
(532 | ) | 299 | (233 | ) | ||||||||||||||||||||||||||||||||||||||||||
Net change in allowance |
(30 |
) |
(18 |
) |
(48 |
) |
23 | (24 | ) | (1 | ) | 55 | 1 | 56 | (78 |
) |
(58 |
) |
(136 |
) |
289 | (46 | ) | 243 | ||||||||||||||||||||||||||||||||||||||||
Balance at end of period |
$ |
1,282 |
$ |
1,047 |
$ |
2,329 |
$ | 1,390 | $ | 1,001 | $ | 2,391 | $ | 1,046 | $ | 882 | $ | 1,928 | $ |
1,282 |
$ |
1,047 |
$ |
2,329 |
$ | 1,046 | $ | 882 | $ | 1,928 | ||||||||||||||||||||||||||||||||||
Net impaired loans as a percentage of net loans and acceptances |
0.40 |
% |
0.42 | % | 0.35 | % | 0.40 |
% |
0.35 | % | ||||||||||||||||||||||||||||||||||||||||||||||||||||||
| (1) | Includes proceeds from the disposal of loans. |
| (2) | Net impaired loans are gross impaired loans net of stage 3 allowance for credit losses. |
CIBC THIRD QUARTER 2025 |
33 |
$ millions, as at |
2025 Jul. 31 |
2024 Oct. 31 |
||||||||||||||
|
31 to 90 days |
Over 90 days |
Total |
Total |
|||||||||||||
Residential mortgages |
$ |
1,134 |
$ |
– |
$ |
1,134 |
$ | 1,216 | ||||||||
Personal |
231 |
– |
231 |
261 | ||||||||||||
Credit card |
241 |
157 |
398 |
392 | ||||||||||||
Business and government |
338 |
– |
338 |
226 | ||||||||||||
$ |
1,944 |
$ |
157 |
$ |
2,101 |
$ | 2,095 | |||||||||
Direct exposures |
||||||||||||||||||||||||||||||||||||||||||||||||||||||||
Funded |
Unfunded |
Derivative MTM receivables and repo-style transactions (1)
|
||||||||||||||||||||||||||||||||||||||||||||||||||||||
$ millions, as at July 31, 2025 |
Corporate |
Sovereign |
Banks |
Total funded (A) |
Corporate |
Banks |
Total unfunded (B) |
Corporate |
Sovereign |
Banks |
Net exposure (C) |
Total direct exposure (A)+(B)+(C) |
||||||||||||||||||||||||||||||||||||||||||||
U.K. |
$ |
12,514 |
$ |
919 |
$ |
2,943 |
$ |
16,376 |
$ |
8,795 |
$ |
1,156 |
$ |
9,951 |
$ |
637 |
$ |
68 |
$ |
636 |
$ |
1,341 |
$ |
27,668 |
||||||||||||||||||||||||||||||||
Europe excluding U.K. (2)
|
8,950 |
3,199 |
8,806 |
20,955 |
7,801 |
2,500 |
10,301 |
536 |
153 |
1,759 |
2,448 |
33,704 |
||||||||||||||||||||||||||||||||||||||||||||
Caribbean |
5,586 |
2,095 |
5,354 |
13,035 |
2,449 |
3,133 |
5,582 |
36 |
– |
178 |
214 |
18,831 |
||||||||||||||||||||||||||||||||||||||||||||
Latin America (3)
|
714 |
18 |
34 |
766 |
621 |
2 |
623 |
2 |
52 |
– |
54 |
1,443 |
||||||||||||||||||||||||||||||||||||||||||||
Asia |
2,023 |
2,121 |
1,297 |
5,441 |
467 |
629 |
1,096 |
1 |
683 |
1,500 |
2,184 |
8,721 |
||||||||||||||||||||||||||||||||||||||||||||
Oceania (4)
|
5,695 |
1,151 |
1,063 |
7,909 |
4,122 |
229 |
4,351 |
48 |
2 |
67 |
117 |
12,377 |
||||||||||||||||||||||||||||||||||||||||||||
Other |
291 |
– |
26 |
317 |
430 |
1 |
431 |
– |
– |
2 |
2 |
750 |
||||||||||||||||||||||||||||||||||||||||||||
Total (5)
|
$ |
35,773 |
$ |
9,503 |
$ |
19,523 |
$ |
64,799 |
$ |
24,685 |
$ |
7,650 |
$ |
32,335 |
$ |
1,260 |
$ |
958 |
$ |
4,142 |
$ |
6,360 |
$ |
103,494 |
||||||||||||||||||||||||||||||||
October 31, 2024 |
$ |
32,732 |
$ |
10,255 |
$ |
14,484 |
$ |
57,471 |
$ |
20,602 |
$ |
6,625 |
$ |
27,227 |
$ |
891 |
$ |
911 |
$ |
2,607 |
$ |
4,409 |
$ |
89,107 |
||||||||||||||||||||||||||||||||
| (1) | The amounts shown are net of CVA and collateral. Collateral on derivative MTM receivables was $9.1 billion (October 31, 2024: $8.3 billion), collateral on repo-style transactions was $142.3 billion (October 31, 2024: $112.0 billion), and both comprise cash and investment grade debt securities. |
(2) |
Exposures to Russia and Ukraine are de minimis. |
(3) |
Includes Mexico, Central America and South America. |
(4) |
Includes Australia and New Zealand. |
(5) |
Excludes exposure of $6,152 million (October 31, 2024: $6,419 million) to supranationals (a multinational organization or a political union comprising member nation-states). |
34 |
CIBC THIRD QUARTER 2025 |
$ millions, as at |
2025 Jul. 31 |
2024 Oct. 31 |
||||||||||||||||||||||||||||||||||
Subject to market risk |
Subject to market risk |
|||||||||||||||||||||||||||||||||||
|
Consolidated balance sheet |
Trading |
Non- trading |
Not subject to market risk |
Consolidated balance sheet |
Trading |
Non- trading |
Not subject to market risk |
Non-traded risk primary risk sensitivity |
||||||||||||||||||||||||||||
Cash and non-interest-bearing deposits with banks |
$ |
19,101 |
$ |
– |
$ |
3,342 |
$ |
15,759 |
$ |
8,565 |
$ |
– |
$ |
3,328 |
$ |
5,237 |
Foreign exchange |
|||||||||||||||||||
Interest-bearing deposits with banks |
36,086 |
– |
36,086 |
– |
39,499 |
– |
39,499 |
– |
Interest rate |
|||||||||||||||||||||||||||
Securities |
274,997 |
115,499 |
159,498 |
– |
254,345 |
100,969 |
153,376 |
– |
Interest rate, equity |
|||||||||||||||||||||||||||
Cash collateral on securities borrowed |
21,690 |
– |
21,690 |
– |
17,028 |
– |
17,028 |
– |
Interest rate |
|||||||||||||||||||||||||||
Securities purchased under resale agreements |
86,210 |
22,280 |
63,930 |
– |
83,721 |
24,977 |
58,744 |
– |
Interest rate |
|||||||||||||||||||||||||||
Loans |
||||||||||||||||||||||||||||||||||||
Residential mortgages |
285,935 |
– |
285,935 |
– |
280,672 |
– |
280,672 |
– |
Interest rate |
|||||||||||||||||||||||||||
Personal |
47,259 |
– |
47,259 |
– |
46,681 |
– |
46,681 |
– |
Interest rate |
|||||||||||||||||||||||||||
Credit card |
21,321 |
– |
21,321 |
– |
20,551 |
– |
20,551 |
– |
Interest rate |
|||||||||||||||||||||||||||
Business and government (1)
|
231,414 |
290 |
231,124 |
– |
214,305 |
101 |
214,204 |
– |
Interest rate |
|||||||||||||||||||||||||||
Allowance for credit losses |
(4,285 |
) |
– |
(4,285 |
) |
– |
(3,917 |
) |
– |
(3,917 |
) |
– |
Interest rate |
|||||||||||||||||||||||
Derivative instruments |
34,614 |
30,948 |
3,666 |
– |
36,435 |
33,482 |
2,953 |
– |
|
Interest rate, foreign exchange |
|
|||||||||||||||||||||||||
Other assets |
47,913 |
5,702 |
25,555 |
16,656 |
44,100 |
3,132 |
26,055 |
14,913 |
|
Interest rate, equity, foreign exchange |
|
|||||||||||||||||||||||||
$ |
1,102,255 |
$ |
174,719 |
$ |
895,121 |
$ |
32,415 |
$ |
1,041,985 |
$ |
162,661 |
$ |
859,174 |
$ |
20,150 |
|||||||||||||||||||||
Deposits |
$ |
792,672 |
$ |
29,727 |
(2)
|
$ |
697,659 |
$ |
65,286 |
$ |
764,857 |
$ |
28,041 |
(2) |
$ |
673,215 |
$ |
63,601 |
Interest rate |
|||||||||||||||||
Obligations related to securities sold short |
20,827 |
20,617 |
210 |
– |
21,642 |
21,425 |
217 |
– |
Interest rate |
|||||||||||||||||||||||||||
Cash collateral on securities lent |
5,304 |
– |
5,304 |
– |
7,997 |
– |
7,997 |
– |
Interest rate |
|||||||||||||||||||||||||||
Obligations related to securities sold under repurchase agreements |
145,659 |
– |
145,659 |
– |
110,153 |
– |
110,153 |
– |
Interest rate |
|||||||||||||||||||||||||||
Derivative instruments |
36,552 |
35,220 |
1,332 |
– |
40,654 |
39,115 |
1,539 |
– |
Interest rate, foreign exchange |
|||||||||||||||||||||||||||
Other liabilities (1)
|
30,666 |
3,507 |
14,883 |
12,276 |
30,210 |
3,261 |
13,808 |
13,141 |
Interest rate |
|||||||||||||||||||||||||||
Subordinated indebtedness |
7,699 |
– |
7,699 |
– |
7,465 |
– |
7,465 |
– |
Interest rate |
|||||||||||||||||||||||||||
$ |
1,039,379 |
$ |
89,071 |
$ |
872,746 |
$ |
77,562 |
$ |
982,978 |
$ |
91,842 |
$ |
814,394 |
$ |
76,742 |
|||||||||||||||||||||
(1) |
Certain information has been revised to conform to the presentation adopted in the first quarter of 2025. |
(2) |
Comprises FVO deposits which are considered trading for market risk purposes, including certain deposit notes that have equity risk exposures and are economically hedged by trading books. |
As at or for the three months ended |
As at or for the nine months ended |
|||||||||||||||||||||||||||||||||||||||||||
$ millions |
2025 Jul. 31 |
2025 Apr. 30 |
2024 Jul. 31 |
2025 Jul. 31 |
2024 Jul. 31 |
|||||||||||||||||||||||||||||||||||||||
High |
Low |
As at |
Average |
As at |
Average |
As at |
Average |
Average |
Average |
|||||||||||||||||||||||||||||||||||
Interest rate risk |
$ |
11.9 |
$ |
4.3 |
$ |
9.0 |
$ |
7.4 |
$ | 6.6 | $ | 7.0 | $ | 7.4 | $ | 11.2 | $ |
7.8 |
$ | 9.8 | ||||||||||||||||||||||||
Credit spread risk |
2.0 |
1.2 |
1.3 |
1.6 |
1.4 | 1.6 | 2.6 | 2.8 | 1.8 |
2.5 | ||||||||||||||||||||||||||||||||||
Equity risk |
11.6 |
7.5 |
9.5 |
9.5 |
10.0 | 12.2 | 6.7 | 6.2 | 9.8 |
6.1 | ||||||||||||||||||||||||||||||||||
Foreign exchange risk |
2.8 |
0.6 |
0.8 |
1.0 |
1.1 | 1.1 | 0.8 | 1.4 | 1.2 |
1.3 | ||||||||||||||||||||||||||||||||||
Commodity risk |
3.2 |
1.5 |
2.5 |
2.3 |
2.3 | 5.0 | 3.3 | 3.3 | 3.4 |
2.8 | ||||||||||||||||||||||||||||||||||
Diversification effect (1)
|
n/m |
n/m |
(13.3 |
) |
(10.6 |
) |
(10.8 | ) | (13.1 | ) | (10.1 | ) | (11.8 | ) | (12.1 |
) |
(10.7 | ) | ||||||||||||||||||||||||||
| Total VaR (one-day measure) | $ |
15.0 |
$ |
9.2 |
$ |
9.8 |
$ |
11.2 |
$ | 10.6 | $ | 13.8 | $ | 10.7 | $ | 13.1 | $ |
11.9 |
$ | 11.8 | ||||||||||||||||||||||||
| (1) | Total VaR is less than the sum of the VaR of the different market risk types due to risk offsets resulting from a portfolio diversification effect. |
| n/m | Not meaningful. It is not meaningful to compute a diversification effect because the high and low may occur on different days for different risk types. |
CIBC THIRD QUARTER 2025 |
35 |
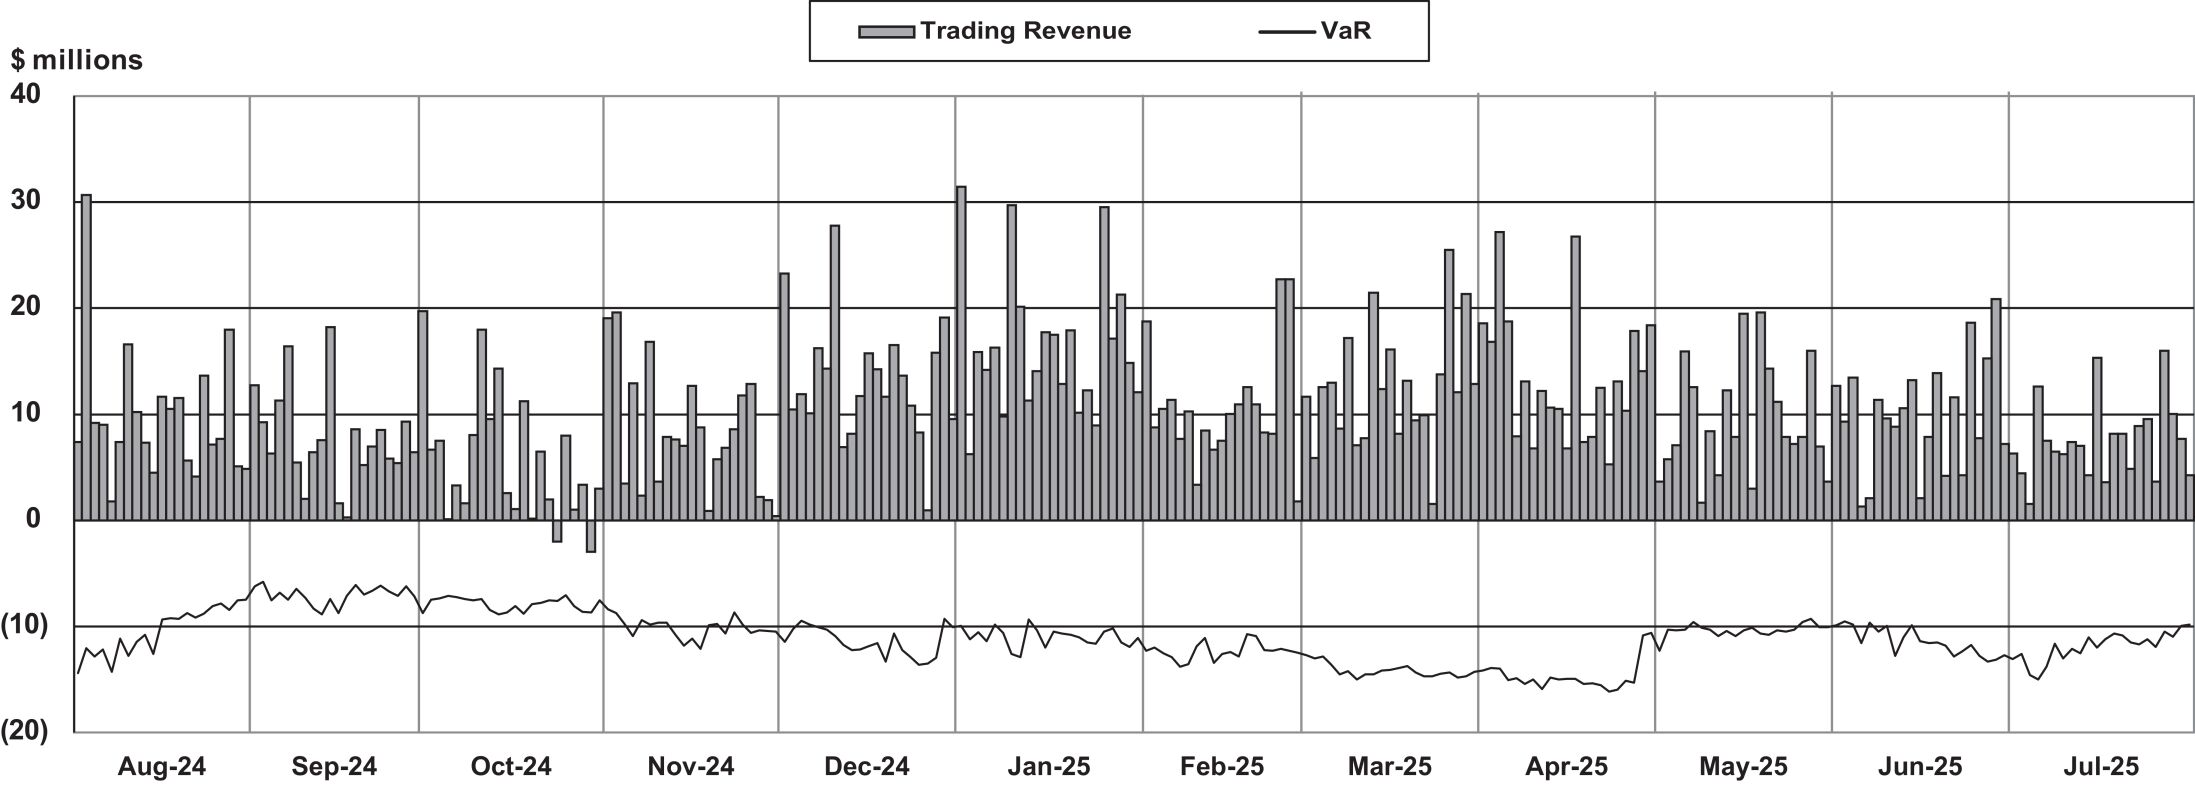
| $ millions (pre-tax), as at | 2025 Jul. 31 |
2025 Apr. 30 |
2024 Jul. 31 |
|||||||||||||||||||||||||||||||||
CAD |
(1)
|
USD |
Total |
CAD | (1) |
USD | Total | CAD | (1) |
USD | Total | |||||||||||||||||||||||||
| 100 basis point increase in interest rates |
||||||||||||||||||||||||||||||||||||
| Increase (decrease) in net interest income |
$ |
116 |
$ |
31 |
$ |
147 |
$ | 84 | $ | 37 | $ | 121 | $ | 145 | $ | 79 | $ | 224 | ||||||||||||||||||
| Increase (decrease) in EVE |
(1,072 |
) |
(441 |
) |
(1,513 |
) |
(1,055 | ) | (457 | ) | (1,512) | (919 | ) | (406 | ) | (1,325 | ) | |||||||||||||||||||
| 100 basis point decrease in interest rates |
||||||||||||||||||||||||||||||||||||
| Increase (decrease) in net interest income |
(191 |
) |
(34 |
) |
(225 |
) |
(148 | ) | (41 | ) | (189 | ) | (191 | ) | (80 | ) | (271 | ) | ||||||||||||||||||
| Increase (decrease) in EVE |
922 |
437 |
1,359 |
903 | 463 | 1,366 | 831 | 417 | 1,248 | |||||||||||||||||||||||||||
| (1) | Includes CAD and other currency exposures. |
36 |
CIBC THIRD QUARTER 2025 |
| $ millions, as at | Bank owned liquid assets |
|
Securities received as collateral |
|
Total liquid assets |
|
Encumbered liquid assets |
|
Unencumbered liquid assets |
(1) | ||||||||||||
| 2025 |
Cash and deposits with banks |
$ |
55,187 |
$ |
– |
$ |
55,187 |
$ |
282 |
$ |
54,905 |
|||||||||||
| Jul. 31 |
Securities issued or guaranteed by sovereigns, central banks, and multilateral development banks |
184,041 |
118,248 |
302,289 |
187,527 |
114,762 |
||||||||||||||||
| Other debt securities |
6,934 |
13,251 |
20,185 |
9,103 |
11,082 |
|||||||||||||||||
| Equities |
70,459 |
36,042 |
106,501 |
65,016 |
41,485 |
|||||||||||||||||
| Canadian government guaranteed National Housing Act mortgage-backed securities |
31,334 |
3,773 |
35,107 |
22,990 |
12,117 |
|||||||||||||||||
| Other liquid assets (2)
|
18,666 |
4,688 |
23,354 |
8,119 |
15,235 |
|||||||||||||||||
$ |
366,621 |
$ |
176,002 |
$ |
542,623 |
$ |
293,037 |
$ |
249,586 |
|||||||||||||
| 2024 |
Cash and deposits with banks | $ | 48,064 | $ | – | $ | 48,064 | $ | 560 | $ | 47,504 | |||||||||||
| Oct. 31 |
Securities issued or guaranteed by sovereigns, central banks, and multilateral development banks |
178,324 | 108,499 | 286,823 | 146,992 | 139,831 | ||||||||||||||||
| Other debt securities | 6,093 | 11,328 | 17,421 | 3,696 | 13,725 | |||||||||||||||||
| Equities | 58,102 | 33,424 | 91,526 | 54,269 | 37,257 | |||||||||||||||||
| Canadian government guaranteed National Housing Act mortgage-backed securities |
35,155 | 2,038 | 37,193 | 20,263 | 16,930 | |||||||||||||||||
| Other liquid assets (2)
|
16,021 | 2,849 | 18,870 | 8,971 | 9,899 | |||||||||||||||||
| $ | 341,759 | $ | 158,138 | $ | 499,897 | $ | 234,751 | $ | 265,146 | |||||||||||||
| (1) | Unencumbered liquid assets are defined as on-balance sheet assets, assets borrowed or purchased under resale agreements, and other off-balance sheet collateral received less encumbered liquid assets. |
| (2) | Includes cash pledged as collateral for derivatives transactions, select asset-backed securities and precious metals. |
$ millions, as at |
2025 Jul. 31 |
2024 Oct. 31 |
||||||
| CIBC (parent) |
$ |
159,722 |
$ |
185,357 |
||||
| Domestic subsidiaries |
14,460 |
7,882 |
||||||
| Foreign subsidiaries |
75,404 |
71,907 |
||||||
$ |
249,586 |
$ |
265,146 |
|||||
CIBC THIRD QUARTER 2025 |
37 |
Encumbered |
Unencumbered |
Total assets |
||||||||||||||||||||||||||||
$ millions, as at |
Pledged as collateral |
Other |
(1) |
Available as collateral |
Other |
(2) |
||||||||||||||||||||||||
| 2025 |
Cash and deposits with banks |
$ |
– |
$ |
282 |
$ |
54,905 |
$ |
– |
$ |
55,187 |
|||||||||||||||||||
| Jul. 31 |
Securities (3)
|
263,316 |
6,449 |
182,564 |
– |
452,329 |
||||||||||||||||||||||||
Loans, net of allowance (4)
|
– |
60,959 |
24,883 |
495,802 |
581,644 |
|||||||||||||||||||||||||
Other assets |
5,328 |
– |
6,785 |
70,414 |
82,527 |
|||||||||||||||||||||||||
$ |
268,644 |
$ |
67,690 |
$ |
269,137 |
$ |
566,216 |
$ |
1,171,687 |
|||||||||||||||||||||
| 2024 |
Cash and deposits with banks |
$ |
– |
$ |
560 |
$ |
47,504 |
$ |
– |
$ |
48,064 |
|||||||||||||||||||
| Oct. 31 |
Securities (3)
|
206,861 |
7,117 |
200,712 |
– |
414,690 |
||||||||||||||||||||||||
Loans, net of allowance (4)(5)
|
– |
57,998 |
26,919 |
473,375 |
558,292 |
|||||||||||||||||||||||||
Other assets (5)
|
7,067 |
– |
4,195 |
69,273 |
80,535 |
|||||||||||||||||||||||||
$ |
213,928 |
$ |
65,675 |
$ |
279,330 |
$ |
542,648 |
$ |
1,101,581 |
|||||||||||||||||||||
(1) |
Includes assets supporting CIBC’s long-term funding activities and assets restricted for legal or other reasons, such as restricted cash. |
(2) |
Other unencumbered assets are not subject to any restrictions on their use to secure funding or as collateral, however, they are not considered immediately available to existing borrowing programs. |
(3) |
Total securities comprise certain on-balance sheet securities, as well as off-balance sheet securities received under resale agreements, secured borrowings transactions, and collateral-for-collateral transactions. |
(4) |
Loans included as available as collateral represent the loans underlying National Housing Act mortgage-backed securities and Federal Home Loan Banks eligible loans. |
(5) |
Certain information has been revised to conform to the presentation adopted in the first quarter of 2025. |
38 |
CIBC THIRD QUARTER 2025 |
$ millions, average of the three months ended July 31, 2025 |
Total unweighted value |
(1)
|
Total weighted value |
(2)
| ||||||
| HQLA |
||||||||||
| 1 |
HQLA |
n/a |
$ |
200,482 |
||||||
| Cash outflows |
||||||||||
| 2 |
Retail deposits and deposits from small business customers, of which: |
$ |
228,840 |
17,778 |
||||||
| 3 |
Stable deposits |
100,556 |
3,017 |
|||||||
| 4 |
Less stable deposits |
128,284 |
14,761 |
|||||||
| 5 |
Unsecured wholesale funding, of which: |
250,364 |
109,178 |
|||||||
| 6 |
Operational deposits (all counterparties) and deposits in networks of cooperative banks |
130,187 |
31,321 |
|||||||
| 7 |
Non-operational deposits (all counterparties) |
103,695 |
61,375 |
|||||||
| 8 |
Unsecured debt |
16,482 |
16,482 |
|||||||
| 9 |
Secured wholesale funding |
n/a |
30,073 |
|||||||
| 10 |
Additional requirements, of which: |
190,409 |
44,657 |
|||||||
| 11 |
Outflows related to derivative exposures and other collateral requirements |
22,301 |
8,520 |
|||||||
| 12 |
Outflows related to loss of funding on debt products |
6,801 |
6,801 |
|||||||
| 13 |
Credit and liquidity facilities |
161,307 |
29,336 |
|||||||
| 14 |
Other contractual funding obligations |
5,688 |
4,809 |
|||||||
| 15 |
Other contingent funding obligations |
466,661 |
8,910 |
|||||||
| 16 |
Total cash outflows |
n/a |
215,405 |
|||||||
| Cash inflows |
||||||||||
| 17 |
Secured lending (e.g. reverse repos) |
138,080 |
26,466 |
|||||||
| 18 |
Inflows from fully performing exposures |
20,990 |
11,020 |
|||||||
| 19 |
Other cash inflows |
20,096 |
20,096 |
|||||||
| 20 |
Total cash inflows |
$ |
179,166 |
$ |
57,582 |
|||||
Total adjusted value |
||||||||||
| 21 |
Total HQLA |
n/a |
$ |
200,482 |
||||||
| 22 |
Total net cash outflows |
n/a |
$ |
157,823 |
||||||
| 23 |
LCR |
n/a |
127 |
% | ||||||
| $ millions, average of the three months ended April 30, 2025 |
Total adjusted value |
|||||||||
| 24 |
Total HQLA |
n/a |
$ |
211,847 |
||||||
| 25 |
Total net cash outflows |
n/a |
$ |
161,768 |
||||||
| 26 |
LCR |
n/a |
131 |
% | ||||||
(1) |
Unweighted inflow and outflow values are calculated as outstanding balances maturing or callable within 30 days of various categories or types of liabilities, off-balance sheet items or contractual receivables. |
(2) |
Weighted values are calculated after the application of haircuts (for HQLA) and inflow and outflow rates prescribed by OSFI. |
n/a |
Not applicable as per the LCR common disclosure template. |
CIBC THIRD QUARTER 2025 |
39 |
a |
b |
c |
d |
e |
||||||||||||||||||||||
Unweighted value by residual maturity |
||||||||||||||||||||||||||
| $ millions, as at July 31, 2025 | No maturity |
<6 months |
6 months to <1 year |
>1 year |
Weighted value |
|||||||||||||||||||||
| ASF item |
||||||||||||||||||||||||||
| 1 |
Capital |
$ |
63,039 |
$ |
– |
$ |
– |
$ |
7,212 |
$ |
70,251 |
|||||||||||||||
| 2 |
Regulatory capital |
63,039 |
– |
– |
7,212 |
70,251 |
||||||||||||||||||||
| 3 |
Other capital instruments |
– |
– |
– |
– |
– |
||||||||||||||||||||
| 4 |
Retail deposits and deposits from small business customers |
197,940 |
51,866 |
22,214 |
18,319 |
268,747 |
||||||||||||||||||||
| 5 |
Stable deposits |
89,552 |
20,941 |
11,511 |
9,487 |
125,391 |
||||||||||||||||||||
| 6 |
Less stable deposits |
108,388 |
30,925 |
10,703 |
8,832 |
143,356 |
||||||||||||||||||||
| 7 |
Wholesale funding |
199,843 |
217,748 |
72,155 |
114,195 |
264,333 |
||||||||||||||||||||
| 8 |
Operational deposits |
134,095 |
3,924 |
140 |
3 |
69,082 |
||||||||||||||||||||
| 9 |
Other wholesale funding |
65,748 |
213,824 |
72,015 |
114,192 |
195,251 |
||||||||||||||||||||
| 10 |
Liabilities with matching interdependent assets |
– |
1,161 |
589 |
12,918 |
– |
||||||||||||||||||||
| 11 |
Other liabilities |
– |
|
82,903 (1)
|
|
9,783 |
||||||||||||||||||||
| 12 |
NSFR derivative liabilities |
|
9,687 (1)
|
|
||||||||||||||||||||||
| 13 |
All other liabilities and equity not included in the above categories |
– |
63,370 |
126 |
9,720 |
9,783 |
||||||||||||||||||||
| 14 |
Total ASF |
613,114 |
||||||||||||||||||||||||
| RSF item |
||||||||||||||||||||||||||
| 15 |
Total NSFR HQLA |
24,816 |
||||||||||||||||||||||||
| 16 |
Deposits held at other financial institutions for operational purposes |
– |
3,408 |
– |
111 |
1,814 |
||||||||||||||||||||
| 17 |
Performing loans and securities |
127,499 |
137,742 |
75,901 |
334,782 |
442,402 |
||||||||||||||||||||
| 18 |
Performing loans to financial institutions secured by Level 1 HQLA |
– |
26,022 |
4,864 |
207 |
3,940 |
||||||||||||||||||||
| 19 |
Performing loans to financial institutions secured by non-Level 1 HQLA and unsecured performing loans to financial institutions |
5,309 |
52,654 |
7,400 |
12,786 |
27,518 |
||||||||||||||||||||
| 20 |
Performing loans to non-financial corporate clients, loans to retail and small business customers, and loans to sovereigns, central banks and public sector entities, of which: |
78,895 |
24,010 |
19,545 |
127,258 |
197,166 |
||||||||||||||||||||
| 21 |
With a risk weight of less than or equal to 35% under the Basel II standardized approach for credit risk |
– |
– |
– |
– |
– |
||||||||||||||||||||
| 22 |
Performing residential mortgages, of which: |
18,926 |
34,442 |
43,486 |
181,813 |
181,646 |
||||||||||||||||||||
| 23 |
With a risk weight of less than or equal to 35% under the Basel II standardized approach for credit risk |
18,926 |
34,356 |
43,410 |
176,263 |
176,847 |
||||||||||||||||||||
| 24 |
Securities that are not in default and do not qualify as HQLA, including exchange-traded equities |
24,369 |
614 |
606 |
12,718 |
32,132 |
||||||||||||||||||||
| 25 |
Assets with matching interdependent liabilities |
– |
1,161 |
589 |
12,918 |
– |
||||||||||||||||||||
| 26 |
Other assets |
17,194 |
|
77,205 (1)
|
|
45,922 |
||||||||||||||||||||
| 27 |
Physical traded commodities, including gold |
6,785 |
5,767 |
|||||||||||||||||||||||
| 28 |
Assets posted as initial margin for derivative contracts and contributions to default funds of central counterparties |
|
13,008 (1)
|
|
11,057 |
|||||||||||||||||||||
| 29 |
NSFR derivative assets |
|
8,402 (1)
|
|
– |
|||||||||||||||||||||
| 30 |
NSFR derivative liabilities before deduction of variation margin posted |
|
19 (1)
|
|
870 |
|||||||||||||||||||||
| 31 |
All other assets not included in the above categories |
10,409 |
46,752 |
176 |
8,848 |
28,228 |
||||||||||||||||||||
| 32 |
Off-balance sheet items |
|
493,581 (1)
|
|
17,072 |
|||||||||||||||||||||
| 33 |
Total RSF |
$ |
532,026 |
|||||||||||||||||||||||
| 34 |
NSFR |
115 |
% |
|||||||||||||||||||||||
| $ millions, as at April 30, 2025 | Weighted value |
|||||||||||||||||||||||||
| 35 |
Total ASF |
$ | 598,473 | |||||||||||||||||||||||
| 36 |
Total RSF |
$ | 530,530 | |||||||||||||||||||||||
| 37 |
NSFR |
113 | % | |||||||||||||||||||||||
(1) |
No assigned time period per disclosure template design. |
40 |
CIBC THIRD QUARTER 2025 |
$ millions, as at July 31, 2025 |
Less than 1 month |
1–3 months |
3–6 months |
6–12 months |
Less than 1 year total |
1–2 years |
Over 2 years |
Total |
||||||||||||||||||||||||
| Deposits from banks (1)
|
$ |
4,474 |
$ |
1,243 |
$ |
656 |
$ |
625 |
$ |
6,998 |
$ |
– |
$ |
– |
$ |
6,998 |
||||||||||||||||
| Certificates of deposit and commercial paper |
6,669 |
20,748 |
19,804 |
33,408 |
80,629 |
695 |
– |
81,324 |
||||||||||||||||||||||||
| Bearer deposit notes and bankers’ acceptances |
395 |
790 |
1,265 |
4,156 |
6,606 |
– |
– |
6,606 |
||||||||||||||||||||||||
| Senior unsecured medium-term notes (2)
|
1,871 |
1,375 |
2,153 |
12,210 |
17,609 |
20,453 |
29,108 |
67,170 |
||||||||||||||||||||||||
| Senior unsecured structured notes |
– |
– |
– |
91 |
91 |
– |
69 |
160 |
||||||||||||||||||||||||
| Covered bonds/asset-backed securities |
||||||||||||||||||||||||||||||||
| Mortgage securitization (3)
|
– |
154 |
746 |
578 |
1,478 |
2,025 |
11,666 |
15,169 |
||||||||||||||||||||||||
| Covered bonds |
– |
– |
2,775 |
11,590 |
14,365 |
11,225 |
17,412 |
43,002 |
||||||||||||||||||||||||
| Cards securitization |
– |
– |
117 |
1,343 |
1,460 |
– |
984 |
2,444 |
||||||||||||||||||||||||
| Subordinated liabilities |
– |
– |
– |
– |
– |
– |
7,699 |
7,699 |
||||||||||||||||||||||||
| Other (4)
|
– |
– |
– |
– |
– |
– |
9 |
9 |
||||||||||||||||||||||||
$ |
13,409 |
$ |
24,310 |
$ |
27,516 |
$ |
64,001 |
$ |
129,236 |
$ |
34,398 |
$ |
66,947 |
$ |
230,581 |
|||||||||||||||||
| Of which: |
||||||||||||||||||||||||||||||||
| Secured |
$ |
– |
$ |
154 |
$ |
3,638 |
$ |
13,511 |
$ |
17,303 |
$ |
13,250 |
$ |
30,062 |
$ |
60,615 |
||||||||||||||||
| Unsecured |
13,409 |
24,156 |
23,878 |
50,490 |
111,933 |
21,148 |
36,885 |
169,966 |
||||||||||||||||||||||||
$ |
13,409 |
$ |
24,310 |
$ |
27,516 |
$ |
64,001 |
$ |
129,236 |
$ |
34,398 |
$ |
66,947 |
$ |
230,581 |
|||||||||||||||||
| October 31, 2024 |
$ |
25,956 |
$ |
11,157 |
$ |
43,907 |
$ |
36,822 |
$ |
117,842 |
$ |
34,558 |
$ |
62,917 |
$ |
215,317 |
||||||||||||||||
(1) |
Includes non-negotiable term deposits from banks. |
(2) |
Includes wholesale funding liabilities which are subject to conversion under bail-in regulations. See the “Capital management” section for additional details. |
(3) |
Includes $500 million (October 31, 2024: $500 million) of HELOC securitization. |
(4) |
Includes Federal Home Loan Bank (FHLB) deposits. |
| $ billions, as at | 2025 Jul. 31 |
2024 Oct. 31 |
||||||||||||||
| CAD |
$ |
49.2 |
21 |
% |
$ | 48.8 | 23 | % | ||||||||
| USD |
129.5 |
56 |
124.3 | 57 | ||||||||||||
| Other |
51.9 |
23 |
42.2 | 20 | ||||||||||||
$ |
230.6 |
100 |
% |
$ | 215.3 | 100 | % | |||||||||
As at July 31, 2025 |
Morningstar DBRS |
Fitch |
Moody’s |
S&P |
||||||||||||
| Deposit/Counterparty (1)
|
AA |
AA |
Aa2 |
A+ |
||||||||||||
| Senior debt (2)
|
AA |
AA |
Aa2 |
A+ |
||||||||||||
| Bail-in senior debt (3)
|
AA(L) |
AA- |
A2 |
A- |
||||||||||||
| Subordinated indebtedness |
A(H) |
A |
Baa1 |
A- |
||||||||||||
| Subordinated indebtedness – NVCC (4)
|
A(L) |
A |
Baa1 |
BBB+ |
||||||||||||
| Limited recourse capital notes – NVCC (4)(5)
|
BBB(H) |
BBB+ |
Baa3 |
BBB- |
||||||||||||
| Preferred shares – NVCC (4)(5)
|
Pfd-2 |
BBB+ |
Baa3 |
P-2(L) |
||||||||||||
| Short-term debt |
R-1(H) |
F1+ |
P-1 |
A-1 |
||||||||||||
| Outlook |
Stable |
Stable |
Stable |
Stable |
(1) |
Morningstar DBRS Long-Term Issuer Rating; Fitch Ratings Inc. (Fitch) Long-Term Deposit Rating and Derivative Counterparty Rating; Moody’s Investors Service, Inc. (Moody’s) Long-Term Deposit and Counterparty Risk Assessment Rating; Standard & Poor’s (S&P’s) Issuer Credit Rating. |
(2) |
Includes senior debt issued on or after September 23, 2018 which is not subject to bail-in regulations. |
(3) |
Comprises liabilities which are subject to conversion under bail-in regulations. See the “Capital management” section for additional details. |
(4) |
Comprises instruments which are treated as NVCC in accordance with OSFI’s CAR Guideline. |
(5) |
Morningstar DBRS rating does not apply to limited recourse capital notes and associated preferred shares issued in USD. Fitch rating only applies to limited recourse capital notes and associated preferred shares issued in USD. |
CIBC THIRD QUARTER 2025 |
41 |
$ billions, as at |
2025 Jul. 31 |
2024 Oct. 31 |
||||||
One-notch downgrade |
$ |
– |
$ |
– |
||||
Two-notch downgrade |
0.1 |
0.1 |
||||||
Three-notch downgrade |
0.4 |
0.3 |
||||||
| $ millions, as at July 31, 2025 | Less than 1 month |
1–3 months |
3–6 months |
6–9 months |
9–12 months |
1–2 years |
2–5 years |
Over 5 years |
No specified maturity |
Total | ||||||||||||||||||||||||||||||
Assets |
||||||||||||||||||||||||||||||||||||||||
Cash and non-interest-bearing deposits with banks (1)
|
$ |
19,101 |
$ |
– |
$ |
– |
$ |
– |
$ |
– |
$ |
– |
$ |
– |
$ |
– |
$ |
– |
$ |
19,101 |
||||||||||||||||||||
Interest-bearing deposits with banks |
36,086 |
– |
– |
– |
– |
– |
– |
– |
– |
36,086 |
||||||||||||||||||||||||||||||
Securities |
8,949 |
10,392 |
13,998 |
5,904 |
7,308 |
34,917 |
68,108 |
50,988 |
74,433 |
274,997 |
||||||||||||||||||||||||||||||
Cash collateral on securities borrowed |
21,690 |
– |
– |
– |
– |
– |
– |
– |
– |
21,690 |
||||||||||||||||||||||||||||||
Securities purchased under resale agreements |
46,936 |
17,496 |
12,820 |
2,350 |
3,558 |
3,044 |
6 |
– |
– |
86,210 |
||||||||||||||||||||||||||||||
Loans |
||||||||||||||||||||||||||||||||||||||||
Residential mortgages |
4,914 |
13,288 |
20,049 |
15,364 |
34,861 |
86,693 |
100,753 |
10,013 |
– |
285,935 |
||||||||||||||||||||||||||||||
Personal |
980 |
865 |
586 |
1,000 |
684 |
743 |
4,875 |
5,230 |
32,296 |
47,259 |
||||||||||||||||||||||||||||||
Credit card |
448 |
895 |
1,343 |
1,343 |
1,343 |
5,373 |
10,576 |
– |
– |
21,321 |
||||||||||||||||||||||||||||||
Business and government (2)
|
4,624 |
7,437 |
14,732 |
12,916 |
19,759 |
54,693 |
82,645 |
22,927 |
11,681 |
231,414 |
||||||||||||||||||||||||||||||
Allowance for credit losses |
– |
– |
– |
– |
– |
– |
– |
– |
(4,285 |
) |
(4,285 |
) |
||||||||||||||||||||||||||||
Derivative instruments |
2,516 |
4,574 |
4,229 |
2,464 |
1,597 |
6,008 |
7,538 |
5,688 |
– |
34,614 |
||||||||||||||||||||||||||||||
Other assets |
– |
– |
– |
– |
– |
– |
– |
– |
47,913 |
47,913 |
||||||||||||||||||||||||||||||
$ |
146,244 |
$ |
54,947 |
$ |
67,757 |
$ |
41,341 |
$ |
69,110 |
$ |
191,471 |
$ |
274,501 |
$ |
94,846 |
$ |
162,038 |
$ |
1,102,255 |
|||||||||||||||||||||
October 31, 2024 |
$ | 130,008 | $ | 45,680 | $ | 57,993 | $ | 52,094 | $ | 61,184 | $ | 186,218 | $ | 260,975 | $ | 101,546 | $ | 146,287 | $ | 1,041,985 | ||||||||||||||||||||
Liabilities |
||||||||||||||||||||||||||||||||||||||||
Deposits (3)
|
$ |
40,083 |
$ |
45,283 |
$ |
53,647 |
$ |
57,171 |
$ |
53,307 |
$ |
50,002 |
$ |
69,340 |
$ |
24,624 |
$ |
399,215 |
$ |
792,672 |
||||||||||||||||||||
Obligations related to securities sold short |
20,827 |
– |
– |
– |
– |
– |
– |
– |
– |
20,827 |
||||||||||||||||||||||||||||||
Cash collateral on securities lent |
5,304 |
– |
– |
– |
– |
– |
– |
– |
– |
5,304 |
||||||||||||||||||||||||||||||
Obligations related to securities sold under repurchase agreements |
105,477 |
34,996 |
1,562 |
– |
– |
624 |
3,000 |
– |
– |
145,659 |
||||||||||||||||||||||||||||||
Derivative instruments |
3,466 |
4,257 |
4,283 |
2,158 |
2,258 |
6,267 |
4,522 |
9,338 |
3 |
36,552 |
||||||||||||||||||||||||||||||
Other liabilities (2)
|
23 |
46 |
70 |
71 |
69 |
258 |
568 |
782 |
28,779 |
30,666 |
||||||||||||||||||||||||||||||
Subordinated indebtedness |
– |
– |
– |
– |
– |
– |
131 |
7,568 |
– |
7,699 |
||||||||||||||||||||||||||||||
Equity |
– |
– |
– |
– |
– |
– |
– |
– |
62,876 |
62,876 |
||||||||||||||||||||||||||||||
$ |
175,180 |
$ |
84,582 |
$ |
59,562 |
$ |
59,400 |
$ |
55,634 |
$ |
57,151 |
$ |
77,561 |
$ |
42,312 |
$ |
490,873 |
$ |
1,102,255 |
|||||||||||||||||||||
October 31, 2024 |
$ | 188,502 | $ | 48,833 | $ | 75,616 | $ | 49,168 | $ | 46,158 | $ | 55,388 | $ | 73,705 | $ | 39,445 | $ | 465,170 | $ | 1,041,985 | ||||||||||||||||||||
| (1) | Cash includes interest-bearing demand deposits with Bank of Canada. |
| (2) | Certain information has been revised to conform to the presentation adopted in the first quarter of 2025. |
| (3) | Comprises $256.1 billion (October 31, 2024: $252.9 billion) of personal deposits; $509.5 billion (October 31, 2024: $492.0 billion) of business and government deposits and secured borrowings; and $27.1 billion (October 31, 2024: $20.0 billion) of bank deposits. |
| $ millions, as at July 31, 2025 | Less than 1 month |
|
1–3 months |
|
3–6 months |
|
6–9 months |
|
9–12 months |
|
1–2 years |
|
2–5 years |
|
Over 5 years |
|
|
No specified maturity |
(1) |
Total | ||||||||||||||||||||
Unutilized credit commitments |
$ |
2,641 |
$ |
10,815 |
$ |
4,839 |
$ |
6,644 |
$ |
8,867 |
$ |
25,194 |
$ |
89,379 |
$ |
5,321 |
$ |
257,984 |
$ |
411,684 |
||||||||||||||||||||
Standby and performance letters of credit |
6,023 |
3,042 |
5,455 |
4,066 |
4,745 |
576 |
802 |
186 |
– |
24,895 |
||||||||||||||||||||||||||||||
Backstop liquidity facilities |
– |
198 |
28,680 |
57 |
132 |
405 |
– |
– |
– |
29,472 |
||||||||||||||||||||||||||||||
Documentary and commercial letters of credit |
24 |
98 |
40 |
4 |
4 |
– |
20 |
– |
– |
190 |
||||||||||||||||||||||||||||||
Other (2)
|
1,637 |
– |
– |
– |
– |
– |
– |
– |
56 |
1,693 |
||||||||||||||||||||||||||||||
$ |
10,325 |
$ |
14,153 |
$ |
39,014 |
$ |
10,771 |
$ |
13,748 |
$ |
26,175 |
$ |
90,201 |
$ |
5,507 |
$ |
258,040 |
$ |
467,934 |
|||||||||||||||||||||
October 31, 2024 |
$ | 18,455 | $ | 35,462 | $ | 8,910 | $ | 11,720 | $ | 12,084 | $ | 26,766 | $ | 77,636 | $ | 3,562 | $ | 245,816 | $ | 440,411 |
| (1) | Includes $198.6 billion (October 31, 2024: $189.6 billion) of personal, home equity and credit card lines, which are unconditionally cancellable at our discretion. |
| (2) | Includes forward-dated securities financing trades. |
42 |
CIBC THIRD QUARTER 2025 |
| $ millions, as at July 31, 2025 | Less than 1 month |
1–3 months |
3–6 months |
6–9 months |
9–12 months |
1–2 years |
2–5 years |
Over 5 years |
Total | |||||||||||||||||||||||||||
Purchase obligations (1)
|
$ |
110 |
$ |
220 |
$ |
312 |
$ |
236 |
$ |
238 |
$ |
597 |
$ |
746 |
$ |
254 |
$ |
2,713 |
||||||||||||||||||
Future lease commitments (2)
|
– |
1 |
5 |
6 |
6 |
33 |
94 |
427 |
572 |
|||||||||||||||||||||||||||
Investment commitments |
– |
1 |
1 |
12 |
– |
10 |
49 |
460 |
533 |
|||||||||||||||||||||||||||
Underwriting commitments |
311 |
– |
– |
– |
– |
– |
– |
– |
311 |
|||||||||||||||||||||||||||
Pension contributions (3)
|
14 |
28 |
– |
– |
– |
– |
– |
– |
42 |
|||||||||||||||||||||||||||
$ |
435 |
$ |
250 |
$ |
318 |
$ |
254 |
$ |
244 |
$ |
640 |
$ |
889 |
$ |
1,141 |
$ |
4,171 |
|||||||||||||||||||
October 31, 2024 (2)
|
$ | 607 | $ | 263 | $ | 292 | $ | 321 | $ | 279 | $ | 737 | $ | 850 | $ | 1,203 | $ | 4,552 | ||||||||||||||||||
| (1) | Obligations that are legally binding agreements whereby we agree to purchase products or services with specific minimum or baseline quantities defined at fixed, minimum or variable prices over a specified period of time are defined as purchase obligations. Purchase obligations are included through to the termination date specified in the respective agreements, even if the contract is renewable. Many of the purchase agreements for goods and services include clauses that would allow us to cancel the agreement prior to expiration of the contract within a specific notice period. However, the amount above includes our obligations without regard to such termination clauses (unless actual notice of our intention to terminate the agreement has been communicated to the counterparty). The table excludes purchases of debt and equity instruments that settle within standard market time frames. |
| (2) | Excludes lease obligations that are accounted for under IFRS 16, which are recognized on the interim consolidated balance sheet, and operating and tax expenses relating to lease commitments. The table includes lease obligations that are not accounted for under IFRS 16, including those related to future starting lease commitments for which we have not yet recognized a lease liability and right-of-use asset. |
| (3) | Includes estimated minimum funding contributions for our funded defined benefit pension plans in Canada, the U.S., the U.K., and the Caribbean. Estimated minimum funding contributions are included only for the remaining annual period ending October 31, 2025 as the minimum contributions are affected by various factors, such as market performance and regulatory requirements, and therefore are subject to significant variability. |
CIBC THIRD QUARTER 2025 |
43 |
44 |
CIBC THIRD QUARTER 2025 |
CIBC THIRD QUARTER 2025 |
45 |
46 |
CIBC THIRD QUARTER 2025 |
CIBC THIRD QUARTER 2025 |
47 |
48 |
CIBC THIRD QUARTER 2025 |
CIBC THIRD QUARTER 2025 |
49 |
50 |
CIBC THIRD QUARTER 2025 |
| Contents | ||
52 |
||
53 |
||
54 |
||
55 |
||
56 |
||
57 |
||
| 57 | Note 1 | – | Changes in accounting policies | |||
| 57 | Note 2 | – | Significant estimates and assumptions | |||
| 58 | Note 3 | – | Fair value measurement | |||
| 61 | Note 4 | – | Significant transactions | |||
| 62 | Note 5 | – | Securities | |||
| 64 | Note 6 | – | Loans | |||
| 69 | Note 7 | – | Deposits | |||
| 70 | Note 8 | – | Subordinated indebtedness |
| 70 | Note 9 | – | Share capital | |||
| 72 | Note 10 | – | Post-employment benefits | |||
| 72 | Note 11 | – | Income taxes | |||
| 73 | Note 12 | – | Earnings per share | |||
| 73 | Note 13 | – | Contingent liabilities and provisions | |||
| 74 | Note 14 | – | Interest income and expense | |||
| 74 | Note 15 | – | Segmented information |
CIBC THIRD QUARTER 2025 |
51 |
Unaudited, millions of Canadian dollars, as at |
2025 Jul. 31 |
2024 Oct. 31 |
||||||
ASSETS |
||||||||
Cash and non-interest-bearing deposits with banks |
$ |
19,101 |
$ | 8,565 | ||||
Interest-bearing deposits with banks |
36,086 |
39,499 | ||||||
Securities |
274,997 |
254,345 | ||||||
Cash collateral on securities borrowed |
21,690 |
17,028 | ||||||
Securities purchased under resale agreements |
86,210 |
83,721 | ||||||
Loans |
||||||||
Residential mortgages |
285,935 |
280,672 | ||||||
Personal |
47,259 |
46,681 | ||||||
Credit card |
21,321 |
20,551 | ||||||
Business and government (1)
|
231,414 |
214,305 | ||||||
Allowance for credit losses |
(4,285 |
) |
(3,917 | ) | ||||
581,644 |
558,292 | |||||||
Other |
||||||||
Derivative instruments |
34,614 |
36,435 | ||||||
Property and equipment |
3,274 |
3,359 | ||||||
Goodwill |
5,422 |
5,443 | ||||||
Software and other intangible assets |
2,830 |
2,830 | ||||||
Investments in equity -accounted associates and joint ventures |
772 |
785 | ||||||
Deferred tax assets |
933 |
821 | ||||||
Other assets |
34,682 |
30,862 | ||||||
82,527 |
80,535 | |||||||
$ |
1,102,255 |
$ | 1,041,985 | |||||
LIABILITIES AND EQUITY |
||||||||
Deposits |
||||||||
Personal |
$ |
256,135 |
$ | 252,894 | ||||
Business and government |
448,861 |
435,499 | ||||||
Bank |
27,061 |
20,009 | ||||||
Secured borrowings |
60,615 |
56,455 | ||||||
792,672 |
764,857 | |||||||
Obligations related to securities sold short |
20,827 |
21,642 | ||||||
Cash collateral on securities lent |
5,304 |
7,997 | ||||||
Obligations related to securities sold under repurchase agreements |
145,659 |
110,153 | ||||||
Other |
||||||||
Derivative instruments |
36,552 |
40,654 | ||||||
Deferred tax liabilities |
47 |
49 | ||||||
Other liabilities (1)
|
30,619 |
30,161 | ||||||
67,218 |
70,864 | |||||||
Subordinated indebtedness |
7,699 |
7,465 | ||||||
Equity |
||||||||
Preferred shares and other equity instruments |
6,669 |
4,946 | ||||||
Common shares (Note 9) |
16,867 |
17,011 | ||||||
Contributed surplus |
175 |
159 | ||||||
Retained earnings |
35,655 |
33,471 | ||||||
Accumulated other comprehensive income (AOCI) |
3,233 |
3,148 | ||||||
Total shareholders’ equity |
62,599 |
58,735 | ||||||
Non-controlling interests |
277 |
272 | ||||||
Total equity |
62,876 |
59,007 | ||||||
$ |
1,102,255 |
$ | 1,041,985 | |||||
| (1) | Includes customers’ liability under acceptances of $8 million (October 31, 2024: $6 million) in business and government loans and acceptances of $8 million (October 31, 2024: $6 million) in other liabilities. Prior period amounts have been revised to conform to the presentation adopted in the first quarter of 2025. |
52 |
CIBC THIRD QUARTER 2025 |
For the three months ended |
For the nine months ended |
|||||||||||||||||||||||
Unaudited, millions of Canadian dollars, except as noted |
2025 Jul. 31 |
2025 Apr. 30 |
2024 Jul. 31 |
2025 Jul. 31 |
2024 Jul. 31 |
|||||||||||||||||||
| Interest income (1)
|
||||||||||||||||||||||||
| Loans |
$ |
7,976 |
$ | 7,685 | $ | 8,726 | $ |
23,957 |
$ | 25,257 | ||||||||||||||
| Securities |
2,260 |
2,230 | 2,482 | 6,830 |
7,167 | |||||||||||||||||||
| Securities borrowed or purchased under resale agreements |
1,307 |
1,341 | 1,528 | 4,038 |
4,370 | |||||||||||||||||||
| Deposits with banks and other | 546 |
603 | 711 | 1,842 |
2,160 | |||||||||||||||||||
12,089 |
11,859 | 13,447 | 36,667 |
38,954 | ||||||||||||||||||||
| Interest expense |
||||||||||||||||||||||||
| Deposits |
6,090 |
6,110 | 7,713 | 19,106 |
23,000 | |||||||||||||||||||
| Securities sold short |
135 |
156 | 156 | 424 |
462 | |||||||||||||||||||
| Securities lent or sold under repurchase agreements |
1,619 |
1,608 | 1,769 | 4,897 |
4,615 | |||||||||||||||||||
| Subordinated indebtedness |
106 |
101 | 134 | 314 |
390 | |||||||||||||||||||
| Other | 91 |
96 | 143 | 289 |
425 | |||||||||||||||||||
8,041 |
8,071 | 9,915 | 25,030 |
28,892 | ||||||||||||||||||||
Net interest income |
4,048 |
3,788 | 3,532 | 11,637 |
10,062 | |||||||||||||||||||
| Non-interest income |
||||||||||||||||||||||||
| Underwriting and advisory fees |
291 |
198 | 165 | 670 |
525 | |||||||||||||||||||
| Deposit and payment fees |
257 |
241 | 249 | 744 |
708 | |||||||||||||||||||
| Credit fees |
253 |
248 | 303 | 746 |
1,001 | |||||||||||||||||||
| Card fees |
105 |
88 | 97 | 307 |
309 | |||||||||||||||||||
| Investment management and custodial fees |
555 |
538 | 508 | 1,646 |
1,454 | |||||||||||||||||||
| Mutual fund fees |
493 |
475 | 452 | 1,499 |
1,331 | |||||||||||||||||||
| Income from insurance activities, net |
71 |
81 | 87 | 236 |
271 | |||||||||||||||||||
| Commissions on securities transactions |
132 |
125 | 109 | 394 |
302 | |||||||||||||||||||
| Gains (losses) from financial instruments measured/designated at fair value through profit or loss (FVTPL), net |
859 |
997 | 869 | 3,017 |
2,399 | |||||||||||||||||||
| Gains (losses) from debt securities measured at fair value through other comprehensive income (FVOCI) and amortized cost, net |
(25 |
) |
9 | 3 | (3 |
) |
49 | |||||||||||||||||
| Foreign exchange other than trading (FXOTT) |
99 |
87 | 99 | 283 |
293 | |||||||||||||||||||
| Income (loss) from equity-accounted associates and joint ventures |
29 |
36 | 20 | 91 |
61 | |||||||||||||||||||
| Other | 87 |
111 | 111 | 290 |
224 | |||||||||||||||||||
3,206 |
3,234 | 3,072 | 9,920 |
8,927 | ||||||||||||||||||||
Total revenue |
7,254 |
7,022 | 6,604 | 21,557 |
18,989 | |||||||||||||||||||
|
Provision for credit losses |
559 |
605 | 483 | 1,737 |
1,582 | |||||||||||||||||||
| Non-interest expenses |
||||||||||||||||||||||||
| Employee compensation and benefits |
2,377 |
2,255 | 2,095 | 6,909 |
6,054 | |||||||||||||||||||
| Occupancy costs |
204 |
202 | 197 | 607 |
622 | |||||||||||||||||||
| Computer, software and office equipment |
732 |
691 | 722 | 2,119 |
1,996 | |||||||||||||||||||
| Communications |
99 |
104 | 91 | 299 |
273 | |||||||||||||||||||
| Advertising and business development |
97 |
92 | 78 | 277 |
241 | |||||||||||||||||||
| Professional fees |
68 |
63 | 67 | 196 |
183 | |||||||||||||||||||
| Business and capital taxes |
30 |
27 | 31 | 93 |
94 | |||||||||||||||||||
| Other (Note 13) |
369 |
385 | 401 | 1,173 |
1,185 | |||||||||||||||||||
3,976 |
3,819 | 3,682 | 11,673 |
10,648 | ||||||||||||||||||||
| Income before income taxes |
2,719 |
2,598 | 2,439 | 8,147 |
6,759 | |||||||||||||||||||
| Income taxes |
623 |
591 | 644 | 1,873 |
1,487 | |||||||||||||||||||
| Net income |
$ |
2,096 |
$ | 2,007 | $ | 1,795 | $ |
6,274 |
$ | 5,272 | ||||||||||||||
| Net income attributable to non-controlling interests |
$ |
2 |
$ | 9 | $ | 9 | $ |
19 |
$ | 31 | ||||||||||||||
| Preferred shareholders and other equity instrument holders |
$ |
82 |
$ | 78 | $ | 63 | $ |
248 |
$ | 191 | ||||||||||||||
| Common shareholders |
2,012 |
1,920 | 1,723 | 6,007 |
5,050 | |||||||||||||||||||
| Net income attributable to equity shareholders |
$ |
2,094 |
$ | 1,998 | $ | 1,786 | $ |
6,255 |
$ | 5,241 | ||||||||||||||
| Earnings per share |
||||||||||||||||||||||||
| Basic |
$ |
2.16 |
$ | 2.05 | $ | 1.83 | $ |
6.41 |
$ | 5.39 | ||||||||||||||
| Diluted |
2.15 |
2.04 | 1.82 | 6.37 |
5.38 | |||||||||||||||||||
| Dividends per common share |
0.97 |
0.97 | 0.90 | 2.91 |
2.70 | |||||||||||||||||||
| (1) | Interest income included $11.0 billion for the quarter ended July 31, 2025 (April 30, 2025: $10.7 billion; July 31, 2024: $12.4 billion) and $33.3 billion for the nine months ended July 31, 2025 (July 31, 2024: $36.3 billion), calculated based on the effective interest rate method. |
CIBC THIRD QUARTER 2025 |
53 |
| For the three months ended |
For the nine months ended |
|||||||||||||||||||||||
Unaudited, millions of Canadian dollars |
2025 Jul. 31 |
2025 Apr. 30 |
2024 Jul. 31 |
2025 Jul. 31 |
2024 Jul. 31 |
|||||||||||||||||||
Net income |
$ |
2,096 |
$ | 2,007 | $ | 1,795 | $ |
6,274 |
$ | 5,272 | ||||||||||||||
Other comprehensive income (loss) (OCI), net of income tax, that is subject to subsequent reclassification to net income |
||||||||||||||||||||||||
Net foreign currency translation adjustments |
||||||||||||||||||||||||
Net gains (losses) on investments in foreign operations |
295 |
(3,061 | ) | 161 | (313 |
) |
(198 | ) | ||||||||||||||||
Net gains (losses) on hedges of investments in foreign operations |
(215 |
) |
1,897 | (111 | ) | 111 |
72 | |||||||||||||||||
80 |
(1,164 | ) | 50 | (202 |
) |
(126 | ) | |||||||||||||||||
Net change in debt securities measured at FVOCI |
||||||||||||||||||||||||
Net gains (losses) on debt securities measured at FVOCI |
159 |
(17 | ) | 2 | 252 |
183 | ||||||||||||||||||
Net (gains) losses reclassified to net income |
(4 |
) |
(6 | ) | (1 | ) | (19 |
) |
(32 | ) | ||||||||||||||
155 |
(23 | ) | 1 | 233 |
151 | |||||||||||||||||||
Net change in cash flow hedges |
||||||||||||||||||||||||
Net gains (losses) on derivatives designated as cash flow hedges |
(343 |
) |
472 | 1,270 | 455 |
1,767 | ||||||||||||||||||
Net (gains) losses reclassified to net income |
(202 |
) |
(194 | ) | (274 | ) | (431 |
) |
(482 | ) | ||||||||||||||
(545 |
) |
278 | 996 | 24 |
1,285 | |||||||||||||||||||
OCI, net of income tax, that is not subject to subsequent reclassification to net income |
||||||||||||||||||||||||
Net gains (losses) on post-employment defined benefit plans |
53 |
(47 | ) | 172 | 25 |
107 | ||||||||||||||||||
Net gains (losses) due to fair value change of fair value option (FVO) liabilities attributable to changes in credit risk |
(167 |
) |
157 | 59 | (12 |
) |
(197 | ) | ||||||||||||||||
Net gains (losses) on equity securities designated at FVOCI |
4 |
12 | (2 | ) | 19 |
(12 | ) | |||||||||||||||||
(110 |
) |
122 | 229 | 32 |
(102 | ) | ||||||||||||||||||
Total other comprehensive income (loss) (1)
|
(420 |
) |
(787 | ) | 1,276 | 87 |
1,208 | |||||||||||||||||
Comprehensive income |
$ |
1,676 |
$ | 1,220 | $ | 3,071 | $ |
6,361 |
$ | 6,480 | ||||||||||||||
Comprehensive income attributable to non-controlling interests |
$ |
2 |
$ | 9 | $ | 9 | $ |
19 |
$ | 31 | ||||||||||||||
Preferred shareholders and other equity instrument holders |
$ |
82 |
$ | 78 | $ | 63 | $ |
248 |
$ | 191 | ||||||||||||||
Common shareholders |
1,592 |
1,133 | 2,999 | 6,094 |
6,258 | |||||||||||||||||||
Comprehensive income attributable to equity shareholders |
$ |
1,674 |
$ | 1,211 | $ | 3,062 | $ |
6,342 |
$ | 6,449 | ||||||||||||||
(1) Includes $10 million of gains for the quarter ended July 31, 2025 (April 30, 2025: $20 million of gains; July 31, 2024: $14 million of gains), and $27 million of gains for the nine months ended July 31, 2025 (July 31, 2024: $68 million of gains), relating to our investments in equity-accounted associates and joint ventures. |
||||||||||||||||||||||||
| For the three months ended |
For the nine months ended |
|||||||||||||||||||||||
Unaudited, millions of Canadian dollars |
2025 Jul. 31 |
2025 Apr. 30 |
2024 Jul. 31 |
2025 Jul. 31 |
2024 Jul. 31 |
|||||||||||||||||||
Income tax (expense) benefit allocated to each component of OCI |
||||||||||||||||||||||||
Subject to subsequent reclassification to net income |
||||||||||||||||||||||||
Net foreign currency translation adjustments |
||||||||||||||||||||||||
Net gains (losses) on investments in foreign operations |
$ |
(5 |
) |
$ | 79 | $ | (4 | ) | $ |
11 |
$ | 7 | ||||||||||||
Net gains (losses) on hedges of investments in foreign operations |
(13 |
) |
(216 | ) | 5 | (77 |
) |
(13 | ) | |||||||||||||||
(18 |
) |
(137 | ) | 1 | (66 |
) |
(6 | ) | ||||||||||||||||
Net change in debt securities measured at FVOCI |
||||||||||||||||||||||||
Net gains (losses) on debt securities measured at FVOCI |
(51 |
) |
17 | 9 | (45 |
) |
(25 | ) | ||||||||||||||||
Net (gains) losses reclassified to net income |
1 |
2 | – | 6 |
12 | |||||||||||||||||||
(50 |
) |
19 | 9 | (39 |
) |
(13 | ) | |||||||||||||||||
Net change in cash flow hedges |
||||||||||||||||||||||||
Net gains (losses) on derivatives designated as cash flow hedges |
132 |
(181 | ) | (489 | ) | (175 |
) |
(680 | ) | |||||||||||||||
Net (gains) losses reclassified to net income |
78 |
74 | 106 | 166 |
186 | |||||||||||||||||||
210 |
(107 | ) | (383 | ) | (9) |
(494 | ) | |||||||||||||||||
Not subject to subsequent reclassification to net income |
||||||||||||||||||||||||
Net gains (losses) on post-employment defined benefit plans |
(22 |
) |
19 | (66 | ) | (11 |
) |
(40 | ) | |||||||||||||||
Net gains (losses) due to fair value change of FVO liabilities attributable to changes in credit risk |
64 |
(60 | ) | (23 | ) | 4 |
75 | |||||||||||||||||
Net gains (losses) on equity securities designated at FVOCI |
(1 |
) |
(5 | ) | 1 | (7 |
) |
4 | ||||||||||||||||
41 |
(46 | ) | (88 | ) | (14 |
) |
39 | |||||||||||||||||
$ |
183 |
$ |
(271 | ) | $ | (461 | ) | $ |
(128 |
) |
$ | (474 | ) | |||||||||||
54 |
CIBC THIRD QUARTER 2025 |
| For the three months ended |
For the nine months ended |
|||||||||||||||||||
Unaudited, millions of Canadian dollars |
2025 Jul. 31 |
2024 Jul. 31 |
2025 Jul. 31 |
2024 Jul. 31 |
||||||||||||||||
Preferred shares and other equity instruments |
||||||||||||||||||||
Balance at beginning of period |
$ |
5,942 |
$ |
5,098 | $ |
4,946 |
$ | 4,925 | ||||||||||||
Issue of preferred shares and limited recourse capital notes |
1,027 |
500 | 2,320 |
1,000 | ||||||||||||||||
Redemption of preferred shares |
(300 |
) |
(650 | ) | (600 |
) |
(975 | ) | ||||||||||||
Treasury shares |
– |
1 | 3 |
(1 | ) | |||||||||||||||
Balance at end of period |
$ |
6,669 |
$ | 4,949 | $ |
6,669 |
$ | 4,949 | ||||||||||||
Common shares |
||||||||||||||||||||
Balance at beginning of period |
$ |
16,929 |
$ | 16,813 | $ |
17,011 |
$ | 16,082 | ||||||||||||
Issue of common shares |
46 |
103 | 132 |
837 | ||||||||||||||||
Purchase of common shares for cancellation |
(100 |
) |
– | (272 |
) |
– | ||||||||||||||
Treasury shares |
(8 |
) |
3 | (4 |
) |
– | ||||||||||||||
Balance at end of period |
$ |
16,867 |
$ | 16,919 | $ |
16,867 |
$ | 16,919 | ||||||||||||
Contributed surplus |
||||||||||||||||||||
Balance at beginning of period |
$ |
156 |
$ | 114 | $ |
159 |
$ | 109 | ||||||||||||
Compensation expense arising from equity-settled share-based awards |
3 |
3 | 11 |
9 | ||||||||||||||||
Exercise of stock options and settlement of other equity-settled share-based awards |
(3 |
) |
(1 | ) | (9 |
) |
(4 | ) | ||||||||||||
Other (1)
|
19 |
12 | 14 |
14 | ||||||||||||||||
Balance at end of period |
$ |
175 |
$ | 128 | $ |
175 |
$ | 128 | ||||||||||||
Retained earnings |
||||||||||||||||||||
Balance at beginning of period |
$ |
34,984 |
$ | 31,990 | $ |
33,471 |
$ | 30,352 | ||||||||||||
Net income attributable to equity shareholders |
2,094 |
1,786 | 6,255 |
5,241 | ||||||||||||||||
Dividends and distributions |
||||||||||||||||||||
Preferred and other equity instruments |
(82 |
) |
(63 | ) | (248 |
) |
(191 | ) | ||||||||||||
Common |
(904 |
) |
(849 | ) | (2,728 |
) |
(2,532 | ) | ||||||||||||
Premium on purchase of common shares for cancellation |
(428 |
) |
– | (1,066 |
) |
– | ||||||||||||||
Realized gains (losses) on equity securities designated at FVOCI reclassified from AOCI |
2 |
(19 | ) | 2 |
(18 | ) | ||||||||||||||
Other |
(11 |
) |
(1 | ) | (31 |
) |
(8 | ) | ||||||||||||
Balance at end of period |
$ |
35,655 |
$ | 32,844 | $ |
35,655 |
$ | 32,844 | ||||||||||||
AOCI, net of income tax |
||||||||||||||||||||
AOCI, net of income tax, that is subject to subsequent reclassification to net income |
||||||||||||||||||||
Net foreign currency translation adjustments |
||||||||||||||||||||
Balance at beginning of period |
$ |
1,894 |
$ | 1,986 | $ |
2,176 |
$ | 2,162 | ||||||||||||
Net change in foreign currency translation adjustments |
80 |
50 | (202 |
) |
(126 | ) | ||||||||||||||
Balance at end of period |
$ |
1,974 |
$ | 2,036 | $ |
1,974 |
$ | 2,036 | ||||||||||||
Net gains (losses) on debt securities measured at FVOCI |
||||||||||||||||||||
Balance at beginning of period |
$ |
(229 |
) |
$ | (257 | ) | $ |
(307 |
) |
$ | (407 | ) | ||||||||
Net change in debt securities measured at FVOCI |
155 |
1 | 233 |
151 | ||||||||||||||||
Balance at end of period |
$ |
(74 |
) |
$ | (256 | ) | $ |
(74 |
) |
$ | (256 | ) | ||||||||
Net gains (losses) on cash flow hedges |
||||||||||||||||||||
Balance at beginning of period |
$ |
1,078 |
$ | (737 | ) | $ |
509 |
$ | (1,026 | ) | ||||||||||
Net change in cash flow hedges |
(545 |
) |
996 | 24 |
1,285 | |||||||||||||||
Balance at end of period |
$ |
533 |
$ | 259 | $ |
533 |
$ | 259 | ||||||||||||
AOCI, net of income tax, that is not subject to subsequent reclassification to net income |
||||||||||||||||||||
Net gains (losses) on post-employment defined benefit plans |
||||||||||||||||||||
Balance at beginning of period |
$ |
814 |
$ | 527 | $ |
842 |
$ | 592 | ||||||||||||
Net change in post-employment defined benefit plans |
53 |
172 | 25 |
107 | ||||||||||||||||
Balance at end of period |
$ |
867 |
$ | 699 | $ |
867 |
$ | 699 | ||||||||||||
Net gains (losses) due to fair value change of FVO liabilities attributable to changes in credit risk |
||||||||||||||||||||
Balance at beginning of period |
$ |
67 |
$ | (128 | ) | $ |
(88 |
) |
$ | 128 | ||||||||||
Net change attributable to changes in credit risk |
(167 |
) |
59 | (12 |
) |
(197 | ) | |||||||||||||
Balance at end of period |
$ |
(100 |
) |
$ | (69 | ) | $ |
(100 |
) |
$ | (69 | ) | ||||||||
Net gains (losses) on equity securities designated at FVOCI |
||||||||||||||||||||
Balance at beginning of period |
$ |
31 |
$ | 3 | $ |
16 |
$ | 14 | ||||||||||||
Net gains (losses) on equity securities designated at FVOCI |
4 |
(2 | ) | 19 |
(12 | ) | ||||||||||||||
Realized (gains) losses on equity securities designated at FVOCI reclassified to retained earnings |
(2 |
) |
19 | (2 |
) |
18 | ||||||||||||||
Balance at end of period |
$ |
33 |
$ | 20 | $ |
33 |
$ | 20 | ||||||||||||
Total AOCI, net of income tax |
$ |
3,233 |
$ | 2,689 | $ |
3,233 |
$ | 2,689 | ||||||||||||
Non-controlling interests |
||||||||||||||||||||
Balance at beginning of period |
$ |
280 |
$ | 247 | $ |
272 |
$ | 232 | ||||||||||||
Net income attributable to non-controlling interests |
2 |
9 | 19 |
31 | ||||||||||||||||
Dividends |
(3 |
) |
(2 | ) | (7 |
) |
(6 | ) | ||||||||||||
Other |
(2 |
) |
– | (7 |
) |
(3 | ) | |||||||||||||
Balance at end of period |
$ |
277 |
$ | 254 | $ |
277 |
$ | 254 | ||||||||||||
Equity at end of period |
$ |
62,876 |
$ | 57,783 | $ |
62,876 |
$ | 57,783 | ||||||||||||
| (1) | Includes the portion of the estimated tax benefit related to employee stock options that is incremental to the amount recognized in the interim consolidated statement of income. |
CIBC THIRD QUARTER 2025 |
55 |
For the three months ended |
For the nine months ended |
|||||||||||||||||||
Unaudited, millions of Canadian dollars |
2025 Jul. 31 |
2024 Jul. 31 |
2025 Jul. 31 |
2024 Jul. 31 |
||||||||||||||||
Cash flows provided by (used in) operating activities |
||||||||||||||||||||
Net income |
$ |
2,096 |
$ | 1,795 | $ |
6,274 |
$ | 5,272 | ||||||||||||
Adjustments to reconcile net income to cash flows provided by (used in) operating activities: |
||||||||||||||||||||
Provision for credit losses |
559 |
483 | 1,737 |
1,582 | ||||||||||||||||
Amortization and impairment (1)
|
287 |
317 | 854 |
881 | ||||||||||||||||
Stock options and restricted shares expense |
3 |
3 | 11 |
9 | ||||||||||||||||
Deferred income taxes |
(150 |
) |
(22 | ) | (136 |
) |
(41 | ) | ||||||||||||
Losses (gains) from debt securities measured at FVOCI and amortized cost |
25 |
(3 | ) | 3 |
(49 | ) | ||||||||||||||
Net losses (gains) on disposal of property and equipment |
– |
– | (2 |
) |
– | |||||||||||||||
Other non-cash items, net |
457 |
(1,075 | ) | 246 |
(1,564 | ) | ||||||||||||||
Net changes in operating assets and liabilities |
||||||||||||||||||||
Interest-bearing deposits with banks |
(511 |
) |
2,679 | 3,413 |
(1,263 | ) | ||||||||||||||
Loans, net of repayments |
(10,756 |
) |
(11,803 | ) | (24,905 |
) |
(20,675 | ) | ||||||||||||
Deposits, net of withdrawals |
5,718 |
9,523 | 24,038 |
14,341 | ||||||||||||||||
Obligations related to securities sold short |
734 |
591 | (815 |
) |
5,374 | |||||||||||||||
Accrued interest receivable |
327 |
53 | 416 |
(485 | ) | |||||||||||||||
Accrued interest payable |
(292 |
) |
(130 | ) | (1,003 |
) |
632 | |||||||||||||
Derivative assets |
3,907 |
1,145 | 1,848 |
2,948 | ||||||||||||||||
Derivative liabilities |
(7,402 |
) |
(3,004 | ) | (4,308 |
) |
(5,477 | ) | ||||||||||||
Securities measured at FVTPL |
(6,309 |
) |
(9,337 | ) | (16,050 |
) |
(23,446 | ) | ||||||||||||
Other assets and liabilities measured/designated at FVTPL |
2,703 |
748 | 3,197 |
3,141 | ||||||||||||||||
Current income taxes |
(250 |
) |
(15 | ) | (489 |
) |
(83 | ) | ||||||||||||
Cash collateral on securities lent |
(1,411 |
) |
(114 | ) | (2,693 |
) |
434 | |||||||||||||
Obligations related to securities sold under repurchase agreements |
12,380 |
14,359 | 35,506 |
28,250 | ||||||||||||||||
Cash collateral on securities borrowed |
(2,745 |
) |
(2,740 | ) | (4,662 |
) |
(1,844 | ) | ||||||||||||
Securities purchased under resale agreements |
5,051 |
6,721 | (2,489 |
) |
863 | |||||||||||||||
Other, net |
1,440 |
2,115 | (1,861 |
) |
3,131 | |||||||||||||||
5,861 |
12,289 | 18,130 |
11,931 | |||||||||||||||||
Cash flows provided by (used in) financing activities |
||||||||||||||||||||
Issue of subordinated indebtedness |
– |
1,000 | 1,250 |
2,250 | ||||||||||||||||
Redemption/repurchase/maturity of subordinated indebtedness |
(1,000 |
) |
(1,536 | ) | (1,069 |
) |
(1,536 | ) | ||||||||||||
| Issue of preferred shares and limited recourse capital notes, net of issuance cost | 1,024 |
498 | 2,311 |
996 | ||||||||||||||||
| Redemption of preferred shares | (300 |
) |
(650 | ) | (600 |
) |
(975 | ) | ||||||||||||
Issue of common shares for cash |
43 |
57 | 123 |
181 | ||||||||||||||||
Purchase of common shares for cancellation |
(528 |
) |
– | (1,338 |
) |
– | ||||||||||||||
Net sale (purchase) of treasury shares |
(8 |
) |
4 | (1 |
) |
(1 | ) | |||||||||||||
Dividends and distributions paid |
(986 |
) |
(867 | ) | (2,976 |
) |
(2,071 | ) | ||||||||||||
Repayment of lease liabilities |
(77 |
) |
(79 | ) | (235 |
) |
(207 | ) | ||||||||||||
Other, net |
(8 |
) |
– | (22 |
) |
– | ||||||||||||||
(1,840 |
) |
(1,573 | ) | (2,557 |
) |
(1,363 | ) | |||||||||||||
Cash flows provided by (used in) investing activities |
||||||||||||||||||||
Purchase of securities measured/designated at FVOCI and amortized cost |
(26,677 |
) |
(20,641 | ) | (68,068 |
) |
(60,208 | ) | ||||||||||||
Proceeds from sale of securities measured/designated at FVOCI and amortized cost |
13,745 |
4,864 | 34,024 |
21,462 | ||||||||||||||||
Proceeds from maturity of debt securities measured at FVOCI and amortized cost |
14,255 |
6,709 | 29,708 |
19,754 | ||||||||||||||||
Net sale (purchase) of property, equipment and software |
(282 |
) |
(275 | ) | (721 |
) |
(696 | ) | ||||||||||||
1,041 |
(9,343 | ) | (5,057 |
) |
(19,688 | ) | ||||||||||||||
Effect of exchange rate changes on cash and non-interest-bearing deposits with banks |
28 |
12 | 20 |
(12 | ) | |||||||||||||||
Net increase (decrease) in cash and non-interest-bearing deposits with banks during the period |
5,090 |
1,385 | 10,536 |
(9,132 | ) | |||||||||||||||
Cash and non-interest-bearing deposits with banks at beginning of period |
14,011 |
10,299 | 8,565 |
20,816 | ||||||||||||||||
Cash and non-interest-bearing deposits with banks at end of period (2)
|
$ |
19,101 |
$ | 11,684 | $ |
19,101 |
$ | 11,684 | ||||||||||||
Cash interest paid |
$ |
8,333 |
$ | 10,045 | $ |
26,033 |
$ | 28,261 | ||||||||||||
Cash interest received |
11,929 |
13,037 | 35,705 |
37,183 | ||||||||||||||||
Cash dividends received |
487 |
463 | 1,378 |
1,286 | ||||||||||||||||
Cash income taxes paid |
1,022 |
679 | 2,497 |
1,610 | ||||||||||||||||
| (1) | Comprises amortization and impairment of buildings, right-of-use assets, furniture, equipment, leasehold improvements, and software and other intangible assets. |
| (2) | Includes restricted cash of $550 million (July 31, 2024: $465 million) and interest-bearing demand deposits with Bank of Canada. |
56 |
CIBC THIRD QUARTER 2025 |
CIBC THIRD QUARTER 2025 |
57 |
| Carrying value | ||||||||||||||||||||||||||||||
| $ millions, as at | Amortized cost |
Mandatorily measured at FVTPL |
Designated at FVTPL |
Fair value through OCI |
Total | Fair value |
Fair value over (under) carrying value |
|||||||||||||||||||||||
2025 |
Financial assets |
|||||||||||||||||||||||||||||
Jul. 31 |
Cash and deposits with banks |
$ |
55,187 |
$ |
– |
$ |
– |
$ |
– |
$ |
55,187 |
$ |
55,187 |
$ |
– |
|||||||||||||||
Securities |
68,812 |
122,092 |
– |
84,093 |
274,997 |
274,660 |
(337 |
) |
||||||||||||||||||||||
Cash collateral on securities borrowed |
21,690 |
– |
– |
– |
21,690 |
21,690 |
– |
|||||||||||||||||||||||
Securities purchased under resale agreements |
63,930 |
22,280 |
– |
– |
86,210 |
86,210 |
– |
|||||||||||||||||||||||
Loans |
||||||||||||||||||||||||||||||
Residential mortgages |
285,375 |
5 |
– |
– |
285,380 |
285,398 |
18 |
|||||||||||||||||||||||
Personal |
46,181 |
– |
– |
– |
46,181 |
46,207 |
26 |
|||||||||||||||||||||||
Credit card |
20,459 |
– |
– |
– |
20,459 |
20,476 |
17 |
|||||||||||||||||||||||
Business and government (1)
|
229,165 |
379 |
80 |
– |
229,624 |
229,671 |
47 |
|||||||||||||||||||||||
Derivative instruments |
– |
34,614 |
– |
– |
34,614 |
34,614 |
– |
|||||||||||||||||||||||
Other assets |
19,776 |
610 |
– |
– |
20,386 |
20,386 |
– |
|||||||||||||||||||||||
Financial liabilities |
||||||||||||||||||||||||||||||
Deposits |
||||||||||||||||||||||||||||||
Personal |
$ |
237,579 |
$ |
– |
$ |
18,556 |
$ |
– |
$ |
256,135 |
$ |
256,397 |
$ |
262 |
||||||||||||||||
Business and government |
426,140 |
– |
22,721 |
– |
448,861 |
449,763 |
902 |
|||||||||||||||||||||||
Bank |
27,061 |
– |
– |
– |
27,061 |
27,061 |
– |
|||||||||||||||||||||||
Secured borrowings |
59,634 |
– |
981 |
– |
60,615 |
60,784 |
169 |
|||||||||||||||||||||||
Derivative instruments |
– |
36,552 |
– |
– |
36,552 |
36,552 |
– |
|||||||||||||||||||||||
Obligations related to securities sold short |
– |
20,827 |
– |
– |
20,827 |
20,827 |
– |
|||||||||||||||||||||||
Cash collateral on securities lent |
5,304 |
– |
– |
– |
5,304 |
5,304 |
– |
|||||||||||||||||||||||
Obligations related to securities sold under repurchase agreements |
134,851 |
– |
10,808 |
– |
145,659 |
145,659 |
– |
|||||||||||||||||||||||
Other liabilities (1)
|
19,799 |
175 |
21 |
– |
19,995 |
19,995 |
– |
|||||||||||||||||||||||
Subordinated indebtedness |
7,699 |
– |
– |
– |
7,699 |
7,966 |
267 |
|||||||||||||||||||||||
2024 |
Financial assets |
|||||||||||||||||||||||||||||
Oct. 31 |
Cash and deposits with banks |
$ | 48,064 | $ | – | $ | – | $ | – | $ | 48,064 | $ | 48,064 | $ | – | |||||||||||||||
Securities |
71,610 | 106,042 | – | 76,693 | 254,345 | 253,437 | (908 | ) | ||||||||||||||||||||||
Cash collateral on securities borrowed |
17,028 | – | – | – | 17,028 | 17,028 | – | |||||||||||||||||||||||
Securities purchased under resale agreements |
58,744 | 24,977 | – | – | 83,721 | 83,721 | – | |||||||||||||||||||||||
Loans |
||||||||||||||||||||||||||||||
Residential mortgages |
280,220 | 3 | – | – | 280,223 | 279,805 | (418 | ) | ||||||||||||||||||||||
Personal |
45,739 | – | – | – | 45,739 | 45,750 | 11 | |||||||||||||||||||||||
Credit card |
19,649 | – | – | – | 19,649 | 19,682 | 33 | |||||||||||||||||||||||
Business and government (1)
|
212,460 | 116 | 105 | – | 212,681 | 212,750 | 69 | |||||||||||||||||||||||
Derivative instruments |
– | 36,435 | – | – | 36,435 | 36,435 | – | |||||||||||||||||||||||
Other assets |
20,121 | 364 | – | – | 20,485 | 20,485 | – | |||||||||||||||||||||||
Financial liabilities |
||||||||||||||||||||||||||||||
Deposits |
||||||||||||||||||||||||||||||
Personal |
$ | 235,593 | $ | – | $ | 17,301 | $ | – | $ | 252,894 | $ | 253,378 | $ | 484 | ||||||||||||||||
Business and government |
414,441 | – | 21,058 | – | 435,499 | 436,528 | 1,029 | |||||||||||||||||||||||
Bank |
20,009 | – | – | – | 20,009 | 20,009 | – | |||||||||||||||||||||||
Secured borrowings |
55,285 | – | 1,170 | – | 56,455 | 56,588 | 133 | |||||||||||||||||||||||
Derivative instruments |
– | 40,654 | – | – | 40,654 | 40,654 | – | |||||||||||||||||||||||
Obligations related to securities sold short |
– | 21,642 | – | – | 21,642 | 21,642 | – | |||||||||||||||||||||||
Cash collateral on securities lent |
7,997 | – | – | – | 7,997 | 7,997 | – | |||||||||||||||||||||||
Obligations related to securities sold under repurchase agreements |
100,407 | – | 9,746 | – | 110,153 | 110,153 | – | |||||||||||||||||||||||
Other liabilities (1)
|
20,657 | 158 | 19 | – | 20,834 | 20,834 | – | |||||||||||||||||||||||
Subordinated indebtedness |
7,465 | – | – | – | 7,465 | 7,698 | 233 | |||||||||||||||||||||||
| (1) | Certain information has been revised to conform to the presentation adopted in the first quarter of 2025. |
58 |
CIBC THIRD QUARTER 2025 |
| Level 1 | Level 2 | Level 3 | ||||||||||||||||||||||||||||||||||||||
| Quoted market price | Valuation technique – observable market inputs |
Valuation technique – non-observable market inputs
|
Total |
Total | ||||||||||||||||||||||||||||||||||||
| $ millions, as at | 2025 Jul. 31 |
2024 Oct. 31 |
2025 Jul. 31 |
2024 Oct. 31 |
2025 Jul. 31 |
2024 Oct. 31 |
2025 Jul. 31 |
2024 Oct. 31 |
||||||||||||||||||||||||||||||||
Financial assets |
||||||||||||||||||||||||||||||||||||||||
Debt securities measured at FVTPL |
||||||||||||||||||||||||||||||||||||||||
Government issued or guaranteed |
$ |
3,558
|
$ |
4,258 | $ |
34,665 |
$ | 32,328 | $ |
– |
$ | – | $ |
38,223 |
$ | 36,586 | ||||||||||||||||||||||||
Corporate debt |
– |
– | 3,601 |
4,385 | 101 |
– | 3,702 |
4,385 | ||||||||||||||||||||||||||||||||
Mortgage- and asset-backed |
– |
– | 6,187 |
4,213 | 505 |
70 | 6,692 |
4,283 | ||||||||||||||||||||||||||||||||
3,558 |
4,258 | 44,453 |
40,926 | 606 |
70 | 48,617 |
45,254 | |||||||||||||||||||||||||||||||||
Loans measured at FVTPL |
||||||||||||||||||||||||||||||||||||||||
Business and government |
– |
– | 203 |
116 | 256 |
(1)
|
105 | (1) |
459 |
221 | ||||||||||||||||||||||||||||||
Residential mortgages |
– |
– | 5 |
3 | – |
– | 5 |
3 | ||||||||||||||||||||||||||||||||
– |
– | 208 |
119 | 256 |
105 | 464 |
224 | |||||||||||||||||||||||||||||||||
Debt securities measured at FVOCI |
||||||||||||||||||||||||||||||||||||||||
Government issued or guaranteed |
10,466 |
2,760 | 57,547 |
60,051 | – |
– | 68,013 |
62,811 | ||||||||||||||||||||||||||||||||
Corporate debt |
– |
– | 9,998 |
9,083 | – |
– | 9,998 |
9,083 | ||||||||||||||||||||||||||||||||
Mortgage- and asset-backed |
– |
– | 5,124 |
4,127 | – |
– | 5,124 |
4,127 | ||||||||||||||||||||||||||||||||
10,466 |
2,760 | 72,669 |
73,261 | – |
– | 83,135 |
76,021 | |||||||||||||||||||||||||||||||||
Corporate equity mandatorily measured at FVTPL and designated at FVOCI |
72,407 |
59,904 | 1,005 |
916 | 1,021 |
640 | 74,433 |
61,460 | ||||||||||||||||||||||||||||||||
Securities purchased under resale agreements measured at FVTPL |
– |
– | 22,280 |
24,977 | – |
– | 22,280 |
24,977 | ||||||||||||||||||||||||||||||||
Other assets |
– |
– | 610 |
364 | – |
– | 610 |
364 | ||||||||||||||||||||||||||||||||
Derivative instruments |
||||||||||||||||||||||||||||||||||||||||
Interest rate |
2 |
2 | 6,826 |
6,718 | 47 |
51 | 6,875 |
6,771 | ||||||||||||||||||||||||||||||||
Foreign exchange |
– |
– | 15,863 |
15,525 | – |
– | 15,863 |
15,525 | ||||||||||||||||||||||||||||||||
Credit |
– |
– | 2 |
2 | 34 |
44 | 36 |
46 | ||||||||||||||||||||||||||||||||
Equity |
4,855 |
5,821 | 4,169 |
5,157 | 19 |
6 | 9,043 |
10,984 | ||||||||||||||||||||||||||||||||
Precious metal and other commodity |
37 |
32 | 2,760 |
3,077 | – |
– | 2,797 |
3,109 | ||||||||||||||||||||||||||||||||
4,894 |
5,855 | 29,620 |
30,479 | 100 |
101 | 34,614 |
36,435 | |||||||||||||||||||||||||||||||||
Total financial assets |
$ |
91,325 |
$ | 72,777 | $ |
170,845 |
$ | 171,042 | $ |
1,983 |
$ | 916 | $ |
264,153 |
$ | 244,735 | ||||||||||||||||||||||||
Financial liabilities |
||||||||||||||||||||||||||||||||||||||||
Deposits and other liabilities (2)
|
$ |
– |
$ | – | $ |
(42,077 |
) |
$ | (39,290 | ) | $ |
(377 |
) |
$ | (416 | ) | $ |
(42,454 |
) |
$ | (39,706 | ) | ||||||||||||||||||
Obligations related to securities sold short |
(7,040 |
) |
(9,199 | ) | (13,787 |
) |
(12,443 | ) | – |
– | (20,827 |
) |
(21,642 | ) | ||||||||||||||||||||||||||
Obligations related to securities sold under repurchase agreements |
– |
– | (10,808 |
) |
(9,746 | ) | – |
– | (10,808 |
) |
(9,746 | ) | ||||||||||||||||||||||||||||
Derivative instruments |
||||||||||||||||||||||||||||||||||||||||
Interest rate |
(2 |
) |
(2 | ) | (7,453 |
) |
(8,236 | ) | (1,135 |
) |
(1,028 | ) | (8,590 |
) |
(9,266 | ) | ||||||||||||||||||||||||
Foreign exchange |
– |
– | (13,870 |
) |
(16,065 | ) | – |
(4 | ) | (13,870 |
) |
(16,069 | ) | |||||||||||||||||||||||||||
Credit |
– |
– | (6 |
) |
(5 | ) | (39 |
) |
(50 | ) | (45 |
) |
(55 | ) | ||||||||||||||||||||||||||
Equity |
(4,389 |
) |
(4,712 | ) | (6,899 |
) |
(6,404 | ) | (7 |
) |
(1 | ) | (11,295 |
) |
(11,117 | ) | ||||||||||||||||||||||||
Precious metal and other commodity |
(43 |
) |
(39 | ) | (2,709 |
) |
(4,108 | ) | – |
– | (2,752 |
) |
(4,147 | ) | ||||||||||||||||||||||||||
(4,434 |
) |
(4,753 | ) | (30,937 |
) |
(34,818 | ) | (1,181 |
) |
(1,083 | ) | (36,552 |
) |
(40,654 | ) | |||||||||||||||||||||||||
Total financial liabilities |
$ |
(11,474 |
) |
$ | (13,952 | ) | $ |
(97,609 |
) |
$ | (96,297 | ) | $ |
(1,558 |
) |
$ | (1,499 | ) | $ |
(110,641 |
) |
$ | (111,748 | ) | ||||||||||||||||
| (1) | Includes loans designated at FVTPL. |
| (2) | Comprises deposits designated at FVTPL of $41,997 million (October 31, 2024: $39,008 million), net bifurcated embedded derivative liabilities of $261 million (October 31, 2024: $521 million), other liabilities designated at FVTPL of $21 million (October 31, 2024: $19 million), and other financial liabilities measured at fair value of $175 million (October 31, 2024: $158 million). |
CIBC THIRD QUARTER 2025 |
59 |
Net gains (losses) included in income (1)
|
||||||||||||||||||||||||||||||||||||
| $ millions, for the three months ended | Opening balance |
|
Realized | Unrealized | (2) |
|
Net unrealized gains (losses) included in OCI |
(3) |
|
Transfer in to Level 3 |
|
|
Transfer out of Level 3 |
|
Purchases/ Issuances |
|
Sales/ Settlements |
|
Closing balance |
|
||||||||||||||||
Jul. 31, 2025 |
||||||||||||||||||||||||||||||||||||
Debt securities measured at FVTPL |
||||||||||||||||||||||||||||||||||||
Corporate debt |
$ |
77 |
$ |
– |
$ |
(62 |
) |
$ |
– |
$ |
– |
$ |
– |
$ |
86 |
$ |
– |
$ |
101 |
|||||||||||||||||
Mortgage- and asset-backed |
454 |
– |
– |
– |
– |
– |
84 |
(33 |
) |
505 |
||||||||||||||||||||||||||
Loans measured at FVTPL |
||||||||||||||||||||||||||||||||||||
Business and government |
261 |
– |
2 |
– |
– |
– |
– |
(7 |
) |
256 |
||||||||||||||||||||||||||
Corporate equity mandatorily measured at FVTPL and designated at FVOCI |
978 |
3 |
31 |
8 |
– |
– |
32 |
(31 |
) |
1,021 |
||||||||||||||||||||||||||
Derivative instruments |
||||||||||||||||||||||||||||||||||||
Interest rate |
63 |
– |
(8 |
) |
– |
– |
(8 |
) |
– |
– |
47 |
|||||||||||||||||||||||||
Foreign exchange |
– |
– |
– |
– |
– |
– |
– |
– |
– |
|||||||||||||||||||||||||||
Credit |
46 |
– |
(12 |
) |
– |
– |
– |
– |
– |
34 |
||||||||||||||||||||||||||
Equity |
19 |
– |
(4 |
) |
– |
11 |
(7 |
) |
– |
– |
19 |
|||||||||||||||||||||||||
Total assets |
$ |
1,898 |
$ |
3 |
$ |
(53 |
) |
$ |
8 |
$ |
11 |
$ |
(15 |
) |
$ |
202 |
$ |
(71 |
) |
$ |
1,983 |
|||||||||||||||
Deposits and other liabilities (4)
|
$ |
(330 |
) |
$ |
(6 |
) |
$ |
(42 |
) |
$ |
– |
$ |
– |
$ |
1 |
$ |
(27 |
) |
$ |
27 |
$ |
(377 |
) |
|||||||||||||
Derivative instruments |
||||||||||||||||||||||||||||||||||||
Interest rate |
(1,016 |
) |
– |
(131 |
) |
– |
– |
22 |
– |
(10 |
) |
(1,135 |
) |
|||||||||||||||||||||||
Foreign exchange |
(36 |
) |
– |
1 |
– |
– |
35 |
– |
– |
– |
||||||||||||||||||||||||||
Credit |
(51 |
) |
– |
12 |
– |
– |
– |
– |
– |
(39 |
) |
|||||||||||||||||||||||||
Equity |
(17 |
) |
– |
2 |
– |
– |
14 |
(6 |
) |
– |
(7 |
) |
||||||||||||||||||||||||
Total liabilities |
$ |
(1,450 |
) |
$ |
(6 |
) |
$ |
(158 |
) |
$ |
– |
$ |
– |
$ |
72 |
$ |
(33 |
) |
$ |
17 |
$ |
(1,558 |
) |
|||||||||||||
Apr. 30, 2025 |
||||||||||||||||||||||||||||||||||||
Debt securities measured at FVTPL |
||||||||||||||||||||||||||||||||||||
Corporate debt |
$ | 80 | $ | – | $ | (6 | ) | $ | (4 | ) | $ | – | $ | – | $ | 7 | $ | – | $ | 77 | ||||||||||||||||
Mortgage- and asset-backed |
72 | – | – | – | 386 | – | – | (4 | ) | 454 | ||||||||||||||||||||||||||
Loans measured at FVTPL |
||||||||||||||||||||||||||||||||||||
Business and government |
100 | – | (3 | ) | (5 | ) | – | – | 178 | (9 | ) | 261 | ||||||||||||||||||||||||
Corporate equity mandatorily measured at FVTPL and designated at FVOCI |
962 | – | 6 | (6 | ) | – | – | 30 | (14 | ) | 978 | |||||||||||||||||||||||||
Derivative instruments |
||||||||||||||||||||||||||||||||||||
Interest rate |
23 | – | 40 | – | – | – | – | – | 63 | |||||||||||||||||||||||||||
Foreign exchange |
12 | – | (12 | ) | – | – | – | – | – | – | ||||||||||||||||||||||||||
Credit |
49 | – | (3 | ) | – | – | – | – | – | 46 | ||||||||||||||||||||||||||
Equity |
6 | – | 6 | – | 7 | – | – | – | 19 | |||||||||||||||||||||||||||
Total assets |
$ | 1,304 | $ | – | $ | 28 | $ | (15 | ) | $ | 393 | $ | – | $ | 215 | $ | (27 | ) | $ | 1,898 | ||||||||||||||||
Deposits and other liabilities (4)
|
$ | (379 | ) | $ | 3 | $ | 10 | $ | – | $ | – | $ | 2 | $ | (29 | ) | $ | 63 | $ | (330 | ) | |||||||||||||||
Derivative instruments |
||||||||||||||||||||||||||||||||||||
Interest rate |
(1,284 | ) | – | 155 | – | – | 96 | – | 17 | (1,016 | ) | |||||||||||||||||||||||||
Foreign exchange |
– | – | (36 | ) | – | – | – | – | – | (36 | ) | |||||||||||||||||||||||||
Credit |
(54 | ) | – | 3 | – | – | – | – | – | (51 | ) | |||||||||||||||||||||||||
Equity |
(1 | ) | – | – | – | (5 | ) | – | (11 | ) | – | (17 | ) | |||||||||||||||||||||||
Total liabilities |
$ | (1,718 | ) | $ | 3 | $ | 132 | $ | – | $ | (5 | ) | $ | 98 | $ | (40 | ) | $ | 80 | $ | (1,450 | ) | ||||||||||||||
Jul. 31, 2024 |
||||||||||||||||||||||||||||||||||||
Debt securities measured at FVTPL |
||||||||||||||||||||||||||||||||||||
Corporate debt |
$ | – | $ | – | $ | – | $ | – | $ | – | $ | – | $ | – | $ | – | $ | – | ||||||||||||||||||
Mortgage- and asset-backed |
101 | – | – | – | – | – | 9 | (46 | ) | 64 | ||||||||||||||||||||||||||
Loans measured at FVTPL |
||||||||||||||||||||||||||||||||||||
Business and government |
121 | – | 2 | – | – | – | – | (10 | ) | 113 | ||||||||||||||||||||||||||
Corporate equity mandatorily measured at FVTPL and designated at FVOCI |
608 | 3 | 9 | (1 | ) | – | – | 26 | (22 | ) | 623 | |||||||||||||||||||||||||
Derivative instruments |
||||||||||||||||||||||||||||||||||||
Interest rate |
36 | – | 67 | – | – | (17 | ) | – | – | 86 | ||||||||||||||||||||||||||
Foreign exchange |
– | – | – | – | – | – | – | – | – | |||||||||||||||||||||||||||
Credit |
46 | (1 | ) | 1 | – | – | – | – | – | 46 | ||||||||||||||||||||||||||
Equity |
5 | – | 1 | – | – | – | 3 | – | 9 | |||||||||||||||||||||||||||
Total assets |
$ | 917 | $ | 2 | $ | 80 | $ | (1 | ) | $ | – | $ | (17 | ) | $ | 38 | $ | (78 | ) | $ | 941 | |||||||||||||||
Deposits and other liabilities (4)
|
$ | (380 | ) | $ | 19 | $ | (56 | ) | $ | – | $ | (1 | ) | $ | 3 | $ | (1 | ) | $ | 28 | $ | (388 | ) | |||||||||||||
Derivative instruments |
||||||||||||||||||||||||||||||||||||
Interest rate |
(1,222 | ) | – | 233 | – | – | 59 | (4 | ) | – | (934 | ) | ||||||||||||||||||||||||
Foreign exchange |
(13 | ) | – | (5 | ) | – | – | 13 | – | – | (5 | ) | ||||||||||||||||||||||||
Credit |
(51 | ) | – | – | – | – | – | – | – | (51 | ) | |||||||||||||||||||||||||
Equity |
(4 | ) | – | – | – | – | 1 | – | 2 | (1 | ) | |||||||||||||||||||||||||
Total liabilities |
$ | (1,670 | ) | $ | 19 | $ | 172 | $ | – | $ | (1 | ) | $ | 76 | $ | (5 | ) | $ | 30 | $ | (1,379 | ) | ||||||||||||||
| (1) | Cumulative AOCI gains or losses related to equity securities designated at FVOCI are reclassified from AOCI to retained earnings at the time of disposal or derecognition. |
| (2) | Comprises unrealized gains and losses relating to the assets and liabilities held at the end of the reporting period. |
| (3) | Foreign exchange translation on debt securities and loans measured at FVTPL held by foreign operations and denominated in the same currency as the foreign operations is included in OCI. |
| (4) | Includes deposits designated at FVTPL of $203 million (April 30, 2025: $208 million; July 31, 2024: $213 million), net bifurcated embedded derivative liabilities of $153 million (April 30, 2025: $111 million; July 31, 2024: $172 million) and other liabilities designated at FVTPL of $21 million (April 30, 2025: $11 million; July 31, 2024: $3 million). |
60 |
CIBC THIRD QUARTER 2025 |
Net gains (losses) included in income (1)
|
||||||||||||||||||||||||||||||||||||
| $ millions, for the nine months ended | Opening balance |
|
Realized | Unrealized | (2) |
|
Net unrealized gains (losses) included in OCI |
(3) |
|
Transfer in to Level 3 |
|
|
Transfer out of Level 3 |
|
Purchases/ Issuances |
|
Sales/ Settlements |
|
Closing balance |
|
||||||||||||||||
Jul. 31, 2025 |
||||||||||||||||||||||||||||||||||||
Debt securities measured at FVTPL |
||||||||||||||||||||||||||||||||||||
Corporate debt |
$ |
– |
$ |
– |
$ |
(78 |
) |
$ |
(4 |
) |
$ |
– |
$ |
– |
$ |
183 |
$ |
– |
$ |
101 |
||||||||||||||||
Mortgage- and asset-backed |
70 |
– |
(1 |
) |
– |
386 |
– |
106 |
(56 |
) |
505 |
|||||||||||||||||||||||||
Loans measured at FVTPL |
||||||||||||||||||||||||||||||||||||
Business and government |
105 |
– |
– |
(1 |
) |
– |
– |
178 |
(26 |
) |
256 |
|||||||||||||||||||||||||
Corporate equity mandatorily measured at FVTPL and designated at FVOCI |
640 |
1 |
57 |
11 |
– |
– |
366 |
(54 |
) |
1,021 |
||||||||||||||||||||||||||
Derivative instruments |
||||||||||||||||||||||||||||||||||||
Interest rate |
51 |
– |
9 |
– |
– |
(13 |
) |
– |
– |
47 |
||||||||||||||||||||||||||
Foreign exchange |
– |
– |
– |
– |
– |
– |
– |
– |
– |
|||||||||||||||||||||||||||
Credit |
44 |
– |
(10 |
) |
– |
– |
– |
– |
– |
34 |
||||||||||||||||||||||||||
Equity |
6 |
– |
2 |
– |
18 |
(7 |
) |
– |
– |
19 |
||||||||||||||||||||||||||
Total assets |
$ |
916 |
$ |
1 |
$ |
(21 |
) |
$ |
6 |
$ |
404 |
$ |
(20 |
) |
$ |
833 |
$ |
(136 |
) |
$ |
1,983 |
|||||||||||||||
Deposits and other liabilities (4)
|
$ |
(416 |
) |
$ |
(5 |
) |
$ |
(55 |
) |
$ |
– |
$ |
(3 |
) |
$ |
5 |
$ |
(57 |
) |
$ |
154 |
$ |
(377 |
) |
||||||||||||
Derivative instruments |
||||||||||||||||||||||||||||||||||||
Interest rate |
(1,028 |
) |
– |
(286 |
) |
– |
– |
151 |
– |
28 |
(1,135 |
) |
||||||||||||||||||||||||
Foreign exchange |
(4 |
) |
– |
(31 |
) |
– |
– |
35 |
– |
– |
– |
|||||||||||||||||||||||||
Credit |
(50 |
) |
– |
11 |
– |
– |
– |
– |
– |
(39 |
) |
|||||||||||||||||||||||||
Equity |
(1 |
) |
– |
2 |
– |
(5 |
) |
14 |
(17 |
) |
– |
(7 |
) |
|||||||||||||||||||||||
Total liabilities |
$ |
(1,499 |
) |
$ |
(5 |
) |
$ |
(359 |
) |
$ |
– |
$ |
(8 |
) |
$ |
205 |
$ |
(74 |
) |
$ |
182 |
$ (1,558 |
) |
|||||||||||||
Jul. 31, 2024 |
||||||||||||||||||||||||||||||||||||
Debt securities measured at FVTPL |
||||||||||||||||||||||||||||||||||||
Corporate debt |
$ | – | $ | – | $ | – | $ | – | $ | – | $ | – | $ | – | $ | – | $ | – | ||||||||||||||||||
Mortgage- and asset-backed |
151 | – | (3 | ) | – | – | – | 70 | (154 | ) | 64 | |||||||||||||||||||||||||
Loans measured at FVTPL |
||||||||||||||||||||||||||||||||||||
Business and government |
144 | – | 4 | (1 | ) | – | – | – | (34 | ) | 113 | |||||||||||||||||||||||||
Corporate equity mandatorily measured at FVTPL and designated at FVOCI |
587 | 8 | 19 | (14 | ) | – | – | 88 | (65 | ) | 623 | |||||||||||||||||||||||||
Derivative instruments |
||||||||||||||||||||||||||||||||||||
Interest rate |
21 | – | 120 | – | – | (55 | ) | – | – | 86 | ||||||||||||||||||||||||||
Foreign exchange |
– | – | – | – | – | – | – | – | – | |||||||||||||||||||||||||||
Credit |
46 | (4 | ) | 3 | – | – | – | 1 | – | 46 | ||||||||||||||||||||||||||
Equity |
4 | – | 1 | – | 2 | (2 | ) | 5 | (1 | ) | 9 | |||||||||||||||||||||||||
Total assets |
$ | 953 | $ | 4 | $ | 144 | $ | (15 | ) | $ | 2 | $ | (57 | ) | $ | 164 | $ | (254 | ) | $ | 941 | |||||||||||||||
Deposits and other liabilities (4)
|
$ | (242 | ) | $ | (1 | ) | $ | (123 | ) | $ | – | $ | (2 | ) | $ | 11 | $ | (102 | ) | $ | 71 | $ | (388 | ) | ||||||||||||
Derivative instruments |
||||||||||||||||||||||||||||||||||||
Interest rate |
(1,817 | ) | – | 416 | – | – | 422 | (4 | ) | 49 | (934 | ) | ||||||||||||||||||||||||
Foreign exchange |
– | – | (27 | ) | – | – | 22 | – | – | (5 | ) | |||||||||||||||||||||||||
Credit |
(52 | ) | 1 | 1 | – | (2 | ) | – | – | 1 | (51 | ) | ||||||||||||||||||||||||
Equity |
(5 | ) | – | (1 | ) | – | (1 | ) | 4 | – | 2 | (1 | ) | |||||||||||||||||||||||
Total liabilities |
$ | (2,116 | ) | $ | – | $ | 266 | $ | – | $ | (5 | ) | $ | 459 | $ | (106 | ) | $ | 123 | $ | (1,379 | ) | ||||||||||||||
| (1) | Cumulative AOCI gains or losses related to equity securities designated at FVOCI are reclassified from AOCI to retained earnings at the time of disposal or derecognition. |
| (2) | Comprises unrealized gains and losses relating to the assets and liabilities held at the end of the reporting period. |
| (3) | Foreign exchange translation on debt securities and loans measured at FVTPL held by foreign operations and denominated in the same currency as the foreign operations is included in OCI. |
| (4) | Includes deposits designated at FVTPL of $203 million (July 31, 2024: $213 million), net bifurcated embedded derivative liabilities of $153 |
CIBC THIRD QUARTER 2025 |
61 |
| $ millions, as at | 2025 Jul. 31 |
2024 Oct. 31 |
||||||
| Carrying amount | ||||||||
Securities measured and designated at FVOCI |
$ |
84,093 |
$ | 76,693 | ||||
Securities measured at amortized cost (1)
|
68,812 |
71,610 | ||||||
Securities mandatorily measured and designated at FVTPL |
122,092 |
106,042 | ||||||
$ |
274,997 |
$ | 254,345 | |||||
| (1) | There were no sales of securities measured at amortized cost during the quarter (October 31, 2024: a realized gain of nil). |
| $ millions, as at | 2025 Jul. 31 |
2024 Oct. 31 |
||||||||||||||||||||||||||||||
|
|
Cost/ Amortized cost |
(1)
|
|
Gross unrealized gains |
|
Gross unrealized losses |
Fair value |
|
|
Cost/ Amortized cost |
(1) |
|
Gross unrealized gains |
|
|
Gross unrealized losses |
|
Fair value |
|
|||||||||||||
Securities issued or guaranteed by: |
||||||||||||||||||||||||||||||||
Canadian federal government |
$ |
12,596 |
$ |
7 |
$ |
(16 |
) |
$ |
12,587 |
$ | 11,715 | $ | 1 | $ | (31 | ) | $ | 11,685 | ||||||||||||||
Other Canadian governments |
16,729 |
17 |
(59 |
) |
16,687 |
16,506 | 9 | (101 | ) | 16,414 | ||||||||||||||||||||||
U.S. Treasury and agencies |
31,729 |
52 |
(118 |
) |
31,663 |
29,362 | 10 | (220 | ) | 29,152 | ||||||||||||||||||||||
Other foreign governments |
7,051 |
27 |
(2 |
) |
7,076 |
5,542 | 22 | (4 | ) | 5,560 | ||||||||||||||||||||||
Mortgage-backed securities |
3,631 |
3 |
(15 |
) |
3,619 |
3,493 | – | (23 | ) | 3,470 | ||||||||||||||||||||||
Asset-backed securities |
1,503 |
2 |
– |
1,505 |
656 | 1 | – | 657 | ||||||||||||||||||||||||
Corporate debt |
9,993 |
10 |
(5 |
) |
9,998 |
9,085 | 7 | (9 | ) | 9,083 | ||||||||||||||||||||||
83,232 |
118 |
(215 |
) |
83,135 |
76,359 | 50 | (388 | ) | 76,021 | |||||||||||||||||||||||
Corporate equity (2)
|
916 |
65 |
(23 |
) |
958 |
653 | 51 | (32 | ) | 672 | ||||||||||||||||||||||
$ |
84,148 |
$ |
183 |
$ |
(238 |
) |
$ |
84,093 |
$ | 77,012 | $ | 101 | $ | (420 | ) | $ | 76,693 | |||||||||||||||
| (1) | Net of allowance for credit losses for debt securities measured at FVOCI of $23 million (October 31, 2024: $19 million). |
| (2) | Includes restricted stock. |
62 |
CIBC THIRD QUARTER 2025 |
| Stage 1 | Stage 2 | Stage 3 | ||||||||||||||||||||
| $ millions, as at or for the three months ended | |
Collective provision 12-month ECL performing |
|
|
Collective provision lifetime ECL performing |
|
|
Collective and individual provision lifetime ECL credit-impaired
|
(1) |
Total | ||||||||||||
2025 |
Debt securities measured at FVOCI and amortized cost |
|||||||||||||||||||||
Jul. 31 |
Balance at beginning of period |
$ |
6 |
$ |
16 |
$ |
11 |
$ |
33 |
|||||||||||||
Provision for (reversal of) credit losses (2)
|
(1 |
) |
4 |
26 |
29 |
|||||||||||||||||
Write-offs |
– |
– |
– |
– |
||||||||||||||||||
Foreign exchange and other |
1 |
– |
– |
1 |
||||||||||||||||||
Balance at end of period |
$ |
6 |
$ |
20 |
$ |
37 |
$ |
63 |
||||||||||||||
Comprises: |
||||||||||||||||||||||
Debt securities measured at FVOCI |
$ |
3 |
$ |
20 |
$ |
– |
$ |
23 |
||||||||||||||
Debt securities measured at amortized cost |
3 |
– |
37 |
40 |
||||||||||||||||||
2025 |
Debt securities measured at FVOCI and amortized cost |
|||||||||||||||||||||
Apr. 30 |
Balance at beginning of period |
$ | 7 | $ | 18 | $ | 12 | $ | 37 | |||||||||||||
Reversal of credit losses (2)
|
(1 | ) | (1 | ) | – | (2 | ) | |||||||||||||||
Write-offs |
– | – | – | – | ||||||||||||||||||
Foreign exchange and other |
– | (1 | ) | (1 | ) | (2 | ) | |||||||||||||||
Balance at end of period |
$ | 6 | $ | 16 | $ | 11 | $ | 33 | ||||||||||||||
Comprises: |
||||||||||||||||||||||
Debt securities measured at FVOCI |
$ | 2 | $ | 16 | $ | – | $ | 18 | ||||||||||||||
Debt securities measured at amortized cost |
4 | – | 11 | 15 | ||||||||||||||||||
2024 |
Debt securities measured at FVOCI and amortized cost |
|||||||||||||||||||||
Jul. 31 |
Balance at beginning of period |
$ | 6 | $ | 19 | $ | 13 | $ | 38 | |||||||||||||
Provision for (reversal of) credit losses (2)
|
1 | (1 | ) | (1 | ) | (1 | ) | |||||||||||||||
Write-offs |
– | – | – | – | ||||||||||||||||||
Foreign exchange and other |
– | – | – | – | ||||||||||||||||||
Balance at end of period |
$ | 7 | $ | 18 | $ | 12 | $ | 37 | ||||||||||||||
Comprises: |
||||||||||||||||||||||
Debt securities measured at FVOCI |
$ | 1 | $ | 18 | $ | – | $ | 19 | ||||||||||||||
Debt securities measured at amortized cost |
6 | – | 12 | 18 | ||||||||||||||||||
$ millions, as at or for the nine months ended |
||||||||||||||||||||||
2025 |
Debt securities measured at FVOCI and amortized cost |
|||||||||||||||||||||
Jul. 31 |
Balance at beginning of period |
$ |
7 |
$ |
17 |
$ |
12 |
$ |
36 |
|||||||||||||
Provision for (reversal of) credit losses (2)
|
(2 |
) |
3 |
25 |
26 |
|||||||||||||||||
Write-offs |
– |
– |
– |
– |
||||||||||||||||||
Foreign exchange and other |
1 |
– |
– |
1 |
||||||||||||||||||
Balance at end of period |
$ |
6 |
$ |
20 |
$ |
37 |
$ |
63 |
||||||||||||||
2024 |
Debt securities measured at FVOCI and amortized cost |
|||||||||||||||||||||
Jul. 31 |
Balance at beginning of period |
$ | 8 | $ | 20 | $ | 14 | $ | 42 | |||||||||||||
Reversal of credit losses (2)
|
– | (2 | ) | (2 | ) | (4 | ) | |||||||||||||||
Write-offs |
– | – | – | – | ||||||||||||||||||
Foreign exchange and other |
(1 | ) | – | – | (1 | ) | ||||||||||||||||
Balance at end of period |
$ | 7 | $ | 18 | $ | 12 | $ | 37 | ||||||||||||||
| (1) | Includes stage 3 ECL allowance on originated credit-impaired amortized cost debt securities. |
| (2) | Included in gains (losses) from debt securities measured at FVOCI and amortized cost, net on our interim consolidated statement of income. |
CIBC THIRD QUARTER 2025 |
63 |
| $ millions, as at or for the three months ended | 2025 Jul. 31 |
|||||||||||||||
Stage 1 |
Stage 2 |
Stage 3 |
||||||||||||||
|
Collective
provision 12-month
ECL
performing |
Collective
provision lifetime ECL
performing |
Collective and individual provision lifetime ECL credit-impaired |
Total |
|||||||||||||
Residential mortgages |
||||||||||||||||
Balance at beginning of period |
$ |
92 |
$ |
132 |
$ |
258 |
$ |
482 |
||||||||
Provision for (reversal of) credit losses |
||||||||||||||||
Originations net of repayments and other derecognitions (1)
|
4 |
(4 |
) |
(19 |
) |
(19 |
) |
|||||||||
Changes in model |
– |
– |
– |
– |
||||||||||||
Net remeasurement (2)
|
(24 |
) |
53 |
75 |
104 |
|||||||||||
Transfers (2)
|
||||||||||||||||
– to 12-month ECL |
30 |
(28 |
) |
(2 |
) |
– |
||||||||||
– to lifetime ECL performing |
(3 |
) |
8 |
(5 |
) |
– |
||||||||||
– to lifetime ECL credit-impaired |
– |
(2 |
) |
2 |
– |
|||||||||||
Total provision for (reversal of) credit losses (3)
|
7 |
27 |
51 |
85 |
||||||||||||
Write-offs |
– |
– |
(5 |
) |
(5 |
) |
||||||||||
Recoveries |
– |
– |
3 |
3 |
||||||||||||
Interest income on impaired loans |
– |
– |
(10 |
) |
(10 |
) |
||||||||||
Foreign exchange and other |
– |
(1 |
) |
1 |
– |
|||||||||||
Balance at end of period |
$ |
99 |
$ |
158 |
$ |
298 |
$ |
555 |
||||||||
Personal |
||||||||||||||||
Balance at beginning of period |
$ |
242 |
$ |
647 |
$ |
206 |
$ |
1,095 |
||||||||
Provision for (reversal of) credit losses |
||||||||||||||||
Originations net of repayments and other derecognitions (1)
|
14 |
(11 |
) |
(7 |
) |
(4 |
) |
|||||||||
Changes in model |
– |
– |
– |
– |
||||||||||||
Net remeasurement (2)
|
(112 |
) |
200 |
107 |
195 |
|||||||||||
Transfers (2)
|
||||||||||||||||
– to 12-month ECL |
134 |
(133 |
) |
(1 |
) |
– |
||||||||||
– to lifetime ECL performing |
(29 |
) |
35 |
(6 |
) |
– |
||||||||||
– to lifetime ECL credit-impaired |
(1 |
) |
(17 |
) |
18 |
– |
||||||||||
Total provision for (reversal of) credit losses (3)
|
6 |
74 |
111 |
191 |
||||||||||||
Write-offs |
– |
– |
(146 |
) |
(146 |
) |
||||||||||
Recoveries |
– |
– |
19 |
19 |
||||||||||||
Interest income on impaired loans |
– |
– |
(2 |
) |
(2 |
) |
||||||||||
Foreign exchange and other |
5 |
(1 |
) |
(4 |
) |
– |
||||||||||
Balance at end of period |
$ |
253 |
$ |
720 |
$ |
184 |
$ |
1,157 |
||||||||
Credit card |
||||||||||||||||
Balance at beginning of period |
$ |
291 |
$ |
702 |
$ |
– |
$ |
993 |
||||||||
Provision for (reversal of) credit losses |
||||||||||||||||
Originations net of repayments and other derecognitions (1)
|
9 |
(9 |
) |
– |
– |
|||||||||||
Changes in model |
– |
– |
– |
– |
||||||||||||
Net remeasurement (2)
|
(145 |
) |
213 |
93 |
161 |
|||||||||||
Transfers (2)
|
||||||||||||||||
– to 12-month ECL |
201 |
(201 |
) |
– |
– |
|||||||||||
– to lifetime ECL performing |
(18 |
) |
18 |
– |
– |
|||||||||||
– to lifetime ECL credit-impaired |
(1 |
) |
(97 |
) |
98 |
– |
||||||||||
Total provision for (reversal of) credit losses (3)
|
46 |
(76 |
) |
191 |
161 |
|||||||||||
Write-offs |
– |
– |
(232 |
) |
(232 |
) |
||||||||||
Recoveries |
– |
– |
41 |
41 |
||||||||||||
Interest income on impaired loans |
– |
– |
– |
– |
||||||||||||
Foreign exchange and other |
– |
– |
– |
– |
||||||||||||
Balance at end of period |
$ |
337 |
$ |
626 |
$ |
– |
$ |
963 |
||||||||
Business and government |
||||||||||||||||
Balance at beginning of period |
$ |
333 |
$ |
1,103 |
$ |
449 |
$ |
1,885 |
||||||||
Provision for (reversal of) credit losses |
||||||||||||||||
Originations net of repayments and other derecognitions (1)
|
14 |
(12 |
) |
(14 |
) |
(12 |
) |
|||||||||
Changes in model |
84 |
(84 |
) |
– |
– |
|||||||||||
Net remeasurement (2)
|
(39 |
) |
84 |
89 |
134 |
|||||||||||
Transfers (2)
|
||||||||||||||||
– to 12-month ECL |
39 |
(38 |
) |
(1 |
) |
– |
||||||||||
– to lifetime ECL performing |
(9 |
) |
11 |
(2 |
) |
– |
||||||||||
– to lifetime ECL credit-impaired |
– |
(56 |
) |
56 |
– |
|||||||||||
Total provision for (reversal of) credit losses (3)
|
89 |
(95 |
) |
128 |
122 |
|||||||||||
Write-offs |
– |
– |
(94 |
) |
(94 |
) |
||||||||||
Recoveries |
– |
– |
13 |
13 |
||||||||||||
Interest income on impaired loans |
– |
– |
(22 |
) |
(22 |
) |
||||||||||
Foreign exchange and other |
– |
5 |
4 |
9 |
||||||||||||
Balance at end of period |
$ |
422 |
$ |
1,013 |
$ |
478 |
$ |
1,913 |
||||||||
Total ECL allowance (4)
|
$ |
1,111 |
$ |
2,517 |
$ |
960 |
$ |
4,588 |
||||||||
Comprises: |
||||||||||||||||
Loans |
$ |
992 |
$ |
2,341 |
$ |
952 |
$ |
4,285 |
||||||||
Undrawn credit facilities and other off-balance sheet exposures (5)
|
119 |
176 |
8 |
303 |
||||||||||||
| (1) | Excludes the disposal and write-off of impaired loans. |
| (2) | Transfers represent stage movements of ECL allowances before net remeasurement. Net remeasurement represents the current period change in ECL allowances for transfers, net write-offs, changes in forecasts of forward-looking information, parameter updates, and partial repayments in the period. |
| (3) | Provision for (reversal of) credit losses for loans and undrawn credit facilities and other off-balance sheet exposures is presented as Provision for (reversal of) credit losses on our interim consolidated statement of income. |
| (4) | See Note 5 to the interim consolidated financial statements for the ECL allowance on debt securities measured at FVOCI and amortized cost. The ECL allowances for other financial assets classified at amortized cost were immaterial as at July 31, 2025, April 30, 2025 and July 31, 2024 and were excluded from the table above. Financial assets other than loans that are classified at amortized cost are presented on our interim consolidated balance sheet net of ECL allowances. |
| (5) | Included in Other liabilities on our interim consolidated balance sheet. |
64 |
CIBC THIRD QUARTER 2025 |
| $ millions, as at or for the three months ended | 2025 Apr. 30 |
2024 Jul. 31 |
||||||||||||||||||||||||||||||
| Stage 1 | Stage 2 | Stage 3 | Stage 1 | Stage 2 | Stage 3 | |||||||||||||||||||||||||||
| Collective provision 12-month ECL performing |
Collective provision lifetime ECL performing |
Collective and individual provision lifetime ECL credit-impaired |
Total | Collective provision 12-month
ECL performing |
Collective provision lifetime ECL performing |
Collective and individual provision lifetime ECL credit-impaired
|
Total | |||||||||||||||||||||||||
Residential mortgages |
||||||||||||||||||||||||||||||||
Balance at beginning of period |
$ | 91 | $ | 128 | $ | 253 | $ | 472 | $ | 92 | $ | 151 | $ | 256 | $ | 499 | ||||||||||||||||
Provision for (reversal of) credit losses |
||||||||||||||||||||||||||||||||
Originations net of repayments and other derecognitions (1)
|
3 | (6 | ) | (21 | ) | (24 | ) | 3 | (5 | ) | (14 | ) | (16 | ) | ||||||||||||||||||
Changes in model |
– | – | – | – | – | – | – | – | ||||||||||||||||||||||||
Net remeasurement (2)
|
(35 | ) | 42 | 48 | 55 | (41 | ) | 46 | 27 | 32 | ||||||||||||||||||||||
Transfers (2)
|
||||||||||||||||||||||||||||||||
– to 12-month ECL |
38 | (35 | ) | (3 | ) | – | 40 | (40 | ) | – | – | |||||||||||||||||||||
– to lifetime ECL performing |
(2 | ) | 6 | (4 | ) | – | (3 | ) | 4 | (1 | ) | – | ||||||||||||||||||||
– to lifetime ECL credit-impaired |
– | (3 | ) | 3 | – | – | (2 | ) | 2 | – | ||||||||||||||||||||||
Total provision for (reversal of) credit losses (3)
|
4 | 4 | 23 | 31 | (1 | ) | 3 | 14 | 16 | |||||||||||||||||||||||
Write-offs |
– | – | (2 | ) | (2 | ) | – | – | (8 | ) | (8 | ) | ||||||||||||||||||||
Recoveries |
– | – | – | – | – | – | 3 | 3 | ||||||||||||||||||||||||
Interest income on impaired loans |
– | – | (9 | ) | (9 | ) | – | – | (9 | ) | (9 | ) | ||||||||||||||||||||
Foreign exchange and other |
(3 | ) | – | (7 | ) | (10 | ) | – | (1 | ) | 2 | 1 | ||||||||||||||||||||
Balance at end of period |
$ | 92 | $ | 132 | $ | 258 | $ | 482 | $ | 91 | $ | 153 | $ | 258 | $ | 502 | ||||||||||||||||
Personal |
||||||||||||||||||||||||||||||||
Balance at beginning of period |
$ | 228 | $ | 680 | $ | 187 | $ | 1,095 | $ | 175 | $ | 724 | $ | 196 | $ | 1,095 | ||||||||||||||||
Provision for (reversal of) credit losses |
||||||||||||||||||||||||||||||||
Originations net of repayments and other derecognitions (1)
|
9 | (14 | ) | (7 | ) | (12 | ) | 8 | (14 | ) | (10 | ) | (16 | ) | ||||||||||||||||||
Changes in model |
5 | 21 | – | 26 | – | – | – | – | ||||||||||||||||||||||||
Net remeasurement (2)
|
(198 | ) | 171 | 148 | 121 | (133 | ) | 149 | 121 | 137 | ||||||||||||||||||||||
Transfers (2)
|
||||||||||||||||||||||||||||||||
– to 12-month ECL |
211 | (208 | ) | (3 | ) | – | 143 | (142 | ) | (1 | ) | – | ||||||||||||||||||||
– to lifetime ECL performing |
(10 | ) | 14 | (4 | ) | – | (18 | ) | 20 | (2 | ) | – | ||||||||||||||||||||
– to lifetime ECL credit-impaired |
(1 | ) | (17 | ) | 18 | – | – | (25 | ) | 25 | – | |||||||||||||||||||||
Total provision for (reversal of) credit losses (3)
|
16 | (33 | ) | 152 | 135 | – | (12 | ) | 133 | 121 | ||||||||||||||||||||||
Write-offs |
– | – | (149 | ) | (149 | ) | – | – | (146 | ) | (146 | ) | ||||||||||||||||||||
Recoveries |
– | – | 24 | 24 | – | – | 15 | 15 | ||||||||||||||||||||||||
Interest income on impaired loans |
– | – | (2 | ) | (2 | ) | – | – | (2 | ) | (2 | ) | ||||||||||||||||||||
Foreign exchange and other |
(2 | ) | – | (6 | ) | (8 | ) | 4 | – | (3 | ) | 1 | ||||||||||||||||||||
Balance at end of period |
$ | 242 | $ | 647 | $ | 206 | $ | 1,095 | $ | 179 | $ | 712 | $ | 193 | $ | 1,084 | ||||||||||||||||
Credit card |
||||||||||||||||||||||||||||||||
Balance at beginning of period |
$ | 277 | $ | 683 | $ | – | $ | 960 | $ | 184 | $ | 608 | $ | – | $ | 792 | ||||||||||||||||
Provision for (reversal of) credit losses |
||||||||||||||||||||||||||||||||
Originations net of repayments and other derecognitions (1)
|
9 | (10 | ) | – | (1 | ) | 5 | (2 | ) | – | 3 | |||||||||||||||||||||
Changes in model |
– | – | – | – | – | – | – | – | ||||||||||||||||||||||||
Net remeasurement (2)
|
(225 | ) | 351 | 92 | 218 | (72 | ) | 172 | 111 | 211 | ||||||||||||||||||||||
Transfers (2)
|
||||||||||||||||||||||||||||||||
– to 12-month ECL |
250 | (250 | ) | – | – | 96 | (96 | ) | – | – | ||||||||||||||||||||||
– to lifetime ECL performing |
(19 | ) | 19 | – | – | (20 | ) | 20 | – | – | ||||||||||||||||||||||
– to lifetime ECL credit-impaired |
(1 | ) | (91 | ) | 92 | – | – | (54 | ) | 54 | – | |||||||||||||||||||||
Total provision for (reversal of) credit losses (3)
|
14 | 19 | 184 | 217 | 9 | 40 | 165 | 214 | ||||||||||||||||||||||||
Write-offs |
– | – | (221 | ) | (221 | ) | – | – | (198 | ) | (198 | ) | ||||||||||||||||||||
Recoveries |
– | – | 37 | 37 | – | – | 33 | 33 | ||||||||||||||||||||||||
Interest income on impaired loans |
– | – | – | – | – | – | – | – | ||||||||||||||||||||||||
Foreign exchange and other |
– | – | – | – | – | – | – | – | ||||||||||||||||||||||||
Balance at end of period |
$ | 291 | $ | 702 | $ | – | $ | 993 | $ | 193 | $ | 648 | $ | – | $ | 841 | ||||||||||||||||
Business and government |
||||||||||||||||||||||||||||||||
Balance at beginning of period |
$ | 320 | $ | 1,057 | $ | 472 | $ | 1,849 | $ | 312 | $ | 953 | $ | 435 | $ | 1,700 | ||||||||||||||||
Provision for (reversal of) credit losses |
||||||||||||||||||||||||||||||||
Originations net of repayments and other derecognitions (1)
|
7 | (23 | ) | (12 | ) | (28 | ) | 2 | (32 | ) | (9 | ) | (39 | ) | ||||||||||||||||||
Changes in model |
1 | 2 | – | 3 | – | – | – | – | ||||||||||||||||||||||||
Net remeasurement (2)
|
3 | 139 | 105 | 247 | (43 | ) | 129 | 85 | 171 | |||||||||||||||||||||||
Transfers (2)
|
||||||||||||||||||||||||||||||||
– to 12-month ECL |
30 | (29 | ) | (1 | ) | – | 55 | (50 | ) | (5 | ) | – | ||||||||||||||||||||
– to lifetime ECL performing |
(15 | ) | 16 | (1 | ) | – | (9 | ) | 11 | (2 | ) | – | ||||||||||||||||||||
– to lifetime ECL credit-impaired |
– | (13 | ) | 13 | – | – | (23 | ) | 23 | – | ||||||||||||||||||||||
Total provision for (reversal of) credit losses (3)
|
26 | 92 | 104 | 222 | 5 | 35 | 92 | 132 | ||||||||||||||||||||||||
Write-offs |
– | – | (85 | ) | (85 | ) | – | – | (142 | ) | (142 | ) | ||||||||||||||||||||
Recoveries |
– | – | 3 | 3 | – | – | 18 | 18 | ||||||||||||||||||||||||
Interest income on impaired loans |
– | – | (24 | ) | (24 | ) | – | – | (20 | ) | (20 | ) | ||||||||||||||||||||
Foreign exchange and other |
(13 | ) | (46 | ) | (21 | ) | (80 | ) | (6 | ) | 3 | 6 | 3 | |||||||||||||||||||
Balance at end of period |
$ | 333 | $ | 1,103 | $ | 449 | $ | 1,885 | $ | 311 | $ | 991 | $ | 389 | $ | 1,691 | ||||||||||||||||
Total ECL allowance (4)
|
$ | 958 | $ | 2,584 | $ | 913 | $ | 4,455 | $ | 774 | $ | 2,504 | $ | 840 | $ | 4,118 | ||||||||||||||||
Comprises: |
||||||||||||||||||||||||||||||||
Loans |
$ | 844 | $ | 2,443 | $ | 904 | $ | 4,191 | $ | 684 | $ | 2,407 | $ | 829 | $ | 3,920 | ||||||||||||||||
Undrawn credit facilities and other off-balance sheet exposures (5)
|
114 | 141 | 9 | 264 | 90 | 97 | 11 | 198 | ||||||||||||||||||||||||
CIBC THIRD QUARTER 2025 |
65 |
| $ millions, as at or for the nine months ended |
2025 Jul. 31 |
2024 Jul. 31 |
||||||||||||||||||||||||||||||
Stage 1 |
Stage 2 |
Stage 3 |
Stage 1 | Stage 2 | Stage 3 | |||||||||||||||||||||||||||
Collective provision 12-month ECL performing |
Collective provision lifetime ECL performing |
Collective and individual provision lifetime ECL credit-impaired
|
Total |
Collective provision 12-month
ECL performing |
Collective provision lifetime ECL performing |
Collective and individual provision lifetime ECL credit-impaired
|
Total | |||||||||||||||||||||||||
Residential mortgages |
||||||||||||||||||||||||||||||||
Balance at beginning of period |
$ |
89 |
$ |
126 |
$ |
234 |
$ |
449 |
$ | 90 | $ | 142 | $ | 224 | $ | 456 | ||||||||||||||||
Provision for (reversal of) credit losses |
||||||||||||||||||||||||||||||||
Originations net of repayments and other derecognitions (1)
|
11 |
(15 |
) |
(55 |
) |
(59 |
) |
11 | (11 | ) | (35 | ) | (35 | ) | ||||||||||||||||||
Changes in model |
– |
– |
– |
– |
– | 4 | 11 | 15 | ||||||||||||||||||||||||
Net remeasurement (2)
|
(97 |
) |
131 |
164 |
198 |
(79 | ) | 90 | 83 | 94 | ||||||||||||||||||||||
Transfers (2)
|
||||||||||||||||||||||||||||||||
– to 12-month ECL |
104 |
(98 |
) |
(6 |
) |
– |
76 | (75 | ) | (1 | ) | – | ||||||||||||||||||||
– to lifetime ECL performing |
(7 |
) |
21 |
(14 |
) |
– |
(7 | ) | 10 | (3 | ) | – | ||||||||||||||||||||
– to lifetime ECL credit-impaired |
– |
(7 |
) |
7 |
– |
– | (6 | ) | 6 | – | ||||||||||||||||||||||
Total provision for (reversal of) credit losses (3)
|
11 |
32 |
96 |
139 |
1 | 12 | 61 | 74 | ||||||||||||||||||||||||
Write-offs |
– |
– |
(9 |
) |
(9 |
) |
– | – | (15 | ) | (15 | ) | ||||||||||||||||||||
Recoveries |
– |
– |
6 |
6 |
– | – | 7 | 7 | ||||||||||||||||||||||||
Interest income on impaired loans |
– |
– |
(27 |
) |
(27 |
) |
– | – | (21 | ) | (21 | ) | ||||||||||||||||||||
Foreign exchange and other |
(1 |
) |
– |
(2 |
) |
(3 |
) |
– | (1 | ) | 2 | 1 | ||||||||||||||||||||
Balance at end of period |
$ |
99 |
$ |
158 |
$ |
298 |
$ |
555 |
$ | 91 | $ | 153 | $ | 258 | $ | 502 | ||||||||||||||||
Personal |
||||||||||||||||||||||||||||||||
Balance at beginning of period |
$ |
247 |
$ |
546 |
$ |
190 |
$ |
983 |
$ | 174 | $ | 709 | $ | 181 | $ | 1,064 | ||||||||||||||||
Provision for (reversal of) credit losses |
||||||||||||||||||||||||||||||||
Originations net of repayments and other derecognitions (1)
|
30 |
(30 |
) |
(21 |
) |
(21 |
) |
23 | (43 | ) | (30 | ) | (50 | ) | ||||||||||||||||||
Changes in model |
(15 |
) |
97 |
– |
82 |
– | – | – | – | |||||||||||||||||||||||
Net remeasurement (2)
|
(429 |
) |
558 |
367 |
496 |
(398 | ) | 487 | 339 | 428 | ||||||||||||||||||||||
Transfers (2)
|
||||||||||||||||||||||||||||||||
– to 12-month ECL |
473 |
(467 |
) |
(6 |
) |
– |
427 | (426 | ) | (1 | ) | – | ||||||||||||||||||||
– to lifetime ECL performing |
(54 |
) |
72 |
(18 |
) |
– |
(52 | ) | 56 | (4 | ) | – | ||||||||||||||||||||
– to lifetime ECL credit-impaired |
(3 |
) |
(53 |
) |
56 |
– |
– | (72 | ) | 72 | – | |||||||||||||||||||||
Total provision for (reversal of) credit losses (3)
|
2 |
177 |
378 |
557 |
– | 2 | 376 | 378 | ||||||||||||||||||||||||
Write-offs |
– |
– |
(433 |
) |
(433 |
) |
– | – | (404 | ) | (404 | ) | ||||||||||||||||||||
Recoveries |
– |
– |
60 |
60 |
– | – | 47 | 47 | ||||||||||||||||||||||||
Interest income on impaired loans |
– |
– |
(6 |
) |
(6 |
) |
– | – | (5 | ) | (5 | ) | ||||||||||||||||||||
Foreign exchange and other |
4 |
(3 |
) |
(5 |
) |
(4 |
) |
5 | 1 | (2 | ) | 4 | ||||||||||||||||||||
Balance at end of period |
$ |
253 |
$ |
720 |
$ |
184 |
$ |
1,157 |
$ | 179 | $ | 712 | $ | 193 | $ | 1,084 | ||||||||||||||||
Credit card |
||||||||||||||||||||||||||||||||
Balance at beginning of period |
$ |
295 |
$ |
660 |
$ |
– |
$ |
955 |
$ | 181 | $ | 591 | $ | – | $ | 772 | ||||||||||||||||
Provision for (reversal of) credit losses |
||||||||||||||||||||||||||||||||
Originations net of repayments and other derecognitions (1)
|
28 |
(24 |
) |
– |
4 |
17 | (26 | ) | – | (9 | ) | |||||||||||||||||||||
Changes in model |
(26 |
) |
32 |
– |
6 |
– | – | – | – | |||||||||||||||||||||||
Net remeasurement (2)
|
(583 |
) |
828 |
297 |
542 |
(260 | ) | 498 | 284 | 522 | ||||||||||||||||||||||
Transfers (2)
|
||||||||||||||||||||||||||||||||
– to 12-month ECL |
683 |
(683 |
) |
– |
– |
308 | (308 | ) | – | – | ||||||||||||||||||||||
– to lifetime ECL performing |
(58 |
) |
58 |
– |
– |
(53 | ) | 53 | – | – | ||||||||||||||||||||||
– to lifetime ECL credit-impaired |
(2 |
) |
(245 |
) |
247 |
– |
– | (160 | ) | 160 | – | |||||||||||||||||||||
Total provision for (reversal of) credit losses (3)
|
42 |
(34 |
) |
544 |
552 |
12 | 57 | 444 | 513 | |||||||||||||||||||||||
Write-offs |
– |
– |
(657 |
) |
(657 |
) |
– | – | (535 | ) | (535 | ) | ||||||||||||||||||||
Recoveries |
– |
– |
113 |
113 |
– | – | 91 | 91 | ||||||||||||||||||||||||
Interest income on impaired loans |
– |
– |
– |
– |
– | – | – | – | ||||||||||||||||||||||||
Foreign exchange and other |
– |
– |
– |
– |
– | – | – | – | ||||||||||||||||||||||||
Balance at end of period |
$ |
337 |
$ |
626 |
$ |
– |
$ |
963 |
$ | 193 | $ | 648 | $ | – | $ | 841 | ||||||||||||||||
Business and government |
||||||||||||||||||||||||||||||||
Balance at beginning of period |
$ |
265 |
$ |
1,061 |
$ |
401 |
$ |
1,727 |
$ | 294 | $ | 864 | $ | 667 | $ | 1,825 | ||||||||||||||||
Provision for (reversal of) credit losses |
||||||||||||||||||||||||||||||||
Originations net of repayments and other derecognitions (1)
|
35 |
(57 |
) |
(47 |
) |
(69 |
) |
14 | (54 | ) | (30 | ) | (70 | ) | ||||||||||||||||||
Changes in model |
85 |
(82 |
) |
– |
3 |
12 | 29 | – | 41 | |||||||||||||||||||||||
Net remeasurement (2)
|
(44 |
) |
302 |
297 |
555 |
(107 | ) | 404 | 349 | 646 | ||||||||||||||||||||||
Transfers (2)
|
||||||||||||||||||||||||||||||||
– to 12-month ECL |
116 |
(112 |
) |
(4 |
) |
– |
139 | (129 | ) | (10 | ) | – | ||||||||||||||||||||
– to lifetime ECL performing |
(31 |
) |
36 |
(5 |
) |
– |
(31 | ) | 36 | (5 | ) | – | ||||||||||||||||||||
– to lifetime ECL credit-impaired |
– |
(131 |
) |
131 |
– |
– | (158 | ) | 158 | – | ||||||||||||||||||||||
Total provision for (reversal of) credit losses (3)
|
161 |
(44 |
) |
372 |
489 |
27 | 128 | 462 | 617 | |||||||||||||||||||||||
Write-offs |
– |
– |
(256 |
) |
(256 |
) |
– | – | (749 | ) | (749 | ) | ||||||||||||||||||||
Recoveries |
– |
– |
30 |
30 |
– | – | 67 | 67 | ||||||||||||||||||||||||
Interest income on impaired loans |
– |
– |
(69 |
) |
(69 |
) |
– | – | (64 | ) | (64 | ) | ||||||||||||||||||||
Foreign exchange and other |
(4 |
) |
(4 |
) |
– |
(8 |
) |
(10 | ) | (1 | ) | 6 | (5 | ) | ||||||||||||||||||
Balance at end of period |
$ |
422 |
$ |
1,013 |
$ |
478 |
$ |
1,913 |
$ | 311 | $ | 991 | $ | 389 | $ | 1,691 | ||||||||||||||||
Total ECL allowance (4)
|
$ |
1,111 |
$ |
2,517 |
$ |
960 |
$ |
4,588 |
$ | 774 | $ | 2,504 | $ | 840 | $ | 4,118 | ||||||||||||||||
Comprises: |
||||||||||||||||||||||||||||||||
Loans |
$ |
992 |
$ |
2,341 |
$ |
952 |
$ |
4,285 |
$ | 684 | $ | 2,407 | $ | 829 | $ | 3,920 | ||||||||||||||||
Undrawn credit facilities and other off-balance sheet exposures (5)
|
119 |
176 |
8 |
303 |
90 | 97 | 11 | 198 | ||||||||||||||||||||||||
66 |
CIBC THIRD QUARTER 2025 |
| Base case | Upside case | Downside case | ||||||||||||||||||||||
| As at July 31, 2025 | |
Average value over the next 12 months |
|
|
Average value over the remaining forecast period |
(1) |
|
Average value over the next 12 months |
|
|
Average value over the remaining forecast period |
(1) |
|
Average value over the next 12 months |
|
|
Average value over the remaining forecast period |
(1) |
||||||
Real gross domestic product (GDP) year-over-year growth |
||||||||||||||||||||||||
Canada (2)
|
1.0 |
% |
1.9 |
% |
2.0 |
% |
2.5 |
% |
(1.2 |
)% |
1.1 |
% |
||||||||||||
United States |
1.9 |
% |
1.9 |
% |
3.2 |
% |
2.8 |
% |
(0.3 |
)% |
1.1 |
% |
||||||||||||
Unemployment rate |
||||||||||||||||||||||||
Canada (2)
|
6.8 |
% |
6.3 |
% |
6.1 |
% |
5.7 |
% |
7.9 |
% |
7.0 |
% |
||||||||||||
United States |
4.5 |
% |
4.1 |
% |
3.7 |
% |
3.4 |
% |
5.0 |
% |
4.6 |
% |
||||||||||||
Canadian Housing Price Index year-over-year growth (2)
|
0.4 |
% |
2.8 |
% |
4.7 |
% |
4.9 |
% |
(4.2 |
)% |
(0.4 |
)% |
||||||||||||
Canadian household debt service ratio |
14.5 |
% |
14.6 |
% |
14.1 |
% |
14.3 |
% |
15.7 |
% |
15.4 |
% |
||||||||||||
West Texas Intermediate Oil Price (US$) |
$ |
69 |
$ |
71 |
$ |
73 |
$ |
85 |
$ |
55 |
$ |
60 |
||||||||||||
| As at April 30, 2025 | ||||||||||||||||||||||||
Real GDP year-over-year growth |
||||||||||||||||||||||||
Canada (2)
|
0.8 | % | 2.0 | % | 2.0 | % | 2.7 | % | (0.3 | )% | 1.1 | % | ||||||||||||
United States |
1.7 | % | 2.0 | % | 3.2 | % | 2.9 | % | 0.6 | % | 0.9 | % | ||||||||||||
Unemployment rate |
||||||||||||||||||||||||
Canada (2)
|
6.9 | % | 6.2 | % | 6.2 | % | 5.5 | % | 8.0 | % | 7.0 | % | ||||||||||||
United States |
4.5 | % | 4.1 | % | 3.8 | % | 3.4 | % | 4.9 | % | 4.6 | % | ||||||||||||
Canadian Housing Price Index year-over-year growth (2)
|
1.5 | % | 3.0 | % | 4.7 | % | 5.7 | % | (2.7 | )% | 1.4 | % | ||||||||||||
Canadian household debt service ratio |
14.6 | % | 14.7 | % | 14.1 | % | 14.3 | % | 15.2 | % | 15.1 | % | ||||||||||||
West Texas Intermediate Oil Price (US$) |
$ | 73 | $ | 74 | $ | 82 | $ | 100 | $ | 60 | $ | 60 | ||||||||||||
| As at October 31, 2024 | ||||||||||||||||||||||||
Real GDP year-over-year growth |
||||||||||||||||||||||||
Canada (2)
|
1.6 | % | 2.3 | % | 2.5 | % | 2.7 | % | 0.4 | % | 1.4 | % | ||||||||||||
United States |
2.0 | % | 2.0 | % | 3.0 | % | 2.9 | % | 0.7 | % | 0.9 | % | ||||||||||||
Unemployment rate |
||||||||||||||||||||||||
Canada (2)
|
6.6 | % | 5.9 | % | 5.7 | % | 5.2 | % | 7.2 | % | 6.8 | % | ||||||||||||
United States |
4.5 | % | 4.0 | % | 3.7 | % | 3.3 | % | 5.1 | % | 4.7 | % | ||||||||||||
Canadian Housing Price Index year-over-year growth (2)
|
2.6 | % | 2.5 | % | 7.1 | % | 4.0 | % | (2.3 | )% | 0.9 | % | ||||||||||||
Canadian household debt service ratio |
14.8 | % | 14.8 | % | 14.4 | % | 14.7 | % | 15.3 | % | 15.2 | % | ||||||||||||
West Texas Intermediate Oil Price (US$) |
$ | 78 | $ | 74 | $ | 88 | $ | 100 | $ | 60 | $ | 61 | ||||||||||||
| (1) | The remaining forecast period is generally four years. |
| (2) | National-level forward-looking forecasts are presented in the table above, which represent the aggregation of the provincial-level forecasts used to estimate our ECL. Housing Price Index growth rates are also forecasted at the municipal level in some cases. As a result, the forecasts for individual provinces or municipalities reflected in our ECL will differ from the national forecasts presented above. |
CIBC THIRD QUARTER 2025 |
67 |
$ millions, as at |
2025 Jul. 31 |
2024 Oct. 31 |
||||||||||||||||||||||||||||||
Stage 1 |
Stage 2 |
Stage 3 |
(2)
|
Total |
Stage 1 | Stage 2 | Stage 3 | (2)
|
Total | |||||||||||||||||||||||
Residential mortgages |
||||||||||||||||||||||||||||||||
– Exceptionally low |
$ |
171,858 |
$ |
124 |
$ |
– |
$ |
171,982 |
$ | 160,515 | $ | 6,130 | $ | – | $ | 166,645 | ||||||||||||||||
– Very low |
85,698 |
1,005 |
– |
86,703 |
81,198 | 5,926 | – | 87,124 | ||||||||||||||||||||||||
– Low |
11,133 |
2,720 |
– |
13,853 |
10,329 | 3,638 | – | 13,967 | ||||||||||||||||||||||||
– Medium |
1,065 |
6,646 |
– |
7,711 |
851 | 6,534 | – | 7,385 | ||||||||||||||||||||||||
– High |
6 |
1,496 |
– |
1,502 |
7 | 1,561 | – | 1,568 | ||||||||||||||||||||||||
– Default |
– |
– |
1,034 |
1,034 |
– | – | 790 | 790 | ||||||||||||||||||||||||
– Not rated |
2,753 |
186 |
211 |
3,150 |
2,757 | 232 | 204 | 3,193 | ||||||||||||||||||||||||
Gross residential mortgages (3)(4)
|
272,513 |
12,177 |
1,245 |
285,935 |
255,657 | 24,021 | 994 | 280,672 | ||||||||||||||||||||||||
ECL allowance |
99 |
158 |
298 |
555 |
89 | 126 | 234 | 449 | ||||||||||||||||||||||||
Net residential mortgages |
272,414 |
12,019 |
947 |
285,380 |
255,568 | 23,895 | 760 | 280,223 | ||||||||||||||||||||||||
Personal |
||||||||||||||||||||||||||||||||
– Exceptionally low |
18,160 |
128 |
– |
18,288 |
16,689 | 83 | – | 16,772 | ||||||||||||||||||||||||
– Very low |
10,582 |
277 |
– |
10,859 |
9,685 | 12 | – | 9,697 | ||||||||||||||||||||||||
– Low |
6,561 |
2,107 |
– |
8,668 |
10,498 | 1,374 | – | 11,872 | ||||||||||||||||||||||||
– Medium |
4,280 |
2,495 |
– |
6,775 |
3,848 | 1,822 | – | 5,670 | ||||||||||||||||||||||||
– High |
747 |
886 |
– |
1,633 |
465 | 1,102 | – | 1,567 | ||||||||||||||||||||||||
– Default |
– |
– |
249 |
249 |
– | – | 260 | 260 | ||||||||||||||||||||||||
– Not rated |
722 |
30 |
35 |
787 |
782 | 29 | 32 | 843 | ||||||||||||||||||||||||
Gross personal (4)
|
41,052 |
5,923 |
284 |
47,259 |
41,967 | 4,422 | 292 | 46,681 | ||||||||||||||||||||||||
ECL allowance |
230 |
664 |
184 |
1,078 |
221 | 531 | 190 | 942 | ||||||||||||||||||||||||
Net personal |
40,822 |
5,259 |
100 |
46,181 |
41,746 | 3,891 | 102 | 45,739 | ||||||||||||||||||||||||
Credit card |
||||||||||||||||||||||||||||||||
– Exceptionally low |
7,189 |
– |
– |
7,189 |
7,185 | – | – | 7,185 | ||||||||||||||||||||||||
– Very low |
457 |
– |
– |
457 |
502 | – | – | 502 | ||||||||||||||||||||||||
– Low |
6,781 |
390 |
– |
7,171 |
6,800 | 4 | – | 6,804 | ||||||||||||||||||||||||
– Medium |
4,718 |
1,067 |
– |
5,785 |
3,853 | 1,512 | – | 5,365 | ||||||||||||||||||||||||
– High |
4 |
537 |
– |
541 |
2 | 522 | – | 524 | ||||||||||||||||||||||||
– Default |
– |
– |
– |
– |
– | – | – | – | ||||||||||||||||||||||||
– Not rated |
172 |
6 |
– |
178 |
165 | 6 | – | 171 | ||||||||||||||||||||||||
Gross credit card |
19,321 |
2,000 |
– |
21,321 |
18,507 | 2,044 | – | 20,551 | ||||||||||||||||||||||||
ECL allowance |
307 |
555 |
– |
862 |
279 | 623 | – | 902 | ||||||||||||||||||||||||
Net credit card |
19,014 |
1,445 |
– |
20,459 |
18,228 | 1,421 | – | 19,649 | ||||||||||||||||||||||||
Business and government |
||||||||||||||||||||||||||||||||
– Investment grade |
114,274 |
747 |
– |
115,021 |
101,809 | 722 | – | 102,531 | ||||||||||||||||||||||||
– Non-investment grade |
100,848 |
9,924 |
– |
110,772 |
97,131 | 9,000 | – | 106,131 | ||||||||||||||||||||||||
– Watchlist |
49 |
3,577 |
– |
3,626 |
25 | 3,745 | – | 3,770 | ||||||||||||||||||||||||
– Default |
– |
– |
1,752 |
1,752 |
– | – | 1,628 | 1,628 | ||||||||||||||||||||||||
– Not rated |
231 |
12 |
– |
243 |
230 | 15 | – | 245 | ||||||||||||||||||||||||
Gross business and government (3)(5)
|
215,402 |
14,260 |
1,752 |
231,414 |
199,195 | 13,482 | 1,628 | 214,305 | ||||||||||||||||||||||||
ECL allowance |
356 |
964 |
470 |
1,790 |
211 | 1,021 | 392 | 1,624 | ||||||||||||||||||||||||
Net business and government |
215,046 |
13,296 |
1,282 |
229,624 |
198,984 | 12,461 | 1,236 | 212,681 | ||||||||||||||||||||||||
Total net amount of loans |
$ |
547,296 |
$ |
32,019 |
$ |
2,329 |
$ |
581,644 |
$ | 514,526 | $ | 41,668 | $ | 2,098 | $ | 558,292 | ||||||||||||||||
| (1) | The table excludes debt securities measured at FVOCI, for which ECL allowances of $23 million (October 31, 2024: $19 million) were recognized in AOCI. In addition, the table excludes debt securities classified at amortized cost, for which ECL allowances of $40 million were recognized as at July 31, 2025 (October 31, 2024: $17 million). Other financial assets classified at amortized cost were also excluded from the table above as their ECL allowances were immaterial as at July 31, 2025 and October 31, 2024. Financial assets other than loans that are classified at amortized cost are presented on our interim consolidated balance sheet net of ECL allowances. |
| (2) | Excludes foreclosed assets of $6 million (October 31, 2024: $8 million) which were included in Other assets on our interim consolidated balance sheet. |
| (3) | Includes $5 million (October 31, 2024: $3 million) of residential mortgages and $459 million (October 31, 2024: $221 million) of business and government loans that are measured and designated at FVTPL. |
| (4) | The internal risk rating grades presented for residential mortgages and certain personal loans do not take into account loan guarantees or insurance issued by the Canadian government (federal or provincial), Canadian government agencies, or private insurers, as the determination of whether a significant increase in credit risk has occurred for these loans is based on relative changes in the loans’ lifetime PD without considering collateral or other credit enhancements. |
| (5) | Includes customers’ liability under acceptances of $8 million (October 31, 2024: $6 million). |
68 |
CIBC THIRD QUARTER 2025 |
$ millions, as at |
2025 Jul. 31 |
2024 Oct. 31 |
||||||||||||||||||||||||||||||
Stage 1 |
Stage 2 |
Stage 3 |
Total |
Stage 1 | Stage 2 | Stage 3 | Total | |||||||||||||||||||||||||
Retail |
||||||||||||||||||||||||||||||||
– Exceptionally low |
$ |
173,343 |
$ |
182 |
$ |
– |
$ |
173,525 |
$ | 164,577 | $ | 117 | $ | – | $ | 164,694 | ||||||||||||||||
– Very low |
14,431 |
480 |
– |
14,911 |
15,112 | 4 | – | 15,116 | ||||||||||||||||||||||||
– Low |
14,949 |
1,768 |
– |
16,717 |
14,988 | 984 | – | 15,972 | ||||||||||||||||||||||||
– Medium |
2,418 |
1,422 |
– |
3,840 |
2,263 | 1,280 | – | 3,543 | ||||||||||||||||||||||||
– High |
507 |
423 |
– |
930 |
325 | 539 | – | 864 | ||||||||||||||||||||||||
– Default |
– |
– |
46 |
46 |
– | – | 43 | 43 | ||||||||||||||||||||||||
– Not rated |
602 |
8 |
– |
610 |
565 | 9 | – | 574 | ||||||||||||||||||||||||
Gross retail |
206,250 |
4,283 |
46 |
210,579 |
197,830 | 2,933 | 43 | 200,806 | ||||||||||||||||||||||||
ECL allowance |
53 |
127 |
– |
180 |
42 | 52 | – | 94 | ||||||||||||||||||||||||
Net retail |
206,197 |
4,156 |
46 |
210,399 |
197,788 | 2,881 | 43 | 200,712 | ||||||||||||||||||||||||
Business and government |
||||||||||||||||||||||||||||||||
– Investment grade |
174,625 |
655 |
– |
175,280 |
156,560 | 571 | – | 157,131 | ||||||||||||||||||||||||
– Non-investment grade |
75,201 |
2,987 |
– |
78,188 |
66,788 | 3,018 | – | 69,806 | ||||||||||||||||||||||||
– Watch list |
57 |
845 |
– |
902 |
28 | 878 | – | 906 | ||||||||||||||||||||||||
– Default |
– |
– |
224 |
224 |
– | – | 123 | 123 | ||||||||||||||||||||||||
– Not rated |
1,012 |
56 |
– |
1,068 |
1,117 | 91 | – | 1,208 | ||||||||||||||||||||||||
Gross business and government |
250,895 |
4,543 |
224 |
255,662 |
224,493 | 4,558 | 123 | 229,174 | ||||||||||||||||||||||||
ECL allowance |
66 |
49 |
8 |
123 |
54 | 40 | 9 | 103 | ||||||||||||||||||||||||
Net business and government |
250,829 |
4,494 |
216 |
255,539 |
224,439 | 4,518 | 114 | 229,071 | ||||||||||||||||||||||||
Total net undrawn credit facilities and other off-balance sheet exposures |
$ |
457,026 |
$ |
8,650 |
$ |
262 |
$ |
465,938 |
$ | 422,227 | $ | 7,399 | $ | 157 | $ | 429,783 | ||||||||||||||||
$ millions, as at |
2025 Jul. 31 |
2024 Oct. 31 |
||||||||||||||||||
Payable on demand |
(3)
|
|
Payable after notice |
(4)
|
Payable on a fixed date |
(5)(6)
|
Total |
Total | ||||||||||||
Personal |
$ |
14,933 |
$ |
142,631 |
$ |
98,571 |
$ |
256,135 |
$ | 252,894 | ||||||||||
Business and government (7)
|
105,432 |
118,524 |
224,905 |
448,861 |
435,499 | |||||||||||||||
Bank |
17,357 |
338 |
9,366 |
27,061 |
20,009 | |||||||||||||||
Secured borrowings (8)
|
– |
– |
60,615 |
60,615 |
56,455 | |||||||||||||||
$ |
137,722 |
$ |
261,493 |
$ |
393,457 |
$ |
792,672 |
$ | 764,857 | |||||||||||
Comprises: |
||||||||||||||||||||
Held at amortized cost |
$ |
750,675 |
$ | 725,849 | ||||||||||||||||
Designated at fair value |
41,997 |
39,008 | ||||||||||||||||||
$ |
792,672 |
$ | 764,857 | |||||||||||||||||
Total deposits include (9) : |
||||||||||||||||||||
Non-interest-bearing deposits |
||||||||||||||||||||
Canada |
$ |
88,037 |
$ | 84,460 | ||||||||||||||||
U.S. |
12,670 |
12,927 | ||||||||||||||||||
Other international |
5,954 |
5,691 | ||||||||||||||||||
Interest-bearing deposits |
||||||||||||||||||||
Canada |
536,382 |
526,186 | ||||||||||||||||||
U.S. |
109,383 |
101,141 | ||||||||||||||||||
Other international |
40,246 |
34,452 | ||||||||||||||||||
$ |
792,672 |
$ | 764,857 | |||||||||||||||||
| (1) | Includes deposits of $300.4 billion (October 31, 2024: $288.4 billion) denominated in U.S. dollars and deposits of $63.8 billion (October 31, 2024: $52.9 billion) denominated in other foreign currencies. |
| (2) | Net of purchased notes of $0.2 billion (October 31, 2024: $0.6 billion). |
| (3) | Includes all deposits for which we do not have the right to require notice of withdrawal. These deposits are generally chequing accounts. |
| (4) | Includes all deposits for which we can legally require notice of withdrawal. These deposits are generally savings accounts. |
| (5) | Includes all deposits that mature on a specified date. These deposits are generally term deposits, guaranteed investment certificates, and similar instruments. |
| (6) | Includes $65.7 billion (October 31, 2024: $61.1 billion) of deposits which are subject to the bank recapitalization (bail-in) conversion regulations issued by the Department of Finance Canada. These regulations provide certain statutory powers to the Canada Deposit Insurance Corporation (CDIC), including the ability to convert specified eligible shares and liabilities of CIBC into common shares in the event that CIBC is determined to be non-viable. |
| (7) | Includes $17.2 billion (October 31, 2024: $15.5 billion) of structured note liabilities that were sold upon issuance to third-party financial intermediaries, who may resell the notes to retail investors in foreign jurisdictions. |
| (8) | Comprises liabilities issued by, or as a result of, activities associated with the securitization of residential mortgages, Covered Bond Programme, and consolidated securitization vehicles. |
| (9) | Classification is based on geographical location of the CIBC office. |
CIBC THIRD QUARTER 2025 |
69 |
| For the three months ended |
For the nine months ended |
|||||||||||||||||||||||||||||||||||
$ millions, except number of shares |
2025 Jul. 31 |
2024 Jul. 31 |
2025 Jul. 31 |
2024 Jul. 31 |
||||||||||||||||||||||||||||||||
Number of shares |
Amount |
Number of shares |
Amount | Number of shares |
Amount |
Number of shares |
Amount | |||||||||||||||||||||||||||||
Balance at beginning of period |
934,230,189 |
$ |
16,929 |
943,002,419 | $ |
16,813 |
|
942,294,598 |
$ |
17,011 |
931,098,941 | $ | 16,082 | |||||||||||||||||||||||
Issuance pursuant to: |
||||||||||||||||||||||||||||||||||||
Equity-settled share-based compensation plans |
786,626 |
46 |
204,180 | 12 | 2,191,152 |
132 |
897,057 | 49 | ||||||||||||||||||||||||||||
Shareholder investment plan (1)
|
– |
– |
651,277 | 45 | 629 |
– |
10,462,890 | 652 | ||||||||||||||||||||||||||||
Employee share purchase plan (2)
|
– |
– |
688,578 | 46 | – |
– |
2,146,385 | 136 | ||||||||||||||||||||||||||||
935,016,815 |
$ |
16,975 |
944,546,454 | $ | 16,916 | 944,486,379 |
$ |
17,143 |
944,605,273 | $ | 16,919 | |||||||||||||||||||||||||
Purchase of common shares for cancellation |
(5,500,000 |
) |
(100 |
) |
– | – | (15,000,000 |
) |
(272 |
) |
– | – | ||||||||||||||||||||||||
Treasury shares |
(66,124 |
) |
(8 |
) |
43,463 | 3 | (35,688 |
) |
(4 |
) |
(15,356 | ) | – | |||||||||||||||||||||||
Balance at end of period |
929,450,691 |
$ |
16,867 |
944,589,917 | $ | 16,919 | 929,450,691 |
$ |
16,867 |
944,589,917 | $ |
16,919 | ||||||||||||||||||||||||
| (1) | Commencing with dividends paid on January 28, 2025 and for future dividends declared until further notice, common shares received by participants under the shareholder investment plan were purchased from the open market, a change from issuance from Treasury. For the share purchase option, this change became effective February 1, 2025. |
(2) |
Commencing October 11, 2024, employee contributions to our Canadian employee share purchase plan were used to acquire common shares in the open market. Previously, these shares were issued from Treasury. |
70 |
CIBC THIRD QUARTER 2025 |
| $ millions, as at | 2025 Jul. 31 |
2024 Oct. 31 |
||||||||
Common Equity Tier 1 (CET1) capital |
$ |
46,616 |
$ | 44,516 | ||||||
Tier 1 capital |
A | 53,303 |
49,481 | |||||||
Total capital |
61,338 |
56,809 | ||||||||
Total risk-weighted assets (RWA) |
B | 347,712 |
333,502 | |||||||
CET1 ratio |
13.4 |
% |
13.3 | % | ||||||
Tier 1 capital ratio |
15.3 |
% |
14.8 | % | ||||||
Total capital ratio |
17.6 |
% |
17.0 | % | ||||||
Leverage ratio exposure |
C | $ |
1,244,201 |
$ |
|
|||||
Leverage ratio |
A/C | 4.3 |
% |
4.3 | % | |||||
TLAC available |
D | $ |
114,311 |
$ | 101,062 | |||||
TLAC ratio |
D/B | 32.9 |
% |
30.3 | % | |||||
TLAC leverage ratio |
D/C | 9.2 |
% |
8.7 | % | |||||
CIBC THIRD QUARTER 2025 |
71 |
For the three months ended |
For the nine months ended |
|||||||||||||||||||||||||||||||||||||||||||
| $ millions | 2025 Jul. 31 |
2025 Apr. 30 |
2024 Jul. 31 |
2025 Jul. 31 |
2025 Apr. 30 |
2024 Jul. 31 |
2025 Jul. 31 |
2024 Jul. 31 |
2025 Jul. 31 |
2024 Jul. 31 |
||||||||||||||||||||||||||||||||||
| Pension plans | Other post-employment plans |
Pension plans |
Other post-employment plans
|
|||||||||||||||||||||||||||||||||||||||||
Current service cost |
$ |
56 |
$ | 57 | $ | 47 | $ |
2 |
$ | 1 | $ | 1 | $ |
170 |
$ | 142 | $ |
4 |
$ | 3 | ||||||||||||||||||||||||
Net interest (income) expense |
(17 |
) |
(20 | ) | (16 | ) | 5 |
5 | 6 | (57 |
) |
(47 | ) | 15 |
18 | |||||||||||||||||||||||||||||
Interest expense on effect of asset ceiling |
– |
1 | 1 | – |
– | – | 2 |
1 | – |
– | ||||||||||||||||||||||||||||||||||
Plan administration costs |
1 |
2 | 2 | – |
– | – | 5 |
6 | – |
– | ||||||||||||||||||||||||||||||||||
Net defined benefit plan expense recognized in net income |
$ |
40 |
$ | 40 | $ | 34 | $ |
7 |
$ | 6 | $ | 7 | $ |
120 |
$ | 102 | $ |
19 |
$ | 21 | ||||||||||||||||||||||||
| For the three months ended |
For the nine months ended |
|||||||||||||||||||||
| $ millions | 2025 Jul. 31 |
2025 Apr. 30 |
2024 Jul. 31 |
2025 Jul. 31 |
2024 Jul. 31 |
|||||||||||||||||
Defined contribution pension plans |
$ |
20 |
$ | 23 | $ | 17 | $ |
63 |
$ | 55 | ||||||||||||
Government pension plans (1)
|
57 |
58 | 52 | 171 |
147 | |||||||||||||||||
Total defined contribution plan expense |
$ |
77 |
$ | 81 | $ | 69 | $ |
234 |
$ | 202 | ||||||||||||
| (1) | Includes Canada Pension Plan, Quebec Pension Plan, and U.S. Federal Insurance Contributions Act. |
| For the three months ended |
For the nine months ended |
|||||||||||||||||||||||||||||||||||||||||||
| $ millions | 2025 Jul. 31 |
2025 Apr. 30 |
2024 Jul. 31 |
2025 Jul. 31 |
2025 Apr. 30 |
2024 Jul. 31 |
2025 Jul. 31 |
2024 Jul. 31 (2)
|
2025 Jul. 31 |
2024 Jul. 31 |
||||||||||||||||||||||||||||||||||
| Pension plans | Other post-employment plans |
Pension plans | Other post-employment plans
|
|||||||||||||||||||||||||||||||||||||||||
Net actuarial gains (losses) on defined benefit obligations |
$ |
68 |
$ | 260 | $ | (294 | ) | $ |
4 |
$ | 8 | $ |
(15 | ) | $ |
162 |
$ | (726 | ) | $ |
5 |
$ | (38 | ) | ||||||||||||||||||||
Net actuarial gains (losses) on plan assets |
3 |
(334 | ) | 549 | – |
– | – | (132 |
) |
913 | – |
– | ||||||||||||||||||||||||||||||||
Changes in asset ceiling excluding interest income |
– |
– | (2 | ) | – |
– | – | 1 |
(2 | ) | – |
– | ||||||||||||||||||||||||||||||||
Net remeasurement gains (losses) recognized in OCI |
$ |
71 |
$ | (74 | ) | $ | 253 | $ |
4 |
$ | 8 | $ | (15 | ) | $ |
31 |
$ |
185 | $ |
5 |
$ | (38 | ) | |||||||||||||||||||||
| (1) | The Canadian post-employment defined benefit plans are remeasured on a quarterly basis for changes in the discount rate and for actual asset returns. All other Canadian plans’ actuarial assumptions and foreign plans’ actuarial assumptions are updated at least annually. |
| (2) | Includes the transfer of the accumulated actuarial losses of $5 million to retained earnings upon the settlement of a pension plan for one of our subsidiaries. |
72 |
CIBC THIRD QUARTER 2025 |
| For the three months ended |
For the nine months ended |
|||||||||||||||||||||||
| $ millions, except number of shares and per share amounts | 2025 Jul. 31 |
2025 Apr. 30 |
2024 Jul. 31 |
2025 Jul. 31 |
2024 Jul. 31 |
|||||||||||||||||||
| Basic earnings per share |
||||||||||||||||||||||||
| Net income attributable to equity shareholders |
$ |
2,094 |
$ | 1,998 | $ | 1,786 | $ |
6,255 |
$ | 5,241 | ||||||||||||||
| Less: Preferred share dividends and distributions on other equity instruments |
82 |
78 | 63 | 248 |
191 | |||||||||||||||||||
| Net income attributable to common shareholders |
$ |
2,012 |
$ | 1,920 | $ | 1,723 | $ |
6,007 |
$ | 5,050 | ||||||||||||||
| Weighted-average common shares outstanding (thousands) |
932,258 |
938,495 | 943,467 | 937,588 |
937,696 | |||||||||||||||||||
| Basic earnings per share |
$ |
2.16 |
$ | 2.05 | $ | 1.83 | $ |
6.41 |
$ | 5.39 | ||||||||||||||
| Diluted earnings per share |
||||||||||||||||||||||||
| Net income attributable to common shareholders |
$ |
2,012 |
$ | 1,920 | $ | 1,723 | $ |
6,007 |
$ | 5,050 | ||||||||||||||
| Weighted-average common shares outstanding (thousands) |
932,258 |
938,495 | 943,467 | 937,588 |
937,696 | |||||||||||||||||||
| Add: Stock options potentially exercisable (1) (thousands) |
5,260 |
4,253 | 2,317 | 4,991 |
1,596 | |||||||||||||||||||
| Weighted-average diluted common shares outstanding (thousands) |
937,518 |
942,748 | 945,784 | 942,579 |
939,292 | |||||||||||||||||||
| Diluted earnings per share |
$ |
2.15 |
$ | 2.04 | $ | 1.82 | $ |
6.37 |
$ | 5.38 | ||||||||||||||
| (1) | Excludes average options outstanding of nil (April 30, 2025 : 2,422,512; July 31, 2024: 2,553,244) with a weighted-average exercise price of nil (April 30, 2025: $94.35; July 31, 2024: $70.05) for the quarter ended July 31, 2025, and average options outstanding of 2,150,302 (July 31, 2024: 2,553,244) with a weighted-average price of $94.35 (July 31, 2024: $70.05) for the nine months ended July 31, 2025, as the options’ exercise prices were greater than the average market price of CIBC’s common shares. |
• |
Quantum Biopharma v. CIBC World Markets Inc., et al.: |
• |
Salko v. CIBC Investor Services Inc., CIBC World Markets Inc., et al.: |
• |
Pope v. CIBC, CIBC Trust Corporation, and CIBC Asset Management Inc.: |
• |
Order Execution Only Class Actions Pozgaj and Woodard
Pozgaj Woodard Pozgaj |
CIBC THIRD QUARTER 2025 |
73 |
| • | The Registered Retirement Savings Plan (RRSP) of J.T.G v. His Majesty The King : In July 2025, the Federal Court of Appeal dismissed the RRSP’s appeal of assessments issued under Part I, allowed the RRSP’s appeal of the assessments under Part XI.1 and vacated the related assessments, and reinstated the assessments of Part I tax for the 2005 taxation year that were vacated by the Tax Court of Canada. The parties to the appeal have until September 29, 2025 to seek leave from the Supreme Court of Canada to appeal the decision. |
• |
Reale v. CIBC: |
For the three months ended |
For the nine months ended |
|||||||||||||||||||||||||||||||||||||||||||
$ millions |
2025 Jul. 31 |
2025 Apr. 30 |
2024 Jul. 31 |
2025 Jul. 31 |
2024 Jul. 31 |
|||||||||||||||||||||||||||||||||||||||
Interest income |
Interest expense |
Interest income |
Interest expense |
Interest income |
Interest expense |
Interest income |
Interest expense |
Interest income |
Interest expense |
|||||||||||||||||||||||||||||||||||
| Measured at amortized cost (1)(2)
|
$ |
10,193 |
$ |
7,399 |
$ |
9,977 |
$ |
7,403 |
$ |
11,435 |
$ |
9,351 |
$ |
30,849 |
$ |
23,072 |
$ |
33,523 |
$ |
27,263 |
||||||||||||||||||||||||
| Debt securities measured at FVOCI (1)
|
806 |
n/a |
756 |
n/a |
976 |
n/a |
2,424 |
n/a |
2,748 |
n/a |
||||||||||||||||||||||||||||||||||
| Other (3)
|
1,090 |
642 |
1,126 |
668 |
1,036 |
564 |
3,394 |
1,958 |
2,683 |
1,629 |
||||||||||||||||||||||||||||||||||
| Total |
$ |
12,089 |
$ |
8,041 |
$ |
11,859 |
$ |
8,071 |
$ |
13,447 |
$ |
9,915 |
$ |
36,667 |
$ |
25,030 |
$ |
38,954 |
$ |
28,892 |
||||||||||||||||||||||||
(1) |
Interest income for financial instruments that are measured at amortized cost and debt securities that are measured at FVOCI is calculated using the effective interest rate method. |
(2) |
Includes interest income on sublease-related assets and interest expense on lease liabilities under IFRS 16. |
(3) |
Includes interest income and expense and dividend income for financial instruments that are mandatorily measured and designated at FVTPL and equity securities designated at FVOCI. |
n/a |
Not applicable. |
74 |
CIBC THIRD QUARTER 2025 |
| $ millions, for the three months ended | Canadian Personal and Business Banking |
Canadian Commercial Banking and Wealth Management |
U.S. Commercial Banking and Wealth Management |
Capital Markets |
Corporate and Other |
CIBC Total |
||||||||||||||||||||
2025 |
Net interest income |
$ |
2,459 |
$ |
751 |
$ |
548 |
$ |
176 |
$ |
114 |
$ |
4,048 |
|||||||||||||
Jul. 31 |
Non-interest income (1)
|
602 |
972 |
242 |
1,330 |
60 |
3,206 |
|||||||||||||||||||
Total revenue |
3,061 |
1,723 |
790 |
1,506 |
174 |
7,254 |
||||||||||||||||||||
Provision for credit losses |
444 |
21 |
17 |
76 |
1 |
559 |
||||||||||||||||||||
Amortization and impairment (2)
|
58 |
1 |
23 |
– |
205 |
287 |
||||||||||||||||||||
Other non-interest expenses |
1,459 |
878 |
427 |
721 |
204 |
3,689 |
||||||||||||||||||||
Income (loss) before income taxes |
1,100 |
823 |
323 |
709 |
(236 |
) |
2,719 |
|||||||||||||||||||
Income taxes |
288 |
225 |
69 |
169 |
(128 |
) |
623 |
|||||||||||||||||||
Net income (loss) |
$ |
812 |
$ |
598 |
$ |
254 |
$ |
540 |
$ |
(108 |
) |
$ |
2,096 |
|||||||||||||
Net income (loss) attributable to: |
||||||||||||||||||||||||||
Non-controlling interests |
$ |
– |
$ |
– |
$ |
– |
$ |
– |
$ |
2 |
$ |
2 |
||||||||||||||
Equity shareholders |
812 |
598 |
254 |
540 |
(110 |
) |
2,094 |
|||||||||||||||||||
Average assets (3)(4)
|
$ |
340,683 |
$ |
105,275 |
$ |
63,669 |
$ |
381,214 |
$ |
212,606 |
$ |
1,103,447 |
||||||||||||||
2025 |
Net interest income |
$ | 2,272 | $ | 707 | $ | 536 | $ | 171 | $ | 102 | $ | 3,788 | |||||||||||||
Apr. 30 |
Non-interest income (1)
|
587 | 933 | 233 | 1,374 | 107 | 3,234 | |||||||||||||||||||
Total revenue |
2,859 | 1,640 | 769 | 1,545 | 209 | 7,022 | ||||||||||||||||||||
Provision for credit losses |
389 | 54 | 123 | 34 | 5 | 605 | ||||||||||||||||||||
Amortization and impairment (2)
|
57 | – | 25 | – | 199 | 281 | ||||||||||||||||||||
Other non-interest expenses |
1,421 | 833 | 416 | 719 | 149 | 3,538 | ||||||||||||||||||||
Income (loss) before income taxes |
992 | 753 | 205 | 792 | (144 | ) | 2,598 | |||||||||||||||||||
Income taxes |
258 | 204 | 32 | 226 | (129 | ) | 591 | |||||||||||||||||||
Net income (loss) |
$ | 734 | $ | 549 | $ | 173 | $ | 566 | $ | (15 | ) | $ | 2,007 | |||||||||||||
Net income (loss) attributable to: |
||||||||||||||||||||||||||
Non-controlling interests |
$ | – | $ | – | $ | – | $ | – | $ | 9 | $ | 9 | ||||||||||||||
Equity shareholders |
734 | 549 | 173 | 566 | (24 | ) | 1,998 | |||||||||||||||||||
Average assets (3)(4)
|
$ | 337,350 | $ | 102,709 | $ | 65,820 | $ | 370,517 | $ | 219,610 | $ | 1,096,006 | ||||||||||||||
2024 |
Net interest income (6)
|
$ | 2,183 | $ | 585 | $ | 477 | $ | (85 | ) | $ | 372 | $ | 3,532 | ||||||||||||
Jul. 31 (5)
|
Non-interest income (1)
|
592 | 938 | 254 | 1,177 | 111 | 3,072 | |||||||||||||||||||
Total revenue (6)
|
2,775 | 1,523 | 731 | 1,092 | 483 | 6,604 | ||||||||||||||||||||
Provision for credit losses |
342 | 42 | 47 | 41 | 11 | 483 | ||||||||||||||||||||
Amortization and impairment (2)
|
58 | 1 | 25 | 2 | 231 | 317 | ||||||||||||||||||||
Other non-interest expenses |
1,414 | 792 | 395 | 649 | 115 | 3,365 | ||||||||||||||||||||
Income before income taxes |
961 | 688 | 264 | 400 | 126 | 2,439 | ||||||||||||||||||||
Income taxes (6)
|
268 | 187 | 48 | 111 | 30 | 644 | ||||||||||||||||||||
Net income |
$ | 693 | $ | 501 | $ | 216 | $ | 289 | $ | 96 | $ | 1,795 | ||||||||||||||
Net income attributable to: |
||||||||||||||||||||||||||
Non-controlling interests |
$ | – | $ | – | $ | – | $ | – | $ | 9 | $ | 9 | ||||||||||||||
Equity shareholders |
693 | 501 | 216 | 289 | 87 | 1,786 | ||||||||||||||||||||
Average assets (3)(4)
|
$ | 333,970 | $ | 96,170 | $ | 61,793 | $ | 321,784 | $ | 198,295 | $ | 1,012,012 | ||||||||||||||
$ millions, for the nine months ended |
||||||||||||||||||||||||||
2025 |
Net interest income |
$ |
7,057 |
$ |
2,176 |
$ |
1,646 |
$ |
417 |
$ |
341 |
$ |
11,637 |
|||||||||||||
Jul. 31 |
Non-interest income (1)
|
1,786 |
2,890 |
760 |
4,208 |
276 |
9,920 |
|||||||||||||||||||
Total revenue |
8,843 |
5,066 |
2,406 |
4,625 |
617 |
21,557 |
||||||||||||||||||||
Provision for credit losses |
1,261 |
114 |
208 |
131 |
23 |
1,737 |
||||||||||||||||||||
Amortization and impairment (2)
|
173 |
2 |
71 |
1 |
607 |
854 |
||||||||||||||||||||
Other non-interest expenses |
4,282 |
2,563 |
1,290 |
2,144 |
540 |
10,819 |
||||||||||||||||||||
Income (loss) before income taxes |
3,127 |
2,387 |
837 |
2,349 |
(553 |
) |
8,147 |
|||||||||||||||||||
Income taxes |
816 |
649 |
154 |
624 |
(370 |
) |
1,873 |
|||||||||||||||||||
Net income (loss) |
$ |
2,311 |
$ |
1,738 |
$ |
683 |
$ |
1,725 |
$ |
(183 |
) |
$ |
6,274 |
|||||||||||||
Net income (loss) attributable to: |
||||||||||||||||||||||||||
Non-controlling interests |
$ |
– |
$ |
– |
$ |
– |
$ |
– |
$ |
19 |
$ |
19 |
||||||||||||||
Equity shareholders |
2,311 |
1,738 |
683 |
1,725 |
(202 |
) |
6,255 |
|||||||||||||||||||
Average assets (3)(4)
|
$ |
338,754 |
$ |
102,750 |
$ |
64,654 |
$ |
375,881 |
$ |
216,566 |
$ |
1,098,605 |
||||||||||||||
2024 |
Net interest income (6)
|
$ | 6,353 | $ | 1,556 | $ | 1,400 | $ | 269 | $ | 484 | $ | 10,062 | |||||||||||||
Jul. 31 (5)
|
Non-interest income (1)
|
1,747 | 2,860 | 687 | 3,376 | 257 | 8,927 | |||||||||||||||||||
Total revenue (6)
|
8,100 | 4,416 | 2,087 | 3,645 | 741 | 18,989 | ||||||||||||||||||||
Provision for credit losses |
953 | 99 | 477 | 53 | – | 1,582 | ||||||||||||||||||||
Amortization and impairment (2)
|
174 | 2 | 73 | 6 | 626 | 881 | ||||||||||||||||||||
Other non-interest expenses |
4,069 | 2,241 | 1,230 | 1,821 | 406 | 9,767 | ||||||||||||||||||||
Income (loss) before income taxes |
2,904 | 2,074 | 307 | 1,765 | (291 | ) | 6,759 | |||||||||||||||||||
Income taxes (6)
|
791 | 562 | 7 | 482 | (355 | ) | 1,487 | |||||||||||||||||||
Net income |
$ | 2,113 | $ | 1,512 | $ | 300 | $ | 1,283 | $ | 64 | $ | 5,272 | ||||||||||||||
Net income attributable to: |
||||||||||||||||||||||||||
Non-controlling interests |
$ | – | $ | – | $ | – | $ | – | $ | 31 | $ | 31 | ||||||||||||||
Equity shareholders |
2,113 | 1,512 | 300 | 1,283 | 33 | 5,241 | ||||||||||||||||||||
Average assets (3)(4)
|
$ | 332,894 | $ | 94,686 | $ | 60,454 | $ | 309,523 | $ | 197,263 | $ | 994,820 | ||||||||||||||
| (1) | Includes intersegment revenue, which represents internal sales commissions and revenue allocations under the Product Owner/Customer Segment/Distributor Channel allocation management model. |
| (2) | Comprises amortization and impairment of buildings, right-of-use assets, furniture, equipment, leasehold improvements, and software and other intangible assets. |
| (3) | Assets are disclosed on an average basis as this measure is most relevant to a financial institution and is the measure reviewed by management. |
| (4) | Average balances are calculated as a weighted average of daily closing balances. |
| (5) | Certain prior period information has been restated for the external reporting changes noted above. |
| (6) | Capital Markets net interest income and income taxes includes a reversal of a taxable equivalent basis (TEB) adjustment of $123 million for the three months ended July 31, 2024 and a TEB adjustment of $16 million for the nine months ended July 31, 2024 with equivalent offsets in Corporate and Other. TEB adjustment offset is no longer applied since the third quarter of 2024 upon the enactment of Bill C-59 in June 2024, which eliminated the dividend received deduction for Canadian banks. |
CIBC THIRD QUARTER 2025 |
75 |
Date |
Share purchase option |
Dividend reinvestment & stock dividend options |
||||||||
May 1/25 |
$87.19 |
|||||||||
Jun. 2/25 |
$92.80 |
|||||||||
Jul. 2/25 |
$97.02 |
|||||||||
Jul. 28/25 |
$101.09 |
|||||||||
